UNITED STATES
SECURITIES AND EXCHANGE COMMISSION
Washington, D.C. 20549
FORM N-CSR
CERTIFIED SHAREHOLDER REPORT OF REGISTERED
MANAGEMENT INVESTMENT COMPANIES
Investment Company Act file number 811-07685
Frontegra Funds, Inc.
(Exact name of registrant as specified in charter)
400 Skokie Blvd.
Suite 500
Northbrook, Illinois 60062
(Address of principal executive offices) (Zip code)
William D. Forsyth III
400 Skokie Blvd., Suite 500
Northbrook, Illinois 60062
(Name and address of agent for service)
(847) 509-9860
Registrant's telephone number, including area code
Date of fiscal year end: June 30, 2009
Date of reporting period: June 30, 2009
Item 1. Reports to Stockholders.
ANNUAL REPORT
Frontegra Columbus Core Plus Fund
Frontegra Columbus Core Fund
Frontegra IronBridge Small Cap Fund
Frontegra IronBridge SMID Fund
Frontegra New Star International Equity Fund
Frontegra Netols Small Cap Value Fund
Frontegra Asset Management, Inc.
June 30, 2009
TABLE OF CONTENTS
| Shareholder Letter | 1 |
| Expense Example | 2 |
| Frontegra Columbus Core Plus Fund | |
| Frontegra Columbus Core Fund | |
| Report from Reams Asset Management Company, LLC | 5 |
| Investment Highlights | 7 |
| Schedule of Investments | 8 |
| Statement of Assets and Liabilities | 16 |
| Statement of Operations | 17 |
| Statements of Changes in Net Assets | 18 |
| Financial Highlights | 19 |
| Investment Highlights | 20 |
| Schedule of Investments | 21 |
| Statement of Assets and Liabilities | 26 |
| Statement of Operations | 27 |
| Statements of Changes in Net Assets | 28 |
| Financial Highlights | 29 |
| Frontegra IronBridge Small Cap Fund | |
| Frontegra IronBridge SMID Fund | |
| Report from IronBridge Capital Management, L.P. | 31 |
| Investment Highlights | 34 |
| Schedule of Investments | 35 |
| Statement of Assets and Liabilities | 39 |
| Statement of Operations | 40 |
| Statements of Changes in Net Assets | 41 |
| Financial Highlights | 42 |
| Investment Highlights | 43 |
| Schedule of Investments | 44 |
| Statement of Assets and Liabilities | 48 |
| Statement of Operations | 49 |
| Statements of Changes in Net Assets | 50 |
| Financial Highlights | 51 |
| | |
| Frontegra New Star International Equity Fund | |
| Report from New Star Institutional Managers Limited | 53 |
| Investment Highlights | 55 |
| Schedule of Investments | 56 |
| Portfolio Diversification | 59 |
| Statement of Assets and Liabilities | 60 |
| Statement of Operations | 61 |
| Statements of Changes in Net Assets | 62 |
| Financial Highlights | 63 |
| Frontegra Netols Small Cap Value Fund | |
| Report from Netols Asset Management, Inc. | 65 |
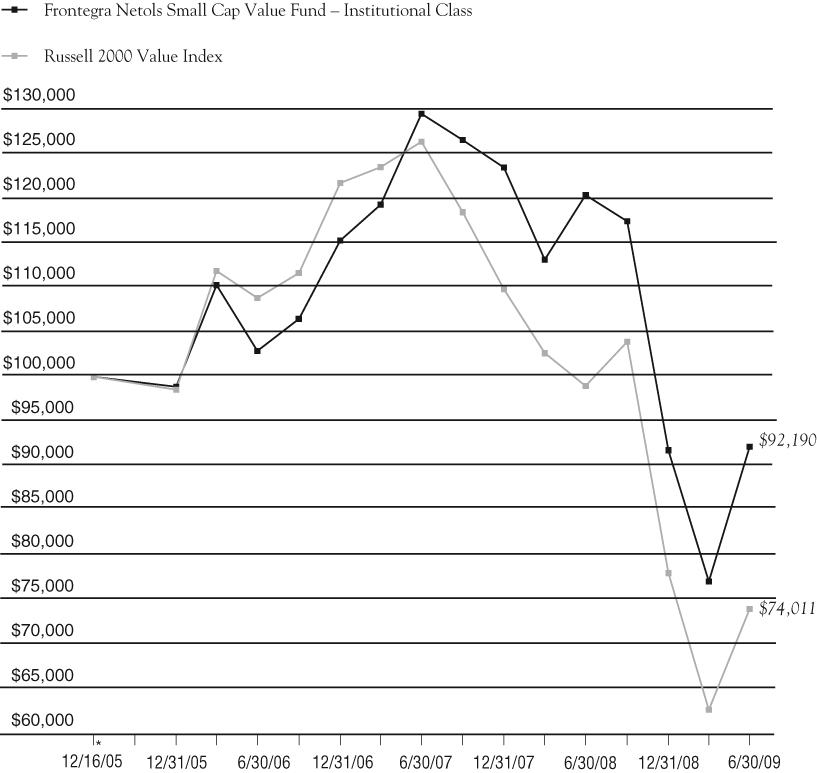
| Investment Highlights | 66 |
| Schedule of Investments | 67 |
| Statement of Assets and Liabilities | 70 |
| Statement of Operations | 71 |
| Statements of Changes in Net Assets | 72 |
| Financial Highlights | 73 |
| Notes to Financial Statements | 75 |
| Report of Independent Registered Public Accounting Firm | 85 |
| Board of Directors’ Approval of Interim and New Subadvisory Agreements and Advisory Agreement | 86 |
| Additional Information | |
| Directors and Officers | 89 |
| Foreign Tax Credit | 92 |
| Qualified Dividend Income/Dividends Received Deduction | 92 |
| Additional Information Applicable to Foreign Shareholders Only | 93 |
| | |
This report is submitted for the general information of the shareholders of the Funds. It is not authorized for distribution to prospective investors unless accompanied or preceded by an effective Prospectus for the applicable Fund. The Prospectus may be obtained by calling 1-888-825-2100. Each Prospectus includes more complete information about management fees and expenses, investment objectives, risks and operating policies of the applicable Fund. Please read the Prospectus carefully.
Frontegra Funds, Inc. are distributed by Frontegra Strategies, LLC, 400 Skokie Blvd., Suite 500, Northbrook, IL 60062. Frontegra Strategies, LLC, member of FINRA and SIPC, is an affiliate of Frontegra Asset Management, Inc., the Funds’ investment adviser.
| This page intentionally left blank. |
DEAR FELLOW SHAREHOLDERS:
We are pleased to report on the progress of the Frontegra Funds over the past twelve months ending June 30, 2009. This has been a particularly volatile period for both equity and bond markets. The S&P 500 Index was down -26.21%, and small capitalization stocks were also down, with the Russell 2000 Index returning -25.01%. International stocks, as measured by the MSCI EAFE Index, returned -30.96% over the same time frame. The U.S. bond market, as measured by the Barclays Capital U.S. Aggregate Bond Index, was up 6.05% for the twelve-month period, due almost entirely to the strength of U.S. Treasury securities; other sectors of the bond market experienced historically negative returns relative to Treasurys.
Fund Results
For the twelve month period ending June 30, 2009, the Funds generated the following net (i.e. after fee) returns:
The Frontegra Columbus Core Plus Fund, managed by Reams Asset Management, returned 10.52% versus the 6.05% return of the Barclays Capital U.S. Aggregate Bond Index. The Frontegra Columbus Core Fund, also managed by Reams Asset Management, returned 8.64%.
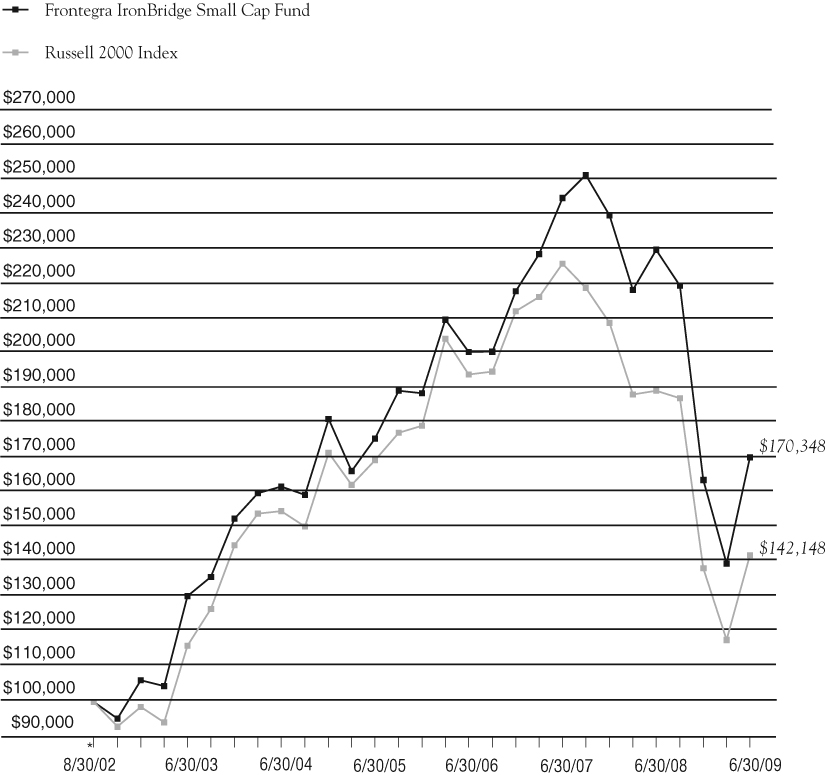
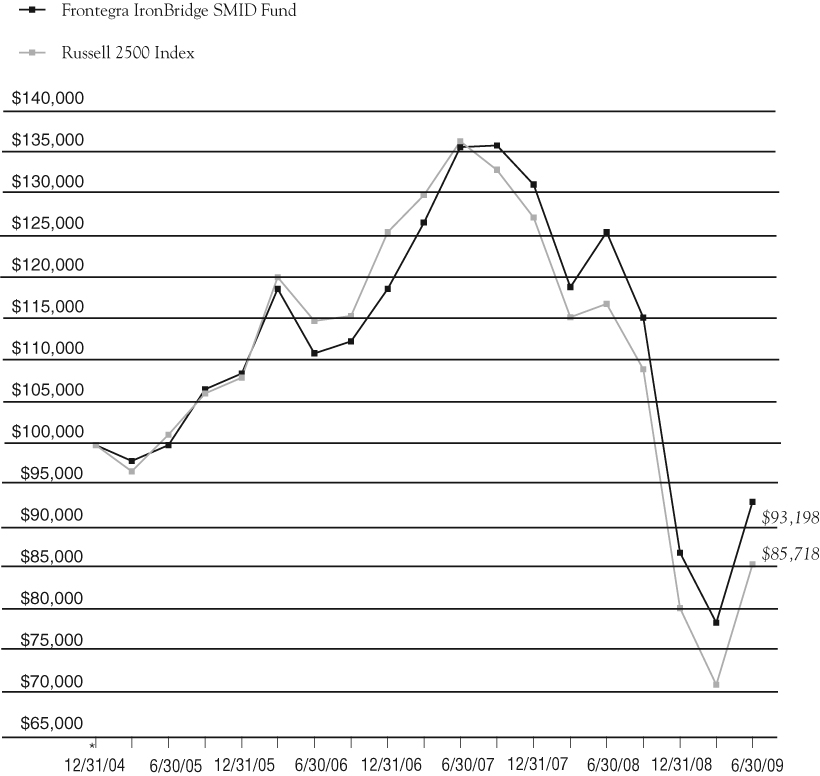
The Frontegra IronBridge Small Cap Fund, managed by IronBridge Capital Management, returned -26.00% versus the -25.01% return for the Russell 2000 Index; the Frontegra IronBridge SMID Fund returned -25.78% versus the Russell 2500 Index return of -26.72%.
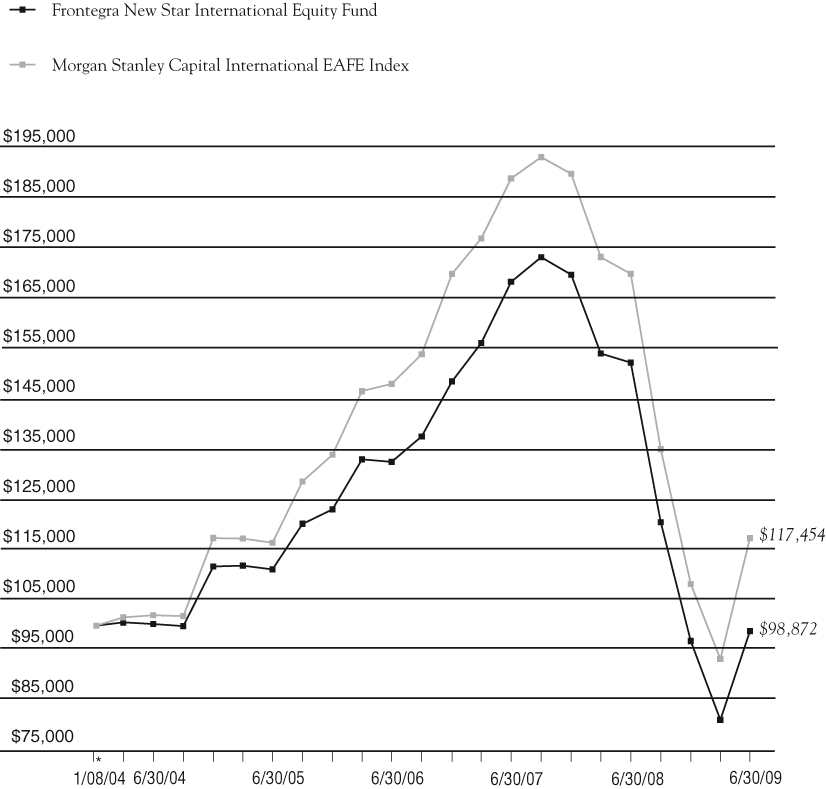
The Frontegra New Star International Equity Fund, managed by New Star Institutional Managers, returned -35.13% versus the benchmark return of -30.96% for the MSCI EAFE Index.
The Frontegra Netols Small Cap Value Fund (Institutional Class), managed by Netols Asset Management, returned -23.42% versus the Russell 2000 Value Index return of - -25.24%.
Outlook
Major economic factors expected to affect the capital markets over the next twelve months include the mortgage and credit crisis, the steep decline in housing prices, the slowing of the economy and the potential rise in inflation. We and the subadvisers of the Frontegra Funds will strive to navigate these turbulent waters with skill and dexterity.
We will continue to oversee the investment management of the Frontegra Funds with the care and diligence that have served our shareholders well in the past. As always, we appreciate your investment and continued confidence in the Frontegra Funds.
Best regards,
 William D. Forsyth, CFA
President
Frontegra Funds, Inc.
Frontegra Funds
EXPENSE EXAMPLE
June 30, 2009
As a shareholder of a mutual fund, you incur two types of costs: (1) transaction costs, including redemption fees, and (2) ongoing costs, including management fees, distribution and/or service (12b-1) fees and other fund expenses. Although the Funds charge no sales loads, you will be assessed fees for outgoing wire transfers, returned checks and stop payment orders at prevailing rates charged by U.S. Bancorp Fund Services, LLC, the Funds’ transfer agent. If you request that a redemption be made by wire transfer, currently the Funds’ transfer agent charges a $15.00 fee. A redemption fee of 2.00% of the then current value of the shares redeemed may be imposed on certain redemptions of shares made within 30 days of purchase for the Frontegra New Star International Equity Fund.
This Example is intended to help you understand your ongoing costs (in dollars) of investing in the Funds and to compare these costs with the ongoing costs of investing in other mutual funds. The Example is based on an investment of $1,000 invested at the beginning of the period and held for the entire period (1/1/09 – 6/30/09).
Actual Expenses
The first line of the table on the following page for each Fund provides information about actual account values and actual expenses. The Example includes management fees, registration fees, fee waivers/reimbursements and other expenses. However, the Example does not include portfolio trading commissions and related expenses and other extraordinary expenses as determined under generally accepted accounting principles. You may use the information in this line, together with the amount you invested, to estimate the expenses that you paid over the period. Simply divide your account value by $1,000 (for example, an $8,600 account value divided by $1,000 = 8.6), then multiply the result by the number in the first line under the heading entitled “Expenses Paid During the Period’’ to estimate the expenses you paid on your account during this period.
Hypothetical Example for Comparison Purposes
The second line of the table for each Fund provides information about hypothetical account values and hypothetical expenses based on each of the Fund’s actual expense ratios and an assumed rate of return of 5% per year before expenses, which is not the actual return. The hypothetical account values and expenses may not be used to estimate the actual ending account balance or expenses you paid for the period. You may use this information to compare the ongoing costs of investing in each of the Funds and other funds. To do so, compare this 5% hypothetical example with the 5% hypothetical examples that appear in the shareholder reports of the other funds. Please note that the expenses shown in the table are meant to highlight your ongoing costs only and do not reflect any transactional costs. Therefore, the second line of the table is useful in comparing ongoing costs only, and will not help you determine the relative total costs of owning different funds. In addition, if these transactional costs were included, your costs could have been higher.
Frontegra Funds
EXPENSE EXAMPLE (continued)
June 30, 2009
| | Beginning Account | Ending Account | Annualized | Expenses Paid |
| Frontegra Fund | Value 1/1/2009 | Value 6/30/2009 | Expense Ratio* | During the Period* |
| | | | | |
| Columbus Core Plus Fund | | | | |
| Actual Fund Return | $1,000.00 | $1,217.70 | 0.35% | $1.92 |
| Hypothetical 5% Return | $1,000.00 | $1,023.06 | 0.35% | $1.76 |
| | | | | |
| Columbus Core Fund | | | | |
| Actual Fund Return | $1,000.00 | $1,174.10 | 0.35% | $1.89 |
| Hypothetical 5% Return | $1,000.00 | $1,023.06 | 0.35% | $1.76 |
| | | | | |
| IronBridge Small Cap Fund | | | | |
| Actual Fund Return | $1,000.00 | $1,039.60 | 1.09% | $5.51 |
| Hypothetical 5% Return | $1,000.00 | $1,019.39 | 1.09% | $5.46 |
| | | | | |
| IronBridge SMID Fund | | | | |
| Actual Fund Return | $1,000.00 | $1,070.20 | 0.95% | $4.88 |
| Hypothetical 5% Return | $1,000.00 | $1,020.08 | 0.95% | $4.76 |
| | | | | |
| New Star International Equity Fund | | | | |
| Actual Fund Return | $1,000.00 | $1,020.90 | 0.75% | $3.76 |
| Hypothetical 5% Return | $1,000.00 | $1,021.08 | 0.75% | $3.76 |
| | | | | |
| Netols Small Cap Value | | | | |
| Fund – Institutional Class | | | | |
| Actual Fund Return | $1,000.00 | $1,004.50 | 1.10% | $5.47 |
| Hypothetical 5% Return | $1,000.00 | $1,019.34 | 1.10% | $5.51 |
| | | | | |
| Netols Small Cap | | | | |
| Value Fund – Class Y | | | | |
| Actual Fund Return | $1,000.00 | $1,001.10 | 1.50% | $7.44 |
| Hypothetical 5% Return | $1,000.00 | $1,017.36 | 1.50% | $7.50 |
| * | Expenses are equal to each Fund’s annualized expense ratio indicated above, multiplied by the average account value over the period, multiplied by 181/365 to reflect the one-half year period. |
FRONTEGRA
COLUMBUS CORE PLUS FUND
FRONTEGRA
COLUMBUS CORE FUND
REPORT FROM REAMS ASSET
MANAGEMENT COMPANY, LLC:
Dear Fellow Shareholders:
The Frontegra Columbus Core Plus Fund strives to achieve a high level of total return consistent with the preservation of capital by investing in a diversified portfolio of fixed income securities of varying maturities. This objective is relative to and measured against the Barclays Capital U.S. Aggregate Bond Index.
The Frontegra Columbus Core Fund strives to achieve a high level of total return consistent with the preservation of capital by investing in a diversified portfolio of investment grade bonds of varying maturities. This objective is relative to and measured against the Barclays Capital U.S. Aggregate Bond Index.
Performance Review
For the 12 month fiscal year ending June 30, 2009, the Frontegra Columbus Core Plus Fund had a net return of 10.52% compared to a return of 6.05% for the Barclays Capital U.S. Aggregate Bond Index. The difference in performance was 4.47%. Macro factors were mixed for the period, with duration strategy adding 32 basis points as the portfolio was positioned defensively and rates rose. Yield curve strategy subtracted 72 basis points. Sector decisions subtracted 190 basis points while security selection added 712 basis points. Within these categories, the high yield sector added 585 basis points and investment grade holdings added 245 basis points as spreads tightened in their overweighted sectors. Government-related holdings added 41 basis points and asset backed holdings added 12 basis points to performance. Commercial mortgage backed securities (“CMBS”) subtracted 249 basis points from performance as strong performance in the 2Q of 2009 could not offset the negative performance in the previous three quarters. Mortgage backed securities (“MBS”) holdings subtracted 112 basis points from performance as spreads tightened in this under-weighted sector.
For the 12 month fiscal year ending June 30, 2009, the Frontegra Columbus Core Fund had a net return of 8.64% compared to a return of 6.05% for the Barclays Capital U.S. Aggregate Bond Index. The difference in performance was 2.59%. Macro factors were mixed for the period, with duration strategy adding 14 basis points as the portfolio was positioned defensively and rates rose. Yield curve strategy subtracted 50 basis points. Sector decisions subtracted 287 basis points and security selection added 617 basis points. Within these categories, the investment grade sector added 740 basis points to performance as the sector outperformed and was overweighted. Government-related holdings added 19 basis points and Asset-Backed Securities added 9 basis points. CMBS subtracted 339 basis points from performance as strong performance in the second quarter of 2009 could not offset the negative performance in the previous three quarters. MBS holdings subtracted 99 basis points from performance as spreads tightened in this underweighted sector.
Fixed Income Outlook
U.S. fixed income markets experienced significant outperformance in all non government-guaranteed sectors in the second quarter 2009. This was a sharp reversal from the negative performance these sectors witnessed in the previous quarter. The financial system saw liquidity begin to slowly return during the second quarter after the near freezing of these markets during the worst of the credit crisis. The return of liquidity was most important for financial companies.
| • | We believe spreads reached their crest last November driven by technical considerations more so than fundamental. The collapse of two broker-dealers, coupled with the unprecedented deleveraging that transpired, appeared to be a major driver of spreads. The financial firms that were at the epicenter of the crisis experienced a loss of confidence early in the year, but government support through multiple programs designed to improve liquidity took hold and sentiment steadily improved. The financial sector was further helped by the release of the bank stress test results in early May. The results were better than initial concerns and helped to restore confidence to the battered financial sector. Many banks quickly demonstrated their ability to raise capital, issuing debt and equity offerings, while some affected exchange offers of debt into common stock. In June, ten banks were given approval to repay TARP (Troubled Asset Relief Program) funds as many financial firms were able to raise needed capital. |
| • | The improvement in sentiment in financial firms provided the backdrop for corporate spreads to tighten 235 basis points in the quarter. The high yield sector had its best month on record in April and spreads tightened 570 basis points in the quarter. Notwithstanding the |
| | strong returns experienced in both high yield and investment grade corporate bonds during the last three months, spreads remain wide on a historic basis. Although the healing has commenced, the ultimate repair to the markets will take multiple quarters. |
| • | CMBS spreads tightened 285 basis points over the past three months as the market became increasingly confident that these securities would be included in the Federal Reserve’s TALF (Term Asset-Backed Securities Loan Facility) program. Although official inclusion of the securities in the program was not announced until May, much of the improved returns for this sector were based on the anticipation of this inclusion in the program. Despite the sharp spread tightening from exceptionally wide levels, CMBS spreads remain attractive on a historic basis. MBS spreads tightened 65 basis points during the last three months to levels that are currently very tight. |
| • | Long-term Treasury rates rose during the quarter as market participants began to look past the current economic slowdown and also became increasingly focused on the future supply the Treasury will need to issue to pay for current spending. The Fed attempted to combat the higher rates in March by announcing plans to buy an additional $750 billion in agency MBS and $300 billion in Treasurys. The initial news moved long Treasury rates down, but the overwhelming size of market forces quickly reversed this move and rates continued higher. A steeper yield curve resulted since the Fed funds target rate remained at 0-0.25%, keeping short rates anchored at very low levels. |
Columbus Core Plus Portfolio Strategy
| • | Credit exposure remains heavily overweighted with an emphasis on investment grade financial issuers. We continue to view the investment grade credit sector as the most attractive opportunity in the fixed income markets going forward. |
| • | High yield holdings have been reduced as spreads have tightened on the considerable outperformance for this sector. High yield holdings remain diversified over many sectors and industries. |
| • | In the mortgage market, the CMBS sector continues to be overweighted. While we view this as an attractive sector, spreads have tightened significantly prompting us to reduce the magnitude of our overweight. All holdings in this sector remain at the senior-most structural level. |
| • | We continue to be underweighted in the Treasury sector, but some of the proceeds from the CMBS sales have been re-invested in this sector. Mortgage pass-through holdings remain in an underweight position as we believe these spreads to be very unattractive relative to corporate and CMBS holdings. |
Columbus Core Portfolio Strategy
| • | Credit exposure remains heavily overweighted with an emphasis on investment grade financial issuers. We continue to view the investment grade credit sector as the most attractive opportunity in the fixed income markets going forward. |
| • | In the mortgage market, the CMBS sector continues to be overweighted. While we view this as an attractive sector, spreads have tightened significantly prompting us to reduce the magnitude of our overweight. All holdings in this sector remain at the senior-most structural level. |
| • | We continue to be underweighted in the Treasury sector, but some of the proceeds from the CMBS sales have been re-invested in this sector. |
| • | Mortgage pass-through holdings remain in an underweight position as we believe these spreads to be very unattractive relative to corporate and CMBS holdings. |
We appreciate your continued support as fellow shareholders in the Funds.
Regards,
 |  |
| Mark M. Egan, CFA, CPA | Robert A. Crider, CFA |
| Reams Asset Management Company, LLC | Reams Asset Management Company, LLC |
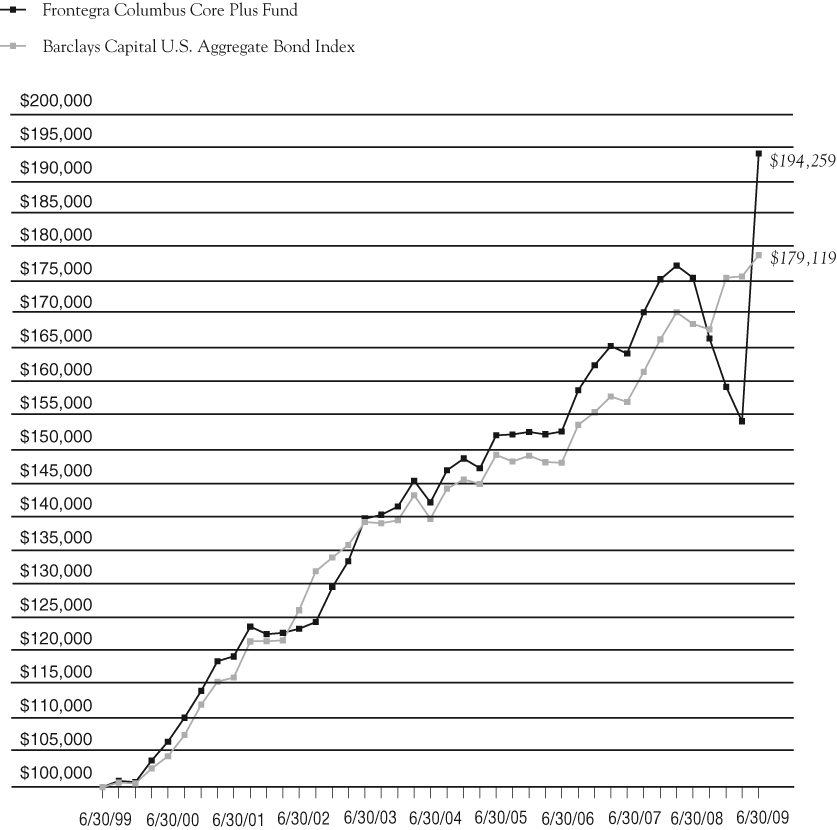
INVESTMENT HIGHLIGHTS
Growth of a $100,000 Investment (Unaudited)
| | | | | |
| | Portfolio Total Return* | | | |
| | FOR PERIODS ENDED 6/30/09 | FUND | INDEX | |
| | | | | |
| | SIX MONTHS | 21.77% | 1.90% | |
| | | | | |
| | ONE YEAR | 10.52% | 6.05% | |
| | | | | |
| | FIVE YEAR | | | |
| | AVERAGE ANNUAL | 6.41% | 5.01% | |
| | | | | |
| | TEN YEAR | | | |
| | AVERAGE ANNUAL | 6.86% | 5.98% | |
| | | | | |
This chart assumes an initial gross investment of $100,000 made on 6/30/99. Returns shown include the reinvestment of all distributions. Past performance is not predictive of future results. Investment return and principal value will fluctuate so that shares, when redeemed, may be worth more or less than the original cost. In the absence of existing fee waivers, total return would be reduced. To receive current to the most recent month-end performance, please call 1-888-825-2100.
The Barclays Capital U.S. Aggregate Bond Index (formerly the Lehman Brothers Aggregate Bond Index) is an unmanaged market value-weighted performance benchmark for investment-grade fixed-rate debt issues, including government, corporate, asset backed and mortgage backed securities, with maturities of at least one year. The Index does not reflect investment management fees, brokerage commissions and other expenses associated with investing in fixed income securities. A direct investment in the index is not possible.
| * | The returns shown do not reflect the deduction of taxes that a shareholder would pay on Fund distributions or the redemption of Fund shares. |
Frontegra Columbus Core Plus Fund
SCHEDULE OF INVESTMENTS
June 30, 2009
| Principal Amount | | Value | |
| | | | | | |
| ASSET BACKED SECURITIES 3.7% | | | |
| | | Americredit Automobile | | | |
| | | Receivables Trust | | | |
| $ | 1,630,000 | | 2008-AF, Class A4, | | | |
| | | | 6.960%, 10/14/2014 | | $ | 1,488,543 | |
| | | | Countrywide | | | | |
| | | | Asset-Backed Certificates | | | | |
| | 492,108 | | 2006-S3, Class A1, | | | | |
| | | | 0.424%, 06/25/2021 (c) | | | 307,009 | |
| | 576,304 | | 2006-S2, Class A2, | | | | |
| | | | 5.627%, 07/25/2027 | | | 406,128 | |
| | 4,449,261 | | 2006-S2, Class A3, | | | | �� |
| | | | 5.841%, 07/25/2027 | | | 1,086,793 | |
| | 1,909,617 | | 2006-S2, Class A4, | | | | |
| | | | 6.091%, 07/25/2027 | | | 317,428 | |
| | 1,148,889 | | 2006-S5, Class A3, | | | | |
| | | | 5.762%, 06/25/2035 | | | 242,873 | |
| | 3,296,290 | | 2006-S7, Class A3, | | | | |
| | | | 5.712%, 11/25/2035 (c) | | | 621,836 | |
| | 1,765,949 | | 2007-S2, Class A, | | | | |
| | | | 5.779%, 05/25/2037 | | | 629,752 | |
| | | | GMAC Mortgage | | | | |
| | | | Corporation Loan Trust | | | | |
| | 1,295,000 | | 2006-HE2, Class A3, | | | | |
| | | | 6.320%, 05/25/2036 | | | 396,700 | |
| | 2,270,000 | | 2006-HE3, Class A3, | | | | |
| | | | 5.805%, 10/25/2036 | | | 748,749 | |
| | | | GSAA Home Equity Trust | | | | |
| | 1,370,712 | | 2006-S1, Class 1A1, | | | | |
| | | | 0.474%, 01/25/2037 | | | 235,716 | |
| | | | Hertz Vehicle Financing LLC | | | | |
| | 715,000 | | 2005-1A, Class A4, 0.564%, | | | | |
| | | | 11/25/2011 (Acquired 08/21/2008 and | | | | |
| | | | 12/10/2008, Cost $645,183) (a)(c) | | | 643,586 | |
| | 880,000 | | 2005-2A, Class A5, 0.564%, | | | | |
| | | | 11/25/2011 (Acquired 08/01/2008 and | | | | |
| | | | 12/10/2008, Cost $810,589) (a)(c) | | | 817,606 | |
| | 2,715,000 | | 2005-2A, Class A6, 5.080%, | | | | |
| | | | 11/25/2011 (Acquired Multiple | | | | |
| | | | Dates, Cost $2,643,134) (a) | | | 2,648,768 | |
| | | | Home Equity Mortgage Trust | | | | |
| | 1,440,000 | | 2005-5, Class A1F2, | | | | |
| | | | 5.150%, 04/25/2036 | | | 249,404 | |
| | 4,606,040 | | 2006-5, Class A1, | | | | |
| | | | 5.500%, 01/25/2037 | | | 595,085 | |
| | | | Keystone Owner Trust | | | | |
| | 6,759 | | 1998-P1, Class M1, 7.530%, | | | | |
| | | | 05/25/2025 (Acquired 12/10/2008, | | | | |
| | | | Cost $5,762) (a) | | | 6,039 | |
| | | | Mid-State Trust | | | | |
| | 868,147 | | 11, Class A1, 4.864%, 07/15/2038 | | | 470,001 | |
| | | | Residential Funding | | | | |
| | | | Mortgage Securities | | | | |
| | 300,035 | | 2005-HS1, Class AI2, | | | | |
| | | | 4.660%, 07/25/2020 | | | 252,967 | |
| | 704,377 | | 2003-HS1, Class AI6, | | | | |
| | | | 3.830%, 02/25/2033 | | | 474,472 | |
| | 630,000 | | 2005-HS1, Class AI4, | | | | |
| | | | 5.110%, 09/25/2035 | | | 91,258 | |
| | 1,350,000 | | 2006-HSA1, Class A3, | | | | |
| | | | 5.230%, 02/25/2036 | | | 476,952 | |
| | 2,169,360 | | 2006-HSA1, Class A5, | | | | |
| | | | 5.310%, 02/25/2036 | | | 652,547 | |
| | 1,460,000 | | 2006-HSA1, Class A4, | | | | |
| | | | 5.490%, 02/25/2036 | | | 246,306 | |
| | 590,000 | | 2006-HSA2, Class AI3, | | | | |
| | | | 5.550%, 03/25/2036 | | | 186,454 | |
| | 820,000 | | 2006-HSA2, Class AI4, | | | | |
| | | | 5.810%, 03/25/2036 | | | 68,074 | |
| | | | Saco I Trust | | | | |
| | 1,427,280 | | 2006-9, Class A1, | | | | |
| | | | 0.464%, 08/25/2036 | | | 188,348 | |
| | | | Total Asset Backed Securities | | | | |
| | | | (Cost $17,251,907) | | | 14,549,394 | |
The accompanying notes are an integral part of these financial statements.
Frontegra Columbus Core Plus Fund
SCHEDULE OF INVESTMENTS (continued)
June 30, 2009
| Principal Amount | | Value | |
| | | | | | |
| CORPORATE BONDS 61.7% | | | |
| | | | | | |
| | | Airlines 4.9% | | | |
| | | American Airlines | | | |
| $ | 2,420,000 | | 10.375%, 07/02/2019 | | $ | 2,420,000 | |
| | | | Continental Airlines | | | | |
| | 3,565,000 | | 5.983%, 04/19/2022 | | | 2,941,125 | |
| | | | Delta Air Lines, Inc. | | | | |
| | 7,489,941 | | Series 2002-1, 6.718%, 07/02/2024 | | | 5,692,355 | |
| | | | Northwest Airlines, Inc. | | | | |
| | 5,856,605 | | 7.027%, 11/01/2019 | | | 4,538,869 | |
| | | | United Airlines | | | | |
| | 4,999,634 | | 6.636%, 07/02/2022 | | | 3,749,726 | |
| | | | | | | 19,342,075 | |
| | | | Auto Components 0.2% | | | | |
| | | | Arvinmeritor, Inc. | | | | |
| | 300,000 | | 8.125%, 09/15/2015 | | | 157,500 | |
| | | | TRW Automotive Inc. | | | | |
| | 995,000 | | 7.250%, 03/15/2017 (Acquired | | | | |
| | | | Multiple Dates, Cost $868,077) (a) | | | 686,550 | |
| | | | | | | 844,050 | |
| | | | Building Products 0.2% | | | | |
| | | | USG Corp. | | | | |
| | 1,070,000 | | 7.750%, 01/15/2018 | | | 909,500 | |
| | | | | | | | |
| | | | Commercial Banks 9.2% | | | | |
| | | | Barclays Bank PLC | | | | |
| | 280,000 | | 6.050%, 12/04/2017 (Acquired | | | | |
| | | | 10/31/2008 and 12/10/2008, | | | | |
| | | | Cost $225,628) (a)(b)(c) | | | 242,807 | |
| | 9,845,000 | | 7.434%, 12/15/2017 | | | | |
| | | | (Acquired Multiple Dates, | | | | |
| | | | Cost $6,405,461) (a)(b) | | | 6,596,150 | |
| | 3,395,000 | | 6.750%, 05/22/2019 (b) | | | 3,367,066 | |
| | | | BB&T Corp. | | | | |
| | 3,045,000 | | 6.850%, 04/30/2019 | | | 3,166,690 | |
| | | | Deutsche Bank, LLC | | | | |
| | 4,785,000 | | 5.628%, 01/19/2016 (Acquired | | | | |
| | | | Multiple Dates, Cost $3,235,018) (a) | | | 3,110,250 | |
| | | | Manufacturers & Traders Trust Co. | | | | |
| | 2,200,000 | | 2.708%, 04/01/2013 | | | | |
| | | | (Acquired Multiple Dates, | | | | |
| | | | Cost $2,015,279) (a)(c) | | | 1,729,171 | |
| | 1,685,000 | | 5.629%, 12/01/2021 (c) | | | 1,271,660 | |
| | | | Marshall & Ilsley Bank | | | | |
| | 6,235,000 | | 0.916%, 12/04/2012 (c) | | | 4,334,759 | |
| | | | Regions Bank | | | | |
| | 1,955,000 | | 7.500%, 05/15/2018 | | | 1,722,906 | |
| | | | Wachovia Corp. | | | | |
| | 9,989,000 | | 5.800%, 03/29/2049 | | | 5,993,400 | |
| | | | Wells Fargo Alternative Loan Trust | | | | |
| | 5,560,000 | | 7.700%, 12/29/2049 (c) | | | 4,614,800 | |
| | 500,000 | | 7.980%, 12/31/2049 (c) | | | 415,000 | |
| | | | | | | 36,564,659 | |
| | | | Computers & Peripherals 0.3% | | | | |
| | | | Tyco Electronics Group SA | | | | |
| | 1,135,000 | | 5.950%, 01/15/2014 (b) | | | 1,059,946 | |
| | | | | | | | |
| | | | Consumer Finance 6.1% | | | | |
| | | | American Express Co. | | | | |
| | 3,975,000 | | 8.125%, 05/20/2019 | | | 4,124,973 | |
| | | | Ford Motor Credit Co. | | | | |
| | 3,580,000 | | 7.800%, 06/01/2012 | | | 3,080,307 | |
| | 650,000 | | 7.000%, 10/01/2013 | | | 522,621 | |
| | 10,820,000 | | 8.000%, 12/15/2016 | | | 8,272,204 | |
| | | | GMAC LLC | | | | |
| | 10,557,000 | | 6.750%, 12/01/2014 | | | | |
| | | | (Acquired Multiple Dates, | | | | |
| | | | Cost $8,353,146) (a) | | | 8,287,245 | |
| | | | | | | 24,287,350 | |
| | | | Diversified Financial Services 14.9% | | | | |
| | | | American General Finance | | | | |
| | 3,680,000 | | 5.200%, 12/15/2011 | | | 2,310,278 | |
| | 1,350,000 | | 5.900%, 09/15/2012 | | | 805,752 | |
| | 210,000 | | 5.375%, 10/01/2012 | | | 123,827 | |
| | 4,115,000 | | 6.900%, 12/15/2017 | | | 2,228,198 | |
The accompanying notes are an integral part of these financial statements.
Frontegra Columbus Core Plus Fund
SCHEDULE OF INVESTMENTS (continued)
June 30, 2009
| Principal Amount | | Value | |
| | | | | | |
| CORPORATE BONDS 61.7% (continued) | | | |
| | | | |
| | | Diversified Financial | | | |
| | | Services 14.9% (continued) | | | |
| | | Bank of America Corp. | | | |
| $ | 6,315,000 | | 5.750%, 12/01/2017 | | $ | 5,623,053 | |
| | 3,265,000 | | 5.420%, 03/15/2017 | | | 2,711,393 | |
| | 2,025,000 | | 7.625%, 06/01/2019 | | | 2,034,034 | |
| | | | CIT Group Inc. | | | | |
| | 1,110,000 | | 1.306%, 11/03/2010 | | | 827,931 | |
| | 635,000 | | 5.600%, 11/02/2011 (b) | | | 466,036 | |
| | 990,000 | | 1.170%, 02/13/2012 | | | 584,148 | |
| | 2,840,000 | | 7.625%, 11/30/2012 | | | 1,944,679 | |
| | 1,655,000 | | 1.010%, 12/21/2012 | | | 927,296 | |
| | | | Citigroup, Inc. | | | | |
| | 9,800,000 | | 8.500%, 05/22/2019 | | | 9,968,942 | |
| | | | Credit Suisse Guernsey | | | | |
| | 10,179,000 | | 5.860%, 05/15/2017 (b)(c) | | | 6,616,350 | |
| | | | Credit Suisse New York | | | | |
| | 60,000 | | 6.000%, 02/15/2018 (b) | | | 59,900 | |
| | | | General Motors Acceptance Corp. | | | | |
| | 785,000 | | 6.875%, 08/28/2012 | | | 639,759 | |
| | 3,605,000 | | 6.750%, 12/01/2014 | | | 2,771,437 | |
| | | | International Lease Finance Corp. | | | | |
| | 815,000 | | 4.750%, 01/13/2012 | | | 641,931 | |
| | 2,925,000 | | 5.350%, 03/01/2012 | | | 2,283,115 | |
| | 995,000 | | 5.300%, 05/01/2012 | | | 771,291 | |
| | 4,280,000 | | 5.625%, 09/20/2013 | | | 3,233,360 | |
| | 2,000,000 | | 6.625%, 11/15/2013 | | | 1,539,416 | |
| | | | JPMorgan Chase & Co. | | | | |
| | 2,495,000 | | 6.300%, 04/23/2019 | | | 2,509,531 | |
| | | | Lehman Brothers Holdings | | | | |
| | 7,000,000 | | 6.875%, 05/02/2018 (e) | | | 1,120,000 | |
| | | | PNC Funding Corp. | | | | |
| | 1,975,000 | | 6.700%, 06/10/2019 | | | 2,037,013 | |
| | | | Societe Generale | | | | |
| | 7,060,000 | | 5.922%, 04/05/2017 | | | | |
| | | | (Acquired Multiple Dates, | | | | |
| | | | Cost $3,275,520) (a)(b)(c) | | | 4,377,200 | |
| | | | | | | 59,155,870 | |
| | | | Diversified Telecommunication | | | | |
| | | | Services 3.0% | | | | |
| | | | British Telecom PLC | | | | |
| | 3,370,000 | | 5.950%, 01/15/2018 (b) | | | 3,037,186 | |
| | | | Deutsche Telekom | | | | |
| | | | International Finance B.V. | | | | |
| | 6,570,000 | | 6.000%, 07/08/2019 (b) | | | 6,628,473 | |
| | | | Qwest Corporation | | | | |
| | 3,115,000 | | 7.125%, 11/15/2043 | | | 2,164,925 | |
| | | | | | | 11,830,584 | |
| | | | Electric Utilities 1.3% | | | | |
| | | | AES Eastern Energy | | | | |
| | 705,811 | | 9.000%, 01/02/2017 | | | 656,404 | |
| | | | Entergy Louisiana LLC | | | | |
| | 590,000 | | 5.500%, 04/01/2019 | | | 556,702 | |
| | | | Great River Energy | | | | |
| | 490,000 | | 7.233%, 07/01/2038 (Acquired | | | | |
| | | | 4/23/2008 and 12/10/2008, | | | | |
| | | | Cost $493,609) (a) | | | 476,216 | |
| | | | Indianapolis Power & Light Co. | | | | |
| | 1,100,000 | | 6.050%, 10/01/2036 (Acquired | | | | |
| | | | Multiple Dates, Cost $1,060,828) (a) | | | 852,188 | |
| | | | Mackinaw Power LLC | | | | |
| | 1,203,094 | | 6.296%, 10/31/2023 (Acquired | | | | |
| | | | Multiple Dates, Cost $1,158,461) (a) | | | 991,963 | |
| | | | Tenaska Gateway Partners Ltd. | | | | |
| | 566,065 | | 6.052%, 12/30/2023 (Acquired | | | | |
| | | | 05/31/2007 and 08/03/2007, | | | | |
| | | | Cost $566,065) (a) | | | 475,942 | |
| | | | Windsor Financing LLC | | | | |
| | 1,060,497 | | 5.881%, 07/15/2017 (Acquired | | | | |
| | | | 02/07/2006 and 08/03/2007, | | | | |
| | | | Cost $1,064,469) (a) | | | 932,919 | |
| | | | | | | 4,942,334 | |
| | | | Food & Staples Retailing 0.1% | | | | |
| | | | CVS Caremark Corp. | | | | |
| | 179,751 | | 6.943%, 01/10/2030 (Acquired | | | | |
| | | | 03/05/2009, Cost $142,226) (a) | | | 162,645 | |
The accompanying notes are an integral part of these financial statements.
Frontegra Columbus Core Plus Fund
SCHEDULE OF INVESTMENTS (continued)
June 30, 2009
| Principal Amount | | Value | |
| | | | | | |
| CORPORATE BONDS 61.7% (continued) | | | |
| | | | | | |
| | | Gas Utilities 0.1% | | | |
| | | Source Gas LLC | | | |
| $ | 765,000 | | 5.900%, 04/01/2017 (Acquired | | | |
| | | | Multiple Dates, Cost $744,555) (a) | | $ | 579,455 | |
| | | | | | | | |
| | | | Industrial Consumer | | | | |
| | | | Services 1.3% | | | | |
| | | | ERAC USA Finance Company | | | | |
| | 5,480,000 | | 6.375%, 10/15/2017 | | | | |
| | | | (Acquired Multiple Dates, | | | | |
| | | | Cost $4,717,157) (a) | | | 4,947,930 | |
| | | | | | | | |
| | | | Insurance 13.3% | | | | |
| | | | Aflac, Inc. | | | | |
| | 3,025,000 | | 8.500%, 05/15/2019 | | | 3,232,315 | |
| | | | AIG, Inc. | | | | |
| | 1,755,000 | | 6.300%, 05/10/2011 (Acquired | | | | |
| | | | Multiple Dates, Cost $1,589,159) (a) | | | 1,648,744 | |
| | | | Allstate Corp. | | | | |
| | 2,715,000 | | 7.450%, 05/16/2019 | | | 2,937,250 | |
| | | | ASIF I | | | | |
| | 280,000 | | 1.242%, 07/26/2010 | | | 253,400 | |
| | | | ASIF Global Financing XIX | | | | |
| | 330,000 | | 4.900%, 01/17/2013 (Acquired | | | | |
| | | | 05/01/2009, Cost $239,007) (a) | | | 280,741 | |
| | | | Farmers Insurance Exchange | | | | |
| | 485,000 | | 8.625%, 05/01/2024 (Acquired | | | | |
| | | | 04/20/2009, Cost $313,509) (a) | | | 391,308 | |
| | 1,570,000 | | 7.050%, 07/15/2028 (Acquired | | | | |
| | | | 04/17/2009 and 04/20/2009, | | | | |
| | | | Cost $960,968) (a) | | | 1,086,870 | |
| | | | Genworth Global Funding | | | | |
| | 545,000 | | 5.200%, 10/08/2010 | | | 531,007 | |
| | 430,000 | | 5.250%, 05/15/2012 | | | 404,326 | |
| | | | Hartford Financial Services Group | | | | |
| | 1,400,000 | | 5.375%, 03/15/2017 | | | 1,110,159 | |
| | 2,020,000 | | 6.300%, 03/15/2018 | | | 1,642,610 | |
| | 540,000 | | 6.000%, 10/15/2036 | | | 368,698 | |
| | 540,000 | | 6.100%, 10/01/2041 | | | 373,216 | |
| | 875,000 | | 8.125%, 06/15/2068 (c) | | | 612,500 | |
| | | | Hartford Life Global Funding | | | | |
| | 430,000 | | 0.729%, 03/15/2011 (c) | | | 392,140 | |
| | | | Jackson National Life Global Funding | | | | |
| | 860,000 | | 5.125%, 02/10/2011 (Acquired | | | | |
| | | | Multiple Dates, Cost $856,179) (a) | | | 831,714 | |
| | 930,000 | | 5.375%, 05/08/2013 (Acquired | | | | |
| | | | 05/01/2008 and 12/10/2008, | | | | |
| | | | Cost $924,074) (a) | | | 895,227 | |
| | | | Lincoln National Corp. | | | | |
| | 1,135,000 | | 8.750%, 07/01/2019 | | | 1,144,617 | |
| | 4,195,000 | | 6.050%, 04/20/2067 | | | 2,663,825 | |
| | | | Metlife, Inc. | | | | |
| | 460,000 | | 6.817%, 08/15/2018 | | | 463,270 | |
| | 5,842,000 | | 7.875%, 12/15/2037 | | | | |
| | | | (Acquired Multiple Dates, | | | | |
| | | | Cost $3,966,802) (a)(c) | | | 4,732,020 | |
| | 3,205,000 | | 9.250%, 04/08/2038 | | | | |
| | | | (Acquired Multiple Dates, | | | | |
| | | | Cost $2,104,047) (a)(c) | | | 2,852,450 | |
| | | | Metropolitan Life Global Funding | | | | |
| | 4,380,000 | | 5.125%, 06/10/2014 (Acquired | | | | |
| | | | 06/03/2009 and 06/04/2009, | | | | |
| | | | Cost $4,374,846) (a) | | | 4,345,915 | |
| | | | Monumental Global Funding | | | | |
| | 1,455,000 | | 1.262%, 01/25/2013 | | | | |
| | | | (Acquired Multiple Dates, | | | | |
| | | | Cost $1,355,433) (a)(c) | | | 1,109,109 | |
| | 1,605,000 | | 5.500%, 04/22/2013 (Acquired | | | | |
| | | | Multiple Dates, Cost $1,603,246) (a) | | | 1,548,594 | |
| | 885,000 | | 5.250%, 01/15/2014 (Acquired | | | | |
| | | | 05/06/2009 and 06/10/2009, | | | | |
| | | | Cost $823,112) (a) | | | 834,728 | |
| | | | Nationwide Financial Services, Inc. | | | | |
| | 645,000 | | 6.750%, 05/15/2067 | | | 381,048 | |
The accompanying notes are an integral part of these financial statements.
Frontegra Columbus Core Plus Fund
SCHEDULE OF INVESTMENTS (continued)
June 30, 2009
| Principal Amount | | Value | |
| | | | | | |
| CORPORATE BONDS 61.7% (continued) | | | |
| | | | | | |
| | | Insurance 13.3% (continued) | | | |
| | | Nationwide Life Global Fund | | | |
| $ | 340,000 | | 1.199%, 10/09/2009 (Acquired | | | |
| | | | 02/18/2009, Cost $327,414) (a)(c) | | $ | 338,274 | |
| | 795,000 | | 5.450%, 10/02/2012 (Acquired | | | | |
| | | | 09/25/2007 and 12/10/2008, | | | | |
| | | | Cost $792,876) (a) | | | 778,608 | |
| | | | Nationwide Mutual Insurance Co. | | | | |
| | 895,000 | | 7.875%, 04/01/2033 (Acquired | | | | |
| | | | 05/07/2009, Cost $591,075) (a) | | | 634,110 | |
| | 415,000 | | 6.600%, 04/15/2034 (Acquired | | | | |
| | | | 04/28/2009, Cost $240,916) (a) | | | 249,377 | |
| | | | Pricoa Global Funding I | | | | |
| | 1,955,000 | | 5.400%, 10/18/2012 | | | | |
| | | | (Acquired Multiple Dates, | | | | |
| | | | Cost $1,945,087) (a) | | | 1,896,682 | |
| | 3,180,000 | | 5.450%, 06/11/2014 (Acquired | | | | |
| | | | 06/04/2009 and 06/05/2009, | | | | |
| | | | Cost $3,170,509) (a) | | | 3,174,502 | |
| | | | Protective Life Corp. | | | | |
| | 855,000 | | 5.450%, 09/28/2012 | | | 853,628 | |
| | | | Prudential Financial, Inc. | | | | |
| | 1,265,000 | | 6.100%, 06/15/2017 | | | 1,203,458 | |
| | 2,510,000 | | 6.000%, 12/01/2017 | | | 2,361,300 | |
| | 1,040,000 | | 7.375%, 06/15/2019 | | | 1,021,103 | |
| | 980,000 | | 8.875%, 06/15/2068 | | | 813,400 | |
| | | | Torchmark Corp. | | | | |
| | 2,485,000 | | 9.250%, 06/15/2019 | | | 2,536,862 | |
| | | | | | | 52,929,105 | |
| | | | Media 1.1% | | | | |
| | | | Time Warner, Inc. | | | | |
| | 365,000 | | 9.150%, 02/01/2023 | | | 395,757 | |
| | 1,585,000 | | 7.700%, 05/01/2032 | | | 1,557,525 | |
| | | | Viacom, Inc. | | | | |
| | 2,430,000 | | 6.250%, 04/30/2016 | | | 2,393,939 | |
| | | | | | | 4,347,221 | |
| | | | | | | | |
| | | | | | | | |
| | | | Metals & Mining 1.2% | | | | |
| | | | Alcoa Inc. | | | | |
| | 2,690,000 | | 6.750%, 07/15/2018 | | | 2,386,517 | |
| | 1,175,000 | | 5.950%, 02/01/2037 | | | 800,570 | |
| | | | U.S. Steel Corp. | | | | |
| | 1,830,000 | | 5.650%, 06/01/2013 | | | 1,647,044 | |
| | | | | | | 4,834,131 | |
| | | | Multi-Utilities & | | | | |
| | | | Unregulated Power 1.2% | | | | |
| | | | Borger Energy Funding | | | | |
| | 2,545,716 | | 7.260%, 12/31/2022 (Acquired | | | | |
| | | | 08/14/2008 and 12/10/2008, | | | | |
| | | | Cost $2,450,094) (a) | | | 2,208,409 | |
| | | | Homer City Funding LLC | | | | |
| | 2,074,800 | | 8.137%, 10/01/2019 | | | 1,867,320 | |
| | | | Kiowa Power Partners LLC | | | | |
| | 686,659 | | 4.811%, 12/30/2013 (Acquired | | | | |
| | | | Multiple Dates, Cost $685,060) (a) | | | 632,715 | |
| | | | | | | 4,708,444 | |
| | | | Oil, Gas & Consumable Fuels 1.0% | | | | |
| | | | Tennessee Gas Pipeline Co. | | | | |
| | 1,110,000 | | 7.500%, 04/01/2017 | | | 1,161,334 | |
| | | | USX Marathon Group | | | | |
| | 665,000 | | 8.125%, 07/15/2023 | | | 660,295 | |
| | | | Valero Energy Corp. | | | | |
| | 2,655,000 | | 6.625%, 06/15/2037 | | | 2,265,034 | |
| | | | | | | 4,086,663 | |
| | | | Real Estate Investment Trusts 2.3% | | | | |
| | | | AMB Property LP | | | | |
| | 2,345,000 | | 6.300%, 06/01/2013 | | | 2,174,643 | |
| | | | Liberty Property LP | | | | |
| | 1,245,000 | | 6.625%, 10/01/2017 | | | 1,056,503 | |
| | | | Prologis Trust | | | | |
| | 985,000 | | 5.625%, 11/15/2016 | | | 757,165 | |
| | 1,050,000 | | 6.625%, 05/15/2018 | | | 826,773 | |
| | | | Regency Centers LP | | | | |
| | 1,945,000 | | 5.875%, 06/15/2017 | | | 1,575,703 | |
The accompanying notes are an integral part of these financial statements.
Frontegra Columbus Core Plus Fund
SCHEDULE OF INVESTMENTS (continued)
June 30, 2009
| Principal Amount | | Value | |
| | | | | | |
| CORPORATE BONDS 61.7% (continued) | | | |
| | | | | | |
| | | Real Estate Investment | | | |
| | | Trusts 2.3% (continued) | | | |
| | | Simon Property Group LP | | | |
| $ | 1,300,000 | | 5.100%, 06/15/2015 | | $ | 1,187,062 | |
| | 950,000 | | 5.750%, 12/01/2015 | | | 874,934 | |
| | 160,000 | | 6.100%, 05/01/2016 | | | 149,313 | |
| | 665,000 | | 5.250%, 12/01/2016 | | | 590,708 | |
| | | | | | | 9,192,804 | |
| | | | Total Corporate Bonds | | | | |
| | | | (Cost $240,232,645) | | | 244,724,766 | |
| | | | | | | | |
| MORTGAGE BACKED SECURITIES 13.0% | | | | |
| | | | Bank of America | | | | |
| | | | Commercial Mortgage Inc. | | | | |
| | 3,680,000 | | Series 2006-5, Class A4, | | | | |
| | | | 5.414%, 09/10/2016 | | | 2,934,244 | |
| | 3,830,000 | | Series 2009-UB1, Class A4, | | | | |
| | | | 5.699%, 05/24/2017 (Acquired | | | | |
| | | | 06/18/2009, Cost $3,099,607) (a) | | | 3,190,869 | |
| | 3,045,000 | | Series 2006-3, Class A4, | | | | |
| | | | 5.889%, 07/10/2044 | | | 2,417,861 | |
| | 3,080,000 | | Series 2007-3, Class A2, | | | | |
| | | | 5.837%, 06/10/2049 | | | 2,801,124 | |
| | | | Citigroup/Deutsche Bank | | | | |
| | | | Commercial Mortgage Trust | | | | |
| | 2,290,000 | | Series 2006-CD2, Class A4, | | | | |
| | | | 5.545%, 01/15/2046 | | | 1,901,981 | |
| | 2,375,000 | | Series 2006-CD3, Class A5, | | | | |
| | | | 5.617%, 10/15/2048 | | | 1,932,965 | |
| | | | CitiMortgage Alternative Loan Trust | | | | |
| | 1,789,016 | | Series 2007-A4, Class 2A1, | | | | |
| | | | 5.500%, 04/25/2022 | | | 1,335,612 | |
| | | | Credit Suisse First Boston | | | | |
| | | | Mortgage Securities Corp. | | | | |
| | 371,232 | | Pool # 2005-10, 5.000%, 09/25/2015 | | | 309,863 | |
| | 78,956 | | Pool # 2003-1, 7.000%, 02/25/2033 | | | 76,340 | |
| | | | FNMA REMIC | | | | |
| | 77,502 | | Series 1994-3, Class PL, | | | | |
| | | | 5.500%, 01/25/2024 (g) | | | 82,821 | |
| | | | FNMA TBA | | | | |
| | 7,700,000 | | Pool #000TBA, | | | | |
| | | | 4.500%, 08/15/2035 (f)(g) | | | 7,654,277 | |
| | | | GNMA Pool | | | | |
| | 1,720 | | Pool #36629, 9.500%, 10/15/2009 (f) | | | 1,745 | |
| | | | GS Mortgage Securities Corp. II | | | | |
| | 3,225,119 | | Series 2007-EOP, Class A1, | | | | |
| | | | 0.409%, 03/06/2020 | | | | |
| | | | (Acquired Multiple Dates, | | | | |
| | | | Cost $3,163,003) (a)(c) | | | 2,762,464 | |
| | | | LB-UBS Commercial Mortgage Trust | | | | |
| | 6,195,000 | | Series 2006-C1, Class A4, | | | | |
| | | | 5.156%, 02/15/2031 | | | 5,159,177 | |
| | 4,075,000 | | Series 2006-C6, Class A4, | | | | |
| | | | 5.372%, 09/15/2039 | | | 3,304,054 | |
| | 2,610,000 | | Series 2007-C1, Class A4, | | | | |
| | | | 5.424%, 02/15/2040 | | | 1,897,154 | |
| | 3,695,000 | | Series 2007-C2, Class A3, | | | | |
| | | | 5.430%, 02/15/2040 | | | 2,670,685 | |
| | 335,000 | | Series 2007-C3, Class A4, | | | | |
| | | | 6.136%, 07/15/2044 (c) | | | 243,256 | |
| | | | Master Asset Securitization Trust | | | | |
| | 350,067 | | Pool # 2004-3, 4.750%, 01/25/2014 | | | 344,707 | |
| | | | Residential Accredit Loans, Inc. | | | | |
| | 1,192,675 | | Series 2005-QS3, Class 2A1, | | | | |
| | | | 5.000%, 03/25/2020 | | | 1,069,855 | |
| | 1,392,480 | | Series 2004-QS4, Class A1, | | | | |
| | | | 4.350%, 03/25/2034 | | | 1,241,917 | |
| | | | Wachovia Bank | | | | |
| | | | Commercial Mortgage Trust | | | | |
| | 2,650,000 | | Series 2006-C23, Class A4, | | | | |
| | | | 5.418%, 01/15/2045 | | | 2,115,791 | |
| | 2,855,000 | | Series 2006-C24, Class A3, | | | | |
| | | | 5.558%, 03/15/2045 | | | 2,442,048 | |
| | 935,000 | | Series 2007-C31, Class A2, | | | | |
| | | | 5.421%, 04/15/2047 | | | 858,196 | |
The accompanying notes are an integral part of these financial statements.
Frontegra Columbus Core Plus Fund
SCHEDULE OF INVESTMENTS (continued)
June 30, 2009
| Principal Amount | | Value | |
| | | | | | |
| MORTGAGE BACKED | | | |
SECURITIES 13.0% (continued) | | | |
| | | Wells Fargo Alternative Loan Trust | | | |
| $ | 1,575,676 | | Series 2007-PA3, Class 6A1, | | | |
| | | | 5.500%, 07/25/2037 | | $ | 1,018,773 | |
| | | | Wells Fargo Mortgage | | | | |
| | | | Backed Securities Trust | | | | |
| | 2,256,183 | | Pool # 2006-3, 5.500%, 03/25/2036 | | | 1,929,893 | |
| | | | Total Mortgage Backed Securities | | | | |
| | | | (Cost $54,851,942) | | | 51,697,672 | |
| | | | | | | | |
| INSTITUTIONAL TERM LOANS 0.0% | | | | |
| | | | Chrysler LLC | | | | |
| | 7,319,322 | | 6.467%, 11/29/2013 (e) | | | 77,804 | |
| | | | Total Institutional Term Loans | | | | |
| | | | (Cost $3,516,368) | | | 77,804 | |
| | | | | | | | |
| Number of Shares | | | | |
| PREFERRED STOCKS 0.1% | | | | |
| | | | | | | | |
| | | | Thrifts & Mortgage Finance 0.1% | | | | |
| | 169,732 | | Fannie Mae | | | | |
| | | | 8.25%, 12/31/2010 (c)(g) | | | 227,441 | |
| | 141,065 | | Freddie Mac | | | | |
| | | | 8.375%, 12/31/2012 (c)(g) | | | 172,099 | |
| | | | Total Preferred Stocks | | | | |
| | | | (Cost $4,155,967) | | | 399,540 | |
| | | | | | | | |
| Principal Amount | | | |
| U.S. TREASURY OBLIGATIONS 15.3% | | | | |
| | | | | | | | |
| | | | United States Treasury Bonds 0.2% | | | | |
| | 515,000 | | 4.500%, 05/15/2038 | | | 531,657 | |
| | | | | | | | |
| | | | United States Treasury Notes 15.1% | | | | |
| | 25,845,000 | | 0.875%, 05/31/2011 | | | 25,752,217 | |
| | 23,000,000 | | 1.125%, 06/30/2011 | | | 23,001,840 | |
| | 10,859,867 | | 2.125%, 01/15/2019 | | | 11,216,201 | |
| | | | | | | 59,970,258 | |
| | | | Total U.S. Treasury Obligations | | | | |
| | | | (Cost $60,448,066) | | | 60,501,915 | |
| | | | | | | | |
| SHORT-TERM INVESTMENTS 1.8% | | | | |
| | | | | | | | |
| | | | Variable Rate Demand Notes (d) 1.8% | | | | |
| | 2,509,227 | | American Family Financial | | | | |
| | | | Services, Inc., 0.100% | | | 2,509,227 | |
| | 4,713,324 | | U.S. Bank, N.A. | | | 4,713,324 | |
| | | | Total Short-Term Investments | | | | |
| | | | (Cost $7,222,551) | | | 7,222,551 | |
| | | | | | | | |
| | | | Total Investments 95.6% | | | | |
| | | | (Cost $387,679,446) | | | 379,173,642 | |
| | | | | | | | |
| | | | Other Assets in Excess | | | | |
| | | | of Liabilities 4.4% | | | 17,537,483 | |
| | | | | | | | |
| | | | TOTAL NET ASSETS 100.0% | | $ | 396,711,125 | |
| (a) | Security exempt from registration under Rule 144A of the Securities Act of 1933. These securities may be resold in transactions exempt from registration normally to qualified institutional buyers. The total value of these securities amounted to $74,988,060 (18.9% of net assets) at June 30, 2009. |
| (b) | U.S.-dollar denominated security of foreign issuer. |
| (d) | Variable rate demand notes are considered short-term obligations and are payable upon demand. Interest rates change periodically on specified dates. The rates listed are as of June 30, 2009. |
| (e) | Security is in default. |
| (g) | Entity under conservatorship of the federal government. |
The accompanying notes are an integral part of these financial statements.
Frontegra Columbus Core Plus Fund
SCHEDULE OF INVESTMENTS (continued)
June 30, 2009
Credit Default Swaps
| | | | Rating of | Pay/ | | | | Unrealized |
| | Reference | Buy/Sell | Reference Entity | Receive | Fixed | Expiration | Notional | Appreciation/ |
| Counterparty | Entity | Protection(1) | (Moody’s/S&P) | Fixed Rate | Rate | Date | Value(2) | (Depreciation) |
| JPMorgan | Dow Jones | | | | | | | |
| | North American | Sell | B2/B | Receive | 5.000% | 6/20/14 | $17,404,800 | $422,098 |
| | High Yield Index | | | | | | | |
| (1) | If the Fund is a seller of protection and a credit event occurs, as defined under the terms of that particular swap agreement, the Fund will either (i) pay to the buyer of protection an amount equal to the notional amount of the swap and take delivery of the referenced obligation or underlying securities comprising the referenced index or (ii) pay a net settlement amount in the form of cash or securities equal to the notional amount of the swap less the recovery value of the referenced obligation or underlying securities comprising the referenced index. |
| (2) | The maximum potential amount the Fund could be required to make as a seller of credit protection or receive as a buyer of credit protection if a credit event occurs as defined under the terms of that particular swap agreement. |
ALLOCATION OF PORTFOLIO HOLDINGS
At June 30, 2009, the allocation of portfolio holdings as a percentage of the Fund’s total net assets were:
| Asset-Backed Securities | | | 3.7 | % | Preferred Stocks | | | 0.1 | |
| Corporate Bonds | | | 61.7 | | U.S. Treasury Obligations | | | 15.3 | |
| Mortgage-Backed Securities | | | 13.0 | | Short-Term Investments | | | 1.8 | |
| Institutional Term Loans | | | 0.0 | * | Other Assets in Excess of Liabilities | | | 4.4 | |
| | | | | | Total | | | 100.0 | % |
The accompanying notes are an integral part of these financial statements.
Frontegra Columbus Core Plus Fund
STATEMENT OF ASSETS AND LIABILITIES
June 30, 2009
| Assets: | | | |
| Investments at value (cost $387,679,446) | | $ | 379,173,642 | |
| Cash | | | 12,088 | |
| Interest receivable | | | 4,086,525 | |
| Deposit with broker and custodian for swaps | | | 3,110,000 | |
| Receivable for Fund shares sold | | | 83,753 | |
| Receivable for investments sold | | | 45,389,201 | |
| Unrealized appreciation on swaps | | | 422,098 | |
| Prepaid expenses and other assets | | | 19,130 | |
| Total assets | | | 432,296,437 | |
| | | | | |
| Liabilities: | | | | |
| Payable for investments purchased | | | 32,242,517 | |
| Payable for Fund shares redeemed | | | 1,689 | |
| Accrued investment advisory fee | | | 85,040 | |
| Accrued expenses | | | 64,773 | |
| Swap payments received | | | 3,046,844 | |
| Payable to swap counterparty | | | 144,449 | |
| Total liabilities | | | 35,585,312 | |
| Net Assets | | $ | 396,711,125 | |
| | | | | |
| Net Assets Consist of: | | | | |
| Paid in capital | | $ | 414,135,638 | |
| Undistributed net investment income | | | 1,273,273 | |
| Accumulated net realized loss on investments sold, swap contracts and foreign currency | | | (10,614,080 | ) |
| Net unrealized depreciation on investments | | | (8,505,804 | ) |
| Net unrealized appreciation on swap contracts | | | 422,098 | |
| Net Assets | | $ | 396,711,125 | |
| | | | | |
| Capital Stock, $0.01 Par Value | | | | |
| Authorized | | | 100,000,000 | |
| Issued and outstanding | | | 13,047,886 | |
| Net Asset Value, Redemption Price and Offering Price Per Share | | $ | 30.40 | |
The accompanying notes are an integral part of these financial statements.
Frontegra Columbus Core Plus Fund
STATEMENT OF OPERATIONS
| | | Year Ended | |
| | | June 30, 2009 | |
| Investment Income: | | | |
| Interest income | | $ | 36,455,407 | |
| Dividend income | | | 94,510 | |
| Total investment income | | | 36,549,917 | |
| | | | | |
| Expenses: | | | | |
| Investment advisory fees (Note 3) | | | 1,594,707 | |
| Fund administration and accounting fees | | | 138,164 | |
| Custody fees | | | 39,400 | |
| Audit fees | | | 35,105 | |
| Legal fees | | | 33,568 | |
| Shareholder servicing fees | | | 26,840 | |
| Federal and state registration fees | | | 23,962 | |
| Reports to shareholders | | | 11,985 | |
| Directors’ fees and related expenses | | | 8,145 | |
| Compliance related expenses | | | 5,618 | |
| Other | | | 20,822 | |
| Total expenses before waiver and reimbursement | | | 1,938,316 | |
| Waiver and reimbursement of expenses by Adviser (Note 3) | | | (542,331 | ) |
| Net expenses | | | 1,395,985 | |
| Net Investment Income | | | 35,153,932 | |
| | | | | |
| Realized and Unrealized Gain (Loss) on Investments: | | | | |
| Net realized gain (loss) on: | | | | |
| Investments | | | (8,895,311 | ) |
| Swap contracts | | | 2,197,511 | |
| Futures | | | 831,878 | |
| Change in net unrealized appreciation/(depreciation) on: | | | | |
| Investments | | | 354,573 | |
| Swap contracts | | | 1,390,660 | |
| Net Realized and Unrealized Loss on Investments | | | (4,120,689 | ) |
| Net Increase in Net Assets Resulting from Operations | | $ | 31,033,243 | |
The accompanying notes are an integral part of these financial statements.
Frontegra Columbus Core Plus Fund
STATEMENTS OF CHANGES IN NET ASSETS
| | | For the | | | For the | |
| | | Year Ended | | | Year Ended | |
| | | June 30, 2009 | | | June 30, 2008 | |
| Operations: | | | | | | |
| Net investment income | | $ | 35,153,932 | | | $ | 21,156,499 | |
| Net realized gain (loss) on: | | | | | | | | |
| Investments | | | (8,895,311 | ) | | | 14,888,690 | |
| Swap contracts | | | 2,197,511 | | | | 513,045 | |
| Futures | | | 831,878 | | | | — | |
| Foreign currency translation | | | — | | | | 24,984 | |
| Change in net unrealized appreciation/(depreciation) on: | | | | | | | | |
| Investments | | | 354,573 | | | | (7,299,904 | ) |
| Swap contracts | | | 1,390,660 | | | | (1,217,325 | ) |
| Net increase in net assets resulting from operations | | | 31,033,243 | | | | 28,065,989 | |
| | | | | | | | | |
| Distributions From: | | | | | | | | |
| Net investment income | | | (33,077,660 | ) | | | (21,303,876 | ) |
| Net realized gain | | | (9,661,730 | ) | | | (3,906,915 | ) |
| Total distributions | | | (42,739,390 | ) | | | (25,210,791 | ) |
| | | | | | | | | |
| Capital Share Transactions: | | | | | | | | |
| Shares issued in connection with acquisition of Columbus Core Plus Fund (see Note 6) | | | — | | | | 139,917,106 | |
| Shares sold | | | 110,670,953 | | | | 106,418,312 | |
| Shares issued to holders in reinvestment of distributions | | | 33,980,127 | | | | 23,395,411 | |
| Shares redeemed | | | (170,148,652 | ) | | | (115,500,980 | ) |
| Net increase (decrease) in net assets resulting from capital share transactions | | | (25,497,572 | ) | | | 154,229,849 | |
| Total Increase (Decrease) in Net Assets | | | (37,203,719 | ) | | | 157,085,047 | |
| | | | | | | | | |
| Net Assets: | | | | | | | | |
| Beginning of Year | | | 433,914,844 | | | | 276,829,797 | |
| End of Year (includes undistributed net investment | | | | | | | | |
| income of $1,273,273 and $968,538, respectively) | | $ | 396,711,125 | | | $ | 433,914,844 | |
| | | | | | | | | |
| Share Transactions: | | | | | | | | |
| Shares issued in connection with acquisition of Columbus Core Plus Fund (see Note 6) | | | — | | | | 4,545,718 | |
| Shares sold | | | 4,019,040 | | | | 3,393,596 | |
| Shares issued to holders in reinvestment of distributions | | | 1,277,512 | | | | 749,094 | |
| Shares redeemed | | | (6,367,246 | ) | | | (3,675,366 | ) |
| Net increase (decrease) in shares outstanding | | | (1,070,694 | ) | | | 5,013,042 | |
The accompanying notes are an integral part of these financial statements.
Frontegra Columbus Core Plus Fund
FINANCIAL HIGHLIGHTS
| | | Year | | | Year | | | Year | | | Year | | | Year | |
| | | Ended | | | Ended | | | Ended | | | Ended | | | Ended | |
| | | June 30, | | | June 30, | | | June 30, | | | June 30, | | | June 30, | |
| | | 2009 | | | 2008 | | | 2007 | | | 2006 | | | 2005 | |
| Net Asset Value, Beginning of Year | | $ | 30.73 | | | $ | 30.40 | | | $ | 29.72 | | | $ | 31.50 | | | $ | 30.51 | |
| | | | | | | | | | | | | | | | | | | | | |
| Income (Loss) from | | | | | | | | | | | | | | | | | | | | |
| Investment Operations: | | | | | | | | | | | | | | | | | | | | |
| Net investment income | | | 2.50 | | | | 1.48 | | | | 1.54 | | | | 1.41 | | | | 1.13 | |
| Net realized and unrealized gain (loss) on investments | | | 0.16 | | | | 0.61 | | | | 0.68 | | | | (1.30 | ) | | | 0.98 | |
| Total Income from Investment Operations | | | 2.66 | | | | 2.09 | | | | 2.22 | | | | 0.11 | | | | 2.11 | |
| | | | | | | | | | | | | | | | | | | | | |
| Less Distributions: | | | | | | | | | | | | | | | | | | | | |
| From net investment income | | | (2.33 | ) | | | (1.49 | ) | | | (1.54 | ) | | | (1.45 | ) | | | (1.12 | ) |
| From net realized gain on investments | | | (0.66 | ) | | | (0.27 | ) | | | — | | | | (0.44 | ) | | | — | |
| Total Distributions | | | (2.99 | ) | | | (1.76 | ) | | | (1.54 | ) | | | (1.89 | ) | | | (1.12 | ) |
| | | | | | | | | | | | | | | | | | | | | |
| Net Asset Value, End of Year | | $ | 30.40 | | | $ | 30.73 | | | $ | 30.40 | | | $ | 29.72 | | | $ | 31.50 | |
| Total Return | | | 10.52 | % | | | 6.92 | % | | | 7.52 | % | | | 0.36 | % | | | 7.00 | % |
| | | | | | | | | | | | | | | | | | | | | |
| Supplemental Data and Ratios: | | | | | | | | | | | | | | | | | | | | |
| Net assets, end of period (in thousands) | | $ | 396,711 | | | $ | 433,915 | | | $ | 276,830 | | | $ | 313,880 | | | $ | 316,474 | |
| Ratio of expenses to average net assets | | | | | | | | | | | | | | | | | | | | |
| Before waivers and reimbursements | | | 0.49 | % | | | 0.49 | % | | | 0.50 | % | | | 0.50 | % | | | 0.50 | % |
| Net of waivers and reimbursements | | | 0.35 | % | | | 0.30 | % | | | 0.20 | % | | | 0.20 | % | | | 0.41 | % |
| Ratio of net investment income to average net assets | | | | | | | | | | | | | | | | | | | | |
| Before waivers and reimbursements | | | 8.68 | % | | | 4.68 | % | | | 4.65 | % | | | 4.29 | % | | | 3.21 | % |
| Net of waivers and reimbursements | | | 8.82 | % | | | 4.87 | % | | | 4.95 | % | | | 4.59 | % | | | 3.30 | % |
| Portfolio turnover rate | | | 424 | % | | | 1,093 | % | | | 978 | % | | | 1,247 | % | | | 1,222 | % |
The accompanying notes are an integral part of these financial statements.
Growth of a $100,000 Investment (Unaudited)
| * | 2/23/01 commencement of operations. |
| | | | | |
| | Portfolio Total Return** | | | |
| | FOR PERIODS ENDED 6/30/09 | FUND | INDEX | |
| | | | | |
| | SIX MONTHS | 17.40% | 1.90% | |
| | | | | |
| | ONE YEAR | 8.64% | 6.05% | |
| | | | | |
| | FIVE YEAR | | | |
| | AVERAGE ANNUAL | 5.75% | 5.01% | |
| | | | | |
| | SINCE COMMENCEMENT | | | |
| | AVERAGE ANNUAL | 5.66% | 5.52% | |
| | | | | |
This chart assumes an initial gross investment of $100,000 made on 2/23/01 (commencement of operations). Returns shown include the reinvestment of all distributions. Past performance is not predictive of future results. Investment return and principal value will fluctuate so that shares, when redeemed, may be worth more or less than the original cost. In the absence of existing fee waivers, total return would be reduced. To receive current to the most recent month-end performance, please call 1-888-825-2100.
The Barclays Capital U.S. Aggregate Bond Index (formerly the Lehman Brothers Aggregate Bond Index) is an unmanaged market value-weighted performance benchmark for investment-grade fixed-rate debt issues, including government, corporate, asset backed and mortgage backed securities, with maturities of at least one year. The Index does not reflect investment management fees, brokerage commissions and other expenses associated with investing in fixed income securities. A direct investment in the index is not possible.
| ** | The returns shown do not reflect the deduction of taxes that a shareholder would pay on Fund distributions or the redemption of Fund shares. |
Frontegra Columbus Core Fund
SCHEDULE OF INVESTMENTS
June 30, 2009
| Principal Amount | | Value | |
| | | | | | |
| ASSET BACKED SECURITIES 2.5% | | | |
| | | Americredit Automobile | | | |
| | | Receivables Trust | | | |
| $ | 355,000 | | 2008-AF, Class A4, | | | |
| | | | 6.960%, 10/14/2014 | | $ | 324,192 | |
| | | | Hertz Vehicle Financing LLC | | | | |
| | 160,000 | | 2005-1A, Class A4, 0.564%, | | | | |
| | | | 11/25/2011 (Acquired 08/21/2008, | | | | |
| | | | Cost $147,448) (a)(c) | | | 144,019 | |
| | 200,000 | | 2005-2A, Class A5, 0.564%, | | | | |
| | | | 11/25/2011 (Acquired 08/01/2008, | | | | |
| | | | Cost $187,856) (a)(c) | | | 185,820 | |
| | 440,000 | | 2005-2A, Class A6, 5.080%, | | | | |
| | | | 11/25/2011 (Acquired Multiple | | | | |
| | | | Dates, Cost $433,307) (a) | | | 429,266 | |
| | | | Keystone Owner Trust | | | | |
| | 30,415 | | 1998-P1, Class M1, 7.530%, | | | | |
| | | | 05/25/2025 (Acquired 04/22/2003, | | | | |
| | | | Cost $31,484) (a) | | | 27,173 | |
| | | | Mid-State Trust | | | | |
| | 253,965 | | 11, Class A1, 4.864%, 07/15/2038 | | | 137,493 | |
| | | | Total Asset Backed Securities | | | | |
| | | | (Cost $1,407,776) | | | 1,247,963 | |
| | | | | | | | |
| CORPORATE BONDS 63.3% | | | | |
| | | | | | | | |
| | | | Airlines 3.7% | | | | |
| | | | American Airlines | | | | |
| | 310,000 | | 10.375%, 07/02/2019 | | | 310,000 | |
| | | | Continental Airlines | | | | |
| | 585,000 | | 5.983%, 04/19/2022 | | | 482,625 | |
| | | | Delta Air Lines, Inc. | | | | |
| | 932,621 | | Series 2002-1, 6.718%, 07/02/2024 | | | 708,792 | |
| | | | Northwest Airlines, Inc. | | | | |
| | 468,528 | | 7.027%, 11/01/2019 | | | 363,109 | |
| | | | | | | 1,864,526 | |
| | | | Commercial Banks 9.9% | | | | |
| | | | Barclays Bank PLC | | | | |
| | 1,080,000 | | 7.434%, 12/15/2017 | | | | |
| | | | (Acquired Multiple Dates, | | | | |
| | | | Cost $503,886) (a)(b)(c) | | | 723,600 | |
| | 465,000 | | 6.750%, 05/22/2019 | | | 461,174 | |
| | | | BB&T Corp. | | | | |
| | 390,000 | | 6.850%, 04/30/2019 | | | 405,586 | |
| | | | Deutsche Bank, LLC | | | | |
| | 1,310,000 | | 5.628%, 01/31/2049 | | | | |
| | | | (Acquired Multiple Dates, | | | | |
| | | | Cost $898,230) (a) | | | 851,500 | |
| | | | Manufacturers & Traders Trust Co. | | | | |
| | 335,000 | | 5.629%, 12/01/2021 | | | 252,822 | |
| | | | Marshall & Ilsley Bank | | | | |
| | 1,655,000 | | 5.413%, 12/04/2012 | | | 1,150,606 | |
| | | | Wachovia Corp. | | | | |
| | 955,000 | | 5.800%, 03/29/2049 (c) | | | 573,000 | |
| | | | Wells Fargo Alternative Loan Trust | | | | |
| | 730,000 | | 7.700%, 12/29/2049 (c) | | | 605,900 | |
| | | | | | | 5,024,188 | |
| | | | Computers & Peripherals 0.2% | | | | |
| | | | Tyco Electronics Group SA | | | | |
| | 135,000 | | 5.950%, 01/15/2014 (b) | | | 126,073 | |
| | | | | | | | |
| | | | Consumer Finance 1.1% | | | | |
| | | | American Express Co. | | | | |
| | 515,000 | | 8.125%, 05/20/2019 | | | 534,431 | |
| | | | | | | | |
| | | | Diversified Financial Services 13.5% | | | | |
| | | | American General Finance | | | | |
| | 135,000 | | 5.900%, 09/15/2012 | | | 80,575 | |
| | 305,000 | | 6.900%, 12/15/2017 | | | 165,152 | |
| | | | Bank of America Corp. | | | | |
| | 1,525,000 | | 5.420%, 03/15/2017 | | | 1,266,424 | |
| | 265,000 | | 7.625%, 06/01/2019 | | | 266,182 | |
The accompanying notes are an integral part of these financial statements.
Frontegra Columbus Core Fund
SCHEDULE OF INVESTMENTS (continued)
June 30, 2009
| Principal Amount | | Value | |
| | | | | | |
| CORPORATE BONDS 63.3% (continued) | | | |
| | | | | | |
| | | Diversified Financial | | | |
| | | Services 13.5% (continued) | | | |
| | | CIT Group Inc. | | | |
| $ | 200,000 | | 5.168%, 11/03/2010 | | $ | 149,177 | |
| | 40,000 | | 5.600%, 11/02/2011(b) | | | 29,357 | |
| | 170,000 | | 5.610%, 02/13/2012 | | | 100,308 | |
| | 310,000 | | 5.638%, 12/21/2012 | | | 173,693 | |
| | | | Citigroup, Inc. | | | | |
| | 920,000 | | 6.125%, 05/15/2018 | | | 804,688 | |
| | 840,000 | | 8.500%, 05/22/2019 | | | 854,481 | |
| | | | Credit Suisse Guernsey | | | | |
| | 1,225,000 | | 5.860%, 05/15/2017 (b)(c) | | | 796,250 | |
| | | | General Electric Company | | | | |
| | 310,000 | | 5.900%, 05/13/2014 | | | 316,405 | |
| | | | International Lease Finance Corp. | | | | |
| | 175,000 | | 5.300%, 05/01/2012 | | | 135,654 | |
| | 565,000 | | 5.625%, 09/20/2013 | | | 426,834 | |
| | | | JPMorgan Chase & Co. | | | | |
| | 325,000 | | 6.300%, 04/23/2019 | | | 326,893 | |
| | | | PNC Funding Corp. | | | | |
| | 260,000 | | 6.700%, 06/10/2019 | | | 268,164 | |
| | | | Societe Generale | | | | |
| | 1,080,000 | | 5.922%, 04/05/2017 | | | | |
| | | | (Acquired Multiple Dates, | | | | |
| | | | Cost $531,491) (a)(b)(c) | | | 669,600 | |
| | | | | | | 6,829,837 | |
| | | | Diversified Telecommunication | | | | |
| | | | Services 2.3% | | | | |
| | | | British Telecom PLC | | | | |
| | 385,000 | | 5.950%, 01/15/2018 (b) | | | 346,978 | |
| | | | Deutsche Telekom | | | | |
| | | | International Finance B.V. | | | | |
| | 810,000 | | 6.000%, 07/08/2019 (b) | | | 817,209 | |
| | | | | | | 1,164,187 | |
| | | | Electric Utilities 1.8% | | | | |
| | | | Entergy Arkansas Inc. | | | | |
| | 175,000 | | 5.000%, 07/01/2018 | | | 161,547 | |
| | | | Entergy Louisiana LLC | | | | |
| | 70,000 | | 5.500%, 04/01/2019 | | | 66,049 | |
| | | | Great River Energy | | | | |
| | 100,000 | | 7.233%, 07/01/2038 (Acquired | | | | |
| | | | 04/23/2008, Cost $100,000) (a) | | | 97,187 | |
| | | | Indianapolis Power & Light Co. | | | | |
| | 290,000 | | 6.050%, 10/01/2036 (Acquired | | | | |
| | | | Multiple Dates, Cost $276,407) (a) | | | 224,668 | |
| | | | Mackinaw Power LLC | | | | |
| | 274,470 | | 6.296%, 10/31/2023 (Acquired | | | | |
| | | | Multiple Dates, Cost $267,835) (a) | | | 226,303 | |
| | | | Windsor Financing LLC | | | | |
| | 182,216 | | 5.881%, 07/15/2017 (Acquired | | | | |
| | | | Multiple Dates, Cost $182,095) (a) | | | 160,295 | |
| | | | | | | 936,049 | |
| | | | Food & Staples Retailing 0.9% | | | | |
| | | | CVS Caremark Corp. | | | | |
| | 529,538 | | 6.943%, 01/10/2030 (Acquired | | | | |
| | | | 02/19/2009, Cost $409,735) (a) | | | 479,142 | |
| | | | | | | | |
| | | | Gas Utilities 0.6% | | | | |
| | | | EQT Corp. | | | | |
| | 270,000 | | 8.125%, 06/01/2019 | | | 288,999 | |
| | | | | | | | |
| | | | Industrial Consumer Services 1.2% | | | | |
| | | | ERAC USA Finance Company | | | | |
| | 665,000 | | 6.375%, 10/15/2017 (Acquired | | | | |
| | | | Multiple Dates, Cost $511,241) (a) | | | 600,433 | |
| | | | | | | | |
| | | | Insurance 19.4% | | | | |
| | | | Aflac, Inc. | | | | |
| | 390,000 | | 8.500%, 05/15/2019 | | | 416,728 | |
| | | | Allstate Corp. | | | | |
| | 355,000 | | 7.450%, 05/16/2019 | | | 384,060 | |
The accompanying notes are an integral part of these financial statements.
Frontegra Columbus Core Fund
SCHEDULE OF INVESTMENTS (continued)
June 30, 2009
| Principal Amount | | Value | |
| | | | | | |
| CORPORATE BONDS 63.3% (continued) | | | |
| | | | | | |
| | | Insurance 19.4% (continued) | | | |
| | | Genworth Global Funding | | | |
| $ | 795,000 | | 5.875%, 05/03/2013 (Acquired | | | |
| | | | Multiple Dates, Cost $572,678) (a) | | $ | 715,123 | |
| | 45,000 | | 5.750%, 05/15/2013 | | | 40,746 | |
| | | | Hartford Financial Services Group | | | | |
| | 280,000 | | 5.375%, 03/15/2017 | | | 222,032 | |
| | | | Hartford Life Global Funding | | | | |
| | 85,000 | | 2.096%, 03/15/2011 (c) | | | 77,516 | |
| | 165,000 | | 1.231%, 01/17/2012 | | | 142,441 | |
| | 520,000 | | 1.203%, 08/15/2013 (Acquired | | | | |
| | | | 08/28/2008, Cost $485,445) (a) | | | 459,722 | |
| | | | Jackson National Life Global Funding | | | | |
| | 155,000 | | 5.125%, 02/10/2011 (Acquired | | | | |
| | | | Multiple Dates, Cost $154,198) (a) | | | 149,902 | |
| | 180,000 | | 5.375%, 05/08/2013 (Acquired | | | | |
| | | | 05/01/2008 and 05/28/2008, | | | | |
| | | | Cost $179,526) (a) | | | 173,270 | |
| | | | Lincoln National Corp. | | | | |
| | 235,000 | | 8.750%, 07/01/2019 | | | 236,991 | |
| | 1,256,000 | | 7.000%, 05/17/2066 | | | 791,280 | |
| | 795,000 | | 6.050%, 04/20/2067 | | | 504,825 | |
| | | | Metlife, Inc. | | | | |
| | 555,000 | | 5.125%, 06/10/2014 (Acquired | | | | |
| | | | 06/3/2009 and 06/4/2009, | | | | |
| | | | Cost $554,348) (a) | | | 550,681 | |
| | 550,000 | | 6.817%, 08/15/2018 | | | 553,910 | |
| | | | Monumental Global Funding | | | | |
| | 355,000 | | 1.262%, 01/25/2013 (Acquired | | | | |
| | | | Multiple Dates, Cost $330,299) (a)(c) | | | 270,607 | |
| | 260,000 | | 5.500%, 04/22/2013 (Acquired | | | | |
| | | | 4/18/2008, Cost $259,888) (a) | | | 250,863 | |
| | 110,000 | | 5.250%, 01/15/2014 (Acquired | | | | |
| | | | 06/10/2009, Cost $103,768) (a) | | | 103,751 | |
| | | | Nationwide Life Global Fund | | | | |
| | 795,000 | | 5.450%, 10/02/2012 (Acquired | | | | |
| | | | 09/25/2007, Cost $794,006) (a) | | | 778,608 | |
| | | | Principal Financial Group, Inc. | | | | |
| | 170,000 | | 8.875%, 05/15/2019 | | | 178,469 | |
| | | | Principal Life Funding | | | | |
| | 295,000 | | 5.150%, 06/17/2011 | | | 296,638 | |
| | | | Pricoa Global Funding I | | | | |
| | 350,000 | | 5.400%, 10/18/2012 (Acquired | | | | |
| | | | 10/11/2007 and 04/25/2008, | | | | |
| | | | Cost $349,431) (a) | | | 339,560 | |
| | 395,000 | | 5.450%, 06/11/2014 (Acquired | | | | |
| | | | 06/4/2009 and 06/5/2009, | | | | |
| | | | Cost $393,825) (a) | | | 394,317 | |
| | | | Protective Life Corp. | | | | |
| | 730,000 | | 5.450%, 09/28/2012 | | | 728,829 | |
| | | | Prudential Financial Inc. | | | | |
| | 290,000 | | 6.100%, 06/15/2017 | | | 275,892 | |
| | 315,000 | | 6.000%, 12/01/2017 | | | 296,339 | |
| | 130,000 | | 7.375%, 06/15/2019 | | | 127,638 | |
| | | | Torchmark Corp. | | | | |
| | 325,000 | | 9.250%, 06/15/2019 | | | 331,783 | |
| | | | | | | 9,792,521 | |
| | | | Machinery Manufacturing 0.5% | | | | |
| | | | Weatherford International | | | | |
| | 290,000 | | 6.500%, 08/01/2036 | | | 262,447 | |
| | | | | | | | |
| | | | Media 0.5% | | | | |
| | | | Time Warner, Inc. | | | | |
| | 75,000 | | 9.150%, 02/01/2023 | | | 81,320 | |
| | 185,000 | | 7.700%, 05/01/2032 | | | 181,793 | |
| | | | | | | 263,113 | |
| | | | Metals & Mining 1.6% | | | | |
| | | | Alcoa Inc. | | | | |
| | 140,000 | | 6.750%, 07/15/2018 | | | 124,205 | |
| | 275,000 | | 5.900%, 02/01/2027 | | | 196,090 | |
| | 235,000 | | 5.950%, 02/01/2037 | | | 160,114 | |
| | | | Arcelormittal SA Luxembourg | | | | |
| | 285,000 | | 9.850%, 06/01/2019 | | | 307,576 | |
| | | | | | | 787,985 | |
The accompanying notes are an integral part of these financial statements.
Frontegra Columbus Core Fund
SCHEDULE OF INVESTMENTS (continued)
June 30, 2009
| Principal Amount | | Value | |
| | | | | | |
| CORPORATE BONDS 63.3% (continued) | | | |
| | | | | | |
| | | Multi-Utilities & | | | |
| | | Unregulated Power 0.3% | | | |
| | | Kiowa Power Partners LLC | | | |
| $ | 172,383 | | 4.811%, 12/30/2013 (Acquired | | | |
| | | | 08/03/2007 and 11/22/2004, | | | |
| | | | Cost $172,224) (a) | | $ | 158,841 | |
| | | | | | | | |
| | | | Oil, Gas & Consumable Fuels 1.9% | | | | |
| | | | PF Export Receivables Master Trust | | | | |
| | 286,404 | | 3.748%, 06/01/2013 (Acquired | | | | |
| | | | Multiple Dates, Cost $286,449) (a) | | | 293,624 | |
| | | | Talisman Energy, Inc. | | | | |
| | 280,000 | | 7.750%, 06/01/2019 | | | 310,182 | |
| | | | Valero Energy Corp. | | | | |
| | 405,000 | | 6.625%, 06/15/2037 | | | 345,514 | |
| | | | | | | 949,320 | |
| | | | Real Estate Investment Trusts 3.9% | | | | |
| | | | AMB Property LP | | | | |
| | 165,000 | | 6.300%, 06/01/2013 | | | 153,013 | |
| | | | Boston Properties LP | | | | |
| | 225,000 | | 6.250%, 01/15/2013 | | | 223,956 | |
| | | | Federal Realty Investment Trust | | | | |
| | 235,000 | | 5.650%, 06/01/2016 | | | 205,845 | |
| | 105,000 | | 6.200%, 01/15/2017 | | | 93,008 | |
| | | | Liberty Property LP | | | | |
| | 455,000 | | 6.625%, 10/01/2017 | | | 386,112 | |
| | | | Realty Income Corp. | | | | |
| | 275,000 | | 5.950%, 09/15/2016 | | | 244,610 | |
| | | | Regency Centers LP | | | | |
| | 265,000 | | 5.250%, 08/01/2015 | | | 215,126 | |
| | | | Simon Property Group LP | | | | |
| | 250,000 | | 5.100%, 06/15/2015 | | | 228,281 | |
| | 125,000 | | 5.750%, 12/01/2015 | | | 115,123 | |
| | 20,000 | | 6.100%, 05/01/2016 | | | 18,664 | |
| | 75,000 | | 5.250%, 12/01/2016 | | | 66,621 | |
| | | | | | | 1,950,359 | |
| | | | Total Corporate Bonds | | | | |
| | | | (Cost $30,450,882) | | | 32,012,451 | |
| | | | | |
| MORTGAGE BACKED SECURITIES 12.9% | | | | |
| | | | Banc of America Commercial Mortgage Inc. | | | | |
| | 405,000 | | Series 2006-5, Class A4, | | | | |
| | | | 5.414%, 09/10/2016 | | | 322,926 | |
| | 495,000 | | Series 2009-UB1, Class A4, | | | | |
| | | | 5.699%, 05/24/2017 (Acquired | | | | |
| | | | 06/18/2009, Cost $400,602) (a) | | | 412,397 | |
| | 385,000 | | Series 2006-3, Class A4, | | | | |
| | | | 5.889%, 07/10/2044 | | | 305,707 | |
| | | | CitiMortgage Alternative Loan Trust | | | | |
| | 1,542,554 | | Series 2007-A7, Class 3A1, | | | | |
| | | | 5.750%, 07/25/2022 | | | 1,092,803 | |
| | | | Credit Suisse First Boston | | | | |
| | | | Mortgage Securities Corp. | | | | |
| | 98,267 | | Pool # 2005-10, 5.000%, 09/25/2015 | | | 82,022 | |
| | 22,515 | | Pool # 2003-1, 7.000%, 02/25/2033 | | | 21,769 | |
| | | | FNMA TBA | | | | |
| | 965,000 | | Pool #000TBA, | | | | |
| | | | 4.500%, 08/15/2035 (e)(f) | | | 959,270 | |
| | | | GS Mortgage Securities Corp. II | | | | |
| | 529,906 | | Series 2007-EOP, Class A1, 5.410%, | | | | |
| | | | 03/06/2020 (Acquired 09/17/2007 and | | | | |
| | | | 04/22/2008, Cost $521,087) (a)(c) | | | 453,889 | |
| | | | Master Asset Securitization Trust | | | | |
| | 92,493 | | Pool # 2004-3, 4.750%, 01/25/2014 | | | 91,076 | |
| | | | Residential Accredit Loans, Inc. | | | | |
| | 291,932 | | Series 2004-QS4, Class A1, | | | | |
| | | | 4.350%, 03/25/2034 | | | 260,367 | |
| | | | Residential Asset Securitization Trust | | | | |
| | 223,355 | | Series 2003-A6, Class A1, | | | | |
| | | | 4.500%, 07/25/2033 | | | 211,511 | |
| | | | UBS Commercial Mortgage Trust | | | | |
| | 800,000 | | Series 2006-C1, Class A4, | | | | |
| | | | 5.156%, 02/15/2031 | | | 666,238 | |
| | 580,000 | | Series 2007-C1, Class A4, | | | | |
| | | | 5.424%, 02/15/2040 | | | 421,590 | |
| | 360,000 | | Series 2007-C2, Class A3, | | | | |
| | | | 5.430%, 02/15/2040 | | | 260,202 | |
The accompanying notes are an integral part of these financial statements.
Frontegra Columbus Core Fund
SCHEDULE OF INVESTMENTS (continued)
June 30, 2009
| Principal Amount | | Value | |
| | | | | | |
| MORTGAGE BACKED | | | |
SECURITIES 12.9% (continued) | | | |
| $ | 43,000 | | Series 2007-C3, Class A4, | | | |
| | | | 6.136%, 07/15/2044 (c) | | $ | 31,224 | |
| | | | Wachovia Bank Commercial | | | | |
| | | | Mortgage Trust | | | | |
| | 325,000 | | Series 2006-C23, Class A4, | | | | |
| | | | 5.418%, 01/15/2045 | | | 259,484 | |
| | 690,000 | | Series 2006-C24, Class A3, | | | | |
| | | | 5.558%, 03/15/2045 | | | 590,197 | |
| | 115,000 | | Series 2007-C31, Class A2, | | | | |
| | | | 5.421%, 04/15/2047 | | | 105,554 | |
| | | | Total Mortgage Backed Securities | | | | |
| | | | (Cost $7,157,479) | | | 6,548,226 | |
| | | | | | | | |
| U.S. TREASURY OBLIGATIONS 15.6% | | | | |
| | | | | | | | |
| | | | United States Treasury Notes 15.6% | | | | |
| | 3,205,000 | | 0.875%, 05/31/2011 | | | 3,193,494 | |
| | 3,240,000 | | 1.125%, 06/30/2011 | | | 3,240,259 | |
| | 1,395,446 | | 2.125%, 01/15/2019 | | | 1,441,234 | |
| | | | Total U.S. Treasury Obligations | | | | |
| | | | (Cost $7,807,382) | | | 7,874,987 | |
| | | | | | | | |
| SHORT-TERM INVESTMENTS 5.8% | | | | |
| | | | | | | | |
| | | | United States Treasury Bills 3.2% | | | | |
| | 1,100,000 | | 0.215%, 12/03/2009 | | $ | 1,098,629 | |
| | 500,000 | | 0.265%, 12/24/2009 | | | 499,280 | |
| | | | | | | 1,597,909 | |
| | | | Variable Rate Demand Notes (d) 2.6% | | | | |
| | 498,112 | | American Family | | | | |
| | | | Financial Services, Inc., 0.100% | | | 498,112 | |
| | 822,582 | | U.S. Bank, N.A. | | | 822,582 | |
| | | | | | | 1,320,694 | |
| | | | Total Short-Term Investments | | | | |
| | | | (Cost $2,918,603) | | | 2,918,603 | |
| | | | | | | | |
| | | | Total Investments 100.1% | | | | |
| | | | (Cost $49,742,122) | | | 50,602,230 | |
| | | | | | | | |
| | | | Liabilities in Excess | | | | |
| | | | of Other Assets (0.1)% | | | (25,967 | ) |
| | | | | | | | |
| | | | TOTAL NET ASSETS 100.0% | | $ | 50,576,263 | |
| (a) | Security exempt from registration under Rule 144A of the Securities Act of 1933. These securities may be resold in transactions exempt from registration normally to qualified institutional buyers. The total value of these securities amounted to $10,331,830 (20.4% of net assets) at June 30, 2009. |
| (b) | U.S.-dollar denominated security of foreign issuer. |
| (d) | Variable rate demand notes are considered short-term obligations and are payable upon demand. Interest rates change periodically on specified dates. The rates listed are as of June 30, 2009. |
| (f) | Entity under conservatorship of the federal government. |
ALLOCATION OF PORTFOLIO HOLDINGS
At June 30, 2009, the allocation of portfolio holdings as a percentage of the Fund’s total net assets were:
| Asset-Backed Securities | | | 2.5 | % | U.S. Treasury Obligations | | | 15.6 | |
| Corporate Bonds | | | 63.3 | | Short-Term Investments | | | 5.8 | |
| Mortgage-Backed Securities | | | 12.9 | | Liabilities in Excess of Other Assets | | | (0.1 | ) |
| | | | | | Total | | | 100.0 | % |
The accompanying notes are an integral part of these financial statements.
Frontegra Columbus Core Fund
STATEMENT OF ASSETS AND LIABILITIES
June 30, 2009
| Assets: | | | |
| Investments at value (cost $49,742,122) | | $ | 50,602,230 | |
| Cash | | | 10,498 | |
| Interest receivable | | | 483,401 | |
| Receivable for investments sold | | | 3,506,665 | |
| Receivable from Adviser | | | 6,312 | |
| Prepaid expenses and other assets | | | 16,233 | |
| Total assets | | | 54,625,339 | |
| | | | | |
| Liabilities: | | | | |
| Payable for investments purchased | | | 4,002,282 | |
| Accrued expenses | | | 46,794 | |
| Total liabilities | | | 4,049,076 | |
| Net Assets | | $ | 50,576,263 | |
| | | | | |
| Net Assets Consist of: | | | | |
| Paid in capital | | $ | 59,325,507 | |
| Undistributed net investment income | | | 118,324 | |
| Accumulated net realized loss | | | (9,727,676 | ) |
| Net unrealized appreciation on investments | | | 860,108 | |
| Net Assets | | $ | 50,576,263 | |
| | | | | |
| Capital Stock, $0.01 Par Value | | | | |
| Authorized | | | 50,000,000 | |
| Issued and outstanding | | | 4,871,786 | |
| Net Asset Value, Redemption Price and Offering Price Per Share | | $ | 10.38 | |
The accompanying notes are an integral part of these financial statements.
Frontegra Columbus Core Fund
STATEMENT OF OPERATIONS
| | | Year Ended | |
| | | June 30, 2009 | |
| Investment Income: | | | |
| Interest income | | $ | 5,793,919 | |
| Total Investment Income | | | 5,793,919 | |
| | | | | |
| Expenses: | | | | |
| Investment advisory fees (Note 3) | | | 343,157 | |
| Fund administration and accounting fees | | | 72,958 | |
| Audit fees | | | 37,571 | |
| Legal fees | | | 26,370 | |
| Custody fees | | | 23,305 | |
| Federal and state registration fees | | | 22,729 | |
| Shareholder servicing fees | | | 10,990 | |
| Directors’ fees and related expenses | | | 8,895 | |
| Compliance related expenses | | | 6,068 | |
| Reports to shareholders | | | 2,790 | |
| Other | | | 5,563 | |
| Total expenses before waiver and reimbursement | | | 560,396 | |
| Waiver and reimbursement of expenses by Adviser (Note 3) | | | (276,351 | ) |
| Net expenses | | | 284,045 | |
| Net Investment Income | | | 5,509,874 | |
| | | | | |
| Realized and Unrealized Gain (Loss) on Investments: | | | | |
| Net realized gain (loss) on: | | | | |
| Investments | | | (8,876,168 | ) |
| Swap contracts | | | 71,746 | |
| Change in net unrealized appreciation/(depreciation) on: | | | | |
| Investments | | | 1,302,219 | |
| Swap contracts | | | 72,889 | |
| Net Realized and Unrealized Loss on Investments | | | (7,429,314 | ) |
| Net Decrease in Net Assets Resulting from Operations | | $ | (1,919,440 | ) |
The accompanying notes are an integral part of these financial statements.
Frontegra Columbus Core Fund
STATEMENTS OF CHANGES IN NET ASSETS
| | | For the | | | For the | |
| | | Year Ended | | | Year Ended | |
| | | June 30, 2009 | | | June 30, 2008 | |
| Operations: | | | | | | |
| Net investment income | | $ | 5,509,874 | | | $ | 4,469,938 | |
| Net realized gain (loss) on: | | | | | | | | |
| Investments | | | (8,876,168 | ) | | | 2,827,256 | |
| Swap contracts | | | 71,746 | | | | (326,444 | ) |
| Change in net unrealized appreciation/depreciation on: | | | | | | | | |
| Investments | | | 1,302,219 | | | | 136,506 | |
| Swap contracts | | | 72,889 | | | | (78,950 | ) |
| Net increase (decrease) in net assets resulting from operations | | | (1,919,440 | ) | | | 7,028,306 | |
| | | | | | | | | |
| Distributions From: | | | | | | | | |
| Net investment income | | | (5,468,450 | ) | | | (4,337,398 | ) |
| Total distributions | | | (5,468,450 | ) | | | (4,337,398 | ) |
| | | | | | | | | |
| Capital Share Transactions: | | | | | | | | |
| Shares issued in connection with acquisition of Columbus Core Fund (see Note 6) | | | — | | | | 14,423,390 | |
| Shares sold | | | 14,029,124 | | | | 25,991,538 | |
| Shares issued to holders in reinvestment of distributions | | | 4,545,747 | | | | 3,182,396 | |
| Shares redeemed | | | (60,476,919 | ) | | | (37,193,125 | ) |
| Net increase (decrease) in net assets resulting from capital share transactions | | | (41,902,048 | ) | | | 6,404,199 | |
| Total Increase (Decrease) in Net Assets | | | (49,289,938 | ) | | | 9,095,107 | |
| | | | | | | | | |
| Net Assets: | | | | | | | | |
| Beginning of Year | | | 99,866,201 | | | | 90,771,094 | |
| End of Year (includes undistributed net investment | | | | | | | | |
| income of $118,324 and $88,773, respectively) | | $ | 50,576,263 | | | $ | 99,866,201 | |
| | | | | | | | | |
| Transactions in Shares: | | | | | | | | |
| Shares issued in connection with acquisition of Columbus Core Fund (see Note 6) | | | — | | | | 1,425,241 | |
| Shares sold | | | 1,382,214 | | | | 2,516,992 | |
| Shares issued to holders in reinvestment of distributions | | | 484,314 | | | | 307,136 | |
| Shares redeemed | | | (6,693,940 | ) | | | (3,638,089 | ) |
| Net increase (decrease) in shares outstanding | | | (4,827,412 | ) | | | 611,280 | |
The accompanying notes are an integral part of these financial statements.
Frontegra Columbus Core Fund
FINANCIAL HIGHLIGHTS
| | | Year | | | Year | | | Year | | | Year | | | Year | |
| | | Ended | | | Ended | | | Ended | | | Ended | | | Ended | |
| | | June 30, | | | June 30, | | | June 30, | | | June 30, | | | June 30, | |
| | | 2009 | | | 2008 | | | 2007 | | | 2006 | | | 2005 | |
| Net Asset Value, Beginning of Year | | $ | 10.30 | | | $ | 9.99 | | | $ | 9.86 | | | $ | 10.36 | | | $ | 10.22 | |
| | | | | | | | | | | | | | | | | | | | | |
| Income (Loss) from | | | | | | | | | | | | | | | | | | | | |
| Investment Operations: | | | | | | | | | | | | | | | | | | | | |
| Net investment income | | | 0.72 | | | | 0.48 | | | | 0.48 | | | | 0.42 | | | | 0.37 | |
| Net realized and unrealized gain (loss) on investments | | | 0.08 | | | | 0.30 | | | | 0.13 | | | | (0.43 | ) | | | 0.27 | |
| Total Income (Loss) from Investment Operations | | | 0.80 | | | | 0.78 | | | | 0.61 | | | | (0.01 | ) | | | 0.64 | |
| | | | | | | | | | | | | | | | | | | | | |
| Less Distributions: | | | | | | | | | | | | | | | | | | | | |
| From net investment income | | | (0.72 | ) | | | (0.47 | ) | | | (0.48 | ) | | | (0.43 | ) | | | (0.37 | ) |
| From net realized gain on investments | | | — | | | | — | | | | — | | | | (0.06 | ) | | | (0.13 | ) |
| Total Distributions | | | (0.72 | ) | | | (0.47 | ) | | | (0.48 | ) | | | (0.49 | ) | | | (0.50 | ) |
| | | | | | | | | | | | | | | | | | | | | |
| Net Asset Value, End of Year | | $ | 10.38 | | | $ | 10.30 | | | $ | 9.99 | | | $ | 9.86 | | | $ | 10.36 | |
| Total Return | | | 8.64 | % | | | 7.89 | % | | | 6.26 | % | | | (0.11 | )% | | | 6.32 | % |
| | | | | | | | | | | | | | | | | | | | | |
| Supplemental Data and Ratios: | | | | | | | | | | | | | | | | | | | | |
| Net assets, end of period (in thousands) | | $ | 50,576 | | | $ | 99,866 | | | $ | 90,771 | | | $ | 96,887 | | | $ | 95,719 | |
| Ratio of expenses to average net assets | | | | | | | | | | | | | | | | | | | | |
| Before waivers and reimbursements | | | 0.69 | % | | | 0.66 | % | | | 0.66 | % | | | 0.65 | % | | | 0.62 | % |
| Net of waivers and reimbursements | | | 0.35 | % | | | 0.30 | % | | | 0.20 | % | | | 0.20 | % | | | 0.40 | % |
| Ratio of net investment income to average net assets | | | | | | | | | | | | | | | | | | | | |
| Before waivers and reimbursements | | | 6.38 | % | | | 4.29 | % | | | 4.31 | % | | | 3.75 | % | | | 2.85 | % |
| Net of waivers and reimbursements | | | 6.72 | % | | | 4.65 | % | | | 4.77 | % | | | 4.20 | % | | | 3.07 | % |
| Portfolio turnover rate | | | 414 | % | | | 965 | % | | | 980 | % | | | 1,121 | % | | | 1,080 | % |
The accompanying notes are an integral part of these financial statements.
FRONTEGRA
IRONBRIDGE
SMALL CAP FUND
FRONTEGRA
IRONBRIDGE
SMID FUND
REPORT FROM IRONBRIDGE CAPITAL
MANAGEMENT, L.P.
Dear Fellow Shareholders:
The Frontegra IronBridge Small Cap Fund strives to achieve capital appreciation by investing in a diversified portfolio of equity securities of companies with small market capitalizations. The objective is relative to, and measured against, the Russell 2000®(1) Index.
The Frontegra IronBridge SMID Fund strives to achieve capital appreciation by investing in a diversified portfolio of equity securities of companies with small and mid market capitalizations. The objective is relative to, and measured against, the Russell 2500TM(2) Index.
Performance Review
For the year ending June 30, 2009, the Frontegra IronBridge Small Cap Fund modestly trailed the benchmark, returning -26.00% net of fees compared with the Russell 2000 Index return of -25.01% for the same period.
| Small Cap Fund Best Performers | Return | | Small Cap Fund Worst Performers | Return |
| Cypress Semiconductor Corp. | 140.18% | | International Coal Group Inc. | -90.57% |
| Netflix Inc. | 101.75% | | Berry Petroleum Co. | -87.04% |
| Cathay General Bancorp | 95.52% | | Sangamo Biosciences Inc. | -77.85% |
| Synaptics Inc. | 49.78% | | RTI International Metals Inc. | -76.28% |
| Neogen Corp. | 48.67% | | Tesco Corp. | -74.90% |
| PICO Holdings Inc. | 43.44% | | First Industrial Realty Trust Inc. | -72.98% |
| Tractor Supply Co. | 42.44% | | LeapFrog Enterprises Inc. | -71.14% |
| Axsys Technologies Inc. | 42.09% | | Hansen Medical Inc. | -70.45% |
| Cerner Corp. | 40.22% | | Veeco Instruments Inc. | -69.80% |
| Tyler Technologies Inc. | 37.12% | | Unit Corp. | -66.91% |
The stock selection within Financials, Energy, and Industrials was a positive contributor to the relative return profile, while exposure amongst the Health Care, Information Technology, and Consumer Discretionary names detracted from the Fund’s performance.
The Frontegra IronBridge SMID Fund outperformed its benchmark, the Russell 2500 Index, for the 12-month period ending June 30, 2009. The Fund returned -25.78% net of fees, versus the -26.72% return of the Russell 2500 Index.
| SMID Fund Best Performers | Return | | SMID Fund Worst Performers | Return |
| Cypress Semiconductor Corp. | 136.89% | | Berry Petroleum Co. | -83.53% |
| O’Reilly Automotive Inc. | 70.22% | | Arch Coal Inc. | -78.91% |
| Synaptics Inc. | 54.11% | | Woodward Governor Co. | -75.44% |
| F5 Networks Inc. | 52.80% | | BE Aerospace Inc. | -72.22% |
| Flowserve Corp. | 49.37% | | Hansen Medical Inc. | -70.18% |
| Barr Pharmaceuticals Inc. | 40.87% | | Affiliated Managers Group Inc. | -67.16% |
| Cerner Corp. | 37.45% | | Cepheid Inc. | -66.83% |
| priceline.com Inc. | 36.01% | | Alexandria Real Estate Equities Inc. | -64.53% |
| Intuit Inc. | 26.83% | | Abercrombie & Fitch Co. | -63.62% |
| Mid-America Apartment | | | Intersil Corp. | -59.10% |
| Communities Inc. | 23.59% | | | |
| (1) | Russell 2000® Index is either a registered trademark or tradename of Russell Investment Group in the U.S. and/or other countries. Indexes are unmanaged and cannot be invested in directly. |
| (2) | Russell 2500™ Index is either a registered trademark or tradename of Russell Investment Group in the U.S. and/or other countries. Indexes are unmanaged and cannot be invested in directly. |
The stock selection within Energy, Information Technology, Materials, Financials, and Industrials was a positive contributor to the relative return profile, while exposure amongst the Utilities, Health Care, and Consumer Staples detracted from the Fund’s performance.
Stocks surged in the final three months of the Funds’ fiscal year, reversing the trend of significant decline that occurred since mid-2008. The sharp rebound was a combination of better than expected earnings associated with massive corporate cost cutting efforts and a “quantitative easing” that began on March 9, 2009. Since that date, the Russell 2000 Index is up 49%, while the Russell 2500 Index is up 47%. Quantitative easing entails a forced increase in the money supply, which is aimed at offsetting powerful deflationary forces and freeing up credit markets. So far, the quantitative easing is having its intended effect of offsetting powerful deflationary forces as the asset prices of everything from corn to oil to stocks have stopped falling and significantly increased. However, the key asset price that needs to stabilize in order for the economy to stabilize is the price of housing. We believe that quantitative easing will continue until housing prices stop falling. Recent house price data suggests that we may be getting close.
The U.S. Federal Reserve’s aggressive quantitative easing strategy is an experiment in monetary policy that this country has never tried before. It is bold in that the Federal Reserve has indicated a willingness to expand its balance sheet by $3 trillion, thereby releasing $30 trillion(3) of liquidity into the economy in the hope of offsetting the debt deflationary forces that were gripping the economy and led to the quantitative easing of March 9, 2009. From a historical perspective, the largest expansion of the Federal Reserve’s balance sheet in history was $100 billion. This takes the “government intervention phase” to a completely new level. It is a game changer.
The strategy of quantitative easing amounts to using a huge monetary sledgehammer to pound down the systemic cost of capital. Rather than allowing the market to determine the cost of capital, the Federal Reserve tries to push the cost of capital to where the Fed wants it to go in order to fix what the Fed assumes is a broken market. There is no question that the Federal Reserve and the Government got what they wanted in the near term. Quantitative easing had the immediate effect of driving a powerful rally in the debt and equity markets. Interest rates fell, capital markets thawed, and consumers began to refinance their mortgages at historically low, long-term mortgage rates.
The idea that the government can manipulate the cost of capital concerns us. Investors with IronBridge Capital Management know that we prefer market-based pricing mechanisms, across all markets, in order to optimize resource allocation within the economy. Perhaps quantitative easing is the right near-term solution, as it appears to have had the desired effect of stabilizing asset prices, which is critical for a global banking system as leveraged as the current one. However, at the company-specific level, it changes the relative winners and losers in ways that make it difficult for free market-oriented investors to outperform, at least in the near term.
Portfolio Outlook
IronBridge’s portfolio strategy never waivers – we buy companies that we believe create shareholder value and offer attractive payoff structures. We diversify the portfolio by sector and Life Cycle to help force excess return to come from stock selection and to minimize factor bets.
Our Life Cycle approach compels us to think about the nature of competition and the changing winners and losers in the competition for capital. The degree to which the U.S. government is proposing to interfere with the natural market forces that determine the future winners and losers has never been this high. This complicates current decision-making – there is so much that can change (or not) over the next several months. Current major proposals being considered include Health Care Reform, Cap & Trade, Tax Reform, and Financial Reform. The passage (or not) of these massive intrusions into the private markets will undoubtedly influence future CFROIs, and growth rates, and the relative competitive position of thousands of companies. Some proposals, if passed, could literally turn the wealth-creation process upside down. We must consider this in our assessment of the long-term competitive position of both the companies we own, and those we do not own.
| (3) | $3 trillion of capital in the banking system converts into $30 trillion of lending capacity at current reserve requirements. |
For example, our holdings in the Financials sector are generally higher quality, more conservatively managed companies that did not participate in financial “sinnovation”. This approach has served the portfolio well in terms of excess return among our Financials holdings relative to those held in the benchmark. However, if financial reform results in increasing the reserve requirements for ALL banks, the more conservative banks will be less profitable because of less leverage and have nowhere to go but down, while the least conservative banks will generate fewer losses, improve their balance sheet, and will likely go up. Using our current approach, the potential effect could negatively impact our results.
Our reluctance to get all of our new buy ideas into the portfolio immediately relates to the uncertainty regarding the previously identified government proposals, which could change the competitive landscape across multiple industries. Therefore, for the moment, we continue to own companies with skilled management teams who are doing the right things to create shareholder value and companies that have attractive payoff structures, recognizing that many of these payoff structures can change depending on the degree of government intrusion into their markets.
From a risk control perspective, we do not want to guess on these various proposals. Therefore, we try to stay broadly diversified and fairly tight to our benchmark weights in terms of the portfolio’s sector and Life Cycle weights. The only exception is with Turn Arounds (distressed businesses). Turn Arounds have benefited from what we believe is a very rare exceptional increase in value due to an increase in option value associated with quantitative easing. Because option value is a function of the square root of time, the upside from here is less attractive relative to the downside. We do not believe it is prudent to add highly leveraged, potentially bankrupt companies to the portfolio, even if non-ownership might hurt us. Additionally, payoff structures are unusually wide, given the greater uncertainty. This supports the case for more stocks in the portfolio at this time. Therefore, the current number of stocks we own is at the higher end of our historical range. As events unfold, and payoff structures narrow, the number of stocks in the portfolio may fall as we adapt to the new environment and learn from our calculations of downside risk versus upside reward potential.
While we were more optimistic entering the spring months, our outlook is a little more cautious for the latter summer months because the valuation milestones are less clear, especially following the dramatic market increase. Earnings season is about to kick off, and we will have a better idea as to whether CFROI and asset growth can keep the markets moving higher now that quantitative easing has had its desired impact on the cost of capital. While there is genuine progress on several milestones that relate to the self-correcting mechanisms of capitalism, there is also tremendous uncertainty as to what degree the changes proposed in Washington may or may not influence winners and losers in the competition for capital across virtually every industry.
The good news is that we have a list of buy candidates prepared and will take advantage of opportunities as they present themselves and as more information regarding various government proposals succeed, are modified, or fail. Then we will have even more confidence in our calculated payoff structures, and we will be in position to act for the benefit of our clients.
Thank you for your continued support.
 |  |
| Christopher C. Faber | Jeffrey B. Madden |
| IronBridge Capital Management, L.P. | IronBridge Capital Management, L.P. |
INVESTMENT HIGHLIGHTS
Growth of a $100,000 Investment (Unaudited)
| * | 8/30/02 commencement of operations. |
| | | | | |
| | Portfolio Total Return** | | | |
| | FOR PERIODS ENDED 6/30/09 | FUND | INDEX | |
| | | | | |
| | SIX MONTHS | 3.96% | 2.64% | |
| | | | | |
| | ONE YEAR | (26.00)% | (25.01)% | |
| | | | | |
| | FIVE YEAR | | | |
| | AVERAGE ANNUAL | 1.01% | (1.71)% | |
| | | | | |
| | SINCE COMMENCEMENT | | | |
| | AVERAGE ANNUAL | 8.11% | 5.28% | |
| | | | | |
This chart assumes an initial gross investment of $100,000 made on 8/30/02 (commencement of operations). Returns shown include the reinvestment of all distributions. Past performance is not predictive of future results. Investment return and principal value will fluctuate so that shares, when redeemed, may be worth more or less than the original cost. To receive current to the most recent month-end performance, please call 1-888-825-2100.
The Russell 2000 Index measures the performance of the 2,000 smallest companies in the Russell 3000 Index. The Russell 3000 Index measures the performance of the 3,000 largest U.S. companies based on total market capitalization. The Index does not reflect investment management fees, brokerage commissions and other expenses associated with investing in equity securities. A direct investment in the index is not possible.
| ** | The returns shown do not reflect the deduction of taxes that a shareholder would pay on Fund distributions or the redemption of Fund shares. |
Frontegra IronBridge Small Cap Fund
SCHEDULE OF INVESTMENTS
June 30, 2009
| Number of Shares | | Value | |
| | | | | | |
| COMMON STOCKS 96.1% | | | |
| | | | | | |
| | | Aerospace & Defense 3.2% | | | |
| | 19,764 | | Axsys Technologies, Inc. (a) | | $ | 1,060,141 | |
| | 69,803 | | Esterline Technologies Corp. (a) | | | 1,889,567 | |
| | 109,450 | | Moog Inc. - Class A (a) | | | 2,824,904 | |
| | 105,551 | | Orbital Sciences Corp. (a) | | | 1,601,209 | |
| | 49,777 | | Triumph Group, Inc. | | | 1,991,080 | |
| | | | | | | 9,366,901 | |
| | | | Apparel Retail 0.5% | | | | |
| | 48,110 | | The Buckle, Inc. | | | 1,528,455 | |
| | | | | | | | |
| | | | Auto Components 1.3% | | | | |
| | 158,396 | | Gentex Corp. | | | 1,837,394 | |
| | 135,881 | | Superior Industries | | | | |
| | | | International, Inc. | | | 1,915,922 | |
| | | | | | | 3,753,316 | |
| | | | Biotechnology 4.3% | | | | |
| | 64,009 | | Albany Molecular Research, Inc. (a) | | | 537,035 | |
| | 214,237 | | Cepheid, Inc. (a) | | | 2,018,113 | |
| | 213,337 | | Exelixis, Inc. (a) | | | 1,038,951 | |
| | 105,972 | | Isis Pharmaceuticals, Inc. (a) | | | 1,748,538 | |
| | 90,116 | | Luminex Corp. (a) | | | 1,670,751 | |
| | 57,719 | | Metabolix, Inc. (a) | | | 474,450 | |
| | 33,960 | | Myriad Genetics, Inc. (a) | | | 1,210,674 | |
| | 5,615 | | Myriad Pharmaceuticals Inc. (a) | | | 26,110 | |
| | 59,721 | | Onyx Pharmaceuticals, Inc. (a) | | | 1,687,715 | |
| | 34,473 | | Techne Corp. | | | 2,199,722 | |
| | | | | | | 12,612,059 | |
| | | | Building Products 1.9% | | | | |
| | 185,120 | | Apogee Enterprises, Inc. | | | 2,276,976 | |
| | 99,353 | | Universal Forest Products, Inc. | | | 3,287,591 | |
| | | | | | | 5,564,567 | |
| | | | Capital Markets 2.9% | | | | |
| | 152,339 | | Jefferies Group, Inc. (a) | | | 3,249,391 | |
| | 109,476 | | Knight Capital | | | | |
| | | | Group, Inc. - Class A (a) | | | 1,866,566 | |
| | 87,390 | | optionsXpress Holdings, Inc. | | | 1,357,166 | |
| | 84,249 | | Waddell & Reed Financial, Inc. | | | 2,221,646 | |
| | | | | | | 8,694,769 | |
| | | | Chemicals 4.3% | | | | |
| | 60,006 | | Arch Chemicals, Inc. | | | 1,475,548 | |
| | 84,174 | | FMC Corp. | | | 3,981,430 | |
| | 77,720 | | Lubrizol Corp. | | | 3,676,933 | |
| | 186,345 | | Methanex Corp. (b) | | | 2,280,863 | |
| | 41,091 | | Minerals Technologies, Inc. | | | 1,480,098 | |
| | | | | | | 12,894,872 | |
| | | | Commercial Banks 3.9% | | | | |
| | 87,587 | | Cullen/Frost Bankers, Inc. | | | 4,039,512 | |
| | 35,141 | | IBERIABANK Corp. | | | 1,384,907 | |
| | 102,556 | | TCF Financial Corp. | | | 1,371,174 | |
| | 41,268 | | United Bankshares, Inc. | | | 806,377 | |
| | 80,445 | | Westamerica Bancorporation | | | 3,990,876 | |
| | | | | | | 11,592,846 | |
| | | | Commercial Services & Supplies 1.9% | | | | |
| | 39,524 | | PICO Holdings, Inc. (a) | | | 1,134,339 | |
| | 14,256 | | Strayer Education, Inc. | | | 3,109,376 | |
| | 47,397 | | Tetra Tech, Inc. (a) | | | 1,357,924 | |
| | | | | | | 5,601,639 | |
| | | | Communications Equipment 2.0% | | | | |
| | 92,045 | | Polycom, Inc. (a) | | | 1,865,752 | |
| | 245,865 | | Tekelec (a) | | | 4,137,908 | |
| | | | | | | 6,003,660 | |
| | | | Computers & Peripherals 1.2% | | | | |
| | 88,237 | | Synaptics Inc. (a) | | | 3,410,360 | |
| | | | | | | | |
| | | | Construction & Engineering 1.3% | | | | |
| | 98,980 | | Insituform Technologies, Inc. (a) | | | 1,679,690 | |
| | 173,155 | | MasTec, Inc. (a) | | | 2,029,377 | |
| | | | | | | 3,709,067 | |
| | | | Consumer Electronics 0.5% | | | | |
| | 75,418 | | Universal Electronics, Inc. (a) | | | 1,521,181 | |
The accompanying notes are an integral part of these financial statements.
Frontegra IronBridge Small Cap Fund
SCHEDULE OF INVESTMENTS (continued)
June 30, 2009
| Number of Shares | | Value | |
| | | | | | |
| COMMON STOCKS 96.1% (continued) | | | |
| | | | |
| | | Distributors 0.5% | | | |
| | 54,767 | | WESCO International, Inc. (a) | | $ | 1,371,366 | |
| | | | | | | | |
| | | | Diversified Financial Services 0.7% | | | | |
| | 61,340 | | Financial Federal Corp. | | | 1,260,537 | |
| | 31,981 | | GATX Corp. | | | 822,551 | |
| | | | | | | 2,083,088 | |
| | | | Electric Utilities 1.9% | | | | |
| | 150,288 | | Black Hills Corp. | | | 3,455,121 | |
| | 50,715 | | ITC Holdings Corp. | | | 2,300,432 | |
| | | | | | | 5,755,553 | |
| | | | Electrical Equipment 2.9% | | | | |
| | 88,308 | | American Superconductor Corp. (a) | | | 2,318,085 | |
| | 42,461 | | SunPower Corp. (a) | | | 1,016,941 | |
| | 129,497 | | Thomas & Betts Corp. (a) | | | 3,737,283 | |
| | 76,136 | | Woodward Governor Co. | | | 1,507,493 | |
| | | | | | | 8,579,802 | |
| | | | Electronic Equipment | | | | |
| | | | & Instruments 6.0% | | | | |
| | 203,164 | | Daktronics, Inc. | | | 1,564,363 | |
| | 25,750 | | Dionex Corp. (a) | | | 1,571,522 | |
| | 161,316 | | FLIR Systems, Inc. (a) | | | 3,639,289 | |
| | 24,340 | | Itron, Inc. (a) | | | 1,340,404 | |
| | 162,289 | | National Instruments Corp. | | | 3,661,240 | |
| | 65,585 | | Rofin-Sinar Technologies, Inc. (a) | | | 1,312,356 | |
| | 76,399 | | ScanSource, Inc. (a) | | | 1,873,303 | |
| | 152,555 | | Trimble Navigation Ltd. (a) | | | 2,994,655 | |
| | | | | | | 17,957,132 | |
| | | | Energy Equipment & Services 3.5% | | | | |
| | 48,694 | | Lufkin Industries, Inc. | | | 2,047,582 | |
| | 62,484 | | Oceaneering International, Inc. (a) | | | 2,824,277 | |
| | 113,953 | | Oil States International, Inc. (a) | | | 2,758,802 | |
| | 104,040 | | Unit Corp. (a) | | | 2,868,383 | |
| | | | | | | 10,499,044 | |
| | | | Food Products 1.8% | | | | |
| | 132,579 | | Corn Products International, Inc. | | | 3,551,792 | |
| | 77,024 | | Flowers Foods, Inc. | | | 1,682,204 | |
| | | | | | | 5,233,996 | |
| | | | Gas Utilities 3.3% | | | | |
| | 88,148 | | AGL Resources, Inc. | | | 2,803,106 | |
| | 166,941 | | Southern Union Co. | | | 3,070,045 | |
| | 148,769 | | UGI Corp. | | | 3,792,122 | |
| | | | | | | 9,665,273 | |
| | | | Health Care Equipment & Supplies 6.7% | | | | |
| | 120,831 | | ABIOMED, Inc. (a) | | | 1,065,729 | |
| | 54,191 | | Gen-Probe, Inc. (a) | | | 2,329,129 | |
| | 126,013 | | Hansen Medical, Inc. (a) | | | 622,504 | |
| | 39,599 | | IDEXX Laboratories, Inc. (a) | | | 1,829,474 | |
| | 141,973 | | Illumina, Inc. (a) | | | 5,528,429 | |
| | 29,254 | | Neogen Corp. (a) | | | 847,781 | |
| | 42,202 | | SonoSite, Inc. (a) | | | 846,572 | |
| | 131,504 | | Varian, Inc. (a) | | | 5,185,203 | |
| | 81,144 | | ZOLL Medical Corp. (a) | | | 1,569,325 | |
| | | | | | | 19,824,146 | |
| | | | Health Care Providers & Services 3.9% | | | | |
| | 86,539 | | Cerner Corp. (a) | | | 5,390,514 | |
| | 138,924 | | Owens & Minor, Inc. | | | 6,087,650 | |
| | | | | | | 11,478,164 | |
| | | | Hotels Restaurants & Leisure 0.9% | | | | |
| | 87,521 | | WMS Industries, Inc. (a) | | | 2,757,787 | |
| | | | | | | | |
| | | | Household Durables 3.0% | | | | |
| | 135,917 | | AptarGroup, Inc. | | | 4,589,917 | |
| | 43,078 | | Snap-on, Inc. | | | 1,238,062 | |
| | 116,905 | | Tupperware Brands Corp. | | | 3,041,868 | |
| | | | | | | 8,869,847 | |
| | | | Industrial Conglomerates 2.6% | | | | |
| | 23,797 | | Alleghany Corp. | | | 6,448,987 | |
| | 49,468 | | Raven Industries, Inc. | | | 1,266,381 | |
| | | | | | | 7,715,368 | |
| | | | Insurance 3.1% | | | | |
| | 245,315 | | American Financial Group, Inc. | | | 5,293,898 | |
The accompanying notes are an integral part of these financial statements.
Frontegra IronBridge Small Cap Fund
SCHEDULE OF INVESTMENTS (continued)
June 30, 2009
| Number of Shares | | Value | |
| | | | | | |
| COMMON STOCKS 96.1% (continued) | | | |
| | | | | | |
| | | Insurance 3.1% (continued) | | | |
| | 105,709 | | Argo Group International | | | |
| | | | Holdings, Ltd. (a)(b) | | $ | 2,983,108 | |
| | 65,061 | | Stewart Information Services Corp. | | | 927,119 | |
| | | | | | | 9,204,125 | |
| | | | Internet & Catalog Retail 0.5% | | | | |
| | 36,820 | | Netflix, Inc. (a) | | | 1,522,139 | |
| | | | | | | | |
| | | | IT Services 0.5% | | | | |
| | 101,606 | | Tyler Technologies, Inc. (a) | | | 1,587,086 | |
| | | | | | | | |
| | | | Leisure Equipment & Products 0.6% | | | | |
| | 347,338 | | Callaway Golf Co. | | | 1,761,004 | |
| | | | | | | | |
| | | | Machinery 4.0% | | | | |
| | 90,670 | | Astec Industries, Inc. (a) | | | 2,691,992 | |
| | 65,185 | | IDEX Corp. | | | 1,601,596 | |
| | 60,343 | | Kaydon Corp. | | | 1,964,768 | |
| | 67,708 | | Lincoln Electric Holdings, Inc. | | | 2,440,196 | |
| | 42,648 | | Valmont Industries, Inc. | | | 3,074,068 | |
| | | | | | | 11,772,620 | |
| | | | Marine 1.3% | | | | |
| | 166,723 | | Alexander & Baldwin, Inc. | | | 3,907,987 | |
| | | | | | | | |
| | | | Metals & Mining 1.3% | | | | |
| | 64,799 | | Carpenter Technology | | | 1,348,467 | |
| | 219,312 | | GrafTech International Ltd. (a) | | | 2,480,419 | |
| | | | | | | 3,828,886 | |
| | | | Multiline Retail 0.4% | | | | |
| | 49,260 | | Big Lots, Inc. (a) | | | 1,035,938 | |
| | | | | | | | |
| | | | Multi-Utilities & | | | | |
| | | | Unregulated Power 2.2% | | | | |
| | 362,815 | | Avista Corp. | | | 6,461,735 | |
| | | | | | | | |
| | | | Oil & Gas 1.7% | | | | |
| | 93,213 | | Cabot Oil & Gas Corp. | | | 2,856,046 | |
| | 87,011 | | Swift Energy Co. (a) | | | 1,448,733 | |
| | 82,162 | | Tesco Corp. (a)(b) | | | 652,366 | |
| | | | | | | 4,957,145 | |
| | | | Real Estate 4.5% | | | | |
| | 23,240 | | Alexandria Real Estate Equities, Inc. | | | 831,760 | |
| | 178,530 | | Corporate Office Properties Trust | | | 5,236,285 | |
| | 140,781 | | Mid-America Apartment | | | | |
| | | | Communities, Inc. | | | 5,168,070 | |
| | 82,224 | | The St. Joe Co. (a) | | | 2,178,114 | |
| | | | | | | 13,414,229 | |
| | | | Semiconductor & Semiconductor | | | | |
| | | | Equipment 2.5% | | | | |
| | 329,592 | | Cypress Semiconductor Corp. (a) | | | 3,032,246 | |
| | 124,651 | | Semtech Corp. (a) | | | 1,983,197 | |
| | 36,201 | | Standard Microsystems Corp. (a) | | | 740,311 | |
| | 73,155 | | Varian Semiconductor | | | | |
| | | | Equipment Associates, Inc. (a) | | | 1,754,989 | |
| | | | | | | 7,510,743 | |
| | | | Software 2.8% | | | | |
| | 70,470 | | ANSYS, Inc. (a) | | | 2,195,845 | |
| | 85,647 | | Informatica Corp. (a) | | | 1,472,272 | |
| | 103,347 | | Jack Henry & Associates, Inc. | | | 2,144,450 | |
| | 114,588 | | Parametric Technology Corp. (a) | | | 1,339,534 | |
| | 38,560 | | Sybase, Inc. (a) | | | 1,208,470 | |
| | | | | | | 8,360,571 | |
| | | | Specialty Retail 1.2% | | | | |
| | 88,025 | | Tractor Supply Co. (a) | | | 3,637,193 | |
| | | | | | | | |
| | | | Telephone Communications 0.5% | | | | |
| | 220,559 | | TeleCommunication | | | | |
| | | | Systems, Inc. (a) | | | 1,568,174 | |
| | | | | | | | |
| | | | Textiles, Apparel & Luxury Goods 1.1% | | | | |
| | 146,998 | | Wolverine World Wide, Inc. | | | 3,242,776 | |
The accompanying notes are an integral part of these financial statements.
Frontegra IronBridge Small Cap Fund
SCHEDULE OF INVESTMENTS (continued)
June 30, 2009
| Number of Shares | | Value | |
| | | | | | |
| COMMON STOCKS 96.1% (continued) | | | |
| | | | | | |
| | | Thrifts & Mortgage Finance 1.0% | | | |
| | 175,392 | | Provident Financial Services, Inc. | | $ | 1,596,067 | |
| | 106,750 | | Washington Federal, Inc. | | | 1,387,750 | |
| | | | | | | 2,983,817 | |
| | | | Total Common Stocks | | | | |
| | | | (Cost $300,102,895) | | | 284,800,426 | |
| | | | | | | | |
| EXCHANGE TRADED FUNDS 1.9% | | | | |
| | 113,610 | | iShares Russell 2000 Index Fund | | | 5,789,566 | |
| | | | Total Exchange Traded Funds | | | | |
| | | | (Cost $5,166,289) | | | 5,789,566 | |
| | | | | | | | |
| Principal Amount | | | |
| SHORT-TERM INVESTMENTS 0.3% | | | | |
| | | | | | | | |
| | | | Variable Rate Demand Notes (c) 0.3% | | | | |
| $ | 571,927 | | American Family | | | | |
| | | | Financial Services, Inc., 0.100% | | | 571,927 | |
| | 236,667 | | U.S. Bank, N.A. | | | 236,667 | |
| | | | | | | 808,594 | |
| | | | Total Short-Term Investments | | | | |
| | | | (Cost $808,594) | | | 808,594 | |
| | | | | | | | |
| | | | Total Investments 98.3% | | | | |
| | | | (Cost $306,077,778) | | | 291,398,586 | |
| | | | | | | | |
| | | | Other Assets in Excess | | | | |
| | | | of Liabilities 1.7% | | | 5,046,106 | |
| | | | | | | | |
| | | | TOTAL NET ASSETS 100.0% | | $ | 296,444,692 | |
| (b) | U.S.-dollar denominated security of foreign issuer. |
| (c) | Variable rate demand notes are considered short-term obligations and are payable upon demand. Interest rates change periodically on specified dates. The rates listed are as of June 30, 2009. |
ALLOCATION OF PORTFOLIO HOLDINGS
At June 30, 2009, the allocation of portfolio holdings as a percentage of the Fund’s total net assets were:
| Common Stocks | | | 96.1 | % |
| Exchange Traded Funds | | | 1.9 | |
| Short-Term Investments | | | 0.3 | |
| Other Assets in Excess of Liabilities | | | 1.7 | |
| Total | | | 100.0 | % |
The accompanying notes are an integral part of these financial statements.
Frontegra IronBridge Small Cap Fund
STATEMENT OF ASSETS AND LIABILITIES
June 30, 2009
| Assets: | | | |
| Investments at value (cost $306,077,778) | | $ | 291,398,586 | |
| Cash | | | 24,551 | |
| Dividends and interest receivable | | | 307,876 | |
| Receivable for Fund shares sold | | | 124,771 | |
| Receivable for investments sold | | | 5,963,691 | |
| Prepaid expenses and other assets | | | 22,130 | |
| Total assets | | | 297,841,605 | |
| | | | | |
| Liabilities: | | | | |
| Payable for investments purchased | | | 1,041,675 | |
| Payable for Fund shares redeemed | | | 49,865 | |
| Accrued investment advisory fee | | | 247,372 | |
| Accrued expenses | | | 58,001 | |
| Total liabilities | | | 1,396,913 | |
| Net Assets | | $ | 296,444,692 | |
| | | | | |
| Net Assets Consist of: | | | | |
| Paid in capital | | $ | 360,881,103 | |
| Undistributed net investment income | | | 1,187,053 | |
| Accumulated net realized loss | | | (50,944,272 | ) |
| Net unrealized depreciation on investments | | | (14,679,192 | ) |
| Net Assets | | $ | 296,444,692 | |
| | | | | |
| Capital Stock, $0.01 Par Value | | | | |
| Authorized | | | 50,000,000 | |
| Issued and outstanding | | | 25,111,874 | |
| Net Asset Value, Redemption Price and Offering Price Per Share | | $ | 11.80 | |
The accompanying notes are an integral part of these financial statements.
Frontegra IronBridge Small Cap Fund
STATEMENT OF OPERATIONS
| | | Year Ended | |
| | | June 30, 2009 | |
| Investment Income: | | | |
Dividend income(1) | | $ | 4,352,997 | |
| Interest income | | | 137,450 | |
| Total Investment Income | | | 4,490,447 | |
| | | | | |
| Expenses: | | | | |
| Investment advisory fees (Note 3) | | | 3,002,000 | |
| Fund administration and accounting fees | | | 88,342 | |
| Audit fees | | | 34,676 | |
| Legal fees | | | 28,908 | |
| Custody fees | | | 27,937 | |
| Federal and state registration fees | | | 27,110 | |
| Shareholder servicing fees | | | 21,105 | |
| Reports to shareholders | | | 17,990 | |
| Directors’ fees and related expenses | | | 8,295 | |
| Compliance related expenses | | | 5,268 | |
| Other | | | 14,835 | |
| Total expenses | | | 3,276,466 | |
| Net Investment Income | | | 1,213,981 | |
| | | | | |
| Realized and Unrealized Loss on Investments: | | | | |
| Net realized loss on: | | | | |
| Investments | | | (50,963,550 | ) |
| Change in net unrealized appreciation/(depreciation) on: | | | | |
| Investments | | | (50,588,011 | ) |
| Net Realized and Unrealized Loss on Investments | | | (101,551,561 | ) |
| Net Decrease in Net Assets Resulting from Operations | | $ | (100,337,580 | ) |
| (1) | Net of $14,051 in foreign withholding taxes. |
The accompanying notes are an integral part of these financial statements.
Frontegra IronBridge Small Cap Fund
STATEMENTS OF CHANGES IN NET ASSETS
| | | For the | | | For the | |
| | | Year Ended | | | Year Ended | |
| | | June 30, 2009 | | | June 30, 2008 | |
| Operations: | | | | | | |
| Net investment income | | $ | 1,213,981 | | | $ | 369,703 | |
| Net realized gain (loss) on investments | | | (50,963,550 | ) | | | 42,297,592 | |
| Change in net unrealized appreciation/(depreciation) on investments | | | (50,588,011 | ) | | | (68,499,235 | ) |
| Net decrease in net assets resulting from operations | | | (100,337,580 | ) | | | (25,831,940 | ) |
| | | | | | | | | |
| Distributions From: | | | | | | | | |
| Net investment income | | | (189,366 | ) | | | (96,114 | ) |
| Net realized gain | | | (16,024,635 | ) | | | (45,487,192 | ) |
| Total distributions | | | (16,214,001 | ) | | | (45,583,306 | ) |
| | | | | | | | | |
| Capital Share Transactions: | | | | | | | | |
| Shares sold | | | 54,279,666 | | | | 36,326,779 | |
| Shares issued to holders in reinvestment of distributions | | | 15,455,049 | | | | 43,952,221 | |
| Shares redeemed | | | (56,770,624 | ) | | | (41,234,537 | ) |
| Net increase in net assets resulting from capital share transactions | | | 12,964,091 | | | | 39,044,463 | |
| Total Decrease in Net Assets | | | (103,587,490 | ) | | | (32,370,783 | ) |
| | | | | | | | | |
| Net Assets: | | | | | | | | |
| Beginning of Year | | | 400,032,182 | | | | 432,402,965 | |
| End of Year (includes undistributed net investment | | | | | | | | |
| income of $1,187,053 and $189,366, respectively) | | $ | 296,444,692 | | | $ | 400,032,182 | |
| | | | | | | | | |
| Share Transactions: | | | | | | | | |
| Shares sold | | | 4,728,426 | | | | 1,988,935 | |
| Shares issued to holders in reinvestment of distributions | | | 1,412,710 | | | | 2,473,395 | |
| Shares redeemed | | | (4,512,723 | ) | | | (2,226,907 | ) |
| Net increase in shares outstanding | | | 1,628,413 | | | | 2,235,423 | |
The accompanying notes are an integral part of these financial statements.
Frontegra IronBridge Small Cap Fund
FINANCIAL HIGHLIGHTS
| | | Year | | | Year | | | Year | | | Year | | | Year | |
| | | Ended | | | Ended | | | Ended | | | Ended | | | Ended | |
| | | June 30, | | | June 30, | | | June 30, | | | June 30, | | | June 30, | |
| | | 2009 | | | 2008 | | | 2007 | | | 2006 | | | 2005 | |
| Net Asset Value, Beginning of Year | | $ | 17.03 | | | $ | 20.35 | | | $ | 18.25 | | | $ | 16.14 | | | $ | 15.83 | |
| | | | | | | | | | | | | | | | | | | | | |
| Income (Loss) from | | | | | | | | | | | | | | | | | | | | |
| Investment Operations: | | | | | | | | | | | | | | | | | | | | |
| Net investment income (loss) | | | 0.05 | | | | 0.02 | | | | — | | | | 0.03 | | | | (0.03 | ) |
| Net realized and unrealized gain (loss) on investments | | | (4.53 | ) | | | (1.16 | ) | | | 3.82 | | | | 2.25 | | | | 1.38 | |
| Total Income (Loss) from Investment Operations | | | (4.48 | ) | | | (1.14 | ) | | | 3.82 | | | | 2.28 | | | | 1.35 | |
| | | | | | | | | | | | | | | | | | | | | |
| Less Distributions: | | | | | | | | | | | | | | | | | | | | |
| From net investment income | | | (0.01 | ) | | | (0.01 | ) | | | (0.02 | ) | | | — | | | | — | |
| From net realized gain on investments | | | (0.74 | ) | | | (2.17 | ) | | | (1.70 | ) | | | (0.17 | ) | | | (1.04 | ) |
| Total Distributions | | | (0.75 | ) | | | (2.18 | ) | | | (1.72 | ) | | | (0.17 | ) | | | (1.04 | ) |
| | | | | | | | | | | | | | | | | | | | | |
| Net Asset Value, End of Year | | $ | 11.80 | | | $ | 17.03 | | | $ | 20.35 | | | $ | 18.25 | | | $ | 16.14 | |
| Total Return | | | (26.00 | )% | | | (6.07 | )% | | | 22.11 | % | | | 14.20 | % | | | 8.47 | % |
| | | | | | | | | | | | | | | | | | | | | |
| Supplemental Data and Ratios: | | | | | | | | | | | | | | | | | | | | |
| Net assets, end of period (in thousands) | | $ | 296,445 | | | $ | 400,032 | | | $ | 432,403 | | | $ | 404,219 | | | $ | 319,081 | |
| Ratio of expenses to average net assets | | | | | | | | | | | | | | | | | | | | |
| Before waivers and reimbursements | | | 1.09 | % | | | 1.07 | % | | | 1.07 | % | | | 1.08 | % | | | 1.11 | % |
| Net of waivers and reimbursements | | | 1.09 | % | | | 1.08 | % | | | 1.10 | % | | | 1.10 | % | | | 1.10 | % |
| Ratio of net investment income (loss) to average net assets | | | | | | | | | | | | | | | | | | | | |
| Before waivers and reimbursements | | | 0.40 | % | | | 0.10 | % | | | (0.01 | )% | | | 0.17 | % | | | (0.28 | )% |
| Net of waivers and reimbursements | | | 0.40 | % | | | 0.09 | % | | | (0.08 | )% | | | 0.15 | % | | | (0.27 | )% |
| Portfolio turnover rate | | | 39 | % | | | 53 | % | | | 34 | % | | | 60 | % | | | 56 | % |
The accompanying notes are an integral part of these financial statements.
INVESTMENT HIGHLIGHTS
Growth of a $100,000 Investment (Unaudited)
| * | 12/31/04 commencement of operations. |
| | | | | |
| | Portfolio Total Return** | | | |
| | FOR PERIODS ENDED 6/30/09 | FUND | INDEX | |
| | | | | |
| | SIX MONTHS | 7.01% | 6.52% | |
| | | | | |
| | ONE YEAR | (25.78)% | (26.72)% | |
| | | | | |
| | THREE YEAR | | | |
| | AVERAGE ANNUAL | (5.67)% | (9.31)% | |
| | | | | |
| | SINCE COMMENCEMENT | | | |
| | AVERAGE ANNUAL | (1.56)% | (3.37)% | |
| | | | | |
This chart assumes an initial gross investment of $100,000 made on 12/31/04 (commencement of operations). Returns shown include the reinvestment of all distributions. Past performance is not predictive of future results. Investment return and principal value will fluctuate so that shares, when redeemed, may be worth more or less than the original cost. In the absence of existing fee waivers, total return would be reduced. To receive current to the most recent month-end performance, please call 1-888-825-2100.
The Russell 2500 Index measures the performance of the 2,500 smallest companies in the Russell 3000 Index. The Russell 3000 Index measures the performance of the 3,000 largest U.S. companies based on total market capitalization. The Index does not reflect investment management fees, brokerage commissions and other expenses associated with investing in equity securities. A direct investment in the index is not possible.
| ** | The returns shown do not reflect the deduction of taxes that a shareholder would pay on Fund distributions or the redemption of Fund shares. |
Frontegra IronBridge SMID Fund
SCHEDULE OF INVESTMENTS
June 30, 2009
| Number of Shares | | Value | |
| | | | | | |
| COMMON STOCKS 95.8% | | | |
| | | | | | |
| | | Aerospace & Defense 1.2% | | | |
| | 59,768 | | Esterline Technologies Corp. (a) | | $ | 1,617,920 | |
| | 59,879 | | Teledyne Technologies, Inc. (a) | | | 1,961,037 | |
| | | | | | | 3,578,957 | |
| | | | Apparel Retail 0.3% | | | | |
| | 28,239 | | The Buckle, Inc. | | | 897,153 | |
| | | | | | | | |
| | | | Auto Components 0.5% | | | | |
| | 129,336 | | Gentex Corp. | | | 1,500,298 | |
| | | | | | | | |
| | | | Biotechnology 3.6% | | | | |
| | 24,307 | | Alexion Pharmaceuticals, Inc. (a) | | | 999,261 | |
| | 165,733 | | Cepheid, Inc. (a) | | | 1,561,205 | |
| | 142,722 | | Isis Pharmaceuticals, Inc. (a) | | | 2,354,913 | |
| | 126,066 | | Luminex Corp. (a) | | | 2,337,263 | |
| | 68,207 | | Onyx Pharmaceuticals, Inc. (a) | | | 1,927,530 | |
| | 29,528 | | Techne Corp. | | | 1,884,182 | |
| | | | | | | 11,064,354 | |
| | | | Capital Markets 2.4% | | | | |
| | 116,875 | | Knight Capital Group, | | | | |
| | | | Inc. - Class A (a) | | | 1,992,719 | |
| | 140,985 | | SEI Investments Co. | | | 2,543,369 | |
| | 105,534 | | Waddell & Reed Financial, Inc. | | | 2,782,932 | |
| | | | | | | 7,319,020 | |
| | | | Chemicals 6.9% | | | | |
| | 133,600 | | Albemarle Corp. | | | 3,416,152 | |
| | 114,287 | | Calgon Carbon Corp. (a) | | | 1,587,446 | |
| | 103,168 | | FMC Corp. | | | 4,879,846 | |
| | 102,121 | | Lubrizol Corp. | | | 4,831,344 | |
| | 166,862 | | Methanex Corp. (b) | | | 2,042,391 | |
| | 40,581 | | Minerals Technologies, Inc. | | | 1,461,728 | |
| | 63,626 | | Sigma-Aldrich Corp. | | | 3,153,305 | |
| | | | | | | 21,372,212 | |
| | | | Commercial Banks 2.1% | | | | |
| | 115,761 | | Cullen/Frost Bankers, Inc. | | | 5,338,897 | |
| | 219,799 | | KeyCorp | | | 1,151,747 | |
| | | | | | | 6,490,644 | |
| | | | Commercial Services & Supplies 1.1% | | | | |
| | 15,276 | | Strayer Education, Inc. | | | 3,331,848 | |
| | | | | | | | |
| | | | Communications Equipment 0.9% | | | | |
| | 77,781 | | F5 Networks, Inc. (a) | | | 2,690,445 | |
| | | | | | | | |
| | | | Computers & Peripherals 0.9% | | | | |
| | 67,719 | | Synaptics Inc. (a) | | | 2,617,339 | |
| | | | | | | | |
| | | | Construction & Engineering 2.9% | | | | |
| | 52,125 | | Jacobs Engineering Group, Inc. (a) | | | 2,193,941 | |
| | 146,784 | | Quanta Services, Inc. (a) | | | 3,395,114 | |
| | 66,351 | | URS Corp. (a) | | | 3,285,702 | |
| | | | | | | 8,874,757 | |
| | | | Containers & Packaging 0.6% | | | | |
| | 41,770 | | Greif Inc. - Class A | | | 1,847,070 | |
| | | | | | | | |
| | | | Diversified Financial Services 0.7% | | | | |
| | 78,620 | | GATX Corp. | | | 2,022,106 | |
| | | | | | | | |
| | | | Electric Utilities 1.0% | | | | |
| | 68,250 | | ITC Holdings Corp. | | | 3,095,820 | |
| | | | | | | | |
| | | | Electrical Equipment 2.5% | | | | |
| | 88,152 | | American Superconductor Corp. (a) | | | 2,313,990 | |
| | 88,373 | | AMETEK, Inc. | | | 3,055,938 | |
| | 52,564 | | Roper Industries, Inc. | | | 2,381,675 | |
| | | | | | | 7,751,603 | |
| | | | Electronic Equipment | | | | |
| | | | & Instruments 3.8% | | | | |
| | 92,510 | | Amphenol Corp. - Class A | | | 2,927,016 | |
| | 157,828 | | Avnet, Inc. (a) | | | 3,319,123 | |
| | 51,777 | | FLIR Systems, Inc. (a) | | | 1,168,089 | |
The accompanying notes are an integral part of these financial statements.
Frontegra IronBridge SMID Fund
SCHEDULE OF INVESTMENTS (continued)
June 30, 2009
| Number of Shares | | Value | |
| | | | | | |
| COMMON STOCKS 95.8% (continued) | | | |
| | | | | | |
| | | Electronic Equipment | | | |
| | | & Instruments 3.8% (continued) | | | |
| | 30,986 | | Itron, Inc. (a) | | $ | 1,706,399 | |
| | 126,098 | | Trimble Navigation Ltd. (a) | | | 2,475,304 | |
| | | | | | | 11,595,931 | |
| | | | Energy Equipment & Services 4.0% | | | | |
| | 75,319 | | FMC Technologies, Inc. (a) | | | 2,830,488 | |
| | 104,457 | | Helmerich & Payne, Inc. | | | 3,224,587 | |
| | 58,893 | | Oceaneering International, Inc. (a) | | | 2,661,964 | |
| | 141,003 | | Pride International, Inc. (a) | | | 3,533,535 | |
| | | | | | | 12,250,574 | |
| | | | Food Products 4.1% | | | | |
| | 127,181 | | Corn Products International, Inc. | | | 3,407,179 | |
| | 106,384 | | Flowers Foods, Inc. | | | 2,323,427 | |
| | 210,835 | | McCormick & Co., Inc. | | | 6,858,462 | |
| | | | | | | 12,589,068 | |
| | | | Gas Utilities 3.1% | | | | |
| | 75,650 | | New Jersey Resources Corp. | | | 2,802,076 | |
| | 262,873 | | UGI Corp. | | | 6,700,633 | |
| | | | | | | 9,502,709 | |
| | | | Health Care Equipment & Supplies 5.6% | | | | |
| | 22,350 | | C.R. Bard, Inc. | | | 1,663,958 | |
| | 42,684 | | Gen-Probe, Inc. (a) | | | 1,834,558 | |
| | 116,474 | | Hansen Medical, Inc. (a) | | | 575,382 | |
| | 173,732 | | Illumina, Inc. (a) | | | 6,765,124 | |
| | 13,240 | | Intuitive Surgical, Inc. (a) | | | 2,166,858 | |
| | 247,431 | | PerkinElmer, Inc. | | | 4,305,299 | |
| | | | | | | 17,311,179 | |
| | | | Health Care Providers & Services 3.8% | | | | |
| | 112,317 | | Cerner Corp. (a) | | | 6,996,226 | |
| | 108,671 | | Owens & Minor, Inc. | | | 4,761,963 | |
| | | | | | | 11,758,189 | |
| | | | Hotels Restaurants & Leisure 0.9% | | | | |
| | 90,945 | | WMS Industries, Inc. (a) | | | 2,865,677 | |
| | | | | | | | |
| | | | Household Durables 3.4% | | | | |
| | 134,483 | | AptarGroup, Inc. | | | 4,541,491 | |
| | 83,877 | | Snap-on, Inc. | | | 2,410,625 | |
| | 137,823 | | Tupperware Brands Corp. | | | 3,586,154 | |
| | | | | | | 10,538,270 | |
| | | | Industrial Conglomerates 1.3% | | | | |
| | 15,333 | | Alleghany Corp. | | | 4,155,243 | |
| | | | | | | | |
| | | | Insurance 3.1% | | | | |
| | 135,175 | | American Financial Group, Inc. | | | 2,917,076 | |
| | 14,865 | | Markel Corp. (a) | | | 4,187,471 | |
| | 52,906 | | RLI Corp. | | | 2,370,189 | |
| | | | | | | 9,474,736 | |
| | | | Internet & Catalog Retail 1.4% | | | | |
| | 41,647 | | Netflix Inc. (a) | | | 1,721,687 | |
| | 23,888 | | priceline.com, Inc. (a) | | | 2,664,706 | |
| | | | | | | 4,386,393 | |
| | | | Internet Software & Services 0.6% | | | | |
| | 92,399 | | Akamai Technologies, Inc. (a) | | | 1,772,213 | |
| | | | | | | | |
| | | | Leisure Equipment & Products 1.4% | | | | |
| | 126,501 | | Callaway Golf Co. | | | 641,360 | |
| | 155,637 | | Hasbro, Inc. | | | 3,772,641 | |
| | | | | | | 4,414,001 | |
| | | | Machinery 2.0% | | | | |
| | 30,162 | | Flowserve Corp. | | | 2,105,609 | |
| | 50,296 | | Harsco Corp. | | | 1,423,377 | |
| | 28,098 | | IDEX Corp. | | | 690,368 | |
| | 26,897 | | Valmont Industries, Inc. | | | 1,938,736 | |
| | | | | | | 6,158,090 | |
| | | | Marine 1.3% | | | | |
| | 168,882 | | Alexander & Baldwin, Inc. | | | 3,958,594 | |
| | | | | | | | |
| | | | Metals & Mining 1.1% | | | | |
| | 79,228 | | Arch Coal, Inc. | | | 1,217,734 | |
The accompanying notes are an integral part of these financial statements.
Frontegra IronBridge SMID Fund
SCHEDULE OF INVESTMENTS (continued)
June 30, 2009
| Number of Shares | | Value | |
| | | | | | |
| COMMON STOCKS 95.8% (continued) | | | |
| | | | | | |
| | | Metals & Mining 1.1% (continued) | | | |
| | 205,729 | | GrafTech International Ltd. (a) | | $ | 2,326,795 | |
| | | | | | | 3,544,529 | |
| | | | Multiline Retail 0.5% | | | | |
| | 73,451 | | Big Lots, Inc. (a) | | | 1,544,675 | |
| | | | | | | | |
| | | | Multi-Utilities & | | | | |
| | | | Unregulated Power 2.6% | | | | |
| | 99,891 | | Energen Corp. | | | 3,985,651 | |
| | 216,054 | | MDU Resources Group, Inc. | | | 4,098,544 | |
| | | | | | | 8,084,195 | |
| | | | Oil & Gas 3.2% | | | | |
| | 96,120 | | Cabot Oil & Gas Corp. | | | 2,945,117 | |
| | 246,042 | | Denbury Resources, Inc. (a) | | | 3,624,199 | |
| | 110,180 | | Questar Corp. | | | 3,422,191 | |
| | | | | | | 9,991,507 | |
| | | | Paper & Forest Products 1.6% | | | | |
| | 137,141 | | Rayonier Inc. | | | 4,985,075 | |
| | | | | | | | |
| | | | Real Estate 4.7% | | | | |
| | 186,657 | | Corporate Office Properties Trust | | | 5,474,650 | |
| | 72,958 | | Mid-America Apartment | | | | |
| | | | Communities, Inc. | | | 2,678,288 | |
| | 237,245 | | The St. Joe Co. (a) | | | 6,284,620 | |
| | | | | | | 14,437,558 | |
| | | | Semiconductor & Semiconductor | | | | |
| | | | Equipment 2.3% | | | | |
| | 133,747 | | Altera Corp. | | | 2,177,401 | |
| | 266,867 | | Cypress Semiconductor Corp. (a) | | | 2,455,177 | |
| | 103,463 | | Varian Semiconductor | | | | |
| | | | Equipment Associates, Inc. (a) | | | 2,482,077 | |
| | | | | | | 7,114,655 | |
| | | | Software 5.1% | | | | |
| | 44,870 | | BMC Software, Inc. (a) | | | 1,516,157 | |
| | 80,579 | | Citrix Systems, Inc. (a) | | | 2,569,664 | |
| | 97,401 | | Informatica Corp. (a) | | | 1,674,323 | |
| | 110,039 | | Intuit, Inc. (a) | | | 3,098,698 | |
| | 112,455 | | McAfee, Inc. (a) | | | 4,744,477 | |
| | 68,973 | | Sybase, Inc. (a) | | | 2,161,614 | |
| | | | | | | 15,764,933 | |
| | | | Specialty Retail 1.6% | | | | |
| | 100,640 | | GameStop Corp. - Class A (a) | | | 2,215,087 | |
| | 67,502 | | O’Reilly Automotive, Inc. (a) | | | 2,570,476 | |
| | | | | | | 4,785,563 | |
| | | | Textiles, Apparel & Luxury Goods 2.0% | | | | |
| | 47,605 | | VF Corp. | | | 2,634,937 | |
| | 157,197 | | Wolverine World Wide, Inc. | | | 3,467,766 | |
| | | | | | | 6,102,703 | |
| | | | Thrifts & Mortgage Finance 2.4% | | | | |
| | 332,806 | | Hudson City Bancorp, Inc. | | | 4,422,992 | |
| | 202,586 | | People’s United Financial Inc. | | | 3,046,893 | |
| | | | | | | 7,469,885 | |
| | | | Trading Companies & Distributors 1.3% | | | | |
| | 48,416 | | W.W. Grainger, Inc. | | | 3,964,302 | |
| | | | Total Common Stocks | | | | |
| | | | (Cost $312,427,393) | | | 294,974,073 | |
The accompanying notes are an integral part of these financial statements.
Frontegra IronBridge SMID Fund
SCHEDULE OF INVESTMENTS (continued)
June 30, 2009
| Principal Amount | | Value | |
| | | | | | |
| SHORT-TERM INVESTMENTS 4.3% | | | |
| | | | | | |
| | | Commercial Paper 2.8% | | | |
| $ | 8,575,000 | | U.S. Bancorp, 07/01/2009 | | $ | 8,575,000 | |
| | | | | | | | |
| | | | Variable Rate Demand Notes (c) 1.5% | | | | |
| | 4,367,739 | | American Family Financial | | | | |
| | | | Services, Inc., 0.100% | | | 4,367,739 | |
| | 222,939 | | U.S. Bank, N.A. | | | 222,939 | |
| | | | | | | 4,590,678 | |
| | | | Total Short-Term Investments | | | | |
| | | | (Cost $13,165,678) | | | 13,165,678 | |
| | | | | | | | |
| | | | Total Investments 100.1% | | | | |
| | | | (Cost $325,593,071) | | | 308,139,751 | |
| | | | | | | | |
| | | | Liabilities in Excess | | | | |
| | | | of Other Assets - (0.1%) | | | (166,672 | ) |
| | | | | | | | |
| | | | TOTAL NET ASSETS 100.0% | | $ | 307,973,079 | |
| (b) | U.S.-dollar denominated security of foreign issuer. |
| (c) | Variable rate demand notes are considered short-term obligations and are payable upon demand. Interest rates change periodically on specified dates. The rates listed are as of June 30, 2009. |
ALLOCATION OF PORTFOLIO HOLDINGS
At June 30, 2009, the allocation of portfolio holdings as a percentage of the Fund’s total net assets were:
| Common Stocks | | | 95.8 | % |
| Short-Term Investments | | | 4.3 | |
| Liabilities in Excess of Other Assets | | | (0.1 | ) |
| Total | | | 100.0 | % |
The accompanying notes are an integral part of these financial statements.
Frontegra IronBridge SMID Fund
STATEMENT OF ASSETS AND LIABILITIES
June 30, 2009
| Assets: | | | |
| Investments at value (cost $325,593,071) | | $ | 308,139,751 | |
| Cash | | | 21,825 | |
| Dividends and interest receivable | | | 305,283 | |
| Receivable for Fund shares sold | | | 1,077,408 | |
| Receivable for investments sold | | | 8,145,041 | |
| Prepaid expenses and other assets | | | 24,257 | |
| Total assets | | | 317,713,565 | |
| | | | | |
| Liabilities: | | | | |
| Payable for investments purchased | | | 8,724,796 | |
| Payable for Fund shares redeemed | | | 749,732 | |
| Accrued investment advisory fee | | | 207,670 | |
| Accrued expenses | | | 58,288 | |
| Total liabilities | | | 9,740,486 | |
| Net Assets | | $ | 307,973,079 | |
| | | | | |
| Net Assets Consist of: | | | | |
| Paid in capital | | $ | 372,865,584 | |
| Undistributed net investment income | | | 1,315,023 | |
| Accumulated net realized loss | | | (48,754,208 | ) |
| Net unrealized depreciation on investments | | | (17,453,320 | ) |
| Net Assets | | $ | 307,973,079 | |
| | | | | |
| Capital Stock, $0.01 Par Value | | | | |
| Authorized | | | 50,000,000 | |
| Issued and outstanding | | | 37,394,503 | |
| Net Asset Value, Redemption Price and Offering Price Per Share | | $ | 8.24 | |
The accompanying notes are an integral part of these financial statements.
Frontegra IronBridge SMID Fund
STATEMENT OF OPERATIONS
| | | Year Ended | |
| | | June 30, 2009 | |
| Investment Income: | | | |
| Dividend income | | $ | 3,498,792 | |
| Interest income | | | 128,940 | |
| Total Investment Income | | | 3,627,732 | |
| | | | | |
| Expenses: | | | | |
| Investment advisory fees (Note 3) | | | 2,054,210 | |
| Fund administration and accounting fees | | | 70,065 | |
| Federal and state registration fees | | | 43,097 | |
| Custody fees | | | 34,551 | |
| Audit fees | | | 31,470 | |
| Legal fees | | | 28,370 | |
| Shareholder servicing fees | | | 19,235 | |
| Reports to shareholders | | | 9,145 | |
| Directors’ fees and related expenses | | | 7,895 | |
| Compliance related expenses | | | 5,168 | |
| Other | | | 10,950 | |
| Total expenses before waiver and reimbursement | | | 2,314,156 | |
| Waiver and reimbursement of expenses by Adviser (Note 3) | | | (18,348 | ) |
| Net expenses | | | 2,295,808 | |
| Net Investment Income | | | 1,331,924 | |
| | | | | |
| Realized and Unrealized Loss on Investments: | | | | |
| Net realized loss on: | | | | |
| Investments | | | (48,731,590 | ) |
| Change in net unrealized appreciation/(depreciation) on: | | | | |
| Investments | | | (21,178,183 | ) |
| Net Realized and Unrealized Loss on Investments | | | (69,909,773 | ) |
| Net Decrease in Net Assets Resulting from Operations | | $ | (68,577,849 | ) |
The accompanying notes are an integral part of these financial statements.
Frontegra IronBridge SMID Fund
STATEMENTS OF CHANGES IN NET ASSETS
| | | For the | | | For the | |
| | | Year Ended | | | Year Ended | |
| | | June 30, 2009 | | | June 30, 2008 | |
| Operations: | | | | | | |
| Net investment income | | $ | 1,331,924 | | | $ | 407,274 | |
| Net realized gain (loss) on investments | | | (48,731,590 | ) | | | 11,781,369 | |
| Change in net unrealized appreciation/(depreciation) on investments | | | (21,178,183 | ) | | | (26,410,549 | ) |
| Net decrease in net assets resulting from operations | | | (68,577,849 | ) | | | (14,221,906 | ) |
| | | | | | | | | |
| Distributions From: | | | | | | | | |
| Net investment income | | | (259,686 | ) | | | (329,765 | ) |
| Net realized gain | | | (2,364,348 | ) | | | (17,799,377 | ) |
| Total distributions | | | (2,624,034 | ) | | | (18,129,142 | ) |
| | | | | | | | | |
| Capital Share Transactions: | | | | | | | | |
| Shares sold | | | 179,601,797 | | | | 79,034,738 | |
| Shares issued to holders in reinvestment of distributions | | | 2,451,437 | | | | 16,459,234 | |
| Shares redeemed | | | (36,257,970 | ) | | | (23,187,391 | ) |
| Net increase in net assets resulting from capital share transactions | | | 145,795,264 | | | | 72,306,581 | |
| Total Increase in Net Assets | | | 74,593,381 | | | | 39,955,533 | |
| | | | | | | | | |
| Net Assets: | | | | | | | | |
| Beginning of Year | | | 233,379,698 | | | | 193,424,165 | |
| End of Year (includes undistributed net investment | | | | | | | | |
| income of $1,315,023 and $259,686, respectively) | | $ | 307,973,079 | | | $ | 233,379,698 | |
| | | | | | | | | |
| Share Transactions: | | | | | | | | |
| Shares sold | | | 20,791,374 | | | | 6,848,087 | |
| Shares issued to holders in reinvestment of distributions | | | 328,171 | | | | 1,407,976 | |
| Shares redeemed | | | (4,509,587 | ) | | | (1,949,251 | ) |
| Net increase in shares outstanding | | | 16,609,958 | | | | 6,306,812 | |
The accompanying notes are an integral part of these financial statements.
Frontegra IronBridge SMID Fund
FINANCIAL HIGHLIGHTS
| | | Year | | | Year | | | Year | | | Year | | | Period | |
| | | Ended | | | Ended | | | Ended | | | Ended | | | Ended | |
| | | June 30, | | | June 30, | | | June 30, | | | June 30, | | | June 30, | |
| | | 2009 | | | 2008 | | | 2007 | | | 2006 | | | 2005(1) | |
| Net Asset Value, Beginning of Year | | $ | 11.23 | | | $ | 13.36 | | | $ | 11.07 | | | $ | 10.00 | | | $ | 10.00 | |
| | | | | | | | | | | | | | | | | | | | | |
| Income (Loss) from | | | | | | | | | | | | | | | | | | | | |
| Investment Operations: | | | | | | | | | | | | | | | | | | | | |
| Net investment income | | | 0.03 | | | | 0.02 | | | | 0.01 | | | | 0.06 | (2) | | | 0.04 | (2) |
| Net realized and unrealized gain (loss) on investments | | | (2.93 | ) | | | (0.98 | ) | | | 2.43 | | | | 1.04 | | | | (0.04 | ) |
| Total Income (Loss) from Investment Operations | | | (2.90 | ) | | | (0.96 | ) | | | 2.44 | | | | 1.10 | | | | 0.00 | |
| | | | | | | | | | | | | | | | | | | | | |
| Less Distributions: | | | | | | | | | | | | | | | | | | | | |
| From net investment income | | | (0.01 | ) | | | (0.02 | ) | | | — | (3) | | | (0.03 | ) | | | — | |
| From net realized gain on investments | | | (0.08 | ) | | | (1.15 | ) | | | (0.15 | ) | | | — | | | | — | |
| Total Distributions | | | (0.09 | ) | | | (1.17 | ) | | | (0.15 | ) | | | (0.03 | ) | | | — | |
| | | | | | | | | | | | | | | | | | | | | |
| Net Asset Value, End of Year | | $ | 8.24 | | | $ | 11.23 | | | $ | 13.36 | | | $ | 11.07 | | | $ | 10.00 | |
| Total Return | | | (25.78 | )% | | | (7.48 | )% | | | 22.25 | % | | | 11.02 | % | | | 0.00 | %(4) |
| | | | | | | | | | | | | | | | | | | | | |
| Supplemental Data and Ratios: | | | | | | | | | | | | | | | | | | | | |
| Net assets, end of period (in thousands) | | $ | 307,973 | | | $ | 233,380 | | | $ | 193,424 | | | $ | 133,058 | | | $ | 41,638 | |
| Ratio of expenses to average net assets | | | | | | | | | | | | | | | | | | | | |
| Before waivers and reimbursements | | | 0.96 | % | | | 0.96 | % | | | 0.98 | % | | | 1.08 | % | | | 1.49 | %(5) |
| Net of waivers and reimbursements | | | 0.95 | % | | | 0.95 | % | | | 0.95 | % | | | 0.95 | % | | | 0.95 | %(5) |
| Ratio of net investment income to average net assets | | | | | | | | | | | | | | | | | | | | |
| Before waivers and reimbursements | | | 0.54 | % | | | 0.19 | % | | | 0.08 | % | | | 0.15 | % | | | 0.35 | %(5) |
| Net of waivers and reimbursements | | | 0.55 | % | | | 0.20 | % | | | 0.10 | % | | | 0.28 | % | | | 0.89 | %(5) |
| Portfolio turnover rate | | | 46 | % | | | 71 | % | | | 71 | % | | | 91 | % | | | 44 | %(4) |
| (1) | Commenced operations on December 31, 2004. |
| (2) | Per share net investment income has been calculated using the daily average share method. |
| (3) | Less than one cent per share. |
The accompanying notes are an integral part of these financial statements.
FRONTEGRA
NEW STAR INTERNATIONAL
EQUITY FUND
REPORT FROM NEW STAR
INSTITUTIONAL MANAGERS LIMITED:
Dear Shareholders:
The Frontegra New Star International Equity Fund strives to achieve capital appreciation by investing in a diversified portfolio of securities of large- and mid-cap companies located outside the United States. The objective is relative to and measured against the Morgan Stanley EAFE Index.
Performance Review
The Frontegra New Star International Equity Fund returned -35.13%, net of fees, for the one year period ending June 30, 2009. The Fund’s return underperformed the -30.96% return of its benchmark, the MSCI EAFE Index. This underperformance resulted chiefly from a sector allocation that was too defensive, too focused on capital preservation when the rally took off. The Fund invests in quality stocks and these rose less sharply than the deep cyclical and leveraged companies which led the rally. Our asset allocation, meanwhile, being overweight East Asia and emerging markets, for instance, helped performance.
Executive Summary
The period under review catches the full force of the global credit crunch. The bursting of one of the all time great credit bubbles and its offspring the US housing market crisis, have taken their toll on the global financial system. Banks and indebted corporations have been pushed to the brink, and some over, while in a number of cases governments’ finances have been stretched to extremes.
At the time of writing, the situation appears to be stabilizing though not without massive and co-ordinated intervention by the major central banks and governments G20, unprecedented in its scale. Many commentators question whether enough has been done and whether we can still avoid a 1930’s style depression. Our view is that recovery is already underway and will probably surprise consensus on the upside.
Why this relative optimism?
Firstly, the problems faced by the US housing market are present elsewhere but not to the same degree. Many compare the situation in the US to that in the UK housing market, but the scale of over-building in California, Nevada and Southern Florida is hardly replicated anywhere in the UK, where there are some pockets of oversupply in the bigger cities but where the market is still fairly tight overall. As a result, prices in the US are still falling and are close to 50% down from the peak in the worst areas, while in the UK prices have fallen approximately 20% and appear to be consolidating.
“Core Europe” didn’t party as hard as the Anglo-Saxon countries and the worst appears to be over, though the economies of the periphery (Portugal, Spain, Ireland, etc.) continue to look vulnerable. The after shocks of the banking crisis have led to a cyclical slowdown in Europe and a consequent rise in unemployment. This has caused consumption to slow, but against a backdrop of healthier personal balance sheets than their counterparts in the US. In other words, Europe has gone into this slowdown in better shape than the US and that bodes well for the medium term and any recovery.
If that’s true for Europe relative to the US, then it is even more so for Asia and emerging markets. Many of Europe’s banks have been caught highly leveraged as the crisis unfolded, but that is not the case in Asia. Lending to the corporate sector has remained robust, the housing market is in good shape and most importantly these markets remain savings long. Banks’, governments’, individuals’ and corporate balance sheets are all in good shape.
This explains how it has come to pass that the Chinese leadership now lecture the US on currency stability. It is they who threaten to withhold financing of the US budget deficit. We are witnessing a shift of global economic hegemony away from the US and Europe towards Asia. We don’t see a switch in financial power from Wall Street to Shanghai– more a case of China and possibly others, assuming their rightful place in a “multi-polar” world. A much discussed topic, but now it is actually happening. This supports the logic of US investors looking to increase exposure to International and Emerging Market mandates.
This view explains the positioning of the portfolio. We are overweight Asia and in particular Hong Kong, which benefits from the growth in China and super low US interest rates. We are fully invested in emerging markets, especially those which are experiencing faster growth than the G7 and which are savings long. The underweights are in the slower growing or indeed shrinking markets of continental Europe and Japan.
We are overweight in IT and Energy and underweight in European Banks and Staples. Our focus is to adhere to our philosophical bias of owning high or improving Return on Invested Capital (ROIC) companies. We believe we are building the foundations of the next bull market and to our mind it will have a distinct Asian flavour.
Richard Lewis
New Star Institutional Managers Limited
INVESTMENT HIGHLIGHTS
Growth of a $100,000 Investment (Unaudited)
| * | 1/08/04 commencement of operations. |
| | | | | |
| | Portfolio Total Return** | | | |
| | FOR PERIODS ENDED 6/30/09 | FUND | INDEX | |
| | | | | |
| | SIX MONTHS | 2.09% | 8.42% | |
| | | | | |
| | ONE YEAR | (35.13)% | (30.96)% | |
| | | | | |
| | FIVE YEAR | (0.23)% | 2.79% | |
| | | | | |
| | SINCE COMMENCEMENT | | | |
| | AVERAGE ANNUAL | (0.19)% | 2.92% | |
| | | | | |
This chart assumes an initial gross investment of $100,000 made on 1/08/04 (commencement of operations). Returns shown include the reinvestment of all distributions. Past performance is not predictive of future results. Investment return and principal value will fluctuate so that shares, when redeemed, may be worth more or less than the original cost. In the absence of existing fee waivers, total return would be reduced. To receive current to the most recent month-end performance, please call 1-888-825-2100.
The Morgan Stanley Capital International EAFE Index measures the overall performance of stock markets in 21 countries within Europe, Australasia and the Far East. The Index does not reflect investment management fees, brokerage commissions and other expenses associated with investing in equity securities. A direct investment in the index is not possible.
| ** | The returns shown do not reflect the deduction of taxes that a shareholder would pay on Fund distributions or the redemption of Fund shares. |
Frontegra New Star International Equity Fund
SCHEDULE OF INVESTMENTS
June 30, 2009
| Number of Shares | | Value | |
| | | | | | |
| COMMON STOCKS 99.2% | | | |
| | | | | | |
| | | Australia 8.1% | | | |
| | 120,296 | | Australia and New Zealand | | | |
| | | | Banking Group Ltd. | | $ | 1,598,454 | |
| | 65,084 | | CSL Ltd. | | | 1,686,100 | |
| | 63,211 | | Newcrest Mining Ltd. | | | 1,554,043 | |
| | 444,748 | | Paladin Energy Ltd. (a) | | | 1,766,807 | |
| | 138,654 | | QBE Insurance Group Ltd. | | | 2,223,380 | |
| | 35,046 | | Rio Tinto Ltd. | | | 1,474,135 | |
| | 18,399 | | Rio Tinto Ltd. Rights (a) | | | 312,830 | |
| | 116,103 | | Santos Ltd. | | | 1,369,660 | |
| | 216,704 | | Sonic Healthcare | | | 2,151,324 | |
| | 367,039 | | Suncorp-Metway Ltd. | | | 1,981,597 | |
| | | | | | | 16,118,330 | |
| | | | Brazil 0.4% | | | | |
| | 58,618 | | Redecard SA | | | 901,930 | |
| | | | | | | | |
| | | | China 1.5% | | | | |
| | 2,050,000 | | Huaneng Power International, Inc. | | | 1,438,959 | |
| | 1,412,000 | | PetroChina Co., Ltd. - Class H | | | 1,566,854 | |
| | | | | | | 3,005,813 | |
| | | | Denmark 0.7% | | | | |
| | 24,700 | | Novo-Nordisk A/S - Class B | | | 1,335,399 | |
| | | | | | | | |
| | | | Finland 2.9% | | | | |
| | 59,890 | | Fortum Oyj | | | 1,362,760 | |
| | 301,520 | | Nokia Oyj | | | 4,416,016 | |
| | | | | | | 5,778,776 | |
| | | | France 13.5% | | | | |
| | 39,364 | | Alstom | | | 2,322,367 | |
| | 184,246 | | Axa | | | 3,460,929 | |
| | 71,778 | | BNP Paribas | | | 4,657,116 | |
| | 48,781 | | Bouygues SA | | | 1,834,001 | |
| | 31,191 | | GDF Suez | | | 1,161,299 | |
| | 24,764 | | LVMH Moet Hennessy | | | | |
| | | | Louis Vuitton SA | | | 1,889,878 | |
| | 40,208 | | Technip SA | | | 1,968,011 | |
| | 43,982 | | Thales SA | | | 1,966,705 | |
| | 109,718 | | Total SA | | | 5,922,799 | |
| | 73,023 | | Vivendi | | | 1,745,082 | |
| | | | | | | 26,928,187 | |
| | | | Germany 6.6% | | | | |
| | 65,480 | | Bayer AG | | | 3,510,859 | |
| | 18,467 | | Deutsche Boerse AG | | | 1,432,117 | |
| | 103,473 | | Deutsche Telekom AG | | | 1,219,327 | |
| | 64,031 | | E.ON AG | | | 2,265,424 | |
| | 26,800 | | Fresenius Medical Care AG | | | 1,198,956 | |
| | 75,404 | | GEA Group AG | | | 1,141,379 | |
| | 14,838 | | Merck KGaA | | | 1,509,133 | |
| | 21,900 | | SAP AG | | | 880,817 | |
| | | | | | | 13,158,012 | |
| | | | Hong Kong 8.1% | | | | |
| | 180 | | The Bank of East Asia, Ltd. | | | 549 | |
| | 236,000 | | Cheung Kong (Holdings) Ltd. | | | 2,713,221 | |
| | 4,340,000 | | China Construction Bank | | | 3,365,578 | |
| | 132,000 | | China Mobile | | | | |
| | | | (Hong Kong) Ltd. - ADR | | | 1,321,695 | |
| | 833,000 | | Hang Lung Properties Ltd. | | | 2,756,944 | |
| | 4,715,000 | | Industrial and Commercial | | | | |
| | | | Bank of China Ltd. | | | 3,285,269 | |
| | 109,000 | | Sun Hung Kai Properties Ltd. | | | 1,361,436 | |
| | 364,000 | | Television Broadcasts Ltd. | | | 1,463,036 | |
| | | | | | | 16,267,728 | |
| | | | Israel 0.7% | | | | |
| | 29,100 | | Teva Pharmaceutical | | | | |
| | | | Industries Ltd. - ADR | | | 1,435,794 | |
| | | | | | | | |
| | | | Japan 15.8% | | | | |
| | 96,900 | | Capcom Co., Ltd | | | 1,746,182 | |
| | 23,200 | | East Japan Railway Co. | | | 1,399,201 | |
| | 31,000 | | Fanuc Ltd. | | | 2,497,119 | |
| | 182 | | Inpex Holdings, Inc. | | | 1,458,494 | |
| | 69,000 | | Kao Corp. | | | 1,507,707 | |
The accompanying notes are an integral part of these financial statements.
Frontegra New Star International Equity Fund
SCHEDULE OF INVESTMENTS (continued)
June 30, 2009
| Number of Shares | | Value | |
| | | | | | |
| COMMON STOCKS 99.2% (continued) | | | |
| | | | | | |
| | | Japan 15.8% (continued) | | | |
| | 6,800 | | Keyence Corp. | | $ | 1,390,531 | |
| | 97,900 | | Mitsubishi Corp. | | | 1,817,047 | |
| | 265,100 | | Mitsubishi Tokyo | | | | |
| | | | Financial Group, Inc. | | | 1,645,610 | |
| | 68,000 | | Mitsui Fudosan Co., Ltd. | | | 1,187,979 | |
| | 32,500 | | Nidec Corp. | | | 1,973,582 | |
| | 129,000 | | Nikon Corp. | | | 2,241,615 | |
| | 6,900 | | Nintendo Co., Ltd. | | | 1,907,375 | |
| | 241,000 | | Nomura Holdings, Inc. | | | 2,036,373 | |
| | 60,000 | | Nomura Research Institute Ltd. | | | 1,335,963 | |
| | 1,500 | | NTT DoCoMo, Inc. | | | 2,198,578 | |
| | 32,300 | | Sumitomo Mitsui | | | | |
| | | | Financial Group, Inc. | | | 1,317,683 | |
| | 50,800 | | Takeda Pharmaceutical Co., Ltd. | | | 1,982,748 | |
| | 53,600 | | Toyota Motor Corp. | | | 2,041,958 | |
| | | | | | | 31,685,745 | |
| | | | Mexico 0.5% | | | | |
| | 24,800 | | America Movil SAB de C.V. - ADR | | | 960,256 | |
| | | | | | | | |
| | | | Netherlands 2.3% | | | | |
| | 105,095 | | ASML Holding NV | | | 2,271,950 | |
| | 52,089 | | Unilever NV | | | 1,254,307 | |
| | 65,066 | | Wolters Kluwer NV | | | 1,136,416 | |
| | | | | | | 4,662,673 | |
| | | | Russia 0.6% | | | | |
| | 24,292 | | Lukoil - ADR | | | 1,132,007 | |
| | | | | | | | |
| | | | Singapore 2.1% | | | | |
| | 247,000 | | Great Eastern Holdings Ltd. | | | 1,797,418 | |
| | 29,417 | | ICICI Bank Ltd. - ADR | | | 867,801 | |
| | 1,163,000 | | Noble Group Ltd. | | | 1,461,378 | |
| | | | | | | 4,126,597 | |
| | | | Spain 1.6% | | | | |
| | 43,890 | | Inditex SA | | | 2,103,898 | |
| | 52,468 | | Indra Sistemas, SA | | | 1,135,360 | |
| | | | | | | 3,239,258 | |
| | | | Switzerland 9.7% | | | | |
| | 76,190 | | Credit Suisse Group | | | 3,478,003 | |
| | 36,895 | | Holcim Ltd. (a) | | | 2,095,091 | |
| | 79,200 | | Nestle SA | | | 2,982,710 | |
| | 28,598 | | Roche Holding AG | | | 3,887,465 | |
| | 9,900 | | Syngenta AG | | | 2,298,353 | |
| | 97,430 | | UBS AG - Registered (a) | | | 1,191,703 | |
| | 19,270 | | Zurich Financial Services AG | | | 3,394,485 | |
| | | | | | | 19,327,810 | |
| | | | Taiwan 1.0% | | | | |
| | 211,544 | | Taiwan Semiconductor | | | | |
| | | | Manufacturing Co., Ltd. - ADR | | | 1,990,629 | |
| | | | | | | | |
| | | | United Kingdom 22.8% | | | | |
| | 77,339 | | Anglo American PLC | | | 2,243,840 | |
| | 523,092 | | Aviva PLC | | | 2,938,913 | |
| | 118,676 | | Babcock International Group | | | 939,130 | |
| | 673,145 | | BAE Systems PLC | | | 3,748,739 | |
| | 215,673 | | BG Group PLC | | | 3,612,114 | |
| | 96,408 | | BHP Billiton PLC | | | 2,163,442 | |
| | 61,865 | | Carnival PLC | | | 1,635,606 | |
| | 181,818 | | GlaxoSmithKline PLC | | | 3,196,166 | |
| | 400,147 | | Home Retail Group PLC | | | 1,711,634 | |
| | 584,300 | | International Power PLC | | | 2,287,867 | |
| | 2,552,879 | | Legal & General Group PLC | | | 2,385,173 | |
| | 160,280 | | National Grid PLC | | | 1,443,715 | |
| | 60,968 | | Next PLC | | | 1,473,471 | |
| | 171,527 | | Petrofac Ltd. | | | 1,890,711 | |
| | 147,990 | | Royal Dutch Shell PLC - Class A | | | 3,695,915 | |
| | 108,517 | | SABMiller PLC | | | 2,204,868 | |
| | 344,831 | | Tesco PLC | | | 2,006,025 | |
| | 82,722 | | Unilever PLC | | | 1,937,978 | |
| | 2,077,909 | | Vodafone Group PLC | | | 4,006,563 | |
| | | | | | | 45,521,870 | |
| | | | United States 0.3% | | | | |
| | 7,504 | | Reliance Industries Ltd. (a) | | | 622,832 | |
| | | | Total Common Stocks | | | | |
| | | | (Cost $204,515,168) | | | 198,199,646 | |
The accompanying notes are an integral part of these financial statements.
Frontegra New Star International Equity Fund
SCHEDULE OF INVESTMENTS (continued)
June 30, 2009
| Number of Shares | | Value | |
| | | | | | |
| SHORT-TERM INVESTMENTS 2.1% | | | |
| | | | | | |
| | | Investment Company 2.1% | | | |
| | 4,245,185 | | Fidelity Institutional | | | |
| | | | Money Market Portfolio | | $ | 4,245,185 | |
| | | | Total Short-Term Investments | | | | |
| | | | (Cost $4,245,185) | | | 4,245,185 | |
| | | | | | | | |
| | | | Total Investments 101.3% | | | | |
| | | | (Cost $208,760,353) | | | 202,444,831 | |
| | | | | | | | |
| | | | Liabilities in Excess | | | | |
| | | | of Other Assets (1.3)% | | | (2,561,063 | ) |
| | | | | | | | |
| | | | TOTAL NET ASSETS 100.0% | | $ | 199,883,768 | |
ADR American Depositary Receipt.
CURRENCY DIVERSIFICATION June 30, 2009
(Shown as a percentage of investments)
| Euro | | | 26.6 | % |
| British Pounds | | | 22.5 | |
| Japanese Yen | | | 15.7 | |
| Swiss Francs | | | 9.5 | |
| Hong Kong Dollars | | | 9.5 | |
| Australian Dollars | | | 8.0 | |
| U.S. Dollars | | | 5.6 | |
| Other Currencies | | | 2.6 | |
| Total | | | 100.0 | % |
ALLOCATION OF PORTFOLIO HOLDINGS
At June 30, 2009, the allocation of portfolio holdings as a percentage of the Fund’s total net assets were:
| Common Stocks | | | 99.2 | % |
| Short-Term Investments | | | 2.1 | |
| Liabilities in Excess of Other Assets | | | (1.3 | ) |
| Total | | | 100.0 | % |
The accompanying notes are an integral part of these financial statements.
Frontegra New Star International Equity Fund
PORTFOLIO DIVERSIFICATION
June 30, 2009
| | | Value | | | Percentage |
| Aerospace & Defense | | $ | 5,715,444 | | | | 2.9 | % |
| Apparel Retail | | | 2,103,898 | | | | 1.1 | |
| Apparel, Accessories & Luxury Goods | | | 1,889,878 | | | | 0.9 | |
| Application Software | | | 880,817 | | | | 0.4 | |
| Automobile Manufacturers | | | 2,041,958 | | | | 1.0 | |
| Biotechnology | | | 1,686,100 | | | | 0.8 | |
| Brewers | | | 2,204,868 | | | | 1.1 | |
| Broadcasting | | | 1,463,036 | | | | 0.7 | |
| Catalog Retail | | | 1,711,634 | | | | 0.9 | |
| Coal & Consumable Fuels | | | 1,766,807 | | | | 0.9 | |
| Communications Equipment | | | 4,416,016 | | | | 2.2 | |
| Construction & Engineering | | | 1,834,001 | | | | 0.9 | |
| Construction Materials | | | 2,095,091 | | | | 1.0 | |
| Data Processing & Outsourced Services | | | 901,930 | | | | 0.5 | |
| Department Stores | | | 1,473,471 | | | | 0.7 | |
| Diversified Banks | | | 16,738,061 | | | | 8.4 | |
| Diversified Capital Markets | | | 4,669,706 | | | | 2.3 | |
| Diversified Chemicals | | | 3,510,859 | | | | 1.8 | |
| Diversified Metals & Mining | | | 6,194,247 | | | | 3.1 | |
| Diversified Real Estate Activities | | | 8,019,581 | | | | 4.0 | |
| Diversified Support Services | | | 939,130 | | | | 0.5 | |
| Electric Utilities | | | 3,628,183 | | | | 1.8 | |
| Electronic Components | | | 1,973,582 | | | | 1.0 | |
| Electronic Equipment & Instruments | | | 1,390,531 | | | | 0.7 | |
| Fertilizers & Agricultural Chemicals | | | 2,298,353 | | | | 1.2 | |
| Food Retail | | | 2,006,025 | | | | 1.0 | |
| Gold | | | 1,554,043 | | | | 0.8 | |
| Health Care Services | | | 3,350,280 | | | | 1.7 | |
| Heavy Electrical Equipment | | | 2,322,367 | | | | 1.2 | |
| Home Entertainment Software | | | 3,653,557 | | | | 1.8 | |
| Hotels, Resorts & Cruise Lines | | | 1,635,606 | | | | 0.8 | |
| Household Products | | | 1,507,707 | | | | 0.8 | |
| Independent Power Producers & | | | | | | | | |
| Energy Traders | | | 3,726,825 | | | | 1.9 | |
| Industrial Machinery | | | 3,638,498 | | | | 1.8 | |
| Integrated Oil & Gas | | | 15,929,689 | | | | 8.0 | |
| Integrated Telecommunication Services | | | 1,219,327 | | | | 0.6 | |
| Investment Banking & Brokerage | | | 2,036,373 | | | | 1.0 | |
| IT Consulting & Other Services | | | 2,471,323 | | | | 1.2 | |
| Life & Health Insurance | | | 4,182,591 | | | | 2.1 | |
| Movies & Entertainment | | | 1,745,082 | | | | 0.9 | |
| Multi-line Insurance | | | 9,794,327 | | | | 4.9 | |
| Multi-Utilities | | | 2,605,014 | | | | 1.3 | |
| Oil & Gas Equipment & Services | | | 3,858,722 | | | | 1.9 | |
| Oil & Gas Exploration & Production | | | 2,828,154 | | | | 1.4 | |
| Oil Refining & Marketing | | | 622,832 | | | | 0.3 | |
| Packaged Foods & Meats | | | 6,174,996 | | | | 3.1 | |
| Pharmaceuticals | | | 13,346,704 | | | | 6.7 | |
| Photographic Products | | | 2,241,615 | | | | 1.1 | |
| Property & Casualty Insurance | | | 4,204,977 | | | | 2.1 | |
| Publishing | | | 1,136,416 | | | | 0.6 | |
| Railroads | | | 1,399,201 | | | | 0.7 | |
| Semiconductor Equipment | | | 2,271,950 | | | | 1.1 | |
| Semiconductors | | | 1,990,629 | | | | 1.0 | |
| Specialized Finance | | | 1,432,117 | | | | 0.7 | |
| Trading Companies & Distributors | | | 3,278,425 | | | | 1.6 | |
| Wireless Telecommunication Services | | | 8,487,092 | | | | 4.3 | |
| Total Common Stock | | | 198,199,646 | | | | 99.2 | |
| Total Short-Term Investments | | | 4,245,185 | | | | 2.1 | |
| Total Investments | | | 202,444,831 | | | | 101.3 | |
| Liabilities in Excess of Other Assets | | | (2,561,063 | ) | | | (1.3 | ) |
| Total Net Assets | | $ | 199,883,768 | | | | 100.0 | % |
The accompanying notes are an integral part of these financial statements.
Frontegra New Star International Equity Fund
STATEMENT OF ASSETS AND LIABILITIES
June 30, 2009
| Assets: | | | |
| Investments at value (cost $208,760,353) | | $ | 202,444,831 | |
| Interest and dividends receivable | | | 1,337,557 | |
| Prepaid expenses and other assets | | | 15,873 | |
| Total assets | | | 203,798,261 | |
| | | | | |
| Liabilities: | | | | |
| Payable for investments purchased | | | 1,982,232 | |
| Payable for Fund shares redeemed | | | 2,121 | |
| Accrued investment advisory fee | | | 132,637 | |
| Accrued expenses | | | 91,272 | |
| Payable to custodian for foreign currency (cost $1,707,844) | | | 1,706,231 | |
| Total liabilities | | | 3,914,493 | |
| Net Assets | | $ | 199,883,768 | |
| | | | | |
| Net Assets Consist of: | | | | |
| Paid in capital | | $ | 324,621,014 | |
| Undistributed net investment income | | | 5,474,041 | |
| Accumulated net realized loss | | | (123,897,378 | ) |
| Net unrealized appreciation (depreciation) on: | | | | |
| Investments | | | (6,315,522 | ) |
| Foreign Currency | | | 1,613 | |
| Net Assets | | $ | 199,883,768 | |
| | | | | |
| Capital Stock, $0.01 Par Value | | | | |
| Authorized | | | 100,000,000 | |
| Issued and outstanding | | | 25,568,302 | |
| Net Asset Value, Redemption Price and Offering Price Per Share | | $ | 7.82 | |
The accompanying notes are an integral part of these financial statements.
Frontegra New Star International Equity Fund
STATEMENT OF OPERATIONS
| | | Year Ended | |
| | | June 30, 2009 | |
| Investment Income: | | | |
Dividend income(1) | | $ | 7,521,558 | |
| Interest income | | | 78,601 | |
| Total Investment Income | | | 7,600,159 | |
| | | | | |
| Expenses: | | | | |
| Investment advisory fees (Note 3) | | | 2,455,064 | |
| Custody fees | | | 254,079 | |
| Fund administration and accounting fees | | | 97,401 | |
| Audit fees | | | 45,596 | |
| Legal fees | | | 39,090 | |
| Federal and state registration fees | | | 29,241 | |
| Reports to shareholders | | | 20,450 | |
| Shareholder servicing fees | | | 20,263 | |
| Directors’ fees and related expenses | | | 9,045 | |
| Interest expense | | | 8,872 | |
| Compliance related expenses | | | 5,768 | |
| Other | | | 20,835 | |
| Total expenses before waiver and reimbursement | | | 3,005,704 | |
| Waiver and reimbursement of expenses by Adviser (Note 3) | | | (1,057,926 | ) |
| Net expenses | | | 1,947,778 | |
| Net Investment Income | | | 5,652,381 | |
| | | | | |
| Realized and Unrealized Gain (Loss) on Investments: | | | | |
| Net realized loss on: | | | | |
| Investments | | | (120,490,311 | ) |
| Foreign currency transactions | | | (167,107 | ) |
| Change in net unrealized appreciation/(depreciation) on: | | | | |
| Investments | | | (49,838,040 | ) |
| Foreign currency translation | | | 77,733 | |
| Net Realized and Unrealized Loss on Investments | | | (170,417,725 | ) |
| Net Decrease in Net Assets Resulting from Operations | | $ | (164,765,344 | ) |
| (1) | Net of $675,497 in foreign withholding taxes. |
The accompanying notes are an integral part of these financial statements.
Frontegra New Star International Equity Fund
STATEMENTS OF CHANGES IN NET ASSETS
| | | For the | | | For the | |
| | | Year Ended | | | Year Ended | |
| | | June 30, 2009 | | | June 30, 2008 | |
| Operations: | | | | | | |
| Net investment income | | $ | 5,652,381 | | | $ | 11,383,632 | |
| Net realized gain (loss) on: | | | | | | | | |
| Investments | | | (120,490,311 | ) | | | 26,884,421 | |
| Foreign currency transactions | | | (167,107 | ) | | | 1,271,787 | |
| Change in net unrealized appreciation/(depreciation) on: | | | | | | | | |
| Investments | | | (49,838,040 | ) | | | (101,010,043 | ) |
| Foreign currency translation | | | 77,733 | | | | (107,752 | ) |
| Net decrease in net assets resulting from operations | | | (164,765,344 | ) | | | (61,577,955 | ) |
| | | | | | | | | |
| Distributions From: | | | | | | | | |
| Net investment income | | | (10,274,560 | ) | | | (10,852,936 | ) |
| Net realized gain on investments | | | (11,287,593 | ) | | | (50,797,918 | ) |
| Total distributions | | | (21,562,153 | ) | | | (61,650,854 | ) |
| | | | | | | | | |
| Capital Share Transactions: | | | | | | | | |
| Shares sold | | | 32,708,631 | | | | 27,684,564 | |
| Shares issued to holders in reinvestment of distributions | | | 17,427,623 | | | | 56,429,837 | |
| Shares redeemed | | | (138,012,420 | ) | | | (199,418,432 | ) |
| Net decrease in net assets resulting from capital share transactions | | | (87,876,166 | ) | | | (115,304,031 | ) |
| Total Decrease in Net Assets | | | (274,203,663 | ) | | | (238,532,840 | ) |
| | | | | | | | | |
| Net Assets: | | | | | | | | |
| Beginning of Year | | | 474,087,431 | | | | 712,620,271 | |
| End of Year (includes undistributed net investment | | | | | | | | |
| income of $5,474,041 and $10,263,578, respectively) | | $ | 199,883,768 | | | $ | 474,087,431 | |
| | | | | | | | | |
| Capital Share Transactions: | | | | | | | | |
| Shares sold | | | 3,543,690 | | | | 1,853,880 | |
| Shares issued to holders in reinvestment of distributions | | | 2,311,356 | | | | 3,946,143 | |
| Shares redeemed | | | (16,095,020 | ) | | | (14,217,936 | ) |
| Net decrease in shares outstanding | | | (10,239,974 | ) | | | (8,417,913 | ) |
The accompanying notes are an integral part of these financial statements.
Frontegra New Star International Equity Fund
FINANCIAL HIGHLIGHTS
| | | Year | | | Year | | | Year | | | Year | | | Year | |
| | | Ended | | | Ended | | | Ended | | | Ended | | | Ended | |
| | | June 30, | | | June 30, | | | June 30, | | | June 30, | | | June 30, | |
| | | 2009 | | | 2008 | | | 2007 | | | 2006 | | | 2005 | |
| Net Asset Value, Beginning of Year | | $ | 13.24 | | | $ | 16.11 | | | $ | 13.08 | | | $ | 11.07 | | | $ | 10.03 | |
| | | | | | | | | | | | | | | | | | | | | |
| Income (Loss) from | | | | | | | | | | | | | | | | | | | | |
| Investment Operations: | | | | | | | | | | | | | | | | | | | | |
| Net investment income | | | 0.29 | | | | 0.31 | | | | 0.25 | | | | 0.31 | (1) | | | 0.21 | (1) |
| Net realized and unrealized gain (loss) on investments | | | (4.97 | ) | | | (1.75 | ) | | | 3.25 | | | | 1.81 | | | | 0.87 | |
| Total Income (Loss) from Investment Operations | | | (4.68 | ) | | | (1.44 | ) | | | 3.50 | | | | 2.12 | | | | 1.08 | |
| | | | | | | | | | | | | | | | | | | | | |
| Less Distributions: | | | | | | | | | | | | | | | | | | | | |
| From net investment income | | | (0.35 | ) | | | (0.25 | ) | | | (0.22 | ) | | | (0.07 | ) | | | (0.01 | ) |
| From net realized gain on investments | | | (0.39 | ) | | | (1.18 | ) | | | (0.25 | ) | | | (0.04 | ) | | | (0.03 | ) |
| Total Distributions | | | (0.74 | ) | | | (1.43 | ) | | | (0.47 | ) | | | (0.11 | ) | | | (0.04 | ) |
| | | | | | | | | | | | | | | | | | | | | |
| Net Asset Value, End of Year | | $ | 7.82 | | | $ | 13.24 | | | $ | 16.11 | | | $ | 13.08 | | | $ | 11.07 | |
| Total Return | | | (35.13 | )% | | | (9.60 | )% | | | 27.12 | % | | | 19.27 | % | | | 10.87 | % |
| | | | | | | | | | | | | | | | | | | | | |
| Supplemental Data and Ratios: | | | | | | | | | | | | | | | | | | | | |
| Net assets, end of period (in thousands) | | $ | 199,884 | | | $ | 474,087 | | | $ | 712,620 | | | $ | 531,321 | | | $ | 137,478 | |
| Ratio of expenses to average net assets | | | | | | | | | | | | | | | | | | | | |
| Before waivers and reimbursements | | | 1.16 | % | | | 1.06 | % | | | 1.07 | % | | | 1.09 | % | | | 1.31 | % |
| Net of waivers and reimbursements | | | 0.75 | % | | | 0.75 | % | | | 0.75 | % | | | 0.75 | % | | | 0.95 | % |
| Ratio of net investment income to average net assets | | | | | | | | | | | | | | | | | | | | |
| Before waivers and reimbursements | | | 1.78 | % | | | 1.44 | % | | | 1.30 | % | | | 1.60 | % | | | 1.60 | % |
| Net of waivers and reimbursements | | | 2.19 | % | | | 1.75 | % | | | 1.62 | % | | | 1.94 | % | | | 1.96 | % |
| Portfolio turnover rate | | | 57 | % | | | 54 | % | | | 62 | % | | | 35 | % | | | 44 | % |
| (1) | Per share net investment income has been calculated using the daily average share method. |
The accompanying notes are an integral part of these financial statements.
FRONTEGRA
NETOLS SMALL CAP
VALUE FUND
REPORT FROM NETOLS ASSET MANAGEMENT, INC.:
Dear Fellow Shareholders:
Since its inception on December 16, 2005, the Frontegra Netols Small Cap Value Fund (Institutional Class) has outperformed the benchmark after fees, returning -2.27% annualized, net of fees, compared to -8.16% annualized for the Russell 2000 Value Index.
Performance Review
For the year ended June 30, 2009, the Frontegra Netols Small Cap Value Fund (Institutional Class) has outperformed, returning -23.42% net of fees, compared to -25.24% for the Russell 2000 Value Index.
Portfolio Review
The economic slowdown resulting from a worldwide credit crunch was the dominant market factor during the past 12 months. Lehman Brothers’ bankruptcy in September was the triggering event. Concern over the health of the financial system led to questions of safety for even the historically safest holdings including cash and cash equivalents. Seizing up of the credit markets put a halt to world trade as consumers and corporations curbed spending to repay outstanding debt. The economic slowdown and lower tolerance for risk resulted in Consumer Staples and Utilities outperforming on a relative basis. Conversely, economically sensitive sectors like Energy and Materials underperformed by a wide margin.
Overall, our market outlook remains guarded despite finding attractive “one off” opportunities. It remains to be seen if the economy is beginning to recover or just restocking at a very low level. China appears to be the only area with growth as their stimulus package appears to be taking hold. Regardless, we believe we have entered a period of tighter credit, increased government regulation, and higher taxes that could mute an eventual recovery. Therefore, we believe small cap equities with a strong financial position and defendable market position should outperform.
Positive Contributions to Relative Performance July 2008 through June 2009
| • | Stock Selection – Consumer Staples |
| • | Overweight – Health Care, Consumer Staples |
| • | Best Performing Stocks – ICU Medical, Carter’s, Tetra Tech, 99 Cents Only Stores, EnergySolutions |
Negative Contributions to Relative Performance July 2008 through June 2009
| • | Overweight – Consumer Discretionary |
| • | Underweight – Utilities, Information Technology |
| • | Worst Performing Stocks – Champion Enterprises, Sunrise Senior Living, Arbor Realty Trust, MGP Ingredients, ION Geophysical |
Thank you for your continued support.
Jeff Netols
Netols Asset Management, Inc.
INVESTMENT HIGHLIGHTS
Growth of a $100,000 Investment (Unaudited)
| * | 12/16/05 commencement of operations. |
| | | | | |
| | Portfolio Total Return** | | | |
| | FOR PERIODS ENDED 6/30/09 | FUND | INDEX | |
| | | | | |
| | SIX MONTHS | 0.44% | (5.17)% | |
| | | | | |
| | ONE YEAR | (23.42)% | (25.24)% | |
| | | | | |
| | THREE YEAR | (3.60)% | (12.07)% | |
| | | | | |
| | SINCE COMMENCEMENT | | | |
| | AVERAGE ANNUAL | (2.27)% | (8.16)% | |
| | | | | |
This chart assumes an initial gross investment of $100,000 made on 12/16/05 (commencement of operations). Returns shown include the reinvestment of all distributions. Past performance is not predictive of future results. Investment return and principal value will fluctuate so that shares, when redeemed, may be worth more or less than the original cost. In the absence of existing fee waivers, total return would be reduced. To receive current to the most recent month-end performance, please call 1-888-825-2100.
The Russell 2000 Value Index measures the performance of those Russell 2000 companies with lower price-to-book ratios and lower forecasted growth values. The Russell 2000 Index measures the performance of the 2,000 smallest companies in the Russell 3000 Index. The Russell 3000 Index measures the performance of the 3,000 largest U.S. companies based on total market capitalization. The Index does not reflect investment management fees, brokerage commissions and other expenses associated with investing in equity securities. A direct investment in the index is not possible.
| ** | The returns shown do not reflect the deduction of taxes that a shareholder would pay on Fund distributions or the redemption of Fund shares. |
The above graph relates to Institutional Class shares of the Fund. Performance for Class Y shares will vary from the performance of the Institutional Class shares shown above due to differences in expenses.
Frontegra Netols Small Cap Value Fund
SCHEDULE OF INVESTMENTS
June 30, 2009
| Number of Shares | | Value | |
| | | | | | |
| COMMON STOCKS 96.7% | | | |
| | | | | | |
| | | Advertising 0.8% | | | |
| | 22,573 | | Arbitron, Inc. | | $ | 358,685 | |
| | | | | | | | |
| | | | Aerospace & Defense 1.8% | | | | |
| | 11,488 | | American Science & | | | | |
| | | | Engineering, Inc. | | | 794,051 | |
| | | | | | | | |
| | | | Apparel & Accessories 4.3% | | | | |
| | 48,188 | | Carter’s, Inc. (a) | | | 1,185,907 | |
| | 32,057 | | Under Armour, Inc. (a) | | | 717,436 | |
| | | | | | | 1,903,343 | |
| | | | Application Software 1.5% | | | | |
| | 44,605 | | Fair Isaac Corp. | | | 689,593 | |
| | | | | | | | |
| | | | Auto Parts and Equipment 1.1% | | | | |
| | 46,523 | | Tenneco, Inc. (a) | | | 493,144 | |
| | | | | | | | |
| | | | Chemicals - Agriculture/Fertilizer 1.7% | | | | |
| | 31,264 | | Terra Industries, Inc. | | | 757,214 | |
| | | | | | | | |
| | | | Chemicals - Commodity 0.3% | | | | |
| | 14,663 | | Spartech Corp. | | | 134,753 | |
| | | | | | | | |
| | | | Construction & Engineering 1.0% | | | | |
| | 25,359 | | Tutor Perini Corp. (a) | | | 440,232 | |
| | | | | | | | |
| | | | Diversified Metals & Mining 2.6% | | | | |
| | 20,934 | | Compass Minerals International, Inc. | | | 1,149,486 | |
| | | | | | | | |
| | | | Educational Services 0.9% | | | | |
| | 22,755 | | Corinthian Colleges, Inc. (a) | | | 385,242 | |
| | | | | | | | |
| | | | Electrical Component 2.9% | | | | |
| | 64,924 | | C&D Technologies, Inc. (a) | | | 129,848 | |
| | 31,285 | | General Cable Corp. (a) | | | 1,175,690 | |
| | | | | | | 1,305,538 | |
| | | | Food Distributors 2.8% | | | | |
| | 46,738 | | United Natural Foods, Inc. (a) | | | 1,226,872 | |
| | | | | | | | |
| | | | General Merchandise 2.1% | | | | |
| | 74,208 | | Fred’s, Inc. - Class A | | | 935,021 | |
| | | | | | | | |
| | | | Health Care - Distributors 2.2% | | | | |
| | 51,686 | | PSS World Medical, Inc. (a) | | | 956,708 | |
| | | | | | | | |
| | | | Health Care - Facility 1.5% | | | | |
| | 72,853 | | Sunrise Senior Living, Inc. (a) | | | 120,207 | |
| | 35,738 | | U.S. Physical Therapy, Inc. (a) | | | 527,136 | |
| | | | | | | 647,343 | |
| | | | Health Care - Services 1.3% | | | | |
| | 35,475 | | Gentiva Health Services, Inc. (a) | | | 583,918 | |
| | | | | | | | |
| | | | Health Care - Supplies 8.5% | | | | |
| | 14,589 | | Haemonetics Corp. (a) | | | 831,573 | |
| | 28,360 | | ICU Medical, Inc. (a) | | | 1,167,014 | |
| | 49,249 | | Medical Action Industries, Inc. (a) | | | 563,901 | |
| | 73,703 | | Merit Medical Systems, Inc. (a) | | | 1,201,359 | |
| | | | | | | 3,763,847 | |
| | | | Homebuilding 0.0% | | | | |
| | 72,549 | | Champion Enterprises, Inc. (a) | | | 23,216 | |
| | | | | | | | |
| | | | Industrial REITS 0.3% | | | | |
| | 35,279 | | First Industrial Realty Trust, Inc. | | | 153,464 | |
| | | | | | | | |
| | | | Insurance - Property/Casualty 2.5% | | | | |
| | 18,384 | | Hanover Insurance Group Inc. | | | 700,614 | |
| | 27,851 | | Stewart Information Services Corp. | | | 396,877 | |
| | | | | | | 1,097,491 | |
| | | | Integrated Telecommunication | | | | |
| | | | Services 0.6% | | | | |
| | 34,168 | | Alaska Communications | | | | |
| | | | Systems Group, Inc. | | | 250,110 | |
The accompanying notes are an integral part of these financial statements.
Frontegra Netols Small Cap Value Fund
SCHEDULE OF INVESTMENTS (continued)
June 30, 2009
| Number of Shares | | Value | |
| | | | | | |
| COMMON STOCKS 96.7% (continued) | | | |
| | | | | | |
| | | Investment Bank and Brokerage 0.8% | | | |
| | 5,090 | | Greenhill & Co., Inc. | | $ | 367,549 | |
| | | | | | | | |
| | | | IT Consulting & Services 4.2% | | | | |
| | 21,902 | | CACI International Inc. - Class A (a) | | | 935,434 | |
| | 21,662 | | ManTech International | | | | |
| | | | Corp. - Class A (a) | | | 932,332 | |
| | | | | | | 1,867,766 | |
| | | | Leisure Products 1.2% | | | | |
| | 95,391 | | Smith & Wesson Holding Corp. (a) | | | 541,821 | |
| | | | | | | | |
| | | | Life Science Tools 1.5% | | | | |
| | 16,767 | | Varian, Inc. (a) | | | 661,123 | |
| | | | | | | | |
| | | | Machinery - Construction / Farm 2.0% | | | | |
| | 28,151 | | Westinghouse Air Brake | | | | |
| | | | Technologies Corp. | | | 905,618 | |
| | | | | | | | |
| | | | Machinery - Industrial 3.5% | | | | |
| | 19,075 | | IDEX Corp. | | | 468,673 | |
| | 17,364 | | Kaydon Corp. | | | 565,372 | |
| | 26,705 | | Robbins & Myers, Inc. | | | 514,071 | |
| | | | | | | 1,548,116 | |
| | | | Marine 0.8% | | | | |
| | 15,371 | | Alexander & Baldwin, Inc. | | | 360,296 | |
| | | | | | | | |
| | | | Movies and Entertainment 1.2% | | | | |
| | 19,787 | | DreamWorks Animation | | | | |
| | | | SKG, Inc. (a) | | | 545,923 | |
| | | | | | | | |
| | | | Oil & Gas - Equipment/Services 2.0% | | | | |
| | 54,931 | | ENGlobal Corp. (a) | | | 270,261 | |
| | 94,021 | | ION Geophysical Corp. (a) | | | 241,634 | |
| | 64,168 | | North American | | | | |
| | | | Energy Partners (a)(b) | | | 390,783 | |
| | | | | | | 902,678 | |
| | | | Oil & Gas Exploration - Products 4.1% | | | | |
| | 21,744 | | Encore Acquisition Co. (a) | | | 670,802 | |
| | 33,467 | | Forest Oil Corp. (a) | | | 499,328 | |
| | 18,450 | | Whiting Petroleum Corp. (a) | | | 648,702 | |
| | | | | | | 1,818,832 | |
| | | | Oil & Gas - Storage 1.3% | | | | |
| | 56,606 | | General Maritime Corp. | | | 559,833 | |
| | | | | | | | |
| | | | Packaged Foods/Meats 4.5% | | | | |
| | 44,863 | | Lance, Inc. | | | 1,037,681 | |
| | 33,966 | | TreeHouse Foods, Inc. (a) | | | 977,202 | |
| | | | | | | 2,014,883 | |
| | | | Personal Products 2.1% | | | | |
| | 13,957 | | Chattem, Inc. (a) | | | 950,472 | |
| | | | | | | | |
| | | | Railroads 2.6% | | | | |
| | 25,379 | | Genesee & Wyoming, Inc. (a) | | | 672,797 | |
| | 28,988 | | Kansas City Southern (a) | | | 466,997 | |
| | | | | | | 1,139,794 | |
| | | | Regional Banks 5.9% | | | | |
| | 19,129 | | First Midwest Bancorp, Inc. | | | 139,833 | |
| | 27,810 | | Glacier Bancorp, Inc. | | | 410,754 | |
| | 59,869 | | Old National Bancorp | | | 587,914 | |
| | 15,205 | | Prosperity Bancshares, Inc. | | | 453,565 | |
| | 74,655 | | UCBH Holdings, Inc. | | | 94,065 | |
| | 18,541 | | Westamerica Bancorporation | | | 919,819 | |
| | | | | | | 2,605,950 | |
| | | | Research & Consulting 1.1% | | | | |
| | 24,141 | | School Specialty, Inc. (a) | | | 487,890 | |
| | | | | | | | |
| | | | Residential REITS 2.9% | | | | |
| | 19,770 | | Mid-America Apartment | | | | |
| | | | Communities, Inc. | | | 725,757 | |
| | 39,599 | | Sun Communities, Inc. | | | 545,674 | |
| | | | | | | 1,271,431 | |
| | | | Restaurants 2.0% | | | | |
| | 51,783 | | The Cheesecake Factory, Inc. (a) | | | 895,846 | |
The accompanying notes are an integral part of these financial statements.
Frontegra Netols Small Cap Value Fund
SCHEDULE OF INVESTMENTS (continued)
June 30, 2009
| Number of Shares | | Value | |
| | | | | | |
| COMMON STOCKS 96.7% (continued) | | | |
| | | | | | |
| | | Retail - Apparel 1.2% | | | |
| | 20,224 | | Abercrombie & Fitch Co. - Class A | | $ | 513,487 | |
| | | | | | | | |
| | | | Retail REITS 0.7% | | | | |
| | 64,859 | | Cedar Shopping Centers, Inc. | | | 293,163 | |
| | | | | | | | |
| | | | Services - Environmental 4.1% | | | | |
| | 79,951 | | EnergySolutions, Inc. | | | 735,549 | |
| | 55,297 | | Fuel Tech, Inc. (a) | | | 536,381 | |
| | 18,515 | | Tetra Tech, Inc. (a) | | | 530,455 | |
| | | | | | | 1,802,385 | |
| | | | Specialty Stores 2.0% | | | | |
| | 21,632 | | Tractor Supply Co. (a) | | | 893,834 | |
| | | | | | | | |
| | | | Steel 1.4% | | | | |
| | 39,577 | | Commercial Metals Co. | | | 634,419 | |
| | | | | | | | |
| | | | Technology Distributions 0.3% | | | | |
| | 28,728 | | GTSI Corp. (a) | | | 154,269 | |
| | | | | | | | |
| | | | Thrifts & Mortgage Finance 1.4% | | | | |
| | 137,013 | | MGIC Investment Corp. | | | 602,857 | |
| | | | | | | | |
| | | | Trading Cos & Distributors 1.2% | | | | |
| | 21,196 | | GATX Corp. | | | 545,161 | |
| | | | | | | | |
| | | | Total Common Stocks | | | | |
| | | | (Cost $46,422,626) | | | 42,934,667 | |
| | | | | | | | |
| SHORT-TERM INVESTMENTS 20.8% | | | | |
| | 2,031,002 | | AIM Liquid Assets Portfolio | | | 2,031,002 | |
| | 3,600,000 | | Fidelity Institutional | | | | |
| | | | Money Market Portfolio | | | 3,600,000 | |
| | 3,600,000 | | Fidelity Institutional Money | | | | |
| | | | Market Government Portfolio | | | 3,600,000 | |
| | | | Total Short-Term Investments | | | | |
| | | | (Cost $9,231,002) | | | 9,231,002 | |
| | | | | | | | |
| | | | Total Investments 117.5% | | | | |
| | | | (Cost $55,653,628) | | | 52,165,669 | |
| | | | | | | | |
| | | | Liabilities in Excess | | | | |
| | | | of Other Assets (17.5)% | | | (7,766,801 | ) |
| | | | | | | | |
| | | | TOTAL NET ASSETS 100.0% | | $ | 44,398,868 | |
| (b) | U.S.-dollar denominated security of foreign issuer. |
ALLOCATION OF PORTFOLIO HOLDINGS
At June 30, 2009, the allocation of portfolio holdings as a percentage of the Fund’s total net assets were:
| Common Stocks | | | 96.7 | % |
| Short-Term Investments | | | 20.8 | |
| Liabilities in Excess of Other Assets | | | (17.5 | ) |
| Total | | | 100.0 | % |
The accompanying notes are an integral part of these financial statements.
Frontegra Netols Small Cap Value Fund
STATEMENT OF ASSETS AND LIABILITIES
June 30, 2009
| Assets: | | | |
| Investments at value (cost $55,653,628) | | $ | 52,165,669 | |
| Dividends and interest receivable | | | 17,392 | |
| Receivable for Fund shares sold | | | 30,412 | |
| Prepaid expenses and other assets | | | 4,531 | |
| Total assets | | | 52,218,004 | |
| | | | | |
| Liabilities: | | | | |
| Payable for investments purchased | | | 7,765,942 | |
| Payable to the investment adviser | | | 20,631 | |
| Accrued distribution and shareholder servicing fees | | | 974 | |
| Accrued expenses | | | 31,589 | |
| Total liabilities | | | 7,819,136 | |
| Net Assets | | $ | 44,398,868 | |
| | | | | |
| Net Assets Consist of: | | | | |
| Paid in capital | | $ | 52,013,134 | |
| Undistributed net investment income | | | 64,517 | |
| Accumulated net realized loss | | | (4,190,824 | ) |
| Net unrealized depreciation on investments | | | (3,487,959 | ) |
| Net Assets | | $ | 44,398,868 | |
| | | | | |
| Capital Stock, $0.01 Par Value | | | | |
| Institutional Class Shares Authorized | | | 50,000,000 | |
| Class Y Shares Authorized | | | 50,000,000 | |
| | | | | |
| Institutional Class: | | | | |
| Net Assets | | $ | 43,504,067 | |
| Issued and Outstanding | | | 4,816,751 | |
| Net Asset Value, Redemption Price and Offering Price Per Share | | $ | 9.03 | |
| | | | | |
| Class Y: | | | | |
| Net Assets | | $ | 894,801 | |
| Issued and Outstanding | | | 99,660 | |
| Net Asset Value, Redemption Price and Offering Price Per Share | | $ | 8.98 | |
The accompanying notes are an integral part of these financial statements.
Frontegra Netols Small Cap Value Fund
STATEMENT OF OPERATIONS
| | | Year Ended | |
| | | June 30, 2009 | |
| Investment Income: | | | |
| Dividend income | | $ | 400,534 | |
| Interest income | | | 23,176 | |
| Total Investment Income | | | 423,710 | |
| | | | | |
| Expenses: | | | | |
| Investment advisory fees (Note 3) | | | 322,554 | |
| Fund administration and accounting fees | | | 31,065 | |
| Legal fees | | | 29,610 | |
| Audit fees | | | 27,127 | |
| Shareholder servicing fees | | | 15,413 | |
| Custody fees | | | 12,816 | |
| Directors’ fees and related expenses | | | 8,695 | |
| Federal and state registration fees | | | 7,918 | |
| Compliance related expenses | | | 5,393 | |
| Distribution and shareholder servicing fees - Class Y (Note 8) | | | 3,439 | |
| Reports to shareholders | | | 2,990 | |
| Other | | | 2,436 | |
| Total expenses before waiver and reimbursement | | | 469,456 | |
| Waiver and reimbursement of expenses by Adviser (Note 3) | | | (111,209 | ) |
| Net expenses | | | 358,247 | |
| Net Investment Income | | | 65,463 | |
| | | | | |
| Realized and Unrealized Loss on Investments: | | | | |
| Net realized loss on investments | | | (3,424,284 | ) |
| Change in net unrealized appreciation/(depreciation) on investments | | | (4,798,290 | ) |
| Net Realized and Unrealized Loss on Investments | | | (8,222,574 | ) |
| Net Decrease in Net Assets Resulting from Operations | | $ | (8,157,111 | ) |
The accompanying notes are an integral part of these financial statements.
Frontegra Netols Small Cap Value Fund
STATEMENTS OF CHANGES IN NET ASSETS
| | | For the | | | For the | |
| | | Year Ended | | | Year Ended | |
| | | June 30, 2009 | | | June 30, 2008 | |
| Operations: | | | | | | |
| Net investment income | | $ | 65,463 | | | $ | 16,648 | |
| Net realized loss on investments: | | | (3,424,284 | ) | | | (762,753 | ) |
| Change in net unrealized appreciation/(depreciation) on investments | | | (4,798,290 | ) | | | (752,047 | ) |
| Net decrease in net assets resulting from operations | | | (8,157,111 | ) | | | (1,498,152 | ) |
| | | | | | | | | |
| Distributions to Institutional Class Shareholders From: | | | | | | | | |
| Net investment income | | | (12,872 | ) | | | (34,466 | ) |
| Net realized gain | | | — | | | | (251,672 | ) |
| Total distributions | | | (12,872 | ) | | | (286,138 | ) |
| | | | | | | | | |
| Distributions to Class Y Shareholders From: | | | | | | | | |
| Net investment income | | | — | | | | (1,500 | ) |
| Net realized gain | | | — | | | | (13,294 | ) |
| Total distributions | | | — | | | | (14,794 | ) |
| | | | | | | | | |
| Capital Share Transactions: | | | | | | | | |
| Shares sold - Institutional Class | | | 25,776,914 | | | | 16,844,013 | |
| Shares sold - Class Y | | | 172,350 | | | | 1,331,225 | |
| Shares issued to holders in reinvestment of distributions - Institutional Class | | | 11,142 | | | | 258,792 | |
| Shares issued to holders in reinvestment of distributions - Class Y | | | — | | | | 14,794 | |
| Shares redeemed - Institutional Class | | | (5,704,581 | ) | | | (1,404,962 | ) |
| Shares redeemed - Class Y | | | (66,608 | ) | | | (232,924 | ) |
| Net increase in net assets resulting from capital share transactions | | | 20,189,217 | | | | 16,810,938 | |
| Total Increase in Net Assets | | | 12,019,234 | | | | 15,011,854 | |
| | | | | | | | | |
| Net Assets: | | | | | | | | |
| Beginning of Year | | | 32,379,634 | | | | 17,367,780 | |
| End of Year (includes undistributed net investment | | | | | | | | |
| income of $64,517 and $12,872, respectively) | | $ | 44,398,868 | | | $ | 32,379,634 | |
| | | | | | | | | |
| Transactions in Shares – Institutional Class: | | | | | | | | |
| Shares sold | | | 2,834,988 | | | | 1,401,889 | |
| Shares issued to holders in reinvestment of distributions | | | 1,297 | | | | 21,388 | |
| Shares redeemed | | | (674,248 | ) | | | (117,167 | ) |
| Net increase in shares outstanding | | | 2,162,037 | | | | 1,306,110 | |
| | | | | | | | | |
| Transactions in Shares – Class Y: | | | | | | | | |
| Shares sold | | | 18,620 | | | | 106,767 | |
| Shares issued to holders in reinvestment of distributions | | | — | | | | 1,223 | |
| Shares redeemed | | | (6,746 | ) | | | (20,204 | ) |
| Net increase in shares outstanding | | | 11,874 | | | | 87,786 | |
The accompanying notes are an integral part of these financial statements.
Frontegra Netols Small Cap Value Fund
FINANCIAL HIGHLIGHTS
| | | Institutional Class | |
| | | Year | | | Year | | | Year | | | Period | |
| | | Ended | | | Ended | | | Ended | | | Ended | |
| | | June 30, | | | June 30, | | | June 30, | | | June 30, | |
| | | 2009 | | | 2008 | | | 2007 | | | 2006(1) | |
| Net Asset Value, Beginning of Period | | $ | 11.81 | | | $ | 12.88 | | | $ | 10.29 | | | $ | 10.00 | |
| | | | | | | | | | | | | | | | | |
| Income (Loss) from | | | | | | | | | | | | | | | | |
| Investment Operations: | | | | | | | | | | | | | | | | |
| Net investment income | | | 0.01 | (2) | | | — | (2) | | | 0.03 | | | | — | (2) |
| Net realized and unrealized gain (loss) on investments | | | (2.79 | ) | | | (0.90 | ) | | | 2.62 | | | | 0.29 | |
| Total Income (Loss) from Investment Operations | | | (2.78 | ) | | | (0.90 | ) | | | 2.65 | | | | 0.29 | |
| | | | | | | | | | | | | | | | | |
| Less Distributions: | | | | | | | | | | | | | | | | |
| From net investment income | | | — | (2) | | | (0.02 | ) | | | — | | | | — | |
| From net realized gain on investments | | | — | | | | (0.15 | ) | | | (0.06 | ) | | | — | |
| Total Distributions | | | — | | | | (0.17 | ) | | | (0.06 | ) | | | — | |
| | | | | | | | | | | | | | | | | |
| Net Asset Value, End of Period | | $ | 9.03 | | | $ | 11.81 | | | $ | 12.88 | | | $ | 10.29 | |
| Total Return | | | (23.42 | )% | | | (7.01 | )% | | | 25.81 | % | | | 2.90 | %(3) |
| | | | | | | | | | | | | | | | | |
| Supplemental Data and Ratios: | | | | | | | | | | | | | | | | |
| Net assets, end of period (in thousands) | | $ | 43,504 | | | $ | 31,346 | | | $ | 17,368 | | | $ | 7,728 | |
| Ratio of expenses to average net assets | | | | | | | | | | | | | | | | |
| Before waivers and reimbursements | | | 1.45 | % | | | 1.59 | % | | | 2.10 | % | | | 4.59 | %(4) |
| Net of waivers and reimbursements | | | 1.10 | % | | | 1.10 | % | | | 1.10 | % | | | 1.10 | %(4) |
| Ratio of net investment income (loss) to average net assets | | | | | | | | | | | | | | | | |
| Before waivers and reimbursements | | | (0.13 | )% | | | (0.40 | )% | | | (0.70 | )% | | | (3.44 | )%(4) |
| Net of waivers and reimbursements | | | 0.22 | % | | | 0.09 | % | | | 0.30 | % | | | 0.05 | %(4) |
| Portfolio turnover rate | | | 36 | % | | | 32 | % | | | 49 | % | | | 41 | %(3) |
| (1) | Commenced operations on December 16, 2005. |
| (2) | Less than one cent per share. |
The accompanying notes are an integral part of these financial statements.
Frontegra Netols Small Cap Value Fund
FINANCIAL HIGHLIGHTS
| | | Class Y | |
| | | Year | | | Period | |
| | | Ended | | | Ended | |
| | | June 30, | | | June 30, | |
| | | 2009 | | | 2008(1) | |
| Net Asset Value, Beginning of Period | | $ | 11.78 | | | $ | 12.54 | |
| | | | | | | | | |
| Income (Loss) from | | | | | | | | |
| Investment Operations: | | | | | | | | |
| Net investment income | | | (0.02 | ) | | | (0.02 | ) |
| Net realized and unrealized loss on investments | | | (2.78 | ) | | | (0.57 | ) |
| Total Loss from Investment Operations | | | (2.80 | ) | | | (0.59 | ) |
| | | | | | | | | |
| Less Distributions: | | | | | | | | |
| From net investment income | | | — | | | | (0.02 | ) |
| From net realized gain on investments | | | — | | | | (0.15 | ) |
| Total Distributions | | | — | | | | (0.17 | ) |
| | | | | | | | | |
| Net Asset Value, End of Period | | $ | 8.98 | | | $ | 11.78 | |
| Total Return | | | (23.77 | )% | | | (4.76 | )%(2) |
| | | | | | | | | |
| Supplemental Data and Ratios: | | | | | | | | |
| Net assets, end of period (in thousands) | | $ | 895 | | | $ | 1,034 | |
| Ratio of expenses to average net assets | | | | | | | | |
| Before waivers and reimbursements | | | 1.85 | % | | | 2.01 | %(3) |
| Net of waivers and reimbursements | | | 1.50 | % | | | 1.55 | %(3) |
| Ratio of net investment income (loss) to average net assets | | | | | | | | |
| Before waivers and reimbursements | | | (0.53 | )% | | | (0.80 | )%(3) |
| Net of waivers and reimbursements | | | (0.18 | )% | | | (0.34 | )%(3) |
| Portfolio turnover rate | | | 36 | % | | | 32 | %(2) |
| (1) | Commenced operations on November 1, 2007. |
The accompanying notes are an integral part of these financial statements.
Frontegra Funds
NOTES TO FINANCIAL STATEMENTS
June 30, 2009
| | Frontegra Funds, Inc. (“Frontegra”) was incorporated on May 24, 1996 as a Maryland corporation and is registered under the Investment Company Act of 1940, as amended (the “1940 Act”), as an open-end investment company issuing its shares in series, each series representing a distinct portfolio with its own investment objectives and policies. Frontegra consists of six series: the Frontegra Columbus Core Plus Fund (formerly Frontegra Total Return Bond Fund), the Frontegra Columbus Core Fund (formerly Frontegra Investment Grade Bond Fund), the Frontegra IronBridge Small Cap Fund, the Frontegra IronBridge SMID Fund, the Frontegra New Star International Equity Fund and the Frontegra Netols Small Cap Value Fund (the “Funds”). The Frontegra Columbus Core Plus and Columbus Core Funds seek a high level of total return, consistent with the preservation of capital. The investment objective of the Frontegra IronBridge Small Cap Fund, the Frontegra IronBridge SMID Fund, the Frontegra New Star International Equity Fund and the Frontegra Netols Small Cap Value Fund is capital appreciation. The Frontegra Columbus Core Plus and Columbus Core Funds, sub-advised by Reams Asset Management Company, LLC (“Reams”), commenced operations on November 25, 1996 and February 23, 2001, respectively. The Frontegra IronBridge Small Cap and IronBridge SMID Funds, sub-advised by IronBridge Capital Management, L.P. (“IronBridge”), commenced operations on August 30, 2002 and December 31, 2004, respectively. The Frontegra New Star International Equity Fund, sub-advised by New Star Institutional Managers Limited (“New Star”), commenced operations on January 8, 2004. The Frontegra Netols Small Cap Value Fund – Institutional Class and the Netols Small Cap Value Fund – Class Y, sub-advised by Netols Asset Management, Inc. (“Netols”), commenced operations on December 16, 2005 and November 1, 2007, respectively. |
| (2) | Significant Accounting Policies |
| | The following is a summary of significant accounting policies consistently followed by the Funds in the preparation of their financial statements. |
| | Debt securities (other than short-term instruments) are valued by an independent pricing service, which uses valuation methods such as matrix pricing and other analytical pricing models as well as market transactions and dealer quotations. Debt securities, such as term loans, when not priced by an independent pricing service, are priced by an independent dealer based on the current closing bid price. Credit default swaps are valued by a third party pricing service. Equity securities for which market quotations are readily available are valued at the last trade price on the national securities exchange on which such securities are primarily traded. Equity securities for which there were no transactions on a given day or securities not listed on a national securities exchange are valued at the most recent bid price. Equity securities that are traded using the National Association of Securities Dealers’ Automated Quotation System (“NASDAQ”) are valued using the NASDAQ Official Closing Price (“NOCP”). Shares of underlying mutual funds are valued at their respective NAVs. Most securities that are primarily traded on foreign exchanges generally are valued at the last sale price of such securities on their respective exchange. In certain countries, market maker prices, usually the mean between the bid and ask prices, are used. In certain circumstances, such as when a significant event occurs in a foreign market so that the last sale price no longer reflects actual value, the fair value of these securities may be determined using fair valuation procedures approved by the Board of Directors. The Directors have retained an independent fair value pricing service to assist in valuing foreign securities held by the Frontegra New Star International Equity Fund. In valuing assets, prices denominated in foreign currencies are converted to U.S. dollar equivalents at the current exchange rate, which approximates market value. Securities maturing within 60 days or less when purchased are valued by the amortized cost method. Any securities or other assets for which market quotations are not readily available are valued at their fair value as determined in good faith by Reams, IronBridge, New Star and Netols pursuant to guidelines established by the Board of Directors. |
Frontegra Funds
NOTES TO FINANCIAL STATEMENTS (continued)
June 30, 2009
| | Statement of Financial Accounting Standards No. 157 “Fair Value Measurements” (SFAS 157) establishes an authoritative definition of fair value and sets out a hierarchy for measuring fair value. SFAS 157 requires additional disclosures about the various inputs used to develop the measurements of fair value. These inputs are summarized in the three broad levels listed below: |
| Level 1 - | Quoted prices in active markets for identical securities. |
| Level 2 - | Other significant observable inputs (including quoted prices for similar securities, interest rates, prepayment speeds, credit risk, etc.). |
| Level 3 - | Significant unobservable inputs (including the Fund’s own assumptions in determining the fair value of investments). |
| | The inputs or methodology used for valuing securities are not necessarily an indication of the risk associated with investing in those securities. The following is a summary of the inputs used to value the Funds’ net assets as of June 30, 2009: |
| Columbus Core Plus | | | | | | | | | | | | |
| | | Level 1 | | | Level 2 | | | Level 3 | | | Total | |
| Equity | | | | | | | | | | | | |
| Preferred Stock | | $ | 399,540 | | | $ | — | | | $ | — | | | $ | 399,540 | |
| Fixed Income | | | | | | | | | | | | | | | | |
| U.S. Treasury Obligations | | | — | | | | 60,501,915 | | | | — | | | | 60,501,915 | |
| Corporate Bonds | | | — | | | | 244,724,766 | | | | — | | | | 244,724,766 | |
| Asset Backed Securities | | | — | | | | 14,549,394 | | | | — | | | | 14,549,394 | |
| Mortgage Backed Securities | | | — | | | | 51,697,672 | | | | — | | | | 51,697,672 | |
| Institutional Term Loans | | | — | | | | 77,804 | | | | — | | | | 77,804 | |
| Total Fixed Income | | | — | | | | 371,551,551 | | | | — | | | | 371,951,091 | |
| Short-Term Investments | | | — | | | | 7,222,551 | | | | — | | | | 7,222,551 | |
| Total Investments in Securities | | $ | 399,540 | | | $ | 378,774,102 | | | $ | — | | | $ | 379,173,642 | |
Other Financial Instruments* | | $ | — | | | $ | 422,098 | | | $ | — | | | $ | 422,098 | |
| Columbus Core | | | | | | | | | | | | |
| | | Level 1 | | | Level 2 | | | Level 3 | | | Total | |
| Fixed Income | | | | | | | | | | | | |
| U.S. Treasury Obligations | | $ | — | | | $ | 7,874,987 | | | $ | — | | | $ | 7,874,987 | |
| Corporate Bonds | | | — | | | | 32,012,451 | | | | — | | | | 32,012,451 | |
| Asset Backed Securities | | | — | | | | 1,247,963 | | | | — | | | | 1,247,963 | |
| Mortgage Backed Securities | | | — | | | | 6,548,226 | | | | — | | | | 6,548,226 | |
| Total Fixed Income | | | — | | | | 47,683,627 | | | | — | | | | 47,683,627 | |
| Short-Term Investments | | | — | | | | 2,918,603 | | | | — | | | | 2,918,603 | |
| Total Investments in Securities | | $ | — | | | $ | 50,602,230 | | | $ | — | | | $ | 50,602,230 | |
| * | Other financial instruments are derivative instruments not reflected in the Schedule of Investments, such as futures, forwards, swap contracts, and written options. Futures, forwards, and swap contracts are valued at the unrealized appreciation (depreciation) on the instrument while written options are valued at market value. |
Frontegra Funds
NOTES TO FINANCIAL STATEMENTS (continued)
June 30, 2009
| IronBridge Small Cap | | | | | | | | | | | | |
| | | Level 1 | | | Level 2 | | | Level 3 | | | Total | |
| Equity | | | | | | | | | | | | |
| Common Stock | | $ | 271,386,197 | | | $ | — | | | $ | — | | | $ | 271,386,197 | |
| Real Estate Investment Trusts | | | 13,414,229 | | | | — | | | | — | | | | 13,414,229 | |
| Exchange Traded Funds | | | 5,789,566 | | | | — | | | | — | | | | 5,789,566 | |
| Total Equity | | | 290,589,992 | | | | — | | | | — | | | | 290,589,992 | |
| Short-Term Investments | | | — | | | | 808,594 | | | | — | | | | 808,594 | |
| Total Investments in Securities | | $ | 290,589,992 | | | $ | 808,594 | | | $ | — | | | $ | 291,398,586 | |
| IronBridge SMID | | | | | | | | | | | | |
| | | Level 1 | | | Level 2 | | | Level 3 | | | Total | |
| Equity | | | | | | | | | | | | |
| Common Stock | | $ | 280,536,515 | | | $ | — | | | $ | — | | | $ | 280,536,515 | |
| Real Estate Investment Trusts | | | 14,437,558 | | | | — | | | | — | | | | 14,437,558 | |
| Total Equity | | | 294,974,073 | | | | — | | | | — | | | | 294,974,073 | |
| Short-Term Investments | | | — | | | | 13,165,678 | | | | — | | | | 13,165,678 | |
| Total Investments in Securities | | $ | 294,974,073 | | | $ | 13,165,678 | | | $ | — | | | $ | 308,139,751 | |
| New Star International Equity | | | | | | | | | | | | |
| | | Level 1 | | | Level 2 | | | Level 3 | | | Total | |
| Equity | | | | | | | | | | | | |
| Common Stock | | $ | 198,199,646 | | | $ | — | | | $ | — | | | $ | 198,199,646 | |
| Short-Term Investments | | | 4,245,185 | | | | — | | | | — | | | | 4,245,185 | |
| Total Investments in Securities | | $ | 202,444,831 | | | $ | — | | | $ | — | | | $ | 202,444,831 | |
| Netols Small Cap Value | | | | | | | | | | | | |
| | | Level 1 | | | Level 2 | | | Level 3 | | | Total | |
| Equity | | | | | | | | | | | | |
| Common Stock | | $ | 41,216,609 | | | $ | — | | | $ | — | | | $ | 41,216,609 | |
| Real Estate Investment Trusts | | | 1,718,058 | | | | — | | | | — | | | | 1,718,058 | |
| Total Equity | | | 42,934,667 | | | | — | | | | — | | | | 42,934,667 | |
| Short-Term Investments | | | 9,231,002 | | | | — | | | | — | | | | 9,231,002 | |
| Total Investments in Securities | | $ | 52,165,669 | | | $ | — | | | $ | — | | | $ | 52,165,669 | |
Frontegra Funds
NOTES TO FINANCIAL STATEMENTS (continued)
June 30, 2009
| | In July 2008, the Funds adopted Statement on Financial Accounting Standards No. 161, “Disclosures about Derivative Instruments and Hedging Activities” (“SFAS 161”) was issued and is effective for fiscal years beginning after November 15, 2008. SFAS 161 is intended to improve financial reporting for derivative instruments by requiring enhanced disclosure that enables investors to understand how and why an entity uses derivatives, how derivatives are accounted for, and how derivative instruments affect an entity’s results of operations and financial position. The adoption of SFAS 161 has had no impact on the Funds’ financial statements. |
| | Each Fund intends to comply with the requirements of Subchapter M of the Internal Revenue Code necessary to qualify as a regulated investment company and to make the requisite distributions of income and capital gains to its shareholders sufficient to relieve it from all or substantially all federal income taxes. Therefore, no federal income tax provision has been provided. |
| | Financial Accounting Standards Board (“FASB”) Interpretation No. 48,Accounting for Uncertainty in Income Taxes (“FIN 48”) requires the Funds to analyze all open tax years. Open tax years are those years that are open for examination by the relevant income taxing authority. As of June 30, 2009, open Federal and state income tax years include the tax years ended June 30, 2007, June 30, 2008 and June 30, 2009. The Funds have no examinations in progress. |
| | The Funds have reviewed all open tax years and concluded that the adoption of FIN 48 resulted in no effect to the Funds’ financial positions or results of operations. There is no tax liability resulting from uncertain income tax positions taken or expected to be taken on the tax returns for the fiscal year-end June 30, 2007, June 30, 2008 and June 30, 2009. The Funds are also not aware of any tax positions for which it is reasonably possible that the total amounts of unrecognized tax expense will significantly change in twelve months. |
| (c) | Distributions to Shareholders |
| | Dividends from net investment income are usually declared and paid quarterly for the Frontegra Columbus Core Plus and Frontegra Columbus Core Funds and at least annually for the Frontegra IronBridge Small Cap Fund, Frontegra IronBridge SMID Fund, Frontegra New Star International Equity Fund and the Frontegra Netols Small Cap Value Fund. Distributions of net realized gains, if any, are declared and paid at least annually for all Funds. |
| | All short-term capital gains are included in ordinary income for tax purposes. Distributions to shareholders are recorded on the ex-dividend date. |
| | The tax character of distributions paid during the years ended June 30, 2009 and June 30, 2008 were as follows: |
| | | Year Ended | | | Year Ended | |
| | | June 30, 2009 | | | June 30, 2008 | |
| | | Ordinary | | | Long-Term | | | Total | | | Ordinary | | | Long-Term | | | Total | |
| | | Income | | | Capital Gains | | | Distributions | | | Income | | | Capital Gains | | | Distributions | |
| Columbus Core Plus | | $ | 42,290,396 | | | $ | 448,994 | | | $ | 42,739,390 | | | $ | 25,210,791 | | | $ | — | | | $ | 25,210,791 | |
| Columbus Core | | | 5,468,450 | | | | — | | | | 5,468,450 | | | | 4,337,398 | | | | — | | | | 4,337,398 | |
| IronBridge Small Cap | | | 1,863,120 | | | | 14,358,247 | | | | 16,221,367 | | | | 10,391,454 | | | | 35,191,852 | | | | 45,583,306 | |
| IronBridge SMID | | | 1,319,242 | | | | 1,306,867 | | | | 2,626,109 | | | | 7,030,056 | | | | 11,099,086 | | | | 18,129,142 | |
| New Star International Equity | | | 10,274,811 | | | | 11,287,342 | | | | 21,562,153 | | | | 31,026,819 | | | | 30,624,035 | | | | 61,650,854 | |
| Netols Small Cap Value | | | 12,995 | | | | — | | | | 12,995 | | | | 143,320 | | | | 157,612 | | | | 300,932 | |
Frontegra Funds
NOTES TO FINANCIAL STATEMENTS (continued)
June 30, 2009
| | At June 30, 2009 the components of accumulated earnings/losses on a tax basis were as follows: |
| | | | | | | | | | | | | | | New Star | | | Netols | |
| | | Columbus | | | Columbus | | | IronBridge | | | IronBridge | | | International | | | Small Cap | |
| | | Core Plus | | | Core | | | Small Cap | | | SMID | | | Equity | | | Value | |
| Cost of investments | | $ | 388,551,325 | | | $ | 50,039,002 | | | $ | 306,680,738 | | | $ | 328,016,591 | | | $ | 214,127,463 | | | $ | 56,537,609 | |
| Gross unrealized appreciation | | $ | 21,641,215 | | | $ | 2,899,102 | | | $ | 39,847,060 | | | $ | 29,247,920 | | | $ | 15,385,924 | | | $ | 4,907,535 | |
| Gross unrealized depreciation | | | (31,018,898 | ) | | | (2,335,874 | ) | | | (55,129,212 | ) | | | (49,124,760 | ) | | | (27,068,556 | ) | | | (9,279,475 | ) |
| Net unrealized | | | | | | | | | | | | | | | | | | | | | | | | |
| appreciation/depreciation | | | (9,377,683 | ) | | | 563,228 | | | | (15,282,152 | ) | | | (19,876,840 | ) | | | (11,682,632 | ) | | | (4,371,940 | ) |
| Undistributed ordinary income | | | 1,674,632 | | | | 118,324 | | | | 1,187,053 | | | | 1,315,023 | | | | 5,738,700 | | | | 64,517 | |
| Undistributed long-term capital gain | | | — | | | | — | | | | — | | | | — | | | | — | | | | — | |
| Total distributable earnings | | | 1,674,632 | | | | 118,324 | | | | 1,187,053 | | | | 1,315,023 | | | | 5,738,700 | | | | 64,517 | |
| Other accumulated losses | | | (9,721,462 | ) | | | (9,430,796 | ) | | | (50,341,312 | ) | | | (46,330,688 | ) | | | (118,793,314 | ) | | | (3,306,843 | ) |
| Total accumulated earnings/(losses) | | $ | (17,424,513 | ) | | $ | (8,749,244 | ) | | $ | (64,436,411 | ) | | $ | (64,892,505 | ) | | $ | (124,737,246 | ) | | $ | (7,614,266 | ) |
| | The difference between book-basis and tax-basis unrealized appreciation is attributable primarily to the tax deferral of losses on wash sales and swaps. |
| | The Funds intend to utilize provisions of the federal income tax laws, which allow them to carry a realized capital loss forward for eight years following the year of loss and offset such losses against any future realized capital gains. At June 30, 2009, the Funds had the following capital loss carryforward available: |
| | | Expiring | | | | |
| | | 6/30/15 | | | 6/30/16 | | | 6/30/17 | | | TOTAL | |
| Columbus Core | | $ | (452,904 | ) | | $ | — | | | $ | — | | | $ | (452,904 | ) |
| Ironbridge Small Cap | | | — | | | | — | | | | (9,341,207 | ) | | | (9,341,207 | ) |
| Ironbridge SMID | | | — | | | | — | | | | (7,523,419 | ) | | | (7,523,419 | ) |
| New Star International | | | — | | | | — | | | | (18,645,962 | ) | | | (18,645,962 | ) |
| Netols Small Cap Value | | | — | | | | (119,331 | ) | | | (351,558 | ) | | | (470,889 | ) |
| | In order to meet certain excise tax requirements, the Funds are required to measure and distribute annually, net capital gains realized during the twelve month period ending October 31st. In connection with this requirement, the Funds are permitted, for tax purposes, to defer into their next fiscal year any net capital losses incurred from November 1st through the end of the fiscal year. As of June 30, 2009, the following funds deferred, on a tax basis, post October losses of: |
| | | Post-October | | | Post-October | |
| | | Loss Deferred | | | Currency Loss Deferred | |
| Columbus Core Plus | | $ | 8,993,414 | | | $ | 1,519 | |
| Columbus Core | | | 8,906,107 | | | | — | |
| Ironbridge Small Cap | | | 41,000,105 | | | | — | |
| Ironbridge SMID | | | 38,807,269 | | | | — | |
| New Star International Equity | | | 99,886,824 | | | | 262,141 | |
| Netols Small Cap Value | | | 2,835,954 | | | | — | |
Frontegra Funds
NOTES TO FINANCIAL STATEMENTS (continued)
June 30, 2009
| (d) | When-Issued Securities |
| | The Frontegra Columbus Core Plus and Columbus Core Funds may purchase securities on a when-issued basis. The price of securities purchased on a when-issued basis is fixed at the time the commitment to purchase is made, but delivery and payment for the securities take place at a later date, normally within 45 days of the purchase. At the time of purchase, the Funds will record the transaction and reflect the value of the security and related liability in determining their net asset value. During the period between the purchase and settlement, no payment is made by the Funds to the issuer and no interest is accrued. The Funds maintain segregated cash, U.S. government securities and liquid securities equal in value to commitments for when-issued securities. |
| | The Frontegra Columbus Core Plus and Columbus Core Funds may enter into mortgage dollar rolls, in which a Fund would sell mortgage backed securities for delivery in the current month and simultaneously contract to purchase similar securities on a specified future date. While a Fund would forego principal and interest paid on the mortgage-backed securities during the roll period, it would be compensated by the difference between the current sale price and the lower price for the future purchase as well as by any interest earned on the proceeds of the initial sale. A Fund also could be compensated through the receipt of fee income equivalent to a lower forward price. |
| | Each Fund may enter into futures contracts, including index and interest rate futures contracts. Upon entering into a contract, the Fund deposits and maintains as collateral such initial margin as required by the exchange on which the transaction is effected. Pursuant to the contract, the Fund agrees to receive from or pay to the broker an amount of cash equal to the daily fluctuation in value of the contract. Such receipts or payments are known as variation margin and are recorded by the Fund as unrealized gains and losses. When the contract is closed, the Fund records a realized gain or loss equal to the difference between the value of the contract at the time it was opened and the value at the time it was closed. As collateral for futures contracts, the Fund is required under the 1940 Act to maintain assets consisting of cash, cash equivalents or other liquid securities. This collateral is required to be adjusted daily to reflect the market value of the purchase obligation for long futures contracts or the market value of the instrument underlying the contract, but not less than the market price at which the futures contract was established, for short futures contracts. |
| | The risks inherent in the use of futures contracts include 1) adverse changes in the value of such instruments; and 2) the possible absence of a liquid secondary market for any particular instrument at any time. There were no futures contracts open at June 30, 2009. |
| | The Columbus Core Plus and Columbus Core Funds may enter into credit default swap agreements. The credit default swap agreement may have as a reference obligation one or more securities that are or are not currently held by a Fund. The buyer in a credit default swap agreement is obligated to pay the seller a periodic fee, typically expressed in basis points on the principal amount of the underlying obligation (the “notional” amount), over the term of the agreement in return for a contingent payment upon the occurrence of a credit event with respect to the underlying reference obligation. A credit event is typically a default. |
| | A Fund may be either the buyer or seller of protection in the transaction. As a seller, a Fund accrues for and receives a fixed rate of income throughout the term of the agreement, which typically is between one month and five years, provided that no credit event occurs. If a credit event occurs, the maximum payout amount for a sale contract is limited to the notional amount of the swap contract (“Maximum Payout Amount”). At June 30, 2009, the Frontegra Columbus Core Plus Fund had sale contracts outstanding with Maximum Payout Amounts aggregating $17,404,800, with net unrealized appreciation of $422,098. At June 30, 2009, the Frontegra |
Frontegra Funds
NOTES TO FINANCIAL STATEMENTS (continued)
June 30, 2009
| | Columbus Core Fund had no sale contracts outstanding. If a Fund is a buyer and no credit event occurs, the Fund may lose its investment and recover nothing. However, if a credit event occurs, the buyer typically receives full notional value for a reference obligation that may have little or no value. |
| | Credit default swaps may involve greater risks than if a Fund had invested in the reference obligation directly. Credit default swaps are subject to general market risk, liquidity risk, counterparty credit risk and credit risk of the issuer. As noted above, if a Fund is a buyer in a credit default swap agreement and no credit event occurs, it will lose its investment. In addition, the value of the reference obligation received by a Fund as a seller if a credit event occurs, coupled with the periodic payments previously received, may be less than the full notional value it pays to the buyer, resulting in a loss of value to the Fund. |
| (h) | Foreign Currency Translation |
| | Values of investments denominated in foreign currencies are converted into U.S. dollars using a spot market rate of exchange each day. Purchases and sales of investments and dividend and interest income are translated to U.S. dollars using a spot market rate of exchange prevailing on the dates of such transactions. The portion of security gains or losses resulting from changes in foreign exchange rates are included with net realized and unrealized gain or loss from investments, as appropriate, for both financial reporting and tax purposes. |
| | Each Fund, respectively, bears the risk of charges in the foreign currency exchange rates and their impact on the value of assets and liabilities denominated in foreign currency. Each Fund also bears the risk of a counterparty failing to fulfill its obligation under a foreign currency contract. |
| | Under the Funds’ organizational documents, their officers and directors are indemnified against certain liabilities arising out of the performance of their duties to the Funds. In addition, in the normal course of business, the Funds enter into contracts that provide general indemnifications to other parties. The Funds’ maximum exposure under these arrangements is unknown as this would involve future claims that may be made against the Funds that have not yet occurred. However, the Funds have not had prior claims or losses pursuant to these contracts and expect the risk of loss to be remote. |
| | In May 2009, the FASB issued SFAS No. 165, “Subsequent Events” (SFAS No. 165). The Funds adopted SFAS No. 165 which requires an entity to recognize in the financial statements the effects of all subsequent events that provide additional evidence about conditions that existed at the date of the balance sheet. For non-recognized subsequent events that must be disclosed to keep the financial statements from being misleading, an entity will be required to disclose the nature of the event as well as an estimate of its financial effect, or a statement that such an estimate cannot be made. In addition, SFAS No. 165 requires an entity to disclose the date through which subsequent events have been evaluated. The Funds have evaluated subsequent events through the issuance of their financial statements on August 28, 2009. |
| | Investment transactions are accounted for on the trade date. The Funds determine the gain or loss realized from investment transactions by comparing the original cost of the specifically identified security lot sold with the net sale proceeds. Dividend income, less foreign taxes withheld, is recognized on the ex-dividend date, except that certain dividends from foreign securities are recorded as soon as the information becomes available to the Funds. Interest income is recognized on an accrual basis. All discounts/premiums are accreted/amortized using the effective interest method and are included in interest income. |
Frontegra Funds
NOTES TO FINANCIAL STATEMENTS (continued)
June 30, 2009
| | Income, expenses (other than expenses attributable to a specific class), and realized and unrealized gains or losses on investments attributable to the Funds are generally allocated to each respective class in proportion to the relative net assets of each class. |
| | The preparation of financial statements in conformity with U.S. generally accepted accounting principles requires management to make estimates and assumptions that affect the reported amounts of assets and liabilities and disclosure of contingent assets and liabilities at the date of the financial statements, and the reported amounts of increases and decreases in net assets from operations during the reporting period. Actual results could differ from those estimates. |
| | Net investment income and realized gains and losses for federal income tax purposes may differ from that reported on the financial statements because of permanent book-to-tax differences. GAAP requires that permanent differences in net investment income and realized gains and losses due to differences between financial reporting and tax reporting be reclassified between various components of net assets. These reclassifications have no effect on net assets or net asset value per share. For the year ended June 30, 2009, the following table shows the reclassifications made: |
| | | | | | | | | | | | | | New Star | | | Netols | |
| | Columbus | | | Columbus | | | IronBridge | | | IronBridge | | | International | | | Small Cap | |
| | Core Plus | | | Core | | | Small Cap | | | SMID | | | Equity | | | Value | |
| Paid in capital | $ | 735,654 | | | $ | — | | | $ | 7,366 | | | $ | 2,075 | | | $ | (1 | ) | | $ | 946 | |
| Accumulated net investment income (loss) | | (1,771,537 | ) | | | (11,873 | ) | | | (26,928 | ) | | | (16,901 | ) | | | (167,358 | ) | | | (946 | ) |
| Accumulated net realized gain (loss) | | 1,035,883 | | | | 11,873 | | | | 19,562 | | | | 14,826 | | | | 167,359 | | | | — | |
| | The permanent differences primarily relate to foreign currency, paydown, swap and Real Estate Investment Trust (REIT) adjustments with differing book and tax methods. |
| | Each of the Funds has entered into an agreement with Frontegra Asset Management, Inc. (the “Adviser”), with whom certain officers and a director of the Funds are affiliated, to furnish investment advisory services to the Funds. Fees are calculated daily and payable monthly, at annual rates set forth in the following table (expressed as a percentage of each Fund’s average daily net assets). Pursuant to expense cap agreements, the Adviser has agreed to waive its management fee and/or reimburse each Fund’s operating expenses (exclusive of brokerage, interest, taxes and extraordinary expenses) to ensure that each Fund’s operating expenses do not exceed the expense limitation listed below. Expenses waived are netted with advisory fees on the Statement of Assets and Liabilities. On a monthly basis, these accounts are settled by the Fund making payment to the Advisor or the Advisor reimbursing the Fund if the reimbursement amount exceeds the advisory fee. If the amount of fees waived exceeds the advisory fee earned, this is shown on the Statement of Assets and Liabilities as a receivable from the Advisor. The expense cap agreements will continue in effect until October 31, 2009 with successive renewal terms of one year unless terminated by the Adviser or a Fund prior to any such renewal. |
| | Frontegra Fund | Annual Advisory Fees | Expense Limitation |
| | Columbus Core Plus | 0.40% | 0.35% |
| | Columbus Core | 0.42% | 0.35% |
| | IronBridge Small Cap | 1.00% | 1.10% |
| | IronBridge SMID | 0.85% | 0.95% |
| | New Star International Equity | 0.95% | 0.75% |
| | Netols Small Cap Value - Institutional Class | 1.00% | 1.10% |
| | Netols Small Cap Value - Class Y | 1.00% | 1.50% |
Frontegra Funds
NOTES TO FINANCIAL STATEMENTS (continued)
June 30, 2009
| | Any waivers or reimbursements are subject to later adjustment to allow the Adviser to recoup amounts waived or reimbursed to the extent actual fees and expenses for a fiscal period are less than each Fund’s expense limitation cap, provided, however, that the Adviser shall only be entitled to recoup such amounts for a period of three years from the date such amount was waived or reimbursed. Expenses attributable to a specific class may only be recouped with respect to that class. |
| | The following table shows the waived or reimbursed expenses subject to potential recovery expiring in: |
| | | | | | | | | | | | | New Star | | | | |
| | | | Columbus | | | Columbus | | | IronBridge | | | International | | | Netols Small | |
| | | | Core Plus | | | Core | | | SMID | | | Equity | | | Cap Value | |
| | 2010 | | $ | 874,012 | | | $ | 416,403 | | | $ | 43,079 | | | $ | 1,947,759 | | | $ | 114,909 | |
| | 2011 | | | 802,439 | | | | 341,113 | | | | 22,812 | | | | 2,007,759 | | | | 110,227 | |
| | 2012 | | | 542,331 | | | | 276,351 | | | | 18,348 | | | | 1,057,926 | | | | 111,209 | |
| | | | $ | 2,218,782 | | | $ | 1,033,867 | | | $ | 84,239 | | | $ | 5,013,444 | | | $ | 336,345 | |
| | There are currently no available expenses subject to recapture with respect to the IronBridge Small Cap Fund. |
| (4) | Investment Transactions |
| | The aggregate purchases and sales of securities, excluding short-term investments and U.S. Government securities, for the Funds for the year ended June 30, 2009 are summarized below: |
| | | | | | | | | | | | | | | | New Star | | | Netols | |
| | | | Columbus | | | Columbus | | | IronBridge | | | IronBridge | | | International | | | Small Cap | |
| | | | Core Plus | | | Core | | | Small Cap | | | SMID | | | Equity | | | Value | |
| | Purchase | | $ | 1,023,217,364 | | | $ | 259,567,125 | | | $ | 127,836,578 | | | $ | 254,959,352 | | | $ | 158,813,173 | | | $ | 31,895,943 | |
| | Sales | | $ | 1,167,855,272 | | | $ | 318,058,574 | | | $ | 119,598,189 | | | $ | 113,569,395 | | | $ | 257,628,309 | | | $ | 12,020,162 | |
| | Purchases and sales of long-term U.S. Government securities for the Frontegra Columbus Core Plus Fund were $564,064,238 and $505,403,087, respectively. Purchases and sales of long-term U.S. Government securities for the Frontegra Columbus Core Fund were $50,137,897 and $45,384,390, respectively. |
| | There were no purchases or sales of long-term U.S. Government securities for the Frontegra IronBridge Small Cap Fund, the Frontegra IronBridge SMID Fund, the Frontegra New Star International Equity Fund or the Frontegra Netols Small Cap Value Fund. |
| | The Independent Directors of the Funds were paid $50,000 in director fees during the year ended June 30, 2009. The Interested Director did not receive any remuneration from the Funds. |
| | On August 3, 2007, Frontegra Columbus Core Plus Fund acquired all the net assets of Columbus Core Plus Fund pursuant to a plan of reorganization approved by Columbus Core Plus Fund shareholders on July 24, 2007. The acquisition was accomplished by a tax-free exchange of 4,545,718 shares of Frontegra Columbus Core Plus Fund (valued at $139,917,106) for the 14,269,548 shares of Columbus Core Plus Fund outstanding on August 3, 2007. Columbus Core Plus Fund’s net assets at that date ($139,917,106), included $85,451 of unrealized appreciation and accumulated net realized losses of $2,099,813 (of which $797,500 was available to offset future capital gains for federal income tax purposes, subject to certain limitations), were combined with those of Frontegra Columbus Core Plus Fund. The aggregate net assets of |
Frontegra Funds
NOTES TO FINANCIAL STATEMENTS (continued)
June 30, 2009
| | Frontegra Columbus Core Plus Fund and Columbus Core Plus Fund immediately before the acquisition were $277,318,845 and $139,917,106, respectively. The combined net assets after the acquisition were $417,235,951. |
| | On August 3, 2007, Frontegra Columbus Core Fund acquired all the net assets of Columbus Core Fund pursuant to a plan of reorganization approved by Columbus Core Fund shareholders on July 24, 2007. The acquisition was accomplished by a tax-free exchange of 1,425,241 shares of Frontegra Columbus Core Fund (valued at $14,423,390) for the 1,480,025 shares of Columbus Core Fund outstanding on August 3, 2007. Columbus Core Fund’s net assets at that date ($14,423,390), included $815 of unrealized depreciation and accumulated net realized losses of $485,611 (of which $285,222 was available to offset future capital gains for federal income tax purposes, subject to certain limitations), were combined with those of Frontegra Columbus Core Fund. The aggregate net assets of Frontegra Columbus Core Fund and Columbus Core Fund immediately before the acquisition were $91,486,920 and $14,423,390, respectively. The combined net assets after the acquisition were $105,910,310. |
| | The Frontegra New Star International Equity Fund has a $50 million unsecured line of credit with U.S. Bank, N.A., intended to provide short-term financing, if necessary, subject to certain restrictions, in connection with shareholder redemptions. Borrowings under this arrangement bear interest at the bank’s prime rate. At June 30, 2009, the Fund had no balance outstanding. Based upon balances outstanding during the year, the weighted average interest rate was 3.25% and the weighted average amount outstanding was $264,597. |
| (8) | Distribution Plan and Shareholder Servicing Fee |
| | Frontegra, on behalf of the Frontegra Columbus Core Plus Fund, the Frontegra IronBridge SMID Fund and the Frontegra Netols Small Cap Value Fund (collectively, the “Funds”), has adopted a distribution plan pursuant to Rule 12b-1 under the Investment Company Act of 1940 for each Fund’s Class Y shares (the “12b-1 Plan”). Pursuant to the 12b-1 Plan, each Fund pays an annual fee of up to 0.25% to Frontegra Strategies, LLC (the “Distributor”) for payments to brokers, dealers and other financial intermediaries who perform activities or incur expenses intended to result in the sale of Class Y shares of the Funds. For the year ended June 30, 2009, the Netols Small Cap Value Fund incurred $2,149 under the 12b-1 Plan. |
| | Class Y shares of the Funds also pay an annual shareholder servicing fee of up to 0.15% per year to the Distributor for payments to brokers, dealers, and other financial intermediaries who provide on-going account services to shareholders. Those services include establishing and maintaining shareholder accounts, mailing prospectuses, account statements and other Fund documents to shareholders, processing shareholder transactions, answering shareholder inquiries and providing other personal services to shareholders. For the year ended June 30, 2009, the Netols Small Cap Value Fund incurred $1,290 in shareholder servicing expenses. |
| (9) | Accounting Pronouncements |
| | In June 2009, the FASB issued Statement of Financial Accounting Standards No. 168, “The FASB Accounting Standards Codification™ and the Hierarchy of Generally Accepted Accounting Principles – a replacement of FASB Statement No. 162 (“SFAS 168”). SFAS 168 replaces SFAS No. 162, “The Hierarchy of Generally Accepted Accounting Principles” and establishes the “FASB Accounting Standards Codification™” (“Codification”) as the source of authoritative accounting principles recognized by the FASB to be applied by nongovernmental entities in the preparation of financial statements in conformity with U.S. GAAP. All guidance contained in the Codification carries an equal level of authority. On the effective date of SFAS 168, the Codification will supersede all then-existing non-SEC accounting and reporting standards. All other nongrandfathered non-SEC accounting literature not included in the Codification will become nonauthoritative. SFAS 168 is effective for financial statements issued for interim and annual periods ending after September 15, 2009. The Funds evaluated this new statement, and have determined that it will not have a significant impact on the determination or reporting of the Funds’ financial statements. |
Frontegra Funds
REPORT OF INDEPENDENT REGISTERED
PUBLIC ACCOUNTING FIRM
June 30, 2009
To the Shareholders and Board of Directors of Frontegra Funds, Inc.:
We have audited the accompanying statements of assets and liabilities, including the schedules of investments, of Frontegra Funds, Inc., (comprising, respectively, Frontegra Columbus Core Plus Fund, Frontegra Columbus Core Fund, Frontegra IronBridge Small Cap Fund, Frontegra IronBridge SMID Fund, Frontegra New Star International Equity Fund, and Frontegra Netols Small Cap Value Fund, collectively referred to as the “Funds”) as of June 30, 2009, and the related statements of operations, the statements of changes in net assets, and the financial highlights for each of the periods indicated therein. These financial statements and financial highlights are the responsibility of the Funds’ management. Our responsibility is to express an opinion on these financial statements and financial highlights based on our audits.
We conducted our audits in accordance with the standards of the Public Company Accounting Oversight Board (United States). Those standards require that we plan and perform the audit to obtain reasonable assurance about whether the financial statements and financial highlights are free of material misstatement. We were not engaged to perform an audit of the Funds’ internal control over financial reporting. Our audits included consideration of internal control over financial reporting as a basis for designing audit procedures that are appropriate in the circumstances, but not for the purpose of expressing an opinion on the effectiveness of the Funds’ internal control over financial reporting. Accordingly, we express no such opinion. An audit also includes examining, on a test basis, evidence supporting the amounts and disclosures in the financial statements and financial highlights, assessing the accounting principles used and significant estimates made by management, and evaluating the overall financial statement presentation. Our procedures included confirmation of securities owned as of June 30, 2009, by correspondence with the custodian and brokers or by other appropriate auditing procedures where replies from brokers were not received. We believe that our audits provide a reasonable basis for our opinion.
In our opinion, the financial statements and financial highlights referred to above present fairly, in all material respects, the financial position of each of the respective Funds constituting Frontegra Funds, Inc., at June 30, 2009, the results of their operations, the changes in their net assets, and the financial highlights for each of the periods indicated therein, in conformity with U.S. generally accepted accounting principles.
Chicago, Illinois
August 28, 2009
BOARD OF DIRECTORS’ APPROVAL OF INTERIM AND NEW SUBADVISORY AGREEMENTS AND NEW ADVISORY AGREEMENT
Board of Directors’ Approval of Interim and New Subadvisory Agreements relating to Frontegra New Star International Equity Fund
The Board of Directors (the “Board”) of Frontegra Funds, Inc. (the “Corporation”) approved a new subadvisory agreement (the “New Subadvisory Agreement”) between Frontegra Asset Management, Inc. (“Frontegra”) and New Star Institutional Managers Limited (“New Star”), subadviser to the Frontegra New Star International Equity Fund (the “International Equity Fund”), at a meeting held on February 17, 2009. At this meeting, the Board also approved an interim subadvisory agreement (the “Interim Subadvisory Agreement”), which contains identical terms as the prior subadvisory agreement between Frontegra and New Star (the “Prior Subadvisory Agreement”) with respect to services provided and fee structure. The Board considered substantially the same factors in approving the Interim Subadvisory Agreement as were considered in approving the New Subadvisory Agreement.
The New Subadvisory Agreement was considered due to a change in control of New Star. On April 1, 2009, New Star Asset Management Group plc (“NSAM”), the parent company of New Star, underwent a capital restructuring that was followed by the acquisition of NSAM’s shares by Henderson Group plc (“Henderson”) on April 9, 2009 (the “Henderson Transaction”). Following the Henderson Transaction, certain senior personnel of New Star (the “Management Group”) and Henderson, through holding companies, signed a definitive purchase agreement that will result in another change in control. Pursuant to the agreement, the Management Group will indirectly acquire voting control of New Star’s parent company from Henderson, subject to various conditions (the “Management Buyout”).
The change in control of New Star pursuant to the Henderson Transaction constituted an “assignment” and termination of the Prior Subadvisory Agreement within the meaning of the Investment Company Act of 1940, as amended (the “1940 Act”). An investment advisory or subadvisory agreement terminates upon its “assignment” under the applicable provisions of the 1940 Act. Since this change in control, New Star has continued to provide subadvisory services to the Fund pursuant to the Interim Subadvisory Agreement, which will remain in effect until International Equity Fund shareholders approve the New Subadvisory Agreement or August 29, 2009, whichever is sooner. The Management Buyout will be a second change in control of New Star and will constitute another “assignment” and termination of the subadvisory agreement between the Adviser and New Star. Assuming International Equity Fund shareholder approval, following the closing of the Management Buyout, a second new subadvisory agreement will take effect. Because this agreement is identical to the first New Subadvisory Agreement (other than the effective date), they are referred to collectively as the “New Subadvisory Agreement.”
In reaching its decision to approve the New Subadvisory Agreement, the Board considered that, except with respect to the effective and termination dates and the addition of a provision to clarify that New Star will pay expenses for costs relating to any special meeting of directors or shareholders convened for the primary benefit of New Star, the terms of the New Subadvisory Agreement are the same as the terms of the Prior Subadvisory Agreement. The Board also evaluated the New Subadvisory Agreement in light of the conclusions it reached and materials received in connection with the approval of the Prior Subadvisory Agreement on July 24, 2008. These materials included New Star’s Form ADV and Code of Ethics, information regarding New Star’s compliance program, personnel and financial condition, memoranda prepared by the Corporation’s legal counsel and New Star’s responses to detailed requests submitted on behalf of the Board. At the February meeting, the Board also considered new information available since it approved the Prior Subadvisory Agreement, including information regarding the structure, terms and reasons for the Henderson Transaction. Additionally, the Board reviewed the subadvisory fees that would be payable by Frontegra under the New Subadvisory Agreement, which are identical to the subadvisory fees payable under the Prior Subadvisory Agreement, and the fact that no changes would be made to the expense cap agreement between the Corporation and Frontegra on behalf of the International Equity Fund. The Board received updated information regarding the Henderson Transaction and Management Buyout at meetings held on April 30, 2009 and May 19, 2009.
In approving the New Subadvisory Agreement on February 17, 2009, the Board considered the following factors and made the following conclusions based in part on its review on July 24, 2008:
Nature, extent and quality of the services provided. The Board’s analysis of the nature, extent and quality of New Star’s services to the International Equity Fund took into account knowledge gained from New Star’s presentations to the Board at meetings throughout the year. The Board reviewed and considered New Star’s non-US equity (EAFE) investment strategy and experience as an international manager, key personnel involved in providing investment management services to the International Equity Fund and financial condition. The Board considered that the services provided by New Star would not change under the New Subadvisory Agreement, including the selection of broker-dealers for execution of portfolio transactions, monitoring adherence to the International Equity Fund’s investment restrictions and assisting with the International Equity Fund’s compliance with applicable securities laws and regulations. The Board also considered that, after the Henderson Transaction, there would be no changes to New Star’s key investment professionals who manage the International Equity Fund and New Star’s investment policy committee will continue to oversee the day-to-day management responsibilities for the International Equity Fund’s portfolio and approve all investment decisions for the International Equity Fund. The Board concluded that the nature, extent and quality of the services provided by New Star to the International Equity Fund was appropriate and that the International Equity Fund was likely to continue to benefit from services provided by New Star under the New Subadvisory Agreement.
Investment performance of New Star. The Board reviewed the performance record of the International Equity Fund and noted that the International Equity Fund had outperformed its benchmark index for the one-year period and had underperformed its benchmark index for the three-year and since-inception periods ended June 30, 2008. The Board also considered New Star’s quarterly portfolio commentary and review of the International Equity Fund’s performance, including discussions of the reasons for the International Equity Fund’s underperformance during these periods. The Board also compared the International Equity Fund’s recent performance to the performance of New Star’s composite of other accounts managed in the EAFE style. The Board concluded that the International Equity Fund and its shareholders were likely to benefit from New Star’s continued services to the International Equity Fund.
Subadvisory fees. The Board reviewed and considered the subadvisory fee payable by Frontegra to New Star under the New Subadvisory Agreement. The Board also reviewed information regarding New Star’s fee structures for other institutional clients. The Board determined that the subadvisory fee was appropriate. In evaluating the subadvisory fee, the Board noted that the fee is paid by Frontegra and that therefore the overall advisory fee paid by the International Equity Fund is not directly affected by the subadvisory fee.
Costs and profitability. The Board did not consider the cost of services provided by New Star under the New Subadvisory Agreement or the profitability to New Star from its relationship with the International Equity Fund because it did not view these factors as relevant given that the subadvisory fee is paid by the Adviser.
Economies of scale. Because the subadvisory fee is not paid by the International Equity Fund, the Board did not consider whether the fee should reflect any potential economies of scale that might be realized as International Equity Fund assets increase.
Benefits to New Star. The Board considered information presented regarding any benefits to New Star from serving as subadviser to the International Equity Fund (in addition to the subadvisory fee). New Star provided information to the Board regarding its policies for the use of soft dollar commissions. The Board also noted that New Star receives consulting services from Frontier Partners, Inc., an affiliate of Frontegra (“Frontier”).
On the basis of its review of the foregoing information, the Board found that the terms of the New Subadvisory Agreement were fair and reasonable and in the best interest of the shareholders of the International Equity Fund.
Board of Directors’ Approval of Investment Advisory Agreement relating to Frontegra IronBridge Global Focus Fund
The Board met on February 17, 2009 to consider the approval of a new investment advisory agreement (the “Advisory Agreement”) with IronBridge Capital Management, L.P. (“IronBridge”) for a new portfolio of the Corporation, the Frontegra IronBridge Global Focus Fund (the “Global Focus Fund”).
When the Board reviewed the Advisory Agreement, the Board was provided materials relevant to its consideration of the Advisory Agreement, such as IronBridge’s Form ADV and Code of Ethics and information regarding IronBridge’s compliance program, investment strategy, investment process and personnel. The Board also reviewed the fee that would be payable by the Fund under the Advisory Agreement, the proposed expense cap agreement between the Company and IronBridge on behalf of the Global Focus Fund and comparative fee and expense information provided by an independent third party.
In approving the Advisory Agreement, the Directors considered the following factors and made the following conclusions:
Nature, extent and quality of the services to be provided. The Board considered the background of IronBridge’s portfolio managers and the services IronBridge would provide to the Fund and its shareholders. The Board discussed the fact that IronBridge had chosen the Fund’s investment strategy and would make the day-to-day investment decisions for the Global Focus Fund. The Board discussed IronBridge’s responsibilities for overseeing the Global Focus Fund’s activities and for monitoring the Global Focus Fund’s compliance with applicable requirements under the securities laws. The Board noted that the Advisory Agreement, and services to be provided by IronBridge under the Advisory Agreement, are substantially similar to the existing investment advisory agreement between Frontegra and the Corporation, on behalf of other Frontegra Funds, and the services provided by Frontegra under such agreement. The Board also considered that IronBridge currently has served as subadviser to two other series of the Company, the Frontegra IronBridge Small Cap Fund and Frontegra IronBridge SMID Fund, since their inception. The Board concluded that the range of services to be provided by IronBridge was appropriate.
Investment performance. Because the Global Focus Fund had not yet commenced operations, the Board did not consider the investment performance of the Global Focus Fund.
Proposed fees. The Board compared the Global Focus Fund’s contractual advisory fee and total expense ratio to the industry data provided by an independent service with respect to other mutual funds in the same peer group. The Board noted that the Global Focus Fund’s advisory fee was slightly above the industry average but that the Global Focus Fund’s total expense ratio, after giving effect to the proposed expense cap agreement, would be below the industry average. The Board concluded that the advisory fee and total expense ratio are competitive with those of comparable funds. The Board concluded that the proposed fee to be paid by the Fund to IronBridge was reasonable in light of the nature and quality of services to be provided and fees paid by comparable funds.
Costs and profitability. IronBridge did not provide any specific information regarding the costs of services to be provided or the profits that might be realized because the Global Focus Fund had not yet commenced operations.
Economies of scale. Because the Global Focus Fund had not yet commenced operations, the Board did not consider whether any alternative fee structures, such as breakpoint fees, would be appropriate to reflect any economies of scale that may result from increases in the Global Focus Fund’s assets.
Benefits to IronBridge. The Board considered information presented regarding any benefits to IronBridge or its affiliates from serving as adviser to the Global Focus Fund (in addition to the advisory fee). The Board noted that IronBridge utilizes soft dollar arrangements on a limited basis, whereby it would receive brokerage and research services from brokers that execute the Global Focus Fund’s portfolio transactions. The Board concluded that the benefits to IronBridge from its relationship with the Global Focus Fund would be reasonable.
On the basis of its review of the foregoing information, the Board found that the terms of the Advisory Agreement were fair and reasonable and in the best interest of the Global Focus Fund’s shareholders.
Frontegra Funds
ADDITIONAL INFORMATION
(Unaudited)
DIRECTORS AND OFFICERS
The business and affairs of the Funds are managed under the direction of the Funds’ Board of Directors. Information pertaining to the directors and officers of the Funds is set forth below. The SAI includes additional information about the Funds’ directors and officers and is available without charge, upon request by calling 1-888-825-2100.
Interested Director and Officers
| | | | | | Number of | |
| | | | Principal | | Funds in | Other |
| | Position(s) | | Occupation(s) | | Complex | Directorships |
| Name, Address and Age | Held with | Term of | During Past | | Overseen | Held by |
| as of June 30, 2009 | Funds | Office | Five Years | | by Director | Director |
| William D. Forsyth III* | President and | Elected | Mr. Forsyth received his B.S. in Finance | | 8** | None |
| Frontegra Asset | Secretary | annually | from the University of Illinois in 1986 | | | |
| Management, Inc. | since | by the | and his M.B.A. from the University of | | | |
| 400 Skokie Boulevard | August 2008; | Board of | Chicago in 1988. Mr. Forsyth has served | | | |
| Suite 500 | Co-President, | Directors | as President of the Adviser since August | | | |
| Northbrook, IL 60062 | Treasurer and | | 2008 and as Treasurer and a Director of | | | |
| Born 1963 | Assistant | | the Adviser since May 1996. Mr. Forsyth | | | |
| | Secretary | | served as Co-President and Assistant | | | |
| | from May | | Secretary of the Adviser from May 1996 | | | |
| | 1996 to | | until August 2008. Mr. Forsyth has served | | | |
| | August 2008; | | as President of Timpani Capital | | | |
| | Director | Indefinite | Management LLC since August 2008 and | | | |
| | since | | served as Co-President from April until | | | |
| | May 1996 | | August 2008. Mr. Forsyth has served as | | | |
| | | | President of the Distributor since August | | | |
| | | | 2008 and as Co-President from August | | | |
| | | | 2007 to August 2008. From July 1993 | | | |
| | | | until the present, Mr. Forsyth also served | | | |
| | | | as a Partner of Frontier Partners, Inc., a | | | |
| | | | consulting/marketing firm. From April | | | |
| | | | 1987 until June 1993, Mr. Forsyth served | | | |
| | | | as a Partner of Brinson Partners, Inc., an | | | |
| | | | investment adviser, and from June 1986 | | | |
| | | | until April 1987, he served as a product | | | |
| | | | marketing representative of Harris Trust | | | |
| | | | & Savings Bank. Mr. Forsyth has earned | | | |
| | | | the right to use the Chartered Financial | | | |
| | | | Analyst (CFA) designation. | | | |
| * | Mr. Forsyth is an “interested person” of the Funds because he serves as a director and officer of the Adviser and owns 100% of the Adviser. |
| ** | The Frontegra Funds consist of eight separate series, six of which are discussed in this Annual Report. The Frontegra Sky International Value Fund and Frontegra Timpani Small Cap Growth Fund are additional series of Frontegra that are not included in this Annual Report. As of the date of this Annual Report, such funds had not commenced operations. |
Frontegra Funds
ADDITIONAL INFORMATION (continued)
(Unaudited)
Interested Director and Officers
| | | | | | Number of | |
| | | | Principal | | Funds in | Other |
| | Position(s) | | Occupation(s) | | Complex | Directorships |
| Name, Address and Age | Held with | Term of | During Past | | Overseen | Held by |
| as of June 30, 2009 | Funds | Office | Five Years | | by Director | Director |
| Elyce D. Dilworth | Chief | Elected | Ms. Dilworth received her B.B.A. in | | N.A. | N.A. |
| Frontegra Asset | Compliance | Annually | Finance from the University of Wisconsin – | | | |
| Management, Inc. | Officer | by the | Milwaukee in 1989 and her M.S. in | | | |
| 400 Skokie Blvd., | since | Board of | Accounting from the University of | | | |
| Suite 500 | January 2008; | Directors | Wisconsin – Milwaukee in 1991. | | | |
| Northbrook, IL 60062 | Anti-Money | | Ms. Dilworth has served as Chief | | | |
| Born 1966 | Laundering | | Compliance Officer of the Adviser since | | | |
| | Compliance | | January 2008 and as Secretary since | | | |
| | Officer since | | August 2008. Ms. Dilworth has served | | | |
| | February 2008; | | as Chief Financial Officer and Chief | | | |
| | Treasurer and | | Compliance Officer of Timpani Capital | | | |
| | Assistant | | Management LLC since April 2008. | | | |
| | Secretary since | | Ms. Dilworth has served as Chief | | | |
| | August 2008 | | Compliance Officer of the Distributor | | | |
| | | | since August 2008. From June 2004 | | | |
| | | | until May 2007, Ms. Dilworth was the | | | |
| | | | Chief Compliance Officer for the | | | |
| | | | Van Wagoner Funds, Inc., and the | | | |
| | | | President, Secretary and Treasurer from | | | |
| | | | January 2005 until May 2007. From April | | | |
| | | | 1994 until December 2003, Ms. Dilworth | | | |
| | | | was employed by UMB Fund Services, Inc., | | | |
| | | | a service provider to mutual funds and alternative | | | |
| | | | investment products. From January 1992 | | | |
| | | | until April 1994, Ms. Dilworth was a Staff | | | |
| | | | Accountant for PricewaterhouseCoopers | | | |
| | | | LLP, a public accounting firm. | | | |
Frontegra Funds
ADDITIONAL INFORMATION (continued)
(Unaudited)
Independent Directors
| | | | | | Number of | |
| | | | Principal | | Funds in | Other |
| | Position(s) | | Occupation(s) | | Complex | Directorships |
| Name, Address and Age | Held with | Term of | During Past | | Overseen | Held by |
| as of June 30, 2009 | Funds | Office | Five Years | | by Director | Director |
| David L. Heald | Director | Indefinite | Mr. Heald received his B.A. in English from | | 8** | None |
| 400 Skokie Boulevard | since | | Denison University in 1966 and his J.D. from | | | |
| Suite 260 | June | | Vanderbilt University School of Law in 1969. | | | |
| Northbrook, IL 60062 | 1996 | | Mr. Heald has been a principal and a Director | | | |
| Born 1943 | | | of Consulting Fiduciaries, Inc. ("CFI"), a | | | |
| | | | registered investment adviser, since August of | | | |
| | | | 1994. CFI provides professional, independent, | | | |
| | | | fiduciary decision making, consultation and | | | |
| | | | alternative dispute resolution services to ERISA | | | |
| | | | plans, plan sponsors and investment managers. | | | |
| | | | Between April 1994 and August 1994, Mr. Heald | | | |
| | | | engaged in the private practice of law. From | | | |
| | | | August 1992 until April 1994, Mr. Heald was a | | | |
| | | | managing director and the chief administrative | | | |
| | | | officer of Calamos Asset Management, Inc., a | | | |
| | | | registered investment adviser specializing in | | | |
| | | | convertible securities, and he served as an officer | | | |
| | | | and director of CFS Investment Trust, a registered | | | |
| | | | investment company comprised of four series. | | | |
| | | | From January 1990 until August 1992, Mr. Heald | | | |
| | | | was a partner in the Chicago based law firm of | | | |
| | | | Gardner, Carton & Douglas. | | | |
| | | | | | | |
| James M. Snyder | Director | Indefinite | Mr. Snyder received his B.S. in Finance from | | 8** | None |
| 400 Skokie Boulevard | since May | | Indiana University in 1969 and his M.B.A. from | | | |
| Suite 500 | 2002 | | DePaul University in 1973. Mr. Snyder served as | | | |
| Northbrook, IL 60062 | | | an investment professional with Northern Trust | | | |
| Born 1947 | | | from June 1969 until his retirement in June 2001. | | | |
| | | | He served in a variety of capacities at Northern | | | |
| | | | Trust, most recently as Executive Vice President | | | |
| | | | of Northern Trust and Vice Chairman of Northern | | | |
| | | | Trust Global Investments. Mr. Snyder has earned | | | |
| | | | the right to use the CFA designation. | | | |
| ** | The Frontegra Funds consist of eight separate series, six of which are discussed in this Annual Report. The Frontegra Sky International Value Fund and Frontegra Timpani Small Cap Growth Fund are additional series of Frontegra that are not included in this Annual Report. As of the date of this Annual Report, such funds had not commenced operations. |
Frontegra Funds
ADDITIONAL INFORMATION (continued)
(Unaudited)
Foreign Tax Credit
For the year ended June 30, 2009 Frontegra New Star International Equity Fund earned foreign source income and paid foreign taxes, which they intend to pass through to their shareholders pursuant to Section 853 of the Internal Revenue Code as follows.
| | | Foreign Source Income Earned | | | Foreign Taxes Paid | |
| Australia | | $ | 481,198 | | | $ | 1,860 | |
| Brazil | | | 1,191 | | | | 179 | |
| Switzerland | | | 550,941 | | | | 82,641 | |
| China | | | 108,399 | | | | 10,840 | |
| Germany | | | 695,915 | | | | 68,466 | |
| Denmark | | | 26,837 | | | | 4,026 | |
| Spain | | | 303,200 | | | | 45,480 | |
| Finland | | | 237,943 | | | | 35,691 | |
| France | | | 1,089,029 | | | | 163,350 | |
| United Kingdom | | | 2,258,225 | | | | — | |
| Hong Kong | | | 523,557 | | | | 7,706 | |
| India | | | 13,638 | | | | — | |
| Italy | | | 177,849 | | | | 26,121 | |
| Japan | | | 1,034,446 | | | | 72,412 | |
| Luxembourg | | | 16,232 | | | | 2,328 | |
| Netherlands | | | 403,323 | | | | 60,498 | |
| Russian Federation | | | 19,232 | | | | 12,063 | |
| Singapore | | | 51,359 | | | | — | |
| Taiwan | | | 204,279 | | | | 41,020 | |
| Total | | $ | 8,196,795 | | | $ | 634,682 | |
Qualified Dividend Income/Dividends Received Deduction
For the fiscal year ended June 30, 2009, certain dividends paid by the Funds may be subject to a maximum tax rate of 15%, as provided for by the Jobs and Growth Tax Relief Reconciliation Act of 2004. The percentage of dividends declared from ordinary income designated as qualified dividend income was as follows:
| IronBridge Small Cap | 80.20% |
| IronBridge SMID | 62.28% |
| New Star International Equity | 83.39% |
| Netols Small Cap Value | 100.00% |
Frontegra Funds
ADDITIONAL INFORMATION (continued)
(Unaudited)
For corporate shareholders, the percent of ordinary income distributions qualifying for the corporate dividends received deduction for the fiscal year ended June 30, 2009 was as follows:
| IronBridge Small Cap | 41.60% |
| IronBridge SMID | 34.05% |
| Netols Small Cap Value | 82.72% |
Additional Information Applicable to Foreign Shareholders Only
The percent of ordinary income distributions designated as interest related dividends for the fiscal year ended June 30, 2009 was as follows:
| Columbus Core Plus | 65.96% |
| Columbus Core | 77.69% |
| IronBridge Small Cap | 6.51% |
| IronBridge SMID | 5.73% |
| New Star International Equity | 0.14% |
The percent of ordinary income distributions designated as short-term capital gain distributions for the fiscal year ended June 30, 2009 was as follows:
| Columbus Core Plus | 21.78% |
| IronBridge Small Cap | 88.39% |
| IronBridge SMID | 79.03% |
| | This page intentionally left blank. |
A Note on Forward-Looking Statements
This report includes forward-looking statements such as adviser, subadviser and/or portfolio manager predictions, assessments, analyses or outlooks for individual securities, industries, market sectors and/or markets. These statements involve risks and uncertainties. In addition to the general risks described for the Funds in the current Prospectuses, other factors bearing on these statements include the accuracy of the adviser’s, subadvisers’ or portfolio manager’s forecasts and predictions, and the appropriateness of the investment programs designed by the adviser, subadviser or portfolio manager to implement their strategies efficiently and effectively. Any one or more of these factors, as well as other risks affecting the securities markets and investment instruments generally, could cause the actual results of the Funds to differ materially as compared to benchmarks associated with the Funds.
In addition, portfolio composition will change due to ongoing management of the Funds. Specific securities named in this report may not currently be owned by the applicable Fund, or the Fund’s position in the securities may have changed.
Additional Information
Frontegra Funds has adopted proxy voting policies and procedures that delegate to Frontegra Asset Management, Inc., the Funds’ investment adviser (the “Adviser”), the authority to vote proxies. The proxy voting policies permit the Adviser to delegate its authority to vote proxies to each Fund’s subadviser. A description of the Frontegra Funds’ proxy voting policies and procedures is available without charge, upon request, by calling the Funds toll free at 1-888-825-2100. A description of these policies and procedures is also included in the Funds’ Statement of Additional Information, which is available on the SEC’s website at http://www.sec.gov or by calling the Funds toll free at 1-888-825-2100.
The actual voting records relating to each Fund’s portfolio securities during the most recent twelve months ended June 30 are available without charge by calling the Funds toll free at 1-888-825-2100 or by accessing the SEC’s website at http://www.sec.gov.
Each Fund files a complete schedule of portfolio holdings for its first and third fiscal quarters with the SEC on Form N-Q. The Form N-Q is available on the SEC’s website at http://www.sec.gov. The Form N-Q may also be reviewed and copied at the SEC’s Public Reference Room in Washington, D.C. Information on the operation of the Public Reference Room may be obtained by calling toll-free 1-800-SEC-0330.
Item 2. Code of Ethics.
The registrant has adopted a code of ethics that applies to the registrant’s principal executive officer and principal financial officer. The registrant has not made any amendments to its code of ethics during the period covered by this report. The registrant has not granted any waivers from any provisions of the code of ethics during the period covered by this report.
A copy of the registrant’s Code of Ethics is filed herewith.
Item 3. Audit Committee Financial Expert.
The registrant’s board of directors has determined that it does not have an audit committee financial expert serving on its audit committee. At this time, the registrant believes that the experience provided by each member of the audit committee together offers the registrant adequate oversight for the registrant’s level of financial complexity.
Item 4. Principal Accountant Fees and Services.
The registrant has engaged its principal accountant to perform audit services, audit-related services, tax services and other services during the past two fiscal years. “Audit services” refer to performing an audit of the registrant's annual financial statements or services that are normally provided by the accountant in connection with statutory and regulatory filings or engagements for those fiscal years. “Audit-related services” refer to the assurance and related services by the principal accountant that are reasonably related to the performance of the audit. “Tax services” refer to professional services rendered by the principal accountant for tax compliance, tax advice, and tax planning. There were no “Other services” provided by the principal accountant. The following table details the aggregate fees billed or expected to be billed for each of the last two fiscal years for audit fees, audit-related fees, tax fees and other fees by the principal accountant.
| | FYE 6/30/2009 | FYE 6/30/2008 |
| Audit Fees | $169,900 | $193,800 |
| Audit-Related Fees | | - |
| Tax Fees | 34,800 | 33,600 |
| All Other Fees | | - |
The audit committee has adopted pre-approval policies and procedures that require the audit committee to pre-approve all audit and non-audit services of the registrant, including services provided to any entity affiliated with the registrant.
The percentage of fees billed by Ernst & Young LLP applicable to non-audit services pursuant to waiver of pre-approval requirement were as follows:
| | FYE 6/30/2009 | FYE 6/30/2008 |
| Audit-Related Fees | 0% | 0% |
| Tax Fees | 0% | 0% |
| All Other Fees | 0% | 0% |
All of the principal accountant’s hours spent on auditing the registrant’s financial statements were attributed to work performed by full-time permanent employees of the principal accountant. (If more than 50 percent of the accountant’s hours were spent to audit the registrant's financial statements for the most recent fiscal year, state how many hours were attributed to work performed by persons other than the principal accountant's full-time, permanent employees.)
The following table indicates the non-audit fees billed or expected to be billed by the registrant’s accountant for services to the registrant and to the registrant’s investment adviser (and any other controlling entity, etc.—not sub-adviser) for the last two years. The audit committee of the board of trustees/directors has considered whether the provision of non-audit services that were rendered to the registrant's investment adviser is compatible with maintaining the principal accountant's independence and has concluded that the provision of such non-audit services by the accountant has not compromised the accountant’s independence.
| Non-Audit Related Fees | FYE 6/30/2009 | FYE 6/30/2008 |
| Registrant | $0 | $0 |
| Registrant’s Investment Adviser | $0 | $0 |
Item 5. Audit Committee of Listed Registrants.
Not applicable to registrants who are not listed issuers (as defined in Rule 10A-3 under the Securities Exchange Act of 1934).
Item 6. Investments.
| (a) | Schedule of Investments is included as part of the report to shareholders filed under Item 1 of this Form. |
(b) Not Applicable.
Item 7. Disclosure of Proxy Voting Policies and Procedures for Closed-End Management Investment Companies.
Not applicable to open-end investment companies.
Item 8. Portfolio Managers of Closed-End Management Investment Companies.
Not applicable to open-end investment companies.
Item 9. Purchases of Equity Securities by Closed-End Management Investment Company and Affiliated Purchasers.
Not applicable to open-end investment companies.
Item 10. Submission of Matters to a Vote of Security Holders.
Not Applicable.
Item 11. Controls and Procedures.
| (a) | Based on an evaluation of the Registrant's disclosure controls and procedures (as defined in Rule 30a-3(c) under the Investment Company Act of 1940 (the “Act”)) as of a date within 90 days prior to the filing date of this Form N-CSR, the Registrant’s President and Treasurer have concluded that the disclosure controls and procedures are effective. |
| (b) | There were no changes in the Registrant's internal control over financial reporting (as defined in Rule 30a-3(d) under the Act) that occurred during the second fiscal quarter of the period covered by this report that have materially affected, or are reasonably likely to materially affect, the Registrant's internal control over financial reporting. |
Item 12. Exhibits.
| (a) | (1) Any code of ethics or amendment thereto, that is the subject of the disclosure required by Item 2, to the extent that the registrant intends to satisfy Item 2 requirements through filing an exhibit. Incorporated by reference to the Registrant’s Form N-CSR filed September 8, 2009. |
(2) A separate certification for each principal executive and principal financial officer pursuant to Section 302 of the Sarbanes-Oxley Act of 2002. Filed herewith.
(3) Any written solicitation to purchase securities under Rule 23c-1 under the Act sent or given during the period covered by the report by or on behalf of the registrant to 10 or more persons. Not applicable to open-end investment companies.
| (b) | Certifications pursuant to Section 906 of the Sarbanes-Oxley Act of 2002. Furnished herewith. |
SIGNATURES
Pursuant to the requirements of the Securities Exchange Act of 1934 and the Investment Company Act of 1940, the registrant has duly caused this report to be signed on its behalf by the undersigned, thereunto duly authorized.
Frontegra Funds, Inc.
By: /s/William D. Forsyth III
William D. Forsyth III, President
(Principal Executive Officer)
Date: September 2, 2009
Pursuant to the requirements of the Securities Exchange Act of 1934 and the Investment Company Act of 1940, this report has been signed below by the following persons on behalf of the registrant and in the capacities and on the dates indicated.
By: /s/William D. Forsyth III
William D. Forsyth III, President and Secretary
(Principal Executive Officer)
By: /s/Elyce D. Dilworth
Elyce D. Dilworth, Treasurer and Assistant Secretary
(Principal Financial Officer)