UNITED STATES
SECURITIES AND EXCHANGE COMMISSION
Washington, D.C. 20549
FORM N-CSR
CERTIFIED SHAREHOLDER REPORT OF REGISTERED
MANAGEMENT INVESTMENT COMPANIES
Investment Company Act file number | 811-07685 |
|
Frontegra Funds, Inc. |
(Exact name of registrant as specified in charter) |
|
400 Skokie Blvd. Suite 500 Northbrook, Illinois | | 60062 |
(Address of principal executive offices) | | (Zip code) |
|
William D. Forsyth III 400 Skokie Blvd., Suite 500 Northbrook, Illinois 60062 |
(Name and address of agent for service) |
|
Registrant’s telephone number, including area code: | (847) 509-9860 | |
|
Date of fiscal year end: | June 30 | |
|
Date of reporting period: | June 30, 2011 | |
| | | | | | | | |
Item 1. Reports to Stockholders.
1

ANNUAL REPORT
Frontegra Mastholm International Equity Fund
Frontegra SAM Global Equity Fund
Frontegra HEXAM Emerging Markets Fund
Frontegra Timpani Small Cap Growth Fund
Frontegra Netols Small Cap Value Fund
Frontegra Phocas Small Cap Value Fund
Frontegra Asset Management, Inc.
June 30, 2011

TABLE OF CONTENTS
| Shareholder Letter | | | 1 | | |
|
| Expense Example | | | 2 | | |
|
| Frontegra Mastholm International Equity Fund | |
|
| Report from Mastholm Asset Management, LLC | | | 6 | | |
|
| Investment Highlights | | | 8 | | |
|
| Schedule of Investments | | | 9 | | |
|
| Portfolio Diversification | | | 11 | | |
|
| Statement of Assets and Liabilities | | | 12 | | |
|
| Statement of Operations | | | 13 | | |
|
| Statements of Changes in Net Assets | | | 14 | | |
|
| Financial Highlights | | | 15 | | |
|
| Frontegra SAM Global Equity Fund | |
|
| Report from Sustainable Asset Management USA, Inc. | | | 17 | | |
|
| Investment Highlights | | | 19 | | |
|
| Schedule of Investments | | | 20 | | |
|
| Portfolio Diversification | | | 22 | | |
|
| Statement of Assets and Liabilities | | | 23 | | |
|
| Statement of Operations | | | 24 | | |
|
| Statements of Changes in Net Assets | | | 25 | | |
|
| Financial Highlights | | | 26 | | |
|
| Frontegra HEXAM Emerging Markets Fund | |
|
| Report from HEXAM Capital Partners, LLP | | | 28 | | |
|
| Investment Highlights | | | 30 | | |
|
| Schedule of Investments | | | 31 | | |
|
| Portfolio Diversification | | | 32 | | |
|
| Statement of Assets and Liabilities | | | 33 | | |
|
| Statement of Operations | | | 34 | | |
|
| Statement of Changes in Net Assets | | | 35 | | |
|
| Financial Highlights | | | 36 | | |
|
| Frontegra Timpani Small Cap Growth Fund | |
|
| Report from Timpani Capital Management LLC | | | 38 | | |
|
| Schedule of Investments | | | 40 | | |
|
| Portfolio Diversification | | | 43 | | |
|
| Statement of Assets and Liabilities | | | 44 | | |
|
| Statement of Operations | | | 45 | | |
|
| Statements of Changes in Net Assets | | | 46 | | |
|
| Financial Highlights | | | 47 | | |
|

| Frontegra Netols Small Cap Value Fund | |
|
| Report from Netols Asset Management, Inc. | | | 49 | | |
|
| Investment Highlights | | | 50 | | |
|
| Schedule of Investments | | | 51 | | |
|
| Portfolio Diversification | | | 53 | | |
|
| Statement of Assets and Liabilities | | | 54 | | |
|
| Statement of Operations | | | 55 | | |
|
| Statements of Changes in Net Assets | | | 56 | | |
|
| Financial Highlights | | | 57 | | |
|
| Frontegra Phocas Small Cap Value Fund | |
|
| Report from Phocas Financial Corporation | | | 60 | | |
|
| Investment Highlights | | | 61 | | |
|
| Schedule of Investments | | | 62 | | |
|
| Portfolio Diversification | | | 66 | | |
|
| Statement of Assets and Liabilities | | | 67 | | |
|
| Statement of Operations | | | 68 | | |
|
| Statements of Changes in Net Assets | | | 69 | | |
|
| Financial Highlights | | | 70 | | |
|
| Notes to Financial Statements | | | 72 | | |
|
| Report of Independent Registered Public Accounting Firm | | | 82 | | |
|
| Board of Directors' Approval of Advisory and Subadvisory Agreements | | | 83 | | |
|
| Voting Results of Special Meetings of Shareholders | | | 91 | | |
|
| Additional Information | |
|
| Directors and Officers | | | 92 | | |
|
| Foreign Tax Credit | | | 96 | | |
|
| Qualified Dividend Income/Dividends Received Deduction | | | 97 | | |
|
| Additional Information Applicable to Foreign Shareholders Only | | | 97 | | |
|
This report is submitted for the general information of the shareholders of the Funds. It is not authorized for distribution to prospective investors unless accompanied or preceded by an effective Prospectus for the applicable Fund. The Prospectus may be obtained by calling 1-888-825-2100. Each Prospectus includes more complete information about management fees and expenses, investment objectives, risks and operating policies of the applicable Fund. Please read the Prospectus carefully.
Frontegra Funds, Inc. are distributed by Frontegra Strategies, LLC, 400 Skokie Blvd., Suite 500, Northbrook, IL 60062. Frontegra Strategies, LLC, member of FINRA and SIPC, is an affiliate of Frontegra Asset Management, Inc., the Funds' investment adviser.
This page intentionally left blank.

DEAR FELLOW SHAREHOLDERS:
We are pleased to report on the progress of the Frontegra Funds over the past twelve months ending June 30, 2011. Despite increased volatility of late, global markets have produced strong returns over the past twelve months, as memories of the Great Recession move to the background. The S&P 500 Index was up 30.69%, and small capitalization stocks advanced strongly, with the Russell 2000® Index returning 37.41%. International stocks, as measured by the MSCI EAFE Index, returned 30.93% over the twelve-month period.
Fund Results
For the twelve month period ending June 30, 2011, the Frontegra Mastholm International Equity Fund, managed by Mastholm Asset Management, returned 32.58%, net, versus the benchmark return of 30.93% for the MSCI EAFE Index.
For the ten month period ending June 30, 2011, the Frontegra SAM Global Equity Fund, managed by Sustainable Asset Management USA, returned 25.64%, net, versus the MSCI World Index (Net) return of 25.41%.
For the period from December 20, 2010 (inception) through June 30, 2011, the Frontegra HEXAM Emerging Markets Fund, managed by HEXAM Capital Partners, returned -5.00%, net, versus the MSCI Emerging Markets Index (Net) return of 4.59%.
For the period from March 23, 2011 (inception) through June 30, 2011, the Frontegra Timpani Small Cap Growth Fund, managed by Timpani Capital Management, returned 7.60%, net, versus the Russell 2000® Growth Index return of 4.11%.
For the twelve month period ending June 30, 2011, the Frontegra Netols Small Cap Value Fund - Institutional Class, managed by Netols Asset Management, returned 36.43%, net, versus the Russell 2000® Value Index return of 31.35%. The Frontegra Netols Small Cap Value Fund - Class Y, returned 35.90%, net, over the same time period.
The Frontegra Phocas Small Cap Value Fund - Class L, returned 33.55%, net, versus the Russell 2000 Value Index return of 31.35% for the twelve month period ending June 30, 2011. For the period from April 7, 2011 (inception) through June 30, 2011, the Frontegra Phocas Small Cap Value Fund - Class I, managed by Phocas Financial, returned -3.66%, net, versus the Russell 2000 Value Index return of -3.29%.
Outlook
Despite the rebound in markets around the world over the past twelve months, lingering questions remain with regard to the U.S. government's debt limit, a European debt crisis looms and unemployment in the U.S. remains stubbornly high. As we enter a new fiscal year, we will do our best to manage your assets with the thoughtfulness and skill needed in these volatile times.
We will continue to oversee the investment management of the Frontegra Funds with the care and diligence that have served our shareholders well in the past. As always, we appreciate your investment and continued confidence in the Frontegra Funds.
Best regards,
William D. Forsyth, CFA
President
Frontegra Funds, Inc.
page 1

Frontegra Funds
EXPENSE EXAMPLE
June 30, 2011 (Unaudited)
As a shareholder of a mutual fund, you incur two types of costs: (1) transaction costs, including redemption fees, and (2) ongoing costs, including management fees, distribution and/or service (12b-1) fees and other fund expenses. Although the Funds charge no sales loads, you will be assessed fees for outgoing wire transfers, returned checks and stop payment orders at prevailing rates charged by U.S. Bancorp Fund Services, LLC, the Funds' transfer agent. If you request that a redemption be made by wire transfer, currently the Funds' transfer agent charges a $15.00 fee. A redemption fee of 2.00% of the then current value of the shares redeemed may be imposed on certain redemptions of shares made within 30 days of purchase for the Frontegra Mastholm International Equity, Frontegra SAM Global Equity and Frontegra HEXAM Emerging Markets Funds.
This Example is intended to help you understand your ongoing costs (in dollars) of investing in the Funds and to compare these costs with the ongoing costs of investing in other mutual funds. The Example is based on an investment of $1,000 invested at the beginning of the period and held for the entire period (1/1/11 – 06/30/11).
Actual Expenses
The first line of the table on the following page for each Fund provides information about actual account values and actual expenses. The Example includes management fees, registration fees, fee waivers/reimbursements and other expenses. However, the Example does not include portfolio trading commissions and related expenses and other extraordinary expenses as determined under generally accepted accounting principles. You may use the information in this line, together with the amount you invested, to estimate the expenses that you paid over the period. Simply divide your account value by $1,000 (for example, an $8,600 account value divided by $1,000 = 8.6), then multiply the result by the number in the first line under the heading entitled "Expenses Paid During the Period'' to estimate the expenses you paid on your account during this period.
Hypothetical Example for Comparison Purposes
The second line of the table for each Fund provides information about hypothetical account values and hypothetical expenses based on each of the Fund's actual expense ratios and an assumed rate of return of 5% per year before expenses, which is not the actual return. The hypothetical account values and expenses may not be used to estimate the actual ending account balance or expenses you paid for the period. You may use this information to compare the ongoing costs of investing in each of the Funds and other funds. To do so, compare this 5% hypothetical example with the 5% hypothetical examples that appear in the shareholder reports of the other funds. Please note that the expenses shown in the table are meant to highlight your ongoing costs only and do not reflect any transactional costs. Therefore, the second line of the table is useful in comparing ongoing costs only, and will not help you determine the relative total costs of owning different funds. In addition, if these transactional costs were included, your costs could have been higher.
page 2

Frontegra Funds
EXPENSE EXAMPLE (continued)
June 30, 2011 (Unaudited)
| Frontegra Funds | | Beginning Account
Value 1/1/2011 | | Ending Account
Value 6/30/2011 | | Annualized
Expense Ratio* | | Expenses Paid
During the Period* | |
| Mastholm International Equity Fund | |
| Actual Fund Return | | $ | 1,000.00 | | | $ | 1,042.50 | | | | 0.75 | % | | $ | 3.80 | | |
| Hypothetical 5% Return | | $ | 1,000.00 | | | $ | 1,021.08 | | | | 0.75 | % | | $ | 3.76 | | |
| SAM Global Equity Fund | |
| Actual Fund Return | | $ | 1,000.00 | | | $ | 1,049.50 | | | | 1.20 | % | | $ | 6.10 | | |
| Hypothetical 5% Return | | $ | 1,000.00 | | | $ | 1,018.84 | | | | 1.20 | % | | $ | 6.01 | | |
| HEXAM Emerging Markets Fund | |
| Actual Fund Return | | $ | 1,000.00 | | | $ | 934.10 | | | | 1.30 | % | | $ | 6.23 | | |
| Hypothetical 5% Return | | $ | 1,000.00 | | | $ | 1,018.35 | | | | 1.30 | % | | $ | 6.50 | | |
Netols Small Cap Value
Fund – Institutional Class | |
| Actual Fund Return | | $ | 1,000.00 | | | $ | 1,070.90 | | | | 1.10 | % | | $ | 5.65 | | |
| Hypothetical 5% Return | | $ | 1,000.00 | | | $ | 1,019.34 | | | | 1.10 | % | | $ | 5.51 | | |
Netols Small Cap
Value Fund – Class Y | |
| Actual Fund Return | | $ | 1,000.00 | | | $ | 1,068.40 | | | | 1.50 | % | | $ | 7.70 | | |
| Hypothetical 5% Return | | $ | 1,000.00 | | | $ | 1,017.35 | | | | 1.50 | % | | $ | 7.51 | | |
Phocas Small Cap
Value Fund – Class L | |
| Actual Fund Return | | $ | 1,000.00 | | | $ | 1,023.40 | | | | 0.99 | % | | $ | 4.97 | | |
| Hypothetical 5% Return | | $ | 1,000.00 | | | $ | 1,019.89 | | | | 0.99 | % | | $ | 4.96 | | |
* Expenses are equal to each Fund's annualized expense ratio indicated above, multiplied by the average account value over the period, multiplied by 181/365 to reflect the one-half year period.
page 3

Frontegra Funds
EXPENSE EXAMPLE (continued)
June 30, 2011 (Unaudited)
| Frontegra Funds | | Beginning Account
Value | | Ending Account
Value 6/30/2011 | | Annualized
Expense Ratio | | Expenses Paid
During the Period | |
Timpani Small Cap Growth
Fund – Institutional Class | |
| Actual Fund Return* | | $ | 1,000.00 | | | $ | 1,076.00 | | | | 1.10 | % | | $ | 2.60 | | |
| Hypothetical 5% Return** | | $ | 1,000.00 | | | $ | 1,019.34 | | | | 1.10 | % | | $ | 5.51 | | |
Phocas Small Cap Value
Fund – Class I | |
| Actual Fund Return*** | | $ | 1,000.00 | | | $ | 963.40 | | | | 1.10 | % | | $ | 2.46 | | |
| Hypothetical 5% Return**** | | $ | 1,000.00 | | | $ | 1,019.34 | | | | 1.10 | % | | $ | 5.51 | | |
* Actual expenses are equal to the Fund's annualized expense ratio of 1.10% multiplied by the average account value over the period, multiplied by 99/365 to reflect the most recent fiscal period end since the Timpani Small Cap Growth Fund - Institutional Class commenced operations on March 23, 2011.
** Hypothetical expenses are equal to the Fund's annualized expense ratio of 1.10% multiplied by the average account value over the period commencing January 1, 2011, multiplied by 181/365 to reflect information had the Timpani Small Cap Growth Fund - Institutional Class been in operation for the entire fiscal half year.
*** Actual expenses are equal to the Fund's annualized expense ratio of 1.10% multiplied by the average account value over the period, multiplied by 83/365 to reflect the most recent fiscal period end since the Phocas Small Cap Value Fund - Class I commenced operations on April 7, 2011.
**** Hypothetical expenses are equal to the Fund's annualized expense ratio of 1.10% multiplied by the average account value over the period commencing January 1, 2011, multiplied by 181/365 to reflect information had the Phocas Small Cap Value Fund - Class I been in operation for the entire fiscal half year.
page 4

FRONTEGRA
MASTHOLM INTERNATIONAL EQUITY FUND

REPORT FROM MASTHOLM ASSET
MANAGEMENT, LLC
Dear Shareholders:
The Frontegra Mastholm International Equity Fund strives to achieve capital appreciation by investing in a diversified portfolio of securities of large- and mid-cap companies located outside the United States. The objective is relative to and measured against the MSCI EAFE Index.
Performance Review
The Frontegra Mastholm International Equity Fund returned 32.58%, net of fees, for the fiscal year ending June 30, 2011. The Fund's return outperformed the 30.93% return of its benchmark, the MSCI EAFE Index.
Portfolio Review and Strategy
International equity markets were volatile during the fiscal year. In July and August of 2010, the portfolio trailed the benchmark due to profit taking among Japanese and other Asian holdings. A strong rally began in September, and the Fund outperformed the benchmark due to overweighting in consumer discretionary and materials stocks, while also being underweighted in financials and utilities. During the first two quarters of 2011, most growth oriented international managers trailed the broader MSCI EAFE Index due to a retreat among materials stocks and several brief rallies in European banks and utilities.
The backdrop for this volatile market performance pattern was a series of significant macroeconomic events that have occurred during the past twelve months. The failure of the European Central Bank, the European Commission and the various governments involved, particularly Germany, to lead the Eurozone out of a crisis of sovereign credit led to IMF-led bailouts in Greece, Portugal and Ireland. At the time of publication of this report, the European Union seems to have come up with a viable intermediate term solution to the borrowing needs of these countries, but the underlying problems remain which include high borrowing costs, a lack of competitiveness and government debt at an unsustainable level relative to GDP. European bank stocks remain historically cheap even when compared to the market low in March of 2009.
The other major events during this fiscal year included unrest in the Middle East, which led to rapidly rising oil prices, spiraling food inflation costs globally, rising interest rates in China to curb excessive growth, higher interest rates in Europe to curb inflation and the earthquake and subsequent tsunami in Japan which led to a nuclear power crisis.
The investment team reduced the portfolio exposure to Japan immediately after the nuclear accident and then took advantage of the dramatic market fall to redeploy assets back into the country and participate in the subsequent strong rally. Japanese investments have added over 200 basis points to returns during the year. Other Asian markets including Hong Kong and South Korea were among our largest contributors to performance.
From a sector perspective, consumer discretionary stocks have driven performance higher, the portfolio is significantly overweighted in autos and auto parts companies which in aggregate advanced more than 65% during the fiscal year. The massive increase in auto production and earnings is a result of a multi-year rebound in auto sales after the global recession. Currently, the portfolio is invested in automotive stocks in Germany, Japan and South Korea.
From a sector perspective, the portfolio has been underweighted in financials throughout the period. In addition, our financial exposure has been concentrated in higher quality names which have lagged the market during bank stock rallies.
The portfolio also benefitted during the fiscal year by being underweighted in the troubled peripheral European countries including Greece, Italy, Ireland, Portugal and Spain. Over the past several months, the investment team selectively added a few banking and retail companies to the portfolio in Spain and Italy as these markets began to stabilize.
page 6

The portfolio remains underweighted in the United Kingdom and Australia, while overweighted in Europe and slightly underweighted in Japan. Emerging market exposure was about 7% at the end of the fiscal year, primarily in South Korea, which was additive during the year due to a strong currency and outperformance among carmakers such as Hyundai and KIA. Overall, investments in emerging markets added about 100 basis points to the Fund's returns during the measurement period.
Throughout the credit crisis, market rebound and current environment of uncertainty, the portfolio team has followed its strict discipline to identify companies with top and bottom line fundamental improvement, while closely monitoring holdings that lag the index. Portfolio holdings continue to exceed expectations for earnings growth in a period of slowing global growth. The Mastholm investment process is designed to identify companies with accelerating top and bottom line growth, regardless of the economic environment.
Thank you for your continued support.
Robert L. Gernstetter
Managing Director
Mastholm Asset Management, LLC
page 7

INVESTMENT HIGHLIGHTS
Growth of a $100,000 Investment (Unaudited)
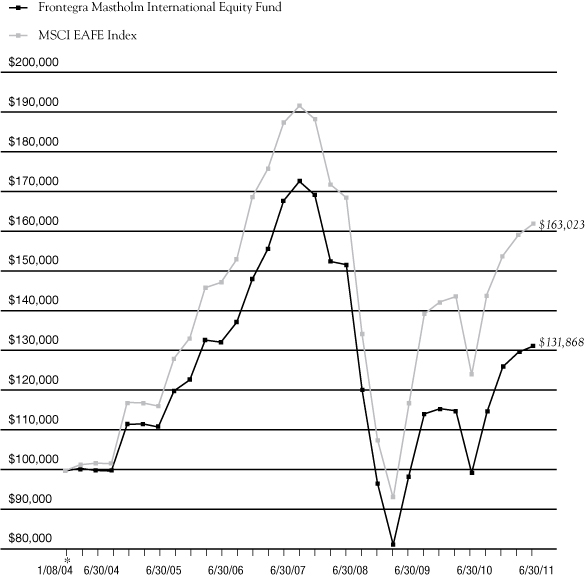
* 1/08/04 commencement of operations.
This chart assumes an initial gross investment of $100,000 made on 1/08/04 (commencement of operations). Returns shown include the reinvestment of all distributions. Past performance is not predictive of future results. Investment return and principal value will fluctuate so that shares, when redeemed, may be worth more or less than the original cost. In the absence of existing fee waivers, total return would be reduced. Effective October 12, 2009, Mastholm Asset Management, LLC became subadviser to the Fund. New Star Institutional Managers Limited served as subadviser prior to Mastholm Asset Management, LLC. To receive current to the most recent month-end performance, please call 1-888-825-2100.
The MSCI EAFE Index measures the overall performance of stock markets in 21 countries within Europe, Australasia and the Far East. The Index does not reflect investment management fees, brokerage commissions and other expenses associated with investing in equity securities. A direct investment in the index is not possible.
** The returns shown do not reflect the deduction of taxes that a shareholder would pay on Fund distributions or the redemption of Fund shares.
Portfolio Total Return**
| FOR PERIODS ENDED 6/30/11 | | FUND | | INDEX | |
| SIX MONTHS | | | 4.25 | % | | | 5.35 | % | |
| ONE YEAR | | | 32.58 | % | | | 30.93 | % | |
FIVE YEAR
AVERAGE ANNUAL | | | (0.13 | )% | | | 1.96 | % | |
AVERAGE ANNUAL
SINCE INCEPTION | | | 3.77 | % | | | 6.75 | % | |
page 8

Frontegra Mastholm International Equity Fund
SCHEDULE OF INVESTMENTS
June 30, 2011
| Number of Shares | | | | Value | |
| COMMON STOCKS 97.0% | | | |
| | | Australia 3.0% | |
| | 19,200 | | | Brambles Ltd. | | $ | 148,681 | | |
| | 17,000 | | | Incitec Pivot Ltd. | | | 70,381 | | |
| | 2,300 | | | Rio Tinto Ltd. | | | 204,724 | | |
| | | | 423,786 | | |
| | | Belgium 2.5% | |
| | 2,300 | | | Anheuser-Busch InBev NV | | | 133,415 | | |
| | 1,400 | | | Solvay SA | | | 216,320 | | |
| | | | 349,735 | | |
| | | China 0.5% | |
| | 1,350 | | | 51job, Inc. - ADR (a) | | | 75,775 | | |
| | | Finland 0.5% | |
| | 1,300 | | | Metso OYJ | | | 73,844 | | |
| | | France 14.1% | |
| | 1,600 | | | Accor SA | | | 71,228 | | |
| | 2,497 | | | BNP Paribas | | | 192,748 | | |
| | 3,400 | | | Cie de St-Gobain | | | 220,173 | | |
| | 3,000 | | | Cie Generale des
Etablissements
Michelin - Class B | | | 293,396 | | |
| | 2,200 | | | Pernod-Ricard SA | | | 216,848 | | |
| | 2,600 | | | Safran SA | | | 111,039 | | |
| | 2,700 | | | Sanofi | | | 217,071 | | |
| | 600 | | | Schneider Electric SA | | | 100,235 | | |
| | 2,300 | | | Valeo SA | | | 157,029 | | |
| | 1,700 | | | Vallourec SA | | | 207,058 | | |
| | 3,500 | | | Vinci SA | | | 224,187 | | |
| | | | 2,011,012 | | |
| | | Germany 10.1% | |
| | 1,789 | | | Bayer AG | | | 143,830 | | |
| | 800 | | | Bayerische Motoren Werke AG | | | 79,828 | | |
| | 1,100 | | | Deutsche Bank AG | | | 65,003 | | |
| | 5,100 | | | E.ON AG | | | 144,847 | | |
| | 1,800 | | | Fresenius SE & Co. KGaA | | | 187,888 | | |
| Number of Shares | | | | Value | |
| | | Germany 10.1% (continued) | |
| | 7,400 | | | Kloeckner & Co. SE (a) | | $ | 222,725 | | |
| | 500 | | | Muenchener
Rueckversicherungs AG | | | 76,460 | | |
| | 2,400 | | | SAP AG | | | 145,306 | | |
| | 1,600 | | | Siemens AG | | | 219,728 | | |
| | 800 | | | Volkswagen AG | | | 146,988 | | |
| | | | 1,432,603 | | |
| | | Hong Kong 1.1% | |
| | 75,400 | | | Galaxy Entertainment
Group Ltd. (a) | | | 161,232 | | |
| | | Ireland 1.8% | |
| | 4,400 | | | Kerry Group PLC | | | 181,945 | | |
| | 6,300 | | | Smurfit Kappa Group PLC (a) | | | 75,098 | | |
| | | | 257,043 | | |
| | | Italy 2.6% | |
| | 66,000 | | | Intesa Sanpaolo SpA | | | 175,725 | | |
| | 10,200 | | | Lottomatica SpA | | | 197,912 | | |
| | | | 373,637 | | |
| | | Japan 17.5% | |
| | 8,800 | | | Bridgestone Corp. | | | 201,786 | | |
| | 3,000 | | | Canon, Inc. | | | 141,979 | | |
| | 22,900 | | | Fuji Heavy Industries Ltd. | | | 176,931 | | |
| | 9,600 | | | Gree, Inc. | | | 208,802 | | |
| | 3,100 | | | K's Holdings Corp. | | | 133,812 | | |
| | 37,000 | | | Nachi-Fujikoshi Corp. | | | 218,309 | | |
| | 1,660 | | | ORIX Corp. | | | 160,628 | | |
| | 198 | | | Rakuten, Inc. | | | 204,382 | | |
| | 3,800 | | | Sanrio Co. Ltd. | | | 147,742 | | |
| | 11,400 | | | Sega Sammy Holdings, Inc. | | | 219,348 | | |
| | 19,100 | | | Sekisui Chemical Co. Ltd. | | | 162,518 | | |
| | 3,800 | | | Softbank Corp. | | | 143,025 | | |
| | 41,000 | | | Tokyo Gas Co. Ltd. | | | 184,870 | | |
| | 2,400 | | | Yamada Denki Co. Ltd. | | | 194,671 | | |
| | | | 2,498,803 | | |
The accompanying notes are an integral part of these financial statements.
page 9

Frontegra Mastholm International Equity Fund
SCHEDULE OF INVESTMENTS (continued)
June 30, 2011
| Number of Shares | | | | Value | |
| COMMON STOCKS 97.0% (continued) | | | |
| | | Netherlands 5.0% | |
| | 28,800 | | | ING Groep NV (a) | | $ | 354,539 | | |
| | 1,100 | | | Koninklijke DSM NV | | | 71,392 | | |
| | 3,900 | | | Royal Dutch Shell PLC | | | 138,449 | | |
| | 5,500 | | | SBM Offshore NV | | | 145,480 | | |
| | | | 709,860 | | |
| | | Norway 2.7% | |
| | 2,100 | | | Algeta ASA (a) | | | 75,318 | | |
| | 5,500 | | | Yara International ASA | | | 309,602 | | |
| | | | 384,920 | | |
| | | Portugal 0.5% | |
| | 3,900 | | | Jeronimo Martins SGPS SA | | | 74,880 | | |
| | | Singapore 1.8% | |
| | 27,700 | | | Keppel Corp. Ltd. | | | 249,871 | | |
| | | South Korea 6.3% | |
| | 1,400 | | | Cheil Industries, Inc. | | | 167,190 | | |
| | 1,060 | | | Hyundai Motor Co. | | | 235,302 | | |
| | 3,111 | | | Kia Motors Corp. | | | 210,673 | | |
| | 500 | | | LG Household &
Health Care Ltd. | | | 214,958 | | |
| | 84 | | | Samsung Electronics Co. Ltd. | | | 64,988 | | |
| | | | 893,111 | | |
| | | Spain 2.2% | |
| | 11,600 | | | Banco Santander SA | | | 133,953 | | |
| | 1,900 | | | Inditex SA | | | 173,143 | | |
| | | | 307,096 | | |
| | | Switzerland 9.2% | |
| | 7,000 | | | Clariant AG (a) | | | 133,797 | | |
| | 1,600 | | | Meyer Burger Technology AG (a) | | | 70,279 | | |
| | 6,200 | | | Nestle SA | | | 385,311 | | |
| | 7,000 | | | Novartis AG | | | 428,784 | | |
| | 275 | | | The Swatch Group AG | | | 138,620 | | |
| | 8,600 | | | UBS AG (a) | | | 156,810 | | |
| | | | 1,313,601 | | |
| Number of Shares | | | | Value | |
| | | United Kingdom 15.6% | |
| | 10,320 | | | BG Group PLC | | $ | 234,203 | | |
| | 8,200 | | | BHP Billiton PLC | | | 322,699 | | |
| | 3,300 | | | Burberry Group PLC | | | 76,797 | | |
| | 23,000 | | | HSBC Holdings PLC | | | 228,276 | | |
| | 5,700 | | | Imperial Tobacco Group PLC | | | 189,460 | | |
| | 17,300 | | | Prudential PLC | | | 199,913 | | |
| | 5,300 | | | Reckitt Benckiser Group PLC | | | 292,616 | | |
| | 45,200 | | | Tesco | | | 291,627 | | |
| | 4,600 | | | Unilever PLC | | | 148,099 | | |
| | 10,600 | | | Xstrata PLC | | | 233,327 | | |
| | | | 2,217,017 | | |
| | | Total Common Stocks | |
| | | | | (Cost $12,335,045) | | | 13,807,826 | | |
| SHORT-TERM INVESTMENTS 4.2% | | | |
| | | Investment Company 4.2% | |
| | 598,076 | | | Fidelity Institutional Money
Market Portfolio | | | 598,076 | | |
| | | Total Short-Term Investments | |
| | | | | (Cost $598,076) | | | 598,076 | | |
| | | Total Investments 101.2% | |
| | | | | (Cost $12,933,121) | | | 14,405,902 | | |
| | | | | Liabilities in Excess of
Other Assets (1.2)% | | | (169,481 | ) | |
| | | | | TOTAL NET ASSETS 100.0% | | $ | 14,236,421 | | |
(a) Non-Income Producing.
ADR - American Depositary Receipt.
The accompanying notes are an integral part of these financial statements.
page 10

Frontegra Mastholm International Equity Fund
SCHEDULE OF INVESTMENTS (continued)
June 30, 2011
PORTFOLIO DIVERSIFICATION
| Sectors | | Percentage | |
| Consumer Discretionary | | | 23.8 | % | |
| Consumer Staples | | | 15.0 | | |
| Industrials | | | 14.4 | | |
| Materials | | | 13.3 | | |
| Financials | | | 12.3 | | |
| Health Care | | | 7.4 | | |
| Information Technology | | | 3.9 | | |
| Energy | | | 3.6 | | |
| Utilities | | | 2.3 | | |
| Telecomm Service | | | 1.0 | | |
| Total Common Stocks | | | 97.0 | | |
| Total Short-Term Investments | | | 4.2 | | |
| Total Investments | | | 101.2 | | |
| Liabilities in Excess of Other Assets | | | (1.2 | ) | |
| Total Net Assets | | | 100.0 | % | |
The accompanying notes are an integral part of these financial statements.
page 11

Frontegra Mastholm International Equity Fund
STATEMENT OF ASSETS AND LIABILITIES
June 30, 2011
| ASSETS: | |
| Investments at value (cost $12,933,121) | | $ | 14,405,902 | | |
| Foreign currency at value (cost $3,284) | | | 3,362 | | |
| Cash | | | 16,974 | | |
| Interest and dividends receivable | | | 79,540 | | |
| Receivable for investments sold | | | 12,905 | | |
| Receivable from Adviser | | | 20,825 | | |
| Receivable for foreign currency | | | 212,854 | | |
| Prepaid expenses and other assets | | | 8,738 | | |
| Total assets | | | 14,761,100 | | |
| LIABILITIES: | |
| Payable for investments purchased | | | 212,851 | | |
| Payable for foreign currency | | | 212,744 | | |
| Accrued expenses | | | 99,084 | | |
| Total liabilities | | | 524,679 | | |
| Net Assets | | $ | 14,236,421 | | |
| NET ASSETS CONSIST OF: | |
| Paid in capital | | $ | 19,093,222 | | |
| Undistributed net investment income | | | 329,115 | | |
| Accumulated net realized loss | | | (6,669,993 | ) | |
| Net unrealized appreciation on: | |
| Investments | | | 1,472,781 | | |
| Foreign currency | | | 11,296 | | |
| Net Assets | | $ | 14,236,421 | | |
| CAPITAL STOCK, $0.01 PAR VALUE | |
| Authorized | | | 100,000,000 | | |
| Issued and outstanding | | | 1,451,922 | | |
| Net Asset Value, Redemption Price and Offering Price Per Share | | $ | 9.81 | | |
The accompanying notes are an integral part of these financial statements.
page 12

Frontegra Mastholm International Equity Fund
STATEMENT OF OPERATIONS
| | | Year Ended
June 30, 2011 | |
| INVESTMENT INCOME: | |
| Dividend income(1) | | $ | 480,368 | | |
| Interest income | | | 107 | | |
| Total Investment Income | | | 480,475 | | |
| EXPENSES: | |
| Investment advisory fees | | | 358,219 | | |
| Custody fees | | | 101,976 | | |
| Fund administration and accounting fees | | | 52,152 | | |
| Audit fees | | | 39,853 | | |
| Legal fees | | | 39,320 | | |
| Federal and state registration fees | | | 24,138 | | |
| Reports to shareholders | | | 11,928 | | |
| Directors' fees and related expenses | | | 11,768 | | |
| Shareholder servicing fees | | | 10,082 | | |
| Other | | | 11,149 | | |
| Total expenses before waiver and reimbursement | | | 660,585 | | |
| Waiver and reimbursement of expenses by Adviser | | | (377,781 | ) | |
| Net expenses | | | 282,804 | | |
| Net Investment Income | | | 197,671 | | |
| REALIZED AND UNREALIZED GAIN (LOSS) ON INVESTMENTS: | |
| Net realized gain on: | |
| Investments | | | 9,872,480 | | |
| Foreign currency transactions | | | 105,137 | | |
| Change in net unrealized appreciation/(depreciation) on: | |
| Investments | | | 1,738,867 | | |
| Foreign currency transactions | | | (26,555 | ) | |
| Net Realized and Unrealized Gain on Investments | | | 11,689,929 | | |
| Net Increase in Net Assets Resulting from Operations | | $ | 11,887,600 | | |
(1) Net of $61,202 in foreign withholding taxes
The accompanying notes are an integral part of these financial statements.
page 13

Frontegra Mastholm International Equity Fund
STATEMENTS OF CHANGES IN NET ASSETS
| | | For the
Year Ended
June 30, 2011 | | For the
Year Ended
June 30, 2010 | |
| OPERATIONS: | |
| Net investment income | | $ | 197,671 | | | $ | 906,816 | | |
| Net realized gain (loss) on: | |
| Investments | | | 9,872,480 | | | | 16,444,788 | | |
| Foreign currency transactions | | | 105,137 | | | | (104,437 | ) | |
| Change in net unrealized appreciation/(depreciation) on: | |
| Investments | | | 1,738,867 | | | | 6,049,436 | | |
| Foreign currency transactions | | | (26,555 | ) | | | 36,238 | | |
| Net increase in net assets resulting from operations | | | 11,887,600 | | | | 23,332,841 | | |
| DISTRIBUTIONS PAID FROM: | |
| Net investment income | | | (944,668 | ) | | | (5,738,700 | ) | |
| Net realized gain on investments | | | — | | | | — | | |
| Net decrease in net assets resulting from distributions paid | | | (944,668 | ) | | | (5,738,700 | ) | |
| CAPITAL SHARE TRANSACTIONS: | |
| Shares sold | | | 6,660,977 | | | | 12,774,821 | | |
| Shares issued to holders in reinvestment of distributions | | | 944,668 | | | | 5,738,700 | | |
| Shares redeemed | | | (42,828,671 | ) | | | (197,476,360 | ) | |
| Redemption fees | | | — | | | | 1,445 | | |
| Net decrease in net assets resulting from capital share transactions | | | (35,223,026 | ) | | | (178,961,394 | ) | |
| Total Decrease in Net Assets | | | (24,280,094 | ) | | | (161,367,253 | ) | |
| NET ASSETS: | |
| Beginning of Period | | | 38,516,515 | | | | 199,883,768 | | |
End of Period (includes undistributed net investment
income of $329,115 and $590,856 respectively) | | $ | 14,236,421 | | | $ | 38,516,515 | | |
| TRANSACTIONS IN SHARES: | |
| Shares sold | | | 733,550 | | | | 1,454,683 | | |
| Shares issued to holders in reinvestment of distributions | | | 101,687 | | | | 664,201 | | |
| Shares redeemed | | | (4,486,262 | ) | | | (22,584,239 | ) | |
| Net decrease in shares outstanding | | | (3,651,025 | ) | | | (20,465,355 | ) | |
The accompanying notes are an integral part of these financial statements.
page 14

Frontegra Mastholm International Equity Fund
FINANCIAL HIGHLIGHTS
| | | Year
Ended
June 30,
2011 | | Year
Ended
June 30,
2010(1) | | Year
Ended
June 30,
2009(2) | | Year
Ended
June 30,
2008(2) | | Year
Ended
June 30,
2007(2) | |
| Net Asset Value, Beginning of Period | | $ | 7.55 | | | $ | 7.82 | | | $ | 13.24 | | | $ | 16.11 | | | $ | 13.08 | | |
INCOME (LOSS) FROM
INVESTMENT OPERATIONS: | |
| Net investment income (loss) | | | 0.30 | | | | 0.27 | | | | 0.29 | | | | 0.31 | | | | 0.25 | | |
| Net realized and unrealized gain (loss) on investments | | | 2.15 | | | | (0.18 | ) | | | (4.97 | ) | | | (1.75 | ) | | | 3.25 | | |
| Total Income (Loss) from Investment Operations | | | 2.45 | | | | 0.09 | | | | (4.68 | ) | | | (1.44 | ) | | | 3.50 | | |
| LESS DISTRIBUTIONS: | |
| From net investment income | | | (0.19 | ) | | | (0.36 | ) | | | (0.35 | ) | | | (0.25 | ) | | | (0.22 | ) | |
| From net realized gain on investments | | | — | | | | — | | | | (0.39 | ) | | | (1.18 | ) | | | (0.25 | ) | |
| Total Distributions | | | (0.19 | ) | | | (0.36 | ) | | | (0.74 | ) | | | (1.43 | ) | | | (0.47 | ) | |
| Net Asset Value, End of Period | | $ | 9.81 | | | $ | 7.55 | | | $ | 7.82 | | | $ | 13.24 | | | $ | 16.11 | | |
| Total Return | | | 32.58 | % | | | 0.52 | % | | | (35.13 | )% | | | (9.60 | )% | | | 27.12 | % | |
| SUPPLEMENTAL DATA AND RATIOS: | |
| Net assets, end of period (in thousands) | | $ | 14,236 | | | $ | 38,517 | | | $ | 199,884 | | | $ | 474,087 | | | $ | 712,620 | | |
| Ratio of expenses to average net assets: | |
| Before waivers and reimbursements | | | 1.75 | % | | | 1.34 | % | | | 1.16 | % | | | 1.06 | % | | | 1.07 | % | |
| Net of waivers and reimbursements | | | 0.75 | % | | | 0.75 | % | | | 0.75 | % | | | 0.75 | % | | | 0.75 | % | |
| Ratio of net investment income (loss) to average net assets: | |
| Before waivers and reimbursements | | | (0.48 | )% | | | 0.07 | % | | | 1.78 | % | | | 1.44 | % | | | 1.30 | % | |
| Net of waivers and reimbursements | | | 0.52 | % | | | 0.66 | % | | | 2.19 | % | | | 1.75 | % | | | 1.62 | % | |
| Portfolio turnover rate | | | 264 | % | | | 268 | % | | | 57 | % | | | 54 | % | | | 62 | % | |
(1) Effective October 12, 2009, Mastholm Asset Management, LLC became subadviser to the Fund.
(2) New Star Institutional Managers Limited served as subadviser.
The accompanying notes are an integral part of these financial statements.
page 15

FRONTEGRA
SAM GLOBAL EQUITY FUND

REPORT FROM SUSTAINABLE ASSET
MANAGEMENT USA, INC.
Dear Shareholders:
The Frontegra SAM Global Equity Fund strives to achieve capital appreciation by investing in a non-diversified portfolio of equity and equity-related securities issued by U.S. and non-U.S. companies that combine their market and financial strategy with a high level of environmental awareness and a clearly defined social policy. The objective is measured against the MSCI World Index (Net).
Performance Review
The Frontegra SAM Global Equity Fund returned 25.64%, net of fees, for the ten month period ending June 30, 2011. The Fund's return outperformed the 25.41% return of its benchmark, the MSCI World Index (Net).
Stock selection was the main driver of strategy performance as sustainability leader companies with attractive valuations outperformed the market. Stock selection worked well across all sectors but was particularly effective in Financials, Consumer Discretionary, Energy and Utilities stocks. Within Financials, the positive extra-performance was also achieved by overweighting insurance companies while underweighting the banking sector, which was most sensitive to the sovereign debt crisis. Stock selection was less effective within Industrial and IT stocks. In particular, within the Industrial sector, the negative contribution came from exposure in Japanese stocks underperforming the market after the earthquake.
Over the period, deviations in portfolio regional and currency allocations relative to the benchmark were not large and as a result, the performance contribution from such exposure was not significant. On a regional level, Europe and the U.S. were the best performing regions, while Asian equities (as measured by MSCI AC Asia ex-Japan) underperformed in relative terms.
Portfolio Outlook and Strategy
Major historic events, both politically and environmentally, have affected financial markets. Radical political changes started to spread out from Tunisia to a number of countries in Northern Africa and the Middle East. In countries such as Libya and Bahrain, the situations escalated and now threaten to turn into long-lasting military conflicts. In addition, Australia and Japan were victims of extreme natural disasters whose full measure of damage is difficult to capture.
The debate about the European sovereign debt crisis and potential contagion over the rest of Europe continued to keep markets volatile. While the situation is far from being resolved, European Union leaders agreed on a longer-term financial stability mechanism that should preserve the solvency of its individual members and re-establish confidence in the European currency union.
Economic data released over the period remained positive but showed the global economy clearly growing at a much slower pace. Signs of softening momentum in the global economy are confirmed by the latest data released in June by the Conference Board Consumer Confidence Index. U.S. consumer sentiment remains weak as consumers are pessimistic about the outlook for the job market over the next several months.
The current macroeconomic recovery is increasingly showing some signs of fatigue, as also reflected by deteriorating macro indicators like the consumer index and housing market in the U.S. At the same time, the quantitative easing program in the U.S. came to the end of its term at the end of June, leading investors to increasingly take a more defensive stance.
Given the current environment, it is very likely that the U.S. Federal Reserve and the European Central Bank will continue with accommodative monetary policies for the foreseeable future. Overall, we expect the stock market to remain lukewarm until the overall picture of the future strength of the economies and the outcome of the sovereign debt crisis becomes more visible.
page 17

Despite our cautious outlook, from a valuation perspective we see attractive investment opportunities in global equity markets. The current valuation level of companies in the portfolio is attractive, and the strategy should benefit from its positioning in companies that offer growth at a reasonable price.
While the investment strategy remains focused on investing in sustainable companies with attractive valuation and stable earnings outlook, we also keep underweighting sectors where earnings visibility is lower, namely Financials.
Sincerely,
Diego d'Argenio
Sustainable Asset Management USA, Inc.
page 18

INVESTMENT HIGHLIGHTS
Growth of a $100,000 Investment (Unaudited)
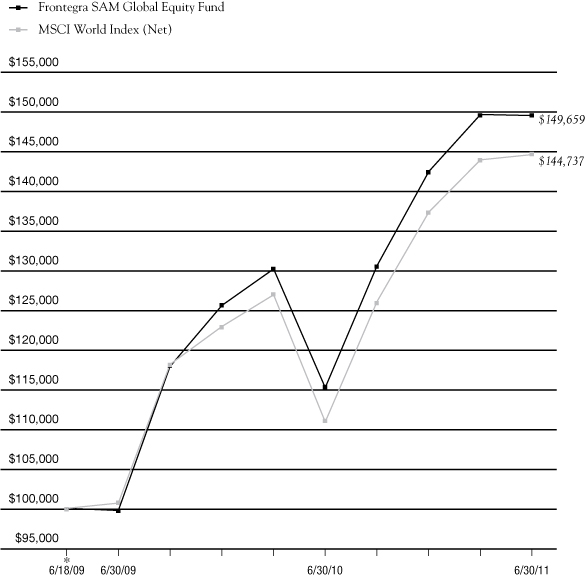
* 6/18/2009 commencement of operations.
This chart assumes an initial gross investment of $100,000 made on 6/18/2009 (commencement of operations). Returns shown include the reinvestment of all distributions. Past performance is not predictive of future results. Investment return and principal value will fluctuate so that shares, when redeemed, may be worth more or less than the original cost. In the absence of existing fee waivers, total return would be reduced. Effective June 10, 2011, Sustainable Asset Management USA, Inc. ("SAM") became subadviser to the Fund. Prior to June 10, 2011, SAM served as adviser to the Fund. To receive current to the most recent month-end performance, please call 1-888-825-2100.
The MSCI World Index measures the overall performance of stock markets in 23 developed market countries in North America, Europe, and the Asia/Pacific Region. The Index does not reflect investment management fees, brokerage commissions and other expenses associated with investing in equity securities. A direct investment in the index is not possible.
** The returns shown do not reflect the deduction of taxes that a shareholder would pay on Fund distributions or the redemption of Fund shares.
Portfolio Total Return**
| FOR PERIODS ENDED 6/30/11 | | FUND | | INDEX | |
| SIX MONTHS | | | 4.95 | % | | | 5.29 | % | |
| ONE YEAR | | | 29.89 | % | | | 30.51 | % | |
AVERAGE ANNUAL
SINCE INCEPTION | | | 21.94 | % | | | 19.95 | % | |
page 19

Frontegra SAM Global Equity Fund
SCHEDULE OF INVESTMENTS
June 30, 2011
| Number of Shares | | | | Value | |
| COMMON STOCKS 97.9% | | | |
| | | Australia 1.6% | |
| | 11,010 | | | National Australia Bank Ltd. | | $ | 302,540 | | |
| | | Canada 9.0% | |
| | 4,350 | | | Bank of Nova Scotia | | | 261,740 | | |
| | 4,990 | | | Canadian Imperial Bank of
Commerce | | | 393,995 | | |
| | 78,720 | | | Sherritt International Corp. | | | 501,157 | | |
| | 2,224 | | | Teck Resources Ltd. - Class B | | | 113,039 | | |
| | 8,320 | | | TELUS Corp. | | | 458,077 | | |
| | | | 1,728,008 | | |
| | | France 4.8% | |
| | 3,980 | | | Cie de St-Gobain | | | 257,732 | | |
| | 1,850 | | | Technip SA | | | 198,339 | | |
| | 6,940 | | | Valeo SA | | | 473,818 | | |
| | | | 929,889 | | |
| | | Germany 5.5% | |
| | 6,470 | | | Deutsche Bank AG | | | 382,338 | | |
| | 4,696 | | | Henkel AG & Co. KGaA | | | 325,991 | | |
| | 2,282 | | | Muenchener
Rueckversicherungs AG | | | 348,962 | | |
| | | | 1,057,291 | | |
| | | Israel 1.6% | |
| | 6,470 | | | Teva Pharmaceutical
Industries Ltd. - ADR | | | 311,983 | | |
| | | Italy 2.8% | |
| | 92,500 | | | Snam Rete Gas SpA | | | 547,826 | | |
| | | Japan 6.7% | |
| | 15,600 | | | Asahi Group Holdings Ltd. | | | 312,950 | | |
| | 36,700 | | | ITOCHU Corp. | | | 379,742 | | |
| | 10,100 | | | Mitsubishi Corp. | | | 250,916 | | |
| | 65,000 | | | Mitsui OSK Lines Ltd. | | | 347,991 | | |
| | | | 1,291,599 | | |
| Number of Shares | | | | Value | |
| | | Netherlands 1.3% | |
| | 9,603 | | | Koninklijke Philips
Electronics NV | | $ | 246,627 | | |
| | | Norway 4.8% | |
| | 16,650 | | | DnB NOR ASA | | | 232,075 | | |
| | 31,613 | | | Norsk Hydro ASA | | | 242,057 | | |
| | 27,750 | | | Telenor ASA | | | 454,429 | | |
| | | | 928,561 | | |
| | | Spain 2.6% | |
| | 14,340 | | | Repsol YPF SA | | | 497,838 | | |
| | | Sweden 2.0% | |
| | 5,922 | | | Boliden AB | | | 109,355 | | |
| | 19,700 | | | Svenska Cellulosa AB | | | 277,348 | | |
| | | | 386,703 | | |
| | | Switzerland 2.0% | |
| | 1,530 | | | Zurich Financial Services AG | | | 386,890 | | |
| | | United Kingdom 12.0% | |
| | 6,507 | | | AstraZeneca PLC | | | 324,582 | | |
| | 93,670 | | | Barclays PLC | | | 385,537 | | |
| | 14,181 | | | BG Group PLC | | | 321,825 | | |
| | 69,370 | | | BT Group PLC | | | 224,342 | | |
| | 148,000 | | | Legal & General Group PLC | | | 280,765 | | |
| | 183,980 | | | Logica PLC | | | 395,675 | | |
| | 24,737 | | | Travis Perkins PLC | | | 392,849 | | |
| | | | 2,325,575 | | |
| | | United States 41.2% | |
| | 3,171 | | | Chevron Corp. | | | 326,106 | | |
| | 16,000 | | | Dell, Inc. (a) | | | 266,720 | | |
| | 4,541 | | | Forest Oil Corp. (a) | | | 121,290 | | |
| | 11,560 | | | General Cable Corp. (a) | | | 492,225 | | |
| | 24,230 | | | Hartford Financial Services
Group, Inc. | | | 638,945 | | |
| | 17,931 | | | Health Net, Inc. (a) | | | 575,405 | | |
| | 15,768 | | | Hewlett-Packard Co. | | | 573,955 | | |
The accompanying notes are an integral part of these financial statements.
page 20

Frontegra SAM Global Equity Fund
SCHEDULE OF INVESTMENTS (continued)
June 30, 2011
| Number of Shares | | | | Value | |
| COMMON STOCKS 97.9% (continued) | | | |
| | | United States 41.2% (continued) | |
| | 2,655 | | | International Business
Machines Corp. | | $ | 455,465 | | |
| | 11,650 | | | Johnson Controls, Inc. | | | 485,339 | | |
| | 5,336 | | | Kimberly Clark Corp. | | | 355,164 | | |
| | 7,436 | | | Limited Brands, Inc. | | | 285,914 | | |
| | 2,456 | | | McDonalds Corp. | | | 207,090 | | |
| | 16,090 | | | Microsoft Corp. | | | 418,340 | | |
| | 16,650 | | | Mylan, Inc. (a) | | | 410,756 | | |
| | 8,510 | | | Northeast Utilities | | | 299,297 | | |
| | 4,831 | | | Occidental Petroleum Corp. | | | 502,617 | | |
| | 25,306 | | | Pfizer, Inc. | | | 521,304 | | |
| | 8,292 | | | Procter & Gamble Co. | | | 527,122 | | |
| | 12,950 | | | Reynolds American, Inc. | | | 479,798 | | |
| | | | 7,942,852 | | |
| | | Total Common Stocks | |
| | | | | (Cost $16,224,835) | | | 18,884,182 | | |
| Number of Shares | | | | Value | |
| SHORT-TERM INVESTMENTS 1.6% | |
| | 310,814 | | | AIM STIT-STIC Prime
Portfolio - Institutional Class | | $ | 310,814 | | |
| | | Total Short-Term Investments | |
| | | (Cost $310,814) | | | 310,814 | | |
| | | Total Investments 99.5% | |
| | | (Cost $16,535,649) | | | 19,194,996 | | |
| | | Other Assets in Excess of
Liabilities 0.5% | | | 96,741 | | |
| | | TOTAL NET ASSETS 100.0% | | $ | 19,291,737 | | |
(a) Non-Income Producing.
ADR - American Depositary Receipt.
The accompanying notes are an integral part of these financial statements.
page 21

Frontegra SAM Global Equity Fund
SCHEDULE OF INVESTMENTS (continued)
June 30, 2011
PORTFOLIO DIVERSIFICATION
| Sectors | | Percentage | |
| Financial | | | 18.7 | % | |
| Industrials | | | 12.3 | | |
| Health Care | | | 11.1 | | |
| Information Technology | | | 11.0 | | |
| Consumer Staples | | | 10.4 | | |
| Energy | | | 10.2 | | |
| Consumer Discretionary | | | 7.5 | | |
| Materials | | | 6.4 | | |
| Telecommunication Services | | | 5.9 | | |
| Utilities | | | 4.4 | | |
| Total Common Stocks | | | 97.9 | | |
| Total Short-Term Investments | | | 1.6 | | |
| Total Investments | | | 99.5 | | |
| Other Assets in Excess of Liabilities | | | 0.5 | | |
| Total Net Assets | | | 100.0 | % | |
The accompanying notes are an integral part of these financial statements.
page 22

Frontegra SAM Global Equity Fund
STATEMENT OF ASSETS AND LIABILITIES
June 30, 2011
| ASSETS: | |
| Investments at value (cost $16,535,649) | | $ | 19,194,996 | | |
| Interest and dividends receivable | | | 103,146 | | |
| Receivable for investments sold | | | 265,709 | | |
| Receivable from Adviser | | | 17,065 | | |
| Prepaid expenses and other assets | | | 3,031 | | |
| Total assets | | | 19,583,947 | | |
| LIABILITIES: | |
| Payable for investments purchased | | | 257,031 | | |
| Accrued expenses | | | 35,179 | | |
| Total liabilities | | | 292,210 | | |
| Net Assets | | $ | 19,291,737 | | |
| NET ASSETS CONSIST OF: | |
| Paid in capital | | $ | 15,337,644 | | |
| Undistributed net investment income | | | 256,065 | | |
| Accumulated net realized gain | | | 1,036,823 | | |
| Net unrealized appreciation on: | |
| Investments | | | 2,659,347 | | |
| Foreign currency | | | 1,858 | | |
| Net Assets | | $ | 19,291,737 | | |
| CAPITAL STOCK, $0.01 PAR VALUE | |
| Authorized | | | 50,000,000 | | |
| Issued and outstanding | | | 1,467,183 | | |
| Net Asset Value, Redemption Price and Offering Price Per Share | | $ | 13.15 | | |
The accompanying notes are an integral part of these financial statements.
page 23

Frontegra SAM Global Equity Fund
STATEMENT OF OPERATIONS
| | | Period Ended
June 30, 2011 | | Year Ended
August 31, 2010 | |
| INVESTMENT INCOME: | |
| Dividend income(1) | | $ | 567,323 | | | $ | 424,367 | | |
| Interest income | | | 176 | | | | 92 | | |
| Income from securities loaned(2) | | | 515 | | | | 545 | | |
| Total Investment Income | | | 568,014 | | | | 425,004 | | |
| EXPENSES: | |
| Investment advisory fees | | | 132,326 | | | | 122,289 | | |
| Fund administration and accounting fees | | | 72,661 | | | | 85,712 | | |
| Shareholder servicing fees | | | 52,956 | | | | 62,752 | | |
| Custody fees | | | 38,694 | | | | 35,961 | | |
| Audit fees | | | 36,611 | | | | 23,926 | | |
| Federal and state registration fees | | | 28,196 | | | | 63,114 | | |
| Legal fees | | | 11,484 | | | | 12,222 | | |
| Compliance related expenses | | | 9,096 | | | | — | | |
| Reports to shareholders | | | 4,892 | | | | 1,393 | | |
| Directors' fees and related expenses | | | 3,522 | | | | 20,257 | | |
| Other | | | 8,788 | | | | 2,614 | | |
| Total expenses before waiver and reimbursement | | | 399,226 | | | | 430,240 | | |
| Waiver and reimbursement of expenses by Adviser | | | (200,711 | ) | | | (246,789 | ) | |
| Net expenses | | | 198,515 | | | | 183,451 | | |
| Net Investment Income | | | 369,499 | | | | 241,553 | | |
| REALIZED AND UNREALIZED GAIN (LOSS) ON INVESTMENTS: | |
| Net realized gain (loss) on: | |
| Investments | | | 1,123,497 | | | | 853,885 | | |
| Foreign currency transactions | | | (9,469 | ) | | | 6,421 | | |
| Change in net unrealized appreciation/(depreciation) on: | |
| Investments | | | 2,694,665 | | | | (694,954 | ) | |
| Foreign currency transactions | | | 1,829 | | | | (1,805 | ) | |
| Net Realized and Unrealized Gain on Investments | | | 3,810,522 | | | | 163,547 | | |
| Net Increase in Net Assets Resulting from Operations | | $ | 4,180,021 | | | $ | 405,100 | | |
(1) Net of foreign withholding taxes of $43,421 and $28,719 respectively
(2) Prior to the reorganization as discussed in Note 1, the Frontegra SAM Global Equity Fund engaged in securities lending.
The accompanying notes are an integral part of these financial statements.
page 24

Frontegra SAM Global Equity Fund
STATEMENTS OF CHANGES IN NET ASSETS
| | | For the
Period Ended
June 30, 2011 | | For the
Year Ended
August 31, 2010 | | For the Period
June 18, 2009(1)
through
August 31, 2009 | |
| OPERATIONS: | |
| Net investment income | | $ | 369,499 | | | $ | 241,553 | | | $ | 5,576 | | |
| Net realized gain (loss) on: | |
| Investments | | | 1,123,497 | | | | 853,885 | | | | 635,679 | | |
| Foreign currency transactions | | | (9,469 | ) | | | 6,421 | | | | 4,574 | | |
| Change in net unrealized appreciation/(depreciation) on: | |
| Investments | | | 2,694,665 | | | | (694,954 | ) | | | 659,636 | | |
| Foreign currency transactions | | | 1,829 | | | | (1,805 | ) | | | 1,834 | | |
| Net increase in net assets resulting from operations | | | 4,180,021 | | | | 405,100 | | | | 1,307,299 | | |
DISTRIBUTIONS PAID TO INSTITUTIONAL CLASS
SHAREHOLDERS FROM: | |
| Net investment income | | | (311,090 | ) | | | (51,677 | ) | | | — | | |
| Net realized gain on investments | | | (638,890 | ) | | | (936,892 | ) | | | — | | |
| Net decrease in net assets resulting from distributions paid | | | (949,980 | ) | | | (988,569 | ) | | | — | | |
DISTRIBUTIONS PAID TO INVESTOR CLASS
SHAREHOLDERS FROM: | |
| Net investment income | | | — | | | | (21 | ) | | | — | | |
| Net realized gain on investments | | | — | | | | (456 | ) | | | — | | |
| Net decrease in net assets resulting from distributions paid | | | — | | | | (477 | ) | | | — | | |
| CAPITAL SHARE TRANSACTIONS: | |
| Shares sold - Institutional Class | | | 1,190,996 | | | | 6,210,174 | | | | 10,306,820 | | |
| Shares sold - Investor Class | | | — | | | | 5,500 | | | | 3,000 | | |
| Shares issued to holders in reinvestment of distributions - Institutional Class | | | 918,565 | | | | 861,288 | | | | — | | |
| Shares issued to holders in reinvestment of distributions - Investor Class | | | — | | | | 477 | | | | — | | |
| Shares redeemed - Institutional Class | | | (2,813,237 | ) | | | (1,345,517 | ) | | | — | | |
| Shares redeemed - Investor Class | | | — | | | | — | | | | — | | |
| Redemption fees - Institutional Class | | | — | | | | 277 | | | | — | | |
| Net increase (decrease) in net assets resulting from capital share transactions | | | (703,676 | ) | | | 5,732,199 | | | | 10,309,820 | | |
| Total Increase in Net Assets | | | 2,526,365 | | | | 5,148,253 | | | | 11,617,119 | | |
| NET ASSETS: | |
| Beginning of Period | | | 16,765,372 | | | | 11,617,119 | | | | — | | |
End of Period (includes undistributed net investment income of
$256,065, $206,426, and $10,150 respectively) | | $ | 19,291,737 | | | $ | 16,765,372 | | | $ | 11,617,119 | | |
| TRANSACTIONS IN SHARES – INSTITUTIONAL CLASS: | |
| Shares sold | | | 88,951 | | | | 536,115 | | | | 1,027,702 | | |
| Conversion of Investor Class shares(2) | | | 1,839 | | | | — | | | | — | | |
| Shares issued to holders in reinvestment of distributions | | | 74,459 | | | | 75,551 | | | | — | | |
| Shares redeemed | | | (221,931 | ) | | | (115,503 | ) | | | — | | |
| Net increase (decrease) in shares outstanding | | | (56,682 | ) | | | 496,163 | | | | 1,027,702 | | |
| TRANSACTIONS IN SHARES – INVESTOR CLASS:(2) | |
| Shares sold | | | — | | | | 472 | | | | 310 | | |
| Shares issued to holders in reinvestment of distributions | | | — | | | | 42 | | | | — | | |
| Net increase in shares outstanding | | | — | | | | 514 | | | | 310 | | |
(1) Commencement of operations
(2) All Investor Class shares converted into the Institutional Class on June 10, 2011
The accompanying notes are an integral part of these financial statements.
page 25

Frontegra SAM Global Equity Fund
FINANCIAL HIGHLIGHTS
| | | Period
Ended
June 30,
2011(1)(2) | | Year
Ended
August 31,
2010 | | Period
Ended
August 31,
2009(3) | |
| Net Asset Value, Beginning of Period | | $ | 11.00 | | | $ | 11.30 | | | $ | 10.00 | | |
INCOME FROM
INVESTMENT OPERATIONS: | |
| Net investment income | | | 0.25 | | | | 0.18 | (4) | | | 0.01 | (4) | |
| Net realized and unrealized gain on investments | | | 2.53 | | | | 0.47 | | | | 1.29 | | |
| Total Income from Investment Operations | | | 2.78 | | | | 0.65 | | | | 1.30 | | |
| LESS DISTRIBUTIONS: | |
| From net investment income | | | (0.21 | ) | | | (0.05 | ) | | | — | | |
| From net realized gain on investments | | | (0.42 | ) | | | (0.90 | ) | | | — | | |
| Total Distributions | | | (0.63 | ) | | | (0.95 | ) | | | 0.00 | | |
| Redemption fees retained | | | — | | | | — | (5) | | | — | | |
| Net Asset Value, End of Period | | $ | 13.15 | | | $ | 11.00 | | | $ | 11.30 | | |
| Total Return | | | 25.64 | %(6) | | | 5.42 | % | | | 13.00 | %(6) | |
| SUPPLEMENTAL DATA AND RATIOS: | |
| Net assets, end of period (in thousands) | | $ | 19,292 | | | $ | 16,756 | | | $ | 11,614 | | |
| Ratio of expenses to average net assets: | |
| Before waivers and reimbursements | | | 2.41 | %(7) | | | 2.81 | % | | | 4.06 | %(7) | |
| Net of waivers and reimbursements | | | 1.20 | %(7) | | | 1.20 | % | | | 1.20 | %(7) | |
| Ratio of net investment income (loss) to average net assets: | |
| Before waivers and reimbursements | | | 1.02 | %(7) | | | (0.03 | )% | | | (2.59 | )%(7) | |
| Net of waivers and reimbursements | | | 2.23 | %(7) | | | 1.58 | % | | | 0.27 | %(7) | |
| Portfolio turnover rate | | | 33 | %(6) | | | 88 | % | | | 72 | %(6) | |
(1) Effective June 30, 2011, the Fund changed its fiscal year end to June 30 from August 31.
(2) Effective June 10, 2011 Frontegra Asset Management, Inc. became adviser and Sustainable Asset Management USA, Inc. became subadviser to the Fund.
(3) Commenced operations on June 18, 2009.
(4) Per share net investment income has been calculated using the daily average share method.
(5) Less than one cent per share.
(6) Not annualized.
(7) Annualized.
The accompanying notes are an integral part of these financial statements.
page 26

FRONTEGRA
HEXAM EMERGING MARKETS FUND

REPORT FROM HEXAM CAPITAL
PARTNERS, LLP
Dear Shareholders:
The Frontegra HEXAM Emerging Markets Fund aims to achieve long-term capital growth by investing in a high conviction portfolio of up to 80 global emerging markets stocks. The Fund's benchmark is the MSCI Emerging Markets Index (Net).
Performance Review
The Fund returned -5.00% since its inception on December 20, 2010 through June 30, 2011 against a 4.59% return for the MSCI Emerging Markets Index (Net).
At a country level, the main detractors to performance were stock selection in China and Russia, as well as not owning South Korean automakers and heavy manufacturers. Positive performance was generated from the underweight to India, as well as stock selection in Zambian copper miner First Quantum Minerals and Indonesian company Straits Asia Resources.
Portfolio Review and Strategy
While the Fund saw relative underperformance from certain individual stocks since its inception to June 30, 2011, a considerable portion of the underperformance was a function of what the Fund was not invested in.
Following the devastating Japanese earthquake and tsunami, South Korean automakers benefitted significantly from the loss of key Japanese rivals in the dominant U.S. car market. A number of auto stocks and associated companies — which included Hyundai Motors, Kia Motors, Hyundai Heavy Industries and Hyundai Mobis — saw share price rises of up to 50% following the tsunami. However, we are comfortable being out of these stocks as we cannot foresee these companies replicating the selling prices and volume sales growth that they have seen over the last few months. With the Japanese automakers set to bring production back to pre-tsunami levels well before the end of the year, we do not believe the Korean stocks are going to get a similar opportunity to perform unless there is another similar disruption in Japan.
Another detractor for the Fund was the zero exposure to Gazprom, which again was boosted by the effects of the Japanese tsunami. Gazprom was one of the major beneficiaries from the negativity toward nuclear energy and the sudden positivity towards gas. While rhetoric such as that from German Chancellor Angela Merkel led to fears for the future of nuclear power and impacted on the price of uranium, we still believe clean and efficient nuclear power has a major part to play in future energy needs. The Chinese and Indians still plan on building a number of power stations and it will continue to be an important source of energy in Europe. Again, we believe this was about short-term perceptions, not fundamentals.
In addition to this, a large part of the index performance over the first few months of the year can also be attributed to the central European states. While the markets of Czech, Hungary and Poland were largely muted in local currency terms, these markets are linked to the euro currency which rose considerably against the U.S. dollar over the period.
While the above describes a significant part of the underperformance, there have also been stock selection factors, particularly Nine Dragons Paper ("NDP"), a Chinese packaging company. The recent Chinese slowdown has had an impact on the stock, with the company geared to Chinese retail sales. The largest factor for NDP's underperformance in Q2 was probably the rise in input costs. In addition, the Japanese tsunami has had a considerable impact, with NDP typically sourcing 10%-15% of its packaging cardboard from Japan — which effectively stopped.
Another area that has lagged has been our overweight to Turkey — which has been affected by the Middle East crisis, with many investors using the country as a proxy for the region. With the oil prices up at $125, there was a massive liquidity drain of investment out of Turkey
page 28

and into Russian energy, an area we had little exposure to. However, the market remains very negative on bank earnings, but bank earnings have been very robust and we expect results coming out in August to be strong.
With a high conviction concentrated fund like ours, the stock specific detraction has been very visible. However, it is not unusual for us to see these sorts of periods of underperformance when the market moves against us in the short term. We are constantly checking our convictions and believe the current portfolio will reverse the relative losses in the coming months.
Outlook
With the emerging market tightening cycle likely to largely come to an end over the next quarter, particularly in China, we believe many global emerging markets remain strongly undervalued. Emerging equities now trade on a forward P/E of between 10x and 10.5x, which is about one standard deviation lower than the long-term average. Global emerging markets also offer strong value compared to developed markets, trading at a discount of about 11%. We still think the markets will finish higher this year, perhaps even by 15%-20%, and the Fund will show strong relative performance.
Thank you for your continued support.
| | | |
|
| Bryan Collings, CFA | | Grant Shotter, CFA | |
|
| Managing Partner and Portfolio Manager | | Partner and Portfolio Manager | |
|
| HEXAM Capital Partners, LLP | | HEXAM Capital Partners, LLP | |
|
| | | |
|
| Stuart Richards | | Marina Akopian | |
|
| Partner and Portfolio Manager | | Partner and Portfolio Manager | |
|
| HEXAM Capital Partners, LLP | | HEXAM Capital Partners, LLP | |
|
page 29

INVESTMENT HIGHLIGHTS
Growth of a $100,000 Investment (Unaudited)
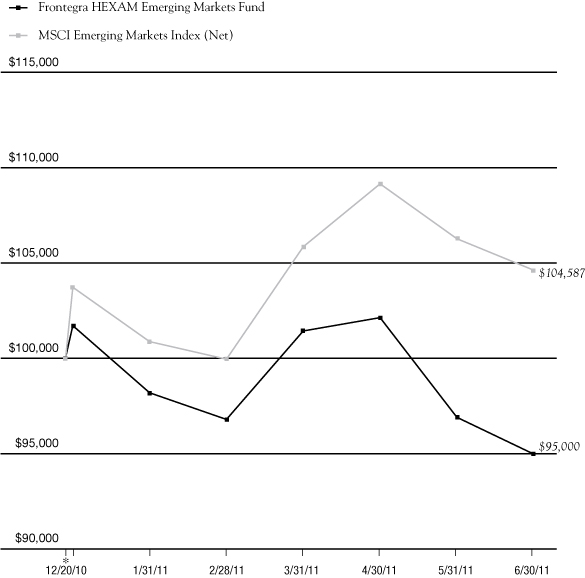
* 12/20/10 commencement of operations.
This chart assumes an initial gross investment of $100,000 made on 12/20/10 (commencement of operations). Returns shown include the reinvestment of all distributions. Past performance is not predictive of future results. Investment return and principal value will fluctuate so that shares, when redeemed, may be worth more or less than the original cost. In the absence of existing fee waivers, total return would be reduced. To receive current to the most recent month-end performance, please call 1-888-825-2100.
The MSCI Emerging Markets Index is a free float-adjusted market capitalization index that is designed to measure equity market performance in the global emerging markets. The Index does not reflect investment management fees, brokerage commissions and other expenses associated with investing in equity securities. A direct investment in the index is not possible.
** The returns shown do not reflect the deduction of taxes that a shareholder would pay on Fund distributions or the redemption of Fund shares.
Portfolio Total Return**
| FOR PERIODS ENDED 6/30/11 | | FUND | | INDEX | |
| SIX MONTHS | | | (6.59 | )% | | | 0.88 | % | |
| SINCE INCEPTION | | | (5.00 | )% | | | 4.59 | % | |
page 30

Frontegra HEXAM Emerging Markets Fund
SCHEDULE OF INVESTMENTS
June 30, 2011
| Number of Shares | | | | Value | |
| COMMON STOCKS 88.2% | | | |
| | | Brazil 17.7% | |
| | 37,201 | | | Cosan Ltd. | | $ | 457,200 | | |
| | 18,799 | | | Gafisa SA | | | 177,839 | | |
| | 22,954 | | | Localiza Rent a Car SA | | | 408,293 | | |
| | 20,826 | | | NOMOS-BANK (a) | | | 371,744 | | |
| | 45,619 | | | Petroleo Brasileiro SA - ADR | | | 1,544,659 | | |
| | 47,013 | | | Vale SA - ADR | | | 1,502,065 | | |
| | | | 4,461,800 | | |
| | | China 2.6% | |
| | 800,000 | | | China Construction Bank Corp. | | | 663,094 | | |
| | | Hong Kong 15.0% | |
| | 439,000 | | | China Overseas Land &
Investment Ltd. (b) | | | 940,992 | | |
| | 72,500 | | | China Shenhua Energy Co. Ltd. | | | 345,651 | | |
| | 1,276,000 | | | Industrial & Commercial
Bank of China | | | 969,090 | | |
| | 964,712 | | | Nine Dragons Paper
Holdings Ltd. (b) | | | 839,290 | | |
| | 468,000 | | | PetroChina Co. Ltd. Class H (b) | | | 684,406 | | |
| | | | 3,779,429 | | |
| | | Kazakhstan 3.3% | |
| | 24,940 | | | Kazakhmys PLC (b) | | | 552,381 | | |
| | 99,999 | | | Uranium One, Inc. (a)(b) | | | 275,802 | | |
| | | | 828,183 | | |
| | | Russian Federation 16.3% | |
| | 16,771 | | | Evraz Group SA (a)(b) | | | 522,417 | | |
| | 53,794 | | | Magnitogorsk Iron &
Steel Works (b) | | | 612,176 | | |
| | 18,559 | | | Mechel (b) | | | 443,375 | | |
| | 28,530 | | | MMC Norilsk Nickel - ADR | | | 747,485 | | |
| | 310,654 | | | Sberbank of Russia | | | 1,143,206 | | |
| | 51,352 | | | VimpelCom Ltd. | | | 655,252 | | |
| | | | 4,123,911 | | |
| | | Singapore 1.7% | |
| | 181,773 | | | Straits Asia Resources Ltd. (b) | | | 442,482 | | |
| Number of Shares | | | | Value | |
| | | South Africa 7.4% | |
| | 7,150 | | | Anglo American PLC | | $ | 354,304 | | |
| | 24,726 | | | Impala Platinum Holdings Ltd. (b) | | | 666,217 | | |
| | 14,952 | | | Naspers Ltd. | | | 844,585 | | |
| | | | 1,865,106 | | |
| | | South Korea 10.8% | |
| | 14,319 | | | KB Financial Group, Inc. (b) | | | 677,291 | | |
| | 7,900 | | | POSCO - ADR | | | 858,098 | | |
| | 1,550 | | | Samsung Electronics Co. Ltd. (b) | | | 1,199,176 | | |
| | | | 2,734,565 | | |
| | | Thailand 1.5% | |
| | 73,715 | | | Bangkok Bank PCL (b) | | | 379,071 | | |
| | | Turkey 10.7% | |
| | 113,020 | | | Haci Omer Sabanci
Holding AS (b) | | | 474,921 | | |
| | 163,554 | | | Tekfen Holding AS (b) | | | 564,327 | | |
| | 276,239 | | | Turk Hava Yollari (a)(b) | | | 723,362 | | |
| | 167,565 | | | Turkiye Garanti Bankasi AS (b) | | | 759,876 | | |
| | 58,459 | | | Turkiye Is Bankasi, Class C (b) | | | 179,375 | | |
| | | | 2,701,861 | | |
| | | Zambia 1.2% | |
| | 2,040 | | | First Quantum Minerals Ltd. (b) | | | 297,439 | | |
| | | Total Common Stocks | |
| | | | | (Cost $23,036,283) | | | 22,276,941 | | |
| PREFERRED STOCKS 7.3% | | | |
| | | Brazil 7.3% | |
| | 36,111 | | | Banco Bradesco SA - ADR | | | 739,914 | | |
| | 47,387 | | | Itau Unibanco Holding SA - ADR | | | 1,115,964 | | |
| | | | 1,855,878 | | |
| | | Total Preferred Stocks | |
| | | | | (Cost $1,694,241) | | | 1,855,878 | | |
| EXCHANGE TRADED FUNDS 1.5% | | | |
| | 25,229 | | | iShare MSCI Taiwan Index Fund | | | 382,976 | | |
| | | Total Exchange Traded Funds | |
| | | | | (Cost $353,085) | | | 382,976 | | |
The accompanying notes are an integral part of these financial statements.
page 31

Frontegra HEXAM Emerging Markets Fund
SCHEDULE OF INVESTMENTS (continued)
June 30, 2011
| PARTICIPATORY NOTES 1.0% | |
| | 5,558 | | | JPMorgan, 3/28/2016
(Bharat Heavy Electricals Ltd.) | | $ | 255,057 | | |
| | | Total Participatory Notes | |
| | | (Cost $256,281) | | | 255,057 | | |
| | | Total Investments 98.0% | |
| | | (Cost $25,339,890) | | | 24,770,852 | | |
| | | Assets in Excess
of Other Liabilities 2.0% | | | 504,093 | | |
| | | TOTAL NET ASSETS 100.0% | | $ | 25,274,945 | | |
(a) Non-Income Producing.
(b) U.S. traded security of a foreign issuer.
ADR - American Depositary Receipt.
PORTFOLIO DIVERSIFICATION
| Sectors | | Percentage | |
| Financials | | | 32.9 | % | |
| Basic Materials | | | 29.6 | | |
| Oil & Gas | | | 9.5 | | |
| Consumer Services | | | 6.3 | | |
| Technology | | | 4.5 | | |
| Consumer Goods | | | 4.2 | | |
| Industrials | | | 1.2 | | |
| Total Common Stocks | | | 88.2 | | |
| Total Preferred Stocks | | | 7.3 | | |
| Total Exchange Traded Funds | | | 1.5 | | |
| Total Participatory Notes | | | 1.0 | | |
| Total Investments | | | 98.0 | | |
| Other Assets in Excess of Liabilities | | | 2.0 | | |
| Total Net Assets | | | 100.0 | % | |
The accompanying notes are an integral part of these financial statements.
page 32

Frontegra HEXAM Emerging Markets Fund
STATEMENT OF ASSETS AND LIABILITIES
June 30, 2011
| ASSETS: | |
| Investments at value (cost $25,339,890) | | $ | 24,770,852 | | |
| Foreign currency at value (cost $118,056) | | | 119,520 | | |
| Interest and dividends receivable | | | 97,046 | | |
| Receivable for investments sold | | | 486,233 | | |
| Prepaid expenses and other assets | | | 535 | | |
| Total assets | | | 25,474,186 | | |
| LIABILITIES: | |
| Accrued investment advisory fee | | | 26,234 | | |
| Payable to the custodian | | | 112,455 | | |
| Accrued expenses | | | 60,552 | | |
| Total liabilities | | | 199,241 | | |
| Net Assets | | $ | 25,274,945 | | |
| NET ASSETS CONSIST OF: | |
| Paid in capital | | $ | 25,575,894 | | |
| Undistributed net investment income | | | 83,636 | | |
| Accumulated net realized gain | | | 182,685 | | |
| Net unrealized depreciation on: | |
| Investments | | | (569,038 | ) | |
| Foreign currency | | | 1,768 | | |
| Net Assets | | $ | 25,274,945 | | |
| CAPITAL STOCK, $0.01 PAR VALUE | |
| Authorized | | �� | 50,000,000 | | |
| Issued and outstanding | | | 2,661,514 | | |
| Net Asset Value, Redemption Price and Offering Price Per Share | | $ | 9.50 | | |
The accompanying notes are an integral part of these financial statements.
page 33

Frontegra HEXAM Emerging Markets Fund
STATEMENT OF OPERATIONS
| | | For the Period
December 20, 2010(1)
through
June 30, 2011 | |
| INVESTMENT INCOME: | |
| Dividend income(2) | | $ | 215,522 | | |
| Interest income | | | 620 | | |
| Total Investment Income | | | 216,142 | | |
| EXPENSES: | |
| Investment advisory fees | | | 66,196 | | |
| Audit fees | | | 31,345 | | |
| Custody fees | | | 26,495 | | |
| Legal fees | | | 15,872 | | |
| Fund administration and accounting fees | | | 15,586 | | |
| Directors' fees and related expenses | | | 4,832 | | |
| Shareholder servicing fees | | | 3,940 | | |
| Reports to shareholders | | | 3,389 | | |
| Federal and state registration fees | | | 1,990 | | |
| Other | | | 1,865 | | |
| Total expenses before waiver and reimbursement | | | 171,510 | | |
| Waiver and reimbursement of expenses by Adviser | | | (75,925 | ) | |
| Net expenses | | | 95,585 | | |
| Net Investment Income | | | 120,557 | | |
| REALIZED AND UNREALIZED GAIN (LOSS) ON INVESTMENTS: | |
| Net realized gain (loss) on: | |
| Investments | | | 182,685 | | |
| Foreign currency transactions | | | (36,921 | ) | |
| Change in net unrealized appreciation/(depreciation) on: | |
| Investments | | | (569,038 | ) | |
| Foreign currency transactions | | | 1,768 | | |
| Net Realized and Unrealized Loss on Investments | | | (421,506 | ) | |
| Net Decrease in Net Assets Resulting from Operations | | $ | (300,949 | ) | |
(1) Commencement of operations
(2) Net of $23,327 in foreign withholding taxes
The accompanying notes are an integral part of these financial statements.
page 34

Frontegra HEXAM Emerging Markets Fund
STATEMENT OF CHANGES IN NET ASSETS
| | | For the Period
December 20, 2010(1)
through
June 30, 2011 | |
| OPERATIONS: | |
| Net investment income | | $ | 120,557 | | |
| Net realized gain (loss) on: | |
| Investments | | | 182,685 | | |
| Foreign currency transactions | | | (36,921 | ) | |
| Change in net unrealized appreciation/(depreciation) on: | |
| Investments | | | (569,038 | ) | |
| Foreign currency transactions | | | 1,768 | | |
| Net decrease in net assets resulting from operations | | | (300,949 | ) | |
| DISTRIBUTIONS PAID FROM: | |
| Net investment income | | | — | | |
| Net realized gain on investments | | | — | | |
| Net decrease in net assets resulting from distributions paid | | | — | | |
| CAPITAL SHARE TRANSACTIONS: | |
| Shares sold | | | 25,615,894 | | |
| Shares issued to holders in reinvestment of distributions | | | — | | |
| Shares redeemed | | | (40,000 | ) | |
| Net increase in net assets resulting from capital share transactions | | | 25,575,894 | | |
| Total Increase in Net Assets | | | 25,274,945 | | |
| NET ASSETS: | |
| Beginning of Period | | | — | | |
| End of Period (includes undistributed net investment income of $83,636) | | $ | 25,274,945 | | |
| TRANSACTIONS IN SHARES: | |
| Shares sold | | | 2,665,635 | | |
| Shares issued to holders in reinvestment of distributions | | | — | | |
| Shares redeemed | | | (4,121 | ) | |
| Net increase in shares outstanding | | | 2,661,514 | | |
(1) Commencement of operations
The accompanying notes are an integral part of these financial statements.
page 35

Frontegra HEXAM Emerging Markets Fund
FINANCIAL HIGHLIGHTS
| | | Period
Ended
June 30,
2011(1) | |
| Net Asset Value, Beginning of Period | | $ | 10.00 | | |
INCOME (LOSS) FROM
INVESTMENT OPERATIONS: | |
| Net investment income | | | 0.08 | (2) | |
| Net realized and unrealized loss on investments | | | (0.58 | ) | |
| Total Loss from Investment Operations | | | (0.50 | ) | |
| Net Asset Value, End of Period | | $ | 9.50 | | |
| Total Return | | | (5.00 | )%(3) | |
| SUPPLEMENTAL DATA AND RATIOS: | |
| Net assets, end of period (in thousands) | | $ | 25,275 | | |
| Ratio of expenses to average net assets: | |
| Before waivers and reimbursements | | | 2.33 | %(4) | |
| Net of waivers and reimbursements | | | 1.30 | %(4) | |
| Ratio of net investment income to average net assets: | |
| Before waivers and reimbursements | | | 0.61 | %(4) | |
| Net of waivers and reimbursements | | | 1.64 | %(4) | |
| Portfolio turnover rate | | | 33 | %(3) | |
(1) Commenced operations on December 20, 2010.
(2) Per share net investment income has been calculated using the daily average share method.
(3) Not Annualized.
(4) Annualized.
The accompanying notes are an integral part of these financial statements.
page 36

FRONTEGRA
TIMPANI SMALL CAP GROWTH FUND

REPORT FROM TIMPANI CAPITAL
MANAGEMENT LLC
Dear Fellow Shareholders:
The Frontegra Timpani Small Cap Growth Fund strives to achieve capital appreciation by investing in a diversified portfolio of growth companies with small market capitalizations. Timpani seeks to:
• Invest in companies where growth is robust, sustainable and underestimated by the market.
• Conduct fundamental research that provides unique insights into the perception gap that exists between market expectations and a company's true growth rate.
• Manage risk by continuously evaluating the size of the perception gap relative to market expectations and monitoring market sentiment.
• Act on new relevant incremental data points, both positive and negative, in an effort to exploit investor biases.
Performance Review
We are pleased to report that the Fund outperformed its benchmark, the Russell 2000® Growth Index, for the period March 23, 2011 (inception) through June 30, 2011, returning 7.60% (net of fees) vs. 4.11% for the Index.
Strong stock selection was responsible for the majority of the outperformance, which was offset slightly by sector allocation. In particular, consumer discretionary, producer durables, and materials and processing delivered the most significant gains, while technology detracted from performance. An overweight position in energy and underweight position in health care also detracted from performance.
The individual stocks that outperformed during the period tended to be those with the largest perception gaps, and investors rewarded those despite some of the overhanging macro concerns. Consumer discretionary companies led the outperformance in the portfolio with five of the eight best performers for the period. Companies with strong distribution channel gains such as SodaStream International and Steven Madden contributed most to the outperformance, while secular growers in specialty retail like Ulta Salon, Cosmetics & Fragrance also made positive contributions. OSI Systems was the largest contributor to outperformance in producer durables, while Polypore International was a strong contributor within materials and processing.
Portfolio Outlook
The benchmark was relatively flat during the quarter despite significant intra-quarter volatility as the market digested macro concerns against positive micro data points in the form of a relatively strong earnings season. Questions about the viability of Greek debt and potential for default resurfaced and caused fears of a European debt contagion. In addition, softer economic data in the U.S. and the prospective end of the Federal Reserve's Quantitative Easing Program caused investors to be relatively risk averse for most of the quarter. Stubbornly high unemployment, geopolitical risks and high commodity costs continue to be risks that investors take seriously on a macro level. Margin compression from higher commodity costs is a real risk, which is why we have sought to own companies that we believe to have pricing power to maintain or perhaps increase margins.
On a micro level, companies maintained a constructive outlook on the economy and exceeded analyst expectations. In general, the weak dollar has helped many companies with exposure to international markets, which have higher secular growth rates. Corporate balance sheets are generally sound, and companies are generating cash which enables them to increase cash deployment in the form of dividends, share buybacks or accretive acquisitions. We believe that positive corporate fundamentals will lead to the potential for increased M&A activity, which could benefit the companies we own as both buyers and potential sellers. Our analysis continues to confirm our optimism regarding the fundamental strength of the companies in our portfolio. In particular, meetings with company management teams and other
page 38

fundamental data points indicate that many companies continue to achieve robust growth, and the perception gaps that exist remain quite large.
The tug of war between the macro concerns and positive micro data points approached resolution late in the period as a new Greek austerity plan was passed. We are well aware of the macro concerns investors have, but we believe we are positioned in companies with secular growth tailwinds that will be less susceptible to a macro slowdown. We are optimistic that market participants will look beyond sovereign debt fears and will focus on and reward companies that have strong, sustainable, company-specific growth drivers.
During the period, we continued to focus on finding robust and sustainable growers with company-specific perception gaps. Neither the annual reconstitution of the Russell Index on June 20th, nor the results from our bottom-up stock picking process led to any major changes in portfolio sector allocation. We continue to be overweight in consumer discretionary, energy and technology as those are the areas that we are finding the secular growth stories with the largest perception gaps. We are underweight financials and health care, although our exposure to health care did increase in the quarter. We took advantage of the volatility during the quarter by adding and initiating positions in companies where we believe the market has underestimated growth rates and feel very comfortable with the composition of the portfolio. Looking ahead, we are confident that our bottom-up process will continue to add value for shareholders.
Thank you for your continued support.
Sincerely,
Brandon Nelson, CFA
Chief Investment Officer
Timpani Capital Management LLC
page 39

Frontegra Timpani Small Cap Growth Fund
SCHEDULE OF INVESTMENTS
June 30, 2011
| Number of Shares | | | | Value | |
| COMMON STOCKS 99.7% | | | |
| | | Agricultural Machinery and Equipment 1.0% | |
| | 697 | | | Titan Machinery, Inc. (a) | | $ | 20,060 | | |
| | | Aerospace Product and Parts Manufacturing 1.1% | |
| | 241 | | | TransDigm Group, Inc. (a) | | | 21,977 | | |
| | | Animal Slaughtering and
Processing 0.6% | |
| | 638 | | | Darling International, Inc. (a) | | | 11,293 | | |
| | | Basic Chemical
Manufacturing 0.8% | |
| | 332 | | | Innophos Holdings, Inc. | | | 16,202 | | |
| | | Biotechnology 1.6% | |
| | 930 | | | Cepheid, Inc. (a) | | | 32,215 | | |
| | | Business Support Services 1.2% | |
| | 283 | | | Portfolio Recovery Associates,
Inc. (a) | | | 23,995 | | |
| | | Clothing Stores 0.9% | |
| | 780 | | | Body Central Corp. (a) | | | 18,353 | | |
| | | Communications Equipment Manufacturing 2.9% | |
| | 228 | | | Acme Packet, Inc. (a) | | | 15,990 | | |
| | 542 | | | ADTRAN, Inc. | | | 20,981 | | |
| | 1,104 | | | Calix, Inc. (a) | | | 22,985 | | |
| | | | 59,956 | | |
| | | Computer and Peripheral Equipment Manufacturing 1.1% | |
| | 490 | | | VeriFone Systems, Inc. (a) | | | 21,732 | | |
| Number of Shares | | | | Value | |
| | | Computer Systems Design and Related Services 5.8% | |
| | 1,381 | | | Allot Communications Ltd. (a) | | $ | 25,258 | | |
| | 4,474 | | | Callidus Software, Inc. (a) | | | 26,173 | | |
| | 310 | | | Computer Programs and
Systems, Inc. | | | 19,679 | | |
| | 602 | | | Convio, Inc. (a) | | | 6,508 | | |
| | 1,327 | | | Vocus, Inc. (a) | | | 40,619 | | |
| | | | 118,237 | | |
| | | Cut and Sew Apparel
Manufacturing 1.4% | |
| | 483 | | | G-III Apparel Group Ltd. (a) | | | 16,654 | | |
| | 511 | | | Zumiez, Inc. (a) | | | 12,760 | | |
| | | | 29,414 | | |
| | | Data Processing, Hosting,
and Related Services 1.2% | |
| | 322 | | | HMS Holdings Corp. (a) | | | 24,752 | | |
| | | Electronic Shopping and Mail-Order Houses 0.9% | |
| | 2,414 | | | ValueVision Media, Inc. (a) | | | 18,467 | | |
| | | Engineering and Contracting 1.7% | |
| | 2,802 | | | Furmanite Corp. (a) | | | 22,248 | | |
| | 515 | | | Team, Inc. (a) | | | 12,427 | | |
| | | | 34,675 | | |
| | | Full-Service Restaurants 4.2% | |
| | 506 | | | BJ's Restaurants, Inc. (a) | | | 26,494 | | |
| | 217 | | | Panera Bread Co. (a) | | | 27,268 | | |
| | 859 | | | Red Robin Gourmet
Burgers, Inc. (a) | | | 31,251 | | |
| | | | 85,013 | | |
| | | Health and Personal Care Stores 1.3% | |
| | 405 | | | Ulta Salon, Cosmetics &
Fragrance, Inc. (a) | | | 26,155 | | |
The accompanying notes are an integral part of these financial statements.
page 40

Frontegra Timpani Small Cap Growth Fund
SCHEDULE OF INVESTMENTS (continued)
June 30, 2011
| Number of Shares | | | | Value | |
| COMMON STOCKS 99.7% (continued) | | | |
| | | Health Care Management Services 2.8% | |
| | 963 | | | SXC Health Solutions Corp. (a) | | $ | 56,741 | | |
| | | Household Appliance
Manufacturing 2.4% | |
| | 1,376 | | | iRobot Corp. (a) | | | 48,559 | | |
| | | Lessors of Nonfinancial
Intangible Assets (except
Copyrighted Works) 1.9% | |
| | 1,013 | | | Acacia Research Corp. (a) | | | 37,167 | | |
| | 62 | | | RPX Corp. (a) | | | 1,738 | | |
| | | | 38,905 | | |
| | | Machinery - Industrial 4.3% | |
| | 455 | | | Gardner Denver, Inc. | | | 38,242 | | |
| | 659 | | | Kaman Corp. | | | 23,375 | | |
| | 483 | | | Robbins & Myers, Inc. | | | 25,527 | | |
| | | | 87,144 | | |
| | | Media 3.0% | |
| | 674 | | | IMAX Corp. (a) | | | 21,858 | | |
| | 3,859 | | | interCLICK, Inc. (a) | | | 30,718 | | |
| | 339 | | | RealD, Inc. (a) | | | 7,929 | | |
| | | | 60,505 | | |
| | | Medical Equipment and Supplies Manufacturing 3.6% | |
| | 330 | | | Hill-Rom Holdings, Inc. | | | 15,193 | | |
| | 2,545 | | | Uroplasty, Inc. (a) | | | 19,088 | | |
| | 672 | | | ZOLL Medical Corp. (a) | | | 38,076 | | |
| | | | 72,357 | | |
| | | Navigational, Measuring, Electromedical, and Control Instruments Manufacturing 2.0% | |
| | 1,493 | | | LeCroy Corp. (a) | | | 17,976 | | |
| | 737 | | | Ultratech, Inc. (a) | | | 22,390 | | |
| | | | 40,366 | | |
| Number of Shares | | | | Value | |
| | | Oil and Gas Equipment and
Services 7.8% | |
| | 669 | | | Basic Energy Services, Inc. (a) | | $ | 21,053 | | |
| | 306 | | | CARBO Ceramics, Inc. | | | 49,862 | | |
| | 687 | | | Complete Production Services,
Inc. (a) | | | 22,918 | | |
| | 182 | | | Core Laboratories N.V. (b) | | | 20,300 | | |
| | 574 | | | Global Geophysical Services, Inc. (a) | | | 10,217 | | |
| | 1,148 | | | Pioneer Drilling Co. (a) | | | 17,496 | | |
| | 1,665 | | | Union Drilling, Inc. (a) | | | 17,133 | | |
| | | | 158,979 | | |
| | | Oil and Gas Extraction 5.6% | |
| | 665 | | | Brigham Exploration Co. (a) | | | 19,903 | | |
| | 628 | | | Carrizo Oil & Gas, Inc. (a) | | | 26,219 | | |
| | 1,266 | | | Northern Oil and Gas, Inc. (a) | | | 28,043 | | |
| | 628 | | | Oasis Petroleum, Inc. (a) | | | 18,639 | | |
| | 417 | | | Rosetta Resources, Inc. (a) | | | 21,492 | | |
| | | | 114,296 | | |
| | | Other Ambulatory Health Care Services 0.4% | |
| | 307 | | | ExamWorks Group, Inc. (a) | | | 7,795 | | |
| | | Other Chemical Product
and Preparation
Manufacturing 2.0% | |
| | 604 | | | Polypore International, Inc. (a) | | | 40,975 | | |
| | | Other Financial Investment
Activities 0.8% | |
| | 636 | | | Financial Engines, Inc. (a) | | | 16,485 | | |
| | | Other Food Manufacturing 2.6% | |
| | 887 | | | SodaStream International Ltd. (a) | | | 53,938 | | |
| | | Other Furniture Related Product Manufacturing 2.2% | |
| | 673 | | | Tempur-Pedic International,
Inc. (a) | | | 45,643 | | |
The accompanying notes are an integral part of these financial statements.
page 41

Frontegra Timpani Small Cap Growth Fund
SCHEDULE OF INVESTMENTS (continued)
June 30, 2011
| Number of Shares | | | | Value | |
| COMMON STOCKS 99.7% (continued) | | | |
| | | Other General Purpose Machinery Manufacturing 1.0% | |
| | 862 | | | TriMas Corp. (a) | | $ | 21,335 | | |
| | | Other Information Services 3.2% | |
| | 1,542 | | | Keynote Systems, Inc. | | | 33,353 | | |
| | 489 | | | Travelzoo, Inc. (a) | | | 31,609 | | |
| | | | 64,962 | | |
| | | Other Leather and Allied Product Manufacturing 1.0% | |
| | 527 | | | Vera Bradley, Inc. (a) | | | 20,131 | | |
| | | Other Nonmetallic Mineral Product Manufacturing 1.6% | |
| | 1,408 | | | Globe Specialty Metals, Inc. | | | 31,567 | | |
| | | Pesticide, Fertilizer, and Other Agricultural Chemical Manufacturing 0.5% | |
| | 238 | | | LSB Industries, Inc. (a) | | | 10,215 | | |
| | | Pharmaceutical and Medicine Manufacturing 1.2% | |
| | 3,579 | | | Akorn, Inc. (a) | | | 25,053 | | |
| | | Plastics Product Manufacturing 3.0% | |
| | 330 | | | Raven Industries, Inc. | | | 18,384 | | |
| | 3,166 | | | ZAGG, Inc. (a) | | | 42,424 | | |
| | | | 60,808 | | |
| | | Printing and Related Support Activities 0.9% | |
| | 2,174 | | | InnerWorkings, Inc. (a) | | | 18,131 | | |
| | | Semiconductor and Other Electronic Component Manufacturing 9.2% | |
| | 1,138 | | | CEVA, Inc. (a) | | | 34,663 | | |
| | 461 | | | IPG Photonics Corp. (a) | | | 33,519 | | |
| | 1,144 | | | Ixia (a) | | | 14,643 | | |
| | | Semiconductor and Other
Electronic Component
Manufacturing (continued) | |
| | 2,525 | | | Nova Measuring Instruments
Ltd. (a) | | $ | 25,553 | | |
| | 595 | | | Omnivision Technologies, Inc. (a) | | | 20,712 | | |
| | 1,094 | | | OSI Systems, Inc. (a) | | | 47,042 | | |
| | 740 | | | TTM Technologies, Inc. (a) | | | 11,855 | | |
| | | | 187,987 | | |
| | | Soap, Cleaning Compound,
and Toilet Preparation Manufacturing 0.9% | |
| | 629 | | | Elizabeth Arden, Inc. (a) | | | 18,260 | | |
| | | Software Publishers 6.4% | |
| | 629 | | | BroadSoft, Inc. (a) | | | 23,984 | | |
| | 262 | | | LogMeIn, Inc. (a) | | | 10,105 | | |
| | 1,117 | | | Medidata Solutions, Inc. (a) | | | 26,663 | | |
| | 865 | | | RightNow Technologies, Inc. (a) | | | 28,026 | | |
| | 3,394 | | | Web.com Group, Inc. (a) | | | 41,814 | | |
| | | | 130,592 | | |
| | | Textiles, Apparel & Luxury
Goods 1.7% | |
| | 942 | | | Steven Madden Ltd. (a) | | | 35,334 | | |
| | | Total Common Stocks | |
| | | | | (Cost $1,854,098) | | | 2,029,559 | | |
| SHORT-TERM INVESTMENTS 1.2% | | | |
| | 23,662 | | | AIM STIT-STIC Prime
Portfolio - Institutional Class | | | 23,662 | | |
| | | Total Short-Term Investments | |
| | | | | (Cost $23,662) | | | 23,662 | | |
| | | Total Investments 100.9% | |
| | | | | (Cost $1,877,760) | | | 2,053,221 | | |
| | | | | Liabilities in Excess
of Other Assets (0.9)% | | | (17,331 | ) | |
| | | | | TOTAL NET ASSETS 100.0% | | $ | 2,035,890 | | |
The accompanying notes are an integral part of these financial statements.
page 42

Frontegra Timpani Small Cap Growth Fund
SCHEDULE OF INVESTMENTS (continued)
June 30, 2011
(a) Non-Income Producing Security.
(b) U.S. traded security of a foreign issuer.
PORTFOLIO DIVERSIFICATION
| Sectors | | Percentage | |
| Technology | | | 29.8 | % | |
| Consumer Discretionary | | | 23.8 | | |
| Producer Durables | | | 13.7 | | |
| Health Care | | | 12.1 | | |
| Energy | | | 9.9 | | |
| Materials & Processing | | | 8.4 | | |
| Financial Services | | | 2.0 | | |
| Total Common Stocks | | | 99.7 | | |
| Total Short-Term Investments | | | 1.2 | | |
| Total Investments | | | 100.9 | | |
| Liabilities in Excess of Other Assets | | | (0.9 | ) | |
| Total Net Assets | | | 100.0 | % | |
The accompanying notes are an integral part of these financial statements.
page 43

Frontegra Timpani Small Cap Growth Fund
STATEMENT OF ASSETS AND LIABILITIES
June 30, 2011
| ASSETS: | |
| Investments at value (cost $1,877,760) | | $ | 2,053,221 | | |
| Interest and dividends receivable | | | 122 | | |
| Receivable for investments sold | | | 44,571 | | |
| Receivable from Adviser | | | 8,896 | | |
| Prepaid expenses and other assets | | | 5,635 | | |
| Total assets | | | 2,112,445 | | |
| LIABILITIES: | |
| Payable for investments purchased | | | 40,719 | | |
| Accrued expenses | | | 35,836 | | |
| Total liabilities | | | 76,555 | | |
| Net Assets | | $ | 2,035,890 | | |
| NET ASSETS CONSIST OF: | |
| Paid in capital | | $ | 1,907,662 | | |
| Accumulated net realized loss | | | (47,233 | ) | |
| Unrealized appreciation on investments | | | 175,461 | | |
| Net Assets | | $ | 2,035,890 | | |
| CAPITAL STOCK, $0.01 PAR VALUE | |
| Authorized | | | 50,000,000 | | |
| Issued and outstanding | | | 189,305 | | |
| Net Asset Value, Redemption Price and Offering Price Per Share | | $ | 10.75 | | |
The accompanying notes are an integral part of these financial statements.
page 44

Frontegra Timpani Small Cap Growth Fund
STATEMENT OF OPERATIONS
| | | For the Period
March 23, 2011(1)
through
June 30, 2011 | |
| INVESTMENT INCOME: | |
| Dividend income(2) | | $ | 809 | | |
| Interest income | | | 28 | | |
| Total Investment Income | | | 837 | | |
| EXPENSES: | |
| Audit fees | | | 21,045 | | |
| Fund administration and accounting fees | | | 6,676 | | |
| Legal fees | | | 6,034 | | |
| Investment advisory fees | | | 4,737 | | |
| Directors' fees and related expenses | | | 4,367 | | |
| Shareholder servicing fees | | | 3,590 | | |
| Custody fees | | | 2,646 | | |
| Reports to shareholders | | | 2,154 | | |
| Other | | | 534 | | |
| Total expenses before waiver and reimbursement | | | 51,783 | | |
| Waiver and reimbursement of expenses by Adviser | | | (46,572 | ) | |
| Net expenses | | | 5,211 | | |
| Net Investment Loss | | | (4,374 | ) | |
| REALIZED AND UNREALIZED GAIN (LOSS) ON INVESTMENTS: | |
| Net realized loss on investments | | | (47,233 | ) | |
| Change in net unrealized appreciation/(depreciation) on investments | | | 175,461 | | |
| Net Realized and Unrealized Gain on Investments | | | 128,228 | | |
| Net Increase in Net Assets Resulting from Operations | | $ | 123,854 | | |
(1) Commencement of operations
(2) Net of $6 in foreign withholding taxes
The accompanying notes are an integral part of these financial statements.
page 45

Frontegra Timpani Small Cap Growth Fund
STATEMENT OF CHANGES IN NET ASSETS
| | | For the Period
March 23, 2011(1)
through
June 30, 2011 | |
| OPERATIONS: | |
| Net investment loss | | $ | (4,374 | ) | |
| Net realized loss on investments | | | (47,233 | ) | |
| Change in net unrealized appreciation/(depreciation) on investments | | | 175,461 | | |
| Net increase in net assets resulting from operations | | | 123,854 | | |
| CAPITAL SHARE TRANSACTIONS: | |
| Shares sold | | | 1,912,036 | | |
| Shares issued to holders in reinvestment of distributions | | | — | | |
| Shares redeemed | | | — | | |
| Net increase in net assets resulting from capital share transactions | | | 1,912,036 | | |
| Total Increase in Net Assets | | | 2,035,890 | | |
| NET ASSETS: | |
| Beginning of Period | | | — | | |
| End of Period (includes undistributed net investment income of $0) | | $ | 2,035,890 | | |
| TRANSACTIONS IN SHARES: | |
| Shares sold | | | 189,305 | | |
| Shares issued to holders in reinvestment of distributions | | | — | | |
| Shares redeemed | | | — | | |
| Net increase in shares outstanding | | | 189,305 | | |
(1) Commencement of operations
The accompanying notes are an integral part of these financial statements.
page 46

Frontegra Timpani Small Cap Growth Fund
FINANCIAL HIGHLIGHTS
| | | Period
Ended
June 30,
2011(1) | |
| Net Asset Value, Beginning of Period | | $ | 10.00 | | |
INCOME (LOSS) FROM
INVESTMENT OPERATIONS: | |
| Net investment loss | | | (0.02 | )(2) | |
| Net realized and unrealized gain on investments | | | 0.77 | | |
| Total Income from Investment Operations | | | 0.75 | | |
| Net Asset Value, End of Period | | $ | 10.75 | | |
| Total Return | | | 7.60 | %(3) | |
| SUPPLEMENTAL DATA AND RATIOS: | |
| Net assets, end of period (in thousands) | | $ | 2,036 | | |
| Ratio of expenses to average net assets: | |
| Before waivers and reimbursements | | | 10.93 | %(4) | |
| Net of waivers and reimbursements | | | 1.10 | %(4) | |
| Ratio of net investment loss to average net assets: | |
| Before waivers and reimbursements | | | (10.75 | )%(4) | |
| Net of waivers and reimbursements | | | (0.92 | )%(4) | |
| Portfolio turnover rate | | | 28 | %(3) | |
(1) Commenced operations on March 23, 2011.
(2) Net investment loss per share is calculated using ending balances prior to consideration of adjustments for permanent book to tax differences.
(3) Not Annualized.
(4) Annualized.
The accompanying notes are an integral part of these financial statements.
page 47

FRONTEGRA
NETOLS SMALL CAP VALUE FUND

REPORT FROM NETOLS ASSET MANAGEMENT, INC.
Dear Fellow Shareholders:
Since its inception on December 16, 2005, the Frontegra Netols Small Cap Value Fund (Institutional Class) has outperformed the benchmark after fees, returning 6.34% annualized, compared to 3.59% annualized for the Russell 2000® Value Index.
Performance Review
For the year ended June 30, 2011, the Frontegra Netols Small Cap Value Fund (Institutional Class) has outperformed the benchmark, returning 36.43% net of fees, compared to 31.35% for the Russell 2000 Value Index.
Portfolio Review
The dominant market factor over the past 12 months was continued government stimulus spending. The world economy encountered a variety of headwinds including debt issues in the U.S. and Europe, political unrest in North Africa and the Middle East, and disruptions associated with the tsunami in Japan. Each challenge raised further doubts regarding the trajectory of the world economy and was met with additional government stimulus. The U.S. entered a second round of quantitative easing while Japan injected capital into its banking system. This continued easy access to capital drove financial and physical asset prices higher, resulting in inflationary pressures. As a result, China raised interest rates during the past year in an attempt to slow the economy and curb inflation. However, with additional stimulus plans in place, investors became less risk adverse. This resulted in outperformance of the more cyclical Materials and Energy sectors. Additionally, the relatively stable Financials, Consumer Staples, and Utilities sectors underperformed for the period.
Positive Contributions to Relative Performance July 2010 through June 2011
• Stock Selection – Industrials and Consumer Discretionary
• Overweight – Energy
• Underweight – Financials
• Best Performing Stocks – Sunrise Senior Living, ION Geophysical, Entegris, Robbins & Myers, Titan International
Negative Contributions to Relative Performance July 2010 through June 2011
• Stock Selection – Materials and Health Care
• Worst Performing Stocks – Corinthian Colleges, Spartech, General Maritime, Tekelec, DreamWorks Animation
Overall, our market outlook is mixed. Most companies continue to see stable to positive trends in their businesses despite questions surrounding the world economy. However, general economic uncertainty has resulted in a muted recovery in the employment market. Weak domestic employment growth, European debt issues, and China's fight against inflation are among the headwinds the economy is facing. As a result, we believe it is increasingly important for companies to have positive pricing power and the ability to gain market share to outperform in the current market environment.
Thank you for your continued support.
Jeff Netols
President
Netols Asset Management, Inc.
page 49

INVESTMENT HIGHLIGHTS
Growth of a $100,000 Investment (Unaudited)
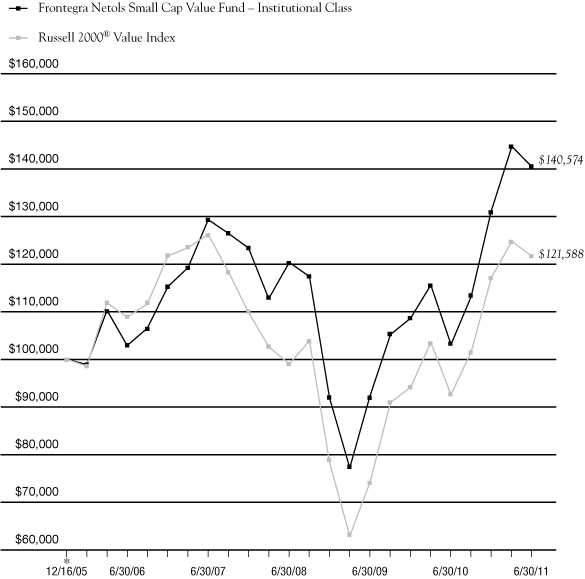
* 12/16/05 commencement of operations.
This chart assumes an initial gross investment of $100,000 made on 12/16/05 (commencement of operations). Returns shown include the reinvestment of all distributions. Past performance is not predictive of future results. Investment return and principal value will fluctuate so that shares, when redeemed, may be worth more or less than the original cost. In the absence of existing fee waivers, total return would be reduced. To receive current to the most recent month-end performance, please call 1-888-825-2100.
The Russell 2000 Value Index measures the performance of those Russell 2000 companies with lower price-to-book ratios and lower forecasted growth values. The Russell 2000 Index measures the performance of the 2,000 smallest companies in the Russell 3000 Index. The Russell 3000 Index measures the performance of the 3,000 largest U.S. companies based on total market capitalization. The Index does not reflect investment management fees, brokerage commissions and other expenses associated with investing in equity securities. A direct investment in the index is not possible.
** The returns shown do not reflect the deduction of taxes that a shareholder would pay on Fund distributions or the redemption of Fund shares.
The above graph relates to Institutional Class shares of the Fund. Performance for Class Y shares will vary from the performance of the Institutional Class shares shown above due to differences in expenses.
Portfolio Total Return**
| FOR PERIODS ENDED 6/30/11 | | FUND | | INDEX | |
| SIX MONTHS | | | 7.09 | % | | | 3.77 | % | |
| ONE YEAR | | | 36.43 | % | | | 31.35 | % | |
FIVE YEAR
AVERAGE ANNUAL | | | 6.44 | % | | | 2.24 | % | |
AVERAGE ANNUAL
SINCE INCEPTION | | | 6.34 | % | | | 3.59 | % | |
page 50

Frontegra Netols Small Cap Value Fund
SCHEDULE OF INVESTMENTS
June 30, 2011
| Number of Shares | | | | Value | |
| COMMON STOCKS 97.1% | | | |
| | | Aerospace & Defense 0.8% | |
| | 19,756 | | | American Science
& Engineering, Inc. | | $ | 1,580,480 | | |
| | | Apparel & Accessories 1.5% | |
| | 93,073 | | | Carter's, Inc. (a) | | | 2,862,925 | | |
| | | Application Software 1.7% | |
| | 108,257 | | | Fair Isaac Corp. | | | 3,269,362 | | |
| | | Auto Parts & Equipment 3.1% | |
| | 170,392 | | | Modine Manufacturing Co. (a) | | | 2,618,925 | | |
| | 75,054 | | | Tenneco, Inc. (a) | | | 3,307,630 | | |
| | | | 5,926,555 | | |
| | | Building Materials 0.8% | |
| | 126,546 | | | Gibraltar Industries, Inc. (a) | | | 1,432,501 | | |
| | | Chemicals - Commodity 1.6% | |
| | 156,645 | | | Ferro Corp. (a) | | | 2,105,309 | | |
| | 140,397 | | | Spartech Corp. (a) | | | 855,018 | | |
| | | | 2,960,327 | | |
| | | Commercial Services & Supplies 1.2% | |
| | 85,655 | | | Herman Miller, Inc. | | | 2,331,529 | | |
| | | Communications Equipment
Manufacturing 1.0% | |
| | 271,989 | | | Harmonic, Inc. (a) | | | 1,966,480 | | |
| | | Diversified Metals & Mining 1.8% | |
| | 39,725 | | | Compass Minerals
International, Inc. | | | 3,419,131 | | |
| | | Educational Services 0.8% | |
| | 34,508 | | | Capella Education Co. (a) | | | 1,444,160 | | |
| | | Food Distributors 1.6% | |
| | 70,677 | | | United Natural Foods, Inc. (a) | | | 3,015,787 | | |
| Number of Shares | | | | Value | |
| | | General Rental Centers 1.6% | |
| | 117,027 | | | United Rentals, Inc. (a) | | $ | 2,972,486 | | |
| | | Health Care - Distributors 1.7% | |
| | 117,057 | | | PSS World Medical, Inc. (a) | | | 3,278,767 | | |
| | | Health Care - Facility 4.3% | |
| | 56,948 | | | LifePoint Hospitals, Inc. (a) | | | 2,225,528 | | |
| | 381,324 | | | Sunrise Senior Living, Inc. (a) | | | 3,634,018 | | |
| | 91,627 | | | U.S. Physical Therapy, Inc. | | | 2,265,935 | | |
| | | | 8,125,481 | | |
| | | Health Care - Managed Care 1.2% | |
| | 41,447 | | | Magellan Health Services, Inc. (a) | | | 2,268,809 | | |
| | | Health Care - Services 1.1% | |
| | 99,768 | | | Gentiva Health Services, Inc. (a) | | | 2,078,167 | | |
| | | Health Care - Supplies 3.0% | |
| | 34,614 | | | Haemonetics Corp. (a) | | | 2,228,103 | | |
| | 194,335 | | | Merit Medical Systems, Inc. (a) | | | 3,492,200 | | |
| | | | 5,720,303 | | |
| | | Home Furnishings 2.8% | |
| | 104,559 | | | Aaron's, Inc. | | | 2,954,837 | | |
| | 111,161 | | | Ethan Allen Interiors, Inc. | | | 2,366,618 | | |
| | | | 5,321,455 | | |
| | | Industrial REITS 1.6% | |
| | 256,970 | | | First Industrial Realty
Trust, Inc. (a) | | | 2,942,306 | | |
| | | Insurance - Property/Casualty 1.1% | |
| | 52,826 | | | Hanover Insurance Group, Inc. | | | 1,992,068 | | |
| | | IT Consulting & Services 4.5% | |
| | 69,367 | | | Arbitron, Inc. | | | 2,866,938 | | |
| | 55,173 | | | CACI International,
Inc. - Class A (a) | | | 3,480,313 | | |
| | 398,304 | | | CIBER, Inc. (a) | | | 2,210,587 | | |
| | | | 8,557,838 | | |
The accompanying notes are an integral part of these financial statements.
page 51

Frontegra Netols Small Cap Value Fund
SCHEDULE OF INVESTMENTS (continued)
June 30, 2011
| Number of Shares | | | | Value | |
| COMMON STOCKS 97.1% (continued) | | | |
| | | Lessors of Real Estate 1.4% | |
| | 74,853 | | | American Campus
Communities, Inc. | | $ | 2,658,779 | | |
| | | Machinery - Construction/Farm 4.2% | |
| | 117,155 | | | Commercial Vehicle
Group, Inc. (a) | | | 1,662,429 | | |
| | 132,042 | | | Titan International, Inc. | | | 3,203,339 | | |
| | 48,171 | | | Westinghouse Air Brake
Technologies Corp. | | | 3,165,798 | | |
| | | | 8,031,566 | | |
| | | Machinery - Industrial 6.3% | |
| | 87,800 | | | Actuant Corp., Class A | | | 2,355,674 | | |
| | 42,301 | | | Gardner Denver, Inc. | | | 3,555,399 | | |
| | 51,826 | | | IDEX Corp. | | | 2,376,222 | | |
| | 69,119 | | | Robbins & Myers, Inc. | | | 3,652,939 | | |
| | | | 11,940,234 | | |
| | | Movies and Entertainment 0.5% | |
| | 45,221 | | | DreamWorks Animation
SKG, Inc. (a) | | | 908,942 | | |
| | | Oil & Gas - Equipment/Services 3.7% | |
| | 261,092 | | | ION Geophysical Corp. (a) | | | 2,469,930 | | |
| | 204,126 | | | North American Energy
Partners, Inc. (a)(b) | | | 1,563,605 | | |
| | 80,459 | | | Superior Energy Services, Inc. (a) | | | 2,988,247 | | |
| | | | 7,021,782 | | |
| | | Oil & Gas - Exploration/Products 3.2% | |
| | 70,727 | | | Bill Barrett Corp. (a) | | | 3,278,197 | | |
| | 48,592 | | | Whiting Petroleum Corp. (a) | | | 2,765,371 | | |
| | | | 6,043,568 | | |
| | | Other General Purpose Machinery Manufacturing 1.1% | |
| | 85,116 | | | TriMas Corp. (a) | | | 2,106,621 | | |
| Number of Shares | | | | Value | |
| | | Packaged Foods/Meats 2.9% | |
| | 295,204 | | | SunOpta, Inc. (a)(b) | | $ | 2,098,900 | | |
| | 61,537 | | | TreeHouse Foods, Inc. (a) | | | 3,360,536 | | |
| | | | 5,459,436 | | |
| | | Railroads 3.2% | |
| | 60,016 | | | Genesee & Wyoming, Inc. (a) | | | 3,519,338 | | |
| | 43,892 | | | Kansas City Southern (a) | | | 2,604,113 | | |
| | | | 6,123,451 | | |
| | | Regional Banks 8.2% | |
| | 47,213 | | | Bank of Hawaii Corp. | | | 2,196,349 | | |
| | 55,617 | | | Community Bank System, Inc. | | | 1,378,746 | | |
| | 107,178 | | | First Midwest Bancorp, Inc. | | | 1,317,218 | | |
| | 145,036 | | | Glacier Bancorp, Inc. | | | 1,955,085 | | |
| | 200,214 | | | Old National Bancorp | | | 2,162,311 | | |
| | 62,604 | | | Prosperity Bancshares, Inc. | | | 2,743,307 | | |
| | 79,017 | | | Webster Financial Corp. | | | 1,660,937 | | |
| | 41,940 | | | Westamerica Bancorporation | | | 2,065,545 | | |
| | | | 15,479,498 | | |
| | | Residential REITS 4.1% | |
| | 49,896 | | | Mid-America Apartment
Communities, Inc. | | | 3,366,483 | | |
| | 118,715 | | | Sun Communities, Inc. | | | 4,429,257 | | |
| | | | 7,795,740 | | |
| | | Restaurants 3.5% | |
| | 158,182 | | | Dominos Pizza, Inc. (a) | | | 3,992,514 | | |
| | 81,173 | | | The Cheesecake Factory, Inc. (a) | | | 2,546,397 | | |
| | | | 6,538,911 | | |
| | | Retail - Apparel 1.6% | |
| | 117,997 | | | ANN, Inc. (a) | | | 3,079,722 | | |
| | | Retail REITS 0.6% | |
| | 223,589 | | | Cedar Shopping Centers, Inc. | | | 1,151,483 | | |
| | | Semiconductor Equipment 2.9% | |
| | 126,464 | | | Advanced Energy
Industries, Inc. (a) | | | 1,870,403 | | |
| | 357,945 | | | Entegris, Inc. (a) | | | 3,622,403 | | |
| | | | 5,492,806 | | |
The accompanying notes are an integral part of these financial statements.
page 52

Frontegra Netols Small Cap Value Fund
SCHEDULE OF INVESTMENTS (continued)
June 30, 2011
| Number of Shares | | | | Value | |
| COMMON STOCKS 97.1% (continued) | | | |
| | | Semiconductors 3.1% | |
| | 185,734 | | | Fairchild Semiconductor
International, Inc. (a) | | $ | 3,103,615 | | |
| | 358,653 | | | Integrated Device
Technology, Inc. (a) | | | 2,819,013 | | |
| | | | 5,922,628 | | |
| | | Specialized REITS 1.5% | |
| | 439,144 | | | FelCor Lodging Trust, Inc. (a) | | | 2,340,637 | | |
| | 10,522 | | | National Health Investors, Inc. | | | 467,492 | | |
| | | | 2,808,129 | | |
| | | Specialty Stores 2.2% | |
| | 61,403 | | | Tractor Supply Co. | | | 4,106,633 | | |
| | | Sporting Goods, Hobby, and Musical Instrument Stores 0.7% | |
| | 49,148 | | | Cabela's, Inc. (a) | | | 1,334,368 | | |
| | | Steel 1.9% | |
| | 63,385 | | | Carpenter Technology Corp. | | | 3,656,047 | | |
| | | Thrifts & Mortgage Finance 1.5% | |
| | 127,209 | | | Astoria Financial Corp. | | | 1,627,003 | | |
| | 191,007 | | | MGIC Investment Corp. (a) | | | 1,136,492 | | |
| | | | 2,763,495 | | |
| | | Total Common Stocks | |
| | | | | (Cost $133,411,637) | | | 183,890,756 | | |
| Number of Shares | | | | Value | |
| SHORT-TERM INVESTMENTS 3.0% | |
| | | Investment Company 3.0% | |
| | 5,606,740 | | | Fidelity Institutional Money
Market Portfolio | | $ | 5,606,740 | | |
| | | Total Short-Term Investments | |
| | | (Cost $5,606,740) | | | 5,606,740 | | |
| | | Total Investments 100.1% | |
| | | (Cost $139,018,377) | | | 189,497,496 | | |
| | | Liabilities in Excess
of Other Assets (0.1)% | | | (255,383 | ) | |
| | | TOTAL NET ASSETS 100.0% | | $ | 189,242,113 | | |
PORTFOLIO DIVERSIFICATION
| Sectors | | Percentage | |
| Financials | | | 19.8 | % | |
| Industrials | | | 19.3 | | |
| Consumer Discretionary | | | 16.7 | | |
| Information Technology | | | 13.3 | | |
| Health Care | | | 11.3 | | |
| Energy | | | 6.9 | | |
| Materials | | | 5.3 | | |
| Consumer Staples | | | 4.5 | | |
| Total Common Stocks | | | 97.1 | | |
| Total Short-Term Investments | | | 3.0 | | |
| Total Investments | | | 100.1 | | |
| Liabilities in Excess of Other Assets | | | (0.1 | ) | |
| Total Net Assets | | | 100.0 | % | |
(a) Non-Income Producing.
(b) U.S. traded security of a foreign issuer
The accompanying notes are an integral part of these financial statements.
page 53

Frontegra Netols Small Cap Value Fund
STATEMENT OF ASSETS AND LIABILITIES
June 30, 2011
| ASSETS: | |
| Investments at value (cost $139,018,377) | | $ | 189,497,496 | | |
| Interest receivable | | | 37,946 | | |
| Receivable for Fund shares sold | | | 177,699 | | |
| Receivable for investments sold | | | 845,137 | | |
| Prepaid expenses and other assets | | | 10,910 | | |
| Total assets | | | 190,569,188 | | |
| LIABILITIES: | |
| Payable for investments purchased | | | 1,040,880 | | |
| Payable for Fund shares redeemed | | | 62,133 | | |
| Accrued investment advisory fee | | | 136,607 | | |
| Accrued distribution and shareholder servicing fees | | | 21,975 | | |
| Accrued expenses | | | 65,480 | | |
| Total liabilities | | | 1,327,075 | | |
| Net Assets | | $ | 189,242,113 | | |
| NET ASSETS CONSIST OF: | |
| Paid in capital | | $ | 144,364,999 | | |
| Accumulated net realized loss | | | (5,602,005 | ) | |
| Unrealized appreciation on investments | | | 50,479,119 | | |
| Net Assets | | $ | 189,242,113 | | |
| CAPITAL STOCK, $0.01 PAR VALUE | |
| Institutional Class Shares Authorized | | | 50,000,000 | | |
| Class Y Shares Authorized | | | 50,000,000 | | |
| INSTITUTIONAL CLASS: | |
| Net Assets | | $ | 166,450,055 | | |
| Issued and Outstanding | | | 12,104,141 | | |
| Net Asset Value, Redemption Price and Offering Price Per Share | | $ | 13.75 | | |
| CLASS Y: | |
| Net Assets | | $ | 22,792,058 | | |
| Issued and Outstanding | | | 1,677,213 | | |
| Net Asset Value, Redemption Price and Offering Price Per Share | | $ | 13.59 | | |
The accompanying notes are an integral part of these financial statements.
page 54

Frontegra Netols Small Cap Value Fund
STATEMENT OF OPERATIONS
| | | Year Ended
June 30, 2011 | |
| INVESTMENT INCOME: | |
| Dividend income | | $ | 1,242,383 | | |
| Interest income | | | 7,826 | | |
| Total Investment Income | | | 1,250,209 | | |
| EXPENSES: | |
| Investment advisory fees | | | 1,683,161 | | |
| Distribution and shareholder servicing fees - Class Y | | | 76,931 | | |
| Fund administration and accounting fees | | | 64,955 | | |
| Shareholder servicing fees | | | 35,360 | | |
| Legal fees | | | 32,354 | | |
| Audit fees | | | 24,656 | | |
| Custody fees | | | 18,020 | | |
| Directors' fees and related expenses | | | 12,619 | | |
| Federal and state registration fees | | | 11,702 | | |
| Reports to shareholders | | | 6,629 | | |
| Other | | | 15,711 | | |
| Total expenses before waiver and reimbursement | | | 1,982,098 | | |
| Waiver and reimbursement of expenses by Adviser | | | (53,689 | ) | |
| Net expenses | | | 1,928,409 | | |
| Net Investment Loss | | | (678,200 | ) | |
| REALIZED AND UNREALIZED GAIN ON INVESTMENTS: | |
| Net realized gain on investments | | | 1,382,190 | | |
| Change in net unrealized appreciation/(depreciation) on investments | | | 49,439,621 | | |
| Net Realized and Unrealized Gain on Investments | | | 50,821,811 | | |
| Net Increase in Net Assets Resulting from Operations | | $ | 50,143,611 | | |
The accompanying notes are an integral part of these financial statements.
page 55

Frontegra Netols Small Cap Value Fund
STATEMENTS OF CHANGES IN NET ASSETS
| | | For the
Year Ended
June 30, 2011 | | For the
Year Ended
June 30, 2010 | |
| OPERATIONS: | |
| Net investment income (loss) | | $ | (678,200 | ) | | $ | 64,463 | | |
| Net realized gain (loss) on investments | | | 1,382,190 | | | | (2,816,578 | ) | |
| Change in net unrealized appreciation/(depreciation) on investments | | | 49,439,621 | | | | 4,527,457 | | |
| Net increase in net assets resulting from operations | | | 50,143,611 | | | | 1,775,342 | | |
| DISTRIBUTIONS PAID TO INSTITUTIONAL CLASS SHAREHOLDERS FROM: | |
| Net investment income | | | (28,623 | ) | | | (105,774 | ) | |
| Net realized gain | | | — | | | | — | | |
| Return of capital | | | — | | | | (34,387 | ) | |
| Net decrease in net assets resulting from distributions paid | | | (28,623 | ) | | | (140,161 | ) | |
| DISTRIBUTIONS PAID TO CLASS Y CLASS SHAREHOLDERS FROM: | |
| Net investment income | | | — | | | | — | | |
| Net realized gain | | | — | | | | — | | |
| Net decrease in net assets resulting from distributions paid | | | — | | | | — | | |
| CAPITAL SHARE TRANSACTIONS: | |
| Shares sold - Institutional Class | | | 25,607,408 | | | | 87,906,355 | | |
| Shares sold - Class Y | | | 5,239,684 | | | | 17,583,054 | | |
| Shares issued to holders in reinvestment of distributions - Institutional Class | | | 17,071 | | | | 100,276 | | |
| Shares issued to holders in reinvestment of distributions - Class Y | | | — | | | | — | | |
| Shares redeemed - Institutional Class | | | (23,382,163 | ) | | | (13,668,980 | ) | |
| Shares redeemed - Class Y | | | (3,572,240 | ) | | | (2,737,389 | ) | |
| Net increase in net assets resulting from capital share transactions | | | 3,909,760 | | | | 89,183,316 | | |
| Total Increase in Net Assets | | | 54,024,748 | | | | 90,818,497 | | |
| NET ASSETS: | |
| Beginning of Period | | | 135,217,365 | | | | 44,398,868 | | |
| End of Period (includes undistributed net investment income of $0 and $0, respectively) | | $ | 189,242,113 | | | $ | 135,217,365 | | |
| TRANSACTIONS IN SHARES – INSTITUTIONAL CLASS: | |
| Shares sold | | | 2,079,703 | | | | 8,334,941 | | |
| Shares issued to holders in reinvestment of distributions | | | 1,349 | | | | 9,764 | | |
| Shares redeemed | | | (1,846,948 | ) | | | (1,291,419 | ) | |
| Net increase in shares outstanding | | | 234,104 | | | | 7,053,286 | | |
| TRANSACTIONS IN SHARES – CLASS Y: | |
| Shares sold | | | 419,253 | | | | 1,709,218 | | |
| Shares issued to holders in reinvestment of distributions | | | — | | | | — | | |
| Shares redeemed | | | (298,101 | ) | | | (252,817 | ) | |
| Net increase in shares outstanding | | | 121,152 | | | | 1,456,401 | | |
The accompanying notes are an integral part of these financial statements.
page 56

Frontegra Netols Small Cap Value Fund
FINANCIAL HIGHLIGHTS
| | | Institutional Class | |
| | | Year
Ended
June 30,
2011 | | Year
Ended
June 30,
2010 | | Year
Ended
June 30,
2009 | | Year
Ended
June 30,
2008 | | Year
Ended
June 30,
2007 | |
| Net Asset Value, Beginning of Period | | $ | 10.08 | | | $ | 9.03 | | | $ | 11.81 | | | $ | 12.88 | | | $ | 10.29 | | |
INCOME (LOSS) FROM
INVESTMENT OPERATIONS: | |
| Net investment income (loss) | | | (0.05 | )(1) | | | 0.02 | (2) | | | 0.01 | | | | — | (3) | | | 0.03 | | |
| Net realized and unrealized gain (loss) on investments | | | 3.72 | | | | 1.05 | | | | (2.79 | ) | | | (0.90 | ) | | | 2.62 | | |
| Total Income (Loss) from Investment Operations | | | 3.67 | | | | 1.07 | | | | (2.78 | ) | | | (0.90 | ) | | | 2.65 | | |
| LESS DISTRIBUTIONS: | |
| From net investment income | | | — | (3) | | | (0.02 | ) | | | — | (3) | | | (0.02 | ) | | | — | | |
| From net realized gain on investments | | | — | | | | — | | | | — | | | | (0.15 | ) | | | (0.06 | ) | |
| From return of capital | | | — | | | | — | (3) | | | — | | | | — | | | | — | | |
| Total Distributions | | | — | | | | (0.02 | ) | | | — | | | | (0.17 | ) | | | (0.06 | ) | |
| Net Asset Value, End of Period | | $ | 13.75 | | | $ | 10.08 | | | $ | 9.03 | | | $ | 11.81 | | | $ | 12.88 | | |
| Total Return | | | 36.43 | % | | | 11.76 | % | | | (23.42 | )% | | | (7.01 | )% | | | 25.81 | % | |
| SUPPLEMENTAL DATA AND RATIOS: | |
| Net assets, end of period (in thousands) | | $ | 166,450 | | | $ | 119,657 | | | $ | 43,504 | | | $ | 31,346 | | | $ | 17,368 | | |
| Ratio of expenses to average net assets: | |
| Before waivers and reimbursements | | | 1.13 | % | | | 1.18 | % | | | 1.45 | % | | | 1.59 | % | | | 2.10 | % | |
| Net of waivers and reimbursements | | | 1.10 | % | | | 1.10 | % | | | 1.10 | % | | | 1.10 | % | | | 1.10 | % | |
| Ratio of net investment income (loss) to average net assets: | |
| Before waivers and reimbursements | | | (0.39 | )% | | | 0.17 | % | | | (0.13 | )% | | | (0.40 | )% | | | (0.70 | )% | |
| Net of waivers and reimbursements | | | (0.36 | )% | | | 0.25 | % | | | 0.22 | % | | | 0.09 | % | | | 0.30 | % | |
| Portfolio turnover rate | | | 33 | % | | | 41 | % | | | 36 | % | | | 32 | % | | | 49 | % | |
(1) Net investment loss per share is calculated using ending balances prior to consideration of adjustments for permanent book to tax differences.
(2) Per share net investment income has been calculated using the daily average share method.
(3) Less than one cent per share.
The accompanying notes are an integral part of these financial statements.
page 57

Frontegra Netols Small Cap Value Fund
FINANCIAL HIGHLIGHTS
| | | Class Y | |
| | | Year
Ended
June 30,
2011 | | Year
Ended
June 30,
2010 | | Year
Ended
June 30,
2009 | | Period
Ended
June 30,
2008(1) | |
| Net Asset Value, Beginning of Period | | $ | 10.00 | | | $ | 8.98 | | | $ | 11.78 | | | $ | 12.54 | | |
INCOME (LOSS) FROM
INVESTMENT OPERATIONS: | |
| Net investment loss | | | (0.09 | )(2) | | | — | | | | (0.02 | ) | | | (0.02 | ) | |
| Net realized and unrealized gain (loss) on investments | | | 3.68 | | | | 1.02 | | | | (2.78 | ) | | | (0.57 | ) | |
| Total Income (Loss) from Investment Operations | | | 3.59 | | | | 1.02 | | | | (2.80 | ) | | | (0.59 | ) | |
| LESS DISTRIBUTIONS: | |
| From net investment income | | | — | | | | — | | | | — | | | | (0.02 | ) | |
| From net realized gain on investments | | | — | | | | — | | | | — | | | | (0.15 | ) | |
| Total Distributions | | | — | | | | — | | | | — | | | | (0.17 | ) | |
| Net Asset Value, End of Period | | $ | 13.59 | | | $ | 10.00 | | | $ | 8.98 | | | $ | 11.78 | | |
| Total Return | | | 35.90 | % | | | 11.36 | % | | | (23.77 | )% | | | (4.76 | )%(3) | |
| SUPPLEMENTAL DATA AND RATIOS: | |
| Net assets, end of period (in thousands) | | $ | 22,792 | | | $ | 15,560 | | | $ | 895 | | | $ | 1,034 | | |
| Ratio of expenses to average net assets: | |
| Before waivers and reimbursements | | | 1.53 | % | | | 1.58 | % | | | 1.85 | % | | | 2.01 | %(4) | |
| Net of waivers and reimbursements | | | 1.50 | % | | | 1.50 | % | | | 1.50 | % | | | 1.55 | %(4) | |
| Ratio of net investment loss to average net assets: | |
| Before waivers and reimbursements | | | (0.79 | )% | | | (0.23 | )% | | | (0.53 | )% | | | (0.80 | )%(4) | |
| Net of waivers and reimbursements | | | (0.76 | )% | | | (0.15 | )% | | | (0.18 | )% | | | (0.34 | )%(4) | |
| Portfolio turnover rate | | | 33 | % | | | 41 | % | | | 36 | % | | | 32 | %(3) | |
(1) Commenced operations on November 1, 2007.
(2) Net investment loss per share is calculated using ending balances prior to consideration of adjustments for permanent book to tax differences.
(3) Not annualized.
(4) Annualized.
The accompanying notes are an integral part of these financial statements.
page 58

FRONTEGRA
PHOCAS SMALL CAP VALUE FUND

REPORT FROM PHOCAS FINANCIAL CORPORATION
Dear Fellow Shareholders:
The Frontegra Phocas Small Cap Value Fund strives to achieve capital appreciation by investing in a diversified portfolio of equity securities of companies with small market capitalizations. The objective is relative to, and measured against, the Russell 2000® Value Index.
Performance Review
The Frontegra Phocas Small Cap Value Fund - Class L returned 33.55%, net of fees, for the twelve month period ending June 30, 2011. The Fund's return outperformed the 31.35% return of its benchmark, the Russell 2000 Value Index. The Frontegra Phocas Small Cap Value Fund - Class I returned -3.66%, net of fees, since its inception on April 7, 2011 through June 30, 2011, versus the benchmark Russell 2000 Value Index return of -3.29%.
For the year, the Financials sector contributed the most to the Fund's return, rising 24.43% vs. the benchmark's 18.89%. Industrials came in second best for the Fund, rising 44.11% vs. 35.62% for the benchmark. The weakest contributing sectors were Utilities and Telecommunication Services, which outperformed the benchmark's matching sectors by 0.78% and 0.39%, respectively.
Portfolio Outlook and Strategy
Generally, sector weights in the Fund are kept closely in line with the corresponding sector weights in the benchmark. During the second quarter of 2011, Russell rebalanced their indices, including the benchmark. The sectors with the largest increases were Consumer Discretionary (+250bps) and Technology (+270bps), while reductions in exposure were largely seen in Energy (-220bps) and Financials (-190bps). Per our investment strategy of being closely in line with sector weights in the benchmark, we repositioned the portfolio to become more in line with the new sector weights. Thus, we increased Consumer Discretionary by 260bps, increased Technology by 120bps (we were overweight and are now slightly underweight this sector), reduced Energy by 200bps, and reduced Financials by 150bps. Currently, we are about 100bps overweight in Energy and Health Care, and are about 100bps underweight in Consumer Discretionary and Utilities.
While we believe the macroeconomic issues in southern Europe are real, and it is certainly possible that U.S. politicians will continue to pander to votes rather than compromise, we also believe that it's more likely than not that the economic recovery should continue through at least this year. Interest rates remain quite low and we don't expect to see substantially worsening unemployment and real estate prices. Corporations are flush with cash, and are putting it to work with acquisitions and shareholder friendly actions like higher dividends and share repurchases. If the U.S. government can actually come to an agreement to get expenses closer in line with revenues, then we expect to see markets move higher in a relief rally.
Because it is quite difficult, if not impossible, to time markets on a consistent basis, our core investment strategy remains to concentrate on identifying undervalued stocks in each economic sector.
Thank you for your continued support.
| | | |
|
| William Schaff, CFA | | Steve Block, CFA | |
|
| Chief Executive Officer and Portfolio Manager | | Portfolio Manager | |
|
| Phocas Financial Corporation | | Phocas Financial Corporation | |
|
page 60

INVESTMENT HIGHLIGHTS
Growth of a $100,000 Investment (Unaudited)
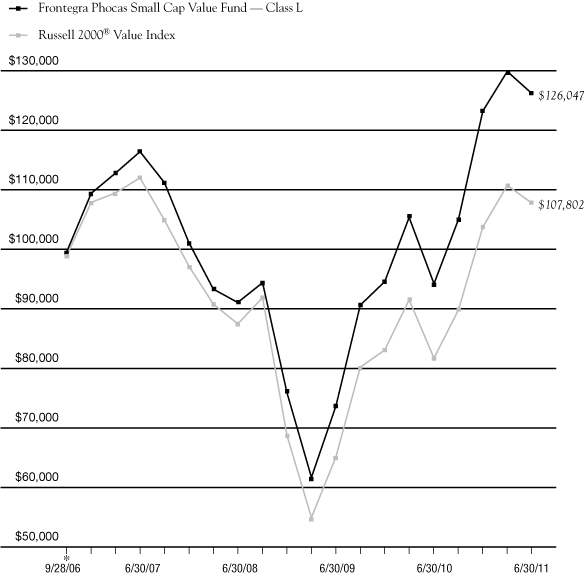
* 9/29/06 commencement of operations.
This chart assumes an initial gross investment of $100,000 made on 9/29/06. Returns shown include the reinvestment of all distributions. Past performance is not predictive of future results. Investment return and principal value will fluctuate so that shares, when redeemed, may be worth more or less than the original cost. In the absence of fee waivers, total return would be reduced. Effective October 8, 2010, Phocas Financial Corp. ("Phocas") became subadvisor to the Fund. Prior to October 8, 2010, Phocas served as adviser to the Fund. To receive current to the most recent month-end performance, please call 1-888-825-2100.
The Russell 2000® Value Index measures the performance of those Russell 2000® companies with lower price-to-book ratios and lower forecasted growth values.
** The returns shown do not reflect the deduction of taxes that a shareholder would pay on Fund distributions or the redemption of Fund shares.
The above graph relates to Class L shares of the Fund. Performance for Class I shares will vary from the performance of Class L shares shown above due to differences in expenses.
Portfolio Total Return**
| FOR PERIODS ENDED 6/30/11 | | FUND | | INDEX | |
| SIX MONTHS | | | 2.34 | % | | | 3.77 | % | |
| ONE YEAR | | | 33.55 | % | | | 31.35 | % | |
THREE YEAR
AVERAGE ANNUAL | | | 11.36 | % | | | 7.09 | % | |
AVERAGE ANNUAL
SINCE INCEPTION | | | 4.99 | % | | | 1.59 | % | |
page 61

Frontegra Phocas Small Cap Value Fund
SCHEDULE OF INVESTMENTS
June 30, 2011
| Number of Shares | | | | Value | |
| COMMON STOCKS 97.2% | |
| | | Aerospace Product and Parts Manufacturing 2.2% | |
| | 3,413 | | | AAR Corp. (a) | | $ | 92,458 | | |
| | 3,563 | | | Triumph Group, Inc. | | | 354,804 | | |
| | | | 447,262 | | |
| | | Agencies, Brokerages, and Other Insurance Related Activities 0.6% | |
| | 11,637 | | | National Financial
Partners Corp. (a) | | | 134,291 | | |
| | | Animal Slaughtering and
Processing 1.8% | |
| | 21,249 | | | Darling International, Inc. (a) | | | 376,107 | | |
| | | Architectural, Engineering, and Related Services 1.2% | |
| | 3,849 | | | Tetra Tech, Inc. (a) | | | 86,602 | | |
| | 3,689 | | | URS Corp. (a) | | | 165,046 | | |
| | | | 251,648 | | |
| | | Basic Chemical
Manufacturing 2.8% | |
| | 3,272 | | | Ashland, Inc. | | | 211,437 | | |
| | 5,815 | | | Huntsman Corp. | | | 109,613 | | |
| | 7,409 | | | Sensient Technologies Corp. | | | 274,652 | | |
| | | | 595,702 | | |
| | | Clothing Stores 0.8% | |
| | 3,924 | | | Childrens Place Retail
Stores, Inc. (a) | | | 174,579 | | |
| | | Communications Equipment Manufacturing 0.9% | |
| | 8,773 | | | Arris Group, Inc. (a) | | | 101,854 | | |
| | 16,734 | | | Tellabs, Inc. | | | 77,144 | | |
| | | | 178,998 | | |
| Number of Shares | | | | Value | |
| | | Computer Systems Design and
Related Services 3.7% | |
| | 19,178 | | | ICG Group, Inc. (a) | | $ | 234,547 | | |
| | 9,229 | | | JDA Software Group, Inc. (a) | | | 285,084 | | |
| | 7,653 | | | SYNNEX Corp. (a) | | | 242,600 | | |
| | | | 762,231 | | |
| | | Cut and Sew Apparel
Manufacturing 3.4% | |
| | 3,003 | | | G-III Apparel Group Ltd. (a) | | | 103,543 | | |
| | 13,346 | | | Iconix Brand Group, Inc. (a) | | | 322,973 | | |
| | 10,777 | | | Perry Ellis International, Inc. (a) | | | 272,119 | | |
| | | | 698,635 | | |
| | | Depository Credit
Intermediation 12.9% | |
| | 13,854 | | | Banco Latinoamericano de
Exportaciones S.A. (b) | | | 239,951 | | |
| | 30,092 | | | Boston Private Financial
Holdings, Inc. | | | 198,005 | | |
| | 27,129 | | | Center Financial Corp. (a) | | | 172,269 | | |
| | 10,888 | | | Columbia Banking System, Inc. | | | 187,491 | | |
| | 27,166 | | | First Horizon National Corp. | | | 259,164 | | |
| | 15,245 | | | First Pactrust Bancorp, Inc. | | | 226,541 | | |
| | 3,933 | | | IBERIABANK Corp. | | | 226,698 | | |
| | 7,666 | | | Old National Bancorp | | | 82,793 | | |
| | 1,441 | | | Republic Bancorp, Inc. - Class A | | | 28,676 | | |
| | 8,281 | | | Southwest Bancorp, Inc. (a) | | | 81,071 | | |
| | 6,824 | | | State Bank Financial Corp. (a) | | | 111,709 | | |
| | 5,618 | | | SVB Financial Group (a) | | | 335,451 | | |
| | 49,008 | | | Synovus Financial Corp. | | | 101,936 | | |
| | 16,501 | | | Washington Banking Co. | | | 218,143 | | |
| | 6,533 | | | Wintrust Financial Corp. | | | 210,232 | | |
| | | | 2,680,130 | | |
| | | Electric Power Generation, Transmission and
Distribution 2.1% | |
| | 5,844 | | | Great Plains Energy, Inc. | | | 121,146 | | |
| | 4,559 | | | Portland General Electric Co. | | | 115,252 | | |
The accompanying notes are an integral part of these financial statements.
page 62

Frontegra Phocas Small Cap Value Fund
SCHEDULE OF INVESTMENTS (continued)
June 30, 2011
| Number of Shares | | | | Value | |
| COMMON STOCKS 97.2% (continued) | | | |
| | | Electric Power Generation, Transmission and
Distribution 2.1% (continued) | |
| | 5,352 | | | The Empire District Electric Co. | | $ | 103,080 | | |
| | 3,601 | | | Unitil Corp. | | | 94,706 | | |
| | | | 434,184 | | |
| | | Electrical Equipment
Manufacturing 0.5% | |
| | 3,059 | | | Powell Industries, Inc. (a) | | | 111,654 | | |
| | | Electronic Shopping and Mail-Order Houses 0.4% | |
| | 6,067 | | | Systemax, Inc. (a) | | | 90,641 | | |
| | | Fruit and Vegetable Preserving and Specialty Food Manufacturing 1.1% | |
| | 4,295 | | | Treehouse Foods, Inc. (a) | | | 234,550 | | |
| | | Full-Service Restaurants 1.0% | |
| | 5,273 | | | P.F. Chang's China Bistro, Inc. | | | 212,185 | | |
| | | Furniture and Home Furnishing Merchant Wholesalers 1.4% | |
| | 8,460 | | | United Stationers, Inc. | | | 299,738 | | |
| | | General Freight Trucking 0.5% | |
| | 4,145 | | | Werner Enterprises, Inc. (a) | | | 104,211 | | |
| | | Health Care Providers &
Services 1.6% | |
| | 6,477 | | | Wellcare Health Plans, Inc. (a) | | | 332,983 | | |
| | | Highway, Street, and Bridge Construction 0.4% | |
| | 6,823 | | | Sterling Construction
Co., Inc. (a) | | | 93,953 | | |
| Number of Shares | | | | Value | |
| | | Household and Institutional
Furniture and Kitchen Cabinet Manufacturing 0.5% | |
| | 9,051 | | | Pier 1 Imports, Inc. (a) | | $ | 104,720 | | |
| | | Insurance Carriers 3.5% | |
| | 3,360 | | | Alterra Capital Holdings Ltd. (b) | | | 74,928 | | |
| | 37,318 | | | CNO Financial Group, Inc. (a) | | | 295,186 | | |
| | 3,717 | | | Infinity Property & Casualty Corp. | | | 203,171 | | |
| | 4,930 | | | Unitrin, Inc. | | | 146,273 | | |
| | | | 719,558 | | |
| | | Lawn and Garden Equipment and Supplies Stores 0.9% | |
| | 6,390 | | | Titan Machinery, Inc. (a) | | | 183,904 | | |
| | | Management of Companies and Enterprises 3.0% | |
| | 12,416 | | | Ares Capital Corp. | | | 199,525 | | |
| | 6,326 | | | Hancock Holding Co. | | | 195,980 | | |
| | 9,457 | | | Prospect Capital Corp. | | | 95,610 | | |
| | 6,600 | | | Safeguard Scientifics, Inc. (a) | | | 124,608 | | |
| | | | 615,723 | | |
| | | Management, Scientific, and Technical Consulting Services 1.5% | |
| | 10,159 | | | Huron Consulting Group, Inc. (a) | | | 306,903 | | |
| | | Medical Equipment and Supplies Manufacturing 1.3% | |
| | 6,286 | | | Orthofix International N.V. (a)(b) | | | 266,966 | | |
| | | Metal Ore Mining 2.0% | |
| | 8,325 | | | Coeur d'Alene Mines Corp. (a) | | | 201,965 | | |
| | 5,582 | | | Materion Corp. (a) | | | 206,367 | | |
| | | | 408,332 | | |
The accompanying notes are an integral part of these financial statements.
page 63

Frontegra Phocas Small Cap Value Fund
SCHEDULE OF INVESTMENTS (continued)
June 30, 2011
| Number of Shares | | | | Value | |
| COMMON STOCKS 97.2% (continued) | | | |
| | | Miscellaneous Durable Goods Merchant Wholesalers 0.3% | |
| | 1,211 | | | Schnitzer Steel Industries,
Inc. - Class A | | $ | 69,753 | | |
| | | Motor Vehicle Parts
Manufacturing 0.5% | |
| | 4,250 | | | Fuel Systems Solutions, Inc. (a) | | | 106,038 | | |
| | | Natural Gas Distribution 1.4% | |
| | 5,117 | | | Atmos Energy Corp. | | | 170,140 | | |
| | 3,123 | | | Laclede Group, Inc. | | | 118,143 | | |
| | | | 288,283 | | |
| | | Newspaper, Periodical, Book, and Directory Publishers 0.5% | |
| | 3,318 | | | Meredith Corp. | | | 103,289 | | |
| | | Nonscheduled Air Transportation 0.9% | |
| | 3,304 | | | Atlas Air Worldwide Holdings,
Inc. (a) | | | 196,621 | | |
| | | Oil and Gas Extraction 4.7% | |
| | 11,212 | | | Goodrich Petroleum Corp. (a) | | | 206,413 | | |
| | 8,340 | | | Petroleum Development Corp. (a) | | | 249,449 | | |
| | 18,208 | | | Rex Energy Corp. (a) | | | 186,996 | | |
| | 8,688 | | | Swift Energy Co. (a) | | | 323,802 | | |
| | | | 966,660 | | |
| | | Other Fabricated Metal Product Manufacturing 1.9% | |
| | 5,698 | | | Timken Co. | | | 287,179 | | |
| | 2,888 | | | Watts Water Technologies,
Inc. - Class A | | | 102,264 | | |
| | | | 389,443 | | |
| | | Other Food Manufacturing 0.4% | |
| | 3,935 | | | Snyders-Lance, Inc. | | | 85,114 | | |
| Number of Shares | | | | Value | |
| | | Other General Merchandise
Stores 1.0% | |
| | 6,227 | | | Big Lots, Inc. (a) | | $ | 206,425 | | |
| | | Other General Purpose Machinery Manufacturing 1.4% | |
| | 3,870 | | | Esterline Technologies Corp. (a) | | | 295,668 | | |
| | | Other Professional, Scientific, and Technical Services 0.6% | |
| | 5,768 | | | Teletech Holdings, Inc. (a) | | | 121,590 | | |
| | | Personal Care Services 1.6% | |
| | 7,160 | | | Steiner Leisure Ltd. (a)(b) | | | 327,069 | | |
| | | Petroleum and Coal Products Manufacturing 0.4% | |
| | 1,155 | | | Ameron International Corp. | | | 75,860 | | |
| | | Pharmaceutical and Medicine Manufacturing 3.6% | |
| | 4,380 | | | Emergent BioSolutions, Inc. (a) | | | 98,769 | | |
| | 9,125 | | | Par Pharmaceutical Companies,
Inc. (a) | | | 300,942 | | |
| | 15,062 | | | Rigel Pharmaceuticals, Inc. (a) | | | 138,119 | | |
| | 11,148 | | | ViroPharma, Inc. (a) | | | 206,238 | | |
| | | | 744,068 | | |
| | | Plastics Product
Manufacturing 0.4% | |
| | 4,196 | | | Tredegar Corp. | | | 76,997 | | |
| | | Printing and Related Support Activities 1.0% | |
| | 8,504 | | | American Greetings Corp. | | | 204,436 | | |
| | | Rail Transportation 1.1% | |
| | 3,755 | | | Kansas City Southern (a) | | | 222,784 | | |
The accompanying notes are an integral part of these financial statements.
page 64

Frontegra Phocas Small Cap Value Fund
SCHEDULE OF INVESTMENTS (continued)
June 30, 2011
| Number of Shares | | | | Value | |
| COMMON STOCKS 97.2% (continued) | | | |
| | | Real Estate Investment Trusts 12.5% | |
| | 13,146 | | | Acadia Realty Trust | | $ | 267,258 | | |
| | 3,806 | | | Alexandria Real Estate Equities, Inc. | | | 294,660 | | |
| | 33,158 | | | Cogdell Spencer, Inc. | | | 198,616 | | |
| | 15,140 | | | Colonial Properties Trust | | | 308,856 | | |
| | 8,138 | | | DuPont Fabros Technology, Inc. | | | 205,078 | | |
| | 9,890 | | | First Industrial Realty Trust, Inc. (a) | | | 113,241 | | |
| | 23,887 | | | Glimcher Realty Trust | | | 226,926 | | |
| | 5,391 | | | Kilroy Realty Corp. | | | 212,891 | | |
| | 10,943 | | | LaSalle Hotel Properties | | | 288,239 | | |
| | 37,728 | | | Strategic Hotels & Resorts, Inc. (a) | | | 267,114 | | |
| | 5,487 | | | Sun Communities, Inc. | | | 204,720 | | |
| | | | 2,587,599 | | |
| | | Semiconductor and Other Electronic Component Manufacturing 5.9% | |
| | 24,133 | | | Fairchild Semiconductor
International, Inc. - Class A (a) | | | 403,262 | | |
| | 15,201 | | | Microsemi Corp. (a) | | | 311,621 | | |
| | 5,808 | | | Plexus Corp. (a) | | | 202,177 | | |
| | 38,367 | | | RF Micro Devices, Inc. (a) | | | 234,806 | | |
| | 7,960 | | | TriQuint Semiconductor, Inc. (a) | | | 81,112 | | |
| | | | 1,232,978 | | |
| | | Software Publishers 1.8% | |
| | 17,210 | | | Compuware Corp. (a) | | | 167,970 | | |
| | 27,457 | | | S1 Corp. (a) | | | 205,378 | | |
| | | | 373,348 | | |
| Number of Shares | | | | Value | |
| | | Support Activities for Mining 1.8% | |
| | 5,614 | | | Basic Energy Services, Inc. (a) | | $ | 176,672 | | |
| | 33,968 | | | Parker Drilling Co. (a) | | | 198,713 | | |
| | | | 375,385 | | |
| | | Trading Companies &
Distributors 0.6% | |
| | 18,863 | | | Aceto Corp. | | | 126,571 | | |
| | | Water, Sewage and Other Systems 0.9% | |
| | 6,076 | | | American Water Works Co., Inc. | | | 178,938 | | |
| | | Total Common Stocks | |
| | | | | (Cost $15,792,186) | | | 20,174,705 | | |
| SHORT-TERM INVESTMENTS 3.2% | | | |
| | 655,881 | | | AIM STIT-STIC Prime
Portfolio - Institutional Class | | | 655,881 | | |
| | | Total Short-Term Investments | |
| | | | | (Cost $655,881) | | | 655,881 | | |
| | | Total Investments 100.4% | |
| | | | | (Cost $16,448,067) | | | 20,830,586 | | |
| | | | | Liabilities in Excess of
Other Assets (0.4)% | | | (82,613 | ) | |
| | | | | TOTAL NET ASSETS 100.0% | | $ | 20,747,973 | | |
(a) Non-Income Producing Security.
(b) U.S. traded security of a foreign issuer.
The accompanying notes are an integral part of these financial statements.
page 65

Frontegra Phocas Small Cap Value Fund
SCHEDULE OF INVESTMENTS (continued)
June 30, 2011
PORTFOLIO DIVERSIFICATION
| Sectors | | Percentage | |
| Financials | | | 21.1 | % | |
| Industrials | | | 15.9 | | |
| Information Technology | | | 11.7 | | |
| Consumer Discretionary | | | 10.7 | | |
| Health Care | | | 7.4 | | |
| Energy | | | 6.5 | | |
| Materials | | | 5.2 | | |
| Utilities | | | 4.3 | | |
| Consumer Staples | | | 3.4 | | |
| Lodging/Resorts | | | 2.7 | | |
| Office | | | 2.4 | | |
| Apartments | | | 1.5 | | |
| Shopping Centers | | | 1.3 | | |
| Regional Malls | | | 1.1 | | |
| Diversified | | | 1.0 | | |
| Manufactured Homes | | | 1.0 | | |
| Total Common Stocks | | | 97.2 | | |
| Total Short-Term Investments | | | 3.2 | | |
| Total Investments | | | 100.4 | | |
| Liabilities in Excess of Other Assets | | | (0.4 | ) | |
| Total Net Assets | | | 100.0 | % | |
The accompanying notes are an integral part of these financial statements.
page 66

Frontegra Phocas Small Cap Value Fund
STATEMENT OF ASSETS AND LIABILITIES
June 30, 2011
| ASSETS: | |
| Investments at value (cost $16,448,067) | | $ | 20,830,586 | | |
| Interest receivable | | | 23,537 | | |
| Receivable for Fund shares sold | | | 990 | | |
| Receivable for investments sold | | | 255,878 | | |
| Prepaid expenses and other assets | | | 9,156 | | |
| Total assets | | | 21,120,147 | | |
| LIABILITIES: | |
| Payable for investments purchased | | | 302,296 | | |
| Payable for Fund shares redeemed | | | 10,000 | | |
| Accrued investment advisory fee | | | 10,203 | | |
| Accrued subadministration fee | | | 61 | | |
| Accrued expenses | | | 49,614 | | |
| Total liabilities | | | 372,174 | | |
| Net Assets | | $ | 20,747,973 | | |
| NET ASSETS CONSIST OF: | |
| Paid in capital | | $ | 19,412,287 | | |
| Accumulated net realized loss | | | (3,046,833 | ) | |
| Unrealized appreciation on investments | | | 4,382,519 | | |
| Net Assets | | $ | 20,747,973 | | |
| CAPITAL STOCK, $0.01 PAR VALUE | |
| Class L Shares Authorized | | | 50,000,000 | | |
| Class I Shares Authorized | | | 50,000,000 | | |
| CLASS L: | |
| Net Assets | | $ | 20,507,175 | | |
| Issued and Outstanding | | | 836,675 | | |
| Net Asset Value, Redemption Price and Offering Price Per Share | | $ | 24.51 | | |
| CLASS I: | |
| Net Assets | | $ | 240,803 | | |
| Issued and Outstanding | | | 9,825 | | |
| Net Asset Value, Redemption Price and Offering Price Per Share | | $ | 24.51 | | |
The accompanying notes are an integral part of these financial statements.
page 67

Frontegra Phocas Small Cap Value Fund
STATEMENT OF OPERATIONS
| | | Year Ended
June 30, 2011 | |
| INVESTMENT INCOME: | |
| Dividend income | | $ | 219,700 | | |
| Interest income | | | 587 | | |
| Total Investment Income | | | 220,287 | | |
| EXPENSES: | |
| Investment advisory fees | | | 177,974 | | |
| Fund administration and accounting fees | | | 42,294 | | |
| Audit fees | | | 25,105 | | |
| Legal fees | | | 23,643 | | |
| Federal and state registration fees | | | 14,231 | | |
| Shareholder servicing fees | | | 12,618 | | |
| Reports to shareholders | | | 6,891 | | |
| Directors' fees and related expenses | | | 6,837 | | |
| Custody fees | | | 6,292 | | |
| Subadministration fees - Class I | | | 61 | | |
| Other | | | 3,558 | | |
| Total expenses before waiver and reimbursement | | | 319,504 | | |
| Waiver and reimbursement of expenses by Adviser | | | (132,404 | ) | |
| Net expenses | | | 187,100 | | |
| Net Investment Income | | | 33,187 | | |
| REALIZED AND UNREALIZED GAIN ON INVESTMENTS: | |
| Net realized gain on investments | | | 1,348,663 | | |
| Change in net unrealized appreciation/(depreciation) on investments | | | 3,730,879 | | |
| Net Realized and Unrealized Gain on Investments | | | 5,079,542 | | |
| Net Increase in Net Assets Resulting from Operations | | $ | 5,112,729 | | |
The accompanying notes are an integral part of these financial statements.
page 68

Frontegra Phocas Small Cap Value Fund
STATEMENTS OF CHANGES IN NET ASSETS
| | | For the
Year Ended
June 30, 2011 | | For the Six
Months Ended
June 30, 2010(1) | | For the
Year Ended
December 31, 2009 | |
| OPERATIONS: | |
| Net investment income | | $ | 33,187 | | | $ | 16,088 | | | $ | 67,895 | | |
| Net realized gain (loss) on investments | | | 1,348,663 | | | | 1,494,477 | | | | (2,924,744 | ) | |
Change in net unrealized appreciation/(depreciation)
on investments | | | 3,730,879 | | | | (1,213,825 | ) | | | 6,566,932 | | |
| Net increase in net assets resulting from operations | | | 5,112,729 | | | | 296,740 | | | | 3,710,083 | | |
| DISTRIBUTIONS PAID TO CLASS L SHAREHOLDERS FROM: | |
| Net investment income | | | (50,863 | ) | | | — | | | | (75,678 | ) | |
| Net decrease in net assets resulting from distributions paid | | | (50,863 | ) | | | — | | | | (75,678 | ) | |
| DISTRIBUTIONS PAID TO CLASS I SHAREHOLDERS FROM: | |
| Net investment income | | | — | | | | — | | | | — | | |
| Net decrease in net assets resulting from distributions paid | | | — | | | | — | | | | — | | |
| CAPITAL SHARE TRANSACTIONS: | |
| Shares sold - Class L | | | 2,200,504 | | | | 921,266 | | | | 2,201,503 | | |
| Shares sold - Class I | | | 249,950 | | | | — | | | | — | | |
| Shares issued to holders in reinvestment of distributions - Class L | | | 50,863 | | | | — | | | | 75,678 | | |
| Shares issued to holders in reinvestment of distributions - Class I | | | — | | | | — | | | | — | | |
| Shares redeemed - Class L | | | (1,991,047 | ) | | | (5,373,421 | ) | | | (3,782,494 | ) | |
| Shares redeemed - Class I | | | — | | | | — | | | | — | | |
| Redemption fees - Class L | | | 286 | | | | 230 | | | | 210 | | |
| Net increase (decrease) in net assets resulting from capital share transactions | | | 510,556 | | | | (4,451,925 | ) | | | (1,505,103 | ) | |
| Total Increase (Decrease) in Net Assets | | | 5,572,422 | | | | (4,155,185 | ) | | | 2,129,302 | | |
| NET ASSETS: | |
| Beginning of Period | | | 15,175,551 | | | | 19,330,736 | | | | 17,201,434 | | |
End of Period (includes undistributed net investment income of
$0, $14,924 and $0, respectively) | | $ | 20,747,973 | | | $ | 15,175,551 | | | $ | 19,330,736 | | |
| TRANSACTIONS IN SHARES – CLASS L: | |
| Shares sold | | | 96,712 | | | | 47,147 | | | | 143,940 | | |
| Shares issued to holders in reinvestment of distributions | | | 2,163 | | | | — | | | | 4,240 | | |
| Shares redeemed | | | (86,785 | ) | | | (268,474 | ) | | | (254,710 | ) | |
| Net increase (decrease) in shares outstanding | | | 12,090 | | | | (221,327 | ) | | | (106,530 | ) | |
| TRANSACTIONS IN SHARES – CLASS I:(2) | |
| Shares sold | | | 9,825 | | | | — | | | | — | | |
| Shares issued to holders in reinvestment of distributions | | | — | | | | — | | | | — | | |
| Shares redeemed | | | — | | | | — | | | | — | | |
| Net increase in shares outstanding | | | 9,825 | | | | — | | | | — | | |
(1) Effective June 30, 2010 the Fund changed its fiscal year end to June 30 from December 31.
(2) Commenced operations on April 7, 2011.
The accompanying notes are an integral part of these financial statements.
page 69

Frontegra Phocas Small Cap Value Fund
FINANCIAL HIGHLIGHTS
| | | Class L | |
| | | Year
Ended
June 30,
2011(1) | | Six Months
Ended
June 30,
2010(2) | | Year
Ended
December 31,
2009 | | Year
Ended
December 31,
2008 | | Year
Ended
December 31,
2007 | | Period
Ended
December 31,
2006(3) | |
| Net Asset Value, Beginning of Period | | $ | 18.40 | | | $ | 18.48 | | | $ | 14.93 | | | $ | 20.01 | | | $ | 21.86 | | | $ | 20.00 | | |
INCOME (LOSS) FROM
INVESTMENT OPERATIONS: | |
| Net investment income | | | 0.04 | (4) | | | 0.02 | (4) | | | 0.06 | (4) | | | 0.13 | (4) | | | 0.05 | (4) | | | 0.03 | | |
Net realized and unrealized
gain (loss) on investments | | | 6.13 | | | | (0.10 | ) | | | 3.56 | | | | (5.08 | ) | | | (1.68 | ) | | | 1.85 | | |
Total Income (Loss) from
Investment Operations | | | 6.17 | | | | (0.08 | ) | | | 3.62 | | | | (4.95 | ) | | | (1.63 | ) | | | 1.88 | | |
| LESS DISTRIBUTIONS: | |
| From net investment income | | | (0.06 | ) | | | — | | | | (0.07 | ) | | | (0.13 | ) | | | (0.09 | ) | | | (0.02 | ) | |
| From net realized gain on investments | | | — | | | | — | | | | — | | | | — | | | | (0.13 | ) | | | — | | |
| Total Distributions | | | (0.06 | ) | | | — | | | | (0.07 | ) | | | (0.13 | ) | | | (0.22 | ) | | | (0.02 | ) | |
| Redemption fees retained | | | — | (5) | | | — | (5) | | | — | (5) | | | — | (5) | | | — | (5) | | | — | | |
| Net Asset Value, End of Period | | $ | 24.51 | | | $ | 18.40 | | | $ | 18.48 | | | $ | 14.93 | | | $ | 20.01 | | | $ | 21.86 | | |
| Total Return | | | 33.55 | % | | | (0.43 | )%(6) | | | 24.29 | % | | | (24.68 | )% | | | (7.46 | )% | | | 9.41 | %(6) | |
SUPPLEMENTAL DATA
AND RATIOS: | |
| Net assets, end of period (in thousands) | | $ | 20,507 | | | $ | 15,176 | | | $ | 19,331 | | | $ | 17,201 | | | $ | 21,936 | | | $ | 1,233 | | |
| Ratio of expenses to average net assets: | |
| Before waivers and reimbursements | | | 1.69 | % | | | 1.68 | %(7) | | | 1.71 | % | | | 1.52 | % | | | 2.43 | % | | | 14.93 | %(7) | |
| Net of waivers and reimbursements | | | 0.99 | % | | | 0.99 | %(7) | | | 0.99 | % | | | 0.99 | % | | | 1.18 | % | | | 1.50 | %(7) | |
Ratio of net investment income (loss)
to average net assets: | |
| Before waivers and reimbursements | | | (0.52 | )% | | | (0.53 | )%(7) | | | (0.31 | )% | | | 0.21 | % | | | (0.54 | )% | | | (12.79 | )%(7) | |
| Net of waivers and reimbursements | | | 0.18 | % | | | 0.16 | %(7) | | | 0.41 | % | | | 0.74 | % | | | 0.71 | % | | | 0.63 | %(7) | |
| Portfolio turnover rate | | | 37 | % | | | 43 | %(6) | | | 67 | % | | | 34 | % | | | 148 | % | | | 11 | %(6) | |
(1) Effective October 8, 2010 Frontegra Asset Management, Inc. became adviser and Phocas Financial Corp. became subadviser to the Fund.
(2) Effective June 30, 2010, the Fund changed its fiscal year end to June 30 from December 31.
(3) Commenced operations on September 29, 2006.
(4) Per share net investment income has been calculated using the daily average shares method.
(5) Less than one cent per share.
(6) Not annualized.
(7) Annualized.
The accompanying notes are an integral part of these financial statements.
page 70

Frontegra Phocas Small Cap Value Fund
FINANCIAL HIGHLIGHTS
| | | Class I | |
| | | Period
Ended
June 30,
2011(1) | |
| Net Asset Value, Beginning of Period | | $ | 25.44 | | |
INCOME (LOSS) FROM
INVESTMENT OPERATIONS: | |
| Net investment income | | | (0.04 | ) | |
| Net realized and unrealized loss on investments | | | (0.89 | ) | |
| Total Loss from Investment Operations | | | (0.93 | ) | |
| Net Asset Value, End of Period | | $ | 24.51 | | |
| Total Return | | | (3.66 | )%(2) | |
| SUPPLEMENTAL DATA AND RATIOS: | |
| Net assets, end of period (in thousands) | | $ | 241 | | |
| Ratio of expenses to average net assets: | |
| Before waivers and reimbursements | | | 1.76 | %(3) | |
| Net of waivers and reimbursements | | | 1.10 | %(3) | |
| Ratio of net investment income (loss) to average net assets: | |
| Before waivers and reimbursements | | | (1.41 | )%(3) | |
| Net of waivers and reimbursements | | | (0.75 | )%(3) | |
| Portfolio turnover rate | | | 37 | %(2) | |
(1) Commenced operations on April 7, 2011.
(2) Not annualized.
(3) Annualized.
The accompanying notes are an integral part of these financial statements.
page 71

Frontegra Funds
NOTES TO FINANCIAL STATEMENTS
June 30, 2011
(1) ORGANIZATION
Frontegra Funds, Inc. (the "Company") was incorporated on May 24, 1996 as a Maryland corporation and is registered under the Investment Company Act of 1940, as amended (the "1940 Act"), as an open-end investment company issuing shares in series (each, a "Fund," or collectively, the "Funds"), each series representing a distinct portfolio with its own investment objectives and policies. Each Fund's investment objective is capital appreciation.
As of June 30, 2011, the Company had six series in operations. A summary of each Fund's investment adviser, subadviser and capital structure is as follows:
| Fund | | Investment Adviser | | Subadviser | | Capital Structure | | Commencement
of Operations | |
| Frontegra Mastholm International Equity Fund | | Frontegra Asset Management, Inc. ("Frontegra") | | Mastholm Asset Management, LLC ("Mastholm") | | Single Class | | Jan. 8, 2004 | |
|
| Frontegra SAM Global Equity Fund | | Frontegra | | Sustainable Asset Management USA, Inc. ("SAM") | | Single Class | | June 18, 2009 | |
|
| Frontegra HEXAM Emerging Markets Fund | | Frontegra | | HEXAM Capital Partners, LLP ("HEXAM") | | Single Class | | Dec. 20, 2010 | |
|
| Frontegra Timpani Small Cap Growth Fund | | Timpani Capital Management LLC ("Timpani") (a) | | | None | | | Multi-Class
• Institutional
• Class Y (b) | | Mar. 23, 2011 | |
|
| Frontegra Netols Small Cap Value Fund | | Frontegra | | Netols Asset Management, Inc. ("Netols") | | Multi-Class
• Institutional
• Class Y | | Dec. 16, 2005 | |
|
| Frontegra Phocas Small Cap Value Fund | | Frontegra | | Phocas Financial Corp. ("Phocas") | | Multi-Class
• Class L
• Class I | | Sep. 28, 2006 | |
|
(a) Timpani Capital Management LLC is an affiliate of Frontegra Asset Management, Inc.
(b) As of June 30, 2011, the Class Y shares of the Frontegra Timpani Small Cap Growth Fund had not commenced operations.
Two of the six Funds reorganized with predecessor funds with comparable investment objectives. A summary of the reorganizations for each of these Funds is included below:
| Fund | | Predecessor Fund | | Date of Reorganization | |
| Frontegra SAM Global Equity Fund | | SAM Sustainable Global Active Fund | | June 10, 2011 | |
|
| Frontegra Phocas Small Cap Value Fund | | Phocas Small Cap Value Fund | | Oct. 8, 2010 | |
|
page 72

Frontegra Funds
NOTES TO FINANCIAL STATEMENTS (continued)
June 30, 2011
The reorganizations were effected via a tax-free reorganization and the net assets of the predecessor funds comprised substantially all of the net assets of the respective Frontegra Fund on the date of the reorganization. The predecessor funds were deemed to be the accounting survivor for financial reporting purposes, and as a result, the financial statements and financial highlights reflect the operations of the predecessor funds for periods prior to the reorganization date. Shareholders in the respective predecessor funds were issued shares in the respective Frontegra Fund on the date of the reorganization and the final net asset value of the respective predecessor fund served as the beginning net asset value for the respective Frontegra Fund. Information with respect to net assets and other relevant operating data for the predecessor funds on the reorganization date is included below:
| | | SAM Sustainable
Global Active Fund | | Phocas
Small Cap Value Fund | |
| Net assets | | $ | 20,440,464 | | | $ | 17,426,430 | | |
| Shares outstanding | | | 1,608,297 | | | | 825,087 | | |
| Net asset value | | $ | 12.71 | | | $ | 21.12 | | |
| Investments at fair value | | $ | 20,531,653 | | | $ | 17,425,756 | | |
| Unrealized appreciation/(depreciation) | | $ | 2,067,675 | | | $ | 2,660,123 | | |
| Undistributed net investment income | | $ | 206,426 | | | $ | 124,241 | | |
| Accumulated net realized gain (loss) | | $ | 552,216 | | | $ | (4,486,379 | ) | |
| Tax capital loss carryforward | | $ | — | | | $ | 4,208,769 | | |
(2) SIGNIFICANT ACCOUNTING POLICIES
The following is a summary of significant accounting policies consistently followed by the Funds in the preparation of their financial statements.
(a) Investment Valuation
Equity securities for which market quotations are readily available are valued at the last reported sale price on the national securities exchange on which such securities are primarily traded. Equity securities for which there were no transactions on a given day or securities not listed on a national securities exchange are valued at the most recent sale price. Equity securities that are traded on NASDAQ are valued using the NASDAQ Official Closing Price ("NOCP"). Debt securities (other than short-term instruments) are valued by an independent pricing service, which uses valuation methods such as matrix pricing and other analytical pricing models as well as market transactions and evaluated dealer bid quotations. Shares of underlying mutual funds are valued at their respective NAVs. Exchange traded funds are valued at the last reported sale price on the exchange on which the security is principally traded. Securities that are primarily traded on foreign exchanges, including participatory notes, generally are valued at the last sale price of such securities on their respective exchange. In certain countries, market maker prices, usually the mean between the bid and ask prices, are used. In certain circumstances, such as when a significant event occurs in a foreign market so that the last sale price no longer reflects actual value, the fair value of these securities may be determined using fair valuation procedures approved by the Board of Directors. The Directors have retained an independent fair value pricing service to assist in valuing foreign securities held by the Frontegra Mastholm International Equity, Frontegra SAM Global Equity and Frontegra HEXAM Emerging Markets Funds. In valuing assets, prices denominated in foreign currencies are converted to U.S. dollar equivalents at the current exchange rate, which approximates market value. Securities maturing within 60 days or less when purchased are valued by the amortized cost method. Any securities or other assets for which market quotations are not readily available are valued at their fair value as determined in good faith by the advisers or subadvisers pursuant to guidelines established by the Board of Directors.
page 73

Frontegra Funds
NOTES TO FINANCIAL STATEMENTS (continued)
June 30, 2011
On January 21, 2010, the FASB issued ASU 2010-06, Improving Disclosures about Fair Value Measurements. ASU 2010-06 amends ASC 820, Fair Value Measurements and Disclosures, (formerly FASB Statement No. 157), to require additional disclosures regarding fair value measurements. Specifically, the amendment requires reporting entities to disclose: i) the input and valuation techniques used to measure fair value for both recurring and nonrecurring fair value measurements, for Level 2 or Level 3 positions; ii) transfers between all levels (including Level 1 and Level 2) will be required to be disclosed on a gross basis (i.e. transfers out must be disclosed separately from transfers in) as well as the reason(s) for the transfers; and iii) purchases, sales, issuances and settlements must be shown on a gross basis in the Level 3 rollforward rather than as one net number.
The effective date of this guidance is for interim and annual periods beginning after December 15, 2009; however, the requirement to provide the Level 3 activity for purchases, sales, issuances and settlements on a gross basis was be effective for interim and annual periods beginning after December 15, 2010. The Funds have disclosed the applicable requirements of this accounting standard in their financial statements.
The Funds follow a fair value hierarchy that distinguishes between market data obtained from independent sources (observable inputs) and the Funds' own market assumptions (unobservable inputs). These inputs are used in determining the value of each Fund's investments and are summarized in the following fair value hierarchy:
Level 1 — Quoted prices in active markets for identical securities
Level 2 — Evaluated prices based on other significant observable inputs (including quoted prices for similar securities, foreign security indices, foreign exchange rates, fair value estimates for foreign securities and changes in benchmark securities indices).
Level 3 — Significant unobservable inputs (including the Fund's own assumptions in determining fair value of investments)
Mastholm International Equity
| Description | | Level 1 | | Level 2 | | Level 3 | | Total | |
| Equity | | | | | | | | | | | | | | | | | |
| Common Stock | | $ | 13,807,826 | | | $ | — | | | $ | — | | | $ | 13,807,826 | | |
| Total Equity | | | 13,807,826 | | | | — | | | | — | | | | 13,807,826 | | |
| Short-Term Investments | | | 598,076 | | | | — | | | | — | | | | 598,076 | | |
| Total Investments in Securities | | $ | 14,405,902 | | | $ | — | | | $ | — | | | $ | 14,405,902 | | |
SAM Global Equity
| Description | | Level 1 | | Level 2 | | Level 3 | | Total | |
| Equity | | | | | | | | | | | | | | | | | |
| Common Stock | | $ | 18,884,182 | | | $ | — | | | $ | — | | | $ | 18,884,182 | | |
| Total Equity | | | 18,884,182 | | | | — | | | | — | | | | 18,884,182 | | |
| Short-Term Investments | | | 310,814 | | | | — | | | | — | | | | 310,814 | | |
| Total Investments in Securities | | $ | 19,194,996 | | | $ | — | | | $ | — | | | $ | 19,194,996 | | |
page 74

Frontegra Funds
NOTES TO FINANCIAL STATEMENTS (continued)
June 30, 2011
HEXAM Emerging Markets
| Description | | Level 1 | | Level 2 | | Level 3 | | Total | |
| Equity | | | | | | | | | | | | | | | | | |
| Common Stock | | $ | 22,276,941 | | | $ | — | | | $ | — | | | $ | 22,276,941 | | |
| Preferred Stocks | | | 1,855,878 | | | | — | | | | — | | | | 1,855,878 | | |
| Exchange Traded Funds | | | 382,976 | | | | — | | | | — | | | | 382,976 | | |
| Participatory Notes | | | — | | | | 255,057 | | | | — | | | | 255,057 | | |
| Total Equity | | | 24,515,795 | | | | 255,057 | | | | — | | | | 24,770,852 | | |
| Total Investments in Securities | | $ | 24,515,795 | | | $ | 255,057 | | | $ | — | | | $ | 24,770,852 | | |
Timpani Small Cap Growth
| Description | | Level 1 | | Level 2 | | Level 3 | | Total | |
| Equity | | | | | | | | | | | | | | | | | |
| Common Stock | | $ | 2,029,559 | | | $ | — | | | $ | — | | | $ | 2,029,559 | | |
| Total Equity | | | 2,029,559 | | | | — | | | | — | | | | 2,029,559 | | |
| Short-Term Investments | | | 23,662 | | | | | | — | | | | 23,662 | | |
| Total Investments in Securities | | $ | 2,053,221 | | | $ | — | | | $ | — | | | $ | 2,053,221 | | |
Netols Small Cap Value
| Description | | Level 1 | | Level 2 | | Level 3 | | Total | |
| Equity | | | | | | | | | | | | | | | | | |
| Common Stock | | $ | 183,890,756 | | | $ | — | | | $ | — | | | $ | 183,890,756 | | |
| Total Equity | | | 183,890,756 | | | | — | | | | — | | | | 183,890,756 | | |
| Short-Term Investments | | | 5,606,740 | | | | — | | | | — | | | | 5,606,740 | | |
| Total Investments in Securities | | $ | 189,497,496 | | | $ | — | | | $ | — | | | $ | 189,497,496 | | |
Phocas Small Cap Value
| Description | | Level 1 | | Level 2 | | Level 3 | | Total | |
| Equity | | | | | | | | | | | | | | | | | |
| Common Stock | | $ | 20,174,705 | | | $ | — | | | $ | — | | | $ | 20,174,705 | | |
| Total Equity | | | 20,174,705 | | | | — | | | | — | | | | 20,174,705 | | |
| Short-Term Investments | | | 655,881 | | | | — | | | | — | | | | 655,881 | | |
| Total Investments in Securities | | $ | 20,830,586 | | | $ | — | | | $ | — | | | $ | 20,830,586 | | |
| | | Mastholm
International Equity | |
| Transfers into Level 1 | | $ | 13,807,826 | | |
| Transfers out of Level 2 | | $ | (13,807,826 | ) | |
| Net transfers | | $ | — | | |
Transfers between Level 1 and Level 2 relate to the use of systematic fair valuation. On days when systematic fair valuation is used, non-U.S. dollar denominated securities move from a Level 1 to a Level 2 classification. At June 30, 2010, securities in the Mastholm International Equity Fund were adjusted using systematic fair valuation. At June 30, 2011, securities in the Mastholm International
page 75

Frontegra Funds
NOTES TO FINANCIAL STATEMENTS (continued)
June 30, 2011
Equity Fund were not adjusted using systematic fair valuation. There were no other significant transfers into or out of Level 1, Level 2 or Level 3 in any of the Funds.
(b) Federal Income Taxes
Each Fund intends to comply with the requirements of Subchapter M of the Internal Revenue Code necessary to qualify as a regulated investment company and to make the requisite distributions of income and capital gains to its shareholders sufficient to relieve it from all or substantially all federal income taxes. Therefore, no federal income tax provision has been provided.
The Funds have adopted financial reporting rules regarding recognition and measurement of tax positions taken or expected to be taken on a tax return. The Funds have reviewed all open tax years and concluded that there is no effect to any of the Fund's financial positions or results of operations and no tax liability resulting from unrecognized tax benefits relating to uncertain income tax position taken or expected to be taken on a tax return. Open tax years are those years that are open for examination by the relevant income taxing authority. As of June 30, 2011, open federal and state income tax years include the tax years ended June 30, 2008, June 30, 2009 and June 30, 2010. The Funds have no examinations in progress. The Funds are also not aware of any tax positions for which it is reasonably possible that the total amounts of unrecognized tax expense will significantly change in twelve months.
(c) Distributions to Shareholders
Dividends from net investment income and net realized gains, if any, are declared and paid at least annually.
All short-term capital gains are included in ordinary income for tax purposes. Distributions to shareholders are recorded on the ex-dividend date.
The tax character of distributions paid during the years ended June 30, 2011 and June 30, 2010 were as follows:
| | | Year Ended June 30, 2011 | | Year Ended June 30, 2010 | |
| | | Ordinary
Income | | Long-Term
Capital Gains | | Total
Distributions | | Ordinary
Income | | Long-Term
Capital Gains | | Total
Distributions | |
Mastholm International
Equity | | $ | 944,668 | | | $ | — | | | $ | 944,668 | | | $ | 5,738,700 | | | $ | — | | | $ | 5,738,700 | | |
| SAM Global Equity | | | 911,892 | | | | 38,088 | | | | 949,980 | | | | 989,046 | * | | | — | | | | 989,046 | | |
| Netols Small Cap Value | | | 28,623 | | | | — | | | | 28,623 | | | | 105,774 | | | | 34,387 | | | | 140,161 | | |
| Phocas Small Cap Value | | | 50,863 | | | | — | | | | 50,863 | | | | — | | | | — | | | | — | | |
Pursuant to Internal Revenue Code Section 852(b)(3), the SAM Global Equity Fund designated as long-term capital gain dividend the amount necessary to reduce the earnings and profits of the Fund related to net capital gain to zero for the tax year ended June 30, 2011.
The HEXAM Emerging Markets Fund and Timpani Small Cap Growth Fund commenced operations on December 20, 2010 and March 23, 2011, respectively. Neither Fund paid distributions during fiscal 2011.
* Ordinary income distributed was for the period September 1, 2009 through August 31, 2010.
page 76

Frontegra Funds
NOTES TO FINANCIAL STATEMENTS (continued)
June 30, 2011
At June 30, 2011 the components of accumulated earnings/losses on a tax basis were as follows:
| | | Mastholm
International
Equity | | SAM
Global Equity | | HEXAM
Emerging Markets | | Timpani Small
Cap Growth | | Netols Small
Cap Value | | Phocas Small
Cap Value | |
| Cost of investments | | $ | 12,983,495 | | | $ | 16,598,124 | | | $ | 25,341,185 | | | $ | 1,881,980 | | | $ | 140,900,044 | | | $ | 16,627,777 | | |
| Gross unrealized appreciation | | $ | 1,564,223 | | | $ | 3,077,085 | | | $ | 873,452 | | | $ | 216,277 | | | $ | 54,497,515 | | | $ | 4,611,927 | | |
| Gross unrealized depreciation | | | (141,816 | ) | | | (480,213 | ) | | | (1,443,785 | ) | | | (45,036 | ) | | | (5,900,063 | ) | | | (409,118 | ) | |
Net unrealized appreciation/
depreciation | | | 1,422,407 | | | | 2,596,872 | | | | (570,333 | ) | | | 171,241 | | | | 48,597,452 | | | | 4,202,809 | | |
| Undistributed ordinary income | | | 335,544 | | | | 948,935 | | | | 267,616 | | | | — | | | | — | | | | — | | |
| Undistributed long-term capital gain | | | — | | | | 406,428 | | | | — | | | | — | | | | — | | | | — | | |
| Total distributable earnings | | | 335,544 | | | | 1,355,363 | | | | 267,616 | | | | — | | | | — | | | | — | | |
| Other accumulated gains/(losses) | | | (6,614,752 | ) | | | 1,858 | | | | 1,768 | | | | (43,013 | ) | | | (3,720,338 | ) | | | (2,867,123 | ) | |
| Total accumulated earnings/(losses) | | $ | (4,856,801 | ) | | $ | 3,954,093 | | | $ | (300,949 | ) | | $ | 128,228 | | | $ | 44,877,114 | | | $ | 1,335,686 | | |
The difference between book-basis and tax-basis unrealized appreciation is attributable primarily to the tax deferral of losses on wash sales and investments in Passive Foreign Investment Companies.
At June 30, 2011, the Funds had the following capital loss carryforwards available, which may be utilized to offset any net realized capital gains:
| | | Expiring | | | |
| | | 6/30/17 | | 6/30/18 | | Total | |
| Mastholm International Equity | | $ | — | | | $ | 6,626,048 | | | $ | 6,626,048 | | |
| Netols Small Cap Value | | | — | | | | 3,720,338 | | | | 3,720,338 | | |
| Phocas Small Cap Value | | | 2,867,123 | | | | — | | | | 2,867,123 | | |
At June 30, 2011, Timpani Small Cap Growth Fund had short-term capital loss carryforward that will not expire of $43,013.
During the year ended June 30, 2011, capital loss carryforwards utilized by the Mastholm International Equity Fund, Netols Small Cap Value Fund and Phocas Small Cap Value Fund were $5,845,278, $1,173,677 and $1,341,646, respectively.
(e) Futures Contracts
Each Fund may enter into futures contracts, including index and interest rate futures contracts. Upon entering into a contract, the Fund deposits and maintains as collateral such initial margin as required by the exchange on which the transaction is effected. Pursuant to the contract, the Fund agrees to receive from or pay to the broker an amount of cash equal to the daily fluctuation in value of the contract. Such receipts or payments are known as variation margin and are recorded by the Fund as unrealized gains and losses. When the contract is closed, the Fund records a realized gain or loss equal to the difference between the value of the contract at the time it was opened and the value at the time it was closed. As collateral for futures contracts, the Fund is required under the 1940 Act to maintain assets consisting of cash, cash equivalents or other liquid securities. This collateral is required to be adjusted daily to reflect the market value of the purchase obligation for long futures contracts or the market value of the instrument underlying the contract, but not less than the market price at which the futures contract was established, for short futures contracts.
page 77

Frontegra Funds
NOTES TO FINANCIAL STATEMENTS (continued)
June 30, 2011
The risks inherent in the use of futures contracts include: 1) adverse changes in the value of such instruments; and 2) the possible absence of a liquid secondary market for any particular instrument at any time. During the period ended June 30, 2011, there were no futures contracts open and outstanding.
(f) Foreign Currency Translation
Values of investments denominated in foreign currencies are converted into U.S. dollars using a spot market rate of exchange each day. Purchases and sales of investments and dividend and interest income are translated to U.S. dollars using a spot market rate of exchange prevailing on the dates of such transactions. The portion of security gains or losses resulting from changes in foreign exchange rates are included with net realized and unrealized gain or loss from investments, as appropriate, for both financial reporting and tax purposes.
Each Fund, respectively, bears the risk of changes in the foreign currency exchange rates and their impact on the value of assets and liabilities denominated in foreign currency. Each Fund also bears the risk of a counterparty failing to fulfill its obligation under a foreign currency contract.
(g) Indemnifications
Under the Funds' organizational documents, their officers and directors are indemnified against certain liabilities arising out of the performance of their duties to the Funds. In addition, in the normal course of business, the Funds enter into contracts that provide general indemnifications to other parties. The Funds' maximum exposure under these arrangements is unknown as this would involve future claims that may be made against the Funds that have not yet occurred. However, the Funds have not had prior claims or losses pursuant to these contracts and expect the risk of loss to be remote.
(h) Subsequent Events
Each Fund follows authoritative standards of accounting for and disclosure of events that occur after the balance sheet date but before financial statements are issued or are available to be issued. These standards require the Fund to recognize in the financial statements the effects of all recognized subsequent events that provide additional evidence about conditions that existed at the date of the balance sheet. For nonrecognized subsequent events that must be disclosed to keep the financial statements from being misleading, the Fund is required to disclose the nature of the event as well as an estimate of its financial effect, or a statement that such an estimate cannot be made. Management has evaluated subsequent events through the date of the issuance and has determined there is no impact to the Funds' financial statements.
(i) Other
Investment transactions are accounted for on the trade date. The Funds determine the gain or loss realized from investment transactions by comparing the original cost of the specifically identified security lot sold with the net sale proceeds. Dividend income, less foreign taxes withheld, is recognized on the ex-dividend date, except that certain dividends from foreign securities are recorded as soon as the information becomes available to the Funds. Interest income is recognized on an accrual basis. All discounts/premiums are accreted/amortized using the effective interest method and are included in interest income.
Income, expenses (other than expenses attributable to a specific class) and realized and unrealized gains or losses on investments attributable to the Funds are generally allocated to each respective class in proportion to the relative net assets of each class.
The preparation of financial statements in conformity with U.S. generally accepted accounting principles ("GAAP") requires management to make estimates and assumptions that affect the reported amounts of assets and liabilities and disclosure of
page 78

Frontegra Funds
NOTES TO FINANCIAL STATEMENTS (continued)
June 30, 2011
contingent assets and liabilities at the date of the financial statements, and the reported amounts of increases and decreases in net assets from operations during the reporting period. Actual results could differ from those estimates.
Net investment income and realized gains and losses for federal income tax purposes may differ from that reported on the financial statements because of permanent book-to-tax differences. GAAP requires that permanent differences in net investment income and realized gains and losses due to differences between financial reporting and tax reporting be reclassified between various components of net assets. These reclassifications have no effect on net assets or net asset value per share. For the year ended June 30, 2011, the following table shows the reclassifications made:
| | | Mastholm
International
Equity | | SAM
Global Equity | | HEXAM
Emerging Markets | | Timpani Small
Cap Growth | | Netols Small
Cap Value | | Phocas Small
Cap Value | |
| Paid in capital | | $ | (91,351,836 | ) | | $ | (699 | ) | | $ | — | | | $ | (4,374 | ) | | $ | (706,824 | ) | | $ | (2,751 | ) | |
Accumulated net
investment income (loss) | | | 485,256 | | | | (8,770 | ) | | | (36,921 | ) | | | 4,374 | | | | 706,823 | | | | 2,752 | | |
Accumulated net
realized gain (loss) | | | 90,866,580 | | | | 9,469 | | | | 36,921 | | | | — | | | | 1 | | | | (1 | ) | |
The permanent differences primarily relate to foreign currency and Passive Foreign Investment Company adjustments with differing book and tax methods, net operating losses, and capital loss carryforward limitations.
(3) INVESTMENT ADVISER AND RELATED PARTIES
The Frontegra Mastholm International Equity, SAM Global Equity, HEXAM Emerging Markets, Netols Small Cap Value and Phocas Small Cap Value Funds have entered into an agreement with Frontegra, with whom certain officers and a director of the Funds are affiliated, to furnish investment advisory services to the Funds. Timpani, an affiliate of Frontegra, is the investment adviser to the Frontegra Timpani Small Cap Growth Fund. Fees are calculated daily and payable monthly, at annual rates set forth in the following table (expressed as a percentage of each Fund's average daily net assets). Pursuant to expense cap agreements, Frontegra and Timpani have agreed to waive their respective management fees and/or reimburse each Fund's operating expenses (exclusive of brokerage, interest, taxes and extraordinary expenses) to ensure that each Fund's operating expenses do not exceed the expense limitation listed below. Expenses waived are netted with advisory fees on the Statement of Assets and Liabilities. On a monthly basis, these accounts are settled by each Fund making payment to the respective adviser or the respective adviser reimbursing the Fund if the reimbursement amount exceeds the advisory fee. If the amount of fees waived exceeds the advisory fee earned, this is shown on the Statement of Assets and Liabilities as a receivable from the respective adviser. The expense cap agreements will continue in effect until October 31, 2011 (October 31, 2012 for the Frontegra Phocas Small Cap Value Fund – Class L and Class I) with successive renewal terms of one year unless terminated by an adviser or a Fund prior to any such renewal.
page 79

Frontegra Funds
NOTES TO FINANCIAL STATEMENTS (continued)
June 30, 2011
| Frontegra Fund | | Annual Advisory Fees | | Expense Limitation | |
| Mastholm International Equity | | | 0.95 | % | | | 0.75 | % | |
| SAM Global Equity | | | 0.80 | % | | | 1.20 | % | |
| HEXAM Emerging Markets | | | 0.90 | % | | | 1.30 | % | |
| Timpani Small Cap Growth | | | 1.00 | % | | | 1.10 | % | |
| Netols Small Cap Value - Institutional Class | | | 1.00 | % | | | 1.10 | % | |
| Netols Small Cap Value - Class Y | | | 1.00 | % | | | 1.50 | % | |
| Phocas Small Cap Value - Class L | | | 1.00 | % | | | 0.99 | % | |
| Phocas Small Cap Value - Class I | | | 1.00 | % | | | 1.10 | % | |
Any waivers or reimbursements are subject to later adjustment to allow the advisers to recoup amounts waived or reimbursed to the extent actual fees and expenses for a fiscal period are less than each Fund's expense limitation cap, provided, however, that an adviser shall only be entitled to recoup such amounts for a period of three years from the date such amount was waived or reimbursed. Expenses attributable to a specific class may only be recouped with respect to that class.
The following table shows the waived or reimbursed expenses subject to potential recovery expiring in:
| | | Mastholm
International
Equity | | SAM
Global
Equity | | HEXAM
Emerging
Markets | | Timpani
Small Cap
Growth | | Netols
Small Cap
Value | | Phocas
Small Cap
Value | |
| | 2012 | | | $ | 1,057,926 | | | $ | — | | | $ | — | | | $ | — | | | $ | 111,209 | | | $ | — | | |
| | 2013 | | | | 811,681 | | | | — | | | | — | | | | — | | | | 75,253 | | | | — | | |
| | 2014 | | | | 377,781 | | | | 26,548 | * | | | 75,925 | | | | 46,572 | | | | 53,689 | | | | 104,993 | ** | |
| | | | | $ | 2,247,388 | | | $ | 26,548 | | | $ | 75,925 | | | $ | 46,572 | | | $ | 240,151 | | | $ | 104,993 | | |
* Expenses waived/reimbursed were for the period June 10, 2011 through June 30, 2011.
** Expenses waived/reimbursed were for the period October 8, 2010 through June 30, 2011.
The Frontegra Phocas Small Cap Value Fund has entered into a subadministration agreement with Frontegra under which Frontegra will provide certain shareholder and subadministrative services to Class I shareholders of the Fund. For its services, Frontegra, with whom certain officers and a director of the Fund are affiliated, receives an annual fee of 0.11% of Class I average net assets. This fee is calculated daily and payable monthly.
As of June 30, 2011, affiliates of Timpani owned a controlling interest in the Frontegra Timpani Small Cap Growth Fund. Shareholders with a controlling interest could affect the outcome of proxy voting or the direction of management of the Fund.
(4) INVESTMENT TRANSACTIONS
The aggregate purchases and sales of securities, excluding short-term investments for the Funds for the year ended June 30, 2011 are summarized below:
| | | Mastholm
International
Equity | | SAM
Global
Equity | | HEXAM
Emerging
Markets | | Timpani
Small Cap
Growth | | Netols
Small Cap
Value | | Phocas
Small Cap
Value | |
| Purchases | | $ | 93,752,796 | | | $ | 6,456,425 | | | $ | 29,930,052 | | | $ | 2,396,611 | | | $ | 55,462,051 | | | $ | 7,162,487 | | |
| Sales | | $ | 128,265,550 | | | $ | 7,856,936 | | | $ | 4,772,780 | | | $ | 495,280 | | | $ | 54,156,356 | | | $ | 6,836,842 | | |
There were no purchases or sales of U.S. Government securities for the Funds.
page 80

Frontegra Funds
NOTES TO FINANCIAL STATEMENTS (continued)
June 30, 2011
(5) DIRECTORS FEES
The Independent Directors of the Funds were paid $62,000 in director fees during the year ended June 30, 2011. The Interested Director did not receive any remuneration from the Funds.
(6) LINE OF CREDIT
The Frontegra Mastholm International Equity Fund has a $2 million unsecured line of credit with U.S. Bank, N.A., intended to provide short-term financing, if necessary, subject to certain restrictions, in connection with shareholder redemptions. Borrowings under this arrangement bear interest at the bank's prime rate. At June 30, 2011, the Fund had no balance outstanding. Based upon balances outstanding during the year, the weighted average interest rate was 3.25% and the weighted average amount outstanding was $1,271,000. Interest expense of $459 is included in other expenses on the Statement of Operations. During the fiscal year ended June 30, 2011, none of the other Funds had a line of credit.
(7) DISTRIBUTION PLAN AND SHAREHOLDER SERVICING FEE
Frontegra, on behalf of the Frontegra Netols Small Cap Value Fund, has adopted a distribution plan pursuant to Rule 12b-1 under the Investment Company Act of 1940 for the Fund's Class Y shares (the "12b-1 Plan"). Pursuant to the 12b-1 Plan, the Fund pays an annual fee of up to 0.25% to Frontegra Strategies, LLC (the "Distributor") for payments to brokers, dealers and other financial intermediaries who perform activities or incur expenses intended to result in the sale of Class Y shares of the Fund. For the year ended June 30, 2011, the Netols Small Cap Value Fund Class Y shares incurred $ 48,082 under the 12b-1 Plan.
Class Y shares of the Fund also pay an annual shareholder servicing fee of up to 0.15% per year to the Distributor for payments to brokers, dealers, and other financial intermediaries who provide on-going account services to shareholders. Those services include establishing and maintaining shareholder accounts, mailing prospectuses, account statements and other Fund documents to shareholders, processing shareholder transactions, and providing other recordkeeping and administrative services. For the year ended June 30, 2011, the Netols Small Cap Value Fund Class Y shares incurred $28,849 in shareholder servicing expenses.
(8) LEGISLATIVE UPDATE
On December 22, 2010, the Regulated Investment Company Modernization Act of 2010 (the "Act") was enacted, which changed various technical rules governing the tax treatment of regulated investment companies. The changes are generally effective for taxable years beginning after the date of enactment. One of the more prominent changes addresses capital loss carryforwards. Under the Act, each Fund will be permitted to carry forward capital losses incurred in taxable years beginning after the date of enactment for an unlimited period. However, any losses incurred during those future taxable years will be required to be utilized prior to the losses incurred in pre-enactment taxable years, which carry an expiration date. As a result of this ordering rule, pre-enactment capital loss carryforwards may be more likely to expire unused. Additionally, post-enactment capital loss carryforwards will retain their character as either short-term or long-term capital losses rather than being considered all short-term as permitted under previous regulation.
(9) RECENT ACCOUNTING PRONOUNCEMENT
In May 2011, the FASB issued ASU No. 2011-04 "Amendments to Achieve Common Fair Value Measurement and Disclosure Requirements" in GAAP and the International Financial Reporting Standards ("IFRSs"). ASU No. 2011-04 amends FASB ASC Topic 820, Fair Value Measurements and Disclosures, to establish common requirements for measuring fair value and for disclosing information about fair value measurements in accordance with GAAP and IFRSs. ASU No. 2011-04 is effective for fiscal years beginning after December 15, 2011 and for interim periods within those fiscal years. Management is currently evaluating the impact of these amendments and does not believe they will have a material impact on the Company's financial statements.
page 81

Frontegra Funds
REPORT OF INDEPENDENT REGISTERED PUBLIC ACCOUNTING FIRM
June 30, 2011
The Shareholders and Board of Directors of Frontegra Funds, Inc:
We have audited the accompanying statements of assets and liabilities, including the schedules of investments, of Frontegra Funds, Inc. (comprising, respectively, Frontegra Mastholm International Equity Fund, Frontegra SAM Global Equity Fund, Frontegra HEXAM Emerging Markets Fund, Frontegra Timpani Small Cap Growth Fund, Frontegra Netols Small Cap Value Fund, and Frontegra Phocas Small Cap Value Fund, collectively referred to as the Funds) as of June 30, 2011, and for the Frontegra Mastholm International Equity Fund, Frontegra SAM Global Equity Fund, Frontegra HEXAM Emerging Markets Fund, Frontegra Timpani Small Cap Growth Fund, and Frontegra Netols Small Cap Value Fund, the related statements of operations, the statements of changes in net assets, and the financial highlights for each of the periods indicated therein. We have also audited the related statements of operations, the statements of changes in net assets, and the financial highlights of the Frontegra Phocas Small Cap Value Fund for the period ended June 30, 2011. Other auditors were engaged to audit the related financial statements and financial highlights of the Frontegra Phocas Small Cap Value Fund (formally known as the Phocas Small Cap Value Fund) for the periods prior to the year ended June 30, 2011 and have issued an unqualified opinion on these financial statements and financial highlights in their report dated August 26, 2010. These financial statements and financial highlights are the responsibility of the Funds' management. Our responsibility is to express an opinion on these financial statements and financial highlights based on our audits.
We conducted our audits in accordance with the standards of the Public Company Accounting Oversight Board (United States). Those standards require that we plan and perform the audit to obtain reasonable assurance about whether the financial statements and financial highlights are free of material misstatement. We were not engaged to perform an audit of the Funds' internal control over financial reporting. Our audits included consideration of internal control over financial reporting as a basis for designing audit procedures that are appropriate in the circumstances, but not for the purpose of expressing an opinion on the effectiveness of the Funds' internal control over financial reporting. Accordingly, we express no such opinion. An audit also includes examining, on a test basis, evidence supporting the amounts and disclosures in the financial statements and financial highlights, assessing the accounting principles used and significant estimates made by management, and evaluating the overall financial statement presentation. Our procedures included confirmation of securities owned as of June 30, 2011, by correspondence with the custodian and brokers or by other appropriate auditing procedures where replies from brokers were not received. We believe that our audits provide a reasonable basis for our opinion.
In our opinion, the financial statements and financial highlights referred to above present fairly, in all material respects, the financial position of each of the respective Funds constituting Frontegra Funds, Inc. at June 30, 2011, the results of their operations, the changes in their net assets, and the financial highlights for each of the periods indicated therein and referred to above, in conformity with U.S. generally accepted accounting principles.

Chicago, Illinois
August 29, 2011
page 82

BOARD OF DIRECTORS' APPROVAL OF ADVISORY AND SUBADVISORY AGREEMENTS
Approval of Advisory Agreement for Frontegra Timpani Small Cap Growth Fund
The Board of Directors (the "Board") of Frontegra Funds, Inc. (the "Company") met on February 23, 2011 to consider the approval of the investment advisory agreement with Timpani Capital Management LLC ("Timpani") (the "Timpani Advisory Agreement") for the Frontegra Timpani Small Cap Growth Fund, a portfolio of the Company (the "Timpani Small Cap Growth Fund").
When the Board reviewed the Timpani Advisory Agreement, the Board was provided materials relevant to its consideration of the agreement, such as Timpani's Form ADV and Code of Ethics, information regarding Timpani's compliance program, personnel and financial condition and a memorandum prepared by the Company's legal counsel. The Board also reviewed the advisory fee payable by the Timpani Small Cap Growth Fund under the Timpani Advisory Agreement, the proposed expense cap agreement between the Company and Timpani on behalf of the Timpani Small Cap Growth Fund and comparative fee and expense information provided by an independent third party. The Board was also provided with Timpani's response to a detailed request submitted by the Company's legal counsel on behalf of the directors.
In considering the Timpani Advisory Agreement, the Board reviewed and analyzed various factors with respect to the Timpani Small Cap Growth Fund that it determined were relevant, including the factors below, and made the following conclusions. In its deliberations, the Board did not identify any single factor as determinative.
Nature, Extent and Quality of the Services to be Provided. The Board considered Timpani's background and services it would provide to the Timpani Small Cap Growth Fund and its shareholders under the Timpani Advisory Agreement. The Board discussed the fact that Timpani had chosen the Timpani Small Cap Growth Fund's investment strategy. The Board noted that Timpani had been in operations for three years and that Brandon M. Nelson, the sole portfolio manager, Chief Investment Officer and a director of Timpani, has fifteen years of investment experience. The Board discussed Timpani's responsibilities for overseeing the Timpani Small Cap Growth Fund's activities and for monitoring its compliance with applicable requirements under the securities laws. The Board concluded that the range of services to be provided by Timpani was appropriate and that Timpani was qualified to provide such services.
Performance Record of the Timpani Small Cap Growth Fund. Because the Timpani Small Cap Growth Fund had not commenced operations, the Board did not consider the investment performance of the Fund. However, the Board reviewed the historical performance for Timpani's small cap growth private accounts. The Board concluded that Timpani appeared to have an effective small cap growth investment process.
Advisory Fees. The Board compared the Timpani Small Cap Growth Fund's contractual advisory fee and total expense ratio to the industry data provided by an independent service with respect to other mutual funds in the same peer group. The Board noted that the Timpani Small Cap Growth Fund's advisory fee was slightly above the industry average. The Board noted that, after giving effect to the contractual expense cap agreement, the total expense ratio was comparable to the industry average for Class Y shares and below the industry average for Institutional Class shares. The Board concluded that the advisory fee to be paid by the Timpani Small Cap Growth Fund to Timpani was reasonable in light of the nature and quality of services to be provided and fees paid by comparable funds.
Costs and Profitability. Timpani did not provide any specific information regarding the costs of services provided or the profits that might be realized because the Timpani Small Cap Growth Fund had not commenced operations.
Economies of Scale. Because the Timpani Small Cap Growth Fund had not commenced operations, the Board did not consider whether any alternative fee structures, such as breakpoint fees, would be appropriate to reflect any economies of scale that may result from increases in the Timpani Small Cap Growth Fund's assets.
page 83

Benefits to Timpani. The Board considered information presented regarding any benefits to Timpani or its affiliates from serving as adviser to the Timpani Small Cap Growth Fund (in addition to the advisory fee). The Board noted that Timpani's affiliate, Frontier Partners, Inc. ("Frontier"), provides consulting services to, and is compensated by, Timpani. However, the Board determined that Timpani's services to the Timpani Small Cap Growth Fund would not be compromised by this potential conflict of interest. The Board also noted that Bill Forsyth, the president of the Company and Frontier, is also the president and an officer of Timpani.
On the basis of its review of the foregoing information, the Board found that the terms of the Timpani Advisory Agreement were fair and reasonable and in the best interests of the shareholders of the Timpani Small Cap Growth Fund.
Renewal of Advisory Agreement and Subadvisory Agreements for Frontegra Mastholm International Equity Fund and Frontegra Netols Small Cap Value Fund
The Board met on May 17, 2011 to consider the annual renewal of the investment advisory agreement with Frontegra (the "Frontegra Advisory Agreement") and the subadvisory agreements (each, a "Subadvisory Agreement") for the Frontegra Mastholm International Equity Fund and the Frontegra Netols Small Cap Value Fund, portfolios of the Company (each a "Fund" and collectively, the "Funds").
Frontegra Advisory Agreement
When the Board reviewed the Frontegra Advisory Agreement on May 17, 2011, the Board was provided materials relevant to its consideration of the agreement, such as Frontegra's Form ADV and Code of Ethics, information regarding Frontegra's compliance program, personnel and financial condition and a memorandum prepared by the Company's legal counsel. The Board also reviewed the advisory fee payable by each Fund under the Frontegra Advisory Agreement, the proposed expense cap agreements between the Company and Frontegra on behalf of each Fund and comparative fee and expense information provided by an independent third party. The Board was also provided with Frontegra's response to a detailed request submitted by the Company's legal counsel on behalf of the Directors.
The Board considered whether the Frontegra Advisory Agreement would continue to be in the best interests of each Fund and its shareholders and the overall fairness of the Frontegra Advisory Agreement. Among other things, the Board reviewed information concerning: (1) the nature, extent and quality of the services provided by Frontegra; the investment performance of each Fund; (2) the cost of the services provided and the profits realized by Frontegra and its affiliates from their relationship with the Company on behalf of each Fund; the extent to which economies of scale have been or will be realized as each Fund grows; and (3) the extent to which fee levels reflect the economies of scale, if any, for the benefit of the shareholders of each Fund. In its deliberations, the Board did not identify any single factor as determinative.
In considering the Frontegra Advisory Agreement, the Board reviewed and analyzed various factors with respect to each Fund that it determined were relevant, including the factors below, and made the following conclusions.
Nature, Extent and Quality of the Services to be Provided. The Board considered Frontegra's background and services it would continue to provide to the Funds and their shareholders under the Frontegra Advisory Agreement. The Board discussed the fact that Frontegra had chosen the investment strategy for each Fund and had selected the subadvisers to make the day-to-day investment decisions for the Funds. The Board noted that Frontegra has 15 years of experience in hiring and supervising subadvisers to portfolios in the Frontegra family of funds. The Board discussed Frontegra's responsibilities for overseeing the subadvisers and for monitoring each Fund's compliance with applicable requirements under the securities laws. The Board concluded that the range of services to be provided by Frontegra was appropriate and that Frontegra was qualified to provide such services.
Performance Record of the Funds. As described in more detail under "Board Renewal of Subadvisory Agreements," the Board reviewed each Fund's performance record for the period ended March 31, 2011. The Board noted that the Frontegra Mastholm International Equity Fund (the "Mastholm International Equity Fund") had outperformed its benchmark index for the past one-year period and underperformed
page 84

its benchmark index for the three-, five-year and since inception periods ended March 31, 2011, and the Frontegra Netols Small Cap Value Fund (the "Netols Small Cap Value Fund") had outperformed its benchmark index for the past one-, three-, five-year and since inception periods ended March 31, 2011. The Board concluded that Frontegra has developed the necessary expertise and resources in selecting and managing qualified subadvisers to provide investment advisory services to the Funds in accordance with each Fund's investment objective and strategy.
Advisory Fees. The Board compared each Fund's contractual advisory fee and total expense ratio to the industry data provided by an independent service with respect to other mutual funds in the same peer group. The Board noted that the advisory fee for the Mastholm International Equity Fund was slightly above the industry average while the total expense ratio of the Fund, after giving effect to the contractual expense cap agreement, was well below the industry average. The Board noted that the advisory fee for the Netols Small Cap Value Fund was slightly above the industry average. The total expense ratio for Institutional Class shares of the Fund was in line with the industry average while the total expense ratio for Class Y shares of the Fund was above the industry average. The Board noted that overall, the Funds' total expense ratios were competitive with industry averages. The Board concluded that the advisory fee to be paid by each Fund to Frontegra was reasonable in light of the nature and quality of services to be provided and fees paid by comparable funds.
Costs and Profitability. The Board reviewed information concerning Frontegra's financial condition, costs and profitability. The Board also considered the effect of the contractual expense cap agreements on Frontegra's compensation. The Board noted that Frontegra was reimbursing expenses to both Funds. The Board concluded that Frontegra's current level of profitability was reasonable considering the quality of management and the fact that Frontegra was waiving its fees and/or reimbursing expenses for both Funds.
Economies of Scale. The Board reviewed net asset growth on a per Fund and aggregate basis and considered whether there may be economies of scale in the management of each Fund if its assets were to increase significantly. However, the Board concluded that the assets of the Funds were not likely to increase to such an extent that breakpoints would be appropriate, particularly in light of the expense cap agreements in place between Frontegra and each Fund. The Board also noted that the overall assets in the Fund family had declined due to Fund reorganizations.
Benefits to Frontegra. The Board considered information presented regarding any benefits to Frontegra or its affiliates from serving as adviser to the Funds (in addition to the advisory fee). The Board noted that Frontier, an affiliate of Frontegra, provided consulting services to, and was compensated by, one of the subadvisers. However, the Board determined that Frontegra's services to the Funds would not be compromised by this potential conflict of interest.
On the basis of its review of the foregoing information, the Board found that the terms of the Frontegra Advisory Agreement were fair and reasonable and in the best interests of each Fund's shareholders.
Renewal of Subadvisory Agreements
Mastholm International Equity Fund
When the Board reviewed the subadvisory agreement between Frontegra and Mastholm Asset Management, LLC ("Mastholm") on behalf of the Mastholm International Equity Fund (the "Mastholm Subadvisory Agreement ") on May 17, 2011, the Board was provided materials relevant to its consideration of the Mastholm Subadvisory Agreement, such as Mastholm's Form ADV and Code of Ethics, information regarding Mastholm's compliance program, personnel and financial condition and a memorandum prepared by the Company's legal counsel. The Board also reviewed the subadvisory fee payable by Frontegra under the Mastholm Subadvisory Agreement and the proposed expense cap agreement between the Company and Frontegra on behalf of the Mastholm International Equity Fund. The Board was also provided with Mastholm's responses to a detailed request submitted by the Company's legal counsel on behalf of the directors.
page 85

In considering the Mastholm Subadvisory Agreement, the Board analyzed and reviewed various factors with respect to the Mastholm International Equity Fund that it determined were relevant and made the following conclusions. In its deliberations, the Board did not identify any single factor as determinative.
Nature, Extent and Quality of the Services to be Provided. The Board's analysis of the nature, extent and quality of Mastholm's services to the Fund took into account knowledge gained from Mastholm's presentations to the Board at meetings throughout the year. The Board reviewed and considered Mastholm's non-U.S. equity investment strategy and experience as an international equity fund manager, key personnel involved in providing investment management services to the Mastholm International Equity Fund and financial condition. The Board also considered services provided by Mastholm under the Mastholm Subadvisory Agreement, including the selection of broker-dealers for execution of portfolio transactions, monitoring adherence to the Fund's investment restrictions and assisting with the Fund's compliance with applicable securities laws and regulations. The Board concluded that the nature, extent and quality of the services provided by Mastholm to the Fund were appropriate and that the Fund was likely to continue to benefit from services provided by Mastholm under the Mastholm Subadvisory Agreement.
Investment Performance of Mastholm. The Board reviewed the performance record of the Mastholm International Equity Fund and noted that the Fund had outperformed its benchmark index for the past one-year period and underperformed its benchmark index for the three-, five-year and since inception periods ended March 31, 2011. The Board also considered Mastholm's quarterly portfolio commentary and review of the Fund's performance, including discussion of the reasons for the Fund's underperformance. The Board noted Frontegra's statements that it would closely monitor the performance of the Fund. The Board also compared the Fund's recent performance to the performance of Mastholm's other accounts managed in the non-U.S. growth style. The Board noted that Mastholm had been engaged as subadviser in November 2009 when it replaced the previous subadviser. The Board concluded that the Fund's performance was satisfactory and that Mastholm would continue to provide a high level of subadvisory services to the Fund.
Subadvisory Fees. The Board reviewed and considered the subadvisory fee payable by Frontegra to Mastholm under the Mastholm Subadvisory Agreement. The Board reviewed information regarding Mastholm's fee structure for comparable accounts. The Board determined that the subadvisory fee payable was appropriate. In evaluating the subadvisory fee, the Board noted that such amounts are paid by Frontegra and that therefore the overall advisory fee paid by the Mastholm International Equity Fund is not directly affected by the subadvisory fee.
Costs and Profitability. The Board did not consider the cost of services provided by Mastholm or the profitability to Mastholm from its relationship with the Mastholm International Equity Fund because it did not view these factors as relevant given that the subadvisory fee is paid by Frontegra.
Economies of Scale. Because the subadvisory fee is not paid by the Mastholm International Equity Fund, the Board did not consider whether the fee should reflect any potential economies of scale that might be realized as the Fund's assets increase.
Benefits to Mastholm. The Board considered information presented regarding any benefits to Mastholm from serving as subadviser to the Mastholm International Equity Fund (in addition to the subadvisory fee). The Board also noted that Frontegra's affiliate, Frontier, provides consulting services to, and is compensated by, Mastholm. The Board believed that Mastholm generally benefits from its association with the Fund. The Board concluded that the benefits realized by Mastholm from its relationship to the Fund were appropriate.
On the basis of its review of the foregoing information, the Board found that the terms of the Mastholm Subadvisory Agreement were fair and reasonable and in the best interests of the shareholders of the Mastholm International Equity Fund.
Frontegra Netols Small Cap Value Fund
When the Board reviewed the subadvisory agreement between Frontegra and Netols Asset Management, Inc. ("Netols") on behalf of the Frontegra Netols Small Cap Value Fund (the "Netols Small Cap Value Fund") (the "Netols Subadvisory Agreement") on May 17, 2011,
page 86

the Board was provided materials relevant to its consideration of the Netols Subadvisory Agreement, such as Netols' Form ADV and Code of Ethics, information regarding Netols' compliance program, personnel and financial condition and a memorandum prepared by the Company's legal counsel. The Board also reviewed the subadvisory fee payable by Frontegra under the Netols Subadvisory Agreement and the proposed expense cap agreement between the Company and Frontegra on behalf of the Netols Small Cap Value Fund. The Board was also provided with Netols' responses to a detailed request submitted by the Company's legal counsel on behalf of the directors.
In considering the Netols Subadvisory Agreement, the Board analyzed and reviewed various factors with respect to the Netols Small Cap Value Fund that it determined were relevant, including the factors below, and made the following conclusions. In its deliberations, the Board did not identify any single factor as determinative.
Nature, Extent and Quality of the Services to be Provided. The Board's analysis of the nature, extent and quality of Netols' services to the Fund took into account knowledge gained from Netols' presentations to the Board at meetings throughout the year. The Board reviewed and considered Netols' investment strategy and experience as a small-cap value manager, key personnel involved in providing investment management services to the Netols Small Cap Value Fund and financial condition. The Board also considered services provided by Netols under the Netols Subadvisory Agreement, including the selection of broker-dealers for execution of portfolio transactions, monitoring adherence to the Fund's investment restrictions and assisting with the Fund's compliance with applicable securities laws and regulations. The Board concluded that the nature, extent and quality of the services provided by Netols to the Fund were appropriate and that the Fund was likely to continue to benefit from services provided by Netols under the Netols Subadvisory Agreement.
Investment Performance of Netols. The Board reviewed the performance record of the Netols Small Cap Value Fund and noted that the Fund had outperformed its benchmark index for the past one-, three-, five-year and since inception periods ended March 31, 2011. The Board also considered Netols' quarterly portfolio commentary and review of the Fund's performance. The Board also compared the Fund's recent performance to the performance of Netols' composite of other accounts managed in the small cap value style. The Board concluded that the Fund's performance was satisfactory and that Netols would continue to provide a high level of subadvisory services to the Fund.
Subadvisory Fees. The Board reviewed and considered the subadvisory fee payable by Frontegra to Netols under the Netols Subadvisory Agreement. The Board determined that the subadvisory fee payable was appropriate in light of the Netols Small Cap Value Fund's investment style. In evaluating the subadvisory fee, the Board noted that such amounts are paid by Frontegra and that therefore the overall advisory fee paid by the Fund is not directly affected by the subadvisory fee.
Costs and Profitability. The Board did not consider the cost of services provided by Netols or the profitability to Netols from its relationship with the Netols Small Cap Value Fund because it did not view these factors as relevant given that the subadvisory fee is paid by Frontegra.
Economies of Scale. Because the subadvisory fee is not paid by the Netols Small Cap Value Fund, the Board did not consider whether the fee should reflect any potential economies of scale that might be realized as the Fund's assets increase.
Benefits to Netols. The Board considered information presented regarding any benefits to Netols from serving as subadviser to the Netols Small Cap Value Fund (in addition to the subadvisory fee). Netols provided information to the Board regarding its policies of the use of soft dollar commissions. The Board believed that Netols generally benefits from its association with the Fund. The Board concluded that the benefits realized by Netols from its relationship to the Fund were appropriate.
On the basis of its review of the foregoing information, the Board found that the terms of the Netols Subadvisory Agreement were fair and reasonable and in the best interests of the shareholders of the Netols Small Cap Value Fund.
Board Approval of New Advisory and Subadvisory Agreements for Frontegra SAM Global Equity Fund
On May 17, 2011, the Board also considered the approval of the Frontegra Advisory Agreement and a subadvisory agreement with respect to a new series of the Company, the Frontegra SAM Global Equity Fund (the "SAM Global Equity Fund").
page 87

When the Board reviewed the Frontegra Advisory Agreement, the Board was provided materials relevant to its consideration of the agreement, such as Frontegra's Form ADV and Code of Ethics and information regarding Frontegra's compliance program, organizational structure and financial condition. The Board also reviewed the fee that would be payable by the SAM Global Equity Fund under the Frontegra Advisory Agreement, the proposed expense cap agreement between the SAM Global Equity Fund and Frontegra and comparative fee and expense information provided by an independent third party. The Board was also provided with Frontegra's response to a detailed request submitted by the Company's legal counsel on behalf of the directors.
In considering the Frontegra Advisory Agreement, the Board analyzed and reviewed various factors with respect to the SAM Global Equity Fund that it determined were relevant, including the factors below, and made the following conclusions. In its deliberations, the Board did not identify any single factor as determinative.
Nature, Extent and Quality of the Services to be Provided. The Board considered Frontegra's background and services it would provide to the SAM Global Equity Fund and its shareholders. The Board discussed the fact that Frontegra had chosen the Fund's investment strategy and had selected Sustainable Asset Management USA, Inc. ("SAM") to make the day-to-day investment decisions for the Fund. The Board noted that Frontegra has 15 years of experience in hiring and supervising subadvisers to other portfolios in the Frontegra family of funds. The Board discussed Frontegra's responsibilities for overseeing SAM as subadviser to the Fund and for monitoring the Fund's compliance with applicable requirements under the securities laws. The Board concluded that the range of services to be provided by Frontegra was appropriate.
Proposed Fees. The Board compared the SAM Global Equity Fund's contractual advisory fee and total expense ratio to the industry data provided by an independent service with respect to other mutual funds in the same peer group. The Board noted that the Fund's advisory fee and total expense ratio, after giving effect to the proposed expense cap agreement, were below the industry averages. The Board concluded that the advisory fee and total expense ratio are competitive with those of comparable funds. The Board concluded that the proposed fee to be paid by the Fund to Frontegra was reasonable in light of the nature and quality of services to be provided and fees paid by comparable funds.
Costs and Profitability. Frontegra did not provide any specific information regarding the costs of services to be provided or the profits it might realize because the SAM Global Equity Fund had not commenced operations.
Economies of Scale. Because the SAM Global Equity Fund had not commenced operations, the Board did not consider whether any alternative fee structures, such as breakpoint fees, would be appropriate to reflect any economies of scale that may result from increases in the Fund's assets.
Benefits to Frontegra. The Board considered information presented regarding any benefits to Frontegra or its affiliates from serving as adviser to the SAM Global Equity Fund (in addition to the advisory fee). The Board believed Frontegra would generally benefit from its association with the Fund. The Board concluded that such potential benefits were reasonable.
The Board also reviewed the subadvisory agreement between Frontegra and SAM on behalf of the SAM Global Equity Fund (the "SAM Subadvisory Agreement") on May 17, 2011. The Board was provided materials relevant to its consideration of the agreement, such as SAM's Form ADV and Code of Ethics and information regarding SAM's compliance program, performance track record, investment strategy, trading procedures, personnel and financial condition.
In considering the SAM Subadvisory Agreement, the Board analyzed and reviewed various factors with respect to the SAM Global Equity Fund and made the following conclusions. In its deliberations, the Board did not identify any single factor as determinative.
Nature, Extent and Quality of the Services to be Provided. The Board considered SAM's background as a manager of global equities. The Board reviewed information regarding SAM's investment program and the investment experience of the portfolio managers for the SAM Global Equity Fund. The Board determined that the Fund was likely to benefit from SAM's experience in investing in global equities.
page 88

Investment Performance of SAM. The Board reviewed historical performance data for the predecessor to the SAM Global Equity Fund. The Board concluded that SAM appeared to have an effective global equities investment process.
Proposed Fee. The Board determined that the proposed subadvisory fee was appropriate in light of the SAM Global Equity Fund's investment style. In evaluating the subadvisory fee, the Board noted that the fee is paid by Frontegra and that therefore the overall advisory fee paid by the Fund is not directly affected by the subadvisory fee.
Costs and Profitability. SAM did not provide any specific information regarding the costs of services to be provided or the profits it might realize because the Fund had not commenced operations.
Economies of Scale. Because the subadvisory fee is not paid by the SAM Global Equity Fund, the Board did not consider whether the fee should reflect any potential economies of scale that might be realized as the Fund's assets increase.
Benefits to SAM. The Board considered information presented regarding any benefits to SAM from serving as subadviser to the Fund (in addition to the subadvisory fee). The Board noted that SAM does not participate in soft dollar arrangements. The Board believed that SAM will generally benefit from its association with the SAM Global Equity Fund. The Board concluded that the benefits to be realized by SAM from its relationship to the Fund were appropriate.
On the basis of its review of the foregoing information, the Board found that the terms of the SAM Subadvisory Agreement were fair and reasonable and in the best interests of the shareholders of the SAM Global Equity Fund.
Board Approval of New Advisory Agreement for Lockwell Small Cap Value Fund
On May 17, 2011, the Board also considered the approval of a new investment advisory agreement with Lockwell Investments, LLC ("Lockwell") (the "Lockwell Advisory Agreement") for a new series of the Company, the Lockwell Small Cap Value Fund.
When the Board of Directors reviewed the Lockwell Advisory Agreement, the Board was provided materials relevant to its consideration of the Lockwell Advisory Agreement, such as Lockwell's Form ADV and Code of Ethics and information regarding Lockwell's compliance program, investment strategy, investment process and personnel. The Board also received an in-person presentation by a representative of Lockwell. The Board also reviewed the fee that would be payable by the Lockwell Small Cap Value Fund under the Lockwell Advisory Agreement, the proposed expense cap agreement between the Company and Lockwell on behalf of the Fund and comparative fee and expense information provided by an independent third party. The Board was also provided with Frontegra's response to a detailed request submitted by the Company's legal counsel on behalf of the directors.
In considering the Lockwell Advisory Agreement, the Board reviewed and analyzed various factors with respect to the Lockwell Small Cap Value Fund that it determined were relevant, including the factors below, and made the following conclusions. In its deliberations, the Board did not identify any single factor as determinative.
Nature, extent and quality of the services to be provided. The Board considered the background of Lockwell's portfolio manager and the services Lockwell would provide to the Lockwell Small Cap Value Fund and its shareholders. The Board discussed the fact that Lockwell had chosen the Fund's investment strategy and would make the day-to-day investment decisions for the Fund. The Board noted that, although Lockwell is a newly formed investment adviser, Richard Glass, a managing member of Lockwell, would be the sole portfolio manager of the Fund and has 20 years of investment experience. The Board discussed Lockwell's responsibilities for overseeing the Fund's activities and for monitoring the Fund's compliance with applicable requirements under the securities laws. The Board concluded that the range of services to be provided by Lockwell was appropriate.
Investment performance. Because the Fund had not commenced operations, the Board did not consider the investment performance of the Fund. However, the Board reviewed Lockwell's historical performance of small cap value accounts and noted the strong performance of accounts managed in the small cap value category.
page 89

Proposed fees. The Board compared the Fund's proposed contractual advisory fee and total expense ratio to the industry data provided by an independent service with respect to other mutual funds in the same peer group. The Board noted that the Fund's advisory fee was slightly above the industry average but that the Fund's total expense ratio, after giving effect to the proposed expense cap agreement, was below the industry average. The Board concluded that the advisory fee and total expense ratio are competitive with those of comparable funds. The Board noted that the proposed advisory fee was the same as that for other small cap funds managed by Frontegra, the investment adviser to other series of the Company. The Board concluded that the proposed fee to be paid by the Fund to Lockwell was reasonable in light of the nature and quality of services to be provided and fees paid by comparable funds.
Costs and profitability. Lockwell did not provide any specific information regarding the costs of services to be provided or the profits that might be realized because the Lockwell Small Cap Value Fund had not commenced operations.
Economies of scale. Because the Lockwell Small Cap Value Fund had not commenced operations, the Board did not consider whether any alternative fee structures, such as breakpoint fees, would be appropriate to reflect any economies of scale that may result from increases in the Fund's assets.
Benefits to Lockwell. The Board considered information presented regarding any benefits to Lockwell or its affiliates from serving as adviser to the Fund (in addition to the advisory fee). The Board noted that Frontier, an affiliate of Frontegra, will provide consulting services to, and be compensated by, Lockwell. The Board also noted that Lockwell would pay compensation to Frontegra for its subadministrative services to the Lockwell Small Cap Value Fund pursuant to a subadministration agreement. The Board believed Lockwell would generally benefit from its association with the Fund. The Board concluded that such potential benefits were reasonable.
On the basis of its review of the foregoing information, the Board of Directors found that the terms of the Lockwell Advisory Agreement were fair and reasonable and in the best interests of shareholders of the Lockwell Small Cap Value Fund.
page 90

VOTING RESULTS OF SPECIAL MEETING OF SHAREHOLDERS
A special meeting of shareholders (the "Special Meeting") of the Frontegra Columbus Core Plus Fund and Frontegra Columbus Core Fund (collectively, the "Funds") was held on April 18, 2011. At the Special Meeting, shareholders voted on a proposal to approve a new subadvisory agreement between Frontegra Asset Management, Inc. (the "Adviser"), on behalf of the Funds, and Scout Investments, Inc. ("Scout Investments"). Shareholders also voted on a proposal to approve the agreement and plan of reorganization between Frontegra Funds, Inc. (the "Company"), on behalf of the Funds, and Scout Funds, Inc. ("Scout Funds"), on behalf of the Scout Core Plus Bond Fund and Scout Core Bond Fund (the "Scout Bond Funds"). Further details regarding each proposal and the Special Meeting are contained in a definitive proxy statement filed with the SEC on March 11, 2011.
At the Special Meeting held on April 18, 2011, the following actions were taken:
(1) A new subadvisory agreement between Scout Investments and the Adviser was approved by shareholders of each Fund (voting separately on a Fund-by-Fund basis) as follows:
| Fund | | Votes For | | Votes Against | | Abstained | | Broker Non-Votes | |
| Frontegra Columbus Core Plus Fund | | | 9,200,083 | | | | 8,801 | | | | 13,122 | | | | N/A | | |
| Frontegra Columbus Core Fund | | | 5,595,358 | | | | 13,851 | | | | 0 | | | | N/A | | |
(2) The agreement and plan of reorganization between the Company, on behalf of each of the following Funds, and Scout Funds, on behalf of the Scout Bond Funds, was approved by shareholders of each Fund (voting separately on a Fund-by-Fund basis) as follows:
| Fund | | Votes For | | Votes Against | | Abstained | | Broker Non-Votes | |
| Frontegra Columbus Core Plus Fund | | | 9,200,083 | | | | 8,801 | | | | 13,122 | | | | N/A | | |
| Frontegra Columbus Core Fund | | | 5,595,358 | | | | 13,851 | | | | 0 | | | | N/A | | |
page 91

Frontegra Funds
ADDITIONAL INFORMATION
(Unaudited)
DIRECTORS AND OFFICERS
The business and affairs of the Funds are managed under the direction of the Funds' Board of Directors. Information pertaining to the directors and officers of the Funds is set forth below. The SAI includes additional information about the Funds' directors and officers and is available without charge, upon request by calling 1-888-825-2100.
Interested Director and Officers
Name, Address and
Year of Birth | | Position(s)
Held with
Company | | Term of
Office and
Length
of Time
Served | | Principal
Occupation(s)
During Past
Five Years | | Number of
Funds in
Complex
Overseen
by Director | | Other
Directorships
Held by
Director | |
| William D. Forsyth III* Frontegra Funds, Inc. 400 Skokie Boulevard Suite 500 Northbrook, Illinois 60062 Year of Birth: 1963 | | President and Secretary
Director
Co-President, Treasurer and Assistant Secretary | | Elected annually by the Board of Directors; since August 2008.
Indefinite; since May 1996.
From May 1996 to August 2008. | | Mr. Forsyth received his B.S. in Finance from the University of Illinois in 1986 and his M.B.A. from the University of Chicago in 1988. Mr. Forsyth has served as President of Frontegra since August 2008 and as Treasurer and a Director of Frontegra since May 1996. Mr. Forsyth served as Co-President and Assistant Secretary of Frontegra from May 1996 to August 2008. Mr. Forsyth has served as President of Timpani since August 2008 and served as Co-President from April 2008 to August 2008. Mr. Forsyth has served as President of Frontegra Strategies, LLC, the principal distributor of the Fund's shares, since August 2008 and as Co-President from August 2007 to August 2008. From July 1993 until the present, Mr. Forsyth has been a Partner of Frontier Partners, Inc., a consulting/marketing firm ("Frontier"). From April 1987 until June 1993, Mr. Forsyth served as a Partner of Brinson Partners, Inc., an investment adviser, and from June 1986 until April 1987, he served as a product marketing representative of Harris Trust & Savings Bank. Mr. Forsyth has earned the right to use the CFA designation. | | | 8 | ** | | None | |
|
* Mr. Forsyth is an "interested person" of the Funds because he serves as a director and officer of Frontegra, owns 100% of Frontegra and has an indirect equity ownership interest in Timpani.
** As of June 30, 2011, the Frontegra Funds consist of eight separate series, six of which are discussed in this Annual Report. The Frontegra Sky International Equity Fund and the Lockwell Small Cap Value Fund are additional series of Frontegra that are not included in this Annual Report. As of the date of this Annual Report, such Funds had not commenced operations.
page 92

Frontegra Funds
ADDITIONAL INFORMATION (continued)
(Unaudited)
Interested Director and Officers
Name, Address and
Year of Birth | | Position(s)
Held with
Company | | Term of
Office and
Length
of Time
Served | | Principal
Occupation(s)
During Past
Five Years | | Number of
Funds in
Complex
Overseen
by Director | | Other
Directorships
Held by
Director | |
| Elyce D. Dilworth Frontegra Funds, Inc. 400 Skokie Boulevard Suite 500 Northbrook, Illinois 60062 Year of Birth: 1966 | | Treasurer, Assistant Secretary, Chief Compliance Officer and Anti-Money Laundering Compliance Officer | | Elected annually by the Board of Directors; Treasurer and Assistant Secretary since August 2008; Chief Compliance Officer since January 2008; Anti-Money Laundering Compliance Officer since February 2008. | | Ms. Dilworth received her B.B.A. in Finance from the University of Wisconsin – Milwaukee in 1989 and her M.S. in Accounting from the University of Wisconsin – Milwaukee in 1991. Ms. Dilworth has served as Chief Compliance Officer of Frontegra since January 2008 and as Secretary since August 2008. Ms. Dilworth served as Chief Compliance Officer of Timpani from April 2008 through June 2011. She served as Chief Financial Officer of Timpani from April 2008 to March 2010. Ms. Dilworth has served as Chief Compliance Officer of Frontier from September 2010 through June 2011. Ms. Dilworth has served as Chief Compliance Officer of the Distributor since August 2008. From June 2004 until May 2007, Ms. Dilworth was the Chief Compliance Officer for Van Wagoner Funds, Inc. (n/k/a Embarcadero Funds, Inc.), and the President, Secretary and Treasurer from January 2005 until May 2007. From April 1994 until December 2003, Ms. Dilworth was employed by UMB Fund Services, Inc., a service provider to mutual funds and alternative investment products. From January 1992 until April 1994, Ms. Dilworth was a Staff Accountant for PricewaterhouseCoopers LLP, a public accounting firm. | | N/A | | N/A | |
|
page 93

Frontegra Funds
ADDITIONAL INFORMATION (continued)
(Unaudited)
Independent Directors
Name, Address and
Year of Birth | | Position(s)
Held with
Company | | Term of
Office and
Length
of Time
Served | | Principal
Occupation(s)
During Past
Five Years | | Number of
Funds in
Complex
Overseen
by Director | | Other
Directorships
Held by
Director | |
| David L. Heald 400 Skokie Blvd., Suite 260, Northbrook, IL 60062 Year of Birth: 1943 | | Lead Independent Director | | Indefinite; since June 1996 | | Mr. Heald received his B.A. in English from Denison University in 1966 and his J.D. from Vanderbilt University School of Law in 1969. Mr. Heald has been a principal and a director of Consulting Fiduciaries, Inc. ("CFI"), a registered investment adviser, since August of 1994. CFI provides professional, independent, fiduciary decision making, consultation and alternative dispute resolution services to ERISA plans, plan sponsors and investment managers. Between April 1994 and August 1994, Mr. Heald engaged in the private practice of law. From August 1992 until April 1994, Mr. Heald was a managing director and the chief administrative officer of Calamos Asset Management, Inc., a registered investment adviser specializing in convertible securities, and he served as an officer and director of CFS Investment Trust, a registered investment company comprised of four series. From January 1990 until August 1992, Mr. Heald was a partner in the Chicago based law firm of Gardner, Carton & Douglas. | | | 8 | ** | | None | |
|
** As of June 30, 2011, the Frontegra Funds consist of eight separate series, six of which are discussed in this Annual Report. The Frontegra Sky International Equity Fund and the Lockwell Small Cap Value Fund are additional series of Frontegra that are not included in this Annual Report. As of the date of this Annual Report, such Funds had not commenced operations.
page 94

Frontegra Funds
ADDITIONAL INFORMATION (continued)
(Unaudited)
Independent Directors
Name, Address and
Year of Birth | | Position(s)
Held with
Company | | Term of
Office and
Length
of Time
Served | | Principal
Occupation(s)
During Past
Five Years | | Number of
Funds in
Complex
Overseen
by Director | | Other
Directorships
Held by
Director | |
| James M. Snyder 400 Skokie Boulevard Suite 500 Northbrook, Illinois 60062 Year of Birth: 1947 | | Independent Director | | Indefinite; since May 2002 | | Mr. Snyder received his B.S. in Finance from Indiana University in 1969 and his M.B.A. from DePaul University in 1973. Mr. Snyder is a private investor and Chairman of The Snyder Family Foundation. Mr. Snyder served as an investment professional with Northern Trust from June 1969 until his retirement in June 2001. He served in a variety of capacities at Northern Trust, most recently as Executive Vice President of Northern Trust and Vice Chairman of Northern Trust Global Investments. Mr. Snyder has earned the right to use the Chartered Financial Analyst (CFA) designation. | | | 8 | ** | | IronBridge Funds, Inc. (with oversight of six portfolios) | |
|
** As of June 30, 2011, the Frontegra Funds consist of eight separate series, six of which are discussed in this Annual Report. The Frontegra Sky International Equity Fund and the Lockwell Small Cap Value Fund are additional series of Frontegra that are not included in this Annual Report. As of the date of this Annual Report, such Funds had not commenced operations.
page 95

Frontegra Funds
ADDITIONAL INFORMATION (continued)
(Unaudited)
FOREIGN TAX CREDIT
For the year ended June 30, 2011, the Frontegra Mastholm International Equity Fund earned foreign source income and paid foreign taxes, which it intends to pass through to its shareholders pursuant to Section 853 of the Internal Revenue Code as follows:
| | | Foreign Source Income Earned | | Foreign Taxes Paid | |
| Australia | | $ | 13,713 | | | $ | — | | |
| Belgium | | | 11,215 | | | | 1,869 | | |
| Brazil | | | 20,040 | | | | 2,400 | | |
| Canada | | | 239 | | | | 36 | | |
| Switzerland | | | 45,205 | | | | 8,476 | | |
| Germany | | | 42,941 | | | | 7,268 | | |
| Spain | | | 5,715 | | | | 893 | | |
| France | | | 51,345 | | | | 7,802 | | |
| United Kingdom | | | 113,961 | | | | — | | |
| Hong Kong | | | 14,296 | | | | — | | |
| Israel | | | 1,951 | | | | — | | |
| Jersey | | | 4,606 | | | | 461 | | |
| Japan | | | 113,659 | | | | 7,956 | | |
| Korea, Republic Of | | | 50,470 | | | | 8,328 | | |
| Luxembourg | | | 4,069 | | | | 610 | | |
| Netherlands | | | 44,389 | | | | 6,658 | | |
| Singapore | | | 2,314 | | | | — | | |
| Total | | $ | 540,128 | | | $ | 52,757 | | |
For the year ended June 30, 2011, the Frontegra SAM Global Equity Fund earned foreign source income and paid foreign taxes, which it intends to pass through to its shareholders pursuant to Section 853 of the Internal Revenue Code as follows:
| | | Foreign Source Income Earned | | Foreign Taxes Paid | |
| Australia | | $ | 22,603 | | | $ | — | | |
| Canada | | | 56,999 | | | | 8,372 | | |
| Switzerland | | | 30,497 | | | | 3,514 | | |
| Germany | | | 35,203 | | | | 5,171 | | |
| Spain | | | 61,728 | | | | 9,067 | | |
| France | | | 23,226 | | | | 3,412 | | |
| Israel | | | 1,609 | | | | 205 | | |
| Italy | | | 19,630 | | | | 2,884 | | |
| Japan | | | 29,852 | | | | 2,046 | | |
| Norway | | | 29,336 | | | | 7,182 | | |
| Netherlands | | | 10,675 | | | | 1,568 | | |
| United Kingdom | | | 54,541 | | | | — | | |
| Total | | $ | 375,899 | | | $ | 43,421 | | |
page 96

Frontegra Funds
ADDITIONAL INFORMATION (continued)
(Unaudited)
For the year ended June 30, 2011, the Frontegra HEXAM Emerging Markets Fund earned foreign source income and paid foreign taxes, which it intends to pass through to its shareholders pursuant to Section 853 of the Internal Revenue Code as follows:
| | | Foreign Source Income Earned | | Foreign Taxes Paid | |
| Bermuda | | $ | 7,903 | | | $ | 1,186 | | |
| Brazil | | | 56,908 | | | | 5,737 | | |
| Canada | | | 1,286 | | | | 193 | | |
| China | | | 47,735 | | | | 4,773 | | |
| United Kingdom | | | 4,434 | | | | — | | |
| Hong Kong | | | 45,050 | | | | — | | |
| Korea, Republic Of | | | 168 | | | | 28 | | |
| Russian Federation | | | 13,853 | | | | 2,078 | | |
| Singapore | | | 6,722 | | | | — | | |
| Turkey | | | 46,197 | | | | 6,930 | | |
| Taiwan | | | 9,797 | | | | 1,959 | | |
| South Africa | | | 56 | | | | — | | |
| Total | | $ | 240,109 | | | $ | 22,883 | | |
QUALIFIED DIVIDEND INCOME/DIVIDENDS RECEIVED DEDUCTION
For the fiscal year ended June 30, 2011, certain dividends paid by the Funds may be subject to a maximum tax rate of 15%, as provided for by the Jobs and Growth Tax Relief Reconciliation Act of 2004. The percentage of dividends declared from ordinary income designated as qualified dividend income was as follows:
| Mastholm International Equity | | | 100.00 | % | |
| SAM Global Equity | | | 18.58 | % | |
| Phocas Small Cap Value | | | 70.50 | % | |
For corporate shareholders, the percent of ordinary income distributions qualifying for the corporate dividends received deduction for the fiscal year ended June 30, 2011 was as follows:
| SAM Global Equity | | | 6.84 | % | |
| Phocas Small Cap Value | | | 70.50 | % | |
ADDITIONAL INFORMATION APPLICABLE TO FOREIGN SHAREHOLDERS ONLY
The percent of ordinary income distributions designated as interest related dividends for the fiscal year ended June 30, 2011 was as follows:
| Mastholm International Equity | | | 0.98 | % | |
| Phocas Small Cap Value | | | 0.32 | % | |
The percent of ordinary income distributions designated as short-term capital gain distributions for the fiscal year ended June 30, 2011 was as follows:
page 97
This page intentionally left blank.

A NOTE ON FORWARD-LOOKING STATEMENTS
This report includes forward-looking statements such as adviser, subadviser and/or portfolio manager predictions, opinions, assessments, analyses or outlooks for individual securities, industries, market sectors and/or markets. These statements involve risks and uncertainties. In addition to the general risks described for the Funds in the current Prospectuses, other factors bearing on these statements include the accuracy of the advisers', subadvisers' or portfolio managers' forecasts and predictions, and the appropriateness of the investment programs designed by an adviser, subadviser or portfolio manager to implement their strategies efficiently and effectively. Any one or more of these factors, as well as other risks affecting the securities markets and investment instruments generally, could cause the actual results of the Funds to differ materially as compared to benchmarks associated with the Funds.
In addition, portfolio composition will change due to ongoing management of the Funds. Specific securities named in this report may not currently be owned by the applicable Fund, or the Fund's position in the securities may have changed.
ADDITIONAL INFORMATION
Frontegra Funds has adopted proxy voting policies and procedures that delegate to Frontegra Asset Management, Inc. the authority to vote proxies. The proxy voting policies permit Frontegra to delegate its authority to vote proxies to each Fund's adviser or subadviser. A description of the Frontegra Funds' proxy voting policies and procedures is available without charge, upon request, by calling the Funds toll free at 1-888-825-2100. A description of these policies and procedures is also included in the Funds' Statement of Additional Information, which is available on the SEC's website at http://www.sec.gov or by calling the Funds toll free at 1-888-825-2100.
The actual voting records relating to each Fund's portfolio securities during the most recent twelve months ended June 30 are available without charge by calling the Funds toll free at 1-888-825-2100 or by accessing the SEC's website at http://www.sec.gov.
Each Fund files a complete schedule of portfolio holdings for its first and third fiscal quarters with the SEC on Form N-Q. The Form N-Q is available on the SEC's website at http://www.sec.gov. The Form N-Q may also be reviewed and copied at the SEC's Public Reference Room in Washington, D.C. Information on the operation of the Public Reference Room may be obtained by calling toll-free 1-800-SEC-0330.
Item 2. Code of Ethics.
The registrant has adopted a code of ethics that applies to the registrant’s principal executive officer and principal financial officer. The registrant has not made any amendments to its code of ethics during the period covered by this report. The registrant has not granted any waivers from any provisions of the code of ethics during the period covered by this report.
A copy of the registrant’s Code of Ethics is Incorporated by reference. See Item 12(a)(1).
Item 3. Audit Committee Financial Expert.
The registrant’s board of directors has determined that it does not have an audit committee financial expert serving on its audit committee. At this time, the registrant believes that the experience provided by each member of the audit committee together offers the registrant adequate oversight for the registrant’s level of financial complexity.
Item 4. Principal Accountant Fees and Services.
The registrant has engaged its principal accountant, Ernst & Young, LLP (“E&Y”), to perform audit services, audit-related services, tax services and other services during the past two fiscal years. In the following table, “Audit Fees” are fees billed for professional services for the audit of the registrant’s annual financial statements or for services that are normally provided by E&Y in connection with statutory and regulatory filings or engagements for those fiscal years. “Audit-Related Fees” are fees billed for professional services for assurance and related services by E&Y that are reasonably related to the performance of the audit. “Tax Fees” are fees billed for professional services rendered by E&Y for tax compliance, tax advice and tax planning. There were no other services provided by E&Y. The Audit-Related Fees for fiscal year 2010 relate to a consent issued by E&Y for a Form N-14 filed with the Securities and Exchange Commission. The following table details the aggregate fees billed or expected to be billed for each of the last two fiscal years by E&Y.
| | FYE 6/30/2011 | | FYE 6/30/2010 | |
Audit Fees | | $ | 145,800 | | $ | 200,300 | |
Audit-Related Fees | | $ | 0 | | $ | 3,000 | |
Tax Fees | | $ | 32,500 | | $ | 42,000 | |
All Other Fees | | $ | 0 | | $ | 0 | |
The audit committee has adopted pre-approval policies and procedures that require the audit committee to pre-approve all audit and non-audit services of the registrant, including services provided to any entity affiliated with the registrant with respect to any engagement that directly relates to the operations and financial reporting of the registrant. In accordance with its pre-approval policies and procedures, the audit committee pre-approved all audit and tax services provided by E&Y during fiscal 2011. During the last two fiscal years, there were no non-audit services rendered by E&Y to the registrant’s investment adviser or any entity controlling, controlled by or under common control with the investment adviser that provides ongoing services to the registrant. All of E&Y’s hours spent on auditing the registrant’s financial statements were attributed to work performed by full-time permanent employees of E&Y.
2
Item 5. Audit Committee of Listed Registrants.
Not applicable to registrants who are not listed issuers (as defined in Rule 10A-3 under the Securities Exchange Act of 1934).
Item 6. Investments.
(a) Schedule of Investments is included as part of the report to shareholders filed under Item 1 of this Form.
(b) Not Applicable.
Item 7. Disclosure of Proxy Voting Policies and Procedures for Closed-End Management Investment Companies.
Not applicable to open-end investment companies.
Item 8. Portfolio Managers of Closed-End Management Investment Companies.
Not applicable to open-end investment companies.
Item 9. Purchases of Equity Securities by Closed-End Management Investment Company and Affiliated Purchasers.
Not applicable to open-end investment companies.
Item 10. Submission of Matters to a Vote of Security Holders.
Not Applicable.
Item 11. Controls and Procedures.
(a) Based on an evaluation of the registrant’s disclosure controls and procedures (as defined in Rule 30a-3(c) under the Investment Company Act of 1940 (the “Act”)) as of a date within 90 days prior to the filing date of this Form N-CSR, the registrant’s principal executive officer and principal financial officer have concluded that the disclosure controls and procedures are effective.
(b) There were no changes in the Registrant’s internal control over financial reporting (as defined in Rule 30a-3(d) under the Act) that occurred during the second fiscal quarter of the period covered by this report that has materially affected, or is reasonably likely to materially affect, the Registrant’s internal control over financial reporting.
Item 12. Exhibits.
(a) (1) Any code of ethics or amendment thereto, that is the subject of the disclosure required by Item 2, to the extent that the registrant intends to satisfy Item 2 requirements through
3
filing an exhibit. Incorporated by reference to the Registrant’s Form N-CSR filed September 8, 2008.
(2) A separate certification for each principal executive and principal financial officer pursuant to Section 302 of the Sarbanes-Oxley Act of 2002. Filed herewith.
(3) Any written solicitation to purchase securities under Rule 23c-1 under the Act sent or given during the period covered by the report by or on behalf of the registrant to 10 or more persons. Not applicable to open-end investment companies.
(b) Certifications pursuant to Section 906 of the Sarbanes-Oxley Act of 2002. Furnished herewith.
4
SIGNATURES
Pursuant to the requirements of the Securities Exchange Act of 1934 and the Investment Company Act of 1940, the registrant has duly caused this report to be signed on its behalf by the undersigned, thereunto duly authorized.
Frontegra Funds, Inc. | |
| |
| |
By: | /s/ William D. Forsyth III | |
| William D. Forsyth III, President | |
| (Principal Executive Officer) | |
| | |
Date: | September 7, 2011 | |
Pursuant to the requirements of the Securities Exchange Act of 1934 and the Investment Company Act of 1940, this report has been signed below by the following persons on behalf of the registrant and in the capacities and on the dates indicated.
By: | /s/ William D. Forsyth III | |
| William D. Forsyth III, President and Secretary | |
| (Principal Executive Officer) | |
| | |
Date: | September 7, 2011 | |
| |
| |
By: | /s/ Elyce D. Dilworth | |
| Elyce D. Dilworth, Treasurer and Assistant Secretary | |
| (Principal Financial Officer) | |
| | |
Date: | September 7, 2011 | |
5