UNITED STATES
SECURITIES AND EXCHANGE COMMISSION
Washington, D.C. 20549
FORM N-CSR
CERTIFIED SHAREHOLDER REPORT OF REGISTERED
MANAGEMENT INVESTMENT COMPANIES
Investment Company Act file number | 811-07685 |
|
Frontegra Funds, Inc. |
(Exact name of registrant as specified in charter) |
|
400 Skokie Blvd. Suite 500 Northbrook, Illinois | | 60062 |
(Address of principal executive offices) | | (Zip code) |
|
William D. Forsyth III 400 Skokie Blvd., Suite 500 Northbrook, Illinois 60062 |
(Name and address of agent for service) |
|
Registrant’s telephone number, including area code: | (847) 509-9860 | |
|
Date of fiscal year end: | June 30 | |
|
Date of reporting period: | June 30, 2013 | |
| | | | | | | | |
Item 1. Reports to Stockholders.

ANNUAL REPORT
Frontegra RobecoSAM Global Equity Fund
Frontegra MFG Global Equity Fund
Frontegra MFG Core Infrastructure Fund
Frontegra HEXAM Emerging Markets Fund
Frontegra Timpani Small Cap Growth Fund
Frontegra Netols Small Cap Value Fund
Frontegra Phocas Small Cap Value Fund
Lockwell Small Cap Value Fund
Frontegra Asset Management, Inc.
June 30, 2013

TABLE OF CONTENTS
Shareholder Letter | | | 1 | | |
Frontegra RobecoSAM Global Equity Fund | |
Report from RobecoSAM USA, Inc. | | | 4 | | |
Investment Highlights | | | 6 | | |
Frontegra MFG Global Equity Fund | |
Report from MFG Asset Management | | | 8 | | |
Investment Highlights | | | 11 | | |
Frontegra MFG Core Infrastructure Fund | |
Report from MFG Asset Management | | | 14 | | |
Investment Highlights | | | 16 | | |
Frontegra HEXAM Emerging Markets Fund | |
Report from HEXAM Capital Partners, LLP | | | 18 | | |
Investment Highlights | | | 20 | | |
Frontegra Timpani Small Cap Growth Fund | |
Report from Timpani Capital Management LLC | | | 22 | | |
Investment Highlights | | | 24 | | |
Frontegra Netols Small Cap Value Fund | |
Report from Netols Asset Management, Inc. | | | 26 | | |
Investment Highlights | | | 27 | | |
Frontegra Phocas Small Cap Value Fund | |
Report from Phocas Financial Corporation | | | 30 | | |
Investment Highlights | | | 32 | | |
Lockwell Small Cap Value Fund | |
Report from Lockwell Investments, LLC | | | 34 | | |
Investment Highlights | | | 35 | | |
Expense Example | | | 36 | | |
Schedules of Investments | |
Frontegra RobecoSAM Global Equity Fund | | | 38 | | |
Frontegra MFG Global Equity Fund | | | 40 | | |
Frontegra MFG Core Infrastructure Fund | | | 41 | | |
Frontegra HEXAM Emerging Markets Fund | | | 44 | | |
Frontegra Timpani Small Cap Growth Fund | | | 46 | | |
Frontegra Netols Small Cap Value Fund | | | 48 | | |
Frontegra Phocas Small Cap Value Fund | | | 50 | | |
Lockwell Small Cap Value Fund | | | 53 | | |
Statements of Assets and Liabilities | | | 54 | | |
Statements of Operations | | | 56 | | |
Statements of Changes in Net Assets | | | 58 | | |
Financial Highlights | | | 62 | | |
Notes to Financial Statements | | | 71 | | |
Report of Independent Registered Public Accounting Firm | | | 81 | | |
Board of Directors' Approval of Advisory and Subadvisory Agreements | | | 82 | | |
Additional Information | |
Directors and Officers | | | 92 | | |
Foreign Tax Credit | | | 97 | | |
Qualified Dividend Income/Dividends Received Deduction | | | 98 | | |
Additional Information Applicable to Foreign Shareholders Only | | | 98 | | |
This report is submitted for the general information of the shareholders of the Funds. It is not authorized for distribution to prospective investors unless accompanied or preceded by an effective Prospectus for the applicable Fund. The Prospectus may be obtained by calling 1-888-825-2100. Each Prospectus includes more complete information about management fees and expenses, investment objectives, risks and operating policies of the applicable Fund. Please read the Prospectus carefully.
Frontegra Funds, Inc. are distributed by Frontegra Strategies, LLC, 400 Skokie Blvd., Suite 500, Northbrook, IL 60062. Frontegra Strategies, LLC, member of FINRA and SIPC, is an affiliate of Frontegra Asset Management, Inc., the Funds' investment adviser.

DEAR FELLOW SHAREHOLDERS:
We are pleased to report on the progress of the Frontegra Funds over the past twelve months ending June 30, 2013. The S&P 500 Index was up 20.60%, and small capitalization stocks were up, with the Russell 2000® Index returning 24.21%. International stocks, as measured by the MSCI EAFE Index, returned 18.62% over the twelve-month period.
Fund Results
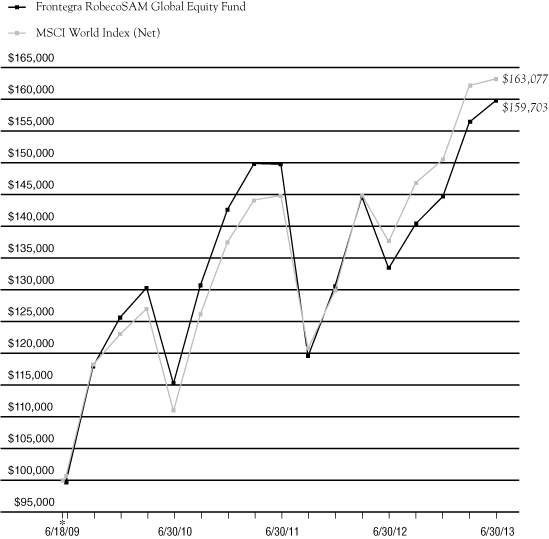
For the twelve month period ending June 30, 2013, the Frontegra RobecoSAM Global Equity Fund, managed by RobecoSAM USA, returned 19.78% (net) versus the MSCI World Index (Net) return of 18.58%.
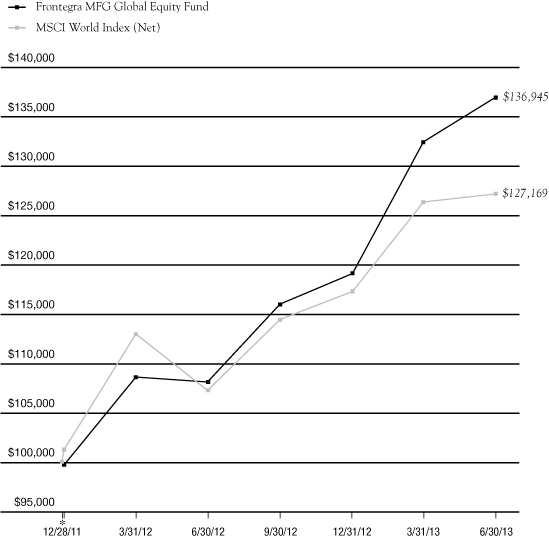
The Frontegra MFG Global Equity Fund, managed by MFG Asset Management, returned 26.68% (net) versus the MSCI World Index (Net) return of 18.58% for the twelve month period ending June 30, 2013.
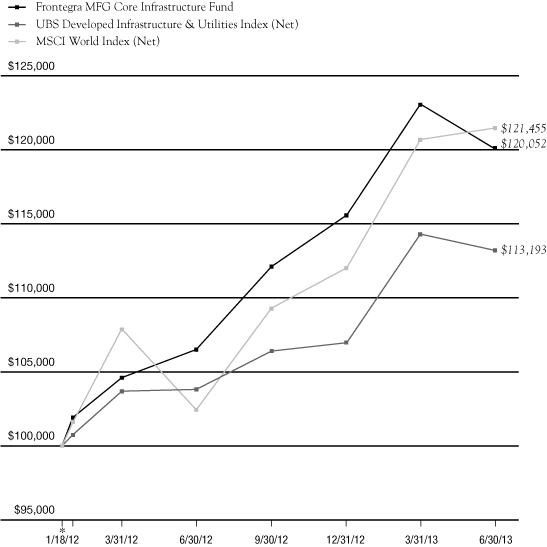
The Frontegra MFG Core Infrastructure Fund, also managed by MFG Asset Management, returned 12.73% (net) versus the UBS Developed Infrastructure & Utilities Index (Net) return of 9.04% and the MSCI World Index (Net) return of 18.58% for the twelve month period ending June 30, 2013.
For the twelve month period ending June 30, 2013, the Frontegra HEXAM Emerging Markets Fund, managed by HEXAM Capital Partners, returned -6.67% (net) versus the MSCI Emerging Markets Index (Net) return of 2.87%.
The Frontegra Timpani Small Cap Growth Fund, managed by Timpani Capital Management, returned 28.35% (net) versus the Russell 2000® Growth Index return of 23.67% for the twelve month period ending June 30, 2013.
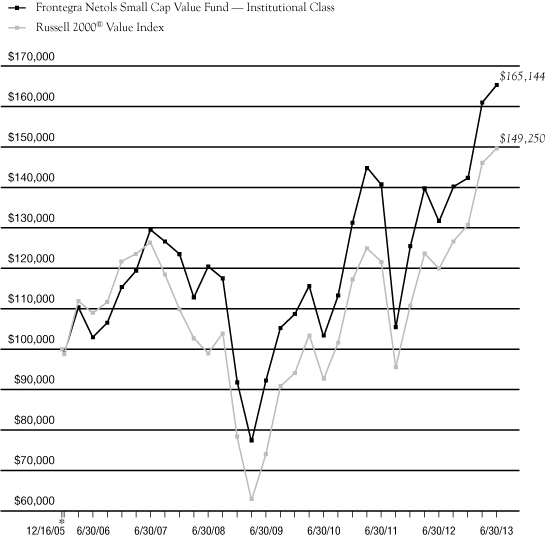
For the twelve month period ending June 30, 2013, the Frontegra Netols Small Cap Value Fund — Institutional Class, managed by Netols Asset Management, returned 25.61% (net) versus the Russell 2000® Value Index return of 24.76%. The Class Y shares returned 25.15% (net) over the same time period.
The Frontegra Phocas Small Cap Value Fund, managed by Phocas Financial, returned 24.29% (net) versus the Russell 2000 Value Index return of 24.76% for the twelve month period ending June 30, 2013.
For the twelve month period ending June 30, 2013, the Lockwell Small Cap Value Fund, managed by Lockwell Investments, returned 27.66% (net) versus the Russell 2000 Value Index return of 24.76%.
Outlook
As we sit here in mid-2013, investment markets present a mixed picture. Despite a modestly improving unemployment picture, U.S. equity markets have performed very well over the past twelve months, while U.S. bond markets have struggled. The Japanese equity market has performed exceptionally well of late, but the Chinese stock market has languished. European equities have experienced fits and starts, occasionally showing signs of progress with their austerity measures while at other times backtracking due to the fragile state of affairs in countries like Greece and Turkey. As we enter a new fiscal year, we will work as diligently as ever to manage your assets with the skill and agility necessary in these uncertain times.
We will continue to oversee the investment management of the Frontegra Funds with the care and diligence that have served our shareholders well in the past. As always, we appreciate your investment and continued confidence in the Frontegra Funds.
Best regards,
William D. Forsyth, CFA
President
Frontegra Funds, Inc.
page 1
This page intentionally left blank.

FRONTEGRA
ROBECOSAM GLOBAL EQUITY FUND

REPORT FROM ROBECOSAM USA, INC.
Dear Shareholders:
The Frontegra RobecoSAM Global Equity Fund strives to achieve capital appreciation by investing in a diversified portfolio of equity and equity-related securities issued by U.S. and non-U.S. companies that combine their market and financial strategy with a high level of environmental awareness and a clearly defined social policy. The objective is measured against the MSCI World Index (Net).
Performance Review
The Frontegra RobecoSAM Global Equity Fund returned 19.78%, net of fees, for the year ended June 30, 2013. The Fund outperformed the 18.58% return of its benchmark, the MSCI World Index (Net).
Portfolio outperformance relative to the benchmark was primarily attributed to the positive contribution of stock selection across most sectors and was particularly strong within Financials, Health Care and Materials stocks. Stock selection had a negative contribution to performance within the Industrials and Utilities sectors.
The largest positive contributions at the stock level included positions in Hartford Financial, Life Technologies and SanDisk. Life Technologies' share price rose 64.5% (in USD terms) after Thermo Fisher announced a binding offer which valued the company at almost $13 billion. Hartford Financial's outperformance was mainly due to improving business fundamentals and strengthening capital position. Outperformance of U.S. semiconductor manufacturer SanDisk was attributed to a positive outlook for the flash memory market where the company enjoys a leading position.
Portfolio sector allocation was positioned with an overweight in Consumer Staples and Telecoms combined with underweight positions in Financials, Industrials and Materials. In terms of performance contribution, sector allocation had a negative impact. In particular, negative contribution came from underweighting Consumer Discretionary and Financials, as both sectors were among the best performing.
Portfolio Outlook and Strategy
Over the period, sentiment on the global equity market improved. The positive momentum was driven by central banks in the U.S. and Europe announcing aggressive monetary policy actions. The U.S. Federal Reserve announced plans to buy $40 billion of mortgage-backed securities each month until improvement is seen in the labour market. The Federal Reserve also extended the zero-interest rate policy into 2015. In Europe, the European Central Bank's (ECB) plan to buy euro-area government bonds was well received by investors. The so-called OMT plan (Outright Monetary Transactions) will have no ex ante limits on the size of the purchases, subject to conditions. European governments that want the ECB to buy their bonds must agree to a program of reforms and oversight by the bailout funds. Also, the Bank of Japan has announced the beginning of quantitative easing. Japanese Prime Minister Shinzo Abe's goal is to put the domestic economy back on self-sustaining growth using a combination of monetary and fiscal stimulus. Over the period, rising expectation of aggressive monetary stimulus fuelled a strong rally in Japanese equities.
Economic data released over the period continued to show growth tilted towards the downside. The euro-area sovereign crisis has hurt business confidence, making companies cautious to invest in new capacities. These problems have been compounded by weakening demand in key export markets such as China and by worries over tax and spending negotiations in the U.S. As a result, the euro-area economy remained in a recession over the period. Also, recent data on Chinese manufacturing activity shows a prolonged slowdown. This trend underlines a sustained slowdown in the country's economy and increases the likelihood of China missing its annual growth target.
In the coming quarters, the stock market will continue to be heavily influenced by further decisions of the U.S., European and Japanese central banks. Even though it can be expected that central banks will continue with a very accommodative monetary policy for the time being, the discussions about tapering bond purchases have just started and might weigh on the markets going forward. Our investment strategy remains focused on investing in sustainable companies with attractive valuations and stable earnings outlooks. We also continue
page 4

to underweight sectors where earnings visibility is lower, namely Financials. Our outlook for the Financial sector remains cautious as a result of the tightening regulation and the ongoing de-leveraging process. Our approach in this space remains very selective with focus on companies with solid cash generation, strong balance sheets and acceptable leverage.
Sincerely,
RobecoSAM USA, Inc.
page 5

INVESTMENT HIGHLIGHTS
Growth of a $100,000 Investment (Unaudited)
* 6/18/09 commencement of operations.
This chart assumes an initial gross investment of $100,000 made on 6/18/09 (commencement of operations). Returns shown include the reinvestment of all distributions. Past performance is not predictive of future results. Investment return and principal value will fluctuate so that shares, when redeemed, may be worth more or less than the original cost. In the absence of existing fee waivers, total return would be reduced. Effective June 10, 2011, RobecoSAM USA, Inc. ("RobecoSAM") became subadviser to the Fund and Frontegra Asset Management, Inc. became adviser to the Fund. Prior to June 10, 2011, RobecoSAM served as adviser to the Fund. Effective February 20, 2013, the Fund changed its name from Frontegra SAM Global Equity Fund to Frontegra RobecoSAM Global Equity Fund. To receive current to the most recent month-end performance, please call 1-888-825-2100.
The MSCI World Index measures the overall performance of stock markets in 24 developed market countries in North America, Europe, and the Asia/Pacific Region. The Index does not reflect investment management fees, brokerage commissions and other expenses associated with investing in equity securities. A direct investment in the index is not possible.
Frontegra Asset Management, Inc. has contractually agreed through October 31, 2014 to waive its management fee and/or reimburse the Fund's operating expenses to the extent necessary to ensure that the Fund's total operating expenses (excluding taxes, interest, brokerage commissions, acquired fund fees and expenses and extraordinary expenses) do not exceed 1.20% of the Fund's average daily net assets. The expense ratios presented are based on the annualized expense ratios as reported in the Fund's current prospectus, which may differ from the expense ratios presented in the Fund's financial highlights.
** The returns shown do not reflect the deduction of taxes that a shareholder would pay on Fund distributions or the redemption of Fund shares.
Portfolio Total Return**
FOR PERIODS
ENDED 6/30/13 | | FUND | | INDEX | |
SIX MONTHS | | | 10.45 | % | | | 8.43 | % | |
ONE YEAR | | | 19.78 | % | | | 18.58 | % | |
AVERAGE ANNUAL
SINCE INCEPTION | | | 12.31 | % | | | 12.89 | % | |
Fund Expenses | |
GROSS EXPENSE RATIO | | | 1.62 | % | |
NET EXPENSE RATIO | | | 1.20 | % | |
page 6

FRONTEGRA
MFG GLOBAL EQUITY FUND

REPORT FROM MFG ASSET MANAGEMENT
Dear Fellow Shareholders:
The investment objective of the Frontegra MFG Global Equity Fund is capital appreciation. The objective is measured against the MSCI World Index (Net).
Performance Review
The Frontegra MFG Global Equity Fund returned 26.68%, net of fees, for the year ended June 30, 2013. The Fund's return outperformed the 18.58% return of its benchmark, the MSCI World Index (Net).
We do not manage the Fund against short-term performance metrics and it is inevitable that it will underperform equity markets at some point in the future. We aim (not guarantee) to produce absolute returns through the business cycle whilst minimizing the risk of a permanent capital loss. We will continue to focus on these objectives and will not chase short-term performance.
Fund Outlook and Strategy
Over the twelve months ending June 30, 2013, the MSCI World Index (Net) made strong gains, rising 18.58% in U.S. dollar terms, with global financial markets experiencing a number of interesting developments. In July 2012, comments from the ECB President, Mario Draghi, that Europe's central bank would do "whatever it takes" to preserve the euro caused markets to rally strongly.
As the twelve month period approached its end, investors became increasingly focused on the implications of the U.S. Federal Reserve ("the Fed") ending its quantitative easing programme. Over one month, U.S. 10 year Treasury yields rose from 2.2% to 2.5%, a 3% fall in value. It is also of note that gold fell around 23% over the past 12 months, notwithstanding common perceptions that it is a defensive store of value; in these markets it appears nothing could be further from the truth.
In our view, the major current investment risk is what will happen when the Fed ends its quantitative easing programme ("QE"). The endgame for QE presents a risk for equity and other asset markets (particularly currency and bond/credit markets) due to the potential redistribution of global money flows and possibility of rising bond yields.
United States
Fundamentally speaking, nothing has changed in our view of the U.S. economy over the past twelve months. There continue to be encouraging signs that the U.S. is undergoing a modest economic recovery. Importantly, house prices are rising and housing starts have increased substantially. However, we believe that there is unlikely to be a significant reduction in the unemployment rate until housing construction reverts to more normalised levels. When this occurs, the U.S. economy should recover significantly.
Europe
Since June 2012, the ECB has taken substantive action with Mario Draghi's "whatever it takes" statement in July and the announcement of the Outright Monetary Transactions (OMT) programme in September. These actions have significantly reduced the probability of a European sovereign-related financial system meltdown. The approaching German election could have important bearings on financial markets and the ongoing stability of Europe, though it appears that Angela Merkel is in a strong political position at the present time. Despite this, it is unlikely that significant progress, such as a move towards a comprehensive European Banking Union, will be made until after the election.
We continue to believe that many European countries face a prolonged period of sub-par (and potentially negative) economic growth due to the effects of fiscal austerity and deleveraging. The major near-term risk for Europe would be a dramatic uplift in European sovereign bond yields which could be triggered by a disorderly unwinding of QE in the U.S. This scenario would stoutly test the resolve of the ECB and test the veracity of its OMT programme.
page 8

China
It is becoming apparent that China's new leadership are intent on mitigating the risks associated with the country's banking and shadow banking systems, while addressing the overcapacity in certain parts of its economy. It is almost beyond comprehension that total credit outstanding in China has increased around 2.5 fold since the beginning of 2009. The ratio of credit to GDP has risen to around 200% over this period. This is probably the largest rapid increase in credit of any large economy in modern times. However, we think it is unlikely China will suffer a financial crisis in the next few years, given its government's substantial resources.
Over the past month, the People's Bank of China has tightened short-term liquidity to curtail lending in its unregulated shadow banking system. We believe there will also be an increased focus on reducing investment in additional production capacity. We regard both of these measures as necessary to preserve the longer-term stability of the country, though they will inevitably slow its economy. The main impact of any slowdown will be felt by Chinese savers, who have bought shadow banking products, and by commodity producers, through lower commodity prices. Indeed, if the Chinese leadership follows through with these policies commodity prices may fall far further. We don't think that the end of U.S. QE has large implications for China as the country's closed capital account means that large flows of capital out of the country are unlikely. We also believe the government will accept a slower rate of economic growth and is unlikely to embark on another large stimulus programme.
The Fund
As at 30 June 2013, the Fund consisted of 25 investments (compared with 24 investments at 30 June 2012). The top ten investments represented 51.6% of the portfolio (compared with 53.1% at 30 June 2012). Over the twelve months to 30 June 2013, the stocks with the strongest local currency returns were Google (+51.8%), Visa (+49.0%) and Lowe's (+46.7%) and the stocks with the weakest were Coca-Cola (+5.5%), Wal-Mart (+9.4%) and Yum! Brands (+9.8%).
We repositioned the defensive part of the Fund as some investments in this area performed strongly. We sold or reduced holdings in the most fully-valued companies, such as multi-national consumer staples names (e.g. Kraft, General Mills, Procter & Gamble and Mondelez), and increased our exposure to other defensive companies which should deliver more attractive returns (e.g. Yum! Brands and Target). We have recently made large investments in the out-of-favour, large-capitalisation technology companies, Microsoft and Oracle. Both these companies remain dominant in their markets but their valuations assume that this dominance (and subsequently earnings) will soon rapidly erode. While both companies have faced some near-term uncertainty, we believe they have strong futures.
The Fund continues to be exposed to the following major investment themes:
• Emerging market consumption growth via investments in multinational consumer franchises. The five largest investments in multinational consumer franchises at 30 June 2013 were Yum! Brands, Danone, McDonald's, Nestle and Colgate-Palmolive. These companies generate, on average, around 40% of their revenues in emerging markets.
• U.S. interest rates. We believe it is likely that U.S. short and long-term interest rates will "normalise" over the next three years as the U.S. economy recovers. This will be a result of the Federal Reserve lifting its base rate and ceasing its quantitative easing programme before taking steps to shrink (or sterilise) its balance sheet. We own four U.S. financial institutions which are likely to benefit from the change in U.S. interest rates; Wells Fargo, U.S. Bancorp, Bank of New York Mellon and State Street.
• A move to a cashless society. There continues to be a strong secular shift from spending via cash and cheque to cashless forms of payments such as credit cards, debit cards, electronic funds transfer and mobile payments. In our opinion, the explosion of smartphones will accelerate this shift on a global basis. We believe that there are only a limited number of companies that are well positioned to benefit from this structural shift. These companies are typically attractive and boast strong network effects, low capital intensity, high returns on capital and operate in industries that have high barriers to entry. Fund investments in this space include PayPal (via eBay), American Express, Visa and MasterCard.
page 9

• U.S. housing. A recovery in new housing construction should drive a strong cyclical recovery in companies exposed to the U.S. housing market, while providing a strong boost to the overall economy. Our major exposure to the U.S. housing market is via home improvement retailer, Lowe's, and the domestic U.S. banks, Wells Fargo and U.S. Bancorp.
• Technology/software. We believe that entrenched global software companies enjoy enormous competitive advantages and exhibit attractive investment characteristics. The Fund's technology/software investments include Microsoft and Oracle.
• Internet/e-commerce. There are a number of internet enabled businesses that also have very attractive investment characteristics with increasing competitive advantages. The Fund's investments in these areas include eBay and Google.
Sincerely,
Hamish Douglass
Portfolio Manager
MFG Asset Management
page 10

INVESTMENT HIGHLIGHTS
Growth of a $100,000 Investment (Unaudited)
* 12/28/11 commencement of operations.
This chart assumes an initial gross investment of $100,000 made on 12/28/11 (commencement of operations). Returns shown include the reinvestment of all distributions. Past performance is not predictive of future results. Investment return and principal value will fluctuate so that shares, when redeemed, may be worth more or less than the original cost. In the absence of existing fee waivers, total return would be reduced. To receive current to the most recent month-end performance, please call 1-888-825-2100.
The MSCI World Index measures the overall performance of stock markets in 24 developed market countries in North America, Europe, and the Asia/Pacific Region. The Index does not reflect investment management fees, brokerage commissions and other expenses associated with investing in equity securities. A direct investment in the index is not possible.
Frontegra Asset Management, Inc. has contractually agreed through October 31, 2014 to waive its management fee and/or reimburse the Fund's operating expenses to the extent necessary to ensure that the Fund's total operating expenses (excluding taxes, interest, brokerage commissions, acquired fund fees and expenses and extraordinary expenses) do not exceed 0.80% of the Fund's average daily net assets. The expense ratios presented are based on the annualized expense ratios as reported in the Fund's current prospectus, which may differ from the expense ratios presented in the Fund's financial highlights.
** The returns shown do not reflect the deduction of taxes that a shareholder would pay on Fund distributions or the redemption of Fund shares.
Portfolio Total Return**
FOR PERIODS ENDED 6/30/13 | | FUND | | INDEX | |
SIX MONTHS | | | 14.98 | % | | | 8.43 | % | |
ONE YEAR | | | 26.68 | % | | | 18.58 | % | |
AVERAGE ANNUAL
SINCE INCEPTION | | | 23.20 | % | | | 17.29 | % | |
Fund Expenses | |
GROSS EXPENSE RATIO | | | 1.14 | % | |
NET EXPENSE RATIO | | | 0.80 | % | |
page 11
This page intentionally left blank.

FRONTEGRA
MFG CORE INFRASTRUCTURE FUND

REPORT FROM MFG ASSET MANAGEMENT
Dear Fellow Shareholders:
The investment objective of the Frontegra MFG Core Infrastructure Fund is long-term capital appreciation. The objective is measured against the UBS Developed Infrastructure & Utilities Index (Net).
The types of infrastructure assets in which the Fund invests are natural monopolies that provide an essential service to the community. Infrastructure assets offer investors protection from the impacts of inflation because their earnings generally have some direct linkage to inflation. Over time the stable, reliable earnings of infrastructure assets are expected to lead to a combination of income and capital growth for investors.
The return from the infrastructure universe (as defined by MFG Asset Management ("MFGAM")) was more than 10% p.a. for the decade to the end of 2012. Just under half of that return was in the form of dividend income.
The universe of infrastructure assets that are held by the Fund is made up of two main sectors:
• Utilities, including both regulated energy utilities and regulated water utilities. Utilities comprise approximately 73% of the Fund. Utilities are typically subject to economic regulation. This requires the utility to efficiently provide an essential service to the community and, in return, permits the utility to earn a fair rate of return on the capital it has invested in its operations. As the utility provides a basic necessity, e.g. energy or water, there is minimal fluctuation in demanded volumes in response to the economic cycle and the price charged for the utility service can be adjusted with limited impact upon demanded volumes. As a result, the earnings of regulated utilities have been, and are expected to continue to be, stable irrespective of economic conditions; and
• Infrastructure, which includes airports, toll roads, ports and broadcast communications infrastructure. Regulation of infrastructure companies is generally done through contracts that regulate the prices the company can charge (rather than the earnings) and allows companies to accrue the benefits of volume growth (i.e. the returns of infrastructure companies are linked to growth in passengers, vehicles or containers). As economies develop, grow and become more inter-dependent, we expect the underlying level of aviation, shipping and vehicle traffic to increase. As a result, the revenues and earnings derived by infrastructure assets are expected to grow. In particular, airport stocks held by the Fund will benefit from the growing wealth of people in emerging markets and the resultant increase in tourism to European, Australian and New Zealand destinations.
Performance Review
The Frontegra MFG Core Infrastructure Fund returned 12.73%, net of fees, for the year ending June 30, 2013. The Fund's return outperformed the 9.04% return of its benchmark, the UBS Developed Infrastructure & Utilities Index (Net).
Most sectors held in the Core Infrastructure strategy performed well during the period with Airports up a weighted average 34%, Toll Roads up 30% and Gas Utilities up 16%. The Ports sector was the worst performing sector held by the Fund, and the only one not generating a positive return, down over 9% on average for the year.
Geographically, stocks held in the Fund and located in the Australia/New Zealand market were up a weighted average of 27%, while European stocks were up 20%. U.S. stocks were up almost 12%, but both U.K. and Canadian stocks underperformed the other sectors, both up approximately 8%.
In terms of the stocks included in the benchmark index but excluded from the Fund because they do not meet MFG's stringent definition of investment grade infrastructure, Japanese stocks were up over 60% on average reflecting increased appetite among international investors for exposure to the yen. These stocks had been very poor performers in previous years. In contrast, large, vertically integrated power companies in Europe with significant exposure to unregulated power generation continued to perform poorly.
page 14

Portfolio Outlook and Strategy
The Core Infrastructure strategy is designed to provide reliable returns in all but the most extreme market conditions. The Fund exceeded that expectation during the year, partly reflecting the continued recovery of stocks held by the Fund that had been over-sold in previous years. We now see the utilities market as broadly in equilibrium while infrastructure stocks, particularly those in Europe, remain cheap.
MFGAM believes that infrastructure and utility assets, with requisite earnings reliability and a linkage of earnings to inflation, offer an attractive, long-term investment proposition. Furthermore, given the predictable nature of earnings and the structural linkage of those earnings to inflation, the investment returns generated by infrastructure assets are different from standard asset classes and offer investors valuable diversification when included in an investment portfolio. In the current uncertain economic and investment climate, the reliable financial performance of infrastructure investments makes them particularly attractive and an investment in listed infrastructure can be expected to reward patient investors with a three to five year timeframe.
Sincerely,
Dennis Eagar | |
Portfolio Manager
MFG Asset Management | |
page 15

INVESTMENT HIGHLIGHTS
Growth of a $100,000 Investment (Unaudited)
* 1/18/12 commencement of operations.
This chart assumes an initial gross investment of $100,000 made on 1/18/12 (commencement of operations). Returns shown include the reinvestment of all distributions. Past performance is not predictive of future results. Investment return and principal value will fluctuate so that shares, when redeemed, may be worth more or less than the original cost. In the absence of existing fee waivers, total return would be reduced. To receive current to the most recent month-end performance, please call 1-888-825-2100.
The MSCI World Index measures the overall performance of stock markets in 24 developed market countries in North America, Europe, and the Asia/Pacific Region. The UBS Developed Infrastructure & Utilities Index is a global developed markets infrastructure and utilities benchmark. Neither index reflects investment management fees, brokerage commissions or other expenses associated with investing in equity securities. A direct investment in an index is not possible.
Frontegra Asset Management, Inc. has contractually agreed through October 31, 2014 to waive its management fee and/or reimburse the Fund's operating expenses to the extent necessary to ensure that the Fund's total operating expenses (excluding taxes, interest, brokerage commissions, acquired fund fees and expenses and extraordinary expenses) do not exceed 0.70% of the Fund's average daily net assets. The expense ratios presented are based on the annualized expense ratios as reported in the Fund's current prospectus, which may differ from the expense ratios presented in the Fund's financial highlights.
** The returns shown do not reflect the deduction of taxes that a shareholder would pay on Fund distributions or the redemption of Fund shares.
Portfolio Total Return**
FOR PERIODS
ENDED 6/30/13 | | FUND | | UBS
INDEX | | MSCI
INDEX | |
SIX MONTHS | | | 3.87 | % | | | 5.83 | % | | | 8.43 | % | |
ONE YEAR | | | 12.73 | % | | | 9.04 | % | | | 18.58 | % | |
AVERAGE ANNUAL
SINCE INCEPTION | | | 13.44 | % | | | 8.90 | % | | | 14.35 | % | |
Fund Expenses | |
GROSS EXPENSE RATIO | | | 6.55 | % | |
NET EXPENSE RATIO | | | 0.70 | % | |
page 16

FRONTEGRA
HEXAM EMERGING MARKETS FUND

REPORT FROM HEXAM CAPITAL PARTNERS, LLP
Dear Shareholders:
The Frontegra HEXAM Emerging Markets Fund aims to achieve long-term capital growth by investing at least 80% of its net assets in securities of emerging market companies. The Fund's benchmark is the MSCI Emerging Markets Index (Net).
Performance Review
The Frontegra HEXAM Emerging Markets Fund returned -6.67%, net of fees, for the year ended June 30, 2013. The Fund's return underperformed the 2.87% return of its benchmark, the MSCI Emerging Markets Index (Net).
Portfolio Review and Strategy
Investment sentiment remained negatively skewed over the past twelve months. On-going concerns about the euro zone, Chinese growth dynamics and leadership transition, and the U.S. fiscal cliff heightened risk-aversion further. In fact, these broader economic concerns are so elevated that the valuation gap between cyclical and defensive equities is at unprecedented levels. Interestingly, the performance of emerging markets relative to the S&P in recent years has resulted in a complete evaporation of relative return gains of the former since 1990. This is remarkable given the fundamental differences in the economies of emerging markets ("EM") versus developed markets ("DM") and the substantial earnings differentials over the period.
Over the reporting period, the Fund maintained its cyclical stance, and we have been increasing the number of non-commodity names in the portfolio that suffered most due to the negative sentiment towards cyclicals.
The biggest contribution to return at a country level came from an overweight position to China and underweight positions to South Africa, Chile and Peru. Overweight to Brazil was the biggest detraction at a country level, while underweights to Taiwan and ASEAN also detracted.
At a stock level, copper stocks (Kazakhstani Kazakhmys and Zambian First Quantum Minerals) detracted the most from the Fund's performance as sentiment towards commodities remained extremely negative. Brazilian Vale was one of the biggest laggards as well. The biggest contribution to return came from Kroton Educacional, an education company in Brazil, followed by Kingboard Chemicals, a Chinese laminate producer, and Qihoo 360, a leading Chinese Internet company.
Outlook
Although we have been witnessing historic high valuation gaps over the past three years and have experienced a few false bounces, some indicators are strongly suggesting that we have reached the bottom. A few points:
• U.S. corporate bonds are on course for their worst year (from a total return perspective) since 1973.
• June was the biggest month of global bond fund redemptions in over 20 years.
• The outperformance of defensive stocks versus cyclicals in emerging markets is now at its highest level since the 1998 Asia crisis.
• The Commitment of Traders speculative gold short positions on a contract basis are currently at their highest level ever.
Equities and the U.S. dollar are up 8-9% for the first six months of 2013, while bonds and commodities are down 4-6%. The biggest winners of 2013 are the U.S. and Japanese stock markets followed by Greek government bonds and Swiss equities. The two biggest debates we are witnessing among investors are those regarding EM versus DM and those over cyclical stocks versus defensive stocks. Investors withdrew $13.9 billion from equity mutual funds invested in BRIC countries this year or 27% of the inflows since 2005. The Defensives over Cyclicals gap is at extremes, while the DM over EM gap is approaching an inflection point (vs. 2009 trough). Anecdotal evidence from investment banks' trading flows also suggests that EM capitulation is near the end. We are in our third big period of EM defensives'
page 18

outperformance, the other two times being 1994-1998 and the financial crisis of 2008. The HEXAM strategy itself has never had valuations in the previous twelve years as low as current levels nor a dividend yield as high.
Thank you for your continued support.
Bryan Collings, CFA | | Grant Shotter, CFA | |
Managing Partner and Portfolio Manager
HEXAM Capital Partners, LLP | | Partner and Portfolio Manager
HEXAM Capital Partners, LLP | |
Stuart Richards | | Marina Akopian | |
Partner and Portfolio Manager
HEXAM Capital Partners, LLP | | Partner and Portfolio Manager
HEXAM Capital Partners, LLP | |
page 19

INVESTMENT HIGHLIGHTS
Growth of a $100,000 Investment (Unaudited)

* 12/20/10 commencement of operations.
This chart assumes an initial gross investment of $100,000 made on 12/20/10 (commencement of operations). Returns shown include the reinvestment of all distributions. Past performance is not predictive of future results. Investment return and principal value will fluctuate so that shares, when redeemed, may be worth more or less than the original cost. In the absence of existing fee waivers, total return would be reduced. To receive current to the most recent month-end performance, please call 1-888-825-2100.
The MSCI Emerging Markets Index is a free float-adjusted market capitalization index that is designed to measure equity market performance in the global emerging markets. The Index does not reflect investment management fees, brokerage commissions and other expenses associated with investing in equity securities. A direct investment in the index is not possible.
Frontegra Asset Management, Inc. has contractually agreed through October 31, 2014 to waive its management fee and/or reimburse the Fund's operating expenses to the extent necessary to ensure that the Fund's total operating expenses (excluding taxes, interest, brokerage commissions, acquired fund fees and expenses and extraordinary expenses) do not exceed 1.30% of the Fund's average daily net assets. The expense ratios presented are based on the annualized expense ratios as reported in the Fund's current prospectus, which may differ from the expense ratios presented in the Fund's financial highlights.
** The returns shown do not reflect the deduction of taxes that a shareholder would pay on Fund distributions or the redemption of Fund shares.
Portfolio Total Return**
FOR PERIODS
ENDED 6/30/13 | | FUND | | INDEX | |
SIX MONTHS | | | (18.83 | )% | | | (9.57 | )% | |
ONE YEAR | | | (6.67 | )% | | | 2.87 | % | |
AVERAGE ANNUAL
SINCE INCEPTION | | | (16.98 | )% | | | (3.91 | )% | |
Fund Expenses | |
GROSS EXPENSE RATIO | | | 1.66 | % | |
NET EXPENSE RATIO | | | 1.31 | % | |
page 20

FRONTEGRA
TIMPANI SMALL CAP GROWTH FUND

REPORT FROM TIMPANI CAPITAL MANAGEMENT LLC
Dear Fellow Shareholders:
The Frontegra Timpani Small Cap Growth Fund strives to achieve capital appreciation by investing in a diversified portfolio of growth companies with small market capitalizations. Timpani seeks to:
• Invest in companies where growth is robust, sustainable and underestimated by the market.
• Conduct fundamental research that provides unique insights into the perception gap that exists between market expectations and a company's true growth rate.
• Manage risk by continuously evaluating the size of the perception gap relative to market expectations and monitoring market sentiment.
• Act on new relevant incremental data points, both positive and negative, in an effort to exploit investor biases.
Performance Review
We are pleased to report the Fund outperformed its benchmark, the Russell 2000® Growth Index, for the year ended June 30, 2013, returning 28.35% (net of fees) vs. 23.67% for the benchmark. The vast majority of outperformance occurred in 2013 as macro concerns abated and the market embraced company-specific fundamental drivers. We were relatively in line over the latter half of 2012 despite large stylistic headwinds caused by changes in U.S. tax law.
Strong stock selection drove the majority of the outperformance, and sector allocation was slightly accretive to performance. In particular, an overweight in Consumer Discretionary was a positive contributor to performance, while an overweight in Technology in the second half of 2012 was an almost equal detractor from performance. There were no other sector allocations that produced any meaningful performance, but in total, sector allocations were slightly positive. Stock selection was positive in every sector except for Technology. Health Care and Consumer Discretionary led the way with significant relative outperformance versus the benchmark.
As we expected, the individual stocks that outperformed during the period tended to be those with the largest perception gaps. The period was characterized by sustained improvement in macroeconomic fundamentals with a continued realization that systemic risk is declining. This led to declining volatility, falling stock correlations and valuation multiples expanding over the course of the period as investors were more comfortable taking on risk. As economic concerns have lessened, the Fund's absolute and relative performance has strengthened. Continued focus by the market on company-specific fundamentals should continue to be a positive for the Fund.
There were several companies with secular growth profiles that were rewarded with large positive absolute and relative performance as investors recognized the value in robust, sustainable growth and strong business models that were able to gain market share in a competitive environment. Consumer Discretionary companies led the outperformance in the portfolio with three of the top six best performers for the period. Companies levered to an improving consumer environment with strong business models and strong secular growth drivers such as Conn's, Lithia Motors and Multimedia Games contributed most to the outperformance. Capital Senior Living, TearLab and HCI Group were companies from other sectors that were rewarded by investors with strong relative and absolute performance because of their strong secular growth profiles.
Portfolio Outlook
The benchmark was up significantly during the period. Unusually high correlations among stocks started to ease in 2012 and have gone even lower in 2013. Investors have focused more of their attention on company fundamentals while still keeping an attentive eye on the potential changes in Federal Reserve interest rate policy. Stubbornly high unemployment, geopolitical risks, European debt and moderating growth in emerging markets continue to be issues that investors are fearful of despite mostly positive company fundamentals. During
page 22

2013, the relative performance of the portfolio versus the index has been more positive. This is a function of continued positive bottom-up stock selection within the portfolio. We are very aware of the macro risks that continue to exist and feel confident that the portfolio is well positioned with companies that are poised to grow and gain share in any type of economic environment.
On a micro level, companies maintained a constructive outlook on the economy although the number of companies able to exceed analyst expectations consistently has moderated. Corporate balance sheets are generally sound, and companies are generating ample cash flow which enables them to increase cash deployment in the form of dividends, share buybacks or accretive acquisitions. We believe that positive corporate fundamentals coupled with historically low borrowing rates will lead to the potential for increased M&A activity which could benefit the companies we own as both buyers and potential acquisition targets. This thesis came to fruition numerous times over the past year as many of our companies were bought out at significant premiums, including: Market Leader, Conceptus, National Financial Partners, Kenexa and Schiff Nutrition. Our analysis continues to confirm our optimism regarding the fundamental strength of the companies in our portfolio. In particular, meetings with company management teams and other fundamental data points indicate that many companies continue to achieve robust growth and that significant perception gaps still exist. More attention was finally given to company-specific fundamentals, which is a step in the right direction, but we remain vigilant in continuing to assess broader risks to the portfolio.
During the period, we continued to focus on finding robust and sustainable growers with company-specific perception gaps. The results from our disciplined bottom-up stock picking process resulted in some changes in portfolio sector allocation. Our weightings in Financial Services and Technology have declined, while our exposure to Consumer Discretionary and Energy has increased meaningfully. Current sector positioning has us overweight Consumer Discretionary and Energy and underweight Financial Services, Consumer Staples and Materials & Processing. We took advantage of the declining volatility during the past year by adding and initiating positions in companies where we believe there is secular growth and where the market has underestimated that growth. This is classic perception gap investing. Looking ahead, we are confident that our bottom-up process will continue to add value for shareholders.
Thank you for your continued support.
Sincerely,
Brandon Nelson, CFA | |
Chief Investment Officer
Timpani Capital Management LLC | |
page 23

INVESTMENT HIGHLIGHTS
Growth of a $100,000 Investment (Unaudited)

* 3/23/11 commencement of operations.
This chart assumes an initial gross investment of $100,000 made on 3/23/11. Returns shown include the reinvestment of all distributions. Past performance is not predictive of future results. Investment return and principal value will fluctuate so that shares, when redeemed, may be worth more or less than the original cost. In the absence of fee waivers, total return would be reduced. To receive current to the most recent month-end performance, please call 1-888-825-2100.
The Russell 2000® Growth Index measures the performance of the small-cap growth segment of the U.S. equity universe. The Index does not reflect investment management fees, brokerage commissions and other expenses associated with investing in equity securities. A direct investment in the index is not possible.
Timpani Capital Management LLC has contractually agreed through October 31, 2014 to waive its management fee and/or reimburse the Fund's operating expenses to the extent necessary to ensure that the Fund's total operating expenses (excluding taxes, interest, brokerage commissions, acquired fund fees and expenses and extraordinary expenses) do not exceed 1.10% of the Fund's average daily net assets. The expense ratios presented are based on the annualized expense ratios as reported in the Fund's current prospectus, which may differ from the expense ratios presented in the Fund's financial highlights.
** The returns shown do not reflect the deduction of taxes that a shareholder would pay on Fund distributions or the redemption of Fund shares.
Portfolio Total Return**
FOR PERIODS ENDED 6/30/13 | | FUND | | INDEX | |
SIX MONTHS | | | 23.21 | % | | | 17.44 | % | |
ONE YEAR | | | 28.35 | % | | | 23.67 | % | |
AVERAGE ANNUAL
SINCE INCEPTION | | | 13.08 | % | | | 10.42 | % | |
Fund Expenses | |
GROSS EXPENSE RATIO | | | 5.25 | % | |
NET EXPENSE RATIO | | | 1.10 | % | |
page 24

FRONTEGRA
NETOLS SMALL CAP VALUE FUND

REPORT FROM NETOLS ASSET MANAGEMENT, INC.
Dear Fellow Shareholders:
The Frontegra Netols Small Cap Value Fund strives to achieve capital appreciation by investing at least 80% of its assets in equity securities of small capitalization companies. The objective is relative to, and measured against, the Russell 2000® Value Index.
Performance Review
Since its inception on December 16, 2005, the Frontegra Netols Small Cap Value Fund (Institutional Class) has outperformed the benchmark after fees, returning 6.88% annualized, compared to 5.48% annualized for the Russell 2000 Value Index. For the year ended June 30, 2013, the Fund outperformed the benchmark, returning 25.61% net of fees, compared to 24.76% for the Index.
Portfolio Review
The dominant market factor over the past 12 months has been a slowly strengthening U.S. economy and the implications for Federal Reserve policy. An improving employment outlook and housing market were among the factors that increased consumer confidence. This drove the market higher as obstacles that included a drought, presidential election, fiscal cliff, and sequester deadline all passed without a significant disruption to the economy. During the past year, the portfolio was positioned for a stable to slightly improving economy. As the domestic outlook strengthened, more cyclical Consumer Discretionary and Industrial sectors outperformed. Conversely, Utilities and the more emerging market dependent Energy sector underperformed during the period.
Positive Contributions to Relative Performance July 2012 through June 2013
• Stock Selection — Financials and Health Care
• Overweight — Consumer Discretionary and Industrials
• Best Performing Stocks — MGIC Investment Corp., Sunrise Senior Living, Domino's Pizza, TriMas, Cabela's
Negative Contributions to Relative Performance July 2012 through June 2013
• Stock Selection — Materials and Consumer Staples
• Underweight — Financials
• Worst Performing Stocks — Titan International, Merit Medical Systems, Ciber, Schnitzer Steel, Intrepid Potash
Overall, we believe the domestic economy should remain on a path of modest growth. Despite the residual impact of federal budget issues, the underpinnings of the economy appear to be strengthening. Continued improvement in the employment market should help drive the economy through improved consumer confidence. Additionally, with low wholesale inventories in the system, a restocking of the supply chain would be additive to an increase in general sales activity.
Thank you for your continued support.
Jeff Netols
President
Netols Asset Management, Inc.
page 26

INVESTMENT HIGHLIGHTS
Growth of a $100,000 Investment (Unaudited)
* 12/16/05 commencement of operations.
This chart assumes an initial gross investment of $100,000 made on 12/16/05 (commencement of operations). Returns shown include the reinvestment of all distributions. Past performance is not predictive of future results. Investment return and principal value will fluctuate so that shares, when redeemed, may be worth more or less than the original cost. In the absence of existing fee waivers, total return would be reduced. To receive current to the most recent month-end performance, please call 1-888-825-2100.
The Russell 2000 Value Index measures the performance of those Russell 2000 companies with lower price-to-book ratios and lower forecasted growth values. The Index does not reflect investment management fees, brokerage commissions and other expenses associated with investing in equity securities. A direct investment in the index is not possible.
Frontegra Asset Management, Inc. has contractually agreed through October 31, 2014 to waive its management fee and/or reimburse the Fund's operating expenses to the extent necessary to ensure that the Fund's total operating expenses (excluding taxes, interest, brokerage commissions, acquired fund fees and expenses and extraordinary expenses) do not exceed 1.10% of the Fund's average daily net assets for the Institutional Class. The expense ratios presented are based on the annualized expense ratios as reported in the Fund's current prospectus, which may differ from the expense ratios presented in the Fund's financial highlights.
** The returns shown do not reflect the deduction of taxes that a shareholder would pay on Fund distributions or the redemption of Fund shares.
The above graph relates to Institutional Class shares of the Fund. Performance for Class Y shares will vary from the performance of the Institutional Class shares shown above due to differences in expenses.
Portfolio Total Return**
FOR PERIODS
ENDED 6/30/13 | | FUND | | INDEX | |
SIX MONTHS | | | 16.11 | % | | | 14.39 | % | |
ONE YEAR | | | 25.61 | % | | | 24.76 | % | |
FIVE YEAR
AVERAGE ANNUAL | | | 6.53 | % | | | 8.59 | % | |
AVERAGE ANNUAL
SINCE INCEPTION | | | 6.88 | % | | | 5.48 | % | |
Fund Expenses | |
GROSS EXPENSE RATIO | | | 1.22 | % | |
NET EXPENSE RATIO | | | 1.10 | % | |
page 27
This page intentionally left blank.

FRONTEGRA
PHOCAS SMALL CAP VALUE FUND

REPORT FROM PHOCAS FINANCIAL CORPORATION
Dear Fellow Shareholders:
The Frontegra Phocas Small Cap Value Fund strives to achieve capital appreciation by investing in a diversified portfolio of equity securities of companies with small market capitalizations. The objective is relative to, and measured against, the Russell 2000® Value Index.
Performance Review
During the twelve month period ended June 30, 2013, the Frontegra Phocas Small Cap Value Fund returned 24.29%, net of fees, compared to the 24.76% return of the benchmark, the Russell 2000 Value Index (the "Benchmark").
The challenges for the year have been steady: economic headwinds continue in Europe, weakness in China, and continued uncertainty in the Middle East. In the U.S., healthcare implementation uncertainties and sluggish domestic expansion continue in the background. Despite all of these ongoing issues, the U.S. equities markets continued to climb up the wall of worry and deliver positive total returns for investors during the second quarter of 2013, just not as strongly as the first quarter of 2013.
For the year ended June 30, the Benchmark's sector performances were all up. The sector performance leader was Consumer Discretionary (+43.9%), that sector was followed by Industrials (+29.2%), Consumer Staples (+24.1%), Financials (+22.9%), Information Technology (+22.3%), Materials (+21.6%), Healthcare (+19.1%), Energy (+16.5%), Telecommunication Services (15.5%), and Utilities (+14.8%).
Despite a strong rebound in the second half of the year, the first half of the year saw the Fund's performance negatively impacted by several factors. The second half rebound was driven by stronger performance from the Energy, Industrials, Consumer Staples, Utilities, and Financials sectors in the third quarter, and for the fourth quarter by Materials, Healthcare, Energy, Financials, Consumer Staples and Utilities holdings. During the first quarter, the worst sectors were Materials, Consumer Staples, Industrials, and Financials. Consumer Discretionary was relatively flat versus the Benchmark. Though Materials represented only 5% of the Benchmark, many of the stocks within the index are mining/metals related companies as well as paper companies, neither of which the Fund owned at that time. Within Industrials, our largest positions had too much international revenue exposure, which greatly penalized them relative to pure domestic companies. As usual, earnings disappointments, no matter how small or insignificant, were met with share price compression inconsistent with the actual underlying financial performance — that may be because of factors including money flows affecting sector ETFs. High beta stocks and less liquid names continued to be excessively punished if on the wrong side of earnings estimates.
For the second quarter of the year, the Fund underperformed the Benchmark due to weaker performance from the Energy, Materials, and Healthcare sectors. Consumer Staples, though a small weight, continued to be a drag on the Fund's performance due to weakness in two of our three holdings. Within Consumer Discretionary, the Fund lost more ground, driven by lack of exposure to the homebuilding industry, which ran up significantly during the quarter as well as the year. No exposure to homebuilding stocks also cost the Fund during the quarter — that did not even include homebuilding related companies such as the furniture makers. We also lost ground in Financials, most of it coming from underperformance within the insurance subsector. Cash was also a drag, as it averaged about 3% of the total Fund value during the quarter, costing the Fund even more relative performance.
Portfolio Review and Strategy
At the end of June, Russell reconstituted their small cap equity index. Not only were individual names adjusted, but there were shifts in sector weights. The biggest changes were: (1) the Financials sector now represents almost 39% of the Benchmark, up from the prior level of 37%; (2) Consumer Discretionary declined from the 12% level to 11%; and (3) Technology went from 12% to under 11%.
page 30

To position for the rest of the year, we will be increasing our weight within Financials to align more closely with the Benchmark. We will remain underweighted within Utilities as the utility companies represent high valuations relative to their fundamentals. Because of the government's war on greenhouse gases and coal-fired power generators, utilities are confronting a rising yield curve as well as a tougher regulatory environment. Only those utilities that have a portion of their overall revenue mix from unregulated businesses will be able to provide a boost to EPS growth (i.e., Aqua America and Black Hills). We remain fans of the Technology company valuations and remain overweighted relative to the Benchmark.
Good news for the portfolio came with a couple of M&A deals that lifted the Fund's return in the most recent quarter. National Financial Partners, a financial services and insurance company, was acquired for $25.35/share by Madison Dearborn Partners, a private equity firm. Belo Corp., a media company that owns television stations and cable channels, was acquired for $13.75/share by Gannett. These deals usually add about 30+ bps. to the Fund's performance and, historically, we have benefitted from a number of these deals each year.
Because it is quite difficult, if not impossible, to time markets or sectors on a consistent basis, our core investment strategy remains to concentrate on identifying undervalued stocks in each sector. We believe that this will continue to be the best strategy, longer-term. We also feel that the best performing companies remain those that are finding new growth opportunities, are overhauling their operations to reduce costs significantly, or are investing their free cash flow and cash on their balance sheets to acquire promising businesses. In addition, we continue to search for companies with greatly discounted valuations based on concerns that we think can be repaired in a timely fashion. We remain fully invested with less than 5% cash or equivalents.
Thank you for your continued support.
William Schaff, CFA | | Steve Block, CFA | |
Chief Executive Officer and Portfolio Manager
Phocas Financial Corporation | | Portfolio Manager
Phocas Financial Corporation | |
page 31

INVESTMENT HIGHLIGHTS
Growth of a $100,000 Investment (Unaudited)
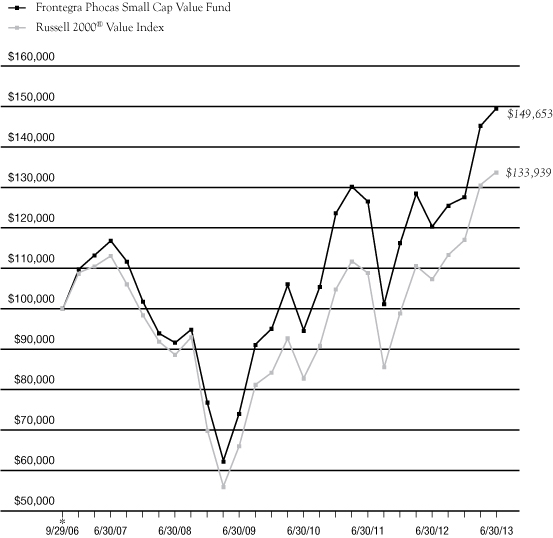
* 9/29/06 commencement of operations.
This chart assumes an initial gross investment of $100,000 made on 9/29/06. Returns shown include the reinvestment of all distributions. Past performance is not predictive of future results. Investment return and principal value will fluctuate so that shares, when redeemed, may be worth more or less than the original cost. In the absence of fee waivers, total return would be reduced. Effective October 8, 2010, Phocas Financial Corp. ("Phocas") became subadviser to the Fund and Frontegra Asset Management, Inc. became adviser to the Fund. Prior to October 8, 2010, Phocas served as adviser to the Fund. To receive current to the most recent month-end performance, please call 1-888-825-2100.
The Russell 2000® Value Index measures the performance of those Russell 2000® companies with lower price-to-book ratios and lower forecasted growth values. The Index does not reflect investment management fees, brokerage commissions and other expenses associated with investing in equity securities. A direct investment in the index is not possible.
Frontegra Asset Management, Inc. has contractually agreed through October 31, 2014 to waive its management fee and/or reimburse the Fund's operating expenses to the extent necessary to ensure that the Fund's total operating expenses (excluding taxes, interest, brokerage commissions, acquired fund fees and expenses and extraordinary expenses) do not exceed 1.10% of the Fund's average daily net assets. The expense ratios presented are based on the annualized expense ratios as reported in the Fund's current prospectus, which may differ from the expense ratios presented in the Fund's financial highlights.
** The returns shown do not reflect the deduction of taxes that a shareholder would pay on Fund distributions or the redemption of Fund shares.
Portfolio Total Return**
FOR PERIODS ENDED 6/30/13 | | FUND | | INDEX | |
SIX MONTHS | | | 17.22 | % | | | 14.39 | % | |
ONE YEAR | | | 24.29 | % | | | 24.76 | % | |
FIVE YEAR
AVERAGE ANNUAL | | | 10.29 | % | | | 8.59 | % | |
AVERAGE ANNUAL
SINCE INCEPTION | | | 6.15 | % | | | 4.42 | % | |
Fund Expenses | |
GROSS EXPENSE RATIO | | | 2.57 | % | |
NET EXPENSE RATIO | | | 1.26 | % | |
page 32

LOCKWELL SMALL CAP VALUE FUND

REPORT FROM LOCKWELL INVESTMENTS, LLC
Dear Fellow Shareholders:
The Lockwell Small Cap Value Fund strives to take advantage of a number of investor biases which are particularly prevalent within the small cap equity universe. These biases result in an opportunity set of high-quality companies whose valuations, in our opinion, do not accurately reflect the attractiveness of their franchises or business prospects. The strategy attempts to exploit these biases by using an intensive, bottom-up, research-focused process; seeking high-quality companies with specific catalysts; and becoming involved with company managements when appropriate.
Performance Review
The Lockwell Small Cap Value Fund returned 27.66%, net of fees, for the twelve month period ending June 30, 2013. The Fund outperformed the 24.76% return of its benchmark, the Russell 2000® Value Index.
Outperformance was the result of both strong stock selection and sector allocation. The positive impact of stock selection came from many different sectors. The sector allocation aided performance largely through underweight positions in the REIT sector within Financials and the Utility sector. These bond proxies have long had stretched valuation multiples and so we have been underweight those areas for a number of years. When interest rates moved higher in the second quarter, our portfolio benefited.
Our overall sector positioning didn't significantly change during the first half of 2013. We continued to be overweight Industrials and Materials and underweight Financials. Additionally, we continued to maintain a frictional cash position of 3-5% in the Fund. Given the positive performance of the Fund during the first half of the year, the cash position slightly detracted from Fund performance.
Portfolio Outlook
The first half of 2013 had many similarities to the second half of 2012, with most markets continuing to be highly correlated and focused on macroeconomic issues although to a lesser extent than in 2012. Similar to 2012, investors were still concerned about the strength of the Euro bloc, the uncertainty of how the U.S. would handle fiscal and monetary issues and slowing economic growth across regions. However, markets in general reacted better in 2013 with greater clarity on central bank policy, the outcome of the elections and improving, albeit mildly improving, economic data in some parts of the world. Also similar to 2012, small cap companies continued to produce strong profits and cash flow. Many companies continued to buy back stock and/or pay dividends with their excess cash. We believe small cap valuations are close to fair value at this point and companies continue to be cautious with regard to their earnings forecasts for 2013. Our expectation for the second half of 2013 is that companies will deliver reasonable earnings, but without meaningful top line growth, they will likely not see much margin improvement as most cost cutting opportunities have already been realized. While merger and acquisition activity started to accelerate in the past year, we would not be surprised to see this to continue to grow as the year progresses given the strength of balance sheets and current valuations.
On June 20, 2013, the Board of Directors approved a plan to liquidate the Fund, which occurred on July 31, 2013.
Thank you for your investment in the Lockwell Small Cap Value Fund.
Richard Glass, CFA
Principal
Lockwell Investments, LLC
page 34

INVESTMENT HIGHLIGHTS
Growth of a $100,000 Investment (Unaudited)
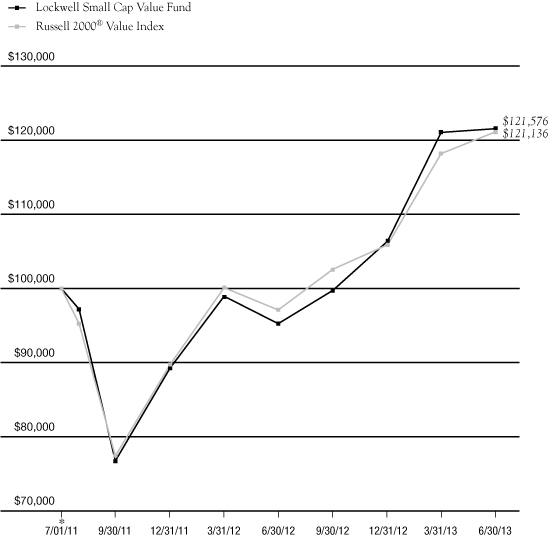
* 7/01/11 commencement of operations.
This chart assumes an initial gross investment of $100,000 made on 7/01/11. Returns shown include the reinvestment of all distributions. Past performance is not predictive of future results. Investment return and principal value will fluctuate so that shares, when redeemed, may be worth more or less than the original cost. In the absence of fee waivers, total return would be reduced. To receive current to the most recent month-end performance, please call 1-888-825-2100.
The Russell 2000® Value Index measures the performance of those Russell 2000® companies with lower price-to-book ratios and lower forecasted growth values. The Index does not reflect investment management fees, brokerage commissions and other expenses associated with investing in equity securities. A direct investment in the index is not possible.
Lockwell Investments, LLC has contractually agreed through October 31, 2014 to waive its management fee and/or reimburse the Fund's operating expenses to the extent necessary to ensure that the Fund's total operating expenses (excluding taxes, interest, brokerage commissions, acquired fund fees and expenses and extraordinary expenses) do not exceed 1.10% of the Fund's average daily net assets. The expense ratios presented are based on the annualized expense ratios as reported in the Fund's current prospectus, which may differ from the expense ratios presented in the Fund's financial highlights.
** The returns shown do not reflect the deduction of taxes that a shareholder would pay on Fund distributions or the redemption of Fund shares.
Portfolio Total Return**
FOR PERIODS ENDED 6/30/13 | | FUND | | INDEX | |
SIX MONTHS | | | 14.27 | % | | | 14.39 | % | |
ONE YEAR | | | 27.66 | % | | | 24.76 | % | |
AVERAGE ANNUAL
SINCE INCEPTION | | | 10.26 | % | | | 10.06 | % | |
Fund Expenses | |
GROSS EXPENSE RATIO | | | 9.64 | % | |
NET EXPENSE RATIO | | | 1.11 | % | |
page 35

Frontegra Funds
EXPENSE EXAMPLE
June 30, 2013 (Unaudited)
As a shareholder of a mutual fund, you incur two types of costs: (1) transaction costs, including redemption fees, and (2) ongoing costs, including management fees, distribution and/or service (12b-1) fees and other fund expenses. Although the Funds charge no sales loads, you will be assessed fees for outgoing wire transfers, returned checks and stop payment orders at prevailing rates charged by U.S. Bancorp Fund Services, LLC, the Funds' transfer agent. If you request that a redemption be made by wire transfer, currently the Funds' transfer agent charges a $15.00 fee. A redemption fee of 2.00% of the then current value of the shares redeemed may be imposed on certain redemptions of shares made within 30 days of purchase for the Frontegra RobecoSAM Global Equity, Frontegra MFG Global Equity, Frontegra MFG Core Infrastructure, Frontegra HEXAM Emerging Markets and Lockwell Small Cap Value Funds.
This Example is intended to help you understand your ongoing costs (in dollars) of investing in the Funds and to compare these costs with the ongoing costs of investing in other mutual funds. The Example is based on an investment of $1,000 invested at the beginning of the period and held for the entire period (1/1/13 – 6/30/13).
Actual Expenses
The first line of the table on the following page for each Fund provides information about actual account values and actual expenses. The Example includes management fees, registration fees, fee waivers/reimbursements and other expenses. However, the Example does not include portfolio trading commissions and related expenses and other extraordinary expenses as determined under generally accepted accounting principles. You may use the information in this line, together with the amount you invested, to estimate the expenses that you paid over the period. Simply divide your account value by $1,000 (for example, an $8,600 account value divided by $1,000 = 8.6), then multiply the result by the number in the first line under the heading entitled "Expenses Paid During the Period" to estimate the expenses you paid on your account during this period.
Hypothetical Example for Comparison Purposes
The second line of the table for each Fund provides information about hypothetical account values and hypothetical expenses based on each of the Fund's actual expense ratios and an assumed rate of return of 5% per year before expenses, which is not the actual return. The hypothetical account values and expenses may not be used to estimate the actual ending account balance or expenses you paid for the period. You may use this information to compare the ongoing costs of investing in each of the Funds and other funds. To do so, compare this 5% hypothetical example with the 5% hypothetical examples that appear in the shareholder reports of the other funds.
Please note that the expenses shown in the table are meant to highlight your ongoing costs only and do not reflect any transactional costs, such as redemption fees. Therefore, the second line of the table is useful in comparing ongoing costs only, and will not help you determine the relative total costs of owning different funds. In addition, if these transactional costs were included, your costs could have been higher.
page 36

Frontegra Funds
EXPENSE EXAMPLE (continued)
June 30, 2013 (Unaudited)
| | Beginning Account
Value 1/1/2013 | | Ending Account
Value 6/30/2013 | | Annualized
Expense Ratio* | | Expenses Paid
During the Period* | |
RobecoSAM Global Equity Fund | |
Actual Fund Return | | $ | 1,000.00 | | | $ | 1,104.50 | | | | 1.20 | % | | $ | 6.26 | | |
Hypothetical 5% Return | | $ | 1,000.00 | | | $ | 1,018.84 | | | | 1.20 | % | | $ | 6.01 | | |
MFG Global Equity Fund | |
Actual Fund Return | | $ | 1,000.00 | | | $ | 1,149.80 | | | | 0.80 | % | | $ | 4.26 | | |
Hypothetical 5% Return | | $ | 1,000.00 | | | $ | 1,020.83 | | | | 0.80 | % | | $ | 4.01 | | |
MFG Core Infrastructure Fund | |
Actual Fund Return* | | $ | 1,000.00 | | | $ | 1,038.70 | | | | 0.70 | % | | $ | 3.54 | | |
Hypothetical 5% Return** | | $ | 1,000.00 | | | $ | 1,021.32 | | | | 0.70 | % | | $ | 3.51 | | |
HEXAM Emerging Markets Fund | |
Actual Fund Return | | $ | 1,000.00 | | | $ | 811.70 | | | | 1.30 | % | | $ | 5.84 | | |
Hypothetical 5% Return | | $ | 1,000.00 | | | $ | 1,018.35 | | | | 1.30 | % | | $ | 6.51 | | |
Timpani Small Cap Growth Fund | |
Actual Fund Return | | $ | 1,000.00 | | | $ | 1,232.10 | | | | 1.10 | % | | $ | 6.09 | | |
Hypothetical 5% Return | | $ | 1,000.00 | | | $ | 1,019.34 | | | | 1.10 | % | | $ | 5.51 | | |
Netols Small Cap Value
Fund – Institutional Class | |
Actual Fund Return | | $ | 1,000.00 | | | $ | 1,161.10 | | | | 1.10 | % | | $ | 5.89 | | |
Hypothetical 5% Return | | $ | 1,000.00 | | | $ | 1,019.34 | | | | 1.10 | % | | $ | 5.51 | | |
Netols Small Cap Value
Fund – Class Y | |
Actual Fund Return | | $ | 1,000.00 | | | $ | 1,157.90 | | | | 1.50 | % | | $ | 8.03 | | |
Hypothetical 5% Return | | $ | 1,000.00 | | | $ | 1,017.36 | | | | 1.50 | % | | $ | 7.50 | | |
Phocas Small Cap Value Fund | |
Actual Fund Return | | $ | 1,000.00 | | | $ | 1,172.20 | | | | 1.10 | % | | $ | 5.92 | | |
Hypothetical 5% Return | | $ | 1,000.00 | | | $ | 1,019.34 | | | | 1.10 | % | | $ | 5.51 | | |
Lockwell Small Cap Value Fund | |
Actual Fund Return | | $ | 1,000.00 | | | $ | 1,142.70 | | | | 1.10 | % | | $ | 5.84 | | |
Hypothetical 5% Return | | $ | 1,000.00 | | | $ | 1,019.34 | | | | 1.10 | % | | $ | 5.51 | | |
* Expenses are equal to each Fund's annualized expense ratio indicated above, multiplied by the average account value over the period, multiplied by 181/365 to reflect the one-half year period.
page 37

Frontegra RobecoSAM Global Equity Fund
SCHEDULE OF INVESTMENTS
June 30, 2013
Number of Shares | | | | Value | |
COMMON STOCKS 94.7% | | | |
| | | Australia 4.1% | |
| | 12,722 | | | AGL Energy Ltd. | | $ | 168,474 | | |
| | 7,528 | | | National Australia Bank Ltd. | | | 204,340 | | |
| | 5,252 | | | Westpac Banking Corp. | | | 138,717 | | |
| | 5,123 | | | Woodside Petroleum Ltd. | | | 164,031 | | |
| | | | 675,562 | | |
| | | Canada 3.0% | |
| | 2,227 | | | Canadian Imperial
Bank of Commerce | | | 158,052 | | |
| | 11,187 | | | TELUS Corp. | | | 326,558 | | |
| | | | 484,610 | | |
| | | France 3.6% | |
| | 11,945 | | | Total SA | | | 583,132 | | |
| | | Germany 3.2% | |
| | 1,972 | | | Adidas AG | | | 213,407 | | |
| | 2,472 | | | Fresenius SE & Co. KGaA | | | 304,745 | | |
| | | | 518,152 | | |
| | | Italy 3.1% | |
| | 14,313 | | | Eni SpA | | | 293,988 | | |
| | 48,191 | | | Snam SpA | | | 219,546 | | |
| | | | 513,534 | | |
| | | Japan 4.8% | |
| | 12,000 | | | Keihin Corp. | | | 183,182 | | |
| | 43,000 | | | Marubeni Corp. | | | 287,447 | | |
| | 15,800 | | | Stanley Electric Co. Ltd. | | | 307,780 | | |
| | | | 778,409 | | |
| | | Netherlands 2.4% | |
| | 5,195 | | | Koninklijke DSM NV | | | 338,508 | | |
| | 1,774 | | | Koninklijke Philips Electronics NV | | | 48,364 | | |
| | | | 386,872 | | |
| | | Norway 1.9% | |
| | 21,357 | | | DnB NOR ASA | | | 309,226 | | |
Number of Shares | | | | Value | |
| | | Sweden 0.8% | |
| | 3,200 | | | Svenska Handelsbanken AB -
Class A | | $ | 128,456 | | |
| | | Switzerland 10.7% | |
| | 2,420 | | | Roche Holding AG | | | 602,086 | | |
| | 4,984 | | | Swiss RE AG | | | 370,944 | | |
| | 910 | | | Swisscom AG | | | 398,471 | | |
| | 1,483 | | | Zurich Insurance Group AG | | | 384,665 | | |
| | | | 1,756,166 | | |
| | | United Kingdom 7.2% | |
| | 58,457 | | | Barclays PLC | | | 247,572 | | |
| | 74,165 | | | BT Group PLC | | | 348,783 | | |
| | 146,900 | | | Legal & General Group PLC | | | 382,957 | | |
| | 49,324 | | | WM Morrison Supermarkets PLC | | | 196,402 | | |
| | | | 1,175,714 | | |
| | | United States 49.9% | |
| | 1,413 | | | Caterpillar, Inc. | | | 116,558 | | |
| | 10,447 | | | Cisco Systems, Inc. | | | 253,967 | | |
| | 2,334 | | | Colgate-Palmolive Co. | | | 133,715 | | |
| | 6,423 | | | Dell, Inc. | | | 85,747 | | |
| | 4,093 | | | E.I. du Pont de Nemours & Co. | | | 214,883 | | |
| | 3,807 | | | Emerson Electric Co. | | | 207,634 | | |
| | 12,738 | | | Hartford Financial Services
Group, Inc. | | | 393,859 | | |
| | 3,413 | | | Illinois Tool Works, Inc. | | | 236,077 | | |
| | 2,539 | | | International Business
Machines Corp. | | | 485,228 | | |
| | 4,066 | | | Kimberly-Clark Corp. | | | 394,971 | | |
| | 4,400 | | | Life Technologies Corp. (a) | | | 325,644 | | |
| | 5,668 | | | Limited Brands, Inc. | | | 279,149 | | |
| | 349 | | | MasterCard, Inc. - Class A | | | 200,501 | | |
| | 2,908 | | | McDonald's Corp. | | | 287,892 | | |
| | 16,939 | | | Microsoft Corp. | | | 584,904 | | |
| | 2,156 | | | National Oilwell Varco, Inc. | | | 148,548 | | |
| | 3,090 | | | Noble Corp. | | | 116,122 | | |
| | 6,558 | | | Occidental Petroleum Corp. | | | 585,170 | | |
The accompanying notes are an integral part of these financial statements.
page 38

Frontegra RobecoSAM Global Equity Fund
SCHEDULE OF INVESTMENTS (continued)
June 30, 2013
Number of Shares | | | | Value | |
| COMMON STOCKS 94.7% (continued) | | | |
| | | United States 49.9% (continued) | |
| | 8,593 | | | ONEOK, Inc. | | $ | 354,977 | | |
| | 8,437 | | | Oracle Corp. | | | 259,185 | | |
| | 2,317 | | | Parker-Hannifin Corp. | | | 221,042 | | |
| | 21,012 | | | Pfizer, Inc. | | | 588,546 | | |
| | 10,279 | | | Reynolds American, Inc. | | | 497,195 | | |
| | 2,772 | | | SanDisk Corp. (a) | | | 169,369 | | |
| | 7,337 | | | The Procter & Gamble Co. | | | 564,876 | | |
| | 2,203 | | | UnitedHealth Group, Inc. | | | 144,252 | | |
| | 6,956 | | | Wells Fargo & Co. | | | 287,074 | | |
| | | | 8,137,085 | | |
| | | Total Common Stocks | |
| | | | | (Cost $12,130,036) | | | 15,446,918 | | |
PREFERRED STOCKS 1.4% | | | |
| | | Germany 1.4% | |
| | 2,365 | | | Henkel AG & Co. KGaA | | | 222,413 | | |
| | | Total Preferred Stocks | |
| | | | | (Cost $105,339) | | | 222,413 | | |
SHORT-TERM INVESTMENTS 3.2% | | | |
| | | Investment Company 3.2% | |
| | 519,922 | | | STIT-STIC Prime Portfolio -
Institutional Class, 0.02% | | | 519,922 | | |
| | | Total Short-Term Investments | |
| | | | | (Cost $519,922) | | | 519,922 | | |
| | | Total Investments 99.3% | |
| | | | | (Cost $12,755,297) | | | 16,189,253 | | |
| | | | | Other Assets in Excess
of Liabilities 0.7% | | | 118,609 | | |
| | | | | TOTAL NET ASSETS 100.0% | | $ | 16,307,862 | | |
(a) Non-Income Producing.
PORTFOLIO DIVERSIFICATION
Sectors | | Percentage | |
Financials | | | 18.4 | % | |
Information Technology | | | 12.5 | | |
Consumer Staples | | | 12.3 | | |
Health Care | | | 12.1 | | |
Energy | | | 11.6 | | |
Consumer Discretionary | | | 7.8 | | |
Industrials | | | 6.8 | | |
Telecommunication Services | | | 6.6 | | |
Utilities | | | 4.6 | | |
Materials | | | 3.4 | | |
Total Common and Preferred Stocks | | | 96.1 | | |
Total Short-Term Investments | | | 3.2 | | |
Total Investments | | | 99.3 | | |
Other Assets in Excess of Liabilities | | | 0.7 | | |
Total Net Assets | | | 100.0 | % | |
The accompanying notes are an integral part of these financial statements.
page 39

Frontegra MFG Global Equity Fund
SCHEDULE OF INVESTMENTS
June 30, 2013
Number of Shares | | | | Value | |
COMMON STOCKS 97.1% | | | |
| | | France 4.5% | |
| | 206,488 | | | Danone | | $ | 15,497,485 | | |
| | | Germany 1.2% | |
| | 39,729 | | | Adidas AG | | | 4,299,416 | | |
| | | Netherlands 1.3% | |
| | 116,141 | | | Unilever NV | | | 4,573,772 | | |
| | | Switzerland 7.5% | |
| | 163,873 | | | Nestle SA | | | 10,747,904 | | |
| | 214,019 | | | Novartis AG | | | 15,203,721 | | |
| | | | 25,951,625 | | |
| | | United Kingdom 4.7% | |
| | 3,250,669 | | | Tesco PLC | | | 16,384,859 | | |
| | | United States 77.9% | |
| | 214,436 | | | American Express Co. | | | 16,031,235 | | |
| | 84,847 | | | Colgate-Palmolive Co. | | | 4,860,885 | | |
| | 363,789 | | | eBay, Inc. (a) | | | 18,815,167 | | |
| | 24,749 | | | Google, Inc. - Class A (a) | | | 21,788,277 | | |
| | 132,905 | | | Johnson & Johnson | | | 11,411,223 | | |
| | 454,349 | | | Lowe's Companies, Inc. | | | 18,582,874 | | |
| | 17,305 | | | MasterCard, Inc. - Class A | | | 9,941,723 | | |
| | 146,865 | | | McDonald's Corp. | | | 14,539,635 | | |
| | 673,268 | | | Microsoft Corp. | | | 23,247,944 | | |
| | 514,743 | | | Oracle Corp. | | | 15,812,905 | | |
| | 179,723 | | | State Street Corp. | | | 11,719,737 | | |
| | 221,391 | | | Target Corp. | | | 15,244,984 | | |
| | 485,148 | | | The Bank of New York
Mellon Corp. | | | 13,608,401 | | |
| | 102,259 | | | The Coca-Cola Co. | | | 4,101,608 | | |
| | 322,366 | | | U.S. Bancorp | | | 11,653,531 | | |
| | 65,025 | | | Visa, Inc. - Class A | | | 11,883,319 | | |
| | 185,269 | | | Wal-Mart Stores, Inc. | | | 13,800,688 | | |
Number of Shares | | | | Value | |
| | | United States 77.9% (continued) | |
| | 414,926 | | | Wells Fargo & Co. | | $ | 17,123,996 | | |
| | 228,008 | | | Yum! Brands, Inc. | | | 15,810,075 | | |
| | | | 269,978,207 | | |
| | | Total Common Stocks | |
| | | | | (Cost $309,243,949) | | | 336,685,364 | | |
SHORT-TERM INVESTMENTS 2.9% | | | |
| | | Investment Company 2.9% | |
| | 10,123,484 | | | STIT Liquid Assets
Portfolio - Institutional
Class, 0.09% | | | 10,123,484 | | |
| | | Total Short-Term Investments | |
| | | | | (Cost $10,123,484) | | | 10,123,484 | | |
| | | Total Investments 100.0% | |
| | | | | (Cost $319,367,433) | | | 346,808,848 | | |
| | | | | Liabilities in Excess
of Other Assets 0.0% | | | (113,989 | ) | |
| | | | | TOTAL NET ASSETS 100.0% | | $ | 346,694,859 | | |
(a) Non-Income Producing.
PORTFOLIO DIVERSIFICATION
Sectors | | Percentage | |
Information Technology | | | 29.3 | % | |
Consumer Staples | | | 24.6 | | |
Financials | | | 20.2 | | |
Consumer Discretionary | | | 15.3 | | |
Health Care | | | 7.7 | | |
Total Common Stocks | | | 97.1 | | |
Total Short-Term Investments | | | 2.9 | | |
Total Investments | | | 100.0 | | |
Liabilities in Excess of Other Assets | | | 0.0 | | |
Total Net Assets | | | 100.0 | % | |
The accompanying notes are an integral part of these financial statements.
page 40

Frontegra MFG Core Infrastructure Fund
SCHEDULE OF INVESTMENTS
June 30, 2013
Number of Shares | | | | Value | |
COMMON STOCKS 95.0% | | | |
| | | Australia 7.1% | |
| | 12,292 | | | APA Group | | $ | 67,338 | | |
| | 21,168 | | | DUET Group | | | 38,912 | | |
| | 29,990 | | | Envestra Ltd. | | | 27,290 | | |
| | 55,731 | | | SP AusNet | | | 59,889 | | |
| | 25,305 | | | Spark Infrastructure Group | | | 40,153 | | |
| | 35,500 | | | Sydney Airport | | | 109,737 | | |
| | 27,816 | | | Transurban Group | | | 171,969 | | |
| | | | 515,288 | | |
| | | Austria 0.3% | |
| | 400 | | | Flughafen Wien AG | | | 22,867 | | |
| | | Belgium 0.7% | |
| | 1,154 | | | Elia System Operator SA/NV | | | 48,322 | | |
| | | Canada 8.5% | |
| | 2,498 | | | Emera, Inc. | | | 78,453 | | |
| | 5,047 | | | Enbridge, Inc. | | | 212,159 | | |
| | 3,654 | | | Fortis, Inc. | | | 111,840 | | |
| | 4,835 | | | TransCanada Corp. | | | 208,167 | | |
| | 581 | | | Valener, Inc. | | | 8,850 | | |
| | | | 619,469 | | |
| | | France 7.0% | |
| | 1,887 | | | Aeroports de Paris | | | 183,503 | | |
| | 4,195 | | | Eutelsat Communications SA | | | 119,091 | | |
| | 7,348 | | | SES SA - ADR | | | 210,418 | | |
| | | | 513,012 | | |
| | | Germany 1.9% | |
| | 1,757 | | | Fraport AG Frankfurt Airport
Services Worldwide | | | 106,299 | | |
| | 1,387 | | | Hamburger Hafen und Logistik AG | | | 29,680 | | |
| | | | 135,979 | | |
Number of Shares | | | | Value | |
| | | Hong Kong 2.8% | |
| | 23,984 | | | Power Assets Holdings Ltd. | | $ | 206,875 | | |
| | | Italy 9.0% | |
| | 12,370 | | | Atlantia SpA | | | 201,749 | | |
| | 28,057 | | | Gemina SpA (a) | | | 50,325 | | |
| | 46,952 | | | Snam SpA | | | 213,902 | | |
| | 4,339 | | | Societa Iniziative Autostradali e
Servizi SpA | | | 35,497 | | |
| | 38,338 | | | Terna Rete Elettrica
Nazionale SpA | | | 159,288 | | |
| | | | 660,761 | | |
| | | Mexico 1.9% | |
| | 7,594 | | | Grupo Aeroportuario del Centro
Norte SAB de CV | | | 24,908 | | |
| | 10,699 | | | Grupo Aeroportuario del Pacifico
SAB de CV - Class B | | | 54,447 | | |
| | 5,721 | | | Grupo Aeroportuario del Sureste
SAB de CV - Class B | | | 63,844 | | |
| | | | 143,199 | | |
| | | Netherlands 1.9% | |
| | 2,430 | | | Koninklijke Vopak NV | | | 143,363 | | |
| | | New Zealand 1.3% | |
| | 25,223 | | | Auckland International Airport Ltd. | | | 58,053 | | |
| | 17,396 | | | Vector Ltd. | | | 36,129 | | |
| | | | 94,182 | | |
| | | Spain 6.4% | |
| | 12,090 | | | Abertis Infraestructuras SA | | | 210,874 | | |
| | 4,553 | | | Enagas SA | | | 112,512 | | |
| | 2,572 | | | Red Electrica Corp. SA | | | 141,446 | | |
| | | | 464,832 | | |
| | | Switzerland 0.8% | |
| | 117 | | | Flughafen Zuerich AG | | | 58,776 | | |
The accompanying notes are an integral part of these financial statements.
page 41

Frontegra MFG Core Infrastructure Fund
SCHEDULE OF INVESTMENTS (continued)
June 30, 2013
Number of Shares | | | | Value | |
| COMMON STOCKS 95.0% (continued) | | | |
| | | United Kingdom 7.3% | |
| | 18,871 | | | National Grid PLC | | $ | 214,117 | | |
| | 6,952 | | | Pennon Group PLC | | | 68,147 | | |
| | 4,544 | | | Severn Trent PLC | | | 115,003 | | |
| | 13,000 | | | United Utilities Group PLC | | | 135,244 | | |
| | | | 532,511 | | |
| | | United States 38.1% | |
| | 340 | | | ALLETE, Inc. | | | 16,949 | | |
| | 1,292 | | | Alliant Energy Corp. | | | 65,143 | | |
| | 3,679 | | | American Electric Power Co., Inc. | | | 164,746 | | |
| | 181 | | | American States Water Co. | | | 9,714 | | |
| | 2,060 | | | American Water Works Co., Inc. | | | 84,934 | | |
| | 1,631 | | | Aqua America, Inc. | | | 51,034 | | |
| | 1,050 | | | Atmos Energy Corp. | | | 43,113 | | |
| | 516 | | | Avista Corp. | | | 13,942 | | |
| | 396 | | | California Water Service Group | | | 7,726 | | |
| | 4,544 | | | CenterPoint Energy, Inc. | | | 106,739 | | |
| | 640 | | | Cleco Corp. | | | 29,715 | | |
| | 2,804 | | | CMS Energy Corp. | | | 76,185 | | |
| | 3,409 | | | Consolidated Edison, Inc. | | | 198,779 | | |
| | 1,830 | | | DTE Energy Co. | | | 122,628 | | |
| | 2,483 | | | Duke Energy Corp. | | | 167,602 | | |
| | 345 | | | El Paso Electric Co. | | | 12,182 | | |
| | 1,630 | | | Great Plains Energy, Inc. | | | 36,740 | | |
| | 532 | | | IDACORP, Inc. | | | 25,408 | | |
| | 827 | | | Integrys Energy Group, Inc. | | | 48,404 | | |
| | 608 | | | ITC Holdings Corp. | | | 55,510 | | |
| | 199 | | | MGE Energy, Inc. | | | 10,897 | | |
| | 3,294 | | | NiSource, Inc. | | | 94,340 | | |
| | 3,334 | | | Northeast Utilities | | | 140,095 | | |
| | 254 | | | Northwest Natural Gas Co. | | | 10,790 | | |
| | 352 | | | NorthWestern Corp. | | | 14,045 | | |
| | 2,496 | | | NV Energy, Inc. | | | 58,556 | | |
Number of Shares | | | | Value | |
| | | United States 38.1% (continued) | |
| | 2,442 | | | Pepco Holdings, Inc. | | $ | 49,231 | | |
| | 4,908 | | | PG&E Corp. | | | 224,443 | | |
| | 841 | | | Piedmont Natural Gas Co., Inc. | | | 28,375 | | |
| | 1,165 | | | Pinnacle West Capital Corp. | | | 64,623 | | |
| | 687 | | | PNM Resources, Inc. | | | 15,244 | | |
| | 652 | | | Portland General Electric Co. | | | 19,945 | | |
| | 2,037 | | | Questar Corp. | | | 48,582 | | |
| | 1,406 | | | SCANA Corp. | | | 69,035 | | |
| | 263 | | | SJW Corp. | | | 6,891 | | |
| | 537 | | | Southwest Gas Corp. | | | 25,126 | | |
| | 2,299 | | | TECO Energy, Inc. | | | 39,520 | | |
| | 401 | | | The Empire District Electric Co. | | | 8,946 | | |
| | 3,771 | | | The Southern Co. | | | 166,414 | | |
| | 481 | | | UIL Holdings Corp. | | | 18,398 | | |
| | 356 | | | UNS Energy Corp. | | | 15,924 | | |
| | 872 | | | Vectren Corp. | | | 29,500 | | |
| | 1,343 | | | Westar Energy, Inc. | | | 42,922 | | |
| | 2,431 | | | Wisconsin Energy Corp. | | | 99,647 | | |
| | 5,184 | | | Xcel Energy, Inc. | | | 146,915 | | |
| | | | 2,785,597 | | |
| | | Total Common Stocks | |
| | | | | (Cost $6,761,040) | | | 6,945,033 | | |
CLOSED-END FUNDS 1.0% | | | |
| | | United Kingdom 1.0% | |
| | 21,272 | | | HICL Infrastructure Co. Ltd. | | | 42,934 | | |
| | 14,172 | | | International Public
Partnerships Ltd. | | | 27,741 | | |
| | | | 70,675 | | |
| | | Total Closed-End Funds | |
| | | | | (Cost $68,909) | | | 70,675 | | |
The accompanying notes are an integral part of these financial statements.
page 42

Frontegra MFG Core Infrastructure Fund
SCHEDULE OF INVESTMENTS (continued)
June 30, 2013
Number of Shares | | | | Value | |
SHORT-TERM INVESTMENTS 3.2% | |
| | | Investment Company 3.2% | |
| | 230,973 | | | STIT Liquid Assets
Portfolio - Institutional
Class, 0.09% | | $ | 230,973 | | |
| | | Total Short-Term Investments | |
| | | (Cost $230,973) | | | 230,973 | | |
| | | Total Investments 99.2% | |
| | | (Cost $7,060,922) | | | 7,246,681 | | |
| | | Other Assets in Excess
of Liabilities 0.8% | | | 56,068 | | |
| | | TOTAL NET ASSETS 100.0% | | $ | 7,302,749 | | |
(a) Non-Income Producing.
ADR - American Depositary Receipt.
PORTFOLIO DIVERSIFICATION
Sectors | | Percentage | |
Integrated Power | | | 29.3 | % | |
Transmission & Distribution | | | 20.0 | | |
Gas | | | 13.8 | | |
Airport | | | 10.0 | | |
Toll Road | | | 8.5 | | |
Water Utility | | | 6.5 | | |
Communications | | | 4.5 | | |
Port | | | 2.4 | | |
Total Common Stocks | | | 95.0 | | |
Social | | | 1.0 | | |
Total Closed-End Funds | | | 1.0 | | |
Total Short-Term Investments | | | 3.2 | | |
Total Investments | | | 99.2 | | |
Other Assets in Excess of Liabilities | | | 0.8 | | |
Total Net Assets | | | 100.0 | % | |
The accompanying notes are an integral part of these financial statements.
page 43

Frontegra HEXAM Emerging Markets Fund
SCHEDULE OF INVESTMENTS
June 30, 2013
Number of Shares | | | | Value | |
COMMON STOCKS 93.6% | | | |
| | | Brazil 17.2% | |
| | 27,108 | | | Cia Energetica de Minas
Gerais - ADR | | $ | 243,159 | | |
| | 27,500 | | | Cia Hering | | | 388,588 | | |
| | 156,673 | | | Gol Linhas Aereas
Inteligentes SA - ADR (a) | | | 524,855 | | |
| | 82,000 | | | JBS SA | | | 235,561 | | |
| | 263,500 | | | PDG Realty SA
Empreendimentos e Participacoes | | | 245,627 | | |
| | 47,578 | | | Petroleo Brasileiro SA - ADR | | | 638,497 | | |
| | 29,200 | | | SLC Agricola SA | | | 251,649 | | |
| | 36,955 | | | Tim Participacoes SA - ADR | | | 687,363 | | |
| | 56,076 | | | Vale SA - ADR | | | 737,399 | | |
| | | | 3,952,698 | | |
| | | China 17.4% | |
| | 87,500 | | | Anhui Conch Cement Co. Ltd. | | | 236,912 | | |
| | 5,083 | | | Baidu, Inc. - ADR (a) | | | 480,496 | | |
| | 356,788 | | | BBMG Corp. | | | 219,426 | | |
| | 1,407,000 | | | China Construction Bank Corp. | | | 995,923 | | |
| | 267,000 | | | CNOOC Ltd. | | | 453,030 | | |
| | 568,400 | | | Haitong Securities Co. Ltd. (a) | | | 688,876 | | |
| | 74,000 | | | Ping An Insurance (Group)
Company of China Ltd. | | | 498,037 | | |
| | 63,600 | | | Sinopharm Group Co. Ltd. | | | 159,737 | | |
| | 168,200 | | | ZTE Corp. | | | 271,079 | | |
| | | | 4,003,516 | | |
| | | Egypt 1.0% | |
| | 60,570 | | | Commercial International
Bank Egypt SAE - GDR | | | 239,252 | | |
| | | Hong Kong 10.2% | |
| | 332,000 | | | China Unicom United Network
Communications Group Co. Ltd. | | | 440,895 | | |
| | 473,000 | | | CSR Corp. Ltd. | | | 278,090 | | |
| | 1,517,000 | | | Industrial & Commercial
Bank of China | | | 956,431 | | |
Number of Shares | | | | Value | |
| | | Hong Kong 10.2% (continued) | |
| | 1,025,213 | | | Nine Dragons Paper Holdings Ltd. | | $ | 666,199 | | |
| | | | 2,341,615 | | |
| | | India 2.2% | |
| | 12,949 | | | ICICI Bank Ltd. - ADR | | | 495,299 | | |
| | | Russian Federation 9.5% | |
| | 50,434 | | | Etalon Group Ltd. - GDR (a) | | | 172,989 | | |
| | 30,209 | | | Gazprom OAO - ADR | | | 198,775 | | |
| | 50,861 | | | Magnitogorsk Iron & Steel
Works - GDR | | | 151,260 | | |
| | 9,147 | | | Mail.ru Group Ltd. - GDR | | | 262,153 | | |
| | 30,914 | | | MMC Norilsk Nickel OJSC - ADR | | | 445,471 | | |
| | 229,965 | | | Sberbank of Russia (b) | | | 641,602 | | |
| | 27,948 | | | Sberbank of Russia - ADR | | | 318,328 | | |
| | | | 2,190,578 | | |
| | | South Africa 7.1% | |
| | 238,933 | | | African Bank Investments Ltd. | | | 394,473 | | |
| | 101,598 | | | African Minerals Ltd. (a) | | | 292,828 | | |
| | 100,821 | | | Glencore Xstrata PLC | | | 417,327 | | |
| | 8,538 | | | Randgold Resources Ltd. | | | 530,476 | | |
| | | | 1,635,104 | | |
| | | South Korea 21.9% | |
| | 6,676 | | | Gamevil, Inc. (a) | | | 430,238 | | |
| | 4,997 | | | GS Engineering &
Construction Corp. | | | 122,732 | | |
| | 7,727 | | | Hankook Tire Worldwide
Co. Ltd. | | | 357,240 | | |
| | 9,738 | | | Hyundai Engineering &
Construction Co. Ltd. | | | 476,647 | | |
| | 2,264 | | | Hyundai Mobis | | | 541,195 | | |
| | 24,205 | | | KB Financial Group, Inc. | | | 724,847 | | |
| | 2,718 | | | LG Chem Ltd. | | | 602,122 | | |
| | 1,480 | | | Mando Corp. | | | 132,831 | | |
| | 1,014 | | | Samsung Electronics Co. Ltd. | | | 1,191,531 | | |
| | 3,852 | | | SK Innovation Co. Ltd. | | | 457,025 | | |
| | | | 5,036,408 | | |
The accompanying notes are an integral part of these financial statements.
page 44

Frontegra HEXAM Emerging Markets Fund
SCHEDULE OF INVESTMENTS (continued)
June 30, 2013
Number of Shares | | | | Value | |
| COMMON STOCKS 93.6% (continued) | | | |
| | | Taiwan 3.4% | |
| | 139,000 | | | Hon Hai Precision
Industry Co. Ltd. | | $ | 343,198 | | |
| | 316,000 | | | Innolux Corp. (a) | | | 157,626 | | |
| | 40,000 | | | MStar Semiconductor, Inc. | | | 288,279 | | |
| | | | 789,103 | | |
| | | Turkey 1.0% | |
| | 80,166 | | | Turkiye Is Bankasi | | | 236,919 | | |
| | | Zambia 2.7% | |
| | 41,083 | | | First Quantum Minerals Ltd. | | | 609,389 | | |
| | | Total Common Stocks | |
| | | | | (Cost $27,008,331) | | | 21,529,881 | | |
PREFERRED STOCKS 2.9% | | | |
| | | Brazil 2.9% | |
| | 52,097 | | | Itau Unibanco Holding SA - ADR | | | 673,093 | | |
| | | Total Preferred Stocks | |
| | | | | (Cost $855,412) | | | 673,093 | | |
SHORT-TERM INVESTMENTS 3.3% | | | |
| | | Investment Company 3.3% | |
| | 768,725 | | | Fidelity Institutional Money
Market Portfolio - Class I, 0.07% | | | 768,725 | | |
| | | Total Short-Term Investments | |
| | | | | (Cost $768,725) | | | 768,725 | | |
| | | Total Investments 99.8% | |
| | | | | (Cost $28,632,468) | | | 22,971,699 | | |
| | | | | Other Assets in Excess
of Liabilities 0.2% | | | 37,350 | | |
| | | | | TOTAL NET ASSETS 100.0% | | $ | 23,009,049 | | |
(a) Non-Income Producing.
(b) Level 2 investment. See note 2.
ADR - American Depositary Receipt.
GDR - Global Depositary Receipt.
PORTFOLIO DIVERSIFICATION
Sectors | | Percentage | |
Financials | | | 31.6 | % | |
Basic Materials | | | 16.7 | | |
Technology | | | 14.9 | | |
Industrials | | | 10.7 | | |
Oil & Gas | | | 7.6 | | |
Consumer Goods | | | 6.6 | | |
Telecommunications | | | 4.9 | | |
Consumer Services | | | 2.4 | | |
Utilities | | | 1.1 | | |
Total Common and Preferred Stocks | | | 96.5 | | |
Total Short-Term Investments | | | 3.3 | | |
Total Investments | | | 99.8 | | |
Other Assets in Excess of Liabilities | | | 0.2 | | |
Total Net Assets | | | 100.0 | % | |
The accompanying notes are an integral part of these financial statements.
page 45

Frontegra Timpani Small Cap Growth Fund
SCHEDULE OF INVESTMENTS
June 30, 2013
Number of Shares | | | | Value | |
COMMON STOCKS 97.9% | | | |
| | | Consumer Discretionary 24.1% | |
| | 1,148 | | | American Woodmark Corp. (a) | | $ | 39,836 | | |
| | 588 | | | Buffalo Wild Wings, Inc. (a) | | | 57,718 | | |
| | 632 | | | Capella Education Co. (a) | | | 26,323 | | |
| | 2,723 | | | Conn's, Inc. (a) | | | 140,943 | | |
| | 1,925 | | | Diversified Restaurant
Holdings, Inc. (a) | | | 15,323 | | |
| | 524 | | | DSW, Inc. - Class A | | | 38,498 | | |
| | 905 | | | Fiesta Restaurant Group, Inc. (a) | | | 31,123 | | |
| | 1,097 | | | Five Below, Inc. (a) | | | 40,326 | | |
| | 2,805 | | | Grand Canyon Education, Inc. (a) | | | 90,405 | | |
| | 2,056 | | | Ignite Restaurant Group, Inc. (a) | | | 38,797 | | |
| | 317 | | | Jack In the Box, Inc. (a) | | | 12,455 | | |
| | 1,511 | | | Lithia Motors, Inc. - Class A | | | 80,551 | | |
| | 1,064 | | | Meritage Homes Corp. (a) | | | 46,135 | | |
| | 3,863 | | | Multimedia Games Holdings
Co., Inc. (a) | | | 100,708 | | |
| | 2,883 | | | New York & Co, Inc. (a) | | | 18,307 | | |
| | 637 | | | Red Robin Gourmet Burgers, Inc. (a) | | | 35,150 | | |
| | 413 | | | SodaStream International Ltd. (a) | | | 30,004 | | |
| | 1,454 | | | The Ryland Group, Inc. | | | 58,305 | | |
| | 1,007 | | | Tile Shop Holdings, Inc. (a) | | | 29,163 | | |
| | 1,884 | | | Tuesday Morning Corp. (a) | | | 19,537 | | |
| | 524 | | | Tumi Holdings, Inc. (a) | | | 12,576 | | |
| | | | 962,183 | | |
| | | Consumer Staples 0.6% | |
| | 2,663 | | | Inventure Foods, Inc. (a) | | | 22,263 | | |
| | | Energy 8.3% | |
| | 1,402 | | | Diamondback Energy, Inc. (a) | | | 46,715 | | |
| | 535 | | | Dril-Quip, Inc. (a) | | | 48,305 | | |
| | 1,508 | | | EPL Oil & Gas, Inc. (a) | | | 44,275 | | |
| | 2,015 | | | Oasis Petroleum, Inc. (a) | | | 78,323 | | |
| | 5,617 | | | PowerSecure International, Inc. (a) | | | 84,424 | | |
| | 3,747 | | | Synergy Resources Corp. (a) | | | 27,428 | | |
| | | | 329,470 | | |
Number of Shares | | | | Value | |
| | | Financial Services 3.5% | |
| | 1,773 | | | HCI Group, Inc. | | $ | 54,467 | | |
| | 1,488 | | | Market Leader, Inc. (a) | | | 15,921 | | |
| | 3,433 | | | Tree.com, Inc. | | | 58,842 | | |
| | 1,627 | | | United Insurance Holdings Corp. | | | 11,373 | | |
| | | | 140,603 | | |
| | | Health Care 21.8% | |
| | 1,773 | | | Acadia Healthcare Company, Inc. (a) | | | 58,633 | | |
| | 740 | | | Addus HomeCare Corp. (a) | | | 14,608 | | |
| | 281 | | | Air Methods Corp. | | | 9,520 | | |
| | 3,517 | | | Albany Molecular Research, Inc. (a) | | | 41,747 | | |
| | 2,748 | | | BioScrip, Inc. (a) | | | 45,342 | | |
| | 4,063 | | | Capital Senior Living Corp. (a) | | | 97,106 | | |
| | 3,823 | | | Cardiovascular Systems, Inc. (a) | | | 81,048 | | |
| | 3,172 | | | Healthways, Inc. (a) | | | 55,129 | | |
| | 565 | | | Jazz Pharmaceuticals PLC (a) | | | 38,832 | | |
| | 3,740 | | | Lannett Co., Inc. (a) | | | 44,543 | | |
| | 2,755 | | | Ligand Pharmaceuticals, Inc. -
Class B (a) | | | 103,092 | | |
| | 5,471 | | | Novadaq Technologies, Inc. (a) | | | 73,640 | | |
| | 2,645 | | | Team Health Holdings, Inc. (a) | | | 108,630 | | |
| | 9,154 | | | TearLab Corp. (a) | | | 97,216 | | |
| | | | 869,086 | | |
| | | Materials & Processing 3.0% | |
| | 1,149 | | | Apogee Enterprises, Inc. | | | 27,576 | | |
| | 544 | | | Beacon Roofing Supply, Inc. (a) | | | 20,607 | | |
| | 624 | | | Eagle Materials, Inc. | | | 41,352 | | |
| | 1,454 | | | U.S. Silica Holdings, Inc. | | | 30,214 | | |
| | | | 119,749 | | |
| | | Producer Durables 18.7% | |
| | 595 | | | Allegiant Travel Co. | | | 63,064 | | |
| | 619 | | | Barrett Business Services, Inc. | | | 32,318 | | |
| | 796 | | | CoStar Group, Inc. (a) | | | 102,740 | | |
| | 2,213 | | | MasTec, Inc. (a) | | | 72,808 | | |
| | 833 | | | MAXIMUS, Inc. | | | 62,042 | | |
| | 528 | | | Old Dominion Freight Line, Inc. (a) | | | 21,975 | | |
| | 3,350 | | | On Assignment, Inc. (a) | | | 89,512 | | |
The accompanying notes are an integral part of these financial statements.
page 46

Frontegra Timpani Small Cap Growth Fund
SCHEDULE OF INVESTMENTS (continued)
June 30, 2013
Number of Shares | | | | Value | |
| COMMON STOCKS 97.9% (continued) | | | |
| | | Producer Durables 18.7% (continued) | |
| | 2,442 | | | Primoris Services Corp. | | $ | 48,156 | | |
| | 990 | | | Proto Labs, Inc. (a) | | | 64,320 | | |
| | 223 | | | TransDigm Group, Inc. | | | 34,960 | | |
| | 1,304 | | | TrueBlue, Inc. (a) | | | 27,449 | | |
| | 2,288 | | | WageWorks, Inc. (a) | | | 78,821 | | |
| | 2,598 | | | Wesco Aircraft Holdings, Inc. (a) | | | 48,245 | | |
| | | | 746,410 | | |
| | | Technology 16.8% | |
| | 1,257 | | | Acxiom Corp. (a) | | | 28,509 | | |
| | 1,919 | | | Ambarella, Inc. (a) | | | 32,297 | | |
| | 2,755 | | | Callidus Software, Inc. (a) | | | 18,155 | | |
| | 2,922 | | | Carbonite, Inc. (a) | | | 36,203 | | |
| | 859 | | | CommVault Systems, Inc. (a) | | | 65,190 | | |
| | 1,382 | | | Computer Task Group, Inc. | | | 31,745 | | |
| | 2,878 | | | FormFactor, Inc. (a) | | | 19,426 | | |
| | 447 | | | Guidewire Software, Inc. (a) | | | 18,796 | | |
| | 3,832 | | | inContact, Inc. (a) | | | 31,499 | | |
| | 8,089 | | | LifeLock, Inc. (a) | | | 94,722 | | |
| | 2,964 | | | MagnaChip Semiconductor
Corp. (a) | | | 54,152 | | |
| | 1,502 | | | Mitek Systems, Inc. (a) | | | 8,682 | | |
| | 1,502 | | | NeuStar, Inc. - Class A (a) | | | 73,117 | | |
| | 932 | | | PROS Holdings, Inc. (a) | | | 27,913 | | |
| | 1,138 | | | Semtech Corp. (a) | | | 39,864 | | |
| | 1,509 | | | Tangoe, Inc. (a) | | | 23,284 | | |
| | 121 | | | Textura Corp. (a) | | | 3,147 | | |
| | 901 | | | Tyler Technologies, Inc. (a) | | | 61,764 | | |
| | | | 668,465 | | |
| | | Utilities 1.1% | |
| | 3,506 | | | Pike Electric Corp. | | | 43,124 | | |
| | | Total Common Stocks | |
| | | | | (Cost $2,870,441) | | | 3,901,353 | | |
Number of Shares | | | | Value | |
SHORT-TERM INVESTMENTS 2.3% | |
| | | Investment Company 2.3% | |
| | 89,867 | | | STIT-STIC Prime Portfolio -
Institutional Class, 0.02% | | $ | 89,867 | | |
| | | Total Short-Term Investments | |
| | | (Cost $89,867) | | | 89,867 | | |
| | | Total Investments 100.2% | |
| | | (Cost $2,960,308) | | | 3,991,220 | | |
| | | Liabilities in Excess
of Other Assets (0.2)% | | | (7,941 | ) | |
| | | TOTAL NET ASSETS 100.0% | | $ | 3,983,279 | | |
(a) Non-Income Producing.
PORTFOLIO DIVERSIFICATION
Sectors | | Percentage | |
Consumer Discretionary | | | 24.1 | % | |
Health Care | | | 21.8 | | |
Producer Durables | | | 18.7 | | |
Technology | | | 16.8 | | |
Energy | | | 8.3 | | |
Financial Services | | | 3.5 | | |
Materials and Processing | | | 3.0 | | |
Utilities | | | 1.1 | | |
Consumer Staples | | | 0.6 | | |
Total Common Stocks | | | 97.9 | | |
Total Short-Term Investments | | | 2.3 | | |
Total Investments | | | 100.2 | | |
Liabilities in Excess of Other Assets | | | (0.2 | ) | |
Total Net Assets | | | 100.0 | % | |
The accompanying notes are an integral part of these financial statements.
page 47

Frontegra Netols Small Cap Value Fund
SCHEDULE OF INVESTMENTS
June 30, 2013
Number of Shares | | | | Value | |
COMMON STOCKS 97.1% | | | |
| | | Consumer Discretionary 20.4% | |
| | 40,339 | | | Aaron's, Inc. | | $ | 1,129,895 | | |
| | 345,987 | | | Accuride Corp. (a) | | | 1,750,694 | | |
| | 67,802 | | | ANN, Inc. (a) | | | 2,251,026 | | |
| | 46,061 | | | Cabela's, Inc. (a) | | | 2,982,910 | | |
| | 49,421 | | | Capella Education Co. (a) | | | 2,058,385 | | |
| | 29,737 | | | Carter's, Inc. | | | 2,202,620 | | |
| | 57,146 | | | DeVry, Inc. | | | 1,772,669 | | |
| | 47,009 | | | Domino's Pizza, Inc. | | | 2,733,573 | | |
| | 74,741 | | | Ethan Allen Interiors, Inc. | | | 2,152,541 | | |
| | 30,823 | | | Outerwall, Inc. (a) | | | 1,808,385 | | |
| | 43,584 | | | Tenneco, Inc. (a) | | | 1,973,484 | | |
| | 44,540 | | | The Cheesecake Factory, Inc. | | | 1,865,781 | | |
| | 282,131 | | | Zale Corp. (a) | | | 2,567,392 | | |
| | | | 27,249,355 | | |
| | | Consumer Staples 5.6% | |
| | 160,837 | | | Boulder Brands, Inc. (a) | | | 1,938,086 | | |
| | 27,890 | | | Casey's General Stores, Inc. | | | 1,677,862 | | |
| | 278,655 | | | SUPERVALU, Inc. (a) | | | 1,733,234 | | |
| | 33,184 | | | TreeHouse Foods, Inc. (a) | | | 2,174,879 | | |
| | | | 7,524,061 | | |
| | | Energy 4.6% | |
| | 75,349 | | | Bill Barrett Corp. (a) | | | 1,523,557 | | |
| | 62,574 | | | Superior Energy Services, Inc. (a) | | | 1,623,169 | | |
| | 31,866 | | | Whiting Petroleum Corp. (a) | | | 1,468,704 | | |
| | 247,050 | | | Willbros Group, Inc. (a) | | | 1,516,887 | | |
| | | | 6,132,317 | | |
| | | Financials 19.3% | |
| | 57,931 | | | Cedar Fair LP | | | 2,398,343 | | |
| | 52,579 | | | Community Bank System, Inc. | | | 1,622,062 | | |
| | 46,409 | | | Endurance Specialty
Holdings Ltd. | | | 2,387,743 | | |
| | 90,167 | | | Glacier Bancorp, Inc. | | | 2,000,806 | | |
| | 407,293 | | | MGIC Investment Corp. (a) | | | 2,472,269 | | |
| | 129,051 | | | Old National Bancorp | | | 1,784,775 | | |
Number of Shares | | | | Value | |
| | | Financials 19.3% (continued) | |
| | 83,569 | | | PHH Corp. (a) | | $ | 1,703,136 | | |
| | 30,541 | | | Prosperity Bancshares, Inc. | | | 1,581,718 | | |
| | 97,648 | | | Selective Insurance Group, Inc. | | | 2,247,857 | | |
| | 81,335 | | | Sterling Financial Corp. | | | 1,934,146 | | |
| | 47,430 | | | The Hanover Insurance
Group, Inc. | | | 2,320,750 | | |
| | 44,265 | | | Walter Investment
Management Corp. (a) | | | 1,496,600 | | |
| | 71,583 | | | Webster Financial Corp. | | | 1,838,252 | | |
| | | | 25,788,457 | | |
| | | Health Care 7.3% | |
| | 61,697 | | | Acadia Healthcare
Company, Inc. (a) | | | 2,040,320 | | |
| | 35,256 | | | Haemonetics Corp. (a) | | | 1,457,836 | | |
| | 30,751 | | | LifePoint Hospitals, Inc. (a) | | | 1,501,879 | | |
| | 24,682 | | | Magellan Health Services, Inc. (a) | | | 1,384,166 | | |
| | 58,967 | | | U.S. Physical Therapy, Inc. | | | 1,629,848 | | |
| | 65,572 | | | VCA Antech, Inc. (a) | | | 1,710,773 | | |
| | | | 9,724,822 | | |
| | | Industrials 15.2% | |
| | 57,171 | | | Actuant Corp. - Class A | | | 1,884,928 | | |
| | 137,756 | | | Commercial Vehicle
Group, Inc. (a) | | | 1,027,660 | | |
| | 31,055 | | | General Cable Corp. | | | 954,941 | | |
| | 17,874 | | | Genesee & Wyoming, Inc. (a) | | | 1,516,430 | | |
| | 70,019 | | | Herman Miller, Inc. | | | 1,895,414 | | |
| | 223,056 | | | PGT, Inc. (a) | | | 1,933,895 | | |
| | 92,926 | | | Titan International, Inc. | | | 1,567,662 | | |
| | 75,327 | | | TriMas Corp. (a) | | | 2,808,191 | | |
| | 48,154 | | | United Rentals, Inc. (a) | | | 2,403,366 | | |
| | 40,086 | | | United Stationers, Inc. | | | 1,344,885 | | |
| | 54,462 | | | Westinghouse Air Brake
Technologies Corp. | | | 2,909,905 | | |
| | | | 20,247,277 | | |
The accompanying notes are an integral part of these financial statements.
page 48

Frontegra Netols Small Cap Value Fund
SCHEDULE OF INVESTMENTS (continued)
June 30, 2013
Number of Shares | | | | Value | |
| COMMON STOCKS 97.1% (continued) | | | |
| | | Information Technology 10.6% | |
| | 158,664 | | | Checkpoint Systems, Inc. (a) | | $ | 2,251,442 | | |
| | 276,185 | | | Ciber, Inc. (a) | | | 922,458 | | |
| | 158,281 | | | Entegris, Inc. (a) | | | 1,486,258 | | |
| | 58,996 | | | Fair Isaac Corp. | | | 2,703,787 | | |
| | 121,265 | | | Fairchild Semiconductor
International, Inc. (a) | | | 1,673,457 | | |
| | 49,211 | | | Liquidity Services, Inc. (a) | | | 1,706,145 | | |
| | 156,014 | | | Polycom, Inc. (a) | | | 1,644,388 | | |
| | 75,769 | | | Progress Software Corp. (a) | | | 1,743,445 | | |
| | | | 14,131,380 | | |
| | | Materials 7.1% | |
| | 24,102 | | | Acuity Brands, Inc. | | | 1,820,183 | | |
| | 32,098 | | | Carpenter Technology Corp. | | | 1,446,657 | | |
| | 18,584 | | | Compass Minerals
International, Inc. | | | 1,570,906 | | |
| | 61,444 | | | Intrepid Potash, Inc. | | | 1,170,508 | | |
| | 33,163 | | | Kraton Performance
Polymers, Inc. (a) | | | 703,056 | | |
| | 50,551 | | | Schnitzer Steel Industries, Inc. | | | 1,181,883 | | |
| | 37,942 | | | Sensient Technologies Corp. | | | 1,535,513 | | |
| | | | 9,428,706 | | |
| | | Real Estate Investment Trusts 5.9% | |
| | 327,714 | | | FelCor Lodging Trust, Inc. (a) | | | 1,936,790 | | |
| | 131,358 | | | First Industrial Realty Trust, Inc. | | | 1,992,701 | | |
| | 25,347 | | | National Health Investors, Inc. | | | 1,517,271 | | |
| | 49,328 | | | Sun Communities, Inc. | | | 2,454,561 | | |
| | | | 7,901,323 | | |
| | | Utilities 1.1% | |
| | 62,450 | | | The Empire District Electric Co. | | | 1,393,260 | | |
| | | Total Common Stocks | |
| | | | | (Cost $87,227,479) | | | 129,520,958 | | |
Number of Shares | | | | Value | |
SHORT-TERM INVESTMENTS 2.9% | |
| | | Investment Company 2.9% | |
| | 3,809,546 | | | Fidelity Institutional
Money Market Portfolio -
Select Class, 0.02% | | $ | 3,809,546 | | |
| | | Total Short-Term Investments | |
| | | (Cost $3,809,546) | | | 3,809,546 | | |
| | | Total Investments 100.0% | |
| | | (Cost $91,037,025) | | | 133,330,504 | | |
| | | Other Assets in Excess
of Liabilities 0.0% | | | 48,443 | | |
| | | TOTAL NET ASSETS 100.0% | | $ | 133,378,947 | | |
(a) Non-Income Producing.
PORTFOLIO DIVERSIFICATION
Sectors | | Percentage | |
Consumer Discretionary | | | 20.4 | % | |
Financials | | | 19.3 | | |
Industrials | | | 15.2 | | |
Information Technology | | | 10.6 | | |
Health Care | | | 7.3 | | |
Materials | | | 7.1 | | |
Real Estate Investment Trusts | | | 5.9 | | |
Consumer Staples | | | 5.6 | | |
Energy | | | 4.6 | | |
Utilities | | | 1.1 | | |
Total Common Stocks | | | 97.1 | | |
Total Short-Term Investments | | | 2.9 | | |
Total Investments | | | 100.0 | | |
Other Assets in Excess of Liabilities | | | 0.0 | | |
Total Net Assets | | | 100.0 | % | |
The accompanying notes are an integral part of these financial statements.
page 49

Frontegra Phocas Small Cap Value Fund
SCHEDULE OF INVESTMENTS
June 30, 2013
Number of Shares | | | | Value | |
COMMON STOCKS 97.0% | | | |
| | | Consumer Discretionary 12.5% | |
| | 1,381 | | | Bob Evans Farms, Inc. | | $ | 64,879 | | |
| | 676 | | | Cracker Barrel Old Country
Store, Inc. | | | 63,990 | | |
| | 2,754 | | | Dana Holding Corp. | | | 53,042 | | |
| | 1,588 | | | Deckers Outdoor Corp. (a) | | | 80,210 | | |
| | 1,752 | | | Destination Maternity Corp. | | | 43,099 | | |
| | 2,871 | | | DeVry, Inc. | | | 89,058 | | |
| | 880 | | | Group 1 Automotive, Inc. | | | 56,611 | | |
| | 1,753 | | | Lamar Advertising Co. - Class A (a) | | | 76,080 | | |
| | 1,303 | | | Meredith Corp. | | | 62,153 | | |
| | 1,290 | | | Outerwall, Inc. (a) | | | 75,684 | | |
| | 1,999 | | | Perry Ellis International, Inc. | | | 40,600 | | |
| | 4,371 | | | Pier 1 Imports, Inc. | | | 102,675 | | |
| | 1,100 | | | Rent-A-Center, Inc. | | | 41,305 | | |
| | 11,684 | | | Scientific Games Corp. - Class A (a) | | | 131,445 | | |
| | 1,994 | | | Stage Stores, Inc. | | | 46,859 | | |
| | 1,759 | | | Steiner Leisure Ltd. (a) | | | 92,981 | | |
| | | | 1,120,671 | | |
| | | Consumer Staples 3.2% | |
| | 1,455 | | | CST Brands, Inc. (a) | | | 44,829 | | |
| | 4,469 | | | Darling International, Inc. (a) | | | 83,392 | | |
| | 1,578 | | | Post Holdings, Inc. (a) | | | 68,895 | | |
| | 1,251 | | | USANA Health Sciences, Inc. (a) | | | 90,547 | | |
| | | | 287,663 | | |
| | | Energy 6.3% | |
| | 2,751 | | | Carrizo Oil & Gas, Inc. (a) | | | 77,936 | | |
| | 7,342 | | | Goodrich Petroleum Corp. (a) | | | 93,978 | | |
| | 3,100 | | | Gulfport Energy Corp. (a) | | | 145,917 | | |
| | 1,035 | | | Hornbeck Offshore Services, Inc. (a) | | | 55,372 | | |
| | 4,273 | | | Kodiak Oil & Gas Corp. (a) | | | 37,987 | | |
| | 1,130 | | | PDC Energy, Inc. (a) | | | 58,172 | | |
| | 5,760 | | | Rex Energy Corp. (a) | | | 101,261 | | |
| | | | 570,623 | | |
Number of Shares | | | | Value | |
| | | Financials 22.9% | |
| | 3,493 | | | American Equity Investment Life
Holding Co. | | $ | 54,840 | | |
| | 2,688 | | | Ameris Bancorp (a) | | | 45,293 | | |
| | 4,332 | | | Banc of California, Inc. | | | 58,829 | | |
| | 5,164 | | | Banco Latinoamericano de
Comercio Exterior S.A. | | | 115,622 | | |
| | 2,849 | | | Banner Corp. | | | 96,268 | | |
| | 13,910 | | | CNO Financial Group, Inc. | | | 180,274 | | |
| | 2,898 | | | First Republic Bank | | | 111,515 | | |
| | 2,657 | | | Hanmi Financial Corp. (a) | | | 46,949 | | |
| | 9,884 | | | Heritage Commerce Corp. (a) | | | 69,188 | | |
| | 838 | | | IBERIABANK Corp. | | | 44,925 | | |
| | 11,101 | | | ICG Group, Inc. (a) | | | 126,552 | | |
| | 8,360 | | | National Penn Bancshares, Inc. | | | 84,938 | | |
| | 1,289 | | | Nelnet, Inc. - Class A | | | 46,520 | | |
| | 12,111 | | | NewBridge Bancorp (a) | | | 72,545 | | |
| | 2,610 | | | Primerica, Inc. | | | 97,718 | | |
| | 2,791 | | | Protective Life Corp. | | | 107,202 | | |
| | 5,429 | | | State Bank Financial Corp. | | | 81,598 | | |
| | 1,576 | | | SVB Financial Group (a) | | | 131,312 | | |
| | 50,468 | | | Synovus Financial Corp. | | | 147,367 | | |
| | 5,258 | | | United Community Banks, Inc. (a) | | | 65,304 | | |
| | 6,261 | | | Washington Banking Co. | | | 88,906 | | |
| | 11,683 | | | Wilshire Bancorp, Inc. | | | 77,341 | | |
| | 2,781 | | | Wintrust Financial Corp. | | | 106,457 | | |
| | | | 2,057,463 | | |
| | | Health Care 3.8% | |
| | 14,161 | | | Accuray, Inc. (a) | | | 81,284 | | |
| | 1,373 | | | United Therapeutics Corp. (a) | | | 90,371 | | |
| | 3,047 | | | ViroPharma, Inc. (a) | | | 87,297 | | |
| | 1,555 | | | WellCare Health Plans, Inc. (a) | | | 86,380 | | |
| | | | 345,332 | | |
| | | Industrials 12.4% | |
| | 12,894 | | | Aceto Corp. | | | 179,613 | | |
| | 625 | | | AMERCO | | | 101,187 | | |
The accompanying notes are an integral part of these financial statements.
page 50

Frontegra Phocas Small Cap Value Fund
SCHEDULE OF INVESTMENTS (continued)
June 30, 2013
Number of Shares | | | | Value | |
| COMMON STOCKS 97.0% (continued) | | | |
| | | Industrials 12.4% (continued) | |
| | 2,215 | | | Beacon Roofing Supply, Inc. (a) | | $ | 83,904 | | |
| | 1,154 | | | Esterline Technologies Corp. (a) | | | 83,423 | | |
| | 2,677 | | | MYR Group, Inc. (a) | | | 52,068 | | |
| | 1,868 | | | Park-Ohio Holdings Corp. (a) | | | 61,607 | | |
| | 3,020 | | | Performant Financial Corp. (a) | | | 35,002 | | |
| | 3,968 | | | Spirit Airlines, Inc. (a) | | | 126,063 | | |
| | 1,610 | | | The Timken Company | | | 90,611 | | |
| | 2,245 | | | Trinity Industries, Inc. | | | 86,298 | | |
| | 1,272 | | | UniFirst Corp. | | | 116,070 | | |
| | 2,157 | | | URS Corp. | | | 101,853 | | |
| | | | 1,117,699 | | |
| | | Information Technology 14.0% | |
| | 3,613 | | | Compuware Corp. | | | 37,394 | | |
| | 3,233 | | | Euronet Worldwide, Inc. (a) | | | 103,003 | | |
| | 6,311 | | | Fairchild Semiconductor
International, Inc. (a) | | | 87,092 | | |
| | 13,790 | | | Integrated Device
Technology, Inc. (a) | | | 109,493 | | |
| | 9,680 | | | Internap Network Services Corp. (a) | | | 80,054 | | |
| | 1,129 | | | Measurement Specialties, Inc. (a) | | | 52,532 | | |
| | 3,827 | | | Methode Electronics, Inc. | | | 65,097 | | |
| | 5,538 | | | Microsemi Corp. (a) | | | 125,989 | | |
| | 1,908 | | | NeuStar, Inc. - Class A (a) | | | 92,882 | | |
| | 3,570 | | | Progress Software Corp. (a) | | | 82,146 | | |
| | 7,181 | | | Saba Software, Inc. (a) | | | 70,015 | | |
| | 4,089 | | | Skyworks Solutions, Inc. (a) | | | 89,508 | | |
| | 2,811 | | | SYNNEX Corp. (a) | | | 118,849 | | |
| | 13,080 | | | United Online, Inc. | | | 99,146 | | |
| | 1,433 | | | Verint Systems, Inc. (a) | | | 50,829 | | |
| | | | 1,264,029 | | |
| | | Materials 4.7% | |
| | 1,220 | | | Ashland, Inc. | | | 101,870 | | |
| | 9,043 | | | Boise, Inc. | | | 77,227 | | |
| | 2,078 | | | Cabot Corp. | | | 77,759 | | |
Number of Shares | | | | Value | |
| | | Materials 4.7% (continued) | |
| | 924 | | | Kaiser Aluminum Corp. | | $ | 57,233 | | |
| | 2,762 | | | Sensient Technologies Corp. | | | 111,778 | | |
| | | | 425,867 | | |
| | | Real Estate Investment Trusts 12.0% | |
| | 4,582 | | | Acadia Realty Trust | | | 113,130 | | |
| | 1,780 | | | Aviv REIT, Inc. | | | 45,016 | | |
| | 2,601 | | | CoreSite Realty Corp. | | | 82,738 | | |
| | 5,573 | | | CubeSmart | | | 89,057 | | |
| | 4,995 | | | First Industrial Realty Trust, Inc. | | | 75,774 | | |
| | 1,510 | | | Kilroy Realty Corp. | | | 80,045 | | |
| | 6,311 | | | Medical Properties Trust, Inc. | | | 90,373 | | |
| | 9,221 | | | NorthStar Realty Finance Corp. | | | 83,911 | | |
| | 2,737 | | | Potlatch Corp. | | | 110,684 | | |
| | 1,152 | | | PS Business Parks, Inc. | | | 83,140 | | |
| | 2,958 | | | Sabra Health Care REIT, Inc. | | | 77,233 | | |
| | 11,653 | | | Strategic Hotels & Resorts, Inc. (a) | | | 103,246 | | |
| | 1,238 | | | The Geo Group, Inc. | | | 42,030 | | |
| | | | 1,076,377 | | |
| | | Utilities 5.2% | |
| | 2,949 | | | Aqua America, Inc. | | | 92,274 | | |
| | 1,908 | | | Atmos Energy Corp. | | | 78,343 | | |
| | 2,224 | | | Black Hills Corp. | | | 108,420 | | |
| | 1,165 | | | Laclede Group, Inc. | | | 53,194 | | |
| | 1,774 | | | PNM Resources, Inc. | | | 39,365 | | |
| | 1,699 | | | Portland General Electric Co. | | | 51,972 | | |
| | 1,989 | | | The Empire District Electric Co. | | | 44,375 | | |
| | | | 467,943 | | |
| | | Total Common Stocks | |
| | | | | (Cost $6,388,818) | | | 8,733,667 | | |
CLOSED-END FUNDS 0.6% | | | |
| | | Financials 0.6% | |
| | 4,994 | | | Prospect Capital Corp. | | | 53,935 | | |
| | | Total Closed-End Funds | |
| | | | | (Cost $53,614) | | | 53,935 | | |
The accompanying notes are an integral part of these financial statements.
page 51

Frontegra Phocas Small Cap Value Fund
SCHEDULE OF INVESTMENTS (continued)
June 30, 2013
Number of Shares | | | | Value | |
SHORT-TERM INVESTMENTS 1.7% | |
| | | Investment Company 1.7% | |
| | 151,397 | | | STIT-STIC Prime Portfolio -
Institutional Class, 0.02% | | $ | 151,397 | | |
| | | Total Short-Term Investments | |
| | | (Cost $151,397) | | | 151,397 | | |
| | | Total Investments 99.3% | |
| | | (Cost $6,593,829) | | | 8,938,999 | | |
| | | Other Assets in Excess
of Liabilities 0.7% | | | 65,126 | | |
| | | TOTAL NET ASSETS 100.0% | | $ | 9,004,125 | | |
(a) Non-Income Producing.
PORTFOLIO DIVERSIFICATION
Sectors | | Percentage | |
Financials | | | 22.9 | % | |
Information Technology | | | 14.0 | | |
Consumer Discretionary | | | 12.5 | | |
Industrials | | | 12.4 | | |
Real Estate Investment Trusts | | | 12.0 | | |
Energy | | | 6.3 | | |
Utilities | | | 5.2 | | |
Materials | | | 4.7 | | |
Health Care | | | 3.8 | | |
Consumer Staples | | | 3.2 | | |
Total Common Stocks | | | 97.0 | | |
Financials | | | 0.6 | | |
Total Closed-End Funds | | | 0.6 | | |
Total Short-Term Investments | | | 1.7 | | |
Total Investments | | | 99.3 | | |
Other Assets in Excess of Liabilities | | | 0.7 | | |
Total Net Assets | | | 100.0 | % | |
The accompanying notes are an integral part of these financial statements.
page 52

Lockwell Small Cap Value Fund
SCHEDULE OF INVESTMENTS
June 30, 2013
Number of Shares | | | | Value | |
SHORT-TERM INVESTMENTS 100.4% | |
| | | Investment Company 100.4% | |
| | 3,492,356 | | | STIT Liquid Assets
Portfolio - Institutional
Class, 0.09% | | $ | 3,492,356 | | |
| | | Total Short-Term Investments | |
| | | (Cost $3,492,356) | | | 3,492,356 | | |
| | | Total Investments 100.4% | |
| | | (Cost $3,492,356) | | | 3,492,356 | | |
| | | Liabilities in Excess
of Other Assets (0.4)% | | | (14,719 | ) | |
| | | TOTAL NET ASSETS 100.0% | | $ | 3,477,637 | | |
PORTFOLIO DIVERSIFICATION
Sectors | | Percentage | |
Total Short-Term Investments | | | 100.4 | % | |
Total Investments | | | 100.4 | | |
Liabilities in Excess of Other Assets | | | (0.4 | ) | |
Total Net Assets | | | 100.0 | % | |
The accompanying notes are an integral part of these financial statements.
page 53

Frontegra Funds
STATEMENTS OF ASSETS AND LIABILITIES
June 30, 2013
| | | RobecoSAM Global
Equity Fund(1) | | MFG Global
Equity Fund | | MFG Core
Infrastructure Fund | | HEXAM Emerging
Markets Fund | |
ASSETS: | |
Investments at cost | | $ | 12,755,297 | | | $ | 319,367,433 | | | $ | 7,060,922 | | | $ | 28,632,468 | | |
Foreign currency at cost | | $ | — | | | $ | 354,248 | | | $ | 32,412 | | | $ | 85,127 | | |
Investments at value | | $ | 16,189,253 | | | $ | 346,808,848 | | | $ | 7,246,681 | | | $ | 22,971,699 | | |
Foreign currency at value | | | — | | | | 348,274 | | | | 31,771 | | | | 85,735 | | |
Cash | | | — | | | | — | | | | 6,720 | | | | 45,849 | | |
Receivable for investments sold | | | 81,576 | | | | — | | | | 9,165 | | | | 358,219 | | |
Receivable for Fund shares sold | | | — | | | | 2,148,364 | | | | — | | | | — | | |
Interest and dividends receivable | | | 62,197 | | | | 651,799 | | | | 34,587 | | | | 152,985 | | |
Receivable for foreign currency | | | 81,444 | | | | 584,327 | | | | — | | | | 45,933 | | |
Receivable from Adviser | | | — | | | | — | | | | 986 | | | | — | | |
Prepaid expenses and other assets | | | 14,784 | | | | 22,766 | | | | 2,355 | | | | 1,106 | | |
Total assets | | | 16,429,254 | | | | 350,564,378 | | | | 7,332,265 | | | | 23,661,526 | | |
LIABILITIES: | |
Payable for investments purchased | | | — | | | | 3,041,834 | | | | — | | | | 382,708 | | |
Payable for Fund shares redeemed | | | — | | | | 1,737 | | | | — | | | | — | | |
Payable to Directors | | | 800 | | | | 800 | | | | 800 | | | | 800 | | |
Payable for foreign currency | | | 81,281 | | | | 584,327 | | | | — | | | | 222,731 | | |
Payable to Adviser | | | 7,969 | | | | 171,322 | | | | — | | | | 10,632 | | |
Accrued distribution and shareholder servicing fees | | | — | | | | — | | | | — | | | | — | | |
Accrued expenses | | | 31,342 | | | | 69,499 | | | | 28,716 | | | | 35,606 | | |
Total liabilities | | | 121,392 | | | | 3,869,519 | | | | 29,516 | | | | 652,477 | | |
Net Assets | | $ | 16,307,862 | | | $ | 346,694,859 | | | $ | 7,302,749 | | | $ | 23,009,049 | | |
NET ASSETS CONSIST OF: | |
Paid in capital | | $ | 13,121,827 | | | $ | 313,779,442 | | | $ | 7,036,967 | | | $ | 33,739,791 | | |
Undistributed net investment income (loss) | | | 139,604 | | | | 1,889,158 | | | | 88,512 | | | | 95,052 | | |
Accumulated net realized gain (loss) | | | (385,966 | ) | | | 3,595,451 | | | | (7,416 | ) | | | (5,165,535 | ) | |
Net unrealized appreciation/depreciation on: | |
Investments | | | 3,433,956 | | | | 27,441,415 | | | | 185,759 | | | | (5,660,769 | ) | |
Foreign currency | | | (1,559 | ) | | | (10,607 | ) | | | (1,073 | ) | | | 510 | | |
Net Assets | | $ | 16,307,862 | | | $ | 346,694,859 | | | $ | 7,302,749 | | | $ | 23,009,049 | | |
CAPITAL STOCK, $0.01 PAR VALUE | | | | | | | | | |
Net Assets | | $ | 16,307,862 | | | $ | 346,694,859 | | | $ | 7,302,749 | | | $ | 23,009,049 | | |
Authorized | | | 50,000,000 | | | | 50,000,000 | | | | 50,000,000 | | | | 50,000,000 | | |
Issued and Outstanding | | | 1,297,000 | | | | 25,823,257 | | | | 632,655 | | | | 3,760,682 | | |
Net Asset Value, Redemption Price and Offering Price Per Share | | $ | 12.57 | | | $ | 13.43 | | | $ | 11.54 | | | $ | 6.12 | | |
CAPITAL STOCK, $0.01 PAR VALUE | | | | | | | | | |
Net Assets | | | | | | | | | |
Authorized | | | | | | | | | |
Issued and Outstanding | | | | | | | | | |
Net Asset Value, Redemption Price and Offering Price Per Share | | | | | | | | | | | | | | | | | |
(1) Effective February 20, 2013, the Fund changed its name from Frontegra SAM Global Equity Fund to Frontegra RobecoSAM
Global Equity Fund.
(2) Liquidation basis.
The accompanying notes are an integral part of these financial statements.
page 54

| | | Timpani Small Cap
Growth Fund | | Netols Small Cap
Value Fund | | Phocas Small Cap
Value Fund | | Lockwell Small Cap
Value Fund(2) | |
ASSETS: | |
Investments at cost | | $ | 2,960,308 | | | $ | 91,037,025 | | | $ | 6,593,829 | | | $ | 3,492,356 | | |
Foreign currency at cost | | $ | — | | | $ | — | | | $ | — | | | $ | — | | |
Investments at value | | $ | 3,991,220 | | | $ | 133,330,504 | | | $ | 8,938,999 | | | $ | 3,492,356 | | |
Foreign currency at value | | | — | | | | — | | | | — | | | | — | | |
Cash | | | 4,896 | | | | 14,851 | | | | 6,297 | | | | 5,020 | | |
Receivable for investments sold | | | 53,724 | | | | 535,910 | | | | 117,514 | | | | — | | |
Receivable for Fund shares sold | | | — | | | | 31,571 | | | | 6,975 | | | | — | | |
Interest and dividends receivable | | | 381 | | | | 125,099 | | | | 8,820 | | | | 1,409 | | |
Receivable for foreign currency | | | — | | | | — | | | | — | | | | — | | |
Receivable from Adviser | | | 6,308 | | | | — | | | | — | | | | 1,702 | | |
Prepaid expenses and other assets | | | 1,249 | | | | 7,639 | | | | 9,661 | | | | 4,154 | | |
Total assets | | | 4,057,778 | | | | 134,045,574 | | | | 9,088,266 | | | | 3,504,641 | | |
LIABILITIES: | |
Payable for investments purchased | | | 44,564 | | | | 370,024 | | | | 45,266 | | | | — | | |
Payable for Fund shares redeemed | | | — | | | | 110,757 | | | | — | | | | — | | |
Payable to Directors | | | 798 | | | | 800 | | | | — | | | | 1,030 | | |
Payable for foreign currency | | | — | | | | — | | | | — | | | | — | | |
Payable to Adviser | | | — | | | | 117,315 | | | | 11,614 | | | | — | | |
Accrued distribution and shareholder servicing fees | | | — | | | | 23,787 | | | | — | | | | — | | |
Accrued expenses | | | 29,137 | | | | 43,944 | | | | 27,261 | | | | 25,974 | | |
Total liabilities | | | 74,499 | | | | 666,627 | | | | 84,141 | | | | 27,004 | | |
Net Assets | | $ | 3,983,279 | | | $ | 133,378,947 | | | $ | 9,004,125 | | | $ | 3,477,637 | | |
NET ASSETS CONSIST OF: | |
Paid in capital | | $ | 3,056,099 | | | $ | 77,128,759 | | | $ | 6,362,740 | | | $ | 2,630,730 | | |
Undistributed net investment income (loss) | | | (16,332 | ) | | | 9,294 | | | | 16,849 | | | | — | | |
Accumulated net realized gain (loss) | | | (87,400 | ) | | | 13,947,415 | | | | 279,366 | | | | 846,907 | | |
Net unrealized appreciation/depreciation on: | |
Investments | | | 1,030,912 | | | | 42,293,479 | | | | 2,345,170 | | | | — | | |
Foreign currency | | | — | | | | — | | | | — | | | | — | | |
Net Assets | | $ | 3,983,279 | | | $ | 133,378,947 | | | $ | 9,004,125 | | | $ | 3,477,637 | | |
CAPITAL STOCK, $0.01 PAR VALUE | | | | Institutional Class | | | | | |
Net Assets | | $ | 3,983,279 | | | $ | 113,150,858 | | | $ | 9,004,125 | | | $ | 3,477,637 | | |
Authorized | | | 50,000,000 | | | | 50,000,000 | | | | 50,000,000 | | | | 50,000,000 | | |
Issued and Outstanding | | | 301,325 | | | | 7,373,226 | | | | 313,506 | | | | 287,618 | | |
Net Asset Value, Redemption Price and Offering Price Per Share | | $ | 13.22 | | | $ | 15.35 | | | $ | 28.72 | | | $ | 12.09 | | |
CAPITAL STOCK, $0.01 PAR VALUE | | | | Class Y | | | | | |
Net Assets | | | | $ | 20,228,089 | | | | | | |
Authorized | | | | | 50,000,000 | | | | | | |
Issued and Outstanding | | | | | 1,345,877 | | | | | | |
Net Asset Value, Redemption Price and Offering Price Per Share | | | | | | $ | 15.03 | | | | | | | | | | |
The accompanying notes are an integral part of these financial statements.
page 55

Frontegra Funds
STATEMENTS OF OPERATIONS
For the Year Ended June 30, 2013
| | | RobecoSAM Global
Equity Fund(1) | | MFG Global
Equity Fund | | MFG Core
Infrastructure Fund | | HEXAM Emerging
Markets Fund | |
INVESTMENT INCOME: | |
Dividend income | | $ | 527,951 | (2) | | $ | 3,670,464 | (3) | | $ | 161,576 | (4) | | $ | 422,235 | (5) | |
Interest income | | | 477 | | | | 6,612 | | | | 7,510 | | | | 1,351 | | |
Total investment income | | | 528,428 | | | | 3,677,076 | | | | 169,086 | | | | 423,586 | | |
EXPENSES: | |
Investment advisory fees | | | 145,519 | | | | 1,377,580 | | | | 23,692 | | | | 209,217 | | |
Fund administration and accounting fees | | | 38,004 | | | | 123,282 | | | | 31,621 | | | | 41,220 | | |
Custody fees | | | 23,440 | | | | 38,635 | | | | 12,658 | | | | 34,889 | | |
Federal and state registration fees | | | 21,120 | | | | 24,612 | | | | 2,155 | | | | 3,368 | | |
Audit fees | | | 17,506 | | | | 16,351 | | | | 16,354 | | | | 17,506 | | |
Legal fees | | | 17,287 | | | | 13,662 | | | | 13,612 | | | | 14,294 | | |
Directors' fees and related expenses | | | 9,999 | | | | 10,242 | | | | 10,475 | | | | 9,905 | | |
Shareholder servicing fees | | | 8,089 | | | | 14,317 | | | | 6,186 | | | | 6,960 | | |
Reports to shareholders | | | 4,379 | | | | 4,341 | | | | 3,454 | | | | 3,538 | | |
Distribution and shareholder servicing fees - Class Y | | | — | | | | — | | | | — | | | | — | | |
Subadministration fees - Class I | | | — | | | | — | | | | — | | | | — | | |
Other | | | 11,407 | | | | 49,086 | | | | 3,548 | | | | 18,657 | | |
Total expenses before waiver and reimbursement | | | 296,750 | | | | 1,672,108 | | | | 123,755 | | | | 359,554 | | |
Waiver and reimbursement of expenses by Adviser | | | (78,470 | ) | | | (294,528 | ) | | | (100,062 | ) | | | (57,353 | ) | |
Net expenses | | | 218,280 | | | | 1,377,580 | | | | 23,693 | | | | 302,201 | | |
Net Investment Income (Loss) | | | 310,148 | | | | 2,299,496 | | | | 145,393 | | | | 121,385 | | |
REALIZED AND UNREALIZED GAIN (LOSS) ON INVESTMENTS: | |
Net realized gain (loss) on: | |
Investments | | | (97,457 | ) | | | 5,005,073 | | | | (7,191 | ) | | | (2,205,411 | ) | |
Foreign currency transactions | | | (35,600 | ) | | | (3,763 | ) | | | (822 | ) | | | (26,333 | ) | |
Change in net unrealized appreciation/depreciation on: | |
Investments | | | 3,097,456 | | | | 27,963,825 | | | | 106,260 | | | | 15,213 | | |
Foreign currency transactions | | | (3,208 | ) | | | (8,349 | ) | | | (1,243 | ) | | | 3,857 | | |
Net Realized and Unrealized Gain (Loss) on Investments | | | 2,961,191 | | | | 32,956,786 | | | | 97,004 | | | | (2,212,674 | ) | |
Net Increase (Decrese) in Net Assets Resulting from Operations | | $ | 3,271,339 | | | $ | 35,256,282 | | | $ | 242,397 | | | $ | (2,091,289 | ) | |
(1) Effective February 20, 2013, the Fund changed its name from Frontegra SAM Global Equity Fund to Frontegra RobecoSAM
Global Equity Fund.
(2) Net of $37,062 in foreign withholding taxes.
(3) Net of $205,121 in foreign withholding taxes.
(4) Net of $14,538 in foreign withholding taxes.
(5) Net of $51,879 in foreign withholding taxes.
(6) Net of $5 in foreign withholding taxes.
(7) Net of $42 in foreign withholding taxes.
(8) Liquidation basis.
The accompanying notes are an integral part of these financial statements.
page 56

| | | Timpani Small Cap
Growth Fund | | Netols Small Cap
Value Fund | | Phocas Small Cap
Value Fund | | Lockwell Small Cap
Value Fund(8) | |
INVESTMENT INCOME: | |
Dividend income | | $ | 24,252 | (6) | | $ | 1,518,434 | | | $ | 152,632 | | | $ | 40,276 | (7) | |
Interest income | | | 46 | | | | 3,024 | | | | 234 | | | | 245 | | |
Total investment income | | | 24,298 | | | | 1,521,458 | | | | 152,866 | | | | 40,521 | | |
EXPENSES: | |
Investment advisory fees | | | 32,651 | | | | 1,456,144 | | | | 108,121 | | | | 31,950 | | |
Fund administration and accounting fees | | | 27,429 | | | | 120,330 | | | | 33,358 | | | | 27,048 | | |
Custody fees | | | 7,175 | | | | 17,557 | | | | 17,114 | | | | 6,488 | | |
Federal and state registration fees | | | 5,013 | | | | 10,364 | | | | 15,338 | | | | 21,034 | | |
Audit fees | | | 15,479 | | | | 15,507 | | | | 15,479 | | | | 14,380 | | |
Legal fees | | | 16,567 | | | | 14,819 | | | | 39,136 | | | | 14,117 | | |
Directors' fees and related expenses | | | 9,903 | | | | 9,905 | | | | 10,101 | | | | 10,232 | | |
Shareholder servicing fees | | | 6,243 | | | | 22,738 | | | | 11,255 | | | | 6,272 | | |
Reports to shareholders | | | 3,764 | | | | 9,432 | | | | 4,507 | | | | 3,090 | | |
Distribution and shareholder servicing fees - Class Y | | | — | | | | 73,988 | | | | — | | | | — | | |
Subadministration fees - Class I | | | — | | | | — | | | | 1,314 | | | | — | | |
Other | | | 6,944 | | | | 46,872 | | | | 6,635 | | | | 2,416 | | |
Total expenses before waiver and reimbursement | | | 131,168 | | | | 1,797,656 | | | | 262,358 | | | | 137,027 | | |
Waiver and reimbursement of expenses by Adviser | | | (95,252 | ) | | | (121,910 | ) | | | (147,770 | ) | | | (101,882 | ) | |
Net expenses | | | 35,916 | | | | 1,675,746 | | | | 114,588 | | | | 35,145 | | |
Net Investment Income (Loss) | | | (11,618 | ) | | | (154,288 | ) | | | 38,278 | | | | 5,376 | | |
REALIZED AND UNREALIZED GAIN (LOSS) ON INVESTMENTS: | |
Net realized gain (loss) on: | |
Investments | | | 367,810 | | | | 24,070,378 | | | | 3,196,331 | | | | 885,862 | | |
Foreign currency transactions | | | — | | | | — | | | | — | | | | — | | |
Change in net unrealized appreciation/depreciation on: | |
Investments | | | 501,400 | | | | 7,618,584 | | | | (1,003,094 | ) | | | (111,852 | ) | |
Foreign currency transactions | | | — | | | | — | | | | — | | | | — | | |
Net Realized and Unrealized Gain (Loss) on Investments | | | 869,210 | | | | 31,688,962 | | | | 2,193,237 | | | | 774,010 | | |
Net Increase (Decrese) in Net Assets Resulting from Operations | | $ | 857,592 | | | $ | 31,534,674 | | | $ | 2,231,515 | | | $ | 779,386 | | |
The accompanying notes are an integral part of these financial statements.
page 57

Frontegra Funds
STATEMENTS OF CHANGES IN NET ASSETS
| | | RobecoSAM Global Equity Fund(1) | | MFG Global Equity Fund | |
| | | For the
Year Ended
June 30, 2013 | | For the
Year Ended
June 30, 2012 | | For the
Year Ended
June 30, 2013 | | For the Period
December 28, 2011(2)
through
June 30, 2012 | |
OPERATIONS: | |
Net investment income | | $ | 310,148 | | | $ | 298,252 | | | $ | 2,299,496 | | | $ | 575,272 | | |
Net realized gain (loss) on: | |
Investments | | | (97,457 | ) | | | (73,629 | ) | | | 5,005,073 | | | | 57,026 | | |
Foreign currency transactions | | | (35,600 | ) | | | (51,607 | ) | | | (3,763 | ) | | | (14,867 | ) | |
Change in net unrealized appreciation/depreciation on: | |
Investments | | | 3,097,456 | | | | (2,322,847 | ) | | | 27,963,825 | | | | (522,410 | ) | |
Foreign currency transactions | | | (3,208 | ) | | | (209 | ) | | | (8,349 | ) | | | (2,258 | ) | |
Net increase (decrease) in net assets resulting from operations | | | 3,271,339 | | | | (2,150,040 | ) | | | 35,256,282 | | | | 92,763 | | |
DISTRIBUTIONS PAID TO SHAREHOLDERS FROM: | |
Net investment income | | | (295,231 | ) | | | (342,421 | ) | | | (966,980 | ) | | | — | | |
Net realized gain on investments | | | — | | | | (1,251,705 | ) | | | (1,466,648 | ) | | | — | | |
Net decrease in net assets resulting from distributions paid | | | (295,231 | ) | | | (1,594,126 | ) | | | (2,433,628 | ) | | | — | | |
CAPITAL SHARE TRANSACTIONS: | |
Shares sold | | | 454,816 | | | | 5,331,367 | | | | 203,278,933 | | | | 111,032,500 | | |
Shares issued to holders in reinvestment of distributions | | | 277,765 | | | | 1,585,837 | | | | 2,415,348 | | | | — | | |
Shares redeemed | | | (7,352,755 | ) | | | (2,512,847 | ) | | | (373,668 | ) | | | (2,574,697 | ) | |
Redemption fees | | | — | | | | — | | | | 1,026 | | | | — | | |
Net increase (decrease) in net assets resulting from capital share transactions | | | (6,620,174 | ) | | | 4,404,357 | | | | 205,321,639 | | | | 108,457,803 | | |
Total Increase (Decrease) in Net Assets | | | (3,644,066 | ) | | | 660,191 | | | | 238,144,293 | | | | 108,550,566 | | |
NET ASSETS: | |
Beginning of Period | | | 19,951,928 | | | | 19,291,737 | | | | 108,550,566 | | | | — | | |
End of Period | | $ | 16,307,862 | | | $ | 19,951,928 | | | $ | 346,694,859 | | | $ | 108,550,566 | | |
Undistributed net investment income | | $ | 139,604 | | | $ | 160,287 | | | $ | 1,889,158 | | | $ | 560,405 | | |
TRANSACTIONS IN SHARES: | |
Shares sold | | | 42,720 | | | | 477,250 | | | | 15,602,744 | | | | 10,276,542 | | |
Shares issued to holders in reinvestment of distributions | | | 24,132 | | | | 156,703 | | | | 205,562 | | | | — | | |
Shares redeemed | | | (637,832 | ) | | | (233,156 | ) | | | (28,164 | ) | | | (233,427 | ) | |
Net increase (decrease) in shares outstanding | | | (570,980 | ) | | | 400,797 | | | | 15,780,142 | | | | 10,043,115 | | |
(1) Effective February 20, 2013, the Fund changed its name from Frontegra SAM Global Equity Fund to Frontegra RobecoSAM Global Equity Fund.
(2) Commencement of operations.
The accompanying notes are an integral part of these financial statements.
page 58

Frontegra Funds
STATEMENTS OF CHANGES IN NET ASSETS (continued)
| | | MFG Core Infrastructure Fund | | HEXAM Emerging Markets Fund | |
| | | For the
Year Ended
June 30, 2013 | | For the Period
January 18, 2012(1)
through
June 30, 2012 | | For the
Year Ended
June 30, 2013 | | For the
Year Ended
June 30, 2012 | |
OPERATIONS: | |
Net investment income | | $ | 145,393 | | | $ | 54,210 | | | $ | 121,385 | | | $ | 233,164 | | |
Net realized gain (loss) on: | |
Investments | | | (7,191 | ) | | | 1,609 | | | | (2,205,411 | ) | | | (2,958,829 | ) | |
Foreign currency transactions | | | (822 | ) | | | 7,763 | | | | (26,333 | ) | | | (68,229 | ) | |
Change in net unrealized appreciation/depreciation on: | |
Investments | | | 106,260 | | | | 79,499 | | | | 15,213 | | | | (5,106,944 | ) | |
Foreign currency transactions | | | (1,243 | ) | | | 170 | | | | 3,857 | | | | (5,115 | ) | |
Net increase (decrease) in net assets resulting from operations | | | 242,397 | | | | 143,251 | | | | (2,091,289 | ) | | | (7,905,953 | ) | |
DISTRIBUTIONS PAID TO SHAREHOLDERS FROM: | |
Net investment income | | | (118,030 | ) | | | — | | | | (120,490 | ) | | | (128,066 | ) | |
Net realized gain on investments | | | (1,836 | ) | | | — | | | | — | | | | (183,995 | ) | |
Net decrease in net assets resulting from distributions paid | | | (119,866 | ) | | | — | | | | (120,490 | ) | | | (312,061 | ) | |
CAPITAL SHARE TRANSACTIONS: | |
Shares sold | | | 4,342,000 | | | | 2,600,104 | | | | 5,490,500 | | | | 2,689,500 | | |
Shares issued to holders in reinvestment of distributions | | | 99,221 | | | | — | | | | 3,189 | | | | 9,738 | | |
Shares redeemed | | | (4,358 | ) | | | — | | | | (15 | ) | | | (29,015 | ) | |
Net increase in net assets resulting from capital share transactions | | | 4,436,863 | | | | 2,600,104 | | | | 5,493,674 | | | | 2,670,223 | | |
Total Increase (Decrease) in Net Assets | | | 4,559,394 | | | | 2,743,355 | | | | 3,281,895 | | | | (5,547,791 | ) | |
NET ASSETS: | |
Beginning of Period | | | 2,743,355 | | | | — | | | | 19,727,154 | | | | 25,274,945 | | |
End of Period | | $ | 7,302,749 | | | $ | 2,743,355 | | | $ | 23,009,049 | | | $ | 19,727,154 | | |
Undistributed net investment income | | $ | 88,512 | | | $ | 61,972 | | | $ | 95,052 | | | $ | 120,490 | | |
TRANSACTIONS IN SHARES: | |
Shares sold | | | 366,605 | | | | 257,551 | | | | 768,937 | | | | 332,363 | | |
Shares issued to holders in reinvestment of distributions | | | 8,891 | | | | — | | | | 430 | | | | 1,415 | | |
Shares redeemed | | | (392 | ) | | | — | | | | (2 | ) | | | (3,975 | ) | |
Net increase in shares outstanding | | | 375,104 | | | | 257,551 | | | | 769,365 | | | | 329,803 | | |
(1) Commencement of operations.
The accompanying notes are an integral part of these financial statements.
page 59

Frontegra Funds
STATEMENTS OF CHANGES IN NET ASSETS (continued)
| | | Timpani Small Cap Growth Fund | | Netols Small Cap Value Fund | |
| | | For the
Year Ended
June 30, 2013 | | For the
Year Ended
June 30, 2012 | | For the
Year Ended
June 30, 2013 | | For the
Year Ended
June 30, 2012 | |
OPERATIONS: | |
Net investment loss | | $ | (11,618 | ) | | $ | (21,614 | ) | | $ | (154,288 | ) | | $ | (270,951 | ) | |
Net realized gain (loss) on investments | | | 367,810 | | | | (407,979 | ) | | | 24,070,378 | | | | 2,363,339 | | |
Change in net unrealized appreciation/depreciation on investments | | | 501,400 | | | | 354,051 | | | | 7,618,584 | | | | (15,804,224 | ) | |
Net increase (decrease) in net assets resulting from operations | | | 857,592 | | | | (75,542 | ) | | | 31,534,674 | | | | (13,711,836 | ) | |
| DISTRIBUTIONS PAID TO SHAREHOLDERS FROM: | | | | | | Institutional Class | | Institutional Class | |
Net investment income | | | — | | | | — | | | | — | | | | — | | |
Net realized gain on investments | | | — | | | | — | | | | (5,798,112 | ) | | | — | | |
Net decrease in net assets resulting from distributions paid | | | — | | | | — | | | | (5,798,112 | ) | | | — | | |
DISTRIBUTIONS PAID TO SHAREHOLDERS FROM: | | | | | | Class Y | | Class Y | |
Net investment income | | | | | | | — | | | | — | | |
Net realized gain on investments | | | | | | | (899,137 | ) | | | — | | |
Net decrease in net assets resulting from distributions paid | | | | | | | (899,137 | ) | | | — | | |
CAPITAL SHARE TRANSACTIONS: | | | | | | Institutional Class | | Institutional Class | |
Shares sold | | | 302,712 | | | | 879,324 | | | | 8,289,832 | | | | 6,241,189 | | |
Shares issued to holders in reinvestment of distributions | | | — | | | | — | | | | 5,233,889 | | | | — | | |
Shares redeemed | | | (1,457 | ) | | | (15,240 | ) | | | (56,528,040 | ) | | | (26,076,834 | ) | |
Net increase (decrease) in net assets resulting from capital share transactions | | | 301,255 | | | | 864,084 | | | | (43,004,319 | ) | | | (19,835,645 | ) | |
CAPITAL SHARE TRANSACTIONS: | | | | | | Class Y | | Class Y | |
Shares sold | | | | | | | 2,276,127 | | | | 3,738,101 | | |
Shares issued to holders in reinvestment of distributions | | | | | | | 898,733 | | | | — | | |
Shares redeemed | | | | | | | (3,937,645 | ) | | | (7,124,107 | ) | |
Net decrease in net assets resulting from capital share transactions | | | | | | | (762,785 | ) | | | (3,386,006 | ) | |
Total Increase (Decrease) in Net Assets | | | 1,158,847 | | | | 788,542 | | | | (18,929,679 | ) | | | (36,933,487 | ) | |
NET ASSETS: | |
Beginning of Period | | | 2,824,432 | | | | 2,035,890 | | | | 152,308,626 | | | | 189,242,113 | | |
End of Period | | $ | 3,983,279 | | | $ | 2,824,432 | | | $ | 133,378,947 | | | $ | 152,308,626 | | |
Undistributed net investment income (loss) | | $ | (16,332 | ) | | $ | (12,271 | ) | | $ | 9,294 | | | $ | (16,756 | ) | |
TRANSACTIONS IN SHARES: | | | | | | Institutional Class | | Institutional Class | |
Shares sold | | | 27,417 | | | | 86,238 | | | | 612,746 | | | | 528,581 | | |
Shares issued to holders in reinvestment of distributions | | | — | | | | — | | | | 396,207 | | | | — | | |
Shares redeemed | | | (130 | ) | | | (1,505 | ) | | | (4,101,006 | ) | | | (2,167,443 | ) | |
Net increase (decrease) in shares outstanding | | | 27,287 | | | | 84,733 | | | | (3,092,053 | ) | | | (1,638,862 | ) | |
TRANSACTIONS IN SHARES: | | | | | | Class Y | | Class Y | |
Shares sold | | | | | | | 164,466 | | | | 313,502 | | |
Shares issued to holders in reinvestment of distributions | | | | | | | 69,346 | | | | — | | |
Shares redeemed | | | | | | | (291,921 | ) | | | (586,729 | ) | |
Net decrease in shares outstanding | | | | | | | (58,109 | ) | | | (273,227 | ) | |
The accompanying notes are an integral part of these financial statements.
page 60

Frontegra Funds
STATEMENTS OF CHANGES IN NET ASSETS (continued)
| | | Phocas Small Cap Value Fund | | Lockwell Small Cap Value Fund | |
| | | For the
Year Ended
June 30, 2013 | | For the
Year Ended
June 30, 2012 | | For the
Year Ended
June 30, 2013(2) | | For the
Year Ended
June 30, 2012 | |
OPERATIONS: | |
Net investment income | | $ | 38,278 | | | $ | 53,407 | | | $ | 5,376 | | | $ | 5,175 | | |
Net realized gain (loss) on investments | | | 3,196,331 | | | | 129,868 | | | | 885,862 | | | | (3,413 | ) | |
Change in net unrealized appreciation/depreciation on investments | | | (1,003,094 | ) | | | (1,034,255 | ) | | | (111,852 | ) | | | 111,852 | | |
Net increase (decrease) in net assets resulting from operations | | | 2,231,515 | | | | (850,980 | ) | | | 779,386 | | | | 113,614 | | |
DISTRIBUTIONS PAID TO SHAREHOLDERS FROM: | | Institutional Class | | Institutional Class | | | | | |
Net investment income | | | (61,412 | ) | | | (13,249 | ) | | | (13,921 | ) | | | (528 | ) | |
Net realized gain on investments | | | — | | | | — | | | | (734 | ) | | | — | | |
Net decrease in net assets resulting from distributions paid | | | (61,412 | ) | | | (13,249 | ) | | | (14,655 | ) | | | (528 | ) | |
DISTRIBUTIONS PAID TO SHAREHOLDERS FROM(1): | | | | Class I | | | | | |
Net investment income | | | | | (792 | ) | | | | | |
Net decrease in net assets resulting from distributions paid | | | | | (792 | ) | | | | | |
CAPITAL SHARE TRANSACTIONS(1): | | Institutional Class | | Institutional Class | | | | | |
Shares sold | | | 1,139,262 | | | | 746,588 | | | | 1,897,630 | | | | 2,898,045 | | |
Shares issued in connection with Class I conversion | | | 3,516,268 | | | | — | | | | — | | | | — | | |
Shares issued to holders in reinvestment of distributions | | | 61,412 | | | | 13,249 | | | | 14,554 | | | | 338 | | |
Shares redeemed | | | (20,192,417 | ) | | | (1,425,314 | ) | | | (1,644,192 | ) | | | (566,555 | ) | |
Net increase (decrease) in net assets resulting from capital share transactions | | | (15,475,475 | ) | | | (665,477 | ) | | | 267,992 | | | | 2,331,828 | | |
CAPITAL SHARE TRANSACTIONS(1): | | | | Class I | | | | | |
Shares sold | | | | | 3,273,796 | | | | | | |
Shares issued to holders in reinvestment of distributions | | | | | 755 | | | | | | |
Shares redeemed | | | | | (182,529 | ) | | | | | |
Net increase in net assets resulting from capital share transactions | | | | | 3,092,022 | | | | | | |
Total Increase (Decrease) in Net Assets | | | (13,305,372 | ) | | | 1,561,524 | | | | 1,032,723 | | | | 2,444,914 | | |
NET ASSETS: | |
Beginning of Period | | | 22,309,497 | | | | 20,747,973 | | | | 2,444,914 | | | | — | | |
End of Period | | $ | 9,004,125 | | | $ | 22,309,497 | | | $ | 3,477,637 | | | $ | 2,444,914 | | |
Undistributed net investment income | | $ | 16,849 | | | $ | 39,983 | | | $ | — | | | $ | 4,647 | | |
TRANSACTIONS IN SHARES(1): | | Institutional Class | | Institutional Class | | | | | |
Shares sold | | | 43,996 | | | | 32,296 | | | | 163,575 | | | | 314,206 | | |
Conversion of Class I shares | | | 144,702 | | | | — | | | | — | | | | — | | |
Shares issued to holders in reinvestment of distributions | | | 2,510 | | | | 601 | | | | 1,381 | | | | 38 | | |
Shares redeemed | | | (835,389 | ) | | | (61,659 | ) | | | (134,001 | ) | | | (57,581 | ) | |
Net increase (decrease) in shares outstanding | | | (644,181 | ) | | | (28,762 | ) | | | 30,955 | | | | 256,663 | | |
TRANSACTIONS IN SHARES(1): | | | | Class I | | | | | |
Shares sold | | | | | 147,976 | | | | | | |
Shares issued to holders in reinvestment of distributions | | | | | 34 | | | | | | |
Shares redeemed | | | | | (8,061 | ) | | | | | |
Net increase in shares outstanding | | | | | 139,949 | | | | | | |
(1) Effective November 1, 2012, Class I shares of the Frontegra Phocas Small Cap Value Fund were converted into Class L shares of the Fund. Class L shares were redesignated Institutional Class shares. Shares redeemed for the year ended June 30, 2013, includes $3,516,268, representing 144,822 shares, related to the conversion of Class I shares.
(2) Liquidation basis.
The accompanying notes are an integral part of these financial statements.
page 61

Frontegra RobecoSAM Global Equity Fund
FINANCIAL HIGHLIGHTS
| | | Year
Ended
June 30,
2013 | | Year
Ended
June 30,
2012 | | Period
Ended
June 30,
2011(1)(2) | | Year
Ended
August 31,
2010 | | Period
Ended
August 31,
2009(3) | |
Net Asset Value, Beginning of Period | | $ | 10.68 | | | $ | 13.15 | | | $ | 11.00 | | | $ | 11.30 | | | $ | 10.00 | | |
INCOME (LOSS) FROM
INVESTMENT OPERATIONS: | |
Net investment income | | | 0.22 | | | | 0.18 | (4) | | | 0.25 | | | | 0.18 | (4) | | | 0.01 | (4) | |
Net realized and unrealized gain (loss) on investments | | | 1.86 | | | | (1.67 | ) | | | 2.53 | | | | 0.47 | | | | 1.29 | | |
Total Income (Loss) from Investment Operations | | | 2.08 | | | | (1.49 | ) | | | 2.78 | | | | 0.65 | | | | 1.30 | | |
LESS DISTRIBUTIONS: | |
From net investment income | | | (0.19 | ) | | | (0.21 | ) | | | (0.21 | ) | | | (0.05 | ) | | | — | | |
From net realized gain on investments | | | — | | | | (0.77 | ) | | | (0.42 | ) | | | (0.90 | ) | | | — | | |
Total Distributions | | | (0.19 | ) | | | (0.98 | ) | | | (0.63 | ) | | | (0.95 | ) | | | — | | |
Redemption fees retained | | | — | | | | — | | | | — | | | | — | (5) | | | — | | |
Net Asset Value, End of Period | | $ | 12.57 | | | $ | 10.68 | | | $ | 13.15 | | | $ | 11.00 | | | $ | 11.30 | | |
Total Return | | | 19.78 | % | | | (10.91 | )% | | | 25.64 | %(6) | | | 5.42 | % | | | 13.00 | %(6) | |
SUPPLEMENTAL DATA AND RATIOS: | |
Net assets, end of period (in thousands) | | $ | 16,308 | | | $ | 19,952 | | | $ | 19,292 | | | $ | 16,756 | | | $ | 11,614 | | |
Ratio of expenses to average net assets | |
Before waivers and reimbursements | | | 1.63 | % | | | 1.62 | % | | | 2.41 | %(7) | | | 2.81 | % | | | 4.06 | %(7) | |
Net of waivers and reimbursements | | | 1.20 | % | | | 1.20 | % | | | 1.20 | %(7) | | | 1.20 | % | | | 1.20 | %(7) | |
Ratio of net investment income (loss) to average net assets | |
Before waivers and reimbursements | | | 1.28 | % | | | 1.16 | % | | | 1.02 | %(7) | | | (0.03 | )% | | | (2.59 | )%(7) | |
Net of waivers and reimbursements | | | 1.71 | % | | | 1.58 | % | | | 2.23 | %(7) | | | 1.58 | % | | | 0.27 | %(7) | |
Portfolio turnover rate | | | 36 | % | | | 52 | % | | | 33 | %(6) | | | 88 | % | | | 72 | %(6) | |
(1) Effective June 30, 2011, the Fund changed its fiscal year end to June 30 from August 31.
(2) Effective June 10, 2011, Frontegra Asset Management, Inc. became adviser and RobecoSAM USA, Inc. (f/k/a Sustainable Asset Management USA, Inc.) became subadviser to the Fund.
(3) Commenced operations on June 18, 2009.
(4) Per share net investment income has been calculated using the daily average share method.
(5) Less than one cent per share.
(6) Not annualized.
(7) Annualized.
The accompanying notes are an integral part of these financial statements.
page 62

Frontegra MFG Global Equity Fund
FINANCIAL HIGHLIGHTS
| | | Year
Ended
June 30,
2013 | | Period
Ended
June 30,
2012(1) | |
Net Asset Value, Beginning of Period | | $ | 10.81 | | | $ | 10.00 | | |
INCOME FROM
INVESTMENT OPERATIONS: | |
Net investment income | | | 0.17 | (2) | | | 0.11 | (2) | |
Net realized and unrealized gain on investments | | | 2.68 | | | | 0.70 | | |
Total Income from Investment Operations | | | 2.85 | | | | 0.81 | | |
LESS DISTRIBUTIONS: | |
From net investment income | | | (0.09 | ) | | | — | | |
From net realized gain on investments | | | (0.14 | ) | | | — | | |
Total Distributions | | | (0.23 | ) | | | — | | |
Redemption fees retained | | | — | (3) | | | — | | |
Net Asset Value, End of Period | | $ | 13.43 | | | $ | 10.81 | | |
Total Return | | | 26.68 | % | | | 8.10 | %(4) | |
SUPPLEMENTAL DATA AND RATIOS: | |
Net assets, end of period (in thousands) | | $ | 346,695 | | | $ | 108,551 | | |
Ratio of expenses to average net assets | |
Before waivers and reimbursements | | | 0.97 | % | | | 1.14 | %(5) | |
Net of waivers and reimbursements | | | 0.80 | % | | | 0.80 | %(5) | |
Ratio of net investment income to average net assets | |
Before waivers and reimbursements | | | 1.17 | % | | | 1.70 | %(5) | |
Net of waivers and reimbursements | | | 1.34 | % | | | 2.04 | %(5) | |
Portfolio turnover rate | | | 31 | % | | | 19 | %(4) | |
(1) Commenced operations on December 28, 2011.
(2) Per share net investment income has been calculated using the daily average share method.
(3) Less than one cent per share.
(4) Not annualized.
(5) Annualized.
The accompanying notes are an integral part of these financial statements.
page 63

Frontegra MFG Core Infrastructure Fund
FINANCIAL HIGHLIGHTS
| | | Year
Ended
June 30,
2013 | | Period
Ended
June 30,
2012(1) | |
Net Asset Value, Beginning of Period | | $ | 10.65 | | | $ | 10.00 | | |
INCOME FROM
INVESTMENT OPERATIONS: | |
Net investment income | | | 0.49 | (2) | | | 0.24 | | |
Net realized and unrealized gain on investments | | | 0.84 | | | | 0.41 | | |
Total Income from Investment Operations | | | 1.33 | | | | 0.65 | | |
LESS DISTRIBUTIONS: | |
From net investment income | | | (0.44 | ) | | | — | | |
From net realized gain on investments | | | — | (3) | | | — | | |
Total Distributions | | | (0.44 | ) | | | — | | |
Net Asset Value, End of Period | | $ | 11.54 | | | $ | 10.65 | | |
Total Return | | | 12.73 | % | | | 6.50 | %(4) | |
SUPPLEMENTAL DATA AND RATIOS: | |
Net assets, end of period (in thousands) | | $ | 7,303 | | | $ | 2,743 | | |
Ratio of expenses to average net assets | |
Before waivers and reimbursements | | | 3.66 | % | | | 6.55 | %(5) | |
Net of waivers and reimbursements | | | 0.70 | % | | | 0.70 | %(5) | |
Ratio of net investment income (loss) to average net assets | |
Before waivers and reimbursements | | | 1.34 | % | | | (1.09 | )%(5) | |
Net of waivers and reimbursements | | | 4.30 | % | | | 4.76 | %(5) | |
Portfolio turnover rate | | | 7 | % | | | 7 | %(4) | |
(1) Commenced operations on January 18, 2012.
(2) Per share net investment income has been calculated using the daily average share method.
(3) Less than one cent per share.
(4) Not annualized.
(5) Annualized.
The accompanying notes are an integral part of these financial statements.
page 64

Frontegra HEXAM Emerging Markets Fund
FINANCIAL HIGHLIGHTS
| | | Year
Ended
June 30,
2013 | | Year
Ended
June 30,
2012 | | Period
Ended
June 30,
2011(1) | |
Net Asset Value, Beginning of Period | | $ | 6.59 | | | $ | 9.50 | | | $ | 10.00 | | |
INCOME (LOSS) FROM
INVESTMENT OPERATIONS: | |
Net investment income | | | 0.02 | | | | 0.08 | (2) | | | 0.08 | (2) | |
Net realized and unrealized loss on investments | | | (0.45 | ) | | | (2.87 | ) | | | (0.58 | ) | |
Total Loss from Investment Operations | | | (0.43 | ) | | | (2.79 | ) | | | (0.50 | ) | |
LESS DISTRIBUTIONS: | |
From net investment income | | | (0.04 | ) | | | (0.05 | ) | | | — | | |
From net realized gain on investments | | | — | | | | (0.07 | ) | | | — | | |
Total Distributions | | | (0.04 | ) | | | (0.12 | ) | | | — | | |
Net Asset Value, End of Period | | $ | 6.12 | | | $ | 6.59 | | | $ | 9.50 | | |
Total Return | | | (6.67 | )% | | | (29.51 | )% | | | (5.00 | )%(3) | |
SUPPLEMENTAL DATA AND RATIOS: | |
Net assets, end of period (in thousands) | | $ | 23,009 | | | $ | 19,727 | | | $ | 25,275 | | |
Ratio of expenses to average net assets | |
Before waivers and reimbursements | | | 1.55 | % | | | 1.65 | % | | | 2.33 | %(4) | |
Net of waivers and reimbursements | | | 1.30 | % | | | 1.30 | % | | | 1.30 | %(4) | |
Ratio of net investment income to average net assets | |
Before waivers and reimbursements | | | 0.27 | % | | | 0.71 | % | | | 0.61 | %(4) | |
Net of waivers and reimbursements | | | 0.52 | % | | | 1.06 | % | | | 1.64 | %(4) | |
Portfolio turnover rate | | | 86 | % | | | 89 | % | | | 33 | %(3) | |
(1) Commenced operations on December 20, 2010.
(2) Per share net investment income has been calculated using the daily average share method.
(3) Not annualized.
(4) Annualized.
The accompanying notes are an integral part of these financial statements.
page 65

Frontegra Timpani Small Cap Growth Fund
FINANCIAL HIGHLIGHTS
| | | Year
Ended
June 30,
2013 | | Year
Ended
June 30,
2012 | | Period
Ended
June 30,
2011(1) | |
Net Asset Value, Beginning of Period | | $ | 10.31 | | | $ | 10.75 | | | $ | 10.00 | | |
INCOME (LOSS) FROM
INVESTMENT OPERATIONS: | |
Net investment loss | | | (0.04 | )(2) | | | (0.08 | )(2) | | | (0.02 | )(3) | |
Net realized and unrealized gain (loss) on investments | | | 2.95 | | | | (0.36 | ) | | | 0.77 | | |
Total Income (Loss) from Investment Operations | | | 2.91 | | | | (0.44 | ) | | | 0.75 | | |
Net Asset Value, End of Period | | $ | 13.22 | | | $ | 10.31 | | | $ | 10.75 | | |
Total Return | | | 28.35 | % | | | (4.28 | )% | | | 7.60 | %(4) | |
SUPPLEMENTAL DATA AND RATIOS: | |
Net assets, end of period (in thousands) | | $ | 3,983 | | | $ | 2,824 | | | $ | 2,036 | | |
Ratio of expenses to average net assets | |
Before waivers and reimbursements | | | 4.02 | % | | | 5.25 | % | | | 10.93 | %(5) | |
Net of waivers and reimbursements | | | 1.10 | % | | | 1.10 | % | | | 1.10 | %(5) | |
Ratio of net investment loss to average net assets | |
Before waivers and reimbursements | | | (3.28 | )% | | | (5.02 | )% | | | (10.75 | )%(5) | |
Net of waivers and reimbursements | | | (0.36 | )% | | | (0.87 | )% | | | (0.92 | )%(5) | |
Portfolio turnover rate | | | 140 | % | | | 138 | % | | | 28 | %(4) | |
(1) Commenced operations on March 23, 2011.
(2) Per share net investment income has been calculated using the daily average share method.
(3) Net investment loss per share is calculated using ending balances prior to consideration of adjustments for permanent book to tax differences.
(4) Not annualized.
(5) Annualized.
The accompanying notes are an integral part of these financial statements.
page 66

Frontegra Netols Small Cap Value Fund
FINANCIAL HIGHLIGHTS
| | | Institutional Class | |
| | | Year
Ended
June 30,
2013 | | Year
Ended
June 30,
2012 | | Year
Ended
June 30,
2011 | | Year
Ended
June 30,
2010 | | Year
Ended
June 30,
2009 | |
Net Asset Value, Beginning of Period | | $ | 12.86 | | | $ | 13.75 | | | $ | 10.08 | | | $ | 9.03 | | | $ | 11.81 | | |
INCOME (LOSS) FROM
INVESTMENT OPERATIONS: | |
Net investment income (loss) | | | 0.01 | | | | 0.01 | | | | (0.05 | )(1) | | | 0.02 | (2) | | | 0.01 | | |
Net realized and unrealized gain (loss) on investments | | | 3.17 | | | | (0.90 | ) | | | 3.72 | | | | 1.05 | | | | (2.79 | ) | |
Total Income (Loss) from Investment Operations | | | 3.18 | | | | (0.89 | ) | | | 3.67 | | | | 1.07 | | | | (2.78 | ) | |
LESS DISTRIBUTIONS: | |
From net investment income | | | — | | | | — | | | | — | (3) | | | (0.02 | ) | | | — | (3) | |
From net realized gain on investments | | | (0.69 | ) | | | — | | | | — | | | | — | | | | — | | |
From return of capital | | | — | | | | — | | | | — | | | | — | (3) | | | — | | |
Total Distributions | | | (0.69 | ) | | | — | | | | — | | | | (0.02 | ) | | | — | | |
Net Asset Value, End of Period | | $ | 15.35 | | | $ | 12.86 | | | $ | 13.75 | | | $ | 10.08 | | | $ | 9.03 | | |
Total Return | | | 25.61 | % | | | (6.47 | )% | | | 36.43 | % | | | 11.76 | % | | | (23.42 | )% | |
SUPPLEMENTAL DATA AND RATIOS: | |
Net assets, end of period (in thousands) | | $ | 113,151 | | | $ | 134,544 | | | $ | 166,450 | | | $ | 119,657 | | | $ | 43,504 | | |
Ratio of expenses to average net assets | |
Before waivers and reimbursements | | | 1.18 | % | | | 1.22 | % | | | 1.13 | % | | | 1.18 | % | | | 1.45 | % | |
Net of waivers and reimbursements | | | 1.10 | % | | | 1.10 | % | | | 1.10 | % | | | 1.10 | % | | | 1.10 | % | |
Ratio of net investment income (loss) to average net assets | |
Before waivers and reimbursements | | | (0.14 | )% | | | (0.08 | )% | | | (0.39 | )% | | | 0.17 | % | | | (0.13 | )% | |
Net of waivers and reimbursements | | | (0.06 | )% | | | 0.04 | % | | | (0.36 | )% | | | 0.25 | % | | | 0.22 | % | |
Portfolio turnover rate | | | 28 | % | | | 28 | % | | | 33 | % | | | 41 | % | | | 36 | % | |
(1) Net investment loss per share is calculated using ending balances prior to consideration of adjustments for permanent book to tax differences.
(2) Per share net investment income has been calculated using the daily average share method.
(3) Less than one cent per share.
The accompanying notes are an integral part of these financial statements.
page 67

Frontegra Netols Small Cap Value Fund
FINANCIAL HIGHLIGHTS
| | | Class Y | |
| | | Year
Ended
June 30,
2013 | | Year
Ended
June 30,
2012 | | Year
Ended
June 30,
2011 | | Year
Ended
June 30,
2010 | | Year
Ended
June 30,
2009 | |
Net Asset Value, Beginning of Period | | $ | 12.65 | | | $ | 13.59 | | | $ | 10.00 | | | $ | 8.98 | | | $ | 11.78 | | |
INCOME (LOSS) FROM
INVESTMENT OPERATIONS: | |
Net investment loss | | | (0.05 | ) | | | (0.05 | ) | | | (0.09 | )(1) | | | — | | | | (0.02 | ) | |
Net realized and unrealized gain (loss) on investments | | | 3.12 | | | | (0.89 | ) | | | 3.68 | | | | 1.02 | | | | (2.78 | ) | |
Total Income (Loss) from Investment Operations | | | 3.07 | | | | (0.94 | ) | | | 3.59 | | | | 1.02 | | | | (2.80 | ) | |
LESS DISTRIBUTIONS: | |
From net investment income | | | — | | | | — | | | | — | | | | — | | | | — | | |
From net realized gain on investments | | | (0.69 | ) | | | — | | | | — | | | | — | | | | — | | |
Total Distributions | | | (0.69 | ) | | | — | | | | — | | | | — | | | | — | | |
Net Asset Value, End of Period | | $ | 15.03 | | | $ | 12.65 | | | $ | 13.59 | | | $ | 10.00 | | | $ | 8.98 | | |
Total Return | | | 25.15 | % | | | (6.92 | )% | | | 35.90 | % | | | 11.36 | % | | | (23.77 | )% | |
SUPPLEMENTAL DATA AND RATIOS: | |
Net assets, end of period (in thousands) | | $ | 20,228 | | | $ | 17,765 | | | $ | 22,792 | | | $ | 15,560 | | | $ | 895 | | |
Ratio of expenses to average net assets | |
Before waivers and reimbursements | | | 1.58 | % | | | 1.62 | % | | | 1.53 | % | | | 1.58 | % | | | 1.85 | % | |
Net of waivers and reimbursements | | | 1.50 | % | | | 1.50 | % | | | 1.50 | % | | | 1.50 | % | | | 1.50 | % | |
Ratio of net investment loss to average net assets | |
Before waivers and reimbursements | | | (0.54 | )% | | | (0.48 | )% | | | (0.79 | )% | | | (0.23 | )% | | | (0.53 | )% | |
Net of waivers and reimbursements | | | (0.46 | )% | | | (0.36 | )% | | | (0.76 | )% | | | (0.15 | )% | | | (0.18 | )% | |
Portfolio turnover rate | | | 28 | % | | | 28 | % | | | 33 | % | | | 41 | % | | | 36 | % | |
(1) Net investment loss per share is calculated using ending balances prior to consideration of adjustments for permanent book to tax differences.
The accompanying notes are an integral part of these financial statements.
page 68

Frontegra Phocas Small Cap Value Fund
FINANCIAL HIGHLIGHTS
| | | Year
Ended
June 30,
2013 | | Year
Ended
June 30,
2012 | | Year
Ended
June 30,
2011(1) | | Six Months
Ended
June 30,
2010(2) | | Year
Ended
December 31,
2009 | | Year
Ended
December 31,
2008 | |
Net Asset Value, Beginning of Period | | $ | 23.30 | | | $ | 24.51 | | | $ | 18.40 | | | $ | 18.48 | | | $ | 14.93 | | | $ | 20.01 | | |
INCOME (LOSS) FROM
INVESTMENT OPERATIONS: | |
Net investment income | | | 0.20 | | | | 0.06 | | | | 0.04 | (3) | | | 0.02 | (3) | | | 0.06 | (3) | | | 0.13 | (3) | |
Net realized and unrealized gain (loss) on investments | | | 5.41 | | | | (1.25 | ) | | | 6.13 | | | | (0.10 | ) | | | 3.56 | | | | (5.08 | ) | |
Total Income (Loss) from Investment Operations | | | 5.61 | | | | (1.19 | ) | | | 6.17 | | | | (0.08 | ) | | | 3.62 | | | | (4.95 | ) | |
LESS DISTRIBUTIONS: | |
From net investment income | | | (0.19 | ) | | | (0.02 | ) | | | (0.06 | ) | | | — | | | | (0.07 | ) | | | (0.13 | ) | |
From net realized gain on investments | | | — | | | | — | | | | — | | | | — | | | | — | | | | — | | |
Total Distributions | | | (0.19 | ) | | | (0.02 | ) | | | (0.06 | ) | | | — | | | | (0.07 | ) | | | (0.13 | ) | |
Redemption fees retained | | | — | | | | — | | | | — | (4) | | | — | (4) | | | — | (4) | | | — | (4) | |
Net Asset Value, End of Period | | $ | 28.72 | | | $ | 23.30 | | | $ | 24.51 | | | $ | 18.40 | | | $ | 18.48 | | | $ | 14.93 | | |
Total Return | | | 24.29 | % | | | (4.91 | )% | | | 33.55 | % | | | (0.43 | )%(5) | | | 24.29 | % | | | (24.68 | )% | |
SUPPLEMENTAL DATA AND RATIOS: | |
Net assets, end of period (in thousands) | | $ | 9,004 | | | $ | 18,821 | | | $ | 20,507 | | | $ | 15,176 | | | $ | 19,331 | | | $ | 17,201 | | |
Ratio of expenses to average net assets | |
Before waivers and reimbursements | | | 2.50 | % | | | 1.70 | % | | | 1.69 | % | | | 1.68 | %(6) | | | 1.71 | % | | | 1.52 | % | |
Net of waivers and reimbursements | | | 1.05 | % | | | 0.99 | % | | | 0.99 | % | | | 0.99 | %(6) | | | 0.99 | % | | | 0.99 | % | |
Ratio of net investment income (loss) to
average net assets | |
Before waivers and reimbursements | | | (1.08 | )% | | | (0.51 | )% | | | (0.52 | )% | | | (0.53 | )%(6) | | | (0.31 | )% | | | 0.21 | % | |
Net of waivers and reimbursements | | | 0.37 | % | | | 0.20 | % | | | 0.18 | % | | | 0.16 | %(6) | | | 0.41 | % | | | 0.74 | % | |
Portfolio turnover rate | | | 196 | % | | | 50 | % | | | 37 | % | | | 43 | %(5) | | | 67 | % | | | 34 | % | |
(1) Effective October 8, 2010, Frontegra Asset Management, Inc. became adviser and Phocas Financial Corp. became subadviser to the Fund.
(2) Effective June 30, 2010, the Fund changed its fiscal year end to June 30 from December 31.
(3) Per share net investment income has been calculated using the daily average shares method.
(4) Less than one cent per share.
(5) Not annualized.
(6) Annualized.
The accompanying notes are an integral part of these financial statements.
page 69

Lockwell Small Cap Value Fund
FINANCIAL HIGHLIGHTS
| | | Year
Ended
June 30,
2013(1) | | Year
Ended
June 30,
2012 | |
Net Asset Value, Beginning of Period | | $ | 9.53 | | | $ | 10.00 | | |
INCOME (LOSS) FROM
INVESTMENT OPERATIONS: | |
Net investment income | | | 0.03 | | | | 0.04 | (2) | |
Net realized and unrealized gain (loss) on investments | | | 2.58 | | | | (0.51 | ) | |
Total Income (Loss) from Investment Operations | | | 2.61 | | | | (0.47 | ) | |
LESS DISTRIBUTIONS: | |
From net investment income | | | (0.05 | ) | | | — | (3) | |
From net realized gain on investments | | | — | (3) | | | — | | |
Total Distributions | | | (0.05 | ) | | | — | | |
Net Asset Value, End of Period | | $ | 12.09 | | | $ | 9.53 | | |
Total Return | | | 27.66 | % | | | (4.76 | )% | |
SUPPLEMENTAL DATA AND RATIOS: | |
Net assets, end of period (in thousands) | | $ | 3,478 | | | $ | 2,445 | | |
Ratio of expenses to average net assets | |
Before waivers and reimbursements | | | 4.29 | % | | | 9.63 | % | |
Net of waivers and reimbursements | | | 1.10 | % | | | 1.10 | % | |
Ratio of net investment income (loss) to average net assets | |
Before waivers and reimbursements | | | (3.02 | )% | | | (8.13 | )% | |
Net of waivers and reimbursements | | | 0.17 | % | | | 0.40 | % | |
Portfolio turnover rate | | | 107 | % | | | 92 | % | |
(1) Liquidation basis.
(2) Per share net investment income has been calculated using the daily average share method.
(3) Less than one cent per share.
The accompanying notes are an integral part of these financial statements.
page 70

NOTES TO FINANCIAL STATEMENTS
June 30, 2013
(1) ORGANIZATION
Frontegra Funds, Inc. (the "Company") was incorporated on May 24, 1996 as a Maryland corporation and is registered under the Investment Company Act of 1940, as amended (the "1940 Act"), as an open-end investment company issuing shares in series (each, a "Fund," or collectively, the "Funds"), each series representing a distinct portfolio with its own investment objectives and policies. The investment objective of each of the Frontegra RobecoSAM Global Equity Fund (formerly known as Frontegra SAM Global Equity Fund) and Frontegra HEXAM Emerging Markets Fund is long-term capital growth. The investment objective of each of the Frontegra MFG Global Equity Fund, Frontegra Timpani Small Cap Growth Fund and Frontegra Netols Small Cap Value Fund is capital appreciation. The investment objective of the Frontegra Phocas Small Cap Value Fund is long-term total investment through capital appreciation. The investment objective of each of the Frontegra MFG Core Infrastructure Fund and Lockwell Small Cap Value Fund is long-term capital appreciation.
As of June 30, 2013, the Company had eight series in operations. A summary of each Fund's investment adviser, subadviser and capital structure is as follows:
Fund | | Investment Adviser | | Subadviser | | Capital Structure | | Commencement
of Operations | |
Frontegra RobecoSAM Global Equity Fund (a) | | Frontegra Asset Management, Inc. ("Frontegra") | | RobecoSAM USA, Inc. | | Single Class | | June 18, 2009 | |
Frontegra MFG Global Equity Fund (a) | | Frontegra | | MFG Asset Management | | Single Class | | Dec. 28, 2011 | |
Frontegra MFG Core Infrastructure Fund (a) | | Frontegra | | MFG Asset Management | | Single Class | | Jan. 18, 2012 | |
Frontegra HEXAM Emerging Markets Fund (a) | | Frontegra | | HEXAM Capital Partners, LLP | | Single Class | | Dec. 20, 2010 | |
Frontegra Timpani Small Cap Growth Fund | | Timpani Capital Management LLC ("Timpani") (b) | | None | | Multi-Class
• Institutional
• Class Y (c) | | Mar. 23, 2011 | |
Frontegra Netols Small Cap Value Fund | | Frontegra | | Netols Asset Management, Inc. | | Multi-Class
• Institutional
• Class Y | | Dec. 16, 2005 | |
Frontegra Phocas Small Cap Value Fund | | Frontegra | | Phocas Financial Corp. | | Single Class (d) | | Sep. 29, 2006 | |
Lockwell Small Cap Value Fund (a) | | Lockwell Investments, LLC ("Lockwell") | | None | | Single Class | | July 1, 2011 | |
(a) A redemption fee of 2.00% will be charged on shares of the Fund redeemed 30 days or less from their date of purchase.
(b) Timpani is an affiliate of Frontegra.
(c) As of June 30, 2013, the Class Y shares of the Frontegra Timpani Small Cap Growth Fund had not commenced operations.
(d) Effective November 1, 2012, the Class I shares of the Frontegra Phocas Small Cap Value Fund were converted into Class L shares of the Fund. Class L shares were redesignated Institutional Class shares.
page 71

NOTES TO FINANCIAL STATEMENTS (continued)
June 30, 2013
On June 20, 2013, the Board of Directors approved a plan to liquidate the Lockwell Small Cap Value Fund with such liquidation effective July 31, 2013. For more information regarding the liquidation, see Note 2 (f) Subsequent Events.
The accompanying 2013 financial statements for the Lockwell Small Cap Value Fund are prepared on the liquidation basis of accounting in accordance with accounting principles generally accepted in the United States of America. Under the liquidation basis of accounting, assets are stated at their fair value or estimated realizable amount, liabilities are stated at their anticipated settlement amounts and all other costs of liquidation have been accrued. Assets and liabilities historically were carried at values that approximated fair value.
(2) SIGNIFICANT ACCOUNTING POLICIES
The following is a summary of significant accounting policies consistently followed by the Funds in the preparation of their financial statements.
(a) Investment Valuation
Equity securities for which market quotations are readily available are valued at the last reported sale price on the national securities exchange on which such securities are primarily traded. Equity securities for which there were no transactions on a given day or securities not listed on a national securities exchange are valued at the most recent bid price. Equity securities that are traded on NASDAQ are valued using the NASDAQ Official Closing Price ("NOCP"). Debt securities (other than short-term instruments) are valued by an independent pricing service, which uses valuation methods such as matrix pricing and other analytical pricing models as well as market transactions and evaluated dealer bid quotations. Shares of underlying mutual funds are valued at their respective NAVs. Exchange traded funds are valued at the last reported sale price on the exchange on which the security is principally traded. Securities that are primarily traded on foreign exchanges, including participatory notes, generally are valued at the last sale price of such securities on their respective exchange. In certain circumstances, such as when a significant event occurs in a foreign market so that the last sale price no longer reflects actual value, the fair value of these securities may be determined using fair valuation procedures approved by the Board of Directors. The Directors have retained an independent fair value pricing service to assist in valuing foreign securities held by the Frontegra RobecoSAM Global Equity, Frontegra MFG Global Equity, Frontegra MFG Core Infrastructure and Frontegra HEXAM Emerging Markets Funds. In valuing assets, prices denominated in foreign currencies are converted to U.S. dollar equivalents at the current exchange rate, which approximates fair value. Securities maturing within 60 days or less when purchased are valued by the amortized cost method. Any securities or other assets for which market quotations are not readily available are valued at their fair value as determined in good faith by the advisers or subadvisers pursuant to guidelines established by the Board of Directors.
The Funds follow a fair value hierarchy that distinguishes between market data obtained from independent sources (observable inputs) and the Funds' own market assumptions (unobservable inputs). These inputs are used in determining the value of each Fund's investments and are summarized in the following fair value hierarchy:
Level 1 — Quoted prices in active markets for identical securities
Level 2 — Evaluated prices based on other significant observable inputs (including quoted prices for similar securities, foreign security indices, foreign exchange rates, fair value estimates for foreign securities and changes in benchmark securities indices)
Level 3 — Significant unobservable inputs (including the Fund's own assumptions in determining fair value of investments)
page 72

NOTES TO FINANCIAL STATEMENTS (continued)
June 30, 2013
RobecoSAM Global Equity
Description | | Level 1 | | Level 2 | | Level 3 | | Total | |
Equity (a) | | | | | | | | | | | | | | | | | |
Common Stocks | | $ | 15,446,918 | | | $ | — | | | $ | — | | | $ | 15,446,918 | | |
Preferred Stocks | | | 222,413 | | | | — | | | | — | | | | 222,413 | | |
Total Equity | | | 15,669,331 | | | | — | | | | — | | | | 15,669,331 | | |
Short-Term Investments | | | 519,922 | | | | — | | | | — | | | | 519,922 | | |
Total Investments in Securities | | $ | 16,189,253 | | | $ | — | | | $ | — | | | $ | 16,189,253 | | |
MFG Global Equity
Description | | Level 1 | | Level 2 | | Level 3 | | Total | |
Equity (a) | | | | | | | | | | | | | | | | | |
Common Stocks | | $ | 336,685,364 | | | $ | — | | | $ | — | | | $ | 336,685,364 | | |
Total Equity | | | 336,685,364 | | | | — | | | | — | | | | 336,685,364 | | |
Short-Term Investments | | | 10,123,484 | | | | — | | | | — | | | | 10,123,484 | | |
Total Investments in Securities | | $ | 346,808,848 | | | $ | — | | | $ | — | | | $ | 346,808,848 | | |
MFG Core Infrastructure
Description | | Level 1 | | Level 2 | | Level 3 | | Total | |
Equity (a) | | | | | | | | | | | | | | | | | |
Common Stocks | | $ | 6,945,033 | | | $ | — | | | $ | — | | | $ | 6,945,033 | | |
Closed-End Funds | | | 70,675 | | | | — | | | | — | | | | 70,675 | | |
Total Equity | | | 7,015,708 | | | | — | | | | — | | | | 7,015,708 | | |
Short-Term Investments | | | 230,973 | | | | — | | | | — | | | | 230,973 | | |
Total Investments in Securities | | $ | 7,246,681 | | | $ | — | | | $ | — | | | $ | 7,246,681 | | |
HEXAM Emerging Markets
Description | | Level 1 | | Level 2 | | Level 3 | | Total | |
Equity (a) | | | | | | | | | | | | | | | | | |
Common Stocks | | $ | 20,888,279 | | | $ | 641,602 | | | $ | — | | | $ | 21,529,881 | | |
Preferred Stocks | | | 673,093 | | | | — | | | | — | | | | 673,093 | | |
Total Equity | | | 21,561,372 | | | | 641,602 | | | | — | | | | 22,202,974 | | |
Short-Term Investments | | | 768,725 | | | | — | | | | — | | | | 768,725 | | |
Total Investments in Securities | | $ | 22,330,097 | | | $ | 641,602 | | | $ | — | | | $ | 22,971,699 | | |
Timpani Small Cap Growth
Description | | Level 1 | | Level 2 | | Level 3 | | Total | |
Equity (a) | | | | | | | | | | | | | | | | | |
Common Stocks | | $ | 3,901,353 | | | $ | — | | | $ | — | | | $ | 3,901,353 | | |
Total Equity | | | 3,901,353 | | | | — | | | | — | | | | 3,901,353 | | |
Short-Term Investments | | | 89,867 | | | | — | | | | — | | | | 89,867 | | |
Total Investments in Securities | | $ | 3,991,220 | | | $ | — | | | $ | — | | | $ | 3,991,220 | | |
page 73

NOTES TO FINANCIAL STATEMENTS (continued)
June 30, 2013
Netols Small Cap Value
Description | | Level 1 | | Level 2 | | Level 3 | | Total | |
Equity (a) | | | | | | | | | | | | | | | | | |
Common Stocks | | $ | 129,520,958 | | | $ | — | | | $ | — | | | $ | 129,520,958 | | |
Total Equity | | | 129,520,958 | | | | — | | | | — | | | | 129,520,958 | | |
Short-Term Investments | | | 3,809,546 | | | | — | | | | — | | | | 3,809,546 | | |
Total Investments in Securities | | $ | 133,330,504 | | | $ | — | | | $ | — | | | $ | 133,330,504 | | |
Phocas Small Cap Value
Description | | Level 1 | | Level 2 | | Level 3 | | Total | |
Equity (a) | | | | | | | | | | | | | | | | | |
Common Stocks | | $ | 8,733,667 | | | $ | — | | | $ | — | | | $ | 8,733,667 | | |
| Closed-End Funds | | | 53,935 | | | | — | | | | — | | | | 53,935 | | |
Total Equity | | | 8,787,602 | | | | — | | | | — | | | | 8,787,602 | | |
Short-Term Investments | | | 151,397 | | | | — | | | | — | | | | 151,397 | | |
Total Investments in Securities | | $ | 8,938,999 | | | $ | — | | | $ | — | | | $ | 8,938,999 | | |
Lockwell Small Cap Value
Description | | Level 1 | | Level 2 | | Level 3 | | Total | |
Short-Term Investments | | $ | 3,492,356 | | | $ | — | | | $ | — | | | $ | 3,492,356 | | |
Total Investments in Securities | | $ | 3,492,356 | | | $ | — | | | $ | — | | | $ | 3,492,356 | | |
(a) See Fund's Schedule of Investments for sector or country classifications
| | | RobecoSAM
Global Equity | | MFG
Global Equity | | MFG Core
Infrastructure | | HEXAM
Emerging Markets | |
Transfers into Level 1 | | $ | 8,339,032 | | | $ | 24,825,878 | | | $ | 1,432,256 | | | $ | 13,462,971 | | |
Transfers out of Level 2 | | $ | (8,339,032 | ) | | $ | (24,825,878 | ) | | $ | (1,432,256 | ) | | $ | (13,462,971 | ) | |
Net transfers | | $ | — | | | $ | — | | | $ | — | | | $ | — | | |
Transfers between Level 1 and Level 2 relate to the use of systematic fair valuation. On days when systematic fair valuation is used, non-U.S. dollar denominated securities move from Level 1 to Level 2 classification. At June 30, 2012, securities in the RobecoSAM Global Equity Fund, MFG Global Equity Fund, MFG Core Infrastructure Fund and HEXAM Emerging Markets Fund were adjusted using systematic fair valuation resulting in a Level 2 classification. At June 30, 2013, securities in the RobecoSAM Global Equity Fund, MFG Global Equity Fund, MFG Core Infrastructure Fund and HEXAM Emerging Markets Fund were not adjusted using systematic fair valuation resulting in a Level 1 classification. The Funds did not hold any Level 3 securities during the fiscal year ended June 30, 2013. It is the Funds' policy to record transfers at the end of the reporting period.
(b) Federal Income Taxes
Each Fund intends to comply with the requirements of Subchapter M of the Internal Revenue Code necessary to qualify as a regulated investment company and to make the requisite distributions of income and capital gains to its shareholders sufficient to relieve it from all or substantially all federal income taxes. Therefore, no federal income tax provision has been provided.
The Funds have adopted financial reporting rules regarding recognition and measurement of tax positions taken or expected to be taken on a tax return. The Funds recognized interest and penalties, if any, related to unrecognized tax benefits as income tax
page 74

NOTES TO FINANCIAL STATEMENTS (continued)
June 30, 2013
expense on the Statement of Operations. During the fiscal year, the Funds did not incur any interest or penalties. The Funds have reviewed all open tax years and concluded that there is no effect to any of the Fund's financial positions or results of operations and no tax liability resulting from unrecognized tax benefits relating to uncertain income tax position taken or expected to be taken on a tax return. Open tax years are those years that are open for examination by the relevant income taxing authority. As of June 30, 2013, open federal and state income tax years include the tax years ended June 30, 2010, June 30, 2011, June 30, 2012 and June 30, 2013. The Funds have no examinations in progress.
(c) Distributions to Shareholders
Dividends from net investment income and net realized gains, if any, are declared and paid at least annually.
All short-term capital gains are included in ordinary income for tax purposes. Distributions to shareholders are recorded on the ex-dividend date.
The tax character of distributions paid during the years ended June 30, 2013 and June 30, 2012 were as follows:
| | | Year Ended June 30, 2013 | | Year Ended June 30, 2012 | |
| | | Ordinary
Income | | Long-Term
Capital Gains | | Total
Distributions | | Ordinary
Income | | Long-Term
Capital Gains | | Total
Distributions | |
RobecoSAM Global Equity | | $ | 295,231 | | | $ | — | | | $ | 295,231 | | | $ | 1,035,293 | | | $ | 558,833 | | | $ | 1,594,126 | | |
MFG Global Equity | | | 2,433,628 | | | | — | | | | 2,433,628 | | | | — | | | | — | | | | — | | |
MFG Core Infrastructure | | | 119,866 | | | | — | | | | 119,866 | | | | — | | | | — | | | | — | | |
HEXAM Emerging Markets | | | 120,490 | | | | — | | | | 120,490 | | | | 312,061 | | | | — | | | | 312,061 | | |
Timpani Small Cap Growth | | | — | | | | — | | | | — | | | | — | | | | — | | | | — | | |
Netols Small Cap Value | | | — | | | | 6,697,249 | | | | 6,697,249 | | | | — | | | | — | | | | — | | |
Phocas Small Cap Value | | | 61,412 | | | | — | | | | 61,412 | | | | 14,041 | | | | — | | | | 14,041 | | |
Lockwell Small Cap Value | | | 14,655 | | | | — | | | | 14,655 | | | | 528 | | | | — | | | | 528 | | |
A final distribution of $288,417 of short-term capital gains and $558,490 of long-term capital gains was made on July 12, 2013 for the Lockwell Small Cap Value Fund.
At June 30, 2013, the components of accumulated earnings/losses on a tax basis were as follows:
| | RobecoSAM
Global
Equity | | MFG
Global
Equity | | MFG
Core
Infrastructure | | HEXAM
Emerging
Markets | | Timpani
Small Cap
Growth | | Netols
Small Cap
Value | | Phocas
Small Cap
Value | | Lockwell
Small Cap
Value | |
Cost of investments | | $ | 12,833,312 | | | $ | 319,490,469 | | | $ | 7,065,825 | | | $ | 28,987,542 | | | $ | 2,961,310 | | | $ | 93,054,652 | | | $ | 6,645,669 | | | $ | 3,492,356 | | |
Gross unrealized
appreciation | | $ | 3,631,602 | | | $ | 32,822,603 | | | $ | 373,347 | | | $ | 439,336 | | | $ | 1,054,030 | | | $ | 45,256,269 | | | $ | 2,408,166 | | | $ | — | | |
Gross unrealized
depreciation | | | (275,661 | ) | | | (5,504,224 | ) | | | (192,491 | ) | | | (6,455,179 | ) | | | (24,120 | ) | | | (4,980,417 | ) | | | (114,836 | ) | | | — | | |
Net unrealized
appreciation/
depreciation | | | 3,355,941 | | | | 27,318,379 | | | | 180,856 | | | | (6,015,843 | ) | | | 1,029,910 | | | | 40,275,852 | | | | 2,293,330 | | | | — | | |
page 75

NOTES TO FINANCIAL STATEMENTS (continued)
June 30, 2013
(table continued from prior page)
| | RobecoSAM
Global
Equity | | MFG
Global
Equity | | MFG
Core
Infrastructure | | HEXAM
Emerging
Markets | | Timpani
Small Cap
Growth | | Netols
Small Cap
Value | | Phocas
Small Cap
Value | | Lockwell
Small Cap
Value | |
Undistributed
ordinary income | | $ | 139,604 | | | $ | 5,379,860 | | | $ | 90,723 | | | $ | 95,052 | | | $ | — | | | $ | 24,395 | | | $ | 16,849 | | | $ | 288,417 | | |
Undistributed
long-term
capital gain | | | — | | | | 227,785 | | | | — | | | | — | | | | — | | | | 15,949,941 | | | | 331,206 | | | | 558,490 | | |
Total distributable
earnings | | | 139,604 | | | | 5,607,645 | | | | 90,723 | | | | 95,052 | | | | — | | | | 15,974,336 | | | | 348,055 | | | | 846,907 | | |
Other accumulated
losses | | | (309,510 | ) | | | (10,607 | ) | | | (5,797 | ) | | | (4,809,951 | ) | | | (102,730 | ) | | | — | | | | — | | | | — | | |
Total accumulated
earnings/(losses) | | $ | 3,186,035 | | | $ | 32,915,417 | | | $ | 265,782 | | | $ | (10,730,742 | ) | | $ | 927,180 | | | $ | 56,250,188 | | | $ | 2,641,385 | | | $ | 846,907 | | |
The difference between book-basis and tax-basis unrealized appreciation is attributable primarily to the tax deferral of losses on wash sales.
As of the end of their tax year ended June 30, 2013, the following Funds have capital loss carryforwards ("CLCFs") as summarized in the table below. Under the provision of the Regulated Investment Company Modernization Act of 2010, CLCFs that originated in a tax year that began before December 23, 2010 (pre-effective CLCFs) may be carried forward, subject to certain limitations, and applied to offset future capital gains, and thus reduce the amount of distributable capital gains, for up to eight succeeding tax years, after which any unutilized CLCFs expire. Pre-effective CLCFs are applied as short-term capital loss regardless of whether the originating capital loss was short term or long term. CLCFs that originate in tax years beginning after December 22, 2010 (post effective CLCFs), are applied consistent with the character in which they originated as a new loss on the first day of the immediately succeeding tax year, and thus take precedent over the application of pre-effective CLCFs. Post-effective CLCFs can be carried forward indefinitely.
Post-effective CLCFs not subject to expiration:
| Fund | | Short-term
Amount | | Long-term
Amount | | Total | |
RobecoSAM Global Equity | | $ | — | | | $ | 307,951 | | | $ | 307,951 | | |
HEXAM Emerging Markets | | | 1,898,866 | | | | 1,157,606 | | | | 3,056,472 | | |
Timpani Small Cap Growth | | | 86,398 | | | | — | | | | 86,398 | | |
During the year ended June 30, 2013, the Funds utilized capital loss carry forwards as follows:
Fund | | Amount | |
Timpani Small Cap Growth | | $ | 252,543 | | |
Netols Small Cap Value | | | 934,891 | | |
Phocas Small Cap Value | | | 2,649,941 | | |
page 76

NOTES TO FINANCIAL STATEMENTS (continued)
June 30, 2013
In order to meet certain excise tax requirements, the Funds are required to measure and distribute annually, net capital gains realized during the twelve month period ending October 31st. In connection with this requirement, the Funds are permitted, for tax purposes, to defer into their next fiscal year any net capital losses incurred from November 1st through the end of the fiscal year. As of June 30, 2013, the following Funds deferred, on a tax basis, post-October losses and post-December late-year losses of:
| | | Post-October
Capital Loss Deferred | | Ordinary Late-Year Loss
Deferred Per Regulated Investment
Company Modernization Act of 2010 | |
MFG Core Infrastructure | | $ | 4,724 | | | $ | — | | |
HEXAM Emerging Markets | | | 1,753,989 | | | | — | | |
Timpani Small Cap Growth | | | — | | | | 16,332 | | |
(d) Foreign Currency Translation
Values of investments denominated in foreign currencies are converted into U.S. dollars using a spot market rate of exchange each day. Purchases and sales of investments and dividend and interest income are translated to U.S. dollars using a spot market rate of exchange prevailing on the dates of such transactions. The portion of security gains or losses resulting from changes in foreign exchange rates are included with net realized and unrealized gain or loss from investments, as appropriate, for both financial reporting and tax purposes.
Each Fund, respectively, bears the risk of changes in the foreign currency exchange rates and their impact on the value of assets and liabilities denominated in foreign currency. Each Fund also bears the risk of a counterparty failing to fulfill its obligation under a foreign currency contract.
Investments in securities of foreign companies involve additional risks including: currency exchange rate fluctuation; less available public information about the issuers of securities; less stringent regulatory standards; lack of uniform accounting, auditing and financial reporting standards; and country risks including less liquidity, high inflation rates and political and economic instability. The risks of foreign investments are typically greater in emerging and less developed markets.
(e) Indemnifications
Under the Funds' organizational documents, their officers and directors are indemnified against certain liabilities arising out of the performance of their duties to the Funds. In addition, in the normal course of business, the Funds enter into contracts that provide general indemnifications to other parties. The Funds' maximum exposure under these arrangements is unknown as this would involve future claims that may be made against the Funds that have not yet occurred. However, the Funds have not had prior claims or losses pursuant to these contracts and expect the risk of loss to be remote.
(f) Subsequent Events
Effective July 31, 2013, the Lockwell Small Cap Value Fund was liquidated under the plan previously approved by the Board of Directors. On August 20, 2013, the Board of Directors approved a plan of liquidation for the Frontegra HEXAM Emerging Markets Fund, which will occur on or about September 27, 2013. After August 22, 2013, the Fund no longer accepts incoming purchases or exchanges. At the special meeting of shareholders held on August 16, 2013, shareholders of the Frontegra RobecoSAM Global Equity Fund approved a new subadvisory agreement between Frontegra and RobecoSAM USA, Inc. As of
page 77

NOTES TO FINANCIAL STATEMENTS (continued)
June 30, 2013
August 20, 2013, the number of authorized shares for the Frontegra MFG Global Equity Fund was increased from 50 million to 100 million.
(g) Other
Investment transactions are accounted for on the trade date. The Funds determine the gain or loss realized from investment transactions by comparing the original cost of the specifically identified security lot sold with the net sale proceeds. Dividend income, less foreign taxes withheld, is recognized on the ex-dividend date, except that certain dividends from foreign securities are recorded as soon as the information becomes available to the Funds. Interest income is recognized on an accrual basis. All discounts/premiums are accreted/amortized using the effective interest method and are included in interest income. Withholding taxes on foreign dividends have been provided for in accordance with the Funds' understanding of the applicable country's tax codes and regulations.
Income, expenses (other than expenses attributable to a specific class) and realized and unrealized gains or losses on investments attributable to the Funds are generally allocated to each respective class in proportion to the relative net assets of each class.
The preparation of financial statements in conformity with U.S. generally accepted accounting principles ("GAAP") requires management to make estimates and assumptions that affect the reported amounts of assets and liabilities and disclosure of contingent assets and liabilities at the date of the financial statements, and the reported amounts of increases and decreases in net assets from operations during the reporting period. Actual results could differ from those estimates.
Net investment income and realized gains and losses for federal income tax purposes may differ from that reported on the financial statements because of permanent book-to-tax differences. GAAP requires that permanent differences in net investment income and realized gains and losses due to differences between financial reporting and tax reporting be reclassified between various components of net assets. These reclassifications have no effect on net assets or net asset value per share. For the year ended June 30, 2013, the following table shows the reclassifications made:
| | RobecoSAM
Global
Equity | | MFG
Global
Equity | | MFG
Core
Infrastructure | | HEXAM
Emerging
Markets | | Timpani
Small Cap
Growth | | Netols
Small Cap
Value | | Phocas
Small Cap
Value | | Lockwell
Small Cap
Value | |
Paid in capital | | $ | — | | | $ | — | | | $ | — | | | $ | — | | | $ | (7,557 | ) | | $ | 6,710 | | | $ | — | | | $ | 30,910 | | |
Accumulated net
investment income (loss) | | | (35,600 | ) | | | (3,763 | ) | | | (823 | ) | | | (26,333 | ) | | | 7,557 | | | | 180,338 | | | | — | | | | 3,898 | | |
Accumulated net
realized gain (loss) | | | 35,600 | | | | 3,763 | | | | 823 | | | | 26,333 | | | | — | | | | (187,048 | ) | | | — | | | | (34,808 | ) | |
The permanent differences primarily relate to foreign currency, net operating losses, and capital loss carryforward limitations.
(3) INVESTMENT ADVISER AND RELATED PARTIES
The RobecoSAM Global Equity, MFG Global Equity, MFG Core Infrastructure, HEXAM Emerging Markets, Netols Small Cap Value and Phocas Small Cap Value Funds have entered into an agreement with Frontegra, with whom certain officers and a director of the Funds are affiliated, to furnish investment advisory services to the Funds. Timpani, an affiliate of Frontegra, is the investment adviser to the Frontegra Timpani Small Cap Growth Fund. Lockwell is the investment adviser to the Lockwell Small Cap Value Fund. Fees are calculated daily and payable monthly, at annual rates set forth in the following table (expressed as a percentage of
page 78

NOTES TO FINANCIAL STATEMENTS (continued)
June 30, 2013
each Fund's average daily net assets). Pursuant to expense cap agreements, Frontegra, Timpani and Lockwell have agreed to waive their respective management fees and/or reimburse each Fund's operating expenses (exclusive of brokerage, acquired fund fees and expenses, interest, taxes and extraordinary expenses) to ensure that each Fund's operating expenses do not exceed the expense limitation listed below. Expenses waived are netted with advisory fees payable on the Statements of Assets and Liabilities. On a monthly basis, these accounts are settled by each Fund making payment to the respective adviser or the respective adviser reimbursing the Fund if the reimbursement amount exceeds the advisory fee. If the amount of fees waived exceeds the advisory fee earned, this is shown on the Statement of Assets and Liabilities as a receivable from the respective adviser. The expense cap agreements will continue in effect until October 31, 2014, with successive renewal terms of one year unless terminated by an adviser or a Fund prior to any such renewal.
Frontegra Fund | | Annual Advisory Fees | | Expense Limitation | |
RobecoSAM Global Equity | | | 0.80 | % | | | 1.20 | % | |
MFG Global Equity | | | 0.80 | % | | | 0.80 | % | |
MFG Core Infrastructure | | | 0.70 | % | | | 0.70 | % | |
HEXAM Emerging Markets | | | 0.90 | % | | | 1.30 | % | |
Timpani Small Cap Growth | | | 1.00 | % | | | 1.10 | % | |
Netols Small Cap Value - Institutional Class | | | 1.00 | % | | | 1.10 | % | |
Netols Small Cap Value - Class Y | | | 1.00 | % | | | 1.50 | % | |
Phocas Small Cap Value | | | 1.00 | % | | | 1.10 | % | |
Lockwell Small Cap Value | | | 1.00 | % | | | 1.10 | % | |
Any waivers or reimbursements are subject to later adjustment to allow the advisers to recoup amounts waived or reimbursed to the extent actual fees and expenses for a fiscal period are less than each Fund's expense limitation cap, provided, however, that an adviser shall only be entitled to recoup such amounts for a period of three years from the date such amount was waived or reimbursed. Expenses attributable to a specific class may only be recouped with respect to that class.
The following table shows the waived or reimbursed expenses subject to potential recovery expiring in:
| | | RobecoSAM
Global
Equity | | MFG
Global
Equity | | MFG
Core
Infrastructure | | HEXAM
Emerging
Markets | | Timpani
Small Cap
Growth | | Netols
Small Cap
Value | | Phocas
Small Cap
Value | | Lockwell
Small Cap
Value | |
| | 2014 | | | $ | 26,548 | * | | $ | — | | | $ | — | | | $ | 75,925 | | | $ | 46,572 | | | $ | 53,689 | | | $ | 104,993 | ** | | $ | — | | |
| | 2015 | | | | 78,884 | | | | 95,480 | *** | | | 66,588 | **** | | | 77,799 | | | | 103,400 | | | | 194,049 | | | | 146,574 | | | | 109,516 | | |
| | 2016 | | | | 78,740 | | | | 294,528 | | | | 100,062 | | | | 57,353 | | | | 95,252 | | | | 121,910 | | | | 147,770 | | | | 101,882 | | |
| | Total | | | $ | 183,902 | | | $ | 390,008 | | | $ | 166,650 | | | $ | 211,077 | | | $ | 245,224 | | | $ | 369,648 | | | $ | 399,337 | | | $ | 211,398 | | |
* Expenses waived/reimbursed were for the period June 10, 2011 through June 30, 2011.
** Expenses waived/reimbursed were for the period October 8, 2010 through June 30, 2011.
*** Expenses waived/reimbursed were for the period December 28, 2011 through June 30, 2012.
**** Expenses waived/reimbursed were for the period January 18, 2012 through June 30, 2012.
The Frontegra Phocas Small Cap Value Fund entered into a subadministration agreement with Frontegra under which Frontegra provided certain shareholder and subadministrative services to Class I shareholders of the Fund. For its services, Frontegra, with
page 79

NOTES TO FINANCIAL STATEMENTS (continued)
June 30, 2013
whom certain officers and a director of the Fund are affiliated, received an annual fee of 0.11% of Class I average net assets. This fee was calculated daily and payable monthly. The subadministration agreement was terminated effective October 31, 2012.
The beneficial ownership, either directly or indirectly, of more than 25% of the voting securities creates a presumption of control of the Funds. As of June 30, 2013, affiliates of Frontegra owned a controlling interest in the Frontegra MFG Core Infrastructure Fund and affiliates of Timpani owned a controlling interest in the Frontegra Timpani Small Cap Growth Fund. As of June 30, 2013, one shareholder owned a controlling interest in the Frontegra MFG Global Equity Fund, but is not considered an affiliate of Frontegra. As of June 30, 2013, one shareholder owned a controlling interest in the Frontegra HEXAM Emerging Markets Fund, but is not considered an affiliate of Frontegra. Shareholders with a controlling interest could affect the outcome of proxy voting or the direction of management of a Fund.
(4) INVESTMENT TRANSACTIONS
The aggregate purchases and sales of securities, excluding short-term investments for the Funds for the year ended June 30, 2013 are summarized below:
| | | RobecoSAM
Global
Equity | | MFG
Global
Equity | | MFG
Core
Infrastructure | | HEXAM
Emerging
Markets | | Timpani
Small Cap
Growth | | Netols
Small Cap
Value | | Phocas
Small Cap
Value | | Lockwell
Small Cap
Value | |
Purchases | | $ | 6,234,831 | | | $ | 250,985,441 | | | $ | 4,456,665 | | | $ | 23,740,073 | | | $ | 4,769,582 | | | $ | 40,139,512 | | | $ | 20,328,961 | | | $ | 2,927,306 | | |
Sales | | $ | 12,337,992 | | | $ | 51,944,554 | | | $ | 240,750 | | | $ | 18,855,416 | | | $ | 4,524,448 | | | $ | 92,044,842 | | | $ | 35,238,045 | | | $ | 6,060,118 | | |
There were no purchases or sales of U.S. Government securities for the Funds.
(5) DISTRIBUTION PLAN AND SHAREHOLDER SERVICING FEE
The Company, on behalf of the Frontegra Netols Small Cap Value Fund and the Frontegra Timpani Small Cap Growth Fund, has adopted a distribution plan pursuant to Rule 12b-1 under the Investment Company Act of 1940 for each Fund's Class Y shares (the "12b-1 Plan"). Pursuant to the 12b-1 Plan, the Fund pays an annual fee of up to 0.25% to Frontegra Strategies, LLC (the "Distributor"), an affiliate of Frontegra, for payments to brokers, dealers and other financial intermediaries who perform activities or incur expenses intended to result in the sale of Class Y shares of the Fund. As of June 30, 2013, the Class Y shares of the Frontegra Timpani Small Cap Growth Fund had not commenced operations. For the year ended June 30, 2013, the Netols Small Cap Value Fund Class Y shares incurred $46,242 under the 12b-1 Plan.
Class Y shares of the Funds also pay an annual shareholder servicing fee of up to 0.15% per year to the Distributor for payments to brokers, dealers, and other financial intermediaries who provide on-going account services to shareholders. Those services include establishing and maintaining shareholder accounts, mailing prospectuses, account statements and other Fund documents to shareholders, processing shareholder transactions, and providing other recordkeeping and administrative services. For the year ended June 30, 2013, the Netols Small Cap Value Fund Class Y shares incurred $27,746 in shareholder servicing expenses.
page 80

REPORT OF INDEPENDENT REGISTERED
PUBLIC ACCOUNTING FIRM
June 30, 2013
To the Shareholders and Board of Directors of Frontegra Funds, Inc.
We have audited the accompanying statements of assets and liabilities, including the schedules of investments, of Frontegra Funds, Inc. (the "Funds") comprising Frontegra RobecoSAM Global Equity Fund, Frontegra MFG Global Equity Fund, Frontegra MFG Core Infrastructure Fund, Frontegra HEXAM Emerging Markets Fund, Frontegra Timpani Small Cap Growth Fund, Frontegra Netols Small Cap Value Fund, Frontegra Phocas Small Cap Value Fund, and Lockwell Small Cap Value Fund as of June 30, 2013, the related statements of operations for the year then ended, and the statements of changes in net assets and the financial highlights for each of the two periods in the period then ended. These financial statements and financial highlights are the responsibility of the Funds' management. Our responsibility is to express an opinion on these financial statements and financial highlights based on our audits. The financial highlights for periods prior to June 30, 2012, were audited by other auditors whose report dated August 29, 2011, expressed an unqualified opinion on those financial highlights.
We conducted our audits in accordance with the standards of the Public Company Accounting Oversight Board (United States). Those standards require that we plan and perform the audit to obtain reasonable assurance about whether the financial statements and financial highlights are free of material misstatement. An audit includes examining, on a test basis, evidence supporting the amounts and disclosures in the financial statements. Our procedures included confirmation of securities owned as of June 30, 2013, by correspondence with the custodian and brokers or by other appropriate auditing procedures where replies from brokers were not received. An audit also includes assessing the accounting principles used and significant estimates made by management, as well as evaluating the overall financial statement presentation. We believe that our audits provide a reasonable basis for our opinion.
In our opinion, the financial statements and financial highlights referred to above present fairly, in all material respects, the financial position of each of the Funds constituting Frontegra Funds, Inc. as of June 30, 2013, the results of their operations for the year then ended, and the changes in their net assets and the financial highlights for each of the two periods in the period then ended, in conformity with accounting principles generally accepted in the United States of America.
As discussed in Note 1 to the financial statements, on June 20, 2013, the Board of Directors approved a plan to liquidate the Lockwell Small Cap Value Fund. The liquidation was effective on July 31, 2013. As discussed in Note 2 to the financial statements, on August 20, 2013, the Board of Directors approved a plan to liquidate the Frontegra HEXAM Emerging Markets Fund.
COHEN FUND AUDIT SERVICES, LTD.
Cleveland, Ohio
August 23, 2013
page 81

BOARD OF DIRECTORS' APPROVAL OF ADVISORY AND
SUBADVISORY AGREEMENTS
(Unaudited)
Renewal of Advisory Agreement for Frontegra Timpani Small Cap Growth Fund
The Board of Directors (the "Board") of Frontegra Funds, Inc. (the "Company") met on May 14, 2013 to consider the annual renewal of the investment advisory agreement with Timpani Capital Management LLC ("Timpani") (the "Timpani Advisory Agreement") for the Frontegra Timpani Small Cap Growth Fund, a portfolio of the Company (the "Timpani Fund").
When the Board reviewed the Timpani Advisory Agreement, the Board was provided materials relevant to its consideration of the agreement, such as Timpani's Form ADV brochure, information regarding Timpani's compliance program, personnel and financial condition, certain summary data provided by Fund management and a memorandum prepared by the Company's legal counsel. The Board also reviewed the advisory fee payable by the Timpani Fund under the Timpani Advisory Agreement, the expense cap agreement between the Company and Timpani on behalf of the Timpani Fund and comparative fee and expense information provided by an independent service. The Board was also provided with Timpani's response to the Section 15(c) request submitted by the Company's legal counsel on behalf of the directors.
In evaluating the Timpani Advisory Agreement, the Board took into account their cumulative experience in working with Timpani and its ongoing review of information and discussions with the Fund's portfolio manager throughout the year at Board meetings. The independent directors met in executive session to discuss the materials and the proposed approval of the Timpani Advisory Agreement. During the executive session, the directors discussed their responsibilities and Timpani's 15(c) response with legal counsel.
In considering the Timpani Advisory Agreement, the Board reviewed and analyzed various factors with respect to the Timpani Fund that it determined were relevant, including the factors below, and made the following conclusions. In its deliberations, the Board did not identify any single factor as determinative.
Nature, Extent and Quality of the Services to be Provided. The Board considered Timpani's experience as a small cap growth manager and services it would continue to provide to the Timpani Fund and its shareholders under the Timpani Advisory Agreement. The Board discussed the experience of Timpani and its portfolio manager managing small cap growth accounts. The Board discussed Timpani's responsibilities for managing the Fund's investments and overseeing the Fund's other activities, such as monitoring its compliance with applicable requirements under the securities laws. The Board noted that certain distribution, administrative and compliance services are provided by Frontegra Asset Management, Inc. ("Frontegra") and Frontegra Strategies, LLC, each an affiliate of Timpani. The Board concluded that the range of services to be provided by Timpani was appropriate and that Timpani was qualified to provide such services.
Investment Performance. The Board reviewed the Fund's performance for the year ended December 31, 2012 and the periods ended March 31, 2013. The Board noted that the Fund outperformed the benchmark index for 2012, underperformed the index for the year ended March 31, 2013 and slightly outperformed the index for the period from inception through March 31, 2013. The Board also reviewed the historical performance for Timpani's small cap growth private accounts. The Board concluded that Timpani appeared to have an effective small cap growth investment process.
Advisory Fee. The Board compared the Timpani Fund's contractual advisory fee and total expense ratio to industry data with respect to other mutual funds in the same Morningstar peer group. The Board noted that the Timpani Fund's advisory fee was slightly above the industry average. The Board noted that, after giving effect to the expense cap agreement, the total expense ratio was slightly below the industry average for Class Y shares and below the industry average for Institutional Class shares. The Board noted that the advisory fee was the same as that for other small cap funds managed by Frontegra and Lockwell Investments, LLC ("Lockwell"), the investment advisers to other series of the company. The Board also considered the fee rates charged to Timpani's separate account clients and the sub-account of a collective fund managed by Timpani, noting that additional regulatory and compliance requirements are associated with
page 82

registered investment companies such as the Fund, among other differences. The Board concluded that the advisory fee paid by the Timpani Fund to Timpani was reasonable in light of the nature and quality of services to be provided and fees paid by comparable funds.
Costs and Profitability. The Board reviewed information concerning Timpani's financial condition, costs and profitability. The Board also considered the effect of the expense cap agreement on Timpani's compensation, noting that the Fund had not yet reached financial "break even" and that Timpani was waiving its advisory fee and reimbursing Fund expenses under the expense cap agreement. Given that Timpani was not yet realizing a profit from the Fund, the Board concluded that the advisory fee was reasonable.
Economies of Scale. Given the Fund's current asset level, the Board did not consider whether any alternative fee structures, such as breakpoint fees, would be appropriate to reflect any economies of scale that may result from increases in the Timpani Fund's assets.
Benefits to Timpani. The Board considered information presented regarding any benefits to Timpani or its affiliates from serving as adviser to the Timpani Fund (in addition to the advisory fee). The Board noted that Timpani's affiliate, Frontier Partners, Inc. ("Frontier"), provides consulting services to, and is compensated by, Timpani. However, the Board determined that Timpani's services to the Timpani Fund would not be compromised by this potential conflict of interest. The Board also noted that Bill Forsyth, the president of the Company and Frontegra, is also the president and an officer of Timpani and that Frontegra and its affiliates provide various services to Timpani with respect to the Fund. The Board considered other benefits to Timpani from its relationship with the Fund and concluded such benefits were appropriate.
On the basis of its review of the foregoing information, the Board found that the terms of the Timpani Advisory Agreement were fair and reasonable and in the best interests of the shareholders of the Timpani Fund.
Renewal of Advisory Agreement for Lockwell Small Cap Value Fund
On May 14, 2013, the Board also considered the renewal of the investment advisory agreement with Lockwell (the "Lockwell Advisory Agreement") for the Lockwell Small Cap Value Fund, a series of the Company (the "Lockwell Fund").
When the Board of Directors reviewed the Lockwell Advisory Agreement, the Board was provided materials relevant to its consideration of the agreement, such as Lockwell's Form ADV brochure and information regarding Lockwell's compliance program, investment strategy, performance record, investment process and personnel. The Board also discussed the renewal of the agreement with a principal of Lockwell, including Lockwell's financial condition and potential strategic partners to enhance the Fund's prospects for growth. The Board reviewed the advisory fee payable by the Fund, the expense cap agreement between the Company and Lockwell on behalf of the Fund and comparative fee and expense information provided by an independent service. The Board also reviewed certain summary data provided by Fund management and Lockwell's response to the 15(c) request submitted by the Company's legal counsel on behalf of the directors.
In evaluating the Lockwell Advisory Agreement, the Board took into account its cumulative experience in working with Lockwell and its ongoing review of information and discussions with representatives of Lockwell throughout the year at Board meetings. The independent directors met in executive session to discuss the materials and the proposed approval of the agreement. During the executive session, the independent directors also discussed their responsibilities and Lockwell's 15(c) response with legal counsel.
In considering the Lockwell Advisory Agreement, the Board reviewed and analyzed various factors with respect to the Lockwell Fund that it determined were relevant, including the factors below, and made the following conclusions. In its deliberations, the Board did not identify any single factor as determinative.
Nature, Extent and Quality of the Services to be Provided. The Board considered the experience of Lockwell's portfolio manager and the services Lockwell would continue to provide to the Lockwell Fund and its shareholders under the Lockwell Advisory Agreement. The Board discussed the Lockwell's responsibilities for managing the Fund's investments and for overseeing the Fund's activities, either directly or through Lockwell's subadministration agreement with Frontegra. The Board concluded that the range of services to be provided by Lockwell was appropriate and that Lockwell was qualified to provide such services.
page 83

Investment Performance. The Board reviewed the Fund's performance for the year ended December 31, 2012 and the periods ended March 31, 2013, noting that the Fund had outperformed its benchmark since its inception in 2011. The Board reviewed Lockwell's historical performance of small cap value accounts and noted the strong performance of both the Fund and other accounts managed in the strategy.
Advisory Fee. The Board compared the Fund's contractual advisory fee and total expense ratio to industry data with respect to other mutual funds in the same Morningstar peer group. The Board noted that the Fund's advisory fee was slightly above the industry average for both the small value and small blend categories but that the Fund's total expense ratio, after giving effect to the expense cap agreement, was below the industry average with respect to both categories. The Board noted that the advisory fee was the same as that for other small cap funds managed by Frontegra and Timpani, the investment advisers to other series of the Company, and in line with Lockwell's separate account fee schedule. The Board concluded that the advisory fee was reasonable in light of the nature and quality of services to be provided and fees paid by comparable funds.
Costs and Profitability. The Board reviewed information concerning Lockwell's financial condition, costs and profitability. The Board noted that the Fund has not yet reached financial "break even" and that Lockwell was waiving its advisory fee and reimbursing Fund expenses under the expense cap agreement. The Board also considered Lockwell's discussions with outside parties with respect to potential strategic investments in the firm as well as internal resources available to supplement current capital levels. The Board concluded that Lockwell has sufficient resources to provide the contracted services to the Fund.
Economies of Scale. Given the Fund's current asset level, the Board did not consider whether any alternative fee structures, such as breakpoint fees, would be appropriate to reflect any economies of scale that may result from increases in the Fund's assets.
Benefits to Lockwell. The Board considered information presented regarding any benefits to Lockwell from serving as adviser to the Fund (in addition to the advisory fee). The Board noted that Lockwell pays compensation to Frontegra for its subadministrative services to the Lockwell Fund pursuant to the subadministration agreement. The Board noted that Lockwell pays for independent research through a soft dollar accrual from the Fund's brokerage commissions. The Board concluded that such benefits were reasonable.
On the basis of its review of the foregoing information, the Board of Directors found that the terms of the Lockwell Advisory Agreement were fair and reasonable and in the best interests of shareholders of the Lockwell Fund.
Renewal of Advisory Agreement and Subadvisory Agreements for Frontegra Netols Small Cap Value Fund, Frontegra HEXAM Emerging Markets Fund, Frontegra Phocas Small Cap Value Fund, Frontegra RobecoSAM Global Equity Fund, Frontegra MFG Global Equity Fund and Frontegra MFG Core Infrastructure Fund
At the May 14, 2013 meeting, the Board also considered the annual renewal of the investment advisory agreement with Frontegra (the "Frontegra Advisory Agreement") and the subadvisory agreements for the Frontegra Netols Small Cap Value Fund (the "Netols Fund"), the Frontegra HEXAM Emerging Markets Fund (the "HEXAM Fund"), the Frontegra Phocas Small Cap Value Fund (the "Phocas Fund"), the Frontegra RobecoSAM Global Equity Fund (the "RobecoSAM Fund"), the Frontegra MFG Global Equity Fund (the "MFG Global Equity Fund") and the Frontegra MFG Core Infrastructure Fund (the "Core Infrastructure Fund"), portfolios of the Company (each a "Fund" and collectively, the "Funds"). In evaluating the Frontegra Advisory Agreement and subadvisory agreements, the Board took into account its cumulative experience in working with Frontegra and each subadviser and their ongoing review of information and discussions with Frontegra and representatives of each subadviser throughout the year at Board meetings. The independent directors met in executive session to consider the Frontegra Advisory Agreement and subadvisory agreements and to discuss the Section 15(c) responses with the Company's legal counsel. Legal counsel also reported on certain 15(c) data it had reviewed on behalf of the Board.
page 84

Frontegra Advisory Agreement
When the Board reviewed the Frontegra Advisory Agreement, the Board was provided materials relevant to its consideration of the agreement, such as Frontegra's Form ADV brochure, information regarding Frontegra's compliance program, personnel and financial condition, certain summary data provided by Fund management and a memorandum prepared by the Company's legal counsel. The Board also reviewed the advisory fee payable by each Fund under the Frontegra Advisory Agreement, the expense cap agreements between the Company and Frontegra on behalf of each Fund and comparative fee and expense information provided by an independent service. The Board was also provided with Frontegra's response to the 15(c) request submitted by the Company's legal counsel on behalf of the directors.
In considering the Frontegra Advisory Agreement, the Board reviewed and analyzed various factors with respect to each Fund that it determined were relevant, including the factors below, and made the following conclusions. In its deliberations, the Board did not identify any single factor as determinative.
Nature, Extent and Quality of the Services to be Provided. The Board considered the services Frontegra would continue to provide to the Funds and their shareholders under the Frontegra Advisory Agreement. The Board noted that Frontegra serves as a manager of managers and had selected the subadvisers to make the day-to-day investment decisions for the Funds. The Board noted that Frontegra has 17 years of experience in hiring and supervising subadvisers to portfolios in the Frontegra family of funds. The Board discussed Frontegra's responsibilities for overseeing the subadvisers and supervising the management of the Funds' investments. The Board also considered the quality of other services provided by Frontegra, including oversight of service providers, monitoring each Fund's compliance with applicable requirements under the securities laws and the shareholder servicing and administrative services provided by Frontegra to the Funds. The Board concluded that the range of services to be provided by Frontegra was appropriate and that Frontegra was qualified to provide such services.
Performance Record of the Funds. As described in more detail under "Board Renewal of Subadvisory Agreements," the Board reviewed each Fund's performance record for the periods ended December 31, 2012 and March 31, 2013. The Board concluded that Frontegra has developed the necessary expertise and resources in selecting and managing qualified subadvisers to provide investment advisory services to the Funds in accordance with each Fund's investment objective and strategy.
Advisory Fees. The Board compared each Fund's contractual advisory fee and total expense ratio to the industry data with respect to other mutual funds in the same Morningstar peer group. The Board noted that the advisory fee for the Netols Fund, the MFG Global Equity Fund and the Phocas Fund was above the industry average for funds in the same Morningstar category. The advisory fee for the RobecoSAM Fund, the Core Infrastructure Fund and the HEXAM Fund was below the industry average for funds in the same Morningstar category. With respect to the Netols Fund and the Phocas Fund, the Board noted that the advisory fee was the same as that for other small cap funds managed by Lockwell and Timpani, the investment advisers to other series of the Company. After giving effect to the expense cap agreement with Frontegra with respect to each Fund, the total net expense ratio was slightly above the industry average for funds in the same Morningstar category with respect to the RobecoSAM Fund and below the industry average for funds in the same Morningstar category with respect to the Phocas Fund, the MFG Global Equity Fund, the Core Infrastructure Fund and the HEXAM Fund. With respect to the Netols Fund, the net expense ratio for both the Class Y and Institutional Class shares was above the industry average for funds in the Small Blend category, below the industry average for funds in the Small Value category with respect to the Institutional Class shares and above the industry average for funds in the Small Value category with respect to Class Y shares. The Board concluded that the advisory fee paid by each Fund to Frontegra was reasonable in light of the nature and quality of services to be provided and fees paid by comparable funds.
Costs and Profitability. The Board reviewed information concerning Frontegra's financial condition, costs and profitability. The Board also considered the effect of the contractual expense cap agreements on Frontegra's compensation. The Board noted that Frontegra was waiving a portion of its advisory fee for four of the Funds and waiving its advisory fee and reimbursing Fund expenses under the expense cap agreement for two of the Funds.
page 85

The Board concluded that Frontegra's current level of profitability was reasonable considering the quality of management and the fact that Frontegra was waiving its fees and/or reimbursing expenses for the Funds.
Economies of Scale. The Board reviewed net asset growth on a per Fund and aggregate basis and considered whether there may be economies of scale in the management of each Fund if its assets were to increase significantly. However, the Board concluded that the assets of the Funds were not likely to increase to such an extent that breakpoints would be appropriate, particularly in light of the expense cap agreements in place between Frontegra and each Fund.
Benefits to Frontegra. The Board considered information presented regarding any benefits to Frontegra or its affiliates from serving as adviser to the Funds (in addition to the advisory fee). The Board noted that Frontier, an affiliate of Frontegra, provides consulting services to, and is compensated by, certain subadvisers. However, the Board determined that Frontegra's services to the Funds would not be compromised by this potential conflict of interest.
On the basis of its review of the foregoing information, the Board found that the terms of the Frontegra Advisory Agreement were fair and reasonable and in the best interests of each Fund's shareholders.
Renewal of Subadvisory Agreements
Frontegra Netols Small Cap Value Fund
When the Board reviewed the subadvisory agreement between Frontegra and Netols Asset Management, Inc. ("Netols") on behalf of the Netols Fund (the "Netols Subadvisory Agreement"), the Board was provided materials relevant to its consideration, such as Netols' Form ADV brochure, information regarding Netols' compliance program, performance record, personnel and financial condition and a memorandum prepared by the Company's legal counsel. The Board also reviewed the subadvisory fee payable by Frontegra under the Netols Subadvisory Agreement and the expense cap agreement between the Company and Frontegra on behalf of the Netols Fund. The Board was also provided with Netols' responses to the 15(c) request submitted by the Company's legal counsel on behalf of the directors.
In considering the Netols Subadvisory Agreement, the Board analyzed and reviewed various factors with respect to the Netols Fund that it determined were relevant, including the factors below, and made the following conclusions. In its deliberations, the Board did not identify any single factor as determinative.
Nature, Extent and Quality of the Services to be Provided. The Board reviewed and considered Netols' investment strategy and experience as a small cap value manager, key personnel involved in providing investment management services to the Netols Fund, compliance record and financial condition. The Board also considered services provided by Netols under the Netols Subadvisory Agreement, including managing the Fund's investments, the selection of broker-dealers for execution of portfolio transactions, monitoring adherence to the Fund's investment restrictions and assisting with the Fund's compliance program. The Board concluded that the nature, extent and quality of the services provided by Netols to the Fund were appropriate and that the Fund was likely to continue to benefit from services provided by Netols under the Netols Subadvisory Agreement.
Investment Performance. The Board noted that the Fund had underperformed its benchmark index for the past one-, three- and five-year periods ended December 31, 2012 and had outperformed the index for the since inception period. The Board also considered Netols' quarterly portfolio commentary and discussion of the reasons for the Fund's underperformance in certain periods. The Board also compared the Fund's recent performance to the performance of Netols' composite of other accounts managed in the small cap value style. The Board concluded that the Fund's performance was satisfactory and that Netols would continue to provide a high level of subadvisory services to the Fund.
Subadvisory Fee. The Board reviewed and considered the subadvisory fee payable by Frontegra to Netols under the Netols Subadvisory Agreement. The Board also considered information with respect to fees charged to Netols' separate account clients. The Board determined
page 86

that the subadvisory fee was appropriate. In evaluating the subadvisory fee, the Board noted that such amounts are paid by Frontegra and that therefore the overall advisory fee paid by the Fund is not directly affected by the subadvisory fee.
Costs and Profitability. The Board did not consider the cost of services provided by Netols or the profitability to Netols from its relationship with the Netols Fund because it did not view these factors as relevant given that the subadvisory fee is paid by Frontegra.
Economies of Scale. Because the subadvisory fee is not paid by the Netols Fund, the Board did not consider whether the fee should reflect any potential economies of scale that might be realized as the Fund's assets increase.
Benefits to Netols. The Board considered information presented regarding any benefits to Netols from serving as subadviser to the Netols Fund (in addition to the subadvisory fee). Netols provided information to the Board regarding its receipt of unsolicited research from broker-dealers. The Board noted that Frontier continues to receive referral fees from Netols for previously solicited clients, but that Frontier no longer provides consulting services to Netols. The Board concluded that the benefits realized by Netols from its relationship to the Fund were appropriate.
On the basis of its review of the foregoing information, the Board found that the terms of the Netols Subadvisory Agreement were fair and reasonable and in the best interests of the shareholders of the Netols Fund.
Frontegra HEXAM Emerging Markets Fund
When the Board reviewed the subadvisory agreement between Frontegra and HEXAM Capital Partners, LLP ("HEXAM") on behalf of the HEXAM Fund (the "HEXAM Subadvisory Agreement"), the Board was provided materials relevant to its consideration, such as HEXAM's Form ADV brochure, information regarding HEXAM's compliance program, performance record, personnel and financial condition and a memorandum prepared by the Company's legal counsel. The Board also reviewed the subadvisory fee payable by Frontegra under the HEXAM Subadvisory Agreement and the expense cap agreement between the Company and Frontegra on behalf of the HEXAM Fund. The Board was also provided with HEXAM's responses to the 15(c) request submitted by the Company's legal counsel on behalf of the directors.
In considering the HEXAM Subadvisory Agreement, the Board also took into account its recent in person meeting with HEXAM's managing partner, who also serves as one of the Fund's portfolio managers. The Board analyzed and reviewed various factors with respect to the HEXAM Fund that it determined were relevant, including the factors below, and made the following conclusions. In its deliberations, the Board did not identify any single factor as determinative.
Nature, Extent and Quality of the Services to be Provided. The Board reviewed and considered HEXAM's investment strategy and experience as an emerging markets manager, key personnel involved in providing investment management services to the HEXAM Fund, compliance record and financial condition. The Board also considered services provided by HEXAM under the HEXAM Subadvisory Agreement, including managing the Fund's investments, the selection of broker-dealers for execution of portfolio transactions, monitoring adherence to the Fund's investment restrictions and assisting with the Fund's compliance program. The Board concluded that the nature, extent and quality of the services provided by HEXAM to the Fund were appropriate and that the Fund was likely to continue to benefit from services provided by HEXAM under the HEXAM Subadvisory Agreement.
Investment Performance. The Board noted that the Fund had underperformed its benchmark index for the one-year and since inception periods ended December 31, 2012. The Board considered its recent discussion with one of the Fund's portfolio managers as well as HEXAM's quarterly portfolio commentary and review of the Fund's performance, including discussion of reasons for the Fund's underperformance such as the number of holdings in the Fund. The Board also reviewed the performance of HEXAM's composite of other accounts managed in the emerging markets style. The Board concluded that HEXAM has an effective emerging markets investment strategy and would continue to provide a high level of subadvisory services to the Fund.
Subadvisory Fee. The Board reviewed and considered the subadvisory fee payable by Frontegra to HEXAM under the HEXAM Subadvisory Agreement. The Board also considered the fees charged by HEXAM for other accounts. The Board determined that the subadvisory fee
page 87

was appropriate. In evaluating the subadvisory fee, the Board noted that such amounts are paid by Frontegra and that therefore the overall advisory fee paid by the Fund is not directly affected by the subadvisory fee.
Costs and Profitability. The Board did not consider the cost of services provided by HEXAM or the profitability to HEXAM from its relationship with the HEXAM Fund because it did not view these factors as relevant given that the subadvisory fee is paid by Frontegra.
Economies of Scale. Because the subadvisory fee is not paid by the HEXAM Emerging Markets Fund, the Board did not consider whether the fee should reflect any potential economies of scale that might be realized as the Fund's assets increase.
Benefits to HEXAM. The Board considered information presented regarding any benefits to HEXAM from serving as subadviser to the HEXAM Fund (in addition to the subadvisory fee). The Board noted that Frontier provides consulting services to HEXAM for which Frontier may be compensated by HEXAM. The Board concluded that the benefits realized by HEXAM from its relationship to the Fund were appropriate.
On the basis of its review of the foregoing information, the Board found that the terms of the HEXAM Subadvisory Agreement were fair and reasonable and in the best interests of the shareholders of the HEXAM Fund.
Frontegra Phocas Small Cap Value Fund
When the Board reviewed the subadvisory agreement between Frontegra and Phocas Financial Corp. ("Phocas") on behalf of the Phocas Fund (the "Phocas Subadvisory Agreement"), the Board was provided materials relevant to its consideration, such as Phocas' Form ADV brochure, information regarding Phocas' compliance program, performance record, personnel and financial condition and a memorandum prepared by the Company's legal counsel. The Board also reviewed the subadvisory fee payable by Frontegra under the Phocas Subadvisory Agreement and the expense cap agreement between the Company and Frontegra on behalf of the Phocas Fund. The Board was also provided with Phocas' responses to the 15(c) request submitted by the Company's legal counsel on behalf of the directors.
In considering the Phocas Subadvisory Agreement, the Board analyzed and reviewed various factors with respect to the Phocas Fund that it determined were relevant, including the factors below, and made the following conclusions. In its deliberations, the Board did not identify any single factor as determinative.
Nature, Extent and Quality of the Services to be Provided. The Board reviewed and considered Phocas' investment strategy and experience as a small cap value manager, key personnel involved in providing investment management services to the Phocas Fund, compliance record and financial condition. The Board also considered services provided by Phocas under the Phocas Subadvisory Agreement, including managing the Fund's investments, the selection of broker-dealers for execution of portfolio transactions, monitoring adherence to the Fund's investment restrictions and assisting with the Fund's compliance program. The Board concluded that the nature, extent and quality of the services provided by Phocas to the Fund were appropriate and that the Fund was likely to continue to benefit from services provided by Phocas under the Phocas Subadvisory Agreement.
Investment Performance. The Board noted that the Fund had underperformed its benchmark index for the past one- and three-year periods and had outperformed its benchmark index for the five-year period ended December 31, 2012. The Board noted that the Fund had been reorganized into the Frontegra family of funds on October 8, 2010 and returns for the prior periods were for the predecessor fund, also managed by Phocas. The Board also considered Phocas' quarterly portfolio commentary, including reasons for the Fund's recent underperformance. The Board also reviewed the performance of Phocas' composite of other accounts managed in the small cap value style. The Board concluded that Phocas would continue to provide a high level of subadvisory services to the Fund.
Subadvisory Fee. The Board reviewed and considered the subadvisory fee payable by Frontegra to Phocas under the Phocas Subadvisory Agreement. The Board noted that the subadvisory fee has been reduced due to the Fund's current asset size and considered the fees charged to separate accounts and a sub-account of a collective fund managed by Phocas. The Board determined that the subadvisory fee was appropriate. In evaluating the subadvisory fee, the Board noted that such amounts are paid by Frontegra and that therefore the overall advisory fee paid by the Fund is not directly affected by the subadvisory fee.
page 88

Costs and Profitability. The Board noted that the Fund had previously been profitable to Phocas, based on Phocas' 15(c) response to the Board. However, the Board did not consider the cost of services provided by Phocas or the profitability to Phocas from its relationship with the Phocas Fund to be material factors because the subadvisory fee is paid by Frontegra.
Economies of Scale. Because the subadvisory fee is not paid by the Phocas Fund, the Board did not consider whether the fee should reflect any potential economies of scale that might be realized as the Fund's assets increase.
Benefits to Phocas. The Board considered information presented regarding any benefits to Phocas from serving as subadviser to the Phocas Small Cap Value Fund (in addition to the subadvisory fee). The Board noted that Frontier provides consulting services to Phocas for which Frontier may be compensated by Phocas. The Board concluded that the benefits realized by Phocas from its relationship to the Fund were appropriate.
On the basis of its review of the foregoing information, the Board found that the terms of the Phocas Subadvisory Agreement were fair and reasonable and in the best interests of the shareholders of the Phocas Fund.
Frontegra RobecoSAM Global Equity Fund
The Board approved the existing subadvisory agreement between Frontegra and RobecoSAM USA, Inc. ("RobecoSAM") with respect to the RobecoSAM Fund as well as a new subadvisory agreement that would take effect upon the proposed change of control of RobecoSAM's parent company at a meeting held on May 14, 2013. Following the Board meeting, on July 1, 2013, Robeco Groep N.V., a parent company of RobecoSAM, was sold to ORIX Corporation (the "Transaction"). Following the closing of the Transaction and approval by the shareholders of the Fund, the new subadvisory agreement would take effect.
The Board reviewed the existing and new subadvisory agreements along with materials relevant to its consideration of the agreements, such as information regarding RobecoSAM and ORIX Corporation's business, personnel and financial condition. The Board discussed the proposal with a representative of RobecoSAM who participated in the meeting and provided additional information to the Board about RobecoSAM, ORIX Corporation and the Transaction. The Board was also provided with RobecoSAM's responses to detailed requests submitted by the Fund's legal counsel, a memorandum prepared by RobecoSAM's chief compliance officer and other information relevant to their consideration of the agreements. The Board considered that, except with respect to the effective and termination dates, the terms of the new subadvisory agreement are the same as the terms of the existing subadvisory agreement in all material respects.
In reaching its decision to approve the continuation of the existing agreement as well as the new subadvisory agreement, the Board, with the assistance of the Company's legal counsel, considered their legal responsibilities with regard to all factors deemed to be relevant to the Fund, including, but not limited to the following: (1) the quality of RobecoSAM's services provided to the Fund; (2) the fact that RobecoSAM has been responsible for the selection of investments for the Fund's portfolio and its day-to-day investment management since the Fund's inception; (3) the fact that the Transaction is not expected to affect the manner in which RobecoSAM provides subadvisory services to the Fund; (4) the fact that the current portfolio managers will continue to manage the Fund; (5) the fact that the fee structure under the new subadvisory agreement would be identical to the fee structure under the existing advisory agreements in all material respects; (6) the fact that the subadvisory services under the new subadvisory agreement and the existing subadvisory agreement are substantially similar; and (7) other factors deemed relevant.
In approving the existing and new subadvisory agreements, the Board considered the following factors and made the following conclusions:
Nature, Extent and Quality of Services Provided to the Fund. The Board's analysis of the nature, extent and quality of RobecoSAM's services to the Fund took into account knowledge gained from RobecoSAM's presentations to the Board at meetings throughout the year. The Board noted that the services that RobecoSAM would provide under the new subadvisory agreement are the same services that RobecoSAM provides under the existing subadvisory agreement. The Board considered the functions that RobecoSAM performs, RobecoSAM's financial condition and its background and history in providing services to the Fund under the existing subadvisory agreement and previously, as the Fund's investment adviser prior to the reorganization of the Fund into the Company in 2011. The Board
page 89

also considered the fact that RobecoSAM has not experienced any significant legal, compliance or regulatory difficulties. Based on the information provided and the Board's prior experience with RobecoSAM, the Board concluded that the nature and extent of the services that RobecoSAM currently provides and will continue to provide under both the existing and new subadvisory agreement, as well as the quality of those services, was appropriate and that the Fund was likely to continue to benefit from services provided by RobecoSAM.
With respect to the new subadvisory agreement, the Board considered representations by RobecoSAM that Robeco Groep's ownership by ORIX as contemplated by the Transaction would not lead to a reduction in the quality or scope of services provided to the Fund. The Board took into account that:
• there will be no changes (including changes to the fee structure) that will adversely impact RobecoSAM's ability to provide the same quality of services as were provided in the past;
• the new subadvisory agreement is substantially similar to the existing subadvisory agreement;
• the principals of RobecoSAM would remain the same following the change in control; and
• the Fund would not bear any expenses related to the Transaction, including expenses related to the proxy statement.
Investment Performance. The Board reviewed the Fund's investment performance as of December 31, 2012 and March 31, 2013, both in absolute terms as well as compared to other funds in the Fund's peer group. The Board noted that the Fund had outperformed its benchmark for the quarter ended March 31, 2013 but underperformed its benchmark for the one-year, three-year and since inception periods ended March 31, 2013. The Board also considered RobecoSAM's quarterly performance reports, including a discussion of the reasons for the Fund's underperformance in certain periods. Additionally, the Board reviewed the performance of the Fund against the performance of RobecoSAM's composite of other accounts managed in the sustainable global equities strategy. After considering all of the information, the Board concluded that the Fund and its shareholders were likely to benefit from RobecoSAM's continued investment management services.
Subadvisory Fee. The Board reviewed and considered the subadvisory fee payable by Frontegra to RobecoSAM. The Board also reviewed information regarding RobecoSAM's fee schedule for separately managed accounts. The Board determined that the subadvisory fee was appropriate. In evaluating the subadvisory fee, the Board noted that such amounts are paid by Frontegra and that therefore the overall advisory fee paid by the Fund is not directly affected by the subadvisory fee.
Costs and Profitability. The Board did not consider the cost of services provided by RobecoSAM under the existing subadvisory agreement because it did not view this factor as relevant given that the subadvisory fee is paid by Frontegra. The Board noted that the Fund is not profitable to RobecoSAM due to the current asset size of the Fund.
Economies of Scale and Fee Levels Reflecting Those Economies. The Board did not view economies of scale as relevant given the current asset size of the Fund. Because the subadvisory fee is not paid by the Fund, the Board did not consider whether the fee should reflect any potential economies of scale that might be realized as the Fund's assets increase.
Other Benefits to RobecoSAM. In addition to the above factors, the Board also discussed other benefits received by RobecoSAM from its management of the Fund, including, without limitation, possible soft dollar benefits.
Based on all of the information presented to and considered by the Board and the conclusions that it reached, the Board approved continuation of the existing subadvisory agreement and the new subadvisory agreement on the basis that each agreement's terms and conditions are fair to, and in the best interests of, the Fund and its shareholders.
Frontegra MFG Global Equity and MFG Core Infrastructure Funds
When the Board reviewed the subadvisory agreement between Frontegra and Magellan Asset Management Limited d/b/a MFG Asset Management ("Magellan") on behalf of the MFG Global Equity and Core Infrastructure Funds (the "Magellan Subadvisory Agreement"),
page 90

the Board was provided materials relevant to its consideration, such as Magellan's Form ADV brochure, information regarding Magellan's compliance program, performance record, personnel and financial condition and a memorandum prepared by the Company's legal counsel. The Board also considered a report by the Company's legal counsel and Treasurer, who had reviewed certain additional financial information relating to Magellan's parent company and internal control audit on their behalf. The Board reviewed the subadvisory fees payable to Magellan under the Magellan Subadvisory Agreement and the expense cap agreement between the Company and Frontegra on behalf of each Fund. The Board was also provided with Magellan's responses to the 15(c) request submitted by the Company's legal counsel on behalf of the Directors.
In considering the Magellan Subadvisory Agreement, the Board noted that two representatives of Magellan had attended the March 2013 Board meeting in person and had discussed various issues relating to the Board's consideration of the subadvisory agreement at that time. The Board analyzed and reviewed various factors with respect to the Funds that it determined were relevant, including the factors below, and made the following conclusions. In its deliberations, the Board did not identify any single factor as determinative.
Nature, Extent and Quality of the Services to be Provided. The Board reviewed and considered Magellan's investment strategy for each Fund and experience as a Global Equity and Infrastructure manager, key personnel involved in providing investment management services to the Funds and financial condition. The Board also considered services provided by Magellan under the Magellan Subadvisory Agreement, including the management of each Fund's investments, the selection of broker-dealers for execution of portfolio transactions, monitoring adherence to each Fund's investment restrictions and assisting with the Funds' compliance program. The Board concluded that the nature, extent and quality of the services provided by Magellan to the Funds were appropriate and that each Fund was likely to continue to benefit from services provided by Magellan under the Magellan Subadvisory Agreement.
Investment Performance. The Board reviewed the performance record of the MFG Global Equity and Core Infrastructure Funds. It noted that the Global Equity Fund had outperformed its benchmark index for the one year and since inception periods ended December 31, 2012. The Board also compared the Fund's 2012 performance to the performance of Magellan's composite of other accounts managed in the global equity style. The Board noted that the Core Infrastructure Fund had outperformed its benchmark for the since inception period ended December 31, 2012. The Board also considered Magellans' quarterly portfolio commentary and review of each Fund's performance. The Board concluded that each Fund's performance was satisfactory and that Magellan would continue to provide a high level of subadvisory services to the Funds.
Subadvisory Fees. The Board reviewed and considered the subadvisory fees payable by Frontegra to Magellan under the Magellan Subadvisory Agreement. The Board noted that Magellan also shares in the Funds' organizational expenses and expense reimbursements made by Frontegra. The Board reviewed information regarding fees charged to Magellan's other institutional clients for similar mandates. The Board determined that the subadvisory fee was appropriate. In evaluating the subadvisory fee, the Board noted that such amounts are paid by Frontegra and that therefore the overall advisory fee paid by each Fund is not directly affected by the subadvisory fee.
Costs and Profitability. The Board did not consider the cost of services provided by Magellan or the profitability to Magellan from its relationship with the Funds to be material factors because the subadvisory fee is paid by Frontegra.
Economies of Scale. Because the subadvisory fee is not paid by the Funds, the Board did not consider whether the fee should reflect any potential economies of scale that might be realized as the Funds' assets increase.
Benefits to Magellan. The Board considered information presented regarding any benefits to Magellan from serving as subadviser to the Funds (in addition to the subadvisory fee). Magellan provided information regarding commission sharing arrangements for which it receives third party research services. The Board also noted that Frontier provides consulting services to Magellan for which Frontier may be compensated by Magellan. The Board concluded that the benefits realized by Magellan from its relationship with each Fund were appropriate.
On the basis of its review of the foregoing information, the Board found that the terms of the Magellan Subadvisory Agreement were fair and reasonable and in the best interests of the shareholders of each of the Funds.
page 91

ADDITIONAL INFORMATION
(Unaudited)
DIRECTORS AND OFFICERS (as of June 30, 2013)
The business and affairs of the Funds are managed under the direction of the Funds' Board of Directors. Information pertaining to the directors and officers of the Funds is set forth below. The SAI includes additional information about the Funds' directors and officers and is available without charge, upon request by calling 1-888-825-2100.
Interested Director and Officers
Name, Address and
Year of Birth | | Position(s)
Held with
Company | | Term of
Office and
Length
of Time
Served | | Principal
Occupation(s)
During Past
Five Years | | Number of
Funds in
Complex
Overseen
by Director | | Other
Directorships
Held by
Director | |
William D. Forsyth III* Frontegra Funds, Inc.
400 Skokie Boulevard Suite 500 Northbrook, Illinois 60062 Year of Birth: 1963 | | President
Director
Co-President, Treasurer and Assistant Secretary
Secretary | | Elected annually by the Board; since August 2008. Indefinite; since May 1996. From May 1996 to August 2008.
From August 2008 to May 2013. | | Mr. Forsyth received his B.S. in Finance from the University of Illinois in 1986 and his M.B.A. from the University of Chicago in 1988. Mr. Forsyth has served as President of Frontegra since August 2008 and as Treasurer and a Director of Frontegra since May 1996. Mr. Forsyth served as Co-President and Assistant Secretary of Frontegra from May 1996 to August 2008. Mr. Forsyth has served as President of Timpani since August 2008 and served as Co-President from April 2008 to August 2008. Mr. Forsyth has served as President of Frontegra Strategies, LLC, the principal distributor of the Funds' shares, since August 2008 and as Co-President from August 2007 to August 2008. From July 1993 until the present, Mr. Forsyth also served as a Partner of Frontier Partners, Inc., a consulting/marketing firm ("Frontier"). From April 1987 until June 1993, Mr. Forsyth served as a Partner of Brinson Partners, Inc., an investment adviser, and from June 1986 until April 1987, he served as a product marketing representative of Harris Trust & Savings Bank. Mr. Forsyth has earned the right to use the CFA designation. | | | 8 | | | None | |
* Mr. Forsyth is an "interested person" of the Funds because he serves as a director and officer of Frontegra, owns 100% of Frontegra and has an indirect equity ownership interest in Timpani.
page 92

ADDITIONAL INFORMATION (continued)
(Unaudited)
Interested Director and Officers
Name, Address and
Year of Birth | | Position(s)
Held with
Company | | Term of
Office and
Length
of Time
Served | | Principal
Occupation(s)
During Past
Five Years | | Number of
Funds in
Complex
Overseen
by Director | | Other
Directorships
Held by
Director | |
Elyce D. Dilworth Frontegra Funds, Inc. 400 Skokie Boulevard Suite 500 Northbrook, Illinois 60062 Year of Birth: 1966 | | Treasurer, Assistant Secretary, Chief Compliance Officer and Anti-Money Laundering Compliance Officer | | Elected annually by the Board; Treasurer and Assistant Secretary since August 2008; Chief Compliance Officer since January 2008; Anti-Money Laundering Compliance Officer since February 2008. | | Ms. Dilworth received her B.B.A. in Finance from the University of Wisconsin – Milwaukee in 1989 and her M.S. in Accounting from the University of Wisconsin – Milwaukee in 1991. Ms. Dilworth has served as Chief Compliance Officer of Frontegra since January 2008 and as Secretary since August 2008. Ms. Dilworth served as Chief Compliance Officer of Timpani from April 2008 to June 2011. She served as Chief Financial Officer of Timpani from April 2008 to March 2010. Ms. Dilworth served as Chief Compliance Officer of Frontier from September 2010 to June 2011. Ms. Dilworth has also served as Chief Compliance Officer of the Distributor since August 2008. From June 2004 until May 2007, Ms. Dilworth was the Chief Compliance Officer for Van Wagoner Funds, Inc. (n/k/a Embarcadero Funds, Inc.), and the President, Secretary and Treasurer from January 2005 until May 2007. From April 1994 until December 2003, Ms. Dilworth was employed by UMB Fund Services, Inc., a service provider to mutual funds and alternative investment products. From January 1992 until April 1994, Ms. Dilworth was a Staff Accountant for PricewaterhouseCoopers LLP, a public accounting firm. | | | N/A | | | N/A | |
page 93

ADDITIONAL INFORMATION (continued)
(Unaudited)
Interested Director and Officers
Name, Address and
Year of Birth | | Position(s)
Held with
Company | | Term of
Office and
Length
of Time
Served | | Principal
Occupation(s)
During Past
Five Years | | Number of
Funds in
Complex
Overseen
by Director | | Other
Directorships
Held by
Director | |
Robert A. Nanney Frontegra Funds, Inc.
400 Skokie Boulevard Suite 500 Northbrook, Illinois 60062 Year of Birth: 1979 | | Vice President and Secretary | | Elected annually by the Board; Vice President and Secretary since May 2013. | | Mr. Nanney received his B.A. from Loyola University Chicago in 2002 and his juris doctorate degree from Loyola University Chicago School of Law in 2005. Mr. Nanney has been in-house counsel of Frontegra since May 2011. Mr. Nanney has served as in-house counsel and Chief Compliance Officer of Timpani since July 2011. Mr. Nanney has served as in-house counsel and Chief Compliance Officer of Frontier since July 2011. From March 2008 until May 2011, Mr. Nanney served as associate general counsel of Superfund Asset Management, Inc., an introducing broker, and from May 2006 until March 2008, he served as a tax associate for Wealth & Tax Advisory Services, Inc., a tax consulting firm. | | | N/A | | | N/A | |
page 94

ADDITIONAL INFORMATION (continued)
(Unaudited)
Independent Directors
Name, Address and
Year of Birth | | Position(s)
Held with
Company | | Term of
Office and
Length
of Time
Served | | Principal
Occupation(s)
During Past
Five Years | | Number of
Funds in
Complex
Overseen
by Director | | Other
Directorships
Held by
Director | |
David L. Heald 400 Skokie Boulevard Suite 500 Northbrook, Illinois 60062 Year of Birth: 1943 | | Lead Independent Director | | Indefinite; since June 1996 | | Mr. Heald received his B.A. in English from Denison University in 1966 and his J.D. from Vanderbilt University School of Law in 1969. Mr. Heald previously served as a principal and a director of Consulting Fiduciaries, Inc. ("CFI") from 1994 to 2011. CFI was a registered investment adviser that provided professional, independent, fiduciary decision making, consultation and alternative dispute resolution services to ERISA plans, plan sponsors and investment managers. Between April 1994 and August 1994, Mr. Heald engaged in the private practice of law. From August 1992 until April 1994, Mr. Heald was a managing director and the chief administrative officer of Calamos Asset Management, Inc., a registered investment adviser specializing in convertible securities, and he served as an officer and director of CFS Investment Trust, a registered investment company comprised of four series. From January 1990 until August 1992, Mr. Heald was a partner in the Chicago based law firm of Gardner, Carton & Douglas. | | | 8 | | | None | |
page 95

ADDITIONAL INFORMATION (continued)
(Unaudited)
Independent Directors
Name, Address and
Year of Birth | | Position(s)
Held with
Company | | Term of
Office and
Length
of Time
Served | | Principal
Occupation(s)
During Past
Five Years | | Number of
Funds in
Complex
Overseen
by Director | | Other
Directorships
Held by
Director | |
James M. Snyder
400 Skokie Boulevard Suite 500
Northbrook, Illinois 60062 Year of Birth: 1947 | | Independent Director | | Indefinite; since May 2002 | | Mr. Snyder received his B.S. in Finance from Indiana University in 1969 and his M.B.A. from DePaul University in 1973. Mr. Snyder is a private investor and Chairman of The Snyder Family Foundation. Mr. Snyder served as an investment professional with Northern Trust from June 1969 until his retirement in June 2001. He served in a variety of capacities at Northern Trust, including as Chief Investment Officer, Executive Vice President of Northern Trust and Vice Chairman of Northern Trust Global Investments. Mr. Snyder has earned the right to use the Chartered Financial Analyst (CFA) designation. | | | 8 | | | IronBridge Funds, Inc. (with oversight of four portfolios) | |
page 96

ADDITIONAL INFORMATION (continued)
(Unaudited)
FOREIGN TAX CREDIT
For the year ended June 30, 2013, the Frontegra MFG Core Infrastructure Fund earned foreign source income and paid foreign taxes, which it intends to pass through to its shareholders pursuant to Section 853 of the Internal Revenue Code as follows:
| | | Foreign Source Income Earned | | Foreign Taxes Paid | |
Australia | | $ | 36,635 | | | $ | 2,142 | | |
Austria | | | 254 | | | | 88 | | |
Belgium | | | 1,146 | | | | 263 | | |
Canada | | | 11,081 | | | | 1,662 | | |
France | | | 4,975 | | | | 746 | | |
Germany | | | 3,521 | | | | 588 | | |
Guernsey | | | 1,308 | | | | 58 | | |
Hong Kong | | | 3,355 | | | | — | | |
Italy | | | 22,113 | | | | 3,350 | | |
Luxembourg | | | 3,944 | | | | 591 | | |
Mexico | | | 1,770 | | | | — | | |
Netherlands | | | 1,228 | | | | 184 | | |
New Zealand | | | 2,752 | | | | — | | |
Spain | | | 11,113 | | | | 1,899 | | |
Switzerland | | | 539 | | | | 81 | | |
United Kingdom | | | 21,275 | | | | — | | |
| | $ | 127,009 | | | $ | 11,652 | | |
For the year ended June 30, 2013, the Frontegra HEXAM Emerging Markets Fund earned foreign source income and paid foreign taxes, which it intends to pass through to its shareholders pursuant to Section 853 of the Internal Revenue Code as follows:
| | | Foreign Source Income Earned | | Foreign Taxes Paid | |
Brazil | | $ | 144,408 | | | $ | 13,275 | | |
Canada | | | 6,763 | | | | 1,014 | | |
China | | | 74,805 | | | | 7,481 | | |
Hong Kong | | | 98,282 | | | | 7,697 | | |
India | | | 3,711 | | | | — | | |
Jersey | | | 9,159 | | | | — | | |
Russian Federation | | | 37,059 | | | | 4,608 | | |
South Africa | | | 7,040 | | | | 1,056 | | |
South Korea | | | 54,775 | | | | 11,613 | | |
United Kingdom | | | 25,729 | | | | — | | |
| | $ | 461,731 | | | $ | 46,744 | | |
page 97

ADDITIONAL INFORMATION (continued)
(Unaudited)
QUALIFIED DIVIDEND INCOME/DIVIDENDS RECEIVED DEDUCTION
For the fiscal year ended June 30, 2013, certain dividends paid by the Funds may be subject to a maximum tax rate of 15%, as provided for by the Jobs and Growth Tax Relief Reconciliation Act of 2004. The percentage of dividends declared from ordinary income designated as qualified dividend income was as follows:
RobecoSAM Global Equity | | | 100.00 | % | |
MFG Global Equity | | | 66.20 | % | |
MFG Core Infrastructure | | | 96.72 | % | |
HEXAM Emerging Markets | | | 100.00 | % | |
Phocas Small Cap Value | | | 100.00 | % | |
Lockwell Small Cap Value | | | 40.63 | % | |
For corporate shareholders, the percent of ordinary income distributions qualifying for the corporate dividends received deduction for the fiscal year ended June 30, 2013 was as follows:
RobecoSAM Global Equity | | | 77.92 | % | |
MFG Global Equity | | | 41.76 | % | |
MFG Core Infrastructure | | | 31.12 | % | |
HEXAM Emerging Markets | | | 9.32 | % | |
Phocas Small Cap Value | | | 100.00 | % | |
Lockwell Small Cap Value | | | 40.64 | % | |
ADDITIONAL INFORMATION APPLICABLE TO FOREIGN SHAREHOLDERS ONLY
The percent of ordinary income distributions designated as interest related dividends for the fiscal year ended June 30, 2013 was as follows:
RobecoSAM Global Equity | | | 0.06 | % | |
MFG Global Equity | | | 0.12 | % | |
MFG Core Infrastructure | | | 0.06 | % | |
HEXAM Emerging Markets | | | 0.21 | % | |
Phocas Small Cap Value | | | 0.18 | % | |
Lockwell Small Cap Value | | | 0.21 | % | |
The percent of ordinary income distributions designated as short-term capital gain distributions for the fiscal year ended June 30, 2013 was as follows:
MFG Global Equity | | | 60.27 | % | |
MFG Core Infrastructure | | | 1.53 | % | |
Lockwell Small Cap Value | | | 5.01 | % | |
page 98
This page intentionally left blank.
This page intentionally left blank.

A NOTE ON FORWARD-LOOKING STATEMENTS
This report includes forward-looking statements such as adviser, subadviser and/or portfolio manager predictions, opinions, assessments, analyses or outlooks for individual securities, industries, market sectors and/or markets. These statements involve risks and uncertainties. In addition to the general risks described for the Funds in the current Prospectuses, other factors bearing on these statements include the accuracy of the advisers', subadvisers' or portfolio managers' forecasts and predictions, and the appropriateness of the investment programs designed by an adviser, subadviser or portfolio manager to implement their strategies efficiently and effectively. Any one or more of these factors, as well as other risks affecting the securities markets and investment instruments generally, could cause the actual results of the Funds to differ materially as compared to benchmarks associated with the Funds.
In addition, portfolio composition will change due to ongoing management of the Funds. Specific securities named in this report may not currently be owned by the applicable Fund, or the Fund's position in the securities may have changed.
ADDITIONAL INFORMATION
Frontegra Funds has adopted proxy voting policies and procedures that delegate to Frontegra Asset Management, Inc. ("Frontegra"), Timpani Capital Management LLC and Lockwell Investments, LLC, the authority to vote proxies. The proxy voting policies permit Frontegra to delegate its authority to vote proxies to a Fund's subadviser. A description of the Frontegra Funds' proxy voting policies and procedures is available without charge, upon request, by calling the Funds toll free at 1-888-825-2100. A description of these policies and procedures is also included in the Funds' Statement of Additional Information, which is available on the SEC's website at http://www.sec.gov and the Funds' website at www.frontegra.com or by calling the Funds toll free at 1-888-825-2100.
The actual voting records relating to each Fund's portfolio securities during the most recent twelve months ended June 30 are available without charge by calling the Funds toll free at 1-888-825-2100 or by accessing the SEC's website at http://www.sec.gov.
Each Fund files a complete schedule of portfolio holdings for its first and third fiscal quarters with the SEC on Form N-Q. The Form N-Q is available on the SEC's website at http://www.sec.gov. The Form N-Q may also be reviewed and copied at the SEC's Public Reference Room in Washington, D.C. Information on the operation of the Public Reference Room may be obtained by calling toll-free 1-800-SEC-0330.
Item 2. Code of Ethics.
The registrant has adopted a code of ethics that applies to the registrant’s principal executive officer and principal financial officer. The registrant has not made any amendments to its code of ethics during the period covered by this report. The registrant has not granted any waivers from any provisions of the code of ethics during the period covered by this report.
A copy of the registrant’s Code of Ethics is Incorporated by reference. See Item 12(a)(1).
Item 3. Audit Committee Financial Expert.
The registrant’s board of directors has determined that it does not have an audit committee financial expert serving on its audit committee. At this time, the registrant believes that the experience provided by each member of the audit committee together offers the registrant adequate oversight for the registrant’s level of financial complexity.
Item 4. Principal Accountant Fees and Services.
The registrant has engaged its principal accountant to perform audit services, audit-related services, tax services and other services during the past two fiscal years. In the following table, “Audit Fees” are fees billed for professional services for the audit of the registrant’s annual financial statements or services that are normally provided by the accountant in connection with statutory and regulatory filings or engagements for those fiscal years. The “All Other Fees” for fiscal year 2013 relate to the principal accountant’s review of the registrant’s semi-annual report for the period ended December 31, 2012. “Tax Fees” refer to professional services rendered by the principal accountant for tax compliance, tax advice, and tax planning. There were no other services provided by the principal accountant. The following table details the aggregate fees billed for each of the last two fiscal years by the principal accountant.
| | FYE 6/30/2013 | | FYE 6/30/2012 | |
Audit Fees | | $ | 96,000 | | $ | 96,000 | |
Tax Fees | | $ | 24,000 | | $ | 24,000 | |
All Other Fees | | $ | 1,500 | | $ | 0 | |
The audit committee has adopted pre-approval policies and procedures that require the audit committee to pre-approve all audit and non-audit services of the registrant, including services provided to any entity affiliated with the registrant with respect to any engagement that directly relates to the operations and financial reporting of the registrant. In accordance with its pre-approval policies and procedures, the audit committee pre-approved all audit and tax services provided by the principal accountant during fiscal year 2013. During the last two fiscal years, there were no non-audit services rendered by the principal accountant to the registrant’s investment adviser or any entity controlling, controlled by or under common control with the investment adviser that provides ongoing services to the registrant. All of the hours spent on auditing the registrant’s financial statements were attributed to work performed by full-time permanent employees of the principal accountant.
Item 5. Audit Committee of Listed Registrants.
Not applicable to registrants who are not listed issuers (as defined in Rule 10A-3 under the Securities Exchange Act of 1934).
Item 6. Investments.
(a) Schedule of Investments is included as part of the report to shareholders filed under Item 1 of this Form.
(b) Not Applicable.
Item 7. Disclosure of Proxy Voting Policies and Procedures for Closed-End Management Investment Companies.
Not applicable to open-end investment companies.
Item 8. Portfolio Managers of Closed-End Management Investment Companies.
Not applicable to open-end investment companies.
Item 9. Purchases of Equity Securities by Closed-End Management Investment Company and Affiliated Purchasers.
Not applicable to open-end investment companies.
Item 10. Submission of Matters to a Vote of Security Holders.
Not Applicable.
Item 11. Controls and Procedures.
(a) Based on an evaluation of the registrant’s disclosure controls and procedures (as defined in Rule 30a-3(c) under the Investment Company Act of 1940 (the “Act”)) as of a date within 90 days prior to the filing date of this Form N-CSR, the registrant’s principal executive officer and principal financial officer have concluded that the disclosure controls and procedures are effective.
(b) There were no changes in the registrant’s internal control over financial reporting (as defined in Rule 30a-3(d) under the Act) that occurred during the second fiscal quarter of the period covered by this report that has materially affected, or is reasonably likely to materially affect, the registrant’s internal control over financial reporting.
Item 12. Exhibits.
(a) (1) Any code of ethics or amendment thereto, that is the subject of the disclosure required by Item 2, to the extent that the registrant intends to satisfy Item 2 requirements through filing an exhibit. Incorporated by reference to the registrant’s Form N-CSR filed September 8, 2008.
(2) A separate certification for each principal executive and principal financial officer pursuant to Section 302 of the Sarbanes-Oxley Act of 2002. Filed herewith.
(3) Any written solicitation to purchase securities under Rule 23c-1 under the Act sent or given during the period covered by the report by or on behalf of the registrant to 10 or more persons. Not applicable to open-end investment companies.
(b) Certifications pursuant to Section 906 of the Sarbanes-Oxley Act of 2002. Furnished herewith.
SIGNATURES
Pursuant to the requirements of the Securities Exchange Act of 1934 and the Investment Company Act of 1940, the registrant has duly caused this report to be signed on its behalf by the undersigned, thereunto duly authorized.
Frontegra Funds, Inc. |
| |
| |
By: | /s/ William D. Forsyth III | |
| William D. Forsyth III, President |
| (Principal Executive Officer) |
| |
Date: | 8/27/13 | |
Pursuant to the requirements of the Securities Exchange Act of 1934 and the Investment Company Act of 1940, this report has been signed below by the following persons on behalf of the registrant and in the capacities and on the dates indicated.
By: | /s/ William D. Forsyth III | |
| William D. Forsyth III, President and Secretary |
| (Principal Executive Officer) |
| |
Date: | 8/27/13 |
| |
| |
By: | /s/ Elyce D. Dilworth | |
| Elyce D. Dilworth, Treasurer and Assistant Secretary |
| (Principal Financial Officer) |
| |
Date: | 8/27/13 |