UNITED STATES
SECURITIES AND EXCHANGE COMMISSION
Washington, D.C. 20549
FORM N-CSR
CERTIFIED SHAREHOLDER REPORT OF REGISTERED
MANAGEMENT INVESTMENT COMPANIES
Investment Company Act file number | 811-07685 |
|
Frontier Funds, Inc. |
(Exact name of registrant as specified in charter) |
|
400 Skokie Blvd. Suite 500 Northbrook, Illinois | | 60062 |
(Address of principal executive offices) | | (Zip code) |
|
William D. Forsyth III 400 Skokie Blvd., Suite 500 Northbrook, Illinois 60062 |
(Name and address of agent for service) |
|
Registrant’s telephone number, including area code: | (847) 509-9860 | |
|
Date of fiscal year end: | June 30 | |
|
Date of reporting period: | June 30, 2015 | |
| | | | | | | | |
Item 1. Reports to Stockholders.

ANNUAL REPORT
Frontier MFG Global Equity Fund
Frontier MFG Global Plus Fund
Frontier MFG Core Infrastructure Fund
Frontier Timpani Small Cap Growth Fund
Frontier Netols Small Cap Value Fund
Frontier Phocas Small Cap Value Fund
Frontegra Asset Management, Inc.
June 30, 2015

TABLE OF CONTENTS
Shareholder Letter | | | 1 | | |
Frontier MFG Global Equity Fund | |
Report from MFG Asset Management | | | 4 | | |
Investment Highlights | | | 6 | | |
Frontier MFG Global Plus Fund | |
Report from MFG Asset Management | | | 8 | | |
Investment Highlights | | | 10 | | |
Frontier MFG Core Infrastructure Fund | |
Report from MFG Asset Management | | | 12 | | |
Investment Highlights | | | 14 | | |
Frontier Timpani Small Cap Growth Fund | |
Report from Timpani Capital Management LLC | | | 16 | | |
Investment Highlights | | | 18 | | |
Frontier Netols Small Cap Value Fund | |
Report from Netols Asset Management, Inc. | | | 20 | | |
Investment Highlights | | | 21 | | |
Frontier Phocas Small Cap Value Fund | |
Report from Phocas Financial Corporation | | | 24 | | |
Investment Highlights | | | 26 | | |
Expense Example | | | 27 | | |
Schedules of Investments | |
Frontier MFG Global Equity Fund | | | 30 | | |
Frontier MFG Global Plus Fund | | | 31 | | |
Frontier MFG Core Infrastructure Fund | | | 32 | | |
Frontier Timpani Small Cap Growth Fund | | | 35 | | |
Frontier Netols Small Cap Value Fund | | | 37 | | |
Frontier Phocas Small Cap Value Fund | | | 39 | | |
Statements of Assets and Liabilities | | | 42 | | |
Statements of Operations | | | 44 | | |
Statements of Changes in Net Assets | | | 46 | | |
Financial Highlights | | | 49 | | |
Notes to Financial Statements | | | 57 | | |
Report of Independent Registered Public Accounting Firm | | | 65 | | |
Board of Directors' Approval of Advisory and Subadvisory Agreements | | | 66 | | |
Additional Information | |
Directors and Officers | | | 73 | | |
Foreign Tax Credit | | | 77 | | |
Qualified Dividend Income/Dividends Received Deduction | | | 78 | | |
Additional Information Applicable to Foreign Shareholders Only | | | 78 | | |
This report is submitted for the general information of the shareholders of the Funds. It is not authorized for distribution to prospective investors unless accompanied or preceded by an effective Prospectus for the applicable Fund. The Prospectus may be obtained by calling 1-888-825-2100. Each Prospectus includes more complete information about management fees and expenses, investment objectives, risks and operating policies of the applicable Fund. Please read the Prospectus carefully.
Frontier Funds, Inc. are distributed by Frontegra Strategies, LLC, 400 Skokie Blvd., Suite 500, Northbrook, IL 60062. Frontegra Strategies, LLC, member of FINRA and SIPC, is an affiliate of Frontegra Asset Management, Inc., the Funds' investment adviser.

DEAR FELLOW SHAREHOLDERS:
We are pleased to report on the progress of the Frontier Funds over the past twelve months ending June 30, 2015. The S&P 500 Index was up 7.42% and small capitalization stocks were up, with the Russell 2000® Index returning 6.49%. International stocks, as measured by the MSCI EAFE Index, returned -4.22% over the twelve-month period.
Fund Results
The Frontier MFG Global Equity Fund, managed by MFG Asset Management, returned 6.72% (net) versus the MSCI World Index (Net) return of 1.43% for the twelve-month period ending June 30, 2015.
For the period from March 23, 2015, (inception), through June 30, 2015, the Frontier MFG Global Plus Fund, also managed by MFG Asset Management, returned -0.90% (net) versus the MSCI World Index (Net) return of -1.69%.
The Frontier MFG Core Infrastructure Fund, also managed by MFG Asset Management, returned -4.03% (net) versus the S&P Global Infrastructure Index return of -5.15% and the MSCI World Index (Net) return of 1.43% for the twelve-month period ending June 30, 2015.
The Frontier Timpani Small Cap Growth Fund — Institutional Class, managed by Timpani Capital Management, returned 15.62% (net) versus the Russell 2000® Growth Index return of 12.34% for the twelve-month period ending June 30, 2015. The Class Y shares returned 15.15% (net) over the same time period.
For the twelve-month period ending June 30, 2015, the Frontier Netols Small Cap Value Fund — Institutional Class, managed by Netols Asset Management, returned 3.61% (net) versus the Russell 2000® Value Index return of 0.78%. The Class Y shares returned 3.61% (net) over the same time period.
The Frontier Phocas Small Cap Value Fund, managed by Phocas Financial, returned 0.84% (net) versus the Russell 2000 Value Index return of 0.78% for the twelve-month period ending June 30, 2015.
Outlook
As of mid-2015, equity markets in North America and Europe have enjoyed robust returns over the trailing twelve months. For European markets, however, those returns have been largely mitigated by a strong U.S. dollar, which has risen almost 20% versus the Euro over the same time period. The employment picture in the U.S. has continued to improve, yet there is a steady preoccupation with regard to when and by how much the Fed will raise interest rates here in the U.S. Recent fears of a potential Greek exit from the European Union seem to have abated, yet concerns remain as to how robustly the Greek public will embrace the austerity measures to which their leaders agreed. As we enter a new fiscal year, we will work as fervently as ever to manage your assets with the skill and agility necessary in these turbulent times.
We will continue to oversee the investment management of the Frontier Funds with the care and diligence that have served our shareholders well in the past. As always, we appreciate your investment and continued confidence in the Frontier Funds.
Best regards,
William D. Forsyth, CFA
President
Frontier Funds, Inc.
page 1
This page intentionally left blank.

FRONTIER
MFG GLOBAL EQUITY FUND

REPORT FROM MFG ASSET MANAGEMENT
Dear Shareholders:
The investment objective of the Frontier MFG Global Equity Fund is capital appreciation. The objective is measured against the MSCI World Index (Net).
Performance Review
The Frontier MFG Global Equity Fund returned 6.72%, net of fees, for the year ended June 30, 2015. The Fund's return outperformed the 1.43% return of its benchmark, the MSCI World Index (Net).
We feel strongly that people cannot retire on "relative investment returns"; only by generating investment returns that exceed the rate of inflation (ideally by a satisfactory margin) will investors increase their wealth over time. As such, we are happy to be judged by the Fund's absolute returns over time.
Fund Outlook and Strategy
Equity markets have generally been up over the past twelve months. However, they performed at a much slower pace as investors fretted over slowing global economic outlook, uncertainty of the U.S. rate trajectory and the escalation of the sovereign debt crisis in Greece.
Our views on the world's largest economic zones have not altered materially over the past twelve months. China's growth continues to slow, with risks centred on the property market and shadow banking system. The United States' economic recovery continues, while the Eurozone remains in a structural and political muddle, which is hindering sustainable economic growth. The prospect of "Abenomics" solving Japan's intractable problems appears as uncertain as ever. Finally, emerging markets and commodities-linked economies face a period of heightened uncertainty as China slows and the U.S. Federal Reserve ("Fed") moves towards normalising interest rates.
We remain focused on the risks associated with the massive compression in risk premia we have seen in markets over the past few years and the potential for these risk premia to unwind as the Fed increases interest rates.
In addition, we believe there is a "Great Disagreement" as to where U.S. monetary policy (and hence U.S. interest rates) is headed over the next three years or so. In one corner is the Fed, which is anticipating a normalisation of the U.S. economy and U.S. monetary policy (and hence higher interest rates). In the other corner is "the market" which is effectively pricing secular stagnation with prolonged low inflation and economic growth (and hence lower interest rates). We believe it is unusual to see such a fundamental and large disagreement between the market and policy setters. In our view, if the Fed is right, many assets are currently mispriced and a normalisation of U.S. monetary policy could lead to material losses for investors.
At the end of April 2015, we increased the cash weighting of the Fund to approximately 15%. The cash weighting increases the defensiveness of our portfolio and should act as a partial hedge to increasing interest rates.
The Fund
On June 30, 2015, the Fund held investments in 24 companies (compared to 28 at June 30, 2014).
Over the past twelve months, the three stocks with the strongest returns in local currency were Target (+44.5%), Lowe's (+41.4%) and Visa (+28.3%), while the stocks with the weakest returns were Tesco (-24.7%), American Express (-17.0%) and Google (-7.7%). On an absolute basis, the three largest stock contributors in local currency were Lowe's, Target and eBay. The three bottom contributors were Tesco, Google and American Express.
page 4

Over the past twelve months, we have made the following major changes to the Fund:
• In April 2015, we increased the cash weighting to approximately 15% (from 10%).
• We added new positions in Home Depot, IBM, Intel, Lloyds Banking Group, QUALCOMM, and Woolworths.
• We exited the positions in Adidas, Coca-Cola, Danone, Diageo, DIRECTV, Johnson & Johnson, McDonald's, U.S. Bancorp, Wal-Mart and Novartis.
Equity markets have become more challenging and value has become harder to find as share prices have continued to rise. While nothing is certain in investing, we predict that the next three years will be challenging for equities as they battle the headwind of rising long-term interest rates.
We feel comfortable with the Fund's overall risk profile and construction. We believe it is likely to deliver satisfactory returns over the next investment cycle, while also exhibiting below-benchmark downside risk in the event that there is a major downturn in markets.
Yours sincerely,
Hamish Douglass
Portfolio Manager
MFG Asset Management
page 5

INVESTMENT HIGHLIGHTS
Growth of a $1,000,000 Investment (Unaudited)
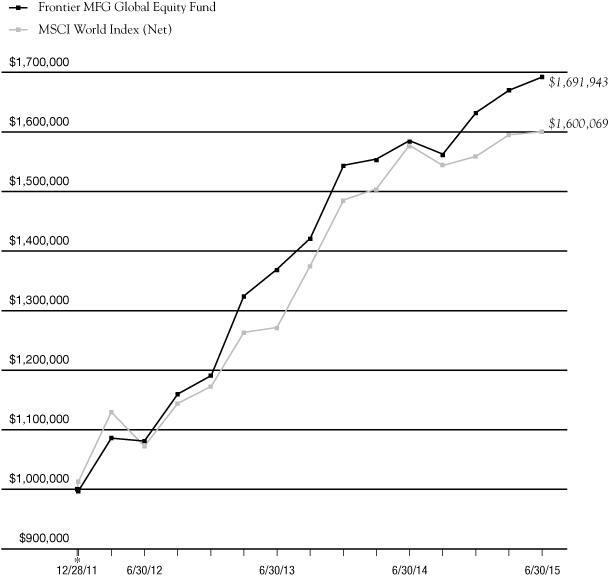
* 12/28/11 commencement of operations.
Portfolio Total Return**
FOR PERIODS ENDED 6/30/15 | | FUND | | INDEX | |
SIX MONTHS | | | 3.63 | % | | | 2.63 | % | |
ONE YEAR | | | 6.72 | % | | | 1.43 | % | |
AVERAGE ANNUAL
SINCE INCEPTION | | | 16.18 | % | | | 14.34 | % | |
Fund Expenses | |
GROSS EXPENSE RATIO | | | 0.89 | % | |
NET EXPENSE RATIO | | | 0.80 | % | |
This chart assumes an initial gross investment of $1,000,000 made on 12/28/11 (commencement of operations). Returns shown include the reinvestment of all distributions. Past performance is not predictive of future results. Investment return and principal value will fluctuate so that shares, when redeemed, may be worth more or less than the original cost. In the absence of existing fee waivers, total return would be reduced. To receive current to the most recent month-end performance, please call 1-888-825-2100.
The MSCI World Index represents large and mid cap equities across 23 Developed Markets countries. The index covers approximately 85% of the free float-adjusted market capitalization in each country. The index does not reflect investment management fees, brokerage commissions and other expenses associated with investing in equity securities. A direct investment in the index is not possible.
Frontegra Asset Management, Inc. has contractually agreed through October 31, 2016, to waive its management fee and/or reimburse the Fund's operating expenses to the extent necessary to ensure that the Fund's total operating expenses (excluding taxes, interest, brokerage commissions, acquired fund fees and expenses and extraordinary expenses) do not exceed 0.80% of the Fund's average daily net assets. The expense ratios presented are based on the annualized expense ratios as reported in the Fund's current prospectus, which may differ from the expense ratios presented in the Fund's financial highlights.
** The returns shown do not reflect the deduction of taxes that a shareholder would pay on Fund distributions or the redemption of Fund shares.
page 6

FRONTIER
MFG GLOBAL PLUS FUND

REPORT FROM MFG ASSET MANAGEMENT
Dear Fellow Shareholders:
The investment objective of the Frontier MFG Global Plus Fund is capital appreciation. The objective is measured against the MSCI World Index (Net).
Performance Review
The Frontier MFG Global Plus Fund returned -0.90%, net of fees, for the period beginning March 23, 2015, inception, and ending June 30, 2015. The Fund's return outperformed the -1.69% return of its benchmark, the MSCI World Index (Net) for the same period.
We feel strongly that people cannot retire on "relative investment returns"; only by generating investment returns that exceed the rate of inflation (ideally by a satisfactory margin) will investors increase their wealth over time. As such, we are happy to be judged by the Fund's absolute returns over time.
Fund Outlook and Strategy
Equity markets have generally been up over the past twelve months. However, they performed at a much slower pace as investors fretted over slowing global economic outlook, uncertainty of the U.S. rate trajectory and the escalation of the sovereign debt crisis in Greece.
Our views on the world's largest economic zones have not altered materially over the past three months. China's growth continues to slow, with risks centred on the property market and shadow banking system. The United States' economic recovery continues, while the Eurozone remains in a structural and political muddle, which is hindering sustainable economic growth. The prospect of "Abenomics" solving Japan's intractable problems appears as uncertain as ever. Finally, emerging markets and commodities-linked economies face a period of heightened uncertainty as China slows and the U.S. Federal Reserve ("Fed") moves towards normalising interest rates.
We remain focused on the risks associated with the massive compression in risk premia we have seen in markets over the past few years and the potential for these risk premia to unwind as the Fed increases interest rates.
In addition, we believe there is a "Great Disagreement" as to where U.S. monetary policy (and hence U.S. interest rates) is headed over the next three years or so. In one corner is the Fed, which is anticipating a normalisation of the U.S. economy and U.S. monetary policy (and hence higher interest rates). In the other corner is "the market" which is effectively pricing secular stagnation with prolonged low inflation and economic growth (and hence lower interest rates). We believe it is unusual to see such a fundamental and large disagreement between the market and policy setters. In our view, if the Fed is right, many assets are currently mispriced and a normalisation of U.S. monetary policy could lead to material losses for investors.
At the end of April 2015, we increased the cash weighting of the Fund to approximately 15%. The cash weighting increases the defensiveness of our portfolio and should act as a partial hedge to increasing interest rates.
The Fund
On June 30, 2015, the Fund held investments in 24 companies.
Since inception, the stocks with the strongest returns in local currency were Yum! Brands (+13.4%) and Lloyds Banking Group (5.6%), while the stocks with the weakest returns were Tesco (-14.1%) and Lowe's (-11.6%). On an absolute basis, the largest stock contributors in local currency were Yum! Brands and Microsoft, which added +0.6% and +0.3%, respectively. The bottom contributors were Lowe's and Tesco, which detracted -0.7% and -0.5%, respectively.
page 8

Since the Fund's inception, we have made the following major changes to the Fund:
• In April 2015, we increased the cash weighting to approximately 15%.
• We exited the positions in Danone and Wal-Mart.
Equity markets have become more challenging and value has become harder to find as share prices have continued to rise. While nothing is certain in investing, we predict that the next three years will be challenging for equities as they battle the headwind of rising long-term interest rates.
We feel comfortable with the Fund's overall risk profile and construction. We believe it is likely to deliver satisfactory returns over the next investment cycle, while also exhibiting below-benchmark downside risk in the event that there is a major downturn in markets.
Yours sincerely,
Hamish Douglass
Portfolio Manager
MFG Asset Management
page 9

INVESTMENT HIGHLIGHTS
Growth of a $1,000,000 Investment (Unaudited)
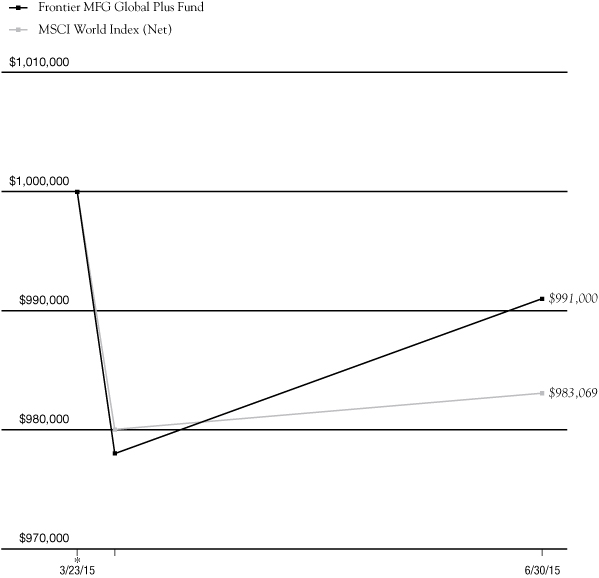
* 3/23/15 commencement of operations.
Portfolio Total Return**
FOR PERIOD ENDED 6/30/15 | | FUND | | INDEX | |
SINCE INCEPTION | | | (0.90 | )% | | | (1.69 | )% | |
Fund Expenses | |
GROSS EXPENSE RATIO | | | 1.25 | % | |
NET EXPENSE RATIO | | | 0.80 | % | |
This chart assumes an initial gross investment of $1,000,000 made on 3/23/15 (commencement of operations). Returns shown include the reinvestment of all distributions. Past performance is not predictive of future results. Investment return and principal value will fluctuate so that shares, when redeemed, may be worth more or less than the original cost. In the absence of existing fee waivers, total return would be reduced. To receive current to the most recent month-end performance, please call 1-888-825-2100.
The MSCI World Index represents large and mid cap equities across 23 Developed Markets countries. The index covers approximately 85% of the free float-adjusted market capitalization in each country. The index does not reflect investment management fees, brokerage commissions and other expenses associated with investing in equity securities. A direct investment in the index is not possible.
Frontegra Asset Management, Inc. has contractually agreed through October 31, 2016, to waive its management fee and/or reimburse the Fund's operating expenses to the extent necessary to ensure that the Fund's total operating expenses (excluding taxes, interest, brokerage commissions, acquired fund fees and expenses and extraordinary expenses) do not exceed 0.80% of the Fund's average daily net assets. The expense ratios presented are based on the annualized expense ratios as reported in the Fund's current prospectus, which may differ from the expense ratios presented in the Fund's financial highlights.
** The returns shown do not reflect the deduction of taxes that a shareholder would pay on Fund distributions or the redemption of Fund shares.
page 10

FRONTIER
MFG CORE INFRASTRUCTURE FUND

REPORT FROM MFG ASSET MANAGEMENT
Dear Fellow Shareholders:
The objective of the Frontier MFG Core Infrastructure Fund is long-term capital appreciation. The Fund's performance is measured against the S&P Global Infrastructure Index.
The types of infrastructure assets in which the Fund invests are generally natural monopolies that provide an essential service to the community. Infrastructure assets offer investors protection from the impacts of inflation because their earnings generally have some direct linkage to inflation. Over time, the stable, reliable earnings of infrastructure assets are expected to lead to a combination of income and capital growth for investors.
The universe of infrastructure assets that are held by the Fund is made up of two main sectors:
• Utilities: Utilities comprise approximately 65% of the Fund and includes both regulated energy utilities and regulated water utilities. Utilities are typically subject to economic regulation. The terms of regulation typically require a utility to efficiently provide an essential service to the community and, in return, permit the utility to earn a fair rate of return on the capital it has invested in its operations. As a utility provides a basic necessity, e.g. energy or water, there is minimal fluctuation in demanded volumes in response to the economic cycle, while the price charged for the utility service can be adjusted with limited impact upon demanded volumes. As a result, the earnings of regulated utilities have been, and are expected to continue to be, stable irrespective of economic conditions.
• Infrastructure: This includes airports, ports, toll roads and broadcast communications infrastructure. Regulation of infrastructure companies is generally less intensive than regulation of utilities and this allows companies to accrue the benefits of volume growth (i.e. the returns of infrastructure companies are linked to growth in passengers, vehicles or containers). As economies develop, grow and become more inter-dependent, we expect the underlying level of aviation, shipping and vehicle traffic to increase. As a result, the revenues and earnings derived by infrastructure assets are expected to grow.
Performance Review
The Fund returned -4.03%, net of fees, for the year ended June 30, 2015. The Fund's return outperformed the -5.15% return of its benchmark, the S&P Global Infrastructure Index. Note that the strong U.S. dollar had a material negative impact on the Fund's returns.
The Non-Utility sectors held in the Fund performed well during the year with Airport stocks generating a weighted average return of 26%, Ports 25%, Energy Infrastructure 16%, Communications 12% and Toll Roads 10%. The Utility exposures performed modestly with a weighted average return of 3%.
Geographically, Asia Pacific and Latin American stocks were the strongest performers returning 22% and 20% respectively. U.S. stocks dragged the performance of the Fund down, returning less than 1% on average.
The best performing stocks in the Fund during the year were Mexican airport company OMAB (Total Shareholder Return of +60%), New Zealand power utility Vector (+40%), another Mexican airport company ASURB (+38%), Zurich Airport (+35%), Auckland Airport (+33%) and Australian toll road company Transurban (+32%). Approximately one-third of the stocks in the Fund saw negative returns for the year, the vast majority being U.S. utilities. U.S. utilities had delivered exceptional returns in previous years so some fall back was not unexpected.
page 12

In terms of the stocks included in the benchmark index but excluded from the Fund because they do not meet MFGAM's stringent definition of investment grade infrastructure:
• Companies with a meaningful exposure to competitive power generation delivered negative returns as did pipelines with a meaningful exposure to the price of oil. (MFGAM includes oil & gas pipelines in the Fund only if their earnings are not dependent on the price of the product being transported and they are not structured as MLPs);
• Japanese stocks were up strongly generating a weighted average return of +62%;
• Chinese infrastructure stocks were also up strongly (+25%) although results were highly variable from a high of +41% (China Merchant Holdings) to a low of -48% (China Resources and Transportation Group). However, Chinese infrastructure stocks fell heavily in the last month of the year.
Portfolio Outlook and Strategy
The Fund is designed to provide reliable returns in all but the most extreme market conditions. We now see the utilities market as broadly in equilibrium while infrastructure stocks, particularly those in Europe, remain cheap.
We believe that infrastructure and utility assets, with requisite earnings reliability and a linkage of earnings to inflation, offer an attractive, long-term investment proposition. Furthermore, given the predictable nature of earnings and the structural linkage of those earnings to inflation, the investment returns generated by infrastructure assets are different from standard asset classes and offer investors valuable diversification when included in an investment portfolio. In the current uncertain economic and investment climate, the reliable financial performance of infrastructure investments makes them particularly attractive and an investment in listed infrastructure can be expected to reward patient investors with a three to five year timeframe.
Yours sincerely,
Dennis Eagar
Portfolio Manager
MFG Asset Management
page 13

INVESTMENT HIGHLIGHTS
Growth of a $100,000 Investment (Unaudited)
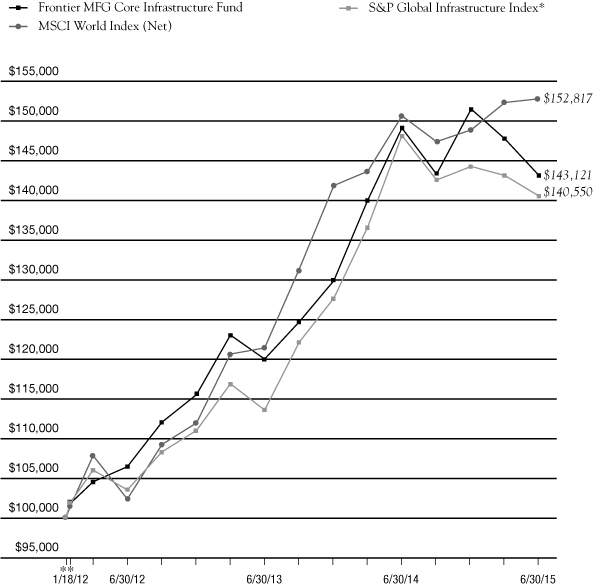
* The UBS Developed Infrastructure & Utilities Index (Net), a former benchmark index for the Frontier MFG Core Infrastructure Fund, was discontinued on April 1, 2015.
** 1/18/12 commencement of operations.
Portfolio Total Return***
FOR PERIODS
ENDED
6/30/15 | | FUND | | MSCI
INDEX | | S&P
GLOBAL
INDEX | |
SIX MONTHS | | | (5.54 | )% | | | 2.63 | % | | | (2.60 | )% | |
ONE YEAR | | | (4.03 | )% | | | 1.43 | % | | | (5.15 | )% | |
AVERAGE
ANNUAL
SINCE
INCEPTION | | | 10.95 | % | | | 13.08 | % | | | 10.37 | % | |
Fund Expenses | |
GROSS EXPENSE RATIO | | | 1.46 | % | |
NET EXPENSE RATIO | | | 0.71 | % | |
This chart assumes an initial gross investment of $100,000 made on 1/18/12 (commencement of operations). Returns shown include the reinvestment of all distributions. Past performance is not predictive of future results. Investment return and principal value will fluctuate so that shares, when redeemed, may be worth more or less than the original cost. In the absence of existing fee waivers, total return would be reduced. To receive current to the most recent month-end performance, please call 1-888-825-2100.
The MSCI World Index represents large and mid cap equities across 23 Developed Markets countries and covers approximately 85% of the free float-adjusted market capitalization in each country. The S&P Global Infrastructure Index is a global developed markets infrastructure and utilities benchmark. Neither index reflects investment management fees, brokerage commissions or other expenses associated with investing in equity securities. A direct investment in an index is not possible.
Frontegra Asset Management, Inc. has contractually agreed through October 31, 2016, to waive its management fee and/or reimburse the Fund's operating expenses to the extent necessary to ensure that the Fund's total operating expenses (excluding taxes, interest, brokerage commissions, acquired fund fees and expenses and extraordinary expenses) do not exceed 0.70% of the Fund's average daily net assets. The expense ratios presented are based on the annualized expense ratios as reported in the Fund's current prospectus, which may differ from the expense ratios presented in the Fund's financial highlights.
*** The returns shown do not reflect the deduction of taxes that a shareholder would pay on Fund distributions or the redemption of Fund shares.
page 14

FRONTIER
TIMPANI SMALL CAP GROWTH FUND

REPORT FROM TIMPANI CAPITAL MANAGEMENT LLC
Dear Fellow Shareholders:
The Frontier Timpani Small Cap Growth Fund strives to achieve capital appreciation by investing in a diversified portfolio of growth companies with small market capitalizations. Timpani seeks to:
• Invest in companies where growth is robust, sustainable and underestimated by the market.
• Conduct fundamental research that provides unique insights into the perception gap that exists between market expectations and a company's true growth rate.
• Manage risk by continuously evaluating the size of the perception gap relative to market expectations and monitoring market sentiment.
• Act on new relevant incremental data points, both positive and negative, in an effort to exploit investor biases.
Performance Review
For the year ended June 30, 2015, the Fund outperformed its benchmark, the Russell 2000® Growth Index, with the Institutional Class returning 15.62%, net of fees, compared to 12.34% for the benchmark. The relative performance in the second half of calendar 2014 was slightly below benchmark, while the first half of calendar 2015 was strong.
Very early in the period, performance was weak due to a continued stylistic correction in high growth, small capitalization stocks that began in the spring. However, by August, the correction was over and for the rest of 2014, we were investing in a mostly neutral stylistic environment. During this period, we outperformed as strong, company-specific fundamental drivers produced positive earnings revisions that were rewarded by investors. So far in 2015, we have seen the neutral style environment turn positive as the macro backdrop has been benign for growth stocks overall.
During the period, sector allocation was a slight positive contributor to performance. An overweight in Health Care and underweight in Materials & Processing were positive contributors to performance, while an overweight in Energy at the beginning of the period was a negative contributor. Stock selection was solidly positive during the period as a driver of performance. For the full period, stock selection was most positive for Financial Services, Consumer Discretionary and Producer Durables, and most negative for Technology and Materials & Processing. One stand-out individual positive contributor was Financial Services stock, LendingTree, a Fund holding for over three years. Consumers are increasingly using the internet to shop for money and LendingTree is efficiently connecting those consumers to various financial lenders. Other strong performers included Health Care stocks, Horizon Pharma and Adeptus Health. Horizon investors are excited about a recent opportunistic acquisition, as well as continued strength in its base business and product pipeline. Adeptus has numerous growth engines including a substantial unit growth opportunity and an increasing addressable market. Consumer Discretionary stocks, Skechers and Jack in the Box, were also winners during the period, along with Technology stock, VASCO Data Security. While fundamentally unrelated to one another, these companies are similar in that they all have a sustainable growth profile and are consistently meeting or exceeding analyst and investor expectations. Negative outliers included Consumer Discretionary stock Marchex, and a trio of Energy companies: Sanchez Energy, Diamondback Energy, and Basic Energy Services. Marchex had company-specific negative data points, while the Energy companies suffered from a collapse in oil prices. All four were sold from the portfolio in 2014.
Portfolio Outlook
The market remains obsessed with U.S. Federal Reserve monetary policy, and the timing of the inevitable first interest rate hike. Late 2015, or early 2016, seem likely to mark the first increase, however, commentary from the Fed suggests further increases will be gradual and drawn out over time. The Fed has been telegraphing the rate increases for several months and will be increasing rates from unusually
page 16

low levels. Importantly, rising interest rates by the Fed are most likely to be accompanied by further improvement in the domestic economy. These factors cause us to conclude market disruption will be minimal once rate increases commence. The biggest macro risk is economic recession and that seems very unlikely in the intermediate term, even if the Fed begins raising interest rates soon. Meanwhile, international central banks remain very accommodative, supporting global growth prospects. Economic problems within Europe and China are worth monitoring, however, don't appear to be derailing U.S. growth.
On a micro level, the bullishness we communicated in the Semi-Annual Report is playing out as expected. Fundamental data points from company management teams continue to confirm the economy is on solid footing and that secular growth can be found in numerous pockets of the economy. That growth is being sought by investors and can potentially drive upside to analyst estimates and lead to strong stock price performance. Based on where we are in the current stock market cycle, we expect secular growth and upside surprise to continue to be embraced by the marketplace. In other words, even though valuations have expanded since this bull market began in 2009, we see room for further expansion.
During the period, we continued to focus on finding robust and sustainable growers where the growth is being underestimated. That research has resulted in sector weights that vary from the benchmark weights. Key overweights include Health Care, Consumer Discretionary, and Technology, while notable underweights include Materials & Processing, Producer Durables and Consumer Staples.
We will continue to make it our mission to find companies that have characteristics consistent with our investment process. We believe this approach is most value-added for shareholders over the long term.
Thank you for your continued support.
Sincerely,
Brandon Nelson, CFA
Chief Investment Officer
Timpani Capital Management LLC
page 17

INVESTMENT HIGHLIGHTS
Growth of a $100,000 Investment (Unaudited)
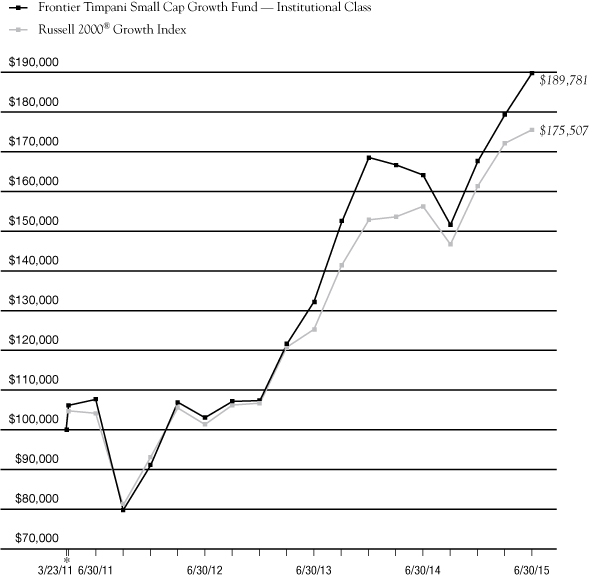
* 3/23/11 commencement of operations.
Portfolio Total Return**
FOR PERIODS ENDED 6/30/15 | | FUND | | INDEX | |
SIX MONTHS | | | 13.22 | % | | | 8.74 | % | |
ONE YEAR | | | 15.62 | % | | | 12.34 | % | |
AVERAGE ANNUAL
SINCE INCEPTION | | | 16.18 | % | | | 14.08 | % | |
Institutional Class Expenses | |
GROSS EXPENSE RATIO | | | 2.46 | % | |
NET EXPENSE RATIO | | | 1.10 | % | |
This chart assumes an initial gross investment of $100,000 made on 3/23/11. Returns shown include the reinvestment of all distributions. Past performance is not predictive of future results. Investment return and principal value will fluctuate so that shares, when redeemed, may be worth more or less than the original cost. In the absence of fee waivers, total return would be reduced. To receive current to the most recent month-end performance, please call 1-888-825-2100.
The Russell 2000® Growth Index measures the performance of the small-cap growth segment of the U.S. equity universe. The index does not reflect investment management fees, brokerage commissions and other expenses associated with investing in equity securities. A direct investment in the index is not possible.
Timpani Capital Management LLC has contractually agreed through October 31, 2016, to waive its management fee and/or reimburse the Fund's operating expenses to the extent necessary to ensure that the Fund's total operating expenses (excluding taxes, interest, brokerage commissions, acquired fund fees and expenses and extraordinary expenses) do not exceed 1.10% of the Fund's average daily net assets of the Institutional Class. The expense ratios presented are based on the annualized expense ratios as reported in the Fund's current prospectus, which may differ from the expense ratios presented in the Fund's financial highlights.
** The returns shown do not reflect the deduction of taxes that a shareholder would pay on Fund distributions or the redemption of Fund shares.
The above graph relates to Institutional Class shares of the Fund. Performance for Class Y shares will vary from the performance of the Institutional Class shares shown above due to differences in expenses.
page 18

FRONTIER
NETOLS SMALL CAP VALUE FUND

REPORT FROM NETOLS ASSET MANAGEMENT, INC.
Dear Fellow Shareholders:
The Frontier Netols Small Cap Value Fund strives to achieve capital appreciation by investing at least 80% of its assets in equity securities of small capitalization companies. The Fund's performance is measured against the Russell 2000® Value Index.
Performance Review
Since its inception on December 16, 2005, the Frontier Netols Small Cap Value Fund (Institutional Class) has outperformed the benchmark after fees, returning 8.27% annualized, compared to 6.64% annualized for the Russell 2000 Value Index. For the year ended June 30, 2015, the Fund outperformed the benchmark, returning 3.61% net of fees, compared to 0.78% for the Index.
Portfolio Review
The dominant market factor over the past twelve months was the anticipation of the normalization of Federal Reserve policy. A steadily improving domestic economy and positive employment trends led many investors to believe the first rate increases would take place by mid-year 2015. However, weakness in many economies outside the U.S. drove numerous central banks to cut rates, resulting in rapid appreciation of the dollar. These offsetting forces produced intra-quarter fluctuations in the treasury and equity markets despite ending up relatively unchanged over the period. During the past year, the Fund's portfolio was positioned to capitalize on a stronger domestic economy. As a result, the more domestically focused sectors and better growth potential areas like the Health Care, Financials, and Consumer Discretionary sectors outperformed. Conversely, internationally impacted Energy and Materials, as well as interest rate sensitive and growth constrained Utilities underperformed during the period.
Positive Contributions to Relative Performance July 2014 through June 2015
• Stock Selection — Materials, Health Care and Financials
• Overweight — Health Care, Consumer Staples and Information Technology
• Best Performing Stocks — TASER International, Acadia Healthcare, PGT, U.S. Physical Therapy and Domino's Pizza
Negative Contributions to Relative Performance July 2014 through June 2015
• Stock Selection — Information Technology, Energy and Consumer Staples
• Underweight — Financials
• Worst Performing Stocks — Willbros Group, Bill Barrett, Boulder Brands, Titan International and Cloud Peak Energy
Portfolio Outlook
We believe the U.S. economy continues to move along, anchored by a solid employment outlook driving consumer confidence. However, foreign currency fluctuations remain a near term headwind for corporate earnings as the dollar continues to strengthen. While the domestic outlook remains stable, some international economies have softened. Additionally, there is a growing need for cash in some overseas markets resulting from market disruptions in China and credit defaults in Greece. If the actions of foreign central banks and the ECB can effectively address these issues and stimulate economic growth, other regions could begin to provide a much needed growth engine outside the United States.
Thank you for your continued support.
Jeff Netols
President
Netols Asset Management, Inc.
page 20

INVESTMENT HIGHLIGHTS
Growth of a $100,000 Investment (Unaudited)
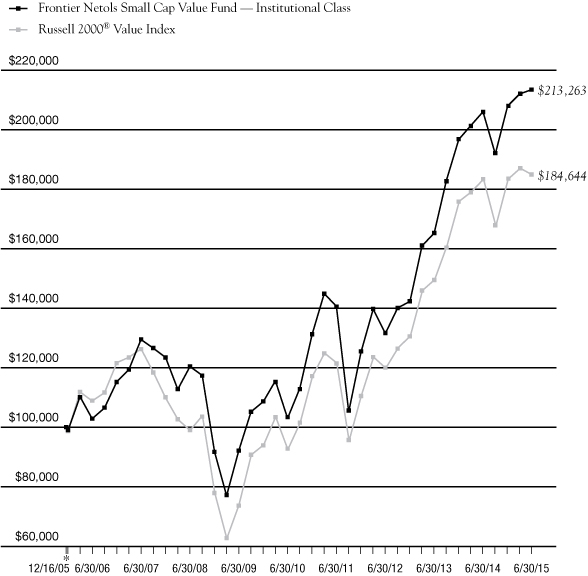
* 12/16/05 commencement of operations.
Portfolio Total Return**
FOR PERIODS
ENDED 6/30/15 | | FUND | | INDEX | |
SIX MONTHS | | | 2.65 | % | | | 0.76 | % | |
ONE YEAR | | | 3.61 | % | | | 0.78 | % | |
FIVE YEAR
AVERAGE ANNUAL | | | 15.66 | % | | | 14.81 | % | |
AVERAGE ANNUAL
SINCE INCEPTION | | | 8.27 | % | | | 6.64 | % | |
Institutional Class Expenses | |
GROSS EXPENSE RATIO | | | 1.17 | % | |
NET EXPENSE RATIO | | | 1.10 | % | |
This chart assumes an initial gross investment of $100,000 made on 12/16/05 (commencement of operations). Returns shown include the reinvestment of all distributions. Past performance is not predictive of future results. Investment return and principal value will fluctuate so that shares, when redeemed, may be worth more or less than the original cost. In the absence of existing fee waivers, total return would be reduced. To receive current to the most recent month-end performance, please call 1-888-825-2100.
The Russell 2000 Value Index measures the performance of those Russell 2000 companies with lower price-to-book ratios and lower forecasted growth values. The index does not reflect investment management fees, brokerage commissions and other expenses associated with investing in equity securities. A direct investment in the index is not possible.
Frontegra Asset Management, Inc. has contractually agreed through October 31, 2016, to waive its management fee and/or reimburse the Fund's operating expenses to the extent necessary to ensure that the Fund's total operating expenses (excluding taxes, interest, brokerage commissions, acquired fund fees and expenses and extraordinary expenses) do not exceed 1.10% of the Fund's average daily net assets for the Institutional Class. The expense ratios presented are based on the annualized expense ratios as reported in the Fund's current prospectus, which may differ from the expense ratios presented in the Fund's financial highlights.
** The returns shown do not reflect the deduction of taxes that a shareholder would pay on Fund distributions or the redemption of Fund shares.
The above graph relates to Institutional Class shares of the Fund. Performance for Class Y shares will vary from the performance of the Institutional Class shares shown above due to differences in expenses.
page 21
This page intentionally left blank.

FRONTIER
PHOCAS SMALL CAP VALUE FUND

REPORT FROM PHOCAS FINANCIAL CORPORATION
Dear Fellow Shareholders:
The Frontier Phocas Small Cap Value Fund strives to achieve capital appreciation by investing in a diversified portfolio of equity securities of companies with small market capitalizations. The Fund's performance is measured against the Russell 2000® Value Index.
Performance Review
During the twelve-month period ended June 30, 2015, the Frontier Phocas Small Cap Value Fund returned 0.84%, net of fees, compared to the 0.78% return of the benchmark, the Russell 2000 Value Index (the "Benchmark").
There have been three significant factors affecting equity prices during the year. One of the contributing issues in broader equity markets has been the situation regarding Greece and the Eurozone, with uncertainty about the risks of contagion if Greece were to leave the Eurozone, and how that might affect the economies of other countries. Additionally, there are concerns about the timing of interest rate hikes here in the U.S., and their potential negative effects on the U.S. economy. As if those two issues did not hurt enough, oil prices tumbled from their previous levels, and those price declines caused contractions in the stock prices of companies in the Energy sector.
For the year ended June 30, sectors in the Benchmark which contributed positively to the Fund's performance were Health Care and Financials. Health Care rose 24.82% for the year, driven by a 42.72% increase in the Pharmaceuticals and Biotechnology group. Financials rose 7.17% for the period, lifted by companies in the Banks and Insurance groups; those two groups were up 12.35% and 10.29%, respectively.
On the other hand, as alluded to above, the Energy sector within the Benchmark declined significantly, falling 49.45% for the twelve-month period ended June 30. Overall, the Materials sector also impaired the Benchmark's performance, falling 10.94% for the period. The third largest declining Benchmark sector was the Telecommunications sector, which contracted some 6.76% for the period.
Portfolio Review and Strategy
Within Pharmaceuticals and Biotechnology, the Fund was lifted by performances by United Therapeutics, Progenics Pharmaceuticals, and Impax Laboratories. The Fund's holdings in State Bank Financial, United Community Banks, and Fidelity Southern were its top three performers in the Banks group for the year ended June 30. Among the Fund's Insurance holdings, Argo Group Holdings International was a standout for the period.
Offsetting those gains, the Fund's overall performance for the period was impaired by its holdings in the Energy, Consumer Staples, and Industrials sectors. The top underperformers in the Energy sector for the Fund were Goodrich Petroleum, Comstock Resources, and Rosetta Resources.
Within the Consumer Staples sector, the underperformance of the Fund's holdings was driven largely by stock price declines in the Food, Beverage, and Tobacco group. The aggregate underperformances for the period in that area were from two companies, Post Holdings and Darling Ingredients.
Stocks in the Capital Goods group within the Industrials sector also reduced the Fund's performance for the year ended June 30. There were four significant underperformers in that group, each declining roughly the same proportion over the period. Those four companies were Timken Company, Triumph Group, Trinity Industries, and WESCO International. Esterline Technologies and Regal-Beloit also harmed the Fund's performance during the period.
Because it is quite difficult, if not impossible, to time markets or sectors on a consistent basis, our core investment strategy remains to concentrate on identifying undervalued stocks in each sector. We believe that this will continue to be the best strategy, longer-term.
page 24

We also feel that the best performing companies remain those that are finding new growth opportunities, are overhauling their operations to reduce costs significantly, or are investing their free cash flow and cash on their balance sheets to acquire promising businesses. In addition, we continue to search for companies with greatly discounted valuations based on concerns that we think can be repaired in a timely fashion. We remain fully invested with less than 5% cash or equivalents.
Thank you for your continued support.
William Schaff, CFA | | Steve Block, CFA | |
Chief Executive Officer and Portfolio Manager | | Portfolio Manager | |
Phocas Financial Corporation | | Phocas Financial Corporation | |
page 25

INVESTMENT HIGHLIGHTS
Growth of a $100,000 Investment (Unaudited)
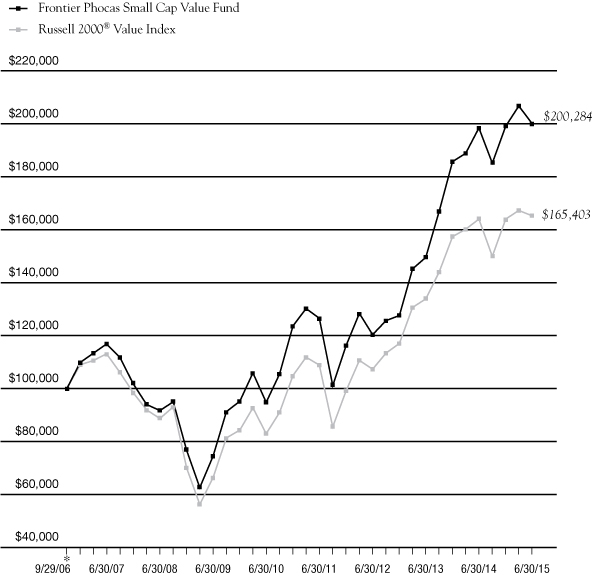
* 9/29/06 commencement of operations.
Portfolio Total Return**
FOR PERIODS ENDED 6/30/15 | | FUND | | INDEX | |
SIX MONTHS | | | 0.50 | % | | | 0.76 | % | |
ONE YEAR | | | 0.84 | % | | | 0.78 | % | |
FIVE YEAR
AVERAGE ANNUAL | | | 16.13 | % | | | 14.81 | % | |
AVERAGE ANNUAL
SINCE INCEPTION | | | 8.26 | % | | | 5.92 | % | |
Fund Expenses | |
GROSS EXPENSE RATIO | | | 2.00 | % | |
NET EXPENSE RATIO | | | 1.13 | % | |
This chart assumes an initial gross investment of $100,000 made on 9/29/06. Returns shown include the reinvestment of all distributions. Past performance is not predictive of future results. Investment return and principal value will fluctuate so that shares, when redeemed, may be worth more or less than the original cost. In the absence of fee waivers, total return would be reduced. Effective October 8, 2010, Phocas Financial Corp. ("Phocas") became subadviser to the Fund and Frontegra Asset Management, Inc. became adviser to the Fund. Prior to October 8, 2010, Phocas served as adviser to the Fund. To receive current to the most recent month-end performance, please call 1-888-825-2100.
The Russell 2000® Value Index measures the performance of those Russell 2000® companies with lower price-to-book ratios and lower forecasted growth values. The index does not reflect investment management fees, brokerage commissions and other expenses associated with investing in equity securities. A direct investment in the index is not possible.
Frontegra Asset Management, Inc. has contractually agreed through October 31, 2016, to waive its management fee and/or reimburse the Fund's operating expenses to the extent necessary to ensure that the Fund's total operating expenses (excluding taxes, interest, brokerage commissions, acquired fund fees and expenses and extraordinary expenses) do not exceed 1.10% of the Fund's average daily net assets. The expense ratios presented are based on the annualized expense ratios as reported in the Fund's current prospectus, which may differ from the expense ratios presented in the Fund's financial highlights.
** The returns shown do not reflect the deduction of taxes that a shareholder would pay on Fund distributions or the redemption of Fund shares.
page 26

Frontier Funds
EXPENSE EXAMPLE
June 30, 2015 (Unaudited)
As a shareholder of a mutual fund, you incur two types of costs: (1) transaction costs, including redemption fees, and (2) ongoing costs, including management fees, distribution and/or service (12b-1) fees and other fund expenses. Although the Funds charge no sales loads, you will be assessed fees for outgoing wire transfers, returned checks and stop payment orders at prevailing rates charged by U.S. Bancorp Fund Services, LLC, the Funds' transfer agent. If you request that a redemption be made by wire transfer, currently the Funds' transfer agent charges a $15.00 fee. A redemption fee of 2.00% of the then current value of the shares redeemed may be imposed on certain redemptions of shares made within 30 days of purchase for the Frontier MFG Global Equity, Frontier MFG Global Plus and Frontier MFG Core Infrastructure Funds.
This Example is intended to help you understand your ongoing costs (in dollars) of investing in the Funds and to compare these costs with the ongoing costs of investing in other mutual funds. The Example is based on an investment of $1,000 invested at the beginning of the period and held for the entire period (1/1/15 – 6/30/15).
Actual Expenses
The first line of the table on the following page for each Fund provides information about actual account values and actual expenses. The Example includes management fees, registration fees, fee waivers/reimbursements and other expenses. However, the Example does not include portfolio trading commissions and related expenses and other extraordinary expenses as determined under generally accepted accounting principles. You may use the information in this line, together with the amount you invested, to estimate the expenses that you paid over the period. Simply divide your account value by $1,000 (for example, an $8,600 account value divided by $1,000 = 8.6), then multiply the result by the number in the first line under the heading entitled "Expenses Paid During the Period" to estimate the expenses you paid on your account during this period.
Hypothetical Example for Comparison Purposes
The second line of the table for each Fund provides information about hypothetical account values and hypothetical expenses based on each of the Fund's actual expense ratios and an assumed rate of return of 5% per year before expenses, which is not the actual return. The hypothetical account values and expenses may not be used to estimate the actual ending account balance or expenses you paid for the period. You may use this information to compare the ongoing costs of investing in each of the Funds and other funds. To do so, compare this 5% hypothetical example with the 5% hypothetical examples that appear in the shareholder reports of the other funds.
Please note that the expenses shown in the table are meant to highlight your ongoing costs only and do not reflect any transactional costs, such as redemption fees. Therefore, the second line of the table is useful in comparing ongoing costs only, and will not help you determine the relative total costs of owning different funds. In addition, if these transactional costs were included, your costs could have been higher.
page 27

Frontier Funds
EXPENSE EXAMPLE (continued)
June 30, 2015 (Unaudited)
| | Beginning Account
Value 1/1/2015 | | Ending Account
Value 6/30/2015 | | Annualized
Expense Ratio* | | Expenses Paid
During the Period* | |
MFG Global Equity Fund | |
Actual Fund Return | | $ | 1,000.00 | | | $ | 1,036.30 | | | | 0.80 | % | | $ | 4.04 | | |
Hypothetical 5% Return | | $ | 1,000.00 | | | $ | 1,020.83 | | | | 0.80 | % | | $ | 4.01 | | |
MFG Core Infrastructure Fund | |
Actual Fund Return | | $ | 1,000.00 | | | $ | 944.60 | | | | 0.70 | % | | $ | 3.38 | | |
Hypothetical 5% Return | | $ | 1,000.00 | | | $ | 1,021.32 | | | | 0.70 | % | | $ | 3.51 | | |
Timpani Small Cap Growth
Fund – Institutional Class | |
Actual Fund Return | | $ | 1,000.00 | | | $ | 1,132.20 | | | | 1.10 | % | | $ | 5.82 | | |
Hypothetical 5% Return | | $ | 1,000.00 | | | $ | 1,019.34 | | | | 1.10 | % | | $ | 5.51 | | |
Timpani Small Cap Growth
Fund – Class Y | |
Actual Fund Return | | $ | 1,000.00 | | | $ | 1,129.70 | | | | 1.50 | % | | $ | 7.92 | | |
Hypothetical 5% Return | | $ | 1,000.00 | | | $ | 1,017.36 | | | | 1.50 | % | | $ | 7.50 | | |
Netols Small Cap Value
Fund – Institutional Class | |
Actual Fund Return | | $ | 1,000.00 | | | $ | 1,026.50 | | | | 1.10 | % | | $ | 5.53 | | |
Hypothetical 5% Return | | $ | 1,000.00 | | | $ | 1,019.34 | | | | 1.10 | % | | $ | 5.51 | | |
Netols Small Cap Value
Fund – Class Y | |
Actual Fund Return | | $ | 1,000.00 | | | $ | 1,026.90 | | | | 1.10 | % | | $ | 5.53 | | |
Hypothetical 5% Return | | $ | 1,000.00 | | | $ | 1,019.34 | | | | 1.10 | % | | $ | 5.51 | | |
Phocas Small Cap Value Fund | |
Actual Fund Return | | $ | 1,000.00 | | | $ | 1,005.00 | | | | 1.10 | % | | $ | 5.47 | | |
Hypothetical 5% Return | | $ | 1,000.00 | | | $ | 1,019.34 | | | | 1.10 | % | | $ | 5.51 | | |
* Expenses are equal to each Fund's annualized expense ratio indicated above, multiplied by the average account value over the period, multiplied by 181/365 to reflect the one-half year period.
page 28

Frontier Funds
EXPENSE EXAMPLE (continued)
June 30, 2015 (Unaudited)
| | Beginning Account
Value | | Ending Account
Value 6/30/2015 | | Annualized
Expense Ratio | | Expenses Paid
During the Period | |
MFG Global Plus Fund | |
Actual Fund Return* | | $ | 1,000.00 | | | $ | 991.00 | | | | 0.80 | % | | $ | 2.16 | | |
Hypothetical 5% Return** | | $ | 1,000.00 | | | $ | 1,020.83 | | | | 0.80 | % | | $ | 4.01 | | |
* Actual expenses are equal to the Fund's annualized expense ratio of 0.80% multiplied by the average account value over the period, multiplied by 99/365 to reflect the most recent fiscal period end since the MFG Global Plus Fund commenced operations on March 23, 2015.
** Hypothetical expenses are equal to the Fund's annualized expense ratio of 0.80% multiplied by the average account value over the period commencing January 1, 2015, multiplied by 181/365 to reflect information had the MFG Global Plus Fund been in operation for the entire fiscal half year.
page 29

Frontier MFG Global Equity Fund
SCHEDULE OF INVESTMENTS
June 30, 2015
Number of Shares | | | | Value | |
COMMON STOCKS 84.6% | | | |
| | | Australia 2.8% | |
| | 1,489,815 | | | Woolworths Ltd. | | $ | 30,989,679 | | |
| | | France 2.8% | |
| | 312,551 | | | Sanofi | | | 30,747,063 | | |
| | | Germany 1.2% | |
| | 188,068 | | | SAP SE | | | 13,125,217 | | |
| | | Netherlands 1.6% | |
| | 418,438 | | | Unilever NV | | | 17,425,975 | | |
| | | Switzerland 2.3% | |
| | 363,434 | | | Nestle SA | | | 26,238,617 | | |
| | | United Kingdom 8.2% | |
| | 34,049,158 | | | Lloyds Banking Group PLC | | | 45,602,888 | | |
| | 13,477,312 | | | Tesco PLC | | | 45,009,784 | | |
| | | | 90,612,672 | | |
| | | United States 65.7% | |
| | 83,598 | | | American Express Co. | | | 6,497,237 | | |
| | 1,395,757 | | | eBay, Inc. (a) | | | 84,080,402 | | |
| | 41,929 | | | Google, Inc. - Class A (a) | | | 22,643,337 | | |
| | 22,238 | | | Google, Inc. - Class C (a) | | | 11,575,107 | | |
| | 1,530,535 | | | Intel Corp. | | | 46,551,222 | | |
| | 324,608 | | | International Business
Machines Corp. | | | 52,800,737 | | |
| | 878,535 | | | Lowe's Companies, Inc. | | | 58,835,489 | | |
| | 328,602 | | | MasterCard, Inc. - Class A | | | 30,717,715 | | |
| | 1,768,138 | | | Microsoft Corp. | | | 78,063,293 | | |
| | 704,738 | | | Oracle Corp. | | | 28,400,941 | | |
| | 228,886 | | | QUALCOMM, Inc. | | | 14,335,130 | | |
| | 398,121 | | | State Street Corp. | | | 30,655,317 | | |
| | 532,975 | | | Target Corp. | | | 43,506,749 | | |
| | 754,303 | | | The Bank of New York
Mellon Corp. | | | 31,658,097 | | |
| | 409,978 | | | The Home Depot, Inc. | | | 45,560,855 | | |
Number of Shares | | | | Value | |
| | | United States 65.7% (continued) | |
| | 788,898 | | | Visa, Inc. - Class A | | $ | 52,974,501 | | |
| | 485,671 | | | Wells Fargo & Co. | | | 27,314,137 | | |
| | 676,978 | | | Yum! Brands, Inc. | | | 60,982,178 | | |
| | | | 727,152,444 | | |
| | | Total Common Stocks | |
| | | | | (Cost $807,261,624) | | | 936,291,667 | | |
SHORT-TERM INVESTMENTS 15.4% | | | |
| | | Investment Company 15.4% | |
| | 169,924,409 | | | STIT Liquid Assets Portfolio -
Institutional Class, 0.10% | | | 169,924,409 | | |
| | | Total Short-Term Investments | |
| | | | | (Cost $169,924,409) | | | 169,924,409 | | |
| | | Total Investments 100.0% | |
| | | | | (Cost $977,186,033) | | | 1,106,216,076 | | |
| | | | | Other Assets in Excess of
Liabilities 0.0% | | | 308,747 | | |
| | | | | TOTAL NET ASSETS 100.0% | | $ | 1,106,524,823 | | |
(a) Non-Income Producing.
PORTFOLIO DIVERSIFICATION
Sectors | | Percentage | |
Information Technology | | | 39.3 | % | |
Consumer Discretionary | | | 18.9 | | |
Financials | | | 12.8 | | |
Consumer Staples | | | 10.8 | | |
Health Care | | | 2.8 | | |
Total Common Stocks | | | 84.6 | | |
Total Short-Term Investments | | | 15.4 | | |
Total Investments | | | 100.0 | | |
Other Assets in Excess of Liabilities | | | 0.0 | | |
Total Net Assets | | | 100.0 | % | |
The accompanying notes are an integral part of these financial statements.
page 30

Frontier MFG Global Plus Fund
SCHEDULE OF INVESTMENTS
June 30, 2015
Number of Shares | | | | Value | |
COMMON STOCKS 84.7% | | | |
| | | Australia 2.9% | |
| | 8,061 | | | Woolworths Ltd. | | $ | 167,677 | | |
| | | France 2.8% | |
| | 1,652 | | | Sanofi | | | 162,515 | | |
| | | Germany 1.2% | |
| | 1,016 | | | SAP SE | | | 70,906 | | |
| | | Netherlands 1.5% | |
| | 2,143 | | | Unilever NV | | | 89,246 | | |
| | | Switzerland 2.4% | |
| | 1,970 | | | Nestle SA | | | 142,227 | | |
| | | United Kingdom 8.1% | |
| | 179,683 | | | Lloyds Banking Group PLC | | | 240,653 | | |
| | 70,751 | | | Tesco PLC | | | 236,285 | | |
| | | | 476,938 | | |
| | | United States 65.8% | |
| | 448 | | | American Express Co. | | | 34,819 | | |
| | 7,390 | | | eBay, Inc. (a) | | | 445,175 | | |
| | 229 | | | Google, Inc. - Class A (a) | | | 123,669 | | |
| | 123 | | | Google, Inc. - Class C (a) | | | 64,023 | | |
| | 8,021 | | | Intel Corp. | | | 243,959 | | |
| | 1,700 | | | International Business
Machines Corp. | | | 276,521 | | |
| | 4,651 | | | Lowe's Companies, Inc. | | | 311,477 | | |
| | 1,734 | | | MasterCard, Inc. - Class A | | | 162,095 | | |
| | 9,404 | | | Microsoft Corp. | | | 415,186 | | |
| | 3,716 | | | Oracle Corp. | | | 149,755 | | |
| | 1,274 | | | QUALCOMM, Inc. | | | 79,791 | | |
| | 2,100 | | | State Street Corp. | | | 161,700 | | |
| | 2,848 | | | Target Corp. | | | 232,482 | | |
| | 3,987 | | | The Bank of New York
Mellon Corp. | | | 167,334 | | |
| | 2,163 | | | The Home Depot, Inc. | | | 240,374 | | |
Number of Shares | | | | Value | |
| | | United States 65.8% (continued) | |
| | 4,171 | | | Visa, Inc. - Class A | | $ | 280,083 | | |
| | 2,598 | | | Wells Fargo & Co. | | | 146,112 | | |
| | 3,551 | | | Yum! Brands, Inc. | | | 319,874 | | |
| | | | 3,854,429 | | |
| | | Total Common Stocks | |
| | | | | (Cost $5,038,829) | | | 4,963,938 | | |
SHORT-TERM INVESTMENTS 15.2% | | | |
| | | Investment Company 15.2% | |
| | 888,697 | | | STIT Liquid Assets Portfolio -
Institutional Class, 0.10% | | | 888,697 | | |
| | | Total Short-Term Investments | |
| | | | | (Cost $888,697) | | | 888,697 | | |
| | | Total Investments 99.9% | |
| | | | | (Cost $5,927,526) | | | 5,852,635 | | |
| | | | | Other Assets in Excess of
Liabilities 0.1% | | | 6,711 | | |
| | | | | TOTAL NET ASSETS 100.0% | | $ | 5,859,346 | | |
(a) Non-Income Producing.
PORTFOLIO DIVERSIFICATION
Sectors | | Percentage | |
Information Technology | | | 39.4 | % | |
Consumer Discretionary | | | 18.9 | | |
Financials | | | 12.8 | | |
Consumer Staples | | | 10.8 | | |
Health Care | | | 2.8 | | |
Total Common Stocks | | | 84.7 | | |
Total Short-Term Investments | | | 15.2 | | |
Total Investments | | | 99.9 | | |
Other Assets in Excess of Liabilities | | | 0.1 | | |
Total Net Assets | | | 100.0 | % | |
The accompanying notes are an integral part of these financial statements.
page 31

Frontier MFG Core Infrastructure Fund
SCHEDULE OF INVESTMENTS
June 30, 2015
Number of Shares | | | | Value | |
COMMON STOCKS 95.7% | | | |
| | | Australia 8.0% | |
| | 393,082 | | | APA Group | | $ | 2,499,052 | | |
| | 1,223,041 | | | AusNet Services | | | 1,316,376 | | |
| | 526,911 | | | DUET Group | | | 939,105 | | |
| | 517,265 | | | Spark Infrastructure Group | | | 780,234 | | |
| | 781,774 | | | Sydney Airport | | | 3,003,830 | | |
| | 612,964 | | | Transurban Group | | | 4,398,278 | | |
| | | | 12,936,875 | | |
| | | Austria 0.4% | |
| | 6,818 | | | Flughafen Wien AG | | | 591,515 | | |
| | | Canada 8.6% | |
| | 50,142 | | | Emera, Inc. | | | 1,579,332 | | |
| | 105,217 | | | Enbridge, Inc. | | | 4,920,516 | | |
| | 97,511 | | | Fortis, Inc. | | | 2,738,740 | | |
| | 112,811 | | | TransCanada Corp. | | | 4,584,697 | | |
| | 8,146 | | | Valener, Inc. | | | 109,831 | | |
| | | | 13,933,116 | | |
| | | France 6.1% | |
| | 31,692 | | | Aeroports de Paris | | | 3,580,887 | | |
| | 80,007 | | | Eutelsat Communications SA | | | 2,582,223 | | |
| | 108,116 | | | SES SA - ADR | | | 3,632,273 | | |
| | | | 9,795,383 | | |
| | | Germany 1.6% | |
| | 32,577 | | | Fraport AG Frankfurt Airport
Services Worldwide | | | 2,046,186 | | |
| | 24,712 | | | Hamburger Hafen und
Logistik AG | | | 500,037 | | |
| | | | 2,546,223 | | |
| | | Hong Kong 3.0% | |
| | 525,583 | | | Power Assets Holdings Ltd. | | | 4,793,714 | | |
| | | Italy 8.3% | |
| | 189,334 | | | Atlantia SpA | | | 4,677,519 | | |
| | 1,007,848 | | | Snam SpA | | | 4,795,531 | | |
Number of Shares | | | | Value | |
| | | Italy 8.3% (continued) | |
| | 80,260 | | | Societa Iniziative Autostradali
e Servizi SpA | | $ | 856,305 | | |
| | 709,109 | | | Terna Rete Elettrica
Nazionale SpA | | | 3,133,747 | | |
| | | | 13,463,102 | | |
| | | Mexico 2.3% | |
| | 106,238 | | | Grupo Aeroportuario del
Centro Norte SAB de CV | | | 522,082 | | |
| | 159,984 | | | Grupo Aeroportuario del
Pacifico SAB de CV - Class B | | | 1,095,230 | | |
| | 95,357 | | | Grupo Aeroportuario del
Sureste SAB de CV - Class B | | | 1,354,746 | | |
| | 611,157 | | | OHL Mexico SAB de CV (a) | | | 793,230 | | |
| | | | 3,765,288 | | |
| | | Netherlands 1.4% | |
| | 45,098 | | | Koninklijke Vopak NV | | | 2,275,815 | | |
| | | New Zealand 1.3% | |
| | 420,186 | | | Auckland International
Airport Ltd. | | | 1,405,185 | | |
| | 351,447 | | | Vector Ltd. | | | 783,539 | | |
| | | | 2,188,724 | | |
| | | Spain 9.6% | |
| | 288,708 | | | Abertis Infraestructuras SA | | | 4,734,659 | | |
| | 48,058 | | | Aena SA (a) | | | 5,022,361 | | |
| | 84,222 | | | Enagas SA | | | 2,290,570 | | |
| | 43,320 | | | Red Electrica Corp. SA | | | 3,471,473 | | |
| | | | 15,519,063 | | |
| | | Switzerland 1.0% | |
| | 2,166 | | | Flughafen Zuerich AG | | | 1,676,133 | | |
| | | United Kingdom 7.6% | |
| | 363,427 | | | National Grid PLC | | | 4,666,466 | | |
| | 140,523 | | | Pennon Group PLC | | | 1,789,547 | | |
| | 84,050 | | | Severn Trent PLC | | | 2,748,225 | | |
| | 216,947 | | | United Utilities Group PLC | | | 3,040,612 | | |
| | | | 12,244,850 | | |
The accompanying notes are an integral part of these financial statements.
page 32

Frontier MFG Core Infrastructure Fund
SCHEDULE OF INVESTMENTS (continued)
June 30, 2015
Number of Shares | | | | Value | |
| COMMON STOCKS 95.7% (continued) | | | |
| | | United States 36.5% | |
| | 7,159 | | | ALLETE, Inc. | | $ | 332,106 | | |
| | 16,751 | | | Alliant Energy Corp. | | | 966,868 | | |
| | 38,349 | | | Ameren Corp. | | | 1,444,990 | | |
| | 61,645 | | | American Electric Power Co., Inc. | | | 3,265,336 | | |
| | 3,329 | | | American States Water Co. | | | 124,471 | | |
| | 38,466 | | | American Tower Corp. | | | 3,588,493 | | |
| | 26,629 | | | American Water Works Co., Inc. | | | 1,294,968 | | |
| | 26,201 | | | Aqua America, Inc. | | | 641,662 | | |
| | 14,928 | | | Atmos Energy Corp. | | | 765,508 | | |
| | 9,229 | | | Avista Corp. | | | 282,869 | | |
| | 4,338 | | | California Water Service Group | | | 99,123 | | |
| | 63,631 | | | CenterPoint Energy, Inc. | | | 1,210,898 | | |
| | 8,950 | | | Cleco Corp. | | | 481,957 | | |
| | 40,889 | | | CMS Energy Corp. | | | 1,301,906 | | |
| | 43,352 | | | Consolidated Edison, Inc. | | | 2,509,214 | | |
| | 42,011 | | | Crown Castle International Corp. | | | 3,373,483 | | |
| | 48,744 | | | Duke Energy Corp. | | | 3,442,301 | | |
| | 48,225 | | | Edison International | | | 2,680,346 | | |
| | 5,972 | | | El Paso Electric Co. | | | 206,990 | | |
| | 46,980 | | | Eversource Energy | | | 2,133,362 | | |
| | 22,821 | | | Great Plains Energy, Inc. | | | 551,355 | | |
| | 7,439 | | | IDACORP, Inc. | | | 417,625 | | |
| | 22,970 | | | ITC Holdings Corp. | | | 739,175 | | |
| | 46,803 | | | NiSource, Inc. | | | 2,133,749 | | |
| | 4,041 | | | Northwest Natural Gas Co. | | | 170,449 | | |
| | 6,962 | | | NorthWestern Corp. | | | 339,398 | | |
| | 7,569 | | | ONE Gas, Inc. | | | 322,137 | | |
| | 69,096 | | | PG&E Corp. | | | 3,392,614 | | |
| | 11,659 | | | Piedmont Natural Gas Co., Inc. | | | 411,679 | | |
| | 17,741 | | | Pinnacle West Capital Corp. | | | 1,009,285 | | |
| | 11,788 | | | PNM Resources, Inc. | | | 289,985 | | |
| | 11,592 | | | Portland General Electric Co. | | | 384,391 | | |
| | 98,764 | | | PPL Corp. | | | 2,910,575 | | |
| | 25,972 | | | Questar Corp. | | | 543,075 | | |
| | 21,153 | | | SCANA Corp. | | | 1,071,399 | | |
| | 34,348 | | | Sempra Energy | | | 3,398,391 | | |
| | 1,405 | | | SJW Corp. | | | 43,119 | | |
| | 6,903 | | | Southwest Gas Corp. | | | 367,309 | | |
Number of Shares | | | | Value | |
| | | United States 36.5% (continued) | |
| | 34,855 | | | TECO Energy, Inc. | | $ | 615,539 | | |
| | 6,418 | | | The Empire District Electric Co. | | | 139,912 | | |
| | 6,408 | | | The Laclede Group, Inc. | | | 333,600 | | |
| | 79,814 | | | The Southern Co. | | | 3,344,207 | | |
| | 8,369 | | | UIL Holdings Corp. | | | 383,468 | | |
| | 12,229 | | | Vectren Corp. | | | 470,572 | | |
| | 46,669 | | | WEC Energy Group, Inc. | | | 2,098,700 | | |
| | 19,523 | | | Westar Energy, Inc. | | | 668,077 | | |
| | 74,761 | | | Xcel Energy, Inc. | | | 2,405,809 | | |
| | | | 59,102,445 | | |
| | | Total Common Stocks | |
| | | | | (Cost $159,473,209) | | | 154,832,246 | | |
CLOSED-END FUNDS 1.1% | | | |
| | | United Kingdom 1.1% | |
| | 446,232 | | | HICL Infrastructure Co. Ltd. | | | 1,079,752 | | |
| | 289,267 | | | International Public
Partnerships Ltd. | | | 616,767 | | |
| | | | 1,696,519 | | |
| | | Total Closed-End Funds | |
| | | | | (Cost $1,627,670) | | | 1,696,519 | | |
SHORT-TERM INVESTMENTS 2.2% | | | |
| | | Investment Company 2.2% | |
| | 3,610,701 | | | STIT Liquid Assets Portfolio -
Institutional Class, 0.10% | | | 3,610,701 | | |
| | | Total Short-Term Investments | |
| | | | | (Cost $3,610,701) | | | 3,610,701 | | |
| | | Total Investments 99.0% | |
| | | | | (Cost $164,711,580) | | | 160,139,466 | | |
| | | | | Other Assets in Excess of
Liabilities 1.0% | | | 1,582,381 | | |
| | | | | TOTAL NET ASSETS 100.0% | | $ | 161,721,847 | | |
(a) Non-Income Producing.
ADR - American Depositary Receipt
The accompanying notes are an integral part of these financial statements.
page 33

Frontier MFG Core Infrastructure Fund
SCHEDULE OF INVESTMENTS (continued)
June 30, 2015
PORTFOLIO DIVERSIFICATION
Sectors | | Percentage | |
Integrated Power | | | 25.6 | % | |
Transmission & Distribution | | | 16.5 | | |
Gas | | | 15.6 | | |
Airport | | | 12.6 | | |
Toll Road | | | 9.6 | | |
Communications | | | 8.1 | | |
Water Utility | | | 6.0 | | |
Port | | | 1.7 | | |
Total Common Stocks | | | 95.7 | | |
Social | | | 1.1 | | |
Total Closed-End Funds | | | 1.1 | | |
Total Short-Term Investments | | | 2.2 | | |
Total Investments | | | 99.0 | | |
Other Assets in Excess of Liabilities | | | 1.0 | | |
Total Net Assets | | | 100.0 | % | |
The accompanying notes are an integral part of these financial statements.
page 34

Frontier Timpani Small Cap Growth Fund
SCHEDULE OF INVESTMENTS
June 30, 2015
Number of Shares | | | | Value | |
COMMON STOCKS 98.5% | | | |
| | | Consumer Discretionary 23.1% | |
| | 3,841 | | | Asbury Automotive
Group, Inc. (a) | | $ | 348,071 | | |
| | 15,431 | | | Big 5 Sporting Goods Corp. | | | 219,274 | | |
| | 13,578 | | | BJ's Restaurants, Inc. (a) | | | 657,854 | | |
| | 691 | | | Fogo de Chao, Inc. (a) | | | 16,003 | | |
| | 5,624 | | | Gentherm, Inc. (a) | | | 308,814 | | |
| | 13,884 | | | G-III Apparel Group Ltd. (a) | | | 976,739 | | |
| | 3,767 | | | Grand Canyon Education, Inc. (a) | | | 159,721 | | |
| | 13,154 | | | IMAX Corp. (a) | | | 529,712 | | |
| | 11,779 | | | Jack in the Box, Inc. | | | 1,038,437 | | |
| | 6,680 | | | Kona Grill, Inc. (a) | | | 129,659 | | |
| | 10,470 | | | Lithia Motors, Inc. - Class A | | | 1,184,785 | | |
| | 12,195 | | | Malibu Boats, Inc. - Class A (a) | | | 244,998 | | |
| | 17,775 | | | Motorcar Parts of America, Inc. (a) | | | 534,850 | | |
| | 32,297 | | | Nautilus, Inc. (a) | | | 694,708 | | |
| | 31,379 | | | PFSweb, Inc. (a) | | | 434,913 | | |
| | 26,415 | | | Red Lion Hotels Corp. (a) | | | 202,339 | | |
| | 10,484 | | | Skechers U.S.A., Inc. -
Class A (a) | | | 1,151,038 | | |
| | 15,651 | | | Sonic Corp. | | | 450,749 | | |
| | 17,109 | | | The Habit Restaurants, Inc. -
Class A (a) | | | 535,341 | | |
| | 11,708 | | | The Ryland Group, Inc. | | | 542,900 | | |
| | 11,771 | | | Wayfair, Inc. - Class A (a) | | | 443,060 | | |
| | 16,216 | | | Zoe's Kitchen, Inc. (a) | | | 663,883 | | |
| | | | 11,467,848 | | |
| | | Consumer Staples 0.5% | |
| | 5,255 | | | Diplomat Pharmacy, Inc. (a) | | | 235,161 | | |
| | | Financial Services 7.5% | |
| | 9,608 | | | Euronet Worldwide, Inc. (a) | | | 592,813 | | |
| | 29,277 | | | LendingTree, Inc. (a) | | | 2,301,465 | | |
| | 3,505 | | | Marcus & Millichap, Inc. (a) | | | 161,721 | | |
| | 29,573 | | | WisdomTree Investments, Inc. | | | 649,571 | | |
| | | | 3,705,570 | | |
Number of Shares | | | | Value | |
| | | Health Care 32.1% | |
| | 21,025 | | | AAC Holdings, Inc. (a) | | $ | 915,849 | | |
| | 13,576 | | | Adeptus Health, Inc. - Class A (a) | | | 1,289,584 | | |
| | 12,928 | | | AMAG Pharmaceuticals, Inc. (a) | | | 892,808 | | |
| | 20,406 | | | ANI Pharmaceuticals, Inc. (a) | | | 1,266,192 | | |
| | 12,040 | | | BioDelivery Sciences
International, Inc. (a) | | | 95,838 | | |
| | 11,223 | | | Cantel Medical Corp. | | | 602,338 | | |
| | 5,968 | | | Capital Senior Living Corp. (a) | | | 146,216 | | |
| | 20,508 | | | Cardiovascular Systems, Inc. (a) | | | 542,437 | | |
| | 4,206 | | | Cynosure, Inc. - Class A (a) | | | 162,268 | | |
| | 30,143 | | | Depomed, Inc. (a) | | | 646,869 | | |
| | 28,331 | | | Dipexium Pharmaceuticals, Inc. (a) | | | 360,370 | | |
| | 7,290 | | | Eagle Pharmaceuticals, Inc. (a) | | | 589,470 | | |
| | 13,783 | | | Heska Corp. (a) | | | 409,217 | | |
| | 43,880 | | | Horizon Pharma Plc (a) | | | 1,524,391 | | |
| | 3,556 | | | ICU Medical, Inc. (a) | | | 340,167 | | |
| | 18,382 | | | INC Research Holdings, Inc. -
Class A (a) | | | 737,486 | | |
| | 17,248 | | | Inogen, Inc. (a) | | | 769,261 | | |
| | 16,710 | | | Intersect ENT, Inc. (a) | | | 478,407 | | |
| | 6,001 | | | Intrexon Corp. (a) | | | 292,849 | | |
| | 17,446 | | | Lannett Co., Inc. (a) | | | 1,036,990 | | |
| | 19,626 | | | LDR Holding Corp. (a) | | | 848,825 | | |
| | 10,555 | | | Ligand Pharmaceuticals, Inc. (a) | | | 1,065,000 | | |
| | 17,924 | | | Nobilis Health Corp. (a) | | | 121,883 | | |
| | 5,518 | | | Retrophin, Inc. (a) | | | 182,922 | | |
| | 10,100 | | | Team Health Holdings, Inc. (a) | | | 659,833 | | |
| | | | 15,977,470 | | |
| | | Materials & Processing 1.8% | |
| | 13,371 | | | Apogee Enterprises, Inc. | | | 703,849 | | |
| | 3,809 | | | PGT, Inc. (a) | | | 55,269 | | |
| | 3,735 | | | U.S. Concrete, Inc. (a) | | | 141,519 | | |
| | | | 900,637 | | |
| | | Producer Durables 7.5% | |
| | 2,931 | | | Allegiant Travel Co. | | | 521,366 | | |
| | 3,659 | | | CoStar Group, Inc. (a) | | | 736,410 | | |
| | 12,786 | | | CUI Global, Inc. (a) | | | 64,697 | | |
The accompanying notes are an integral part of these financial statements.
page 35

Frontier Timpani Small Cap Growth Fund
SCHEDULE OF INVESTMENTS (continued)
June 30, 2015
Number of Shares | | | | Value | |
| COMMON STOCKS 98.5% (continued) | | | |
| | | Producer Durables 7.5% (continued) | |
| | 2,948 | | | Old Dominion Freight Line, Inc. (a) | | $ | 202,248 | | |
| | 50,798 | | | Radiant Logistics, Inc. (a) | | | 371,333 | | |
| | 27,491 | | | Scorpio Tankers, Inc. | | | 277,384 | | |
| | 7,728 | | | The Middleby Corp. (a) | | | 867,314 | | |
| | 2,617 | | | TransDigm Group, Inc. (a) | | | 587,962 | | |
| | 5,435 | | | USA Truck, Inc. (a) | | | 115,385 | | |
| | | | 3,744,099 | | |
| | | Technology 25.0% | |
| | 27,934 | | | Attunity Ltd. (a) | | | 365,097 | | |
| | 12,193 | | | Autobytel, Inc. (a) | | | 194,966 | | |
| | 10,905 | | | Barracuda Networks, Inc. (a) | | | 432,056 | | |
| | 5,748 | | | Cavium, Inc. (a) | | | 395,520 | | |
| | 16,456 | | | CEVA, Inc. (a) | | | 319,740 | | |
| | 6,238 | | | Criteo SA - ADR (a) | | | 297,365 | | |
| | 5,609 | | | EPAM Systems, Inc. (a) | | | 399,529 | | |
| | 7,926 | | | Globant SA (a) | | | 241,188 | | |
| | 16,152 | | | GTT Communications, Inc. (a) | | | 385,548 | | |
| | 2,502 | | | Imperva, Inc. (a) | | | 169,386 | | |
| | 65,129 | | | inContact, Inc. (a) | | | 642,823 | | |
| | 15,714 | | | Mellanox Technologies Ltd. (a) | | | 763,543 | | |
| | 8,138 | | | Proofpoint, Inc. (a) | | | 518,147 | | |
| | 31,426 | | | Q2 Holdings, Inc. (a) | | | 887,785 | | |
| | 12,360 | | | Qorvo, Inc. (a) | | | 992,137 | | |
| | 12,538 | | | Qualys, Inc. (a) | | | 505,908 | | |
| | 28,426 | | | Radware Ltd. (a) | | | 631,057 | | |
| | 21,005 | | | Super Micro Computer, Inc. (a) | | | 621,328 | | |
| | 25,307 | | | TechTarget, Inc. (a) | | | 225,992 | | |
| | 32,027 | | | The Rubicon Project, Inc. (a) | | | 479,124 | | |
| | 3,513 | | | The Ultimate Software
Group, Inc. (a) | | | 577,326 | | |
| | 39,550 | | | TubeMogul, Inc. (a) | | | 565,170 | | |
| | 3,930 | | | Tyler Technologies, Inc. (a) | | | 508,463 | | |
| | 25,231 | | | VASCO Data Security
International, Inc. (a) | | | 761,724 | | |
| | 9,389 | | | Verint Systems, Inc. (a) | | | 570,335 | | |
| | | | 12,451,257 | | |
Number of Shares | | | | Value | |
| | | Utilities 1.0% | |
| | 60,699 | | | Boingo Wireless, Inc. (a) | | $ | 501,374 | | |
| | | Total Common Stocks | |
| | | (Cost $38,393,723) | | | 48,983,416 | | |
SHORT-TERM INVESTMENTS 2.1% | |
| | | Investment Company 2.1% | |
| | 1,039,492 | | | STIT-STIC Prime Portfolio -
Institutional Class, 0.07% | | | 1,039,492 | | |
| | | Total Short-Term Investments | |
| | | (Cost $1,039,492) | | | 1,039,492 | | |
| | | Total Investments 100.6% | |
| | | (Cost $39,433,215) | | | 50,022,908 | | |
| | | Liabilities in Excess of
Other Assets (0.6)% | | | (306,245 | ) | |
| | | TOTAL NET ASSETS 100.0% | | $ | 49,716,663 | | |
(a) Non-Income Producing.
ADR - American Depositary Receipt
PORTFOLIO DIVERSIFICATION
Sectors | | Percentage | |
Health Care | | | 32.1 | % | |
Technology | | | 25.0 | | |
Consumer Discretionary | | | 23.1 | | |
Producer Durables | | | 7.5 | | |
Financial Services | | | 7.5 | | |
Materials and Processing | | | 1.8 | | |
Utilities | | | 1.0 | | |
Consumer Staples | | | 0.5 | | |
Total Common Stocks | | | 98.5 | | |
Total Short-Term Investments | | | 2.1 | | |
Total Investments | | | 100.6 | | |
Liabilities in Excess of Other Assets | | | (0.6 | ) | |
Total Net Assets | | | 100.0 | % | |
The accompanying notes are an integral part of these financial statements.
page 36

Frontier Netols Small Cap Value Fund
SCHEDULE OF INVESTMENTS
June 30, 2015
Number of Shares | | | | Value | |
COMMON STOCKS 98.5% | | | |
| | | Consumer Discretionary 13.7% | |
| | 144,282 | | | Accuride Corp. (a) | | $ | 555,486 | | |
| | 16,478 | | | Bob Evans Farms, Inc. | | | 841,202 | | |
| | 20,450 | | | Cabela's, Inc. (a) | | | 1,022,091 | | |
| | 19,777 | | | Capella Education Co. | | | 1,061,431 | | |
| | 13,203 | | | Carter's, Inc. | | | 1,403,479 | | |
| | 11,847 | | | Domino's Pizza, Inc. | | | 1,343,450 | | |
| | 39,959 | | | Ethan Allen Interiors, Inc. | | | 1,052,520 | | |
| | 19,354 | | | Tenneco, Inc. (a) | | | 1,111,694 | | |
| | 19,773 | | | The Cheesecake Factory, Inc. | | | 1,078,320 | | |
| | 45,007 | | | The Finish Line, Inc. - Class A | | | 1,252,095 | | |
| | | | 10,721,768 | | |
| | | Consumer Staples 5.0% | |
| | 33,838 | | | Boulder Brands, Inc. (a) | | | 234,836 | | |
| | 24,869 | | | Cal-Maine Foods, Inc. | | | 1,298,162 | | |
| | 14,335 | | | Casey's General Stores, Inc. | | | 1,372,433 | | |
| | 125,337 | | | SUPERVALU, Inc. (a) | | | 1,013,976 | | |
| | | | 3,919,407 | | |
| | | Energy 3.7% | |
| | 82,301 | | | Bill Barrett Corp. (a) | | | 706,966 | | |
| | 96,917 | | | Cloud Peak Energy, Inc. (a) | | | 451,633 | | |
| | 284,391 | | | McDermott International, Inc. (a) | | | 1,518,648 | | |
| | 161,329 | | | Willbros Group, Inc. (a) | | | 206,501 | | |
| | | | 2,883,748 | | |
| | | Financials 17.4% | |
| | 44,888 | | | BancorpSouth, Inc. | | | 1,156,315 | | |
| | 23,549 | | | Community Bank System, Inc. | | | 889,446 | | |
| | 20,605 | | | Endurance Specialty Holdings Ltd. | | | 1,353,749 | | |
| | 40,035 | | | Glacier Bancorp, Inc. | | | 1,177,830 | | |
| | 151,978 | | | MGIC Investment Corp. (a) | | | 1,729,510 | | |
| | 62,990 | | | Old National Bancorp | | | 910,835 | | |
| | 43,365 | | | Selective Insurance Group, Inc. | | | 1,216,388 | | |
| | 54,322 | | | State Bank Financial Corp. | | | 1,178,787 | | |
| | 83,997 | | | Sterling Bancorp | | | 1,234,756 | | |
Number of Shares | | | | Value | |
| | | Financials 17.4% (continued) | |
| | 21,057 | | | The Hanover Insurance
Group, Inc. | | $ | 1,558,850 | | |
| | 31,779 | | | Webster Financial Corp. | | | 1,256,859 | | |
| | | | 13,663,325 | | |
| | | Health Care 14.4% | |
| | 14,996 | | | Acadia Healthcare
Company, Inc. (a) | | | 1,174,637 | | |
| | 58,882 | | | Albany Molecular
Research, Inc. (a) | | | 1,190,594 | | |
| | 22,847 | | | CONMED Corp. | | | 1,331,295 | | |
| | 15,651 | | | Haemonetics Corp. (a) | | | 647,325 | | |
| | 21,223 | | | Integra LifeSciences Holdings
Corp. (a) | | | 1,429,793 | | |
| | 70,194 | | | Invacare Corp. | | | 1,518,296 | | |
| | 13,655 | | | LifePoint Hospitals, Inc. (a) | | | 1,187,302 | | |
| | 26,181 | | | U.S. Physical Therapy, Inc. | | | 1,433,672 | | |
| | 25,516 | | | VCA Antech, Inc. (a) | | | 1,388,198 | | |
| | | | 11,301,112 | | |
| | | Industrials 13.8% | |
| | 46,016 | | | Brady Corp. - Class A | | | 1,138,436 | | |
| | 55,172 | | | Briggs & Stratton Corp. | | | 1,062,613 | | |
| | 92,477 | | | Commercial Vehicle
Group, Inc. (a) | | | 666,759 | | |
| | 7,938 | | | Genesee & Wyoming, Inc. (a) | | | 604,717 | | |
| | 33,508 | | | Herman Miller, Inc. | | | 969,386 | | |
| | 106,233 | | | PGT, Inc. (a) | | | 1,541,441 | | |
| | 43,438 | | | Thermon Group Holdings, Inc. (a) | | | 1,045,553 | | |
| | 41,680 | | | TriMas Corp. (a) | | | 1,233,728 | | |
| | 8,690 | | | United Rentals, Inc. (a) | | | 761,418 | | |
| | 18,844 | | | Westinghouse Air Brake
Technologies Corp. | | | 1,775,858 | | |
| | | | 10,799,909 | | |
The accompanying notes are an integral part of these financial statements.
page 37

Frontier Netols Small Cap Value Fund
SCHEDULE OF INVESTMENTS (continued)
June 30, 2015
Number of Shares | | | | Value | |
| COMMON STOCKS 98.5% (continued) | | | |
| | | Information Technology 15.1% | |
| | 38,957 | | | Bottomline Technologies (de),
Inc. (a) | | $ | 1,083,394 | | |
| | 14,953 | | | CACI International, Inc. -
Class A (a) | | | 1,209,548 | | |
| | 95,008 | | | Checkpoint Systems, Inc. | | | 967,181 | | |
| | 70,277 | | | Entegris, Inc. (a) | | | 1,023,936 | | |
| | 16,891 | | | Fair Isaac Corp. | | | 1,533,365 | | |
| | 104,316 | | | FormFactor, Inc. (a) | | | 959,707 | | |
| | 35,970 | | | ManTech International Corp. -
Class A | | | 1,043,130 | | |
| | 26,254 | | | Plexus Corp. (a) | | | 1,152,026 | | |
| | 47,441 | | | Progress Software Corp. (a) | | | 1,304,627 | | |
| | 45,929 | | | VeriFone Systems, Inc. (a) | | | 1,559,749 | | |
| | | | 11,836,663 | | |
| | | Materials 7.5% | |
| | 9,087 | | | Acuity Brands, Inc. | | | 1,635,478 | | |
| | 20,822 | | | Carpenter Technology Corp. | | | 805,395 | | |
| | 12,378 | | | Compass Minerals
International, Inc. | | | 1,016,729 | | |
| | 14,291 | | | Sensient Technologies Corp. | | | 976,647 | | |
| | 41,745 | | | Unifi, Inc. (a) | | | 1,398,458 | | |
| | | | 5,832,707 | | |
| | | Real Estate Investment Trusts 7.9% | |
| | 150,658 | | | Campus Crest Communities, Inc. | | | 834,645 | | |
| | 31,334 | | | Education Realty Trust, Inc. | | | 982,634 | | |
| | 94,755 | | | FelCor Lodging Trust, Inc. | | | 936,180 | | |
| | 50,807 | | | First Industrial Realty Trust, Inc. | | | 951,615 | | |
| | 13,564 | | | National Health Investors, Inc. | | | 845,037 | | |
| | 26,423 | | | Sun Communities, Inc. | | | 1,633,734 | | |
| | | | 6,183,845 | | |
| | | Total Common Stocks | |
| | | | | (Cost $47,393,000) | | | 77,142,484 | | |
Number of Shares | | | | Value | |
SHORT-TERM INVESTMENTS 1.5% | |
| | | Investment Company 1.5% | |
| | 1,195,446 | | | Fidelity Institutional Money
Market Portfolio, Select
Class, 0.05% | | $ | 1,195,446 | | |
| | | Total Short-Term Investments | |
| | | (Cost $1,195,446) | | | 1,195,446 | | |
| | | Total Investments 100.0% | |
| | | (Cost $48,588,446) | | | 78,337,930 | | |
| | | Liabilities in Excess of
Other Assets 0.0% | | | (14,745 | ) | |
| | | TOTAL NET ASSETS 100.0% | | $ | 78,323,185 | | |
(a) Non-Income Producing.
PORTFOLIO DIVERSIFICATION
Sectors | | Percentage | |
Financials | | | 17.4 | % | |
Information Technology | | | 15.1 | | |
Health Care | | | 14.4 | | |
Industrials | | | 13.8 | | |
Consumer Discretionary | | | 13.7 | | |
Real Estate Investment Trusts | | | 7.9 | | |
Materials | | | 7.5 | | |
Consumer Staples | | | 5.0 | | |
Energy | | | 3.7 | | |
Total Common Stocks | | | 98.5 | | |
Total Short-Term Investments | | | 1.5 | | |
Total Investments | | | 100.0 | | |
Liabilities in Excess of Other Assets | | | 0.0 | | |
Total Net Assets | | | 100.0 | % | |
The accompanying notes are an integral part of these financial statements.
page 38

Frontier Phocas Small Cap Value Fund
SCHEDULE OF INVESTMENTS
June 30, 2015
Number of Shares | | | | Value | |
COMMON STOCKS 97.5% | | | |
| | | Consumer Discretionary 11.7% | |
| | 2,281 | | | American Axle & Manufacturing
Holdings, Inc. (a) | | $ | 47,696 | | |
| | 4,963 | | | Columbia Sportswear Co. | | | 300,063 | | |
| | 18,070 | | | Dana Holding Corp. | | | 371,880 | | |
| | 2,075 | | | DineEquity, Inc. | | | 205,612 | | |
| | 7,965 | | | DSW, Inc. - Class A | | | 265,792 | | |
| | 8,674 | | | Express, Inc. (a) | | | 157,086 | | |
| | 21,181 | | | Harte-Hanks, Inc. | | | 126,239 | | |
| | 4,035 | | | HSN, Inc. | | | 283,216 | | |
| | 10,989 | | | Interval Leisure Group, Inc. | | | 251,099 | | |
| | 5,208 | | | Meredith Corp. | | | 271,597 | | |
| | 8,940 | | | National CineMedia, Inc. | | | 142,683 | | |
| | 15,992 | | | Ruth's Hospitality Group, Inc. | | | 257,791 | | |
| | 9,378 | | | Sinclair Broadcast Group, Inc. -
Class A | | | 261,740 | | |
| | 11,942 | | | The E.W. Scripps Co. - Class A | | | 272,875 | | |
| | 5,611 | | | Time, Inc. | | | 129,109 | | |
| | | | 3,344,478 | | |
| | | Consumer Staples 0.5% | |
| | 1,710 | | | TreeHouse Foods, Inc. (a) | | | 138,561 | | |
| | | Energy 4.3% | |
| | 6,385 | | | Carrizo Oil & Gas, Inc. (a) | | | 314,398 | | |
| | 8,865 | | | Delek US Holdings, Inc. | | | 326,409 | | |
| | 5,649 | | | PDC Energy, Inc. (a) | | | 303,012 | | |
| | 26,206 | | | Synergy Resources Corp. (a) | | | 299,535 | | |
| | | | 1,243,354 | | |
| | | Financials 27.5% | |
| | 12,254 | | | American Equity Investment
Life Holding Co. | | | 330,613 | | |
| | 12,575 | | | Ameris Bancorp | | | 318,022 | | |
| | 6,048 | | | Argo Group International
Holdings Ltd. | | | 336,874 | | |
| | 11,986 | | | Banco Latinoamericano
de Comercio Exterior S.A. | | | 385,709 | | |
Number of Shares | | | | Value | |
| | | Financials 27.5% (continued) | |
| | 8,503 | | | Banner Corp. | | $ | 407,549 | | |
| | 7,889 | | | BNC Bancorp | | | 152,494 | | |
| | 17,562 | | | Boston Private Financial
Holdings, Inc. | | | 235,506 | | |
| | 5,595 | | | Capital Bank Financial Corp. (a) | | | 162,647 | | |
| | 32,282 | | | CNO Financial Group, Inc. | | | 592,375 | | |
| | 2,195 | | | Endurance Specialty Holdings Ltd. | | | 144,212 | | |
| | 13,178 | | | Fidelity Southern Corp. | | | 229,824 | | |
| | 16,259 | | | Heritage Commerce Corp. | | | 156,249 | | |
| | 12,933 | | | Heritage Financial Corp. | | | 231,113 | | |
| | 35,154 | | | Heritage Oaks Bancorp | | | 276,662 | | |
| | 12,346 | | | HomeStreet, Inc. (a) | | | 281,736 | | |
| | 2,905 | | | IBERIABANK Corp. | | | 198,208 | | |
| | 13,648 | | | National Penn Bancshares, Inc. | | | 153,949 | | |
| | 4,254 | | | Nelnet, Inc. - Class A | | | 184,241 | | |
| | 35,058 | | | NewBridge Bancorp | | | 313,068 | | |
| | 11,002 | | | NorthStar Asset Management
Group, Inc. | | | 203,427 | | |
| | 15,532 | | | Radian Group, Inc. | | | 291,380 | | |
| | 10,227 | | | Seacoast Banking Corp of
Florida (a) | | | 161,587 | | |
| | 15,036 | | | State Bank Financial Corp. | | | 326,281 | | |
| | 17,495 | | | Synovus Financial Corp. | | | 539,196 | | |
| | 7,877 | | | Trico Bancshares | | | 189,442 | | |
| | 19,663 | | | United Community Banks, Inc. | | | 410,367 | | |
| | 27,116 | | | Wilshire Bancorp, Inc. | | | 342,475 | | |
| | 6,454 | | | Wintrust Financial Corp. | | | 344,514 | | |
| | | | 7,899,720 | | |
| | | Health Care 7.0% | |
| | 20,959 | | | Accuray, Inc. (a) | | | 141,264 | | |
| | 16,276 | | | Aceto Corp. | | | 400,878 | | |
| | 6,617 | | | Alere, Inc. (a) | | | 349,047 | | |
| | 4,944 | | | Impax Laboratories, Inc. (a) | | | 227,028 | | |
| | 4,213 | | | PAREXEL International Corp. (a) | | | 270,938 | | |
| | 8,957 | | | PharMerica Corp. (a) | | | 298,268 | | |
The accompanying notes are an integral part of these financial statements.
page 39

Frontier Phocas Small Cap Value Fund
SCHEDULE OF INVESTMENTS (continued)
June 30, 2015
Number of Shares | | | | Value | |
| COMMON STOCKS 97.5% (continued) | | | |
| | | Health Care 7.0% (continued) | |
| | 3,600 | | | Prestige Brands Holdings, Inc. (a) | | $ | 166,464 | | |
| | 20,813 | | | Progenics Pharmaceuticals, Inc. (a) | | | 155,265 | | |
| | | | 2,009,152 | | |
| | | Industrials 14.5% | |
| | 1,197 | | | Allegiant Travel Co. | | | 212,922 | | |
| | 1,449 | | | AMERCO | | | 473,693 | | |
| | 4,602 | | | Avis Budget Group, Inc. (a) | | | 202,856 | | |
| | 30,046 | | | CBIZ, Inc. (a) | | | 289,643 | | |
| | 6,490 | | | Deluxe Corp. | | | 402,380 | | |
| | 4,845 | | | Engility Holdings, Inc. | | | 121,900 | | |
| | 2,679 | | | Esterline Technologies Corp. (a) | | | 255,416 | | |
| | 3,474 | | | Kadant, Inc. | | | 163,973 | | |
| | 9,976 | | | MYR Group, Inc. (a) | | | 308,857 | | |
| | 5,892 | | | Park-Ohio Holdings Corp. | | | 285,526 | | |
| | 11,664 | | | SkyWest, Inc. | | | 175,427 | | |
| | 10,908 | | | Tetra Tech, Inc. | | | 279,681 | | |
| | 6,494 | | | The Timken Company | | | 237,486 | | |
| | 1,328 | | | UniFirst Corp. | | | 148,537 | | |
| | 9,934 | | | Wabash National Corp. (a) | | | 124,572 | | |
| | 3,050 | | | WESCO International, Inc. (a) | | | 209,352 | | |
| | 8,443 | | | West Corp. | | | 254,134 | | |
| | | | 4,146,355 | | |
| | | Information Technology 9.4% | |
| | 5,073 | | | ARRIS Group, Inc. (a) | | | 155,234 | | |
| | 39,449 | | | Atmel Corp. | | | 388,770 | | |
| | 20,448 | | | Cypress Semiconductor Corp. (a) | | | 240,469 | | |
| | 5,777 | | | Mentor Graphics Corp. | | | 152,686 | | |
| | 3,443 | | | Methode Electronics, Inc. | | | 94,510 | | |
| | 6,805 | | | Plexus Corp. (a) | | | 298,603 | | |
| | 10,836 | | | Progress Software Corp. (a) | | | 297,990 | | |
| | 4,980 | | | Silicon Motion Technology
Corp. - ADR | | | 172,358 | | |
| | 4,036 | | | Solera Holdings, Inc. | | | 179,844 | | |
| | 4,336 | | | SYNNEX Corp. | | | 317,352 | | |
| | 6,471 | | | Verint Systems, Inc. (a) | | | 393,081 | | |
| | | | 2,690,897 | | |
Number of Shares | | | | Value | |
| | | Materials 4.1% | |
| | 1,364 | | | Ashland, Inc. | | $ | 166,272 | | |
| | 9,276 | | | Ferro Corp. (a) | | | 155,651 | | |
| | 2,814 | | | Kaiser Aluminum Corp. | | | 233,787 | | |
| | 5,360 | | | Materion Corp. | | | 188,940 | | |
| | 6,410 | | | Sensient Technologies Corp. | | | 438,059 | | |
| | | | 1,182,709 | | |
| | | Real Estate Investment Trusts 14.2% | |
| | 10,633 | | | Acadia Realty Trust | | | 309,527 | | |
| | 7,923 | | | CoreSite Realty Corp. | | | 360,021 | | |
| | 19,304 | | | First Industrial Realty Trust, Inc. | | | 361,564 | | |
| | 30,469 | | | First Potomac Realty Trust | | | 313,831 | | |
| | 17,529 | | | Hudson Pacific Properties, Inc. | | | 497,298 | | |
| | 3,986 | | | Kilroy Realty Corp. | | | 267,660 | | |
| | 10,024 | | | Kite Realty Group Trust | | | 245,287 | | |
| | 10,518 | | | Pebblebrook Hotel Trust | | | 451,012 | | |
| | 9,970 | | | Sabra Health Care REIT, Inc. | | | 256,628 | | |
| | 11,029 | | | STAG Industrial, Inc. | | | 220,580 | | |
| | 27,046 | | | Strategic Hotels & Resorts, Inc. (a) | | | 327,797 | | |
| | 7,620 | | | Sun Communities, Inc. | | | 471,144 | | |
| | | | 4,082,349 | | |
| | | Utilities 4.3% | |
| | 5,162 | | | Black Hills Corp. | | | 225,321 | | |
| | 4,914 | | | Chesapeake Utilities Corp. | | | 264,619 | | |
| | 2,429 | | | IDACORP, Inc. | | | 136,364 | | |
| | 3,818 | | | Laclede Group, Inc. | | | 198,765 | | |
| | 5,229 | | | Portland General Electric Co. | | | 173,394 | | |
| | 5,189 | | | South Jersey Industries, Inc. | | | 128,324 | | |
| | 4,615 | | | The Empire District Electric Co. | | | 100,607 | | |
| | | | 1,227,394 | | |
| | | Total Common Stocks | |
| | | | | (Cost $23,459,992) | | | 27,964,969 | | |
The accompanying notes are an integral part of these financial statements.
page 40

Frontier Phocas Small Cap Value Fund
SCHEDULE OF INVESTMENTS (continued)
June 30, 2015
Number of Shares | | | | Value | |
SHORT-TERM INVESTMENTS 1.7% | |
| | | Investment Company 1.7% | |
| | 482,439 | | | STIT-STIC Prime Portfolio -
Institutional Class, 0.07% | | $ | 482,439 | | |
| | | Total Short-Term Investments | |
| | | (Cost $482,439) | | | 482,439 | | |
| | | Total Investments 99.2% | |
| | | (Cost $23,942,431) | | | 28,447,408 | | |
| | | Other Assets in Excess of
Liabilities 0.8% | | | 238,424 | | |
| | | TOTAL NET ASSETS 100.0% | | $ | 28,685,832 | | |
(a) Non-Income Producing.
ADR - American Depositary Receipt | |
PORTFOLIO DIVERSIFICATION
Sectors | | Percentage | |
Financials | | | 27.5 | % | |
Industrials | | | 14.5 | | |
Real Estate Investment Trusts | | | 14.2 | | |
Consumer Discretionary | | | 11.7 | | |
Information Technology | | | 9.4 | | |
Health Care | | | 7.0 | | |
Energy | | | 4.3 | | |
Utilities | | | 4.3 | | |
Materials | | | 4.1 | | |
Consumer Staples | | | 0.5 | | |
Total Common Stocks | | | 97.5 | | |
Total Short-Term Investments | | | 1.7 | | |
Total Investments | | | 99.2 | | |
Other Assets in Excess of Liabilities | | | 0.8 | | |
Total Net Assets | | | 100.0 | % | |
The accompanying notes are an integral part of these financial statements.
page 41

Frontier Funds
STATEMENTS OF ASSETS AND LIABILITIES
June 30, 2015
| | | MFG Global
Equity Fund | | MFG Global
Plus Fund | | MFG Core
Infrastructure Fund | |
ASSETS: | |
Investments at cost | | $ | 977,186,033 | | | $ | 5,927,526 | | | $ | 164,711,580 | | |
Foreign currency at cost | | $ | 22,877 | | | $ | 16,567 | | | $ | 888,051 | | |
Investments at value | | $ | 1,106,216,076 | | | $ | 5,852,635 | | | $ | 160,139,466 | | |
Foreign currency at value | | | 22,893 | | | | 16,421 | | | | 884,245 | | |
Receivable for Fund shares sold | | | 15,012 | | | | — | | | | 113,091 | | |
Interest and dividends receivable | | | 1,048,603 | | | | 2,544 | | | | 867,823 | | |
Prepaid expenses and other assets | | | 37,334 | | | | 19,531 | | | | 17,690 | | |
Total assets | | | 1,107,339,918 | | | | 5,891,131 | | | | 162,022,315 | | |
LIABILITIES: | |
Payable for Fund shares redeemed | | | — | | | | — | | | | 175,251 | | |
Payable to Adviser | | | 680,746 | | | | 323 | | | | 70,750 | | |
Accrued expenses | | | 134,349 | | | | 31,462 | | | | 54,467 | | |
Total liabilities | | | 815,095 | | | | 31,785 | | | | 300,468 | | |
Net Assets | | $ | 1,106,524,823 | | | $ | 5,859,346 | | | $ | 161,721,847 | | |
NET ASSETS CONSIST OF: | |
Paid in capital | | $ | 956,102,528 | | | $ | 5,922,000 | | | $ | 166,150,516 | | |
Undistributed net investment income | | | 4,384,256 | | | | 16,849 | | | | 237,834 | | |
Accumulated undistributed net realized gain (loss) | | | 17,083,458 | | | | (4,476 | ) | | | (91,136 | ) | |
Net unrealized appreciation/depreciation on: | |
Investments | | | 129,030,043 | | | | (74,891 | ) | | | (4,572,114 | ) | |
Foreign currency | | | (75,462 | ) | | | (136 | ) | | | (3,253 | ) | |
Net Assets | | $ | 1,106,524,823 | | | $ | 5,859,346 | | | $ | 161,721,847 | | |
CAPITAL STOCK, $0.01 PAR VALUE | |
Net Assets | | $ | 1,106,524,823 | | | $ | 5,859,346 | | | $ | 161,721,847 | | |
Authorized | | | 100,000,000 | | | | 100,000,000 | | | | 50,000,000 | | |
Issued and Outstanding | | | 69,188,315 | | | | 591,226 | | | | 12,355,197 | | |
Net Asset Value, Redemption Price and Offering Price Per Share | | $ | 15.99 | | | $ | 9.91 | | | $ | 13.09 | | |
The accompanying notes are an integral part of these financial statements.
page 42

Frontier Funds
STATEMENTS OF ASSETS AND LIABILITIES (continued)
June 30, 2015
| | | Timpani Small Cap
Growth Fund | | Netols Small Cap
Value Fund | | Phocas Small Cap
Value Fund | |
ASSETS: | |
Investments at cost | | $ | 39,433,215 | | | $ | 48,588,446 | | | $ | 23,942,431 | | |
Investments at value | | $ | 50,022,908 | | | $ | 78,337,930 | | | $ | 28,447,408 | | |
Receivable for investments sold | | | 316,171 | | | | 42,888 | | | | 313,177 | | |
Receivable for Fund shares sold | | | 21,735 | | | | 49,981 | | | | 6,178 | | |
Interest and dividends receivable | | | 60 | | | | 63,936 | | | | 35,616 | | |
Prepaid expenses and other assets | | | 14,501 | | | | 8,687 | | | | 11,845 | | |
Total assets | | | 50,375,375 | | | | 78,503,422 | | | | 28,814,224 | | |
LIABILITIES: | |
Payable for investments purchased | | | 471,861 | | | | 73,421 | | | | 82,412 | | |
Payable for Fund shares redeemed | | | 121,463 | | | | 9,576 | | | | 1,544 | | |
Payable to Adviser | | | 31,416 | | | | 61,515 | | | | 17,023 | | |
Accrued distribution and shareholder servicing fees | | | 710 | | | | 4,201 | | | | — | | |
Accrued expenses | | | 33,262 | | | | 31,524 | | | | 27,413 | | |
Total liabilities | | | 658,712 | | | | 180,237 | | | | 128,392 | | |
Net Assets | | $ | 49,716,663 | | | $ | 78,323,185 | | | $ | 28,685,832 | | |
NET ASSETS CONSIST OF: | |
Paid in capital | | $ | 41,220,542 | | | $ | 40,554,147 | | | $ | 23,906,021 | | |
Undistributed net investment income (loss) | | | (188,198 | ) | | | — | | | | 136,465 | | |
Accumulated undistributed net realized gain (loss) | | | (1,905,374 | ) | | | 8,019,554 | | | | 138,369 | | |
Net unrealized appreciation on investments | | | 10,589,693 | | | | 29,749,484 | | | | 4,504,977 | | |
Net Assets | | $ | 49,716,663 | | | $ | 78,323,185 | | | $ | 28,685,832 | | |
CAPITAL STOCK, $0.01 PAR VALUE | | Institutional Class | | Institutional Class | | | |
Net Assets | | $ | 47,454,564 | | | $ | 77,802,461 | | | $ | 28,685,832 | | |
Authorized | | | 50,000,000 | | | | 50,000,000 | | | | 100,000,000 | | |
Issued and Outstanding | | | 2,553,953 | | | | 6,705,190 | | | | 835,517 | | |
Net Asset Value, Redemption Price and Offering Price Per Share | | $ | 18.58 | | | $ | 11.60 | | | $ | 34.33 | | |
CAPITAL STOCK, $0.01 PAR VALUE | | Class Y | | Class Y | | | |
Net Assets | | $ | 2,262,099 | | | $ | 520,724 | | | | |
Authorized | | | 50,000,000 | | | | 50,000,000 | | | | |
Issued and Outstanding | | | 122,435 | | | | 47,048 | | | | |
Net Asset Value, Redemption Price and Offering Price Per Share | | $ | 18.48 | | | $ | 11.07 | | | | |
The accompanying notes are an integral part of these financial statements.
page 43

Frontier Funds
STATEMENTS OF OPERATIONS
For the Year Ended June 30, 2015
| | | MFG Global
Equity Fund | | MFG Global(1)
Plus Fund | | MFG Core
Infrastructure Fund | |
INVESTMENT INCOME: | |
Dividend income | | $ | 14,017,528 | (2) | | $ | 26,026 | (3) | | $ | 3,733,726 | (4) | |
Interest income | | | 86,405 | | | | 224 | | | | 2,825 | | |
Total investment income | | | 14,103,933 | | | | 26,250 | | | | 3,736,551 | | |
EXPENSES: | |
Investment advisory fees | | | 7,928,498 | | | | 11,659 | | | | 706,295 | | |
Fund administration and accounting fees | | | 225,738 | | | | 7,064 | | | | 52,812 | | |
Custody fees | | | 151,017 | | | | 9,245 | | | | 45,883 | | |
Federal and state registration fees | | | 43,322 | | | | 9,465 | | | | 31,245 | | |
Transfer agent fees | | | 35,175 | | | | 2,210 | | | | 12,304 | | |
Directors' fees and related expenses | | | 19,200 | | | | 5,000 | | | | 19,197 | | |
Legal fees | | | 18,420 | | | | 2,923 | | | | 21,130 | | |
Audit fees | | | 17,135 | | | | 16,914 | | | | 17,135 | | |
Reports to shareholders | | | 12,675 | | | | 1,985 | | | | 6,148 | | |
Other | | | 98,967 | | | | 5,876 | | | | 26,373 | | |
Total expenses before waiver and reimbursement | | | 8,550,147 | | | | 72,341 | | | | 938,522 | | |
Waiver and reimbursement of expenses by Adviser | | | (621,649 | ) | | | (60,682 | ) | | | (232,227 | ) | |
Net expenses | | | 7,928,498 | | | | 11,659 | | | | 706,295 | | |
Net Investment Income | | | 6,175,435 | | | | 14,591 | | | | 3,030,256 | | |
REALIZED AND UNREALIZED GAIN (LOSS)
ON INVESTMENTS: | |
Net realized gain (loss) on: | |
Investments | | | 27,905,829 | | | | (4,476 | ) | | | 18,860 | | |
Foreign currency transactions | | | (102,432 | ) | | | 2,258 | | | | (51,376 | ) | |
Change in net unrealized appreciation/depreciation on: | |
Investments | | | 31,856,303 | | | | (74,891 | ) | | | (8,935,477 | ) | |
Foreign currency transactions | | | (102,745 | ) | | | (136 | ) | | | (5,981 | ) | |
Net Realized and Unrealized Gain (Loss) on Investments | | | 59,556,955 | | | | (77,245 | ) | | | (8,973,974 | ) | |
Net Increase (Decrease) in Net Assets Resulting from Operations | | $ | 65,732,390 | | | $ | (62,654 | ) | | $ | (5,943,718 | ) | |
(1) Commenced operations on March 23, 2015.
(2) Net of $477,046 in foreign withholding taxes.
(3) Net of $1,736 in foreign withholding taxes.
(4) Net of $326,387 in foreign withholding taxes.
The accompanying notes are an integral part of these financial statements.
page 44

Frontier Funds
STATEMENTS OF OPERATIONS (continued)
For the Year Ended June 30, 2015
| | | Timpani Small Cap
Growth Fund | | Netols Small Cap
Value Fund | | Phocas Small Cap
Value Fund | |
INVESTMENT INCOME: | |
Dividend income | | $ | 45,974 | (5) | | $ | 881,757 | | | $ | 444,759 | | |
Interest income | | | 500 | | | | 313 | | | | 512 | | |
Total investment income | | | 46,474 | | | | 882,070 | | | | 445,271 | | |
EXPENSES: | |
Investment advisory fees | | | 314,707 | | | | 882,728 | | | | 262,563 | | |
Federal and state registration fees | | | 32,928 | | | | 11,359 | | | | 21,664 | | |
Fund administration and accounting fees | | | 32,541 | | | | 42,762 | | | | 33,117 | | |
Directors' fees and related expenses | | | 19,201 | | | | 19,201 | | | | 19,199 | | |
Legal fees | | | 18,563 | | | | 19,764 | | | | 16,960 | | |
Transfer agent fees | | | 16,116 | | | | 15,673 | | | | 11,574 | | |
Audit fees | | | 15,129 | | | | 15,135 | | | | 15,135 | | |
Custody fees | | | 12,385 | | | | 15,807 | | | | 12,658 | | |
Reports to shareholders | | | 8,037 | | | | 8,321 | | | | 5,663 | | |
Distribution and shareholder servicing fees - Class Y | | | 6,596 | | | | — | | | | — | | |
Other | | | 7,823 | | | | 9,538 | | | | 5,088 | | |
Total expenses before waiver and reimbursement | | | 484,026 | | | | 1,040,288 | | | | 403,621 | | |
Waiver and reimbursement of expenses by Adviser | | | (131,253 | ) | | | (69,287 | ) | | | (114,802 | ) | |
Net expenses | | | 352,773 | | | | 971,001 | | | | 288,819 | | |
Net Investment Income (Loss) | | | (306,299 | ) | | | (88,931 | ) | | | 156,452 | | |
REALIZED AND UNREALIZED GAIN (LOSS)
ON INVESTMENTS: | |
Net realized gain (loss) on investments | | | (1,321,289 | ) | | | 13,553,228 | | | | 370,123 | | |
Change in net unrealized appreciation/depreciation on investments | | | 8,399,839 | | | | (10,639,302 | ) | | | (331,926 | ) | |
Net Realized and Unrealized Gain on Investments | | | 7,078,550 | | | | 2,913,926 | | | | 38,197 | | |
Net Increase in Net Assets Resulting from Operations | | $ | 6,772,251 | | | $ | 2,824,995 | | | $ | 194,649 | | |
(5) Net of $168 in foreign withholding taxes.
The accompanying notes are an integral part of these financial statements.
page 45

Frontier Funds
STATEMENTS OF CHANGES IN NET ASSETS
| | | MFG Global Equity Fund | | MFG Global Plus Fund | |
| | | For the
Year Ended
June 30, 2015 | | For the
Year Ended
June 30, 2014 | | For the Period
March 23, 2015(1)
through
June 30, 2015 | |
OPERATIONS: | |
Net investment income | | $ | 6,175,435 | | | $ | 7,537,146 | | | $ | 14,591 | | |
Net realized gain (loss) on: | |
Investments | | | 27,905,829 | | | | 5,422,340 | | | | (4,476 | ) | |
Foreign currency transactions | | | (102,432 | ) | | | 1,286 | | | | 2,258 | | |
Change in net unrealized appreciation/depreciation on: | |
Investments | | | 31,856,303 | | | | 69,732,325 | | | | (74,891 | ) | |
Foreign currency transactions | | | (102,745 | ) | | | 37,890 | | | | (136 | ) | |
Net increase (decrease) in net assets resulting from operations | | | 65,732,390 | | | | 82,730,987 | | | | (62,654 | ) | |
DISTRIBUTIONS PAID TO SHAREHOLDERS FROM: | |
Net investment income | | | (7,806,584 | ) | | | (3,309,753 | ) | | | — | | |
Net realized gain on investments | | | (14,749,904 | ) | | | (5,090,258 | ) | | | — | | |
Net decrease in net assets resulting from distributions paid | | | (22,556,488 | ) | | | (8,400,011 | ) | | | — | | |
CAPITAL SHARE TRANSACTIONS: | |
Shares sold | | | 498,489,918 | | | | 401,764,717 | | | | 5,922,000 | | |
Shares issued to holders in reinvestment of distributions | | | 20,274,009 | | | | 7,777,052 | | | | — | | |
Shares redeemed | | | (246,459,830 | ) | | | (39,525,775 | ) | | | — | | |
Redemption fees | | | 1,688 | | | | 1,307 | | | | — | | |
Net increase in net assets resulting from capital share transactions | | | 272,305,785 | | | | 370,017,301 | | | | 5,922,000 | | |
Total Increase in Net Assets | | | 315,481,687 | | | | 444,348,277 | | | | 5,859,346 | | |
NET ASSETS: | |
Beginning of Period | | | 791,043,136 | | | | 346,694,859 | | | | — | | |
End of Period | | $ | 1,106,524,823 | | | $ | 791,043,136 | | | $ | 5,859,346 | | |
Undistributed net investment income | | $ | 4,384,256 | | | $ | 6,117,837 | | | $ | 16,849 | | |
TRANSACTIONS IN SHARES: | |
Shares sold | | | 32,287,531 | | | | 27,908,105 | | | | 591,226 | | |
Shares issued to holders in reinvestment of distributions | | | 1,313,083 | | | | 536,348 | | | | — | | |
Shares redeemed | | | (16,019,051 | ) | | | (2,660,958 | ) | | | — | | |
Net increase in shares outstanding | | | 17,581,563 | | | | 25,783,495 | | | | 591,226 | | |
(1) Commencement of operations.
The accompanying notes are an integral part of these financial statements.
page 46

Frontier Funds
STATEMENTS OF CHANGES IN NET ASSETS (continued)
| | | MFG Core Infrastructure Fund | | Timpani Small Cap Growth Fund | |
| | | For the
Year Ended
June 30, 2015 | | For the
Year Ended
June 30, 2014 | | For the
Year Ended
June 30, 2015 | | For the
Year Ended
June 30, 2014 | |
OPERATIONS: | |
Net investment income (loss) | | $ | 3,030,256 | | | $ | 826,498 | | | $ | (306,299 | ) | | $ | (71,872 | ) | |
Net realized gain (loss) on: | |
Investments | | | 18,860 | | | | 26,315 | | | | (1,321,289 | ) | | | (361,238 | ) | |
Foreign currency transactions | | | (51,376 | ) | | | (14,225 | ) | | | — | | | | — | | |
Change in net unrealized appreciation/depreciation on: | |
Investments | | | (8,935,477 | ) | | | 4,177,604 | | | | 8,399,839 | | | | 1,158,942 | | |
Foreign currency transactions | | | (5,981 | ) | | | 3,801 | | | | — | | | | — | | |
Net increase (decrease) in net assets resulting from operations | | | (5,943,718 | ) | | | 5,019,993 | | | | 6,772,251 | | | | 725,832 | | |
DISTRIBUTIONS PAID TO SHAREHOLDERS FROM: | | | | | | Institutional Class | | Institutional Class | |
Net investment income | | | (3,388,775 | ) | | | (253,056 | ) | | | — | | | | — | | |
Net realized gain on investments | | | (128,895 | ) | | | — | | | | — | | | | (135,449 | ) | |
Net decrease in net assets resulting from distributions paid | | | (3,517,670 | ) | | | (253,056 | ) | | | — | | | | (135,449 | ) | |
CAPITAL SHARE TRANSACTIONS: | | | | | | Institutional Class | | Institutional Class | |
Shares sold | | | 114,530,022 | | | | 53,704,784 | | | | 30,079,520 | | | | 11,857,476 | | |
Shares issued to holders in reinvestment of distributions | | | 3,166,238 | | | | 244,776 | | | | — | | | | 127,954 | | |
Shares redeemed | | | (12,181,750 | ) | | | (354,534 | ) | | | (2,574,944 | ) | | | (3,043,387 | ) | |
Redemption fees | | | 2,805 | | | | 1,208 | | | | — | | | | — | | |
Net increase in net assets resulting from capital share transactions | | | 105,517,315 | | | | 53,596,234 | | | | 27,504,576 | | | | 8,942,043 | | |
CAPITAL SHARE TRANSACTIONS: | | | | | | Class Y | | Class Y | |
Shares sold | | | | | | | 1,105,481 | | | | 1,177,000 | | |
Shares redeemed | | | | | | | (358,350 | ) | | | — | | |
Net increase in net assets resulting from capital share transactions | | | | | | | 747,131 | | | | 1,177,000 | | |
Total Increase in Net Assets | | | 96,055,927 | | | | 58,363,171 | | | | 35,023,958 | | | | 10,709,426 | | |
NET ASSETS: | |
Beginning of Period | | | 65,665,920 | | | | 7,302,749 | | | | 14,692,705 | | | | 3,983,279 | | |
End of Period | | $ | 161,721,847 | | | $ | 65,665,920 | | | $ | 49,716,663 | | | $ | 14,692,705 | | |
Undistributed net investment income (loss) | | $ | 237,834 | | | $ | 647,729 | | | $ | (188,198 | ) | | $ | (47,277 | ) | |
TRANSACTIONS IN SHARES: | | | | | | Institutional Class | | Institutional Class | |
Shares sold | | | 8,340,792 | | | | 4,023,089 | | | | 1,871,234 | | | | 734,505 | | |
Shares issued to holders in reinvestment of distributions | | | 231,339 | | | | 20,280 | | | | — | | | | 8,114 | | |
Shares redeemed | | | (865,296 | ) | | | (27,662 | ) | | | (156,298 | ) | | | (204,927 | ) | |
Net increase in shares outstanding | | | 7,706,835 | | | | 4,015,707 | | | | 1,714,936 | | | | 537,692 | | |
TRANSACTIONS IN SHARES: | | | | | | Class Y | | Class Y | |
Shares sold | | | | | | | 68,452 | | | | 75,743 | | |
Shares redeemed | | | | | | | (21,760 | ) | | | — | | |
Net increase in shares outstanding | | | | | | | 46,692 | | | | 75,743 | | |
The accompanying notes are an integral part of these financial statements.
page 47

Frontier Funds
STATEMENTS OF CHANGES IN NET ASSETS (continued)
| | | Netols Small Cap Value Fund | | Phocas Small Cap Value Fund | |
| | | For the
Year Ended
June 30, 2015 | | For the
Year Ended
June 30, 2014 | | For the
Year Ended
June 30, 2015 | | For the
Year Ended
June 30, 2014 | |
OPERATIONS: | |
Net investment income (loss) | | $ | (88,931 | ) | | $ | (337,695 | ) | | $ | 156,452 | | | $ | (18,695 | ) | |
Net realized gain on investments | | | 13,553,228 | | | | 28,516,118 | | | | 370,123 | | | | 1,411,818 | | |
Change in net unrealized appreciation/depreciation on investments | | | (10,639,302 | ) | | | (1,904,693 | ) | | | (331,926 | ) | | | 2,491,733 | | |
Net increase in net assets resulting from operations | | | 2,824,995 | | | | 26,273,730 | | | | 194,649 | | | | 3,884,856 | | |
DISTRIBUTIONS PAID TO SHAREHOLDERS FROM: | | Institutional Class | | Institutional Class | | | | | |
Net investment income | | | — | | | | — | | | | (19,945 | ) | | | (16,849 | ) | |
Net realized gain on investments | | | (20,922,751 | ) | | | (26,286,823 | ) | | | (1,223,630 | ) | | | (680,655 | ) | |
Net decrease in net assets resulting from distributions paid | | | (20,922,751 | ) | | | (26,286,823 | ) | | | (1,243,575 | ) | | | (697,504 | ) | |
DISTRIBUTIONS PAID TO SHAREHOLDERS FROM: | | Class Y | | Class Y | | | | | |
Net realized gain on investments | | | (140,390 | ) | | | (239,893 | ) | | | | | |
Net decrease in net assets resulting from distributions paid | | | (140,390 | ) | | | (239,893 | ) | | | | | |
CAPITAL SHARE TRANSACTIONS: | | Institutional Class | | Institutional Class | |
Shares sold | | | 4,476,451 | | | | 25,306,701 | | | | 8,336,269 | | | | 13,555,485 | | |
Shares issued to holders in reinvestment of distributions | | | 18,286,489 | | | | 22,953,330 | | | | 1,243,575 | | | | 697,504 | | |
Shares redeemed | | | (25,348,922 | ) | | | (61,531,235 | ) | | | (3,996,912 | ) | | | (2,292,640 | ) | |
Net increase (decrease) in net assets resulting from capital share transactions | | | (2,585,982 | ) | | | (13,271,204 | ) | | | 5,582,932 | | | | 11,960,349 | | |
CAPITAL SHARE TRANSACTIONS: | | Class Y | | Class Y | | | | | |
Shares sold | | | 30,613 | | | | 87,891 | | | | | | |
Shares issued to holders in reinvestment of distributions | | | 140,390 | | | | 239,893 | | | | | | |
Shares redeemed | | | (161,366 | ) | | | (21,044,865 | ) | | | | | |
Net increase (decrease) in net assets resulting from capital share transactions | | | 9,637 | | | | (20,717,081 | ) | | | | | |
Total Increase (Decrease) in Net Assets | | | (20,814,491 | ) | | | (34,241,271 | ) | | | 4,534,006 | | | | 15,147,701 | | |
NET ASSETS: | |
Beginning of Period | | | 99,137,676 | | | | 133,378,947 | | | | 24,151,826 | | | | 9,004,125 | | |
End of Period | | $ | 78,323,185 | | | $ | 99,137,676 | | | $ | 28,685,832 | | | $ | 24,151,826 | | |
Undistributed net investment income (loss) | | $ | — | | | $ | (51,811 | ) | | $ | 136,465 | | | $ | — | | |
TRANSACTIONS IN SHARES: | | Institutional Class | | Institutional Class | | | | | |
Shares sold | | | 359,802 | | | | 1,583,761 | | | | 242,804 | | | | 405,895 | | |
Shares issued to holders in reinvestment of distributions | | | 1,644,468 | | | | 1,688,987 | | | | 36,869 | | | | 21,402 | | |
Shares redeemed | | | (2,016,766 | ) | | | (3,928,288 | ) | | | (115,864 | ) | | | (69,095 | ) | |
Net increase (decrease) in shares outstanding | | | (12,496 | ) | | | (655,540 | ) | | | 163,809 | | | | 358,202 | | |
TRANSACTIONS IN SHARES: | | Class Y | | Class Y | | | | | |
Shares sold | | | 2,349 | | | | 5,581 | | | | | | |
Shares issued to holders in reinvestment of distributions | | | 13,232 | | | | 18,257 | | | | | | |
Shares redeemed | | | (13,308 | ) | | | (1,324,940 | ) | | | | | |
Net increase (decrease) in shares outstanding | | | 2,273 | | | | (1,301,102 | ) | | | | | |
The accompanying notes are an integral part of these financial statements.
page 48

Frontier MFG Global Equity Fund
FINANCIAL HIGHLIGHTS
| | | Year
Ended
June 30,
2015 | | Year
Ended
June 30,
2014 | | Year
Ended
June 30,
2013 | | Period
Ended
June 30,
2012(1) | |
Net Asset Value, Beginning of Period | | $ | 15.33 | | | $ | 13.43 | | | $ | 10.81 | | | $ | 10.00 | | |
INCOME FROM INVESTMENT OPERATIONS: | |
Net investment income | | | 0.10 | (2) | | | 0.19 | (2) | | | 0.17 | (2) | | | 0.11 | (2) | |
Net realized and unrealized gain on investments | | | 0.91 | | | | 1.91 | | | | 2.68 | | | | 0.70 | | |
Total Income from Investment Operations | | | 1.01 | | | | 2.10 | | | | 2.85 | | | | 0.81 | | |
LESS DISTRIBUTIONS: | |
From net investment income | | | (0.12 | ) | | | (0.08 | ) | | | (0.09 | ) | | | — | | |
From net realized gain on investments | | | (0.23 | ) | | | (0.12 | ) | | | (0.14 | ) | | | — | | |
Total Distributions | | | (0.35 | ) | | | (0.20 | ) | | | (0.23 | ) | | | — | | |
Redemption fees retained | | | — | (3) | | | — | (3) | | | — | (3) | | | — | | |
Net Asset Value, End of Period | | $ | 15.99 | | | $ | 15.33 | | | $ | 13.43 | | | $ | 10.81 | | |
Total Return | | | 6.72 | % | | | 15.76 | % | | | 26.68 | % | | | 8.10 | %(4) | |
SUPPLEMENTAL DATA AND RATIOS: | |
Net assets, end of period (in thousands) | | $ | 1,106,525 | | | $ | 791,043 | | | $ | 346,695 | | | $ | 108,551 | | |
Ratio of expenses to average net assets | |
Before waivers and reimbursements | | | 0.86 | % | | | 0.89 | % | | | 0.97 | % | | | 1.14 | %(5) | |
Net of waivers and reimbursements | | | 0.80 | % | | | 0.80 | % | | | 0.80 | % | | | 0.80 | %(5) | |
Ratio of net investment income to average net assets | |
Before waivers and reimbursements | | | 0.56 | % | | | 1.18 | % | | | 1.17 | % | | | 1.70 | %(5) | |
Net of waivers and reimbursements | | | 0.62 | % | | | 1.27 | % | | | 1.34 | % | | | 2.04 | %(5) | |
Portfolio turnover rate | | | 69 | % | | | 20 | % | | | 31 | % | | | 19 | %(4) | |
(1) Commenced operations on December 28, 2011.
(2) Per share net investment income has been calculated using the daily average share method.
(3) Less than one cent per share.
(4) Not annualized.
(5) Annualized.
The accompanying notes are an integral part of these financial statements.
page 49

Frontier MFG Global Plus Fund
FINANCIAL HIGHLIGHTS
| | | Period
Ended
June 30,
2015(1) | |
Net Asset Value, Beginning of Period | | $ | 10.00 | | |
LOSS FROM INVESTMENT OPERATIONS: | |
Net investment income | | | 0.03 | | |
Net realized and unrealized loss on investments | | | (0.12 | ) | |
Total Loss from Investment Operations | | | (0.09 | ) | |
Net Asset Value, End of Period | | $ | 9.91 | | |
Total Return | | | (0.90 | )%(2) | |
SUPPLEMENTAL DATA AND RATIOS: | |
Net assets, end of period (in thousands) | | $ | 5,859 | | |
Ratio of expenses to average net assets | |
Before waivers and reimbursements | | | 4.96 | %(3) | |
Net of waivers and reimbursements | | | 0.80 | %(3) | |
Ratio of net investment income (loss) to average net assets | |
Before waivers and reimbursements | | | (3.16 | )%(3) | |
Net of waivers and reimbursements | | | 1.00 | %(3) | |
Portfolio turnover rate | | | 7 | %(2) | |
(1) Commenced operations on March 23, 2015.
(2) Not annualized.
(3) Annualized.
The accompanying notes are an integral part of these financial statements.
page 50

Frontier MFG Core Infrastructure Fund
FINANCIAL HIGHLIGHTS
| | | Year
Ended
June 30,
2015 | | Year
Ended
June 30,
2014 | | Year
Ended
June 30,
2013 | | Period
Ended
June 30,
2012(1) | |
Net Asset Value, Beginning of Period | | $ | 14.13 | | | $ | 11.54 | | | $ | 10.65 | | | $ | 10.00 | | |
INCOME (LOSS) FROM INVESTMENT OPERATIONS: | |
Net investment income | | | 0.42 | (2) | | | 0.55 | (2) | | | 0.49 | (2) | | | 0.24 | | |
Net realized and unrealized gain (loss) on investments | | | (0.96 | ) | | | 2.22 | | | | 0.84 | | | | 0.41 | | |
Total Income (Loss) from Investment Operations | | | (0.54 | ) | | | 2.77 | | | | 1.33 | | | | 0.65 | | |
LESS DISTRIBUTIONS: | |
From net investment income | | | (0.47 | ) | | | (0.18 | ) | | | (0.44 | ) | | | — | | |
From net realized gain on investments | | | (0.03 | ) | | | — | | | | — | (3) | | | — | | |
Total Distributions | | | (0.50 | ) | | | (0.18 | ) | | | (0.44 | ) | | | — | | |
Redemption fees retained | | | — | (3) | | | — | (3) | | | — | | | | — | | |
Net Asset Value, End of Period | | $ | 13.09 | | | $ | 14.13 | | | $ | 11.54 | | | $ | 10.65 | | |
Total Return | | | (4.03 | )% | | | 24.22 | % | | | 12.73 | % | | | 6.50 | %(4) | |
SUPPLEMENTAL DATA AND RATIOS: | |
Net assets, end of period (in thousands) | | $ | 161,722 | | | $ | 65,666 | | | $ | 7,303 | | | $ | 2,743 | | |
Ratio of expenses to average net assets | |
Before waivers and reimbursements | | | 0.93 | % | | | 1.45 | % | | | 3.66 | % | | | 6.55 | %(5) | |
Net of waivers and reimbursements | | | 0.70 | % | | | 0.70 | % | | | 0.70 | % | | | 0.70 | %(5) | |
Ratio of net investment income (loss) to average net assets | |
Before waivers and reimbursements | | | 2.77 | % | | | 3.47 | % | | | 1.34 | % | | | (1.09 | )%(5) | |
Net of waivers and reimbursements | | | 3.00 | % | | | 4.22 | % | | | 4.30 | % | | | 4.76 | %(5) | |
Portfolio turnover rate | | | 17 | % | | | 16 | % | | | 7 | % | | | 7 | %(4) | |
(1) Commenced operations on January 18, 2012.
(2) Per share net investment income has been calculated using the daily average share method.
(3) Less than one cent per share.
(4) Not annualized.
(5) Annualized.
The accompanying notes are an integral part of these financial statements.
page 51

Frontier Timpani Small Cap Growth Fund
FINANCIAL HIGHLIGHTS
| | | Institutional Class | |
| | | Year
Ended
June 30,
2015 | | Year
Ended
June 30,
2014 | | Year
Ended
June 30,
2013 | | Year
Ended
June 30,
2012 | | Period
Ended
June 30,
2011(1) | |
Net Asset Value, Beginning of Period | | $ | 16.06 | | | $ | 13.22 | | | $ | 10.31 | | | $ | 10.75 | | | $ | 10.00 | | |
INCOME (LOSS) FROM INVESTMENT OPERATIONS: | |
Net investment loss | | | (0.16 | )(2) | | | (0.14 | )(2) | | | (0.04 | )(2) | | | (0.08 | )(2) | | | (0.02 | )(3) | |
Net realized and unrealized gain (loss) on investments | | | 2.68 | | | | 3.32 | | | | 2.95 | | | | (0.36 | ) | | | 0.77 | | |
Total Income (Loss) from Investment Operations | | | 2.52 | | | | 3.18 | | | | 2.91 | | | | (0.44 | ) | | | 0.75 | | |
LESS DISTRIBUTIONS: | |
From net realized gain on investments | | | — | | | | (0.34 | ) | | | — | | | | — | | | | — | | |
Total Distributions | | | — | | | | (0.34 | ) | | | — | | | | — | | | | — | | |
Net Asset Value, End of Period | | $ | 18.58 | | | $ | 16.06 | | | $ | 13.22 | | | $ | 10.31 | | | $ | 10.75 | | |
Total Return | | | 15.62 | % | | | 24.16 | % | | | 28.35 | % | | | (4.28 | )% | | | 7.60 | %(4) | |
SUPPLEMENTAL DATA AND RATIOS: | |
Net assets, end of period (in thousands) | | $ | 47,455 | | | $ | 13,478 | | | $ | 3,983 | | | $ | 2,824 | | | $ | 2,036 | | |
Ratio of expenses to average net assets | |
Before waivers and reimbursements | | | 1.52 | % | | | 2.46 | % | | | 4.02 | % | | | 5.25 | % | | | 10.93 | %(5) | |
Net of waivers and reimbursements | | | 1.10 | % | | | 1.10 | % | | | 1.10 | % | | | 1.10 | % | | | 1.10 | %(5) | |
Ratio of net investment loss to average net assets | |
Before waivers and reimbursements | | | (1.37 | )% | | | (2.26 | )% | | | (3.28 | )% | | | (5.02 | )% | | | (10.75 | )%(5) | |
Net of waivers and reimbursements | | | (0.95 | )% | | | (0.90 | )% | | | (0.36 | )% | | | (0.87 | )% | | | (0.92 | )%(5) | |
Portfolio turnover rate(6) | | | 124 | % | | | 173 | % | | | 140 | % | | | 138 | % | | | 28 | %(4) | |
(1) Commenced operations on March 23, 2011.
(2) Per share net investment loss has been calculated using the daily average share method.
(3) Net investment loss per share is calculated using ending balances prior to consideration of adjustments for permanent book to tax differences.
(4) Not annualized.
(5) Annualized.
(6) Portfolio turnover is calculated on the basis of the Fund as a whole without distinguishing between the classes of shares issued.
The accompanying notes are an integral part of these financial statements.
page 52

Frontier Timpani Small Cap Growth Fund
FINANCIAL HIGHLIGHTS
| | | Class Y | |
| | | Year
Ended
June 30,
2015 | | Period
Ended
June 30,
2014(1) | |
Net Asset Value, Beginning of Period | | $ | 16.04 | | | $ | 16.35 | | |
INCOME (LOSS) FROM INVESTMENT OPERATIONS: | |
Net investment loss | | | (0.23 | )(2) | | | (0.08 | )(2) | |
Net realized and unrealized gain (loss) on investments | | | 2.67 | | | | (0.23 | )(3) | |
Total Income (Loss) from Investment Operations | | | 2.44 | | | | (0.31 | ) | |
Net Asset Value, End of Period | | $ | 18.48 | | | $ | 16.04 | | |
Total Return | | | 15.15 | % | | | (1.90 | )%(4) | |
SUPPLEMENTAL DATA AND RATIOS: | |
Net assets, end of period (in thousands) | | $ | 2,262 | | | $ | 1,215 | | |
Ratio of expenses to average net assets | |
Before waivers and reimbursements | | | 1.95 | % | | | 2.73 | %(5) | |
Net of waivers and reimbursements | | | 1.50 | % | | | 1.50 | %(5) | |
Ratio of net investment loss to average net assets | |
Before waivers and reimbursements | | | (1.82 | )% | | | (2.36 | )%(5) | |
Net of waivers and reimbursements | | | (1.37 | )% | | | (1.13 | )%(5) | |
Portfolio turnover rate(6) | | | 124 | % | | | 173 | %(4) | |
(1) Commenced operations on January 6, 2014.
(2) Per share net investment loss has been calculated using the daily average share method.
(3) Net realized and unrealized loss on investments does not reconcile with net realized and unrealized gain on investments in the Statement of Operations due to the timing of the Class Y inception.
(4) Not annualized.
(5) Annualized.
(6) Portfolio turnover is calculated on the basis of the Fund as a whole without distinguishing between the classes of shares issued.
The accompanying notes are an integral part of these financial statements.
page 53

Frontier Netols Small Cap Value Fund
FINANCIAL HIGHLIGHTS
| | | Institutional Class | |
| | | Year
Ended
June 30,
2015 | | Year
Ended
June 30,
2014 | | Year
Ended
June 30,
2013 | | Year
Ended
June 30,
2012 | | Year
Ended
June 30,
2011 | |
Net Asset Value, Beginning of Period | | $ | 14.66 | | | $ | 15.35 | | | $ | 12.86 | | | $ | 13.75 | | | $ | 10.08 | | |
INCOME (LOSS) FROM INVESTMENT OPERATIONS: | |
Net investment income (loss) | | | 0.01 | | | | (0.04 | )(1) | | | 0.01 | | | | 0.01 | | | | (0.05 | )(2) | |
Net realized and unrealized gain (loss) on investments | | | 0.37 | | | | 3.50 | | | | 3.17 | | | | (0.90 | ) | | | 3.72 | | |
Total Income (Loss) from Investment Operations | | | 0.38 | | | | 3.46 | | | | 3.18 | | | | (0.89 | ) | | | 3.67 | | |
LESS DISTRIBUTIONS: | |
From net investment income | | | — | | | | — | | | | — | | | | — | | | | — | (3) | |
From net realized gain on investments | | | (3.44 | ) | | | (4.15 | ) | | | (0.69 | ) | | | — | | | | — | | |
Total Distributions | | | (3.44 | ) | | | (4.15 | ) | | | (0.69 | ) | | | — | | | | — | | |
Net Asset Value, End of Period | | $ | 11.60 | | | $ | 14.66 | | | $ | 15.35 | | | $ | 12.86 | | | $ | 13.75 | | |
Total Return | | | 3.61 | % | | | 24.63 | % | | | 25.61 | % | | | (6.47 | )% | | | 36.43 | % | |
SUPPLEMENTAL DATA AND RATIOS: | |
Net assets, end of period (in thousands) | | $ | 77,802 | | | $ | 98,504 | | | $ | 113,151 | | | $ | 134,544 | | | $ | 166,450 | | |
Ratio of expenses to average net assets | |
Before waivers and reimbursements | | | 1.18 | % | | | 1.17 | % | | | 1.18 | % | | | 1.22 | % | | | 1.13 | % | |
Net of waivers and reimbursements | | | 1.10 | % | | | 1.10 | % | | | 1.10 | % | | | 1.10 | % | | | 1.10 | % | |
Ratio of net investment income (loss) to average net assets | |
Before waivers and reimbursements | | | (0.18 | )% | | | (0.35 | )% | | | (0.14 | )% | | | (0.08 | )% | | | (0.39 | )% | |
Net of waivers and reimbursements | | | (0.10 | )% | | | (0.28 | )% | | | (0.06 | )% | | | 0.04 | % | | | (0.36 | )% | |
Portfolio turnover rate(4) | | | 22 | % | | | 24 | % | | | 28 | % | | | 28 | % | | | 33 | % | |
(1) Per share net investment loss has been calculated using the daily average share method.
(2) Net investment loss per share is calculated using ending balances prior to consideration of adjustments for permanent book to tax differences.
(3) Less than one cent per share.
(4) Portfolio turnover is calculated on the basis of the Fund as a whole without distinguishing between the classes of shares issued.
The accompanying notes are an integral part of these financial statements.
page 54

Frontier Netols Small Cap Value Fund
FINANCIAL HIGHLIGHTS
| | | Class Y | |
| | | Year
Ended
June 30,
2015 | | Year
Ended
June 30,
2014 | | Year
Ended
June 30,
2013 | | Year
Ended
June 30,
2012 | | Year
Ended
June 30,
2011 | |
Net Asset Value, Beginning of Period | | $ | 14.15 | | | $ | 15.03 | | | $ | 12.65 | | | $ | 13.59 | | | $ | 10.00 | | |
INCOME (LOSS) FROM INVESTMENT OPERATIONS: | |
Net investment loss | | | (0.01 | )(1) | | | (0.17 | )(1) | | | (0.05 | ) | | | (0.05 | ) | | | (0.09 | )(2) | |
Net realized and unrealized gain (loss) on investments | | | 0.37 | | | | 3.44 | | | | 3.12 | | | | (0.89 | ) | | | 3.68 | | |
Total Income (Loss) from Investment Operations | | | 0.36 | | | | 3.27 | | | | 3.07 | | | | (0.94 | ) | | | 3.59 | | |
LESS DISTRIBUTIONS: | |
From net realized gain on investments | | | (3.44 | ) | | | (4.15 | ) | | | (0.69 | ) | | | — | | | | — | | |
Total Distributions | | | (3.44 | ) | | | (4.15 | ) | | | (0.69 | ) | | | — | | | | — | | |
Net Asset Value, End of Period | | $ | 11.07 | | | $ | 14.15 | | | $ | 15.03 | | | $ | 12.65 | | | $ | 13.59 | | |
Total Return | | | 3.61 | % | | | 23.84 | % | | | 25.15 | % | | | (6.92 | )% | | | 35.90 | % | |
SUPPLEMENTAL DATA AND RATIOS: | |
Net assets, end of period (in thousands) | | $ | 521 | | | $ | 633 | | | $ | 20,228 | | | $ | 17,765 | | | $ | 22,792 | | |
Ratio of expenses to average net assets | |
Before waivers and reimbursements | | | 1.18 | % | | | 1.57 | % | | | 1.58 | % | | | 1.62 | % | | | 1.53 | % | |
Net of waivers and reimbursements | | | 1.10 | % | | | 1.50 | % | | | 1.50 | % | | | 1.50 | % | | | 1.50 | % | |
Ratio of net investment loss to average net assets | |
Before waivers and reimbursements | | | (0.18 | )% | | | (1.19 | )% | | | (0.54 | )% | | | (0.48 | )% | | | (0.79 | )% | |
Net of waivers and reimbursements | | | (0.10 | )% | | | (1.12 | )% | | | (0.46 | )% | | | (0.36 | )% | | | (0.76 | )% | |
Portfolio turnover rate(3) | | | 22 | % | | | 24 | % | | | 28 | % | | | 28 | % | | | 33 | % | |
(1) Per share net investment loss has been calculated using the daily average share method.
(2) Net investment loss per share is calculated using ending balances prior to consideration of adjustments for permanent book to tax differences.
(3) Portfolio turnover is calculated on the basis of the Fund as a whole without distinguishing between the classes of shares issued.
The accompanying notes are an integral part of these financial statements.
page 55

Frontier Phocas Small Cap Value Fund
FINANCIAL HIGHLIGHTS
| | | Year
Ended
June 30,
2015 | | Year
Ended
June 30,
2014 | | Year
Ended
June 30,
2013 | | Year
Ended
June 30,
2012 | | Year
Ended
June 30,
2011(1) | |
Net Asset Value, Beginning of Period | | $ | 35.96 | | | $ | 28.72 | | | $ | 23.30 | | | $ | 24.51 | | | $ | 18.40 | | |
INCOME (LOSS) FROM INVESTMENT OPERATIONS: | |
Net investment income (loss) | | | 0.19 | | | | (0.05 | )(2) | | | 0.20 | | | | 0.06 | | | | 0.04 | (2) | |
Net realized and unrealized gain (loss) on investments | | | 0.08 | | | | 9.25 | | | | 5.41 | | | | (1.25 | ) | | | 6.13 | | |
Total Income (Loss) from Investment Operations | | | 0.27 | | | | 9.20 | | | | 5.61 | | | | (1.19 | ) | | | 6.17 | | |
LESS DISTRIBUTIONS: | |
From net investment income | | | (0.03 | ) | | | (0.05 | ) | | | (0.19 | ) | | | (0.02 | ) | | | (0.06 | ) | |
From net realized gain on investments | | | (1.87 | ) | | | (1.91 | ) | | | — | | | | — | | | | — | | |
Total Distributions | | | (1.90 | ) | | | (1.96 | ) | | | (0.19 | ) | | | (0.02 | ) | | | (0.06 | ) | |
Redemption fees retained | | | — | | | | — | | | | — | | | | — | | | | — | (3) | |
Net Asset Value, End of Period | | $ | 34.33 | | | $ | 35.96 | | | $ | 28.72 | | | $ | 23.30 | | | $ | 24.51 | | |
Total Return | | | 0.84 | % | | | 32.72 | % | | | 24.29 | % | | | (4.91 | )% | | | 33.55 | % | |
SUPPLEMENTAL DATA AND RATIOS: | |
Net assets, end of period (in thousands) | | $ | 28,686 | | | $ | 24,152 | | | $ | 9,004 | | | $ | 18,821 | | | $ | 20,507 | | |
Ratio of expenses to average net assets | |
Before waivers and reimbursements | | | 1.54 | % | | | 1.97 | % | | | 2.50 | % | | | 1.70 | % | | | 1.69 | % | |
Net of waivers and reimbursements | | | 1.10 | % | | | 1.10 | % | | | 1.05 | % | | | 0.99 | % | | | 0.99 | % | |
Ratio of net investment income (loss) to average net assets | |
Before waivers and reimbursements | | | 0.16 | % | | | (1.00 | )% | | | (1.08 | )% | | | (0.51 | )% | | | (0.52 | )% | |
Net of waivers and reimbursements | | | 0.60 | % | | | (0.13 | )% | | | 0.37 | % | | | 0.20 | % | | | 0.18 | % | |
Portfolio turnover rate | | | 52 | % | | | 53 | % | | | 196 | % | | | 50 | % | | | 37 | % | |
(1) Effective October 8, 2010, Frontegra Asset Management, Inc. became adviser and Phocas Financial Corp. became subadviser to the Fund.
(2) Per share net investment income (loss) has been calculated using the daily average shares method.
(3) Less than one cent per share.
The accompanying notes are an integral part of these financial statements.
page 56

NOTES TO FINANCIAL STATEMENTS
June 30, 2015
(1) ORGANIZATION
Frontier Funds, Inc. (the "Company") was incorporated on May 24, 1996, as a Maryland corporation and is registered under the Investment Company Act of 1940, as amended (the "1940 Act"), as an open-end investment company issuing shares in series (each, a "Fund," or collectively, the "Funds"), each series representing a distinct portfolio with its own investment objectives and policies. The investment objective of each of the Frontier MFG Global Equity Fund, Frontier MFG Global Plus Fund, Frontier Timpani Small Cap Growth Fund and Frontier Netols Small Cap Value Fund is capital appreciation. The investment objective of the Frontier MFG Core Infrastructure Fund is long-term capital appreciation. The investment objective of the Frontier Phocas Small Cap Value Fund is long-term total investment through capital appreciation.
Effective October 31, 2014, the Company changed its name from "Frontegra Funds, Inc." to "Frontier Funds, Inc." and each Fund was renamed as listed in the table below.
As of June 30, 2015, the Company had six series in operations. A summary of each Fund's investment adviser, subadviser and capital structure is as follows:
Fund | | Investment Adviser | | Subadviser | | Capital Structure | | Commencement
of Operations | |
Frontier MFG Global Equity Fund (a) | | Frontegra Asset Management, Inc. ("Frontegra") | | MFG Asset Management | | Single Class | | Dec. 28, 2011 | |
Frontier MFG Global Plus Fund (a) | | Frontegra | | MFG Asset Management | | Multi-Class
• Institutional
• Class Y (b) | | Mar. 23, 2015 | |
Frontier MFG Core Infrastructure Fund (a) | | Frontegra | | MFG Asset Management | | Single Class | | Jan. 18, 2012 | |
Frontier Timpani Small Cap Growth Fund | | Timpani Capital Management LLC ("Timpani") (c) | | | None | | | Multi-Class
• Institutional
• Class Y | | Mar. 23, 2011 | |
Frontier Netols Small Cap Value Fund | | Frontegra | | Netols Asset Management, Inc. | | Multi-Class
• Institutional
• Class Y | | Dec. 16, 2005 | |
Frontier Phocas Small Cap Value Fund | | Frontegra | | Phocas Financial Corp. | | Single Class | | Sep. 29, 2006 | |
(a) A redemption fee of 2.00% will be charged on shares of the Fund redeemed 30 days or less from their date of purchase.
(b) As of June 30, 2015, the Class Y shares of the Frontier MFG Global Plus Fund had not commenced operations.
(c) Timpani is an affiliate of Frontegra.
page 57

NOTES TO FINANCIAL STATEMENTS (continued)
June 30, 2015
(2) SIGNIFICANT ACCOUNTING POLICIES
The following is a summary of significant accounting policies consistently followed by the Funds in the preparation of their financial statements.
(a) Investment Valuation
Equity securities for which market quotations are readily available are valued at the last reported sale price on the national securities exchange on which such securities are primarily traded. Equity securities for which there were no transactions on a given day or securities not listed on a national securities exchange are valued at the most recent bid price. Equity securities that are traded on NASDAQ are valued using the NASDAQ Official Closing Price ("NOCP"). Debt securities are valued at the bid price provided by an independent pricing service, which uses valuation methods such as matrix pricing and other analytical pricing models as well as market transactions and dealer bid quotations. Shares of underlying mutual funds are valued at their respective NAVs. Exchange traded funds are valued at the last reported sale price on the exchange on which the security is principally traded. Securities that are primarily traded on foreign exchanges generally are valued at the last sale price of such securities on their respective exchange. In certain circumstances, such as when a significant event occurs in a foreign market so that the last sale price no longer reflects actual value, the fair value of these securities may be determined using fair valuation procedures approved by the Board of Directors (the "Board"). The Board has retained an independent fair value pricing service to assist in valuing foreign securities held by the Frontier MFG Global Equity, Frontier MFG Global Plus and Frontier MFG Core Infrastructure Funds. In valuing assets, prices denominated in foreign currencies are converted to U.S. dollar equivalents at the current exchange rate, which approximates fair value. Debt securities maturing within 60 days or less, which are not priced by a pricing service, may be valued by the amortized cost method. Any securities or other assets for which market quotations are not readily available are valued at their fair value as determined in good faith by the advisers or subadvisers pursuant to guidelines established by the Board.
The Funds follow a fair value hierarchy that distinguishes between market data obtained from independent sources (observable inputs) and the Funds' own market assumptions (unobservable inputs). These inputs are used in determining the value of each Fund's investments and are summarized in the following fair value hierarchy:
Level 1 — Quoted prices in active markets for identical securities
Level 2 — Evaluated prices based on other significant observable inputs (including quoted prices for similar securities, foreign security indices, foreign exchange rates, fair value estimates for foreign securities and changes in benchmark securities indices)
Level 3 — Significant unobservable inputs (including the Fund's own assumptions in determining fair value of investments)
The following is a summary of inputs used to value the Funds' securities as of June 30, 2015:
MFG Global Equity
Description | | Level 1 | | Level 2 | | Level 3 | | Total | |
Equity (a) | |
| Common Stocks | | $ | 936,291,667 | | | $ | — | | | $ | — | | | $ | 936,291,667 | | |
| Total Equity | | | 936,291,667 | | | | — | | | | — | | | | 936,291,667 | | |
Short-Term Investments | | | 169,924,409 | | | | — | | | | — | | | | 169,924,409 | | |
Total Investments in Securities | | $ | 1,106,216,076 | | | $ | — | | | $ | — | | | $ | 1,106,216,076 | | |
page 58

NOTES TO FINANCIAL STATEMENTS (continued)
June 30, 2015
MFG Global Plus
Description | | Level 1 | | Level 2 | | Level 3 | | Total | |
Equity (a) | |
| Common Stocks | | $ | 4,963,938 | | | $ | — | | | $ | — | | | $ | 4,963,938 | | |
| Total Equity | | | 4,963,938 | | | | — | | | | — | | | | 4,963,938 | | |
Short-Term Investments | | | 888,697 | | | | — | | | | — | | | | 888,697 | | |
Total Investments in Securities | | $ | 5,852,635 | | | $ | — | | | $ | — | | | $ | 5,852,635 | | |
MFG Core Infrastructure
Description | | Level 1 | | Level 2 | | Level 3 | | Total | |
Equity (a) | |
| Common Stocks | | $ | 154,832,246 | | | $ | — | | | $ | — | | | $ | 154,832,246 | | |
| Closed-End Funds | | | 1,696,519 | | | | — | | | | — | | | | 1,696,519 | | |
| Total Equity | | | 156,528,765 | | | | — | | | | — | | | | 156,528,765 | | |
Short-Term Investments | | | 3,610,701 | | | | — | | | | — | | | | 3,610,701 | | |
Total Investments in Securities | | $ | 160,139,466 | | | $ | — | | | $ | — | | | $ | 160,139,466 | | |
Timpani Small Cap Growth
Description | | Level 1 | | Level 2 | | Level 3 | | Total | |
Equity (a) | |
| Common Stocks | | $ | 48,983,416 | | | $ | — | | | $ | — | | | $ | 48,983,416 | | |
| Total Equity | | | 48,983,416 | | | | — | | | | — | | | | 48,983,416 | | |
Short-Term Investments | | | 1,039,492 | | | | — | | | | — | | | | 1,039,492 | | |
Total Investments in Securities | | $ | 50,022,908 | | | $ | — | | | $ | — | | | $ | 50,022,908 | | |
Netols Small Cap Value
Description | | Level 1 | | Level 2 | | Level 3 | | Total | |
Equity (a) | |
| Common Stocks | | $ | 77,142,484 | | | $ | — | | | $ | — | | | $ | 77,142,484 | | |
| Total Equity | | | 77,142,484 | | | | — | | | | — | | | | 77,142,484 | | |
Short-Term Investments | | | 1,195,446 | | | | — | | | | — | | | | 1,195,446 | | |
Total Investments in Securities | | $ | 78,337,930 | | | $ | — | | | $ | — | | | $ | 78,337,930 | | |
Phocas Small Cap Value
Description | | Level 1 | | Level 2 | | Level 3 | | Total | |
Equity (a) | |
| Common Stocks | | $ | 27,964,969 | | | $ | — | | | $ | — | | | $ | 27,964,969 | | |
| Total Equity | | | 27,964,969 | | | | — | | | | — | | | | 27,964,969 | | |
Short-Term Investments | | | 482,439 | | | | — | | | | — | | | | 482,439 | | |
Total Investments in Securities | | $ | 28,447,408 | | | $ | — | | | $ | — | | | $ | 28,447,408 | | |
(a) See Fund's Schedule of Investments for sector or country classifications.
page 59

NOTES TO FINANCIAL STATEMENTS (continued)
June 30, 2015
For the year ended June 30, 2015, there were no transfers between Levels 1, 2 and 3. The Funds did not hold any Level 3 securities during the fiscal year ended June 30, 2015. It is the Funds' policy to record transfers at the end of the reporting period.
(b) Federal Income Taxes
Each Fund intends to comply with the requirements of Subchapter M of the Internal Revenue Code necessary to qualify as a regulated investment company and to make the requisite distributions of income and capital gains to its shareholders sufficient to relieve it from all or substantially all federal income taxes. Therefore, no federal income tax provision has been provided.
The Funds have adopted financial reporting rules regarding recognition and measurement of tax positions taken or expected to be taken on a tax return. The Funds recognize interest and penalties, if any, related to unrecognized tax benefits as income tax expense on the Statement of Operations. During the year, the Funds did not incur any interest or penalties. The Funds have reviewed all open tax years and concluded that there is no effect to any of the Fund's financial positions or results of operations and no tax liability resulting from unrecognized tax benefits relating to uncertain income tax positions taken or expected to be taken on a tax return. Open tax years are those years that are open for examination by the relevant income taxing authority. As of June 30, 2015, open federal and state income tax years include the tax years ended June 30, 2012, June 30, 2013, June 30, 2014 and June 30, 2015. The Funds have no examinations in progress.
(c) Distributions to Shareholders
With the exception of the Frontier MFG Core Infrastructure Fund, dividends from net investment income are usually declared and paid annually. The Frontier MFG Core lnfrastructure Fund usually declares and pays dividends quarterly. Distributions from net realized gains, if any, are declared and paid at least annually for all Funds. All short-term capital gains are included in ordinary income for tax purposes. Distributions to shareholders are recorded on the ex-dividend date.
The tax character of distributions paid during the fiscal years ended June 30, 2015, and June 30, 2014, were as follows:
| | Year Ended June 30, 2015 | | Year Ended June 30, 2014 | |
| | Ordinary
Income | | Long-Term
Capital Gains | | Total
Distributions | | Ordinary
Income | | Long-Term
Capital Gains | | Total
Distributions | |
MFG Global Equity | | $ | 16,691,674 | | | $ | 5,864,814 | | | $ | 22,556,488 | | | $ | 7,828,247 | | | $ | 571,764 | | | $ | 8,400,011 | | |
MFG Core Infrastructure | | | 3,489,745 | | | | 27,925 | | | | 3,517,670 | | | | 253,056 | | | | — | | | | 253,056 | | |
Timpani Small Cap Growth | | | — | | | | — | | | | — | | | | 5,119 | | | | 130,330 | | | | 135,449 | | |
Netols Small Cap Value | | | — | | | | 21,063,141 | | | | 21,063,141 | | | | 954,829 | | | | 25,571,887 | | | | 26,526,716 | | |
Phocas Small Cap Value | | | 316,055 | | | | 927,520 | | | | 1,243,575 | | | | 126,612 | | | | 570,892 | | | | 697,504 | | |
page 60

NOTES TO FINANCIAL STATEMENTS (continued)
June 30, 2015
At June 30, 2015, the components of accumulated earnings/losses on a tax basis were as follows:
| | MFG
Global
Equity | | MFG
Global
Plus | | MFG
Core
Infrastructure | | Timpani
Small Cap
Growth | | Netols
Small Cap
Value | | Phocas
Small Cap
Value | |
Cost of investments | | $ | 988,685,878 | | | $ | 5,928,338 | | | $ | 165,129,525 | | | $ | 39,575,216 | | | $ | 50,058,716 | | | $ | 23,967,663 | | |
Gross unrealized appreciation | | $ | 154,970,966 | | | $ | 88,059 | | | $ | 4,330,474 | | | $ | 11,198,149 | | | $ | 32,372,622 | | | $ | 5,233,966 | | |
Gross unrealized depreciation | | | (37,440,768 | ) | | | (163,762 | ) | | | (9,320,533 | ) | | | (750,457 | ) | | | (4,093,408 | ) | | | (754,221 | ) | |
Net unrealized appreciation/depreciation | | | 117,530,198 | | | | (75,703 | ) | | | (4,990,059 | ) | | | 10,447,692 | | | | 28,279,214 | | | | 4,479,745 | | |
Undistributed ordinary income | | | 9,255,166 | | | | 16,849 | | | | 382,816 | | | | — | | | | 955,823 | | | | 136,465 | | |
Undistributed long-term capital gain | | | 23,712,393 | | | | — | | | | 181,827 | | | | — | | | | 8,534,001 | | | | 163,601 | | |
Total distributable earnings | | | 32,967,559 | | | | 16,849 | | | | 564,643 | | | | — | | | | 9,489,824 | | | | 300,066 | | |
Other accumulated losses | | | (75,462 | ) | | | (3,800 | ) | | | (3,253 | ) | | | (1,951,571 | ) | | | — | | | | — | | |
Total accumulated earnings (losses) | | $ | 150,422,295 | | | $ | (62,654 | ) | | $ | (4,428,669 | ) | | $ | 8,496,121 | | | $ | 37,769,038 | | | $ | 4,779,811 | | |
The difference between book-basis and tax-basis unrealized appreciation is attributable primarily to the tax deferral of losses on wash sales and mark-to-market on passive foreign investment companies.
At June 30, 2015, the Timpani Small Cap Growth Fund had a short-term capital loss carryforward that will not expire of $1,597,380.
In order to meet certain excise tax requirements, the Funds are required to measure and distribute annually, net capital gains realized during the twelve month period ending October 31. In connection with this requirement, the Funds are permitted, for tax purposes, to defer into their next fiscal year any net capital losses incurred from November 1 through the end of the fiscal year. As of June 30, 2015, the following Funds deferred, on a tax basis, post-October losses and ordinary late-year losses of:
| | Post-October
Capital Loss Deferred | | Ordinary Late-Year
Loss Deferred | |
MFG Global Plus | | $ | 3,664 | | | $ | — | | |
Timpani Small Cap Growth | | | 165,993 | | | | 188,198 | | |
d) Foreign Currency Translation
Values of investments denominated in foreign currencies are converted into U.S. dollars using a spot market rate of exchange each day. Purchases and sales of investments and dividend and interest income are translated to U.S. dollars using a spot market rate of exchange prevailing on the dates of such transactions. The portion of security gains or losses resulting from changes in foreign exchange rates are included with net realized and unrealized gain or loss from investments, as appropriate, for both financial reporting and tax purposes.
Each Fund, respectively, bears the risk of changes in the foreign currency exchange rates and their impact on the value of assets and liabilities denominated in foreign currency. Each Fund also bears the risk of a counterparty failing to fulfill its obligation under a foreign currency contract.
Investments in securities of foreign companies involve additional risks including: currency exchange rate fluctuation; less available public information about the issuers of securities; less stringent regulatory standards; lack of uniform accounting, auditing and financial reporting standards; and country risks including less liquidity, high inflation rates and political and economic instability. The risks of foreign investments are typically greater in emerging and less developed markets.
page 61

NOTES TO FINANCIAL STATEMENTS (continued)
June 30, 2015
(e) Indemnifications
Under the Funds' organizational documents, their officers and directors are indemnified against certain liabilities arising out of the performance of their duties to the Funds. In addition, in the normal course of business, the Funds enter into contracts that provide general indemnifications to other parties. The Funds' maximum exposure under these arrangements is unknown as this would involve future claims that may be made against the Funds that have not yet occurred. However, the Funds have not had prior claims or losses pursuant to these contracts and expect the risk of loss to be remote.
(f) Subsequent Event
At the special meeting of shareholders held on August 18, 2015, shareholders of the Frontier Timpani Small Cap Growth Fund approved a new advisory agreement between Timpani and the Company to take effect upon a proposed change of control at Timpani. The terms of the new advisory agreement are substantially similar to the terms of the prior advisory agreement and the advisory fee is identical.
(g) Other
Investment transactions are accounted for on the trade date. The Funds determine the gain or loss realized from investment transactions by comparing the original cost of the specifically identified security lot sold with the net sale proceeds. Dividend income, less foreign taxes withheld, is recognized on the ex-dividend date, except that certain dividends from foreign securities are recorded as soon as the information becomes available to the Funds. Interest income is recognized on an accrual basis. All discounts/premiums are accreted/amortized using the effective interest method and are included in interest income. Withholding taxes on foreign dividends have been provided for in accordance with the Funds' understanding of the applicable country's tax codes and regulations.
Income, expenses (other than expenses attributable to a specific class) and realized and unrealized gains or losses on investments attributable to the Funds are generally allocated to each respective class in proportion to the relative net assets of each class.
The preparation of financial statements in conformity with U.S. generally accepted accounting principles ("GAAP") requires management to make estimates and assumptions that affect the reported amounts of assets and liabilities and disclosure of contingent assets and liabilities at the date of the financial statements, and the reported amounts of increases and decreases in net assets from operations during the reporting period. Actual results could differ from those estimates.
Net investment income and realized gains and losses for federal income tax purposes may differ from that reported on the financial statements because of permanent book-to-tax differences. GAAP requires that permanent differences in net investment income and realized gains and losses due to differences between financial reporting and tax reporting be reclassified between various components of net assets. These reclassifications have no effect on net assets or net asset value per share. For the fiscal year ended June 30, 2015, the following table shows the reclassifications made:
| | MFG
Global
Equity | | MFG
Global
Plus | | MFG
Core
Infrastructure | | Timpani
Small Cap
Growth | | Netols
Small Cap
Value | | Phocas
Small Cap
Value | |
Paid in capital | | $ | — | | | $ | — | | | $ | — | | | $ | (206,307 | ) | | $ | (1,555 | ) | | $ | — | | |
Undistributed net investment income (loss) | | | (102,432 | ) | | | 2,258 | | | | (51,376 | ) | | | 165,378 | | | | 140,742 | | | | (42 | ) | |
Accumulated undistributed net realized gain (loss) | | | 102,432 | | | | (2,258 | ) | | | 51,376 | | | | 40,929 | | | | (139,187 | ) | | | 42 | | |
The permanent differences primarily relate to foreign currency and net operating losses.
page 62

NOTES TO FINANCIAL STATEMENTS (continued)
June 30, 2015
(3) INVESTMENT ADVISER AND RELATED PARTIES
The MFG Global Equity, MFG Global Plus, MFG Core Infrastructure, Netols Small Cap Value and Phocas Small Cap Value Funds have entered into an agreement with Frontegra, with whom certain officers and a director of the Funds are affiliated, to furnish investment advisory services to the Funds. Timpani, an affiliate of Frontegra, is the investment adviser to the Timpani Small Cap Growth Fund. Fees are calculated daily and payable monthly, at annual rates set forth in the following table (expressed as a percentage of each Fund's average daily net assets). Pursuant to expense cap agreements, Frontegra and Timpani have agreed to waive their respective management fees and/or reimburse each Fund's operating expenses (exclusive of brokerage, acquired fund fees and expenses, interest, taxes and extraordinary expenses) to ensure that each Fund's operating expenses do not exceed the expense limitation listed below. Expenses waived are netted with advisory fees payable on the Statement of Assets and Liabilities. On a monthly basis, these accounts are settled by each Fund making payment to the respective adviser or the respective adviser reimbursing the Fund if the reimbursement amount exceeds the advisory fee. If the amount of fees waived exceeds the advisory fee earned, this is shown on the Statement of Assets and Liabilities as a receivable from the respective adviser. The expense cap agreements will continue in effect until October 31, 2016, with successive renewal terms of one year unless terminated by an adviser or a Fund prior to any such renewal.
Frontier Fund | | Annual Advisory Fees | | Expense Limitation | |
MFG Global Equity | | | 0.80 | % | | | 0.80 | % | |
MFG Global Plus | | | 0.80 | % | | | 0.80 | % | |
MFG Core Infrastructure | | | 0.70 | % | | | 0.70 | % | |
Timpani Small Cap Growth - Institutional Class | | | 1.00 | % | | | 1.10 | % | |
Timpani Small Cap Growth - Class Y | | | 1.00 | % | | | 1.50 | % | |
Netols Small Cap Value - Institutional Class | | | 1.00 | % | | | 1.10 | % | |
Netols Small Cap Value - Class Y | | | 1.00 | % | | | 1.50 | % | |
Phocas Small Cap Value | | | 1.00 | % | | | 1.10 | % | |
Any waivers or reimbursements are subject to later adjustment to allow the advisers to recoup amounts waived or reimbursed to the extent actual fees and expenses for a fiscal period are less than each Fund's expense limitation cap, provided, however, that an adviser shall only be entitled to recoup such amounts for a period of three years from the date such amount was waived or reimbursed. Expenses attributable to a specific class may only be recouped with respect to that class.
The following table shows the waived or reimbursed expenses subject to potential recovery expiring in:
| | MFG
Global
Equity | | MFG
Global
Plus | | MFG
Core
Infrastructure | | Timpani
Small Cap
Growth | | Netols
Small Cap
Value | | Phocas
Small Cap
Value | |
| | 2016 | | | $ | 294,528 | | | $ | — | | | $ | 100,062 | | | $ | 95,252 | | | $ | 121,910 | | | $ | 147,770 | | |
| | 2017 | | | | 524,574 | | | | — | | | | 147,255 | | | | 107,201 | | | | 78,732 | | | | 117,689 | | |
| | 2018 | | | | 621,649 | | | | 60,682 | * | | | 232,227 | | | | 131,253 | | | | 69,287 | | | | 114,802 | | |
| | Total | | | $ | 1,440,751 | | | $ | 60,682 | | | $ | 479,544 | | | $ | 333,706 | | | $ | 269,929 | | | $ | 380,261 | | |
* Expenses waived/reimbursed were for the period March 23, 2015 through June 30, 2015.
The beneficial ownership, either directly or indirectly, of more than 25% of a Fund's voting securities creates a presumption of control. As of June 30, 2015, an affiliate of Frontegra owned a controlling interest in the Frontier MFG Global Plus Fund. Shareholders with a controlling interest could affect the outcome of proxy voting or direction of management of a Fund.
page 63

NOTES TO FINANCIAL STATEMENTS (continued)
June 30, 2015
(4) INVESTMENT TRANSACTIONS
The aggregate purchases and sales of securities, excluding short-term investments, for the Funds for the year ended June 30, 2015, are summarized below:
| | MFG
Global
Equity | | MFG
Global
Plus | | MFG
Core
Infrastructure | | Timpani
Small Cap
Growth | | Netols
Small Cap
Value | | Phocas
Small Cap
Value | |
Purchases | | $ | 710,040,513 | | | $ | 5,340,766 | | | $ | 117,930,208 | | | $ | 65,944,109 | | | $ | 18,800,019 | | | $ | 17,883,418 | | |
Sales | | $ | 607,505,112 | | | $ | 297,462 | | | $ | 16,592,984 | | | $ | 38,206,054 | | | $ | 41,665,380 | | | $ | 13,271,429 | | |
There were no purchases or sales of U.S. Government securities for the Funds.
(5) DISTRIBUTION PLAN AND SHAREHOLDER SERVICING FEE
The Company, on behalf of the Frontier Netols Small Cap Value Fund, the Frontier Timpani Small Cap Growth Fund and the Frontier MFG Global Plus Fund, has adopted a distribution plan pursuant to Rule 12b-1 under the Investment Company Act of 1940 for each Fund's Class Y shares (the "12b-1 Plan"). Pursuant to the 12b-1 Plan, each Fund pays an annual fee of up to 0.25% to Frontegra Strategies, LLC (the "Distributor"), an affiliate of Frontegra, for payments to brokers, dealers and other financial intermediaries who perform activities or incur expenses intended to result in the sale of Class Y shares of the Funds. As of June 30, 2015, the Class Y shares of the Frontier MFG Global Plus Fund had not commenced operations. For the year ended June 30, 2015, the Netols Small Cap Value Fund and the Timpani Small Cap Growth Fund incurred $0 and $4,123, respectively, under the 12b-1 Plan.
Class Y shares of the Funds also pay an annual shareholder servicing fee of up to 0.15% per year to the Distributor for payments to brokers, dealers, and other financial intermediaries who provide on-going account services to shareholders. Those services include establishing and maintaining shareholder accounts, mailing prospectuses, account statements and other Fund documents to shareholders, processing shareholder transactions, and providing other recordkeeping and administrative services. For the year ended June 30, 2015, the Netols Small Cap Value Fund and the Timpani Small Cap Growth Fund incurred $0 and $2,473, respectively, in shareholder servicing expenses.
page 64

REPORT OF INDEPENDENT REGISTERED PUBLIC ACCOUNTING FIRM
June 30, 2015
To the Shareholders and Board of Directors of Frontier Funds, Inc.
We have audited the accompanying statements of assets and liabilities, including the schedules of investments, of Frontier Funds, Inc. (the "Funds"), comprising Frontier MFG Global Equity Fund, Frontier MFG Global Plus Fund, Frontier MFG Core Infrastructure Fund, Frontier Timpani Small Cap Growth Fund, Frontier Netols Small Cap Value Fund, and Frontier Phocas Small Cap Value Fund as of June 30, 2015, and the related statements of operations for the year then ended, the statements of changes in net assets for each of the two years in the period then ended, and the financial highlights for each of the four periods in the period then ended for Frontier MFG Global Equity Fund, Frontier MFG Core Infrastructure Fund, Frontier Timpani Small Cap Growth Fund, Frontier Netols Small Cap Value Fund, and Frontier Phocas Small Cap Value Fund, and the related statements of operations and changes in net assets and financial highlights for the period March 23, 2015 (commencement of operations) through June 30, 2015, for Frontier MFG Global Plus Fund. These financial statements and financial highlights are the responsibility of the Funds' management. Our responsibility is to express an opinion on these financial statements and financial highlights based on our audits. The financial highlights for periods prior to June 30, 2012, were audited by other auditors whose report dated August 29, 2011, expressed an unqualified opinion on those financial highlights.
We conducted our audits in accordance with the standards of the Public Company Accounting Oversight Board (United States). Those standards require that we plan and perform the audit to obtain reasonable assurance about whether the financial statements and financial highlights are free of material misstatement. An audit includes examining, on a test basis, evidence supporting the amounts and disclosures in the financial statements. Our procedures included confirmation of securities owned as of June 30, 2015, by correspondence with the custodian and brokers or by other appropriate auditing procedures where replies from brokers were not received. An audit also includes assessing the accounting principles used and significant estimates made by management, as well as evaluating the overall financial statement presentation. We believe that our audits provide a reasonable basis for our opinion.
In our opinion, the financial statements and financial highlights referred to above present fairly, in all material respects, the financial position of each of the Funds as of June 30, 2015, and the results of their operations, changes in their net assets, and their financial highlights for the periods indicated above, in conformity with accounting principles generally accepted in the United States of America.
COHEN FUND AUDIT SERVICES, LTD.
Cleveland, Ohio
August 26, 2015
page 65

BOARD OF DIRECTORS' APPROVAL OF ADVISORY AND
SUBADVISORY AGREEMENTS
(Unaudited)
The Board of Directors (the "Board") of Frontier Funds, Inc. (the "Company"), including the directors who are not "interested persons" as defined in Section 2(a)(9) of the Investment Company Act of 1940, as amended (the "Independent Directors"), met on February 19, 2015, to consider the approval of an advisory agreement with Frontegra Asset Management, Inc. ("Frontegra") and a subadvisory agreement between Frontegra and Magellan Asset Management Ltd. ("Magellan") with respect to a new series of the Company, the Frontier MFG Global Plus Fund (the "Global Plus Fund"). The Board also considered the renewal of the advisory agreement and subadvisory agreement with respect to two existing series of the Company, the Frontier MFG Global Equity Fund (the "Global Equity Fund") and the Frontier MFG Core Infrastructure Fund (the "Core Infrastructure Fund") (each of the Global Plus Fund, Global Equity Fund and Core Infrastructure Fund is a "Fund" and collectively, the "Funds").
In connection with its review, the Board was provided materials relevant to its consideration of the agreements with Frontegra and Magellan, such as performance assessments for the Global Equity and Core Infrastructure Funds against peer groups and appropriate benchmarks, the Form ADV brochure for Frontegra and Magellan, information regarding each firm's compliance program, personnel and financial condition and a memorandum prepared by the Company's legal counsel. The Board also reviewed the advisory fee payable by each Fund under the advisory agreements, each Fund's net expenses ratio, after giving effect to the expense cap agreement between the Company and Frontegra on behalf of each Fund, and comparative fee and expense information provided by an independent service. The Board considered the subadvisory fees paid by Frontegra to Magellan, noting that the subadvisory fee was negotiated at arm's length between Frontegra and Magellan, an unaffiliated third party, and Frontegra would compensate Magellan from its own fees. The Board was also provided with Frontegra's and Magellan's responses to the Section 15(c) request submitted by the Company's legal counsel on behalf of the directors. The directors discussed with representatives of management the nature, extent and quality of the advisory and other services provided to the Funds by Frontegra and Magellan.
In evaluating the advisory and subadvisory agreements, the Board took into account their cumulative experience in working with Frontegra and Magellan and their ongoing review of information and discussions with representatives of Frontegra and Magellan throughout the year at Board meetings. The Independent Directors met in executive session to discuss the materials and the proposed approval of the advisory and subadvisory agreements. During the executive session, the Independent Directors discussed their responsibilities and the 15(c) responses with legal counsel.
In considering the advisory and subadvisory agreements, the Board reviewed and analyzed various factors with respect to each Fund that it determined were relevant, including the factors below, and made the following conclusions. In its deliberations, the Board did not identify any single factor as determinative.
Advisory Agreement
Nature, Extent and Quality of the Services to be Provided. The Board considered the services Frontegra would provide the Global Plus Fund, and would continue to provide to the other Funds and their shareholders, under the advisory agreement. The Board noted that Frontegra serves as a manager of managers and had selected Magellan to make the day-to-day investment decisions for the Funds. The Board considered that Frontegra has 19 years of experience in hiring and supervising subadvisers to portfolios in the Frontier family of funds. The Board discussed Frontegra's responsibilities for overseeing Magellan and supervising the management of the Funds' investments. The Board also considered the quality of other services provided by Frontegra, including performance oversight, risk management oversight, oversight and coordination of service providers, oversight of financial reporting, administration of the Funds' compliance program and the shareholder servicing and administrative services provided by Frontegra to the Funds. The Board concluded that the range of services to be provided by Frontegra was appropriate and that Frontegra was qualified to provide such services.
page 66

Performance Record of the Global Equity and Core Infrastructure Funds. As described in more detail under "Subadvisory Agreement," the Board reviewed the performance record of each existing Fund for the periods ended December 31, 2014. The Directors considered that Frontegra does not directly manage the Funds' investment portfolios, but had delegated those duties to Magellan. The Board also considered Frontegra's continual monitoring of Magellan and the Funds' performance during the year. The Board concluded that they were satisfied with Frontegra's performance in selecting and overseeing Magellan as subadviser to the Funds.
Advisory Fees. The Board compared each Fund's contractual advisory fee and total expense ratio to the industry data with respect to other mutual funds in the same Morningstar peer group and asset range. The Board noted that the advisory fee for the Global Equity Fund was in line with the world stock category average and above the large growth category average. The advisory fee for the Core Infrastructure Fund was below the industry average for funds in the same Morningstar category. With respect to the Global Plus Fund, the advisory fee was in line with or slightly above the industry average for funds in the same Morningstar category, depending on the asset range. After giving effect to the expense cap agreement with Frontegra with respect to each Fund, the total net expense ratio was below the industry average for funds in the same Morningstar category. The Board concluded that the advisory fee paid by each Fund to Frontegra was reasonable in light of the nature and quality of services to be provided and fees paid by comparable funds.
Costs and Profitability. The Board reviewed information concerning Frontegra's financial condition, costs, and, with respect to the existing Funds, profitability. The Board also considered the effect of the contractual expense cap agreements on Frontegra's compensation. The Board noted that Frontegra was reimbursing Fund expenses under the expense cap agreement for the existing Funds. The Board concluded that Frontegra's current level of profitability was reasonable considering the quality of management and the fact that Frontegra was reimbursing expenses for the Global Equity and Core Infrastructure Funds. With respect to the Global Plus Fund, Frontegra did not provide any specific information regarding the costs of services to be provided or the profits it might realize because the Fund had not commenced operations.
Economies of Scale. The Board reviewed net asset growth for the Global Equity and Core Infrastructure Funds and considered whether there may be economies of scale in the management of each Fund. The Board concluded that the level of the advisory fee and expense cap agreement for each of the existing Funds appropriately reflected the sharing of economies of scale with Fund shareholders.
Benefits to Frontegra. The Board considered information presented regarding any benefits to Frontegra or its affiliates from serving as adviser to the Funds (in addition to the advisory fee). The Board noted that Frontier Partners, Inc. ("Frontier"), an affiliate of Frontegra, provides consulting services to, and is compensated by, Magellan. However, the Board determined that Frontegra's services to the Funds would not be compromised by this potential conflict of interest.
On the basis of its review of the foregoing information, the Board found that the terms of the advisory agreement were fair and reasonable and in the best interests of each Fund's shareholders.
Subadvisory Agreement
Nature, Extent and Quality of the Services to be Provided. The Board reviewed and considered Magellan's investment strategy for each Fund and experience as a global equity and infrastructure manager, key personnel involved in providing investment management services to the Funds and financial condition, including the financial condition of Magellan's parent company. The Board also considered services provided by Magellan under the subadvisory agreement, including the management of each Fund's investments, the selection of broker-dealers for execution of portfolio transactions, monitoring adherence to each Fund's investment restrictions and assisting with the Funds' compliance program. The Board considered that Magellan has retained Frontier to assist in raising assets for these strategies. The Board concluded that the nature, extent and quality of the services provided by Magellan to the Global Equity and Core Infrastructure Funds were appropriate and that each Fund was likely to continue to benefit from services provided by Magellan under the subadvisory agreement. With respect to the Global Plus Fund, the Board considered the Company's experience with Magellan since the two existing Funds were launched as well as Magellan's expertise in global equity securities and the background of the proposed manager who currently serves as
page 67

the portfolio manager to the Global Equity Fund. The Board determined that the Global Plus Fund was likely to benefit from Magellan's subadvisory services.
Investment Performance. The Board reviewed the performance record of the Global Equity and Core Infrastructure Funds as of December 31, 2014. It noted that the Global Equity Fund had outperformed its benchmark index for the one-year, three-year and since-inception periods ended December 31, 2014. The Board noted that the Core Infrastructure Fund had outperformed its benchmark for the one-year and since-inception periods ended December 31, 2014. The Board also considered Magellan's quarterly portfolio commentary and discussion of each existing Fund's performance. The Board also reviewed the performance of Magellan's composite of other accounts managed in the global equity, global equity plus and core infrastructure style. The Board concluded that Magellan would continue to provide a high level of subadvisory services to the Global Equity and Core Infrastructure Funds.
Subadvisory Fees. The Board reviewed and considered the subadvisory fees payable by Frontegra to Magellan under the subadvisory agreement for all three Funds. The Board noted that Magellan also shares in the Funds' expense reimbursements made by Frontegra. The Board reviewed information regarding fees charged to Magellan's other institutional clients for similar mandates. The Board determined that the subadvisory fee was appropriate. In evaluating the subadvisory fee, the Board noted that such amounts are paid by Frontegra and that therefore the overall advisory fee paid by each Fund is not directly affected by the subadvisory fee.
Costs and Profitability. The Board did not consider the cost of services provided by Magellan or the profitability to Magellan from its relationship with the Funds to be material factors because the subadvisory fee is paid by Frontegra.
Economies of Scale. Because the subadvisory fee is not paid by the Funds, the Board did not consider whether the fee should reflect any potential economies of scale that might be realized as the Funds' assets increase.
Benefits to Magellan. The Board considered any benefits to Magellan from serving as subadviser to the Funds (in addition to the subadvisory fee). The Board noted that Magellan transacts with full service brokers who provide research reports and other general research services to Magellan. The Board also noted that Frontier provides consulting services to Magellan for which Frontier is compensated by Magellan. The Board concluded that the benefits realized by Magellan from its relationship with each Fund were reasonable.
On the basis of its review of the foregoing information, the Board found that the terms of the subadvisory agreement were fair and reasonable and in the best interests of the shareholders of each of the Funds.
The Board, including the Independent Directors, also met on May 19, 2015, to consider the annual renewal of (a) the investment advisory agreement between Frontegra and the Company on behalf of the Frontier Netols Small Cap Value Fund (the "Netols Fund") and the Frontier Phocas Small Cap Value Fund (the "Phocas Fund") (the "Frontegra Advisory Agreement") and (b) the investment advisory agreement between Timpani Capital Management LLC ("Timpani") and the Company on behalf of the Frontier Timpani Small Cap Growth Fund (the "Timpani Fund") (the "Timpani Advisory Agreement"). The Board also considered the approval of a new investment advisory agreement between Timpani and the Company to be effective upon the change of control of Timpani on or about August 19, 2015, subject to approval by the shareholders of the Timpani Fund (the "New Timpani Advisory Agreement"). The Board also considered the annual renewal of the subadvisory agreements for the Netols Fund and the Phocas Fund.
In connection with its review, the Board was provided materials relevant to its consideration of the agreements with Frontegra and Timpani (each, an "Adviser") and each subadviser, such as Fund performance assessments against peer groups and appropriate benchmarks, the Advisers' and subadvisers' Form ADV, information regarding the Advisers' and subadvisers' compliance program, personnel and financial condition, certain summary data provided by Fund management and a memorandum prepared by the Company's legal counsel. The Board also reviewed the advisory fee payable by each Fund under the advisory agreements, the expense cap agreement between the Company and the Adviser on behalf of each Fund and comparative fee and expense information provided by an independent service. The Board considered the subadvisory fees paid by Frontegra to the subadvisers, noting that the applicable subadvisory fee structure was negotiated at arm's length between Frontegra and each subadviser, each an unaffiliated third party, and Frontegra would compensate each
page 68

subadviser from its own fees. The Board was also provided with the Advisers' and subadvisers' responses to the Section 15(c) request submitted by the Company's legal counsel on behalf of the directors. The directors discussed with representatives of management the operations of the Funds and the nature, extent and quality of the advisory and other services provided to the Funds by the advisers and the subadvisers, as applicable.
In evaluating the advisory and subadvisory agreements, the Board took into account their cumulative experience in working with the Advisers and subadvisers and their ongoing review of information and discussions with representatives of the Advisers and subadvisers throughout the year at Board meetings. The Independent Directors met in executive session to discuss the materials and the proposed approval of the advisory and subadvisory agreements. During the executive session, the Independent Directors discussed their responsibilities and the Advisers' and subadvisers' 15(c) responses with legal counsel.
In considering the advisory and subadvisory agreements, the Board reviewed and analyzed various factors with respect to each Fund that it determined were relevant, including the factors below, and made the following conclusions. In its deliberations, the Board did not identify any single factor as determinative.
Frontegra Advisory Agreement (Netols Fund and Phocas Fund)
Nature, Extent and Quality of the Services to be Provided. The Board considered the services Frontegra would continue to provide to the Funds and their shareholders under the Frontegra Advisory Agreement. The Board noted that Frontegra serves as a manager of managers and had selected the subadvisers to make the day-to-day investment decisions for the Funds. The Board considered that Frontegra has 19 years of experience in hiring and supervising subadvisers to portfolios in the Frontier family of funds. The Board discussed Frontegra's responsibilities for overseeing the subadvisers and supervising the management of the Funds' investments. The Board also considered the quality of other services provided by Frontegra, including performance oversight, risk management oversight, oversight and coordination of service providers, oversight of financial reporting, oversight of the Funds' valuation policy, administration of the Funds' compliance program and the shareholder servicing and administrative services provided by Frontegra to the Funds. The Board concluded that the range of services to be provided by Frontegra was appropriate and that Frontegra was qualified to provide such services.
Performance Record of the Funds. As described in more detail under "Subadvisory Agreements," the Board reviewed each Fund's performance record for the periods ended December 31, 2014. The Directors considered that Frontegra does not directly manage the Funds' investment portfolios, but had delegated those duties to the respective subadvisers. The Board also considered Frontegra's continual monitoring of subadvisers and their performance during the year. The Board concluded that they were satisfied with Frontegra's performance in selecting and overseeing the subadvisers to the Funds.
Advisory Fees. The Board compared each Fund's contractual advisory fee and total expense ratio to the industry data with respect to other mutual funds in the same Morningstar peer group. The Board noted that the advisory fee for the Netols Fund and the Phocas Fund was above the industry average for funds in the Small Value Morningstar category. With respect to the Netols Fund and the Phocas Fund, the Board noted that the advisory fee was the same as that for the small cap fund managed by Timpani, the investment adviser to another series of the Company. After giving effect to the expense cap agreement with Frontegra with respect to each Fund, the total net expense ratio was above the industry average for funds in the Small Value Morningstar category with respect to the Class Y shares of the Netols Fund and below the industry average with respect to the Institutional Class shares of the Netols Fund for funds in the Small Value Morningstar category. With respect to the Phocas Fund, the total net expense ratio was below the industry average for funds in the Small Value Morningstar category. The Board concluded that the advisory fee paid by each Fund to Frontegra was reasonable in light of the nature and quality of services to be provided and fees paid by comparable funds.
Costs and Profitability. The Board reviewed information concerning Frontegra's financial condition, costs and profitability. The Board also considered the effect of the contractual expense cap agreements on Frontegra's compensation. The Board noted that Frontegra was
page 69

waiving a portion of its advisory fee for the Netols Fund and the Phocas Fund. The Board concluded that Frontegra's current level of profitability was reasonable considering the quality of management and the fact that Frontegra was waiving its fees for the Funds.
Economies of Scale. The Board reviewed net asset growth on a per Fund and aggregate basis, and considered whether there may be economies of scale in the management of each Fund if its assets were to increase significantly. However, the Board concluded that the assets of the Funds were not likely to increase to such an extent that breakpoints would be appropriate, particularly in light of the expense cap agreements in place between Frontegra and each Fund.
Benefits to Frontegra. The Board considered information presented regarding any benefits to Frontegra or its affiliates from serving as adviser to the Funds (in addition to the advisory fee). The Board noted that Frontier, an affiliate of Frontegra, provides consulting services to, and is compensated by, certain subadvisers. However, the Board determined that Frontegra's services to the Funds would not be compromised by this potential conflict of interest.
On the basis of its review of the foregoing information, the Board found that the terms of the Frontegra Advisory Agreement were fair and reasonable and in the best interests of each Fund's shareholders.
Timpani Advisory Agreement (Timpani Fund)
Nature, Extent and Quality of the Services to be Provided. The Board considered Timpani's experience as a small cap growth manager and services it would continue to provide to the Fund and its shareholders under the Timpani Advisory Agreement and the New Timpani Advisory Agreement. The Board discussed Timpani's responsibilities for managing the Fund's investments and overseeing the Fund's other activities, such as monitoring its compliance with applicable requirements under the securities laws. The Board also considered Timpani's efforts, in conjunction with its affiliate Frontier, to market Timpani's strategy and increase the Fund's assets. The Board concluded that the range of services to be provided by Timpani was appropriate and that Timpani was qualified to provide such services.
Investment Performance. The Board reviewed the Fund's investment performance, both in absolute terms as well as compared to the Fund's benchmark index. The Board reviewed the Fund's performance for the one-year, three-year and since-inception periods ended December 31, 2014. The Board noted that the Fund underperformed the benchmark index for the one-year period but outperformed the index for the three-year and since-inception periods ended December 31, 2014. The Board also noted that the Fund outperformed the benchmark for the first quarter of 2015. The Board also reviewed the historical performance for Timpani's small cap growth private accounts. The Board concluded that the Fund's performance was satisfactory and that Timpani would continue to provide a high level of advisory services to the Fund.
Advisory Fee. The Board reviewed and considered the advisory fee payable by the Fund to Timpani under the Timpani Advisory Agreement and the New Timpani Advisory Agreement. The Board compared the Fund's contractual advisory fee and total expense ratio to industry data with respect to other mutual funds in the same Morningstar peer group. The Board noted that the Fund's advisory fee was above the industry average. The Board noted that, after giving effect to the expense cap agreement, the total expense ratio was in line with the industry average for Class Y shares and below the industry average for Institutional Class shares. The Board also considered the fee rates charged to Timpani's separate account clients and the sub-account of a collective fund managed by Timpani and the sleeve of a mutual fund for which Timpani serves as subadviser. The Board concluded that the advisory fee paid by the Fund to Timpani was reasonable in light of the nature and quality of services to be provided and fees paid by comparable funds.
Costs and Profitability. The Board reviewed information concerning Timpani's financial condition, costs and profitability. The Board also considered the effect of the expense cap agreement on Timpani's compensation. The Board noted that Timpani continues to waive the majority of its investment advisory fees under the expense cap agreement but that the Fund had reached financial "break even." The Board also concluded that the profitability information supported the Board's determinations that Timpani had the financial resources to provide quality services to the Fund and that the advisory fee was reasonable.
page 70

Economies of Scale. Given the Fund's current asset level, the Board did not consider whether any alternative fee structures, such as breakpoint fees, would be appropriate to reflect any economies of scale that may result from increases in the Fund's assets.
Benefits to Timpani. In addition to the above factors, the Board also discussed other benefits received by Timpani from its management of the Fund, including, without limitation, possible soft dollar benefits. The Board noted that Timpani's affiliate, Frontier, provides consulting services to, and is compensated by, Timpani. However, the Board determined that Timpani's services to the Fund would not be compromised by this potential conflict of interest. The Board also noted that William D. Forsyth III, the president of the Company and Frontegra, is also the president and a director of Timpani and that Frontegra and its affiliates provide various services to Timpani with respect to the Fund for which Timpani is not charged. The Board concluded that the other benefits to Timpani from its relationship with the Fund were reasonable.
On the basis of its review of the foregoing information, the Board found that the terms of the Timpani Advisory Agreement and the New Timpani Advisory Agreement were fair and reasonable and in the best interests of the shareholders of the Timpani Fund.
Renewal of Subadvisory Agreements
Subadvisory Agreement between Frontegra and Netols Asset Management, Inc. ("Netols")
Nature, Extent and Quality of the Services to be Provided. The Board reviewed and considered Netols' investment strategy and experience as a small cap value manager, key personnel involved in providing investment management services to the Netols Fund, compliance record and financial condition. The Board noted that Netols had hired a new Chief Compliance Officer. The Board also considered services provided by Netols under the subadvisory agreement, including managing the Fund's investments, the selection of broker-dealers for execution of portfolio transactions, monitoring adherence to the Fund's investment restrictions and assisting with the Fund's compliance program. The Board concluded that the nature, extent and quality of the services provided by Netols to the Fund were appropriate and that the Fund was likely to continue to benefit from services provided by Netols under the Netols Subadvisory Agreement.
Investment Performance. The Board noted that both classes of the Fund had outperformed the benchmark index for the one-year period ended December 31, 2014, and the Institutional Class shares had outperformed the Fund's benchmark index for the three-year and since-inception periods. The Board noted that both classes of the Fund had underperformed its benchmark index for the five-year period ended December 31, 2014, and noted Netols' discussion of the reasons for the Fund's underperformance for that period. The Board also compared the Fund's recent performance to the performance of Netols' composite of other accounts managed in the small cap value style and noted Netols' explanation that performance dispersion was primarily due to differences in expenses. The Board concluded that the Fund's performance was satisfactory and that Netols would continue to provide a high level of subadvisory services to the Fund.
Subadvisory Fee. The Board reviewed and considered the subadvisory fee payable by Frontegra to Netols under the subadvisory agreement. The Board also considered information with respect to fees charged to Netols' separate account clients. The Board determined that the subadvisory fee was appropriate. In evaluating the subadvisory fee, the Board noted that such amounts are paid by Frontegra and that therefore the overall advisory fee paid by the Fund is not directly affected by the subadvisory fee.
Costs and Profitability. The Board did not consider the cost of services provided by Netols or the profitability to Netols from its relationship with the Netols Fund because it did not view these factors as relevant given that the subadvisory fee is paid by Frontegra.
Economies of Scale. Because the subadvisory fee is not paid by the Netols Fund, the Board did not consider whether the fee should reflect any potential economies of scale that might be realized as the Fund's assets increase.
Benefits to Netols. The Board considered information presented regarding any benefits to Netols from serving as subadviser to the Netols Fund (in addition to the subadvisory fee). The Board considered that Netols receives unsolicited research from broker-dealers. The Board
page 71

noted that Frontier continues to receive referral fees from Netols for previously solicited clients, but that Frontier no longer provides consulting services to Netols. The Board concluded that the benefits realized by Netols from its relationship to the Fund were reasonable.
On the basis of its review of the foregoing information, the Board found that the terms of the subadvisory agreement were fair and reasonable and in the best interests of the shareholders of the Netols Fund.
Subadvisory Agreement between Frontegra and Phocas Financial Corp. ("Phocas")
Nature, Extent and Quality of the Services to be Provided. The Board reviewed and considered Phocas' investment strategy and experience as a small cap value manager, key personnel involved in providing investment management services to the Phocas Fund, compliance record and financial condition. The Board also considered services provided by Phocas under the subadvisory agreement, including managing the Fund's investments, the selection of broker-dealers for execution of portfolio transactions, monitoring adherence to the Fund's investment restrictions and assisting with the Fund's compliance program. The Board noted that Phocas has retained Frontier to raise assets for its small cap value equity strategy and assists Frontier in efforts to increase Fund assets so it reaches critical mass. The Board concluded that the nature, extent and quality of the services provided by Phocas to the Fund were appropriate and that the Fund was likely to continue to benefit from services provided by Phocas under the subadvisory agreement.
Investment Performance. The Board noted that the Fund had outperformed its benchmark index for the past one-, three- and five-year and since-inception periods ended December 31, 2014. The Board noted that the Fund had been reorganized into the Frontier family of funds on October 8, 2010, and returns for the prior periods were for the predecessor fund, also managed by Phocas. The Board also reviewed the performance of Phocas' composite of other accounts managed in the small cap value style. The Board concluded that the Fund's performance was satisfactory and that Phocas would continue to provide a high level of subadvisory services to the Fund.
Subadvisory Fee. The Board reviewed and considered the subadvisory fee payable by Frontegra to Phocas under the subadvisory agreement. In evaluating the subadvisory fee, the Board noted that such amounts are paid by Frontegra and that therefore the overall advisory fee paid by the Fund is not directly affected by the subadvisory fee. The Board considered the fees charged to separate accounts and a sub-account of a collective fund managed by Phocas. The Board concluded that Phocas would continue to provide a high level of services to the Fund and that the subadvisory fee was appropriate.
Costs and Profitability. The Board did not consider the cost of services provided by Phocas or the profitability to Phocas from its relationship with the Phocas Fund to be material factors because the subadvisory fee is paid by Frontegra.
Economies of Scale. Because the subadvisory fee is not paid by the Phocas Fund, the Board did not consider whether the fee should reflect any potential economies of scale that might be realized as the Fund's assets increase.
Benefits to Phocas. The Board considered information presented regarding any benefits to Phocas from serving as subadviser to the Fund (in addition to the subadvisory fee). The Fund allows Phocas to serve clients that do not meet Phocas' eligibility criteria for separate accounts. The Board noted that Frontier provides consulting services to Phocas for which Frontier may be compensated by Phocas. The Board concluded that the benefits realized by Phocas from its relationship to the Fund were reasonable.
On the basis of its review of the foregoing information, the Board found that the terms of the subadvisory agreement were fair and reasonable and in the best interests of the shareholders of the Phocas Fund.
page 72

ADDITIONAL INFORMATION
(Unaudited)
DIRECTORS AND OFFICERS AS OF JUNE 30, 2015
The business and affairs of the Funds are managed under the direction of the Funds' Board of Directors. Information pertaining to the directors and officers of the Funds is set forth below. The SAI includes additional information about the Funds' directors and officers and is available without charge, upon request by calling 1-888-825-2100.
Interested Director and Officers
Name, Address and
Year of Birth | | Position(s)
Held with
Company | | Term of
Office and
Length
of Time
Served | | Principal
Occupation(s)
During Past
Five Years | | Number of
Funds in
Complex
Overseen
by Director | | Other
Directorships
Held by
Director | |
William D. Forsyth III*
Frontier Funds, Inc.
400 Skokie Boulevard
Suite 500
Northbrook, Illinois 60062
Year of Birth: 1963 | | President
Director
Secretary | | Elected
annually by
the Board;
since
August
2008 (co-
president
from
1996 –
2008).
Indefinite;
since
May 1996.
Indefinite;
since
August
2014. | | Mr. Forsyth received his B.S. in Finance from the University of Illinois in 1986 and his M.B.A. from the University of Chicago in 1988. Mr. Forsyth has served as President of Frontegra since August 2008 and as Treasurer and a Director of Frontegra since May 1996. Mr. Forsyth served as Co-President and Assistant Secretary of Frontegra from May 1996 to August 2008. Mr. Forsyth has served as President of Timpani since August 2008 and served as Co-President from April 2008 to August 2008. Mr. Forsyth has served as President of Frontegra Strategies, LLC, the principal distributor of the Funds' shares, since August 2008 and as Co-President from August 2007 to August 2008. From July 1993 until the present, Mr. Forsyth also served as a Partner of Frontier Partners, Inc., a consulting/marketing firm ("Frontier"). From April 1987 until June 1993, Mr. Forsyth served as a Partner of Brinson Partners, Inc., an investment adviser, and from June 1986 until April 1987, he served as a product marketing representative of Harris Trust & Savings Bank. Mr. Forsyth has earned the right to use the CFA designation. | | | 6 | | | None | |
* Mr. Forsyth is an "interested person" of the Funds because he serves as a director and officer of Frontegra, owns 100% of Frontegra and has an indirect equity ownership interest in Timpani.
page 73

ADDITIONAL INFORMATION (continued)
(Unaudited)
Interested Director and Officers
Name, Address and
Year of Birth | | Position(s)
Held with
Company | | Term of
Office and
Length
of Time
Served | | Principal
Occupation(s)
During Past
Five Years | | Number of
Funds in
Complex
Overseen
by Director | | Other
Directorships
Held by
Director | |
Elyce D. Dilworth Frontier Funds, Inc. 400 Skokie Boulevard Suite 500 Northbrook, Illinois 60062 Year of Birth: 1966 | | Treasurer, Assistant Secretary, Chief Compliance Officer and Anti-Money Laundering Compliance Officer | | Elected annually by the Board; Treasurer and Assistant Secretary since August 2008; Chief Compliance Officer since January 2008; Anti-Money Laundering Compliance Officer since February 2008. | | Ms. Dilworth received her B.B.A. in Finance from the University of Wisconsin – Milwaukee in 1989 and her M.S. in Accounting from the University of Wisconsin – Milwaukee in 1991. Ms. Dilworth has served as Chief Compliance Officer of Frontegra since January 2008 and as Secretary since August 2008. Ms. Dilworth served as Chief Compliance Officer of Timpani from April 2008 to June 2011 and from September 2014 to February 2015. She served as Chief Financial Officer of Timpani from April 2008 to March 2010. Ms. Dilworth served as Chief Compliance Officer of Frontier from September 2010 to June 2011 and from September 2014 to February 2015. Ms. Dilworth has also served as Chief Compliance Officer of the Distributor since August 2008. From June 2004 until May 2007, Ms. Dilworth was the Chief Compliance Officer for Van Wagoner Funds, Inc. (n/k/a Embarcadero Funds, Inc.), and the President, Secretary and Treasurer from January 2005 until May 2007. From April 1994 until December 2003, Ms. Dilworth was employed by UMB Fund Services, Inc., a service provider to mutual funds and alternative investment products. From January 1992 until April 1994, Ms. Dilworth was a Staff Accountant for PricewaterhouseCoopers LLP, a public accounting firm. | | N/A | | N/A | |
page 74

ADDITIONAL INFORMATION (continued)
(Unaudited)
Independent Directors
Name, Address and
Year of Birth | | Position(s)
Held with
Company | | Term of
Office and
Length
of Time
Served | | Principal
Occupation(s)
During Past
Five Years | | Number of
Funds in
Complex
Overseen
by Director | | Other
Directorships
Held by
Director | |
David L. Heald 400 Skokie Boulevard Suite 500 Northbrook, Illinois 60062 Year of Birth: 1943 | | Lead Independent Director | | Indefinite; since June 1996 | | Mr. Heald received his B.A. in English from Denison University in 1966 and his J.D. from Vanderbilt University School of Law in 1969. Mr. Heald previously served as a principal and a director of Consulting Fiduciaries, Inc. ("CFI") from 1994 to 2011. CFI was a registered investment adviser that provided professional, independent, fiduciary decision making, consultation and alternative dispute resolution services to ERISA plans, plan sponsors and investment managers. Between April 1994 and August 1994, Mr. Heald engaged in the private practice of law. From August 1992 until April 1994, Mr. Heald was a managing director and the chief administrative officer of Calamos Asset Management, Inc., a registered investment adviser specializing in convertible securities, and he served as an officer and director of CFS Investment Trust, a registered investment company comprised of four series. From January 1990 until August 1992, Mr. Heald was a partner in the Chicago based law firm of Gardner, Carton & Douglas. | | | 6 | | | None | |
page 75

ADDITIONAL INFORMATION (continued)
(Unaudited)
Independent Directors
Name, Address and
Year of Birth | | Position(s)
Held with
Company | | Term of
Office and
Length
of Time
Served | | Principal
Occupation(s)
During Past
Five Years | | Number of
Funds in
Complex
Overseen
by Director | | Other
Directorships
Held by
Director | |
Steven K. Norgaard
400 Skokie Boulevard
Suite 500
Northbrook, Illinois 60062
Year of Birth: 1964 | | Independent Director | | Indefinite; since October 2013 | | Mr. Norgaard received his B.S. in Accountancy from the University of Illinois in 1987 and his J.D. from the University of Chicago in 1990. He has been an attorney with Steven K. Norgaard P.C. since 1994. From 1990 to 1994, he was an associate at McDermott, Will & Emery. | | | 6 | | | Boulder Growth & Income Fund, Inc. | |
James M. Snyder
400 Skokie Boulevard
Suite 500
Northbrook, Illinois 60062
Year of Birth: 1947 | | Independent Director | | Indefinite; since May 2002 | | Mr. Snyder received his B.S. in Finance from Indiana University in 1969 and his M.B.A. from DePaul University in 1973. Mr. Snyder is a private investor and chairman of a family foundation. Mr. Snyder served as an investment professional with Northern Trust from June 1969 until his retirement in June 2001. He served in a variety of capacities at Northern Trust, including as Chief Investment Officer, Executive Vice President of Northern Trust and Vice Chairman of Northern Trust Global Investments. Mr. Snyder has earned the right to use the Chartered Financial Analyst (CFA) designation. | | | 6 | | | IronBridge Funds, Inc. (with oversight of four portfolios) | |
page 76

ADDITIONAL INFORMATION (continued)
(Unaudited)
FOREIGN TAX CREDIT
For the year ended June 30, 2015, the Frontier MFG Core Infrastructure Fund earned foreign source income and paid foreign taxes, which it intends to pass through to its shareholders pursuant to Section 853 of the Internal Revenue Code as follows:
| | | Foreign Source Income Earned | | Foreign Taxes Paid | |
Australia | | $ | 466,134 | | | $ | 48,150 | | |
Austria | | | 12,609 | | | | 1,891 | | |
Canada | | | 305,773 | | | | 45,866 | | |
France | | | 127,899 | | | | 19,185 | | |
Germany | | | 62,786 | | | | 9,418 | | |
Hong Kong | | | 144,415 | | | | — | | |
Italy | | | 493,644 | | | | 74,047 | | |
Luxembourg | | | 151,907 | | | | 22,786 | | |
Mexico | | | 35,304 | | | | 781 | | |
Netherlands | | | 43,939 | | | | 6,591 | | |
New Zealand | | | 51,646 | | | | — | | |
Spain | | | 260,907 | | | | 39,136 | | |
Switzerland | | | 31,096 | | | | 4,664 | | |
United Kingdom | | | 510,210 | | | | — | | |
| | | $ | 2,698,269 | | | $ | 272,515 | | |
page 77

ADDITIONAL INFORMATION (continued)
(Unaudited)
QUALIFIED DIVIDEND INCOME/DIVIDENDS RECEIVED DEDUCTION
For the fiscal year ended June 30, 2015, certain dividends paid by the Funds may be subject to a maximum tax rate of 15%, as provided for by the Jobs and Growth Tax Relief Reconciliation Act of 2004. The percentage of dividends declared from ordinary income designated as qualified dividend income was as follows:
MFG Global Equity | | | 96.27 | % | |
MFG Core Infrastructure | | | 100.00 | % | |
Phocas Small Cap Value | | | 30.69 | % | |
For corporate shareholders, the percent of ordinary income distributions qualifying for the corporate dividends received deduction for the fiscal year ended June 30, 2015 was as follows:
MFG Global Equity | | | 59.57 | % | |
MFG Core Infrastructure | | | 35.72 | % | |
Phocas Small Cap Value | | | 28.87 | % | |
ADDITIONAL INFORMATION APPLICABLE TO FOREIGN SHAREHOLDERS ONLY
The percent of ordinary income distributions designated as interest related dividends for the fiscal year ended June 30, 2015 was as follows:
MFG Global Equity | | | 0.19 | % | |
MFG Core Infrastructure | | | 0.05 | % | |
Phocas Small Cap Value | | | 0.15 | % | |
The percent of ordinary income distributions designated as short-term capital gain distributions for the fiscal year ended June 30, 2015 was as follows:
MFG Global Equity | | | 53.23 | % | |
MFG Core Infrastructure | | | 2.89 | % | |
Phocas Small Cap Value | | | 93.69 | % | |
page 78
This page intentionally left blank.
This page intentionally left blank.

A NOTE ON FORWARD-LOOKING STATEMENTS
This report includes forward-looking statements such as adviser, subadviser and/or portfolio manager predictions, opinions, assessments, analyses or outlooks for individual securities, industries, market sectors and/or markets. These statements involve risks and uncertainties. In addition to the general risks described for the Funds in the current Prospectuses, other factors bearing on these statements include the accuracy of the advisers', subadvisers' or portfolio managers' forecasts and predictions, and the appropriateness of the investment programs designed by an adviser, subadviser or portfolio manager to implement their strategies efficiently and effectively. Any one or more of these factors, as well as other risks affecting the securities markets and investment instruments generally, could cause the actual results of the Funds to differ materially as compared to benchmarks associated with the Funds.
In addition, portfolio composition will change due to ongoing management of the Funds. Specific securities named in this report may not currently be owned by the applicable Fund, or the Fund's position in the securities may have changed.
ADDITIONAL INFORMATION
Frontegra Funds has adopted proxy voting policies and procedures that delegate to Frontegra Asset Management, Inc. ("Frontegra") and Timpani Capital Management LLC the authority to vote proxies. The proxy voting policies permit Frontegra to delegate its authority to vote proxies to a Fund's subadviser. A description of the Frontegra Funds' proxy voting policies and procedures is available without charge, upon request, by calling the Funds toll free at 1-888-825-2100. A description of these policies and procedures is also included in the Funds' Statement of Additional Information, which is available on the SEC's website at http://www.sec.gov and the Funds' website at www.frontegra.com or by calling the Funds toll free at 1-888-825-2100.
The actual voting records relating to each Fund's portfolio securities during the most recent twelve months ended June 30 are available without charge by calling the Funds toll free at 1-888-825-2100 or by accessing the SEC's website at http://www.sec.gov.
Each Fund files a complete schedule of portfolio holdings for its first and third fiscal quarters with the SEC on Form N-Q. The Form N-Q is available on the SEC's website at http://www.sec.gov. The Form N-Q may also be reviewed and copied at the SEC's Public Reference Room in Washington, D.C. Information on the operation of the Public Reference Room may be obtained by calling toll-free 1-800-SEC-0330.
Item 2. Code of Ethics.
The registrant has adopted a code of ethics that applies to the registrant’s principal executive officer and principal financial officer. The registrant has not made any amendments to its code of ethics during the period covered by this report. The registrant has not granted any waivers from any provisions of the code of ethics during the period covered by this report.
A copy of the registrant’s Code of Ethics is Incorporated by reference. See Item 12(a)(1).
Item 3. Audit Committee Financial Expert.
The registrant’s board of directors has determined that there is at least one audit committee financial expert serving on its audit committee. Steven Norgaard is the “audit committee financial expert” and is considered to be “independent” as each term is defined in Item 3 of Form N-CSR.
Item 4. Principal Accountant Fees and Services.
The registrant has engaged its principal accountant to perform audit services, audit-related services, tax services and other services during the past two fiscal years. In the following table, “Audit Fees” are fees billed for professional services for the audit of the registrant’s annual financial statements or services that are normally provided by the accountant in connection with statutory and regulatory filings or engagements for those fiscal years. The “All Other Fees” for fiscal year 2015 relate to the principal accountant’s review of the registrant’s semi-annual report for the period ended December 31, 2014. “Tax Fees” refer to professional services rendered by the principal accountant for tax compliance, tax advice, and tax planning. There were no other services provided by the principal accountant. The following table details the aggregate fees billed for each of the last two fiscal years by the principal accountant.
| | FYE 6/30/2015 | | FYE 6/30/2014 | |
Audit Fees | | $ | 76,800 | | $ | 72,000 | |
Tax Fees | | $ | 18,000 | | $ | 18,000 | |
All Other Fees | | $ | 2,000 | | $ | 1,500 | |
The audit committee has adopted pre-approval policies and procedures that require the audit committee to pre-approve all audit and non-audit services of the registrant, including services provided to any entity affiliated with the registrant with respect to any engagement that directly relates to the operations and financial reporting of the registrant. In accordance with its pre-approval policies and procedures, the audit committee pre-approved all audit and tax services provided by the principal accountant during fiscal year 2015. All of the hours spent on auditing the registrant’s financial statements were attributed to work performed by full-time permanent employees of the principal accountant.
The following table indicates the non-audit fees billed or expected to be billed by the registrant’s accountant for services to the registrant and to the registrant’s investment adviser for the last two years. The audit committee has considered whether the provision of non-audit services that were rendered to the registrant’s investment adviser is compatible with maintaining the principal accountant���s independence and has concluded that the provision of such non-audit services by the accountant has not compromised the accountant’s independence.
Non-Audit Related Fees | | FYE 06/30/2015 | | FYE 06/30/2014 | |
Registrant | | — | | — | |
Registrant’s Investment Adviser | | $ | 8,000 | | $ | 27,750 | |
| | | | | | | |
Item 5. Audit Committee of Listed Registrants.
Not applicable to registrants who are not listed issuers (as defined in Rule 10A-3 under the Securities Exchange Act of 1934).
Item 6. Investments.
(a) Schedule of Investments is included as part of the report to shareholders filed under Item 1 of this Form.
(b) Not Applicable.
Item 7. Disclosure of Proxy Voting Policies and Procedures for Closed-End Management Investment Companies.
Not applicable to open-end investment companies.
Item 8. Portfolio Managers of Closed-End Management Investment Companies.
Not applicable to open-end investment companies.
Item 9. Purchases of Equity Securities by Closed-End Management Investment Company and Affiliated Purchasers.
Not applicable to open-end investment companies.
Item 10. Submission of Matters to a Vote of Security Holders.
Not Applicable.
Item 11. Controls and Procedures.
(a) Based on an evaluation of the registrant’s disclosure controls and procedures (as defined in Rule 30a-3(c) under the Investment Company Act of 1940 (the “Act”)) as of a date within 90 days prior to the filing date of this Form N-CSR, the registrant’s principal executive officer
and principal financial officer have concluded that the disclosure controls and procedures are effective.
(b) There were no changes in the registrant’s internal control over financial reporting (as defined in Rule 30a-3(d) under the Act) that occurred during the second fiscal quarter of the period covered by this report that has materially affected, or is reasonably likely to materially affect, the registrant’s internal control over financial reporting.
Item 12. Exhibits.
(a) (1) Any code of ethics or amendment thereto, that is the subject of the disclosure required by Item 2, to the extent that the registrant intends to satisfy Item 2 requirements through filing an exhibit. Incorporated by reference to the registrant’s Form N-CSR filed September 8, 2008.
(2) A separate certification for each principal executive and principal financial officer pursuant to Section 302 of the Sarbanes-Oxley Act of 2002. Filed herewith.
(3) Any written solicitation to purchase securities under Rule 23c-1 under the Act sent or given during the period covered by the report by or on behalf of the registrant to 10 or more persons. Not applicable to open-end investment companies.
(b) Certifications pursuant to Section 906 of the Sarbanes-Oxley Act of 2002. Furnished herewith.
SIGNATURES
Pursuant to the requirements of the Securities Exchange Act of 1934 and the Investment Company Act of 1940, the registrant has duly caused this report to be signed on its behalf by the undersigned, thereunto duly authorized.
Frontier Funds, Inc. | |
| |
| |
By: | /s/ William D. Forsyth III | |
| William D. Forsyth III, President | |
| (Principal Executive Officer) | |
| | |
Date: | 8/31/2015 | |
Pursuant to the requirements of the Securities Exchange Act of 1934 and the Investment Company Act of 1940, this report has been signed below by the following persons on behalf of the registrant and in the capacities and on the dates indicated.
By: | /s/ William D. Forsyth III | |
| William D. Forsyth III, President and Secretary | |
| (Principal Executive Officer) | |
| | |
Date: | 8/31/2015 | |
| | |
| | |
By: | /s/ Elyce D. Dilworth | |
| Elyce D. Dilworth, Treasurer and Assistant Secretary | |
| (Principal Financial Officer) | |
| | |
Date: | 8/31/2015 | |