UNITED STATES
SECURITIES AND EXCHANGE COMMISSION
Washington, D.C. 20549
FORM N-CSR
CERTIFIED SHAREHOLDER REPORT OF REGISTERED
MANAGEMENT INVESTMENT COMPANIES
Investment Company Act file number | 811-07685 |
|
Frontegra Funds, Inc. |
(Exact name of registrant as specified in charter) |
|
400 Skokie Blvd. Suite 500 Northbrook, Illinois | | 60062 |
(Address of principal executive offices) | | (Zip code) |
|
William D. Forsyth III 400 Skokie Blvd., Suite 500 Northbrook, Illinois 60062 |
(Name and address of agent for service) |
|
Registrant’s telephone number, including area code: | (847) 509-9860 | |
|
Date of fiscal year end: | June 30 | |
|
Date of reporting period: | June 30, 2012 | |
| | | | | | | | |
Item 1. Reports to Stockholders.

ANNUAL REPORT
Frontegra SAM Global Equity Fund
Frontegra MFG Global Equity Fund
Frontegra MFG Core Infrastructure Fund
Frontegra HEXAM Emerging Markets Fund
Frontegra Timpani Small Cap Growth Fund
Frontegra Netols Small Cap Value Fund
Frontegra Phocas Small Cap Value Fund
Lockwell Small Cap Value Fund
Frontegra Asset Management, Inc.
June 30, 2012

TABLE OF CONTENTS
| Shareholder Letter | | | 1 | | |
|
| Frontegra SAM Global Equity Fund | |
|
| Report from Sustainable Asset Management USA, Inc. | | | 4 | | |
|
| Investment Highlights | | | 6 | | |
|
| Frontegra MFG Global Equity Fund | |
|
| Report from MFG Asset Management | | | 8 | | |
|
| Investment Highlights | | | 11 | | |
|
| Frontegra MFG Core Infrastructure Fund | |
|
| Report from MFG Asset Management | | | 14 | | |
|
| Investment Highlights | | | 16 | | |
|
| Frontegra HEXAM Emerging Markets Fund | |
|
| Report from HEXAM Capital Partners, LLP | | | 18 | | |
|
| Investment Highlights | | | 20 | | |
|
| Frontegra Timpani Small Cap Growth Fund | |
|
| Report from Timpani Capital Management LLC | | | 22 | | |
|
| Investment Highlights | | | 24 | | |
|
| Frontegra Netols Small Cap Value Fund | |
|
| Report from Netols Asset Management, Inc. | | | 26 | | |
|
| Investment Highlights | | | 27 | | |
|
| Frontegra Phocas Small Cap Value Fund | |
|
| Report from Phocas Financial Corporation | | | 30 | | |
|
| Investment Highlights | | | 32 | | |
|
| Lockwell Small Cap Value Fund | |
|
| Report from Lockwell Investments, LLC | | | 34 | | |
|
| Investment Highlights | | | 36 | | |
|
| Expense Example | | | 37 | | |
|
| Schedules of Investments | |
|
| Frontegra SAM Global Equity Fund | | | 40 | | |
|
| Frontegra MFG Global Equity Fund | | | 42 | | |
|
| Frontegra MFG Core Infrastructure Fund | | | 43 | | |
|
| Frontegra HEXAM Emerging Markets Fund | | | 46 | | |
|
| Frontegra Timpani Small Cap Growth Fund | | | 48 | | |
|
| Frontegra Netols Small Cap Value Fund | | | 51 | | |
|
| Frontegra Phocas Small Cap Value Fund | | | 53 | | |
|
| Lockwell Small Cap Value Fund | | | 56 | | |
|
| Statements of Assets and Liabilities | | | 60 | | |
|
| Statements of Operations | | | 62 | | |
|
| Statements of Changes in Net Assets | | | 64 | | |
|
| Financial Highlights | | | 68 | | |
|
| Notes to Financial Statements | | | 78 | | |
|
| Report of Independent Registered Public Accounting Firm | | | 89 | | |
|
| Board of Directors' Approval of Advisory and Subadvisory Agreements | | | 90 | | |
|
| Additional Information | |
|
| Directors and Officers | | | 96 | | |
|
| Foreign Tax Credit | | | 100 | | |
|
| Qualified Dividend Income/Dividends Received Deduction | | | 101 | | |
|
| Additional Information Applicable to Foreign Shareholders Only | | | 101 | | |
|
This report is submitted for the general information of the shareholders of the Funds. It is not authorized for distribution to prospective investors unless accompanied or preceded by an effective Prospectus for the applicable Fund. The Prospectus may be obtained by calling 1-888-825-2100. Each Prospectus includes more complete information about management fees and expenses, investment objectives, risks and operating policies of the applicable Fund. Please read the Prospectus carefully.
Frontegra Funds, Inc. are distributed by Frontegra Strategies, LLC, 400 Skokie Blvd., Suite 500, Northbrook, IL 60062. Frontegra Strategies, LLC, member of FINRA and SIPC, is an affiliate of Frontegra Asset Management, Inc., the Funds' investment adviser.

DEAR FELLOW SHAREHOLDERS:
We are pleased to report on the progress of the Frontegra Funds over the past twelve months ending June 30, 2012. The S&P 500 Index was up 5.45%, and small capitalization stocks were down, with the Russell 2000® Index returning -2.08%. International stocks, as measured by the MSCI EAFE Index, returned -13.83% over the twelve-month period.
Fund Results
For the twelve month period ending June 30, 2012, the Frontegra SAM Global Equity Fund, managed by Sustainable Asset Management USA, returned -10.91% (net) versus the MSCI World Index (Net) return of -4.98%.
For the period from December 28, 2011 (inception), through June 30, 2012, the Frontegra MFG Global Equity Fund, managed by MFG Asset Management, returned 8.10% (net) versus the MSCI World Index (Net) return of 7.24%.
For the period from January 18, 2012 (inception), through June 30, 2012, the Frontegra MFG Core Infrastructure Fund, also managed by MFG Asset Management, returned 6.50% (net) versus the UBS Developed Infrastructure & Utilities Index (Net) return of 3.81% and the MSCI World Index (Net) return of 2.43%.
For the twelve month period ending June 30, 2012, the Frontegra HEXAM Emerging Markets Fund, managed by HEXAM Capital Partners, returned -29.51% (net) versus the MSCI Emerging Markets Index (Net) return of -15.95%.
The Frontegra Timpani Small Cap Growth Fund, managed by Timpani Capital Management, returned -4.28% (net) versus the Russell 2000® Growth Index return of -2.71% for the twelve month period ending June 30, 2012.
For the twelve month period ending June 30, 2012, the Frontegra Netols Small Cap Value Fund - Institutional Class, managed by Netols Asset Management, returned -6.47% (net) versus the Russell 2000® Value Index return of -1.44%. The Frontegra Netols Small Cap Value Fund - Class Y, returned -6.92% (net) over the same time period.
The Frontegra Phocas Small Cap Value Fund - Class L, managed by Phocas Financial, returned -4.91% (net) versus the Russell 2000 Value Index return of -1.44% for the twelve month period ending June 30, 2012. For the same period, the Frontegra Phocas Small Cap Value Fund - Class I, returned -4.95% (net).
For the period from July 1, 2011, (inception) through June 30, 2012, the Lockwell Small Cap Value Fund, managed by Lockwell Investments, returned -4.76% (net) versus the Russell 2000 Value Index return of -2.91%.
Outlook
We have experienced volatile and difficult investment markets over the trailing twelve months, as short-term markets have been preoccupied with the European sovereign debt crisis. Exacerbating the situation is continued sluggishness in the U.S. market, with unemployment lingering at just over 8% and the housing market in a prolonged slump. As we enter a new fiscal year, we will endeavor to manage your assets with the skill and nimbleness necessary in these volatile times.
We will continue to oversee the investment management of the Frontegra Funds with the care and diligence that have served our shareholders well in the past. As always, we appreciate your investment and continued confidence in the Frontegra Funds.
Best regards,
William D. Forsyth, CFA
President
Frontegra Funds, Inc.
page 1
This page intentionally left blank.

FRONTEGRA
SAM GLOBAL EQUITY FUND

REPORT FROM SUSTAINABLE ASSET
MANAGEMENT USA, INC.
Dear Shareholders:
The Frontegra SAM Global Equity Fund strives to achieve capital appreciation by investing in a non-diversified portfolio of equity and equity-related securities issued by U.S. and non-U.S. companies that combine their market and financial strategy with a high level of environmental awareness and a clearly defined social policy. The objective is measured against the MSCI World Index (Net).
Performance Review
The Frontegra SAM Global Equity Fund returned -10.91%, net of fees, for the year ended June 30, 2012. The Fund's return underperformed the -4.98% return of its benchmark, the MSCI World Index (Net).
Portfolio underperformance relative to the benchmark is mainly explained by the negative contribution of stock selection. In particular, stock selection was negative within Information Technology, Industrials and Consumer stocks while we outperformed within Financials, Materials and Telecommunication stocks. Within Financials, the positive performance contribution was achieved by overweighting insurance companies while underweighting the banking sector, which is most sensitive to the sovereign debt crisis. The investment decisions in this area reflected our cautious view on banking stocks given the tightening regulation and the ongoing deleveraging process.
The largest negative contribution over the period came from exposure in IT stocks. Portfolio holdings in this area were affected by investor concern over the outlook for the PC market amid the global economic slowdown. Portfolio sector allocation was over the period positioned with overweight (relative to MSCI World) in Health Care, Consumer Staples and Telecommunications combined with underweight positions in Financials, Materials and Consumer Discretionary. Such portfolio sector allocation has had a positive impact as Financials and Materials were among the worst performing sectors.
Portfolio Outlook and Strategy
Global equity markets remained volatile over the period. Unprecedented events such as the US debt downgrade by Standard & Poor's and the escalation of the European sovereign debt crisis, have severely affected financial markets. The downgrade of the US debt credit rating from AAA to AA+ has triggered a sharp sell-off in equity markets and pushed volatility to its highest level since 2009. The rising risk aversion has also put pressure on interest rates in Europe, particularly in Italy and Spain where yields approached unsustainable levels.
Over the period, the European Central Bank has implemented a Long-Term Refinancing Program (LTRO) providing European banks with cheap loans for about 1.1 trillion EUR. The lending facility program has been effective in relieving liquidity pressures on banks in the EU-periphery reducing the risk of a potential EU collapse.
Economic data released continued to show growth momentum tilted towards the downside. The Composite Leading Indicators, designed to anticipate turning points in economic activity relative to trend, points to a negative change in momentum across most countries. In addition, latest available data for China's manufacturing sector in June also show a prolonged slowdown.
Over the next quarters, we believe equity markets will continue to be heavily influenced by any further political and fiscal decisions aiming to ease strains in the financial markets. The Fed and the ECB will continue their accommodating monetary policy for the foreseeable future. We maintain a cautious outlook for the stock markets as the overall macro picture remains tepid, and the sovereign debt issues are far from resolved. Despite this cautious outlook, from a valuation perspective we continue to see attractive investment opportunities in global equity markets.
page 4

Our investment strategy remains focused on investing in sustainable companies with attractive valuations and stable earnings outlook. We also keep underweighting sectors where earnings visibility is lower, namely Financials. Our outlook for the financial sector remains cautious as a result of the tightening regulation and the ongoing de-leveraging process. Our approach in this space remains very selective with focus on companies with solid cash generation, strong balance sheets and acceptable leverage.
Sincerely,
| Diego d'Argenio | |
|
| Sustainable Asset Management USA, Inc. | |
|
page 5

INVESTMENT HIGHLIGHTS
Growth of a $100,000 Investment (Unaudited)
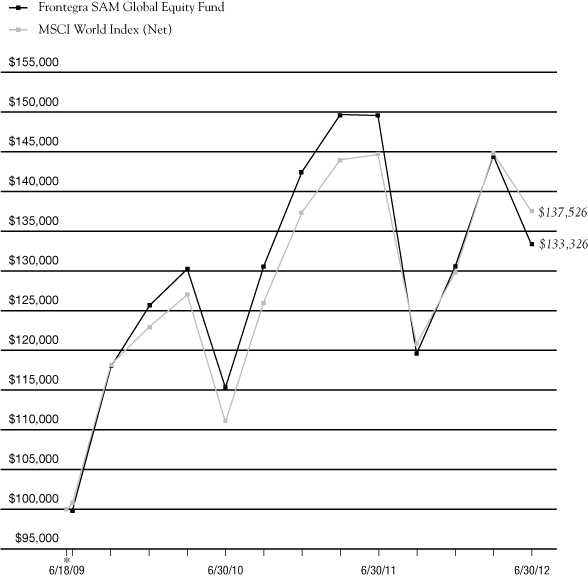
* 6/18/09 commencement of operations.
This chart assumes an initial gross investment of $100,000 made on 6/18/09 (commencement of operations). Returns shown include the reinvestment of all distributions. Past performance is not predictive of future results. Investment return and principal value will fluctuate so that shares, when redeemed, may be worth more or less than the original cost. In the absence of existing fee waivers, total return would be reduced. Effective June 10, 2011, Sustainable Asset Management USA, Inc. ("SAM") became subadviser to the Fund and Frontegra Asset Management, Inc. became adviser to the Fund. Prior to June 10, 2011, SAM served as adviser to the Fund. To receive current to the most recent month-end performance, please call 1-888-825-2100.
The MSCI World Index measures the overall performance of stock markets in 23 developed market countries in North America, Europe, and the Asia/Pacific Region. The Index does not reflect investment management fees, brokerage commissions and other expenses associated with investing in equity securities. A direct investment in the index is not possible.
** The returns shown do not reflect the deduction of taxes that a shareholder would pay on Fund distributions or the redemption of Fund shares.
Portfolio Total Return**
FOR PERIODS
ENDED 6/30/12 | | FUND | | INDEX | |
| SIX MONTHS | | | 2.10 | % | | | 5.91 | % | |
| ONE YEAR | | | (10.91 | )% | | | (4.98 | )% | |
AVERAGE ANNUAL
SINCE INCEPTION | | | 9.95 | % | | | 11.08 | % | |
page 6

FRONTEGRA
MFG GLOBAL EQUITY FUND

REPORT FROM MFG ASSET MANAGEMENT
Dear Fellow Shareholders:
The investment objective of the Frontegra MFG Global Equity Fund is capital appreciation. The objective is measured against the MSCI World Index (Net).
Performance Review
The Frontegra MFG Global Equity Fund returned 8.10%, net of fees, for the period beginning December 28, 2011, inception, through June 30, 2012. The Fund's return outperformed the 7.24% return of its benchmark, the MSCI World Index (Net).
We do not manage the Fund against short term performance metrics and it is inevitable the Fund will underperform markets at some point in the future. We aim (not guarantee) to produce absolute returns through the business cycle whilst minimising the risk of a permanent capital loss. We will continue to focus on these objectives and will not chase short term performance.
Portfolio Outlook and Strategy
We have seen volatile and difficult investment markets since the Fund's inception. The major event driving short term markets has been the European sovereign debt crisis. Notwithstanding the volatility and uncertainty, the Fund remained fully invested since inception with cash at June 30, 2012 of 3.2%.
We continue to consider the risk of a systemic financial system meltdown as a result of the current European sovereign debt crisis as low. We continue to hold this view notwithstanding dramatically higher credit default swap costs for certain European sovereign debt, soaring sovereign bond yields, an undercapitalised European banking system and credit rating downgrades for both banks and sovereigns.
Whilst we consider the risk of a financial Armageddon event to be low, the probability is not zero. We believe that a key lesson from the global financial crisis is that prudent portfolio construction is critical for reducing risk, and particularly important in the circumstances that a "tail event" strikes. The key to prudent portfolio construction is to ensure an investment portfolio does not have a high level of aggregation risk (i.e. the risk attached to similar economic, competitive or regulatory forces) and avoiding or minimising exposure to speculative excesses or bubbles. We feel comfortable with the overall risk profile and construction of the Fund's portfolio and believe it is likely to exhibit substantially less downside risk than the market in the event that the situation in Europe deteriorates materially.
The extraordinary policy responses in recent years, particularly by the Federal Reserve and ECB, have fueled a number of current bubbles and distortions in certain asset markets, most notably foreign exchange and bond markets. It is inevitable that these distortions will unwind at some point and there is a reasonable chance that bond prices and foreign exchange markets could adjust very rapidly. The longer these policy responses are held in place, the more complacent investors are likely to become, believing that this environment is the "new normal". These policy settings will not last indefinitely and we consider the portfolio is well positioned for the eventual correction.
As of June 30, 2012, the Fund's portfolio consisted of 24 investments with the top 10 investments representing 53.1% of the portfolio. The cash weighting of 3.2% at June 30, 2012 is consistent with our view that it remains an attractive time to be investing in a carefully selected portfolio of stocks. The portfolio is well balanced and valuations are currently not stretched and we believe the portfolio should continue to deliver attractive returns for investors over time.
Since inception to June 30, 2012, the three stocks with the strongest returns in local currency were eBay (34.6%), Home Depot (23.5%) and Visa (20.6%) and the stocks with the weakest returns were Tesco (-23.3%), McDonalds (-12.2%) and Google (-10.3%).
There have been very few major changes to the Fund's portfolio since inception. The material changes have been an increase in the weighting of investments in Lowe's, Tesco, Wal-Mart and Danone and a new investment in Novartis, a diversified global healthcare company based in Switzerland.
page 8

The Fund's portfolio continues to be exposed to the following major investment themes:
• Emerging market consumption growth via investments in multinational consumer franchises. The five largest investments in multinational consumer franchises at June 30, 2012 were Danone, Kraft, Nestlé, McDonalds and Procter & Gamble which have on average approximately 40% of their sales revenue from emerging markets.
• A move to a cashless society. There continues to be a strong secular shift from spending via cash and cheque to cashless forms of payments such as credit cards, debit cards, electronic funds transfer and mobile payments. In our opinion, the explosion of smart mobile phones will accelerate this shift on a global basis. We believe that there are only a limited number of companies that are well positioned to benefit from this structural shift. The companies are typically highly attractive with strong network effects, low capital intensity, high barriers to entry and high returns on capital. As of June 30, 2012, the Fund invested in the payments space through exposure to companies such as PayPal (via eBay), American Express, Visa and MasterCard.
• Internet/e-commerce. There are a number of internet enabled businesses that have very attractive investment characteristics with increasing competitive advantages. The Fund's internet investments at June 30, 2012 were eBay and Google.
• U.S. housing. A recovery in new housing construction should drive a strong cyclical recovery in companies exposed to the U.S. housing market and also provide a strong boost to the overall economy. Our major exposure to the U.S. housing market is via our exposure to the home improvement retailers, Lowe's and Home Depot, and the domestic U.S. banks, Wells Fargo and U.S. Bancorp.
Europe
In recent months, the failed first round of Greek elections spooked markets as investors held the view that there was an increasing probability that Greece would leave the Eurozone which could trigger a disorderly default scenario. With this uncertainty, sovereign bond yields increased in Spain and Italy and there has been focus on the solvency of Spain and the Spanish banking system. It is not surprising that markets have been volatile, as investors headed to the "safety" of German Bunds, U.S. Treasuries and the U.S. dollar. This was predictable in our view.
The meeting of EU leaders on June 28, 2012 announced a number of measures that are aimed at breaking the negative feedback loop between individual country's banks and sovereign debt, the issue of subordination of private sector debt to bailout funds provided by the EU and the first step towards an EU banking union. Importantly, the EU leaders announced that they have agreed to refinance Spanish banks with an injection of up to €100 billion to be lent directly by the European Stability Mechanism (ESM) rather than via a loan to the Spanish government, which would increase Spanish government debt. This should assist in breaking the negative feedback loop between the level of sovereign debt and the solvency of the banking system. The immediate market reaction was not surprising, equities and commodities rallied, German Bunds and U.S. Treasuries fell and the U.S. dollar fell.
In our view it is likely that investors will become concerned that these measures have not solved the fundamental issues and Spanish and Italian bond yields will again start rising. The markets will focus on the fact that the bailout mechanisms are not large enough to bailout Spain, let alone Italy.
Additionally, in our view the German government strongly believes that the only way for the euro to survive is for a closer integration of Europe. This is what Merkel refers to as a policy of "more Europe". Merkel appears to be pursuing Helmut Kohl's original vision of an integrated Europe, together with a monetary union. Germany is pursuing closer fiscal integration (more direct controls over government budgets) and a banking union. Even for Germany, political integration is an impossible objective. With closer integration, it is likely that Germany would permit a more traditional central bank role for the ECB, including acting as the lender of last resort to governments and possibly some form of mutualisation of European sovereign debt. Unfortunately, this process is politically extremely difficult (including treaty change and referendums) and will take a number of years to achieve. We also believe that Germany considers that the only environment in which this change will be possible is an environment of fear and uncertainty. It is interesting that the French government has championed the concept of a banking union, as they have been historically the main opponents of further European integration. Many believe that Merkel is losing the battle and has been rolled by France, Italy and Spain in recent discussions. Contrary to this view, we believe Merkel has them exactly where she wants them. They are all moving in the direction of closer integration.
page 9

It is highly unlikely that Germany will support policies in the short term that will remove market pressure until greater integration is achieved. It is therefore likely that the environment of uncertainty could persist for a number of years. This will make financial markets difficult and uncertain. We are expecting this and it does not worry us. We believe the tail risk probability of a European sovereign and financial system meltdown is low. In the event that financial markets get ahead of the German plans to integrate Europe, and the risk of a meltdown materially increases, we believe Germany will have no hesitation in evoking the safety mechanisms. These would most likely involve the ECB printing an unlimited amount of money to monetise sovereign debt. This could either involve the ECB purchasing government bonds of troubled countries in the secondary market or granting the ESM, or a subsidiary of the ESM, a banking licence which would enable the ESM to access the ECB's unlimited funding capacity. The ESM would then be in a position to purchase an "unlimited" quantity of government bonds. Many parties have been urging Germany to allow this to happen immediately. Some people have interpreted Germany's response of "nein" as a lack of understanding of the severity of the issues. We believe that Germany completely understands the issues, but believe if they allow this today, pressure would be removed and there is no chance of finding a lasting solution and a closer integration of Europe.
In assessing whether it is likely that the ECB will print money in the event of a severe sovereign liquidity crisis, it is important to look at the actions taken by the ECB in late 2011 and early 2012 when the European banking system was facing a dangerous liquidity squeeze. The ECB offered European banks an unlimited amount of 3 year loans at an interest cost of 1%. In total, the ECB "printed" €1 trillion of new money. This policy, supported by the Bundesbank, has materially reduced the liquidity risk of the entire European banking system. We believe Germany will support the ECB acting in an unlimited way in the event of a sovereign liquidity crisis.
We continue to believe that many European countries face a prolonged period (possibly 5-7 years) of sub-par economic growth (and in many instances recessions) due to the combined effects of fiscal austerity by governments, deleveraging of bank balance sheets and household deleveraging.
U.S.
There are signs that the U.S. is undergoing a modest economic recovery. We believe that there is unlikely to be a meaningful reduction in the unemployment rate in the short term until housing construction reverts to more normalised levels, which we consider will take another two to three years. When this happens, we believe the U.S. economy will recover significantly. We have a number of investments in our portfolio that are strongly leveraged to a recovery in U.S. housing starts, including investments in Lowe's, Home Depot, Wells Fargo and U.S. Bancorp.
China
China's economic growth over the past three years has been aided by an enormous stimulus programme, focused on fixed asset investment by local governments. It is highly likely that a meaningful portion of the investment has been directed towards unproductive and uneconomic assets. This has been funded by Chinese banks lending to local government off balance sheet financing entities, as local governments are not permitted to borrow directly. It is estimated that local government debt now sits at 40-50% of GDP. If you add central government debt at around 20% of GDP, China's government debt as a percentage of GDP is catching the U.S., UK and Germany. Clearly a policy of continuing to drive GDP growth via the build up of off balance sheet local government debt is unsustainable. The investment boom and expansion of credit has lead to rampant property markets and inflationary pressures. Some market participants have stated that they believe that the policies of recent years will result in a hard economic landing, with massive loan write offs and a property crash. We believe this scenario is unlikely as we believe the Chinese authorities have the tools available to absorb bad loans and curb further speculation. We agree with many economists that China is engineering a relatively soft landing with slowing economic growth, albeit at healthy levels.
Sincerely,
| Hamish Douglass | |
|
| Portfolio Manager | |
|
| MFG Asset Management | |
|
page 10

INVESTMENT HIGHLIGHTS
Growth of a $100,000 Investment (Unaudited)
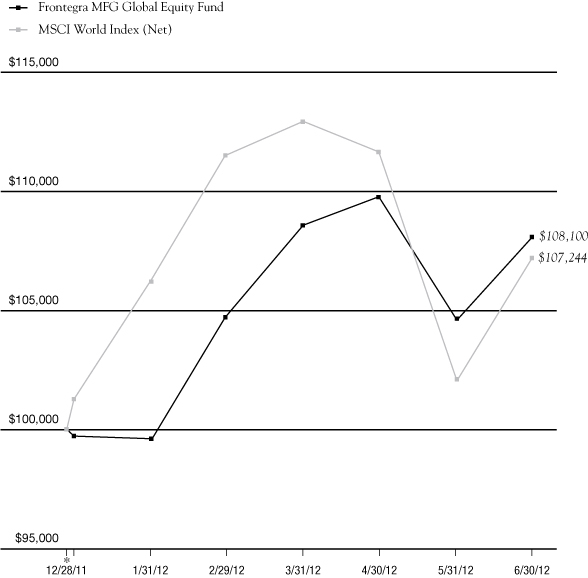
* 12/28/11 commencement of operations.
This chart assumes an initial gross investment of $100,000 made on 12/28/11 (commencement of operations). Returns shown include the reinvestment of all distributions. Past performance is not predictive of future results. Investment return and principal value will fluctuate so that shares, when redeemed, may be worth more or less than the original cost. In the absence of existing fee waivers, total return would be reduced. To receive current to the most recent month-end performance, please call 1-888-825-2100.
The MSCI World Index measures the overall performance of stock markets in 23 developed market countries in North America, Europe, and the Asia/Pacific Region. The Index does not reflect investment management fees, brokerage commissions and other expenses associated with investing in equity securities. A direct investment in the index is not possible.
** The returns shown do not reflect the deduction of taxes that a shareholder would pay on Fund distributions or the redemption of Fund shares.
Portfolio Total Return**
| FOR PERIODS ENDED 6/30/12 | | FUND | | INDEX | |
| SIX MONTHS | | | 8.43 | % | | | 5.91 | % | |
| SINCE INCEPTION | | | 8.10 | % | | | 7.24 | % | |
page 11
This page intentionally left blank.

FRONTEGRA
MFG CORE INFRASTRUCTURE FUND

REPORT FROM MFG ASSET MANAGEMENT
Dear Fellow Shareholders:
The investment objective of the Frontegra MFG Core Infrastructure Fund is long-term capital appreciation. The objective is measured against the UBS Developed Infrastructure & Utilities Index (Net).
Generally, infrastructure assets are natural monopolies that provide an essential service to the community. Infrastructure assets offer investors protection from the impacts of inflation because their earnings generally have some direct linkage to inflation. Over time the stable, reliable earnings of infrastructure assets are expected to lead to a combination of income and capital growth for investors.
The return from the infrastructure universe as defined by MFG Asset Management ("MFGAM") was more than 10% p.a. for the decade to the end of 2011. Just under half of that return was in the form of dividend income.
The universe of infrastructure assets that are held by the Fund is made up of two main sectors:
• Utilities, including both regulated energy utilities and regulated water utilities. Utilities comprise approximately 78% of the Fund. Utilities are typically subject to economic regulation that requires the utility to efficiently provide an essential service to the community and, in return, permits the utility to earn a fair rate of return on the capital it has invested in its operations. As the utility provides a basic necessity, e.g. energy or water, there is minimal fluctuation in demanded volumes in response to the economic cycle and the price charged for the utility service can be adjusted with limited impact upon demanded volumes. As a result, the earnings of regulated utilities have been, and are expected to continue to be, stable irrespective of economic conditions; and
• Infrastructure, which includes airports, ports, toll roads and broadcast communications infrastructure. Regulation of infrastructure companies is generally less intensive than for utilities and allows companies to accrue the benefits of volume growth i.e. the returns of infrastructure companies are linked to growth in passengers, vehicles or containers. As economies develop, grow and become more inter-dependent, we expect the underlying level of aviation, shipping and vehicle traffic to increase. As a result, the revenues and earnings derived by infrastructure assets are expected to grow.
Performance Review
The Frontegra MFG Core Infrastructure Fund returned 6.50%, net of fees, for the period beginning January 18, 2012, inception, and ending June 30, 2012. The Fund's return outperformed the 3.81% return of its benchmark, the UBS Developed Infrastructure & Utilities Index (Net).
Most sectors held in the Core Infrastructure strategy performed well during the period with Ports up an average 21%, Airports up an average 15% and Water Utilities up around 14%. The Toll Roads sector was a standout poor performer in the portfolio — down 5% for the period — due to its holdings of European inter-urban toll roads.
A number of sectors excluded from the Core Infrastructure strategy but included in the benchmark performed quite poorly during the period helping to explain the relative out-performance of the portfolio. Japanese power companies were down an average of 4% for the period while the Competitive Power sector, which has a large weighting in the benchmark index, was down an average 2%.
Geographically, the period saw the UK market up almost 13% and the Australian/New Zealand market was up over 9%, while Canada up less than 2%, lagged the index.
Portfolio Outlook and Strategy
While investors are currently being assaulted with a daily diet of seemingly cataclysmic news, regulated utilities and infrastructure assets continue to quietly go about their business of providing essential services. Consumers continue to turn the lights on, use the restroom and use their cars and, accordingly, the owners of the assets that provide these services continue to earn reliable returns.
page 14

MFGAM believes that infrastructure assets, with requisite earnings reliability and a linkage of earnings to inflation, offer an attractive, long-term investment proposition. Furthermore, given the predictable nature of earnings and the structural linkage of those earnings to inflation, the investment returns generated by infrastructure assets are different from standard asset classes and offer investors valuable diversification when included in an investment portfolio. In the current uncertain economic and investment climate, the reliable financial performance of infrastructure investments makes them particularly attractive and an investment in listed infrastructure can be expected to reward patient investors with a three to five year timeframe.
Sincerely,
| Dennis Eagar | |
|
| Portfolio Manager | |
|
| MFG Asset Management | |
|
page 15

INVESTMENT HIGHLIGHTS
Growth of a $100,000 Investment (Unaudited)
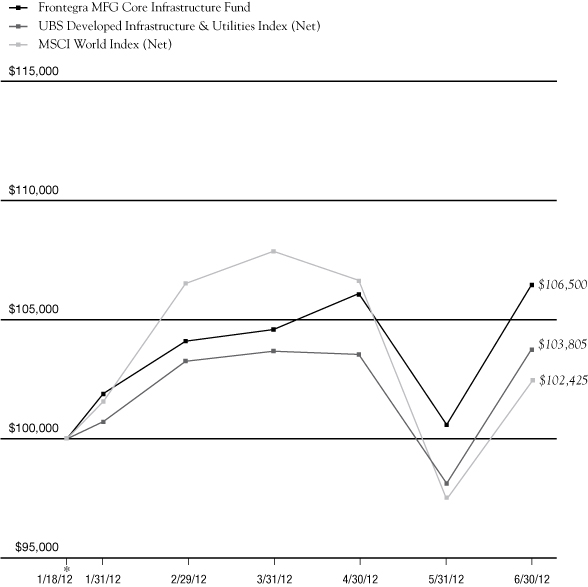
* 1/18/12 commencement of operations.
This chart assumes an initial gross investment of $100,000 made on 1/18/12 (commencement of operations). Returns shown include the reinvestment of all distributions. Past performance is not predictive of future results. Investment return and principal value will fluctuate so that shares, when redeemed, may be worth more or less than the original cost. In the absence of existing fee waivers, total return would be reduced. To receive current to the most recent month-end performance, please call 1-888-825-2100.
The MSCI World Index measures the overall performance of stock markets in 23 developed market countries in North America, Europe, and the Asia/Pacific Region. The Index does not reflect investment management fees, brokerage commissions and other expenses associated with investing in equity securities. A direct investment in the index is not possible.
The UBS Developed Infrastructure & Utilities Index (Net) is a global developed markets infrastructure and utilities benchmark, where dividends are included, dividends are reinvested after the deduction of withholding taxes and is denominated in U.S. dollars. The index is a free-float market capitalization-weighted index and inclusion criteria requires the constituents to have a free float market capitalization greater than US$500m and more than 50% of EBITDA is derived from Infrastructure or Utility businesses. Infrastructure and Utilities are defined as the permanent assets that a society requires to facilitate the orderly operation of an economy. Due to the large size and cost and often monopoly characteristics of these assets, Infrastructure and Utilities have historically been financed, built, owned and operated by the state. Infrastructure includes Transport (roads, airports, seaports, rail) and Communications (broadcast/mobile towers, satellites, fiber and copper cables). Utilities includes Energy (gas and electricity transmission, distribution and generation) and Water (irrigation, potable water, waste treatment).
** The returns shown do not reflect the deduction of taxes that a shareholder would pay on Fund distributions or the redemption of Fund shares.
Portfolio Total Return**
FOR PERIODS
ENDED 6/30/12 | | FUND | | UBS
INDEX | | MSCI
INDEX | |
| SINCE INCEPTION | | | 6.50 | % | | | 3.81 | % | | | 2.43 | % | |
page 16

FRONTEGRA
HEXAM EMERGING MARKETS FUND

REPORT FROM HEXAM CAPITAL PARTNERS, LLP
Dear Shareholders:
The Frontegra HEXAM Emerging Markets Fund aims to achieve long-term capital growth by investing at least 80% of its net assets in securities of emerging market companies. The Fund's benchmark is the MSCI Emerging Markets Index (Net).
Performance Review
The Frontegra HEXAM Emerging Markets Fund returned -29.51%, net of fees, for the year ended June 30, 2012. The Fund's return underperformed the -15.95% return of its benchmark, the MSCI Emerging Markets Index (Net).
Portfolio Review and Strategy
The twelve months ending June 30, 2012, was once again a volatile period for emerging market equities, largely as a result of prolonged problems in the developed markets, namely Europe.
Despite economic decoupling, financial markets have not decoupled. As emerging markets remain less liquid and non-core for many long-term investors compared to developed peers, they will clearly be more volatile in the short-term. However, the situation can change rapidly and a 2011 announcement by the Japanese government pension fund, one of the largest pension funds in the world, that it is changing its benchmark from developed to emerging markets may be a sign for things to come.
The year was highlighted by the continued fears over the health of the European economy, with the debt strife spreading from the peripheral nations to the core economies — largely Spain and Italy. Early in the 12-month period, the market was also concerned about slowing growth in the U.S., with fears of a double dip recession. We never subscribed to this view, which was largely proved correct as the U.S. economy posted resilient data particularly in the fourth quarter of 2011. Our view on emerging market inflation also proved correct, with inflation peaking and monetary loosening measures being enacted in Brazil and China, for example.
At the country level, the largely risk-off environment led to a sharp fall for commodity linked markets, with our main overweight markets of Brazil and Russia detracting from performance over the period.
Our decision to have a zero weighting in India throughout the majority of 2011 proved the most beneficial, with the country struggling with twin deficits and political inactivity. Stubborn inflation also provides little room for policymakers to stimulate the economy.
At stock level, Samsung Electronics was the most significant stock performer, as the company continues to thrive in the mobile communications space. The company is now selling more smartphones than Apple in many parts of the globe and was boosted by the launch of its latest Galaxy phone.
China Overseas Land & Investment also continued to defy the China property sceptics. The Hong Kong-listed company followed on from a strong 2011 with strong sales in over the first half of 2012. By the end of June 2012, China Overseas Land & Investment reached 81% of its full year sales target of HKD80bn.
The largest detractors over the half were our holdings in Russian steel stocks Mechel and Evraz, with panic selling yet again dragging valuations to distressed levels. While we retain a holding in Evraz, we exited our position in Mechel. Brazilian homebuilder PDG Realty also saw downward pressure during the period after reporting weaker-than-expected fourth quarter 2011 and first quarter 2012 numbers. However, we remain confident in the long term potential of the stock considering its geographic and income segment diversification, as well as its current oversold valuation.
While the Fund struggled during the risk-off environment, there were periods of optimism. The strong outperformance of the Fund during October 2011 and January 2012 highlighted the ability of the portfolio to outperform the benchmark once noise in the market subsides and investors once again focus on fundamentals.
page 18

The volatility late in the period led to a number of valuation anomalies in the market, opening up a number of attractive buying opportunities, particularly in China. We added stocks such as internet and technology companies Baidu and Qihoo 360 — as well as China Unicom, BBMG, CNOOC and Ping An Insurance. After strong relative performance, we decided to take profits on the holdings in China Overseas Land & Investment and Naspers.
Outlook
At the end of June, emerging market ("EM") equities were trading at 9.5x forward earnings, 13.7% below the five-year average of 11.1x. The EM discount to developed markets continues to be significantly wider than the last few years. Consensus now expects 11.1% EPS growth in 2012 and 11.6% in 2013 for the global market equity ("GEM") universe. The HEXAM GEMs strategy continues to display strong GARP characteristics, with stronger forecast earnings growth and a lower P/E than the overall market. While sceptics continue to be negative on China, we remain bullish on the short and longer term prospects for the market. While China is currently seeing softer growth than it has achieved in the recent past, it is unlikely to experience a hard landing. The Chinese government has ample room to implement monetary easing and is poised to continue to follow recent interest rate and reserve requirement ratio (RRR) cuts with further loosening over the course of the year.
Thank you for your continued support.
| Bryan Collings, CFA | | Grant Shotter, CFA | |
|
| Managing Partner and Portfolio Manager | | Partner and Portfolio Manager | |
|
| HEXAM Capital Partners, LLP | | HEXAM Capital Partners, LLP | |
|
| Stuart Richards | | Marina Akopian | |
|
| Partner and Portfolio Manager | | Partner and Portfolio Manager | |
|
| HEXAM Capital Partners, LLP | | HEXAM Capital Partners, LLP | |
|
page 19

INVESTMENT HIGHLIGHTS
Growth of a $100,000 Investment (Unaudited)
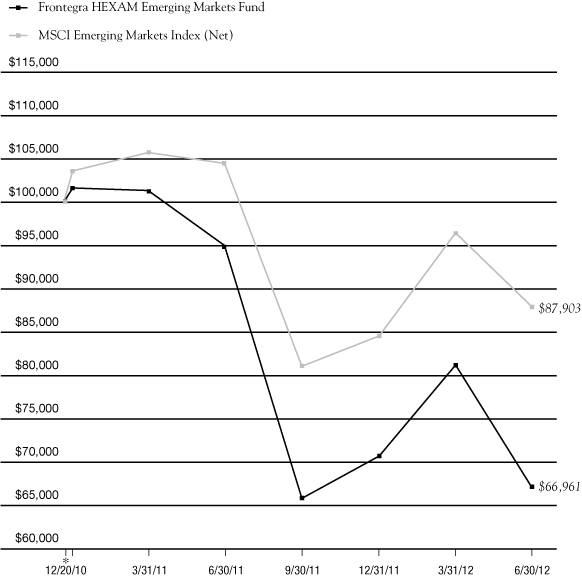
* 12/20/10 commencement of operations.
This chart assumes an initial gross investment of $100,000 made on 12/20/10 (commencement of operations). Returns shown include the reinvestment of all distributions. Past performance is not predictive of future results. Investment return and principal value will fluctuate so that shares, when redeemed, may be worth more or less than the original cost. In the absence of existing fee waivers, total return would be reduced. To receive current to the most recent month-end performance, please call 1-888-825-2100.
The MSCI Emerging Markets Index is a free float-adjusted market capitalization index that is designed to measure equity market performance in the global emerging markets. The Index does not reflect investment management fees, brokerage commissions and other expenses associated with investing in equity securities. A direct investment in the index is not possible.
** The returns shown do not reflect the deduction of taxes that a shareholder would pay on Fund distributions or the redemption of Fund shares.
Portfolio Total Return**
FOR PERIODS
ENDED 6/30/12 | | FUND | | INDEX | |
| SIX MONTHS | | | (5.18 | )% | | | 3.93 | % | |
| ONE YEAR | | | (29.51 | )% | | | (15.95 | )% | |
AVERAGE ANNUAL
SINCE INCEPTION | | | (23.11 | )% | | | (8.10 | )% | |
page 20

FRONTEGRA
TIMPANI SMALL CAP GROWTH FUND

REPORT FROM TIMPANI CAPITAL MANAGEMENT LLC
Dear Fellow Shareholders:
The Frontegra Timpani Small Cap Growth Fund strives to achieve capital appreciation by investing in a diversified portfolio of growth companies with small market capitalizations. Timpani seeks to:
• Invest in companies where growth is robust, sustainable and underestimated by the market.
• Conduct fundamental research that provides unique insights into the perception gap that exists between market expectations and a company's true growth rate.
• Manage risk by continuously evaluating the size of the perception gap relative to market expectations and monitoring market sentiment.
• Act on new relevant incremental data points, both positive and negative, in an effort to exploit investor biases.
Performance Review
The Fund underperformed its benchmark, the Russell 2000® Growth Index, for the year ended June 30, 2012, returning -4.28%, net of fees, vs. -2.71% for the Index. The vast majority of underperformance occurred in August and September when the market dramatically sold off largely due to macroeconomic concerns surrounding a potential European debt contagion. Although we underperformed over the period, we were encouraged to see over 400 basis points of outperformance during the second half of the fiscal year as investors became more focused on company specific fundamentals.
Sector allocation was responsible for all of the underperformance, as good stock selection was accretive to performance and offset some of the weakness in sector allocation. In particular, underweights in health care, financials and consumer staples were significant detractors of performance while overweights in energy and technology also hurt performance. In general, the more defensive sectors which we were underweight near the beginning of the period (health care and consumer staples) tended to outperform in a down market, while sectors in which we were overweight (energy and technology) and more sensitive to economic growth tended to underperform. An overweight in producer durables and an underweight in utilities were positive contributors to performance that helped offset some of the headwinds within sector allocation.
As we expected, the individual stocks that outperformed during the period tended to be those with the largest perception gaps. The period was really a tale of two extremes. During Q3 and Q4 of 2011, there were few companies rewarded with positive absolute performance as investors focused instead on macro concerns around the unfolding European debt crisis. This macro-focused period was characterized by investors worrying about sovereign debt issues in Europe, the debt ceiling debate, continued high unemployment and slowing growth in China. These concerns caused rising volatility, rising stock correlations and increased sensitivity to valuation, all of which led to Timpani's underperformance.
This calendar year through June has been quite different as companies showing strong fundamentals have been rewarded by investors with positive absolute and relative performance. With investors focused on company specific data points, we saw declining volatility, falling stock correlations, more focus on company specific growth profiles and outperformance by Timpani. There were several companies with secular growth profiles that were rewarded with large positive absolute and relative performance as investors recognized the value in robust, sustainable growth and strong business models that were able to gain market share in a competitive environment. Health care companies led the outperformance in the portfolio with the top three best performers for the period. Companies with less macro sensitive business models and strong secular growth drivers such as SXC Health Solutions, Akorn and ZOLL Medical contributed most to the outperformance. OSI Systems, Altisource and Ulta were companies from other sectors that were rewarded by investors with strong relative and absolute performance because of their strong secular growth profiles.
page 22

Portfolio Outlook
The benchmark has been up significantly after rebounding from the strong selloff that bottomed in October of 2011. Unusually high stock correlations among stocks has started to ease in 2012 as the market continued to digest macro concerns about the ongoing European debt crisis. Investors have directed more of their attention to company fundamentals while still keeping an attentive eye on the lingering problems in Europe. Stubbornly high unemployment, geopolitical risks, moderating growth in China, and European debt continue to be issues that investors are fearful of despite mostly positive company fundamentals. During 2012, the relative performance of the portfolio versus the index has been significantly more positive as the Fund returned 13.19% vs. 8.81% for the Index. This is a function of high correlations of individual stocks starting to ease coupled with continued positive bottom up stock selection within the portfolio. We are very aware of the macro risks that continue to exist, and we feel confident that the portfolio is well positioned with companies that are poised to grow and gain share in any type of economic environment.
On a micro level, companies maintained a constructive outlook on the economy and mostly exceeded analyst expectations. Corporate balance sheets are generally sound, and companies are generating ample cash flow which enables them to increase cash deployment in the form of dividends, share buybacks or accretive acquisitions. We believe that positive corporate fundamentals coupled with historically low borrowing rates will lead to the potential for increased M&A activity, which could benefit the companies we own as both buyers and potential acquisition targets. This thesis came to fruition numerous times over the past year as many of our companies were bought out at significant premiums including interclick, Brigham Exploration, HealthSpring, RightNow Technologies, ZOLL Medical and Catalyst Health Solutions. Our analysis continues to confirm our optimism regarding the fundamental strength of the companies in our portfolio. In particular, meetings with company management teams and other fundamental data points indicate that many companies continue to achieve robust growth and that significant perception gaps still exist. We experienced a year with significant volatility centered on macro concerns, where stocks moved with changes in perceived systemic risk. More attention was finally given to company specific fundamentals, which is a step in the right direction, but we must remain mindful of dark clouds still on the horizon.
We are well aware of investors' macro concerns, but we believe we are positioned in companies with secular growth tailwinds that will be less susceptible to a macro slowdown. We are optimistic that market participants will look beyond sovereign debt fears and will focus on and reward companies that have strong, sustainable, company-specific growth drivers. We believe we are well positioned to outperform once these fears subside. According to a recent industry report, the number one factor explaining outperformance once stock correlations start to drop is positive earnings revisions, on which our disciplined approach is centered. We have seen that in our relative performance over the past five months, and we are optimistic that the trend can continue going forward.
During the period, we continued to focus on finding robust and sustainable growers with company-specific perception gaps. The results from our disciplined, bottom-up stock picking process resulted in changes in portfolio sector allocation. Our weightings in consumer discretionary, technology and energy have declined, while our exposure to financials and health care has increased meaningfully. Current sector positioning has us overweight technology and health care and underweight energy, consumer staples, and materials and processing. We took advantage of the declining volatility during the past two quarters by adding and initiating positions in companies where we believe there is secular growth and where the market has underestimated that growth. This is classic perception gap investing. Looking ahead, we are confident that our bottom-up process will continue to add value for shareholders.
Thank you for your continued support.
Sincerely,
| Brandon Nelson, CFA | |
|
Chief Investment Officer
Timpani Capital Management LLC | |
|
page 23

INVESTMENT HIGHLIGHTS
Growth of a $100,000 Investment (Unaudited)

* 3/23/11 commencement of operations.
This chart assumes an initial gross investment of $100,000 made on 3/23/11 (commencement of operations). Returns shown include the reinvestment of all distributions. Past performance is not predictive of future results. Investment return and principal value will fluctuate so that shares, when redeemed, may be worth more or less than the original cost. In the absence of fee waivers, total return would be reduced. To receive current to the most recent month-end performance, please call 1-888-825-2100.
The Russell 2000® Growth Index measures the performance of the small-cap growth segment of the U.S. Equity universe.
** The returns shown do not reflect the deduction of taxes that a shareholder would pay on Fund distributions or the redemption of Fund shares.
Portfolio Total Return**
FOR PERIODS
ENDED 6/30/12 | | FUND | | INDEX | |
| SIX MONTHS | | | 13.19 | % | | | 8.81 | % | |
| ONE YEAR | | | (4.28 | )% | | | (2.71 | )% | |
AVERAGE ANNUAL
SINCE INCEPTION | | | 2.35 | % | | | 1.01 | % | |
page 24

FRONTEGRA
NETOLS SMALL CAP VALUE FUND

REPORT FROM NETOLS ASSET MANAGEMENT, INC.
Dear Fellow Shareholders:
The Frontegra Netols Small Cap Value Fund strives to achieve capital appreciation by investing at least 80% of its assets in equity securities of small capitalization companies. The objective is relative to, and measured against, the Russell 2000® Value Index.
Performance Review
Since its inception on December 16, 2005, the Frontegra Netols Small Cap Value Fund (Institutional Class) has outperformed the benchmark after fees, returning 4.27% annualized, compared to 2.81% annualized for the Russell 2000 Value Index. For the year ended June 30, 2012, the Fund underperformed the benchmark, returning -6.47% net of fees, compared to -1.44% for the Index.
Portfolio Review
The dominant market factor over the past 12 months was the ebb and flow of investor confidence that led to a series of risk on, risk off trades in the market. Political issues in Washington, sovereign debt issues that threatened the breakup of the euro, and concerns over a potential economic slowdown led to risk off trades in the third quarter of 2011 and again in the second quarter of 2012. During the past year the portfolio has been positioned for a stable to slightly improving economy. Periods of uncertainty over the past 12 months resulted in outperformance of relatively more stable Utilities, Financials, and Consumer Staples. Conversely, more cyclical Energy, Information Technology, and Materials underperformed for the period.
Positive Contributions to Relative Performance July 2011 through June 2012
• Stock Selection – Consumer Discretionary and Consumer Staples
• Overweight – Consumer Discretionary
• Best Performing Stocks – Carter's, United Rentals, Coinstar, Fair Isaac, United Natural Foods
Negative Contributions to Relative Performance July 2011 through June 2012
• Stock Selection – Health Care and Energy
• Underweight – Financials
• Worst Performing Stocks – Gentiva, Bill Barrett, MGIC Investment Corp., Superior Energy, Ferro Corp.
Overall, our market outlook remains mixed. Most companies continue to manage through the current economic environment despite a slowdown in Europe and China. There are a few factors that could enhance economic growth in the current environment. Internationally, resolution of Europe's debt issues paired with recently coordinated stimulus efforts from central banks would be a plus for economic activity. Domestically, completion of the November elections should remove uncertainty on many fronts and potentially provide an environment more conducive to business planning. This could lead to increased hiring and business investment that has been recently deferred. Overall, we believe the economy should continue along a stable path with opportunities for improvement.
Thank you for your continued support.
Jeff Netols
President
Netols Asset Management, Inc.
page 26

INVESTMENT HIGHLIGHTS
Growth of a $100,000 Investment (Unaudited)

* 12/16/05 commencement of operations.
This chart assumes an initial gross investment of $100,000 made on 12/16/05 (commencement of operations). Returns shown include the reinvestment of all distributions. Past performance is not predictive of future results. Investment return and principal value will fluctuate so that shares, when redeemed, may be worth more or less than the original cost. In the absence of existing fee waivers, total return would be reduced. To receive current to the most recent month-end performance, please call 1-888-825-2100.
The Russell 2000 Value Index measures the performance of those Russell 2000 companies with lower price-to-book ratios and lower forecasted growth values. The Russell 2000 Index measures the performance of the 2,000 smallest companies in the Russell 3000 Index. The Russell 3000 Index measures the performance of the 3,000 largest U.S. companies based on total market capitalization. The Index does not reflect investment management fees, brokerage commissions and other expenses associated with investing in equity securities. A direct investment in the index is not possible.
** The returns shown do not reflect the deduction of taxes that a shareholder would pay on Fund distributions or the redemption of Fund shares.
The above graph relates to Institutional Class shares of the Fund. Performance for Class Y shares will vary from the performance of the Institutional Class shares shown above due to differences in expenses.
Portfolio Total Return**
FOR PERIODS
ENDED 6/30/12 | | FUND | | INDEX | |
| SIX MONTHS | | | 4.98 | % | | | 8.23 | % | |
| ONE YEAR | | | (6.47 | )% | | | (1.44 | )% | |
FIVE YEAR
AVERAGE ANNUAL | | | 0.31 | % | | | (1.05 | )% | |
AVERAGE ANNUAL
SINCE INCEPTION | | | 4.27 | % | | | 2.81 | % | |
page 27
This page intentionally left blank.

FRONTEGRA
PHOCAS SMALL CAP VALUE FUND

REPORT FROM PHOCAS FINANCIAL CORPORATION
Dear Fellow Shareholders:
The Frontegra Phocas Small Cap Value Fund strives to achieve capital appreciation by investing in a diversified portfolio of equity securities of companies with small market capitalizations. The objective is relative to, and measured against, the Russell 2000® Value Index.
Performance Review
The Frontegra Phocas Small Cap Value Fund — Class L returned -4.91%, net of fees, for the year ended June 30, 2012, and Class I returned -4.95%, net of fees. Both classes underperformed the -1.44% return of the Fund's benchmark, the Russell 2000 Value Index (the "Benchmark").
The Benchmark's total annual return, ending June 30, was led by modest declines in most major sectors, except Utilities, Consumer Staples and, surprisingly, Financials. In general, global economic and political concerns drove investors away from equities. Within equities, investors chose to go to traditional safe haven sectors like staples and utilities. Financials benefitted from continued improvement in their balance sheets and their ability to produce positive earnings.
The Benchmark's annual return was led by Utilities (+8.74%), Financials (+7.71%), and Consumer Staples (+3.27%). Consumer Discretionary (+0.00%) also outperformed the Benchmark. Meanwhile, Energy was the worst performer (-25.89%), followed behind by Telecom Services (-25.34%), Information Technology (-12.91%), Materials (-11.04%), Industrials (-6.18%), and Health Care (-4.43%).
The strongest relative performers in the Fund were Utilities (+10.5%), Industrials (-4.90%), and Information Technology (-12.55%). Consumer Staples (+2.32%) was in-line with the Benchmark. Unfortunately, most of the other major sectors were relative underperformers: Energy (-30.16%), Materials (-16.50%), Consumer Discretionary (-15.12%), Health Care (-5.44%) and Financials (+5.92%). Energy was the hardest hit sector as the effects of global economic weakness started to pressure energy prices, worldwide. This has had an undue impact on short-term pricing behavior of fundamentally cheap small cap domestic E&P companies.
However, what surprised us the most was earnings disappointments were met with significant share price underperformance inconsistent with the actual underlying financial performance — that may be because of factors including money flows affecting sector ETFs. High beta stocks and less liquid names were excessively punished if on the wrong side of earnings estimates.
Portfolio Review and Strategy
A European recession and slowing Asian economies sent investors scurrying to safe haven investments, and markets declined in the second quarter. Here in America, we have issues of our own. Employers are very slow to hire, and many of them point to the specter of profits pressured by higher medical insurance costs for employees. They're also nervous about the potential for a European recession to spillover to the U.S. Thus, slow growth of perhaps 2% is what most economists expect for the U.S. — not a recession, but an economy growing barely fast enough to keep from stalling.
We must keep in mind, however, that it's certainly possible that things could start going the right way again. Housing here in the U.S. is certainly improving, and interest rates remain at incredible lows, making it quite cost effective for businesses to borrow and expand. It's possible that our politicians will come to some agreement on a prudent course for spending and taxation which would reduce the uncertainty that is partly holding back this economy. And it's even possible that Spain, Italy and Greece finally come to the understanding that they cannot continue along this path to financial ruin and begin to take measures to behave in a fiscally responsible manner. The European community is now developing plans to support the weakest banks and the debt of the most fiscally troubled countries.
page 30

Because it is quite difficult, if not impossible, to time markets or sectors on a consistent basis, our core investment strategy remains to concentrate on identifying undervalued stocks in each sector. Though it may not have been the best equity investment strategy for 2012, we believe that it will continue to be the best strategy, longer-term.
Due to benchmark restructuring, the biggest changes are primarily due to significant changes in sector weights, especially within Industrials and Financials. The large ebbs and flows of share price valuation within the broader market have also changed relative valuations within sectors. We feel that the best performing companies are still likely to be those who are finding new growth opportunities, are overhauling their operations to reduce costs significantly, or are investing their free cash flow and cash on their balance sheets to acquire promising businesses. In addition, we continue to search for companies with greatly discounted valuations based on concerns that we think can be repaired in a timely fashion. We remain fully invested with less than 5% cash or equivalents.
Thank you for your continued support.
| William Schaff, CFA | | Steve Block, CFA | |
|
| Chief Executive Officer and Portfolio Manager | | Portfolio Manager | |
|
| Phocas Financial Corporation | | Phocas Financial Corporation | |
|
page 31

INVESTMENT HIGHLIGHTS
Growth of a $100,000 Investment (Unaudited)

* 9/29/06 commencement of operations.
This chart assumes an initial gross investment of $100,000 made on 9/29/06 (commencement of operations). Returns shown include the reinvestment of all distributions. Past performance is not predictive of future results. Investment return and principal value will fluctuate so that shares, when redeemed, may be worth more or less than the original cost. In the absence of fee waivers, total return would be reduced. Effective October 8, 2010, Phocas Financial Corp. ("Phocas") became subadviser to the Fund and Frontegra Asset Management, Inc. became adviser to the Fund. Prior to October 8, 2010, Phocas served as adviser to the Fund. To receive current to the most recent month-end performance, please call 1-888-825-2100.
The Russell 2000® Value Index measures the performance of those Russell 2000® companies with lower price-to-book ratios and lower forecasted growth values.
** The returns shown do not reflect the deduction of taxes that a shareholder would pay on Fund distributions or the redemption of Fund shares.
The above graph relates to Class L shares of the Fund. Performance for Class I shares will vary from the performance of Class L shares shown above due to differences in expenses.
Portfolio Total Return**
| FOR PERIODS ENDED 6/30/12 | | FUND | | INDEX | |
| SIX MONTHS | | | 3.51 | % | | | 8.23 | % | |
| ONE YEAR | | | (4.91 | )% | | | (1.44 | )% | |
FIVE YEAR
AVERAGE ANNUAL | | | 0.59 | % | | | (1.05 | )% | |
AVERAGE ANNUAL
SINCE INCEPTION | | | 3.28 | % | | | 1.24 | % | |
page 32

LOCKWELL SMALL CAP VALUE FUND

REPORT FROM LOCKWELL INVESTMENTS, LLC
Dear Fellow Shareholders:
The Lockwell Small Cap Value Fund strives to take advantage of a number of investor biases which are particularly prevalent within the small cap equity universe. These biases result in an opportunity set of high-quality companies whose valuations, in our opinion, do not accurately reflect the attractiveness of their franchises or business prospects. The strategy attempts to exploit these biases by using an intensive, bottom-up, research-focused process; seeking high-quality companies with specific catalysts; and becoming involved with company managements when appropriate.
Performance Review
The Lockwell Small Cap Value Fund returned -4.76%, net of fees, since its inception on July 1, 2011 through June 30, 2012, versus the benchmark Russell 2000® Value Index return of -2.91%.
The past twelve months have been marked by substantial volatility as investors reacted to geopolitical and macroeconomic news. During this period, we saw correlations between asset classes increase substantially relative to historical norms as investor sentiment overwhelmed company fundamentals at times. The small cap value market was down over 21% during the third quarter of 2011, and then rebounded by more than 29% in aggregate during the fourth quarter of 2011 and first quarter of 2012. The small cap market returned to a risk-averse state during the second quarter of 2012, as worries over the European debt crisis and slowing growth in Asia and the U.S. intensified.
While experiencing the extreme swings in the market over the 12-month period, our Fund underperformed the Russell 2000 Value Index by 1.85%. This underperformance was largely attributable to our underweighting of Real Estate Investment Trusts (REITs) in Financials and our stock selection within the Energy sector. REITs made up approximately 13% of the Russell 2000 Value Index during the year while we held approximately 2-3% in REITs throughout this period. While REITs were rewarded by investors this year, we believe that for the most part these securities are unattractive given their rich valuations and low yields and therefore maintain a substantial underweight. Our Energy holdings were generally hurt by the sharp reduction in natural gas prices and the resulting pullback of many companies in their natural gas drilling programs.
On the positive side, we added value through our stock selection in the Consumer Discretionary, Information Technology, and Materials sectors. Even in light of the macroeconomic concerns, many of our holdings in these sectors had catalysts realized that resulted in strong growth and solid price appreciation. Additionally, our more defensive holdings in Health Care and Consumer Staples added value to the portfolio as the market pulled back in the second quarter of 2012.
Portfolio Outlook
Looking to the year ahead, we will continue to face headwinds as the European debt crisis unfolds and growth slows in most parts of the world. Specifically, we believe that slowing growth in Asia will continue to negatively impact U.S. companies. In the U.S., the upcoming Presidential election and discussion of the approaching fiscal cliff will no doubt result in some political theatre. The question remains as to how the outcomes of these events will play through to employment and growth of the economy.
Specific to the small cap universe, we remain somewhat skeptical about the likelihood of further margin expansion, given that many companies' margins are already at historically high levels. We think the majority of cost cutting opportunities have already been realized by most small cap companies. From an earnings perspective, we believe that expectations for the second half of 2012 will be reduced given the headwinds mentioned.
page 34

On the positive side, small cap companies generally have solid balance sheets and are starting to return more cash to shareholders through dividend payments and share repurchases. Although large cap stocks appear to be more attractively valued at the current time, small cap stocks are less exposed to overseas markets which may be important if Europe worsens. Overall, we believe that small cap stocks are fairly valued but not overvalued.
Our portfolio positioning will continue to be a result of our bottom-up, fundamental research. Currently, we continue to have overweight positions relative to the benchmark in Industrials, Health Care, and Information Technology; while being underweight Financials and Utilities. Similar to REITs within the Financials sector, we believe Utility stocks currently trade at high valuations and also may face some regulatory headwinds. As always, we continue to look for undervalued securities with identifiable catalysts. Over the longer-term, we believe the fundamentals of these companies will produce superior stock price movements that will benefit our shareholders.
Thank you for your continued support.
Richard Glass, CFA
Principal
Lockwell Investments, LLC
page 35

INVESTMENT HIGHLIGHTS
Growth of a $100,000 Investment (Unaudited)
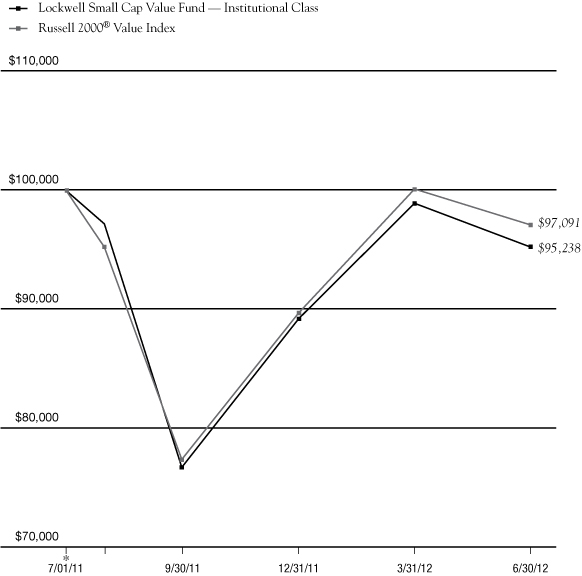
* 7/01/11 commencement of operations.
This chart assumes an initial gross investment of $100,000 made on 7/01/11 (commencement of operations). Returns shown include the reinvestment of all distributions. Past performance is not predictive of future results. Investment return and principal value will fluctuate so that shares, when redeemed, may be worth more or less than the original cost. In the absence of fee waivers, total return would be reduced. To receive current to the most recent month-end performance, please call 1-888-825-2100.
The Russell 2000® Value Index measures the performance of those Russell 2000® companies with lower price-to-book ratios and lower forecasted growth values.
** The returns shown do not reflect the deduction of taxes that a shareholder would pay on Fund distributions or the redemption of Fund shares.
Portfolio Total Return**
FOR PERIODS
ENDED 6/30/12 | | FUND | | INDEX | |
| SIX MONTHS | | | 6.73 | % | | | 8.23 | % | |
| SINCE INCEPTION | | | (4.76 | )% | | | (2.91 | )% | |
page 36

EXPENSE EXAMPLE
June 30, 2012 (Unaudited)
As a shareholder of a mutual fund, you incur two types of costs: (1) transaction costs, including redemption fees, and (2) ongoing costs, including management fees, distribution and/or service (12b-1) fees and other fund expenses. Although the Funds charge no sales loads, you will be assessed fees for outgoing wire transfers, returned checks and stop payment orders at prevailing rates charged by U.S. Bancorp Fund Services, LLC, the Funds' transfer agent. If you request that a redemption be made by wire transfer, currently the Funds' transfer agent charges a $15.00 fee. A redemption fee of 2.00% of the then current value of the shares redeemed may be imposed on certain redemptions of shares made within 30 days of purchase for the Frontegra SAM Global Equity, Frontegra MFG Global Equity, Frontegra MFG Core Infrastructure, Frontegra HEXAM Emerging Markets and Lockwell Small Cap Value Funds.
This Example is intended to help you understand your ongoing costs (in dollars) of investing in the Funds and to compare these costs with the ongoing costs of investing in other mutual funds. The Example is based on an investment of $1,000 invested at the beginning of the period and held for the entire period (1/1/12 – 6/30/12).
Actual Expenses
The first line of the table on the following page for each Fund provides information about actual account values and actual expenses. The Example includes management fees, registration fees, fee waivers/reimbursements and other expenses. However, the Example does not include portfolio trading commissions and related expenses and other extraordinary expenses as determined under generally accepted accounting principles. You may use the information in this line, together with the amount you invested, to estimate the expenses that you paid over the period. Simply divide your account value by $1,000 (for example, an $8,600 account value divided by $1,000 = 8.6), then multiply the result by the number in the first line under the heading entitled "Expenses Paid During the Period" to estimate the expenses you paid on your account during this period.
Hypothetical Example for Comparison Purposes
The second line of the table for each Fund provides information about hypothetical account values and hypothetical expenses based on each of the Fund's actual expense ratios and an assumed rate of return of 5% per year before expenses, which is not the actual return. The hypothetical account values and expenses may not be used to estimate the actual ending account balance or expenses you paid for the period. You may use this information to compare the ongoing costs of investing in each of the Funds and other funds. To do so, compare this 5% hypothetical example with the 5% hypothetical examples that appear in the shareholder reports of the other funds.
Please note that the expenses shown in the table are meant to highlight your ongoing costs only and do not reflect any transactional costs, such as redemption fees. Therefore, the second line of the table is useful in comparing ongoing costs only, and will not help you determine the relative total costs of owning different funds. In addition, if these transactional costs were included, your costs could have been higher.
page 37

EXPENSE EXAMPLE (continued)
June 30, 2012 (Unaudited)
| | | Beginning Account
Value 1/1/2012 | | Ending Account
Value 6/30/2012 | | Annualized
Expense Ratio* | | Expenses Paid
During the Period* | |
| SAM Global Equity Fund | |
| Actual Fund Return | | $ | 1,000.00 | | | $ | 1,021.00 | | | | 1.20 | % | | $ | 6.03 | | |
| Hypothetical 5% Return | | $ | 1,000.00 | | | $ | 1,018.90 | | | | 1.20 | % | | $ | 6.02 | | |
| MFG Global Equity Fund | |
| Actual Fund Return | | $ | 1,000.00 | | | $ | 1,084.30 | | | | 0.80 | % | | $ | 4.15 | | |
| Hypothetical 5% Return | | $ | 1,000.00 | | | $ | 1,020.89 | | | | 0.80 | % | | $ | 4.02 | | |
| HEXAM Emerging Markets Fund | |
| Actual Fund Return | | $ | 1,000.00 | | | $ | 948.20 | | | | 1.30 | % | | $ | 6.30 | | |
| Hypothetical 5% Return | | $ | 1,000.00 | | | $ | 1,018.40 | | | | 1.30 | % | | $ | 6.52 | | |
Timpani Small Cap Growth
Fund – Institutional Class | |
| Actual Fund Return | | $ | 1,000.00 | | | $ | 1,131.90 | | | | 1.10 | % | | $ | 5.83 | | |
| Hypothetical 5% Return | | $ | 1,000.00 | | | $ | 1,019.39 | | | | 1.10 | % | | $ | 5.52 | | |
Netols Small Cap Value
Fund – Institutional Class | |
| Actual Fund Return | | $ | 1,000.00 | | | $ | 1,049.80 | | | | 1.10 | % | | $ | 5.61 | | |
| Hypothetical 5% Return | | $ | 1,000.00 | | | $ | 1,019.39 | | | | 1.10 | % | | $ | 5.52 | | |
Netols Small Cap Value
Fund – Class Y | |
| Actual Fund Return | | $ | 1,000.00 | | | $ | 1,047.20 | | | | 1.50 | % | | $ | 7.64 | | |
| Hypothetical 5% Return | | $ | 1,000.00 | | | $ | 1,017.40 | | | | 1.50 | % | | $ | 7.52 | | |
Phocas Small Cap Value
Fund – Class L | |
| Actual Fund Return | | $ | 1,000.00 | | | $ | 1,035.10 | | | | 0.99 | % | | $ | 5.01 | | |
| Hypothetical 5% Return | | $ | 1,000.00 | | | $ | 1,019.94 | | | | 0.99 | % | | $ | 4.97 | | |
Phocas Small Cap Value
Fund – Class I | |
| Actual Fund Return | | $ | 1,000.00 | | | $ | 1,035.10 | | | | 1.10 | % | | $ | 5.57 | | |
| Hypothetical 5% Return | | $ | 1,000.00 | | | $ | 1,019.39 | | | | 1.10 | % | | $ | 5.52 | | |
| Lockwell Small Cap Value Fund | |
| Actual Fund Return | | $ | 1,000.00 | | | $ | 1,067.30 | | | | 1.10 | % | | $ | 5.65 | | |
| Hypothetical 5% Return | | $ | 1,000.00 | | | $ | 1,019.39 | | | | 1.10 | % | | $ | 5.52 | | |
* Expenses are equal to each Fund's annualized expense ratio indicated above, multiplied by the average account value over the period, multiplied by 182/366 to reflect the one-half year period.
page 38

EXPENSE EXAMPLE (continued)
June 30, 2012 (Unaudited)
| | | Beginning Account
Value | | Ending Account
Value 6/30/2012 | | Annualized
Expense Ratio | | Expenses Paid
During the Period | |
| MFG Core Infrastructure Fund | |
| Actual Fund Return* | | $ | 1,000.00 | | | $ | 1,065.00 | | | | 0.70 | % | | $ | 3.24 | | |
| Hypothetical 5% Return** | | $ | 1,000.00 | | | $ | 1,021.38 | | | | 0.70 | % | | $ | 3.52 | | |
* Actual expenses are equal to the Fund's annualized expense ratio of 0.70% multiplied by the average account value over the period, multiplied by 164/366 to reflect the most recent fiscal period end since the MFG Core Infrastructure Fund commenced operations on January 18, 2012.
** Hypothetical expenses are equal to the Fund's annualized expense ratio of 0.70% multiplied by the average account value over the period commencing January 1, 2012, multiplied by 182/366 to reflect information had the MFG Core Infrastructure Fund been in operation for the entire fiscal half year.
page 39

Frontegra SAM Global Equity Fund
SCHEDULE OF INVESTMENTS
June 30, 2012
| Number of Shares | | | | Value | |
| COMMON STOCKS 94.3% | | | |
| | | Australia 1.6% | |
| | 13,210 | | | National Australia Bank Ltd. | | $ | 321,763 | | |
| | | Canada 8.2% | |
| | 5,450 | | | Bank of Nova Scotia | | | 282,256 | | |
| | 1,990 | | | Canadian Imperial Bank
of Commerce | | | 140,049 | | |
| | 111,420 | | | Sherritt International Corp. | | | 536,252 | | |
| | 2,524 | | | Teck Resources Ltd. - Class B | | | 78,167 | | |
| | 10,020 | | | TELUS Corp. | | | 601,731 | | |
| | | | 1,638,455 | | |
| | | France 4.1% | |
| | 5,300 | | | Cie de St-Gobain | | | 195,831 | | |
| | 14,000 | | | Total SA | | | 630,126 | | |
| | | | 825,957 | | |
| | | Germany 3.4% | |
| | 3,700 | | | Adidas AG | | | 265,209 | | |
| | 2,100 | | | Fresenius SE & Co. KGaA | | | 217,430 | | |
| | 2,996 | | | Henkel AG & Co. KGaA | | | 199,072 | | |
| | | | 681,711 | | |
| | | Israel 1.4% | |
| | 7,270 | | | Teva Pharmaceutical Industries
Ltd. - ADR | | | 286,729 | | |
| | | Italy 5.5% | |
| | 14,900 | | | Ansaldo STS SpA | | | 106,028 | | |
| | 14,000 | | | Eni SpA | | | 297,433 | | |
| | 19,000 | | | Fiat Industrial SpA | | | 187,018 | | |
| | 111,400 | | | Snam SpA | | | 499,087 | | |
| | | | 1,089,566 | | |
| | | Japan 5.6% | |
| | 56,000 | | | Marubeni Corp. | | | 373,123 | | |
| | 36,000 | | | Mitsui OSK Lines Ltd. | | | 129,775 | | |
| | 39,300 | | | Stanley Electric Co. Ltd. | | | 610,321 | | |
| | | | 1,113,219 | | |
| Number of Shares | | | | Value | |
| | | Netherlands 3.3% | |
| | 6,900 | | | Koninklijke DSM NV | | $ | 340,167 | | |
| | 17,600 | | | Koninklijke KPN NV | | | 168,292 | | |
| | 8,003 | | | Koninklijke Philips
Electronics NV | | | 157,705 | | |
| | | | 666,164 | | |
| | | Norway 2.7% | |
| | 11,900 | | | Aker Solutions ASA | | | 168,853 | | |
| | 19,800 | | | DnB NOR ASA | | | 196,881 | | |
| | 36,213 | | | Norsk Hydro ASA | | | 163,309 | | |
| | | | 529,043 | | |
| | | Switzerland 9.4% | |
| | 10,500 | | | Noble Corp. | | | 341,565 | | |
| | 1,900 | | | Roche Holding AG | | | 328,192 | | |
| | 6,600 | | | Swiss RE AG | | | 416,076 | | |
| | 900 | | | Swisscom AG | | | 362,592 | | |
| | 1,900 | | | Zurich Financial Services AG | | | 429,636 | | |
| | | | 1,878,061 | | |
| | | United Kingdom 6.2% | |
| | 68,470 | | | Barclays PLC | | | 174,958 | | |
| | 97,970 | | | BT Group PLC | | | 324,626 | | |
| | 163,700 | | | Legal & General Group PLC | | | 327,280 | | |
| | 11,637 | | | Travis Perkins PLC | | | 177,182 | | |
| | 55,000 | | | WM Morrison Supermarkets PLC | | | 229,502 | | |
| | | | 1,233,548 | | |
| | | United States 42.9% | |
| | 21,700 | | | Dell, Inc. (a) | | | 271,684 | | |
| | 27,330 | | | Hartford Financial Services
Group, Inc. | | | 481,827 | | |
| | 17,568 | | | Hewlett-Packard Co. | | | 353,292 | | |
| | 3,105 | | | International Business
Machines Corp. | | | 607,276 | | |
| | 6,936 | | | Kimberly-Clark Corp. | | | 581,029 | | |
| | 10,500 | | | Life Technologies Corp. (a) | | | 472,395 | | |
| | 8,936 | | | Limited Brands, Inc. | | | 380,048 | | |
| | 300 | | | MasterCard, Inc. - Class A | | | 129,033 | | |
| | 3,306 | | | McDonald's Corp. | | | 292,680 | | |
The accompanying notes are an integral part of these financial statements.
page 40

Frontegra SAM Global Equity Fund
SCHEDULE OF INVESTMENTS (continued)
June 30, 2012
| Number of Shares | | | | Value | |
| COMMON STOCKS 94.3% (continued) | | | |
| | | United States 42.9% (continued) | |
| | 21,090 | | | Microsoft Corp. | | $ | 645,144 | | |
| | 19,150 | | | Mylan, Inc. (a) | | | 409,236 | | |
| | 7,831 | | | Occidental Petroleum Corp. | | | 671,665 | | |
| | 17,000 | | | Oracle Corp. | | | 504,900 | | |
| | 30,506 | | | Pfizer, Inc. | | | 701,637 | | |
| | 12,450 | | | Reynolds American, Inc. | | | 558,632 | | |
| | 7,800 | | | SanDisk Corp. (a) | | | 284,544 | | |
| | 26,100 | | | The Kroger Co. | | | 605,259 | | |
| | 9,892 | | | The Procter & Gamble Co. | | | 605,885 | | |
| | | | 8,556,166 | | |
| | | Total Common Stocks | |
| | | | | (Cost $18,483,882) | | | 18,820,382 | | |
| SHORT-TERM INVESTMENTS 4.7% | | | |
| | | Investment Company 4.7% | |
| | 933,250 | | | STIT-STIC Prime
Portfolio - Institutional
Class, 0.08% | | $ | 933,250 | | |
| | | Total Short-Term Investments | |
| | | | | (Cost $933,250) | | | 933,250 | | |
| | | Total Investments 99.0% | |
| | | | | (Cost $19,417,132) | | | 19,753,632 | | |
| | | | | Other Assets in Excess of
Liabilities 1.0% | | | 198,296 | | |
| | | | | TOTAL NET ASSETS 100.0% | | $ | 19,951,928 | | |
(a) Non-Income Producing.
ADR - American Depositary Receipt.
PORTFOLIO DIVERSIFICATION
| Sectors | | Percentage | |
| Information Technology | | | 14.0 | % | |
| Consumer Staples | | | 13.9 | | |
| Financials | | | 13.9 | | |
| Health Care | | | 12.1 | | |
| Energy | | | 10.6 | | |
| Consumer Discretionary | | | 7.8 | | |
| Telecommunication Services | | | 7.3 | | |
| Industrials | | | 6.6 | | |
| Materials | | | 5.6 | | |
| Utilities | | | 2.5 | | |
| Total Common Stocks | | | 94.3 | | |
| Total Short-Term Investments | | | 4.7 | | |
| Total Investments | | | 99.0 | | |
| Other Assets in Excess of Liabilities | | | 1.0 | | |
| Total Net Assets | | | 100.0 | % | |
The accompanying notes are an integral part of these financial statements.
page 41

Frontegra MFG Global Equity Fund
SCHEDULE OF INVESTMENTS
June 30, 2012
| Number of Shares | | | | Value | |
| COMMON STOCKS 96.4% | | | |
| | | France 4.9% | |
| | 85,722 | | | Danone | | $ | 5,327,344 | | |
| | | Netherlands 3.2% | |
| | 105,179 | | | Unilever NV | | | 3,513,559 | | |
| | | Switzerland 10.1% | |
| | 71,740 | | | Nestle SA | | | 4,281,290 | | |
| | 120,391 | | | Novartis AG | | | 6,731,219 | | |
| | | | 11,012,509 | | |
| | | United Kingdom 4.6% | |
| | 1,023,181 | | | Tesco PLC | | | 4,972,466 | | |
| | | United States 73.6% | |
| | 80,838 | | | American Express Co. | | | 4,705,580 | | |
| | 15,104 | | | Colgate-Palmolive Co. | | | 1,572,326 | | |
| | 180,933 | | | eBay, Inc. (a) | | | 7,600,996 | | |
| | 11,157 | | | Google, Inc. - Class A (a) | | | 6,471,841 | | |
| | 50,987 | | | Johnson & Johnson | | | 3,444,682 | | |
| | 120,339 | | | Kraft Foods, Inc. | | | 4,647,492 | | |
| | 232,127 | | | Lowe's Companies, Inc. | | | 6,601,692 | | |
| | 9,663 | | | MasterCard, Inc. - Class A | | | 4,156,153 | | |
| | 46,256 | | | McDonald's Corp. | | | 4,095,044 | | |
| | 44,773 | | | PepsiCo, Inc. | | | 3,163,660 | | |
| | 72,776 | | | Target Corp. | | | 4,234,835 | | |
| | 21,019 | | | The Coca-Cola Co. | | | 1,643,476 | | |
| | 20,846 | | | The Home Depot, Inc. | | | 1,104,630 | | |
| | 59,765 | | | The Procter & Gamble Co. | | | 3,660,606 | | |
| | 137,370 | | | U.S. Bancorp | | | 4,417,819 | | |
| | 39,892 | | | Visa, Inc. - Class A | | | 4,931,848 | | |
| | 72,768 | | | Wal-Mart Stores, Inc. | | | 5,073,385 | | |
| | 150,857 | | | Wells Fargo & Co. | | | 5,044,658 | | |
| | 50,900 | | | Yum! Brands, Inc. | | | 3,278,978 | | |
| | | | 79,849,701 | | |
| | | Total Common Stocks | |
| | | | | (Cost $105,197,989) | | | 104,675,579 | | |
| Number of Shares | | | | Value | |
| SHORT-TERM INVESTMENTS 3.2% | |
| | | Investment Company 3.2% | |
| | 3,468,812 | | | STIT-STIC Liquid Assets
Portfolio - Institutional
Class, 0.16% | | $ | 3,468,812 | | |
| | | Total Short-Term Investments | |
| | | (Cost $3,468,812) | | | 3,468,812 | | |
| | | Total Investments 99.6% | |
| | | (Cost $108,666,801) | | | 108,144,391 | | |
| | | Other Assets in Excess of
Liabilities 0.4% | | | 406,175 | | |
| | | TOTAL NET ASSETS 100.0% | | $ | 108,550,566 | | |
(a) Non-Income Producing.
PORTFOLIO DIVERSIFICATION
| Sectors | | Percentage | |
| Consumer Staples | | | 38.8 | % | |
| Information Technology | | | 21.3 | | |
| Consumer Discretionary | | | 13.9 | | |
| Financials | | | 13.0 | | |
| Health Care | | | 9.4 | | |
| Total Common Stocks | | | 96.4 | | |
| Total Short-Term Investments | | | 3.2 | | |
| Total Investments | | | 99.6 | | |
| Liabilities in Excess of Other Assets | | | 0.4 | | |
| Total Net Assets | | | 100.0 | % | |
The accompanying notes are an integral part of these financial statements.
page 42

Frontegra MFG Core Infrastructure Fund
SCHEDULE OF INVESTMENTS
June 30, 2012
| Number of Shares | | | | Value | |
| COMMON STOCKS 97.5% | | | |
| | | Australia 8.1% | |
| | 5,190 | | | APA Group | | $ | 26,643 | | |
| | 8,135 | | | DUET Group | | | 15,413 | | |
| | 13,024 | | | Envestra Ltd. | | | 10,515 | | |
| | 26,305 | | | SP AusNet | | | 27,568 | | |
| | 11,844 | | | Spark Infrastructure Group | | | 18,570 | | |
| | 16,605 | | | Sydney Airport | | | 49,488 | | |
| | 12,875 | | | Transurban Group | | | 75,203 | | |
| | | | 223,400 | | |
| | | Austria 0.3% | |
| | 185 | | | Flughafen Wien AG | | | 7,313 | | |
| | | Belgium 0.7% | |
| | 494 | | | Elia System Operator SA/NV | | | 20,315 | | |
| | | Canada 9.4% | |
| | 1,095 | | | Emera, Inc. | | | 36,149 | | |
| | 2,089 | | | Enbridge, Inc. | | | 83,428 | | |
| | 1,684 | | | Fortis, Inc. | | | 53,409 | | |
| | 1,889 | | | TransCanada Corp. | | | 79,171 | | |
| | 331 | | | Valener, Inc. | | | 4,971 | | |
| | | | 257,128 | | |
| | | France 5.4% | |
| | 882 | | | Aeroports de Paris | | | 66,711 | | |
| | 3,444 | | | SES SA | | | 81,429 | | |
| | | | 148,140 | | |
| | | Germany 2.2% | |
| | 820 | | | Fraport AG Frankfurt Airport
Services Worldwide | | | 44,152 | | |
| | 638 | | | Hamburger Hafen und Logistik AG | | | 16,292 | | |
| | | | 60,444 | | |
| | | Hong Kong 2.7% | |
| | 10,008 | | | Power Assets Holdings Ltd. | | | 75,102 | | |
| | | Italy 9.5% | |
| | 1,772 | | | ACEA SpA | | | 10,547 | | |
| Number of Shares | | | | Value | |
| | | Italy 9.5% (continued) | |
| | 5,784 | | | Atlantia SpA | | $ | 73,825 | | |
| | 13,073 | | | Gemina SpA (a) | | | 10,070 | | |
| | 19,430 | | | Snam SpA | | | 87,049 | | |
| | 2,009 | | | Societa Iniziative Autostradali e
Servizi SpA | | | 14,153 | | |
| | 17,927 | | | Terna Rete Elettrica Nazionale SpA | | | 64,780 | | |
| | | | 260,424 | | |
| | | Mexico 1.7% | |
| | 3,531 | | | Grupo Aeroportuario del Centro
Norte SAB de CV | | | 7,279 | | |
| | 4,966 | | | Grupo Aeroportuario del Pacifico
SAB de CV - Class B | | | 19,689 | | |
| | 2,630 | | | Grupo Aeroportuario del Sureste
SAB de CV - Class B | | | 20,583 | | |
| | | | 47,551 | | |
| | | Netherlands 2.7% | |
| | 1,135 | | | Koninklijke Vopak NV | | | 72,802 | | |
| | | New Zealand 1.4% | |
| | 10,822 | | | Auckland International Airport Ltd. | | | 21,225 | | |
| | 8,376 | | | Vector Ltd. | | | 18,008 | | |
| | | | 39,233 | | |
| | | Spain 6.5% | |
| | 6,472 | | | Abertis Infraestructuras SA | | | 87,466 | | |
| | 2,129 | | | Enagas SA | | | 38,846 | | |
| | 1,206 | | | Red Electrica Corp. SA | | | 52,637 | | |
| | | | 178,949 | | |
| | | Switzerland 0.7% | |
| | 53 | | | Flughafen Zuerich AG | | | 18,617 | | |
| | | United Kingdom 8.9% | |
| | 8,102 | | | National Grid PLC | | | 85,865 | | |
| | 3,214 | | | Pennon Group PLC | | | 38,472 | | |
| | 2,118 | | | Severn Trent PLC | | | 54,905 | | |
| | 6,078 | | | United Utilities Group PLC | | | 64,385 | | |
| | | | 243,627 | | |
The accompanying notes are an integral part of these financial statements.
page 43

Frontegra MFG Core Infrastructure Fund
SCHEDULE OF INVESTMENTS (continued)
June 30, 2012
| Number of Shares | | | | Value | |
| COMMON STOCKS 97.5% (continued) | | | |
| | | United States 37.3% | |
| | 174 | | | ALLETE, Inc. | | $ | 7,273 | | |
| | 620 | | | Alliant Energy Corp. | | | 28,253 | | |
| | 1,500 | | | American Electric Power Co., Inc. | | | 59,850 | | |
| | 96 | | | American States Water Co. | | | 3,800 | | |
| | 981 | | | American Water Works Co., Inc. | | | 33,629 | | |
| | 718 | | | Aqua America, Inc. | | | 17,921 | | |
| | 472 | | | Atmos Energy Corp. | | | 16,553 | | |
| | 278 | | | Avista Corp. | | | 7,423 | | |
| | 216 | | | California Water Service Group | | | 3,990 | | |
| | 2,072 | | | CenterPoint Energy, Inc. | | | 42,828 | | |
| | 81 | | | CH Energy Group, Inc. | | | 5,321 | | |
| | 1,108 | | | Consolidated Edison, Inc. | | | 68,907 | | |
| | 804 | | | DTE Energy Co. | | | 47,701 | | |
| | 195 | | | El Paso Electric Co. | | | 6,466 | | |
| | 666 | | | Great Plains Energy, Inc. | | | 14,259 | | |
| | 241 | | | IDACORP, Inc. | | | 10,141 | | |
| | 377 | | | Integrys Energy Group, Inc. | | | 21,440 | | |
| | 264 | | | ITC Holdings Corp. | | | 18,192 | | |
| | 112 | | | MGE Energy, Inc. | | | 5,298 | | |
| | 1,351 | | | NiSource, Inc. | | | 33,437 | | |
| | 876 | | | Northeast Utilities | | | 33,998 | | |
| | 137 | | | Northwest Natural Gas Co. | | | 6,521 | | |
| | 193 | | | NorthWestern Corp. | | | 7,083 | | |
| | 1,153 | | | NV Energy, Inc. | | | 20,270 | | |
| | 1,105 | | | Pepco Holdings, Inc. | | | 21,625 | | |
| | 1,593 | | | PG&E Corp. | | | 72,114 | | |
| | 375 | | | Piedmont Natural Gas Co., Inc. | | | 12,071 | | |
| | 533 | | | Pinnacle West Capital Corp. | | | 27,577 | | |
| | 422 | | | PNM Resources, Inc. | | | 8,246 | | |
| | 369 | | | Portland General Electric Co. | | | 9,838 | | |
| | 1,054 | | | Progress Energy, Inc. | | | 63,419 | | |
| Number of Shares | | | | Value | |
| | | United States 37.3% (continued) | |
| | 621 | | | SCANA Corp. | | $ | 29,709 | | |
| | 46 | | | SJW Corp. | | | 1,104 | | |
| | 235 | | | Southwest Gas Corp. | | | 10,258 | | |
| | 1,050 | | | TECO Energy, Inc. | | | 18,963 | | |
| | 215 | | | The Empire District Electric Co. | | | 4,537 | | |
| | 1,258 | | | The Southern Co. | | | 58,245 | | |
| | 263 | | | UIL Holdings Corp. | | | 9,431 | | |
| | 177 | | | UNS Energy Corp. | | | 6,799 | | |
| | 400 | | | Vectren Corp. | | | 11,808 | | |
| | 549 | | | Westar Energy, Inc. | | | 16,443 | | |
| | 267 | | | WGL Holdings, Inc. | | | 10,613 | | |
| | 1,094 | | | Wisconsin Energy Corp. | | | 43,290 | | |
| | 2,309 | | | Xcel Energy, Inc. | | | 65,598 | | |
| | | | 1,022,242 | | |
| | | Total Common Stocks | |
| | | | | (Cost $2,608,142) | | | 2,675,287 | | |
| CLOSED-END FUNDS 0.8% | | | |
| | | United Kingdom 0.8% | |
| | 6,735 | | | HICL Infrastructure Co. Ltd. | | | 12,505 | | |
| | 5,509 | | | International Public
Partnerships Ltd. | | | 10,217 | | |
| | | Total Closed-End Funds | |
| | | | | (Cost $12,393) | | | 22,722 | | |
| POOLED INVESTMENT VEHICLE 0.5% | | | |
| | | Airport 0.5% | |
| | 5,505 | | | Australian Infrastructure Fund | | | 13,617 | | |
| | | Total Pooled Investment Vehicle | |
| | | | | (Cost $11,592) | | | 13,617 | | |
The accompanying notes are an integral part of these financial statements.
page 44

Frontegra MFG Core Infrastructure Fund
SCHEDULE OF INVESTMENTS (continued)
June 30, 2012
| Number of Shares | | | | Value | |
| SHORT-TERM INVESTMENTS 1.0% | |
| | | Investment Company 1.0% | |
| | 27,065 | | | STIT-STIC Liquid Assets
Portfolio - Institutional
Class, 0.16% | | $ | 27,065 | | |
| | | Total Short-Term Investments | |
| | | (Cost $27,065) | | | 27,065 | | |
| | | Total Investments 99.8% | |
| | | (Cost $2,659,192) | | | 2,738,691 | | |
| | | Other Assets in Excess of
Liabilities 0.2% | | | 4,664 | | |
| | | TOTAL NET ASSETS 100.0% | | $ | 2,743,355 | | |
(a) Non-Income Producing.
PORTFOLIO DIVERSIFICATION
| Sectors | | Percentage | |
| Integrated Power | | | 29.3 | % | |
| Transmission & Distribution | | | 21.2 | | |
| Gas | | | 14.1 | | |
| Airport | | | 9.7 | | |
| Toll Road | | | 9.1 | | |
| Water Utility | | | 7.9 | | |
| Port | | | 3.2 | | |
| Communications | | | 3.0 | | |
| Total Common Stocks | | | 97.5 | | |
| Social | | | 0.8 | | |
| Total Closed-End Funds | | | 0.8 | | |
| Airport | | | 0.5 | | |
| Total Pooled Investment Vehicle | | | 0.5 | | |
| Total Short-Term Investments | | | 1.0 | | |
| Total Investments | | | 99.8 | | |
| Other Assets in Excess of Liabilities | | | 0.2 | | |
| Total Net Assets | | | 100.0 | % | |
The accompanying notes are an integral part of these financial statements.
page 45

Frontegra HEXAM Emerging Markets Fund
SCHEDULE OF INVESTMENTS
June 30, 2012
| Number of Shares | | | | Value | |
| COMMON STOCKS 92.6% | | | |
| | | Brazil 18.4% | |
| | 20,700 | | | BRF - Brasil Foods SA | | $ | 311,763 | | |
| | 28,200 | | | Kroton Educacional SA (a) | | | 404,642 | | |
| | 147,700 | | | OGX Petroleo e Gas
Participacoes SA (a) | | | 404,456 | | |
| | 120,000 | | | PDG Realty SA
Empreendimentos e Participacoes | | | 210,904 | | |
| | 19,639 | | | Petroleo Brasileiro SA - ADR | | | 368,624 | | |
| | 22,681 | | | Tim Participacoes SA - ADR | | | 622,820 | | |
| | 65,417 | | | Vale SA - ADR | | | 1,298,528 | | |
| | | | 3,621,737 | | |
| | | China 16.8% | |
| | 2,502 | | | Baidu, Inc. - ADR (a) | | | 287,680 | | |
| | 302,288 | | | BBMG Corp. | | | 213,123 | | |
| | 1,192,000 | | | China Construction Bank Corp. | | | 823,522 | | |
| | 227,000 | | | CNOOC Ltd. | | | 457,659 | | |
| | 38,000 | | | Ping An Insurance (Group)
Company of China, Ltd. | | | 307,263 | | |
| | 879,000 | | | Prince Frog International
Holdings Ltd. | | | 316,842 | | |
| | 17,638 | | | Qihoo 360 Technology Co.
Ltd. - ADR (a) | | | 304,961 | | |
| | 15,009 | | | WuXi PharmaTech Cayman,
Inc. - ADR (a) | | | 211,927 | | |
| | 196,400 | | | ZTE Corp. | | | 383,088 | | |
| | | | 3,306,065 | | |
| | | Hong Kong 8.7% | |
| | 282,000 | | | China Unicom United Network
Communications Group Co. Ltd. | | | 354,610 | | |
| | 1,285,000 | | | Industrial & Commercial
Bank of China | | | 720,356 | | |
| | 126,500 | | | Kingboard Chemical Holdings Ltd. | | | 246,373 | | |
| | 698,213 | | | Nine Dragons Paper Holdings Ltd. | | | 395,248 | | |
| | | | 1,716,587 | | |
| Number of Shares | | | | Value | |
| | | Kazakhstan 5.7% | |
| | 68,799 | | | Kazakhmys PLC | | $ | 780,032 | | |
| | 136,023 | | | Uranium One, Inc. (a) | | | 346,037 | | |
| | | | 1,126,069 | | |
| | | Russian Federation 14.6% | |
| | 95,381 | | | Evraz PLC | | | 391,165 | | |
| | 38,473 | | | Gazprom OAO - ADR | | | 365,494 | | |
| | 6,762 | | | Lukoil OAO - ADR | | | 379,213 | | |
| | 50,861 | | | Magnitogorsk Iron & Steel
Works - GDR (a) | | | 186,863 | | |
| | 18,784 | | | NOMOS-BANK - GDR (a) | | | 225,408 | | |
| | 3,580 | | | Novatek OAO - GDR | | | 382,264 | | |
| | 280,348 | | | Sberbank of Russia | | | 749,892 | | |
| | 19,390 | | | Sberbank of Russia - ADR | | | 209,800 | | |
| | | | 2,890,099 | | |
| | | South Africa 4.8% | |
| | 16,124 | | | Anglo American PLC | | | 529,919 | | |
| | 4,525 | | | Randgold Resources Ltd. | | | 406,264 | | |
| | | | 936,183 | | |
| | | South Korea 19.1% | |
| | 10,980 | | | Hankook Tire Co. Ltd. | | | 437,875 | | |
| | 2,550 | | | Hyundai Mobis | | | 618,110 | | |
| | 27,515 | | | KB Financial Group, Inc. | | | 898,830 | | |
| | 2,302 | | | LG Chem Ltd. | | | 595,931 | | |
| | 692 | | | Samsung Electronics Co. Ltd. | | | 732,819 | | |
| | 2,457 | | | Samsung Fire & Marine
Insurance Co. Ltd. | | | 487,569 | | |
| | | | 3,771,134 | | |
| | | Switzerland 1.4% | |
| | 22,204 | | | Xstrata PLC | | | 279,179 | | |
| | | Zambia 3.1% | |
| | 34,777 | | | First Quantum Minerals Ltd. | | | 614,857 | | |
| | | Total Common Stocks | |
| | | | | (Cost $23,487,682) | | | 18,261,910 | | |
The accompanying notes are an integral part of these financial statements.
page 46

Frontegra HEXAM Emerging Markets Fund
SCHEDULE OF INVESTMENTS (continued)
June 30, 2012
| Number of Shares | | | | Value | |
| PREFERRED STOCKS 6.3% | | | |
| | | Brazil 6.3% | |
| | 41,584 | | | Banco Bradesco SA - ADR | | $ | 618,354 | | |
| | 45,133 | | | Itau Unibanco Holding SA - ADR | | | 628,251 | | |
| | | | 1,246,605 | | |
| | | Total Preferred Stocks | |
| | | | | (Cost $1,696,815) | | | 1,246,605 | | |
| SHORT-TERM INVESTMENTS 1.2% | | | |
| | | Investment Company 1.2% | |
| | 234,245 | | | Fidelity Institutional Money
Market Portfolio, 0.18% | | | 234,245 | | |
| | | Total Short-Term Investments | |
| | | | | (Cost $234,245) | | | 234,245 | | |
| | | Total Investments 100.1% | |
| | | | | (Cost $25,418,742) | | | 19,742,760 | | |
| | | | | Liabilities in Excess of
Other Assets (0.1)% | | | (15,606 | ) | |
| | | | | TOTAL NET ASSETS 100.0% | | $ | 19,727,154 | | |
(a) Non-Income Producing.
ADR - American Depositary Receipt.
GDR - Global Depositary Receipt.
PORTFOLIO DIVERSIFICATION
| Sectors | | Percentage | |
| Financials | | | 29.8 | % | |
| Basic Materials | | | 27.7 | | |
| Oil & Gas | | | 11.9 | | |
| Consumer Goods | | | 10.6 | | |
| Technology | | | 8.7 | | |
| Telecommunications | | | 4.9 | | |
| Industrials | | | 4.2 | | |
| Health Care | | | 1.1 | | |
| Total Common Stocks | | | 98.9 | | |
| Total Short-Term Investments | | | 1.2 | | |
| Total Investments | | | 100.1 | | |
| Liabilities in Excess of Other Assets | | | (0.1 | ) | |
| Total Net Assets | | | 100.0 | % | |
The accompanying notes are an integral part of these financial statements.
page 47

Frontegra Timpani Small Cap Growth Fund
SCHEDULE OF INVESTMENTS
June 30, 2012
| Number of Shares | | | | Value | |
| COMMON STOCKS 98.9% | | | |
| | | Consumer Discretionary 18.2% | |
| | 1,000 | | | Asbury Automotive Group, Inc. (a) | | $ | 23,690 | | |
| | 482 | | | Brunswick Corp. | | | 10,710 | | |
| | 266 | | | Buffalo Wild Wings, Inc. (a) | | | 23,046 | | |
| | 386 | | | Genesco, Inc. (a) | | | 23,218 | | |
| | 2,805 | | | Grand Canyon Education, Inc. (a) | | | 58,737 | | |
| | 5,262 | | | LeapFrog Enterprises, Inc. (a) | | | 53,988 | | |
| | 1,164 | | | Lithia Motors, Inc. - Class A | | | 26,830 | | |
| | 1,614 | | | Multimedia Games
Holdings Co., Inc. (a) | | | 22,596 | | |
| | 465 | | | Polaris Industries, Inc. | | | 33,238 | | |
| | 5,610 | | | Smith & Wesson Holding Corp. (a) | | | 46,619 | | |
| | 920 | | | Sturm, Ruger & Company, Inc. | | | 36,938 | | |
| | 2,230 | | | Town Sports International
Holdings, Inc. (a) | | | 29,637 | | |
| | 623 | | | Ulta Salon, Cosmetics &
Fragrance, Inc. | | | 58,176 | | |
| | 631 | | | Vitamin Shoppe, Inc. (a) | | | 34,661 | | |
| | 789 | | | Zumiez, Inc. (a) | | | 31,244 | | |
| | | | 513,328 | | |
| | | Consumer Staples 0.6% | |
| | 2,840 | | | Inventure Foods, Inc. (a) | | | 17,892 | | |
| | | Energy 4.2% | |
| | 363 | | | Approach Resources, Inc. (a) | | | 9,271 | | |
| | 126 | | | Core Laboratories NV (b) | | | 14,603 | | |
| | 604 | | | Gulfmark Offshore, Inc. (a) | | | 20,560 | | |
| | 1,062 | | | Hornbeck Offshore Services, Inc. (a) | | | 41,185 | | |
| | 323 | | | Oasis Petroleum, Inc. (a) | | | 7,810 | | |
| | 325 | | | Rosetta Resources, Inc. (a) | | | 11,908 | | |
| | 653 | | | Sanchez Energy Corp. (a) | | | 13,582 | | |
| | | | 118,919 | | |
| | | Financial Services 8.7% | |
| | 726 | | | Altisource Portfolio
Solutions SA (a)(b) | | | 53,165 | | |
| | 1,431 | | | AmTrust Financial Services, Inc. | | | 42,515 | | |
| Number of Shares | | | | Value | |
| | | Financial Services 8.7% (continued) | |
| | 2,535 | | | Bankrate, Inc. (a) | | $ | 46,619 | | |
| | 1,447 | | | Homeowners Choice, Inc. | | | 25,467 | | |
| | 903 | | | Market Leader, Inc. (a) | | | 4,587 | | |
| | 1,149 | | | Texas Capital Bancshares, Inc. (a) | | | 46,408 | | |
| | 2,306 | | | Tree.com, Inc. (a) | | | 26,381 | | |
| | | | 245,142 | | |
| | | Health Care 24.7% | |
| | 1,366 | | | ABIOMED, Inc. (a) | | | 31,172 | | |
| | 1,020 | | | Acadia Healthcare
Company, Inc. (a) | | | 17,891 | | |
| | 630 | | | Air Methods Corp. (a) | | | 61,898 | | |
| | 5,587 | | | Akorn, Inc. (a) | | | 88,108 | | |
| | 885 | | | Align Technology, Inc. (a) | | | 29,612 | | |
| | 3,380 | | | Capital Senior Living Corp. (a) | | | 35,828 | | |
| | 234 | | | Catalyst Health Solutions, Inc. (a) | | | 21,865 | | |
| | 497 | | | Cubist Pharmaceuticals, Inc. (a) | | | 18,841 | | |
| | 489 | | | Cyberonics, Inc. (a) | | | 21,976 | | |
| | 3,440 | | | Endologix, Inc. (a) | | | 53,114 | | |
| | 2,513 | | | HealthStream, Inc. (a) | | | 65,338 | | |
| | 1,103 | | | Jazz Pharmaceuticals, Inc. (a)(b) | | | 49,646 | | |
| | 965 | | | Novadaq Technologies, Inc. (a)(b) | | | 6,437 | | |
| | 491 | | | Omnicell, Inc. (a) | | | 7,188 | | |
| | 743 | | | PhotoMedex, Inc. (a) | | | 9,027 | | |
| | 216 | | | Questcor Pharmaceuticals, Inc. (a) | | | 11,500 | | |
| | 994 | | | SXC Health Solutions Corp. (a) | | | 98,615 | | |
| | 1,029 | | | Team Health Holdings, Inc. (a) | | | 24,789 | | |
| | 749 | | | VIVUS, Inc. (a) | | | 21,376 | | |
| | 893 | | | Vocera Communications, Inc. (a) | | | 23,923 | | |
| | | | 698,144 | | |
| | | Materials & Processing 3.2% | |
| | 840 | | | Eagle Materials, Inc. | | | 31,366 | | |
| | 481 | | | Valmont Industries, Inc. | | | 58,186 | | |
| | | | 89,552 | | |
| | | Producer Durables 14.7% | |
| | 363 | | | Allegiant Travel Co. (a) | | | 25,294 | | |
| | 189 | | | CoStar Group, Inc. (a) | | | 15,347 | | |
The accompanying notes are an integral part of these financial statements.
page 48

Frontegra Timpani Small Cap Growth Fund
SCHEDULE OF INVESTMENTS (continued)
June 30, 2012
| Number of Shares | | | | Value | |
| COMMON STOCKS 98.9% (continued) | | | |
| | | Producer Durables 14.7% (continued) | |
| | 364 | | | ExlService Holdings, Inc. (a) | | $ | 8,969 | | |
| | 663 | | | FARO Technologies, Inc. (a) | | | 27,899 | | |
| | 2,377 | | | InnerWorkings, Inc. (a) | | | 32,161 | | |
| | 2,171 | | | On Assignment, Inc. (a) | | | 34,649 | | |
| | 1,690 | | | OSI Systems, Inc. (a) | | | 107,045 | | |
| | 483 | | | Raven Industries, Inc. | | | 33,612 | | |
| | 1,227 | | | Spirit Airlines, Inc. (a) | | | 23,877 | | |
| | 1,045 | | | Team, Inc. (a) | | | 32,583 | | |
| | 619 | | | Titan International, Inc. | | | 15,184 | | |
| | 358 | | | Titan Machinery, Inc. (a) | | | 10,872 | | |
| | 350 | | | TransDigm Group, Inc. (a) | | | 47,005 | | |
| | | | 414,497 | | |
| | | Technology 24.6% | |
| | 1,226 | | | Acacia Research Corp. (a) | | | 45,656 | | |
| | 2,376 | | | Allot Communications Ltd. (a)(b) | | | 66,196 | | |
| | 502 | | | Bottomline Technologies, Inc. (a) | | | 9,061 | | |
| | 670 | | | Brightcove, Inc. (a) | | | 10,218 | | |
| | 6,228 | | | Callidus Software, Inc. (a) | | | 31,015 | | |
| | 883 | | | CommVault Systems, Inc. (a) | | | 43,770 | | |
| | 2,978 | | | Datalink Corp. (a) | | | 28,440 | | |
| | 907 | | | DealerTrack Holdings, Inc. (a) | | | 27,310 | | |
| | 329 | | | Demandware, Inc. (a) | | | 7,794 | | |
| | 816 | | | Ellie Mae, Inc. (a) | | | 14,688 | | |
| | 574 | | | Fortinet, Inc. (a) | | | 13,328 | | |
| | 2,695 | | | Guidance Software, Inc. (a) | | | 25,629 | | |
| | 1,591 | | | Kenexa Corp. (a) | | | 46,187 | | |
| | 912 | | | NeuStar, Inc. - Class A (a) | | | 30,460 | | |
| | 2,351 | | | PROS Holdings, Inc. (a) | | | 39,544 | | |
| | 1,821 | | | Radware Ltd. (a)(b) | | | 69,726 | | |
| | 1,533 | | | Silicon Motion Technology
Corp. - ADR (a)(b) | | | 21,631 | | |
| Number of Shares | | | | Value | |
| | | Technology 24.6% (continued) | |
| | 388 | | | Sourcefire, Inc. (a) | | $ | 19,943 | | |
| | 2,262 | | | Synacor, Inc. (a) | | | 30,989 | | |
| | 3,151 | | | Tangoe, Inc. (a) | | | 67,149 | | |
| | 432 | | | Ultratech, Inc. (a) | | | 13,608 | | |
| | 1,842 | | | Web.com Group, Inc. (a) | | | 33,745 | | |
| | | | 696,087 | | |
| | | Total Common Stocks | |
| | | | | (Cost $2,264,049) | | | 2,793,561 | | |
| SHORT-TERM INVESTMENTS 3.0% | | | |
| | | Investment Company 3.0% | |
| | 84,495 | | | STIT-STIC Prime
Portfolio - Institutional
Class, 0.08% | | | 84,495 | | |
| | | Total Short-Term Investments | |
| | | | | (Cost $84,495) | | | 84,495 | | |
| | | Total Investments 101.9% | |
| | | | | (Cost $2,348,544) | | | 2,878,056 | | |
| | | | | Liabilities in Excess of
Other Assets (1.9)% | | | (53,624 | ) | |
| | | | | TOTAL NET ASSETS 100.0% | | $ | 2,824,432 | | |
(a) Non-Income Producing.
(b) U.S. traded security of a foreign issuer.
ADR - American Depositary Receipt.
The accompanying notes are an integral part of these financial statements.
page 49

Frontegra Timpani Small Cap Growth Fund
SCHEDULE OF INVESTMENTS (continued)
June 30, 2012
PORTFOLIO DIVERSIFICATION
| Sectors | | Percentage | |
| Health Care | | | 24.7 | % | |
| Technology | | | 24.6 | | |
| Consumer Discretionary | | | 18.2 | | |
| Producer Durables | | | 14.7 | | |
| Financial Services | | | 8.7 | | |
| Energy | | | 4.2 | | |
| Materials and Processing | | | 3.2 | | |
| Consumer Staples | | | 0.6 | | |
| Total Common Stocks | | | 98.9 | | |
| Total Short-Term Investments | | | 3.0 | | |
| Total Investments | | | 101.9 | | |
| Liabilities in Excess of Other Assets | | | (1.9 | ) | |
| Total Net Assets | | | 100.0 | % | |
The accompanying notes are an integral part of these financial statements.
page 50

Frontegra Netols Small Cap Value Fund
SCHEDULE OF INVESTMENTS
June 30, 2012
| Number of Shares | | | | Value | |
| COMMON STOCKS 98.5% | | | |
| | | Consumer Discretionary 19.9% | |
| | 78,707 | | | Aaron's, Inc. | | $ | 2,228,195 | | |
| | 306,518 | | | Accuride Corp. (a) | | | 1,839,108 | | |
| | 97,696 | | | ANN, Inc. (a) | | | 2,490,271 | | |
| | 95,129 | | | Cabela's, Inc. (a) | | | 3,596,828 | | |
| | 53,794 | | | Capella Education Co. (a) | | | 1,869,879 | | |
| | 57,478 | | | Carter's, Inc. (a) | | | 3,023,343 | | |
| | 48,764 | | | Coinstar, Inc. (a) | | | 3,348,136 | | |
| | 85,873 | | | Domino's Pizza, Inc. | | | 2,654,334 | | |
| | 107,693 | | | Ethan Allen Interiors, Inc. | | | 2,146,322 | | |
| | 62,800 | | | Tenneco, Inc. (a) | | | 1,684,296 | | |
| | 69,562 | | | The Cheesecake Factory, Inc. (a) | | | 2,223,202 | | |
| | 38,454 | | | Tractor Supply Co. | | | 3,193,989 | | |
| | | | 30,297,903 | | |
| | | Consumer Staples 4.6% | |
| | 230,319 | | | SunOpta, Inc. (a)(b) | | | 1,292,090 | | |
| | 41,846 | | | TreeHouse Foods, Inc. (a) | | | 2,606,587 | | |
| | 57,465 | | | United Natural Foods, Inc. (a) | | | 3,152,530 | | |
| | | | 7,051,207 | | |
| | | Energy 4.2% | |
| | 62,456 | | | Bill Barrett Corp. (a) | | | 1,337,807 | | |
| | 81,521 | | | Superior Energy Services, Inc. (a) | | | 1,649,170 | | |
| | 45,916 | | | Whiting Petroleum Corp. (a) | | | 1,888,066 | | |
| | 245,832 | | | Willbros Group, Inc. (a) | | | 1,588,075 | | |
| | | | 6,463,118 | | |
| | | Financials 17.5% | |
| | 40,458 | | | Bank of Hawaii Corp. | | | 1,859,045 | | |
| | 83,472 | | | Cedar Fair LP | | | 2,501,656 | | |
| | 63,478 | | | Community Bank System, Inc. | | | 1,721,523 | | |
| | 62,518 | | | Endurance Specialty
Holdings Ltd. (b) | | | 2,395,690 | | |
| | 129,920 | | | Glacier Bancorp, Inc. | | | 2,012,461 | | |
| | 402,815 | | | MGIC Investment Corp. (a) | | | 1,160,107 | | |
| | 178,048 | | | Old National Bancorp | | | 2,138,357 | | |
| | 115,573 | | | PHH Corp. (a) | | | 2,020,216 | | |
| | 50,340 | | | Prosperity Bancshares, Inc. | | | 2,115,790 | | |
| Number of Shares | | | | Value | |
| | | Financials 17.5% (continued) | |
| | 131,945 | | | Selective Insurance Group, Inc. | | $ | 2,297,162 | | |
| | 59,575 | | | The Hanover Insurance
Group, Inc. | | | 2,331,170 | | |
| | 31,639 | | | Walter Investment
Management Corp. | | | 741,618 | | |
| | 83,723 | | | Webster Financial Corp. | | | 1,813,440 | | |
| | 34,082 | | | Westamerica Bancorporation | | | 1,608,330 | | |
| | | | 26,716,565 | | |
| | | Health Care 9.3% | |
| | 29,668 | | | Haemonetics Corp. (a) | | | 2,198,695 | | |
| | 44,309 | | | LifePoint Hospitals, Inc. (a) | | | 1,815,783 | | |
| | 35,564 | | | Magellan Health Services, Inc. (a) | | | 1,612,116 | | |
| | 166,548 | | | Merit Medical Systems, Inc. (a) | | | 2,300,028 | | |
| | 68,936 | | | PSS World Medical, Inc. (a) | | | 1,446,967 | | |
| | 355,136 | | | Sunrise Senior Living, Inc. (a) | | | 2,588,941 | | |
| | 84,965 | | | U.S. Physical Therapy, Inc. | | | 2,160,660 | | |
| | | | 14,123,190 | | |
| | | Industrials 16.3% | |
| | 87,531 | | | Actuant Corp. - Class A | | | 2,377,342 | | |
| | 185,019 | | | Commercial Vehicle
Group, Inc. (a) | | | 1,594,864 | | |
| | 33,049 | | | Gardner Denver, Inc. | | | 1,748,623 | | |
| | 35,687 | | | General Cable Corp. (a) | | | 925,721 | | |
| | 33,205 | | | Genesee & Wyoming, Inc. (a) | | | 1,754,552 | | |
| | 33,727 | | | Gibraltar Industries, Inc. (a) | | | 350,086 | | |
| | 27,480 | | | Harsco Corp. | | | 560,042 | | |
| | 75,041 | | | Herman Miller, Inc. | | | 1,389,760 | | |
| | 40,087 | | | Robbins & Myers, Inc. | | | 1,676,438 | | |
| | 108,570 | | | Titan International, Inc. | | | 2,663,222 | | |
| | 89,974 | | | TriMas Corp. (a) | | | 1,808,478 | | |
| | 96,757 | | | United Rentals, Inc. (a) | | | 3,293,608 | | |
| | 57,760 | | | United Stationers, Inc. | | | 1,556,632 | | |
| | 39,237 | | | Westinghouse Air Brake
Technologies Corp. | | | 3,060,878 | | |
| | | | 24,760,246 | | |
The accompanying notes are an integral part of these financial statements.
page 51

Frontegra Netols Small Cap Value Fund
SCHEDULE OF INVESTMENTS (continued)
June 30, 2012
| Number of Shares | | | | Value | |
| COMMON STOCKS 98.5% (continued) | | | |
| | | Information Technology 10.9% | |
| | 63,301 | | | Arbitron, Inc. | | $ | 2,215,535 | | |
| | 395,775 | | | CIBER, Inc. (a) | | | 1,705,790 | | |
| | 228,065 | | | Entegris, Inc. (a) | | | 1,947,675 | | |
| | 85,006 | | | Fair Isaac Corp. | | | 3,594,054 | | |
| | 138,215 | | | Fairchild Semiconductor
International, Inc. (a) | | | 1,948,832 | | |
| | 253,025 | | | Integrated Device
Technology, Inc. (a) | | | 1,422,000 | | |
| | 100,002 | | | Progress Software Corp. (a) | | | 2,087,042 | | |
| | 79,747 | | | WMS Industries, Inc. (a) | | | 1,590,952 | | |
| | | | 16,511,880 | | |
| | | Materials 5.5% | |
| | 34,729 | | | Acuity Brands, Inc. | | | 1,768,053 | | |
| | 46,250 | | | Carpenter Technology Corp. | | | 2,212,600 | | |
| | 34,040 | | | Compass Minerals
International, Inc. | | | 2,596,571 | | |
| | 81,093 | | | Intrepid Potash, Inc. (a) | | | 1,845,677 | | |
| | | | 8,422,901 | | |
| | | Real Estate Investment
Trusts 9.0% | |
| | 470,073 | | | FelCor Lodging Trust, Inc. (a) | | | 2,209,343 | | |
| | 212,714 | | | First Industrial Realty
Trust, Inc. (a) | | | 2,684,451 | | |
| | 35,105 | | | Mid-America Apartment
Communities, Inc. | | | 2,395,565 | | |
| | 40,374 | | | National Health Investors, Inc. | | | 2,055,844 | | |
| | 97,278 | | | Sun Communities, Inc. | | | 4,303,579 | | |
| | | | 13,648,782 | | |
| | | Utilities 1.3% | |
| | 94,158 | | | The Empire District Electric Co. | | | 1,986,734 | | |
| | | Total Common Stocks | |
| | | | | (Cost $115,307,631) | | | 149,982,526 | | |
| Number of Shares | | | | Value | |
| SHORT-TERM INVESTMENTS 1.6% | |
| | | Investment Company 1.6% | |
| | 2,461,728 | | | Fidelity Institutional Money
Market Portfolio, 0.13% | | $ | 2,461,728 | | |
| | | Total Short-Term Investments | |
| | | (Cost $2,461,728) | | | 2,461,728 | | |
| | | Total Investments 100.1% | |
| | | (Cost $117,769,359) | | | 152,444,254 | | |
| | | Liabilities in Excess of
Other Assets (0.1)% | | | (135,628 | ) | |
| | | TOTAL NET ASSETS 100.0% | | $ | 152,308,626 | | |
(a) Non-Income Producing.
(b) U.S. traded security of a foreign issuer.
PORTFOLIO DIVERSIFICATION
| Sectors | | Percentage | |
| Consumer Discretionary | | | 19.9 | % | |
| Financials | | | 17.5 | | |
| Industrials | | | 16.3 | | |
| Information Technology | | | 10.9 | | |
| Health Care | | | 9.3 | | |
| Real Estate Investment Trusts | | | 9.0 | | |
| Materials | | | 5.5 | | |
| Consumer Staples | | | 4.6 | | |
| Energy | | | 4.2 | | |
| Utilities | | | 1.3 | | |
| Total Common Stocks | | | 98.5 | | |
| Total Short-Term Investments | | | 1.6 | | |
| Total Investments | | | 100.1 | | |
| Liabilities in Excess of Other Assets | | | (0.1 | ) | |
| Total Net Assets | | | 100.0 | % | |
The accompanying notes are an integral part of these financial statements.
page 52

Frontegra Phocas Small Cap Value Fund
SCHEDULE OF INVESTMENTS
June 30, 2012
| Number of Shares | | | | Value | |
| COMMON STOCKS 95.2% | | | |
| | | Consumer Discretionary 10.7% | |
| | 4,057 | | | ANN, Inc. (a) | | $ | 103,413 | | |
| | 27,091 | | | Belo Corp. - Class A | | | 174,466 | | |
| | 3,317 | | | Big Lots, Inc. (a) | | | 135,300 | | |
| | 2,980 | | | Bob Evans Farms, Inc. | | | 119,796 | | |
| | 2,067 | | | Cracker Barrel Old Country
Store, Inc. | | | 129,808 | | |
| | 8,383 | | | Dana Holding Corp. | | | 107,386 | | |
| | 2,011 | | | Group 1 Automotive, Inc. | | | 91,722 | | |
| | 3,512 | | | Helen of Troy Ltd. (a)(b) | | | 119,022 | | |
| | 8,061 | | | Iconix Brand Group, Inc. (a) | | | 140,825 | | |
| | 3,985 | | | Meredith Corp. | | | 127,281 | | |
| | 6,113 | | | Perry Ellis International, Inc. (a) | | | 126,845 | | |
| | 13,360 | | | Pier 1 Imports, Inc. | | | 219,505 | | |
| | 3,366 | | | Rent-A-Center, Inc. | | | 113,569 | | |
| | 11,016 | | | Scientific Games
Corp. - Class A (a) | | | 94,187 | | |
| | 4,835 | | | Steiner Leisure Ltd. (a)(b) | | | 224,392 | | |
| | 5,378 | | | The Finish Line, Inc. - Class A | | | 112,454 | | |
| | 2,446 | | | The Warnaco Group Inc. (a) | | | 104,151 | | |
| | 3,594 | | | Wolverine World Wide, Inc. | | | 139,375 | | |
| | | | 2,383,497 | | |
| | | Consumer Staples 2.6% | |
| | 10,114 | | | Darling International, Inc. (a) | | | 166,780 | | |
| | 4,485 | | | Snyders-Lance, Inc. | | | 113,157 | | |
| | 4,895 | | | TreeHouse Foods, Inc. (a) | | | 304,909 | | |
| | | | 584,846 | | |
| | | Energy 5.9% | |
| | 7,801 | | | Energy XXI (Bermuda) Ltd. (b) | | | 244,093 | | |
| | 18,743 | | | Goodrich Petroleum Corp. (a) | | | 259,778 | | |
| | 6,200 | | | Hornbeck Offshore
Services, Inc. (a) | | | 240,436 | | |
| | 9,506 | | | PDC Energy, Inc. (a) | | | 233,087 | | |
| | 11,175 | | | Rex Energy Corp. (a) | | | 125,272 | | |
| | 11,972 | | | Swift Energy Co. (a) | | | 222,799 | | |
| | | | 1,325,465 | | |
| Number of Shares | | | | Value | |
| | | Financials 22.7% | |
| | 10,677 | | | American Equity Investment Life
Holding Co. | | $ | 117,554 | | |
| | 15,791 | | | Banco Latinoamericano de
Exportaciones S.A. (b) | | | 338,401 | | |
| | 13,252 | | | Banner Corp. | | | 290,351 | | |
| | 18,727 | | | Boston Private Financial
Holdings, Inc. | | | 167,232 | | |
| | 42,536 | | | CNO Financial Group, Inc. | | | 331,781 | | |
| | 10,883 | | | Columbia Banking System, Inc. | | | 204,818 | | |
| | 6,354 | | | First Financial Bancorp | | | 101,537 | | |
| | 22,787 | | | First Pactrust Bancorp, Inc. | | | 270,254 | | |
| | 7,710 | | | First Republic Bank (a) | | | 259,056 | | |
| | 27,989 | | | Heritage Commerce Corp. (a) | | | 181,928 | | |
| | 5,189 | | | IBERIABANK Corp. | | | 261,785 | | |
| | 33,938 | | | ICG Group, Inc. (a) | | | 313,927 | | |
| | 1,949 | | | Infinity Property &
Casualty Corp. | | | 112,399 | | |
| | 14,316 | | | Janus Capital Group, Inc. | | | 111,951 | | |
| | 13,264 | | | National Financial
Partners Corp. (a) | | | 177,738 | | |
| | 5,012 | | | Primerica, Inc. | | | 133,971 | | |
| | 8,531 | | | Protective Life Corp. | | | 250,896 | | |
| | 7,523 | | | Safeguard Scientifics, Inc. (a) | | | 116,456 | | |
| | 16,596 | | | State Bank Financial Corp. (a) | | | 251,595 | | |
| | 4,819 | | | SVB Financial Group (a) | | | 282,972 | | |
| | 19,142 | | | Washington Banking Co. | | | 266,074 | | |
| | 40,117 | | | Wilshire Bancorp, Inc. (a) | | | 219,841 | | |
| | 8,502 | | | Wintrust Financial Corp. | | | 301,821 | | |
| | | | 5,064,338 | | |
| | | Health Care 5.5% | |
| | 4,983 | | | Emergent BioSolutions, Inc. (a) | | | 75,492 | | |
| | 6,457 | | | Health Net, Inc. (a) | | | 156,712 | | |
| | 7,165 | | | Orthofix International N.V. (a)(b) | | | 295,556 | | |
| | 6,823 | | | Par Pharmaceutical
Companies, Inc. (a) | | | 246,583 | | |
The accompanying notes are an integral part of these financial statements.
page 53

Frontegra Phocas Small Cap Value Fund
SCHEDULE OF INVESTMENTS (continued)
June 30, 2012
| Number of Shares | | | | Value | |
| COMMON STOCKS 95.2% (continued) | | | |
| | | Health Care 5.5% (continued) | |
| | 4,388 | | | Quality Systems, Inc. | | $ | 120,714 | | |
| | 5,038 | | | ViroPharma, Inc. (a) | | | 119,401 | | |
| | 4,101 | | | WellCare Health Plans, Inc. (a) | | | 217,353 | | |
| | | | 1,231,811 | | |
| | | Industrials 13.2% | |
| | 33,279 | | | Aceto Corp. | | | 300,509 | | |
| | 6,770 | | | Beacon Roofing Supply, Inc. (a) | | | 170,739 | | |
| | 3,514 | | | Esterline Technologies Corp. (a) | | | 219,098 | | |
| | 5,724 | | | Huron Consulting Group, Inc. (a) | | | 181,165 | | |
| | 4,281 | | | Kansas City Southern | | | 297,786 | | |
| | 5,274 | | | Spirit Airlines, Inc. (a) | | | 102,632 | | |
| | 9,192 | | | Tetra Tech, Inc. (a) | | | 239,727 | | |
| | 4,902 | | | Timken Co. | | | 224,462 | | |
| | 7,283 | | | Titan Machinery, Inc. (a) | | | 221,185 | | |
| | 6,862 | | | Trinity Industries, Inc. | | | 171,413 | | |
| | 3,812 | | | Triumph Group, Inc. | | | 214,501 | | |
| | 3,887 | | | UniFirst Corp. | | | 247,796 | | |
| | 4,007 | | | United Stationers, Inc. | | | 107,989 | | |
| | 3,580 | | | URS Corp. | | | 124,871 | | |
| | 4,700 | | | Werner Enterprises, Inc. | | | 112,283 | | |
| | | | 2,936,156 | | |
| | | Information Technology 12.5% | |
| | 15,526 | | | Arris Group, Inc. (a) | | | 215,967 | | |
| | 24,654 | | | Compuware Corp. (a) | | | 229,036 | | |
| | 4,986 | | | Ebix, Inc. | | | 99,471 | | |
| | 16,244 | | | Emulex Corp. (a) | | | 116,957 | | |
| | 5,578 | | | Euronet Worldwide, Inc. (a) | | | 95,495 | | |
| | 27,507 | | | Fairchild Semiconductor
International, Inc. - Class A (a) | | | 387,849 | | |
| | 2,572 | | | Itron, Inc. (a) | | | 106,069 | | |
| | 10,520 | | | JDA Software Group, Inc. (a) | | | 312,339 | | |
| | 3,439 | | | Measurement Specialties, Inc. (a) | | | 111,802 | | |
| | 17,327 | | | Microsemi Corp. (a) | | | 320,376 | | |
| | 7,293 | | | Plexus Corp. (a) | | | 205,662 | | |
| | 8,399 | | | Progress Software Corp. (a) | | | 175,287 | | |
| Number of Shares | | | | Value | |
| | | Information
Technology 12.5% (continued) | |
| | 26,768 | | | RF Micro Devices, Inc. (a) | | $ | 113,764 | | |
| | 8,723 | | | SYNNEX Corp. (a) | | | 300,856 | | |
| | | | 2,790,930 | | |
| | | Materials 4.4% | |
| | 3,730 | | | Ashland, Inc. | | | 258,526 | | |
| | 15,871 | | | Calgon Carbon Corp. (a) | | | 225,686 | | |
| | 8,509 | | | Materion Corp. | | | 195,962 | | |
| | 8,445 | | | Sensient Technologies Corp. | | | 310,185 | | |
| | | | 990,359 | | |
| | | Real Estate Investment Trusts 11.3% | |
| | 11,458 | | | Acadia Realty Trust | | | 265,596 | | |
| | 3,698 | | | Alexandria Real Estate Equities, Inc. | | | 268,919 | | |
| | 2,999 | | | American Campus
Communities, Inc. | | | 134,895 | | |
| | 9,519 | | | Colonial Properties Trust | | | 210,751 | | |
| | 7,917 | | | CoreSite Realty Corp. | | | 204,417 | | |
| | 18,424 | | | CubeSmart | | | 215,008 | | |
| | 4,387 | | | EastGroup Properties, Inc. | | | 233,827 | | |
| | 10,853 | | | First Potomac Realty Trust | | | 127,740 | | |
| | 4,598 | | | Kilroy Realty Corp. | | | 222,589 | | |
| | 4,580 | | | LaSalle Hotel Properties | | | 133,461 | | |
| | 35,469 | | | Strategic Hotels & Resorts, Inc. (a) | | | 229,130 | | |
| | 6,051 | | | Sun Communities, Inc. | | | 267,696 | | |
| | | | 2,514,029 | | |
| | | Utilities 6.4% | |
| | 6,925 | | | American Water Works Co., Inc. | | | 237,389 | | |
| | 5,833 | | | Atmos Energy Corp. | | | 204,563 | | |
| | 6,805 | | | Black Hills Corp. | | | 218,917 | | |
| | 6,660 | | | Great Plains Energy, Inc. | | | 142,590 | | |
| | 3,560 | | | Laclede Group, Inc. | | | 141,724 | | |
| | 5,934 | | | NorthWestern Corp. | | | 217,778 | | |
| | 5,197 | | | Portland General Electric Co. | | | 138,552 | | |
| | 6,081 | | | The Empire District Electric Co. | | | 128,309 | | |
| | | | 1,429,822 | | |
| | | Total Common Stocks | |
| | | | | (Cost $17,984,176) | | | 21,251,253 | | |
The accompanying notes are an integral part of these financial statements.
page 54

Frontegra Phocas Small Cap Value Fund
SCHEDULE OF INVESTMENTS (continued)
June 30, 2012
| Number of Shares | | | | Value | |
| CLOSED-END FUNDS 1.6% | | | |
| | | Financials 1.6% | |
| | 14,152 | | | Ares Capital Corp. | | $ | 225,866 | | |
| | 10,779 | | | Prospect Capital Corp. | | | 122,773 | | |
| | | Total Closed-End Funds | |
| | | | | (Cost $267,452) | | | 348,639 | | |
| SHORT-TERM INVESTMENTS 4.8% | | | |
| | | Investment Company 4.8% | |
| | 1,057,521 | | | STIT-STIC Prime
Portfolio - Institutional
Class, 0.08% | | | 1,057,521 | | |
| | | Total Short-Term Investments | |
| | | | | (Cost $1,057,521) | | | 1,057,521 | | |
| | | Total Investments 101.6% | |
| | | | | (Cost $19,309,149) | | | 22,657,413 | | |
| | | | | Liabilities in Excess of
Other Assets (1.6)% | | | (347,916 | ) | |
| | | | | TOTAL NET ASSETS 100.0% | | $ | 22,309,497 | | |
(a) Non-Income Producing.
(b) U.S. traded security of a foreign issuer.
PORTFOLIO DIVERSIFICATION
| Sectors | | Percentage | |
| Financials | | | 22.7 | % | |
| Industrials | | | 13.2 | | |
| Information Technology | | | 12.5 | | |
| Real Estate Investment Trusts | | | 11.3 | | |
| Consumer Discretionary | | | 10.7 | | |
| Utilities | | | 6.4 | | |
| Energy | | | 5.9 | | |
| Health Care | | | 5.5 | | |
| Materials | | | 4.4 | | |
| Consumer Staples | | | 2.6 | | |
| Total Common Stocks | | | 95.2 | | |
| Financials | | | 1.6 | | |
| Total Closed-End Funds | | | 1.6 | | |
| Total Short-Term Investments | | | 4.8 | | |
| Total Investments | | | 101.6 | | |
| Liabilities in Excess of Other Assets | | | (1.6 | ) | |
| Total Net Assets | | | 100.0 | % | |
The accompanying notes are an integral part of these financial statements.
page 55

Lockwell Small Cap Value Fund
SCHEDULE OF INVESTMENTS
June 30, 2012
| Number of Shares | | | | Value | |
| COMMON STOCKS 91.7% | | | |
| | | Consumer Discretionary 9.7% | |
| | 1,560 | | | AFC Enterprises, Inc. (a) | | $ | 36,099 | | |
| | 505 | | | Ascent Capital Group, Inc. -
Class A (a) | | | 26,134 | | |
| | 1,560 | | | Carrols Restaurant Group, Inc. (a) | | | 9,266 | | |
| | 7,300 | | | Denny's Corp. (a) | | | 32,412 | | |
| | 1,560 | | | Fiesta Restaurant Group, Inc. (a) | | | 20,639 | | |
| | 780 | | | Hanesbrands, Inc. (a) | | | 21,629 | | |
| | 1,130 | | | Hillenbrand, Inc. | | | 20,769 | | |
| | 1,340 | | | Pier 1 Imports, Inc. | | | 22,016 | | |
| | 2,085 | | | Shuffle Master, Inc. (a) | | | 28,774 | | |
| | 765 | | | Tenneco, Inc. (a) | | | 20,517 | | |
| | | | 238,255 | | |
| | | Consumer Staples 3.1% | |
| | 988 | | | Ingredion, Inc. | | | 48,925 | | |
| | 1,050 | | | Snyder's-Lance, Inc. | | | 26,492 | | |
| | | | 75,417 | | |
| | | Energy 2.5% | |
| | 2,190 | | | Goodrich Petroleum Corp. (a) | | | 30,353 | | |
| | 1,510 | | | Key Energy Services, Inc. (a) | | | 11,476 | | |
| | 970 | | | Superior Energy Services, Inc. (a) | | | 19,624 | | |
| | | | 61,453 | | |
| | | Financials 18.0% | |
| | 1,005 | | | Alterra Capital Holdings Ltd. (b) | | | 23,467 | | |
| | 900 | | | AmTrust Financial Services, Inc. | | | 26,739 | | |
| | 805 | | | Argo Group International
Holdings Ltd. (b) | | | 23,562 | | |
| | 1,520 | | | Capitol Federal Financial, Inc. | | | 18,058 | | |
| | 6,850 | | | CNO Financial Group, Inc. | | | 53,429 | | |
| | 1,070 | | | Eagle Bancorp, Inc. (a) | | | 16,853 | | |
| | 1,335 | | | Employers Holdings, Inc. | | | 24,083 | | |
| | 515 | | | Greenhill & Co., Inc. | | | 18,360 | | |
| | 855 | | | MB Financial, Inc. | | | 18,417 | | |
| | 1,265 | | | Northwest Bancshares, Inc. | | | 14,813 | | |
| | 2,280 | | | Ocwen Financial Corp. (a) | | | 42,818 | | |
| Number of Shares | | | | Value | |
| | | Financials 18.0% (continued) | |
| | 655 | | | Platinum Underwriters
Holdings Ltd. (b) | | $ | 24,956 | | |
| | 550 | | | ProAssurance Corp. | | | 49,000 | | |
| | 3,260 | | | Provident New York Bancorp | | | 24,742 | | |
| | 1,075 | | | State Bank Financial Corp. (a) | | | 16,297 | | |
| | 1,340 | | | ViewPoint Financial Group | | | 20,958 | | |
| | 1,860 | | | Walker & Dunlop, Inc. (a) | | | 23,901 | | |
| | | | 440,453 | | |
| | | Health Care 6.6% | |
| | 3,795 | | | HealthSouth Corp. (a) | | | 88,272 | | |
| | 705 | | | Hill-Rom Holdings, Inc. | | | 21,749 | | |
| | 635 | | | Par Pharmaceutical
Companies, Inc. (a) | | | 22,949 | | |
| | 1,065 | | | U.S. Physical Therapy, Inc. | | | 27,083 | | |
| | | | 160,053 | | |
| | | Industrials 22.3% | |
| | 3,840 | | | ACCO Brands Corp. (a) | | | 39,706 | | |
| | 1,055 | | | Actuant Corp. - Class A | | | 28,654 | | |
| | 965 | | | Aegion Corp. (a) | | | 17,264 | | |
| | 4,885 | | | AerCap Holdings NV (a)(b) | | | 55,103 | | |
| | 1,390 | | | Belden, Inc. | | | 46,357 | | |
| | 1,435 | | | Celadon Group, Inc. | | | 23,505 | | |
| | 590 | | | Curtiss-Wright Corp. | | | 18,320 | | |
| | 1,060 | | | Forward Air Corp. | | | 34,205 | | |
| | 950 | | | G&K Services, Inc. - Class A | | | 29,631 | | |
| | 831 | | | HEICO Corp. - Class A | | | 26,807 | | |
| | 675 | | | Hub Group, Inc. - Class A (a) | | | 24,435 | | |
| | 980 | | | ICF International, Inc. (a) | | | 23,363 | | |
| | 1,215 | | | Insperity, Inc. | | | 32,865 | | |
| | 1,425 | | | KAR Auction Services, Inc. (a) | | | 24,496 | | |
| | 553 | | | Moog, Inc. - Class A (a) | | | 22,867 | | |
| | 1,000 | | | Quanex Building Products Corp. | | | 17,880 | | |
| | 285 | | | Snap-on, Inc. | | | 17,741 | | |
| | 480 | | | Triumph Group, Inc. | | | 27,009 | | |
| | 1,320 | | | United Stationers, Inc. | | | 35,574 | | |
| | | | 545,782 | | |
The accompanying notes are an integral part of these financial statements.
page 56

Lockwell Small Cap Value Fund
SCHEDULE OF INVESTMENTS (continued)
June 30, 2012
| Number of Shares | | | | Value | |
| COMMON STOCKS 91.7% (continued) | | | |
| | | Information Technology 17.3% | |
| | 955 | | | ACI Worldwide, Inc. (a) | | $ | 42,221 | | |
| | 2,405 | | | Compuware Corp. (a) | | | 22,342 | | |
| | 2,430 | | | EarthLink, Inc. | | | 18,079 | | |
| | 1,850 | | | GSI Group, Inc. (a) | | | 21,201 | | |
| | 3,025 | | | Intermec, Inc. (a) | | | 18,755 | | |
| | 1,455 | | | MAXIMUS, Inc. | | | 75,296 | | |
| | 1,055 | | | Microsemi Corp. (a) | | | 19,507 | | |
| | 585 | | | NeuStar, Inc. - Class A (a) | | | 19,539 | | |
| | 665 | | | Plantronics, Inc. | | | 22,211 | | |
| | 3,666 | | | Radisys Corp. (a) | | | 23,022 | | |
| | 910 | | | Rogers Corp. (a) | | | 36,045 | | |
| | 1,890 | | | Sapient Corp. | | | 19,032 | | |
| | 705 | | | ScanSource, Inc. (a) | | | 21,601 | | |
| | 1,130 | | | Verint Systems, Inc. (a) | | | 33,347 | | |
| | 865 | | | Zebra Technologies Corp. (a) | | | 29,722 | | |
| | | | 421,920 | | |
| | | Materials 6.3% | |
| | 740 | | | A. Schulman, Inc. | | | 14,689 | | |
| | 515 | | | Cytec Industries, Inc. | | | 30,200 | | |
| | 1,120 | | | HB Fuller Co. | | | 34,384 | | |
| | 360 | | | Innophos Holdings, Inc. | | | 20,326 | | |
| | 595 | | | Materion Corp. | | | 13,703 | | |
| | 725 | | | Rock-Tenn Co. - Class A | | | 39,548 | | |
| | | | 152,850 | | |
| | | Real Estate Investment Trusts 1.8% | |
| | 1,130 | | | Agree Realty Corp. | | | 25,007 | | |
| | 835 | | | Pebblebrook Hotel Trust | | | 19,464 | | |
| | | | 44,471 | | |
| | | Utilities 4.1% | |
| | 445 | | | ALLETE, Inc. | | | 18,601 | | |
| | 460 | | | Cleco Corp. | | | 19,242 | | |
| | 645 | | | El Paso Electric Co. | | | 21,388 | | |
| Number of Shares | | | | Value | |
| | | Utilities 4.1% (continued) | |
| | 600 | | | NorthWestern Corp. | | $ | 22,020 | | |
| | 685 | | | UGI Corp. | | | 20,160 | | |
| | | | 101,411 | | |
| | | Total Common Stocks | |
| | | | | (Cost $2,131,188) | | | 2,242,065 | | |
| EXCHANGE TRADED FUND 4.8% | | | |
| | 1,720 | | | Vanguard Small-Cap Value
Index Fund | | | 117,304 | | |
| | | Total Exchange Traded Fund | |
| | | | | (Cost $116,329) | | | 117,304 | | |
| SHORT-TERM INVESTMENTS 3.8% | | | |
| | | Investment Company 3.8% | |
| | 92,568 | | | STIT-STIC Liquid Assets
Portfolio - Institutional
Class, 0.16% | | | 92,568 | | |
| | | Total Short-Term Investments | |
| | | | | (Cost $92,568) | | | 92,568 | | |
| | | Total Investments 100.3% | |
| | | | | (Cost $2,340,085) | | | 2,451,937 | | |
| | | | | Liabilities in Excess of
Other Assets (0.3)% | | | (7,023 | ) | |
| | | | | TOTAL NET ASSETS 100.0% | | $ | 2,444,914 | | |
(a) Non-Income Producing.
(b) U.S. traded security of a foreign issuer.
The accompanying notes are an integral part of these financial statements.
page 57

Lockwell Small Cap Value Fund
SCHEDULE OF INVESTMENTS (continued)
June 30, 2012
PORTFOLIO DIVERSIFICATION
| Sectors | | Percentage | |
| Industrials | | | 22.3 | % | |
| Financials | | | 18.0 | | |
| Information Technology | | | 17.3 | | |
| Consumer Discretionary | | | 9.7 | | |
| Health Care | | | 6.6 | | |
| Materials | | | 6.3 | | |
| Utilities | | | 4.1 | | |
| Consumer Staples | | | 3.1 | | |
| Energy | | | 2.5 | | |
| Real Estate Investment Trusts | | | 1.8 | | |
| Total Common Stocks | | | 91.7 | | |
| Total Exchange Traded Funds | | | 4.8 | | |
| Total Short-Term Investments | | | 3.8 | | |
| Total Investments | | | 100.3 | | |
| Liabilities in Excess of Other Assets | | | (0.3 | ) | |
| Total Net Assets | | | 100.0 | % | |
The accompanying notes are an integral part of these financial statements.
page 58
This page intentionally left blank.

STATEMENTS OF ASSETS AND LIABILITIES
June 30, 2012
| | | SAM Global
Equity Fund | | MFG Global
Equity Fund | | MFG Core
Infrastructure Fund | | HEXAM Emerging
Markets Fund | |
| ASSETS: | |
| Investments at cost | | $ | 19,417,132 | | | $ | 108,666,801 | | | $ | 2,659,192 | | | $ | 25,418,742 | | |
| Foreign currency at cost | | $ | 14 | | | $ | 264,662 | | | $ | 18,373 | | | $ | 124,392 | | |
| Investments at value | | $ | 19,753,632 | | | $ | 108,144,391 | | | $ | 2,738,691 | | | $ | 19,742,760 | | |
| Foreign currency at value | | | 13 | | | | 267,367 | | | | 18,457 | | | | 126,962 | | |
| Cash | | | 6,993 | | | | — | | | | — | | | | 6,652 | | |
| Receivable for investments sold | | | 501,198 | | | | — | | | | — | | | | — | | |
| Receivable for Fund shares sold | | | 59,990 | | | | — | | | | — | | | | — | | |
| Interest and dividends receivable | | | 74,081 | | | | 221,037 | | | | 19,461 | | | | 159,889 | | |
| Receivable from Adviser | | | — | | | | — | | | | — | | | | — | | |
| Prepaid expenses and other assets | | | 15,002 | | | | 5,357 | | | | 2,646 | | | | 4,056 | | |
| Total assets | | | 20,410,909 | | | | 108,638,152 | | | | 2,779,255 | | | | 20,040,319 | | |
| LIABILITIES: | |
| Payable for investments purchased | | | 411,235 | | | | — | | | | — | | | | 126,962 | | |
| Payable for foreign currency | | | — | | | | — | | | | — | | | | 124,392 | | |
| Payable for Fund shares redeemed | | | — | | | | — | | | | — | | | | — | | |
| Payable to Adviser | | | 12,298 | | | | 41,493 | | | | 4,424 | | | | 7,827 | | |
| Accrued distribution and shareholder servicing fees | | | — | | | | — | | | | — | | | | — | | |
| Dividend withholding tax payable | | | — | | | | — | | | | — | | | | 15,859 | | |
| Accrued expenses | | | 35,448 | | | | 46,093 | | | | 31,476 | | | | 38,125 | | |
| Total liabilities | | | 458,981 | | | | 87,586 | | | | 35,900 | | | | 313,165 | | |
| Net Assets | | $ | 19,951,928 | | | $ | 108,550,566 | | | $ | 2,743,355 | | | $ | 19,727,154 | | |
| NET ASSETS CONSIST OF: | |
| Paid in capital | | $ | 19,742,001 | | | $ | 108,457,803 | | | $ | 2,600,104 | | | $ | 28,246,117 | | |
| Undistributed net investment income (loss) | | | 160,287 | | | | 560,405 | | | | 61,972 | | | | 120,490 | | |
| Accumulated net realized gain (loss) | | | (288,509 | ) | | | 57,026 | | | | 1,610 | | | | (2,960,124 | ) | |
| Net unrealized appreciation/depreciation on: | |
| Investments | | | 336,500 | | | | (522,410 | ) | | | 79,499 | | | | (5,675,982 | ) | |
| Foreign currency | | | 1,649 | | | | (2,258 | ) | | | 170 | | | | (3,347 | ) | |
| Net Assets | | $ | 19,951,928 | | | $ | 108,550,566 | | | $ | 2,743,355 | | | $ | 19,727,154 | | |
| CAPITAL STOCK, $0.01 PAR VALUE | | | | | | | | | |
| Net Assets | | $ | 19,951,928 | | | $ | 108,550,566 | | | $ | 2,743,355 | | | $ | 19,727,154 | | |
| Authorized | | | 50,000,000 | | | | 50,000,000 | | | | 50,000,000 | | | | 50,000,000 | | |
| Issued and Outstanding | | | 1,867,980 | | | | 10,043,115 | | | | 257,551 | | | | 2,991,317 | | |
| Net Asset Value, Redemption Price and Offering Price Per Share | | $ | 10.68 | | | $ | 10.81 | | | $ | 10.65 | | | $ | 6.59 | | |
| CAPITAL STOCK, $0.01 PAR VALUE | | | | | | | | | |
| Net Assets | | | | | | | | | |
| Authorized | | | | | | | | | |
| Issued and Outstanding | | | | | | | | | |
| Net Asset Value, Redemption Price and Offering Price Per Share | | | | | | | | | |
The accompanying notes are an integral part of these financial statements.
page 60

| | | Timpani Small Cap
Growth Fund | | Netols Small Cap
Value Fund | | Phocas Small Cap
Value Fund | | Lockwell Small Cap
Value Fund | |
| ASSETS: | |
| Investments at cost | | $ | 2,348,544 | | | $ | 117,769,359 | | | $ | 19,309,149 | | | $ | 2,340,085 | | |
| Foreign currency at cost | | $ | — | | | $ | — | | | $ | — | | | $ | — | | |
| Investments at value | | $ | 2,878,056 | | | $ | 152,444,254 | | | $ | 22,657,413 | | | $ | 2,451,937 | | |
| Foreign currency at value | | | — | | | | — | | | | — | | | | — | | |
| Cash | | | — | | | | 19,381 | | | | — | | | | 52 | | |
| Receivable for investments sold | | | 52,252 | | | | 279,259 | | | | 313,351 | | | | 8,699 | | |
| Receivable for Fund shares sold | | | 78 | | | | 63,835 | | | | 119 | | | | 119,916 | | |
| Interest and dividends receivable | | | 328 | | | | 70,177 | | | | 23,717 | | | | 1,691 | | |
| Receivable from Adviser | | | — | | | | — | | | | — | | | | 3,558 | | |
| Prepaid expenses and other assets | | | 1,860 | | | | 19,279 | | | | 4,403 | | | | 15,942 | | |
| Total assets | | | 2,932,574 | | | | 152,896,185 | | | | 22,999,003 | | | | 2,601,795 | | |
| LIABILITIES: | |
| Payable for investments purchased | | | 76,704 | | | | 366,389 | | | | 641,085 | | | | 128,133 | | |
| Payable for foreign currency | | | — | | | | — | | | | — | | | | — | | |
| Payable for Fund shares redeemed | | | — | | | | 34,907 | | | | 200 | | | | — | | |
| Payable to Adviser | | | 3,994 | | | | 109,476 | | | | 11,631 | | | | — | | |
| Accrued distribution and shareholder servicing fees | | | — | | | | 20,305 | | | | — | | | | — | | |
| Dividend withholding tax payable | | | — | | | | — | | | | — | | | | — | | |
| Accrued expenses | | | 27,444 | | | | 56,482 | | | | 36,590 | | | | 28,748 | | |
| Total liabilities | | | 108,142 | | | | 587,559 | | | | 689,506 | | | | 156,881 | | |
| Net Assets | | $ | 2,824,432 | | | $ | 152,308,626 | | | $ | 22,309,497 | | | $ | 2,444,914 | | |
| NET ASSETS CONSIST OF: | |
| Paid in capital | | $ | 2,762,401 | | | $ | 120,889,153 | | | $ | 21,838,215 | | | $ | 2,331,828 | | |
| Undistributed net investment income (loss) | | | (12,271 | ) | | | (16,756 | ) | | | 39,983 | | | | 4,647 | | |
| Accumulated net realized gain (loss) | | | (455,210 | ) | | | (3,238,666 | ) | | | (2,916,965 | ) | | | (3,413 | ) | |
| Net unrealized appreciation/depreciation on: | |
| Investments | | | 529,512 | | | | 34,674,895 | | | | 3,348,264 | | | | 111,852 | | |
| Foreign currency | | | — | | | | — | | | | — | | | | — | | |
| Net Assets | | $ | 2,824,432 | | | $ | 152,308,626 | | | $ | 22,309,497 | | | $ | 2,444,914 | | |
| CAPITAL STOCK, $0.01 PAR VALUE | | Institutional Class | | Institutional Class | | Class L | | | |
| Net Assets | | $ | 2,824,432 | | | $ | 134,543,714 | | | $ | 18,821,111 | | | $ | 2,444,914 | | |
| Authorized | | | 50,000,000 | | | | 50,000,000 | | | | 50,000,000 | | | | 50,000,000 | | |
| Issued and Outstanding | | | 274,038 | | | | 10,465,279 | | | | 807,913 | | | | 256,663 | | |
| Net Asset Value, Redemption Price and Offering Price Per Share | | $ | 10.31 | | | $ | 12.86 | | | $ | 23.30 | | | $ | 9.53 | | |
| CAPITAL STOCK, $0.01 PAR VALUE | | | | Class Y | | Class I | | | |
| Net Assets | | | | $ | 17,764,912 | | | $ | 3,488,386 | | | | | | |
| Authorized | | | | | 50,000,000 | | | | 50,000,000 | | | | | | |
| Issued and Outstanding | | | | | 1,403,986 | | | | 149,774 | | | | | | |
| Net Asset Value, Redemption Price and Offering Price Per Share | | | | $ | 12.65 | | | $ | 23.29 | | | | | | |
The accompanying notes are an integral part of these financial statements.
page 61

STATEMENTS OF OPERATIONS
For the Year Ended June 30, 2012
| | | SAM Global
Equity Fund | | MFG Global(1)
Equity Fund | | MFG Core(2)
Infrastructure Fund | | HEXAM Emerging
Markets Fund | |
| INVESTMENT INCOME: | |
| Dividend income | | $ | 524,759 | (3) | | $ | 798,268 | (4) | | $ | 62,123 | (5) | | $ | 517,187 | (6) | |
| Interest income | | | 152 | | | | 2,077 | | | | 61 | | | | 1,124 | | |
| Total investment income | | | 524,911 | | | | 800,345 | | | | 62,184 | | | | 518,311 | | |
| EXPENSES: | |
| Investment advisory fees | | | 151,107 | | | | 225,073 | | | | 7,973 | | | | 197,440 | | |
| Fund administration and accounting fees | | | 45,936 | | | | 32,542 | | | | 15,521 | | | | 46,543 | | |
| Audit fees | | | 21,500 | | | | 18,331 | | | | 18,337 | | | | 17,255 | | |
| Legal fees | | | 18,514 | | | | 7,865 | | | | 5,119 | | | | 14,482 | | |
| Custody fees | | | 16,681 | | | | 11,559 | | | | 10,053 | | | | 43,809 | | |
| Federal and state registration fees | | | 10,501 | | | | 1,458 | | | | 1,744 | | | | 1,567 | | |
| Directors' fees and related expenses | | | 10,420 | | | | 5,669 | | | | 2,935 | | | | 10,665 | | |
| Shareholder servicing fees | | | 9,749 | | | | 6,511 | | | | 2,683 | | | | 9,637 | | |
| Reports to shareholders | | | 9,141 | | | | 5,418 | | | | 3,736 | | | | 6,512 | | |
| Distribution and shareholder servicing fees - Class Y | | | — | | | | — | | | | — | | | | — | | |
| Subadministration fees - Class I | | | — | | | | — | | | | — | | | | — | | |
| Other | | | 11,994 | | | | 6,127 | | | | 6,461 | | | | 15,036 | | |
| Total expenses before waiver and reimbursement | | | 305,543 | | | | 320,553 | | | | 74,562 | | | | 362,946 | | |
| Waiver and reimbursement of expenses by Adviser | | | (78,884 | ) | | | (95,480 | ) | | | (66,588 | ) | | | (77,799 | ) | |
| Net expenses | | | 226,659 | | | | 225,073 | | | | 7,974 | | | | 285,147 | | |
| Net Investment Income (Loss) | | | 298,252 | | | | 575,272 | | | | 54,210 | | | | 233,164 | | |
| REALIZED AND UNREALIZED GAIN (LOSS) ON INVESTMENTS: | |
| Net realized gain (loss) on: | |
| Investments | | | (73,629 | ) | | | 57,026 | | | | 1,609 | | | | (2,958,829 | ) | |
| Foreign currency transactions | | | (51,607 | ) | | | (14,867 | ) | | | 7,763 | | | | (68,229 | ) | |
| Change in net unrealized appreciation/depreciation on: | |
| Investments | | | (2,322,847 | ) | | | (522,410 | ) | | | 79,499 | | | | (5,106,944 | ) | |
| Foreign currency transactions | | | (209 | ) | | | (2,258 | ) | | | 170 | | | | (5,115 | ) | |
| Net Realized and Unrealized Gain (Loss) on Investments | | | (2,448,292 | ) | | | (482,509 | ) | | | 89,041 | | | | (8,139,117 | ) | |
| Net Increase (Decrease) in Net Assets Resulting from Operations | | $ | (2,150,040 | ) | | $ | 92,763 | | | $ | 143,251 | | | $ | (7,905,953 | ) | |
(1) Commenced operations on December 28, 2011.
(2) Commenced operations on January 18, 2012.
(3) Net of $50,514 in foreign withholding taxes.
(4) Net of $66,334 in foreign withholding taxes.
(5) Net of $6,148 in foreign withholding taxes.
(6) Net of $65,247 in foreign withholding taxes.
(7) Net of $42 in foreign withholding taxes.
The accompanying notes are an integral part of these financial statements.
page 62

| | | Timpani Small Cap
Growth Fund | | Netols Small Cap
Value Fund | | Phocas Small Cap
Value Fund | | Lockwell Small Cap
Value Fund | |
| INVESTMENT INCOME: | |
| Dividend income | | $ | 5,749 | (7) | | $ | 1,543,360 | | | $ | 260,482 | | | $ | 19,192 | | |
| Interest income | | | 58 | | | | 3,183 | | | | 517 | | | | 99 | | |
| Total investment income | | | 5,807 | | | | 1,546,543 | | | | 260,999 | | | | 19,291 | | |
| EXPENSES: | |
| Investment advisory fees | | | 24,928 | | | | 1,582,661 | | | | 207,554 | | | | 12,832 | | |
| Fund administration and accounting fees | | | 27,769 | | | | 177,584 | | | | 46,379 | | | | 26,023 | | |
| Audit fees | | | 13,334 | | | | 13,822 | | | | 14,224 | | | | 16,499 | | |
| Legal fees | | | 19,960 | | | | 16,579 | | | | 9,393 | | | | 13,319 | | |
| Custody fees | | | 7,855 | | | | 20,030 | | | | 6,660 | | | | 8,313 | | |
| Federal and state registration fees | | | 11,416 | | | | 11,497 | | | | 14,542 | | | | 20,279 | | |
| Directors' fees and related expenses | | | 8,379 | | | | 10,507 | | | | 9,276 | | | | 8,053 | | |
| Shareholder servicing fees | | | 3,364 | | | | 49,247 | | | | 21,299 | | | | 3,409 | | |
| Reports to shareholders | | | 7,098 | | | | 12,624 | | | | 9,654 | | | | 6,752 | | |
| Distribution and shareholder servicing fees - Class Y | | | — | | | | 76,567 | | | | — | | | | — | | |
| Subadministration fees - Class I | | | — | | | | — | | | | 2,108 | | | | — | | |
| Other | | | 6,718 | | | | 40,425 | | | | 13,077 | | | | 8,153 | | |
| Total expenses before waiver and reimbursement | | | 130,821 | | | | 2,011,543 | | | | 354,166 | | | | 123,632 | | |
| Waiver and reimbursement of expenses by Adviser | | | (103,400 | ) | | | (194,049 | ) | | | (146,574 | ) | | | (109,516 | ) | |
| Net expenses | | | 27,421 | | | | 1,817,494 | | | | 207,592 | | | | 14,116 | | |
| Net Investment Income (Loss) | | | (21,614 | ) | | | (270,951 | ) | | | 53,407 | | | | 5,175 | | |
| REALIZED AND UNREALIZED GAIN (LOSS) ON INVESTMENTS: | |
| Net realized gain (loss) on: | |
| Investments | | | (407,979 | ) | | | 2,363,339 | | | | 129,868 | | | | (3,413 | ) | |
| Foreign currency transactions | | | — | | | | — | | | | — | | | | — | | |
| Change in net unrealized appreciation/depreciation on: | |
| Investments | | | 354,051 | | | | (15,804,224 | ) | | | (1,034,255 | ) | | | 111,852 | | |
| Foreign currency transactions | | | — | | | | — | | | | — | | | | — | | |
| Net Realized and Unrealized Gain (Loss) on Investments | | | (53,928 | ) | | | (13,440,885 | ) | | | (904,387 | ) | | | 108,439 | | |
| Net Increase (Decrease) in Net Assets Resulting from Operations | | $ | (75,542 | ) | | $ | (13,711,836 | ) | | $ | (850,980 | ) | | $ | 113,614 | | |
The accompanying notes are an integral part of these financial statements.
page 63

STATEMENTS OF CHANGES IN NET ASSETS
| | | SAM Global Equity Fund | | MFG Global Equity Fund | |
| | | For the
Year Ended
June 30, 2012 | | For the Period
September 1, 2010
through
June 30, 2011 | | For the
Year Ended
August 31, 2010 | | For the Period
December 28, 2011(1)
through
June 30, 2012 | |
| OPERATIONS: | |
| Net investment income | | $ | 298,252 | | | $ | 369,499 | | | $ | 241,553 | | | $ | 575,272 | | |
| Net realized gain (loss) on: | |
| Investments | | | (73,629 | ) | | | 1,123,497 | | | | 853,885 | | | | 57,026 | | |
| Foreign currency transactions | | | (51,607 | ) | | | (9,469 | ) | | | 6,421 | | | | (14,867 | ) | |
| Change in net unrealized appreciation/depreciation on: | |
| Investments | | | (2,322,847 | ) | | | 2,694,665 | | | | (694,954 | ) | | | (522,410 | ) | |
| Foreign currency transactions | | | (209 | ) | | | 1,829 | | | | (1,805 | ) | | | (2,258 | ) | |
| Net increase (decrease) in net assets resulting from operations | | | (2,150,040 | ) | | | 4,180,021 | | | | 405,100 | | | | 92,763 | | |
| DISTRIBUTIONS PAID TO SHAREHOLDERS FROM: | | Institutional Class | | Institutional Class | | Institutional Class | | | |
| Net investment income | | | (342,421 | ) | | | (311,090 | ) | | | (51,677 | ) | | | — | | |
| Net realized gain on investments | | | (1,251,705 | ) | | | (638,890 | ) | | | (936,892 | ) | | | — | | |
| Net decrease in net assets resulting from distributions paid | | | (1,594,126 | ) | | | (949,980 | ) | | | (988,569 | ) | | | — | | |
| DISTRIBUTIONS PAID TO SHAREHOLDERS FROM: | | | | | | Investor Class | | | |
| Net investment income | | | — | | | | — | | | | (21 | ) | | | — | | |
| Net realized gain on investments | | | — | | | | — | | | | (456 | ) | | | — | | |
| Net decrease in net assets resulting from distributions paid | | | — | | | | — | | | | (477 | ) | | | — | | |
| CAPITAL SHARE TRANSACTIONS: | | Institutional Class | | Institutional Class | | Institutional Class | | | |
| Shares sold | | | 5,331,367 | | | | 1,190,996 | | | | 6,210,174 | | | | 111,032,500 | | |
| Shares issued to holders in reinvestment of distributions | | | 1,585,837 | | | | 918,565 | | | | 861,288 | | | | — | | |
| Shares redeemed | | | (2,512,847 | ) | | | (2,813,237 | ) | | | (1,345,517 | ) | | | (2,574,697 | ) | |
| Redemption fees | | | — | | | | — | | | | 277 | | | | — | | |
| Net increase (decrease) in net assets resulting from capital share transactions | | | 4,404,357 | | | | (703,676 | ) | | | 5,726,222 | | | | 108,457,803 | | |
| CAPITAL SHARE TRANSACTIONS: | | | | | | Investor Class | | | |
| Shares sold | | | — | | | | — | | | | 5,500 | | | | — | | |
| Shares issued to holders in reinvestment of distributions | | | — | | | | — | | | | 477 | | | | — | | |
| Net increase in net assets resulting from capital share transactions | | | — | | | | — | | | | 5,977 | | | | — | | |
| Total Increase in Net Assets | | | 660,191 | | | | 2,526,365 | | | | 5,148,253 | | | | 108,550,566 | | |
| NET ASSETS: | |
| Beginning of Period | | | 19,291,737 | | | | 16,765,372 | | | | 11,617,119 | | | | — | | |
| End of Period | | $ | 19,951,928 | | | $ | 19,291,737 | | | $ | 16,765,372 | | | $ | 108,550,566 | | |
| Undistributed net investment income | | $ | 160,287 | | | $ | 256,065 | | | $ | 206,426 | | | $ | 560,405 | | |
| TRANSACTIONS IN SHARES: | | Institutional Class | | Institutional Class | | Institutional Class | | | |
| Shares sold | | | 477,250 | | | | 88,951 | | | | 536,115 | | | | 10,276,542 | | |
| Conversion of Investor Class shares(2) | | | — | | | | 1,839 | | | | — | | | | — | | |
| Shares issued to holders in reinvestment of distributions | | | 156,703 | | | | 74,459 | | | | 75,551 | | | | — | | |
| Shares redeemed | | | (233,156 | ) | | | (221,931 | ) | | | (115,503 | ) | | | (233,427 | ) | |
| Net increase (decrease) in shares outstanding | | | 400,797 | | | | (56,682 | ) | | | 496,163 | | | | 10,043,115 | | |
| TRANSACTIONS IN SHARES: | | | | | | Investor Class(2) | | | |
| Shares sold | | | | | | | 472 | | | | |
| Shares issued to holders in reinvestment of distributions | | | | | | | 42 | | | | |
| Net increase in shares outstanding | | | | | | | 514 | | | | |
(1) Commencement of operations.
(2) All Investor Class shares converted into the Institutional Class on June 10, 2011.
The accompanying notes are an integral part of these financial statements.
page 64

STATEMENTS OF CHANGES IN NET ASSETS (continued)
| | | MFG Core Infrastructure Fund | | HEXAM Emerging Markets Fund | |
| | | For the Period
January 18, 2012(1)
through
June 30, 2012 | | For the
Year Ended
June 30, 2012 | | For the Period
December 20, 2010(1)
through
June 30, 2011 | |
| OPERATIONS: | |
| Net investment income | | $ | 54,210 | | | $ | 233,164 | | | $ | 120,557 | | |
| Net realized gain (loss) on: | |
| Investments | | | 1,609 | | | | (2,958,829 | ) | | | 182,685 | | |
| Foreign currency transactions | | | 7,763 | | | | (68,229 | ) | | | (36,921 | ) | |
| Change in net unrealized appreciation/depreciation on: | |
| Investments | | | 79,499 | | | | (5,106,944 | ) | | | (569,038 | ) | |
| Foreign currency transactions | | | 170 | | | | (5,115 | ) | | | 1,768 | | |
| Net increase (decrease) in net assets resulting from operations | | | 143,251 | | | | (7,905,953 | ) | | | (300,949 | ) | |
| DISTRIBUTIONS PAID TO SHAREHOLDERS FROM: | |
| Net investment income | | | — | | | | (128,066 | ) | | | — | | |
| Net realized gain on investments | | | — | | | | (183,995 | ) | | | — | | |
| Net decrease in net assets resulting from distributions paid | | | — | | | | (312,061 | ) | | | — | | |
| CAPITAL SHARE TRANSACTIONS: | |
| Shares sold | | | 2,600,104 | | | | 2,689,500 | | | | 25,615,894 | | |
| Shares issued to holders in reinvestment of distributions | | | — | | | | 9,738 | | | | — | | |
| Shares redeemed | | | — | | | | (29,015 | ) | | | (40,000 | ) | |
| Net increase in net assets resulting from capital share transactions | | | 2,600,104 | | | | 2,670,223 | | | | 25,575,894 | | |
| Total Increase (Decrease) in Net Assets | | | 2,743,355 | | | | (5,547,791 | ) | | | 25,274,945 | | |
| NET ASSETS: | |
| Beginning of Period | | | — | | | | 25,274,945 | | | | — | | |
| End of Period | | $ | 2,743,355 | | | $ | 19,727,154 | | | $ | 25,274,945 | | |
| Undistributed net investment income | | $ | 61,972 | | | $ | 120,490 | | | $ | 83,636 | | |
| TRANSACTIONS IN SHARES: | |
| Shares sold | | | 257,551 | | | | 332,363 | | | | 2,665,635 | | |
| Shares issued to holders in reinvestment of distributions | | | — | | | | 1,415 | | | | — | | |
| Shares redeemed | | | — | | | | (3,975 | ) | | | (4,121 | ) | |
| Net increase in shares outstanding | | | 257,551 | | | | 329,803 | | | | 2,661,514 | | |
(1) Commencement of operations.
The accompanying notes are an integral part of these financial statements.
page 65

STATEMENTS OF CHANGES IN NET ASSETS (continued)
| | | Timpani Small Cap Growth Fund | | Netols Small Cap Value Fund | |
| | | For the
Year Ended
June 30, 2012 | | For the Period
March 23, 2011(1)
through
June 30, 2011 | | For the
Year Ended
June 30, 2012 | | For the
Year Ended
June 30, 2011 | |
| OPERATIONS: | |
| Net investment income (loss) | | $ | (21,614 | ) | | $ | (4,374 | ) | | $ | (270,951 | ) | | $ | (678,200 | ) | |
| Net realized gain (loss) on investments | | | (407,979 | ) | | | (47,233 | ) | | | 2,363,339 | | | | 1,382,190 | | |
| Change in net unrealized appreciation/depreciation on investments | | | 354,051 | | | | 175,461 | | | | (15,804,224 | ) | | | 49,439,621 | | |
| Net increase (decrease) in net assets resulting from operations | | | (75,542 | ) | | | 123,854 | | | | (13,711,836 | ) | | | 50,143,611 | | |
| DISTRIBUTIONS PAID TO SHAREHOLDERS FROM: | | | | | | Institutional Class | | Institutional Class | |
| Net investment income | | | — | | | | — | | | | — | | | | (28,623 | ) | |
| Net decrease in net assets resulting from distributions paid | | | — | | | | — | | | | — | | | | (28,623 | ) | |
| CAPITAL SHARE TRANSACTIONS: | | | | | | Institutional Class | | Institutional Class | |
| Shares sold | | | 879,324 | | | | 1,912,036 | | | | 6,241,189 | | | | 25,607,408 | | |
| Shares issued to holders in reinvestment of distributions | | | — | | | | — | | | | — | | | | 17,071 | | |
| Shares redeemed | | | (15,240 | ) | | | — | | | | (26,076,834 | ) | | | (23,382,163 | ) | |
| Net increase (decrease) in net assets resulting from capital share transactions | | | 864,084 | | | | 1,912,036 | | | | (19,835,645 | ) | | | 2,242,316 | | |
| CAPITAL SHARE TRANSACTIONS: | | | | | | Class Y | | Class Y | |
| Shares sold | | | — | | | | — | | | | 3,738,101 | | | | 5,239,684 | | |
| Shares redeemed | | | — | | | | — | | | | (7,124,107 | ) | | | (3,572,240 | ) | |
| Net increase (decrease) in net assets resulting from capital share transactions | | | — | | | | — | | | | (3,386,006 | ) | | | 1,667,444 | | |
| Total Increase (Decrease) in Net Assets | | | 788,542 | | | | 2,035,890 | | | | (36,933,487 | ) | | | 54,024,748 | | |
| NET ASSETS: | |
| Beginning of Period | | | 2,035,890 | | | | — | | | | 189,242,113 | | | | 135,217,365 | | |
| End of Period | | $ | 2,824,432 | | | $ | 2,035,890 | | | $ | 152,308,626 | | | $ | 189,242,113 | | |
| Undistributed net investment income (loss) | | $ | (12,271 | ) | | $ | — | | | $ | (16,756 | ) | | $ | — | | |
| TRANSACTIONS IN SHARES: | | | | | | Institutional Class | | Institutional Class | |
| Shares sold | | | 86,238 | | | | 189,305 | | | | 528,581 | | | | 2,079,703 | | |
| Shares issued to holders in reinvestment of distributions | | | — | | | | — | | | | — | | | | 1,349 | | |
| Shares redeemed | | | (1,505 | ) | | | — | | | | (2,167,443 | ) | | | (1,846,948 | ) | |
| Net increase (decrease) in shares outstanding | | | 84,733 | | | | 189,305 | | | | (1,638,862 | ) | | | 234,104 | | |
| TRANSACTIONS IN SHARES: | | | | | | Class Y | | Class Y | |
| Shares sold | | | | | | | 313,502 | | | | 419,253 | | |
| Shares issued to holders in reinvestment of distributions | | | | | | | — | | | | — | | |
| Shares redeemed | | | | | | | (586,729 | ) | | | (298,101 | ) | |
| Net increase (decrease) in shares outstanding | | | | | | | (273,227 | ) | | | 121,152 | | |
(1) Commencement of operations.
The accompanying notes are an integral part of these financial statements.
page 66

STATEMENTS OF CHANGES IN NET ASSETS (continued)
| | | Phocas Small Cap Value Fund | | Lockwell Small Cap Value Fund | |
| | | For the
Year Ended
June 30, 2012 | | For the
Year Ended
June 30, 2011 | | For the
Year Ended
June 30, 2012 | |
| OPERATIONS: | |
| Net investment income | | $ | 53,407 | | | $ | 33,187 | | | $ | 5,175 | | |
| Net realized gain (loss) on investments | | | 129,868 | | | | 1,348,663 | | | | (3,413 | ) | |
| Change in net unrealized appreciation/depreciation on investments | | | (1,034,255 | ) | | | 3,730,879 | | | | 111,852 | | |
| Net increase (decrease) in net assets resulting from operations | | | (850,980 | ) | | | 5,112,729 | | | | 113,614 | | |
| DISTRIBUTIONS PAID TO SHAREHOLDERS FROM: | | Class L | | Class L | | | |
| Net investment income | | | (13,249 | ) | | | (50,863 | ) | | | (528 | ) | |
| Net decrease in net assets resulting from distributions paid | | | (13,249 | ) | | | (50,863 | ) | | | (528 | ) | |
| DISTRIBUTIONS PAID TO SHAREHOLDERS FROM: | | Class I | | Class I | | | |
| Net investment income | | | (792 | ) | | | — | | | | — | | |
| Net decrease in net assets resulting from distributions paid | | | (792 | ) | | | — | | | | — | | |
| CAPITAL SHARE TRANSACTIONS: | | Class L | | Class L | | | |
| Shares sold | | | 746,588 | | | | 2,200,504 | | | | 2,898,045 | | |
| Shares issued to holders in reinvestment of distributions | | | 13,249 | | | | 50,863 | | | | 338 | | |
| Shares redeemed | | | (1,425,314 | ) | | | (1,991,047 | ) | | | (566,555 | ) | |
| Redemption fees | | | — | | | | 286 | | | | — | | |
| Net increase (decrease) in net assets resulting from capital share transactions | | | (665,477 | ) | | | 260,606 | | | | 2,331,828 | | |
| CAPITAL SHARE TRANSACTIONS: | | Class I | | Class I | | | |
| Shares sold | | | 3,273,796 | | | | 249,950 | | | | — | | |
| Shares issued to holders in reinvestment of distributions | | | 755 | | | | — | | | | — | | |
| Shares redeemed | | | (182,529 | ) | | | — | | | | — | | |
| Net increase in net assets resulting from capital share transactions | | | 3,092,022 | | | | 249,950 | | | | — | | |
| Total Increase in Net Assets | | | 1,561,524 | | | | 5,572,422 | | | | 2,444,914 | | |
| NET ASSETS: | |
| Beginning of Period | | | 20,747,973 | | | | 15,175,551 | | | | — | | |
| End of Period | | $ | 22,309,497 | | | $ | 20,747,973 | | | $ | 2,444,914 | | |
| Undistributed net investment income | | $ | 39,983 | | | $ | — | | | $ | 4,647 | | |
| TRANSACTIONS IN SHARES: | | Class L | | Class L | | | |
| Shares sold | | | 32,296 | | | | 96,712 | | | | 314,206 | | |
| Shares issued to holders in reinvestment of distributions | | | 601 | | | | 2,163 | | | | 38 | | |
| Shares redeemed | | | (61,659 | ) | | | (86,785 | ) | | | (57,581 | ) | |
| Net increase (decrease) in shares outstanding | | | (28,762 | ) | | | 12,090 | | | | 256,663 | | |
| TRANSACTIONS IN SHARES: | | Class I | | Class I | | | |
| Shares sold | | | 147,976 | | | | 9,825 | | | | |
| Shares issued to holders in reinvestment of distributions | | | 34 | | | | — | | | | |
| Shares redeemed | | | (8,061 | ) | | | — | | | | |
| Net increase in shares outstanding | | | 139,949 | | | | 9,825 | | | | |
The accompanying notes are an integral part of these financial statements.
page 67

Frontegra SAM Global Equity Fund
FINANCIAL HIGHLIGHTS
| | | Year
Ended
June 30,
2012 | | Period
Ended
June 30,
2011(1)(2) | | Year
Ended
August 31,
2010 | | Period
Ended
August 31,
2009(3) | |
| Net Asset Value, Beginning of Period | | $ | 13.15 | | | $ | 11.00 | | | $ | 11.30 | | | $ | 10.00 | | |
| INCOME (LOSS) FROM INVESTMENT OPERATIONS: | |
| Net investment income | | | 0.18 | (4) | | | 0.25 | | | | 0.18 | (4) | | | 0.01 | (4) | |
| Net realized and unrealized gain (loss) on investments | | | (1.67 | ) | | | 2.53 | | | | 0.47 | | | | 1.29 | | |
| Total Income (Loss) from Investment Operations | | | (1.49 | ) | | | 2.78 | | | | 0.65 | | | | 1.30 | | |
| LESS DISTRIBUTIONS: | |
| From net investment income | | | (0.21 | ) | | | (0.21 | ) | | | (0.05 | ) | | | — | | |
| From net realized gain on investments | | | (0.77 | ) | | | (0.42 | ) | | | (0.90 | ) | | | — | | |
| Total Distributions | | | (0.98 | ) | | | (0.63 | ) | | | (0.95 | ) | | | — | | |
| Redemption fees retained | | | — | | | | — | | | | — | (5) | | | — | | |
| Net Asset Value, End of Period | | $ | 10.68 | | | $ | 13.15 | | | $ | 11.00 | | | $ | 11.30 | | |
| Total Return | | | (10.91 | )% | | | 25.64 | %(6) | | | 5.42 | % | | | 13.00 | %(6) | |
| SUPPLEMENTAL DATA AND RATIOS: | |
| Net assets, end of period (in thousands) | | $ | 19,952 | | | $ | 19,292 | | | $ | 16,756 | | | $ | 11,614 | | |
| Ratio of expenses to average net assets | |
| Before waivers and reimbursements | | | 1.62 | % | | | 2.41 | %(7) | | | 2.81 | % | | | 4.06 | %(7) | |
| Net of waivers and reimbursements | | | 1.20 | % | | | 1.20 | %(7) | | | 1.20 | % | | | 1.20 | %(7) | |
| Ratio of net investment income (loss) to average net assets | |
| Before waivers and reimbursements | | | 1.16 | % | | | 1.02 | %(7) | | | (0.03 | )% | | | (2.59 | )%(7) | |
| Net of waivers and reimbursements | | | 1.58 | % | | | 2.23 | %(7) | | | 1.58 | % | | | 0.27 | %(7) | |
| Portfolio turnover rate | | | 52 | % | | | 33 | %(6) | | | 88 | % | | | 72 | %(6) | |
(1) Effective June 30, 2011, the Fund changed its fiscal year end to June 30 from August 31.
(2) Effective June 10, 2011, Frontegra Asset Management, Inc. became adviser and Sustainable Asset Management USA, Inc. became subadviser to the Fund.
(3) Commenced operations on June 18, 2009.
(4) Per share net investment income has been calculated using the daily average share method.
(5) Less than one cent per share.
(6) Not annualized.
(7) Annualized.
The accompanying notes are an integral part of these financial statements.
page 68

Frontegra MFG Global Equity Fund
FINANCIAL HIGHLIGHTS
| | | Period
Ended
June 30,
2012(1) | |
| Net Asset Value, Beginning of Period | | $ | 10.00 | | |
| INCOME FROM INVESTMENT OPERATIONS: | |
| Net investment income | | | 0.11 | (2) | |
| Net realized and unrealized gain on investments | | | 0.70 | | |
| Total Income from Investment Operations | | | 0.81 | | |
| Net Asset Value, End of Period | | $ | 10.81 | | |
| Total Return | | | 8.10 | %(3) | |
| SUPPLEMENTAL DATA AND RATIOS: | |
| Net assets, end of period (in thousands) | | $ | 108,551 | | |
| Ratio of expenses to average net assets | |
| Before waivers and reimbursements | | | 1.14 | %(4) | |
| Net of waivers and reimbursements | | | 0.80 | %(4) | |
| Ratio of net investment income to average net assets | |
| Before waivers and reimbursements | | | 1.70 | %(4) | |
| Net of waivers and reimbursements | | | 2.04 | %(4) | |
| Portfolio turnover rate | | | 19 | %(3) | |
(1) Commenced operations on December 28, 2011.
(2) Per share net investment income has been calculated using the daily average share method.
(3) Not annualized.
(4) Annualized.
The accompanying notes are an integral part of these financial statements.
page 69

Frontegra MFG Core Infrastructure Fund
FINANCIAL HIGHLIGHTS
| | | Period
Ended
June 30,
2012(1) | |
| Net Asset Value, Beginning of Period | | $ | 10.00 | | |
| INCOME FROM INVESTMENT OPERATIONS: | |
| Net investment income | | | 0.24 | | |
| Net realized and unrealized gain on investments | | | 0.41 | | |
| Total Income from Investment Operations | | | 0.65 | | |
| Net Asset Value, End of Period | | $ | 10.65 | | |
| Total Return | | | 6.50 | %(2) | |
| SUPPLEMENTAL DATA AND RATIOS: | |
| Net assets, end of period (in thousands) | | $ | 2,743 | | |
| Ratio of expenses to average net assets | |
| Before waivers and reimbursements | | | 6.55 | %(3) | |
| Net of waivers and reimbursements | | | 0.70 | %(3) | |
| Ratio of net investment income (loss) to average net assets | |
| Before waivers and reimbursements | | | (1.09 | )%(3) | |
| Net of waivers and reimbursements | | | 4.76 | %(3) | |
| Portfolio turnover rate | | | 7 | %(2) | |
(1) Commenced operations on January 18, 2012.
(2) Not annualized.
(3) Annualized.
The accompanying notes are an integral part of these financial statements.
page 70

Frontegra HEXAM Emerging Markets Fund
FINANCIAL HIGHLIGHTS
| | | Year
Ended
June 30,
2012 | | Period
Ended
June 30,
2011(1) | |
| Net Asset Value, Beginning of Period | | $ | 9.50 | | | $ | 10.00 | | |
| INCOME (LOSS) FROM INVESTMENT OPERATIONS: | |
| Net investment income | | | 0.08 | (2) | | | 0.08 | (2) | |
| Net realized and unrealized loss on investments | | | (2.87 | ) | | | (0.58 | ) | |
| Total Loss from Investment Operations | | | (2.79 | ) | | | (0.50 | ) | |
| LESS DISTRIBUTIONS: | |
| From net investment income | | | (0.05 | ) | | | — | | |
| From net realized gain on investments | | | (0.07 | ) | | | — | | |
| Total Distributions | | | (0.12 | ) | | | — | | |
| Net Asset Value, End of Period | | $ | 6.59 | | | $ | 9.50 | | |
| Total Return | | | (29.51 | )% | | | (5.00 | )%(3) | |
| SUPPLEMENTAL DATA AND RATIOS: | |
| Net assets, end of period (in thousands) | | $ | 19,727 | | | $ | 25,275 | | |
| Ratio of expenses to average net assets | |
| Before waivers and reimbursements | | | 1.65 | % | | | 2.33 | %(4) | |
| Net of waivers and reimbursements | | | 1.30 | % | | | 1.30 | %(4) | |
| Ratio of net investment income to average net assets | |
| Before waivers and reimbursements | | | 0.71 | % | | | 0.61 | %(4) | |
| Net of waivers and reimbursements | | | 1.06 | % | | | 1.64 | %(4) | |
| Portfolio turnover rate | | | 89 | % | | | 33 | %(3) | |
(1) Commenced operations on December 20, 2010.
(2) Per share net investment income has been calculated using the daily average share method.
(3) Not annualized.
(4) Annualized.
The accompanying notes are an integral part of these financial statements.
page 71

Frontegra Timpani Small Cap Growth Fund
FINANCIAL HIGHLIGHTS
| | | Year
Ended
June 30,
2012 | | Period
Ended
June 30,
2011(1) | |
| Net Asset Value, Beginning of Period | | $ | 10.75 | | | $ | 10.00 | | |
| INCOME (LOSS) FROM INVESTMENT OPERATIONS: | |
| Net investment loss | | | (0.08 | )(2) | | | (0.02 | )(3) | |
| Net realized and unrealized gain (loss) on investments | | | (0.36 | ) | | | 0.77 | | |
| Total Income (Loss) from Investment Operations | | | (0.44 | ) | | | 0.75 | | |
| Net Asset Value, End of Period | | $ | 10.31 | | | $ | 10.75 | | |
| Total Return | | | (4.28 | )% | | | 7.60 | %(4) | |
| SUPPLEMENTAL DATA AND RATIOS: | |
| Net assets, end of period (in thousands) | | $ | 2,824 | | | $ | 2,036 | | |
| Ratio of expenses to average net assets | |
| Before waivers and reimbursements | | | 5.25 | % | | | 10.93 | %(5) | |
| Net of waivers and reimbursements | | | 1.10 | % | | | 1.10 | %(5) | |
| Ratio of net investment loss to average net assets | |
| Before waivers and reimbursements | | | (5.02 | )% | | | (10.75 | )%(5) | |
| Net of waivers and reimbursements | | | (0.87 | )% | | | (0.92 | )%(5) | |
| Portfolio turnover rate | | | 138 | % | | | 28 | %(4) | |
(1) Commenced operations on March 23, 2011.
(2) Per share net investment income has been calculated using the daily average share method.
(3) Net investment loss per share is calculated using ending balances prior to consideration of adjustments for permanent book to tax differences.
(4) Not annualized.
(5) Annualized.
The accompanying notes are an integral part of these financial statements.
page 72

Frontegra Netols Small Cap Value Fund
FINANCIAL HIGHLIGHTS
| | | Institutional Class | |
| | | Year
Ended
June 30,
2012 | | Year
Ended
June 30,
2011 | | Year
Ended
June 30,
2010 | | Year
Ended
June 30,
2009 | | Year
Ended
June 30,
2008 | |
| Net Asset Value, Beginning of Period | | $ | 13.75 | | | $ | 10.08 | | | $ | 9.03 | | | $ | 11.81 | | | $ | 12.88 | | |
INCOME (LOSS) FROM
INVESTMENT OPERATIONS: | |
| Net investment income (loss) | | | 0.01 | | | | (0.05 | )(1) | | | 0.02 | (2) | | | 0.01 | | | | — | (3) | |
| Net realized and unrealized gain (loss) on investments | | | (0.90 | ) | | | 3.72 | | | | 1.05 | | | | (2.79 | ) | | | (0.90 | ) | |
| Total Income (Loss) from Investment Operations | | | (0.89 | ) | | | 3.67 | | | | 1.07 | | | | (2.78 | ) | | | (0.90 | ) | |
| LESS DISTRIBUTIONS: | |
| From net investment income | | | — | | | | — | (3) | | | (0.02 | ) | | | — | (3) | | | (0.02 | ) | |
| From net realized gain on investments | | | — | | | | — | | | | — | | | | — | | | | (0.15 | ) | |
| From return of capital | | | — | | | | — | | | | — | (3) | | | — | | | | — | | |
| Total Distributions | | | — | | | | — | | | | (0.02 | ) | | | — | | | | (0.17 | ) | |
| Net Asset Value, End of Period | | $ | 12.86 | | | $ | 13.75 | | | $ | 10.08 | | | $ | 9.03 | | | $ | 11.81 | | |
| Total Return | | | (6.47 | )% | | | 36.43 | % | | | 11.76 | % | | | (23.42 | )% | | | (7.01 | )% | |
| SUPPLEMENTAL DATA AND RATIOS: | |
| Net assets, end of period (in thousands) | | $ | 134,544 | | | $ | 166,450 | | | $ | 119,657 | | | $ | 43,504 | | | $ | 31,346 | | |
| Ratio of expenses to average net assets | |
| Before waivers and reimbursements | | | 1.22 | % | | | 1.13 | % | | | 1.18 | % | | | 1.45 | % | | | 1.59 | % | |
| Net of waivers and reimbursements | | | 1.10 | % | | | 1.10 | % | | | 1.10 | % | | | 1.10 | % | | | 1.10 | % | |
| Ratio of net investment income (loss) to average net assets | |
| Before waivers and reimbursements | | | (0.08 | )% | | | (0.39 | )% | | | 0.17 | % | | | (0.13 | )% | | | (0.40 | )% | |
| Net of waivers and reimbursements | | | 0.04 | % | | | (0.36 | )% | | | 0.25 | % | | | 0.22 | % | | | 0.09 | % | |
| Portfolio turnover rate | | | 28 | % | | | 33 | % | | | 41 | % | | | 36 | % | | | 32 | % | |
(1) Net investment loss per share is calculated using ending balances prior to consideration of adjustments for permanent book to tax differences.
(2) Per share net investment income has been calculated using the daily average share method.
(3) Less than one cent per share.
The accompanying notes are an integral part of these financial statements.
page 73

Frontegra Netols Small Cap Value Fund
FINANCIAL HIGHLIGHTS
| | | Class Y | |
| | | Year
Ended
June 30,
2012 | | Year
Ended
June 30,
2011 | | Year
Ended
June 30,
2010 | | Year
Ended
June 30,
2009 | | Period
Ended
June 30,
2008(1) | |
| Net Asset Value, Beginning of Period | | $ | 13.59 | | | $ | 10.00 | | | $ | 8.98 | | | $ | 11.78 | | | $ | 12.54 | | |
INCOME (LOSS) FROM
INVESTMENT OPERATIONS: | |
| Net investment loss | | | (0.05 | ) | | | (0.09 | )(2) | | | — | | | | (0.02 | ) | | | (0.02 | ) | |
| Net realized and unrealized gain (loss) on investments | | | (0.89 | ) | | | 3.68 | | | | 1.02 | | | | (2.78 | ) | | | (0.57 | ) | |
| Total Income (Loss) from Investment Operations | | | (0.94 | ) | | | 3.59 | | | | 1.02 | | | | (2.80 | ) | | | (0.59 | ) | |
| LESS DISTRIBUTIONS: | |
| From net investment income | | | — | | | | — | | | | — | | | | — | | | | (0.02 | ) | |
| From net realized gain on investments | | | — | | | | — | | | | — | | | | — | | | | (0.15 | ) | |
| Total Distributions | | | — | | | | — | | | | — | | | | — | | | | (0.17 | ) | |
| Net Asset Value, End of Period | | $ | 12.65 | | | $ | 13.59 | | | $ | 10.00 | | | $ | 8.98 | | | $ | 11.78 | | |
| Total Return | | | (6.92 | )% | | | 35.90 | % | | | 11.36 | % | | | (23.77 | )% | | | (4.76 | )%(3) | |
| SUPPLEMENTAL DATA AND RATIOS: | |
| Net assets, end of period (in thousands) | | $ | 17,765 | | | $ | 22,792 | | | $ | 15,560 | | | $ | 895 | | | $ | 1,034 | | |
| Ratio of expenses to average net assets | |
| Before waivers and reimbursements | | | 1.62 | % | | | 1.53 | % | | | 1.58 | % | | | 1.85 | % | | | 2.01 | %(4) | |
| Net of waivers and reimbursements | | | 1.50 | % | | | 1.50 | % | | | 1.50 | % | | | 1.50 | % | | | 1.55 | %(4) | |
| Ratio of net investment loss to average net assets | |
| Before waivers and reimbursements | | | (0.48 | )% | | | (0.79 | )% | | | (0.23 | )% | | | (0.53 | )% | | | (0.80 | )%(4) | |
| Net of waivers and reimbursements | | | (0.36 | )% | | | (0.76 | )% | | | (0.15 | )% | | | (0.18 | )% | | | (0.34 | )%(4) | |
| Portfolio turnover rate | | | 28 | % | | | 33 | % | | | 41 | % | | | 36 | % | | | 32 | %(3) | |
(1) Commenced operations on November 1, 2007.
(2) Net investment loss per share is calculated using ending balances prior to consideration of adjustments for permanent book to tax differences.
(3) Not annualized.
(4) Annualized.
The accompanying notes are an integral part of these financial statements.
page 74

Frontegra Phocas Small Cap Value Fund
FINANCIAL HIGHLIGHTS
| | | Class L | |
| | | Year
Ended
June 30,
2012 | | Year
Ended
June 30,
2011(1) | | Six Months
Ended
June 30,
2010(2) | | Year
Ended
December 31,
2009 | | Year
Ended
December 31,
2008 | | Year
Ended
December 31,
2007 | |
| Net Asset Value, Beginning of Period | | $ | 24.51 | | | $ | 18.40 | | | $ | 18.48 | | | $ | 14.93 | | | $ | 20.01 | | | $ | 21.86 | | |
INCOME (LOSS) FROM
INVESTMENT OPERATIONS: | |
| Net investment income | | | 0.06 | | | | 0.04 | (3) | | | 0.02 | (3) | | | 0.06 | (3) | | | 0.13 | (3) | | | 0.05 | (3) | |
| Net realized and unrealized gain (loss) on investments | | | (1.25 | ) | | | 6.13 | | | | (0.10 | ) | | | 3.56 | | | | (5.08 | ) | | | (1.68 | ) | |
| Total Income (Loss) from Investment Operations | | | (1.19 | ) | | | 6.17 | | | | (0.08 | ) | | | 3.62 | | | | (4.95 | ) | | | (1.63 | ) | |
| LESS DISTRIBUTIONS: | |
| From net investment income | | | (0.02 | ) | | | (0.06 | ) | | | — | | | | (0.07 | ) | | | (0.13 | ) | | | (0.09 | ) | |
| From net realized gain on investments | | | — | | | | — | | | | — | | | | — | | | | — | | | | (0.13 | ) | |
| Total Distributions | | | (0.02 | ) | | | (0.06 | ) | | | — | | | | (0.07 | ) | | | (0.13 | ) | | | (0.22 | ) | |
| Redemption fees retained | | | — | | | | — | (4) | | | — | (4) | | | — | (4) | | | — | (4) | | | — | (4) | |
| Net Asset Value, End of Period | | $ | 23.30 | | | $ | 24.51 | | | $ | 18.40 | | | $ | 18.48 | | | $ | 14.93 | | | $ | 20.01 | | |
| Total Return | | | (4.91 | )% | | | 33.55 | % | | | (0.43 | )%(5) | | | 24.29 | % | | | (24.68 | )% | | | (7.46 | )% | |
| SUPPLEMENTAL DATA AND RATIOS: | |
| Net assets, end of period (in thousands) | | $ | 18,821 | | | $ | 20,507 | | | $ | 15,176 | | | $ | 19,331 | | | $ | 17,201 | | | $ | 21,936 | | |
| Ratio of expenses to average net assets | |
| Before waivers and reimbursements | | | 1.70 | % | | | 1.69 | % | | | 1.68 | %(6) | | | 1.71 | % | | | 1.52 | % | | | 2.43 | % | |
| Net of waivers and reimbursements | | | 0.99 | % | | | 0.99 | % | | | 0.99 | %(6) | | | 0.99 | % | | | 0.99 | % | | | 1.18 | % | |
Ratio of net investment income (loss) to
average net assets | |
| Before waivers and reimbursements | | | (0.51 | )% | | | (0.52 | )% | | | (0.53 | )%(6) | | | (0.31 | )% | | | 0.21 | % | | | (0.54 | )% | |
| Net of waivers and reimbursements | | | 0.20 | % | | | 0.18 | % | | | 0.16 | %(6) | | | 0.41 | % | | | 0.74 | % | | | 0.71 | % | |
| Portfolio turnover rate | | | 50 | % | | | 37 | % | | | 43 | %(5) | | | 67 | % | | | 34 | % | | | 148 | % | |
(1) Effective October 8, 2010, Frontegra Asset Management, Inc. became adviser and Phocas Financial Corp. became subadviser to the Fund.
(2) Effective June 30, 2011, the Fund changed its fiscal year end to June 30 from December 31.
(3) Per share net investment income has been calculated using the daily average shares method.
(4) Less than one cent per share.
(5) Not annualized.
(6) Annualized.
The accompanying notes are an integral part of these financial statements.
page 75

Frontegra Phocas Small Cap Value Fund
FINANCIAL HIGHLIGHTS
| | | Class I | |
| | | Year
Ended
June 30,
2012 | | Period
Ended
June 30,
2011(1) | |
| Net Asset Value, Beginning of Period | | $ | 24.51 | | | $ | 25.44 | | |
INCOME (LOSS) FROM
INVESTMENT OPERATIONS: | |
| Net investment income (loss) | | | 0.02 | | | | (0.04 | ) | |
| Net realized and unrealized loss on investments | | | (1.23 | ) | | | (0.89 | ) | |
| Total Loss from Investment Operations | | | (1.21 | ) | | | (0.93 | ) | |
| LESS DISTRIBUTIONS: | |
| From net investment income | | | (0.01 | ) | | | — | | |
| From net realized gain on investments | | | — | | | | — | | |
| Total Distributions | | | (0.01 | ) | | | — | | |
| Net Asset Value, End of Period | | $ | 23.29 | | | $ | 24.51 | | |
| Total Return | | | (4.95 | )% | | | (3.66 | )%(2) | |
| SUPPLEMENTAL DATA AND RATIOS: | |
| Net assets, end of period (in thousands) | | $ | 3,488 | | | $ | 241 | | |
| Ratio of expenses to average net assets | |
| Before waivers and reimbursements | | | 1.81 | % | | | 1.76 | %(3) | |
| Net of waivers and reimbursements | | | 1.10 | % | | | 1.10 | %(3) | |
| Ratio of net investment income (loss) to average net assets | |
| Before waivers and reimbursements | | | (0.59 | )% | | | (1.41 | )%(3) | |
| Net of waivers and reimbursements | | | 0.12 | % | | | (0.75 | )%(3) | |
| Portfolio turnover rate | | | 50 | % | | | 37 | %(2) | |
(1) Commenced operations on April 7, 2011.
(2) Not annualized.
(3) Annualized.
The accompanying notes are an integral part of these financial statements.
page 76

Lockwell Small Cap Value Fund
FINANCIAL HIGHLIGHTS
| | | Year
Ended
June 30,
2012 | |
| Net Asset Value, Beginning of Period | | $ | 10.00 | | |
INCOME (LOSS) FROM
INVESTMENT OPERATIONS: | |
| Net investment income | | | 0.04 | (1) | |
| Net realized and unrealized loss on investments | | | (0.51 | ) | |
| Total Loss from Investment Operations | | | (0.47 | ) | |
| LESS DISTRIBUTIONS: | |
| From net investment income | | | — | (2) | |
| From net realized gain on investments | | | — | | |
| Total Distributions | | | — | | |
| Net Asset Value, End of Period | | $ | 9.53 | | |
| Total Return | | | (4.76 | )% | |
| SUPPLEMENTAL DATA AND RATIOS: | |
| Net assets, end of period (in thousands) | | $ | 2,445 | | |
| Ratio of expenses to average net assets | |
| Before waivers and reimbursements | | | 9.63 | % | |
| Net of waivers and reimbursements | | | 1.10 | % | |
| Ratio of net investment income (loss) to average net assets | |
| Before waivers and reimbursements | | | (8.13 | )% | |
| Net of waivers and reimbursements | | | 0.40 | % | |
| Portfolio turnover rate | | | 92 | % | |
(1) Per share net investment income has been calculated using the daily average share method.
(2) Less than one cent per share.
The accompanying notes are an integral part of these financial statements.
page 77

NOTES TO FINANCIAL STATEMENTS
June 30, 2012
(1) ORGANIZATION
Frontegra Funds, Inc. (the "Company") was incorporated on May 24, 1996 as a Maryland corporation and is registered under the Investment Company Act of 1940, as amended (the "1940 Act"), as an open-end investment company issuing shares in series (each, a "Fund," or collectively, the "Funds"), each series representing a distinct portfolio with its own investment objectives and policies. The investment objective of each of the Frontegra MFG Global Equity Fund, Frontegra MFG Core Infrastructure Fund, Frontegra Timpani Small Cap Growth Fund and Frontegra Netols Small Cap Value Fund is capital appreciation. The investment objective of each of the Frontegra SAM Global Equity Fund and Frontegra HEXAM Emerging Markets Fund is long-term capital growth. The investment objective of the Frontegra Phocas Small Cap Value Fund is long-term total investment through capital appreciation. The investment objective of the Lockwell Small Cap Value Fund is long-term capital appreciation.
As of June 30, 2012, the Company had eight series in operations. A summary of each Fund's investment adviser, subadviser and capital structure is as follows:
| Fund | | Investment Adviser | | Subadviser | | Capital Structure | | Commencement
of Operations | |
| Frontegra SAM Global Equity Fund | | Frontegra Asset Management, Inc. ("Frontegra") | | Sustainable Asset Management USA, Inc. ("SAM") | | Single Class | | June 18, 2009 | |
|
| Frontegra MFG Global Equity Fund | | Frontegra | | MFG Asset Management ("MFG") | | Single Class | | Dec. 28, 2011 | |
|
| Frontegra MFG Core Infrastructure Fund | | Frontegra | | MFG Asset Management ("MFG") | | Single Class | | Jan. 18, 2012 | |
|
| Frontegra HEXAM Emerging Markets Fund | | Frontegra | | HEXAM Capital Partners, LLP ("HEXAM") | | Single Class | | Dec. 20, 2010 | |
|
| Frontegra Timpani Small Cap Growth Fund | | Timpani Capital Management LLC ("Timpani") (a) | | None | | Multi-Class
• Institutional
• Class Y (b) | | Mar. 23, 2011 | |
|
| Frontegra Netols Small Cap Value Fund | | Frontegra | | Netols Asset Management, Inc. ("Netols") | | Multi-Class
• Institutional
• Class Y | | Dec. 16, 2005 | |
|
| Frontegra Phocas Small Cap Value Fund | | Frontegra | | Phocas Financial Corp. ("Phocas") | | Multi-Class
• Class L
• Class I | | Sep. 29, 2006 | |
|
| Lockwell Small Cap Value Fund | | Lockwell Investments, LLC ("Lockwell") | | None | | Single Class | | July 1, 2011 | |
|
(a) Timpani is an affiliate of Frontegra.
(b) As of June 30, 2012, the Class Y shares of the Frontegra Timpani Small Cap Growth Fund had not commenced operations.
page 78

NOTES TO FINANCIAL STATEMENTS (continued)
June 30, 2012
Two of the eight Funds reorganized with predecessor funds with comparable investment objectives. A summary of the reorganizations for each of these Funds is included below:
| Fund | | Predecessor Fund | | Date of Reorganization | |
| Frontegra SAM Global Equity Fund | | SAM Sustainable Global Active Fund | | June 10, 2011 | |
|
| Frontegra Phocas Small Cap Value Fund | | Phocas Small Cap Value Fund | | Oct. 8, 2010 | |
|
The reorganizations were effected via a tax-free reorganization and the net assets of the predecessor funds comprised substantially all of the net assets of the respective Frontegra Fund on the date of the reorganization. The predecessor funds were deemed to be the accounting survivor for financial reporting purposes, and as a result, the financial statements and financial highlights reflect the operations of the predecessor funds for periods prior to the reorganization date. Shareholders in the respective predecessor funds were issued shares in the respective Frontegra Fund on the date of the reorganization and the final net asset value of the respective predecessor fund served as the beginning net asset value for the respective Frontegra Fund. Information with respect to net assets and other relevant operating data for the predecessor funds on the reorganization date is included below:
| | | SAM Sustainable
Global Active Fund | | Phocas
Small Cap Value Fund | |
| Net assets | | $ | 20,440,464 | | | $ | 17,426,430 | | |
| Shares outstanding | | | 1,608,297 | | | | 825,087 | | |
| Net asset value | | $ | 12.71 | | | $ | 21.12 | | |
| Investments at fair value | | $ | 20,531,653 | | | $ | 17,425,756 | | |
| Unrealized appreciation/(depreciation) | | $ | 2,067,675 | | | $ | 2,660,123 | | |
| Undistributed net investment income | | $ | 206,426 | | | $ | 124,241 | | |
| Accumulated net realized gain (loss) | | $ | 552,216 | | | $ | (4,486,379 | ) | |
| Tax capital loss carryforward | | $ | — | | | $ | 4,208,769 | | |
(2) SIGNIFICANT ACCOUNTING POLICIES
The following is a summary of significant accounting policies consistently followed by the Funds in the preparation of their financial statements.
(a) Investment Valuation
Equity securities for which market quotations are readily available are valued at the last reported sale price on the national securities exchange on which such securities are primarily traded. Equity securities for which there were no transactions on a given day or securities not listed on a national securities exchange are valued at the most recent bid price. Equity securities that are traded on NASDAQ are valued using the NASDAQ Official Closing Price ("NOCP"). Debt securities (other than short-term instruments) are valued by an independent pricing service, which uses valuation methods such as matrix pricing and other analytical pricing models as well as market transactions and evaluated dealer bid quotations. Shares of underlying mutual funds are valued at their respective NAVs. Exchange traded funds are valued at the last reported sale price on the exchange on which the security is principally traded. Securities that are primarily traded on foreign exchanges, including participatory notes, generally are valued at the last sale price of such securities on their respective exchange. In certain circumstances, such as when a significant event occurs in a foreign market so that the last sale price no longer reflects actual value, the fair value of these securities may be determined using fair valuation procedures approved by the Board of Directors. The Directors have retained an independent
page 79

NOTES TO FINANCIAL STATEMENTS (continued)
June 30, 2012
fair value pricing service to assist in valuing foreign securities held by the Frontegra SAM Global Equity, Frontegra MFG Global Equity, Frontegra MFG Core Infrastructure and Frontegra HEXAM Emerging Markets Funds. In valuing assets, prices denominated in foreign currencies are converted to U.S. dollar equivalents at the current exchange rate, which approximates fair value. Securities maturing within 60 days or less when purchased are valued by the amortized cost method. Any securities or other assets for which market quotations are not readily available are valued at their fair value as determined in good faith by the advisers or subadvisers pursuant to guidelines established by the Board of Directors.
The Funds follow a fair value hierarchy that distinguishes between market data obtained from independent sources (observable inputs) and the Funds' own market assumptions (unobservable inputs). These inputs are used in determining the value of each Fund's investments and are summarized in the following fair value hierarchy:
Level 1 — Quoted prices in active markets for identical securities
Level 2 — Evaluated prices based on other significant observable inputs (including quoted prices for similar securities, foreign security indices, foreign exchange rates, fair value estimates for foreign securities and changes in benchmark securities indices).
Level 3 — Significant unobservable inputs (including the Fund's own assumptions in determining fair value of investments)
SAM Global Equity
| Description | | Level 1 | | Level 2 | | Level 3 | | Total | |
| Equity (a) | | | | | | | | | | | | | | | | | |
| Common Stocks | | $ | 10,481,350 | | | $ | 8,339,032 | | | $ | — | | | $ | 18,820,382 | | |
| Total Equity | | | 10,481,350 | | | | 8,339,032 | | | | — | | | | 18,820,382 | | |
| Short-Term Investments | | | 933,250 | | | | — | | | | — | | | | 933,250 | | |
| Total Investments in Securities | | $ | 11,414,600 | | | $ | 8,339,032 | | | $ | — | | | $ | 19,753,632 | | |
MFG Global Equity
| Description | | Level 1 | | Level 2 | | Level 3 | | Total | |
| Equity (a) | | | | | | | | | | | | | | | | | |
| Common Stocks | | $ | 79,849,701 | | | $ | 24,825,878 | | | $ | — | | | $ | 104,675,579 | | |
| Total Equity | | | 79,849,701 | | | | 24,825,878 | | | | — | | | | 104,675,579 | | |
| Short-Term Investments | | | 3,468,812 | | | | — | | | | — | | | | 3,468,812 | | |
| Total Investments in Securities | | $ | 83,318,513 | | | $ | 24,825,878 | | | $ | — | | | $ | 108,144,391 | | |
MFG Core Infrastructure
| Description | | Level 1 | | Level 2 | | Level 3 | | Total | |
| Equity (a) | | | | | | | | | | | | | | | | | |
| Common Stocks | | $ | 1,279,370 | | | $ | 1,395,917 | | | $ | — | | | $ | 2,675,287 | | |
| Closed-End Funds | | | — | | | | 22,722 | | | | — | | | | 22,722 | | |
| Pooled Investment Vehicle | | | — | | | | 13,617 | | | | — | | | | 13,617 | | |
| Total Equity | | | 1,279,370 | | | | 1,432,256 | | | | — | | | | 2,711,626 | | |
| Short-Term Investments | | | 27,065 | | | | — | | | | — | | | | 27,065 | | |
| Total Investments in Securities | | $ | 1,306,435 | | | $ | 1,432,256 | | | $ | — | | | $ | 2,738,691 | | |
page 80

NOTES TO FINANCIAL STATEMENTS (continued)
June 30, 2012
HEXAM Emerging Markets
| Description | | Level 1 | | Level 2 | | Level 3 | | Total | |
| Equity (a) | | | | | | | | | | | | | | | | | |
| Common Stocks | | $ | 4,049,047 | | | $ | 14,212,863 | | | $ | — | | | $ | 18,261,910 | | |
| Preferred Stocks | | | 1,246,605 | | | | — | | | | — | | | | 1,246,605 | | |
| Total Equity | | | 5,295,652 | | | | 14,212,863 | | | | — | | | | 19,508,515 | | |
| Short-Term Investments | | | 234,245 | | | | — | | | | — | | | | 234,245 | | |
| Total Investments in Securities | | $ | 5,529,897 | | | $ | 14,212,863 | | | $ | — | | | $ | 19,742,760 | | |
Timpani Small Cap Growth
| Description | | Level 1 | | Level 2 | | Level 3 | | Total | |
| Equity (a) | | | | | | | | | | | | | | | | | |
| Common Stocks | | $ | 2,793,561 | | | $ | — | | | $ | — | | | $ | 2,793,561 | | |
| Total Equity | | | 2,793,561 | | | | — | | | | — | | | | 2,793,561 | | |
| Short-Term Investments | | | 84,495 | | | | — | | | | — | | | | 84,495 | | |
| Total Investments in Securities | | $ | 2,878,056 | | | $ | — | | | $ | — | | | $ | 2,878,056 | | |
Netols Small Cap Value
| Description | | Level 1 | | Level 2 | | Level 3 | | Total | |
| Equity (a) | | | | | | | | | | | | | | | | | |
| Common Stocks | | $ | 136,333,744 | | | $ | — | | | $ | — | | | $ | 136,333,744 | | |
| Real Estate Investment Trusts | | | 13,648,782 | | | | — | | | | — | | | | 13,648,782 | | |
| Total Equity | | | 149,982,526 | | | | — | | | | — | | | | 149,982,526 | | |
| Short-Term Investments | | | 2,461,728 | | | | — | | | | — | | | | 2,461,728 | | |
| Total Investments in Securities | | $ | 152,444,254 | | | $ | — | | | $ | — | | | $ | 152,444,254 | | |
Phocas Small Cap Value
| Description | | Level 1 | | Level 2 | | Level 3 | | Total | |
| Equity (a) | | | | | | | | | | | | | | | | | |
| Common Stocks | | $ | 18,737,224 | | | $ | — | | | $ | — | | | $ | 18,737,224 | | |
| Closed End Funds | | | 348,639 | | | | — | | | | — | | | | 348,639 | | |
| Real Estate Investment Trusts | | | 2,514,029 | | | | — | | | | — | | | | 2,514,029 | | |
| Total Equity | | | 21,599,892 | | | | — | | | | — | | | | 21,599,892 | | |
| Short-Term Investments | | | 1,057,521 | | | | — | | | | — | | | | 1,057,521 | | |
| Total Investments in Securities | | $ | 22,657,413 | | | $ | — | | | $ | — | | | $ | 22,657,413 | | |
Lockwell Small Cap Value
| Description | | Level 1 | | Level 2 | | Level 3 | | Total | |
| Equity (a) | | | | | | | | | | | | | | | | | |
| Common Stocks | | $ | 2,197,594 | | | $ | — | | | $ | — | | | $ | 2,197,594 | | |
| Real Estate Investment Trusts | | | 44,471 | | | | — | | | | — | | | | 44,471 | | |
| Exchange Traded Fund | | | 117,304 | | | | — | | | | — | | | | 117,304 | | |
| Total Equity | | | 2,359,369 | | | | — | | | | — | | | | 2,359,369 | | |
| Short-Term Investments | | | 92,568 | | | | — | | | | — | | | | 92,568 | | |
| Total Investments in Securities | | $ | 2,451,937 | | | $ | — | | | $ | — | | | $ | 2,451,937 | | |
(a) See Fund's Schedule of Investments for sector or country classifications
page 81

NOTES TO FINANCIAL STATEMENTS (continued)
June 30, 2012
| | | SAM
Global Equity | | HEXAM
Emerging Markets | |
| Transfers out of Level 1 | | $ | (8,339,032 | ) | | $ | (14,212,863 | ) | |
| Transfers into Level 2 | | $ | 8,339,032 | | | $ | 14,212,863 | | |
| Net transfers | | $ | — | | | $ | — | | |
Transfers between Level 1 and Level 2 relate to the use of systematic fair valuation. On days when systematic fair valuation is used, non-U.S. dollar denominated securities move from Level 1 to a Level 2 classification. At June 30, 2011, securities in the SAM Global Equity Fund and HEXAM Emerging Markets Fund were not adjusted using systematic fair valuation. During the period, securities in the MFG Global Equity Fund and MFG Core Infrastructure Fund were considered Level 1 securities at the time of purchase. At June 30, 2012, securities in the SAM Global Equity Fund, MFG Global Equity Fund, MFG Core Infrastructure Fund and HEXAM Emerging Markets Fund were adjusted using systematic fair valuation resulting in a Level 2 classification. There were no other transfers into or out of Level 1, Level 2 or Level 3 in any of the Funds. It is the Funds' policy to record transfers at the end of the reporting period.
(b) Federal Income Taxes
Each Fund intends to comply with the requirements of Subchapter M of the Internal Revenue Code necessary to qualify as a regulated investment company and to make the requisite distributions of income and capital gains to its shareholders sufficient to relieve it from all or substantially all federal income taxes. Therefore, no federal income tax provision has been provided.
The Funds have adopted financial reporting rules regarding recognition and measurement of tax positions taken or expected to be taken on a tax return. The Funds recognized interest and penalties, if any, related to unrecognized tax benefits as income tax expense on the Statement of Operations. During the fiscal year, the Funds did not incur any interest or penalties. The Funds have reviewed all open tax years and concluded that there is no effect to any of the Fund's financial positions or results of operations and no tax liability resulting from unrecognized tax benefits relating to uncertain income tax position taken or expected to be taken on a tax return. Open tax years are those years that are open for examination by the relevant income taxing authority. As of June 30, 2012, open federal and state income tax years include the tax years ended June 30, 2009, June 30, 2010, June 30, 2011 and June 30, 2012. The Funds have no examinations in progress. The Funds are also not aware of any tax positions for which it is reasonably possible that the total amounts of unrecognized tax expense will significantly change in twelve months.
(c) Distributions to Shareholders
Dividends from net investment income and net realized gains, if any, are declared and paid at least annually.
All short-term capital gains are included in ordinary income for tax purposes. Distributions to shareholders are recorded on the ex-dividend date.
The tax character of distributions paid during the years ended June 30, 2012 and June 30, 2011 were as follows:
| | | Year Ended June 30, 2012 | | Period Ended June 30, 2011 | |
| | | Ordinary
Income | | Long-Term
Capital Gains | | Total
Distributions | | Ordinary
Income | | Long-Term
Capital Gains | | Total
Distributions | |
| SAM Global Equity | | $ | 1,035,293 | | | $ | 558,833 | | | $ | 1,594,126 | | | $ | 911,892 | | | $ | 38,088 | | | $ | 949,980 | | |
| HEXAM Emerging Markets | | | 312,061 | | | | — | | | | 312,061 | | | | — | | | | — | | | | — | | |
| Netols Small Cap Value | | | — | | | | — | | | | — | | | | 28,623 | | | | — | | | | 28,623 | | |
| Phocas Small Cap Value | | | 14,041 | | | | — | | | | 14,041 | | | | 50,863 | | | | — | | | | 50,863 | | |
| Lockwell Small Cap Value | | | 528 | | | | — | | | | 528 | | | | — | | | | — | | | | — | | |
page 82

NOTES TO FINANCIAL STATEMENTS (continued)
June 30, 2012
Pursuant to Internal Revenue Code Section 852(b)(3), the SAM Global Equity Fund designated as long-term capital gain dividend the amount necessary to reduce the earnings and profits of the Fund related to net capital gain to zero for the tax year ended June 30, 2011.
The HEXAM Emerging Markets Fund and Timpani Small Cap Growth Fund commenced operations on December 20, 2010 and March 23, 2011, respectively. Neither Fund paid distributions during fiscal year 2011. The Lockwell Small Cap Value Fund, MFG Global Equity Fund and MFG Core Infrastructure Fund commenced operations on July 1, 2011, December 28, 2011 and January 18, 2012, respectively; therefore, there is no information to be reported in the prior fiscal period.
At June 30, 2012 the components of accumulated earnings/losses on a tax basis were as follows:
| | | SAM
Global
Equity | | MFG
Global
Equity | | MFG
Core
Infrastructure | | HEXAM
Emerging
Markets | | Timpani
Small Cap
Growth | | Netols
Small Cap
Value | | Phocas
Small Cap
Value | | Lockwell
Small Cap
Value | |
| Cost of investments | | $ | 19,510,012 | | | $ | 108,704,216 | | | $ | 2,661,638 | | | $ | 25,452,806 | | | $ | 2,350,283 | | | $ | 120,080,149 | | | $ | 19,456,379 | | | $ | 2,343,606 | | |
Gross unrealized
appreciation | | $ | 2,056,576 | | | $ | 3,077,161 | | | $ | 129,557 | | | $ | 384,346 | | | $ | 577,602 | | | $ | 41,684,144 | | | $ | 4,150,804 | | | $ | 214,419 | | |
Gross unrealized
depreciation | | | (1,812,956 | ) | | | (3,636,986 | ) | | | (52,504 | ) | | | (6,094,392 | ) | | | (49,829 | ) | | | (9,320,039 | ) | | | (949,770 | ) | | | (106,088 | ) | |
Net unrealized
appreciation/
depreciation | | | 243,620 | | | | (559,825 | ) | | | 77,053 | | | | (5,710,046 | ) | | | 527,773 | | | | 32,364,105 | | | | 3,201,034 | | | | 108,331 | | |
Undistributed
ordinary income | | | 160,287 | | | | 654,846 | | | | 66,028 | | | | 120,490 | | | | — | | | | — | | | | 39,983 | | | | 4,755 | | |
Undistributed
long-term
capital gain | | | — | | | | — | | | | — | | | | — | | | | — | | | | — | | | | — | | | | — | | |
Total distributable
earnings | | | 160,287 | | | | 654,846 | | | | 66,028 | | | | 120,490 | | | | — | | | | — | | | | 39,983 | | | | 4,755 | | |
Other accumulated
gains(losses) | | | (193,980 | ) | | | (2,258 | ) | | | 170 | | | | (2,929,407 | ) | | | (465,742 | ) | | | (944,632 | ) | | | (2,769,735 | ) | | | — | | |
Total accumulated
earnings/(losses) | | $ | 209,927 | | | $ | 92,763 | | | $ | 143,251 | | | $ | (8,518,963 | ) | | $ | 62,031 | | | $ | 31,419,473 | | | $ | 471,282 | | | $ | 113,086 | | |
The difference between book-basis and tax-basis unrealized appreciation is attributable primarily to the tax deferral of losses on wash sales.
page 83

NOTES TO FINANCIAL STATEMENTS (continued)
June 30, 2012
As of the end of their tax year ended June 30, 2012, the following Funds have capital loss carry forward ("CLCFs") as summarized in the table below. Under the provision of the Regulated Investment Company Modernization Act of 2010, CLCFs that originated in a tax year that began before December 23, 2010 (pre-effective CLCFs) may be carried forward, subject to certain limitations, and applied to offset future capital gains, and thus reduce the amount of distributable capital gains, for up to eight succeeding tax years, after which any unutilized CLCFs expire. Pre-effective CLCFs are applied as short-term capital loss regardless of whether the originating capital loss was short term or long term. CLCFs that originate in tax years beginning after December 22, 2010 (post effective CLCFs), are applied consistent with the character in which they originated as a new loss on the first day of the immediately succeeding tax year, and thus take precedent over the application of pre-effective CLCFs. Post-effective CLCFs can be carried forward indefinitely.
Pre-effective CLCFs subject to expiration:
| | | Expires | | | |
| Fund | | 6/30/17 | | 6/30/18 | | Total | |
| Netols Small Cap Value | | $ | — | | | $ | 927,876 | | | $ | 927,876 | | |
| Phocas Small Cap Value | | | 2,652,152 | | | | — | | | | 2,652,152 | | |
Post-effective CLCFs not subject to expiration:
| Fund | | Short-term
Amount | | Long-term
Amount | | Total | |
| HEXAM Emerging Markets | | $ | 951,691 | | | $ | — | | | $ | 951,691 | | |
| Timpani Small Cap Growth | | | 338,941 | | | | — | | | | 338,941 | | |
During the year ended June 30, 2012, the Funds utilized capital loss carry forwards as follows:
| Fund | | Amount | |
| Netols Small Cap Value | | $ | 2,783,078 | | |
| Phocas Small Cap Value | | | 213,133 | | |
In order to meet certain excise tax requirements, the Funds are required to measure and distribute annually, net capital gains realized during the twelve month period ending October 31st. In connection with this requirement, the Funds are permitted, for tax purposes, to defer into their next fiscal year any net capital losses incurred from November 1st through the end of the fiscal year. As of June 30, 2012, the following Funds deferred, on a tax basis, post October losses and post December late-year losses of:
| | | Post-October
Capital Loss Deferred | | Late-Year Net Investment Income Loss
Deferred Per Regulated Investment
Company Modernization Act of 2010 | |
| SAM Global Equity | | $ | 195,629 | | | $ | — | | |
| HEXAM Emerging Markets | | | 1,974,369 | | | | — | | |
| Timpani Small Cap Growth | | | 114,530 | | | | 12,271 | | |
| Netols Small Cap Value | | | — | | | | 16,756 | | |
| Phocas Small Cap Value | | | 117,583 | | | | — | | |
page 84

NOTES TO FINANCIAL STATEMENTS (continued)
June 30, 2012
(d) Foreign Currency Translation
Values of investments denominated in foreign currencies are converted into U.S. dollars using a spot market rate of exchange each day. Purchases and sales of investments and dividend and interest income are translated to U.S. dollars using a spot market rate of exchange prevailing on the dates of such transactions. The portion of security gains or losses resulting from changes in foreign exchange rates are included with net realized and unrealized gain or loss from investments, as appropriate, for both financial reporting and tax purposes.
Each Fund, respectively, bears the risk of changes in the foreign currency exchange rates and their impact on the value of assets and liabilities denominated in foreign currency. Each Fund also bears the risk of a counterparty failing to fulfill its obligation under a foreign currency contract.
Investments in securities of foreign companies involve additional risks including: currency exchange rate fluctuation; less available public information about the issuers of securities; less stringent regulatory standards; lack of uniform accounting, auditing and financial reporting standards; and country risks including less liquidity, high inflation rates and political and economic instability. The risks of foreign investments are typically greater in emerging and less developed markets.
(e) Indemnifications
Under the Funds' organizational documents, their officers and directors are indemnified against certain liabilities arising out of the performance of their duties to the Funds. In addition, in the normal course of business, the Funds enter into contracts that provide general indemnifications to other parties. The Funds' maximum exposure under these arrangements is unknown as this would involve future claims that may be made against the Funds that have not yet occurred. However, the Funds have not had prior claims or losses pursuant to these contracts and expect the risk of loss to be remote.
(f) Other
Investment transactions are accounted for on the trade date. The Funds determine the gain or loss realized from investment transactions by comparing the original cost of the specifically identified security lot sold with the net sale proceeds. Dividend income, less foreign taxes withheld, is recognized on the ex-dividend date, except that certain dividends from foreign securities are recorded as soon as the information becomes available to the Funds. Interest income is recognized on an accrual basis. All discounts/premiums are accreted/amortized using the effective interest method and are included in interest income. Withholding taxes on foreign dividends have been provided for in accordance with the Funds' understanding of the applicable country's tax codes and regulations.
Income, expenses (other than expenses attributable to a specific class) and realized and unrealized gains or losses on investments attributable to the Funds are generally allocated to each respective class in proportion to the relative net assets of each class.
The preparation of financial statements in conformity with U.S. generally accepted accounting principles ("GAAP") requires management to make estimates and assumptions that affect the reported amounts of assets and liabilities and disclosure of contingent assets and liabilities at the date of the financial statements, and the reported amounts of increases and decreases in net assets from operations during the reporting period. Actual results could differ from those estimates.
Net investment income and realized gains and losses for federal income tax purposes may differ from that reported on the financial statements because of permanent book-to-tax differences. GAAP requires that permanent differences in net investment income and realized gains and losses due to differences between financial reporting and tax reporting be reclassified between various
page 85

NOTES TO FINANCIAL STATEMENTS (continued)
June 30, 2012
components of net assets. These reclassifications have no effect on net assets or net asset value per share. For the year ended June 30, 2012, the following table shows the reclassifications made:
| | | SAM
Global
Equity | | MFG
Global
Equity | | MFG
Core
Infrastructure | | HEXAM
Emerging
Markets | | Timpani
Small Cap
Growth | | Netols
Small Cap
Value | | Phocas
Small Cap
Value | | Lockwell
Small Cap
Value | |
| Paid in capital | | $ | — | | | $ | — | | | $ | — | | | $ | — | | | $ | (9,345 | ) | | $ | (254,195 | ) | | $ | (617 | ) | | $ | — | | |
Accumulated net
investment income (loss) | | | (51,609 | ) | | | (14,867 | ) | | | 7,762 | | | | (68,244 | ) | | | 9,343 | | | | 254,195 | | | | 617 | | | | — | | |
Accumulated net
realized gain (loss) | | | 51,609 | | | | 14,867 | | | | (7,762 | ) | | | 68,244 | | | | 2 | | | | — | | | | — | | | | — | | |
The permanent differences primarily relate to foreign currency, net operating losses, and capital loss carryforward limitations.
(3) INVESTMENT ADVISER AND RELATED PARTIES
The SAM Global Equity, MFG Global Equity, MFG Core Infrastructure, HEXAM Emerging Markets, Netols Small Cap Value and Phocas Small Cap Value Funds have entered into an agreement with Frontegra, with whom certain officers and a director of the Funds are affiliated, to furnish investment advisory services to the Funds. Timpani, an affiliate of Frontegra, is the investment adviser to the Frontegra Timpani Small Cap Growth Fund. Lockwell is the investment adviser to the Lockwell Small Cap Value Fund. Fees are calculated daily and payable monthly, at annual rates set forth in the following table (expressed as a percentage of each Fund's average daily net assets). Pursuant to expense cap agreements, Frontegra, Timpani and Lockwell have agreed to waive their respective management fees and/or reimburse each Fund's operating expenses (exclusive of brokerage, interest, taxes and extraordinary expenses) to ensure that each Fund's operating expenses do not exceed the expense limitation listed below. Expenses waived are netted with advisory fees payable on the Statements of Assets and Liabilities. On a monthly basis, these accounts are settled by each Fund making payment to the respective adviser or the respective adviser reimbursing the Fund if the reimbursement amount exceeds the advisory fee. If the amount of fees waived exceeds the advisory fee earned, this is shown on the Statement of Assets and Liabilities as a receivable from the respective adviser. The expense cap agreements will continue in effect until October 31, 2013, with successive renewal terms of one year unless terminated by an adviser or a Fund prior to any such renewal.
| Frontegra Fund | | Annual Advisory Fees | | Expense Limitation | |
| SAM Global Equity | | | 0.80 | % | | | 1.20 | % | |
| MFG Global Equity | | | 0.80 | % | | | 0.80 | % | |
| MFG Core Infrastructure | | | 0.70 | % | | | 0.70 | % | |
| HEXAM Emerging Markets | | | 0.90 | % | | | 1.30 | % | |
| Timpani Small Cap Growth | | | 1.00 | % | | | 1.10 | % | |
| Netols Small Cap Value - Institutional Class | | | 1.00 | % | | | 1.10 | % | |
| Netols Small Cap Value - Class Y | | | 1.00 | % | | | 1.50 | % | |
| Phocas Small Cap Value - Class L | | | 1.00 | % | | | 0.99 | % | |
| Phocas Small Cap Value - Class I | | | 1.00 | % | | | 1.10 | % | |
| Lockwell Small Cap Value | | | 1.00 | % | | | 1.10 | % | |
Any waivers or reimbursements are subject to later adjustment to allow the advisers to recoup amounts waived or reimbursed to the extent actual fees and expenses for a fiscal period are less than each Fund's expense limitation cap, provided, however, that an adviser shall only be entitled to recoup such amounts for a period of three years from the date such amount was waived or reimbursed. Expenses attributable to a specific class may only be recouped with respect to that class.
page 86

NOTES TO FINANCIAL STATEMENTS (continued)
June 30, 2012
The following table shows the waived or reimbursed expenses subject to potential recovery expiring in:
| | | SAM
Global
Equity | | MFG
Global
Equity | | MFG
Core
Infrastructure | | HEXAM
Emerging
Markets | | Timpani
Small Cap
Growth | | Netols
Small Cap
Value | | Phocas
Small Cap
Value | | Lockwell
Small Cap
Value | |
| | 2013 | | | $ | — | | | $ | — | | | $ | — | | | $ | — | | | $ | — | | | $ | 75,253 | | | $ | — | | | $ | — | | |
| | 2014 | | | | 26,548 | * | | | — | | | | — | | | | 75,925 | | | | 46,572 | | | | 53,689 | | | | 104,993 | ** | | | — | | |
| | 2015 | | | | 78,884 | | | | 95,480 | *** | | | 66,588 | **** | | | 77,799 | | | | 103,400 | | | | 194,049 | | | | 146,574 | | | | 109,516 | | |
| | Total | | | $ | 105,432 | | | $ | 95,480 | | | $ | 66,588 | | | $ | 153,724 | | | $ | 149,972 | | | $ | 322,991 | | | $ | 251,567 | | | $ | 109,516 | | |
* Expenses waived/reimbursed were for the period June 10, 2011 through June 30, 2011.
** Expenses waived/reimbursed were for the period October 8, 2010 through June 30, 2011.
*** Expenses waived/reimbursed were for the period December 28, 2011 through June 30, 2012.
**** Expenses waived/reimbursed were for the period January 18, 2012 through June 30, 2012.
The Frontegra Phocas Small Cap Value Fund has entered into a subadministration agreement with Frontegra under which Frontegra provides certain shareholder and subadministrative services to Class I shareholders of the Fund. For its services, Frontegra, with whom certain officers and a director of the Fund are affiliated, receives an annual fee of 0.11% of Class I average net assets. This fee is calculated daily and payable monthly.
The beneficial ownership, either directly or indirectly, of more than 25% of the voting securities creates a presumption of control of the Funds. As of June 30, 2012, affiliates of Frontegra owned a controlling interest in the Frontegra MFG Core Infrastructure Fund and affiliates of Timpani owned a controlling interest in the Frontegra Timpani Small Cap Growth Fund. As of June 30, 2012, one shareholder owned a controlling interest in the Frontegra MFG Global Equity Fund, but is not considered an affiliate of Frontegra. Shareholders with a controlling interest could affect the outcome of proxy voting or the direction of management of a Fund.
(4) INVESTMENT TRANSACTIONS
The aggregate purchases and sales of securities, excluding short-term investments for the Funds for the year ended June 30, 2012 are summarized below:
| | | SAM
Global
Equity | | MFG
Global
Equity | | MFG
Core
Infrastructure | | HEXAM
Emerging
Markets | | Timpani
Small Cap
Growth | | Netols
Small Cap
Value | | Phocas
Small Cap
Value | | Lockwell
Small Cap
Value | |
| Purchases | | $ | 11,992,668 | | | $ | 114,384,153 | | | $ | 2,801,355 | | | $ | 21,924,958 | | | $ | 4,255,113 | | | $ | 43,608,202 | | | $ | 12,568,136 | | | $ | 3,439,058 | | |
| Sales | | $ | 9,599,867 | | | $ | 9,243,190 | | | $ | 176,704 | | | $ | 19,121,522 | | | $ | 3,410,771 | | | $ | 63,711,101 | | | $ | 10,198,367 | | | $ | 1,187,980 | | |
There were no purchases or sales of U.S. Government securities for the Funds.
(5) DISTRIBUTION PLAN AND SHAREHOLDER SERVICING FEE
Frontegra, on behalf of the Frontegra Netols Small Cap Value Fund and the Frontegra Timpani Small Cap Growth Fund, has adopted a distribution plan pursuant to Rule 12b-1 under the Investment Company Act of 1940 for each Fund's Class Y shares (the "12b-1 Plan"). Pursuant to the 12b-1 Plan, the Fund pays an annual fee of up to 0.25% to Frontegra Strategies, LLC (the "Distributor"), an affiliate of Frontegra, for payments to brokers, dealers and other financial intermediaries who perform activities or incur expenses intended to result in the sale of Class Y shares of the Fund. As of June 30, 2012, the Class Y shares of the Frontegra Timpani Small
page 87

NOTES TO FINANCIAL STATEMENTS (continued)
June 30, 2012
Cap Growth Fund had not commenced operations. For the year ended June 30, 2012, the Netols Small Cap Value Fund Class Y shares incurred $47,854 under the 12b-1 Plan.
Class Y shares of the Funds also pay an annual shareholder servicing fee of up to 0.15% per year to the Distributor for payments to brokers, dealers, and other financial intermediaries who provide on-going account services to shareholders. Those services include establishing and maintaining shareholder accounts, mailing prospectuses, account statements and other Fund documents to shareholders, processing shareholder transactions, and providing other recordkeeping and administrative services. For the year ended June 30, 2012, the Netols Small Cap Value Fund Class Y shares incurred $28,713 in shareholder servicing expenses.
page 88

REPORT OF INDEPENDENT REGISTERED PUBLIC ACCOUNTING FIRM
June 30, 2012
To the Shareholders and Board of Directors
Frontegra Funds, Inc.
We have audited the accompanying statements of assets and liabilities, including the schedules of investments, of Frontegra Funds, Inc., comprising the Frontegra SAM Global Equity Fund, Frontegra MFG Global Equity Fund, Frontegra MFG Core Infrastructure Fund, Frontegra HEXAM Emerging Markets Fund, Frontegra Timpani Small Cap Growth Fund, Frontegra Netols Small Cap Value Fund, Frontegra Phocas Small Cap Value Fund, and Lockwell Small Cap Value Fund (the "Funds"), as of June 30, 2012, and the related statements of operations, changes in net assets and financial highlights for the year or period then ended. These financial statements and financial highlights are the responsibility of the Funds' management. Our responsibility is to express an opinion on these financial statements and financial highlights based on our audit. The statements of changes in net assets and financial highlights for the periods ended prior to June 30, 2012, were audited by another independent registered public accounting firm, which expressed unqualified opinions on those statements and financial highlights.
We conducted our audit in accordance with the standards of the Public Company Accounting Oversight Board (United States). Those standards require that we plan and perform the audit to obtain reasonable assurance about whether the financial statements and financial highlights are free of material misstatement. An audit includes examining, on a test basis, evidence supporting the amounts and disclosures in the financial statements. Our procedures included confirmation of securities owned as of June 30, 2012, by correspondence with the custodian and brokers or by other appropriate auditing procedures where replies from brokers were not received. An audit also includes assessing the accounting principles used and significant estimates made by management, as well as evaluating the overall financial statement presentation. We believe that our audit provides a reasonable basis for our opinion.
In our opinion, the financial statements and financial highlights referred to above present fairly, in all material respects, the financial position of each of the funds constituting Frontegra Funds, Inc. as of June 30, 2012, the results of their operations, the changes in their net assets and the financial highlights for the year or period then ended, in conformity with accounting principles generally accepted in the United States of America.

Westlake, Ohio
August 24, 2012
page 89

BOARD OF DIRECTORS' APPROVAL OF ADVISORY AND
SUBADVISORY AGREEMENTS
(Unaudited)
Renewal of Advisory Agreement for Frontegra Timpani Small Cap Growth Fund
The Board of Directors (the "Board") of Frontegra Funds, Inc. (the "Company") met on May 22, 2012 to consider the annual renewal of the investment advisory agreement with Timpani Capital Management LLC ("Timpani") (the "Timpani Advisory Agreement") for the Frontegra Timpani Small Cap Growth Fund, a portfolio of the Company (the "Timpani Small Cap Growth Fund").
When the Board reviewed the Timpani Advisory Agreement, the Board was provided materials relevant to its consideration of the agreement, such as Timpani's Form ADV and Code of Ethics, information regarding Timpani's compliance program, personnel and financial condition and a memorandum prepared by the Company's legal counsel. The Board also reviewed the advisory fee payable by the Timpani Small Cap Growth Fund under the Timpani Advisory Agreement, the expense cap agreement between the Company and Timpani on behalf of the Timpani Small Cap Growth Fund and comparative fee and expense information provided by an independent third party. The Board was also provided with Timpani's response to a detailed request submitted by the Company's legal counsel on behalf of the directors. The independent directors met in executive session to discuss the materials and the proposed approval of the Timpani Advisory Agreement.
In considering the Timpani Advisory Agreement, the Board reviewed and analyzed various factors with respect to the Timpani Small Cap Growth Fund that it determined were relevant, including the factors below, and made the following conclusions. In its deliberations, the Board did not identify any single factor as determinative.
Nature, Extent and Quality of the Services to be Provided. The Board considered Timpani's background and services it would continue to provide to the Timpani Small Cap Growth Fund and its shareholders under the Timpani Advisory Agreement. The Board discussed the fact that Timpani had chosen the Timpani Small Cap Growth Fund's investment strategy. The Board noted that Timpani had been managing small cap growth accounts since 2008 and that Brandon M. Nelson, the sole portfolio manager, Chief Investment Officer and a director of Timpani, has 16 years of investment experience. The Board discussed Timpani's responsibilities for overseeing the Timpani Small Cap Growth Fund's activities and for monitoring its compliance with applicable requirements under the securities laws. The Board concluded that the range of services to be provided by Timpani was appropriate and that Timpani was qualified to provide such services.
Performance Record of the Timpani Small Cap Growth Fund. The Board reviewed the Fund's performance for the period ended December 31, 2011 and the year ended March 31, 2012. The Board noted that the Fund lagged the benchmark index for the first period and outperformed the index for the second period. The Board also reviewed the historical performance for Timpani's small cap growth private accounts. The Board concluded that Timpani appeared to have an effective small cap growth investment process.
Advisory Fees. The Board compared the Timpani Small Cap Growth Fund's contractual advisory fee and total expense ratio to the industry data provided by an independent service with respect to other mutual funds in the same peer group. The Board noted that the Timpani Small Cap Growth Fund's advisory fee was slightly above the industry average. The Board noted that, after giving effect to the expense cap agreement, the total expense ratio was comparable to the industry average for Class Y shares and below the industry average for Institutional Class shares. The Board concluded that the advisory fee to be paid by the Timpani Small Cap Growth Fund to Timpani was reasonable in light of the nature and quality of services to be provided and fees paid by comparable funds.
Costs and Profitability. The Board reviewed information concerning Timpani's financial condition, costs and profitability. The Board also considered the effect of the expense cap agreement on Timpani's compensation, noting that the Fund had not yet reached financial "break even." Given that Timpani was not yet realizing a profit from the Fund, the Board concluded that the advisory fee was reasonable.
Economies of Scale. Given the Fund's current asset level, the Board did not consider whether any alternative fee structures, such as breakpoint fees, would be appropriate to reflect any economies of scale that may result from increases in the Timpani Small Cap Growth Fund's assets.
page 90

Benefits to Timpani. The Board considered information presented regarding any benefits to Timpani or its affiliates from serving as adviser to the Timpani Small Cap Growth Fund (in addition to the advisory fee). The Board noted that Timpani's affiliate, Frontier Partners, Inc. ("Frontier"), provides consulting services to, and is compensated by, Timpani. However, the Board determined that Timpani's services to the Timpani Small Cap Growth Fund would not be compromised by this potential conflict of interest. The Board also noted that William D. Forsyth III, the president of the Company and Frontier, is also the president and an officer of Timpani and that Frontier and its affiliates provide various services to Timpani with respect to the Fund. The Board considered other benefits to Timpani from its relationship with the Fund and concluded such benefits were appropriate.
On the basis of its review of the foregoing information, the Board found that the terms of the Timpani Advisory Agreement were fair and reasonable and in the best interests of the shareholders of the Timpani Small Cap Growth Fund.
Renewal of Advisory Agreement and Subadvisory Agreements for Frontegra Netols Small Cap Value Fund, Frontegra HEXAM Emerging Markets Fund and Frontegra Phocas Small Cap Value Fund
At the May 22, 2012 meeting, the Board also considered the annual renewal of the investment advisory agreement with Frontegra (the "Frontegra Advisory Agreement") and the subadvisory agreements for the Frontegra Netols Small Cap Value Fund, Frontegra HEXAM Emerging Markets Fund and Frontegra Phocas Small Cap Value Fund, portfolios of the Company (each a "Fund" and collectively, the "Funds"). The independent directors met in executive session to consider the Frontegra Advisory Agreement and subadvisory agreements.
Frontegra Advisory Agreement
When the Board reviewed the Frontegra Advisory Agreement, the Board was provided materials relevant to its consideration of the agreement, such as Frontegra's Form ADV and Code of Ethics, information regarding Frontegra's compliance program, personnel and financial condition and a memorandum prepared by the Company's legal counsel. The Board also reviewed the advisory fee payable by each Fund under the Frontegra Advisory Agreement, the proposed expense cap agreements between the Company and Frontegra on behalf of each Fund and comparative fee and expense information provided by an independent third party. The Board was also provided with Frontegra's response to a detailed request submitted by the Company's legal counsel on behalf of the directors.
In considering the Frontegra Advisory Agreement, the Board reviewed and analyzed various factors with respect to each Fund that it determined were relevant, including the factors below, and made the following conclusions. In its deliberations, the Board did not identify any single factor as determinative.
Nature, Extent and Quality of the Services to be Provided. The Board considered Frontegra's background and services it would continue to provide to the Funds and their shareholders under the Frontegra Advisory Agreement. The Board discussed the fact that Frontegra had chosen the investment strategy for each Fund and had selected the subadvisers to make the day-to-day investment decisions for the Funds. The Board noted that Frontegra has 16 years of experience in hiring and supervising subadvisers to portfolios in the Frontegra family of funds. The Board discussed Frontegra's responsibilities for overseeing the subadvisers and for monitoring each Fund's compliance with applicable requirements under the securities laws. The Board also discussed the shareholder servicing and administrative services provided by Frontegra to the Funds. The Board concluded that the range of services to be provided by Frontegra was appropriate and that Frontegra was qualified to provide such services.
Performance Record of the Funds. As described in more detail under "Board Renewal of Subadvisory Agreements," the Board reviewed each Fund's performance record for the periods ended December 31, 2011 and March 31, 2012. The Board concluded that Frontegra has developed the necessary expertise and resources in selecting and managing qualified subadvisers to provide investment advisory services to the Funds in accordance with each Fund's investment objective and strategy.
page 91

Advisory Fees. The Board compared each Fund's contractual advisory fee and total expense ratio to the industry data provided by an independent service with respect to other mutual funds in the same peer group. The Board noted that the advisory fee for the Netols Small Cap Value Fund was above the industry average. The total expense ratio for Institutional Class shares of the Fund was in line with the industry average while the total expense ratio for Class Y shares of the Fund was above the industry average. The Board noted that the advisory fee and total expense ratio for the HEXAM Emerging Markets Fund were both below the industry average. With respect to the Phocas Small Cap Value Fund, the Board noted that the advisory fee was in line with the industry average and the total expense ratio for both Class I and Class L shares was well below the industry average. The Board concluded that the advisory fee to be paid by each Fund to Frontegra was reasonable in light of the nature and quality of services to be provided and fees paid by comparable funds.
Costs and Profitability. The Board reviewed information concerning Frontegra's financial condition, costs and profitability. The Board also considered the effect of the contractual expense cap agreements on Frontegra's compensation. The Board noted that Frontegra was reimbursing expenses to all three Funds. The Board concluded that Frontegra's current level of profitability was reasonable considering the quality of management and the fact that Frontegra was waiving its fees and/or reimbursing expenses for the Funds.
Economies of Scale. The Board reviewed net asset growth on a per Fund and aggregate basis and considered whether there may be economies of scale in the management of each Fund if its assets were to increase significantly. However, the Board concluded that the assets of the Funds were not likely to increase to such an extent that breakpoints would be appropriate, particularly in light of the expense cap agreements in place between Frontegra and each Fund.
Benefits to Frontegra. The Board considered information presented regarding any benefits to Frontegra or its affiliates from serving as adviser to the Funds (in addition to the advisory fee). The Board noted that Frontier, an affiliate of Frontegra, provides consulting services to, and is compensated by, two of the subadvisers. However, the Board determined that Frontegra's services to the Funds would not be compromised by this potential conflict of interest. The Board also noted that Frontegra receives a subadministration fee from the Phocas Fund Class I shares.
On the basis of its review of the foregoing information, the Board found that the terms of the Frontegra Advisory Agreement were fair and reasonable and in the best interests of each Fund's shareholders.
Renewal of Subadvisory Agreements
Frontegra Netols Small Cap Value Fund
When the Board reviewed the subadvisory agreement between Frontegra and Netols Asset Management, Inc. ("Netols") on behalf of the Frontegra Netols Small Cap Value Fund (the "Netols Small Cap Value Fund") (the "Netols Subadvisory Agreement"), the Board was provided materials relevant to its consideration of the Netols Subadvisory Agreement, such as Netols' Form ADV and Code of Ethics, information regarding Netols' compliance program, personnel and financial condition and a memorandum prepared by the Company's legal counsel. The Board also reviewed the subadvisory fee payable by Frontegra under the Netols Subadvisory Agreement and the expense cap agreement between the Company and Frontegra on behalf of the Netols Small Cap Value Fund. The Board was also provided with Netols' responses to a detailed request submitted by the Company's legal counsel on behalf of the directors.
In considering the Netols Subadvisory Agreement, the Board analyzed and reviewed various factors with respect to the Netols Small Cap Value Fund that it determined were relevant, including the factors below, and made the following conclusions. In its deliberations, the Board did not identify any single factor as determinative.
Nature, Extent and Quality of the Services to be Provided. The Board's analysis of the nature, extent and quality of Netols' services to the Fund took into account knowledge gained from Netols' presentations to the Board at meetings throughout the year. The Board reviewed and considered Netols' investment strategy and experience as a small-cap value manager, key personnel involved in providing investment management services to the Netols Small Cap Value Fund and financial condition. The Board also considered services provided by Netols
page 92

under the Netols Subadvisory Agreement, including the selection of broker-dealers for execution of portfolio transactions, monitoring adherence to the Fund's investment restrictions and assisting with the Fund's compliance with applicable securities laws and regulations. The Board concluded that the nature, extent and quality of the services provided by Netols to the Fund were appropriate and that the Fund was likely to continue to benefit from services provided by Netols under the Netols Subadvisory Agreement.
Investment Performance of Netols. The Board reviewed the performance record of the Netols Small Cap Value Fund and noted that the Fund had underperformed its benchmark index for the past one- and three-year periods ended March 31, 2012 and had outperformed the index for the five-year period ended March 31, 2012. The Board also considered Netols' quarterly portfolio commentary and review of the Fund's performance. The Board also compared the Fund's recent performance to the performance of Netols' composite of other accounts managed in the small cap value style. The Board concluded that the Fund's performance was satisfactory and that Netols would continue to provide a high level of subadvisory services to the Fund.
Subadvisory Fees. The Board reviewed and considered the subadvisory fee payable by Frontegra to Netols under the Netols Subadvisory Agreement. The Board determined that the subadvisory fee was appropriate. In evaluating the subadvisory fee, the Board noted that such amounts are paid by Frontegra and that therefore the overall advisory fee paid by the Fund is not directly affected by the subadvisory fee.
Costs and Profitability. The Board did not consider the cost of services provided by Netols or the profitability to Netols from its relationship with the Netols Small Cap Value Fund because it did not view these factors as relevant given that the subadvisory fee is paid by Frontegra.
Economies of Scale. Because the subadvisory fee is not paid by the Netols Small Cap Value Fund, the Board did not consider whether the fee should reflect any potential economies of scale that might be realized as the Fund's assets increase.
Benefits to Netols. The Board considered information presented regarding any benefits to Netols from serving as subadviser to the Netols Small Cap Value Fund (in addition to the subadvisory fee). Netols provided information to the Board regarding its receipt of unsolicited research from broker-dealers. The Board believed that Netols generally benefits from its association with the Fund. The Board concluded that the benefits realized by Netols from its relationship to the Fund were appropriate.
On the basis of its review of the foregoing information, the Board found that the terms of the Netols Subadvisory Agreement were fair and reasonable and in the best interests of the shareholders of the Netols Small Cap Value Fund.
Frontegra HEXAM Emerging Markets Fund
When the Board reviewed the subadvisory agreement between Frontegra and Hexam Capital Partners, LLP ("HEXAM") on behalf of the Frontegra HEXAM Emerging Markets Fund (the "HEXAM Emerging Markets Fund") (the "HEXAM Subadvisory Agreement"), the Board was provided materials relevant to its consideration of the HEXAM Subadvisory Agreement, such as HEXAM's Form ADV and Code of Ethics, information regarding HEXAM's compliance program, personnel and financial condition and a memorandum prepared by the Company's legal counsel. The Board also reviewed the subadvisory fee payable by Frontegra under the HEXAM Subadvisory Agreement and the expense cap agreement between the Company and Frontegra on behalf of the HEXAM Emerging Markets Fund. The Board was also provided with HEXAM's responses to a detailed request submitted by the Company's legal counsel on behalf of the directors.
In considering the HEXAM Subadvisory Agreement, the Board analyzed and reviewed various factors with respect to the HEXAM Emerging Markets Fund that it determined were relevant, including the factors below, and made the following conclusions. In its deliberations, the Board did not identify any single factor as determinative.
Nature, Extent and Quality of the Services to be Provided. The Board's analysis of the nature, extent and quality of HEXAM's services to the Fund took into account knowledge gained from HEXAM's presentations to the Board at meetings throughout the year. The Board reviewed and considered HEXAM's investment strategy and experience as an emerging markets manager, key personnel involved in providing investment management services to the HEXAM Emerging Markets Fund and financial condition. The Board also considered services
page 93

provided by HEXAM under the HEXAM Subadvisory Agreement, including the selection of broker-dealers for execution of portfolio transactions, monitoring adherence to the Fund's investment restrictions and assisting with the Fund's compliance with applicable securities laws and regulations. The Board concluded that the nature, extent and quality of the services provided by HEXAM to the Fund were appropriate and that the Fund was likely to continue to benefit from services provided by HEXAM under the HEXAM Subadvisory Agreement.
Investment Performance of HEXAM. The Board reviewed the performance record of the HEXAM Emerging Markets Fund and noted that the Fund had underperformed its benchmark index for the one-year period ended March 31, 2012. The Board also considered HEXAM's quarterly portfolio commentary and review of the Fund's performance, including discussion of the reason for the Fund's underperformance. The Board also reviewed the performance of HEXAM's composite of other accounts managed in the emerging markets style. The Board concluded that HEXAM would continue to provide a high level of subadvisory services to the Fund.
Subadvisory Fees. The Board reviewed and considered the subadvisory fee payable by Frontegra to HEXAM under the HEXAM Subadvisory Agreement. The Board determined that the subadvisory fee was appropriate. In evaluating the subadvisory fee, the Board noted that such amounts are paid by Frontegra and that therefore the overall advisory fee paid by the Fund is not directly affected by the subadvisory fee.
Costs and Profitability. The Board did not consider the cost of services provided by HEXAM or the profitability to HEXAM from its relationship with the HEXAM Emerging Markets Fund because it did not view these factors as relevant given that the subadvisory fee is paid by Frontegra.
Economies of Scale. Because the subadvisory fee is not paid by the HEXAM Emerging Markets Fund, the Board did not consider whether the fee should reflect any potential economies of scale that might be realized as the Fund's assets increase.
Benefits to HEXAM. The Board considered information presented regarding any benefits to HEXAM from serving as subadviser to the HEXAM Emerging Markets Fund (in addition to the subadvisory fee). The Board believed that HEXAM generally benefits from its association with the Fund. The Board concluded that the benefits realized by HEXAM from its relationship to the Fund were appropriate.
On the basis of its review of the foregoing information, the Board found that the terms of the HEXAM Subadvisory Agreement were fair and reasonable and in the best interests of the shareholders of the HEXAM Emerging Markets Fund.
Frontegra Phocas Small Cap Value Fund
When the Board reviewed the subadvisory agreement between Frontegra and Phocas Financial Corp. ("Phocas") on behalf of the Frontegra Phocas Small Cap Value Fund (the "Phocas Small Cap Value Fund") (the "Phocas Subadvisory Agreement"), the Board was provided materials relevant to its consideration of the Phocas Subadvisory Agreement, such as Phocas' Form ADV and Code of Ethics, information regarding Phocas' compliance program, personnel and financial condition and a memorandum prepared by the Company's legal counsel. The Board also reviewed the subadvisory fee payable by Frontegra under the Phocas Subadvisory Agreement and the expense cap agreement between the Company and Frontegra on behalf of the Phocas Small Cap Value Fund. The Board was also provided with Phocas' responses to a detailed request submitted by the Company's legal counsel on behalf of the directors.
In considering the Phocas Subadvisory Agreement, the Board analyzed and reviewed various factors with respect to the Phocas Small Cap Value Fund that it determined were relevant, including the factors below, and made the following conclusions. In its deliberations, the Board did not identify any single factor as determinative.
Nature, Extent and Quality of the Services to be Provided. The Board's analysis of the nature, extent and quality of Phocas' services to the Fund took into account knowledge gained from Phocas' presentations to the Board at meetings throughout the year. The Board reviewed and considered Phocas' investment strategy and experience as a small cap value manager, key personnel involved in providing investment management services to the Phocas Small Cap Value Fund and financial condition. The Board also considered services provided by Phocas under the Phocas Subadvisory Agreement, including the selection of broker-dealers for execution of portfolio transactions,
page 94

monitoring adherence to the Fund's investment restrictions and assisting with the Fund's compliance with applicable securities laws and regulations. The Board concluded that the nature, extent and quality of the services provided by Phocas to the Fund were appropriate and that the Fund was likely to continue to benefit from services provided by Phocas under the Phocas Subadvisory Agreement.
Investment Performance of Phocas. The Board reviewed the performance record of the Phocas Small Cap Value Fund and noted that the Fund had slightly underperformed its benchmark index for the past one-year period and had outperformed its benchmark index for the past three- and five-year periods ended March 31, 2012. The Board noted that the Fund had been reorganized into the Frontegra family of funds on October 8, 2010 and returns for the prior periods were for the predecessor fund, also managed by Phocas. The Board also considered Phocas' quarterly portfolio commentary and review of the Fund's performance. The Board also reviewed the performance of Phocas' composite of other accounts managed in the small cap value style. The Board concluded that the Fund's performance was satisfactory and that Phocas would continue to provide a high level of subadvisory services to the Fund.
Subadvisory Fees. The Board reviewed and considered the subadvisory fee payable by Frontegra to Phocas under the Phocas Subadvisory Agreement. The Board determined that the subadvisory fee was appropriate. In evaluating the subadvisory fee, the Board noted that such amounts are paid by Frontegra and that therefore the overall advisory fee paid by the Fund is not directly affected by the subadvisory fee.
Costs and Profitability. The Board did not consider the cost of services provided by Phocas or the profitability to Phocas from its relationship with the Phocas Small Cap Value Fund because it did not view these factors as relevant given that the subadvisory fee is paid by Frontegra.
Economies of Scale. Because the subadvisory fee is not paid by the Phocas Small Cap Value Fund, the Board did not consider whether the fee should reflect any potential economies of scale that might be realized as the Fund's assets increase.
Benefits to Phocas. The Board considered information presented regarding any benefits to Phocas from serving as subadviser to the Phocas Small Cap Value Fund (in addition to the subadvisory fee). The Board believed that Phocas generally benefits from its association with the Fund. The Board concluded that the benefits realized by Phocas from its relationship to the Fund were appropriate.
On the basis of its review of the foregoing information, the Board found that the terms of the Phocas Subadvisory Agreement were fair and reasonable and in the best interests of the shareholders of the Phocas Small Cap Value Fund.
page 95

ADDITIONAL INFORMATION
(Unaudited)
DIRECTORS AND OFFICERS
The business and affairs of the Funds are managed under the direction of the Funds' Board of Directors. Information pertaining to the directors and officers of the Funds is set forth below. The SAI includes additional information about the Funds' directors and officers and is available without charge, upon request by calling 1-888-825-2100.
Interested Director and Officers
Name, Address and
Year of Birth | | Position(s)
Held with
Company | | Term of
Office and
Length
of Time
Served | | Principal
Occupation(s)
During Past
Five Years | | Number of
Funds in
Complex
Overseen
by Director | | Other
Directorships
Held by
Director | |
William D. Forsyth III*
Frontegra Funds, Inc.
400 Skokie Boulevard
Suite 500
Northbrook, Illinois 60062
Year of Birth: 1963 | | President and Secretary
Director
Co-President, Treasurer and Assistant Secretary | | Elected annually by the Board; since August 2008.
Indefinite; since May 1996.
From May 1996 to August 2008. | | Mr. Forsyth received his B.S. in Finance from the University of Illinois in 1986 and his M.B.A. from the University of Chicago in 1988. Mr. Forsyth has served as President of Frontegra since August 2008 and as Treasurer and a Director of Frontegra since May 1996. Mr. Forsyth served as Co-President and Assistant Secretary of Frontegra from May 1996 to August 2008. Mr. Forsyth has served as President of Timpani since August 2008 and served as Co-President from April 2008 to August 2008. Mr. Forsyth has served as President of Frontegra Strategies, LLC, the principal distributor of the Funds' shares, since August 2008 and as Co-President from August 2007 to August 2008. From July 1993 until the present, Mr. Forsyth also served as a Partner of Frontier Partners, Inc., a consulting/marketing firm ("Frontier"). From April 1987 until June 1993, Mr. Forsyth served as a Partner of Brinson Partners, Inc., an investment adviser, and from June 1986 until April 1987, he served as a product marketing representative of Harris Trust & Savings Bank. Mr. Forsyth has earned the right to use the CFA designation. | | | 8 | | | None | |
|
* Mr. Forsyth is an "interested person" of the Funds because he serves as a director and officer of Frontegra, owns 100% of Frontegra and has an indirect equity ownership interest in Timpani.
page 96

ADDITIONAL INFORMATION (continued)
(Unaudited)
Interested Director and Officers
Name, Address and
Year of Birth | | Position(s)
Held with
Company | | Term of
Office and
Length
of Time
Served | | Principal
Occupation(s)
During Past
Five Years | | Number of
Funds in
Complex
Overseen
by Director | | Other
Directorships
Held by
Director | |
| Elyce D. Dilworth Frontegra Funds, Inc. 400 Skokie Boulevard Suite 500 Northbrook, Illinois 60062 Year of Birth: 1966 | | Treasurer, Assistant Secretary, Chief Compliance Officer and Anti-Money Laundering Compliance Officer | | Elected annually by the Board; Treasurer and Assistant Secretary since August 2008; Chief Compliance Officer since January 2008; Anti-Money Laundering Compliance Officer since February 2008. | | Ms. Dilworth received her B.B.A. in Finance from the University of Wisconsin – Milwaukee in 1989 and her M.S. in Accounting from the University of Wisconsin – Milwaukee in 1991. Ms. Dilworth has served as Chief Compliance Officer of Frontegra since January 2008 and as Secretary since August 2008. Ms. Dilworth served as Chief Compliance Officer of Timpani from April 2008 to June 2011. She served as Chief Financial Officer of Timpani from April 2008 to March 2010. Ms. Dilworth served as Chief Compliance Officer of Frontier from September 2010 to June 2011. Ms. Dilworth has also served as Chief Compliance Officer of the Distributor since August 2008. From June 2004 until May 2007, Ms. Dilworth was the Chief Compliance Officer for Van Wagoner Funds, Inc. (n/k/a Embarcadero Funds, Inc.), and the President, Secretary and Treasurer from January 2005 until May 2007. From April 1994 until December 2003, Ms. Dilworth was employed by UMB Fund Services, Inc., a service provider to mutual funds and alternative investment products. From January 1992 until April 1994, Ms. Dilworth was a Staff Accountant for PricewaterhouseCoopers LLP, a public accounting firm. | | N/A | | N/A | |
|
page 97

ADDITIONAL INFORMATION (continued)
(Unaudited)
Independent Directors
Name, Address and
Year of Birth | | Position(s)
Held with
Company | | Term of
Office and
Length
of Time
Served | | Principal
Occupation(s)
During Past
Five Years | | Number of
Funds in
Complex
Overseen
by Director | | Other
Directorships
Held by
Director | |
| David L. Heald 400 Skokie Boulevard Suite 500 Northbrook, Illinois 60062 Year of Birth: 1943 | | Lead Independent Director | | Indefinite; since June 1996 | | Mr. Heald received his B.A. in English from Denison University in 1966 and his J.D. from Vanderbilt University School of Law in 1969. Mr. Heald previously served as a principal and a director of Consulting Fiduciaries, Inc. ("CFI") from 1994 to 2011. CFI was a registered investment adviser that provided professional, independent, fiduciary decision making, consultation and alternative dispute resolution services to ERISA plans, plan sponsors and investment managers. Between April 1994 and August 1994, Mr. Heald engaged in the private practice of law. From August 1992 until April 1994, Mr. Heald was a managing director and the chief administrative officer of Calamos Asset Management, Inc., a registered investment adviser specializing in convertible securities, and he served as an officer and director of CFS Investment Trust, a registered investment company comprised of four series. From January 1990 until August 1992, Mr. Heald was a partner in the Chicago based law firm of Gardner, Carton & Douglas. | | | 8 | | | None | |
|
page 98

ADDITIONAL INFORMATION (continued)
(Unaudited)
Independent Directors
Name, Address and
Year of Birth | | Position(s)
Held with
Company | | Term of
Office and
Length
of Time
Served | | Principal
Occupation(s)
During Past
Five Years | | Number of
Funds in
Complex
Overseen
by Director | | Other
Directorships
Held by
Director | |
James M. Snyder
400 Skokie Boulevard
Suite 500
Northbrook, Illinois 60062
Year of Birth: 1947 | | Independent Director | | Indefinite; since May 2002 | | Mr. Snyder received his B.S. in Finance from Indiana University in 1969 and his M.B.A. from DePaul University in 1973. Mr. Snyder is a private investor and Chairman of The Snyder Family Foundation. Mr. Snyder served as an investment professional with Northern Trust from June 1969 until his retirement in June 2001. He served in a variety of capacities at Northern Trust, including as Chief Investment Officer, Executive Vice President of Northern Trust and Vice Chairman of Northern Trust Global Investments. Mr. Snyder has earned the right to use the Chartered Financial Analyst (CFA) designation. | | | 8 | | | IronBridge Funds, Inc. (with oversight of six portfolios) | |
|
page 99

ADDITIONAL INFORMATION (continued)
(Unaudited)
FOREIGN TAX CREDIT
For the year ended June 30, 2012, the Frontegra SAM Global Equity Fund earned foreign source income and paid foreign taxes, which it intends to pass through to its shareholders pursuant to Section 853 of the Internal Revenue Code as follows:
| | | Foreign Source Income Earned | | Foreign Taxes Paid | |
| Australia | | $ | 22,282 | | | $ | — | | |
| Canada | | | 59,533 | | | | 8,930 | | |
| France | | | 18,311 | | | | 2,747 | | |
| Germany | | | 11,034 | | | | 1,655 | | |
| Israel | | | 7,564 | | | | 1,642 | | |
| Italy | | | 47,191 | | | | 10,423 | | |
| Japan | | | 31,597 | | | | 2,212 | | |
| Netherlands | | | 32,899 | | | | 4,935 | | |
| Norway | | | 19,604 | | | | 2,940 | | |
| Spain | | | 20,096 | | | | 3,014 | | |
| Switzerland | | | 32,551 | | | | 4,883 | | |
| United Kingdom | | | 71,164 | | | | — | | |
| | | $ | 373,826 | | | $ | 43,381 | | |
For the year ended June 30, 2012, the Frontegra MFG Core Infrastructure Fund earned foreign source income and paid foreign taxes, which it intends to pass through to its shareholders pursuant to Section 853 of the Internal Revenue Code as follows:
| | | Foreign Source Income Earned | | Foreign Taxes Paid | |
| Australia | | $ | 7,535 | | | $ | 679 | | |
| Austria | | | 245 | | | | 37 | | |
| Belgium | | | 910 | | | | 136 | | |
| Canada | | | 4,403 | | | | 660 | | |
| France | | | 1,830 | | | | 274 | | |
| Germany | | | 1,738 | | | | 261 | | |
| Guernsey | | | 576 | | | | 25 | | |
| Hong Kong | | | 2,301 | | | | — | | |
| Italy | | | 9,246 | | | | 1,816 | | |
| Luxembourg | | | 3,147 | | | | 472 | | |
| Mexico | | | 1,332 | | | | — | | |
| Netherlands | | | 1,104 | | | | 166 | | |
| New Zealand | | | 1,074 | | | | — | | |
| Spain | | | 2,267 | | | | 340 | | |
| Switzerland | | | 555 | | | | 83 | | |
| United Kingdom | | | 9,948 | | | | — | | |
| | | $ | 48,211 | | | $ | 4,949 | | |
page 100

ADDITIONAL INFORMATION (continued)
(Unaudited)
For the year ended June 30, 2012, the Frontegra HEXAM Emerging Markets Fund earned foreign source income and paid foreign taxes, which it intends to pass through to its shareholders pursuant to Section 853 of the Internal Revenue Code as follows:
| | | Foreign Source Income Earned | | Foreign Taxes Paid | |
| Bermuda | | $ | 11,632 | | | $ | — | | |
| Brazil | | | 241,751 | | | | 24,820 | | |
| Canada | | | 5,024 | | | | 754 | | |
| Cayman Island | | | 5,095 | | | | — | | |
| China | | | 52,811 | | | | 5,281 | | |
| Hong Kong | | | 81,226 | | | | 8,853 | | |
| Jersey | | | 1,810 | | | | — | | |
| Luxembourg | | | 42,428 | | | | 6,364 | | |
| Russian Federation | | | 34,023 | | | | 5,100 | | |
| South Africa | | | 6,895 | | | | — | | |
| South Korea | | | 36,518 | | | | 6,025 | | |
| United Kingdom | | | 54,078 | | | | — | | |
| | | $ | 573,291 | | | $ | 57,197 | | |
QUALIFIED DIVIDEND INCOME/DIVIDENDS RECEIVED DEDUCTION
For the fiscal year ended June 30, 2012, certain dividends paid by the Funds may be subject to a maximum tax rate of 15%, as provided for by the Jobs and Growth Tax Relief Reconciliation Act of 2004. The percentage of dividends declared from ordinary income designated as qualified dividend income was as follows:
| SAM Global Equity | | | 55.32 | % | |
| HEXAM Emerging Markets | | | 100.00 | % | |
| Phocas Small Cap Value | | | 100.00 | % | |
| Lockwell Small Cap Value | | | 100.00 | % | |
For corporate shareholders, the percent of ordinary income distributions qualifying for the corporate dividends received deduction for the fiscal year ended June 30, 2012 was as follows:
| SAM Global Equity | | | 20.22 | % | |
| HEXAM Emerging Markets | | | 1.33 | % | |
| Phocas Small Cap Value | | | 100.00 | % | |
| Lockwell Small Cap Value | | | 100.00 | % | |
ADDITIONAL INFORMATION APPLICABLE TO FOREIGN SHAREHOLDERS ONLY
The percent of ordinary income distributions designated as interest related dividends for the fiscal year ended June 30, 2012 was as follows:
| SAM Global Equity | | | 0.02 | % | |
| HEXAM Emerging Markets | | | 0.17 | % | |
| Phocas Small Cap Value | | | 0.20 | % | |
| Lockwell Small Cap Value | | | 0.51 | % | |
page 101

Frontegra Funds
ADDITIONAL INFORMATION (continued)
(Unaudited)
The percent of ordinary income distributions designated as short-term capital gain distributions for the fiscal year ended June 30, 2012 was as follows:
| SAM Global Equity | | | 66.93 | % | |
| HEXAM Emerging Markets | | | 58.96 | % | |
CHANGE OF INDEPENDENT REGISTERED PUBLIC ACCOUNTING FIRM
On February 29, 2012, the Audit Committee of the Board of Directors of the Company approved the appointment of Cohen Fund Audit Services, Ltd. ("Cohen") as the Company's independent registered public accounting firm, replacing Ernst & Young LLP ("E&Y"). On May 22, 2012, the Audit Committee engaged Cohen to audit the Company's financial statements for the fiscal year ended June 30, 2012.
E&Y's report on the financial statements of the Company for each of the fiscal years ended June 30, 2010 and June 30, 2011, did not contain an adverse opinion or a disclaimer of opinion and was not qualified or modified as to uncertainty, audit scope or accounting principles. During the fiscal years ended June 30, 2010 and June 30, 2011, there were no disagreements between the Company and E&Y on any matter of accounting principles or practices, financial statement disclosure, or auditing scope or procedure, which disagreement(s), if not resolved to the satisfaction of E&Y, would have caused it to make reference to the subject matter of the disagreement(s) in connection with its reports. During the fiscal years ended June 30, 2010 and June 30, 2011, there were no reportable events as defined in Item 304(a)(1)(v) of Regulation S-K promulgated by the Securities and Exchange Commission.
page 102
This page intentionally left blank.
This page intentionally left blank.

A NOTE ON FORWARD-LOOKING STATEMENTS
This report includes forward-looking statements such as adviser, subadviser and/or portfolio manager predictions, opinions, assessments, analyses or outlooks for individual securities, industries, market sectors and/or markets. These statements involve risks and uncertainties. In addition to the general risks described for the Funds in the current Prospectuses, other factors bearing on these statements include the accuracy of the advisers', subadvisers' or portfolio managers' forecasts and predictions, and the appropriateness of the investment programs designed by an adviser, subadviser or portfolio manager to implement their strategies efficiently and effectively. Any one or more of these factors, as well as other risks affecting the securities markets and investment instruments generally, could cause the actual results of the Funds to differ materially as compared to benchmarks associated with the Funds.
In addition, portfolio composition will change due to ongoing management of the Funds. Specific securities named in this report may not currently be owned by the applicable Fund, or the Fund's position in the securities may have changed.
ADDITIONAL INFORMATION
Frontegra Funds has adopted proxy voting policies and procedures that delegate to Frontegra Asset Management, Inc. ("Frontegra"), Timpani Capital Management LLC and Lockwell Investments, LLC, the authority to vote proxies. The proxy voting policies permit Frontegra to delegate its authority to vote proxies to a Fund's subadviser. A description of the Frontegra Funds' proxy voting policies and procedures is available without charge, upon request, by calling the Funds toll free at 1-888-825-2100. A description of these policies and procedures is also included in the Funds' Statement of Additional Information, which is available on the SEC's website at http://www.sec.gov and the Funds' website at www.frontegra.com or by calling the Funds toll free at 1-888-825-2100.
The actual voting records relating to each Fund's portfolio securities during the most recent twelve months ended June 30 are available without charge by calling the Funds toll free at 1-888-825-2100 or by accessing the SEC's website at http://www.sec.gov.
Each Fund files a complete schedule of portfolio holdings for its first and third fiscal quarters with the SEC on Form N-Q. The Form N-Q is available on the SEC's website at http://www.sec.gov. The Form N-Q may also be reviewed and copied at the SEC's Public Reference Room in Washington, D.C. Information on the operation of the Public Reference Room may be obtained by calling toll-free 1-800-SEC-0330.
Item 2. Code of Ethics.
The registrant has adopted a code of ethics that applies to the registrant’s principal executive officer and principal financial officer. The registrant has not made any amendments to its code of ethics during the period covered by this report. The registrant has not granted any waivers from any provisions of the code of ethics during the period covered by this report.
A copy of the registrant’s Code of Ethics is Incorporated by reference. See Item 12(a)(1).
Item 3. Audit Committee Financial Expert.
The registrant’s board of directors has determined that it does not have an audit committee financial expert serving on its audit committee. At this time, the registrant believes that the experience provided by each member of the audit committee together offers the registrant adequate oversight for the registrant’s level of financial complexity.
Item 4. Principal Accountant Fees and Services.
The registrant has engaged its principal accountant to perform audit services, audit-related services, tax services and other services during the past two fiscal years. In the following table, “Audit Fees” are fees billed for professional services for the audit of the registrant’s annual financial statements or services that are normally provided by the accountant in connection with statutory and regulatory filings or engagements for those fiscal years. The “Audit-Related Fees” for fiscal year 2012 relate to the review of the predecessor auditor’s work papers by the successor auditor and to notification given to the Securities and Exchange Commission of the change in auditors. “Tax Fees” refer to professional services rendered by the principal accountant for tax compliance, tax advice, and tax planning. There were no other services provided by the principal accountant. The following table details the aggregate fees billed or expected to be billed for each of the last two fiscal years by the principal accountant.
| | Cohen Fund Audit
Services, Ltd. | | Ernst & Young,
LLP | | Ernst & Young,
LLP | |
| | FYE 6/30/2012 | | FYE 6/30/2012 | | FYE 6/30/2011 | |
Audit Fees | | $ | 96,000 | | $ | 0 | | $ | 145,800 | |
Audit-Related Services | | $ | 0 | | $ | 6,590 | | $ | 0 | |
Tax Fees | | $ | 24,000 | | $ | 7,500 | | $ | 33,000 | |
All Other Fees | | $ | 0 | | $ | 0 | | $ | 0 | |
The audit committee has adopted pre-approval policies and procedures that require the audit committee to pre-approve all audit and non-audit services of the registrant, including services provided to any entity affiliated with the registrant with respect to any engagement that directly relates to the operations and financial reporting of the registrant. In accordance with its pre-approval policies and procedures, the audit committee pre-approved all audit and tax services
provided by the principal accountant during fiscal year 2012. During the last two fiscal years, there were no non-audit services rendered by the principal accountant to the registrant’s investment adviser or any entity controlling, controlled by or under common control with the investment adviser that provides ongoing services to the registrant. All of the hours spent on auditing the registrant’s financial statements were attributed to work performed by full-time permanent employees of the principal accountant.
Item 5. Audit Committee of Listed Registrants.
Not applicable to registrants who are not listed issuers (as defined in Rule 10A-3 under the Securities Exchange Act of 1934).
Item 6. Investments.
(a) Schedule of Investments is included as part of the report to shareholders filed under Item 1 of this Form.
(b) Not Applicable.
Item 7. Disclosure of Proxy Voting Policies and Procedures for Closed-End Management Investment Companies.
Not applicable to open-end investment companies.
Item 8. Portfolio Managers of Closed-End Management Investment Companies.
Not applicable to open-end investment companies.
Item 9. Purchases of Equity Securities by Closed-End Management Investment Company and Affiliated Purchasers.
Not applicable to open-end investment companies.
Item 10. Submission of Matters to a Vote of Security Holders.
Not Applicable.
Item 11. Controls and Procedures.
(a) Based on an evaluation of the registrant’s disclosure controls and procedures (as defined in Rule 30a-3(c) under the Investment Company Act of 1940 (the “Act”)) as of a date within 90 days prior to the filing date of this Form N-CSR, the registrant’s principal executive officer and principal financial officer have concluded that the disclosure controls and procedures are effective.
(b) There were no changes in the Registrant’s internal control over financial reporting (as defined in Rule 30a-3(d) under the Act) that occurred during the second fiscal quarter of the period covered by this report that has materially affected, or is reasonably likely to materially affect, the Registrant’s internal control over financial reporting.
Item 12. Exhibits.
(a) (1) Any code of ethics or amendment thereto, that is the subject of the disclosure required by Item 2, to the extent that the registrant intends to satisfy Item 2 requirements through filing an exhibit. Incorporated by reference to the Registrant’s Form N-CSR filed September 8, 2008.
(2) A separate certification for each principal executive and principal financial officer pursuant to Section 302 of the Sarbanes-Oxley Act of 2002. Filed herewith.
(3) Any written solicitation to purchase securities under Rule 23c-1 under the Act sent or given during the period covered by the report by or on behalf of the registrant to 10 or more persons. Not applicable to open-end investment companies.
(b) Certifications pursuant to Section 906 of the Sarbanes-Oxley Act of 2002. Furnished herewith.
SIGNATURES
Pursuant to the requirements of the Securities Exchange Act of 1934 and the Investment Company Act of 1940, the registrant has duly caused this report to be signed on its behalf by the undersigned, thereunto duly authorized.
Frontegra Funds, Inc. |
| |
| |
By: | /s/ William D. Forsyth III | |
| William D. Forsyth III, President | |
| (Principal Executive Officer) | |
| | |
Date: | September 4, 2012 | |
Pursuant to the requirements of the Securities Exchange Act of 1934 and the Investment Company Act of 1940, this report has been signed below by the following persons on behalf of the registrant and in the capacities and on the dates indicated.
By: | /s/ William D. Forsyth III | |
| William D. Forsyth III, President and Secretary | |
| (Principal Executive Officer) | |
| | |
Date: | September 4, 2012 | |
By: | /s/ Elyce D. Dilworth | |
| Elyce D. Dilworth, Treasurer and Assistant Secretary | |
| (Principal Financial Officer) | |
| | |
Date: | September 4, 2012 | |