UNITED STATES
SECURITIES AND EXCHANGE COMMISSION
Washington, D.C. 20549
FORM N-CSR
CERTIFIED SHAREHOLDER REPORT OF REGISTERED
MANAGEMENT INVESTMENT COMPANIES
Investment Company Act file number 811-07685
Frontegra Funds, Inc.
(Exact name of registrant as specified in charter)
400 Skokie Blvd.
Suite 500
Northbrook, Illinois 60062
(Address of principal executive offices) (Zip code)
William D. Forsyth III
400 Skokie Blvd., Suite 500
Northbrook, Illinois 60062
(Name and address of agent for service)
(847) 509-9860
Registrant’s telephone number, including area code
Date of fiscal year end: June 30
Date of reporting period: June 30, 2010
Item 1. Reports to Stockholders.
ANNUAL REPORT
Frontegra Columbus Core Plus Fund
Frontegra Columbus Core Fund
Frontegra IronBridge Small Cap Fund
Frontegra IronBridge SMID Fund
Frontegra IronBridge Global Focus Fund
Frontegra Mastholm International Equity Fund
Frontegra Netols Small Cap Value Fund
Frontegra Asset Management, Inc.
TABLE OF CONTENTS
| Shareholder Letter | 1 |
| Expense Example | 2 |
| Frontegra Columbus Core Plus Fund | |
| Frontegra Columbus Core Fund | |
| Report from Reams Asset Management Company, LLC | 5 |
| Investment Highlights | 8 |
| Schedule of Investments | 9 |
| Statement of Assets and Liabilities | 16 |
| Statement of Operations | 17 |
| Statements of Changes in Net Assets | 18 |
| Financial Highlights | 19 |
| Investment Highlights | 21 |
| Schedule of Investments | 22 |
| Statement of Assets and Liabilities | 28 |
| Statement of Operations | 29 |
| Statements of Changes in Net Assets | 30 |
| Financial Highlights | 31 |
| Frontegra IronBridge Small Cap Fund | |
| Frontegra IronBridge SMID Fund | |
| Report from IronBridge Capital Management, L.P. | 33 |
| Investment Highlights | 36 |
| Schedule of Investments | 37 |
| Statement of Assets and Liabilities | 41 |
| Statement of Operations | 42 |
| Statements of Changes in Net Assets | 43 |
| Financial Highlights | 44 |
| Investment Highlights | 45 |
| Schedule of Investments | 46 |
| Statement of Assets and Liabilities | 50 |
| Statement of Operations | 51 |
| Statements of Changes in Net Assets | 52 |
| Financial Highlights | 53 |
| Frontegra IronBridge Global Focus Fund | |
| Report from IronBridge Capital Management, L.P. | 55 |
| Investment Highlights | 57 |
| Schedule of Investments | 58 |
| Portfolio Diversification | 60 |
| Statement of Assets and Liabilities | 61 |
| Statement of Operations | 62 |
| Statements of Changes in Net Assets | 63 |
| Financial Highlights | 64 |
| Frontegra Mastholm International Equity Fund | |
| Report from Mastholm Asset Management, LLC | 66 |
| Investment Highlights | 68 |
| Schedule of Investments | 69 |
| Portfolio Diversification | 71 |
| Statement of Assets and Liabilities | 72 |
| Statement of Operations | 73 |
| Statements of Changes in Net Assets | 74 |
| Financial Highlights | 75 |
| Frontegra Netols Small Cap Value Fund | |
| Report from Netols Asset Management, Inc. | 77 |
| Investment Highlights | 78 |
| Schedule of Investments | 79 |
| Statement of Assets and Liabilities | 82 |
| Statement of Operations | 83 |
| Statements of Changes in Net Assets | 84 |
| Financial Highlights | 85 |
| Notes to Financial Statements | 87 |
| Report of Independent Registered Public Accounting Firm | 101 |
| Board of Directors’ Approval of Interim and New Subadvisory Agreements and Advisory Agreement | 102 |
| Voting Results of Special Meetings of Shareholders | 107 |
| Additional Information | |
| Directors and Officers | 108 |
| Foreign Tax Credit | 111 |
| Qualified Dividend Income/Dividends Received Deduction | 111 |
| Additional Information Applicable to Foreign Shareholders Only | 112 |
This report is submitted for the general information of the shareholders of the Funds. It is not authorized for distribution to prospective investors unless accompanied or preceded by an effective Prospectus for the applicable Fund. The Prospectus may be obtained by calling 1-888-825-2100. Each Prospectus includes more complete information about management fees and expenses, investment objectives, risks and operating policies of the applicable Fund. Please read the Prospectus carefully.
Frontegra Funds, Inc. are distributed by Frontegra Strategies, LLC, 400 Skokie Blvd., Suite 500, Northbrook, IL 60062. Frontegra Strategies, LLC, member of FINRA and SIPC, is an affiliate of Frontegra Asset Management, Inc., the Funds’ investment adviser.
| This page intentionally left blank. |
DEAR FELLOW SHAREHOLDERS:
We are pleased to report on the progress of the Frontegra Funds over the past twelve months ending June 30, 2010. The past twelve months have seen a general rebound following the volatile markets of late 2008 and early 2009. The S&P 500 Index was up 14.43%, and small capitalization stocks advanced strongly, with the Russell 2000 Index returning 21.48%. International stocks, as measured by the MSCI EAFE Index, returned 6.38% over the twelve-month period. The U.S. bond market, as measured by the Barclays Capital U.S. Aggregate Bond Index, was up 9.50% for the year.
Fund Results
For the twelve month period ending June 30, 2010, the Funds generated the following net (i.e. after fee) returns:
The Frontegra Columbus Core Plus Fund - Institutional Class, managed by Reams Asset Management Company, returned 19.12% versus the 9.50% return of the Barclays Capital U.S. Aggregate Bond Index; the Frontegra Columbus Core Fund, also managed by Reams Asset Management Company, returned 15.60%.
The Frontegra IronBridge Small Cap Fund, managed by IronBridge Capital Management, returned 16.72% versus the 21.48% return for the Russell 2000 Index; the Frontegra IronBridge SMID Fund returned 15.88% versus the Russell 2500 Index return of 24.03%.
The Frontegra Mastholm International Equity Fund, managed by Mastholm Asset Management since mid-October 2009, returned 0.52% versus the benchmark return of 6.38% for the MSCI EAFE Index.
The Frontegra Netols Small Cap Value Fund - Institutional Class, managed by Netols Asset Management, returned 11.76% versus the Russell 2000 Value Index return of 25.07%.
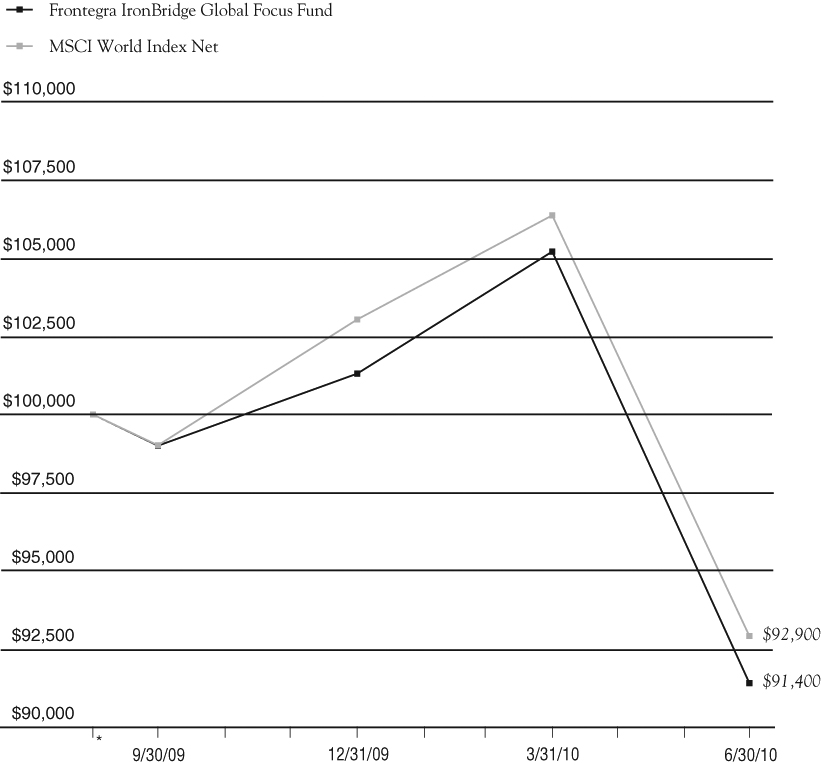
For the period from September 18, 2009, through June 30, 2010, the Frontegra IronBridge Global Focus Fund, also managed by IronBridge Capital Management, returned -8.60% versus the MSCI World Index Net return of -7.10%.
Outlook
While markets have rebounded from their lows, they remain tentative and volatile. As we embark on a new fiscal year, we will endeavor to navigate these turbulent waters with agility and skill.
We will continue to oversee the investment management of the Frontegra Funds with the care and diligence that have served our shareholders well in the past. As always, we appreciate your investment and continued confidence in the Frontegra Funds.
Best regards,
William D. Forsyth, CFA
President
Frontegra Funds, Inc.
Frontegra Funds
EXPENSE EXAMPLE
June 30, 2010 (Unaudited)
As a shareholder of a mutual fund, you incur two types of costs: (1) transaction costs, including redemption fees, and (2) ongoing costs, including management fees, distribution and/or service (12b-1) fees and other fund expenses. Although the Funds charge no sales loads, you will be assessed fees for outgoing wire transfers, returned checks and stop payment orders at prevailing rates charged by U.S. Bancorp Fund Services, LLC, the Funds’ transfer agent. If you request that a redemption be made by wire transfer, currently the Funds’ transfer agent charges a $15.00 fee. A redemption fee of 2.00% of the then current value of the shares redeemed may be imposed on certain redemptions of shares made within 30 days of purchase for the Frontegra IronBridge Global Focus and Mastholm International Equity Funds.
This Example is intended to help you understand your ongoing costs (in dollars) of investing in the Funds and to compare these costs with the ongoing costs of investing in other mutual funds. The Example is based on an investment of $1,000 invested at the beginning of the period and held for the entire period (1/1/10 – 6/30/10).
Actual Expenses
The first line of the table on the following page for each Fund provides information about actual account values and actual expenses. The Example includes management fees, registration fees, fee waivers/reimbursements and other expenses. However, the Example does not include portfolio trading commissions and related expenses and other extraordinary expenses as determined under generally accepted accounting principles. You may use the information in this line, together with the amount you invested, to estimate the expenses that you paid over the period. Simply divide your account value by $1,000 (for example, an $8,600 account value divided by $1,000 = 8.6), then multiply the result by the number in the first line under the heading entitled “Expenses Paid During the Period’’ to estimate the expenses you paid on your account during this period.
Hypothetical Example for Comparison Purposes
The second line of the table for each Fund provides information about hypothetical account values and hypothetical expenses based on each of the Fund’s actual expense ratios and an assumed rate of return of 5% per year before expenses, which is not the actual return. The hypothetical account values and expenses may not be used to estimate the actual ending account balance or expenses you paid for the period. You may use this information to compare the ongoing costs of investing in each of the Funds and other funds. To do so, compare this 5% hypothetical example with the 5% hypothetical examples that appear in the shareholder reports of the other funds. Please note that the expenses shown in the table are meant to highlight your ongoing costs only and do not reflect any transactional costs. Therefo re, the second line of the table is useful in comparing ongoing costs only, and will not help you determine the relative total costs of owning different funds. In addition, if these transactional costs were included, your costs could have been higher.
EXPENSE EXAMPLE (continued)
June 30, 2010 (Unaudited)
| | Beginning Account | Ending Account | Annualized | Expenses Paid |
| Frontegra Fund | Value 1/1/2010 | Value 6/30/2010 | Expense Ratio* | During the Period* |
| | | | | |
| Columbus Core Plus | | | | |
| Fund – Institutional Class | | | | |
| Actual Fund Return | $1,000.00 | $1,073.00 | 0.35% | $1.80 |
| Hypothetical 5% Return | $1,000.00 | $1,023.00 | 0.35% | $1.76 |
| | | | | |
| Columbus Core Plus | | | | |
| Fund – Class Y | | | | |
| Actual Fund Return | $1,000.00 | $1,070.80 | 0.75% | $3.85 |
| Hypothetical 5% Return | $1,000.00 | $1,021.08 | 0.75% | $3.76 |
| | | | | |
| Columbus Core Fund | | | | |
| Actual Fund Return | $1,000.00 | $1,057.00 | 0.35% | $1.79 |
| Hypothetical 5% Return | $1,000.00 | $1,023.00 | 0.35% | $1.76 |
| | | | | |
| IronBridge Small Cap Fund | | | | |
| Actual Fund Return | $1,000.00 | $ 974.00 | 1.07% | $5.24 |
| Hypothetical 5% Return | $1,000.00 | $1,019.00 | 1.07% | $5.36 |
| | | | | |
| IronBridge SMID Fund | | | | |
| Actual Fund Return | $1,000.00 | $ 980.00 | 0.95% | $4.66 |
| Hypothetical 5% Return | $1,000.00 | $1,020.00 | 0.95% | $4.76 |
| | | | | |
| IronBridge Global Focus Fund | | | | |
| Actual Fund Return | $1,000.00 | $ 902.20 | 1.00% | $4.72 |
| Hypothetical 5% Return | $1,000.00 | $1,019.84 | 1.00% | $5.01 |
| | | | | |
| Mastholm International Equity Fund | | | | |
| Actual Fund Return | $1,000.00 | $ 859.00 | 0.75% | $3.46 |
| Hypothetical 5% Return | $1,000.00 | $1,021.00 | 0.75% | $3.76 |
| | | | | |
| Netols Small Cap Value | | | | |
| Fund – Institutional Class | | | | |
| Actual Fund Return | $1,000.00 | $ 948.00 | 1.10% | $5.31 |
| Hypothetical 5% Return | $1,000.00 | $1,019.00 | 1.10% | $5.51 |
| | | | | |
| Netols Small Cap | | | | |
| Value Fund – Class Y | | | | |
| Actual Fund Return | $1,000.00 | $ 946.00 | 1.50% | $7.24 |
| Hypothetical 5% Return | $1,000.00 | $1,017.00 | 1.50% | $7.50 |
| * | Expenses are equal to each Fund’s annualized expense ratio indicated above, multiplied by the average account value over the period, multiplied by 181/365 to reflect the one-half year period. |
FRONTEGRA
COLUMBUS CORE PLUS FUND
FRONTEGRA
COLUMBUS CORE FUND
REPORT FROM REAMS ASSET
MANAGEMENT COMPANY, LLC:
Dear Fellow Shareholders:
The Frontegra Columbus Core Plus Fund strives to achieve a high level of total return consistent with the preservation of capital by investing in a diversified portfolio of fixed income securities of varying maturities. This objective is relative to and measured against the Barclays Capital U.S. Aggregate Bond Index.
The Frontegra Columbus Core Fund strives to achieve a high level of total return consistent with the preservation of capital by investing in a diversified portfolio of investment grade bonds of varying maturities. This objective is relative to and measured against the Barclays Capital U.S. Aggregate Bond Index.
Performance Review
For the 12 month fiscal year ending June 30, 2010, the Frontegra Columbus Core Plus Fund, Institutional Class, had a net return of 19.12% compared to a return of 9.50% for the Barclays Capital U.S. Aggregate Bond Index. Macro factors were positive, with duration strategy adding 26 basis points and the yield curve strategy adding 7 basis points. Sector decisions added 481 basis points while security selection added 483 basis points. Within these categories, investment grade credit added 400 basis points and high yield added 271 basis points as spreads tightened in these overweighted sectors particularly in the last two quarters of 2009. An overweight position in asset backed securities (“ABS”) and commercial mortgage backed securities (“CMBS”) added 215 and 115 basis po ints to performance, respectively. Non-dollar added 2 basis points to performance. Government related subtracted 21 basis points and mortgage backed securities (“MBS”) subtracted 18 basis points as the portfolio was underweight in these two outperforming sectors.
For the 12 month fiscal year ending June 30, 2010, the Frontegra Columbus Core Fund had a net return of 15.60% compared to a return of 9.50% for the Barclays Capital U.S. Aggregate Bond Index. Macro factors were positive, with duration strategy adding 48 basis points and the yield curve strategy neither adding to nor subtracting from performance. Sector decisions added 340 basis points while security selection added 257 basis points. Within these categories, investment grade credit added 460 basis points due to an overweight position in this outperforming sector as well as superior issue selection. An overweight position in CMBS and ABS added 70 and 47 basis points, respectively. MBS added 41 basis points to performance. Government related subtracted 21 basis points as t he portfolio was underweight in this outperforming sector. For both Funds, outperformance for the fiscal year was largely attributable to sector and security selection and the portfolios’ defensive positioning in the second half of the year.
Fixed Income Outlook
| • | During the second quarter, global capital markets weathered multiple storms. The largest and most far reaching of these storms has been sovereign debt problems in Europe, with Greece being the hardest hit. In a desperate attempt to find a solution to the crisis, government officials presented a series of small bailout plans. When these failed to pacify investor concerns, a massive €750 billion bailout package was approved by the European Union and the International Monetary Fund. In addition to the bailout proposals, Germany announced a ban on short selling of sovereign debt and financial equities in an attempt to settle the volatile markets. |
| • | All of the proposed government bailout packages focused on liquidity in hopes that the crises could be averted. Despite the massive size of the final bailout, investors were unsatisfied as they arrived at the sobering conclusion that abundant liquidity cannot rectify a problem rooted in inadequate solvency. A not-unexpected chain reaction to investors’ displeasure has been a pummeling of the Euro currency (approximately a 9.3% decline vs. the U.S. dollar in the second quarter), as the bailout compromises the credibility of the European Union. |
| • | Domestically, the oil spill tragedy in the Gulf of Mexico cast a pall over the capital markets after the Deepwater Horizon drilling rig exploded and sank. Each mitigation attempt initially inspired hope, but quickly faded to frustration as oil continued to flow. While oil washed up on shores, estimates of the flow-rate of the spill crept higher, the scope of liabilities broadened, and the nation’s patience grew increasingly thin, BP was persuaded by the Obama administration to contribute $20 billion to a claims fund. Relief well drilling is currently underway but not expected to be operational until August at the earliest. |
| • | The announcement that Goldman Sachs was being sued by the SEC and the shock of the “flash crash” provided added momentum for passage of the financial reform legislation. The “flash crash” occurred when an already jittery market (a result of the social unrest in Greece) saw the Dow Jones Industrial Average suddenly fall nearly 1,000 points intra-day before recovering almost 700 points in approximately 20 minutes. Lawmakers seized the moment and passed separate bills in both the House and the Senate. An agreement in a House-Senate conference committee was announced, but the passing of Senator Byrd and a last minute addition of a $19 billion charge to banks for the government bailout left the Democratic members uncertain of securing the 60 votes necessary for passage of the final bill in the Senate. |
| • | Concerns rose late in the quarter that unemployment and personal debt continue to weigh down many U.S. consumers, impeding their ability to assist in the nation’s economic recovery. Consumer spending is now needed to replace government spending; however, anemic housing numbers, retail sales, and the consumer confidence index all paint a picture that consumer strength may be weaker than most economists expected. The U.S. government has provided abundant deficit spending, but pressure from record outstanding debt and budget deficits is mounting. When government spending declines and if consumers remain weak, economic growth will be disappointing and market volatility is likely to remain elevated. |
| • | In regard to market performance during the second quarter, nearly all risk sectors underperformed. High yield option-adjusted spreads widened 129 basis points, as initial strength gave way to selling pressure (a result of heightened investors’ concern over the European debt crisis). CMBS widened 51 basis points. Investment grade credit and ABS option-adjusted spreads widened 44 and 14 basis points, respectively. The MBS sector witnessed modest positive excess returns during the second quarter. The historically steep Treasury yield curve flattened and yields declined in a flight to quality rally. The 30-year Treasury rate declined 82 basis points, but the 2-year Treasury declined only 41 basis points. |
Columbus Core Plus Portfolio Strategy
| • | As spreads widened in May and June, we increased our allocation to the corporate sector. The portfolio is overweight in the credit sector with holdings focused on bank, insurance and utility issues that we expect to outperform. |
| • | Our weighting in Treasury securities declined during the quarter to make room in the portfolio for the additions in the corporate sector. |
| • | We maintain a “barbell” positioning to take advantage of the historically steep yield curve. If the yield curve flattens further, as we anticipate it might, the portfolio should outperform. |
| • | The portfolio is defensively positioned in MBS and, as a result, we are underweight the sector. Our focus is on 10-year amortization, low coupon, agency mortgage securities. We believe these shorter maturity securities have attractive spreads and a lower risk profile relative to other agency securities in the MBS sector. |
| • | We maintain our overweight position in the ABS sector. The holdings in this sector are focused on auto finance, which is backed by solid collateral. |
Columbus Core Portfolio Strategy
| • | The portfolio remains overweight in Treasury securities as we maintain a lower risk profile and also as a result of our “barbell” positioning to take advantage of the historically steep yield curve. If the yield curve flattens further, as we anticipate it might, the portfolio should outperform. |
| • | After initially reducing some positions in April, we increased our allocation to the corporate sector as spreads widened in May and June. The portfolio is focused on bank, insurance and utility issues that we expect to outperform. |
| • | The portfolio is defensively positioned in MBS and, as a result, we are underweight the sector. Our focus is on 10-year amortization, low coupon, agency mortgage securities. We believe these shorter maturity securities have attractive spreads and a lower risk profile relative to other agency securities in the MBS sector. |
| • | We maintain our overweight position in the ABS sector. The holdings in this sector are focused on auto finance, which is backed by solid collateral. |
We appreciate your continued support as fellow shareholders in the Funds.
Regards,
 |  |
| Mark M. Egan, CFA, CPA | Thomas M. Fink, CFA |
| Reams Asset Management Company, LLC | Reams Asset Management Company, LLC |
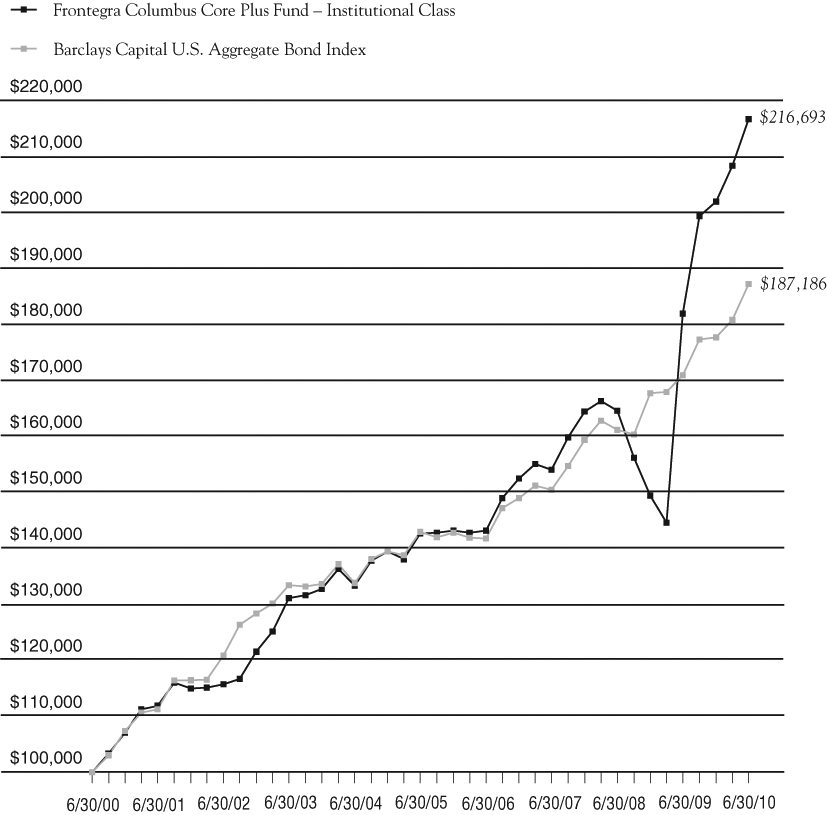
Growth of a $100,000 Investment (Unaudited)
| | | | | |
| | Portfolio Total Return* | | | |
| | FOR PERIODS ENDED 6/30/10 | FUND | INDEX | |
| | | | | |
| | SIX MONTHS | 7.30% | 5.33% | |
| | | | | |
| | ONE YEAR | 19.12% | 9.50% | |
| | | | | |
| | FIVE YEAR | | | |
| | AVERAGE ANNUAL | 8.72% | 5.54% | |
| | | | | |
| | TEN YEAR | | | |
| | AVERAGE ANNUAL | 8.04% | 6.47% | |
| | | | | |
This chart assumes an initial gross investment of $100,000 made on 6/30/00. Returns shown include the reinvestment of all distributions. Past performance is not predictive of future results. Investment return and principal value will fluctuate so that shares, when redeemed, may be worth more or less than the original cost. In the absence of existing fee waivers, total return would be reduced. The recent growth rate in the fixed income market has helped to produce short-term returns for some asset classes that are not typical and may not continue in the future. Because of ongoing market volatility, Fund performance may be subject to substantial short-term changes. To receive current to the most recent month-end performance, please call 1-888-825-2100.
The Barclays Capital U.S. Aggregate Bond Index (formerly the Lehman Brothers Aggregate Bond Index) is an unmanaged market value-weighted performance benchmark for investment-grade fixed-rate debt issues, including government, corporate, asset backed and mortgage backed securities, with maturities of at least one year. The Index does not reflect investment management fees, brokerage commissions and other expenses associated with investing in fixed income securities. A direct investment in the index is not possible.
| * | The returns shown do not reflect the deduction of taxes that a shareholder would pay on Fund distributions or the redemption of Fund shares. |
The above graph relates to Institutional Class shares of the Fund. Performance for Class Y shares will vary from the performance of the Institutional Class shares shown above due to differences in expenses.Frontegra Columbus Core Plus Fund SCHEDULE OF INVESTMENTS
June 30, 2010
| Principal Amount | | Value | |
| | | | | | |
| ASSET BACKED SECURITIES 10.3% | | | |
| | | Americredit Automobile | | | |
| | | Receivables Trust | | | |
| $ | 1,630,000 | | Series 2008-AF, Class A4, | | | |
| | | | 6.960%, 10/14/2014 | | $ | 1,741,994 | |
| | | | Capital One Multi-Asset | | | | |
| | | | Execution Trust | | | | |
| | 1,395,000 | | Series 2006-9A, Class A9, | | | | |
| | | | 0.365%, 05/15/2013 | | | 1,394,893 | |
| | | | Chase Issuance Trust | | | | |
| | 1,545,000 | | Series 2009-A7, Class A7, | | | | |
| | | | 0.8000%, 09/17/2012 | | | 1,546,025 | |
| | 1,570,000 | | Series 2005-A13, Class A13, | | | | |
| | | | 0.390%, 02/15/2013 | | | 1,569,129 | |
| | | | Chrysler Financial Auto | | | | |
| | | | Securitization Trust | | | | |
| | 2,225,000 | | Series 2009-B, Class A-2, | | | | |
| | | | 1.150%, 11/08/2011 | | | 2,228,554 | |
| | | | Chrysler Financial Automobile TALF | | | | |
| | 1,010,000 | | Series 2009-AF, Class A3, | | | | |
| | | | 2.820%, 01/15/2016 | | | 1,030,068 | |
| | | | Countrywide Asset-Backed Certificates | | | | |
| | 3,630,588 | | Series 2006-S2, Class A3, | | | | |
| | | | 5.841%, 07/25/2027 | | | 1,185,430 | |
| | 1,558,244 | | Series 2006-S2, Class A4, | | | | |
| | | | 6.091%, 07/25/2027 | | | 314,531 | |
| | 850,409 | | Series 2006-S5, Class A3, | | | | |
| | | | 5.762%, 06/25/2035 | | | 242,722 | |
| | 1,444,276 | | Series 2007-S2, Class A6, | | | | |
| | | | 5.779%, 05/25/2037 | | | 818,445 | |
| | | | Credit Suisse Mortgage | | | | |
| | | | Capital Certificates | | | | |
| | 1,865,756 | | Series 2009-12R, Class 41A1, | | | | |
| | | | 5.250%, 03/27/2037 | | | | |
| | | | (Acquired 10/06/2009, | | | | |
| | | | Cost $1,858,760) (b) | | | 1,865,756 | |
| | | | Fifth Third Auto Trust | | | | |
| | 1,602,632 | | Series 2008-1, Class A3A, | | | | |
| | | | 4.070%, 01/17/2012 | | | 1,611,395 | |
| | | | Ford Credit Auto Owner Trust | | | | |
| | 4,025,000 | | Series 2009-A, Class A3B, | | | | |
| | | | 2.850%, 05/15/2013 | | | 4,102,633 | |
| | 2,355,000 | | Series 2009-D, Class A3, | | | | |
| | | | 2.170%, 10/15/2013 | | | 2,386,859 | |
| | | | GE Capital Credit Card | | | | |
| | | | Master Note Trust | | | | |
| | 2,450,000 | | Series 2009-3, Class A, | | | | |
| | | | 2.540%, 09/15/2014 | | | 2,478,999 | |
| | | | GMAC Mortgage | | | | |
| | | | Corporation Loan Trust | | | | |
| | 1,921,232 | | Series 2006-HE3, Class A3, | | | | |
| | | | 5.805%, 10/25/2036 | | | 1,000,528 | |
| | | | GSAA Home Equity Trust | | | | |
| | 1,246,229 | | Series 2006-S1, Class 1A1, | | | | |
| | | | 0.507%, 01/25/2037 | | | 159,125 | |
| | | | Hertz Vehicle Financing LLC | | | | |
| | 595,833 | | Series 2005-1A, Class A4, | | | | |
| | | | 0.597%, 11/25/2011 | | | | |
| | | | (Acquired 08/21/2008 and | | | | |
| | | | 12/10/2008, Cost $575,908) (a)(b) | | | 594,393 | |
| | 733,333 | | Series 2005-2A, Class A5, | | | | |
| | | | 0.597%, 11/25/2011 | | | | |
| | | | (Acquired 08/01/2008 and | | | | |
| | | | 12/10/2008, Cost $713,583) (a)(b) | | | 731,561 | |
| | 1,825,000 | | Series 2009-2A, Class A1, | | | | |
| | | | 4.260%, 03/25/2014 | | | | |
| | | | (Acquired 10/16/2009, | | | | |
| | | | Cost $1,824,891) (a)(b) | | | 1,901,780 | |
| | | | Home Equity Mortgage Trust | | | | |
| | 4,384,619 | | Series 2006-5, Class A1, | | | | |
| | | | 5.500%, 01/25/2037 | | | 569,115 | |
| | | | Hyundai Auto Receivables Trust | | | | |
| | 4,140,000 | | Series 2009-A, Class A3, | | | | |
| | | | 2.030%, 08/15/2013 | | | 4,195,854 | |
The accompanying notes are an integral part of these financial statements.
Frontegra Columbus Core Plus Fund SCHEDULE OF INVESTMENTS (continued)
June 30, 2010
| Principal Amount | | Value | |
| | | | | | |
ASSET BACKED SECURITIES 10.3% (continued) | | | |
| | | Keystone Owner Trust | | | |
| $ | 6,224 | | Series 1998-P1, Class M1, | | | |
| | | | 7.530%, 05/25/2025 | | | |
| | | | (Acquired 12/10/2008, | | | |
| | | | Cost $5,734)(b) | | $ | 6,074 | |
| | | | Mid-State Trust | | | | |
| | 900,398 | | Series 11, Class A1, | | | | |
| | | | 4.864%, 07/15/2038 | | | 865,537 | |
| | | | Residential Funding Mortgage Securities | | | | |
| | 129,137 | | Series 2005-HS1, Class AI2, | | | | |
| | | | 4.660%, 09/25/2035 | | | 122,096 | |
| | 470,582 | | Series 2003-HS1, Class AI6, | | | | |
| | | | 3.830%, 02/25/2033 | | | 412,248 | |
| | 630,000 | | Series 2005-HS1, Class AI4, | | | | |
| | | | 5.110%, 09/25/2035 | | | 151,034 | |
| | 1,677,901 | | Series 2006-HSA1, Class A3, | | | | |
| | | | 5.230%, 02/25/2036 | | | 742,213 | |
| | 1,360,964 | | Series 2006-HSA1, Class A4, | | | | |
| | | | 5.490%, 02/25/2036 | | | 232,776 | |
| | 1,867,874 | | Series 2006-HSA1, Class A5, | | | | |
| | | | 5.310%, 02/25/2036 | | | 889,351 | |
| | 472,445 | | Series 2006-HSA2, Class AI2, | | | | |
| | | | 5.500%, 03/25/2036 | | | 426,161 | |
| | 1,160,000 | | Series 2006-HSA2, Class AI3, | | | | |
| | | | 5.543%, 03/25/2036 | | | 539,094 | |
| | 820,000 | | Series 2006-HSA2, Class AI4, | | | | |
| | | | 5.810%, 03/25/2036 | | | 164,609 | |
| | | | SACO I Trust | | | | |
| | 973,649 | | Series 2006-9, Class A1, | | | | |
| | | | 0.497%, 08/25/2036 | | | 169,518 | |
| | | | SLM Student Loan Trust | | | | |
| | 1,220,594 | | Series 2008-1, Class A1, | | | | |
| | | | 0.511%, 07/25/2013 | | | 1,221,347 | |
| | 3,479,380 | | Series 2008-2, Class A1, | | | | |
| | | | 0.613%, 01/25/2015 | | | 3,480,907 | |
| | | | Total Asset Backed Securities | | | | |
| | | | (Cost $47,423,273) | | | 43,092,754 | |
| | | | | |
| CORPORATE BONDS 24.5% | | | | |
| | | | | | | | |
| | | | Airlines 1.2% | | | | |
| | | | Northwest Airlines, Inc. | | | | |
| | 3,261,371 | | 7.027%, 11/01/2019 | | | 3,098,303 | |
| | | | United Airlines | | | | |
| | 1,899,132 | | 6.636%, 07/02/2022 | | | 1,747,202 | |
| | | | | | | 4,845,505 | |
| | | | Commercial Banks 1.2% | | | | |
| | | | Manufacturers & Traders Trust Co. | | | | |
| | 1,860,000 | | 5.629%, 12/01/2021 | | | 1,758,163 | |
| | | | Marshall & Ilsley Bank | | | | |
| | 3,405,000 | | 0.808%, 12/04/2012 (a) | | | 3,071,092 | |
| | | | | | | 4,829,255 | |
| | | | Consumer Finance 1.6% | | | | |
| | | | Ford Motor Credit Co. | | | | |
| | 1,540,000 | | 8.000%, 12/15/2016 | | | 1,574,790 | |
| | 1,605,000 | | 8.125%, 01/15/2020 | | | 1,638,211 | |
| | | | GMAC, Inc. | | | | |
| | 1,767,000 | | 6.750%, 12/01/2014 | | | 1,709,573 | |
| | 1,955,000 | | 8.300%, 02/12/2015 | | | | |
| | | | (Acquired 02/09/2010 and | | | | |
| | | | 03/04/2010, Cost $1,945,313) (b) | | | 1,979,437 | |
| | | | | | | 6,902,011 | |
| | | | Diversified Financial Services 7.1% | | | | |
| | | | Bank of America Corp. | | | | |
| | 1,730,000 | | 5.750%, 12/01/2017 | | | 1,794,150 | |
| | 4,270,000 | | 7.625%, 06/01/2019 | | | 4,891,319 | |
| | 1,630,000 | | 5.625%, 07/01/2020 | | | 1,642,947 | |
| | | | Capital One Bank | | | | |
| | 1,260,000 | | 8.800%, 07/15/2019 | | | 1,572,998 | |
| | | | Citigroup, Inc. | | | | |
| | 5,875,000 | | 8.500%, 05/22/2019 | | | 7,003,728 | |
| | | | Credit Suisse AG | | | | |
| | 1,605,000 | | 5.400%, 01/14/2020 | | | 1,595,794 | |
| | | | Goldman Sachs Group, Inc. / The | | | | |
| | 3,290,000 | | 6.000%, 06/15/2020 | | | 3,392,427 | |
The accompanying notes are an integral part of these financial statements.
Frontegra Columbus Core Plus Fund SCHEDULE OF INVESTMENTS (continued)
June 30, 2010
| Principal Amount | | Value | |
| | | | | | |
CORPORATE BONDS 24.5% (continued) | | | |
| | | | | | |
| | | Diversified Financial | | | |
| | | Services 7.1% (continued) | | | |
| | | Lehman Brothers Holdings | | | |
| $ | 7,000,000 | | 6.875%, 05/02/2018 | | | |
| | | | (Acquired 09/16/2008, | | | |
| | | | Cost $2,343,205) (d) | | $ | 1,426,250 | |
| | | | Lloyds TSB Bank PLC | | | | |
| | 2,525,000 | | 5.800%, 01/13/2020 | | | | |
| | | | (Acquired Multiple Dates, | | | | |
| | | | Cost $2,452,897) (b)(c) | | | 2,383,335 | |
| | | | Morgan Stanley | | | | |
| | 4,170,000 | | 5.500%, 01/26/2020 | | | 4,034,058 | |
| | | | | | | 29,737,006 | |
| | | | Diversified Telecommunication | | | | |
| | | | Services 0.3% | | | | |
| | | | Qwest Corp. | | | | |
| | 1,515,000 | | 7.125%, 11/15/2043 | | | 1,306,688 | |
| | | | | | | | |
| | | | Electric Utilities 5.0% | | | | |
| | | | AES Eastern Energy | | | | |
| | 1,235,524 | | 9.000%, 01/02/2017 | | | 1,272,590 | |
| | 3,020,000 | | 9.670%, 01/02/2029 | | | 3,261,600 | |
| | | | AES Red Oak LLC | | | | |
| | 253,485 | | 8.540%, 11/30/2019 | | | 250,317 | |
| | | | Borger Energy Funding | | | | |
| | 2,413,025 | | 7.260%, 12/31/2022 | | | | |
| | | | (Acquired 08/14/2008 and | | | | |
| | | | 12/10/2008, Cost $2,330,242) (b) | | | 2,250,146 | |
| | | | Bruce Mansfield Unit | | | | |
| | 843,751 | | 6.850%, 06/01/2034 | | | 881,432 | |
| | | | Homer City Funding LLC | | | | |
| | 4,060,060 | | 8.734%, 10/01/2026 | | | 3,735,255 | |
| | | | Indianapolis Power & Light Co. | | | | |
| | 1,100,000 | | 6.050%, 10/01/2036 | | | | |
| | | | (Acquired Multiple Dates, | | | | |
| | | | Cost $1,061,374) (b) | | | 1,173,199 | |
| | | | Indiantown Cogeneration LP | | | | |
| | 2,680,000 | | 9.770%, 12/15/2020 | | | 2,962,392 | |
| | | | Kiowa Power Partners LLC | | | | |
| | 584,512 | | 4.811%, 12/30/2013 | | | | |
| | | | (Acquired Multiple Dates, | | | | |
| | | | Cost $582,248) (b) | | | 594,255 | |
| | | | Mackinaw Power LLC | | | | |
| | 1,147,297 | | 6.296%, 10/31/2023 | | | | |
| | | | (Acquired Multiple Dates, | | | | |
| | | | Cost $1,109,805) (b) | | | 1,175,613 | |
| | | | Selkirk Cogen Funding Corp. | | | | |
| | 723,577 | | 8.980%, 06/26/2012 | | | 768,793 | |
| | | | Tenaska Gateway Partners Ltd. | | | | |
| | 539,477 | | 6.052%, 12/30/2023 | | | | |
| | | | (Acquired 05/31/2007 and | | | | |
| | | | 08/03/2007, Cost $539,477) (b) | | | 554,442 | |
| | | | Windsor Financing LLC | | | | |
| | 1,811,892 | | 5.881%, 07/15/2017 | | | | |
| | | | (Acquired Multiple Dates, | | | | |
| | | | Cost $1,633,223) (b) | | | 1,697,399 | |
| | | | | | | 20,577,433 | |
| | | | Industrial Consumer Services 0.3% | | | | |
| | | | ERAC USA Finance Company | | | | |
| | 975,000 | | 6.375%, 10/15/2017 | | | | |
| | | | (Acquired 10/23/2008 and | | | | |
| | | | 12/10/2008, Cost $744,635) (b) | | | 1,097,537 | |
| | | | | | | | |
| | | | Insurance 6.7% | | | | |
| | | | AIG, Inc. | | | | |
| | 2,020,000 | | 4.250%, 05/15/2013 | | | 1,949,300 | |
| | | | AIG Sunamerica | | | | |
| | 280,000 | | 0.000%, 07/26/2010 | | | 278,600 | |
| | | | AIG Sunamerica Global Financial | | | | |
| | 3,760,000 | | 6.300%, 05/10/2011 | | | | |
| | | | (Acquired Multiple Dates, | | | | |
| | | | Cost $3,640,140) (b) | | | 3,797,600 | |
| | 1,090,000 | | 6.900%, 03/15/2032 | | | | |
| | | | (Acquired 02/23/2010, | | | | |
| | | | Cost $1,014,310) (b) | | | 1,008,250 | |
The accompanying notes are an integral part of these financial statements.
Frontegra Columbus Core Plus Fund SCHEDULE OF INVESTMENTS (continued)
June 30, 2010
| Principal Amount | | Value | |
| | | | | | |
CORPORATE BONDS 24.5% (continued) | | | |
| | | | | | |
| | | Insurance 6.7% (continued) | | | |
| | | ASIF Global Financing XIX | | | |
| $ | 3,945,000 | | 4.900%, 01/17/2013 | | | |
| | | | (Acquired Multiple Dates, | | | |
| | | | Cost $3,878,206) (b) | | $ | 3,866,100 | |
| | | | Genworth Global Funding | | | | |
| | 430,000 | | 5.250%, 05/15/2012 | | | 442,427 | |
| | 2,590,000 | | 5.875%, 05/03/2013 | | | | |
| | | | (Acquired 02/10/2010, | | | | |
| | | | Cost $2,604,096) (b) | | | 2,677,902 | |
| | | | Hartford Financial | | | | |
| | | | Services Group, Inc. | | | | |
| | 965,000 | | 4.000%, 03/30/2015 | | | 947,421 | |
| | 560,000 | | 8.125%, 06/15/2038 | | | 508,200 | |
| | 1,350,000 | | 6.625%, 03/30/2040 | | | 1,253,572 | |
| | | | Jackson National Life Global Funding | | | | |
| | 830,000 | | 5.375%, 05/08/2013 | | | | |
| | | | (Acquired 05/01/2008 and | | | | |
| | | | 12/10/2008, Cost $825,359) (b) | | | 891,671 | |
| | | | Lincoln National Corp. | | | | |
| | 1,270,000 | | 6.250%, 02/15/2020 | | | 1,360,575 | |
| | 1,315,000 | | 7.000%, 06/15/2040 | | | 1,385,017 | |
| | | | Monumental Global Funding | | | | |
| | 1,605,000 | | 5.500%, 04/22/2013 | | | | |
| | | | (Acquired Multiple Dates, | | | | |
| | | | Cost $1,603,546) (b) | | | 1,716,698 | |
| | 885,000 | | 5.250%, 01/15/2014 | | | | |
| | | | (Acquired 05/06/2009 and | | | | |
| | | | 06/10/2009, Cost $835,130) (b) | | | 963,386 | |
| | | | Nationwide Life Global Fund | | | | |
| | 795,000 | | 5.450%, 10/02/2012 | | | | |
| | | | (Acquired 09/25/2007 and | | | | |
| | | | 12/10/2008, Cost $793,225) (b) | | | 824,856 | |
| | | | Prudential Financial, Inc. | | | | |
| | 1,080,000 | | 5.375%, 06/21/2020 | | | 1,093,798 | |
| | 1,295,000 | | 6.625%, 06/21/2040 | | | 1,317,910 | |
| | | | Prudential Holdings LLC | | | | |
| | 1,045,000 | | 7.245%, 12/18/2023 | | | | |
| | | | (Acquired 02/11/2010 and | | | | |
| | | | 04/08/2010, Cost $1,137,154) (b) | | | 1,171,905 | |
| | 490,000 | | 8.695%, 12/18/2023 | | | | |
| | | | (Acquired Multiple Dates, | | | | |
| | | | Cost $570,568) (b) | | | 585,241 | |
| | | | | | | 28,040,429 | |
| | | | Oil and Gas 0.4% | | | | |
| | | | Shell International Finance BV | | | | |
| | 1,885,000 | | 3.100%, 06/28/2015 | | | 1,914,170 | |
| | | | | | | | |
| | | | Oil, Gas & Consumable Fuels 0.8% | | | | |
| | | | Anadarko Petroleum Corporation | | | | |
| | 905,000 | | 6.200%, 03/15/2040 | | | 716,019 | |
| | | | El Paso Corp. | | | | |
| | 1,355,000 | | 7.000%, 06/15/2017 | | | 1,347,370 | |
| | | | Valero Energy Corp. | | | | |
| | 1,430,000 | | 6.125%, 02/01/2020 | | | 1,469,462 | |
| | | | | | | 3,532,851 | |
| | | | Total Corporate Bonds | | | | |
| | | | (Cost $97,423,067) | | | 102,782,885 | |
| | | | | |
| MORTGAGE BACKED SECURITIES 21.9% | | | | |
| | | | Bank of America | | | | |
| | | | Commercial Mortgage, Inc. | | | | |
| | 3,935,000 | | Series 2006-3, Class A4, | | | | |
| | | | 5.889%, 07/10/2044 | | | 3,996,971 | |
| | 4,440,000 | | Series 2009-UB1, Class A4, | | | | |
| | | | 5.621%, 06/24/2050 | | | | |
| | | | (Acquired 06/18/2009 and | | | | |
| | | | 07/07/2009, Cost $3,670,269) (b) | | | 4,708,724 | |
| | | | CitiMortgage Alternative Loan Trust | | | | |
| | 1,858,421 | | Series 2007-A4, Class 2A1, | | | | |
| | | | 5.500%, 04/25/2022 | | | 1,585,943 | |
The accompanying notes are an integral part of these financial statements.
Frontegra Columbus Core Plus Fund SCHEDULE OF INVESTMENTS (continued)
June 30, 2010
| Principal Amount | | Value | |
| | | | | | |
| MORTGAGE BACKED | | | |
SECURITIES 21.9% (continued) | | | |
| | | Credit Suisse First Boston | | | |
| | | Mortgage Securities Corp. | | | |
| $ | 306,375 | | Pool # 2005-10, | | | |
| | | | 5.000%, 09/25/2015 | | $ | 305,828 | |
| | 64,319 | | Pool # 2003-1, 7.000%, 02/25/2033 | | | 69,269 | |
| | | | Credit Suisse Mortgage | | | | |
| | 2,625,000 | | Pool #2009-RR1, | | | | |
| | | | 5.383%, 11/15/2016 | | | | |
| | | | (Acquired 07/09/2009 and | | | | |
| | | | 12/29/2009, Cost $2,154,493) (b) | | | 2,700,770 | |
| | | | FHLMC REMIC (e) | | | | |
| | 8,559,600 | | Series 3609, 4.000%, 12/15/2024 | | | 8,996,839 | |
| | 249,241 | | Series 2750, 4.000%, 05/15/2026 | | | 251,233 | |
| | | | FNMA Pool (e) | | | | |
| | 4,518,873 | | Pool #MA0357, 4.000%, 04/25/2019 | | | 4,778,598 | |
| | 4,518,005 | | Pool #931711, 4.000%, 08/01/2019 | | | 4,777,680 | |
| | 2,308,865 | | Pool #MA0174, 4.000%, 09/25/2019 | | | 2,441,568 | |
| | 5,055,926 | | Pool #MA0235, 4.000%, 09/25/2019 | | | 5,346,518 | |
| | 4,629,250 | | Pool #932108, 4.000%, 11/25/2019 | | | 4,895,318 | |
| | 15,161,453 | | Pool #MA0298, 4.000%, 06/25/2019 | | | 16,032,864 | |
| | 6,781,940 | | Pool #MA0380, 4.000%, 05/25/2020 | | | 7,171,736 | |
| | 727,158 | | Pool #464398, 5.970%, 01/25/2040 | | | 807,639 | |
| | 562,800 | | Pool #464400, 5.970%, 01/25/2040 | | | 625,090 | |
| | | | FNMA REMIC (e) | | | | |
| | 62,815 | | Series 1994-3, Class PL, | | | | |
| | | | 5.500%, 01/25/2024 | | | 69,540 | |
| | | | FNMA TBA (e) | | | | |
| | 2,552,637 | | Pool #000TBA, 3.330%, 01/01/2020 | | | 2,598,099 | |
| | | | GS Mortgage Securities Corp. II | | | | |
| | 2,445,811 | | Series 2007-EOP, Class A1, | | | | |
| | | | 0.444%, 03/06/2020 | | | | |
| | | | (Acquired Multiple Dates, | | | | |
| | | | Cost $2,372,656) (a)(b) | | | 2,367,455 | |
| | 4,405,000 | | Series 2007-GG10, Class A4, | | | | |
| | | | 5.999%, 08/10/2045 (a) | | | 4,330,867 | |
| | | | LB-UBS Commercial Mortgage Trust | | | | |
| | 1,280,000 | | Series 2007-C2, Class A3, | | | | |
| | | | 5.430%, 02/15/2040 | | | 1,283,869 | |
| | | | Master Asset Securitization Trust | | | | |
| | 207,338 | | Pool # 2004-3, 4.750%, 01/25/2014 | | | 211,569 | |
| | | | Morgan Stanley Mortgage Loan Trust | | | | |
| | 735,591 | | Series 2006-7, 5.000%, 06/25/2021 | | | 667,944 | |
| | | | Morgan Stanley REMIC Trust | | | | |
| | 4,045,000 | | Series 2009-GG10, Class A4A, | | | | |
| | | | 5.805%, 08/12/2045 | | | | |
| | | | (Acquired 01/04/2010 and | | | | |
| | | | 01/25/2010, Cost $3,784,247) (b) | | | 4,240,486 | |
| | | | Residential Accredit Loans, Inc. | | | | |
| | 991,855 | | Series 2005-QS3, Class A1, | | | | |
| | | | 5.000%, 03/25/2020 | | | 924,544 | |
| | 1,113,795 | | Series 2004-QS4, Class A1, | | | | |
| | | | 4.350%, 03/25/2034 | | | 1,096,989 | |
| | | | Wachovia Bank | | | | |
| | | | Commercial Mortgage Trust | | | | |
| | 1,220,000 | | Series 2006-C23, Class A4, | | | | |
| | | | 5.418%, 01/15/2045 | | | 1,272,140 | |
| | | | Wells Fargo Alternative Loan Trust | | | | |
| | 1,697,613 | | Series 2007-PA3, Class 6A1, | | | | |
| | | | 5.500%, 07/25/2022 | | | 1,376,109 | |
| | | | Wells Fargo Mortgage | | | | |
| | | | Backed Securities Trust | | | | |
| | 1,730,556 | | Pool # 2006-3, 5.500%, 03/25/2036 | | | 1,658,851 | |
| | | | Total Mortgage Backed Securities | | | | |
| | | | (Cost $87,082,916) | | | 91,591,050 | |
| | | | | |
| U.S. GOVERNMENT AGENCY ISSUE 3.6% | | | | |
| | | | FHLMC (e) | | | | |
| | 6,995,000 | | 0.308%, 09/19/2011 (a) | | | 6,993,223 | |
| | 8,060,000 | | 0.270%, 01/11/2012 (a) | | | 8,049,853 | |
| | | | Total U.S. Government | | | | |
| | | | Agency Issue | | | | |
| | | | (Cost $15,044,328) | | | 15,043,076 | |
The accompanying notes are an integral part of these financial statements.
Frontegra Columbus Core Plus Fund SCHEDULE OF INVESTMENTS (continued)
June 30, 2010
| Principal Amount | | Value | |
| | | | | | |
| U.S. TREASURY OBLIGATIONS 30.4% | | | |
| | | United States Treasury Bonds 1.7% | | | |
| $ | 6,645,000 | | 4.375%, 05/15/2040 | | $ | 7,186,966 | |
| | | | | | | | |
| | | | United States Treasury Notes 28.7% | | | | |
| | 50,635,000 | | 1.000%, 09/30/2011 | | | 50,983,116 | |
| | 40,685,000 | | 0.875%, 02/29/2012 | | | 40,902,665 | |
| | 7,255,000 | | 3.250%, 03/31/2017 | | | 7,644,956 | |
| | 13,430,000 | | 3.125%, 04/30/2017 | | | 14,038,540 | |
| | 6,265,000 | | 2.750%, 05/31/2017 | | | 6,397,154 | |
| | | | | | | 119,966,431 | |
| | | | Total U.S. Treasury Obligations | | | | |
| | | | (Cost $125,778,417) | | | 127,153,397 | |
| | | | | | | | |
| SHORT-TERM INVESTMENTS 14.0% | | | | |
| | | | Commercial Paper 13.3% | | | | |
| | 14,084,000 | | Intesa Funding LLC, | | | | |
| | | | 0.000%, 07/01/2010 | | | 14,084,000 | |
| | 41,400,000 | | U.S. Bank, N.A., | | | | |
| | | | 0.000%, 07/01/2010 | | | 41,400,000 | |
| | | | | | | 55,484,000 | |
| | | | Variable Rate Demand Notes 0.7% | | | | |
| | 3,074,877 | | American Family Financial | | | | |
| | | | Services, Inc., 0.100% (f) | | | 3,074,877 | |
| | | | Total Short-Term Investments | | | | |
| | | | (Cost $58,558,877) | | | 58,558,877 | |
| | | | | | | | |
| | | | Total Investments 104.7% | | | | |
| | | | (Cost $431,310,878) | | | 438,222,039 | |
| | | | | | | | |
| | | | Liabilities in Excess of | | | | |
| | | | Other Assets (4.7)% | | | (19,783,417 | ) |
| | | | | | | | |
| | | | TOTAL NET ASSETS 100.0% | | $ | 418,438,622 | |
| (b) | Security exempt from registration under Rule 144A of the Securities Act of 1933. These securities may be resold in transactions exempt from registration normally to qualified institutional buyers. The total value of these securities amounted to $49,525,971 (11.8% of net assets) at June 30, 2010. |
| (c) | U.S. Dollar denominated security of a foreign issuer. |
| (d) | Security is in default. |
| (e) | Entity under conservatorship of the federal government. |
| (f) | Variable rate demand notes are considered short-term obligations and are payable upon demand. Interest rates change periodically on specified dates. The rates listed are as of June 30, 2010. |
ALLOCATION OF PORTFOLIO HOLDINGS
At June 30, 2010, the allocation of portfolio holdings as a percentage of the Fund’s total net assets were:
| Asset-Backed Securities | | | 10.3 | % | | U.S. Treasury Obligations | | | 30.4 | |
| Corporate Bonds | | | 24.5 | | | Short-Term Investments | | | 14.0 | |
| Mortgage-Backed Securities | | | 21.9 | | | Liabilities in Excess of Other Assets | | | (4.7 | ) |
U.S. Government Agency Issue | | | 3.6 | | | | | | 100.0 | % |
The accompanying notes are an integral part of these financial statements.
Frontegra Columbus Core Plus Fund SCHEDULE OF INVESTMENTS (continued)
June 30, 2010
Credit Default Swaps
| | | | | Rating of | | (Pay)/ | | | | | | | | | Unrealized | |
| | Reference | Buy/Sell | | Reference Entity | | Receive | | Fixed | | Expiration | | Notional | | | Appreciation/ | |
| Counterparty | Entity | Protection(1) | | (Moody’s/S&P) | | Fixed Rate | | Rate | | Date | | Value(2) | | | (Depreciation) | |
| JPMorgan | CDX North American | | | | | | | | | | | | | | | |
| | Investment Grade Index | Sell | | B2/B | | Receive | | 5.00% | | 6/20/15 | | $ | 4,460,000 | | | $ | 68,414 | |
| JPMorgan | CDX North American | | | | | | | | | | | | | | | | | |
| | High Yield Index | Sell | | Baa1/BBB | | Receive | | 1.00% | | 6/20/15 | | | 14,150,000 | | | | 62,411 | |
| JPMorgan | General Electric | | | | | | | | | | | | | | | | | |
| | Capital Corp. | Sell | | Aa2/AA+ | | Receive | | 1.00% | | 6/20/15 | | | 3,530,000 | | | | 77,133 | |
| | | | | | | | | | | | | $ | 22,140,000 | | | $ | 207,958 | |
| (1) | If the Fund is a seller of protection and a credit event occurs, as defined under the terms of that particular swap agreement, the Fund will either (i) pay to the buyer of protection an amount equal to the notional amount of the swap and take delivery of the referenced obligation or underlying securities comprising the referenced index or (ii) pay a net settlement amount in the form of cash or securities equal to the notional amount of the swap less the recovery value of the referenced obligation of underlying securities comprising the referenced index. |
| (2) | The maximum potential amount the Fund could be required to make as a seller of credit protection or receive as a buyer of credit protection if a credit event occurs as defined under the terms of that particular swap agreement. |
The accompanying notes are an integral part of these financial statements.
Frontegra Columbus Core Plus Fund STATEMENT OF ASSETS AND LIABILITIES
June 30, 2010
| Assets: | | | |
| Investments at value (cost $431,310,878) | | $ | 438,222,039 | |
| Interest receivable | | | 2,226,520 | |
| Deposit with broker and custodian for swaps | | | 440,055 | |
| Receivable for Fund shares sold | | | 519,587 | |
| Receivable for investments sold | | | 273,351 | |
| Unrealized appreciation on swaps | | | 207,958 | |
| Unrealized appreciation on foreign currency contracts | | | 343,893 | |
| Prepaid expenses and other assets | | | 188,254 | |
| Total assets | | | 442,421,657 | |
| Liabilities: | | | | |
| Payable for investments purchased | | | 22,422,239 | |
| Payable for Fund shares purchased | | | 10,532 | |
| Payable to the custodian | | | 610,687 | |
| Accrued investment advisory fee | | | 96,368 | |
| Accrued distribution and shareholder servicing fees | | | 4,385 | |
| Accrued expenses | | | 99,363 | |
| Swap payments received | | | 739,461 | |
| Total liabilities | | | 23,983,035 | |
| Net Assets | | $ | 418,438,622 | |
| Net Assets Consist of: | | | | |
| Paid in capital | | $ | 404,328,214 | |
| Undistributed net investment income | | | 2,076,318 | |
| Accumulated net realized gain on investments sold, swap contracts and foreign currency | | | 4,571,078 | |
| Net unrealized appreciation/(depreciation) on: | | | | |
| Investments | | | 6,911,161 | |
| Swap contracts | | | 207,958 | |
| Foreign currency | | | 343,893 | |
| Net Assets | | $ | 418,438,622 | |
| Capital Stock, $0.01 Par Value | | | | |
| Institutional Class Shares Authorized | | | 100,000,000 | |
| Class Y Shares Authorized | | | 50,000,000 | |
| Institutional Class: | | | | |
| Net Assets | | $ | 414,336,584 | |
| Issued and Outstanding | | | 12,670,375 | |
| Net Asset Value, Redemption Price and Offering Price Per Share | | $ | 32.70 | |
| Class Y: | | | | |
| Net Assets | | $ | 4,102,038 | |
| Issued and outstanding | | | 125,472 | |
| Net Asset Value, Redemption Price and Offering Price Per Share | | $ | 32.69 | |
The accompanying notes are an integral part of these financial statements.
Frontegra Columbus Core Plus Fund STATEMENT OF OPERATIONS
| | | Year Ended | |
| | | June 30, 2010 | |
| Investment Income: | | | |
| Interest income | | $ | 24,206,207 | |
| Total Investment Income | | | 24,206,207 | |
| | | | | |
| Expenses: | | | | |
| Investment advisory fees (Note 3) | | | 1,660,169 | |
| Fund administration and accounting fees | | | 117,318 | |
| Custody fees | | | 41,975 | |
| Federal and state registration fees | | | 43,430 | |
| Audit fees | | | 36,316 | |
| Legal fees | | | 36,034 | |
| Shareholder servicing fees | | | 33,513 | |
| Reports to shareholders | | | 13,745 | |
| Directors’ fees and related expenses | | | 8,395 | |
| Distribution and shareholder servicing fees - Class Y (Note 8) | | | 6,426 | |
| Compliance related expenses | | | 553 | |
| Other | | | 22,162 | |
| Total expenses before waiver and reimbursement | | | 2,020,036 | |
| Waiver and reimbursement of expenses by Adviser (Note 3) | | | (562,186 | ) |
| Net expenses | | | 1,457,850 | |
| Net Investment Income | | | 22,748,357 | |
| | | | | |
| Realized and Unrealized Gain (Loss) on Investments: | | | | |
| Net realized gain (loss) on : | | | | |
| Investments | | | 31,203,341 | |
| Swap contracts | | | 2,960,659 | |
| Foreign currency contracts | | | (513,824 | ) |
| Change in net unrealized appreciation/(depreciation) on: | | | | |
| Investments | | | 15,416,965 | |
| Swap contracts | | | (214,140 | ) |
| Foreign currency contracts | | | 343,893 | |
| Net Realized and Unrealized Gain on Investments | | | 49,196,894 | |
| Net Increase in Net Assets Resulting from Operations | | $ | 71,945,251 | |
The accompanying notes are an integral part of these financial statements.
Frontegra Columbus Core Plus Fund STATEMENTS OF CHANGES IN NET ASSETS
| | | For the | | | For the | |
| | | Year Ended | | | Year Ended | |
| | | June 30, 2010 | | | June 30, 2009 | |
| Operations: | | | | | | |
| Net investment income | | $ | 22,748,357 | | | $ | 35,153,932 | |
| Net realized gain (loss) on: | | | | | | | | |
| Investments | | | 31,203,341 | | | | (8,895,311 | ) |
| Swap contracts | | | 2,960,659 | | | | 2,197,511 | |
| Foreign currency | | | (513,824 | ) | | | — | |
| Futures | | | — | | | | 831,878 | |
| Change in net unrealized appreciation/(depreciation) on: | | | | | | | | |
| Investments | | | 15,416,965 | | | | 354,573 | |
| Swap contracts | | | (214,140 | ) | | | 1,390,660 | |
| Foreign currency contracts | | | 343,893 | | | | — | |
| Net increase in net assets resulting from operations | | | 71,945,251 | | | | 31,033,243 | |
| Distributions Paid to Institutional Class Shareholders From: | | | | | | | | |
| Net investment income | | | (23,504,203 | ) | | | (33,077,660 | ) |
| Net realized gain | | | (16,735,772 | ) | | | (9,661,730 | ) |
| Net decrease in net assets resulting from distributions paid | | | (40,239,975 | ) | | | (42,739,390 | ) |
| Distributions Paid to Class Y Shareholders From: | | | | | | | | |
| Net investment income | | | (99,014 | ) | | | — | |
| Net realized gain | | | (71,341 | ) | | | — | |
| Net decrease in net assets resulting from distributions paid | | | (170,355 | ) | | | — | |
| Capital Share Transactions: | | | | | | | | |
| Shares sold - Institutional Class | | | 146,415,967 | | | | 110,670,953 | |
| Shares sold - Class Y | | | 4,020,332 | | | | — | |
| Shares issued to holders in reinvestment of distributions - Institutional Class | | | 33,641,301 | | | | 33,980,127 | |
| Shares issued to holders in reinvestment of distributions - Class Y | | | 170,089 | | | | — | |
| Shares redeemed - Institutional Class | | | (193,952,206 | ) | | | (170,148,652 | ) |
| Shares redeemed - Class Y | | | (102,907 | ) | | | — | |
| Net decrease in net assets resulting from capital share transactions | | | (9,807,424 | ) | | | (25,497,572 | ) |
| Total Increase (Decrease) in Net Assets | | | 21,727,497 | | | | (37,203,719 | ) |
| Net Assets: | | | | | | | | |
| Beginning of Period | | | 396,711,125 | | | | 433,914,844 | |
| End of Period (includes undistributed net investment income of $2,076,318 and $1,273,273 respectively) | | $ | 418,438,622 | | | $ | 396,711,125 | |
| Transactions In Shares – Institutional Class: | | | | | | | | |
| Shares sold | | | 4,546,295 | | | | 4,019,040 | |
| Shares issued to holders in reinvestment of distributions | | | 1,057,362 | | | | 1,277,512 | |
| Shares redeemed | | | (5,981,168 | ) | | | (6,367,246 | ) |
| Net decrease in shares outstanding | | | (377,511 | ) | | | (1,070,694 | ) |
| Transactions In Shares – Class Y: | | | | | | | | |
| Shares sold | | | 123,322 | | | | — | |
| Shares issued to holders in reinvestment of distributions | | | 5,351 | | | | — | |
| Shares redeemed | | | (3,201 | ) | | | — | |
| Net increase in shares outstanding | | | 125,472 | | | | — | |
The accompanying notes are an integral part of these financial statements.
Frontegra Columbus Core Plus Fund FINANCIAL HIGHLIGHTS
| | | Institutional Class | |
| | | Year | | | Year | | | Year | | | Year | | | Year | |
| | | Ended | | | Ended | | | Ended | | | Ended | | | Ended | |
| | | June 30, | | | June 30, | | | June 30, | | | June 30, | | | June 30, | |
| | | 2010 | | | 2009 | | | 2008 | | | 2007 | | | 2006 | |
| Net Asset Value, Beginning of Period | | $ | 30.40 | | | $ | 30.73 | | | $ | 30.40 | | | $ | 29.72 | | | $ | 31.50 | |
| | | | | | | | | | | | | | | | | | | | | |
| Income (Loss) from | | | | | | | | | | | | | | | | | | | | |
| Investment Operations: | | | | | | | | | | | | | | | | | | | | |
| Net investment income | | | 1.84 | | | | 2.50 | | | | 1.48 | | | | 1.54 | | | | 1.41 | |
| Net realized and unrealized gain (loss) on investments | | | 3.80 | | | | 0.16 | | | | 0.61 | | | | 0.68 | | | | (1.30 | ) |
| Total Income from Investment Operations | | | 5.64 | | | | 2.66 | | | | 2.09 | | | | 2.22 | | | | 0.11 | |
| | | | | | | | | | | | | | | | | | | | | |
| Less Distributions: | | | | | | | | | | | | | | | | | | | | |
| From net investment income | | | (1.90 | ) | | | (2.33 | ) | | | (1.49 | ) | | | (1.54 | ) | | | (1.45 | ) |
| From net realized gain on investments | | | (1.44 | ) | | | (0.66 | ) | | | (0.27 | ) | | | — | | | | (0.44 | ) |
| Total Distributions | | | (3.34 | ) | | | (2.99 | ) | | | (1.76 | ) | | | (1.54 | ) | | | (1.89 | ) |
| | | | | | | | | | | | | | | | | | | | | |
| Net Asset Value, End of Period | | $ | 32.70 | | | $ | 30.40 | | | $ | 30.73 | | | $ | 30.40 | | | $ | 29.72 | |
| | | | | | | | | | | | | | | | | | | | | |
| Total Return | | | 19.12 | % | | | 10.52 | % | | | 6.92 | % | | | 7.52 | % | | | 0.36 | % |
| | | | | | | | | | | | | | | | | | | | | |
| Supplemental Data and Ratios: | | | | | | | | | | | | | | | | | | | | |
| Net assets, end of period (in thousands) | | $ | 414,337 | | | $ | 396,711 | | | $ | 433,915 | | | $ | 276,830 | | | $ | 313,880 | |
| Ratio of expenses to average net assets | | | | | | | | | | | | | | | | | | | | |
| Before waivers and reimbursements | | | 0.49 | % | | | 0.49 | % | | | 0.49 | % | | | 0.50 | % | | | 0.50 | % |
| Net of waivers and reimbursements | | | 0.35 | % | | | 0.35 | % | | | 0.30 | % | | | 0.20 | % | | | 0.20 | % |
| Ratio of net investment income to average net assets | | | | | | | | | | | | | | | | | | | | |
| Before waivers and reimbursements | | | 5.35 | % | | | 8.68 | % | | | 4.68 | % | | | 4.65 | % | | | 4.29 | % |
| Net of waivers and reimbursements | | | 5.49 | % | | | 8.82 | % | | | 4.87 | % | | | 4.95 | % | | | 4.59 | % |
| Portfolio turnover rate | | | 1,006 | % | | | 424 | % | | | 1,093 | % | | | 978 | % | | | 1,247 | % |
The accompanying notes are an integral part of these financial statements.
Frontegra Columbus Core Plus Fund FINANCIAL HIGHLIGHTS
| | | Class Y | |
| | | Period | |
| | | Ended | |
| | | June 30, | |
| | | 2010(1) | |
| Net Asset Value, Beginning of Period | | $ | 33.08 | |
| | | | | |
| Income (Loss) from | | | | |
| Investment Operations: | | | | |
| Net investment income | | | 0.98 | |
| Net realized and unrealized gain on investments | | | 1.30 | |
| Total Income from Investment Operations | | | 2.28 | |
| | | | | |
| Less Distributions: | | | | |
| From net investment income | | | (1.23 | ) |
| From net realized gain on investments | | | (1.44 | ) |
| Total Distributions | | | (2.67 | ) |
| | | | | |
| Net Asset Value, End of Period | | $ | 32.69 | |
| | | | | |
| Total Return | | | 7.33 | %(2) |
| | | | | |
| Supplemental Data and Ratios: | | | | |
| Net assets, end of period (in thousands) | | $ | 4,102 | |
| Ratio of expenses to average net assets | | | | |
| Before waivers and reimbursements | | | 0.89 | %(3) |
| Net of waivers and reimbursements | | | 0.75 | %(3) |
| Ratio of net investment income to average net assets | | | | |
| Before waivers and reimbursements | | | 3.98 | %(3) |
| Net of waivers and reimbursements | | | 4.12 | %(3) |
| Portfolio turnover rate | | | 1,006 | %(2) |
| (1) | Commenced operations on November 12, 2009. |
The accompanying notes are an integral part of these financial statements.
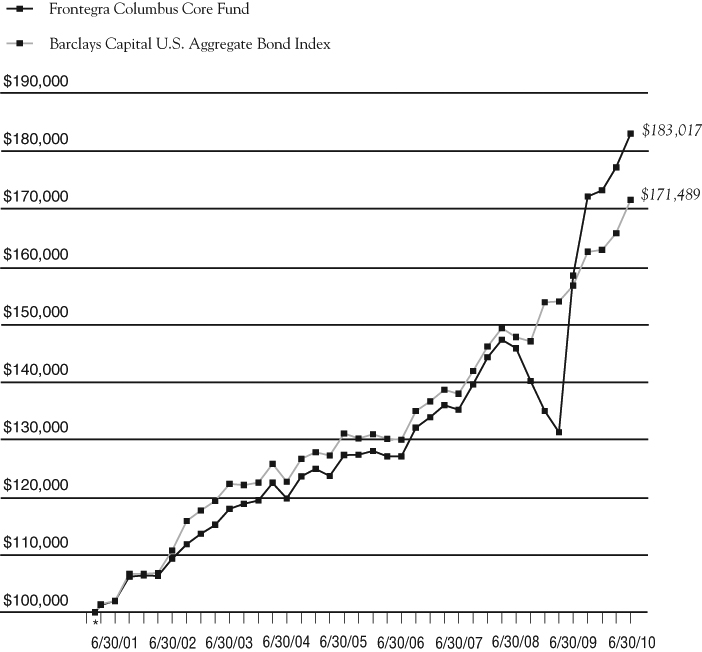
Growth of a $100,000 Investment (Unaudited)
* 2/23/01 commencement of operations.
| | | | | |
| | Portfolio Total Return** | | | |
| | FOR PERIODS ENDED 6/30/10 | FUND | INDEX | |
| | | | | |
| | SIX MONTHS | 5.73% | 5.33% | |
| | | | | |
| | ONE YEAR | 15.60% | 9.50% | |
| | | | | |
| | FIVE YEAR | | | |
| | AVERAGE ANNUAL | 7.54% | 5.54% | |
| | | | | |
| | SINCE COMMENCEMENT | | | |
| | AVERAGE ANNUAL | 6.68% | 5.94% | |
| | | | | |
This chart assumes an initial gross investment of $100,000 made on 2/23/01 (commencement of operations). Returns shown include the reinvestment of all distributions. Past performance is not predictive of future results. Investment return and principal value will fluctuate so that shares, when redeemed, may be worth more or less than the original cost. In the absence of existing fee waivers, total return would be reduced. The recent growth rate in the fixed income market has helped to produce short-term returns for some asset classes that are not typical and may not continue in the future. Because of ongoing market volatility, Fund performance may be subject to substantial short-term changes. To receive current to the most recent month-end performance, please call 1-888-825-2100.
The Barclays Capital U.S. Aggregate Bond Index (formerly the Lehman Brothers Aggregate Bond Index) is an unmanaged market value-weighted performance benchmark for investment-grade fixed-rate debt issues, including government, corporate, asset backed and mortgage backed securities, with maturities of at least one year. The Index does not reflect investment management fees, brokerage commissions and other expenses associated with investing in fixed income securities. A direct investment in the index is not possible.
| ** | The returns shown do not reflect the deduction of taxes that a shareholder would pay on Fund distributions or the redemption of Fund shares. |
Frontegra Columbus Core Fund SCHEDULE OF INVESTMENTS
June 30, 2010
| Principal Amount | | Value | |
| | | | | | |
| ASSET BACKED SECURITIES 9.2% | | | |
| | | Americredit Automobile | | | |
| | | Receivables Trust | | | |
| $ | 355,000 | | Series 2008-AF, Class A4, | | | |
| | | | 6.960%, 10/14/2014 | | $ | 379,391 | |
| | | | Capital One Multi-Asset | | | | |
| | | | Execution Trust | | | | |
| | 235,000 | | Series 2006-9A, Class A9, | | | | |
| | | | 0.365%, 05/15/2013 | | | 234,982 | |
| | | | Chase Issuance Trust | | | | |
| | 230,000 | | Series 2009-A7, Class A7, | | | | |
| | | | 0.800%, 09/17/2012 | | | 230,153 | |
| | 260,000 | | Series 2005-A13, Class A13, | | | | |
| | | | 0.390%, 02/15/2013 | | | 259,856 | |
| | | | Chrysler Financial Auto | | | | |
| | | | Securitization Trust | | | | |
| | 360,000 | | Series 2009-B, Class A-2, | | | | |
| | | | 1.150%, 11/08/2011 | | | 360,575 | |
| | | | Chrysler Financial Automobile TALF | | | | |
| | 155,000 | | Series 2009-AF, Class A3, | | | | |
| | | | 2.820%, 01/15/2016 | | | 158,080 | |
| | | | Credit Suisse Mortgage | | | | |
| | | | Capital Certificates | | | | |
| | 286,185 | | Series 2009-12R, Class 41A1, | | | | |
| | | | 5.250%, 03/27/2037 | | | | |
| | | | (Acquired 10/06/2009, | | | | |
| | | | Cost $285,112) (b) | | | 286,185 | |
| | | | Fifth Third Auto Trust | | | | |
| | 266,781 | | Series 2008-1, Class A3A, | | | | |
| | | | 4.070%, 01/17/2012 | | | 268,240 | |
| | | | Ford Credit Auto Owner Trust | | | | |
| | 550,000 | | Series 2009-A, Class A3B, | | | | |
| | | | 2.850%, 05/15/2013 | | | 560,608 | |
| | 375,000 | | Series 2009-D, Class A3, | | | | |
| | | | 2.170%, 10/15/2013 | | | 380,073 | |
| | | | GE Capital Credit Card | | | | |
| | | | Master Note Trust | | | | |
| | 385,000 | | Series 2009-3, Class A, | | | | |
| | | | 2.540%, 09/15/2014 | | | 389,557 | |
| | | | Hertz Vehicle Financing LLC | | | | |
| | 112,500 | | Series 2005-1A, Class A4, | | | | |
| | | | 0.597%, 11/25/2011 | | | | |
| | | | (Acquired 08/21/2008, | | | | |
| | | | Cost $109,487) (a)(b) | | | 112,228 | |
| | 166,667 | | Series 2005-2A, Class A5, | | | | |
| | | | 0.597%, 11/25/2011 | | | | |
| | | | (Acquired 08/01/2008, | | | | |
| | | | Cost $163,226) (a)(b) | | | 166,264 | |
| | 280,000 | | Series 2009-2A, Class A1, | | | | |
| | | | 4.260%, 03/25/2014 | | | | |
| | | | (Acquired 10/16/2009, | | | | |
| | | | Cost $279,983) (a)(b) | | | 291,780 | |
| | | | Hyundai Auto Receivables Trust | | | | |
| | 640,000 | | Series 2009-A, Class A3, | | | | |
| | | | 2.030%, 08/15/2013 | | | 648,634 | |
| | | | Keystone Owner Trust | | | | |
| | 28,009 | | Series 1998-P1, Class M1, | | | | |
| | | | 7.530%, 05/25/2025 | | | | |
| | | | (Acquired 04/22/2003, | | | | |
| | | | Cost $28,479) (b) | | | 27,333 | |
| | | | Mid-State Trust | | | | |
| | 127,230 | | Series 11, Class A1, | | | | |
| | | | 4.864%, 07/15/2038 | | | 122,304 | |
| | | | Sears Credit Account Master Trust | | | | |
| | 445,000 | | Series 2002-3, Class A, | | | | |
| | | | 1.000%, 05/17/2016 | | | 441,959 | |
| | | | SLM Student Loan Trust | | | | |
| | 201,969 | | Series 2008-1, Class A1, | | | | |
| | | | 0.511%, 07/25/2013 | | | 202,093 | |
| | 575,061 | | Series 2008-2, Class A1, | | | | |
| | | | 0.613%, 01/25/2015 | | | 575,313 | |
| | | | Total Asset Backed Securities | | | | |
| | | | (Cost $6,035,041) | | | 6,095,608 | |
The accompanying notes are an integral part of these financial statements.
Frontegra Columbus Core Fund SCHEDULE OF INVESTMENTS (continued)
June 30, 2010
| Principal Amount | | Value | |
| | | | | | |
| CORPORATE BONDS 20.8% | | | |
| | | Airlines 0.7% | | | |
| | | Northwest Airlines, Inc. | | | |
| $ | 505,826 | | 7.027%, 11/01/2019 | | $ | 480,534 | |
| | | | | | | | |
| | | | Commercial Banks 1.2% | | | | |
| | | | Manufacturers & Traders Trust Co. | | | | |
| | 285,000 | | 5.629%, 12/01/2021 | | | 269,396 | |
| | | | Marshall & Ilsley Bank | | | | |
| | 570,000 | | 0.808%, 12/04/2012(a) | | | 514,103 | |
| | | | | | | 783,499 | |
| | | | Construction Materials 0.1% | | | | |
| | | | Lafarge Coppee SA | | | | |
| | 70,000 | | 6.500%, 07/15/2016 | | | 72,514 | |
| | | | | | | | |
| | | | Diversified Financial Services 7.3% | | | | |
| | | | Bank of America Corp. | | | | |
| | 80,000 | | 5.750%, 12/01/2017 | | | 82,966 | |
| | 660,000 | | 7.625%, 06/01/2019 | | | 756,035 | |
| | 245,000 | | 5.625%, 07/01/2020 | | | 246,946 | |
| | | | Capital One Bank | | | | |
| | 155,000 | | 8.800%, 07/15/2019 | | | 193,504 | |
| | | | Citigroup, Inc. | | | | |
| | 905,000 | | 8.500%, 05/22/2019 | | | 1,078,872 | |
| | | | Credit Suisse AG | | | | |
| | 245,000 | | 5.400%, 01/14/2020 | | | 243,595 | |
| | | | Goldman Sachs Group, Inc. / The | | | | |
| | 510,000 | | 6.000%, 06/15/2020 | | | 525,878 | |
| | | | JPMorgan Chase & Co. | | | | |
| | 280,000 | | 5.150%, 10/01/2015 | | | 299,580 | |
| | 230,000 | | 4.950%, 03/25/2020 | | | 239,028 | |
| | | | Lloyds TSB Bank PLC | | | | |
| | 370,000 | | 5.800%, 01/13/2020 | | | | |
| | | | (Acquired Multiple Dates, | | | | |
| | | | Cost $361,326) (b)(d) | | | 349,241 | |
| | | | Morgan Stanley | | | | |
| | 645,000 | | 5.500%, 01/26/2020 | | | 623,973 | |
| | | | Wachovia Corp. | | | | |
| | 130,000 | | 5.625%, 10/15/2016 | | | 140,305 | |
| | | | | | | 4,779,923 | |
| | | | Electric Utilities 2.8% | | | | |
| | | | Bruce Mansfield Unit | | | | |
| | 392,443 | | 6.850%, 06/01/2034 | | | 409,969 | |
| | | | Entergy Arkansas, Inc. | | | | |
| | 175,000 | | 5.000%, 07/01/2018 | | | 175,324 | |
| | | | Entergy Texas, Inc. | | | | |
| | 360,000 | | 3.600%, 06/01/2015 | | | 365,318 | |
| | | | Indianapolis Power & Light Co. | | | | |
| | 165,000 | | 6.050%, 10/01/2036 | | | | |
| | | | (Acquired Multiple Dates, | | | | |
| | | | Cost $152,372) (b) | | | 175,980 | |
| | | | Kiowa Power Partners LLC | | | | |
| | 163,859 | | 4.811%, 12/30/2013 | | | | |
| | | | (Acquired 11/22/2004 and | | | | |
| | | | 08/03/2007, Cost $163,625) (b) | | | 166,590 | |
| | | | Mackinaw Power LLC | | | | |
| | 279,195 | | 6.296%, 10/31/2023 | | | | |
| | | | (Acquired Multiple Dates, | | | | |
| | | | Cost $268,813) (b) | | | 286,086 | |
| | | | Ohio Power Co. | | | | |
| | 60,000 | | 6.000%, 06/01/2016 | | | 67,952 | |
| | | | Oncor Electric Delivery Co. LLC | | | | |
| | 175,000 | | 7.000%, 09/01/2022 | | | 210,970 | |
| | | | | | | 1,858,189 | |
| | | | Industrial Consumer Services 0.2% | | | | |
| | | | ERAC USA Finance Company | | | | |
| | 135,000 | | 6.375%, 10/15/2017 | | | | |
| | | | (Acquired 10/23/2008, | | | | |
| | | | Cost $103,631) (b) | | | 151,967 | |
The accompanying notes are an integral part of these financial statements.
Frontegra Columbus Core Fund SCHEDULE OF INVESTMENTS (continued)
June 30, 2010
| Principal Amount | | Value | |
| | | | | | |
CORPORATE BONDS 20.8% (continued) | | | |
| | | Insurance 6.8% | | | |
| | | AIG Sunamerica Global Financial | | | |
| $ | 250,000 | | 6.300%, 05/10/2011 | | | |
| | | | (Acquired 09/30/2009, | | | |
| | | | Cost $248,081) (b) | | $ | 252,500 | |
| | | | ASIF Global Financing XIX | | | | |
| | 594,000 | | 4.900%, 01/17/2013 | | | | |
| | | | (Acquired Multiple Dates, | | | | |
| | | | Cost $587,401) (b) | | | 582,120 | |
| | 185,000 | | 6.900%, 03/15/2032 | | | | |
| | | | (Acquired 02/23/2010, | | | | |
| | | | Cost $172,154) (b) | | | 171,125 | |
| | | | Farmers Insurance Exchange | | | | |
| | 230,000 | | 6.000%, 08/01/2014 | | | | |
| | | | (Acquired 07/15/2009, | | | | |
| | | | Cost $198,841) (b) | | | 235,832 | |
| | | | Genworth Global Funding | | | | |
| | 450,000 | | 5.875%, 05/03/2013 | | | | |
| | | | (Acquired 11/25/2008 and | | | | |
| | | | 01/20/2009, Cost $328,962) (b) | | | 465,273 | |
| | | | Hartford Financial Services Group, Inc. | | | | |
| | 390,000 | | 4.000%, 03/30/2015 | | | 382,896 | |
| | | | Jackson National Life Global Funding | | | | |
| | 235,000 | | 5.375%, 05/08/2013 | | | | |
| | | | (Acquired Multiple Dates, | | | | |
| | | | Cost $235,360) (b) | | | 252,461 | |
| | | | Lincoln National Corp. | | | | |
| | 170,000 | | 6.250%, 02/15/2020 | | | 182,124 | |
| | 205,000 | | 7.000%, 06/15/2040 | | | 215,915 | |
| | | | Monumental Global Funding | | | | |
| | 390,000 | | 5.500%, 04/22/2013 | | | | |
| | | | (Acquired Multiple Dates, | | | | |
| | | | Cost $393,011) (b) | | | 417,142 | |
| | 135,000 | | 5.250%, 01/15/2014 | | | | |
| | | | (Acquired 0/10/2009 and | | | | |
| | | | 09/30/2009, Cost $130,306) (b) | | | 146,957 | |
| | | | Nationwide Life Global Fund | | | | |
| | 300,000 | | 5.450%, 10/02/2012 | | | | |
| | | | (Acquired 09/25/2007 and | | | | |
| | | | 09/30/2009, Cost $298,605) (b) | | | 311,266 | |
| | | | Prudential Financial, Inc. | | | | |
| | 165,000 | | 5.375%, 06/21/2020 | | | 167,108 | |
| | 205,000 | | 6.625%, 06/21/2040 | | | 208,626 | |
| | | | Prudential Holdings LLC | | | | |
| | 360,000 | | 8.695%, 12/18/2023 | | | | |
| | | | (Acquired 01/06/2010, | | | | |
| | | | Cost $421,073) (b) | | | 429,973 | |
| | | | | | | 4,421,318 | |
| | | | Oil and Gas 0.6% | | | | |
| | | | Merey Sweeny LP | | | | |
| | 330,260 | | 8.850%, 12/18/2019 | | | | |
| | | | (Acquired 01/19/2010, | | | | |
| | | | Cost $378,594) (b) | | | 391,041 | |
| | | | | | | | |
| | | | Oil and Gas Extraction 0.6% | | | | |
| | | | Devon OEI Operating, Inc. | | | | |
| | 345,000 | | 7.500%, 09/15/2027 | | | 412,024 | |
| | | | | | | | |
| | | | Support Activities for Mining 0.5% | | | | |
| | | | Shell International Finance BV | | | | |
| | 290,000 | | 3.100%, 06/28/2015 | | | 294,488 | |
| | | | Total Corporate Bonds | | | | |
| | | | (Cost $12,912,752) | | | 13,645,497 | |
| | | | | |
| MORTGAGE BACKED SECURITIES 19.8% | | | | |
| | | | Bank of America | | | | |
| | | | Commercial Mortgage, Inc. | | | | |
| | 385,000 | | Series 2006-3, Class A4, | | | | |
| | | | 5.889%, 07/10/2044 | | | 391,063 | |
| | 725,000 | | Series 2009-UB1, Class A4, | | | | |
| | | | 5.621%, 06/24/2050 | | | | |
| | | | (Acquired Multiple Dates, | | | | |
| | | | Cost $611,344) (b) | | | 768,879 | |
The accompanying notes are an integral part of these financial statements.
Frontegra Columbus Core Fund SCHEDULE OF INVESTMENTS (continued)
June 30, 2010
| Principal Amount | | Value | |
| | | | | | |
| MORTGAGE BACKED | | | |
SECURITIES 19.8% (continued) | | | |
| | | CitiMortgage Alternative Loan Trust | | | |
| $ | 1,037,782 | | Series 2007-A7, Class 3A1, | | | |
| | | | 5.750%, 07/25/2022 | | $ | 880,193 | |
| | | | Credit Suisse First Boston | | | | |
| | | | Mortgage Securities Corp. | | | | |
| | 81,099 | | Pool # 2005-10, 5.000%, 09/25/2015 | | | 80,954 | |
| | 18,341 | | Pool # 2003-1, 7.000%, 02/25/2033 | | | 19,753 | |
| | | | Fannie Mae-Aces (c) | | | | |
| | 249,249 | | Series 2010-M1, Class A1, | | | | |
| | | | 3.305%, 06/25/2019 | | | 256,550 | |
| | | | FHLMC REMIC (c) | | | | |
| | 1,470,227 | | Series 3609, 4.000%, 12/15/2024 | | | 1,545,329 | |
| | 37,676 | | Series 2750, 4.000%, 05/15/2026 | | | 37,977 | |
| | | | FNMA Pool (c) | | | | |
| | 27,651 | | Pool #735065, 4.498%, 08/25/2013 | | | 29,237 | |
| | 624,951 | | Pool #MA0357, 4.000%, 04/25/2019 | | | 660,870 | |
| | 596,066 | | Pool #931711, 4.000%, 08/25/2019 | | | 630,325 | |
| | 244,417 | | Pool #MA0174, 4.000%, 09/25/2019 | | | 258,465 | |
| | 657,462 | | Pool #932108, 4.000%, 11/25/2019 | | | 695,250 | |
| | 957,260 | | Pool #MA0235, 4.000%, 09/25/2019 | | | 1,012,279 | |
| | 2,195,218 | | Pool #MA0298, 4.000%, 06/25/2019 | | | 2,321,389 | |
| | 954,316 | | Pool #MA0380, 4.000%, 05/25/2020 | | | 1,009,166 | |
| | 124,513 | | Pool #464398, 5.970%, 01/25/2040 | | | 138,294 | |
| | 94,630 | | Pool #464400, 5.970%, 01/25/2040 | | | 105,104 | |
| | | | FNMA TBA (c) | | | | |
| | 396,432 | | Pool #000TBA, 3.330%, 01/01/2020 | | | 403,493 | |
| | | | GS Mortgage Securities Corp. II | | | | |
| | 358,477 | | Series 2007-EOP, Class A1, | | | | |
| | | | 0.444%, 03/06/2020 | | | | |
| | | | (Acquired 09/17/2007 through | | | | |
| | | | 04/22/2008, Cost $352,035) (a)(b) | | | 346,992 | |
| | | | LB-UBS Commercial Mortgage Trust | | | | |
| | 125,000 | | Series 2007-C2, Class A3, | | | | |
| | | | 5.430%, 02/15/2040 | | | 125,378 | |
| | | | Master Asset Securitization Trust | | | | |
| | 54,782 | | Pool # 2004-3, 4.750%, 01/25/2014 | | | 55,900 | |
| | | | Morgan Stanley REMIC Trust | | | | |
| | 675,000 | | Series 2009-GG10, Class A4A, | | | | |
| | | | 5.805%, 08/12/2045 | | | | |
| | | | (Acquired 01/04/2010 and | | | | |
| | | | 01/25/2010, Cost $631,056) (b) | | | 707,621 | |
| | | | Residential Accredit Loans, Inc. | | | | |
| | 233,506 | | Series 2004-QS4, Class A1, | | | | |
| | | | 4.350%, 03/25/2034 | | | 229,983 | |
| | | | Residential Asset Securitization Trust | | | | |
| | 140,277 | | Series 2003-A6, Class A1, | | | | |
| | | | 4.500%, 07/25/2033 | | | 137,471 | |
| | | | Wachovia Bank Commercial Mortgage Trust | | | | |
| | 205,000 | | Series 2006-C23, Class A4, | | | | |
| | | | 5.418%, 01/15/2045 | | | 213,761 | |
| | | | Total Mortgage Backed Securities | | | | |
| | | | (Cost $12,565,616) | | | 13,061,676 | |
| | | | | |
| U.S. GOVERNMENT AGENCY ISSUE 3.6% | | | | |
| | | | FHLMC (c) | | | | |
| | 1,105,000 | | 0.308%, 09/19/2011 (a) | | | 1,104,719 | |
| | 1,275,000 | | 0.270%, 01/11/2012 (a) | | | 1,273,395 | |
| | | | Total U.S. Government | | | | |
| | | | Agency Issue | | | | |
| | | | (Cost $2,378,312) | | | 2,378,114 | |
| | | | | |
| U.S. TREASURY OBLIGATIONS 37.6% | | | | |
| | | | United States Treasury Bonds 1.7% | | | | |
| | 1,050,000 | | 4.375%, 05/15/2040 | | | 1,135,638 | |
| | | | | | | | |
| | | | United States Treasury Notes 35.9% | | | | |
| | 13,810,000 | | 1.000%, 09/30/2011 | | | 13,904,944 | |
| | 5,920,000 | | 0.875%, 02/29/2012 | | | 5,951,672 | |
| | 800,000 | | 3.250%, 03/31/2017 | | | 843,000 | |
| | 1,895,000 | | 3.125%, 04/30/2017 | | | 1,980,866 | |
| | 960,000 | | 2.750%, 05/31/2017 | | | 980,250 | |
| | | | | | | 23,660,732 | |
| | | | Total U.S. Treasury Obligations | | | | |
| | | | (Cost $24,604,109) | | | 24,796,370 | |
The accompanying notes are an integral part of these financial statements.
Frontegra Columbus Core Fund SCHEDULE OF INVESTMENTS (continued)
June 30, 2010
| Principal Amount | | Value | |
| | | | | | |
| SHORT-TERM INVESTMENTS 15.0% | | | |
| | | Commercial Paper 15.0% | | | |
| $ | 3,290,000 | | Intesa Funding LLC, | | | |
| | | | 0.000%, 07/01/2010 | | $ | 3,290,000 | |
| | 6,580,000 | | U.S. Bank, N.A., | | | | |
| | | | 0.000%, 07/01/2010 | | | 6,580,000 | |
| | | | | | | 9,870,000 | |
| | | | Total Short-Term Investments | | | | |
| | | | (Cost $9,870,000) | | | 9,870,000 | |
| | | | | | | | |
| | | | Total Investments 106.0% | | | | |
| | | | (Cost $68,365,830) | | | 69,847,265 | |
| | | | | | | | |
| | | | Liabilities in Excess | | | | |
| | | | of Other Assets (6.0)% | | | (3,928,998 | ) |
| | | | | | | | |
| | | | TOTAL NET ASSETS 100.0% | | $ | 65,918,267 | |
| (b) | Security exempt from registration under Rule 144A of the Securities Act of 1933. These securities may be resold in transactions exempt from registration normally to qualified institutional buyers. The total value of these securities amounted to $7,492,836 (11.4% of net assets) at June 30, 2010. |
| (c) | Entity under conservatorship of the federal government. |
| (d) | U.S. Dollar denominated security of a foreign issuer. |
ALLOCATION OF PORTFOLIO HOLDINGS
At June 30, 2010, the allocation of portfolio holdings as a percentage of the Fund’s total net assets were:
| Asset-Backed Securities | | | 9.2 | % | | U.S. Treasury Obligations | | | 37.6 | |
| Corporate Bonds | | | 20.8 | | | Short-Term Investments | | | 15.0 | |
| Mortgage-Backed Securities | | | 19.8 | | | Liabilities in Excess of Other Assets | | | (6.0 | ) |
U.S. Government Agency Issue | | | 3.6 | | | | | | 100.0 | % |
The accompanying notes are an integral part of these financial statements.
Frontegra Columbus Core Fund SCHEDULE OF INVESTMENTS (continued)
June 30, 2010
Credit Default Swaps
| | | | Rating of | (Pay)/ | | | | | | | Unrealized | |
| | Reference | Buy/Sell | Reference Entity | Receive | Fixed | Expiration | | Notional | | | Appreciation/ | |
| Counterparty | Entity | Protection(1) | (Moody’s/S&P) | Fixed Rate | Rate | Date | | Value(2) | | | (Depreciation) | |
| JPMorgan | CDX North American | | | | | | | | | | | |
| | Investment Grade Index | SELL | Baa1/BBB | Receive | 1.00% | 6/20/15 | | $ | 2,070,000 | | | $ | 9,130 | |
| JPMorgan | General Electric | | | | | | | | | | | | | |
| | Capital Corp. | SELL | Aa2/AA+ | Receive | 1.00% | 6/20/15 | | | 510,000 | | | | 11,144 | |
| | | | | | | | | $ | 2,580,000 | | | $ | 20,274 | |
| (1) | If the Fund is a seller of protection and a credit event occurs, as defined under the terms of that particular swap agreement, the Fund will either (i) pay to the buyer of protection an amount equal to the notional amount of the swap and take delivery of the referenced obligation or underlying securities comprising the referenced index or (ii) pay a net settlement amount in the form of cash or securities equal to the notional amount of the swap less the recovery value of the referenced obligation of underlying securities comprising the referenced index. |
| (2) | The maximum potential amount the Fund could be required to make as a seller of credit protection or receive as a buyer of credit protection if a credit event occurs as defined under the terms of that particular swap agreement. |
The accompanying notes are an integral part of these financial statements.
Frontegra Columbus Core Fund STATEMENT OF ASSETS AND LIABILITIES
June 30, 2010
| Assets: | | | |
| Investments at value (cost $68,365,830) | | $ | 69,847,265 | |
| Cash | | | 3,671,961 | |
| Interest receivable | | | 268,850 | |
| Unrealized gain on swaps | | | 20,274 | |
| Prepaid expenses and other assets | | | 15,013 | |
| Total assets | | | 73,823,363 | |
| | | | | |
| Liabilities: | | | | |
| Payable for investments purchased | | | 7,775,578 | |
| Accrued investment advisory fee | | | 2,424 | |
| Accrued expenses | | | 64,227 | |
| Swap payments received | | | 62,867 | |
| Total liabilities | | | 7,905,096 | |
| Net Assets | | $ | 65,918,267 | |
| | | | | |
| Net Assets Consist of: | | | | |
| Paid in capital | | $ | 69,131,119 | |
| Undistributed net investment income | | | 117,332 | |
| Accumulated net realized loss | | | (4,831,893 | ) |
| Net unrealized appreciation on investments | | | 1,481,435 | |
| Unrealized appreciation on swaps contracts | | | 20,274 | |
| Net Assets | | $ | 65,918,267 | |
| | | | | |
| Capital Stock, $0.01 Par Value | | | | |
| Authorized | | | 50,000,000 | |
| Issued and outstanding | | | 5,691,885 | |
| Net Asset Value, Redemption Price and Offering Price Per Share | | $ | 11.58 | |
The accompanying notes are an integral part of these financial statements.
Frontegra Columbus Core Fund STATEMENT OF OPERATIONS
| | | Year Ended | |
| | | June 30, 2010 | |
| Investment Income: | | | |
| Interest income | | $ | 2,415,019 | |
| Dividend income | | | 1,771 | |
| Total Investment Income | | | 2,416,790 | |
| | | | | |
| Expenses: | | | | |
| Investment advisory fees (Note 3) | | | 257,009 | |
| Fund administration and accounting fees | | | 43,811 | |
| Audit fees | | | 35,416 | |
| Legal fees | | | 29,399 | |
| Federal and state registration fees | | | 24,788 | |
| Custody fees | | | 21,279 | |
| Shareholder servicing fees | | | 11,098 | |
| Directors’ fees and related expenses | | | 8,395 | |
| Reports to shareholders | | | 2,243 | |
| Compliance related expenses | | | 462 | |
| Other | | | 6,495 | |
| Total expenses before waiver and reimbursement | | | 440,395 | |
| Waiver and reimbursement of expenses by Adviser (Note 3) | | | (226,221 | ) |
| Net expenses | | | 214,174 | |
| Net Investment Income | | | 2,202,616 | |
| | | | | |
| Realized and Unrealized Gain on Investments: | | | | |
| Net realized gain on: | | | | |
| Investments | | | 4,834,509 | |
| Swap contracts | | | 127,420 | |
| Change in net unrealized appreciation/(depreciation) on: | | | | |
| Investments | | | 621,327 | |
| Swap contracts | | | 20,274 | |
| Net Realized and Unrealized Gain on Investments | | | 5,603,530 | |
| Net Increase in Net Assets Resulting from Operations | | $ | 7,806,146 | |
The accompanying notes are an integral part of these financial statements.
Frontegra Columbus Core Fund STATEMENTS OF CHANGES IN NET ASSETS
| | | For the Year | | | For the Year | |
| | | Ended | | | Ended | |
| | | June 30, 2010 | | | June 30, 2009 | |
| Operations: | | | | | | |
| Net investment income | | $ | 2,202,616 | | | $ | 5,509,874 | |
| Net realized gain (loss) on: | | | | | | | | |
| Investments | | | 4,834,509 | | | | (8,876,168 | ) |
| Swap contracts | | | 127,420 | | | | 71,746 | |
| Change in net unrealized appreciation/(depreciation) on: | | | | | | | | |
| Investments | | | 621,327 | | | | 1,302,219 | |
| Swap contracts | | | 20,274 | | | | 72,889 | |
| Net increase (decrease) in net assets resulting from operations | | | 7,806,146 | | | | (1,919,440 | ) |
| | | | | | | | | |
| Distributions Paid From: | | | | | | | | |
| Net investment income | | | (2,269,754 | ) | | | (5,468,450 | ) |
| Net decrease in net assets resulting from distributions paid | | | (2,269,754 | ) | | | (5,468,450 | ) |
| | | | | | | | | |
| Capital Share Transactions: | | | | | | | | |
| Shares sold | | | 34,674,100 | | | | 14,029,124 | |
| Shares issued to holders in reinvestment of distributions | | | 2,063,249 | | | | 4,545,747 | |
| Shares redeemed | | | (26,931,737 | ) | | | (60,476,919 | ) |
| Net increase in net assets resulting from capital share transactions | | | 9,805,612 | | | | (41,902,048 | ) |
| Total Increase (Decrease) in Net Assets | | | 15,342,004 | | | | (49,289,938 | ) |
| | | | | | | | | |
| Net Assets: | | | | | | | | |
| Beginning of Period | | | 50,576,263 | | | | 99,866,201 | |
| End of Period (includes undistributed net investment | | | | | | | | |
| income of $117,332 and $118,324 respectively) | | $ | 65,918,267 | | | $ | 50,576,263 | |
| | | | | | | | | |
| Transactions in Shares: | | | | | | | | |
| Shares sold | | | 3,076,887 | | | | 1,382,214 | |
| Shares issued to holders in reinvestment of distributions | | | 182,766 | | | | 484,314 | |
| Shares redeemed | | | (2,439,554 | ) | | | (6,693,940 | ) |
| Net increase (decrease) in shares outstanding | | | 820,099 | | | | (4,827,412 | ) |
The accompanying notes are an integral part of these financial statements.
Frontegra Columbus Core Fund FINANCIAL HIGHLIGHTS
| | | Year | | | Year | | | Year | | | Year | | | Year | |
| | | Ended | | | Ended | | | Ended | | | Ended | | | Ended | |
| | | June 30, | | | June 30, | | | June 30, | | | June 30, | | | June 30, | |
| | | 2010 | | | 2009 | | | 2008 | | | 2007 | | | 2006 | |
| Net Asset Value, Beginning of Period | | $ | 10.38 | | | $ | 10.30 | | | $ | 9.99 | | | $ | 9.86 | | | $ | 10.36 | |
| | | | | | | | | | | | | | | | | | | | | |
| Income (Loss) from | | | | | | | | | | | | | | | | | | | | |
| Investment Operations: | | | | | | | | | | | | | | | | | | | | |
| Net investment income | | | 0.40 | (1) | | | 0.72 | | | | 0.48 | | | | 0.48 | | | | 0.42 | |
| Net realized and unrealized gain (loss) on investments | | | 1.20 | | | | 0.08 | | | | 0.30 | | | | 0.13 | | | | (0.43 | ) |
| Total Income (Loss) from Investment Operations | | | 1.60 | | | | 0.80 | | | | 0.78 | | | | 0.61 | | | | (0.01 | ) |
| | | | | | | | | | | | | | | | | | | | | |
| Less Distributions: | | | | | | | | | | | | | | | | | | | | |
| From net investment income | | | (0.40 | ) | | | (0.72 | ) | | | (0.47 | ) | | | (0.48 | ) | | | (0.43 | ) |
| From net realized gain on investments | | | — | | | | — | | | | — | | | | — | | | | (0.06 | ) |
| Total Distributions | | | (0.40 | ) | | | (0.72 | ) | | | (0.47 | ) | | | (0.48 | ) | | | (0.49 | ) |
| | | | | | | | | | | | | | | | | | | | | |
| Net Asset Value, End of Period | | $ | 11.58 | | | $ | 10.38 | | | $ | 10.30 | | | $ | 9.99 | | | $ | 9.86 | |
| | | | | | | | | | | | | | | | | | | | | |
| Total Return | | | 15.60 | % | | | 8.64 | % | | | 7.89 | % | | | 6.26 | % | | | (0.11 | )% |
| | | | | | | | | | | | | | | | | | | | | |
| Supplemental Data and Ratios: | | | | | | | | | | | | | | | | | | | | |
| Net assets, end of period (in thousands) | | $ | 65,918 | | | $ | 50,576 | | | $ | 99,866 | | | $ | 90,771 | | | $ | 96,887 | |
| Ratio of expenses to average net assets | | | | | | | | | | | | | | | | | | | | |
| Before waivers and reimbursements | | | 0.72 | % | | | 0.69 | % | | | 0.66 | % | | | 0.66 | % | | | 0.65 | % |
| Net of waivers and reimbursements | | | 0.35 | % | | | 0.35 | % | | | 0.30 | % | | | 0.20 | % | | | 0.20 | % |
| Ratio of net investment income to average net assets | | | | | | | | | | | | | | | | | | | | |
| Before waivers and reimbursements | | | 3.23 | % | | | 6.38 | % | | | 4.29 | % | | | 4.31 | % | | | 3.75 | % |
| Net of waivers and reimbursements | | | 3.60 | % | | | 6.72 | % | | | 4.65 | % | | | 4.77 | % | | | 4.20 | % |
| Portfolio turnover rate | | | 1,063 | % | | | 414 | % | | | 965 | % | | | 980 | % | | | 1,121 | % |
| (1) | Per share net investment income has been calculated using the daily average share method. |
The accompanying notes are an integral part of these financial statements.
FRONTEGRA
IRONBRIDGE
SMALL CAP FUND
FRONTEGRA
IRONBRIDGE
SMID FUND
REPORT FROM IRONBRIDGE CAPITAL
MANAGEMENT, L.P.
Dear Fellow Shareholders:
The Frontegra IronBridge Small Cap Fund strives to achieve capital appreciation by investing in a diversified portfolio of equity securities of companies with small market capitalizations. The objective is relative to, and measured against, the Russell 2000®(1) Index.
The Frontegra IronBridge SMID Fund strives to achieve capital appreciation by investing in a diversified portfolio of equity securities of companies with small and mid market capitalizations. The objective is relative to, and measured against, the Russell 2500TM(2) Index.
Performance Review
For the year ending June 30, 2010, the Frontegra IronBridge Small Cap Fund achieved positive absolute returns but trailed the benchmark, returning 16.72% net of fees compared with the Russell 2000 Index return of 21.48% for the same period.
| Small Cap Fund Best Performers | Return | | Small Cap Fund Worst Performers | Return | |
| Netflix Inc. | 162.82% | | Myriad Genetics Inc. | -58.06% | |
| Lubrizol Corp. | 72.88% | | Isis Pharmaceuticals Inc. | -42.00% | |
| Methanex Corp. | 65.62% | | TeleCommunication Systems Inc. (Cl A) | -41.77% | |
| Tupperware Brands Corp. | 56.60% | | LeapFrog Enterprises Inc. (Cl A) | -40.18% | |
| Mid-America Apartment Communities Inc. | 48.24% | | Stewart Information Services Corp. | -36.40% | |
| Tractor Supply Co. | 48.21% | | KB Home | -34.03% | |
| Unit Corp. | 47.23% | | Tetra Tech Inc. | -31.55% | |
| National Instruments Corp. | 43.39% | | Synaptics Inc. | -28.85% | |
| Corporate Office Properties Trust | 34.09% | | Atwood Oceanics Inc. | -27.21% | |
| Alexander & Baldwin Inc. | 32.39% | | Tekelec | -21.33% | |
The stock selection within Energy, Utilities and Materials was a positive contributor to the relative return profile, while exposure amongst the Information Technology, Health Care, Financials, Industrials, Consumer Staples and Consumer Discretionary names detracted from the Fund’s relative performance. The small allocation to cash was also a significant detractor from the Fund’s relative performance.
The Frontegra IronBridge SMID Fund achieved positive absolute returns but trailed its benchmark for the 12-month period ending June 30, 2010, returning 15.88% net of fees, versus the 24.03% return of the Russell 2500 Index.
| SMID Fund Best Performers | Return | | SMID Fund Worst Performers | Return | |
| Netflix Inc. | 162.82% | | Isis Pharmaceuticals Inc. | -41.94% | |
| Akamai Technologies Inc. | 111.52% | | Bucyrus International Inc. | -30.90% | |
| F5 Networks Inc. | 98.12% | | Atheros Communications Inc. | -29.87% | |
| Hasbro Inc. | 74.32% | | McAfee Inc. | -27.19% | |
| Lubrizol Corp. | 72.88% | | Greenhill & Co. | -26.05% | |
| priceline.com Inc. | 58.26% | | Reliance Steel & Aluminum Co. | -24.77% | |
| Albemarle Corp. | 57.46% | | Synaptics Inc. | -23.57% | |
| Tupperware Brands Corp. | 56.60% | | URS Corp. | -20.54% | |
| Corporate Office Properties Trust | 34.09% | | Jefferies Group Inc. | -17.90% | |
| Cerner Corp. | 21.83% | | DeVry Inc. | -15.96% | |
The stock selection within Consumer Discretionary was a positive contributor to the relative return profile, while exposure amongst all other sectors with the exception of Telecommunication Services detracted from the Fund’s relative performance. Selection within Telecommunication Services did not have a meaningful impact on the Fund’s relative performance. The small allocation to cash was also a significant detractor from relative performance.
| (1) | Russell 2000® Index is either a registered trademark or trade name of Russell Investment Group in the U.S. and/or other countries. Indexes are unmanaged and cannot be invested in directly. |
| (2) | Russell 2500™ Index is either a registered trademark or tradename of Russell Investment Group in the U.S. and/or other countries. Indexes are unmanaged and cannot be invested in directly. |
Stocks surged in the first three quarters of the Funds’ fiscal year. Low quality stocks continued to lead higher quality stocks. Based on a review of our internal pricing equation, we estimate that quantitative easing by the Federal Reserve drove the required return down from 8% to a low of 4%, while government subsidies to consumers in the housing and automotive sectors pulled demand forward and stopped the decline in economic return and reinvestment. The Federal Reserve’s injection of approximately $1.5 trillion of liquidity into the U.S. financial system resulted in an 89% increase in the Russell 2000 Index of small stocks from the March 9, 2009 lows to March 30, 2010.
In the fourth quarter of the Funds’ fiscal year, the Russell 2000 Index fell 9.92% when the Fed wound down its quantitative easing and discount rates increased. Yet, this quarterly decline does not tell the more dramatic story of the 16.78% decline from the April 23rd intra-quarter peak in the index. IronBridge has long suspected that volatility might increase as markets struggle to determine the ultimate outcome of the massive sovereign debts that governments had been accumulating. Sovereign debt has increased due to entitlements as well as the absorption of toxic debt from the 2008 debt crisis, followed by the accompanying increase in government spending required to replace reserves in an insolvent global banking system and to offset the precipitous decline in private investment.
We are disappointed to underperform our benchmarks. We believe our “quality” bias is the main reason for the underperformance as low quality stocks outperformed high quality stocks by approximately 21.67% in the Russell 2000 Index during the fiscal year. Companies with leverage (defined as Total Debt as a percentage of Total Capital) in the highest quintile returned 37.05% for the fiscal year versus 15.38% for companies with leverage in the lowest quintile of the Russell 2000 Index.
Over shorter time periods, there are several reasons why high quality stocks may not outperform. They might not outperform during periods of artificial stimulants, when government props up the economy in various ways which transfer wealth from taxpayers to targeted industry and company recipients. Additionally, high quality stocks might not outperform in periods when the investor’s discount rate is the primary driver of value, such as during periods of excess liquidity or periods when rapidly-falling credit spreads reduce the refinance risk of overleveraged companies. Additionally, they may not outperform during the early stage of an economic recovery as firms with high operating leverage improve economic returns and growth relatively faster than those less dependent on mean reverting cyclical fac tors.
One may very well pose the question, “When do high quality companies outperform if they underperform in so many environments?” The answer is always the same. They outperform over the long term, because eventually companies with only operating leverage, but without a long-term wealth creation advantage, “roll over” and investors “give back” excess gains. Investing this way requires a fine-tuned sense of timing by the manager, which is very difficult to repeat. Eventually, overleveraged companies must either pay down debt or roll it over. Then they are confronted by the fact that the only way to pay down debt is through appropriate capital allocation decisions. If managements of highly leveraged low quality companies fail to appropriately allocate capital, they will be at the mercy of the credit markets to continually roll over very risky debt. One day, in a hostile credit environment, they might try to roll the debt and go bust, losing 100% of their equity. Examples of low quality stocks that significantly outperformed for a finite period of time include: Countrywide Financial, Lehman Brothers, Bear Stearns, Enron, and WorldCom. The list does not stop there, especially in our small cap universe. One might argue that a highly skilled trader might be able to buy and sell low quality stocks and make money for their clients and we cannot argue as that is certainly possible, briefly and at high, imminent risk. However, such strategies require a short-term mindset, and are more akin to the speculator as opposed to an investor tuned to the broader benefits of legitimate long-term wealth creation.
Portfolio Outlook
We continue to anticipate market volatility as investors try to understand the potential consequences of such huge government deficits and investors vacillate among the potential outcomes of inflation, deflation, and pro wealth creation.
We suspect that low quality leadership has run its course. This is based on several observations. First, the end of quantitative easing means discount rates should start to find their natural level. Note: the investor’s discount rate in our pricing model has risen from 4.6% (mid April 2010) to 5.5% (end of June 2010).
Second, the dismal scorecard of the Stimulus Act (last year’s American Recovery & Reinvestment Act) suggests American voters have no appetite for additional government giveaways in the name of job creation. Giveaways drive deficits higher without creating real, sustainable, job growth. The November elections will be an important milestone that will test this thesis. Further, the staggering government deficits will likely limit any
sort of additional major artificial stimulant going forward. Therefore, it will be up to true market forces associated with the self-correcting mechanisms of capitalism to heal the economy and set the stage for economic growth and the associated wealth creation that will drive markets higher over the longer term. These forces take time. Market forces reward skilled allocators of capital, while punishing the poor ones, who only exist and survive because of artificial stimulants via special interests tied to government handouts. It is unlikely that lower quality companies can continue to significantly lead for much longer.
Underneath this volatile macro environment, high quality companies continue to allocate capital in ways that either drive innovation and/or increase productivity thus increasing wealth creation. Our strategy is to continue to use this volatility to our advantage to invest in companies that are likely to create long-term, shareholder value and to position the portfolio for outperformance across longer term time horizons.
Thank you for your continued support.
 |  |
| Christopher C. Faber | Jeffrey B. Madden |
| IronBridge Capital Management, L.P. | IronBridge Capital Management, L.P. |
Growth of a $100,000 Investment (Unaudited)
* 8/30/02 commencement of operations.
| | | | | |
| | Portfolio Total Return** | | | |
| | FOR PERIODS ENDED 6/30/10 | FUND | INDEX | |
| | | | | |
| | SIX MONTHS | (2.56)% | (1.95)% | |
| | | | | |
| | ONE YEAR | 16.72% | 21.48% | |
| | | | | |
| | FIVE YEAR | | | |
| | AVERAGE ANNUAL | 2.50% | 0.37% | |
| | | | | |
| | SINCE COMMENCEMENT | | | |
| | AVERAGE ANNUAL | 9.17% | 7.22% | |
| | | | | |
This chart assumes an initial gross investment of $100,000 made on 8/30/02 (commencement of operations). Returns shown include the reinvestment of all distributions. Past performance is not predictive of future results. Investment return and principal value will fluctuate so that shares, when redeemed, may be worth more or less than the original cost. To receive current to the most recent month-end performance, please call 1-888-825-2100.
The Russell 2000 Index measures the performance of the 2,000 smallest companies in the Russell 3000 Index. The Russell 3000 Index measures the performance of the 3,000 largest U.S. companies based on total market capitalization. The Index does not reflect investment management fees, brokerage commissions and other expenses associated with investing in equity securities. A direct investment in the index is not possible.
| ** | The returns shown do not reflect the deduction of taxes that a shareholder would pay on Fund distributions or the redemption of Fund shares. |
Frontegra IronBridge Small Cap Fund SCHEDULE OF INVESTMENTS
June 30, 2010
| Number of Shares | | Value | |
| | | | | | |
| COMMON STOCKS 98.0% | | | |
| | | | | | |
| | | Aerospace & Defense 3.6% | | | |
| | 82,810 | | Esterline Technologies Corp. (a) | | $ | 3,929,334 | |
| | 117,543 | | Moog, Inc. - Class A (a) | | | 3,788,411 | |
| | 127,670 | | Orbital Sciences Corp. (a) | | | 2,013,356 | |
| | 58,711 | | Triumph Group, Inc. | | | 3,911,914 | |
| | | | | | | 13,643,015 | |
| | | | Apparel Retail 1.0% | | | | |
| | 110,419 | | The Buckle, Inc. | | | 3,579,784 | |
| | | | | | | | |
| | | | Biotechnology 3.6% | | | | |
| | 111,989 | | Cepheid, Inc. (a) | | | 1,794,064 | |
| | 354,861 | | Exelixis, Inc. (a) | | | 1,231,368 | |
| | 167,182 | | Isis Pharmaceuticals, Inc. (a) | | | 1,599,932 | |
| | 183,192 | | Luminex Corp. (a) | | | 2,971,374 | |
| | 117,612 | | Martek Biosciences Corp. (a) | | | 2,788,580 | |
| | 107,476 | | Metabolix, Inc. (a) | | | 1,537,982 | |
| | 44,050 | | Myriad Genetics, Inc. (a) | | | 658,547 | |
| | 43,045 | | Onyx Pharmaceuticals, Inc. (a) | | | 929,342 | |
| | | | | | | 13,511,189 | |
| | | | Building Products 1.2% | | | | |
| | 224,568 | | Apogee Enterprises, Inc. | | | 2,432,072 | |
| | 74,881 | | Universal Forest Products, Inc. | | | 2,269,643 | |
| | | | | | | 4,701,715 | |
| | | | Capital Markets 3.0% | | | | |
| | 163,654 | | Jefferies Group, Inc. | | | 3,449,826 | |
| | 211,212 | | Knight Capital Group, | | | | |
| | | | Inc. - Class A (a) | | | 2,912,613 | |
| | 64,602 | | Stifel Financial Corp. (a) | | | 2,803,081 | |
| | 87,379 | | Waddell & Reed Financial, Inc. | | | 1,911,853 | |
| | | | | | | 11,077,373 | |
| | | | Chemicals 4.6% | | | | |
| | 64,447 | | Arch Chemicals, Inc. | | | 1,981,101 | |
| | 89,819 | | Cabot Corp. | | | 2,165,536 | |
| | 72,076 | | FMC Corp. | | | 4,139,325 | |
| | 53,519 | | Lubrizol Corp. | | | 4,298,111 | |
| | 142,637 | | Methanex Corp. (b) | | | 2,808,522 | |
| | 39,152 | | Minerals Technologies, Inc. | | | 1,861,286 | |
| | | | | | | 17,253,881 | |
| | | | Commercial Banks 5.6% | | | | |
| | 134,972 | | Columbia Banking System, Inc. | | | 2,464,588 | |
| | 110,277 | | Cullen/Frost Bankers, Inc. | | | 5,668,238 | |
| | 243,910 | | First Midwest Bancorp, Inc. | | | 2,965,946 | |
| | 71,130 | | IBERIABANK Corp. | | | 3,661,772 | |
| | 472,955 | | National Penn Bancshares, Inc. | | | 2,842,460 | |
| | 210,656 | | TCF Financial Corp. | | | 3,498,996 | |
| | | | | | | 21,102,000 | |
| | | | Commercial Services & Supplies 3.1% | | | | |
| | 39,910 | | American Public Education, Inc. (a) | | | 1,744,067 | |
| | 51,022 | | Blackboard, Inc. (a) | | | 1,904,651 | |
| | 330,790 | | LeapFrog Enterprises, Inc. (a) | | | 1,329,776 | |
| | 49,719 | | PICO Holdings, Inc. (a) | | | 1,490,078 | |
| | 14,135 | | Strayer Education, Inc. | | | 2,938,525 | |
| | 106,287 | | Tetra Tech, Inc. (a) | | | 2,084,288 | |
| | | | | | | 11,491,385 | |
| | | | Communications Equipment 2.1% | | | | |
| | 72,241 | | Polycom, Inc. (a) | | | 2,152,059 | |
| | 85,099 | | Riverbed Technology, Inc. (a) | | | 2,350,434 | |
| | 260,249 | | Tekelec (a) | | | 3,445,697 | |
| | | | | | | 7,948,190 | |
| | | | Computers & Peripherals 1.1% | | | | |
| | 153,151 | | Synaptics, Inc. (a) | | | 4,211,653 | |
| | | | | | | | |
| | | | Construction & Engineering 1.3% | | | | |
| | 100,722 | | Insituform Technologies, Inc. (a) | | | 2,062,787 | |
| | 299,875 | | MasTec, Inc. (a) | | | 2,818,825 | |
| | | | | | | 4,881,612 | |
| | | | Consumer Discretionary 0.9% | | | | |
| | 24,077 | | Deckers Outdoor Corp. (a) | | | 3,439,881 | |
| | | | | | | | |
| | | | Consumer Electronics 0.5% | | | | |
| | 108,856 | | Universal Electronics, Inc. (a) | | | 1,810,275 | |
The accompanying notes are an integral part of these financial statements.
Frontegra IronBridge Small Cap Fund SCHEDULE OF INVESTMENTS (CONTINUED)
June 30, 2010
| Number of Shares | | Value | |
| | | | | | |
COMMON STOCKS 98.0% (continued) | | | |
| | | Distributors 0.3% | | | |
| | 152,150 | | Wausau Paper Corp. (a) | | $ | 1,030,056 | |
| | | | | | | | |
| | | | Diversified Financial Services 0.5% | | | | |
| | 68,659 | | GATX Corp. | | | 1,831,822 | |
| | | | | | | | |
| | | | Electric Utilities 2.1% | | | | |
| | 209,157 | | Black Hills Corp. | | | 5,954,700 | |
| | 39,608 | | ITC Holdings Corp. | | | 2,095,659 | |
| | | | | | | 8,050,359 | |
| | | | Electrical Equipment 1.6% | | | | |
| | 49,208 | | American Superconductor Corp. (a) | | | 1,313,362 | |
| | 133,383 | | Thomas & Betts Corp. (a) | | | 4,628,390 | |
| | | | | | | 5,941,752 | |
| | | | Electronic Equipment | | | | |
| | | | & Instruments 5.1% | | | | |
| | 28,730 | | Dionex Corp. (a) | | | 2,139,236 | |
| | 74,956 | | FLIR Systems, Inc. (a) | | | 2,180,470 | |
| | 29,862 | | Itron, Inc. (a) | | | 1,846,069 | |
| | 190,791 | | National Instruments Corp. | | | 6,063,338 | |
| | 85,477 | | Rofin-Sinar Technologies, Inc. (a) | | | 1,779,631 | |
| | 111,800 | | ScanSource, Inc. (a) | | | 2,787,174 | |
| | 80,616 | | Trimble Navigation Ltd. (a) | | | 2,257,248 | |
| | | | | | | 19,053,166 | |
| | | | Energy Equipment & Services 2.2% | | | | |
| | 86,352 | | Atwood Oceanics, Inc. (a) | | | 2,203,703 | |
| | 125,210 | | Superior Energy Services, Inc. (a) | | | 2,337,671 | |
| | 94,604 | | Unit Corp. (a) | | | 3,839,976 | |
| | | | | | | 8,381,350 | |
| | | | Food Products 2.4% | | | | |
| | 101,530 | | BJ’s Wholesale Club, Inc. (a) | | | 3,757,625 | |
| | 147,610 | | Corn Products International, Inc. | | | 4,472,583 | |
| | 66,680 | | Imperial Sugar Co. | | | 673,468 | |
| | | | | | | 8,903,676 | |
| | | | Gas Utilities 3.4% | | | | |
| | 106,483 | | AGL Resources, Inc. | | | 3,814,221 | |
| | 183,161 | | Southern Union Co. | | | 4,003,900 | |
| | 194,102 | | UGI Corp. | | | 4,937,955 | |
| | | | | | | 12,756,076 | |
| | | | General Merchandise 0.9% | | | | |
| | 294,566 | | Fred’s, Inc. - Class A | | | 3,257,900 | |
| | | | | | | | |
| | | | Health Care Equipment & Supplies 3.3% | | | | |
| | 67,845 | | Gen-Probe, Inc. (a) | | | 3,081,520 | |
| | 38,227 | | IDEXX Laboratories, Inc. (a) | | | 2,328,024 | |
| | 97,796 | | Illumina, Inc. (a) | | | 4,257,060 | |
| | 99,817 | | ZOLL Medical Corp. (a) | | | 2,705,041 | |
| | | | | | | 12,371,645 | |
| | | | Health Care Providers & Services 4.8% | | | | |
| | 47,025 | | Cerner Corp. (a) | | | 3,568,727 | |
| | 89,050 | | LifePoint Hospitals, Inc. (a) | | | 2,796,170 | |
| | 49,100 | | MWI Veterinary Supply, Inc. (a) | | | 2,467,766 | |
| | 252,613 | | Owens & Minor, Inc. | | | 7,169,157 | |
| | 56,600 | | Sirona Dental Systems, Inc. (a) | | | 1,971,944 | |
| | | | | | | 17,973,764 | |
| | | | Hotels, Restaurants & Leisure 0.8% | | | | |
| | 76,493 | | WMS Industries, Inc. (a) | | | 3,002,350 | |
| | | | | | | | |
| | | | Household Durables 3.8% | | | | |
| | 164,708 | | AptarGroup, Inc. | | | 6,229,257 | |
| | 231,812 | | KB Home | | | 2,549,932 | |
| | 46,410 | | Snap-On, Inc. | | | 1,898,633 | |
| | 93,050 | | Tupperware Brands Corp. | | | 3,708,042 | |
| | | | | | | 14,385,864 | |
| | | | Industrial Conglomerates 2.3% | | | | |
| | 29,402 | | Alleghany Corp. (a) | | | 8,623,607 | |
| | | | | | | | |
| | | | Insurance 3.0% | | | | |
| | 147,637 | | American Financial Group, Inc. | | | 4,033,443 | |
| | 118,578 | | Argo Group International | | | | |
| | | | Holdings Ltd. (b) | | | 3,627,301 | |
| | 319,860 | | MBIA, Inc. (a) | | | 1,794,415 | |
The accompanying notes are an integral part of these financial statements.
Frontegra IronBridge Small Cap Fund SCHEDULE OF INVESTMENTS (CONTINUED)
June 30, 2010
| Number of Shares | | Value | |
| | | | | | |
COMMON STOCKS 98.0% (continued) | | | |
| | | | | | |
| | | Insurance 3.0% (continued) | | | |
| | 191,771 | | Stewart Information Services Corp. | | $ | 1,729,774 | |
| | | | | | | 11,184,933 | |
| | | | Internet & Catalog Retail 0.7% | | | | |
| | 22,505 | | Netflix, Inc. (a) | | | 2,445,168 | |
| | | | | | | | |
| | | | Leisure Equipment & Products 0.4% | | | | |
| | 249,085 | | Callaway Golf Co. | | | 1,504,473 | |
| | | | | | | | |
| | | | Life Sciences Tools & Services 1.0% | | | | |
| | 302,823 | | Bruker Corp. (a) | | | 3,682,328 | |
| | | | | | | | |
| | | | Machinery 3.3% | | | | |
| | 111,726 | | Astec Industries, Inc. (a) | | | 3,098,162 | |
| | 66,523 | | IDEX Corp. | | | 1,900,562 | |
| | 58,963 | | Kaydon Corp. | | | 1,937,524 | |
| | 39,400 | | Lincoln Electric Holdings, Inc. | | | 2,009,006 | |
| | 45,088 | | Valmont Industries, Inc. | | | 3,276,094 | |
| | | | | | | 12,221,348 | |
| | | | Marine 1.3% | | | | |
| | 164,440 | | Alexander & Baldwin, Inc. | | | 4,897,023 | |
| | | | | | | | |
| | | | Metals & Mining 2.0% | | | | |
| | 97,869 | | Carpenter Technology Corp. | | | 3,213,039 | |
| | 296,941 | | GrafTech International Ltd. (a) | | | 4,341,277 | |
| | | | | | | 7,554,316 | |
| | | | Multiline Retail 1.3% | | | | |
| | 152,431 | | Big Lots, Inc. (a) | | | 4,891,511 | |
| | | | | | | | |
| | | | Multi-Utilities & | | | | |
| | | | Unregulated Power 1.0% | | | | |
| | 200,196 | | Avista Corp. | | | 3,909,828 | |
| | | | | | | | |
| | | | Nondepository Credit | | | | |
| | | | Intermediation 0.5% | | | | |
| | 165,524 | | Fifth Street Finance Corp. | | | 1,825,730 | |
| | | | Oil & Gas 1.7% | | | | |
| | 158,362 | | Swift Energy Co. (a) | | | 4,261,521 | |
| | 183,268 | | Tesco Corp. (a) | | | 2,250,531 | |
| | | | | | | 6,512,052 | |
| | | | Real Estate 5.6% | | | | |
| | 52,370 | | Alexandria Real Estate Equities, Inc. | | | 3,318,687 | |
| | 159,265 | | Corporate Office Properties Trust | | | 6,013,846 | |
| | 116,305 | | Mid-America Apartment | | | | |
| | | | Communities, Inc. | | | 5,986,218 | |
| | 86,883 | | Potlatch Corp. | | | 3,104,330 | |
| | 182,720 | | Redwood Trust, Inc. | | | 2,675,021 | |
| | | | | | | 21,098,102 | |
| | | | Semiconductor & Semiconductor | | | | |
| | | | Equipment 4.1% | | | | |
| | 402,288 | | Cypress Semiconductor Corp. (a) | | | 4,038,972 | |
| | 162,799 | | Semtech Corp. (a) | | | 2,665,020 | |
| | 225,770 | | Skyworks Solutions, Inc. (a) | | | 3,790,678 | |
| | 132,737 | | Standard Microsystems Corp. (a) | | | 3,090,117 | |
| | 59,365 | | Varian Semiconductor | | | | |
| | | | Equipment Associates, Inc. (a) | | | 1,701,401 | |
| | | | | | | 15,286,188 | |
| | | | Semiconductor & Other Electronic | | | | |
| | | | Component Manufacturing 0.7% | | | | |
| | 302,329 | | Celestica, Inc. (a) | | | 2,436,772 | |
| | | | | | | | |
| | | | Software 2.8% | | | | |
| | 99,871 | | Informatica Corp. (a) | | | 2,384,919 | |
| | 112,331 | | Jack Henry & Associates, Inc. | | | 2,682,464 | |
| | 167,755 | | Parametric Technology Corp. (a) | | | 2,628,721 | |
| | 94,397 | | Progress Software Corp. (a) | | | 2,834,742 | |
| | | | | | | 10,530,846 | |
| | | | Specialty Stores 1.9% | | | | |
| | 115,269 | | Tractor Supply Co. | | | 7,027,951 | |
| | | | | | | | |
| | | | Telephone Communications 0.3% | | | | |
| | 283,481 | | TeleCommunication | | | | |
| | | | Systems, Inc. (a) | | | 1,173,612 | |
The accompanying notes are an integral part of these financial statements.
Frontegra IronBridge Small Cap Fund SCHEDULE OF INVESTMENTS (CONTINUED)
June 30, 2010
| Number of Shares | | Value | |
| | | | | | |
COMMON STOCKS 98.0% (continued) | | | |
| | | | | | |
| | | Textiles, Apparel & Luxury Goods 0.6% | | | |
| | 81,642 | | Wolverine World Wide, Inc. | | $ | 2,059,011 | |
| | | | | | | | |
| | | | Thrifts & Mortgage Finance 0.7% | | | | |
| | 231,304 | | Provident Financial Services, Inc. | | | 2,703,944 | |
| | | | Total Common Stocks | | | | |
| | | | (Cost $349,780,502) | | | 367,160,476 | |
| | | | | |
| EXCHANGE TRADED FUNDS 0.5% | | | | |
| | 31,179 | | iShares Russell 2000 Index Fund | | | 1,904,413 | |
| | | | Total Exchange Traded Funds | | | | |
| | | | (Cost $1,417,772) | | | 1,904,413 | |
| | | | | | | | |
| SHORT-TERM INVESTMENTS 1.6% | | | | |
| | | | | | | | |
| | | | Commercial Paper 1.6% | | | | |
| $ | 6,094,000 | | U.S. Bank, N.A., | | | | |
| | | | 0.000%, 07/01/2010 | | | 6,094,000 | |
| | | | Total Short-Term Investments | | | | |
| | | | (Cost $6,094,000) | | | 6,094,000 | |
| | | | | | | | |
| | | | Total Investments 100.1% | | | | |
| | | | (Cost $357,292,274) | | | 375,158,889 | |
| | | | | | | | |
| | | | Liabilities in Excess | | | | |
| | | | of Other Assets (0.1)% | | | (546,673 | ) |
| | | | | | | | |
| | | | TOTAL NET ASSETS 100.0% | | $ | 374,612,216 | |
| (b) | U.S. Dollar denominated security of foreign issuer. |
ALLOCATION OF PORTFOLIO HOLDINGS
At June 30, 2010, the allocation of portfolio holdings as a percentage of the Fund’s total net assets were:
| Common Stocks | | | 98.0 | % |
| Exchange Traded Funds | | | 0.5 | |
| Short-Term Investments | | | 1.6 | |
| Liabilities in Excess of Other Assets | | | (0.1 | ) |
| | | | 100.0 | % |
The accompanying notes are an integral part of these financial statements.
Frontegra IronBridge Small Cap Fund
STATEMENT OF ASSETS AND LIABILITIES
June 30, 2010
| Assets: | | | |
| Investments at value (cost $357,292,274) | | $ | 375,158,889 | |
| Cash | | | 20,094 | |
| Interest receivable | | | 320,147 | |
| Receivable for Fund shares sold | | | 126,806 | |
| Total assets | | | 375,625,936 | |
| | | | | |
| Liabilities: | | | | |
| Payable for investments purchased | | | 470,716 | |
| Payable for Fund shares purchased | | | 150,957 | |
| Accrued investment advisory fee | | | 322,512 | |
| Accrued expenses | | | 69,535 | |
| Total liabilities | | | 1,013,720 | |
| Net Assets | | $ | 374,612,216 | |
| | | | | |
| Net Assets Consist of: | | | | |
| Paid in capital | | $ | 389,102,347 | |
| Undistributed net investment income | | | 515,859 | |
| Accumulated net realized loss | | | (32,872,605 | ) |
| Unrealized appreciation on investments | | | 17,866,615 | |
| Net Assets | | $ | 374,612,216 | |
| | | | | |
| Capital Stock, $0.01 Par Value | | | | |
| Authorized | | | 50,000,000 | |
| Issued and outstanding | | | 27,274,817 | |
| Net Asset Value, Redemption Price and Offering Price Per Share | | $ | 13.73 | |
The accompanying notes are an integral part of these financial statements.
Frontegra IronBridge Small Cap Fund STATEMENT OF OPERATIONS
| | | Year Ended | |
| | | June 30, 2010 | |
| Investment Income: | | | |
Dividend income(1) | | $ | 4,575,154 | |
| Interest income | | | 169,578 | |
| Total Investment Income | | | 4,744,732 | |
| | | | | |
| Expenses: | | | | |
| Investment advisory fees (Note 3) | | | 3,763,829 | |
| Fund administration and accounting fees | | | 94,888 | |
| Audit fees | | | 34,263 | |
| Legal fees | | | 31,757 | |
| Shareholder servicing fees | | | 28,505 | |
| Custody fees | | | 27,447 | |
| Federal and state registration fees | | | 26,192 | |
| Reports to shareholders | | | 18,622 | |
| Directors’ fees and related expenses | | | 9,271 | |
| Compliance related expenses | | | 462 | |
| Other | | | 17,827 | |
| Total expenses | | | 4,053,063 | |
| Net Investment Income | | | 691,669 | |
| | | | | |
| Realized and Unrealized Gain on Investments: | | | | |
| Net realized gain on: | | | | |
| Investments | | | 17,903,367 | |
| Change in net unrealized appreciation/(depreciation) on: | | | | |
| Investments | | | 32,545,807 | |
| Net Realized and Unrealized Gain on Investments | | | 50,449,174 | |
| Net Increase in Net Assets Resulting from Operations | | $ | 51,140,843 | |
| (1) | Net of $14,743 in foreign withholding taxes. |
The accompanying notes are an integral part of these financial statements.
Frontegra IronBridge Small Cap Fund STATEMENTS OF CHANGES IN NET ASSETS
| | | For the Year | | | For the Year | |
| | | Ended | | | Ended | |
| | | June 30, 2010 | | | June 30, 2009 | |
| Operations: | | | | | | |
| Net investment income | | $ | 691,669 | | | $ | 1,213,981 | |
| Net realized gain (loss) on investments | | | 17,903,367 | | | | (50,963,550 | ) |
| Change in net unrealized appreciation/(depreciation) on investments | | | 32,545,807 | | | | (50,588,011 | ) |
| Net increase (decrease) in net assets resulting from operations | | | 51,140,843 | | | | (100,337,580 | ) |
| | | | | | | | | |
| Distributions Paid From: | | | | | | | | |
| Net investment income | | | (1,187,053 | ) | | | (189,366 | ) |
| Net realized gain | | | — | | | | (16,024,635 | ) |
| Net decrease in net assets resulting from distributions paid | | | (1,187,053 | ) | | | (16,214,001 | ) |
| | | | | | | | | |
| Capital Share Transactions: | | | | | | | | |
| Shares sold | | | 76,401,484 | | | | 54,279,666 | |
| Shares issued to holders in reinvestment of distributions | | | 1,116,870 | | | | 15,455,049 | |
| Shares redeemed | | | (49,304,620 | ) | | | (56,770,624 | ) |
| Net increase in net assets resulting from capital share transactions | | | 28,213,734 | | | | 12,964,091 | |
| Total Increase (Decrease) in Net Assets | | | 78,167,524 | | | | (103,587,490 | ) |
| | | | | | | | | |
| Net Assets: | | | | | | | | |
| Beginning of Period | | | 296,444,692 | | | | 400,032,182 | |
| End of Period (includes undistributed net investment | | | | | | | | |
| income of $515,859 and $1,187,053 respectively) | | $ | 374,612,216 | | | $ | 296,444,692 | |
| | | | | | | | | |
| Transactions in Shares: | | | | | | | | |
| Shares sold | | | 5,508,155 | | | | 4,728,426 | |
| Shares issued to holders in reinvestment of distributions | | | 80,991 | | | | 1,412,710 | |
| Shares redeemed | | | (3,426,203 | ) | | | (4,512,723 | ) |
| Net increase in shares outstanding | | | 2,162,943 | | | | 1,628,413 | |
The accompanying notes are an integral part of these financial statements.
Frontegra IronBridge Small Cap Fund FINANCIAL HIGHLIGHTS
| | | Year | | | Year | | | Year | | | Year | | | Year | |
| | | Ended | | | Ended | | | Ended | | | Ended | | | Ended | |
| | | June 30, | | | June 30, | | | June 30, | | | June 30, | | | June 30, | |
| | | 2010(1) | | | 2009 | | | 2008 | | | 2007 | | | 2006 | |
| Net Asset Value, Beginning of Period | | $ | 11.80 | | | $ | 17.03 | | | $ | 20.35 | | | $ | 18.25 | | | $ | 16.14 | |
| | | | | | | | | | | | | | | | | | | | | |
| Income (Loss) from | | | | | | | | | | | | | | | | | | | | |
| Investment Operations: | | | | | | | | | | | | | | | | | | | | |
| Net investment income | | | 0.04 | (2) | | | 0.05 | | | | 0.02 | | | | — | | | | 0.03 | |
| Net realized and unrealized gain (loss) on investments | | | 1.93 | | | | (4.53 | ) | | | (1.16 | ) | | | 3.82 | | | | 2.25 | |
| Total Income (Loss) from Investment Operations | | | 1.97 | | | | (4.48 | ) | | | (1.14 | ) | | | 3.82 | | | | 2.28 | |
| | | | | | | | | | | | | | | | | | | | | |
| Less Distributions: | | | | | | | | | | | | | | | | | | | | |
| From net investment income | | | (0.04 | ) | | | (0.01 | ) | | | (0.01 | ) | | | (0.02 | ) | | | — | |
| From net realized gain on investments | | | — | | | | (0.74 | ) | | | (2.17 | ) | | | (1.70 | ) | | | (0.17 | ) |
| Total Distributions | | | (0.04 | ) | | | (0.75 | ) | | | (2.18 | ) | | | (1.72 | ) | | | (0.17 | ) |
| | | | | | | | | | | | | | | | | | | | | |
| Net Asset Value, End of Period | | $ | 13.73 | | | $ | 11.80 | | | $ | 17.03 | | | $ | 20.35 | | | $ | 18.25 | |
| | | | | | | | | | | | | | | | | | | | | |
| Total Return | | | 16.72 | % | | | (26.00 | )% | | | (6.07 | )% | | | 22.11 | % | | | 14.20 | % |
| | | | | | | | | | | | | | | | | | | | | |
| Supplemental Data and Ratios: | | | | | | | | | | | | | | | | | | | | |
| Net assets, end of period (in thousands) | | $ | 374,612 | | | $ | 296,445 | | | $ | 400,032 | | | $ | 432,403 | | | $ | 404,219 | |
| Ratio of expenses to average net assets | | | | | | | | | | | | | | | | | | | | |
| Before waivers and reimbursements | | | 1.08 | % | | | 1.09 | % | | | 1.07 | % | | | 1.07 | % | | | 1.08 | % |
| Net of waivers and reimbursements | | | 1.08 | % | | | 1.09 | % | | | 1.08 | % | | | 1.10 | % | | | 1.10 | % |
| Ratio of net investment income (loss) to average net assets | | | | | | | | | | | | | | | | | | | | |
| Before waivers and reimbursements | | | 0.27 | % | | | 0.40 | % | | | 0.10 | % | | | (0.01 | )% | | | 0.17 | % |
| Net of waivers and reimbursements | | | 0.27 | % | | | 0.40 | % | | | 0.09 | % | | | (0.08 | )% | | | 0.15 | % |
| Portfolio turnover rate | | | 44 | % | | | 39 | % | | | 53 | % | | | 34 | % | | | 60 | % |
| (1) | Effective March 1, 2010, IronBridge Capital Management, L.P. became investment adviser to the Fund. |
| (2) | Per share net investment income has been calculated using the daily average share method. |
The accompanying notes are an integral part of these financial statements.
Growth of a $100,000 Investment (Unaudited)
* 12/31/04 commencement of operations.
| | | | | |
| | Portfolio Total Return** | | | |
| | FOR PERIODS ENDED 6/30/10 | FUND | INDEX | |
| | | | | |
| | SIX MONTHS | (1.96)% | (1.69)% | |
| | | | | |
| | ONE YEAR | 15.88% | 24.03% | |
| | | | | |
| | FIVE YEAR | | | |
| | AVERAGE ANNUAL | 1.55% | 0.98% | |
| | | | | |
| | SINCE COMMENCEMENT | | | |
| | AVERAGE ANNUAL | 1.41% | 1.12% | |
| | | | | |
This chart assumes an initial gross investment of $100,000 made on 12/31/04 (commencement of operations). Returns shown include the reinvestment of all distributions. Past performance is not predictive of future results. Investment return and principal value will fluctuate so that shares, when redeemed, may be worth more or less than the original cost. In the absence of existing fee waivers, total return would be reduced. To receive current to the most recent month-end performance, please call 1-888-825-2100.
The Russell 2500 Index measures the performance of the 2,500 smallest companies in the Russell 3000 Index. The Russell 3000 Index measures the performance of the 3,000 largest U.S. companies based on total market capitalization. The Index does not reflect investment management fees, brokerage commissions and other expenses associated with investing in equity securities. A direct investment in the index is not possible.
| ** | The returns shown do not reflect the deduction of taxes that a shareholder would pay on Fund distributions or the redemption of Fund shares. |
Frontegra IronBridge SMID Fund SCHEDULE OF INVESTMENTS
June 30, 2010
| Number of Shares | | Value | |
| | | | | | |
| COMMON STOCKS 98.5% | | | |
| | | Aerospace & Defense 3.0% | | | |
| | 103,382 | | Esterline Technologies Corp. (a) | | $ | 4,905,476 | |
| | 131,756 | | Parker Hannifin Corp. | | | 7,307,188 | |
| | 92,198 | | Teledyne Technologies, Inc. (a) | | | 3,556,999 | |
| | | | | | | 15,769,663 | |
| | | | Apparel Retail 0.9% | | | | |
| | 150,602 | | The Buckle, Inc. | | | 4,882,517 | |
| | | | | | | | |
| | | | Auto Components 0.7% | | | | |
| | 191,052 | | Cooper Tire & Rubber Co. | | | 3,725,514 | |
| | | | | | | | |
| | | | Biotechnology 3.7% | | | | |
| | 92,295 | | Alexion Pharmaceuticals, Inc. (a) | | | 4,724,581 | |
| | 199,873 | | Cepheid, Inc. (a) | | | 3,201,965 | |
| | 185,344 | | Luminex Corp. (a) | | | 3,006,280 | |
| | 71,368 | | United Therapeutics Corp. (a) | | | 3,483,472 | |
| | 113,058 | | Watson Pharmaceuticals, Inc. (a) | | | 4,586,763 | |
| | | | | | | 19,003,061 | |
| | | | Capital Markets 2.5% | | | | |
| | 70,502 | | Greenhill & Co., Inc. | | | 4,309,787 | |
| | 222,791 | | Jefferies Group, Inc. | | | 4,696,434 | |
| | 169,285 | | Waddell & Reed Financial, Inc. | | | 3,703,956 | |
| | | | | | | 12,710,177 | |
| | | | Chemicals 6.4% | | | | |
| | 131,354 | | Albemarle Corp. | | | 5,216,067 | |
| | 198,716 | | Cabot Corp. | | | 4,791,043 | |
| | 191,226 | | Calgon Carbon Corp. (a) | | | 2,531,832 | |
| | 138,285 | | FMC Corp. | | | 7,941,708 | |
| | 105,944 | | Lubrizol Corp. | | | 8,508,363 | |
| | 206,815 | | Methanex Corp. (b) | | | 4,072,187 | |
| | | | | | | 33,061,200 | |
| | | | Commercial Banks 4.3% | | | | |
| | 159,291 | | Cullen/Frost Bankers, Inc. | | | 8,187,557 | |
| | 300,999 | | Fifth Third Bancorp | | | 3,699,278 | |
| | 809,035 | | Keycorp | | | 6,221,479 | |
| | 184,443 | | Whitney Holding Corp. | | | 1,706,098 | |
| | 117,285 | | Zions Bancorporation | | | 2,529,838 | |
| | | | | | | 22,344,250 | |
| | | | Communications Equipment 2.3% | | | | |
| | 71,860 | | F5 Networks, Inc. (a) | | | 4,927,440 | |
| | 211,038 | | Tekelec (a) | | | 2,794,143 | |
| | 660,491 | | Tellabs, Inc. | | | 4,220,538 | |
| | | | | | | 11,942,121 | |
| | | | Construction & Engineering 3.7% | | | | |
| | 624,366 | | Louisiana-Pacific Corp. (a) | | | 4,177,009 | |
| | 193,256 | | McDermott International, Inc. (a) | | | 4,185,925 | |
| | 301,675 | | Quanta Services, Inc. (a) | | | 6,229,589 | |
| | 112,340 | | URS Corp.(a) | | | 4,420,579 | |
| | | | | | | 19,013,102 | |
| | | | Containers & Packaging 1.5% | | | | |
| | 64,547 | | Greif, Inc. - Class A | | | 3,584,940 | |
| | 82,053 | | Rock-Tenn Co. | | | 4,075,573 | |
| | | | | | | 7,660,513 | |
| | | | Diversified Consumer Services 1.0% | | | | |
| | 101,332 | | DeVry, Inc. | | | 5,318,917 | |
| | | | | | | | |
| | | | Diversified Financial Services 0.9% | | | | |
| | 175,085 | | GATX Corp. | | | 4,671,268 | |
| | | | | | | | |
| | | | Electric Utilities 1.4% | | | | |
| | 136,119 | | ITC Holdings Corp. | | | 7,202,056 | |
| | | | | | | | |
| | | | Electrical Equipment 2.3% | | | | |
| | 63,985 | | American Superconductor Corp. (a) | | | 1,707,760 | |
| | 115,947 | | AMETEK, Inc. | | | 4,655,272 | |
| | 97,512 | | Roper Industries, Inc. | | | 5,456,771 | |
| | | | | | | 11,819,803 | |
| | | | Electronic Equipment | | | | |
| | | | & Instruments 3.2% | | | | |
| | 139,088 | | Amphenol Corp. - Class A | | | 5,463,377 | |
The accompanying notes are an integral part of these financial statements.
Frontegra IronBridge SMID Fund SCHEDULE OF INVESTMENTS (continued)
June 30, 2010
| Number of Shares | | Value | |
| | | | | | |
COMMON STOCKS 98.5% (continued) | | | |
| | | | | | |
| | | Electronic Equipment | | | |
| | | & Instruments 3.2% (continued) | | | |
| | 298,770 | | Avnet, Inc. (a) | | $ | 7,203,344 | |
| | 139,211 | | Trimble Navigation Ltd. (a) | | | 3,897,908 | |
| | | | | | | 16,564,629 | |
| | | | Energy Equipment & Services 1.6% | | | | |
| | 119,199 | | Helmerich & Payne, Inc. | | | 4,353,148 | |
| | 174,169 | | Pride International, Inc. (a) | | | 3,890,935 | |
| | | | | | | 8,244,083 | |
| | | | Food Products 4.7% | | | | |
| | 187,928 | | BJ’s Wholesale Club, Inc. (a) | | | 6,955,215 | |
| | 202,227 | | Corn Products International, Inc. | | | 6,127,478 | |
| | 291,144 | | McCormick & Co., Inc. | | | 11,051,826 | |
| | | | | | | 24,134,519 | |
| | | | Gas Utilities 3.5% | | | | |
| | 174,753 | | New Jersey Resources Corp. | | | 6,151,306 | |
| | 481,455 | | UGI Corp. | | | 12,248,215 | |
| | | | | | | 18,399,521 | |
| | | | Health Care Equipment & Supplies 3.4% | | | | |
| | 51,721 | | C.R. Bard, Inc. | | | 4,009,929 | |
| | 206,518 | | Illumina, Inc. (a) | | | 8,989,728 | |
| | 231,725 | | PerkinElmer, Inc. | | | 4,789,756 | |
| | | | | | | 17,789,413 | |
| | | | Health Care Providers & Services 3.6% | | | | |
| | 63,442 | | Cerner Corp. (a) | | | 4,814,613 | |
| | 277,449 | | Owens & Minor, Inc. | | | 7,874,003 | |
| | 155,443 | | Universal Healthcare Services, Inc. | | | 5,930,150 | |
| | | | | | | 18,618,766 | |
| | | | Hotels, Restaurants & Leisure 1.2% | | | | |
| | 64,421 | | Darden Restaurants, Inc. | | | 2,502,756 | |
| | 94,660 | | WMS Industries, Inc. (a) | | | 3,715,405 | |
| | | | | | | 6,218,161 | |
| | | | Household Durables 1.6% | | | | |
| | 5,252 | | NVR, Inc. (a) | | | 3,440,217 | |
| | 126,681 | | Tupperware Brands Corp. | | | 5,048,238 | |
| | | | | | | 8,488,455 | |
| | | | Industrial Conglomerates 1.3% | | | | |
| | 22,183 | | Alleghany Corp. (a) | | | 6,506,274 | |
| | | | | | | | |
| | | | Insurance 4.4% | | | | |
| | 213,057 | | American Financial Group, Inc. | | | 5,820,717 | |
| | 201,032 | | Genworth Financial, Inc. (a) | | | 2,627,488 | |
| | 451,670 | | MBIA, Inc. (a) | | | 2,533,869 | |
| | 19,882 | | Markel Corp. (a) | | | 6,759,880 | |
| | 101,824 | | RLI Corp. | | | 5,346,779 | |
| | | | | | | 23,088,733 | |
| | | | Internet & Catalog Retail 1.5% | | | | |
| | 42,528 | | Netflix, Inc. (a) | | | 4,620,667 | |
| | 19,118 | | priceline.com, Inc. (a) | | | 3,375,092 | |
| | | | | | | 7,995,759 | |
| | | | Internet Software & Services 1.2% | | | | |
| | 149,281 | | Akamai Technologies, Inc. (a) | | | 6,056,330 | |
| | | | | | | | |
| | | | Leisure Equipment & Products 1.7% | | | | |
| | 210,473 | | Hasbro, Inc. | | | 8,650,440 | |
| | | | | | | | |
| | | | Life Science Tools & Services 1.0% | | | | |
| | 110,700 | | Life Technologies Corp. (a) | | | 5,230,575 | |
| | | | | | | | |
| | | | Machinery 2.2% | | | | |
| | 88,342 | | Bucyrus International, Inc. | | | 4,191,828 | |
| | 172,277 | | Dover Corp. | | | 7,199,456 | |
| | | | | | | 11,391,284 | |
| | | | Marine 1.4% | | | | |
| | 244,641 | | Alexander & Baldwin, Inc. | | | 7,285,409 | |
| | | | | | | | |
| | | | Metals & Mining 2.0% | | | | |
| | 137,216 | | Arch Coal, Inc. | | | 2,718,249 | |
| | 278,520 | | GrafTech International Ltd. (a) | | | 4,071,962 | |
The accompanying notes are an integral part of these financial statements.
Frontegra IronBridge SMID Fund SCHEDULE OF INVESTMENTS (continued)
June 30, 2010
| Number of Shares | | Value | |
| | | | | | |
COMMON STOCKS 98.5% (continued) | | | |
| | | | | | |
| | | Metals & Mining 2.0% (continued) | | | |
| | 104,145 | | Reliance Steel & Aluminum Co. | | $ | 3,764,842 | |
| | | | | | | 10,555,053 | |
| | | | Multiline Retail 1.5% | | | | |
| | 244,266 | | Big Lots, Inc. (a) | | | 7,838,496 | |
| | | | | | | | |
| | | | Multi-Utilities & | | | | |
| | | | Unregulated Power 1.4% | | | | |
| | 167,996 | | Energen Corp. | | | 7,447,263 | |
| | | | | | | | |
| | | | Oil & Gas 2.4% | | | | |
| | 109,635 | | Cabot Oil & Gas Corp. | | | 3,433,768 | |
| | 201,089 | | Questar Corp. | | | 9,147,539 | |
| | | | | | | 12,581,307 | |
| | | | Paper & Forest Products 1.1% | | | | |
| | 126,192 | | Rayonier, Inc. | | | 5,554,972 | |
| | | | | | | | |
| | | | Real Estate 4.9% | | | | |
| | 229,663 | | Corporate Office Properties Trust | | | 8,672,075 | |
| | 129,734 | | Digital Realty Trust, Inc. | | | 7,483,057 | |
| | 114,111 | | Mid-America Apartment | | | | |
| | | | Communities, Inc. | | | 5,873,293 | |
| | 140,167 | | The St. Joe Co. (a) | | | 3,246,268 | |
| | | | | | | 25,274,693 | |
| | | | Semiconductor & | | | | |
| | | | Semiconductor Equipment 3.9% | | | | |
| | 167,266 | | Altera Corp. | | | 4,149,870 | |
| | 119,394 | | Atheros Communications, Inc. (a) | | | 3,288,111 | |
| | 660,155 | | Atmel Corp. (a) | | | 3,168,744 | |
| | 545,823 | | Cypress Semiconductor Corp. (a) | | | 5,480,063 | |
| | 152,011 | | NetLogic Microsystems, Inc. (a) | | | 4,134,699 | |
| | | | | | | 20,221,487 | |
| | | | Software 2.9% | | | | |
| | 94,083 | | Citrix Systems, Inc. (a) | | | 3,973,125 | |
| | 152,982 | | Informatica Corp. (a) | | | 3,653,210 | |
| | 108,309 | | McAfee, Inc. (a) | | | 3,327,253 | |
| | 130,000 | | Progress Software Corp. (a) | | | 3,903,900 | |
| | | | | | | 14,857,488 | |
| | | | Specialty Retail 1.7% | | | | |
| | 182,176 | | O’Reilly Automotive, Inc. (a) | | | 8,664,290 | |
| | | | | | | | |
| | | | Textiles, Apparel & Luxury Goods 1.2% | | | | |
| | 88,174 | | VF Corp. | | | 6,276,225 | |
| | | | | | | | |
| | | | Thrifts & Mortgage Finance 2.4% | | | | |
| | 508,055 | | Hudson City Bancorp, Inc. | | | 6,218,593 | |
| | 473,211 | | People’s United Financial, Inc. | | | 6,388,348 | |
| | | | | | | 12,606,941 | |
| | | | Trading Companies & Distributors 1.0% | | | | |
| | 52,929 | | W.W. Grainger, Inc. | | | 5,263,789 | |
| | | | Total Common Stocks | | | | |
| | | | (Cost $486,603,327) | | | 510,928,517 | |
| | | | | | | | |
| Principal Amount | | | | |
| | | | | |
| SHORT-TERM INVESTMENTS 0.8% | | | | |
| | | | Commercial Paper 0.8% | | | | |
| $ | 3,991,000 | | U.S. Bank, N.A., 0.000%, 07/01/2010 | | | 3,991,000 | |
| | | | Total Short-Term Investments | | | | |
| | | | (Cost $3,991,000) | | | 3,991,000 | |
| | | | | | | | |
| | | | Total Investments 99.3% | | | | |
| | | | (Cost $490,594,327) | | | 514,919,517 | |
| | | | | | | | |
| | | | Other Assets in Excess | | | | |
| | | | of Liabilities 0.7% | | | 3,456,682 | |
| | | | | | | | |
| | | | TOTAL NET ASSETS 100.0% | | $ | 518,376,199 | |
| (b) | U.S. Dollar denominated security of foreign issuer. |
The accompanying notes are an integral part of these financial statements.
Frontegra IronBridge SMID Fund SCHEDULE OF INVESTMENTS (continued)
June 30, 2010
ALLOCATION OF PORTFOLIO HOLDINGS
At June 30, 2010, the allocation of portfolio holdings as a percentage of the Fund’s total net assets were:
| Common Stocks | | | 98.5 | % |
| Short-Term Investments | | | 0.8 | |
| Other Assets in Excess of Liabilities | | | 0.7 | |
| | | | 100.0 | % |
The accompanying notes are an integral part of these financial statements.
Frontegra IronBridge SMID Fund STATEMENT OF ASSETS AND LIABILITIES
June 30, 2010
| Assets: | | | |
| Investments at value (cost $490,594,327) | | $ | 514,919,517 | |
| Cash | | | 28,094 | |
| Interest receivable | | | 441,926 | |
| Receivable for Fund shares sold | | | 514,570 | |
| Receivable for investments sold | | | 3,037,027 | |
| Total assets | | | 518,941,134 | |
| | | | | |
| Liabilities: | | | | |
| Payable for Fund shares purchased | | | 95,051 | |
| Accrued investment advisory fee | | | 383,982 | |
| Accrued expenses | | | 85,902 | |
| Total liabilities | | | 564,935 | |
| Net Assets | | $ | 518,376,199 | |
| | | | | |
| Net Assets Consist of: | | | | |
| Paid in capital | | $ | 540,527,174 | |
| Undistributed net investment income | | | 1,449,567 | |
| Accumulated net realized loss | | | (47,925,732 | ) |
| Unrealized appreciation on investments | | | 24,325,190 | |
| Net Assets | | $ | 518,376,199 | |
| | | | | |
| Capital Stock, $0.01 Par Value | | | | |
| Authorized | | | 100,000,000 | |
| Issued and outstanding | | | 54,439,247 | |
| Net Asset Value, Redemption Price and Offering Price Per Share | | $ | 9.52 | |
The accompanying notes are an integral part of these financial statements.
Frontegra IronBridge SMID Fund STATEMENT OF OPERATIONS
| | | Year Ended | |
| | | June 30, 2010 | |
| Investment Income: | | | |
Dividend income(1) | | $ | 5,596,013 | |
| Interest income | | | 23,695 | |
| Total Investment Income | | | 5,619,708 | |
| | | | | |
| Expenses: | | | | |
| Investment advisory fees (Note 3) | | | 3,778,426 | |
| Fund administration and accounting fees | | | 109,564 | |
| Custody fees | | | 45,661 | |
| Audit fees | | | 34,634 | |
| Shareholder servicing fees | | | 30,842 | |
| Legal fees | | | 29,625 | |
| Federal and state registration fees | | | 29,487 | |
| Reports to shareholders | | | 23,031 | |
| Directors’ fees and related expenses | | | 9,508 | |
| Compliance related expenses | | | 491 | |
| Other | | | 21,851 | |
| Total expenses before recapture | | | 4,113,120 | |
| Expenses recaptured by Adviser (Note 3) | | | 64,646 | |
| Net expenses | | | 4,177,766 | |
| Net Investment Income | | | 1,441,942 | |
| | | | | |
| Realized and Unrealized Gain on Investments: | | | | |
| Net realized gain on: | | | | |
| Investments | | | 836,101 | |
| Change in net unrealized appreciation/(depreciation) on: | | | | |
| Investments | | | 41,778,510 | |
| Net Realized and Unrealized Gain on Investments | | | 42,614,611 | |
| Net Increase in Net Assets Resulting from Operations | | $ | 44,056,553 | |
| (1) | Net of $17,149 in foreign withholding taxes. |
The accompanying notes are an integral part of these financial statements.
Frontegra IronBridge SMID Fund STATEMENTS OF CHANGES IN NET ASSETS
| | | For the Year | | | For the Year | |
| | | Ended | | | Ended | |
| | | June 30, 2010 | | | June 30, 2009 | |
| Operations: | | | | | | |
| Net investment income | | $ | 1,441,942 | | | $ | 1,331,924 | |
| Net realized gain (loss) on investments | | | 836,101 | | | | (48,731,590 | ) |
| Change in net unrealized appreciation/(depreciation) on investments | | | 41,778,510 | | | | (21,178,183 | ) |
| Net increase (decrease) in net assets resulting from operations | | | 44,056,553 | | | | (68,577,849 | ) |
| | | | | | | | | |
| Distributions Paid From: | | | | | | | | |
| Net investment income | | | (1,315,023 | ) | | | (259,686 | ) |
| Net realized gain | | | — | | | | (2,364,348 | ) |
| Net decrease in net assets resulting from distributions paid | | | (1,315,023 | ) | | | (2,624,034 | ) |
| | | | | | | | | |
| Capital Share Transactions: | | | | | | | | |
| Shares sold | | | 242,121,127 | | | | 179,601,797 | |
| Shares issued to holders in reinvestment of distributions | | | 1,153,134 | | | | 2,451,437 | |
| Shares redeemed | | | (75,612,671 | ) | | | (36,257,970 | ) |
| Net increase in net assets resulting from capital share transactions | | | 167,661,590 | | | | 145,795,264 | |
| Total Increase in Net Assets | | | 210,403,120 | | | | 74,593,381 | |
| | | | | | | | | |
| Net Assets: | | | | | | | | |
| Beginning of Period | | | 307,973,079 | | | | 233,379,698 | |
| End of Period (includes undistributed net investment | | | | | | | | |
| income of $1,449,567 and $1,315,023 respectively) | | $ | 518,376,199 | | | $ | 307,973,079 | |
| | | | | | | | | |
| Transactions in Shares: | | | | | | | | |
| Shares sold | | | 24,708,177 | | | | 20,791,374 | |
| Shares issued to holders in reinvestment of distributions | | | 120,874 | | | | 328,171 | |
| Shares redeemed | | | (7,784,307 | ) | | | (4,509,587 | ) |
| Net increase in shares outstanding | | | 17,044,744 | | | | 16,609,958 | |
The accompanying notes are an integral part of these financial statements.
Frontegra IronBridge SMID Fund FINANCIAL HIGHLIGHTS
| | | Year | | | Year | | | Year | | | Year | | | Year | |
| | | Ended | | | Ended | | | Ended | | | Ended | | | Ended | |
| | | June 30, | | | June 30, | | | June 30, | | | June 30, | | | June 30, | |
| | | 2010(1) | | | 2009 | | | 2008 | | | 2007 | | | 2006 | |
| Net Asset Value, Beginning of Period | | $ | 8.24 | | | $ | 11.23 | | | $ | 13.36 | | | $ | 11.07 | | | $ | 10.00 | |
| | | | | | | | | | | | | | | | | | | | | |
| Income (Loss) from | | | | | | | | | | | | | | | | | | | | |
| Investment Operations: | | | | | | | | | | | | | | | | | | | | |
| Net investment income | | | 0.03 | (2) | | | 0.03 | | | | 0.02 | | | | 0.01 | | | | 0.06 | (2) |
| Net realized and unrealized gain (loss) on investments | | | 1.28 | | | | (2.93 | ) | | | (0.98 | ) | | | 2.43 | | | | 1.04 | |
| Total Income (Loss) from Investment Operations | | | 1.31 | | | | (2.90 | ) | | | (0.96 | ) | | | 2.44 | | | | 1.10 | |
| | | | | | | | | | | | | | | | | | | | | |
| Less Distributions: | | | | | | | | | | | | | | | | | | | | |
| From net investment income | | | (0.03 | ) | | | (0.01 | ) | | | (0.02 | ) | | | — | (3) | | | (0.03 | ) |
| From net realized gain on investments | | | — | | | | (0.08 | ) | | | (1.15 | ) | | | (0.15 | ) | | | — | |
| Total Distributions | | | (0.03 | ) | | | (0.09 | ) | | | (1.17 | ) | | | (0.15 | ) | | | (0.03 | ) |
| | | | | | | | | | | | | | | | | | | | | |
| Net Asset Value, End of Period | | $ | 9.52 | | | $ | 8.24 | | | $ | 11.23 | | | $ | 13.36 | | | $ | 11.07 | |
| | | | | | | | | | | | | | | | | | | | | |
| Total Return | | | 15.88 | % | | | (25.78 | )% | | | (7.48 | )% | | | 22.25 | % | | | 11.02 | % |
| | | | | | | | | | | | | | | | | | | | | |
| Supplemental Data and Ratios: | | | | | | | | | | | | | | | | | | | | |
| Net assets, end of period (in thousands) | | $ | 518,376 | | | $ | 307,973 | | | $ | 233,380 | | | $ | 193,424 | | | $ | 133,058 | |
| Ratio of expenses to average net assets | | | | | | | | | | | | | | | | | | | | |
| Before waivers and reimbursements | | | 0.93 | % | | | 0.96 | % | | | 0.96 | % | | | 0.98 | % | | | 1.08 | % |
| Net of waivers and reimbursements | | | 0.94 | % | | | 0.95 | % | | | 0.95 | % | | | 0.95 | % | | | 0.95 | % |
| Ratio of net investment income to average net assets | | | | | | | | | | | | | | | | | | | | |
| Before waivers and reimbursements | | | 0.43 | % | | | 0.54 | % | | | 0.19 | % | | | 0.08 | % | | | 0.15 | % |
| Net of waivers and reimbursements | | | 0.42 | % | | | 0.55 | % | | | 0.20 | % | | | 0.10 | % | | | 0.28 | % |
| Portfolio turnover rate | | | 45 | % | | | 46 | % | | | 71 | % | | | 71 | % | | | 91 | % |
| (1) | Effective March 1, 2010, IronBridge Capital Management, L.P. became investment adviser to the Fund. |
| (2) | Per share net investment income has been calculated using the daily average share method. |
| (3) | Less than one cent per share. |
The accompanying notes are an integral part of these financial statements.
FRONTEGRA
IRONBRIDGE GLOBAL
FOCUS FUND
REPORT FROM IRONBRIDGE CAPITAL MANAGEMENT, L.P.
Dear Shareholders:
The Frontegra IronBridge Global Focus Fund strives to achieve long-term capital appreciation by investing primarily in equity securities of companies traded in developed markets throughout the world, including the United States.
Performance Review
Since inception on September 18, 2009, the Frontegra IronBridge Global Focus Fund returned -8.60%, net of fees, versus the MSCI World Index Net return of -7.10%.
The stock selection within Financials, Industrials, Energy, Consumer Staples and Telecommunications was a positive contributor to the relative return profile, while selection amongst the Health Care, Utilities, Consumer Discretionary, Information Technology and Materials detracted from the Fund’s relative performance.
The strong recovery from the lows of March 2009 came to a halt in the fourth quarter of the Fund’s fiscal year. Absent further stimulus packages, equity markets responded with a sharp decline in response either to concerns over sovereign debt levels or to signs of slowdown in early cycle parts of the global economy.
Corporate results released during the fourth quarter of the Fund’s fiscal year were characterized by margins holding up or improving, but sales growth was generally disappointing. The revisions ratio which had peaked in October 2009 at over 2.1x and had stabilized at 1.3x in the first three month of 2010, is now running at just over 1x according to the latest data from Merrill Lynch.
The short-term consequence of money printing, fiscal stimuli and intervention was the “Reflation” of risk assets in general from the Fund’s inception through March 2010. Authorities managed to force discount rates down and all risky assets rose, especially those of the most highly levered companies. Beginning around October 2009 and continuing through March 2010, the real economy showed very positive signs in response to the various massive fiscal and monetary stimuli. This was evident in an improvement in a number of lead indicators that subsequently ushered in a period of stability in income and employment.
The fourth quarter of the Fund’s year may signal a return of deflationary tendencies, with private sector de-leveraging, many government bond yields hitting new lows and lead indicators decelerating. While short term fiscal deficits and money printing are prerequisites to help the private sector repair balance sheets, they cannot by themselves raise living standards. Productivity and innovation raise living standards. The consequences of all this debt accumulation and deficit funding are likely higher volatility and lower growth.
Portfolio Outlook
It is all too easy to put too much of the emphasis on short-term predictions for GDP, consumer expenditure, employment or indeed, the scale of future money printing. Instead, from our perspective, the outlook for economies and markets in general should be viewed as part of a major longer term “re-balancing” phase. We anticipate that this “re-balancing” phase will be volatile for equity markets, bond markets and currency markets alike, as a large scale tug of war develops between debtors trying to deleverage and the authorities trying to get them to start borrowing and spending again. The various asset markets currently sit in-between, trying to predict who will win this tug of war.
Continued deleveraging could lead to sustained bouts of deflation like that experienced in Japan. That has serious consequences for highly leveraged government and financial sectors. On the other hand, successful reflation could lead to another round of major asset price bubbles. Unfortunately, because centrally directed liquidity can never be allocated fairly and equally across the economy as a whole, that could easily result in mis-allocation of capital like we have seen in the past. The most obvious recent example stemmed from the highly damaging trifecta of poor tax policy, lax lending practices and inappropriate monetary policy which drove house prices in many regions of the world to unsustainable highs and trapped financial capital in a non-productive asset.
Reflecting on this current macro environment, the biggest short run challenge for all investors is likely that the consequences of further government and central bank intervention will frame returns from markets for the foreseeable future.
The consensus generated around the G20 summit at the height of the financial crisis ensured all risk assets rose in tandem. This regime lasted a few short months and quarters but has now been replaced by the longer term re-balancing phase; a phase where all members of the G20 face up to their own specific challenges. These challenges are in turn driven by wide differences in budget deficits, current accounts, private debt accumulation, savings rates, currency regimes and even straightforward demographics.
In Europe, by way of example, the challenge is that when governments try to cut their budget deficits, the critical question is the extent to which the negative impact on aggregate demand can be offset by a reduction in private sector saving and/or an improvement in net exports. The problem is that the private sector in much of Europe is trying to increase saving rates following the boom of the 2000s that ultimately went bust. At the same time, the fixed exchange rate regime restricts the ability of many peripheral European countries from improving their external position. So the Eurozone will face the re-balancing phase with a tough choice between sustaining fiscal transfers from core to peripheral Europe or the unwinding of the currency union.
Might there be the potential for other offsets to emerge? For example, could there be a reduction in private sector savings in the rest of the world to mop up the products and services made more affordable by a weakening Euro currency? This outcome seems unlikely given the fact that U.K., U.S. and Japanese households are probably going to have to remain prudent themselves. At the same time, the combined consumer spending power of the developing countries is unlikely to be sufficient to plug a consumption gap that according to the IMF would occur if developed economy governments chose to reduce their deficits to 3% of GDP. That action alone would withdraw roughly $2.2trn of demand from the global economy.
However, before we conclude that the re-balancing phase is doomed to fail, it is possible to turn to evidence from our own framework that points towards a more positive long-term path and a more successful outcome. A better bet for offsetting fiscal austerity can be found in the financial conditions in the corporate sector.
The data from our own framework reveals that the corporate sector aggregate ROIs have troughed at levels higher than in any previous recession. In addition, corporate sector balance sheets, with the exception of those with significantly underfunded pension funds, have rarely been in better shape. Companies have been in capital preservation mode and are emerging from the liquidity crisis with record levels of cash.
Aggregate asset growth charts for the major developed economies illustrate the degree to which investment has lagged economic growth for a number of years. Investment share of GDP in the developed world is at all time lows and the gap between ROI and asset growth at the corporate level in the U.S. alone, is higher than at any time since the early 1990’s. Given the challenges posed by the need to upgrade technology, support aging populations and tackle the threats from an over reliance on carbon consumption, it is clear that an investment boom could be both necessary and highly productive.
In addition, many parts of the developed world have the exchange rate flexibility to improve net exports via currency depreciation rather than via deflation. This could further accelerate a more productive re-balancing. At the same time, it is possible that it is deemed more politically expedient to re-balance long-term Western living standards via currency debasement than via nominal wage cuts.
As we have identified, we anticipate further volatility ahead as this re-balancing phase unfolds. However, because our economic-based risk controls work, we can put our forward looking focus firmly on picking better stocks. We can continue to monitor our long-term milestones and search for attractive stock opportunities across the globe, opportunities where managements are undertaking the correct capital allocation decisions, appropriate for their position in the corporate Life Cycle. We can look for attractive pay-off structures and continue to manage portfolios with Life Cycle diversification and diversification by source of Net Cash Receipts, our primary tools for risk control.
Best regards,
 |  |
| Stephen Barrow | Matt Halkyard, CFA |
| | |
 |  |
| James Clarke, CFA | Peter Rutter, CFA |
Growth of a $100,000 Investment (Unaudited)
* 9/18/09 commencement of operations.
| | | | | |
| | Portfolio Total Return** | | | |
| | FOR THE PERIOD ENDED 6/30/10 | FUND | INDEX | |
| | | | | |
| | SINCE INCEPTION | (8.60)% | (7.10)% | |
| | | | | |
This chart assumes an initial gross investment of $100,000 made on 9/18/09. Returns shown include the reinvestment of all distributions. Past performance is not predictive of future results. Investment return and principal value will fluctuate so that shares, when redeemed, may be worth more or less than the original cost. In the absence of existing fee waivers, total return would be reduced. To receive current to the most recent month-end performance, please call 1-888-825-2100.
The MSCI World Index Net is a free float-adjusted market capitalization weighted index that is designed to measure the equity market performance of developed markets. As of June 2007 the MSCI World Index consisted of the following 23 developed market country indices: Australia, Austria, Belgium, Canada, Denmark, Finland, France, Germany, Greece, Hong Kong, Ireland, Italy, Japan, Netherlands, New Zealand, Norway, Portugal, Singapore, Spain, Sweden, Switzerland, the United Kingdom, and the United States. The Index does not reflect investment management fees, brokerage commissions and other expenses associated with investing in equity securities. A direct investment in an index is not possible.
| ** | The returns shown do not reflect the deduction of taxes that a shareholder would pay on Fund distributions or the redemption of Fund shares. |
Frontegra IronBridge Global Focus Fund SCHEDULE OF INVESTMENTS
June 30, 2010
| Number of Shares | | Value | |
| | | | | | |
| COMMON STOCKS 99.0% | | | |
| | | Australia 1.0% | | | |
| | 22,380 | | Westpac Banking Corp. | | $ | 394,481 | |
| | | | | | | | |
| | | | Canada 9.7% | | | | |
| | 19,578 | | Barrick Gold Corp. | | | 889,037 | |
| | 49,794 | | Brookfield Asset Management, Inc. | | | 1,126,340 | |
| | 19,714 | | Canadian Natural Resources Ltd. | | | 655,097 | |
| | 11,141 | | Petrobank Energy & Resources Ltd. (a) | | | 391,931 | |
| | 13,528 | | TD Bank Financial Group | | | 876,578 | |
| | | | | | | 3,938,983 | |
| | | | Finland 1.5% | | | | |
| | 29,271 | | Sampo Oyj | | | 617,141 | |
| | | | | | | | |
| | | | France 2.8% | | | | |
| | 6,520 | | Compagnie Generale des | | | | |
| | | | Etablissements Michelin - Class B | | | 454,264 | |
| | 23,260 | | Legrand SA | | | 689,453 | |
| | | | | | | 1,143,717 | |
| | | | Germany 3.4% | | | | |
| | 15,260 | | Bayer AG | | | 852,752 | |
| | 19,199 | | E.ON AG | | | 516,228 | |
| | | | | | | 1,368,980 | |
| | | | Hong Kong 1.9% | | | | |
| | 207,100 | | Hang Lung Properties Ltd. | | | 792,147 | |
| | | | | | | | |
| | | | Ireland 1.9% | | | | |
| | 38,421 | | CRH PLC | | | 791,594 | |
| | | | | | | | |
| | | | Japan 10.3% | | | | |
| | 19,820 | | Canon, Inc. | | | 738,681 | |
| | 16,460 | | Mitsui Sumitomo Insurance Group | | | 352,299 | |
| | 38,700 | | Seven & I Holdings Co. Ltd. | | | 886,666 | |
| | 14,300 | | Shin-Etsu Chemical Co. Ltd. | | | 664,881 | |
| | 17,500 | | Softbank Corp. | | | 464,157 | |
| | 23,000 | | Sony Corp. | | | 613,479 | |
| | 24,500 | | Suzuki Motor Corp. | | | 480,823 | |
| | | | | | | 4,200,986 | |
| | | | Netherlands 0.9% | | | | |
| | 7,673 | | Fugro N.V. | | | 354,474 | |
| | | | | | | | |
| | | | Spain 1.2% | | | | |
| | 44,950 | | Banco Santander SA | | | 471,355 | |
| | | | | | | | |
| | | | Sweden 1.7% | | | | |
| | 28,720 | | Svenska Handelsbanken AB | | | 702,603 | |
| | | | | | | | |
| | | | Switzerland 7.4% | | | | |
| | 7,522 | | Lonza Group AG | | | 500,810 | |
| | 37,086 | | Nestle SA | | | 1,788,244 | |
| | 5,259 | | Roche Holding AG | | | 723,858 | |
| | | | | | | 3,012,912 | |
| | | | United Kingdom 5.9% | | | | |
| | 37,811 | | BHP Billiton PLC | | | 980,383 | |
| | 22,099 | | Standard Chartered PLC | | | 538,119 | |
| | 159,443 | | Tesco PLC | | | 899,483 | |
| | | | | | | 2,417,985 | |
| | | | United States 49.4% | | | | |
| | 4,010 | | Apple, Inc. (a) | | | 1,008,635 | |
| | 11,761 | | Avnet, Inc. (a) | | | 283,558 | |
| | 12,910 | | BB&T Corp. | | | 339,662 | |
| | 3,089 | | Beckman Coulter, Inc. | | | 186,236 | |
| | 23,804 | | Becton, Dickinson & Co. | | | 1,609,626 | |
| | 12,260 | | Berkshire Hathaway, Inc. (a) | | | 976,999 | |
| | 21,790 | | Best Buy Co., Inc. | | | 737,809 | |
| | 19,720 | | Costco Wholesale Corp. | | | 1,081,248 | |
| | 9,677 | | Exelon Corp. | | | 367,436 | |
| | 16,700 | | Exxon Mobil Corp. | | | 953,069 | |
| | 4,747 | | The Goldman Sachs Group, Inc. | | | 623,139 | |
| | 7,224 | | International Business Machines Corp. | | | 892,020 | |
| | 15,505 | | Johnson & Johnson | | | 915,725 | |
| | 20,792 | | JPMorgan Chase & Co. | | | 761,195 | |
| | 3,181 | | Lubrizol Corp. | | | 255,466 | |
| | 46,260 | | Microsoft Corp. | | | 1,064,442 | |
| | 16,119 | | National Oilwell Varco, Inc. | | | 533,055 | |
The accompanying notes are an integral part of these financial statements.
Frontegra IronBridge Global Focus Fund
SCHEDULE OF INVESTMENTS (continued)
June 30, 2010
| Number of Shares | | Value | |
| | | | | | |
COMMON STOCKS 99.0% (continued) | | | |
| | | | | | |
| | | United States 49.4% (continued) | | | |
| | 12,688 | | Northern Trust Corp. | | $ | 592,530 | |
| | 20,791 | | Occidental Petroleum Corp. | | | 1,604,026 | |
| | 46,713 | | Oracle Corp. | | | 1,002,461 | |
| | 15,470 | | Ross Stores, Inc. | | | 824,396 | |
| | 22,241 | | Union Pacific Corp. | | | 1,545,972 | |
| | 19,996 | | United Technologies Corp. | | | 1,297,940 | |
| | 25,810 | | W.R. Berkley Corp. | | | 682,933 | |
| | | | | | | 20,139,578 | |
| | | | Total Common Stocks | | | | |
| | | | (Cost $44,221,165) | | | 40,346,936 | |
| | | | | | | | |
| | | | | | | | |
| Principal Amount | | | | |
| | | | | �� | | | |
| SHORT-TERM INVESTMENTS 1.1% | | | | |
| | | | Commercial Paper 1.1% | | | | |
| $ | 472,000 | | U.S. Bank, N.A., | | | | |
| | | | 0.000%, 07/01/2010 | | | 472,000 | |
| | | | Total Short-Term Investments | | | | |
| | | | (Cost $472,000) | | | 472,000 | |
| | | | | | | | |
| | | | Total Investments 100.1% | | | | |
| | | | (Cost $44,693,165) | | | 40,818,936 | |
| | | | | | | | |
| | | | Liabilities in Excess | | | | |
| | | | of Other Assets (0.1)% | | | (54,512 | ) |
| | | | | | | | |
| | | | TOTAL NET ASSETS 100.0% | | $ | 40,764,424 | |
| (a) | Non-Income Producing. |
ALLOCATION OF PORTFOLIO HOLDINGS
At June 30, 2010, the allocation of portfolio holdings as a percentage of the Fund’s total net assets were:
| Common Stock | | | 99.0 | % |
| Short-Term Investments | | | 1.1 | |
| Liabilities in Excess of Other Assets | | | (0.1 | ) |
| | | | 100.0 | % |
The accompanying notes are an integral part of these financial statements.
Frontegra IronBridge Global Focus Fund PORTFOLIO DIVERSIFICATION
June 30, 2010
| | | Value | | | Percentage | |
| Consumer Discretionary | | $ | 3,110,771 | | | | 7.6 | % | |
| Consumer Staples | | | 4,655,641 | | | | 11.4 | | |
| Energy | | | 4,491,652 | | | | 11.0 | | |
| Financials | | | 9,847,521 | | | | 24.2 | | |
| Health Care | | | 4,789,007 | | | | 11.8 | | |
| Industrials | | | 3,533,365 | | | | 8.7 | | |
| Information Technology | | | 4,989,797 | | | | 12.2 | | |
| Materials | | | 3,581,361 | | | | 8.8 | | |
| Telecomm Service | | | 464,157 | | | | 1.1 | | |
| Utilities | | | 883,664 | | | | 2.2 | | |
| Total Common Stocks | | | 40,346,936 | | | | 99.0 | | |
| Total Short-Term Investments | | | 472,000 | | | | 1.1 | | |
| Total Investments | | | 40,818,936 | | | | 100.1 | | |
| Liabilities in Excess of Other Assets | | | (54,512 | ) | | | (0.1 | ) | |
| Total Net Assets | | $ | 40,764,424 | | | | 100.0 | % | |
The accompanying notes are an integral part of these financial statements.
Frontegra IronBridge Global Focus Fund STATEMENT OF ASSETS AND LIABILITIES
June 30, 2010
| Assets: | | | |
| Investments at value (cost $44,693,165) | | $ | 40,818,936 | |
| Cash | | | 38,765 | |
| Interest and dividends receivable | | | 97,815 | |
| Receivable for Fund shares sold | | | 825 | |
| Receivable for investments sold | | | 86,081 | |
| Prepaid expenses and other assets | | | 2,576 | |
| Total assets | | | 41,044,998 | |
| | | | | |
| Liabilities: | | | | |
| Payable for investments purchased | | | 194,218 | |
| Accrued investment advisory fee | | | 16,117 | |
| Accrued expenses | | | 70,239 | |
| Total liabilities | | | 280,574 | |
| Net Assets | | $ | 40,764,424 | |
| | | | | |
| Net Assets Consist of: | | | | |
| Paid in capital | | $ | 43,782,585 | |
| Undistributed net investment income | | | 344,498 | |
| Accumulated net realized gain | | | 512,640 | |
| Net unrealized depreciation on: | | | | |
| Investments | | | (3,874,229 | ) |
| Foreign currency | | | (1,070 | ) |
| Net Assets | | $ | 40,764,424 | |
| | | | | |
| Capital Stock, $0.01 Par Value | | | | |
| Authorized | | | 50,000,000 | |
| Issued and outstanding | | | 4,466,843 | |
| Net Asset Value, Redemption Price and Offering Price Per Share | | $ | 9.13 | |
The accompanying notes are an integral part of these financial statements.
Frontegra IronBridge Global Focus Fund STATEMENT OF OPERATIONS
| | | For the period | |
| | | September 18, 2009(1) | |
| | | through | |
| | | June 30, 2010 | |
| Investment Income: | | | |
Dividend income(2) | | $ | 725,805 | |
| Interest income | | | 470 | |
| Total Investment Income | | | 726,275 | |
| | | | | |
| Expenses: | | | | |
| Investment advisory fees (Note 3) | | | 280,795 | |
| Legal fees | | | 35,890 | |
| Audit fees | | | 34,944 | |
| Fund administration and accounting fees | | | 26,857 | |
| Custody fees | | | 25,160 | |
| Sub-administration fees (Note 3) | | | 16,491 | |
| Shareholder servicing fees | | | 9,145 | |
| Reports to shareholders | | | 7,342 | |
| Directors’ fees and related expenses | | | 5,443 | |
| Federal and state registration fees | | | 4,616 | |
| Compliance related expenses | | | 422 | |
| Other | | | 3,322 | |
| Total expenses before waiver and reimbursement | | | 450,427 | |
| Waiver and reimbursement of expenses by Adviser (Note 3) | | | (126,432 | ) |
| Net expenses | | | 323,995 | |
| Net Investment Income | | | 402,280 | |
| | | | | |
| Realized and Unrealized Loss on Investments: | | | | |
| Net realized loss on: | | | | |
| Investments | | | (374,892 | ) |
| Foreign currency transactions | | | (12,404 | ) |
| Change in net unrealized appreciation/(depreciation) on: | | | | |
| Investments | | | (3,874,229 | ) |
| Foreign currency transactions | | | (1,070 | ) |
| Net Realized and Unrealized Loss on Investments | | | (4,262,595 | ) |
| Net Decrease in Net Assets Resulting from Operations | | $ | (3,860,315 | ) |
| (1) | Commencement of operations |
| (2) | Net of $56,043 in foreign withholding taxes |
The accompanying notes are an integral part of these financial statements.
Frontegra IronBridge Global Focus Fund STATEMENT OF CHANGES IN NET ASSETS
| | | For the period | |
| | | September 18, 2009(1) | |
| | | through | |
| | | June 30, 2010 | |
| Operations: | | | |
| Net investment income | | $ | 402,280 | |
| Net realized loss on: | | | | |
| Investments | | | (374,892 | ) |
| Foreign currency transactions | | | (12,404 | ) |
| Change in net unrealized appreciation/(depreciation) on: | | | | |
| Investments | | | (3,874,229 | ) |
| Foreign currency transactions | | | (1,070 | ) |
| Net decrease in net assets resulting from operations | | | (3,860,315 | ) |
| | | | | |
| Distributions Paid From: | | | | |
| Net investment income | | | (45,378 | ) |
| Net decrease in net assets resulting from distributions paid | | | (45,378 | ) |
| | | | | |
| Capital Share Transactions: | | | | |
| Shares sold | | | 45,459,527 | |
| Shares issued to holders in reinvestment of distributions | | | 33,135 | |
| Shares redeemed | | | (822,545 | ) |
| Net increase in net assets resulting from capital share transactions | | | 44,670,117 | |
| Total Increase in Net Assets | | | 40,764,424 | |
| | | | | |
| Net Assets: | | | | |
| Beginning of Period | | | — | |
| End of Period (includes undistributed net investment income of $344,498) | | $ | 40,764,424 | |
| | | | | |
| Transactions In Shares: | | | | |
| Shares sold | | | 4,543,097 | |
| Shares issued to holders in reinvestment of distributions | | | 3,347 | |
| Shares redeemed | | | (79,601 | ) |
| Net increase in shares outstanding | | | 4,466,843 | |
| (1) | Commencement of operations |
The accompanying notes are an integral part of these financial statements.
Frontegra IronBridge Global Focus Fund FINANCIAL HIGHLIGHTS
| | | For the Period | |
| | | Ended | |
| | | June 30, | |
| | | 2010(1) | |
| Net Asset Value, Beginning of Period | | $ | 10.00 | |
| | | | | |
| Income (Loss) from | | | | |
| Investment Operations: | | | | |
| Net investment income | | | 0.09 | |
| Net realized and unrealized loss on investments | | | (0.95 | ) |
| Total Loss from Investment Operations | | | (0.86 | ) |
| | | | | |
| Less Distributions: | | | | |
| From net investment income | | | (0.01 | ) |
| Total Distributions | | | (0.01 | ) |
| | | | | |
| Net Asset Value, End of Period | | $ | 9.13 | |
| | | | | |
| Total Return | | | (8.60 | )%(2) |
| | | | | |
| Supplemental Data and Ratios: | | | | |
| Net assets, end of period (in thousands) | | $ | 40,764 | |
| Ratio of expenses to average net assets | | | | |
| Before waivers and reimbursements | | | 1.36 | %(3) |
| Net of waivers and reimbursements | | | 1.00 | %(1) |
| Ratio of net investment income to average net assets | | | | |
| Before waivers and reimbursements | | | 0.86 | %(3) |
| Net of waivers and reimbursements | | | 1.22 | %(3) |
| Portfolio turnover rate | | | 41 | %(2) |
| (1) | Commenced operations on September 18, 2009. |
The accompanying notes are an integral part of these financial statements.
FRONTEGRA
MASTHOLM INTERNATIONAL
EQUITY FUND
REPORT FROM MASTHOLM ASSET MANAGEMENT, LLC:
Dear Shareholders:
The Frontegra Mastholm International Equity Fund (formerly, the Frontegra New Star International Equity Fund) strives to achieve capital appreciation by investing in a diversified portfolio of securities of large- and mid-cap companies located outside the United States. The objective is relative to and measured against the Morgan Stanley EAFE Index.
Performance Review
The Frontegra Mastholm International Equity Fund returned 0.52%, net of fees, for the fiscal year ending June 30, 2010. The Fund’s return underperformed the 6.38% return of its benchmark, the MSCI EAFE Index. Effective October 12, 2009, Mastholm Asset Management replaced New Star Institutional Managers, Ltd. as subadviser to the Fund and the Fund was renamed the Frontegra Mastholm International Equity Fund.
Portfolio Outlook and Strategy
The global equity recovery which began in March of 2009 was based on investor expectations that a global depression had been averted. The massive amounts of government stimulus enacted during the credit crisis fueled a rally among lower quality, higher risk stocks, particularly banks that were decimated during the credit crisis. Corporate earnings did improve in the second half of 2009, which led investors to concentrate investments in cyclical recovery stocks, materials, and emerging markets on the basis that early stage signs of economic recovery would lead to higher levels of economic growth.
The market rally stalled in January 2010 as the Greek debt crisis took center stage. A series of political missteps among European leaders trying to figure out how to solve the crisis of confidence drove the euro down about 20% from its November 2009 high, and led investors to speculate about the impact of potentially slower growth in the Eurozone on Chinese exports to Europe, their major export market. Recent strong economic activity in Germany due to a lower euro may offset some of the economic growth hurdles facing the Mediterranean countries of Spain, Portugal, Italy and Greece, which will suffer from recent austerity measures. During this difficult time in Europe, the Fund had virtually no exposure to any stocks in these countries.
While stock markets were relatively flat in the first quarter of 2010, markets fell sharply in the second quarter due to the ongoing sovereign debt crisis and deteriorating expectations about the strength of the global recovery. Corporate earnings have been quite strong in calendar year 2010 and the vast majority of Fund holdings have met or exceeded analyst expectations.
The direction of capital markets in this tepid environment continues to be driven by investor fears of a slowdown led by negative consumption trends in the United States and United Kingdom, as well as periphery states in Continental Europe. Although corporate profits have been surprisingly strong, investors are concerned about the impact of slower economic growth in the second half of 2010 and what impact that might have on the ability of corporations to pass along higher input costs.
The portfolio remains underweighted in the United Kingdom, Australia and Japan, while overweighted in Switzerland, the Netherlands and Germany. Emerging market exposure was about 9% at the end of the fiscal year, primarily in South Korea, which was additive during 2010 due to a strong currency and outperformance among carmakers such as Hyundai.
From a sector perspective, the portfolio has been underweighted in financials throughout the period from October when Mastholm began to manage the portfolio. In addition, our financial exposure has been concentrated in higher quality names which lagged the rally in riskier stocks.
The portfolio remains overweighted in technology stocks, particularly in the LED space, which has experienced above expectations growth for televisions and street lighting. Consumer discretionary stocks have also been overweighted due to a rebound in consumer spending. Telecom, utilities and health care remain slightly below market weight.
If investor expectations for continued global growth do not materialize, companies with demonstrated top and bottom line earnings growth should be quite competitive in a difficult environment. The Mastholm investment process is designed to identify companies with accelerating top and bottom line growth, regardless of the economic environment.
Thank you for your continued support.
Thomas M. Garr
Mastholm Asset Management, LLC
Growth of a $100,000 Investment (Unaudited)
* 1/08/04 commencement of operations.
| | | | | |
| | Portfolio Total Return** | | | |
| | FOR PERIODS ENDED 6/30/10 | FUND | INDEX | |
| | | | | |
| | SIX MONTHS | (14.11)% | (12.93)% | |
| | | | | |
| | ONE YEAR | 0.52% | 6.38% | |
| | | | | |
| | FIVE YEAR | (2.21)% | 1.35% | |
| | | | | |
| | SINCE COMMENCEMENT | | | |
| | AVERAGE ANNUAL | (0.08)% | 3.44% | |
| | | | | |
This chart assumes an initial gross investment of $100,000 made on 1/08/04 (commencement of operations). Returns shown include the reinvestment of all distributions. Past performance is not predictive of future results. Investment return and principal value will fluctuate so that shares, when redeemed, may be worth more or less than the original cost. In the absence of existing fee waivers, total return would be reduced. Effective October 12, 2009, Mastholm Asset Management, LLC became subadviser to the Fund. To receive current to the most recent month-end performance, please call 1-888-825-2100.
The Morgan Stanley Capital International EAFE Index measures the overall performance of stock markets in 21 countries within Europe, Australasia and the Far East. The Index does not reflect investment management fees, brokerage commissions and other expenses associated with investing in equity securities. A direct investment in the index is not possible.
| ** | The returns shown do not reflect the deduction of taxes that a shareholder would pay on Fund distributions or the redemption of Fund shares. |
Frontegra Mastholm International Equity Fund SCHEDULE OF INVESTMENTS
June 30, 2010
| Number of Shares | | Value | |
| | | | | | |
| COMMON STOCKS 94.3% | | | |
| | | | | | |
| | | Australia 1.5% | | | |
| | 11,400 | | BHP Billiton Ltd. | | $ | 354,649 | |
| | 15,800 | | QBE Insurance Group Ltd. | | | 239,750 | |
| | | | | | | 594,399 | |
| | | | Belgium 1.6% | | | | |
| | 12,600 | | Anheuser-Busch InBev NV | | | 605,825 | |
| | | | | | | | |
| | | | Brazil 0.8% | | | | |
| | 22,900 | | Hypermarcas SA (a) | | | 293,704 | |
| | | | | | | | |
| | | | Canada 4.2% | | | | |
| | 129,200 | | Cline Mining Corp. (a) | | | 129,862 | |
| | 8,800 | | Niko Resources Ltd. | | | 818,456 | |
| | 9,500 | | Open Text Corp. (a) | | | 356,630 | |
| | 22,700 | | Sino-Forest Corp. (a) | | | 322,625 | |
| | | | | | | 1,627,573 | |
| | | | China 2.5% | | | | |
| | 12,600 | | Ctrip.com International | | | | |
| | | | Ltd. - ADR (a) | | | 473,256 | |
| | 39,000 | | Lianhua Supermarket | | | | |
| | | | Holdings, Co. Ltd. | | | 142,857 | |
| | 10,000 | | Sina Corp. (a) | | | 352,600 | |
| | | | | | | 968,713 | |
| | | | France 6.0% | | | | |
| | 16,497 | | BNP Paribas | | | 887,554 | |
| | 4,200 | | EDF SA | | | 159,796 | |
| | 94,100 | | Natixis (a) | | | 408,625 | |
| | 30,800 | | Valeo SA (a) | | | 837,654 | |
| | | | | | | 2,293,629 | |
| | | | Germany 8.0% | | | | |
| | 7,100 | | Adidas AG | | | 343,746 | |
| | 19,800 | | Aixtron AG | | | 468,098 | |
| | 3,400 | | Allianz SE | | | 336,510 | |
| | 6,097 | | Bayer AG | | | 340,710 | |
| | 18,500 | | Daimler AG | | | 935,834 | |
| | 9,700 | | Fresenius Medical Care AG | | | 640,708 | |
| | | | | | | 3,065,606 | |
| | | | Hong Kong 2.2% | | | | |
| | 25,800 | | ASM Pacific Technology Ltd. | | | 200,433 | |
| | 801,000 | | SJM Holdings Ltd. | | | 670,843 | |
| | | | | | | 871,276 | |
| | | | Japan 20.9% | | | | |
| | 10,300 | | Canon, Inc. | | | 383,878 | |
| | 8,300 | | Eisai Co. Ltd. | | | 275,401 | |
| | 9,000 | | Fanuc Ltd. | | | 1,016,303 | |
| | 2,100 | | Fast Retailing, Co. Ltd. | | | 317,760 | |
| | 4,000 | | Keyence Corp. | | | 924,970 | |
| | 27,700 | | Komatsu Ltd. | | | 498,770 | |
| | 19,100 | | Mitsubishi Corp. | | | 395,149 | |
| | 85,700 | | Mitsubishi Tokyo | | | | |
| | | | Financial Group, Inc. | | | 389,139 | |
| | 35,000 | | Nabtesco Corp. | | | 539,510 | |
| | 30,600 | | Nikon Corp. | | | 527,355 | |
| | 6,900 | | ORIX Corp. | | | 499,869 | |
| | 291 | | Rakuten, Inc. | | | 210,258 | |
| | 49,800 | | Sega Sammy Holdings, Inc. | | | 715,359 | |
| | 27,500 | | Softbank Corp. | | | 729,390 | |
| | 11,500 | | Tokyo Electron Ltd. | | | 619,473 | |
| | | | | | | 8,042,584 | |
| | | | Netherlands 9.9% | | | | |
| | 6,400 | | ArcelorMittal | | | 171,660 | |
| | 14,553 | | ASML Holding NV | | | 400,498 | |
| | 10,300 | | European Aeronautic Defense | | | | |
| | | | and Space Co. NV | | | 210,201 | |
| | 49,200 | | ING Groep NV (a) | | | 364,106 | |
| | 45,100 | | Koninklijke Ahold NV | | | 557,883 | |
| | 38,800 | | Koninklijke Philips Electronics NV | | | 1,158,651 | |
| | 22,300 | | Royal Dutch Shell PLC | | | 560,571 | |
| | 15,500 | | TNT NV | | | 390,401 | |
| | | | | | | 3,813,971 | |
| | | | Norway 1.9% | | | | |
| | 142,100 | | Storebrand ASA (a) | | | 730,594 | |
The accompanying notes are an integral part of these financial statements.
Frontegra Mastholm International Equity Fund SCHEDULE OF INVESTMENTS (continued)
June 30, 2010
| Number of Shares | | Value | |
| | | | | | |
COMMON STOCKS 94.3% (continued) | | | |
| | | | | | |
| | | South Korea 4.3% | | | |
| | 4,200 | | Hyundai Motor Co. | | $ | 491,437 | |
| | 9,900 | | Korean Air Lines Co., Ltd. (a) | | | 657,761 | |
| | 4,100 | | Samsung Electro-Mechanics Co. Ltd. | | | 512,704 | |
| | | | | | | 1,661,902 | |
| | | | Sweden 1.8% | | | | |
| | 7,600 | | Modern Times Group AB | | | 416,050 | |
| | 26,800 | | Telefonaktiebolaget LM Ericsson | | | 297,271 | |
| | | | | | | 713,321 | |
| | | | Switzerland 13.6% | | | | |
| | 19,300 | | Adecco SA | | | 920,742 | |
| | 78,000 | | Clariant AG (a) | | | 987,668 | |
| | 21,948 | | Credit Suisse Group AG | | | 825,184 | |
| | 21,700 | | Nestle SA | | | 1,046,348 | |
| | 4,100 | | Novartis AG | | | 198,699 | |
| | 4,500 | | Roche Holdings AG | | | 619,388 | |
| | 5,100 | | Sonova Holding AG | | | 625,859 | |
| | | | | | | 5,223,888 | |
| | | | United Kingdom 15.1% | | | | |
| | 86,400 | | Barclays PLC | | | 344,866 | |
| | 40,520 | | BG Group PLC | | | 602,647 | |
| | 147,700 | | Electrocomponents PLC | | | 475,611 | |
| | 41,900 | | HSBC Holdings PLC | | | 382,785 | |
| | 23,916 | | Imperial Tobacco Group PLC | | | 668,229 | |
| | 179,900 | | Kingfisher PLC | | | 563,548 | |
| | 249,900 | | Lloyds Banking Group PLC | | | 200,797 | |
| | 51,500 | | Tesco PLC | | | 292,865 | |
| | 12,564 | | Unilever PLC | | | 335,861 | |
| | 203,655 | | Vodafone Group PLC | | | 419,629 | |
| | 65,200 | | WPP PLC | | | 614,215 | |
| | 68,700 | | Xstrata PLC | | | 899,602 | |
| | | | | | | 5,800,655 | |
| | | | Total Common Stocks | | | | |
| | | | (Cost $36,580,664) | | | 36,307,640 | |
| | | | | |
| PREFERRED STOCKS 1.1% | | | | |
| | | | Brazil 1.1% | | | | |
| | 4,400 | | Companhia de Bebidas das Americas | | | 437,806 | |
| | | | Total Preferred Stocks | | | | |
| | | | (Cost $430,868) | | | 437,806 | |
| | | | | |
| SHORT-TERM INVESTMENTS 3.4% | | | | |
| | | | | | | | |
| | | | Investment Company 3.4% | | | | |
| | 1,296,248 | | Fidelity Institutional | | | | |
| | | | Money Market Portfolio | | | 1,296,248 | |
| | | | Total Short-Term Investments | | | | |
| | | | (Cost $1,296,248) | | | 1,296,248 | |
| | | | | | | | |
| | | | Total Investments 98.8% | | | | |
| | | | (Cost $38,307,780) | | | 38,041,694 | |
| | | | | | | | |
| | | | Other Assets in Excess | | | | |
| | | | of Liabilities 1.2% | | | 474,821 | |
| | | | | | | | |
| | | | TOTAL NET ASSETS 100.0% | | $ | 38,516,515 | |
ADR - American Depositary Receipt.
ALLOCATION OF PORTFOLIO HOLDINGS
At June 30, 2010, the allocation of portfolio holdings as a percentage of the Fund’s total net assets were:
| Common Stocks | | | 94.3 | % |
| Preferred Stocks | | | 1.1 | |
| Short-Term Investments | | | 3.4 | |
| Other Assets in Excess of Liabilities | | | 1.2 | |
| | | | 100.0 | % |
The accompanying notes are an integral part of these financial statements.
Frontegra Mastholm International Equity Fund PORTFOLIO DIVERSIFICATION
June 30, 2010
| | | Value | | | Percentage | |
| Consumer Discretionary | | $ | 7,117,315 | | | | 18.5 | % | |
| Consumer Staples | | | 3,943,572 | | | | 10.2 | | |
| Energy | | | 1,981,674 | | | | 5.1 | | |
| Financials | | | 5,609,779 | | | | 14.6 | | |
| Health Care | | | 2,700,765 | | | | 7.0 | | |
| Industrials | | | 5,787,488 | | | | 15.0 | | |
| Information Technology | | | 4,992,166 | | | | 13.0 | | |
| Materials | | | 2,866,066 | | | | 7.5 | | |
| Telecomm Service | | | 1,149,019 | | | | 3.0 | | |
| Utilities | | | 159,796 | | | | 0.4 | | |
| Total Common Stocks | | | 36,307,640 | | | | 94.3 | | |
| Preferred Stocks | | | 437,806 | | | | 1.1 | | |
| Total Short-Term Investments | | | 1,296,248 | | | | 3.4 | | |
| Total Investments | | | 38,041,694 | | | | 98.8 | | |
| Other Assets in Excess of Liabilities | | | 474,821 | | | | 1.2 | | |
| Total Net Assets | | $ | 38,516,515 | | | | 100.0 | % | |
The accompanying notes are an integral part of these financial statements.
Frontegra Mastholm International Equity Fund STATEMENT OF ASSETS AND LIABILITIES
June 30, 2010
| Assets: | | | |
| Investments at value (cost $38,307,780) | | $ | 38,041,694 | |
| Foreign currency at value (cost $50,392) | | | 50,372 | |
| Cash | | | 46,110 | |
| Interest and dividends receivable | | | 481,371 | |
| Receivable for investments sold | | | 720,918 | |
| Receivable from Adviser | | | 2,109 | |
| Prepaid expenses and other assets | | | 8,496 | |
| Total assets | | | 39,351,070 | |
| | | | | |
| Liabilities: | | | | |
| Payable for investments purchased | | $ | 751,941 | |
| Accrued expenses | | | 82,614 | |
| Total liabilities | | | 834,555 | |
| Net Assets | | $ | 38,516,515 | |
| | | | | |
| Net Assets Consist of: | | | | |
| Paid in capital | | $ | 145,668,084 | |
| Undistributed net investment income | | | 590,856 | |
| Accumulated net realized loss | | | (107,514,190 | ) |
| Net unrealized appreciation/(depreciation) on: | | | | |
| Investments | | | (266,086 | ) |
| Foreign currency | | | 37,851 | |
| Net Assets | | $ | 38,516,515 | |
| | | | | |
| Capital Stock, $0.01 Par Value | | | | |
| Authorized | | | 100,000,000 | |
| Issued and outstanding | | | 5,102,947 | |
| Net Asset Value, Redemption Price and Offering Price Per Share | | $ | 7.55 | |
The accompanying notes are an integral part of these financial statements.
Frontegra Mastholm International Equity Fund STATEMENT OF OPERATIONS
| | | Year Ended | |
| | | June 30, 2010 | |
| Investment Income: | | | |
Dividend income(1) | | $ | 1,931,248 | |
| Interest income | | | 7,860 | |
| Total Investment Income | | | 1,939,108 | |
| | | | | |
| Expenses: | | | | |
| Investment advisory fees (Note 3) | | | 1,306,126 | |
| Custody fees | | | 284,388 | |
| Fund administration and accounting fees | | | 73,370 | |
| Legal fees | | | 53,086 | |
| Audit fees | | | 43,840 | |
| Federal and state registration fees | | | 25,815 | |
| Shareholder servicing fees | | | 15,613 | |
| Reports to shareholders | | | 15,405 | |
| Directors’ fees and related expenses | | | 8,545 | |
| Interest expense | | | 1,185 | |
| Compliance related expenses | | | 512 | |
| Other | | | 16,088 | |
| Total expenses before waiver and reimbursement | | | 1,843,973 | |
| Waiver and reimbursement of expenses by Adviser (Note 3) | | | (811,681 | ) |
| Net expenses | | | 1,032,292 | |
| Net Investment Income | | | 906,816 | |
| | | | | |
| Realized and Unrealized Gain (Loss) on Investments: | | | | |
| Net realized gain (loss) on: | | | | |
| Investments | | | 16,444,788 | |
| Foreign currency transactions | | | (104,437 | ) |
| Change in net unrealized appreciation/(depreciation) on: | | | | |
| Investments | | | 6,049,436 | |
| Foreign currency transactions | | | 36,238 | |
| Net Realized and Unrealized Gain on Investments | | | 22,426,025 | |
| Net Increase in Net Assets Resulting from Operations | | $ | 23,332,841 | |
| (1) | Net of $140,672 in foreign withholding taxes |
The accompanying notes are an integral part of these financial statements.
Frontegra Mastholm International Equity Fund STATEMENTS OF CHANGES IN NET ASSETS
| | | For the Year | | | For the Year | |
| | | Ended | | | Ended | |
| | | June 30, 2010 | | | June 30, 2009 | |
| Operations: | | | | | | |
| Net investment income | | $ | 906,816 | | | $ | 5,652,381 | |
| Net realized gain (loss) on: | | | | | | | | |
| Investments | | | 16,444,788 | | | | (120,490,311 | ) |
| Foreign currency transactions | | | (104,437 | ) | | | (167,107 | ) |
| Change in net unrealized appreciation/(depreciation) on: | | | | | | | | |
| Investments | | | 6,049,436 | | | | (49,838,040 | ) |
| Foreign currency translation | | | 36,238 | | | | 77,733 | |
| Net increase (decrease) in net assets resulting from operations | | | 23,332,841 | | | | (164,765,344 | ) |
| | | | | | | | | |
| Distributions Paid From: | | | | | | | | |
| Net investment income | | | (5,738,700 | ) | | | (10,274,560 | ) |
| Net realized gain on investments | | | — | | | | (11,287,593 | ) |
| Net decrease in net assets resulting from distributions paid | | | (5,738,700 | ) | | | (21,562,153 | ) |
| | | | | | | | | |
| Capital Share Transactions: | | | | | | | | |
| Shares sold | | | 12,774,821 | | | | 32,708,631 | |
| Shares issued to holders in reinvestment of distributions | | | 5,738,700 | | | | 17,427,623 | |
| Shares redeemed | | | (197,476,360 | ) | | | (138,012,420 | ) |
| Redemption fees | | | 1,445 | | | | — | |
| Net decrease in net assets resulting from capital share transactions | | | (178,961,394 | ) | | | (87,876,166 | ) |
| Total Decrease in Net Assets | | | (161,367,253 | ) | | | (274,203,663 | ) |
| | | | | | | | | |
| Net Assets: | | | | | | | | |
| Beginning of Period | | | 199,883,768 | | | | 474,087,431 | |
| End of Period (includes undistributed net investment | | | | | | | | |
| income of $590,856 and $5,474,041 respectively) | | $ | 38,516,515 | | | $ | 199,883,768 | |
| | | | | | | | | |
| Transactions in Shares: | | | | | | | | |
| Shares sold | | | 1,454,683 | | | | 3,543,690 | |
| Shares issued to holders in reinvestment of distributions | | | 664,201 | | | | 2,311,356 | |
| Shares redeemed | | | (22,584,239 | ) | | | (16,095,020 | ) |
| Net decrease in shares outstanding | | | (20,465,355 | ) | | | (10,239,974 | ) |
The accompanying notes are an integral part of these financial statements.
Frontegra Mastholm International Equity Fund FINANCIAL HIGHLIGHTS
| | | Year | | | Year | | | Year | | | Year | | | Year | |
| | | Ended | | | Ended | | | Ended | | | Ended | | | Ended | |
| | | June 30, | | | June 30, | | | June 30, | | | June 30, | | | June 30, | |
| | | 2010(1) | | | 2009 | | | 2008 | | | 2007 | | | 2006 | |
| Net Asset Value, Beginning of Period | | $ | 7.82 | | | $ | 13.24 | | | $ | 16.11 | | | $ | 13.08 | | | $ | 11.07 | |
| | | | | | | | | | | | | | | | | | | | | |
| Income (Loss) from | | | | | | | | | | | | | | | | | | | | |
| Investment Operations: | | | | | | | | | | | | | | | | | | | | |
| Net investment income | | | 0.27 | | | | 0.29 | | | | 0.31 | | | | 0.25 | | | | 0.31 | (2) |
| Net realized and unrealized gain (loss) on investments | | | (0.18 | ) | | | (4.97 | ) | | | (1.75 | ) | | | 3.25 | | | | 1.81 | |
| Total Income (Loss) from Investment Operations | | | 0.09 | | | | (4.68 | ) | | | (1.44 | ) | | | 3.50 | | | | 2.12 | |
| | | | | | | | | | | | | | | | | | | | | |
| Less Distributions: | | | | | | | | | | | | | | | | | | | | |
| From net investment income | | | (0.36 | ) | | | (0.35 | ) | | | (0.25 | ) | | | (0.22 | ) | | | (0.07 | ) |
| From net realized gain on investments | | | — | | | | (0.39 | ) | | | (1.18 | ) | | | (0.25 | ) | | | (0.04 | ) |
| Total Distributions | | | (0.36 | ) | | | (0.74 | ) | | | (1.43 | ) | | | (0.47 | ) | | | (0.11 | ) |
| | | | | | | | | | | | | | | | | | | | | |
| Net Asset Value, End of Period | | $ | 7.55 | | | $ | 7.82 | | | $ | 13.24 | | | $ | 16.11 | | | $ | 13.08 | |
| | | | | | | | | | | | | | | | | | | | | |
| Total Return | | | 0.52 | % | | | (35.13 | )% | | | (9.60 | )% | | | 27.12 | % | | | 19.27 | % |
| | | | | | | | | | | | | | | | | | | | | |
| Supplemental Data and Ratios: | | | | | | | | | | | | | | | | | | | | |
| Net assets, end of period (in thousands) | | $ | 38,517 | | | $ | 199,884 | | | $ | 474,087 | | | $ | 712,620 | | | $ | 531,321 | |
| Ratio of expenses to average net assets | | | | | | | | | | | | | | | | | | | | |
| Before waivers and reimbursements | | | 1.34 | % | | | 1.16 | % | | | 1.06 | % | | | 1.07 | % | | | 1.09 | % |
| Net of waivers and reimbursements | | | 0.75 | % | | | 0.75 | % | | | 0.75 | % | | | 0.75 | % | | | 0.75 | % |
| Ratio of net investment income to average net assets | | | | | | | | | | | | | | | | | | | | |
| Before waivers and reimbursements | | | 0.07 | % | | | 1.78 | % | | | 1.44 | % | | | 1.30 | % | | | 1.60 | % |
| Net of waivers and reimbursements | | | 0.66 | % | | | 2.19 | % | | | 1.75 | % | | | 1.62 | % | | | 1.94 | % |
| Portfolio turnover rate | | | 268 | % | | | 57 | % | | | 54 | % | | | 62 | % | | | 35 | % |
| (1) | Effective October 12, 2009, Mastholm Asset Management, LLC became subadviser to the Fund. |
| (2) | Per share net investment income has been calculated using the daily average share method. |
The accompanying notes are an integral part of these financial statements.
FRONTEGRA
NETOLS SMALL CAP
VALUE FUND
REPORT FROM NETOLS ASSET MANAGEMENT:
Dear Fellow Shareholders:
Since its inception on December 16, 2005, the Frontegra Netols Small Cap Value Fund (Institutional Class) has outperformed the benchmark, returning 0.66% annualized, net of fees, compared to -1.69% annualized for the Russell 2000 Value Index.
Performance Review
For the year ended June 30, 2010, the Frontegra Netols Small Cap Value Fund (Institutional Class) has returned 11.76%, net of fees, compared to 25.07% for the Russell 2000 Value Index.
Portfolio Review
The impact of stimulus spending has been the dominant market factor during the past 12 months. The injection of low cost capital into the financial system re-inflated paper assets and once again fueled investor appetites for risk. Corporations also used this opportunity to raise fresh capital to solidify their balance sheets. However, as China announced plans to slow its economy and sovereign debt issues hit Europe, investors questioned the strength of the economy and began to price risk back into the market. With national debt levels rising and tax receipts falling, the focus changed from stimulus programs to potential austerity programs, increased government regulation, and tax law changes.
Our market outlook remains conflicted. Most companies continue to see favorable trends in their businesses. However, questions remain regarding the trajectory of the economic recovery. China’s attempt to slow growth, European credit issues, and domestic debt levels combined with new government spending may drive increased corporate and personal tax burdens. This could potentially dampen the current recovery. Mid-term elections may provide some relief to equity markets with enough change in Congress to place some checks and balances on the current administration’s reform efforts.
Positive Contributions to Relative Performance July 2009 through June 2010
| • | Stock Selection – Energy, Financials and Consumer Staples |
| • | Underweight – Telecom Services and Utilities |
| • | Best Performing Stocks – Kansas City Southern, Whiting Petroleum, Sun Communities, Tenneco and Forest Oil |
Negative Contributions to Relative Performance July 2009 through June 2010
| • | Stock Selection – Consumer Discretionary, Information Technology and Health Care |
| • | Overweight – Health Care |
| • | Worst Performing Stocks – Champion Enterprises, Corinthian Colleges, ENGlobal, General Maritime and Gibraltar Industries |
Thank you for your continued support.
Jeff Netols
Netols Asset Management
Growth of a $100,000 Investment (Unaudited)
* 12/16/05 commencement of operations.
| | | | | |
| | Portfolio Total Return** | | | |
| | FOR PERIODS ENDED 6/30/10 | FUND | INDEX | |
| | | | | |
| | SIX MONTHS | (5.17)% | (1.64)% | |
| | | | | |
| | ONE YEAR | 11.76% | 25.07% | |
| | | | | |
| | THREE YEAR | (7.33)% | (9.85)% | |
| | | | | |
| | SINCE COMMENCEMENT | | | |
| | AVERAGE ANNUAL | 0.66% | (1.69)% | |
| | | | | |
This chart assumes an initial gross investment of $100,000 made on 12/16/05 (commencement of operations). Returns shown include the reinvestment of all distributions. Past performance is not predictive of future results. Investment return and principal value will fluctuate so that shares, when redeemed, may be worth more or less than the original cost. In the absence of existing fee waivers, total return would be reduced. To receive current to the most recent month-end performance, please call 1-888-825-2100.
The Russell 2000 Value Index measures the performance of those Russell 2000 companies with lower price-to-book ratios and lower forecasted growth values. The Russell 2000 Index measures the performance of the 2,000 smallest companies in the Russell 3000 Index. The Russell 3000 Index measures the performance of the 3,000 largest U.S. companies based on total market capitalization. The Index does not reflect investment management fees, brokerage commissions and other expenses associated with investing in equity securities. A direct investment in the index is not possible.
| ** | The returns shown do not reflect the deduction of taxes that a shareholder would pay on Fund distributions or the redemption of Fund shares. |
The above graph relates to Institutional Class shares of the Fund. Performance for Class Y shares will vary from the performance of the Institutional Class shares shown above due to differences in expenses.
Frontegra Netols Small Cap Value Fund SCHEDULE OF INVESTMENTS
June 30, 2010
| Number of Shares | | Value | |
| | | | | | |
| COMMON STOCKS 97.7% | | | |
| | | | | | |
| | | Advertising 0.9% | | | |
| | 49,587 | | Arbitron, Inc. | | $ | 1,270,915 | |
| | | | | | | | |
| | | | Aerospace & Defense 1.2% | | | | |
| | 21,609 | | American Science & | | | | |
| | | | Engineering, Inc. | | | 1,646,822 | |
| | | | | | | | |
| | | | Apparel & Accessories 1.9% | | | | |
| | 98,156 | | Carter’s, Inc. (a) | | | 2,576,595 | |
| | | | | | | | |
| | | | Application Software 1.7% | | | | |
| | 107,609 | | Fair Isaac Corp. | | | 2,344,800 | |
| | | | | | | | |
| | | | Auto Parts & Equipment 2.4% | | | | |
| | 168,373 | | Modine Manufacturing Co. (a) | | | 1,293,105 | |
| | 94,322 | | Tenneco, Inc. (a) | | | 1,986,421 | |
| | | | | | | 3,279,526 | |
| | | | Building Products 0.7% | | | | |
| | 99,614 | | Gibraltar Industries, Inc. (a) | | | 1,006,101 | |
| | | | | | | | |
| | | | Chemicals - Commodity 1.4% | | | | |
| | 191,425 | | Spartech Corp. (a) | | | 1,962,106 | |
| | | | | | | | |
| | | | Communications Equipment | | | | |
| | | | Manufacturing 1.0% | | | | |
| | 238,357 | | Harmonic, Inc. (a) | | | 1,296,662 | |
| | | | | | | | |
| | | | Construction & Engineering 1.0% | | | | |
| | 79,032 | | Tutor Perini Corp. (a) | | | 1,302,447 | |
| | | | | | | | |
| | | | Diversified Metals & Mining 2.3% | | | | |
| | 45,271 | | Compass Minerals | | | | |
| | | | International, Inc. | | | 3,181,646 | |
| | | | | | | | |
| | | | Educational Services 1.1% | | | | |
| | 146,290 | | Corinthian Colleges, Inc. (a) | | | 1,440,956 | |
| | | | | | | | |
| | | | Food Distributors 1.8% | | | | |
| | 80,023 | | United Natural Foods, Inc. (a) | | | 2,391,087 | |
| | | | | | | | |
| | | | Health Care - Distributors 2.2% | | | | |
| | 138,764 | | PSS World Medical, Inc. (a) | | | 2,934,859 | |
| | | | | | | | |
| | | | Health Care - Facility 2.9% | | | | |
| | 61,184 | | LifePoint Hospitals, Inc. (a) | | | 1,921,178 | |
| | 123,862 | | Sunrise Senior Living, Inc. (a) | | | 344,336 | |
| | 95,474 | | U.S. Physical Therapy, Inc. (a) | | | 1,611,601 | |
| | | | | | | 3,877,115 | |
| | | | Health Care - Managed Care 1.2% | | | | |
| | 46,671 | | Magellan Health Services, Inc. (a) | | | 1,695,091 | |
| | | | | | | | |
| | | | Health Care - Services 3.3% | | | | |
| | 89,795 | | Gentiva Health Services, Inc. (a) | | | 2,425,363 | |
| | 94,881 | | Rehabcare Group, Inc. (a) | | | 2,066,508 | |
| | | | | | | 4,491,871 | |
| | | | Health Care - Supplies 4.3% | | | | |
| | 34,408 | | Haemonetics Corp. (a) | | | 1,841,516 | |
| | 101,983 | | Medical Action Industries, Inc. (a) | | | 1,222,776 | |
| | 172,965 | | Merit Medical Systems, Inc. (a) | | | 2,779,548 | |
| | | | | | | 5,843,840 | |
| | | | Industrial REITS 0.8% | | | | |
| | 212,475 | | First Industrial Realty Trust, Inc. (a) | | | 1,024,130 | |
| | | | | | | | |
| | | | Insurance - Property/Casualty 1.7% | | | | |
| | 52,233 | | Hanover Insurance Group, Inc. | | | 2,272,136 | |
| | | | | | | | |
| | | | IT Consulting & Services 3.5% | | | | |
| | 58,398 | | CACI International, | | | | |
| | | | Inc. - Class A (a) | | | 2,480,747 | |
| | 51,986 | | ManTech International | | | | |
| | | | Corp. - Class A (a) | | | 2,213,044 | |
| | | | | | | 4,693,791 | |
| | | | Machinery - Construction / Farm 2.8% | | | | |
| | 180,516 | | Titan International, Inc. | | | 1,799,745 | |
The accompanying notes are an integral part of these financial statements.
Frontegra Netols Small Cap Value Fund SCHEDULE OF INVESTMENTS (CONTINUED)
June 30, 2010
| Number of Shares | | Value | |
| | | | | | |
COMMON STOCKS 97.7% (continued) | | | |
| | | | | | |
| | | Machinery - Construction / | | | |
| | | Farm 2.8% (continued) | | | |
| | 51,259 | | Westinghouse Air Brake | | | |
| | | | Technologies Corp. | | $ | 2,044,721 | |
| | | | | | | 3,844,466 | |
| | | | Machinery - Industrial 6.3% | | | | |
| | 48,874 | | Gardner Denver, Inc. | | | 2,179,292 | |
| | 55,799 | | IDEX Corp. | | | 1,594,178 | |
| | 50,705 | | Kaydon Corp. | | | 1,666,166 | |
| | 25,297 | | Nordson Corp. | | | 1,418,656 | |
| | 78,114 | | Robbins & Myers, Inc. | | | 1,698,198 | |
| | | | | | | 8,556,490 | |
| | | | Marine 2.6% | | | | |
| | 62,986 | | Alexander & Baldwin, Inc. | | | 1,875,723 | |
| | 395,370 | | Eagle Bulk Shipping, Inc. (a) | | | 1,668,461 | |
| | | | | | | 3,544,184 | |
| | | | Movies and Entertainment 1.4% | | | | |
| | 67,144 | | DreamWorks | | | | |
| | | | Animation SKG, Inc. (a) | | | 1,916,961 | |
| | | | | | | | |
| | | | Oil & Gas - Equipment/Services 3.2% | | | | |
| | 318,605 | | ION Geophysical Corp. (a) | | | 1,108,745 | |
| | 180,682 | | North American Energy | | | | |
| | | | Partners, Inc. (a)(b) | | | 1,595,422 | |
| | 90,400 | | Superior Energy Services, Inc. (a) | | | 1,687,768 | |
| | | | | | | 4,391,935 | |
| | | | Oil & Gas - Exploration/Products 4.5% | | | | |
| | 103,210 | | Forest Oil Corp. (a) | | | 2,823,826 | |
| | 41,967 | | Whiting Petroleum Corp. (a) | | | 3,291,052 | |
| | | | | | | 6,114,878 | |
| | | | Oil & Gas - Storage 1.3% | | | | |
| | 286,339 | | General Maritime Corp. (b) | | | 1,729,488 | |
| | | | | | | | |
| | | | Packaged Foods/Meats 3.0% | | | | |
| | 56,237 | | Lance, Inc. | | | 927,348 | |
| | 67,109 | | TreeHouse Foods, Inc. (a) | | | 3,064,197 | |
| | | | | | | 3,991,545 | |
| | | | Railroads 3.1% | | | | |
| | 59,656 | | Genesee & Wyoming, Inc. (a) | | | 2,225,765 | |
| | 55,907 | | Kansas City Southern (a) | | | 2,032,220 | |
| | | | | | | 4,257,985 | |
| | | | Regional Banks 9.8% | | | | |
| | 41,319 | | Bank of Hawaii Corp. | | | 1,997,774 | |
| | 55,284 | | Community Bank System, Inc. | | | 1,217,906 | |
| | 140,597 | | First Midwest Bancorp, Inc. | | | 1,709,659 | |
| | 133,661 | | Glacier Bancorp, Inc. | | | 1,960,807 | |
| | 185,369 | | Old National Bancorp | | | 1,920,423 | |
| | 51,635 | | Prosperity Bancshares, Inc. | | | 1,794,316 | |
| | 49,532 | | Westamerica Bancorporation | | | 2,601,421 | |
| | | | | | | 13,202,306 | |
| | | | Residential REITS 4.2% | | | | |
| | 49,597 | | Mid-America Apartment | | | | |
| | | | Communities, Inc. | | | 2,552,757 | |
| | 118,004 | | Sun Communities, Inc. | | | 3,063,384 | |
| | | | | | | 5,616,141 | |
| | | | Restaurants 3.1% | | | | |
| | 180,846 | | Dominos Pizza, Inc. (a) | | | 2,043,560 | |
| | 98,614 | | The Cheesecake Factory, Inc. (a) | | | 2,195,147 | |
| | | | | | | 4,238,707 | |
| | | | Retail - Apparel 1.8% | | | | |
| | 146,489 | | AnnTaylor Stores Corp. (a) | | | 2,383,376 | |
| | | | | | | | |
| | | | Retail - Catalog 1.5% | | | | |
| | 82,387 | | HSN, Inc. (a) | | | 1,977,288 | |
| | | | | | | | |
| | | | Retail REITS 1.0% | | | | |
| | 226,233 | | Cedar Shopping Centers, Inc. | | | 1,361,923 | |
| | | | | | | | |
| | | | Semiconductor Equipment 2.3% | | | | |
| | 125,706 | | Advanced Energy Industries, Inc. (a) | | | 1,544,927 | |
The accompanying notes are an integral part of these financial statements.
Frontegra Netols Small Cap Value Fund SCHEDULE OF INVESTMENTS (CONTINUED)
June 30, 2010
| Number of Shares | | Value | |
| | | | | | |
COMMON STOCKS 97.7% (continued) | | | |
| | | | | | |
| | | Semiconductor | | | |
| | | Equipment 2.3% (continued) | | | |
| | 389,901 | | Entegris, Inc. (a) | | $ | 1,547,907 | |
| | | | | | | 3,092,834 | |
| | | | Semiconductors 1.4% | | | | |
| | 226,512 | | Fairchild Semiconductor | | | | |
| | | | International, Inc. (a) | | | 1,904,966 | |
| | | | | | | | |
| | | | Services - Environmental 1.0% | | | | |
| | 69,493 | | Tetra Tech, Inc. (a) | | | 1,362,758 | |
| | | | | | | | |
| | | | Specialty Stores 1.9% | | | | |
| | 41,290 | | Tractor Supply Co. | | | 2,517,452 | |
| | | | | | | | |
| | | | Steel 1.7% | | | | |
| | 68,999 | | Carpenter Technology Corp. | | | 2,265,237 | |
| | | | | | | | |
| | | | Technology Distributions 0.1% | | | | |
| | 23,625 | | GTSI Corp. (a) | | | 128,992 | |
| | | | | | | | |
| | | | Thrifts & Mortgage Finance 2.4% | | | | |
| | 144,409 | | Astoria Financial Corp. | | | 1,987,068 | |
| | 175,088 | | MGIC Investment Corp. (a) | | | 1,206,356 | |
| | | | | | | 3,193,424 | |
| | | | Total Common Stocks | | | | |
| | | | (Cost $131,086,334) | | | 132,125,832 | |
| | | | | |
| SHORT-TERM INVESTMENTS 2.0% | | | | |
| | | | | | | | |
| | | | Investment Company 2.0% | | | | |
| | 2,750,925 | | Fidelity Money Market Portfolio | | | 2,750,925 | |
| | | | Total Short-Term Investments | | | | |
| | | | (Cost $2,750,925) | �� | | 2,750,925 | |
| | | | | | | | |
| | | | Total Investments 99.7% | | | | |
| | | | (Cost $133,837,259) | | | 134,876,757 | |
| | | | | | | | |
| | | | Other Assets in Excess | | | | |
| | | | of Liabilities 0.3% | | | 340,608 | |
| | | | | | | | |
| | | | TOTAL NET ASSETS 100.0% | | $ | 135,217,365 | |
| (b) | U.S. Dollar denominated security of foreign issuer. |
ALLOCATION OF PORTFOLIO HOLDINGS
At June 30, 2010, the allocation of portfolio holdings as a percentage of the Fund’s total net assets were:
| Common Stocks | | | 97.7 | % |
| Short-Term Investments | | | 2.0 | |
| Other Assets in Excess of Liabilities | | | 0.3 | |
| | | | 100.0 | % |
The accompanying notes are an integral part of these financial statements.
Frontegra Netols Small Cap Value Fund STATEMENT OF ASSETS AND LIABILITIES
June 30, 2010
| Assets: | | | |
| Investments at value (cost $133,837,259) | | $ | 134,876,757 | |
| Interest receivable | | | 37,176 | |
| Receivable for Fund shares sold | | | 125,204 | |
| Receivable for investments sold | | | 1,331,635 | |
| Prepaid expenses and other assets | | | 4,454 | |
| Total assets | | | 136,375,226 | |
| | | | | |
| Liabilities: | | | | |
| Payable for investments purchased | | | 960,587 | |
| Accrued investment advisory fee | | | 111,038 | |
| Accrued distribution and shareholder servicing fees | | | 27,533 | |
| Accrued expenses | | | 58,703 | |
| Total liabilities | | | 1,157,861 | |
| Net Assets | | $ | 135,217,365 | |
| | | | | |
| Net Assets Consist of: | | | | |
| Paid in capital | | $ | 141,162,063 | |
| Accumulated net realized loss | | | (6,984,196 | ) |
| Unrealized appreciation on investments | | | 1,039,498 | |
| Net Assets | | $ | 135,217,365 | |
| | | | | |
Capital Stock, $0.01 Par Value | | | | |
| Institutional Class Shares Authorized | | | 50,000,000 | |
| Class Y Shares Authorized | | | 50,000,000 | |
| | | | | |
| Institutional Class: | | | | |
| Net Assets | | $ | 119,657,408 | |
| Issued and Outstanding | | | 11,870,037 | |
| Net Asset Value, Redemption Price and Offering Price Per Share | | $ | 10.08 | |
| | | | | |
| Class Y: | | | | |
| Net Assets | | $ | 15,559,957 | |
| Issued and Outstanding | | | 1,556,061 | |
| Net Asset Value, Redemption Price and Offering Price Per Share | | $ | 10.00 | |
The accompanying notes are an integral part of these financial statements.
Frontegra Netols Small Cap Value Fund STATEMENT OF OPERATIONS
| | | Year Ended | |
| | | June 30, 2010 | |
| Investment Income: | | | |
| Dividend income | | $ | 1,153,216 | |
| Interest income | | | 8,735 | |
| Total Investment Income | | | 1,161,951 | |
| | | | | |
| Expenses: | | | | |
| Investment advisory fees (Note 3) | | | 969,735 | |
| Fund administration and accounting fees | | | 39,316 | |
| Distribution and shareholder servicing fees - Class Y (Note 8) | | | 30,905 | |
| Legal fees | | | 30,484 | |
| Audit fees | | | 25,187 | |
| Custody fees | | | 23,704 | |
| Shareholder servicing fees | | | 15,537 | |
| Federal and state registration fees | | | 15,144 | |
| Directors’ fees and related expenses | | | 8,195 | |
| Reports to shareholders | | | 5,553 | |
| Compliance related expenses | | | 507 | |
| Other | | | 8,474 | |
| Total expenses before waiver and reimbursement | | | 1,172,741 | |
| Waiver and reimbursement of expenses by Adviser (Note 3) | | | (75,253 | ) |
| Net expenses | | | 1,097,488 | |
| Net Investment Income | | | 64,463 | |
| | | | | |
| Realized and Unrealized Gain (Loss) on Investments: | | | | |
| Net realized loss on: | | | | |
| Investments | | | (2,816,578 | ) |
| Change in net unrealized appreciation/(depreciation) on: | | | | |
| Investments | | | 4,527,457 | |
| Net Realized and Unrealized Gain on Investments | | | 1,710,879 | |
| Net Increase in Net Assets Resulting from Operations | | $ | 1,775,342 | |
The accompanying notes are an integral part of these financial statements.
Frontegra Netols Small Cap Value Fund STATEMENTS OF CHANGES IN NET ASSETS
| | | For the | | | For the | |
| | | Year Ended | | | Year Ended | |
| | | June 30, 2010 | | | June 30, 2009 | |
| Operations: | | | | | | |
| Net investment income | | $ | 64,463 | | | $ | 65,463 | |
| Net realized loss on investments: | | | (2,816,578 | ) | | | (3,424,284 | ) |
| Change in net unrealized appreciation/(depreciation) on investments | | | 4,527,457 | | | | (4,798,290 | ) |
| Net increase (decrease) in net assets resulting from operations | | | 1,775,342 | | | | (8,157,111 | ) |
| | | | | | | | | |
| Distributions Paid to Institutional Class Shareholders From: | | | | | | | | |
| Net investment income | | | (105,774 | ) | | | (12,872 | ) |
| Net realized gain | | | — | | | | — | |
| Return of capital | | | (34,387 | ) | | | — | |
| Net decrease in net assets resulting from distributions paid | | | (140,161 | ) | | | (12,872 | ) |
| | | | | | | | | |
| Distributions Paid to Class Y Shareholders From: | | | | | | | | |
| Net investment income | | | — | | | | — | |
| Net realized gain | | | — | | | | — | |
| Net decrease in net assets resulting from distributions paid | | | — | | | | — | |
| | | | | | | | | |
| Capital Share Transactions: | | | | | | | | |
| Shares sold - Institutional Class | | | 87,906,355 | | | | 25,776,914 | |
| Shares sold - Class Y | | | 17,583,054 | | | | 172,350 | |
| Shares issued to holders in reinvestment of distributions - Institutional Class | | | 100,276 | | | | 11,142 | |
| Shares issued to holders in reinvestment of distributions - Class Y | | | — | | | | — | |
| Shares redeemed - Institutional Class | | | (13,668,980 | ) | | | (5,704,581 | ) |
| Shares redeemed - Class Y | | | (2,737,389 | ) | | | (66,608 | ) |
| Net increase in net assets resulting from capital share transactions | | | 89,183,316 | | | | 20,189,217 | |
| Total Increase in Net Assets | | | 90,818,497 | | | | 12,019,234 | |
| | | | | | | | | |
| Net Assets: | | | | | | | | |
| Beginning of Period | | | 44,398,868 | | | | 32,379,634 | |
| End of Period (includes undistributed net investment | | | | | | | | |
| income of $0 and $64,517 respectively) | | $ | 135,217,365 | | | $ | 44,398,868 | |
| | | | | | | | | |
| Transactions In Shares – Institutional Class: | | | | | | | | |
| Shares sold | | | 8,334,941 | | | | 2,834,988 | |
| Shares issued to holders in reinvestment of distributions | | | 9,764 | | | | 1,297 | |
| Shares redeemed | | | (1,291,419 | ) | | | (674,248 | ) |
| Net increase in shares outstanding | | | 7,053,286 | | | | 2,162,037 | |
| | | | | | | | | |
| Transactions In Shares – Class Y: | | | | | | | | |
| Shares sold | | | 1,709,218 | | | | 18,620 | |
| Shares issued to holders in reinvestment of distributions | | | — | | | | — | |
| Shares redeemed | | | (252,817 | ) | | | (6,746 | ) |
| Net increase in shares outstanding | | | 1,456,401 | | | | 11,874 | |
The accompanying notes are an integral part of these financial statements.
Frontegra Netols Small Cap Value Fund FINANCIAL HIGHLIGHTS
| | | Institutional Class | |
| | | Year | | | Year | | | Year | | | Year | | | Period | |
| | | Ended | | | Ended | | | Ended | | | Ended | | | Ended | |
| | | June 30, | | | June 30, | | | June 30, | | | June 30, | | | June 30, | |
| | | 2010 | | | 2009 | | | 2008 | | | 2007 | | | 2006(1) | |
| Net Asset Value, Beginning of Period | | $ | 9.03 | | | $ | 11.81 | | | $ | 12.88 | | | $ | 10.29 | | | $ | 10.00 | |
| | | | | | | | | | | | | | | | | | | | | |
| Income (Loss) from | | | | | | | | | | | | | | | | | | | | |
| Investment Operations: | | | | | | | | | | | | | | | | | | | | |
| Net investment income | | | 0.02 | (2) | | | 0.01 | | | | — | (3) | | | 0.03 | | | | — | (3) |
| Net realized and unrealized gain (loss) on investments | | | 1.05 | | | | (2.79 | ) | | | (0.90 | ) | | | 2.62 | | | | 0.29 | |
| Total Income (Loss) from Investment Operations | | | 1.07 | | | | (2.78 | ) | | | (0.90 | ) | | | 2.65 | | | | 0.29 | |
| | | | | | | | | | | | | | | | | | | | | |
| Less Distributions: | | | | | | | | | | | | | | | | | | | | |
| From net investment income | | | (0.02 | ) | | | — | (3) | | | (0.02 | ) | | | — | | | | — | |
| From net realized gain on investments | | | — | | | | — | | | | (0.15 | ) | | | (0.06 | ) | | | — | |
| From return of capital | | | (0.00 | )(6) | | | — | | | | — | | | | — | | | | — | |
| Total Distributions | | | (0.02 | ) | | | — | | | | (0.17 | ) | | | (0.06 | ) | | | — | |
| | | | | | | | | | | | | | | | | | | | | |
| Net Asset Value, End of Period | | $ | 10.08 | | | $ | 9.03 | | | $ | 11.81 | | | $ | 12.88 | | | $ | 10.29 | |
| | | | | | | | | | | | | | | | | | | | | |
| Total Return | | | 11.76 | % | | | (23.42 | )% | | | (7.01 | )% | | | 25.81 | % | | | 2.90 | %(4) |
| | | | | | | | | | | | | | | | | | | | | |
| Supplemental Data and Ratios: | | | | | | | | | | | | | | | | | | | | |
| Net assets, end of period (in thousands) | | $ | 119,657 | | | $ | 43,504 | | | $ | 31,346 | | | $ | 17,368 | | | $ | 7,728 | |
| Ratio of expenses to average net assets | | | | | | | | | | | | | | | | | | | | |
| Before waivers and reimbursements | | | 1.18 | % | | | 1.45 | % | | | 1.59 | % | | | 2.10 | % | | | 4.59 | %(5) |
| Net of waivers and reimbursements | | | 1.10 | % | | | 1.10 | % | | | 1.10 | % | | | 1.10 | % | | | 1.10 | %(5) |
| Ratio of net investment income (loss) to average net assets | | | | | | | | | | | | | | | | | | | | |
| Before waivers and reimbursements | | | 0.17 | % | | | (0.13 | )% | | | (0.40 | )% | | | (0.70 | )% | | | (3.44 | )%(5) |
| Net of waivers and reimbursements | | | 0.25 | % | | | 0.22 | % | | | 0.09 | % | | | 0.30 | % | | | 0.05 | %(5) |
| Portfolio turnover rate | | | 41 | % | | | 36 | % | | | 32 | % | | | 49 | % | | | 41 | %(4) |
| (1) | Commenced operations on December 16, 2005. |
| (2) | Per share net investment income has been calculated using the daily average share method. |
| (3) | Less than one cent per share. |
| (6) | Less than one cent per share. |
The accompanying notes are an integral part of these financial statements.
Frontegra Netols Small Cap Value Fund FINANCIAL HIGHLIGHTS
| | | Class Y | |
| | | Year | | | Year | | | Period | |
| | | Ended | | | Ended | | | Ended | |
| | | June 30, | | | June 30, | | | June 30, | |
| | | 2010 | | | 2009 | | | 2008(1) | |
| Net Asset Value, Beginning of Period | | $ | 8.98 | | | $ | 11.78 | | | $ | 12.54 | |
| | | | | | | | | | | | | |
| Income (Loss) from | | | | | | | | | | | | |
| Investment Operations: | | | | | | | | | | | | |
| Net investment loss | | | 0.00 | | | | (0.02 | ) | | | (0.02 | ) |
| Net realized and unrealized gain (loss) on investments | | | 1.02 | | | | (2.78 | ) | | | (0.57 | ) |
| Total Income (Loss) from Investment Operations | | | 1.02 | | | | (2.80 | ) | | | (0.59 | ) |
| | | | | | | | | | | | | |
| Less Distributions: | | | | | | | | | | | | |
| From net investment income | | | — | | | | — | | | | (0.02 | ) |
| From net realized gain on investments | | | — | | | | — | | | | (0.15 | ) |
| Total Distributions | | | — | | | | — | | | | (0.17 | ) |
| | | | | | | | | | | | | |
| Net Asset Value, End of Period | | $ | 10.00 | | | $ | 8.98 | | | $ | 11.78 | |
| | | | | | | | | | | | | |
| Total Return | | | 11.36 | % | | | (23.77 | )% | | | (4.76 | )%(2) |
| | | | | | | | | | | | | |
| Supplemental Data and Ratios: | | | | | | | | | | | | |
| Net assets, end of period (in thousands) | | $ | 15,560 | | | $ | 895 | | | $ | 1,034 | |
| Ratio of expenses to average net assets | | | | | | | | | | | | |
| Before waivers and reimbursements | | | 1.58 | % | | | 1.85 | % | | | 2.01 | %(3) |
| Net of waivers and reimbursements | | | 1.50 | % | | | 1.50 | % | | | 1.55 | %(3) |
| Ratio of net investment loss to average net assets | | | | | | | | | | | | |
| Before waivers and reimbursements | | | (0.23 | )% | | | (0.53 | )% | | | (0.80 | )%(3) |
| Net of waivers and reimbursements | | | (0.15 | )% | | | (0.18 | )% | | | (0.34 | )%(3) |
| Portfolio turnover rate | | | 41 | % | | | 36 | % | | | 32 | %(2) |
| (1) | Commenced operations on November 1, 2007. |
The accompanying notes are an integral part of these financial statements.
NOTES TO FINANCIAL STATEMENTS
June 30, 2010
Frontegra Funds, Inc. (the “Company”) was incorporated on May 24, 1996 as a Maryland corporation and is registered under the Investment Company Act of 1940, as amended (the “1940 Act”), as an open-end investment company issuing shares in series, each series representing a distinct portfolio with its own investment objectives and policies. The Company consists of seven series: the Frontegra Columbus Core Plus Fund (formerly Frontegra Total Return Bond Fund), the Frontegra Columbus Core Fund (formerly Frontegra Investment Grade Bond Fund), the Frontegra IronBridge Small Cap Fund, the Frontegra IronBridge SMID Fund, the Frontegra IronBridge Global Focus Fund, the Frontegra Mastholm International Equity Fund (formerly Frontegra New Star International Equity Fund) and the Frontegra Netols Small Cap Value Fund (the “Funds”). The Frontegra Columbus Core Plus and Columbus Core Funds seek a high level of total return, consistent with the preservation of capital. The investment objective of the Frontegra IronBridge Small Cap Fund, Frontegra IronBridge SMID Fund, Frontegra IronBridge Global Focus Fund, Frontegra Mastholm International Equity Fund and the Frontegra Netols Small Cap Value Fund is capital appreciation. The Frontegra Columbus Core Plus and Columbus Core Funds are sub-advised by Reams Asset Management Company, LLC (“Reams”). The Frontegra Columbus Core Plus Fund – Institutional Class and the Frontegra Columbus Core Plus Fund – Class Y commenced operations on November 25, 1996 and November 12, 2009, respectively. The Frontegra Columbus Core Fund commenced operations on February 23, 2001. The Frontegra IronBridge Small Cap, IronBridge SMID and IronBridge Global Focus Funds advised b y IronBridge Capital Management, L.P. (“IronBridge”), commenced operations on August 30, 2002, December 31, 2004 and September 18, 2009, respectively. Prior to March 1, 2010, IronBridge served as investment subadviser to each of these Funds. The Frontegra Mastholm International Equity Fund, sub-advised by Mastholm Asset Management, LLC (“Mastholm”), commenced operations on January 8, 2004. Mastholm began managing the Fund on October 12, 2009. The Frontegra Netols Small Cap Value Fund – Institutional Class and the Netols Small Cap Value Fund – Class Y, sub-advised by Netols Asset Management, Inc. (“Netols”), commenced operations on December 16, 2005 and November 1, 2007, respectively.
(2) Significant Accounting Policies
The following is a summary of significant accounting policies consistently followed by the Funds in the preparation of their financial statements.
(a) Investment Valuation
Debt securities (other than short-term instruments) are valued by an independent pricing service, which uses valuation methods such as matrix pricing and other analytical pricing models as well as market transactions and evaluated dealer bid quotations. Debt securities, such as term loans, when not priced by an independent pricing service, are priced by an independent dealer based on the current closing bid price. Credit default swaps are valued by a third party pricing service. Equity securities for which market quotations are readily available are valued at the last reported sale price on the national securities exchange on which such securities are primarily traded. Equity securities for which there were no transactions on a given day or securities not listed on a national securities exchange are valued at the most recent sale price. Equity securities that are traded using the National Association of Securities Dealers’ Automated Quotation System (“NASDAQ”) are valued using the NASDAQ Official Closing Price (“NOCP”). Shares of underlying mutual funds are valued at their respective NAVs. Securities that are primarily traded on foreign exchanges generally are valued at the last sale price of such securities on their respective exchange. In certain countries, market maker prices, usually the mean between the bid and ask prices, are used. In certain circumstances, such as when a significant event occurs in a foreign market so that the last sale price no longer reflects actual value, the fair value of these securities may be determined using fair valuation procedures approved by the Board of Directors. The Directors have retained an independent fair value pricing service to assist in valuing foreign securities held by the Frontegra IronBridge Global Focus and Mastholm International Equity Funds. In valuing assets, prices denominated in foreign curren-
Frontegra Funds
NOTES TO FINANCIAL STATEMENTS (continued)
June 30, 2010
cies are converted to U.S. dollar equivalents at the current exchange rate, which approximates market value. Securities maturing within 60 days or less when purchased are valued by the amortized cost method. Any securities or other assets for which market quotations are not readily available are valued at their fair value as determined in good faith by Reams, IronBridge, Mastholm and Netols pursuant to guidelines established by the Board of Directors.
On January 21, 2010, the FASB issued ASU 2010-06, Improving Disclosures about Fair Value Measurements. ASU 2010-06 amends ASC 820, Fair Value Measurements and Disclosures, (formerly FASB Statement No. 157), to require additional disclosures regarding fair value measurements. Specifically, the amendment requires reporting entities to disclose i) the input and valuation techniques used to measure fair value for both recurring and nonrecurring fair value measurements, for Level 2 or Level 3 positions, ii) transfers between all levels (including Level 1 and Level 2) will be required to be disclosed on a gross basis (i.e. transfers out must be disclosed se parately from transfers in) as well as the reason(s) for the transfers and iii) purchases, sales, issuances and settlements must be shown on a gross basis in the Level 3 rollforward rather than as one net number. Examples of inputs used in valuing Level 2 securities are current yields, current discount rates, credit quality, yields for comparable securities and trading volume.
The effective date of this guidance is for interim and annual periods beginning after December 15, 2009; however, the requirement to provide the Level 3 activity for purchases, sales, issuances and settlements on a gross basis will be effective for interim and annual periods beginning after December 15, 2010. The Funds have disclosed the applicable requirements of this accounting standard in their financial statements.
The Funds follow a fair value hierarchy that distinguishes between market data obtained from independent sources (observable inputs) and the Funds’ own market assumptions (unobservable inputs). These inputs are used in determining the value of each Fund’s investments and are summarized in the following fair value hierarchy:
| | Level 1 — | Quoted prices in active markets for identical securities |
| | Level 2 — | Other significant observable inputs (including quoted prices for similar securities, interest rates, current yields, credit quality, prepayment speeds for mortgage related securities, collateral for asset backed securities, foreign security indices, foreign exchange rates, and fair value estimates for foreign securities, and changes in benchmark securities indices, interest rates and credit quality of issuers/counterparties for credit default swaps). |
| | Level 3 — | Significant unobservable inputs (including the Fund’s own assumptions in determining fair value of investments) |
NOTES TO FINANCIAL STATEMENTS (continued)
June 30, 2010
The inputs or methodology used for valuing securities are not necessarily an indication of the risk associated with investing in those securities. The following is a summary of the inputs used to value the Funds’ net assets as of June 30, 2010:
| | Columbus Core Plus Fund | | | | | | | | | | | | |
| | | | Level 1 - Quoted | | | Level 2 - | | | | | | | |
| | | | prices in active markets | | | Significant other | | | Level 3 - Significant | | | | |
| | Description | | for identical assets | | | observable inputs | | | unobservable inputs | | | Total | |
| | Fixed Income | | | | | | | | | | | | |
| | U.S. Treasury Obligations | | $ | — | | | $ | 127,153,397 | | | $ | — | | | $ | 127,153,397 | |
| | Corporate Bonds | | | — | | | | 102,782,855 | | | | — | | | | 102,782,855 | |
| | U.S. Government Agency Issues | | | — | | | | 15,043,076 | | | | — | | | | 15,043,076 | |
| | Asset Backed Securities | | | — | | | | 43,092,754 | | | | — | | | | 43,092,754 | |
| | Mortgage Backed Securities | | | — | | | | 91,591,050 | | | | — | | | | 91,591,050 | |
| | Total Equity | | | — | | | | 379,663,162 | | | | — | | | | 379,663,162 | |
| | Short-Term Investments | | | — | | | | 58,558,877 | | | | — | | | | 58,558,877 | |
| | Total Investments in Securities | | $ | — | | | $ | 438,222,039 | | | $ | — | | | $ | 438,222,039 | |
| | Other Financial instruments* | | | | | | | | | | | | | | | | |
| | Foreign currency contracts | | $ | — | | | $ | 343,893 | | | $ | — | | | $ | 343,893 | |
| | Swap contracts | | $ | — | | | $ | 207,958 | | | $ | — | | | $ | 207,958 | |
| * | Other financial instruments are derivative instruments not reflected in the Schedule of Investments, such as futures, forwards, swaps contracts, and written options. Futures, forwards, and swap contracts are valued at the unrealized appreciation (depreciation) on the instrument while written options are valued at market value. |
| | Columbus Core Fund | | | | | | | | | | | | |
| | | | Level 1 - Quoted | | | Level 2 - | | | | | | | |
| | | | prices in active markets | | | Significant other | | | Level 3 - Significant | | | | |
| | Description | | for identical assets | | | observable inputs | | | unobservable inputs | | | Total | |
| | Fixed Income | | | | | | | | | | | | |
| | U.S. Treasury Obligations | | $ | — | | | $ | 24,796,370 | | | $ | — | | | $ | 24,796,370 | |
| | Corporate Bonds | | | — | | | | 13,645,497 | | | | — | | | | 13,645,497 | |
| | U.S. Government Agency Issues | | | — | | | | 2,378,114 | | | | — | | | | 2,378,114 | |
| | Asset Backed Securities | | | — | | | | 6,095,608 | | | | — | | | | 6,095,608 | |
| | Mortgage Backed Securities | | | — | | | | 13,061,676 | | | | — | | | | 13,061,676 | |
| | Total Fixed Income | | | — | | | | 59,977,265 | | | | — | | | | 59,977,265 | |
| | Short-Term Investments | | | — | | | | 9,870,000 | | | | — | | | | 9,870,000 | |
| | Total Investments in Securities | | $ | — | | | $ | 69,847,265 | | | $ | — | | | $ | 69,847,265 | |
| | Other Financial instruments* | | $ | — | | | $ | 20,274 | | | $ | — | | | $ | 20,274 | |
| * | Other financial instruments are derivative instruments not reflected in the Schedule of Investments, such as futures, forwards, swaps contracts, and written options. Futures, forwards, and swap contracts are valued at the unrealized appreciation (depreciation) on the instrument while written options are valued at market value. |
Frontegra FundsNOTES TO FINANCIAL STATEMENTS (continued)
June 30, 2010
| | IronBridge Small Cap Fund | | | | | | | | | | | | |
| | | | Level 1 - Quoted | | | Level 2 - | | | | | | | |
| | | | prices in active markets | | | Significant other | | | Level 3 - Significant | | | | |
| | Description | | for identical assets | | | observable inputs | | | unobservable inputs | | | Total | |
| | Equity | | | | | | | | | | | | |
| | Common Stocks | | $ | 367,160,476 | | | $ | — | | | $ | — | | | $ | 367,160,476 | |
| | Exchange Traded Funds | | | 1,904,413 | | | | — | | | | — | | | | 1,904,413 | |
| | Total Equity | | | 369,064,889 | | | | — | | | | — | | | | 369,064,889 | |
| | Short-Term Investments | | | — | | | | 6,094,000 | | | | — | | | | 6,094,000 | |
| | Total Investments in Securities | | $ | 369,064,889 | | | $ | 6,094,000 | | | $ | — | | | $ | 375,158,889 | |
| | IronBridge SMID Fund | | | | | | | | | | | | |
| | | | Level 1 - Quoted | | | Level 2 - | | | | | | | |
| | | | prices in active markets | | | Significant other | | | Level 3 - Significant | | | | |
| | Description | | for identical assets | | | observable inputs | | | unobservable inputs | | | Total | |
| | Equity | | | | | | | | | | | | |
| | Common Stocks | | $ | 510,928,517 | | | $ | — | | | $ | — | | | $ | 510,928,517 | |
| | Total Equity | | | 510,928,517 | | | | — | | | | — | | | | 510,928,517 | |
| | Short-Term Investments | | | — | | | | 3,991,000 | | | | — | | | | 3,991,000 | |
| | Total Investments in Securities | | $ | 510,928,517 | | | $ | 3,991,000 | | | $ | — | | | $ | 514,919,517 | |
| | IronBridge Global Focus Fund | | | | | | | | | | | | |
| | | | Level 1 - Quoted | | | Level 2 - | | | | | | | |
| | | | prices in active markets | | | Significant other | | | Level 3 - Significant | | | | |
| | Description | | for identical assets | | | observable inputs | | | unobservable inputs | | | Total | |
| | Equity | | | | | | | | | | | | |
| | Common Stocks | | $ | 24,078,562 | | | $ | 16,268,374 | | | $ | — | | | $ | 40,346,936 | |
| | Total Equity | | | 24,078,562 | | | | 16,268,374 | | | | — | | | | 40,346,936 | |
| | Short-Term Investments | | | — | | | | 472,000 | | | | — | | | | 472,000 | |
| | Total Investments in Securities | | $ | 24,078,562 | | | $ | 16,740,374 | | | $ | — | | | $ | 40,818,936 | |
NOTES TO FINANCIAL STATEMENTS (continued)
June 30, 2010
| | Mastholm International Equity Fund | | | | | | | | | | | | |
| | | | Level 1 - Quoted | | | Level 2 - | | | | | | | |
| | | | prices in active markets | | | Significant other | | | Level 3 - Significant | | | | |
| | Description | | for identical assets | | | observable inputs | | | unobservable inputs | | | Total | |
| | Equity | | | | | | | | | | | | |
| | Preferred Stocks | | $ | 437,806 | | | $ | — | | | $ | — | | | $ | 437,806 | |
| | Common Stocks | | | 2,422,338 | | | | 33,885,302 | | | | — | | | | 36,307,640 | |
| | Total Equity | | | — | | | | 33,885,302 | | | | — | | | | 36,745,446 | |
| | Short-Term Investments | | | 1,296,248 | | | | — | | | | — | | | | 1,296,248 | |
| | Total Investments in Securities | | $ | 4,156,392 | | | $ | 33,885,302 | | | $ | — | | | $ | 38,041,694 | |
| | Netols Small Cap Value Fund | | | | | | | | | | | | |
| | | | Level 1 - Quoted | | | Level 2 - | | | | | | | |
| | | | prices in active markets | | | Significant other | | | Level 3 - Significant | | | | |
| | Description | | for identical assets | | | observable inputs | | | unobservable inputs | | | Total | |
| | Equity | | | | | | | | | | | | |
| | Common Stocks | | $ | 132,125,832 | | | $ | — | | | $ | — | | | $ | 132,125,832 | |
| | Total Equity | | | 132,125,832 | | | | — | | | | — | | | | 132,125,832 | |
| | Short-Term Investments | | | 2,750,925 | | | | — | | | | — | | | | 2,750,925 | |
| | Total Investments in Securities | | $ | 134,876,757 | | | $ | — | | | $ | — | | | $ | 134,876,757 | |
For the year ended June 30, 2010, there were no significant transfers between Level 1 and Level 2.
(b) Off-Balance Sheet Risk
The Frontegra Columbus Core Plus Fund is party to financial instruments with off-balance sheet risk, primarily forward contracts, in order to hedge the impact of adverse changes in the relationships between the U.S. dollar and various foreign currencies. These instruments involve market risk in excess of the amount recognized in the Statement of Assets and Liabilities. Risks also arise from the possible inability of counterparties to meet the terms of their contracts, future adverse movement in currency values and contract positions that are not exact offsets. The contract amount indicates the extent of the Fund’s involvement in such currencies.
A forward contract is an agreement between two parties to exchange different currencies at a specified rate at an agreed upon future date. Forward contracts are reported in the financial statements as unrealized gain (loss) as measured by the difference between the forward exchange rate at the reporting date and the forward exchange rate on the date that a Fund entered into the contract. At June 30, 2010, the Frontegra Columbus Core Plus Fund had entered into strategic forward currency contracts that obligated the Fund to deliver and receive specified amounts of currencies at a specified future date. The terms of the open contracts are as follows:
| | Columbus Core Plus Fund | | | | | | | | | | | | | | |
| | | | | | | | | | | | | | | | Asset | | | Liability | |
| | | | | | | | | | | | | | | | Derivatives | | | Derivatives | |
| | | Settlement | | | | | | U.S. $ Value at | | Currency to | | U.S. $ Value at | | | Unrealized | | | Unrealized | |
| | Counterparty | Date | | Currency to be Delivered | | June 30, 2010 | | be Received | | June 30, 2010 | | | Appreciation | | | Depreciation | |
| | Goldman Sachs | 11/29/10 | | | 5,242,522 | | Australian Dollar | | $ | 4,536,338 | | U.S. Dollar | | $ | 4,333,263 | | | $ | 203,075 | | | $ | — | |
| | Goldman Sachs | 11/29/10 | | | 5,242,522 | | Australian Dollar | | | 4,192,445 | | U.S. Dollar | | | 4,333,263 | | | | 140,818 | | | | — | |
| | | | | | | | | | $ | 8,728,783 | | | | $ | 8,666,526 | | | $ | 343,893 | | | $ | — | |
NOTES TO FINANCIAL STATEMENTS (continued)
June 30, 2010
The Frontegra Columbus Core Plus Fund had net unrealized depreciation on forward currency contracts of $343,893 as of June 30, 2010.
The Frontegra Columbus Core Fund, Frontegra IronBridge Small Cap Fund, Frontegra IronBridge SMID Fund, Frontegra IronBridge Global Focus Fund, Frontegra Mastholm International Equity Fund and Frontegra Netols Small Cap Value Fund held no forward contracts at June 30, 2010.
(c) Federal Income Taxes
Each Fund intends to comply with the requirements of Subchapter M of the Internal Revenue Code necessary to qualify as a regulated investment company and to make the requisite distributions of income and capital gains to its shareholders sufficient to relieve it from all or substantially all federal income taxes. Therefore, no federal income tax provision has been provided.
The Funds have adopted financial reporting rules regarding recognition and measurement of tax positions taken or expected to be taken on a tax return. The Funds have reviewed all open tax years and concluded that there is no effect to any of the Fund’s financial positions or results of operations and no tax liability resulting from unrecognized tax benefits relating to uncertain income tax position taken or expected to be taken on a tax return. Open tax years are those years that are open for examination by the relevant income taxing authority. As of June 30, 2010, open Federal and state income tax years include the tax years ended June 30, 2007, June 30, 2008 and June 30, 2009. The Funds have no examinations in progress. The Funds are also not aware of any tax positi ons for which it is reasonably possible that the total amounts of unrecognized tax expense will significantly change in twelve months.
(d) Distributions to Shareholders
Dividends from net investment income are usually declared and paid quarterly for the Frontegra Columbus Core Plus and Frontegra Columbus Core Funds and at least annually for the Frontegra IronBridge Small Cap Fund, Frontegra IronBridge SMID Fund, Frontegra IronBridge Global Focus Fund, Frontegra Mastholm International Equity Fund and the Frontegra Netols Small Cap Value Fund. Distributions of net realized gains, if any, are declared and paid at least annually for all Funds.
All short-term capital gains are included in ordinary income for tax purposes. Distributions to shareholders are recorded on the ex-dividend date.
The tax character of distributions paid during the years ended June 30, 2010 and June 30, 2009 were as follows:
| | | | Year Ended June 30, 2010 | | | Year Ended June 30, 2009 | |
| | | | Ordinary | | | Long-Term | | | Return | | | Total | | | Ordinary | | | Long-Term | | | Total | |
| | | | Income | | | Capital Gains | | | of Capital | | | Distributions | | | Income | | | Capital Gains | | | Distributions | |
| | Columbus Core Plus | | $ | 40,410,331 | | | $ | — | | | $ | — | | | $ | 40,410,331 | | | $ | 42,290,396 | | | $ | 448,994 | | | $ | 42,739,390 | |
| | Columbus Core | | | 2,269,754 | | | | — | | | | — | | | | 2,269,754 | | | | 5,468,450 | | | | — | | | | 5,468,450 | |
| | IronBridge Small Cap | | | 1,187,053 | | | | — | | | | — | | | | 1,187,053 | | | | 1,863,120 | | | | 14,358,247 | | | | 16,221,367 | |
| | IronBridge SMID | | | 1,315,023 | | | | — | | | | — | | | | 1,315,023 | | | | 1,319,242 | | | | 1,306,867 | | | | 2,626,109 | |
| | IronBridge Global Focus | | | 45,378 | | | | — | | | | — | | | | 45,378 | | | | — | | | | — | | | | — | |
| | Mastholm International Equity | | | 5,738,700 | | | | — | | | | — | | | | 5,738,700 | | | | 10,274,811 | | | | 11,287,342 | | | | 21,562,153 | |
| | Netols Small Cap Value | | | 105,774 | | | | — | | | | 34,387 | | | | 140,161 | | | | 12,995 | | | | — | | | | 12,995 | |
NOTES TO FINANCIAL STATEMENTS (continued)
June 30, 2010
At June 30, 2010 the components of accumulated earnings/losses on a tax basis were as follows:
| | | | Columbus | | | Columbus | | | IronBridge | | | IronBridge | | | IronBridge | | | Mastholm | | | Netols Small | |
| | | | Core Plus | | | Core | | | Small Cap | | | SMID | | | Global Focus | | | International | | | Cap Value | |
| | Cost of investments | | $ | 432,078,515 | | | $ | 68,402,748 | | | $ | 358,340,147 | | | $ | 495,439,166 | | | $ | 43,338,797 | | | $ | 39,332,123 | | | $ | 135,931,321 | |
| | Gross unrealized | | | | | | | | | | | | | | | | | | | | | | | | | | | | |
| | appreciation | | $ | 12,712,356 | | | $ | 1,577,337 | | | $ | 55,402,700 | | | $ | 63,263,651 | | | $ | 2,358,266 | | | $ | 2,326,521 | | | $ | 13,569,425 | |
| | Gross unrealized | | | | | | | | | | | | | | | | | | | | | | | | | | | | |
| | depreciation | | | (6,568,832 | ) | | | (132,820 | ) | | | (38,583,958 | ) | | | (43,783,300 | ) | | | (4,878,127 | ) | | | (3,616,950 | ) | | | (14,623,989 | ) |
| | Net unrealized | | | | | | | | | | | | | | | | | | | | | | | | | | | | |
| | appreciation/depreciation | | | 6,143,524 | | | | 1,444,517 | | | | 16,818,742 | | | | 19,480,351 | | | | (2,519,861 | ) | | | (1,290,429 | ) | | | (1,054,564 | ) |
| | Undistributed | | | | | | | | | | | | | | | | | | | | | | | | | | | | |
| | ordinary income | | | 13,588,602 | | | | 137,606 | | | | 515,859 | | | | 1,449,567 | | | | 351,753 | | | | 628,090 | | | | — | |
| | Total distributable earnings | | | 13,588,602 | | | | 137,606 | | | | 515,859 | | | | 1,449,567 | | | | 351,753 | | | | 628,090 | | | | — | |
| | Other accumulated losses | | | (5,621,718 | ) | | | (4,794,975 | ) | | | (31,824,732 | ) | | | (43,080,893 | ) | | | (850,053 | ) | | | (106,489,230 | ) | | | (4,890,134 | ) |
| | Total accumulated | | | | | | | | | | | | | | | | | | | | | | | | | | | | |
| | earnings/(losses) | | $ | 14,110,408 | | | $ | (3,212,852 | ) | | $ | (14,490,131 | ) | | $ | (22,150,975 | ) | | $ | (3,018,161 | ) | | $ | (107,151,569 | ) | | $ | (5,944,698 | ) |
The difference between book-basis and tax-basis unrealized appreciation is attributable primarily to the tax deferral of losses on wash sales and swaps.
The Funds intend to utilize provisions of the federal income tax laws, which allow them to carry a realized capital loss forward for eight years following the year of loss and offset such losses against any future realized capital gains. At June 30, 2010, the Funds had the following capital loss carryforward available:
| | | | Expiring | | | | |
| | | | 6/30/15 | | | 6/30/16 | | | 6/30/17 | | | 6/30/18 | | | Total | |
| | Columbus Core | | $ | 452,904 | | | $ | — | | | $ | — | | | $ | 4,294,089 | | | $ | 4,746,993 | |
| | IronBridge Small Cap | | | — | | | | — | | | | 9,341,207 | | | | 22,483,525 | | | | 31,824,732 | |
| | IronBridge SMID | | | — | | | | — | | | | 7,523,419 | | | | 32,363,479 | | | | 39,886,898 | |
| | IronBridge Global Focus | | | — | | | | — | | | | — | | | | 477,401 | | | | 477,401 | |
| | Mastholm International | | | — | | | | — | | | | 18,645,962 | | | | 85,177,200 | | | | 103,823,162 | |
| | Netols Small Cap Value | | | — | | | | 119,331 | | | | 351,558 | | | | 4,419,245 | | | | 4,890,134 | |
In order to meet certain excise tax requirements, the Funds are required to measure and distribute annually, net capital gains realized during the twelve month period ending October 31st. In connection with this requirement, the Funds are permitted, for tax purposes, to defer into their next fiscal year any net capital losses incurred from November 1st through the end of the fiscal year. As of June 30, 2010, the following funds deferred, on a tax basis, post October losses of:
| | | | Post-October | | | Post October | |
| | | | Capital Loss Deferred | | | Currency Loss Deferred | |
| | Columbus Core Plus | | $ | 4,236,454 | | | $ | 169,779 | |
| | IronBridge SMID | | | 3,182,601 | | | | — | |
| | IronBridge Global Focus | | | 364,327 | | | | 7,255 | |
| | Mastholm International | | | 2,703,919 | | | | — | |
NOTES TO FINANCIAL STATEMENTS (continued)
June 30, 2010
(e) When-Issued Securities
The Frontegra Columbus Core Plus and Columbus Core Funds may purchase securities on a when-issued basis. The price of securities purchased on a when-issued basis is fixed at the time the commitment to purchase is made, but delivery and payment for the securities take place at a later date, normally within 45 days of the purchase. At the time of purchase, the Funds will record the transaction and reflect the value of the security and related liability in determining their net asset value. During the period between the purchase and settlement, no payment is made by the Funds to the issuer and no interest is accrued. The Funds maintain segregated cash, U.S. government securities and liquid securities equal in value to commitments for when-issued securities.
(f) Mortgage Dollar Rolls
The Frontegra Columbus Core Plus and Columbus Core Funds may enter into mortgage dollar rolls, in which a Fund would sell mortgage backed securities for delivery in the current month and simultaneously contract to purchase similar securities on a specified future date. While a Fund would forego principal and interest paid on the mortgage-backed securities during the roll period, it would be compensated by the difference between the current sale price and the lower price for the future purchase as well as by any interest earned on the proceeds of the initial sale. A Fund also could be compensated through the receipt of fee income equivalent to a lower forward price. For financial reporting and tax purposes, the Funds treat mortgage dollar rolls as two separate transactions; one involving the purchase of a security and a separate transaction involving the sale.
(g) Futures Contracts
Each Fund may enter into futures contracts, including index and interest rate futures contracts. Upon entering into a contract, the Fund deposits and maintains as collateral such initial margin as required by the exchange on which the transaction is effected. Pursuant to the contract, the Fund agrees to receive from or pay to the broker an amount of cash equal to the daily fluctuation in value of the contract. Such receipts or payments are known as variation margin and are recorded by the Fund as unrealized gains and losses. When the contract is closed, the Fund records a realized gain or loss equal to the difference between the value of the contract at the time it was opened and the value at the time it was closed. As collateral for futures contracts, the Fund is required under the 1 940 Act to maintain assets consisting of cash, cash equivalents or other liquid securities. This collateral is required to be adjusted daily to reflect the market value of the purchase obligation for long futures contracts or the market value of the instrument underlying the contract, but not less than the market price at which the futures contract was established, for short futures contracts.
The risks inherent in the use of futures contracts include 1) adverse changes in the value of such instruments; and 2) the possible absence of a liquid secondary market for any particular instrument at any time. There were no futures contracts open at June 30, 2010.
(h) Credit Default Swaps
The Columbus Core Plus and Columbus Core Funds may enter into credit default swap agreements. The credit default swap agreement may have as a reference obligation one or more securities that are or are not currently held by a Fund. The buyer in a credit default swap agreement is obligated to pay the seller a periodic fee, typically expressed in basis points on the principal amount of the underlying obligation (the “notional” amount), over the term of the agreement in return for a contingent payment upon the occurrence of a credit event with respect to the underlying reference obligation. A credit event is typically a default.
A Fund may be either the buyer or seller of protection in the transaction. As a seller, a Fund accrues for and receives a fixed rate of income throughout the term of the agreement, which typically is between one month and five years, provided that no credit event occurs. If a credit event occurs, the maximum payout amount for a sale contract is limited to the notional amount of the swap contract (“Maximum Payout Amount”). At June 30, 2010, the Frontegra Columbus Core Plus and Columbus Core Funds had sale contracts out-
Frontegra Funds
NOTES TO FINANCIAL STATEMENTS (continued)
June 30, 2010
standing with Maximum Payout Amounts aggregating $22,140,000 and $2,580,000, respectively, with net unrealized appreciation of $207,958 and $20,274, respectively. If a Fund is a buyer and no credit event occurs, the Fund may lose its investment and recover nothing. However, if a credit event occurs, the buyer typically receives full notional value for a reference obligation that may have little or no value.
Credit default swaps may involve greater risks than if a Fund had invested in the reference obligation directly. Credit default swaps are subject to general market risk, liquidity risk, counterparty credit risk and credit risk of the issuer. As noted above, if a Fund is a buyer in a credit default swap agreement and no credit event occurs, it will lose its investment. In addition, the value of the reference obligation received by a Fund as a seller if a credit event occurs, coupled with the periodic payments previously received, may be less than the full notional value it pays to the buyer, resulting in a loss of value to the Fund.
(i) Foreign Currency Translation
Values of investments denominated in foreign currencies are converted into U.S. dollars using a spot market rate of exchange each day. Purchases and sales of investments and dividend and interest income are translated to U.S. dollars using a spot market rate of exchange prevailing on the dates of such transactions. The portion of security gains or losses resulting from changes in foreign exchange rates are included with net realized and unrealized gain or loss from investments, as appropriate, for both financial reporting and tax purposes.
Each Fund, respectively, bears the risk of changes in the foreign currency exchange rates and their impact on the value of assets and liabilities denominated in foreign currency. Each Fund also bears the risk of a counterparty failing to fulfill its obligation under a foreign currency contract.
(j) Indemnifications
Under the Funds’ organizational documents, their officers and directors are indemnified against certain liabilities arising out of the performance of their duties to the Funds. In addition, in the normal course of business, the Funds enter into contracts that provide general indemnifications to other parties. The Funds’ maximum exposure under these arrangements is unknown as this would involve future claims that may be made against the Funds that have not yet occurred. However, the Funds have not had prior claims or losses pursuant to these contracts and expect the risk of loss to be remote.
(k) Subsequent Events
In preparing the financial statements as of June 30, 2010, management considered the impact of subsequent events through the date of issuance for potential recognition or disclosure in these financial statements.
The IronBridge Small Cap Fund, IronBridge SMID Fund and IronBridge Global Focus Fund (collectively, the “Frontegra IronBridge Funds”) were reorganized into corresponding series of IronBridge Funds, Inc., a newly formed open-end management investment company organized as a Maryland corporation, effective July 23, 2010. As a result, the Frontegra IronBridge Funds are no longer series of the Company.
(l) Other
Investment transactions are accounted for on the trade date. The Funds determine the gain or loss realized from investment transactions by comparing the original cost of the specifically identified security lot sold with the net sale proceeds. Dividend income, less foreign taxes withheld, is recognized on the ex-dividend date, except that certain dividends from foreign securities are recorded as soon as the information becomes available to the Funds. Interest income is recognized on an accrual basis. All discounts/premiums are accreted/amortized using the effective interest method and are included in interest income.
Frontegra Funds
NOTES TO FINANCIAL STATEMENTS (continued)
June 30, 2010
Income, expenses (other than expenses attributable to a specific class), and realized and unrealized gains or losses on investments attributable to the Funds are generally allocated to each respective class in proportion to the relative net assets of each class.
The preparation of financial statements in conformity with U.S. generally accepted accounting principles requires management to make estimates and assumptions that affect the reported amounts of assets and liabilities and disclosure of contingent assets and liabilities at the date of the financial statements, and the reported amounts of increases and decreases in net assets from operations during the reporting period. Actual results could differ from those estimates.
Net investment income and realized gains and losses for federal income tax purposes may differ from that reported on the financial statements because of permanent book-to-tax differences. GAAP requires that permanent differences in net investment income and realized gains and losses due to differences between financial reporting and tax reporting be reclassified between various components of net assets. These reclassifications have no effect on net assets or net asset value per share. For the year ended June 30, 2010, the following table shows the reclassifications made:
| | | | Columbus | | | Columbus | | | IronBridge | | | IronBridge | | | IronBridge | | | Mastholm | | | Netols Small | |
| | | | Core Plus | | | Core | | | Small Cap | | | SMID | | | Global Focus | | | International | | | Cap Value | |
| | Paid in capital | | $ | — | | | $ | — | | | $ | 7,510 | | | $ | — | | | $ | (887,532 | ) | | $ | 8,464 | | | $ | — | |
| | Accumulated net | | | | | | | | | | | | | | | | | | | | | | | | | | | | |
| | investment income (loss) | | | 1,657,905 | | | | 66,146 | | | | (175,810 | ) | | | 7,625 | | | | (12,404 | ) | | | (51,301 | ) | | | (23,206 | ) |
| | Accumulated net | | | | | | | | | | | | | | | | | | | | | | | | | | | | |
| | realized gain (loss) | | | (1,657,905 | ) | | | (66,146 | ) | | | 168,300 | | | | (7,625 | ) | | | 899,936 | | | | 42,837 | | | | 23,206 | |
The permanent differences primarily relate to foreign currency, paydown, swap and Real Estate Investment Trust (REIT) adjustments with differing book and tax methods.
(3) Investment Advisers and Related Parties
The Frontegra Columbus Core Plus, Columbus Core, Mastholm International Equity and Netols Small Cap Value Funds have entered into an agreement with Frontegra, with whom certain officers and a director of the Funds are affiliated, to furnish investment advisory services to the Funds. IronBridge provides investment advisory services to the IronBridge Small Cap, IronBridge SMID and IronBridge Global Focus Funds. Fees are calculated daily and payable monthly, at annual rates set forth in the following table (expressed as a percentage of each Fund’s average daily net assets). Pursuant to expense cap agreements, Frontegra and IronBridge have agreed to waive their respective management fees and/or reimburse each Fund’s operating expenses (exclusive of brokerage, interest, taxes and extraordinary e xpenses) to ensure that each Fund’s operating expenses do not exceed the expense limitation listed below. Expenses waived are netted with advisory fees on the Statement of Assets and Liabilities. On a monthly basis, these accounts are settled by each Fund making payment to the respective adviser or the respective adviser reimbursing the Fund if the reimbursement amount exceeds the advisory fee. If the amount of fees waived exceeds the advisory fee earned, this is shown on the Statement of Assets and Liabilities as a receivable from the respective adviser. The expense cap agreements will continue in effect until October 31, 2010 with successive renewal terms of one year unless terminated by an adviser or a Fund prior to any such renewal.
Frontegra Funds
NOTES TO FINANCIAL STATEMENTS (continued)
June 30, 2010
| | Frontegra Fund | Annual Advisory Fees | Expense Limitation |
| | Columbus Core Plus - Institutional Class | 0.40% | 0.35% |
| | Columbus Core Plus - Class Y | 0.40% | 0.75% |
| | Columbus Core | 0.42% | 0.35% |
| | IronBridge Small Cap | 1.00% | 1.10% |
| | IronBridge SMID | 0.85% | 0.95% |
| | IronBridge Global Focus | 0.85% | 1.00% |
| | Mastholm International Equity | 0.95% | 0.75% |
| | Netols Small Cap Value - Institutional Class | 1.00% | 1.10% |
| | Netols Small Cap Value - Class Y | 1.00% | 1.50% |
Any waivers or reimbursements are subject to later adjustment to allow the advisers to recoup amounts waived or reimbursed to the extent actual fees and expenses for a fiscal period are less than each Fund’s expense limitation cap, provided, however, that an adviser shall only be entitled to recoup such amounts for a period of three years from the date such amount was waived or reimbursed. Expenses attributable to a specific class may only be recouped with respect to that class.
The following table shows the waived or reimbursed expenses subject to potential recovery expiring in:
| | | | | | | | | | | | | Mastholm | | | Netols | |
| | | | Columbus | | | Columbus | | | IronBridge | | | International | | | Small Cap | |
| | | | Core Plus | | | Core | | | Global Focus | | | Equity | | | Value | |
| | 2011 | | $ | 802,439 | | | $ | 341,113 | | | $ | — | | | $ | 2,007,759 | | | $ | 110,227 | |
| | 2012 | | | 542,331 | | | | 276,351 | | | | — | | | | 1,057,926 | | | | 111,209 | |
| | 2013 | | | 562,186 | | | | 226,221 | | | | 126,432 | | | | 811,681 | | | | 75,253 | |
| | | | $ | 1,906,956 | | | $ | 843,685 | | | $ | 126,432 | | | $ | 3,877,366 | | | $ | 296,689 | |
There are currently no available expenses subject to recapture with respect to the IronBridge Small Cap Fund. During the year ended June 30, 2010, Frontegra recovered $64,646 of previously waived expenses from the IronBridge SMID Fund.
The Frontegra IronBridge Global Focus Fund has entered into an agreement with Frontegra under which Frontegra will provide sub-administration services, including general management of the Fund, Board reporting and oversight, the provision of certain officers of the Funds including the Fund’s President, Treasurer and Chief Compliance Officer, oversight of the Fund’s contracts, supervision of the Fund’s service providers, and oversight of other regulatory matters for the Fund. For its services, Frontegra, with whom certain officers and a director of the Fund are affiliated, receives an annual fee of 0.05% on the first $200 million of net assets, 0.04% on the next $200 million of assets, and 0.03% on any assets in excess of $400 million. This fee is calculated daily and payable monthly based on the Fund’s average net assets.
(4) Investment Transactions
The aggregate purchases and sales of securities, excluding short-term investments for the Funds for the year ended June 30, 2010 are summarized below:
| | | | | | | | Mastholm | Netols |
| | | Columbus | Columbus | IronBridge | IronBridge | IronBridge | International | Small Cap |
| | | Core Plus | Core | Small Cap | SMID | Global Focus | Equity | Value |
| | Purchases | $3,926,649,038 | $611,324,265 | $185,497,962 | $363,909,766 | $61,351,221 | $338,322,081 | $133,496,121 |
| | Sales | $3,995,361,303 | $612,193,830 | $157,714,514 | $187,754,142 | $16,791,873 | $521,164,682 | $ 38,027,856 |
NOTES TO FINANCIAL STATEMENTS (continued)
June 30, 2010
Purchases and sales of long-term U.S. Government securities for the Frontegra Columbus Core Plus Fund were $3,009,054,850 and $2,956,068,955, respectively. Purchases and sales of long-term U.S. Government securities for the Frontegra Columbus Core Fund were $459,991,011 and $449,349,035, respectively.
There were no purchases or sales of long-term U.S. Government securities for the Frontegra IronBridge Small Cap Fund, the Frontegra IronBridge SMID Fund, the Frontegra IronBridge Global Focus Fund, the Frontegra Mastholm International Equity Fund or the Frontegra Netols Small Cap Value Fund.
(5) Directors Fees
The Independent Directors of the Funds were paid $58,000 in director fees during the year ended June 30, 2010. The Interested Director did not receive any remuneration from the Funds.
(6) Formation of the IronBridge Global Focus Fund
On September 18, 2009, all of the assets and liabilities of the IronBridge Global Focus Fund, L.P. (the “Partnership”) were transferred to the Frontegra IronBridge Global Focus Fund, a newly formed series of the Company. The market value of assets on the day of transfer of $29,100,861 for the Global Focus Fund became the cost basis for financial reporting purposes of the Fund. The Global Focus Fund retains the basis and holding periods of the assets transferred from the Partnership for tax purposes. On the date of the transfer, the tax basis of securities held for the Global Focus Fund was $887,532 lower than their basis for financial reporting purposes. On June 30, 2010, the tax basis of the remaining securities held by the Global Focus Fund was $1,501,936 lower than the basis f or financial reporting purposes.
(7) Line of Credit
The Frontegra Mastholm International Equity Fund has a $20 million unsecured line of credit with U.S. Bank, N.A., intended to provide short-term financing, if necessary, subject to certain restrictions, in connection with shareholder redemptions. Borrowings under this arrangement bear interest at the bank’s prime rate. At June 30, 2010, the Fund had no balance outstanding. Based upon balances outstanding during the year, the weighted average interest rate was 3.25% and the weighted average amount outstanding was $371,507.
(8) Distribution Plan and Shareholder Servicing Fee
Frontegra, on behalf of the Frontegra Columbus Core Plus Fund and the Frontegra Netols Small Cap Value Fund (collectively, the “Funds”), has adopted a distribution plan pursuant to Rule 12b-1 under the Investment Company Act of 1940 for each Fund’s Class Y shares (the “12b-1 Plan”). Pursuant to the 12b-1 Plan, each Fund pays an annual fee of up to 0.25% to Frontegra Strategies, LLC (the “Distributor”) for payments to brokers, dealers and other financial intermediaries who perform activities or incur expenses intended to result in the sale of Class Y shares of the Funds. For the year ended June 30, 2010, the Columbus Core Plus and Netols Small Cap Value Funds incurred $4,016 and $19,316, respectively, under the 12b-1 Plan.
Class Y shares of the Funds also pay an annual shareholder servicing fee of up to 0.15% per year to the Distributor for payments to brokers, dealers, and other financial intermediaries who provide on-going account services to shareholders. Those services include establishing and maintaining shareholder accounts, mailing prospectuses, account statements and other Fund documents to shareholders, processing shareholder transactions, and providing other recordkeeping and administrative services. For the year ended June 30, 2010, the Columbus Core Plus and Netols Small Cap Value Funds incurred $2,410 and $11,589, respectively, in shareholder servicing expenses.
Frontegra Funds
NOTES TO FINANCIAL STATEMENTS (continued)
June 30, 2010
(9) Other Derivative Information
At June 30, 2010, the Funds have invested in derivative contracts which are reflected on the Statement of Assets and Liabilities as follows:
| | Columbus Core Plus Fund | | | |
| | | Asset Derivatives | | Liability Derivatives | |
| | | Statement of Assets | | Fair Value | | Statement of Assets | | Fair Value | |
| | | and Liabilities Location | | Amount | | and Liabilities Location | | Amount | |
| | Foreign exchange contracts | Unrealized appreciation on | | | | Unrealized depreciation on | | | |
| | | forward exchange contracts | | $ | 343,893 | | forward exchange contracts | | $ | — | |
| | Credit default swap contracts | Unrealized appreciation on | | | | | Unrealized depreciation on | | | | |
| | | credit default contracts | | | 207,958 | | credit default contracts | | | — | |
| | Total | | | $ | 551,851 | | Total | | $ | — | |
| | Columbus Core Fund | | | | | | | |
| | | Asset Derivatives | | Liability Derivatives | |
| | | Statement of Assets | | Fair Value | | Statement of Assets | | Fair Value | |
| | | and Liabilities Location | | Amount | | and Liabilities Location | | Amount | |
| | Credit default swap contracts | Unrealized appreciation on | | | | Unrealized depreciation on | | | |
| | | credit default contracts | | $ | 20,274 | | credit default contracts | | $ | — | |
| | Total | | | $ | 20,274 | | Total | | $ | — | |
The Columbus Core Plus Fund held foreign exchange contracts during the current fiscal year with an average notional value of $13,579,001 for the year ended June 30, 2010. The Columbus Core Plus Fund and Columbus Core Fund were parties to credit default swap contracts during the current fiscal year and had average notional values of $5,535,000 and $645,000, respectively for the year ended June 30, 2010. With respect to the IronBridge Small Cap Fund, IronBridge SMID Fund, IronBridge Global Focus Fund, Mastholm International Equity Fund, and Netols Small Cap Value Fund, there were no derivative contracts that impacted the Statement of Assets and Liabilities as of June 30, 2010.
For the year ended June 30, 2010, the effect of derivative contracts on the Funds’ Statement of Operations was as follows:
| | Columbus Core Plus Fund | | | | | | | | |
| | | | | | | | | | | | Change in Net Unrealized | |
| | Net Realized Gain on Investments | | Appreciation (Depreciation) on Investments | |
| | | | Options | | | Contracts | | | Total | | | | Options | | | Contracts | | | Total | |
| | Credit Default Swaps | | $ | — | | | $ | 2,960,659 | | | $ | 2,960,659 | | Credit Default Swaps | | $ | — | | | $ | (214,140 | ) | | $ | (214,140 | ) |
| | Equity/Foreign | | | | | | | | | | | | | Equity/Foreign | | | | | | | | | | | | |
| | ��exchange contracts | | | | | | | (513,824 | ) | | | (513,824 | ) | exchange contracts | | | | | | | 343,893 | | | | 343,893 | |
| | Total | | $ | — | | | $ | 2,446,835 | | | $ | 2,446,835 | | Total | | $ | — | | | $ | 129,753 | | | $ | 129,753 | |
NOTES TO FINANCIAL STATEMENTS (continued)
June 30, 2010
| | Columbus Core Fund | | | | | | | | | | | | | | | | | |
| | | | | | | | | | | | Change in Net Unrealized | |
| | Net Realized Gain on Investments | | Appreciation (Depreciation) on Investments | |
| | | | Options | | | Contracts | | | Total | | | | Options | | | Contracts | | | Total | |
| | Credit Default Swaps | | $ | — | | | $ | 127,420 | | | $ | 127,420 | | Credit Default Swaps | | $ | — | | | $ | 20,274 | | | $ | 20,274 | |
| | Total | | $ | — | | | $ | 127,420 | | | $ | 127,420 | | Total | | $ | — | | | $ | 20,274 | | | $ | 20,274 | |
Credit default swaps are subject to credit risk. Foreign exchange contracts are subject to foreign exchange risk and counterparty risk. With respect to the Frontegra IronBridge Small Cap Fund, Frontegra IronBridge SMID Fund, Frontegra IronBridge Global Focus Fund, Frontegra Mastholm International Equity Fund and Frontegra Netols Small Cap Value Fund, there were no derivative contracts that impacted the Statement of Operations during the year ended June 30, 2010.
REPORT OF INDEPENDENT REGISTERED
PUBLIC ACCOUNTING FIRM
June 30, 2010
To the Shareholders and Board of Directors of Frontegra Funds, Inc.:
We have audited the accompanying statements of assets and liabilities, including the schedules of investments, of Frontegra Funds, Inc., (comprising, respectively, Frontegra Columbus Core Plus Fund, Frontegra Columbus Core Fund, Frontegra IronBridge Small Cap Fund, Frontegra IronBridge SMID Fund, Frontegra IronBridge Global Focus Fund, Frontegra Mastholm International Equity Fund (formerly Frontegra New Star International Equity Fund), and Frontegra Netols Small Cap Value Fund, collectively referred to as the “Funds”) as of June 30, 2010, and the related statements of operations, the statements of changes in net assets, and the financial highlights for each of the periods indicated therein. These financial statements and financial highlights are the responsibility of the Funds’ management. Our responsibility is to exp ress an opinion on these financial statements and financial highlights based on our audits.
We conducted our audits in accordance with the standards of the Public Company Accounting Oversight Board (United States). Those standards require that we plan and perform the audit to obtain reasonable assurance about whether the financial statements and financial highlights are free of material misstatement. We were not engaged to perform an audit of the Funds’ internal control over financial reporting. Our audits included consideration of internal control over financial reporting as a basis for designing audit procedures that are appropriate in the circumstances, but not for the purpose of expressing an opinion on the effectiveness of the Funds’ internal control over financial reporting. Accordingly, we express no such opinion. An audit also includes examining, on a test basis, evidence s upporting the amounts and disclosures in the financial statements and financial highlights, assessing the accounting principles used and significant estimates made by management, and evaluating the overall financial statement presentation. Our procedures included confirmation of securities owned as of June 30, 2010, by correspondence with the custodian and brokers or by other appropriate auditing procedures where replies from brokers were not received. We believe that our audits provide a reasonable basis for our opinion.
In our opinion, the financial statements and financial highlights referred to above present fairly, in all material respects, the financial position of each of the respective Funds constituting Frontegra Funds, Inc., at June 30, 2010, the results of their operations, the changes in their net assets, and the financial highlights for each of the periods indicated therein, in conformity with U.S. generally accepted accounting principles.
Chicago, Illinois
August 30, 2010
BOARD OF DIRECTORS’ APPROVAL OF ADVISORY AND SUBADVISORY AGREEMENTS
Board Approval of Interim and New Advisory Agreements for Frontegra IronBridge Small Cap Fund and Frontegra IronBridge SMID Fund
The Board of Directors (the “Board”) of Frontegra Funds, Inc. (the “Company”), including a majority of the directors who are not “interested persons” of the Company or IronBridge Capital Management, L.P. (“IronBridge”), held a special meeting on February 24, 2010 to consider the restructuring of the advisory agreements for the Frontegra IronBridge Small Cap Fund (the “IronBridge Small Cap Fund”) and Frontegra IronBridge SMID Fund (the “IronBridge SMID Fund”) (collectively, the “IronBridge Funds”). Frontegra Asset Management, Inc. (“FAM”), the investment adviser to the IronBridge Funds, had notified the Board that it wished to resign as the investment adviser to the Funds and that IronBridge, the current subadviser to the IronBridg e Funds, wished to resign as subadviser to the Funds and become the successor principal investment adviser to the Funds, as mutually agreed to by FAM and IronBridge.
In order to avoid disruption of the IronBridge Funds’ investment management program, the Board unanimously approved an interim investment advisory agreement between the Company, on behalf of the IronBridge Funds, and IronBridge (the “Interim Agreement”) in accordance with Rule 15a-4 under the Investment Company Act of 1940, as amended (the “1940 Act”). Additionally, the Board unanimously approved a new investment advisory agreement between the Company, on behalf of the IronBridge Funds, and IronBridge (the “New Agreement”), subject to approval by shareholders of the IronBridge Funds. Under the New Agreement, IronBridge would continue to provide investment advisory services to the IronBridge Funds, pending shareholder approval of the New Agreement. The Board cons idered substantially the same factors in approving the Interim Agreement as were considered in approving the New Agreement.
When the Board reviewed the New Agreement on February 24, 2010, the Board was provided materials relevant to its consideration of the New Agreement, such as IronBridge’s Form ADV and Code of Ethics, information regarding IronBridge’s compliance program, personnel and financial condition and a memorandum prepared by the Company’s legal counsel. The Board also reviewed a statement from IronBridge regarding the proposed restructuring of the IronBridge Funds’ advisory arrangements. The Board discussed the proposal with an officer of IronBridge, who attended the meeting and presented additional information to the directors. The Board reviewed the advisory fees that would be payable by each IronBridge Fund to IronBridge under the New Agreement, the proposed expense cap agreement betwee n the Company and IronBridge on behalf of each IronBridge Fund and comparative fee and expense information provided by an independent third party. The Board was also provided with IronBridge’s responses to detailed requests submitted by the Company’s legal counsel. The Board also evaluated the New Agreement in light of the conclusions it reached and information considered in connection with the approval of the previous subadvisory agreement between FAM and IronBridge with respect to the IronBridge Funds on August 18, 2009.
In the course of its review, the Board considered its legal responsibilities in approving the New Agreement. The Board also considered all factors it deemed to be relevant to the IronBridge Funds, including but not limited to the following: (1) the quality of services provided to the Funds since IronBridge first became the subadviser to the IronBridge Small Cap Fund in 2002 and to the IronBridge SMID Fund in 2004; (2) the performance of each Fund since IronBridge first became the subadviser to the Funds; (3) the fact that IronBridge, as subadviser to the Funds, has been responsible for the stock selection of the Funds’ portfolios and their day-to-day investment management since their inceptions; (4) the fact that the same portfolio managers would continue to manage the Funds under the New Agreement and thus the Funds would benefit from continuity of portfolio management; (5) the fee structure under the New Agreement would be identical to the fee structure under the Prior Agreement; (6) the investment advisory services under the New Agreement and the Prior Agreement are identical; (7) the terms of the transaction agreement (pursuant to which FAM and certain employees of FAM’s affiliate, Frontier Partners, Inc., will be admitted as limited partners of IronBridge pending approval by shareholders of the IronBridge Funds of the reorganization of the IronBridge Funds into corresponding series of IronBridge Funds, Inc.) (the “Transaction Agreement”), including IronBridge’s agreement to use its reasonable best efforts to comply with Section 15(f) of the 1940 Act; and (8) other factors deemed relevant.
The Board considered whether the New Agreement would be in the best interests of each of the IronBridge Funds and their shareholders and the overall fairness of the New Agreement. Among other things, the Board reviewed information concerning: (1) the nature, extent and quality of the services provided by IronBridge; (2) each Fund’s investment performance; (3) the financial condition of IronBridge; (4) the extent to which economies of scale have been or will be realized as each Fund grows; and (5) the extent to which fee levels reflect the economies of scale, if any, for the benefit of each Fund’s shareholders. In their deliberations, the Board did not identify any single factor as determinative.
IronBridge Small Cap Fund
Investment Performance of the IronBridge Small Cap Fund. The Board reviewed the performance record of the IronBridge Small Cap Fund. It noted that the IronBridge Small Cap Fund had slightly underperformed its benchmark for the one-year period and outperformed its benchmark index for the three-, five-year and since-inception periods ended June 30, 2009. The Board also reviewed performance information for the year ended December 31, 2009, noting that the IronBridge Small Cap Fund slightly underperformed its benchmark. The Board also considered IronBridge’s quarterly portfolio commentary and review of the IronBridge Small Cap Fund’s performance. The Board compared the IronBridge Small Cap Fund’s performance for the period ended June 30, 2009 to the performance for the corresponding composite of IronBridge’s separate account clients. It noted that the IronBridge Small Cap Fund slightly underperformed the composite. The Board concluded that IronBridge would continue to provide a high level of advisory services to the IronBridge Small Cap Fund.
Advisory fees for the IronBridge Small Cap Fund. The Board compared the IronBridge Small Cap Fund’s contractual advisory fee and total expense ratio to the industry data provided by an independent service with respect to other mutual funds in the same peer group. The Board noted that the Fund’s advisory fees were slightly above the industry average but that the total expense ratio of the Fund, after giving effect to the contractual expense cap agreement, was below the industry average. The Board noted that overall, the Fund’s total expense ratio compared favorably to industry averages. The Board also noted that IronBridge’s management fees for separately managed accounts are similar to the fees charged to the Iro nBridge Small Cap Fund. The Board concluded that the advisory fee to be paid by the Fund to IronBridge was reasonable in light of the nature and quality of services to be provided and fees paid by comparable funds.
Costs and profitability. The Board reviewed information concerning IronBridge’s financial condition, costs and profitability. The Board also considered the fact that IronBridge had entered into a contractual expense cap agreement on behalf of the IronBridge Small Cap Fund. The Board concluded that IronBridge’s current level of profitability was reasonable considering the quality of management and the fact that IronBridge has agreed to waive its fees and/or reimburse expenses for the Fund under a new expense cap/reimbursement agreement. The Board noted that the IronBridge Small Cap Fund’s expenses are below the current expense cap.
IronBridge SMID Fund
Investment Performance of the IronBridge SMID Fund. The Board reviewed the performance record of the IronBridge SMID Fund. It noted that the IronBridge SMID Fund had outperformed its benchmark index for the one-, three-year and since-inception periods ended June 30, 2009. The Board also reviewed performance information for the year ended December 31, 2009, noting that the IronBridge Small Cap Fund slightly underperformed its benchmark. The Board also considered IronBridge’s quarterly portfolio commentary and review of the IronBridge SMID Fund’s performance. The Board compared the IronBridge SMID Fund’s performance for the period ended June 30, 2009 to the performance for the corresponding composite of IronBr idge’s separate account clients. It noted that the IronBridge SMID Fund slightly underperformed the composite. The Board concluded that IronBridge would continue to provide a high level of advisory services to the IronBridge SMID Fund.
Advisory fees for the IronBridge SMID Fund. The Board compared the IronBridge SMID Fund’s contractual advisory fee and total expense ratio to the industry data provided by an independent service with respect to other mutual funds in the same peer group. The Board noted that the Fund’s advisory fees were slightly above the industry average. The Board noted that the total expense ratio of Institutional Class shares of the Fund, after giving effect to the contractual expense cap agreement, was below the industry average. The Board noted that the total expense ratio of Class Y shares of the Fund, after giving effect to the contractual expense cap agreement, was above the industry average. The Board noted that overall, the Fund&# 8217;s total expense ratios compared favorably to industry averages. The Board also noted that IronBridge’s management fees for separately
managed accounts are similar to the fees charged to the IronBridge SMID Fund. The Board concluded that the advisory fee to be paid by the Fund to IronBridge was reasonable in light of the nature and quality of services to be provided and fees paid by comparable funds.
Costs and profitability. The Board reviewed information concerning IronBridge’s financial condition, costs and profitability. The Board also considered the fact that IronBridge had entered into a contractual expense cap agreement on behalf of the IronBridge SMID Fund. The Board concluded that IronBridge’s current level of profitability was reasonable considering the quality of management and the fact that IronBridge has agreed to waive its fees and/or reimburse expenses for the Fund under a new expense cap/reimbursement agreement.
Board Considerations Applicable to both IronBridge Funds
Nature, Extent and Quality of the Services to be Provided. The Board considered IronBridge’s background and services it would provide to the IronBridge Funds and their shareholders under the New Agreement. The Board’s analysis of the nature, extent and quality of IronBridge’s services to the IronBridge Funds took into account knowledge gained from IronBridge’s presentations to the Board at meetings throughout the year in its previous capacity as subadviser to the Funds and in its capacity as investment adviser to another series of the Company. The Board reviewed and considered IronBridge’s proprietary investment style, key personnel involved in providing investment management services to the Funds and IronBridge’ ;s financial condition. The Board also considered services provided by IronBridge under the New Agreement, including the selection of broker-dealers for execution of portfolio transactions, monitoring adherence to the Funds’ investment restrictions and assisting with each Fund’s compliance with applicable securities laws and regulations. The Board concluded that the nature, extent and quality of the services provided by IronBridge to the Funds under the New Agreement was appropriate and that the Funds would likely continue to benefit from services provided by IronBridge under the New Agreement. The Board concluded that the range of services to be provided by IronBridge was appropriate and that IronBridge was qualified to provide such services.
Economies of Scale. The Board considered whether there may be economies of scale in the management of each IronBridge Fund if its assets were to increase significantly. However, the Board concluded that the assets of the Funds were not likely to increase to such an extent that breakpoints would be appropriate, particularly in light of the new expense cap/reimbursement agreement to be in place between IronBridge and the Funds.
Benefits to IronBridge. The Board considered information presented regarding any benefits to IronBridge or its affiliates from serving as adviser to the IronBridge Funds (in addition to the advisory fee). The Board noted that IronBridge utilizes soft dollar arrangements on a limited basis, whereby it would receive brokerage and research services from brokers that execute IronBridge’s portfolio transactions. The Board noted that FAM would receive compensation from IronBridge for its subadministrative services to the Funds pursuant to a subadministration agreement. The Board also reviewed the principal terms of the Transaction Agreement between IronBridge and FAM, which provides for certain economic benefits to IronBridge and FAM, t heir affiliates and personnel. The Board concluded that the benefits to IronBridge from its relationship with the Funds would be reasonable.
On the basis of its review of the foregoing information, the Board found that the terms of the New Agreement were fair and reasonable and in the best interest of the shareholders of the IronBridge Small Cap Fund and IronBridge SMID Fund.
Board Approval of New Advisory and Subadvisory Agreements for Frontegra Phocas Small Cap Value Fund
On May 17, 2010, the Board considered the approval of investment advisory and subadvisory agreements in connection with a proposed reorganization of Phocas Small Cap Value Fund, a series of Advisors Series Trust, into Frontegra Phocas Small Cap Value Fund, a new portfolio of the Company. The Board considered the approval of the investment advisory agreement between the Company, on behalf of the Frontegra Phocas Small Cap Value Fund, and FAM (the “Advisory Agreement”) and a new subadvisory agreement between FAM and Phocas Financial Corporation (“Phocas”) (the “Subadvisory Agreement”).
The Board considered materials it had previously received relevant to its consideration of the Advisory Agreement, such as FAM’s Form ADV, Code of Ethics, information regarding FAM’s compliance program, organizational structure and financial condition and responses to an information request submitted on behalf of the Board. The Board also reviewed the fee that would be payable by the Frontegra Phocas Small Cap Value
Fund under the Advisory Agreement, the proposed expense caps applicable to each class of the Fund and comparative fee and expense information provided by an independent third party.
In approving the Advisory Agreement, the Board considered the following factors and made the following conclusions:
Nature, extent and quality of the services to be provided. The Board considered FAM’s background and services it would provide to the Frontegra Phocas Small Cap Value Fund and its shareholders. The Board discussed the fact that Phocas currently serves as investment adviser to the Phocas Small Cap Value Fund and that Phocas would continue to make the day-to-day investment decisions for the Fund under the supervision of FAM following the reorganization. The Board noted that FAM has 15 years of experience in hiring and supervising subadvisers to other portfolios in the Frontegra family of funds. The Board discussed FAM’s responsibilities for overseeing Phocas as subadviser to the Fund and for monitoring the Fund’s complia nce with applicable requirements under the securities laws. The Board concluded that the range of services to be provided by FAM was appropriate.
Performance record of Frontegra Phocas Small Cap Value Fund. Performance information was not considered because the Frontegra Phocas Small Cap Value Fund had not commenced operations as a series of the Company.
Proposed fees. The Board compared the Frontegra Phocas Small Cap Value Fund’s contractual advisory fee and total expense ratios to the industry data provided by an independent service with respect to other mutual funds in the same peer group. The Board noted that the Fund’s advisory fee was slightly above the industry average and that the Fund’s total expense ratios for both Class L and Class I shares, after giving effect to the proposed expense cap agreement, were below the industry average. The Board concluded that the advisory fee and total expense ratios are competitive with those of comparable funds. The Board concluded that the proposed fee to be paid by the Fund to FAM were reasonable in light of the nature and quality of services to be provided and fees paid by comparable funds.
Costs and profitability. FAM did not provide any specific information regarding the costs of services to be provided or the profits they might realize because the Frontegra Phocas Small Cap Value Fund had not yet commenced operations as a series of the Company.
Economies of scale. Because the Frontegra Phocas Small Cap Value Fund had not yet commenced operations as a series of the Company, the Board did not consider whether any alternative fee structures, such as breakpoint fees, would be appropriate to reflect any economies of scale that may result from increases in the Fund’s assets.
Benefits to FAM. The Board considered information presented regarding any benefits to FAM or its affiliates from serving as adviser to the Frontegra Phocas Small Cap Value Fund (in addition to the advisory fee). The Board noted that Frontier Partners, Inc., an affiliate of FAM, will provide consulting services to, and will be compensated by, Phocas. However, the Board determined that FAM’s services to the Fund would not be compromised by this potential conflict of interest. The Board noted that FAM would receive compensation from the Fund for its subadministrative services to the Fund pursuant to a subadministration agreement. The Board concluded that the benefits to FAM from its relationship to the Fund would be reason able.
On the basis of its review of the foregoing information, the Board found that the terms of the Advisory Agreement were fair and reasonable and in the best interests of the Frontegra Phocas Small Cap Value Fund.
The Board considered materials previously received relevant to its consideration of the Subadvisory Agreement, such as Phocas’ Form ADV and Code of Ethics and information regarding Phocas’ compliance program, performance track record, investment strategy, trading procedures, personnel and financial condition. In approving the Subadvisory Agreement between FAM and Phocas regarding the Fund, the Board considered the following factors and made the following conclusions:
Nature, extent and quality of the services to be provided. The Board considered Phocas’ background as an independent manager specializing in small cap value and large cap value equities, real estate investment trusts and income equity strategies. The Board reviewed information regarding Phocas’ investment program and the investment experience of the proposed portfolio managers for the Fund. The Board considered the fact that
Phocas, as the investment adviser to the Phocas Small Cap Value Fund, has made the day-to-day investment decisions for the Fund since its inception and that the Fund would benefit from continuity of portfolio management following the reorganization. The Board determined that the Fund was likely to benefit from the services Phocas would provide to the Fund.
Investment performance of Phocas. The Board reviewed historical performance data for Phocas’ small cap value composite and the performance record of the Phocas Small Cap Value Fund. The Board concluded that Phocas appeared to have an effective small cap value investment process and that Phocas would provide a high level of subadvisory services to the Fund.
Proposed fee. The Board determined that the proposed subadvisory fee was appropriate in light of the Frontegra Phocas Small Cap Value Fund’s investment style and in comparison to the fees paid by other advisory clients of Phocas. In evaluating the subadvisory fee, the Board noted that the fee is paid by FAM and that therefore the overall advisory fee paid by the Fund is not directly affected by the subadvisory fee.
Costs and profitability. Phocas did not provide any specific information regarding the costs of services to be provided or the profits they might realize because the Fund had not yet commenced operations as a portfolio of the Company.
Economies of scale. Because the subadvisory fee is not paid by the Fund, the Board did not consider whether the fee should reflect any potential economies of scale that might be realized as Fund assets increase.
Benefits to Phocas. The Board considered information presented regarding any benefits to Phocas from serving as subadviser to the Fund (in addition to the subadvisory fee). The Board noted that Phocas receives consulting services from Frontier Partners, Inc.
On the basis of its review of the foregoing information, the Board found that the terms of the Advisory Agreement and Subadvisory Agreement were fair and reasonable and in the best interests of the Frontegra Phocas Small Cap Value Fund.
VOTING RESULTS OF SPECIAL MEETINGS OF SHAREHOLDERS
A special meeting of shareholders (the “Special Meeting”) of the Frontegra Mastholm International Equity Fund (the “Mastholm Fund”) was held on February 26, 2010. At the Special Meeting, shareholders voted on a proposal to approve a new subadvisory agreement between Mastholm Asset Management, LLC (“Mastholm”) and Frontegra Asset Management, Inc. (“Frontegra”). Further details regarding the proposal and the Special Meeting are contained in a definitive proxy statement filed with the SEC on January 14, 2010.
At the Special Meeting held on February 26, 2010, a new subadvisory agreement between Mastholm and Frontegra was approved by the shareholders of the Mastholm Fund as follows:
| Votes For | Votes Against | Abstained | Broker Non-Votes | |
| 16,818,207 | 0 | 0 | N/A | |
A special meeting of shareholders (the “Special Meeting”) of the Frontegra IronBridge Small Cap Fund, Frontegra IronBridge SMID Fund and Frontegra IronBridge Global Focus Fund (collectively, the “Funds”) was held on June 29, 2010. At the Special Meeting, shareholders voted on a proposal to approve a new investment advisory agreement between the Frontegra Funds, Inc. (the “Company”), on behalf of the Frontegra IronBridge Small Cap Fund and the Frontegra IronBridge SMID Fund and IronBridge Capital Management, L.P. (“IronBridge”). Shareholders also voted on a proposal to approve the agreement and plan of reorganization between the Company, on behalf of the Funds, and IronBridge Funds, Inc., on behalf of the IronBridge Frontegra Small Cap Fund, IronBridge Frontegra SMID Fund and IronBridge Frontegra Global Fund. Further details regarding each proposal and the Special Meeting are contained in a definitive proxy statement filed with the SEC on May 20, 2010.
At the special meeting held on June 29, 2010, the following actions were taken:
| (1) | A new investment advisory agreement between the Company, on behalf of each of the following Funds and IronBridge was approved by shareholders of each Fund (voting separately on a Fund-by-Fund basis) as follows: |
| | Fund | Votes For | Votes Against | Abstained | Broker Non-Votes |
| | Frontegra IronBridge Small Cap Fund | 15,178,710 | 15,199 | 3,614 | N/A |
| | Frontegra IronBridge SMID Fund | 28,513,586 | 31,460 | 19,409 | N/A |
| (2) | The agreement and plan of reorganization between the Company, on behalf of each of the following Funds, and IronBridge Funds, Inc., on behalf of the IronBridge Frontegra Small Cap Fund, IronBridge Frontegra SMID Fund and IronBridge Frontegra Global Fund was approved by shareholders of each Fund (voting separately on a Fund-by-Fund basis) as follows: |
| | Fund | Votes For | Votes Against | Abstained | Broker Non-Votes |
| | Frontegra IronBridge Small Cap Fund | 15,178,710 | 15,199 | 3,614 | N/A |
| | Frontegra IronBridge SMID Fund | 28,510,951 | 31,460 | 22,044 | N/A |
| | Frontegra IronBridge Global Focus Fund | 2,265,492 | 0 | 0 | N/A |
ADDITIONAL INFORMATION
(Unaudited)
DIRECTORS AND OFFICERS
The business and affairs of the Funds are managed under the direction of the Funds’ Board of Directors. Information pertaining to the directors and officers of the Funds is set forth below. The SAI includes additional information about the Funds’ directors and officers and is available without charge, upon request by calling 1-888-825-2100.
Interested Director and Officers
| | | | | | Number of | |
| | | | Principal | | Funds in | Other |
| | Position(s) | | Occupation(s) | | Complex | Directorships |
| Name, Address and Age | Held with | Term of | During Past | | Overseen | Held by |
| as of June 30, 2010 | Funds | Office | Five Years | | by Director | Director |
| William D. Forsyth III* | President and | Elected | Mr. Forsyth received his B.S. in Finance | | 9** | None |
| Frontegra Asset | Secretary | annually | from the University of Illinois in 1986 | | | |
| Management, Inc. | since | by the | and his M.B.A. from the University of | | | |
| 400 Skokie Boulevard | August 2008; | Board of | Chicago in 1988. Mr. Forsyth has served | | | |
| Suite 500 | Co-President, | Directors | as President of the Adviser since August | | | |
| Northbrook, IL 60062 | Treasurer and | | 2008 and as Treasurer and a Director of | | | |
| Born 1963 | Assistant | | the Adviser since May 1996. Mr. Forsyth | | | |
| | Secretary | | served as Co-President and Assistant | | | |
| | from May | | Secretary of the Adviser from May 1996 | | | |
| | 1996 to | | until August 2008. Mr. Forsyth has served | | | |
| | August 2008; | | as President of Timpani Capital | | | |
| | Director | Indefinite | Management LLC since August 2008 and | | | |
| | since | | served as Co-President from April until | | | |
| | May 1996 | | August 2008. Mr. Forsyth has served as | | | |
| | | | President of the Distributor since August | | | |
| | | | 2008 and as Co-President from August | | | |
| | | | 2007 to August 2008. From July 1993 | | | |
| | | | until the present, Mr. Forsyth also served | | | |
| | | | as a Partner of Frontier Partners, Inc., a | | | |
| | | | consulting/marketing firm. From April | | | |
| | | | 1987 until June 1993, Mr. Forsyth served | | | |
| | | | as a Partner of Brinson Partners, Inc., an | | | |
| | | | investment adviser, and from June 1986 | | | |
| | | | until April 1987, he served as a product | | | |
| | | | marketing representative of Harris Trust | | | |
| | | | & Savings Bank. Mr. Forsyth has earned | | | |
| | | | the right to use the Chartered Financial | | | |
| | | | Analyst (CFA) designation. | | | |
| * | Mr. Forsyth is an “interested person” of the Funds because he serves as a director and officer of the Adviser and owns 100% of the Adviser. |
| ** | As of June 30, 2010, the Frontegra Funds consist of nine separate series, seven of which are discussed in this Annual Report. The Frontegra Sky International Value Fund and Frontegra Timpani Small Cap Growth Fund are additional series of Frontegra that are not included in this Annual Report. As of the date of this Annual Report, such funds had not commenced operations. |
Frontegra FundsADDITIONAL INFORMATION (continued)
(Unaudited)
Interested Director and Officers
| | | | | | Number of | |
| | | | Principal | | Funds in | Other |
| | Position(s) | | Occupation(s) | | Complex | Directorships |
| Name, Address and Age | Held with | Term of | During Past | | Overseen | Held by |
| as of June 30, 2010 | Funds | Office | Five Years | | by Director | Director |
| Elyce D. Dilworth | Chief | Elected | Ms. Dilworth received her B.B.A. in | | N.A. | N.A. |
| Frontegra Asset | Compliance | Annually | Finance from the University of Wisconsin – | | | |
| Management, Inc. | Officer | by the | Milwaukee in 1989 and her M.S. in | | | |
| 400 Skokie Blvd., | since | Board of | Accounting from the University of | | | |
| Suite 500 | January 2008; | Directors | Wisconsin – Milwaukee in 1991. | | | |
| Northbrook, IL 60062 | Anti-Money | | Ms. Dilworth has served as Chief | | | |
| Born 1966 | Laundering | | Compliance Officer of the Adviser since | | | |
| | Compliance | | January 2008 and as Secretary since | | | |
| | Officer since | | August 2008. Ms. Dilworth has served | | | |
| | February 2008; | | as Chief Compliance Officer of Timpani | | | |
| | Treasurer and | | Capital Management LLC since April 2008 | | | |
| | Assistant | | and Chief Financial Officer from April 2008 | | | |
| | Secretary since | | to March 2010. Ms. Dilworth has served as | | | |
| | August 2008 | | Chief Compliance Officer of IronBridge | | | |
| | | | Funds, Inc. since May 2010. Ms. Dilworth | | | |
| | | | has served as Chief Compliance Officer of | | | |
| | | | the Distributor since August 2008. From | | | |
| | | | June 2004 until May 2007, Ms. Dilworth | | | |
| | | | was the Chief Compliance Officer for | | | |
| | | | Van Wagoner Funds, Inc. (n/k/a/ Embarcadero | | | |
| | | | Funds, Inc.), and the President, Secretary and | | | |
| | | | Treasurer from January 2005 until May 2007. | | | |
| | | | From April 1994 until December 2003, | | | |
| | | | Ms. Dilworth was employed by UMB Fund | | | |
| | | | Services, Inc., a service provider to mutual | | | |
| | | | funds and alternative investment products. | | | |
| | | | From January 1992 until April 1994, | | | |
| | | | Ms. Dilworth was a Staff Accountant for | | | |
| | | | PricewaterhouseCoopers LLP, a public | | | |
| | | | accounting firm. | | | |
ADDITIONAL INFORMATION (continued)
(Unaudited)
Independent Directors
| | | | | | Number of | |
| | | | Principal | | Funds in | Other |
| | Position(s) | | Occupation(s) | | Complex | Directorships |
| Name, Address and Age | Held with | Term of | During Past | | Overseen | Held by |
| as of June 30, 2010 | Funds | Office | Five Years | | by Director | Director |
| David L. Heald | Independent | Indefinite | Mr. Heald received his B.A. in English from | | 9** | None |
| 400 Skokie Boulevard | Director | | Denison University in 1966 and his J.D. from | | | |
| Suite 260 | since | | Vanderbilt University School of Law in 1969. | | | |
| Northbrook, IL 60062 | June | | Mr. Heald has been a principal and a director | | | |
| Born 1943 | 1996 | | of Consulting Fiduciaries, Inc. ("CFI"), a | | | |
| | | | registered investment adviser, since August of | | | |
| | | | 1994. CFI provides professional, independent, | | | |
| | | | fiduciary decision making, consultation and | | | |
| | | | alternative dispute resolution services to ERISA | | | |
| | | | plans, plan sponsors and investment managers. | | | |
| | | | Between April 1994 and August 1994, Mr. Heald | | | |
| | | | engaged in the private practice of law. From | | | |
| | | | August 1992 until April 1994, Mr. Heald was a | | | |
| | | | managing director and the chief administrative | | | |
| | | | officer of Calamos Asset Management, Inc., a | | | |
| | | | registered investment adviser specializing in | | | |
| | | | convertible securities, and he served as an officer | | | |
| | | | and director of CFS Investment Trust, a registered | | | |
| | | | investment company comprised of four series. | | | |
| | | | From January 1990 until August 1992, Mr. Heald | | | |
| | | | was a partner in the Chicago based law firm of | | | |
| | | | Gardner, Carton & Douglas. | | | |
| | | | | | | |
| James M. Snyder | Independent | Indefinite | Mr. Snyder received his B.S. in Finance from | | 9** | IronBridge |
| 400 Skokie Boulevard | Director | | Indiana University in 1969 and his M.B.A. from | | | Funds, Inc. |
| Suite 500 | since May | | DePaul University in 1973. Mr. Snyder is a | | | |
| Northbrook, IL 60062 | 2002 | | private investor and Chairman of The Snyder | | | |
| Born 1947 | | | Family Foundation. Mr. Snyder served as an | | | |
| | | | investment professional with Northern Trust | | | |
| | | | from June 1969 until his retirement in June 2001. | | | |
| | | | He served in a variety of capacities at Northern | | | |
| | | | Trust, most recently as Executive Vice President | | | |
| | | | of Northern Trust and Vice Chairman of Northern | | | |
| | | | Trust Global Investments. Mr. Snyder has earned | | | |
| | | | the right to use the CFA designation. | | | |
| ** | As of June 30, 2010, the Frontegra Funds consist of nine separate series, seven of which are discussed in this Annual Report. The Frontegra Sky International Value Fund and Frontegra Timpani Small Cap Growth Fund are additional series of Frontegra that are not included in this Annual Report. As of the date of this Annual Report, such funds had not commenced operations. |
Frontegra Funds
ADDITIONAL INFORMATION (continued)
(Unaudited)
Foreign Tax Credit
For the year ended June 30, 2010, the Frontegra Mastholm International Equity Fund earned foreign source income and paid foreign taxes, which it intends to pass through to its shareholders pursuant to Section 853 of the Internal Revenue Code as follows.
| | | | Foreign Source Income Earned | | | Foreign Taxes Paid | |
| | Australia | | $ | 230,960 | | | $ | 7,831 | |
| | Belgium | | | 6,409 | | | | 961 | |
| | Bermuda | | | 96,875 | | | | — | |
| | Brazil | | | 53,453 | | | | 3,636 | |
| | Canada | | | 26,489 | | | | 3,973 | |
| | Switzerland | | | 144,750 | | | | 21,712 | |
| | China | | | 19,507 | | | | 1,951 | |
| | Germany | | | 69,580 | | | | 10,437 | |
| | Denmark | | | 9,427 | | | | 1,414 | |
| | Spain | | | 88,040 | | | | 13,206 | |
| | France | | | 51,621 | | | | 7,732 | |
| | United Kingdom | | | 591,638 | | | | — | |
| | Hong Kong | | | 66,996 | | | | 7,375 | |
| | Israel | | | 4,540 | | | | 908 | |
| | Jersey | | | 39,204 | | | | — | |
| | Japan | | | 378,770 | | | | 26,514 | |
| | Korea, Republic Of | | | 25,187 | | | | 4,344 | |
| | Luxembourg | | | 1,659 | | | | 253 | |
| | Mexico | | | 39,243 | | | | — | |
| | Netherlands | | | 71,871 | | | | 10,781 | |
| | Russian Federation | | | 3,568 | | | | 778 | |
| | Sweden | | | 7,623 | | | | 1,143 | |
| | Singapore | | | 45,279 | | | | — | |
| | Total | | $ | 2,072,689 | | | $ | 124,949 | |
Qualified Dividend Income/Dividends Received Deduction
For the fiscal year ended June 30, 2010, certain dividends paid by the Funds may be subject to a maximum tax rate of 15%, as provided for by the Jobs and Growth Tax Relief Reconciliation Act of 2004. The percentage of dividends declared from ordinary income designated as qualified dividend income was as follows:
| | IronBridge Small Cap | 100.00% |
| | IronBridge SMID | 100.00% |
| | IronBridge Global Focus | 100.00% |
| | Mastholm International Equity | 100.00% |
| | Netols Small Cap Value | 100.00% |
Frontegra Funds
ADDITIONAL INFORMATION (continued)
(Unaudited)
For corporate shareholders, the percent of ordinary income distributions qualifying for the corporate dividends received deduction for the fiscal year ended June 30, 2010 was as follows:
| | IronBridge Small Cap | 100.00% |
| | IronBridge SMID | 100.00% |
| | IronBridge Global Focus | 69.15% |
| | Netols Small Cap Value | 100.00% |
Additional Information Applicable to Foreign Shareholders Only
The percent of ordinary income distributions designated as interest related dividends for the fiscal year ended June 30, 2010 was as follows:
| | Columbus Core Plus | 47.01% |
| | Columbus Core | 98.84% |
| | IronBridge Small Cap | 11.51% |
| | IronBridge SMID | 9.81% |
| | Mastholm International Equity | 1.23% |
| | Netols Small Cap Value | 29.50% |
The percent of ordinary income distributions designated as short-term capital gain distributions for the fiscal year ended June 30, 2010 was as follows:
| This page intentionally left blank. |
A Note on Forward-Looking Statements
This report includes forward-looking statements such as adviser, subadviser and/or portfolio manager predictions, opinions, assessments, analyses or outlooks for individual securities, industries, market sectors and/or markets. These statements involve risks and uncertainties. In addition to the general risks described for the Funds in the current Prospectuses, other factors bearing on these statements include the accuracy of the adviser’s, subadvisers’ or portfolio manager’s forecasts and predictions, and the appropriateness of the investment programs designed by the adviser, subadviser or portfolio manager to implement their strategies efficiently and effectively. Any one or more of these factors, as well as other risks affecting the securities markets and investment instruments gene rally, could cause the actual results of the Funds to differ materially as compared to benchmarks associated with the Funds.
In addition, portfolio composition will change due to ongoing management of the Funds. Specific securities named in this report may not currently be owned by the applicable Fund, or the Fund’s position in the securities may have changed.
Additional Information
Frontegra Funds has adopted proxy voting policies and procedures that delegate to Frontegra Asset Management, Inc., the Funds’ investment adviser (the “Adviser”), the authority to vote proxies. The proxy voting policies permit the Adviser to delegate its authority to vote proxies to each Fund’s subadviser. A description of the Frontegra Funds’ proxy voting policies and procedures is available without charge, upon request, by calling the Funds toll free at 1-888-825-2100. A description of these policies and procedures is also included in the Funds’ Statement of Additional Information, which is available on the SEC’s website at http://www.sec.gov or by calling the Funds toll free at 1-888-825-2100.
The actual voting records relating to each Fund’s portfolio securities during the most recent twelve months ended June 30 are available without charge by calling the Funds toll free at 1-888-825-2100 or by accessing the SEC’s website at http://www.sec.gov.
Each Fund files a complete schedule of portfolio holdings for its first and third fiscal quarters with the SEC on Form N-Q. The Form N-Q is available on the SEC’s website at http://www.sec.gov. The Form N-Q may also be reviewed and copied at the SEC’s Public Reference Room in Washington, D.C. Information on the operation of the Public Reference Room may be obtained by calling toll-free 1-800-SEC-0330.
Item 2. Code of Ethics.
The registrant has adopted a code of ethics that applies to the registrant’s principal executive officer and principal financial officer. The registrant has not made any amendments to its code of ethics during the period covered by this report. The registrant has not granted any waivers from any provisions of the code of ethics during the period covered by this report.
A copy of the registrant’s Code of Ethics is Incorporated by reference. See Item 12(a)(1).
Item 3. Audit Committee Financial Expert.
The registrant’s board of directors has determined that it does not have an audit committee financial expert serving on its audit committee. At this time, the registrant believes that the experience provided by each member of the audit committee together offers the registrant adequate oversight for the registrant’s level of financial complexity.
Item 4. Principal Accountant Fees and Services.
The registrant has engaged its principal accountant, Ernst & Young, LLP (“E&Y”), to perform audit services, audit-related services, tax services and other services during the past two fiscal years. In the following table, “Audit Fees” are fees billed for professional services for the audit of the registrant’s annual financial statements or for services that are normally provided by E&Y in connection with statutory and regulatory filings or engagements for those fiscal years. “Audit-Related Fees” are fees billed for professional services for assurance and related services by E&Y that are reasonably related to the performance of the a udit. “Tax Fees” are fees billed for professional services rendered by E&Y for tax compliance, tax advice and tax planning. There were no other services provided by E&Y. The Audit-Related Fees for fiscal year 2010 relate to a consent issued by E&Y for a Form N-14 filed with the Securities and Exchange Commission. The following table details the aggregate fees billed for each of the last two fiscal years by E&Y.
| | FYE 6/30/2010 | FYE 6/30/2009 |
| Audit Fees | $200,300 | $169,400 |
| Audit-Related Fees | $3,000 | $0 |
| Tax Fees | $42,000 | $34,800 |
| All Other Fees | $0 | $0 |
The audit committee has adopted pre-approval policies and procedures that require the audit committee to pre-approve all audit and non-audit services of the registrant, including services provided to any entity affiliated with the registrant with respect to any engagement that directly relates to the operations and financial reporting of the registrant. In accordance with its pre-approval policies and procedures, the audit committee pre-approved all audit and tax services provided by E&Y during fiscal 2010. During the last two fiscal years, there were no non-audit services rendered by E&Y to the registrant’s investment adviser or any entity controlling, controlled by or under common control with the investment adviser that provides ongoing services to the registrant. All of E&Y’s hours spent on auditing the registrant’s financial statements were attributed to work performed by full-time permanent employees of E&Y.
Item 5. Audit Committee of Listed Registrants.
Not applicable to registrants who are not listed issuers (as defined in Rule 10A-3 under the Securities Exchange Act of 1934).
Item 6. Investments.
| (a) | Schedule of Investments is included as part of the report to shareholders filed under Item 1 of this Form. |
(b) Not Applicable.
Item 7. Disclosure of Proxy Voting Policies and Procedures for Closed-End Management Investment Companies.
Not applicable to open-end investment companies.
Item 8. Portfolio Managers of Closed-End Management Investment Companies.
Not applicable to open-end investment companies.
Item 9. Purchases of Equity Securities by Closed-End Management Investment Company and Affiliated Purchasers.
Not applicable to open-end investment companies.
Item 10. Submission of Matters to a Vote of Security Holders.
Not Applicable.
Item 11. Controls and Procedures.
| (a) | Based on an evaluation of the registrant’s disclosure controls and procedures (as defined in Rule 30a-3(c) under the Investment Company Act of 1940 (the “Act”)) as of a date within 90 days prior to the filing date of this Form N-CSR, the registrant’s principal executive officer and principal financial officer have concluded that the disclosure controls and procedures are effective. |
| (b) | There were no changes in the registrant’s internal control over financial reporting (as defined in Rule 30a-3(d) under the Act) that occurred during the second fiscal quarter of the period covered by this report that have materially affected, or are reasonably likely to materially affect, the registrant’s internal control over financial reporting. |
Item 12. Exhibits.
| (a) | (1) | Any code of ethics or amendment thereto, that is the subject of the disclosure required by Item 2, to the extent that the registrant intends to satisfy Item 2 requirements through filing an exhibit. Incorporated by reference to the Registrant’s Form N-CSR filed September 8, 2008. |
| | (2) | A separate certification for each principal executive and principal financial officer pursuant to Section 302 of the Sarbanes-Oxley Act of 2002. Filed herewith. |
| | (3) | Any written solicitation to purchase securities under Rule 23c-1 under the Act sent or given during the period covered by the report by or on behalf of the registrant to 10 or more persons. Not applicable to open-end investment companies. |
| (b) | Certifications pursuant to Section 906 of the Sarbanes-Oxley Act of 2002. Furnished herewith. |
Pursuant to the requirements of the Securities Exchange Act of 1934 and the Investment Company Act of 1940, the registrant has duly caused this report to be signed on its behalf by the undersigned, thereunto duly authorized.
Frontegra Funds, Inc.
By: /s/William D. Forsyth III
William D. Forsyth III, President
(Principal Executive Officer)
Date: September 9, 2010
Pursuant to the requirements of the Securities Exchange Act of 1934 and the Investment Company Act of 1940, this report has been signed below by the following persons on behalf of the registrant and in the capacities and on the dates indicated.
By: /s/William D. Forsyth III
William D. Forsyth III, President and Secretary
(Principal Executive Officer)
Date: September 9, 2010
By: /s/Elyce D. Dilworth
Elyce D. Dilworth, Treasurer and Assistant Secretary
(Principal Financial Officer)
Date: September 9, 2010