UNITED STATES
SECURITIES AND EXCHANGE COMMISSION
Washington, D.C. 20549
FORM N-CSR
CERTIFIED SHAREHOLDER REPORT OF REGISTERED
MANAGEMENT INVESTMENT COMPANIES
Investment Company Act file number | 811-07685 |
|
Frontegra Funds, Inc. |
(Exact name of registrant as specified in charter) |
|
400 Skokie Blvd. Suite 500 Northbrook, Illinois | | 60062 |
(Address of principal executive offices) | | (Zip code) |
|
William D. Forsyth III 400 Skokie Blvd., Suite 500 Northbrook, Illinois 60062 |
(Name and address of agent for service) |
|
Registrant’s telephone number, including area code: | (847) 509-9860 | |
|
Date of fiscal year end: | June 30 | |
|
Date of reporting period: | June 30, 2014 | |
| | | | | | | | |
Item 1. Reports to Stockholders.

ANNUAL REPORT
Frontegra RobecoSAM Global Equity Fund
Frontegra MFG Global Equity Fund
Frontegra MFG Core Infrastructure Fund
Frontegra Timpani Small Cap Growth Fund
Frontegra Netols Small Cap Value Fund
Frontegra Phocas Small Cap Value Fund
Frontegra Asset Management, Inc.
June 30, 2014

TABLE OF CONTENTS
Shareholder Letter | | | 1 | | |
Frontegra RobecoSAM Global Equity Fund | |
Report from RobecoSAM USA, Inc. | | | 4 | | |
Investment Highlights | | | 6 | | |
Frontegra MFG Global Equity Fund | |
Report from MFG Asset Management | | | 8 | | |
Investment Highlights | | | 10 | | |
Frontegra MFG Core Infrastructure Fund | |
Report from MFG Asset Management | | | 12 | | |
Investment Highlights | | | 14 | | |
Frontegra Timpani Small Cap Growth Fund | |
Report from Timpani Capital Management LLC | | | 16 | | |
Investment Highlights | | | 18 | | |
Frontegra Netols Small Cap Value Fund | |
Report from Netols Asset Management, Inc. | | | 20 | | |
Investment Highlights | | | 21 | | |
Frontegra Phocas Small Cap Value Fund | |
Report from Phocas Financial Corporation | | | 24 | | |
Investment Highlights | | | 25 | | |
Expense Example | | | 26 | | |
Schedules of Investments | |
Frontegra RobecoSAM Global Equity Fund | | | 29 | | |
Frontegra MFG Global Equity Fund | | | 31 | | |
Frontegra MFG Core Infrastructure Fund | | | 32 | | |
Frontegra Timpani Small Cap Growth Fund | | | 35 | | |
Frontegra Netols Small Cap Value Fund | | | 37 | | |
Frontegra Phocas Small Cap Value Fund | | | 39 | | |
Statements of Assets and Liabilities | | | 42 | | |
Statements of Operations | | | 44 | | |
Statements of Changes in Net Assets | | | 46 | | |
Financial Highlights | | | 49 | | |
Notes to Financial Statements | | | 57 | | |
Report of Independent Registered Public Accounting Firm | | | 65 | | |
Board of Directors' Approval of Advisory and Subadvisory Agreements | | | 66 | | |
Additional Information | |
Directors and Officers | | | 73 | | |
Foreign Tax Credit | | | 78 | | |
Qualified Dividend Income/Dividends Received Deduction | | | 79 | | |
Additional Information Applicable to Foreign Shareholders Only | | | 79 | | |
This report is submitted for the general information of the shareholders of the Funds. It is not authorized for distribution to prospective investors unless accompanied or preceded by an effective Prospectus for the applicable Fund. The Prospectus may be obtained by calling 1-888-825-2100. Each Prospectus includes more complete information about management fees and expenses, investment objectives, risks and operating policies of the applicable Fund. Please read the Prospectus carefully.
Frontegra Funds, Inc. are distributed by Frontegra Strategies, LLC, 400 Skokie Blvd., Suite 500, Northbrook, IL 60062. Frontegra Strategies, LLC, member of FINRA and SIPC, is an affiliate of Frontegra Asset Management, Inc., the Funds' investment adviser.

DEAR FELLOW SHAREHOLDERS:
As we embark on a new fiscal year, I want to inform you of a name change for the funds — from the Frontegra Funds to the Frontier Funds — that will formally take place in the fourth quarter of 2014. Absolutely nothing will change with regard to your investments or the advisers and subadvisers managing the funds; the name change is strictly cosmetic in nature.
We are pleased to report on the progress of the Frontegra Funds over the past twelve months ending June 30, 2014. The S&P 500 Index was up 24.61%, and small capitalization stocks were up, with the Russell 2000® Index returning 23.64%. International stocks, as measured by the MSCI EAFE Index, returned 23.57% over the twelve-month period.
Fund Results
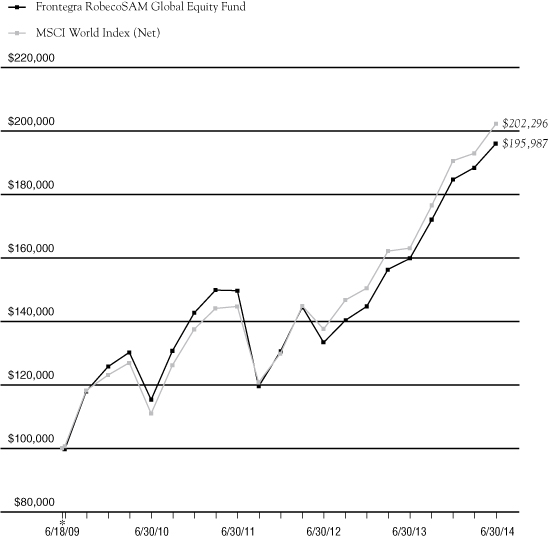
For the twelve month period ending June 30, 2014, the Frontegra RobecoSAM Global Equity Fund, managed by RobecoSAM USA, returned 22.72% (net) versus the MSCI World Index (Net) return of 24.05%.
The Frontegra MFG Global Equity Fund, managed by MFG Asset Management, returned 15.76% (net) versus the MSCI World Index (Net) return of 24.05% for the twelve month period ending June 30, 2014.
The Frontegra MFG Core Infrastructure Fund, also managed by MFG Asset Management, returned 24.22% (net) versus the UBS Developed Infrastructure & Utilities Index (Net) return of 24.70% and the MSCI World Index (Net) return of 24.05% for the twelve month period ending June 30, 2014.
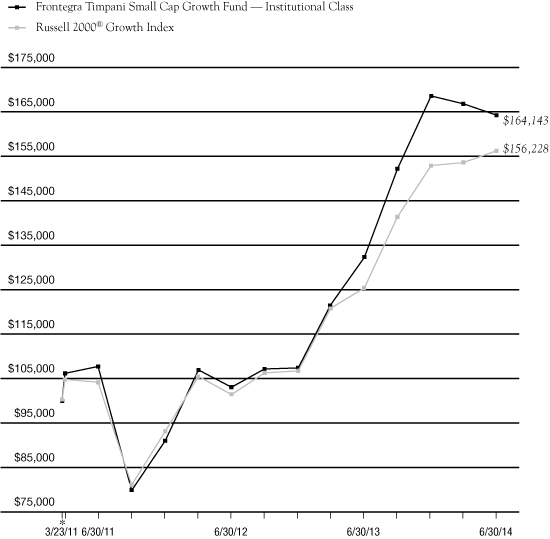
The Frontegra Timpani Small Cap Growth Fund — Institutional Class, managed by Timpani Capital Management, returned 24.16% (net) versus the Russell 2000® Growth Index return of 24.73% for the twelve month period ending June 30, 2014. The Class Y shares returned -1.90% (net) since inception on January 6, 2014, versus the Russell 2000® Growth Index return of 3.63%.
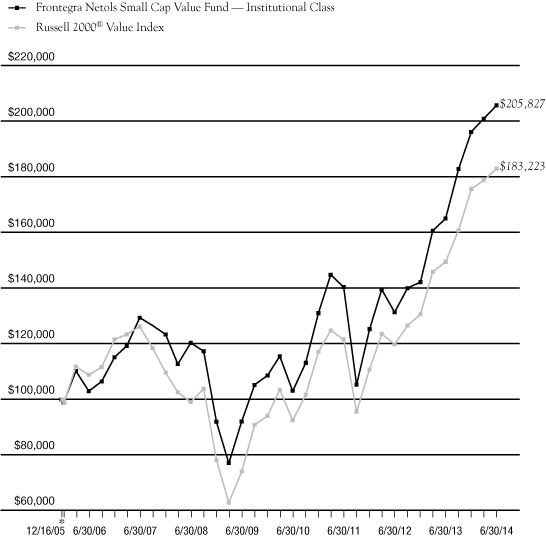
For the twelve month period ending June 30, 2014, the Frontegra Netols Small Cap Value Fund — Institutional Class, managed by Netols Asset Management, returned 24.63% (net) versus the Russell 2000® Value Index return of 22.54%. The Class Y shares returned 23.84% (net) over the same time period.
The Frontegra Phocas Small Cap Value Fund, managed by Phocas Financial, returned 32.72% (net) versus the Russell 2000 Value Index return of 22.54% for the twelve month period ending June 30, 2014.
Outlook
As of mid-2014, developed equity markets around the globe have performed remarkably well over the past twelve months, especially in North America and Europe. Moreover, the unemployment rate in the U.S. has dropped appreciably over the same period. Despite relatively rosy equity markets, fixed income markets have produced far more modest returns, and there is continuing speculation as to how the unwinding of the Fed's quantitative easing program will impact markets around the world. As we enter a new fiscal year, we will work as judiciously as ever to manage your assets with the skill and agility necessary in these vacillating markets.
We will continue to oversee the investment management of the Frontegra Funds with the care and diligence that have served our shareholders well in the past. As always, we appreciate your investment and continued confidence in the Frontegra Funds.
Best regards,
William D. Forsyth, CFA
President
Frontegra Funds, Inc.
page 1
This page intentionally left blank.

FRONTEGRA
ROBECOSAM GLOBAL EQUITY FUND

REPORT FROM ROBECOSAM USA, INC.
Dear Shareholders:
The Frontegra RobecoSAM Global Equity Fund strives to achieve capital appreciation by investing in a diversified portfolio of equity and equity-related securities issued by U.S. and non-U.S. companies that combine their market and financial strategy with a high level of environmental awareness and a clearly defined social policy. The Fund's performance is measured against the MSCI World Index (Net).
Performance Review
The Frontegra RobecoSAM Global Equity Fund returned 22.72%, net of fees, for the year ended June 30, 2014. The Fund underperformed the 24.05% return of its benchmark, the MSCI World Index (Net).
The portfolio's underperformance relative to the benchmark is primarily attributed to weak stock selection within Health Care, Information Technology and Consumer Discretionary. Stock selection had a positive contribution within the Energy, Telecommunication Services and Consumer Staples sectors.
The largest positive contributions at the stock level included overweight positions in Japanese oil and gas company Inpex, telecom operator Swisscom and U.S. energy company ONEOK. ONEOK's outperformance was driven by strong business fundamentals which led the company to increase the dividend in the first quarter by USD 0.16 to USD 0.56 per share. Swisscom's positive stock performance reflects a solid underlying business. Inpex's strong outperformance in the Energy sector was supported by good earnings results and also the confirmation that one of the largest liquefied natural gas projects, Ichthys, is progressing on schedule. The largest negative contributors included positions in IBM (IT), Barclays (Financials) and Pfizer (Health Care). Pfizer's underperformance over the period follows the decision to drop its takeover bid for UK pharmaceutical firm AstraZeneca.
The portfolio sector allocation was positioned with overweights in Energy, Consumer Staples and Telecommunication Services combined with underweight positions in Financials, Materials, Industrials and Consumer Discretionary. In terms of performance contribution, sector allocation had a slight negative impact.
Portfolio Outlook and Strategy
Over the period, sentiment on the global equity market has remained positive. The positive momentum was largely driven by still very accommodative global monetary conditions which have caused investors to seek exposure to the equity markets. In Europe, the European Central Bank announced an aggressive monetary policy action to fight the threat of deflation. The package of measures includes cuts to its policy rates, negative rates on its deposit facility and a so-called targeted longer-term refinancing operation (TLTRO). The TLTRO will provide cheap, fixed rate four year funding to European banks. The goal is to discourage banks from using the cheap public funds to buy sovereign bonds by giving them an incentive to increase credit origination and ultimately increase lending activity to the real economy.
On the macroeconomic front, it is worth highlighting the data released for Chinese manufacturing activity. The HSBC Chinese PMI Index rose to 50.7 in June from 49.4 in May. This was the first time this year that the index moved above 50. The recovery in the eurozone manufacturing sector was extended to a twelfth successive month in June. However, the upturn is losing momentum. The Markit Eurozone Manufacturing PMI dipped to a seven-month low of 51.8 down from 52.2 in the prior month. The average figure for the second quarter was also slightly below that for the first quarter.
page 4

In the coming quarters, we expect global monetary conditions to remain highly accommodative. Our focus remains on investing in sustainable companies with attractive valuations and stable earnings outlooks. We also maintain an underweight in sectors where earnings visibility and valuation upside is limited, such as Financials, Industrials and Materials. Our outlook for the Financial sector remains cautious, and our approach in this space remains very selective with focus on companies with solid cash generation, strong balance sheets and acceptable leverage. In addition, we remain underweight in Materials. Such positioning comes mainly from not investing in large benchmark holdings in the mining and chemical space where we see limited investment opportunities.
Sincerely,
Diego d'Argenio
RobecoSAM USA, Inc.
page 5

INVESTMENT HIGHLIGHTS
Growth of a $100,000 Investment (Unaudited)
* 6/18/09 commencement of operations.
This chart assumes an initial gross investment of $100,000 made on 6/18/09 (commencement of operations). Returns shown include the reinvestment of all distributions. Past performance is not predictive of future results. Investment return and principal value will fluctuate so that shares, when redeemed, may be worth more or less than the original cost. In the absence of existing fee waivers, total return would be reduced. Effective June 10, 2011, RobecoSAM USA, Inc. ("RobecoSAM") became subadviser to the Fund and Frontegra Asset Management, Inc. became adviser to the Fund. Prior to June 10, 2011, RobecoSAM served as adviser to the Fund. Effective February 20, 2013, the Fund changed its name from Frontegra SAM Global Equity Fund to Frontegra RobecoSAM Global Equity Fund. To receive current to the most recent month-end performance, please call 1-888-825-2100.
The MSCI World Index measures the overall performance of stock markets in 24 developed market countries in North America, Europe, and the Asia/Pacific Region. The Index does not reflect investment management fees, brokerage commissions and other expenses associated with investing in equity securities. A direct investment in the index is not possible.
Frontegra Asset Management, Inc. has contractually agreed through October 31, 2015 to waive its management fee and/or reimburse the Fund's operating expenses to the extent necessary to ensure that the Fund's total operating expenses (excluding taxes, interest, brokerage commissions, acquired fund fees and expenses and extraordinary expenses) do not exceed 1.20% of the Fund's average daily net assets. The expense ratios presented are based on the annualized expense ratios as reported in the Fund's current prospectus, which may differ from the expense ratios presented in the Fund's financial highlights.
** The returns shown do not reflect the deduction of taxes that a shareholder would pay on Fund distributions or the redemption of Fund shares.
Portfolio Total Return**
FOR PERIODS
ENDED 6/30/14 | | FUND | | INDEX | |
SIX MONTHS | | | 6.17 | % | | | 6.18 | % | |
ONE YEAR | | | 22.72 | % | | | 24.05 | % | |
FIVE YEAR
AVERAGE ANNUAL | | | 14.47 | % | | | 14.99 | % | |
AVERAGE ANNUAL
SINCE INCEPTION | | | 14.30 | % | | | 15.03 | % | |
Fund Expenses | |
GROSS EXPENSE RATIO | | | 1.63 | % | |
NET EXPENSE RATIO | | | 1.20 | % | |
page 6

FRONTEGRA
MFG GLOBAL EQUITY FUND

REPORT FROM MFG ASSET MANAGEMENT
Dear Fellow Shareholders:
The investment objective of the Frontegra MFG Global Equity Fund is capital appreciation. The Fund's performance is measured against the MSCI World Index (Net).
Performance Review
The Frontegra MFG Global Equity Fund returned 15.76%, net of fees, for the year ended June 30, 2014. The Fund's return underperformed the 24.05% return of its benchmark, the MSCI World Index (Net).
We feel strongly that people cannot retire on "relative investment returns"; only by generating investment returns that exceed the rate of inflation (ideally by a satisfactory margin) will investors increase their wealth over time. As such, we are happy to be judged on the absolute returns of our strategy over time.
Fund Outlook and Strategy
In general, equity markets have been strong over the past twelve months. This is reflected in the performance of the MSCI World Index (Net) which has risen by 24.05%. The current investment environment is extraordinary. Many world equity indices ended June at or near all-time record highs. The 10-year bond yields of Spanish, Irish and Italian government debt closed below 2.85%, credit default swaps on major banks are now below 2007 levels, and the European Central Bank has recently reduced the interest rate on deposits by banks to minus 0.1%.
We continue to see capital flows that are distorting markets and causing asset prices and currencies to diverge from underlying economic trends. The enormous U.S.$600 billion per annum quantitative easing (QE) being undertaken by the Bank of Japan, as part of Prime Minister Abe's economic plan, is encouraging Japanese banks, insurers and pension funds to sell Japanese government bonds and invest in other assets, including foreign sovereign bonds. This may, in part, explain the rally in U.S. and European government bonds over the past 6 months (as well as the strong Australian dollar), when economic data would have suggested that the opposite might have been expected. We also note recent reports that China's State Administration of Foreign Exchange, which manages China's vast foreign exchange reserves, has become the world's largest public sector equity investor; elsewhere, numerous other central banks have also increased their exposure to equity markets.
Against this backdrop, we would expect the Fund to lag general equity market indices. Despite this, we will not chase momentum and will always have a conservative, defensive bias built into our portfolio. As Warren Buffett has often said, "To finish first you must first finish."
It is a little surreal that equity market volatility and other risk measures appear benign as we edge closer to a cycle of increasing long-term interest rates, with the U.S. Federal Reserve and the Bank of England ending their QE programmes and China appearing to be entering a period of lower growth. While we are not predicting a major downturn in equity markets (in the absence of a major global event), they have become more challenging and value has become harder to find as share prices have continued to rise. While nothing is certain in investing, we predict that the next three years will be challenging for equities as they battle the headwind of rising long-term interest rates.
The Fund
The Fund was invested in 28 companies on June 30, 2014, compared to 25 on June 30, 2013. The top ten investments represented 52.7% of the Fund, while they represented 51.6% on June 30, 2013. Over the twelve months ending June 30, 2014, the three stocks with the strongest returns in local currency were DIRECTV (+43.3%), Bank of New York Mellon (+35.8%) and Oracle (+33.2%), while the stocks with the weakest returns were Target (-13.9%), Tesco (-10.4%) and Adidas (-9.9%). On an absolute basis, the three largest stock
page 8

contributors, in local currency, were Oracle, DIRECTV and Microsoft which added +1.9%, +1.7% and +1.6%, respectively. Conversely, the three bottom contributors were Target, Tesco and Adidas which detracted -0.7%, -0.6% and -0.2%, respectively. Over the past twelve months, we have made the following major changes to the portfolio:
• We added a new position in global beverages giant Diageo, enterprise software vendor SAP and European pharmaceutical Sanofi.
• In September 2013, we also made a new investment in DIRECTV, the world's largest pay television company by subscriber numbers. Our initial purchase price was around $60 per share. In May 2014, AT&T made a cash and share takeover offer which valued DIRECTV at $95 per share. The transaction is subject to regulatory and shareholder approval and, assuming AT&T receives the necessary approvals, is anticipated to close in around twelve months. DIRECTV is currently trading at around $85 per share, reflecting the transaction uncertainty and time to completion.
• We exited the holding in Colgate-Palmolive and reduced the positions in Google, American Express, McDonald's and Johnson & Johnson.
• We increased the positions in Nestle, Visa, Target and Tesco.
Sincerely,
Hamish Douglass
Portfolio Manager
MFG Asset Management
page 9

INVESTMENT HIGHLIGHTS
Growth of a $1,000,000 Investment (Unaudited)

* 12/28/11 commencement of operations.
This chart assumes an initial gross investment of $1,000,000 made on 12/28/11 (commencement of operations). Returns shown include the reinvestment of all distributions. Past performance is not predictive of future results. Investment return and principal value will fluctuate so that shares, when redeemed, may be worth more or less than the original cost. In the absence of existing fee waivers, total return would be reduced. To receive current to the most recent month-end performance, please call 1-888-825-2100.
The MSCI World Index measures the overall performance of stock markets in 24 developed market countries in North America, Europe, and the Asia/Pacific Region. The Index does not reflect investment management fees, brokerage commissions and other expenses associated with investing in equity securities. A direct investment in the index is not possible.
Frontegra Asset Management, Inc. has contractually agreed through October 31, 2015 to waive its management fee and/or reimburse the Fund's operating expenses to the extent necessary to ensure that the Fund's total operating expenses (excluding taxes, interest, brokerage commissions, acquired fund fees and expenses and extraordinary expenses) do not exceed 0.80% of the Fund's average daily net assets. The expense ratios presented are based on the annualized expense ratios as reported in the Fund's current prospectus, which may differ from the expense ratios presented in the Fund's financial highlights.
** The returns shown do not reflect the deduction of taxes that a shareholder would pay on Fund distributions or the redemption of Fund shares.
Portfolio Total Return**
FOR PERIODS ENDED 6/30/14 | | FUND | | INDEX | |
SIX MONTHS | | | 2.68 | % | | | 6.18 | % | |
ONE YEAR | | | 15.76 | % | | | 24.05 | % | |
AVERAGE ANNUAL
SINCE INCEPTION | | | 20.18 | % | | | 19.94 | % | |
Fund Expenses | |
GROSS EXPENSE RATIO | | | 0.97 | % | |
NET EXPENSE RATIO | | | 0.80 | % | |
page 10

FRONTEGRA
MFG CORE INFRASTRUCTURE FUND

REPORT FROM MFG ASSET MANAGEMENT
Dear Fellow Shareholders:
The investment objective of the Frontegra MFG Core Infrastructure Fund is long-term capital appreciation. The Fund's performance is measured against the UBS Developed Infrastructure & Utilities Index (Net).
The types of infrastructure assets in which the Fund invests are natural monopolies that provide an essential service to the community. Infrastructure assets offer investors protection from the impacts of inflation because their earnings generally have some direct linkage to inflation. Over time, the stable, reliable earnings of infrastructure assets are expected to lead to a combination of income and capital growth for investors.
The universe of infrastructure assets that are held by the Fund is made up of two main sectors:
• Utilities, including both regulated energy utilities and regulated water utilities. Utilities comprise approximately 70% of the Fund. Utilities are typically subject to economic regulation. This requires the utility to efficiently provide an essential service to the community and, in return, permits the utility to earn a fair rate of return on the capital it has invested in its operations. As the utility provides a basic necessity, e.g. energy or water, there is minimal fluctuation in demanded volumes in response to the economic cycle and the price charged for the utility service can be adjusted with limited impact upon demand volumes. As a result, the earnings of regulated utilities have been, and are expected to continue to be, stable irrespective of economic conditions; and
• Infrastructure, which includes airports, toll roads, broadcast communications infrastructure and ports. Regulation of infrastructure companies is generally done through contracts that regulate the prices the company can charge (rather than the earnings) and allows companies to accrue the benefits of volume growth (i.e. the returns of infrastructure companies are linked to growth in passengers, vehicles, spectrum usage or containers). As a result, the revenues and earnings derived by infrastructure assets are expected to grow over time.
Performance Review
The Frontegra MFG Core Infrastructure Fund returned 24.22%, net of fees, for the year ending June 30, 2014. The Fund's return underperformed the 24.70% return of its benchmark, the UBS Developed Markets Infrastructure & Utilities Index (Net). While underperformance may be seen as disappointing, it was not surprising given the strong rise in the benchmark for the year. As discussed below, the investment strategy used in this Fund results in a much lower beta than the benchmark and the return for risk of the Fund was materially better than the benchmark for the year.
Most sectors held in the Core Infrastructure strategy performed well during the year with Toll Roads generating a Total Shareholder Return (TSR) of 43%, Airports a TSR of 29%, and Water and Gas Utilities TSRs of 26% and 25%, respectively. The Ports sector was the worst performing sector held by the Fund, and the only one not generating a positive return, generating a TSR of -13% for the year.
Geographically, European stocks were the strongest performers providing a TSR of 38% for the year, while USA and Canada were at the lower end with TSRs of 19% and 14% respectively.
The best performing stocks in the Fund during the year were Italian toll road company Atlantia (TSR of 73%), Spanish utility Red Electrica (67%), Vienna Airport (58%), another Italian toll road company, SIAS (59%) and Australian utility Envestra, which is the subject of a takeover battle (45%). Pleasingly, only one stock of the 90 in the portfolio generated a negative TSR for the year. Dutch company Vopak, which owns oil and chemical tank facilities in key strategically located ports around the world, was impacted by the backwardation of the oil curve and the troubles in Crimea resulting in a TSR of -19%.
page 12

In terms of the stocks included in the benchmark index but excluded from the Fund because they do not meet our stringent definition of investment grade infrastructure, Japanese electrical utilities (which were up over 60% on average in the previous year) fell sharply producing TSRs ranging from -6% to -42%. These stocks had also been very poor performers in previous years. In contrast, large, vertically integrated power companies in Europe with significant exposure to unregulated power generation and which had performed poorly for a number of years finally rewarded their shareholders with some decent returns.
Portfolio Outlook and Strategy
The Core Infrastructure strategy is designed to provide reliable returns in all but the most extreme market conditions. The Fund exceeded that expectation during the last year, partly reflecting the continued recovery of stocks held by the Fund that had been over-sold in previous years. We now see the utilities market as broadly in equilibrium while infrastructure stocks, particularly those in Europe, remain cheap.
We believe that infrastructure and utility assets, with requisite earnings reliability and a linkage of earnings to inflation offer an attractive, long-term investment proposition. Furthermore, given the predictable nature of earnings and the structural linkage of those earnings to inflation, the investment returns generated by infrastructure assets are different from standard asset classes and offer investors valuable diversification when included in an investment portfolio. In the current uncertain economic and investment climate, the reliable financial performance of infrastructure investments makes them particularly attractive and an investment in listed infrastructure can be expected to reward patient investors with a three to five year timeframe.
Sincerely,
Dennis Eagar
Portfolio Manager
MFG Asset Management
page 13

INVESTMENT HIGHLIGHTS
Growth of a $100,000 Investment (Unaudited)

* 1/18/12 commencement of operations.
This chart assumes an initial gross investment of $100,000 made on 1/18/12 (commencement of operations). Returns shown include the reinvestment of all distributions. Past performance is not predictive of future results. Investment return and principal value will fluctuate so that shares, when redeemed, may be worth more or less than the original cost. In the absence of existing fee waivers, total return would be reduced. To receive current to the most recent month-end performance, please call 1-888-825-2100.
The MSCI World Index measures the overall performance of stock markets in 24 developed market countries in North America, Europe, and the Asia/Pacific Region. The UBS Developed Infrastructure & Utilities Index is a global developed markets infrastructure and utilities benchmark. Neither index reflects investment management fees, brokerage commissions or other expenses associated with investing in equity securities. A direct investment in an index is not possible.
Frontegra Asset Management, Inc. has contractually agreed through October 31, 2015 to waive its management fee and/or reimburse the Fund's operating expenses to the extent necessary to ensure that the Fund's total operating expenses (excluding taxes, interest, brokerage commissions, acquired fund fees and expenses and extraordinary expenses) do not exceed 0.70% of the Fund's average daily net assets. The expense ratios presented are based on the annualized expense ratios as reported in the Fund's current prospectus, which may differ from the expense ratios presented in the Fund's financial highlights.
** The returns shown do not reflect the deduction of taxes that a shareholder would pay on Fund distributions or the redemption of Fund shares.
Portfolio Total Return**
FOR PERIODS
ENDED 6/30/14 | | FUND | | UBS
INDEX | | MSCI
INDEX | |
SIX MONTHS | | | 14.78 | % | | | 15.38 | % | | | 6.18 | % | |
ONE YEAR | | | 24.22 | % | | | 24.70 | % | | | 24.05 | % | |
AVERAGE ANNUAL
SINCE INCEPTION | | | 17.72 | % | | | 15.09 | % | | | 18.22 | % | |
Fund Expenses | |
GROSS EXPENSE RATIO | | | 3.66 | % | |
NET EXPENSE RATIO | | | 0.70 | % | |
page 14

FRONTEGRA
TIMPANI SMALL CAP GROWTH FUND

REPORT FROM TIMPANI CAPITAL MANAGEMENT LLC
Dear Fellow Shareholders:
The Frontegra Timpani Small Cap Growth Fund strives to achieve capital appreciation by investing in a diversified portfolio of growth companies with small market capitalizations. Timpani seeks to:
• Invest in companies where growth is robust, sustainable and underestimated by the market.
• Conduct fundamental research that provides unique insights into the perception gap that exists between market expectations and a company's true growth rate.
• Manage risk by continuously evaluating the size of the perception gap relative to market expectations and monitoring market sentiment.
• Act on new relevant incremental data points, both positive and negative, in an effort to exploit investor biases.
Performance Review
For the year ended June 30, 2014, the Fund modestly trailed its benchmark, the Russell 2000® Growth Index, returning 24.16% (net of fees) vs. 24.73% for the benchmark. It was a tale of two halves. The relative performance in the second half of calendar 2013 was strong while the relative performance in the first half of calendar 2014 was weak.
The strength from 2013 was caused by several company-specific fundamental drivers along with a fairly benign macro environment, which resulted in a stylistic tailwind for Timpani. That tailwind became a headwind in the spring of 2014, as high-growth, small capitalization stocks fell victim to a fierce, targeted correction. Broadly speaking, underlying fundamentals were not worsening prior to, or during this correction. Instead, the correction was primarily stock valuation-driven. The rally in small capitalization stocks in 2013 was largely driven by improving valuation, or multiple expansion. During the spring of 2014, we saw some of that multiple expansion unwind. We are not alarmed by this. A digestion of some of the gains from 2013 is healthy long term, however, can be modestly painful to live through while it is happening.
During the period, sector allocation was a slight negative contributor to performance. An overweight in Energy and Health Care were positive contributors to performance, while an overweight in Consumer Discretionary and Technology were negative contributors. Stock selection was fairly neutral during the period as a driver of performance. Similar to the overall portfolio performance, stock selection was notably positive in the second half of 2013 and notably negative in the first half of 2014. For the full period, stock selection was most positive for Consumer Discretionary and Health Care, and most negative for Technology and Producer Durables. Stand-out individual positive contributors included health care companies, Lannett Company, BioDelivery Sciences, Repligen and Horizon Pharma as well as energy stock, Diamondback Energy. While fundamentally unrelated to one another, these companies are similar in that they all have a sustainable growth profile and are consistently meeting or exceeding analyst and investor expectations. Negative outliers included Conn's, PowerSecure International and TearLab. These three companies provided negative data points which delayed or halted the expected growth trajectory. All three were sold from the portfolio.
Portfolio Outlook
While the spring 2014 correction arrived seemingly overnight, we are hopeful the worst is behind us. We struggled from late March through May, however, we saw strength in absolute and relative performance in June. This is encouraging and perhaps, is evidence that the style correction has concluded and going forward, we can expect a more style-neutral environment.
While there are always minor macro concerns in the news, the environment is fairly benign. The domestic and global economy is growing modestly, there are very few impactful global disruptions, and most central banks are accommodating. While we know interest rate
page 16

increases by the U.S. Federal Reserve are inevitable and likely to start in mid-2015, those have been well telegraphed by the marketplace, thus, we expect the news to be digested without much fanfare. More importantly, we understand interest rate increases are most likely to be accompanied by a sharply stronger economy, which should be favorable for stocks.
On a micro level, things also appear favorable. Confirming the macro economic recovery, we are beginning to see pockets of the economy where pricing is improving. For example, over the past few weeks, we have had several meetings with companies within the transportation, pharmaceuticals, and oil services industries where management teams are seeing evidence of pricing improvement. In addition, corporate balance sheets are generally sound, and companies are generating cash which enables them to increase cash deployment in the form of dividends, share buybacks or accretive acquisitions. We believe that positive corporate fundamentals will lead to the potential for increased M&A activity, which could benefit the companies we own as both buyers and potential sellers. Our analysis continues to confirm our optimism regarding the fundamental strength of the companies in our portfolio.
During the period, we continued to focus on finding robust and sustainable growers where the growth is being underestimated. That research has resulted in sector weights that vary from the benchmark weights. Key overweights include Consumer Discretionary, Energy, and Producer Durables, while notable underweights include Financial Services, Materials & Processing and Technology.
While the volatility in the marketplace may or may not remain elevated, we will continue to make it our mission to find companies that have characteristics consistent with our investment process. We believe this approach is most value-added for shareholders over the long term.
Thank you for your continued support.
Sincerely,
Brandon Nelson, CFA
Chief Investment Officer
Timpani Capital Management LLC
page 17

INVESTMENT HIGHLIGHTS
Growth of a $100,000 Investment (Unaudited)
* 3/23/11 commencement of operations.
This chart assumes an initial gross investment of $100,000 made on 3/23/11. Returns shown include the reinvestment of all distributions. Past performance is not predictive of future results. Investment return and principal value will fluctuate so that shares, when redeemed, may be worth more or less than the original cost. In the absence of fee waivers, total return would be reduced. To receive current to the most recent month-end performance, please call 1-888-825-2100.
The Russell 2000® Growth Index measures the performance of the small-cap growth segment of the U.S. equity universe. The Index does not reflect investment management fees, brokerage commissions and other expenses associated with investing in equity securities. A direct investment in the index is not possible.
Timpani Capital Management LLC has contractually agreed through October 31, 2015 to waive its management fee and/or reimburse the Fund's operating expenses to the extent necessary to ensure that the Fund's total operating expenses (excluding taxes, interest, brokerage commissions, acquired fund fees and expenses and extraordinary expenses) do not exceed 1.10% of the Fund's average daily net assets of the Institutional Class. The expense ratios presented are based on the annualized expense ratios as reported in the Fund's current prospectus, which may differ from the expense ratios presented in the Fund's financial highlights.
** The returns shown do not reflect the deduction of taxes that a shareholder would pay on Fund distributions or the redemption of Fund shares.
The above graph relates to Institutional Class shares of the Fund. Performance for Class Y shares will vary from the performance of the Institutional Class shares shown above due to differences in expenses.
Portfolio Total Return**
FOR PERIODS ENDED 6/30/14 | | FUND | | INDEX | |
SIX MONTHS | | | (2.61 | )% | | | 2.22 | % | |
ONE YEAR | | | 24.16 | % | | | 24.73 | % | |
AVERAGE ANNUAL
SINCE INCEPTION | | | 16.36 | % | | | 14.61 | % | |
Fund Expenses | |
GROSS EXPENSE RATIO | | | 4.02 | % | |
NET EXPENSE RATIO | | | 1.10 | % | |
page 18

FRONTEGRA
NETOLS SMALL CAP VALUE FUND

REPORT FROM NETOLS ASSET MANAGEMENT, INC.
Dear Fellow Shareholders:
The Frontegra Netols Small Cap Value Fund strives to achieve capital appreciation by investing at least 80% of its assets in equity securities of small capitalization companies. The Fund's performance is measured against the Russell 2000® Value Index.
Performance Review
Since its inception on December 16, 2005, the Frontegra Netols Small Cap Value Fund (Institutional Class) has outperformed the benchmark after fees, returning 8.82% annualized, compared to 7.35% annualized for the Russell 2000 Value Index. For the year ended June 30, 2014, the Fund outperformed the benchmark, returning 24.63% net of fees, compared to 22.54% for the Index.
Portfolio Review
The dominant market factor over the past twelve months continues to be a slowly strengthening domestic economy and the implications for Federal Reserve Policy. Stronger payroll numbers have been a key factor in the improved outlook for the economy. This outlook drove the market higher as investors looked past the uncertainty associated with a new Fed Chairperson, unusually severe winter weather in the first quarter, and geopolitical concerns in many parts of the world. During the past year, the Fund's portfolio was positioned for a stable to slightly stronger economy. As this outlook played out, Energy, Health Care and Industrial sectors outperformed. Conversely, less cyclical Financials and Consumer Staples sectors underperformed during the period.
Positive Contributions to Relative Performance July 2013 through June 2014
• Stock Selection — Energy, Materials, and Financials
• Overweight — Health Care, Industrials, and Information Technology
• Best Performing Stocks — Zale, United Rentals, Willbros Group, VeriFone Systems and Acuity Brands
Negative Contributions to Relative Performance July 2013 through June 2014
• Stock Selection — Health Care and Utilities
• Underweight — Energy and Utilities
• Worst Performing Stocks — Liquidity Services, Haemonetics, Ethan Allen Interiors, Kraton Performance Polymers and Intrepid Potash
Overall, we believe the domestic economy continues to move forward. As employment trends strengthen, consumer confidence should improve and drive further economic activity. Improved business sentiment should eventually result in higher levels of business investment and commercial construction. These factors have been slow to materialize in the current recovery and could potentially provide another leg of economic growth.
Thank you for your continued support.
Jeff Netols
President
Netols Asset Management, Inc.
page 20

INVESTMENT HIGHLIGHTS
Growth of a $100,000 Investment (Unaudited)
* 12/16/05 commencement of operations.
This chart assumes an initial gross investment of $100,000 made on 12/16/05 (commencement of operations). Returns shown include the reinvestment of all distributions. Past performance is not predictive of future results. Investment return and principal value will fluctuate so that shares, when redeemed, may be worth more or less than the original cost. In the absence of existing fee waivers, total return would be reduced. To receive current to the most recent month-end performance, please call 1-888-825-2100.
The Russell 2000 Value Index measures the performance of those Russell 2000 companies with lower price-to-book ratios and lower forecasted growth values. The Index does not reflect investment management fees, brokerage commissions and other expenses associated with investing in equity securities. A direct investment in the index is not possible.
Frontegra Asset Management, Inc. has contractually agreed through October 31, 2015 to waive its management fee and/or reimburse the Fund's operating expenses to the extent necessary to ensure that the Fund's total operating expenses (excluding taxes, interest, brokerage commissions, acquired fund fees and expenses and extraordinary expenses) do not exceed 1.10% of the Fund's average daily net assets for the Institutional Class. The expense ratios presented are based on the annualized expense ratios as reported in the Fund's current prospectus, which may differ from the expense ratios presented in the Fund's financial highlights.
** The returns shown do not reflect the deduction of taxes that a shareholder would pay on Fund distributions or the redemption of Fund shares.
The above graph relates to Institutional Class shares of the Fund. Performance for Class Y shares will vary from the performance of the Institutional Class shares shown above due to differences in expenses.
Portfolio Total Return**
FOR PERIODS
ENDED 6/30/14 | | FUND | | INDEX | |
SIX MONTHS | | | 4.71 | % | | | 4.20 | % | |
ONE YEAR | | | 24.63 | % | | | 22.54 | % | |
FIVE YEAR
AVERAGE ANNUAL | | | 17.42 | % | | | 19.88 | % | |
AVERAGE ANNUAL
SINCE INCEPTION | | | 8.82 | % | | | 7.35 | % | |
Fund Expenses | |
GROSS EXPENSE RATIO | | | 1.19 | % | |
NET EXPENSE RATIO | | | 1.11 | % | |
page 21
This page intentionally left blank.

FRONTEGRA
PHOCAS SMALL CAP VALUE FUND

REPORT FROM PHOCAS FINANCIAL CORPORATION
Dear Fellow Shareholders:
The Frontegra Phocas Small Cap Value Fund strives to achieve capital appreciation by investing in a diversified portfolio of equity securities of companies with small market capitalizations. The Fund's performance is measured against the Russell 2000® Value Index.
Performance Review
During the twelve month period ended June 30, 2014, the Frontegra Phocas Small Cap Value Fund returned 32.72%, net of fees, compared to the 22.54% return of the benchmark, the Russell 2000 Value Index (the "Benchmark").
The challenges for the year have been steady: economic headwinds continue in Europe, weakness in China, and continued uncertainty in the Middle East. In the U.S., mixed data suggesting a sluggish domestic expansion continue in the background. Despite all of these ongoing issues, the U.S. equities markets continued to climb up the wall of worry and deliver positive total returns for investors for the twelve-month period.
For the year ended June 30, the Benchmark's sector performances were all up. The sector performance leaders were Energy and Health Care (+34.3%). Those sectors were followed by Industrials (+25.4%), Information Technology (+24.5%), Utilities (+22.7%), Materials (+22.2%), Consumer Discretionary (+21.6%), Consumer Staples (+18.4%), Financials (+18.3%) and Telecommunication Services (4.7%).
For the Fund, the Financials sector was the strongest contributor to returns over the twelve-month period. Despite being a little underweight the Benchmark's sector weight, our holdings outperformed the Benchmark. Strong contributions were also made by our holdings in the Industrials, Energy, and Information Technology sectors. Health Care, Materials, Consumer Discretionary, and Utilities also kicked in. The smallest sector contribution was from the Consumer Staples sector. Cash also added slightly to performance for the period.
Portfolio Review and Strategy
Within Financials, banks were attractive performers as a group. The Fund's positions in SVB Financial, Wilshire Bancorp, Bladex and First Republic Bank each contributed solidly to the return for the period. The REIT holdings in the Fund were also strong. NorthStar Realty Finance and Pebblebrook Hotel Trust were the standouts in that group, but Hudson Pacific Properties, Strategic Hotels & Resorts and First Industrial Realty Trust also put in attractive contributions. Strong Energy names were Goodrich Petroleum, Carrizo Oil & Gas, Comstock Resources, Kodiak Oil & Gas and Gulfport Energy.
In the Industrials sector, Trinity Industries and Aceto each added strongly to performance for the period, atop attractive showings by Esterline Technologies and Timken. Spirit Airlines and AMERCO were also major contributors from the transportation group.
Because it is quite difficult, if not impossible, to time markets or sectors on a consistent basis, our core investment strategy remains to concentrate on identifying undervalued stocks in each sector. We believe that this will continue to be the best strategy, longer-term. We also feel that the best performing companies remain those that are finding new growth opportunities, are overhauling their operations to reduce costs significantly, or are investing their free cash flow and cash on their balance sheets to acquire promising businesses. In addition, we continue to search for companies with greatly discounted valuations based on concerns that we think can be repaired in a timely fashion. We remain fully invested with less than 5% cash or equivalents.
Thank you for your continued support.
William Schaff, CFA | | Steve Block, CFA | |
Chief Executive Officer and Portfolio Manager | | Portfolio Manager | |
Phocas Financial Corporation | | Phocas Financial Corporation | |
page 24

INVESTMENT HIGHLIGHTS
Growth of a $100,000 Investment (Unaudited)

* 9/29/06 commencement of operations.
This chart assumes an initial gross investment of $100,000 made on 9/29/06. Returns shown include the reinvestment of all distributions. Past performance is not predictive of future results. Investment return and principal value will fluctuate so that shares, when redeemed, may be worth more or less than the original cost. In the absence of fee waivers, total return would be reduced. Effective October 8, 2010, Phocas Financial Corp. ("Phocas") became subadviser to the Fund and Frontegra Asset Management, Inc. became adviser to the Fund. Prior to October 8, 2010, Phocas served as adviser to the Fund. To receive current to the most recent month-end performance, please call 1-888-825-2100.
The Russell 2000® Value Index measures the performance of those Russell 2000® companies with lower price-to-book ratios and lower forecasted growth values. The Index does not reflect investment management fees, brokerage commissions and other expenses associated with investing in equity securities. A direct investment in the index is not possible.
Frontegra Asset Management, Inc. has contractually agreed through October 31, 2015 to waive its management fee and/or reimburse the Fund's operating expenses to the extent necessary to ensure that the Fund's total operating expenses (excluding taxes, interest, brokerage commissions, acquired fund fees and expenses and extraordinary expenses) do not exceed 1.10% of the Fund's average daily net assets. The expense ratios presented are based on the annualized expense ratios as reported in the Fund's current prospectus, which may differ from the expense ratios presented in the Fund's financial highlights.
** The returns shown do not reflect the deduction of taxes that a shareholder would pay on Fund distributions or the redemption of Fund shares.
Portfolio Total Return**
FOR PERIODS ENDED 6/30/14 | | FUND | | INDEX | |
SIX MONTHS | | | 6.83 | % | | | 4.20 | % | |
ONE YEAR | | | 32.72 | % | | | 22.54 | % | |
FIVE YEAR
AVERAGE ANNUAL | | | 21.70 | % | | | 19.88 | % | |
AVERAGE ANNUAL
SINCE INCEPTION | | | 9.26 | % | | | 6.60 | % | |
Fund Expenses | |
GROSS EXPENSE RATIO | | | 2.62 | % | |
NET EXPENSE RATIO | | | 1.22 | % | |
page 25

Frontegra Funds
EXPENSE EXAMPLE
June 30, 2014 (Unaudited)
As a shareholder of a mutual fund, you incur two types of costs: (1) transaction costs, including redemption fees, and (2) ongoing costs, including management fees, distribution and/or service (12b-1) fees and other fund expenses. Although the Funds charge no sales loads, you will be assessed fees for outgoing wire transfers, returned checks and stop payment orders at prevailing rates charged by U.S. Bancorp Fund Services, LLC, the Funds' transfer agent. If you request that a redemption be made by wire transfer, currently the Funds' transfer agent charges a $15.00 fee. A redemption fee of 2.00% of the then current value of the shares redeemed may be imposed on certain redemptions of shares made within 30 days of purchase for the Frontegra RobecoSAM Global Equity, Frontegra MFG Global Equity and Frontegra MFG Core Infrastructure Funds.
This Example is intended to help you understand your ongoing costs (in dollars) of investing in the Funds and to compare these costs with the ongoing costs of investing in other mutual funds. The Example is based on an investment of $1,000 invested at the beginning of the period and held for the entire period (1/1/14 – 6/30/14).
Actual Expenses
The first line of the table on the following page for each Fund provides information about actual account values and actual expenses. The Example includes management fees, registration fees, fee waivers/reimbursements and other expenses. However, the Example does not include portfolio trading commissions and related expenses and other extraordinary expenses as determined under generally accepted accounting principles. You may use the information in this line, together with the amount you invested, to estimate the expenses that you paid over the period. Simply divide your account value by $1,000 (for example, an $8,600 account value divided by $1,000 = 8.6), then multiply the result by the number in the first line under the heading entitled "Expenses Paid During the Period" to estimate the expenses you paid on your account during this period.
Hypothetical Example for Comparison Purposes
The second line of the table for each Fund provides information about hypothetical account values and hypothetical expenses based on each of the Fund's actual expense ratios and an assumed rate of return of 5% per year before expenses, which is not the actual return. The hypothetical account values and expenses may not be used to estimate the actual ending account balance or expenses you paid for the period. You may use this information to compare the ongoing costs of investing in each of the Funds and other funds. To do so, compare this 5% hypothetical example with the 5% hypothetical examples that appear in the shareholder reports of the other funds.
Please note that the expenses shown in the table are meant to highlight your ongoing costs only and do not reflect any transactional costs, such as redemption fees. Therefore, the second line of the table is useful in comparing ongoing costs only, and will not help you determine the relative total costs of owning different funds. In addition, if these transactional costs were included, your costs could have been higher.
page 26

Frontegra Funds
EXPENSE EXAMPLE (continued)
June 30, 2014 (Unaudited)
| | | Beginning Account
Value 1/1/2014 | | Ending Account
Value 6/30/2014 | | Annualized
Expense Ratio* | | Expenses Paid
During the Period* | |
RobecoSAM Global Equity Fund | |
Actual Fund Return | | $ | 1,000.00 | | | $ | 1,061.70 | | | | 1.20 | % | | $ | 6.13 | | |
Hypothetical 5% Return | | $ | 1,000.00 | | | $ | 1,018.84 | | | | 1.20 | % | | $ | 6.01 | | |
MFG Global Equity Fund | |
Actual Fund Return | | $ | 1,000.00 | | | $ | 1,026.80 | | | | 0.80 | % | | $ | 4.02 | | |
Hypothetical 5% Return | | $ | 1,000.00 | | | $ | 1,020.83 | | | | 0.80 | % | | $ | 4.01 | | |
MFG Core Infrastructure Fund | |
Actual Fund Return | | $ | 1,000.00 | | | $ | 1,147.80 | | | | 0.70 | % | | $ | 3.73 | | |
Hypothetical 5% Return | | $ | 1,000.00 | | | $ | 1,021.32 | | | | 0.70 | % | | $ | 3.51 | | |
Timpani Small Cap Growth
Fund – Institutional Class | |
Actual Fund Return | | $ | 1,000.00 | | | $ | 973.90 | | | | 1.10 | % | | $ | 5.38 | | |
Hypothetical 5% Return | | $ | 1,000.00 | | | $ | 1,019.34 | | | | 1.10 | % | | $ | 5.51 | | |
Netols Small Cap Value
Fund – Institutional Class | |
Actual Fund Return | | $ | 1,000.00 | | | $ | 1,047.10 | | | | 1.10 | % | | $ | 5.58 | | |
Hypothetical 5% Return | | $ | 1,000.00 | | | $ | 1,019.34 | | | | 1.10 | % | | $ | 5.51 | | |
Netols Small Cap Value
Fund – Class Y | |
Actual Fund Return | | $ | 1,000.00 | | | $ | 1,045.80 | | | | 1.50 | % | | $ | 7.61 | | |
Hypothetical 5% Return | | $ | 1,000.00 | | | $ | 1,017.36 | | | | 1.50 | % | | $ | 7.50 | | |
Phocas Small Cap Value Fund | |
Actual Fund Return | | $ | 1,000.00 | | | $ | 1,068.30 | | | | 1.10 | % | | $ | 5.64 | | |
Hypothetical 5% Return | | $ | 1,000.00 | | | $ | 1,019.34 | | | | 1.10 | % | | $ | 5.51 | | |
* Expenses are equal to each Fund's annualized expense ratio indicated above, multiplied by the average account value over the period, multiplied by 181/365 to reflect the one-half year period.
page 27

Frontegra Funds
EXPENSE EXAMPLE (continued)
June 30, 2014 (Unaudited)
| | | Beginning Account
Value | | Ending Account
Value 6/30/2014 | | Annualized
Expense Ratio | | Expenses Paid
During the Period | |
Timpani Small Cap Growth
Fund – Class Y | |
Actual Fund Return* | | $ | 1,000.00 | | | $ | 981.00 | | | | 1.50 | % | | $ | 7.12 | | |
Hypothetical 5% Return** | | $ | 1,000.00 | | | $ | 1,017.36 | | | | 1.50 | % | | $ | 7.50 | | |
* Actual expenses are equal to the Fund's annualized expense ratio of 1.50% multiplied by the average account value over the period, multiplied by 175/365 to reflect the most recent fiscal period end since the Timpani Small Cap Growth Fund — Class Y commenced operations on January 6, 2014.
** Hypothetical expenses are equal to the Fund's annualized expense ratio of 1.50% multiplied by the average account value over the period commencing January 1, 2014, multiplied by 181/365 to reflect information had the Timpani Small Cap Growth Fund — Class Y been in operation for the entire fiscal half year.
page 28

Frontegra RobecoSAM Global Equity Fund
SCHEDULE OF INVESTMENTS
June 30, 2014
Number of Shares | | | | Value | |
COMMON STOCKS 93.0% | | | |
| | | Australia 6.1% | |
| | 23,943 | | | AGL Energy Ltd. | | $ | 349,493 | | |
| | 8,638 | | | National Australia Bank Ltd. | | | 267,000 | | |
| | 7,084 | | | Westpac Banking Corp. | | | 226,314 | | |
| | 6,515 | | | Woodside Petroleum Ltd. | | | 252,307 | | |
| | | | 1,095,114 | | |
| | | France 4.0% | |
| | 9,838 | | | Total SA | | | 711,009 | | |
| | | Israel 1.4% | |
| | 19,080 | | | Mizrahi Tefahot Bank Ltd. | | | 246,764 | | |
| | | Italy 0.9% | |
| | 6,278 | | | Eni SpA | | | 171,757 | | |
| | | Japan 7.0% | |
| | 4,700 | | | Honda Motor Co. Ltd. | | | 164,097 | | |
| | 37,900 | | | Inpex Corp. | | | 576,141 | | |
| | 13,800 | | | Keihin Corp. | | | 219,318 | | |
| | 11,200 | | | Stanley Electric Co. Ltd. | | | 291,982 | | |
| | | | 1,251,538 | | |
| | | Netherlands 2.7% | |
| | 4,827 | | | Koninklijke DSM NV | | | 351,565 | | |
| | 3,957 | | | Koninklijke Philips NV | | | 125,570 | | |
| | | | 477,135 | | |
| | | Norway 1.9% | |
| | 18,454 | | | DNB ASA | | | 337,559 | | |
| | | Philippines 0.4% | |
| | 133,500 | | | Manila Water Co., Inc. | | | 77,990 | | |
| | | Sweden 1.7% | |
| | 4,183 | | | Atlas Copco AB - Class A | | | 120,891 | | |
| | 3,672 | | | Svenska Handelsbanken AB -
Class A | | | 179,765 | | |
| | | | 300,656 | | |
Number of Shares | | | | Value | |
| | | Switzerland 8.0% | |
| | 3,943 | | | Nestle SA | | $ | 305,463 | | |
| | 1,761 | | | Roche Holding AG | | | 525,242 | | |
| | 868 | | | Schindler Holding AG | | | 131,942 | | |
| | 643 | | | Swisscom AG | | | 373,778 | | |
| | 279 | | | Zurich Insurance Group AG | | | 84,096 | | |
| | | | 1,420,521 | | |
| | | United Kingdom 10.2% | |
| | 4,294 | | | AstraZeneca PLC | | | 318,971 | | |
| | 53,891 | | | Barclays PLC | | | 196,262 | | |
| | 65,796 | | | BT Group PLC | | | 433,408 | | |
| | 2,629 | | | Croda International PLC | | | 99,028 | | |
| | 17,469 | | | Drax Group PLC | | | 191,486 | | |
| | 6,689 | | | GlaxoSmithKline PLC | | | 179,039 | | |
| | 46,529 | | | Legal & General Group PLC | | | 179,485 | | |
| | 8,250 | | | SSE PLC | | | 221,244 | | |
| | | | 1,818,923 | | |
| | | United States 48.7% | |
| | 7,335 | | | Abbott Laboratories | | | 300,001 | | |
| | 3,592 | | | Celanese Corp. - Class A | | | 230,894 | | |
| | 13,762 | | | Cisco Systems, Inc. | | | 341,986 | | |
| | 4,145 | | | Colgate-Palmolive Co. | | | 282,606 | | |
| | 4,478 | | | Dollar Tree, Inc. (a) | | | 243,872 | | |
| | 1,347 | | | E.I. du Pont de Nemours & Co. | | | 88,148 | | |
| | 3,628 | | | Emerson Electric Co. | | | 240,754 | | |
| | 1,956 | | | Fluor Corp. | | | 150,416 | | |
| | 1,836 | | | Fossil Group, Inc. (a) | | | 191,899 | | |
| | 2,839 | | | Franklin Resources, Inc. | | | 164,208 | | |
| | 2,769 | | | GNC Holdings, Inc. | | | 94,423 | | |
| | 3,401 | | | Illinois Tool Works, Inc. | | | 297,792 | | |
| | 2,067 | | | International Business
Machines Corp. | | | 374,685 | | |
| | 6,631 | | | L Brands, Inc. | | | 388,974 | | |
| | 4,147 | | | MasterCard, Inc. - Class A | | | 304,680 | | |
| | 4,623 | | | McDonald's Corp. | | | 465,721 | | |
| | 2,512 | | | Mead Johnson Nutrition Co. | | | 234,043 | | |
| | 10,697 | | | Microsoft Corp. | | | 446,065 | | |
The accompanying notes are an integral part of these financial statements.
page 29

Frontegra RobecoSAM Global Equity Fund
SCHEDULE OF INVESTMENTS (continued)
June 30, 2014
Number of Shares | | | | Value | |
| COMMON STOCKS 93.0% (continued) | | | |
| | | United States 48.7% (continued) | |
| | 1,440 | | | National Oilwell Varco, Inc. | | $ | 118,584 | | |
| | 6,022 | | | Occidental Petroleum Corp. | | | 618,038 | | |
| | 6,150 | | | ONE Gas, Inc. | | | 232,163 | | |
| | 9,302 | | | Oracle Corp. | | | 377,010 | | |
| | 1,491 | | | Parker-Hannifin Corp. | | | 187,463 | | |
| | 17,519 | | | Pfizer, Inc. | | | 519,964 | | |
| | 4,747 | | | The Chubb Corp. | | | 437,531 | | |
| | 5,069 | | | The Coca-Cola Co. | | | 214,723 | | |
| | 7,788 | | | The Hartford Financial
Services Group, Inc. | | | 278,888 | | |
| | 3,737 | | | UnitedHealth Group, Inc. | | | 305,500 | | |
| | 7,982 | | | Wells Fargo & Co. | | | 419,534 | | |
| | 3,279 | | | Xylem, Inc. | | | 128,143 | | |
| | | | 8,678,708 | | |
| | | Total Common Stocks | |
| | | | | (Cost $12,722,762) | | | 16,587,674 | | |
PREFERRED STOCKS 2.9% | | | |
| | | Germany 2.9% | |
| | 2,591 | | | Henkel AG & Co. KGaA | | | 299,546 | | |
| | 804 | | | Volkswagen AG | | | 211,156 | | |
| | | | 510,702 | | |
| | | Total Preferred Stocks | |
| | | | | (Cost $315,499) | | | 510,702 | | |
Number of Shares | | | | Value | |
SHORT-TERM INVESTMENTS 4.6% | |
| | | Investment Company 4.6% | |
| | 815,977 | | | STIT-STIC Prime Portfolio -
Institutional Class, 0.01% | | $ | 815,977 | | |
| | | Total Short-Term Investments | |
| | | (Cost $815,977) | | | 815,977 | | |
| | | Total Investments 100.5% | |
| | | (Cost $13,854,238) | | | 17,914,353 | | |
| | | Liabilities in Excess of
Other Assets (0.5)% | | | (83,963 | ) | |
| | | TOTAL NET ASSETS 100.0% | | $ | 17,830,390 | | |
(a) Non-Income Producing.
PORTFOLIO DIVERSIFICATION
Sectors | | Percentage | |
Financials | | | 16.9 | % | |
Energy | | | 13.7 | | |
Consumer Discretionary | | | 12.7 | | |
Health Care | | | 12.1 | | |
Information Technology | | | 10.4 | | |
Industrials | | | 7.8 | | |
Consumer Staples | | | 7.5 | | |
Utilities | | | 6.0 | | |
Telecommunication Services | | | 4.5 | | |
Materials | | | 4.3 | | |
Total Common and Preferred Stocks | | | 95.9 | | |
Total Short-Term Investments | | | 4.6 | | |
Total Investments | | | 100.5 | | |
Liabilities in Excess of Other Assets | | | (0.5 | ) | |
Total Net Assets | | | 100.0 | % | |
The accompanying notes are an integral part of these financial statements.
page 30

Frontegra MFG Global Equity Fund
SCHEDULE OF INVESTMENTS
June 30, 2014
Number of Shares | | | | Value | |
COMMON STOCKS 97.8% | | | |
| | | France 7.4% | |
| | 358,283 | | | Danone | | $ | 26,609,982 | | |
| | 300,087 | | | Sanofi | | | 31,878,337 | | |
| | | | 58,488,319 | | |
| | | Germany 3.1% | |
| | 114,678 | | | Adidas AG | | | 11,615,407 | | |
| | 168,274 | | | SAP SE | | | 12,995,554 | | |
| | | | 24,610,961 | | |
| | | Netherlands 1.3% | |
| | 246,324 | | | Unilever NV | | | 10,778,151 | | |
| | | Switzerland 7.0% | |
| | 442,828 | | | Nestle SA | | | 34,305,687 | | |
| | 233,987 | | | Novartis AG | | | 21,187,592 | | |
| | | | 55,493,279 | | |
| | | United Kingdom 6.6% | |
| | 258,167 | | | Diageo PLC | | | 8,244,449 | | |
| | 9,034,582 | | | Tesco PLC | | | 43,942,158 | | |
| | | | 52,186,607 | | |
| | | United States 72.4% | |
| | 156,687 | | | American Express Co. | | | 14,864,896 | | |
| | 519,715 | | | DIRECTV (a) | | | 44,180,972 | | |
| | 920,555 | | | eBay, Inc. (a) | | | 46,082,983 | | |
| | 24,157 | | | Google, Inc. - Class A (a) | | | 14,123,873 | | |
| | 24,157 | | | Google, Inc. - Class C (a) | | | 13,897,039 | | |
| | 99,435 | | | Johnson & Johnson | | | 10,402,890 | | |
| | 973,302 | | | Lowe's Companies, Inc. | | | 46,708,763 | | |
| | 301,588 | | | MasterCard, Inc. - Class A | | | 22,157,670 | | |
| | 157,505 | | | McDonald's Corp. | | | 15,867,054 | | |
| | 1,226,730 | | | Microsoft Corp. | | | 51,154,641 | | |
| | 832,422 | | | Oracle Corp. | | | 33,738,064 | | |
| | 257,340 | | | State Street Corp. | | | 17,308,688 | | |
| | 719,314 | | | Target Corp. | | | 41,684,246 | | |
| | 848,786 | | | The Bank of New York
Mellon Corp. | | | 31,812,499 | | |
| | 219,051 | | | The Coca-Cola Co. | | | 9,279,000 | | |
| | 487,756 | | | U.S. Bancorp | | | 21,129,590 | | |
Number of Shares | | | | Value | |
| | | United States 72.4% (continued) | |
| | 170,208 | | | Visa, Inc. - Class A | | $ | 35,864,528 | | |
| | 413,342 | | | Wal-Mart Stores, Inc. | | | 31,029,584 | | |
| | 637,033 | | | Wells Fargo & Co. | | | 33,482,455 | | |
| | 463,884 | | | Yum! Brands, Inc. | | | 37,667,381 | | |
| | | | 572,436,816 | | |
| | | Total Common Stocks | |
| | | | | (Cost $676,820,393) | | | 773,994,133 | | |
SHORT-TERM INVESTMENTS 1.9% | | | |
| | | Investment Company 1.9% | |
| | 14,835,097 | | | STIT Liquid Assets Portfolio -
Institutional Class, 0.06% | | | 14,835,097 | | |
| | | Total Short-Term Investments | |
| | | | | (Cost $14,835,097) | | | 14,835,097 | | |
| | | Total Investments 99.7% | |
| | | | | (Cost $691,655,490) | | | 788,829,230 | | |
| | | | | Other Assets in Excess of
Liabilities 0.3% | | | 2,213,906 | | |
| | | | | TOTAL NET ASSETS 100.0% | | $ | 791,043,136 | | |
(a) Non-Income Producing.
PORTFOLIO DIVERSIFICATION
Sectors | | Percentage | |
Information Technology | | | 29.1 | % | |
Consumer Discretionary | | | 25.0 | | |
Consumer Staples | | | 20.7 | | |
Financials | | | 15.0 | | |
Health Care | | | 8.0 | | |
Total Common Stocks | | | 97.8 | | |
Total Short-Term Investments | | | 1.9 | | |
Total Investments | | | 99.7 | | |
Other Assets in Excess of Liabilities | | | 0.3 | | |
Total Net Assets | | | 100.0 | % | |
The accompanying notes are an integral part of these financial statements.
page 31

Frontegra MFG Core Infrastructure Fund
SCHEDULE OF INVESTMENTS
June 30, 2014
Number of Shares | | | | Value | |
COMMON STOCKS 97.6% | | | |
| | | Australia 7.9% | |
| | 107,109 | | | APA Group | | $ | 695,880 | | |
| | 162,751 | | | DUET Group | | | 371,388 | | |
| | 230,282 | | | Envestra Ltd. | | | 295,317 | | |
| | 434,028 | | | SP AusNet | | | 542,279 | | |
| | 184,598 | | | Spark Infrastructure Group | | | 322,024 | | |
| | 284,030 | | | Sydney Airport | | | 1,130,228 | | |
| | 259,223 | | | Transurban Group | | | 1,806,372 | | |
| | | | 5,163,488 | | |
| | | Austria 0.4% | |
| | 2,690 | | | Flughafen Wien AG | | | 250,472 | | |
| | | Belgium 0.6% | |
| | 7,215 | | | Elia System Operator SA/NV | | | 364,554 | | |
| | | Canada 8.3% | |
| | 18,210 | | | Emera, Inc. | | | 582,112 | | |
| | 42,591 | | | Enbridge, Inc. | | | 2,020,882 | | |
| | 27,489 | | | Fortis, Inc. | | | 836,482 | | |
| | 40,345 | | | TransCanada Corp. | | | 1,925,656 | | |
| | 3,649 | | | Valener, Inc. | | | 54,031 | | |
| | | | 5,419,163 | | |
| | | France 6.9% | |
| | 13,525 | | | Aeroports de Paris | | | 1,781,974 | | |
| | 28,197 | | | Eutelsat Communications SA | | | 979,733 | | |
| | 46,140 | | | SES SA - ADR | | | 1,750,072 | | |
| | | | 4,511,779 | | |
| | | Germany 1.6% | |
| | 11,827 | | | Fraport AG Frankfurt Airport
Services Worldwide | | | 835,647 | | |
| | 8,975 | | | Hamburger Hafen und
Logistik AG | | | 238,355 | | |
| | | | 1,074,002 | | |
| | | Hong Kong 2.9% | |
| | 219,862 | | | Power Assets Holdings Ltd. | | | 1,921,920 | | |
Number of Shares | | | | Value | |
| | | Italy 8.9% | |
| | 71,427 | | | Atlantia SpA | | $ | 2,036,300 | | |
| | 336,360 | | | Snam SpA | | | 2,026,543 | | |
| | 28,108 | | | Societa Iniziative Autostradali
e Servizi SpA | | | 361,020 | | |
| | 274,744 | | | Terna Rete Elettrica
Nazionale SpA | | | 1,449,150 | | |
| | | | 5,873,013 | | |
| | | Mexico 2.6% | |
| | 43,527 | | | Grupo Aeroportuario del Centro
Norte SAB de CV | | | 175,571 | | |
| | 59,032 | | | Grupo Aeroportuario del Pacifico
SAB de CV - Class B | | | 399,780 | | |
| | 35,498 | | | Grupo Aeroportuario del Sureste
SAB de CV - Class B | | | 451,061 | | |
| | 221,944 | | | OHL Mexico SAB de CV (a) | | | 677,457 | | |
| | | | 1,703,869 | | |
| | | Netherlands 1.2% | |
| | 16,381 | | | Koninklijke Vopak NV | | | 800,769 | | |
| | | New Zealand 1.2% | |
| | 152,502 | | | Auckland International
Airport Ltd. | | | 520,739 | | |
| | 127,604 | | | Vector Ltd. | | | 283,778 | | |
| | | | 804,517 | | |
| | | Spain 7.0% | |
| | 84,174 | | | Abertis Infraestructuras SA | | | 1,936,936 | | |
| | 30,592 | | | Enagas SA | | | 984,406 | | |
| | 18,489 | | | Red Electrica Corp. SA | | | 1,691,175 | | |
| | | | 4,612,517 | | |
| | | Switzerland 0.7% | |
| | 786 | | | Flughafen Zuerich AG | | | 483,052 | | |
| | | United Kingdom 7.7% | |
| | 141,647 | | | National Grid PLC | | | 2,036,273 | | |
| | 48,928 | | | Pennon Group PLC | | | 657,319 | | |
The accompanying notes are an integral part of these financial statements.
page 32

Frontegra MFG Core Infrastructure Fund
SCHEDULE OF INVESTMENTS (continued)
June 30, 2014
Number of Shares | | | | Value | |
| COMMON STOCKS 97.6% (continued) | | | |
| | | United Kingdom 7.7% (continued) | |
| | 30,670 | | | Severn Trent PLC | | $ | 1,014,075 | | |
| | 87,319 | | | United Utilities Group PLC | | | 1,318,034 | | |
| | | | 5,025,701 | | |
| | | United States 39.7% | |
| | 2,910 | | | ALLETE, Inc. | | | 149,428 | | |
| | 6,542 | | | Alliant Energy Corp. | | | 398,146 | | |
| | 15,043 | | | Ameren Corp. | | | 614,958 | | |
| | 25,346 | | | American Electric Power Co., Inc. | | | 1,413,546 | | |
| | 1,922 | | | American States Water Co. | | | 63,868 | | |
| | 16,163 | | | American Tower Corp. | | | 1,454,347 | | |
| | 11,099 | | | American Water Works Co., Inc. | | | 548,846 | | |
| | 11,649 | | | Aqua America, Inc. | | | 305,437 | | |
| | 6,883 | | | Atmos Energy Corp. | | | 367,552 | | |
| | 2,981 | | | Avista Corp. | | | 99,923 | | |
| | 2,767 | | | California Water Service Group | | | 66,961 | | |
| | 28,253 | | | CenterPoint Energy, Inc. | | | 721,582 | | |
| | 4,147 | | | Cleco Corp. | | | 244,466 | | |
| | 16,708 | | | CMS Energy Corp. | | | 520,454 | | |
| | 18,158 | | | Consolidated Edison, Inc. | | | 1,048,443 | | |
| | 19,382 | | | Crown Castle International Corp. | | | 1,439,307 | | |
| | 10,975 | | | DTE Energy Co. | | | 854,623 | | |
| | 19,028 | | | Duke Energy Corp. | | | 1,411,687 | | |
| | 1,998 | | | El Paso Electric Co. | | | 80,340 | | |
| | 10,131 | | | Great Plains Energy, Inc. | | | 272,220 | | |
| | 3,456 | | | IDACORP, Inc. | | | 199,860 | | |
| | 5,494 | | | Integrys Energy Group, Inc. | | | 390,788 | | |
| | 10,830 | | | ITC Holdings Corp. | | | 395,078 | | |
| | 19,521 | | | NiSource, Inc. | | | 767,956 | | |
| | 19,590 | | | Northeast Utilities | | | 926,019 | | |
| | 1,345 | | | Northwest Natural Gas Co. | | | 63,417 | | |
| | 1,940 | | | NorthWestern Corp. | | | 101,249 | | |
| | 17,247 | | | Pepco Holdings, Inc. | | | 473,948 | | |
| | 28,813 | | | PG&E Corp. | | | 1,383,600 | | |
| | 5,369 | | | Piedmont Natural Gas Co., Inc. | | | 200,854 | | |
| | 7,582 | | | Pinnacle West Capital Corp. | | | 438,543 | | |
Number of Shares | | | | Value | |
| | | United States 39.7% (continued) | |
| | 5,472 | | | PNM Resources, Inc. | | $ | 160,494 | | |
| | 5,371 | | | Portland General Electric Co. | | | 186,213 | | |
| | 39,165 | | | PPL Corp. | | | 1,391,532 | | |
| | 12,033 | | | Questar Corp. | | | 298,418 | | |
| | 9,728 | | | SCANA Corp. | | | 523,464 | | |
| | 13,481 | | | Sempra Energy | | | 1,411,595 | | |
| | 263 | | | SJW Corp. | | | 7,154 | | |
| | 3,195 | | | Southwest Gas Corp. | | | 168,664 | | |
| | 14,963 | | | TECO Energy, Inc. | | | 276,516 | | |
| | 2,344 | | | The Empire District Electric Co. | | | 60,194 | | |
| | 2,963 | | | The Laclede Group, Inc. | | | 143,854 | | |
| | 31,122 | | | The Southern Co. | | | 1,412,316 | | |
| | 3,884 | | | UIL Holdings Corp. | | | 150,350 | | |
| | 2,865 | | | UNS Energy Corp. | | | 173,075 | | |
| | 5,665 | | | Vectren Corp. | | | 240,762 | | |
| | 8,856 | | | Westar Energy, Inc. | | | 338,211 | | |
| | 14,830 | | | Wisconsin Energy Corp. | | | 695,824 | | |
| | 31,120 | | | Xcel Energy, Inc. | | | 1,002,998 | | |
| | | | 26,059,080 | | |
| | | Total Common Stocks | |
| | | | | (Cost $59,746,544) | | | 64,067,896 | | |
CLOSED-END FUNDS 0.9% | | | |
| | | United Kingdom 0.9% | |
| | 154,540 | | | HICL Infrastructure Co. Ltd. | | | 370,005 | | |
| | 97,355 | | | International Public
Partnerships Ltd. | | | 222,095 | | |
| | | | 592,100 | | |
| | | Total Closed-End Funds | |
| | | | | (Cost $550,089) | | | 592,100 | | |
The accompanying notes are an integral part of these financial statements.
page 33

Frontegra MFG Core Infrastructure Fund
SCHEDULE OF INVESTMENTS (continued)
June 30, 2014
Number of Shares | | | | Value | |
SHORT-TERM INVESTMENTS 2.4% | |
| | | Investment Company 2.4% | |
| | 1,585,604 | | | STIT Liquid Assets Portfolio -
Institutional Class, 0.06% | | $ | 1,585,604 | | |
| | | Total Short-Term Investments | |
| | | (Cost $1,585,604) | | | 1,585,604 | | |
| | | Total Investments 100.9% | |
| | | (Cost $61,882,237) | | | 66,245,600 | | |
| | | Liabilities in Excess of
Other Assets (0.9)% | | | (579,680 | ) | |
| | | TOTAL NET ASSETS 100.0% | | $ | 65,665,920 | | |
(a) Non-Income Producing.
ADR - American Depositary Receipt
PORTFOLIO DIVERSIFICATION
Sectors | | Percentage | |
Integrated Power | | | 28.1 | % | |
Transmission & Distribution | | | 17.7 | | |
Gas | | | 16.0 | | |
Toll Road | | | 10.4 | | |
Airport | | | 9.2 | | |
Communications | | | 8.6 | | |
Water Utility | | | 6.0 | | |
Port | | | 1.6 | | |
Total Common Stocks | | | 97.6 | | |
Social | | | 0.9 | | |
Total Closed-End Funds | | | 0.9 | | |
Total Short-Term Investments | | | 2.4 | | |
Total Investments | | | 100.9 | | |
Liabilities in Excess of Other Assets | | | (0.9 | ) | |
Total Net Assets | | | 100.0 | % | |
The accompanying notes are an integral part of these financial statements.
page 34

Frontegra Timpani Small Cap Growth Fund
SCHEDULE OF INVESTMENTS
June 30, 2014
Number of Shares | | | | Value | |
COMMON STOCKS 96.4% | | | |
| | | Consumer Discretionary 25.3% | |
| | 2,402 | | | Century Communities, Inc. (a) | | $ | 53,204 | | |
| | 5,634 | | | Fiesta Restaurant Group, Inc. (a) | | | 261,474 | | |
| | 3,261 | | | Gentherm, Inc. (a) | | | 144,951 | | |
| | 2,409 | | | G-III Apparel Group Ltd. (a) | | | 196,719 | | |
| | 7,380 | | | Grand Canyon Education, Inc. (a) | | | 339,259 | | |
| | 5,862 | | | Jack In the Box, Inc. | | | 350,782 | | |
| | 4,723 | | | JAKKS Pacific, Inc. (a) | | | 36,556 | | |
| | 5,215 | | | Kate Spade & Co. (a) | | | 198,900 | | |
| | 8,960 | | | Kona Grill, Inc. (a) | | | 173,914 | | |
| | 3,777 | | | Lithia Motors, Inc. - Class A | | | 355,302 | | |
| | 31,061 | | | Marchex, Inc. - Class B | | | 373,353 | | |
| | 1,246 | | | Monro Muffler Brake, Inc. | | | 66,275 | | |
| | 9,406 | | | Motorcar Parts of America, Inc. (a) | | | 229,036 | | |
| | 14,517 | | | Nautilus, Inc. (a) | | | 160,994 | | |
| | 4,220 | | | Penske Automotive Group, Inc. | | | 208,890 | | |
| | 1,234 | | | Shutterstock, Inc. (a) | | | 102,397 | | |
| | 1,863 | | | Skechers U.S.A., Inc. - Class A (a) | | | 85,139 | | |
| | 6,834 | | | The Finish Line, Inc. - Class A | | | 203,243 | | |
| | 9,726 | | | Tuesday Morning Corp. (a) | | | 173,317 | | |
| | | | 3,713,705 | | |
| | | Consumer Staples 2.9% | |
| | 3,767 | | | Inventure Foods, Inc. (a) | | | 42,454 | | |
| | 2,124 | | | J&J Snack Foods Corp. | | | 199,911 | | |
| | 722 | | | The Hain Celestial Group, Inc. (a) | | | 64,070 | | |
| | 1,515 | | | TreeHouse Foods, Inc. (a) | | | 121,306 | | |
| | | | 427,741 | | |
| | | Energy 12.2% | |
| | 5,105 | | | American Eagle Energy Corp. (a) | | | 30,579 | | |
| | 5,287 | | | Basic Energy Services, Inc. (a) | | | 154,486 | | |
| | 7,502 | | | C&J Energy Services, Inc. (a) | | | 253,418 | | |
| | 4,981 | | | Diamondback Energy, Inc. (a) | | | 442,313 | | |
| | 4,759 | | | Natural Gas Services Group, Inc. (a) | | | 157,332 | | |
| | 15,624 | | | Precision Drilling Corp. | | | 221,236 | | |
| | 9,410 | | | Sanchez Energy Corp. (a) | | | 353,722 | | |
| | 17,971 | | | Vertex Energy, Inc. (a) | | | 174,498 | | |
| | | | 1,787,584 | | |
Number of Shares | | | | Value | |
| | | Financial Services 1.8% | |
| | 8,847 | | | Tree.com, Inc. (a) | | $ | 257,802 | | |
| | | Health Care 20.7% | |
| | 5,955 | | | Air Methods Corp. (a) | | | 307,576 | | |
| | 2,807 | | | ANI Pharmaceuticals, Inc. (a) | | | 96,673 | | |
| | 31,677 | | | BioDelivery Sciences
International, Inc. (a) | | | 382,341 | | |
| | 2,612 | | | Cantel Medical Corp. | | | 95,652 | | |
| | 5,577 | | | Cardiovascular Systems, Inc. (a) | | | 173,779 | | |
| | 8,494 | | | Dipexium Pharmaceuticals,
Inc. (a) | | | 82,392 | | |
| | 12,591 | | | Horizon Pharma, Inc. (a) | | | 199,190 | | |
| | 1,313 | | | Jazz Pharmaceuticals PLC (a) | | | 193,024 | | |
| | 11,096 | | | Lannett Co., Inc. (a) | | | 550,584 | | |
| | 6,956 | | | Ligand Pharmaceuticals, Inc. (a) | | | 433,289 | | |
| | 2,783 | | | Novadaq Technologies, Inc. (a) | | | 45,864 | | |
| | 8,970 | | | Repligen Corp. (a) | | | 204,426 | | |
| | 2,693 | | | STAAR Surgical Co. (a) | | | 45,242 | | |
| | 4,729 | | | Team Health Holdings, Inc. (a) | | | 236,166 | | |
| | | | 3,046,198 | | |
| | | Materials & Processing 1.3% | |
| | 9,460 | | | Builders FirstSource, Inc. (a) | | | 70,761 | | |
| | 6,300 | | | Stock Building Supply
Holdings, Inc. (a) | | | 124,299 | | |
| | | | 195,060 | | |
| | | Producer Durables 18.0% | |
| | 3,672 | | | Celadon Group, Inc. | | | 78,287 | | |
| | 1,267 | | | CoStar Group, Inc. (a) | | | 200,401 | | |
| | 9,057 | | | CUI Global, Inc. (a) | | | 76,079 | | |
| | 2,896 | | | Forward Air Corp. | | | 138,574 | | |
| | 8,068 | | | Hawaiian Holdings, Inc. (a) | | | 110,612 | | |
| | 3,159 | | | Hub Group, Inc. - Class A (a) | | | 159,214 | | |
| | 1,567 | | | ITT Corp. | | | 75,373 | | |
| | 7,249 | | | Korn/Ferry International (a) | | | 212,903 | | |
| | 4,537 | | | Marten Transport Ltd. | | | 101,402 | | |
| | 1,029 | | | MAXIMUS, Inc. | | | 44,268 | | |
The accompanying notes are an integral part of these financial statements.
page 35

Frontegra Timpani Small Cap Growth Fund
SCHEDULE OF INVESTMENTS (continued)
June 30, 2014
Number of Shares | | | | Value | |
| COMMON STOCKS 96.4% (continued) | | | |
| | | Producer Durables 18.0% (continued) | |
| | 3,472 | | | Maxwell Technologies, Inc. (a) | | $ | 52,531 | | |
| | 3,394 | | | Mobile Mini, Inc. | | | 162,539 | | |
| | 2,712 | | | Old Dominion Freight Line,
Inc. (a) | | | 172,700 | | |
| | 772 | | | Power Solutions International,
Inc. (a) | | | 55,561 | | |
| | 7,115 | | | Swift Transportation Co. (a) | | | 179,511 | | |
| | 3,531 | | | The Middleby Corp. (a) | | | 292,084 | | |
| | 913 | | | TransDigm Group, Inc. | | | 152,708 | | |
| | 5,785 | | | Wabash National Corp. (a) | | | 82,436 | | |
| | 6,260 | | | WageWorks, Inc. (a) | | | 301,795 | | |
| | | | 2,648,978 | | |
| | | Technology 14.2% | |
| | 20,873 | | | AudioCodes Ltd. (a) | | | 147,155 | | |
| | 5,395 | | | Callidus Software, Inc. (a) | | | 64,416 | | |
| | 3,021 | | | Cavium, Inc. (a) | | | 150,023 | | |
| | 1,839 | | | Dealertrack Technologies, Inc. (a) | | | 83,380 | | |
| | 9,426 | | | Diodes, Inc. (a) | | | 272,977 | | |
| | 17,824 | | | Glu Mobile, Inc. (a) | | | 89,120 | | |
| | 4,155 | | | inContact, Inc. (a) | | | 38,184 | | |
| | 20,071 | | | MaxLinear, Inc. - Class A (a) | | | 202,115 | | |
| | 9,825 | | | Perficient, Inc. (a) | | | 191,293 | | |
| | 2,071 | | | Proofpoint, Inc. (a) | | | 77,580 | | |
| | 8,895 | | | Super Micro Computer, Inc. (a) | | | 224,777 | | |
| | 13,530 | | | TechTarget, Inc. (a) | | | 119,335 | | |
| | 2,872 | | | Tyler Technologies, Inc. (a) | | | 261,955 | | |
| | 3,705 | | | Ubiquiti Networks, Inc. (a) | | | 167,429 | | |
| | | | 2,089,739 | | |
| | | Total Common Stocks | |
| | | | | (Cost $11,976,953) | | | 14,166,807 | | |
Number of Shares | | | | Value | |
SHORT-TERM INVESTMENTS 2.9% | |
| | | Investment Company 2.9% | |
| | 425,881 | | | STIT-STIC Prime Portfolio -
Institutional Class, 0.01% | | $ | 425,881 | | |
| | | Total Short-Term Investments | |
| | | (Cost $425,881) | | | 425,881 | | |
| | | Total Investments 99.3% | |
| | | (Cost $12,402,834) | | | 14,592,688 | | |
| | | Other Assets in Excess of
Liabilities 0.7% | | | 100,017 | | |
| | | TOTAL NET ASSETS 100.0% | | $ | 14,692,705 | | |
(a) Non-Income Producing.
PORTFOLIO DIVERSIFICATION
Sectors | | Percentage | |
Consumer Discretionary | | | 25.3 | % | |
Health Care | | | 20.7 | | |
Producer Durables | | | 18.0 | | |
Technology | | | 14.2 | | |
Energy | | | 12.2 | | |
Consumer Staples | | | 2.9 | | |
Financial Services | | | 1.8 | | |
Materials and Processing | | | 1.3 | | |
Total Common Stocks | | | 96.4 | | |
Total Short-Term Investments | | | 2.9 | | |
Total Investments | | | 99.3 | | |
Other Assets in Excess of Liabilities | | | 0.7 | | |
Total Net Assets | | | 100.0 | % | |
The accompanying notes are an integral part of these financial statements.
page 36

Frontegra Netols Small Cap Value Fund
SCHEDULE OF INVESTMENTS
June 30, 2014
Number of Shares | | | | Value | |
COMMON STOCKS 98.1% | | | |
| | | Consumer Discretionary 14.0% | |
| | 203,085 | | | Accuride Corp. (a) | | $ | 993,086 | | |
| | 39,797 | | | ANN, Inc. (a) | | | 1,637,248 | | |
| | 27,037 | | | Cabela's, Inc. (a) | | | 1,687,109 | | |
| | 26,146 | | | Capella Education Co. | | | 1,422,081 | | |
| | 17,453 | | | Carter's, Inc. | | | 1,203,035 | | |
| | 33,849 | | | DeVry, Inc. | | | 1,433,167 | | |
| | 19,343 | | | Domino's Pizza, Inc. | | | 1,413,780 | | |
| | 47,581 | | | Ethan Allen Interiors, Inc. | | | 1,177,154 | | |
| | 25,584 | | | Tenneco, Inc. (a) | | | 1,680,869 | | |
| | 26,142 | | | The Cheesecake Factory, Inc. | | | 1,213,511 | | |
| | | | 13,861,040 | | |
| | | Consumer Staples 6.0% | |
| | 110,960 | | | Boulder Brands, Inc. (a) | | | 1,573,413 | | |
| | 18,947 | | | Casey's General Stores, Inc. | | | 1,331,785 | | |
| | 183,756 | | | SUPERVALU, Inc. (a) | | | 1,510,474 | | |
| | 19,478 | | | TreeHouse Foods, Inc. (a) | | | 1,559,603 | | |
| | | | 5,975,275 | | |
| | | Energy 5.5% | |
| | 47,815 | | | Bill Barrett Corp. (a) | | | 1,280,486 | | |
| | 151,438 | | | McDermott International, Inc. (a) | | | 1,225,133 | | |
| | 43,410 | | | Superior Energy Services, Inc. | | | 1,568,837 | | |
| | 113,012 | | | Willbros Group, Inc. (a) | | | 1,395,698 | | |
| | | | 5,470,154 | | |
| | | Financials 17.2% | |
| | 56,765 | | | BancorpSouth, Inc. | | | 1,394,716 | | |
| | 31,136 | | | Community Bank System, Inc. | | | 1,127,123 | | |
| | 27,239 | | | Endurance Specialty
Holdings Ltd. | | | 1,405,260 | | |
| | 52,927 | | | Glacier Bancorp, Inc. | | | 1,502,068 | | |
| | 239,067 | | | MGIC Investment Corp. (a) | | | 2,208,979 | | |
| | 75,748 | | | Old National Bancorp | | | 1,081,681 | | |
| | 30,209 | | | PHH Corp. (a) | | | 694,203 | | |
| | 57,318 | | | Selective Insurance Group, Inc. | | | 1,416,901 | | |
| | 67,716 | | | State Bank Financial Corp. | | | 1,145,078 | | |
| | 100,701 | | | Sterling Bancorp | | | 1,208,412 | | |
Number of Shares | | | | Value | |
| | | Financials 17.2% (continued) | |
| | 27,842 | | | The Hanover Insurance
Group, Inc. | | $ | 1,758,222 | | |
| | 25,984 | | | Walter Investment
Management Corp. (a) | | | 773,804 | | |
| | 42,015 | | | Webster Financial Corp. | | | 1,325,153 | | |
| | | | 17,041,600 | | |
| | | Health Care 9.8% | |
| | 29,332 | | | Acadia Healthcare
Company, Inc. (a) | | | 1,334,606 | | |
| | 66,501 | | | Albany Molecular
Research, Inc. (a) | | | 1,338,000 | | |
| | 20,693 | | | Haemonetics Corp. (a) | | | 730,049 | | |
| | 28,058 | | | Integra LifeSciences
Holdings Corp. (a) | | | 1,320,409 | | |
| | 72,881 | | | Invacare Corp. | | | 1,338,824 | | |
| | 18,052 | | | LifePoint Hospitals, Inc. (a) | | | 1,121,029 | | |
| | 34,614 | | | U.S. Physical Therapy, Inc. | | | 1,183,453 | | |
| | 38,488 | | | VCA Antech, Inc. (a) | | | 1,350,544 | | |
| | | | 9,716,914 | | |
| | | Industrials 17.0% | |
| | 36,382 | | | Actuant Corp. - Class A | | | 1,257,726 | | |
| | 57,534 | | | Briggs & Stratton Corp. | | | 1,177,146 | | |
| | 122,231 | | | Commercial Vehicle
Group, Inc. (a) | | | 1,227,199 | | |
| | 10,493 | | | Genesee & Wyoming, Inc. (a) | | | 1,101,765 | | |
| | 41,098 | | | Herman Miller, Inc. | | | 1,242,804 | | |
| | 140,445 | | | PGT, Inc. (a) | | | 1,189,569 | | |
| | 95,186 | | | TASER International, Inc. (a) | | | 1,265,974 | | |
| | 57,417 | | | Thermon Group Holdings, Inc. (a) | | | 1,511,216 | | |
| | 66,231 | | | Titan International, Inc. | | | 1,114,005 | | |
| | 44,216 | | | TriMas Corp. (a) | | | 1,685,956 | | |
| | 13,925 | | | United Rentals, Inc. (a) | | | 1,458,365 | | |
| | 31,968 | | | Westinghouse Air Brake
Technologies Corp. | | | 2,640,237 | | |
| | | | 16,871,962 | | |
The accompanying notes are an integral part of these financial statements.
page 37

Frontegra Netols Small Cap Value Fund
SCHEDULE OF INVESTMENTS (continued)
June 30, 2014
Number of Shares | | | | Value | |
| COMMON STOCKS 98.1% (continued) | | | |
| | | Information Technology 13.1% | |
| | 113,259 | | | Checkpoint Systems, Inc. (a) | | $ | 1,584,493 | | |
| | 92,908 | | | Entegris, Inc. (a) | | | 1,277,021 | | |
| | 27,955 | | | Fair Isaac Corp. | | | 1,782,411 | | |
| | 71,181 | | | Fairchild Semiconductor
International, Inc. (a) | | | 1,110,424 | | |
| | 44,373 | | | Monotype Imaging Holdings, Inc. | | | 1,249,987 | | |
| | 42,677 | | | Park Electrochemical Corp. | | | 1,203,918 | | |
| | 29,701 | | | Plexus Corp. (a) | | | 1,285,756 | | |
| | 52,616 | | | Progress Software Corp. (a) | | | 1,264,889 | | |
| | 60,720 | | | VeriFone Systems, Inc. (a) | | | 2,231,460 | | |
| | | | 12,990,359 | | |
| | | Materials 8.9% | |
| | 14,146 | | | Acuity Brands, Inc. | | | 1,955,684 | | |
| | 18,839 | | | Carpenter Technology Corp. | | | 1,191,567 | | |
| | 16,364 | | | Compass Minerals
International, Inc. | | | 1,566,689 | | |
| | 69,754 | | | Intrepid Potash, Inc. (a) | | | 1,169,077 | | |
| | 25,237 | | | Sensient Technologies Corp. | | | 1,406,206 | | |
| | 55,190 | | | Unifi, Inc. (a) | | | 1,519,381 | | |
| | | | 8,808,604 | | |
| | | Real Estate Investment Trusts 6.6% | |
| | 192,359 | | | FelCor Lodging Trust, Inc. | | | 2,021,693 | | |
| | 77,079 | | | First Industrial Realty Trust, Inc. | | | 1,452,169 | | |
| | 19,388 | | | National Health Investors, Inc. | | | 1,212,913 | | |
| | 36,468 | | | Sun Communities, Inc. | | | 1,817,565 | | |
| | | | 6,504,340 | | |
| | | Total Common Stocks | |
| | | | | (Cost $56,851,462) | | | 97,240,248 | | |
Number of Shares | | | | Value | |
SHORT-TERM INVESTMENTS 1.6% | |
| | | Investment Company 1.6% | |
| | 1,607,005 | | | Fidelity Institutional Money
Market Portfolio, Select
Class, 0.01% | | $ | 1,607,005 | | |
| | | Total Short-Term Investments | |
| | | (Cost $1,607,005) | | | 1,607,005 | | |
| | | Total Investments 99.7% | |
| | | (Cost $58,458,467) | | | 98,847,253 | | |
| | | Other Assets in Excess of
Liabilities 0.3% | | | 290,423 | | |
| | | TOTAL NET ASSETS 100.0% | | $ | 99,137,676 | | |
(a) Non-Income Producing.
PORTFOLIO DIVERSIFICATION
Sectors | | Percentage | |
Financials | | | 17.2 | % | |
Industrials | | | 17.0 | | |
Consumer Discretionary | | | 14.0 | | |
Information Technology | | | 13.1 | | |
Health Care | | | 9.8 | | |
Materials | | | 8.9 | | |
Real Estate Investment Trusts | | | 6.6 | | |
Consumer Staples | | | 6.0 | | |
Energy | | | 5.5 | | |
Total Common Stocks | | | 98.1 | | |
Total Short-Term Investments | | | 1.6 | | |
Total Investments | | | 99.7 | | |
Other Assets in Excess of Liabilities | | | 0.3 | | |
Total Net Assets | | | 100.0 | % | |
The accompanying notes are an integral part of these financial statements.
page 38

Frontegra Phocas Small Cap Value Fund
SCHEDULE OF INVESTMENTS
June 30, 2014
Number of Shares | | | | Value | |
COMMON STOCKS 96.7% | | | |
| | | Consumer Discretionary 8.6% | |
| | 11,036 | | | American Axle & Manufacturing
Holdings, Inc. (a) | | $ | 208,470 | | |
| | 1,346 | | | Cracker Barrel Old Country
Store, Inc. | | | 134,021 | | |
| | 12,161 | | | Dana Holding Corp. | | | 296,972 | | |
| | 3,161 | | | Deckers Outdoor Corp. (a) | | | 272,889 | | |
| | 3,487 | | | Destination Maternity Corp. | | | 79,399 | | |
| | 4,149 | | | Guess?, Inc. | | | 112,023 | | |
| | 5,548 | | | Interval Leisure Group, Inc. | | | 121,723 | | |
| | 2,593 | | | Meredith Corp. | | | 125,397 | | |
| | 2,379 | | | Meritage Homes Corp. (a) | | | 100,418 | | |
| | 23,268 | | | Scientific Games Corp. -
Class A (a) | | | 258,740 | | |
| | 5,548 | | | Steven Madden Ltd. (a) | | | 190,296 | | |
| | 7,988 | | | The E.W. Scripps Co. -
Class A (a) | | | 169,026 | | |
| | | | 2,069,374 | | |
| | | Consumer Staples 1.7% | |
| | 8,895 | | | Darling International, Inc. (a) | | | 185,905 | | |
| | 2,282 | | | Post Holdings, Inc. (a) | | | 116,177 | | |
| | 1,467 | | | TreeHouse Foods, Inc. (a) | | | 117,463 | | |
| | | | 419,545 | | |
| | | Energy 8.2% | |
| | 5,478 | | | Carrizo Oil & Gas, Inc. (a) | | | 379,406 | | |
| | 13,051 | | | Comstock Resources, Inc. | | | 376,391 | | |
| | 12,880 | | | Goodrich Petroleum Corp. (a) | | | 355,488 | | |
| | 19,815 | | | Kodiak Oil & Gas Corp. (a) | | | 288,308 | | |
| | 2,255 | | | PDC Energy, Inc. (a) | | | 142,403 | | |
| | 11,467 | | | Rex Energy Corp. (a) | | | 203,081 | | |
| | 4,310 | | | Rosetta Resources, Inc. (a) | | | 236,404 | | |
| | | | 1,981,481 | | |
| | | Financials 23.1% | |
| | 10,511 | | | American Equity Investment Life
Holding Co. | | | 258,571 | | |
| | 10,786 | | | Ameris Bancorp (a) | | | 232,546 | | |
Number of Shares | | | | Value | |
| | | Financials 23.1% (continued) | |
| | 4,684 | | | Argo Group International
Holdings Ltd. | | $ | 239,399 | | |
| | 10,281 | | | Banco Latinoamericano de
Comercio Exterior S.A. | | | 305,037 | | |
| | 7,293 | | | Banner Corp. | | | 289,022 | | |
| | 7,109 | | | BBCN Bancorp, Inc. | | | 113,389 | | |
| | 4,799 | | | Capital Bank Financial Corp. (a) | | | 113,304 | | |
| | 27,690 | | | CNO Financial Group, Inc. | | | 492,882 | | |
| | 13,946 | | | Heritage Commerce Corp. | | | 113,939 | | |
| | 11,094 | | | Heritage Financial Corp. | | | 178,502 | | |
| | 15,895 | | | Heritage Oaks Bancorp (a) | | | 121,279 | | |
| | 2,492 | | | IBERIABANK Corp. | | | 172,422 | | |
| | 23,889 | | | ICG Group, Inc. (a) | | | 498,802 | | |
| | 8,394 | | | International Bancshares Corp. | | | 226,638 | | |
| | 16,643 | | | National Penn Bancshares, Inc. | | | 176,083 | | |
| | 3,648 | | | Nelnet, Inc. - Class A | | | 151,137 | | |
| | 30,071 | | | NewBridge Bancorp (a) | | | 242,372 | | |
| | 6,181 | | | OceanFirst Financial Corp. | | | 102,357 | | |
| | 12,897 | | | State Bank Financial Corp. | | | 218,088 | | |
| | 1,867 | | | SVB Financial Group (a) | | | 217,730 | | |
| | 9,226 | | | Synovus Financial Corp. | | | 224,930 | | |
| | 16,865 | | | United Community Banks, Inc. | | | 276,080 | | |
| | 8,169 | | | United Financial Bancorp, Inc. | | | 110,690 | | |
| | 23,259 | | | Wilshire Bancorp, Inc. | | | 238,870 | | |
| | 5,536 | | | Wintrust Financial Corp. | | | 254,656 | | |
| | | | 5,568,725 | | |
| | | Health Care 4.1% | |
| | 32,840 | | | Accuray, Inc. (a) | | | 288,992 | | |
| | 34,541 | | | Progenics Pharmaceuticals, Inc. (a) | | | 148,872 | | |
| | 2,733 | | | United Therapeutics Corp. (a) | | | 241,843 | | |
| | 4,219 | | | WellCare Health Plans, Inc. (a) | | | 314,990 | | |
| | | | 994,697 | | |
The accompanying notes are an integral part of these financial statements.
page 39

Frontegra Phocas Small Cap Value Fund
SCHEDULE OF INVESTMENTS (continued)
June 30, 2014
Number of Shares | | | | Value | |
| COMMON STOCKS 96.7% (continued) | | | |
| | | Industrials 16.2% | |
| | 13,961 | | | Aceto Corp. | | $ | 253,253 | | |
| | 1,244 | | | AMERCO | | | 361,705 | | |
| | 3,935 | | | Avis Budget Group, Inc. (a) | | | 234,880 | | |
| | 18,780 | | | CBIZ, Inc. (a) | | | 169,583 | | |
| | 4,217 | | | Deluxe Corp. | | | 247,032 | | |
| | 2,298 | | | Esterline Technologies Corp. (a) | | | 264,546 | | |
| | 2,980 | | | Kadant, Inc. | | | 114,581 | | |
| | 5,330 | | | MYR Group, Inc. (a) | | | 135,009 | | |
| | 5,054 | | | Park-Ohio Holdings Corp. | | | 293,688 | | |
| | 3,762 | | | Regal-Beloit Corp. | | | 295,543 | | |
| | 7,913 | | | Spirit Airlines, Inc. (a) | | | 500,418 | | |
| | 4,325 | | | Tetra Tech, Inc. | | | 118,938 | | |
| | 3,206 | | | The Timken Company | | | 217,495 | | |
| | 5,790 | | | Trinity Industries, Inc. | | | 253,139 | | |
| | 1,492 | | | Triumph Group, Inc. | | | 104,171 | | |
| | 1,139 | | | UniFirst Corp. | | | 120,734 | | |
| | 2,610 | | | WESCO International, Inc. (a) | | | 225,452 | | |
| | | | 3,910,167 | | |
| | | Information Technology 12.3% | |
| | 8,758 | | | AOL, Inc. (a) | | | 348,481 | | |
| | 33,838 | | | Atmel Corp. (a) | | | 317,062 | | |
| | 6,437 | | | Euronet Worldwide, Inc. (a) | | | 310,521 | | |
| | 3,783 | | | Knowles Corp. (a) | | | 116,289 | | |
| | 3,544 | | | Methode Electronics, Inc. | | | 135,416 | | |
| | 4,479 | | | Microsemi Corp. (a) | | | 119,858 | | |
| | 4,638 | | | NCR Corp. (a) | | | 162,747 | | |
| | 7,107 | | | Progress Software Corp. (a) | | | 170,852 | | |
| | 4,933 | | | Rovi Corp. (a) | | | 118,195 | | |
| | 13,714 | | | Saba Software, Inc. (a) | | | 154,283 | | |
| | 8,159 | | | Skyworks Solutions, Inc. | | | 383,147 | | |
| | 3,509 | | | SYNNEX Corp. (a) | | | 255,631 | | |
| | 8,492 | | | TiVo, Inc. (a) | | | 109,632 | | |
| | 5,551 | | | Verint Systems, Inc. (a) | | | 272,276 | | |
| | | | 2,974,390 | | |
Number of Shares | | | | Value | |
| | | Materials 4.4% | |
| | 1,170 | | | Ashland, Inc. | | $ | 127,226 | | |
| | 2,464 | | | Cabot Corp. | | | 142,887 | | |
| | 2,250 | | | Domtar Corp. | | | 96,412 | | |
| | 2,414 | | | Kaiser Aluminum Corp. | | | 175,908 | | |
| | 4,377 | | | Kraton Performance Polymers,
Inc. (a) | | | 98,001 | | |
| | 3,313 | | | Materion Corp. | | | 122,548 | | |
| | 5,498 | | | Sensient Technologies Corp. | | | 306,349 | | |
| | | | 1,069,331 | | |
| | | Real Estate Investment Trusts 13.3% | |
| | 9,121 | | | Acadia Realty Trust | | | 256,209 | | |
| | 6,796 | | | CoreSite Realty Corp. | | | 224,744 | | |
| | 16,559 | | | First Industrial Realty Trust, Inc. | | | 311,972 | | |
| | 26,135 | | | First Potomac Realty Trust | | | 342,891 | | |
| | 15,036 | | | Hudson Pacific Properties, Inc. | | | 381,012 | | |
| | 4,653 | | | Kilroy Realty Corp. | | | 289,789 | | |
| | 18,356 | | | NorthStar Realty Finance Corp. | | | 319,027 | | |
| | 9,022 | | | Pebblebrook Hotel Trust | | | 333,453 | | |
| | 2,293 | | | PS Business Parks, Inc. | | | 191,443 | | |
| | 10,144 | | | Sabra Health Care REIT, Inc. | | | 291,234 | | |
| | 23,199 | | | Strategic Hotels & Resorts,
Inc. (a) | | | 271,660 | | |
| | | | 3,213,434 | | |
| | | Utilities 4.8% | |
| | 4,427 | | | Black Hills Corp. | | | 271,773 | | |
| | 2,810 | | | Chesapeake Utilities Corp. | | | 200,437 | | |
| | 2,084 | | | IDACORP, Inc. | | | 120,518 | | |
| | 2,318 | | | Laclede Group, Inc. | | | 112,539 | | |
| | 3,533 | | | PNM Resources, Inc. | | | 103,623 | | |
| | 3,383 | | | Portland General Electric Co. | | | 117,289 | | |
| | 3,959 | | | The Empire District Electric Co. | | | 101,667 | | |
| | 3,287 | | | UIL Holdings Corp. | | | 127,240 | | |
| | | | 1,155,086 | | |
| | | Total Common Stocks | |
| | | | | (Cost $18,519,327) | | | 23,356,230 | | |
The accompanying notes are an integral part of these financial statements.
page 40

Frontegra Phocas Small Cap Value Fund
SCHEDULE OF INVESTMENTS (continued)
June 30, 2014
Number of Shares | | | | Value | |
SHORT-TERM INVESTMENTS 3.4% | |
| | | Investment Company 3.4% | |
| | 811,536 | | | STIT-STIC Prime Portfolio -
Institutional Class, 0.01% | | $ | 811,536 | | |
| | | Total Short-Term Investments | |
| | | (Cost $811,536) | | | 811,536 | | |
| | | Total Investments 100.1% | |
| | | (Cost $19,330,863) | | | 24,167,766 | | |
| | | Liabilities in Excess of
Other Assets (0.1)% | | | (15,940 | ) | |
| | | TOTAL NET ASSETS 100.0% | | $ | 24,151,826 | | |
(a) Non-Income Producing.
PORTFOLIO DIVERSIFICATION
Sectors | | Percentage | |
Financials | | | 23.1 | % | |
Industrials | | | 16.2 | | |
Real Estate Investment Trusts | | | 13.3 | | |
Information Technology | | | 12.3 | | |
Consumer Discretionary | | | 8.6 | | |
Energy | | | 8.2 | | |
Utilities | | | 4.8 | | |
Materials | | | 4.4 | | |
Health Care | | | 4.1 | | |
Consumer Staples | | | 1.7 | | |
Total Common Stocks | | | 96.7 | | |
Total Short-Term Investments | | | 3.4 | | |
Total Investments | | | 100.1 | | |
Liabilities in Excess of Other Assets | | | (0.1 | ) | |
Total Net Assets | | | 100.0 | % | |
The accompanying notes are an integral part of these financial statements.
page 41

Frontegra Funds
STATEMENTS OF ASSETS AND LIABILITIES
June 30, 2014
| | | RobecoSAM Global
Equity Fund | | MFG Global
Equity Fund | | MFG Core
Infrastructure Fund | |
ASSETS: | |
Investments at cost | | $ | 13,854,238 | | | $ | 691,655,490 | | | $ | 61,882,237 | | |
Foreign currency at cost | | $ | 223 | | | $ | 75,631 | | | $ | 114,245 | | |
Investments at value | | $ | 17,914,353 | | | $ | 788,829,230 | | | $ | 66,245,600 | | |
Foreign currency at value | | | 224 | | | | 76,206 | | | | 114,836 | | |
Cash | | | 608 | | | | — | | | | — | | |
Receivable for investments sold | | | — | | | | — | | | | 1,459,134 | | |
Receivable for Fund shares sold | | | — | | | | 586,179 | | | | 55,523 | | |
Interest and dividends receivable | | | 67,108 | | | | 2,499,314 | | | | 304,696 | | |
Receivable for foreign currency | | | — | | | | 205,491 | | | | — | | |
Prepaid expenses and other assets | | | 12,743 | | | | 27,654 | | | | 21,517 | | |
Total assets | | | 17,995,036 | | | | 792,224,074 | | | | 68,201,306 | | |
LIABILITIES: | |
Payable for investments purchased | | | 122,943 | | | | 386,551 | | | | 2,470,719 | | |
Payable for Fund shares redeemed | | | — | | | | 8,303 | | | | 6,076 | | |
Payable to Directors | | | 800 | | | | 801 | | | | 803 | | |
Payable to Custodian | | | — | | | | 4,433 | | | | 583 | | |
Payable for foreign currency | | | — | | | | 205,491 | | | | — | | |
Payable to Adviser | | | 11,707 | | | | 451,237 | | | | 17,095 | | |
Accrued expenses | | | 29,196 | | | | 124,122 | | | | 40,110 | | |
Total liabilities | | | 164,646 | | | | 1,180,938 | | | | 2,535,386 | | |
Net Assets | | $ | 17,830,390 | | | $ | 791,043,136 | | | $ | 65,665,920 | | |
NET ASSETS CONSIST OF: | |
Paid in capital | | $ | 11,588,932 | | | $ | 683,796,743 | | | $ | 60,633,201 | | |
Undistributed net investment income | | | 162,927 | | | | 6,117,837 | | | | 647,729 | | |
Accumulated undistributed net realized gain | | | 2,017,662 | | | | 3,927,533 | | | | 18,899 | | |
Net unrealized appreciation on: | |
Investments | | | 4,060,115 | | | | 97,173,740 | | | | 4,363,363 | | |
Foreign currency | | | 754 | | | | 27,283 | | | | 2,728 | | |
Net Assets | | $ | 17,830,390 | | | $ | 791,043,136 | | | $ | 65,665,920 | | |
CAPITAL STOCK, $0.01 PAR VALUE | |
Net Assets | | $ | 17,830,390 | | | $ | 791,043,136 | | | $ | 65,665,920 | | |
Authorized | | | 50,000,000 | | | | 100,000,000 | | | | 50,000,000 | | |
Issued and Outstanding | | | 1,190,215 | | | | 51,606,752 | | | | 4,648,362 | | |
Net Asset Value, Redemption Price and Offering Price Per Share | | $ | 14.98 | | | $ | 15.33 | | | $ | 14.13 | | |
The accompanying notes are an integral part of these financial statements.
page 42

Frontegra Funds
STATEMENTS OF ASSETS AND LIABILITIES (continued)
June 30, 2014
| | | Timpani Small Cap
Growth Fund | | Netols Small Cap
Value Fund | | Phocas Small Cap
Value Fund | |
ASSETS: | |
Investments at cost | | $ | 12,402,834 | | | $ | 58,458,467 | | | $ | 19,330,863 | | |
Investments at value | | $ | 14,592,688 | | | $ | 98,847,253 | | | $ | 24,167,766 | | |
Cash | | | — | | | | 9,178 | | | | — | | |
Receivable for investments sold | | | 253,075 | | | | 552,097 | | | | — | | |
Receivable for Fund shares sold | | | 29,900 | | | | 49,418 | | | | 4,689 | | |
Interest and dividends receivable | | | 712 | | | | 82,895 | | | | 17,729 | | |
Receivable from Adviser | | | 4,763 | | | | — | | | | — | | |
Prepaid expenses and other assets | | | 18,250 | | | | 7,167 | | | | 7,158 | | |
Total assets | | | 14,899,388 | | | | 99,548,008 | | | | 24,197,342 | | |
LIABILITIES: | |
Payable for investments purchased | | | 173,741 | | | | 201,173 | | | | — | | |
Payable for Fund shares redeemed | | | 3,021 | | | | 85,123 | | | | 3,624 | | |
Payable to Directors | | | 800 | | | | 799 | | | | 801 | | |
Payable to Custodian | | | 583 | | | | — | | | | 583 | | |
Payable to Adviser | | | — | | | | 81,796 | | | | 12,953 | | |
Accrued distribution and shareholder servicing fees | | | 353 | | | | 6,383 | | | | — | | |
Accrued expenses | | | 28,185 | | | | 35,058 | | | | 27,555 | | |
Total liabilities | | | 206,683 | | | | 410,332 | | | | 45,516 | | |
Net Assets | | $ | 14,692,705 | | | $ | 99,137,676 | | | $ | 24,151,826 | | |
NET ASSETS CONSIST OF: | |
Paid in capital | | $ | 13,175,142 | | | $ | 43,132,047 | | | $ | 18,323,089 | | |
Undistributed net investment loss | | | (47,277 | ) | | | (51,811 | ) | | | — | | |
Accumulated undistributed net realized gain (loss) | | | (625,014 | ) | | | 15,668,654 | | | | 991,834 | | |
Net unrealized appreciation on investments | | | 2,189,854 | | | | 40,388,786 | | | | 4,836,903 | | |
Net Assets | | $ | 14,692,705 | | | $ | 99,137,676 | | | $ | 24,151,826 | | |
CAPITAL STOCK, $0.01 PAR VALUE | | Institutional Class | | Institutional Class | | | |
Net Assets | | $ | 13,477,989 | | | $ | 98,504,281 | | | $ | 24,151,826 | | |
Authorized | | | 50,000,000 | | | | 50,000,000 | | | | 100,000,000 | | |
Issued and Outstanding | | | 839,017 | | | | 6,717,686 | | | | 671,708 | | |
Net Asset Value, Redemption Price and Offering Price Per Share | | $ | 16.06 | | | $ | 14.66 | | | $ | 35.96 | | |
CAPITAL STOCK, $0.01 PAR VALUE | | Class Y | | Class Y | | | |
Net Assets | | $ | 1,214,716 | | | $ | 633,395 | | | | |
Authorized | | | 50,000,000 | | | | 50,000,000 | | | | |
Issued and Outstanding | | | 75,743 | | | | 44,775 | | | | |
Net Asset Value, Redemption Price and Offering Price Per Share | | $ | 16.04 | | | $ | 14.15 | | | | |
The accompanying notes are an integral part of these financial statements.
page 43

Frontegra Funds
STATEMENTS OF OPERATIONS
For the Year Ended June 30, 2014
| | | RobecoSAM Global
Equity Fund | | MFG Global
Equity Fund | | MFG Core
Infrastructure Fund | |
INVESTMENT INCOME: | |
Dividend income | | $ | 481,278 | (1) | | $ | 12,268,481 | (2) | | $ | 962,996 | (3) | |
Interest income | | | 215 | | | | 10,778 | | | | 519 | | |
Total investment income | | | 481,493 | | | | 12,279,259 | | | | 963,515 | | |
EXPENSES: | |
Investment advisory fees | | | 141,575 | | | | 4,742,112 | | | | 137,016 | | |
Fund administration and accounting fees | | | 31,862 | | | | 171,608 | | | | 33,874 | | |
Custody fees | | | 29,180 | | | | 98,323 | | | | 33,158 | | |
Federal and state registration fees | | | 22,184 | | | | 29,813 | | | | 5,551 | | |
Legal fees | | | 18,074 | | | | 22,652 | | | | 18,863 | | |
Directors' fees and related expenses | | | 17,500 | | | | 17,500 | | | | 17,504 | | |
Audit fees | | | 16,247 | | | | 16,247 | | | | 16,244 | | |
Transfer agent fees | | | 7,554 | | | | 27,099 | | | | 7,233 | | |
Reports to shareholders | | | 3,320 | | | | 11,637 | | | | 2,687 | | |
Other | | | 7,229 | | | | 129,696 | | | | 12,142 | | |
Total expenses before waiver and reimbursement | | | 294,725 | | | | 5,266,687 | | | | 284,272 | | |
Waiver and reimbursement of expenses by Adviser | | | (82,363 | ) | | | (524,574 | ) | | | (147,255 | ) | |
Net expenses | | | 212,362 | | | | 4,742,113 | | | | 137,017 | | |
Net Investment Income | | | 269,131 | | | | 7,537,146 | | | | 826,498 | | |
REALIZED AND UNREALIZED GAIN (LOSS)
ON INVESTMENTS: | |
Net realized gain (loss) on: | |
Investments | | | 2,720,932 | | | | 5,422,340 | | | | 26,315 | | |
Foreign currency transactions | | | (23,551 | ) | | | 1,286 | | | | (14,225 | ) | |
Change in net unrealized appreciation on: | |
Investments | | | 626,159 | | | | 69,732,325 | | | | 4,177,604 | | |
Foreign currency transactions | | | 2,313 | | | | 37,890 | | | | 3,801 | | |
Net Realized and Unrealized Gain on Investments | | | 3,325,853 | | | | 75,193,841 | | | | 4,193,495 | | |
Net Increase in Net Assets Resulting from Operations | | $ | 3,594,984 | | | $ | 82,730,987 | | | $ | 5,019,993 | | |
(1) Net of $31,807 in foreign withholding taxes.
(2) Net of $813,601 in foreign withholding taxes.
(3) Net of $80,757 in foreign withholding taxes.
The accompanying notes are an integral part of these financial statements.
page 44

Frontegra Funds
STATEMENTS OF OPERATIONS (continued)
For the Year Ended June 30, 2014
| | | Timpani Small Cap
Growth Fund | | Netols Small Cap
Value Fund | | Phocas Small Cap
Value Fund | |
INVESTMENT INCOME: | |
Dividend income | | $ | 15,905 | (4) | | $ | 910,432 | | | $ | 130,486 | | |
Interest income | | | 171 | | | | 174 | | | | 349 | | |
Total investment income | | | 16,076 | | | | 910,606 | | | | 130,835 | | |
EXPENSES: | |
Investment advisory fees | | | 79,034 | | | | 1,125,152 | | | | 135,936 | | |
Fund administration and accounting fees | | | 27,296 | | | | 51,917 | | | | 29,544 | | |
Custody fees | | | 11,662 | | | | 22,250 | | | | 9,007 | | |
Federal and state registration fees | | | 13,023 | | | | 12,040 | | | | 22,501 | | |
Legal fees | | | 15,911 | | | | 19,107 | | | | 19,028 | | |
Directors' fees and related expenses | | | 17,502 | | | | 17,499 | | | | 18,306 | | |
Audit fees | | | 14,248 | | | | 14,247 | | | | 14,245 | | |
Transfer agent fees | | | 9,015 | | | | 18,080 | | | | 9,315 | | |
Reports to shareholders | | | 1,765 | | | | 10,268 | | | | 4,273 | | |
Distribution and shareholder servicing fees - Class Y | | | 1,012 | | | | 10,602 | | | | — | | |
Other | | | 4,681 | | | | 25,871 | | | | 5,064 | | |
Total expenses before waiver and reimbursement | | | 195,149 | | | | 1,327,033 | | | | 267,219 | | |
Waiver and reimbursement of expenses by Adviser | | | (107,201 | ) | | | (78,732 | ) | | | (117,689 | ) | |
Net expenses | | | 87,948 | | | | 1,248,301 | | | | 149,530 | | |
Net Investment Loss | | | (71,872 | ) | | | (337,695 | ) | | | (18,695 | ) | |
REALIZED AND UNREALIZED GAIN (LOSS)
ON INVESTMENTS: | |
Net realized gain (loss) on investments | | | (361,238 | ) | | | 28,516,118 | | | | 1,411,818 | | |
Change in net unrealized appreciation/depreciation on investments | | | 1,158,942 | | | | (1,904,693 | ) | | | 2,491,733 | | |
Net Realized and Unrealized Gain on Investments | | | 797,704 | | | | 26,611,425 | | | | 3,903,551 | | |
Net Increase in Net Assets Resulting from Operations | | $ | 725,832 | | | $ | 26,273,730 | | | $ | 3,884,856 | | |
(4) Net of $121 in foreign withholding taxes.
The accompanying notes are an integral part of these financial statements.
page 45

Frontegra Funds
STATEMENTS OF CHANGES IN NET ASSETS
| | | RobecoSAM Global Equity Fund | | MFG Global Equity Fund | |
| | | For the
Year Ended
June 30, 2014 | | For the
Year Ended
June 30, 2013 | | For the
Year Ended
June 30, 2014 | | For the
Year Ended
June 30, 2013 | |
OPERATIONS: | |
Net investment income | | $ | 269,131 | | | $ | 310,148 | | | $ | 7,537,146 | | | $ | 2,299,496 | | |
Net realized gain (loss) on: | |
Investments | | | 2,720,932 | | | | (97,457 | ) | | | 5,422,340 | | | | 5,005,073 | | |
Foreign currency transactions | | | (23,551 | ) | | | (35,600 | ) | | | 1,286 | | | | (3,763 | ) | |
Change in net unrealized appreciation/depreciation on: | |
Investments | | | 626,159 | | | | 3,097,456 | | | | 69,732,325 | | | | 27,963,825 | | |
Foreign currency transactions | | | 2,313 | | | | (3,208 | ) | | | 37,890 | | | | (8,349 | ) | |
Net increase in net assets resulting from operations | | | 3,594,984 | | | | 3,271,339 | | | | 82,730,987 | | | | 35,256,282 | | |
DISTRIBUTIONS PAID TO SHAREHOLDERS FROM: | |
Net investment income | | | (231,994 | ) | | | (295,231 | ) | | | (3,309,753 | ) | | | (966,980 | ) | |
Net realized gain on investments | | | (307,567 | ) | | | — | | | | (5,090,258 | ) | | | (1,466,648 | ) | |
Net decrease in net assets resulting from distributions paid | | | (539,561 | ) | | | (295,231 | ) | | | (8,400,011 | ) | | | (2,433,628 | ) | |
CAPITAL SHARE TRANSACTIONS: | |
Shares sold | | | 178,469 | | | | 454,816 | | | | 401,764,717 | | | | 203,278,933 | | |
Shares issued to holders in reinvestment of distributions | | | 501,905 | | | | 277,765 | | | | 7,777,052 | | | | 2,415,348 | | |
Shares redeemed | | | (2,213,269 | ) | | | (7,352,755 | ) | | | (39,525,775 | ) | | | (373,668 | ) | |
Redemption fees | | | — | | | | — | | | | 1,307 | | | | 1,026 | | |
Net increase (decrease) in net assets resulting from capital share transactions | | | (1,532,895 | ) | | | (6,620,174 | ) | | | 370,017,301 | | | | 205,321,639 | | |
Total Increase (Decrease) in Net Assets | | | 1,522,528 | | | | (3,644,066 | ) | | | 444,348,277 | | | | 238,144,293 | | |
NET ASSETS: | |
Beginning of Period | | | 16,307,862 | | | | 19,951,928 | | | | 346,694,859 | | | | 108,550,566 | | |
End of Period | | $ | 17,830,390 | | | $ | 16,307,862 | | | $ | 791,043,136 | | | $ | 346,694,859 | | |
Undistributed net investment income | | $ | 162,927 | | | $ | 139,604 | | | $ | 6,117,837 | | | $ | 1,889,158 | | |
TRANSACTIONS IN SHARES: | |
Shares sold | | | 13,101 | | | | 42,720 | | | | 27,908,105 | | | | 15,602,744 | | |
Shares issued to holders in reinvestment of distributions | | | 36,556 | | | | 24,132 | | | | 536,348 | | | | 205,562 | | |
Shares redeemed | | | (156,442 | ) | | | (637,832 | ) | | | (2,660,958 | ) | | | (28,164 | ) | |
Net increase (decrease) in shares outstanding | | | (106,785 | ) | | | (570,980 | ) | | | 25,783,495 | | | | 15,780,142 | | |
The accompanying notes are an integral part of these financial statements.
page 46

Frontegra Funds
STATEMENTS OF CHANGES IN NET ASSETS (continued)
| | | MFG Core Infrastructure Fund | | Timpani Small Cap Growth Fund | |
| | | For the
Year Ended
June 30, 2014 | | For the
Year Ended
June 30, 2013 | | For the
Year Ended
June 30, 2014 | | For the
Year Ended
June 30, 2013 | |
OPERATIONS: | |
Net investment income (loss) | | $ | 826,498 | | | $ | 145,393 | | | $ | (71,872 | ) | | $ | (11,618 | ) | |
Net realized gain (loss) on: | |
Investments | | | 26,315 | | | | (7,191 | ) | | | (361,238 | ) | | | 367,810 | | |
Foreign currency transactions | | | (14,225 | ) | | | (822 | ) | | | — | | | | — | | |
Change in net unrealized appreciation/depreciation on: | |
Investments | | | 4,177,604 | | | | 106,260 | | | | 1,158,942 | | | | 501,400 | | |
Foreign currency transactions | | | 3,801 | | | | (1,243 | ) | | | — | | | | — | | |
Net increase in net assets resulting from operations | | | 5,019,993 | | | | 242,397 | | | | 725,832 | | | | 857,592 | | |
DISTRIBUTIONS PAID TO SHAREHOLDERS FROM: | | | | | | Institutional Class | | Institutional Class | |
Net investment income | | | (253,056 | ) | | | (118,030 | ) | | | — | | | | — | | |
Net realized gain on investments | | | — | | | | (1,836 | ) | | | (135,449 | ) | | | — | | |
Net decrease in net assets resulting from distributions paid | | | (253,056 | ) | | | (119,866 | ) | | | (135,449 | ) | | | — | | |
CAPITAL SHARE TRANSACTIONS: | | | | | | Institutional Class | | Institutional Class | |
Shares sold | | | 53,704,784 | | | | 4,342,000 | | | | 11,857,476 | | | | 302,712 | | |
Shares issued to holders in reinvestment of distributions | | | 244,776 | | | | 99,221 | | | | 127,954 | | | | — | | |
Shares redeemed | | | (354,534 | ) | | | (4,358 | ) | | | (3,043,387 | ) | | | (1,457 | ) | |
Redemption fees | | | 1,208 | | | | — | | | | — | | | | — | | |
Net increase in net assets resulting from capital share transactions | | | 53,596,234 | | | | 4,436,863 | | | | 8,942,043 | | | | 301,255 | | |
CAPITAL SHARE TRANSACTIONS(1): | | | | | | Class Y | | | |
Shares sold | | | | | | | 1,177,000 | | | | |
Net increase in net assets resulting from capital share transactions | | | | | | | 1,177,000 | | | | |
Total Increase in Net Assets | | | 58,363,171 | | | | 4,559,394 | | | | 10,709,426 | | | | 1,158,847 | | |
NET ASSETS: | |
Beginning of Period | | | 7,302,749 | | | | 2,743,355 | | | | 3,983,279 | | | | 2,824,432 | | |
End of Period | | $ | 65,665,920 | | | $ | 7,302,749 | | | $ | 14,692,705 | | | $ | 3,983,279 | | |
Undistributed net investment income (loss) | | $ | 647,729 | | | $ | 88,512 | | | $ | (47,277 | ) | | $ | (16,332 | ) | |
TRANSACTIONS IN SHARES: | | | | | | Institutional Class | | Institutional Class | |
Shares sold | | | 4,023,089 | | | | 366,605 | | | | 734,505 | | | | 27,417 | | |
Shares issued to holders in reinvestment of distributions | | | 20,280 | | | | 8,891 | | | | 8,114 | | | | — | | |
Shares redeemed | | | (27,662 | ) | | | (392 | ) | | | (204,927 | ) | | | (130 | ) | |
Net increase in shares outstanding | | | 4,015,707 | | | | 375,104 | | | | 537,692 | | | | 27,287 | | |
TRANSACTIONS IN SHARES(1): | | | | | | Class Y | | | |
Shares sold | | | | | | | 75,743 | | | | |
Net increase in shares outstanding | | | | | | | 75,743 | | | | |
(1) Class Y commenced operations on January 6, 2014.
The accompanying notes are an integral part of these financial statements.
page 47

Frontegra Funds
STATEMENTS OF CHANGES IN NET ASSETS (continued)
| | | Netols Small Cap Value Fund | | Phocas Small Cap Value Fund | |
| | | For the
Year Ended
June 30, 2014 | | For the
Year Ended
June 30, 2013 | | For the
Year Ended
June 30, 2014 | | For the
Year Ended
June 30, 2013 | |
OPERATIONS: | |
Net investment income (loss) | | $ | (337,695 | ) | | $ | (154,288 | ) | | $ | (18,695 | ) | | $ | 38,278 | | |
Net realized gain on investments | | | 28,516,118 | | | | 24,070,378 | | | | 1,411,818 | | | | 3,196,331 | | |
Change in net unrealized appreciation/depreciation on investments | | | (1,904,693 | ) | | | 7,618,584 | | | | 2,491,733 | | | | (1,003,094 | ) | |
Net increase in net assets resulting from operations | | | 26,273,730 | | | | 31,534,674 | | | | 3,884,856 | | | | 2,231,515 | | |
DISTRIBUTIONS PAID TO SHAREHOLDERS FROM: | | Institutional Class | | Institutional Class | | Institutional Class | | Institutional Class | |
Net investment income | | | — | | | | — | | | | (16,849 | ) | | | (61,412 | ) | |
Net realized gain on investments | | | (26,286,823 | ) | | | (5,798,112 | ) | | | (680,655 | ) | | | — | | |
Net decrease in net assets resulting from distributions paid | | | (26,286,823 | ) | | | (5,798,112 | ) | | | (697,504 | ) | | | (61,412 | ) | |
DISTRIBUTIONS PAID TO SHAREHOLDERS FROM: | | Class Y | | Class Y | | | | | |
Net realized gain on investments | | | (239,893 | ) | | | (899,137 | ) | | | | | |
Net decrease in net assets resulting from distributions paid | | | (239,893 | ) | | | (899,137 | ) | | | | | |
CAPITAL SHARE TRANSACTIONS(1): | | Institutional Class | | Institutional Class | | Institutional Class | | Institutional Class | |
Shares sold | | | 25,306,701 | | | | 8,289,832 | | | | 13,555,485 | | | | 1,139,262 | | |
Shares issued in connection with Class I conversion | | | — | | | | — | | | | — | | | | 3,516,268 | | |
Shares issued to holders in reinvestment of distributions | | | 22,953,330 | | | | 5,233,889 | | | | 697,504 | | | | 61,412 | | |
Shares redeemed | | | (61,531,235 | ) | | | (56,528,040 | ) | | | (2,292,640 | ) | | | (20,192,417 | ) | |
Net increase (decrease) in net assets resulting from capital share transactions | | | (13,271,204 | ) | | | (43,004,319 | ) | | | 11,960,349 | | | | (15,475,475 | ) | |
CAPITAL SHARE TRANSACTIONS: | | Class Y | | Class Y | | | | | |
Shares sold | | | 87,891 | | | | 2,276,127 | | | | | | |
Shares issued to holders in reinvestment of distributions | | | 239,893 | | | | 898,733 | | | | | | |
Shares redeemed | | | (21,044,865 | ) | | | (3,937,645 | ) | | | | | |
Net decrease in net assets resulting from capital share transactions | | | (20,717,081 | ) | | | (762,785 | ) | | | | | |
Total Increase (Decrease) in Net Assets | | | (34,241,271 | ) | | | (18,929,679 | ) | | | 15,147,701 | | | | (13,305,372 | ) | |
NET ASSETS: | |
Beginning of Period | | | 133,378,947 | | | | 152,308,626 | | | | 9,004,125 | | | | 22,309,497 | | |
End of Period | | $ | 99,137,676 | | | $ | 133,378,947 | | | $ | 24,151,826 | | | $ | 9,004,125 | | |
Undistributed net investment income (loss) | | $ | (51,811 | ) | | $ | 9,294 | | | $ | — | | | $ | 16,849 | | |
TRANSACTIONS IN SHARES(1): | | Institutional Class | | Institutional Class | | Institutional Class | | Institutional Class | |
Shares sold | | | 1,583,761 | | | | 612,746 | | | | 405,895 | | | | 43,996 | | |
Conversion of Class I shares | | | — | | | | — | | | | — | | | | 144,702 | | |
Shares issued to holders in reinvestment of distributions | | | 1,688,987 | | | | 396,207 | | | | 21,402 | | | | 2,510 | | |
Shares redeemed | | | (3,928,288 | ) | | | (4,101,006 | ) | | | (69,095 | ) | | | (835,389 | ) | |
Net increase (decrease) in shares outstanding | | | (655,540 | ) | | | (3,092,053 | ) | | | 358,202 | | | | (644,181 | ) | |
TRANSACTIONS IN SHARES: | | Class Y | | Class Y | | | | | |
Shares sold | | | 5,581 | | | | 164,466 | | | | | | |
Shares issued to holders in reinvestment of distributions | | | 18,257 | | | | 69,346 | | | | | | |
Shares redeemed | | | (1,324,940 | ) | | | (291,921 | ) | | | | | |
Net decrease in shares outstanding | | | (1,301,102 | ) | | | (58,109 | ) | | | | | |
(1) Effective November 1, 2012, Class I shares of the Frontegra Phocas Small Cap Value Fund were converted into Class L shares of the Fund. Class L shares were redesignated Institutional Class shares. Shares redeemed for the year ended June 30, 2013, includes $3,516,268, representing 144,822 shares, related to the conversion of Class I shares.
The accompanying notes are an integral part of these financial statements.
page 48

Frontegra RobecoSAM Global Equity Fund
FINANCIAL HIGHLIGHTS
| | | Year
Ended
June 30,
2014 | | Year
Ended
June 30,
2013 | | Year
Ended
June 30,
2012 | | Period
Ended
June 30,
2011(1)(2) | | Year
Ended
August 31,
2010 | | Period
Ended
August 31,
2009(3) | |
Net Asset Value, Beginning of Period | | $ | 12.57 | | | $ | 10.68 | | | $ | 13.15 | | | $ | 11.00 | | | $ | 11.30 | | | $ | 10.00 | | |
INCOME (LOSS) FROM
INVESTMENT OPERATIONS: | |
Net investment income | | | 0.21 | | | | 0.22 | | | | 0.18 | (4) | | | 0.25 | | | | 0.18 | (4) | | | 0.01 | (4) | |
Net realized and unrealized gain (loss) on investments | | | 2.62 | | | | 1.86 | | | | (1.67 | ) | | | 2.53 | | | | 0.47 | | | | 1.29 | | |
Total Income (Loss) from Investment Operations | | | 2.83 | | | | 2.08 | | | | (1.49 | ) | | | 2.78 | | | | 0.65 | | | | 1.30 | | |
LESS DISTRIBUTIONS: | |
From net investment income | | | (0.18 | ) | | | (0.19 | ) | | | (0.21 | ) | | | (0.21 | ) | | | (0.05 | ) | | | — | | |
From net realized gain on investments | | | (0.24 | ) | | | — | | | | (0.77 | ) | | | (0.42 | ) | | | (0.90 | ) | | | — | | |
Total Distributions | | | (0.42 | ) | | | (0.19 | ) | | | (0.98 | ) | | | (0.63 | ) | | | (0.95 | ) | | | — | | |
Redemption fees retained | | | — | | | | — | | | | — | | | | — | | | | — | (5) | | | — | | |
Net Asset Value, End of Period | | $ | 14.98 | | | $ | 12.57 | | | $ | 10.68 | | | $ | 13.15 | | | $ | 11.00 | | | $ | 11.30 | | |
Total Return | | | 22.72 | % | | | 19.78 | % | | | (10.91 | )% | | | 25.64 | %(6) | | | 5.42 | % | | | 13.00 | %(6) | |
SUPPLEMENTAL DATA AND RATIOS: | |
Net assets, end of period (in thousands) | | $ | 17,830 | | | $ | 16,308 | | | $ | 19,952 | | | $ | 19,292 | | | $ | 16,756 | | | $ | 11,614 | | |
Ratio of expenses to average net assets | |
Before waivers and reimbursements | | | 1.67 | % | | | 1.63 | % | | | 1.62 | % | | | 2.41 | %(7) | | | 2.81 | % | | | 4.06 | %(7) | |
Net of waivers and reimbursements | | | 1.20 | % | | | 1.20 | % | | | 1.20 | % | | | 1.20 | %(7) | | | 1.20 | % | | | 1.20 | %(7) | |
Ratio of net investment income (loss) to average net assets | |
Before waivers and reimbursements | | | 1.05 | % | | | 1.28 | % | | | 1.16 | % | | | 1.02 | %(7) | | | (0.03 | )% | | | (2.59 | )%(7) | |
Net of waivers and reimbursements | | | 1.52 | % | | | 1.71 | % | | | 1.58 | % | | | 2.23 | %(7) | | | 1.58 | % | | | 0.27 | %(7) | |
Portfolio turnover rate | | | 56 | % | | | 36 | % | | | 52 | % | | | 33 | %(6) | | | 88 | % | | | 72 | %(6) | |
(1) Effective June 30, 2011, the Fund changed its fiscal year end to June 30 from August 31.
(2) Effective June 10, 2011, Frontegra Asset Management, Inc. became adviser and RobecoSAM USA, Inc. (f/k/a Sustainable Asset Management USA, Inc.) became subadviser to the Fund.
(3) Commenced operations on June 18, 2009.
(4) Per share net investment income has been calculated using the daily average share method.
(5) Less than one cent per share.
(6) Not annualized.
(7) Annualized.
The accompanying notes are an integral part of these financial statements.
page 49

Frontegra MFG Global Equity Fund
FINANCIAL HIGHLIGHTS
| | | Year
Ended
June 30,
2014 | | Year
Ended
June 30,
2013 | | Period
Ended
June 30,
2012(1) | |
Net Asset Value, Beginning of Period | | $ | 13.43 | | | $ | 10.81 | | | $ | 10.00 | | |
INCOME FROM
INVESTMENT OPERATIONS: | |
Net investment income | | | 0.19 | (2) | | | 0.17 | (2) | | | 0.11 | (2) | |
Net realized and unrealized gain on investments | | | 1.91 | | | | 2.68 | | | | 0.70 | | |
Total Income from Investment Operations | | | 2.10 | | | | 2.85 | | | | 0.81 | | |
LESS DISTRIBUTIONS: | |
From net investment income | | | (0.08 | ) | | | (0.09 | ) | | | — | | |
From net realized gain on investments | | | (0.12 | ) | | | (0.14 | ) | | | — | | |
Total Distributions | | | (0.20 | ) | | | (0.23 | ) | | | — | | |
Redemption fees retained | | | — | (3) | | | — | (3) | | | — | | |
Net Asset Value, End of Period | | $ | 15.33 | | | $ | 13.43 | | | $ | 10.81 | | |
Total Return | | | 15.76 | % | | | 26.68 | % | | | 8.10 | %(4) | |
SUPPLEMENTAL DATA AND RATIOS: | |
Net assets, end of period (in thousands) | | $ | 791,043 | | | $ | 346,695 | | | $ | 108,551 | | |
Ratio of expenses to average net assets | |
Before waivers and reimbursements | | | 0.89 | % | | | 0.97 | % | | | 1.14 | %(5) | |
Net of waivers and reimbursements | | | 0.80 | % | | | 0.80 | % | | | 0.80 | %(5) | |
Ratio of net investment income to average net assets | |
Before waivers and reimbursements | | | 1.18 | % | | | 1.17 | % | | | 1.70 | %(5) | |
Net of waivers and reimbursements | | | 1.27 | % | | | 1.34 | % | | | 2.04 | %(5) | |
Portfolio turnover rate | | | 20 | % | | | 31 | % | | | 19 | %(4) | |
(1) Commenced operations on December 28, 2011.
(2) Per share net investment income has been calculated using the daily average share method.
(3) Less than one cent per share.
(4) Not annualized.
(5) Annualized.
The accompanying notes are an integral part of these financial statements.
page 50

Frontegra MFG Core Infrastructure Fund
FINANCIAL HIGHLIGHTS
| | | Year
Ended
June 30,
2014 | | Year
Ended
June 30,
2013 | | Period
Ended
June 30,
2012(1) | |
Net Asset Value, Beginning of Period | | $ | 11.54 | | | $ | 10.65 | | | $ | 10.00 | | |
INCOME FROM
INVESTMENT OPERATIONS: | |
Net investment income | | | 0.55 | (2) | | | 0.49 | (2) | | | 0.24 | | |
Net realized and unrealized gain on investments | | | 2.22 | | | | 0.84 | | | | 0.41 | | |
Total Income from Investment Operations | | | 2.77 | | | | 1.33 | | | | 0.65 | | |
LESS DISTRIBUTIONS: | |
From net investment income | | | (0.18 | ) | | | (0.44 | ) | | | — | | |
From net realized gain on investments | | | — | | | | — | (3) | | | — | | |
Total Distributions | | | (0.18 | ) | | | (0.44 | ) | | | — | | |
Redemption fees retained | | | — | (3) | | | — | | | | — | | |
Net Asset Value, End of Period | | $ | 14.13 | | | $ | 11.54 | | | $ | 10.65 | | |
Total Return | | | 24.22 | % | | | 12.73 | % | | | 6.50 | %(4) | |
SUPPLEMENTAL DATA AND RATIOS: | |
Net assets, end of period (in thousands) | | $ | 65,666 | | | $ | 7,303 | | | $ | 2,743 | | |
Ratio of expenses to average net assets | |
Before waivers and reimbursements | | | 1.45 | % | | | 3.66 | % | | | 6.55 | %(5) | |
Net of waivers and reimbursements | | | 0.70 | % | | | 0.70 | % | | | 0.70 | %(5) | |
Ratio of net investment income (loss) to average net assets | |
Before waivers and reimbursements | | | 3.47 | % | | | 1.34 | % | | | (1.09 | )%(5) | |
Net of waivers and reimbursements | | | 4.22 | % | | | 4.30 | % | | | 4.76 | %(5) | |
Portfolio turnover rate | | | 16 | % | | | 7 | % | | | 7 | %(4) | |
(1) Commenced operations on January 18, 2012.
(2) Per share net investment income has been calculated using the daily average share method.
(3) Less than one cent per share.
(4) Not annualized.
(5) Annualized.
The accompanying notes are an integral part of these financial statements.
page 51

Frontegra Timpani Small Cap Growth Fund
FINANCIAL HIGHLIGHTS
| | | Institutional Class | |
| | | Year
Ended
June 30,
2014 | | Year
Ended
June 30,
2013 | | Year
Ended
June 30,
2012 | | Period
Ended
June 30,
2011(1) | |
Net Asset Value, Beginning of Period | | $ | 13.22 | | | $ | 10.31 | | | $ | 10.75 | | | $ | 10.00 | | |
INCOME (LOSS) FROM
INVESTMENT OPERATIONS: | |
Net investment loss | | | (0.14 | )(2) | | | (0.04 | )(2) | | | (0.08 | )(2) | | | (0.02 | )(3) | |
Net realized and unrealized gain (loss) on investments | | | 3.32 | | | | 2.95 | | | | (0.36 | ) | | | 0.77 | | |
Total Income (Loss) from Investment Operations | | | 3.18 | | | | 2.91 | | | | (0.44 | ) | | | 0.75 | | |
LESS DISTRIBUTIONS: | |
From net realized gain on investments | | | (0.34 | ) | | | — | | | | — | | | | — | | |
Total Distributions | | | (0.34 | ) | | | — | | | | — | | | | — | | |
Net Asset Value, End of Period | | $ | 16.06 | | | $ | 13.22 | | | $ | 10.31 | | | $ | 10.75 | | |
Total Return | | | 24.16 | % | | | 28.35 | % | | | (4.28 | )% | | | 7.60 | %(4) | |
SUPPLEMENTAL DATA AND RATIOS: | |
Net assets, end of period (in thousands) | | $ | 13,478 | | | $ | 3,983 | | | $ | 2,824 | | | $ | 2,036 | | |
Ratio of expenses to average net assets | |
Before waivers and reimbursements | | | 2.46 | % | | | 4.02 | % | | | 5.25 | % | | | 10.93 | %(5) | |
Net of waivers and reimbursements | | | 1.10 | % | | | 1.10 | % | | | 1.10 | % | | | 1.10 | %(5) | |
Ratio of net investment loss to average net assets | |
Before waivers and reimbursements | | | (2.26 | )% | | | (3.28 | )% | | | (5.02 | )% | | | (10.75 | )%(5) | |
Net of waivers and reimbursements | | | (0.90 | )% | | | (0.36 | )% | | | (0.87 | )% | | | (0.92 | )%(5) | |
Portfolio turnover rate | | | 173 | % | | | 140 | % | | | 138 | % | | | 28 | %(4) | |
(1) Commenced operations on March 23, 2011.
(2) Per share net investment loss has been calculated using the daily average share method.
(3) Net investment loss per share is calculated using ending balances prior to consideration of adjustments for permanent book to tax differences.
(4) Not annualized.
(5) Annualized.
The accompanying notes are an integral part of these financial statements.
page 52

Frontegra Timpani Small Cap Growth Fund
FINANCIAL HIGHLIGHTS
| | | Class Y | |
| | | Period
Ended
June 30,
2014(1) | |
Net Asset Value, Beginning of Period | | $ | 16.35 | | |
LOSS FROM
INVESTMENT OPERATIONS: | |
Net investment loss | | | (0.08 | )(2) | |
Net realized and unrealized loss on investments | | | (0.23 | )(3) | |
Total Loss from Investment Operations | | | (0.31 | ) | |
Net Asset Value, End of Period | | $ | 16.04 | | |
Total Return | | | (1.90 | )%(4) | |
SUPPLEMENTAL DATA AND RATIOS: | |
Net assets, end of period (in thousands) | | $ | 1,215 | | |
Ratio of expenses to average net assets | |
Before waivers and reimbursements | | | 2.73 | %(5) | |
Net of waivers and reimbursements | | | 1.50 | %(5) | |
Ratio of net investment loss to average net assets | |
Before waivers and reimbursements | | | (2.36 | )%(5) | |
Net of waivers and reimbursements | | | (1.13 | )%(5) | |
Portfolio turnover rate | | | 173 | %(4) | |
(1) Commenced operations on January 6, 2014.
(2) Per share net investment loss has been calculated using the daily average share method.
(3) Net realized and unrealized loss on investments does not reconcile with net realized and unrealized gain on investments in the Statement of Operations due to the timing of the Class Y inception.
(4) Not annualized.
(5) Annualized.
The accompanying notes are an integral part of these financial statements.
page 53

Frontegra Netols Small Cap Value Fund
FINANCIAL HIGHLIGHTS
| | | Institutional Class | |
| | | Year
Ended
June 30,
2014 | | Year
Ended
June 30,
2013 | | Year
Ended
June 30,
2012 | | Year
Ended
June 30,
2011 | | Year
Ended
June 30,
2010 | |
Net Asset Value, Beginning of Period | | $ | 15.35 | | | $ | 12.86 | | | $ | 13.75 | | | $ | 10.08 | | | $ | 9.03 | | |
INCOME (LOSS) FROM
INVESTMENT OPERATIONS: | |
Net investment income (loss) | | | (0.04 | )(1) | | | 0.01 | | | | 0.01 | | | | (0.05 | )(2) | | | 0.02 | (1) | |
Net realized and unrealized gain (loss) on investments | | | 3.50 | | | | 3.17 | | | | (0.90 | ) | | | 3.72 | | | | 1.05 | | |
Total Income (Loss) from Investment Operations | | | 3.46 | | | | 3.18 | | | | (0.89 | ) | | | 3.67 | | | | 1.07 | | |
LESS DISTRIBUTIONS: | |
From net investment income | | | — | | | | — | | | | — | | | | — | (3) | | | (0.02 | ) | |
From net realized gain on investments | | | (4.15 | ) | | | (0.69 | ) | | | — | | | | — | | | | — | | |
From return of capital | | | — | | | | — | | | | — | | | | — | | | | — | (3) | |
Total Distributions | | | (4.15 | ) | | | (0.69 | ) | | | — | | | | ��� | | | | (0.02 | ) | |
Net Asset Value, End of Period | | $ | 14.66 | | | $ | 15.35 | | | $ | 12.86 | | | $ | 13.75 | | | $ | 10.08 | | |
Total Return | | | 24.63 | % | | | 25.61 | % | | | (6.47 | )% | | | 36.43 | % | | | 11.76 | % | |
SUPPLEMENTAL DATA AND RATIOS: | |
Net assets, end of period (in thousands) | | $ | 98,504 | | | $ | 113,151 | | | $ | 134,544 | | | $ | 166,450 | | | $ | 119,657 | | |
Ratio of expenses to average net assets | |
Before waivers and reimbursements | | | 1.17 | % | | | 1.18 | % | | | 1.22 | % | | | 1.13 | % | | | 1.18 | % | |
Net of waivers and reimbursements | | | 1.10 | % | | | 1.10 | % | | | 1.10 | % | | | 1.10 | % | | | 1.10 | % | |
Ratio of net investment income (loss) to average
net assets | |
Before waivers and reimbursements | | | (0.35 | )% | | | (0.14 | )% | | | (0.08 | )% | | | (0.39 | )% | | | 0.17 | % | |
Net of waivers and reimbursements | | | (0.28 | )% | | | (0.06 | )% | | | 0.04 | % | | | (0.36 | )% | | | 0.25 | % | |
Portfolio turnover rate | | | 24 | % | | | 28 | % | | | 28 | % | | | 33 | % | | | 41 | % | |
(1) Per share net investment income has been calculated using the daily average share method.
(2) Net investment loss per share is calculated using ending balances prior to consideration of adjustments for permanent book to tax differences.
(3) Less than one cent per share.
The accompanying notes are an integral part of these financial statements.
page 54

Frontegra Netols Small Cap Value Fund
FINANCIAL HIGHLIGHTS
| | | Class Y | |
| | | Year
Ended
June 30,
2014 | | Year
Ended
June 30,
2013 | | Year
Ended
June 30,
2012 | | Year
Ended
June 30,
2011 | | Year
Ended
June 30,
2010 | |
Net Asset Value, Beginning of Period | | $ | 15.03 | | | $ | 12.65 | | | $ | 13.59 | | | $ | 10.00 | | | $ | 8.98 | | |
INCOME (LOSS) FROM
INVESTMENT OPERATIONS: | |
Net investment loss | | | (0.17 | )(1) | | | (0.05 | ) | | | (0.05 | ) | | | (0.09 | )(2) | | | — | | |
Net realized and unrealized gain (loss) on investments | | | 3.44 | | | | 3.12 | | | | (0.89 | ) | | | 3.68 | | | | 1.02 | | |
Total Income (Loss) from Investment Operations | | | 3.27 | | | | 3.07 | | | | (0.94 | ) | | | 3.59 | | | | 1.02 | | |
LESS DISTRIBUTIONS: | |
From net realized gain on investments | | | (4.15 | ) | | | (0.69 | ) | | | — | | | | — | | | | — | | |
Total Distributions | | | (4.15 | ) | | | (0.69 | ) | | | — | | | | — | | | | — | | |
Net Asset Value, End of Period | | $ | 14.15 | | | $ | 15.03 | | | $ | 12.65 | | | $ | 13.59 | | | $ | 10.00 | | |
Total Return | | | 23.84 | % | | | 25.15 | % | | | (6.92 | )% | | | 35.90 | % | | | 11.36 | % | |
SUPPLEMENTAL DATA AND RATIOS: | |
Net assets, end of period (in thousands) | | $ | 633 | | | $ | 20,228 | | | $ | 17,765 | | | $ | 22,792 | | | $ | 15,560 | | |
Ratio of expenses to average net assets | |
Before waivers and reimbursements | | | 1.57 | % | | | 1.58 | % | | | 1.62 | % | | | 1.53 | % | | | 1.58 | % | |
Net of waivers and reimbursements | | | 1.50 | % | | | 1.50 | % | | | 1.50 | % | | | 1.50 | % | | | 1.50 | % | |
Ratio of net investment loss to average net assets | |
Before waivers and reimbursements | | | (1.19 | )% | | | (0.54 | )% | | | (0.48 | )% | | | (0.79 | )% | | | (0.23 | )% | |
Net of waivers and reimbursements | | | (1.12 | )% | | | (0.46 | )% | | | (0.36 | )% | | | (0.76 | )% | | | (0.15 | )% | |
Portfolio turnover rate | | | 24 | % | | | 28 | % | | | 28 | % | | | 33 | % | | | 41 | % | |
(1) Per share net investment loss has been calculated using the daily average share method.
(2) Net investment loss per share is calculated using ending balances prior to consideration of adjustments for permanent book to tax differences.
The accompanying notes are an integral part of these financial statements.
page 55

Frontegra Phocas Small Cap Value Fund
FINANCIAL HIGHLIGHTS
| | | Year
Ended
June 30,
2014 | | Year
Ended
June 30,
2013 | | Year
Ended
June 30,
2012 | | Year
Ended
June 30,
2011(1) | | Six Months
Ended
June 30,
2010(2) | | Year
Ended
December 31,
2009 | |
Net Asset Value, Beginning of Period | | $ | 28.72 | | | $ | 23.30 | | | $ | 24.51 | | | $ | 18.40 | | | $ | 18.48 | | | $ | 14.93 | | |
INCOME (LOSS) FROM
INVESTMENT OPERATIONS: | |
Net investment income (loss) | | | (0.05 | )(3) | | | 0.20 | | | | 0.06 | | | | 0.04 | (3) | | | 0.02 | (3) | | | 0.06 | (3) | |
Net realized and unrealized gain (loss)
on investments | | | 9.25 | | | | 5.41 | | | | (1.25 | ) | | | 6.13 | | | | (0.10 | ) | | | 3.56 | | |
Total Income (Loss) from Investment Operations | | | 9.20 | | | | 5.61 | | | | (1.19 | ) | | | 6.17 | | | | (0.08 | ) | | | 3.62 | | |
LESS DISTRIBUTIONS: | |
From net investment income | | | (0.05 | ) | | | (0.19 | ) | | | (0.02 | ) | | | (0.06 | ) | | | — | | | | (0.07 | ) | |
From net realized gain on investments | | | (1.91 | ) | | | — | | | | — | | | | — | | | | — | | | | — | | |
Total Distributions | | | (1.96 | ) | | | (0.19 | ) | | | (0.02 | ) | | | (0.06 | ) | | | — | | | | (0.07 | ) | |
Redemption fees retained | | | — | | | | — | | | | — | | | | — | (4) | | | — | (4) | | | — | (4) | |
Net Asset Value, End of Period | | $ | 35.96 | | | $ | 28.72 | | | $ | 23.30 | | | $ | 24.51 | | | $ | 18.40 | | | $ | 18.48 | | |
Total Return | | | 32.72 | % | | | 24.29 | % | | | (4.91 | )% | | | 33.55 | % | | | (0.43 | )%(5) | | | 24.29 | % | |
SUPPLEMENTAL DATA AND RATIOS: | |
Net assets, end of period (in thousands) | | $ | 24,152 | | | $ | 9,004 | | | $ | 18,821 | | | $ | 20,507 | | | $ | 15,176 | | | $ | 19,331 | | |
Ratio of expenses to average net assets | |
Before waivers and reimbursements | | | 1.97 | % | | | 2.50 | % | | | 1.70 | % | | | 1.69 | % | | | 1.68 | %(6) | | | 1.71 | % | |
Net of waivers and reimbursements | | | 1.10 | % | | | 1.05 | % | | | 0.99 | % | | | 0.99 | % | | | 0.99 | %(6) | | | 0.99 | % | |
Ratio of net investment income (loss) to
average net assets | |
Before waivers and reimbursements | | | (1.00 | )% | | | (1.08 | )% | | | (0.51 | )% | | | (0.52 | )% | | | (0.53 | )%(6) | | | (0.31 | )% | |
Net of waivers and reimbursements | | | (0.13 | )% | | | 0.37 | % | | | 0.20 | % | | | 0.18 | % | | | 0.16 | %(6) | | | 0.41 | % | |
Portfolio turnover rate | | | 53 | % | | | 196 | % | | | 50 | % | | | 37 | % | | | 43 | %(5) | | | 67 | % | |
(1) Effective October 8, 2010, Frontegra Asset Management, Inc. became adviser and Phocas Financial Corp. became subadviser to the Fund.
(2) Effective June 30, 2010, the Fund changed its fiscal year end to June 30 from December 31.
(3) Per share net investment income has been calculated using the daily average shares method.
(4) Less than one cent per share.
(5) Not annualized.
(6) Annualized.
The accompanying notes are an integral part of these financial statements.
page 56

NOTES TO FINANCIAL STATEMENTS
June 30, 2014
(1) ORGANIZATION
Frontegra Funds, Inc. (the "Company") was incorporated on May 24, 1996 as a Maryland corporation and is registered under the Investment Company Act of 1940, as amended (the "1940 Act"), as an open-end investment company issuing shares in series (each, a "Fund," or collectively, the "Funds"), each series representing a distinct portfolio with its own investment objectives and policies. The investment objective of the Frontegra RobecoSAM Global Equity Fund is long-term capital growth. The investment objective of each of the Frontegra MFG Global Equity Fund, Frontegra Timpani Small Cap Growth Fund and Frontegra Netols Small Cap Value Fund is capital appreciation. The investment objective of the Frontegra MFG Core Infrastructure Fund is long-term capital appreciation. The investment objective of the Frontegra Phocas Small Cap Value Fund is long-term total investment through capital appreciation.
As of June 30, 2014, the Company had six series in operations. A summary of each Fund's investment adviser, subadviser and capital structure is as follows:
Fund | | Investment Adviser | | Subadviser | | Capital Structure | | Commencement
of Operations | |
Frontegra RobecoSAM Global Equity Fund (a) | | Frontegra Asset Management, Inc. ("Frontegra") | | RobecoSAM USA, Inc. | | Single Class | | June 18, 2009 | |
Frontegra MFG Global Equity Fund (a) | | Frontegra | | MFG Asset Management | | Single Class | | Dec. 28, 2011 | |
Frontegra MFG Core Infrastructure Fund (a) | | Frontegra | | MFG Asset Management | | Single Class | | Jan. 18, 2012 | |
Frontegra Timpani Small Cap Growth Fund | | Timpani Capital Management LLC ("Timpani") (b) | | None | | Multi-Class
• Institutional
• Class Y | | Mar. 23, 2011 | |
Frontegra Netols Small Cap Value Fund | | Frontegra | | Netols Asset Management, Inc. | | Multi-Class
• Institutional
• Class Y | | Dec. 16, 2005 | |
Frontegra Phocas Small Cap Value Fund | | Frontegra | | Phocas Financial Corp. | | Single Class (c) | | Sep. 29, 2006 | |
(a) A redemption fee of 2.00% will be charged on shares of the Fund redeemed 30 days or less from their date of purchase.
(b) Timpani is an affiliate of Frontegra.
(c) Effective November 1, 2012, the Class I shares of the Frontegra Phocas Small Cap Value Fund were converted into Class L shares of the Fund. Class L shares were redesignated Institutional Class shares.
page 57

NOTES TO FINANCIAL STATEMENTS (continued)
June 30, 2014
(2) SIGNIFICANT ACCOUNTING POLICIES
The following is a summary of significant accounting policies consistently followed by the Funds in the preparation of their financial statements.
(a) Investment Valuation
Equity securities for which market quotations are readily available are valued at the last reported sale price on the national securities exchange on which such securities are primarily traded. Equity securities for which there were no transactions on a given day or securities not listed on a national securities exchange are valued at the most recent bid price. Equity securities that are traded on NASDAQ are valued using the NASDAQ Official Closing Price ("NOCP"). Debt securities (other than short-term instruments) are valued by an independent pricing service, which uses valuation methods such as matrix pricing and other analytical pricing models as well as market transactions and evaluated dealer bid quotations. Shares of underlying mutual funds are valued at their respective NAVs. Exchange traded funds are valued at the last reported sale price on the exchange on which the security is principally traded. Securities that are primarily traded on foreign exchanges generally are valued at the last sale price of such securities on their respective exchange. In certain circumstances, such as when a significant event occurs in a foreign market so that the last sale price no longer reflects actual value, the fair value of these securities may be determined using fair valuation procedures approved by the Board of Directors (the "Board"). The Board has retained an independent fair value pricing service to assist in valuing foreign securities held by the Frontegra RobecoSAM Global Equity, Frontegra MFG Global Equity and Frontegra MFG Core Infrastructure Funds. In valuing assets, prices denominated in foreign currencies are converted to U.S. dollar equivalents at the current exchange rate, which approximates fair value. Securities maturing within 60 days or less when purchased are valued by the amortized cost method. Any securities or other assets for which market quotations are not readily available are valued at their fair value as determined in good faith by the advisers or subadvisers pursuant to guidelines established by the Board.
The Funds follow a fair value hierarchy that distinguishes between market data obtained from independent sources (observable inputs) and the Funds' own market assumptions (unobservable inputs). These inputs are used in determining the value of each Fund's investments and are summarized in the following fair value hierarchy:
Level 1 — Quoted prices in active markets for identical securities
Level 2 — Evaluated prices based on other significant observable inputs (including quoted prices for similar securities, foreign security indices, foreign exchange rates, fair value estimates for foreign securities and changes in benchmark securities indices)
Level 3 — Significant unobservable inputs (including the Fund's own assumptions in determining fair value of investments)
RobecoSAM Global Equity
Description | | Level 1 | | Level 2 | | Level 3 | | Total | |
Equity (a) | |
| Common Stocks | | $ | 16,587,674 | | | $ | — | | | $ | — | | | $ | 16,587,674 | | |
| Preferred Stocks | | | 510,702 | | | | — | | | | — | | | | 510,702 | | |
| Total Equity | | | 17,098,376 | | | | — | | | | — | | | | 17,098,376 | | |
Short-Term Investments | | | 815,977 | | | | — | | | | — | | | | 815,977 | | |
Total Investments in Securities | | $ | 17,914,353 | | | $ | — | | | $ | — | | | $ | 17,914,353 | | |
page 58

NOTES TO FINANCIAL STATEMENTS (continued)
June 30, 2014
MFG Global Equity
Description | | Level 1 | | Level 2 | | Level 3 | | Total | |
Equity (a) | |
| Common Stocks | | $ | 773,994,133 | | | $ | — | | | $ | — | | | $ | 773,994,133 | | |
| Total Equity | | | 773,994,133 | | | | — | | | | — | | | | 773,994,133 | | |
Short-Term Investments | | | 14,835,097 | | | | — | | | | — | | | | 14,835,097 | | |
Total Investments in Securities | | $ | 788,829,230 | | | $ | — | | | $ | — | | | $ | 788,829,230 | | |
MFG Core Infrastructure
Description | | Level 1 | | Level 2 | | Level 3 | | Total | |
Equity (a) | |
| Common Stocks | | $ | 64,067,896 | | | $ | — | | | $ | — | | | $ | 64,067,896 | | |
| Closed-End Funds | | | 592,100 | | | | — | | | | — | | | | 592,100 | | |
| Total Equity | | | 64,659,996 | | | | — | | | | — | | | | 64,659,996 | | |
Short-Term Investments | | | 1,585,604 | | | | — | | | | — | | | | 1,585,604 | | |
Total Investments in Securities | | $ | 66,245,600 | | | $ | — | | | $ | — | | | $ | 66,245,600 | | |
Timpani Small Cap Growth
Description | | Level 1 | | Level 2 | | Level 3 | | Total | |
Equity (a) | |
| Common Stocks | | $ | 14,166,807 | | | $ | — | | | $ | — | | | $ | 14,166,807 | | |
| Total Equity | | | 14,166,807 | | | | — | | | | — | | | | 14,166,807 | | |
Short-Term Investments | | | 425,881 | | | | — | | | | — | | | | 425,881 | | |
Total Investments in Securities | | $ | 14,592,688 | | | $ | — | | | $ | — | | | $ | 14,592,688 | | |
Netols Small Cap Value
Description | | Level 1 | | Level 2 | | Level 3 | | Total | |
Equity (a) | |
| Common Stocks | | $ | 97,240,248 | | | $ | — | | | $ | — | | | $ | 97,240,248 | | |
| Total Equity | | | 97,240,248 | | | | — | | | | — | | | | 97,240,248 | | |
Short-Term Investments | | | 1,607,005 | | | | — | | | | — | | | | 1,607,005 | | |
Total Investments in Securities | | $ | 98,847,253 | | | $ | — | | | $ | — | | | $ | 98,847,253 | | |
Phocas Small Cap Value
Description | | Level 1 | | Level 2 | | Level 3 | | Total | |
Equity (a) | |
| Common Stocks | | $ | 23,356,230 | | | $ | — | | | $ | — | | | $ | 23,356,230 | | |
| Total Equity | | | 23,356,230 | | | | — | | | | — | | | | 23,356,230 | | |
Short-Term Investments | | | 811,536 | | | | — | | | | — | | | | 811,536 | | |
Total Investments in Securities | | $ | 24,167,766 | | | $ | — | | | $ | — | | | $ | 24,167,766 | | |
(a) See Fund's Schedule of Investments for sector or country classifications.
page 59

NOTES TO FINANCIAL STATEMENTS (continued)
June 30, 2014
For the year ended June 30, 2014, there were no transfers between Levels 1, 2 and 3. The Funds did not hold any Level 3 securities during the fiscal year ended June 30, 2014. It is the Funds' policy to record transfers at the end of the reporting period.
(b) Federal Income Taxes
Each Fund intends to comply with the requirements of Subchapter M of the Internal Revenue Code necessary to qualify as a regulated investment company and to make the requisite distributions of income and capital gains to its shareholders sufficient to relieve it from all or substantially all federal income taxes. Therefore, no federal income tax provision has been provided.
The Funds have adopted financial reporting rules regarding recognition and measurement of tax positions taken or expected to be taken on a tax return. The Funds recognize interest and penalties, if any, related to unrecognized tax benefits as income tax expense on the Statement of Operations. During the fiscal year, the Funds did not incur any interest or penalties. The Funds have reviewed all open tax years and concluded that there is no effect to any of the Fund's financial positions or results of operations and no tax liability resulting from unrecognized tax benefits relating to uncertain income tax positions taken or expected to be taken on a tax return. Open tax years are those years that are open for examination by the relevant income taxing authority. As of June 30, 2014, open federal and state income tax years include the tax years ended June 30, 2011, June 30, 2012, June 30, 2013 and June 30, 2014. The Funds have no examinations in progress.
(c) Distributions to Shareholders
Dividends from net investment income and net realized gains, if any, are declared and paid at least annually. All short-term capital gains are included in ordinary income for tax purposes. Distributions to shareholders are recorded on the ex-dividend date.
The tax character of distributions paid during the fiscal years ended June 30, 2014 and June 30, 2013 were as follows:
| | Year Ended June 30, 2014 | | Year Ended June 30, 2013 | |
| | | Ordinary
Income | | Long-Term
Capital Gains | | Total
Distributions | | Ordinary
Income | | Long-Term
Capital Gains | | Total
Distributions | |
RobecoSAM Global Equity | | $ | 306,528 | | | $ | 233,033 | | | $ | 539,561 | | | $ | 295,231 | | | $ | — | | | $ | 295,231 | | |
MFG Global Equity | | | 7,828,247 | | | | 571,764 | | | | 8,400,011 | | | | 2,433,628 | | | | — | | | | 2,433,628 | | |
MFG Core Infrastructure | | | 253,056 | | | | — | | | | 253,056 | | | | 119,866 | | | | — | | | | 119,866 | | |
Timpani Small Cap Growth | | | 5,119 | | | | 130,330 | | | | 135,449 | | | | — | | | | — | | | | — | | |
Netols Small Cap Value | | | 954,829 | | | | 25,571,887 | | | | 26,526,716 | | | | — | | | | 6,697,249 | | | | 6,697,249 | | |
Phocas Small Cap Value | | | 126,612 | | | | 570,892 | | | | 697,504 | | | | 61,412 | | | | — | | | | 61,412 | | |
At June 30, 2014, the components of accumulated earnings/losses on a tax basis were as follows:
| | RobecoSAM
Global
Equity | | MFG
Global
Equity | | MFG
Core
Infrastructure | | Timpani
Small Cap
Growth | | Netols
Small Cap
Value | | Phocas
Small Cap
Value | |
Cost of investments | | $ | 14,032,448 | | | $ | 692,539,573 | | | $ | 61,953,497 | | | $ | 12,648,604 | | | $ | 60,088,308 | | | $ | 19,386,221 | | |
Gross unrealized appreciation | | $ | 4,161,173 | | | $ | 109,067,541 | | | $ | 4,639,712 | | | $ | 2,361,981 | | | $ | 40,961,461 | | | $ | 4,990,957 | | |
Gross unrealized depreciation | | | (279,268 | ) | | | (12,777,884 | ) | | | (347,609 | ) | | | (417,897 | ) | | | (2,202,516 | ) | | | (209,412 | ) | |
Net unrealized appreciation/depreciation | | | 3,881,905 | | | | 96,289,657 | | | | 4,292,103 | | | | 1,944,084 | | | | 38,758,945 | | | | 4,781,545 | | |
page 60

NOTES TO FINANCIAL STATEMENTS (continued)
June 30, 2014
(table continued from prior page)
| | RobecoSAM
Global
Equity | | MFG
Global
Equity | | MFG
Core
Infrastructure | | Timpani
Small Cap
Growth | | Netols
Small Cap
Value | | Phocas
Small Cap
Value | |
Undistributed ordinary income | | $ | 448,153 | | | $ | 10,064,210 | | | $ | 731,959 | | | $ | — | | | $ | — | | | $ | 296,108 | | |
Undistributed long-term capital gain | | | 1,910,646 | | | | 865,243 | | | | 5,929 | | | | 419,609 | | | | 17,356,588 | | | | 751,084 | | |
Total distributable earnings | | | 2,358,799 | | | | 10,929,453 | | | | 737,888 | | | | 419,609 | | | | 17,356,588 | | | | 1,047,192 | | |
Other accumulated gains (losses) | | | 754 | | | | 27,283 | | | | 2,728 | | | | (846,130 | ) | | | (109,904 | ) | | | — | | |
Total accumulated earnings | | $ | 6,241,458 | | | $ | 107,246,393 | | | $ | 5,032,719 | | | $ | 1,517,563 | | | $ | 56,005,629 | | | $ | 5,828,737 | | |
The difference between book-basis and tax-basis unrealized appreciation is attributable primarily to the tax deferral of losses on wash sales and mark-to-market on passive foreign investment companies.
During the year ended June 30, 2014, the Funds utilized capital loss carryforwards as follows:
Fund | | Amount | |
RobecoSAM Global Equity | | $ | 307,951 | | |
Timpani Small Cap Growth | | | 86,398 | | |
As of June 30, 2014, the Funds do not have any capital loss carryforwards available for future use.
In order to meet certain excise tax requirements, the Funds are required to measure and distribute annually, net capital gains realized during the twelve month period ending October 31. In connection with this requirement, the Funds are permitted, for tax purposes, to defer into their next fiscal year any net capital losses incurred from November 1 through the end of the fiscal year. As of June 30, 2014, the following Funds deferred, on a tax basis, post-October losses and ordinary late-year losses of:
| | Post-October
Capital Loss Deferred | | Ordinary Late-Year
Loss Deferred | |
Timpani Small Cap Growth | | $ | 798,853 | | | $ | 47,277 | | |
Netols Small Cap Value | | | — | | | | 109,904 | | |
(d) Foreign Currency Translation
Values of investments denominated in foreign currencies are converted into U.S. dollars using a spot market rate of exchange each day. Purchases and sales of investments and dividend and interest income are translated to U.S. dollars using a spot market rate of exchange prevailing on the dates of such transactions. The portion of security gains or losses resulting from changes in foreign exchange rates are included with net realized and unrealized gain or loss from investments, as appropriate, for both financial reporting and tax purposes.
Each Fund, respectively, bears the risk of changes in the foreign currency exchange rates and their impact on the value of assets and liabilities denominated in foreign currency. Each Fund also bears the risk of a counterparty failing to fulfill its obligation under a foreign currency contract.
Investments in securities of foreign companies involve additional risks including: currency exchange rate fluctuation; less available public information about the issuers of securities; less stringent regulatory standards; lack of uniform accounting, auditing and
page 61

NOTES TO FINANCIAL STATEMENTS (continued)
June 30, 2014
financial reporting standards; and country risks including less liquidity, high inflation rates and political and economic instability. The risks of foreign investments are typically greater in emerging and less developed markets.
(e) Indemnifications
Under the Funds' organizational documents, their officers and directors are indemnified against certain liabilities arising out of the performance of their duties to the Funds. In addition, in the normal course of business, the Funds enter into contracts that provide general indemnifications to other parties. The Funds' maximum exposure under these arrangements is unknown as this would involve future claims that may be made against the Funds that have not yet occurred. However, the Funds have not had prior claims or losses pursuant to these contracts and expect the risk of loss to be remote.
(f) Other
Investment transactions are accounted for on the trade date. The Funds determine the gain or loss realized from investment transactions by comparing the original cost of the specifically identified security lot sold with the net sale proceeds. Dividend income, less foreign taxes withheld, is recognized on the ex-dividend date, except that certain dividends from foreign securities are recorded as soon as the information becomes available to the Funds. Interest income is recognized on an accrual basis. All discounts/premiums are accreted/amortized using the effective interest method and are included in interest income. Withholding taxes on foreign dividends have been provided for in accordance with the Funds' understanding of the applicable country's tax codes and regulations.
Income, expenses (other than expenses attributable to a specific class) and realized and unrealized gains or losses on investments attributable to the Funds are generally allocated to each respective class in proportion to the relative net assets of each class.
The preparation of financial statements in conformity with U.S. generally accepted accounting principles ("GAAP") requires management to make estimates and assumptions that affect the reported amounts of assets and liabilities and disclosure of contingent assets and liabilities at the date of the financial statements, and the reported amounts of increases and decreases in net assets from operations during the reporting period. Actual results could differ from those estimates.
Net investment income and realized gains and losses for federal income tax purposes may differ from that reported on the financial statements because of permanent book-to-tax differences. GAAP requires that permanent differences in net investment income and realized gains and losses due to differences between financial reporting and tax reporting be reclassified between various components of net assets. These reclassifications have no effect on net assets or net asset value per share. For the fiscal year ended June 30, 2014, the following table shows the reclassifications made:
| | RobecoSAM
Global
Equity | | MFG
Global
Equity | | MFG
Core
Infrastructure | | Timpani
Small Cap
Growth | | Netols
Small Cap
Value | | Phocas
Small Cap
Value | |
Paid in capital | | $ | — | | | $ | — | | | $ | — | | | $ | — | | | $ | (8,427 | ) | | $ | — | | |
Undistributed net investment income (loss) | | | (13,814 | ) | | | 1,286 | | | | (14,225 | ) | | | 40,927 | | | | 276,590 | | | | 18,695 | | |
Accumulated undistributed net realized gain (loss) | | | 13,814 | | | | (1,286 | ) | | | 14,225 | | | | (40,927 | ) | | | (268,163 | ) | | | (18,695 | ) | |
The permanent differences primarily relate to foreign currency and net operating losses.
page 62

NOTES TO FINANCIAL STATEMENTS (continued)
June 30, 2014
(3) INVESTMENT ADVISER AND RELATED PARTIES
The RobecoSAM Global Equity, MFG Global Equity, MFG Core Infrastructure, Netols Small Cap Value and Phocas Small Cap Value Funds have entered into an agreement with Frontegra, with whom certain officers and a director of the Funds are affiliated, to furnish investment advisory services to the Funds. Timpani, an affiliate of Frontegra, is the investment adviser to the Frontegra Timpani Small Cap Growth Fund. Fees are calculated daily and payable monthly, at annual rates set forth in the following table (expressed as a percentage of each Fund's average daily net assets). Pursuant to expense cap agreements, Frontegra and Timpani have agreed to waive their respective management fees and/or reimburse each Fund's operating expenses (exclusive of brokerage, acquired fund fees and expenses, interest, taxes and extraordinary expenses) to ensure that each Fund's operating expenses do not exceed the expense limitation listed below. Expenses waived are netted with advisory fees payable on the Statement of Assets and Liabilities. On a monthly basis, these accounts are settled by each Fund making payment to the respective adviser or the respective adviser reimbursing the Fund if the reimbursement amount exceeds the advisory fee. If the amount of fees waived exceeds the advisory fee earned, this is shown on the Statement of Assets and Liabilities as a receivable from the respective adviser. The expense cap agreements will continue in effect until October 31, 2015, with successive renewal terms of one year unless terminated by an adviser or a Fund prior to any such renewal.
Frontegra Fund | | Annual Advisory Fees | | Expense Limitation | |
RobecoSAM Global Equity | | | 0.80 | % | | | 1.20 | % | |
MFG Global Equity | | | 0.80 | % | | | 0.80 | % | |
MFG Core Infrastructure | | | 0.70 | % | | | 0.70 | % | |
Timpani Small Cap Growth - Institutional Class | | | 1.00 | % | | | 1.10 | % | |
Timpani Small Cap Growth - Class Y | | | 1.00 | % | | | 1.50 | % | |
Netols Small Cap Value - Institutional Class | | | 1.00 | % | | | 1.10 | % | |
Netols Small Cap Value - Class Y | | | 1.00 | % | | | 1.50 | % | |
Phocas Small Cap Value | | | 1.00 | % | | | 1.10 | % | |
Any waivers or reimbursements are subject to later adjustment to allow the advisers to recoup amounts waived or reimbursed to the extent actual fees and expenses for a fiscal period are less than each Fund's expense limitation cap, provided, however, that an adviser shall only be entitled to recoup such amounts for a period of three years from the date such amount was waived or reimbursed. Expenses attributable to a specific class may only be recouped with respect to that class.
The following table shows the waived or reimbursed expenses subject to potential recovery expiring in:
| | | RobecoSAM
Global
Equity | | MFG
Global
Equity | | MFG
Core
Infrastructure | | Timpani
Small Cap
Growth | | Netols
Small Cap
Value | | Phocas
Small Cap
Value | |
2015 | | $ | 78,884 | | | $ | 95,480 | * | | $ | 66,588 | ** | | $ | 103,400 | | | $ | 194,049 | | | $ | 146,574 | | |
2016 | | | 78,470 | | | | 294,528 | | | | 100,062 | | | | 95,252 | | | | 121,910 | | | | 147,770 | | |
2017 | | | 82,363 | | | | 524,574 | | | | 147,255 | | | | 107,201 | | | | 78,732 | | | | 117,689 | | |
Total | | $ | 239,717 | | | $ | 914,582 | | | $ | 313,905 | | | $ | 305,853 | | | $ | 394,691 | | | $ | 412,033 | | |
* Expenses waived/reimbursed were for the period December 28, 2011 through June 30, 2012.
** Expenses waived/reimbursed were for the period January 18, 2012 through June 30, 2012.
page 63

NOTES TO FINANCIAL STATEMENTS (continued)
June 30, 2014
(4) INVESTMENT TRANSACTIONS
The aggregate purchases and sales of securities, excluding short-term investments, for the Funds for the year ended June 30, 2014, are summarized below:
| | RobecoSAM
Global
Equity | | MFG
Global
Equity | | MFG
Core
Infrastructure | | Timpani
Small Cap
Growth | | Netols
Small Cap
Value | | Phocas
Small Cap
Value | |
Purchases | | $ | 9,659,875 | | | $ | 480,431,468 | | | $ | 56,567,876 | | | $ | 23,013,557 | | | $ | 26,394,257 | | | $ | 17,935,960 | | |
Sales | | $ | 11,577,921 | | | $ | 118,277,364 | | | $ | 3,106,202 | | | $ | 13,524,369 | | | $ | 85,110,089 | | | $ | 7,206,493 | | |
There were no purchases or sales of U.S. Government securities for the Funds.
(5) DISTRIBUTION PLAN AND SHAREHOLDER SERVICING FEE
The Company, on behalf of the Frontegra Netols Small Cap Value Fund and the Frontegra Timpani Small Cap Growth Fund, has adopted a distribution plan pursuant to Rule 12b-1 under the Investment Company Act of 1940 for each Fund's Class Y shares (the "12b-1 Plan"). Pursuant to the 12b-1 Plan, each Fund pays an annual fee of up to 0.25% to Frontegra Strategies, LLC (the "Distributor"), an affiliate of Frontegra, for payments to brokers, dealers and other financial intermediaries who perform activities or incur expenses intended to result in the sale of Class Y shares of the Funds. For the year ended June 30, 2014, the Netols Small Cap Value Fund and the Timpani Small Cap Growth Fund incurred $6,626 and $632, respectively, under the 12b-1 Plan.
Class Y shares of the Funds also pay an annual shareholder servicing fee of up to 0.15% per year to the Distributor for payments to brokers, dealers, and other financial intermediaries who provide on-going account services to shareholders. Those services include establishing and maintaining shareholder accounts, mailing prospectuses, account statements and other Fund documents to shareholders, processing shareholder transactions, and providing other recordkeeping and administrative services. For the year ended June 30, 2014, the Netols Small Cap Value Fund and the Timpani Small Cap Growth Fund incurred $3,976 and $380, respectively, in shareholder servicing expenses.
page 64

REPORT OF INDEPENDENT REGISTERED PUBLIC ACCOUNTING FIRM
June 30, 2014
To the Shareholders and Board of Directors of Frontegra Funds, Inc.
We have audited the accompanying statements of assets and liabilities, including the schedules of investments, of Frontegra Funds, Inc. (the "Funds") comprising Frontegra RobecoSAM Global Equity Fund, Frontegra MFG Global Equity Fund, Frontegra MFG Core Infrastructure Fund, Frontegra Timpani Small Cap Growth Fund, Frontegra Netols Small Cap Value Fund, and Frontegra Phocas Small Cap Value Fund as of June 30, 2014, and the related statements of operations for the year then ended, the statements of changes in net assets for each of the two years in the period then ended, and the financial highlights for each of the three periods in the period then ended. These financial statements and financial highlights are the responsibility of the Funds' management. Our responsibility is to express an opinion on these financial statements and financial highlights based on our audits. The financial highlights for periods prior to June 30, 2012, were audited by other auditors whose report dated August 29, 2011, expressed an unqualified opinion on those financial highlights.
We conducted our audits in accordance with the standards of the Public Company Accounting Oversight Board (United States). Those standards require that we plan and perform the audit to obtain reasonable assurance about whether the financial statements and financial highlights are free of material misstatement. An audit includes examining, on a test basis, evidence supporting the amounts and disclosures in the financial statements. Our procedures included confirmation of securities owned as of June 30, 2014, by correspondence with the custodian and brokers or by other appropriate auditing procedures where replies from brokers or counterparties were not received. An audit also includes assessing the accounting principles used and significant estimates made by management, as well as evaluating the overall financial statement presentation. We believe that our audits provide a reasonable basis for our opinion.
In our opinion, the financial statements and financial highlights referred to above present fairly, in all material respects, the financial position of each of the Funds constituting Frontegra Funds, Inc. as of June 30, 2014, the results of their operations for the year then ended, the changes in their net assets for each of the two periods in the period then ended, and the financial highlights for each of the three periods in the period then ended, in conformity with accounting principles generally accepted in the United States of America.
COHEN FUND AUDIT SERVICES, LTD.
Cleveland, Ohio
August 25, 2014
page 65

BOARD OF DIRECTORS' APPROVAL OF ADVISORY AND
SUBADVISORY AGREEMENTS
(Unaudited)
The Board of Directors (the "Board") of Frontegra Funds, Inc. (the "Company"), including the directors who are not "interested persons" as defined in Section 2(a)(9) of the Investment Company Act of 1940, as amended (the "Independent Directors") met on May 21, 2014, to consider the annual renewal of (a) the investment advisory agreement between Frontegra Asset Management, Inc. ("Frontegra") and the Company on behalf of the Frontegra Netols Small Cap Value Fund (the "Netols Fund"), the Frontegra Phocas Small Cap Value Fund (the "Phocas Fund"), the Frontegra RobecoSAM Global Equity Fund (the "RobecoSAM Fund"), the Frontegra MFG Global Equity Fund (the "Global Equity Fund") and the Frontegra MFG Core Infrastructure Fund (the "Infrastructure Fund") (the "Frontegra Advisory Agreement") and (b) the investment advisory agreement between Timpani Capital Management LLC ("Timpani") and the Company on behalf of the Frontegra Timpani Small Cap Growth Fund (the "Timpani Fund") (the "Timpani Advisory Agreement"). The Board also considered the annual renewal of the subadvisory agreements for the Netols Fund, the Phocas Fund, the RobecoSAM Fund, the Global Equity Fund and the Infrastructure Fund.
In connection with its review, the Board was provided materials relevant to its consideration of the agreements with Frontegra and Timpani (each, an "Adviser") and each subadviser, such as Fund performance assessments against peer groups and appropriate benchmarks, the Advisers' and subadvisers' Form ADV, information regarding the Advisers' and subadvisers' compliance program, personnel and financial condition, certain summary data provided by Fund management and a memorandum prepared by the Company's legal counsel. The Board also reviewed the advisory fee payable by each Fund under the advisory agreements, the expense cap agreement between the Company and the Adviser on behalf of each Fund and comparative fee and expense information provided by an independent service. The Board considered the subadvisory fees paid by Frontegra to the subadvisers, noting that the applicable subadvisory fee structure was negotiated at arm's length between Frontegra and each subadviser, each an unaffiliated third party, and Frontegra would compensate each subadviser from its own fees. The Board was also provided with the Advisers' and subadvisers' responses to the Section 15(c) request submitted by the Company's legal counsel on behalf of the directors. The directors discussed with representatives of management the operations of the Funds and the nature, extent and quality of the advisory and other services provided to the Funds by the Advisers and the subadvisers, as applicable.
In evaluating the advisory and subadvisory agreements, the Board took into account their cumulative experience in working with the Advisers and subadvisers and their ongoing review of information and discussions with representatives of the Advisers and subadvisers throughout the year at Board meetings. The Independent Directors met in executive session to discuss the materials and the proposed approval of the advisory and subadvisory agreements. During the executive session, the Independent Directors discussed their responsibilities and the Advisers' and subadvisers' 15(c) responses with legal counsel.
In considering the advisory and subadvisory agreements, the Board reviewed and analyzed various factors with respect to each Fund that it determined were relevant, including the factors below, and made the following conclusions. In its deliberations, the Board did not identify any single factor as determinative.
Frontegra Advisory Agreement (Netols Fund, Phocas Fund, RobecoSAM Fund, Global Equity Fund and Infrastructure Fund)
Nature, Extent and Quality of the Services to be Provided. The Board considered the services Frontegra would continue to provide to the Funds and their shareholders under the Frontegra Advisory Agreement. The Board noted that Frontegra serves as a manager of managers and had selected the subadvisers to make the day-to-day investment decisions for the Funds. The Board considered that Frontegra has 18 years of experience in hiring and supervising subadvisers to portfolios in the Frontegra family of funds. The Board discussed Frontegra's responsibilities for overseeing the subadvisers and supervising the management of the Funds' investments. The Board also considered the quality of other services provided by Frontegra, including performance oversight, risk management oversight, oversight and coordination
page 66

of service providers, oversight of financial reporting, administration of the Funds' compliance program and the shareholder servicing and administrative services provided by Frontegra to the Funds. The Board concluded that the range of services to be provided by Frontegra was appropriate and that Frontegra was qualified to provide such services.
Performance Record of the Funds. As described in more detail under "Subadvisory Agreements," the Board reviewed each Fund's performance record for the periods ended December 31, 2013, and March 31, 2014. The Directors considered that Frontegra does not directly manage the Funds' investment portfolios, but had delegated those duties to the respective subadvisers. The Board also considered Frontegra's continual monitoring of subadvisers and their performance during the year, and noted Frontegra's review of any underperforming Funds and, if applicable, steps taken to monitor and address such underperformance. The Board concluded that they were satisfied with Frontegra's performance in selecting and overseeing the subadvisers to the Funds.
Advisory Fees. The Board compared each Fund's contractual advisory fee and total expense ratio to the industry data with respect to other mutual funds in the same Morningstar peer group. The Board noted that the advisory fee for the Netols Fund and the Phocas Fund was above the industry average for funds in the same Morningstar category. The advisory fee for the RobecoSAM Fund, Global Equity Fund and the Infrastructure Fund was slightly below the industry average for funds in the same Morningstar category. With respect to the Netols Fund and the Phocas Fund, the Board noted that the advisory fee was the same as that for the small cap fund managed by Timpani, the investment adviser to another series of the Company. After giving effect to the expense cap agreement with Frontegra with respect to each Fund, the total net expense ratio was above the industry average for funds in the same Morningstar category with respect to the RobecoSAM Fund and the Class Y shares of the Netols Fund and below the industry average for funds in the same Morningstar category with respect to the Phocas Fund, the Global Equity Fund, the Infrastructure Fund and the Institutional Class shares of the Netols Fund. The Board concluded that the advisory fee paid by each Fund to Frontegra was reasonable in light of the nature and quality of services to be provided and fees paid by comparable funds.
Costs and Profitability. The Board reviewed information concerning Frontegra's financial condition, costs and profitability. The Board also considered the effect of the contractual expense cap agreements on Frontegra's compensation. The Board noted that Frontegra was waiving a portion of its advisory fee for three of the Funds and waiving its advisory fee and reimbursing Fund expenses under the expense cap agreement for two of the Funds. The Board concluded that Frontegra's current level of profitability was reasonable considering the quality of management and the fact that Frontegra was waiving its fees and/or reimbursing expenses for the Funds.
Economies of Scale. The Board reviewed net asset growth on a per Fund and aggregate basis and considered whether there may be economies of scale in the management of each Fund if its assets were to increase significantly. However, the Board concluded that the assets of the Funds were not likely to increase to such an extent that breakpoints would be appropriate, particularly in light of the expense cap agreements in place between Frontegra and each Fund.
Benefits to Frontegra. The Board considered information presented regarding any benefits to Frontegra or its affiliates from serving as adviser to the Funds (in addition to the advisory fee). The Board noted that Frontier Partners, Inc. ("Frontier"), an affiliate of Frontegra, provides consulting services to, and is compensated by, certain subadvisers. However, the Board determined that Frontegra's services to the Funds would not be compromised by this potential conflict of interest.
On the basis of its review of the foregoing information, the Board found that the terms of the Frontegra Advisory Agreement were fair and reasonable and in the best interests of each Fund's shareholders.
Timpani Advisory Agreement (Timpani Fund)
Nature, Extent and Quality of the Services to be Provided. The Board considered Timpani's experience as a small cap growth manager and services it would continue to provide to the Timpani Fund and its shareholders under the Timpani Advisory Agreement. The Board considered the experience of Timpani and its portfolio manager managing small cap growth accounts. The Board discussed Timpani's
page 67

responsibilities for managing the Fund's investments and overseeing the Fund's other activities, such as monitoring its compliance with applicable requirements under the securities laws. The Board noted that certain distribution, administrative and compliance services are provided by Frontegra and Frontegra Strategies, LLC, each an affiliate of Timpani. The Board also considered Timpani's efforts, in conjunction with its affiliate Frontier, to market Timpani's strategy and increase the Fund's assets so that it achieves critical mass. The Board concluded that the range of services to be provided by Timpani was appropriate and that Timpani was qualified to provide such services.
Investment Performance. The Board reviewed the Fund's performance for the one-year and since-inception periods ended December 31, 2013, and March 31, 2014. The Board noted that the Fund outperformed the benchmark index for the one-year and since-inception periods ended December 31, 2013. The Board also reviewed the historical performance for Timpani's small cap growth private accounts. The Board concluded that the Fund's performance was satisfactory and that Timpani would continue to provide a high level of advisory services to the Fund.
Advisory Fee. The Board compared the Fund's contractual advisory fee and total expense ratio to industry data with respect to other mutual funds in the same Morningstar peer group. The Board noted that the Fund's advisory fee was above the industry average. The Board noted that, after giving effect to the expense cap agreement, the total expense ratio was slightly below the industry average for Class Y shares and below the industry average for Institutional Class shares. The Board noted that the advisory fee was the same as that for other small cap funds managed by Frontegra, the investment adviser to other series of the company. The Board also considered the fee rates charged to Timpani's separate account clients and the sub-account of a collective fund managed by Timpani, noting that additional regulatory and compliance requirements are associated with registered investment companies such as the Fund, among other differences. The Board concluded that the advisory fee paid by the Timpani Fund to Timpani was reasonable in light of the nature and quality of services to be provided and fees paid by comparable funds.
Costs and Profitability. The Board reviewed information concerning Timpani's financial condition, costs and profitability. The Board also considered the effect of the expense cap agreement on Timpani's compensation, noting that the Fund had not yet reached financial "break even" and that Timpani was waiving its advisory fee and reimbursing Fund expenses under the expense cap agreement. The Board concluded that Timpani had the financial resources to provide quality services to the Fund and that the profitability information supported the Board's determination that the advisory fee was reasonable.
Economies of Scale. Given the Fund's current asset level, the Board did not consider whether any alternative fee structures, such as breakpoint fees, would be appropriate to reflect any economies of scale that may result from increases in the Fund's assets.
Benefits to Timpani. The Board considered information presented regarding any benefits to Timpani or its affiliates from serving as adviser to the Fund (in addition to the advisory fee). The Board noted that Timpani's affiliate, Frontier, provides consulting services to, and is compensated by, Timpani. However, the Board determined that Timpani's services to the Fund would not be compromised by this potential conflict of interest. The Board also noted that William D. Forsyth III, the president of the Company and Frontegra, is also the president and an officer of Timpani and that Frontegra and its affiliates provide various services to Timpani with respect to the Fund for which Timpani is not charged. The Board concluded that the other benefits to Timpani from its relationship with the Fund were reasonable.
On the basis of its review of the foregoing information, the Board found that the terms of the Timpani Advisory Agreement were fair and reasonable and in the best interests of the shareholders of the Timpani Fund.
Renewal of Subadvisory Agreements
Subadvisory Agreement between Frontegra and Netols Asset Management, Inc. ("Netols")
Nature, Extent and Quality of the Services to be Provided. The Board reviewed and considered Netols' investment strategy and experience as a small cap value manager, key personnel involved in providing investment management services to the Netols Fund, compliance
page 68

record and financial condition. The Board also considered services provided by Netols under the subadvisory agreement, including managing the Fund's investments, the selection of broker-dealers for execution of portfolio transactions, monitoring adherence to the Fund's investment restrictions and assisting with the Fund's compliance program. The Board concluded that the nature, extent and quality of the services provided by Netols to the Fund were appropriate and that the Fund was likely to continue to benefit from services provided by Netols under the Netols Subadvisory Agreement.
Investment Performance. The Board reviewed the Fund's investment performance as of December 31, 2013, and March 31, 2014. The Board noted that the Fund had outperformed its benchmark index for the one-year period ended December 31, 2013, and the Institutional Class shares had outperformed the Fund's benchmark index for the since-inception period. The Board noted that the Fund had underperformed its benchmark index for the past three- and five-year periods ended December 31, 2013. The Board also considered Netols' quarterly portfolio commentary and discussion of the reasons for the Fund's underperformance in certain periods. The Board also compared the Fund's recent performance to the performance of Netols' composite of other accounts managed in the small cap value style. The Board concluded that the Fund's performance was satisfactory and that Netols would continue to provide a high level of subadvisory services to the Fund.
Subadvisory Fee. The Board reviewed and considered the subadvisory fee payable by Frontegra to Netols under the subadvisory agreement. The Board also considered information with respect to fees charged to Netols' separate account clients. The Board determined that the subadvisory fee was appropriate. In evaluating the subadvisory fee, the Board noted that such amounts are paid by Frontegra and that therefore the overall advisory fee paid by the Fund is not directly affected by the subadvisory fee.
Costs and Profitability. The Board did not consider the cost of services provided by Netols or the profitability to Netols from its relationship with the Netols Fund because it did not view these factors as relevant given that the subadvisory fee is paid by Frontegra.
Economies of Scale. Because the subadvisory fee is not paid by the Netols Fund, the Board did not consider whether the fee should reflect any potential economies of scale that might be realized as the Fund's assets increase.
Benefits to Netols. The Board considered information presented regarding any benefits to Netols from serving as subadviser to the Netols Fund (in addition to the subadvisory fee). Netols provided information to the Board regarding its receipt of unsolicited research from broker-dealers. The Board noted that Frontier continues to receive referral fees from Netols for previously solicited clients, but that Frontier no longer provides consulting services to Netols. The Board concluded that the benefits realized by Netols from its relationship to the Fund were reasonable.
On the basis of its review of the foregoing information, the Board found that the terms of the subadvisory agreement were fair and reasonable and in the best interests of the shareholders of the Netols Fund.
Subadvisory Agreement between Frontegra and Phocas Financial Corp. ("Phocas")
Nature, Extent and Quality of the Services to be Provided. The Board reviewed and considered Phocas' investment strategy and experience as a small cap value manager, key personnel involved in providing investment management services to the Phocas Fund, compliance record and financial condition. The Board also considered services provided by Phocas under the subadvisory agreement, including managing the Fund's investments, the selection of broker-dealers for execution of portfolio transactions, monitoring adherence to the Fund's investment restrictions and assisting with the Fund's compliance program. The Board noted that Phocas has retained Frontier to raise assets for its small cap value equity strategy and assists Frontier in efforts to increase Fund assets so it reaches critical mass. The Board concluded that the nature, extent and quality of the services provided by Phocas to the Fund were appropriate and that the Fund was likely to continue to benefit from services provided by Phocas under the subadvisory agreement.
Investment Performance. The Board reviewed the Fund's investment performance as of December 31, 2013, and March 31, 2014. The Board noted that the Fund had outperformed its benchmark index for the past one-, three-, and five-year and since-inception periods ended December 31, 2013. The Board noted that the Fund had been reorganized into the Frontegra family of funds on October 8, 2010,
page 69

and returns for the prior periods were for the predecessor fund, also managed by Phocas. The Board also reviewed the performance of Phocas' composite of other accounts managed in the small cap value style. The Board concluded that the Fund's performance was satisfactory and that Phocas would continue to provide a high level of subadvisory services to the Fund.
Subadvisory Fee. The Board reviewed and considered the subadvisory fee payable by Frontegra to Phocas under the subadvisory agreement. The Board noted that given the Fund's current asset size and the fact that Frontegra was currently reimbursing Fund expenses, Phocas' subadvisory fee had been waived during the past year. The Board considered the fees charged to separate accounts and a sub-account of a collective fund managed by Phocas. The Board concluded that Phocas would continue to provide a high level of services to the Fund and that the subadvisory fee was appropriate.
Costs and Profitability. The Board did not consider the cost of services provided by Phocas or the profitability to Phocas from its relationship with the Phocas Fund to be material factors because the subadvisory fee is paid by Frontegra. The Board noted that Phocas was currently waiving its subadvisory fee.
Economies of Scale. Because the subadvisory fee is not paid by the Phocas Fund, the Board did not consider whether the fee should reflect any potential economies of scale that might be realized as the Fund's assets increase.
Benefits to Phocas. The Board considered information presented regarding any benefits to Phocas from serving as subadviser to the Fund (in addition to the subadvisory fee). The Fund allows Phocas to serve clients that do not meet Phocas' eligibility criteria for separate accounts. The Board noted that Frontier provides consulting services to Phocas for which Frontier may be compensated by Phocas. The Board concluded that the benefits realized by Phocas from its relationship to the Fund were reasonable.
On the basis of its review of the foregoing information, the Board found that the terms of the subadvisory agreement were fair and reasonable and in the best interests of the shareholders of the Phocas Fund.
Subadvisory Agreement between Frontegra and RobecoSAM USA, Inc. ("RobecoSAM")
Nature, Extent and Quality of Services Provided to the Fund. The Board reviewed and considered RobecoSAM's investment strategy and experience in sustainability investing, key personnel involved in providing investment management services to the Fund and the financial resources and services provided by RobecoSAM's affiliates and parent company. The Board considered RobecoSAM's background and history in providing services to the Fund. The Board also considered the fact that there were no material changes to RobecoSAM's operations, personnel or services to the Fund as a result of the recent acquisition of Robeco Groep N.A. by ORIX Corporation. The Board discussed RobecoSAM's efforts to increase Fund assets so that it reaches critical mass with a representative of RobecoSAM. The Board concluded that the nature, extent and quality of the services provided by RobecoSAM was appropriate and that the Fund was likely to continue to benefit from services provided by RobecoSAM.
Investment Performance. The Board reviewed the Fund's investment performance as of December 31, 2013, and March 31, 2014. The Board noted that the Fund had outperformed its benchmark for the year ended December 31, 2013 but underperformed its benchmark for the three-year and since-inception periods ended December 31, 2013. The Board also considered RobecoSAM's quarterly performance reports, including a discussion of the reasons for the Fund's underperformance in certain periods. Additionally, the Board reviewed the performance of the Fund against the performance of RobecoSAM's composite of other accounts managed in the sustainable global equities strategy. The Board concluded that the Fund and its shareholders were likely to benefit from RobecoSAM's continued investment management services.
Subadvisory Fee. The Board reviewed and considered the subadvisory fee payable by Frontegra to RobecoSAM. The Board also reviewed information regarding RobecoSAM's fee schedule for separately managed accounts. The Board determined that the subadvisory fee was appropriate. In evaluating the subadvisory fee, the Board noted that such amounts are paid by Frontegra and that therefore the overall advisory fee paid by the Fund is not directly affected by the subadvisory fee.
page 70

Costs and Profitability. The Board did not consider the cost of services provided by RobecoSAM under the subadvisory agreement because it did not view this factor as relevant given that the subadvisory fee is paid by Frontegra. The Board noted that the Fund is not profitable to RobecoSAM due to the current asset size of the Fund.
Economies of Scale and Fee Levels Reflecting Those Economies. The Board did not view economies of scale as relevant given the current asset size of the Fund. Because the subadvisory fee is not paid by the Fund, the Board did not consider whether the fee should reflect any potential economies of scale that might be realized as the Fund's assets increase.
Other Benefits to RobecoSAM. The Board also considered information presented regarding any benefits to RobecoSAM from serving as subadviser to the Fund (in addition to the subadvisory fee). The Board noted that RobecoSAM received a limited amount of soft dollar benefits. The Board concluded that the benefits received by RobecoSAM for its relationship to the Fund were reasonable.
Based on its review of the foregoing, the Board found that the terms of the subadvisory agreement were fair and reasonable and in the best interests of the shareholders of the RobecoSAM Fund.
Subadvisory Agreement between Frontegra and Magellan Asset Management Limited d/b/a MFG Asset Management ("Magellan")
Nature, Extent and Quality of the Services to be Provided. The Board reviewed and considered Magellan's investment strategy for each Fund and experience as a global equity and infrastructure manager, key personnel involved in providing investment management services to the Funds and financial condition, including the financial condition of Magellan's parent company. The Board also considered services provided by Magellan under the subadvisory agreement, including the management of each Fund's investments, the selection of broker-dealers for execution of portfolio transactions, monitoring adherence to each Fund's investment restrictions and assisting with the Funds' compliance program. The Board considered that Magellan has retained Frontier to assist in raising assets for both strategies and, in the case of the Infrastructure Fund, to increase Fund assets so that it reaches critical mass. The Board concluded that the nature, extent and quality of the services provided by Magellan to the Funds were appropriate and that each Fund was likely to continue to benefit from services provided by Magellan under the subadvisory agreement.
Investment Performance. The Board reviewed the performance record of the Global Equity and Infrastructure Funds as of December 31, 2013, and March 31, 2014. It noted that the Global Equity Fund had outperformed its benchmark index for the one-year and since-inception periods ended December 31, 2013. The Board also compared the Fund's 2013 performance to the performance of Magellan's composite of other accounts managed in the global equity style. The Board noted that the Infrastructure Fund had underperformed its benchmark for the year ended December 31, 2013, but outperformed its benchmark for the since-inception period. The Board also considered Magellan's quarterly portfolio commentary, explanation for the Infrastructure Fund's recent underperformance and review of each Fund's performance. The Board concluded that Magellan would continue to provide a high level of subadvisory services to the Funds.
Subadvisory Fees. The Board reviewed and considered the subadvisory fees payable by Frontegra to Magellan under the subadvisory agreement. The Board noted that Magellan also shares in the Funds' expense reimbursements made by Frontegra. The Board reviewed information regarding fees charged to Magellan's other institutional clients for similar mandates. The Board determined that the subadvisory fee was appropriate. In evaluating the subadvisory fee, the Board noted that such amounts are paid by Frontegra and that therefore the overall advisory fee paid by each Fund is not directly affected by the subadvisory fee.
Costs and Profitability. The Board did not consider the cost of services provided by Magellan or the profitability to Magellan from its relationship with the Funds to be material factors because the subadvisory fee is paid by Frontegra.
Economies of Scale. Because the subadvisory fee is not paid by the Funds, the Board did not consider whether the fee should reflect any potential economies of scale that might be realized as the Funds' assets increase.
page 71

Benefits to Magellan. The Board considered information presented regarding any benefits to Magellan from serving as subadviser to the Funds (in addition to the subadvisory fee). The Board noted that Magellan transacts with full service brokers who provide research reports and other general research services to Magellan. The Board also noted that Frontier provides consulting services to Magellan for which Frontier is compensated by Magellan. The Board concluded that the benefits realized by Magellan from its relationship with each Fund were reasonable.
On the basis of its review of the foregoing information, the Board found that the terms of the subadvisory agreement were fair and reasonable and in the best interests of the shareholders of each of the Funds.
page 72

ADDITIONAL INFORMATION
(Unaudited)
DIRECTORS AND OFFICERS AS OF JUNE 30, 2014
The business and affairs of the Funds are managed under the direction of the Funds' Board of Directors. Information pertaining to the directors and officers of the Funds is set forth below. The SAI includes additional information about the Funds' directors and officers and is available without charge, upon request by calling 1-888-825-2100.
Interested Director and Officers
Name, Address and
Year of Birth | | Position(s)
Held with
Company | | Term of
Office and
Length
of Time
Served | | Principal
Occupation(s)
During Past
Five Years | | Number of
Funds in
Complex
Overseen
by Director | | Other
Directorships
Held by
Director | |
William D. Forsyth III*
Frontegra Funds, Inc.
400 Skokie Boulevard
Suite 500
Northbrook, Illinois 60062
Year of Birth: 1963 | | President
Director
Co-President, Treasurer and Assistant Secretary
Secretary | | Elected annually by the Board; since August 2008.
Indefinite; since May 1996.
From May 1996 to August 2008.
From August 2008 to May 2013. | | Mr. Forsyth received his B.S. in Finance from the University of Illinois in 1986 and his M.B.A. from the University of Chicago in 1988. Mr. Forsyth has served as President of Frontegra since August 2008 and as Treasurer and a Director of Frontegra since May 1996. Mr. Forsyth served as Co-President and Assistant Secretary of Frontegra from May 1996 to August 2008. Mr. Forsyth has served as President of Timpani since August 2008 and served as Co-President from April 2008 to August 2008. Mr. Forsyth has served as President of Frontegra Strategies, LLC, the principal distributor of the Funds' shares, since August 2008 and as Co-President from August 2007 to August 2008. From July 1993 until the present, Mr. Forsyth also served as a Partner of Frontier Partners, Inc., a consulting/marketing firm ("Frontier"). From April 1987 until June 1993, Mr. Forsyth served as a Partner of Brinson Partners, Inc., an investment adviser, and from June 1986 until April 1987, he served as a product marketing representative of Harris Trust & Savings Bank. Mr. Forsyth has earned the right to use the CFA designation. | | | 6 | | | None | |
* Mr. Forsyth is an "interested person" of the Funds because he serves as a director and officer of Frontegra, owns 100% of Frontegra and has an indirect equity ownership interest in Timpani.
page 73

ADDITIONAL INFORMATION (continued)
(Unaudited)
Interested Director and Officers
Name, Address and
Year of Birth | | Position(s)
Held with
Company | | Term of
Office and
Length
of Time
Served | | Principal
Occupation(s)
During Past
Five Years | | Number of
Funds in
Complex
Overseen
by Director | | Other
Directorships
Held by
Director | |
Elyce D. Dilworth Frontegra Funds, Inc. 400 Skokie Boulevard Suite 500 Northbrook, Illinois 60062 Year of Birth: 1966 | | Treasurer, Assistant Secretary, Chief Compliance Officer and Anti-Money Laundering Compliance Officer | | Elected annually by the Board; Treasurer and Assistant Secretary since August 2008; Chief Compliance Officer since January 2008; Anti-Money Laundering Compliance Officer since February 2008. | | Ms. Dilworth received her B.B.A. in Finance from the University of Wisconsin – Milwaukee in 1989 and her M.S. in Accounting from the University of Wisconsin – Milwaukee in 1991. Ms. Dilworth has served as Chief Compliance Officer of Frontegra since January 2008 and as Secretary since August 2008. Ms. Dilworth served as Chief Compliance Officer of Timpani from April 2008 to June 2011. She served as Chief Financial Officer of Timpani from April 2008 to March 2010. Ms. Dilworth served as Chief Compliance Officer of Frontier from September 2010 to June 2011. Ms. Dilworth has also served as Chief Compliance Officer of the Distributor since August 2008. From June 2004 until May 2007, Ms. Dilworth was the Chief Compliance Officer for Van Wagoner Funds, Inc. (n/k/a Embarcadero Funds, Inc.), and the President, Secretary and Treasurer from January 2005 until May 2007. From April 1994 until December 2003, Ms. Dilworth was employed by UMB Fund Services, Inc., a service provider to mutual funds and alternative investment products. From January 1992 until April 1994, Ms. Dilworth was a Staff Accountant for PricewaterhouseCoopers LLP, a public accounting firm. | | N/A | | N/A | |
page 74

ADDITIONAL INFORMATION (continued)
(Unaudited)
Interested Director and Officers
Name, Address and
Year of Birth | | Position(s)
Held with
Company | | Term of
Office and
Length
of Time
Served | | Principal
Occupation(s)
During Past
Five Years | | Number of
Funds in
Complex
Overseen
by Director | | Other
Directorships
Held by
Director | |
Robert A. Nanney Frontegra Funds, Inc.
400 Skokie Boulevard
Suite 500 Northbrook, Illinois 60062 Year of Birth: 1979 | | Vice President and Secretary | | Elected annually by the Board; since May 2013. | | Mr. Nanney received his B.A. from Loyola University Chicago in 2002 and his J.D. from Loyola University Chicago School of Law in 2005. Mr. Nanney has been in-house counsel of Frontegra since May 2011. Mr. Nanney has served as in-house counsel and Chief Compliance Officer of Timpani since July 2011. Mr. Nanney has served as in-house counsel and Chief Compliance Officer of Frontier since July 2011. From March 2008 until May 2011, Mr. Nanney served as associate general counsel of Superfund Asset Management, Inc., an introducing broker, and from May 2006 until March 2008, he served as a tax associate for Wealth & Tax Advisory Services, Inc., a tax consulting firm. | | N/A | | N/A | |
page 75

ADDITIONAL INFORMATION (continued)
(Unaudited)
Independent Directors
Name, Address and
Year of Birth | | Position(s)
Held with
Company | | Term of
Office and
Length
of Time
Served | | Principal
Occupation(s)
During Past
Five Years | | Number of
Funds in
Complex
Overseen
by Director | | Other
Directorships
Held by
Director | |
David L. Heald 400 Skokie Boulevard Suite 500 Northbrook, Illinois 60062 Year of Birth: 1943 | | Lead Independent Director | | Indefinite; since June 1996 | | Mr. Heald received his B.A. in English from Denison University in 1966 and his J.D. from Vanderbilt University School of Law in 1969. Mr. Heald previously served as a principal and a director of Consulting Fiduciaries, Inc. ("CFI") from 1994 to 2011. CFI was a registered investment adviser that provided professional, independent, fiduciary decision making, consultation and alternative dispute resolution services to ERISA plans, plan sponsors and investment managers. Between April 1994 and August 1994, Mr. Heald engaged in the private practice of law. From August 1992 until April 1994, Mr. Heald was a managing director and the chief administrative officer of Calamos Asset Management, Inc., a registered investment adviser specializing in convertible securities, and he served as an officer and director of CFS Investment Trust, a registered investment company comprised of four series. From January 1990 until August 1992, Mr. Heald was a partner in the Chicago based law firm of Gardner, Carton & Douglas. | | | 6 | | | None | |
page 76

ADDITIONAL INFORMATION (continued)
(Unaudited)
Independent Directors
Name, Address and
Year of Birth | | Position(s)
Held with
Company | | Term of
Office and
Length
of Time
Served | | Principal
Occupation(s)
During Past
Five Years | | Number of
Funds in
Complex
Overseen
by Director | | Other
Directorships
Held by
Director | |
Steven K. Norgaard
400 Skokie Boulevard
Suite 500
Northbrook, Illinois 60062
Year of Birth: 1964 | | Independent Director | | Indefinite; since October 2013 | | Mr. Norgaard received his B.S. in Accountancy from the University of Illinois in 1987 and his J.D. from the University of Chicago in 1990. He has been an attorney with Steven K. Norgaard P.C. since 1994. From 1990 to 1994, he was an associate at McDermott, Will & Emery. | | | 6 | | | Boulder Growth & Income Fund, Inc., Boulder Total Return Fund, Inc., The Denali Fund, Inc. and The First Opportunity Fund, Inc. | |
James M. Snyder
400 Skokie Boulevard
Suite 500
Northbrook, Illinois 60062
Year of Birth: 1947 | | Independent Director | | Indefinite; since May 2002 | | Mr. Snyder received his B.S. in Finance from Indiana University in 1969 and his M.B.A. from DePaul University in 1973. Mr. Snyder is a private investor and Chairman of The Snyder Family Foundation. Mr. Snyder served as an investment professional with Northern Trust from June 1969 until his retirement in June 2001. He served in a variety of capacities at Northern Trust, including as Chief Investment Officer, Executive Vice President of Northern Trust and Vice Chairman of Northern Trust Global Investments. Mr. Snyder has earned the right to use the Chartered Financial Analyst (CFA) designation. | | | 6 | | | IronBridge Funds, Inc. (with oversight of four portfolios) | |
page 77

ADDITIONAL INFORMATION (continued)
(Unaudited)
FOREIGN TAX CREDIT
For the year ended June 30, 2014, the Frontegra MFG Core Infrastructure Fund earned foreign source income and paid foreign taxes, which it intends to pass through to its shareholders pursuant to Section 853 of the Internal Revenue Code as follows:
| | Foreign Source Income Earned | | Foreign Taxes Paid | |
Australia | | $ | 152,899 | | | $ | 9,673 | | |
Austria | | | 3,657 | | | | 549 | | |
Belgium | | | 12,219 | | | | 1,833 | | |
Canada | | | 66,202 | | | | 9,930 | | |
France | | | 30,015 | | | | 4,502 | | |
Germany | | | 20,641 | | | | 3,096 | | |
Guernsey | | | 10,603 | | | | — | | |
Hong Kong | | | 41,069 | | | | — | | |
Italy | | | 146,569 | | | | 21,986 | | |
Luxembourg | | | 21,340 | | | | 3,201 | | |
Mexico | | | 12,395 | | | | — | | |
Netherlands | | | 7,208 | | | | 1,081 | | |
New Zealand | | | 18,122 | | | | — | | |
Spain | | | 39,633 | | | | 5,930 | | |
Switzerland | | | 2,923 | | | | 438 | | |
United Kingdom | | | 150,364 | | | | — | | |
| | $ | 735,859 | | | $ | 62,219 | | |
page 78

ADDITIONAL INFORMATION (continued)
(Unaudited)
QUALIFIED DIVIDEND INCOME/DIVIDENDS RECEIVED DEDUCTION
For the fiscal year ended June 30, 2014, certain dividends paid by the Funds may be subject to a maximum tax rate of 15%, as provided for by the Jobs and Growth Tax Relief Reconciliation Act of 2004. The percentage of dividends declared from ordinary income designated as qualified dividend income was as follows:
RobecoSAM Global Equity | | | 91.51 | % | |
MFG Global Equity | | | 68.22 | % | |
MFG Core Infrastructure | | | 100.00 | % | |
| Timpani Small Cap Growth | | | 32.34 | % | |
| Netols Small Cap Value | | | 77.39 | % | |
Phocas Small Cap Value | | | 35.96 | % | |
For corporate shareholders, the percent of ordinary income distributions qualifying for the corporate dividends received deduction for the fiscal year ended June 30, 2014 was as follows:
RobecoSAM Global Equity | | | 62.07 | % | |
MFG Global Equity | | | 38.87 | % | |
MFG Core Infrastructure | | | 29.92 | % | |
| Timpani Small Cap Growth | | | 31.74 | % | |
| Netols Small Cap Value | | | 71.65 | % | |
Phocas Small Cap Value | | | 34.29 | % | |
ADDITIONAL INFORMATION APPLICABLE TO FOREIGN SHAREHOLDERS ONLY
The percent of ordinary income distributions designated as interest related dividends for the fiscal year ended June 30, 2014 was as follows:
RobecoSAM Global Equity | | | 0.06 | % | |
MFG Global Equity | | | 0.07 | % | |
MFG Core Infrastructure | | | 0.04 | % | |
Timpani Small Cap Growth | | | 0.13 | % | |
Netols Small Cap Value | | | 0.01 | % | |
Phocas Small Cap Value | | | 0.07 | % | |
The percent of ordinary income distributions designated as short-term capital gain distributions for the fiscal year ended June 30, 2014 was as follows:
RobecoSAM Global Equity | | | 24.32 | % | |
MFG Global Equity | | | 57.72 | % | |
Timpani Small Cap Growth | | | 100.00 | % | |
Netols Small Cap Value | | | 100.00 | % | |
Phocas Small Cap Value | | | 86.69 | % | |
page 79
This page intentionally left blank.

A NOTE ON FORWARD-LOOKING STATEMENTS
This report includes forward-looking statements such as adviser, subadviser and/or portfolio manager predictions, opinions, assessments, analyses or outlooks for individual securities, industries, market sectors and/or markets. These statements involve risks and uncertainties. In addition to the general risks described for the Funds in the current Prospectuses, other factors bearing on these statements include the accuracy of the advisers', subadvisers' or portfolio managers' forecasts and predictions, and the appropriateness of the investment programs designed by an adviser, subadviser or portfolio manager to implement their strategies efficiently and effectively. Any one or more of these factors, as well as other risks affecting the securities markets and investment instruments generally, could cause the actual results of the Funds to differ materially as compared to benchmarks associated with the Funds.
In addition, portfolio composition will change due to ongoing management of the Funds. Specific securities named in this report may not currently be owned by the applicable Fund, or the Fund's position in the securities may have changed.
ADDITIONAL INFORMATION
Frontegra Funds has adopted proxy voting policies and procedures that delegate to Frontegra Asset Management, Inc. ("Frontegra") and Timpani Capital Management LLC the authority to vote proxies. The proxy voting policies permit Frontegra to delegate its authority to vote proxies to a Fund's subadviser. A description of the Frontegra Funds' proxy voting policies and procedures is available without charge, upon request, by calling the Funds toll free at 1-888-825-2100. A description of these policies and procedures is also included in the Funds' Statement of Additional Information, which is available on the SEC's website at http://www.sec.gov and the Funds' website at www.frontegra.com or by calling the Funds toll free at 1-888-825-2100.
The actual voting records relating to each Fund's portfolio securities during the most recent twelve months ended June 30 are available without charge by calling the Funds toll free at 1-888-825-2100 or by accessing the SEC's website at http://www.sec.gov.
Each Fund files a complete schedule of portfolio holdings for its first and third fiscal quarters with the SEC on Form N-Q. The Form N-Q is available on the SEC's website at http://www.sec.gov. The Form N-Q may also be reviewed and copied at the SEC's Public Reference Room in Washington, D.C. Information on the operation of the Public Reference Room may be obtained by calling toll-free 1-800-SEC-0330.
Item 2. Code of Ethics.
The registrant has adopted a code of ethics that applies to the registrant’s principal executive officer and principal financial officer. The registrant has not made any amendments to its code of ethics during the period covered by this report. The registrant has not granted any waivers from any provisions of the code of ethics during the period covered by this report.
A copy of the registrant’s Code of Ethics is Incorporated by reference. See Item 12(a)(1).
Item 3. Audit Committee Financial Expert.
The registrant’s board of directors has determined that there is at least one audit committee financial expert serving on its audit committee. Steven Norgaard is the “audit committee financial expert” and is considered to be “independent” as each term is defined in Item 3 of Form N-CSR.
Item 4. Principal Accountant Fees and Services.
The registrant has engaged its principal accountant to perform audit services, audit-related services, tax services and other services during the past two fiscal years. In the following table, “Audit Fees” are fees billed for professional services for the audit of the registrant’s annual financial statements or services that are normally provided by the accountant in connection with statutory and regulatory filings or engagements for those fiscal years. The “All Other Fees” for fiscal year 2014 relate to the principal accountant’s review of the registrant’s semi-annual report for the period ended December 31, 2013. “Tax Fees” refer to professional services rendered by the principal accountant for tax compliance, tax advice, and tax planning. There were no other services provided by the principal accountant. The following table details the aggregate fees billed for each of the last two fiscal years by the principal accountant.
| | FYE 6/30/2014 | | FYE 6/30/2013 | |
Audit Fees | | $ | 72,000 | | $ | 96,000 | |
Tax Fees | | $ | 18,000 | | $ | 24,000 | |
All Other Fees | | $ | 1,500 | | $ | 1,500 | |
The audit committee has adopted pre-approval policies and procedures that require the audit committee to pre-approve all audit and non-audit services of the registrant, including services provided to any entity affiliated with the registrant with respect to any engagement that directly relates to the operations and financial reporting of the registrant. In accordance with its pre-approval policies and procedures, the audit committee pre-approved all audit and tax services provided by the principal accountant during fiscal year 2014. All of the hours spent on auditing the registrant’s financial statements were attributed to work performed by full-time permanent employees of the principal accountant.
The following table indicates the non-audit fees billed or expected to be billed by the registrant’s accountant for services to the registrant and to the registrant’s investment adviser for the last two years. The audit committee has considered whether the provision of non-audit services that were rendered to the registrant’s investment adviser is compatible with maintaining the principal accountant’s independence and has concluded that the provision of such non-audit services by the accountant has not compromised the accountant’s independence.
Non-Audit Related Fees | | FYE 06/30/2014 | | FYE 06/30/2013 | |
Registrant | | — | | — | |
Registrant’s Investment Adviser | | $ | 27,750 | | — | |
| | | | | | |
Item 5. Audit Committee of Listed Registrants.
Not applicable to registrants who are not listed issuers (as defined in Rule 10A-3 under the Securities Exchange Act of 1934).
Item 6. Investments.
(a) Schedule of Investments is included as part of the report to shareholders filed under Item 1 of this Form.
(b) Not Applicable.
Item 7. Disclosure of Proxy Voting Policies and Procedures for Closed-End Management Investment Companies.
Not applicable to open-end investment companies.
Item 8. Portfolio Managers of Closed-End Management Investment Companies.
Not applicable to open-end investment companies.
Item 9. Purchases of Equity Securities by Closed-End Management Investment Company and Affiliated Purchasers.
Not applicable to open-end investment companies.
Item 10. Submission of Matters to a Vote of Security Holders.
Not Applicable.
Item 11. Controls and Procedures.
(a) Based on an evaluation of the registrant’s disclosure controls and procedures (as defined in Rule 30a-3(c) under the Investment Company Act of 1940 (the “Act”)) as of a date within 90 days prior to the filing date of this Form N-CSR, the registrant’s principal executive officer
and principal financial officer have concluded that the disclosure controls and procedures are effective.
(b) There were no changes in the registrant’s internal control over financial reporting (as defined in Rule 30a-3(d) under the Act) that occurred during the second fiscal quarter of the period covered by this report that has materially affected, or is reasonably likely to materially affect, the registrant’s internal control over financial reporting.
Item 12. Exhibits.
(a) (1) Any code of ethics or amendment thereto, that is the subject of the disclosure required by Item 2, to the extent that the registrant intends to satisfy Item 2 requirements through filing an exhibit. Incorporated by reference to the registrant’s Form N-CSR filed September 8, 2008.
(2) A separate certification for each principal executive and principal financial officer pursuant to Section 302 of the Sarbanes-Oxley Act of 2002. Filed herewith.
(3) Any written solicitation to purchase securities under Rule 23c-1 under the Act sent or given during the period covered by the report by or on behalf of the registrant to 10 or more persons. Not applicable to open-end investment companies.
(b) Certifications pursuant to Section 906 of the Sarbanes-Oxley Act of 2002. Furnished herewith.
SIGNATURES
Pursuant to the requirements of the Securities Exchange Act of 1934 and the Investment Company Act of 1940, the registrant has duly caused this report to be signed on its behalf by the undersigned, thereunto duly authorized.
Frontegra Funds, Inc. |
| |
| |
By: | /s/ William D. Forsyth III | |
| William D. Forsyth III, President |
| (Principal Executive Officer) |
| |
Date: | 8/28/14 | |
Pursuant to the requirements of the Securities Exchange Act of 1934 and the Investment Company Act of 1940, this report has been signed below by the following persons on behalf of the registrant and in the capacities and on the dates indicated.
By: | /s/ William D. Forsyth III | |
| William D. Forsyth III, President and Secretary |
| (Principal Executive Officer) |
| |
Date: | 8/28/14 | |
| |
| |
By: | /s/ Elyce D. Dilworth | |
| Elyce D. Dilworth, Treasurer and Assistant Secretary |
| (Principal Financial Officer) |
| |
Date: | 8/28/14 | |