UNITED STATES
SECURITIES AND EXCHANGE COMMISSION
Washington, D.C. 20549
FORM N-CSR
CERTIFIED SHAREHOLDER REPORT OF REGISTERED
MANAGEMENT INVESTMENT COMPANIES
Investment Company Act file number | 811-1800 |
|
U.S. GLOBAL INVESTORS FUNDS |
(Exact name of registrant as specified in charter) |
|
7900 CALLAGHAN ROAD SAN ANTONIO, TX | | 78229 |
(Address of principal executive offices) | | (Zip code) |
|
SUSAN B. MCGEE, ESQ. 7900 CALLAGHAN ROAD SAN ANTONIO, TX 78229 |
(Name and address of agent for service) |
|
Registrant’s telephone number, including area code: | 210-308-1234 | |
|
Date of fiscal year end: | DECEMBER 31, 2011 | |
|
Date of reporting period: | JUNE 30, 2011 | |
| | | | | | | | |
ITEM 1. REPORTS TO STOCKHOLDERS.
U.S. Global Investors Funds
Semi-Annual Report
June 30, 2011

U.S. Global Investors Funds Semi-Annual Report June 30, 2011
U.S. Global Investors Funds
Semi-Annual Report
June 30, 2011
(unaudited)
Table of Contents
| Letter to Shareholders | | | 1 | | |
|
| Definitions for Management Teams' Perspectives | | | 13 | | |
|
| Management Teams' Perspectives | | | 16 | | |
|
| Expense Example | | | 71 | | |
|
| Portfolios of Investments | | | 74 | | |
|
| Notes to Portfolios of Investments | | | 134 | | |
|
| Statements of Assets and Liabilities | | | 146 | | |
|
| Statements of Operations | | | 152 | | |
|
| Statements of Changes in Net Assets | | | 158 | | |
|
| Notes to Financial Statements | | | 167 | | |
|
| Financial Highlights | | | 186 | | |
|
| Additional Information | | | 202 | | |
|
| Privacy Policy | | | |
|
Nasdaq Symbols
U.S. Global Investors Funds
Investor Class
| U.S. Treasury Securities Cash Fund | | USTXX | |
| U.S. Government Securities Savings Fund | | UGSXX | |
| Near-Term Tax Free Fund | | NEARX | |
| Tax Free Fund | | USUTX | |
| All American Equity Fund | | GBTFX | |
| Holmes Growth Fund | | ACBGX | |
| Global MegaTrends Fund | | MEGAX | |
| Global Resources Fund | | PSPFX | |
| World Precious Minerals Fund | | UNWPX | |
| Gold and Precious Metals Fund | | USERX | |
| Eastern European Fund | | EUROX | |
| Global Emerging Markets Fund | | GEMFX | |
| China Region Fund | | USCOX | |
Institutional Class
| Global MegaTrends Fund | | MEGIX | |
| Global Resources Fund | | PIPFX | |
| World Precious Minerals Fund | | UNWIX | |
P.O. Box 659405
San Antonio, Texas 78265-9604
Tel 1•800•US•FUNDS
Fax 1•210•308•1217
www.usfunds.com
U.S. Global Investors Funds
Dear Fellow Shareholder:

We appreciate your trust and perseverance through these volatile markets.
These long, continuous waves of boom and bust inherent in history are called supercycles. Currently, the global economy is experiencing two supercycle S-curves simultaneously evolving: A super debt contraction cycle in Europe and America, and an infrastructure buildout cycle in emerging markets. Based on the history of financial markets, the debt contraction cycle will be a period of frequent, strong headwinds for another two years or so. The good news, however, is that we believe the infrastructure buildout cycle will continue to be a powerful wind hitting investors' sails for another 10 years. These two crosswinds will generate volatility in asset classes, but will also create opportunities.
The debt contraction cycle still has a little distance to go. In a comprehensive review of 400 years of market movements, Rodney Sullivan, co-editor of the CFA Digest, identified three distinct patterns among the 47 major financial bubbles: financial innovation, investor exuberance and speculative leverage.
Financial innovation initially benefits society as a whole. During the exuberance stage, the use of these innovations broadens; they become mainstream and attract speculation. The third step – the tipping point for a bubble to form – is when the limbic "greed center" of the brain influences people's decision making. Speculators pile on massive leverage hoping to achieve greater success, but create an imbalance in the marketplace. Eventually, the party comes to an end and the bubble bursts.
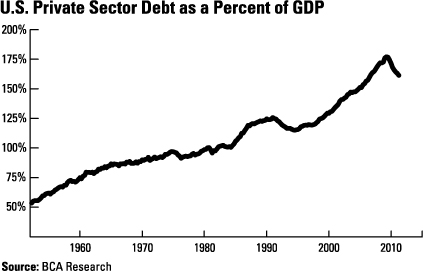
During the heyday of the housing boom, government policies encouraged speculators: American homeowners leveraged their homes 100-to-1, Fannie Mae was leveraged 80-to-1, and Wall Street investment firms leveraged themselves over 30-to-1. At its height, private sector debt reached 180 percent of the U.S. GDP.
1
U.S. Global Investors Funds
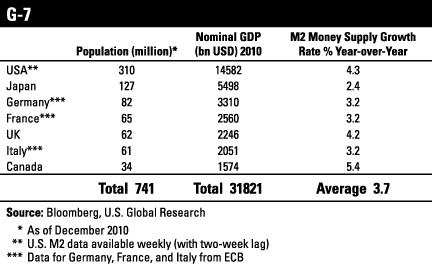
Debt continues to burden many developed countries. A year ago, debt in the developed world climbed so high that the debt-to-GDP ratio of the G-7 group – Canada, France, Germany, Italy, Japan, the U.K. and the U.S. – was at its highest level in 60 years. Since then, many of these countries have been dealing with the reality of their governments' overindulgent borrowing habits by instituting strong austerity measures. These measures help strengthen a country's fiscal balance sheet but put a damper on its economic growth.
Historically, leverage-induced recessions take four years to fully recover. This is longer than a normal recession, when it takes roughly five quarters to repair the damage. Presently, we should be more than halfway through this healing process, yet there appears to be no real policies to spur economic and private sector job growth on the horizon. In fact, many regulations are having the opposite effect. Sadly, there won't be a cure until investors demand that politicians and voters create a deregulation cycle.
In the wake of the credit crisis, the U.S. government hastily passed the 2,300-page Dodd-Frank Wall Street Reform and Consumer Protection Act. According to Wayne Crews of the Competitive Enterprise Institute, there are currently more than 4,000 new regulations in the pipeline and a record 81,405 pages of new rules were created in the Federal Register during 2010. The intentions were good – to protect consumers and to prevent investors from market
2
U.S. Global Investors Funds

manipulations and institutions piling on too much risk – but the government's focus on expedience omitted important cost-benefit analyses from taking place and possible unintended consequences flew under the radar. Intuition and history suggest we don't need thousands of new rules that mainly benefit the regulatory industry while further burdening our already fragile economic system.
Estimates place the total cost of the bill at $6.5 billion, which includes 5,000 new employees to implement it, but that's just the tip of the iceberg. The true cost of Dodd-Frank is much larger in terms of overall economic impact and many thought-leaders believe it is sabotaging the U.S. recovery. The onslaught of new regulations has created an "atmosphere of uncertainty" and companies are unwilling to deploy new capital, despite carrying large amounts of cash on their balance sheets.
When speaking to an oversight panel for the Federal Reserve earlier this year, JPMorgan Chase CEO Jamie Dimon explained these new regulations could spell "suffocation through regulation" for the U.S. economy and questioned whether anyone had "bothered to study the cumulative effect" of them. PIMCO co-CIO Bill Gross, who manages the world's largest bond portfolio, echoed similar sentiments regarding these "oppressive regulations."
One must also consider the inherent cost of compliance with these new regulations. Research from economists Nicole and Mark Crain shows that the net cost of compliance with federal regulations totaled $1.75 trillion in 2009, nearly 12 percent of America's GDP. That's more than $8,000 per employee and up from only about 4 percent of GDP in 1950. Furthermore, businesses with fewer than 20 employees bear a disproportionate share of the federal regulatory burden – 36 percent more per employee than larger companies, according to data from the Small Business Administration. Small businesses have historically created seven out of every 10 jobs, so it isn't surprising that job growth in the U.S. remains weak.
3
U.S. Global Investors Funds
Broad-brush vilifying of business leaders is diverting attention away from the government's fiscal issues which must be fixed. Money flows to where it is most respected. It's shocking to see how much the landscape has changed when the New York Stock Exchange, "the symbol of America's capitalism for more than two centuries," as coined by The New York Times, is to be controlled by a German company.
You may not have direct exposure to these financial regulations, but everyone can experience the inefficiencies and frustrations of an overregulated system when they board an airplane. In essence, everyone is treated as guilty until proven innocent before they fly. Full-body scanners have been commissioned throughout the United States, but there's a reason frequent flyers such as pilots and flight attendants have had their unions fight for exemption from using these scanners. Medical evidence from Columbia University shows that radiation emitted from these machines is 20 times greater than originally estimated. The researchers said the most likely risk is carcinoma, a form of skin cancer, and that children are the most at risk of being affected.
Those who decline exposing themselves to this health risk are subjected to an intimidating and extensive pat-down by Transportation Security Administration (TSA) officials. Last year, a TSA official admitted off-the-record that screeners punish those who decline to be scanned by making the pat-downs so aggressive and uncomfortable that it encourages compliance the next time around. These intrusive pat-downs have ignited a backlash across the country as images taken by appalled travelers showed the inappropriate touching of young children and the elderly. When representatives in Texas presented a bill that would make the extensive pat-downs equivalent to sexual assault if done inappropriately, federal authorities threatened to make Texas a "no-fly zone" and the bill was withdrawn. The idea of selling more regulation as a salve for life's uncertainties has been counterproductive, paralyzing the economic recovery efforts as business leaders are forced to halt hiring in order to digest the full impact of the latest rules.
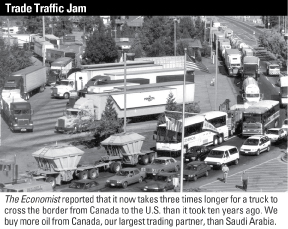
In an age of increasing security threats, it makes sense to strengthen our national defenses, but this heightened security must be applied in a way that revitalizes trade flows and breaks down regulatory barriers, in order to remain competitive in a globalized economy.
4
U.S. Global Investors Funds
One must remember that it is not political parties, but political policies which determine outcomes. As global investors, we watch government policies closely because they have historically been precursors to change. Efficient fiscal and monetary policies can promote prosperity. Policies also can discourage business development; in this case, we tend to allocate our portfolios where policies align with growth and development.
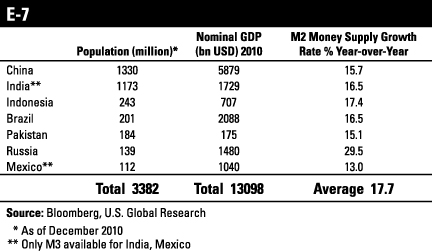
America's entrepreneurial spirit – what made America the greatest economic force in the world – is now being exported to countries such as China, India and Brazil, with policies conducive to developing and building infrastructure, coupled with governments driven to support their growing populations and increase their discretionary income. We keep track of the policies for the E-7 countries, which are the world's largest emerging nations by population. These countries hold nearly half of the world's population but make up less than 20 percent of global GDP. The G-7 industrialized nations are an inverse of this; they contain 11 percent of the world's population but control more than 50 percent of the global economy.
5
U.S. Global Investors Funds
However, the tide is turning. The most business-friendly fiscal and economic policies can be found in emerging markets, where free market policies and massive infrastructure spending are stimulating growth. Many of these emerging economies are averaging over 6 percent GDP growth and personal incomes are rising around 8 percent. Emerging economies are now home to 27 percent of the world's purchasing power, according to economic research firm ISI Group. In addition, with average money supply growth rates in these countries around 20 percent, businesses have ample access to the capital necessary to grow.
6
U.S. Global Investors Funds
Over the past 40 years, the Chinese government has undergone a complete transformation, learning from mistakes and adopting free market capitalism; the country is not alone. Many E-7 countries have implemented forward-looking policies focused on growth, such as building vital infrastructure. Over the next three years, Merrill Lynch estimates that $6 trillion will be spent on infrastructure in emerging countries. In China alone, 18,000 miles of high-speed rail will connect 250 cities and 700 million people.
Some of America's largest and oldest companies have recognized this transformation and shifted capital overseas. This past quarter of financial results showed that more than 50 of the largest companies in the S&P Composite 1500 Index had revenue growth above 10 percent while GDP growth in the U.S. was less than 2 percent. Companies such as General Electric, Caterpillar and Coca-Cola have long outgrown U.S. borders and are now expanding in record levels elsewhere around the world.
The United Parcel Service (UPS) of America has leveraged explosive growth in foreign markets to become "the world's largest package delivery company" with more than 400,000 employees worldwide and nearly 4 billion packages delivered across 220 countries and territories. General Electric (GE), the 130-year old icon of American capitalism, has concentrated its development overseas which has fueled a greater than 500 percent rise in GE's offshore profits to $92 billion last year. Recently, the company announced it was relocating its health care division, which makes MRI machines, from the U.S. to China, another illustration that companies will go where they can grow.
It's the same story for the U.S. car manufacturers General Motors (GM) and Ford. GM says China remains a priority for the "long-term success" of the company. In an interview with journalist Maria Bartiromo for USA Today, Ford CEO Alan Mulally said, "The Ford brand is one of the strongest, most aware brands in the world. In Brazil, with our new products, we're going to be covering nearly 82 percent of the market. In Russia, we have six new models over the next few years. In India, we have eight new models, and we'll be participating in nearly 70 percent of the total market."
These multinational companies are examples of how American business is keeping its entrepreneurial spirit and creating jobs by reinventing itself in the developing world. Growth in these emerging
7
U.S. Global Investors Funds
markets also have powered a strong first half of the year for commodities, including gold.
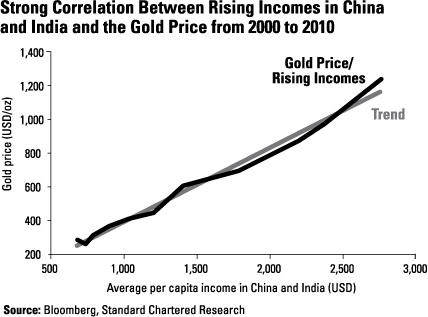
The two main drivers of gold demand – the Fear Trade and Love Trade – have continued to push gold prices to hit new nominal highs. Most pundits and market commentators focus on the Fear Trade, which is driven by negative real interest rates and deficit spending, while the Love Trade is what sets this gold bull market apart from those in the past. The Love Trade is driven by rising incomes in countries that have strong cultural affinities toward the precious metal. Countries such as India, Hong Kong, China and Russia accounted for 60 percent of the entire gold jewelry market in 2010. Visit www.usfunds.com to download our special report The Fear and Love Trade for Gold.
In fact, the rise in gold prices has been closely tied to the rise in gold demand from China and India. When the average per capita income in China and India was well below $1,000 a year, gold prices hovered just above $200 an ounce. As average incomes have approached $3,000 a year over the past decade, gold prices have followed. With the long-term outlook for wages in both these economies rather rosy, gold demand should continue to experience the trickle-down effect.
8
U.S. Global Investors Funds
Another area with potential growth is gold equities, which have lagged bullion significantly this year. In June, the ratio of gold bullion to an index that tracks gold and silver companies (XAU) was at the second-lowest level in nearly 30 years. Gold stocks also have a history of performing well when the U.S. economy hits a bump in the road. Depression-era babies and investors who love history might remember gold stocks' strong performance during the depression of the 1930s.
This divergence sets the stage for a strong rally in gold equities relative to bullion should a mean reversion to historical levels materialize just as it has done in the past. According to Desjardins, one current catalyst for a rebound in gold stocks is increased profitability from rising gold prices and decreased input costs – due to oil's 28 percent decline from 2011 highs. In addition, many quality gold companies are "paying investors to wait" by increasing dividend yield rates above those of money funds. This creates a cash incentive to hold shares of the company and allows investors to participate in rising earnings.
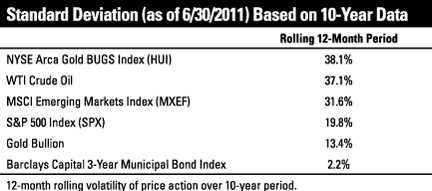
Life is often about managing expectations, gathering facts to recognize cycles and patterns that help us to make informed decisions. Investors must "anticipate before they participate" in assets such as emerging markets and commodities. Gold prices can rise or fall approximately 15 percent within a year – this happens nearly 70 percent of the time. For gold stocks, the volatility is historically around 40 percent. For emerging markets, it's roughly 30 percent. Investors looking to initiate or add to positions in gold or other volatile asset classes must be aware of this volatility and use it to their advantage.
9
U.S. Global Investors Funds
For investors, focusing on the long-term strategy of their portfolios is essential to navigating through today's unpredictable markets and preventing emotion-based decisions. For the many investors still recovering from the 2008 market decline, today's volatility is only exacerbating these familiar feelings. This is particularly true for leveraged investors who are forced to quickly sell assets when they find themselves on the wrong side of the fence.
Anxious investors have poured money into cash, U.S. government debt and money market funds despite the microscopic yields on these investments. Meanwhile, several great American companies, whose balance sheets are the envy of Washington, are carrying dividend yields above the 5-year government note.
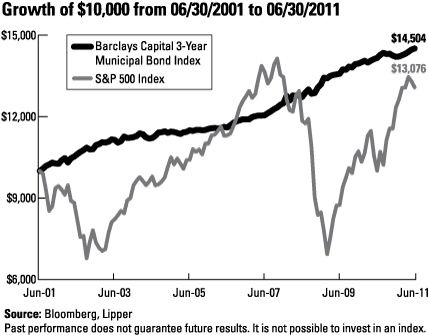
Those investors who can't endure the emotional volatility of stocks can still find opportunities in the marketplace. Like living things, each investment carries its own DNA of volatility. The yields on short-term municipal bonds are currently much more attractive than those of a CD or money market fund. In up and down markets, municipal bond funds have provided steady results. There are also added tax benefits because municipal bond funds seek current income that is exempt from federal income tax.
10
U.S. Global Investors Funds
Over the past decade, the Barclays Capital 3-Year Municipal Bond Index has generated a higher return with significantly less volatility than the S&P 500. This is why we suggest that investors consider adding tax-free bond funds to their portfolios. We also suggest that investors consider diversifying their portfolios with up to 25 percent in fixed-income funds, domestic equities, commodity-related investments and international equities. Investors also must remember to rebalance on an annual basis and be opportunistic when sharp selloffs create cheap entry points. Naturally, every investor has a different appetite for returns, tolerance for risk and unique financial circumstances. Visit www.usfunds.com to learn from our educational webcasts, such as Anticipate Before You Participate, and for our latest insights on market events.
A key to U.S. Global Investors' investment process over the past decade has been the tracking of geopolitical and economic changes around the world to seek out the best gold, natural resources, emerging markets and infrastructure opportunities for our shareholders. There will always be some good opportunities and we're working relentlessly to find them. Our investment team will continue to analyze U.S. and international companies and travel to the far corners of capitalism to speak with entrepreneurs and company executives about the future of their businesses. This is how we believe we have created value for shareholders, and how we plan to continue do so in the future.
Thank you for your continued confidence in our investment philosophy.
Sincerely,

Frank Holmes
CEO and Chief Investment Officer
U.S. Global Investors, Inc.
11
U.S. Global Investors Funds
All opinions expressed and data provided are subject to change without notice. Some of these opinions may not be appropriate to every investor. An S-curve is a type of curve that shows a rapid, exponential increase in growth for a period of time, followed by a tapering or leveling off. Diversification does not protect an investor from market risks and does not assure a profit. Standard deviation is a measure of the dispersion of a set of data from its mean. The more spread apart the data, the higher the deviation. Standard deviation is also known as historical volatility. M2 Money Supply is a broad measure of money supply that includes M1 in addition to all time-related deposits, savings deposits, and non-institutional money-market funds. M3 money supply is the broadest monetary aggregate, including physical currency, demand accounts, savings and money market accounts, certificates of deposit, deposits of eurodollars and repurchase agreements.
The S&P 500 Stock Index is a widely recognized capitalization-weighted index of 500 common stock prices in U.S. companies. The Barclays 3-Year Municipal Bond Index is a total return benchmark designed for long-term municipal assets. The index includes bonds with a minimum credit rating BAA3, are issued as part of a deal of at least $50 million, have an amount outstanding of at least $5 million and have a maturity of 8 to 12 years. The Philadelphia Stock Exchange Gold and Silver Index (XAU) is a capitalization-weighted index that includes the leading companies involved in the mining of gold and silver. The NYSE Arca Gold BUGS (Basket of Unhedged Gold Stocks) Index (HUI) is a modified equal dollar weighted index of companies involved in gold mining. The HUI Index was designed to provide significant exposure to near term movements in gold prices by including companies that do not hedge their gold production beyond 1.5 years. The MSCI Emerging Markets Index is a free float-adjusted market capitalization index that is designed to measure equity market performance in the global emerging markets. The S&P 1500 Composite is a broad-based capitalization-weighted index of 1500 U.S. companies and is comprised of the S&P 400, S&P 500, and the S&P 600. The index was developed with a base value of 100 as of December 30, 1994.
Holdings as a percentage of net assets as of June 30, 2011: Caterpillar, Inc. (All American Equity Fund 1.04%, Holmes Growth Fund 2.12%, Global MegaTrends Fund 3.62%), The Coca-Cola Co. (All American Equity Fund 1.03%), Coca-Cola Enterprises, Inc. (All American Equity Fund 1.19%), Ford Motor Company 0.00%, General Motors 0.00%, General Electric Co. (All American Equity Fund 1.03%), JPMorgan Chase & Co. (All American Equity Fund 0.89%, Holmes Growth Fund 1.53%), United Parcel Service of America, Inc. 0.00%.
12
Definitions for Management Teams' Perspectives
Benchmark Index Definitions
Returns for indexes reflect no deduction for fees, expenses or taxes, unless noted.
The Barclays Capital 3-Year Municipal Bond Index is a total return benchmark designed for municipal assets. The index includes bonds with a minimum credit rating of BAA3, are issued as part of a deal of at least $50 million, have an amount outstanding of at least $5 million and have a maturity of two to four years.
The Barclays Capital 10-Year Municipal Bond Index is a total return benchmark designed for long-term municipal assets. The index includes bonds with a minimum credit rating of BAA3, are issued as part of a deal of at least $50 million, have an amount outstanding of at least $5 million and have a maturity of 8 to 12 years.
The FTSE Gold Mines Index encompasses all gold mining companies that have a sustainable and attributable gold production of at least 300,000 ounces a year and that derive 75% or more of their revenue from mined gold.
The Hang Seng Composite Index is a market-capitalization weighted index that comprises the top 200 companies listed on the Stock Exchange of Hong Kong, based on average market capitalization for the twelve months.
The MSCI Emerging Markets Europe 10/40 Index (Net Total Return) is a free float-adjusted market capitalization index that is designed to measure equity performance in the emerging market countries of Europe (Czech Republic, Hungary, Poland, Russia and Turkey). The index is calculated on a net return basis (i.e., reflects the minimum possible dividend reinvestment after deduction of the maximum rate withholding tax). The index is periodically rebalanced relative to the constituents' weights in the parent index.
The MSCI Emerging Markets Net Total Return Index is a free float-adjusted market capitalization index that is designed to measure equity market performance in emerging market countries on a net return basis (i.e., reflects the minimum possible dividend reinvestment after deduction of the maximum rate withholding tax).
The Morgan Stanley Commodity Related Equity Index is an equal-dollar weighted index of 20 stocks involved in commodity-related industries such as energy, non-ferrous metals, agriculture and forest products.
The NYSE Arca Gold Miners Index is a modified market capitalization-weighted index comprised of publicly-traded companies involved primarily in the mining for gold and silver.
The S&P 500 Index is a widely recognized capitalization-weighted index of 500 common stock prices in U.S. companies.
13
Definitions for Management Teams' Perspectives
The S&P Composite 1500 Index is a broad-based capitalization-weighted index of 1500 U.S. companies and is comprised of the S&P 400, S&P 500 and the S&P 600.
Other Index Definitions
The Barclays Capital Municipal Bond Index is an unmanaged index representative of the tax-exempt bond market.
The Consumer Price Index (CPI) is one of the most widely recognized price measures for tracking the price of a market basket of goods and services purchased by individuals. The weights of components are based on consumer spending patterns.
The ISM Manufacturing Composite Index is a diffusion index calculated from five of the eight sub-components of a monthly survey of purchasing managers at roughly 300 manufacturing firms from 21 industries in all 50 states.
The KBW Bank Index is a modified capitalization-weighted index consisting of 24 exchange-listed and National Market System stocks, representing national money center banks and leading regional institutions. The index is intended to reflect the evolving financial sector.
The MSCI All Country Far East Free ex Japan Index is a free float-adjusted market capitalization-weighted index that is designed to measure the equity market performance of the Far East, excluding Japan. The index consists of the following developed and emerging market country indices: China, Hong Kong, Indonesia, Korea, Malaysia, New Zealand, Philippines, Singapore, Taiwan and Thailand.
The Purchasing Manager's Index is an indicator of the economic health of the manufacturing sector. The PMI index is based on five major indicators: new orders, inventory levels, production, supplier deliveries and the employment environment.
The Reuters/Jefferies CRB Index is an unweighted geometric average of commodity price levels relative to the base year average price.
The S&P Global Infrastructure Index provides liquid and tradable exposure to 75 companies from around the world that represent the listed infrastructure universe. To create diversified exposure across the global listed infrastructure market, the index has balanced weights across three distinct infrastructure clusters: Utilities, Transportation and Energy.
The S&P Oil & Gas Refining and Marketing Index tracks the market performance of downstream oil and gas companies.
14
Definitions for Management Teams' Perspectives
The S&P/TSX Venture Composite Index is a broad market indicator for the Canadian venture capital market. The index is market capitalization weighted and, at its inception, included 531 companies. A quarterly revision process is used to remove companies that comprise less than 0.05% of the weight of the index, and add companies whose weight, when included, will be greater than 0.05% of the index.
The U.S. Trade Weighted Dollar Index provides a general indication of the international value of the U.S. dollar.
Terms Used
M1 and M2 are measures of total money supplies. M1 money supply includes funds that are readily accessible for spending. M2 includes everything in M1 and also all time-related deposits, savings deposits, and non-institutional money-market funds.
15
Money Market Funds
Management Team's Perspective
INTRODUCTION
The U.S. Treasury Securities Cash Fund (USTXX) seeks to obtain a high level of current income while maintaining the highest degree of safety of principal and liquidity. The U.S. Government Securities Savings Fund (UGSXX) seeks to achieve a consistently high yield with safety of principal.
PERFORMANCE
| U.S. Treasury Securities Cash Fund | | As of June 30, 2011 | |
| 7-Day Yield | | | 0.01 | % | |
| 7-Day Effective Yield | | | 0.01 | % | |
| Weighted Average Days to Maturity | | | 6 | | |
| U.S. Government Securities Savings Fund | | As of June 30, 2011 | |
| 7-Day Yield | | | 0.01 | % | |
| 7-Day Effective Yield | | | 0.01 | % | |
| Weighted Average Days to Maturity | | | 10 | | |
An investment in either the U.S. Treasury Securities Cash Fund or the U.S. Government Securities Savings Fund is neither insured nor guaranteed by the Federal Deposit Insurance Corporation (FDIC) or by any other government agency. Although the funds seek to preserve the value of your investments at $1.00 per share, it is possible to lose money by investing in these funds.
Pursuant to a voluntary arrangement, the Adviser has agreed to limit total fund operating expenses to not exceed 1.00% for the U.S. Treasury Securities Cash Fund and 0.45% for the U.S. Government Securities Savings Fund on an annualized basis. In addition, the yields reported above include the effects of the Adviser's voluntary waiver of fees and/or reimbursement of expenses to maintain a minimum net yield for the funds. The Adviser can modify or terminate these arrangements at any time.
THE SIX-MONTH PERIOD IN REVIEW – ECONOMIC AND POLITICAL ISSUES THAT AFFECTED THE FUNDS
The economy hit a soft patch in the first half of 2011 as first and second quarter GDP grew at an anemic 0.4 and 1.3 percent, respectively. Unemployment as of June 2011 was 9.2 percent, little changed from the 9.4 percent at the end of 2010. Many cyclical indicators reached multi-year highs during 2010, such as the ISM Manufacturing Composite Index, which
16
Money Market Funds
hit the highest level in nearly seven years. Since February 2011, the index has declined and, while still positive, the rate of change has slowed significantly. Consumer confidence has declined because of higher gasoline prices, a lack of employment improvement, continued global concerns and ongoing political wrangling in the U.S. The Federal Reserve has largely remained on the sidelines during the first half of the year. The Fed allowed quantitative easing (QE2) to end as scheduled at the end of June. We believe the Fed is in an awkward position as growth is too slow but any additional stimulus would not be politically acceptable, so the Fed will need to walk a fine line in the second half of the year.
Inflation has picked up and can no longer be ignored as the June year-over-year Consumer Price Index hit 3.6 percent. While the Fed insists that inflation is contained and commodity prices have sustained their elevated levels even during the slow growth of the first half, the current environment does not appear transitory.
Fiscal austerity remains in vogue to address long-term fiscal imbalances in the developed world and will likely be a significant drag on growth in the U.S. and Europe for some time. Spending cuts and higher taxes could transform a stimulative fiscal tailwind into a stiff headwind.
Yields on the three-month Treasury bill fell 11 basis points to 0.02 percent, while yields on the six-month bills fell 9 basis points to 0.10 percent. One-year agency discount note yields fell 6 basis points to 0.18 percent. The market was still influenced by periodic bouts of risk aversion or other disruptions, with investors at times seeking to own short-term Treasury securities at almost any cost.
INVESTMENT HIGHLIGHTS
The U.S. Treasury Securities Cash Fund performed in line with the Lipper Treasury money market funds for the six months ending June 30, 2011, returning 0.00 percent, the same as the peer group. The U.S. Government Securities Savings Fund also performed in line with the Lipper government-only money market funds for the year, returning 0.00 percent versus 0.01 percent for the peer group.
The U.S. Treasury Securities Cash Fund took a laddered approach by buying fixed-rate securities across the money market spectrum, with a weighted average maturity of 15 days over the period.
The U.S. Government Securities Savings Fund followed a similar laddered approach with a weighted average maturity of 14 days. The fund took
17
Money Market Funds
advantage of higher yields by selectively extending its ladder, but overall it continued to be a very difficult environment for money market fund investors over the past year.
CURRENT OUTLOOK
The Fed continues to emphasize that it will keep interest rates low for an extended period, and recent developments have reinforced this position. The Fed appears unlikely to change course before 2012, and monetary policy is likely to remain loose for some time.
18
Tax Free Funds
Management Team's Perspective
INTRODUCTION
The Near-Term Tax Free Fund (NEARX) and the Tax Free Fund (USUTX) seek to provide a high level of current income exempt from federal income taxation and to preserve capital. However, a portion of any distribution may be subject to federal and/or state income taxes. The Near-Term Tax Free Fund will maintain a weighted average maturity of less than five years, while the Tax Free Fund will generally maintain a longer weighted average maturity.
PERFORMANCE GRAPHS
Near-Term Tax Free Fund
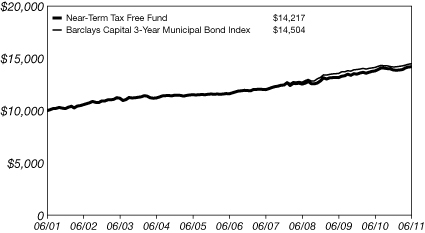
Average Annual Performance For the Periods Ended
June 30, 2011
| | | Six Month | | One Year | | Five Year | | Ten Year | |
| Near-Term Tax Free Fund | | | 2.18 | % | | | 2.95 | % | | | 4.13 | % | | | 3.58 | % | |
Barclays Capital 3-Year Municipal
Bond Index | | | 2.17 | % | | | 2.48 | % | | | 4.57 | % | | | 3.79 | % | |
Performance data quoted above is historical. Past performance is no guarantee of future results. Current performance may be higher or lower than the performance data quoted. Investment return and principal value of an investment will fluctuate so that an investor's shares, when redeemed, may be worth more or less than their original cost. The graph and table do not reflect the deduction of taxes that a shareholder would pay on fund distributions or the redemption of fund shares. Returns for periods less than one year are not annualized.
Pursuant to a voluntary arrangement, the Adviser has agreed to limit total fund operating expenses (exclusive of acquired fund fees and expenses, extraordinary expenses, taxes, brokerage commissions and interest, and advisory fee performance adjustments, if any) to not exceed 0.45%. The Adviser can modify or terminate this arrangement at any time.
See Definitions for Management Teams' Perspectives for index definitions.
Please visit our website at www.usfunds.com for updated performance information for different time periods.
19
Tax Free Funds
Tax Free Fund
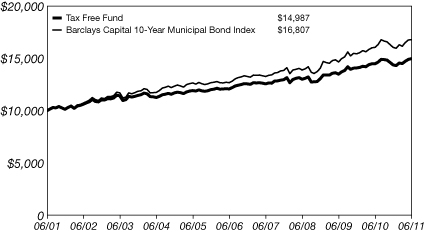
Average Annual Performance For the Periods Ended
June 30, 2011
| | | Six Month | | One Year | | Five Year | | Ten Year | |
| Tax Free Fund | | | 4.17 | % | | | 3.28 | % | | | 4.41 | % | | | 4.13 | % | |
Barclays Capital 10-Year Municipal
Bond Index | | | 4.56 | % | | | 4.49 | % | | | 5.80 | % | | | 5.33 | % | |
Performance data quoted above is historical. Past performance is no guarantee of future results. Current performance may be higher or lower than the performance data quoted. Investment return and principal value of an investment will fluctuate so that an investor's shares, when redeemed, may be worth more or less than their original cost. The graph and table do not reflect the deduction of taxes that a shareholder would pay on fund distributions or the redemption of fund shares. Returns for periods less than one year are not annualized.
Pursuant to a voluntary arrangement, the Adviser has agreed to limit total fund operating expenses (exclusive of acquired fund fees and expenses, extraordinary expenses, taxes, brokerage commissions and interest, and advisory fee performance adjustments, if any) to not exceed 0.70%. The Adviser can modify or terminate this arrangement at any time.
See Definitions for Management Teams' Perspectives for index definitions.
Please visit our website at www.usfunds.com for updated performance information for different time periods.
THE SIX-MONTH PERIOD IN REVIEW – ECONOMIC AND POLITICAL ISSUES THAT AFFECTED THE FUNDS
The municipal bond market exhibited strong performance over the past six months as the Barclays Capital Municipal Bond Index rose 4.42 percent.
During the first quarter of 2011, the market exhibited mixed performance and overall returns were muted. This followed a difficult fourth quarter of 2010 with municipal bond analyst Meredith Whitney scaring bond investors
20
Tax Free Funds
by telling 60 Minutes that she anticipated substantial municipal defaults during 2011.
Many of those fears subsided and the market gained confidence in the second quarter as actual defaults remained very low and most municipal governments appeared to be making the tough but necessary changes. This has been particularly true for low-quality and long-duration bonds that outperformed during the second quarter of 2011.
The long end of the yield curve benefited the most, as bonds with maturities of 20 years or more rose by about 6 percent. Municipals followed the general trend in Treasuries as yields steadily declined during the quarter. Economic growth was much slower than expected, employment remained stuck in the mud and international events implied weaker global growth.
Revenue-backed municipals modestly outperformed the overall municipal index, driven by hospital and industrial development issues. High-yield bonds rose 4.98 percent, with all the positive returns occurring during the last three months.
In specialty state trading, California and Texas outperformed, while Connecticut and Puerto Rico underperformed.
The Federal Reserve stayed the course during the first half of 2011 and has pledged to keep interest rates low and monetary policy loose for an extended period of time.
INVESTMENT HIGHLIGHTS
Over the six months ended June 30, 2011, the Near-Term Tax Free Fund returned 2.18 percent, outperforming its benchmark, the Barclays Capital 3-Year Municipal Bond Index, which returned 2.17 percent. The Tax Free Fund returned 4.17 percent and trailed the performance of its benchmark, the Barclays Capital 10-Year Municipal Bond Index, which returned 4.56 percent.
The Near-Term Tax Free Fund trailed its Lipper peer group for the past six months, while the Tax Free Fund outperformed its respective Lipper peer group. The performance difference for the funds was primarily driven by fund credit and maturity preferences relative to their benchmarks and peer groups.
Strengths
• The Tax Free Fund maintained significant exposure to hospital-backed municipals, which outperformed.
21
Tax Free Funds
• The Tax Free Fund benefited from significant exposure to Texas and California, which both outperformed.
• From a maturity perspective, the Near-Term Tax Free Fund benefited from a slightly longer maturity profile than its benchmark.
Weaknesses
• The conservative credit profile of both funds proved to be an asset during the first quarter but negatively impacted performance during the second quarter.
• The Tax Free Fund maintained a relatively short maturity/duration profile. This negatively impacted performance in relation to its benchmark, as it was the long end of the market that outperformed.
• Both funds had little to no exposure to industrial development, which was one of the best-performing sectors of the market.
CURRENT OUTLOOK
Opportunities
• There is currently a lot of discussion surrounding the outlook for municipals as governments struggle with bloated budgets and little or no revenue growth. This appears to be an opportunity to purchase high-quality general obligation or essential service debt at distressed levels.
Threats
• Continued outperformance of low-quality bonds is the most significant threat on a relative basis.
• When the Fed reverses its monetary policy stance and begins to raise interest rates, the macro environment could become more difficult.
22
Tax Free Funds
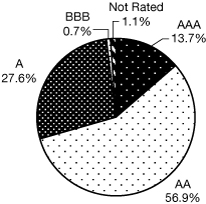
Near-Term Tax Free Fund
Municipal Bond Ratings June 30, 2011
(Based on Total Municipal Bonds)
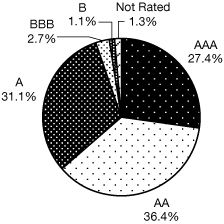
Tax Free Fund
Municipal Bond Ratings June 30, 2011
(Based on Total Municipal Bonds)
23
All American Equity Fund
Management Team's Perspective
INTRODUCTION
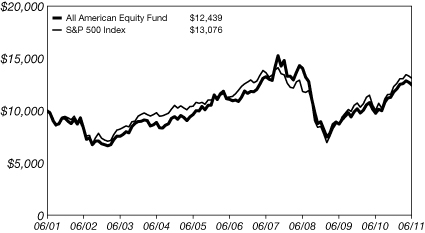
The principal objective of the All American Equity Fund (GBTFX) is to seek long-term capital appreciation by investing primarily in a broadly diversified portfolio of domestic common stocks. The fund invests in large-capitalization stocks, while retaining the flexibility to seek out promising individual stock opportunities, including stocks with meaningful dividend yields.
PERFORMANCE GRAPH
All American Equity Fund
Average Annual Performance For the Periods Ended
June 30, 2011
| | | Six Month | | One Year | | Five Year | | Ten Year | |
| All American Equity Fund | | | 5.55 | % | | | 27.69 | % | | | 2.32 | % | | | 2.21 | % | |
| S&P 500 Index | | | 6.02 | % | | | 30.69 | % | | | 2.94 | % | | | 2.72 | % | |
Performance data quoted above is historical. Past performance is no guarantee of future results. Current performance may be higher or lower than the performance data quoted. Investment return and principal value of an investment will fluctuate so that an investor's shares, when redeemed, may be worth more or less than their original cost. The graph and table do not reflect the deduction of taxes that a shareholder would pay on fund distributions or the redemption of fund shares. Returns for periods less than one year are not annualized.
Pursuant to a voluntary arrangement, the Adviser has agreed to limit total fund operating expenses (exclusive of acquired fund fees and expenses, extraordinary expenses, taxes, brokerage commissions and interest, and advisory fee performance adjustments, if any) to not exceed 2.20%. The Adviser can modify or terminate this arrangement at any time.
See Definitions for Management Teams' Perspectives for index definitions.
Please visit our website at www.usfunds.com for updated performance information for different time periods.
24
All American Equity Fund
THE SIX-MONTH PERIOD IN REVIEW – ECONOMIC AND POLITICAL ISSUES THAT AFFECTED THE FUND
The U.S. real GDP was originally announced to have increased 1.90 percent in the quarter ended March 31, 2011, but was revised down to 0.4 percent following second-quarter results. While economists had estimated a sequential increase of 2.00 percent for the quarter ended June 30, 2011, real GDP was actually lower, increasing only 1.30 percent.
To aid a recovering economy, the Federal Reserve kept its short-term interest rate target in a range of zero to 0.25 percent for the six-month period. The 10-year U.S. Treasury note yield began 2011 at 3.30 percent, rose to a high of 3.74 percent on February 8 and ended the period at a yield of 3.16 percent.
In an effort to stimulate the economy, the Fed continued its second round of quantitative easing (QE2) to purchase $600 billion in U.S. Treasury bonds and concluded QE2 on June 30, 2011.
Inflation remained relatively contained, with year-over-year change in the Consumer Price Index (CPI) registering 1.6 percent in January and rising to 3.6 percent in June. The core CPI, which excludes food and fuel, registered 1.0 percent in January and ended the period at 1.6 percent in June.
The employment picture remained weak. Unemployment was at 9.0 percent in January and ended the period at 9.2 percent.
Stock market performance was marked by an oscillating market. The benchmark S&P 500 Index began the year at 1,257.64, rose to 1,343.01 in mid-February, declined to 1,256.88 in mid-March, rose irregularly to a period high of 1,363.61 in late April, declined to 1,265.42 in mid-June and rose again to finish the period at 1,320.64.
The political environment was one of strongly divided partisan debates, with the Democrats controlling the Presidency and the Senate, and the Republicans controlling the House of Representatives. Issues debated included national healthcare legislation, financial regulatory reform, the federal budget and the national debt. Some observers also interpreted the environment as an anti-business tilt on the part of the current administration and parts of the legislative bodies.
25
All American Equity Fund
INVESTMENT HIGHLIGHTS
Overview
The fund returned 5.55 percent for the six-month period ended June 30, 2011, compared to a 6.02 percent return for the benchmark S&P 500 Index.
Because the fund is actively managed and a holding period is generally not a consideration in investment decisions, the portfolio turnover rate may fluctuate from year to year as the fund adjusts its portfolio composition. Its annual portfolio turnover was, and is expected to continue to be, more than 100 percent.
Strengths
• Although the fund was underweight the consumer staples sector – which was one of the better-performing sectors in the index – stock selection within the sector provided positive returns. Herbalife Ltd.,(1) Lorillard, Inc.(2) and Dr Pepper Snapple Group, Inc.(3) were among the sector investments contributing to performance.
• The fund was overweight the underperforming information technology sector, but stock selection was also strong in this sector, resulting in positive sector performance for the fund. The fund benefited from owning NVIDIA Corp.,(4) JDS Uniphase Corp.(4) and Informatica Corp.(5)
• Defensive option strategies also contributed positively to fund performance.
Weaknesses
• The healthcare sector was the best-performing sector in the benchmark index, but the fund was underweight the sector. In addition, sector stock selection failed to enhance relative performance.
• The fund's underweighting in the industrial sector during the period diminished the fund's return as the sector outperformed in the benchmark. Also, stock selection in the sector was less than optimal.
• The fund was overweight the energy sector, which was the second best-performing sector in the index, but stock selection in the sector detracted from performance.
26
All American Equity Fund
CURRENT OUTLOOK
Opportunities
• The cyclical recovery now underway in the global economy should provide an opportunity for corporate earnings gains, thereby providing a positive fundamental background for stocks.
• Corporate cash levels are high, providing corporations the ability to pursue mergers and acquisitions (M&A). An increase in M&A activity holds promise for both portfolio gains and an increase in overall market valuations.
• Low interest rates, if continued throughout 2011, should provide a favorable backdrop for the economy and stock prices.
Threats
• The market is currently anticipating a "slow patch" in the ongoing economic recovery, and if the slowdown is worse than expected, it would be negative for stocks.
• An escalation in concerns over sovereign debt obligations in Europe would be negative for stocks.
• The end of quantitative easing as of June 30, 2011, by the Federal Reserve might result in unintended consequences.
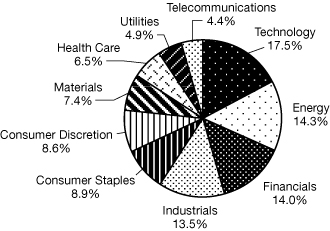
The fund ended the period overweighted in materials, industrials and utilities, and it maintained an emphasis on dividend paying stocks.
(1)This security comprised 0.78% of the fund's total net assets as of 06/30/11.
(2)This security comprised 1.19% of the fund's total net assets as of 06/30/11.
(3)This security comprised 1.14% of the fund's total net assets as of 06/30/11.
(4)The fund did not hold this security as of 06/30/11.
(5)This security comprised 1.59% of the fund's total net assets as of 06/30/11.
27
All American Equity Fund
Top 10 Holdings Based on Net Assets
(excluding repurchase agreement) June 30, 2011
Halliburton Co.
Oil - Field Services | | | 2.78 | % | |
Ball Corp.
Containers - Metal/Glass | | | 2.09 | % | |
Oracle Corp.
Enterprise Software/Services | | | 1.79 | % | |
Cummins, Inc.
Engines - Internal Combustion | | | 1.69 | % | |
Informatica Corp.
Enterprise Software/Services | | | 1.59 | % | |
Check Point Software Technologies Ltd.
Application Software | | | 1.55 | % | |
Altera Corp.
Electronic Components - Semiconductors | | | 1.51 | % | |
QUALCOMM, Inc.
Wireless Equipment | | | 1.48 | % | |
Netflix, Inc.
E-Commerce/Services | | | 1.43 | % | |
Exxon Mobil Corp.
Oil Companies - Integrated | | | 1.33 | % | |
| TOTAL TOP TEN HOLDINGS | | | 17.24 | % | |
Portfolio Allocation by Industry Sector*
Based on Total Investments June 30, 2011
* Summary information above may differ from the portfolio schedule included in the financial statements due to the use of different classifications of securities for presentation purposes.
28
Holmes Growth Fund
Management Team's Perspective
INTRODUCTION
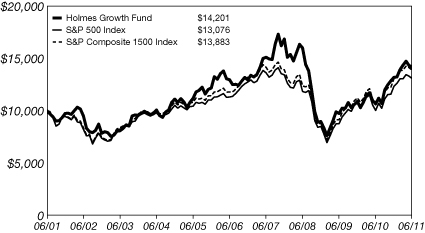
The Holmes Growth Fund (ACBGX) invests in companies with good growth prospects and strong positive earnings momentum. The fund's primary objective is to seek long-term capital appreciation.
PERFORMANCE GRAPH
Holmes Growth Fund
Average Annual Performance For the Periods Ended
June 30, 2011
| | | Six Month | | One Year | | Five Year | | Ten Year | |
| Holmes Growth Fund | | | 7.61 | % | | | 33.24 | % | | | 1.81 | % | | | 3.57 | % | |
| S&P Composite 1500 Index | | | 6.31 | % | | | 31.71 | % | | | 3.33 | % | | | 3.33 | % | |
Performance data quoted above is historical. Past performance is no guarantee of future results. Current performance may be higher or lower than the performance data quoted. Investment return and principal value of an investment will fluctuate so that an investor's shares, when redeemed, may be worth more or less than their original cost. The graph and table do not reflect the deduction of taxes that a shareholder would pay on fund distributions or the redemption of fund shares. Returns for periods less than one year are not annualized.
Pursuant to a voluntary arrangement, the Adviser has agreed to limit total fund operating expenses (exclusive of acquired fund fees and expenses, extraordinary expenses, taxes, brokerage commissions and interest, and advisory fee performance adjustments, if any) to not exceed 2.20%. The Adviser can modify or terminate this arrangement at any time.
See Definitions for Management Teams' Perspectives for index definitions.
Please visit our website at www.usfunds.com for updated performance information for different time periods.
29
Holmes Growth Fund
THE SIX-MONTH PERIOD IN REVIEW – ECONOMIC AND POLITICAL ISSUES THAT AFFECTED THE FUND
The U.S. real GDP was originally announced to have increased 1.90 percent in the quarter ended March 31, 2011, but was revised down to 0.4 percent following second-quarter results. While economists had estimated a sequential increase of 2.00 percent for the quarter ended June 30, 2011, real GDP was actually lower, increasing only 1.30 percent.
To aid a recovering economy, the Federal Reserve kept its short-term interest rate target in a range of zero to 0.25 percent for the six-month period. The 10-year U.S. Treasury note yield began 2011 at 3.30 percent, rose to a high of 3.74 percent on February 8 and ended the period at a yield of 3.16 percent.
In an effort to stimulate the economy, the Fed continued its second round of quantitative easing (QE2) to purchase $600 billion in U.S. Treasury bonds and concluded QE2 on June 30, 2011.
Inflation remained relatively contained, with year-over-year change in the Consumer Price Index (CPI) registering 1.6 percent in January and rising to 3.6 percent in June. The core CPI, which excludes food and fuel, registered 1.0 percent in January and ended the period at 1.6 percent in June.
The employment picture remained weak. Unemployment was at 9.0 percent in January and ended the period at 9.2 percent.
Stock market performance was marked by an oscillating market. The benchmark S&P Composite 1500 Index began the year at 290.89, rose to 310.35 in mid-February, declined to 291.40 in mid-March, rose irregularly to a period high of 316.45 in late April, declined to 293.70 in mid-June and rose again to finish the period at 306.38.
The political environment was one of strongly divided partisan debates, with the Democrats controlling the Presidency and the Senate, and the Republicans controlling the House of Representatives. Issues debated included national healthcare legislation, financial regulatory reform, the federal budget and the national debt. Some observers also interpreted the environment as an anti-business tilt on the part of the current administration and parts of the legislative bodies.
30
Holmes Growth Fund
INVESTMENT HIGHLIGHTS
Overview
The fund returned 7.61 percent for the six months ended June 30, 2011, outperforming the benchmark, the S&P Composite 1500 Index, which returned 6.31 percent.
Strengths
• The fund benefited from being overweight the consumer discretionary sector as the fund's holdings outperformed. Stock selection in the sector also benefited performance with the fund's largest holding, Newfoundland Capital Corp. Ltd.,(1) providing significant outperformance. Priceline.com, Inc.,(2) Netflix, Inc.(3) and DIRECTV(4) also aided performance.
• Although the fund was underweight the consumer staples sector in relation to its benchmark, the holdings in the fund had significant outperformance. Stock selection resulted in a positive contribution from investments in the sector as Herbalife Ltd.(5) and The Estee Lauder Cos., Inc.(6) outperformed.
• The fund was underweight healthcare, the best-performing sector in the benchmark; however, stock selection resulted in a positive contribution from the sector. Valeant Pharmaceuticals International, Inc.(7) significantly enhanced the fund's return from the sector.
• Defensive option strategies also aided the fund performance.
Weaknesses
• Relative fund performance was diminished by investments in the energy sector. Although this was the second-best performing sector in the S&P Composite 1500 Index and the fund was slightly overweight the sector, stock selection resulted in diminished performance. Investments in Alange Energy Corp.(8) and Pacific Rubiales Energy Corp.(9) failed to live up to expectations in the period.
• The fund was overweight the underperforming materials sector, and stock selection was less than optimal.
• The fund was approximately equal-weight the industrial sector, but stock selection proved to be disappointing.
31
Holmes Growth Fund
CURRENT OUTLOOK
Opportunities
• The cyclical recovery now underway in the global economy should provide an opportunity for corporate earnings gains, thereby providing a positive fundamental background for stocks.
• Corporate cash levels are high, providing corporations the ability to pursue mergers and acquisitions (M&A). An increase in M&A activity holds promise for both portfolio gains and an increase in overall market valuations.
• Low interest rates, if continued throughout 2011, should provide a favorable backdrop for the economy and stock prices.
Threats
• The market is currently anticipating a "slow patch" in the ongoing economic recovery, and if the slowdown is worse than expected, it would be negative for stocks.
• An escalation in concerns over sovereign debt obligations in Europe would be negative for stocks.
• The end of QE2 by the Fed might result in unintended consequences.
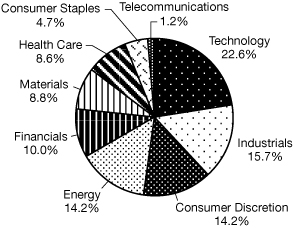
From a fund construction viewpoint, as of June 30, 2011, the fund was in an offensive posture with overweight positions in technology, industrials, materials and consumer discretion.
(1)This security comprised 7.68% of the fund's total net assets as of 06/30/11.
(2)The fund did not hold this security as of 06/30/11.
(3)This security comprised 1.84% of the fund's total net assets as of 06/30/11.
(4)This security comprised 1.07% of the fund's total net assets as of 06/30/11.
(5)This security comprised 1.08% of the fund's total net assets as of 06/30/11.
(6)This security comprised 1.72% of the fund's total net assets as of 06/30/11.
(7)This security comprised 0.85% of the fund's total net assets as of 06/30/11.
(8)This security comprised 1.29% of the fund's total net assets as of 06/30/11.
(9)This security comprised 1.61% of the fund's total net assets as of 06/30/11.
32
Holmes Growth Fund
Top 10 Holdings Based on Net Assets
(excluding repurchase agreement) June 30, 2011
Newfoundland Capital Corp., Ltd.
Radio | | | 7.68 | % | |
WABCO Holdings, Inc.
Automotive - Truck Parts & Equipment | | | 2.42 | % | |
Halliburton Co.
Oil - Field Services | | | 2.39 | % | |
Ball Corp.
Containers - Metal/Glass | | | 2.25 | % | |
Caterpillar, Inc.
Machinery - Construction & Mining | | | 2.12 | % | |
Cummins, Inc.
Engines - Internal Combustion | | | 1.94 | % | |
Netflix, Inc.
E-Commerce/Services | | | 1.84 | % | |
Altera Corp.
Electronic Components - Semiconductors | | | 1.84 | % | |
SolarWinds, Inc.
Communication Software | | | 1.83 | % | |
Baidu, Inc.
Web Portals/Internet Service Providers | | | 1.80 | % | |
| TOTAL TOP TEN HOLDINGS | | | 26.11 | % | |
Portfolio Allocation by Industry Sector*
Based on Total Investments June 30, 2011
* Summary information above may differ from the portfolio schedule included in the financial statements due to the use of different classifications of securities for presentation purposes.
33
Global MegaTrends Fund
Management Team's Perspective
INTRODUCTION
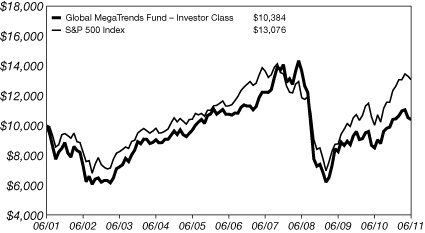
The Global MegaTrends Fund (MEGAX and MEGIX) focuses on companies that are well positioned to benefit from future investments in global infrastructure, both in the private and public sectors. The fund considers a broad range of investable opportunities, including publicly traded infrastructure assets (such as airports and toll roads), select utilities, construction and engineering firms, telecom operators, select companies in the alternative energy space, and companies in the steel, cement and raw materials sectors.
PERFORMANCE GRAPH
Global MegaTrends Fund
Average Annual Performance For the Periods Ended
June 30, 2011
| | | Six Month | | One Year | | Five Year | | Ten Year | | Since Inception
(Institutional
Class) | |
Global MegaTrends Fund
- Investor Class | | | (0.11 | )% | | | 22.60 | % | | | (0.69 | )% | | | 0.38 | % | | | n/a | | |
Global MegaTrends Fund - Institutional
Class (Inception 3/1/10) | | | 0.11 | % | | | 23.18 | % | | | n/a | | | | n/a | | | | 9.76 | % | |
| S&P 500 Index | | | 6.02 | % | | | 30.69 | % | | | 2.94 | % | | | 2.72 | % | | | 15.76 | % | |
| S&P Global Infrastructure Index | | | 8.48 | % | | | 31.96 | % | | | 5.61 | % | | | n/a | | | | 14.65 | % | |
Performance data quoted above is historical. Past performance is no guarantee of future results. Current performance may be higher or lower than the performance data quoted. Investment return and principal value of an investment will fluctuate so that an investor's shares, when redeemed, may be worth more or less than their original cost. The graph and table do not reflect the deduction of taxes that a shareholder would pay on fund distributions or the redemption of fund shares. Returns for periods less than one year are not annualized.
The S&P Global Infrastructure Index is not included in the line graph as it had less than ten years of data.
Pursuant to a voluntary arrangement, the Adviser has agreed to limit total fund operating expenses (exclusive of acquired fund fees and expenses, extraordinary expenses, taxes, brokerage commissions and interest, and advisory fee performance adjustments, if any) to not exceed 2.35% for the Investor Class. Also pursuant to a voluntary agreement, the Adviser has agreed to waive all class specific expenses of the Institutional Class. The Adviser can modify or terminate these arrangements at any time.
See Definitions for Management Teams' Perspectives for index definitions.
Please visit our website at www.usfunds.com for updated performance information for different time periods.
34
Global MegaTrends Fund
THE SIX-MONTH PERIOD IN REVIEW – ECONOMIC AND POLITICAL ISSUES THAT AFFECTED THE FUND
Political and economic considerations are very influential on the investment climate in which the Global MegaTrends Fund operates.
The Japanese earthquake and devastation of the nuclear plant in Onahama negatively affected some of our holdings in the nuclear industry, in particular, Uranium Energy Corp.(1) and Dongfang Electric Corp. Ltd.(2) Regardless of the short-term negative sentiment toward nuclear stocks, we continue to believe that nuclear energy will play an important role in the buildup of the power generation capacity globally. We plan to monitor for opportunities as sentiment improves.
In May 2011, Chancellor Angela Merkel's ruling coalition announced in a policy reversal after Japan's Fukushima disaster that Germany plans to phase out all nuclear reactors by 2022. In order to replace 17 nuclear reactors that supply around 25 percent of power in the country, Germany will resort to building more coal and gas fired plants as well as further increasing reliance on alternative energy sources. Alternative sources (wind, solar and hydroelectric) currently account for 17 percent of installed capacity in Germany and the government would like to increase this capacity to around 50 percent in the future. It appears that neighboring Switzerland is also tilting toward a gradual phasing out of its nuclear plants (currently producing 40 percent of the country's electricity) with the final closure of nuclear plants expected by 2034.
Barring any unforeseen circumstances, we believe the current negative sentiment toward nuclear energy will subside in coming years with most of the growth occurring in the emerging markets.
INVESTMENT HIGHLIGHTS
Overview
For the six months ended June 30, 2011, the Investor Class of the fund had a negative 0.11 percent return and the Institutional Class posted a positve 0.11 percent return. The benchmark S&P 500 Index returned 6.02 percent, while the S&P Global Infrastructure Index returned 8.48 percent.
Strengths
• Top contributors to fund performance over the six-month period were Brazilian telecom operator Telecomunicacoes de Sao Paulo S.A.(3)
35
Global MegaTrends Fund
(formerly Vivo Participacoes S.A.), CSX Corp.,(4) Rackspace Hosting, Inc.(5) and Kolon Industries, Inc.,(6) all of which had significant double-digit gains.
• Although the fund had no exposure to the U.S. utilities sector, which outperformed within the benchmark S&P 500 Index, Brazil's CPFL Energia S.A.(7) was a top contributing international utility for the fund.
• In general, the fund's overseas holdings significantly outperformed the domestic holdings.
Weaknesses
• The fund's underperformance compared to the benchmark S&P 500 Index was mainly a result of stock selection, both domestic and international.
• The most negative impact for the fund during the six-month period came from Uranium Energy Corp.(1) The first half of the year was characterized by continuation of negative publicity towards nuclear energy with Germany vowing to phase out all of its nuclear plants by 2022.
• Other underperforming holdings included Cameco Corp.(8) and Dongfang Electric Corp. Ltd.(2)
CURRENT OUTLOOK
Based on the continuing trend of population growth and urbanization, particularly in emerging nations, we believe the infrastructure theme will be prominent for years to come. In developed countries, decades of underinvestment in infrastructure assets have resulted in a significant deterioration of existing infrastructure.
We remain encouraged by the awareness of the political leaders around the world that investments in infrastructure are needed to sustain economic growth and competitiveness.
Opportunities
• Until recently China was at the forefront of the infrastructure boom, but it appears that India is now stepping up with an estimated $1 trillion of needed investments.
• Although the lower oil price compared to the peak in 2008 may change the relative attractiveness of wind and solar energy, we believe investments in alternative energy sources will gain traction due to a global need for power. In our view, nuclear energy also fits into this group despite the current headwinds.
36
Global MegaTrends Fund
• Improved water infrastructure will be crucial as emerging economies develop. Opportunities in this space are currently limited, but they offer significant potential, both in desalination and waste treatment.
Threats
• While many countries remain committed to improving their infrastructure, delays due to tight credit conditions and legal impediments appear to affect numerous projects.
• Government subsidies are still required for sustainable development of alternative energy and this support could change as the political climate changes. There appears to be growing opposition from residents to the development of wind farms in various parts of the world on health and aesthetic grounds.
(1)This security comprised 0.96% of the fund's total net assets as of 06/30/11.
(2)The fund did not hold this security as of 06/30/11.
(3)This security comprised 2.17% of the fund's total net assets as of 06/30/11.
(4)This security comprised 3.34% of the fund's total net assets as of 06/30/11.
(5)This security comprised 1.79% of the fund's total net assets as of 06/30/11.
(6)This security comprised 1.52% of the fund's total net assets as of 06/30/11.
(7)This security comprised 2.96% of the fund's total net assets as of 06/30/11.
(8)This security comprised 2.07% of the fund's total net assets as of 06/30/11.
37
Global MegaTrends Fund
Top 10 Holdings Based on Net Assets
(excluding repurchase agreement) June 30, 2011
Caterpillar, Inc.
Machinery - Construction & Mining | | | 3.62 | % | |
CSX Corp.
Transportation - Rail | | | 3.34 | % | |
Compania de Concessoes Rodoviarias
Public Thoroughfares | | | 3.16 | % | |
CPFL Energia S.A.
Electric - Integrated | | | 2.96 | % | |
Cummins, Inc.
Engines - Internal Combustion | | | 2.87 | % | |
Grupo Empresarial Ibiza S.A.
Metal & Mineral Mining | | | 2.72 | % | |
Zhuzhou CSR Times Electric Co., Ltd.
Electric Products - Miscellaneous | | | 2.38 | % | |
SNC-Lavalin Group, Inc.
Engineering/R&D Services | | | 2.24 | % | |
Telecomunicacoes de Sao Paulo S.A.
Telephone - Integrated | | | 2.17 | % | |
McDermott International, Inc.
Engineering/R&D Services | | | 2.07 | % | |
| TOTAL TOP TEN HOLDINGS | | | 27.53 | % | |
Portfolio Allocation by Industry Sector*
Based on Total Investments June 30, 2011
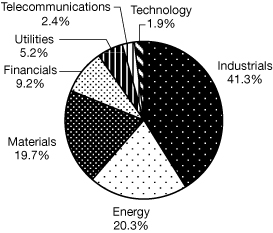
* Summary information above may differ from the portfolio schedule included in the financial statements due to the use of different classifications of securities for presentation purposes.
38
Global Resources Fund
Management Team's Perspective
INTRODUCTION
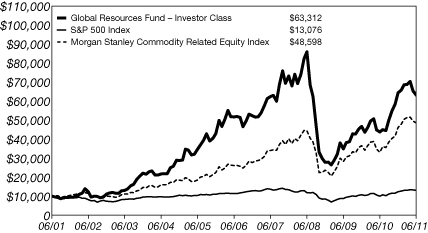
The Global Resources Fund (PSPFX and PIPFX) is a non-diversified natural resources fund with the principal objective of achieving long-term growth of capital while providing protection against inflation and monetary instability. The fund invests globally in companies involved in the exploration, production, transportation and processing of petroleum, natural gas, industrial commodities, metals, minerals and forestry.
PERFORMANCE GRAPH
Global Resources Fund
Average Annual Performance For the Periods Ended
June 30, 2011
| | | Six Month | | One Year | | Five Year | | Ten Year | | Since Inception
(Institutional
Class) | |
Global Resources Fund - Investor
Class | | | (1.93 | )% | | | 44.47 | % | | | 4.12 | % | | | 20.26 | % | | | n/a | | |
Global Resources Fund - Institutional
Class (Inception 3/1/10) | | | (1.67 | )% | | | 45.34 | % | | | n/a | | | | n/a | | | | 26.13 | % | |
| S&P 500 Index | | | 6.02 | % | | | 30.69 | % | | | 2.94 | % | | | 2.72 | % | | | 15.76 | % | |
Morgan Stanley Commodity
Related Equity Index | | | 5.41 | % | | | 47.06 | % | | | 13.22 | % | | | 17.11 | % | | | 22.31 | % | |
Performance data quoted above is historical. Past performance is no guarantee of future results. Current performance may be higher or lower than the performance data quoted. Investment return and principal value of an investment will fluctuate so that an investor's shares, when redeemed, may be worth more or less than their original cost. The graph and table do not reflect the deduction of taxes that a shareholder would pay on fund distributions or the redemption of fund shares. Returns for periods less than one year are not annualized.
Pursuant to a voluntary arrangement, the Adviser has agreed to limit total fund operating expenses (exclusive of acquired fund fees and expenses, extraordinary expenses, taxes, brokerage commissions and interest, and advisory fee performance adjustments, if any) to not exceed 1.90% for the Investor Class. Also pursuant to a voluntary agreement, the Adviser has agreed to waive all class specific expenses of the Institutional Class. The Adviser can modify or terminate these arrangements at any time.
See Definitions for Management Teams' Perspectives for index definitions.
Please visit our website at www.usfunds.com for updated performance information for different time periods.
39
Global Resources Fund
THE SIX-MONTH PERIOD IN REVIEW – ECONOMIC AND POLITICAL ISSUES THAT AFFECTED THE FUND
In a replay of the first half of last year, the global economy and equity markets came under pressure once again in the second quarter following strong gains early in 2011. Financial market volatility increased in the period due to a series of macro events that included waning economic growth, a sovereign debt crisis affecting several European countries on the verge of default, the unwinding of the Federal Reserve's quantitative easing program (QE2), and the national debt limit in the U.S. which was set to expire this summer. Additionally, China bears continued to preach impending doom as the country continued to rein in liquidity that was fueling food and housing inflation. All of these factors pressured global markets after peaking in early April. Year-to-date, the fund's benchmark Morgan Stanley Commodity Related Equity Index gained 5.41 percent, but lost nearly the same amount in the second quarter as investors' risk aversion increased due to macro uncertainty.
Given the global economic headwinds above, as well as heightened investors' risk aversion, management increased its weighting in large capitalization domestic resource companies, which also appeared attractive on a relative value basis.
INVESTMENT HIGHLIGHTS
Overview
In the first half of 2011, the Investor Class of the Global Resources Fund declined 1.93 percent and the Institutional Class declined 1.67 percent, underperforming the fund's benchmark, the Morgan Stanley Commodity Related Equity Index (CRX), which gained 5.41 percent.
After posting solid positive first-quarter results of 6.80 percent, the fund declined 8.18 percent during the second quarter (Investor Class). The second quarter proved to be a volatile period for commodities – the underlying Reuters/Jefferies CRB Index fell 5.95 percent, the worst performance since the fourth quarter of 2008. On a twelve-month basis, the fund posted a total return of 44.47 percent (Investor Class), trailing its benchmark by 2.59 percent, but outperforming the broader S&P 500 Index by 13.78 percentage points.
Because the fund is actively managed and a holding period is generally not a consideration in investment decisions, the portfolio turnover rate may fluctuate from year-to-year as the fund adjusts its portfolio composition. Its annual portfolio turnover was, and is expected to continue to be, more than 100 percent.
40
Global Resources Fund
Strengths
• The S&P Oil & Gas Refining and Marketing Index gained 11 percent year-to-date, driven by strong margins and the wide divergence between West Texas Intermediate crude and the more internationally focused Brent crude. Fund holdings in this sector such as Holly Corp.,(1) Frontier Oil Corp.(2) and Tesoro Corp.(3) all meaningfully contributed to the fund's return in the period.
• Select industrials with exposure to oil and gas or infrastructure performed particularly well in the six-month period, such as Robbins & Myers, Inc.(4)
• Additionally, consistent with higher oil prices that exceeded $100 a barrel, oil & gas service and equipment stocks such as Halliburton Co.,(3) CARBO Ceramics, Inc.(3) and Oil States International, Inc.(5) outperformed the fund's benchmark.
• Individual materials equities outperformed due to firm-specific events. Consolidated Thompson Iron Mines Ltd.(3) returned 25 percent following a bid from Cliffs Natural Resources, Inc.(3) Small capitalization gold explorer NGEx Resources, Inc.(6) gained over 100 percent on better-than-expected drilling results.
Weaknesses
• Despite a 5.6 percent increase in the price of gold bullion from January to June, gold stocks, and particularly small capitalization precious metal equities, underperformed our benchmark. Gran Colombia Gold Corp.,(7) Silvercorp Metals, Inc.(3) and Medoro Resources Ltd.(3) were examples of holdings that underperformed.
• With civil unrest in North Africa and the Middle East, international resource equities such as Niko Resources Ltd.,(8) Pacific Rubiales Energy Corp.,(9) Alange Energy Corp.(10) and ShaMaran Petroleum Corp.(11) underperformed the benchmark.
• China-centric stocks such as Teck Resources Ltd.(3) and Vale S.A.(3) declined as investors became increasingly concerned about further economic growth in the region.
CURRENT OUTLOOK
Opportunities
• The International Energy Agency said that growth in oil demand should average about 1.2 million barrels per day every year for the next five years. It also reported that the 2011 "bull run" in oil was justified by changes in fundamentals.
41
Global Resources Fund
• China's steel demand may increase to between 670 and 750 million tons by 2015. This estimate is based on the assumption that China's economy will grow at a rate of 8 to 9 percent year-over-year in the next five years. The first four months of this year saw China's steel production grow by 8.3 percent year-over-year.
• Global natural gas use may rise more than 50 percent by 2035 from 2010 levels and meet more than a quarter of global energy demand, according to the International Energy Agency.
• Saudi Arabia's Oil Minister Ali Al-Naimi indicated that the OPEC nation will invest $125 billion in the next five years on both upstream and downstream assets to continue to meet the world's oil needs.
Threats
• A potential "hard landing" in China concerning economic growth could derail the bull market for commodities. These risks include a chronic power shortage, auto sales deceleration, weak manufacturing sector data, property market corrections and monetary tightening.
• Price inflation in emerging countries, and budget cuts and fiscal austerity measures in developed countries, may weigh on economic growth over the intermediate term, which could slow the demand for commodities.
Looking ahead to the second half of the year, some economists expect growth to reaccelerate due to inventory restocking and an improving industrial supply chain following the tsunami in Japan, which should aid global manufacturing. Additionally, China appears to be nearing an end to its aggressive policy stance towards reducing liquidity and slowing growth. Moreover, with general expectations for stabilization in food and energy prices, economic growth may strengthen as confidence returns to the marketplace.
(1)This security comprised 1.84% of the fund's total net assets as of 06/30/11.
(2)This security comprised 0.35% of the fund's total net assets as of 06/30/11.
(3)The fund did not hold this security as of 06/30/11.
(4)This security comprised 1.82% of the fund's total net assets as of 06/30/11.
(5)This security comprised 1.41% of the fund's total net assets as of 06/30/11.
(6)This security comprised 0.51% of the fund's total net assets as of 06/30/11.
(7)This security comprised 1.34% of the fund's total net assets as of 06/30/11.
(8)This security comprised 1.17% of the fund's total net assets as of 06/30/11.
(9)This security comprised 2.22% of the fund's total net assets as of 06/30/11.
(10)This security comprised 1.75% of the fund's total net assets as of 06/30/11.
(11)This security comprised 0.63% of the fund's total net assets as of 06/30/11.
42
Global Resources Fund
Top 10 Holdings Based on Net Assets
(excluding repurchase agreements) June 30, 2011
HRT Participacoes Em Petroleo
Oil Companies - Exploration & Production | | | 6.18 | % | |
Freeport-McMoRan Copper & Gold, Inc.
Metal - Copper | | | 4.46 | % | |
United States Steel Corp.
Steel - Producers | | | 4.34 | % | |
Goldcorp, Inc.
Gold Mining | | | 4.22 | % | |
Newmont Mining Corp.
Gold Mining | | | 4.14 | % | |
Barrick Gold Corp.
Gold Mining | | | 4.12 | % | |
Tyson Foods, Inc.
Food - Meat Products | | | 2.96 | % | |
ConAgra Foods, Inc.
Food - Miscellaneous/Diversified | | | 2.94 | % | |
Schlumberger Ltd.
Oil - Field Services | | | 2.91 | % | |
Potash Corporation of Saskatchewan, Inc.
Agricultural Chemicals | | | 2.89 | % | |
| TOTAL TOP TEN HOLDINGS | | | 39.16 | % | |
43
Global Resources Fund
Portfolio Allocation by Industry Sector* June 30, 2011
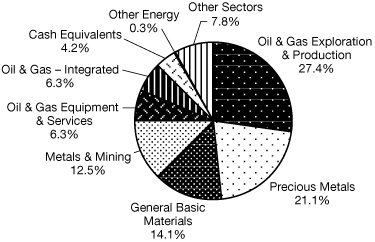
| Energy: | |
| Oil & Gas Exploration & Production | | | 27.4 | % | | | |
| Oil & Gas Equipment & Services | | | 6.3 | % | | | |
Oil & Gas - Integrated (includes Refining and
Marketing) | | | 6.3 | % | | | |
| Other Energy | | | 0.3 | % | | | |
| Total Energy | | | | | 40.3 | % | |
| Basic Materials: | |
Precious Metals (includes Gold/Silver Mining and
Platinum) | | | 21.1 | % | | | |
| General Basic Materials | | | 14.1 | % | | | |
Metals & Mining (includes Copper, Coal and
Aluminum) | | | 12.5 | % | | | |
| Total Basic Materials | | | | | 47.7 | % | |
| Other Sectors | | | | | 7.8 | % | |
| Repurchase Agreements | | | | | 4.2 | % | |
| | | | 100.0 | % | |
* Summary information above may differ from the portfolio schedule included in the financial statements due to the use of different classifications of securities for presentation purposes.
44
Precious Metals and Minerals Funds
Management Team's Perspective
INTRODUCTION
The World Precious Minerals Fund (UNWPX and UNWIX) and the Gold and Precious Metals Fund (USERX) pursue an objective of long-term capital growth through investments in gold, precious metals and minerals companies. The Gold and Precious Metals Fund focuses on the equity securities of established gold and precious metals companies and pursues current income as a secondary objective. The World Precious Minerals Fund focuses on equity securities of companies principally engaged in the exploration, mining and processing of precious minerals such as gold, silver, platinum and diamonds. Although this fund has the latitude to invest in a broad range of precious minerals, it currently remains focused on the gold sector.
PERFORMANCE GRAPHS
World Precious Minerals Fund

Average Annual Performance For the Periods Ended
June 30, 2011
| | | Six Month | | One Year | | Five Year | | Ten Year | | Since Inception
(Institutional
Class) | |
World Precious Minerals Fund
- Investor Class | | | (18.00 | )% | | | 15.88 | % | | | 6.99 | % | | | 25.32 | % | | | n/a | | |
World Precious Minerals Fund - Institutional
Class (Inception 3/1/10) | | | (17.81 | )% | | | 16.55 | % | | | n/a | | | | n/a | | | | 15.09 | % | |
| S&P 500 Index | | | 6.02 | % | | | 30.69 | % | | | 2.94 | % | | | 2.72 | % | | | 15.76 | % | |
| NYSE Arca Gold Miners Index* | | | (11.18 | )% | | | 5.62 | % | | | 7.59 | % | | | 19.00 | % | | | 16.74 | % | |
* These are not total returns. These returns reflect simple appreciation only and do not reflect dividend reinvestment.
Performance data quoted above is historical. Past performance is no guarantee of future results. Current performance may be higher or lower than the performance data quoted. Investment return and principal value of an investment will fluctuate so that an investor's shares, when redeemed, may be worth more or less than their original cost. The graph and table do not reflect the deduction of taxes that a shareholder would pay on fund distributions or the redemption of fund shares. Returns for periods less than one year are not annualized.
Pursuant to a voluntary arrangement, the Adviser has agreed to limit total fund operating expenses (exclusive of acquired fund fees and expenses, extraordinary expenses, taxes, brokerage commissions and interest, and advisory fee performance adjustments, if any) to not exceed 1.90% for the Investor Class. Also pursuant to a voluntary agreement, the Adviser has agreed to waive all class specific expenses of the Institutional Class. The Adviser can modify or terminate these arrangements at any time.
See Definitions for Management Teams' Perspectives for index definitions.
Please visit our website at www.usfunds.com for updated performance information for different time periods.
45
Precious Metals and Minerals Funds
Gold and Precious Metals Fund
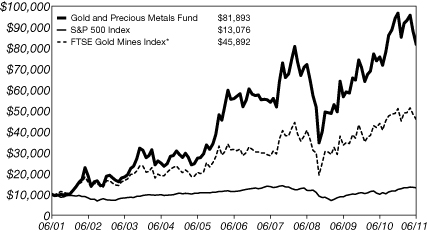
Average Annual Performance For the Periods Ended
June 30, 2011
| | | Six Month | | One Year | | Five Year | | Ten Year | |
| Gold and Precious Metals Fund | | | (15.41 | )% | | | 7.97 | % | | | 7.96 | % | | | 23.39 | % | |
| S&P 500 Index | | | 6.02 | % | | | 30.69 | % | | | 2.94 | % | | | 2.72 | % | |
| FTSE Gold Mines Index* | | | (10.15 | )% | | | 4.37 | % | | | 7.78 | % | | | 16.44 | % | |
* These are not total returns. These returns reflect simple appreciation only and do not reflect dividend reinvestment.
Performance data quoted above is historical. Past performance is no guarantee of future results. Current performance may be higher or lower than the performance data quoted. Investment return and principal value of an investment will fluctuate so that an investor's shares, when redeemed, may be worth more or less than their original cost. The graph and table do not reflect the deduction of taxes that a shareholder would pay on fund distributions or the redemption of fund shares. Returns for periods less than one year are not annualized.
Pursuant to a voluntary arrangement, the Adviser has agreed to limit total fund operating expenses (exclusive of acquired fund fees and expenses, extraordinary expenses, taxes, brokerage commissions and interest, and advisory fee performance adjustments, if any) to not exceed 1.90%. The Adviser can modify or terminate this arrangement at any time.
See Definitions for Management Teams' Perspectives for index definitions.
Please visit our website at www.usfunds.com for updated performance information for different time periods.
46
Precious Metals and Minerals Funds
THE SIX-MONTH PERIOD IN REVIEW – ECONOMIC AND POLITICAL ISSUES THAT AFFECTED THE FUNDS
Early in the year, Bank of America Merrill Lynch lowered its outlook on free cash flow within the North American precious metals industry. The company estimates the industry will generate $6.3 billion of free cash flow in 2011, which is down by more than half compared to its prior 2011 free cash flow estimate of $13.1 billion. This is due to companies reporting higher than anticipated capital spending plans for 2011, with strong commodity prices leading companies to advance development projects more rapidly and expanding existing mines. The decline in free cash flow may restrain some companies from making acquisitions this year absent a boost in metal prices.
Mining in the U.S. remains a challenge, as President Obama's fiscal year 2012 proposed budget calls for charging a 5 percent royalty on the gross proceeds of hard rock minerals mined on public lands including silver, gold and copper. The president's budget would also establish a new abandoned mine land fee on hard rock mining similar to the coal mining industry. On the political front, South Africa's mining community was rocked by the global mining rankings published by the Toronto-based Fraser Institute, which placed the country 67 out of 79 jurisdictions across the world. The ratings are derived from assessing mining company executives' views on the attractiveness of the mining policies implemented by the governments in various jurisdictions. Over the past five years, South Africa has fallen precipitously from 37th place in the rankings. Zimbabwe is placed at 71, just behind South Africa.
During the first two months of 2011, China imported more gold than its total 2010 imports. At the country's current rate, Chinese consumers could buy half of the new mine supply produced this year. Many believe gold is on its way to becoming a permanently accepted financial asset for money managers around the world. Reinforcing this notion, J.P. Morgan recently stated it is the only tri-party collateral manager to accept physical gold as collateral to satisfy securities lending and repo obligations with counterparties. This comes as more clients look to use gold as a hedge against inflation and to post as collateral.
Hong Kong's Chinese Gold & Silver Exchange Society, a century old bullion-trading bourse, announced plans to start trading gold quoted in yuan. The plan is to expand the role of the yuan in global trade as China works to reduce its dependence on the dollar as its functional foreign exchange currency. In another innovative move, the World Gold Council (WGC) and the Industrial and Commercial Bank of China (ICBC) launched the "Only Gold
47
Precious Metals and Minerals Funds
Gift Bar" as the first gold investment gifting product in China, which the WGC says should further boost the already-growing gold market in the country. The product consists of bars weighing 10, 20, 50, 100 and 1,000 grams. The Industrial and Commercial Bank of China's Gold Accumulation Plan (ICBC GAP) allows investors in China to accumulate gold through a daily dollar averaging program. The minimum investment required is 200 Renminbi or 1 gram of gold per day, which is equal to 42 dollars. One million accounts have already been opened and the ICBC Bank is the world's largest consumer bank with approximately 212 million accounts.
People's Bank of China (PBOC) has announced that in view of the rising demand for their Panda coins, the output number of gold Pandas will be raised from the previously announced 300,000 units to 500,000 this year. The smaller coins in the series will have their maximum circulation numbers increased from 200,000 coins to 600,000 for each series. Also, the PBOC says that it is doubling the maximum issuance of silver Panda coins from 3 million to 6 million. To emphasize this growth in demand, issuance in 2010 was just 1.5 million.
Overall Chinese gold demand could rise over 22 percent in the next three years and sharply outpace domestic production, according to the head of the country's largest state-owned gold miner China National Gold Group Corp., signaling room for a strong ramp up in imports. Gold production should reach 400 tons by 2014, a gain of nearly 19 percent from 2010, but consumption is set to grow by nearly a quarter to 700 tons. The China Gold Association indicated that China's gold production is expected to rise by more than 10 percent in 2011 from a year ago, and expected world gold prices would continue to climb in the second half of the year. Despite the price of gold having quadrupled in the past ten years, the gold industry struggles to sustain new mine production of bullion at the same level it was in 2001.
Mexico ramped up its gold reserves in the first quarter of this year, buying over $4 billion of bullion. This was the third biggest off-market purchase of gold by any country over the past decade, and Mexico's reserves went from just 6.84 tons at the end of January to 100.15 tons, or 3.22 million ounces, by the end of March. The International Monetary Fund also reported that Russia and Thailand purchased 18.8 and 9.3 tons to bring their respective totals to 811.1 and 108.9.
The import of gold and silver by India has risen 222 percent between April and May 2011, as compared to a year ago. In the month of May alone, imports were a staggering $9 billion, a growth of 500 percent compared to the month a year ago. To put this into perspective, the annual average of
48
Precious Metals and Minerals Funds
gold imports by India is $22 billion; May imports alone comprised 40 percent of that average.
Indonesia will audit more than 8,000 existing mining permits to make sure they are in line with mining and environmental laws. The announcement came days after the country passed new regulations on environmental protection. Indonesia had already stopped issuing new mining permits ahead of mining regulations stemming from a 2008 law.
Macquarie Equities research noted that capital costs have recently risen to peak 2007 levels. While gold company dividend payouts have historically been lower than the dividend yield of the broader market, we have started to see this trend reverse as management teams realize the importance of providing an income stream to shareholders.
Zambia raised the price of electricity for mining companies by 30 percent. Frederick Bantubonse, the general manager of the Chamber of Mines of Zambia, an industry body that represents foreign mining companies, said the higher cost of electricity would affect profitability. The cost of electricity to the mines was last raised by 35 percent in 2008.
INVESTMENT HIGHLIGHTS
For the six-month period ending June 30, 2011, the World Precious Minerals Fund Investor Class declined 18.00 percent and the Institutional Class lost 17.81 percent. The fund's benchmark, the NYSE Arca Gold Miners Index, decreased 10.84 percent on a total return basis.
The Gold and Precious Metals Fund Investor Class fell 15.41 percent, compared to the 9.74 percent decline (total return basis) of its benchmark, the FTSE Gold Mines Index.
Spot gold finished the period at $1,500.35 per ounce, up $79.57, or 5.60 percent. The S&P 500 Index posted a positive return of 6.02 percent, the U.S. Trade Weighted Dollar Index fell 5.98 percent and the yield on the 90-day Treasury bill finished the first half of the year with a yield of 0.015 percent.
Both funds underperformed against their benchmarks primarily due to their higher relative exposure to mid-tier and smaller capitalization stocks. The World Precious Minerals Fund focuses primarily on junior companies in the exploration and development stage of precious metals mining, and the Gold and Precious Metals Fund invests in mid-tiered companies involved in the mining, fabrication or processing of precious metals. The S&P/TSX Venture
49
Precious Metals and Minerals Funds
Composite Index, a broad market indicator for the Canadian venture capital market, posted a negative 16.77 percent return for the six-month period.
Strengths
• The biggest success in the World Precious Minerals Fund was our holding in Extorre Gold Mines Ltd.,(1) which appreciated over 90 percent in the last six months as the company continued to have tremendous exploration results with its delineation of high grade gold and silver veins in Argentina.
• Both funds benefited compared to their benchmarks by overweighting Goldcorp, Inc.(2) and IAMGOLD Corp.(3)
• The Gold and Precious Metals Fund benefited from much more limited exposure to Barrick Gold Corp.(4) and Newmont Mining Corp.,(5) both of which declined during the six-month period.
Weaknesses
• The funds' junior and mid-tiered stock holdings negatively affected their performance in relation to their benchmarks during this period. These junior and mid-tier miners depend on funding for their projects, and therefore, are particularly sensitive to the financial markets. Due to greater government regulation over the first half of the year, the KBW Bank Index, a financial sector indicator, fell 6.76 percent compared to a return of 6.02 for the S&P 500 Index. We believe this is a short-term setback for junior to mid-tiered companies and that over the long term, the trend will reverse and they will return to their long-term historical outperformance over senior gold mining companies.
• In the second quarter, gold bullion significantly outperformed the gold miners as equities were significantly penalized from a rise in systemic risk due to the potential of a contraction in liquidity with sovereign debt issues.
• The funds' worst performer was Gran Colombia Gold Corp.,(6) which fell over the last six months as it merged with Medoro Resources Ltd.(7) The combined company should emerge as the largest publicly-traded gold producer in Colombia, but the timing of the merger coincided with the sell off in the junior gold mining space as capital became very scarce.
CURRENT OUTLOOK
Opportunities
• Quebec's 25-year "Plan Nord" plans to develop its huge frozen northern reaches into a powerhouse of mining and renewable energy, targeting $83
50
Precious Metals and Minerals Funds
billion of private and public investment. The province, which topped a Fraser Institute survey of best mining districts from 2007 to 2009, has now slipped to fourth. Plan Nord covers an area roughly the size of South Africa.
• Chile and China signed agreements to increase cooperation in mining during a visit by China's Vice-President Xi Jinping. The governments also confirmed financial cooperation and development funding accords between Chile's Banco del Estado de Chile(7) and China Development Bank Corp.,(7) both state-owned. China, a top importer of commodities, is by far the biggest buyer of copper from Chile, the world's top producer of the metal.
Threats
• Peru's newly elected president Ollanta Humala has raised concern for Peru's mining industry. President Humala has suggested Peru could impose a windfall tax of up to 40 percent on mining companies and raise the corporate tax rate from 30 percent. Royalties could be raised to 5 percent from 3 percent.
• Brazil is considering a new tax on large mining projects as part of the government's overhaul of the mining code. The proposal would levy the tax on 25 percent of the existing mining concessions and include a potential increase in royalties that companies must pay to the government.
• Tanzania, one of Africa's top gold producers, is considering a "super profit" tax on earnings from minerals as one of the ways to fund its five-year development plan.
(1)This security comprised 2.15% of the total net assets of the World Precious Minerals Fund and 0.00% of the Gold and Precious Metals Fund as of 06/30/11.
(2)This security comprised 4.55% of the total net assets of the World Precious Minerals Fund and 6.69% of the Gold and Precious Metals Fund as of 06/30/11.
(3)This security comprised 0.56% of the total net assets of the World Precious Minerals Fund and 2.32% of the Gold and Precious Metals Fund as of 06/30/11.
(4)This security comprised 0.00% of the total net assets of the World Precious Minerals Fund and 0.85% of the Gold and Precious Metals Fund as of 06/30/11.
(5)This security comprised 0.00% of the total net assets of the World Precious Minerals Fund and 2.01% of the Gold and Precious Metals Fund as of 06/30/11.
(6)This security comprised 3.43% of the total net assets of the World Precious Minerals Fund and 3.01% of the Gold and Precious Metals Fund as of 06/30/11.
(7)Neither fund held this security as of 06/30/11.
51
Precious Metals and Minerals Funds
World Precious Minerals Fund
Top 10 Holdings Based on Net Assets
(excluding repurchase agreement) June 30, 2011
SPDR Gold Trust
Exchange-Traded Funds | | | 5.26 | % | |
Romarco Minerals, Inc.
Gold Mining | | | 4.66 | % | |
Goldcorp, Inc.
Gold Mining | | | 4.55 | % | |
Yamana Gold, Inc.
Gold Mining | | | 3.67 | % | |
Gran Colombia Gold Corp.
Gold Mining | | | 3.43 | % | |
Silvercorp Metals, Inc.
Silver Mining | | | 3.42 | % | |
First Majestic Silver Corp.
Silver Mining | | | 2.85 | % | |
Dundee Precious Metals, Inc.
Gold Mining | | | 2.29 | % | |
Harmony Gold Mining Co., Ltd.
Gold Mining | | | 2.26 | % | |
Sprott Physical Gold Trust
Exchange-Traded Funds | | | 2.23 | % | |
| TOTAL TOP TEN HOLDINGS | | | 34.62 | % | |
Portfolio Allocation by Industry*
Based on Total Investments June 30, 2011
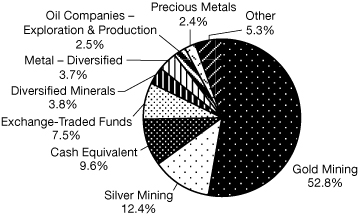
* Summary information above may differ from the portfolio schedule included in the financial statements due to the use of different classifications of securities for presentation purposes.
52
Precious Metals and Minerals Funds
Gold and Precious Metals Fund
Top 10 Holdings Based on Net Assets
(excluding repurchase agreement) June 30, 2011
Dundee Precious Metals, Inc.
Gold Mining | | | 6.70 | % | |
Goldcorp, Inc.
Gold Mining | | | 6.69 | % | |
First Majestic Silver Corp.
Silver Mining | | | 5.34 | % | |
SPDR Gold Trust
Exchange-Traded Funds | | | 5.09 | % | |
Yamana Gold, Inc.
Gold Mining | | | 4.88 | % | |
Silvercorp Metals, Inc.
Silver Mining | | | 4.79 | % | |
Silver Standard Resources, Inc.
Silver Mining | | | 3.87 | % | |
Harmony Gold Mining Co., Ltd.
Gold Mining | | | 3.61 | % | |
Sprott Physical Gold Trust
Exchange-Traded Funds | | | 3.29 | % | |
Gran Colombia Gold Corp.
Gold Mining | | | 3.01 | % | |
| TOTAL TOP TEN HOLDINGS | | | 47.27 | % | |
Portfolio Allocation by Industry*
Based on Total Investments June 30, 2011
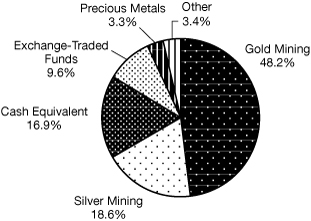
* Summary information above may differ from the portfolio schedule included in the financial statements due to the use of different classifications of securities for presentation purposes.
53
Eastern European Fund
Management Team's Perspective
INTRODUCTION
The investment objective of the Eastern European Fund (EUROX) is to achieve long-term capital growth by investing in a non-diversified portfolio of equity securities of companies located in the emerging markets of Eastern Europe.(1)
PERFORMANCE GRAPH
Eastern European Fund
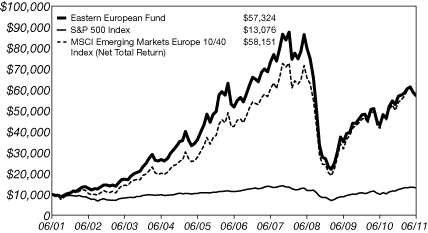
Average Annual Performance For the Periods Ended
June 30, 2011
| | | Six Month | | One Year | | Five Year | | Ten Year | |
| Eastern European Fund | | | 0.46 | % | | | 32.93 | % | | | 2.03 | % | | | 19.07 | % | |
| S&P 500 Index | | | 6.02 | % | | | 30.69 | % | | | 2.94 | % | | | 2.72 | % | |
MSCI Emerging Markets Europe 10/40
Index (Net Total Return) | | | 7.23 | % | | | 39.50 | % | | | 6.44 | % | | | 19.23 | % | |
Performance data quoted above is historical. Past performance is no guarantee of future results. Current performance may be higher or lower than the performance data quoted. Investment return and principal value of an investment will fluctuate so that an investor's shares, when redeemed, may be worth more or less than their original cost. Foreign and emerging market investing involves special risks such as currency fluctuation and less public disclosure, as well as economic and political risk. The graph and table do not reflect the deduction of taxes that a shareholder would pay on fund distributions or the redemption of fund shares. Returns for periods less than one year are not annualized.
Pursuant to a voluntary arrangement, the Adviser has agreed to limit total fund operating expenses (exclusive of acquired fund fees and expenses, extraordinary expenses, taxes, brokerage commissions and interest, and advisory fee performance adjustments, if any) to not exceed 2.85%. The Adviser can modify or terminate this arrangement at any time.
See Definitions for Management Teams' Perspectives for index definitions.
Please visit our website at www.usfunds.com for updated performance information for different time periods.
54
Eastern European Fund
THE SIX-MONTH PERIOD IN REVIEW – ECONOMIC AND POLITICAL ISSUES THAT AFFECTED THE FUND
The price of oil has risen sharply since the beginning of the year due to geopolitical events and natural disasters. As an energy exporter of crude oil and natural gas, Russia is one of the few large economies in the world that directly benefits from higher energy prices. At the same time, Russia is relatively safe from the type of political uprising seen in the Middle East and North Africa.
Russia is the world's largest oil producer, and it is estimated that for every $10 increase in the average annual price of oil, Russia's revenues rise by $20 billion. Since Russia is not a member of OPEC, it is not bound by production caps and can increase production as it sees fit while prices are at elevated levels. Russia is also the world's top exporter of natural gas, and after the uprising in Libya shut down 11 billion cubic-meters of natural gas flow, Italy turned to Russia for gas supplies. In addition, a shutdown of several Japanese nuclear facilities could mean as much as a 14 percent increase in natural gas consumption to meet Japan's energy demands.
While higher energy prices may slow consumer spending in the U.S., Western Europe and certain emerging market countries, they have the opposite effect for the Russian economy. With increased cash flow from its natural gas and crude oil exports, the Russian government has the much-needed capital to invest in the country's aging infrastructure and to support domestic consumption. The Russian government is discussing a boost to 2012-2014 planned social spending, which should be positive for consumer stocks. Spending growth is expected to accelerate from 8.9 percent in 2011 to over 10 percent a year in 2012-2013, as the government plans to spend an additional $35 billion per year in 2012-2014 compared to previous plans. That yearly spending increase is substantial; it is roughly equivalent to 2 percent of GDP.
Early in the year, Central European sails caught the wind of economic activity in Germany. Industrial production in the Czech Republic and Hungary rose by double-digit percentages, boosted by strong sales of German carmakers. While there is no direct way to invest in auto suppliers located in Central Europe, as public listings are limited to banks and telecommunication companies, currency appreciation lifted Hungarian, Czech and, to a lesser extent, Polish markets.
The Turkish economy surged 11 percent in the first quarter, outpacing China. Growth remained domestically driven, with private consumption expanding
55
Eastern European Fund
12.1 percent and gross fixed capital formation growing 36.6 percent. Turkey's hot economy stands in contrast with those of most neighbors in the European Union. The signs of overheating led the Turkish Central Bank to raise reserve requirements of the banks, in an effort to stem loan growth, which reached more than 35 percent in the first quarter. As a result, financials, which comprise more than half of the Istanbul Exchange index, underwent a significant correction. An unorthodox policy implemented by the Central Bank of keeping interest rates low, while at the same time increasing reserve requirements, also put pressure on the Turkish lira, boosting exports.
INVESTMENT HIGHLIGHTS
Overview
The fund gained 0.46 percent for the six months ended June 30, 2011, compared to a 7.23 percent return for the benchmark MSCI Emerging Markets Europe 10/40 Index (Net Total Return).
The fund was up for the first four months of this year but down in May and June, directionally the same as the benchmark. The worst drawdown was in the month of May, when the fund lost 4.56 percent while the benchmark declined 6.97 percent during the same period.
Across the fund's peer universe, most funds were negatively affected this year by the convergence between Russian listed shares and London GDRs. Historically, local shares traded at a wide discount to GDRs due to a limit imposed on GDRs as a percentage of shares outstanding. In some cases, the discount was as wide as 25 to 35 percent. With the limit removed, local shares closed the pricing gap and lifted the MSCI Index, which is calculated using local shares.
Strengths
• In Central Europe, stock returns were buoyed by stronger currencies. The Hungarian forint appreciated 13.4 percent against the dollar, while the Czech koruna gained 11.3 percent, and the Polish zloty gained 8.0 percent.
• The fund's significant underweighting in the utility sector positively contributed to performance relative to the benchmark, as tariff increases were capped in a populist move by the Russian government ahead of the elections.
• Stock selection within the industrial sector contributed to the performance of the fund. Airport operator TAV Havalimanlari Holding A.S.(2) proved resilient in a period when other industrial names registered double-digit declines.
56
Eastern European Fund
• The fund's consumer stocks in Russia were beneficiaries of a decreasing unemployment rate, which fell to 6.1 percent in June, and real wages advancing 4.2 percent. While the sector underperformed during most of the period, it recently began to outperform on strong retail sales data.
• Even though Turkey was one of the weakest among the emerging markets for the six months, the fund's positioning within the country had a positive contribution to the performance relative to the benchmark. We do expect performance among Turkish stocks to improve as the country has the highest growth potential in the region.
• The fund also increased its allocation to Poland, where the state privatization program continues to present attractive buying opportunities.
Weaknesses
• Energy was the best-performing sector during the period, after mostly mediocre performance in 2010. While our stock selection in the sector was robust, underweighting in this sector relative to the benchmark hurt the fund.
• During the first four months of the year, large-cap Russian energy names were buoyed by an inflow of money into the Russian index. The fund's stock selection in the Russian energy space is based on production and reserve growth profile of individual companies, not index weight. Earlier in the year, money inflow lifted index heavyweights, like Gazprom OAO,(3) but after the tide left, the fund's core holdings, including NovaTek OAO,(4) TNK-BP Holding(5) and Rosneft Oil Co. OJSC,(6) all outperformed year-to-date.
• Materials underperformed, despite healthy demand and a positive pricing environment. While MMC Norilsk Nickel OJSC(7) outperformed the sector, our relative underweighting hurt the fund's return.
• While the fund made up ground in energy and consumer sectors, we lost ground in materials, specifically steel and aluminum companies. Steel prices are up strongly this year as well as iron ore and coking coal prices. Because of higher prices and announced infrastructure spending, we expected the vertically integrated Russian steel companies to perform well in this environment. However, the stock returns were disappointing, and we have since trimmed our exposure.
CURRENT OUTLOOK
Opportunities
• The euro zone debt jitters could facilitate a banking consolidation process in Eastern Europe, giving the healthier banks a larger market share. Some
57
Eastern European Fund
of the Western European banks directly affected by the euro zone debt crisis have already sold their Polish subsidiaries to preserve capital for their core domestic operations.
• The Russian government is discussing a boost to 2012-2014 planned budget spending, which should be positive for consumer stocks. Spending growth is expected to accelerate from 8.9 percent in 2011 to over 10 percent a year in 2012-2013, as the government plans to spend an additional $35 billion per year in 2012-2014 compared to previous plans. That yearly spending increase is substantial; it is roughly equivalent to 2 percent of GDP.
• The new tax regime in Russia will translate into about a $3.40 per barrel decrease in oil export duty, which should improve profitability of upstream operations in the oil sector. A lower profitability threshold should increase the number of new wells by 20 to 30 percent, boosting demand for drilling services.
• Turkish GDP expanded 11 percent year-over-year in the first quarter, faster than the 9.2 percent growth seen in the fourth quarter of 2010. Turkish growth remains domestically driven, as private consumption and gross fixed capital formation grew 11.6 percent and 33.6 percent, respectively.
• Turkish utilities continue to expect power consumption growth to surpass the country's GDP development by 1 to 2 percent going forward (6.4 percent and 4.0 percent projected GDP growth in 2011 and 2012, respectively).
Threats
• In Poland, public sector wages grew faster than wages in the private sector since 2004. Higher wages, combined with better social benefits and stable employment, led many Poles to cast a wary eye toward privatization plans. Powerful unions were recently able to block or delay IPO plans.
• Domestic demand for gas has remained flat since 2007, but Gazprom's sales of its own gas dropped by 19 billion cubic meters on top of a similar fall in Europe. The state giant is coming under increased pressure from independent gas producers, which are on track to double their production to 116 billion cubic meters by 2015.
• A rate increase in the new social contribution tax in Russia may have caused a spike in "informal" employment and wages, which could explain acceleration in retail sales amid stagnant real wage and disposable income growth.
(1)The following countries are considered to be in the Eastern European region: Albania, Armenia, Azerbaijan, Belarus, Bulgaria, Croatia, Czech Republic,
58
Eastern European Fund
Estonia, FYR Macedonia, Georgia, Hungary, Latvia, Lithuania, Moldova, Poland, Romania, Russia, Slovakia, Slovenia, Turkey and Ukraine.
(2)This security comprised 1.21% of the fund's total net assets as of 06/30/11.
(3)This security comprised 4.41% of the fund's total net assets as of 06/30/11.
(4)This security comprised 5.30% of the fund's total net assets as of 06/30/11.
(5)This security comprised 4.28% of the fund's total net assets as of 06/30/11.
(6)This security comprised 3.53% of the fund's total net assets as of 06/30/11.
(7)This security comprised 2.37% of the fund's total net assets as of 06/30/11.
59
Eastern European Fund
Top 10 Holdings Based on Net Assets
(excluding repurchase agreement) June 30, 2011
Sberbank RF
Commercial Banks - Non US | | | 6.35 | % | |
NovaTek OAO
Oil Companies - Exploration & Production | | | 5.30 | % | |
Lukoil OAO
Oil Companies - Integrated | | | 4.90 | % | |
Gazprom OAO
Oil Companies - Exploration & Production | | | 4.41 | % | |
TNK-BP Holding
Oil Companies - Integrated | | | 4.28 | % | |
Rosneft Oil Co. OJSC
Oil Companies - Integrated | | | 3.53 | % | |
Turkiye Garanti Bankasi A.S.
Commercial Banks - Non US | | | 3.27 | % | |
MOL Hungarian Oil & Gas Nyrt.
Oil Companies - Integrated | | | 3.24 | % | |
KGHM Polska Miedz S.A.
Metal - Diversified | | | 3.00 | % | |
Powszechny Zaklad Ubezpieczen S.A.
Property/Casualty Insurance | | | 2.96 | % | |
| TOTAL TOP TEN HOLDINGS | | | 41.24 | % | |
Country Distribution*
Based on Total Investments June 30, 2011
(excluding repurchase agreement)
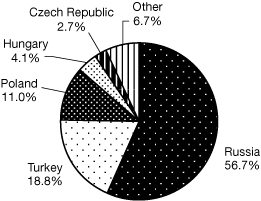
* Country distribution shown is based on domicile. The locale of company operations may be different.
60
Global Emerging Markets Fund
Management Team's Perspective
INTRODUCTION
The investment objective of the Global Emerging Markets Fund (GEMFX) is to achieve long-term capital growth by investing in a non-diversified portfolio of the equity securities of companies located in or with a significant business presence in emerging market countries.(1)
PERFORMANCE GRAPH
Global Emerging Markets Fund
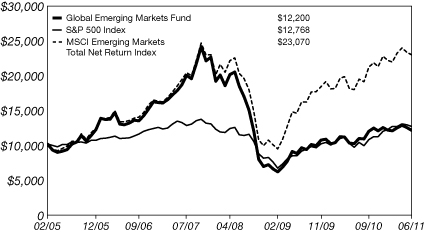
Average Annual Performance For the Periods Ended
June 30, 2011
| | | Six Month | | One Year | | Five Year | | Inception | |
Global Emerging Markets Fund
(Inception 2/24/05) | | | (3.16 | )% | | | 18.72 | % | | | (1.25 | )% | | | 3.18 | % | |
| S&P 500 Index | | | 6.02 | % | | | 30.69 | % | | | 2.94 | % | | | 3.93 | % | |
MSCI Emerging Markets Net Total
Return Index | | | 0.88 | % | | | 27.80 | % | | | 11.42 | % | | | 14.07 | % | |
Performance data quoted above is historical. Past performance is no guarantee of future results. Current performance may be higher or lower than the performance data quoted. Investment return and principal value of an investment will fluctuate so that an investor's shares, when redeemed, may be worth more or less than their original cost. Foreign and emerging market investing involves special risks such as currency fluctuation and less public disclosure, as well as economic and political risk. The graph and table do not reflect the deduction of taxes that a shareholder would pay on fund distributions or the redemption of fund shares. Returns for periods less than one year are not annualized.
Pursuant to a voluntary arrangement, the Adviser has agreed to limit total fund operating expenses (exclusive of acquired fund fees and expenses, extraordinary expenses, taxes, brokerage commissions and interest, and advisory fee performance adjustments, if any) to not exceed 3.15%. The Adviser can modify or terminate this arrangement at any time.
See Definitions for Management Teams' Perspectives for index definitions.
Please visit our website at www.usfunds.com for updated performance information for different time periods.
61
Global Emerging Markets Fund
THE SIX-MONTH PERIOD IN REVIEW – ECONOMIC AND POLITICAL ISSUES THAT AFFECTED THE FUND
Given the global nature of the fund and its cross-sector exposure, the fund can be volatile at times.
The political events in the Middle East early in 2011 negatively affected the fund, with Centamin Egypt Ltd.,(2) with mining operations in Egypt, being one of the main detractors of performance. The other significant drag on performance was Dongfang Electric Corp. Ltd.(3) The company manufactures equipment for power plants, including nuclear, and the Japanese earthquake, which severely damaged the nuclear plant in Onahama, soured sentiment for the space across the board. Separately, some global uranium producers corrected by as much as 50 percent following the Japanese earthquake. Negative publicity for nuclear related stocks continued through the second quarter with Germany and Switzerland aiming to phase out their reactors by 2022 and 2034, respectively.
The second quarter of 2011 was challenging for many emerging markets, most of which finished in negative territory. The notable exceptions were Poland, Chile, South Korea and Taiwan, which were among our key holdings. The Turkish market continued to struggle at the prospect of deteriorating current account deficit as a result of higher oil prices.
The first half of the year witnessed a presidential election in Peru, which led to wild swings in local capital markets at the prospect of left-leaning Ollanta Humala taking office. Opinions are still divided on how Peru will be governed under Humala, who officially takes office at the end of July and promised, among other things, to restructure the tax system for the mining companies and spread the benefits of higher commodities prices more evenly in the country.
Elsewhere in Latin America, a proposed change in the mobile termination rates in Mexico clouded the outlook for many major investors.
Although China delivered better-than-expected GDP growth for the first two quarters, 9.7 percent and 9.5 percent, respectively, investors did not take comfort in this market (down 3.5 percent in the second quarter) as well-publicized accounting irregularities seemed to have weighed on sentiment.
62
Global Emerging Markets Fund
INVESTMENT HIGHLIGHTS
Overview
The fund declined 3.16 percent for the six months ended June 30, 2011, compared to a 0.88 percent positive return for the MSCI Emerging Markets Net Total Return Index, the fund's benchmark.
Strengths
• Although Brazil was an underperformer in the first half of 2011, selected stocks provided a good return for the fund. In fact, the best contribution for the fund came from Brazilian telecom operator, Telecomunicacoes de Sao Paulo S.A.(3) (formerly Vivo Participacoes S.A.).
• MercadoLibre, Inc.,(4) the Latin American equivalent of eBay, Inc.,(2) was the second best contributor for the fund.
Weaknesses
• Credicorp Ltd.(5) was one of the casualties of the political uncertainty in Peru as the stock declined and was one of key detractors of performance.
• The performance of Asian stocks was uneven. The biggest disappointment was Evergreen Marine Corp.,(6) a Taiwanese shipping company that negatively impacted return.
• The fund underweighted its exposure to South Korea in the first half of 2011. This adversely impacted performance as this market turned out to be among the best performers in the broad emerging markets universe.
• The fund had no exposure to the Hungarian equity market, which, with a return of 20 percent, was one of the best performers.
CURRENT OUTLOOK
Opportunities
• As the Chinese leadership embarked on the route of recalibrating the economy away from fixed-asset formation and toward domestic consumption, the fund's portfolio was redesigned to capture this trend. An overhaul of the social security system in China should encourage greater consumption by households over time.
• Growth of incomes per capita around the world has created opportunities for protein producers, particularly in agriculturally rich countries like Brazil and Australia. Demand for poultry and, to a lesser extent, for pork and beef are likely to remain strong for years to come.
63
Global Emerging Markets Fund
• The issue of urbanization in China, as the country is preparing for 90 million people to move to cities by 2015, will be positive for resources such as iron ore and copper. As a result of continued strong demand for copper, Chile's state-owned Corporación Nacional del Cobre de Chile,(2) the largest copper producer in the world, announced a record $16.3 billion in planned capital expenditures for 2011-15.
Threats
• Talk about the dangers for the Chinese real estate market has put some investors on edge in anticipation of a correction. If the correction were to be drastic, demand for many global commodities would likely fall precipitously. Additionally, reports of accounting irregularities in some Chinese firms have spooked investors.
• Although the sovereign crisis in Europe has been centered on Portugal, Ireland, Greece and Spain, the situation in Hungary remains precarious given the fiscal situation in the country. A deterioration of the climate in Hungary would impact sentiment for other countries in the region.
• Continued instability in the Middle East does not provide comfort for investors as numerous western companies have exposure to the region.
(1)Emerging market countries are those countries defined as such by the World Bank, the International Finance Corporation, the United Nations or the European Bank for Reconstruction and Development or included in the MSCI Emerging Markets Index.
(2)The fund did not hold this security as of 06/30/11.
(3)This security comprised 2.31% of the fund's total net assets as of 06/30/11.
(4)This security comprised 1.99% of the fund's total net assets as of 06/30/11.
(5)This security comprised 2.16% of the fund's total net assets as of 06/30/11.
(6)This security comprised 0.99% of the fund's total net assets as of 06/30/11.
64
Global Emerging Markets Fund
Top 10 Holdings Based on Net Assets
(excluding repurchase agreement) June 30, 2011
Naspers Ltd.
Multimedia | | | 2.59 | % | |
Lojas Renner S.A.
Retail - Apparel/Shoe | | | 2.44 | % | |
KGHM Polska Miedz S.A.
Metal - Diversified | | | 2.40 | % | |
Telecomunicacoes de Sao Paulo S.A.
Telephone - Integrated | | | 2.31 | % | |
Hyundai Motor Co.
Automotive - Cars & Light Trucks | | | 2.23 | % | |
Baidu, Inc.
Web Portals/Internet Service Providers | | | 2.22 | % | |
SACI Falabella
Retail - Major Department Store | | | 2.20 | % | |
Credicorp Ltd.
Commercial Banks - Non US | | | 2.16 | % | |
Sberbank RF
Commercial Banks - Non US | | | 2.02 | % | |
MercadoLibre, Inc.
E-Commerce/Products | | | 1.99 | % | |
| TOTAL TOP TEN HOLDINGS | | | 22.56 | % | |
Country Distribution*
Based on Total Investments June 30, 2011
(excluding repurchase agreement)
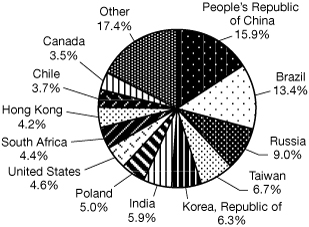
* Country distribution shown is based on domicile. The locale of company operations may be different.
65
China Region Fund
Management Team's Perspective
INTRODUCTION
The China Region Fund (USCOX) seeks long-term growth of capital. The fund invests in both established and emerging companies registered and operating in the China region.(1)
PERFORMANCE GRAPH
China Region Fund
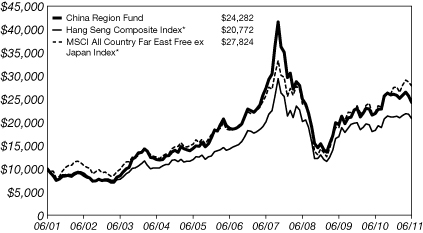
Average Annual Performance For the Periods Ended
June 30, 2011
| | | Six Month | | One Year | | Five Year | | Ten Year | |
| China Region Fund | | | (6.97 | )% | | | 10.68 | % | | | 5.33 | % | | | 9.27 | % | |
| Hang Seng Composite Index* | | | (1.93 | )% | | | 13.54 | % | | | 7.83 | % | | | 7.58 | % | |
MSCI All Country Far East Free ex
Japan Index* | | | 1.13 | % | | | 25.03 | % | | | 8.62 | % | | | 10.77 | % | |
* These are not total returns. These returns reflect simple appreciation only and do not reflect dividend reinvestment.
Performance data quoted above is historical. Past performance is no guarantee of future results. Current performance may be higher or lower than the performance data quoted. Investment return and principal value of an investment will fluctuate so that an investor's shares, when redeemed, may be worth more or less than their original cost. The graph and table do not reflect the deduction of taxes that a shareholder would pay on fund distributions or the redemption of fund shares. Returns for periods less than one year are not annualized.
Pursuant to a voluntary arrangement, the Adviser has agreed to limit total fund operating expenses (exclusive of acquired fund fees and expenses, extraordinary expenses, taxes, brokerage commissions and interest, and advisory fee performance adjustments, if any) to not exceed 2.55%. The Adviser can modify or terminate this arrangement at any time.
See Definitions for Management Teams' Perspectives for index definitions.
Please visit our website at www.usfunds.com for updated performance information for different time periods.
66
China Region Fund
THE SIX-MONTH PERIOD IN REVIEW – ECONOMIC AND POLITICAL ISSUES THAT AFFECTED THE FUND
During the first six months of 2011, China continued its monetary tightening policy in an effort to control inflation at the expense of economic growth. The People's Bank of China (PBOC) raised the required reserve ratio (RRR) every month for the first six months, and the RRR is now at 21.5 percent for major banks. The PBOC also raised interest rates three times this year, 25 basis points each time, with the one-year deposit rate reaching 3.5 percent. In spite of these efforts, China's inflation rose to a three-year high at 6.4 percent in June.
However, due to the tightening monetary policy, the Chinese economy is showing signs of a slowdown. The Purchasing Managers' Index (PMI) hit a 28-month low at 50.9 in June this year, though industrial production continues expanding.
China has delivered better-than-expected GDP growth for the first two quarters, 9.7 percent and 9.5 percent for the first and second quarters, respectively.
Fixed asset investment (FAI) continued to show strength, growing 25.6 percent for the first half of the year. With more affordable housing projects, including 10 million units planned for construction this year, FAI is expected to continue its high growth. Export year-over-year growth in June was 17.9 percent, declining for the prior four months.
One of the bright spots is China's consumer consumption—retail sales increased 16.9 and 17.1 percent for May and June, respectively. Money supply (M2) was slower compared with money supply during the same period in 2010. On average, M2 growth this year has been maintained around 16 percent, a target of the PBOC.
Credit supply is targeted to a new loan limit from Rmb 6.5 to 7.5 trillion, which is below or at last year's total lending. For the first half, banks' lending has been at target levels.
The performance of the various sectors in the Hang Seng Composite Index (HSCI), the fund's benchmark, was mixed, with utilities, information technology, energy and services increasing, and the rest declining. The index was down 1.93 percent (simple price appreciation basis), with utilities as the best performing sector, up 8.97 percent, and industrial goods the worst performer, down 15.94 percent.
67
China Region Fund
INVESTMENT HIGHLIGHTS
Overview
The fund decreased 6.97 percent for the six months ended June 30, 2011, compared to a near flat return (-0.17 percent) for the HSCI (total return basis).
Because the fund is actively managed and a holding period is generally not a consideration in investment decisions, the portfolio turnover rate may fluctuate from year to year as the fund adjusts its portfolio composition. Its annual portfolio turnover was, and is expected to continue to be, more than 100 percent.
Strengths
• Allocations to Indonesia and South Korea provided positive contribution to the fund. On a company-specific level, positive contributors to performance from Indonesia included PT Astra International Tbk(2) and Bank Mandiri Tbk PT.(3) In South Korea, Hyundai Motor Co.(4) was the best contributor.
• The information technology sector was the second-best performer among HSCI Index sectors. Sina Corp.(5) was the best contributor to fund performance in this sector. Sina Corp., a Chinese web services company, is best known for its Twitter-like social networking platform called Weibo. The company benefited from its potential in monetizing its Weibo user base of more than 140 million people.
• Two strong contributors to performance, Macau gaming operator Wynn Macau Ltd.(6) and high end vehicle manufacturer and distributor Brilliance China Automotive Holdings Ltd.,(6) were related to China's increasing demand for tourism and luxury goods.
Weaknesses
• Industrial goods and materials were the two worst performers among the sectors in the HSCI, down 15.94 and 12.76 percent, respectively. This was because the market was worried about a possible hard economic landing in China. The fund's industrial goods and material stocks, which were the fund's largest allocations, also underperformed, which negatively impacted the fund's performance compared to the benchmark.
CURRENT OUTLOOK
Opportunities
• China is set to build 10 million units of affordable houses this year, most of which will most likely start in the second half. China plans to build 36 million
68
China Region Fund
units in next five years for their low-income population. This construction will drive demand for building materials, furniture and home appliances.
• The rise in interest rates has helped widen net interest margins for China's large banks. Also, due to today's depressed prices, banks also have historically low valuations, providing an attractive entry point.
• China is expected to invest in a water system and agriculture infrastructures in the aftermath of drought and flood in the spring and the summer this year.
• China is in the process of an economic structural change in which emphasis will be focused on consumer consumption, Rmb appreciation and internationalization, and industrial value chain enhancement. Opportunities should arise from companies that are the leaders in related sectors.
Threats
• In the near term, inflation remains a concern. China reiterated after its release of second quarter economic statistics that the government will continue its current tightening monetary policy, which will help control inflation but will sacrifice, to a certain extent, economic growth.
• The economic state of the G-3 (Europe, United States and Japan) is still key as a meaningful slowdown in any of these trade partners could impact exports.
(1)The China region is defined as any country that either shares a border with China or is located in the South China Sea or the East China Sea and includes: the People's Republic of China (PRC or China), Bangladesh, Hong Kong, India, Indonesia, Kazakhstan, Korea, Kyrgyzstan, Laos, Malaysia, Mongolia, Nepal, Pakistan, Philippines, Singapore, Taiwan, Tajikistan, Thailand and Vietnam.
(2)This security comprised 1.31 percent of the fund's total net assets as of 06/30/11.
(3)This security comprised 2.88 percent of the fund's total net assets as of 06/30/11.
(4)This security comprised 2.14 percent of the fund's total net assets as of 06/30/11.
(5)This security comprised 3.09 percent of the fund's total net assets as of 06/30/11.
(6)The fund did not hold this security as of 06/30/11.
69
China Region Fund
Top 10 Holdings Based on Net Assets
(excluding repurchase agreement) June 30, 2011
Sina Corp.
Web Portals/Internet Service Providers | | | 3.09 | % | |
Agricultural Bank of China Ltd.
Commercial Banks - Non US | | | 3.06 | % | |
Bank Mandiri Tbk PT
Commercial Banks - Non US | | | 2.88 | % | |
POSCO Chemtech Co., Ltd.
Advanced Materials/Products | | | 2.37 | % | |
CNOOC Ltd.
Oil Companies - Exploration & Production | | | 2.36 | % | |
PetroChina Co., Ltd.
Oil Companies - Integrated | | | 2.34 | % | |
China State Construction International Holdings Ltd.
Building & Construction | | | 2.26 | % | |
Baidu, Inc.
Web Portals/Internet Service Providers | | | 2.23 | % | |
SJM Holdings Ltd.
Casino Hotels | | | 2.20 | % | |
Hyundai Motor Co.
Automotive - Cars & Light Trucks | | | 2.14 | % | |
| TOTAL TOP TEN HOLDINGS | | | 24.93 | % | |
Country Distribution*
Based on Total Investments June 30, 2011
(excluding repurchase agreement)
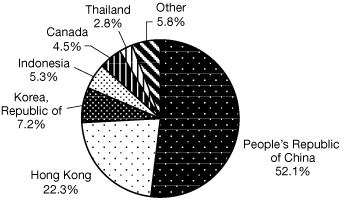
* Country distribution shown is based on domicile and not intended to conform to the China region definition in the prospectus. The locale of company operations may be different.
70
Expense Example (unaudited) June 30, 2011
As a shareholder of the funds, you incur two types of costs: (1) transaction costs, including short-term trading fees and exchange fees; and (2) ongoing costs, including management fees and other fund expenses. This example is intended to help you understand your ongoing costs (in dollars) of investing in other mutual funds.
The example is based on an investment of $1,000 invested at the beginning of the period and held for the entire period as indicated below.
• Actual Expenses. The first line of the following table for each fund provides information about actual account values and actual expenses. You may use the information in this line, together with the amount you invested, to estimate the expenses you paid over the period. Simply divide your account value by $1,000 (for example, an $8,600 account value divided by $1,000 = 8.6), then multiply the result by the number in the first line under the heading "Expenses Paid During Period" to estimate the expenses you paid on your account during this period.
• Hypothetical Example for Comparison Purposes. The second line of the following table for each fund provides information about hypothetical account values and hypothetical expenses based on the fund's actual expense ratio and an assumed rate of return of 5 percent per year before expenses, which is not the fund's actual return. The hypothetical account values and expenses may not be used to estimate the actual ending account balance or expenses you paid for the period. You may use this information to compare the ongoing costs of investing in these funds and other funds. To do so, compare this 5 percent hypothetical example with the 5 percent hypothetical examples that appear in the shareholder reports of other funds.
Please note that the expenses shown in the table are meant to highlight your ongoing costs only and do not reflect any direct or transactional costs, such as small account, exchange or short-term trading fees. Therefore, the second line of the table is useful in comparing ongoing costs only, and will not help you determine the relative total costs of owning different funds. In addition, if these direct or transactional costs were included, your costs would have been higher.
71
Expense Example (unaudited) June 30, 2011
| Six Months Ended June 30, 2011 | | Beginning
Account Value
January 1,
2011 | | Ending
Account Value
June 30,
2011 | | Expenses
Paid During
Period* | |
| U.S. Treasury Securities Cash Fund | |
| Based on Actual Fund Return | | $ | 1,000.00 | | | $ | 1,000.00 | | | $ | 0.45 | | |
| Based on Hypothetical 5% Yearly Return | | $ | 1,000.00 | | | $ | 1,024.35 | | | $ | 0.45 | | |
| U.S. Government Securities Savings Fund | |
| Based on Actual Fund Return | | $ | 1,000.00 | | | $ | 1,000.00 | | | $ | 0.40 | | |
| Based on Hypothetical 5% Yearly Return | | $ | 1,000.00 | | | $ | 1,024.40 | | | $ | 0.40 | | |
| Near-Term Tax Free Fund | |
| Based on Actual Fund Return | | $ | 1,000.00 | | | $ | 1,021.80 | | | $ | 2.26 | | |
| Based on Hypothetical 5% Yearly Return | | $ | 1,000.00 | | | $ | 1,022.56 | | | $ | 2.26 | | |
| Tax Free Fund | |
| Based on Actual Fund Return | | $ | 1,000.00 | | | $ | 1,041.70 | | | $ | 3.54 | | |
| Based on Hypothetical 5% Yearly Return | | $ | 1,000.00 | | | $ | 1,021.32 | | | $ | 3.51 | | |
| All American Equity Fund | |
| Based on Actual Fund Return | | $ | 1,000.00 | | | $ | 1,055.50 | | | $ | 11.21 | | |
| Based on Hypothetical 5% Yearly Return | | $ | 1,000.00 | | | $ | 1,013.88 | | | $ | 10.99 | | |
| Holmes Growth Fund | |
| Based on Actual Fund Return | | $ | 1,000.00 | | | $ | 1,076.10 | | | $ | 10.66 | | |
| Based on Hypothetical 5% Yearly Return | | $ | 1,000.00 | | | $ | 1,014.53 | | | $ | 10.34 | | |
| Global MegaTrends Fund Investor Class | |
| Based on Actual Fund Return | | $ | 1,000.00 | | | $ | 998.90 | | | $ | 10.85 | | |
| Based on Hypothetical 5% Yearly Return | | $ | 1,000.00 | | | $ | 1,013.93 | | | $ | 10.94 | | |
Global MegaTrends Fund Institutional
Class | |
| Based on Actual Fund Return | | $ | 1,000.00 | | | $ | 1,001.10 | | | $ | 8.93 | | |
| Based on Hypothetical 5% Yearly Return | | $ | 1,000.00 | | | $ | 1,015.87 | | | $ | 9.00 | | |
| Global Resources Fund Investor Class | |
| Based on Actual Fund Return | | $ | 1,000.00 | | | $ | 980.70 | | | $ | 8.40 | | |
| Based on Hypothetical 5% Yearly Return | | $ | 1,000.00 | | | $ | 1,016.31 | | | $ | 8.55 | | |
| Global Resources Fund Institutional Class | |
| Based on Actual Fund Return | | $ | 1,000.00 | | | $ | 983.30 | | | $ | 5.41 | | |
| Based on Hypothetical 5% Yearly Return | | $ | 1,000.00 | | | $ | 1,019.34 | | | $ | 5.51 | | |
World Precious Minerals Fund Investor
Class | |
| Based on Actual Fund Return | | $ | 1,000.00 | | | $ | 820.00 | | | $ | 8.12 | | |
| Based on Hypothetical 5% Yearly Return | | $ | 1,000.00 | | | $ | 1,015.87 | | | $ | 9.00 | | |
World Precious Minerals Fund
Institutional Class | |
| Based on Actual Fund Return | | $ | 1,000.00 | | | $ | 821.90 | | | $ | 5.29 | | |
| Based on Hypothetical 5% Yearly Return | | $ | 1,000.00 | | | $ | 1,018.99 | | | $ | 5.86 | | |
| Gold and Precious Metals Fund | |
| Based on Actual Fund Return | | $ | 1,000.00 | | | $ | 845.90 | | | $ | 7.60 | | |
| Based on Hypothetical 5% Yearly Return | | $ | 1,000.00 | | | $ | 1,016.56 | | | $ | 8.30 | | |
| Eastern European Fund | |
| Based on Actual Fund Return | | $ | 1,000.00 | | | $ | 1,004.60 | | | $ | 9.74 | | |
| Based on Hypothetical 5% Yearly Return | | $ | 1,000.00 | | | $ | 1,015.08 | | | $ | 9.79 | | |
72
Expense Example (unaudited) June 30, 2011
| Six Months Ended June 30, 2011 | | Beginning
Account Value
January 1,
2011 | | Ending
Account Value
June 30,
2011 | | Expenses
Paid During
Period* | |
| Global Emerging Markets Fund | |
| Based on Actual Fund Return | | $ | 1,000.00 | | | $ | 968.40 | | | $ | 14.74 | | |
| Based on Hypothetical 5% Yearly Return | | $ | 1,000.00 | | | $ | 1,009.82 | | | $ | 15.05 | | |
| China Region Fund | |
| Based on Actual Fund Return | | $ | 1,000.00 | | | $ | 930.30 | | | $ | 11.58 | | |
| Based on Hypothetical 5% Yearly Return | | $ | 1,000.00 | | | $ | 1,012.79 | | | $ | 12.08 | | |
* These calculations are based on expenses incurred in the most recent fiscal half-year. The funds' Investor Classes' annualized expense ratios (after reimbursements and offsets) for the six-month period ended June 30, 2011, were 0.09%, 0.08%, 0.45%, 0.70%, 2.20%, 2.07%, 2.19%, 1.71%, 1.80%, 1.66%, 1.96%, 3.02% and 2.42%, respectively, for the U.S. Treasury Securities Cash, U.S. Government Securities Savings, Near-Term Tax Free, Tax Free, All American Equity, Holmes Growth, Global MegaTrends, Global Resources, World Precious Minerals, Gold and Precious Metals, Eastern European, Global Emerging Markets and China Region Funds. The funds' Institutional Class's annualized expense ratios (after reimbursements and offsets) for the six-month period ended June 30, 2011, were 1.80%, 1.10% and 1.17%, respectively, for the Global MegaTrends, Global Resources and World Precious Minerals Funds. The dollar amounts shown as "Expenses Paid" are equal to the annualized expense ratio multiplied by the average account value over the period, multiplied by 181, the number of days in the period, then divided by 365 days in the current fiscal year.
73
Portfolio of Investments (unaudited) June 30, 2011
U.S. TREASURY SECURITIES CASH FUND
UNITED STATES
GOVERNMENT
OBLIGATIONS 31.25% | | Coupon
Rate | | Maturity
Date | | Principal
Amount | | Value | |
| United States Treasury Bills 31.25% | |
| Yield | | | 0.05 | % | | 07/14/11 | | $ | 10,000,000 | | | $ | 9,999,837 | | |
| Yield | | | 0.06 | % | | 07/21/11 | | | 20,000,000 | | | | 19,999,389 | | |
| Total United States Government Obligations | | | 29,999,226 | | |
| (cost $29,999,226) | |
REPURCHASE AGREEMENTS 49.28%
Joint Tri-Party Repurchase Agreements,
06/30/11, collateralized by U.S. Treasury
securities held in joint tri-party
repurchase accounts: | |
0.01% Credit Suisse Securities USA LLC,
repurchase price $23,509,043 | | | 0.01 | % | | 07/01/11 | | | 23,509,036 | | | | 23,509,036 | | |
0.00% Morgan Stanley, repurchase price
$23,800,000 | | | 0.00 | % | | 07/01/11 | | | 23,800,000 | | | | 23,800,000 | | |
| Total Repurchase Agreements | | | 47,309,036 | | |
| (cost $47,309,036) | |
| Total Investments 80.53% | | | 77,308,262 | | |
| (cost $77,308,262) | |
| Other assets and liabilities, net 19.47% | | | 18,691,908 | | |
| NET ASSETS 100% | | $ | 96,000,170 | | |
See notes to portfolios of investments and notes to financial statements.
74
Portfolio of Investments (unaudited) June 30, 2011
U.S. GOVERNMENT SECURITIES SAVINGS FUND
UNITED STATES
GOVERNMENT AND AGENCY
OBLIGATIONS 74.16% | | Coupon
Rate | | Maturity
Date | | Principal
Amount | | Value | |
| Federal Farm Credit Bank 53.63% | | | |
| Discount Notes: | |
| | Yield | | | | 0.01 | % | | 07/01/11 | | $ | 50,000,000 | | | $ | 50,000,000 | | |
| | Yield | | | | 0.03 | % | | 07/08/11 | | | 20,000,000 | | | | 19,999,884 | | |
| | Yield | | | | 0.22 | % | | 07/13/11 | | | 2,000,000 | | | | 1,999,853 | | |
| Fixed Rates: | |
| | | | | | 3.50 | % | | 10/03/11 | | | 4,000,000 | | | | 4,034,480 | | |
| | | | | | 4.30 | % | | 11/23/11 | | | 1,000,000 | | | | 1,016,474 | | |
| Variable Rates: | |
| | | | | | 0.26 | % | | 07/01/11 | | | 7,000,000 | | | | 7,000,000 | | |
| | | | | | 0.19 | % | | 10/07/11 | | | 3,200,000 | | | | 3,200,352 | | |
| | | | | | 0.14 | % | | 10/26/11 | | | 5,000,000 | | | | 5,000,000 | | |
| | | | | | 0.13 | % | | 11/23/11 | | | 4,000,000 | | | | 4,000,181 | | |
| | | | | | 0.13 | % | | 12/07/11 | | | 1,100,000 | | | | 1,099,762 | | |
| | | | | | 0.20 | % | | 02/13/12 | | | 3,950,000 | | | | 3,951,740 | | |
| | | | 101,302,726 | | |
| Federal Home Loan Bank 20.53% | | | |
| Discount Notes: | |
| | Yield | | | | 0.06 | % | | 07/01/11 | | | 10,000,000 | | | | 10,000,000 | | |
| | Yield | | | | 0.07 | % | | 07/06/11 | | | 10,000,000 | | | | 9,999,903 | | |
| | Yield | | | | 0.07 | % | | 07/13/11 | | | 5,000,000 | | | | 4,999,883 | | |
| Fixed Rates: | |
| | | | | | 3.63 | % | | 07/01/11 | | | 1,750,000 | | | | 1,750,000 | | |
| | | | | | 1.38 | % | | 06/08/12 | | | 2,000,000 | | | | 2,020,947 | | |
| Variable Rates: | |
| | | | | | 0.19 | % | | 07/22/11 | | | 5,000,000 | | | | 5,000,000 | | |
| | | | | | 0.11 | % | | 09/09/11 | | | 5,000,000 | | | | 4,999,417 | | |
| | | | 38,770,150 | | |
| Total Investments 74.16% | | | 140,072,876 | | |
| (cost $140,072,876) | |
| Other assets and liabilities, net 25.84% | | | 48,813,536 | | |
| NET ASSETS 100% | | $ | 188,886,412 | | |
See notes to portfolios of investments and notes to financial statements.
75
Portfolio of Investments (unaudited) June 30, 2011
NEAR-TERM TAX FREE FUND
| MUNICIPAL BONDS 88.64% | | Coupon
Rate | | Maturity
Date | | Principal
Amount | | Value | |
| Alabama 4.31% | |
| Alabama State Public School & College Authority | | | 5.00 | % | | 12/01/16 | | $ | 290,000 | | | $ | 341,988 | | |
| Bessemer, Alabama Water Revenue | | | 4.00 | % | | 01/01/16 | | | 300,000 | | | | 300,366 | | |
Jasper Alabama Water Works & Sewer Board,
Inc., Utilities Revenue, Series A | | | 3.00 | % | | 06/01/15 | | | 90,000 | | | | 93,087 | | |
Jasper Alabama Water Works & Sewer Board,
Inc., Utilities Revenue, Series A | | | 3.00 | % | | 06/01/16 | | | 90,000 | | | | 92,441 | | |
Mountain Brook City Board of Education Capital
Outlay | | | 4.00 | % | | 02/15/15 | | | 200,000 | | | | 217,570 | | |
University of Alabama at Birmingham, Hospital
Revenue, Series A | | | 5.00 | % | | 09/01/15 | | | 300,000 | | | | 326,433 | | |
| | | | 1,371,885 | | |
| Alaska 1.02% | |
| Alaska Municipal Bond Bank Authority, Series A | | | 4.00 | % | | 02/01/16 | | | 300,000 | | | | 325,527 | | |
| Arizona 4.23% | |
Arizona Board Regents Certificates of
Participation, Series B | | | 4.50 | % | | 06/01/16 | | | 200,000 | | | | 217,960 | | |
Arizona Health Facilities Authority Revenues,
Series D | | | 5.00 | % | | 01/01/14 | | | 250,000 | | | | 269,745 | | |
Arizona School Facilities Board Certificates,
Series A-1 | | | 5.00 | % | | 09/01/17 | | | 325,000 | | | | 345,225 | | |
Arizona State Transportation Board Excise Tax
Revenue | | | 5.00 | % | | 07/01/17 | | | 175,000 | | | | 203,728 | | |
Pima County Unified School District, GO
Unlimited, Refunding | | | 3.70 | % | | 07/01/12 | | | 300,000 | | | | 308,619 | | |
| | | | 1,345,277 | | |
| California 2.66% | |
California State, Refunding, Recreational Facility,
GO Unlimited | | | 5.00 | % | | 12/01/19 | | | 250,000 | | | | 265,513 | | |
San Diego, California Community College District,
Capital Appreciation, Election 2002, GO
Unlimited (ZCB) | | | 4.34 | %(1) | | 05/01/15 | | | 300,000 | | | | 271,815 | | |
Vernon, California Electric Systems Revenue,
Series A | | | 3.75 | % | | 08/01/13 | | | 300,000 | | | | 309,723 | | |
| | | | 847,051 | | |
| Connecticut 1.48% | |
| Connecticut State, Series D, GO Unlimited | | | 5.38 | % | | 11/15/18 | | | 250,000 | | | | 267,398 | | |
| Connecticut State, Series E, GO Unlimited | | | 5.13 | % | | 11/15/14 | | | 200,000 | | | | 203,270 | | |
| | | | 470,668 | | |
See notes to portfolios of investments and notes to financial statements.
76
Portfolio of Investments (unaudited) June 30, 2011
NEAR-TERM TAX FREE FUND
| MUNICIPAL BONDS | | Coupon
Rate | | Maturity
Date | | Principal
Amount | | Value | |
| District of Columbia 2.07% | |
| District of Columbia Certifications of Participation | | | 4.00 | % | | 01/01/14 | | $ | 250,000 | | | $ | 263,688 | | |
Washington D.C. Convention Center Authority
Dedicated Tax Revenue, Refunding, Series A | | | 5.00 | % | | 10/01/13 | | | 110,000 | | | | 117,478 | | |
Washington D.C. Convention Center Authority
Dedicated Tax Revenue, Refunding, Series A | | | 5.00 | % | | 10/01/16 | | | 250,000 | | | | 277,632 | | |
| | | | 658,798 | | |
| Florida 11.00% | |
Broward County, Florida School Board Certificates
of Participation, Series A | | | 5.00 | % | | 07/01/15 | | | 325,000 | | | | 356,291 | | |
| Cape Coral, Florida Gas Tax Revenue, Series A | | | 4.00 | % | | 10/01/16 | | | 255,000 | | | | 265,628 | | |
Florida Gulf Coast University Financing Corp.,
Florida Capital Improvement Revenue, Series B | | | 3.00 | % | | 02/01/16 | | | 365,000 | | | | 373,942 | | |
Florida State Board of Education Lottery Revenue,
Series A | | | 4.00 | % | | 07/01/14 | | | 300,000 | | | | 321,822 | | |
Florida State Board of Governors Parking Facilities
Revenue, Series A | | | 3.00 | % | | 07/01/17 | | | 300,000 | | | | 312,876 | | |
| Fort Pierce, Florida Stormwater Utilities Revenue | | | 4.50 | % | | 10/01/17 | | | 255,000 | | | | 265,152 | | |
Hillsborough Country Florida Community
Investment Tax Revenue | | | 4.00 | % | | 05/01/16 | | | 300,000 | | | | 318,222 | | |
Lake County, Florida School Board Certificates of
Participation, Series A | | | 3.70 | % | | 06/01/15 | | | 400,000 | | | | 413,364 | | |
Miami - Dade County, Florida Water & Sewer
Revenue System, Series A | | | 4.00 | % | | 10/01/16 | | | 235,000 | | | | 257,635 | | |
Orange County, Florida Tourist Development Tax
Revenue, Refunding | | | 5.00 | % | | 10/01/14 | | | 260,000 | | | | 285,431 | | |
Reedy Creek, Florida Improvement District
Utilities Revenue, Refunding, Series 2 | | | 5.00 | % | | 10/01/16 | | | 300,000 | | | | 331,485 | | |
| | | | 3,501,848 | | |
| Georgia 3.02% | |
| Atlanta Downtown Development Authority | | | 4.25 | % | | 12/01/16 | | | 250,000 | | | | 272,597 | | |
Atlanta, Georgia Water & Wastewater Revenue,
Series B | | | 3.50 | % | | 11/01/13 | | | 400,000 | | | | 420,508 | | |
Emanuel County Georgia Hospital Authority
Revenue Anticipation Certificates | | | 4.30 | % | | 07/01/17 | | | 250,000 | | | | 266,915 | | |
| | | | 960,020 | | |
| Illinois 13.16% | |
| Aurora, Illinois, Series B, GO Unlimited | | | 3.00 | % | | 12/30/15 | | | 200,000 | | | | 207,576 | | |
Chicago Board of Education, Dedicated
Revenues, Series F, GO Unlimited | | | 5.00 | % | | 12/01/16 | | | 300,000 | | | | 332,238 | | |
| Chicago Board of Education, Series A | | | 5.25 | % | | 12/01/13 | | | 250,000 | | | | 265,815 | | |
| Chicago, Illinois Sales Tax Revenue | | | 5.50 | % | | 01/01/15 | | | 350,000 | | | | 391,930 | | |
Chicago, Illinois, Direct Access Bond,
Series E-1 B, GO Unlimited | | | 4.00 | % | | 01/01/19 | | | 200,000 | | | | 204,362 | | |
| Chicago, Illinois, Unrefunded Balance, Series B | | | 5.13 | % | | 01/01/15 | | | 325,000 | | | | 350,292 | | |
See notes to portfolios of investments and notes to financial statements.
77
Portfolio of Investments (unaudited) June 30, 2011
NEAR-TERM TAX FREE FUND
| MUNICIPAL BONDS | | Coupon
Rate | | Maturity
Date | | Principal
Amount | | Value | |
| Illinois (Cont'd) | |
| Dundee Township, GO Unlimited | | | 5.00 | % | | 12/01/13 | | $ | 240,000 | | | $ | 259,214 | | |
| Illinois Finance Authority Revenue, Refunding | | | 5.00 | % | | 07/01/16 | | | 390,000 | | | | 423,220 | | |
| Illinois State Sales Tax Revenue | | | 5.00 | % | | 06/15/14 | | | 200,000 | | | | 218,858 | | |
Illinois State Toll Highway Authority, Toll Highway
Revenue, Series A | | | 5.00 | % | | 01/01/16 | | | 200,000 | | | | 220,294 | | |
| Illinois State, Refunding, GO Unlimited | | | 5.00 | % | | 01/01/16 | | | 300,000 | | | | 327,114 | | |
| Metropolitan Pier & Exposition Authority | | | 5.38 | % | | 06/01/15 | | | 280,000 | | | | 295,288 | | |
State of Illinois, First Series, Refunding, GO
Unlimited | | | 5.50 | % | | 08/01/19 | | | 300,000 | | | | 306,681 | | |
Winnebago County Public Safety Sales Tax,
Series A, GO Unlimited | | | 5.00 | % | | 12/30/16 | | | 350,000 | | | | 384,510 | | |
| | | | 4,187,392 | | |
| Indiana 3.55% | |
| Hamilton Heights Independent School | | | 5.25 | % | | 07/15/11 | | | 195,000 | | | | 195,238 | | |
Indiana State Finance Authority Revenue,
Refunding | | | 4.00 | % | | 05/01/12 | | | 350,000 | | | | 359,653 | | |
Noblesville Independent Redevelopment
Authority Lease Rent Revenue | | | 5.00 | % | | 01/15/24 | | | 250,000 | | | | 252,797 | | |
Tippecanoe County, Indiana School
Improvements | | | 4.00 | % | | 01/15/15 | | | 300,000 | | | | 323,724 | | |
| | | | 1,131,412 | | |
| Iowa 1.62% | |
| Ames, Iowa Hospital Revenue, Refunding | | | 5.00 | % | | 06/15/15 | | | 300,000 | | | | 303,306 | | |
Johnston Community School District, GO
Unlimited | | | 4.00 | % | | 06/01/16 | | | 200,000 | | | | 213,932 | | |
| | | | 517,238 | | |
| Kansas 0.70% | |
Kansas State Development Finance Authority
Revenue | | | 4.00 | % | | 10/01/15 | | | 200,000 | | | | 222,008 | | |
| Kentucky 0.97% | |
Louisville & Jefferson County Metropolitan
Sewer District & Drain Systems, Series A | | | 5.50 | % | | 05/15/15 | | | 300,000 | | | | 307,569 | | |
| Massachusetts 1.91% | |
New Bedford, Massachusetts, State Qualified
Municipal Loan, GO Limited | | | 3.00 | % | | 03/01/15 | | | 345,000 | | | | 363,826 | | |
Stoughton, Massachusetts Public Improvement,
GO Limited | | | 4.00 | % | | 05/01/17 | | | 225,000 | | | | 244,492 | | |
| | | | 608,318 | | |
See notes to portfolios of investments and notes to financial statements.
78
Portfolio of Investments (unaudited) June 30, 2011
NEAR-TERM TAX FREE FUND
| MUNICIPAL BONDS | | Coupon
Rate | | Maturity
Date | | Principal
Amount | | Value | |
| Michigan 3.89% | |
Detroit, Michigan Sewer Disposal Revenue,
Refunding, Series C-1 | | | 5.25 | % | | 07/01/15 | | $ | 400,000 | | | $ | 440,208 | | |
Michigan State Building Authority Revenue,
Refunding, Series I | | | 5.25 | % | | 10/15/14 | | | 300,000 | | | | 328,248 | | |
| Michigan State Grant Anticipation Bonds | | | 5.00 | % | | 09/15/16 | | | 200,000 | | | | 227,116 | | |
Michigan State Hospital Finance Authority
Revenue, Trinity Health, Series A | | | 6.00 | % | | 12/01/18 | | | 200,000 | | | | 242,368 | | |
| | | | 1,237,940 | | |
| Minnesota 0.85% | |
Minneapolis & St Paul, Minnesota Housing &
Redevelopment Authority Health Care
Systems, Children's Health Care, Series B | | | 4.00 | % | | 08/15/16 | | | 250,000 | | | | 270,495 | | |
| Missouri 0.70% | |
Missouri State Health & Educational Facilities
Authority Revenue, Series A | | | 6.75 | % | | 05/15/13 | | | 200,000 | | | | 222,774 | | |
| Nevada 1.65% | |
Clark County Nevada School District, Refunding,
Series A | | | 5.50 | % | | 06/15/16 | | | 250,000 | | | | 271,205 | | |
| Nye County School District, GO Limited | | | 4.00 | % | | 05/01/15 | | | 230,000 | | | | 253,154 | | |
| | | | 524,359 | | |
| New Hampshire 0.31% | |
New Hampshire Health & Education Facilities
Authority Revenue | | | 5.00 | % | | 07/01/14 | | | 95,000 | | | | 97,318 | | |
| New Jersey 1.39% | |
Atlantic City, New Jersey Municipal Utilities
Authority Revenue, Refunding | | | 5.00 | % | | 06/01/17 | | | 150,000 | | | | 167,318 | | |
New Jersey State Transportation Trust Fund
Authority, Series D | | | 4.00 | % | | 06/15/14 | | | 250,000 | | | | 274,362 | | |
| | | | 441,680 | | |
| New York 4.02% | |
Long Island Power Authority, New York Electric
Systems, Revenue, Series E | | | 5.00 | % | | 12/01/17 | | | 330,000 | | | | 371,801 | | |
New York State Dormitory Authority Revenues,
Nonconstruction Supported Debt, Municipal
Facilities Health Lease, Series 1 | | | 5.00 | % | | 01/15/17 | | | 300,000 | | | | 333,564 | | |
| New York, New York, Series G, GO Unlimited | | | 5.00 | % | | 08/01/12 | | | 125,000 | | | | 131,061 | | |
New York, New York, Subseries L-1, GO
Unlimited | | | 4.00 | % | | 04/01/15 | | | 300,000 | | | | 327,831 | | |
Schenectady Metroplex Development Authority
Revenue, Series A | | | 5.00 | % | | 12/15/12 | | | 110,000 | | | | 115,681 | | |
| | | | 1,279,938 | | |
See notes to portfolios of investments and notes to financial statements.
79
Portfolio of Investments (unaudited) June 30, 2011
NEAR-TERM TAX FREE FUND
| MUNICIPAL BONDS | | Coupon
Rate | | Maturity
Date | | Principal
Amount | | Value | |
| Ohio 1.14% | |
Lorain County Community College District, Ohio,
Revenue | | | 3.25 | % | | 12/01/17 | | $ | 350,000 | | | $ | 363,125 | | |
| Pennsylvania 0.63% | |
| Philadelphia, Pennsylvania, GO Unlimited | | | 4.50 | % | | 08/01/12 | | | 195,000 | | | | 202,240 | | |
| Puerto Rico 1.63% | |
| Commonwealth of Puerto Rico, GO Unlimited | | | 6.00 | % | | 07/01/13 | | | 250,000 | | | | 267,755 | | |
Commonwealth of Puerto Rico, Refunding, GO
Unlimited | | | 5.50 | % | | 07/01/11 | | | 250,000 | | | | 250,000 | | |
| | | | 517,755 | | |
| Rhode Island 0.87% | |
Rhode Island State Economic Development
Corporation Revenue, Series A | | | 5.00 | % | | 06/15/17 | | | 250,000 | | | | 276,308 | | |
| South Carolina 2.17% | |
| Jasper County School District, GO Unlimited | | | 4.00 | % | | 03/01/15 | | | 195,000 | | | | 213,866 | | |
| Piedmont Municipal Power Agency | | | 5.00 | % | | 01/01/16 | | | 150,000 | | | | 167,916 | | |
| Spartanburg County School District | | | 3.88 | % | | 04/01/12 | | | 300,000 | | | | 307,518 | | |
| | | | 689,300 | | |
| Tennessee 0.94% | |
Metropolitan Government of Nashville &
Davidson County, Water & Sewer Revenue | | | 6.50 | % | | 12/01/14 | | | 250,000 | | | | 298,390 | | |
| Texas 10.76% | |
Addison, Texas Certificates of Obligation, GO
Unlimited | | | 4.00 | % | | 02/15/20 | | | 250,000 | | | | 264,265 | | |
Annetta, Texas Certificates of Obligation, GO
Limited | | | 4.00 | % | | 08/01/16 | | | 200,000 | | | | 206,576 | | |
Grand Prairie Independent School District,
Refunding, GO Unlimited (ZCB) | | | 3.92 | %(1) | | 08/15/16 | | | 400,000 | | | | 346,684 | | |
Houston, Texas, Public Improvement, Refunding,
GO Limited, Series A | | | 5.38 | % | | 03/01/16 | | | 180,000 | | | | 200,513 | | |
Katy, Texas Independent School District, School
Building, Series D, GO Unlimited | | | 4.50 | % | | 02/15/19 | | | 325,000 | | | | 355,937 | | |
Lewisville, Texas Independent School District, GO
Unlimited, Refunding (ZCB) | | | 4.04 | %(1) | | 08/15/15 | | | 400,000 | | | | 377,256 | | |
| Lower Colorado River Authority Texas, Refunding | | | 5.25 | % | | 05/15/19 | | | 240,000 | | | | 252,801 | | |
North Texas Municipal Water District, Regional
Solid Waste Disposal Systems Revenue | | | 3.00 | % | | 09/01/12 | | | 300,000 | | | | 308,082 | | |
San Antonio, Texas Municipal Drain Utilities
Systems Revenue | | | 4.00 | % | | 02/01/16 | | | 300,000 | | | | 310,875 | | |
San Patricio, Texas Municipal Water District,
Refunding | | | 4.00 | % | | 07/10/18 | | | 200,000 | | | | 205,978 | | |
See notes to portfolios of investments and notes to financial statements.
80
Portfolio of Investments (unaudited) June 30, 2011
NEAR-TERM TAX FREE FUND
| MUNICIPAL BONDS | | Coupon
Rate | | Maturity
Date | | Principal
Amount | | Value | |
| Texas (Cont'd) | |
Texas Municipal Power Agency Revenue,
Refunding | | | 5.00 | % | | 09/01/17 | | $ | 250,000 | | | $ | 286,660 | | |
| Texas State Public Finance Authority Revenue | | | 5.00 | % | | 10/15/21 | | | 300,000 | | | | 309,648 | | |
| | | | 3,425,275 | | |
| Utah 0.99% | |
| Utah State, Refunding, Series B, GO Unlimited | | | 5.38 | % | | 07/01/12 | | | 300,000 | | | | 315,225 | | |
| Virginia 2.08% | |
Virginia College Building Authority Educational
Facilities Revenue, Prerefunded, Series A | | | 5.00 | % | | 09/01/15 | | | 10,000 | | | | 11,623 | | |
Virginia College Building Authority Educational
Facilities Revenue, Unrefunded, Series A | | | 5.00 | % | | 09/01/15 | | | 290,000 | | | | 333,999 | | |
Virginia State Public Building Authority & Public
Facilities Revenue, Refunding, Series A | | | 5.00 | % | | 08/01/12 | | | 300,000 | | | | 315,075 | | |
| | | | 660,697 | | |
| Washington 1.99% | |
Clark County, Washington School District, GO
Unlimited | | | 5.13 | % | | 12/01/11 | | | 100,000 | | | | 101,978 | | |
| Energy Northwest, Washington Electric Revenue | | | 5.00 | % | | 07/01/14 | | | 250,000 | | | | 280,213 | | |
King County, Washington School District No. 401
Highline Public Schools, GO Unlimited | | | 5.50 | % | | 12/01/13 | | | 240,000 | | | | 251,376 | | |
| | | | 633,567 | | |
| Wisconsin 0.93% | |
Chippewa Valley, Wisconsin, Technical College
District Promissory Notes, Series A, GO
Unlimited | | | 4.00 | % | | 04/01/14 | | | 250,000 | | | | 270,330 | | |
Wisconsin State, Refunding, Series 2, GO
Unlimited | | | 4.13 | % | | 11/01/16 | | | 25,000 | | | | 25,973 | | |
| | | | 296,303 | | |
| Total Investments 88.64% | | | 28,207,700 | | |
| (cost $27,324,258) | |
| Other assets and liabilities, net 11.36% | | | 3,615,196 | | |
| NET ASSETS 100% | | $ | 31,822,896 | | |
(1)Represents Yield
See notes to portfolios of investments and notes to financial statements.
81
Portfolio of Investments (unaudited) June 30, 2011
TAX FREE FUND
| MUNICIPAL BONDS 91.87% | | Coupon
Rate | | Maturity
Date | | Principal
Amount | | Value | |
| Alabama 7.00% | |
Alabama 21st Century Authority, Tobacco
Settlement Revenue | | | 5.75 | % | | 12/01/19 | | $ | 275,000 | | | $ | 279,257 | | |
| Alabama State, GO Unlimited, Series A | | | 4.63 | % | | 09/01/22 | | | 375,000 | | | | 388,477 | | |
| Bessemer, Alabama Water Revenue | | | 4.00 | % | | 01/01/16 | | | 200,000 | | | | 200,244 | | |
Mountain Brook City Board of Education Capital
Outlay | | | 4.00 | % | | 02/15/15 | | | 195,000 | | | | 212,131 | | |
University of Alabama at Birmingham, Hospital
Revenue, Series A | | | 5.00 | % | | 09/01/15 | | | 300,000 | | | | 326,433 | | |
| | | | 1,406,542 | | |
| Arizona 2.34% | |
Scottsdale Arizona Municipal Property Corp.,
Excise Tax Revenue, Refunding | | | 5.00 | % | | 07/01/26 | | | 180,000 | | | | 201,222 | | |
University of Arizona Certificates of Participation,
Series C | | | 5.00 | % | | 06/01/22 | | | 260,000 | | | | 267,878 | | |
| | | | 469,100 | | |
| California 12.53% | |
Anaheim, California City School District, Capital
Appreciation, Election 2002, GO Unlimited (ZCB) | | | 4.60 | %(1) | | 08/01/28 | | | 580,000 | | | | 186,835 | | |
| California State, GO Unlimited | | | 5.00 | % | | 03/01/32 | | | 300,000 | | | | 298,071 | | |
| California State, GO Unlimited | | | 4.75 | % | | 03/01/34 | | | 205,000 | | | | 189,039 | | |
| California State, GO Unlimited | | | 5.00 | % | | 06/01/37 | | | 455,000 | | | | 437,724 | | |
Chaffey Community College District, Series C,
GO Unlimited | | | 5.00 | % | | 06/01/32 | | | 300,000 | | | | 304,116 | | |
| Imperial Community College District, GO Unlimited | | | 5.00 | % | | 08/01/29 | | | 500,000 | | | | 509,560 | | |
Los Angeles Unified School District,
Election 2004, Series H, GO Unlimited | | | 5.00 | % | | 07/01/32 | | | 200,000 | | | | 201,232 | | |
Santa Clara Valley Transportation Authority,
Refunding, Series A | | | 5.00 | % | | 04/01/27 | | | 370,000 | | | | 388,774 | | |
| | | | 2,515,351 | | |
| Colorado 0.77% | |
| Colorado Health Facilities Authority Revenue | | | 5.00 | % | | 09/01/16 | | | 150,000 | | | | 154,872 | | |
| District of Columbia 1.64% | |
| District of Columbia Income Tax Revenue, Series A | | | 5.25 | % | | 12/01/27 | | | 300,000 | | | | 330,123 | | |
| Florida 1.53% | |
Florida Board of Education, GO Unlimited,
Refunding, Series C | | | 4.50 | % | | 06/01/28 | | | 300,000 | | | | 307,011 | | |
| Georgia 2.52% | |
| Atlanta Development Authority Revenue | | | 5.25 | % | | 07/01/22 | | | 500,000 | | | | 505,255 | | |
See notes to portfolios of investments and notes to financial statements.
82
Portfolio of Investments (unaudited) June 30, 2011
TAX FREE FUND
| MUNICIPAL BONDS | | Coupon
Rate | | Maturity
Date | | Principal
Amount | | Value | |
| Guam 1.20% | |
Guam Education Financing Foundation Certificate
of Participation, Series A | | | 4.25 | % | | 10/01/18 | | $ | 250,000 | | | $ | 240,102 | | |
| Illinois 8.95% | |
| Chicago Board of Education, GO Unlimited | | | 5.25 | % | | 12/01/19 | | | 300,000 | | | | 326,079 | | |
| Chicago, Illinois Water Revenue, Refunding | | | 5.75 | % | | 11/01/30 | | | 225,000 | | | | 249,316 | | |
| Du Page County, Refunding, GO Unlimited | | | 5.60 | % | | 01/01/21 | | | 490,000 | | | | 569,895 | | |
| Illinois Finance Authority, Refunding, Series A | | | 5.00 | % | | 10/01/14 | | | 150,000 | | | | 165,517 | | |
Illinois Regional Transportation Authority Revenue,
Series A | | | 7.20 | % | | 11/01/20 | | | 235,000 | | | | 282,348 | | |
State of Illinois, First Series, Refunding, GO
Unlimited | | | 5.50 | % | | 08/01/19 | | | 200,000 | | | | 204,454 | | |
| | | | 1,797,609 | | |
| Indiana 1.55% | |
Indianapolis Local Public Improvement Bond Bank,
Waterworks Project, Series 2007 L | | | 5.25 | % | | 01/01/33 | | | 305,000 | | | | 310,697 | | |
| Kansas 6.89% | |
Kansas State Development Finance Authority
Revenue | | | 4.00 | % | | 10/01/15 | | | 250,000 | | | | 277,510 | | |
Kansas State Development Finance Authority,
Hospital Revenue, Series Z | | | 5.00 | % | | 12/15/12 | | | 500,000 | | | | 502,475 | | |
University of Kansas Hospital Authority Health
Facilities Revenue | | | 5.63 | % | | 09/01/27 | | | 570,000 | | | | 603,944 | | |
| | | | 1,383,929 | | |
| Kentucky 1.19% | |
| Bowling Green, Kentucky, GO Unlimited, Series B | | | 4.00 | % | | 09/01/16 | | | 215,000 | | | | 239,069 | | |
| Maryland 1.49% | |
Maryland Health & Higher Educational Facilities
Authority Revenue | | | 5.75 | % | | 07/01/21 | | | 300,000 | | | | 300,000 | | |
| Massachusetts 1.60% | |
Massachusetts Bay Transportation Authority,
Massachusetts Sales Tax Revenue, Refunding,
Series A-1 | | | 5.25 | % | | 07/01/30 | | | 285,000 | | | | 321,480 | | |
| Michigan 4.83% | |
Detroit, Michigan Local Development Financing
Authority, Refunding, Series A | | | 5.38 | % | | 05/01/18 | | | 255,000 | | | | 198,474 | | |
Detroit, Michigan Water Supply System Revenue,
Series B | | | 5.00 | % | | 07/01/16 | | | 430,000 | | | | 466,026 | | |
| Macomb County Building Authority, GO Limited | | | 4.50 | % | | 11/01/23 | | | 300,000 | | | | 304,443 | | |
| | | | 968,943 | | |
See notes to portfolios of investments and notes to financial statements.
83
Portfolio of Investments (unaudited) June 30, 2011
TAX FREE FUND
| MUNICIPAL BONDS | | Coupon
Rate | | Maturity
Date | | Principal
Amount | | Value | |
| Missouri 3.36% | |
| Kansas City Water Revenue | | | 4.00 | % | | 12/01/22 | | $ | 250,000 | | | $ | 275,510 | | |
St. Louis Airport Development Program,
Prerefunded, Series A | | | 5.00 | % | | 07/01/11 | | | 165,000 | | | | 165,000 | | |
St. Louis Airport Development Program,
Unrefunded, Series A | | | 5.00 | % | | 07/01/11 | | | 235,000 | | | | 235,000 | | |
| | | | 675,510 | | |
| Nevada 1.29% | |
| Nye County School District, GO Limited | | | 4.00 | % | | 05/01/15 | | | 235,000 | | | | 258,657 | | |
| New Hampshire 2.25% | |
Manchester, New Hampshire School Facilities
Revenue, Refunding | | | 5.50 | % | | 06/01/26 | | | 300,000 | | | | 355,350 | | |
New Hampshire Health & Education Facilities
Authority Revenue | | | 5.00 | % | | 07/01/14 | | | 95,000 | | | | 97,318 | | |
| | | | 452,668 | | |
| Ohio 2.01% | |
Lorain County Community College District,
Ohio, Revenue | | | 3.25 | % | | 12/01/17 | | | 300,000 | | | | 311,250 | | |
| South Euclid Special Assessment, GO Limited Tax | | | 6.70 | % | | 12/01/14 | | | 90,000 | | | | 92,971 | | |
| | | | 404,221 | | |
| Puerto Rico 1.33% | |
| Commonwealth of Puerto Rico, GO Unlimited | | | 6.00 | % | | 07/01/13 | | | 250,000 | | | | 267,755 | | |
| Rhode Island 2.66% | |
Rhode Island State Health & Educational Building
Corporation Revenue | | | 6.50 | % | | 08/15/32 | | | 500,000 | | | | 533,170 | | |
| South Carolina 1.21% | |
South Carolina Jobs Economic Development
Authority Revenue | | | 5.00 | % | | 11/01/23 | | | 250,000 | | | | 243,260 | | |
| Tennessee 1.14% | |
Memphis, Tennessee Sanitary Sewage System
Revenue, Refunding | | | 5.00 | % | | 05/01/20 | | | 200,000 | | | | 229,284 | | |
| Texas 16.37% | |
Dallas, Texas Waterworks & Sewer Systems
Revenue, Refunding | | | 4.50 | % | | 10/01/19 | | | 225,000 | | | | 249,730 | | |
Duncanville, Texas Independent School District,
GO Unlimited, Prerefunded, Series B | | | 5.25 | % | | 02/15/32 | | | 495,000 | | | | 509,815 | | |
Duncanville, Texas Independent School District,
GO Unlimited, Unrefunded, Series B | | | 5.25 | % | | 02/15/32 | | | 5,000 | | | | 5,039 | | |
| Forney, Texas, GO Limited | | | 5.00 | % | | 02/15/27 | | | 500,000 | | | | 522,320 | | |
See notes to portfolios of investments and notes to financial statements.
84
Portfolio of Investments (unaudited) June 30, 2011
TAX FREE FUND
| MUNICIPAL BONDS | | Coupon
Rate | | Maturity
Date | | Principal
Amount | | Value | |
| Texas (Cont'd) | |
Goose Creek, Texas Independent School District
Schoolhouse, Series A | | | 5.25 | % | | 02/15/18 | | $ | 370,000 | | | $ | 431,779 | | |
Greenville, Texas Independent School District,
GO Unlimited, Refunding | | | 4.00 | % | | 08/15/17 | | | 120,000 | | | | 131,476 | | |
Laredo Independent School District Public
Facility Corp., Lease Revenue, Series F | | | 5.50 | % | | 08/01/24 | | | 100,000 | | | | 100,085 | | |
| North Texas Tollway Authority Revenue, Series F | | | 5.75 | % | | 01/01/38 | | | 250,000 | | | | 248,987 | | |
Prosper, Texas Independent School District,
Capital Appreciation, School Building, GO
Unlimited (ZCB) | | | 6.00 | %(1) | | 08/15/33 | | | 1,000,000 | | | | 325,630 | | |
San Marcos, Texas Tax & Toll Revenue, GO
Limited | | | 5.10 | % | | 08/15/27 | | | 400,000 | | | | 428,320 | | |
White Settlement, Texas Independent School
District, GO Unlimited | | | 4.13 | % | | 08/15/15 | | | 300,000 | | | | 335,328 | | |
| | | | 3,288,509 | | |
| Utah 2.87% | |
Utah State Building Ownership Authority, Lease
Revenue, Refunding, Series C | | | 5.50 | % | | 05/15/19 | | | 500,000 | | | | 575,515 | | |
| Washington 1.35% | |
Spokane County, Washington School District,
No. 81, GO Unlimited | | | 5.05 | % | | 06/01/22 | | | 255,000 | | | | 271,593 | | |
| Total Investments 91.87% | | | 18,450,225 | | |
| (cost $17,880,570) | |
| Other assets and liabilities, net 8.13% | | | 1,633,391 | | |
| NET ASSETS 100% | | $ | 20,083,616 | | |
(1)Represents Yield
See notes to portfolios of investments and notes to financial statements.
85
Portfolio of Investments (unaudited) June 30, 2011
ALL AMERICAN EQUITY FUND
| COMMON STOCKS 95.44% | | Shares | | Value | |
| Aerospace/Defense 2.10% | |
| Lockheed Martin Corp. | | | 2,300 | | | $ | 186,231 | | |
| Raytheon Co. | | | 4,000 | | | | 199,400 | | |
| | | | 385,631 | | |
| Applications Software 2.50% | |
| Check Point Software Technologies Ltd. | | | 5,000 | | | | 284,250 | * | |
| Compuware Corp. | | | 18,000 | | | | 175,680 | * | |
| | | | 459,930 | | |
| Automotive - Truck Parts & Equipment 1.13% | |
| WABCO Holdings, Inc. | | | 3,000 | | | | 207,180 | * | |
| Beverages - Non-alcoholic 3.36% | |
| The Coca-Cola Co. | | | 2,800 | | | | 188,412 | | |
| Coca-Cola Enterprises, Inc. | | | 7,500 | | | | 218,850 | | |
| Dr Pepper Snapple Group, Inc. | | | 5,000 | | | | 209,650 | | |
| | | | 616,912 | | |
| Cable/Satellite TV 1.02% | |
| DIRECTV, Class A | | | 3,700 | | | | 188,034 | * | |
| Chemicals - Diversified 1.97% | |
| Dow Chemical Co. | | | 5,000 | | | | 180,000 | | |
| PPG Industries, Inc. | | | 2,000 | | | | 181,580 | | |
| | | | 361,580 | | |
| Coatings/Paint 0.91% | |
| Sherwin-Williams Co. | | | 2,000 | | | | 167,740 | | |
| Commercial Services - Financial 0.82% | |
| MasterCard, Inc., Class A | | | 500 | | | | 150,670 | | |
| Computer Services 0.93% | |
| International Business Machines Corp. (IBM) | | | 1,000 | | | | 171,550 | | |
| Computers 1.90% | |
| Apple, Inc. | | | 500 | | | | 167,835 | * | |
| Hewlett-Packard Co. | | | 5,000 | | | | 182,000 | | |
| | | | 349,835 | | |
| Containers - Metal/Glass 2.09% | |
| Ball Corp. | | | 10,000 | | | | 384,600 | | |
See notes to portfolios of investments and notes to financial statements.
86
Portfolio of Investments (unaudited) June 30, 2011
ALL AMERICAN EQUITY FUND
| COMMON STOCKS | | Shares | | Value | |
| Containers - Paper/Plastic 1.05% | |
| Bemis Co., Inc. | | | 5,700 | | | $ | 192,546 | | |
| Cosmetics & Toiletries 2.18% | |
| Procter & Gamble Co. | | | 3,000 | | | | 190,710 | | |
| The Estee Lauder Cos., Inc., Class A | | | 2,000 | | | | 210,380 | | |
| | | | 401,090 | | |
| Data Processing/Management 1.01% | |
| Fidelity National Information Services, Inc. | | | 6,000 | | | | 184,740 | | |
| Disposable Medical Products 1.20% | |
| CR Bard, Inc. | | | 2,000 | | | | 219,720 | | |
| Diversified Banking Institutions 2.95% | |
| Citigroup, Inc. | | | 4,600 | | | | 191,544 | | |
| JPMorgan Chase & Co. | | | 4,000 | | | | 163,760 | | |
| The Goldman Sachs Group, Inc. | | | 1,400 | | | | 186,326 | | |
| | | | 541,630 | | |
| Diversified Manufacturing Operations 2.00% | |
| General Electric Co. | | | 10,000 | | | | 188,600 | | |
| Honeywell International, Inc. | | | 3,000 | | | | 178,770 | | |
| | | | 367,370 | | |
| E-Commerce/Services 1.43% | |
| Netflix, Inc. | | | 1,000 | | | | 262,690 | * | |
| Electric - Integrated 3.86% | |
| Dominion Resources, Inc. | | | 4,000 | | | | 193,080 | | |
| Entergy Corp. | | | 2,000 | | | | 136,560 | | |
| Exelon Corp. | | | 4,500 | | | | 192,780 | | |
| Public Service Enterprise Group, Inc. | | | 5,700 | | | | 186,048 | | |
| | | | 708,468 | | |
| Electric Products - Miscellaneous 1.07% | |
| Emerson Electric Co. | | | 3,500 | | | | 196,875 | | |
| Electronic Components - Semiconductors 1.51% | |
| Altera Corp. | | | 6,000 | | | | 278,100 | | |
| Electronic Measuring Instruments 0.84% | |
| Agilent Technologies, Inc. | | | 3,000 | | | | 153,330 | * | |
| Electronics - Military 1.10% | |
| L-3 Communications Holdings, Inc. | | | 2,300 | | | | 201,135 | | |
See notes to portfolios of investments and notes to financial statements.
87
Portfolio of Investments (unaudited) June 30, 2011
ALL AMERICAN EQUITY FUND
| COMMON STOCKS | | Shares | | Value | |
| Engines - Internal Combustion 1.69% | |
| Cummins, Inc. | | | 3,000 | | | $ | 310,470 | | |
| Enterprise Software/Services 3.38% | |
| Informatica Corp. | | | 5,000 | | | | 292,150 | * | |
| Oracle Corp. | | | 10,000 | | | | 329,100 | | |
| | | | 621,250 | | |
| Finance - Other Services 2.08% | |
| CME Group, Inc., Class A | | | 700 | | | | 204,113 | | |
| The NASDAQ OMX Group, Inc. | | | 7,000 | | | | 177,100 | * | |
| | | | 381,213 | | |
| Food - Miscellaneous/Diversified 1.03% | |
| Sara Lee Corp. | | | 10,000 | | | | 189,900 | | |
| Gas - Distribution 0.86% | |
| Sempra Energy | | | 3,000 | | | | 158,640 | | |
| Internet Security 1.18% | |
| VeriSign, Inc. | | | 6,500 | | | | 217,490 | | |
| Investment Management/Advisory Services 1.92% | |
| Janus Capital Group, Inc. | | | 18,000 | | | | 169,920 | * | |
| T. Rowe Price Group, Inc. | | | 3,000 | | | | 181,020 | | |
| | | | 350,940 | | |
| Machinery - Construction & Mining 1.04% | |
| Caterpillar, Inc. | | | 1,800 | | | | 191,628 | | |
| Machinery - Farm 0.90% | |
| Deere & Co. | | | 2,000 | | | | 164,900 | | |
| Medical - HMO 2.97% | |
| Aetna, Inc. | | | 5,000 | | | | 220,450 | | |
| UnitedHealth Group, Inc. | | | 2,500 | | | | 128,950 | | |
| WellPoint, Inc. | | | 2,500 | | | | 196,925 | | |
| | | | 546,325 | | |
| Multi-line Insurance 2.96% | |
| Assurant, Inc. | | | 5,000 | | | | 181,350 | | |
| Genworth Financial, Inc., Class A | | | 17,000 | | | | 174,760 | * | |
| XL Group plc, Class A | | | 8,500 | | | | 186,830 | | |
| | | | 542,940 | | |
See notes to portfolios of investments and notes to financial statements.
88
Portfolio of Investments (unaudited) June 30, 2011
ALL AMERICAN EQUITY FUND
| COMMON STOCKS | | Shares | | Value | |
| Office Automation & Equipment 0.94% | |
| Pitney Bowes, Inc. | | | 7,500 | | | $ | 172,425 | | |
| Oil - Field Services 2.78% | |
| Halliburton Co. | | | 10,000 | | | | 510,000 | | |
| Oil & Gas Drilling 2.03% | |
| Diamond Offshore Drilling, Inc. | | | 2,500 | | | | 176,025 | | |
| Noble Corp. | | | 5,000 | | | | 197,050 | | |
| | | | 373,075 | | |
| Oil Companies - Exploration & Production 4.26% | |
| Cimarex Energy Co. | | | 2,000 | | | | 179,840 | | |
| Concho Resources, Inc. | | | 2,500 | | | | 229,625 | * | |
| Denbury Resources, Inc. | | | 10,000 | | | | 200,000 | * | |
| Devon Energy Corp. | | | 2,200 | | | | 173,382 | | |
| | | | 782,847 | | |
| Oil Companies - Integrated 2.56% | |
| Exxon Mobil Corp. | | | 3,000 | | | | 244,140 | | |
| ConocoPhillips | | | 3,000 | | | | 225,570 | | |
| | | | 469,710 | | |
| Oil Field Machinery & Equipment 1.10% | |
| Cameron International Corp. | | | 4,000 | | | | 201,160 | * | |
| Paper & Related Products 1.09% | |
| MeadWestvaco Corp. | | | 6,000 | | | | 199,860 | | |
| Pharmacy Services 0.92% | |
| Medco Health Solutions, Inc. | | | 3,000 | | | | 169,560 | * | |
| Pipelines 1.04% | |
| Spectra Energy Corp. | | | 7,000 | | | | 191,870 | | |
| Property/Casualty Insurance 1.94% | |
| Chubb Corp. | | | 2,900 | | | | 181,569 | | |
| The Travelers Cos., Inc. | | | 3,000 | | | | 175,140 | | |
| | | | 356,709 | | |
| Publishing - Newspapers 1.93% | |
| Gannett Co., Inc. | | | 13,000 | | | | 186,160 | | |
| The Washington Post Co., Class B | | | 400 | | | | 167,580 | | |
| | | | 353,740 | | |
See notes to portfolios of investments and notes to financial statements.
89
Portfolio of Investments (unaudited) June 30, 2011
ALL AMERICAN EQUITY FUND
| COMMON STOCKS | | Shares | | Value | |
| Retail - Apparel/Shoe 0.89% | |
| The Gap, Inc. | | | 9,000 | | | $ | 162,900 | | |
| Retail - Auto Parts 1.12% | |
| AutoZone, Inc. | | | 700 | | | | 206,395 | * | |
| Retail - Consumer Electronics 0.98% | |
| RadioShack Corp. | | | 13,500 | | | | 179,685 | | |
| Retail - Regional Department Stores 0.95% | |
| Kohl's Corp. | | | 3,500 | | | | 175,035 | | |
| Telecommunication Equipment 1.00% | |
| Tellabs, Inc. | | | 40,000 | | | | 184,400 | | |
| Telephone - Integrated 3.22% | |
| AT&T, Inc. | | | 6,500 | | | | 204,165 | | |
| CenturyLink, Inc. | | | 4,500 | | | | 181,935 | | |
| Verizon Communications, Inc. | | | 5,500 | | | | 204,765 | | |
| | | | 590,865 | | |
| Therapeutics 1.13% | |
| Gilead Sciences, Inc. | | | 5,000 | | | | 207,050 | * | |
| Tobacco 1.19% | |
| Lorillard, Inc. | | | 2,000 | | | | 217,740 | | |
| Transportation - Rail 1.07% | |
| CSX Corp. | | | 7,500 | | | | 196,650 | | |
| Vitamins & Nutrition Products 0.78% | |
| Herbalife Ltd. | | | 2,500 | | | | 144,100 | | |
| Web Portals/Internet Service Providers 1.10% | |
| Google, Inc., Class A | | | 400 | | | | 202,552 | * | |
| Wireless Equipment 2.48% | |
| American Tower Corp., Class A | | | 3,500 | | | | 183,155 | * | |
| QUALCOMM, Inc. | | | 4,800 | | | | 272,592 | | |
| | | | 455,747 | | |
| Total Common Stocks | | | 17,531,127 | | |
| (cost $16,661,787) | |
See notes to portfolios of investments and notes to financial statements.
90
Portfolio of Investments (unaudited) June 30, 2011
ALL AMERICAN EQUITY FUND
| WARRANTS 0.84% | | Shares | | Value | |
| Diversified Banking Institutions 0.84% | |
| Bank of America Corp., Warrants (January 2019) | | | 28,000 | | | $ | 155,120 | * | |
| (cost $217,671) | |
| PURCHASED OPTION 0.00% | | Contracts | | | |
| Diversified Banking Institutions 0.00% | |
| Citigroup, Inc., Strike Price 7.50, Call, Expiration Jan. 2012 | | | 800 | | | | 800 | | |
| (premium $30,300) | |
| Total Investments 96.28% | | | 17,687,047 | | |
| (cost $16,909,758) | |
| Other assets and liabilities, net 3.72% | | | 682,612 | | |
| NET ASSETS 100% | | $ | 18,369,659 | | |
See notes to portfolios of investments and notes to financial statements.
91
Portfolio of Investments (unaudited) June 30, 2011
HOLMES GROWTH FUND
| COMMON STOCKS 89.77% | | Shares | | Value | |
| Agricultural Operations 0.06% | |
| Agriterra Ltd. | | | 500,000 | | | $ | 23,874 | * | |
| Applications Software 1.59% | |
| Check Point Software Technologies Ltd. | | | 12,000 | | | | 682,200 | * | |
| Automotive - Truck Parts & Equipment 2.42% | |
| WABCO Holdings, Inc. | | | 15,000 | | | | 1,035,900 | * | |
| Brewery 1.58% | |
| Cia de Bebidas das Americas, Sponsored ADR | | | 20,000 | | | | 674,600 | | |
| Cable/Satellite TV 1.07% | |
| DIRECTV, Class A | | | 9,000 | | | | 457,380 | * | |
| Chemicals - Diversified 2.11% | |
| EI du Pont de Nemours & Co. | | | 10,000 | | | | 540,500 | | |
| PPG Industries, Inc. | | | 4,000 | | | | 363,160 | | |
| | | | 903,660 | | |
| Chemicals - Specialty 1.62% | |
| Albemarle Corp. | | | 10,000 | | | | 692,000 | | |
| Commercial Services - Financial 1.50% | |
| MasterCard, Inc., Class A | | | 1,000 | | | | 301,340 | | |
| Wright Express Corp. | | | 6,500 | | | | 338,455 | * | |
| | | | 639,795 | | |
| Communications Software 1.83% | |
| SolarWinds, Inc. | | | 30,000 | | | | 784,200 | * | |
| Computers 1.57% | |
| Apple, Inc. | | | 2,000 | | | | 671,340 | * | |
| Consulting Services 0.85% | |
| Gartner, Inc. | | | 9,000 | | | | 362,610 | * | |
| Containers - Metal/Glass 2.25% | |
| Ball Corp. | | | 25,000 | | | | 961,500 | | |
| Cosmetics & Toiletries 1.72% | |
| The Estee Lauder Cos., Inc., Class A | | | 7,000 | | | | 736,330 | | |
| Distribution/Wholesale 1.26% | |
| WW Grainger, Inc. | | | 3,500 | | | | 537,775 | | |
See notes to portfolios of investments and notes to financial statements.
92
Portfolio of Investments (unaudited) June 30, 2011
HOLMES GROWTH FUND
| COMMON STOCKS | | Shares | | Value | |
| Diversified Banking Institutions 2.80% | |
| Citigroup, Inc. | | | 13,000 | | | $ | 541,320 | | |
| JPMorgan Chase & Co. | | | 16,000 | | | | 655,040 | | |
| | | | 1,196,360 | | |
| Diversified Manufacturing Operations 1.23% | |
| Blount International, Inc. | | | 30,000 | | | | 524,100 | * | |
| E-Commerce/Products 1.11% | |
| MercadoLibre, Inc. | | | 6,000 | | | | 476,040 | | |
| E-Commerce/Services 1.84% | |
| Netflix, Inc. | | | 3,000 | | | | 788,070 | * | |
| Electronic Components - Semiconductors 3.37% | |
| Altera Corp. | | | 17,000 | | | | 787,950 | | |
| Cavium, Inc. | | | 7,500 | | | | 326,925 | * | |
| Semtech Corp. | | | 12,000 | | | | 328,080 | * | |
| | | | 1,442,955 | | |
| Electronic Measuring Instruments 0.84% | |
| Agilent Technologies, Inc. | | | 7,000 | | | | 357,770 | * | |
| Engines - Internal Combustion 1.94% | |
| Cummins, Inc. | | | 8,000 | | | | 827,920 | | |
| Enterprise Software/Services 3.04% | |
| Open Text Corp. | | | 10,000 | | | | 640,200 | * | |
| Oracle Corp. | | | 20,000 | | | | 658,200 | | |
| | | | 1,298,400 | | |
| Finance - Commercial 1.16% | |
| IOU Financial, Inc., 144A | | | 1,500,000 | | | | 497,693 | *+ | |
| Finance - Investment Banker/Broker 0.03% | |
| Rodman & Renshaw Capital Group, Inc. | | | 10,000 | | | | 12,500 | * | |
| Footwear & Related Apparel 1.46% | |
| Wolverine World Wide, Inc. | | | 15,000 | | | | 626,250 | | |
| Gold Mining 0.39% | |
| Endeavour Mining Corp. | | | 70,000 | | | | 167,660 | * | |
| Industrial Audio & Video Products 1.14% | |
| Imax Corp. | | | 15,000 | | | | 486,450 | * | |
See notes to portfolios of investments and notes to financial statements.
93
Portfolio of Investments (unaudited) June 30, 2011
HOLMES GROWTH FUND
| COMMON STOCKS | | Shares | | Value | |
| Instruments - Controls 1.76% | |
| Sensata Technologies Holding N.V. | | | 20,000 | | | $ | 753,000 | * | |
| Investment Management/Advisory Services 1.36% | |
| Waddell & Reed Financial, Inc., Class A | | | 16,000 | | | | 581,600 | | |
| Machinery - Construction & Mining 3.23% | |
| Caterpillar, Inc. | | | 8,500 | | | | 904,910 | | |
| Joy Global, Inc. | | | 5,000 | | | | 476,200 | | |
| | | | 1,381,110 | | |
| Machinery - General Industrial 1.01% | |
| Altra Holdings, Inc. | | | 18,000 | | | | 431,820 | * | |
| Medical - Biomedical/Gene 1.32% | |
| Alexion Pharmaceuticals, Inc. | | | 12,000 | | | | 564,360 | * | |
| Medical - Drugs 2.26% | |
| Endo Pharmaceuticals Holdings, Inc. | | | 15,000 | | | | 602,550 | * | |
| Valeant Pharmaceuticals International, Inc. | | | 7,000 | | | | 363,720 | | |
| | | | 966,270 | | |
| Medical - HMO 1.48% | |
| Humana, Inc. | | | 4,000 | | | | 322,160 | | |
| UnitedHealth Group, Inc. | | | 6,000 | | | | 309,480 | | |
| | | | 631,640 | | |
| Medical - Hospitals 1.24% | |
| African Medical Investments plc | | | 1,000,000 | | | | 46,144 | * | |
| Health Management Associates, Inc., Class A | | | 45,000 | | | | 485,100 | * | |
| | | | 531,244 | | |
| Medical Instruments 1.67% | |
| Bruker Corp. | | | 35,000 | | | | 712,600 | * | |
| Metal - Copper 0.69% | |
| Southern Copper Corp. | | | 9,000 | | | | 295,830 | | |
| Oil - Field Services 3.69% | |
| Core Laboratories N.V. | | | 5,000 | | | | 557,700 | | |
| Halliburton Co. | | | 20,000 | | | | 1,020,000 | | |
| | | | 1,577,700 | | |
See notes to portfolios of investments and notes to financial statements.
94
Portfolio of Investments (unaudited) June 30, 2011
HOLMES GROWTH FUND
| COMMON STOCKS | | Shares | | Value | |
| Oil Companies - Exploration & Production 9.38% | |
| Alange Energy Corp. | | | 856,800 | | | $ | 195,444 | * | |
| Alange Energy Corp., 144A | | | 1,350,000 | | | | 307,948 | * | |
| Brigham Exploration Co. | | | 15,000 | | | | 448,950 | * | |
| Cimarex Energy Co. | | | 5,000 | | | | 449,600 | | |
| Concho Resources, Inc. | | | 8,000 | | | | 734,800 | * | |
| Continental Resources, Inc. | | | 10,000 | | | | 649,100 | * | |
| Pacific Rubiales Energy Corp. | | | 25,700 | | | | 688,833 | | |
| Pioneer Natural Resources Co. | | | 6,000 | | | | 537,420 | | |
| | | | 4,012,095 | | |
| Radio 7.68% | |
| Newfoundland Capital Corp., Ltd., Class A | | | 360,100 | | | | 3,281,952 | | |
| Real Estate Management/Services 1.06% | |
| CB Richard Ellis Group, Inc., Class A | | | 18,000 | | | | 451,980 | * | |
| Real Estate Operating/Development 0.23% | |
| Pacific Infrastructure, Inc. (RS) | | | 100,000 | | | | 100,000 | *@ | |
| Retail - Automobile 1.78% | |
| Rush Enterprises, Inc., Class A | | | 40,000 | | | | 761,200 | * | |
| Semiconductor Equipment 0.68% | |
| Veeco Instruments, Inc. | | | 6,000 | | | | 290,460 | * | |
| Telephone - Integrated 1.08% | |
| Telecomunicacoes de Sao Paulo S.A., Sponsored ADR | | | 15,500 | | | | 460,350 | | |
| Transactional Software 0.73% | |
| VeriFone Systems, Inc. | | | 7,000 | | | | 310,450 | * | |
| Vitamins & Nutrition Products 1.08% | |
| Herbalife Ltd. | | | 8,000 | | | | 461,120 | | |
| Web Hosting/Design 1.60% | |
| Rackspace Hosting, Inc. | | | 16,000 | | | | 683,840 | * | |
| Web Portals/Internet Service Providers 2.98% | |
| Baidu, Inc., Sponsored ADR | | | 5,500 | | | | 770,715 | * | |
| Sohu.com, Inc. | | | 7,000 | | | | 505,890 | * | |
| | | | 1,276,605 | | |
| Total Common Stocks | | | 38,382,558 | | |
| (cost $32,630,306) | |
See notes to portfolios of investments and notes to financial statements.
95
Portfolio of Investments (unaudited) June 30, 2011
HOLMES GROWTH FUND
| EXCHANGE-TRADED FUND (ETF) 1.01% | | Shares | | Value | |
| SPDR KBW Bank ETF | | | 18,000 | | | $ | 431,820 | | |
| (cost $431,714) | |
WARRANTS 1.03%
| Diversified Banking Institutions 0.91% | |
| Bank of America Corp., Warrants (January 2019) | | | 70,000 | | | | 387,800 | * | |
| Finance - Commercial 0.00% | |
| IOU Financial, Inc., 144A, Warrants (February 2012) | | | 1,250,000 | | | | 0 | *@ | |
| Gold Mining 0.00% | |
| Gran Colombia Gold Corp., Warrants (November 2011) | | | 33,333 | | | | 1,555 | * | |
| Medical - Hospitals 0.00% | |
| African Medical Investments plc, Warrants (June 2014) | | | 500,000 | | | | 0 | *@ | |
| Oil Companies - Exploration & Production 0.12% | |
| Alange Energy Corp., 144A, Warrants (February 2016) | | | 675,000 | | | | 48,992 | * | |
| Total Warrants | | | 438,347 | | |
| (cost $567,657) | |
| CONVERTIBLE DEBENTURES 1.12% | | Principal
Amount | | | |
| Metal - Iron 0.23% | |
| Pacific Iron Corp., 1.00%, maturity 06/07/12 (RS) | | $ | 100,000 | | | | 100,000 | @ | |
| (cost $100,000) | |
| Metal & Mineral Mining 0.89% | |
| Grupo Empresarial Ibiza S.A., 12.68%, maturity 05/03/12 (RS) | | | 380,000 | | | | 380,000 | @ | |
| (cost $380,000) | |
| Total Convertible Debentures | | | 480,000 | | |
| (cost $480,000) | |
| Total Investments 92.93% | | | 39,732,725 | | |
| (cost $34,109,677) | |
| Other assets and liabilities, net 7.07% | | | 3,024,930 | | |
| NET ASSETS 100% | | $ | 42,757,655 | | |
See notes to portfolios of investments and notes to financial statements.
96
Portfolio of Investments (unaudited) June 30, 2011
GLOBAL MEGATRENDS FUND
| COMMON STOCKS 87.50% | | Shares | | Value | |
| Agricultural Operations 0.13% | |
| Agriterra Ltd. | | | 500,000 | | | $ | 23,874 | * | |
| Airport Development/Maintenance 2.33% | |
| Grupo Aeroportuario del Sureste S.A.B. de C.V., Sponsored ADR | | | 4,000 | | | | 235,760 | | |
| TAV Havalimanlari Holding A.S. | | | 41,700 | | | | 209,129 | * | |
| | | | 444,889 | | |
| Building - Heavy Construction 2.15% | |
| Chicago Bridge & Iron Co. NV | | | 7,000 | | | | 272,300 | | |
| Empresas ICA SAB de CV, Sponsored ADR | | | 15,000 | | | | 138,300 | * | |
| | | | 410,600 | | |
| Building & Construction Products - Miscellaneous 1.00% | |
| China Liansu Group Holdings Ltd. | | | 234,000 | | | | 190,947 | * | |
| Building Products - Cement/Aggregates 2.49% | |
| China Resources Cement Holdings Ltd. | | | 229,500 | | | | 216,472 | | |
| PT Holcim Indonesia Tbk | | | 1,011,700 | | | | 259,516 | | |
| | | | 475,988 | | |
| Chemicals - Fibers 1.52% | |
| Kolon Industries, Inc. | | | 3,000 | | | | 289,597 | * | |
| Coal 3.96% | |
| Bumi Resources Tbk PT | | | 392,100 | | | | 134,868 | | |
| Pacific Coal Resources Ltd., 144A | | | 131,111 | | | | 95,161 | * | |
| Peabody Energy Corp. | | | 5,000 | | | | 294,550 | | |
| Walter Energy, Inc. | | | 2,000 | | | | 231,600 | | |
| | | | 756,179 | | |
| Commercial Services - Financial 1.58% | |
| MasterCard, Inc., Class A | | | 1,000 | | | | 301,340 | | |
| Diversified Banking Institutions 1.05% | |
| The Goldman Sachs Group, Inc. | | | 1,500 | | | | 199,635 | | |
| Diversified Minerals 1.67% | |
| Vale S.A., Class B, Sponsored ADR | | | 10,000 | | | | 319,500 | | |
| Diversified Operations 1.39% | |
| Siam Cement PCL | | | 20,000 | | | | 265,452 | | |
See notes to portfolios of investments and notes to financial statements.
97
Portfolio of Investments (unaudited) June 30, 2011
GLOBAL MEGATRENDS FUND
| COMMON STOCKS | | Shares | | Value | |
| Electric - Generation 1.31% | |
| CEZ A.S. | | | 4,500 | | | $ | 231,554 | | |
| Ronter, Inc. (RS) | | | 349,057 | | | | 23,358 | *@ | |
| | | | 254,912 | | |
| Electric - Integrated 2.96% | |
| CPFL Energia S.A., Sponsored ADR | | | 6,500 | | | | 564,850 | | |
| Electric Products - Miscellaneous 2.38% | |
| Zhuzhou CSR Times Electric Co., Ltd., H shares | | | 135,000 | | | | 454,525 | * | |
| Energy - Alternate Sources 0.52% | |
| Pacific Green Energy Corp. (RS) | | | 100,000 | | | | 100,000 | *@ | |
| Engineering/R&D Services 4.31% | |
| McDermott International, Inc. | | | 20,000 | | | | 396,200 | * | |
| SNC-Lavalin Group, Inc. | | | 7,000 | | | | 427,352 | | |
| | | | 823,552 | | |
| Engines - Internal Combustion 2.87% | |
| Cummins, Inc. | | | 5,300 | | | | 548,497 | | |
| Gas - Distribution 1.04% | |
| NGL Energy Partners L.P. | | | 10,000 | | | | 199,400 | * | |
| Machinery - Construction & Mining 7.49% | |
| Caterpillar, Inc. | | | 6,500 | | | | 691,990 | | |
Changsha Zoomlion Heavy Industry Science and Technology
Development Co., Ltd., H shares | | | 97,500 | | | | 185,434 | * | |
| Joy Global, Inc. | | | 2,500 | | | | 238,100 | | |
| Komatsu Ltd., Sponsored ADR | | | 10,000 | | | | 314,000 | * | |
| | | | 1,429,524 | | |
| Machinery - Farm 1.51% | |
| Deere & Co. | | | 3,500 | | | | 288,575 | | |
| Machinery - General Industrial 1.81% | |
| Babcock & Wilcox Co. | | | 12,500 | | | | 346,375 | * | |
| Marine Services 1.15% | |
| COSCO Pacific Ltd. | | | 125,000 | | | | 219,745 | | |
| Metal - Copper 1.03% | |
| Southern Copper Corp. | | | 6,000 | | | | 197,220 | | |
See notes to portfolios of investments and notes to financial statements.
98
Portfolio of Investments (unaudited) June 30, 2011
GLOBAL MEGATRENDS FUND
| COMMON STOCKS | | Shares | | Value | |
| Non-Ferrous Metals 3.03% | |
| Cameco Corp. | | | 15,000 | | | $ | 395,250 | | |
| Uranium Energy Corp. | | | 60,000 | | | | 183,600 | * | |
| | | | 578,850 | | |
| Oil & Gas - Integrated 2.07% | |
| Marathon Oil Corp. | | | 7,500 | | | | 395,100 | | |
| Oil & Gas Drilling 2.22% | |
| Nabors Industries Ltd. | | | 10,000 | | | | 246,400 | * | |
| Seadrill Ltd. | | | 5,000 | | | | 176,400 | | |
| | | | 422,800 | | |
| Oil Companies - Exploration & Production 1.85% | |
| Alange Energy Corp. | | | 230,100 | | | | 52,488 | * | |
| Alange Energy Corp., 144A | | | 700,000 | | | | 159,677 | * | |
| Pacific Rubiales Energy Corp. | | | 5,233 | | | | 140,259 | | |
| | | | 352,424 | | |
| Oil Field Machinery & Equipment 1.58% | |
| Cameron International Corp. | | | 6,000 | | | | 301,740 | * | |
| Oil Refining & Marketing 3.28% | |
| Frontier Oil Corp. | | | 11,000 | | | | 355,410 | | |
| Western Refining, Inc. | | | 15,000 | | | | 271,050 | * | |
| | | | 626,460 | | |
| Public Thoroughfares 4.30% | |
| Compania de Concessoes Rodoviarias | | | 20,300 | | | | 603,981 | | |
| EcoRodovias Infraestrutura e Logistica S.A. | | | 25,000 | | | | 216,980 | | |
| | | | 820,961 | | |
| Real Estate Management/Services 0.92% | |
| CB Richard Ellis Group, Inc., Class A | | | 7,000 | | | | 175,770 | * | |
| Real Estate Operating/Development 4.07% | |
| LSR Group OJSC, GDR | | | 28,600 | | | | 225,940 | | |
| Mongolia Growth Group Ltd., 144A (RS) | | | 49,000 | | | | 224,919 | *@ | |
| Pacific Infrastructure, Inc. (RS) | | | 326,533 | | | | 326,533 | *@ | |
| | | | 777,392 | | |
| Reinsurance 2.03% | |
| Berkshire Hathaway, Inc., Class B | | | 5,000 | | | | 386,950 | * | |
See notes to portfolios of investments and notes to financial statements.
99
Portfolio of Investments (unaudited) June 30, 2011
GLOBAL MEGATRENDS FUND
| COMMON STOCKS | | Shares | | Value | |
| Retail - Automobile 1.50% | |
| Rush Enterprises, Inc., Class A | | | 15,000 | | | $ | 285,450 | * | |
| Steel - Producers 1.69% | |
| United States Steel Corp. | | | 7,000 | | | | 322,280 | | |
| Telephone - Integrated 2.17% | |
| Telecomunicacoes de Sao Paulo S.A., Sponsored ADR | | | 13,950 | | | | 414,315 | | |
| Transportation - Marine 1.33% | |
| Costamare, Inc. | | | 15,000 | | | | 254,100 | * | |
| Transportation - Rail 6.00% | |
| CSX Corp. | | | 24,300 | | | | 637,146 | | |
| Norfolk Southern Corp. | | | 4,000 | | | | 299,720 | | |
| Union Pacific Corp. | | | 2,000 | | | | 208,800 | | |
| | | | 1,145,666 | | |
| Web Hosting/Design 1.79% | |
| Rackspace Hosting, Inc. | | | 8,000 | | | | 341,920 | * | |
| Total Common Stocks | | | 16,707,354 | | |
| (cost $14,427,095) | |
WARRANTS 0.18%
| Coal 0.04% | |
| Pacific Coal Resources Ltd., 144A, Warrants (March 2016) | | | 55,555 | | | | 7,776 | * | |
| Oil Companies - Exploration & Production 0.14% | |
| Alange Energy Corp., 144A, Warrants (February 2016) | | | 350,000 | | | | 25,403 | * | |
| Total Warrants | | | 33,179 | | |
| (cost $0) | |
| MASTER LIMITED PARTNERSHIP 1.28% | | Units | | | |
| Pipelines 1.28% | |
| El Paso Pipeline Partners, L.P. | | | 7,000 | | | | 243,250 | | |
| (cost $203,323) | |
See notes to portfolios of investments and notes to financial statements.
100
Portfolio of Investments (unaudited) June 30, 2011
GLOBAL MEGATRENDS FUND
| CONVERTIBLE DEBENTURES 3.24% | | Principal
Amount | | Value | |
| Metal - Iron 0.52% | |
| Pacific Iron Corp., 1.00%, maturity 06/07/12 (RS) | | $ | 100,000 | | | $ | 100,000 | @ | |
| Metal & Mineral Mining 2.72% | |
| Grupo Empresarial Ibiza S.A., 12.68%, maturity 05/03/12 (RS) | | | 520,000 | | | | 520,000 | @ | |
| Total Convertible Debentures | | | 620,000 | | |
| (cost $620,000) | |
| Total Investments 92.20% | | | 17,603,783 | | |
| (cost $15,250,418) | |
| Other assets and liabilities, net 7.80% | | | 1,490,218 | | |
| NET ASSETS 100% | | $ | 19,094,001 | | |
See notes to portfolios of investments and notes to financial statements.
101
Portfolio of Investments (unaudited) June 30, 2011
GLOBAL RESOURCES FUND
| COMMON STOCKS 91.69% | | Shares | | Value | |
| Agricultural Chemicals 2.90% | |
| Potash Corporation of Saskatchewan, Inc. | | | 458,600 | | | $ | 26,135,614 | | |
| Spur Ventures, Inc. | | | 274,867 | | | | 104,024 | * | |
| | | | 26,239,638 | | |
| Agricultural Operations 2.96% | |
| Agriterra Ltd. | | | 50,340,000 | | | | 2,403,672 | *+ | |
| Archer-Daniels-Midland Co. | | | 808,866 | | | | 24,387,310 | | |
| | | | 26,790,982 | | |
| Coal 3.98% | |
| Coalcorp Mining, Inc. | | | 779,661 | | | | 109,134 | * | |
| Coalcorp Mining, Inc., 144A | | | 4,953,000 | | | | 693,302 | * | |
| Pacific Coal Resources Ltd., 144A | | | 17,939,815 | | | | 13,020,758 | *+ | |
| Pacific Coal Resources Ltd., 144A (RS) | | | 600,000 | | | | 431,127 | *+@ | |
| Peabody Energy Corp. | | | 200,000 | | | | 11,782,000 | | |
| Sable Mining Africa Ltd. | | | 32,152,500 | | | | 9,933,917 | * | |
| | | | 35,970,238 | | |
| Diamonds/Precious Stones 0.06% | |
| Diamond Fields International Ltd., 144A | | | 1,800,000 | | | | 485,250 | * | |
| Rockwell Diamonds, Inc., 144A | | | 950,000 | | | | 39,401 | * | |
| | | | 524,651 | | |
| Diversified Minerals 3.31% | |
| Atacama Minerals Corp. | | | 1,025,000 | | | | 834,284 | * | |
| BHP Billiton Ltd., Sponsored ADR | | | 274,000 | | | | 25,928,620 | | |
| Calibre Mining Corp., 144A | | | 550,000 | | | | 71,284 | * | |
| Canada Zinc Metals Corp. | | | 1,000,000 | | | | 430,297 | * | |
| Lithium Americas Corp. | | | 476,667 | | | | 825,376 | * | |
| Woulfe Mining Corp. | | | 8,372,700 | | | | 1,823,077 | * | |
| | | | 29,912,938 | | |
| Electric - Generation 0.04% | |
| Ronter, Inc. (RS) | | | 4,868,396 | | | | 325,778 | *@ | |
| Energy - Alternate Sources 0.27% | |
| Infinity Bio-Energy Ltd. | | | 682,400 | | | | 0 | *@ | |
| Pacific Green Energy Corp. (RS) | | | 2,400,000 | | | | 2,400,000 | *+@ | |
| | | | 2,400,000 | | |
| Finance - Investment Banker/Broker 0.12% | |
| Aberdeen International, Inc. | | | 274,750 | | | | 225,053 | * | |
| Aberdeen International, Inc., 144A | | | 1,000,000 | | | | 819,120 | * | |
| | | | 1,044,173 | | |
See notes to portfolios of investments and notes to financial statements.
102
Portfolio of Investments (unaudited) June 30, 2011
GLOBAL RESOURCES FUND
| COMMON STOCKS | | Shares | | Value | |
| Food - Meat Products 2.96% | |
| Tyson Foods, Inc., Class A | | | 1,376,000 | | | $ | 26,721,920 | | |
| Food - Miscellaneous/Diversified 2.94% | |
| ConAgra Foods, Inc. | | | 1,029,747 | | | | 26,577,770 | | |
| Forestry 0.31% | |
| Prima Colombia Hardwood, Inc. | | | 15,065,832 | | | | 2,811,810 | *+ | |
| Gold Mining 14.90% | |
| Barrick Gold Corp. | | | 821,790 | | | | 37,218,869 | | |
| Chesapeake Gold Corp. | | | 177,582 | | | | 2,014,357 | * | |
| Corona Gold Ltd. | | | 50,000 | | | | 5,362 | *@ | |
| Dundee Precious Metals, Inc. | | | 184,816 | | | | 1,496,618 | * | |
| Endeavour Mining Corp. | | | 1,255,000 | | | | 3,005,910 | * | |
| Euromax Resources Ltd., 144A | | | 540,840 | | | | 145,802 | * | |
| Goldcorp, Inc. | | | 790,113 | | | | 38,139,307 | * | |
| Gran Colombia Gold Corp. | | | 10,770,653 | | | | 9,045,807 | * | |
| Kinross Gold Corp. | | | 1 | | | | 16 | | |
| Newmont Mining Corp. | | | 694,100 | | | | 37,460,577 | | |
| NGEx Resources, Inc. | | | 1,500,000 | | | | 4,603,660 | * | |
| Olympus Pacific Minerals, Inc. | | | 265,000 | �� | | | 104,412 | * | |
| Planet Exploration, Inc. | | | 160,000 | | | | 46,037 | * | |
| Rusoro Mining Ltd., 144A | | | 3,119,433 | | | | 679,227 | * | |
| Sunridge Gold Corp. | | | 1,000,000 | | | | 756,908 | * | |
| | | | 134,722,869 | | |
| Machinery - General Industrial 1.82% | |
| Robbins & Myers, Inc. | | | 311,800 | | | | 16,478,630 | | |
| Medical - Hospitals 0.01% | |
| African Medical Investments plc | | | 2,400,000 | | | | 110,745 | * | |
| Metal - Aluminum 1.36% | |
| Alcoa, Inc. | | | 777,300 | | | | 12,327,978 | | |
| Metal - Copper 6.48% | |
| Augusta Resource Corp. | | | 1,000,400 | | | | 4,631,852 | * | |
| Catalyst Copper Corp. | | | 1,800,000 | | | | 186,635 | * | |
| Freeport-McMoRan Copper & Gold, Inc. | | | 761,300 | | | | 40,272,770 | | |
| Los Andes Copper Ltd. | | | 754,000 | | | | 293,172 | * | |
| Southern Copper Corp. | | | 400,000 | | | | 13,148,000 | | |
| Verona Development Corp. | | | 708,800 | | | | 0 | *@ | |
| | | | 58,532,429 | | |
See notes to portfolios of investments and notes to financial statements.
103
Portfolio of Investments (unaudited) June 30, 2011
GLOBAL RESOURCES FUND
| COMMON STOCKS | | Shares | | Value | |
| Metal - Diversified 0.25% | |
| Bell Copper Corp. | | | 2,500,000 | | | $ | 531,391 | * | |
| Concordia Resource Corp. | | | 1,000,000 | | | | 902,069 | * | |
| Orsu Metals Corp., 144A | | | 147,605 | | | | 24,487 | * | |
| Peregrine Metals Ltd. | | | 900,000 | | | | 793,198 | * | |
| | | | 2,251,145 | | |
| Metal - Iron 0.08% | |
| West African Iron Ore Corp. | | | 2,925,000 | | | | 758,204 | * | |
| Mining Services 0.15% | |
| Bounty Mining Ltd. | | | 22,000,000 | | | | 294,924 | *@ | |
| Natasa Mining Ltd. | | | 1,038,350 | | | | 1,074,926 | * | |
| | | | 1,369,850 | | |
| Natural Resource Technology 0.00% | |
| I-Pulse, Inc. (RS) | | | 15,971 | | | | 7,500 | *@ | |
| Non - Ferrous Metals 0.44% | |
| Anfield Nickel Corp., 144A | | | 390,000 | | | | 1,706,465 | * | |
| GoviEx Uranium, Inc. (RS) | | | 750,000 | | | | 2,250,000 | *@ | |
| Sterling Group Ventures, Inc. | | | 500,000 | | | | 69,000 | * | |
| | | | 4,025,465 | | |
| Oil - Field Services 5.74% | |
| Baker Hughes, Inc. | | | 176,500 | | | | 12,806,840 | | |
| Oil States International, Inc. | | | 160,000 | | | | 12,785,600 | * | |
| Schlumberger Ltd. | | | 304,600 | | | | 26,317,440 | | |
| | | | 51,909,880 | | |
| Oil Companies - Exploration & Production 26.46% | |
| Africa Oil Corp. | | | 3,742,430 | | | | 6,596,642 | * | |
| Alange Energy Corp. | | | 18,013,700 | | | | 4,109,092 | *+ | |
| Alange Energy Corp., 144A | | | 46,033,000 | | | | 10,500,555 | *+ | |
| Anadarko Petroleum Corp. | | | 329,000 | | | | 25,254,040 | | |
| Apache Corp. | | | 210,300 | | | | 25,948,917 | | |
| Bankers Petroleum Ltd. | | | 200,000 | | | | 1,426,720 | * | |
| BNK Petroleum, Inc. | | | 1,000,000 | | | | 4,790,295 | * | |
| Brigham Exploration Co. | | | 350,000 | | | | 10,475,500 | * | |
| Devon Energy Corp. | | | 310,700 | | | | 24,486,267 | | |
| HRT Participacoes Em Petroleo (RS) | | | 70,830 | | | | 55,894,543 | *@ | |
| InterOil Corp. | | | 100,000 | | | | 5,851,000 | * | |
| Ivanhoe Energy, Inc. | | | 414,100 | | | | 785,736 | * | |
| Madalena Ventures, Inc. | | | 3,455,500 | | | | 2,042,236 | * | |
| Niko Resources Ltd. | | | 170,000 | | | | 10,612,992 | | |
See notes to portfolios of investments and notes to financial statements.
104
Portfolio of Investments (unaudited) June 30, 2011
GLOBAL RESOURCES FUND
| COMMON STOCKS | | Shares | | Value | |
| Oil Companies - Exploration & Production (Cont'd) | |
| NiMin Energy Corp. | | | 1,025,400 | | | $ | 1,818,066 | * | |
| Pacific Rubiales Energy Corp. | | | 750,000 | | | | 20,102,131 | | |
| Petroamerica Oil Corp. | | | 120,000 | | | | 19,908 | * | |
| Petroamerica Oil Corp., 144A | | | 8,000,000 | | | | 1,327,181 | * | |
| Petromanas Energy, Inc. | | | 5,450,000 | | | | 1,638,758 | * | |
| Pioneer Natural Resources Co. | | | 110,000 | | | | 9,852,700 | | |
| Range Energy Resources, Inc. | | | 15,100,000 | | | | 1,252,527 | *+ | |
| Royalite Petroleum Co., Inc. | | | 2,266,333 | | | | 4,079 | * | |
| SandRidge Energy, Inc. | | | 812,203 | | | | 8,658,084 | * | |
| ShaMaran Petroleum Corp. | | | 7,274,700 | | | | 5,732,565 | * | |
| | | | 239,180,534 | | |
| Oil Companies - Integrated 4.15% | |
| Hess Corp. | | | 330,900 | | | | 24,738,084 | | |
| Marathon Oil Corp. | | | 241,600 | | | | 12,727,488 | | |
| | | | 37,465,572 | | |
| Oil Refining & Marketing 2.24% | |
| Frontier Oil Corp. | | | 98,700 | | | | 3,188,997 | | |
| Holly Corp. | | | 240,000 | | | | 16,656,000 | | |
| Value Creation, Inc. (RS) | | | 336,880 | | | | 438,857 | *@ | |
| | | | 20,283,854 | | |
| Paper & Related Products 1.39% | |
| International Paper Co. | | | 420,700 | | | | 12,545,274 | | |
| Platinum 0.03% | |
| Anooraq Resources Corp. | | | 331,625 | | | | 230,379 | * | |
| Osmium Holdings S.A. (RS) | | | 104 | | | | 0 | *@ | |
| | | | 230,379 | | |
| Precious Metals 0.11% | |
| Fortress Minerals Corp. | | | 170,071 | | | | 957,526 | * | |
| Real Estate Operating/Development 0.97% | |
| Mongolia Growth Group Ltd., 144A (RS) | | | 285,000 | | | | 1,308,202 | *@ | |
| Pacific Infrastructure, Inc. (RS) | | | 7,443,544 | | | | 7,443,544 | *@ | |
| | | | 8,751,746 | | |
| Silver Mining 0.92% | |
| First Majestic Silver Corp. | | | 450,000 | | | | 8,298,000 | * | |
See notes to portfolios of investments and notes to financial statements.
105
Portfolio of Investments (unaudited) June 30, 2011
GLOBAL RESOURCES FUND
| COMMON STOCKS | | Shares | | Value | |
| Steel - Producers 4.34% | |
| United States Steel Corp. | | | 852,100 | | | $ | 39,230,684 | | |
| Total Common Stocks | | | 828,758,162 | | |
| (cost $796,578,182) | |
REAL ESTATE INVESTMENT TRUST (REIT) 1.47%
| Weyerhaeuser Co. | | | 608,400 | | | | 13,299,624 | | |
| (cost $13,448,610) | |
WARRANTS 2.46%
| Coal 0.51% | |
| Coalcorp Mining, Inc., 144A, Warrants (August 2011) | | | 885,500 | | | | 4,591 | * | |
| Coalcorp Mining, Inc., 144A, Warrants (June 2013) | | | 3,803,000 | | | | 29,574 | * | |
| Pacific Coal Resources Ltd., 144A, Warrants (March 2016) | | | 7,907,407 | | | | 1,106,848 | * | |
| Walter Energy, Inc., Warrants (June 2012) | | | 375,000 | | | | 3,421,639 | * | |
| | | | 4,562,652 | | |
| Diversified Minerals 0.00% | |
| Lithium Americas Corp., 144A, Warrants (May 2012) | | | 283,333 | | | | 0 | *@ | |
| Finance - Investment Banker/Broker 0.01% | |
| Aberdeen International, Inc., 144A, Warrants (June 2012) | | | 500,000 | | | | 77,765 | * | |
| Gold Mining 0.79% | |
| Chesapeake Gold Corp., Warrants (February 2012) | | | 53,800 | | | | 257,160 | * | |
| Dundee Precious Metals, Inc., Warrants (November 2015) | | | 625,000 | | | | 3,123,542 | * | |
| Gran Colombia Gold Corp., Warrants (November 2011) | | | 416,666 | | | | 19,441 | * | |
| Gran Colombia Gold Corp., Warrants (August 2015) | | | 3,466,899 | | | | 1,096,381 | * | |
| New Gold, Inc., Warrants (November 2012) | | | 269,000 | | | | 117,144 | * | |
| New Gold, Inc., Warrants (June 2017) | | | 122,570 | | | | 368,555 | * | |
| New Gold, Inc., 144A, Warrants (June 2017) | | | 700,000 | | | | 2,104,827 | * | |
| Rusoro Mining Ltd., 144A, Warrants (November 2011) | | | 216,667 | | | | 0 | *@ | |
| Rusoro Mining Ltd., 144A, Warrants (November 2012) | | | 3,150,000 | | | | 32,661 | * | |
| | | | 7,119,711 | | |
| Gold/Mineral Royalty Companies 0.03% | |
| Franco-Nevada Corp., 144A, Warrants (June 2017) | | | 44,000 | | | | 278,293 | * | |
| Medical - Hospitals 0.00% | |
| African Medical Investments plc, Warrants (June 2014) | | | 1,162,500 | | | | 0 | *@ | |
See notes to portfolios of investments and notes to financial statements.
106
Portfolio of Investments (unaudited) June 30, 2011
GLOBAL RESOURCES FUND
| WARRANTS | | Shares | | Value | |
| Metal - Diversified 0.00% | |
| Peregrine Metals Ltd., 144A, Warrants (September 2011) | | | 450,000 | | | $ | 13,998 | * | |
| Metal - Iron 0.00% | |
| West African Iron Ore Corp., Warrants (March 2016) | | | 2,925,000 | | | | 0 | *@ | |
| Mining Services 0.00% | |
| Bounty Mining Ltd., Warrants (December 2011) | | | 5,500,000 | | | | 0 | *@ | |
| Oil Companies - Exploration & Production 1.12% | |
| Alange Energy Corp., 144A, Warrants (February 2016) | | | 16,123,500 | | | | 1,170,247 | * | |
| Gran Tierra Energy, Inc., Warrants (June 2012) | | | 1,550,000 | | | | 8,618,000 | *@ | |
| Petroamerica Oil Corp., 144A, Warrants (October 2014) | | | 8,000,000 | | | | 373,270 | * | |
| Range Energy Resources, Inc., 144A, Warrants (October 2011) | | | 15,000,000 | | | | 0 | *@ | |
| | | | 10,161,517 | | |
| Total Warrants | | | 22,213,936 | | |
| (cost $4,033,385) | |
| PURCHASED OPTION 0.67% | | Contracts | | | |
| Exchange-Traded Fund 0.67% | |
| Oil Services Holders Trust, Strike Price 150, Call, Expiration Jan. 2012 | | | 4,224 | | | | 6,061,440 | | |
| (premium $5,478,755) | |
| CONVERTIBLE DEBENTURE 0.54% | | Principal
Amount | | | |
| Metal & Mineral Mining 0.54% | |
| Grupo Empresarial Ibiza S.A., 12.68%, maturity 05/03/12 (RS) | | $ | 4,900,000 | | | | 4,900,000 | @ | |
| (cost $4,900,000) | |
| Total Securities | | | 875,233,162 | | |
| (cost $824,438,932) | |
See notes to portfolios of investments and notes to financial statements.
107
Portfolio of Investments (unaudited) June 30, 2011
GLOBAL RESOURCES FUND
| REPURCHASE AGREEMENTS 4.23% | | Principal
Amount | | Value | |
Joint Tri-Party Repurchase Agreement, Barclays Capital, Inc.,
06/30/2011, 0.01%, due 07/01/2011, repurchase price $15,000,004,
collateralized by U.S. Treasury securities held in a joint tri-party
account (cost $15,000,000) | | $ | 15,000,000 | | | $ | 15,000,000 | | |
Joint Tri-Party Repurchase Agreement, Credit Suisse Securities USA LLC,
06/30/2011, 0.01%, due 07/01/2011, repurchase price $23,270,414,
collateralized by U.S. Treasury securities held in a joint tri-party
account (cost $23,270,408) | | | 23,270,408 | | | | 23,270,408 | | |
| Total Repurchase Agreements | | | 38,270,408 | | |
| (cost $38,270,408) | |
| Total Investments 101.06% | | | 913,503,570 | | |
| (cost $862,709,340) | |
| Other assets and liabilities, net (1.06%) | | | (9,577,675 | ) | |
| NET ASSETS 100% | | $ | 903,925,895 | | |
See notes to portfolios of investments and notes to financial statements.
108
Portfolio of Investments (unaudited) June 30, 2011
WORLD PRECIOUS MINERALS FUND
| COMMON STOCKS 78.59% | | Shares | | Value | |
| Agricultural Operations 0.23% | |
| Agriterra Ltd. | | | 29,300,000 | | | $ | 1,399,038 | * | |
| Coal 1.23% | |
| Pacific Coal Resources Ltd., 144A | | | 2,282,222 | | | | 1,656,442 | * | |
| Prophecy Coal Corp., 144A | | | 133,400 | | | | 82,990 | * | |
| Sable Mining Africa Ltd. | | | 18,362,500 | | | | 5,673,324 | * | |
| | | | 7,412,756 | | |
| Diamonds/Precious Stones 0.57% | |
| Diagem, Inc. | | | 406,350 | | | | 0 | *@ | |
| Diamonds North Resources Ltd. | | | 1,757,400 | | | | 255,105 | * | |
| Diamonds North Resources Ltd., 144A | | | 1,046,800 | | | | 151,954 | * | |
| Lucara Diamond Corp. | | | 1,250,000 | | | | 1,542,330 | * | |
| Northern Superior Resources, Inc., Class A | | | 1,467,900 | | | | 456,602 | * | |
| Olivut Resources Ltd. | | | 633,500 | | | | 853,906 | * | |
| Rockwell Diamonds, Inc. | | | 1,000,000 | | | | 41,474 | *+ | |
| Rockwell Diamonds, Inc., 144A | | | 2,575,000 | | | | 106,797 | *+ | |
| | | | 3,408,168 | | |
| Diversified Minerals 3.74% | |
| Aldridge Minerals, Inc. | | | 1,315,000 | | | | 1,186,220 | * | |
| Amarc Resources Ltd. | | | 695,545 | | | | 219,961 | * | |
| Azumah Resources Ltd. | | | 5,150,000 | | | | 2,982,483 | * | |
| Calibre Mining Corp., 144A | | | 900,000 | | | | 116,647 | * | |
| Erdene Resource Development Corp. | | | 406,000 | | | | 429,385 | * | |
| Golden Alliance Resources Corp. | | | 235,000 | | | | 65,789 | * | |
| Grayd Resource Corp. | | | 2,400,000 | | | | 4,230,390 | * | |
| Helio Resource Corp. | | | 500,000 | | | | 197,003 | * | |
| Indochine Mining Ltd. | | | 5,785,500 | | | | 1,365,025 | * | |
| Mindoro Resources Ltd., 144A | | | 2,984,000 | | | | 495,039 | * | |
| Mines Management, Inc. | | | 807,500 | | | | 1,709,839 | * | |
| Moss Lake Gold Mines Ltd. | | | 3,325,000 | | | | 913,604 | *+ | |
| New Pacific Metals Corp. | | | 700,000 | | | | 1,190,316 | * | |
| North American Tungsten Corp. | | | 950,000 | | | | 305,355 | * | |
| Prodigy Gold, Inc. | | | 1,100,000 | | | | 627,301 | * | |
| Roca Mines, Inc. | | | 1,025,000 | | | | 249,754 | * | |
| Rochester Resources Ltd. | | | 1,125,000 | | | | 40,826 | *+ | |
| Rochester Resources Ltd., 144A | | | 6,630,000 | | | | 240,603 | *+ | |
| Rubicon Minerals Corp. | | | 1,500,000 | | | | 5,334,647 | * | |
| Strongbow Exploration, Inc. | | | 825,000 | | | | 256,623 | * | |
| Wallbridge Mining Co., Ltd. | | | 1,541,000 | | | | 343,527 | * | |
| | | | 22,500,337 | | |
| Finance - Investment Banker/Broker 0.32% | |
| Aberdeen International, Inc. | | | 1,386,000 | | | | 1,135,300 | * | |
| Aberdeen International, Inc., 144A | | | 1,000,000 | | | | 819,120 | * | |
| | | | 1,954,420 | | |
See notes to portfolios of investments and notes to financial statements.
109
Portfolio of Investments (unaudited) June 30, 2011
WORLD PRECIOUS MINERALS FUND
| COMMON STOCKS | | Shares | | Value | |
| Financial Services 0.00% | |
| Invictus Financial, Inc. | | | 996,000 | | | $ | 5,164 | * | |
| Gold Mining 49.32% | |
| Almaden Minerals Ltd. | | | 510,000 | | | | 1,692,156 | * | |
| AngloGold Ashanti Ltd., Sponsored ADR | | | 80,000 | | | | 3,367,200 | | |
| Belo Sun Mining Corp., 144A | | | 930,500 | | | | 1,003,391 | * | |
| Brazilian Gold Corp. | | | 500,000 | | | | 559,905 | * | |
| Canaco Resources, Inc. | | | 1,375,000 | | | | 4,747,524 | * | |
| Candente Gold Corp. | | | 650,000 | | | | 350,459 | *+ | |
| Candente Gold Corp., 144A | | | 4,875,000 | | | | 2,628,441 | *+ | |
| Canyon Resources Ltd. | | | 826,316 | | | | 283,578 | * | |
| CB Gold, Inc. | | | 1,000,000 | | | | 798,382 | * | |
| Centerra Gold, Inc. | | | 110,500 | | | | 1,833,169 | | |
| Chalice Gold Mines Ltd. | | | 4,000,000 | | | | 1,415,634 | * | |
| Chesapeake Gold Corp. | | | 698,304 | | | | 7,921,039 | * | |
| Claude Resources, Inc. | | | 2,012,500 | | | | 3,818,627 | * | |
| Colossus Minerals, Inc. | | | 400,000 | | | | 2,903,209 | * | |
| Continental Gold Ltd. | | | 1,510,000 | | | | 11,491,938 | * | |
| Corona Gold Ltd. | | | 812,500 | | | | 87,137 | *@ | |
| Crystallex International Corp. | | | 2,150,000 | | | | 225,750 | * | |
| Dundee Precious Metals, Inc. | | | 1,007,630 | | | | 8,159,666 | * | |
| Eastmain Resources, Inc. | | | 700,000 | | | | 834,673 | * | |
| Elissa Resources Ltd. | | | 36,250 | | | | 13,907 | * | |
| Endeavour Mining Corp. | | | 1,200,000 | | | | 2,874,177 | * | |
| Entree Gold, Inc. | | | 3,000,000 | | | | 6,407,797 | * | |
| Extorre Gold Mines Ltd. | | | 1,008,400 | | | | 12,945,060 | * | |
| Goldcorp, Inc. | | | 567,813 | | | | 27,410,107 | * | |
| Golden Arrow Resources Corp. | | | 1,150,000 | | | | 363,679 | * | |
| Golden Arrow Resources Corp., 144A | | | 1,000,000 | | | | 316,242 | * | |
| Golden Predator Corp. | | | 2,710,000 | | | | 2,697,496 | * | |
| Gran Colombia Gold Corp. | | | 22,268,838 | | | | 18,702,638 | *+ | |
| Grandview Gold, Inc. | | | 1,100,000 | | | | 74,136 | * | |
| Great Basin Gold Ltd. | | | 1,250,000 | | | | 2,566,229 | * | |
| Guyana Goldfields, Inc. | | | 385,000 | | | | 2,734,460 | * | |
| Harmony Gold Mining Co., Ltd., Sponsored ADR | | | 1,030,000 | | | | 13,616,600 | | |
| IAMGOLD Corp. | | | 180,000 | | | | 3,376,800 | | |
| Kaminak Gold Corp., Class A | | | 100,000 | | | | 388,823 | * | |
| Kimber Resources, Inc. | | | 1,100,000 | | | | 1,815,000 | * | |
| Kingsgate Consolidated Ltd. | | | 200,000 | | | | 1,715,920 | | |
| Klondex Mines Ltd. | | | 2,900,000 | | | | 9,471,720 | *+ | |
| Lake Shore Gold Corp. | | | 2,200,000 | | | | 6,409,871 | * | |
| Levon Resources Ltd. | | | 650,000 | | | | 1,179,429 | * | |
| Lexam VG Gold, Inc. | | | 4,656,501 | | | | 2,896,885 | * | |
| Lion One Metals Ltd. | | | 575,000 | | | | 637,928 | * | |
| Malbex Resources, Inc. | | | 206,000 | | | | 89,709 | * | |
| Malbex Resources, Inc., 144A | | | 1,333,333 | | | | 580,642 | * | |
| Mirasol Resources Ltd. | | | 2,050,000 | | | | 9,139,924 | *+ | |
| NGEx Resources, Inc. | | | 2,350,000 | | | | 7,212,401 | * | |
See notes to portfolios of investments and notes to financial statements.
110
Portfolio of Investments (unaudited) June 30, 2011
WORLD PRECIOUS MINERALS FUND
| COMMON STOCKS | | Shares | | Value | |
| Gold Mining (Cont'd) | |
| North Country Gold Corp. | | | 325,000 | | | $ | 515,579 | * | |
| Olympus Pacific Minerals, Inc. | | | 600,000 | | | | 236,404 | * | |
| Pacific Rim Mining Corp. | | | 133,500 | | | | 23,532 | * | |
| Pan African Resources plc | | | 12,033,300 | | | | 2,082,132 | | |
| Petaquilla Minerals Ltd. | | | 2,660,000 | | | | 1,765,151 | * | |
| Pilot Gold, Inc. | | | 100,000 | | | | 228,109 | * | |
| Planet Exploration, Inc. | | | 1,020,500 | | | | 293,627 | * | |
| PMI Gold Corp. | | | 5,690,000 | | | | 3,067,862 | *+ | |
| PMI Gold Corp., CHESS Depository Instrument | | | 5,400,000 | | | | 2,663,965 | *+ | |
| Premier Gold Mines Ltd. | | | 700,000 | | | | 4,115,299 | * | |
| Queenston Mining, Inc. | | | 285,000 | | | | 2,021,256 | * | |
| Radius Gold, Inc. | | | 2,145,000 | | | | 1,178,755 | * | |
| Renaissance Gold, Inc. | | | 510,000 | | | | 883,094 | * | |
| Reunion Gold Corp. | | | 1,820,000 | | | | 3,000,467 | * | |
| Revolution Resources Corp. | | | 570,000 | | | | 342,786 | * | |
| Richmont Mines, Inc. | | | 500,000 | | | | 3,555,000 | * | |
| Rio Alto Mining Ltd. | | | 950,000 | | | | 2,029,136 | * | |
| Romarco Minerals, Inc. | | | 5,120,000 | | | | 8,706,309 | * | |
| Romarco Minerals, Inc., 144A | | | 11,395,706 | | | | 19,377,840 | * | |
| Rusoro Mining Ltd., 144A | | | 6,325,900 | | | | 1,377,406 | * | |
| Rye Patch Gold Corp. | | | 3,800,000 | | | | 1,201,721 | * | |
| San Gold Corp. | | | 1,485,000 | | | | 5,019,545 | * | |
| Sandspring Resources Ltd. | | | 300,000 | | | | 643,890 | * | |
| Solvista Gold Corp. | | | 2,620,000 | | | | 2,309,088 | * | |
| St Barbara Ltd. | | | 2,125,000 | | | | 4,455,359 | * | |
| Sunridge Gold Corp. | | | 1,000,000 | | | | 756,908 | * | |
| Taurus Gold Ltd. (RS) | | | 1,610,169 | | | | 1,899,999 | *@ | |
| Tolima Gold Corp., 144A (RS) | | | 3,250,000 | | | | 1,347,918 | *+@ | |
| Torex Gold Resources, Inc. | | | 1,500,000 | | | | 2,706,206 | * | |
| TriStar Gold, Inc. | | | 1,265,000 | | | | 826,326 | * | |
| Virginia Mines, Inc. | | | 650,000 | | | | 5,998,237 | * | |
| West Kirkland Mining, Inc. | | | 570,000 | | | | 579,190 | * | |
| Yamana Gold, Inc. | | | 1,900,000 | | | | 22,097,000 | | |
| | | | 297,064,554 | | |
| Medical - Hospitals 0.03% | |
| African Medical Investments plc | | | 4,550,000 | | | | 209,954 | * | |
| Metal - Copper 0.82% | |
| Augusta Resource Corp. | | | 552,500 | | | | 2,558,075 | * | |
| Catalyst Copper Corp. | | | 1,564,000 | | | | 162,165 | * | |
| Revett Minerals, Inc. | | | 501,600 | | | | 2,246,785 | * | |
| Verona Development Corp. | | | 48,500 | | | | 0 | *@ | |
| | | | 4,967,025 | | |
See notes to portfolios of investments and notes to financial statements.
111
Portfolio of Investments (unaudited) June 30, 2011
WORLD PRECIOUS MINERALS FUND
| COMMON STOCKS | | Shares | | Value | |
| Metal - Diversified 3.69% | |
| Avion Gold Corp. | | | 3,950,000 | | | $ | 7,945,461 | * | |
| Bearing Resources Ltd. | | | 81,250 | | | | 49,704 | * | |
| Bell Copper Corp. | | | 2,000,000 | | | | 425,113 | * | |
| Cerro Resources NL | | | 21,258,000 | | | | 5,250,684 | * | |
| Dalradian Resources, Inc. | | | 1,600,000 | | | | 2,505,055 | * | |
| Dia Bras Exploration, Inc. | | | 75,000 | | | | 219,296 | * | |
| First Point Minerals Corp. | | | 2,400,000 | | | | 2,314,272 | * | |
| Imperial Metals Corp. | | | 14,400 | | | | 289,060 | * | |
| Mariana Resources Ltd. | | | 4,550,000 | | | | 1,624,862 | * | |
| Orsu Metals Corp. | | | 289,800 | | | | 48,077 | * | |
| Orsu Metals Corp., 144A | | | 1,800,000 | | | | 298,616 | * | |
| Prophecy Platinum Corp. | | | 12,640 | | | | 8,126 | * | |
| Robust Resources Ltd. | | | 600,000 | | | | 974,857 | * | |
| Temex Resources Corp. | | | 950,000 | | | | 256,104 | * | |
| | | | 22,209,287 | | |
| Metal Mining 0.00% | |
| Tigray Resources, Inc. (RS) | | | 275,000 | | | | 0 | *@ | |
| Mining Services 0.78% | |
| Argent Minerals Ltd. | | | 5,625,000 | | | | 1,387,482 | *+ | |
| Energold Drilling Corp. | | | 300,000 | | | | 1,228,679 | * | |
| Geodrill Ltd. | | | 305,000 | | | | 736,845 | * | |
| Natasa Mining Ltd. | | | 1,306,449 | | | | 1,352,469 | * | |
| | | | 4,705,475 | | |
| Oil Companies - Exploration & Production 2.29% | |
| Alange Energy Corp. | | | 5,917,100 | | | | 1,349,745 | * | |
| Alange Energy Corp., 144A | | | 25,150,000 | | | | 5,736,949 | * | |
| Big Sky Energy Corp. | | | 2,000,000 | | | | 0 | *@ | |
| Pacific Rubiales Energy Corp. | | | 250,000 | | | | 6,700,710 | | |
| | | | 13,787,404 | | |
| Platinum 0.83% | |
| Anooraq Resources Corp. | | | 615,875 | | | | 427,846 | * | |
| Eastern Platinum Ltd. | | | 323,500 | | | | 268,340 | * | |
| Osmium Holdings S.A. (RS) | | | 891 | | | | 0 | *@ | |
| Pacific North West Capital Corp. | | | 1,291,666 | | | | 401,783 | * | |
| Platinum Group Metals Ltd. | | | 2,000,000 | | | | 3,483,851 | * | |
| Seafield Resources Ltd. | | | 1,300,000 | | | | 424,594 | * | |
| | | | 5,006,414 | | |
| Precious Metals 2.36% | |
| Atikwa Resources, Inc. | | | 1,333,333 | | | | 82,949 | * | |
| Coeur d'Alene Mines Corp. | | | 260,000 | | | | 6,307,600 | * | |
| Fortress Minerals Corp. | | | 267,500 | | | | 1,506,066 | * | |
See notes to portfolios of investments and notes to financial statements.
112
Portfolio of Investments (unaudited) June 30, 2011
WORLD PRECIOUS MINERALS FUND
| COMMON STOCKS | | Shares | | Value | |
| Precious Metals (Cont'd) | |
| Solitario Exploration & Royalty Corp. | | | 925,000 | | | $ | 2,589,559 | * | |
| Tahoe Resources, Inc. | | | 200,000 | | | | 3,732,697 | * | |
| | | | 14,218,871 | | |
| Silver Mining 12.38% | |
| First Majestic Silver Corp. | | | 929,000 | | | | 17,184,261 | * | |
| Fortuna Silver Mines, Inc. | | | 630,000 | | | | 3,292,239 | * | |
| MAG Silver Corp. | | | 785,000 | | | | 7,846,337 | * | |
| Pan American Silver Corp. | | | 334,500 | | | | 10,332,705 | * | |
| Polymetal, Sponsored GDR | | | 170,600 | | | | 3,292,580 | * | |
| Silver Standard Resources, Inc. | | | 450,000 | | | | 12,010,500 | * | |
| Silvercorp Metals, Inc. | | | 2,193,917 | | | | 20,609,558 | * | |
| | | | 74,568,180 | | |
| Total Common Stocks | | | 473,417,047 | | |
| (cost $443,996,622) | |
EXCHANGE-TRADED FUNDS (ETF) 7.49%
| SPDR Gold Trust | | | 217,000 | | | | 31,677,660 | * | |
| Sprott Physical Gold Trust | | | 1,030,000 | | | | 13,441,500 | * | |
| Total Exchange-Traded Funds | | | 45,119,160 | | |
| (cost $44,200,131) | |
WARRANTS 3.49%
| Coal 0.03% | |
| Pacific Coal Resources Ltd., 144A, Warrants (March 2016) | | | 1,111,111 | | | | 155,529 | * | |
| Diversified Minerals 0.04% | |
| Mines Management, Inc., Warrants (April 2012) | | | 950,300 | | | | 220,945 | * | |
| Rochester Resources Ltd., 144A, Warrants (November 2011) | | | 6,630,000 | | | | 0 | *@ | |
| | | | 220,945 | | |
| Gold Mining 3.08% | |
| Agnico-Eagle Mines Ltd., Warrants (December 2013) | | | 32,400 | | | | 685,260 | * | |
| Agnico-Eagle Mines Ltd., 144A, Warrants (December 2013) | | | 110,000 | | | | 2,326,500 | * | |
| Argonaut Gold, Inc., Warrants (December 2012) | | | 250,000 | | | | 396,599 | * | |
| Candente Gold Corp., 144A, Warrants (December 2011) | | | 2,437,500 | | | | 0 | *@ | |
| Chesapeake Gold Corp., Warrants (February 2012) | | | 194,699 | | | | 930,647 | * | |
| Crystallex International Corp., 144A, Warrants (December 2049) | | | 162,500 | | | | 0 | *@ | |
| Dundee Precious Metals, Inc., Warrants (November 2015) | | | 1,125,000 | | | | 5,622,375 | * | |
| Endeavour Mining Corp., Warrants (February 2014) | | | 1,030,000 | | | | 640,780 | * | |
See notes to portfolios of investments and notes to financial statements.
113
Portfolio of Investments (unaudited) June 30, 2011
WORLD PRECIOUS MINERALS FUND
| WARRANTS | | Shares | | Value | |
| Gold Mining (Cont'd) | |
| Gran Colombia Gold Corp., Warrants (November 2011) | | | 1,728,999 | | | $ | 80,673 | * | |
| Gran Colombia Gold Corp., Warrants (August 2015) | | | 5,997,086 | | | | 1,896,533 | * | |
| Kinross Gold Corp., Warrants (September 2011) | | | 718,947 | | | | 55,909 | * | |
| Kinross Gold Corp., Warrants (September 2013) | | | 779,584 | | | | 921,484 | * | |
| Kinross Gold Corp., Warrants (September 2014) | | | 124,955 | | | | 317,424 | * | |
| New Gold, Inc., Warrants (April 2012) | | | 2,525,100 | | | | 144,000 | * | |
| New Gold, Inc., Warrants (November 2012) | | | 326,000 | | | | 141,967 | * | |
| New Gold, Inc., Warrants (June 2017) | | | 1,141,230 | | | | 3,431,559 | * | |
| New Gold, Inc., 144A, Warrants (June 2017) | | | 300,000 | | | | 902,068 | * | |
| Petaquilla Minerals Ltd., Warrants (January 2014) | | | 2,660,000 | | | | 0 | *@ | |
| Rusoro Mining Ltd., Warrants (November 2012) | | | 225,750 | | | | 2,341 | * | |
| Rusoro Mining Ltd., 144A, Warrants (November 2011) | | | 600,000 | | | | 0 | *@ | |
| Rusoro Mining Ltd., 144A, Warrants (November 2012) | | | 6,105,000 | | | | 63,300 | * | |
| Rye Patch Gold Corp., 144A, Warrants (December 2011) | | | 1,800,000 | | | | 0 | *@ | |
| Solvista Gold Corp., Warrants (April 2013) | | | 1,310,000 | | | | 0 | *@ | |
| Timberline Resources Corp., 144A, Warrants (August 2011) | | | 428,571 | | | | 0 | *@ | |
| Tolima Gold Corp., 144A, Warrants (March 2013) (RS) | | | 1,625,000 | | | | 0 | *@ | |
| | | | 18,559,419 | | |
| Gold/Mineral Royalty Companies 0.17% | |
| Franco-Nevada Corp., Warrants (March 2012) | | | 134,300 | | | | 784,121 | * | |
| Franco-Nevada Corp., Warrants (July 2013) | | | 167,200 | | | | 24,271 | * | |
| Franco-Nevada Corp., 144A, Warrants (June 2017) | | | 37,000 | | | | 234,019 | * | |
| | | | 1,042,411 | | |
| Medical - Hospitals 0.00% | |
| African Medical Investments plc, Warrants (June 2014) | | | 2,125,000 | | | | 0 | *@ | |
| Metal - Diversified 0.00% | |
| Orsu Metals Corp., 144A, Warrants (April 2012) | | | 900,000 | | | | 0 | *@ | |
| Oil Companies - Exploration & Production 0.15% | |
| Alange Energy Corp., 144A, Warrants (February 2016) | | | 12,575,000 | | | | 912,696 | * | |
| Platinum 0.02% | |
| Seafield Resources Ltd., Warrants (December 2012) | | | 1,300,000 | | | | 114,573 | * | |
| Total Warrants | | | 21,005,573 | | |
| (cost $14,158,203) | |
See notes to portfolios of investments and notes to financial statements.
114
Portfolio of Investments (unaudited) June 30, 2011
WORLD PRECIOUS MINERALS FUND
| SPECIAL WARRANTS | | Shares | | Value | |
| Gold/Mineral Exploration & Development 0.02% | |
| Miocene Metals Ltd., Special Warrants (October 2011) (RS) | | | 256,833 | | | $ | 95,868 | *@ | |
Western Exploration & Development Ltd., 144A, Special Warrants
(December 2049) (RS) | | | 600,000 | | | | 0 | *@ | |
| Total Special Warrants | | | 95,868 | | |
| (cost $300,000) | |
| PURCHASED OPTIONS 0.18% | | Contracts | | | |
| Gold Mining 0.18% | |
Allied Nevada Gold Corp., Strike Price 30, Put, Expiration Sep. 2011
(premium $754,136) | | | 5,751 | | | | 690,120 | | |
Gold Resource Corp., Strike Price 20, Put, Expiration Sep. 2011
(premium $532,961) | | | 3,544 | | | | 407,560 | | |
| Total Purchased Options | | | 1,097,680 | | |
| (cost $1,287,097) | |
| CONVERTIBLE DEBENTURE 0.20% | | Principal
Amount | | | |
| Metal - Iron 0.20% | |
| Pacific Iron Corp., 1.00%, maturity 06/07/12 (RS) | | $ | 1,200,000 | | | | 1,200,000 | @ | |
| (cost $1,200,000) | |
| Total Securities | | | 541,935,328 | | |
| (cost $505,142,053) | |
REPURCHASE AGREEMENT 9.59%
Joint Tri-Party Repurchase Agreement, Credit Suisse Securities USA LLC,
06/30/2011, 0.01%, due 07/01/2011, repurchase price $57,779,721,
collateralized by U.S. Treasury securities held in a joint tri-party
account (cost $57,779,705) | | | 57,779,705 | | | | 57,779,705 | | |
| Total Investments 99.56% | | | 599,715,033 | | |
| (cost $562,921,758) | |
| Other assets and liabilities, net 0.44% | | | 2,632,627 | | |
| NET ASSETS 100% | | $ | 602,347,660 | | |
See notes to portfolios of investments and notes to financial statements.
115
Portfolio of Investments (unaudited) June 30, 2011
GOLD AND PRECIOUS METALS FUND
| COMMON STOCKS 65.01% | | Shares | | Value | |
| Gold Mining 40.40% | |
| AngloGold Ashanti Ltd., Sponsored ADR | | | 30,000 | | | $ | 1,262,700 | | |
| AuRico Gold, Inc. | | | 250,000 | | | | 2,747,500 | * | |
| Centerra Gold, Inc. | | | 58,500 | | | | 970,501 | | |
| Claude Resources, Inc. | | | 2,655,000 | | | | 5,037,742 | * | |
| Continental Gold Ltd. | | | 50,000 | | | | 380,528 | * | |
| DRDGOLD Ltd., Sponsored ADR | | | 285,000 | | | | 1,379,400 | | |
| Dundee Precious Metals, Inc. | | | 1,120,387 | | | | 9,072,759 | * | |
| Endeavour Mining Corp. | | | 830,000 | | | | 1,987,972 | * | |
| Gold Fields Ltd., Sponsored ADR | | | 104,200 | | | | 1,520,278 | * | |
| Goldcorp, Inc. | | | 329,864 | | | | 15,923,019 | | |
| Gran Colombia Gold Corp. | | | 7,764,458 | | | | 6,521,034 | * | |
| Great Basin Gold Ltd. | | | 365,000 | | | | 749,339 | * | |
| Harmony Gold Mining Co., Ltd., Sponsored ADR | | | 650,000 | | | | 8,593,000 | | |
| IAMGOLD Corp. | | | 295,000 | | | | 5,534,200 | | |
| Kingsgate Consolidated Ltd. | | | 150,000 | | | | 1,286,940 | | |
| Lake Shore Gold Corp. | | | 250,000 | | | | 728,394 | * | |
| Nevsun Resources Ltd. | | | 150,000 | | | | 912,000 | * | |
| New Gold, Inc. | | | 125,000 | | | | 1,286,250 | * | |
| Newmont Mining Corp. | | | 50,000 | | | | 2,698,500 | | |
| Northgate Minerals Corp. | | | 1,000,000 | | | | 2,600,000 | * | |
| OceanaGold Corp. | | | 608,600 | | | | 1,665,928 | * | |
| Pan African Resources plc | | | 8,291,700 | | | | 1,434,720 | | |
| Richmont Mines, Inc. | | | 250,000 | | | | 1,777,500 | * | |
| Royal Gold, Inc. | | | 50,000 | | | | 2,928,500 | | |
| Rusoro Mining Ltd., 144A | | | 793,000 | | | | 172,668 | * | |
| San Gold Corp. | | | 745,000 | | | | 2,518,223 | * | |
| Silver Lake Resources Ltd. | | | 600,000 | | | | 1,286,940 | * | |
| St Barbara Ltd. | | | 775,000 | | | | 1,624,896 | * | |
| Yamana Gold, Inc. | | | 1,000,000 | | | | 11,630,000 | | |
| | | | 96,231,431 | | |
| Gold/Mineral Royalty Companies 1.58% | |
| Franco-Nevada Corp. | | | 101,000 | | | | 3,770,024 | | |
| Medical - Hospitals 0.04% | |
| African Medical Investments plc | | | 1,925,000 | | | | 88,827 | * | |
| Metal - Diversified 0.51% | |
| Avion Gold Corp. | | | 600,000 | | | | 1,206,906 | * | |
| Oil Companies - Exploration & Production 0.87% | |
| Canadian Natural Resources Ltd. | | | 49,500 | | | | 2,072,070 | | |
| Platinum 0.06% | |
| Eastern Platinum Ltd. | | | 161,800 | | | | 134,211 | * | |
See notes to portfolios of investments and notes to financial statements.
116
Portfolio of Investments (unaudited) June 30, 2011
GOLD AND PRECIOUS METALS FUND
| COMMON STOCKS | | Shares | | Value | |
| Precious Metals 3.21% | |
| Coeur d'Alene Mines Corp. | | | 200,000 | | | $ | 4,852,000 | * | |
| Tahoe Resources, Inc. | | | 150,000 | | | | 2,799,523 | * | |
| | | | 7,651,523 | | |
| Silver Mining 18.34% | |
| First Majestic Silver Corp. | | | 687,500 | | | | 12,717,093 | * | |
| Fortuna Silver Mines, Inc. | | | 450,000 | | | | 2,351,599 | * | |
| Pan American Silver Corp. | | | 190,400 | | | | 5,881,456 | * | |
| Polymetal, Sponsored GDR | | | 109,700 | | | | 2,117,210 | * | |
| Silver Standard Resources, Inc. | | | 345,000 | | | | 9,208,050 | * | |
| Silvercorp Metals, Inc. | | | 1,213,879 | | | | 11,402,985 | | |
| | | | 43,678,393 | | |
| Total Common Stocks | | | 154,833,385 | | |
| (cost $150,690,017) | |
EXCHANGE-TRADED FUNDS (ETF) 9.49%
| ETFS Palladium Trust | | | 35,000 | | | | 2,642,500 | * | |
| SPDR Gold Trust | | | 83,000 | | | | 12,116,340 | * | |
| Sprott Physical Gold Trust | | | 600,000 | | | | 7,830,000 | * | |
| Total Exchange-Traded Funds | | | 22,588,840 | | |
| (cost $22,235,712) | |
WARRANTS 5.54%
| Diversified Minerals 0.00% | |
| Mines Management, Inc., Warrants (April 2012) | | | 40,000 | | | | 9,300 | * | |
| Gold Mining 5.17% | |
| Agnico-Eagle Mines Ltd., Warrants (December 2013) | | | 28,700 | | | | 607,005 | * | |
| Agnico-Eagle Mines Ltd., 144A, Warrants (December 2013) | | | 70,000 | | | | 1,480,500 | * | |
| Crystallex International Corp., 144A, Warrants (December 2049) | | | 62,500 | | | | 0 | *@ | |
| Dundee Precious Metals, Inc., Warrants (June 2012) | | | 56,100 | | | | 27,630 | * | |
| Dundee Precious Metals, Inc., Warrants (November 2015) | | | 1,371,600 | | | | 6,854,800 | * | |
| Endeavour Mining Corp., Warrants (February 2014) | | | 382,500 | | | | 237,959 | * | |
| Gran Colombia Gold Corp., Warrants (November 2011) | | | 280,332 | | | | 13,080 | * | |
| Gran Colombia Gold Corp., Warrants (August 2015) | | | 2,042,773 | | | | 646,012 | * | |
| Kinross Gold Corp., Warrants (September 2011) | | | 428,953 | | | | 33,357 | * | |
| Kinross Gold Corp., Warrants (September 2013) | | | 646,221 | | | | 763,847 | * | |
| Kinross Gold Corp., Warrants (September 2014) | | | 62,435 | | | | 158,604 | * | |
See notes to portfolios of investments and notes to financial statements.
117
Portfolio of Investments (unaudited) June 30, 2011
GOLD AND PRECIOUS METALS FUND
| WARRANTS | | Shares | | Value | |
| Gold Mining (Cont'd) | |
| New Gold, Inc., Warrants (April 2012) | | | 3,078,400 | | | $ | 175,553 | * | |
| New Gold, Inc., Warrants (November 2012) | | | 1,072,500 | | | | 467,054 | * | |
| New Gold, Inc., Warrants (June 2017) | | | 278,800 | | | | 838,322 | * | |
| Rusoro Mining Ltd., Warrants (November 2012) | | | 688,750 | | | | 7,141 | * | |
| Rusoro Mining Ltd., 144A, Warrants (November 2012) | | | 930,000 | | | | 9,643 | * | |
| | | | 12,320,507 | | |
| Gold/Mineral Royalty Companies 0.37% | |
| Franco-Nevada Corp., Warrants (March 2012) | | | 131,700 | | | | 748,815 | * | |
| Franco-Nevada Corp., Warrants (July 2013) | | | 125,000 | | | | 18,145 | * | |
| Franco-Nevada Corp., 144A, Warrants (June 2017) | | | 17,000 | | | | 107,523 | * | |
| | | | 874,483 | | |
| Medical - Hospitals 0.00% | |
| African Medical Investments plc, Warrants (June 2014) | | | 912,500 | | | | 0 | *@ | |
| Total Warrants | | | 13,204,290 | | |
| (cost $8,886,967) | |
| PURCHASED OPTIONS 0.23% | | Contracts | | | |
| Gold Mining 0.23% | |
Allied Nevada Gold Corp., Strike Price 30, Put, Expiration Sep. 2011
(premium $326,437) | | | 3,049 | | | | 365,880 | | |
Gold Resource Corp., Strike Price 20, Put, Expiration Sep. 2011
(premium $158,387) | | | 1,480 | | | | 170,200 | | |
| Total Purchased Options | | | 536,080 | | |
| (cost $484,824) | |
| NOTES 1.72% | | Principal
Amount | | | |
| Gold Mining 1.72% | |
| Barrick Gold Corp., 6.95%, maturity 04/01/19 | | $ | 1,700,000 | | | | 2,024,113 | | |
| Newmont Mining Corp., 6.25%, maturity 10/01/39 | | | 2,000,000 | | | | 2,083,036 | | |
| Total Notes | | | 4,107,149 | | |
| (cost $4,466,528) | |
| Total Securities | | | 195,269,744 | | |
| (cost $186,764,048) | |
See notes to portfolios of investments and notes to financial statements.
118
Portfolio of Investments (unaudited) June 30, 2011
GOLD AND PRECIOUS METALS FUND
| REPURCHASE AGREEMENT 16.69% | | Principal
Amount | | Value | |
Joint Tri-Party Repurchase Agreement, Credit Suisse Securities USA
LLC, 06/30/2011, 0.01%, due 07/01/2011, repurchase price $39,760,203,
collateralized by U.S. Treasury securities held in a joint tri-party
account (cost $39,760,192) | | $ | 39,760,192 | | | $ | 39,760,192 | | |
| Total Investments 98.68% | | | 235,029,936 | | |
| (cost $226,524,240) | |
| Other assets and liabilities, net 1.32% | | | 3,133,840 | | |
| NET ASSETS 100% | | $ | 238,163,776 | | |
See notes to portfolios of investments and notes to financial statements.
119
Portfolio of Investments (unaudited) June 30, 2011
EASTERN EUROPEAN FUND
| COMMON STOCKS 90.56% | | Shares | | Value | |
| Agricultural Operations 0.99% | |
| Kernel Holding S.A. | | | 124,000 | | | $ | 3,438,165 | * | |
| Airlines 1.11% | |
| Turk Hava Yollari, Class AO | | | 1,465,200 | | | | 3,836,547 | * | |
| Airport Development/Maintenance 1.21% | |
| TAV Havalimanlari Holding A.S. | | | 837,100 | | | | 4,198,136 | * | |
| Appliances 1.96% | |
| Arcelik | | | 1,329,200 | | | | 6,797,092 | | |
| Automotive - Cars & Light Trucks 1.30% | |
| Tofas Turk Otomobil Fabrikasi A.S. | | | 990,200 | | | | 4,514,497 | | |
| Cellular Telecommunications 0.85% | |
| Mobile TeleSystems, Sponsored ADR | | | 155,500 | | | | 2,957,610 | ^ | |
| Chemicals - Diversified 0.17% | |
| Ciech S.A. | | | 69,577 | | | | 598,157 | * | |
| Coal 0.03% | |
| Eastcoal, Inc. | | | 142,500 | | | | 100,472 | * | |
| Commercial Banks - Non US 16.49% | |
| Bank Pekao S.A. | | | 62,000 | | | | 3,666,472 | | |
| Komercni Banka A.S. | | | 9,200 | | | | 2,243,568 | | |
| OTP Bank plc | | | 60,900 | | | | 1,982,312 | | |
| Powszechna Kasa Oszczednosci Bank Polski S.A. | | | 250,000 | | | | 3,828,205 | | |
| Sberbank RF | | | 6,150,095 | | | | 22,023,023 | @ | |
| Turkiye Garanti Bankasi A.S. | | | 2,502,382 | | | | 11,347,133 | | |
| Turkiye Is Bankasi, Class C | | | 2,233,520 | | | | 6,852,892 | | |
| VTB Bank OJSC, Sponsored GDR | | | 843,400 | | | | 5,199,561 | * | |
| | | | 57,143,166 | | |
| Electric - Generation 2.22% | |
| CEZ A.S. | | | 85,000 | | | | 4,373,789 | | |
| OGK-4 OJSC | | | 37,068,800 | | | | 3,330,076 | *@ | |
| | | | 7,703,865 | | |
| Finance - Investment Banker/Broker 1.86% | |
| Turkiye Sinai Kalkinma Bankasi A.S. | | | 4,030,653 | | | | 6,456,594 | * | |
| Food - Retail 1.73% | |
| X5 Retail Group N.V., Sponsored GDR | | | 153,000 | | | | 5,982,300 | * | |
See notes to portfolios of investments and notes to financial statements.
120
Portfolio of Investments (unaudited) June 30, 2011
EASTERN EUROPEAN FUND
| COMMON STOCKS | | Shares | | Value | |
| Food - Wholesale/Distribution 1.40% | |
| Eurocash S.A. | | | 450,000 | | | $ | 4,839,945 | * | |
| Gold Mining 1.68% | |
| Dundee Precious Metals, Inc. | | | 236,767 | | | | 1,917,310 | * | |
| Koza Altin Isletmeleri A.S. | | | 291,000 | | | | 3,908,447 | | |
| | | | 5,825,757 | | |
| Housewares 1.08% | |
| Turkiye Sise ve Cam Fabrikalari A.S. | | | 1,718,181 | | | | 3,757,959 | * | |
| Investment Companies 0.11% | |
| Vostok Nafta Investment Ltd. | | | 65,000 | | | | 366,872 | * | |
| Medical - Drugs 2.70% | |
| Pharmstandard, Sponsored GDR | | | 410,000 | | | | 9,348,000 | * | |
| Metal - Aluminum 1.99% | |
| United Co. RUSAL plc | | | 5,037,200 | | | | 6,913,264 | * | |
| Metal - Diversified 6.08% | |
| Grupa Kety S.A. | | | 36,178 | | | | 1,668,556 | * | |
| KGHM Polska Miedz S.A. | | | 145,000 | | | | 10,414,540 | * | |
| MMC Norilsk Nickel OJSC, Sponsored ADR | | | 313,000 | | | | 8,200,600 | * | |
| Orsu Metals Corp. | | | 664,240 | | | | 110,196 | * | |
| Orsu Metals Corp., 144A | | | 4,025,000 | | | | 667,738 | * | |
| | | | 21,061,630 | | |
| Miscellaneous Manufacturers 0.49% | |
| Trakya Cam Sanayii A.S. | | | 800,000 | | | | 1,705,379 | | |
| Oil - Field Services 0.30% | |
| Eurasia Drilling Co., Ltd., Sponsored GDR | | | 35,000 | | | | 1,032,500 | | |
| Oil Companies - Exploration & Production 10.47% | |
| BNK Petroleum, Inc. | | | 550,000 | | | | 2,634,662 | * | |
| Gazprom OAO, Sponsored ADR | | | 1,047,802 | | | | 15,276,953 | | |
| NovaTek OAO, Sponsored GDR | | | 133,077 | | | | 18,377,934 | | |
| | | | 36,289,549 | | |
| Oil Companies - Integrated 17.00% | |
| Lukoil OAO, Sponsored ADR | | | 266,810 | | | | 16,969,116 | | |
| MOL Hungarian Oil & Gas Nyrt. | | | 98,000 | | | | 11,230,253 | * | |
| Rosneft Oil Co. OJSC, Sponsored GDR | | | 1,452,609 | | | | 12,230,968 | | |
| Surgutneftegas OJSC, Sponsored ADR | | | 367,000 | | | | 3,633,300 | * | |
| TNK-BP Holding | | | 4,730,900 | | | | 14,847,087 | @ | |
| | | | 58,910,724 | | |
See notes to portfolios of investments and notes to financial statements.
121
Portfolio of Investments (unaudited) June 30, 2011
EASTERN EUROPEAN FUND
| COMMON STOCKS | | Shares | | Value | |
| Oil Refining & Marketing 0.99% | |
| Tupras Turkiye Petrol Rafinerileri A.S. | | | 140,000 | | | $ | 3,432,937 | | |
| Property/Casualty Insurance 2.96% | |
| Powszechny Zaklad Ubezpieczen S.A. | | | 75,000 | | | | 10,254,120 | | |
| Real Estate Operating/Development 1.89% | |
| Etalon Group Ltd., GDR, 144A | | | 360,000 | | | | 2,385,000 | * | |
| LSR Group OJSC, GDR | | | 527,100 | | | | 4,164,090 | | |
| | | | 6,549,090 | | |
| Retail - Food 2.17% | |
| Magnit OJSC, Sponsored GDR | | | 240,000 | | | | 7,533,600 | * | |
| Silver Mining 1.70% | |
| Polymetal, Sponsored GDR | | | 306,200 | | | | 5,909,660 | * | |
| Steel - Producers 3.54% | |
| Magnitogorsk Iron & Steel Works, Sponsored GDR | | | 366,500 | | | | 4,170,770 | | |
| Mechel, Sponsored ADR | | | 110,000 | | | | 2,627,900 | ^ | |
| Novolipetsk Steel, Sponsored GDR | | | 140,500 | | | | 5,465,450 | | |
| | | | 12,264,120 | | |
| Steel Pipe & Tube 0.81% | |
| OAO TMK, Sponsored GDR | | | 150,000 | | | | 2,797,500 | * | |
| Telecommunication Services 2.23% | |
| Sistema JSFC | | | 5,056,000 | | | | 5,648,806 | *@ | |
| Telefonica Czech Republic A.S. | | | 79,500 | | | | 2,069,090 | | |
| | | | 7,717,896 | | |
| Television 1.05% | |
| CTC Media, Inc. | | | 170,000 | | | | 3,624,400 | ^ | |
| Total Common Stocks | | | 313,861,503 | | |
| (cost $228,895,370) | |
REAL ESTATE INVESTMENT TRUST (REIT) 0.98%
| Emlak Konut Gayrimenkul Yatirim Ortakligi A.S. | | | 2,000,000 | | | | 3,376,255 | * | |
| (cost $2,653,275) | | | | | |
See notes to portfolios of investments and notes to financial statements.
122
Portfolio of Investments (unaudited) June 30, 2011
EASTERN EUROPEAN FUND
| WARRANTS 0.72% | | Shares | | Value | |
| Gold Mining 0.72% | |
| Dundee Precious Metals, Inc., Warrants (November 2015) | | | 500,000 | | | $ | 2,498,834 | * | |
| Metal - Diversified 0.00% | |
| Orsu Metals Corp., 144A, Warrants (April 2012) | | | 2,012,500 | | | | 0 | *@ | |
| Total Warrants | | | 2,498,834 | | |
| (cost $0) | |
| PURCHASED OPTION 0.01% | | Contracts | | | |
| Exchange-Traded Fund 0.01% | |
Market Vectors Russia ETF, Strike Price 37, Put, Expiration July 2011
(premium $105,300) | | | 1,300 | | | | 45,500 | | |
| Total Securities | | | 319,782,092 | | |
| (cost $231,653,945) | |
| REPURCHASE AGREEMENT 5.43% | | Principal
Amount | | | |
Joint Tri-Party Repurchase Agreement, Credit Suisse Securities USA LLC,
06/30/2011, 0.01%, due 07/01/2011, repurchase price $18,835,450,
collateralized by U.S. Treasury securities held in a joint tri-party
account (cost $18,835,445) | | $ | 18,835,445 | | | | 18,835,445 | | |
| Total Investments 97.70% | | | 338,617,537 | | |
| (cost $250,489,390) | |
| Other assets and liabilities, net 2.30% | | | 7,972,124 | | |
| NET ASSETS 100% | | $ | 346,589,661 | | |
| CALL OPTIONS WRITTEN | | Shares Subject
To Call | | | |
| CTC Media, Inc., Strike Price 20, Expiration July 2011 | | | 170,000 | | | | 229,500 | | |
| Mechel, Strike Price 26, Expiration July 2011 | | | 91,000 | | | | 11,375 | | |
| Mobile TeleSystems, Strike Price 19, Expiration July 2011 | | | 3,300 | | | | 1,073 | | |
| Total Call Options Written | | $ | 241,948 | | |
| (premiums received $254,523) (Note 2A) | |
See notes to portfolios of investments and notes to financial statements.
123
Portfolio of Investments (unaudited) June 30, 2011
GLOBAL EMERGING MARKETS FUND
| COMMON STOCKS 88.62% | | Shares | | Value | |
| Advanced Materials/Products 0.90% | |
| POSCO Chemtech Co., Ltd. | | | 700 | | | $ | 108,247 | * | |
| Agricultural Chemicals 1.08% | |
| China BlueChemical Ltd., H shares | | | 155,900 | | | | 129,019 | | |
| Airlines 0.76% | |
| Turk Hava Yollari, Class AO | | | 34,800 | | | | 91,122 | * | |
| Automotive - Cars & Light Trucks 2.23% | |
| Hyundai Motor Co. | | | 1,200 | | | | 266,542 | | |
| Brewery 1.97% | |
| Cia de Bebidas das Americas, Sponsored ADR | | | 7,000 | | | | 236,110 | | |
| Building - Heavy Construction 1.67% | |
| Empresas ICA SAB de CV, Sponsored ADR | | | 10,000 | | | | 92,200 | * | |
| Grana y Montero S.A. | | | 30,000 | | | | 57,174 | * | |
| Trakcja Polska S.A. | | | 48,200 | | | | 50,963 | * | |
| | | | 200,337 | | |
| Building & Construction Products - Miscellaneous 3.96% | |
| China Liansu Group Holdings Ltd. | | | 209,000 | | | | 170,546 | * | |
| China National Building Material Co. Ltd., H shares | | | 57,800 | | | | 113,346 | | |
| Taiwan Glass Industrial Corp. | | | 108,800 | | | | 190,788 | | |
| | | | 474,680 | | |
| Building Products - Cement/Aggregates 0.98% | |
| PT Holcim Indonesia Tbk | | | 457,800 | | | | 117,432 | | |
| Casino Hotels 0.92% | |
| Genting Singapore plc | | | 70,000 | | | | 109,989 | * | |
| Cellular Telecommunications 2.44% | |
| China Unicom (Hong Kong) Ltd. | | | 61,100 | | | | 123,272 | | |
| MTN Group Ltd. | | | 7,954 | | | | 169,271 | | |
| | | | 292,543 | | |
| Chemicals - Diversified 0.99% | |
| Nan Ya Plastics Corp. | | | 44,400 | | | | 118,098 | | |
| Chemicals - Other 1.08% | |
| China Lumena New Materials Corp. | | | 321,700 | | | | 129,395 | * | |
See notes to portfolios of investments and notes to financial statements.
124
Portfolio of Investments (unaudited) June 30, 2011
GLOBAL EMERGING MARKETS FUND
| COMMON STOCKS | | Shares | | Value | |
| Coal 0.73% | |
| Bumi Resources Tbk PT | | | 254,600 | | | $ | 87,573 | | |
| Commercial Banks - Non US 12.42% | |
| Axis Bank Ltd. | | | 4,000 | | | | 115,124 | | |
| Bank Mandiri Tbk PT | | | 123,000 | | | | 103,259 | | |
| Bank of China Ltd., H shares | | | 262,600 | | | | 128,233 | | |
| China Construction Bank Corp., H shares | | | 172,700 | | | | 143,367 | | |
| Credicorp Ltd. | | | 3,000 | | | | 258,300 | | |
| Itau Unibanco Banco Multiplo S.A. | | | 8,837 | | | | 206,321 | | |
| Kredyt Bank S.A. | | | 20,000 | | | | 126,149 | * | |
| Sberbank RF | | | 67,500 | | | | 241,712 | @ | |
| State Bank of India Ltd., Sponsored GDR | | | 1,500 | | | | 165,150 | | |
| | | | 1,487,615 | | |
| E-Commerce/Products 1.99% | |
| MercadoLibre, Inc. | | | 3,000 | | | | 238,020 | | |
| Electric - Generation 1.07% | |
| CEZ A.S. | | | 2,500 | | | | 128,641 | | |
| Electronic Components - Miscellaneous 0.96% | |
| TPK Holding Co., Ltd. | | | 3,800 | | | | 115,457 | * | |
| Energy - Alternate Sources 0.48% | |
| GCL-Poly Energy Holdings Ltd. | | | 111,600 | | | | 57,652 | | |
| Finance - Mortgage Loan/Banker 1.36% | |
| LIC Housing Finance Ltd. | | | 30,000 | | | | 163,007 | * | |
| Finance - Other Services 0.84% | |
| Bolsa de Valores de Colombia | | | 3,000,000 | | | | 69,870 | | |
| Bursa Malaysia Bhd | | | 11,800 | | | | 30,247 | | |
| | | | 100,117 | | |
| Food - Meat Products 0.87% | |
| BRF-Brasil Foods S.A., Sponsored ADR | | | 6,000 | | | | 103,980 | | |
| Food - Retail 1.85% | |
| Cencosud S.A. | | | 20,000 | | | | 144,003 | | |
| X5 Retail Group N.V., Sponsored GDR | | | 2,000 | | | | 78,200 | * | |
| | | | 222,203 | | |
See notes to portfolios of investments and notes to financial statements.
125
Portfolio of Investments (unaudited) June 30, 2011
GLOBAL EMERGING MARKETS FUND
| COMMON STOCKS | | Shares | | Value | |
| Gold Mining 0.52% | |
| Koza Altin Isletmeleri A.S. | | | 4,600 | | | $ | 61,783 | | |
| Internet 1.02% | |
| Netease.com, Sponsored ADR | | | 2,710 | | | | 122,194 | * | |
| Investment Companies 0.47% | |
| Vostok Nafta Investment Ltd. | | | 10,000 | | | | 56,442 | * | |
| Medical - Drugs 1.84% | |
| Chong Kun Dang Pharm Corp. | | | 4,000 | | | | 106,092 | * | |
| Pharmstandard, Sponsored GDR | | | 5,000 | | | | 114,000 | * | |
| | | | 220,092 | | |
| Medical Labs & Testing Services 1.97% | |
| Diagnosticos da America | | | 17,500 | | | | 235,396 | | |
| Metal - Aluminum 0.46% | |
| United Co. RUSAL plc | | | 40,500 | | | | 55,584 | * | |
| Metal - Copper 1.10% | |
| Southern Copper Corp. | | | 4,000 | | | | 131,480 | | |
| Metal - Diversified 3.83% | |
| KGHM Polska Miedz S.A. | | | 4,000 | | | | 287,298 | * | |
| MMC Norilsk Nickel OJSC, Sponsored ADR | | | 5,000 | | | | 131,000 | * | |
| Orsu Metals Corp. | | | 41,083 | | | | 6,816 | * | |
| Orsu Metals Corp., 144A | | | 200,000 | | | | 33,179 | * | |
| | | | 458,293 | | |
| Multimedia 2.59% | |
| Naspers Ltd., Class N | | | 5,500 | | | | 310,675 | | |
| Oil Companies - Exploration & Production 5.57% | |
| Alange Energy Corp. | | | 204,300 | | | | 46,603 | * | |
| Alange Energy Corp., 144A | | | 450,000 | | | | 102,649 | * | |
| CNOOC Ltd., Sponsored ADR | | | 500 | | | | 117,965 | | |
| FX Energy, Inc. | | | 20,000 | | | | 175,600 | * | |
| Gran Tierra Energy, Inc. | | | 15,000 | | | | 99,150 | * | |
| Niko Resources Ltd. | | | 2,000 | | | | 124,859 | | |
| | | | 666,826 | | |
| Oil Companies - Integrated 5.44% | |
| China Petroleum & Chemical Corp., Sponsored ADR | | | 1,000 | | | | 101,440 | * | |
See notes to portfolios of investments and notes to financial statements.
126
Portfolio of Investments (unaudited) June 30, 2011
GLOBAL EMERGING MARKETS FUND
| COMMON STOCKS | | Shares | | Value | |
| Oil Companies - Integrated (Cont'd) | |
| Lukoil OAO, Sponsored ADR | | | 2,000 | | | $ | 127,200 | | |
| PetroChina Co., Ltd., Sponsored ADR | | | 1,500 | | | | 219,045 | | |
| TNK-BP Holding | | | 65,000 | | | | 203,991 | @ | |
| | | | 651,676 | | |
| Patient Monitoring Equipment 1.73% | |
| Opto Circuits India Ltd. | | | 31,048 | | | | 206,998 | | |
| Real Estate Management/Services 0.95% | |
| BR Malls Participacoes S.A. | | | 10,000 | | | | 114,335 | | |
| Real Estate Operating/Development 0.94% | |
| LSR Group OJSC, GDR | | | 14,300 | | | | 112,970 | | |
| Retail - Apparel/Shoe 2.44% | |
| Lojas Renner S.A. | | | 7,669 | | | | 292,279 | | |
| Retail - Hypermarkets 1.58% | |
| Wal-Mart de Mexico SAB de CV, Series V | | | 63,800 | | | | 189,339 | | |
| Retail - Major Department Store 2.20% | |
| SACI Falabella | | | 25,000 | | | | 263,186 | | |
| Retail - Regional Department Stores 0.98% | |
| Golden Eagle Retail Group Ltd. | | | 46,000 | | | | 117,043 | | |
| Semiconductor Components - Integrated Circuits 1.58% | |
| Taiwan Semiconductor Manufacturing Co., Ltd., Sponsored ADR | | | 15,000 | | | | 189,150 | | |
| Shipbuilding 1.73% | |
| Hyundai Heavy Industries Co., Ltd. | | | 500 | | | | 207,826 | | |
| Telephone - Integrated 2.31% | |
| Telecomunicacoes de Sao Paulo S.A., Sponsored ADR | | | 9,300 | | | | 276,210 | | |
| Textile - Apparel 0.68% | |
| LPP S.A. | | | 100 | | | | 81,668 | * | |
| Transportation - Marine 0.99% | |
| Evergreen Marine Corp. | | | 148,000 | | | | 118,715 | * | |
See notes to portfolios of investments and notes to financial statements.
127
Portfolio of Investments (unaudited) June 30, 2011
GLOBAL EMERGING MARKETS FUND
| COMMON STOCKS | | Shares | | Value | |
| Web Portals/Internet Service Providers 4.15% | |
| Baidu, Inc., Sponsored ADR | | | 1,900 | | | $ | 266,247 | * | |
| Sohu.com, Inc. | | | 3,200 | | | | 231,264 | * | |
| | | | 497,511 | | |
| Total Common Stocks | | | 10,615,450 | | |
| (cost $10,003,487) | |
EXCHANGE-TRADED FUNDS (ETF) 1.89%
| iShares FTSE A50 China Index ETF | | | 17,400 | | | | 28,979 | * | |
| iShares MSCI Malaysia Index Fund | | | 2,000 | | | | 30,560 | | |
| iShares MSCI Mexico Investable Market Index Fund | | | 400 | | | | 25,024 | | |
| iShares MSCI South Korea Index Fund | | | 400 | | | | 26,000 | | |
| Market Vectors Indonesia Index ETF | | | 900 | | | | 28,782 | * | |
| PowerShares India Portfolio | | | 1,200 | | | | 28,152 | | |
| ProShares Short MSCI Emerging Markets | | | 2,000 | | | | 59,200 | * | |
| Total Exchange-Traded Funds | | | 226,697 | | |
| (cost $226,144) | |
WARRANTS 0.14%
| Metal - Diversified 0.00% | |
| Orsu Metals Corp., 144A, Warrants (April 2012) | | | 100,000 | | | | 0 | *@ | |
| Oil Companies - Exploration & Production 0.14% | |
| Alange Energy Corp., 144A, Warrants (February 2016) | | | 225,000 | | | | 16,331 | * | |
| Total Warrants | | | 16,331 | | |
| (cost $0) | |
| CONVERTIBLE DEBENTURE 0.83% | | Principal
Amount | | | |
| Metal - Iron 0.83% | |
| Pacific Iron Corp., 1.00%, maturity 06/07/12 (RS) | | $ | 100,000 | | | | 100,000 | @ | |
| (cost $100,000) | |
| Total Investments 91.48% | | | 10,958,478 | | |
| (cost $10,329,631) | |
| Other assets and liabilities, net 8.52% | | | 1,020,758 | | |
| NET ASSETS 100% | | $ | 11,979,236 | | |
See notes to portfolios of investments and notes to financial statements.
128
Portfolio of Investments (unaudited) June 30, 2011
CHINA REGION FUND
| COMMON STOCKS 95.89% | | Shares | | Value | |
| Advanced Materials/Products 2.37% | |
| POSCO Chemtech Co., Ltd. | | | 6,500 | | | $ | 1,005,155 | * | |
| Agricultural Chemicals 1.82% | |
| China BlueChemical Ltd., H shares | | | 934,600 | | | | 773,454 | | |
| Apparel Manufacturers 1.11% | |
| China Lilang Ltd. | | | 338,000 | | | | 473,441 | * | |
| Automotive - Cars & Light Trucks 4.34% | |
| Dongfeng Motor Group Co., Ltd., H shares | | | 220,500 | | | | 417,666 | | |
| Great Wall Motor Co., Ltd., H shares | | | 315,100 | | | | 518,300 | * | |
| Hyundai Motor Co. | | | 4,100 | | | | 910,684 | | |
| | | | 1,846,650 | | |
| Automotive/Truck Parts & Equipment - Original 1.06% | |
| China Yuchai International Ltd. | | | 21,400 | | | | 451,540 | * | |
| Automotive/Truck Parts & Equipment - Replacement 3.63% | |
| Weichai Power Co., Ltd., H shares | | | 120,700 | | | | 704,959 | | |
| Xinyi Glass Holdings Ltd. | | | 845,400 | | | | 837,605 | | |
| | | | 1,542,564 | | |
| Brewery 1.44% | |
| Tsingtao Brewery Co., Ltd., H shares | | | 106,000 | | | | 610,248 | * | |
| Building & Construction 2.26% | |
| China State Construction International Holdings Ltd. | | | 946,080 | | | | 960,456 | | |
| Building & Construction Products - Miscellaneous 2.94% | |
| China Liansu Group Holdings Ltd. | | | 1,000,400 | | | | 816,338 | * | |
| China National Building Material Co., Ltd., H shares | | | 220,900 | | | | 433,185 | | |
| | | | 1,249,523 | | |
| Building Products - Cement/Aggregates 1.10% | |
| China Resources Cement Holdings Ltd. | | | 495,100 | | | | 466,994 | | |
| Casino Hotels 2.20% | |
| SJM Holdings Ltd. | | | 393,500 | | | | 934,479 | | |
| Cellular Telecommunications 0.97% | |
| China Unicom Hong Kong Ltd. | | | 204,500 | | | | 412,587 | | |
See notes to portfolios of investments and notes to financial statements.
129
Portfolio of Investments (unaudited) June 30, 2011
CHINA REGION FUND
| COMMON STOCKS | | Shares | | Value | |
| Chemicals - Other 1.49% | |
| China Lumena New Materials Corp. | | | 1,579,100 | | | $ | 635,151 | * | |
| Coal 4.13% | |
| Bumi Resources Tbk PT | | | 1,145,100 | | | | 393,872 | | |
| China Shenhua Energy Co., Ltd., H shares | | | 113,000 | | | | 540,187 | | |
| Yanzhou Coal Mining Co., H shares | | | 215,000 | | | | 819,193 | | |
| | | | 1,753,252 | | |
| Commercial Banks - Non US 9.96% | |
| Agricultural Bank of China Ltd., H shares | | | 2,466,100 | | | | 1,299,323 | | |
| Bank Mandiri Tbk PT | | | 1,458,000 | | | | 1,223,996 | | |
| Bank of China Ltd., H shares | | | 881,700 | | | | 430,553 | | |
| China Construction Bank Corp., H shares | | | 1,002,400 | | | | 832,140 | | |
| Industrial and Commercial Bank of China Ltd., H shares | | | 586,600 | | | | 445,505 | | |
| | | | 4,231,517 | | |
| Consumer Products - Miscellaneous 1.31% | |
| Biostime International Holdings Ltd. | | | 269,000 | | | | 557,928 | * | |
| Diversified Banking Institutions 1.04% | |
| HSBC Holdings plc | | | 44,600 | | | | 441,601 | | |
| Diversified Minerals 2.17% | |
| Erdene Resource Development Corp. | | | 99,000 | | | | 104,702 | * | |
| Vale S.A., B shares, Sponsored ADR | | | 20,000 | | | | 639,000 | | |
| Woulfe Mining Corp. | | | 814,800 | | | | 177,415 | * | |
| | | | 921,117 | | |
| Diversified Operations 3.04% | |
| China Merchants Holdings International Co., Ltd. | | | 168,800 | | | | 652,923 | | |
| Siam Cement PCL | | | 48,100 | | | | 638,412 | | |
| | | | 1,291,335 | | |
| Electric Generation 1.50% | |
| Datang International Power Generation Co., Ltd., H shares | | | 1,880,000 | | | | 637,800 | * | |
| Electronic Components - Miscellaneous 0.99% | |
| TPK Holding Co., Ltd. | | | 13,900 | | | | 422,331 | * | |
| Yageo Corp., Sponsored GDR | | | 1 | | | | 0 | *@ | |
| | | | 422,331 | | |
| Energy - Alternate Sources 0.52% | |
| GCL-Poly Energy Holdings Ltd. | | | 426,300 | | | | 220,224 | | |
See notes to portfolios of investments and notes to financial statements.
130
Portfolio of Investments (unaudited) June 30, 2011
CHINA REGION FUND
| COMMON STOCKS | | Shares | | Value | |
| Food - Dairy Products 1.01% | |
| China Mengniu Dairy Co., Ltd. | | | 127,600 | | | $ | 429,610 | | |
| Food - Miscellaneous/Diversified 1.19% | |
| Charoen Pokphand Foods PCL | | | 526,000 | | | | 504,782 | | |
| Gold Mining 0.62% | |
| Euromax Resources Ltd., 144A | | | 473,235 | | | | 127,577 | * | |
| Olympus Pacific Minerals, Inc. | | | 340,500 | | | | 134,159 | * | |
| | | | 261,736 | | |
| Hotels & Motels 1.07% | |
| Home Inns & Hotels Management, Inc., Sponsored ADR | | | 12,000 | | | | 456,480 | * | |
| Human Resources 1.06% | |
| 51job, Inc., Sponsored ADR | | | 8,000 | | | | 449,040 | * | |
| Instruments - Controls 0.99% | |
| China Automation Group Ltd. | | | 598,000 | | | | 418,813 | * | |
| Internet Application Software 2.06% | |
| Tencent Holdings Ltd. | | | 32,300 | | | | 877,466 | | |
| Machinery - Construction & Mining 1.98% | |
| International Mining Machinery Holdings Ltd. | | | 447,800 | | | | 429,860 | * | |
| Lonking Holdings Ltd. | | | 756,000 | | | | 413,861 | * | |
| | | | 843,721 | | |
| Marine Services 0.97% | |
| COSCO Pacific Ltd. | | | 233,800 | | | | 411,011 | | |
| Medical - Drugs 2.80% | |
| Chong Kun Dang Pharm Corp. | | | 16,000 | | | | 424,367 | * | |
| Sihuan Pharmaceutical Holdings Group Ltd. | | | 770,000 | | | | 363,145 | * | |
| The United Laboratories International Holdings Ltd. | | | 271,000 | | | | 400,488 | | |
| | | | 1,188,000 | | |
| Non-Ferrous Metals 0.16% | |
| Sterling Group Ventures, Inc. | | | 500,000 | | | | 69,000 | * | |
| Oil - Field Services 1.04% | |
| Anton Oilfield Services Group | | | 2,564,574 | | | | 441,614 | * | |
See notes to portfolios of investments and notes to financial statements.
131
Portfolio of Investments (unaudited) June 30, 2011
CHINA REGION FUND
| COMMON STOCKS | | Shares | | Value | |
| Oil Companies - Exploration & Production 2.36% | |
| CNOOC Ltd., Sponsored ADR | | | 4,259 | | | $ | 1,004,826 | | |
| Oil Companies - Integrated 2.34% | |
| PetroChina Co., Ltd., Sponsored ADR | | | 6,800 | | | | 993,004 | | |
| Petrochemicals 0.00% | |
| Danhua Chemical Technology Co., Ltd., B shares | | | 2 | | | | 2 | * | |
| Power Converters/Power Supply Equipment 1.01% | |
| Dongfang Electric Corp., Ltd., H shares | | | 115,700 | | | | 427,458 | * | |
| Public Thoroughfares 1.55% | |
| Jiangsu Expressway Co., Ltd., H shares | | | 233,300 | | | | 213,460 | | |
| Zhejiang Expressway Co., Ltd., H shares | | | 592,800 | | | | 446,405 | | |
| | | | 659,865 | | |
| Real Estate Operating/Development 1.35% | |
| Mongolia Growth Group Ltd., 144A (RS) | | | 125,000 | | | | 573,773 | *@ | |
| Retail - Apparel/Shoe 1.56% | |
| Belle International Holdings Ltd. | | | 314,600 | | | | 663,018 | | |
| Retail - Automobile 2.41% | |
| China ZhengTong Auto Services Holdings Ltd. | | | 420,000 | | | | 474,957 | * | |
| PT Astra International Tbk | | | 75,000 | | | | 555,734 | | |
| | | | 1,030,691 | | |
| Retail - Consumer Electronics 1.34% | |
| GOME Electrical Appliances Holdings Ltd. | | | 1,425,900 | | | | 568,033 | | |
| Retail - Jewelry 0.00% | |
| Lao Feng Xiang Co., Ltd., B shares | | | 1 | | | | 3 | * | |
| Retail - Regional Department Stores 1.13% | |
| Golden Eagle Retail Group Ltd. | | | 188,000 | | | | 478,350 | | |
| Schools 0.28% | |
| CIBT Education Group, Inc. | | | 436,666 | | | | 119,982 | * | |
| Shipbuilding 1.37% | |
| Hyundai Heavy Industries Co., Ltd. | | | 1,400 | | | | 581,912 | | |
See notes to portfolios of investments and notes to financial statements.
132
Portfolio of Investments (unaudited) June 30, 2011
CHINA REGION FUND
| COMMON STOCKS | | Shares | | Value | |
| Silver Mining 1.26% | |
| Silvercorp Metals, Inc. | | | 57,004 | | | $ | 535,493 | * | |
| Telecommunications Equipment 1.04% | |
| ZTE Corp., H shares | | | 122,000 | | | | 440,544 | | |
| Therapeutics 0.57% | |
| China Shineway Pharmaceutical Group Ltd. | | | 121,500 | | | | 241,384 | | |
| Transportation - Marine 1.00% | |
| Evergreen Marine Corp. | | | 531,900 | | | | 426,650 | * | |
| Web Portals/Internet Service Providers 8.98% | |
| Baidu, Inc., Sponsored ADR | | | 6,773 | | | | 949,100 | * | |
| Netease.com, Sponsored ADR | | | 16,600 | | | | 748,494 | * | |
| Sina Corp. | | | 12,600 | | | | 1,311,660 | * | |
| Sohu.com, Inc. | | | 11,200 | | | | 809,424 | * | |
| | | | 3,818,678 | | |
| Total Common Stocks | | | 40,754,286 | | |
| (cost $39,497,688) | |
EXCHANGE-TRADED FUND (ETF) 0.25%
| iShares FTSE A50 China Index ETF | | | 62,900 | | | | 104,756 | * | |
| (cost $104,443) | |
| Total Investments 96.14% | | | 40,859,042 | | |
| (cost $39,602,131) | |
| Other assets and liabilities, net 3.86% | | | 1,642,059 | | |
| NET ASSETS 100% | | $ | 42,501,101 | | |
See notes to portfolios of investments and notes to financial statements.
133
Notes to Portfolios of Investments (unaudited) June 30, 2011
Legend
* Non-income producing security
+ Affiliated company (see following)
ADR American Depositary Receipt
GDR Global Depositary Receipt
GO General Obligation Bond
RS Restricted Security (see following)
ZCB Zero Coupon Bond
^ Security or portion of security segregated as collateral for written options
@ Security was fair valued at June 30, 2011, by U.S. Global Investors, Inc. (Adviser) in accordance with valuation procedures approved by the Board of Trustees. Fair valued securities, which were primarily composed of restricted securities, as a percentage of net assets at June 30, 2011, were 1.36% of Holmes Growth, 6.78% of Global MegaTrends, 9.33% of Global Resources, 0.77% of World Precious Minerals, 0.00% of Gold and Precious Metals, 13.23% of Eastern European, 4.56% of Global Emerging Markets and 1.35% of China Region. See the Fair Valuation of Securities section of these Notes to Portfolios of Investments for further discussion of fair valued securities. See further information and detail on restricted securities in the Restricted Securities section of these Notes to Portfolios of Investments.
General
The yields reflect the effective yield from the date of purchase.
Variable Rate Notes have periodic reset features, which effectively shorten the maturity dates and reset the interest rates as tied to various interest-bearing instruments. Rates shown are current rates at June 30, 2011.
Securities with a 144A designation are exempt from registration under Rule 144A of the Securities Act of 1933.
Joint Tri-Party Repurchase Agreements
The terms of the joint tri-party repurchase agreements and the securities held as collateral at June 30, 2011, were:
Barclays Capital, Inc. repurchase agreement, 06/30/11, 0.01%, due 07/01/11:
Total principal amount: $15,000,000; Total repurchase price: $15,000,004
Collateral:
$15,241,700 U.S. Treasury Note, 0.625%, 12/31/12
(total collateral market value, including accrued interest, of $15,300,076)
Credit Suisse Securities USA LLC repurchase agreement, 06/30/11, 0.01%, due 07/01/11:
Total principal amount: $163,154,785; Total repurchase price: $163,154,831
Collateral:
$165,140,000 U.S. Treasury Note, 0.875%, 02/29/12
(total collateral market value, including accrued interest, of $166,418,325)
Morgan Stanley repurchase agreement, 06/30/11, 0.00%, due 07/01/11:
Total principal amount: $23,800,000; Total repurchase price: $23,800,000
Collateral:
$35,607,317 U.S. Treasury Inflation Indexed Bond, 0.000%, 02/15/22
(total collateral market value, including accrued interest, of $24,276,001)
Fair Valuation of Securities
For the Funds' policies regarding the valuation of investments and other significant accounting policies, please refer to the Notes to Financial Statements.
The Funds are required to disclose information regarding the fair value measurements of a Fund's assets and liabilities. Fair value is the price that would be received to sell an asset or paid to transfer a liability in an orderly transaction between market participants at the measurement date. The disclosure requirement established a three-tier hierarchy to
134
Notes to Portfolios of Investments (unaudited) June 30, 2011
maximize the use of observable market data and minimize the use of unobservable inputs and to establish classification of fair value measurements for disclosure purposes. Inputs refer broadly to the assumptions that market participants would use in pricing the asset or liability, including assumptions about risk, for example, the risk inherent in a particular valuation technique used to measure fair value including such a pricing model and/or the risk inherent in the inputs to the valuation technique. Inputs may be observable or unobservable. Observable inputs are inputs that reflect the assumptions market participants would use in pricing the asset or liability developed based on market data obtained from sources independent of the reporting entity. Unobservable inputs are inputs that reflect the reporting entity's own assumptions about the assumptions market participants would use in pricing the asset or liability developed based on the best information available in the circumstances.
The inputs or methodology used for valuing securities are not an indication of the risk associated with investing in those securities. For example, money market securities are valued using amortized cost, in accordance with the Investment Company Act of 1940. Generally, amortized cost reflects the current fair value of a security, but since the value is not obtained from a quoted price in an active market, such securities are reflected as Level 2. Fair value determinations are required for securities whose value is affected by a significant event that will materially affect the value of a domestic or foreign security and which occurs subsequent to the time of the close of the principal market on which such domestic or foreign security trades but prior to the calculation of the Fund's NAV.
The three levels defined by the fair value hierarchy are as follows:
Level 1 – quoted prices in active markets for identical securities.
Level 2 – significant observable inputs (including quoted prices for similar securities, interest rates, prepayment speeds, credit risk, etc.)
Level 3 – significant unobservable inputs (including the Fund's own assumptions in determining the fair value of investments).
In some instances, the inputs used to measure fair value might fall in different levels of the fair value hierarchy. The level in the fair value hierarchy within which the fair value measurement in its entirety falls is determined based on the lowest input level that is significant to the fair value measurement in its entirety. Because of the inherent uncertainties of valuation, the values reflected in the financial statements may materially differ from the value received upon actual sale of those investments.
The following table summarizes the valuation of each Fund's securities as of June 30, 2011, using the fair value hierarchy:
| | | Quoted Prices
in Active
Markets for
Identical
Investments
(Level 1)* | | Significant
Other
Observable
Inputs
(Level 2)* | | Significant
Unobservable
Inputs
(Level 3) | | Total | |
| U.S. Treasury Securities Cash Fund | |
Investments in securities**
U.S. Government Obligations | | $ | — | | | $ | 29,999,226 | | | $ | — | | | $ | 29,999,226 | | |
| Repurchase Agreements | | | 47,309,036 | | | | — | | | | — | | | | 47,309,036 | | |
| Total | | $ | 47,309,036 | | | $ | 29,999,226 | | | $ | — | | | $ | 77,308,262 | | |
| U.S. Government Securities Savings Fund | |
Investments in securities**
U.S. Government and Agency Obligations | | $ | — | | | $ | 140,072,876 | | | $ | — | | | $ | 140,072,876 | | |
| Total | | $ | — | | | $ | 140,072,876 | | | $ | — | | | $ | 140,072,876 | | |
135
Notes to Portfolios of Investments (unaudited) June 30, 2011
| | | Quoted Prices
in Active
Markets for
Identical
Investments
(Level 1)* | | Significant
Other
Observable
Inputs
(Level 2)* | | Significant
Unobservable
Inputs
(Level 3) | | Total | |
| Near-Term Tax Free Fund | |
Investments in securities**
Municipal Bonds | | $ | — | | | $ | 28,207,700 | | | $ | — | | | $ | 28,207,700 | | |
| Total | | $ | — | | | $ | 28,207,700 | | | $ | — | | | $ | 28,207,700 | | |
| Tax Free Fund | |
Investments in securities**
Municipal Bonds | | $ | — | | | $ | 18,450,225 | | | $ | — | | | $ | 18,450,225 | | |
| Total | | $ | — | | | $ | 18,450,225 | | | $ | — | | | $ | 18,450,225 | | |
| All American Equity Fund | |
| Investments in securities** | |
| Common Stocks | | $ | 17,531,127 | | | $ | — | | | $ | — | | | $ | 17,531,127 | | |
| Warrants | | | 155,120 | | | | — | | | | — | | | | 155,120 | | |
| Purchased Option | | | 800 | | | | — | | | | — | | | | 800 | | |
| Total | | $ | 17,687,047 | | | $ | — | | | $ | — | | | $ | 17,687,047 | | |
| Holmes Growth Fund | |
| Investments in securities** | |
Common Stocks:
Real Estate Operating/Development | | $ | — | | | $ | — | | | $ | 100,000 | | | $ | 100,000 | | |
| All Other Common Stocks | | | 38,282,558 | | | | — | | | | — | | | | 38,282,558 | | |
| Exchange-Traded Fund | | | 431,820 | | | | — | | | | — | | | | 431,820 | | |
| Warrants: | |
| Finance - Commercial | | | — | | | | — | | | | — | | | | — | | |
| Medical - Hospitals | | | — | | | | — | | | | — | | | | — | | |
| All Other Warrants | | | 438,347 | | | | — | | | | — | | | | 438,347 | | |
| Convertible Debentures: | |
| Metal - Iron | | | — | | | | — | | | | 100,000 | | | | 100,000 | | |
| Metal & Mineral Mining | | | — | | | | — | | | | 380,000 | | | | 380,000 | | |
| Total | | $ | 39,152,725 | | | $ | — | | | $ | 580,000 | | | $ | 39,732,725 | | |
| Global MegaTrends Fund | |
| Investments in securities** | |
Common Stocks:
Electric - Generation | | $ | 231,554 | | | $ | — | | | $ | 23,358 | | | $ | 254,912 | | |
| Energy - Alternate Sources | | | — | | | | — | | | | 100,000 | | | | 100,000 | | |
| Real Estate Operating/Development | | | 225,940 | | | | 224,919 | | | | 326,533 | | | | 777,392 | | |
| All Other Common Stocks | | | 15,575,050 | | | | | | | | 15,575,050 | | |
| Warrants | | | 33,179 | | | | — | | | | — | | | | 33,179 | | |
| Master Limited Partnership | | | 243,250 | | | | — | | | | — | | | | 243,250 | | |
| Convertible Debentures: | |
| Metal - Iron | | | — | | | | — | | | | 100,000 | | | | 100,000 | | |
| Metal & Mineral Mining | | | — | | | | — | | | | 520,000 | | | | 520,000 | | |
| Total | | $ | 16,308,973 | | | $ | 224,919 | | | $ | 1,069,891 | | | $ | 17,603,783 | | |
136
Notes to Portfolios of Investments (unaudited) June 30, 2011
| | | Quoted Prices
in Active
Markets for
Identical
Investments
(Level 1)* | | Significant
Other
Observable
Inputs
(Level 2)* | | Significant
Unobservable
Inputs
(Level 3) | | Total | |
| Global Resources Fund | |
| Investments in securities** | |
Common Stocks:
Coal | | $ | 35,539,111 | | | $ | 431,127 | | | $ | — | | | $ | 35,970,238 | | |
| Electric - Generation | | | — | | | | — | | | | 325,778 | | | | 325,778 | | |
| Energy - Alternate Sources | | | — | | | | — | | | | 2,400,000 | | | | 2,400,000 | | |
| Gold Mining | | | 134,717,507 | | | | — | | | | 5,362 | | | | 134,722,869 | | |
| Metal - Copper | | | 58,532,429 | | | | — | | | | — | | | | 58,532,429 | | |
| Mining Services | | | 1,074,926 | | | | — | | | | 294,924 | | | | 1,369,850 | | |
| Natural Resource Technology | | | — | | | | — | | | | 7,500 | | | | 7,500 | | |
| Non - Ferrous Metals | | | 1,775,465 | | | | — | | | | 2,250,000 | | | | 4,025,465 | | |
| Oil Companies - Exploration & Production | | | 183,285,991 | | | | — | | | | 55,894,543 | | | | 239,180,534 | | |
| Oil Refining & Marketing | | | 19,844,997 | | | | — | | | | 438,857 | | | | 20,283,854 | | |
| Platinum | | | 230,379 | | | | — | | | | — | | | | 230,379 | | |
| Real Estate Operating/Development | | | — | | | | 1,308,202 | | | | 7,443,544 | | | | 8,751,746 | | |
| All Other Common Stocks | | | 322,957,520 | | | | | | | | 322,957,520 | | |
| Real Estate Investment Trust | | | 13,299,624 | | | | — | | | | — | | | | 13,299,624 | | |
| Warrants: | |
| Diversified Minerals | | | — | | | | — | | | | — | | | | — | | |
| Gold Mining | | | 7,119,711 | | | | — | | | | — | | | | 7,119,711 | | |
| Medical - Hospitals | | | — | | | | — | | | | — | | | | — | | |
| Metal - Iron | | | — | | | | — | | | | — | | | | — | | |
| Mining Services | | | — | | | | — | | | | — | | | | — | | |
| Oil Companies - Exploration & Production | | | 1,543,517 | | | | 8,618,000 | | | | — | | | | 10,161,517 | | |
| All Other Warrants | | | 4,932,708 | | | | — | | | | — | | | | 4,932,708 | | |
| Purchased Option | | | 6,061,440 | | | | — | | | | — | | | | 6,061,440 | | |
| Convertible Debenture: | |
| Metal & Mineral Mining | | | — | | | | — | | | | 4,900,000 | | | | 4,900,000 | | |
| Repurchase Agreements | | | 38,270,408 | | | | — | | | | — | | | | 38,270,408 | | |
| Total | | $ | 829,185,733 | | | $ | 10,357,329 | | | $ | 73,960,508 | | | $ | 913,503,570 | | |
| World Precious Minerals Fund | |
| Investments in securities** | |
Common Stocks:
Diamonds/Precious Stones | | $ | 3,408,168 | | | $ | — | | | $ | — | | | $ | 3,408,168 | | |
| Gold Mining | | | 293,729,500 | | | | — | | | | 3,335,054 | | | | 297,064,554 | | |
| Metal - Copper | | | 4,967,025 | | | | — | | | | — | | | | 4,967,025 | | |
| Metal Mining | | | — | | | | — | | | | — | | | | — | | |
| Oil Companies - Exploration & Production | | | 13,787,404 | | | | — | | | | — | | | | 13,787,404 | | |
| Platinum | | | 5,006,414 | | | | — | | | | — | | | | 5,006,414 | | |
| All Other Common Stocks | | | 149,183,482 | | | | — | | | | — | | | | 149,183,482 | | |
| Exchange-Traded Funds | | | 45,119,160 | | | | — | | | | — | | | | 45,119,160 | | |
| Warrants: | |
| Diversified Minerals | | | 220,945 | | | | — | | | | — | | | | 220,945 | | |
| Gold Mining | | | 18,559,419 | | | | — | | | | — | | | | 18,559,419 | | |
| Medical - Hospitals | | | — | | | | — | | | | — | | | | — | | |
| Metal - Diversified | | | — | | | | — | | | | — | | | | — | | |
| All Other Warrants | | | 2,225,209 | | | | — | | | | — | | | | 2,225,209 | | |
| Special Warrants: | |
| Gold/Mineral Exploration & Development | | | — | | | | — | | | | 95,868 | | | | 95,868 | | |
| Purchased Options | | | 1,097,680 | | | | — | | | | — | | | | 1,097,680 | | |
| Convertible Debenture: | |
| Metal - Iron | | | — | | | | — | | | | 1,200,000 | | | | 1,200,000 | | |
| Repurchase Agreement | | | 57,779,705 | | | | — | | | | — | | | | 57,779,705 | | |
| Total | | $ | 595,084,111 | | | $ | — | | | $ | 4,630,922 | | | $ | 599,715,033 | | |
Other Financial Instruments***
Foreign Currency | | $ | (35,165 | ) | | $ | — | | | $ | — | | | $ | (35,165 | ) | |
137
Notes to Portfolios of Investments (unaudited) June 30, 2011
| | | Quoted Prices
in Active
Markets for
Identical
Investments
(Level 1)* | | Significant
Other
Observable
Inputs
(Level 2)* | | Significant
Unobservable
Inputs
(Level 3) | | Total | |
| Gold and Precious Metals Fund | |
| Investments in securities** | |
| Common Stocks | | $ | 154,833,385 | | | $ | — | | | $ | — | | | $ | 154,833,385 | | |
| Exchange-Traded Funds | | | 22,588,840 | | | | — | | | | — | | | | 22,588,840 | | |
| Warrants: | |
| Gold Mining | | | 12,320,507 | | | | — | | | | — | | | | 12,320,507 | | |
| Medical - Hospitals | | | — | | | | — | | | | — | | | | — | | |
| All Other Warrants | | | 883,783 | | | | — | | | | — | | | | 883,783 | | |
| Purchased Options | | | 536,080 | | | | — | | | | — | | | | 536,080 | | |
| Notes: | |
| Gold Mining | | | — | | | | 4,107,149 | | | | — | | | | 4,107,149 | | |
| Repurchase Agreement | | | 39,760,192 | | | | — | | | | — | | | | 39,760,192 | | |
| Total | | $ | 230,922,787 | | | $ | 4,107,149 | | | $ | — | | | $ | 235,029,936 | | |
Other Financial Instruments***
Foreign Currency | | $ | (5,716 | ) | | $ | — | | | $ | — | | | $ | (5,716 | ) | |
| Eastern European Fund | |
| Investments in securities** | |
Common Stocks:
Commercial Banks - Non US | | $ | 35,120,143 | | | $ | 22,023,023 | | | $ | — | | | $ | 57,143,166 | | |
| Electric - Generation | | | 4,373,789 | | | | 3,330,076 | | | | — | | | | 7,703,865 | | |
| Oil Companies - Integrated | | | 44,063,637 | | | | 14,847,087 | | | | — | | | | 58,910,724 | | |
| Telecommunication Services | | | 2,069,090 | | | | 5,648,806 | | | | — | | | | 7,717,896 | | |
| All Other Common Stocks | | | 182,385,852 | | | | — | | | | — | | | | 182,385,852 | | |
| Real Estate Investment Trust | | | 3,376,255 | | | | — | | | | — | | | | 3,376,255 | | |
| Warrants: | |
| Metal - Diversified | | | — | | | | — | | | | — | | | | — | | |
| All Other Warrants | | | 2,498,834 | | | | — | | | | — | | | | 2,498,834 | | |
| Purchased Option | | | 45,500 | | | | — | | | | — | | | | 45,500 | | |
| Repurchase Agreement | | | 18,835,445 | | | | — | | | | — | | | | 18,835,445 | | |
| Total | | $ | 292,768,545 | | | $ | 45,848,992 | | | $ | — | | | $ | 338,617,537 | | |
Other Financial Instruments***
Written Options | | $ | 12,575 | | | $ | — | | | $ | — | | | $ | 12,575 | | |
| Global Emerging Markets Fund | |
| Investments in securities** | |
Common Stocks:
Commercial Banks - Non US | | $ | 1,245,903 | | | $ | 241,712 | | | $ | — | | | $ | 1,487,615 | | |
| Oil Companies - Integrated | | | 447,685 | | | | 203,991 | | | | — | | | | 651,676 | | |
| All Other Common Stocks | | | 8,476,159 | | | | — | | | | — | | | | 8,476,159 | | |
| Exchange-Traded Funds | | | 226,697 | | | | — | | | | — | | | | 226,697 | | |
| Warrants: | |
| Metal - Diversified | | | — | | | | — | | | | — | | | | — | | |
| All Other Warrants | | | 16,331 | | | | — | | | | — | | | | 16,331 | | |
| Convertible Debenture: | |
| Metal - Iron | | | — | | | | — | | | | 100,000 | | | | 100,000 | | |
| Total | | $ | 10,412,775 | | | $ | 445,703 | | | $ | 100,000 | | | $ | 10,958,478 | | |
138
Notes to Portfolios of Investments (unaudited) June 30, 2011
| | | Quoted Prices
in Active
Markets for
Identical
Investments
(Level 1)* | | Significant
Other
Observable
Inputs
(Level 2)* | | Significant
Unobservable
Inputs
(Level 3) | | Total | |
| China Region Fund | |
| Investments in securities** | |
Common Stocks:
Electronic Components - Miscellaneous | | $ | 422,331 | | | $ | — | | | $ | — | | | $ | 422,331 | | |
| Real Estate Operating/Development | | | — | | | | 573,773 | | | | — | | | | 573,773 | | |
| All Other Common Stocks | | | 39,758,182 | | | | — | | | | — | | | | 39,758,182 | | |
| Exchange-Traded Fund | | | 104,756 | | | | — | | | | — | | | | 104,756 | | |
| Total | | $ | 40,285,269 | | | $ | 573,773 | | | $ | — | | | $ | 40,859,042 | | |
* Significant transfers between Levels 1 and 2 included securities valued at $1,376,011, $1,264,805 and $2,131,009 at June 30, 2011, in the Global MegaTrends, Global Emerging Markets and China Region Funds, respectively, included in Level 1 that had previously been included in Level 2 at December 31, 2010. These changes were primarily the result of certain foreign securities using a systematic fair value model at the prior period end but not at June 30, 2011.
** Refer to the portfolio of investments for a detailed list of the fund's investments.
*** Other financial instruments include currency contracts and written options. Currency contracts and written options are reported at their unrealized appreciation/depreciation at measurement date, which represents the change in the contract's value from trade date.
The following is a reconciliation of assets for which significant unobservable inputs (Level 3) were used in determining fair value during the period January 1, 2011, through June 30, 2011:
| | | Beginning
Balance
12/31/10 | | Net
Purchases | | Net Sales | | Total
realized
gain (loss) | | Net
change in
unrealized
appreciation
(depreciation) | | Transfers
out of
Level 3* | | Ending
Balance
06/30/11 | | Net
change in
unrealized
appreciation
(depreciation)
from
Investments
held as of
06/30/11(1) | |
| Holmes Growth Fund | |
Investment in
Securities
Common Stocks: | |
Finance -
Commercial | | $ | 82,723 | | | $ | — | | | $ | — | | | $ | — | | | $ | 226 | | | $ | (82,949 | ) | | $ | — | | | $ | — | | |
Real Estate
Operating/
Development | | | 100,000 | | | | — | | | | — | | | | — | | | | — | | | | — | | | | 100,000 | | | | — | | |
Convertible
Debentures: | |
| Metal - Iron | | | — | | | | 100,000 | | | | — | | | | — | | | | — | | | | — | | | | 100,000 | | | | — | | |
Metal & Mineral
Mining | | | 380,000 | | | | — | | | | — | | | | — | | | | — | | | | — | | | | 380,000 | | | | — | | |
Total Investments in
Securities | | $ | 562,723 | | | $ | 100,000 | | | $ | — | | | $ | — | | | $ | 226 | | | $ | (82,949 | ) | | $ | 580,000 | | | $ | — | | |
139
Notes to Portfolios of Investments (unaudited) June 30, 2011
| | | Beginning
Balance
12/31/10 | | Net
Purchases | | Net Sales | | Total
realized
gain (loss) | | Net
change in
unrealized
appreciation
(depreciation) | | Transfers
out of
Level 3* | | Ending
Balance
06/30/11 | | Net
change in
unrealized
appreciation
(depreciation)
from
Investments
held as of
06/30/11(1) | |
| Global MegaTrends Fund | |
Investments in
Securities
Common Stocks: | |
Electric -
Generation | | $ | 23,358 | | | $ | — | | | $ | — | | | $ | — | | | $ | — | | | $ | — | | | $ | 23,358 | | | $ | — | | |
Energy - Alternate
Sources | | | — | | | | 100,000 | | | | — | | | | — | | | | — | | | | — | | | | 100,000 | | | | — | | |
Real Estate
Operating/
Development | | | 326,533 | | | | — | | | | — | | | | — | | | | — | | | | — | | | | 326,533 | | | | — | | |
Convertible
Debentures: | |
| Metal - Iron | | | — | | | | 100,000 | | | | — | | | | — | | | | — | | | | — | | | | 100,000 | | | | — | | |
Metal & Mineral
Mining | | | 520,000 | | | | — | | | | — | | | | — | | | | — | | | | — | | | | 520,000 | | | | — | | |
Total Investments in
Securities | | $ | 869,891 | | | $ | 200,000 | | | $ | — | | | $ | — | | | $ | — | | | $ | — | | | $ | 1,069,891 | | | $ | — | | |
| Global Resources Fund | |
Investments in
Securities
Common Stocks: | |
| Coal | | $ | 2,400,000 | | | $ | — | | | $ | — | | | $ | — | | | $ | — | | | $ | (2,400,000 | ) | | $ | — | | | $ | — | | |
Electric -
Generation | | | 506,454 | | | | — | | | | (180,676 | ) | | | — | | | | — | | | | — | | | | 325,778 | | | | — | | |
Energy - Alternate
Sources | | | — | | | | 2,400,000 | | | | — | | | | — | | | | — | | | | — | | | | 2,400,000 | | | | — | | |
| Gold Mining | | | — | | | | — | | | | — | | | | — | | | | 5,362 | | | | — | | | | 5,362 | | | | 5,362 | | |
| Metal - Copper | | | — | | | | — | | | | — | | | | — | | | | — | | | | — | | | | — | | | | — | | |
| Mining Services | | | 280,995 | | | | — | | | | — | | | | — | | | | 13,929 | | | | — | | | | 294,924 | | | | 13,929 | | |
Natural Resource
Technology | | | 7,500 | | | | — | | | | — | | | | — | | | | — | | | | — | | | | 7,500 | | | | — | | |
Non - Ferrous
Metals | | | 2,062,500 | | | | — | | | | — | | | | — | | | | 187,500 | | | | — | | | | 2,250,000 | | | | 187,500 | | |
Oil Companies -
Exploration &
Production | | | 33,930,794 | | | | — | | | | — | | | | — | | | | 21,963,749 | | | | — | | | | 55,894,543 | | | | 21,963,749 | | |
Oil Refining &
Marketing | | | 424,402 | | | | — | | | | — | | | | — | | | | 14,455 | | | | — | | | | 438,857 | | | | 14,455 | | |
| Platinum | | | — | | | | — | | | | — | | | | — | | | | — | | | | — | | | | — | | | | — | | |
Real Estate
Operating/
Development | | | 7,443,544 | | | | — | | | | — | | | | — | | | | — | | | | — | | | | 7,443,544 | | | | — | | |
| Warrants: | |
| Mining Services | | | — | | | | — | | | | — | | | | — | | | | — | | | | — | | | | — | | | | — | | |
Oil Companies -
Exploration &
Production | | | 9,165,835 | | | | — | | | | — | | | | — | | | | — | | | | (9,165,835 | ) | | | — | | | | — | | |
Convertible
Debenture: | |
Metal & Mineral
Mining | | | 4,900,000 | | | | — | | | | — | | | | — | | | | — | | | | — | | | | 4,900,000 | | | | — | | |
Total Investments in
Securities | | $ | 61,122,024 | | | $ | 2,400,000 | | | $ | (180,676 | ) | | $ | — | | | $ | 22,184,995 | | | $ | (11,565,835 | ) | | $ | 73,960,508 | | | $ | 22,184,995 | | |
140
Notes to Portfolios of Investments (unaudited) June 30, 2011
| | | Beginning
Balance
12/31/10 | | Net
Purchases | | Net Sales | | Total
realized
gain (loss) | | Net
change in
unrealized
appreciation
(depreciation) | | Transfers
out of
Level 3* | | Ending
Balance
06/30/11 | | Net
change in
unrealized
appreciation
(depreciation)
from
Investments
held as of
06/30/11(1) | |
| World Precious Minerals Fund | |
Investments in
Securities
Common Stocks: | |
Diamonds/Precious
Stones | | $ | — | | | $ | — | | | $ | — | | | $ | — | | | $ | — | | | $ | — | | | $ | — | | | $ | — | | |
| Gold Mining | | | — | | | | 3,220,332 | | | | — | | | | — | | | | 114,722 | | | | — | | | | 3,335,054 | | | | 114,722 | | |
| Metal - Copper | | | — | | | | — | | | | — | | | | — | | | | — | | | | — | | | | — | | | | — | | |
| Metal - Diversified | | | — | | | | — | | | | — | | | | — | | | | — | | | | — | | | | — | | | | — | | |
Oil Companies -
Exploration &
Production | | | — | | | | — | | | | — | | | | — | | | | — | | | | — | | | | — | | | | — | | |
| Platinum | | | — | | | | — | | | | — | | | | — | | | | — | | | | — | | | | — | | | | — | | |
| Warrants: | |
| Gold Mining | | | — | | | | — | | | | — | | | | — | | | | — | | | | — | | | | — | | | | — | | |
| Special Warrants: | |
Gold/Mineral
Exploration &
Development | | | — | | | | — | | | | — | | | | — | | | | 95,868 | | | | — | | | | 95,868 | | | | 95,868 | | |
Convertible
Debenture: | |
| Metal - Iron | | | — | | | | 1,200,000 | | | | — | | | | — | | | | — | | | | — | | | | 1,200,000 | | | | — | | |
Subscription
Receipts: | |
| Gold Mining | | | — | | | | 1,973,981 | | | | — | | | | — | | | | 335,107 | | | | (2,309,088 | ) | | | — | | | | — | | |
Total Investments in
Securities | | $ | — | | | $ | 6,394,313 | | | $ | — | | | $ | — | | | $ | 545,697 | | | $ | (2,309,088 | ) | | $ | 4,630,922 | | | $ | 210,590 | | |
| Global Emerging Markets Fund | |
Investments in
Securities | |
Convertible
Debenture: | |
| Metal - Iron | | $ | — | | | $ | 100,000 | | | $ | — | | | $ | — | | | $ | — | | | $ | — | | | $ | 100,000 | | | $ | — | | |
Total Investments in
Securities | | $ | — | | | $ | 100,000 | | | $ | — | | | $ | — | | | $ | — | | | $ | — | | | $ | 100,000 | | | $ | — | | |
| China Region Fund | |
Investments in
Securities | |
| Common Stocks: | |
Electronic
Components -
Miscellaneous | | $ | — | | | $ | — | | | $ | — | | | $ | — | | | $ | — | | | $ | — | | | $ | — | | | $ | — | | |
Total Investments in
Securities | | $ | — | | | $ | — | | | $ | — | | | $ | — | | | $ | — | | | $ | — | | | $ | — | | | $ | — | | |
* The Funds' policy is to recognize transfers in and transfers out as of the end of the reporting period.
(1) Any difference between Net change in unrealized appreciation (depreciation) from Investments held as of June 30, 2011 may be due to an investment no longer held or categorized as level 3 at period end.
141
Notes to Portfolios of Investments (unaudited) June 30, 2011
Affiliated Companies - Indicated in Portfolio of Investments as "+"
The Investment Company Act of 1940 defines affiliates as companies in which the Fund owns at least 5% of the outstanding voting securities. The following is a summary of transactions with each affiliated company during the period ended June 30, 2011.
| | | Shares of Affiliated Companies | |
| Holmes Growth Fund | | December 31, 2010 | | Additions | | Reductions | | June 30, 2011 | |
IOU Financial, Inc., 144A
(formerly MCO Capital, Inc.) | | | 1,000,000 | | | | 500,000 | | | | — | | | | 1,500,000 | | |
At June 30, 2011, the value of investments in affiliated companies was $497,693, representing 1.16% of net assets, and the total cost was $586,571. There were no realized gains or losses on transactions. There was no income earned for the period.
| | Shares of Affiliated Companies | |
| Global Resources Fund | | December 31, 2010 | | Additions | | Reductions | | June 30, 2011 | |
| Agriterra Ltd. | | | 46,500,000 | | | | 3,840,000 | | | | — | | | | 50,340,000 | | |
| Alange Energy Corp. | | | 26,528,500 | | | | 39,626,400 | | | | (2,108,200 | ) | | | 64,046,700 | | |
Pacific Coal Resources Ltd.
(formerly Pacific Coal, S.A.) | | | 2,400,000 | | | | 16,139,815 | | | | — | | | | 18,539,815 | | |
| Pacific Green Energy Corp. | | | — | | | | 2,400,000 | | | | — | | | | 2,400,000 | | |
| Prima Colombia Hardwood, Inc. | | | 14,965,832 | | | | 100,000 | | | | — | | | | 15,065,832 | | |
| Range Energy Resources, Inc. | | | 15,000,000 | | | | 100,000 | | | | — | | | | 15,100,000 | | |
| Ronter, Inc. | | | 7,568,396 | | | | — | | | | (2,700,000 | ) | | | 4,868,396 | (a) | |
At June 30, 2011, the value of investments in affiliated companies was $36,929,541, representing 4.09% of net assets, and the total cost was $58,217,543. Net realized gains on transactions were $26,865, and there was no income earned for the period.
| | | Shares of Affiliated Companies | |
| World Precious Minerals Fund | | December 31, 2010 | | Additions | | Reductions | | June 30, 2011 | |
| Argent Minerals Ltd. | | | 4,500,000 | | | | 1,125,000 | | | | — | | | | 5,625,000 | | |
| Candente Gold Corp. | | | 5,400,000 | | | | 125,000 | | | | — | | | | 5,525,000 | | |
| Golden Predator Corp. | | | 3,849,000 | | | | 553,113 | | | | (1,692,113 | ) | | | 2,710,000 | (a) | |
| Gran Colombia Gold Corp. | | | 10,813,700 | | | | 11,800,138 | | | | (345,000 | ) | | | 22,268,838 | | |
| Klondex Mines Ltd. | | | 2,620,000 | | | | 280,000 | | | | — | | | | 2,900,000 | | |
| Medoro Resources Ltd. | | | 9,064,174 | | | | 510,000 | | | | (9,574,174 | ) | | | — | (a) | |
| Mirasol Resources Ltd. | | | 1,339,100 | | | | 710,900 | | | | — | | | | 2,050,000 | | |
| Moss Lake Gold Mines Ltd. | | | 3,300,000 | | | | 25,000 | | | | — | | | | 3,325,000 | | |
| PMI Gold Corp. | | | 9,950,000 | | | | 1,190,000 | | | | (50,000 | ) | | | 11,090,000 | | |
| Rochester Resources Ltd. | | | 7,755,000 | | | | — | | | | — | | | | 7,755,000 | | |
| Rockwell Diamonds, Inc. | | | 3,575,000 | | | | — | | | | — | | | | 3,575,000 | | |
| Solvista Gold Corp. | | | — | | | | 2,620,000 | | | | — | | | | 2,620,000 | (a) | |
| Tolima Gold Corp. | | | — | | | | 3,250,000 | | | | — | | | | 3,250,000 | | |
At June 30, 2011, the value of investments in affiliated companies was $50,103,713, representing 8.32% of net assets, and the total cost was $50,327,943. Net realized gains on transactions were $1,037,001, and there was no income earned for the period.
(a) At June 30, 2011, the company is no longer defined as an affiliate, although it was an affiliated company during the year.
142
Notes to Portfolios of Investments (unaudited) June 30, 2011
Restricted Securities - Indicated in Portfolio of Investments as "RS"
The following securities are subject to contractual and regulatory restrictions on resale or transfer. These investments may involve a high degree of business and financial risk. Because of the thinly traded markets for these investments, a Fund may be unable to liquidate its securities in a timely manner, especially if there is negative news regarding the specific securities or the markets overall. These securities could decline significantly in value before the Fund could liquidate these securities. The issuer bears the cost of registration, if any, involved in the disposition of these securities.
| Holmes Growth Fund | | Acquisition
Date | | Cost per
Share/Unit | |
| Grupo Empresarial Ibiza S.A., Convertible Debenture | | 04/19/10 | | $ | 100.00 | | |
| Pacific Infrastructure, Inc. | | 11/22/10 | | $ | 1.00 | | |
| Pacific Iron Corp., Convertible Debenture | | 06/07/11 | | $ | 100.00 | | |
As of June 30, 2011, the total cost of restricted securities was $580,000 and the total value was $580,000, representing 1.36% of net assets.
| Global MegaTrends Fund | | Acquisition
Date | | Cost per
Share/Unit | |
| Grupo Empresarial Ibiza S.A., Convertible Debenture | | 04/19/10 | | $ | 100.00 | | |
| Mongolia Growth Group Ltd., 144A | | 06/21/11 | | $ | 3.61 | | |
| Pacific Green Energy Corp. | | 03/24/11 | | $ | 1.00 | | |
| Pacific Infrastructure, Inc. | | 08/06/10-11/22/10 | | $ | 1.00 | | |
| Pacific Iron Corp., Convertible Debenture | | 06/07/11 | | $ | 100.00 | | |
| Ronter, Inc. | | 08/06/10 | | $ | 0.07 | | |
As of June 30, 2011, the total cost of restricted securities was $1,246,908 and the total value was $1,294,810, representing 6.78% of net assets.
| Global Resources Fund | | Acquisition
Date | | Cost per
Share/Unit | |
| GoviEx Uranium, Inc. | | 10/04/07 | | $ | 1.96 | | |
| Grupo Empresarial Ibiza S.A., Convertible Debenture | | 04/19/10 | | $ | 100.00 | | |
| HRT Participacoes Em Petroleo | | 10/28/09 | | $ | 141.20 | | |
| I-Pulse, Inc. | | 10/04/07 | | $ | 1.88 | | |
| Mongolia Growth Group Ltd., 144A | | 06/21/11 | | $ | 3.61 | | |
| Osmium Holdings S.A. | | 10/22/96-01/29/98 | | $ | 987.07 | | |
| Pacific Coal Resources Ltd., 144A | | 09/10/10 | | $ | 1.00 | | |
| Pacific Green Energy Corp. | | 03/24/11 | | $ | 1.00 | | |
| Pacific Infrastructure, Inc. | | 08/06/10-11/22/10 | | $ | 1.00 | | |
| Ronter, Inc. | | 08/06/10 | | $ | 0.07 | | |
| Value Creation, Inc. | | 08/11/06 | | $ | 10.60 | | |
As of June 30, 2011, the total cost of restricted securities was $31,873,641 and the total value was $75,399,551, representing 8.34% of net assets.
| World Precious Minerals Fund | | Acquisition
Date | | Cost per
Share/Unit | |
| Miocene Metals Ltd., Special Warrants (October 2011) | | 04/28/10 | | $ | 0.00 | | |
| Osmium Holdings S.A. | | 10/22/96-01/29/98 | | $ | 1,280.75 | | |
| Pacific Iron Corp., Convertible Debenture | | 06/07/11 | | $ | 100.00 | | |
| Taurus Gold Ltd. | | 05/31/11 | | $ | 1.18 | | |
| Tigray Resources, Inc. | | 06/29/11 | | $ | 0.00 | | |
143
Notes to Portfolios of Investments (unaudited) June 30, 2011
| World Precious Minerals Fund (Cont'd) | | Acquisition
Date | | Cost per
Share/Unit | |
| Tolima Gold Corp., 144A | | 03/18/11 | | $ | 0.41 | | |
| Tolima Gold Corp., 144A, Warrants (March 2013) | | 03/18/11 | | $ | 0.00 | | |
Western Exploration & Development Ltd., 144A, Special Warrants
(December 2049) | | 08/14/97 | | $ | 0.50 | | |
As of June 30, 2011, the total cost of restricted securities was $5,861,478 and the total value was $4,543,785, representing 0.75% of net assets.
| Global Emerging Markets Fund | | Acquisition
Date | | Cost per
Share/Unit | |
| Pacific Iron Corp., Convertible Debenture | | 06/07/11 | | $ | 100.00 | | |
As of June 30, 2011, the total cost of restricted securities was $100,000 and the total value was $100,000, representing 0.83% of net assets.
| China Region Fund | | Acquisition
Date | | Cost per
Share/Unit | |
| Mongolia Growth Group Ltd., 144A | | 06/21/11 | | $ | 3.61 | | |
As of June 30, 2011, the total cost of restricted securities was $451,296 and the total value was $573,773, representing 1.35% of net assets.
144
[THIS PAGE INTENTIONALLY LEFT BLANK]
Statements of Assets and Liabilities (unaudited)
| | | U.S. Treasury
Securities
Cash Fund | | U.S. Government
Securities
Savings Fund | |
| Investments, at identified cost | | $ | 77,308,262 | | | $ | 140,072,876 | | |
| ASSETS | |
| Investments, at value: | |
| Securities | | $ | 29,999,226 | | | $ | 140,072,876 | | |
| Repurchase agreements | | | 47,309,036 | | | | — | | |
| Cash | | | 18,200,000 | | | | 50,752,267 | | |
| Receivables: | |
| Investments sold | | | — | | | | — | | |
| Interest | | | 7 | | | | 78,172 | | |
| Capital shares sold | | | 638,706 | | | | 197,170 | | |
| From adviser | | | 31,423 | | | | 32,902 | | |
| Other assets | | | 12,379 | | | | 18,767 | | |
| Total Assets | | | 96,190,777 | | | | 191,152,154 | | |
| LIABILITIES | |
| Payables: | |
| Investments purchased | | | — | | | | 2,022,658 | | |
| Capital shares redeemed | | | 151,868 | | | | 190,940 | | |
| Dividends and distributions | | | — | | | | — | | |
| Accounts payable and accrued expenses | | | 38,739 | | | | 52,144 | | |
| Total Liabilities | | | 190,607 | | | | 2,265,742 | | |
| Net Assets | | $ | 96,000,170 | | | $ | 188,886,412 | | |
| NET ASSETS CONSIST OF: | |
| Paid-in capital | | $ | 95,999,263 | | | $ | 188,885,375 | | |
| Accumulated undistributed net investment income | | | 907 | | | | — | | |
| Accumulated net realized gain (loss) on investments | | | — | | | | 1,037 | | |
| Net unrealized appreciation of investments | | | — | | | | — | | |
| Net assets applicable to capital shares outstanding | | $ | 96,000,170 | | | $ | 188,886,412 | | |
| By share class | |
| Net Assets | |
| Investor class | | $ | 96,000,170 | | | $ | 188,886,412 | | |
Capital shares outstanding, an unlimited number of
no par shares authorized | |
| Investor class | | | 96,075,423 | | | | 189,053,619 | | |
Net Asset Value, Public Offering Price, Redemption
Price, per share | |
| Investor class | | $ | 1.00 | | | $ | 1.00 | | |
See accompanying notes to financial statements.
146
June 30, 2011
| | | Near-Term
Tax Free Fund | | Tax Free
Fund | |
| Investments, at identified cost | | $ | 27,324,258 | | | $ | 17,880,570 | | |
| ASSETS | |
| Investments, at value: | |
| Securities | | $ | 28,207,700 | | | $ | 18,450,225 | | |
| Repurchase agreements | | | — | | | | — | | |
| Cash | | | 3,900,575 | | | | 1,689,987 | | |
| Receivables: | |
| Investments sold | | | 25,000 | | | | 30,000 | | |
| Interest | | | 334,204 | | | | 258,233 | | |
| Capital shares sold | | | 17,621 | | | | 851 | | |
| From adviser | | | 5,716 | | | | 3,030 | | |
| Other assets | | | 2,485 | | | | 2,659 | | |
| Total Assets | | | 32,493,301 | | | | 20,434,985 | | |
| LIABILITIES | |
| Payables: | |
| Investments purchased | | | 611,502 | | | | 312,321 | | |
| Capital shares redeemed | | | 24,432 | | | | 1,311 | | |
| Dividends and distributions | | | 8,844 | | | | 11,101 | | |
| Accounts payable and accrued expenses | | | 25,627 | | | | 26,636 | | |
| Total Liabilities | | | 670,405 | | | | 351,369 | | |
| Net Assets | | $ | 31,822,896 | | | $ | 20,083,616 | | |
| NET ASSETS CONSIST OF: | |
| Paid-in capital | | $ | 31,219,797 | | | $ | 19,946,207 | | |
| Accumulated undistributed net investment income | | | 14,238 | | | | 35,951 | | |
| Accumulated net realized gain (loss) on investments | | | (294,581 | ) | | | (468,196 | ) | |
| Net unrealized appreciation of investments | | | 883,442 | | | | 569,654 | | |
| Net assets applicable to capital shares outstanding | | $ | 31,822,896 | | | $ | 20,083,616 | | |
| By share class | |
| Net Assets | |
| Investor class | | $ | 31,822,896 | | | $ | 20,083,616 | | |
Capital shares outstanding, an unlimited number of
no par shares authorized | |
| Investor class | | | 14,207,365 | | | | 1,635,224 | | |
Net Asset Value, Public Offering Price, Redemption
Price, per share | |
| Investor class | | $ | 2.24 | | | $ | 12.28 | | |
147
Statements of Assets and Liabilities (unaudited)
| | | All American
Equity Fund | | Holmes
Growth
Fund | | Global
MegaTrends
Fund | |
| Investments, at identified cost | | $ | 16,909,758 | | | $ | 34,109,677 | | | $ | 15,250,418 | | |
| ASSETS | |
| Investments, at value: | |
| Securities of unaffiliated issuers | | $ | 17,687,047 | | | $ | 39,235,032 | | | $ | 17,603,783 | | |
| Securities of affiliated issuers | | | — | | | | 497,693 | | | | — | | |
| Repurchase agreements | | | — | | | | — | | | | — | | |
| Cash | | | 1,022,922 | | | | 3,955,875 | | | | 2,581,297 | | |
| Foreign currencies (Cost $0,$0,$953,$1,157,939 and $31,299) | | | — | | | | — | | | | 953 | | |
| Receivables: | |
| Investments sold | | | 176,768 | | | | 1,810,606 | | | | 301,239 | | |
| Dividends and interest | | | 10,906 | | | | 31,316 | | | | 54,657 | | |
| Capital shares sold | | | 1,613 | | | | 665 | | | | 538 | | |
| Other assets | | | 7,616 | | | | 9,396 | | | | 8,941 | | |
| Total Assets | | | 18,906,872 | | | | 45,540,583 | | | | 20,551,408 | | |
| LIABILITIES | |
| Payables: | |
| Investments purchased | | | 487,828 | | | | 2,673,427 | | | | 1,406,870 | | |
| Capital shares redeemed | | | 5,239 | | | | 31,473 | | | | 794 | | |
| Adviser and affiliates | | | 13,154 | | | | 45,217 | | | | 12,083 | | |
| Accounts payable and accrued expenses | | | 30,992 | | | | 32,811 | | | | 37,660 | | |
| Unrealized depreciation on foreign currency exchange contracts - Note 2 B | | | — | | | | — | | | | — | | |
| Due to custodian | | | — | | | | — | | | | — | | |
| Total Liabilities | | | 537,213 | | | | 2,782,928 | | | | 1,457,407 | | |
| Net Assets | | $ | 18,369,659 | | | $ | 42,757,655 | | | $ | 19,094,001 | | |
| NET ASSETS CONSIST OF: | |
| Paid-in capital | | $ | 18,535,737 | | | $ | 37,044,982 | | | $ | 30,027,454 | | |
Accumulated undistributed net investment income (distributions
in excess of net investment income) | | | (25,601 | ) | | | (685,994 | ) | | | 116,000 | | |
| Accumulated net realized gain (loss) on investments and foreign currencies | | | (917,766 | ) | | | 775,620 | | | | (13,402,727 | ) | |
Net unrealized appreciation of investments and other assets and
liabilities denominated in foreign currencies | | | 777,289 | | | | 5,623,047 | | | | 2,353,274 | | |
| Net assets applicable to capital shares outstanding | | $ | 18,369,659 | | | $ | 42,757,655 | | | $ | 19,094,001 | | |
| By share class | |
| Net Assets | |
| Investor class | | $ | 18,369,659 | | | $ | 42,757,655 | | | $ | 15,388,972 | | |
| Institutional class | | | n/a | | | | n/a | | | | 3,705,029 | | |
Capital shares outstanding, an unlimited number of
no par shares authorized | |
| Investor class | | | 766,051 | | | | 2,130,923 | | | | 1,744,978 | | |
| Institutional class | | | n/a | | | | n/a | | | | 421,246 | | |
Net Asset Value, Public Offering Price, Redemption
Price, per share | |
| Investor class | | $ | 23.98 | | | $ | 20.07 | | | $ | 8.82 | | |
| Institutional class | | | n/a | | | | n/a | | | | 8.80 | | |
See accompanying notes to financial statements.
148
June 30, 2011
| | | Global
Resources
Fund | | World Precious
Minerals Fund | |
| Investments, at identified cost | | $ | 862,709,340 | | | $ | 562,921,758 | | |
| ASSETS | |
| Investments, at value: | |
| Securities of unaffiliated issuers | | $ | 838,303,621 | | | $ | 491,831,615 | | |
| Securities of affiliated issuers | | | 36,929,541 | | | | 50,103,713 | | |
| Repurchase agreements | | | 38,270,408 | | | | 57,779,705 | | |
| Cash | | | — | | | | — | | |
| Foreign currencies (Cost $0,$0,$953,$1,157,939 and $31,299) | | | 1,157,579 | | | | 31,289 | | |
| Receivables: | |
| Investments sold | | | 105,465 | | | | 3,873,777 | | |
| Dividends and interest | | | 316,337 | | | | 103,237 | | |
| Capital shares sold | | | 612,752 | | | | 280,245 | | |
| Other assets | | | 50,396 | | | | 51,061 | | |
| Total Assets | | | 915,746,099 | | | | 604,054,642 | | |
| LIABILITIES | |
| Payables: | |
| Investments purchased | | | 9,400,831 | | | | 59,238 | | |
| Capital shares redeemed | | | 1,260,859 | | | | 547,568 | | |
| Adviser and affiliates | | | 920,718 | | | | 821,101 | | |
| Accounts payable and accrued expenses | | | 218,808 | | | | 243,910 | | |
| Unrealized depreciation on foreign currency exchange contracts - Note 2 B | | | — | | | | 35,165 | | |
| Due to custodian | | | 18,988 | | | | — | | |
| Total Liabilities | | | 11,820,204 | | | | 1,706,982 | | |
| Net Assets | | $ | 903,925,895 | | | $ | 602,347,660 | | |
| NET ASSETS CONSIST OF: | |
| Paid-in capital | | $ | 1,157,724,566 | | | $ | 674,708,807 | | |
Accumulated undistributed net investment income (distributions
in excess of net investment income) | | | (24,193,401 | ) | | | (77,725,142 | ) | |
| Accumulated net realized gain (loss) on investments and foreign currencies | | | (280,378,637 | ) | | | (31,429,241 | ) | |
Net unrealized appreciation of investments and other assets and
liabilities denominated in foreign currencies | | | 50,773,367 | | | | 36,793,236 | | |
| Net assets applicable to capital shares outstanding | | $ | 903,925,895 | | | $ | 602,347,660 | | |
| By share class | |
| Net Assets | |
| Investor class | | $ | 866,908,198 | | | $ | 599,844,620 | | |
| Institutional class | | | 37,017,697 | | | | 2,503,040 | | |
Capital shares outstanding, an unlimited number of
no par shares authorized | |
| Investor class | | | 74,190,407 | | | | 32,835,349 | | |
| Institutional class | | | 3,143,022 | | | | 136,639 | | |
Net Asset Value, Public Offering Price, Redemption
Price, per share | |
| Investor class | | $ | 11.68 | | | $ | 18.27 | | |
| Institutional class | | | 11.78 | | | | 18.32 | | |
149
Statements of Assets and Liabilities (unaudited)
| | | Gold and Precious
Metals Fund | | Eastern European
Fund | |
| Investments, at identified cost | | $ | 226,524,240 | | | $ | 250,489,390 | | |
| ASSETS | |
| Investments, at value: | |
| Securities | | $ | 195,269,744 | | | $ | 319,782,092 | | |
| Repurchase agreements | | | 39,760,192 | | | | 18,835,445 | | |
| Cash | | | — | | | | — | | |
| Foreign currencies (Cost $2,226,$0,$155,545 and $275,854) | | | 2,225 | | | | — | | |
| Receivables: | |
| Investments sold | | | 3,292,720 | | | | 7,374,807 | | |
| Dividends and interest | | | 145,857 | | | | 2,700,975 | | |
| Capital shares sold | | | 160,791 | | | | 8,080 | | |
| Other assets | | | 30,166 | | | | 32,282 | | |
| Total Assets | | | 238,661,695 | | | | 348,733,681 | | |
| LIABILITIES | |
| Payables: | |
| Investments purchased | | | 36,674 | | | | 1,083,915 | | |
| Capital shares redeemed | | | 110,959 | | | | 258,510 | | |
| Adviser and affiliates | | | 243,581 | | | | 371,655 | | |
| Accounts payable and accrued expenses | | | 100,989 | | | | 187,992 | | |
| Written options at value (Premiums $0,$254,523,$0 and $0) | | | — | | | | 241,948 | | |
| Unrealized depreciation on foreign currency exchange contracts - Note 2 B | | | 5,716 | | | | — | | |
| Due to custodian | | | — | | | | — | | |
| Total Liabilities | | | 497,919 | | | | 2,144,020 | | |
| Net Assets | | $ | 238,163,776 | | | $ | 346,589,661 | | |
| NET ASSETS CONSIST OF: | |
| Paid-in capital | | $ | 201,819,290 | | | $ | 575,917,502 | | |
Accumulated undistributed net investment income (distributions
in excess of net investment income) | | | (5,941,713 | ) | | | 248,256 | | |
| Accumulated net realized gain (loss) on investments and foreign currencies | | | 33,771,832 | | | | (317,765,968 | ) | |
Net unrealized appreciation of investments and other assets and
liabilities denominated in foreign currencies | | | 8,514,367 | | | | 88,189,871 | | |
| Net assets applicable to capital shares outstanding | | $ | 238,163,776 | | | $ | 346,589,661 | | |
| By share class | |
| Net Assets | |
| Investor class | | $ | 238,163,776 | | | $ | 346,589,661 | | |
Capital shares outstanding, an unlimited number
of no par shares authorized | |
| Investor class | | | 14,364,573 | | | | 31,924,269 | | |
Net Asset Value, Public Offering Price,
Redemption Price, per share | |
| Investor class | | $ | 16.58 | | | $ | 10.86 | | |
See accompanying notes to financial statements.
150
June 30, 2011
| | | Global Emerging
Markets Fund | | China Region
Fund | |
| Investments, at identified cost | | $ | 10,329,631 | | | $ | 39,602,131 | | |
| ASSETS | |
| Investments, at value: | |
| Securities | | $ | 10,958,478 | | | $ | 40,859,042 | | |
| Repurchase agreements | | | — | | | | — | | |
| Cash | | | 886,265 | | | | — | | |
| Foreign currencies (Cost $2,226,$0,$155,545 and $275,854) | | | 155,813 | | | | 276,012 | | |
| Receivables: | |
| Investments sold | | | 322,710 | | | | 1,802,974 | | |
| Dividends and interest | | | 61,473 | | | | 132,328 | | |
| Capital shares sold | | | 665 | | | | 749 | | |
| Other assets | | | 14,001 | | | | 12,216 | | |
| Total Assets | | | 12,399,405 | | | | 43,083,321 | | |
| LIABILITIES | |
| Payables: | |
| Investments purchased | | | 355,712 | | | | 104,816 | | |
| Capital shares redeemed | | | 5,029 | | | | 75,207 | | |
| Adviser and affiliates | | | 6,044 | | | | 55,154 | | |
| Accounts payable and accrued expenses | | | 53,384 | | | | 59,058 | | |
| Written options at value (Premiums $0,$254,523,$0 and $0) | | | — | | | | — | | |
| Unrealized depreciation on foreign currency exchange contracts - Note 2 B | | | — | | | | — | | |
| Due to custodian | | | — | | | | 287,985 | | |
| Total Liabilities | | | 420,169 | | | | 582,220 | | |
| Net Assets | | $ | 11,979,236 | | | $ | 42,501,101 | | |
| NET ASSETS CONSIST OF: | |
| Paid-in capital | | $ | 22,990,676 | | | $ | 54,793,937 | | |
Accumulated undistributed net investment income (distributions
in excess of net investment income) | | | (95,431 | ) | | | (532,534 | ) | |
| Accumulated net realized gain (loss) on investments and foreign currencies | | | (11,545,723 | ) | | | (13,019,242 | ) | |
Net unrealized appreciation of investments and other assets and
liabilities denominated in foreign currencies | | | 629,714 | | | | 1,258,940 | | |
| Net assets applicable to capital shares outstanding | | $ | 11,979,236 | | | $ | 42,501,101 | | |
| By share class | |
| Net Assets | |
| Investor class | | $ | 11,979,236 | | | $ | 42,501,101 | | |
Capital shares outstanding, an unlimited number
of no par shares authorized | |
| Investor class | | | 1,348,903 | | | | 4,821,704 | | |
Net Asset Value, Public Offering Price,
Redemption Price, per share | |
| Investor class | | $ | 8.88 | | | $ | 8.81 | | |
151
Statements of Operations (unaudited)
| NET INVESTMENT INCOME | | U.S. Treasury
Securities
Cash Fund | | U.S. Government
Securities
Savings Fund | |
| Income: | |
| Interest and other | | $ | 47,777 | | | $ | 92,057 | | |
| Expenses: | |
| Management fee | | | 244,586 | | | | 491,265 | | |
| Administrative services fee | | | 39,134 | | | | 78,602 | | |
| Transfer agent fees and expenses | | | 103,630 | | | | 121,607 | | |
| Accounting service fees and expenses | | | 9,459 | | | | 16,557 | | |
| Professional fees | | | 16,343 | | | | 20,341 | | |
| Custodian fees | | | 30,703 | | | | 25,959 | | |
| Shareholder reporting expenses | | | 10,889 | | | | 14,270 | | |
| Registration fees | | | 12,019 | | | | 10,791 | | |
| Trustee fees and expenses | | | 9,441 | | | | 9,441 | | |
| Miscellaneous expenses | | | 15,704 | | | | 24,946 | | |
| Total expenses before reductions | | | 491,908 | | | | 813,779 | | |
| Expenses offset - Note 1 H | | | (760 | ) | | | — | | |
| Expenses reimbursed - Note 3 | | | (448,266 | ) | | | (731,547 | ) | |
| Net Expenses | | | 42,882 | | | | 82,232 | | |
| Net Investment Income | | | 4,895 | | | | 9,825 | | |
NET REALIZED AND UNREALIZED
GAIN (LOSS) ON INVESTMENTS | |
| Realized loss from securities | | | — | | | | — | | |
| Net change in unrealized appreciation of investments | | | — | | | | — | | |
| Net Realized and Unrealized Gain on Investments | | | — | | | | — | | |
Net Increase In Net Assets
Resulting From Operations | | $ | 4,895 | | | $ | 9,825 | | |
See accompanying notes to financial statements.
152
For the Six Months Ended June 30, 2011
| NET INVESTMENT INCOME | | Near-Term
Tax Free Fund | | Tax Free
Fund | |
| Income: | |
| Interest and other | | $ | 430,369 | | | $ | 430,842 | | |
| Expenses: | |
| Management fee | | | 72,465 | | | | 72,204 | | |
| Administrative services fee | | | 11,594 | | | | 7,702 | | |
| Transfer agent fees and expenses | | | 26,409 | | | | 23,223 | | |
| Accounting service fees and expenses | | | 22,753 | | | | 17,486 | | |
| Professional fees | | | 18,805 | | | | 17,617 | | |
| Custodian fees | | | 7,563 | | | | 6,199 | | |
| Shareholder reporting expenses | | | 3,340 | | | | 3,415 | | |
| Registration fees | | | 7,769 | | | | 7,527 | | |
| Trustee fees and expenses | | | 9,441 | | | | 9,441 | | |
| Miscellaneous expenses | | | 3,833 | | | | 4,012 | | |
| Total expenses before reductions | | | 183,972 | | | | 168,826 | | |
| Expenses offset - Note 1 H | | | (184 | ) | | | (85 | ) | |
| Expenses reimbursed - Note 3 | | | (118,569 | ) | | | (101,351 | ) | |
| Net Expenses | | | 65,219 | | | | 67,390 | | |
| Net Investment Income | | | 365,150 | | | | 363,452 | | |
NET REALIZED AND UNREALIZED
GAIN (LOSS) ON INVESTMENTS | |
| Realized loss from securities | | | (3,344 | ) | | | (10,965 | ) | |
| Net change in unrealized appreciation of investments | | | 276,702 | | | | 428,929 | | |
| Net Realized and Unrealized Gain on Investments | | | 273,358 | | | | 417,964 | | |
Net Increase In Net Assets
Resulting From Operations | | $ | 638,508 | | | $ | 781,416 | | |
153
Statements of Operations (unaudited)
| NET INVESTMENT INCOME | | All American
Equity Fund | | Holmes
Growth
Fund | | Global
MegaTrends
Fund | |
| Income: | |
| Dividends from unaffiliated issuers | | $ | 166,003 | | | $ | 113,523 | | | $ | 238,259 | | |
| Foreign tax withheld on dividends | | | — | | | | (2,711 | ) | | | (14,588 | ) | |
| Net dividends | | | 166,003 | | | | 110,812 | | | | 223,671 | | |
| Interest and other | | | 252 | | | | 25,035 | | | | 33,247 | | |
| Total income | | | 166,255 | | | | 135,847 | | | | 256,918 | | |
| Expenses: | |
| Management fee | | | 73,300 | | | | 233,868 | | | | 86,098 | | |
| Administrative services fee | | | 7,330 | | | | 16,849 | | | | 3,795 | | |
| Administrative services fee - Investor class | | | — | | | | — | | | | 3,213 | | |
| Administrative services fee - Institutional class | | | — | | | | — | | | | 582 | | |
| Transfer agent fees and expenses - Investor class | | | 44,649 | | | | 44,733 | | | | 32,943 | | |
| Transfer agent fees and expenses - Institutional class | | | — | | | | — | | | | 9,007 | | |
| Accounting service fees and expenses | | | 10,382 | | | | 13,843 | | | | 16,314 | | |
| Professional fees | | | 18,077 | | | | 18,564 | | | | 19,480 | | |
| Professional fees - Investor class | | | — | | | | — | | | | 516 | | |
| Professional fees - Institutional class | | | — | | | | — | | | | 1,396 | | |
| Distribution plan fee | | | 22,906 | | | | 52,653 | | | | 20,084 | | |
| Custodian fees | | | 8,646 | | | | 17,456 | | | | 18,661 | | |
| Shareholder reporting expenses - Investor class | | | 10,770 | | | | 7,885 | | | | 5,744 | | |
| Shareholder reporting expenses - Institutional class | | | — | | | | — | | | | 203 | | |
| Registration fees | | | 7,672 | | | | 7,851 | | | | 3,613 | | |
| Registration fees - Investor class | | | — | | | | — | | | | 4,215 | | |
| Registration fees - Institutional class | | | — | | | | — | | | | 6,172 | | |
| Trustee fees and expenses | | | 9,441 | | | | 9,441 | | | | 9,507 | | |
| Miscellaneous expenses | | | 10,344 | | | | 12,430 | | | | 11,868 | | |
| Total expenses before reductions | | | 223,517 | | | | 435,573 | | | | 253,411 | | |
| Expenses offset - Note 1 H | | | (127 | ) | | | (184 | ) | | | (147 | ) | |
| Expenses reimbursed - Note 3 | | | (21,816 | ) | | | — | | | | (42,710 | ) | |
| Net Expenses | | | 201,574 | | | | 435,389 | | | | 210,554 | | |
| Net Investment Income (Loss) | | | (35,319 | ) | | | (299,542 | ) | | | 46,364 | | |
NET REALIZED AND UNREALIZED
GAIN (LOSS) ON INVESTMENTS | |
| Realized gain (loss) from: | |
| Securities from unaffiliated issuers | | | 2,907,701 | | | | 5,076,349 | | | | 1,448,207 | | |
| Securities from affiliated issuers | | | — | | | | — | | | | — | | |
| Written options | | | 27,703 | | | | 148,050 | | | | — | | |
| Foreign currency transactions | | | 2 | | | | 1,658 | | | | (1,896 | ) | |
| Net realized gain | | | 2,935,406 | | | | 5,226,057 | | | | 1,446,311 | | |
| Net change in unrealized appreciation (depreciation) of: | |
| Investments | | | (1,899,772 | ) | | | (1,914,306 | ) | | | (1,485,038 | ) | |
| Other assets and liabilities denominated in foreign currencies | | | — | | | | 126 | | | | (123 | ) | |
| Net unrealized depreciation | | | (1,899,772 | ) | | | (1,914,180 | ) | | | (1,485,161 | ) | |
| Net Realized and Unrealized Gain (Loss) on Investments | | | 1,035,634 | | | | 3,311,877 | | | | (38,850 | ) | |
Net Increase (Decrease) In Net Assets
Resulting From Operations | | $ | 1,000,315 | | | $ | 3,012,335 | | | $ | 7,514 | | |
See accompanying notes to financial statements.
154
For the Six Months Ended June 30, 2011
| NET INVESTMENT INCOME | | Global
Resources
Fund | | World Precious
Minerals Fund | |
| Income: | |
| Dividends from unaffiliated issuers | | $ | 3,457,606 | | | $ | 675,943 | | |
| Foreign tax withheld on dividends | | | (134,857 | ) | | | (98,352 | ) | |
| Net dividends | | | 3,322,749 | | | | 577,591 | | |
| Interest and other | | | 347,068 | | | | 29,602 | | |
| Total income | | | 3,669,817 | | | | 607,193 | | |
| Expenses: | |
| Management fee | | | 5,579,352 | | | | 4,154,158 | | |
| Administrative services fee | | | 206,610 | | | | 145,477 | | |
| Administrative services fee - Investor class | | | 203,086 | | | | 145,079 | | |
| Administrative services fee - Institutional class | | | 3,524 | | | | 398 | | |
| Transfer agent fees and expenses - Investor class | | | 1,030,289 | | | | 688,813 | | |
| Transfer agent fees and expenses - Institutional class | | | 13,170 | | | | 8,575 | | |
| Accounting service fees and expenses | | | 166,884 | | | | 125,815 | | |
| Professional fees | | | 48,653 | | | | 53,354 | | |
| Professional fees - Investor class | | | 557 | | | | 538 | | |
| Professional fees - Institutional class | | | 1,363 | | | | 1,201 | | |
| Distribution plan fee | | | 1,269,288 | | | | 906,745 | | |
| Custodian fees | | | 112,845 | | | | 146,120 | | |
| Shareholder reporting expenses - Investor class | | | 109,559 | | | | 66,247 | | |
| Shareholder reporting expenses - Institutional class | | | 559 | | | | 269 | | |
| Registration fees | | | 9,526 | | | | 9,709 | | |
| Registration fees - Investor class | | | 13,604 | | | | 8,261 | | |
| Registration fees - Institutional class | | | 6,622 | | | | 6,131 | | |
| Trustee fees and expenses | | | 9,494 | | | | 9,494 | | |
| Miscellaneous expenses | | | 67,087 | | | | 67,465 | | |
| Total expenses before reductions | | | 8,852,072 | | | | 6,543,849 | | |
| Expenses offset - Note 1 H | | | (271 | ) | | | (170 | ) | |
| Expenses reimbursed - Note 3 | | | (25,238 | ) | | | (16,574 | ) | |
| Net Expenses | | | 8,826,563 | | | | 6,527,105 | | |
| Net Investment Income (Loss) | | | (5,156,746 | ) | | | (5,919,912 | ) | |
NET REALIZED AND UNREALIZED
GAIN (LOSS) ON INVESTMENTS | |
| Realized gain (loss) from: | |
| Securities from unaffiliated issuers | | | 128,824,042 | | | | 62,129,024 | | |
| Securities from affiliated issuers | | | 26,865 | | | | 1,037,001 | | |
| Written options | | | (105,112 | ) | | | (395,325 | ) | |
| Foreign currency transactions | | | (286,502 | ) | | | (212,221 | ) | |
| Net realized gain | | | 128,459,293 | | | | 62,558,479 | | |
| Net change in unrealized appreciation (depreciation) of: | |
| Investments | | | (146,014,180 | ) | | | (197,140,862 | ) | |
| Other assets and liabilities denominated in foreign currencies | | | (19,650 | ) | | | (48,769 | ) | |
| Net unrealized depreciation | | | (146,033,830 | ) | | | (197,189,631 | ) | |
| Net Realized and Unrealized Gain (Loss) on Investments | | | (17,574,537 | ) | | | (134,631,152 | ) | |
Net Increase (Decrease) In Net Assets
Resulting From Operations | | $ | (22,731,283 | ) | | $ | (140,551,064 | ) | |
155
Statements of Operations (unaudited)
| NET INVESTMENT INCOME | | Gold and Precious
Metals Fund | | Eastern European
Fund | |
| Income: | |
| Dividends from unaffiliated issuers | | $ | 382,652 | | | $ | 5,494,930 | | |
| Foreign tax withheld on dividends | | | (51,144 | ) | | | (815,263 | ) | |
| Net dividends | | | 331,508 | | | | 4,679,667 | | |
| Interest and other | | | 138,892 | | | | 6,075 | | |
| Total income | | | 470,400 | | | | 4,685,742 | | |
| Expenses: | |
| Management fee | | | 1,308,681 | | | | 2,363,666 | | |
| Administrative services fee | | | 107,007 | | | | 162,518 | | |
| Transfer agent fees and expenses | | | 220,748 | | | | 474,163 | | |
| Accounting service fees and expenses | | | 54,936 | | | | 74,138 | | |
| Professional fees | | | 27,961 | | | | 29,405 | | |
| Distribution plan fee | | | 334,397 | | | | 507,868 | | |
| Custodian fees | | | 67,607 | | | | 257,024 | | |
| Shareholder reporting expenses | | | 41,212 | | | | 54,622 | | |
| Registration fees | | | 16,002 | | | | 12,219 | | |
| Trustee fees and expenses | | | 9,494 | | | | 9,441 | | |
| Miscellaneous expenses | | | 38,906 | | | | 43,150 | | |
| Total expenses before reductions | | | 2,226,951 | | | | 3,988,214 | | |
| Expenses offset - Note 1 H | | | (108 | ) | | | (287 | ) | |
| Expenses reimbursed - Note 3 | | | — | | | | — | | |
| Net Expenses | | | 2,226,843 | | | | 3,987,927 | | |
| Net Investment Income (Loss) | | | (1,756,443 | ) | | | 697,815 | | |
NET REALIZED AND UNREALIZED
GAIN (LOSS) ON INVESTMENTS | |
| Realized gain (loss) from: | |
| Securities from unaffiliated issuers | | | 35,306,131 | | | | 56,756,178 | | |
| Written options | | | (36,724 | ) | | | 128,755 | | |
| Foreign currency transactions | | | (63,790 | ) | | | (115,954 | ) | |
| Net realized gain | | | 35,205,617 | | | | 56,768,979 | | |
| Net change in unrealized appreciation (depreciation) of: | |
| Investments | | | (79,051,595 | ) | | | (54,202,481 | ) | |
| Written options | | | — | | | | 12,575 | | |
| Other assets and liabilities denominated in foreign currencies | | | 9,403 | | | | 33,144 | | |
| Net unrealized depreciation | | | (79,042,192 | ) | | | (54,156,762 | ) | |
| Net Realized and Unrealized Gain (Loss) on Investments | | | (43,836,575 | ) | | | 2,612,217 | | |
Net Increase (Decrease) In Net Assets
Resulting From Operations | | $ | (45,593,018 | ) | | $ | 3,310,032 | | |
See accompanying notes to financial statements.
156
For the Six Months Ended June 30, 2011
| NET INVESTMENT INCOME | | Global Emerging
Markets Fund | | China Region
Fund | |
| Income: | |
| Dividends from unaffiliated issuers | | $ | 170,000 | | | $ | 528,589 | | |
| Foreign tax withheld on dividends | | | (17,603 | ) | | | (31,294 | ) | |
| Net dividends | | | 152,397 | | | | 497,295 | | |
| Interest and other | | | 210 | | | | 1,113 | | |
| Total income | | | 152,607 | | | | 498,408 | | |
| Expenses: | |
| Management fee | | | 78,114 | | | | 298,158 | | |
| Administrative services fee | | | 5,011 | | | | 19,082 | | |
| Transfer agent fees and expenses | | | 31,543 | | | | 75,781 | | |
| Accounting service fees and expenses | | | 15,216 | | | | 20,549 | | |
| Professional fees | | | 24,613 | | | | 23,910 | | |
| Distribution plan fee | | | 15,661 | | | | 59,632 | | |
| Custodian fees | | | 26,269 | | | | 31,644 | | |
| Shareholder reporting expenses | | | 5,863 | | | | 15,039 | | |
| Registration fees | | | 6,975 | | | | 7,223 | | |
| Trustee fees and expenses | | | 9,494 | | | | 9,494 | | |
| Miscellaneous expenses | | | 15,225 | | | | 16,195 | | |
| Total expenses before reductions | | | 233,984 | | | | 576,707 | | |
| Expenses offset - Note 1 H | | | (84 | ) | | | (100 | ) | |
| Expenses reimbursed - Note 3 | | | (44,592 | ) | | | (483 | ) | |
| Net Expenses | | | 189,308 | | | | 576,124 | | |
| Net Investment Income (Loss) | | | (36,701 | ) | | | (77,716 | ) | |
NET REALIZED AND UNREALIZED
GAIN (LOSS) ON INVESTMENTS | |
| Realized gain (loss) from: | |
| Securities from unaffiliated issuers | | | 722,343 | | | | 1,996,482 | | |
| Written options | | | 9,003 | | | | 85,791 | | |
| Foreign currency transactions | | | (1,469 | ) | | | (21,622 | ) | |
| Net realized gain | | | 729,877 | | | | 2,060,651 | | |
| Net change in unrealized appreciation (depreciation) of: | |
| Investments | | | (1,100,844 | ) | | | (5,367,229 | ) | |
| Written options | | | — | | | | — | | |
| Other assets and liabilities denominated in foreign currencies | | | (6,594 | ) | | | 2,031 | | |
| Net unrealized depreciation | | | (1,107,438 | ) | | | (5,365,198 | ) | |
| Net Realized and Unrealized Gain (Loss) on Investments | | | (377,561 | ) | | | (3,304,547 | ) | |
Net Increase (Decrease) In Net Assets
Resulting From Operations | | $ | (414,262 | ) | | $ | (3,382,263 | ) | |
157
Statements of Changes in Net Assets
| | | U.S. Treasury Securities
Cash Fund | | U.S. Government Securities
Savings Fund | |
| | | Six Months Ended
June 30, 2011
(unaudited) | | Year Ended
December 31,
2010 | | Six Months Ended
June 30, 2011
(unaudited) | | Year Ended
December 31,
2010 | |
INCREASE (DECREASE)
IN NET ASSETS | |
| From operations: | |
| Net investment income | | $ | 4,895 | | | $ | 10,459 | | | $ | 9,825 | | | $ | 22,923 | | |
| Net realized gain (loss) | | | — | | | | — | | | | — | | | | 1,037 | | |
| Net unrealized appreciation | | | — | | | | — | | | | — | | | | — | | |
| Net increase in net assets from operations | | | 4,895 | | | | 10,459 | | | | 9,825 | | | | 23,960 | | |
| Distributions to shareholders: | |
| From net investment income | |
| Investor class | | | (4,895 | ) | | | (10,459 | ) | | | (9,825 | ) | | | (22,923 | ) | |
| Total distributions to shareholders | | | (4,895 | ) | | | (10,459 | ) | | | (9,825 | ) | | | (22,923 | ) | |
| From capital share transactions: | |
Proceeds from shares sold
Investor class | | | 64,384,648 | | | | 153,202,824 | | | | 69,764,128 | | | | 144,957,231 | | |
Distributions reinvested
Investor class | | | 4,788 | | | | 10,282 | | | | 9,650 | | | | 22,628 | | |
| | | | 64,389,436 | | | | 153,213,106 | | | | 69,773,778 | | | | 144,979,859 | | |
Cost of shares redeemed
Investor class | | | (67,880,496 | ) | | | (157,611,264 | ) | | | (84,722,059 | ) | | | (194,377,841 | ) | |
Net increase (decrease) in net assets from
capital share transactions | | | (3,491,060 | ) | | | (4,398,158 | ) | | | (14,948,281 | ) | | | (49,397,982 | ) | |
| NET INCREASE (DECREASE) IN NET ASSETS | | | (3,491,060 | ) | | | (4,398,158 | ) | | | (14,948,281 | ) | | | (49,396,945 | ) | |
| NET ASSETS | |
| Beginning of period | | | 99,491,230 | | | | 103,889,388 | | | | 203,834,693 | | | | 253,231,638 | | |
| End of period | | $ | 96,000,170 | | | $ | 99,491,230 | | | $ | 188,886,412 | | | $ | 203,834,693 | | |
| Accumulated undistributed net investment income, end of period | | $ | 907 | | | $ | 907 | | | $ | — | | | $ | — | | |
| Capital Share Activity | |
| Investor class: | |
| Shares sold | | | 64,384,648 | | | | 153,202,824 | | | | 69,764,128 | | | | 144,957,231 | | |
| Shares reinvested | | | 4,788 | | | | 10,282 | | | | 9,650 | | | | 22,628 | | |
| Shares redeemed | | | (67,880,496 | ) | | | (157,611,264 | ) | | | (84,722,059 | ) | | | (194,377,841 | ) | |
| Net share activity | | | (3,491,060 | ) | | | (4,398,158 | ) | | | (14,948,281 | ) | | | (49,397,982 | ) | |
See accompanying notes to financial statements.
158
| | | Near-Term Tax Free Fund | |
| | | Six Months Ended
June 30, 2011
(unaudited) | | Year Ended
December 31,
2010 | |
INCREASE (DECREASE)
IN NET ASSETS | |
| From operations: | |
| Net investment income | | $ | 365,150 | | | $ | 652,612 | | |
| Net realized gain (loss) | | | (3,344 | ) | | | (2,532 | ) | |
| Net unrealized appreciation | | | 276,702 | | | | 21,885 | | |
| Net increase in net assets from operations | | | 638,508 | | | | 671,965 | | |
| Distributions to shareholders: | |
| From net investment income | |
| Investor class | | | (368,552 | ) | | | (656,447 | ) | |
| Total distributions to shareholders | | | (368,552 | ) | | | (656,447 | ) | |
| From capital share transactions: | |
Proceeds from shares sold
Investor class | | | 8,464,610 | | | | 15,798,166 | | |
Distributions reinvested
Investor class | | | 307,991 | | | | 566,087 | | |
| | | | 8,772,601 | | | | 16,364,253 | | |
Cost of shares redeemed
Investor class | | | (6,357,506 | ) | | | (10,579,005 | ) | |
Net increase (decrease) in net assets from
capital share transactions | | | 2,415,095 | | | | 5,785,248 | | |
| NET INCREASE (DECREASE) IN NET ASSETS | | | 2,685,051 | | | | 5,800,766 | | |
| NET ASSETS | |
| Beginning of period | | | 29,137,845 | | | | 23,337,079 | | |
| End of period | | $ | 31,822,896 | | | $ | 29,137,845 | | |
| Accumulated undistributed net investment income, end of period | | $ | 14,238 | | | $ | 17,640 | | |
| Capital Share Activity | |
| Investor class: | |
| Shares sold | | | 3,799,183 | | | | 7,062,013 | | |
| Shares reinvested | | | 138,508 | | | | 253,175 | | |
| Shares redeemed | | | (2,861,120 | ) | | | (4,723,665 | ) | |
| Net share activity | | | 1,076,571 | | | | 2,591,523 | | |
159
Statements of Changes in Net Assets
| | | Tax Free Fund | | All American Equity Fund | |
| | | Six Months Ended
June 30, 2011
(unaudited) | | Year Ended
December 31,
2010 | | Six Months Ended
June 30, 2011
(unaudited) | | Year Ended
December 31,
2010 | |
INCREASE (DECREASE)
IN NET ASSETS | |
| From operations: | |
| Net investment income (loss) | | $ | 363,452 | | | $ | 776,106 | | | $ | (35,319 | ) | | $ | 17,214 | | |
| Net realized gain (loss) | | | (10,965 | ) | | | 63,643 | | | | 2,935,406 | | | | 2,306,745 | | |
| Net unrealized appreciation (depreciation) | | | 428,929 | | | | (339,473 | ) | | | (1,899,772 | ) | | | 161,267 | | |
| Net increase in net assets from operations | | | 781,416 | | | | 500,276 | | | | 1,000,315 | | | | 2,485,226 | | |
| Distributions to shareholders: | |
From net investment income
Investor class | | | (360,964 | ) | | | (776,783 | ) | | | — | | | | — | | |
| Total distributions to shareholders | | | (360,964 | ) | | | (776,783 | ) | | | — | | | | — | | |
| From capital share transactions: | |
Proceeds from shares sold
Investor class | | | 3,914,158 | | | | 7,219,358 | | | | 1,679,237 | | | | 2,787,127 | | |
Distributions reinvested
Investor class | | | 287,356 | | | | 629,779 | | | | — | | | | — | | |
Proceeds from short-term trading fees
Investor class | | | — | | | | — | | | | 276 | | | | 626 | | |
| | | | 4,201,514 | | | | 7,849,137 | | | | 1,679,513 | | | | 2,787,753 | | |
Cost of shares redeemed
Investor class | | | (4,332,594 | ) | | | (9,880,465 | ) | | | (2,070,071 | ) | | | (3,949,320 | ) | |
Net decrease in net assets from
capital share transactions | | | (131,080 | ) | | | (2,031,328 | ) | | | (390,558 | ) | | | (1,161,567 | ) | |
| NET INCREASE (DECREASE) IN NET ASSETS | | | 289,372 | | | | (2,307,835 | ) | | | 609,757 | | | | 1,323,659 | | |
| NET ASSETS | |
| Beginning of period | | | 19,794,244 | | | | 22,102,079 | | | | 17,759,902 | | | | 16,436,243 | | |
| End of period | | $ | 20,083,616 | | | $ | 19,794,244 | | | $ | 18,369,659 | | | $ | 17,759,902 | | |
Accumulated undistributed net investment income,
(distributions in excess of net investment income),
end of period | | $ | 35,951 | | | $ | 33,463 | | | $ | (25,601 | ) | | $ | 9,718 | | |
| Capital Share Activity | |
| Investor class: | |
| Shares sold | | | 322,958 | | | | 584,696 | | | | 70,927 | | | | 135,491 | | |
| Shares reinvested | | | 23,726 | | | | 51,074 | | | | — | | | | — | | |
| Shares redeemed | | | (359,285 | ) | | | (799,442 | ) | | | (86,661 | ) | | | (192,080 | ) | |
| Net share activity | | | (12,601 | ) | | | (163,672 | ) | | | (15,734 | ) | | | (56,589 | ) | |
See accompanying notes to financial statements.
160
| | | Holmes Growth Fund | |
| | | Six Months Ended
June 30, 2011
(unaudited) | | Year Ended
December 31,
2010 | |
INCREASE (DECREASE)
IN NET ASSETS | |
| From operations: | |
| Net investment income (loss) | | $ | (299,542 | ) | | $ | (476,827 | ) | |
| Net realized gain (loss) | | | 5,226,057 | | | | 6,200,424 | | |
| Net unrealized appreciation (depreciation) | | | (1,914,180 | ) | | | 1,603,666 | | |
| Net increase in net assets from operations | | | 3,012,335 | | | | 7,327,263 | | |
| Distributions to shareholders: | |
From net investment income
Investor class | | | — | | | | (449,513 | ) | |
| Total distributions to shareholders | | | — | | | | (449,513 | ) | |
| From capital share transactions: | |
Proceeds from shares sold
Investor class | | | 3,242,722 | | | | 3,457,830 | | |
Distributions reinvested
Investor class | | | — | | | | 416,688 | | |
Proceeds from short-term trading fees
Investor class | | | 63 | | | | 528 | | |
| | | | 3,242,785 | | | | 3,875,046 | | |
Cost of shares redeemed
Investor class | | | (4,101,677 | ) | | | (7,297,562 | ) | |
Net decrease in net assets from
capital share transactions | | | (858,892 | ) | | | (3,422,516 | ) | |
| NET INCREASE (DECREASE) IN NET ASSETS | | | 2,153,443 | | | | 3,455,234 | | |
| NET ASSETS | |
| Beginning of period | | | 40,604,212 | | | | 37,148,978 | | |
| End of period | | $ | 42,757,655 | | | $ | 40,604,212 | | |
Accumulated undistributed net investment income,
(distributions in excess of net investment income),
end of period | | $ | (685,994 | ) | | $ | (386,452 | ) | |
| Capital Share Activity | |
| Investor class: | |
| Shares sold | | | 163,471 | | | | 206,574 | | |
| Shares reinvested | | | — | | | | 22,152 | | |
| Shares redeemed | | | (209,224 | ) | | | (443,142 | ) | |
| Net share activity | | | (45,753 | ) | | | (214,416 | ) | |
161
Statements of Changes in Net Assets
| | | Global MegaTrends Fund | | Global Resources Fund | |
| | | Six Months Ended
June 30, 2011
(unaudited) | | Year Ended
December 31,
2010 | | Six Months Ended
June 30, 2011
(unaudited) | | Year Ended
December 31,
2010 | |
INCREASE (DECREASE)
IN NET ASSETS | |
| From operations: | |
| Net investment income (loss) | | $ | 46,364 | | | $ | 97,830 | | | $ | (5,156,746 | ) | | $ | (7,468,819 | ) | |
| Net realized gain | | | 1,446,311 | | | | 1,200,936 | | | | 128,459,293 | | | | 105,071,300 | | |
| Net unrealized appreciation (depreciation) | | | (1,485,161 | ) | | | (12,461 | ) | | | (146,033,830 | ) | | | 138,954,717 | | |
Net increase (decrease) in net assets
from operations | | | 7,514 | | | | 1,286,305 | | | | (22,731,283 | ) | | | 236,557,198 | | |
| Distributions to shareholders: | |
From net investment income
Investor class | | | — | | | | (13,170 | ) | | | — | | | | (21,220,358 | ) | |
| Institutional class (a) | | | — | | | | (35,430 | ) | | | — | | | | (430,785 | ) | |
| Total distributions to shareholders | | | — | | | | (48,600 | ) | | | — | | | | (21,651,143 | ) | |
| From capital share transactions: | |
Proceeds from shares sold
Investor class | | | 752,897 | | | | 3,924,530 | | | | 281,130,547 | | | | 226,317,551 | | |
| Institutional class (a) | | | 2,616 | | | | 3,798,205 | | | | 22,310,240 | | | | 15,811,980 | | |
Distributions reinvested
Investor class | | | — | | | | 11,854 | | | | — | | | | 19,867,690 | | |
| Institutional class (a) | | | — | | | | 35,329 | | | | — | | | | 430,457 | | |
Proceeds from short-term trading fees
Investor class | | | 12 | | | | 189 | | | | 26,787 | | | | 42,821 | | |
| Institutional class (a) | | | — | | | | — | | | | 330 | | | | 2 | | |
| | | | 755,525 | | | | 7,770,107 | | | | 303,467,904 | | | | 262,470,501 | | |
Cost of shares redeemed
Investor class | | | (1,697,876 | ) | | | (17,251,944 | ) | | | (304,339,931 | ) | | | (287,376,779 | ) | |
| Institutional class (a) | | | (272,860 | ) | | | (11,485 | ) | | | (1,951,968 | ) | | | (590,193 | ) | |
Net increase (decrease) in net assets from
capital share transactions | | | (1,215,211 | ) | | | (9,493,322 | ) | | | (2,823,995 | ) | | | (25,496,471 | ) | |
| NET INCREASE (DECREASE) IN NET ASSETS | | | (1,207,697 | ) | | | (8,255,617 | ) | | | (25,555,278 | ) | | | 189,409,584 | | |
| NET ASSETS | |
| Beginning of period | | | 20,301,698 | | | | 28,557,315 | | | | 929,481,173 | | | | 740,071,589 | | |
| End of period | | $ | 19,094,001 | | | $ | 20,301,698 | | | $ | 903,925,895 | | | $ | 929,481,173 | | |
Accumulated undistributed net investment income,
(distributions in excess of net investment income), end of period | | $ | 116,000 | | | $ | 69,637 | | | $ | (24,193,401 | ) | | $ | (19,036,655 | ) | |
| Capital Share Activity | |
| Investor class | |
| Shares sold | | | 83,073 | | | | 493,451 | | | | 23,054,231 | | | | 22,219,873 | | |
| Shares reinvested | | | — | | | | 1,374 | | | | — | | | | 1,735,173 | | |
| Shares redeemed | | | (188,633 | ) | | | (2,146,538 | ) | | | (25,378,271 | ) | | | (31,066,105 | ) | |
| Net share activity | | | (105,560 | ) | | | (1,651,713 | ) | | | (2,324,040 | ) | | | (7,111,059 | ) | |
| Institutional class (a) | |
| Shares sold | | | 295 | | | | 449,052 | | | | 1,807,824 | | | | 1,511,708 | | |
| Shares reinvested | | | — | | | | 4,113 | | | | — | | | | 37,398 | | |
| Shares redeemed | | | (30,867 | ) | | | (1,347 | ) | | | (161,424 | ) | | | (52,484 | ) | |
| Net share activity | | | (30,572 | ) | | | 451,818 | | | | 1,646,400 | | | | 1,496,622 | | |
(a) Institutional class commenced operations on March 1, 2010.
See accompanying notes to financial statements.
162
| | | World Precious Minerals Fund | |
| | | Six Months Ended
June 30, 2011
(unaudited) | | Year Ended
December 31,
2010 | |
INCREASE (DECREASE)
IN NET ASSETS | |
| From operations: | |
| Net investment income (loss) | | $ | (5,919,912 | ) | | $ | (11,314,271 | ) | |
| Net realized gain | | | 62,558,479 | | | | 90,766,417 | | |
| Net unrealized appreciation (depreciation) | | | (197,189,631 | ) | | | 184,900,146 | | |
Net increase (decrease) in net assets
from operations | | | (140,551,064 | ) | | | 264,352,292 | | |
| Distributions to shareholders: | |
From net investment income
Investor class | | | — | | | | (99,236,093 | ) | |
| Institutional class (a) | | | — | | | | (209,612 | ) | |
| Total distributions to shareholders | | | — | | | | (99,445,705 | ) | |
| From capital share transactions: | |
Proceeds from shares sold
Investor class | | | 82,695,335 | | | | 176,168,966 | | |
| Institutional class (a) | | | 964,702 | | | | 2,132,887 | | |
Distributions reinvested
Investor class | | | — | | | | 95,387,525 | | |
| Institutional class (a) | | | — | | | | 207,819 | | |
Proceeds from short-term trading fees
Investor class | | | 22,543 | | | | 106,901 | | |
| Institutional class (a) | | | — | | | | — | | |
| | | | 83,682,580 | | | | 274,004,098 | | |
Cost of shares redeemed
Investor class | | | (169,403,392 | ) | | | (249,079,298 | ) | |
| Institutional class (a) | | | (211,580 | ) | | | (35,589 | ) | |
Net increase (decrease) in net assets from
capital share transactions | | | (85,932,392 | ) | | | 24,889,211 | | |
| NET INCREASE (DECREASE) IN NET ASSETS | | | (226,483,456 | ) | | | 189,795,798 | | |
| NET ASSETS | |
| Beginning of period | | | 828,831,116 | | | | 639,035,318 | | |
| End of period | | $ | 602,347,660 | | | $ | 828,831,116 | | |
Accumulated undistributed net investment income,
(distributions in excess of net investment income), end of period | | $ | (77,725,142 | ) | | $ | (71,805,230 | ) | |
| Capital Share Activity | |
| Investor class | |
| Shares sold | | | 3,950,876 | | | | 9,059,127 | | |
| Shares reinvested | | | — | | | | 4,369,562 | | |
| Shares redeemed | | | (8,209,771 | ) | | | (13,011,737 | ) | |
| Net share activity | | | (4,258,895 | ) | | | 416,952 | | |
| Institutional class (a) | |
| Shares sold | | | 46,403 | | | | 92,296 | | |
| Shares reinvested | | | — | | | | 9,520 | | |
| Shares redeemed | | | (9,937 | ) | | | (1,643 | ) | |
| Net share activity | | | 36,466 | | | | 100,173 | | |
163
Statements of Changes in Net Assets
| | | Gold and Precious
Metals Fund | | Eastern European Fund | |
| | | Six Months Ended
June 30, 2011
(unaudited) | | Year Ended
December 31,
2010 | | Six Months Ended
June 30, 2011
(unaudited) | | Year Ended
December 31,
2010 | |
INCREASE (DECREASE)
IN NET ASSETS | |
| From operations: | |
| Net investment income (loss) | | $ | (1,756,443 | ) | | $ | (3,557,657 | ) | | $ | 697,815 | | | $ | (1,545,558 | ) | |
| Net realized gain | | | 35,205,617 | | | | 32,921,158 | | | | 56,768,979 | | | | 10,945,987 | | |
| Net unrealized appreciation (depreciation) | | | (79,042,192 | ) | | | 50,218,663 | | | | (54,156,762 | ) | | | 61,400,906 | | |
Net increase (decrease) in net assets
from operations | | | (45,593,018 | ) | | | 79,582,164 | | | | 3,310,032 | | | | 70,801,335 | | |
| Distributions to shareholders: | |
From net investment income
Investor class | | | — | | | | (3,708,191 | ) | | | — | | | | — | | |
From net capital gains
Investor class | | | — | | | | (18,871,531 | ) | | | — | | | | — | | |
| Total distributions to shareholders | | | — | | | | (22,579,722 | ) | | | — | | | | — | | |
| From capital share transactions: | |
Proceeds from shares sold
Investor class | | | 36,505,240 | | | | 106,304,844 | | | | 10,535,655 | | | | 32,629,184 | | |
Distributions reinvested
Investor class | | | — | | | | 21,269,596 | | | | — | | | | — | | |
Proceeds from short-term trading fees
Investor class | | | 20,083 | | | | 158,455 | | | | 68,972 | | | | 164,174 | | |
| | | | 36,525,323 | | | | 127,732,895 | | | | 10,604,627 | | | | 32,793,358 | | |
Cost of shares redeemed
Investor class | | | (53,717,312 | ) | | | (118,179,940 | ) | | | (107,362,139 | ) | | | (127,966,431 | ) | |
Net increase (decrease) in net assets from
capital share transactions | | | (17,191,989 | ) | | | 9,552,955 | | | | (96,757,512 | ) | | | (95,173,073 | ) | |
| NET INCREASE (DECREASE) IN NET ASSETS | | | (62,785,007 | ) | | | 66,555,397 | | | | (93,447,480 | ) | | | (24,371,738 | ) | |
| NET ASSETS | |
| Beginning of period | | | 300,948,783 | | | | 234,393,386 | | | | 440,037,141 | | | | 464,408,879 | | |
| End of period | | $ | 238,163,776 | | | $ | 300,948,783 | | | $ | 346,589,661 | | | $ | 440,037,141 | | |
Accumulated undistributed net investment income, (distributions
in excess of net investment income), end of period | | $ | (5,941,713 | ) | | $ | (4,185,270 | ) | | $ | 248,256 | | | $ | (449,559 | ) | |
| Capital Share Activity | |
| Investor class | |
| Shares sold | | | 2,004,700 | | | | 6,055,096 | | | | 933,432 | | | | 3,355,448 | | |
| Shares reinvested | | | — | | | | 1,079,127 | | | | — | | | | — | | |
| Shares redeemed | | | (2,996,189 | ) | | | (6,936,401 | ) | | | (9,726,532 | ) | | | (13,620,205 | ) | |
| Net share activity | | | (991,489 | ) | | | 197,822 | | | | (8,793,100 | ) | | | (10,264,757 | ) | |
See accompanying notes to financial statements.
164
| | | Global Emerging
Markets Fund | |
| | | Six Months Ended
June 30, 2011
(unaudited) | | Year Ended
December 31,
2010 | |
INCREASE (DECREASE)
IN NET ASSETS | |
| From operations: | |
| Net investment income (loss) | | $ | (36,701 | ) | | $ | (159,135 | ) | |
| Net realized gain | | | 729,877 | | | | 1,062,696 | | |
| Net unrealized appreciation (depreciation) | | | (1,107,438 | ) | | | 854,121 | | |
Net increase (decrease) in net assets
from operations | | | (414,262 | ) | | | 1,757,682 | | |
| Distributions to shareholders: | |
From net investment income
Investor class | | | — | | | | — | | |
From net capital gains
Investor class | | | — | | | | — | | |
| Total distributions to shareholders | | | — | | | | — | | |
| From capital share transactions: | |
Proceeds from shares sold
Investor class | | | 969,030 | | | | 2,208,443 | | |
Distributions reinvested
Investor class | | | — | | | | — | | |
Proceeds from short-term trading fees
Investor class | | | 3,283 | | | | 9,357 | | |
| | | | 972,313 | | | | 2,217,800 | | |
Cost of shares redeemed
Investor class | | | (1,981,676 | ) | | | (4,391,819 | ) | |
Net increase (decrease) in net assets from
capital share transactions | | | (1,009,363 | ) | | | (2,174,019 | ) | |
| NET INCREASE (DECREASE) IN NET ASSETS | | | (1,423,625 | ) | | | (416,337 | ) | |
| NET ASSETS | |
| Beginning of period | | | 13,402,861 | | | | 13,819,198 | | |
| End of period | | $ | 11,979,236 | | | $ | 13,402,861 | | |
Accumulated undistributed net investment income, (distributions
in excess of net investment income), end of period | | $ | (95,431 | ) | | $ | (58,730 | ) | |
| Capital Share Activity | |
| Investor class | |
| Shares sold | | | 106,795 | | | | 259,919 | | |
| Shares reinvested | | | — | | | | — | | |
| Shares redeemed | | | (219,959 | ) | | | (536,473 | ) | |
| Net share activity | | | (113,164 | ) | | | (276,554 | ) | |
165
Statements of Changes in Net Assets
| | | China Region Fund | |
| | | Six Months Ended
June 30, 2011
(unaudited) | | Year Ended
December 31,
2010 | |
INCREASE (DECREASE)
IN NET ASSETS | |
| From operations: | |
| Net investment loss | | $ | (77,716 | ) | | $ | (534,225 | ) | |
| Net realized gain | | | 2,060,651 | | | | 10,072,744 | | |
| Net unrealized depreciation | | | (5,365,198 | ) | | | (3,504,321 | ) | |
Net increase (decrease) in net assets
from operations | | | (3,382,263 | ) | | | 6,034,198 | | |
| Distributions to shareholders | | | — | | | | — | | |
| From capital share transactions: | |
Proceeds from shares sold
Investor class | | | 2,328,332 | | | | 9,110,783 | | |
Distributions reinvested
Investor class | | | — | | | | — | | |
Proceeds from short-term trading fees
Investor class | | | 10,412 | | | | 38,856 | | |
| | | | 2,338,744 | | | | 9,149,639 | | |
Cost of shares redeemed
Investor class | | | (8,298,776 | ) | | | (19,663,761 | ) | |
Net decrease in net assets from
capital share transactions | | | (5,960,032 | ) | | | (10,514,122 | ) | |
| NET DECREASE IN NET ASSETS | | | (9,342,295 | ) | | | (4,479,924 | ) | |
| NET ASSETS | |
| Beginning of period | | | 51,843,396 | | | | 56,323,320 | | |
| End of period | | $ | 42,501,101 | | | $ | 51,843,396 | | |
| Distributions in excess of net investment income, end of period | | $ | (532,534 | ) | | $ | (454,818 | ) | |
| Capital Share Activity | |
| Investor class | |
| Shares sold | | | 247,987 | | | | 1,060,010 | | |
| Shares reinvested | | | — | | | | — | | |
| Shares redeemed | | | (901,064 | ) | | | (2,325,277 | ) | |
| Net share activity | | | (653,077 | ) | | | (1,265,267 | ) | |
See accompanying notes to financial statements.
166
Notes to Financial Statements (unaudited) June 30, 2011
NOTE 1: SIGNIFICANT ACCOUNTING POLICIES
U.S. Global Investors Funds (Trust), consisting of thirteen separate funds (Funds), is organized as a Delaware statutory trust. Each Fund is an open-end management investment company registered under the Investment Company Act of 1940, as amended. All funds are diversified with the exception of Global Resources, World Precious Minerals, Gold and Precious Metals, Eastern European, Global Emerging Markets and China Region. A nondiversified fund may invest a significant portion of its assets in a small number of companies.
Effective March 1, 2010, Global MegaTrends, Global Resources and World Precious Minerals Funds offered a new Institutional class of shares ("Institutional Class"). For all funds, the class existing prior to March 1, 2010, was renamed the Investor Class ("Investor Class").
The following is a summary of significant accounting policies consistently followed by the Funds in the preparation of their financial statements. The policies are in conformity with U.S. generally accepted accounting principles.
A. Security Valuations
The Funds value investments traded on national or international securities exchanges or over-the-counter at the last sales price reported by the security's primary exchange of its market at the time of daily valuation. Securities for which no sale was reported are valued at the mean between the last reported bid and asked quotation. Short-term investments with effective maturities of sixty days or less at the date of purchase may be valued at amortized cost, which approximates market value. An independent pricing service values municipal securities, long-term U.S. Government obligations and corporate debt securities using a system based on such factors as credit rating, maturity, coupon and type of security to determine fair value.
B. Fair Valued Securities
Securities for which market quotations are not readily available or which are subject to legal restrictions are valued at their fair value as determined in good faith under consistently applied procedures under the general supervision of the Board of Trustees. The following factors are generally considered in determining fair value: nature and duration of any trading restrictions, trading volume, market values of unrestricted shares of the same or similar class, investment management's judgment regarding the market experience of the issuer, financial status and other operational and market factors affecting the issuer, issuer's management, quality of the underlying property based on review of independent geological studies, the extent of a Fund's investment in the trading securities of the issuer; and other relevant matters. The fair values may differ from what would have been used had a broader market for these securities existed.
167
Notes to Financial Statements (unaudited) June 30, 2011
For securities traded on international exchanges, if events which may materially affect the value of a Fund's securities occur after the close of the primary exchange and before a Fund's net asset value is next determined, then those securities will be valued at their fair value as determined in good faith under the supervision of the Board of Trustees. The Funds may use a systematic fair value model provided by an independent third party to value international securities.
C. Security Transactions and Investment Income
Security transactions are accounted for on trade date. Realized gains and losses from security transactions are determined on an identified-cost basis. Dividend income is recorded on the ex-dividend date except that certain dividends from foreign securities where the ex-dividend date may have passed are recorded as soon as a Fund is informed of the ex-dividend data. Interest income, which may include original issue discount, is recorded on an accrual basis. Discounts and premiums on securities purchased are accreted and amortized, respectively, on a yield-to-maturity basis as adjustments to interest income. Investment income is recorded net of foreign taxes withheld where recovery of such taxes is uncertain. Investment income and realized and unrealized gains (losses) are allocated to each Fund's share class based on their respective net assets.
The Funds may purchase securities on a when-issued or delayed-delivery basis and segregate on their books collateral with a value at least equal to the amount of the commitment. Losses may arise due to the changes in the value of the underlying securities or if the counterparty does not perform under the contract.
D. Repurchase Agreements
The Funds may enter into repurchase agreements with recognized financial institutions or registered broker-dealers and, in all instances, hold as collateral, underlying securities with a value exceeding the principal amount of the repurchase obligation. The Funds use joint tri-party repurchase agreement accounts with other funds under common management where uninvested cash is collectively invested in repurchase agreements, and each participating fund owns an undivided interest in the account.
E. Foreign Currency Transactions
Some Funds may invest in securities of foreign issuers. The accounting records of these Funds are maintained in U.S. dollars. At each net asset value determination date, the value of assets and liabilities denominated in foreign currencies are translated into U.S. dollars using the current prevailing exchange rate. Security transactions, income and expenses are converted at the prevailing rate of exchange on the respective dates of the transactions. The effect of changes in foreign exchange rates on foreign denominated securities is included with the net realized and unrealized gain or loss on securities. Other foreign currency gains or losses are reported separately.
168
Notes to Financial Statements (unaudited) June 30, 2011
F. Federal Income Taxes
The Funds intend to continue to comply with the requirements of Subchapter M of the Internal Revenue Code applicable to regulated investment companies and to distribute substantially all of their taxable income to shareholders. Accordingly, no provision for federal income taxes is required. Each Fund may be subject to foreign taxes on income and gains on investments, which are accrued based on the Fund's understanding of the tax rules and regulations in the foreign markets.
The Funds recognize the tax benefits of uncertain tax positions only where the position is "more likely than not" to be sustained assuming examination by tax authorities. Management has analyzed the Funds' tax positions, and has concluded that no liability for unrecognized tax benefits should be recorded related to uncertain tax positions taken on returns filed for open tax years or expected to be taken in 2010 tax returns. The Funds' 2007, 2008, 2009 and 2010 tax returns are open to examination by the federal and applicable state tax authorities. The Funds have no examinations in progress. Management is not aware of any tax positions for which it is reasonably possible that the total amounts of unrecognized tax benefits will change materially in the next 12 months.
G. Dividends and Distributions to Shareholders
The Funds record dividends and distributions to shareholders on the ex-dividend date. Distributions are determined in accordance with income tax regulations, which may differ from accounting principles generally accepted in the United States. Accordingly, periodic reclassifications related to permanent book and tax basis differences are made within the Funds' capital accounts to reflect income and gains available for distribution under income tax regulations.
The Funds generally pay income dividends and distribute capital gains, if any, annually. The U.S. Treasury Securities Cash and U.S. Government Securities Savings Funds accrue dividends on a daily basis with payment monthly. The Tax Free and Near-Term Tax Free Funds pay monthly dividends. Dividends and distributions payable at period end are processed for reinvestment on the following business day. A Fund may elect to designate a portion of the earnings and profits distributed to shareholders on the redemption of fund shares during the year as distributions for federal income tax purposes.
H. Expenses
Fund specific expenses are allocated to that Fund and pro rata across share classes. Expenses that are not fund specific are allocated among Funds and pro rata across share classes. Class specific expenses (including, but not limited to, distribution plan fees, if any, a portion of the administrative services fees, transfer agency fees and expenses, shareholder reporting expenses and certain legal and registration fees) are allocated to the class that incurs such expense. Expense offset arrangements have been made with the Funds' custodian so the custodian fees may be paid indirectly by credits earned on the Funds' cash balances. Such deposit arrangements are an alternative to overnight investments.
169
Notes to Financial Statements (unaudited) June 30, 2011
I. Short-Term Trading (Redemption) Fees
Shares held in the All American Equity Fund 30 days or less are subject to a short-term trading fee equal to 0.10% of the proceeds of the redeemed shares. Shares held in the Holmes Growth, Global MegaTrends and Global Resources Funds 30 days or less are subject to a short-term trading fee equal to 0.25% of the proceeds of the redeemed shares. Shares held 30 days or less in the World Precious Minerals and Gold and Precious Metals Funds are subject to a short-term trading fee equal to 0.50% of the proceeds of the redeemed shares. Shares held in the Eastern European and Global Emerging Markets Funds 180 days or less are subject to a short-term trading fee equal to 2.00% of the proceeds of the redeemed shares. Shares held in the China Region Fund 180 days or less are subject to a short-term trading fee equal to 1.00% of the proceeds of the redeemed shares. These fees, which are retained by the Funds, are accounted for as an addition to paid-in capital.
J. Use of Estimates in Financial Statement Preparation
The preparation of financial statements in conformity with accounting principles generally accepted in the United States requires management to make estimates and assumptions that affect the reported amounts of assets and liabilities and disclosure of contingent assets and liabilities at the date of the financial statements and the reported amounts of income and expenses during the reporting period. Actual results could differ from those estimates.
K. Subsequent Events Evaluation
Management has evaluated subsequent events after the balance sheet date of June 30, 2011, through the date that the financial statements were issued and determined that there were no events or transactions that would require recognition or disclosure in the financial statements.
L. New Accounting Pronouncements
In January 2010, the Financial Accounting Standards Board (FASB) issued Accounting Standards Update (ASU) No. 2010-06, Improving Disclosures about Fair Value Measurements. This ASU adds new requirements for disclosures into and out of Levels 1 and 2 fair-value measurements and information on purchases, sales, issuances and settlements on a gross basis in the reconciliation of Level 3 fair-value measurements. It also clarifies existing fair value disclosures about the level of disaggregation, inputs and valuation techniques. Except for the detailed Level 3 reconciliation disclosures, the guidance in the ASU was effective for annual and interim reporting periods in fiscal years beginning after December 15, 2009, and was adopted in 2010. The new disclosures for Level 3 activity were effective for annual and interim reporting periods in fiscal years beginning after December 15, 2010, and have been incorporated in this report. The adoption of the ASU did not have a material effect on the financial statements except for enhanced disclosure in the notes to portfolios.
170
Notes to Financial Statements (unaudited) June 30, 2011
In April 2011, the FASB issued an ASU related to the accounting for repurchase agreements and similar agreements that both entitle and obligate a transferor to repurchase or redeem financial assets before their maturity. The ASU modifies the criteria for determining effective control of transferred assets and, as a result, certain agreements may now be accounted for as secured borrowings. The ASU is effective prospectively for new transfers and existing transactions that are modified in the first interim or annual period beginning on or after December 15, 2011. At this time, management is evaluating the implications of this change, and its impact on the financial statements has not been determined.
In May 2011, the FASB issued ASU No. 2011-04, Fair Value Measurement (Topic 820): Amendments to Achieve Common Fair Value Measurement and Disclosure Requirements in U.S. GAAP and IFRSs. The ASU expands existing disclosure requirements and amends some fair value measurement principles. The ASU is effective for interim and annual periods beginning on or after December 15, 2011, with early adoption prohibited and prospective application required. At this time, management is evaluating the implications of this change, and its impact on the financial statements has not been determined.
NOTE 2: FINANCIAL DERIVATIVE INSTRUMENTS
A. Options Contracts
Equity Funds may purchase or write (sell) options on securities to manage their exposure to stock or commodity markets as well as fluctuations in interest and currency conversion rates. The use of options carries the risks of a change in value of the underlying instruments, an illiquid secondary market, or failure of the counterparty to perform its obligations.
A put option gives the purchaser of the option, upon payment of a premium, the right to sell, and the issuer of the option the obligation to buy, the underlying security, commodity, index, currency or other instrument at the exercise price. A call option, upon payment of a premium, gives the purchaser of the option the right to buy, and the issuer the obligation to sell, the underlying instrument at the exercise price.
Purchasing a put option tends to decrease a Fund's exposure to the underlying instrument, whereas purchasing a call option tends to increase a Fund's exposure to the underlying instrument. A Fund pays a premium which is included in the Statement of Assets and Liabilities as an investment and subsequently marked to market to reflect the current value of the option. Premiums paid to purchase options which expire are treated as realized losses. Premiums paid to purchase options which are exercised or closed are added to the cost of securities acquired or the proceeds from securities sold. The risk associated with purchasing put and call options is limited to the premium paid.
The Funds will realize a loss equal to all or a part of the premium paid for an option if the price of the underlying security or other instrument decreases or does not
171
Notes to Financial Statements (unaudited) June 30, 2011
increase by more than the premium (in the case of a call option), or if the price of the underlying security or other instrument increases or does not decrease by more than the premium (in the case of a put option).
Writing a put option tends to increase a Fund's exposure to the underlying instrument, whereas writing a call option tends to decrease a Fund's exposure to the underlying instrument. The premium received is recorded as a liability in the Statement of Assets and Liabilities and subsequently marked to market to reflect the current value of the option written. Premiums received from writing options which expire are treated as realized gains. Premiums received from options which are exercised or closed are added to the proceeds or offset against amounts paid on the underlying transaction to determine the realized gain or loss. Written options include a risk of loss in excess of the option premium. A Fund as a writer of an option has no control over whether the underlying instrument may be sold (call) or purchased (put) and thus bears the market risk of an unfavorable change in the price of the instrument underlying the written option. There is the risk a Fund may not be able to enter into a closing transaction because of an illiquid market.
A Fund's ability to close out its position as a purchaser or seller of a put or call option is dependent, in part, upon the liquidity of the market for that particular option. There can be no guarantee that a fund will be able to close out an option position when desired. An inability to close out its options positions may reduce a Fund's anticipated profits or increase its losses.
As of June 30, 2011, portfolio securities valued at $5,861,156 were held in escrow by the custodian as cover for call options written for the Eastern European Fund.
Transactions in written call options during the six-month period ended June 30, 2011, were as follows:
| | | All American
Equity Fund | | Holmes
Growth Fund | |
| | | Number of
Contracts | | Premiums
Received | | Number of
Contracts | | Premiums
Received | |
| Options outstanding at December 31, 2010 | | | — | | | $ | — | | | | — | | | $ | — | | |
| Options written | | | 90 | | | | 27,449 | | | | 850 | | | | 130,874 | | |
| Options closed | | | (60 | ) | | | (11,640 | ) | | | (550 | ) | | | (78,536 | ) | |
| Options expired | | | (5 | ) | | | (12,159 | ) | | | (150 | ) | | | (26,169 | ) | |
| Options exercised | | | (25 | ) | | | (3,650 | ) | | | (150 | ) | | | (26,169 | ) | |
| Options outstanding at June 30, 2011 | | | — | | | $ | — | | | | — | | | $ | — | | |
| | | Global
MegaTrends Fund | | Global
Resources Fund | |
| | | Number of
Contracts | | Premiums
Received | | Number of
Contracts | | Premiums
Received | |
| Options outstanding at December 31, 2010 | | | — | | | $ | — | | | | — | | | $ | — | | |
| Options written | | | — | | | | — | | | | 850 | | | | 132,138 | | |
| Options closed | | | — | | | | — | | | | — | | | | — | | |
| Options expired | | | — | | | | — | | | | (850 | ) | | | (132,138 | ) | |
| Options exercised | | | — | | | | — | | | | — | | | | — | | |
| Options outstanding at June 30, 2011 | | | — | | | $ | — | | | | — | | | $ | — | | |
172
Notes to Financial Statements (unaudited) June 30, 2011
| | | World Precious
Minerals Fund | | Gold and Precious
Metals Fund | |
| | | Number of
Contracts | | Premiums
Received | | Number of
Contracts | | Premiums
Received | |
| Options outstanding at December 31, 2010 | | | — | | | $ | — | | | | — | | | $ | — | | |
| Options written | | | 4,000 | | | | 935,061 | | | | 5,200 | | | | 759,582 | | |
| Options closed | | | — | | | | — | | | | — | | | | — | | |
| Options expired | | | (4,000 | ) | | | (935,061 | ) | | | (5,200 | ) | | | (759,582 | ) | |
| Options exercised | | | — | | | | — | | | | — | | | | — | | |
| Options outstanding at June 30, 2011 | | | — | | | $ | — | | | | — | | | $ | — | | |
| | | Eastern
European Fund | | Global Emerging
Markets Fund | |
| | | Number of
Contracts | | Premiums
Received | | Number of
Contracts | | Premiums
Received | |
| Options outstanding at December 31, 2010 | | | — | | | $ | — | | | | — | | | $ | — | | |
| Options written | | | 5,443 | | | | 383,279 | | | | 30 | | | | 9,003 | | |
| Options closed | | | (2,800 | ) | | | (128,756 | ) | | | (30 | ) | | | (9,003 | ) | |
| Options expired | | | — | | | | — | | | | — | | | | — | | |
| Options exercised | | | — | | | | — | | | | — | | | | — | | |
| Options outstanding at June 30, 2011 | | | 2,643 | | | $ | (254,523 | ) | | | — | | | $ | — | | |
| | | China Region Fund | |
| | | Number of
Contracts | | Premiums
Received | |
| Options outstanding at December 31, 2010 | | | — | | | $ | — | | |
| Options written | | | 130 | | | | 85,791 | | |
| Options closed | | | (63 | ) | | | (56,510 | ) | |
| Options expired | | | — | | | | — | | |
| Options exercised | | | (67 | ) | | | (29,281 | ) | |
| Options outstanding at June 30, 2011 | | | — | | | $ | — | | |
B. Forward Foreign Currency Contracts
The Funds enter into forward foreign currency contracts to lock in the U.S. dollar cost of purchase and sale transactions or to defend the portfolio against currency fluctuations. A forward foreign currency contract is a commitment to purchase or sell a foreign currency at a future date at a negotiated rate. These contracts are valued daily, and the Fund's net equity therein, representing unrealized gain or loss on the contracts as measured by the difference between the forward foreign exchange rates at the dates of entry into the contracts and the forward rates at the reporting date, is included in the statement of assets and liabilities. Realized and unrealized gains and losses are included in the statement of operations. Risks may arise upon entering into these contracts from the potential inability of counterparties to meet the terms of the contract and from unanticipated movements in the value of foreign currencies relative to the U.S. dollar.
Open forward foreign currency contracts at June 30, 2011, were:
| Fund Contract | | Foreign
Currency | | In Exchange
for USD | | Settlement
Date | | Value | | Unrealized
Appreciation | | Unrealized
(Depreciation) | |
World Precious Minerals Fund
Sales: | |
| Canadian Dollars | | | 1,883,400 | | | $ | 1,916,947 | | | 07/19/11 | | $ | 1,952,112 | | | $ | — | | | $ | (35,165 | ) | |
Gold and Precious Metals Fund
Sales: | |
| Canadian Dollars | | | 744,600 | | | $ | 766,049 | | | 07/19/11 | | $ | 771,765 | | | $ | — | | | $ | (5,716 | ) | |
173
Notes to Financial Statements (unaudited) June 30, 2011
C. Summary of Derivative Instruments
The following is a summary of the valuations of derivative instruments categorized by location in the Statement of Assets and Liabilities as of June 30, 2011:
| Location | | All
American
Equity Fund | | Holmes
Growth
Fund | | Global
MegaTrends
Fund | | Global
Resources
Fund | |
| Asset derivatives | |
Investments, at value
Equity contracts - Note 2 A | | $ | 800 | | | $ | — | | | $ | — | | | $ | 6,061,440 | | |
| Total | | $ | 800 | | | $ | — | | | $ | — | | | $ | 6,061,440 | | |
| Liability derivatives - none | |
| Location | | World
Precious
Minerals
Fund | | Gold &
Precious
Metals
Fund | | Eastern
European
Fund | | Global
Emerging
Markets
Fund | | China
Region
Fund | |
| Asset derivatives | |
Investments, at value
Equity contracts - Note 2 A | | $ | 1,097,680 | | | $ | 536,080 | | | $ | 45,500 | | | $ | — | | | $ | — | | |
| Total | | $ | 1,097,680 | | | $ | 536,080 | | | $ | 45,500 | | | $ | — | | | $ | — | | |
| Liability derivatives | |
| Written options, at value | | $ | — | | | $ | — | | | $ | 241,948 | | | $ | — | | | $ | — | | |
Unrealized appreciation on foreign
currency exchange contracts
Foreign exchange contracts - Note 2 B | | | 35,165 | | | | 5,716 | | | | — | | | | — | | | | — | | |
| Total | | $ | 35,165 | | | $ | 5,716 | | | $ | 241,948 | | | $ | — | | | $ | — | | |
The following is a summary of the effect of derivative instruments on the Statement of Operations for the six-month period ended June 30, 2011:
| Location | | All
American
Equity Fund | | Holmes
Growth
Fund | | Global
MegaTrends
Fund | | Global
Resources
Fund | |
Realized Gain/(Loss) on derivatives
recognized in income | |
Realized gain (loss) from securities
Equity contracts | | $ | — | | | $ | 50,931 | | | $ | 2,865 | | | $ | 1,112,673 | | |
Realized gain (loss) on written options
Equity contracts | | | 27,703 | | | | 148,050 | | | | — | | | | (105,112 | ) | |
Net realized gain (loss) on foreign currency
transactions
Foreign exchange contracts | | | — | | | | 1,381 | | | | (691 | ) | | | (73,920 | ) | |
| | | | 27,703 | | | | 200,362 | | | | 2,174 | | | | 933,641 | | |
174
Notes to Financial Statements (unaudited) June 30, 2011
| Location | | All
American
Equity Fund | | Holmes
Growth
Fund | | Global
MegaTrends
Fund | | Global
Resources
Fund | |
Change in Unrealized Appreciation/
(Depreciation) on derivatives recognized
in income | |
Net change in unrealized appreciation
(depreciation) on investments
Equity contracts | | $ | (8,800 | ) | | $ | 53,515 | | | $ | 15 | | | $ | 671,378 | | |
Net change in unrealized appreciation
(depreciation) on options written
Equity contracts | | | — | | | | — | | | | — | | | | — | | |
| | | | (8,800 | ) | | | 53,515 | | | | 15 | | | | 671,378 | | |
| Total | | $ | 18,903 | | | $ | 253,877 | | | $ | 2,189 | | | $ | 1,605,019 | | |
| Location | | World
Precious
Minerals
Fund | | Gold &
Precious
Metals
Fund | | Eastern
European
Fund | | Global
Emerging
Markets
Fund | | China
Region
Fund | |
Realized Gain/(Loss) on derivatives
recognized in income | |
Realized gain (loss) from securities
Equity contracts | | $ | (1,681,429 | ) | | $ | (387,395 | ) | | $ | (333,438 | ) | | $ | (88,529 | ) | | $ | 27,076 | | |
Realized gain (loss) on written options
Equity contracts | | | (395,325 | ) | | | (36,724 | ) | | | 128,755 | | | | 9,003 | | | | 85,791 | | |
Net realized gain (loss) on foreign currency
transactions
Foreign exchange contracts | | | (179,801 | ) | | | (39,692 | ) | | | — | | | | (444 | ) | | | 5 | | |
| | | | (2,256,555 | ) | | | (463,811 | ) | | | (204,683 | ) | | | (79,970 | ) | | | 112,872 | | |
Change in Unrealized Appreciation/
(Depreciation) on derivatives recognized
in income | |
Net change in unrealized appreciation
(depreciation) on investments
Equity contracts | | | 663,767 | | | | 353,129 | | | | (5,300 | ) | | | 17,891 | | | | — | | |
Net change in unrealized appreciation
(depreciation) on options written
Equity contracts | | | — | | | | — | | | | 12,575 | | | | — | | | | — | | |
Net change in unrealized appreciation
(depreciation) on translation of assets and
liabilities denominated in foreign currencies
Foreign exchange contracts | | | (57,351 | ) | | | 5,716 | | | | — | | | | — | | | | — | | |
| | | | 606,416 | | | | 358,845 | | | | 7,275 | | | | 17,891 | | | | — | | |
| Total | | $ | (1,650,139 | ) | | $ | (104,966 | ) | | $ | (197,408 | ) | | $ | (62,079 | ) | | $ | 112,872 | | |
175
Notes to Financial Statements (unaudited) June 30, 2011
The average notional amounts of written options, purchased options and forward currency contracts outstanding during the six-month period ended June 30, 2011, were approximately as follows:
| Fund | | Written
Options | | Purchased
Options | | Forward
Currency
Contracts | |
| All American Equity | | $ | 6,677 | | | $ | 3,543 | | | $ | — | | |
| Holmes Growth | | | 34,736 | | | | 8,464 | | | | 58,294 | | |
| Global MegaTrends | | | — | | | | 814 | | | | 30,227 | | |
| Global Resources | | | — | | | | 4,606,641 | | | | 2,455,589 | | |
| World Precious Minerals | | | 156,757 | | | | 5,300,387 | | | | 2,588,057 | | |
| Gold & Precious Metals | | | 119,114 | | | | 2,072,930 | | | | 455,148 | | |
| Eastern European | | | 44,564 | | | | 89,357 | | | | — | | |
| Global Emerging Markets | | | 1,286 | | | | 5,679 | | | | 19,431 | | |
| China Region | | | 8,983 | | | | — | | | | — | | |
NOTE 3: RELATED PARTY TRANSACTIONS
U.S. Global Investors, Inc. (Adviser), under an investment advisory agreement with the Trust in effect through September 30, 2011, furnishes management and investment advisory services and, subject to the supervision of the trustees, directs the investments of each Fund according to its investment objectives, policies and limitations. The Adviser also furnishes all necessary office facilities, business equipment and personnel for administering the affairs of the Trust. Frank E. Holmes, a trustee of the Funds, is the controlling owner of the Adviser.
176
Notes to Financial Statements (unaudited) June 30, 2011
For the services of the Adviser, each Fund pays a base management or advisory fee based upon its net assets. Fees are accrued daily and paid monthly. The contractual management fee for each fund is:
| Fund | | Annual Percentage of
Average Daily Net Assets | |
U.S. Treasury Securities Cash
and U.S. Government Securities Savings
Near-Term Tax Free
Tax Free | | .50% of the first $250,000,000 and
.375% of the excess
.50%
.75% of the first $250,000,000 and
.50% of the excess | |
|
| All American Equity | | .80% of the first $500,000,000 and
.75% of the excess | |
|
| Holmes Growth and Global MegaTrends | | | 1.00 | % | |
|
| Global Resources | | .95% of the first $500,000,000;
.90% of $500,000,001 to $1,000,000,000
and .85% of the excess | |
|
| World Precious Minerals | | 1.00% of the first $500,000,000;
.95% of $500,000,001 to $1,000,000,000
and .90% of the excess | |
|
| Gold and Precious Metals | | .90% of the first $500,000,000
and .85% of the excess | |
|
| Eastern European | | | 1.25 | % | |
|
| Global Emerging Markets | | | 1.375 | % | |
|
| China Region | | | 1.25 | % | |
|
177
Notes to Financial Statements (unaudited) June 30, 2011
The advisory agreement also provides, effective October 1, 2009, that the base advisory fee of the Equity Funds will be adjusted upwards or downwards by 0.25 percent if there is a performance difference of 5 percent or more between a Fund's performance and that of its designated benchmark index over the prior 12 months. The performance adjustment is calculated separately for each share class. For purposes of calculating the performance adjustment for the Institutional Class, the performance will include the performance of the Investor Class shares for periods prior to March 1, 2011. After such time, for purposes of calculating the performance adjustment, the performance of each class will be calculated based on its respective performance. The benchmarks are as follows:
| Fund | | Benchmark Index | |
| All American Equity | | S&P 500 Index | |
|
| Holmes Growth | | S&P Composite 1500 Index | |
|
| Global MegaTrends | | S&P 500 Index | |
|
| Global Resources | | Morgan Stanley Commodity Related Equity Index | |
|
| World Precious Minerals | | NYSE Arca Gold Miners Index | |
|
| Gold and Precious Metals | | FTSE Gold Mines Index | |
|
| Eastern European | | MSCI Emerging Markets Europe 10/40 Index (Net Total Return) | |
|
| Global Emerging Markets | | MSCI Emerging Markets Total Net Return Index | |
|
| China Region | | Hang Seng Composite Index | |
|
No performance adjustment is applied unless the difference between the class's investment performance and the benchmark is 5 percent or greater (positive or negative) during the applicable performance measurement period. The performance fee adjustment is calculated monthly in arrears and is accrued ratably during the month. The management fee, net of any performance fee adjustment, is paid monthly in arrears.
178
Notes to Financial Statements (unaudited) June 30, 2011
The Funds' prospectus and statement of additional information contain additional information about the performance adjustment. The amounts shown as management fees on the Statements of Operations reflects the base fee plus/minus any performance adjustment. During the six months ended June 30, 2011, the Funds recorded performance adjustments as follows:
| Fund | | Investor Class
Performance Fee
Adjustment | | Institutional Class
Performance Fee
Adjustment | |
| All American Equity | | $ | — | | | | N/A | | |
| Holmes Growth | | | 23,254 | | | | N/A | | |
| Global MegaTrends | | | (13,164 | ) | | $ | (468 | ) | |
| Global Resources | | | 789,973 | | | | 7,828 | | |
| World Precious Minerals | | | 571,432 | | | | 512 | | |
| Gold and Precious Metals | | | 104,851 | | | | N/A | | |
| Eastern European | | | (175,673 | ) | | | N/A | | |
| Global Emerging Markets | | | (8,022 | ) | | | N/A | | |
| China Region | | | — | | | | N/A | | |
Under an administrative services agreement, the U.S. Treasury Securities Cash, U.S. Government Securities Savings, Near-Term Tax Free, Tax Free, All American Equity, Holmes Growth, Gold and Precious Metals, Eastern European, Global Emerging Markets and China Region Funds compensate the Adviser at an annual rate of 0.08% of the average daily net assets of each Fund for administrative services provided. The Global MegaTrends, Global Resources and World Precious Minerals Funds compensate the Adviser at an annual rate of 0.08% of the average daily net assets for the Investor Class and 0.06% of the average daily net assets for the Institutional Class for administrative services provided, of which half is a fund-level fee and half is a class-level fee.
The Investor Class shares for Equity Funds in the Trust have adopted a distribution plan pursuant to Rule 12b-1 of the Investment Company Act of 1940 in which a subsidiary of the Adviser is paid a fee at an annual rate of 0.25% of the average daily net assets of the Investor Class for sales and promotional services related to the distribution of Investor Class shares. The Institutional Class does not incur distribution plan fees.
The Adviser has voluntarily agreed to reimburse specific funds so that their total operating expenses will not exceed certain annual percentages of average net assets. The expenses for the six months ended June 30, 2011, were limited as follows for the Investor Class: U.S. Treasury Securities Cash Fund at 1.00%, U.S. Government Securities Savings Fund at 0.45%, Near-Term Tax Free Fund at 0.45%, Tax Free Fund at 0.70%, All American Equity Fund at 2.20%, Holmes Growth Fund at 2.20%, Global MegaTrends Fund at 2.35%, Global Resources, World Precious Minerals, and Gold and Precious Metals Funds at 1.90%, Eastern European Fund
179
Notes to Financial Statements (unaudited) June 30, 2011
at 2.85%, Global Emerging Markets Fund at 3.15% and China Region Fund at 2.55%. These expense limitations are exclusive of any performance fee adjustments and will continue on a voluntary basis at the Adviser's discretion.
The Adviser has agreed to waive all class specific expenses for the Institutional Class. The expense waiver is exclusive of performance fees, and the Adviser can modify or terminate this arrangement at any time.
The Adviser has voluntarily agreed to waive fees and/or reimburse U.S. Treasury Securities Cash Fund and U.S. Government Securities Savings Fund to the extent necessary to maintain the respective fund's yield at a certain level as determined by the Adviser (Minimum Yield). The Adviser may recapture any fees waived and/or expenses reimbursed within three years after the end of the fiscal year of such waiver and/or reimbursement to the extent that such recapture would not cause the fund's yield to fall below the Minimum Yield. For the six months ended June 30, 2011, fees waived and/or expenses reimbursed as a result of this agreement were $444,801 and $359,906 for the U.S. Treasury Securities Cash Fund and the U.S. Government Securities Savings Fund, respectively. At June 30, 2011, the Adviser may seek reimbursement of previously waived and reimbursed fees as follows:
| | | Expires
12/31/2011 | | Expires
12/31/2012 | | Expires
12/31/2013 | | Expires
12/31/2014 | | Total | |
| U.S. Treasury Securities Cash | | $ | 170,642 | | | $ | 789,420 | | | $ | 884,850 | | | $ | 444,801 | | | $ | 2,289,713 | | |
| U.S. Government Securities Savings | | | — | | | | 258,561 | | | | 678,107 | | | | 359,906 | | | | 1,296,574 | | |
United Shareholder Services, Inc. (USSI), a wholly-owned subsidiary of the Adviser, is the transfer agent for the Funds. Each Fund's share class pays an annual fee based on the number of shareholder accounts, certain base fees and transaction-and activity-based fees for transfer agency services. Certain account fees are paid directly by shareholders to the transfer agent, which, in turn, reduces its charge to the Funds.
The Adviser was reimbursed for services of the Funds' Chief Compliance Officer during the six months ended June 30, 2011, in the amount of $86,984.
Brown Brothers Harriman & Co. (BBH) serves as the custodian, fund accounting and administration service agent with a fee structure based on average net assets of the Funds, certain base fees and transaction-based fees.
The independent Trustees receive compensation for serving on the Board. Trustees serving as Chairman of the Board or a special committee or as a member of a committee receive additional compensation. Trustees are also reimbursed for out-of-pocket expenses incurred while attending meetings. Frank E. Holmes receives no compensation from the Funds for serving on the Board.
180
Notes to Financial Statements (unaudited) June 30, 2011
NOTE 4: INVESTMENTS
Cost of purchases and proceeds from sales of long-term securities for the six months ended June 30, 2011, are summarized as follows:
| Fund | | Purchases | | Sales | |
| Near-Term Tax Free | | $ | 2,476,056 | | | $ | 120,000 | | |
| Tax Free | | | 413,321 | | | | 1,387,325 | | |
| All American Equity | | | 22,552,216 | | | | 22,833,563 | | |
| Holmes Growth | | | 31,376,353 | | | | 33,681,772 | | |
| Global MegaTrends | | | 10,574,892 | | | | 13,074,365 | | |
| Global Resources | | | 1,140,761,138 | | | | 1,128,635,781 | | |
| World Precious Minerals | | | 321,405,884 | | | | 421,962,639 | | |
| Gold and Precious Metals | | | 179,354,760 | | | | 213,497,440 | | |
| Eastern European | | | 133,952,552 | | | | 248,175,815 | | |
| Global Emerging Markets | | | 10,762,574 | | | | 12,557,976 | | |
| China Region | | | 85,521,685 | | | | 91,969,410 | | |
U.S. Treasury Securities Cash and U.S. Government Securities Savings held only short-term investments. The Funds neither purchased nor sold long-term U.S. government securities during the period.
Investments in foreign issuers as a percent of total investments at June 30, 2011, were: 4.59% of All American Equity, 26.85% of Holmes Growth, 50.76% of Global MegaTrends, 41.93% of Global Resources, 89.01% of World Precious Minerals, 84.30% of Gold and Precious Metals, 99.18% of Eastern European, 95.39% of Global Emerging Markets and 100.00% of China Region.
NOTE 5: TAX INFORMATION
The following table presents the income tax basis of securities owned at June 30, 2011, and the tax basis components of net unrealized appreciation (depreciation):
| Fund | | Aggregate
Tax Cost | | Gross
Unrealized
Appreciation | | Gross
Unrealized
Depreciation | | Net Unrealized
Appreciation/
(Depreciation) | |
| U.S. Treasury Securities Cash | | $ | 77,308,262 | | | $ | — | | | $ | — | | | $ | — | | |
| U.S. Government Securities Savings | | | 140,072,876 | | | | — | | | | — | | | | — | | |
| Near-Term Tax Free | | | 27,324,258 | | | | 900,860 | | | | (17,418 | ) | | | 883,442 | | |
| Tax Free | | | 17,880,570 | | | | 768,682 | | | | (199,027 | ) | | | 569,655 | | |
| All American Equity | | | 16,909,758 | | | | 1,198,914 | | | | (421,625 | ) | | | 777,289 | | |
| Holmes Growth | | | 34,109,677 | | | | 6,804,588 | | | | (1,181,540 | ) | | | 5,623,048 | | |
| Global MegaTrends | | | 15,250,418 | | | | 2,822,724 | | | | (469,359 | ) | | | 2,353,365 | | |
| Global Resources | | | 862,709,340 | | | | 142,657,009 | | | | (91,862,779 | ) | | | 50,794,230 | | |
| World Precious Minerals | | | 562,921,758 | | | | 133,274,437 | | | | (96,481,162 | ) | | | 36,793,275 | | |
| Gold and Precious Metals | | | 226,524,240 | | | | 26,826,846 | | | | (18,321,150 | ) | | | 8,505,696 | | |
| Eastern European | | | 250,489,390 | | | | 97,969,702 | | | | (9,841,555 | ) | | | 88,128,147 | | |
| Global Emerging Markets | | | 10,329,631 | | | | 1,545,789 | | | | (916,942 | ) | | | 628,847 | | |
| China Region | | | 39,602,131 | | | | 3,031,997 | | | | (1,775,086 | ) | | | 1,256,911 | | |
181
Notes to Financial Statements (unaudited) June 30, 2011
As of December 31, 2010, the components of distributable earnings on a tax basis were as follows:
| Fund | | Undistributed
Tax-Exempt
Income | | Undistributed
Ordinary
Income | | Undistributed
Long-Term
Capital Gains | | Net Unrealized
Appreciation/
(Depreciation) | |
| U.S. Treasury Securities Cash | | $ | — | | | $ | 907 | | | $ | — | | | $ | — | | |
| U.S. Government Securities Savings | | | — | | | | 1,037 | | | | — | | | | — | | |
| Near-Term Tax Free | | | 5,974 | | | | 11,666 | | | | — | | | | 606,740 | | |
| Tax Free | | | 2,831 | | | | 30,632 | | | | — | | | | 140,725 | | |
| All American Equity | | | — | | | | 9,087 | | | | — | | | | 2,648,030 | | |
| Holmes Growth | | | — | | | | — | | | | — | | | | 7,111,585 | | |
| Global MegaTrends | | | — | | | | 36,114 | | | | — | | | | 3,871,686 | | |
| Global Resources | | | — | | | | 30,550,082 | | | | — | | | | 143,583,347 | | |
| World Precious Minerals | | | — | | | | 69,269,383 | | | | — | | | | 91,713,278 | | |
| Gold and Precious Metals | | | — | | | | — | | | | — | | | | 81,966,884 | | |
| Eastern European | | | — | | | | — | | | | — | | | | 123,996,737 | | |
| Global Emerging Markets | | | — | | | | — | | | | — | | | | 1,660,906 | | |
| China Region | | | — | | | | — | | | | — | | | | 6,109,694 | | |
The differences between book-basis and tax-basis unrealized appreciation (depreciation) for All American Equity, Holmes Growth, Global MegaTrends, Global Resources, World Precious Minerals, Gold and Precious Metals, Eastern European, Global Emerging Markets and China Region Funds are attributable primarily to the tax deferral of losses on wash sales, investment in passive foreign investment companies (PFIC), forwards marked to markets, unreversed return of capital in Canadian Trusts, adjustments for partnerships, tax straddle loss deferrals on written options, and adjustments for grantor trusts.
The tax character of distributions paid during the six months ended June 30, 2011, were as follows:
| Fund | | Tax Exempt
Income | | Ordinary
Income | | Long-Term
Capital Gains | | Total | |
| U.S. Treasury Securities Cash | | $ | — | | | $ | 4,895 | | | $ | — | | | $ | 4,895 | | |
| U.S. Government Securities Savings | | | — | | | | 9,825 | | | | — | | | | 9,825 | | |
| Near-Term Tax Free | | | 351,553 | | | | 16,999 | | | | — | | | | 368,552 | | |
| Tax Free | | | 347,068 | | | | 13,896 | | | | — | | | | 360,964 | | |
| All American Equity | | | — | | | | — | | | | — | | | | — | | |
| Holmes Growth | | | — | | | | — | | | | — | | | | — | | |
| Global MegaTrends - Investor Class | | | — | | | | — | | | | — | | | | — | | |
| Global MegaTrends - Institutional Class | | | — | | | | — | | | | — | | | | — | | |
| Global Resources - Investor Class | | | — | | | | — | | | | — | | | | — | | |
| Global Resources - Institutional Class | | | — | | | | — | | | | — | | | | — | | |
| World Precious Minerals - Investor Class | | | — | | | | — | | | | — | | | | — | | |
| World Precious Minerals - Institutional Class | | | — | | | | — | | | | — | | | | — | | |
| Gold and Precious Metals | | | — | | | | — | | | | — | | | | — | | |
| Eastern European | | | — | | | | — | | | | — | | | | — | | |
| Global Emerging Markets | | | — | | | | — | | | | — | | | | — | | |
| China Region | | | — | | | | — | | | | — | | | | — | | |
182
Notes to Financial Statements (unaudited) June 30, 2011
The tax character of distributions paid during the fiscal year ended December 31, 2010, were as follows:
| Fund | | Tax Exempt
Income | | Ordinary
Income | | Long-Term
Capital Gains | | Total | |
| U.S. Treasury Securities Cash | | $ | — | | | $ | 10,459 | | | $ | — | | | $ | 10,459 | | |
| U.S. Government Securities Savings | | | — | | | | 22,923 | | | | — | | | | 22,923 | | |
| Near-Term Tax Free | | | 619,205 | | | | 37,242 | | | | — | | | | 656,447 | | |
| Tax Free | | | 737,171 | | | | 39,612 | | | | — | | | | 776,783 | | |
| All American Equity | | | — | | | | — | | | | — | | | | — | | |
| Holmes Growth | | | — | | | | 449,513 | | | | — | | | | 449,513 | | |
| Global MegaTrends - Investor Class | | | — | | | | 13,170 | | | | — | | | | 13,170 | | |
| Global MegaTrends - Institutional Class | | | — | | | | 35,430 | | | | — | | | | 35,430 | | |
| Global Resources - Investor Class | | | — | | | | 21,220,358 | | | | — | | | | 21,220,358 | | |
| Global Resources - Institutional Class | | | — | | | | 430,785 | | | | — | | | | 430,785 | | |
| World Precious Minerals - Investor Class | | | — | | | | 99,236,093 | | | | — | | | | 99,236,093 | | |
| World Precious Minerals - Institutional Class | | | — | | | | 209,612 | | | | — | | | | 209,612 | | |
| Gold and Precious Metals | | | — | | | | 3,708,191 | | | | 18,871,531 | | | | 22,579,722 | | |
| Eastern European | | | — | | | | — | | | | — | | | | — | | |
| Global Emerging Markets | | | — | | | | — | | | | — | | | | — | | |
| China Region | | | — | | | | — | | | | — | | | | — | | |
Capital loss carryforwards may be used to offset current or future taxable capital gains until expiration. The Fund's tax-basis capital gains and losses are determined only at the end of each fiscal year. Under the recently enacted Regulated Investment Company Modernization Act of 2010, the Funds will be permitted to carry forward capital losses incurred in taxable years beginning after December 22, 2010, for an unlimited period. However, any losses incurred during those future years will be required to be utilized prior to the losses incurred in pre-enactment tax years. As a result of this ordering rule, pre-enactment capital losses that are carried forward will retain their character as either short-term or long-term capital losses rather than being considered all short-term as under previous law. The loss carryforwards and related expiration dates for each fund, as of December 31, 2010, are as follows:
| | | Expiration Date | |
| Fund | | 2011 | | 2012 | | 2013 | | 2014 | | 2015 | |
| U.S. Treasury Securities Cash | | $ | — | | | $ | — | | | $ | — | | | $ | — | | | $ | — | | |
| U.S. Government Securities Savings | | | — | | | | — | | | | — | | | | — | | | | — | | |
| Near-Term Tax Free | | | 46,218 | | | | 33,686 | | | | 2,760 | | | | 202,719 | | | | 2,488 | | |
| Tax Free | | | 25,127 | | | | 421,236 | | | | — | | | | — | | | | — | | |
| All American Equity | | | — | | | | — | | | | — | | | | — | | | | — | | |
| Holmes Growth | | | — | | | | — | | | | — | | | | — | | | | — | | |
| Global MegaTrends | | | — | | | | — | | | | — | | | | — | | | | 7,656,370 | | |
| Global Resources | | | — | | | | — | | | | — | | | | — | | | | — | | |
| World Precious Minerals | | | — | | | | — | | | | — | | | | — | | | | — | | |
| Gold and Precious Metals | | | — | | | | — | | | | — | | | | — | | | | — | | |
| Eastern European | | | — | | | | — | | | | — | | | | — | | | | — | | |
| Global Emerging Markets | | | — | | | | — | | | | — | | | | — | | | | 3,474,958 | | |
| China Region | | | — | | | | — | | | | — | | | | — | | | | — | | |
183
Notes to Financial Statements (unaudited) June 30, 2011
| | | Expiration Date | |
| Fund | | 2016 | | 2017 | | 2018 | | Total | |
| U.S. Treasury Securities Cash | | $ | — | | | $ | — | | | $ | — | | | $ | — | | |
| U.S. Government Securities Savings | | | — | | | | — | | | | — | | | | — | | |
| Near-Term Tax Free | | | 112 | | | | 722 | | | | 2,532 | | | | 291,237 | | |
| Tax Free | | | 10,697 | | | | — | | | | — | | | | 457,060 | | |
| All American Equity | | | 899,593 | | | | 2,923,917 | | | | — | | | | 3,823,510 | | |
| Holmes Growth | | | — | | | | 4,410,934 | | | | — | | | | 4,410,934 | | |
| Global MegaTrends | | | 5,994,166 | | | | 995,675 | | | | — | | | | 14,646,211 | | |
| Global Resources | | | 91,976,938 | | | | 313,223,879 | | | | — | | | | 405,200,817 | | |
| World Precious Minerals | | | 26,243,323 | | | | 65,119,274 | | | | — | | | | 91,362,597 | | |
| Gold and Precious Metals | | | — | | | | — | | | | — | | | | — | | |
| Eastern European | | | 83,605,572 | | | | 257,523,539 | | | | 15,445,946 | | | | 356,575,057 | | |
| Global Emerging Markets | | | 2,965,929 | | | | 5,814,949 | | | | — | | | | 12,255,836 | | |
| China Region | | | 15,020,267 | | | | — | | | | — | | | | 15,020,267 | | |
| Fund | | Post October 31, 2010
Capital Loss Deferral | | Post October 31, 2010
Currency Loss Deferral | |
| Tax Free | | $ | 171 | | | $ | — | | |
| Holmes Growth | | | — | | | | 314 | | |
| Global MegaTrends | | | 202,556 | | | | — | | |
| World Precious Minerals | | | 1,430,147 | | | | — | | |
| Gold and Precious Metals | | | — | | | | 29,380 | | |
| Eastern European | | | — | | | | 59,553 | | |
| Global Emerging Markets | | | — | | | | 2,248 | | |
The above amounts, in accordance with tax rules, are deemed to have occurred on January 1, 2011.
NOTE 6: RISKS OF CONCENTRATIONS
The Near-Term Tax Free Fund and the Tax Free Fund may be exposed to risks related to concentration of investments in a particular state or geographic area. These investments present risks resulting from changes in economic conditions of the region or the issuer.
Because the Global Resources Fund concentrates its investments in a specific industry, the fund may be subject to greater risks and fluctuations than a portfolio representing a broader range of industries.
The investment policies of the World Precious Minerals and Gold and Precious Metals Funds present unique risks to their respective portfolios' values. The prices of gold and other precious metals may be subject to fluctuations caused by international monetary and political developments including trade or currency restrictions, currency devaluation and revaluation, and social and political conditions within a country. Fluctuations in the prices of gold and other precious metals will affect the market values of the securities held by these funds.
184
Notes to Financial Statements (unaudited) June 30, 2011
The Eastern European Fund invests more than 25% of its investments in companies principally engaged in the oil & gas or banking industries. The risk of concentrating investments in this group of industries will make the fund more susceptible to risk in these industries than funds which do not concentrate their investments in an industry.
The Eastern European and Global Emerging Markets Funds may be exposed to risks not typically associated with investment in the United States due to their concentration of investments in emerging markets. These risks include possible revaluation of currencies, less public information about companies, disruptive political or economic conditions and the possible imposition of adverse governmental laws or currency exchange restrictions. Moreover, securities of many foreign issuers and their markets may be less liquid and their prices more volatile than those securities of comparable U.S. issuers.
The China Region Fund may be exposed to risks not typically associated with investments in the United States, due to concentration of investments in foreign issuers in the region. These investments present risks resulting from disruptive political or economic conditions and the potential imposition of adverse governmental laws or currency exchange restrictions affecting the area.
NOTE 7: CREDIT ARRANGEMENTS
Each of the Funds, along with other funds under common management, has a revolving credit facility with BBH. Borrowings of each Fund are collateralized by any or all of the securities held by BBH as the Fund's custodian up to the amount of the borrowing. Interest on borrowings is charged at the current overnight Federal Funds Rate plus 2%. Each Fund has a maximum borrowing limit of 10% of qualified assets. The aggregate of borrowings by all Funds under the agreement cannot exceed $30,000,000 at any one time. There were no borrowings under the revolving credit facility during the period ended June 30, 2011. The U.S. Global Investors Funds paid BBH a total of $22,625 in commitment fees for the six months ended June 30, 2011, under this arrangement.
NOTE 8: SHARES OF BENEFICIAL INTEREST
At June 30, 2011, individual shareholders holding more than 5% of outstanding Investor Class shares comprised 5.05% and 7.70% of the Near-Term Tax Free Fund and the Tax Free Fund, respectively. In addition, the Adviser held 15.14%, 8.02% and 8.27% of the Investor Class shares of U.S. Government Securities Savings Fund, Near-Term Tax Free Fund and Tax Free Fund, respectively. Control is defined by the 1940 Act as the beneficial ownership, either directly or through one or more controlled companies, of more than 25% of the voting securities of a company. Investment activities of these shareholders could have a material impact on the Funds.
185
Financial Highlights
U.S. TREASURY SECURITIES CASH FUND
For a capital share outstanding during the
| | | Investor Class | |
| | | Six Months
Ended
June 30, 2011 | | Year Ended
December 31, | | Six Months
Ended
December 31, | |
Year Ended June 30, | |
| | | (unaudited) | | 2010 | | 2009 | | 2008* | | 2008 | | 2007 | | 2006 | |
| Net asset value, beginning of period | | $ | 1.00 | | | $ | 1.00 | | | $ | 1.00 | | | $ | 1.00 | | | $ | 1.00 | | | $ | 1.00 | | | $ | 1.00 | | |
| Investment Activities | |
| Net investment income | | | — | (a) | | | — | (a) | | | — | (a) | | | — | (a) | | | .02 | | | | .04 | | | | .03 | | |
| Net realized and unrealized gain | | | — | | | | — | | | | — | | | | — | | | | — | | | | — | | | | — | | |
| Total from investment activities | | | — | (a) | | | — | (a) | | | — | (a) | | | — | (a) | | | .02 | | | | .04 | | | | .03 | | |
| Distributions from net investment income | | | — | (a) | | | — | (a) | | | — | (a) | | | — | (a) | | | (.02 | ) | | | (.04 | ) | | | (.03 | ) | |
| Net asset value, end of period | | $ | 1.00 | | | $ | 1.00 | | | $ | 1.00 | | | $ | 1.00 | | | $ | 1.00 | | | $ | 1.00 | | | $ | 1.00 | | |
| Total Return (excluding account fees) (b) | | | — | | | | .01 | % | | | .01 | % | | | .23 | % | | | 2.46 | % | | | 4.36 | % | | | 3.11 | % | |
| Ratios to Average Net Assets: (c) | |
| Net investment income | | | .01 | % | | | .01 | % | | | .01 | % | | | .44 | % | | | 2.43 | % | | | 4.27 | % | | | 3.06 | % | |
| Total expenses | | | 1.01 | % | | | 1.01 | % | | | 1.01 | % | | | 1.11 | % | | | 1.09 | % | | | .91 | % | | | .92 | % | |
| Expenses waived or reimbursed (d)(e) | | | (.92 | )% | | | (.86 | )% | | | (.75 | )% | | | (.38 | )% | | | (.09 | )% | | | (.02 | )% | | | — | | |
| Net recouped fees (e) | | | — | | | | — | | | | — | | | | — | | | | — | (g) | | | — | | | | .03 | % | |
| Net expenses (f) | | | .09 | % | | | .15 | % | | | .26 | % | | | .73 | % | | | 1.00 | % | | | .89 | % | | | .95 | % | |
| Net assets, end of period (in thousands) | | $ | 96,000 | | | $ | 99,491 | | | $ | 103,889 | | | $ | 121,410 | | | $ | 111,955 | | | $ | 116,012 | | | $ | 119,028 | | |
* Effective December 31, 2008, the fiscal year changed to December 31.
(a) The per share amount does not round to a full penny.
(b) Total returns for periods less than one year are not annualized. Assumes investment at the net asset value at the beginning of the period, reinvestment of all distribution and a complete redemption of the investment at the net asset value at the end of the period.
(c) Ratios are annualized for periods of less than one year.
(d) Expenses waived or reimbursed reflect reductions to total expenses, as discussed in the notes to the financial statements. These amounts would decrease the net investment income ratio had such reductions not occurred.
(e) During the year ended June 30, 2004, the Adviser waived fees and/or reimbursed expenses as a result of a Minimum Yield Agreement in the amount of $45,136. As allowed by the recapture provision of this agreement, the U.S. Treasury Securities Cash Fund reimbursed the Adviser the previously waived amount of $45,136 during the year ended June 30, 2006. During the year ended June 30, 2008, the Adviser waived fees and/or reimbursed expenses under the Minimum Yield Agreement in the amount of $4,259. The Fund reimbursed the Adviser the $4,259 during the year ended June 30, 2008. During the six months ended December 31, 2008, the year ended December 31, 2009, the year ended December 31, 2010 and the six months ended June 30, 2011, the Adviser waived fees and/or reimbursed expenses under the Minimum Yield Agreement in the amount of $170,642, $789,420, $884,850 and $444,801, respectively. These waivers/reimbursements are subject to recapture in future periods.
(f) The net expense ratios shown above reflect expenses after waivers and reimbursements but exclude the effect of reductions to total expenses for any expense offset. Expense offset arrangements reduce total expenses, as discussed in the notes to the financial statements. These amounts would decrease the net investment income ratio had such reductions not occurred. The effects of expenses offset are as follows:
| | | Investor Class | |
| | | Six Months
Ended
June 30, 2011 | | Year Ended
December 31, | | Six Months
Ended
December 31, | |
Year Ended June 30, | |
| | | (unaudited) | | 2010 | | 2009 | | 2008* | | 2008 | | 2007 | | 2006 | |
| Ratios to Average Net Assets (c): | |
| Expenses offset (g) | | | — | | | | — | | | | — | | | | — | | | | — | | | | — | | | | — | | |
(g) Effect on the expense ratio was not greater than 0.005%.
See accompanying notes to financial statements.
186
Financial Highlights
U.S. GOVERNMENT SECURITIES SAVINGS FUND
For a capital share outstanding during the
| | | Investor Class | |
| | | Six Months
Ended
June 30, 2011 | | Year Ended
December 31, | | Six Months
Ended
December 31, | | Year Ended June 30, | |
| | | (unaudited) | | 2010 | | 2009 | | 2008* | | 2008 | | 2007 | | 2006 | |
| Net asset value, beginning of period | | $ | 1.00 | | | $ | 1.00 | | | $ | 1.00 | | | $ | 1.00 | | | $ | 1.00 | | | $ | 1.00 | | | $ | 1.00 | | |
| Investment Activities | |
| Net investment income | | | — | (a) | | | — | (a) | | | — | (a) | | | .01 | | | | .03 | | | | .05 | | | | .04 | | |
| Net realized and unrealized gain | | | — | | | | — | (a) | | | — | | | | — | (a) | | | — | (a) | | | — | (a) | | | — | | |
| Total from investment activities | | | — | (a) | | | — | (a) | | | — | (a) | | | .01 | | | | .03 | | | | .05 | | | | .04 | | |
| Distributions from net investment income | | | — | (a) | | | — | (a) | | | — | (a) | | | (.01 | ) | | | (.03 | ) | | | (.05 | ) | | | (.04 | ) | |
| Net asset value, end of period | | $ | 1.00 | | | $ | 1.00 | | | $ | 1.00 | | | $ | 1.00 | | | $ | 1.00 | | | $ | 1.00 | | | $ | 1.00 | | |
| Total Return (excluding account fees) (b) | | | — | | | | .01 | % | | | .10 | % | | | .67 | % | | | 3.47 | % | | | 4.86 | % | | | 3.69 | % | |
| Ratios to Average Net Assets: (c) | |
| Net investment income | | | .01 | % | | | .01 | % | | | .11 | % | | | 1.36 | % | | | 3.42 | % | | | 4.75 | % | | | 3.64 | % | |
| Total expenses | | | .83 | % | | | .82 | % | | | .78 | % | | | .73 | % | | | .65 | % | | | .62 | % | | | .64 | % | |
| Expenses waived or reimbursed (d) | | | (.75 | )% | | | (.67 | )% | | | (.42 | )% | | | (.26 | )% | | | (.20 | )% | | | (.17 | )% | | | (.19 | )% | |
| Net expenses (e) | | | .08 | % | | | .15 | % | | | .36 | % | | | .47 | %(g) | | | .45 | % | | | .45 | % | | | .45 | % | |
| Net assets, end of period (in thousands) | | $ | 188,886 | | | $ | 203,835 | | | $ | 263,232 | | | $ | 357,910 | | | $ | 446,208 | | | $ | 469,095 | | | $ | 435,417 | | |
* Effective December 31, 2008, the fiscal year changed to December 31.
(a) The per share amount does not round to a full penny.
(b) Total returns for periods less than one year are not annualized. Assumes investment at the net asset value at the beginning of the period, reinvestment of all distributions and a complete redemption of the investment at the net asset value at the end of the period.
(c) Ratios are annualized for periods of less than one year.
(d) Expenses waived or reimbursed reflect reductions to total expenses, as discussed in the notes to the financial statements. These amounts would decrease the net investment income ratio had such reductions not occurred. During the year ended December 31, 2009, the year ended December 31, 2010 and the six months ended June 30, 2011, the Adviser waived fees and/or reimbursed expenses under the Minimum Yield Agreement in the amount of $258,561, $678,107 and $359,906, respectively. These waivers/reimbursements are subject to recapture in future periods.
(e) The net expense ratios shown above reflect expenses after waivers and reimbursements but exclude the effect of reductions to total expenses for any expenses offset. Expense offset arrangements reduce total expenses, as discussed in the notes to the financial statements. These amounts would decrease the net investment income ratio had such reductions not occurred. The effect of expenses offset are as follows:
| | | Investor Class | |
| | | Six Months
Ended
June 30, 2011 | | Year Ended
December 31, | | Six Months
Ended
December 31, | | Year Ended June 30, | |
| | | (unaudited) | | 2010 | | 2009 | | 2008* | | 2008 | | 2007 | | 2006 | |
| Ratios to Average Net Assets (c): | |
| Expenses offset (f) | | | — | | | | — | | | | — | | | | — | | | | — | | | | — | | | | — | | |
(f) Effect on the expense ratio was not greater than 0.005%.
(g) The annualized net expense ratio for the six months ended December 31, 2008, exceeded the limitation for the period due to the cost of participating in the U.S. Treasury Guarantee Program for the Money Market Funds. The cost to participate was without regard to the expense limitation.
See accompanying notes to financial statements.
187
Financial Highlights
NEAR-TERM TAX FREE FUND
For a capital share outstanding during the
| | | Investor Class | |
| | | Six Months
Ended
June 30, 2011 | | Year Ended
December 31, | | Six Months
Ended
December 31, | | Year Ended June 30, | |
| | | (unaudited) | | 2010 | | 2009 | | 2008* | | 2008 | | 2007 | | 2006 | |
| Net asset value, beginning of period | | $ | 2.22 | | | $ | 2.21 | | | $ | 2.16 | | | $ | 2.14 | | | $ | 2.12 | | | $ | 2.12 | | | $ | 2.17 | | |
| Investment Activities | |
| Net investment income | | | .03 | | | | .06 | | | | .06 | | | | .03 | | | | .07 | | | | .07 | | | | .07 | | |
| Net realized and unrealized gain (loss) | | | .02 | | | | .01 | | | | .05 | | | | .02 | | | | .02 | | | | — | (a) | | | (.05 | ) | |
| Total from investment activities | | | .05 | | | | .07 | | | | .11 | | | | .05 | | | | .09 | | | | .07 | | | | .02 | | |
| Distributions from net investment income | | | (.03 | ) | | | (.06 | ) | | | (.06 | ) | | | (.03 | ) | | | (.07 | ) | | | (.07 | ) | | | (.07 | ) | |
| Net asset value, end of period | | $ | 2.24 | | | $ | 2.22 | | | $ | 2.21 | | | $ | 2.16 | | | $ | 2.14 | | | $ | 2.12 | | | $ | 2.12 | | |
| Total Return (excluding account fees) (b) | | | 2.18 | % | | | 2.95 | % | | | 5.00 | % | | | 2.55 | % | | | 4.42 | % | | | 3.51 | % | | | .75 | % | |
| Ratios to Average Net Assets: (c) | |
| Net investment income | | | 2.52 | % | | | 2.46 | % | | | 2.63 | % | | | 3.15 | % | | | 3.41 | % | | | 3.43 | % | | | 3.08 | % | |
| Total expenses | | | 1.27 | % | | | 1.30 | % | | | 1.53 | % | | | 1.82 | % | | | 1.91 | % | | | 1.63 | % | | | 1.54 | % | |
| Expenses waived or reimbursed (d) | | | (.82 | )% | | | (.85 | )% | | | (1.08 | )% | | | (1.37 | )% | | | (1.46 | )% | | | (1.18 | )% | | | (1.09 | )% | |
| Net expenses (e) | | | .45 | % | | | .45 | % | | | .45 | % | | | .45 | % | | | .45 | % | | | .45 | % | | | .45 | % | |
| Portfolio turnover rate | | | — | (g) | | | 1 | % | | | — | (g) | | | 8 | % | | | 8 | % | | | 22 | % | | | 33 | % | |
| Net assets, end of period (in thousands) | | $ | 31,823 | | | $ | 29,138 | | | $ | 23,337 | | | $ | 13,989 | | | $ | 13,603 | | | $ | 13,383 | | | $ | 15,830 | | |
* Effective December 31, 2008, the fiscal year changed to December 31.
(a) The per share amount does not round to a full penny.
(b) Total returns for periods less than one year are not annualized. Assumes investment at the net asset value at the beginning of the period, reinvestment of all distributions and a complete redemption of the investment at the net asset value at the end of the period.
(c) Ratios are annualized for periods of less than one year.
(d) Expenses waived or reimbursed reflect reductions to total expenses, as discussed in the notes to the financial statements. These amounts would decrease the net investment income ratio had such reductions not occurred.
(e) The net expense ratios shown above reflect expenses after waivers and reimbursements but exclude the effect of reductions to total expenses for any expenses offset. Expense offset arrangements reduce total expenses, as discussed in the notes to the financial statements. These amounts would decrease the net investment income ratio had such reductions not occurred. The effect of expenses offset are as follows:
| | | Investor Class | |
| | | Six Months
Ended
June 30, 2011 | | Year Ended
December 31, | | Six Months
Ended
December 31, | | Year Ended June 30, | |
| | | (unaudited) | | 2010 | | 2009 | | 2008* | | 2008 | | 2007 | | 2006 | |
| Ratios to Average Net Assets (c): | |
| Expenses offset (f) | | | — | | | | — | | | | — | | | | — | | | | — | | | | — | | | | — | | |
(f) Effect on the expense ratio was not greater than 0.005%.
(g) Portfolio turnover rate was not greater than 0.5%.
See accompanying notes to financial statements.
188
Financial Highlights
TAX FREE FUND
For a capital share outstanding during the
| | | Investor Class | |
| | | Six Months
Ended
June 30, 2011 | | Year Ended
December 31, | | Six Months
Ended
December 31, | | Year Ended June 30, | |
| | | (unaudited) | | 2010 | | 2009 | | 2008* | | 2008 | | 2007 | | 2006 | |
| Net asset value, beginning of period | | $ | 12.01 | | | $ | 12.20 | | | $ | 11.72 | | | $ | 11.93 | | | $ | 11.98 | | | $ | 11.98 | | | $ | 12.33 | | |
| Investment Activities | |
| Net investment income | | | .23 | | | | .44 | | | | .45 | | | | .23 | | | | .47 | | | | .50 | | | | .52 | | |
| Net realized and unrealized gain (loss) | | | .27 | | | | (.19 | ) | | | .48 | | | | (.21 | ) | | | (.05 | ) | | | — | (a) | | | (.36 | ) | |
| Total from investment activities | | | .50 | | | | .25 | | | | .93 | | | | .02 | | | | .42 | | | | .50 | | | | .16 | | |
| Distributions from net investment income | | | (.23 | ) | | | (.44 | ) | | | (.45 | ) | | | (.23 | ) | | | (.47 | ) | | | (.50 | ) | | | (.51 | ) | |
| Net asset value, end of period | | $ | 12.28 | | | $ | 12.01 | | | $ | 12.20 | | | $ | 11.72 | | | $ | 11.93 | | | $ | 11.98 | | | $ | 11.98 | | |
| Total Return (excluding account fees) (b) | | | 4.17 | % | | | 2.04 | % | | | 8.03 | % | | | .22 | % | | | 3.54 | % | | | 4.15 | % | | | 1.30 | % | |
| Ratios to Average Net Assets: (c) | |
| Net investment income | | | 3.78 | % | | | 3.55 | % | | | 3.73 | % | | | 3.92 | % | | | 3.91 | % | | | 4.09 | % | | | 4.01 | % | |
| Total expenses | | | 1.75 | % | | | 1.66 | % | | | 1.75 | % | | | 1.91 | % | | | 1.94 | % | | | 1.86 | % | | | 1.69 | % | |
| Expenses waived or reimbursed (d) | | | (1.05 | )% | | | (.96 | )% | | | (1.05 | )% | | | (1.21 | )% | | | (1.24 | )% | | | (1.16 | )% | | | (.99 | )% | |
| Net expenses (e) | | | .70 | % | | | .70 | % | | | .70 | % | | | .70 | % | | | .70 | % | | | .70 | % | | | .70 | % | |
| Portfolio turnover rate | | | 2 | % | | | 15 | % | | | — | (g) | | | 6 | % | | | 11 | % | | | 6 | % | | | 19 | % | |
| Net assets, end of period (in thousands) | | $ | 20,084 | | | $ | 19,794 | | | $ | 22,102 | | | $ | 16,946 | | | $ | 18,380 | | | $ | 15,940 | | | $ | 14,992 | | |
* Effective December 31, 2008, the fiscal year changed to December 31.
(a) The per share amount does not round to a full penny.
(b) Total returns for periods less than one year are not annualized. Assumes investment at the net asset value at the beginning of the period, reinvestment of all distributions and a complete redemption of the investment at the net asset value at the end of the period.
(c) Ratios are annualized for periods of less than one year.
(d) Expenses waived or reimbursed reflect reductions to total expenses, as discussed in the notes to the financial statements. These amounts would decrease the net investment income ratio had such reductions not occurred.
(e) The net expense ratios shown above reflect expenses after waivers and reimbursements but exclude the effect of reductions to total expenses for any expenses offset. Expense offset arrangements reduce total expenses, as discussed in the notes to the financial statements. These amounts would decrease the net investment income ratio had such reductions not occurred. The effect of expenses offset are as follows:
| | | Investor Class | |
| | | Six Months
Ended
June 30, 2011 | | Year Ended
December 31, | | Six Months
Ended
December 31, | | Year Ended June 30, | |
| | | (unaudited) | | 2010 | | 2009 | | 2008* | | 2008 | | 2007 | | 2006 | |
| Ratios to Average Net Assets (c): | |
| Expenses offset (f) | | | — | | | | — | | | | — | | | | — | | | | — | | | | — | | | | — | | |
(f) Effect on the expense ratio was not greater than 0.005%.
(g) Portfolio turnover rate was not greater than 0.5%.
See accompanying notes to financial statements.
189
Financial Highlights
ALL AMERICAN EQUITY FUND
For a capital share outstanding during the
| | | Investor Class | |
| | | Six Months
Ended
June 30, 2011 | | Year Ended
December 31, | | Six Months
Ended
December 31, | | Year Ended June 30, | |
| | | (unaudited) | | 2010 | | 2009 | | 2008* | | 2008 | | 2007 | | 2006 | |
| Net asset value, beginning of period | | $ | 22.72 | | | $ | 19.60 | | | $ | 17.33 | | | $ | 27.27 | | | $ | 28.58 | | | $ | 27.59 | | | $ | 24.47 | | |
| Investment Activities | |
| Net investment income (loss) | | | (.04 | ) | | | .02 | | | | (.13 | ) | | | .04 | | | | (.15 | ) | | | (.08 | ) | | | (.18 | ) | |
| Net realized and unrealized gain (loss) | | | 1.30 | | | | 3.10 | | | | 2.51 | | | | (9.97 | ) | | | 1.98 | | | | 4.94 | | | | 3.89 | | |
| Total from investment activities | | | 1.26 | | | | 3.12 | | | | 2.38 | | | | (9.93 | ) | | | 1.83 | | | | 4.86 | | | | 3.71 | | |
| Distributions | |
| From net investment income | | | — | | | | — | | | | (.11 | ) | | | (.01 | ) | | | — | | | | — | | | | — | | |
| From net realized gains | | | — | | | | — | | | | — | | | | — | | | | (3.01 | ) | | | (3.87 | ) | | | (.59 | ) | |
| From tax return of capital | | | — | | | | — | | | | — | | | | — | | | | (.13 | ) | | | — | | | | — | | |
| Total distributions | | | — | | | | — | | | | (.11 | ) | | | (.01 | ) | | | (3.14 | ) | | | (3.87 | ) | | | (.59 | ) | |
| Short-Term Trading Fees **(a) | | | — | | | | — | | | | — | | | | — | | | | — | | | | — | | | | — | | |
| Net asset value, end of period | | $ | 23.98 | | | $ | 22.72 | | | $ | 19.60 | | | $ | 17.33 | | | $ | 27.27 | | | $ | 28.58 | | | $ | 27.59 | | |
| Total Return (excluding account fees) (b) | | | 5.55 | % | | | 15.92 | % | | | 13.75 | % | | | (36.42 | )% | | | 5.99 | % | | | 19.59 | % | | | 15.25 | % | |
| Ratios to Average Net Assets: (c) | |
| Net investment income (loss) | | | (.39 | )% | | | .10 | % | | | (.74 | )% | | | .35 | % | | | (.55 | )% | | | (.28 | )% | | | (.67 | )% | |
| Total expenses | | | 2.44 | % | | | 2.56 | % | | | 2.79 | % | | | 2.37 | % | | | 1.98 | % | | | 2.01 | % | | | 2.20 | % | |
| Expenses waived or reimbursed (d) | | | (.24 | )% | | | (.48 | )% | | | (.96 | )% | | | (.62 | )% | | | (.23 | )% | | | (.26 | )% | | | (.44 | )% | |
| Net expenses (e) | | | 2.20 | % | | | 2.08 | % | | | 1.83 | % | | | 1.75 | % | | | 1.75 | % | | | 1.75 | % | | | 1.76 | % | |
| Portfolio turnover rate | | | 127 | % | | | 299 | % | | | 343 | % | | | 205 | % | | | 225 | % | | | 223 | % | | | 369 | % | |
| Net assets, end of period (in thousands) | | $ | 18,370 | | | $ | 17,760 | | | $ | 16,436 | | | $ | 16,234 | | | $ | 26,513 | | | $ | 23,479 | | | $ | 21,547 | | |
* Effective December 31, 2008, the fiscal year changed to December 31.
** Based on average monthly shares outstanding.
(a) The per share amount does not round to a full penny.
(b) Total returns for periods less than one year are not annualized. Assumes investment at the net asset value at the beginning of the period, reinvestment of all distribution and a complete redemption of the investment at the net asset value at the end of the period.
(c) Ratios are annualized for periods of less than one year.
(d) Expenses waived or reimbursed reflect reductions to total expenses, as discussed in the notes to the financial statements. These amounts would increase the net investment loss ratio or decrease the net investment income ratio, as applicable, had such reductions not occurred.
(e) The net expense ratios shown above reflect expenses after waivers and reimbursements but exclude the effect of reductions to total expenses for any expenses offset. Expense offset arrangements reduce total expenses, as discussed in the notes to the financial statements. These amounts would increase the net investment loss ratio, or decrease the net investment income ratio, as applicable, had such reductions not occurred. The effect of expenses offset are as follows:
| | | Investor Class | |
| | | Six Months
Ended
June 30, 2011 | | Year Ended
December 31, | | Six Months
Ended
December 31, | | Year Ended June 30, | |
| | | (unaudited) | | 2010 | | 2009 | | 2008* | | 2008 | | 2007 | | 2006 | |
| Ratios to Average Net Assets (c): | |
| Expenses offset | | | — | (f) | | | — | (f) | | | — | (f) | | | — | (f) | | | — | (f) | | | — | (f) | | | (0.01 | )% | |
(f) Effect on the expense ratio was not greater than 0.005%.
See accompanying notes to financial statements.
190
Financial Highlights
HOLMES GROWTH FUND
For a capital share outstanding during the
| | | Investor Class | |
| | | Six Months
Ended
June 30, 2011 | | Year Ended
December 31, | | Two Months
Ended
December 31, | | Year Ended October 31, | |
| | | (unaudited) | | 2010 | | 2009 | | 2008* | | 2008 | | 2007 | | 2006 | |
| Net asset value, beginning of period | | $ | 18.65 | | | $ | 15.54 | | | $ | 12.79 | | | $ | 14.14 | | | $ | 24.78 | | | $ | 18.34 | | | $ | 16.56 | | |
| Investment Activities | |
| Net investment loss | | | (.14 | ) | | | (.22 | ) | | | (.13 | ) | | | (.01 | ) | | | (.15 | ) | | | (.14 | ) | | | (.14 | ) | |
| Net realized and unrealized gain (loss) | | | 1.56 | | | | 3.54 | | | | 2.88 | | | | (1.34 | ) | | | (10.49 | ) | | | 6.58 | | | | 1.92 | | |
| Total from investment activities | | | 1.42 | | | | 3.32 | | | | 2.75 | | | | (1.35 | ) | | | (10.64 | ) | | | 6.44 | | | | 1.78 | | |
| Distributions | | | — | | | | (.21 | ) | | | — | | | | — | | | | — | | | | — | | | | — | | |
| Short-Term Trading Fees **(a) | | | — | | | | — | | | | — | | | | — | | | | — | | | | — | | | | — | | |
| Net asset value, end of period | | $ | 20.07 | | | $ | 18.65 | | | $ | 15.54 | | | $ | 12.79 | | | $ | 14.14 | | | $ | 24.78 | | | $ | 18.34 | | |
| Total Return (excluding account fees) (b) | | | 7.61 | % | | | 21.35 | % | | | 21.50 | % | | | (9.55 | )% | | | (42.94 | )% | | | 35.11 | % | | | 10.75 | % | |
| Ratios to Average Net Assets: (c) | |
| Net investment loss | | | (1.42 | )% | | | (1.29 | )% | | | (.93 | )% | | | (.27 | )% | | | (.65 | )% | | | (.62 | )% | | | (.69 | )% | |
| Total expenses | | | 2.07 | % | | | 1.93 | % | | | 2.10 | % | | | 2.51 | % | | | 1.74 | % | | | 1.72 | % | | | 1.74 | % | |
| Expenses waived or reimbursed (d) | | | — | | | | — | (f) | | | (.33 | )% | | | (.76 | )% | | | — | | | | — | | | | — | | |
| Net expenses (e) | | | 2.07 | % | | | 1.93 | % | | | 1.77 | % | | | 1.75 | % | | | 1.74 | % | | | 1.72 | % | | | 1.74 | % | |
| Portfolio turnover rate | | | 77 | % | | | 160 | % | | | 219 | % | | | 20 | % | | | 140 | % | | | 98 | % | | | 290 | % | |
| Net assets, end of period (in thousands) | | $ | 42,758 | | | $ | 40,604 | | | $ | 37,149 | | | $ | 32,488 | | | $ | 36,231 | | | $ | 68,881 | | | $ | 61,810 | | |
* Effective December 31, 2008, the fiscal year changed to December 31.
** Based on average monthly shares outstanding.
(a) The per share amount does not round to a full penny.
(b) Total returns for periods less than one year are not annualized. Assumes investment at the net asset value at the beginning of the period, reinvestment of all distributions and a complete redemption of the investment at the net asset value at the end of the period.
(c) Ratios are annualized for periods of less than one year.
(d) Expenses waived or reimbursed reflect reductions to total expenses, as discussed in the notes to the financial statements. These amounts would increase the net investment loss ratio or decrease the net investment income ratio, as applicable, had such reductions not occurred.
(e) The net expense shown above reflect expenses after waivers and reimbursements but exclude the effect of reductions to total expenses for any expenses offset. Expense offset arrangements reduce total expenses, as discussed in the notes to the financial statements. These amounts would increase the net investment loss ratio, or decrease the net investment income ratio, as applicable, had such reductions not occurred. The effect of expenses offset are as follows:
| | | Investor Class | |
| | | Six Months
Ended
June 30, 2011 | | Year Ended
December 31, | | Two Months
Ended
December 31, | | Year Ended October 31, | |
| | | (unaudited) | | 2010 | | 2009 | | 2008* | | 2008 | | 2007 | | 2006 | |
| Ratios to Average Net Assets (c): | |
| Expenses offset | | | — | (f) | | | — | (f) | | | — | (f) | | | — | (f) | | | — | (f) | | | — | (f) | | | (0.01 | )% | |
(f) Effect on the expense ratio was not greater than 0.005%.
See accompanying notes to financial statements.
191
Financial Highlights
GLOBAL MEGATRENDS FUND
For a capital share outstanding during the
| | | Investor Class | |
| | | Six Months
Ended
June 30, 2011 | | Year Ended
December 31, | | Two Months
Ended
December 31, | | Year Ended October 31, | |
| | | (unaudited) | | 2010 | | 2009 | | 2008* | | 2008 | | 2007** | | 2006 | |
| Net asset value, beginning of period | | $ | 8.83 | | | $ | 8.15 | | | $ | 6.28 | | | $ | 6.60 | | | $ | 12.75 | | | $ | 11.07 | | | $ | 10.30 | | |
| Investment Activities | |
| Net investment income (loss) | | | .02 | | | | .06 | | | | .03 | | | | — | (a) | | | — | (a) | | | (.11 | ) | | | (.10 | ) | |
| Net realized and unrealized gain (loss) | | | (.03 | ) | | | .63 | | | | 1.86 | | | | (.31 | ) | | | (5.30 | ) | | | 2.63 | | | | 1.18 | | |
| Total from investment activities | | | (.01 | ) | | | .69 | | | | 1.89 | | | | (.31 | ) | | | (5.30 | ) | | | 2.52 | | | | 1.08 | | |
| Distributions | |
| From net investment income | | | — | | | | (.01 | ) | | | (.02 | ) | | | — | | | | — | | | | — | | | | — | | |
| From net realized gains | | | — | | | | — | | | | — | | | | — | | | | (.85 | ) | | | (.84 | ) | | | (.31 | ) | |
| From tax return of capital | | | — | | | | — | | | | — | | | | (.01 | ) | | | — | | | | — | | | | — | | |
| Total distributions | | | — | | | | (.01 | ) | | | (.02 | ) | | | (.01 | ) | | | (.85 | ) | | | (.84 | ) | | | (.31 | ) | |
| Short-Term Trading Fees ***(a) | | | — | | | | — | | | | — | | | | — | | | | — | | | | — | | | | — | | |
| Net asset value, end of period | | $ | 8.82 | | | $ | 8.83 | | | $ | 8.15 | | | $ | 6.28 | | | $ | 6.60 | | | $ | 12.75 | | | $ | 11.07 | | |
| Total Return (excluding account fees) (b) | | | (.11 | )% | | | 8.43 | % | | | 30.15 | % | | | (4.74 | )% | | | (44.50 | )% | | | 24.49 | % | | | 10.53 | % | |
| Ratios to Average Net Assets: (c) | |
| Net investment income (loss) | | | .39 | % | | | .43 | % | | | .45 | % | | | (.20 | )% | | | (.06 | )% | | | (.93 | )% | | | (.89 | )% | |
| Total expenses | | | 2.50 | % | | | 2.44 | % | | | 2.43 | % | | | 2.96 | % | | | 2.21 | % | | | 2.49 | % | | | 2.55 | % | |
| Expenses waived or reimbursed (d) | | | (.31 | )% | | | (.22 | )% | | | (.48 | )% | | | (1.11 | )% | | | (.21 | )% | | | — | | | | — | | |
| Net expenses (e) | | | 2.19 | % | | | 2.22 | % | | | 1.95 | % | | | 1.85 | % | | | 2.00 | % | | | 2.49 | % | | | 2.55 | % | |
| Portfolio turnover rate (h) | | | 56 | % | | | 104 | % | | | 100 | % | | | 29 | % | | | 92 | % | | | 65 | % | | | 75 | % | |
| Net assets, end of period (in thousands) | | $ | 15,389 | | | $ | 16,332 | | | $ | 28,557 | | | $ | 22,035 | | | $ | 25,387 | | | $ | 17,723 | | | $ | 17,077 | | |
* Effective December 31, 2008, the fiscal year changed to December 31.
** Effective October 1, 2007, U.S. Global Investors, Inc. assumed management of Global MegaTrends Fund from the former subadviser.
*** Based on average monthly shares outstanding.
(a) The per share amount does not round to a full penny.
(b) Total returns for periods less than one year are not annualized. Assumes investment at the net asset value at the beginning of the period, reinvestment of all distributions and a complete redemption of the investment at the net asset value at the end of the period.
(c) Ratios are annualized for periods of less than one year.
(d) Expenses waived or reimbursed reflect reductions to total expenses, as discussed in the notes to the financial statements. These amounts would increase the net investment loss ratio or decrease the net investment income ratio, as applicable, had such reductions not occurred.
(e) The expense ratios shown above exclude the effect of reductions to total expenses for any expenses offset. Expense offset arrangements reduce total expenses, as discussed in the notes to financial statements. These amounts would increase the net investment loss ratio, or decrease the net investment income ratio, as applicable, had such reductions not occurred. The effect of expenses offset are as follows:
| | | Investor Class | |
| | | Six Months
Ended
June 30, 2011 | | Year Ended
December 31, | | Two Months
Ended
December 31, | | Year Ended October 31, | |
| | | (unaudited) | | 2010 | | 2009 | | 2008* | | 2008 | | 2007 | | 2006 | |
| Ratios to Average Net Assets (c): | |
| Expenses offset (g) | | | — | | | | — | | | | — | | | | — | | | | — | | | | — | | | | — | | |
(g) Effect on the expense ratio was not greater than 0.005%
(h) Portfolio turnover rate is calculated at the fund level.
See accompanying notes to financial statements.
192
Financial Highlights
GLOBAL MEGATRENDS FUND
For a capital share outstanding during the
| | | Institutional Class | |
| | | Six Months
Ended
June 30, 2011
(unaudited) | | Period
Ended
December 31,
2010(d) | |
| Net asset value, beginning of period | | $ | 8.79 | | | $ | 7.84 | | |
| Investment Activities | |
| Net investment income | | | .04 | | | | .01 | | |
| Net realized and unrealized gain (loss) | | | (.03 | ) | | | 1.02 | | |
| Total from investment activities | | | .01 | | | | 1.03 | | |
| Distributions | |
| From net investment income | | | — | | | | (.08 | ) | |
| From net realized gains | | | — | | | | — | | |
| From tax return of capital | | | — | | | | — | | |
| Total distributions | | | — | | | | (.08 | ) | |
| Short-Term Trading Fees * | | | — | | | | — | | |
| Net asset value, end of period | | $ | 8.80 | | | $ | 8.79 | | |
| Total Return (excluding account fees) (a) | | | .11 | % | | | 13.08 | % | |
| Ratios to Average Net Assets: (b) | |
| Net investment income (loss) | | | .78 | % | | | .51 | % | |
| Total expenses | | | 2.70 | % | | | 8.09 | % | |
| Expenses waived or reimbursed (c) | | | (.90 | )% | | | (6.48 | )% | |
| Net expenses (e) | | | 1.80 | % | | | 1.61 | % | |
| Portfolio turnover rate (g) | | | 56 | % | | | 104 | % | |
| Net assets, end of period (in thousands) | | $ | 3,705 | | | $ | 3,970 | | |
* Based on average monthly shares outstanding.
(a) Total returns for periods less than one year are not annualized. Assumes investment at the net asset value at the beginning of the period, reinvestment of all distributions and a complete redemption of the investment at the net asset value at the end of the period.
(b) Ratios are annualized for periods of less than one year.
(c) Expenses waived or reimbursed reflect reductions to total expenses, as discussed in the notes to the financial statements. These amounts would increase the net investment loss ratio or decrease the net investment income ratio, as applicable, had such reductions not occurred.
(d) From March 1, 2010, commencement of operations.
(e) The expense ratios shown above exclude the effect of reductions to total expenses for any expenses offset. Expense offset arrangements reduce total expenses, as discussed in the notes to financial statements. These amounts would increase the net investment loss ratio, or decrease the net investment income ratio, as applicable, had such reductions not occurred. The effect of expenses offset are as follows:
| | | Institutional Class | |
| | | Six Months
Ended
June 30, 2011
(unaudited) | | Period
Ended
December 31,
2010(d) | |
| Ratios to Average Net Assets (b): | |
| Expenses offset (f) | | | — | | | | — | | |
(f) Effect on the expense ratio was not greater than 0.005%.
(g) Portfolio turnover rate is calculated at the fund level.
See accompanying notes to financial statements.
193
Financial Highlights
GLOBAL RESOURCES FUND
For a capital share outstanding during the
| | | Investor Class | |
| | | Six Months
Ended
June 30, 2011 | | Year Ended
December 31, | | Six Months
Ended
December 31, | | Year Ended June 30, | |
| | | (unaudited) | | 2010 | | 2009 | | 2008* | | 2008 | | 2007 | | 2006 | |
| Net asset value, beginning of period | | $ | 11.91 | | | $ | 8.85 | | | $ | 5.26 | | | $ | 20.52 | | | $ | 17.70 | | | $ | 17.22 | | | $ | 12.67 | | |
| Investment Activities | |
| Net investment income (loss) | | | (.08 | ) | | | (.09 | ) | | | (.01 | ) | | | (.02 | )** | | | .05 | ** | | | .21 | | | | .29 | | |
| Net realized and unrealized gain (loss) | | | (.15 | ) | | | 3.44 | | | | 3.60 | | | | (13.92 | )** | | | 5.86 | ** | | | 2.86 | | | | 5.63 | | |
| Total from investment activities | | | (.23 | ) | | | 3.35 | | | | 3.59 | | | | (13.94 | ) | | | 5.91 | | | | 3.07 | | | | 5.92 | | |
| Distributions | |
| From net investment income | | | — | | | | (.29 | ) | | | — | | | | — | | | | (.95 | ) | | | (.88 | ) | | | (.32 | ) | |
| From net realized gains | | | — | | | | — | | | | — | | | | (1.32 | ) | | | (2.14 | ) | | | (1.71 | ) | | | (1.05 | ) | |
| Total distributions | | | — | | | | (.29 | ) | | | — | | | | (1.32 | ) | | | (3.09 | ) | | | (2.59 | ) | | | (1.37 | ) | |
| Short-Term Trading Fees **(a) | | | — | | | | — | | | | — | | | | — | | | | — | | | | — | | | | — | | |
| Net asset value, end of period | | $ | 11.68 | | | $ | 11.91 | | | $ | 8.85 | | | $ | 5.26 | | | $ | 20.52 | | | $ | 17.70 | | | $ | 17.22 | | |
| Total Return (excluding account fees) (b) | | | (1.93 | )% | | | 38.00 | % | | | 68.25 | % | | | (67.70 | )% | | | 37.59 | % | | | 20.94 | % | | | 48.91 | % | |
| Ratios to Average Net Assets: (c) | |
| Net investment income (loss) | | | (1.01 | )% | | | (1.04 | )% | | | (.08 | )% | | | (.34 | )% | | | .28 | % | | | .74 | % | | | 1.07 | % | |
| Total expenses | | | 1.71 | % | | | 1.73 | % | | | 1.64 | % | | | 1.20 | % | | | .88 | % | | | .95 | % | | | .96 | % | |
| Expenses waived or reimbursed (d) | | | — | | | | — | | | | (.17 | )% | | | (.12 | )% | | | — | | | | — | | | | — | | |
| Net expenses (e) | | | 1.71 | % | | | 1.73 | % | | | 1.47 | % | | | 1.08 | % | | | .88 | % | | | .95 | % | | | .96 | % | |
| Portfolio turnover rate (g) | | | 114 | % | | | 145 | % | | | 189 | % | | | 100 | % | | | 133 | % | | | 122 | % | | | 157 | % | |
| Net assets, end of period (in thousands) | | $ | 866,908 | | | $ | 911,559 | | | $ | 740,072 | | | $ | 464,524 | | | $ | 2,010,581 | | | $ | 1,383,250 | | | $ | 1,281,664 | | |
* Effective December 31, 2008, the fiscal year changed to December 31.
** Based on average monthly shares outstanding.
(a) The per share amount does not round to a full penny.
(b) Total returns for periods less than one year are not annualized. Assumes investment at the net asset value at the beginning of the period, reinvestment of all distributions and a complete redemption of the investment at the net asset value at the end of the period.
(c) Ratios are annualized for periods of less than one year.
(d) Expenses waived or reimbursed reflect reductions to total expenses, as discussed in the notes to the financial statements. These amounts would increase the net investment loss ratio or decrease the net investment income ratio, as applicable, had such reductions not occurred.
(e) The net expense ratios shown above reflect expenses after waivers and reimbursements but exclude the effect of reductions to total expenses for any expenses offset. Expense offset arrangements reduce total expenses, as discussed in the notes to the financial statements. These amounts would increase the net investment loss ratio, or decrease the net investment income ratio, as applicable, had such reductions not occurred. The effect of expenses offset are as follows:
| | | Investor Class | |
| | | Six Months
Ended
June 30, 2011 | | Year Ended
December 31, | | Six Months
Ended
December 31, | | Year Ended June 30, | |
| | | (unaudited) | | 2010 | | 2009 | | 2008* | | 2008 | | 2007 | | 2006 | |
| Ratios to Average Net Assets (c): | |
| Expenses offset | | | — | (f) | | | — | (f) | | | — | (f) | | | — | (f) | | | (0.01 | )% | | | (0.01 | )% | | | (0.01 | )% | |
(f) Effect on the expense ratio was not greater than 0.005%.
(g) Portfolio turnover rate is calculated at the fund level.
See accompanying notes to financial statements.
194
Financial Highlights
GLOBAL RESOURCES FUND
For a capital share outstanding during the
| | | Institutional Class | |
| | | Six Months
Ended
June 30, 2011
(unaudited) | | Period
Ended
December 31,
2010(e) | |
| Net asset value, beginning of period | | $ | 11.98 | | | $ | 8.87 | | |
| Investment Activities | |
| Net investment loss | | | (.02 | )* | | | (.01 | ) | |
| Net realized and unrealized gain (loss) | | | (.18 | )* | | | 3.41 | | |
| Total from investment activities | | | (.20 | ) | | | 3.40 | | |
| Distributions | |
| From net investment income | | | — | | | | (.29 | ) | |
| From net realized gains | | | — | | | | — | | |
| Total distributions | | | — | | | | (.29 | ) | |
| Short-Term Trading Fees *(a) | | | — | | | | — | | |
| Net asset value, end of period | | $ | 11.78 | | | $ | 11.98 | | |
| Total Return (excluding account fees) (b) | | | (1.67 | )% | | | 38.53 | % | |
| Ratios to Average Net Assets: (c) | |
| Net investment income (loss) | | | (.38 | )% | | | (.35 | )% | |
| Total expenses | | | 1.32 | % | | | 1.74 | % | |
| Expenses waived or reimbursed (d) | | | (.22 | )% | | | (.66 | )% | |
| Net expenses (f) | | | 1.10 | % | | | 1.08 | % | |
| Portfolio turnover rate (h) | | | 114 | % | | | 145 | % | |
| Net assets, end of period (in thousands) | | $ | 37,018 | | | $ | 17,923 | | |
* Based on average monthly shares outstanding.
(a) The per share amount does not round to a full penny.
(b) Total returns for periods less than one year are not annualized. Assumes investment at the net asset value at the beginning of the period, reinvestment of all distributions and a complete redemption of the investment at the net asset value at the end of the period.
(c) Ratios are annualized for periods of less than one year.
(d) Expenses waived or reimbursed reflect reductions to total expenses, as discussed in the notes to the financial statements. These amounts would increase the net investment loss ratio or decrease the net investment income ratio, as applicable, had such reductions not occurred.
(e) From March 1, 2010, commencement of operations.
(f) The net expense ratios shown above reflect expenses after waivers and reimbursements but exclude the effect of reductions to total expenses for any expenses offset. Expense offset arrangements reduce total expenses, as discussed in the notes to the financial statements. These amounts would increase the net investment loss ratio, or decrease the net investment income ratio, as applicable, had such reductions not occurred. The effect of expenses offset are as follows:
| | | Institutional Class | |
| | | Six Months
Ended
June 30, 2011
(unaudited) | | Period
Ended
December 31,
2010(e) | |
| Ratios to Average Net Assets (c): | |
| Expenses offset (g) | | | — | | | | — | | |
(g) Effect on the expense ratio was not greater than 0.005%.
(h) Portfolio turnover rate is calculated at the fund level.
See accompanying notes to financial statements.
195
Financial Highlights
WORLD PRECIOUS MINERALS FUND
For a capital share outstanding during the
| | | Investor Class | |
| | | Six Months
Ended
June 30, 2011 | | Year Ended
December 31, | | Six Months
Ended
December 31, | | Year Ended June 30, | |
| | | (unaudited) | | 2010 | | 2009 | | 2008* | | 2008 | | 2007 | | 2006 | |
| Net asset value, beginning of period | | $ | 22.28 | | | $ | 17.42 | | | $ | 9.56 | | | $ | 25.32 | | | $ | 28.34 | | | $ | 28.86 | | | $ | 15.50 | | |
| Investment Activities | |
| Net investment income (loss) | | | (.17 | )** | | | (.32 | )** | | | (.18 | ) | | | (.06 | )** | | | (.13 | )** | | | — | ** | | | .72 | | |
| Net realized and unrealized gain (loss) | | | (3.84 | )** | | | 8.16 | ** | | | 8.71 | | | | (13.65 | )** | | | 3.70 | ** | | | 3.02 | | | | 13.62 | | |
| Total from investment activities | | | (4.01 | ) | | | 7.84 | | | | 8.53 | | | | (13.71 | ) | | | 3.57 | | | | 3.02 | | | | 14.34 | | |
| Distributions | |
| From net investment income | | | — | | | | (2.98 | ) | | | (.67 | ) | | | — | | | | (3.25 | ) | | | (1.52 | ) | | | (.67 | ) | |
| From net realized gains | | | — | | | | — | | | | — | | | | (2.05 | ) | | | (3.35 | ) | | | (2.04 | ) | | | (.37 | ) | |
| Total distributions | | | — | | | | (2.98 | ) | | | (.67 | ) | | | (2.05 | ) | | | (6.60 | ) | | | (3.56 | ) | | | (1.04 | ) | |
| Short-Term Trading Fees ** | | | — | (a) | | | — | (a) | | | — | (a) | | | — | (a) | | | .01 | | | | .02 | | | | .06 | | |
| Net asset value, end of period | | $ | 18.27 | | | $ | 22.28 | | | $ | 17.42 | | | $ | 9.56 | | | $ | 25.32 | | | $ | 28.34 | | | $ | 28.86 | | |
| Total Return (excluding account fees) (b) | | | (18.00 | )% | | | 45.38 | % | | | 89.50 | % | | | (51.23 | )% | | | 14.14 | % | | | 11.48 | % | | | 96.21 | % | |
| Ratios to Average Net Assets: (c) | |
| Net investment income (loss) | | | (1.63 | )% | | | (1.68 | )% | | | (1.32 | )% | | | (.80 | )% | | | (.43 | )% | | | .06 | % | | | .05 | % | |
| Total expenses | | | 1.80 | % | | | 1.84 | % | | | 1.75 | % | | | 1.36 | % | | | .97 | % | | | .99 | % | | | 1.13 | % | |
| Expenses waived or reimbursed (d) | | | — | | | | — | | | | (.17 | )% | | | (.11 | )% | | | — | | | | — | | | | — | | |
| Net expenses (e) | | | 1.80 | % | | | 1.84 | % | | | 1.58 | % | | | 1.25 | % | | | .97 | % | | | .99 | % | | | 1.13 | % | |
| Portfolio turnover rate (g) | | | 48 | % | | | 68 | % | | | 72 | % | | | 27 | % | | | 58 | % | | | 54 | % | | | 66 | % | |
| Net assets, end of period (in thousands) | | $ | 599,845 | | | $ | 826,598 | | | $ | 639,035 | | | $ | 359,120 | | | $ | 949,014 | | | $ | 923,779 | | | $ | 920,249 | | |
* Effective December 31, 2008, the fiscal year changed to December 31.
** Based on average monthly shares outstanding.
(a) The per share amount does not round to a full penny.
(b) Total returns for periods less than one year are not annualized. Assumes investment at the net asset value at the beginning of the period, reinvestment of all distributions and a complete redemption of the investment at the net asset value at the end of the period.
(c) Ratios are annualized for periods of less than one year.
(d) Expenses waived or reimbursed reflect reductions to total expenses, as discussed in the notes to the financial statements. These amounts would increase the net investment loss ratio or decrease the net investment income ratio, as applicable, had such reductions not occurred.
(e) The net expense ratios shown above reflect expenses after waivers and reimbursements but exclude the effect of reductions to total expenses for any expenses offset. Expense offset arrangements reduce total expenses, as discussed in the notes to the financial statements. These amounts would increase the net investment loss ratio, or decrease the net investment income ratio, as applicable, had such reductions not occurred. The effect of expenses offset are as follows:
| | | Investor Class | |
| | | Six Months
Ended
June 30, 2011 | | Year Ended
December 31, | | Six Months
Ended
December 31, | | Year Ended June 30, | |
| | | (unaudited) | | 2010 | | 2009 | | 2008* | | 2008 | | 2007 | | 2006 | |
| Ratios to Average Net Assets (c): | |
| Expenses offset (f) | | | — | | | | — | | | | — | | | | — | | | | — | | | | — | | | | — | | |
(f) Effect on the expense ratio was not greater than 0.005%.
(g) Portfolio turnover rate is calculated at the fund level.
See accompanying notes to financial statements.
196
Financial Highlights
WORLD PRECIOUS MINERALS FUND
For a capital share outstanding during the
| | | Institutional Class | |
| | | Six Months
Ended
June 30, 2011
(unaudited) | | Period
Ended
December 31,
2010(d) | |
| Net asset value, beginning of period | | $ | 22.29 | | | $ | 17.36 | | |
| Investment Activities | |
| Net investment loss | | | (.10 | )* | | | (.10 | )* | |
| Net realized and unrealized gain (loss) | | | (3.87 | )* | | | 8.14 | * | |
| Total from investment activities | | | (3.97 | ) | | | 8.04 | | |
| Distributions | |
| From net investment income | | | — | | | | (3.11 | ) | |
| From net realized gains | | | — | | | | — | | |
| Total distributions | | | — | | | | (3.11 | ) | |
| Short-Term Trading Fees * | | | — | | | | — | | |
| Net asset value, end of period | | $ | 18.32 | | | $ | 22.29 | | |
| Total Return (excluding account fees) (a) | | | (17.81 | )% | | | 46.72 | % | |
| Ratios to Average Net Assets: (b) | |
| Net investment income (loss) | | | (.99 | )% | | | (.86 | )% | |
| Total expenses | | | 2.42 | % | | | 15.19 | % | |
| Expenses waived or reimbursed (c) | | | (1.25 | )% | | | (14.06 | )% | |
| Net expenses (e) | | | 1.17 | % | | | 1.13 | % | |
| Portfolio turnover rate (g) | | | 48 | % | | | 68 | % | |
| Net assets, end of period (in thousands) | | $ | 2,503 | | | $ | 2,233 | | |
* Based on average monthly shares outstanding.
(a) Total returns for periods less than one year are not annualized. Assumes investment at the net asset value at the beginning of the period, reinvestment of all distributions and a complete redemption of the investment at the net asset value at the end of the period.
(b) Ratios are annualized for periods of less than one year.
(c) Expenses waived or reimbursed reflect reductions to total expenses, as discussed in the notes to the financial statements. These amounts would increase the net investment loss ratio or decrease the net investment income ratio, as applicable, had such reductions not occurred.
(d) From March 1, 2010, commencement of operations.
(e) The net expense ratios shown above reflect expenses after waivers and reimbursements but exclude the effect of reductions to total expenses for any expenses offset. Expense offset arrangements reduce total expenses, as discussed in the notes to the financial statements. These amounts would increase the net investment loss ratio, or decrease the net investment income ratio, as applicable, had such reductions not occurred. The effect of expenses offset are as follows:
| | | Institutional Class | |
| | | Six Months
Ended
June 30, 2011
(unaudited) | | Period
Ended
December 31,
2010(d) | |
| Ratios to Average Net Assets (b): | |
| Expenses offset (f) | | | — | | | | — | | |
(f) Effect on the expense ratio was not greater than 0.005%.
(g) Portfolio turnover rate is calculated at the fund level.
See accompanying notes to financial statements.
197
Financial Highlights
GOLD AND PRECIOUS METALS FUND
For a capital share outstanding during the
| | | Investor Class | |
| | | Six Months
Ended
June 30, 2011 | | Year Ended
December 31, | | Six Months
Ended
December 31, | | Year Ended June 30, | |
| | | (unaudited) | | 2010 | | 2009 | | 2008* | | 2008 | | 2007 | | 2006 | |
| Net asset value, beginning of period | | $ | 19.60 | | | $ | 15.46 | | | $ | 10.83 | | | $ | 17.18 | | | $ | 14.99 | | | $ | 15.48 | | | $ | 7.67 | | |
| Investment Activities | |
| Net investment income (loss) | | | (.14 | ) | | | (.21 | ) | | | (.17 | )** | | | (.03 | ) | | | (.08 | )** | | | .05 | | | | (.01 | )** | |
| Net realized and unrealized gain (loss) | | | (2.88 | ) | | | 5.91 | | | | 4.84 | | | | (5.59 | ) | | | 4.69 | | | | (.56 | ) | | | 7.88 | | |
| Total from investment activities | | | (3.02 | ) | | | 5.70 | | | | 4.67 | | | | (5.62 | ) | | | 4.61 | | | | (.51 | ) | | | 7.87 | | |
| Distributions | |
| From net investment income | | | — | | | | (.26 | ) | | | (.04 | ) | | | — | | | | — | | | | — | | | | (.12 | ) | |
| From net realized gains | | | — | | | | (1.31 | ) | | | — | | | | (.73 | ) | | | (2.43 | ) | | | — | | | | — | | |
| Total distributions | | | — | | | | (1.57 | ) | | | (.04 | ) | | | (.73 | ) | | | (2.43 | ) | | | — | | | | (.12 | ) | |
| Short-Term Trading Fees ** | | | — | (a) | | | .01 | | | | — | (a) | | | — | (a) | | | .01 | | | | .02 | | | | .06 | | |
| Net asset value, end of period | | $ | 16.58 | | | $ | 19.60 | | | $ | 15.46 | | | $ | 10.83 | | | $ | 17.18 | | | $ | 14.99 | | | $ | 15.48 | | |
| Total Return (excluding account fees) (b) | | | (15.41 | )% | | | 36.88 | % | | | 43.11 | % | | | (31.51 | )% | | | 33.49 | % | | | (3.17 | )% | | | 104.15 | % | |
| Ratios to Average Net Assets: (c) | |
| Net investment income (loss) | | | (1.31 | )% | | | (1.46 | )% | | | (1.16 | )% | | | (.66 | )% | | | (.41 | )% | | | .31 | % | | | (.06 | )% | |
| Total expenses | | | 1.66 | % | | | 1.80 | % | | | 1.69 | % | | | 1.54 | % | | | 1.27 | % | | | 1.29 | % | | | 1.47 | % | |
| Expenses waived or reimbursed (d) | | | — | | | | — | | | | (.15 | )% | | | (.15 | )% | | | — | | | | — | | | | — | | |
| Net expenses (e) | | | 1.66 | % | | | 1.80 | % | | | 1.54 | % | | | 1.39 | % | | | 1.27 | % | | | 1.29 | % | | | 1.47 | % | |
| Portfolio turnover rate | | | 76 | % | | | 103 | % | | | 135 | % | | | 61 | % | | | 93 | % | | | 72 | % | | | 78 | % | |
| Net assets, end of period (in thousands) | | $ | 238,164 | | | $ | 300,949 | | | $ | 234,393 | | | $ | 192,206 | | | $ | 259,022 | | | $ | 178,762 | | | $ | 208,027 | | |
* Effective December 31, 2008, the fiscal year changed to December 31.
** Based on average monthly shares outstanding.
(a) The per share amount does not round to a full penny.
(b) Total returns for periods less than one year are not annualized. Assumes investment at the net asset value at the beginning of the period, reinvestment of all distributions and a complete redemption of the investment at the net asset value at the end of the period.
(c) Ratios are annualized for periods of less than one year.
(d) Expenses waived or reimbursed reflect reductions to total expenses, as discussed in the notes to the financial statements. These amounts would increase the net investment loss ratio or decrease the net investment income ratio, as applicable, had such reductions not occurred.
(e) The net expense ratios shown above reflect expenses after waivers and reimbursements but exclude the effect of reductions to total expenses for any expenses offset. Expense offset arrangements reduce total expenses, as discussed in the notes to the financial statements. These amounts would increase the net investment loss ratio, or decrease the net investment income ratio, as applicable, had such reductions not occurred. The effect of expenses offset are as follows:
| | | Investor Class | |
| | | Six Months
Ended
June 30, 2011 | | Year Ended
December 31, | | Six Months
Ended
December 31, | | Year Ended June 30, | |
| | | (unaudited) | | 2010 | | 2009 | | 2008* | | 2008 | | 2007 | | 2006 | |
| Ratios to Average Net Assets (c): | |
| Expenses offset | | | — | (f) | | | — | (f) | | | — | (f) | | | — | (f) | | | — | (f) | | | (0.01 | )% | | | — | (f) | |
(f) Effect on the expense ratio was not greater than 0.005%.
See accompanying notes to financial statements.
198
Financial Highlights
EASTERN EUROPEAN FUND
For a capital share outstanding during the
| | | Investor Class | |
| | | Six Months
Ended
June 30, 2011 | | Year Ended
December 31, | | Two Months
Ended
December 31, | | Year Ended October 31, | |
| | | (unaudited) | | 2010 | | 2009 | | 2008*/** | | 2008*** | | 2007*** | | 2006*** | |
| Net asset value, beginning of period | | $ | 10.81 | | | $ | 9.11 | | | $ | 5.12 | | | $ | 6.35 | | | $ | 19.91 | | | $ | 15.44 | | | $ | 12.88 | | |
| Investment Activities | |
| Net investment income (loss) | | | .02 | | | | (.04 | ) | | | — | (a) | | | (.03 | ) | | | (.03 | ) | | | (.10 | ) | | | .13 | | |
| Net realized and unrealized gain (loss) | | | .03 | | | | 1.74 | | | | 3.99 | | | | (1.20 | ) | | | (10.10 | ) | | | 6.83 | | | | 3.60 | | |
| Total from investment activities | | | .05 | | | | 1.70 | | | | 3.99 | | | | (1.23 | ) | | | (10.13 | ) | | | 6.73 | | | | 3.73 | | |
| Distributions | |
| From net investment income | | | — | | | | — | | | | — | | | | — | | | | — | | | | (.29 | ) | | | — | | |
| From net realized gains | | | — | | | | — | | | | — | | | | — | | | | (3.46 | ) | | | (1.98 | ) | | | (1.22 | ) | |
| Total distributions | | | — | | | | — | | | | — | | | | — | | | | (3.46 | ) | | | (2.27 | ) | | | (1.22 | ) | |
| Short-Term Trading Fees **** | | | — | (a) | | | — | (a) | | | — | (a) | | | — | (a) | | | .03 | | | | .01 | | | | .05 | | |
| Net asset value, end of period | | $ | 10.86 | | | $ | 10.81 | | | $ | 9.11 | | | $ | 5.12 | | | $ | 6.35 | | | $ | 19.91 | | | $ | 15.44 | | |
| Total Return (excluding account fees) (b) | | | .46 | % | | | 18.66 | % | | | 77.93 | % | | | (19.37 | )% | | | (61.36 | )% | | | 48.74 | % | | | 31.03 | % | |
| Ratios to Average Net Assets: (c) | |
| Net investment income (loss) | | | .34 | % | | | (.36 | )% | | | — | (f) | | | (3.02 | )% | | | (.15 | )% | | | (.61 | )% | | | .71 | % | |
| Total expenses | | | 1.96 | % | | | 1.91 | % | | | 2.04 | % | | | 2.37 | % | | | 1.96 | % | | | 1.98 | % | | | 1.95 | % | |
| Expenses waived or reimbursed (d) | | | — | | | | — | | | | (.08 | )% | | | (.27 | )% | | | — | (f) | | | — | | | | — | | |
| Net expenses (e) | | | 1.96 | % | | | 1.91 | % | | | 1.96 | % | | | 2.10 | % | | | 1.96 | % | | | 1.98 | % | | | 1.95 | % | |
| Portfolio turnover rate | | | 34 | % | | | 69 | % | | | 80 | % | | | 11 | % | | | 82 | % | | | 54 | % | | | 68 | % | |
| Net assets, end of period (in thousands) | | $ | 346,590 | | | $ | 440,037 | | | $ | 464,409 | | | $ | 317,320 | | | $ | 415,494 | | | $ | 1,582,707 | | | $ | 1,347,149 | | |
* Effective December 31, 2008, the fiscal year changed to December 31.
** Effective November 7, 2008, U.S. Global Investors, Inc. assumed management of the fund from Charlemagne Capital (IOM) Limited.
*** The per share amounts shown were adjusted to reflect the 3-for-1 stock split which was effective on May 27, 2008.
**** Based on average monthly shares outstanding.
(a) The per share amount does not round to a full penny.
(b) Total returns for periods less than one year are not annualized. Assumes investment at the net asset value at the beginning of the period, reinvestment of all distributions and a complete redemption of the investment at the net asset value at the end of the period.
(c) Ratios are annualized for periods of less than one year.
(d) Expenses waived or reimbursed reflect reductions to total expenses, as discussed in the notes to the financial statements. These amounts would increase the net investment loss ratio or decrease the net investment income ratio, as applicable, had such reductions not occurred.
(e) The expense ratios shown above exclude the effect of reductions to total expenses for any expenses offset and for fees rebated from the subadviser. Expense offset arrangements reduce total expenses, as discussed in the notes to the financial statements. Through June 2006, the subadviser of the above fund provided advisory services to two closed-end investment companies that the above fund had invested in. The subadviser rebated amounts to the above fund representing the portion of management fees paid by the two investment companies to the subadviser based on the above fund's investment. Fees rebated by the subadviser also reduced total expenses. These amounts would increase the net investment loss ratio, or decrease the net investment income ratio, as applicable, had such reductions not occurred. The effect of expenses offset and expenses rebated by the subadviser are as follows:
| | | Investor Class | |
| | | Six Months
Ended
June 30, 2011 | | Year Ended
December 31, | | Two Months
Ended
December 31, | | Year Ended October 31, | |
| | | (unaudited) | | 2010 | | 2009 | | 2008*/** | | 2008*** | | 2007*** | | 2006*** | |
| Ratios to Average Net Assets (c): | |
| Expenses offset | | | — | (f) | | | — | (f) | | | — | (f) | | | — | (f) | | | (0.01 | )% | | | (0.01 | )% | | | (0.01 | )% | |
| Expenses rebated by subadviser | | | n/a | | | | n/a | | | | n/a | | | | n/a | | | | n/a | | | | n/a | | | | (0.01 | )% | |
(f) Effect on the ratio was not greater than 0.005%.
See accompanying notes to financial statements.
199
Financial Highlights
GLOBAL EMERGING MARKETS FUND
For a capital share outstanding during the
| | | Investor Class | |
| | | Six Months
Ended
June 30, 2011 | | Year Ended
December 31, | | Two Months
Ended
December 31, | | Year Ended October 31, | |
| | | (unaudited) | | 2010 | | 2009 | | 2008*/** | | 2008 | | 2007 | | 2006 | |
| Net asset value, beginning of period | | $ | 9.17 | | | $ | 7.95 | | | $ | 5.29 | | | $ | 5.94 | | | $ | 21.88 | | | $ | 13.93 | | | $ | 10.65 | | |
| Investment Activities | |
| Net investment income (loss) | | | (.03 | ) | | | (.11 | ) | | | (.05 | ) | | | (.01 | ) | | | (.43 | ) | | | (.13 | ) | | | .02 | | |
| Net realized and unrealized gain (loss) | | | (.26 | ) | | | 1.32 | | | | 2.71 | | | | (.56 | ) | | | (11.98 | ) | | | 9.18 | | | | 3.50 | | |
| Total from investment activities | | | (.29 | ) | | | 1.21 | | | | 2.66 | | | | (.57 | ) | | | (12.41 | ) | | | 9.05 | | | | 3.52 | | |
| Distributions | |
| From net investment income | | | — | | | | — | | | | — | | | | — | | | | (.46 | ) | | | — | | | | (.05 | ) | |
| From net realized gains | | | — | | | | — | | | | — | | | | — | | | | (3.11 | ) | | | (1.13 | ) | | | (.26 | ) | |
| From tax return of capital | | | — | | | | — | | | | — | | | | (.08 | ) | | | — | | | | — | | | | — | | |
| Total distributions | | | — | | | | — | | | | — | | | | (.08 | ) | | | (3.57 | ) | | | (1.13 | ) | | | (.31 | ) | |
| Short-Term Trading Fees *** | | | — | (a) | | | .01 | | | | — | (a) | | | — | (a) | | | .04 | | | | .03 | | | | .07 | | |
| Net asset value, end of period | | $ | 8.88 | | | $ | 9.17 | | | $ | 7.95 | | | $ | 5.29 | | | $ | 5.94 | | | $ | 21.88 | | | $ | 13.93 | | |
| Total Return (excluding account fees) (b) | | | (3.16 | )% | | | 15.35 | % | | | 50.28 | % | | | (9.59 | )% | | | (66.81 | )% | | | 69.52 | % | | | 34.16 | % | |
| Ratios to Average Net Assets (c): | |
| Net investment income (loss) | | | (.59 | )% | | | (1.22 | )% | | | (.77 | )% | | | (1.16 | )% | | | (1.01 | )% | | | (.92 | )% | | | .13 | % | |
| Total expenses | | | 3.73 | % | | | 3.76 | % | | | 4.02 | % | | | 6.83 | % | | | 2.80 | % | | | 2.75 | % | | | 3.07 | % | |
| Expenses waived or reimbursed (d) | | | (.71 | )% | | | (.77 | )% | | | (1.38 | )% | | | (4.33 | )% | | | (.30 | )% | | | (.39 | )% | | | (1.05 | )% | |
| Net expenses (e) | | | 3.02 | % | | | 2.99 | % | | | 2.64 | % | | | 2.50 | % | | | 2.50 | % | | | 2.36 | % | | | 2.02 | % | |
| Portfolio Turnover Rate | | | 90 | % | | | 190 | % | | | 166 | % | | | 21 | % | | | 83 | % | | | 125 | % | | | 136 | % | |
| Net assets, end of period (in thousands) | | $ | 11,979 | | | $ | 13,403 | | | $ | 13,819 | | | $ | 9,663 | | | $ | 11,708 | | | $ | 59,621 | | | $ | 29,029 | | |
* Effective December 31, 2008, the fiscal year changed to December 31.
** Effective November 7, 2008, U.S. Global Investors, Inc. assumed management of the fund from Charlemagne Capital (IOM) Limited.
*** Based on average monthly shares outstanding.
(a) The per share amount does not round to a full penny.
(b) Total returns for periods less than one year are not annualized. Assumes investment at the net asset value at the beginning of the period, reinvestment of all distributions and a complete redemption of the investment at the net asset value at the end of the period.
(c) Ratios are annualized for periods of less than one year.
(d) Expenses waived or reimbursed reflect reductions to total expenses, as discussed in the notes to the financial statements. These amounts would increase the net investment loss ratio or decrease the net investment income ratio, as applicable, had such reductions not occurred.
(e) The expense ratios shown above exclude the effect of reductions to total expenses for any expenses offset and for fees rebated from the subadviser. Expense offset arrangements reduce total expenses, as discussed in the notes to the financial statements. Through June 2006, the subadviser of the above fund provided advisory services to a closed-end investment company that the above fund had invested in. The subadviser rebated amounts to the above fund representing the portion of management fees paid by the investment company to the subadviser based on the above fund's investment. Fees rebated by the subadviser also reduced total expenses. These amounts would increase the net investment loss ratio, or decrease the net investment income ratio, as applicable, had such reductions not occurred. The effect of expenses offset and expenses rebated by the subadviser are as follows:
| | | Investor Class | |
| | | Six Months
Ended
June 30, 2011 | | Year Ended
December 31, | | Two Months
Ended
December 31, | | Year Ended October 31, | |
| | | (unaudited) | | 2010 | | 2009 | | 2008*/** | | 2008 | | 2007 | | 2006 | |
| Ratios to Average Net Assets (c): | |
| Expenses offset | | | — | (f) | | | — | (f) | | | — | (f) | | | — | (f) | | | — | (f) | | | n/a | | | | n/a | | |
| Expenses rebated by subadviser | | | n/a | | | | n/a | | | | n/a | | | | n/a | | | | n/a | | | | n/a | | | | (0.02 | )% | |
(f) Effect on the expense ratio was not greater than 0.005%.
See accompanying notes to financial statements.
200
Financial Highlights
CHINA REGION FUND
For a capital share outstanding during the
| | | Investor Class | |
| | | Six Months
Ended
June 30, 2011 | | Year Ended
December 31, | | Six Months
Ended
December 31, | | Year Ended June 30, | |
| | | (unaudited) | | 2010 | | 2009 | | 2008* | | 2008 | | 2007 | | 2006 | |
| Net asset value, beginning of period | | $ | 9.47 | | | $ | 8.36 | | | $ | 5.59 | | | $ | 9.09 | | | $ | 12.55 | | | $ | 8.71 | | | $ | 6.87 | | |
| Investment Activities | |
| Net investment income (loss) | | | (.03 | ) | | | (.12 | ) | | | (.05 | ) | | | (.02 | )** | | | (.03 | )** | | | — | ** | | | (.01 | ) | |
| Net realized and unrealized gain (loss) | | | (.63 | ) | | | 1.22 | | | | 2.81 | | | | (3.49 | )** | | | (.27 | )** | | | 3.98 | ** | | | 2.02 | | |
| Total from investment activities | | | (.66 | ) | | | 1.10 | | | | 2.76 | | | | (3.51 | ) | | | (.30 | ) | | | 3.98 | | | | 2.01 | | |
| Distributions | |
| From net investment income | | | — | | | | — | | | | — | | | | — | | | | (.10 | ) | | | (.16 | ) | | | (.19 | ) | |
| From net realized gains | | | — | | | | — | | | | — | | | | — | | | | (2.93 | ) | | | — | | | | — | | |
| From tax return of capital | | | — | | | | — | | | | — | | | | — | | | | (.17 | ) | | | — | | | | — | | |
| Total distributions | | | — | | | | — | | | | — | | | | — | | | | (3.20 | ) | | | (.16 | ) | | | (.19 | ) | |
| Short-Term Trading Fees ** | | | — | | | | .01 | | | | .01 | | | | .01 | | | | .04 | | | | .02 | | | | .02 | | |
| Net asset value, end of period | | $ | 8.81 | | | $ | 9.47 | | | $ | 8.36 | | | $ | 5.59 | | | $ | 9.09 | | | $ | 12.55 | | | $ | 8.71 | | |
| Total Return (excluding account fees) (b) | | | (6.97 | )% | | | 13.28 | % | | | 49.55 | % | | | (38.50 | )% | | | (8.58 | )% | | | 46.34 | % | | | 30.03 | % | |
| Ratios to Average Net Assets: (c) | |
| Net investment income (loss) | | | (.33 | )% | | | (1.02 | )% | | | (.79 | )% | | | (.47 | )% | | | (.26 | )% | | | .02 | % | | | (.08 | )% | |
| Total expenses | | | 2.42 | % | | | 2.39 | % | | | 2.47 | % | | | 2.46 | % | | | 1.95 | % | | | 2.02 | % | | | 2.31 | % | |
| Expenses waived or reimbursed (d) | | | — | | | | — | | | | (.45 | )% | | | (.27 | )% | | | — | | | | — | | | | — | | |
| Net expenses (e) | | | 2.42 | % | | | 2.39 | % | | | 2.02 | % | | | 2.19 | % | | | 1.95 | % | | | 2.02 | % | | | 2.31 | % | |
| Portfolio turnover rate | | | 186 | % | | | 242 | % | | | 327 | % | | | 117 | % | | | 208 | % | | | 208 | % | | | 292 | % | |
| Net assets, end of period (in thousands) | | $ | 42,501 | | | $ | 51,843 | | | $ | 56,323 | | | $ | 38,348 | | | $ | 81,109 | | | $ | 93,805 | | | $ | 67,761 | | |
* Effective December 31, 2008, the fiscal year changed to December 31.
** Based on average monthly shares outstanding.
(a) The per share amount does not round to a full penny.
(b) Total returns for periods less than one year are not annualized. Assumes investment at the net asset value at the beginning of the period, reinvestment of all distributions and a complete redemption of the investment at the net asset value at the end of the period.
(c) Ratios are annualized for periods of less than one year.
(d) Expenses waived or reimbursed reflect reductions to total expenses, as discussed in the notes to the financial statements. These amounts would increase the net investment loss ratio or decrease the net investment income ratio, as applicable, had such reduction not occurred.
(e) The net expense ratios shown above reflect expenses after waivers and reimbursements but exclude the effect of reductions to total expenses for any expenses offset. Expense offset arrangements reduce total expenses, as discussed in the notes to financial statements. These amounts would increase the net investment loss ratio, or decrease the net investment income ratio, as applicable, had such reductions not occurred. The effect of expenses offset are as follows:
| | | Investor Class | |
| | | Six Months
Ended
June 30, 2011 | | Year Ended
December 31, | | Six Months
Ended
December 31, | | Year Ended June 30, | |
| | | (unaudited) | | 2010 | | 2009 | | 2008* | | 2008 | | 2007 | | 2006 | |
| Ratios to Average Net Assets (c): | |
| Expenses offset | | | — | (f) | | | — | (f) | | | — | (f) | | | — | (f) | | | — | (f) | | | — | (f) | | | (0.01 | )% | |
(f) Effect on the expense ratio was not greater than 0.005%.
See accompanying notes to financial statements.
201
Additional Information (unaudited)
Proxy Voting
A description of the policies and procedures that the Funds use to determine how to vote proxies relating to portfolio securities is available without charge, upon request, by calling 1-800-US-FUNDS (1-800-873-8637). It also appears in the Funds' statement of additional information (Form 485B), which can be found on the SEC's website at www.sec.gov.
Information regarding how the Funds voted proxies relating to portfolio securities during the most recent 12-month period ended June 30 is available without charge, upon request, by calling 1-800-US-FUNDS (1-800-873-8637) or accessing the Funds' Form N-PX on the SEC's website at www.sec.gov.
Availability of Quarterly Portfolio Schedules
The Funds provide complete lists of holdings four times in each fiscal year, at the quarter-ends. For the second and fourth quarters, the lists appear in the Funds' semi-annual and annual reports to shareholders. For the first and third quarters, the Funds file the lists with the SEC on Form N-Q. Shareholders can look up the Funds' Forms N-Q on the SEC's website at www.sec.gov. You may also visit or call the SEC's Public Room in Washington, D.C. (1-202-942-8090) or send a request plus a duplicating fee to the SEC, Public Reference Section, Washington, DC 20549-0102 or by electronic request at the following e-mail address: publicinfo@sec.gov.
202
Rev. 08/2010
| FACTS | | WHAT DOES U.S. GLOBAL INVESTORS DO WITH YOUR PERSONAL INFORMATION? | |
| Why? | | Financial companies choose how they share your personal information. Federal law gives consumers the right to limit some but not all sharing. Federal law also requires us to tell you how we collect, share, and protect your personal information. Please read this notice carefully to understand what we do. | |
|
| What? | | The types of personal information we collect and share depend on the product or service you have with us. This information can include:
• Social Security number and account balances
• transaction history and checking account information
• account transactions and wire transfer instructions
When you are no longer our customer, we continue to share your information as described in this notice. | |
|
| How? | | All financial companies need to share customers' personal information to run their everyday business. In the section below, we list the reasons financial companies can share their customers' personal information; the reasons U.S. Global Investors chooses to share; and whether you can limit this sharing. | |
|
Reasons we can share your
personal information | | Does U.S.Global
Investors share? | | Can you limit
this sharing? | |
For our everyday business purposes —
such as to process your transactions, maintain your account(s), respond to court orders and legal investigations, or report to credit bureaus | | No | | No | |
|
For our marketing purposes —
to offer our products and services to you | | Yes | | No | |
|
For joint marketing with other
financial companies | | No | | We don't share | |
|
For our affiliates' everyday
business purposes —
information about your transactions and experiences | | No | | We don't share | |
|
For our affiliates' everyday
business purposes —
information about your creditworthiness | | No | | We don't share | |
|
| For nonaffiliates to market to you | | No | | We don't share | |
|
| Questions? | | Call 1-800-US-Funds (1-800-873-8637) or go to www.usfunds.com | |
|
| Page 2 | |
| Who we are | |
| Who is providing this notice? | | U.S. Global Investors, Inc., U.S. Global Investors Funds, United Shareholder Services, Inc., and U.S. Global Brokerage, Inc. (collectively known as U.S. Global Investors) | |
|
| What we do | |
How does
U.S. Global
Investors protect
my personal
information? | | To protect your personal information from unauthorized access and use, we use security measures that comply with federal law. These measures include computer safeguards and secured files and buildings. | |
|
How does
U.S. Global
Investors collect
my personal
information? | | We collect your personal information, for example, when you
• open an account or buy securities from us
• direct us to sell your securities or give us your contact information
• tell us where to send the money | |
|
Why can't I limit
all sharing? | | Federal law gives you the right to limit only
• sharing for affiliates' everyday business purposes — information about your creditworthiness
• affiliates from using your information to market to you
• sharing for nonaffiliates to market to you
State laws and individual companies may give you additional rights to limit sharing. | |
|
| Definitions | |
| Affiliates | | Companies related by common ownership or control. They can be financial and nonfinancial companies.
• Our affiliates include U.S. Global Investors, Inc., U.S. Global Investors Funds, United Shareholder Services, Inc., and U.S. Global Brokerage, Inc. | |
|
| Nonaffiliates | | Companies not related by common ownership or control. They can be financial and nonfinancial companies.
• Nonaffiliates we share personal information with include companies that perform marketing on our behalf, printing and mailing companies, and companies that service your account(s). | |
|
| Joint marketing | | A formal agreement between nonaffiliated financial companies that together market financial products or services to you.
• U.S. Global Investors doesn't jointly market. | |
|
[THIS PAGE INTENTIONALLY LEFT BLANK]
[THIS PAGE INTENTIONALLY LEFT BLANK]
P.O. Box 659405
San Antonio, Texas
78265-9604
Want to reduce paper waste? You can receive this report and other important documents electronically. Please visit www.usfunds.com and sign up at Access My Account. If you need further assistance, please call us at 800-873-8637.
ITEM 2. CODE OF ETHICS.
Required only in annual report on Form N-CSR.
ITEM 3. AUDIT COMMITTEE FINANCIAL EXPERT.
Required only in annual report on Form N-CSR.
ITEM 4. PRINCIPAL ACCOUNTANT FEES AND SERVICES.
Required only in annual report on Form N-CSR.
ITEM 5. AUDIT COMMITTEE OF LISTED REGISTRANTS.
Required only in annual report on Form N-CSR.
ITEM 6. SCHEDULE OF INVESTMENTS.
Not applicable. The complete schedule of investments is included in Item 1 of this Form N-CSR.
ITEM 7. DISCLOSURE OF PROXY VOTING POLICIES AND PROCEDURES FOR CLOSED-END MANAGEMENT INVESTMENT COMPANIES.
Not applicable.
ITEM 8. PORTFOLIO MANAGERS OF CLOSED-END MANAGEMENT INVESTMENT COMPANIES.
Not applicable.
ITEM 9. PURCHASE OF EQUITY SECURITIES BY CLOSED-END MANAGEMENT INVESTMENT COMPANY AND AFFILIATED PURCHASERS.
Not applicable.
ITEM 10. SUBMISSION OF MATTERS TO A VOTE OF SECURITY HOLDERS.
Not applicable.
ITEM 11. CONTROLS AND PROCEDURES.
(a) The registrant’s president and treasurer have determined that the registrant’s disclosure controls and procedures are effective based on their evaluation of the disclosure controls and procedures as of a date within 90 days of the filing date of this report.
(b) There was no change in the registrant’s internal control over financial reporting that occurred in the registrant’s second fiscal quarter of the period covered by this report that has materially affected, or is reasonably likely to materially affect, the registrant’s internal control over financial reporting.
ITEM 12. EXHIBITS.
(a)(1) Required only in annual report on Form N-CSR.
(a)(2) Certifications of principal executive officer and principal financial officer pursuant to Rule 30a-2(a) under the Investment Company Act of 1940 (17CFR 270.30a-2(a)) and Section 302 of the Sarbanes-Oxley Act of 2002.
(b) Certifications of principal executive officer and principal financial officer pursuant to Rule 30a-2(b) under the Investment Company Act of 1940 (17CFR 270.30a-2(b)) and Section 906 of the Sarbanes-Oxley Act of 2002.
SIGNATURES
Pursuant to the requirements of the Securities Exchange Act of 1934 and the Investment Company Act of 1940, the registrant has duly caused this report to be signed on its behalf by the undersigned, thereunto duly authorized.
U.S. GLOBAL INVESTORS FUNDS | |
| | |
| | |
By: | /s/ Frank E. Holmes | |
| Frank E. Holmes | |
| President, Chief Executive Officer | |
| | |
Date: | August 31, 2011 | |
Pursuant to the requirements of the Securities Exchange Act of 1934 and the Investment Company Act of 1940, this report has been signed below by the following persons on behalf of the registrant and in the capacities and on the dates indicated.
By: | /s/ Frank E. Holmes | |
| Frank E. Holmes | |
| President, Chief Executive Officer | |
| | |
Date: | August 31, 2011 | |
| | |
| | |
By: | /s/ Catherine A. Rademacher | |
| Catherine A. Rademacher | |
| Treasurer | |
| | |
Date: | August 31, 2011 | |