UNITED STATES
SECURITIES AND EXCHANGE COMMISSION
Washington, D.C. 20549
FORM N-CSR
CERTIFIED SHAREHOLDER REPORT OF REGISTERED
MANAGEMENT INVESTMENT COMPANIES
Investment Company Act file number | 811-1800 |
|
U.S. GLOBAL INVESTORS FUNDS |
(Exact name of registrant as specified in charter) |
|
7900 CALLAGHAN ROAD SAN ANTONIO, TX | | 78229 |
(Address of principal executive offices) | | (Zip code) |
|
SUSAN B. MCGEE, ESQ. 7900 CALLAGHAN ROAD SAN ANTONIO, TX 78229 |
(Name and address of agent for service) |
|
Registrant’s telephone number, including area code: | 210-308-1234 | |
|
Date of fiscal year end: | DECEMBER 31, 2013 | |
|
Date of reporting period: | JUNE 30, 2013 | |
| | | | | | | | |
ITEM 1. REPORTS TO STOCKHOLDERS.
U.S. Global Investors Funds
Semi-Annual Report
June 30, 2013

U.S. Global Investors Funds
Semi-Annual Report
June 30, 2013
(unaudited)
Letter to Shareholders | | | 1 | | |
Definitions for Management Teams' Perspectives | | | 11 | | |
Management Teams' Perspectives | | | 13 | | |
Expense Example | | | 66 | | |
Portfolios of Investments | | | 69 | | |
Notes to Portfolios of Investments | | | 138 | | |
Statements of Assets and Liabilities | | | 158 | | |
Statements of Operations | | | 164 | | |
Statements of Changes in Net Assets | | | 170 | | |
Notes to Financial Statements | | | 179 | | |
Financial Highlights | | | 198 | | |
Additional Information | | | 214 | | |
Privacy Policy | | | |
U.S. Global Investors Funds
Investor Class
U.S. Treasury Securities Cash Fund | | USTXX | |
U.S. Government Securities Savings Fund | | UGSXX | |
Near-Term Tax Free Fund | | NEARX | |
Tax Free Fund | | USUTX | |
All American Equity Fund | | GBTFX | |
Holmes Growth Fund | | ACBGX | |
MegaTrends Fund | | MEGAX | |
Global Resources Fund | | PSPFX | |
World Precious Minerals Fund | | UNWPX | |
Gold and Precious Metals Fund | | USERX | |
Emerging Europe Fund | | EUROX | |
Global Emerging Markets Fund | | GEMFX | |
China Region Fund | | USCOX | |
Institutional Class
MegaTrends Fund | | MEGIX | |
Global Resources Fund | | PIPFX | |
World Precious Minerals Fund | | UNWIX | |
P.O. Box 659405
San Antonio, Texas 78265-9604
Tel 1.800.US.FUNDS
Fax 1.210.308.1217
www.usfunds.com
U.S. Global Investors Funds

All that glittered during the first half of the year was not gold. The metal lost a quarter of its value, while gold companies tumbled even more, with the FTSE Gold Mines Index falling 48 percent.
When such a precipitous plummet happens, fear sometimes overrides the fundamental reasons to own gold. Gold is a portfolio diversifier and a store of value. It is a finite resource with increasing global demand. I co-authored a book on gold five years ago based on a lifetime of experience with the metal. My advice hasn't changed: When it comes to gold, moderation is key. Don't try to get rich with the metal because the corresponding risk is simply too high. Limit your exposure to gold as an asset class to 10 percent of your portfolio – no more than 5 percent in bullion and 5 percent in equities. Rebalance each year to keep that level of exposure and use volatility to your advantage.
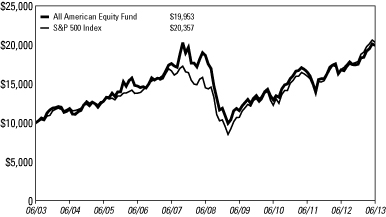
Take a look at the chart below, which shows how investors benefited from a balanced perspective.

1
U.S. Global Investors Funds
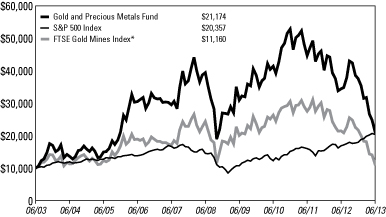
We compare the performance of a hypothetical $10,000 investment of two different portfolios over the past decade, assuming the reinvestment of capital gains and dividends. One shows the growth of $10,000 invested in an S&P 500 Index ETF. The other shows a hypothetical investment with a 5 percent allocation to the World Precious Minerals Fund (UNWPX), a 5 percent allocation to the Gold and Precious Metals Fund (USERX) and a 90 percent allocation to the S&P 500 ETF.
Over 10 years, regardless of the extreme moves seen in gold stocks, the portfolio that included gold stocks never dipped below the portfolio entirely made of U.S. equities. In addition, the combination of gold stocks and U.S. companies increased the portfolio's return by about $1,100! I believe the chart shows the importance of a modest 10 percent weighting in gold mutual funds.
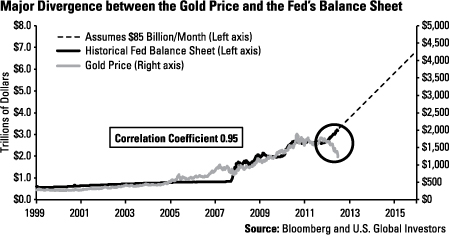
So, what happened to gold during the first half of 2013? In May, the Federal Reserve hinted that signs of a stronger economy could allow for a slowdown of stimulus. By the end of June, the metal fell below $1,200 for the first time since August 2010. Despite the historically high correlation between the gold price and the Fed's balance sheet, monetary easing continued, but gold fell.
2
U.S. Global Investors Funds
The selling of gold put the metal in an extremely oversold territory; mathematically gold was due for a reversal toward the mean by the end of June. On our oscillator chart showing the gold price on a year-over-year percentage change basis, the gold price was nearly at a -3 standard deviation.

There has been an extremely pessimistic view on gold. As one measure of how the bears have ganged up against the yellow metal, take a look at the spike in the level of short positions on the precious metal since the beginning of the year. As of the beginning of July, the number of outstanding gold short contracts was close to 140,000!

3
U.S. Global Investors Funds
In June, while I was on CNBC's Squawk Box, Howard Ward, the chief investment officer of GAMCO Investors, made a bullish call based on the severity of the speculative short position:
"It was off the charts, just like it was a week ago for the short position and the yen, the pound and euro. Well, we've seen what happened to that. You wanted to be on the other side of that trade. I'll take the other side of the gold trade as well. Whenever so many people are on one side, I will take the other side. I think gold probably rallies between here and the end of the year."
What was significant about the first half of 2013 is that gold moved from the weak hands of ETF investors to the strong hands of buyers who prefer the physical metal. Whereas $18 billion left the SPDR Gold Shares ETF in the first half of the year, gold buyers all over the world scooped up a record level of gold coins and bars. On one day alone in April, 63,500 ounces were purchased from the U.S. Mint.
At the same time, in Bangkok, Thailand, crowds of buyers were filling stores, eagerly waiting in multiple lines to purchase gold jewelry and coins.
The most impressive data came from China. Take a look at the chart below, which shows total gold production compared to the gold deliveries on the Shanghai Gold Exchange and the COMEX. Over the first six months of the year, gold imports into China totaled 1,098 metric tons, compared to 1,139 tons for 2012. This is in striking contrast to the gold delivery on the COMEX.

4
U.S. Global Investors Funds
In fact, China's gold demand was so significant that the physical gold delivered on the Shanghai Gold Exchange through June totaled almost all of the official gold reserves in China and about half of the world's gold production for the year.
However, the Love Trade – the buyers with a deep cultural affinity for gold – suffered in India. Historically the world's biggest gold buyer, the country tried to stifle gold demand as the government sought to reduce its record current account deficit. India hiked import tariffs on gold and introduced new constraints on rural lending against gold jewelry and coins.
Regardless of this short-term setback, I believe millions of people across Asia and the Middle East will continue to express their love for the precious metal through the giving of gold coins and jewelry for momentous occasions. We look forward to the reigniting of gold's Love Trade as the yellow metal enters its historical period of seasonal strength with Ramadan beginning in July, followed by the Indian Festival of Lights, wedding season, Christmas and Chinese New Year. We have often published on the impact of this powerful seasonal pattern on www.usfunds.com.

Conversely, the U.S. stock market has been one of the best places to invest in recent years. Following the bottom on March 9, 2009 through July 23, 2013, the S&P 500 Index experienced its strongest bull market since 1949, climbing an astonishing 154 percent.
We believe government policy is a precursor to change, and the Fed's massive bond-buying program over the past few years exemplifies the significant change in helping stocks reach this meaningful milestone.
5
U.S. Global Investors Funds
To see how significant Ben Bernanke's policy actions were, compare the presidential cycles going back to 1929. With all the excess money in the system, President Barack Obama's first-term presidential cycle beat the average of all other presidential cycles going back to 1929.

After a few months into his second term, Obama's presidential cycle remains remarkable. The bold line shows this upward trend. In fact, stocks have been so strong that the S&P 500 experienced its best six months since 1998, rising 13.83 percent.
We're pleased to report that U.S. Global's All American Equity Fund (GBTFX) and Holmes Growth Fund (ACBGX) benefited from U.S. equity exposure, increasing 13.90 percent and 12.97 percent, respectively, from January through June.
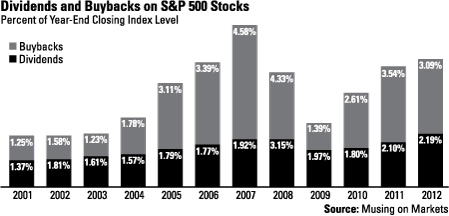
The Power of Growing Dividends
Did you know that since 1870, half of the S&P 500 Index total return has come from dividend growth? There may be short-term periods when dividend-paying stocks underperform, such as the Technology Boom earlier this century, but overall, they add up.
Especially in a low-yielding environment such as today, dividend-paying companies remain attractive. Consider the powerful twin engines of dividend payouts and stock buybacks. You can see in the chart that from 2009 through 2012, companies in the S&P 500 have been buying back more stock and paying out more in dividends. This has led to a fantastic increase of more than 70 percent cumulative return in U.S. stocks over that time frame.
6
U.S. Global Investors Funds
This same increase in buybacks and dividends occurred in 2004 through 2007, with the same result in market rise. In 2007, the S&P 500 hit an intraday record high of 1,576.
Companies have become focused on the return-on-capital model, such as revenues-per-share and earnings-per-share, and the benefits to the investor are numerous. Because of this development, our investment team has shifted focus to seeking companies that offer this value to their investors.
Several of U.S. Global's equity funds offer access to companies with attractive yields. Half of the All American Equity Fund (GBTFX) is dedicated to our shareholder yield model, with the holdings that pay a dividend averaging a dividend yield of 2.90 percent as of June 30, 2013.
For the emerging markets portion of your portfolio, we offer the China Region Fund (USCOX), the Emerging Europe Fund (EUROX) and the Global Emerging Markets Fund (GEMFX). As of June 30, 2013, the dividend-paying stocks in USCOX and EUROX had an average yield of 2.15 percent and 4.95 percent, respectively, while the companies in GEMFX paid a dividend yield averaging 6.08 percent.
A Potential Solution for Those Who Fear Rising Rates
Fear of rising interest rates as the Fed looks to taper its easing programs sent bond prices falling and bond investors running in the first half of 2013. Many investors are wary of volatility and want a safe place to stash cash.
Yet, money market funds may not be the answer. Although yields for long-term bonds rose, rates of short-term money market funds haven't. In fact, the 90-day Treasury bills continued paying around 5 basis points. For an investor, this translates to 50 cents for every $1,000 invested.
7
U.S. Global Investors Funds
Instead, a better alternative may be an investment that seeks to preserve capital and provide stability and tax-free monthly income. The Near-Term Tax Free Fund (NEARX) focuses on shorter average maturities, and a share price around $2 typically results in less volatility than bond funds with longer average maturities. It has been rare for the fund's share price to move more than a couple of pennies in a month. And, the fund has generated consistent positive total returns (yield + appreciation) for investors for over 10 years in a row.
Rather than trying to time entries and exits in and out of stocks and bonds, we suggest allocating your assets strategically and sticking with your plan for the long term.
Consider the "couch potato" approach of a portfolio invested in both stocks and bonds. Below are three different hypothetical portfolios over the past 10 years: (1) $10,000 invested in the Near-Term Tax Free Fund (NEARX), (2) $10,000 invested in the All American Equity Fund (GBTFX), and (3) $10,000 portfolio made of 50 percent allocation to NEARX and the remaining 50 percent allocation to GBTFX, rebalanced on an annual basis. Each investment assumes the reinvestment of capital gains and dividends.
While the investment in GBTFX outperformed over the decade, increasing nearly $20,000, the fund experienced more volatility. Conversely, the investment in NEARX grew much more smoothly, but with less upside. Over the past 10 years, the "couch potato" approach grew to $16,820, with less volatility than a portfolio of only U.S. stocks.

8
U.S. Global Investors Funds
From time to time, in bull and bear markets, prices and fundamentals disconnect, as prices swing too far on fear and rise too fast on greed. We believe fundamentals remain solid and many of the short-term swings are much ado about nothing. In volatile markets, it is important to trust your investment processes and asset allocation disciplines.
Thank you for your trust and confidence in U.S. Global Investors.
Sincerely,

Frank Holmes
CEO and Chief Investment Officer
U.S. Global Investors, Inc.
Please consider carefully a fund's investment objectives, risks, charges and expenses. For this and other important information, obtain a fund prospectus by visiting www.usfunds.com or by calling 1-800-US-FUNDS (1-800-873-8637). Read it carefully before investing. Distributed by U.S. Global Brokerage, Inc.
All opinions expressed and data provided are subject to change without notice. Some of these opinions may not be appropriate to every investor.
Foreign and emerging market investing involves special risks such as currency fluctuation and less public disclosure, as well as economic and political risk. By investing in a specific geographic region, a regional fund's returns and share price may be more volatile than those of a less concentrated portfolio.
The Emerging Europe Fund invests more than 25% of its investments in companies principally engaged in the oil & gas or banking industries. The risk of concentrating investments in this group of industries will make the fund more susceptible to risk in these industries than funds which do not concentrate their investments in an industry and may make the fund's performance more volatile.
Because the Global Resources Fund concentrates its investments in specific industries, the fund may be subject to greater risks and fluctuations than a portfolio representing a broader range of industries.
Gold, precious metals, and precious minerals funds may be susceptible to adverse economic, political or regulatory developments due to concentrating in a single theme. The prices of gold, precious metals, and precious minerals are subject to substantial price fluctuations over short periods of time and may be affected by unpredicted international monetary and political policies. We suggest investing no more than 5% to 10% of your portfolio in these sectors.
9
U.S. Global Investors Funds
Tax-exempt income is federal income tax free. A portion of this income may be subject to state and local income taxes, and if applicable, may subject certain investors to the Alternative Minimum Tax as well. Each tax free fund may invest up to 20% of its assets in securities that pay taxable interest. Income or fund distributions attributable to capital gains are usually subject to both state and federal income taxes. Bond funds are subject to interest-rate risk; their value declines as interest rates rise. The tax free funds may be exposed to risks related to a concentration of investments in a particular state or geographic area. These investments present risks resulting from changes in economic conditions of the region or issuer.
Unlike a money market fund, the Near-Term Tax Free Fund is not subject to the same maturity, credit or diversification limitations as a money market fund and may invest in instruments that a money market fund may not purchase. Though the Near-Term Tax Free Fund seeks minimal fluctuations in share price, it is subject to the risk that a decline in the credit quality of a portfolio holding could cause a fund's share price to decline.
Standard deviation is a measure of the dispersion of a set of data from its mean. The more spread apart the data, the higher the deviation. Standard deviation is also known as historical volatility.
A fund's yield may differ from the average yield of dividend-paying stocks held by the fund.
Diversification does not protect an investor from market risks and does not assure a profit.
Investment objective: The Gold and Precious Metals Fund is an actively managed mutual fund that focuses on gold and precious metals producing companies. The World Precious Minerals Fund is an actively managed fund that focuses on junior and intermediate precious metals exploration companies around the world. The SPDR S&P 500 ETF Trust (SPY) is a passively managed fund that, before expenses, seeks to correspond generally to the price and yield performance of the S&P 500 Index.
Liquidity: The Gold and Precious Metals Fund and World Precious Minerals Fund can be purchased or sold at a net asset value (NAV) determined at the end of each trading day. The SPDR S&P 500 ETF can be purchased or sold intraday. These purchases and redemptions may generate brokerage commissions and other charges not reflected in the ETF's published expense ratio.
Safety/Fluctuations of principal/return: Loss of money is a risk of investing in the Gold and Precious Metals Fund, the World Precious Minerals Fund and the SPDR S&P 500 ETF. Shares of the three securities are subject to sudden fluctuations in value. The SPDR S&P 500 ETF may also be subject to bid-ask premiums or discounts to net asset value (NAV) that could adversely affect a shareholder's actual returns.
Tax features: The Gold and Precious Metals Fund and World Precious Minerals Fund intend to make distributions that may be taxed as ordinary income or capital gains. Under current federal law, long-term capital gains for individual investors in the fund are taxed at a maximum rate of 15%. For the SPDR S&P 500 ETF, long-term capital gain distributions will result from gains on the sale or exchange of capital assets held by the fund for more than one year. Any long-term capital gains distributions you receive from a fund are taxable as long-term capital gain regardless of how long you have owned your shares. Long-term capital gains are currently taxed at a maximum of 15%. Information provided here is neither tax nor legal advice and is general in nature. Federal and state laws and regulations are subject to change.
10
Definitions for Management Teams' Perspectives
Benchmark Index Definitions
Returns for indices reflect no deduction for fees, expenses or taxes, unless noted.
The Barclays Capital 3-Year Municipal Bond Index is a total return benchmark designed for municipal assets. The index includes bonds with a minimum credit rating of BAA3, are issued as part of a deal of at least $50 million, have an amount outstanding of at least $5 million and have a maturity of two to four years.
The Barclays Capital 10-Year Municipal Bond Index is a total return benchmark designed for long-term municipal assets. The index includes bonds with a minimum credit rating of BAA3, are issued as part of a deal of at least $50 million, have an amount outstanding of at least $5 million and have a maturity of 8 to 12 years.
The FTSE Gold Mines Index encompasses all gold mining companies that have a sustainable and attributable gold production of at least 300,000 ounces a year and that derive 75% or more of their revenue from mined gold.
The Hang Seng Composite Index is a market-capitalization weighted index that covers about 95% of the total market capitalization of companies listed on the Main Board of the Hong Kong Stock Exchange.
The MSCI Emerging Markets Europe 10/40 Index (Net Total Return) is a free float-adjusted market capitalization index that is designed to measure equity performance in the emerging market countries of Europe (Czech Republic, Hungary, Poland, Russia and Turkey). The index is calculated on a net return basis (i.e., reflects the minimum possible dividend reinvestment after deduction of the maximum rate withholding tax). The index is periodically rebalanced relative to the constituents' weights in the parent index.
The MSCI Emerging Markets Net Total Return Index is a free float-adjusted market capitalization index that is designed to measure equity market performance in emerging market countries on a net return basis (i.e., reflects the minimum possible dividend reinvestment after deduction of the maximum rate withholding tax).
The Morgan Stanley Commodity Related Equity Index (CRX) is an equal-dollar weighted index of 20 stocks involved in commodity-related industries such as energy, non-ferrous metals, agriculture and forest products.
The NYSE Arca Gold Miners Index is a modified market capitalization-weighted index comprised of publicly-traded companies involved primarily in the mining for gold and silver.
The S&P 500 Index is a widely recognized capitalization-weighted index of 500 common stock prices in U.S. companies.
The S&P Composite 1500 Index is a broad-based capitalization-weighted index of 1500 U.S. companies and is comprised of the S&P 400, S&P 500 and the S&P 600.
11
Definitions for Management Teams' Perspectives
Other Index Definitions
The Barclays Capital Municipal Bond Index is an unmanaged index representative of the tax-exempt bond market.
The MSCI All Country Far East Free ex Japan Index is a free float-adjusted market capitalization-weighted index that is designed to measure the equity market performance of the Far East, excluding Japan. The index consists of the following developed and emerging market country indices: China, Hong Kong, Indonesia, Korea, Malaysia, Philippines, Singapore, Taiwan and Thailand.
The MSCI Emerging Markets Index is a free float-adjusted market capitalization index that is designed to measure equity market performance in the global emerging markets.
The MSCI World Index is a capitalization weighted index that monitors the performance of stocks from around the world.
The Philadelphia Oil Service Sector Index (OSX) is price-weighted index composed of 15 companies that provide oil drilling and production services, oil field equipment, support services and geophysical/reservoir services.
The Philadelphia Stock Exchange Gold and Silver Index (XAU) is a capitalization-weighted index that includes the leading companies involved in the mining of gold and silver.
The S&P High Yield Dividend Aristocrats Index is designed to measure the performance of the 50 highest dividend yielding S&P Composite 1500 constituents which have followed a managed dividends policy of consistently increasing dividends every year for at least 25 years.
The S&P/Case-Shiller Index tracks changes in home prices throughout the United States by following price movements in the value of homes in 20 major metropolitan areas.
The S&P/TSX Venture Composite Index is a broad market indicator for the Canadian venture capital market. The index is market capitalization weighted and, at its inception, included 531 companies. A quarterly revision process is used to remove companies that comprise less than 0.05% of the weight of the index, and add companies whose weight, when included, will be greater than 0.05% of the index.
The U.S. Trade Weighted Dollar Index provides a general indication of the international value of the U.S. dollar.
12
Management Team's Perspective
Introduction
The U.S. Treasury Securities Cash Fund (USTXX) seeks to obtain a high level of current income while maintaining the highest degree of safety of principal and liquidity. The U.S. Government Securities Savings Fund (UGSXX) seeks to achieve a consistently high yield with safety of principal.
Performance
U.S. Treasury Securities Cash Fund | | As of June 30, 2013 | |
| 7-Day Yield | | | 0.01 | % | |
7-Day Effective Yield | | | 0.01 | % | |
U.S. Government Securities Savings Fund | | As of June 30, 2013 | |
| 7-Day Yield | | | 0.01 | % | |
7-Day Effective Yield | | | 0.01 | % | |
An investment in either the U.S. Treasury Securities Cash Fund or the U.S. Government Securities Savings Fund is neither insured nor guaranteed by the Federal Deposit Insurance Corporation (FDIC) or by any other government agency. Although the funds seek to preserve the value of your investments at $1.00 per share, it is possible to lose money by investing in these funds.
Pursuant to a voluntary arrangement, the Adviser has agreed to limit total fund operating expenses to not exceed 1.00% for the U.S. Treasury Securities Cash Fund and 0.45% for the U.S. Government Securities Savings Fund on an annualized basis. In addition, the yields reported above include the effects of the Adviser's voluntary waiver of fees and/or reimbursement of expenses to maintain a minimum net yield for the funds. The Adviser can modify or terminate these arrangements at any time.
The Six-Month Period In Review - Economic And Political Issues That Affected The Funds
The U.S. economy experienced lackluster growth during the first six months of 2013. The employment situation in the country stabilized but has not shown real signs of improvement. Manufacturing data was generally weak, which is a trend we have seen across the globe.
Economic improvements were seen in the housing market and auto-related areas of the economy. Housing has been robust, with the S&P/Case-Shiller Index climbing 12 percent on a year-over-year basis through May. Housing starts and building permits have steadily increased, as well as overall activity in the sector. This has had a positive effect on consumer confidence, which recently hit multi-year highs. Higher
13
housing prices have created a "wealth effect," improving consumers' attitudes toward their financial situations. In addition to stable gasoline prices, increasing consumer confidence drove very strong auto sales.
The Federal Reserve maintained its position during the first half of the year with regard to its quantitative easing program, purchasing $85 billion in Treasuries and mortgage-backed securities each month in an effort to stimulate the economy. In recent months, though, Chairman Ben Bernanke has indicated an inclination to begin reducing this stimulus as soon as September 2013 in a process that has been widely described as "tapering."
Inflation in the U.S. oscillated between 1 and 2 percent during the first six months of the year and allows the Fed plenty of room to maneuver, as deflation still remains a threat. Global inflation, in general, has remained low, allowing global central bankers to comfortably maintain pro-growth policies. And while we have seen some countries begin to tighten monetary policy in the first half of 2013, the vast majority remains engaged in synchronized global monetary easing.
One of the countries tightening its policy is Japan, which committed to an aggressive reflation policy, and the country has been one of the few bright spots in the global economic context.
However, to address long-term imbalances, fiscal austerity is being implemented across the developed world. This is expected to be a drag on growth in the U.S. and Europe for some time, as spending cuts and higher taxes tend to be a headwind to economic growth.
China appears comfortable with a stable-to-slowing economy, focused on addressing domestic imbalances and, thus, has not been the global growth catalyst it was after the financial crisis. Europe remains mired in a continual mild recessionary environment and it is somewhat difficult to see that changing before year end.
Yields on the three-month Treasury bill fell 1 basis point to 0.03 percent, while yields on the six-month bills fell 2 basis points to 0.09 percent. One-year agency discount note yields rose 3 basis points to 0.15 percent. The market was still influenced by periodic bouts of risk aversion or other disruptions, with investors, at times, seeking to own short-term Treasury securities at almost any cost.
Investment Highlights
The U.S. Treasury Securities Cash Fund performed in line with Lipper's Treasury money market funds for the six months ending June 30, 2013, returning 0.00 percent, the same as the peer group. The U.S. Government Securities Savings Fund also performed in line with the Lipper government-only money market funds, returning 0.00 percent versus 0.01 percent for the peer group.
14
The U.S. Treasury Securities Cash Fund had a weighted average maturity of 2 days over the six-month period, as overnight repurchase agreements were some of the highest yielding options with the least amount of interest rate risk in the Treasury money market universe.
The U.S. Government Securities Savings Fund followed a very short-laddered approach for much of the period and had a weighted average maturity of 7 days over the period. The fund took advantage of higher yields by selectively extending its ladder but also took advantage of relatively higher repo rates. Overall, it remained a very difficult environment for money market fund investors.
Current Outlook
The Fed continues to remain accommodative in an attempt to offset fiscal tightening and spur employment growth. We continue to believe that it is unlikely that the Fed will meaningfully change course during 2013, with monetary policy expected to remain very easy during this time.
15
Management Team's Perspective
Introduction
The Near-Term Tax Free Fund (NEARX) and the Tax Free Fund (USUTX) seek to provide a high level of current income exempt from federal income taxation and to preserve capital. However, a portion of any distribution may be subject to federal and/or state income taxes. The Near-Term Tax Free Fund will maintain a weighted average maturity of less than five years, while the Tax Free Fund will generally maintain a longer weighted average maturity.
Performance Graphs
Near-Term Tax Free Fund

Average Annual Performance For the Periods Ended June 30, 2013
| | | Six Month | | One Year | | Five Year | | Ten Year | |
Near-Term Tax Free Fund | | | (0.80 | )% | | | 0.29 | % | | | 3.31 | % | | | 2.81 | % | |
Barclays Capital 3-Year Municipal Bond
Index | | | (0.05 | )% | | | 0.52 | % | | | 3.28 | % | | | 2.98 | % | |
Performance data quoted above is historical. Past performance is no guarantee of future results. Current performance may be higher or lower than the performance data quoted. The principal value and investment return of an investment will fluctuate so that an investor's shares, when redeemed, may be worth more or less than their original cost. The graph and table do not reflect the deduction of taxes that a shareholder would pay on fund distributions or the redemption of fund shares.
The Adviser has contractually agreed to limit total fund operating expenses (exclusive of any acquired fund fees and expenses, performance fees, taxes, brokerage commissions and interest) to not exceed 0.45% on an annualized basis through April 30, 2014.
See Definitions for Management Teams' Perspectives for index definitions.
Please visit our website at www.usfunds.com for updated performance information for different time periods.
16
Tax Free Fund

Average Annual Performance For the Periods Ended June 30, 2013
| | | Six Month | | One Year | | Five Year | | Ten Year | |
Tax Free Fund | | | (3.27 | )% | | | (0.65 | )% | | | 4.21 | % | | | 3.44 | % | |
Barclays Capital 10-Year Municipal Bond
Index | | | (2.77 | )% | | | 0.09 | % | | | 5.94 | % | | | 4.71 | % | |
Performance data quoted above is historical. Past performance is no guarantee of future results. Current performance may be higher or lower than the performance data quoted. The principal value and investment return of an investment will fluctuate so that an investor's shares, when redeemed, may be worth more or less than their original cost. The graph and table do not reflect the deduction of taxes that a shareholder would pay on fund distributions or the redemption of fund shares.
The Adviser has contractually agreed to limit total fund operating expenses (exclusive of any acquired fund fees and expenses, performance fees, taxes, brokerage commissions and interest) to not exceed 0.70% on an annualized basis through April 30, 2014.
See Definitions for Management Teams' Perspectives for index definitions.
Please visit our website at www.usfunds.com for updated performance information for different time periods.
The Six-Month Period In Review - Economic And Political Issues That Affected The Funds
The municipal bond market declined over the past six months, with the Barclays Capital Municipal Bond Index falling 2.69 percent. Most of the action took place in June, during which the index fell 2.83 percent, wiping out the small gains in the market up to that point.
The long end of the yield curve was hit the hardest, as bonds with maturities of 20 years or more fell by more than 4 percent in June. Municipal market performance was generally consistent throughout the yield curve, as returns were better among shorter maturities.
17
At the beginning of 2013, there was a growing sense of optimism that the European economy could produce positive economic growth by mid-year. This optimism was founded on the European Central Bank's supportive commentary as well as its actions that began a year ago.
In addition, fears of an economic hard landing in China last year caused many investors to believe the Chinese government would step in and provide either fiscal or monetary stimulus during the first half of 2013.
Since that time, the economies in Europe have not improved significantly and political uncertainty and summer riots have already dampened the mood for the second half of the year. China has refrained from any significant stimulus, instead managing a modest slowdown to achieve longer-term goals and economic restructuring. The Federal Reserve continued with its quantitative easing program to help boost the economy, which began in September 2012. In total, $85 billion per month is currently being used to buy Treasuries and mortgage-backed securities, but the Fed has begun to intimate that this program may be reduced within the next few months.
Revenue-backed municipals underperformed general obligation credits by a slim margin, driven by underperformance in industrial development and water & sewer issues. Credit factors played less of a role as performance differences between low-quality and high-quality bonds were not significant. High-yield, or junk bonds, outperformed, falling 2.19 percent over the past six months.
In specialty state trading, Puerto Rico and Illinois outperformed, while California and New York underperformed.
Investment Highlights
For the six months ended June 30, 2013, the Near-Term Tax Free Fund declined 0.80 percent, underperforming its benchmark, the Barclays Capital 3-Year Municipal Bond Index, which lost 0.05 percent. The Tax Free Fund decreased 3.27 percent, underperforming its benchmark, the Barclays Capital 10-Year Municipal Bond Index, which lost 2.77 percent.
The Near-Term Tax Free Fund outperformed the Short-Intermediate Lipper peer group for the past six months. The Tax Free Fund also outperformed its respective Lipper peer group. The outperformance of the Tax Free Fund compared to its peers was primarily driven by maturity preferences relative to the Lipper peer group. As discussed above, the long end of the yield curve experienced significant underperformance and the fund was positioned more conservatively than its peers in this regard. The Near-Term Tax Free Fund remained true to form, investing in traditional, high-quality municipals which tended to weather the market turbulence in June better than most. Bond structure also played a role as both funds tend to own higher coupons and more defensively structured securities than many competitors.
18
Strengths
• The Tax Free Fund maintained a relatively short maturity and duration profile. This positively affected performance in relation to its peer group, as longer maturities underperformed.
• Historically, the conservative credit profile of both funds proved to be an asset during volatile periods, but negatively affected performance when low-quality credits significantly outperformed. The market experienced significant interest rate volatility in June and, while the impact on relative performance wasn't as large as it has been in past cycles, the funds still benefited from this positioning.
• The Tax Free Fund benefited from relatively significant exposure to Alabama, Illinois and Georgia, which all outperformed.
• The Near-Term Tax Free Fund benefited from significant exposure to Illinois, Michigan and Florida, which all outperformed.
Weaknesses
• Neither fund had exposure to high-yield, junk-rated securities, which outperformed.
• The Tax Free Fund had exposure to long-term zero coupon bonds, which underperformed.
• Bonds that are subject to the alternative minimum tax (AMT) also outperformed; however, neither fund has exposure to these credits.
Current Outlook
Opportunities
• The selloff in the municipal market in June was significant and created an opportunity to add to positions, as the current conditions still appear favorable.
Threats
• Continued outperformance of low-quality bonds is the most significant threat on a relative basis.
• When the Fed reverses its monetary policy stance and begins to raise interest rates, the macro environment could become more difficult.
19
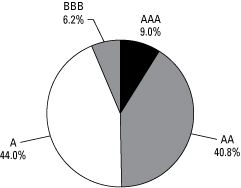
Near-Term Tax Free Fund
Municipal Bond Ratings June 30, 2013
(Based on Total Municipal Bonds)
Tax Free Fund
Municipal Bond Ratings June 30, 2013
(Based on Total Municipal Bonds)

20
Management Team's Perspective
Introduction
The principal objective of the All American Equity Fund (GBTFX) is to seek capital appreciation by investing primarily in a broadly diversified portfolio of domestic common stocks. The fund invests in large-capitalization stocks, while retaining the flexibility to seek out promising individual stock opportunities, including stocks with meaningful dividend yields.
Performance Graph
All American Equity Fund
Average Annual Performance For the Periods Ended June 30, 2013
| | | Six Month | | One Year | | Five Year | | Ten Year | |
All American Equity Fund | | | 13.90 | % | | | 18.81 | % | | | 1.36 | % | | | 7.15 | % | |
S&P 500 Index | | | 13.83 | % | | | 20.70 | % | | | 7.05 | % | | | 7.37 | % | |
Performance data quoted above is historical. Past performance is no guarantee of future results. Current performance may be higher or lower than the performance data quoted.The principal value and investment return of an investment will fluctuate so that an investor's shares, when redeemed, may be worth more or less than their original cost. The graph and table do not reflect the deduction of taxes that a shareholder would pay on fund distributions or the redemption of fund shares.
Pursuant to a voluntary arrangement, the Adviser has agreed to limit total fund operating expenses (exclusive of any acquired fund fees and expenses, performance fees, taxes, brokerage commissions and interest) to not exceed 2.20%. The Adviser can modify or terminate this arrangement at any time.
See Definitions for Management Teams' Perspectives for index definitions.
Please visit our website at www.usfunds.com for updated performance information for different time periods.
21
The Six-Month Period In Review - Economic And Political Issues That Affected The Fund
In the first half of 2013, the U.S. economy experienced lackluster growth, as real GDP rose at an annualized rate of 1.8 percent in the first quarter and 1.7 percent in the second quarter. The weak growth has been driven largely by Europe, as its economy is mired in a mild recession, as well as a larger-than-expected slowdown in China.
Global manufacturing indicators in the U.S. had held up well but weakened during the first half of 2013. On a positive note, the U.S. housing market has been an area of strength as prices moved higher, spurring activity across many sectors of the economy. The auto sector has also been a bright spot, with sales running at about a 16 million annualized rate in recent months.
The Federal Reserve maintained its quantitative easing (QE) policy during the first half of the year and is currently purchasing $85 billion in treasuries and mortgage- backed securities per month in an effort to stimulate the economy. In May and June, the Fed had begun to express a preference for a gradual reduction in this program that it believes may begin as soon as September of this year.
In addition to the Fed, central banks around the world have continued their massive synchronized easing cycle. The Bank of Japan has been particularly aggressive in this regard, and its QE program is almost as large as the Federal Reserve but in a much smaller economy.
Inflation in the U.S. is not really a concern in the short term and has consistently been below 2 percent. The global trend for inflation also remains low, which allows global central bankers to comfortably maintain pro-growth policies.
In many developed countries, fiscal austerity is being implemented to address long-term imbalances. This will act as a drag on growth in the U.S. and Europe for some time, as spending cuts and higher taxes tend to be a headwind to economic growth.
U.S. stocks in the first six months of 2013 have been very robust, with the S&P 500 Index rising 13.83 percent. Dividend-paying stocks performed even better during the first half of 2013, with the S&P High Yield Dividend Aristocrats Index gaining 15.80 percent.
22
Investment Highlights
Overview
The All American Equity Fund returned 13.90 percent for the six months ended June 30, 2013, outperforming the 13.83 percent return for the benchmark S&P 500 Index.
Because the fund is actively managed and holding period is generally not a consideration in investment decisions, the portfolio turnover rate may fluctuate from year to year as the fund adjusts its portfolio composition. The fund's annual portfolio turnover was, and is expected to continue to be, more than 100 percent.
Strengths
• The fund's allocations to consumer staples, health care and industrials sectors positively contributed to relative performance. The fund's stock selection in these three sectors was particularly strong.
• The fund's exposure to dividend-paying stocks over the past six months outperformed other portfolio components.
• MasterCard, Inc.,(1) Celgene Corp.(2) and Constellation Brands, Inc.(3) were among the best positive contributors to fund performance.
Weaknesses
• The fund's allocations to the materials and telecommunication sectors were negative contributors to relative performance.
• Cash and defensive option strategies did not aid fund performance over the past six months as the market rallied strongly.
• Apple, Inc.,(4) Cliffs Natural Resources, Inc.(4) and Randgold Resources Ltd.(4) were among the worst individual contributors to performance.
Current Outlook
Opportunities
• The U.S. economy has been resilient but not spectacular during the past six months. Underwhelming economic data may prove to be a positive surprise for equities in 2013, as it may keep the Fed biased toward maintaining its QE policies.
• Corporate cash levels continue to remain high, providing corporations the ability to pursue mergers and acquisitions (M&A). An increase in M&A activity holds promise for both portfolio gains and an increase in overall market valuations.
23
• The market has been very strong during the first half of the year driven by U.S. economic performance. Any signs of improvement from Europe or China over the next six months could be the next catalyst for the U.S. market.
Threats
• We believe Europe remains the largest wildcard. If the continent remains committed to austerity and political volatility continues, the continent will likely remain in recession.
• China's leaders appear comfortable with slower growth. China has been a significant driver of global growth over past decade and if this is an era for new government policy, it puts global growth at risk.
• Global government policy delays or outright missteps are a threat to global equity markets.
(1)This security comprised 4.37% of the fund's total net assets as of 06/30/13.
(2)This security comprised 1.16% of the fund's total net assets as of 06/30/13.
(3)This security comprised 1.14% of the fund's total net assets as of 06/30/13.
(4)The fund did not hold this security as of 06/30/13.
24
Top 10 Holdings Based on Net Assets June 30, 2013
MasterCard, Inc.
Commercial Services - Financial | | | 4.37 | % | |
Starbucks Corp.
Retail - Restaurants | | | 2.49 | % | |
Wabtec Corp.
Machinery - General Industrial | | | 2.17 | % | |
priceline.com, Inc.
E-Commerce/Services | | | 2.10 | % | |
TJX Companies, Inc.
Retail - Major Department Store | | | 2.03 | % | |
Bank of America Corp.
Diversified Banking Institutions | | | 1.95 | % | |
Union Pacific Corp.
Transportation - Rail | | | 1.95 | % | |
PPG Industries, Inc.
Chemicals - Diversified | | | 1.93 | % | |
Google, Inc.
Web Portals/Internet Service Providers | | | 1.78 | % | |
Continental Resources, Inc.
Oil Companies - Exploration & Production | | | 1.74 | % | |
Total Top 10 Holdings | | | 22.51 | % | |
Portfolio Allocation by Industry Sector*
Based on Total Investments June 30, 2013
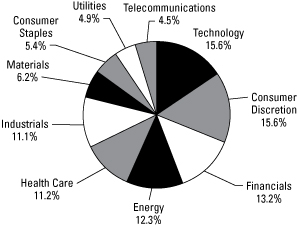
* Summary information above may differ from the portfolio schedule included in the financial statements due to the use of different classifications of securities for presentation purposes.
25
Management Team's Perspective
Introduction
The Holmes Growth Fund (ACBGX) invests in companies with good growth prospects and strong positive earnings momentum. The fund's primary objective is to seek long-term capital appreciation.
Performance Graph
Holmes Growth Fund

Average Annual Performance For the Periods Ended June 30, 2013
| | | Six Month | | One Year | | Five Year | | Ten Year | |
Holmes Growth Fund | | | 12.97 | % | | | 13.71 | % | | | (1.25 | )% | | | 6.43 | % | |
S&P Composite 1500 Index | | | 13.98 | % | | | 21.25 | % | | | 7.32 | % | | | 7.78 | % | |
Performance data quoted above is historical. Past performance is no guarantee of future results. Current performance may be higher or lower than the performance data quoted. The principal value and investment return of an investment will fluctuate so that an investor's shares, when redeemed, may be worth more or less than their original cost. The graph and table do not reflect the deduction of taxes that a shareholder would pay on fund distributions or the redemption of fund shares.
Pursuant to a voluntary arrangement, the Adviser has agreed to limit total fund operating expenses (exclusive of any acquired fund fees and expenses, performance fees, taxes, brokerage commissions and interest) to not exceed 2.20%. The Adviser can modify or terminate this arrangement at any time.
See Definitions for Management Teams' Perspectives for index definitions.
Please visit our website at www.usfunds.com for updated performance information for different time periods.
26
The Six-Month Period In Review - Economic And Political Issues That Affected The Fund
The U.S. economy continued to muddle through the first half of 2013. In the first quarter, real GDP grew at an annualized rate of 1.8 percent. For the second quarter, the economy grew 1.7 percent. This weak growth has been driven largely by a European economy mired in a mild recession and a larger-than-expected slowdown in China. Global manufacturing indicators in the U.S. continued to indicate expansion but did weaken during the first half of 2013.
Housing remained very robust and has been an area of strength as prices moved higher, spurring activity with knock on effects across many sectors of the economy. The auto sector has also been a bright spot, as auto sales have been increasing at nearly a 16 million annualized rate in recent months. This is the most robust period since 2007.
Central banks around the world have continued with their massive synchronized easing cycle. The Bank of Japan has been particularly aggressive in this regard and its quantitative easing (QE) program is almost as large as the Federal Reserve, only its economy is much smaller.
The Federal Reserve maintained its QE policy during the first half of the year, purchasing $85 billion in Treasuries and mortgage-backed securities per month in an effort to stimulate the economy. The Fed has recently indicated a preference for a gradual reduction in this program that may begin as soon as September.
Inflation in the U.S. is not really a concern in the short term and has consistently been below 2 percent. The global trend for inflation is similar, which allows global central bankers to comfortably maintain pro-growth policies.
In many developed countries, fiscal austerity is being implemented to address long-term imbalances. This will act as a drag on growth in the U.S. and Europe for some time, as spending cuts and higher taxes tend to be a headwind to economic growth.
The markets in 2013 have been very robust with the S&P 1500 Index increasing 13.98 percent in the past six months.
Investment Highlights
Overview
The Holmes Growth Fund rose 12.97 percent over the past six months, underperforming the benchmark, the S&P Composite 1500 Index, which returned 13.98 percent. Overall, growth-oriented stocks underperformed the market, hurting the fund's
27
performance, as it emphasizes sustainable growth and relative strength. Stocks geared to classic value factors, such as deep value and price reversals, outperformed.
Because the fund is actively managed and holding period is generally not a consideration in investment decisions, the portfolio turnover rate may fluctuate from year to year as the fund adjusts its portfolio composition. The fund's annual portfolio turnover was, and is expected to continue to be, more than 100 percent.
Strengths
• The fund benefited from its exposure to industrials, energy and consumer discretionary sectors.
• Industry groups that were standout performers for the fund included hotels, restaurants and leisure, and energy equipment and services.
• Celgene Corp.,(1) LinkedIn Corp.(2) and Chuy's Holdings, Inc.(3) were among the best positive contributors to performance.
Weaknesses
• The fund's exposure to technology and financials was a relative drag on the portfolio. Financials rose nearly 20 percent, but the fund was underweight. Technology was among the worst-performing sectors, and the fund was overweight during the period.
• Cash was a drag on performance as the market rallied strongly.
• Investments in Apple, Inc.,(4) Peregrine Semiconductor Corp.(4) and Cyberonics, Inc.(4) failed to live up to expectations and were among the worst contributors to the fund's performance.
Current Outlook
Opportunities
• The U.S. economy has been resilient but underwhelming during the past six months. This may prove to be a positive surprise for equities in 2013, as the Fed may decide to continue its current QE policies.
• Corporate cash levels are high, providing corporations the ability to pursue mergers and acquisitions (M&A). An increase in M&A activity holds promise for both portfolio gains and an increase in overall market valuations.
• The market has been very strong during the first half of the year because of U.S. economic performance, and any improvement in Europe or China could set up the next catalyst for the market.
28
Threats
• We believe Europe remains the largest wildcard. If the continent remains committed to austerity and political volatility continues the continent will likely remain in recession.
• China's leaders appear comfortable with slower growth. China has been a significant driver of global growth over the past decade and if this is a new era for government policy it puts global growth at risk.
• Deep value and price reversals have led the market. If this trend persists, it is a threat to relative performance.
(1)This security comprised 1.25% of the fund's total net assets as of 06/30/13.
(2)This security comprised 0.98% of the fund's total net assets as of 06/30/13.
(3)This security comprised 1.68% of the fund's total net assets as of 06/30/13.
(4)The fund did not hold this security as of 06/30/13.
29
Top 10 Holdings Based on Net Assets June 30, 2013
MasterCard, Inc.
Commercial Services - Financial | | | 4.24 | % | |
Oasis Petroleum, Inc.
Oil Companies - Exploration & Production | | �� | 3.19 | % | |
Wabtec Corp.
Machinery - General Industrial | | | 2.92 | % | |
Starbucks Corp.
Retail - Restaurants | | | 2.69 | % | |
Michael Kors Holdings Ltd.
Apparel Manufacturers | | | 2.54 | % | |
TJX Companies, Inc.
Retail - Major Department Store | | | 2.46 | % | |
Bank of America Corp.
Diversified Banking Institutions | | | 2.46 | % | |
Continental Resources, Inc.
Oil Companies - Exploration & Production | | | 2.35 | % | |
DaVita HealthCare Partners Inc.
Dialysis Centers | | | 2.31 | % | |
Old Dominion Freight Line, Inc.
Transportation - Truck | | | 2.28 | % | |
Total Top 10 Holdings | | | 27.44 | % | |
Portfolio Allocation by Industry Sector*
Based on Total Investments June 30, 2013
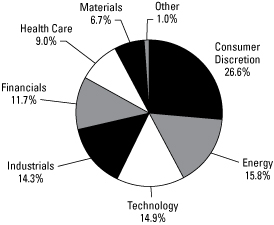
* Summary information above may differ from the portfolio schedule included in the financial statements due to the use of different classifications of securities for presentation purposes.
30
Management Team's Perspective
Introduction
The MegaTrends Fund (MEGAX and MEGIX) focuses on companies that are well positioned to benefit from substantial and sustainable growth that may occur over a multi-year time frame. The fund considers a broad range of investable opportunities, many of which are created by government policies, technological innovations and/or changes in market fundamentals for a product, service or commodity. The fund has the flexibility to invest globally and within any sector of the economy.
Performance Graph
MegaTrends Fund

Average Annual Performance For the Periods Ended June 30, 2013
| | | Six Month | | One Year | | Five Year | | Ten Year | | Since Inception
(Institutional
Class) | |
MegaTrends Fund - Investor Class | | | 11.26 | % | | | 16.66 | % | | | (4.89 | )% | | | 3.96 | % | | | n/a | | |
MegaTrends Fund - Institutional
Class (Inception 3/1/10) | | | 13.23 | % | | | 19.04 | % | | | n/a | | | | n/a | | | | 5.20 | % | |
S&P 500 Index | | | 13.83 | % | | | 20.70 | % | | | 7.05 | % | | | 7.37 | % | | | 13.99 | % | |
Performance data quoted above is historical. Past performance is no guarantee of future results. Current performance may be higher or lower than the performance data quoted. The principal value and investment return of an investment will fluctuate so that an investor's shares, when redeemed, may be worth more or less than their original cost. The graph and table do not reflect the deduction of taxes that a shareholder would pay on fund distributions or the redemption of fund shares.
Pursuant to a voluntary arrangement, the Adviser has agreed to limit total fund operating expenses (exclusive of any acquired fund fees and expenses, performance fees, taxes, brokerage commissions and interest) to not exceed 2.35% for the Investor Class. Also pursuant to a voluntary agreement, the Adviser has agreed to waive all class specific expenses of the Institutional Class. The Adviser can modify or terminate these arrangements at any time.
See Definitions for Management Teams' Perspectives for index definitions.
Please visit our website at www.usfunds.com for updated performance information for different time periods.
31
The Six-Month Period In Review - Economic And Political Issues That Affected The Fund
Political and economic considerations are very influential on the investment climate in which the MegaTrends Fund operates.
In the first six months of 2013, the domestic equity market, as measured by the S&P 500 Index, posted a robust gain of 13.8 percent. Companies with growing or high dividend yields did particularly well in the period, given the global reach for yield during this historically low interest rate environment. The financial, consumer discretionary and health care sectors led the U.S. market to a fresh all-time high on May 21 to 1,669 for the S&P 500, as a recovery in housing, job growth and waning support for President Barack Obama's health care plan fueled earnings growth and investor sentiment.
As the six-month period came to a close, Ben Bernanke suggested that the Federal Reserve's bond-buying program would begin to slow down and end as early as mid-2014 if the economy continued to improve. His statements put pressure on the equity market and prompted a dramatic selloff in Treasury bonds, pushing the 10-year yield to 2.49 percent at period-end from 1.63 percent earlier in the period.
Investment Highlights
Overview
In the first six months of 2013, the Investor Class of the fund had a positive 11.26 percent return and the Institutional Class posted a positive 13.23 percent return. The benchmark S&P 500 Index returned 13.83 percent in the period.
Because the fund is actively managed and holding period is generally not a consideration in investment decisions, the portfolio turnover rate may fluctuate from year to year as the fund adjusts its portfolio composition. The fund's annual portfolio turnover was, and is expected to continue to be, more than 100 percent.
Strengths
• Fund performance improved in the second quarter of the period with a 3.45 percent return, 53 basis points above the benchmark S&P 500 Index return of 2.92 percent.
• The fund benefited from overweighting the financial sector as banks and insurance companies outperformed the S&P 500 Index by an average of 899 basis points. The fund's position in Discover Financial Services(1) outpaced the S&P 500 financial sector and contributed positively to return.
32
• In the consumer discretionary sector, leadership rotated to housing-related stocks from auto manufacturing and retailing. Overall, the consumer discretionary sector outperformed the S&P 500 Index by 595 basis points. Media and publishing companies Twenty-First Century Fox, Inc.(2) (formerly News Corp.) and Discovery Communications, Inc.(3) outperformed the discretionary sector and were two of the best contributors to return.
• The fund's overweight position in health care stocks added to performance, as the sector led the market and maintained a 643 basis point lead over the S&P 500. Bristol-Myers Squibb Co.(3) returned over 25 percent for the portfolio.
• Other top contributors to fund performance in the period were Pacific Power Generation Corp.,(4) Pacific Stone Tech, Inc.,(5) The Allstate Corp.,(3) Toyota Motor Corp.,(6) ICON plc,(7) Wyndham Worldwide Corp.,(3) Prudential plc(3) and McKesson Corp.(8)
Weaknesses
• The fund's allocation to precious metals and coal mining negatively impacted performance during the six-month period.
• The fund's basic materials positions underperformed due to growth concerns in China, a stronger U.S. dollar and weakening commodity prices.
• Negative contributors to fund performance in the period included the Gran Colombia Gold Corp. 5.00% Silver-Linked Notes,(9) Pacific Green Energy Corp.,(10) Andean Pacific Iron Corp.,(11) Pacific Coal Resources Ltd.,(12) Thor Industries Inc.(3) and United States Steel Corp.(3)
Current Outlook
Opportunities
We believe the following investable trends may prove to be multi-year themes:
• The financial sector is steadily recovering from the 2008 financial crisis and is beginning to see signs of incremental credit demand, partially in response to an improving housing industry.
• The health care sector is aided by the demographic tailwind of an aging population and its growing demand for quality medical products and services.
• The discretionary sector appears to have captured two trends involving the nascent recovery in the U.S. housing sub-sector and the growing market share of discount retailing.
33
Threats
• The Fed's decision to begin unwinding quantitative easing later this year could prove to be premature and adversely impact the domestic economy.
• While policymakers in Europe have made strides to stabilize the current debt crisis, many contagion risks remain, which could lead to a liquidity shock and financial market distress.
(1) This security comprised 1.98% of the fund's total net assets as of 06/30/13.
(2) This security comprised 2.14% of the fund's total net assets as of 06/30/13.
(3) The fund did not hold this security as of 06/30/13.
(4) This security comprised 3.09% of the fund's total net assets as of 06/30/13.
(5) This security comprised 5.31% of the fund's total net assets as of 06/30/13.
(6) This security comprised 2.14% of the fund's total net assets as of 06/30/13.
(7) This security comprised 2.17% of the fund's total net assets as of 06/30/13.
(8) This security comprised 2.13% of the fund's total net assets as of 06/30/13.
(9) This security comprised 0.44% of the fund's total net assets as of 06/30/13. Another 0.04% was held in common stock as of 06/30/13.
(10)This security comprised 0.59% of the fund's total net assets as of 06/30/13.
(11)This security comprised 1.77% of the fund's total net assets as of 06/30/13.
(12)This security comprised 0.14% of the fund's total net assets as of 06/30/13.
34
Top 10 Holdings Based on Net Assets June 30, 2013
Pacific Stone Tech, Inc.
Quarrying | | | 5.31 | % | |
Pacific Power Generation Corp.
Electric - Generation | | | 3.09 | % | |
Pacific Infrastructure, Inc.
Real Estate Operating/Development | | | 2.89 | % | |
Time Warner Cable, Inc.
Cable/Satellite TV | | | 2.34 | % | |
Cigna Corp.
Medical - HMO | | | 2.25 | % | |
ICON plc
Medical Labs & Testing Services | | | 2.17 | % | |
Toyota Motor Corp.
Automotive - Cars & Light Trucks | | | 2.14 | % | |
Twenty-First Century Fox, Inc.
Multimedia | | | 2.14 | % | |
McKesson Corp.
Medical - Wholesale Drug Distribution | | | 2.13 | % | |
Mitsubishi Estate Co., Ltd.
Real Estate Management/Services | | | 2.13 | % | |
Total Top 10 Holdings | | | 26.59 | % | |
Portfolio Allocation by Industry Sector*
Based on Total Investments June 30, 2013
* Summary information above may differ from the portfolio schedule included in the financial statements due to the use of different classifications of securities for presentation purposes.
35
Management Team's Perspective
Introduction
The Global Resources Fund (PSPFX and PIPFX) is a non-diversified natural resources fund with the principal objective of seeking long-term growth of capital while providing protection against inflation and monetary instability. The fund invests in companies involved in the exploration, production and processing of petroleum, natural gas, coal, alternative energies, chemicals, mining, iron and steel, and paper and forest products around the globe.
Performance Graph
Global Resources Fund

Average Annual Performance For the Periods Ended June 30, 2013
| | | Six Month | | One Year | | Five Year | | Ten Year | | Since Inception
(Institutional
Class) | |
Global Resources Fund - Investor Class | | | (8.27 | )% | | | 0.44 | % | | | (9.76 | )% | | | 14.67 | % | | | n/a | | |
Global Resources Fund - Institutional
Class (Inception 3/1/10) | | | (8.01 | )% | | | 0.99 | % | | | n/a | | | | n/a | | | | 3.45 | % | |
S&P 500 Index | | | 13.83 | % | | | 20.70 | % | | | 7.05 | % | | | 7.37 | % | | | 13.99 | % | |
Morgan Stanley Commodity Related
Equity Index | | | (2.60 | )% | | | 5.19 | % | | | (1.61 | )% | | | 14.02 | % | | | 2.99 | % | |
Performance data quoted above is historical. Past performance is no guarantee of future results. Current performance may be higher or lower than the performance data quoted. The principal value and investment return of an investment will fluctuate so that an investor's shares, when redeemed, may be worth more or less than their original cost. The graph and table do not reflect the deduction of taxes that a shareholder would pay on fund distributions or the redemption of fund shares.
Pursuant to a voluntary arrangement, the Adviser has agreed to limit total fund operating expenses (exclusive of any acquired fund fees and expenses, performance fees, taxes, brokerage commissions and interest) to not exceed 1.90% for the Investor Class. The Adviser can modify or terminate this arrangement at any time. The Adviser has contractually agreed to waive all class specific expenses of the Institutional Class through April 30, 2014.
See Definitions for Management Teams' Perspectives for index definitions.
Please visit our website at www.usfunds.com for updated performance information for different time periods.
36
The Six-Month Period In Review - Economic And Political Issues That Affected The Fund
In the first half of 2013, the energy and materials sectors underperformed the S&P 500 Index by an average of 700 basis points. Concerns over the deceleration in economic growth in China, which experienced 7.5 percent GDP growth in the second quarter, curbed investors' appetite for commodity-related equities, particularly relative to the broader market. Additionally, weakening emerging market currencies and deteriorating economic fundamentals weighed on investor sentiment towards bellwether commodities. Brent crude oil and copper declined by 8 percent and 16 percent, respectively, in the period. Conversely, the broader domestic market posted a robust 13.8 percent gain, especially for companies with growing or high dividend yields. The financial, consumer discretionary and health care sectors led the U.S. market to a fresh all-time high on May 21 to 1,669 for the S&P 500, as a recovery in housing, job growth and waning support for President Barack Obama's health care plan fueled earnings growth and investor sentiment.
Looking ahead to the second half of the year and 2014, we anticipate global growth will follow the U.S. economy's lead and expand at sufficient rates to improve overall commodity demand. Moreover, we believe the secular long-term trend of urbanization in China and other emerging market countries remains intact and will continue to support per-capita commodity consumption well into the next decade.
Investment Highlights
Overview
For the six-month period ended June 30, 2013, the Investor Class of the Global Resources Fund declined 8.27 percent and the Institutional Class declined 8.01 percent, underperforming the fund's benchmark, the Morgan Stanley Commodity Related Equity Index (CRX), which declined 2.60 percent.
Because the fund is actively managed and holding period is generally not a consideration in investment decisions, the portfolio turnover rate may fluctuate from year to year as the fund adjusts its portfolio composition. The fund's annual portfolio turnover was, and is expected to continue to be, more than 100 percent.
Strengths
• Food product stocks outperformed natural resource equities and the broader equity market in the past six months. This is partially due to Chinese meat processor Shuanghui International Holdings Ltd.,(1) which agreed to buy Smithfield Foods, Inc.(1) in a $7.1 billion deal. The fund benefited from its position in Smithfield, which was the largest contributor to fund performance for the six-month period.
37
• The Philadelphia Oil Service Sector Index outperformed the Morgan Stanley Commodity Related Equity Index by 1,828 basis points in the first half of the year. Hornbeck Offshore Services, Inc.(2) positively impacted portfolio returns.
• The portfolio benefited from an allocation to master limited partnerships and select junior exploration and development companies.
Weaknesses
• The precious metals group was the worst-performing sub-sector in the natural resources area in the first half of 2013. The Philadelphia Stock Exchange Gold and Silver Index lost nearly 45 percent in the period. Holdings in Gran Colombia Gold Corp.,(3) Dundee Precious Metals, Inc.(4) warrants and Barrick Gold Corp.(1) negatively affected fund performance.
• The fund has an overweight position in junior natural resources stocks, which performed poorly as measured by a 32 percent decline in the S&P/TSX Venture Composite Index. Holdings which negatively impacted performance included Pacific Coal Resources Ltd.,(5) which declined by 68 percent.
• Concern over slowing economic growth in China weighed on the price of copper during the first half of 2013. The benchmark price for the metal started the year at $3.65 per pound and closed at $3.05 per pound in the second quarter, for a 16 percent decline. Accordingly, copper equities were negatively impacted, including the fund's position in Southern Copper Corp.(6) lost 26 percent year-to-date.
Current Outlook
Opportunities
• According to Macquarie, the latest round of monthly manufacturing purchasing managers' indices (PMIs) tentatively point to the prospect of a modest upturn in demand for metals and bulk commodities in the coming months. PMIs in the U.S. and Japan, which rank first and third, respectively, in the world output, increased sharply. European PMIs, while still weak, remained stable. However, China's PMI dropped, but still signaled an expansion of economic output.
• According to the International Energy Agency (IEA), the economic recovery and emerging markets led by China will boost growth of oil demand to a record high total in 2014. The IEA estimates that demand may rise by 1.2 million barrels daily next year to a record 92.0 million barrels daily, after record demand was already set this year.
• China plans to spend $6.4 trillion to bring 400 million people to cities over the next decade as the government tries to turn the country into a wealthy world power with economic growth generated by an affluent consumer class. China believes that urbanization is the biggest force driving the country's domestic demand. The government hopes 60 percent of the population of almost 1.4 billion people will be urban residents by 2020 and has plans in place to build homes, roads, hospitals and schools in preparation.
38
Threats
• Capital flight out of emerging market economies, due to rising real interest rates in the U.S. and a strengthening dollar, may cause further distress in the developing world that could impact global growth expectations.
• Easing Federal Reserve policy supported the U.S. housing recovery and has provided a catalyst for the timber and forest sector. However, given the Fed's recent announcement that it will taper its purchase of U.S. Treasuries, an economic recovery could be at risk if this decision proves to be premature.
• Growth expectations for China have softened given the government's efforts to curb excess liquidity and an over-heated property market. Any further dip in expectations could have a detrimental impact on commodities and related equities.
(1)The fund did not hold this security as of 06/30/13.
(2)This security comprised 2.87% of the fund's total net assets as of 06/30/13.
(3)This security comprised 3.19% of the fund's total net assets as of 06/30/13.
(4)This security comprised 0.37% of the fund's total net assets as of 06/30/13.
(5)This security comprised 0.35% of the fund's total net assets as of 06/30/13.
(6)This security comprised 1.98% of the fund's total net assets as of 06/30/13.
Top 10 Holdings Based on Net Assets June 30, 2013
Gran Colombia Gold Corp.
Gold Mining | | | 3.19 | % | |
Western Gas Partners L.P.
Pipelines | | | 2.97 | % | |
Hornbeck Offshore Services, Inc.
Oil - Field Services | | | 2.87 | % | |
Continental Resources, Inc.
Oil Companies - Exploration & Production | | | 2.86 | % | |
Enterprise Products Partners L.P.
Pipelines | | | 2.83 | % | |
Kinder Morgan, Inc.
Pipelines | | | 2.69 | % | |
Anadarko Petroleum Corp.
Oil Companies - Exploration & Production | | | 2.63 | % | |
Mosaic Co.
Agricultural Chemicals | | | 2.20 | % | |
Superior Energy Services, Inc.
Oil Field Services | | | 2.09 | % | |
Vulcan Materials Co.
Building Products - Cement/Aggregates | | | 2.04 | % | |
Total Top 10 Holdings | | | 26.37 | % | |
39
Portfolio Allocation by Industry Sector*
Based on Total Investments June 30, 2013
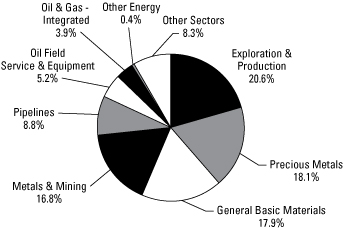
Energy: | |
Oil & Gas Exploration & Production | | | 20.6 | % | | | |
Oil & Gas Equipment & Services | | | 5.2 | % | | | |
Pipelines | | | 8.8 | % | | | |
Oil & Gas - Integrated (includes Refining and
Marketing) | | | 3.9 | % | | | |
Other Energy | | | 0.4 | % | | | |
Total Energy | | | | | 38.9 | % | |
Basic Materials: | |
Precious Metals (includes Gold/Silver Mining and
Platinum) | | | 18.1 | % | | | |
General Basic Materials | | | 17.9 | % | | | |
Metals & Mining (includes Copper and Coal) | | | 16.8 | % | | | |
Total Basic Materials | | | | | 52.8 | % | |
Other Sectors | | | | | 8.3 | % | |
| | | | 100.0 | % | |
* Summary information above may differ from the portfolio schedule included in the financial statements due to the use of different classifications of securities for presentation purposes.
40
Precious Metals and Minerals Funds
Management Team's Perspective
Introduction
The World Precious Minerals Fund (UNWPX and UNWIX) and the Gold and Precious Metals Fund (USERX) pursue an objective of long-term capital growth through investments in gold, precious metals and mining companies. The Gold and Precious Metals Fund focuses on the equity securities of established gold and precious metals companies and pursues current income as a secondary objective. The World Precious Minerals Fund focuses on equity securities of companies principally engaged in the exploration, mining and processing of precious minerals such as gold, silver, platinum and diamonds. Although this fund has the latitude to invest in a broad range of precious minerals, it currently remains focused on the gold sector.
Performance Graphs
World Precious Minerals Fund

Average Annual Performance For the Periods Ended June 30, 2013
| | | Six Month | | One Year | | Five Year | | Ten Year | | Since Inception
(Institutional
Class) | |
World Precious Minerals Fund -
Investor Class | | | (48.72 | )% | | | (44.29 | )% | | | (16.23 | )% | | | 6.56 | % | | | n/a | | |
World Precious Minerals Fund -
Institutional Class (Inception 3/1/10) | | | (48.59 | )% | | | (44.04 | )% | | | n/a | | | | n/a | | | | (20.99 | )% | |
S&P 500 Index | | | 13.83 | % | | | 20.70 | % | | | 7.05 | % | | | 7.37 | % | | | 13.99 | % | |
NYSE Arca Gold Miners Index* | | | (47.50 | )% | | | (45.33 | )% | | | (12.73 | )% | | | 2.85 | % | | | (16.48 | )% | |
* These are not total returns. These returns reflect simple appreciation only and do not reflect dividend reinvestment.
Performance data quoted above is historical. Past performance is no guarantee of future results. Current performance may be higher or lower than the performance data quoted. The principal value and investment return of an investment will fluctuate so that an investor's shares, when redeemed, may be worth more or less than their original cost. The graph and table do not reflect the deduction of taxes that a shareholder would pay on fund distributions or the redemption of fund shares.
Pursuant to a voluntary arrangement, the Adviser has agreed to limit total fund operating expenses (exclusive of any acquired fund fees and expenses, performance fees, taxes, brokerage commissions and interest) to not exceed 1.90% for the Investor Class. Also pursuant to a voluntary agreement, the Adviser has agreed to waive all class specific expenses of the Institutional Class. The Adviser can modify or terminate these arrangements at any time.
See Definitions for Management Teams' Perspectives for index definitions.
Please visit our website at www.usfunds.com for updated performance information for different time periods.
41
Precious Metals and Minerals Funds
Gold and Precious Metals Fund
Average Annual Performance For the Periods Ended June 30, 2013
| | | Six Month | | One Year | | Five Year | | Ten Year | |
Gold and Precious Metals Fund | | | (43.72 | )% | | | (38.58 | )% | | | (11.68 | )% | | | 7.78 | % | |
S&P 500 Index | | | 13.83 | % | | | 20.70 | % | | | 7.05 | % | | | 7.37 | % | |
FTSE Gold Mines Index* | | | (48.74 | )% | | | (48.05 | )% | | | (14.47 | )% | | | 1.10 | % | |
* These are not total returns. These returns reflect simple appreciation only and do not reflect dividend reinvestment.
Performance data quoted above is historical. Past performance is no guarantee of future results. Current performance may be higher or lower than the performance data quoted. The principal value and investment return of an investment will fluctuate so that an investor's shares, when redeemed, may be worth more or less than their original cost. The graph and table do not reflect the deduction of taxes that a shareholder would pay on fund distributions or the redemption of fund shares.
Pursuant to a voluntary arrangement, the Adviser has agreed to limit total fund operating expenses (exclusive of any acquired fund fees and expenses, performance fees, taxes, brokerage commissions and interest) to not exceed 1.90%. The Adviser can modify or terminate this arrangement at any time.
See Definitions for Management Teams' Perspectives for index definitions.
Please visit our website at www.usfunds.com for updated performance information for different time periods.
The Six-Month Period In Review - Economic And Political Issues That Affected The Funds
The price of gold posted its worst semi-annual decline since 1981 in what marked a very turbulent first half of the year for precious metals. Through June 30, gold bullion lost 26.31 percent. In contrast to the negative price action in gold, total assets of the Federal Reserve's balance sheet are approaching $3.2 trillion at the end of June, a previously inconceivable size, and are projected to reach $4 trillion by the end of 2013. The historical correlation between the expansion of the U.S. balance sheet and the price of gold over the past decade suggests we should see much higher prices for gold.
42
Precious Metals and Minerals Funds
Despite reports to the contrary, sales of gold, silver and jewelry pieces rose 38.1 percent in China during the first months of the year, while central bank purchasing from Russia to South Korea added hundreds of metric tons of gold to these countries' reserves. However, the initial incorrect reports of weak Chinese demand set gold prices on a slippery footing. This weakness was further exacerbated on February 15 when SEC filings showed that Soros Fund Management and Moore Capital had liquidated a significant amount of their U.S.-held ETF gold investments in the fourth quarter of 2012. The ensuing selloff sent gold prices crashing down below $1,600 per ounce.
We believe the market overreacted. Being an astute investor in the currency markets, Soros may have swapped his U.S. dollar-based gold holding into yen-denominated gold, which was up almost 19 percent over the six months prior to the February filings.
In April, information concerning gold ETF liquidations for the first quarter garnered headlines, with investors redeeming a record $9.16 billion from gold ETFs. In concert, the major brokerage houses in the U.S. repeatedly pronounced that the gold cycle had run its course and that it was now time to invest aggressively in the broader markets as the U.S. economy was de-risked. The selloff intensified during the second quarter of 2013 as investors saw one of the biggest quarterly price declines in gold bullion and gold equity prices of this 10-plus year cycle. Gold inventories held by ETF holdings of bullion fell another 16.5 percent in the second quarter.
However, the recurring theme of record demand for physical gold only intensified following the significant price declines in the second quarter. On April 26, the Chinese Gold & Silver Society in Hong Kong reported it had sold out of all of its spot gold and placed orders to Switzerland four times larger than normal to keep up with demand. Local merchants in Hong Kong and Macau saw a 150 percent increase in sales in late April. Chinese gold imports from Hong Kong more than tripled since 2012, from 62.9 metric tons to 223.5 metric tons. Premiums for gold physical delivery in Shanghai jumped to a staggering $34.82 per ounce. The likely conclusion is that Asia has been buying the dip in large amounts.
In addition, the U.S. Mint suspended sales of its smallest American Eagle gold coin after it sold off its entire inventory. Similarly, central banks' net purchases exceeded 100 tons for the seventh-consecutive quarter.
Despite the frenzied physical buying around the world, the implications of a lower gold price on miners are severe. Société Générale reports that 16 percent of world gold production is already taking a loss with gold trading at $1,380, and a staggering 44 percent of world production is estimated to be loss-making at a projected gold price of $1,150. Later, Fitch noted that a potential dip below $1,000 per ounce in gold price could result in dividend cuts by gold producers.
Gold stocks rebounded in the last two trading days of the quarter, but the bounce was not enough to reverse the prior losses where buyers stepped aside ahead of
43
Precious Metals and Minerals Funds
quarter-end producer gold liquidation. The decoupling between physical demand and investor demand is unsustainable going forward, and as we approach the strong seasonal demand for gold during the second half of the year, we expect physical demand to reach higher levels.
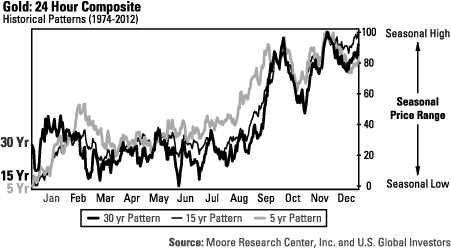
Investment Highlights
For the six months ended June 30, 2013, the World Precious Minerals Fund Investor Class declined 48.72 percent and the Institutional Class lost 48.59 percent. The fund's benchmark, the NYSE Arca Gold Miners Index, decreased 46.99 percent on a total return basis. The strategy of the World Precious Minerals Fund favors junior (exploration and development) stocks and mid-tiered producing stocks. These lower-capitalization stocks have historically outperformed senior gold mining companies over longer time periods, as senior gold miners have typically acquired proven assets of junior gold companies rather than explored for new mining projects with capital-constrained budgets. However, the World Precious Mineral Fund's junior stock holdings negatively affected the fund's performance relative to its benchmark of North American senior gold stocks during the period. This was due to small capitalization stocks having less access to capital in turbulent markets when investor confidence is lower. Even though the fund slightly underperformed its benchmark over the last six months, the gap in performance has narrowed relative to prior reporting periods and may be indicative of a turning point in the fortune of the junior miners.
The Gold and Precious Metals Fund fell 43.72 percent over the last six months, outperforming its benchmark, the FTSE Gold Mines Index, which decreased 48.06 percent on a total return basis. While focusing on established, producing gold companies, the Gold and Precious Metals Fund holds a higher weighting of mid-tier stocks compared to its benchmark. The fund strongly outperformed its benchmark in the first half of the
44
Precious Metals and Minerals Funds
year as the senior gold mining companies reduced their production guidance and faced significant write downs in the carrying value of certain assets from prior acquisitions due to the steep decline in gold prices.
For both gold funds, we maintained a defensive investment position throughout much of the past six months by keeping higher-than-average cash balances on hand to protect the liquidity of the funds. However, to maintain varying degrees of investment exposure to the gold market, we also employed a number of rolling call option positions.
Spot gold finished the period at $1,234.57 per ounce, down $440.78, or 26.31 percent, for the first half of the year. The S&P 500 Index posted a positive return of 13.83 percent, the U.S. Trade Weighted Dollar Index rose 4.22 percent and the yield on a 90-day Treasury bill finished the period at 0.03 percent.
Strengths
• Lucara Diamond Corp.(1) was the largest contributor to performance for the World Precious Minerals Fund. Lucara delivered excellent operating results in 2012 as well as for the first quarter of 2013, beating its production target and delivering at a lower cost. Atlas Energy L.P.(2) was the best performer in the Gold and Precious Minerals Fund. Atlas was an outperformer in the oil and gas space and provided adequate energy cost hedging to offset the rising energy prices faced by gold miners held by the fund.
• SM Energy Co.(3) was the second-best performer in the Gold and Precious Minerals Fund. SM beat on production and earnings for the first quarter while retaining great upside potential.
• Novo Resources Corp.(4) was another large contributor to performance for the World Precious Minerals Fund. Novo released its first NI 43-101 compliant resource estimate for its Western Australian property with an inferred resource of 421,000 ounces of gold. Anadarko Petroleum Corp.(5) was the third-best performer in the Gold and Precious Minerals Fund. Anadarko outperformed over the first half of 2013 after beating analysts' earnings expectations and again helped offset some of the energy price hikes the gold miners may experience.
Weaknesses
• Dundee Precious Metals, Inc.(6) was the worst performer for the Gold and Precious Minerals Fund and the second-worst performer for the World Precious Minerals Fund. Despite posting slightly better-than-expected results, the company delivered underwhelming guidance for 2013 as it faced delays in the refurbishment of the Tsumeb smelter in Namibia and uncertainty with respect to an environmental ruling on its Krumovgrad mine in Bulgaria.
• Gran Colombia Gold Corp.(7) was the second-worst performer for the Gold and Precious Minerals Fund and the worst performer for the World Precious Minerals
45
Precious Metals and Minerals Funds
Fund. Unreliable power coming from the grid forced the company to halt production at its flagship property, leading to a disappointing fourth quarter 2012 production report released early in 2013. Despite the successful implementation of cost-cutting plans, positive drilling results and visibly improved execution, the company is struggling to regain investors' faith in a depressed gold sector.
• Agnico-Eagle Mines Ltd.(8) was another significant detractor to the performance of the World Precious Minerals Fund due to its position size. Agnico was a strong performer in 2012; however, the company became a source of funds in 2013 as investors aiming to rebalance their portfolios took profits and the sell-off depressed the stock price. The Gold and Precious Minerals Fund was negatively affected by Centerra Gold, Inc.(9) In the midst of a successful recovery from a natural disaster that affected its flagship Kumtor mine in 2012, the company found itself forced to renegotiate its operating agreement with the Kyrgyz government who demanded a greater interest in the world-class asset property.
Current Outlook
Opportunities
• During a speech on the current state of the economy and commodity prices, Sprott Global Resource Investments concurs with our thoughts that the debasement of the U.S. dollar is the most likely outcome of the current situation. With the U.S. federal debt exceeding $16 trillion, the off-balance sheet liabilities exceeding $60 trillion, and the annual deficit exceeding $1.5 trillion, the country is attempting to service $76 trillion in debt with $2.5 trillion in revenue, while spending $3.6 trillion annually. A U.S. dollar debasement will increase commodity prices around the world, even though the timing is not predictable.
• In May, it was reported that Soros Fund Management LLC, the hedge fund founded by George Soros, significantly increased its gold-related holdings. The most notable addition was the purchase of over $25 million worth of call options on the Market Vectors Junior Gold Miners ETF (GDXJ).(10) In addition, the fund reportedly owns more than $239.2 million in gold-related financial assets. The release contrasts the fund's February release in which gold-related exposure had declined significantly. This recent move by one of the world's most closely followed hedge funds should help draw appetite for gold stocks and bode well for a surge in gold equities.
• In an analysis of large cap gold equities and their current price-to-book value, TD Securities finds that large caps are currently trading just below one times book value, a level that has marked previous gold equity bottoms during the global financial crisis and the late 1990s gold bear market. Similarly, brokerage firm Paradigm Capital comments that despite the meltdown in gold prices, there are healthy signs for the sector. The current downturn, which started in September 2011, is pushing 1.8 years. Since 1976, there have been four major cycles in the gold sector. The average duration of the four previous downturns has been
46
Precious Metals and Minerals Funds
3.6 years. However, noting that the two previous downturns were just two years in length, Paradigm believes this is likely to turn into a short downturn, in which the gold price will be bottoming out this summer.
Threats
• ABN AMRO, the largest Dutch bank, announced it would be unable to deliver physical gold on customers' gold claims and would instead offer a paper gold claim to its customers. The bank made the paper gold claim appear as valuable as the physical gold claim without telling investors the new "product" is subject to the bank's credit risk as well as to market speculation. This move coincided with the boost in premiums to acquire physical bullion for investor demand.
• In India, the world's largest bullion market, taxes on gold imports were hiked a third time to dampen record imports of gold into the country.
• Money supply remains muted because of the low velocity of money, which is at its lowest level in over 50 years, reports research firm BMO. Velocity is at such low levels that banks use the funds injected by the Fed to increase their monetary reserves rather than increasing the credit creation process by repeated rounds of loans and deposits. Once banks are keen on lending again, there will likely be an explosive increase in the velocity of money, resulting in uncontrollable inflation.
(1) This security comprised 0.66% of the total net assets of the World Precious Minerals Fund and 0.00% of the Gold and Precious Metals Fund as of 06/30/13.
(2) This security comprised 0.00% of the total net assets of the World Precious Minerals Fund and 3.07% of the Gold and Precious Metals Fund as of 06/30/13.
(3) This security comprised 0.00% of the total net assets of the World Precious Minerals Fund and 1.71% of the Gold and Precious Metals Fund as of 06/30/13.
(4) This security comprised 0.52% of the total net assets of the World Precious Minerals Fund and 0.00% of the Gold and Precious Metals Fund as of 06/30/13.
(5) This security comprised 0.00% of the total net assets of the World Precious Minerals Fund and 0.49% of the Gold and Precious Metals Fund as of 06/30/13.
(6) This security comprised 2.73% of the total net assets of the World Precious Minerals Fund and 4.19% of the Gold and Precious Metals Fund as of 06/30/13.
(7) This security comprised 7.64% of the total net assets of the World Precious Minerals Fund and 6.33% of the Gold and Precious Metals Fund as of 06/30/13.
(8) This security comprised 2.50% of the total net assets of the World Precious Minerals Fund and 2.12% of the Gold and Precious Metals Fund as of 06/30/13.
(9) This security comprised 0.83% of the total net assets of the World Precious Minerals Fund and 1.51% of the Gold and Precious Metals Fund as of 06/30/13.
(10)This security comprised 0.38% of the total net assets of the World Precious Minerals Fund and 0.34% of the Gold and Precious Metals Fund as of 06/30/13.
47
Precious Metals and Minerals Funds
World Precious Minerals Fund
Top 10 Holdings Based on Net Assets June 30, 2013
Gran Colombia Gold Corp.
Gold Mining | | | 7.64 | % | |
Virginia Mines, Inc.
Gold Mining | | | 4.71 | % | |
B2Gold Corp.
Gold Mining | | | 4.24 | % | |
Klondex Mines Ltd.
Gold Mining | | | 3.47 | % | |
NGEx Resources, Inc.
Gold Mining | | | 3.17 | % | |
MAG Silver Corp.
Silver Mining | | | 3.04 | % | |
Dundee Precious Metals, Inc.
Gold Mining | | | 2.73 | % | |
SPDR Gold Trust
Exchange-Traded Fund | | | 2.58 | % | |
Agnico-Eagle Mines Ltd.
Gold Mining | | | 2.50 | % | |
Mirasol Resources Ltd.
Gold Mining | | | 1.75 | % | |
Total Top 10 Holdings | | | 35.83 | % | |
Portfolio Allocation by Industry*
Based on Total Investments June 30, 2013

* Summary information above may differ from the portfolio schedule included in the financial statements due to the use of different classifications of securities for presentation purposes.
48
Precious Metals and Minerals Funds
Gold and Precious Metals Fund
Top 10 Holdings Based on Net Assets June 30, 2013
Gran Colombia Gold Corp.
Gold Mining | | | 6.33 | % | |
SPDR Gold Trust
Exchange-Traded Fund | | | 4.46 | % | |
Dundee Precious Metals, Inc.
Gold Mining | | | 4.19 | % | |
B2Gold Corp.
Gold Mining | | | 3.65 | % | |
Atlas Energy L.P.
Pipelines | | | 3.07 | % | |
Yamana Gold, Inc.
Gold Mining | | | 2.42 | % | |
Sandstorm Gold Ltd.
Gold Mining | | | 2.38 | % | |
Franco-Nevada Corp.
Gold/Mineral Royalty Companies | | | 2.32 | % | |
Newmont Mining Corp.
Gold Mining | | | 2.25 | % | |
Barrick Gold Corp.
Gold Mining | | | 2.19 | % | |
Total Top 10 Holdings | | | 33.26 | % | |
Portfolio Allocation by Industry*
Based on Total Investments June 30, 2013
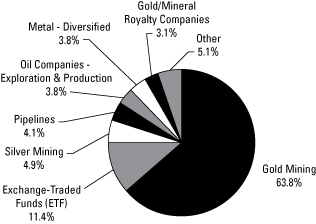
* Summary information above may differ from the portfolio schedule included in the financial statements due to the use of different classifications of securities for presentation purposes.
49
Management Team's Perspective
Introduction
The investment objective of the Emerging Europe Fund (EUROX) is to achieve long-term capital growth by investing in a non-diversified portfolio of equity securities of companies located in the emerging markets of Europe.(1)
Performance Graph
Emerging Europe Fund

Average Annual Performance For the Periods Ended June 30, 2013
| | | Six Month | | One Year | | Five Year | | Ten Year | |
Emerging Europe Fund | | | (10.51 | )% | | | 1.65 | % | | | (11.32 | )% | | | 9.84 | % | |
S&P 500 Index | | | 13.83 | % | | | 20.70 | % | | | 7.05 | % | | | 7.37 | % | |
MSCI Emerging Markets Europe
10/40 Index (Net Total Return) | | | (10.87 | )% | | | 5.09 | % | | | (6.73 | )% | | | 12.54 | % | |
Performance data quoted above is historical. Past performance is no guarantee of future results. Current performance may be higher or lower than the performance data quoted. The principal value and investment return of an investment will fluctuate so that an investor's shares, when redeemed, may be worth more or less than their original cost. The graph and table do not reflect the deduction of taxes that a shareholder would pay on fund distributions or the redemption of fund shares.
Pursuant to a voluntary arrangement, the Adviser has agreed to limit total fund operating expenses (exclusive of any acquired fund fees and expenses, performance fees, taxes, brokerage commissions and interest) to not exceed 2.85%. The Adviser can modify or terminate this arrangement at any time.
See Definitions for Management Teams' Perspectives for index definitions.
Please visit our website at www.usfunds.com for updated performance information for different time periods.
50
The Six-Month Period In Review - Economic And Political Issues That Affected The Fund
Russian inflation continued to accelerate at the fastest pace since 2011. The official consumer price index measure rose 6.9 percent in June from a year ago, 90 basis points above the 6 percent cap of the central bank's target range. The increase is mainly attributed to higher food prices. Persistently high inflation continues to limit the ability of the central bank to ease monetary conditions. This forces private banks to absorb the effect by accepting lower net interest margins, as they are pressured by President Vladimir Putin to lead the necessary credit expansion.
In Prague and other areas of the Czech Republic, days of torrential rain led to the worst flooding in at least a decade, coming close to flooding the city's historic districts and crops grown on the banks of the Vltava River. The repairs may total as much as $1.78 billion, which could cause a further 0.7 percent decrease in GDP growth for 2013, in an economy where GDP has dropped for six quarters in a row and remains in the longest recession in the country's history. Ironically, the floods may prove beneficial in the long run, as the country may be eligible to receive significant funding from the European Union (EU) Solidarity Fund for flood relief.
Poland is seeking to overhaul its pension system to curb the country's public debt, as it battles its worst slowdown in 12 years and tax revenues fall short. The plan is likely to eliminate the present structure which relies on a second "pillar" of privately-managed pension funds. Poland's finance minister argued that the current system is a gigantic burden on public finances. He recommended transferring the 16.2 million Poles enrolled in second-pillar funds back to the state-run pension system in a belief that the pension reform could have positive growth effects by relieving pressure on the fiscal budget. However, the reform increases longer-term fiscal risks and puts less pressure on the administration to press ahead with much needed structural reforms.
Moody's Investors Service upgraded Turkey's credit rating from Ba1 to Baa3 with a stable outlook, bringing about the long-awaited second investment grade rating, following Fitch's upgrade in November 2012. The agency highlighted the recent and expected improvements in finance metrics as well as noticeable progress on structural and institutional reforms.
Lastly, the recent protests in Turkey were, at the core, non-violent and more of a developed world phenomenon. They differ from demonstrations in Russia against election fraud and rampant corruption and from social unrest in Brazil caused by government neglect of the most basic social services. Protesters in Istanbul and other cities oppose what they perceive as government encroachment on their private lives, such as the ban on retail alcohol sales after 10 p.m. and a prescription requirement for the morning-after pill, which was freely dispensed by pharmacies before. The same social issues, such as the role of religion in public life, are part of the fabric of the debate in the United States and Europe, and young Turks are standing up for the secular lifestyle they have taken for granted before.
51
Investment Highlights
Overview
For the six months ended June 30, 2013, the fund declined 10.51 percent, while the benchmark MSCI Emerging Markets Europe 10/40 Index (Net Total Return) lost 10.87 percent.
Georgia, Hungary and Kazakhstan outperformed the index, while the Czech Republic and Poland underperformed. Russian equities, which comprise more than half of the index, performed in line with the index. On a sector basis, consumer discretionary and staples, industrials and information technology were the best-performing sectors, while utilities, energy and materials underperformed.
Strengths
• Stock selection in Russia had the most positive effect on the performance of the fund relative to the benchmark.
• The fund's holdings in the frontier markets, such as Georgia and Kazakhstan, had positive total returns.
• The fund's underweight position in Poland, a country which underperformed the benchmark index, helped to mitigate drawdown.
Weaknesses
• The fund's Canadian-listed securities (with operations in emerging Europe) underperformed the benchmark index and on the aggregate, were the largest negative contributor to the performance of the fund.
• Shares in Koza Altin Isletmeleri A.S.,(2) a gold mining company in Turkey, and warrants in Dundee Precious Metals, Inc.,(3) which operates a mine in Bulgaria, were two of the worst performers in the fund during a period of weakness in gold prices.
• The fund's holdings in Hungary underperformed their peers in the benchmark.
Current Outlook
Opportunities
• Faced with an economic slowdown in the EU, the European Central Bank (ECB) finally committed to "low interest rates for an extended period of time," which should be positive for emerging markets in the periphery.
• Poland's purchasing manager's index (PMI) rose to 49.3 in June, up from 48.0 in May. This is the second-highest result in the current cycle of 15 readings below the 50 mark. The bigger picture is that growth in manufacturing is still bordering on
52
contraction, but June's PMI reading suggests it might swing into growth in the third quarter. In addition, Poland's central bank cut borrowing costs to a record low, cutting by 1.75 percentage points since November. The central bank indicated that the cycle of interest rate reductions was over, and the EU's largest eastern economy is poised to recover.
• Russian President Vladimir Putin's encouragement to increase the nation's links to China materialized in June as Russian companies signed deals to supply China with crude oil and natural gas. Similarly, Beijing agreed to buy a 20 percent stake in a large liquefied natural gas (LNG) project owned by NovaTek OAO,(4) Russia's second-biggest natural gas producer. Embedded in this agreement is an LNG export license for Novatek, breaking up the export monopoly held by Gazprom OAO(5) for more than a decade.
Threats
• Poland's potential overhaul of its pension system to curb public debt may eliminate the present structure, which relies on a second "pillar" of privately managed pension funds. We believe the reform increases longer-term fiscal risks and puts less pressure on the administration to press ahead with much needed structural reforms.
• Russia plans to downsize the privatization program of its state-controlled enterprises in the next three years, bringing revenue from asset sales to 630 billion rubles (or $19 billion) instead of the originally planned 925.9 billion rubles. The delays are caused by "the energetic lobbying of individual agencies and individual officials," according to Prime Minister Dmitry Medvedev. The government continues to rely on state-controlled companies' hefty dividends to help finance its fiscal budget at the cost of depriving the companies from investing earnings to increase their productive capacity.
• Hungarian interest rates have reached an all-time low of 4.25 percent. The central bank still has plenty of room to cut interest rates, as inflation has stabilized below 2 percent per annum.
(1)The following countries are considered to be in the emerging Europe region: Albania, Armenia, Azerbaijan, Belarus, Bulgaria, Croatia, Czech Republic, Estonia, FYR Macedonia, Georgia, Hungary, Latvia, Lithuania, Moldova, Poland, Romania, Russia, Slovakia, Slovenia, Turkey and Ukraine.
(2)This security comprised 1.26% of the fund's total net assets as of 06/30/13.
(3)This security comprised 0.93% of the fund's total net assets as of 06/30/13. Another 0.05% was held in common stock as of 06/30/13.
(4)This security comprised 3.52% of the fund's total net assets as of 06/30/13.
(5)This security comprised 3.06% of the fund's total net assets as of 06/30/13.
53
Top 10 Holdings Based on Net Assets June 30, 2013
Mobile TeleSystems OJSC
Cellular Telecommunication | | | 5.74 | % | |
Magnit OJSC
Food - Retail | | | 5.29 | % | |
Erste Group Bank AG
Commercial Banks - Non US | | | 4.91 | % | |
Tofas Turk Otomobil Fabrikasi A.S.
Automotive - Cars & Light Trucks | | | 4.35 | % | |
Lukoil OAO
Oil Companies - Integrated | | | 4.32 | % | |
Sberbank of Russia
Commercial Banks - Non US | | | 4.11 | % | |
NovaTek OAO
Oil Companies - Exploration & Production | | | 3.52 | % | |
Yandex N.V.
Web Portals/Internet Service Providers | | | 3.50 | % | |
Turkcell Iletisim Hizmetleri A.S.
Cellular Telecommunication | | | 3.28 | % | |
Gazprom OAO
Oil Companies - Exploration & Production | | | 3.06 | % | |
Total Top 10 Holdings | | | 42.08 | % | |
Country Distribution*
Based on Total Investments June 30, 2013

* Country distribution shown is based on domicile. The locale of company operations may be different.
54
Global Emerging Markets Fund
Management Team's Perspective
Introduction
The investment objective of the Global Emerging Markets Fund (GEMFX) is to achieve long-term capital growth by investing in a non-diversified portfolio of the equity securities of companies located in or with a significant business presence in emerging market countries.(1)
Performance Graph
Global Emerging Markets Fund
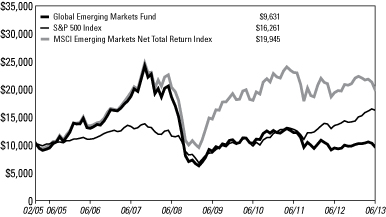
Average Annual Performance For the Periods Ended June 30, 2013
| | | Six Month | | One Year | | Five Year | | Inception | |
Global Emerging Markets Fund
(Inception 2/24/05) | | | (4.23 | )% | | | 2.19 | % | | | (12.30 | )% | | | (0.45 | )% | |
S&P 500 Index | | | 13.83 | % | | | 20.70 | % | | | 7.05 | % | | | 5.99 | % | |
MSCI Emerging Markets Net Total Return
Index | | | (9.57 | )% | | | 2.87 | % | | | (0.43 | )% | | | 8.62 | % | |
Performance data quoted above is historical. Past performance is no guarantee of future results. Current performance may be higher or lower than the performance data quoted. The principal value and investment return of an investment will fluctuate so that an investor's shares, when redeemed, may be worth more or less than their original cost. The graph and table do not reflect the deduction of taxes that a shareholder would pay on fund distributions or the redemption of fund shares.
Pursuant to a voluntary arrangement, the Adviser has agreed to limit total fund operating expenses (exclusive of any acquired fund fees and expenses, performance fees, taxes, brokerage commissions and interest) to not exceed 3.15%. The Adviser can modify or terminate this arrangement at any time.
See Definitions for Management Teams' Perspectives for index definitions.
Please visit our website at www.usfunds.com for updated performance information for different time periods.
55
Global Emerging Markets Fund
The Six-Month Period In Review - Economic And Political Issues That Affected The Fund
The first weeks of 2013 began optimistically, with the resolution of the debt ceiling in the U.S., the successful implementation of a massive monetary easing program in Japan, and hopes from new leadership in China. In addition, the International Monetary Fund published growth forecasts that implied increasing growth across most of the emerging market world.
However, as the months wore on, monetary tightening fears in China, specifically related to the real estate and lending sectors, contributed to the softening of hard commodities during the period. Consequently, large commodity export markets underperformed. Furthermore, strength in U.S. macroeconomic data led to increased speculation the Federal Reserve would implement a program to reduce its Treasury purchases, which sent a wave of uncertainty across financial markets. The result was a risk-off scenario where money flowed to the safety of the U.S. dollar and away from emerging market stocks, bonds, and currencies.
In Asia, the Southeast nations outperformed as they delivered higher economic growth, lowered benchmark rates, and pushed through structural reforms. China and South Korea were laggards; China was not favored by investors as the new administration committed to austerity and deleveraging, which was implemented through tightening in the real estate sector and increased oversight of wealth management products. South Korea saw its exports and overall economic activity at risk from the sustained devaluation of the Japanese yen, which increased the appeal of Japanese exports over their South Korean competitors.
In Latin America, Mexico was the only major economy to outperform the MSCI Emerging Markets Index. The election of President Peña Nieto late in 2012, the promise of major structural reforms, known as the "Pact for Mexico," and the renewed optimism over Mexican exports to a recovering U.S. economy incentivized investments in the country. Doubts over the viability of the "Pact for Mexico" in the short-term and weakness in homebuilders pared performance toward the latter part of the second quarter. Brazil and Peru were laggards; the Brazilian economy continued to struggle with weak growth and high inflation, at a time when material exports have seen weak pricing, and oil exports to the U.S. have decreased significantly. Peru's domestic economy has remained strong with record-low inflation and the largest economic growth of major Latin American economies. However, the country's local market is dominated by materials-driven export companies, which have struggled with the weak pricing across most of the commodities complex.
In emerging Europe, Hungary and Turkey outperformed. In the case of Hungary, aggressive monetary easing policies together with more forbearance on the austerity programs required by the European Union made the country the emerging European
56
Global Emerging Markets Fund
outperformer for the period. Turkey, despite the recent protests, continued to display very compelling growth fundamentals which helped it outperform the benchmark for the period. Russia, the Czech Republic and Poland were laggards. Russia remains in a growth soft patch, exacerbated by the weakness in commodities' complex, and unable to cut rates as it fears a spiraling in inflation. Despite maintaining its rates at or very near zero, the Czech economy continues to show structural impediments for growth in the short term. Poland was the last country of the Eastern European nations to cut its rates and appears to be behind its peers in the cycle. Recent macroeconomic indicators appear to show the easing cycle is giving positive results, however, just as with its Czech neighbor; a series of structural impediments must be addressed for economic activity to rebound.
Investment Highlights
Overview
The fund lost 4.23 percent for the six-month period ended June 30, 2013. This compares to a 9.57 percent decline for the MSCI Emerging Markets Net Total Return Index, the fund's benchmark.
Because the fund is actively managed and holding period is generally not a consideration in investment decisions, the portfolio turnover rate may fluctuate from year to year as the fund adjusts its portfolio composition. The fund's annual portfolio turnover was, and is expected to continue to be, more than 100 percent.
During the six-month period, the fund's portfolio composition emphasized investments in small market capitalization companies, those with market capitalizations between $200 million and $2 billion. In addition, the fund focused on investing in companies with high dividend yields. The fund's three largest country allocations over the six-month period were Taiwan, Malaysia and Indonesia. The three largest sector allocations were financials, information technology and industrials.
Strengths
• The fund's overweighting in Indonesia, Malaysia, Kazakhstan and Taiwan, underweighting in China, Russia and Brazil and its stock selection in South Korea and China positively contributed to performance.
• The fund's overweighting in industrials and information technology, underweighting in materials and energy and its stock selection in financials, materials and information technology positively contributed to performance.
• The largest positive contributions to the fund in the six-month period came from Giant Interactive Group, Inc.(2) in China and Moorim P&P Co., Ltd.(3) in South Korea.
57
Global Emerging Markets Fund
Weaknesses
• The fund's overweighting in Turkey, Poland and Egypt, underweighting in Mexico and its stock selection in Brazil, India and Indonesia negatively contributed to performance.
• The fund's underweighting in health care, staples and telecommunications and its stock selection in energy and industrials negatively contributed to performance.
• Two of the worst performers to the fund in the six-month period were Indonesian companies PT Hexindo Adiperkasa Tbk(4) and PT Indika Energy Tbk.(5)
Current Outlook
Opportunities
• The MSCI Emerging Markets Index closed its worst first half since 2008. The index trailed the MSCI World Index of developed-nation stocks by 21 percentage points in 2013 through June 21, the biggest gap in 15 years. The emerging-markets index now is valued at the biggest discount since 2005, according to weekly data compiled by Bloomberg. Emerging markets have fallen into the buy region and to oversold levels not seen since August 2011. Historically, following the 'buy' signal, emerging markets have increased up to 10 percent in the following six weeks.
• External debt-to-GDP for ASEAN countries (Thailand, Indonesia, Philippines and Malaysia) has consistently decreased since the 1997 Asian financial crisis. The downward trend was made possible after healthy GDP growth along with a reduction of corporate and government debts in the last decade. The recent money outflow from emerging market equity markets has caused the credit default swap premium to rise, which should not be an indication of deteriorating sovereign solvency or a negative credit event.
• The Pacific Alliance bloc – formed by Chile, Colombia, Mexico and Peru – held its seventh summit in Colombia in May. The Alliance, whose goals are to drop barriers on labor, finance and trade and consolidate itself as a nexus for commerce with Asia, agreed to begin dropping tariffs on 90 percent of all goods traded among members. More than a dozen countries attended the event as observers following the international attention drawn by the Alliance's ambitious goals. Canadian Prime Minister Stephen Harper and his Spanish counterpart, Mariano Rajoy, attended the event, raising hopes that the Alliance could expand beyond Latin America.
Threats
• Emerging market currencies were the main casualty of the Fed tapering speculation as money left emerging markets in favor of the U.S dollar. Amongst the hardest hit were the currencies of countries with large current account deficits, such as Turkey and India. The Brazilian real continued to devalue despite expectations for benchmark rate hikes at the next central bank meetings. The
58
Global Emerging Markets Fund
weakness in these currencies is likely to put pressure on emerging market nations that depend on international credit to finance their current account deficits. However, it is likely that after a volatile period, the lower currencies will increase the competitiveness of these nation's exports.
• UBS's global emerging markets strategy team studied numerous corporate governance rankings and concluded emerging market companies continue to have a lower corporate governance score than U.S. companies. Moreover, there is little evidence of emerging markets converging to the corporate governance ratings obtained by developed markets. In fact, over the last two years, corporate governance in emerging markets appear to have declined more pronouncedly, moving further away from an already declining score in developed markets. Strong economic growth in emerging markets appears to have masked this phenomenon, but if growth were to recede, governance risks would pose a serious threat to the markets.
• Credit growth may continue to slow due to Premier Li Keqiang's campaign to curb a record expansion of lending. The process may reduce loans to property developers and local governments. In turn, it may cause lending rates to increase, and increase corporate financing cost and reduce profitability. For the equity market, a cutback on money supply may lower stock valuations.
(1)Emerging market countries are those countries defined as such by the World Bank, the International Finance Corporation, the United Nations or the European Bank for Reconstruction and Development or included in the MSCI Emerging Markets Index.
(2)This security comprised 3.01% of the fund's total net assets as of 06/30/13.
(3)This security comprised 3.37% of the fund's total net assets as of 06/30/13.
(4)This security comprised 1.79% of the fund's total net assets as of 06/30/13.
(5)This security comprised 1.20% of the fund's total net assets as of 06/30/13.
59
Global Emerging Markets Fund
Top 10 Holdings Based on Net Assets June 30, 2013
Moorim P&P Co., Ltd.
Paper & Related Products | | | 3.37 | % | |
MBK PCL
Real Estate Management/Services | | | 3.26 | % | |
Syarikat Takaful Malaysia Bhd
Multi-line Insurance | | | 3.10 | % | |
Chin-Poon Industrial Co.
Circuit Boards | | | 3.08 | % | |
Malaysia Building Society Bhd
Finance - Mortgage Loan/Banker | | | 3.02 | % | |
Giant Interactive Group, Inc.
Internet Content - Entertainment | | | 3.01 | % | |
KCell JSC
Cellular Telecom | | | 2.96 | % | |
MNRB Holdings Bhd
Reinsurance | | | 2.85 | % | |
Chong Hong Construction Co.
Real Estate Operating/Development | | | 2.81 | % | |
Woori Financial Co., Ltd.
Finance - Leasing Company | | | 2.72 | % | |
Total Top 10 Holdings | | | 30.18 | % | |
Country Distribution*
Based on Total Investments June 30, 2013

* Country distribution shown is based on domicile. The locale of company operations may be different.
60
Management Team's Perspective
Introduction
The China Region Fund (USCOX) seeks long-term growth of capital. The fund invests in both established and emerging companies registered and operating in the China region.(1)
Performance Graph
China Region Fund

Average Annual Performance For the Periods Ended June 30, 2013
| | | Six Month | | One Year | | Five Year | | Ten Year | |
China Region Fund | | | (3.29 | )% | | | 8.01 | % | | | (4.09 | )% | | | 9.14 | % | |
Hang Seng Composite Index | | | (6.10 | )% | | | 11.98 | % | | | 1.66 | % | | | 12.73 | % | |
MSCI All Country Far East Free ex Japan
Index* | | | (6.84 | )% | | | 6.40 | % | | | 1.12 | % | | | 9.88 | % | |
* These are not total returns. These returns reflect simple appreciation only and do not reflect dividend reinvestment.
Performance data quoted above is historical. Past performance is no guarantee of future results. Current performance may be higher or lower than the performance data quoted. The principal value and investment return of an investment will fluctuate so that an investor's shares, when redeemed, may be worth more or less than their original cost. The graph and table do not reflect the deduction of taxes that a shareholder would pay on fund distributions or the redemption of fund shares.
Pursuant to a voluntary arrangement, the Adviser has agreed to limit total fund operating expenses (exclusive of any acquired fund fees and expenses, performance fees, taxes, brokerage commissions and interest) to not exceed 2.55%. The Adviser can modify or terminate this arrangement at any time.
See Definitions for Management Teams' Perspectives for index definitions.
Please visit our website at www.usfunds.com for updated performance information for different time periods.
61
The Six-Month Period In Review - Economic And Political Issues That Affected The Fund
China continued its policies to make a structural transition toward a consumption-driven economy. GDP growth in the first and second quarters was 7.7 percent and 7.5 percent, respectively. The government target is 7.5 percent for 2013.
The new leadership is determined to improve China's politics, economy and environment. On the political front, China started an anti-corruption campaign across all levels of government officials. This year, we are seeing some provincial level officials being arrested or under investigation for economic briberies.
On the economic front, China focused on a system-wide reform which includes urbanization of migrants, interest rate liberalization, and removal of a state-owned enterprise (SOE) monopoly in banking, energy and other sectors, as well as decentralization. Through these reforms, China hopes the country can move up the industrial value chain, improve efficiency and competition, and make domestic consumption the major driver of the economy. As such, the government has clearly demonstrated it is more tolerant of slower growth, which it called "preferring quality to quantity." The market has come to accept that China will not stimulate its economy as long as enough jobs are created.
China's State Council recently issued a neutral-to-tightening monetary policy directive after the so-called interbank liquidity crunch, the event in which the confluence of the inaction of the People's Bank of China and demand for cash at the end of the month caused the overnight interbank lending rate to rise to a high of 13.4 percent. The policy statement said China is not tightening, but not easing either; however, it asked banks to reduce their exposure to local governments and to deleverage. The monetary policy priority is clearly a system-wide risk management. Premier Li Keqiang called for an efficient use of money in circulation and increased money velocity. Simply stated, it means China will issue less money but ask the SOEs and local governments to pay back the loans they have borrowed in the last decades and lend that money to profitable small and medium enterprises and private companies. The government also promised credit support for uncompleted infrastructure projects as well as projects in western China. The policy will selectively support key sectors, such as advanced manufacturing, information technology and environmental protection. In the long run, China's policies will create a sustainable and balanced economy if they succeed.
With China's second-quarter GDP growth rate at 7.5 percent, corporate earnings forecasts have been revised down to around 11 percent for H-share companies in Hong Kong for 2013.
62
Since the U.S. Federal Reserve stated its intention to taper its quantitative easing by the second half of the year, ASEAN stock markets have sold off, a reversal of the carry-trade. The net money outflow also caused ASEAN currency to depreciate as the U.S. dollar is appreciating. The phenomena will come to an end once the carry-trade reversal is over. Structurally, ASEAN countries are mostly at the beginning or in the mid-cycle of infrastructure investment and consumption improvements.
Investment Highlights
Overview
For the six months ended June 30, 2013, the fund was down 3.29 percent, outperforming the benchmark Hang Seng Composite Index (HSCI), which declined 6.10 percent.
Because the fund is actively managed and holding period is generally not a consideration in investment decisions, the portfolio turnover rate may fluctuate from year to year as the fund adjusts its portfolio composition. The fund's annual portfolio turnover was, and is expected to continue to be, more than 100 percent.
Strengths
• The fund outperformed both its benchmark index as well as its Lipper peer group average in the first half of the year. While the fund was down 329 basis points, the Lipper peer group average decreased 553 basis points.
• Country allocations in China, Hong Kong, Indonesia and South Korea positively contributed to the fund's relative performance. For example, Hong Kong companies China State Construction International Holdings Ltd.(2) and Truly International Holdings Ltd.(3) and China-based Sunny Optical Technology Group Co., Ltd.(4) provided positive returns during the period.
• The fund's overweighting in property and construction, services and information technology proved to be beneficial to the fund's relative performance against its benchmark. Underweighting energy and telecommunications also proved beneficial.
• Stock selection in property and construction, utilities and consumer goods also helped the fund's outperformance relative to its benchmark.
Weaknesses
• Country allocations in Thailand, the Philippines and Canada detracted from the fund's relative performance against its benchmark index.
• The fund's overweighting in industrial goods and conglomerates and underweighting in financials negatively contributed to performance relative to the benchmark.
63
Current Outlook
Opportunities
• In spite of a stricter policy to curb overcapacity, China's monetary policy is to selectively provide stimulus. In particular, the government plans to support advanced manufacturing, first-time home purchases, natural gas development and distribution, information technology, and environmental protection. The fund is well positioned in those areas of the market.
• New urbanization and reforms under the new leadership in China will likely provide long-term growth opportunities for businesses in construction, engineering and materials and consumption.
Threats
• China's government policies can be summarized in three main tasks: financial risk management, economic transition and reform. The tasks have one goal, which is to maintain long-term sustainable growth. Nevertheless, in the short run, the liquidity will be controlled and the economy will grow at a relatively slower rate compared to the last 10 years, though much higher than developed, global economies. The result of the policy will be that industrial profits will likely grow at a slower pace as well.
(1)The China region is defined as any country that either shares a border with China or is located in the South China Sea or the East China Sea and includes: the People's Republic of China (PRC or China), Bangladesh, Cambodia, Hong Kong, India, Indonesia, Kazakhstan, Korea, Kyrgyzstan, Laos, Malaysia, Mongolia, Myanmar, Nepal, Pakistan, Philippines, Singapore, Taiwan, Tajikistan, Thailand and Vietnam.
(2)This security comprised 3.58% of the fund's total net assets as of 06/30/13.
(3)This security comprised 1.29% of the fund's total net assets as of 06/30/13.
(4)This security comprised 3.22% of the fund's total net assets as of 06/30/13.
64
Top 10 Holdings Based on Net Assets June 30, 2013
HSBC Holdings plc
Diversified Banking Institutions | | | 5.44 | % | |
China State Construction International Holdings Ltd.
Building & Construction - Miscellaneous | | | 3.58 | % | |
Sunny Optical Technology Group Co., Ltd.
Photo Equipment & Supplies | | | 3.22 | % | |
Galaxy Entertainment Group Ltd.
Casino Hotels | | | 3.14 | % | |
Tencent Holdings Ltd.
Internet Application Software | | | 2.56 | % | |
NetEase, Inc.
Internet Content - Entertainment | | | 2.23 | % | |
NagaCorp Ltd.
Casino Hotels | | | 2.08 | % | |
Sino Biopharmaceutical Ltd.
Medical - Drugs | | | 2.08 | % | |
China Medical System Holdings Ltd.
Medical Products | | | 2.05 | % | |
Industrial and Commercial Bank of China Ltd.
Commercial Banks - Non US | | | 2.05 | % | |
Total Top 10 Holdings | | | 28.43 | % | |
Country Distribution*
Based on Total Investments June 30, 2013

* Country distribution shown is based on domicile and not intended to conform to the China region definition in the prospectus. The locale of company operations may be different.
65
Expense Example (unaudited) June 30, 2013
As a shareholder of the funds, you incur two types of costs: (1) transaction costs, including short-term trading fees and exchange fees; and (2) ongoing costs, including management fees and other fund expenses. This example is intended to help you understand your ongoing costs (in dollars) of investing in other mutual funds.
The example is based on an investment of $1,000 invested at the beginning of the period and held for the entire period as indicated below.
• Actual Expenses. The first line of the following table for each fund provides information about actual account values and actual expenses. You may use the information in this line, together with the amount you invested, to estimate the expenses you paid over the period. Simply divide your account value by $1,000 (for example, an $8,600 account value divided by $1,000 = 8.6), then multiply the result by the number in the first line under the heading "Expenses Paid During Period" to estimate the expenses you paid on your account during this period.
• Hypothetical Example for Comparison Purposes. The second line of the following table for each fund provides information about hypothetical account values and hypothetical expenses based on the fund's actual expense ratio and an assumed rate of return of 5 percent per year before expenses, which is not the fund's actual return. The hypothetical account values and expenses may not be used to estimate the actual ending account balance or expenses you paid for the period. You may use this information to compare the ongoing costs of investing in these funds and other funds. To do so, compare this 5 percent hypothetical example with the 5 percent hypothetical examples that appear in the shareholder reports of other funds.
Please note that the expenses shown in the table are meant to highlight your ongoing costs only and do not reflect any direct or transactional costs, such as small account, exchange or short-term trading fees. Therefore, the second line of the table is useful in comparing ongoing costs only, and will not help you determine the relative total costs of owning different funds. In addition, if these direct or transactional costs were included, your costs would have been higher.
66
Expense Example (unaudited) June 30, 2013
Six Months Ended June 30, 2013 | | Beginning
Account Value
January 1,
2013 | | Ending
Account Value
June 30,
2013 | | Expenses
Paid During
Period* | |
U.S. Treasury Securities Cash Fund | |
Based on Actual Fund Return | | $ | 1,000.00 | | | $ | 1,000.00 | | | $ | 0.30 | | |
Based on Hypothetical 5% Yearly Return | | $ | 1,000.00 | | | $ | 1,024.50 | | | $ | 0.30 | | |
U.S. Government Securities Savings Fund | |
Based on Actual Fund Return | | $ | 1,000.00 | | | $ | 1,000.00 | | | $ | 0.40 | | |
Based on Hypothetical 5% Yearly Return | | $ | 1,000.00 | | | $ | 1,024.40 | | | $ | 0.40 | | |
Near-Term Tax Free Fund | |
Based on Actual Fund Return | | $ | 1,000.00 | | | $ | 992.00 | | | $ | 2.22 | | |
Based on Hypothetical 5% Yearly Return | | $ | 1,000.00 | | | $ | 1,022.56 | | | $ | 2.26 | | |
Tax Free Fund | |
Based on Actual Fund Return | | $ | 1,000.00 | | | $ | 967.30 | | | $ | 3.41 | | |
Based on Hypothetical 5% Yearly Return | | $ | 1,000.00 | | | $ | 1,021.32 | | | $ | 3.51 | | |
All American Equity Fund | |
Based on Actual Fund Return | | $ | 1,000.00 | | | $ | 1,139.00 | | | $ | 11.24 | | |
Based on Hypothetical 5% Yearly Return | | $ | 1,000.00 | | | $ | 1,014.28 | | | $ | 10.59 | | |
Holmes Growth Fund | |
Based on Actual Fund Return | | $ | 1,000.00 | | | $ | 1,129.70 | | | $ | 9.77 | | |
Based on Hypothetical 5% Yearly Return | | $ | 1,000.00 | | | $ | 1,015.62 | | | $ | 9.25 | | |
MegaTrends Fund Investor Class | |
Based on Actual Fund Return | | $ | 1,000.00 | | | $ | 1,112.60 | | | $ | 10.95 | | |
Based on Hypothetical 5% Yearly Return | | $ | 1,000.00 | | | $ | 1,014.43 | | | $ | 10.44 | | |
MegaTrends Fund Institutional Class | |
Based on Actual Fund Return | | $ | 1,000.00 | | | $ | 1,132.30 | | | $ | (5.60 | ) | |
Based on Hypothetical 5% Yearly Return | | $ | 1,000.00 | | | $ | 1,030.05 | | | $ | (5.34 | ) | |
Global Resources Fund Investor Class | |
Based on Actual Fund Return | | $ | 1,000.00 | | | $ | 917.30 | | | $ | 8.18 | | |
Based on Hypothetical 5% Yearly Return | | $ | 1,000.00 | | | $ | 1,016.27 | | | $ | 8.60 | | |
Global Resources Fund Institutional Class | |
Based on Actual Fund Return | | $ | 1,000.00 | | | $ | 919.90 | | | $ | 5.62 | | |
Based on Hypothetical 5% Yearly Return | | $ | 1,000.00 | | | $ | 1,018.94 | | | $ | 5.91 | | |
World Precious Minerals Fund Investor Class | |
Based on Actual Fund Return | | $ | 1,000.00 | | | $ | 512.80 | | | $ | 6.68 | | |
Based on Hypothetical 5% Yearly Return | | $ | 1,000.00 | | | $ | 1,015.97 | | | $ | 8.90 | | |
World Precious Minerals Fund
Institutional Class | |
Based on Actual Fund Return | | $ | 1,000.00 | | | $ | 514.10 | | | $ | 4.39 | | |
Based on Hypothetical 5% Yearly Return | | $ | 1,000.00 | | | $ | 1,018.99 | | | $ | 5.86 | | |
Gold and Precious Metals Fund | |
Based on Actual Fund Return | | $ | 1,000.00 | | | $ | 562.80 | | | $ | 7.71 | | |
Based on Hypothetical 5% Yearly Return | | $ | 1,000.00 | | | $ | 1,014.93 | | | $ | 9.94 | | |
Emerging Europe Fund | |
Based on Actual Fund Return | | $ | 1,000.00 | | | $ | 894.90 | | | $ | 9.68 | | |
Based on Hypothetical 5% Yearly Return | | $ | 1,000.00 | | | $ | 1,014.58 | | | $ | 10.29 | | |
67
Expense Example (unaudited) June 30, 2013
Six Months Ended June 30, 2013 | | Beginning
Account Value
January 1,
2013 | | Ending
Account Value
June 30,
2013 | | Expenses
Paid During
Period* | |
Global Emerging Markets Fund | |
Based on Actual Fund Return | | $ | 1,000.00 | | | $ | 957.70 | | | $ | 14.66 | | |
Based on Hypothetical 5% Yearly Return | | $ | 1,000.00 | | | $ | 1,009.82 | | | $ | 15.05 | | |
China Region Fund | |
Based on Actual Fund Return | | $ | 1,000.00 | | | $ | 967.10 | | | $ | 11.61 | | |
Based on Hypothetical 5% Yearly Return | | $ | 1,000.00 | | | $ | 1,012.99 | | | $ | 11.88 | | |
* These calculations are based on expenses incurred in the most recent fiscal half-year. The funds' Investor Class' annualized expense ratios (after reimbursements and offsets) for the six-month period ended June 30, 2012, were 0.06%, 0.08%, 0.45%, 0.70%, 2.12%, 1.85%, 2.09%, 1.72%, 1.78%, 1.99%, 2.06%, 3.02% and 2.38%, respectively, for the U.S. Treasury Securities Cash, U.S. Government Securities Savings, Near-Term Tax Free, Tax Free, All American Equity, Holmes Growth, MegaTrends, Global Resources, World Precious Minerals, Gold and Precious Metals, Emerging Europe, Global Emerging Markets and China Region Funds. The funds' Institutional Class' annualized expense ratios (after reimbursements and offsets) for the six-month period ended June 30, 2013, were (1.06)%, 1.18% and 1.17%, respectively, for the MegaTrends, Global Resources and World Precious Minerals Funds. The dollar amounts shown as "Expenses Paid" are equal to the annualized expense ratio multiplied by the average account value over the period, multiplied by 181, the number of days in the period, then divided by 365 days in the current fiscal year.
68
Portfolio of Investments (unaudited) June 30, 2013
U.S. Treasury Securities Cash Fund
United States
Government
Obligations 25.63% | | Coupon
Rate | | Maturity
Date | | Principal
Amount | | Value | |
United States Treasury Bill 25.63% | |
Yield | | | 0.02 | % | | 07/05/13 | | $ | 20,000,000 | | | $ | 19,999,966 | | |
Total United States Government Obligations | | | 19,999,966 | | |
(cost $19,999,966) | |
Repurchase Agreements 74.25%
Joint Tri-Party Repurchase Agreements,
06/28/13, collateralized by U.S. Treasury
securities held in joint tri-party
repurchase accounts: | |
Credit Suisse Securities USA LLC, repurchase
price $27,938,597 | | | 0.09 | % | | 07/01/13 | | | 27,938,388 | | | | 27,938,388 | | |
Morgan Stanley, repurchase price $30,000,175 | | | 0.07 | % | | 07/01/13 | | | 30,000,000 | | | | 30,000,000 | | |
Total Repurchase Agreements | | | 57,938,388 | | |
(cost $57,938,388) | |
Total Investments 99.88% | | | 77,938,354 | | |
(cost $77,938,354) | |
Other assets and liabilities, net 0.12% | | | 90,622 | | |
Net Assets 100% | | $ | 78,028,976 | | |
See notes to portfolios of investments and notes to financial statements.
69
Portfolio of Investments (unaudited) June 30, 2013
U.S. Government Securities Savings Fund
United States
Government and Agency
Obligations 82.78% | | Coupon
Rate | | Maturity
Date | | Principal
Amount | | Value | |
Federal Farm Credit Bank 35.28% | |
Discount Notes: | |
| | Yield | | | | 0.01 | % | | 07/01/13 | | $ | 20,000,000 | | | $ | 20,000,000 | | |
| | Yield | | | | 0.05 | % | | 07/05/13 | | | 20,000,000 | | | | 19,999,889 | | |
Fixed Rates: | |
| | | 5.10 | % | | 08/05/13 | | | 1,035,000 | | | | 1,039,910 | | |
| | | 3.75 | % | | 02/05/14 | | | 1,000,000 | | | | 1,021,457 | | |
Variable Rate: | |
| | | 0.12 | % | | 03/18/14 | | | 5,000,000 | | | | 4,999,988 | | |
| | | | 47,061,244 | | |
Federal Home Loan Bank 36.99% | |
Discount Notes: | |
| | Yield | | | | 0.07 | % | | 07/03/13 | | | 10,000,000 | | | | 9,999,963 | | |
| | Yield | | | | 0.06 | % | | 07/11/13 | | | 2,500,000 | | | | 2,499,962 | | |
| | Yield | | | | 0.05 | % | | 07/17/13 | | | 5,000,000 | | | | 4,999,889 | | |
| | Yield | | | | 0.06 | % | | 07/19/13 | | | 5,000,000 | | | | 4,999,863 | | |
| | Yield | | | | 0.03 | % | | 07/26/13 | | | 10,000,000 | | | | 9,999,792 | | |
Variable Rates: | |
| | | 0.12 | % | | 07/12/13 | | | 5,000,000 | | | | 5,000,000 | | |
| | | 0.22 | % | | 07/22/13 | | | 4,850,000 | | | | 4,850,112 | | |
| | | 0.11 | % | | 07/25/13 | | | 5,000,000 | | | | 4,999,900 | | |
| | | 0.17 | % | | 11/15/13 | | | 1,990,000 | | | | 1,990,748 | | |
| | | | 49,340,229 | | |
Tennessee Valley Authority 3.01% | |
Fixed Rate: | |
| | | 4.75 | % | | 08/01/13 | | | 4,000,000 | | | | 4,015,702 | | |
United States Treasury Bill 7.50% | |
| | Yield | | | | 0.02 | % | | 07/05/13 | | | 10,000,000 | | | | 9,999,983 | | |
Total Securities | | | 110,417,158 | | |
(cost $110,417,158) | |
See notes to portfolios of investments and notes to financial statements.
70
Portfolio of Investments (unaudited) June 30, 2013
U.S. Government Securities Savings Fund
Repurchase
Agreement 17.11% | | Coupon
Rate | | Maturity
Date | | Principal
Amount | | Value | |
Joint Tri-Party Repurchase Agreement,
06/28/13, collateralized by U.S. Treasury
securities held in a joint tri-party
repurchase account: | |
Credit Suisse Securities USA LLC, repurchase
price $22,816,403 | | | 0.09 | % | | 07/01/13 | | $ | 22,816,232 | | | $ | 22,816,232 | | |
Total Investments 99.89% | | | 133,233,390 | | |
(cost $133,233,390) | |
Other assets and liabilities, net 0.11% | | | 146,345 | | |
Net Assets 100% | | $ | 133,379,735 | | |
See notes to portfolios of investments and notes to financial statements.
71
Portfolio of Investments (unaudited) June 30, 2013
Municipal Bonds 93.20% | | Coupon
Rate | | Maturity
Date | | Principal
Amount | | Value | |
Alabama 2.80% | |
Alabama State Public School & College
Authority | | | 5.00 | % | | 12/01/16 | | $ | 290,000 | | | $ | 326,099 | | |
Bessemer, Alabama Electric Revenue,
Refunding | | | 3.10 | % | | 12/01/21 | | | 100,000 | | | | 100,924 | | |
Bessemer, Alabama Water Revenue | | | 4.00 | % | | 01/01/16 | | | 300,000 | | | | 304,557 | | |
Jasper Alabama Water Works & Sewer Board,
Inc., Utilities Revenue, Series A | | | 3.00 | % | | 06/01/15 | | | 90,000 | | | | 92,568 | | |
Jasper Alabama Water Works & Sewer Board,
Inc., Utilities Revenue, Series A | | | 3.00 | % | | 06/01/16 | | | 90,000 | | | | 92,945 | | |
Mountain Brook City Board of Education Capital
Outlay | | | 4.00 | % | | 02/15/15 | | | 200,000 | | | | 210,258 | | |
University of Alabama at Birmingham, Hospital
Revenue, Series A | | | 5.00 | % | | 09/01/15 | | | 300,000 | | | | 323,241 | | |
| | | | 1,450,592 | | |
Alaska 0.63% | |
Alaska Municipal Bond Bank Authority,
Prerefunded, Series A | | | 4.00 | % | | 02/01/16 | | | 105,000 | | | | 113,555 | | |
Alaska Municipal Bond Bank Authority,
Unrefunded, Series A | | | 4.00 | % | | 02/01/16 | | | 195,000 | | | | 209,902 | | |
| | | | 323,457 | | |
Arizona 3.13% | |
Arizona Board of Regents Certificates of
Participation, Series B | | | 4.50 | % | | 06/01/16 | | | 200,000 | | | | 218,704 | | |
Arizona Health Facilities Authority Revenue,
Series D | | | 5.00 | % | | 01/01/14 | | | 250,000 | | | | 255,877 | | |
Arizona State School Facilities Board
Certificates of Participation, Series A-1 | | | 5.00 | % | | 09/01/17 | | | 325,000 | | | | 349,021 | | |
Arizona State Transportation Board Excise Tax
Revenue | | | 5.00 | % | | 07/01/17 | | | 175,000 | | | | 200,051 | | |
McAllister Academic Village LLC, Arizona State
University Hassayampa Revenue, Refunding | | | 5.75 | % | | 07/01/18 | | | 200,000 | | | | 232,278 | | |
Page, Arizona, Pledged Revenue, Refunding | | | 3.00 | % | | 07/01/16 | | | 350,000 | | | | 360,847 | | |
| | | | 1,616,778 | | |
California 6.59% | |
California State, Refunding, Recreational
Facility, GO Unlimited | | | 5.00 | % | | 12/01/19 | | | 250,000 | | | | 258,162 | | |
California State, Statewide Communities
Development Authority, Enloe Medical
Center Revenue, Series A | | | 5.25 | % | | 08/15/18 | | | 340,000 | | | | 391,337 | | |
Delano, California Union High School District,
GO Unlimited, Refunding, Series A | | | 4.75 | % | | 02/01/17 | | | 200,000 | | | | 215,876 | | |
Los Angeles, California Unified School
District, Series A, GO Unlimited | | | 5.25 | % | | 07/01/20 | | | 1,250,000 | | | | 1,250,000 | | |
See notes to portfolios of investments and notes to financial statements.
72
Portfolio of Investments (unaudited) June 30, 2013
Municipal Bonds (cont'd) | | Coupon
Rate | | Maturity
Date | | Principal
Amount | | Value | |
California (cont'd) | |
San Diego, California Community College
District, Capital Appreciation,
Election 2002, GO Unlimited (ZCB) | | | 4.34 | %(1) | | 05/01/15 | | $ | 300,000 | | | $ | 294,741 | | |
Santa Clara County, California Financing
Authority Revenue, Obstetrics and
Gynecology, El Camino Hospital | | | 5.00 | % | | 02/01/18 | | | 350,000 | | | | 384,143 | | |
Santa Paula Schools Financing Authority,
Santa Paula Elementary School District
Revenue | | | 4.25 | % | | 11/01/22 | | | 300,000 | | | | 314,481 | | |
Vernon, California Electric Systems Revenue,
Series A | | | 3.75 | % | | 08/01/13 | | | 300,000 | | | | 300,549 | | |
| | | | 3,409,289 | | |
Colorado 0.56% | |
Denver, Colorado, Health & Hospital Authority,
Healthcare Revenue, Series A | | | 5.00 | % | | 12/01/16 | | | 265,000 | | | | 291,360 | | |
Connecticut 0.87% | |
Connecticut State Health & Educational
Facilities Authority Revenue, Bridgeport
Hospital, Series D | | | 5.00 | % | | 07/01/19 | | | 395,000 | | | | 448,949 | | |
District of Columbia 1.24% | |
District of Columbia Certifications of
Participation | | | 4.00 | % | | 01/01/14 | | | 250,000 | | | | 254,277 | | |
Washington D.C. Convention Center Authority
Dedicated Tax Revenue, Refunding, Series A | | | 5.00 | % | | 10/01/13 | | | 110,000 | | | | 111,251 | | |
Washington D.C. Convention Center Authority
Dedicated Tax Revenue, Refunding, Series A | | | 5.00 | % | | 10/01/16 | | | 250,000 | | | | 278,108 | | |
| | | | 643,636 | | |
Florida 14.70% | |
Broward County, Florida School Board
Certificates of Participation, Series A | | | 5.00 | % | | 07/01/15 | | | 325,000 | | | | 349,937 | | |
Cape Coral, Florida Gas Tax Revenue, Series A | | | 4.00 | % | | 10/01/16 | | | 255,000 | | | | 264,659 | | |
Citizens Property Insurance Corp., Senior
Secured, Coastal Account, Revenue,
Series A-1 | | | 4.00 | % | | 06/01/18 | | | 100,000 | | | | 107,369 | | |
Escambia County, Florida, Health Facilities
Authority Revenue, Baptist Hospital, Inc.
Project, Series A | | | 5.00 | % | | 08/15/19 | | | 290,000 | | | | 317,936 | | |
Florida Gulf Coast University Financing Corp.,
Florida Capital Improvement Revenue,
Series B | | | 3.00 | % | | 02/01/16 | | | 365,000 | | | | 374,030 | | |
Florida State Board of Education Lottery
Revenue, Series A | | | 4.00 | % | | 07/01/14 | | | 300,000 | | | | 311,106 | | |
See notes to portfolios of investments and notes to financial statements.
73
Portfolio of Investments (unaudited) June 30, 2013
Municipal Bonds (cont'd) | | Coupon
Rate | | Maturity
Date | | Principal
Amount | | Value | |
Florida (cont'd) | |
Florida State Board of Governors Parking
Facilities Revenue, Series A | | | 3.00 | % | | 07/01/17 | | $ | 300,000 | | | $ | 318,342 | | |
Florida State Department of Management
Services Certificates of Participation | | | 5.00 | % | | 08/01/24 | | | 340,000 | | | | 379,834 | | |
Florida State Municipal Power Agency, Stanton
Project Revenue, Refunding | | | 5.13 | % | | 10/01/17 | | | 300,000 | | | | 341,103 | | |
Fort Pierce, Florida Stormwater Utilities
Revenue | | | 4.50 | % | | 10/01/17 | | | 255,000 | | | | 263,512 | | |
Hillsborough County, Florida Community
Investment Tax Revenue | | | 4.00 | % | | 05/01/16 | | | 300,000 | | | | 306,720 | | |
Hillsborough County, Florida School Board,
Refunding, Certificates of Participation | | | 4.00 | % | | 07/01/19 | | | 100,000 | | | | 107,961 | | |
Jacksonville Florida Special Revenue, Series C | | | 5.00 | % | | 10/01/20 | | | 270,000 | | | | 316,024 | | |
Lake County, Florida School Board Certificates of
Participation, Series A | | | 3.70 | % | | 06/01/15 | | | 400,000 | | | | 416,976 | | |
Leesburg, Florida Capital Improvement Revenue
Bonds, Refunded | | | 5.00 | % | | 10/01/21 | | | 405,000 | | | | 459,955 | | |
Margate, Florida Water & Sewer Revenue,
Refunding | | | 4.00 | % | | 10/01/19 | | | 250,000 | | | | 266,183 | | |
Miami - Dade County, Florida Expressway
Authority Toll System Revenue, Series A | | | 5.00 | % | | 07/01/21 | | | 430,000 | | | | 496,340 | | |
Miami - Dade County, Florida Water & Sewer
Revenue System, Series A | | | 4.00 | % | | 10/01/16 | | | 235,000 | | | | 257,370 | | |
Orange County, Florida Tourist Development Tax
Revenue, Refunding | | | 5.00 | % | | 10/01/14 | | | 260,000 | | | | 274,126 | | |
Orlando, Florida Community Redevelopment
Agency Tax Increment Revenue, Downtown
District, Series A | | | 4.00 | % | | 09/01/17 | | | 325,000 | | | | 350,282 | | |
Polk County, Florida School District Revenue | | | 5.00 | % | | 10/01/17 | | | 215,000 | | | | 239,168 | | |
Port St. Lucie, Florida, Southwest Annexation
Special Assessment District No 1, Revenue,
Series B | | | 4.13 | % | | 07/01/17 | | | 200,000 | | | | 208,334 | | |
Reedy Creek, Florida Improvement District
Utilities Revenue, Refunding, Series 2 | | | 5.00 | % | | 10/01/16 | | | 300,000 | | | | 325,095 | | |
Saint Johns County, Florida Transportation
Revenue, Refunding | | | 5.00 | % | | 10/01/20 | | | 310,000 | | | | 350,086 | | |
Volusia County, Florida School Board Sales Tax
Revenue | | | 4.20 | % | | 10/01/16 | | | 200,000 | | | | 199,628 | | |
| | | | 7,602,076 | | |
Georgia 3.05% | |
Atlanta Downtown Development Authority | | | 4.25 | % | | 12/01/16 | | | 250,000 | | | | 271,000 | | |
Atlanta, Georgia Water & Wastewater Revenue,
Series B | | | 3.50 | % | | 11/01/13 | | | 400,000 | | | | 404,148 | | |
Emanuel County Georgia Hospital Authority
Revenue Anticipation Certificates | | | 4.30 | % | | 07/01/17 | | | 250,000 | | | | 255,000 | | |
See notes to portfolios of investments and notes to financial statements.
74
Portfolio of Investments (unaudited) June 30, 2013
Municipal Bonds (cont'd) | | Coupon
Rate | | Maturity
Date | | Principal
Amount | | Value | |
Georgia (cont'd) | |
Georgia State Municipal Electric Authority
Revenue, Unrefunded | | | 5.50 | % | | 01/01/20 | | $ | 190,000 | | | $ | 208,481 | | |
Glynn-Brunswick Memorial Hospital Authority,
Southeast Georgia Health System and
Affiliates Revenue, Anticipation Certificates | | | 4.50 | % | | 08/01/17 | | | 150,000 | | | | 164,551 | | |
Gwinnett County, Georgia, Hospital Authority,
Gwinnett Hospital Systems Revenue,
Series B | | | 5.00 | % | | 07/01/18 | | | 250,000 | | | | 276,328 | | |
| | | | 1,579,508 | | |
Idaho 0.50% | |
Idaho Housing & Finance Association,
Grant & Revenue Anticipation, Federal
Highway Trust Fund, Series A | | | 5.00 | % | | 07/15/21 | | | 225,000 | | | | 256,050 | | |
Illinois 9.63% | |
Aurora, Illinois, Series B, GO Unlimited | | | 3.00 | % | | 12/30/15 | | | 200,000 | | | | 210,274 | | |
Chicago Board of Education, Dedicated
Revenues, Series F, GO Unlimited | | | 5.00 | % | | 12/01/16 | | | 300,000 | | | | 333,408 | | |
Chicago, Illinois Sales Tax Revenue | | | 5.50 | % | | 01/01/15 | | | 350,000 | | | | 374,227 | | |
Chicago, Illinois, Direct Access Bond,
Series E-1 B, GO Unlimited | | | 4.00 | % | | 01/01/19 | | | 200,000 | | | | 209,626 | | |
Chicago, Illinois, O'Hare International Airport
Revenue, Gen - Third Lien, Series C | | | 5.25 | % | | 01/01/23 | | | 250,000 | | | | 279,682 | | |
Chicago, Illinois, Prerefunded Balance,
Series B, GO Unlimited | | | 5.13 | % | | 01/01/15 | | | 85,000 | | | | 87,016 | | |
Chicago, Illinois, Unrefunded Balance,
Series B, GO Unlimited | | | 5.13 | % | | 01/01/15 | | | 240,000 | | | | 252,374 | | |
Dundee Township, GO Unlimited | | | 5.00 | % | | 12/01/13 | | | 240,000 | | | | 243,706 | | |
Illinois Finance Authority Revenue, Refunding | | | 5.00 | % | | 07/01/16 | | | 390,000 | | | | 416,485 | | |
Illinois State Sales Tax Revenue | | | 5.00 | % | | 06/15/14 | | | 200,000 | | | | 209,126 | | |
Illinois State Toll Highway Authority, Toll
Highway Revenue, Series A | | | 5.00 | % | | 01/01/16 | | | 200,000 | | | | 216,878 | | |
Illinois State, Refunding, GO Unlimited | | | 5.00 | % | | 01/01/16 | | | 300,000 | | | | 324,537 | | |
Kaskaskia Community College District No. 501,
GO Unlimited | | | 5.75 | % | | 12/01/19 | | | 500,000 | | | | 579,640 | | |
Lake & McHenry County, Fox Lake, Illinois,
Debt Certificates, Series B | | | 3.00 | % | | 11/01/19 | | | 265,000 | | | | 268,509 | | |
Springfield, Illinois Metropolitan Sanitation
District, Sewer Revenue, Senior Lien,
Series A | | | 4.00 | % | | 01/01/17 | | | 570,000 | | | | 594,162 | | |
Winnebago County Public Safety Sales Tax,
Series A, GO Unlimited | | | 5.00 | % | | 12/30/16 | | | 350,000 | | | | 380,443 | | |
| | | | 4,980,093 | | |
See notes to portfolios of investments and notes to financial statements.
75
Portfolio of Investments (unaudited) June 30, 2013
Municipal Bonds (cont'd) | | Coupon
Rate | | Maturity
Date | | Principal
Amount | | Value | |
Indiana 0.61% | |
Tippecanoe County, Indiana School
Improvements | | | 4.00 | % | | 01/15/15 | | $ | 300,000 | | | $ | 315,354 | | |
Iowa 1.21% | |
Johnston Community School District,
GO Unlimited | | | 4.00 | % | | 06/01/16 | | | 200,000 | | | | 211,210 | | |
University of Iowa Hospitals and Clinics,
Iowa State Board of Regents, Hospital
Revenue, Refunding, Series A | | | 3.00 | % | | 09/01/19 | | | 400,000 | | | | 413,196 | | |
| | | | 624,406 | | |
Kansas 0.41% | |
Kansas State Development Finance Authority
Revenue | | | 4.00 | % | | 10/01/15 | | | 200,000 | | | | 214,438 | | |
Kentucky 1.11% | |
Kentucky Municipal Power Agency, Power
System Revenue, Prairie State Project,
Series A | | | 5.25 | % | | 09/01/22 | | | 240,000 | | | | 266,825 | | |
Louisville & Jefferson County, Louisville Medical
Center, Metropolitan Government Revenue,
Refunding | | | 3.00 | % | | 05/01/19 | | | 305,000 | | | | 306,519 | | |
| | | | 573,344 | | |
Massachusetts 1.15% | |
New Bedford, Massachusetts, State Qualified
Municipal Loan, GO Limited | | | 3.00 | % | | 03/01/15 | | | 345,000 | | | | 356,395 | | |
Stoughton, Massachusetts Public Improvement,
GO Limited | | | 4.00 | % | | 05/01/17 | | | 225,000 | | | | 240,642 | | |
| | | | 597,037 | | |
Michigan 6.02% | |
Detroit, Michigan Sewer Disposal Revenue,
Refunding, Series C-1 | | | 5.25 | % | | 07/01/15 | | | 400,000 | | | | 417,376 | | |
Gibraltar, Michigan School District, Refunding,
GO Unlimited | | | 5.00 | % | | 05/01/21 | | | 475,000 | | | | 538,256 | | |
Michigan House of Representatives Facilities,
Obligations Revenue, Series A | | | 5.00 | % | | 10/15/17 | | | 200,000 | | | | 221,728 | | |
Michigan Public Power Agency AFEC Project
Revenue, Series 2012-A | | | 4.50 | % | | 01/01/19 | | | 280,000 | | | | 305,127 | | |
Michigan State Building Authority Revenue,
Refunding, Series I | | | 5.25 | % | | 10/15/14 | | | 300,000 | | | | 303,819 | | |
Michigan State Grant Anticipation Bonds | | | 5.00 | % | | 09/15/16 | | | 200,000 | | | | 223,920 | | |
Michigan State Hospital Finance Authority
Revenue, Trinity Health, Series A | | | 6.00 | % | | 12/01/18 | | | 200,000 | | | | 240,604 | | |
See notes to portfolios of investments and notes to financial statements.
76
Portfolio of Investments (unaudited) June 30, 2013
Municipal Bonds (cont'd) | | Coupon
Rate | | Maturity
Date | | Principal
Amount | | Value | |
Michigan (cont'd) | |
Michigan State Municipal Bond Authority
Clean Water Revenue | | | 5.50 | % | | 10/01/13 | | $ | 575,000 | | | $ | 582,486 | | |
Wayne County, Michigan Airport Authority
Revenue, Detroit Metropolitan Airport,
Refunding, Series C | | | 4.00 | % | | 12/01/19 | | | 255,000 | | | | 278,947 | | |
| | | | 3,112,263 | | |
Minnesota 1.06% | |
Minneapolis & St Paul, Minnesota Housing &
Redevelopment Authority Health Care
Systems, Children's Health Care, Series B | | | 4.00 | % | | 08/15/16 | | | 250,000 | | | | 267,458 | | |
Minneapolis & St Paul, Minnesota Metropolitan
Airports Commission, Airport Revenue,
Refunding, Series B | | | 5.00 | % | | 01/01/19 | | | 255,000 | | | | 283,065 | | |
| | | | 550,523 | | |
Missouri 1.04% | |
Missouri Development Finance Board, Eastland
Center Project, Tax Allocation, Series A | | | 5.00 | % | | 04/01/17 | | | 250,000 | | | | 274,075 | | |
Missouri State Health & Educational Facilities
Authority, Southwestern Baptist University
Revenue | | | 3.00 | % | | 10/01/17 | | | 265,000 | | | | 262,281 | | |
| | | | 536,356 | | |
Nevada 0.47% | |
Nye County School District, GO Limited | | | 4.00 | % | | 05/01/15 | | | 230,000 | | | | 242,680 | | |
New Hampshire 0.95% | |
New Hampshire Health & Education Facilities
Authority Revenue | | | 5.00 | % | | 07/01/14 | | | 65,000 | | | | 65,651 | | |
New Hampshire Health & Education Facilities
Authority Revenue | | | 5.00 | % | | 01/01/18 | | | 400,000 | | | | 428,188 | | |
| | | | 493,839 | | |
New Jersey 4.40% | |
Atlantic City, New Jersey Municipal Utilities
Authority Revenue, Refunding | | | 5.00 | % | | 06/01/17 | | | 150,000 | | | | 166,070 | | |
Atlantic City, New Jersey, Refunding Tax Appeal,
GO Unlimited | | | 4.00 | % | | 11/01/18 | | | 500,000 | | | | 534,605 | | |
Elizabeth, New Jersey Parking Authority
Project Revenue, Elizabethtown Plaza
Redevelopment, Series B | | | 4.00 | % | | 11/01/17 | | | 255,000 | | | | 273,189 | | |
Hudson County, New Jersey Improvement
Authority Lease Revenue, North Hudson
Regional Fire, Refunding, Series A | | | 5.63 | % | | 09/01/18 | | | 400,000 | | | | 454,552 | | |
See notes to portfolios of investments and notes to financial statements.
77
Portfolio of Investments (unaudited) June 30, 2013
Municipal Bonds (cont'd) | | Coupon
Rate | | Maturity
Date | | Principal
Amount | | Value | |
New Jersey (cont'd) | |
New Jersey Health Care Facilities Financing
Authority Revenue, Holy Name Medical
Center, Refunding | | | 5.00 | % | | 07/01/19 | | $ | 215,000 | | | $ | 233,150 | | |
New Jersey State Transportation Trust Fund
Authority, Series D | | | 4.00 | % | | 06/15/14 | | | 250,000 | | | | 259,035 | | |
Passaic Valley, New Jersey, Sewage
Commissioners Revenue, Series G | | | 5.75 | % | | 12/01/21 | | | 300,000 | | | | 354,558 | | |
| | | | 2,275,159 | | |
New Mexico 0.47% | |
Clayton, New Mexico, Jail Project Revenue | | | 4.00 | % | | 11/01/17 | | | 235,000 | | | | 240,515 | | |
New York 3.71% | |
Long Island Power Authority Revenue, Series B | | | 5.00 | % | | 09/01/21 | | | 465,000 | | | | 535,862 | | |
Long Island Power Authority, New York Electric
Systems, Revenue, Series E | | | 5.00 | % | | 12/01/17 | | | 330,000 | | | | 366,402 | | |
Nassau County Industrial Development Agency,
New York Institute of Technology Project
Revenue, Refunding, Remarketing, Series A | | | 5.00 | % | | 03/01/21 | | | 350,000 | | | | 368,179 | | |
New York State Dormitory Authority Revenues,
Nonconstruction Supported Debt, Municipal
Facilities Health Lease, Series 1 | | | 5.00 | % | | 01/15/17 | | | 300,000 | | | | 329,262 | | |
New York, New York, Subseries L-1,
GO Unlimited | | | 4.00 | % | | 04/01/15 | | | 300,000 | | | | 318,645 | | |
| | | | 1,918,350 | | |
North Carolina 1.31% | |
Beaufort County, North Carolina, GO Limited | | | 5.00 | % | | 06/01/21 | | | 200,000 | | | | 229,954 | | |
North Carolina State Municipal Power
Agency #1, Catawba Electric Revenue,
Refunding, Series A | | | 5.25 | % | | 01/01/20 | | | 400,000 | | | | 448,296 | | |
| | | | 678,250 | | |
Ohio 1.71% | |
Canton, Ohio, City School District, Refunding,
GO Unlimited | | | 5.00 | % | | 12/01/18 | | | 325,000 | | | | 352,456 | | |
Lorain County, Ohio, Community College
District, Revenue | | | 3.25 | % | | 12/01/17 | | | 350,000 | | | | 370,814 | | |
Marion County, Ohio, Variable Refunding,
GO Limited | | | 4.00 | % | | 12/01/20 | | | 150,000 | | | | 158,520 | | |
| | | | 881,790 | | |
Oklahoma 0.67% | |
Oklahoma State Agricultural & Mechanical
Colleges, Oklahoma State University,
Revenue, Series A | | | 5.00 | % | | 08/01/21 | | | 300,000 | | | | 344,802 | | |
See notes to portfolios of investments and notes to financial statements.
78
Portfolio of Investments (unaudited) June 30, 2013
Municipal Bonds (cont'd) | | Coupon
Rate | | Maturity
Date | | Principal
Amount | | Value | |
Oregon 0.43% | |
Oregon State Facilities Authority, Legacy
Health Project Revenue, Refunding, Series A | | | 4.50 | % | | 05/01/20 | | $ | 200,000 | | | $ | 221,908 | | |
Pennsylvania 2.47% | |
Delaware Valley, Pennsylvania, Regional
Financial Authority Revenue, Permanently
Fixed Business Development Services | | | 5.50 | % | | 08/01/18 | | | 295,000 | | | | 332,005 | | |
Lycoming County, Pennsylvania Authority
Health System, Susquehanna Health
Systems Project Revenue, Series A | | | 5.10 | % | | 07/01/20 | | | 140,000 | | | | 153,046 | | |
Philadelphia School District, Pennsylvania,
Refunding, GO Unlimited, Series E | | | 5.25 | % | | 09/01/24 | | | 325,000 | | | | 352,378 | | |
Reading, Pennsylvania School District,
GO Unlimited, Series A | | | 5.00 | % | | 04/01/20 | | | 400,000 | | | | 439,276 | | |
| | | | 1,276,705 | | |
Puerto Rico 1.82% | |
Commonwealth of Puerto Rico, GO Unlimited | | | 6.00 | % | | 07/01/13 | | | 250,000 | | | | 250,000 | | |
Commonwealth of Puerto Rico, Series A,
GO Unlimited | | | 5.00 | % | | 07/01/15 | | | 225,000 | | | | 231,028 | | |
Puerto Rico Infrastructure Financing Authority,
Special Tax Revenue, Refunding, Series C | | | 5.50 | % | | 07/01/17 | | | 445,000 | | | | 460,940 | | |
| | | | 941,968 | | |
Rhode Island 0.53% | |
Rhode Island State Economic Development
Corporation Revenue, Series A | | | 5.00 | % | | 06/15/17 | | | 250,000 | | | | 274,623 | | |
South Carolina 2.88% | |
Jasper County School District, GO Unlimited | | | 4.00 | % | | 03/01/15 | | | 195,000 | | | | 206,242 | | |
Piedmont Municipal Power Agency | | | 5.00 | % | | 01/01/16 | | | 150,000 | | | | 162,461 | | |
South Carolina Transportation Infrastructure
Bank Revenue, Series A | | | 5.25 | % | | 10/01/17 | | | 125,000 | | | | 132,776 | | |
Spartanburg County, South Carolina Regional
Health Services District, Hospital Revenue,
Refunding, Series A | | | 5.00 | % | | 04/15/19 | | | 600,000 | | | | 670,680 | | |
Spartanburg County, South Carolina Sanitation
Sewer District Revenue, Series A | | | 3.50 | % | | 03/01/19 | | | 300,000 | | | | 317,691 | | |
| | | | 1,489,850 | | |
Tennessee 0.53% | |
Metropolitan Government of Nashville &
Davidson County, Water & Sewer Revenue | | | 6.50 | % | | 12/01/14 | | | 250,000 | | | | 271,810 | | |
See notes to portfolios of investments and notes to financial statements.
79
Portfolio of Investments (unaudited) June 30, 2013
Municipal Bonds (cont'd) | | Coupon
Rate | | Maturity
Date | | Principal
Amount | | Value | |
Texas 11.13% | |
Addison, Texas Certificates of Obligation,
GO Unlimited | | | 4.00 | % | | 02/15/20 | | $ | 250,000 | | | $ | 271,250 | | |
Alamo Community College District, GO Limited | | | 5.00 | % | | 08/15/13 | | | 300,000 | | | | 301,737 | | |
Annetta, Texas Certificates of Obligation,
GO Limited | | | 4.00 | % | | 08/01/16 | | | 200,000 | | | | 206,788 | | |
City of Texarkana, Texas, Waterworks &
Sanitary Sewer System Revenue | | | 3.00 | % | | 08/01/19 | | | 90,000 | | | | 92,471 | | |
City of Texarkana, Texas, Waterworks &
Sanitary Sewer System Revenue | | | 3.00 | % | | 08/01/20 | | | 95,000 | | | | 96,455 | | |
Clear Lake, Texas, Waterworks & Sewer
System, GO Unlimited | | | 3.00 | % | | 03/01/19 | | | 125,000 | | | | 128,879 | | |
Corpus Christi, Texas Business & Job
Development Corporation, Seawall Project,
Sales Tax Revenue, Refunding | | | 5.00 | % | | 03/01/20 | | | 350,000 | | | | 394,894 | | |
Frisco, Texas Independent School District,
School Building, GO Unlimited, Series A | | | 4.50 | % | | 08/15/25 | | | 180,000 | | | | 193,775 | | |
Grand Prairie Independent School District,
Refunding, GO Unlimited (ZCB) | | | 3.92 | %(1) | | 08/15/16 | | | 400,000 | | | | 371,452 | | |
Houston, Texas, Hotel Occupancy Tax &
Special Revenue, Refunding, Series B | | | 5.00 | % | | 09/01/19 | | | 295,000 | | | | 322,447 | | |
Houston, Texas, Public Improvement, Refunding,
GO Limited, Series A | | | 5.38 | % | | 03/01/16 | | | 180,000 | | | | 186,125 | | |
Katy, Texas Independent School District,
School Building, Series D, GO Unlimited | | | 4.50 | % | | 02/15/19 | | | 325,000 | | | | 349,661 | | |
Laredo, Texas, Waterworks & Sewer System
Revenue | | | 4.25 | % | | 03/01/18 | | | 100,000 | | | | 107,756 | | |
Lewisville, Texas Independent School District,
GO Unlimited, Refunding (ZCB) | | | 4.04 | %(1) | | 08/15/15 | | | 400,000 | | | | 393,876 | | |
Lower Colorado River Authority Texas,
Transmission Contract Revenue, Refunding,
Series A | | | 5.00 | % | | 05/15/21 | | | 500,000 | | | | 579,845 | | |
San Antonio, Texas, Water Revenue, Refunding | | | 4.50 | % | | 05/15/21 | | | 400,000 | | | | 456,800 | | |
San Patricio, Texas Municipal Water District,
Refunding | | | 4.00 | % | | 07/10/18 | | | 200,000 | | | | 208,200 | | |
Texas Municipal Power Agency Revenue,
Refunding | | | 5.00 | % | | 09/01/17 | | | 250,000 | | | | 281,928 | | |
Texas State Public Finance Authority Revenue | | | 5.00 | % | | 10/15/21 | | | 300,000 | | | | 300,663 | | |
University of Texas Revenue Financing System,
Refunding, Series A | | | 3.00 | % | | 08/15/23 | | | 400,000 | | | | 409,840 | | |
University of Texas, Permanent University Fund,
Revenue, Series C | | | 5.00 | % | | 07/01/13 | | | 100,000 | | | | 100,000 | | |
| | | | 5,754,842 | | |
Utah 1.06% | |
Mountain Regional Water Special Service
District, Utah, Water Revenue, Refunding | | | 5.00 | % | | 12/15/27 | | | 250,000 | | | | 255,463 | | |
See notes to portfolios of investments and notes to financial statements.
80
Portfolio of Investments (unaudited) June 30, 2013
Municipal Bonds (cont'd) | | Coupon
Rate | | Maturity
Date | | Principal
Amount | | Value | |
Utah (cont'd) | |
Tooele City, Utah Municipal Building Authority
Lease Revenue, Refunding | | | 3.75 | % | | 12/01/17 | | $ | 285,000 | | | $ | 294,228 | | |
| | | | 549,691 | | |
Virginia 1.29% | |
Spotsylvania County, Virginia Economic
Development Authority Revenue, Refunding | | | 5.00 | % | | 06/01/23 | | | 300,000 | | | | 340,386 | | |
Virginia College Building Authority Educational
Facilities Revenue, Prerefunded, Series A | | | 5.00 | % | | 09/01/15 | | | 10,000 | | | | 10,955 | | |
Virginia College Building Authority Educational
Facilities Revenue, Unrefunded, Series A | | | 5.00 | % | | 09/01/15 | | | 290,000 | | | | 316,433 | | |
| | | | 667,774 | | |
Washington 0.51% | |
Energy Northwest, Washington Electric
Revenue | | | 5.00 | % | | 07/01/14 | | | 250,000 | | | | 261,762 | | |
Wisconsin 0.55% | |
Chippewa Valley, Wisconsin, Technical College
District Promissory Notes, Series A,
GO Unlimited | | | 4.00 | % | | 04/01/14 | | | 250,000 | | | | 256,967 | | |
Wisconsin State, Refunding, Series 2,
GO Unlimited | | | 4.13 | % | | 11/01/16 | | | 25,000 | | | | 25,876 | | |
| | | | 282,843 | | |
Total Investments 93.20% | | | 48,194,670 | | |
(cost $47,807,581) | |
Other assets and liabilities, net 6.80% | | | 3,518,670 | | |
Net Assets 100% | | $ | 51,713,340 | | |
(1)Represents Yield
See notes to portfolios of investments and notes to financial statements.
81
Portfolio of Investments (unaudited) June 30, 2013
Municipal Bonds 98.18% | | Coupon
Rate | | Maturity
Date | | Principal
Amount | | Value | |
Alabama 6.73% | |
Alabama State Board of Education Revenue,
Refunding | | | 4.00 | % | | 07/01/29 | | $ | 250,000 | | | $ | 232,650 | | |
Alabama State, GO Unlimited, Series A | | | 4.63 | % | | 09/01/22 | | | 375,000 | | | | 383,040 | | |
Bessemer, Alabama Water Revenue | | | 4.00 | % | | 01/01/16 | | | 200,000 | | | | 203,038 | | |
Mountain Brook City Board of Education
Capital Outlay | | | 4.00 | % | | 02/15/15 | | | 195,000 | | | | 205,001 | | |
University of Alabama at Birmingham, Hospital
Revenue, Series A | | | 5.00 | % | | 09/01/15 | | | 300,000 | | | | 323,241 | | |
| | | | 1,346,970 | | |
Arizona 2.43% | |
Scottsdale Arizona Municipal Property Corp.,
Excise Tax Revenue, Refunding | | | 5.00 | % | | 07/01/26 | | | 180,000 | | | | 212,542 | | |
University of Arizona Certificates of
Participation, Series C | | | 5.00 | % | | 06/01/22 | | | 260,000 | | | | 273,999 | | |
| | | | 486,541 | | |
California 9.81% | |
Anaheim, California City School District,
Capital Appreciation, Election 2002,
GO Unlimited (ZCB) | | | 4.60 | %(1) | | 08/01/28 | | | 580,000 | | | | 255,751 | | |
California State, GO Unlimited | | | 5.00 | % | | 03/01/32 | | | 300,000 | | | | 316,326 | | |
California State, GO Unlimited | | | 4.75 | % | | 03/01/34 | | | 205,000 | | | | 207,439 | | |
Chaffey Community College District, Series C,
GO Unlimited | | | 5.00 | % | | 06/01/32 | | | 300,000 | | | | 321,522 | | |
Lindsay Unified School District, Election 2002,
Series C, GO Unlimited (ZCB) | | | 5.25 | %(1) | | 08/01/35 | | | 420,000 | | | | 122,632 | | |
Los Angeles Unified School District,
Election 2004, Series H, GO Unlimited | | | 5.00 | % | | 07/01/32 | | | 200,000 | | | | 206,868 | | |
Santa Clara Valley Transportation Authority,
Refunding, Series A | | | 5.00 | % | | 04/01/27 | | | 370,000 | | | | 400,236 | | |
Santee School District, Series D,
GO Unlimited (ZCB) | | | 5.47 | %(1) | | 08/01/43 | | | 745,000 | | | | 134,227 | | |
| | | | 1,965,001 | | |
Colorado 0.75% | |
Colorado Health Facilities Authority Revenue | | | 5.00 | % | | 09/01/16 | | | 150,000 | | | | 150,948 | | |
Connecticut 2.66% | |
Connecticut State, Health & Educational Facility
Authority, Sacred Heart University Revenue,
Refunding, Series H | | | 5.00 | % | | 07/01/27 | | | 500,000 | | | | 532,790 | | |
See notes to portfolios of investments and notes to financial statements.
82
Portfolio of Investments (unaudited) June 30, 2013
Municipal Bonds (cont'd) | | Coupon
Rate | | Maturity
Date | | Principal
Amount | | Value | |
Delaware 2.24% | |
Delaware State Health Facilities Authority,
Bayhealth Medical Center Projects,
Revenue, Series A | | | 5.00 | % | | 07/01/39 | | $ | 445,000 | | | $ | 448,894 | | |
District of Columbia 2.98% | |
District of Columbia Income Tax Revenue,
Series A | | | 5.25 | % | | 12/01/27 | | | 300,000 | | | | 343,611 | | |
District of Columbia Water & Sewer Authority
Public Utility Revenue, Subordinate Lien | | | 5.00 | % | | 10/01/28 | | | 250,000 | | | | 252,925 | | |
| | | | 596,536 | | |
Florida 3.58% | |
Florida Board of Education, GO Unlimited,
Refunding, Series C | | | 4.50 | % | | 06/01/28 | | | 300,000 | | | | 313,008 | | |
Florida State Board of Education Lottery
Revenue, Series B | | | 5.00 | % | | 07/01/26 | | | 100,000 | | | | 110,393 | | |
Seven Oaks, Florida, Community Development
District, Special Assessment Revenue,
Refunding, Series A1 | | | 5.50 | % | | 05/01/33 | | | 285,000 | | | | 292,592 | | |
| | | | 715,993 | | |
Georgia 4.01% | |
Atlanta & Fulton County, Georgia Recreation
Authority, Park Implementation Revenue,
Series A | | | 4.75 | % | | 12/01/35 | | | 300,000 | | | | 301,617 | | |
Atlanta Development Authority Revenue | | | 5.25 | % | | 07/01/22 | | | 500,000 | | | | 501,415 | | |
| | | | 803,032 | | |
Guam 1.24% | |
Guam Education Financing Foundation
Certificate of Participation, Series A | | | 4.25 | % | | 10/01/18 | | | 250,000 | | | | 247,440 | | |
Illinois 8.36% | |
Chicago Board of Education, GO Unlimited | | | 5.25 | % | | 12/01/19 | | | 300,000 | | | | 345,324 | | |
Chicago, Illinois Water Revenue, Refunding | | | 5.75 | % | | 11/01/30 | | | 225,000 | | | | 256,005 | | |
City Colleges of Chicago, GO Unlimited | | | 5.00 | % | | 01/01/17 | | | 115,000 | | | | 127,533 | | |
Du Page County, Refunding, GO Unlimited | | | 5.60 | % | | 01/01/21 | | | 490,000 | | | | 552,558 | | |
Illinois Finance Authority, Refunding, Series A | | | 5.00 | % | | 10/01/14 | | | 150,000 | | | | 158,421 | | |
Illinois Regional Transportation Authority
Revenue, Series A | | | 7.20 | % | | 11/01/20 | | | 205,000 | | | | 233,149 | | |
| | | | 1,672,990 | | |
See notes to portfolios of investments and notes to financial statements.
83
Portfolio of Investments (unaudited) June 30, 2013
Municipal Bonds (cont'd) | | Coupon
Rate | | Maturity
Date | | Principal
Amount | | Value | |
Indiana 1.61% | |
Indianapolis Local Public Improvement Bond
Bank, Waterworks Project, Series 2007 L | | | 5.25 | % | | 01/01/33 | | $ | 305,000 | | | $ | 323,114 | | |
Kansas 1.34% | |
Kansas State Development Finance Authority
Revenue | | | 4.00 | % | | 10/01/15 | | | 250,000 | | | | 268,047 | | |
Kentucky 2.28% | |
Bowling Green, Kentucky, GO Unlimited,
Series B | | | 4.00 | % | | 09/01/16 | | | 215,000 | | | | 233,617 | | |
Kentucky Municipal Power Agency, Power
System Revenue, Prairie State Project,
Series A | | | 5.25 | % | | 09/01/22 | | | 200,000 | | | | 222,354 | | |
| | | | 455,971 | | |
Maryland 1.01% | |
Maryland State Health & Higher Educational
Facilities Authority, Revenue, Series A | | | 5.25 | % | | 08/15/38 | | | 200,000 | | | | 202,788 | | |
Massachusetts 3.87% | |
Massachusetts Bay Transportation Authority,
Massachusetts Sales Tax Revenue,
Refunding, Series A-1 | | | 5.25 | % | | 07/01/30 | | | 285,000 | | | | 325,963 | | |
Massachusetts Bay Transportation Authority,
Massachusetts Sales Tax Revenue, Series A | | | 5.00 | % | | 07/01/31 | | | 405,000 | | | | 449,429 | | |
| | | | 775,392 | | |
Michigan 3.62% | |
Detroit, Michigan Local Development Financing
Authority, Refunding, Series A | | | 5.38 | % | | 05/01/18 | | | 175,000 | | | | 171,316 | | |
Detroit, Michigan Water Supply System
Revenue, Series B | | | 5.00 | % | | 07/01/16 | | | 430,000 | | | | 442,999 | | |
State of Michigan, Trunk Line Revenue,
Refunding | | | 4.50 | % | | 11/01/26 | | | 105,000 | | | | 111,031 | | |
| | | | 725,346 | | |
Missouri 1.40% | |
Kansas City Water Revenue | | | 4.00 | % | | 12/01/22 | | | 250,000 | | | | 279,490 | | |
Nevada 1.24% | |
Nye County School District, GO Limited | | | 4.00 | % | | 05/01/15 | | | 235,000 | | | | 247,956 | | |
See notes to portfolios of investments and notes to financial statements.
84
Portfolio of Investments (unaudited) June 30, 2013
Municipal Bonds (cont'd) | | Coupon
Rate | | Maturity
Date | | Principal
Amount | | Value | |
New Hampshire 2.16% | |
Manchester, New Hampshire School Facilities
Revenue, Refunding | | | 5.50 | % | | 06/01/26 | | $ | 300,000 | | | $ | 366,087 | | |
New Hampshire Health & Education Facilities
Authority Revenue | | | 5.00 | % | | 07/01/14 | | | 65,000 | | | | 65,651 | | |
| | | | 431,738 | | |
New Jersey 1.18% | |
Passaic Valley, New Jersey, Sewage
Commissioners Revenue, Series G | | | 5.75 | % | | 12/01/21 | | | 200,000 | | | | 236,372 | | |
New York 2.04% | |
Metropolitan Transportation Authority,
New York, Revenue, Series A | | | 5.00 | % | | 11/15/41 | | | 400,000 | | | | 407,644 | | |
Ohio 4.45% | |
Cleveland, Ohio, Parking Facility Revenue,
Prerefunding, Refunding | | | 5.25 | % | | 09/15/22 | | | 130,000 | | | | 159,574 | | |
Lorain County, Ohio, Community College District,
Revenue | | | 3.25 | % | | 12/01/17 | | | 300,000 | | | | 317,841 | | |
Summit County, Ohio, Port Authority Revenue
Development, Bioinnovation Institution | | | 5.38 | % | | 12/01/30 | | | 390,000 | | | | 414,316 | | |
| | | | 891,731 | | |
Pennsylvania 1.63% | |
Philadelphia School District, Pennsylvania,
Refunding, GO Unlimited, Series E | | | 5.25 | % | | 09/01/24 | | | 300,000 | | | | 325,272 | | |
Puerto Rico 1.25% | |
Commonwealth of Puerto Rico, GO Unlimited | | | 6.00 | % | | 07/01/13 | | | 250,000 | | | | 250,000 | | |
Tennessee 1.19% | |
Memphis, Tennessee Sanitary Sewage System
Revenue, Refunding | | | 5.00 | % | | 05/01/20 | | | 200,000 | | | | 238,532 | | |
Texas 17.78% | |
Addison, Texas, Certificates of Obligation,
GO Unlimited | | | 4.50 | % | | 02/15/28 | | | 140,000 | | | | 147,687 | | |
Center, Texas, GO Limited (ZCB) | | | 3.10 | %(1) | | 02/15/20 | | | 150,000 | | | | 127,761 | | |
Dallas, Texas Waterworks & Sewer Systems
Revenue, Refunding | | | 4.50 | % | | 10/01/19 | | | 225,000 | | | | 249,809 | | |
Forney, Texas, GO Limited | | | 5.00 | % | | 02/15/27 | | | 500,000 | | | | 521,795 | | |
Goose Creek, Texas Independent School
District Schoolhouse, Series A | | | 5.25 | % | | 02/15/18 | | | 370,000 | | | | 421,182 | | |
See notes to portfolios of investments and notes to financial statements.
85
Portfolio of Investments (unaudited) June 30, 2013
Municipal Bonds (cont'd) | | Coupon
Rate | | Maturity
Date | | Principal
Amount | | Value | |
Texas (cont'd) | |
Greenville, Texas Independent School District,
GO Unlimited, Refunding | | | 4.00 | % | | 08/15/17 | | $ | 120,000 | | | $ | 130,055 | | |
Laredo Independent School District Public
Facility Corp., Lease Revenue, Series F | | | 5.50 | % | | 08/01/24 | | | 100,000 | | | | 100,084 | | |
North Texas Tollway Authority Revenue,
Series F | | | 5.75 | % | | 01/01/38 | | | 300,000 | | | | 321,273 | | |
Prosper, Texas Independent School District,
Capital Appreciation, School Building,
GO Unlimited (ZCB) | | | 6.00 | %(1) | | 08/15/33 | | | 1,000,000 | | | | 364,590 | | |
San Marcos, Texas Tax & Toll Revenue,
GO Limited | | | 5.10 | % | | 08/15/27 | | | 400,000 | | | | 438,300 | �� | |
Tarrant County, Texas Cultural Education
Facilities Finance Corp., Health Resources
Revenue, Refunding, Series A | | | 5.00 | % | | 02/15/36 | | | 400,000 | | | | 414,964 | | |
White Settlement, Texas Independent School
District, Prerefunded, GO Unlimited | | | 4.13 | % | | 08/15/15 | | | 240,000 | | | | 258,295 | | |
White Settlement, Texas Independent School
District, Unrefunded, GO Unlimited | | | 4.13 | % | | 08/15/15 | | | 60,000 | | | | 64,349 | | |
| | | | 3,560,144 | | |
Utah 3.96% | |
Utah State Building Ownership Authority, Lease
Revenue, Refunding, Series C | | | 5.50 | % | | 05/15/19 | | | 500,000 | | | | 573,815 | | |
Utah State Transit Authority Sales Tax Revenue,
Refunding, Series A | | | 5.00 | % | | 06/15/35 | | | 200,000 | | | | 218,930 | | |
| | | | 792,745 | | |
Washington 1.38% | |
Spokane County, Washington School District,
No. 81, GO Unlimited | | | 5.05 | % | | 06/01/22 | | | 255,000 | | | | 276,785 | | |
Total Investments 98.18% | | | 19,656,202 | | |
(cost $19,092,012) | |
Other assets and liabilities, net 1.82% | | | 365,033 | | |
Net Assets 100% | | $ | 20,021,235 | | |
(1)Represents Yield
See notes to portfolios of investments and notes to financial statements.
86
Portfolio of Investments (unaudited) June 30, 2013
Common Stocks 86.83% | | Shares | | Value | |
Aerospace/Defense 2.22% | |
Northrop Grumman Corp. | | | 3,000 | | | $ | 248,400 | | |
Rockwell Collins, Inc. | | | 3,000 | | | | 190,230 | | |
| | | | 438,630 | | |
Agricultural Chemicals 0.87% | |
CF Industries Holdings, Inc. | | | 1,000 | | | | 171,500 | | |
Beverages - Non-alcoholic 0.89% | |
Coca-Cola Enterprises, Inc. | | | 5,000 | | | | 175,800 | | |
Beverages - Wine/Spirits 1.14% | |
Constellation Brands, Inc., Class A | | | 4,300 | | | | 224,116 | * | |
Casino Hotels 2.51% | |
Las Vegas Sands Corp. | | | 5,000 | | | | 264,650 | | |
Wynn Resorts Ltd. | | | 1,800 | | | | 230,400 | | |
| | | | 495,050 | | |
Casino Services 0.97% | |
International Game Technology | | | 11,500 | | | | 192,165 | | |
Chemicals - Diversified 3.98% | |
LyondellBasell Industries N.V., Class A | | | 3,200 | | | | 212,032 | | |
PPG Industries, Inc. | | | 2,600 | | | | 380,666 | | |
Westlake Chemical Corp. | | | 2,000 | | | | 192,820 | | |
| | | | 785,518 | | |
Commercial Services - Financial 5.41% | |
MasterCard, Inc., Class A | | | 1,500 | | | | 861,750 | | |
Western Union Co. | | | 12,000 | | | | 205,320 | | |
| | | | 1,067,070 | | |
Computers - Memory Devices 1.50% | |
Seagate Technology plc | | | 6,600 | | | | 295,878 | | |
Consulting Services 1.73% | |
Gartner, Inc. | | | 6,000 | | | | 341,940 | * | |
Containers - Metal/Glass 0.86% | |
Ball Corp. | | | 4,100 | | | | 170,314 | | |
Data Processing/Management 0.99% | |
The Dun & Bradstreet Corp. | | | 2,000 | | | | 194,900 | | |
See notes to portfolios of investments and notes to financial statements.
87
Portfolio of Investments (unaudited) June 30, 2013
Common Stocks (cont'd) | | Shares | | Value | |
Dialysis Centers 1.22% | |
DaVita HealthCare Partners Inc. | | | 2,000 | | | $ | 241,600 | * | |
Diversified Banking Institutions 1.95% | |
Bank of America Corp. | | | 30,000 | | | | 385,800 | | |
E-Commerce/Products 0.92% | |
eBay, Inc. | | | 3,500 | | | | 181,020 | * | |
E-Commerce/Services 2.10% | |
priceline.com, Inc. | | | 500 | | | | 413,565 | * | |
Electric - Integrated 4.49% | |
Ameren Corp. | | | 5,100 | | | | 175,644 | | |
FirstEnergy Corp. | | | 5,100 | | | | 190,434 | | |
Integrys Energy Group, Inc. | | | 3,100 | | | | 181,443 | | |
Pinnacle West Capital Corp. | | | 3,000 | | | | 166,410 | | |
TECO Energy, Inc. | | | 10,000 | | | | 171,900 | | |
| | | | 885,831 | | |
Electronics - Military 1.00% | |
L-3 Communications Holdings, Inc. | | | 2,300 | | | | 197,202 | | |
Enterprise Software/Services 0.94% | |
BMC Software, Inc. | | | 4,100 | | | | 185,074 | * | |
Finance - Consumer Loans 0.95% | |
SLM Corp. | | | 8,200 | | | | 187,452 | | |
Food - Retail 1.80% | |
Kroger Co. | | | 5,500 | | | | 189,970 | | |
Safeway, Inc. | | | 7,000 | | | | 165,620 | | |
| | | | 355,590 | | |
Investment Management/Advisory Services 2.31% | |
Ameriprise Financial, Inc. | | | 3,400 | | | | 274,992 | | |
Legg Mason, Inc. | | | 5,800 | | | | 179,858 | | |
| | | | 454,850 | | |
Machinery - General Industrial 2.17% | |
Wabtec Corp. | | | 8,000 | | | | 427,440 | | |
Machinery - Pumps 0.99% | |
Flowserve Corp. | | | 3,600 | | | | 194,436 | | |
See notes to portfolios of investments and notes to financial statements.
88
Portfolio of Investments (unaudited) June 30, 2013
Common Stocks (cont'd) | | Shares | | Value | |
Medical - Biomedical/Gene 2.03% | |
Amgen, Inc. | | | 1,700 | | | $ | 167,722 | | |
Celgene Corp. | | | 2,000 | | | | 233,820 | *^ | |
| | | | 401,542 | | |
Medical - Drugs 0.92% | |
Pfizer, Inc. | | | 6,500 | | | | 182,065 | | |
Medical - Generic Drugs 0.96% | |
Actavis, Inc. | | | 1,500 | | | | 189,330 | * | |
Medical - HMO 2.15% | |
Aetna, Inc. | | | 3,200 | | | | 203,328 | | |
WellPoint, Inc. | | | 2,700 | | | | 220,968 | | |
| | | | 424,296 | | |
Medical - Wholesale Drug Distribution 1.05% | |
AmerisourceBergen Corp., Class A | | | 3,700 | | | | 206,571 | | |
Medical Instruments 1.92% | |
Edwards Lifesciences Corp. | | | 2,500 | | | | 168,000 | * | |
St. Jude Medical, Inc. | | | 4,600 | | | | 209,898 | | |
| | | | 377,898 | | |
Multi-line Insurance 1.98% | |
American International Group, Inc. | | | 4,200 | | | | 187,740 | * | |
Assurant, Inc. | | | 4,000 | | | | 203,640 | | |
| | | | 391,380 | | |
Office Automation & Equipment 1.01% | |
Xerox Corp. | | | 22,000 | | | | 199,540 | | |
Oil - Field Services 1.36% | |
Hornbeck Offshore Services, Inc. | | | 5,000 | | | | 267,500 | * | |
Oil - US Royalty Trusts 1.71% | |
BP Prudhoe Bay Royalty Trust | | | 3,500 | | | | 336,945 | | |
Oil & Gas Drilling 0.87% | |
Diamond Offshore Drilling, Inc. | | | 2,500 | | | | 171,975 | | |
Oil Companies - Exploration & Production 2.51% | |
ConocoPhillips | | | 2,500 | | | | 151,250 | | |
Continental Resources, Inc. | | | 4,000 | | | | 344,240 | * | |
| | | | 495,490 | | |
See notes to portfolios of investments and notes to financial statements.
89
Portfolio of Investments (unaudited) June 30, 2013
Common Stocks (cont'd) | | Shares | | Value | |
Oil Companies - Integrated 1.81% | |
Chevron Corp. | | | 1,500 | | | $ | 177,510 | | |
Exxon Mobil Corp. | | | 2,000 | | | | 180,700 | | |
| | | | 358,210 | | |
Oil Field Machinery & Equipment 2.89% | |
Dresser-Rand Group, Inc. | | | 5,000 | | | | 299,900 | * | |
Dril-Quip, Inc. | | | 3,000 | | | | 270,870 | * | |
| | | | 570,770 | | |
Oil Refining & Marketing 1.22% | |
Marathon Petroleum Corp. | | | 3,400 | | | | 241,604 | | |
Rental Auto/Equipment 0.89% | |
United Rentals, Inc. | | | 3,500 | | | | 174,685 | * | |
Retail - Building Products 0.97% | |
Lowe's Companies, Inc. | | | 4,700 | | | | 192,230 | | |
Retail - Computer Equipment 1.07% | |
GameStop Corp., Class A | | | 5,000 | | | | 210,150 | | |
Retail - Gardening Products 1.19% | |
Tractor Supply Co. | | | 2,000 | | | | 235,220 | | |
Retail - Major Department Store 2.03% | |
TJX Companies, Inc. | | | 8,000 | | | | 400,480 | | |
Retail - Regional Department Stores 0.95% | |
Kohl's Corp. | | | 3,700 | | | | 186,887 | | |
Retail - Restaurants 2.49% | |
Starbucks Corp. | | | 7,500 | | | | 491,175 | | |
Telephone - Integrated 3.06% | |
AT&T, Inc. | | | 7,200 | | | | 254,880 | | |
Frontier Communications Corp. | | | 30,000 | | | | 121,500 | | |
Verizon Communications, Inc. | | | 4,500 | | | | 226,530 | | |
| | | | 602,910 | | |
Tobacco 1.13% | |
Lorillard, Inc. | | | 5,100 | | | | 222,768 | | |
See notes to portfolios of investments and notes to financial statements.
90
Portfolio of Investments (unaudited) June 30, 2013
Common Stocks (cont'd) | | Shares | | Value | |
Transportation - Rail 1.95% | |
Union Pacific Corp. | | | 2,500 | | | $ | 385,700 | | |
Web Portals/Internet Service Providers 1.78% | |
Google, Inc., Class A | | | 400 | | | | 352,148 | * | |
Wireless Equipment 1.02% | |
Motorola Solutions, Inc. | | | 3,500 | | | | 202,055 | | |
Total Common Stocks | | | 17,134,265 | | |
(cost $14,656,545) | |
Real Estate Investment Trust (REIT) 1.11%
American Tower Corp., Class A | | | 3,000 | | | | 219,510 | | |
(cost $159,047) | |
Exchange-Traded Funds (ETF) 2.88%
SPDR S&P Bank ETF | | | 8,000 | | | | 229,760 | | |
SPDR S&P Regional Banking ETF | | | 10,000 | | | | 338,800 | | |
Total Exchange-Traded Funds | | | 568,560 | | |
(cost $456,117) | |
Purchased Put Option 0.34% | | Contracts | | | |
Exchange-Traded Funds 0.34% | |
SPDR S&P 500 ETF, Strike Price 160, Expiration July 2013 | | | 300 | | | | 67,500 | | |
(cost $83,374) | |
Master Limited Partnership 0.57% | | Units | | | |
Oil Companies - Exploration & Production 0.57% | |
Mid-Con Energy Partners L.P. | | | 5,000 | | | | 112,750 | | |
(cost $119,780) | |
Total Investments 91.73% | | | 18,102,585 | | |
(cost $15,474,863) | |
Other assets and liabilities, net 8.27% | | | 1,631,621 | | |
Net Assets 100% | | $ | 19,734,206 | | |
See notes to portfolios of investments and notes to financial statements.
91
Portfolio of Investments (unaudited) June 30, 2013
Written Call Option | | Shares Subject
To Call | | Value | |
Celgene Corp., Strike Price 120, Expiration July 2013
(premiums received $7,154) (Note 2A) | | | 2,000 | | | $ | 5,130 | | |
See notes to portfolios of investments and notes to financial statements.
92
Portfolio of Investments (unaudited) June 30, 2013
Common Stocks 86.31% | | Shares | | Value | |
Agricultural Operations 0.05% | |
Agriterra Ltd. | | | 647,600 | | | $ | 19,599 | * | |
Apparel Manufacturers 2.54% | |
Michael Kors Holdings Ltd. | | | 15,000 | | | | 930,300 | * | |
Casino Hotels 1.59% | |
Las Vegas Sands Corp. | | | 11,000 | | | | 582,230 | | |
Casino Services 1.00% | |
Bally Technologies, Inc. | | | 6,500 | | | | 366,730 | * | |
Chemicals - Diversified 1.58% | |
Westlake Chemical Corp. | | | 6,000 | | | | 578,460 | | |
Commercial Services - Financial 4.24% | |
MasterCard, Inc., Class A | | | 2,700 | | | | 1,551,150 | | |
Consulting Services 1.87% | |
Gartner, Inc. | | | 12,000 | | | | 683,880 | * | |
Dialysis Centers 2.31% | |
DaVita HealthCare Partners Inc. | | | 7,000 | | | | 845,600 | * | |
Diversified Banking Institutions 2.46% | |
Bank of America Corp. | | | 70,000 | | | | 900,200 | | |
E-Commerce/Products 2.59% | |
eBay, Inc. | | | 10,000 | | | | 517,200 | * | |
MercadoLibre, Inc. | | | 4,000 | | | | 431,040 | | |
| | | | 948,240 | | |
E-Commerce/Services 5.53% | |
OpenTable, Inc. | | | 12,000 | | | | 767,400 | * | |
priceline.com, Inc. | | | 1,000 | | | | 827,130 | * | |
TripAdvisor, Inc. | | | 7,000 | | | | 426,090 | * | |
| | | | 2,020,620 | | |
Finance - Commercial 1.77% | |
IOU Financial, Inc. | | | 1,490,000 | | | | 552,613 | *+ | |
IOU Financial, Inc., 144A | | | 250,000 | | | | 92,720 | *+ | |
| | | | 645,333 | | |
See notes to portfolios of investments and notes to financial statements.
93
Portfolio of Investments (unaudited) June 30, 2013
Common Stocks (cont'd) | | Shares | | Value | |
Finance - Investment Banker/Broker 0.15% | |
Canaccord Financial, Inc. | | | 10,000 | | | $ | 54,301 | | |
Food - Baking 0.45% | |
Flowers Foods, Inc. | | | 7,500 | | | | 165,375 | | |
Internet Application Software 1.90% | |
Splunk, Inc. | | | 15,000 | | | | 695,400 | * | |
Internet Content - Information/Network 0.98% | |
LinkedIn Corp., Class A | | | 2,000 | | | | 356,600 | * | |
Internet Financial Services 0.00% | |
Direct Markets Holdings Corp. | | | 10,000 | | | | 70 | * | |
Internet Incubators 1.33% | |
HomeAway, Inc. | | | 15,000 | | | | 485,100 | * | |
Investment Management/Advisory Services 0.95% | |
WisdomTree Investments, Inc. | | | 30,000 | | | | 347,100 | * | |
Machinery - General Industrial 5.56% | |
Chart Industries, Inc. | | | 6,000 | | | | 564,540 | * | |
DXP Enterprises, Inc. | | | 6,000 | | | | 399,600 | * | |
Wabtec Corp. | | | 20,000 | | | | 1,068,600 | | |
| | | | 2,032,740 | | |
Medical - Biomedical/Gene 2.17% | |
Amgen, Inc. | | | 3,300 | | | | 325,578 | | |
Celgene Corp. | | | 4,000 | | | | 467,640 | *^ | |
| | | | 793,218 | | |
Medical - Generic Drugs 2.91% | |
Actavis, Inc. | | | 4,000 | | | | 504,880 | * | |
Mylan, Inc. | | | 18,000 | | | | 558,540 | * | |
| | | | 1,063,420 | | |
Medical - Hospitals 0.01% | |
African Medical Investments plc | | | 1,000,000 | | | | 3,422 | * | |
Medical Instruments 0.92% | |
Edwards Lifesciences Corp. | | | 5,000 | | | | 336,000 | * | |
See notes to portfolios of investments and notes to financial statements.
94
Portfolio of Investments (unaudited) June 30, 2013
Common Stocks (cont'd) | | Shares | | Value | |
Metal - Iron 0.55% | |
Andean Pacific Iron Corp., 144A (RS) | | | 430,000 | | | $ | 200,208 | *@# | |
Oil - Field Services 3.42% | |
Core Laboratories N.V. | | | 4,000 | | | | 606,640 | | |
Hornbeck Offshore Services, Inc. | | | 12,000 | | | | 642,000 | * | |
| | | | 1,248,640 | | |
Oil - US Royalty Trusts 2.11% | |
BP Prudhoe Bay Royalty Trust | | | 8,000 | | | | 770,160 | | |
Oil Companies - Exploration & Production 6.83% | |
Continental Resources, Inc. | | | 10,000 | | | | 860,600 | * | |
Gulfport Energy Corp. | | | 10,000 | | | | 470,700 | * | |
Oasis Petroleum, Inc. | | | 30,000 | | | | 1,166,100 | * | |
| | | | 2,497,400 | | |
Oil Field Machinery & Equipment 5.17% | |
Dresser-Rand Group, Inc. | | | 12,000 | | | | 719,760 | * | |
Dril-Quip, Inc. | | | 7,000 | | | | 632,030 | * | |
Flotek Industries, Inc. | | | 30,000 | | | | 538,200 | * | |
| | | | 1,889,990 | | |
Quarrying 1.20% | |
Pacific Stone Tech, Inc. (RS) | | | 1,757 | | | | 437,651 | *@# | |
Real Estate Operating/Development 0.27% | |
Pacific Infrastructure, Inc. (RS) | | | 100,000 | | | | 100,000 | *@# | |
Recreational Vehicles 1.82% | |
Polaris Industries, Inc. | | | 7,000 | | | | 665,000 | | |
Rental Auto/Equipment 2.94% | |
Avis Budget Group, Inc. | | | 20,000 | | | | 575,000 | * | |
United Rentals, Inc. | | | 10,000 | | | | 499,100 | * | |
| | | | 1,074,100 | | |
Retail - Automobile 1.46% | |
Lithia Motors, Inc., Class A | | | 10,000 | | | | 533,100 | | |
Retail - Discount 1.04% | |
Dollar Tree, Inc. | | | 7,500 | | | | 381,300 | * | |
See notes to portfolios of investments and notes to financial statements.
95
Portfolio of Investments (unaudited) June 30, 2013
Common Stocks (cont'd) | | Shares | | Value | |
Retail - Gardening Products 1.61% | |
Tractor Supply Co. | | | 5,000 | | | $ | 588,050 | | |
Retail - Major Department Store 2.46% | |
TJX Companies, Inc. | | | 18,000 | | | | 901,080 | | |
Retail - Restaurants 4.37% | |
Chuy's Holdings, Inc. | | | 16,000 | | | | 613,440 | * | |
Starbucks Corp. | | | 15,000 | | | | 982,350 | | |
| | | | 1,595,790 | | |
Retail - Vitamins/Nutritional Supplements 1.81% | |
GNC Holdings, Inc., Class A | | | 15,000 | | | | 663,150 | | |
Transportation - Rail 2.11% | |
Union Pacific Corp. | | | 5,000 | | | | 771,400 | | |
Transportation - Truck 2.28% | |
Old Dominion Freight Line, Inc. | | | 20,000 | | | | 832,400 | * | |
Total Common Stocks | | | 31,554,507 | | |
(cost $25,941,434) | |
Exchange-Traded Funds (ETF) 3.03%
SPDR S&P Bank ETF | | | 15,000 | | | | 430,800 | | |
SPDR S&P Regional Banking ETF | | | 20,000 | | | | 677,600 | | |
Total Exchange-Traded Funds | | | 1,108,400 | | |
(cost $891,765) | |
Warrants 0.00%
Gold Mining 0.00% | |
Gran Colombia Gold Corp., 144A, Warrants (October 2017) | | | 3,700 | | | | 0 | *@# | |
Medical - Hospitals 0.00% | |
African Medical Investments plc, Warrants (June 2014) | | | 500,000 | | | | 0 | *@# | |
Total Warrants | | | 0 | | |
(cost $0) | |
See notes to portfolios of investments and notes to financial statements.
96
Portfolio of Investments (unaudited) June 30, 2013
Purchased Put Option 0.34% | | Contracts | | Value | |
Exchange-Traded Funds 0.34% | |
SPDR S&P 500 ETF, Strike Price 160, Expiration July 2013 | | | 550 | | | $ | 123,750 | | |
(cost $157,700) | |
Master Limited Partnership 0.62% | | Units | | | |
Oil Companies - Exploration & Production 0.62% | |
Mid-Con Energy Partners L.P. | | | 10,000 | | | | 225,500 | | |
(cost $239,560) | |
Gold-Linked Note 0.95% | | Principal
Amount | | | |
Gold Mining 0.95% | |
Gran Colombia Gold Corp., 144A, 10.00%, maturity 10/31/17 | | $ | 370,000 | | | | 347,800 | @# | |
(cost $370,000) | |
Silver-Linked Note 0.40%
Gold Mining 0.40% | |
Gran Colombia Gold Corp., 5.00%, maturity 08/11/18 | | | 316,000 | | | | 145,360 | | |
(cost $253,275) | |
Corporate Note 0.41%
Electric - Generation 0.41% | |
Pacific Power Generation Corp.,15.00%, maturity 04/03/17 (RS) | | | 150,000 | | | | 150,000 | @# | |
(cost $150,000) | |
Total Investments 92.06% | | | 33,655,317 | | |
(cost $28,003,734) | |
Other assets and liabilities, net 7.94% | | | 2,903,404 | | |
Net Assets 100% | | $ | 36,558,721 | | |
Written Call Option | | Shares Subject
To Call | | | |
Celgene Corp., Strike Price 120, Expiration July 2013 | | | 4,000 | | | $ | 10,260 | | |
(premiums received $14,308) (Note 2A) | |
See notes to portfolios of investments and notes to financial statements.
97
Portfolio of Investments (unaudited) June 30, 2013
Common Stocks 93.12% | | Shares | | Value | |
Agricultural Operations 0.17% | |
Agriterra Ltd. | | | 627,600 | | | $ | 18,994 | * | |
Audio/Video Products 1.88% | |
Sony Corp., Sponsored ADR | | | 10,000 | | | | 211,900 | | |
Automotive - Cars & Light Trucks 4.19% | |
Ford Motor Co. | | | 15,000 | | | | 232,050 | | |
Toyota Motor Corp., Sponsored ADR | | | 2,000 | | | | 241,320 | | |
| | | | 473,370 | | |
Automotive/Truck Parts & Equipment - Original 2.07% | |
Visteon Corp. | | | 3,700 | | | | 233,544 | * | |
Cable/Satellite TV 4.38% | |
Comcast Corp., Class A | | | 5,500 | | | | 230,340 | | |
Time Warner Cable, Inc. | | | 2,350 | | | | 264,328 | | |
| | | | 494,668 | | |
Casino Hotels 1.88% | |
Las Vegas Sands Corp. | | | 4,000 | | | | 211,720 | | |
Chemicals - Specialty 1.09% | |
Eastman Chemical Co. | | | 1,750 | | | | 122,518 | | |
Coal 0.14% | |
Pacific Coal Resources Ltd. | | | 39,830 | | | | 16,287 | * | |
Commercial Services 0.94% | |
Iron Mountain, Inc. | | | 4,000 | | | | 106,440 | | |
Computer Services 0.94% | |
Cognizant Technology Solutions Corp., Class A | | | 1,700 | | | | 106,437 | * | |
Computers 0.91% | |
Apple, Inc. | | | 260 | | | | 102,981 | | |
Computers - Memory Devices 1.05% | |
EMC Corp. | | | 5,000 | | | | 118,100 | | |
Dialysis Centers 1.87% | |
DaVita HealthCare Partners Inc. | | | 1,750 | | | | 211,400 | * | |
See notes to portfolios of investments and notes to financial statements.
98
Portfolio of Investments (unaudited) June 30, 2013
Common Stocks (cont'd) | | Shares | | Value | |
Diversified Banking Institutions 7.58% | |
Bank of America Corp. | | | 17,500 | | | $ | 225,050 | | |
JPMorgan Chase & Co. | | | 4,100 | | | | 216,439 | | |
Morgan Stanley | | | 8,575 | | | | 209,487 | | |
The Goldman Sachs Group, Inc. | | | 1,350 | | | | 204,188 | | |
| | | | 855,164 | | |
E-Commerce/Products 1.11% | |
Amazon.com, Inc. | | | 450 | | | | 124,960 | * | |
E-Commerce/Services 1.07% | |
Expedia, Inc. | | | 2,000 | | | | 120,300 | | |
Electric - Generation 2.20% | |
Pacific Power Generation Corp. (RS) | | | 349,057 | | | | 248,249 | *@# | |
Electric - Integrated 1.07% | |
PPL Corp. | | | 4,000 | | | | 121,040 | | |
Electronic Components - Miscellaneous 1.07% | |
Jabil Circuit, Inc. | | | 5,900 | | | | 120,242 | | |
Energy - Alternate Sources 0.59% | |
Pacific Green Energy Corp. (RS) | | | 100,000 | | | | 66,410 | *@# | |
Engineering/Research & Development Services 1.05% | |
Fluor Corp. | | | 2,000 | | | | 118,620 | | |
Finance - Credit Card 1.98% | |
Discover Financial Services | | | 4,700 | | | | 223,908 | | |
Food - Miscellaneous/Diversified 1.05% | |
ConAgra Foods, Inc. | | | 3,400 | | | | 118,762 | | |
Gold Mining 0.04% | |
Gran Colombia Gold Corp. | | | 2,848 | | | | 5,038 | * | |
Investment Management/Advisory Services 1.95% | |
WisdomTree Investments, Inc. | | | 19,000 | | | | 219,830 | * | |
Life/Health Insurance 2.06% | |
Manulife Financial Corp. | | | 14,500 | | | | 232,290 | | |
See notes to portfolios of investments and notes to financial statements.
99
Portfolio of Investments (unaudited) June 30, 2013
Common Stocks (cont'd) | | Shares | | Value | |
Medical - Biomedical/Gene 1.84% | |
Amgen, Inc. | | | 2,100 | | | $ | 207,186 | | |
Medical - Drugs 2.06% | |
Merck & Co., Inc. | | | 5,000 | | | | 232,250 | | |
Medical - HMO 4.27% | |
Aetna, Inc. | | | 3,600 | | | | 228,744 | | |
Cigna Corp. | | | 3,500 | | | | 253,715 | | |
| | | | 482,459 | | |
Medical - Hospitals 2.04% | |
Tenet Healthcare Corp. | | | 5,000 | | | | 230,500 | * | |
Medical - Wholesale Drug Distribution 4.22% | |
Cardinal Health, Inc. | | | 5,000 | | | | 236,000 | | |
McKesson Corp. | | | 2,100 | | | | 240,450 | | |
| | | | 476,450 | | |
Medical Instruments 2.94% | |
Edwards Lifesciences Corp. | | | 1,550 | | | | 104,160 | * | |
St. Jude Medical, Inc. | | | 5,000 | | | | 228,150 | | |
| | | | 332,310 | | |
Medical Labs & Testing Services 2.17% | |
ICON plc | | | 6,900 | | | | 244,467 | * | |
Metal - Iron 1.77% | |
Andean Pacific Iron Corp., 144A (RS) | | | 430,000 | | | | 200,208 | *@# | |
Multi-line Insurance 4.01% | |
American International Group, Inc. | | | 5,000 | | | | 223,500 | * | |
MetLife, Inc. | | | 5,000 | | | | 228,800 | | |
| | | | 452,300 | | |
Multimedia 2.14% | |
Twenty-First Century Fox, Inc., Class A | | | 7,400 | | | | 241,240 | | |
Oil Companies - Exploration & Production 2.09% | |
Newfield Exploration Co. | | | 5,000 | | | | 119,450 | * | |
QEP Resources, Inc. | | | 4,200 | | | | 116,676 | | |
| | | | 236,126 | | |
See notes to portfolios of investments and notes to financial statements.
100
Portfolio of Investments (unaudited) June 30, 2013
Common Stocks (cont'd) | | Shares | | Value | |
Oil Field Machinery & Equipment 1.04% | |
National-Oilwell Varco, Inc. | | | 1,700 | | | $ | 117,130 | | |
Oil Refining & Marketing 0.94% | |
Marathon Petroleum Corp. | | | 1,500 | | | | 106,590 | | |
Quarrying 5.31% | |
Pacific Stone Tech, Inc. (RS) | | | 2,405 | | | | 599,061 | *@# | |
Real Estate Management/Services 2.13% | |
Mitsubishi Estate Co., Ltd., ADR | | | 9,000 | | | | 240,390 | | |
Real Estate Operating/Development 2.89% | |
Pacific Infrastructure, Inc. (RS) | | | 326,533 | | | | 326,533 | *@# | |
Recreational Vehicles 2.02% | |
Polaris Industries, Inc. | | | 2,400 | | | | 228,000 | | |
Retail - Major Department Store 2.00% | |
TJX Companies, Inc. | | | 4,500 | | | | 225,270 | | |
Semiconductors Components/Integrated Circuits 0.97% | |
QUALCOMM, Inc. | | | 1,800 | | | | 109,944 | | |
Steel - Specialty 0.98% | |
Allegheny Technologies, Inc. | | | 4,200 | | | | 110,502 | | |
Transportation - Services 0.96% | |
FedEx Corp. | | | 1,100 | | | | 108,438 | | |
Total Common Stocks | | | 10,510,526 | | |
(cost $9,973,512) | |
Exchange-Traded Fund (ETF) 1.01%
iShares Mortgage Real Estate Capped Index Fund | | | 9,000 | | | | 113,940 | | |
(cost $119,675) | |
See notes to portfolios of investments and notes to financial statements.
101
Portfolio of Investments (unaudited) June 30, 2013
Purchased Put Options 0.21% | | Contracts | | Value | |
Exchange-Traded Funds 0.21% | |
SPDR S&P 500 ETF, Strike Price 150, Expiration July 2013 | | | 100 | | | $ | 3,350 | | |
SPDR S&P 500 ETF, Strike Price 155, Expiration July 2013 | | | 100 | | | | 8,850 | | |
SPDR S&P 500 ETF, Strike Price 160, Expiration July 2013 | | | 50 | | | | 11,250 | | |
Total Purchased Put Options | | | 23,450 | | |
(cost $57,924) | |
Silver-Linked Note 0.44% | | Principal
Amount | | | |
Gold Mining 0.44% | |
Gran Colombia Gold Corp., 5.00%, maturity 08/11/18 | | $ | 109,000 | | | | 50,140 | | |
(cost $87,884) | |
Corporate Note 0.89%
Electric - Generation 0.89% | |
Pacific Power Generation Corp., 15.00%, maturity 04/03/17 (RS) | | | 100,000 | | | | 100,000 | @# | |
(cost $100,000) | |
Total Investments 95.67% | | | 10,798,056 | | |
(cost $10,338,995) | |
Other assets and liabilities, net 4.33% | | | 488,242 | | |
Net Assets 100% | | $ | 11,286,298 | | |
See notes to portfolios of investments and notes to financial statements.
102
Portfolio of Investments (unaudited) June 30, 2013
Common Stocks 75.76% | | Shares | | Value | |
Agricultural Chemicals 6.43% | |
CF Industries Holdings, Inc. | | | 30,500 | | | $ | 5,230,750 | | |
Monsanto Co. | | | 75,000 | | | | 7,410,000 | | |
Mosaic Co. | | | 160,000 | | | | 8,609,600 | | |
Potash Corporation of Saskatchewan, Inc. | | | 100,000 | | | | 3,813,000 | | |
Spur Ventures, Inc. | | | 274,867 | | | | 88,873 | * | |
| | | | 25,152,223 | | |
Agricultural Operations 0.52% | |
Agriterra Ltd. | | | 67,958,600 | | | | 2,056,694 | *+ | |
Building Products - Cement/Aggregates 5.74% | |
Eagle Materials, Inc. | | | 100,000 | | | | 6,627,000 | | |
Martin Marietta Materials, Inc. | | | 80,000 | | | | 7,873,600 | | |
Vulcan Materials Co. | | | 165,000 | | | | 7,987,650 | | |
| | | | 22,488,250 | | |
Chemicals - Diversified 2.47% | |
LyondellBasell Industries N.V., Class A | | | 85,000 | | | | 5,632,100 | | |
Sociedad Quimica y Minera de Chile S.A., Sponsored ADR | | | 100,000 | | | | 4,040,000 | | |
| | | | 9,672,100 | | |
Coal 0.96% | |
Pacific Coal Resources Ltd. | | | 3,312,561 | | | | 1,354,573 | *+ | |
Sable Mining Africa Ltd. | | | 30,972,371 | | | | 2,346,755 | * | |
Walter Energy, Inc., 144A | | | 4,293 | | | | 44,459 | * | |
| | | | 3,745,787 | | |
Diamonds/Precious Stones 0.02% | |
Diamond Fields International Ltd. | | | 1,800,000 | | | | 59,911 | * | |
Rockwell Diamonds, Inc., 144A | | | 63,333 | | | | 11,293 | * | |
| | | | 71,204 | | |
Diversified Minerals 0.62% | |
African Potash Ltd. | | | 15,825,000 | | | | 420,541 | *+ | |
Calibre Mining Corp. | | | 600,000 | | | | 28,529 | * | |
Canada Zinc Metals Corp. | | | 1,000,000 | | | | 228,234 | * | |
Lithium Americas Corp. | | | 476,667 | | | | 217,584 | * | |
Niocan, Inc., 144A | | | 362,069 | | | | 67,142 | * | |
Sirocco Mining, Inc. | | | 1,078,900 | | | | 543,785 | * | |
Woulfe Mining Corp. | | | 9,715,100 | | | | 923,884 | * | |
| | | | 2,429,699 | | |
See notes to portfolios of investments and notes to financial statements.
103
Portfolio of Investments (unaudited) June 30, 2013
Common Stocks (cont'd) | | Shares | | Value | |
Electric - Generation 0.88% | |
Pacific Power Generation Corp. (RS) | | | 4,868,396 | | | $ | 3,462,403 | *@# | |
Energy - Alternate Sources 0.41% | |
Pacific Green Energy Corp. (RS) | | | 2,400,000 | | | | 1,593,840 | *+@# | |
Finance - Investment Banker/Broker 0.05% | |
Aberdeen International, Inc. | | | 1,274,750 | | | | 181,839 | | |
Food - Flour & Grain 0.71% | |
Amira Nature Foods Ltd. | | | 330,000 | | | | 2,772,000 | * | |
Food - Meat Products 4.08% | |
BRF S.A., Sponsored ADR | | | 265,000 | | | | 5,753,150 | | |
Minerva S.A. | | | 700,000 | | | | 3,230,649 | * | |
Tyson Foods, Inc., Class A | | | 271,400 | | | | 6,969,552 | | |
| | | | 15,953,351 | | |
Forestry 2.05% | |
Prima Colombia Hardwood, Inc. | | | 15,265,832 | | | | 72,587 | * | |
West Fraser Timber Co., Ltd. | | | 105,000 | | | | 7,938,282 | | |
| | | | 8,010,869 | | |
Gold Mining 5.41% | |
Alamos Gold, Inc. | | | 64,408 | | | | 780,332 | | |
Besra Gold, Inc. | | | 295,000 | | | | 12,624 | * | |
Chesapeake Gold Corp. | | | 103,375 | | | | 313,600 | * | |
Chesapeake Gold Corp., 144A | | | 52,400 | | | | 158,962 | * | |
Corona Minerals Ltd. | | | 50,000 | | | | 1,143 | *@# | |
Goldcorp, Inc. | | | 300,000 | | | | 7,419,000 | | |
Gran Colombia Gold Corp. | | | 740,394 | | | | 1,309,622 | * | |
Kinross Gold Corp., 144A | | | 1 | | | | 5 | | |
Nevsun Resources Ltd. | | | 650,000 | | | | 1,917,500 | | |
NGEx Resources, Inc. | | | 1,500,000 | | | | 2,852,931 | * | |
Randgold Resources Ltd., Sponsored ADR | | | 90,000 | | | | 5,764,500 | | |
Rusoro Mining Ltd. | | | 3,119,433 | | | | 0 | *@# | |
Sunridge Gold Corp. | | | 4,850,000 | | | | 645,714 | * | |
| | | | 21,175,933 | | |
Independent Power Producer 0.46% | |
Calpine Corp. | | | 85,000 | | | | 1,804,550 | * | |
Medical - Hospitals 0.00% | |
African Medical Investments plc | | | 2,507,500 | | | | 8,580 | * | |
See notes to portfolios of investments and notes to financial statements.
104
Portfolio of Investments (unaudited) June 30, 2013
Common Stocks (cont'd) | | Shares | | Value | |
Metal - Copper 3.93% | |
Catalyst Copper Corp. | | | 1,800,000 | | | $ | 42,794 | * | |
Catalyst Copper Corp., 144A | | | 5,000,000 | | | | 118,872 | * | |
Freeport-McMoRan Copper & Gold, Inc. | | | 265,000 | | | | 7,316,650 | | |
Los Andes Copper Ltd. | | | 754,000 | | | | 164,919 | * | |
Southern Copper Corp. | | | 280,000 | | | | 7,733,600 | | |
Verona Development Corp. | | | 708,800 | | | | 0 | *@# | |
| | | | 15,376,835 | | |
Metal - Diversified 3.05% | |
Bell Copper Corp. | | | 2,500,000 | | | | 11,887 | * | |
Concordia Resource Corp. | | | 1,000,000 | | | | 142,647 | * | |
Glencore Xstrata plc | | | 1,750,000 | | | | 7,279,216 | | |
GoviEx Uranium, Inc., 144A (RS) | | | 750,000 | | | | 1,180,050 | *@# | |
HudBay Minerals, Inc. | | | 500,000 | | | | 3,300,000 | | |
Orsu Metals Corp., 144A | | | 147,605 | | | | 8,422 | * | |
| | | | 11,922,222 | | |
Metal - Iron 0.36% | |
Andean Pacific Iron Corp., 144A (RS) | | | 2,600,000 | | | | 1,210,560 | *@# | |
Oceanic Iron Ore Corp. | | | 2,000,000 | | | | 161,666 | * | |
West African Iron Ore Corp., 144A | | | 2,925,000 | | | | 55,632 | * | |
| | | | 1,427,858 | | |
Mining Services 0.34% | |
Bounty Mining Ltd. | | | 22,000,000 | | | | 251,501 | *@# | |
Natasa Mining Ltd. | | | 1,036,350 | | | | 1,079,616 | * | |
| | | | 1,331,117 | | |
Natural Resource Technology 0.01% | |
I-Pulse, Inc., 144A (RS) | | | 15,971 | | | | 50,947 | *@# | |
Non - Ferrous Metals 0.22% | |
Anfield Nickel Corp. | | | 290,000 | | | | 813,561 | * | |
Sterling Group Ventures, Inc., 144A | | | 500,000 | | | | 45,000 | * | |
| | | | 858,561 | | |
Oil - Field Services 4.10% | |
Hornbeck Offshore Services, Inc. | | | 210,000 | | | | 11,235,000 | * | |
Pioneer Energy Services Corp. | | | 730,000 | | | | 4,832,600 | * | |
| | | | 16,067,600 | | |
Oil - US Royalty Trusts 0.25% | |
BP Prudhoe Bay Royalty Trust | | | 10,000 | | | | 962,700 | | |
See notes to portfolios of investments and notes to financial statements.
105
Portfolio of Investments (unaudited) June 30, 2013
Common Stocks (cont'd) | | Shares | | Value | |
Oil Companies - Exploration & Production 14.27% | |
Africa Oil Corp. | | | 231,000 | | | $ | 1,548,714 | * | |
Africa Oilfield Logistics Ltd. | | | 55,834,483 | | | | 5,519,350 | *+ | |
Anadarko Petroleum Corp. | | | 120,000 | | | | 10,311,600 | | |
Birchcliff Energy Ltd. | | | 220,000 | | | | 1,707,194 | * | |
BNK Petroleum, Inc. | | | 931,300 | | | | 752,798 | * | |
Continental Resources, Inc. | | | 130,000 | | | | 11,187,800 | * | |
Gran Tierra Energy, Inc. | | | 1,195,000 | | | | 7,181,950 | * | |
Horn Petroleum Corp., 144A | | | 2,110,889 | | | | 491,815 | * | |
Ivanhoe Energy, Inc. | | | 138,033 | | | | 122,078 | * | |
Pacific Rubiales Energy Corp. | | | 9,288 | | | | 163,139 | | |
Petroamerica Oil Corp. | | | 7,268,000 | | | | 1,762,484 | * | |
Petromanas Energy, Inc. | | | 5,544,000 | | | | 553,583 | * | |
Pioneer Natural Resources Co. | | | 50,800 | | | | 7,353,300 | | |
Range Energy Resources, Inc. | | | 100,000 | | | | 1,664 | *+ | |
Range Energy Resources, Inc., 144A | | | 15,000,000 | | | | 249,631 | *+ | |
Royalite Petroleum Co., Inc. | | | 2,266,333 | | | | 2,040 | * | |
ShaMaran Petroleum Corp. | | | 5,250,000 | | | | 1,797,347 | * | |
Southwestern Energy Co. | | | 120,000 | | | | 4,383,600 | * | |
U.S. Oil Sands, Inc., 144A | | | 7,777,777 | | | | 776,631 | * | |
| | | | 55,866,718 | | |
Oil Companies - Integrated 1.46% | |
Marathon Oil Corp. | | | 80,000 | | | | 2,766,400 | | |
Phillips 66 | | | 50,000 | | | | 2,945,500 | | |
| | | | 5,711,900 | | |
Oil Field Machinery & Equipment 3.14% | |
Cameron International Corp. | | | 105,000 | | | | 6,421,800 | * | |
Dresser-Rand Group, Inc. | | | 98,000 | | | | 5,878,040 | * | |
| | | | 12,299,840 | | |
Oil Field Services 2.09% | |
Superior Energy Services, Inc. | | | 315,000 | | | | 8,171,100 | * | |
Oil Refining & Marketing 1.22% | |
Marathon Petroleum Corp. | | | 65,000 | | | | 4,618,900 | | |
Value Creation, Inc. (RS) | | | 336,880 | | | | 147,368 | *@# | |
| | | | 4,766,268 | | |
Paper & Related Products 1.24% | |
International Paper Co. | | | 110,000 | | | | 4,874,100 | | |
Pipelines 2.69% | |
Kinder Morgan, Inc. | | | 275,600 | | | | 10,514,140 | | |
See notes to portfolios of investments and notes to financial statements.
106
Portfolio of Investments (unaudited) June 30, 2013
Common Stocks (cont'd) | | Shares | | Value | |
Precious Metals 0.16% | |
Fortress Minerals Corp. | | | 170,200 | | | $ | 623,147 | * | |
Quarrying 1.44% | |
Pacific Stone Tech, Inc. (RS) | | | 22,659 | | | | 5,644,130 | *+@# | |
Real Estate Operating/Development 2.14% | |
Mongolia Growth Group Ltd. | | | 285,000 | | | | 929,628 | * | |
Pacific Infrastructure, Inc. (RS) | | | 7,443,544 | | | | 7,443,544 | *@# | |
| | | | 8,373,172 | | |
Silver Mining 1.00% | |
First Majestic Silver Corp. | | | 370,000 | | | | 3,918,300 | * | |
Steel - Producers 1.84% | |
Reliance Steel & Aluminum Co. | | | 110,000 | | | | 7,211,600 | | |
Total Common Stocks | | | 296,551,577 | | |
(cost $378,635,530) | |
Real Estate Investment Trusts (REIT) 3.59%
Plum Creek Timber Co., Inc. | | | 130,000 | | | | 6,067,100 | | |
Weyerhaeuser Co. | | | 280,000 | | | | 7,977,200 | | |
Total Real Estate Investment Trusts | | | 14,044,300 | | |
(cost $11,040,902) | |
Exchange-Traded Funds (ETF) 2.99%
ETFS Palladium Trust | | | 100,000 | | | | 6,465,000 | * | |
ETFS Platinum Trust | | | 40,000 | | | | 5,244,000 | * | |
Total Exchange-Traded Funds | | | 11,709,000 | | |
(cost $12,228,485) | |
Warrants 0.67%
Diversified Minerals 0.00% | |
Niocan, Inc., 144A, Warrants (August 2014) | | | 260,000 | | | | 0 | *@# | |
See notes to portfolios of investments and notes to financial statements.
107
Portfolio of Investments (unaudited) June 30, 2013
Warrants (cont'd) | | Shares | | Value | |
Gold Mining 0.62% | |
Dundee Precious Metals, Inc., Warrants (November 2015) | | | 728,561 | | | $ | 1,441,117 | * | |
Gran Colombia Gold Corp., 144A, Warrants (October 2017) | | | 86,150 | | | | 0 | *@# | |
New Gold, Inc., 144A, Warrants (June 2017) | | | 822,570 | | | | 1,009,097 | * | |
| | | | 2,450,214 | | |
Medical - Hospitals 0.00% | |
African Medical Investments plc, Warrants (June 2014) | | | 1,162,500 | | | | 0 | *@# | |
Metal - Copper 0.00% | |
Catalyst Copper Corp., 144A, Warrants (February 2017) | | | 2,500,000 | | | | 0 | *@# | |
Metal - Iron 0.00% | |
West African Iron Ore Corp., 144A, Warrants (March 2016) | | | 2,925,000 | | | | 13,908 | * | |
Oil Companies - Exploration & Production 0.05% | |
Horn Petroleum Corp., 144A, Warrants (September 2013) | | | 2,110,889 | | | | 50,185 | * | |
Petroamerica Oil Corp., 144A, Warrants (October 2014) | | | 8,000,000 | | | | 133,137 | * | |
U.S. Oil Sands, Inc., 144A, Warrants (May 2014) | | | 7,777,777 | | | | 0 | *@# | |
| | | | 183,322 | | |
Total Warrants | | | 2,647,444 | | |
(cost $672,412) | |
Purchased Call Options 0.27% | | Contracts | | | |
Agricultural Chemicals 0.05% | |
Monsanto Co., Strike Price 100, Expiration Jan. 2014 | | | 300 | | | | 191,250 | | |
Diversified Minerals 0.03% | |
BHP Billiton Ltd., Strike Price 60, Expiration Jan. 2014 | | | 350 | | | | 130,375 | | |
Metal - Copper 0.05% | |
Freeport-McMoRan Copper & Gold, Inc., Strike Price 24,
Expiration Jan. 2014 | | | 500 | | | | 197,500 | | |
Oil Companies - Integrated 0.03% | |
Phillips 66, Strike Price 60, Expiration Aug. 2013 | | | 400 | | | | 94,000 | | |
Oil Field Machinery & Equipment 0.09% | |
Cameron International Corp., Strike Price 57.50, Expiration Nov. 2013 | | | 500 | | | | 350,000 | | |
See notes to portfolios of investments and notes to financial statements.
108
Portfolio of Investments (unaudited) June 30, 2013
Purchased Call Options (cont'd) | | Contracts | | Value | |
Oil Refining & Marketing 0.02% | |
Marathon Petroleum Corp., Strike Price 72.50, Expiration Oct. 2013 | | | 200 | | | $ | 94,000 | | |
Total Purchased Call Options | | | 1,057,125 | | |
(cost $1,480,565) | |
Purchased Put Option 0.12%
Diversified Minerals 0.12% | |
BHP Billiton Ltd., Strike Price 60, Expiration Jan. 2014 | | | 650 | | | | 459,875 | | |
(cost $450,962) | |
Master Limited Partnerships 6.48% | | Units | | | |
Pipelines 6.48% | |
Atlas Energy L.P. | | | 55,000 | | | | 2,694,450 | | |
Enterprise Products Partners L.P. | | | 178,000 | | | | 11,062,700 | | |
Western Gas Partners L.P. | | | 179,000 | | | | 11,615,310 | | |
Total Master Limited Partnerships | | | 25,372,460 | | |
(cost $19,470,176) | |
Convertible Bond 0.17% | | Principal
Amount | | | |
Mining Services 0.17% | |
Great Western Minerals Group Ltd., 8.00%, maturity 04/06/17 | | $ | 1,000,000 | | | | 658,500 | | |
(cost $1,000,000) | |
Gold-Linked Note 2.07%
Gold Mining 2.07% | |
Gran Colombia Gold Corp., 10.00%, maturity 10/31/17 | | | 8,615,000 | | | | 8,098,100 | @# | |
(cost $8,615,000) | |
See notes to portfolios of investments and notes to financial statements.
109
Portfolio of Investments (unaudited) June 30, 2013
Silver-Linked Notes 0.79% | | Principal
Amount | | Value | |
Gold Mining 0.79% | |
Gran Colombia Gold Corp., 5.00%, maturity 08/11/18 | | $ | 4,711,000 | | | $ | 2,167,060 | | |
Gran Colombia Gold Corp., 144A, 5.00%, maturity 08/11/18 | | | 2,000,000 | | | | 920,000 | | |
Total Silver-Linked Notes | | | 3,087,060 | | |
(cost $5,791,599) | |
Corporate Note 0.77%
Electric - Generation 0.77% | |
Pacific Power Generation Corp., 15.00%, maturity 04/03/17 (RS) | | | 3,000,000 | | | | 3,000,000 | @# | |
(cost $3,000,000) | |
Total Investments 93.68% | | | 366,685,441 | | |
(cost $442,385,631) | |
Other assets and liabilities, net 6.32% | | | 24,743,180 | | |
Net Assets 100% | | $ | 391,428,621 | | |
See notes to portfolios of investments and notes to financial statements.
110
Portfolio of Investments (unaudited) June 30, 2013
World Precious Minerals Fund
Common Stocks 71.52% | | Shares | | Value | |
Agricultural Operations 0.79% | |
Agriterra Ltd. | | | 38,506,200 | | | $ | 1,165,349 | * | |
Coal 1.11% | |
Pacific Coal Resources Ltd. | | | 657,464 | | | | 268,850 | * | |
Sable Mining Africa Ltd. | | | 18,071,500 | | | | 1,369,265 | * | |
| | | | 1,638,115 | | |
Diamonds/Precious Stones 1.24% | |
Gold Standard Ventures Corp. | | | 880,000 | | | | 554,400 | * | |
Lucara Diamond Corp. | | | 1,275,000 | | | | 969,997 | * | |
Northern Superior Resources, Inc., Class A | | | 1,510,900 | | | | 71,841 | * | |
Olivut Resources Ltd. | | | 645,000 | | | | 202,415 | * | |
Rockwell Diamonds, Inc., 144A | | | 171,667 | | | | 30,610 | * | |
| | | | 1,829,263 | | |
Diversified Minerals 1.82% | |
Adamera Minerals Corp. | | | 139,538 | | | | 7,298 | * | |
African Potash Ltd. | | | 3,000,000 | | | | 79,723 | * | |
Aldridge Minerals, Inc. | | | 2,060,000 | | | | 401,598 | * | |
Amarc Resources Ltd. | | | 695,545 | | | | 42,994 | * | |
Calibre Mining Corp. | | | 3,799,500 | | | | 180,662 | * | |
Elissa Resources Ltd., 144A | | | 36,250 | | | | 1,379 | * | |
Indochine Mining Ltd. | | | 7,785,500 | | | | 347,154 | * | |
Moss Lake Gold Mines Ltd. | | | 3,353,500 | | | | 223,237 | *+ | |
Sirocco Mining, Inc. | | | 2,783,600 | | | | 1,402,984 | * | |
| | | | 2,687,029 | | |
Finance - Investment Banker/Broker 0.48% | |
Aberdeen International, Inc. | | | 2,425,000 | | | | 345,918 | | |
Difference Capital Financial, Inc. | | | 100,000 | | | | 370,881 | * | |
| | | | 716,799 | | |
Gold Mining 44.80% | |
Agnico-Eagle Mines Ltd. | | | 115,236 | | | | 3,173,599 | | |
Alamos Gold, Inc. | | | 196,886 | | | | 2,385,362 | | |
Almaden Minerals Ltd. | | | 580,000 | | | | 821,834 | * | |
Americas Bullion Royalty Corp. | | | 2,970,200 | | | | 338,951 | * | |
Atna Resources Ltd. | | | 1,746,700 | | | | 182,718 | * | |
AuRico Gold, Inc. | | | 128,288 | | | | 560,619 | | |
B2Gold Corp. | | | 2,945,000 | | | | 6,273,406 | * | |
Banro Corp. | | | 400,000 | | | | 300,000 | * | |
Belo Sun Mining Corp. | | | 500,000 | | | | 223,480 | * | |
Besra Gold, Inc. | | | 605,390 | | | | 25,907 | * | |
Brazilian Gold Corp. | | | 500,000 | | | | 57,059 | * | |
See notes to portfolios of investments and notes to financial statements.
111
Portfolio of Investments (unaudited) June 30, 2013
World Precious Minerals Fund
Common Stocks (cont'd) | | Shares | | Value | |
Gold Mining (cont'd) | |
Canyon Resources Ltd. | | | 4,337,729 | | | $ | 178,518 | *+ | |
Caza Gold Corp. | | | 1,200,000 | | | | 68,470 | * | |
CB Gold, Inc. | | | 1,135,000 | | | | 194,285 | * | |
Centerra Gold, Inc. | | | 390,000 | | | | 1,231,325 | | |
Chalice Gold Mines Ltd. | | | 3,900,000 | | | | 553,555 | * | |
Chesapeake Gold Corp. | | | 410,000 | | | | 1,243,783 | * | |
Chesapeake Gold Corp., 144A | | | 192,199 | | | | 583,058 | * | |
Choice Gold Corp. | | | 975,000 | | | | 30,134 | * | |
Choice Gold Corp., 144A | | | 870,000 | | | | 26,889 | * | |
Comstock Mining, Inc. | | | 1,066,351 | | | | 1,759,479 | * | |
Corona Minerals Ltd. | | | 812,500 | | | | 18,577 | *@# | |
Coventry Resources, Inc. | | | 1,779,100 | | | | 135,351 | * | |
Doray Minerals Ltd. | | | 1,200,000 | | | | 438,009 | * | |
Dundee Precious Metals, Inc. | | | 276,082 | | | | 1,128,955 | * | |
Eastmain Resources, Inc. | | | 976,000 | | | | 250,602 | * | |
Edgewater Exploration Ltd. | | | 500,000 | | | | 57,059 | * | |
Goldcorp, Inc. | | | 2,017 | | | | 49,880 | | |
Gran Colombia Gold Corp. | | | 1,042,193 | | | | 1,843,449 | *+ | |
Guyana Goldfields, Inc. | | | 225,000 | | | | 288,859 | * | |
Harmony Gold Mining Co., Ltd., Sponsored ADR | | | 600,000 | | | | 2,286,000 | | |
Kilo Goldmines Ltd. | | | 2,510,000 | | | | 71,609 | * | |
Kimber Resources, Inc. | | | 1,000,000 | | | | 93,800 | * | |
Kinross Gold Corp. | | | 23,850 | | | | 121,635 | | |
Klondex Mines Ltd. | | | 4,575,832 | | | | 5,134,784 | *+ | |
Lexam VG Gold, Inc. | | | 2,376,000 | | | | 192,059 | * | |
Lexam VG Gold, Inc., 144A | | | 2,406,501 | | | | 194,525 | * | |
Luna Gold Corp. | | | 723,839 | | | | 722,772 | * | |
Malbex Resources, Inc. | | | 450,000 | | | | 7,489 | * | |
Malbex Resources, Inc., 144A | | | 1,333,333 | | | | 22,189 | * | |
Mammoth Resources Corp. | | | 1,000,000 | | | | 47,549 | *+ | |
Midway Gold Corp. | | | 571,863 | | | | 539,267 | * | |
Mirasol Resources Ltd. | | | 2,231,600 | | | | 2,589,085 | *+ | |
NGEx Resources, Inc. | | | 2,464,949 | | | | 4,688,220 | * | |
OceanaGold Corp. | | | 1,000,000 | | | | 1,236,270 | * | |
Pacific Rim Mining Corp., 144A | | | 133,500 | | | | 6,983 | * | |
Papillon Resources Ltd. | | | 2,000,000 | | | | 1,217,549 | * | |
Petaquilla Minerals Ltd., 144A | | | 2,660,000 | | | | 885,360 | * | |
Pilot Gold, Inc. | | | 1,543,200 | | | | 1,174,038 | * | |
PMI Gold Corp. | | | 739,100 | | | | 224,918 | * | |
Premier Gold Mines Ltd. | | | 350,000 | | | | 609,101 | * | |
Pretium Resources, Inc. | | | 350,000 | | | | 2,323,237 | * | |
Radius Gold, Inc. | | | 2,040,000 | | | | 155,199 | * | |
Radius Gold, Inc., 144A | | | 125,000 | | | | 9,510 | * | |
Renaissance Gold, Inc. | | | 557,000 | | | | 111,236 | * | |
Revolution Resources Corp., 144A | | | 570,000 | | | | 27,103 | * | |
Richmont Mines, Inc. | | | 210,000 | | | | 319,200 | * | |
See notes to portfolios of investments and notes to financial statements.
112
Portfolio of Investments (unaudited) June 30, 2013
World Precious Minerals Fund
Common Stocks (cont'd) | | Shares | | Value | |
Gold Mining (cont'd) | |
Rusoro Mining Ltd. | | | 6,325,900 | | | $ | 0 | *@# | |
Rye Patch Gold Corp. | | | 4,081,000 | | | | 756,783 | * | |
Rye Patch Gold Corp., 144A | | | 1,800,000 | | | | 333,793 | * | |
Seafield Resources Ltd., 144A | | | 1,300,000 | | | | 67,995 | * | |
SEMAFO, Inc. | | | 150,000 | | | | 221,102 | | |
Solvista Gold Corp., 144A | | | 2,620,000 | | | | 498,312 | * | |
St Barbara Ltd. | | | 1,500,000 | | | | 616,021 | * | |
Sulliden Gold Corp. Ltd. | | | 1,000,000 | | | | 751,272 | * | |
Sunridge Gold Corp. | | | 3,201,227 | | | | 426,201 | * | |
Taurus Gold Ltd., 144A (RS) | | | 2,448,381 | | | | 672,325 | *@# | |
Timmins Gold Corp. | | | 460,385 | | | | 1,015,732 | * | |
Tolima Gold, Inc. | | | 60,000 | | | | 1,997 | * | |
Tolima Gold, Inc., 144A | | | 4,100,000 | | | | 136,465 | * | |
Torex Gold Resources, Inc. | | | 1,250,000 | | | | 1,581,000 | * | |
TriStar Gold, Inc. | | | 1,392,000 | | | | 463,316 | * | |
True Gold Mining, Inc. | | | 1,225,000 | | | | 291,237 | * | |
Veris Gold Corp. | | | 300,000 | | | | 109,838 | * | |
Virginia Mines, Inc. | | | 838,600 | | | | 6,978,032 | * | |
West Kirkland Mining, Inc. | | | 1,500,000 | | | | 160,477 | * | |
Yamana Gold, Inc. | | | 187,500 | | | | 1,783,125 | | |
| | | | 66,298,882 | | |
Gold/Mineral Royalty Companies 0.60% | |
Franco-Nevada Corp. | | | 25,000 | | | | 894,250 | | |
Investment Companies 0.00% | |
Invictus Financial, Inc. | | | 49,800 | | | | 4,736 | *@# | |
Medical - Hospitals 0.01% | |
African Medical Investments plc | | | 4,637,500 | | | | 15,869 | * | |
Metal - Copper 0.63% | |
Catalyst Copper Corp. | | | 1,564,000 | | | | 37,183 | * | |
Catalyst Copper Corp., 144A | | | 2,000,000 | | | | 47,549 | * | |
Lumina Copper Corp. | | | 30,000 | | | | 138,367 | * | |
Nevada Copper Corp. | | | 375,000 | | | | 716,799 | * | |
Verona Development Corp. | | | 48,500 | | | | 0 | *@# | |
| | | | 939,898 | | |
Metal - Diversified 5.98% | |
Balmoral Resources Ltd. | | | 1,210,500 | | | | 333,836 | * | |
Bell Copper Corp. | | | 2,000,000 | | | | 9,510 | * | |
Cardinal Resources Ltd. | | | 1,866,308 | | | | 72,540 | * | |
Dalradian Resources, Inc. | | | 1,696,000 | | | | 935,457 | * | |
First Point Minerals Corp. | | | 2,400,000 | | | | 308,117 | * | |
See notes to portfolios of investments and notes to financial statements.
113
Portfolio of Investments (unaudited) June 30, 2013
World Precious Minerals Fund
Common Stocks (cont'd) | | Shares | | Value | |
Metal - Diversified (cont'd) | |
Foran Mining Corp. | | | 516,500 | | | $ | 122,795 | * | |
Imperial Metals Corp. | | | 257,500 | | | | 2,571,204 | * | |
Ivanplats Ltd., Class A | | | 100,000 | | | | 145,499 | * | |
Mandalay Resources Corp. | | | 2,530,000 | | | | 1,636,061 | | |
Mariana Resources Ltd. | | | 4,235,000 | | | | 82,111 | * | |
Novo Resources Corp. | | | 1,101,000 | | | | 774,799 | * | |
Orex Minerals, Inc. | | | 1,521,000 | | | | 455,627 | * | |
Orsu Metals Corp. | | | 289,800 | | | | 16,536 | * | |
Orsu Metals Corp., 144A | | | 1,800,000 | | | | 102,706 | * | |
Silver Bull Resources, Inc. | | | 2,100,000 | | | | 808,500 | * | |
Temex Resources Corp. | | | 950,000 | | | | 99,377 | * | |
Trevali Mining Corp. | | | 700,000 | | | | 372,783 | * | |
| | | | 8,847,458 | | |
Metal - Iron 1.25% | |
Andean Pacific Iron Corp., 144A (RS) | | | 3,960,000 | | | | 1,843,776 | *@# | |
Mining Services 1.45% | |
Argent Minerals Ltd. | | | 5,625,000 | | | | 139,329 | * | |
Energold Drilling Corp. | | | 410,000 | | | | 658,932 | * | |
Natasa Mining Ltd. | | | 1,300,849 | | | | 1,355,157 | * | |
| | | | 2,153,418 | | |
Oil Companies - Exploration & Production 0.00% | |
Big Sky Energy Corp. | | | 2,000,000 | | | | 0 | *@# | |
Platinum 0.77% | |
Pacific North West Capital Corp., 144A | | | 1,291,666 | | | | 42,992 | * | |
Platinum Group Metals Ltd. | | | 1,261,000 | | | | 1,103,248 | * | |
| | | | 1,146,240 | | |
Precious Metals 5.82% | |
Candente Gold Corp. | | | 765,000 | | | | 54,562 | *+ | |
Candente Gold Corp., 144A | | | 4,875,000 | | | | 347,701 | *+ | |
Fortress Minerals Corp. | | | 204,300 | | | | 747,996 | * | |
Fortress Minerals Corp., 144A | | | 70,000 | | | | 256,288 | * | |
Pan African Resources plc | | | 8,249,810 | | | | 1,594,199 | * | |
Polymetal International plc | | | 180,100 | | | | 1,248,506 | | |
Primero Mining Corp. | | | 74,934 | | | | 334,925 | * | |
Primero Mining Corp., CDI | | | 368,000 | | | | 1,644,810 | * | |
Roxgold, Inc. | | | 1,500,000 | | | | 549,189 | * | |
Sabina Gold & Silver Corp. | | | 899,400 | | | | 838,203 | * | |
Santana Minerals Ltd. | | | 1,925,800 | | | | 126,803 | * | |
Solitario Exploration & Royalty Corp. | | | 975,000 | | | | 877,500 | * | |
| | | | 8,620,682 | | |
See notes to portfolios of investments and notes to financial statements.
114
Portfolio of Investments (unaudited) June 30, 2013
World Precious Minerals Fund
Common Stocks (cont'd) | | Shares | | Value | |
Silver Mining 4.77% | |
First Majestic Silver Corp. | | | 77,164 | | | $ | 817,167 | * | |
MAG Silver Corp. | | | 770,000 | | | | 4,503,352 | * | |
Pan American Silver Corp. | | | 25,067 | | | | 291,780 | | |
Santacruz Silver Mining Ltd. | | | 949,500 | | | | 893,923 | * | |
SilverCrest Mines, Inc. | | | 400,000 | | | | 547,763 | * | |
| | | | 7,053,985 | | |
Total Common Stocks | | | 105,855,749 | | |
(cost $273,851,737) | | | | | |
Exchange-Traded Funds (ETF) 3.13%
ETFS Palladium Trust | | | 6,500 | | | | 420,225 | * | |
ETFS Platinum Trust | | | 3,000 | | | | 393,300 | * | |
Market Vectors Gold Miners ETF | | | 20 | | | | 488 | | |
Market Vectors Junior Gold Miners ETF | | | 35 | | | | 321 | | |
SPDR Gold Trust | | | 32,000 | | | | 3,812,800 | * | |
Total Exchange-Traded Funds | | | 4,627,134 | | |
(cost $5,952,229) | | | | | |
Warrants 3.51%
Finance - Investment Banker/Broker 0.00% | |
Difference Capital Funding, Inc., 144A, Warrants (October 2014) | | | 500,000 | | | | 0 | *@# | |
Gold Mining 3.21% | |
Choice Gold Corp., 144A, Warrants (December 2013) | | | 870,000 | | | | 0 | *@# | |
Crystallex International Corp., 144A, Warrants (December 2049) | | | 162,500 | | | | 0 | *@# | |
Dundee Precious Metals, Inc., Warrants (November 2015) | | | 1,470,151 | | | | 2,908,006 | * | |
Endeavour Mining Corp., Warrants (February 2014) | | | 1,030,000 | | | | 26,936 | * | |
Gran Colombia Gold Corp., 144A, Warrants (October 2017) | | | 58,450 | | | | 0 | *@# | |
Kinross Gold Corp., Warrants (September 2013) | | | 788,411 | | | | 3,749 | * | |
Kinross Gold Corp., Warrants (September 2014) | | | 250,000 | | | | 20,208 | * | |
New Gold, Inc., Warrants (June 2017) | | | 1,031,279 | | | | 1,265,132 | * | |
New Gold, Inc., 144A, Warrants (June 2017) | | | 352,530 | | | | 432,470 | * | |
Petaquilla Minerals Ltd., 144A, Warrants (January 2014) | | | 2,660,000 | | | | 0 | *@# | |
Solvista Gold Corp., 144A, Warrants (April 2014) | | | 1,310,000 | | | | 0 | *@# | |
Tolima Gold, Inc., 144A, Warrants (December 2013) | | | 2,050,000 | | | | 0 | *@# | |
Torex Gold Resources, Inc., Warrants (October 2013) | | | 4,782,500 | | | | 90,961 | * | |
See notes to portfolios of investments and notes to financial statements.
115
Portfolio of Investments (unaudited) June 30, 2013
World Precious Minerals Fund
Warrants (cont'd) | | Shares | | Value | |
Gold Mining (cont'd) | |
Veris Gold Corp., Warrants (December 2016) | | | 282,200 | | | $ | 10,064 | * | |
| | | | 4,757,526 | | |
Gold/Mineral Royalty Companies 0.29% | |
Franco-Nevada Corp., Warrants (July 2013) | | | 7,400 | | | | 35 | * | |
Franco-Nevada Corp., 144A, Warrants (July 2013) | | | 125,000 | | | | 594 | * | |
Franco-Nevada Corp., Warrants (June 2017) | | | 130,667 | | | | 422,489 | * | |
| | | | 423,118 | | |
Medical - Hospitals 0.00% | |
African Medical Investments plc, Warrants (June 2014) | | | 2,125,000 | | | | 0 | *@# | |
Metal - Copper 0.00% | |
Catalyst Copper Corp., 144A, Warrants (February 2017) | | | 1,000,000 | | | | 0 | *@# | |
Metal - Diversified 0.01% | |
Cardinal Resources Ltd., Warrants (June 2014) | | | 2,799,462 | | | | 8,961 | * | |
Silver Bull Resources, Inc., Warrants (August 2014) | | | 500,000 | | | | 0 | *@# | |
| | | | 8,961 | | |
Total Warrants | | | 5,189,605 | | |
(cost $9,674,332) | |
Special Warrants 0.00%
Gold/Mineral Exploration & Development 0.00% | |
Western Exploration & Development Ltd., 144A, Special Warrants
(December 2049) (RS) | | | 600,000 | | | | 0 | *@# | |
(cost $300,000) | |
Purchased Call Options 2.53% | | Contracts | | | |
Exchange-Traded Funds 0.58% | |
Market Vectors Gold Miners ETF, Strike Price 23, Expiration Jan. 2014 | | | 281 | | | | 109,590 | | |
Market Vectors Gold Miners ETF, Strike Price 30, Expiration Jan. 2014 | | | 1,000 | | | | 135,000 | | |
Market Vectors Gold Miners ETF, Strike Price 38, Expiration Jan. 2014 | | | 1,274 | | | | 46,501 | | |
Market Vectors Junior Gold Miners ETF, Strike Price 12, Expiration Aug. 2013 | | | 24 | | | | 360 | | |
Market Vectors Junior Gold Miners ETF, Strike Price 9, Expiration Jan. 2014 | | | 632 | | | | 110,600 | | |
Market Vectors Junior Gold Miners ETF, Strike Price 12, Expiration Jan. 2014 | | | 5,000 | | | | 425,000 | | |
Market Vectors Junior Gold Miners ETF, Strike Price 16, Expiration Jan. 2014 | | | 849 | | | | 29,715 | | |
| | | | 856,766 | | |
See notes to portfolios of investments and notes to financial statements.
116
Portfolio of Investments (unaudited) June 30, 2013
World Precious Minerals Fund
Purchased Call Options (cont'd) | | Shares | | Value | |
Gold Mining 1.30% | |
Agnico-Eagle Mines Ltd., Strike Price 32.50, Expiration Jan. 2014 | | | 2,079 | | | $ | 458,420 | | |
Agnico-Eagle Mines Ltd., Strike Price 35, Expiration Jan. 2014 | | | 166 | | | | 26,643 | | |
Agnico-Eagle Mines Ltd., Strike Price 40, Expiration Jan. 2014 | | | 425 | | | | 37,825 | | |
AngloGold Ashanti Ltd., Strike Price 25, Expiration Jan. 2014 | | | 641 | | | | 11,217 | | |
AuRico Gold, Inc., Strike Price 5, Expiration Jan. 2014 | | | 2,294 | | | | 120,435 | | |
Barrick Gold Corp., Strike Price 32, Expiration July 2013 | | | 1,500 | | | | 1,500 | | |
Barrick Gold Corp., Strike Price 18, Expiration Jan. 2014 | | | 225 | | | | 36,113 | | |
Barrick Gold Corp., Strike Price 20, Expiration Jan. 2014 | | | 999 | | | | 110,390 | | |
Barrick Gold Corp., Strike Price 23, Expiration Jan. 2014 | | | 100 | | | | 6,450 | | |
Barrick Gold Corp., Strike Price 30, Expiration Jan. 2014 | | | 1,075 | | | | 20,425 | | |
Eldorado Gold Corp., Strike Price 8, Expiration Jan. 2014 | | | 3,299 | | | | 164,950 | | |
Eldorado Gold Corp., Strike Price 13, Expiration Jan. 2014 | | | 740 | | | | 5,550 | | |
Gold Fields Ltd., Strike Price 8, Expiration Jan. 2014 | | | 575 | | | | 8,912 | | |
Goldcorp, Inc., Strike Price 36, Expiration July 2013 | | | 945 | | | | 1,890 | | |
Goldcorp, Inc., Strike Price 30, Expiration Jan. 2014 | | | 775 | | | | 122,837 | | |
Goldcorp, Inc., Strike Price 65, Expiration Jan. 2014 | | | 1,460 | | | | 6,570 | | |
IAMGOLD Corp., Strike Price 8, Expiration Jan. 2014 | | | 1,492 | | | | 22,380 | | |
Kinross Gold Corp., Strike Price 5, Expiration Jan. 2014 | | | 522 | | | | 44,370 | | |
Kinross Gold Corp., Strike Price 12, Expiration Jan. 2014 | | | 1,937 | | | | 17,433 | | |
Newmont Mining Corp., Strike Price 40, Expiration Jan. 2014 | | | 1,075 | | | | 87,612 | | |
Randgold Resources Ltd., Strike Price 82.50, Expiration Jan. 2014 | | | 326 | | | | 92,910 | | |
Yamana Gold, Inc., Strike Price 10, Expiration Jan. 2014 | | | 3,375 | | | | 453,938 | | |
Yamana Gold, Inc., Strike Price 13, Expiration Jan. 2014 | | | 500 | | | | 28,750 | | |
Yamana Gold, Inc., Strike Price 15, Expiration Jan. 2014 | | | 1,099 | | | | 35,168 | | |
| | | | 1,922,688 | | |
Platinum 0.15% | |
Stillwater Mining Co., Strike Price 12, Expiration Jan. 2014 | | | 1,932 | | | | 222,180 | | |
Silver Mining 0.50% | |
First Majestic Silver Corp., Strike Price 12.50, Expiration Jan. 2014 | | | 1,634 | | | | 204,250 | | |
First Majestic Silver Corp., Strike Price 15, Expiration Jan. 2014 | | | 57 | | | | 4,275 | | |
Pan American Silver Corp., Strike Price 13, Expiration Jan. 2014 | | | 671 | | | | 80,520 | | |
Pan American Silver Corp., Strike Price 15, Expiration Jan. 2014 | | | 339 | | | | 23,730 | | |
Silver Wheaton Corp., Strike Price 25, Expiration Jan. 2014 | | | 2,833 | | | | 405,119 | | |
Silver Wheaton Corp., Strike Price 33, Expiration Jan. 2014 | | | 400 | | | | 19,200 | | |
| | | | 737,094 | | |
Total Purchased Call Options | | | 3,738,728 | | |
(cost $10,806,735) | |
See notes to portfolios of investments and notes to financial statements.
117
Portfolio of Investments (unaudited) June 30, 2013
World Precious Minerals Fund
Convertible Bond 0.20% | | Principal
Amount | | Value | |
Gold Mining 0.20% | |
Lake Shore Gold Corp., 6.25%, maturity 09/30/17 | | CAD | 500,000 | | | $ | 294,803 | | |
(cost $414,367) | |
Gold-Linked Note 3.71%
Gold Mining 3.71% | |
Gran Colombia Gold Corp., 144A, 10.00%, maturity 10/31/17 | | $ | 5,845,000 | | | | 5,494,300 | @# | |
(cost $5,845,000) | |
Silver-Linked Notes 2.68%
Gold Mining 2.68% | |
Gran Colombia Gold Corp., 5.00%, maturity 08/11/18 | | | 477,000 | | | | 219,420 | | |
Gran Colombia Gold Corp., 144A, 5.00%, maturity 08/11/18 | | | 8,150,000 | | | | 3,749,000 | | |
Total Silver-Linked Notes | | | 3,968,420 | | |
(cost $8,538,167) | |
Corporate Note 0.54%
Electric - Generation 0.54% | |
Pacific Power Generation Corp., 15.00%, maturity 04/03/17 (RS) | | | 800,000 | | | | 800,000 | @# | |
(cost $800,000) | |
Total Investments 87.82% | | | 129,968,739 | | |
(cost $316,182,567) | |
Other assets and liabilities, net 12.18% | | | 18,029,209 | | |
Net Assets 100% | | $ | 147,997,948 | | |
See notes to portfolios of investments and notes to financial statements.
118
Portfolio of Investments (unaudited) June 30, 2013
Gold and Precious Metals Fund
Common Stocks 44.39% | | Shares | | Value | |
Commercial Banks - Non US 0.78% | |
Sprott Resource Lending Corp. | | | 550,000 | | | $ | 679,949 | | |
Gold Mining 30.92% | |
Agnico-Eagle Mines Ltd. | | | 57,764 | | | | 1,590,821 | | |
Alacer Gold Corp. | | | 225,000 | | | | 475,013 | | |
Alamos Gold, Inc. | | | 112,506 | | | | 1,363,061 | | |
Atna Resources Ltd. | | | 779,800 | | | | 81,573 | * | |
AuRico Gold, Inc. | | | 160,312 | | | | 700,563 | | |
B2Gold Corp. | | | 1,500,000 | | | | 3,195,283 | * | |
Banro Corp. | | | 450,000 | | | | 337,500 | * | |
Centerra Gold, Inc. | | | 420,000 | | | | 1,326,043 | | |
Cia de Minas Buenaventura S.A., Sponsored ADR | | | 20,000 | | | | 295,200 | | |
Comstock Mining, Inc. | | | 1,048,637 | | | | 1,730,251 | * | |
DRDGOLD Ltd., Sponsored ADR | | | 125,000 | | | | 678,750 | | |
Dundee Precious Metals, Inc. | | | 123,288 | | | | 504,149 | * | |
Endeavour Mining Corp. | | | 300,000 | | | | 159,764 | * | |
Goldcorp, Inc. | | | 2,983 | | | | 73,770 | | |
Gran Colombia Gold Corp. | | | 405,766 | | | | 717,726 | * | |
Harmony Gold Mining Co., Ltd., Sponsored ADR | | | 450,000 | | | | 1,714,500 | | |
Kinross Gold Corp. | | | 101,150 | | | | 515,865 | | |
Kirkland Lake Gold, Inc. | | | 75,000 | | | | 315,249 | * | |
Lake Shore Gold Corp. | | | 500,000 | | | | 152,156 | * | |
Luna Gold Corp. | | | 487,961 | | | | 487,242 | * | |
McEwen Mining, Inc. | | | 300,000 | | | | 504,000 | * | |
Nevsun Resources Ltd. | | | 275,000 | | | | 811,250 | | |
New Gold, Inc. | | | 68,000 | | | | 436,560 | * | |
Newcrest Mining Ltd. | | | 100,000 | | | | 898,147 | | |
Newcrest Mining Ltd., Sponsored ADR | | | 50,000 | | | | 473,500 | | |
OceanaGold Corp. | | | 1,000,000 | | | | 1,236,270 | * | |
Osisko Mining Corp. | | | 150,000 | | | | 496,410 | * | |
Richmont Mines, Inc. | | | 100,000 | | | | 152,000 | * | |
Rio Alto Mining Ltd. | | | 300,000 | | | | 556,322 | * | |
Royal Gold, Inc. | | | 12,000 | | | | 504,960 | | |
Sandstorm Gold Ltd. | | | 355,000 | | | | 2,082,973 | * | |
SEMAFO, Inc. | | | 100,000 | | | | 147,401 | | |
St Barbara Ltd. | | | 500,000 | | | | 205,340 | * | |
Timmins Gold Corp. | | | 204,615 | | | | 451,435 | * | |
Veris Gold Corp. | | | 320,700 | | | | 117,417 | * | |
Yamana Gold, Inc. | | | 170,000 | | | | 1,616,700 | | |
| | | | 27,105,164 | | |
Gold/Mineral Royalty Companies 2.04% | |
Franco-Nevada Corp. | | | 50,000 | | | | 1,788,500 | | |
See notes to portfolios of investments and notes to financial statements.
119
Portfolio of Investments (unaudited) June 30, 2013
Gold and Precious Metals Fund
Common Stocks (cont'd) | | Shares | | Value | |
Medical - Hospitals 0.01% | |
African Medical Investments plc | | | 2,000,000 | | | $ | 6,843 | * | |
Metal - Diversified 2.57% | |
Imperial Metals Corp. | | | 111,500 | | | | 1,113,357 | * | |
Mandalay Resources Corp. | | | 1,758,500 | | | | 1,137,159 | | |
| | | | 2,250,516 | | |
Mining Services 0.39% | |
Major Drilling Group International, Inc. | | | 50,000 | | | | 340,450 | | |
Oil Companies - Exploration & Production 2.83% | |
Anadarko Petroleum Corp. | | | 5,000 | | | | 429,650 | | |
QEP Resources, Inc. | | | 20,000 | | | | 555,600 | | |
SM Energy Co. | | | 25,000 | | | | 1,499,500 | | |
| | | | 2,484,750 | | |
Precious Metals 2.11% | |
Pan African Resources plc | | | 4,150,190 | | | | 801,986 | * | |
Polymetal International plc | | | 151,400 | | | | 1,049,549 | | |
| | | | 1,851,535 | | |
Silver Mining 2.74% | |
First Majestic Silver Corp. | | | 62,836 | | | | 665,433 | * | |
Pan American Silver Corp. | | | 125,833 | | | | 1,464,696 | | |
SilverCrest Mines, Inc. | | | 200,000 | | | | 273,882 | * | |
| | | | 2,404,011 | | |
Total Common Stocks | | | 38,911,718 | | |
(cost $86,559,841) | |
Exchange-Traded Funds (ETF) 7.88%
ETFS Palladium Trust | | | 14,000 | | | | 905,100 | * | |
ETFS Physical Silver Shares | | | 40,000 | | | | 776,800 | * | |
ETFS Platinum Trust | | | 10,000 | | | | 1,311,000 | * | |
Market Vectors Gold Miners ETF | | | 20 | | | | 488 | | |
Market Vectors Junior Gold Miners ETF | | | 35 | | | | 321 | | |
SPDR Gold Trust | | | 32,800 | | | | 3,908,120 | * | |
Total Exchange-Traded Funds | | | 6,901,829 | | |
(cost $9,001,775) | |
See notes to portfolios of investments and notes to financial statements.
120
Portfolio of Investments (unaudited) June 30, 2013
Gold and Precious Metals Fund
Warrants 4.38% | | Shares | | Value | |
Gold Mining 4.10% | |
Crystallex International Corp., 144A, Warrants (December 2049) | | | 62,500 | | | $ | 0 | *@# | |
Dundee Precious Metals, Inc., Warrants (November 2015) | | | 1,601,287 | | | | 3,167,398 | * | |
Endeavour Mining Corp., Warrants (February 2014) | | | 382,500 | | | | 10,003 | * | |
Gran Colombia Gold Corp., 144A, Warrants (October 2017) | | | 29,400 | | | | 0 | *@# | |
Kinross Gold Corp., Warrants (September 2013) | | | 662,394 | | | | 3,149 | * | |
Kinross Gold Corp., Warrants (September 2014) | | | 130,000 | | | | 10,508 | * | |
New Gold, Inc., Warrants (June 2017) | | | 325,621 | | | | 399,459 | * | |
Veris Gold Corp., Warrants (December 2016) | | | 195,300 | | | | 6,965 | * | |
| | | | 3,597,482 | | |
Gold/Mineral Royalty Companies 0.28% | |
Franco-Nevada Corp., 144A, Warrants (July 2013) | | | 125,000 | | | | 594 | * | |
Franco-Nevada Corp., Warrants (June 2017) | | | 75,533 | | | | 244,223 | * | |
| | | | 244,817 | | |
Medical - Hospitals 0.00% | |
African Medical Investments plc, Warrants (June 2014) | | | 912,500 | | | | 0 | *@# | |
Total Warrants | | | 3,842,299 | | |
(cost $6,504,021) | |
Purchased Call Options 3.70% | | Contracts | | | |
Exchange-Traded Funds 0.60% | |
Market Vectors Gold Miners ETF, Strike Price 23, Expiration Jan. 2014 | | | 169 | | | | 65,910 | | |
Market Vectors Gold Miners ETF, Strike Price 30, Expiration Jan. 2014 | | | 1,000 | | | | 135,000 | | |
Market Vectors Gold Miners ETF, Strike Price 38, Expiration Jan. 2014 | | | 749 | | | | 27,339 | | |
Market Vectors Junior Gold Miners ETF, Strike Price 12, Expiration Aug. 2013 | | | 16 | | | | 240 | | |
Market Vectors Junior Gold Miners ETF, Strike Price 9, Expiration Jan. 2014 | | | 368 | | | | 64,400 | | |
Market Vectors Junior Gold Miners ETF, Strike Price 12, Expiration Jan. 2014 | | | 2,500 | | | | 212,500 | | |
Market Vectors Junior Gold Miners ETF, Strike Price 16, Expiration Jan. 2014 | | | 475 | | | | 16,625 | | |
| | | | 522,014 | | |
Gold Mining 2.09% | |
Agnico-Eagle Mines Ltd., Strike Price 32.50, Expiration Jan. 2014 | | | 1,040 | | | | 229,320 | | |
Agnico-Eagle Mines Ltd., Strike Price 35, Expiration Jan. 2014 | | | 84 | | | | 13,482 | | |
Agnico-Eagle Mines Ltd., Strike Price 40, Expiration Jan. 2014 | | | 250 | | | | 22,250 | | |
AngloGold Ashanti Ltd., Strike Price 25, Expiration Jan. 2014 | | | 322 | | | | 5,635 | | |
AuRico Gold, Inc., Strike Price 5, Expiration Jan. 2014 | | | 2,573 | | | | 135,082 | | |
Barrick Gold Corp., Strike Price 32, Expiration July 2013 | | | 1,000 | | | | 1,000 | | |
Barrick Gold Corp., Strike Price 18, Expiration Jan. 2014 | | | 225 | | | | 36,113 | | |
Barrick Gold Corp., Strike Price 20, Expiration Jan. 2014 | | | 500 | | | | 55,250 | | |
Barrick Gold Corp., Strike Price 23, Expiration Jan. 2014 | | | 100 | | | | 6,450 | | |
See notes to portfolios of investments and notes to financial statements.
121
Portfolio of Investments (unaudited) June 30, 2013
Gold and Precious Metals Fund
Purchased Call Options (cont'd) | | Shares | | Value | |
Gold Mining (cont'd) | |
Barrick Gold Corp., Strike Price 30, Expiration Jan. 2014 | | | 600 | | | $ | 11,400 | | |
Eldorado Gold Corp., Strike Price 8, Expiration Jan. 2014 | | | 2,000 | | | | 100,000 | | |
Eldorado Gold Corp., Strike Price 13, Expiration Jan. 2014 | | | 626 | | | | 4,695 | | |
Gold Fields Ltd., Strike Price 8, Expiration Jan. 2014 | | | 500 | | | | 7,750 | | |
Goldcorp, Inc., Strike Price 36, Expiration July 2013 | | | 520 | | | | 1,040 | | |
Goldcorp, Inc., Strike Price 30, Expiration Jan. 2014 | | | 650 | | | | 103,025 | | |
Goldcorp, Inc., Strike Price 65, Expiration Jan. 2014 | | | 708 | | | | 3,186 | | |
IAMGOLD Corp., Strike Price 8, Expiration Jan. 2014 | | | 978 | | | | 14,670 | | |
Kinross Gold Corp., Strike Price 5, Expiration Jan. 2014 | | | 2,784 | | | | 236,640 | | |
Kinross Gold Corp., Strike Price 12, Expiration Jan. 2014 | | | 1,438 | | | | 12,942 | | |
Kinross Gold Corp., Strike Price 3, Expiration Jan. 2015 | | | 300 | | | | 70,650 | | |
New Gold, Inc., Strike Price 8, Expiration Jan. 2014 | | | 2,000 | | | | 100,000 | | |
Newmont Mining Corp., Strike Price 40, Expiration Jan. 2014 | | | 600 | | | | 48,900 | | |
Randgold Resources Ltd., Strike Price 82.50, Expiration Jan. 2014 | | | 189 | | | | 53,865 | | |
Royal Gold, Inc., Strike Price 60, Expiration Jan. 2014 | | | 424 | | | | 61,480 | | |
Yamana Gold, Inc., Strike Price 10, Expiration Jan. 2014 | | | 3,374 | | | | 453,803 | | |
Yamana Gold, Inc., Strike Price 13, Expiration Jan. 2014 | | | 500 | | | | 28,750 | | |
Yamana Gold, Inc., Strike Price 15, Expiration Jan. 2014 | | | 600 | | | | 19,200 | | |
| | | | 1,836,578 | | |
Platinum 0.13% | |
Stillwater Mining Co., Strike Price 12, Expiration Jan. 2014 | | | 967 | | | | 111,205 | | |
Silver Mining 0.88% | |
First Majestic Silver Corp., Strike Price 12.50, Expiration Jan. 2014 | | | 1,298 | | | | 162,250 | | |
First Majestic Silver Corp., Strike Price 15, Expiration Jan. 2014 | | | 43 | | | | 3,225 | | |
Pan American Silver Corp., Strike Price 13, Expiration Jan. 2014 | | | 2,228 | | | | 267,360 | | |
Pan American Silver Corp., Strike Price 15, Expiration Jan. 2014 | | | 434 | | | | 30,380 | | |
Silver Wheaton Corp., Strike Price 25, Expiration Jan. 2014 | | | 2,066 | | | | 295,438 | | |
Silver Wheaton Corp., Strike Price 33, Expiration Jan. 2014 | | | 299 | | | | 14,352 | | |
| | | | 773,005 | | |
Total Purchased Call Options | | | 3,242,802 | | |
(cost $8,127,653) | |
Master Limited Partnership 3.07% | | Units | | | |
Pipelines 3.07% | |
Atlas Energy L.P. | | | 55,000 | | | | 2,694,450 | | |
(cost $1,726,513) | |
See notes to portfolios of investments and notes to financial statements.
122
Portfolio of Investments (unaudited) June 30, 2013
Gold and Precious Metals Fund
Convertible Bond 0.34% | | Principal
Amount | | Value | |
Gold Mining 0.34% | |
Lake Shore Gold Corp., 6.25%, maturity 09/30/17 | | CAD | 500,000 | | | $ | 294,803 | | |
(cost $414,367) | |
Corporate Bonds 0.38% | |
Gold Mining 0.16% | |
Eldorado Gold Corp., 6.13%, maturity 12/15/20 | | $ | 60,000 | | | | 58,200 | | |
IAMGOLD Corp., 6.75%, maturity 10/01/20 | | | 60,000 | | | | 51,000 | | |
Kinross Gold Corp., 5.13%, maturity 09/01/21 | | | 30,000 | | | | 29,049 | | |
| | | | 138,249 | | |
Metal - Diversified 0.22% | |
HudBay Minerals, Inc., 9.50%, maturity 10/01/20 | | | 200,000 | | | | 196,000 | | |
Total Corporate Bonds | | | 334,249 | | |
(cost $348,125) | |
Gold-Linked Note 3.15% | |
Gold Mining 3.15% | |
Gran Colombia Gold Corp., 144A, 10.00%, maturity 10/31/17 | | | 2,940,000 | | | | 2,763,600 | @# | |
(cost $2,940,000) | |
Silver-Linked Notes 2.36% | |
Gold Mining 2.36% | |
Gran Colombia Gold Corp., 5.00%, maturity 08/11/18 | | | 250,000 | | | | 115,000 | | |
Gran Colombia Gold Corp., 144A, 5.00%, maturity 08/11/18 | | | 4,250,000 | | | | 1,955,000 | | |
Total Silver-Linked Notes | | | 2,070,000 | | |
(cost $4,465,286) | |
Corporate Notes 4.60% | |
Electric - Generation 0.34% | |
Pacific Power Generation Corp., 15.00%, maturity 04/03/17 (RS) | | | 300,000 | | | | 300,000 | @# | |
See notes to portfolios of investments and notes to financial statements.
123
Portfolio of Investments (unaudited) June 30, 2013
Gold and Precious Metals Fund
Corporate Notes (cont'd) | | Principal
Amount | | Value | |
Gold Mining 4.26% | |
Barrick Gold Corp., 6.95%, maturity 04/01/19 | | $ | 1,700,000 | | | $ | 1,805,420 | | |
Newmont Mining Corp., 6.25%, maturity 10/01/39 | | | 2,000,000 | | | | 1,922,116 | | |
| | | | 3,727,536 | | |
Total Corporate Notes | | | 4,027,536 | | |
(cost $4,766,529) | |
Total Investments 74.25% | | | 65,083,286 | | |
(cost $124,854,110) | |
Other assets and liabilities, net 25.75% | | | 22,573,687 | | |
Net Assets 100% | | $ | 87,656,973 | | |
See notes to portfolios of investments and notes to financial statements.
124
Portfolio of Investments (unaudited) June 30, 2013
Common Stocks 82.63% | | Shares | | Value | |
Agricultural Chemicals 0.93% | |
Uralkali OJSC, Sponsored GDR | | | 36,600 | | | $ | 1,207,873 | | |
Agricultural Operations 0.33% | |
Kernel Holding S.A. | | | 30,000 | | | | 432,044 | * | |
Automotive - Cars & Light Trucks 4.35% | |
Tofas Turk Otomobil Fabrikasi A.S. | | | 910,200 | | | | 5,673,090 | | |
Beverages - Non-alcoholic 0.33% | |
Coca-Cola Icecek A.S. | | | 15,000 | | | | 431,097 | | |
Brewery 0.95% | |
Anadolu Efes Biracilik Ve Malt Sanayii AS | | | 85,000 | | | | 1,233,690 | | |
Building Products - Cement/Aggregates 0.22% | |
Akcansa Cimento A.S. | | | 50,000 | | | | 293,895 | | |
Cellular Telecommunication 10.40% | |
KCell JSC, 144A, GDR | | | 120,000 | | | | 1,806,000 | | |
Mobile TeleSystems OJSC | | | 940,114 | | | | 7,487,406 | | |
Turkcell Iletisim Hizmetleri A.S. | | | 263,094 | | | | 1,524,911 | * | |
Turkcell Iletisim Hizmetleri A.S., Sponsored ADR | | | 191,700 | | | | 2,754,729 | * | |
| | | | 13,573,046 | | |
Chemicals - Diversified 2.55% | |
Synthos S.A. | | | 2,427,081 | | | | 3,324,772 | | |
Coal 0.00% | |
Eastcoal, Inc. | | | 52,100 | | | | 867 | * | |
Commercial Banks - Non US 15.59% | |
Bank of Georgia Holdings plc | | | 9,978 | | | | 253,254 | | |
Erste Group Bank AG | | | 240,702 | | | | 6,408,313 | | |
Sberbank of Russia, Sponsored ADR | | | 470,800 | | | | 5,367,941 | | |
Turkiye Garanti Bankasi A.S. | | | 800,000 | | | | 3,482,353 | | |
Turkiye Halk Bankasi A.S. | | | 35,000 | | | | 295,832 | | |
Turkiye Is Bankasi, Class C | | | 708,600 | | | | 2,088,149 | | |
Turkiye Vakiflar Bankasi T.A.O., Class D | | | 620,600 | | | | 1,542,234 | | |
Yapi ve Kredi Bankasi A.S. | | | 400,000 | | | | 907,612 | | |
| | | | 20,345,688 | | |
Diversified Banking Institutions 0.54% | |
UniCredit SpA | | | 150,000 | | | | 701,373 | | |
See notes to portfolios of investments and notes to financial statements.
125
Portfolio of Investments (unaudited) June 30, 2013
Common Stocks (cont'd) | | Shares | | Value | |
Diversified Operations 0.52% | |
Tekfen Holding A.S. | | | 200,000 | | | $ | 682,631 | | |
Electric - Generation 1.37% | |
CEZ A.S. | | | 74,588 | | | | 1,787,562 | | |
Finance - Investment Banker/Broker 2.24% | |
Turkiye Sinai Kalkinma Bankasi A.S. | | | 2,964,369 | | | | 2,928,711 | | |
Food - Confectionery 0.00% | |
Wawel S.A. | | | 6 | | | | 1,406 | | |
Food - Retail 7.84% | |
Jeronimo Martins, SGPS, S.A. | | | 157,700 | | | | 3,319,161 | | |
Magnit OJSC | | | 30,000 | | | | 6,908,842 | | |
| | | | 10,228,003 | | |
Gold Mining 1.31% | |
Dundee Precious Metals, Inc. | | | 16,530 | | | | 67,595 | * | |
Koza Altin Isletmeleri A.S. | | | 136,000 | | | | 1,648,687 | | |
| | | | 1,716,282 | | |
Housewares 0.43% | |
Turkiye Sise ve Cam Fabrikalari A.S. | | | 400,000 | | | | 558,889 | | |
Machinery - Farm 1.64% | |
Turk Traktor ve Ziraat Makineleri A.S. | | | 60,900 | | | | 2,142,446 | | |
Medical - Drugs 0.52% | |
Richter Gedeon Nyrt. | | | 4,500 | | | | 674,231 | | |
Metal - Diversified 4.31% | |
KGHM Polska Miedz S.A. | | | 59,200 | | | | 2,142,091 | | |
MMC Norilsk Nickel OJSC, Sponsored ADR | | | 225,000 | | | | 3,218,940 | | |
Orsu Metals Corp. | | | 664,240 | | | | 37,901 | * | |
Orsu Metals Corp., 144A | | | 4,025,000 | | | | 229,661 | * | |
| | | | 5,628,593 | | |
Oil Companies - Exploration & Production 9.41% | |
BNK Petroleum, Inc. | | | 465,600 | | | | 376,359 | * | |
Gazprom OAO, Sponsored ADR | | | 607,002 | | | | 3,997,021 | | |
Genel Energy plc | | | 238,339 | | | | 3,323,400 | * | |
NovaTek OAO, Sponsored GDR | | | 38,600 | | | | 4,586,670 | | |
| | | | 12,283,450 | | |
See notes to portfolios of investments and notes to financial statements.
126
Portfolio of Investments (unaudited) June 30, 2013
Common Stocks (cont'd) | | Shares | | Value | |
Oil Companies - Integrated 5.29% | |
Lukoil OAO, Sponsored ADR | | | 98,800 | | | $ | 5,636,418 | | |
MOL Hungarian Oil & Gas Nyrt. | | | 17,000 | | | | 1,271,741 | | |
| | | | 6,908,159 | | |
Oil Refining & Marketing 2.07% | |
Tupras Turkiye Petrol Rafinerileri A.S. | | | 110,500 | | | | 2,696,960 | | |
Precious Metals 0.50% | |
Polymetal International plc | | | 93,500 | | | | 648,169 | | |
Retail - Apparel/Shoe 0.60% | |
Salvatore Ferragamo Italia SpA | | | 25,000 | | | | 778,652 | | |
Steel Pipe & Tube 0.18% | |
OAO TMK, Sponsored GDR | | | 20,000 | | | | 229,951 | | |
Television 0.79% | |
Cyfrowy Polsat S.A. | | | 184,000 | | | | 1,025,623 | * | |
Textile - Products 0.24% | |
Pegas Nonwovens S.A. | | | 12,000 | | | | 310,995 | | |
Tobacco 1.37% | |
Philip Morris CR A.S. | | | 3,194 | | | | 1,792,657 | | |
Web Portals/Internet Service Providers 5.81% | |
Mail.ru Group Ltd., GDR | | | 100,000 | | | | 2,864,435 | | |
Yandex N.V., Class A | | | 170,700 | | | | 4,716,441 | *^ | |
| | | | 7,580,876 | | |
Total Common Stocks | | | 107,821,681 | | |
(cost $103,257,999) | |
Preferred Stock 1.15%
Oil Companies - Integrated 1.15% | |
Surgutneftegas OJSC | | | 2,390,000 | | | | 1,503,346 | | |
(cost $1,707,718) | |
Real Estate Investment Trust (REIT) 0.91%
Sinpas Gayrimenkul Yatirim Ortakligi A.S. | | | 2,000,000 | | | | 1,190,271 | | |
(cost $1,269,166) | |
See notes to portfolios of investments and notes to financial statements.
127
Portfolio of Investments (unaudited) June 30, 2013
Exchange-Traded Fund (ETF) 1.29% | | Shares | | Value | |
Sprott Physical Platinum & Palladium Trust | | | 200,000 | | | $ | 1,680,000 | * | |
(cost $2,000,000) | |
Warrants 0.93%
Gold Mining 0.93% | |
Dundee Precious Metals, Inc., Warrants (November 2015) | | | 612,441 | | | | 1,211,428 | * | |
(cost $745,262) | |
Purchased Call Options 0.15% | | Contracts | | | |
Exchange-Traded Funds 0.15% | |
Market Vectors Russia ETF, Strike Price 27, Expiration Aug. 2013 | | | 3,300 | | | | 123,750 | | |
Market Vectors Russia ETF, Strike Price 28, Expiration Aug. 2013 | | | 3,300 | | | | 66,000 | | |
Total Purchased Call Options | | | 189,750 | | |
(cost $788,205) | |
Corporate Note 1.22% | | Principal
Amount | | | |
Transportation - Services 1.22% | |
Baghlan Group FZCO, 14.75%, maturity 06/27/15 | | $ | 1,600,000 | | | | 1,590,808 | @# | |
(cost $1,612,000) | |
Total Investments 88.28% | | | 115,187,284 | | |
(cost $111,380,350) | |
Other assets and liabilities, net 11.72% | | | 15,295,021 | | |
Net Assets 100% | | $ | 130,482,305 | | |
Written Call Option | | Shares Subject
To Call | | | |
Yandex N.V., Strike Price 28, Expiration Aug. 2013
(premiums received $196,208) (Note 2A) | | | 100,000 | | | $ | 152,500 | | |
See notes to portfolios of investments and notes to financial statements.
128
Portfolio of Investments (unaudited) June 30, 2013
Global Emerging Markets Fund
Common Stocks 88.54% | | Shares | | Value | |
Applications Software 4.28% | |
Hexaware Technologies Ltd. | | | 98,400 | | | $ | 143,730 | | |
Polaris Financial Technology Ltd. | | | 73,300 | | | | 140,890 | | |
| | | | 284,620 | | |
Audio/Video Products 1.99% | |
TCL Multimedia Technology Holdings Ltd. | | | 225,000 | | | | 131,872 | | |
Batteries/Battery System 2.00% | |
Dynapack International Technology Corp. | | | 44,000 | | | | 133,038 | | |
Building Products - Cement/Aggregates 2.40% | |
Eternit S.A. | | | 37,000 | | | | 159,158 | | |
Cellular Telecom 2.96% | |
KCell JSC, GDR | | | 13,100 | | | | 196,696 | | |
Circuit Boards 3.08% | |
Chin-Poon Industrial Co. | | | 140,000 | | | | 204,696 | | |
Coal 1.21% | |
PT Indika Energy Tbk | | | 1,037,300 | | | | 80,018 | | |
Commercial Banks - Non US 10.49% | |
Commercial International Bank Egypt SAE | | | 34,955 | | | | 143,126 | | |
Indian Overseas Bank | | | 97,700 | | | | 81,789 | | |
PT Bank Bukopin Tbk | | | 2,375,800 | | | | 172,269 | | |
PT Bank Pembangunan Daerah Jawa Barat Dan Banten Tbk | | | 1,389,600 | | | | 164,715 | | |
Syndicate Bank | | | 73,000 | | | | 134,769 | | |
| | | | 696,668 | | |
Computer Services 2.00% | |
Asseco Poland S.A. | | | 10,400 | | | | 133,145 | | |
Diversified Financial Services 1.96% | |
Tisco Financial Group PCL | | | 100,000 | | | | 130,505 | | |
Diversified Minerals 0.08% | |
African Potash Ltd. | | | 200,000 | | | | 5,315 | * | |
Diversified Operations 2.13% | |
Tekfen Holding A.S. | | | 41,400 | | | | 141,305 | | |
See notes to portfolios of investments and notes to financial statements.
129
Portfolio of Investments (unaudited) June 30, 2013
Global Emerging Markets Fund
Common Stocks (cont'd) | | Shares | | Value | |
Electronic Components - Miscellaneous 2.18% | |
ILI Technology Corp. | | | 55,000 | | | $ | 145,019 | | |
Finance - Leasing Company 2.72% | |
Woori Financial Co., Ltd. | | | 9,629 | | | | 180,801 | | |
Finance - Mortgage Loan/Banker 5.12% | |
Indiabulls Housing Finance Ltd. | | | 30,600 | | | | 139,217 | *@# | |
Malaysia Building Society Bhd | | | 206,800 | | | | 200,916 | | |
| | | | 340,133 | | |
Gambling (Non-Hotel) 2.31% | |
Asia Entertainment & Resources Ltd. | | | 36,579 | | | | 153,632 | | |
Gas - Distribution 2.14% | |
Korea District Heating Corp. | | | 1,800 | | | | 141,808 | | |
Gold Mining 0.08% | |
Gran Colombia Gold Corp. | | | 2,932 | | | | 5,186 | * | |
Internet Content - Entertainment 3.01% | |
Giant Interactive Group, Inc., Sponsored ADR | | | 25,000 | | | | 200,250 | | |
Machinery - General Industrial 1.79% | |
PT Hexindo Adiperkasa Tbk | | | 265,700 | | | | 119,122 | | |
Metal - Diversified 0.21% | |
Orsu Metals Corp. | | | 41,083 | | | | 2,344 | * | |
Orsu Metals Corp., 144A | | | 200,000 | | | | 11,412 | * | |
| | | | 13,756 | | |
Metal - Iron 2.31% | |
Andean Pacific Iron Corp., 144A (RS) | | | 330,000 | | | | 153,648 | *@# | |
Multi-line Insurance 3.10% | |
Syarikat Takaful Malaysia Bhd | | | 85,900 | | | | 205,705 | | |
Oil Companies - Exploration & Production 0.73% | |
Petrominerales Ltd. | | | 8,500 | | | | 48,500 | | |
Paper & Related Products 3.37% | |
Moorim P&P Co., Ltd. | | | 42,700 | | | | 223,849 | | |
See notes to portfolios of investments and notes to financial statements.
130
Portfolio of Investments (unaudited) June 30, 2013
Global Emerging Markets Fund
Common Stocks (cont'd) | | Shares | | Value | |
Real Estate Management/Services 3.26% | |
MBK PCL | | | 42,800 | | | $ | 216,861 | | |
Real Estate Operating/Development 11.72% | |
Chong Hong Construction Co. | | | 52,000 | | | | 186,477 | | |
Farglory Land Development Co., Ltd. | | | 84,700 | | | | 155,007 | | |
Helbor Empreendimentos S.A. | | | 33,700 | | | | 131,221 | | |
Huaku Development Co., Ltd. | | | 47,800 | | | | 137,300 | | |
Hung Poo Real Estate Development Corp. | | | 168,800 | | | | 164,348 | | |
KrisAssets Holdings Bhd | | | 182,500 | | | | 4,043 | @# | |
| | | | 778,396 | | |
Reinsurance 2.85% | |
MNRB Holdings Bhd | | | 168,000 | | | | 189,097 | | |
Retail - Automobile 2.07% | |
Dogus Otomotiv Servis ve Ticaret A.S. | | | 27,200 | | | | 137,762 | | |
Textile - Products 2.50% | |
Pegas Nonwovens S.A. | | | 6,400 | | | | 165,864 | | |
Transportation - Marine 2.49% | |
SITC International Holdings Co., Ltd. | | | 474,000 | | | | 165,292 | | |
Total Common Stocks | | | 5,881,717 | | |
(cost $6,503,296) | |
Preferred Stocks 4.38%
Commercial Banks - Non US 4.38% | |
Banco Daycoval S.A. | | | 34,800 | | | | 141,898 | | |
Banco Pine S.A. | | | 27,800 | | | | 148,856 | | |
Total Preferred Stocks | | | 290,754 | | |
(cost $371,167) | |
Real Estate Investment Trust (REIT) 2.29%
Al-Aqar Healthcare Real Estate Investment Trust | | | 362,300 | | | | 152,326 | | |
(cost $162,282) | |
See notes to portfolios of investments and notes to financial statements.
131
Portfolio of Investments (unaudited) June 30, 2013
Global Emerging Markets Fund
Corporate Note 0.75% | | Principal
Amount | | Value | |
Electric - Generation 0.75% | |
Pacific Power Generation Corp., 15.00%, maturity 04/03/17 (RS) | | $ | 50,000 | | | $ | 50,000 | @# | |
(cost $50,000) | |
Total Investments 95.96% | | | 6,374,797 | | |
(cost $7,086,745) | |
Other assets and liabilities, net 4.04% | | | 268,268 | | |
Net Assets 100% | | $ | 6,643,065 | | |
See notes to portfolios of investments and notes to financial statements.
132
Portfolio of Investments (unaudited) June 30, 2013
Common Stocks 95.09% | | Shares | | Value | |
Aerospace/Defense - Equipment 1.01% | |
AviChina Industry & Technology Co., Ltd., H shares | | | 504,000 | | | $ | 257,705 | | |
Airport Development/Maintenance 2.14% | |
Airports of Thailand PCL | | | 56,000 | | | | 300,476 | | |
Beijing Capital International Airport Co., Ltd., H shares | | | 376,000 | | | | 245,622 | | |
| | | | 546,098 | | |
Alternative Waste Technology 1.11% | |
China Everbright International Ltd. | | | 367,000 | | | | 283,232 | | |
Appliances 1.12% | |
Haier Electronics Group Co., Ltd. | | | 179,000 | | | | 285,496 | | |
Audio/Video Products 0.87% | |
TCL Multimedia Technology Holdings Ltd. | | | 380,000 | | | | 222,717 | | |
Automotive - Cars & Light Trucks 1.59% | |
Great Wall Motor Co., Ltd., H shares | | | 96,000 | | | | 406,957 | | |
Building - Heavy Construction 0.70% | |
Sino Thai Engineering & Construction PCL | | | 289,300 | | | | 178,980 | | |
Building - Residential/Commercial 0.94% | |
PT Waskita Karya Persero Tbk | | | 3,121,000 | | | | 239,928 | | |
Building & Construction - Miscellaneous 4.87% | |
China State Construction International Holdings Ltd. | | | 588,000 | | | | 913,011 | | |
PT Wijaya Karya Persero Tbk | | | 1,610,500 | | | | 330,360 | | |
| | | | 1,243,371 | | |
Building & Construction Products - Miscellaneous 1.64% | |
China Singyes Solar Technologies Holdings Ltd. | | | 400,000 | | | | 417,711 | | |
Building Products - Cement/Aggregates 0.98% | |
PT Semen Indonesia (Persero) Tbk | | | 146,000 | | | | 249,720 | | |
Casino Hotels 9.59% | |
Galaxy Entertainment Group Ltd. | | | 166,000 | | | | 801,076 | * | |
MGM China Holdings Ltd. | | | 132,000 | | | | 352,366 | | |
NagaCorp Ltd. | | | 684,000 | | | | 531,308 | | |
Sands China Ltd. | | | 102,800 | | | | 482,783 | | |
SJM Holdings Ltd. | | | 116,000 | | | | 279,436 | | |
| | | | 2,446,969 | | |
See notes to portfolios of investments and notes to financial statements.
133
Portfolio of Investments (unaudited) June 30, 2013
Common Stocks (cont'd) | | Shares | | Value | |
Casino Services 1.42% | |
Paradise Co., Ltd. | | | 18,026 | | | $ | 362,921 | | |
Chemicals - Specialty 1.01% | |
China Sanjiang Fine Chemicals Co. Ltd. | | | 535,000 | | | | 256,646 | | |
Commercial Banks - Non US 5.94% | |
Bank of China Ltd., H shares | | | 1,235,000 | | | | 504,146 | | |
China Construction Bank Corp., H shares | | | 406,000 | | | | 285,184 | | |
Industrial and Commercial Bank of China Ltd., H shares | | | 837,000 | | | | 523,123 | | |
Security Bank Corp. | | | 57,700 | | | | 202,428 | | |
| | | | 1,514,881 | | |
Computers - Other 1.63% | |
Ju Teng International Holdings Ltd. | | | 894,000 | | | | 416,881 | | |
Consumer Products - Miscellaneous 2.56% | |
Biostime International Holdings Ltd. | | | 75,000 | | | | 416,555 | | |
Goodbaby International Holdings Ltd. | | | 600,000 | | | | 237,256 | | |
| | | | 653,811 | | |
Containers - Paper/Plastic 1.11% | |
CPMC Holdings Ltd. | | | 386,000 | | | | 283,441 | | |
Diversified Banking Institutions 5.44% | |
HSBC Holdings plc | | | 132,800 | | | | 1,387,179 | | |
Diversified Minerals 0.11% | |
Woulfe Mining Corp. | | | 300,000 | | | | 28,500 | * | |
Diversified Operations 2.39% | |
Alliance Global Group, Inc. | | | 672,800 | | | | 360,751 | * | |
Ayala Corp. | | | 18,590 | | | | 248,482 | | |
| | | | 609,233 | | |
Electric - Generation 2.93% | |
China Datang Corporation Renewable Power Co., Ltd., H shares | | | 1,535,000 | | | | 326,496 | * | |
Huaneng Renewables Corp., Ltd., H shares | | | 1,176,000 | | | | 420,529 | | |
| | | | 747,025 | | |
Electronic Components - Miscellaneous 2.81% | |
AAC Technologies Holdings, Inc. | | | 69,000 | | | | 386,360 | | |
Truly International Holdings Ltd. | | | 678,000 | | | | 330,270 | | |
| | | | 716,630 | | |
See notes to portfolios of investments and notes to financial statements.
134
Portfolio of Investments (unaudited) June 30, 2013
Common Stocks (cont'd) | | Shares | | Value | |
Electronic Measuring Instruments 1.25% | |
Wasion Group Holdings Ltd. | | | 516,000 | | | $ | 318,367 | | |
Gas - Distribution 4.93% | |
Beijing Enterprises Holdings Ltd. | | | 72,800 | | | | 523,090 | | |
China Resources Gas Group Ltd. | | | 126,000 | | | | 320,031 | | |
ENN Energy Holdings Ltd. | | | 78,000 | | | | 414,858 | | |
| | | | 1,257,979 | | |
Gold Mining 0.06% | |
Besra Gold, Inc. | | | 354,110 | | | | 15,138 | * | |
Internet Application Software 2.56% | |
Tencent Holdings Ltd. | | | 16,600 | | | | 653,317 | | |
Internet Content - Entertainment 2.23% | |
NetEase, Inc., Sponsored ADR | | | 9,000 | | | | 568,530 | | |
Internet Security 1.09% | |
Qihoo 360 Technology Co., Ltd., Sponsored ADR | | | 6,000 | | | | 277,020 | * | |
Medical - Drugs 2.08% | |
Sino Biopharmaceutical Ltd. | | | 824,000 | | | | 531,171 | | |
Medical Products 2.05% | |
China Medical System Holdings Ltd. | | | 591,000 | | | | 523,727 | | |
Multimedia 1.18% | |
PT Media Nusantara Citra Tbk | | | 966,000 | | | | 301,500 | * | |
Non - Ferrous Metals 0.18% | |
Sterling Group Ventures, Inc., 144A | | | 500,000 | | | | 45,000 | * | |
Oil - Field Services 2.94% | |
Anton Oilfield Services Group | | | 688,000 | | | | 491,528 | | |
SPT Energy Group, Inc. | | | 428,000 | | | | 258,495 | | |
| | | | 750,023 | | |
Oil Field Machinery & Equipment 2.40% | |
CIMC Enric Holdings Ltd. | | | 218,000 | | | | 337,053 | | |
Hilong Holding Ltd. | | | 468,000 | | | | 274,079 | | |
| | | | 611,132 | | |
See notes to portfolios of investments and notes to financial statements.
135
Portfolio of Investments (unaudited) June 30, 2013
Common Stocks (cont'd) | | Shares | | Value | |
Petrochemicals 0.00% | |
Danhua Chemical Technology Co., Ltd., B shares | | | 2 | | | $ | 1 | * | |
Photo Equipment & Supplies 3.22% | |
Sunny Optical Technology Group Co., Ltd. | | | 686,000 | | | | 820,490 | | |
Pipelines 1.16% | |
China Oil & Gas Group Ltd. | | | 1,480,000 | | | | 296,614 | | |
Power Converters/Supply Equipment 0.98% | |
Boer Power Holdings Ltd. | | | 390,000 | | | | 251,109 | | |
Public Thoroughfares 1.34% | |
Shenzhen International Holdings Ltd. | | | 2,780,000 | | | | 340,702 | | |
Real Estate Operating/Development 1.69% | |
Robinsons Land Corp. | | | 442,800 | | | | 207,535 | | |
Vista Land & Lifescapes, Inc. | | | 1,732,100 | | | | 223,940 | | |
| | | | 431,475 | | |
Retail - Jewelry 0.00% | |
Lao Feng Xiang Co., Ltd., B shares | | | 1 | | | | 2 | | |
Retail - Perfume & Cosmetics 1.33% | |
S.A. S.A. International Holdings Ltd. | | | 346,000 | | | | 339,644 | | |
Retail - Restaurants 1.02% | |
Minor International PCL | | | 329,500 | | | | 259,617 | | |
Therapeutics 1.12% | |
Tong Ren Tang Technologies Co., Ltd., H shares | | | 94,000 | | | | 285,888 | | |
Tobacco 1.09% | |
PT Hanjaya Mandala Sampoerna Tbk | | | 32,500 | | | | 277,912 | | |
Transportation - Marine 1.23% | |
SITC International Holdings Co., Ltd. | | | 900,000 | | | | 313,845 | | |
Water 2.96% | |
Manila Water Co., Inc. | | | 330,000 | | | | 246,896 | | |
Metro Pacific Investments Corp. | | | 1,987,900 | | | | 242,143 | | |
Thai Tap Water Supply PCL | | | 823,100 | | | | 265,394 | | |
| | | | 754,433 | | |
See notes to portfolios of investments and notes to financial statements.
136
Portfolio of Investments (unaudited) June 30, 2013
Common Stocks (cont'd) | | Shares | | Value | |
Water Treatment Systems 1.09% | |
Beijing Enterprises Water Group Ltd. | | | 782,000 | | | $ | 279,236 | | |
Total Common Stocks | | | 24,259,904 | | |
(cost $24,011,482) | |
Purchased Call Options 0.26% | | Contracts | | | |
Exchange-Traded Funds 0.26% | |
iShares FTSE China 25 Index Fund, Strike Price 33, Expiration Jan. 2014 | | | 119 | | | | 25,407 | | |
iShares FTSE China 25 Index Fund, Strike Price 35, Expiration Jan. 2014 | | | 60 | | | | 7,860 | | |
iShares FTSE China 25 Index Fund, Strike Price 33, Expiration Jan. 2015 | | | 100 | | | | 33,750 | | |
Total Purchased Call Options | | | 67,017 | | |
(cost $91,629) | |
Total Investments 95.35% | | | 24,326,921 | | |
(cost $24,103,111) | |
Other assets and liabilities, net 4.65% | | | 1,187,335 | | |
Net Assets 100% | | $ | 25,514,256 | | |
See notes to portfolios of investments and notes to financial statements.
137
Notes to Portfolios of Investments (unaudited) June 30, 2013
Legend
* Non-income producing security
+ Affiliated company (see following)
ADR American Depositary Receipt
GDR Global Depositary Receipt
CDI CHESS Depositary Interest
GO General Obligation Bond
RS Restricted Security (see following)
ZCB Zero Coupon Bond
^ Security or portion of security segregated as collateral for written options
CAD Principal shown in Canadian dollars
# Illiquid security
@ Security was fair valued at June 30, 2013, by U.S. Global Investors, Inc. (Adviser) (other than international securities fair valued pursuant to systematic fair value models) in accordance with valuation procedures approved by the Board of Trustees. These securities, as a percentage of net assets at June 30, 2013, were 3.38% of Holmes Growth Fund, 13.65% of MegaTrends Fund, 8.20% of Global Resources Fund, 5.97% of World Precious Minerals Fund, 3.49% of Gold and Precious Metals Fund, 1.22% of Emerging Europe Fund and 5.22% of Global Emerging Markets Fund, respectively. See the Fair Valuation of Securities section of these Notes to Portfolios of Investments for further discussion of fair valued securities. See further information and detail on restricted securities in the Restricted Securities section of these Notes to Portfolios of Investments.
144A Pursuant to Rule 144A of the Securities Act of 1933, these securities may be resold in transactions exempt from registration, normally to qualified institutional buyers.
General
The yields reflect the effective yield from the date of purchase.
Variable Rate Notes have periodic reset features, which effectively shorten the maturity dates and reset the interest rates as tied to various interest-bearing instruments. Rates shown are current rates at June 30, 2013.
Principal amounts are in U.S. dollars unless otherwise noted.
Joint Tri-Party Repurchase Agreements
The terms of the joint tri-party repurchase agreements and the securities held as collateral at June 30, 2013, were:
Credit Suisse Securities USA LLC repurchase agreement, 06/28/13, 0.09%, due 07/01/13:
Total principal amount: $50,754,620; Total repurchase price: $50,755,000
Collateral:
$11,325,000 U.S. Treasury Note, 0.625%, 05/31/17
$46,960,200 U.S. Treasury Bond, 2.750%, 08/15/42
(total collateral market value, including accrued interest, of $51,771,822)
Morgan Stanley repurchase agreement, 06/28/13, 0.07%, due 07/01/13:
Total principal amount: $30,000,000; Total repurchase price: $30,000,175
Collateral:
$30,631,500 U.S. Treasury Bill, 0.000%, 05/01/14
(total collateral market value, including accrued interest, of $30,600,041)
138
Notes to Portfolios of Investments (unaudited) June 30, 2013
Fair Valuation of Securities
For the Funds' policies regarding the valuation of investments and other significant accounting policies, please refer to the Notes to Financial Statements.
The Funds are required to disclose information regarding the fair value measurements of a Fund's assets and liabilities. Fair value is the price that would be received to sell an asset or paid to transfer a liability in an orderly transaction between market participants at the measurement date. The disclosure requirement established a three-tier hierarchy to maximize the use of observable market data and minimize the use of unobservable inputs and to establish classification of fair value measurements for disclosure purposes. Inputs refer broadly to the assumptions that market participants would use in pricing the asset or liability, including assumptions about risk, for example, the risk inherent in a particular valuation technique used to measure fair value including such a pricing model and/or the risk inherent in the inputs to the valuation technique. Inputs may be observable or unobservable. Observable inputs are inputs that reflect the assumptions market participants would use in pricing the asset or liability developed based on market data obtained from sources independent of the reporting entity. Unobservable inputs are inputs that reflect the reporting entity's own assumptions about the assumptions market participants would use in pricing the asset or liability developed based on the best information available in the circumstances.
The inputs or methodology used for valuing securities are not necessarily an indication of the risk associated with investing in those securities. For example, short term U.S. government obligations are valued using amortized cost, in accordance with the Investment Company Act of 1940. Generally, amortized cost reflects the current fair value of a security, but since the value is not obtained from a quoted price in an active market, such securities are reflected as Level 2. Because of the inherent uncertainties of valuation, the values reflected in the portfolios may materially differ from the values received upon actual sale of those investments.
The three levels defined by the fair value hierarchy are as follows:
Level 1 – Quoted prices in active markets for identical securities.
Level 2 – Prices determined using significant other observable inputs (including quoted prices for similar securities, interest rates, prepayment speeds, credit risk, etc.). Short-term securities with maturities of sixty days or less are valued at amortized cost, which approximates market value, and are categorized as Level 2 in the hierarchy. Municipal securities, long-term U.S. government obligations and corporate debt securities are valued in accordance with the evaluated price supplied by the pricing service and generally categorized as Level 2 in the hierarchy. Other securities that are categorized as Level 2 in the hierarchy include, but are not limited to, warrants that do not trade on an exchange, securities valued at the mean between the last reported bid and ask quotation and international equity securities valued by an independent third party in order to adjust for stale pricing and foreign market holidays.
139
Notes to Portfolios of Investments (unaudited) June 30, 2013
Level 3 – Prices determined using significant unobservable inputs (including the Fund's own assumptions). For restricted equity securities and private placements where observable inputs are limited, assumptions about market activity and risk are used in determining fair value.
The following table summarizes the valuation of each Fund's securities as of June 30, 2013, using the fair value hierarchy:
| | | Quoted Prices
in Active
Markets for
Identical
Investments
(Level 1) | | Significant
Other
Observable
Inputs
(Level 2) | | Significant
Unobservable
Inputs
(Level 3) | | Total | |
U.S. Treasury Securities Cash Fund | |
Investments in Securities*
U.S. Government Obligations | | $ | — | | | $ | 19,999,966 | | | $ | — | | | $ | 19,999,966 | | |
Repurchase Agreements | | | — | | | | 57,938,388 | | | | — | | | | 57,938,388 | | |
Total | | $ | — | | | $ | 77,938,354 | | | $ | — | | | $ | 77,938,354 | | |
U.S. Government Securities Savings Fund | |
Investments in Securities*
U.S. Government and Agency Obligations | | $ | — | | | $ | 110,417,158 | | | $ | — | | | $ | 110,417,158 | | |
Repurchase Agreement | | | — | | | | 22,816,232 | | | | — | | | | 22,816,232 | | |
Total | | $ | — | | | $ | 133,233,390 | | | $ | — | | | $ | 133,233,390 | | |
Near-Term Tax Free Fund | |
Investments in Securities*
Municipal Bonds | | $ | — | | | $ | 48,194,670 | | | $ | — | | | $ | 48,194,670 | | |
Total | | $ | — | | | $ | 48,194,670 | | | $ | — | | | $ | 48,194,670 | | |
Tax Free Fund | |
Investments in Securities*
Municipal Bonds | | $ | — | | | $ | 19,656,202 | | | $ | — | | | $ | 19,656,202 | | |
Total | | $ | — | | | $ | 19,656,202 | | | $ | — | | | $ | 19,656,202 | | |
All American Equity Fund | |
Investments in Securities*
Common Stocks | | $ | 17,134,265 | | | $ | — | | | $ | — | | | $ | 17,134,265 | | |
Real Estate Investment Trust | | | 219,510 | | | | — | | | | — | | | | 219,510 | | |
Exchange-Traded Funds | | | 568,560 | | | | — | | | | — | | | | 568,560 | | |
Purchased Put Option: | |
Exchange-Traded Funds | | | — | | | | 67,500 | | | | — | | | | 67,500 | | |
Master Limited Partnership | | | 112,750 | | | | — | | | | — | | | | 112,750 | | |
Total | | $ | 18,035,085 | | | $ | 67,500 | | | $ | — | | | $ | 18,102,585 | | |
Other Financial Instruments | |
Written Call Option | | $ | — | | | $ | 5,130 | | | $ | — | | | $ | 5,130 | | |
Holmes Growth Fund | |
Investments in Securities*
Common Stocks: | |
Agricultural Operations | | $ | — | | | $ | 19,599 | | | $ | — | | | $ | 19,599 | | |
Medical - Hospitals | | | — | | | | 3,422 | | | | — | | | | 3,422 | | |
Metal - Iron | | | — | | | | — | | | | 200,208 | | | | 200,208 | | |
Quarrying | | | — | | | | — | | | | 437,651 | | | | 437,651 | | |
Real Estate Operating/Development | | | — | | | | — | | | | 100,000 | | | | 100,000 | | |
All Other Common Stocks | | | 30,793,627 | | | | — | | | | — | | | | 30,793,627 | | |
140
Notes to Portfolios of Investments (unaudited) June 30, 2013
| | | Quoted Prices
in Active
Markets for
Identical
Investments
(Level 1) | | Significant
Other
Observable
Inputs
(Level 2) | | Significant
Unobservable
Inputs
(Level 3) | | Total | |
Holmes Growth Fund (cont'd) | |
Investments in Securities* (cont'd) | |
Exchange-Traded Funds | | $ | 1,108,400 | | | $ | — | | | $ | — | | | $ | 1,108,400 | | |
Warrants: | |
Gold Mining | | | — | | | | — | | | | — | | | | — | | |
Medical - Hospitals | | | — | | | | — | | | | — | | | | — | | |
Purchased Put Option: | |
Exchange-Traded Funds | | | — | | | | 123,750 | | | | — | | | | 123,750 | | |
Master Limited Partnership | | | 225,500 | | | | — | | | | — | | | | 225,500 | | |
Gold-Linked Note: | |
Gold Mining | | | — | | | | — | | | | 347,800 | | | | 347,800 | | |
Silver-Linked Note | | | 145,360 | | | | — | | | | — | | | | 145,360 | | |
Corporate Note: | |
Electric - Generation | | | — | | | | — | | | | 150,000 | | | | 150,000 | | |
Total | | $ | 32,272,887 | | | $ | 146,771 | | | $ | 1,235,659 | | | $ | 33,655,317 | | |
Other Financial Instruments | |
Written Call Option | | $ | — | | | $ | 10,260 | | | $ | — | | | $ | 10,260 | | |
MegaTrends Fund | |
Investments in Securities*
Common Stocks: | |
Agricultural Operations | | $ | — | | | $ | 18,994 | | | $ | — | | | $ | 18,994 | | |
Electric - Generation | | | — | | | | — | | | | 248,249 | | | | 248,249 | | |
Energy - Alternate Sources | | | — | | | | — | | | | 66,410 | | | | 66,410 | | |
Metal - Iron | | | — | | | | — | | | | 200,208 | | | | 200,208 | | |
Quarrying | | | — | | | | — | | | | 599,061 | | | | 599,061 | | |
Real Estate Operating/Development | | | — | | | | — | | | | 326,533 | | | | 326,533 | | |
All Other Common Stocks | | | 9,051,071 | | | | — | | | | — | | | | 9,051,071 | | |
Exchange-Traded Fund | | | 113,940 | | | | — | | | | — | | | | 113,940 | | |
Purchased Put Options: | |
Exchange-Traded Funds | | | — | | | | 23,450 | | | | — | | | | 23,450 | | |
Silver-Linked Note | | | 50,140 | | | | — | | | | — | | | | 50,140 | | |
Corporate Note: | |
Electric - Generation | | | — | | | | — | | | | 100,000 | | | | 100,000 | | |
Total | | $ | 9,215,151 | | | $ | 42,444 | | | $ | 1,540,461 | | | $ | 10,798,056 | | |
Global Resources Fund | |
Investments in Securities*
Common Stocks: | |
Agricultural Operations | | $ | — | | | $ | 2,056,694 | | | $ | — | | | $ | 2,056,694 | | |
Coal | | | 1,399,032 | | | | 2,346,755 | | | | — | | | | 3,745,787 | | |
Diamonds/Precious Stones | | | 59,911 | | | | 11,293 | | | | — | | | | 71,204 | | |
Diversified Minerals | | | 1,942,016 | | | | 487,683 | | | | — | | | | 2,429,699 | | |
Electric - Generation | | | — | | | | — | | | | 3,462,403 | | | | 3,462,403 | | |
Energy - Alternate Sources | | | — | | | | — | | | | 1,593,840 | | | | 1,593,840 | | |
Food - Meat Products | | | 12,722,702 | | | | 3,230,649 | | | | — | | | | 15,953,351 | | |
Gold Mining | | | 21,174,790 | | | | — | | | | 1,143 | | | | 21,175,933 | | |
Medical - Hospitals | | | — | | | | 8,580 | | | | — | | | | 8,580 | | |
Metal - Copper | | | 15,376,835 | | | | — | | | | — | | | | 15,376,835 | | |
Metal - Diversified | | | 3,454,534 | | | | 7,287,638 | | | | 1,180,050 | | | | 11,922,222 | | |
Metal - Iron | | | 217,298 | | | | — | | | | 1,210,560 | | | | 1,427,858 | | |
141
Notes to Portfolios of Investments (unaudited) June 30, 2013
| | | Quoted Prices
in Active
Markets for
Identical
Investments
(Level 1) | | Significant
Other
Observable
Inputs
(Level 2) | | Significant
Unobservable
Inputs
(Level 3) | | Total | |
Global Resources Fund (cont'd) | |
Investments in Securities* (cont'd)
Common Stocks: (cont'd) | |
Mining Services | | $ | — | | | $ | 1,079,616 | | | $ | 251,501 | | | $ | 1,331,117 | | |
Natural Resource Technology | | | — | | | | — | | | | 50,947 | | | | 50,947 | | |
Oil Companies - Exploration & Production | | | 50,096,073 | | | | 5,770,645 | | | | — | | | | 55,866,718 | | |
Oil Refining & Marketing | | | 4,618,900 | | | | — | | | | 147,368 | | | | 4,766,268 | | |
Quarrying | | | — | | | | — | | | | 5,644,130 | | | | 5,644,130 | | |
Real Estate Operating/Development | | | 929,628 | | | | — | | | | 7,443,544 | | | | 8,373,172 | | |
All Other Common Stocks | | | 141,294,819 | | | | — | | | | — | | | | 141,294,819 | | |
Real Estate Investment Trusts | | | 14,044,300 | | | | — | | | | — | | | | 14,044,300 | | |
Exchange-Traded Funds | | | 11,709,000 | | | | — | | | | — | | | | 11,709,000 | | |
Warrants: | |
Diversified Minerals | | | — | | | | — | | | | — | | | | — | | |
Gold Mining | | | 2,450,214 | | | | — | | | | — | | | | 2,450,214 | | |
Medical - Hospitals | | | — | | | | — | | | | — | | | | — | | |
Metal - Copper | | | — | | | | — | | | | — | | | | — | | |
Oil Companies - Exploration & Production | | | — | | | | 183,322 | | | | — | | | | 183,322 | | |
All Other Warrants | | | 13,908 | | | | — | | | | — | | | | 13,908 | | |
Purchased Call Options: | |
Agricultural Chemicals | | | — | | | | 191,250 | | | | — | | | | 191,250 | | |
Diversified Minerals | | | — | | | | 130,375 | | | | — | | | | 130,375 | | |
Metal - Copper | | | — | | | | 197,500 | | | | — | | | | 197,500 | | |
Oil Companies - Integrated | | | — | | | | 94,000 | | | | — | | | | 94,000 | | |
Oil Field Machinery & Equipment | | | — | | | | 350,000 | | | | — | | | | 350,000 | | |
Oil Refining & Marketing | | | — | | | | 94,000 | | | | — | | | | 94,000 | | |
Purchased Put Option: | |
Diversified Minerals | | | — | | | | 459,875 | | | | — | | | | 459,875 | | |
Master Limited Partnerships | | | 25,372,460 | | | | — | | | | — | | | | 25,372,460 | | |
Convertible Bond: | |
Mining Services | | | — | | | | 658,500 | | | | — | | | | 658,500 | | |
Gold-Linked Note: | |
Gold Mining | | | — | | | | — | | | | 8,098,100 | | | | 8,098,100 | | |
Silver-Linked Note | | | 3,087,060 | | | | — | | | | — | | | | 3,087,060 | | |
Corporate Note: | |
Electric - Generation | | | — | | | | — | | | | 3,000,000 | | | | 3,000,000 | | |
Total | | $ | 309,963,480 | | | $ | 24,638,375 | | | $ | 32,083,586 | | | $ | 366,685,441 | | |
World Precious Minerals Fund | |
Investments in Securities*
Common Stocks: | |
Agricultural Operations | | $ | — | | | $ | 1,165,349 | | | $ | — | | | $ | 1,165,349 | | |
Coal | | | 268,850 | | | | 1,369,265 | | | | — | | | | 1,638,115 | | |
Diamonds/Precious Stones | | | 1,798,653 | | | | 30,610 | | | | — | | | | 1,829,263 | | |
Diversified Minerals | | | 2,260,152 | | | | 426,877 | | | | — | | | | 2,687,029 | | |
Gold Mining | | | 62,161,629 | | | | 3,446,351 | | | | 690,902 | | | | 66,298,882 | | |
Investment Companies | | | — | | | | 4,736 | | | | — | | | | 4,736 | | |
Medical - Hospitals | | | — | | | | 15,869 | | | | — | | | | 15,869 | | |
Metal - Copper | | | 939,898 | | | | — | | | | — | | | | 939,898 | | |
Metal - Diversified | | | 8,573,565 | | | | 273,893 | | | | — | | | | 8,847,458 | | |
Metal - Iron | | | — | | | | — | | | | 1,843,776 | | | | 1,843,776 | | |
Mining Services | | | 658,932 | | | | 1,494,486 | | | | — | | | | 2,153,418 | | |
Oil Companies - Exploration & Production | | | — | | | | — | | | | — | | | | — | | |
142
Notes to Portfolios of Investments (unaudited) June 30, 2013
| | | Quoted Prices
in Active
Markets for
Identical
Investments
(Level 1) | | Significant
Other
Observable
Inputs
(Level 2) | | Significant
Unobservable
Inputs
(Level 3) | | Total | |
World Precious Minerals Fund (cont'd) | |
Investments in Securities* (cont'd)
Common Stocks: (cont'd) | |
Platinum | | $ | 1,103,248 | | | $ | 42,992 | | | $ | — | | | $ | 1,146,240 | | |
Precious Metals | | | 5,655,500 | | | | 2,965,182 | | | | — | | | | 8,620,682 | | |
All Other Common Stocks | | | 8,665,034 | | | | — | | | | — | | | | 8,665,034 | | |
Exchange-Traded Funds | | | 4,627,134 | | | | — | | | | — | | | | 4,627,134 | | |
Warrants: | |
Finance - Investment Banker/Broker | | | — | | | | — | | | | — | | | | — | | |
Gold Mining | | | 4,747,462 | | | | 10,064 | | | | — | | | | 4,757,526 | | |
Medical - Hospitals | | | — | | | | — | | | | — | | | | — | | |
Metal - Copper | | | — | | | | — | | | | — | | | | — | | |
Metal - Diversified | | | — | | | | 8,961 | | | | — | | | | 8,961 | | |
All Other Warrants | | | 423,118 | | | | — | | | | — | | | | 423,118 | | |
Special Warrants: | |
Gold/Mineral Exploration & Development | | | — | | | | — | | | | — | | | | — | | |
Purchased Call Options: | |
Exchange-Traded Funds | | | — | | | | 856,766 | | | | — | | | | 856,766 | | |
Gold Mining | | | — | | | | 1,922,688 | | | | — | | | | 1,922,688 | | |
Platinum | | | — | | | | 222,180 | | | | — | | | | 222,180 | | |
Silver Mining | | | — | | | | 737,094 | | | | — | | | | 737,094 | | |
Convertible Bond: | |
Gold Mining | | | — | | | | 294,803 | | | | — | | | | 294,803 | | |
Gold-Linked Note: | |
Gold Mining | | | — | | | | — | | | | 5,494,300 | | | | 5,494,300 | | |
Silver-Linked Notes | | | 3,968,420 | | | | — | | | | — | | | | 3,968,420 | | |
Corporate Note: | |
Electric - Generation | | | — | | | | — | | | | 800,000 | | | | 800,000 | | |
Total | | $ | 105,851,595 | | | $ | 15,288,166 | | | $ | 8,828,978 | | | $ | 129,968,739 | | |
Gold and Precious Metals Fund | |
Investments in Securities*
Common Stocks: | |
Gold Mining | | $ | 26,001,677 | | | $ | 1,103,487 | | | $ | — | | | $ | 27,105,164 | | |
Medical - Hospitals | | | — | | | | 6,843 | | | | — | | | | 6,843 | | |
Precious Metals | | | — | | | | 1,851,535 | | | | — | | | | 1,851,535 | | |
All Other Common Stocks | | | 9,948,176 | | | | — | | | | — | | | | 9,948,176 | | |
Exchange-Traded Funds | | | 6,901,829 | | | | — | | | | — | | | | 6,901,829 | | |
Warrants: | |
Gold Mining | | | 3,590,517 | | | | 6,965 | | | | — | | | | 3,597,482 | | |
Medical - Hospitals | | | — | | | | — | | | | — | | | | — | | |
All Other Warrants | | | 244,817 | | | | — | | | | — | | | | 244,817 | | |
Purchased Call Options: | |
Exchange-Traded Funds | | | — | | | | 522,014 | | | | — | | | | 522,014 | | |
Gold Mining | | | — | | | | 1,836,578 | | | | — | | | | 1,836,578 | | |
Platinum | | | — | | | | 111,205 | | | | — | | | | 111,205 | | |
Silver Mining | | | — | | | | 773,005 | | | | — | | | | 773,005 | | |
Master Limited Partnership | | | 2,694,450 | | | | — | | | | — | | | | 2,694,450 | | |
Convertible Bond: | |
Gold Mining | | | — | | | | 294,803 | | | | — | | | | 294,803 | | |
Corporate Bonds: | |
Gold Mining | | | — | | | | 138,249 | | | | — | | | | 138,249 | | |
Metal - Diversified | | | — | | | | 196,000 | | | | — | | | | 196,000 | | |
143
Notes to Portfolios of Investments (unaudited) June 30, 2013
| | | Quoted Prices
in Active
Markets for
Identical
Investments
(Level 1) | | Significant
Other
Observable
Inputs
(Level 2) | | Significant
Unobservable
Inputs
(Level 3) | | Total | |
Gold and Precious Metals Fund (cont'd) | |
Investments in Securities* (cont'd) | |
Gold-Linked Note: | |
Gold Mining | | $ | — | | | $ | — | | | $ | 2,763,600 | | | $ | 2,763,600 | | |
Silver-Linked Notes | | | 2,070,000 | | | | — | | | | — | | | | 2,070,000 | | |
Corporate Notes: | |
Electric - Generation | | | — | | | | — | | | | 300,000 | | | | 300,000 | | |
Gold Mining | | | — | | | | 3,727,536 | | | | — | | | | 3,727,536 | | |
Total | | $ | 51,451,466 | | | $ | 10,568,220 | | | $ | 3,063,600 | | | $ | 65,083,286 | | |
Emerging Europe Fund | |
Investments in Securities*
Common Stocks: | |
Agricultural Chemicals | | $ | — | | | $ | 1,207,873 | | | $ | — | | | $ | 1,207,873 | | |
Agricultural Operations | | | — | | | | 432,044 | | | | — | | | | 432,044 | | |
Automotive - Cars & Light Trucks | | | — | | | | 5,673,090 | | | | — | | | | 5,673,090 | | |
Beverages - Non-alcoholic | | | — | | | | 431,097 | | | | — | | | | 431,097 | | |
Brewery | | | — | | | | 1,233,690 | | | | — | | | | 1,233,690 | | |
Building Products - Cement/Aggregates | | | — | | | | 293,895 | | | | — | | | | 293,895 | | |
Cellular Telecommunication | | | 4,560,729 | | | | 9,012,317 | | | | — | | | | 13,573,046 | | |
Chemicals - Diversified | | | — | | | | 3,324,772 | | | | — | | | | 3,324,772 | | |
Coal | | | — | | | | 867 | | | | — | | | | 867 | | |
Commercial Banks - Non US | | | — | | | | 20,345,688 | | | | — | | | | 20,345,688 | | |
Diversified Banking Institutions | | | — | | | | 701,373 | | | | — | | | | 701,373 | | |
Diversified Operations | | | — | | | | 682,631 | | | | — | | | | 682,631 | | |
Electric - Generation | | | — | | | | 1,787,562 | | | | — | | | | 1,787,562 | | |
Finance - Investment Banker/Broker | | | — | | | | 2,928,711 | | | | — | | | | 2,928,711 | | |
Food - Confectionery | | | — | | | | 1,406 | | | | — | | | | 1,406 | | |
Food - Retail | | | — | | | | 10,228,003 | | | | — | | | | 10,228,003 | | |
Gold Mining | | | 67,595 | | | | 1,648,687 | | | | — | | | | 1,716,282 | | |
Housewares | | | — | | | | 558,889 | | | | — | | | | 558,889 | | |
Machinery - Farm | | | — | | | | 2,142,446 | | | | — | | | | 2,142,446 | | |
Medical - Drugs | | | — | | | | 674,231 | | | | — | | | | 674,231 | | |
Metal - Diversified | | | 359,250 | | | | 5,269,343 | | | | — | | | | 5,628,593 | | |
Oil Companies - Exploration & Production | | | 376,359 | | | | 11,907,091 | | | | — | | | | 12,283,450 | | |
Oil Companies - Integrated | | | — | | | | 6,908,159 | | | | — | | | | 6,908,159 | | |
Oil Refining & Marketing | | | — | | | | 2,696,960 | | | | — | | | | 2,696,960 | | |
Precious Metals | | | — | | | | 648,169 | | | | — | | | | 648,169 | | |
Retail - Apparel/Shoe | | | — | | | | 778,652 | | | | — | | | | 778,652 | | |
Steel Pipe & Tube | | | — | | | | 229,951 | | | | — | | | | 229,951 | | |
Television | | | — | | | | 1,025,623 | | | | — | | | | 1,025,623 | | |
Textile - Products | | | — | | | | 310,995 | | | | — | | | | 310,995 | | |
Tobacco | | | — | | | | 1,792,657 | | | | — | | | | 1,792,657 | | |
Web Portals/Internet Service Providers | | | 4,716,441 | | | | 2,864,435 | | | | — | | | | 7,580,876 | | |
Preferred Stock: | |
Oil Companies - Integrated | | | — | | | | 1,503,346 | | | | — | | | | 1,503,346 | | |
Real Estate Investment Trust | | | — | | | | 1,190,271 | | | | — | | | | 1,190,271 | | |
Exchange-Traded Fund | | | 1,680,000 | | | | — | | | | — | | | | 1,680,000 | | |
Warrants | | | 1,211,428 | | | | — | | | | — | | | | 1,211,428 | | |
Purchased Call Options: | |
Exchange-Traded Funds | | | — | | | | 189,750 | | | | — | | | | 189,750 | | |
144
Notes to Portfolios of Investments (unaudited) June 30, 2013
| | | Quoted Prices
in Active
Markets for
Identical
Investments
(Level 1) | | Significant
Other
Observable
Inputs
(Level 2) | | Significant
Unobservable
Inputs
(Level 3) | | Total | |
Emerging Europe Fund (cont'd) | |
Investments in Securities* (cont'd) | |
Corporate Note: | |
Transportation - Services | | $ | — | | | $ | — | | | $ | 1,590,808 | | | $ | 1,590,808 | | |
Total | | $ | 12,971,802 | | | $ | 100,624,674 | | | $ | 1,590,808 | | | $ | 115,187,284 | | |
Other Financial Instruments | |
Written Call Option | | $ | — | | | $ | 152,500 | | | $ | — | | | $ | 152,500 | | |
Global Emerging Markets Fund | |
Investments in Securities*
Common Stocks: | |
Applications Software | | $ | — | | | $ | 284,620 | | | $ | — | | | $ | 284,620 | | |
Audio/Video Products | | | — | | | | 131,872 | | | | — | | | | 131,872 | | |
Batteries/Battery System | | | — | | | | 133,038 | | | | — | | | | 133,038 | | |
Building Products - Cement/Aggregates | | | — | | | | 159,158 | | | | — | | | | 159,158 | | |
Cellular Telecom | | | — | | | | 196,696 | | | | — | | | | 196,696 | | |
Circuit Boards | | | — | | | | 204,696 | | | | — | | | | 204,696 | | |
Coal | | | — | | | | 80,018 | | | | — | | | | 80,018 | | |
Commercial Banks - Non US | | | — | | | | 696,668 | | | | — | | | | 696,668 | | |
Computer Services | | | — | | | | 133,145 | | | | — | | | | 133,145 | | |
Diversified Financial Services | | | — | | | | 130,505 | | | | — | | | | 130,505 | | |
Diversified Minerals | | | — | | | | 5,315 | | | | — | | | | 5,315 | | |
Diversified Operations | | | — | | | | 141,305 | | | | — | | | | 141,305 | | |
Electronic Components - Miscellaneous | | | — | | | | 145,019 | | | | — | | | | 145,019 | | |
Finance - Leasing Company | | | — | | | | 180,801 | | | | — | | | | 180,801 | | |
Finance - Mortgage Loan/Banker | | | — | | | | 340,133 | | | | — | | | | 340,133 | | |
Gas - Distribution | | | — | | | | 141,808 | | | | — | | | | 141,808 | | |
Machinery - General Industrial | | | — | | | | 119,122 | | | | — | | | | 119,122 | | |
Metal - Diversified | | | — | | | | 13,756 | | | | — | | | | 13,756 | | |
Metal - Iron | | | — | | | | — | | | | 153,648 | | | | 153,648 | | |
Multi-line Insurance | | | — | | | | 205,705 | | | | — | | | | 205,705 | | |
Paper & Related Products | | | — | | | | 223,849 | | | | — | | | | 223,849 | | |
Real Estate Management/Services | | | — | | | | 216,861 | | | | — | | | | 216,861 | | |
Real Estate Operating/Development | | | — | | | | 778,396 | | | | — | | | | 778,396 | | |
Reinsurance | | | — | | | | 189,097 | | | | — | | | | 189,097 | | |
Retail - Automobile | | | — | | | | 137,762 | | | | — | | | | 137,762 | | |
Textile - Products | | | — | | | | 165,864 | | | | — | | | | 165,864 | | |
Transportation - Marine | | | — | | | | 165,292 | | | | — | | | | 165,292 | | |
All Other Common Stocks | | | 407,568 | | | | — | | | | — | | | | 407,568 | | |
Preferred Stocks: | |
Commercial Banks - Non US | | | — | | | | 290,754 | | | | — | | | | 290,754 | | |
Real Estate Investment Trust | | | — | | | | 152,326 | | | | — | | | | 152,326 | | |
Corporate Note: | |
Electric - Generation | | | — | | | | — | | | | 50,000 | | | | 50,000 | | |
Total | | $ | 407,568 | | | $ | 5,763,581 | | | $ | 203,648 | | | $ | 6,374,797 | | |
China Region Fund | |
Investments in Securities*
Common Stocks: | |
Aerospace/Defense - Equipment | | $ | — | | | $ | 257,705 | | | $ | — | | | $ | 257,705 | | |
Airport Development/Maintenance | | | — | | | | 546,098 | | | | — | | | | 546,098 | | |
Alternative Waste Technology | | | — | | | | 283,232 | | | | — | | | | 283,232 | | |
Appliances | | | — | | | | 285,496 | | | | — | | | | 285,496 | | |
145
Notes to Portfolios of Investments (unaudited) June 30, 2013
| | | Quoted Prices
in Active
Markets for
Identical
Investments
(Level 1) | | Significant
Other
Observable
Inputs
(Level 2) | | Significant
Unobservable
Inputs
(Level 3) | | Total | |
China Region Fund (cont'd) | |
Investments in Securities* (cont'd)
Common Stocks: (cont'd) | |
Audio/Video Products | | $ | — | | | $ | 222,717 | | | $ | — | | | $ | 222,717 | | |
Automotive - Cars & Light Trucks | | | — | | | | 406,957 | | | | — | | | | 406,957 | | |
Building - Heavy Construction | | | — | | | | 178,980 | | | | — | | | | 178,980 | | |
Building - Residential/Commercial | | | — | | | | 239,928 | | | | — | | | | 239,928 | | |
Building & Construction - Miscellaneous | | | — | | | | 1,243,371 | | | | — | | | | 1,243,371 | | |
Building & Construction
Products - Miscellaneous | | | — | | | | 417,711 | | | | — | | | | 417,711 | | |
Building Products - Cement/Aggregates | | | — | | | | 249,720 | | | | — | | | | 249,720 | | |
Casino Hotels | | | — | | | | 2,446,969 | | | | — | | | | 2,446,969 | | |
Casino Services | | | — | | | | 362,921 | | | | — | | | | 362,921 | | |
Chemicals - Specialty | | | — | | | | 256,646 | | | | — | | | | 256,646 | | |
Commercial Banks - Non US | | | — | | | | 1,514,881 | | | | — | | | | 1,514,881 | | |
Computers - Other | | | — | | | | 416,881 | | | | — | | | | 416,881 | | |
Consumer Products - Miscellaneous | | | — | | | | 653,811 | | | | — | | | | 653,811 | | |
Containers - Paper/Plastic | | | — | | | | 283,441 | | | | — | | | | 283,441 | | |
Diversified Banking Institutions | | | — | | | | 1,387,179 | | | | — | | | | 1,387,179 | | |
Diversified Operations | | | — | | | | 609,233 | | | | — | | | | 609,233 | | |
Electric - Generation | | | — | | | | 747,025 | | | | — | | | | 747,025 | | |
Electronic Components - Miscellaneous | | | — | | | | 716,630 | | | | — | | | | 716,630 | | |
Electronic Measuring Instruments | | | — | | | | 318,367 | | | | — | | | | 318,367 | | |
Gas - Distribution | | | — | | | | 1,257,979 | | | | — | | | | 1,257,979 | | |
Internet Application Software | | | — | | | | 653,317 | | | | — | | | | 653,317 | | |
Medical - Drugs | | | — | | | | 531,171 | | | | — | | | | 531,171 | | |
Medical Products | | | — | | | | 523,727 | | | | — | | | | 523,727 | | |
Multimedia | | | — | | | | 301,500 | | | | — | | | | 301,500 | | |
Oil - Field Services | | | — | | | | 750,023 | | | | — | | | | 750,023 | | |
Oil Field Machinery & Equipment | | | — | | | | 611,132 | | | | — | | | | 611,132 | | |
Petrochemicals | | | — | | | | 1 | | | | — | | | | 1 | | |
Photo Equipment & Supplies | | | — | | | | 820,490 | | | | — | | | | 820,490 | | |
Pipelines | | | — | | | | 296,614 | | | | — | | | | 296,614 | | |
Power Converters/Supply Equipment | | | — | | | | 251,109 | | | | — | | | | 251,109 | | |
Public Thoroughfares | | | — | | | | 340,702 | | | | — | | | | 340,702 | | |
Real Estate Operating/Development | | | — | | | | 431,475 | | | | — | | | | 431,475 | | |
Retail - Jewelry | | | — | | | | 2 | | | | — | | | | 2 | | |
Retail - Perfume & Cosmetics | | | — | | | | 339,644 | | | | — | | | | 339,644 | | |
Retail - Restaurants | | | — | | | | 259,617 | | | | — | | | | 259,617 | | |
Therapeutics | | | — | | | | 285,888 | | | | — | | | | 285,888 | | |
Tobacco | | | — | | | | 277,912 | | | | — | | | | 277,912 | | |
Transportation - Marine | | | — | | | | 313,845 | | | | — | | | | 313,845 | | |
Water | | | — | | | | 754,433 | | | | — | | | | 754,433 | | |
Water Treatment Systems | | | — | | | | 279,236 | | | | — | | | | 279,236 | | |
All Other Common Stocks | | | 934,188 | | | | — | | | | — | | | | 934,188 | | |
Purchased Call Options: | |
Exchange-Traded Funds | | | — | | | | 67,017 | | | | — | | | | 67,017 | | |
Total | | $ | 934,188 | | | $ | 23,392,733 | | | $ | — | | | $ | 24,326,921 | | |
* Refer to the Portfolio of Investments for a detailed list of the Fund's investments.
146
Notes to Portfolios of Investments (unaudited) June 30, 2013
During the period, Holmes Growth Fund, MegaTrends Fund, Global Resources Fund, World Precious Minerals Fund, Gold and Precious Metals Fund, Emerging Europe Fund, Global Emerging Markets Fund and China Region Fund had transfers from Level 1 to Level 2 in the amount of $23,021, $18,994, $5,912,185, $10,400,315, $2,961,866, $52,548,611, $419,381 and $9,300,182, respectively, due to certain foreign securities being valued using a systematic fair value model at June 30, 2013, but not at the prior period end. Global Resources Fund, World Precious Minerals Fund, Gold and Precious Metals Fund, Emerging Europe Fund and Global Emerging Markets Fund had transfers from Level 1 to Level 2 in the amount of $19,715, $548,958, $19,907, $268,429 and $13,756, respectively, due to securities being valued at the mean between bid and ask quotations at June 30, 2013, but at a quoted price at the prior period end. World Precious Minerals Fund had $4,736 in transfers from Level 1 to Level 2 due to a halt in trading. Holmes Growth Fund, MegaTrends Fund, Global Resources Fund, World Precious Minerals Fund, Gold and Precious Metals Fund and China Region Fund had transfers from Level 2 to Level 1 in the amount of $790,693, $50,140, $3,415,927, $4,195,406, $2,073,150 and $45,000, respectively, due to securities being valued at a quoted price at June 30, 2013, but at the mean between bid and ask quotations at the prior period-end. World Precious Minerals Fund had transfers from Level 2 to Level 1 in the amount of $370,881 resulting from the expiration of a regulatory hold. The Funds' policy is to recognize transfers in and transfers out as of the end of the reporting period.
147
Notes to Portfolios of Investments (unaudited) June 30, 2013
The following is a reconciliation of assets for which unobservable inputs (Level 3) were used in determining fair value during the period January 1, 2013, through June 30, 2013:
| | Beginning
Balance
12/31/12 | | Purchases | | Total
realized
gain (loss) | | Net
change in
unrealized
appreciation
(depreciation) | | Amortized
discounts/
premiums | | Paydowns/
Maturities | |
Holmes Growth Fund | |
Investments in Securities | |
Common Stocks: | |
Metal - Iron | | $ | 100,000 | | | $ | — | | | $ | — | | | $ | 208 | | | $ | — | | | $ | — | | |
Quarrying | | | 379,951 | | | | — | | | | — | | | | 57,700 | | | | — | | | | — | | |
Real Estate Operating/Development | | | 100,000 | | | | — | | | | — | | | | — | | | | — | | | | — | | |
Convertible Debenture: | |
Metal - Iron | | | 100,000 | | | | — | | | | — | | | | — | | | | — | | | | — | | |
Gold-Linked Note: | |
Gold Mining | | | 370,000 | | | | — | | | | — | | | | (22,200 | ) | | | — | | | | — | | |
Corporate Notes: | |
Electric - Generation | | | 150,000 | | | | — | | | | — | | | | — | | | | — | | | | — | | |
Transportation - Air Freight | | | 250,000 | | | | — | | | | — | | | | — | | | | — | | | | (250,000 | ) | |
Total Investments in Securities | | $ | 1,449,951 | | | $ | — | | | $ | — | | | $ | 35,708 | | | $ | — | | | $ | (250,000 | ) | |
| | Beginning
Balance
12/31/12 | | Purchases | | Total
realized
gain (loss) | | Net
change in
unrealized
appreciation
(depreciation) | | Amortized
discounts/
premiums | | Paydowns/
Maturities | |
MegaTrends Fund | |
Investments in Securities | |
Common Stocks: | |
Electric - Generation | | $ | 104,717 | | | $ | — | | | $ | — | | | $ | 143,532 | | | $ | — | | | $ | — | | |
Energy - Alternate Sources | | | 100,000 | | | | — | | | | — | | | | (33,590 | ) | | | — | | | | — | | |
Metal - Iron | | | 100,000 | | | | — | | | | — | | | | 208 | | | | — | | | | — | | |
Quarrying | | | 520,081 | | | | — | | | | — | | | | 78,980 | | | | — | | | | — | | |
Real Estate Operating/Development | | | 326,533 | | | | — | | | | — | | | | — | | | | — | | | | — | | |
Convertible Debenture: | |
Metal - Iron | | | 100,000 | | | | — | | | | — | | | | — | | | | — | | | | — | | |
Corporate Note: | |
Electric - Generation | | | 100,000 | | | | — | | | | — | | | | — | | | | — | | | | — | | |
Total Investments in Securities | | $ | 1,351,331 | | | $ | — | | | $ | — | | | $ | 189,130 | | | $ | — | | | $ | — | | |
148
Notes to Portfolios of Investments (unaudited) June 30, 2013
| | | Reclassifications | | Transfers
into
Level 3* | | Transfers
out of
Level 3* | | Ending
Balance
06/30/13 | | Net
change in
unrealized
appreciation
(depreciation)
from
Investments
held as of
06/30/13(1) | |
Holmes Growth Fund | |
Investments in Securities | |
Common Stocks: | |
Metal - Iron | | $ | 100,000 | | | $ | — | | | $ | — | | | $ | 200,208 | | | $ | 208 | | |
Quarrying | | | — | | | | — | | | | — | | | | 437,651 | | | | 57,700 | | |
Real Estate Operating/Development | | | — | | | | — | | | | — | | | | 100,000 | | | | — | | |
Convertible Debenture: | |
Metal - Iron | | | (100,000 | ) | | | — | | | | — | | | | — | | | | — | | |
Gold-Linked Note: | |
Gold Mining | | | — | | | | | | — | | | | 347,800 | | | | (22,200 | ) | |
Corporate Notes: | |
Electric - Generation | | | — | | | | — | | | | — | | | | 150,000 | | | | — | | |
Transportation - Air Freight | | | — | | | | — | | | | — | | | | — | | | | — | | |
Total Investments in Securities | | $ | — | | | $ | — | | | $ | — | | | $ | 1,235,659 | | | $ | 35,708 | | |
| | | Reclassifications | | Transfers
into
Level 3* | | Transfers
out of
Level 3* | | Ending
Balance
06/30/13 | | Net
change in
unrealized
appreciation
(depreciation)
from
Investments
held as of
06/30/13(1) | |
MegaTrends Fund | |
Investments in Securities | |
Common Stocks: | |
Electric - Generation | | $ | — | | | $ | — | | | $ | — | | | $ | 248,249 | | | $ | 143,532 | | |
Energy - Alternate Sources | | | — | | | | — | | | | — | | | | 66,410 | | | | (33,590 | ) | |
Metal - Iron | | | 100,000 | | | | — | | | | — | | | | 200,208 | | | | 208 | | |
Quarrying | | | — | | | | — | | | | — | | | | 599,061 | | | | 78,980 | | |
Real Estate Operating/Development | | | — | | | | — | | | | — | | | | 326,533 | | | | — | | |
Convertible Debenture: | |
Metal - Iron | | | (100,000 | ) | | | — | | | | — | | | | — | | | | — | | |
Corporate Note: | |
Electric - Generation | | | — | | | | — | | | | — | | | | 100,000 | | | | — | | |
Total Investments in Securities | | $ | — | | | $ | — | | | $ | — | | | $ | 1,540,461 | | | $ | 189,130 | | |
149
Notes to Portfolios of Investments (unaudited) June 30, 2013
| | Beginning
Balance
12/31/12 | | Purchases | | Total
realized
gain (loss) | | Net
change in
unrealized
appreciation
(depreciation) | | Amortized
discounts/
premiums | | Paydowns/
Maturities | |
Global Resources Fund | |
Investments in Securities | |
Common Stocks: | |
Electric - Generation | | $ | 1,460,519 | | | $ | — | | | $ | — | | | $ | 2,001,884 | | | $ | — | | | $ | — | | |
Energy - Alternate Sources | | | 2,400,000 | | | | — | | | | — | | | | (806,160 | ) | | | — | | | | — | | |
Gold Mining | | | 1,300 | | | | — | | | | — | | | | (157 | ) | | | — | | | | — | | |
Metal - Copper | | | — | | | | — | | | | — | | | | — | | | | — | | | | — | | |
Metal - Diversified | | | 1,374,150 | | | | — | | | | — | | | | (194,100 | ) | | | — | | | | — | | |
Metal - Iron | | | 2,600,000 | | | | — | | | | — | | | | (1,389,440 | ) | | | — | | | | — | | |
Mining Services | | | 285,890 | | | | — | | | | — | | | | (34,389 | ) | | | — | | | | — | | |
Natural Resource Technology | | | 50,947 | | | | — | | | | — | | | | — | | | | — | | | | — | | |
Oil Refining & Marketing | | | 426,390 | | | | — | | | | — | | | | (279,022 | ) | | | — | | | | — | | |
Platinum | | | — | | | | — | | | | (102,655 | ) | | | 102,655 | | | | — | | | | — | | |
Quarrying | | | 4,900,009 | | | | — | | | | — | | | | 744,121 | | | | — | | | | — | | |
Real Estate Operating/Development | | | 7,443,544 | | | | — | | | | — | | | | — | | | | — | | | | — | | |
Convertible Debenture: | |
Diversified Minerals | | | 147,635 | | | | — | | | | — | | | | 362,986 | | | | — | | | | — | | |
Gold-Linked Note: | |
Gold Mining | | | 8,615,000 | | | | — | | | | — | | | | (516,900 | ) | | | — | | | | — | | |
Corporate Notes: | |
Electric - Generation | | | 3,000,000 | | | | — | | | | — | | | | — | | | | — | | | | — | | |
Transportation - Air Freight | | | 500,000 | | | | — | | | | — | | | | — | | | | — | | | | (500,000 | ) | |
Total Investments in Securities | | $ | 33,205,384 | | | $ | — | | | $ | (102,655 | ) | | $ | (8,522 | ) | | $ | — | | | $ | (500,000 | ) | |
| | Beginning
Balance
12/31/12 | | Purchases | | Total
realized
gain (loss) | | Net
change in
unrealized
appreciation
(depreciation) | | Amortized
discounts/
premiums | | Paydowns/
Maturities | |
World Precious Minerals Fund | |
Investments in Securities | |
Common Stocks: | |
Gold Mining | | $ | 1,797,024 | | | $ | — | | | $ | — | | | $ | (1,106,122 | ) | | $ | — | | | $ | — | | |
Metal - Copper | | | — | | | | — | | | | — | | | | — | | | | — | | | | — | | |
Metal - Diversified | | | 388,043 | | | | — | | | | — | | | | 4,908 | | | | | | — | | |
Metal - Iron | | | — | | | | — | | | | — | | | | 643,776 | | | | | | — | | |
Oil Companies - Exploration & Production | | | — | | | | — | | | | — | | | | — | | | | — | | | | — | | |
Platinum | | | — | | | | — | | | | (1,141,145 | ) | | | 1,141,145 | | | | — | | | | — | | |
Warrants: | |
Metal - Diversified | | | — | | | | — | | | | — | | | | — | | | | — | | | | — | | |
Special Warrants: | |
Gold/Mineral Exploration & Development | | | — | | | | — | | | | — | | | | — | | | | — | | | | — | | |
Convertible Debenture: | |
Metal - Iron | | | 1,200,000 | | | | — | | | | — | | | | — | | | | — | | | | — | | |
Gold-Linked Note: | |
Gold Mining | | | 5,845,000 | | | | — | | | | — | | | | (350,700 | ) | | | — | | | | — | | |
Corporate Note: | |
Electric - Generation | | | 800,000 | | | | — | | | | — | | | | — | | | | — | | | | — | | |
Total Investments in Securities | | $ | 10,030,067 | | | $ | — | | | $ | (1,141,145 | ) | | $ | 333,007 | | | $ | — | | | $ | — | | |
150
Notes to Portfolios of Investments (unaudited) June 30, 2013
| | | Reclassifications | | Transfers
into
Level 3* | | Transfers
out of
Level 3* | | Ending
Balance
06/30/13 | | Net
change in
unrealized
appreciation
(depreciation)
from
Investments
held as of
06/30/13(1) | |
Global Resources Fund | |
Investments in Securities | |
Common Stocks: | |
Electric - Generation | | $ | — | | | $ | — | | | $ | — | | | $ | 3,462,403 | | | $ | 2,001,884 | | |
Energy - Alternate Sources | | | — | | | | — | | | | — | | | | 1,593,840 | | | | (806,160 | ) | |
Gold Mining | | | — | | | | — | | | | — | | | | 1,143 | | | | (157 | ) | |
Metal - Copper | | | — | | | | — | | | | — | | | | — | | | | — | | |
Metal - Diversified | | | — | | | | — | | | | — | | | | 1,180,050 | | | | (194,100 | ) | |
Metal - Iron | | | — | | | | — | | | | — | | | | 1,210,560 | | | | (1,389,440 | ) | |
Mining Services | | | — | | | | — | | | | — | | | | 251,501 | | | | (34,389 | ) | |
Natural Resource Technology | | | — | | | | — | | | | — | | | | 50,947 | | | | — | | |
Oil Refining & Marketing | | | — | | | | — | | | | — | | | | 147,368 | | | | (279,022 | ) | |
Platinum | | | — | | | | — | | | | — | | | | — | | | | — | | |
Quarrying | | | — | | | | — | | | | — | | | | 5,644,130 | | | | 744,121 | | |
Real Estate Operating/Development | | | — | | | | — | | | | — | | | | 7,443,544 | | | | — | | |
Convertible Debenture: | |
Diversified Minerals | | | — | | | | — | | | | (510,621 | ) | | | — | | | | — | | |
Gold-Linked Note: | |
Gold Mining | | | — | | | | — | | | | — | | | | 8,098,100 | | | | (516,900 | ) | |
Corporate Notes: | |
Electric - Generation | | | — | | | | — | | | | — | | | | 3,000,000 | | | | — | | |
Transportation - Air Freight | | | — | | | | — | | | | — | | | | — | | | | — | | |
Total Investments in Securities | | $ | — | | | $ | — | | | $ | (510,621 | ) | | $ | 32,083,586 | | | $ | (474,163 | ) | |
| | | Reclassifications | | Transfers
into
Level 3* | | Transfers
out of
Level 3* | | Ending
Balance
06/30/13 | | Net
change in
unrealized
appreciation
(depreciation)
from
Investments
held as of
06/30/13(1) | |
World Precious Minerals Fund | |
Investments in Securities | |
Common Stocks: | |
Gold Mining | | $ | — | | | $ | — | | | $ | — | | | $ | 690,902 | | | $ | (1,106,122 | ) | |
Metal - Copper | | | — | | | | — | | | | — | | | | — | | | | — | | |
Metal - Diversified | | | — | | | | — | | | | (392,951 | ) | | | — | | | | — | | |
Metal - Iron | | | 1,200,000 | | | | — | | | | — | | | | 1,843,776 | | | | 643,776 | | |
Oil Companies - Exploration & Production | | | — | | | | — | | | | — | | | | — | | | | — | | |
Platinum | | | — | | | | — | | | | — | | | | — | | | | — | | |
Warrants: | |
Metal - Diversified | | | — | | | | — | | | | — | | | | — | | | | — | | |
Special Warrants: | |
Gold/Mineral Exploration & Development | | | — | | | | — | | | | — | | | | — | | | | — | | |
Convertible Debenture: | |
Metal - Iron | | | (1,200,000 | ) | | | — | | | | — | | | | — | | | | — | | |
Gold-Linked Note: | |
Gold Mining | | | — | | | | — | | | | — | | | | 5,494,300 | | | | (350,700 | ) | |
Corporate Note: | |
Electric - Generation | | | — | | | | — | | | | — | | | | 800,000 | | | | — | | |
Total Investments in Securities | | $ | — | | | $ | — | | | $ | (392,951 | ) | | $ | 8,828,978 | | | $ | (813,046 | ) | |
151
Notes to Portfolios of Investments (unaudited) June 30, 2013
| | Beginning
Balance
12/31/12 | | Purchases | | Total
realized
gain (loss) | | Net
change in
unrealized
appreciation
(depreciation) | | Amortized
discounts/
premiums | | Paydowns/
Maturities | |
Gold and Precious Metals Fund | |
Investments in Securities | |
Gold-Linked Note: | |
Gold Mining | | $ | 2,940,000 | | | $ | — | | | $ | — | | | $ | (176,400 | ) | | $ | — | | | $ | — | | |
Corporate Notes: | |
Electric - Generation | | | 300,000 | | | | — | | | | — | | | | — | | | | — | | | | — | | |
Total Investments in Securities | | $ | 3,240,000 | | | $ | — | | | $ | — | | | $ | (176,400 | ) | | $ | — | | | $ | — | | |
| | Beginning
Balance
12/31/12 | | Purchases | | Total
realized
gain (loss) | | Net
change in
unrealized
appreciation
(depreciation) | | Amortized
discounts/
premiums | | Paydowns/
Maturities | |
Emerging Europe Fund | |
Investments in Securities | |
Corporate Note: | |
Transportation - Services | | $ | — | | | $ | 2,015,000 | | | $ | — | | | $ | (21,192 | ) | | $ | (3,000 | ) | | $ | (400,000 | ) | |
Total Investments in Securities | | $ | — | | | $ | 2,015,000 | | | $ | — | | | $ | (21,192 | ) | | $ | (3,000 | ) | | $ | (400,000 | ) | |
| | Beginning
Balance
12/31/12 | | Purchases | | Total
realized
gain (loss) | | Net
change in
unrealized
appreciation
(depreciation) | | Amortized
discounts/
premiums | | Paydowns/
Maturities | |
Global Emerging Markets Fund | |
Investments in Securities | |
Common Stocks: | |
Metal - Iron | | $ | — | | | $ | — | | | $ | — | | | $ | 53,648 | | | $ | — | | | $ | — | | |
Convertible Debenture: | |
Metal - Iron | | | 100,000 | | | | — | | | | — | | | | — | | | | — | | | | — | | |
Corporate Notes: | |
Transportation - Air Freight | | | 50,000 | | | | — | | | | — | | | | — | | | | — | | | | — | | |
Electric - Generation | | | 50,000 | | | | — | | | | — | | | | — | | | | — | | | | — | | |
Total Investments in Securities | | $ | 200,000 | | | $ | — | | | $ | — | | | $ | 53,648 | | | $ | — | | | $ | — | | |
* The Funds' policy is to recognize transfers in and transfers out as of the end of the reporting period.
(1) Any difference between Net change in unrealized appreciation (depreciation) from Investments held as of June 30, 2013 may be due to an investment no longer held or categorized as Level 3 at period end.
152
Notes to Portfolios of Investments (unaudited) June 30, 2013
| | | Reclassifications | | Transfers
into
Level 3* | | Transfers
out of
Level 3* | | Ending
Balance
06/30/13 | | Net
change in
unrealized
appreciation
(depreciation)
from
Investments
held as of
06/30/13(1) | |
Gold and Precious Metals Fund | |
Investments in Securities | |
Gold-Linked Note: | |
Gold Mining | | $ | — | | | $ | — | | | $ | — | | | $ | 2,763,600 | | | $ | (176,400 | ) | |
Corporate Notes: | |
Electric - Generation | | | — | | | | — | | | | — | | | | 300,000 | | | | — | | |
Total Investments in Securities | | $ | — | | | $ | — | | | $ | — | | | $ | 3,063,600 | | | $ | (176,400 | ) | |
| | | Reclassifications | | Transfers
into
Level 3* | | Transfers
out of
Level 3* | | Ending
Balance
06/30/13 | | Net
change in
unrealized
appreciation
(depreciation)
from
Investments
held as of
06/30/13(1) | |
Emerging Europe Fund | |
Investments in Securities | |
Corporate Note: | |
Transportation - Services | | $ | — | | | $ | — | | | $ | — | | | $ | 1,590,808 | | | $ | (21,192 | ) | |
Total Investments in Securities | | $ | — | | | $ | — | | | $ | — | | | $ | 1,590,808 | | | $ | (21,192 | ) | |
| | | Reclassifications | | Transfers
into
Level 3* | | Transfers
out of
Level 3* | | Ending
Balance
06/30/13 | | Net
change in
unrealized
appreciation
(depreciation)
from
Investments
held as of
06/30/13(1) | |
Global Emerging Markets Fund | |
Investments in Securities | |
Common Stocks: | |
Metal - Iron | | $ | 100,000 | | | $ | — | | | $ | — | | | $ | 153,648 | | | $ | 53,648 | | |
Convertible Debenture: | |
Metal - Iron | | | (100,000 | ) | | | — | | | | — | | | | — | | | | — | | |
Corporate Notes: | |
Transportation - Air Freight | | | — | | | | — | | | | — | | | | 50,000 | | | | — | | |
Electric - Generation | | | — | | | | — | | | | (50,000 | ) | | | — | | | | — | | |
Total Investments in Securities | | $ | — | | | $ | — | | | $ | (50,000 | ) | | $ | 203,648 | | | $ | 53,648 | | |
153
Notes to Portfolios of Investments (unaudited) June 30, 2013
Significant unobservable inputs developed by the Valuation Committee for Level 3 investments are as follows:
| | | Fair Value at
06/30/13 | | Valuation
Technique(s) | | Unobservable
Input | | Range
(Weighted
Average) | |
Holmes Growth Fund | |
Investments in Securities
Common Stocks | | $ | 100,000 | | | Market Transaction(1) | | Discount | | | 0 | % | |
Common Stocks | | |
637,859 | | | Methods of Comparables/
Consensus Pricing(2) | | Discount | | | 0 | %-25% (17%) | |
Gold-Linked Note | | | 347,800 | | | Market Transaction(1) | | Discount | | | 6 | % | |
Corporate Note | | | 150,000 | | | Market Transaction(1) | | Discount | | | 0 | % | |
MegaTrends Fund | |
Investments in Securities
Common Stocks | | | 326,533 | | | Market Transaction(1) | | Discount | | | 0 | %-34% (8%) | |
Common Stocks | | |
1,113,928 | | | Methods of Comparables/
Consensus Pricing(2) | | Discount | | | 0 | %-25% (14%) | |
Corporate Note | | | 100,000 | | | Market Transaction(1) | | Discount | | | 0 | % | |
Global Resources Fund | |
Investments in Securities
Common Stocks | | | 10,668,393 | | | Market Transaction(1) | | Discount | | | 0 | %-100% (56%) | |
Common Stocks | | |
10,317,093 | | | Methods of Comparables/
Consensus Pricing(2) | | Discount | | | 0 | %-25% (14%) | |
Gold-Linked Note | | | 8,098,100 | | | Market Transaction(1) | | Discount | | | 6 | % | |
Corporate Note | | | 3,000,000 | | | Market Transaction(1) | | Discount | | | 0 | % | |
World Precious Minerals Fund | |
Investments in Securities
Common Stocks | | | 690,902 | | | Market Transaction(1) | | Discount | | | 0 | %-100% (91%) | |
Common Stocks | | |
1,843,776 | | | Methods of Comparables/
Consensus Pricing(2) | | Discount | | | 0 | % | |
Special Warrants | | | — | | | Market Transaction(1) | | Discount | | | 100 | % | |
Gold-Linked Note | | | 5,494,300 | | | Market Transaction(1) | | Discount | | | 6 | % | |
Corporate Note | | | 800,000 | | | Market Transaction(1) | | Discount | | | 0 | % | |
Gold and Precious Metals Fund | |
Investments in Securities
Gold-Linked Note | | | 2,763,600 | | | Market Transaction(1) | | Discount | | | 6 | % | |
Corporate Notes | | | 300,000 | | | Market Transaction(1) | | Discount | | | 0 | % | |
Global Emerging Markets Fund | |
Investments in Securities
Common Stocks | | |
153,648 | | | Methods of Comparables/
Consensus Pricing(2) | |
Discount | | |
0 | % | |
Corporate Note | | | 50,000 | | | Market Transaction(1) | | Discount | | | 0 | % | |
(1) Market Transaction refers to most recent known market transaction, including transactions in which the fund participated, as adjusted for any discount as discussed above.
(2) The Methods of Comparables/Consensus Pricing valuation technique involves gathering observable and unobservable data related to securities that exhibit characteristics to that of the Level 3 security, and using such information as an input into the valuation of the Level 3 security.
The majority of securities classified as Level 3 are private companies. The initial valuation is usually cost, which is then adjusted as determined by the Valuation Committee for subsequent known market transactions and evaluated for progress against anticipated milestones and current operations. An evaluation that the holding
154
Notes to Portfolios of Investments (unaudited) June 30, 2013
no longer meets expectations could result in the application of discounts and a significantly lower fair valuation.
Affiliated Companies - Indicated in Portfolio of Investments as "+"
The Investment Company Act of 1940 defines affiliates as companies in which the Fund owns at least 5% of the outstanding voting securities. The following is a summary of transactions with each affiliated company during the period ended June 30, 2013.
| | | Shares of Affiliated Companies | |
Holmes Growth Fund | | December 31, 2012 | | Additions | | Reductions | | June 30, 2013 | |
IOU Financial, Inc. | | | 1,538,000 | | | | 202,000 | | | | — | | | | 1,740,000 | | |
At June 30, 2013, the value of investments in affiliated companies was $645,333, representing 1.77% of net assets, and the total cost was $670,154. There were no realized gains or losses on transactions, and there was no income earned for the period.
| | | Shares of Affiliated Companies | |
Global Resources Fund | | December 31, 2012 | | Additions | | Reductions | | June 30, 2013 | |
Africa Oilfield Logistics Ltd. | | | — | | | | 55,834,483 | | | | — | | | | 55,834,483 | | |
African Potash Ltd. | | | 15,825,000 | | | | — | | | | — | | | | 15,825,000 | | |
Agriterra Ltd. | | | 67,888,600 | | | | 70,000 | | | | — | | | | 67,958,600 | | |
Pacific Coal Resources Ltd. | | | 23,039,115 | | | | 28,967 | | | | (19,755,521 | ) | | | 3,312,561 | | |
Pacific Green Energy Corp. | | | 2,400,000 | | | | — | | | | — | | | | 2,400,000 | | |
Pacific Power Generation Corp. | | | 4,868,396 | | | | — | | | | — | | | | 4,868,396 | (a) | |
Pacific Stone Tech, Inc. | | | 22,659 | | | | — | | | | — | | | | 22,659 | | |
Range Energy Resources, Inc. | | | 15,100,000 | | | | — | | | | — | | | | 15,100,000 | | |
At June 30, 2013, the value of investments in affiliated companies was $16,840,424, representing 4.30% of net assets, and the total cost was $47,161,102. There were no realized gains or losses on transactions, and there was no income earned for the period.
| | | Shares of Affiliated Companies | |
World Precious Minerals Fund | | December 31, 2012 | | Additions | | Reductions | | June 30, 2013 | |
Candente Gold Corp. | | | 5,640,000 | | | | — | | | | — | | | | 5,640,000 | | |
Canyon Resources Ltd. | | | 826,316 | | | | 3,511,413 | | | | — | | | | 4,337,729 | | |
Golden Arrow Resources Corp. | | | 2,155,000 | | | | — | | | | (2,155,000 | ) | | | — | (a) | |
Gran Colombia Gold Corp. | | | 25,385,838 | | | | 15,300 | | | | (24,358,945 | ) | | | 1,042,193 | | |
Klondex Mines Ltd. | | | 4,488,200 | | | | 87,632 | | | | — | | | | 4,575,832 | | |
Mammoth Resources Corp. | | | 702,700 | | | | 297,300 | | | | — | | | | 1,000,000 | | |
Mirasol Resources Ltd. | | | 2,210,000 | | | | 21,600 | | | | — | | | | 2,231,600 | | |
Moss Lake Gold Mines Ltd. | | | 3,345,000 | | | | 8,500 | | | | — | | | | 3,353,500 | | |
Rochester Resources Ltd. | | | 7,000,000 | | | | — | | | | (7,000,000 | ) | | | — | (a) | |
At June 30, 2013, the value of investments in affiliated companies was $10,418,885, representing 7.04% of net assets, and the total cost was $45,324,850. Net realized losses on transactions were $1,016,188, and there was no income earned for the period.
(a) At June 30, 2013, the company is no longer defined as an affiliate, although it was an affiliated company during the period.
Restricted Securities - Indicated in Portfolio of Investments as "RS"
The following securities are subject to contractual and regulatory restrictions on resale or transfer. These investments may involve a high degree of business and financial risk. Because of the thinly traded markets for these investments, a Fund may be unable to
155
Notes to Portfolios of Investments (unaudited) June 30, 2013
liquidate its securities in a timely manner, especially if there is negative news regarding the specific securities or the markets overall. These securities could decline significantly in value before the Fund could liquidate these securities. The issuer bears the cost of registration, if any, involved in the disposition of these securities.
Holmes Growth Fund | | Acquisition
Date | | Cost per
Share/Unit | |
Andean Pacific Iron Corp., 144A | | 06/07/11-10/03/11 | | $ | 0.47 | | |
Pacific Infrastructure, Inc. | | 11/22/10 | | $ | 1.00 | | |
Pacific Power Generation Corp., Corporate Note | | 05/25/12 | | $ | 100.00 | | |
Pacific Stone Tech, Inc. | | 04/19/10 | | $ | 216.28 | | |
As of June 30, 2013, the total cost of restricted securities was $830,000, and the total value was $887,859, representing 2.43% of net assets.
MegaTrends Fund | | Acquisition
Date | | Cost per
Share/Unit | |
Andean Pacific Iron Corp., 144A | | 06/07/11-10/03/11 | | $ | 0.47 | | |
Pacific Green Energy Corp. | | 03/24/11 | | $ | 1.00 | | |
Pacific Infrastructure, Inc. | | 08/06/10-11/22/10 | | $ | 1.00 | | |
Pacific Power Generation Corp. | | 08/06/10 | | $ | 0.07 | | |
Pacific Power Generation Corp., Corporate Note | | 05/25/12 | | $ | 100.00 | | |
Pacific Stone Tech, Inc. | | 04/19/10 | | $ | 216.22 | | |
As of June 30, 2013, the total cost of restricted securities was $1,270,000, and the total value was $1,540,461, representing 13.65% of net assets.
Global Resources Fund | | Acquisition
Date | | Cost per
Share/Unit | |
Andean Pacific Iron Corp., 144A | | 10/03/11 | | $ | 1.00 | | |
GoviEx Uranium, Inc., 144A | | 10/04/07 | | $ | 1.96 | | |
I-Pulse, Inc., 144A | | 10/04/07 | | $ | 1.88 | | |
Pacific Green Energy Corp. | | 03/24/11 | | $ | 1.00 | | |
Pacific Infrastructure, Inc. | | 08/06/10-11/22/10 | | $ | 1.00 | | |
Pacific Power Generation Corp. | | 08/06/10 | | $ | 0.07 | | |
Pacific Power Generation Corp., Corporate Note | | 05/25/12 | | $ | 100.00 | | |
Pacific Stone Tech, Inc. | | 04/19/10 | | $ | 216.22 | | |
Value Creation, Inc. | | 08/11/06 | | $ | 10.60 | | |
As of June 30, 2013, the total cost of restricted securities was $25,740,186, and the total value was $23,732,842, representing 6.06% of net assets.
World Precious Minerals Fund | | Acquisition
Date | | Cost per
Share/Unit | |
Andean Pacific Iron Corp., 144A | | 06/07/11 | | $ | 0.30 | | |
Pacific Power Generation Corp., Corporate Note | | 05/25/12 | | $ | 100.00 | | |
Taurus Gold Ltd., 144A | | 05/31/11-05/29/13 | | $ | 1.17 | | |
Western Exploration & Development Ltd., 144A, Special Warrants
(December 2049) | | 08/14/97 | | $ | 0.50 | | |
As of June 30, 2013, the total cost of restricted securities was $5,167,500, and the total value was $3,316,101, representing 2.24% of net assets.
Gold and Precious Metals Fund | | Acquisition
Date | | Cost per
Share/Unit | |
Pacific Power Generation Corp., Corporate Note | | 05/25/12 | | $ | 100.00 | | |
156
Notes to Portfolios of Investments (unaudited) June 30, 2013
As of June 30, 2013, the total cost of restricted securities was $300,000, and the total value was $300,000, representing 0.34% of net assets.
Global Emerging Markets Fund | | Acquisition
Date | | Cost per
Share/Unit | |
Andean Pacific Iron Corp., 144A | | 06/07/11 | | $ | 0.30 | | |
Pacific Power Generation Corp., Corporate Note | | 05/25/12 | | $ | 100.00 | | |
As of June 30, 2013, the total cost of restricted securities was $150,000, and the total value was $203,648, representing 3.07% of net assets.
157
Statements of Assets and Liabilities (unaudited)
| | | U.S. Treasury
Securities
Cash Fund | | U.S. Government
Securities
Savings Fund | |
Investments, at identified cost | | $ | 77,938,354 | | | $ | 133,233,390 | | |
Assets | |
Investments, at value: | |
Securities | | $ | 19,999,966 | | | $ | 110,417,158 | | |
Repurchase agreements | | | 57,938,388 | | | | 22,816,232 | | |
Cash | | | — | | | | 17 | | |
Receivables: | |
Interest | | | 385 | | | | 120,821 | | |
Capital shares sold | | | 343,391 | | | | 234,273 | | |
From adviser | | | 13,842 | | | | 8,169 | | |
Other assets | | | 13,438 | | | | 19,502 | | |
Total Assets | | | 78,309,410 | | | | 133,616,172 | | |
Liabilities | |
Payables: | |
Investments purchased | | | — | | | | — | | |
Capital shares redeemed | | | 240,435 | | | | 193,450 | | |
Dividends and distributions | | | — | | | | — | | |
Adviser and affiliates | | | — | | | | — | | |
Accounts payable and accrued expenses | | | 39,999 | | | | 42,987 | | |
Total Liabilities | | | 280,434 | | | | 236,437 | | |
Net Assets | | $ | 78,028,976 | | | $ | 133,379,735 | | |
Net Assets Consist of: | |
Paid-in capital | | $ | 78,027,825 | | | $ | 133,377,204 | | |
Accumulated undistributed net investment income | | | 1,151 | | | | 2,531 | | |
Accumulated net realized loss on investments | | | — | | | | — | | |
Net unrealized appreciation of investments | | | — | | | | — | | |
Net assets applicable to capital shares outstanding | | $ | 78,028,976 | | | $ | 133,379,735 | | |
By share class | |
Net Assets | |
Investor class | | $ | 78,028,976 | | | $ | 133,379,735 | | |
Capital shares outstanding, an unlimited number of
no par shares authorized | |
Investor class | | | 78,104,147 | | | | 133,546,980 | | |
Net Asset Value, Public Offering Price, Redemption
Price, per share | |
Investor class | | $ | 1.00 | | | $ | 1.00 | | |
See accompanying notes to financial statements.
158
June 30, 2013
| | | Near-Term
Tax Free Fund | | Tax Free
Fund | |
Investments, at identified cost | | $ | 47,807,581 | | | $ | 19,092,012 | | |
Assets | |
Investments, at value: | |
Securities | | $ | 48,194,670 | | | $ | 19,656,202 | | |
Repurchase agreements | | | — | | | | — | | |
Cash | | | 2,543,131 | | | | 135,871 | | |
Receivables: | |
Interest | | | 628,132 | | | | 266,110 | | |
Capital shares sold | | | 1,030,756 | | | | 887 | | |
From adviser | | | — | | | | 2,154 | | |
Other assets | | | 4,169 | | | | 3,497 | | |
Total Assets | | | 52,400,858 | | | | 20,064,721 | | |
Liabilities | |
Payables: | |
Investments purchased | | | 634,311 | | | | — | | |
Capital shares redeemed | | | 16,076 | | | | 288 | | |
Dividends and distributions | | | 7,233 | | | | 10,796 | | |
Adviser and affiliates | | | 1,026 | | | | — | | |
Accounts payable and accrued expenses | | | 28,872 | | | | 32,402 | | |
Total Liabilities | | | 687,518 | | | | 43,486 | | |
Net Assets | | $ | 51,713,340 | | | $ | 20,021,235 | | |
Net Assets Consist of: | |
Paid-in capital | | $ | 51,509,078 | | | $ | 19,454,347 | | |
Accumulated undistributed net investment income | | | 37,405 | | | | 41,051 | | |
Accumulated net realized loss on investments | | | (220,232 | ) | | | (38,353 | ) | |
Net unrealized appreciation of investments | | | 387,089 | | | | 564,190 | | |
Net assets applicable to capital shares outstanding | | $ | 51,713,340 | | | $ | 20,021,235 | | |
By share class | |
Net Assets | |
Investor class | | $ | 51,713,340 | | | $ | 20,021,235 | | |
Capital shares outstanding, an unlimited number of
no par shares authorized | |
Investor class | | | 23,168,486 | | | | 1,627,721 | | |
Net Asset Value, Public Offering Price, Redemption
Price, per share | |
Investor class | | $ | 2.23 | | | $ | 12.30 | | |
159
Statements of Assets and Liabilities (unaudited)
| | | All American
Equity Fund | | Holmes
Growth Fund | | MegaTrends
Fund | |
Investments, at identified cost | | $ | 15,474,863 | | | $ | 28,003,734 | | | $ | 10,338,995 | | |
Assets | |
Investments, at value: | |
Securities of unaffiliated issuers | | $ | 18,102,585 | | | $ | 33,009,984 | | | $ | 10,798,056 | | |
Securities of affiliated issuers | | | — | | | | 645,333 | | | | — | | |
Cash | | | 1,662,698 | | | | 2,956,145 | | | | 497,857 | | |
Foreign currencies (Cost $0, $0, $0, $1,859,030 and $108,093) | | | — | | | | — | | | | — | | |
Receivables: | |
Investments sold | | | — | | | | — | | | | — | | |
Dividends and interest | | | 11,954 | | | | 25,390 | | | | 21,700 | | |
Capital shares sold | | | 10,304 | | | | 2,259 | | | | 807 | | |
From adviser | | | — | | | | — | | | | — | | |
Other assets | | | 8,957 | | | | 11,511 | | | | 9,181 | | |
Total Assets | | | 19,796,498 | | | | 36,650,622 | | | | 11,327,601 | | |
Liabilities | |
Payables: | |
Investments purchased | | | — | | | | 3,780 | | | | — | | |
Capital shares redeemed | | | 3,731 | | | | 2,057 | | | | 6,306 | | |
Adviser and affiliates | | | 17,041 | | | | 36,201 | | | | 1,002 | | |
Accounts payable and accrued expenses | | | 36,390 | | | | 39,603 | | | | 33,995 | | |
Written options at value (Premiums $7,154, $14,308, $0, $0 and $0) | | | 5,130 | | | | 10,260 | | | | — | | |
Total Liabilities | | | 62,292 | | | | 91,901 | | | | 41,303 | | |
Net Assets | | $ | 19,734,206 | | | $ | 36,558,721 | | | $ | 11,286,298 | | |
Net Assets Consist of: | |
Paid-in capital | | $ | 16,609,831 | | | $ | 29,246,105 | | | $ | 22,955,572 | | |
Accumulated undistributed net investment income (distributions in excess of
net investment income) | | | 6,172 | | | | (209,369 | ) | | | (51,324 | ) | |
Accumulated net realized gain (loss) on investments and foreign currencies | | | 488,457 | | | | 1,866,355 | | | | (12,077,011 | ) | |
Net unrealized appreciation (depreciation) of investments and other assets and
liabilities denominated in foreign currencies | | | 2,629,746 | | | | 5,655,630 | | | | 459,061 | | |
Net assets applicable to capital shares outstanding | | $ | 19,734,206 | | | $ | 36,558,721 | | | $ | 11,286,298 | | |
By share class | |
Net Assets | |
Investor class | | $ | 19,734,206 | | | $ | 36,558,721 | | | $ | 11,251,121 | | |
Institutional class | | | N/A | | | | N/A | | | | 35,177 | | |
Capital shares outstanding, an unlimited number of
no par shares authorized | |
Investor class | | | 682,234 | | | | 1,748,535 | | | | 1,251,331 | | |
Institutional class | | | N/A | | | | N/A | | | | 3,952 | | |
Net Asset Value, Public Offering Price, Redemption
Price, per share | |
Investor class | | $ | 28.93 | | | $ | 20.91 | | | $ | 8.99 | | |
Institutional class | | | N/A | | | | N/A | | | | 8.90 | | |
See accompanying notes to financial statements.
160
June 30, 2013
| | | Global
Resources Fund | | World Precious
Minerals Fund | |
Investments, at identified cost | | $ | 442,385,631 | | | $ | 316,182,567 | | |
Assets | |
Investments, at value: | |
Securities of unaffiliated issuers | | $ | 349,845,017 | | | $ | 119,549,854 | | |
Securities of affiliated issuers | | | 16,840,424 | | | | 10,418,885 | | |
Cash | | | 18,917,435 | | | | 16,748,489 | | |
Foreign currencies (Cost $0, $0, $0, $1,859,030 and $108,093) | | | 1,833,353 | | | | 106,784 | | |
Receivables: | |
Investments sold | | | 7,268,697 | | | | 744,384 | | |
Dividends and interest | | | 683,600 | | | | 315,788 | | |
Capital shares sold | | | 208,351 | | | | 1,443,700 | | |
From adviser | | | — | | | | — | | |
Other assets | | | 63,151 | | | | 47,881 | | |
Total Assets | | | 395,660,028 | | | | 149,375,765 | | |
Liabilities | |
Payables: | |
Investments purchased | | | 2,704,548 | | | | 818,196 | | |
Capital shares redeemed | | | 929,452 | | | | 228,708 | | |
Adviser and affiliates | | | 429,648 | | | | 177,936 | | |
Accounts payable and accrued expenses | | | 167,759 | | | | 152,977 | | |
Written options at value (Premiums $7,154, $14,308, $0, $0 and $0) | | | — | | | | — | | |
Total Liabilities | | | 4,231,407 | | | | 1,377,817 | | |
Net Assets | | $ | 391,428,621 | | | $ | 147,997,948 | | |
Net Assets Consist of: | |
Paid-in capital | | $ | 826,772,694 | | | $ | 537,923,176 | | |
Accumulated undistributed net investment income (distributions in excess of
net investment income) | | | 4,971,017 | | | | (26,968,483 | ) | |
Accumulated net realized gain (loss) on investments and foreign currencies | | | (364,584,353 | ) | | | (176,739,369 | ) | |
Net unrealized appreciation (depreciation) of investments and other assets and
liabilities denominated in foreign currencies | | | (75,730,737 | ) | | | (186,217,376 | ) | |
Net assets applicable to capital shares outstanding | | $ | 391,428,621 | | | $ | 147,997,948 | | |
By share class | |
Net Assets | |
Investor class | | $ | 350,703,416 | | | $ | 147,880,453 | | |
Institutional class | | | 40,725,205 | | | | 117,495 | | |
Capital shares outstanding, an unlimited number of
no par shares authorized | |
Investor class | | | 39,069,422 | | | | 24,657,691 | | |
Institutional class | | | 4,546,144 | | | | 19,543 | | |
Net Asset Value, Public Offering Price, Redemption
Price, per share | |
Investor class | | $ | 8.98 | | | $ | 6.00 | | |
Institutional class | | | 8.96 | | | | 6.01 | | |
161
Statements of Assets and Liabilities (unaudited)
| | | Gold and Precious
Metals Fund | | Emerging Europe
Fund | |
Investments, at identified cost | | $ | 124,854,110 | | | $ | 111,380,350 | | |
Assets | |
Investments, at value: | |
Securities | | $ | 65,083,286 | | | $ | 115,187,284 | | |
Cash | | | 22,694,852 | | | | 13,220,771 | | |
Foreign currencies (Cost $19,613, $2, $12,070 and $20,168) | | | 19,619 | | | | 2 | | |
Receivables: | |
Investments sold | | | 389,142 | | | | 1,030,526 | | |
Dividends and interest | | | 251,106 | | | | 1,812,122 | | |
Capital shares sold | | | 122,306 | | | | 7,246 | | |
From adviser | | | — | | | | — | | |
Other assets | | | 31,928 | | | | 28,392 | | |
Total Assets | | | 88,592,239 | | | | 131,286,343 | | |
Liabilities | |
Payables: | |
Investments purchased | | | 472,277 | | | | 331,281 | | |
Capital shares redeemed | | | 252,017 | | | | 88,272 | | |
Adviser and affiliates | | | 126,327 | | | | 147,547 | | |
Accounts payable and accrued expenses | | | 84,645 | | | | 84,438 | | |
Written options at value (Premiums $0, $196,208, $0 and $0) | | | — | | | | 152,500 | | |
Total Liabilities | | | 935,266 | | | | 804,038 | | |
Net Assets | | $ | 87,656,973 | | | $ | 130,482,305 | | |
Net Assets Consist of: | |
Paid-in capital | | $ | 187,488,281 | | | $ | 434,213,146 | | |
Accumulated undistributed net investment income (distributions in excess of
net investment income) | | | (2,002,254 | ) | | | 4,306,230 | | |
Accumulated net realized loss on investments and foreign currencies | | | (38,056,819 | ) | | | (311,819,480 | ) | |
Net unrealized appreciation (depreciation) of investments and other assets and
liabilities denominated in foreign currencies | | | (59,772,235 | ) | | | 3,782,409 | | |
Net assets applicable to capital shares outstanding | | $ | 87,656,973 | | | $ | 130,482,305 | | |
By share class | |
Net Assets | |
Investor class | | $ | 87,656,973 | | | $ | 130,482,305 | | |
Capital shares outstanding, an unlimited number of
no par shares authorized | |
Investor class | | | 13,218,927 | | | | 15,803,772 | | |
Net Asset Value, Public Offering Price, Redemption
Price, per share | |
Investor class | | $ | 6.63 | | | $ | 8.26 | | |
See accompanying notes to financial statements.
162
June 30, 2013
| | | Global Emerging
Markets Fund | | China Region
Fund | |
Investments, at identified cost | | $ | 7,086,745 | | | $ | 24,103,111 | | |
Assets | |
Investments, at value: | |
Securities | | $ | 6,374,797 | | | $ | 24,326,921 | | |
Cash | | | 267,576 | | | | 2,002,925 | | |
Foreign currencies (Cost $19,613, $2, $12,070 and $20,168) | | | 12,075 | | | | 20,169 | | |
Receivables: | |
Investments sold | | | 153,431 | | | | 8,262 | | |
Dividends and interest | | | 54,701 | | | | 213,527 | | |
Capital shares sold | | | 538 | | | | 2,334 | | |
From adviser | | | 875 | | | | — | | |
Other assets | | | 15,290 | | | | 13,593 | | |
Total Assets | | | 6,879,283 | | | | 26,587,731 | | |
Liabilities | |
Payables: | |
Investments purchased | | | 177,753 | | | | 778,690 | | |
Capital shares redeemed | | | 792 | | | | 193,974 | | |
Adviser and affiliates | | | — | | | | 30,393 | | |
Accounts payable and accrued expenses | | | 57,673 | | | | 70,418 | | |
Written options at value (Premiums $0, $196,208, $0 and $0) | | | — | | | | — | | |
Total Liabilities | | | 236,218 | | | | 1,073,475 | | |
Net Assets | | $ | 6,643,065 | | | $ | 25,514,256 | | |
Net Assets Consist of: | |
Paid-in capital | | $ | 19,947,227 | | | $ | 45,517,755 | | |
Accumulated undistributed net investment income (distributions in excess of
net investment income) | | | 69,758 | | | | 113,823 | | |
Accumulated net realized loss on investments and foreign currencies | | | (12,662,352 | ) | | | (20,341,121 | ) | |
Net unrealized appreciation (depreciation) of investments and other assets and
liabilities denominated in foreign currencies | | | (711,568 | ) | | | 223,799 | | |
Net assets applicable to capital shares outstanding | | $ | 6,643,065 | | | $ | 25,514,256 | | |
By share class | |
Net Assets | |
Investor class | | $ | 6,643,065 | | | $ | 25,514,256 | | |
Capital shares outstanding, an unlimited number of
no par shares authorized | |
Investor class | | | 947,134 | | | | 3,468,855 | | |
Net Asset Value, Public Offering Price, Redemption
Price, per share | |
Investor class | | $ | 7.01 | | | $ | 7.36 | | |
163
Statements of Operations (unaudited)
Net Investment Income | | U.S. Treasury
Securities
Cash Fund | | U.S. Government
Securities
Savings Fund | |
Income: | |
Interest and other | | $ | 27,765 | | | $ | 63,485 | | |
Expenses: | |
Management fee | | | 193,791 | | | | 343,933 | | |
Administrative services fee | | | 31,007 | | | | 55,029 | | |
Transfer agent fees and expenses | | | 86,923 | | | | 89,060 | | |
Accounting service fees and expenses | | | 24,158 | | | | 25,289 | | |
Professional fees | | | 16,787 | | | | 20,685 | | |
Custodian fees | | | 30,348 | | | | 23,672 | | |
Shareholder reporting expenses | | | 7,304 | | | | 9,776 | | |
Registration fees | | | 11,113 | | | | 11,058 | | |
Trustee fees and expenses | | | 11,580 | | | | 11,580 | | |
Miscellaneous expenses | | | 16,210 | | | | 24,188 | | |
Total expenses before reductions | | | 429,221 | | | | 614,270 | | |
Expenses offset - Note 1 H | | | (2 | ) | | | — | | |
Expenses reimbursed - Note 3 | | | (405,330 | ) | | | (557,668 | ) | |
Net expenses | | | 23,889 | | | | 56,602 | | |
Net Investment Income | | | 3,876 | | | | 6,883 | | |
Net Realized and Unrealized
Gain (Loss) on Investments | |
Realized loss from securities | | | — | | | | — | | |
Net change in unrealized depreciation of investments | | | — | | | | — | | |
Net Realized and Unrealized Loss on Investments | | | — | | | | — | | |
Net Increase (Decrease) In Net Assets
Resulting From Operations | | $ | 3,876 | | | $ | 6,883 | | |
See accompanying notes to financial statements.
164
For the Six Months Ended June 30, 2013
Net Investment Income | | Near-Term
Tax Free Fund | | Tax Free
Fund | |
Income: | |
Interest and other | | $ | 608,238 | | | $ | 435,761 | | |
Expenses: | |
Management fee | | | 121,194 | | | | 82,947 | | |
Administrative services fee | | | 19,391 | | | | 8,848 | | |
Transfer agent fees and expenses | | | 35,065 | | | | 25,583 | | |
Accounting service fees and expenses | | | 42,097 | | | | 34,902 | | |
Professional fees | | | 19,546 | | | | 17,608 | | |
Custodian fees | | | 8,321 | | | | 5,785 | | |
Shareholder reporting expenses | | | 4,171 | | | | 4,044 | | |
Registration fees | | | 10,309 | | | | 8,520 | | |
Trustee fees and expenses | | | 11,580 | | | | 11,580 | | |
Miscellaneous expenses | | | 6,197 | | | | 5,319 | | |
Total expenses before reductions | | | 277,871 | | | | 205,136 | | |
Expenses offset - Note 1 H | | | (241 | ) | | | (78 | ) | |
Expenses reimbursed - Note 3 | | | (168,556 | ) | | | (127,641 | ) | |
Net expenses | | | 109,074 | | | | 77,417 | | |
Net Investment Income | | | 499,164 | | | | 358,344 | | |
Net Realized and Unrealized
Gain (Loss) on Investments | |
Realized loss from securities | | | (5,276 | ) | | | (9,488 | ) | |
Net change in unrealized depreciation of investments | | | (913,524 | ) | | | (1,050,478 | ) | |
Net Realized and Unrealized Loss on Investments | | | (918,800 | ) | | | (1,059,966 | ) | |
Net Increase (Decrease) In Net Assets
Resulting From Operations | | $ | (419,636 | ) | | $ | (701,622 | ) | |
165
Statements of Operations (unaudited)
Net Investment Income | | All American
Equity Fund | | Holmes
Growth Fund | | MegaTrends
Fund | |
Income: | |
Dividends from unaffiliated issuers | | $ | 157,327 | | | $ | 94,462 | | | $ | 72,043 | | |
Foreign tax withheld on dividends, net of reimbursements | | | (466 | ) | | | (564 | ) | | | 1,240 | | |
Net dividends | | | 156,861 | | | | 93,898 | | | | 73,283 | | |
Interest and other | | | 85 | | | | 55,264 | | | | 8,726 | | |
Total income | | | 156,946 | | | | 149,162 | | | | 82,009 | | |
Expenses: | |
Management fee | | | 66,134 | | | | 135,337 | | | | 39,335 | | |
Administrative services fee | | | 7,348 | | | | 14,432 | | | | 2,195 | | |
Administrative services fee - Investor class | | | — | | | | — | | | | 2,185 | | |
Administrative services fee - Institutional class | | | — | | | | — | | | | 10 | | |
Transfer agent fees and expenses - Investor class | | | 38,767 | | | | 38,281 | | | | 25,754 | | |
Transfer agent fees and expenses - Institutional class | | | — | | | | — | | | | 8,384 | | |
Accounting service fees and expenses | | | 27,572 | | | | 27,598 | | | | 33,149 | | |
Professional fees | | | 17,092 | | | | 18,846 | | | | 19,360 | | |
Distribution plan fee | | | 22,963 | | | | 45,099 | | | | 13,657 | | |
Custodian fees | | | 7,714 | | | | 12,557 | | | | 11,742 | | |
Shareholder reporting expenses - Investor class | | | 9,385 | | | | 6,569 | | | | 4,389 | | |
Shareholder reporting expenses - Institutional class | | | — | | | | — | | | | 1,157 | | |
Registration fees | | | 8,158 | | | | 8,775 | | | | 3,191 | | |
Registration fees - Investor class | | | — | | | | — | | | | 5,506 | | |
Registration fees - Institutional class | | | — | | | | — | | | | 5,197 | | |
Trustee fees and expenses | | | 11,580 | | | | 11,580 | | | | 11,580 | | |
Miscellaneous expenses | | | 11,809 | | | | 14,424 | | | | 11,700 | | |
Total expenses before reductions | | | 228,522 | | | | 333,498 | | | | 198,491 | | |
Expenses offset - Note 1 H | | | (161 | ) | | | (240 | ) | | | (62 | ) | |
Expenses reimbursed - Note 3 | | | (33,636 | ) | | | — | | | | (84,777 | ) | |
Net expenses | | | 194,725 | | | | 333,258 | | | | 113,652 | | |
Net Investment Income (Loss) | | | (37,779 | ) | | | (184,096 | ) | | | (31,643 | ) | |
Net Realized and Unrealized
Gain (Loss) on Investments | |
Realized gain (loss) from: | |
Securities from unaffiliated issuers | | | 548,836 | | | | 857,938 | | | | 930,724 | | |
Securities from affiliated issuers | | | — | | | | — | | | | — | | |
Written options | | | 13,355 | | | | 49,324 | | | | — | | |
Foreign currency transactions | | | — | | | | 333 | | | | (19 | ) | |
Net realized gain (loss) | | | 562,191 | | | | 907,595 | | | | 930,705 | | |
Net change in unrealized appreciation (depreciation) of: | |
Investments | | | 1,806,638 | | | | 3,671,960 | | | | 265,480 | | |
Written options | | | 2,024 | | | | 4,048 | | | | — | | |
Other assets and liabilities denominated in foreign currencies | | | — | | | | (1 | ) | | | 1 | | |
Net unrealized appreciation (depreciation) | | | 1,808,662 | | | | 3,676,007 | | | | 265,481 | | |
Net Realized and Unrealized Gain (Loss) on Investments | | | 2,370,853 | | | | 4,583,602 | | | | 1,196,186 | | |
Net Increase (Decrease) In Net Assets
Resulting From Operations | | $ | 2,333,074 | | | $ | 4,399,506 | | | $ | 1,164,543 | | |
See accompanying notes to financial statements.
166
For the Six Months Ended June 30, 2013
Net Investment Income | | Global
Resources Fund | | World Precious
Minerals Fund | |
Income: | |
Dividends from unaffiliated issuers | | $ | 3,244,172 | | | $ | 429,638 | | |
Foreign tax withheld on dividends, net of reimbursements | | | (64,479 | ) | | | (55,530 | ) | |
Net dividends | | | 3,179,693 | | | | 374,108 | | |
Interest and other | | | 922,861 | | | | 555,884 | | |
Total income | | | 4,102,554 | | | | 929,992 | | |
Expenses: | |
Management fee | | | 2,440,349 | | | | 1,085,565 | | |
Administrative services fee | | | 93,440 | | | | 46,154 | | |
Administrative services fee - Investor class | | | 82,015 | | | | 46,087 | | |
Administrative services fee - Institutional class | | | 11,425 | | | | 67 | | |
Transfer agent fees and expenses - Investor class | | | 477,430 | | | | 278,178 | | |
Transfer agent fees and expenses - Institutional class | | | 41,117 | | | | 8,409 | | |
Accounting service fees and expenses | | | 85,765 | | | | 50,969 | | |
Professional fees | | | 53,387 | | | | 47,199 | | |
Distribution plan fee | | | 512,593 | | | | 288,044 | | |
Custodian fees | | | 64,075 | | | | 101,486 | | |
Shareholder reporting expenses - Investor class | | | 65,929 | | | | 42,818 | | |
Shareholder reporting expenses - Institutional class | | | 2,320 | | | | 2,650 | | |
Registration fees | | | 7,703 | | | | 5,741 | | |
Registration fees - Investor class | | | 8,009 | | | | 8,722 | | |
Registration fees - Institutional class | | | 8,421 | | | | 5,257 | | |
Trustee fees and expenses | | | 11,580 | | | | 11,580 | | |
Miscellaneous expenses | | | 77,219 | | | | 59,006 | | |
Total expenses before reductions | | | 4,042,777 | | | | 2,087,932 | | |
Expenses offset - Note 1 H | | | (483 | ) | | | (324 | ) | |
Expenses reimbursed - Note 3 | | | (63,283 | ) | | | (31,039 | ) | |
Net expenses | | | 3,979,011 | | | | 2,056,569 | | |
Net Investment Income (Loss) | | | 123,543 | | | | (1,126,577 | ) | |
Net Realized and Unrealized
Gain (Loss) on Investments | |
Realized gain (loss) from: | |
Securities from unaffiliated issuers | | | 18,507,680 | | | | (51,413,888 | ) | |
Securities from affiliated issuers | | | — | | | | (1,016,188 | ) | |
Written options | | | 28,798 | | | | — | | |
Foreign currency transactions | | | (133,958 | ) | | | (39,722 | ) | |
Net realized gain (loss) | | | 18,402,520 | | | | (52,469,798 | ) | |
Net change in unrealized appreciation (depreciation) of: | |
Investments | | | (54,340,848 | ) | | | (93,626,756 | ) | |
Written options | | | — | | | | — | | |
Other assets and liabilities denominated in foreign currencies | | | (32,470 | ) | | | (2,816 | ) | |
Net unrealized appreciation (depreciation) | | | (54,373,318 | ) | | | (93,629,572 | ) | |
Net Realized and Unrealized Gain (Loss) on Investments | | | (35,970,798 | ) | | | (146,099,370 | ) | |
Net Increase (Decrease) In Net Assets
Resulting From Operations | | $ | (35,847,255 | ) | | $ | (147,225,947 | ) | |
167
Statements of Operations (unaudited)
Net Investment Income | | Gold and Precious
Metals Fund | | Emerging Europe
Fund | |
Income: | |
Dividends from unaffiliated issuers | | $ | 601,430 | | | $ | 4,801,069 | | |
Foreign tax withheld on dividends, net of reimbursements | | | (73,817 | ) | | | (625,477 | ) | |
Net dividends | | | 527,613 | | | | 4,175,592 | | |
Interest and other | | | 450,882 | | | | 94,352 | | |
Total income | | | 978,495 | | | | 4,269,944 | | |
Expenses: | |
Management fee | | | 728,354 | | | | 907,764 | | |
Administrative services fee | | | 52,444 | | | | 62,915 | | |
Transfer agent fees and expenses | | | 140,948 | | | | 208,654 | | |
Accounting service fees and expenses | | | 36,215 | | | | 37,106 | | |
Professional fees | | | 29,919 | | | | 27,547 | | |
Distribution plan fee | | | 163,887 | | | | 196,610 | | |
Custodian fees | | | 67,843 | | | | 89,776 | | |
Shareholder reporting expenses | | | 29,966 | | | | 32,292 | | |
Registration fees | | | 11,206 | | | | 10,733 | | |
Trustee fees and expenses | | | 11,580 | | | | 11,580 | | |
Miscellaneous expenses | | | 38,252 | | | | 35,001 | | |
Total expenses before reductions | | | 1,310,614 | | | | 1,619,978 | | |
Expenses offset - Note 1 H | | | (366 | ) | | | (331 | ) | |
Expenses reimbursed - Note 3 | | | (6,766 | ) | | | — | | |
Net expenses | | | 1,303,482 | | | | 1,619,647 | | |
Net Investment Income (Loss) | | | (324,987 | ) | | | 2,650,297 | | |
Net Realized and Unrealized
Gain (Loss) on Investments | |
Realized gain (loss) from: | |
Securities from unaffiliated issuers | | | (23,881,171 | ) | | | 3,532,192 | | |
Written options | | | — | | | | 31,229 | | |
Foreign currency transactions | | | (22,895 | ) | | | (85,146 | ) | |
Net realized gain (loss) | | | (23,904,066 | ) | | | 3,478,275 | | |
Net change in unrealized appreciation (depreciation) of: | |
Investments | | | (48,391,563 | ) | | | (21,827,602 | ) | |
Written options | | | — | | | | 76,148 | | |
Other assets and liabilities denominated in foreign currencies | | | (547 | ) | | | (66,944 | ) | |
Net unrealized depreciation | | | (48,392,110 | ) | | | (21,818,398 | ) | |
Net Realized and Unrealized Loss on Investments | | | (72,296,176 | ) | | | (18,340,123 | ) | |
Net Decrease In Net Assets
Resulting From Operations | | $ | (72,621,163 | ) | | $ | (15,689,826 | ) | |
See accompanying notes to financial statements.
168
For the Six Months Ended June 30, 2013
Net Investment Income | | Global Emerging
Markets Fund | | China Region
Fund | |
Income: | |
Dividends from unaffiliated issuers | | $ | 205,757 | | | $ | 523,261 | | |
Foreign tax withheld on dividends, net of reimbursements | | | (19,451 | ) | | | (21,546 | ) | |
Net dividends | | | 186,306 | | | | 501,715 | | |
Interest and other | | | 7,903 | | | | 145 | | |
Total income | | | 194,209 | | | | 501,860 | | |
Expenses: | |
Management fee | | | 45,716 | | | | 154,538 | | |
Administrative services fee | | | 2,952 | | | | 11,440 | | |
Transfer agent fees and expenses | | | 24,301 | | | | 49,990 | | |
Accounting service fees and expenses | | | 33,122 | | | | 33,126 | | |
Professional fees | | | 24,271 | | | | 23,551 | | |
Distribution plan fee | | | 9,226 | | | | 35,750 | | |
Custodian fees | | | 25,474 | | | | 37,877 | | |
Shareholder reporting expenses | | | 4,474 | | | | 10,407 | | |
Registration fees | | | 8,166 | | | | 8,541 | | |
Trustee fees and expenses | | | 11,580 | | | | 11,580 | | |
Miscellaneous expenses | | | 13,933 | | | | 17,143 | | |
Total expenses before reductions | | | 203,215 | | | | 393,943 | | |
Expenses offset - Note 1 H | | | (60 | ) | | | (144 | ) | |
Expenses reimbursed - Note 3 | | | (91,672 | ) | | | (53,359 | ) | |
Net expenses | | | 111,483 | | | | 340,440 | | |
Net Investment Income (Loss) | | | 82,726 | | | | 161,420 | | |
Net Realized and Unrealized
Gain (Loss) on Investments | |
Realized gain (loss) from: | |
Securities from unaffiliated issuers | | | 26,732 | | | | 1,436,780 | | |
Written options | | | — | | | | — | | |
Foreign currency transactions | | | (17,497 | ) | | | (2,232 | ) | |
Net realized gain (loss) | | | 9,235 | | | | 1,434,548 | | |
Net change in unrealized appreciation (depreciation) of: | |
Investments | | | (376,428 | ) | | | (2,454,940 | ) | |
Written options | | | — | | | | — | | |
Other assets and liabilities denominated in foreign currencies | | | 503 | | | | (5 | ) | |
Net unrealized depreciation | | | (375,925 | ) | | | (2,454,945 | ) | |
Net Realized and Unrealized Loss on Investments | | | (366,690 | ) | | | (1,020,397 | ) | |
Net Decrease In Net Assets
Resulting From Operations | | $ | (283,964 | ) | | $ | (858,977 | ) | |
169
Statements of Changes in Net Assets
| | | U.S. Treasury Securities
Cash Fund | | U.S. Government Securities
Savings Fund | |
| | | Six Months Ended
June 30, 2013
(unaudited) | | Year Ended
December 31,
2012 | | Six Months Ended
June 30, 2013
(unaudited) | | Year Ended
December 31,
2012 | |
Increase (Decrease) in Net Assets | |
From operations: | |
Net investment income | | $ | 3,876 | | | $ | 8,581 | | | $ | 6,883 | | | $ | 15,753 | | |
Net realized loss | | | — | | | | — | | | | — | | | | — | | |
Net unrealized appreciation (depreciation) | | | — | | | | — | | | | — | | | | — | | |
Net increase (decrease) in net assets from operations | | | 3,876 | | | | 8,581 | | | | 6,883 | | | | 15,753 | | |
Distributions to shareholders: | |
From net investment income | |
Investor class | | | (3,876 | ) | | | (8,500 | ) | | | (6,883 | ) | | | (15,792 | ) | |
Total distributions to shareholders | | | (3,876 | ) | | | (8,500 | ) | | | (6,883 | ) | | | (15,792 | ) | |
From capital share transactions: | |
Proceeds from shares sold
Investor class | | | 46,745,242 | | | | 77,104,085 | | | | 42,565,247 | | | | 79,402,411 | | |
Distributions reinvested
Investor class | | | 3,850 | | | | 8,382 | | | | 6,843 | | | | 15,570 | | |
| | | | 46,749,092 | | | | 77,112,467 | | | | 42,572,090 | | | | 79,417,981 | | |
Cost of shares redeemed
Investor class | | | (48,911,966 | ) | | | (87,477,230 | ) | | | (49,617,436 | ) | | | (110,656,435 | ) | |
Net increase (decrease) in net assets from
capital share transactions | | | (2,162,874 | ) | | | (10,364,763 | ) | | | (7,045,346 | ) | | | (31,238,454 | ) | |
Net Increase (Decrease) in Net Assets | | | (2,162,874 | ) | | | (10,364,682 | ) | | | (7,045,346 | ) | | | (31,238,493 | ) | |
Net Assets | |
Beginning of year | | | 80,191,850 | | | | 90,556,532 | | | | 140,425,081 | | | | 171,663,574 | | |
End of period | | $ | 78,028,976 | | | $ | 80,191,850 | | | $ | 133,379,735 | | | $ | 140,425,081 | | |
Accumulated undistributed net investment income, end of period | | $ | 1,151 | | | $ | 1,151 | | | $ | 2,531 | | | $ | 2,531 | | |
Capital Share Activity | |
Investor class: | |
Shares sold | | | 46,745,242 | | | | 77,104,085 | | | | 42,565,247 | | | | 79,402,411 | | |
Shares reinvested | | | 3,850 | | | | 8,382 | | | | 6,843 | | | | 15,570 | | |
Shares redeemed | | | (48,911,966 | ) | | | (87,477,230 | ) | | | (49,617,436 | ) | | | (110,656,435 | ) | |
Net share activity | | | (2,162,874 | ) | | | (10,364,763 | ) | | | (7,045,346 | ) | | | (31,238,454 | ) | |
See accompanying notes to financial statements.
170
| | | Near-Term Tax Free Fund | |
| | | Six Months Ended
June 30, 2013
(unaudited) | | Year Ended
December 31,
2012 | |
Increase (Decrease) in Net Assets | |
From operations: | |
Net investment income | | $ | 499,164 | | | $ | 859,973 | | |
Net realized loss | | | (5,276 | ) | | | (278 | ) | |
Net unrealized appreciation (depreciation) | | | (913,524 | ) | | | 67,999 | | |
Net increase (decrease) in net assets from operations | | | (419,636 | ) | | | 927,694 | | |
Distributions to shareholders: | |
From net investment income | |
Investor class | | | (479,653 | ) | | | (866,558 | ) | |
Total distributions to shareholders | | | (479,653 | ) | | | (866,558 | ) | |
From capital share transactions: | |
Proceeds from shares sold
Investor class | | | 16,968,514 | | | | 15,981,583 | | |
Distributions reinvested
Investor class | | | 421,566 | | | | 739,939 | | |
| | | | 17,390,080 | | | | 16,721,522 | | |
Cost of shares redeemed
Investor class | | | (9,286,761 | ) | | | (7,286,999 | ) | |
Net increase (decrease) in net assets from
capital share transactions | | | 8,103,319 | | | | 9,434,523 | | |
Net Increase (Decrease) in Net Assets | | | 7,204,030 | | | | 9,495,659 | | |
Net Assets | |
Beginning of year | | | 44,509,310 | | | | 35,013,651 | | |
End of period | | $ | 51,713,340 | | | $ | 44,509,310 | | |
Accumulated undistributed net investment income, end of period | | $ | 37,405 | | | $ | 17,894 | | |
Capital Share Activity | |
Investor class: | |
Shares sold | | | 7,480,066 | | | | 7,020,534 | | |
Shares reinvested | | | 186,219 | | | | 325,398 | | |
Shares redeemed | | | (4,104,409 | ) | | | (3,202,347 | ) | |
Net share activity | | | 3,561,876 | | | | 4,143,585 | | |
171
Statements of Changes in Net Assets
| | | Tax Free Fund | | All American Equity Fund | |
| | | Six Months Ended
June 30, 2013
(unaudited) | | Year Ended
December 31,
2012 | | Six Months Ended
June 30, 2013
(unaudited) | | Year Ended
December 31,
2012 | |
Increase (Decrease) in Net Assets | |
From operations: | |
Net investment income (loss) | | $ | 358,344 | | | $ | 718,389 | | | $ | (37,779 | ) | | $ | 47,748 | | |
Net realized gain (loss) | | | (9,488 | ) | | | 1,339 | | | | 562,191 | | | | 1,308,682 | | |
Net unrealized appreciation (depreciation) | | | (1,050,478 | ) | | | 487,421 | | | | 1,808,662 | | | | 531,485 | | |
Net increase (decrease) in net assets from operations | | | (701,622 | ) | | | 1,207,149 | | | | 2,333,074 | | | | 1,887,915 | | |
Distributions to shareholders: | |
From net investment income | |
Investor class | | | (352,684 | ) | | | (718,429 | ) | | | — | | | | — | | |
From net capital gains | |
Investor class | | | — | | | | — | | | | — | | | | — | | |
Total distributions to shareholders | | | (352,684 | ) | | | (718,429 | ) | | | — | | | | — | | |
From capital share transactions: | |
Proceeds from shares sold
Investor class | | | 3,226,745 | | | | 6,942,742 | | | | 1,969,808 | | | | 2,230,319 | | |
Distributions reinvested
Investor class | | | 280,893 | | | | 570,049 | | | | — | | | | — | | |
Proceeds from short-term trading fees
Investor class | | | — | | | | — | | | | 167 | | | | 485 | | |
| | | | 3,507,638 | | | | 7,512,791 | | | | 1,969,975 | | | | 2,230,804 | | |
Cost of shares redeemed
Investor class | | | (5,570,135 | ) | | | (6,526,795 | ) | | | (1,414,911 | ) | | | (3,671,270 | ) | |
Net increase (decrease) in net assets from
capital share transactions | | | (2,062,497 | ) | | | 985,996 | | | | 555,064 | | | | (1,440,466 | ) | |
Net Increase (Decrease) in Net Assets | | | (3,116,803 | ) | | | 1,474,716 | | | | 2,888,138 | | | | 447,449 | | |
Net Assets | |
Beginning of year | | | 23,138,038 | | | | 21,663,322 | | | | 16,846,068 | | | | 16,398,619 | | |
End of period | | $ | 20,021,235 | | | $ | 23,138,038 | | | $ | 19,734,206 | | | $ | 16,846,068 | | |
Accumulated undistributed net investment income (distributions
in excess of net investment income), end of period | | $ | 41,051 | | | $ | 35,391 | | | $ | 6,172 | | | $ | 43,951 | | |
Capital Share Activity | |
Investor class: | |
Shares sold | | | 250,863 | | | | 539,707 | | | | 70,115 | | | | 90,701 | | |
Shares reinvested | | | 22,023 | | | | 44,307 | | | | — | | | | — | | |
Shares redeemed | | | (435,670 | ) | | | (508,977 | ) | | | (51,184 | ) | | | (149,051 | ) | |
Net share activity | | | (162,784 | ) | | | 75,037 | | | | 18,931 | | | | (58,350 | ) | |
See accompanying notes to financial statements.
172
| | | Holmes Growth Fund | |
| | | Six Months Ended
June 30, 2013
(unaudited) | | Year Ended
December 31,
2012 | |
Increase (Decrease) in Net Assets | |
From operations: | |
Net investment income (loss) | | $ | (184,096 | ) | | $ | (185,170 | ) | |
Net realized gain (loss) | | | 907,595 | | | | 1,307,292 | | |
Net unrealized appreciation (depreciation) | | | 3,676,007 | | | | 1,263,574 | | |
Net increase (decrease) in net assets from operations | | | 4,399,506 | | | | 2,385,696 | | |
Distributions to shareholders: | |
From net investment income | |
Investor class | | | — | | | | — | | |
From net capital gains | |
Investor class | | | — | | | | (563,945 | ) | |
Total distributions to shareholders | | | — | | | | (563,945 | ) | |
From capital share transactions: | |
Proceeds from shares sold
Investor class | | | 1,138,002 | | | | 2,717,164 | | |
Distributions reinvested
Investor class | | | — | | | | 521,245 | | |
Proceeds from short-term trading fees
Investor class | | | 2 | | | | 4 | | |
| | | | 1,138,004 | | | | 3,238,413 | | |
Cost of shares redeemed
Investor class | | | (3,618,167 | ) | | | (5,736,316 | ) | |
Net increase (decrease) in net assets from
capital share transactions | | | (2,480,163 | ) | | | (2,497,903 | ) | |
Net Increase (Decrease) in Net Assets | | | 1,919,343 | | | | (676,152 | ) | |
Net Assets | |
Beginning of year | | | 34,639,378 | | | | 35,315,530 | | |
End of period | | $ | 36,558,721 | | | $ | 34,639,378 | | |
Accumulated undistributed net investment income (distributions
in excess of net investment income), end of period | | $ | (209,369 | ) | | $ | (25,273 | ) | |
Capital Share Activity | |
Investor class: | |
Shares sold | | | 56,640 | | | | 139,071 | | |
Shares reinvested | | | — | | | | 28,115 | | |
Shares redeemed | | | (179,588 | ) | | | (300,437 | ) | |
Net share activity | | | (122,948 | ) | | | (133,251 | ) | |
173
Statements of Changes in Net Assets
| | | MegaTrends Fund | | Global Resources Fund | |
| | | Six Months Ended
June 30, 2013
(unaudited) | | Year Ended
December 31,
2012 | | Six Months Ended
June 30, 2013
(unaudited) | | Year Ended
December 31,
2012 | |
Increase (Decrease) in Net Assets | |
From operations: | |
Net investment income (loss) | | $ | (31,643 | ) | | $ | 33,449 | | | $ | 123,543 | | | $ | 2,941,071 | | |
Net realized gain (loss) | | | 930,705 | | | | 1,156,332 | | | | 18,402,520 | | | | (3,922,178 | ) | |
Net unrealized appreciation (depreciation) | | | 265,481 | | | | (396,712 | ) | | | (54,373,318 | ) | | | 38,946,193 | | |
Net increase (decrease) in net assets from operations | | | 1,164,543 | | | | 793,069 | | | | (35,847,255 | ) | | | 37,965,086 | | |
Distributions to shareholders: | |
From net investment income | |
Investor class | | | — | | | | (49,108 | ) | | | — | | | | (9,700,159 | ) | |
Institutional class | | | — | | | | (4,806 | ) | | | — | | | | (3,187,762 | ) | |
Total distributions to shareholders | | | — | | | | (53,914 | ) | | | — | | | | (12,887,921 | ) | |
From capital share transactions: | |
Proceeds from shares sold
Investor class | | | 599,068 | | | | 491,825 | | | | 21,848,255 | | | | 51,610,831 | | |
Institutional class | | | — | | | | 18,619 | | | | 7,227,070 | | | | 43,381,958 | | |
Distributions reinvested
Investor class | | | — | | | | 44,847 | | | | — | | | | 9,250,371 | | |
Institutional class | | | — | | | | 4,536 | | | | — | | | | 3,174,978 | | |
Proceeds from short-term trading fees
Investor class | | | 2 | | | | 18 | | | | 325 | | | | 3,980 | | |
Institutional class | | | — | | | | — | | | | 45 | | | | 77 | | |
| | | | 599,070 | | | | 559,845 | | | | 29,075,695 | | | | 107,422,195 | | |
Cost of shares redeemed
Investor class | | | (828,908 | ) | | | (3,306,097 | ) | | | (77,660,237 | ) | | | (196,087,325 | ) | |
Institutional class | | | (105,334 | ) | | | (2,443,413 | ) | | | (56,587,004 | ) | | | (11,742,608 | ) | |
Net decrease in net assets from
capital share transactions | | | (335,172 | ) | | | (5,189,665 | ) | | | (105,171,546 | ) | | | (100,407,738 | ) | |
Net Increase (Decrease) in Net Assets | | | 829,371 | | | | (4,450,510 | ) | | | (141,018,801 | ) | | | (75,330,573 | ) | |
Net Assets | |
Beginning of year | | | 10,456,927 | | | | 14,907,437 | | | | 532,447,422 | | | | 607,777,995 | | |
End of period | | $ | 11,286,298 | | | $ | 10,456,927 | | | $ | 391,428,621 | | | $ | 532,447,422 | | |
Accumulated undistributed net investment income (distributions
in excess of net investment income), end of period | | $ | (51,324 | ) | | $ | (19,681 | ) | | $ | 4,971,017 | | | $ | 4,847,474 | | |
Capital Share Activity | |
Investor class: | |
Shares sold | | | 68,307 | | | | 61,160 | | | | 2,219,493 | | | | 5,290,383 | | |
Shares reinvested | | | — | | | | 5,620 | | | | — | | | | 955,617 | | |
Shares redeemed | | | (95,190 | ) | | | (410,051 | ) | | | (7,930,463 | ) | | | (20,403,092 | ) | |
Net share activity | | | (26,883 | ) | | | (343,271 | ) | | | (5,710,970 | ) | | | (14,157,092 | ) | |
Institutional class: | |
Shares sold | | | — | | | | 2,339 | | | | 731,164 | | | | 4,563,077 | | |
Shares reinvested | | | — | | | | 585 | | | | — | | | | 329,696 | | |
Shares redeemed | | | (12,614 | ) | | | (309,025 | ) | | | (5,841,614 | ) | | | (1,198,556 | ) | |
Net share activity | | | (12,614 | ) | | | (306,101 | ) | | | (5,110,450 | ) | | | 3,694,217 | | |
See accompanying notes to financial statements.
174
| | | World Precious Minerals Fund | |
| | | Six Months Ended
June 30, 2013
(unaudited) | | Year Ended
December 31,
2012 | |
Increase (Decrease) in Net Assets | |
From operations: | |
Net investment income (loss) | | $ | (1,126,577 | ) | | $ | (3,206,447 | ) | |
Net realized gain (loss) | | | (52,469,798 | ) | | | (25,675,266 | ) | |
Net unrealized appreciation (depreciation) | | | (93,629,572 | ) | | | (17,140,974 | ) | |
Net increase (decrease) in net assets from operations | | | (147,225,947 | ) | | | (46,022,687 | ) | |
Distributions to shareholders: | |
From net investment income | |
Investor class | | | — | | | | — | | |
Institutional class | | | — | | | | — | | |
Total distributions to shareholders | | | — | | | | — | | |
From capital share transactions: | |
Proceeds from shares sold
Investor class | | | 13,111,147 | | | | 36,851,148 | | |
Institutional class | | | — | | | | 31,435 | | |
Distributions reinvested
Investor class | | | — | | | | — | | |
Institutional class | | | — | | | | — | | |
Proceeds from short-term trading fees
Investor class | | | 748 | | | | 8,741 | | |
Institutional class | | | — | | | | — | | |
| | | | 13,111,895 | | | | 36,891,324 | | |
Cost of shares redeemed
Investor class | | | (37,332,208 | ) | | | (108,472,249 | ) | |
Institutional class | | | (376,417 | ) | | | (762,575 | ) | |
Net decrease in net assets from
capital share transactions | | | (24,596,730 | ) | | | (72,343,500 | ) | |
Net Increase (Decrease) in Net Assets | | | (171,822,677 | ) | | | (118,366,187 | ) | |
Net Assets | |
Beginning of year | | | 319,820,625 | | | | 438,186,812 | | |
End of period | | $ | 147,997,948 | | | $ | 319,820,625 | | |
Accumulated undistributed net investment income (distributions
in excess of net investment income), end of period | | $ | (26,968,483 | ) | | $ | (25,841,906 | ) | |
Capital Share Activity | |
Investor class: | |
Shares sold | | | 1,670,761 | | | | 2,986,280 | | |
Shares reinvested | | | — | | | | — | | |
Shares redeemed | | | (4,287,144 | ) | | | (8,829,230 | ) | |
Net share activity | | | (2,616,383 | ) | | | (5,842,950 | ) | |
Institutional class: | |
Shares sold | | | — | | | | 2,159 | | |
Shares reinvested | | | — | | | | — | | |
Shares redeemed | | | (46,201 | ) | | | (64,822 | ) | |
Net share activity | | | (46,201 | ) | | | (62,663 | ) | |
175
Statements of Changes in Net Assets
| | | Gold and Precious Metals Fund | | Emerging Europe Fund | |
| | | Six Months Ended
June 30, 2013
(unaudited) | | Year Ended
December 31,
2012 | | Six Months Ended
June 30, 2013
(unaudited) | | Year Ended
December 31,
2012 | |
Increase (Decrease) in Net Assets | |
From operations: | |
Net investment income (loss) | | $ | (324,987 | ) | | $ | (1,075,576 | ) | | $ | 2,650,297 | | | $ | 2,631,690 | | |
Net realized gain (loss) | | | (23,904,066 | ) | | | (8,771,938 | ) | | | 3,478,275 | | | | 11,640,064 | | |
Net unrealized appreciation (depreciation) | | | (48,392,110 | ) | | | (2,502,399 | ) | | | (21,818,398 | ) | | | 19,357,746 | | |
Net increase (decrease) in net assets from operations | | | (72,621,163 | ) | | | (12,349,913 | ) | | | (15,689,826 | ) | | | 33,629,500 | | |
Distributions to shareholders: | |
From net investment income | |
Investor class | | | — | | | | (256,589 | ) | | | — | | | | (1,152,778 | ) | |
Total distributions to shareholders | | | — | | | | (256,589 | ) | | | — | | | | (1,152,778 | ) | |
From capital share transactions: | |
Proceeds from shares sold
Investor class | | | 22,070,200 | | | | 25,898,154 | | | | 5,002,835 | | | | 8,103,453 | | |
Distributions reinvested
Investor class | | | — | | | | 238,024 | | | | — | | | | 1,112,837 | | |
Proceeds from short-term trading fees
Investor class | | | 4,232 | | | | 6,075 | | | | 2,258 | | | | 47,545 | | |
| | | | 22,074,432 | | | | 26,142,253 | | | | 5,005,093 | | | | 9,263,835 | | |
Cost of shares redeemed
Investor class | | | (28,320,311 | ) | | | (42,098,880 | ) | | | (32,519,642 | ) | | | (61,652,693 | ) | |
Net decrease in net assets from
capital share transactions | | | (6,245,879 | ) | | | (15,956,627 | ) | | | (27,514,549 | ) | | | (52,388,858 | ) | |
Net Decrease in Net Assets | | | (78,867,042 | ) | | | (28,563,129 | ) | | | (43,204,375 | ) | | | (19,912,136 | ) | |
Net Assets | |
Beginning of year | | | 166,524,015 | | | | 195,087,144 | | | | 173,686,680 | | | | 193,598,816 | | |
End of period | | $ | 87,656,973 | | | $ | 166,524,015 | | | $ | 130,482,305 | | | $ | 173,686,680 | | |
Accumulated undistributed net investment income (distributions
in excess of net investment income), end of period | | $ | (2,002,254 | ) | | $ | (1,677,267 | ) | | $ | 4,306,230 | | | $ | 1,655,933 | | |
Capital Share Activity | |
Investor class: | |
Shares sold | | | 2,328,836 | | | | 2,126,571 | | | | 539,087 | | | | 915,162 | | |
Shares reinvested | | | — | | | | 19,952 | | | | — | | | | 123,375 | | |
Shares redeemed | | | (3,243,644 | ) | | | (3,488,632 | ) | | | (3,543,263 | ) | | | (7,091,293 | ) | |
Net share activity | | | (914,808 | ) | | | (1,342,109 | ) | | | (3,004,176 | ) | | | (6,052,756 | ) | |
See accompanying notes to financial statements.
176
| | | Global Emerging Markets Fund | |
| | | Six Months Ended
June 30, 2013
(unaudited) | | Year Ended
December 31,
2012 | |
Increase (Decrease) in Net Assets | |
From operations: | |
Net investment income (loss) | | $ | 82,726 | | | $ | 21,286 | | |
Net realized gain (loss) | | | 9,235 | | | | (231,105 | ) | |
Net unrealized appreciation (depreciation) | | | (375,925 | ) | | | 774,684 | | |
Net increase (decrease) in net assets from operations | | | (283,964 | ) | | | 564,865 | | |
Distributions to shareholders: | |
From net investment income | |
Investor class | | | — | | | | — | | |
Total distributions to shareholders | | | — | | | | — | | |
From capital share transactions: | |
Proceeds from shares sold
Investor class | | | 551,296 | | | | 735,081 | | |
Distributions reinvested
Investor class | | | — | | | | — | | |
Proceeds from short-term trading fees
Investor class | | | 1,084 | | | | 3,216 | | |
| | | | 552,380 | | | | 738,297 | | |
Cost of shares redeemed
Investor class | | | (1,339,842 | ) | | | (1,812,833 | ) | |
Net decrease in net assets from
capital share transactions | | | (787,462 | ) | | | (1,074,536 | ) | |
Net Decrease in Net Assets | | | (1,071,426 | ) | | | (509,671 | ) | |
Net Assets | |
Beginning of year | | | 7,714,491 | | | | 8,224,162 | | |
End of period | | $ | 6,643,065 | | | $ | 7,714,491 | | |
Accumulated undistributed net investment income (distributions
in excess of net investment income), end of period | | $ | 69,758 | | | $ | (12,968 | ) | |
Capital Share Activity | |
Investor class: | |
Shares sold | | | 73,193 | | | | 100,715 | | |
Shares reinvested | | | — | | | | — | | |
Shares redeemed | | | (179,595 | ) | | | (253,227 | ) | |
Net share activity | | | (106,402 | ) | | | (152,512 | ) | |
177
Statements of Changes in Net Assets
| | | China Region Fund | |
| | | Six Months Ended
June 30, 2013
(unaudited) | | Year Ended
December 31,
2012 | |
Increase (Decrease) in Net Assets | |
From operations: | |
Net investment income | | $ | 161,420 | | | $ | 179,211 | | |
Net realized gain (loss) | | | 1,434,548 | | | | (1,458,436 | ) | |
Net unrealized appreciation (depreciation) | | | (2,454,945 | ) | | | 4,621,289 | | |
Net increase (decrease) in net assets from operations | | | (858,977 | ) | | | 3,342,064 | | |
Distributions to shareholders: | |
From net investment income | |
Investor class | | | — | | | | (65,330 | ) | |
Total distributions to shareholders | | | — | | | | (65,330 | ) | |
From capital share transactions: | |
Proceeds from shares sold
Investor class | | | 2,528,320 | | | | 3,015,349 | | |
Distributions reinvested
Investor class | | | — | | | | 60,889 | | |
Proceeds from short-term trading fees
Investor class | | | 3,638 | | | | 17,955 | | |
| | | | 2,531,958 | | | | 3,094,193 | | |
Cost of shares redeemed
Investor class | | | (5,318,532 | ) | | | (7,846,097 | ) | |
Net decrease in net assets from
capital share transactions | | | (2,786,574 | ) | | | (4,751,904 | ) | |
Net Decrease in Net Assets | | | (3,645,551 | ) | | | (1,475,170 | ) | |
Net Assets | |
Beginning of year | | | 29,159,807 | | | | 30,634,977 | | |
End of period | | $ | 25,514,256 | | | $ | 29,159,807 | | |
Accumulated undistributed net investment income (distributions
in excess of net investment income), end of period | | $ | 113,823 | | | $ | (47,597 | ) | |
Capital Share Activity | |
Investor class: | |
Shares sold | | | 327,693 | | | | 415,996 | | |
Shares reinvested | | | — | | | | 8,195 | | |
Shares redeemed | | | (688,787 | ) | | | (1,094,661 | ) | |
Net share activity | | | (361,094 | ) | | | (670,470 | ) | |
See accompanying notes to financial statements.
178
Notes to Financial Statements (unaudited) June 30, 2013
Note 1: Significant Accounting Policies
U.S. Global Investors Funds (Trust), consisting of thirteen separate funds (Funds), is organized as a Delaware statutory trust. Each Fund is an open-end management investment company registered under the Investment Company Act of 1940, as amended. All funds are diversified with the exception of Global Resources, World Precious Minerals, Gold and Precious Metals, Emerging Europe, Global Emerging Markets and China Region. A nondiversified fund may invest a greater percentage of its assets in a particular issuer in comparison to a diversified fund.
On March 19, 2013, the name of the Eastern European Fund changed to the Emerging Europe Fund.
The following is a summary of significant accounting policies consistently followed by the Funds in the preparation of their financial statements. The policies are in conformity with U.S. generally accepted accounting principles.
A. Security Valuations
The Funds value investments traded on national or international securities exchanges or over-the-counter at the last sales price reported by the security's primary exchange of its market at the time of daily valuation. Options and securities for which no sale was reported are valued at the mean between the last reported bid and asked quotation. Short-term investments with effective maturities of sixty days or less at the date of purchase are valued at amortized cost, which approximates market value. Municipal securities, long-term U.S. government obligations and corporate debt securities are valued by an independent pricing service using an evaluated quote based on such factors as institutional-size trading in similar groups of securities, yield, quality, maturity, coupon rate, type of issue, individual trading characteristics and other market data.
B. Fair Valued Securities
Securities for which market quotations are not readily available or which are subject to legal restrictions are valued at their fair value as determined in good faith by the Adviser's Valuation Committee, under policies and procedures established by the Funds' Board of Trustees. Fair value is the price that would be received to sell an asset or paid to transfer a liability in an orderly transaction between market participants at the measurement date. The Valuation Committee meets on a regular basis to review securities which may not have readily available market prices and considers a number of factors in determining fair value, including nature and duration of any trading restrictions, trading volume, market values of unrestricted shares of the same or similar class, investment management's judgment regarding the market experience of the issuer, financial status and other operational and market factors affecting the issuer, issuer's management, quality of the underlying property based on review of independent geological studies and other relevant matters. The fair values may differ from what would have been used had a broader market for these securities existed. The Valuation Committee regularly reviews inputs and assumptions and performs
179
Notes to Financial Statements (unaudited) June 30, 2013
transactional back-testing and disposition analysis. The Valuation Committee reports quarterly to the Funds' Board of Trustees.
For securities traded on international exchanges, if events which may materially affect the value of a Fund's securities occur after the close of the primary exchange and before a Fund's net asset value is next determined, then those securities will be valued at their fair value as determined in good faith under the supervision of the Board of Trustees. The Funds use a systematic fair value model provided by an independent third party to value international securities primarily traded on an exchange or market outside the Western Hemisphere in order to adjust for stale pricing, which may occur between the close of certain foreign exchanges and the New York Stock Exchange.
C. Security Transactions and Investment Income
Security transactions are accounted for on trade date. Realized gains and losses from security transactions are determined on an identified-cost basis. Dividend income is recorded on the ex-dividend date except that certain dividends from foreign securities where the ex-dividend date may have passed are recorded as soon as the Fund has confirmed the ex-dividend date. Interest income, which may include original issue discount, is recorded on an accrual basis. Discounts and premiums on securities purchased are accreted and amortized, respectively, on a yield-to-maturity basis as adjustments to interest income. Investment income is recorded net of foreign taxes withheld where recovery of such taxes is uncertain. Investment income and realized and unrealized gains (losses) are allocated to each Fund's share class based on their respective net assets.
The Funds may purchase securities on a when-issued or delayed-delivery basis and segregate on their books collateral with a value at least equal to the amount of the commitment. Losses may arise due to the changes in the value of the underlying securities or if the counterparty does not perform under the contract.
D. Repurchase Agreements
The Funds may enter into repurchase agreements with recognized financial institutions or registered broker-dealers and, in all instances, hold as collateral, underlying securities with a value exceeding the principal amount of the repurchase obligation. The Funds use joint tri-party repurchase agreement accounts with other funds under common management where uninvested cash is collectively invested in repurchase agreements, and each participating fund owns an undivided interest in the account.
E. Foreign Currency Transactions
Some Funds may invest in securities of foreign issuers. The accounting records of these Funds are maintained in U.S. dollars. At each net asset value determination date, the value of assets and liabilities denominated in foreign currencies are translated into U.S. dollars using the current prevailing exchange rate. Security transactions, income and expenses are converted at the prevailing rate of exchange on the respective dates of the transactions. The effect of changes in foreign exchange rates on foreign
180
Notes to Financial Statements (unaudited) June 30, 2013
denominated securities is included with the net realized and unrealized gain or loss on securities. Other foreign currency gains or losses are reported separately.
F. Federal Income Taxes
The Funds intend to continue to comply with the requirements of Subchapter M of the Internal Revenue Code applicable to regulated investment companies and to distribute substantially all of their taxable income to shareholders. Accordingly, no provision for federal income taxes is required. Each Fund may be subject to foreign taxes on income and gains on investments, which are accrued based on the Fund's understanding of the tax rules and regulations in the foreign markets.
The Funds recognize the tax benefits of uncertain tax positions only where the position is "more likely than not" to be sustained assuming examination by tax authorities. Management has analyzed the Funds' tax positions and has concluded that no liability for unrecognized tax benefits should be recorded related to uncertain tax positions taken on returns filed for open tax years or expected to be taken in 2012 tax returns. The Funds' 2009, 2010, 2011 and 2012 tax returns are open to examination by the federal and applicable state tax authorities. The Funds have no examinations in progress.
G. Dividends and Distributions to Shareholders
The Funds record dividends and distributions to shareholders on the ex-dividend date. Distributions are determined in accordance with income tax regulations, which may differ from accounting principles generally accepted in the United States. Accordingly, periodic reclassifications related to permanent book and tax basis differences are made within the Funds' capital accounts to reflect income and gains available for distribution under income tax regulations.
The Funds generally pay income dividends and distribute capital gains, if any, annually. The U.S. Treasury Securities Cash and U.S. Government Securities Savings Funds accrue dividends on a daily basis with payment monthly. The Tax Free and Near-Term Tax Free Funds pay monthly dividends. Dividends and distributions payable at period end are processed for reinvestment on the following business day. A Fund may elect to designate a portion of the earnings and profits distributed to shareholders on the redemption of fund shares during the year as distributions for federal income tax purposes. Differences in per share dividend rates for multiclass funds generally result from the relative weightings of pro rata income and realized gain allocations and from differences in separate class expenses.
H. Expenses
Fund specific expenses are allocated to that Fund and pro rata across share classes. Expenses that are not fund specific are allocated among Funds and pro rata across share classes. Class specific expenses (including, but not limited to, distribution plan fees, if any, a portion of the administrative services fees, transfer agency fees and expenses, shareholder reporting expenses and certain legal and registration fees) are allocated to the class that incurs such expense. Expense offset arrangements have been made with the Funds' custodian so the custodian fees may be paid indirectly by
181
Notes to Financial Statements (unaudited) June 30, 2013
credits earned on the Funds' cash balances. Such deposit arrangements are an alternative to overnight investments. Custodian fees are presented in the Statement of Operations gross of such credits, and the credits are presented as offsets to expenses.
I. Short-Term Trading (Redemption) Fees
Short-term trading (redemption) fees are assessed on the Equity Funds (listed below). These fees, which are retained by the Funds, are accounted for as an addition to paid-in capital. Prior to March 19, 2013, fees were assessed as follows:
Fund | | Shares Held | | Fee (as % of Proceeds) | |
All American Equity | | 30 days or less | | | 0.10 | % | |
Holmes Growth | | 30 days or less | | | 0.10 | % | |
MegaTrends | | 30 days or less | | | 0.25 | % | |
Global Resources | | 30 days or less | | | 0.25 | % | |
World Precious Minerals | | 30 days or less | | | 0.50 | % | |
Gold and Precious Metals | | 30 days or less | | | 0.50 | % | |
Emerging Europe | | 180 days or less | | | 2.00 | % | |
Global Emerging Markets | | 180 days or less | | | 2.00 | % | |
China Region | | 180 days or less | | | 1.00 | % | |
Effective March 19, 2013, the fee for each of the Equity Funds was reduced to 0.05% of the amount redeemed on shares held seven days or less.
J. Use of Estimates in Financial Statement Preparation
The preparation of financial statements in conformity with accounting principles generally accepted in the United States requires management to make estimates and assumptions that affect the reported amounts of assets and liabilities and disclosure of contingent assets and liabilities at the date of the financial statements and the reported amounts of income and expenses during the reporting period. Actual results could differ from those estimates.
K. Subsequent Events Evaluation
Management has evaluated subsequent events after the balance sheet date of June 30, 2013, through the date that the financial statements were issued and determined that there were no events or transactions that would require recognition or disclosure in the financial statements except as discussed in Note 9.
L. New Accounting Pronouncements
In December 2011, the Financial Accounting Standards Board (FASB) issued Accounting Standards Update (ASU) No. 2011-11, Balance Sheet (Topic 210): Disclosures about Offsetting Assets and Liabilities. The ASU requires an entity to disclose information about offsetting and related arrangements to enable users of its financial statements to understand the effect of those arrangements on its financial position. In January 2013, the FASB issued ASU No. 2013-01, Balance Sheet (Topic 210): Clarifying the Scope of Disclosures about Offsetting Assets and Liabilities. ASU 2013-01 is an amendment to clarify the scope of disclosures
182
Notes to Financial Statements (unaudited) June 30, 2013
required by ASU No. 2011-11. These ASUs are effective for annual reporting periods beginning on or after January 1, 2013, and interim periods within those annual periods. At this time, the Funds do not have netting agreements that will fall under the provisions of these pronouncements and do not intend to enter into such agreements in the future. Therefore, these pronouncements did not have a material impact on the financial statements.
Note 2: Financial Derivative Instruments
A. Options Contracts
Equity Funds may purchase or write (sell) options on securities to manage their exposure to stock or commodity markets as well as fluctuations in interest and currency conversion rates. The use of options carries the risks of a change in value of the underlying instruments, an illiquid secondary market, or failure of the counterparty to perform its obligations.
A put option gives the purchaser of the option, upon payment of a premium, the right to sell, and the issuer of the option the obligation to buy, the underlying security, commodity, index, currency or other instrument at the exercise price. A call option, upon payment of a premium, gives the purchaser of the option the right to buy, and the issuer the obligation to sell, the underlying instrument at the exercise price.
Purchasing a put option tends to decrease a Fund's exposure to the underlying instrument, whereas purchasing a call option tends to increase a Fund's exposure to the underlying instrument. A Fund pays a premium which is included in the Statement of Assets and Liabilities as an investment and subsequently marked to market to reflect the current value of the option. Premiums paid to purchase options which expire are treated as realized losses. Premiums paid to purchase options which are exercised or closed are added to the cost of securities acquired or the proceeds from securities sold. The risk associated with purchasing put and call options is limited to the premium paid.
The Funds will realize a loss equal to all or a part of the premium paid for an option if the price of the underlying security or other instrument decreases or does not increase by more than the premium (in the case of a call option), or if the price of the underlying security or other instrument increases or does not decrease by more than the premium (in the case of a put option).
Writing a put option tends to increase a Fund's exposure to the underlying instrument, whereas writing a call option tends to decrease a Fund's exposure to the underlying instrument. The premium received is recorded as a liability in the Statement of Assets and Liabilities and subsequently marked to market to reflect the current value of the option written. Premiums received from writing options which expire are treated as realized gains. Premiums received from options which are exercised or closed are added to the proceeds or offset against amounts paid on the underlying transaction to determine the realized gain or loss. Written options
183
Notes to Financial Statements (unaudited) June 30, 2013
include a risk of loss in excess of the option premium. A Fund as a writer of an option has no control over whether the underlying instrument may be sold (call) or purchased (put) and thus bears the market risk of an unfavorable change in the price of the instrument underlying the written option. There is also the risk a Fund may not be able to enter into a closing transaction because of an illiquid market.
A Fund's ability to close out its position as a purchaser or seller of a put or call option is dependent, in part, upon the liquidity of the market for that particular option. There can be no guarantee that a fund will be able to close out an option position when desired. An inability to close out its options positions may reduce a Fund's anticipated profits or increase its losses.
As of June 30, 2013, portfolio securities valued at $233,820, $467,640 and $2,763,000 were held in escrow by the custodian as collateral for call options written for the All American Equity Fund, the Holmes Growth Fund and the Emerging Europe Fund, respectively.
Transactions in written call options during the six-month period ended June 30, 2013, were as follows:
| | | All American Equity Fund
Call Options | | Holmes Growth Fund
Call Options | |
| | | Number of
Contracts | | Premiums
Received | | Number of
Contracts | | Premiums
Received | |
Options outstanding at December 31, 2012 | | | — | | | $ | — | | | | — | | | $ | — | | |
Options written | | | 65 | | | | 20,509 | | | | 340 | | | | 91,093 | | |
Options closed | | | — | | | | — | | | | (140 | ) | | | (21,969 | ) | |
Options expired | | | (45 | ) | | | (13,355 | ) | | | (160 | ) | | | (54,816 | ) | |
Options exercised | | | — | | | | — | | | | — | | | | — | | |
Options outstanding at June 30, 2013 | | | 20 | | | $ | 7,154 | | | | 40 | | | $ | 14,308 | | |
| | | Global Resources Fund
Call Options | | Emerging Europe Fund
Call Options | |
| | | Number of
Contracts | | Premiums
Received | | Number of
Contracts | | Premiums
Received | |
Options outstanding at December 31, 2012 | | | — | | | $ | — | | | | 2,000 | | | $ | 291,560 | | |
Options written | | | 18,893 | | | | 1,536,874 | | | | 4,000 | | | | 674,757 | | |
Options closed | | | (8,580 | ) | | | (999,315 | ) | | | (4,000 | ) | | | (697,769 | ) | |
Options expired | | | (4,135 | ) | | | (158,436 | ) | | | (1,000 | ) | | | (72,340 | ) | |
Options exercised | | | (6,178 | ) | | | (379,123 | ) | | | — | | | | — | | |
Options outstanding at June 30, 2013 | | | — | | | $ | — | | | | 1,000 | | | $ | 196,208 | | |
B. Forward Foreign Currency Contracts
The Funds enter into forward foreign currency contracts to lock in the U.S. dollar cost of purchase and sale transactions or to defend the portfolio against currency fluctuations. A forward foreign currency contract is a commitment to purchase or sell a foreign currency at a future date at a negotiated rate. These contracts are valued daily, and the Fund's net equity therein, representing unrealized gain or loss on the contracts as measured by the difference between the forward foreign exchange rates at the dates of entry into the contracts and the forward rates at the reporting
184
Notes to Financial Statements (unaudited) June 30, 2013
date, is included in the Statement of Assets and Liabilities. Realized and unrealized gains and losses are included in the Statement of Operations. Risks may arise upon entering into these contracts from the potential inability of counterparties to meet the terms of the contract and from unanticipated movements in the value of foreign currencies relative to the U.S. dollar.
There were no open forward foreign currency contracts at June 30, 2013.
C. Summary of Derivative Instruments
The following is a summary of the valuations of derivative instruments categorized by location in the Statements of Assets and Liabilities as of June 30, 2013:
Location | | All
American
Equity Fund | | Holmes
Growth
Fund | | MegaTrends
Fund | | Global
Resources
Fund | |
Asset derivatives | |
Investments, at value
Equity contracts - Note 2 A | | $ | 67,500 | | | $ | 123,750 | | | $ | 23,450 | | | $ | 1,517,000 | | |
Total | | $ | 67,500 | | | $ | 123,750 | | | $ | 23,450 | | | $ | 1,517,000 | | |
Liability derivatives | |
Written options, at value | | $ | 5,130 | | | $ | 10,260 | | | $ | — | | | $ | — | | |
Total | | $ | 5,130 | | | $ | 10,260 | | | $ | — | | | $ | — | | |
Location | | World
Precious
Minerals
Fund | | Gold and
Precious
Metals
Fund | | Emerging
Europe
Fund | | China
Region
Fund | |
Asset derivatives | |
Investments, at value
Equity contracts - Note 2 A | | $ | 3,738,728 | | | $ | 3,242,802 | | | $ | 189,750 | | | $ | 67,017 | | |
Total | | $ | 3,738,728 | | | $ | 3,242,802 | | | $ | 189,750 | | | $ | 67,017 | | |
Liability derivatives | |
Written options, at value | | $ | — | | | $ | — | | | $ | 152,500 | | | $ | — | | |
Total | | $ | — | | | $ | — | | | $ | 152,500 | | | $ | — | | |
185
Notes to Financial Statements (unaudited) June 30, 2013
The following is a summary of the effect of derivative instruments on the Statements of Operations for the six-month period ended June 30, 2013:
Location | | All
American
Equity Fund | | Holmes
Growth
Fund | | MegaTrends
Fund | | Global
Resources
Fund | |
Realized gain (loss) on derivatives
recognized in income | |
Realized gain (loss) from securities
Equity contracts | | $ | (19,442 | ) | | $ | (46,812 | ) | | $ | (12,911 | ) | | $ | (1,050,497 | ) | |
Realized gain (loss) from written options
Equity contracts | | | 13,355 | | | | 49,324 | | | | — | | | | 28,798 | | |
| | | | (6,087 | ) | | | 2,512 | | | | (12,911 | ) | | | (1,021,699 | ) | |
Change in unrealized appreciation
(depreciation) on derivatives
recognized in income | |
Net change in unrealized appreciation
(depreciation) of investments
Equity contracts | | | (15,874 | ) | | | (33,950 | ) | | | (34,474 | ) | | | (414,527 | ) | |
Net change in unrealized appreciation
(depreciation) of written options
Equity contracts | | | 2,024 | | | | 4,048 | | | | — | | | | — | | |
| | | | (13,850 | ) | | | (29,902 | ) | | | (34,474 | ) | | | (414,527 | ) | |
Total | | $ | (19,937 | ) | | $ | (27,390 | ) | | $ | (47,385 | ) | | $ | (1,436,226 | ) | |
Location | | World
Precious
Minerals
Fund | | Gold and
Precious
Metals
Fund | | Emerging
Europe
Fund | | Global
Emerging
Markets
Fund | | China
Region
Fund | |
Realized gain (loss) on derivatives
recognized in income | |
Realized gain (loss) from securities
Equity contracts | | $ | (13,827,660 | ) | | $ | (9,069,481 | ) | | $ | 1,729,276 | | | $ | 1,040 | | | $ | 15,607 | | |
Realized gain (loss) from written options
Equity contracts | | | — | | | | — | | | | 31,229 | | | | — | | | | — | | |
| | | | (13,827,660 | ) | | | (9,069,481 | ) | | | 1,760,505 | | | | 1,040 | | | | 15,607 | | |
Change in unrealized appreciation
(depreciation) on derivatives
recognized in income | |
Net change in unrealized appreciation
(depreciation) of investments
Equity contracts | | | 1,591,825 | | | | 1,303,222 | | | | (2,198,844 | ) | | | — | | | | (46,523 | ) | |
Net change in unrealized appreciation
(depreciation) of written options
Equity contracts | | | — | | | | — | | | | 76,148 | | | | — | | | | — | | |
| | | | 1,591,825 | | | | 1,303,222 | | | | (2,122,696 | ) | | | — | | | | (46,523 | ) | |
Total | | $ | (12,235,835 | ) | | $ | (7,766,259 | ) | | $ | (362,191 | ) | | $ | 1,040 | | | $ | (30,916 | ) | |
186
Notes to Financial Statements (unaudited) June 30, 2013
The average notional amounts of written options, purchased options and forward currency contracts outstanding during the six-month period ended June 30, 2013, were approximately as follows:
Fund | | Written
Options | | Purchased
Options | | Forward
Currency
Contracts | |
All American Equity | | $ | 2,019 | | | $ | 18,089 | | | $ | — | | |
Holmes Growth | | | 10,709 | | | | 31,217 | | | | — | | |
MegaTrends | | | — | | | | 19,063 | | | | — | | |
Global Resources | | | 185,314 | | | | 702,067 | | | | — | | |
World Precious Minerals | | | — | | | | 3,870,567 | | | | — | | |
Gold and Precious Metals | | | — | | | | 2,820,770 | | | | — | | |
Emerging Europe | | | 178,607 | | | | 533,323 | | | | — | | |
Global Emerging Markets | | | — | | | | 7,343 | | | | — | | |
China Region | | | — | | | | 87,464 | | | | — | | |
Note 3: Related Party Transactions
U.S. Global Investors, Inc. (Adviser), under an investment advisory agreement with the Trust in effect through October 1, 2013, furnishes management and investment advisory services and, subject to the supervision of the trustees, directs the investments of each Fund according to each Fund's investment objectives, policies and limitations. The Adviser also furnishes all necessary office facilities, business equipment and personnel for administering the affairs of the Trust. Frank E. Holmes, a trustee of the Funds, is the controlling owner of the Adviser.
187
Notes to Financial Statements (unaudited) June 30, 2013
For the services of the Adviser, each Fund pays a base management or advisory fee based upon its net assets. Fees are accrued daily and paid monthly. The contractual management fee for each fund is:
| Fund | | Annual Percentage of
Average Daily Net Assets | |
U.S. Treasury Securities Cash and
U.S. Government Securities Savings
Near-Term Tax Free
Tax Free | | .50% of the first $250,000,000 and
.375% of the excess
.50%
.75% of the first $250,000,000 and
.50% of the excess | |
All American Equity | | .80% of the first $500,000,000 and
.75% of the excess | |
Holmes Growth and MegaTrends | | 1.00% | |
Global Resources | | .95% of the first $500,000,000;
.90% of $500,000,001 to $1,000,000,000
and .85% of the excess | |
World Precious Minerals | | 1.00% of the first $500,000,000;
.95% of $500,000,001 to $1,000,000,000
and .90% of the excess | |
Gold and Precious Metals | | .90% of the first $500,000,000
and .85% of the excess | |
Emerging Europe | | 1.25% | |
Global Emerging Markets | | 1.375% | |
China Region | | 1.25% | |
188
Notes to Financial Statements (unaudited) June 30, 2013
The advisory agreement also provides that the base advisory fee of the Equity Funds will be adjusted upwards or downwards by 0.25 percent if there is a performance difference of 5 percent or more between a Fund's performance and that of its designated benchmark index over the prior 12 months. The performance adjustment is calculated separately for each share class. The benchmarks are as follows:
| Fund | | Benchmark Index | |
All American Equity | | S&P 500 Index | |
Holmes Growth | | S&P Composite 1500 Index | |
MegaTrends | | S&P 500 Index | |
Global Resources | | Morgan Stanley Commodity Related Equity Index | |
World Precious Minerals | | NYSE Arca Gold Miners Index | |
Gold and Precious Metals | | FTSE Gold Mines Index | |
Emerging Europe | | MSCI Emerging Markets Europe 10/40 Index (Net Total Return) | |
Global Emerging Markets | | MSCI Emerging Markets Total Net Return Index | |
China Region | | Hang Seng Composite Index | |
No performance adjustment is applied unless the difference between the class's investment performance and the benchmark is 5 percent or greater (positive or negative) during the applicable performance measurement period. The performance fee adjustment is calculated monthly in arrears and is accrued ratably during the month. The management fee, net of any performance fee adjustment, is paid monthly in arrears.
The Funds' prospectus and statement of additional information contain additional information about the performance adjustment. The amounts shown as management fees on the Statements of Operations reflects the base fee plus/minus any performance adjustment. During the six months ended June 30, 2013, the Funds recorded performance adjustments as follows:
Fund | | Investor Class
Performance Fee
Adjustment | | Institutional Class
Performance Fee
Adjustment | |
All American Equity | | $ | (7,346 | ) | | | N/A | | |
Holmes Growth | | | (45,061 | ) | | | N/A | | |
MegaTrends | | | (14,373 | ) | | $ | (1,252 | ) | |
Global Resources | | | 105,040 | | | | 30,057 | | |
World Precious Minerals | | | (68,647 | ) | | | (200 | ) | |
Gold and Precious Metals | | | 138,360 | | | | N/A | | |
Emerging Europe | | | (75,284 | ) | | | N/A | | |
Global Emerging Markets | | | (5,027 | ) | | | N/A | | |
China Region | | | (24,214 | ) | | | N/A | | |
189
Notes to Financial Statements (unaudited) June 30, 2013
Under an administrative services agreement, the U.S. Treasury Securities Cash, U.S. Government Securities Savings, Near-Term Tax Free, Tax Free, All American Equity, Holmes Growth, Gold and Precious Metals, Emerging Europe, Global Emerging Markets and China Region Funds compensate the Adviser at an annual rate of 0.08% of the average daily net assets of each Fund for administrative services provided. The MegaTrends, Global Resources and World Precious Minerals Funds compensate the Adviser at an annual rate of 0.08% of the average daily net assets for the Investor Class and 0.06% of the average daily net assets for the Institutional Class for administrative services provided, of which half is a fund-level fee and half is a class-level fee.
The Investor Class shares for Equity Funds in the Trust have adopted a distribution plan pursuant to Rule 12b-1 of the Investment Company Act of 1940 in which a subsidiary of the Adviser is paid a fee at an annual rate of 0.25% of the average daily net assets of the Investor Class for sales and promotional services related to the distribution of Investor Class shares. The Institutional Class does not incur distribution plan fees.
The Adviser has voluntarily agreed to reimburse specific funds so that their total operating expenses will not exceed certain annual percentages of average net assets. The expenses for the period ended June 30, 2013, were limited as follows for the Investor Class: U.S. Treasury Securities Cash Fund at 1.00%, U.S. Government Securities Savings Fund at 0.45%, All American Equity Fund at 2.20%, Holmes Growth Fund at 2.20%, MegaTrends Fund at 2.35%, Global Resources, World Precious Minerals, and Gold and Precious Metals Funds at 1.90%, Emerging Europe Fund at 2.85%, Global Emerging Markets Fund at 3.15% and China Region Fund at 2.55%. These expense limitations are exclusive of any performance fee adjustments and will continue on a voluntary basis at the Adviser's discretion.
Effective May 1, 2013, the Adviser contractually limited the total operating expenses of Near-Term Tax Free Fund and Tax Free Fund at 0.45% and 0.70%, respectively, on an annualized basis through April 30, 2014. Prior to May 1, 2013, the Adviser had voluntarily limited the expenses of these funds at the same percentages.
The Adviser has voluntarily agreed to waive all class specific expenses for the Institutional Classes of the MegaTrends Fund and World Precious Minerals Fund; the Adviser can modify or terminate this arrangement at any time. Effective May 1, 2013, the Adviser contractually agreed to waive all class specific expenses for the Institutional Class of the Global Resources Fund until April 30, 2014. Prior to May 1, 2013, the Adviser had voluntarily waived all class specific expenses for the Institutional Class of the Global Resources Fund. These expense waivers are exclusive of any performance fee adjustments.
190
Notes to Financial Statements (unaudited) June 30, 2013
The Adviser has voluntarily agreed to waive fees and/or reimburse U.S. Treasury Securities Cash Fund and U.S. Government Securities Savings Fund to the extent necessary to maintain the respective Fund's yield at a certain level as determined by the Adviser (Minimum Yield). The Adviser may recapture any fees waived and/or expenses reimbursed within three years after the end of the fiscal year of such waiver and/or reimbursement to the extent that such recapture would not cause the Fund's yield to fall below the Minimum Yield. For the six months ended June 30, 2013, fees waived and/or expenses reimbursed as a result of this agreement were $363,694 and $252,937 for the U.S. Treasury Securities Cash Fund and the U.S. Government Securities Savings Fund, respectively. At June 30, 2013, the Adviser may seek reimbursement of previously waived and reimbursed fees as follows:
Fund | | Expires
12/31/2013 | | Expires
12/31/2014 | | Expires
12/31/2015 | | Expires
12/31/2016 | | Total | |
U.S. Treasury Securities Cash | | $ | 884,850 | | | $ | 867,545 | | | $ | 735,584 | | | $ | 363,694 | | | $ | 2,851,673 | | |
U.S. Government Securities Savings | | | 678,107 | | | | 736,531 | | | | 509,874 | | | | 252,937 | | | | 2,177,449 | | |
United Shareholder Services, Inc. (USSI), a wholly-owned subsidiary of the Adviser, is the transfer agent for the Funds. Each Fund's share class pays an annual fee based on the number of shareholder accounts, certain base fees and transaction-and activity-based fees for transfer agency services. Certain account fees are paid directly by shareholders to the transfer agent, which, in turn, reduces its charge to the Funds.
The Adviser was reimbursed for services of the Funds' Chief Compliance Officer during the six months ended June 30, 2013, in the amount of $70,039.
Brown Brothers Harriman & Co. (BBH) serves as the custodian, fund accounting and administration service agent with a fee structure based on average net assets of the Funds, certain base fees and transaction-based fees.
The independent Trustees receive compensation for serving on the Board. Trustees serving as Chairman of the Board or a special committee or as a member of a committee receive additional compensation. Trustees are also reimbursed for out-of-pocket expenses incurred while attending meetings. Frank E. Holmes receives no compensation from the Funds for serving on the Board.
Note 4: Investments
Cost of purchases and proceeds from sales of long-term securities for the six months ended June 30, 2013, are summarized as follows:
Fund | | Purchases | | Sales | |
Near-Term Tax Free | | $ | 11,665,799 | | | $ | 400,000 | | |
Tax Free | | | 653,377 | | | | 1,706,724 | | |
All American Equity | | | 14,895,637 | | | | 15,102,232 | | |
Holmes Growth | | | 19,330,431 | | | | 21,637,471 | | |
191
Notes to Financial Statements (unaudited) June 30, 2013
Fund | | Purchases | | Sales | |
MegaTrends | | $ | 14,333,814 | | | $ | 15,505,900 | | |
Global Resources | | | 224,097,808 | | | | 303,932,452 | | |
World Precious Minerals | | | 26,778,751 | | | | 64,864,214 | | |
Gold and Precious Metals | | | 23,533,238 | | | | 39,676,361 | | |
Emerging Europe | | | 61,094,856 | | | | 100,290,083 | | |
Global Emerging Markets | | | 8,021,763 | | | | 7,936,076 | | |
China Region | | | 26,188,305 | | | | 29,843,281 | | |
U.S. Treasury Securities Cash and U.S. Government Securities Savings held only short-term investments. The Funds neither purchased nor sold long-term U.S. government securities during the period.
Investments in foreign issuers as a percent of total investments at June 30, 2013, were: 2.81% of All American Equity, 11.80% of Holmes Growth, 22.92% of MegaTrends, 36.70% of Global Resources (below 40% due to temporary defensive positioning), 87.03% of World Precious Minerals, 69.21% of Gold and Precious Metals, 99.51% of Emerging Europe, 100.00% of Global Emerging Markets and 99.72% of China Region.
Note 5: Tax Information
The following table presents the income tax basis of securities owned at June 30, 2013, and the tax basis components of net unrealized appreciation (depreciation):
Fund | | Aggregate
Tax Cost | | Gross
Unrealized
Appreciation | | Gross
Unrealized
Depreciation | | Net Unrealized
Appreciation
(Depreciation) | |
U.S. Treasury Securities Cash | | $ | 77,938,354 | | | $ | — | | | $ | — | | | $ | — | | |
U.S. Government Securities Savings | | | 133,233,390 | | | | — | | | | — | | | | — | | |
Near-Term Tax Free | | | 47,807,581 | | | | 863,369 | | | | (476,280 | ) | | | 387,089 | | |
Tax Free | | | 19,092,012 | | | | 861,222 | | | | (297,032 | ) | | | 564,190 | | |
All American Equity | | | 15,474,863 | | | | 2,844,640 | | | | (216,918 | ) | | | 2,627,722 | | |
Holmes Growth | | | 28,003,734 | | | | 6,145,351 | | | | (493,768 | ) | | | 5,651,583 | | |
MegaTrends | | | 10,338,995 | | | | 903,556 | | | | (444,495 | ) | | | 459,061 | | |
Global Resources | | | 442,385,631 | | | | 46,412,696 | | | | (122,112,886 | ) | | | (75,700,190 | ) | |
World Precious Minerals | | | 316,182,567 | | | | 8,707,684 | | | | (194,921,512 | ) | | | (186,213,828 | ) | |
Gold and Precious Metals | | | 124,854,110 | | | | 2,484,834 | | | | (62,255,658 | ) | | | (59,770,824 | ) | |
Emerging Europe | | | 111,380,350 | | | | 18,638,875 | | | | (14,831,941 | ) | | | 3,806,934 | | |
Global Emerging Markets | | | 7,086,745 | | | | 655,027 | | | | (1,366,975 | ) | | | (711,948 | ) | |
China Region | | | 24,103,111 | | | | 2,104,083 | | | | (1,880,273 | ) | | | 223,810 | | |
192
Notes to Financial Statements (unaudited) June 30, 2013
As of December 31, 2012, the components of distributable earnings on a tax basis were as follows:
Fund | | Undistributed
Tax-Exempt
Income | | Undistributed
Ordinary
Income | | Undistributed
Long-Term
Capital Gains | | Net Unrealized
Appreciation
(Depreciation) | |
U.S. Treasury Securities Cash | | $ | — | | | $ | 1,151 | | | $ | — | | | $ | — | | |
U.S. Government Securities Savings | | | — | | | | 2,531 | | | | — | | | | — | | |
Near-Term Tax Free | | | 6,229 | | | | 11,667 | | | | — | | | | 1,300,612 | | |
Tax Free | | | 7,655 | | | | 35,391 | | | | — | | | | 1,614,668 | | |
All American Equity | | | — | | | | 43,951 | | | | — | | | | 821,084 | | |
Holmes Growth | | | — | | | | — | | | | 1,061,560 | | | | 1,979,623 | | |
MegaTrends | | | — | | | | 18,079 | | | | — | | | | 193,580 | | |
Global Resources | | | — | | | | 13,521,849 | | | | — | | | | (21,357,419 | ) | |
World Precious Minerals | | | — | | | | — | | | | — | | | | (92,587,804 | ) | |
Gold and Precious Metals | | | — | | | | — | | | | — | | | | (11,380,125 | ) | |
Emerging Europe | | | — | | | | 1,674,295 | | | | — | | | | 25,600,807 | | |
Global Emerging Markets | | | — | | | | — | | | | — | | | | (335,643 | ) | |
China Region | | | — | | | | 62,355 | | | | — | | | | 2,678,744 | | |
The differences between book-basis and tax-basis unrealized appreciation (depreciation) for All American Equity, Holmes Growth, MegaTrends, Global Resources, World Precious Minerals, Gold and Precious Metals, Emerging Europe, Global Emerging Markets and China Region Funds are attributable primarily to the tax deferral of losses on wash sales, investment in passive foreign investment companies (PFIC), forwards marked to markets, unreversed return of capital in Canadian Trusts, adjustments for partnerships, tax straddle loss deferrals on written options, and adjustments for grantor trusts.
The tax character of distributions paid during the six months ended June 30, 2013, were as follows:
Fund | | Tax Exempt
Income | | Ordinary
Income | | Long-Term
Capital Gains | | Total | |
U.S. Treasury Securities Cash | | $ | — | | | $ | 3,876 | | | $ | — | | | $ | 3,876 | | |
U.S. Government Securities Savings | | | — | | | | 6,883 | | | | — | | | | 6,883 | | |
Near-Term Tax Free | | | 460,776 | | | | 18,877 | | | | — | | | | 479,653 | | |
Tax Free | | | 327,018 | | | | 25,666 | | | | — | | | | 352,684 | | |
All American Equity | | | — | | | | — | | | | — | | | | — | | |
Holmes Growth | | | — | | | | — | | | | — | | | | — | | |
MegaTrends - Investor Class | | | — | | | | — | | | | — | | | | — | | |
MegaTrends - Institutional Class | | | — | | | | — | | | | — | | | | — | | |
Global Resources - Investor Class | | | — | | | | — | | | | — | | | | — | | |
Global Resources - Institutional Class | | | — | | | | — | | | | — | | | | — | | |
World Precious Minerals - Investor Class | | | — | | | | — | | | | — | | | | — | | |
World Precious Minerals - Institutional Class | | | — | | | | — | | | | — | | | | — | | |
Gold and Precious Metals | | | — | | | | — | | | | — | | | | — | | |
Emerging Europe | | | — | | | | — | | | | — | | | | — | | |
Global Emerging Markets | | | — | | | | — | | | | — | | | | — | | |
China Region | | | — | | | | — | | | | — | | | | — | | |
193
Notes to Financial Statements (unaudited) June 30, 2013
The tax character of distributions paid during the fiscal year ended December 31, 2012, were as follows:
Fund | | Tax Exempt
Income | | Ordinary
Income | | Long-Term
Capital Gains | | Total | |
U.S. Treasury Securities Cash | | $ | — | | | $ | 8,500 | | | $ | — | | | $ | 8,500 | | |
U.S. Government Securities Savings | | | — | | | | 15,792 | | | | — | | | | 15,792 | | |
Near-Term Tax Free | | | 827,875 | | | | 38,683 | | | | — | | | | 866,558 | | |
Tax Free | | | 679,446 | | | | 38,983 | | | | — | | | | 718,429 | | |
All American Equity | | | — | | | | — | | | | — | | | | — | | |
Holmes Growth | | | — | | | | — | | | | 563,945 | | | | 563,945 | | |
MegaTrends - Investor Class | | | — | | | | 49,108 | | | | — | | | | 49,108 | | |
MegaTrends - Institutional Class | | | — | | | | 4,806 | | | | — | | | | 4,806 | | |
Global Resources - Investor Class | | | — | | | | 9,700,159 | | | | — | | | | 9,700,159 | | |
Global Resources - Institutional Class | | | — | | | | 3,187,762 | | | | — | | | | 3,187,762 | | |
World Precious Minerals - Investor Class | | | — | | | | — | | | | — | | | | — | | |
World Precious Minerals - Institutional Class | | | — | | | | — | | | | — | | | | — | | |
Gold and Precious Metals | | | — | | | | 256,589 | | | | — | | | | 256,589 | | |
Emerging Europe | | | — | | | | 1,152,778 | | | | — | | | | 1,152,778 | | |
Global Emerging Markets | | | — | | | | — | | | | — | | | | — | | |
China Region | | | — | | | | 65,330 | | | | — | | | | 65,330 | | |
Capital loss carryforwards may be used to offset current or future taxable capital gains until expiration. The Fund's tax-basis capital gains and losses are determined only at the end of each fiscal year. Under the Regulated Investment Company Modernization Act of 2010, the Funds are permitted to carry forward capital losses incurred in taxable years beginning after December 22, 2010, for an unlimited period. However, any losses incurred during those future years are required to be utilized prior to the losses incurred in pre-enactment tax years. As a result of this ordering rule, pre-enactment capital losses that are carried forward retain their character as either short-term or long-term capital losses rather than being considered all short-term as under previous law. The loss carryforwards and related expiration dates for each fund, as of December 31, 2012, are as follows:
| | | No Expiration | | Expiration Date | |
Fund | | Short-Term | | Long-Term | | 2013 | | 2014 | | 2015 | |
U.S. Treasury Securities Cash | | $ | — | | | $ | — | | | $ | — | | | $ | — | | | $ | — | | |
U.S. Government Securities Savings | | | — | | | | — | | | | — | | | | — | | | | — | | |
Near-Term Tax Free | | | — | | | | 3,623 | | | | 2,760 | | | | 202,719 | | | | 2,488 | | |
Tax Free | | | 6,681 | | | | 11,487 | | | | — | | | | — | | | | — | | |
All American Equity | | | — | | | | — | | | | — | | | | — | | | | — | | |
Holmes Growth | | | — | | | | — | | | | — | | | | — | | | | — | | |
MegaTrends | | | — | | | | — | | | | — | | | | — | | | | 6,016,468 | | |
Global Resources | | | 86,321,451 | | | | 21,474,071 | | | | — | | | | — | | | | — | | |
World Precious Minerals | | | 24,662,460 | | | | 16,607,108 | | | | — | | | | — | | | | — | | |
Gold and Precious Metals | | | 7,668,776 | | | | 1,949,089 | | | | — | | | | — | | | | — | | |
Emerging Europe | | | 2,752,268 | | | | — | | | | — | | | | — | | | | — | | |
Global Emerging Markets | | | 489,614 | | | | — | | | | — | | | | — | | | | 3,355,041 | | |
China Region | | | 6,316,272 | | | | 338,716 | | | | — | | | | — | | | | — | | |
194
Notes to Financial Statements (unaudited) June 30, 2013
| | | Expiration Date | |
Fund | | 2016 | | 2017 | | 2018 | | Total | |
U.S. Treasury Securities Cash | | $ | — | | | $ | — | | | $ | — | | | $ | — | | |
U.S. Government Securities Savings | | | — | | | | — | | | | — | | | | — | | |
Near-Term Tax Free | | | 112 | | | | 722 | | | | 2,532 | | | | 214,956 | | |
Tax Free | | | 10,697 | | | | — | | | | — | | | | 28,865 | | |
All American Equity | | | — | | | | 56,792 | | | | — | | | | 56,792 | | |
Holmes Growth | | | — | | | | — | | | | — | | | | — | | |
MegaTrends | | | 5,994,166 | | | | 995,675 | | | | — | | | | 13,006,309 | | |
Global Resources | | | — | | | | 259,212,512 | | | | — | | | | 367,008,034 | | |
World Precious Minerals | | | — | | | | 63,779,512 | | | | — | | | | 105,049,080 | | |
Gold and Precious Metals | | | — | | | | — | | | | — | | | | 9,617,865 | | |
Emerging Europe | | | 28,524,678 | | | | 257,523,539 | | | | 15,445,946 | | | | 304,246,431 | | |
Global Emerging Markets | | | 2,965,929 | | | | 5,814,949 | | | | — | | | | 12,625,533 | | |
China Region | | | 15,020,267 | | | | — | | | | — | | | | 21,675,255 | | |
In accordance with tax rules, the following net capital losses and ordinary losses (currency and late year losses) incurred after October 31, within each Fund's tax year, are deemed to arise on the first day of the Fund's next tax year if the Fund elects to defer such losses.
The Funds elected to defer losses incurred after October 31, 2012, as follows:
Fund | | Post October 31, 2012
Capital Loss Deferral | | Post October 31, 2012
Ordinary Loss Deferral | |
Holmes Growth | | $ | 61,788 | | | $ | 25,273 | | |
Global Resources | | | 11,340,796 | | | | — | | |
World Precious Minerals | | | 17,859,133 | | | | 276,562 | | |
Gold and Precious Metals | | | 4,227,291 | | | | 30,858 | | |
Emerging Europe | | | 265,016 | | | | 18,362 | | |
Global Emerging Markets | | | 21,181 | | | | 7,122 | | |
Note 6: Risks of Concentrations
The Near-Term Tax Free Fund and the Tax Free Fund may be exposed to risks related to concentration of investments in a particular state or geographic area. These investments present risks resulting from changes in economic conditions of the region or the issuer.
Because the Global Resources Fund concentrates its investments in specific industries, the fund may be subject to greater risks and fluctuations than a portfolio representing a broader range of industries.
The investment policies of the World Precious Minerals and Gold and Precious Metals Funds present unique risks to their respective portfolios' values. The prices of gold and other precious metals may be subject to fluctuations caused by international monetary and political developments including trade or currency restrictions, currency devaluation and revaluation, and social and political conditions within a
195
Notes to Financial Statements (unaudited) June 30, 2013
country. Fluctuations in the prices of gold and other precious metals will affect the market values of the securities held by these funds.
The Emerging Europe Fund invests more than 25% of its investments in companies principally engaged in the oil & gas or banking industries. The risk of concentrating investments in this group of industries will make the fund more susceptible to risk in these industries than funds which do not concentrate their investments in an industry.
The Emerging Europe and Global Emerging Markets Funds may be exposed to risks not typically associated with investment in the United States due to their concentration of investments in emerging markets. These risks include possible revaluation of currencies, less public information about companies, disruptive political or economic conditions and the possible imposition of adverse governmental laws or currency exchange restrictions. Moreover, securities of many foreign issuers, including sovereign nations, and their markets may be less liquid and their prices more volatile than those securities of comparable U.S. issuers.
The China Region Fund may be exposed to risks not typically associated with investments in the United States, due to concentration of investments in foreign issuers in the region. These investments present risks resulting from disruptive political or economic conditions and the potential imposition of adverse governmental laws or currency exchange restrictions affecting the area.
Note 7: Credit Arrangements
Each of the Funds has a revolving credit facility with BBH. Borrowings of each Fund are collateralized by any or all of the securities held by BBH as the Fund's custodian up to the amount of the borrowing. Interest on borrowings is charged at the current overnight Federal Funds Rate plus 2%. Each Fund has a maximum borrowing limit of 10% of qualified assets. The aggregate of borrowings by all Funds under the agreement cannot exceed $30,000,000 at any one time. There were no borrowings under the revolving credit facility during the period ended June 30, 2013. The Funds paid BBH a total of $22,625 in commitment fees for the period ended June 30, 2013, under this arrangement.
196
Notes to Financial Statements (unaudited) June 30, 2013
Note 8: Shares of Beneficial Interest
At June 30, 2013, individual shareholders holding more than 5% of outstanding Investor Class shares comprised 5.51% and 6.51% of the U.S. Treasury Securities Cash Fund and the Global Emerging Markets Fund, respectively. In addition, the Adviser held 12.68%, 8.31% and 5.41% of the Investor Class shares of U.S. Government Securities Savings Fund, Tax Free Fund and Global Emerging Markets Fund, respectively, and 32.28% of the Institutional Class shares of MegaTrends Fund. Control is defined by the 1940 Act as the beneficial ownership, either directly or through one or more controlled companies, of more than 25% of the voting securities of a company. Investment activities of these shareholders could have a material impact on the Funds.
Note 9: Subsequent Events
On August 23, 2013, the Board of Trustees of the Funds approved the following initiatives: (1) liquidate the U.S. Treasury Securities Cash Fund, (2) pending shareholder approval, change the U.S. Government Securities Savings Fund to a short-term U.S. government bond fund that is not a money market fund, (3) reorganize the Tax Free Fund into the Near-Term Tax Free Fund and (4) convert transfer agency services to a different provider. These initiatives are projected to be completed by the end of 2013. Shareholders will receive further information on how these changes will affect their accounts in the fall of 2013.
197
U.S. Treasury Securities Cash Fund
For a capital share outstanding during the
| | | Investor Class | |
| | | Six Months
Ended
June 30, 2013 | | Year Ended December 31, | | Six Months
Ended
December 31, | | Year
Ended
June 30, | |
| | | (unaudited) | | 2012 | | 2011 | | 2010 | | 2009 | | 2008* | | 2008 | |
Net asset value, beginning of period | | $ | 1.00 | | | $ | 1.00 | | | $ | 1.00 | | | $ | 1.00 | | | $ | 1.00 | | | $ | 1.00 | | | $ | 1.00 | | |
Investment Activities | |
Net investment income | | | — | (a) | | | — | (a) | | | — | (a) | | | — | (a) | | | — | (a) | | | — | (a) | | | .02 | | |
Net realized and unrealized gain | | | — | | | | — | | | | — | | | | — | | | | — | | | | — | | | | — | | |
Total from investment activities | | | — | (a) | | | — | (a) | | | — | (a) | | | — | (a) | | | — | (a) | | | — | (a) | | | .02 | | |
Distributions from net investment income | | | — | (a) | | | — | (a) | | | — | (a) | | | — | (a) | | | — | (a) | | | — | (a) | | | (.02 | ) | |
Net asset value, end of period | | $ | 1.00 | | | $ | 1.00 | | | $ | 1.00 | | | $ | 1.00 | | | $ | 1.00 | | | $ | 1.00 | | | $ | 1.00 | | |
| Total Return (excluding account fees) (b) | | | — | | | | .01 | % | | | .01 | % | | | .01 | % | | | .01 | % | | | .23 | % | | | 2.46 | % | |
Ratios to Average Net Assets: (c) | |
Net investment income | | | .01 | % | | | .01 | % | | | .01 | % | | | .01 | % | | | .01 | % | | | .44 | % | | | 2.43 | % | |
Total expenses | | | 1.11 | % | | | 1.08 | % | | | .98 | % | | | 1.01 | % | | | 1.01 | % | | | 1.11 | % | | | 1.09 | % | |
Expenses waived or reimbursed (d)(e) | | | (1.05 | )% | | | (.95 | )% | | | (.92 | )% | | | (.86 | )% | | | (.75 | )% | | | (.38 | )% | | | (.09 | )% | |
Net recouped fees (e) | | | — | | | | — | | | | — | | | | — | | | | — | | | | — | | | | — | (g) | |
Net expenses (f) | | | .06 | % | | | .13 | % | | | .06 | % | | | .15 | % | | | .26 | % | | | .73 | % | | | 1.00 | % | |
Net assets, end of period (in thousands) | | $ | 78,029 | | | $ | 80,192 | | | $ | 90,557 | | | $ | 99,491 | | | $ | 103,889 | | | $ | 121,410 | | | $ | 111,955 | | |
* Effective December 31, 2008, the fiscal year changed to December 31.
(a) The per share amount does not round to a full penny.
(b) Total returns for periods less than one year are not annualized. Assumes investment at the net asset value at the beginning of the period, reinvestment of all distribution and a complete redemption of the investment at the net asset value at the end of the period.
(c) Ratios are annualized for periods of less than one year.
(d) Expenses waived or reimbursed reflect reductions to total expenses, as discussed in the notes to the financial statements. These amounts would decrease the net investment income ratio and total returns had such reductions not occurred.
(e) During the year ended June 30, 2008, the Adviser waived fees and/or reimbursed expenses under the Minimum Yield Agreement in the amount of $4,259. The Fund reimbursed the Adviser the $4,259 during the year ended June 30, 2008. During the six months ended December 31, 2008, the year ended December 31, 2009, the year ended December 31, 2010, the year ended December 31, 2011, the year ended December 31, 2012, and the six months ended June 30, 2013, the Adviser waived fees and/or reimbursed expenses under the Minimum Yield Agreement in the amount of $170,642, $789,420, $884,850, $867,545, $735,584 and $363,694, respectively. The waivers/reimbursements from 2010-2013 are subject to recapture in future periods.
(f) The net expense ratios shown above reflect expenses after waivers and reimbursements but exclude the effect of reductions to total expenses for any expenses offset. Expense offset arrangements reduce total expenses, as discussed in the notes to the financial statements. These amounts would decrease the net investment income ratio had such reductions not occurred. The effects of expenses offset are as follows:
| | | Investor Class | |
| | | Six Months
Ended
June 30, 2013 | | Year Ended December 31, | | Six Months
Ended
December 31, | | Year
Ended
June 30, | |
| | | (unaudited) | | 2012 | | 2011 | | 2010 | | 2009 | | 2008* | | 2008 | |
Ratios to Average Net Assets: (c) | | | | | | | | | | | | | | | |
Expenses offset (g) | | | — | | | | — | | | | — | | | | — | | | | — | | | | — | | | | — | | |
(g) Effect on the expense ratio was not greater than 0.005%.
See accompanying notes to financial statements.
198
U.S. Government Securities Savings Fund
For a capital share outstanding during the
| | | Investor Class | |
| | | Six Months
Ended
June 30, 2013 | | Year Ended December 31, | | Six Months
Ended
December 31, | | Year
Ended
June 30, | |
| | | (unaudited) | | 2012 | | 2011 | | 2010 | | 2009 | | 2008* | | 2008 | |
Net asset value, beginning of period | | $ | 1.00 | | | $ | 1.00 | | | $ | 1.00 | | | $ | 1.00 | | | $ | 1.00 | | | $ | 1.00 | | | $ | 1.00 | | |
Investment Activities | |
Net investment income | | | — | (a) | | | — | (a) | | | — | (a) | | | — | (a) | | | — | (a) | | | .01 | | | | .03 | | |
Net realized and unrealized gain | | | — | | | | — | | | | — | | | | — | (a) | | | — | | | | — | (a) | | | — | (a) | |
Total from investment activities | | | — | (a) | | | — | (a) | | | — | (a) | | | — | (a) | | | — | (a) | | | .01 | | | | .03 | | |
Distributions from net investment income | | | — | (a) | | | — | (a) | | | — | (a) | | | — | (a) | | | — | (a) | | | (.01 | ) | | | (.03 | ) | |
Net asset value, end of period | | $ | 1.00 | | | $ | 1.00 | | | $ | 1.00 | | | $ | 1.00 | | | $ | 1.00 | | | $ | 1.00 | | | $ | 1.00 | | |
| Total Return (excluding account fees) (b) | | | — | | | | .01 | % | | | .01 | % | | | .01 | % | | | .10 | % | | | .67 | % | | | 3.47 | % | |
Ratios to Average Net Assets: (c) | |
Net investment income | | | .01 | % | | | .01 | % | | | .01 | % | | | .01 | % | | | .11 | % | | | 1.36 | % | | | 3.42 | % | |
Total expenses | | | .89 | % | | | .87 | % | | | .81 | % | | | .82 | % | | | .78 | % | | | .73 | % | | | .65 | % | |
Expenses waived or reimbursed (d) | | | (.81 | )% | | | (.74 | )% | | | (.74 | )% | | | (.67 | )% | | | (.42 | )% | | | (.26 | )% | | | (.20 | )% | |
Net expenses (e) | | | .08 | % | | | .13 | % | | | .07 | % | | | .15 | % | | | .36 | % | | | .47 | %(g) | | | .45 | % | |
Net assets, end of period (in thousands) | | $ | 133,380 | | | $ | 140,425 | | | $ | 171,664 | | | $ | 203,835 | | | $ | 263,232 | | | $ | 357,910 | | | $ | 446,208 | | |
* Effective December 31, 2008, the fiscal year changed to December 31.
(a) The per share amount does not round to a full penny.
(b) Total returns for periods less than one year are not annualized. Assumes investment at the net asset value at the beginning of the period, reinvestment of all distributions and a complete redemption of the investment at the net asset value at the end of the period.
(c) Ratios are annualized for periods of less than one year.
(d) Expenses waived or reimbursed reflect reductions to total expenses, as discussed in the notes to the financial statements. These amounts would decrease the net investment income ratio and total returns had such reductions not occurred. During the year ended December 31, 2009, the year ended December 31, 2010, the year ended December 31, 2011, the year ended December 31, 2012, and the six months ended June 30, 2013, the Adviser waived fees and/or reimbursed expenses under the Minimum Yield Agreement in the amount of $258,561, $678,107, $736,531, $509,874 and $252,937, respectively. The waivers/reimbursements from 2010-2013 are subject to recapture in future periods.
(e) The net expense ratios shown above reflect expenses after waivers and reimbursements but exclude the effect of reductions to total expenses for any expenses offset. Expense offset arrangements reduce total expenses, as discussed in the notes to the financial statements. These amounts would decrease the net investment income ratio had such reductions not occurred. The effect of expenses offset are as follows:
| | | Investor Class | |
| | | Six Months
Ended
June 30, 2013 | | Year Ended December 31, | | Six Months
Ended
December 31, | | Year
Ended
June 30, | |
| | | (unaudited) | | 2012 | | 2011 | | 2010 | | 2009 | | 2008* | | 2008 | |
Ratios to Average Net Assets: (c) | | | | | | | | | | | | | | | |
Expenses offset (f) | | | — | | | | — | | | | — | | | | — | | | | — | | | | — | | | | — | | |
(f) Effect on the expense ratio was not greater than 0.005%.
(g) The annualized net expense ratio for the six months ended December 31, 2008, exceeded the limitation for the period due to the cost of participating in the U.S. Treasury Guarantee Program for the Money Market Funds. The cost to participate was without regard to the expense limitation.
See accompanying notes to financial statements.
199
Near-Term Tax Free Fund
For a capital share outstanding during the
| | | Investor Class | |
| | | Six Months
Ended
June 30, 2013 | | Year Ended December 31, | | Six Months
Ended
December 31, | | Year
Ended
June 30, | |
| | | (unaudited) | | 2012 | | 2011 | | 2010 | | 2009 | | 2008* | | 2008 | |
Net asset value, beginning of period | | $ | 2.27 | | | $ | 2.26 | | | $ | 2.22 | | | $ | 2.21 | | | $ | 2.16 | | | $ | 2.14 | | | $ | 2.12 | | |
Investment Activities | |
Net investment income | | | .02 | | | | .05 | | | | .05 | | | | .06 | | | | .06 | | | | .03 | | | | .07 | | |
Net realized and unrealized gain (loss) | | | (.04 | ) | | | .01 | | | | .04 | | | | .01 | | | | .05 | | | | .02 | | | | .02 | | |
Total from investment activities | | | (.02 | ) | | | .06 | | | | .09 | | | | .07 | | | | .11 | | | | .05 | | | | .09 | | |
Distributions from net investment income | | | (.02 | ) | | | (.05 | ) | | | (.05 | ) | | | (.06 | ) | | | (.06 | ) | | | (.03 | ) | | | (.07 | ) | |
Net asset value, end of period | | $ | 2.23 | | | $ | 2.27 | | | $ | 2.26 | | | $ | 2.22 | | | $ | 2.21 | | | $ | 2.16 | | | $ | 2.14 | | |
| Total Return (excluding account fees) (a) | | | (.80 | )% | | | 2.67 | % | | | 4.24 | % | | | 2.95 | % | | | 5.00 | % | | | 2.55 | % | | | 4.42 | % | |
Ratios to Average Net Assets: (b) | |
Net investment income | | | 2.06 | % | | | 2.21 | % | | | 2.39 | % | | | 2.46 | % | | | 2.63 | % | | | 3.15 | % | | | 3.41 | % | |
Total expenses | | | 1.15 | % | | | 1.25 | % | | | 1.26 | % | | | 1.30 | % | | | 1.53 | % | | | 1.82 | % | | | 1.91 | % | |
Expenses waived or reimbursed (c) | | | (.70 | )% | | | (.80 | )% | | | (.81 | )% | | | (.85 | )% | | | (1.08 | )% | | | (1.37 | )% | | | (1.46 | )% | |
Net expenses (d) | | | .45 | % | | | .45 | % | | | .45 | % | | | .45 | % | | | .45 | % | | | .45 | % | | | .45 | % | |
Portfolio turnover rate | | | 1 | % | | | 7 | % | | | — | (f) | | | 1 | % | | | — | (f) | | | 8 | % | | | 8 | % | |
Net assets, end of period (in thousands) | | $ | 51,713 | | | $ | 44,509 | | | $ | 35,014 | | | $ | 29,138 | | | $ | 23,337 | | | $ | 13,989 | | | $ | 13,603 | | |
* Effective December 31, 2008, the fiscal year changed to December 31.
(a) Total returns for periods less than one year are not annualized. Assumes investment at the net asset value at the beginning of the period, reinvestment of all distributions and a complete redemption of the investment at the net asset value at the end of the period.
(b) Ratios are annualized for periods of less than one year.
(c) Expenses waived or reimbursed reflect reductions to total expenses, as discussed in the notes to the financial statements. These amounts would decrease the net investment income ratio and total returns had such reductions not occurred.
(d) The net expense ratios shown above reflect expenses after waivers and reimbursements, but exclude the effect of reductions to total expenses for any expenses offset. Expense offset arrangements reduce total expenses, as discussed in the notes to the financial statements. These amounts would decrease the net investment income ratio had such reductions not occurred. The effect of expenses offset are as follows:
| | | Investor Class | |
| | | Six Months
Ended
June 30, 2013 | | Year Ended December 31, | | Six Months
Ended
December 31, | | Year
Ended
June 30, | |
| | | (unaudited) | | 2012 | | 2011 | | 2010 | | 2009 | | 2008* | | 2008 | |
Ratios to Average Net Assets: (b) | | | | | | | | | | | | | | | |
Expenses offset (e) | | | — | | | | — | | | | — | | | | — | | | | — | | | | — | | | | — | | |
(e) Effect on the expense ratio was not greater than 0.005%.
(f) Portfolio turnover rate was not greater than 0.5%.
See accompanying notes to financial statements.
200
Tax Free Fund
For a capital share outstanding during the
| | | Investor Class | |
| | | Six Months
Ended
June 30, 2013 | | Year Ended December 31, | | Six Months
Ended
December 31, | | Year
Ended
June 30, | |
| | | (unaudited) | | 2012 | | 2011 | | 2010 | | 2009 | | 2008* | | 2008 | |
Net asset value, beginning of period | | $ | 12.92 | | | $ | 12.63 | | | $ | 12.01 | | | $ | 12.20 | | | $ | 11.72 | | | $ | 11.93 | | | $ | 11.98 | | |
Investment Activities | |
Net investment income | | | .21 | | | | .41 | | | | .43 | | | | .44 | | | | .45 | | | | .23 | | | | .47 | | |
Net realized and unrealized gain (loss) | | | (.63 | ) | | | .29 | | | | .62 | | | | (.19 | ) | | | .48 | | | | (.21 | ) | | | (.05 | ) | |
Total from investment activities | | | (.42 | ) | | | .70 | | | | 1.05 | | | | .25 | | | | .93 | | | | .02 | | | | .42 | | |
Distributions from net investment income | | | (.20 | ) | | | (.41 | ) | | | (.43 | ) | | | (.44 | ) | | | (.45 | ) | | | (.23 | ) | | | (.47 | ) | |
Net asset value, end of period | | $ | 12.30 | | | $ | 12.92 | | | $ | 12.63 | | | $ | 12.01 | | | $ | 12.20 | | | $ | 11.72 | | | $ | 11.93 | | |
| Total Return (excluding account fees) (a) | | | (3.27 | )% | | | 5.60 | % | | | 8.94 | % | | | 2.04 | % | | | 8.03 | % | | | .22 | % | | | 3.54 | % | |
Ratios to Average Net Assets: (b) | |
Net investment income | | | 3.24 | % | | | 3.18 | % | | | 3.53 | % | | | 3.55 | % | | | 3.73 | % | | | 3.92 | % | | | 3.91 | % | |
Total expenses | | | 1.85 | % | | | 1.84 | % | | | 1.74 | % | | | 1.66 | % | | | 1.75 | % | | | 1.91 | % | | | 1.94 | % | |
Expenses waived or reimbursed (c) | | | (1.15 | )% | | | (1.14 | )% | | | (1.04 | )% | | | (.96 | )% | | | (1.05 | )% | | | (1.21 | )% | | | (1.24 | )% | |
Net expenses (d) | | | .70 | % | | | .70 | % | | | .70 | % | | | .70 | % | | | .70 | % | | | .70 | % | | | .70 | % | |
Portfolio turnover rate | | | 3 | % | | | — | (f) | | | 10 | % | | | 15 | % | | | — | (f) | | | 6 | % | | | 11 | % | |
Net assets, end of period (in thousands) | | $ | 20,021 | | | $ | 23,138 | | | $ | 21,663 | | | $ | 19,794 | | | $ | 22,102 | | | $ | 16,946 | | | $ | 18,380 | | |
* Effective December 31, 2008, the fiscal year changed to December 31.
(a) Total returns for periods less than one year are not annualized. Assumes investment at the net asset value at the beginning of the period, reinvestment of all distributions and a complete redemption of the investment at the net asset value at the end of the period.
(b) Ratios are annualized for periods of less than one year.
(c) Expenses waived or reimbursed reflect reductions to total expenses, as discussed in the notes to the financial statements. These amounts would decrease the net investment income ratio and total returns had such reductions not occurred.
(d) The net expense ratios shown above reflect expenses after waivers and reimbursements, but exclude the effect of reductions to total expenses for any expenses offset. Expense offset arrangements reduce total expenses, as discussed in the notes to the financial statements. These amounts would decrease the net investment income ratio had such reductions not occurred. The effect of expenses offset are as follows:
| | | Investor Class | |
| | | Six Months
Ended
June 30, 2013 | | Year Ended December 31, | | Six Months
Ended
December 31, | | Year
Ended
June 30, | |
| | | (unaudited) | | 2012 | | 2011 | | 2010 | | 2009 | | 2008* | | 2008 | |
Ratios to Average Net Assets: (b) | | | | | | | | | | | | | | | |
Expenses offset (e) | | | — | | | | — | | | | — | | | | — | | | | — | | | | — | | | | — | | |
(e) Effect on the expense ratio was not greater than 0.005%.
(f) Portfolio turnover rate was not greater than 0.5%.
See accompanying notes to financial statements.
201
All American Equity Fund
For a capital share outstanding during the
| | | Investor Class | |
| | | Six Months
Ended
June 30, 2013 | | Year Ended December 31, | | Six Months
Ended
December 31, | | Year
Ended
June 30, | |
| | | (unaudited) | | 2012 | | 2011 | | 2010 | | 2009 | | 2008* | | 2008 | |
Net asset value, beginning of period | | $ | 25.40 | | | $ | 22.72 | | | $ | 22.72 | | | $ | 19.60 | | | $ | 17.33 | | | $ | 27.27 | | | $ | 28.58 | | |
Investment Activities | |
Net investment income (loss) | | | (.06 | ) | | | .07 | | | | (.07 | ) | | | .02 | | | | (.13 | ) | | | .04 | | | | (.15 | ) | |
Net realized and unrealized gain (loss) | | | 3.59 | | | | 2.61 | | | | .10 | | | | 3.10 | | | | 2.51 | | | | (9.97 | ) | | | 1.98 | | |
Total from investment activities | | | 3.53 | | | | 2.68 | | | | .03 | | | | 3.12 | | | | 2.38 | | | | (9.93 | ) | | | 1.83 | | |
Distributions | |
From net investment income | | | — | | | | — | | | | (.03 | ) | | | — | | | | (.11 | ) | | | (.01 | ) | | | — | | |
From net realized gains | | | — | | | | — | | | | — | | | | — | | | | — | | | | — | | | | (3.01 | ) | |
From tax return of capital | | | — | | | | — | | | | — | | | | — | | | | — | | | | — | | | | (.13 | ) | |
Total distributions | | | — | | | | — | | | | (.03 | ) | | | — | | | | (.11 | ) | | | (.01 | ) | | | (3.14 | ) | |
Short-Term Trading Fees **(a) | | | — | | | | — | | | | — | | | | — | | | | — | | | | — | | | | — | | |
Net asset value, end of period | | $ | 28.93 | | | $ | 25.40 | | | $ | 22.72 | | | $ | 22.72 | | | $ | 19.60 | | | $ | 17.33 | | | $ | 27.27 | | |
| Total Return (excluding account fees) (b) | | | 13.90 | % | | | 11.80 | % | | | .14 | % | | | 15.92 | % | | | 13.75 | % | | | (36.42 | )% | | | 5.99 | % | |
Ratios to Average Net Assets: (c) | |
Net investment income (loss) | | | (.41 | )% | | | .28 | % | | | (.32 | )% | | | .10 | % | | | (.74 | )% | | | .35 | % | | | (.55 | )% | |
Total expenses | | | 2.49 | % | | | 2.72 | % | | | 2.42 | % | | | 2.56 | % | | | 2.79 | % | | | 2.37 | % | | | 1.98 | % | |
Expenses waived or reimbursed (d) | | | (.37 | )% | | | (.52 | )% | | | (.24 | )% | | | (.48 | )% | | | (.96 | )% | | | (.62 | )% | | | (.23 | )% | |
Net expenses (e) | | | 2.12 | % | | | 2.20 | % | | | 2.18 | % | | | 2.08 | % | | | 1.83 | % | | | 1.75 | % | | | 1.75 | % | |
Portfolio turnover rate | | | 86 | % | | | 221 | % | | | 223 | % | | | 299 | % | | | 343 | % | | | 205 | % | | | 225 | % | |
Net assets, end of period (in thousands) | | $ | 19,734 | | | $ | 16,846 | | | $ | 16,399 | | | $ | 17,760 | | | $ | 16,436 | | | $ | 16,234 | | | $ | 26,513 | | |
* Effective December 31, 2008, the fiscal year changed to December 31.
** Based on average monthly shares outstanding.
(a) The per share amount does not round to a full penny.
(b) Total returns for periods less than one year are not annualized. Assumes investment at the net asset value at the beginning of the period, reinvestment of all distribution and a complete redemption of the investment at the net asset value at the end of the period.
(c) Ratios are annualized for periods of less than one year.
(d) Expenses waived or reimbursed reflect reductions to total expenses, as discussed in the notes to the financial statements. These amounts would increase the net investment loss ratio or decrease the net investment income ratio, as applicable, and decrease total returns, had such reductions not occurred.
(e) The net expense ratios shown above reflect expenses after waivers and reimbursements, but exclude the effect of reductions to total expenses for any expenses offset. Expense offset arrangements reduce total expenses, as discussed in the notes to the financial statements. These amounts would increase the net investment loss ratio, or decrease the net investment income ratio, as applicable, had such reductions not occurred. The effect of expenses offset are as follows:
| | | Investor Class | |
| | | Six Months
Ended
June 30, 2013 | | Year Ended December 31, | | Six Months
Ended
December 31, | | Year
Ended
June 30, | |
| | | (unaudited) | | 2012 | | 2011 | | 2010 | | 2009 | | 2008* | | 2008 | |
Ratios to Average Net Assets: (c) | | | | | | | | | | | | | | | |
Expenses offset (f) | | | — | | | | — | | | | — | | | | — | | | | — | | | | — | | | | — | | |
(f) Effect on the expense ratio was not greater than 0.005%.
See accompanying notes to financial statements.
202
Holmes Growth Fund
For a capital share outstanding during the
| | | Investor Class | |
| | | Six Months
Ended
June 30, 2013 | | Year Ended December 31, | | Two Months
Ended
December 31, | | Year
Ended
October 31, | |
| | | (unaudited) | | 2012 | | 2011 | | 2010 | | 2009 | | 2008* | | 2008 | |
Net asset value, beginning of period | | $ | 18.51 | | | $ | 17.62 | | | $ | 18.65 | | | $ | 15.54 | | | $ | 12.79 | | | $ | 14.14 | | | $ | 24.78 | | |
Investment Activities | |
Net investment loss | | | (.11 | ) | | | (.10 | ) | | | (.26 | ) | | | (.22 | ) | | | (.13 | ) | | | (.01 | ) | | | (.15 | ) | |
Net realized and unrealized gain (loss) | | | 2.51 | | | | 1.29 | | | | (.77 | ) | | | 3.54 | | | | 2.88 | | | | (1.34 | ) | | | (10.49 | ) | |
Total from investment activities | | | 2.40 | | | | 1.19 | | | | (1.03 | ) | | | 3.32 | | | | 2.75 | | | | (1.35 | ) | | | (10.64 | ) | |
Distributions | |
From net investment income | | | — | | | | — | | | | — | | | | (.21 | ) | | | — | | | | — | | | | — | | |
From net realized gains | | | — | | | | (.30 | ) | | | — | | | | — | | | | — | | | | — | | | | — | | |
Total distributions | | | — | | | | (.30 | ) | | | — | | | | (.21 | ) | | | — | | | | — | | | | — | | |
Short-Term Trading Fees **(a) | | | — | | | | — | | | | — | | | | — | | | | — | | | | — | | | | — | | |
Net asset value, end of period | | $ | 20.91 | | | $ | 18.51 | | | $ | 17.62 | | | $ | 18.65 | | | $ | 15.54 | | | $ | 12.79 | | | $ | 14.14 | | |
| Total Return (excluding account fees) (b) | | | 12.97 | % | | | 6.77 | % | | | (5.52 | )% | | | 21.35 | % | | | 21.50 | % | | | (9.55 | )% | | | (42.94 | )% | |
Ratios to Average Net Assets: (c) | |
Net investment loss | | | (1.02 | )% | | | (.51 | )% | | | (1.25 | )% | | | (1.29 | )% | | | (.93 | )% | | | (.27 | )% | | | (.65 | )% | |
Total expenses | | | 1.85 | % | | | 1.85 | % | | | 2.00 | % | | | 1.93 | % | | | 2.10 | % | | | 2.51 | % | | | 1.74 | % | |
Expenses waived or reimbursed (d) | | | — | | | | — | (f) | | | — | | | | — | (f) | | | (.33 | )% | | | (.76 | )% | | | — | | |
Net expenses (e) | | | 1.85 | % | | | 1.85 | % | | | 2.00 | % | | | 1.93 | % | | | 1.77 | % | | | 1.75 | % | | | 1.74 | % | |
Portfolio turnover rate | | | 58 | % | | | 214 | % | | | 210 | % | | | 160 | % | | | 219 | % | | | 20 | % | | | 140 | % | |
Net assets, end of period (in thousands) | | $ | 36,559 | | | $ | 34,639 | | | $ | 35,316 | | | $ | 40,604 | | | $ | 37,149 | | | $ | 32,488 | | | $ | 36,231 | | |
* Effective December 31, 2008, the fiscal year changed to December 31.
** Based on average monthly shares outstanding.
(a) The per share amount does not round to a full penny.
(b) Total returns for periods less than one year are not annualized. Assumes investment at the net asset value at the beginning of the period, reinvestment of all distributions and a complete redemption of the investment at the net asset value at the end of the period.
(c) Ratios are annualized for periods of less than one year.
(d) Expenses waived or reimbursed reflect reductions to total expenses, as discussed in the notes to the financial statements. These amounts would increase the net investment loss ratio or decrease the net investment income ratio, as applicable, and decrease total returns had such reductions not occurred.
(e) The net expense shown above reflect expenses after waivers and reimbursements but exclude the effect of reductions to total expenses for any expenses offset. Expense offset arrangements reduce total expenses, as discussed in the notes to the financial statements. These amounts would increase the net investment loss ratio, or decrease the net investment income ratio, as applicable, had such reductions not occurred. The effect of expenses offset are as follows:
| | | Investor Class | |
| | | Six Months
Ended
June 30, 2013 | | Year Ended December 31, | | Two Months
Ended
December 31, | | Year
Ended
October 31, | |
| | | (unaudited) | | 2012 | | 2011 | | 2010 | | 2009 | | 2008* | | 2008 | |
Ratios to Average Net Assets: (c) | | | | | | | | | | | | | | | |
Expenses offset (f) | | | — | | | | — | | | | — | | | | — | | | | — | | | | — | | | | — | | |
(f) Effect on the expense ratio was not greater than 0.005%.
See accompanying notes to financial statements.
203
MegaTrends Fund
For a capital share outstanding during the
| | | Investor Class | |
| | | Six Months
Ended
June 30, 2013 | | Year Ended December 31, | | Two Months
Ended
December 31, | | Year
Ended
October 31, | |
| | | (unaudited) | | 2012 | | 2011 | | 2010 | | 2009 | | 2008* | | 2008 | |
Net asset value, beginning of period | | $ | 8.08 | | | $ | 7.68 | | | $ | 8.83 | | | $ | 8.15 | | | $ | 6.28 | | | $ | 6.60 | | | $ | 12.75 | | |
Investment Activities | |
Net investment income (loss) | | | (.03 | )** | | | .02 | ** | | | .04 | | | | .06 | | | | .03 | | | | — | (a) | | | — | (a) | |
Net realized and unrealized gain (loss) | | | .94 | ** | | | .42 | ** | | | (1.19 | ) | | | .63 | | | | 1.86 | | | | (.31 | ) | | | (5.30 | ) | |
Total from investment activities | | | .91 | | | | .44 | | | | (1.15 | ) | | | .69 | | | | 1.89 | | | | (.31 | ) | | | (5.30 | ) | |
Distributions | |
From net investment income | | | — | | | | (.04 | ) | | | — | | | | (.01 | ) | | | (.02 | ) | | | — | | | | — | | |
From net realized gains | | | — | | | | — | | | | — | | | | — | | | | — | | | | — | | | | (.85 | ) | |
From tax return of capital | | | — | | | | — | | | | — | | | | — | | | | — | | | | (.01 | ) | | | — | | |
Total distributions | | | — | | | | (.04 | ) | | | — | | | | (.01 | ) | | | (.02 | ) | | | (.01 | ) | | | (.85 | ) | |
Short-Term Trading Fees **(a) | | | — | | | | — | | | | — | | | | — | | | | — | | | | — | | | | — | | |
Net asset value, end of period | | $ | 8.99 | | | $ | 8.08 | | | $ | 7.68 | | | $ | 8.83 | | | $ | 8.15 | | | $ | 6.28 | | | $ | 6.60 | | |
| Total Return (excluding account fees) (b) | | | 11.26 | % | | | 5.67 | % | | | (13.02 | )% | | | 8.43 | % | | | 30.15 | % | | | (4.74 | )% | | | (44.50 | )% | |
Ratios to Average Net Assets: (c) | |
Net investment income (loss) | | | (.59 | )% | | | .24 | % | | | .35 | % | | | .43 | % | | | .45 | % | | | (.20 | )% | | | (.06 | )% | |
Total expenses | | | 3.37 | % | | | 3.13 | % | | | 2.56 | % | | | 2.44 | % | | | 2.43 | % | | | 2.96 | % | | | 2.21 | % | |
Expenses waived or reimbursed (d) | | | (1.28 | )% | | | (1.05 | )% | | | (.41 | )% | | | (.22 | )% | | | (.48 | )% | | | (1.11 | )% | | | (.21 | )% | |
Net expenses (e) | | | 2.09 | % | | | 2.08 | % | | | 2.15 | % | | | 2.22 | % | | | 1.95 | % | | | 1.85 | % | | | 2.00 | % | |
Portfolio turnover rate (g) | | | 137 | % | | | 398 | % | | | 163 | % | | | 104 | % | | | 100 | % | | | 29 | % | | | 92 | % | |
Net assets, end of period (in thousands) | | $ | 11,251 | | | $ | 10,327 | | | $ | 12,450 | | | $ | 16,332 | | | $ | 28,557 | | | $ | 22,035 | | | $ | 25,387 | | |
* Effective December 31, 2008, the fiscal year changed to December 31.
** Based on average monthly shares outstanding.
(a) The per share amount does not round to a full penny.
(b) Total returns for periods less than one year are not annualized. Assumes investment at the net asset value at the beginning of the period, reinvestment of all distributions and a complete redemption of the investment at the net asset value at the end of the period.
(c) Ratios are annualized for periods of less than one year.
(d) Expenses waived or reimbursed reflect reductions to total expenses, as discussed in the notes to the financial statements. These amounts would increase the net investment loss ratio or decrease the net investment income ratio, as applicable, and decrease total returns had such reductions not occurred.
(e) The expense ratios shown above exclude the effect of reductions to total expenses for any expenses offset. Expense offset arrangements reduce total expenses, as discussed in the notes to financial statements. These amounts would increase the net investment loss ratio, or decrease the net investment income ratio, as applicable, had such reductions not occurred. The effect of expenses offset are as follows:
| | | Investor Class | |
| | | Six Months
Ended
June 30, 2013 | | Year Ended December 31, | | Two Months
Ended
December 31, | | Year
Ended
October 31, | |
| | | (unaudited) | | 2012 | | 2011 | | 2010 | | 2009 | | 2008* | | 2008 | |
Ratios to Average Net Assets: (c) | | | | | | | | | | | | | | | |
Expenses offset (f) | | | — | | | | — | | | | — | | | | — | | | | — | | | | — | | | | — | | |
(f) Effect on the expense ratio was not greater than 0.005%.
(g) Portfolio turnover rate is calculated at the fund level.
See accompanying notes to financial statements.
204
MegaTrends Fund
For a capital share outstanding during the
| | | Institutional Class | |
| | | Six Months
Ended
June 30, 2013 | | Year Ended December 31, | | Period
Ended
December 31, | |
| | | (unaudited) | | 2012 | | 2011 | | 2010 (a) | |
Net asset value, beginning of period | | $ | 7.86 | | | $ | 7.62 | | | $ | 8.79 | | | $ | 7.84 | | |
Investment Activities | |
Net investment income | | | .11 | * | | | .03 | * | | | .04 | | | | .01 | | |
Net realized and unrealized gain (loss) | | | .93 | * | | | .42 | * | | | (1.16 | ) | | | 1.02 | | |
Total from investment activities | | | 1.04 | | | | .45 | | | | (1.12 | ) | | | 1.03 | | |
Distributions from net investment income | | | — | | | | (.21 | ) | | | (.05 | ) | | | (.08 | ) | |
Short-Term Trading Fees | | | — | | | | — | | | | — | | | | — | | |
Net asset value, end of period | | $ | 8.90 | | | $ | 7.86 | | | $ | 7.62 | | | $ | 8.79 | | |
| Total Return (excluding account fees) (b) | | | 13.23 | % | | | 5.95 | % | | | (12.70 | )% | | | 13.08 | % | |
Ratios to Average Net Assets: (c) | |
Net investment income | | | 2.42 | % | | | .31 | % | | | .70 | % | | | .51 | % | |
Total expenses | | | 43.42 | % | | | 3.94 | % | | | 2.81 | % | | | 8.09 | % | |
Expenses waived or reimbursed (d) | | | (44.48 | )% | | | (2.06 | )% | | | (1.00 | )% | | | (6.48 | )% | |
Net expenses (e) | | | (1.06 | )%(f) | | | 1.88 | % | | | 1.81 | % | | | 1.61 | % | |
Portfolio turnover rate (h) | | | 137 | % | | | 398 | % | | | 163 | % | | | 104 | % | |
Net assets, end of period (in thousands) | | $ | 35 | | | $ | 130 | | | $ | 2,458 | | | $ | 3,970 | | |
* Based on average monthly shares outstanding.
(a) From March 1, 2010, commencement of operations.
(b) Total returns for periods less than one year are not annualized. Assumes investment at the net asset value at the beginning of the period, reinvestment of all distributions and a complete redemption of the investment at the net asset value at the end of the period.
(c) Ratios are annualized for periods of less than one year.
(d) Expenses waived or reimbursed reflect reductions to total expenses, as discussed in the notes to the financial statements. These amounts would increase the net investment loss ratio or decrease the net investment income ratio, as applicable, and decrease total returns had such reductions not occurred.
(e) The expense ratios shown above exclude the effect of reductions to total expenses for any expenses offset. Expense offset arrangements reduce total expenses, as discussed in the notes to financial statements. These amounts would increase the net investment loss ratio, or decrease the net investment income ratio, as applicable, had such reductions not occurred. The effect of expenses offset are as follows:
| | | Institutional Class | |
| | | Six Months
Ended
June 30, 2013 | | Year Ended December 31, | | Period
Ended
December 31, | |
| | | (unaudited) | | 2012 | | 2011 | | 2010 (a) | |
| Ratios to Average Net Assets: (c) | | | | | | | | | |
Expenses offset | | | — | | | | — | (g) | | | — | (g) | | | — | (g) | |
(f) For the six months ended June 30, 2013, the net expense ratio was negative due to negative performance fee adjustments to the investment advisory fee. Please refer to Note 3 of the notes to financial statements for further information on the calculation of performance fee adjustments. The ratio may not be indicative of the ratio going forward. The net expense ratio excluding the negative performance adjustments was 2.72% for the six months ended June 30, 2013.
(g) Effect on the expense ratio was not greater than 0.005%.
(h) Portfolio turnover rate is calculated at the fund level.
See accompanying notes to financial statements.
205
Global Resources Fund
For a capital share outstanding during the
| | | Investor Class | |
| | | Six Months
Ended
June 30, 2013 | | Year Ended December 31, | | Six Months
Ended
December 31, | | Year
Ended
June 30, | |
| | | (unaudited) | | 2012 | | 2011 | | 2010 | | 2009 | | 2008* | | 2008 | |
Net asset value, beginning of period | | $ | 9.79 | | | $ | 9.36 | | | $ | 11.91 | | | $ | 8.85 | | | $ | 5.26 | | | $ | 20.52 | | | $ | 17.70 | | |
Investment Activities | |
Net investment income (loss) | | | — | **(a) | | | .04 | ** | | | (.19 | ) | | | (.09 | ) | | | (.01 | ) | | | (.02 | )** | | | .05 | ** | |
Net realized and unrealized gain (loss) | | | (.81 | )** | | | .61 | ** | | | (2.02 | ) | | | 3.44 | | | | 3.60 | | | | (13.92 | )** | | | 5.86 | ** | |
Total from investment activities | | | (.81 | ) | | | .65 | | | | (2.21 | ) | | | 3.35 | | | | 3.59 | | | | (13.94 | ) | | | 5.91 | | |
Distributions | |
From net investment income | | | — | | | | (.22 | ) | | | (.34 | ) | | | (.29 | ) | | | — | | | | — | | | | (.95 | ) | |
From net realized gains | | | — | | | | — | | | | — | | | | — | | | | — | | | | (1.32 | ) | | | (2.14 | ) | |
Total distributions | | | — | | | | (.22 | ) | | | (.34 | ) | | | (.29 | ) | | | — | | | | (1.32 | ) | | | (3.09 | ) | |
Short-Term Trading Fees **(a) | | | — | | | | — | | | | — | | | | — | | | | — | | | | — | | | | — | | |
Net asset value, end of period | | $ | 8.98 | | | $ | 9.79 | | | $ | 9.36 | | | $ | 11.91 | | | $ | 8.85 | | | $ | 5.26 | | | $ | 20.52 | | |
| Total Return (excluding account fees) (b) | | | (8.27 | )% | | | 6.93 | % | | | (18.69 | )% | | | 38.00 | % | | | 68.25 | % | | | (67.70 | )% | | | 37.59 | % | |
Ratios to Average Net Assets: (c) | |
Net investment income (loss) | | | (.03 | )% | | | .44 | % | | | (.79 | )% | | | (1.04 | )% | | | (.08 | )% | | | (.34 | )% | | | .28 | % | |
Total expenses | | | 1.72 | % | | | 1.57 | % | | | 1.72 | % | | | 1.73 | % | | | 1.64 | % | | | 1.20 | % | | | .88 | % | |
Expenses waived or reimbursed (d) | | | — | | | | — | | | | — | | | | — | | | | (.17 | )% | | | (.12 | )% | | | — | | |
Net expenses (e) | | | 1.72 | % | | | 1.57 | % | | | 1.72 | % | | | 1.73 | % | | | 1.47 | % | | | 1.08 | % | | | .88 | % | |
Portfolio turnover rate (g) | | | 50 | % | | | 117 | % | | | 232 | % | | | 145 | % | | | 189 | % | | | 100 | % | | | 133 | % | |
Net assets, end of period (in thousands) | | $ | 350,703 | | | $ | 438,372 | | | $ | 551,793 | | | $ | 911,559 | | | $ | 740,072 | | | $ | 464,524 | | | $ | 2,010,581 | | |
* Effective December 31, 2008, the fiscal year changed to December 31.
** Based on average monthly shares outstanding.
(a) The per share amount does not round to a full penny.
(b) Total returns for periods less than one year are not annualized. Assumes investment at the net asset value at the beginning of the period, reinvestment of all distributions and a complete redemption of the investment at the net asset value at the end of the period.
(c) Ratios are annualized for periods of less than one year.
(d) Expenses waived or reimbursed reflect reductions to total expenses, as discussed in the notes to the financial statements. These amounts would increase the net investment loss ratio or decrease the net investment income ratio, as applicable, and decrease total returns had such reductions not occurred.
(e) The net expense ratios shown above reflect expenses after waivers and reimbursements but exclude the effect of reductions to total expenses for any expenses offset. Expense offset arrangements reduce total expenses, as discussed in the notes to the financial statements. These amounts would increase the net investment loss ratio, or decrease the net investment income ratio, as applicable, had such reductions not occurred. The effect of expenses offset are as follows:
| | | Investor Class | |
| | | Six Months
Ended
June 30, 2013 | | Year Ended December 31, | | Six Months
Ended
December 31, | | Year
Ended
June 30, | |
| | | (unaudited) | | 2012 | | 2011 | | 2010 | | 2009 | | 2008* | | 2008 | |
Ratios to Average Net Assets: (c) | | | | | | | | | | | | | | | |
Expenses offset | | | — | (f) | | | — | (f) | | | — | (f) | | | — | (f) | | | — | (f) | | | — | (f) | | | (.01 | )% | |
(f) Effect on the expense ratio was not greater than 0.005%.
(g) Portfolio turnover rate is calculated at the fund level.
See accompanying notes to financial statements.
206
Global Resources Fund
For a capital share outstanding during the
| | | Institutional Class | |
| | | Six Months
Ended
June 30, 2013 | | Year Ended December 31, | | Period
Ended
December 31, | |
| | | (unaudited) | | 2012 | | 2011 | | 2010 (a) | |
Net asset value, beginning of period | | $ | 9.74 | | | $ | 9.39 | | | $ | 11.98 | | | $ | 8.87 | | |
Investment Activities | |
Net investment income (loss) | | | .03 | * | | | .10 | * | | | — | *(b) | | | (.01 | ) | |
Net realized and unrealized gain (loss) | | | (.81 | )* | | | .60 | * | | | (2.17 | )* | | | 3.41 | | |
Total from investment activities | | | (.78 | ) | | | .70 | | | | (2.17 | ) | | | 3.40 | | |
Distributions from net investment income | | | — | | | | (.35 | ) | | | (.42 | ) | | | (.29 | ) | |
Short-Term Trading Fees *(b) | | | — | | | | — | | | | — | | | | — | | |
Net asset value, end of period | | $ | 8.96 | | | $ | 9.74 | | | $ | 9.39 | | | $ | 11.98 | | |
| Total Return (excluding account fees) (c) | | | (8.01 | )% | | | 7.44 | % | | | (18.23 | )% | | | 38.53 | % | |
Ratios to Average Net Assets: (d) | |
Net investment income (loss) | | | .48 | % | | | 1.02 | % | | | (.02 | )% | | | (.35 | )% | |
Total expenses | | | 1.34 | % | | | 1.21 | % | | | 1.29 | % | | | 1.74 | % | |
Expenses waived or reimbursed (e) | | | (.16 | )% | | | (.14 | )% | | | (.20 | )% | | | (.66 | )% | |
Net expenses (f) | | | 1.18 | % | | | 1.07 | % | | | 1.09 | % | | | 1.08 | % | |
Portfolio turnover rate (h) | | | 50 | % | | | 117 | % | | | 232 | % | | | 145 | % | |
Net assets, end of period (in thousands) | | $ | 40,725 | | | $ | 94,076 | | | $ | 55,985 | | | $ | 17,923 | | |
* Based on average monthly shares outstanding.
(a) From March 1, 2010, commencement of operations.
(b) The per share amount does not round to a full penny.
(c) Total returns for periods less than one year are not annualized. Assumes investment at the net asset value at the beginning of the period, reinvestment of all distributions and a complete redemption of the investment at the net asset value at the end of the period.
(d) Ratios are annualized for periods of less than one year.
(e) Expenses waived or reimbursed reflect reductions to total expenses, as discussed in the notes to the financial statements. These amounts would increase the net investment loss ratio or decrease the net investment income ratio, as applicable, and decrease total returns had such reductions not occurred.
(f) The net expense ratios shown above reflect expenses after waivers and reimbursements but exclude the effect of reductions to total expenses for any expenses offset. Expense offset arrangements reduce total expenses, as discussed in the notes to the financial statements. These amounts would increase the net investment loss ratio, or decrease the net investment income ratio, as applicable, had such reductions not occurred. The effect of expenses offset are as follows:
| | | Institutional Class | |
| | | Six Months
Ended
June 30, 2013 | | Year Ended December 31, | | Period
Ended
December 31, | |
| | | (unaudited) | | 2012 | | 2011 | | 2010 (a) | |
| Ratios to Average Net Assets: (d) | | | | | | | | | |
Expenses offset (g) | | | — | | | | — | | | | — | | | | — | | |
(g) Effect on the expense ratio was not greater than 0.005%.
(h) Portfolio turnover rate is calculated at the fund level.
See accompanying notes to financial statements.
207
World Precious Minerals Fund
For a capital share outstanding during the
| | | Investor Class | |
| | | Six Months
Ended
June 30, 2013 | | Year Ended December 31, | | Six Months
Ended
December 31, | | Year
Ended
June 30, | |
| | | (unaudited) | | 2012 | | 2011 | | 2010 | | 2009 | | 2008* | | 2008 | |
Net asset value, beginning of period | | $ | 11.70 | | | $ | 13.18 | | | $ | 22.28 | | | $ | 17.42 | | | $ | 9.56 | | | $ | 25.32 | | | $ | 28.34 | | |
Investment Activities | |
Net investment loss | | | (.04 | )** | | | (.11 | )** | | | (.32 | ) | | | (.32 | )** | | | (.18 | ) | | | (.06 | )** | | | (.13 | )** | |
Net realized and unrealized gain (loss) | | | (5.66 | )** | | | (1.37 | )** | | | (6.76 | ) | | | 8.16 | ** | | | 8.71 | | | | (13.65 | )** | | | 3.70 | ** | |
Total from investment activities | | | (5.70 | ) | | | (1.48 | ) | | | (7.08 | ) | | | 7.84 | | | | 8.53 | | | | (13.71 | ) | | | 3.57 | | |
Distributions | |
From net investment income | | | — | | | | — | | | | (2.02 | ) | | | (2.98 | ) | | | (.67 | ) | | | — | | | | (3.25 | ) | |
From net realized gains | | | — | | | | — | | | | — | | | | — | | | | — | | | | (2.05 | ) | | | (3.35 | ) | |
Total distributions | | | — | | | | — | | | | (2.02 | ) | | | (2.98 | ) | | | (.67 | ) | | | (2.05 | ) | | | (6.60 | ) | |
Short-Term Trading Fees ** | | | — | (a) | | | — | (a) | | | — | (a) | | | — | (a) | | | — | (a) | | | — | (a) | | | .01 | | |
Net asset value, end of period | | $ | 6.00 | | | $ | 11.70 | | | $ | 13.18 | | | $ | 22.28 | | | $ | 17.42 | | | $ | 9.56 | | | $ | 25.32 | | |
| Total Return (excluding account fees) (b) | | | (48.72 | )% | | | (11.23 | )% | | | (32.58 | )% | | | 45.38 | % | | | 89.50 | % | | | (51.23 | )% | | | 14.14 | % | |
Ratios to Average Net Assets: (c) | |
Net investment loss | | | (.98 | )% | | | (.85 | )% | | | (1.43 | )% | | | (1.68 | )% | | | (1.32 | )% | | | (.80 | )% | | | (.43 | )% | |
Total expenses | | | 1.80 | % | | | 1.45 | % | | | 1.67 | % | | | 1.84 | % | | | 1.75 | % | | | 1.36 | % | | | .97 | % | |
Expenses waived or reimbursed (d) | | | (.02 | )% | | | — | | | | — | | | | — | | | | (.17 | )% | | | (.11 | )% | | | — | | |
Net expenses (e) | | | 1.78 | % | | | 1.45 | % | | | 1.67 | % | | | 1.84 | % | | | 1.58 | % | | | 1.25 | % | | | .97 | % | |
Portfolio turnover rate (g) | | | 13 | % | | | 44 | % | | | 96 | % | | | 68 | % | | | 72 | % | | | 27 | % | | | 58 | % | |
Net assets, end of period (in thousands) | | $ | 147,880 | | | $ | 319,052 | | | $ | 436,504 | | | $ | 826,598 | | | $ | 639,035 | | | $ | 359,120 | | | $ | 949,014 | | |
* Effective December 31, 2008, the fiscal year changed to December 31.
** Based on average monthly shares outstanding.
(a) The per share amount does not round to a full penny.
(b) Total returns for periods less than one year are not annualized. Assumes investment at the net asset value at the beginning of the period, reinvestment of all distributions and a complete redemption of the investment at the net asset value at the end of the period.
(c) Ratios are annualized for periods of less than one year.
(d) Expenses waived or reimbursed reflect reductions to total expenses, as discussed in the notes to the financial statements. These amounts would increase the net investment loss ratio or decrease the net investment income ratio, as applicable, and decrease total returns had such reductions not occurred.
(e) The net expense ratios shown above reflect expenses after waivers and reimbursements but exclude the effect of reductions to total expenses for any expenses offset. Expense offset arrangements reduce total expenses, as discussed in the notes to the financial statements. These amounts would increase the net investment loss ratio, or decrease the net investment income ratio, as applicable, had such reductions not occurred. The effect of expenses offset are as follows:
| | | Investor Class | |
| | | Six Months
Ended
June 30, 2013 | | Year Ended December 31, | | Six Months
Ended
December 31, | | Year
Ended
June 30, | |
| | | (unaudited) | | 2012 | | 2011 | | 2010 | | 2009 | | 2008* | | 2008 | |
Ratios to Average Net Assets: (c) | |
Expenses offset (f) | | | — | | | | — | | | | — | | | | — | | | | — | | | | — | | | | — | | |
(f) Effect on the expense ratio was not greater than 0.005%.
(g) Portfolio turnover rate is calculated at the fund level.
See accompanying notes to financial statements.
208
World Precious Minerals Fund
For a capital share outstanding during the
| | | Institutional Class | |
| | | Six Months
Ended
June 30, 2013 | | Year Ended December 31, | | Period
Ended
December 31, | |
| | | (unaudited) | | 2012 | | 2011 | | 2010 (a) | |
Net asset value, beginning of period | | $ | 11.69 | | | $ | 13.10 | | | $ | 22.29 | | | $ | 17.36 | | |
Investment Activities | |
Net investment loss | | | (.02 | )* | | | (.04 | )* | | | (.16 | )* | | | (.10 | )* | |
Net realized and unrealized gain (loss) | | | (5.66 | )* | | | (1.37 | )* | | | (6.84 | )* | | | 8.14 | * | |
Total from investment activities | | | (5.68 | ) | | | (1.41 | ) | | | (7.00 | ) | | | 8.04 | | |
Distributions from net investment income | | | — | | | | — | | | | (2.19 | ) | | | (3.11 | ) | |
Short-Term Trading Fees | | | — | | | | — | | | | — | | | | — | | |
Net asset value, end of period | | $ | 6.01 | | | $ | 11.69 | | | $ | 13.10 | | | $ | 22.29 | | |
| Total Return (excluding account fees) (b) | | | (48.59 | )% | | | (10.76 | )% | | | (32.28 | )% | | | 46.72 | % | |
Ratios to Average Net Assets: (c) | |
Net investment loss | | | (.41 | )% | | | (.32 | )% | | | (.87 | )% | | | (.86 | )% | |
Total expenses | | | 8.49 | % | | | 3.56 | % | | | 2.38 | % | | | 15.19 | % | |
Expenses waived or reimbursed (d) | | | (7.32 | )% | | | (2.69 | )% | | | (1.27 | )% | | | (14.06 | )% | |
Net expenses (e) | | | 1.17 | % | | | .87 | % | | | 1.11 | % | | | 1.13 | % | |
Portfolio turnover rate (g) | | | 13 | % | | | 44 | % | | | 96 | % | | | 68 | % | |
Net assets, end of period (in thousands) | | $ | 117 | | | $ | 769 | | | $ | 1,683 | | | $ | 2,233 | | |
* Based on average monthly shares outstanding.
(a) From March 1, 2010, commencement of operations.
(b) Total returns for periods less than one year are not annualized. Assumes investment at the net asset value at the beginning of the period, reinvestment of all distributions and a complete redemption of the investment at the net asset value at the end of the period.
(c) Ratios are annualized for periods of less than one year.
(d) Expenses waived or reimbursed reflect reductions to total expenses, as discussed in the notes to the financial statements. These amounts would increase the net investment loss ratio or decrease the net investment income ratio, as applicable, and decrease total returns had such reductions not occurred.
(e) The net expense ratios shown above reflect expenses after waivers and reimbursements but exclude the effect of reductions to total expenses for any expenses offset. Expense offset arrangements reduce total expenses, as discussed in the notes to the financial statements. These amounts would increase the net investment loss ratio, or decrease the net investment income ratio, as applicable, had such reductions not occurred. The effect of expenses offset are as follows:
| | | Institutional Class | |
| | | Six Months
Ended
June 30, 2013 | | Year Ended December 31, | | Period
Ended
December 31, | |
| | | (unaudited) | | 2012 | | 2011 | | 2010 (a) | |
Ratios to Average Net Assets: (c) | |
Expenses offset (f) | | | .01 | % | | | — | | | | — | | | | — | | |
(f) Effect on the expense ratio was not greater than 0.005%.
(g) Portfolio turnover rate is calculated at the fund level.
See accompanying notes to financial statements.
209
Gold and Precious Metals Fund
For a capital share outstanding during the
| | | Investor Class | |
| | | Six Months
Ended
June 30, 2013 | | Year Ended December 31, | | Six Months
Ended
December 31, | | Year
Ended
June 30, | |
| | | (unaudited) | | 2012 | | 2011 | | 2010 | | 2009 | | 2008* | | 2008 | |
Net asset value, beginning of period | | $ | 11.78 | | | $ | 12.61 | | | $ | 19.60 | | | $ | 15.46 | | | $ | 10.83 | | | $ | 17.18 | | | $ | 14.99 | | |
Investment Activities | |
Net investment loss | | | (.03 | ) | | | (.09 | ) | | | (.17 | ) | | | (.21 | ) | | | (.17 | )** | | | (.03 | ) | | | (.08 | )** | |
Net realized and unrealized gain (loss) | | | (5.12 | ) | | | (.72 | ) | | | (4.28 | ) | | | 5.91 | | | | 4.84 | | | | (5.59 | ) | | | 4.69 | | |
Total from investment activities | | | (5.15 | ) | | | (.81 | ) | | | (4.45 | ) | | | 5.70 | | | | 4.67 | | | | (5.62 | ) | | | 4.61 | | |
Distributions | |
From net investment income | | | — | | | | (.02 | ) | | | — | | | | (.26 | ) | | | (.04 | ) | | | — | | | | — | | |
From net realized gains | | | — | | | | — | | | | (2.54 | ) | | | (1.31 | ) | | | — | | | | (.73 | ) | | | (2.43 | ) | |
Total distributions | | | — | | | | (.02 | ) | | | (2.54 | ) | | | (1.57 | ) | | | (.04 | ) | | | (.73 | ) | | | (2.43 | ) | |
Short-Term Trading Fees ** | | | — | (a) | | | — | (a) | | | — | (a) | | | .01 | | | | — | (a) | | | — | (a) | | | .01 | | |
Net asset value, end of period | | $ | 6.63 | | | $ | 11.78 | | | $ | 12.61 | | | $ | 19.60 | | | $ | 15.46 | | | $ | 10.83 | | | $ | 17.18 | | |
| Total Return (excluding account fees) (b) | | | (43.72 | )% | | | (6.44 | )% | | | (23.97 | )% | | | 36.88 | % | | | 43.11 | % | | | (31.51 | )% | | | 33.49 | % | |
Ratios to Average Net Assets: (c) | |
Net investment loss | | | (.50 | )% | | | (.60 | )% | | | (1.06 | )% | | | (1.46 | )% | | | (1.16 | )% | | | (.66 | )% | | | (.41 | )% | |
Total expenses | | | 2.00 | % | | | 1.61 | % | | | 1.56 | % | | | 1.80 | % | | | 1.69 | % | | | 1.54 | % | | | 1.27 | % | |
Expenses waived or reimbursed (d) | | | (.01 | )% | | | — | | | | — | | | | — | | | | (.15 | )% | | | (.15 | )% | | | — | | |
Net expenses (e) | | | 1.99 | % | | | 1.61 | % | | | 1.56 | % | | | 1.80 | % | | | 1.54 | % | | | 1.39 | % | | | 1.27 | % | |
Portfolio turnover rate | | | 22 | % | | | 95 | % | | | 155 | % | | | 103 | % | | | 135 | % | | | 61 | % | | | 93 | % | |
Net assets, end of period (in thousands) | | $ | 87,657 | | | $ | 166,524 | | | $ | 195,087 | | | $ | 300,949 | | | $ | 234,393 | | | $ | 192,206 | | | $ | 259,022 | | |
* Effective December 31, 2008, the fiscal year changed to December 31.
** Based on average monthly shares outstanding.
(a) The per share amount does not round to a full penny.
(b) Total returns for periods less than one year are not annualized. Assumes investment at the net asset value at the beginning of the period, reinvestment of all distributions and a complete redemption of the investment at the net asset value at the end of the period.
(c) Ratios are annualized for periods of less than one year.
(d) Expenses waived or reimbursed reflect reductions to total expenses, as discussed in the notes to the financial statements. These amounts would increase the net investment loss ratio or decrease the net investment income ratio, as applicable, and decrease total returns had such reductions not occurred.
(e) The net expense ratios shown above reflect expenses after waivers and reimbursements but exclude the effect of reductions to total expenses for any expenses offset. Expense offset arrangements reduce total expenses, as discussed in the notes to the financial statements. These amounts would increase the net investment loss ratio, or decrease the net investment income ratio, as applicable, had such reductions not occurred. The effect of expenses offset are as follows:
| | | Investor Class | |
| | | Six Months
Ended
June 30, 2013 | | Year Ended December 31, | | Six Months
Ended
December 31, | | Year
Ended
June 30, | |
| | | (unaudited) | | 2012 | | 2011 | | 2010 | | 2009 | | 2008* | | 2008 | |
Ratios to Average Net Assets: (c) | |
Expenses offset (f) | | | — | | | | — | | | | — | | | | — | | | | — | | | | — | | | | — | | |
(f) Effect on the expense ratio was not greater than 0.005%.
See accompanying notes to financial statements.
210
Emerging Europe Fund
For a capital share outstanding during the
| | | Investor Class | |
| | | Six Months
Ended
June 30, 2013 | | Year Ended December 31, | | Two Months
Ended
December 31, | | Year
Ended
October 31, | |
| | | (unaudited) | | 2012 | | 2011 | | 2010 | | 2009 | | 2008*/** | | 2008*** | |
Net asset value, beginning of period | | $ | 9.23 | | | $ | 7.79 | | | $ | 10.81 | | | $ | 9.11 | | | $ | 5.12 | | | $ | 6.35 | | | $ | 19.91 | | |
Investment Activities | |
Net investment income (loss) | | | .18 | | | | .15 | | | | .03 | | | | (.04 | ) | | | — | (a) | | | (.03 | ) | | | (.03 | ) | |
Net realized and unrealized gain (loss) | | | (1.15 | ) | | | 1.35 | | | | (3.05 | ) | | | 1.74 | | | | 3.99 | | | | (1.20 | ) | | | (10.10 | ) | |
Total from investment activities | | | (.97 | ) | | | 1.50 | | | | (3.02 | ) | | | 1.70 | | | | 3.99 | | | | (1.23 | ) | | | (10.13 | ) | |
Distributions | |
From net investment income | | | — | | | | (.06 | ) | | | — | | | | — | | | | — | | | | — | | | | — | | |
From net realized gains | | | — | | | | — | | | | — | | | | — | | | | — | | | | — | | | | (3.46 | ) | |
Total distributions | | | — | | | | (.06 | ) | | | — | | | | — | | | | — | | | | — | | | | (3.46 | ) | |
Short-Term Trading Fees **** | | | — | (a) | | | — | (a) | | | — | (a) | | | — | (a) | | | — | (a) | | | — | (a) | | | .03 | | |
Net asset value, end of period | | $ | 8.26 | | | $ | 9.23 | | | $ | 7.79 | | | $ | 10.81 | | | $ | 9.11 | | | $ | 5.12 | | | $ | 6.35 | | |
| Total Return (excluding account fees) (b) | | | (10.51 | )% | | | 19.27 | % | | | (27.94 | )% | | | 18.66 | % | | | 77.93 | % | | | (19.37 | )% | | | (61.36 | )% | |
Ratios to Average Net Assets: (c) | |
Net investment income (loss) | | | 3.37 | % | | | 1.39 | % | | | .25 | % | | | (.36 | )% | | | — | (f) | | | (3.02 | )% | | | (.15 | )% | |
Total expenses | | | 2.06 | % | | | 2.15 | % | | | 1.98 | % | | | 1.91 | % | | | 2.04 | % | | | 2.37 | % | | | 1.96 | % | |
Expenses waived or reimbursed (d) | | | — | | | | — | | | | — | | | | — | | | | (.08 | )% | | | (.27 | )% | | | — | (f) | |
Net expenses (e) | | | 2.06 | % | | | 2.15 | % | | | 1.98 | % | | | 1.91 | % | | | 1.96 | % | | | 2.10 | % | | | 1.96 | % | |
Portfolio turnover rate | | | 40 | % | | | 85 | % | | | 85 | % | | | 69 | % | | | 80 | % | | | 11 | % | | | 82 | % | |
Net assets, end of period (in thousands) | | $ | 130,482 | | | $ | 173,687 | | | $ | 193,599 | | | $ | 440,037 | | | $ | 464,409 | | | $ | 317,320 | | | $ | 415,494 | | |
* Effective December 31, 2008, the fiscal year changed to December 31.
** Effective November 7, 2008, U.S. Global Investors, Inc. assumed management of the fund from the former subadviser.
*** The per share amounts shown were adjusted to reflect the 3-for-1 stock split which was effective on May 27, 2008.
**** Based on average monthly shares outstanding.
(a) The per share amount does not round to a full penny.
(b) Total returns for periods less than one year are not annualized. Assumes investment at the net asset value at the beginning of the period, reinvestment of all distributions and a complete redemption of the investment at the net asset value at the end of the period.
(c) Ratios are annualized for periods of less than one year.
(d) Expenses waived or reimbursed reflect reductions to total expenses, as discussed in the notes to the financial statements. These amounts would increase the net investment loss ratio or decrease the net investment income ratio, as applicable, and decrease total returns had such reductions not occurred.
(e) The net expense ratios shown above reflect expenses after waivers and reimbursements but exclude the effect of reductions to total expenses for any expenses offset. Expense offset arrangements reduce total expenses, as discussed in the notes to the financial statements. These amounts would increase the net investment loss ratio, or decrease the net investment income ratio, as applicable, had such reductions not occurred. The effect of expenses offset are as follows:
| | | Investor Class | |
| | | Six Months
Ended
June 30, 2013 | | Year Ended December 31, | | Two Months
Ended
December 31, | | Year
Ended
October 31, | |
| | | (unaudited) | | 2012 | | 2011 | | 2010 | | 2009 | | 2008*/** | | 2008*** | |
Ratios to Average Net Assets: (c) | |
Expenses offset | | | — | (f) | | | — | (f) | | | — | (f) | | | — | (f) | | | — | (f) | | | — | (f) | | | (.01 | )% | |
(f) Effect on the ratio was not greater than 0.005%.
See accompanying notes to financial statements.
211
Global Emerging Markets Fund
For a capital share outstanding during the
| | | Investor Class | |
| | | Six Months
Ended
June 30, 2013 | | Year Ended December 31, | | Two Months
Ended
December 31, | | Year
Ended
October 31, | |
| | | (unaudited) | | 2012 | | 2011 | | 2010 | | 2009 | | 2008*/** | | 2008 | |
Net asset value, beginning of period | | $ | 7.32 | | | $ | 6.82 | | | $ | 9.17 | | | $ | 7.95 | | | $ | 5.29 | | | $ | 5.94 | | | $ | 21.88 | | |
Investment Activities | |
Net investment income (loss) | | | .09 | | | | .02 | | | | (.07 | ) | | | (.11 | ) | | | (.05 | ) | | | (.01 | ) | | | (.43 | ) | |
Net realized and unrealized gain (loss) | | | (.40 | ) | | | .48 | | | | (2.28 | ) | | | 1.32 | | | | 2.71 | | | | (.56 | ) | | | (11.98 | ) | |
Total from investment activities | | | (.31 | ) | | | .50 | | | | (2.35 | ) | | | 1.21 | | | | 2.66 | | | | (.57 | ) | | | (12.41 | ) | |
Distributions | |
From net investment income | | | — | | | | — | | | | — | | | | — | | | | — | | | | — | | | | (.46 | ) | |
From net realized gains | | | — | | | | — | | | | — | | | | — | | | | — | | | | — | | | | (3.11 | ) | |
From tax return of capital | | | — | | | | — | | | | — | | | | — | | | | — | | | | (.08 | ) | | | — | | |
Total distributions | | | — | | | | — | | | | — | | | | — | | | | — | | | | (.08 | ) | | | (3.57 | ) | |
Short-Term Trading Fees *** | | | — | (a) | | | — | (a) | | | — | (a) | | | .01 | | | | — | (a) | | | — | (a) | | | .04 | | |
Net asset value, end of period | | $ | 7.01 | | | $ | 7.32 | | | $ | 6.82 | | | $ | 9.17 | | | $ | 7.95 | | | $ | 5.29 | | | $ | 5.94 | | |
| Total Return (excluding account fees) (b) | | | (4.23 | )% | | | 7.33 | % | | | (25.63 | )% | | | 15.35 | % | | | 50.28 | % | | | (9.59 | )% | | | (66.81 | )% | |
Ratios to Average Net Assets: (c) | |
Net investment income (loss) | | | 2.24 | % | | | .26 | % | | | (.68 | )% | | | (1.22 | )% | | | (.77 | )% | | | (1.16 | )% | | | (1.01 | )% | |
Total expenses | | | 5.51 | % | | | 5.37 | % | | | 3.97 | % | | | 3.76 | % | | | 4.02 | % | | | 6.83 | % | | | 2.80 | % | |
Expenses waived or reimbursed (d) | | | (2.49 | )% | | | (2.51 | )% | | | (1.01 | )% | | | (.77 | )% | | | (1.38 | )% | | | (4.33 | )% | | | (.30 | )% | |
Net expenses (e) | | | 3.02 | % | | | 2.86 | % | | | 2.96 | % | | | 2.99 | % | | | 2.64 | % | | | 2.50 | % | | | 2.50 | % | |
Portfolio turnover rate | | | 117 | % | | | 367 | % | | | 250 | % | | | 190 | % | | | 166 | % | | | 21 | % | | | 83 | % | |
Net assets, end of period (in thousands) | | $ | 6,643 | | | $ | 7,714 | | | $ | 8,224 | | | $ | 13,403 | | | $ | 13,819 | | | $ | 9,663 | | | $ | 11,708 | | |
* Effective December 31, 2008, the fiscal year changed to December 31.
** Effective November 7, 2008, U.S. Global Investors, Inc. assumed management of the fund from the former subadviser.
*** Based on average monthly shares outstanding.
(a) The per share amount does not round to a full penny.
(b) Total returns for periods less than one year are not annualized. Assumes investment at the net asset value at the beginning of the period, reinvestment of all distributions and a complete redemption of the investment at the net asset value at the end of the period.
(c) Ratios are annualized for periods of less than one year.
(d) Expenses waived or reimbursed reflect reductions to total expenses, as discussed in the notes to the financial statements. These amounts would increase the net investment loss ratio or decrease the net investment income ratio, as applicable, and decrease total returns had such reductions not occurred.
(e) The net expense ratios shown above reflect expenses after waivers and reimbursements but exclude the effect of reductions to total expenses for any expenses offset. Expense offset arrangements reduce total expenses, as discussed in the notes to the financial statements. These amounts would increase the net investment loss ratio, or decrease the net investment income ratio, as applicable, had such reductions not occurred. The effect of expenses offset are as follows:
| | | Investor Class | |
| | | Six Months
Ended
June 30, 2013 | | Year Ended December 31, | | Two Months
Ended
December 31, | | Year
Ended
October 31, | |
| | | (unaudited) | | 2012 | | 2011 | | 2010 | | 2009 | | 2008*/** | | 2008 | |
Ratios to Average Net Assets: (c) | |
Expenses offset (f) | | | .01 | % | | | — | | | | — | | | | — | | | | — | | | | — | | | | — | | |
(f) Effect on the expense ratio was not greater than 0.005%.
See accompanying notes to financial statements.
212
China Region Fund
For a capital share outstanding during the
| | | Investor Class | |
| | | Six Months
Ended
June 30, 2013 | | Year Ended December 31, | | Six Months
Ended
December 31, | | Year
Ended
June 30, | |
| | | (unaudited) | | 2012 | | 2011 | | 2010 | | 2009 | | 2008* | | 2008 | |
Net asset value, beginning of period | | $ | 7.61 | | | $ | 6.81 | | | $ | 9.47 | | | $ | 8.36 | | | $ | 5.59 | | | $ | 9.09 | | | $ | 12.55 | | |
Investment Activities | |
Net investment income (loss) | | | .05 | | | | .04 | | | | (.08 | ) | | | (.12 | ) | | | (.05 | ) | | | (.02 | )** | | | (.03 | )** | |
Net realized and unrealized gain (loss) | | | (.30 | ) | | | .78 | | | | (2.59 | ) | | | 1.22 | | | | 2.81 | | | | (3.49 | )** | | | (.27 | )** | |
Total from investment activities | | | (.25 | ) | | | .82 | | | | (2.67 | ) | | | 1.10 | | | | 2.76 | | | | (3.51 | ) | | | (.30 | ) | |
Distributions | |
From net investment income | | | — | | | | (.02 | ) | | | — | | | | — | | | | — | | | | — | | | | (.10 | ) | |
From net realized gains | | | — | | | | — | | | | — | | | | — | | | | — | | | | — | | | | (2.93 | ) | |
From tax return of capital | | | — | | | | — | | | | — | | | | — | | | | — | | | | — | | | | (.17 | ) | |
Total distributions | | | — | | | | (.02 | ) | | | — | | | | — | | | | — | | | | — | | | | (3.20 | ) | |
Short-Term Trading Fees ** | | | — | (a) | | | — | (a) | | | .01 | | | | .01 | | | | .01 | | | | .01 | | | | .04 | | |
Net asset value, end of period | | $ | 7.36 | | | $ | 7.61 | | | $ | 6.81 | | | $ | 9.47 | | | $ | 8.36 | | | $ | 5.59 | | | $ | 9.09 | | |
| Total Return (excluding account fees) (b) | | | (3.29 | )% | | | 12.00 | % | | | (28.09 | )% | | | 13.28 | % | | | 49.55 | % | | | (38.50 | )% | | | (8.58 | )% | |
Ratios to Average Net Assets: (c) | |
Net investment income (loss) | | | 1.13 | % | | | .60 | % | | | (.64 | )% | | | (1.02 | )% | | | (.79 | )% | | | (.47 | )% | | | (.26 | )% | |
Total expenses | | | 2.75 | % | | | 2.64 | % | | | 2.49 | % | | | 2.39 | % | | | 2.47 | % | | | 2.46 | % | | | 1.95 | % | |
Expenses waived or reimbursed (d) | | | (.37 | )% | | | (.39 | )% | | | (.08 | )% | | | — | | | | (.45 | )% | | | (.27 | )% | | | — | | |
Net expenses (e) | | | 2.38 | % | | | 2.25 | % | | | 2.41 | % | | | 2.39 | % | | | 2.02 | % | | | 2.19 | % | | | 1.95 | % | |
Portfolio turnover rate | | | 95 | % | | | 374 | % | | | 426 | % | | | 242 | % | | | 327 | % | | | 117 | % | | | 208 | % | |
Net assets, end of period (in thousands) | | $ | 25,514 | | | $ | 29,160 | | | $ | 30,635 | | | $ | 51,843 | | | $ | 56,323 | | | $ | 38,348 | | | $ | 81,109 | | |
* Effective December 31, 2008, the fiscal year changed to December 31.
** Based on average monthly shares outstanding.
(a) The per share amount does not round to a full penny.
(b) Total returns for periods less than one year are not annualized. Assumes investment at the net asset value at the beginning of the period, reinvestment of all distributions and a complete redemption of the investment at the net asset value at the end of the period.
(c) Ratios are annualized for periods of less than one year.
(d) Expenses waived or reimbursed reflect reductions to total expenses, as discussed in the notes to the financial statements. These amounts would increase the net investment loss ratio or decrease the net investment income ratio, as applicable, and decrease total returns had such reduction not occurred.
(e) The net expense ratios shown above reflect expenses after waivers and reimbursements, but exclude the effect of reductions to total expenses for any expenses offset. Expense offset arrangements reduce total expenses, as discussed in the notes to financial statements. These amounts would increase the net investment loss ratio, or decrease the net investment income ratio, as applicable, had such reductions not occurred. The effect of expenses offset are as follows:
| | | Investor Class | |
| | | Six Months
Ended
June 30, 2013 | | Year Ended December 31, | | Six Months
Ended
December 31, | | Year
Ended
June 30, | |
| | | (unaudited) | | 2012 | | 2011 | | 2010 | | 2009 | | 2008* | | 2008 | |
Ratios to Average Net Assets: (c) | |
Expenses offset (f) | | | — | | | | — | | | | — | | | | — | | | | — | | | | — | | | | — | | |
(f) Effect on the expense ratio was not greater than 0.005%.
See accompanying notes to financial statements.
213
Additional Information (unaudited)
Proxy Voting
A description of the policies and procedures that the Funds use to determine how to vote proxies relating to portfolio securities is available without charge, upon request, by calling 1-800-US-FUNDS (1-800-873-8637). It also appears in the Funds' statement of additional information (Form 485B), which can be found on the SEC's website at www.sec.gov.
Information regarding how the Funds voted proxies relating to portfolio securities during the most recent 12-month period ended June 30 is available without charge, upon request, by calling 1-800-US-FUNDS (1-800-873-8637) or accessing the Funds' Form N-PX on the SEC's website at www.sec.gov.
Availability of Quarterly Portfolio Schedules
The Funds provide complete lists of holdings four times in each fiscal year, at the quarter-ends. For the second and fourth quarters, the lists appear in the Funds' semi-annual and annual reports to shareholders. For the first and third quarters, the Funds file the lists with the SEC on Form N-Q. Shareholders can look up the Funds' Forms N-Q on the SEC's website at www.sec.gov. You may also visit or call the SEC's Public Room in Washington, D.C. (1-202-942-8090) or send a request plus a duplicating fee to the SEC, Public Reference Section, Washington, DC 20549-0102 or by electronic request at the following e-mail address: publicinfo@sec.gov.
214
[THIS PAGE INTENTIONALLY LEFT BLANK]
[THIS PAGE INTENTIONALLY LEFT BLANK]
[THIS PAGE INTENTIONALLY LEFT BLANK]
[THIS PAGE INTENTIONALLY LEFT BLANK]
[THIS PAGE INTENTIONALLY LEFT BLANK]
[THIS PAGE INTENTIONALLY LEFT BLANK]
FACTS | | WHAT DOES U.S. GLOBAL INVESTORS DO WITH YOUR PERSONAL INFORMATION? | |
Why? | | Financial companies choose how they share your personal information. Federal law gives consumers the right to limit some but not all sharing. Federal law also requires us to tell you how we collect, share, and protect your personal information. Please read this notice carefully to understand what we do. | |
What? | | The types of personal information we collect and share depend on the product or service you have with us. This information can include:
• Social Security number and account balances
• transaction history and checking account information
• account transactions and wire transfer instructions
When you are no longer our customer, we continue to share your information as described in this notice. | |
How? | | All financial companies need to share customers' personal information to run their everyday business. In the section below, we list the reasons financial companies can share their customers' personal information; the reasons U.S. Global Investors chooses to share; and whether you can limit this sharing. | |
Reasons we can share your
personal information | | Does U.S.Global
Investors share? | | Can you limit
this sharing? | |
For our everyday business purposes —
such as to process your transactions, maintain your account(s), respond to court orders and legal investigations, or report to credit bureaus | | Yes | | No | |
For our marketing purposes —
to offer our products and services to you | | Yes | | No | |
For joint marketing with other
financial companies | | No | | We don't share | |
For our affiliates' everyday
business purposes —
information about your transactions and experiences | | No | | We don't share | |
For our affiliates' everyday
business purposes —
information about your creditworthiness | | No | | We don't share | |
For nonaffiliates to market to you | | No | | We don't share | |
Questions? | | Call 1-800-US-Funds (1-800-873-8637) or go to www.usfunds.com | |
Page 2 | |
Who we are | |
Who is providing this notice? | | U.S. Global Investors, Inc., U.S. Global Investors Funds, United Shareholder Services, Inc., and U.S. Global Brokerage, Inc. (collectively known as U.S. Global Investors) | |
What we do | |
How does
U.S. Global
Investors protect
my personal
information? | | To protect your personal information from unauthorized access and use, we use security measures that comply with federal law. These measures include computer safeguards and secured files and buildings. | |
How does
U.S. Global
Investors collect
my personal
information? | | We collect your personal information, for example, when you
• open an account or buy securities from us
• direct us to sell your securities or give us your contact information
• tell us where to send the money | |
Why can't I limit
all sharing? | | Federal law gives you the right to limit only
• sharing for affiliates' everyday business purposes — information about your creditworthiness
• affiliates from using your information to market to you
• sharing for nonaffiliates to market to you
State laws and individual companies may give you additional rights to limit sharing. | |
Definitions | |
Affiliates | | Companies related by common ownership or control. They can be financial and nonfinancial companies.
• Our affiliates include U.S. Global Investors, Inc., U.S. Global Investors Funds, United Shareholder Services, Inc., and U.S. Global Brokerage, Inc. | |
Nonaffiliates | | Companies not related by common ownership or control. They can be financial and nonfinancial companies.
• Nonaffiliates we share personal information with include companies that perform marketing on our behalf, printing and mailing companies, and companies that service your account(s). | |
Joint marketing | | A formal agreement between nonaffiliated financial companies that together market financial products or services to you.
• U.S. Global Investors doesn't jointly market. | |

P.O. Box 659405
San Antonio, Texas
78265-9604
Want to reduce paper waste? You can receive this report and other important documents electronically. Please visit www.usfunds.com and sign up at Access My Account. If you need further assistance, please call us at 800-873-8637.
U.S. Global Investors Funds Semi-Annual Report June 30, 2013
ITEM 2. CODE OF ETHICS.
Required only in annual report on Form N-CSR.
ITEM 3. AUDIT COMMITTEE FINANCIAL EXPERT.
Required only in annual report on Form N-CSR.
ITEM 4. PRINCIPAL ACCOUNTANT FEES AND SERVICES.
Required only in annual report on Form N-CSR.
ITEM 5. AUDIT COMMITTEE OF LISTED REGISTRANTS.
Required only in annual report on Form N-CSR.
ITEM 6. SCHEDULE OF INVESTMENTS.
Not applicable. The complete schedule of investments is included in Item 1 of this Form N-CSR.
ITEM 7. DISCLOSURE OF PROXY VOTING POLICIES AND PROCEDURES FOR CLOSED-END MANAGEMENT INVESTMENT COMPANIES.
Not applicable.
ITEM 8. PORTFOLIO MANAGERS OF CLOSED-END MANAGEMENT INVESTMENT COMPANIES.
Not applicable.
ITEM 9. PURCHASE OF EQUITY SECURITIES BY CLOSED-END MANAGEMENT INVESTMENT COMPANY AND AFFILIATED PURCHASERS.
Not applicable.
ITEM 10. SUBMISSION OF MATTERS TO A VOTE OF SECURITY HOLDERS.
Not applicable.
ITEM 11. CONTROLS AND PROCEDURES.
(a) The registrant’s president and treasurer have determined that the registrant’s disclosure controls and procedures are effective based on their evaluation of the disclosure controls and procedures as of a date within 90 days of the filing date of this report.
(b) �� There was no change in the registrant’s internal control over financial reporting that occurred in the registrant’s second fiscal quarter of the period covered by this report that has materially affected, or is reasonably likely to materially affect, the registrant’s internal control over financial reporting.
ITEM 12. EXHIBITS.
(a)(1) Required only in annual report on Form N-CSR.
(a)(2) Certifications of principal executive officer and principal financial officer pursuant to Rule 30a-2(a) under the Investment Company Act of 1940 (17CFR 270.30a-2(a)) and Section 302 of the Sarbanes-Oxley Act of 2002 are filed as exhibits to this report.
(b) Certifications of principal executive officer and principal financial officer pursuant to Rule 30a-2(b) under the Investment Company Act of 1940 (17CFR 270.30a-2(b)) and Section 906 of the Sarbanes-Oxley Act of 2002 are filed as exhibits to this report.
SIGNATURES
Pursuant to the requirements of the Securities Exchange Act of 1934 and the Investment Company Act of 1940, the registrant has duly caused this report to be signed on its behalf by the undersigned, thereunto duly authorized.
U.S. GLOBAL INVESTORS FUNDS
By: | /s/ Frank E. Holmes | |
| Frank E. Holmes | |
| President, Chief Executive Officer | |
| | |
Date: | August 28, 2013 | |
Pursuant to the requirements of the Securities Exchange Act of 1934 and the Investment Company Act of 1940, this report has been signed below by the following persons on behalf of the registrant and in the capacities and on the dates indicated.
By: | /s/ Frank E. Holmes | |
| Frank E. Holmes | |
| President, Chief Executive Officer | |
| | |
Date: | August 28, 2013 | |
By: | /s/ Lisa C.Callicotte | |
| Lisa C. Callicotte | |
| Treasurer | |
| | |
Date: | August 28, 2013 | |