WASHINGTON, D.C. 20549
U.S. GLOBAL INVESTORS FUNDS
ITEM 1. REPORT TO STOCKHOLDERS.
U.S. Global Investors Funds Semi-Annual Report
June 30, 2016

U.S. Global Investors Fund
Semi-Annual Report
June 30, 2016
(unaudited)
Table of Contents
Message to Shareholders | 1 |
Portfolios of Investments | 2 |
Notes to Portfolios of Investments | 56 |
Statements of Assets and Liabilities | 68 |
Statements of Operations | 72 |
Statements of Changes in Net Assets | 76 |
Notes to Financial Statements | 82 |
Financial Highlights | 98 |
Additional Information | 109 |
Expense Example | 110 |
Privacy Policy | |
iii
Nasdaq Symbols
U.S. Global Investors Funds
Investor Class | |
U.S. Government Securities Ultra-Short Bond Fund | UGSDX |
Near-Term Tax Free Fund | NEARX |
All American Equity Fund | GBTFX |
Holmes Macro Trends Fund | MEGAX |
Global Resources Fund | PSPFX |
World Precious Minerals Fund | UNWPX |
Gold and Precious Metals Fund | USERX |
Emerging Europe Fund | EUROX |
China Region Fund | USCOX |
| | |
Institutional Class | |
Global Resources Fund | PIPFX |
World Precious Minerals Fund | UNWIX |
Gold and Precious Metals Fund* | USEIX |
Emerging Europe Fund* | EURIX |
* | The Institutional Class shares of the Gold and Precious Metals and Emerging Europe Funds have not commenced operations and currently are closed to investors. A notice will be issued when each class commences operations and opens to investors. |
 | Atlantic Fund Services
3 Canal Plaza, Suite 600
Portland, ME
04101 |
iv
U.S. Global Investors Funds | |
Dear Fellow Shareholder,
Did you know? The best way to receive timely updates on the events that impact your investments is to subscribe to our free e-newsletter, the Investor Alert. With a balanced analysis of the markets over the week, the Investor Alert is written for you by the investment team with a special commentary from me. There’s no need to wait for dated publications like the Semi-Annual Report. Your time is important, so read the newsletter awarded the Best Electronic Newsletter by the Mutual Fund Education Alliance! Sign up at www.usfunds.com/subscribe. While you are visiting our website, www.usfunds.com, be sure to take a look at additional resources, prepared especially for our fund shareholders: ● My CEO Blog, Frank Talk, where I comment on current market topics
● Quarterly fund commentaries, straight from the portfolio managers
● Up-to-date fund performance, including quarterly performance charts
● Gold Game Film, my weekly video roundup of gold news with host Daniela Cambome of Kitco News We hope you enjoy all the resources at your fingertips. Thank you for investing in U.S. Global Investors Funds! Happy Investing, 
Frank Holmes
CEO and Chief Investment Officer
U.S. Global Investors, Inc. |  |
Please consider carefully a fund’s investment objectives, risks, charges and expenses. For this and other important information, obtain a fund prospectus by visiting www.usfunds.com or by calling 1-800-US-FUNDS (1-800-873-8637). Read it carefully before investing. Foreside Fund Services, LLC, Distributor. U.S. Global Investors, Inc. is the investment adviser.
1
U.S. Government Securities Ultra-Short Bond Fund
Portfolio of Investments (unaudited) | June 30, 2016 |
United States
Government and Agency
Obligations 97.56% | | Coupon Rate % | | Maturity Date | | Principal Amount | | | Value | |
| | | | | | | | | | | |
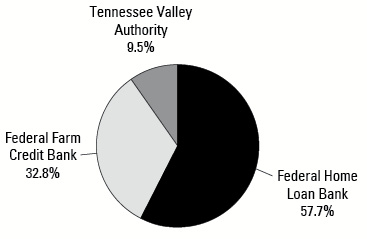
Federal Farm Credit Bank 32.01% | |
Fixed Rates: | | | | | | | | | | |
| | | 1.13 | | 09/22/17 | | $ | 2,000,000 | | | $ | 2,012,986 | |
| | | 1.16 | | 10/23/17 | | | 1,000,000 | | | | 1,007,164 | |
Variable Rates: | | | | | | | | | | | | |
| | | 0.38 | | 07/08/16 | | | 2,000,000 | | | | 2,000,026 | |
| | | 0.40 | | 01/30/17 | | | 1,650,000 | | | | 1,649,596 | |
| | | 0.42 | | 04/27/17 | | | 9,000,000 | | | | 8,992,494 | |
| | | 0.48 | | 03/22/18 | | | 3,000,000 | | | | 2,994,882 | |
| | | | | | | | | | | | 18,657,148 | |
| | | | | | | | | | | | | |
Federal Home Loan Bank 56.32% | |
Fixed Rates: | | | | | | | | | | | | |
| | | 1.10 | | 12/22/16 | | | 9,400,000 | | | | 9,428,003 | |
| | | 0.63 | | 04/26/17 | | | 3,000,000 | | | | 3,003,102 | |
| | | 0.88 | | 09/22/17 | | | 1,500,000 | | | | 1,506,555 | |
| | | 0.88 | | 09/27/17 | | | 3,000,000 | | | | 3,004,782 | |
| | | 1.00 | | 12/19/17 | | | 8,000,000 | | | | 8,041,336 | |
| | | 1.13 | | 03/29/18 | | | 750,000 | | | | 755,736 | |
| | | 1.70 | | 07/26/18 | | | 3,000,000 | | | | 3,002,703 | |
| | | 1.50 | | 03/08/19 | | | 4,000,000 | | | | 4,074,264 | |
| | | | | | | | | | | | 32,816,481 | |
| | | | | | | | | | | | | |
Tennessee Valley Authority 9.23% | |
Fixed Rates: | | | | | | | | | | | | |
| | | 6.25 | | 12/15/17 | | | 2,930,000 | | | | 3,161,376 | |
| | | 1.75 | | 10/15/18 | | | 2,174,000 | | | | 2,219,821 | |
| | | | | | | | | | | | 5,381,197 | |
| | |
Total Investments 97.56% | | | | 56,854,826 | |
(cost $56,583,010) | | | | | | | | | | | | |
Other assets and liabilities, net 2.44% | | | | | | | | | | | 1,422,425 | |
| | | | | | | | | | | | | |
Net Assets 100.0% | | | | | | | | | | $ | 58,277,251 | |
See notes to portfolios of investments and notes to financial statements.
2
U.S. Government Securities Ultra-Short Bond Fund
Portfolio of Investments (unaudited) | June 30, 2016 |
Portfolio Allocation by Issuer
Based on Total Investments | June 30, 2016 |
 |
Portfolio Allocation by Maturity | | June 30, 2016 | |
6 – 12 Months | | $ | 25,073,221 | | | | 44.1 | % |
1 – 3 Years | | | 31,781,605 | | | | 55.9 | % |
| | | $ | 56,854,826 | | | | 100.0 | % |
| | | | | | | | | |
See notes to portfolios of investments and notes to financial statements.
3
Near-Term Tax Free Fund
Portfolio of Investments (unaudited) | June 30, 2016 |
Municipal Bonds 91.27% | | Coupon Rate % | | Maturity Date | | Principal Amount | | | Value | |
| | | | | | | | | | | |
Alabama 0.85% | |
Alabama Public School & College Authority | | 5.00 | | 12/01/16 | | $ | 290,000 | | | $ | 295,290 | |
Bessemer, Alabama Electric Revenue, Refunding, AGM | | 3.10 | | 12/01/21 | | | 100,000 | | | | 106,747 | |
Huntsville City, Alabama Electric System Revenue, AGM | | 4.00 | | 12/01/16 | | | 60,000 | | | | 60,853 | |
Limestone County, Water & Sewer Authority | | 2.25 | | 12/01/21 | | | 365,000 | | | | 371,763 | |
Mobile Alabama, Refunding, GO Unlimited, Series B | | 5.00 | | 02/15/17 | | | 45,000 | | | | 46,220 | |
Pelham, Alabama, GO Unlimited | | 2.00 | | 02/01/18 | | | 130,000 | | | | 132,756 | |
| | | | | | | | | | | | 1,013,629 | |
| | | | | | | | | | | | | |
Alaska 0.04% | |
Valdez Alaska, School District, GO Unlimited | | 4.00 | | 06/30/17 | | | 40,000 | | | | 41,291 | |
| | | | | | | | | | | | | |
Arizona 0.82% | |
Arizona State Transportation Board Excise Tax Revenue | | 5.00 | | 07/01/17 | | | 175,000 | | | | 182,648 | |
McAllister Academic Village LLC, Arizona State University Hassayampa Revenue, Refunding | | 5.75 | | 07/01/18 | | | 200,000 | | | | 219,092 | |
Page, Arizona, Pledged Revenue, Refunding | | 3.00 | | 07/01/16 | | | 350,000 | | | | 350,000 | |
Tempe, Arizona, GO Unlimited, Series A | | 2.00 | | 07/01/19 | | | 220,000 | | | | 227,907 | |
| | | | | | | | | | | | 979,647 | |
| | | | | | | | | | | | | |
Arkansas 0.47% | |
Hot Springs, Arizona Wastewater Revenue | | 4.00 | | 12/01/19 | | | 510,000 | | | | 558,899 | |
| | | | | | | | | | | | | |
California 4.17% | |
California State, Prerefunded, GO Unlimited | | 5.00 | | 09/01/35 | | | 130,000 | | | | 130,885 | |
California State, GO Unlimited | | 5.00 | | 12/01/26 | | | 150,000 | | | | 152,700 | |
California State, Recreational Facility, Refunding, GO Unlimited | | 5.00 | | 12/01/19 | | | 5,000 | | | | 5,016 | |
California State, Statewide Communities Development Authority, Enloe Medical Center Revenue, Series A | | 5.25 | | 08/15/18 | | | 340,000 | | | | 372,769 | |
Chaffey Community College District, GO Unlimited, Series C, NATL | | 5.00 | | 06/01/32 | | | 300,000 | | | | 312,198 | |
Delano, California Union High School District, Refunding, GO Unlimited,
Series A, NATL | | 4.75 | | 02/01/17 | | | 200,000 | | | | 204,572 | |
See notes to portfolios of investments and notes to financial statements.
4
Near-Term Tax Free Fund
Portfolio of Investments (unaudited) | June 30, 2016 |
Municipal Bonds (cont’d) | | Coupon Rate % | | Maturity Date | | Principal Amount | | | Value | |
| | | | | | | | | | | |
California (cont’d) | |
Elk Grove Unified School District, Community Facilities District #1, Refunding, Special Tax Revenue | | 2.00 | | 12/01/16 | | $ | 310,000 | | | $ | 311,355 | |
Los Angeles Unified School District, Election 2004, GO Unlimited, Series H, AGM | | 5.00 | | 07/01/32 | | | 200,000 | | | | 207,932 | |
Newman-Crows Landing Unified School District, GO Unlimited, AGM | | 4.00 | | 08/01/19 | | | 115,000 | | | | 126,356 | |
Orange County Sanitation District, Certificates of Participation, Series B, AGM | | 5.00 | | 02/01/21 | | | 100,000 | | | | 102,590 | |
Riverside County, California Redevelopment Successor Agency, Refunding,
Tax Allocation | | 5.00 | | 10/01/19 | | | 200,000 | | | | 226,024 | |
San Francisco Municipal Transportation Agency | | 5.00 | | 03/01/27 | | | 1,000,000 | | | | 1,227,189 | |
Santa Clara County, California Financing Authority Revenue, Obstetrics and Gynecology, El Camino Hospital, AMBAC | | 5.00 | | 02/01/18 | | | 350,000 | | | | 366,814 | |
Santa Clara Valley Transportation Authority, Series A, AMBAC | | 5.00 | | 04/01/27 | | | 370,000 | | | | 382,188 | |
Santa Paula Schools Financing Authority, Santa Paula Elementary School District Revenue, AGM | | 4.25 | | 11/01/22 | | | 300,000 | | | | 313,068 | |
Sunnyvale Elementary School District, GO Unlimited, Series D | | 4.00 | | 09/01/16 | | | 520,000 | | | | 523,089 | |
| | | | | | | | | | | | 4,964,745 | |
| | | | | | | | | | | | | |
Colorado 1.19% | |
Denver, Colorado, Health & Hospital Authority, Healthcare Revenue, Series A | | 5.00 | | 12/01/16 | | | 265,000 | | | | 269,606 | |
Pueblo County, School District No. 70, GO Unlimited | | 4.00 | | 12/01/24 | | | 990,000 | | | | 1,139,895 | |
| | | | | | | | | | | | 1,409,501 | |
| | | | | | | | | | | | | |
Connecticut 0.63% | |
Bristol, Connecticut, Refunding, GO Unlimited | | 3.00 | | 10/15/16 | | | 180,000 | | | | 181,260 | |
Connecticut State Health & Educational Facilities Authority Revenue, Bridgeport Hospital, Series D | | 5.00 | | 07/01/19 | | | 395,000 | | | | 440,998 | |
Connecticut State, Refunding, GO Unlimited, Series E | | 5.00 | | 12/15/18 | | | 125,000 | | | | 127,439 | |
| | | | | | | | | | | | 749,697 | |
See notes to portfolios of investments and notes to financial statements.
5
Near-Term Tax Free Fund
Portfolio of Investments (unaudited) | June 30, 2016 |
Municipal Bonds (cont’d) | | Coupon Rate % | | Maturity Date | | Principal Amount | | | Value | |
| | | | | | | | | | | |
District of Columbia 0.50% | |
District of Columbia Income Tax Revenue, Series A | | 5.25 | | 12/01/27 | | $ | 300,000 | | | $ | 344,724 | |
Washington D.C. Convention Center Authority Dedicated Tax Revenue, Refunding, Series A, AMBAC | | 5.00 | | 10/01/16 | | | 250,000 | | | | 252,595 | |
| | | | | | | | | | | | 597,319 | |
| | | | | | | | | | | | | |
Florida 6.07% | |
Broward County, Florida, Civic Arena Project, Refunding, Series A, AMBAC | | 5.00 | | 09/01/20 | | | 500,000 | | | | 503,335 | |
Cape Coral, Florida Gas Tax Revenue, Series A | | 4.00 | | 10/01/16 | | | 255,000 | | | | 257,027 | |
Citizens Property Insurance Co., Senior Secured, Coastal Account, Revenue, Series A-1 | | 4.00 | | 06/01/18 | | | 100,000 | | | | 105,991 | |
Delray Beach Florida, Utilities Tax Revenue, Refunding | | 5.00 | | 06/01/23 | | | 505,000 | | | | 619,372 | |
Escambia County, Florida, Health Facilities Authority Revenue, Baptist Hospital, Inc. Project, Series A | | 5.00 | | 08/15/19 | | | 290,000 | | | | 320,056 | |
Florida State Board of Education Lottery Revenue, Series B, BHAC | | 5.00 | | 07/01/26 | | | 100,000 | | | | 105,396 | |
Florida State Board of Governors Parking Facility Revenue, Series A | | 3.00 | | 07/01/17 | | | 300,000 | | | | 307,308 | |
Florida State Department of Management Services Certificates of Participation, Refunding, Series A | | 5.00 | | 08/01/19 | | | 500,000 | | | | 563,055 | |
Florida State Department of Management Services Certificates of Participation, Series A | | 5.00 | | 08/01/24 | | | 340,000 | | | | 372,297 | |
Florida State Municipal Power Agency, Stanton Project Revenue, Refunding | | 5.13 | | 10/01/17 | | | 300,000 | | | | 316,422 | |
Hillsborough County, Florida School Board, Refunding, Series A | | 4.25 | | 07/01/25 | | | 300,000 | | | | 331,929 | |
Hillsborough County, Florida School Board, Certificates of Participation, Refunding, NATL | | 4.00 | | 07/01/19 | | | 100,000 | | | | 103,047 | |
Jacksonville Florida Special Revenue, Series C | | 5.00 | | 10/01/20 | | | 270,000 | | | | 314,315 | |
Leesburg, Florida Capital Improvement Revenue Bonds, Refunding | | 5.00 | | 10/01/21 | | | 405,000 | | | | 469,691 | |
Margate, Florida Water & Sewer Revenue, Refunding, AGM | | 4.00 | | 10/01/19 | | | 250,000 | | | | 272,900 | |
See notes to portfolios of investments and notes to financial statements.
6
Near-Term Tax Free Fund
Portfolio of Investments (unaudited) | June 30, 2016 |
Municipal Bonds (cont’d) | | Coupon Rate % | | Maturity Date | | Principal Amount | | | Value | |
| | | | | | | | | | | |
Florida (cont’d) | |
Miami - Dade County, Florida Expressway Authority Toll System Revenue, Series A | | 5.00 | | 07/01/21 | | $ | 430,000 | | | $ | 509,769 | |
Miami - Dade County, Florida School Board Foundation, Certificates of Participation, Series B, AGC | | 5.00 | | 11/01/31 | | | 200,000 | | | | 202,894 | |
Miami - Dade County, Florida Water & Sewer Revenue System, Series A, AGM | | 4.00 | | 10/01/16 | | | 235,000 | | | | 236,953 | |
Orange County School Board, Certificate of Participation, Series A, NATL | | 5.00 | | 08/01/32 | | | 275,000 | | | | 287,939 | |
Orlando, Florida Community Redevelopment Agency Tax Increment Revenue, Downtown District, Tax Allocation, Series A | | 4.00 | | 09/01/17 | | | 225,000 | | | | 229,907 | |
Polk County, Florida School District Revenue, AGM | | 5.00 | | 10/01/17 | | | 215,000 | | | | 226,303 | |
Saint Johns County, Florida Transportation Revenue, Refunding, AGM | | 5.00 | | 10/01/20 | | | 310,000 | | | | 360,319 | |
Volusia County, Florida School Board Sales Tax Revenue, NATL | | 4.20 | | 10/01/16 | | | 200,000 | | | | 201,660 | |
| | | | | | | | | | | | 7,217,885 | |
| | | | | | | | | | | | | |
Georgia 1.74% | |
Atlanta Downtown Development Authority,
Series A, NATL | | 4.25 | | 12/01/16 | | | 250,000 | | | | 250,653 | |
Carroll City-County, Georgia Hospital Authority, Tanner Medical Center, Inc. Project | | 5.00 | | 07/01/18 | | | 600,000 | | | | 649,740 | |
Georgia State Municipal Electric Authority Revenue, Unrefunded, NATL | | 5.50 | | 01/01/20 | | | 40,000 | | | | 42,225 | |
Georgia State Municipal Gas Authority, Toccoa Project, Refunding, AGM | | 5.00 | | 06/01/22 | | | 600,000 | | | | 702,924 | |
Glynn-Brunswick Memorial Hospital Authority, Southeast Georgia Health System and Affiliates Revenue, Anticipation Certificates, Series A | | 4.50 | | 08/01/17 | | | 150,000 | | | | 155,603 | |
Gwinnett County, Georgia, Hospital Authority, Gwinnett Hospital Systems Revenue, Series B, AGM | | 5.00 | | 07/01/18 | | | 250,000 | | | | 269,978 | |
| | | | | | | | | | | | 2,071,123 | |
| | | | | | | | | | | | | |
Guam 0.21% | |
Guam Education Financing Foundation Certificate of Participation, Series A | | 4.25 | | 10/01/18 | | | 250,000 | | | | 251,633 | |
See notes to portfolios of investments and notes to financial statements.
7
Near-Term Tax Free Fund
Portfolio of Investments (unaudited) | June 30, 2016 |
Municipal Bonds (cont’d) | | Coupon Rate % | | Maturity Date | | Principal Amount | | | Value | |
| | | | | | | | | | | |
Idaho 0.22% | |
Idaho Housing & Finance Association, Grant & Revenue Anticipation, Federal Highway Trust Fund, Series A | | 5.00 | | 07/15/21 | | $ | 225,000 | | | $ | 264,051 | |
| | | | | | | | | | | | | |
Illinois 5.13% | |
Chicago Board of Education, GO Unlimited, NATL | | 5.25 | | 12/01/19 | | | 300,000 | | | | 327,153 | |
Chicago Board of Education, Dedicated Revenues, GO Unlimited, Series F | | 5.00 | | 12/01/16 | | | 300,000 | | | | 305,361 | |
Chicago, Illinois, City Colleges, GO Unlimited, AMBAC | | 5.00 | | 01/01/17 | | | 115,000 | | | | 116,425 | |
Chicago, Illinois, Direct Access Bond, GO Unlimited, Series E-1 B, AMBAC | | 4.00 | | 01/01/19 | | | 200,000 | | | | 200,506 | |
Chicago, Illinois, O’Hare International Airport Revenue, Gen - Third Lien, Series C, AGC | | 5.25 | | 01/01/23 | | | 250,000 | | | | 284,193 | |
Clinton Bond Fayette Etc Counties Community College District No. 501 Kaskaskia, GO Unlimited | | 5.75 | | 12/01/19 | | | 500,000 | | | | 568,980 | |
Du Page County, Refunding, GO Unlimited | | 5.60 | | 01/01/21 | | | 330,000 | | | | 369,907 | |
Du Page County School District No. 33 West Chicago, Refunding, GO Unlimited, Series B | | 4.00 | | 12/01/21 | | | 1,000,000 | | | | 1,116,589 | |
Illinois Metropolitan Pier & Exposition Authority, Unrefunded, NATL (ZCB) | | 1.75(1) | | 06/15/18 | | | 415,000 | | | | 403,363 | |
Illinois Regional Transportation Authority, Series A, AMBAC | | 7.20 | | 11/01/20 | | | 145,000 | | | | 166,456 | |
Illinois State, GO Unlimited | | 5.00 | | 05/01/18 | | | 1,000,000 | | | | 1,061,259 | |
Lake & McHenry County, Fox Lake, Illinois, Debt Certificates, Series B | | 3.00 | | 11/01/19 | | | 265,000 | | | | 275,634 | |
Springfield, Illinois Metropolitan Sanitation District, Sewer Revenue, Senior Lien, Series A | | 4.00 | | 01/01/17 | | | 570,000 | | | | 578,772 | |
Will Grundy Etc Counties Community College District No. 525, Joliet Junior College Project, GO Unlimited | | 6.25 | | 06/01/22 | | | 300,000 | | | | 329,727 | |
| | | | | | | | | | | | 6,104,325 | |
| | | | | | | | | | | | | |
Indiana 2.83% | |
Clark-Pleasant, Indiana School Building | | 5.00 | | 01/15/19 | | | 275,000 | | | | 303,012 | |
Fort Wayne, Indiana Waterworks Utility Revenue | | 2.00 | | 12/01/16 | | | 585,000 | | | | 588,528 | |
Indiana Health & Educational Facilities Financing Authority, AMBAC | | 5.00 | | 11/15/39 | | | 715,000 | | | | 726,604 | |
See notes to portfolios of investments and notes to financial statements.
8
Near-Term Tax Free Fund
Portfolio of Investments (unaudited) | June 30, 2016 |
Municipal Bonds (cont’d) | | Coupon Rate % | | Maturity Date | | Principal Amount | | | Value | |
| | | | | | | | | | | |
Indiana (cont’d) | |
Indiana State Finance Authority, Refunding | | 5.00 | | 07/01/16 | | $ | 200,000 | | | $ | 200,000 | |
Indianapolis Local Public Improvement Bond Bank, Waterworks Project, Series 2007 L, NATL | | 5.25 | | 01/01/33 | | | 305,000 | | | | 323,419 | |
Merrillville Redevelopment Authority, Tax Allocation | | 5.00 | | 08/15/20 | | | 350,000 | | | | 402,395 | |
Tri-Creek 2002 High School Building, AGM | | 5.00 | | 07/15/19 | | | 800,000 | | | | 817,696 | |
| | | | | | | | | | | | 3,361,654 | |
| | | | | | | | | | | | | |
Iowa 0.56% | |
Clive, Iowa, GO Unlimited, Series A | | 2.00 | | 06/01/19 | | | 235,000 | | | | 243,006 | |
University of Iowa Hospitals and Clinics, Iowa State Board of Regents, Hospital Revenue, Series A | | 3.00 | | 09/01/19 | | | 400,000 | | | | 426,308 | |
| | | | | | | | | | | | 669,314 | |
| | | | | | | | | | | | | |
Kansas 1.05% | |
Sedgwick County Unified School District No. 261 Haysville, GO Unlimited | | 5.00 | | 11/01/17 | | | 885,000 | | | | 935,126 | |
Sedgwick County, Kansas, Unified School District No. 266 Maize, GO Unlimited, NATL | | 5.00 | | 09/01/17 | | | 50,000 | | | | 52,482 | |
Wichita, Kansas, Refunding, GO Unlimited, Series A | | 5.00 | | 12/01/17 | | | 250,000 | | | | 265,343 | |
| | | | | | | | | | | | 1,252,951 | |
| | | | | | | | | | | | | |
Kentucky 2.54% | |
Bowling Green, Kentucky, GO Unlimited, Series B | | 4.00 | | 09/01/16 | | | 215,000 | | | | 216,226 | |
Boyle County, Kentucky Library District, Refunding, GO Unlimited, BAM | | 2.00 | | 01/01/17 | | | 220,000 | | | | 221,472 | |
Fort Thomas Independent School District Finance Corp., Series C | | 2.00 | | 11/01/17 | | | 465,000 | | | | 473,296 | |
Jefferson County School District Finance, Refunding, Series B | | 4.00 | | 12/01/22 | | | 500,000 | | | | 581,005 | |
Kentucky Asset Liability Commission, Federal Highway Trust Fund | | 5.00 | | 09/01/17 | | | 450,000 | | | | 471,371 | |
Kentucky Municipal Power Agency, Power System Revenue, Prairie State Project, Series A, NATL | | 5.25 | | 09/01/22 | | | 440,000 | | | | 462,783 | |
Louisville & Jefferson County Metropolitan Sewer District, Series A | | 5.00 | | 05/15/23 | | | 500,000 | | | | 595,160 | |
| | | | | | | | | | | | 3,021,313 | |
See notes to portfolios of investments and notes to financial statements.
9
Near-Term Tax Free Fund
Portfolio of Investments (unaudited) | June 30, 2016 |
Municipal Bonds (cont’d) | | Coupon Rate % | | Maturity Date | | Principal Amount | | | Value | |
| | | | | | | | | | | |
Louisiana 1.64% | |
Lafayette Consolidated Government, GO Unlimited | | 5.00 | | 03/01/23 | | $ | 200,000 | | | $ | 236,004 | |
Louisiana Office Facilities Corp, Refunding | | 5.00 | | 11/01/17 | | | 700,000 | | | | 738,598 | |
Louisiana State, GO Unlimited, Series A | | 5.00 | | 08/01/26 | | | 800,000 | | | | 976,384 | |
| | | | | | | | | | | | 1,950,986 | |
| | | | | | | | | | | | | |
Massachusetts 0.19% | |
Stoughton, Massachusetts Public Improvement, GO Limited, NATL | | 4.00 | | 05/01/17 | | | 225,000 | | | | 225,560 | |
| | | | | | | | | | | | | |
Michigan 2.79% | |
Detroit, Michigan Local Development Financing Authority, Refunding, Tax Allocation, Series A | | 5.38 | | 05/01/18 | | | 70,000 | | | | 70,080 | |
Gibraltar, Michigan School District, Refunding, GO Unlimited, AGM | | 5.00 | | 05/01/21 | | | 475,000 | | | | 542,369 | |
Michigan Public Power Agency AFEC Project Revenue, Series A | | 4.50 | | 01/01/19 | | | 280,000 | | | | 300,992 | |
Michigan State, Trunk Line Revenue, Refunding | | 4.50 | | 11/01/26 | | | 105,000 | | | | 115,556 | |
Michigan State Grant Anticipation Bonds, AGM | | 5.00 | | 09/15/16 | | | 200,000 | | | | 201,748 | |
Michigan State Hospital Finance Authority, Trinity Health, Series A | | 6.00 | | 12/01/18 | | | 200,000 | | | | 224,648 | |
Michigan Strategic Fund, Series A, AGC | | 5.00 | | 10/15/17 | | | 200,000 | | | | 210,684 | |
Portage Public Schools, School Building & Site, GO Unlimited, AGM | | 5.00 | | 05/01/20 | | | 300,000 | | | | 323,619 | |
Romeo Community School District, Refunding, GO Unlimited, Q-SBLF | | 3.00 | | 05/01/18 | | | 500,000 | | | | 519,640 | |
Wayne County, Michigan Airport Authority Revenue, Detroit Metropolitan Airport, Refunding, Series C | | 4.00 | | 12/01/19 | | | 255,000 | | | | 278,825 | |
Zeeland Public Schools, Refunding, GO Unlimited | | 5.00 | | 05/01/18 | | | 490,000 | | | | 527,372 | |
| | | | | | | | | | | | 3,315,533 | |
| | | | | | | | | | | | | |
Minnesota 1.16% | |
Chaska, Minnesota Electric Revenue, Refunding, Series A | | 3.00 | | 10/01/17 | | | 535,000 | | | | 549,916 | |
Lake Washington Sanitary District, GO Unlimited, Series A, AGM | | 2.00 | | 02/01/18 | | | 205,000 | | | | 209,475 | |
See notes to portfolios of investments and notes to financial statements.
10
Near-Term Tax Free Fund
Portfolio of Investments (unaudited) | June 30, 2016 |
Municipal Bonds (cont’d) | | Coupon Rate % | | Maturity Date | | Principal Amount | | | Value | |
| | | | | | | | | | | |
Minnesota (cont’d) | |
Minneapolis & St Paul, Minnesota Housing & Redevelopment Authority Health Care Systems, Children’s Health Care, Series B, AGM | | 4.00 | | 08/15/16 | | $ | 250,000 | | | $ | 250,935 | |
Minneapolis & St Paul, Minnesota Metropolitan Airports Commission, Airport Revenue, Refunding, Series B, NATL | | 5.00 | | 01/01/19 | | | 255,000 | | | | 260,551 | |
Royalton Independent School District No. 485, GO Unlimited, Series A | | 5.00 | | 02/01/17 | | | 110,000 | | | | 112,811 | |
| | | | | | | | | | | | 1,383,688 | |
| | | | | | | | | | | | | |
Mississippi 0.35% | |
Rankin County School District, GO Limited | | 2.00 | | 08/01/19 | | | 400,000 | | | | 409,892 | |
| | | | | | | | | | | | | |
Missouri 1.97% | |
Jackson County, Missouri, Special Obligation Refunding, Truman Sports Complex Project | | 5.00 | | 12/01/18 | | | 215,000 | | | | 235,797 | |
Kansas City, Missouri, Refunding, Series B | | 5.00 | | 08/01/19 | | | 650,000 | | | | 727,350 | |
Kansas City, Missouri Water Revenue, Series F, AGM | | 4.00 | | 12/01/22 | | | 250,000 | | | | 293,858 | |
Missouri Development Finance Board, Eastland Center Project, Tax Allocation, Series A | | 5.00 | | 04/01/17 | | | 250,000 | | | | 257,783 | |
Missouri State Health & Educational Facilities Authority, Southwestern Baptist University Revenue | | 3.00 | | 10/01/17 | | | 265,000 | | | | 271,294 | |
Missouri State Regional Convention & Sports Complex Authority | | 5.00 | | 08/15/19 | | | 500,000 | | | | 560,565 | |
| | | | | | | | | | | | 2,346,647 | |
| | | | | | | | | | | | | |
Nevada 0.09% | |
Clark County, Nevada, Prerefunded, GO Limited, AMBAC | | 5.00 | | 11/01/18 | | | 65,000 | | | | 65,941 | |
Clark County, Nevada, Unrefunded, GO Limited, AMBAC | | 5.00 | | 11/01/18 | | | 35,000 | | | | 35,496 | |
| | | | | | | | | | | | 101,437 | |
New Hampshire 0.53% | |
New Hampshire, Federal Highway Grant Anticipation Bonds | | 5.00 | | 09/01/17 | | | 200,000 | | | | 209,666 | |
New Hampshire Health & Education Facilities Authority Revenue, Southern New Hampshire University Project | | 5.00 | | 01/01/18 | | | 400,000 | | | | 424,400 | |
| | | | | | | | | | | | 634,066 | |
See notes to portfolios of investments and notes to financial statements.
11
Near-Term Tax Free Fund
Portfolio of Investments (unaudited) | June 30, 2016 |
Municipal Bonds (cont’d) | | Coupon Rate % | | Maturity Date | | Principal Amount | | | Value | |
| | | | | | | | | | | |
New Jersey 4.37% | |
Atlantic City, New Jersey, Refunding Tax Appeal, GO Unlimited | | 4.00 | | 11/01/18 | | $ | 500,000 | | | $ | 367,405 | |
Atlantic City, New Jersey Municipal Utilities Authority Revenue, Refunding, AMBAC | | 5.00 | | 06/01/17 | | | 150,000 | | | | 151,086 | |
Camden County, New Jersey Improvement Authority, Refunding | | 4.00 | | 01/15/18 | | | 600,000 | | | | 630,828 | |
Cumberland County, New Jersey Improvement Authority, Technical High School Project, AGM | | 3.00 | | 09/01/17 | | | 550,000 | | | | 564,306 | |
Dennis Township, New Jersey, GO Unlimited | | 2.00 | | 10/01/16 | | | 160,000 | | | | 160,501 | |
Elizabeth, New Jersey Parking Authority Project Revenue, Elizabethtown Plaza Redevelopment, Series B | | 4.00 | | 11/01/17 | | | 255,000 | | | | 265,894 | |
Hudson County, New Jersey Improvement Authority Lease Revenue, North Hudson Regional Fire, Refunding, Series A, AGM | | 5.63 | | 09/01/18 | | | 400,000 | | | | 440,112 | |
New Jersey Economic Development Authority Revenue, School Facilities Construction, Refunding | | 5.00 | | 12/15/18 | | | 710,000 | | | | 761,908 | |
New Jersey Educational Facilities Authority, Montclair State University, Series A, AMBAC | | 5.00 | | 07/01/31 | | | 175,000 | | | | 175,000 | |
New Jersey Health Care Facilities Financing Authority Revenue, Holy Name Medical Center, Refunding | | 5.00 | | 07/01/19 | | | 215,000 | | | | 238,760 | |
Passaic County Improvement Authority | | 5.00 | | 05/01/24 | | | 700,000 | | | | 844,263 | |
Passaic Valley, New Jersey, Sewage Commissioners Revenue, Series G | | 5.75 | | 12/01/21 | | | 500,000 | | | | 599,240 | |
| | | | | | | | | | | | 5,199,303 | |
| | | | | | | | | | | | | |
New Mexico 0.20% | |
Clayton, New Mexico, Jail Project Revenue, CIFG | | 4.00 | | 11/01/17 | | | 235,000 | | | | 237,613 | |
| | | | | | | | | | | | | |
New York 7.39% | |
Arlington Central School District, GO Unlimited | | 5.00 | | 12/15/25 | | | 1,000,000 | | | | 1,228,609 | |
Greece, New York Central School District, GO Unlimited | | 2.00 | | 06/15/19 | | | 455,000 | | | | 468,827 | |
Long Island Power Authority Revenue, New York Electric Systems, Series E | | 5.00 | | 12/01/17 | | | 330,000 | | | | 336,115 | |
See notes to portfolios of investments and notes to financial statements.
12
Near-Term Tax Free Fund
Portfolio of Investments (unaudited) | June 30, 2016 |
Municipal Bonds (cont’d) | | Coupon Rate % | | Maturity Date | | Principal Amount | | | Value | |
| | | | | | | | | | | |
New York (cont’d) | |
Long Island Power Authority Revenue, Series B | | 5.00 | | 09/01/21 | | $ | 465,000 | | | $ | 550,472 | |
Nassau County Industrial Development Agency, New York Institute of Technology Project Revenue, Refunding, Remarketing, Series A | | 5.00 | | 03/01/21 | | | 350,000 | | | | 388,630 | |
New York City, GO Unlimited, Series G | | 5.00 | | 08/01/16 | | | 400,000 | | | | 401,528 | |
New York City, GO Unlimited, Series B | | 5.00 | | 08/01/19 | | | 400,000 | | | | 450,704 | |
New York City Transitional Finance Authority Future Tax Secured Revenue, Series Sub 13-CONV | | 5.00 | | 11/01/16 | | | 425,000 | | | | 431,163 | |
New York State Dormitory Authority, Nonconstruction Supported Debt, Municipal Facilities Health Lease, Series 1 | | 5.00 | | 01/15/17 | | | 300,000 | | | | 307,116 | |
New York State Thruway Authority, Series B | | 5.00 | | 04/01/27 | | | 1,335,000 | | | | 1,407,223 | |
New York State Urban Development, Series D | | 5.50 | | 01/01/19 | | | 250,000 | | | | 279,260 | |
New York State Urban Development, NATL | | 5.50 | | 03/15/19 | | | 615,000 | | | | 693,044 | |
North Castle, New York, Public Improvement, GO Unlimited | | 3.88 | | 12/01/22 | | | 210,000 | | | | 220,137 | |
Patchogue-Medford Union Free School District, GO Unlimited | | 5.00 | | 10/01/17 | | | 465,000 | | | | 489,385 | |
Sodus, New York Central School District, Refunding, GO Unlimited | | 3.00 | | 06/15/18 | | | 640,000 | | | | 667,450 | |
Westchester, New York Unrefunded, GO Unlimited, Series A | | 4.00 | | 10/15/16 | | | 465,000 | | | | 469,464 | |
| | | | | | | | | | | | 8,789,127 | |
| | | | | | | | | | | | | |
North Carolina 1.90% | |
Beaufort County, North Carolina, GO Limited | | 5.00 | | 06/01/21 | | | 200,000 | | | | 232,864 | |
Charlotte, North Carolina Certificates of Participation, Series A | | 5.00 | | 10/01/21 | | | 1,000,000 | | | | 1,165,029 | |
North Carolina Medical Care Commission, Firsthealth Carolina Project, Refunding, Series C | | 4.00 | | 10/01/17 | | | 420,000 | | | | 437,611 | |
North Carolina State Municipal Power Agency #1, Catawba Electric Revenue, Refunding, Series A | | 5.25 | | 01/01/20 | | | 400,000 | | | | 427,416 | |
| | | | | | | | | | | | 2,262,920 | |
See notes to portfolios of investments and notes to financial statements.
13
Near-Term Tax Free Fund
Portfolio of Investments (unaudited) | June 30, 2016 |
Municipal Bonds (cont’d) | | Coupon Rate % | | Maturity Date | | Principal Amount | | | Value | |
| | | | | | | | | | | |
North Dakota 0.21% | |
North Dakota Public Finance Authority, State Revolving Fund Program, Series A | | 4.00 | | 10/01/16 | | $ | 250,000 | | | $ | 252,038 | |
| | | | | | | | | | | | | |
Ohio 0.83% | |
Cleveland, Ohio, Parking Facility Revenue, Prefunding, Refunding, AGM | | 5.25 | | 09/15/22 | | | 130,000 | | | | 161,500 | |
Lorain County, Ohio, Community College District, Revenue | | 3.25 | | 12/01/17 | | | 650,000 | | | | 674,395 | |
Marion County, Ohio, Variable Refunding, GO Limited, CIFG | | 4.00 | | 12/01/20 | | | 150,000 | | | | 152,232 | |
| | | | | | | | | | | | 988,127 | |
| | | | | | | | | | | | | |
Oklahoma 0.98% | |
Edmond Public Works Authority, Revenue, Refunding | | 5.00 | | 07/01/23 | | | 300,000 | | | | 361,617 | |
Oklahoma County, Oklahoma Finance Authority, Jones Public School Project | | 4.00 | | 09/01/16 | | | 200,000 | | | | 201,080 | |
Oklahoma Department of Transportation, Grant Anticipation Notes, NATL | | 5.00 | | 09/01/16 | | | 250,000 | | | | 251,798 | |
Oklahoma State Agricultural & Mechanical Colleges, Oklahoma State University, Series A | | 5.00 | | 08/01/21 | | | 300,000 | | | | 346,824 | |
| | | | | | | | | | | | 1,161,319 | |
| | | | | | | | | | | | | |
Oregon 0.19% | |
Oregon State Facilities Authority, Legacy Health Project Revenue, Refunding, Series A | | 4.50 | | 05/01/20 | | | 200,000 | | | | 226,374 | |
| | | | | | | | | | | | | |
Pennsylvania 2.74% | |
Allegheny County, Pennsylvania Sanitary Authority, AGM | | 5.00 | | 06/01/19 | | | 700,000 | | | | 779,905 | |
Delaware Valley, Pennsylvania, Regional Financial Authority Revenue, Permanently Fixed Business Development Services, AMBAC | | 5.50 | | 08/01/18 | | | 295,000 | | | | 320,405 | |
Lycoming County, Pennsylvania Authority Health System, Susquehanna Health Systems Project, Series A | | 5.10 | | 07/01/20 | | | 140,000 | | | | 156,582 | |
Muhlenberg Township, Pennsylvania, GO Unlimited, AGM | | 3.00 | | 11/01/17 | | | 280,000 | | | | 285,482 | |
Pennsylvania Higher Educational Facilities Authority, State System, Higher Education Project, Refunding, Series AQ | | 5.00 | | 06/15/17 | | | 275,000 | | | | 286,264 | |
See notes to portfolios of investments and notes to financial statements.
14
Near-Term Tax Free Fund
Portfolio of Investments (unaudited) | June 30, 2016 |
Municipal Bonds (cont’d) | | Coupon Rate % | | Maturity Date | | Principal Amount | | | Value | |
| | | | | | | | | | | |
Pennsylvania (cont’d) | |
Philadelphia School District, Pennsylvania, Refunding, GO Unlimited, Series E | | 5.25 | | 09/01/24 | | $ | 625,000 | | | $ | 684,100 | |
Reading, Pennsylvania School District, GO Unlimited, Series A | | 5.00 | | 04/01/20 | | | 400,000 | | | | 441,460 | |
Wilkes-Barre Finance Authority, University of Scranton, Refunding, Series A | | 5.00 | | 11/01/19 | | | 275,000 | | | | 306,617 | |
| | | | | | | | | | | | 3,260,815 | |
| | | | | | | | | | | | | |
South Carolina 0.83% | |
Spartanburg County, South Carolina Regional Health Services District, Hospital Revenue, Refunding, Series A | | 5.00 | | 04/15/19 | | | 600,000 | | | | 664,818 | |
Spartanburg County, South Carolina Sanitation Sewer District, Series A, AGC | | 3.50 | | 03/01/19 | | | 300,000 | | | | 320,481 | |
| | | | | | | | | | | | 985,299 | |
| | | | | | | | | | | | | |
Tennessee 0.19% | |
Memphis, Tennessee Sanitary Sewage System Revenue, Refunding, AGM | | 5.00 | | 05/01/20 | | | 200,000 | | | | 230,716 | |
| | | | | | | | | | | | | |
Texas 23.85% | |
Addison, Texas Certificates of Obligation, GO Limited | | 4.50 | | 02/15/28 | | | 140,000 | | | | 148,795 | |
Addison, Texas Certificates of Obligation, GO Limited | | 4.00 | | 02/15/20 | | | 250,000 | | | | 263,707 | |
Annetta, Texas Certificates of Obligation, GO Limited | | 4.00 | | 08/01/16 | | | 200,000 | | | | 200,570 | |
Arlington, Texas, GO Limited, Series B | | 2.00 | | 08/15/19 | | | 500,000 | | | | 517,915 | |
Beaumont Independent School District, GO Unlimited, PSF-GTD | | 5.00 | | 02/15/23 | | | 1,000,000 | | | | 1,026,479 | |
Bexar, Texas, Venue Project, Refunding, AGM | | 4.00 | | 08/15/16 | | | 1,615,000 | | | | 1,621,524 | |
Brownwood Independent School District, GO Unlimited, BAM | | 4.00 | | 02/15/24 | | | 730,000 | | | | 847,085 | |
Cedar Park, Texas Utility System Revenue | | 2.00 | | 08/15/16 | | | 250,000 | | | | 250,475 | |
Center, Texas Certificates of Obligation, GO Limited, AGM (ZCB) | | 3.52(1) | | 02/15/20 | | | 150,000 | | | | 141,365 | |
Clear Lake, Texas, Waterworks & Sewer System, GO Unlimited | | 3.00 | | 03/01/19 | | | 125,000 | | | | 132,406 | |
Conroe Independent School District, GO Unlimited, PSF-GTD | | 4.00 | | 02/15/17 | | | 55,000 | | | | 56,164 | |
Corpus Christi, Texas Business & Job Development Corporation, Seawall Project, Sales Tax Revenue, Refunding | | 5.00 | | 03/01/20 | | | 350,000 | | | | 397,656 | |
See notes to portfolios of investments and notes to financial statements.
15
Near-Term Tax Free Fund
Portfolio of Investments (unaudited) | June 30, 2016 |
Municipal Bonds (cont’d) | | Coupon Rate % | | Maturity Date | | Principal Amount | | | Value | |
| | | | | | | | | | | |
Texas (cont’d) | |
Dallas Area Rapid Transit, Senior Lien, AMBAC | | 5.00 | | 12/01/16 | | $ | 585,000 | | | $ | 595,647 | |
Dallas, Texas Waterworks & Sewer System Revenue, Unrefunded, AMBAC | | 4.50 | | 10/01/19 | | | 165,000 | | | | 172,724 | |
Dallas, Texas Waterworks & Sewer System Revenue, Prerefunded, AMBAC | | 4.50 | | 10/01/19 | | | 60,000 | | | | 62,892 | |
Forney, Texas, GO Limited, AGM | | 5.00 | | 02/15/27 | | | 500,000 | | | | 513,555 | |
Fort Bend Grand Parkway Toll Road Authority, Series Sub | | 5.00 | | 03/01/25 | | | 1,000,000 | | | | 1,202,789 | |
Fort Worth, Texas Water & Sewer System Revenue | | 5.00 | | 02/15/19 | | | 800,000 | | | | 889,416 | |
Frisco, Texas Independent School District, School Building, GO Unlimited, Series A, PSF-GTD | | 4.50 | | 08/15/25 | | | 180,000 | | | | 187,886 | |
Garland, Texas, GO Limited | | 5.00 | | 02/15/25 | | | 650,000 | | | | 742,827 | |
Garland, Texas, GO Limited | | 5.00 | | 02/15/17 | | | 500,000 | | | | 513,645 | |
Goose Creek, Texas Independent School District, GO Unlimited, Series A, PSF-GTD | | 5.25 | | 02/15/18 | | | 370,000 | | | | 380,708 | |
Grand Prairie, Texas Independent School District, Refunding, GO Unlimited(ZCB) | | 5.06(1) | | 08/15/16 | | | 400,000 | | | | 399,756 | |
Greenville, Texas Independent School District, Refunding, GO Unlimited, PSF-GTD | | 4.00 | | 08/15/17 | | | 120,000 | | | | 120,466 | |
Harris County, Texas, Refunding, GO Unlimited, Series B | | 4.50 | | 10/01/31 | | | 220,000 | | | | 222,039 | |
Harris County, Texas Municipal Utility District No 290, GO Unlimited, Series A, BAM | | 1.50 | | 09/01/17 | | | 200,000 | | | | 201,672 | |
Harris County, Texas Municipal Utility District No. 382, GO Unlimited, BAM | | 3.00 | | 04/01/22 | | | 305,000 | | | | 321,824 | |
Hays County, Texas, GO Limited | | 5.00 | | 02/15/23 | | | 500,000 | | | | 534,570 | |
Houston Community College System, GO Limited | | 5.00 | | 02/15/19 | | | 755,000 | | | | 835,649 | |
Houston, Texas, Hotel Occupancy Tax, Unrefunded, Series B | | 5.00 | | 09/01/19 | | | 45,000 | | | | 45,295 | |
Houston, Texas, Hotel Occupancy Tax, Prerefunded, Series B | | 5.00 | | 09/01/19 | | | 250,000 | | | | 251,690 | |
Houston, Texas Combined Utility System Revenue, AGM | | 5.00 | | 11/15/16 | | | 565,000 | | | | 574,147 | |
Houston, Texas Combined Utility System Revenue, Prerefunded, AGM | | 5.00 | | 11/15/27 | | | 150,000 | | | | 158,936 | |
Houston, Texas Public Improvement, Prerefunded, GO Limited, NATL | | 5.00 | | 03/01/32 | | | 155,000 | | | | 159,498 | |
See notes to portfolios of investments and notes to financial statements.
16
Near-Term Tax Free Fund
Portfolio of Investments (unaudited) | June 30, 2016 |
Municipal Bonds (cont’d) | | Coupon Rate % | | Maturity Date | | Principal Amount | | | Value | |
| | | | | | | | | | | |
Texas (cont’d) | |
Hutto Independent School District, GO Unlimited, AGC | | 4.75 | | 08/01/31 | | $ | 600,000 | | | $ | 626,634 | |
Laredo, Texas, Waterworks & Sewer System Revenue, AGM | | 4.25 | | 03/01/18 | | | 100,000 | | | | 102,414 | |
Lavaca-Navidad River Authority, Series B | | 4.00 | | 08/01/22 | | | 420,000 | | | | 480,955 | |
Lavaca-Navidad River Authority, Series A | | 4.00 | | 08/01/22 | | | 270,000 | | | | 309,185 | |
Lockhart, Texas Certificates of Obligation, GO Limited, BAM | | 4.00 | | 08/01/23 | | | 830,000 | | | | 960,841 | |
Lower Colorado River Authority, Transmission Contract Revenue, Refunding, Series A | | 5.00 | | 05/15/21 | | | 500,000 | | | | 590,955 | |
McKinney, Texas, Refunding, GO Limited | | 1.38 | | 08/15/16 | | | 700,000 | | | | 700,756 | |
Montgomery County, Texas Municipal Utility District No 113, GO Unlimited, BAM | | 2.00 | | 09/01/17 | | | 260,000 | | | | 263,513 | |
Montgomery County, Texas Municipal Utility District No 113, GO Unlimited, BAM | | 2.00 | | 09/01/16 | | | 735,000 | | | | 736,588 | |
Montgomery County, Texas Municipal Utility District No 119, GO Unlimited, Series A, AGM | | 4.00 | | 04/01/18 | | | 315,000 | | | | 330,885 | |
North Texas Tollway Authority Revenue, Series F | | 5.75 | | 01/01/38 | | | 300,000 | | | | 322,776 | |
Olmos Park Higher Education Facilities Corp, University of the Incarnate Word, Refunding | | 5.00 | | 12/01/21 | | | 500,000 | | | | 589,635 | |
Pharr, Texas, Refunding, GO Limited, Series A | | 5.00 | | 08/15/20 | | | 285,000 | | | | 328,160 | |
Plano, Texas, Refunding, GO Limited | | 5.00 | | 09/01/19 | | | 1,000,000 | | | | 1,129,819 | |
Round Rock, Texas, GO Limited | | 2.00 | | 08/15/19 | | | 465,000 | | | | 481,224 | |
Round Rock, Texas, GO Limited, AGM | | 4.75 | | 08/15/25 | | | 1,460,000 | | | | 1,466,773 | |
San Antonio, Texas, Water Revenue, Refunding | | 4.50 | | 05/15/21 | | | 400,000 | | | | 465,400 | |
San Marcos, Texas Tax & Toll Revenue, GO Limited, AGM | | 5.10 | | 08/15/27 | | | 400,000 | | | | 419,716 | |
Texarkana, Texas Waterworks & Sanitary Sewer System Revenue | | 3.00 | | 08/01/20 | | | 95,000 | | | | 100,103 | |
Texarkana, Texas Waterworks & Sanitary Sewer System Revenue | | 3.00 | | 08/01/19 | | | 90,000 | | | | 94,256 | |
Texarkana, Texas, Refunding, GO Limited | | 5.00 | | 02/15/21 | | | 320,000 | | | | 376,083 | |
Texas Municipal Power Agency Revenue, Refunding, Series Sub, AGC | | 5.00 | | 09/01/17 | | | 250,000 | | | | 262,110 | |
Travis County, Texas Water Control & Improvement District No. 10, GO Unlimited | | 2.00 | | 08/15/19 | | | 500,000 | | | | 517,290 | |
See notes to portfolios of investments and notes to financial statements.
17
Near-Term Tax Free Fund
Portfolio of Investments (unaudited) | June 30, 2016 |
Municipal Bonds (cont’d) | | Coupon Rate % | | Maturity Date | | Principal Amount | | | Value | |
| | | | | | | | | | | |
Texas (cont’d) | |
University of Texas System, Series B | | 5.00 | | 08/15/37 | | $ | 250,000 | | | $ | 251,228 | |
Victoria County, Texas Junior College District, GO Limited | | 3.00 | | 08/15/16 | | | 250,000 | | | | 250,758 | |
Waxahachie, Texas, Refunding, GO Limited, AMBAC | | 4.20 | | 08/01/22 | | | 500,000 | | | | 519,455 | |
Wylie, Texas Independent School District, GO Unlimited, PSF-GTD (ZCB) | | 0.50(1) | | 08/15/16 | | | 1,000,000 | | | | 999,359 | |
| | | | | | | | | | | | 28,368,643 | |
| | | | | | | | | | | | | |
Utah 0.97% | |
Davis County, Utah, GO Unlimited | | 5.00 | | 02/01/19 | | | 200,000 | | | | 220,996 | |
Salt Lake County, Utah, Westminster College Project Revenue | | 5.00 | | 10/01/24 | | | 235,000 | | | | 241,874 | |
Utah State Building Ownership Authority, Lease Revenue, Refunding, Series C, AGM | | 5.50 | | 05/15/19 | | | 340,000 | | | | 363,780 | |
Washington County-St George Interlocal Agency, Lease Revenue, Refunding, Series A | | 4.00 | | 12/01/19 | | | 300,000 | | | | 328,239 | |
| | | | | | | | | | | | 1,154,889 | |
| | | | | | | | | | | | | |
Virginia 0.50% | |
Lynchburg, Virginia, Refunding, GO Unlimited | | 5.00 | | 02/01/19 | | | 540,000 | | | | 598,730 | |
| | | | | | | | | | | | | |
Washington 5.82% | |
Cowlitz County, Washington, Refunding, GO Limited, Series B | | 3.00 | | 04/01/17 | | | 175,000 | | | | 177,963 | |
Cowlitz County, Washington, Refunding, GO Limited, Series A | | 3.00 | | 04/01/18 | | | 195,000 | | | | 202,552 | |
Energy Northwest, Columbia Station, Unrefunded | | 5.00 | | 07/01/24 | | | 755,000 | | | | 755,000 | |
Grant County, Washington Public Utility District No. 2, Series A, NATL | | 5.00 | | 01/01/43 | | | 1,000,000 | | | | 1,021,719 | |
Kennewick, Washington, Refunding, GO Limited | | 4.00 | | 12/01/16 | | | 470,000 | | | | 476,665 | |
Snohomish County, Washington Public Utility District No 1, Refunding | | 5.00 | | 12/01/17 | | | 550,000 | | | | 583,512 | |
Spokane County, Washington Public Facilities District, Refunding, Series B | | 5.00 | | 12/01/21 | | | 950,000 | | | | 1,123,545 | |
Tacoma, Washington Metropolitan Park District, GO Unlimited, Series B | | 4.00 | | 12/01/19 | | | 355,000 | | | | 393,308 | |
See notes to portfolios of investments and notes to financial statements.
18
Near-Term Tax Free Fund
Portfolio of Investments (unaudited) | June 30, 2016 |
Municipal Bonds (cont’d) | | Coupon Rate % | | Maturity Date | | Principal Amount | | | Value | |
| | | | | | | | | | | |
Washington (cont’d) | |
Washington State Health Care Facilities Authority, Seattle Children's Hospital Project | | 5.00 | | 10/01/17 | | $ | 150,000 | | | $ | 158,135 | |
Washington State, Motor Vehicle Fuel Tax, GO Unlimited, Series C | | 5.00 | | 02/01/19 | | | 830,000 | | | | 920,047 | |
Washington State, Refunding, GO Unlimited, Series A | | 5.00 | | 01/01/19 | | | 1,000,000 | | | | 1,105,269 | |
| | | | | | | | | | | | 6,917,715 | |
| | | | | | | | | | | | | |
Wisconsin 2.56% | |
Johnson Creek School District, Bond Anticipation Note | | 3.00 | | 03/01/20 | | | 1,000,000 | | | | 1,016,859 | |
Milwaukee, Wisconsin Sewerage System Revenue, Series S5 | | 5.00 | | 06/01/23 | | | 500,000 | | | | 619,520 | |
Waunakee Community School District, GO Unlimited, Series A | | 5.00 | | 04/01/18 | | | 250,000 | | | | 268,560 | |
Wisconsin State Health & Educational Facilities Authority, Luther Hospital Project | | 5.00 | | 11/15/21 | | | 1,000,000 | | | | 1,120,559 | |
Wisconsin State, Refunding, GO Unlimited, Series 2, AMBAC | | 4.13 | | 11/01/16 | | | 25,000 | | | | 25,147 | |
| | | | | | | | | | | | 3,050,645 | |
| |
Total Investments 91.27% | | | | 108,581,059 | |
(cost $106,810,116) | | | | | | | | | | | | |
Other assets and liabilities, net 8.73% | | | | | | | | | | | 10,383,714 | |
| | | | | | | | | | | | | |
Net Assets 100.0% | | | | | | | | | | $ | 118,964,773 | |
(1) | Represents Yield on zero coupon bond. |
See notes to portfolios of investments and notes to financial statements.
19
Near-Term Tax Free Fund
Portfolio of Investments (unaudited) | June 30, 2016 |
Municipal Bond Ratings*
Based on Total Municipal Bonds | June 30, 2016 |
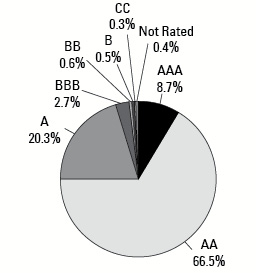 |
* | Credit quality ratings are measured on a scale that generally ranges from AAA (highest) to D (lowest). “Not Rated” is used to classify securities for which a rating is not available. Credit-quality ratings for each issue are obtained from Moody’s and S&P, and the higher rating for each issue is used. |
See notes to portfolios of investments and notes to financial statements.
20
All American Equity Fund
Portfolio of Investments (unaudited) | June 30, 2016 |
Common Stocks 81.55% | | Shares | | | Value | |
| | | | | | | |
Advertising Agencies 2.59% | |
Omnicom Group, Inc. | | | 5,839 | | | $ | 475,820 | |
| | | | | | | | | |
Aerospace/Defense 9.87% | |
Lockheed Martin Corp. | | | 2,196 | | | | 544,981 | |
Northrop Grumman Corp. | | | 3,210 | | | | 713,519 | |
Raytheon Co. | | | 4,059 | | | | 551,821 | |
| | | | | | | | 1,810,321 | |
| | | | | | | | | |
Airlines 2.71% | |
Southwest Airlines Co. | | | 12,687 | | | | 497,457 | |
| | | | | | | | | |
Automotive - Cars & Light Trucks 2.01% | |
Ford Motor Co. | | | 29,365 | | | | 369,118 | |
| | | | | | | | | |
Cable/Satellite TV 3.65% | |
Comcast Corp., Class A | | | 10,255 | | | | 668,524 | |
| | | | | | | | | |
Coatings/Paint 3.25% | |
Sherwin-Williams Co. | | | 2,031 | | | | 596,444 | |
| | | | | | | | | |
Dental Supplies & Equipment 3.11% | |
Patterson Companies, Inc. | | | 11,927 | | | | 571,184 | |
| | | | | | | | | |
Distribution/Wholesale 3.03% | |
WW Grainger, Inc. | | | 2,443 | | | | 555,172 | |
| | | | | | | | | |
Food - Retail 3.16% | |
Kroger Co. | | | 15,767 | | | | 580,068 | |
| | | | | | | | | |
Food-Wholesale/Distribution 2.75% | |
Sysco Corp. | | | 9,931 | | | | 503,899 | |
| | | | | | | | | |
Hotels & Motels 2.10% | |
Wyndham Worldwide Corp. | | | 5,400 | | | | 384,642 | |
| | | | | | | | | |
Life/Health Insurance 3.30% | |
Aflac, Inc. | | | 8,383 | | | | 604,917 | |
| | | | | | | | | |
Medical - Hospitals 3.10% | |
Universal Health Services, Inc., Class B | | | 4,242 | | | | 568,852 | |
| | | | | | | | | |
Medical - Wholesale Drug Distribution 2.99% | |
Cardinal Health, Inc. | | | 7,030 | | | | 548,410 | |
See notes to portfolios of investments and notes to financial statements.
21
All American Equity Fund
Portfolio of Investments (unaudited) | June 30, 2016 |
Common Stocks (cont’d) | | Shares | | | Value | |
| | | | | | | |
Multi-line Insurance 4.00% | |
Hartford Financial Services Group, Inc. | | | 8,300 | | | $ | 368,354 | |
XL Group plc, Class A | | | 10,941 | | | | 364,445 | |
| | | | | | | | 732,799 | |
| | | | | | | | | |
Retail - Apparel/Shoe 3.00% | |
Ross Stores, Inc. | | | 9,700 | | | | 549,893 | |
| | | | | | | | | |
Retail - Building Products 4.98% | |
Home Depot, Inc. | | | 2,957 | | | | 377,579 | |
Lowe's Companies, Inc. | | | 6,771 | | | | 536,060 | |
| | | | | | | | 913,639 | |
| | | | | | | | | |
Retail - Computer Equipment 2.29% | |
GameStop Corp., Class A | | | 15,785 | | | | 419,565 | |
| | | | | | | | | |
Retail - Drug Store 5.28% | |
CVS Health Corp. | | | 3,966 | | | | 379,705 | |
Walgreens Boots Alliance, Inc. | | | 7,067 | | | | 588,469 | |
| | | | | | | | 968,174 | |
| | | | | | | | | |
Retail - Gardening Products 3.38% | |
Tractor Supply Co. | | | 6,800 | | | | 620,024 | |
| | | | | | | | | |
Retail - Major Department Store 3.04% | |
TJX Companies, Inc. | | | 7,225 | | | | 557,987 | |
| | | | | | | | | |
Transport - Services 3.16% | |
United Parcel Service, Inc., Class B | | | 5,372 | | | | 578,672 | |
| | | | | | | | | |
Transport - Truck 2.96% | |
JB Hunt Transport Services, Inc. | | | 6,700 | | | | 542,231 | |
| | | | | | | | | |
Wireless Equipment 1.84% | |
Motorola Solutions, Inc. | | | 5,112 | | | | 337,238 | |
| |
Total Common Stocks | | | | 14,955,050 | |
(cost $14,614,060) | | | | | | | | |
See notes to portfolios of investments and notes to financial statements.
22
All American Equity Fund
Portfolio of Investments (unaudited) | June 30, 2016 |
Exchange-Traded Fund 0.45% | | Shares | | | Value | |
| | | | | | | |
REX Gold Hedged S&P 500 ETF | | | 3,000 | | | $ | 82,284 | |
(cost $78,818) | | | | | | | | |
| | | | | | | | | |
Rights 0.04% | | | | | | | | |
| | | | | | | | | |
Food - Retail 0.04% | |
Casa Ley, S.A. de C.V., Contingent Value Right | | | 7,200 | | | 7,307 | *#@ |
Property Development Centers, LLC, Contingent Value Right | | | 7,200 | | | 352 | *#@ |
| | |
Total Rights | | | | 7,659 | |
(cost $0) | | | | | | | | |
| |
Total Investments 82.04% | | | | 15,044,993 | |
(cost $14,692,878) | | | | | | | | |
Other assets and liabilities, net 17.96% | | | | | | | 3,294,519 | |
| | | | | | | | | |
Net Assets 100.0% | | | | | | $ | 18,339,512 | |
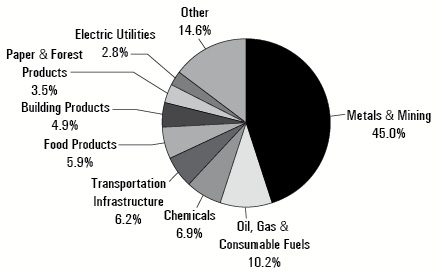
Portfolio Allocation by Industry Sector* Based on Total Investments | June 30, 2016 |
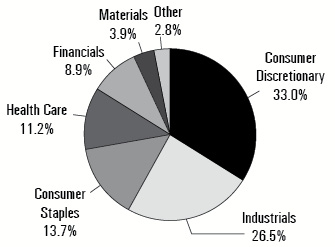 |
* | Summary information above may differ from the portfolio schedule included in the financial statements due to the use of different classifications of securities for presentation purposes. |
See notes to portfolios of investments and notes to financial statements.
23
Holmes Macro Trends Fund
Portfolio of Investments (unaudited) | June 30, 2016 |
Common Stocks 92.08% | | Shares | | | Value | |
| | | | | | | |
Aerospace/Defense 3.16% | |
Lockheed Martin Corp. | | | 4,716 | | | $ | 1,170,370 | |
| | | | | | | | | |
Airlines 10.18% | |
Alaska Air Group, Inc. | | | 16,875 | | | | 983,644 | |
Allegiant Travel Co., Class A | | | 6,744 | | | | 1,021,716 | |
Hawaiian Holdings, Inc. | | | 18,810 | | | | 714,027 | * |
Southwest Airlines Co. | | | 26,799 | | | | 1,050,789 | |
| | | | | | | | 3,770,176 | |
| | | | | | | | | |
Building & Construction Products - Miscellaneous 3.05% | |
Trex Company, Inc. | | | 25,157 | | | | 1,130,052 | * |
| | | | | | | | | |
Coatings/Paint 3.10% | |
Sherwin-Williams Co. | | | 3,902 | | | | 1,145,900 | |
| | | | | | | | | |
Computer Services 2.56% | |
Manhattan Associates, Inc. | | | 14,750 | | | | 945,918 | * |
| | | | | | | | | |
Consulting Services 3.98% | |
Gartner, Inc. | | | 15,129 | | | | 1,473,716 | * |
| | | | | | | | | |
Data Processing/Management 3.17% | |
Jack Henry & Associates, Inc. | | | 13,427 | | | | 1,171,774 | |
| | | | | | | | | |
Diagnostic Kits 3.57% | |
IDEXX Laboratories, Inc. | | | 14,234 | | | | 1,321,769 | * |
| | | | | | | | | |
Energy - Alternate Sources 0.12% | |
Pacific Green Energy Corp. | | | 100,000 | | | 43,820 | *#@ |
| | | | | | | | | |
Finance - Commercial 0.74% | |
IOU Financial, Inc. | | | 891,800 | | | | 272,658 | * |
| | | | | | | | | |
Finance - Credit Card 2.79% | |
MasterCard, Inc., Class A | | | 11,709 | | | | 1,031,095 | |
| | | | | | | | | |
Finance - Investment Banker/Broker 2.66% | |
E*TRADE Financial Corp. | | | 42,000 | | | | 986,580 | * |
| | | | | | | | | |
Finance - Other Services 4.29% | |
MarketAxess Holdings, Inc. | | | 10,923 | | | | 1,588,204 | |
See notes to portfolios of investments and notes to financial statements.
24
Holmes Macro Trends Fund
Portfolio of Investments (unaudited) | June 30, 2016 |
Common Stocks (cont’d) | | Shares | | | Value | |
| | | | | | | |
Food - Miscellaneous/Diversified 1.81% | |
Cal-Maine Foods, Inc. | | | 15,102 | | | $ | 669,321 | |
| | | | | | | | | |
Gold Mining 0.00% | |
Gran Colombia Gold Corp. | | | 500 | | | | 39 | * |
| | | | | | | | | |
Human Resources 2.74% | |
Robert Half International, Inc. | | | 26,600 | | | | 1,015,056 | |
| | | | | | | | | |
Internet Infrastructure Software 3.31% | |
F5 Networks, Inc. | | | 10,776 | | | | 1,226,740 | * |
| | | | | | | | | |
Medical - Biomedical/Gene 2.62% | |
Regeneron Pharmaceuticals, Inc. | | | 2,780 | | | | 970,859 | * |
| | | | | | | | | |
Medical - Drugs 3.01% | |
AbbVie, Inc. | | | 18,000 | | | | 1,114,380 | |
| | | | | | | | | |
Medical - Hospitals 0.00% | |
African Medical Investments plc | | | 1,000,000 | | | 0 | *#@ |
| | | | | | | | | |
Multimedia 3.10% | |
FactSet Research Systems, Inc. | | | 7,111 | | | | 1,147,858 | |
| | | | | | | | | |
Networking Products 3.93% | |
LogMeIn, Inc. | | | 22,929 | | | | 1,454,386 | * |
| | | | | | | | | |
Property/Casualty Insurance 3.31% | |
Universal Insurance Holdings, Inc. | | | 65,960 | | | | 1,225,537 | |
| | | | | | | | | |
Real Estate Operating/Development 0.86% | |
Pacific Infrastructure Ventures, Inc., (RS) | | | 426,533 | | | 318,492 | *#@ |
| | | | | | | | | |
Retail - Auto Parts 3.12% | |
O'Reilly Automotive, Inc. | | | 4,260 | | | | 1,154,886 | * |
| | | | | | | | | |
Retail - Building Products 1.99% | |
Home Depot, Inc. | | | 5,784 | | | | 738,559 | |
| | | | | | | | | |
Retail - Mail Order 2.96% | |
Williams-Sonoma, Inc. | | | 21,013 | | | | 1,095,408 | |
See notes to portfolios of investments and notes to financial statements.
25
Holmes Macro Trends Fund
Portfolio of Investments (unaudited) | June 30, 2016 |
Common Stocks (cont’d) | | Shares | | | Value | |
| | | | | | | |
Retail - Restaurants 12.75% | |
Papa John's International, Inc. | | | 24,113 | | | $ | 1,639,684 | |
Popeyes Louisiana Kitchen, Inc. | | | 14,709 | | | | 803,700 | * |
Ruth's Hospitality Group, Inc. | | | 67,912 | | | | 1,083,196 | |
Texas Roadhouse, Inc., Class A | | | 26,200 | | | | 1,194,720 | |
| | | | | | | | 4,721,300 | |
| | | | | | | | | |
Transport - Services 3.20% | |
United Parcel Service, Inc., Class B | | | 10,985 | | | | 1,183,304 | |
| | |
Total Common Stocks | | | | 34,088,157 | |
(cost $34,145,341) | | | | | | | | |
| | | | | | | | | |
Exchange-Traded Funds 0.28% | | | | | | | | |
| | | | | | | | | |
REX Gold Hedged S&P 500 ETF | | | 3,000 | | | | 82,284 | |
SPDR S&P500 ETF Trust | | | 100 | | | | 20,953 | |
| | |
Total Exchange-Traded Funds | | | | 103,237 | |
(cost $98,180) | | | | | | | | |
| | | | | | | | | |
Warrants 0.00% | | | | | | | | |
| | | | | | | | | |
Gold Mining 0.00% | |
Gran Colombia Gold Corp., 144A, Warrants (October 2017) | | | 3,700 | | | 0 | *#@ |
Gran Colombia Gold Corp., 144A, Warrants (March 2019) | | | 250 | | | | 9 | * |
| | |
Total Warrants | | | | 9 | |
(cost $0) | | | | | | | | |
| | | | | | | | | |
Convertible Debentures 1.28% | | Principal Amount | | | | | |
| | | | | | | | |
Gold Mining 1.28% | |
Gran Colombia Gold Corp., 1.00%, maturity 08/11/18 | | $ | 372,468 | | | | 212,307 | |
Gran Colombia Gold Corp., 6.00%, maturity 01/02/20 | | | 400,971 | | | | 260,631 | |
| |
Total Convertible Debentures | | | | 472,938 | |
(cost $371,127) | | | | | | | | |
See notes to portfolios of investments and notes to financial statements.
26
Holmes Macro Trends Fund
Portfolio of Investments (unaudited) | June 30, 2016 |
Corporate Note 0.57% | | Principal Amount | | | Value | |
| | | | | | | |
Electric - Generation 0.57% | |
Pacific Power Generation Corp., 15.00%, maturity 04/03/17 (RS) | | $ | 212,500 | | | $ | 212,500 | #^@ |
(cost $212,500) | | | | | | | |
| | |
Total Investments 94.21% | | | | 34,876,841 | |
(cost $34,827,148) | | | | | | | | |
Other assets and liabilities, net 5.79% | | | | | | | 2,142,905 | |
| | | | | | | | | |
Net Assets 100.0% | | | | | | $ | 37,019,746 | |
Portfolio Allocation by Industry Sector* Based on Total Investments | June 30, 2016 |
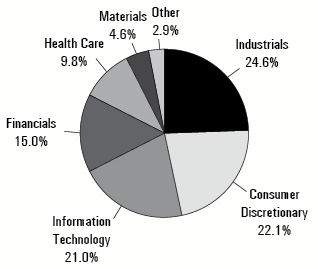 |
* | Summary information above may differ from the portfolio schedule included in the financial statements due to the use of different classifications of securities for presentation purposes. |
See notes to portfolios of investments and notes to financial statements.
27
Global Resources Fund
Portfolio of Investments (unaudited) | June 30, 2016 |
Common Stocks 75.85% | | Shares | | | Value | |
| | | | | | | |
Agricultural Chemicals 4.11% | |
PhosAgro OAO, GDR | | | 89,100 | | | $ | 1,309,023 | |
Syngenta, AG, Sponsored ADR | | | 25,200 | | | | 1,935,108 | |
Yara International ASA | | | 27,300 | | | | 867,234 | |
| | | | | | | | 4,111,365 | |
| | | | | | | | | |
Agricultural Operations 1.75% | |
Agriterra Ltd. | | | 69,849,776 | | | | 153,802 | *+ |
Kernel Holding S.A. | | | 118,800 | | | | 1,595,529 | |
| | | | | | | | 1,749,331 | |
| | | | | | | | | |
Automotive Truck Parts & Equipment - Original 2.01% | |
Lear Corp. | | | 12,100 | | | | 1,231,296 | |
Linamar | | | 22,000 | | | | 783,653 | |
| | | | | | | | 2,014,949 | |
| | | | | | | | | |
Building & Construction Products - Miscellaneous 0.96% | |
Owens Corning | | | 18,600 | | | | 958,272 | |
| | | | | | | | | |
Building Products - Cement/Aggregates 0.07% | |
Polaris Materials Corp. | | | 81,500 | | | | 72,545 | * |
| | | | | | | | | |
Building Products - Wood 1.29% | |
Universal Forest Products, Inc. | | | 13,900 | | | | 1,288,391 | |
| | | | | | | | | |
Chemicals - Diversified 0.90% | |
Westlake Chemical Corp. | | | 21,100 | | | | 905,612 | |
| | | | | | | | | |
Chemicals - Plastics 1.05% | |
Sekisui Jushi | | | 74,100 | | | | 1,055,214 | |
| | | | | | | | | |
Coal 0.08% | |
Caribbean Resources Corp. | | | 17 | | | 16,448 | *+#@ |
Sable Mining Africa Ltd. | | | 19,859,173 | | | | 63,768 | * |
Walter Energy, Inc. | | | 4,293 | | | | 343 | * |
| | | | | | | | 80,559 | |
| | | | | | | | | |
Containers - Paper/Plastic 1.28% | |
Packaging Corporation of America | | | 19,100 | | | | 1,278,363 | |
| | | | | | | | | |
Diamonds/Precious Stones 1.24% | |
Diamond Fields International Ltd. | | | 1,800,000 | | | | 20,899 | * |
Lucara Diamond Corp. | | | 451,400 | | | | 1,215,892 | |
Rockwell Diamonds, Inc., 144A | | | 63,333 | | | | 5,147 | * |
| | | | | | | | 1,241,938 | |
See notes to portfolios of investments and notes to financial statements.
28
Global Resources Fund
Portfolio of Investments (unaudited) | June 30, 2016 |
Common Stocks (cont’d) | | Shares | | | Value | |
| | | | | | | |
Diversified Minerals 3.15% | |
BHP Billiton Ltd., Sponsored ADR | | | 8,900 | | | $ | 254,184 | |
Canada Zinc Metals Corp. | | | 1,000,000 | | | | 150,935 | * |
Ciner Resources | | | 41,000 | | | | 1,148,820 | |
Dundee Sustainable Technologies, Inc. | | | 3,587,500 | | | | 152,725 | * |
Encanto Potash Corp., 144A | | | 3,000,000 | | | | 220,597 | * |
Lundin Mining Corp. | | | 356,800 | | | | 1,204,108 | * |
Niocan, Inc., 144A | | | 362,069 | | | | 23,821 | * |
| | | | | | | | 3,155,190 | |
| | | | | | | | | |
Electronic Components - Semiconductors 0.80% | |
ON Semiconductor | | | 91,200 | | | | 804,384 | * |
| | | | | | | | | |
Energy - Alternate Sources 2.85% | |
First Solar, Inc. | | | 19,600 | | | | 950,208 | * |
Pacific Green Energy Corp. | | | 2,400,000 | | | 1,051,680 | *+#@ |
Vestas Wind Systems A.S. | | | 12,500 | | | | 849,618 | |
| | | | | | | | 2,851,506 | |
| | | | | | | | | |
Food - Miscellaneous/Diversified 2.29% | |
Cal-Maine Foods, Inc. | | | 23,900 | | | | 1,059,248 | |
Ingredion, Inc. | | | 9,500 | | | | 1,229,395 | |
| | | | | | | | 2,288,643 | |
| | | | | | | | | |
Forestry 1.86% | |
Bravern Ventures Ltd. | | | 254,431 | | | | 20,678 | *# |
Fibria Celulose S.A., Sponsored ADR | | | 129,000 | | | | 872,040 | |
Western Forest Products, Inc. | | | 613,200 | | | | 968,248 | |
| | | | | | | | 1,860,966 | |
| | | | | | | | | |
Gold Mining 16.94% | |
Chesapeake Gold Corp., 144A | | | 52,400 | | | | 218,612 | * |
Corona Minerals Ltd. | | | 100,000 | | | 746 | *#@ |
Doray Minerals Ltd. | | | 1,845,400 | | | | 1,464,777 | * |
Endeavour Mining Corp. | | | 65,500 | | | | 1,111,819 | * |
Evolution Mining | | | 499,500 | | | | 872,922 | |
Franco-Nevada Corp. | | | 10,000 | | | | 760,600 | |
Gran Colombia Gold Corp. | | | 119,000 | | | | 9,211 | * |
Kinross Gold Corp. | | | 1 | | | | 5 | * |
Klondex Mines Ltd. | | | 1,767,800 | | | | 6,417,417 | * |
Newcastle Gold Ltd. | | | 166,666 | | | | 96,753 | * |
NGEx Resources, Inc. | | | 971,000 | | | | 683,103 | |
Northern Star Resources Ltd. | | | 316,100 | | | | 1,170,229 | |
Regis Resources | | | 394,200 | | | | 1,010,010 | |
See notes to portfolios of investments and notes to financial statements.
29
Global Resources Fund
Portfolio of Investments (unaudited) | June 30, 2016 |
Common Stocks (cont’d) | | Shares | | | Value | |
| | | | | | | |
Gold Mining (cont’d) | |
Richmont Mines, Inc. | | | 148,300 | | | $ | 1,365,843 | * |
Rusoro Mining Ltd. | | | 2,525,500 | | | | 244,350 | * |
Sibanye Gold, Sponsored ADR | | | 112,900 | | | | 1,537,698 | |
| | | | | | | | 16,964,095 | |
| | | | | | | | | |
Independent Power Producer 1.28% | |
Ormat Technologies | | | 29,200 | | | | 1,277,792 | |
| | | | | | | | | |
Investment Companies 0.42% | |
Atlas African Industries Ltd. | | | 255,854,621 | | | | 424,398 | *+# |
| | | | | | | | | |
Machinery - General Industrial 1.12% | |
Chart Industries | | | 46,700 | | | | 1,126,871 | * |
| | | | | | | | | |
Medical - Hospitals 0.00% | |
African Medical Investments plc | | | 2,507,500 | | | 0 | *#@ |
| | | | | | | | | |
Metal - Aluminum 1.41% | |
Kaiser Aluminum Corp. | | | 15,000 | | | | 1,356,150 | |
Norsk Hydro ASA, Sponsored ADR | | | 14,000 | | | | 51,240 | |
| | | | | | | | 1,407,390 | |
| | | | | | | | | |
Metal - Copper 3.65% | |
Freeport-McMoRan, Inc. | | | 33,300 | | | | 370,962 | |
Nevsun Resources Ltd. | | | 341,800 | | | | 1,004,892 | |
OZ Minerals | | | 286,800 | | | | 1,230,784 | |
Turquoise Hill Resources Ltd. | | | 309,100 | | | | 1,044,758 | * |
Verona Development Corp. | | | 23,626 | | | | 6,035 | * |
| | | | | | | | 3,657,431 | |
| | | | | | | | | |
Metal - Diversified 1.45% | |
Glencore plc | | | 133,000 | | | | 274,131 | |
GoviEx Uranium, Inc., Class A | | | 755,000 | | | | 58,439 | * |
GoviEx Uranium, Inc., 144A, Class A | | | 58,000 | | | | 4,489 | * |
Neo Lithium Corp. (RS) | | | 1,265,000 | | | 1,114,457 | *#@ |
Orsu Metals Corp. | | | 147,605 | | | | 2,285 | * |
| | | | | | | | 1,453,801 | |
| | | | | | | | | |
Metal - Iron 0.01% | |
WAI Capital Investment Corp., 144A | | | 292,500 | | | | 5,660 | *# |
| | | | | | | | | |
Mining Services 0.00% | |
Bounty Mining Ltd. | | | 22,000,000 | | | 0 | *#@ |
See notes to portfolios of investments and notes to financial statements.
30
Global Resources Fund
Portfolio of Investments (unaudited) | June 30, 2016 |
Common Stocks (cont’d) | | Shares | | | Value | |
| | | | | | | |
Natural Resource Technology 0.14% | |
I-Pulse, Inc., (RS) | | | 15,971 | | | $ | 137,351 | *#@ |
| | | | | | | | |
Non - Ferrous Metals 0.01% | |
Sterling Group Ventures, Inc. | | | 500,000 | | | | 12,550 | * |
| | | | | | | | | |
Oil & Gas Drilling 0.98% | |
Atwood Oceanics, Inc. | | | 78,700 | | | | 985,324 | |
| | | | | | | | | |
Oil Companies - Exploration & Production 2.63% | |
Africa Energy Corp. | | | 2,110,889 | | | | 220,574 | * |
BNK Petroleum, Inc. | | | 416,924 | | | | 93,586 | * |
Ivanhoe Energy, Inc. | | | 18,719 | | | | 191 | * |
Parex Resources | | | 92,300 | | | | 893,744 | * |
Range Energy Resources, Inc. | | | 15,000,000 | | | | 232,207 | * |
U.S. Oil Sands, Inc. | | | 7,000,000 | | | | 108,363 | * |
U.S. Oil Sands, Inc., 144A | | | 9,900,000 | | | | 153,257 | * |
Unit Corp. | | | 59,900 | | | | 932,044 | * |
| | | | | | | | 2,633,966 | |
| | | | | | | | | |
Oil Companies - Integrated 1.18% | |
Exxon Mobil Corp. | | | 2,900 | | | | 271,846 | |
OMV AG | | | 32,400 | | | | 910,791 | |
| | | | | | | | 1,182,637 | |
| | | | | | | | | |
Oil Refining & Marketing 2.05% | |
Tesoro Corp. | | | 15,400 | | | | 1,153,768 | |
Valero Energy Corp. | | | 17,600 | | | | 897,600 | |
| | | | | | | | 2,051,368 | |
| | | | | | | | | |
Paper & Related Products 1.23% | |
UPM-Kymmene | | | 67,000 | | | | 1,230,847 | |
| | | | | | | | | |
Pipelines 1.28% | |
EQT Midstream Partners LP | | | 16,000 | | | | 1,284,800 | |
| | | | | | | | | |
Poultry 1.18% | |
Pilgrim's Pride Corp. | | | 46,400 | | | | 1,182,272 | |
| | | | | | | | | |
Power Converters/Supply Equipment 0.97% | |
Gamesa Tecnologica S.A. | | | 48,700 | | | | 970,305 | |
| | | | | | | | | |
Real Estate Operating/Development 5.55% | |
Pacific Infrastructure Ventures, Inc., (RS) | | | 7,443,544 | | | 5,558,094 | *#@ |
See notes to portfolios of investments and notes to financial statements.
31
Global Resources Fund
Portfolio of Investments (unaudited) | June 30, 2016 |
Common Stocks (cont’d) | | Shares | | | Value | |
| | | | | | | |
Steel - Producers 2.22% | |
POSCO, Sponsored ADR | | | 25,500 | | | $ | 1,134,750 | |
Tokyo Steel Manufacturing | | | 197,800 | | | | 1,084,231 | |
| | | | | | | | 2,218,981 | |
| | | | | | | | | |
Steel - Specialty 0.96% | |
Sanyo Special Steel | | | 216,000 | | | | 964,367 | |
| | | | | | | | | |
Textile - Products 1.07% | |
Nitto Boseki | | | 317,000 | | | | 1,071,640 | |
| | | | | | | | | |
Transportation - Marine 1.46% | |
Nordic American Tankers | | | 105,400 | | | | 1,464,006 | |
| | | | | | | | | |
Transportation - Rail 0.97% | |
Union Pacific Corp. | | | 11,100 | | | | 968,475 | |
| |
Total Common Stocks | | | | 75,951,649 | |
(cost $148,559,995) | | | | | | | | |
| | | | | | | | | |
Warrants 0.06% | | | | | | | | |
| | | | | | | | | |
Gold Mining 0.06% | |
Gran Colombia Gold Corp., 144A, Warrants (October 2017) | | | 86,150 | | | 0 | *#@ |
Gran Colombia Gold Corp., 144A, Warrants (March 2019) | | | 59,500 | | | | 2,073 | * |
New Gold, Inc., 144A, Warrants (June 2017) | | | 822,570 | | | | 57,302 | * |
| | | | | | | | 59,375 | |
| | | | | | | | | |
Metal - Copper 0.00% | |
Catalyst Copper Corp., Warrants (February 2017) | | | 83,333 | | | 0 | *#@ |
| |
Total Warrants | | | | 59,375 | |
(cost $0) | | | | | | | | |
| | | | | | | | | |
Purchased Call Option 0.12%
| | Contracts | | | | | |
| | | | | | | | |
Oil Refining & Marketing 0.12% | |
Phillips 66, Strike Price 82.50, Expiration Jan. 2017 | | | 300 | | | | 123,000 | * |
(cost $239,853) | | | | | | | | |
See notes to portfolios of investments and notes to financial statements.
32
Global Resources Fund
Portfolio of Investments (unaudited) | June 30, 2016 |
Convertible Debentures 10.13% | | Principal Amount | | | Value | |
| | | | | | | |
Gold Mining 10.13% | |
Gran Colombia Gold Corp., 1.00%, maturity 08/11/18 | | $ | 6,818,806 | | | $ | 3,886,719 | |
Gran Colombia Gold Corp., 6.00%, maturity 01/02/20 | | | 9,632,710 | | | | 6,261,262 | |
| |
Total Convertible Debentures | | | | 10,147,981 | |
(cost $8,027,866) | | | | | | | | |
| | | | | | | | | |
Corporate Note 2.55% | | | | | | | | |
| | | | | | | | | |
Electric - Generation 2.55% | |
Pacific Power Generation Corp., 15.00%, maturity 04/03/17 (RS) | | | 2,550,000 | | | 2,550,000 | #^@ |
(cost $2,550,000) | | | | | | | | |
| |
Total Investments 88.71% | | | | 88,832,005 | |
(cost $159,377,714) | | | | | | | | |
Other assets and liabilities, net 11.29% | | | | | | | 11,307,168 | |
| | | | | | | | | |
Net Assets 100.0% | | | | | | $ | 100,139,173 | |
Portfolio Allocation by Industry Sector* Based on Total Investments | June 30, 2016 |
 |
* | Summary information above may differ from the portfolio schedule included in the financial statements due to the use of different classifications of securities for presentation purposes. |
See notes to portfolios of investments and notes to financial statements.
33
World Precious Minerals Fund
Portfolio of Investments (unaudited) | June 30, 2016 |
Common Stocks 78.63% | | Shares | | | Value | |
| | | | | | | |
Advanced Materials/Products 0.71% | |
Nano One Materials Corp. | | | 3,000,000 | | | $ | 1,277,139 | *+ |
| | | | | | | | | |
Agricultural Operations 0.03% | |
Agriterra Ltd. | | | 24,045,300 | | | | 52,945 | * |
| | | | | | | | | |
Capital Pools 0.01% | |
Pinecrest Resources Ltd. | | | 100,000 | | | | 16,642 | * |
| | | | | | | | | |
Coal 0.00% | |
Caribbean Resources Corp. | | | 4 | | | 3,870 | *#@ |
| | | | | | | | | |
Diamonds/Precious Stones 1.65% | |
Lucapa Diamond Co., Ltd. | | | 1,250,000 | | | | 339,256 | * |
Lucara Diamond Corp. | | | 900,000 | | | | 2,424,242 | |
Olivut Resources Ltd. | | | 645,000 | | | | 184,721 | * |
Rockwell Diamonds, Inc., 144A | | | 171,667 | | | | 13,952 | * |
| | | | | | | | 2,962,171 | |
| | | | | | | | | |
Diversified Minerals 7.89% | |
Adamera Minerals Corp. | | | 119,543 | | | | 8,790 | * |
Amarc Resources Ltd. | | | 695,545 | | | | 40,378 | * |
Auryn Resources, Inc. | | | 1,000,000 | | | | 2,399,474 | * |
Burey Gold Ltd. | | | 54,500,000 | | | | 2,316,831 | * |
Calibre Mining Corp. | | | 4,650,000 | | | | 521,886 | * |
Canasil Resources, Inc. | | | 1,000,000 | | | | 340,570 | * |
Duketon Mining Ltd. | | | 750,000 | | | | 118,253 | * |
Golden Reign Resources Ltd. | | | 2,013,500 | | | | 405,209 | * |
Indochine Mining Ltd. | | | 10,000 | | | 17,899 | *#@ |
Lithium Americas Corp. | | | 5,000,000 | | | | 4,218,430 | * |
Lithium X Energy Corp. | | | 2,500,300 | | | | 3,251,290 | * |
Pure Energy Minerals Ltd. | | | 286,000 | | | | 152,746 | * |
Terrax Minerals, Inc. (RS) | | | 1,215,000 | | | 375,235 | *#@ |
| | | | | | | | 14,166,991 | |
| | | | | | | | | |
Gold Mining 46.63% | |
Alexandria Minerals Corp. | | | 7,651,675 | | | | 414,581 | * |
Algold Resources Ltd. | | | 5,907,500 | | | | 1,463,215 | * |
Anfield Gold Corp., 144A (RS) | | | 500,000 | | | 477,960 | *#@ |
Blackham Resources Ltd. | | | 1,534,111 | | | | 778,445 | * |
Bonterra Resources, Inc. | | | 1,250,000 | | | | 338,635 | * |
California Gold Mining, Inc. | | | 743,500 | | | | 385,576 | * |
Canyon Resources Ltd. | | | 10,006,593 | | | | 1,007,495 | *+ |
Chesapeake Gold Corp., 144A | | | 192,199 | | | | 801,852 | * |
Comstock Mining, Inc. | | | 2,665,000 | | | | 929,819 | * |
CopperBank Resources Corp. | | | 6,805,418 | | | | 210,702 | * |
See notes to portfolios of investments and notes to financial statements.
34
World Precious Minerals Fund
Portfolio of Investments (unaudited) | June 30, 2016 |
Common Stocks (cont’d) | | Shares | | | Value | |
| | | | | | | |
Gold Mining (cont’d) | |
CopperBank Resources Corp., 144A | | | 174,000 | | | $ | 5,387 | * |
Corona Minerals Ltd. | | | 1,625,000 | | | 12,119 | *#@ |
Dacian Gold, Inc. | | | 200,000 | | | | 431,465 | * |
Detour Gold Corp. | | | 10,000 | | | | 250,165 | * |
Doray Minerals Ltd. | | | 1,500,000 | | | | 1,190,617 | * |
Dundee Precious Metals, Inc. | | | 457,653 | | | | 1,091,042 | * |
Eastmain Resources, Inc. | | | 2,500,000 | | | | 1,180,386 | * |
Endeavour Mining Corp. | | | 50,000 | | | | 848,717 | * |
Gold Standard Ventures Corp. | | | 1,500,000 | | | | 2,790,000 | * |
Golden Arrow Resources Corp. | | | 1,500,000 | | | | 893,997 | * |
Gran Colombia Gold Corp. | | | 192,500 | | | | 14,900 | * |
Harte Gold Corp. | | | 3,400,000 | | | | 763,187 | * |
IDM Mining Ltd. | | | 5,592,500 | | | | 952,320 | * |
IDM Mining Ltd., 144A | | | 95,000 | | | | 16,177 | * |
Integra Gold Corp. | | | 5,000,000 | | | | 3,096,095 | * |
K92 Mining Ltd. | | | 1,000,000 | | | | 843,686 | * |
Klondex Mines Ltd. | | | 6,045,000 | | | | 21,944,386 | * |
Lexam VG Gold, Inc. | | | 2,406,501 | | | | 447,045 | * |
Malbex Resources, Inc. | | | 133,333 | | | | 35,605 | * |
Mammoth Resources Corp. | | | 4,818,000 | | | | 74,585 | *+ |
Mirasol Resources Ltd. | | | 1,900,000 | | | | 3,500,135 | * |
Newcastle Gold Ltd. | | | 66,667 | | | | 38,701 | * |
Newmarket Gold, Inc. | | | 1,000,000 | | | | 2,941,290 | * |
NGEx Resources, Inc. | | | 2,000,000 | | | | 1,393,243 | * |
Northern Star Resources Ltd. | | | 200,000 | | | | 740,417 | |
OceanaGold Corp. | | | 5,348 | | | | 20,408 | |
Osisko Mining, Inc. | | | 200,000 | | | | 348,311 | * |
Petaquilla Minerals Ltd. | | | 2,660,000 | | | | 24,295 | *# |
Pretium Resources, Inc. | | | 875,000 | | | | 9,797,715 | |
Pure Gold Mining, Inc. | | | 3,190,000 | | | | 1,728,395 | * |
Radius Gold, Inc. | | | 125,000 | | | | 14,029 | * |
Red Pine Exploration, Inc. (RS) | | | 12,000,000 | | | 1,676,536 | *+#@ |
Redstar Gold Corp. | | | 15,000,000 | | | | 638,570 | *+ |
Richmont Mines, Inc. | | | 150,000 | | | | 1,381,500 | * |
Rusoro Mining Ltd. | | | 5,054,500 | | | | 489,038 | * |
Rye Patch Gold Corp., 144A | | | 6,116,873 | | | | 2,177,919 | * |
Sandstorm Gold Ltd. | | | 150,000 | | | | 669,000 | * |
Seafield Resources Ltd. | | | 1,300,000 | | | 0 | *#@ |
Skeena Resources Ltd. | | | 6,250,000 | | | | 459,577 | * |
St Barbara Ltd. | | | 1,550,000 | | | | 3,414,330 | * |
Taurus Gold Ltd. | | | 2,448,381 | | | 95,732 | *#@ |
Tolima Gold, Inc. | | | 3,250,000 | | | | 25,156 | * |
Tolima Gold, Inc., 144A | | | 850,000 | | | | 6,579 | * |
TriStar Gold, Inc. | | | 24,008,000 | | | | 5,481,915 | *+ |
Victoria Gold Corp. | | | 3,500,000 | | | | 1,381,632 | * |
See notes to portfolios of investments and notes to financial statements.
35
World Precious Minerals Fund
Portfolio of Investments (unaudited) | June 30, 2016 |
Common Stocks (cont’d) | | Shares | | | Value | |
| | | | | | | |
Gold Mining (cont’d) | |
Wesdome Gold Mines Ltd. | | | 1,062,650 | | | $ | 1,628,582 | * |
| | | | | | | | 83,763,166 | |
| | | | | | | | | |
Medical - Hospitals 0.00% | |
African Medical Investments plc | | | 4,637,500 | | | 0 | *#@ |
| | | | | | | | | |
Metal - Copper 0.07% | |
Rockcliff Copper Corp. | | | 2,620,000 | | | | 116,606 | * |
Verona Development Corp. | | | 1,616 | | | | 413 | |
| | | | | | | | 117,019 | |
| | | | | | | | | |
Metal - Diversified 10.10% | |
Balmoral Resources Ltd. | | | 500,000 | | | | 340,570 | * |
Calico Resources Corp. | | | 4,178,500 | | | | 420,454 | * |
Cardinal Resources Ltd. | | | 13,490,754 | | | | 3,007,036 | * |
Dalradian Resources, Inc. | | | 1,500,000 | | | | 1,137,815 | * |
First Point Minerals Corp. | | | 2,000,000 | | | | 131,584 | * |
Ivanhoe Mines Ltd., Class A | | | 100,000 | | | | 78,176 | * |
Mandalay Resources Corp. | | | 2,500,000 | | | | 2,302,721 | |
Minera Alamos, Inc. | | | 4,450,000 | | | | 464,995 | *+ |
Mineral Mountain Resources Ltd. | | | 2,000,000 | | | | 503,115 | * |
Nemaska Lithium, Inc. | | | 725,000 | | | | 746,352 | * |
Neo Lithium Corp. (RS) | | | 1,735,000 | | | 1,528,524 | *#@ |
Nevada Sunrise Gold Corp. | | | 325,000 | | | | 70,436 | * |
Novo Resources Corp. | | | 1,100,000 | | | | 851,426 | * |
Orex Minerals, Inc. | | | 9,189,000 | | | | 5,690,004 | *+ |
Orsu Metals Corp. | | | 1,869,220 | | | | 28,937 | * |
Silver Bull Resources, Inc. | | | 5,350,000 | | | | 836,985 | * |
| | | | | | | | 18,139,130 | |
| | | | | | | | | |
Mining Services 0.21% | |
Argent Minerals Ltd. | | | 17,100,000 | | | | 384,203 | *+ |
| | | | | | | | | |
Non-Ferrous Metals 0.34% | |
Energizer Resources, Inc. | | | 12,000,000 | | | | 603,739 | * |
| | | | | | | | | |
Oil Companies - Exploration & Production 0.00% | |
Big Sky Energy Corp. | | | 2,000,000 | | | 0 | *#@ |
| | | | | | | | | |
Optical Recognition Equipment 0.00% | |
Nexoptic Technology Corp., 144A | | | 12,083 | | | | 3,180 | * |
| | | | | | | | | |
Platinum 0.57% | |
Pacific North West Capital Corp. | | | 430,555 | | | | 16,663 | * |
See notes to portfolios of investments and notes to financial statements.
36
World Precious Minerals Fund
Portfolio of Investments (unaudited) | June 30, 2016 |
Common Stocks (cont’d) | | Shares | | | Value | |
| | | | | | | |
Platinum (cont’d) | |
Platinum Group Metals Ltd. | | | 300,000 | | | $ | 1,007,779 | * |
| | | | | | | | 1,024,442 | |
| | | | | | | | | |
Precious Metals 8.50% | |
Barsele Minerals Corp. | | | 9,243,000 | | | | 5,365,726 | *+ |
Candente Gold Corp. | | | 4,875,000 | | | | 169,801 | *+ |
Homestake Resource Corp. | | | 832,000 | | | | 112,698 | * |
Kootenay Silver, Inc. | | | 1,000,000 | | | | 309,609 | * |
Lundin Gold, Inc. | | | 621,052 | | | | 2,658,321 | * |
Lundin Gold, Inc., 144A | | | 70,000 | | | | 299,625 | * |
Rouge Resources Ltd. | | | 1,070,000 | | | | 455,522 | * |
Roxgold, Inc. | | | 3,272,500 | | | | 3,875,479 | * |
Santana Minerals Ltd. | | | 2,400,000 | | | | 106,003 | * |
TMAC Resources, Inc. | | | 2,000 | | | | 23,143 | * |
TMAC Resources, Inc. (RS) | | | 167,000 | | | 1,835,843 | *#@ |
Toachi Mining, Inc. | | | 224,500 | | | | 60,819 | * |
| | | | | | | | 15,272,589 | |
| | | | | | | | | |
Silver Mining 1.92% | |
Fortuna Silver Mines, Inc. | | | 225,000 | | | | 1,570,500 | * |
MAG Silver Corp. | | | 100,000 | | | | 1,261,000 | * |
Santacruz Silver Mining Ltd. | | | 1,600,000 | | | | 513,952 | * |
Source Exploration Corp. | | | 4,975,000 | | | | 105,896 | *+ |
| | | | | | | | 3,451,348 | |
| |
Total Common Stocks | | | | 141,238,574 | |
(cost $144,430,121) | | | | | | | | |
| | | | | | | | | |
Subscription Receipts 0.75% | | | | | | | | |
| | | | | | | | | |
Gold Mining 0.75% | |
Rye Patch Gold Corp., Subscription Receipts (RS) | | | 4,000,000 | | | 1,352,994 | *#@ |
(cost $689,223) | | | | | | | | |
| | | | | | | | | |
Units 0.61% | | | | | | | | |
| | | | | | | | | |
Precious Metals 0.61% | |
Toachi Mining, Inc., Units (RS) | | | 4,000,000 | | | 1,102,984 | *#@ |
(cost $622,374) | | | | | | | | |
See notes to portfolios of investments and notes to financial statements.
37
World Precious Minerals Fund
Portfolio of Investments (unaudited) | June 30, 2016 |
Warrants 1.60% | | Shares | | | Values | |
| | | | | | | |
Diversified Minerals 0.02% | |
Burey Gold Ltd., Warrants (August 2017) | | | 3,500,000 | | | $ | 41,765 | * |
| | | | | | | | | |
Gold Mining 0.85% | |
Alamos Gold, Inc., Warrants (August 2018) | | | 110,000 | | | | 42,146 | *# |
Algold Resources Ltd., Warrants (December 2016) | | | 500,000 | | | 7,740 | *#@ |
Algold Resources Ltd., Warrants (April 2018) (RS) | | | 1,250,000 | | | 156,256 | *#@ |
Bonterra Resources, Inc., Warrants (December 2017) | | | 625,000 | | | 24,188 | *#@ |
Bonterra Resources, Inc., Warrants (July 2018) | | | 625,000 | | | 24,188 | *#@ |
Canyon Resources Ltd., Warrants (January 2017) | | | 6,168,864 | | | | 269,144 | *+ |
Gran Colombia Gold Corp., 144A, Warrants (October 2017) | | | 58,450 | | | 0 | *#@ |
Gran Colombia Gold Corp., 144A , Warrants (March 2019) | | | 96,250 | | | | 3,353 | * |
New Gold, Inc., 144A, Warrants (June 2017) | | | 352,530 | | | | 24,558 | * |
Osisko Gold Royalties Ltd., Warrants (February 2022) | | | 377,500 | | | | 932,099 | * |
Osisko Mining, Inc., Warrants (August 2018) | | | 1,000,000 | | | | 46,441 | * |
Redstar Gold Corp., Warrants (May 2019) (RS) | | | 2,500,000 | | | 0 | *+#@ |
Skeena Resources Ltd., Warrants (October 2016) | | | 10,000,000 | | | 0 | *#@ |
Tolima Gold, Inc., 144A, Warrants (December 2016) | | | 425,000 | | | 0 | *#@ |
Veris Gold Corp., Warrants (August 2016) | | | 250,000 | | | 0 | *#@ |
Veris Gold Corp., Warrants (December 2016) | | | 282,200 | | | 0 | *#@ |
| | | | | | | | 1,530,113 | |
| | | | | | | | | |
Metal - Copper 0.00% | |
Catalyst Copper Corp., Warrants (February 2017) | | | 33,333 | | | 0 | *#@ |
| | | | | | | | | |
Metal - Diversified 0.37% | |
Dalradian Resources, Inc., Warrants (July 2017) | | | 1,500,000 | | | | 174,155 | * |
HudBay Minerals, Inc., Warrants (July 2018) | | | 17,000 | | | | 4,605 | * |
Mineral Mountain Resources Ltd., Warrants (October 2016) | | | 700,000 | | | 0 | *#@ |
Orex Minerals, Inc., 144A, Warrants (November 2017) | | | 1,250,000 | | | 483,765 | *+#@ |
| | | | | | | | 662,525 | |
| | | | | | | | | |
Precious Metals 0.36% | |
Barsele Minerals Corp., Warrants (November 2017) | | | 1,250,000 | | | 435,388 | *+#@ |
Barsele Minerals Corp., Warrants (March 2018) | | | 600,000 | | | 208,987 | *+#@ |
| | | | | | | | 644,375 | |
| | | | | | | | | |
Silver Mining 0.00% | |
Source Exploration Corp., Warrants (February 2017) | | | 2,500,000 | | | 0 | *+#@ |
| | |
Total Warrants | | | | 2,878,778 | |
(cost $1,080,467) | | | | | | | | |
See notes to portfolios of investments and notes to financial statements.
38
World Precious Minerals Fund
Portfolio of Investments (unaudited) | June 30, 2016 |
Special Warrant 0.00% | | Shares | | | Values | |
| | | | | | | |
Gold/Mineral Exploration & Development 0.00% | |
Western Exploration & Development Ltd., 144A, Special Warrants | | | 600,000 | | | $ | 0 | *#@ |
(cost $300,000) | | | | | | | |
| | | | | | | | |
Rights 0.10% | | | | | | | |
| | | | | | | | |
Metal - Diversified 0.10% | |
Cardinal Resources Ltd. | | | 1,500,000 | | | | 178,992 | * |
(cost $13,109) | | | | | | | | |
| | | | | | | | | |
Purchased Call Option 0.02% | | Contracts | | | | | |
| | | | | | | | |
Gold Mining 0.02% | |
Eldorado Gold Corp., Strike Price 4.50, Expiration Jul. 2016 | | | 1,600 | | | | 36,000 | * |
(cost $88,945) | | | | | | | | |
| | | | | | | | | |
Convertible Debentures 4.84% | | Principal Amount | | | | | |
| | | | | | | | |
Gold Mining 4.84% | |
Gran Colombia Gold Corp., 1.00%, maturity 08/11/18 | | $ | 8,081,240 | | | | 4,606,307 | |
Gran Colombia Gold Corp., 6.00%, maturity 01/02/20 | | | 6,276,403 | | | | 4,079,662 | |
| | |
Total Convertible Debentures | | | | 8,685,969 | |
(cost $6,772,427) | | | | | | | | |
| | | | | | | | | |
Corporate Note 0.38% | | | | | | | | |
| | | | | | | | | |
Electric - Generation 0.38% | |
Pacific Power Generation Corp., 15.00%, maturity 04/03/17 (RS) | | | 680,000 | | | 680,000 | #^@ |
(cost $680,000) | | | | | | | | |
| | |
Total Investments 86.93% | | | | 156,154,291 | |
(cost $154,676,666) | | | | | | | | |
Other assets and liabilities, net 13.07% | | | | | | | 23,470,099 | |
| | | | | | | | | |
Net Assets 100.0% | | | | | | $ | 179,624,390 | |
See notes to portfolios of investments and notes to financial statements.
39
World Precious Minerals Fund
Portfolio of Investments (unaudited) | June 30, 2016 |
Portfolio Allocation by Industry* Based on Total Investments | June 30, 2016 |
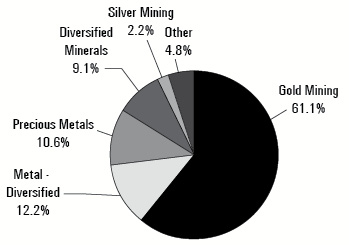 |
* | Summary information above may differ from the portfolio schedule included in the financial statements due to the use of different classifications of securities for presentation purposes. |
See notes to portfolios of investments and notes to financial statements.
40
Gold and Precious Metals Fund
Portfolio of Investments (unaudited) | June 30, 2016 |
Common Stocks 71.23% | | Shares | | | Value | |
| | | | | | | |
Diamonds/Precious Stones 1.29% | |
Lucara Diamond Corp. | | | 475,000 | | | $ | 1,279,461 | |
Petra Diamonds Ltd. | | | 275,000 | | | | 424,419 | |
| | | | | | | | 1,703,880 | |
| | | | | | | | | |
Gold Mining 59.37% | |
Agnico Eagle Mines Ltd. | | | 50,000 | | | | 2,675,000 | |
Barrick Gold Corp. | | | 200,000 | | | | 4,270,000 | |
Comstock Mining, Inc. | | | 4,621,648 | | | | 1,612,493 | * |
Detour Gold Corp. | | | 20,000 | | | | 500,329 | * |
Doray Minerals Ltd. | | | 1,000,000 | | | | 793,745 | * |
Dundee Precious Metals, Inc. | | | 565,306 | | | | 1,347,686 | * |
Endeavour Mining Corp. | | | 200,000 | | | | 3,394,868 | * |
Golden Star Resources Ltd. | | | 1,050,000 | | | | 677,250 | * |
Gran Colombia Gold Corp. | | | 75,000 | | | | 5,805 | * |
Jaguar Mining, Inc. | | | 6,550,000 | | | | 2,534,928 | *+ |
Kirkland Lake Gold, Inc. | | | 300,000 | | | | 2,470,684 | * |
Klondex Mines Ltd. | | | 4,133,688 | | | | 15,005,996 | * |
Marlin Gold Mining Ltd. | | | 1,375,200 | | | | 553,507 | * |
Newmarket Gold, Inc. | | | 1,500,000 | | | | 4,411,935 | * |
Newmont Mining Corp. | | | 75,000 | | | | 2,934,000 | |
Northern Star Resources Ltd. | | | 1,135,000 | | | | 4,201,867 | |
Randgold Resources Ltd., Sponsored ADR | | | 6,000 | | | | 672,240 | |
Richmont Mines, Inc. | | | 300,000 | | | | 2,763,000 | * |
Royal Gold, Inc. | | | 20,000 | | | | 1,440,400 | |
Rye Patch Gold Corp. | | | 70,794 | | | | 25,206 | * |
Sandstorm Gold Ltd. | | | 600,000 | | | | 2,676,000 | * |
Saracen Mineral Holdings Ltd. | | | 450,000 | | | | 483,824 | * |
SEMAFO, Inc. | | | 200,000 | | | | 959,789 | * |
Silver Lake Resources Ltd. | | | 3,000,000 | | | | 1,148,741 | * |
St Barbara Ltd. | | | 3,050,000 | | | | 6,718,521 | * |
Torex Gold Resources, Inc. | | | 2,000,000 | �� | | | 3,575,990 | * |
Wesdome Gold Mines Ltd. | | | 2,642,350 | | | | 4,049,579 | * |
Yamana Gold, Inc. | | | 1,250,000 | | | | 6,500,000 | |
| | | | | | | | 78,403,383 | |
| | | | | | | | | |
Medical - Hospitals 0.00% | |
African Medical Investments plc | | | 2,000,000 | | | 0 | *#@ |
| | | | | | | | | |
Metal - Diversified 3.16% | |
AuRico Metals, Inc. | | | 500,000 | | | | 394,751 | * |
AuRico Metals, Inc. (RS) | | | 2,500,000 | | | 1,856,690 | *#@ |
Mandalay Resources Corp. | | | 2,092,300 | | | | 1,927,193 | |
| | | | | | | | 4,178,634 | |
See notes to portfolios of investments and notes to financial statements.
41
Gold and Precious Metals Fund
Portfolio of Investments (unaudited) | June 30, 2016 |
Common Stocks (cont’d) | | Shares | | | Value | |
| | | | | | | |
Silver Mining 7.41% | |
Fortuna Silver Mines, Inc. | | | 175,000 | | | $ | 1,221,500 | * |
Hecla Mining Co. | | | 600,000 | | | | 3,060,000 | |
Santacruz Silver Mining Ltd. | | | 2,500,000 | | | | 803,050 | * |
Silver Wheaton Corp. | | | 200,000 | | | | 4,706,000 | |
| | | | | | | | 9,790,550 | |
| | |
Total Common Stocks | | | | 94,076,447 | |
(cost $64,870,125) | | | | | | | | |
| | | | | | | | | |
Exchange-Traded Fund 1.14% | | | | | | | | |
| | | | | | | | | |
Global X Lithium ETF | | | 60,000 | | | | 1,499,402 | |
(cost $1,312,775) | |
| | | | | | | | | |
| | | | | | | | | |
Subscription Receipts 2.56% | | | | | | | | |
| | | | | | | | | |
Gold Mining 2.56% | |
Rye Patch Gold Corp., Subscription Receipts (RS) | | | 10,000,000 | | | 3,382,484 | *#@ |
(cost $1,723,058) | | | | | | | | |
| | | | | | | | | |
Warrants 0.35% | | | | | | | | |
| | | | | | | | | |
Gold Mining 0.35% | |
Gran Colombia Gold Corp., 144A, Warrants (October 2017) | | | 29,400 | | | 0 | *#@ |
Gran Colombia Gold Corp., 144A, Warrants (March 2019) | | | 37,500 | | | | 1,307 | * |
Osisko Gold Royalties Ltd., Warrants (February 2022) | | | 183,900 | | | | 454,074 | * |
Veris Gold Corp., Warrants (August 2016) | | | 250,000 | | | 0 | *#@ |
Veris Gold Corp., Warrants (December 2016) | | | 195,300 | | | 0 | *#@ |
| |
Total Warrants | | | | 455,381 | |
(cost $295,705) | | | | | | | | |
| | | | | | | | | |
Purchased Call Option 0.02% | | Contracts | | | | | |
| | | | | | | | |
Gold Mining 0.02% | |
Eldorado Gold Corp., Strike Price 4.50, Expiration Jul. 2016 | | | 1,200 | | | | 27,000 | * |
(cost $66,708) | | | | | | | | |
See notes to portfolios of investments and notes to financial statements.
42
Gold and Precious Metals Fund
Portfolio of Investments (unaudited) | June 30, 2016 |
Convertible Debentures 3.39% | | Principal Amount | | | Value | |
| | | | | | | |
Gold Mining 3.39% | |
Gran Colombia Gold Corp., 6.00%, maturity 01/02/20 | | $ | 3,174,154 | | | $ | 2,063,200 | |
Gran Colombia Gold Corp., 1.00%, maturity 08/11/18 | | | 4,243,218 | | | | 2,418,634 | |
| |
Total Convertible Debentures | | | | 4,481,834 | |
(cost $3,491,890) | | | | | | | | |
| | | | | | | | | |
Corporate Notes 0.53% | | | | | | | | |
| | | | | | | | | |
Coal 0.34% | |
Caribbean Resources Corp., 19.25%, maturity 06/15/15 | | | 485,766 | | | 445,974 | #^@ |
| | | | | | | | | |
Electric - Generation 0.19% | |
Pacific Power Generation Corp., 15.00%, maturity 04/03/17 (RS) | | | 255,000 | | | 255,000 | #^@ |
| | |
Total Corporate Notes | | | | 700,974 | |
(cost $740,766) | | | | | | | | |
| | |
Total Investments 79.22% | | | | 104,623,522 | |
(cost $72,501,027) | | | | | | | | |
Other assets and liabilities, net 20.78% | | | | | | | 27,446,463 | |
| | | | | | | | | |
Net Assets 100.0% | | | | | | $ | 132,069,985 | |
Portfolio Allocation by Industry* Based on Total Investments | June 30, 2016 |
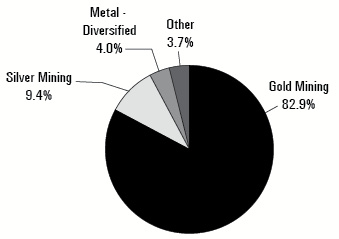 |
* | Summary information above may differ from the portfolio schedule included in the financial statements due to the use of different classifications of securities for presentation purposes. |
See notes to portfolios of investments and notes to financial statements.
43
Emerging Europe Fund
Portfolio of Investments (unaudited) | June 30, 2016 |
Common Stocks 94.31% | | Shares | | | Value | |
| | | | | | | |
Agricultural Chemicals 1.37% | |
PhosAgro OAO, GDR | | | 18,200 | | | $ | 268,009 | |
Uralkali PJSC | | | 113,800 | | | | 311,244 | |
| | | | | | | | 579,253 | |
| | | | | | | | | |
Agricultural Operations 1.33% | |
Kernel Holding S.A. | | | 42,005 | | | | 564,143 | |
| | | | | | | | | |
Airlines 3.18% | |
Aegean Airlines S.A. | | | 50,700 | | | | 350,444 | |
Deutsche Lufthansa | | | 28,100 | | | | 330,388 | |
easyJet plc | | | 11,100 | | | | 161,302 | |
Ryanair Holdings plc, Sponsored ADR | | | 2,302 | | | | 160,081 | |
Turk Hava Yollari AO | | | 7,000 | | | | 13,944 | * |
Wizz Air Holdings plc, 144A | | | 15,300 | | | | 328,071 | * |
| | | | | | | | 1,344,230 | |
| | | | | | | | | |
Airport Development/Maintenance 0.39% | |
TAV Havalimanlari Holding A.S. | | | 38,700 | | | | 166,201 | |
| | | | | | | | | |
Appliances 0.82% | |
Arcelik A.S. | | | 52,700 | | | | 346,996 | |
| | | | | | | | | |
Automotive - Cars & Light Trucks 1.64% | |
Ford Otomotiv Sanayi A.S. | | | 46,300 | | | | 492,779 | |
Tofas Turk Otomobil Fabrikasi A.S. | | | 24,400 | | | | 200,626 | |
| | | | | | | | 693,405 | |
| | | | | | | | | |
Automotive Truck Parts & Equipment 1.01% | |
Brembo S.p.A | | | 7,730 | | | | 425,814 | |
| | | | | | | | | |
Automotive Truck Parts & Equipment - Replacement 0.49% | |
Ege Endustri ve Ticaret A.S. | | | 2,500 | | | | 206,475 | |
| | | | | | | | | |
Building & Construction - Miscellaneous 1.45% | |
Budimex S.A. | | | 14,100 | | | | 615,201 | |
| | | | | | | | | |
Building Products - Cement/Aggregates 0.23% | |
Cimsa Cimento Sanayi VE Ticaret | | | 18,500 | | | | 97,412 | |
| | | | | | | | | |
Cellular Telecommunication 3.10% | |
MegaFon PJSC, GDR | | | 20,600 | | | | 215,122 | |
Mobile TeleSystems OJSC, Sponsored ADR | | | 79,200 | | | | 655,776 | |
Turkcell Iletisim Hizmetleri A.S. | | | 75,000 | | | | 275,738 | |
See notes to portfolios of investments and notes to financial statements.
44
Emerging Europe Fund
Portfolio of Investments (unaudited) | June 30, 2016 |
Common Stocks (cont’d) | | Shares | | | Value | |
| | | | | | | |
Cellular Telecommunication (cont’d) | |
Turkcell Iletisim Hizmetleri A.S., Sponsored ADR | | | 17,897 | | | $ | 163,758 | * |
| | | | | | | | 1,310,394 | |
| | |
Chemicals - Diversified 0.83% | |
Petkim Petrokimya Holding A.S. | | | 264,000 | | | | 352,758 | |
| | | | | | | | | |
Chemicals - Fibers 0.76% | |
Aksa Akrilik Kimya Sanayii A.S. | | | 83,000 | | | | 222,019 | |
Lenzing AG | | | 1,100 | | | | 101,696 | |
| | | | | | | | 323,715 | |
| | | | | | | | | |
Chemicals - Specialty 1.07% | |
Soda Sanayii A.S. | | | 287,000 | | | | 454,971 | |
| | | | | | | | | |
Commercial Banks - Non US 20.06% | |
Akbank T.A.S. | | | 194,000 | | | | 556,027 | |
Akbank T.A.S., Sponsored ADR | | | 17,500 | | | | 99,400 | |
Alpha Bank AE | | | 170,700 | | | | 319,852 | * |
Banca Transilvania S.A. | | | 894,251 | | | | 457,024 | |
Bank Pekao S.A. | | | 7,000 | | | | 244,400 | |
Bank Zachodni WBK S.A. | | | 3,300 | | | | 220,679 | |
BRD-Groupe Societe Generale S.A. | | | 147,000 | | | | 353,632 | |
Eurobank Ergasias S.A. | | | 212,000 | | | | 134,201 | * |
Komercni Banka A.S. | | | 7,500 | | | | 281,206 | |
National Bank of Greece | | | 662,000 | | | | 146,865 | * |
OTP Bank plc | | | 22,850 | | | | 511,323 | |
Powszechna Kasa Oszczednosci Bank Polski S.A. | | | 40,000 | | | | 237,095 | |
Sberbank of Russia, Sponsored ADR | | | 400,000 | | | | 3,492,000 | |
Turkiye Garanti Bankasi A.S. | | | 170,000 | | | | 449,044 | |
Turkiye Halk Bankasi A.S. | | | 64,400 | | | | 191,663 | |
Turkiye Is Bankasi, Class C | | | 28,959 | | | | 46,003 | |
Turkiye Vakiflar Bankasi TAO, Class D | | | 50,000 | | | | 78,520 | |
VTB Bank PJSC, GDR | | | 186,867 | | | | 386,633 | |
Yapi ve Kredi Bankasi A.S. | | | 208,000 | | | | 288,379 | |
| | | | | | | | 8,493,946 | |
| | | | | | | | | |
Computer Services 1.28% | |
Asseco Poland S.A. | | | 24,700 | | | | 327,591 | |
Luxoft Holding, Inc., Class A | | | 4,100 | | | | 213,282 | * |
| | | | | | | | 540,873 | |
| | | | | | | | | |
Distribution/Wholesale 0.74% | |
Neuca S.A. | | | 3,570 | | | | 311,959 | |
See notes to portfolios of investments and notes to financial statements.
45
Emerging Europe Fund
Portfolio of Investments (unaudited) | June 30, 2016 |
Common Stocks (cont’d) | | Shares | | | Value | |
| | | | | | | |
Diversified Operations 0.20% | |
KOC Holding A.S. | | | 18,456 | | | $ | 84,404 | |
| | | | | | | | | |
Electric - Distribution 0.40% | |
Electrica S.A. | | | 42,700 | | | | 137,639 | |
Energa S.A. | | | 12,200 | | | | 29,485 | |
| | | | | | | | 167,124 | |
| | | | | | | | | |
Electric - Generation 1.54% | |
CEZ A.S. | | | 4,868 | | | | 83,048 | |
Inter RAO UES PJSC | | | 14,400,000 | | | | 568,313 | |
| | | | | | | | 651,361 | |
| | | | | | | | | |
Electric - Integrated 0.77% | |
Public Power Corporation S.A. | | | 96,500 | | | | 265,688 | |
RusHydro PJSC, Sponsored ADR | | | 66,942 | | | | 61,420 | |
| | | | | | | | 327,108 | |
| | | | | | | | | |
Electric - Transmission 0.63% | |
Transelectrica S.A. | | | 39,300 | | | | 266,700 | |
| | | | | | | | | |
Electronics - Military 0.67% | |
Safran S.A. | | | 4,180 | | | | 281,490 | |
| | | | | | | | | |
Enterprise Software/Services 0.52% | |
Logo Yazilim Sanayi Ve Ticaret | | | 12,700 | | | | 218,432 | * |
| | | | | | | | | |
Entertainment Software 0.48% | |
CD Projekt S.A. | | | 29,000 | | | | 201,983 | * |
| | | | | | | | | |
Finance - Other Services 0.43% | |
Moscow Exchange MICEX-RTS PJSC | | | 104,000 | | | | 182,987 | |
| | | | | | | | | |
Food - Confectionery 0.11% | |
Ulker Biskuvi Sanayi A.S. | | | 6,500 | | | | 47,499 | |
| | | | | | | | | |
Food - Miscellaneous/Diversified 0.68% | |
Ros Agro plc, GDR | | | 19,400 | | | | 287,348 | |
| | | | | | | | | |
Food - Retail 1.95% | |
BIM Birlesik Magazalar A.S. | | | 11,200 | | | | 218,426 | |
Magnit PJSC, Sponsored GDR | | | 18,200 | | | | 606,771 | |
| | | | | | | | 825,197 | |
See notes to portfolios of investments and notes to financial statements.
46
Emerging Europe Fund
Portfolio of Investments (unaudited) | June 30, 2016 |
Common Stocks (cont’d) | | Shares | | | Value | |
| | | | | | | |
Food - Wholesale/Distribution 1.02% | |
Eurocash S.A. | | | 36,700 | | | $ | 430,036 | |
| | | | | | | | | |
Gambling (Non-Hotel) 1.00% | |
OPAP S.A. | | | 60,600 | | | | 422,355 | |
| | | | | | | | | |
Gold Mining 0.53% | |
Dundee Precious Metals, Inc. | | | 44,041 | | | | 104,993 | * |
Eldorado Gold Corp. | | | 18,500 | | | | 83,250 | |
Koza Altin Isletmeleri A.S. | | | 8,500 | | | | 37,689 | * |
| | | | | | | | 225,932 | |
| | | | | | | | | |
Machinery - Farm 0.96% | |
Turk Traktor ve Ziraat Makineleri A.S. | | | 13,931 | | | | 406,972 | |
| | | | | | | | | |
Medical - Drugs 0.56% | |
Richter Gedeon Nyrt | | | 11,900 | | | | 236,692 | |
| | | | | | | | | |
Metal - Diversified 1.13% | |
KGHM Polska Miedz S.A. | | | 10,000 | | | | 168,767 | |
MMC Norilsk Nickel PJSC, Sponsored ADR | | | 18,500 | | | | 247,345 | |
Orsu Metals Corp. | | | 4,025,000 | | | | 62,309 | * |
| | | | | | | | 478,421 | |
| | | | | | | | | |
Metal - Iron 1.15% | |
Magnitogorsk Iron & Steel Works OJSC, GDR | | | 100,200 | | | | 487,922 | |
| | | | | | | | | |
Miscellaneous Manufacturing 0.86% | |
RHI AG | | | 18,900 | | | | 363,661 | |
| | | | | | | | | |
Multi-line Insurance 0.37% | |
Vienna Insurance Group Wiener Versicherung Gruppe AG | | | 8,200 | | | | 155,734 | |
| | | | | | | | | |
Oil Companies - Exploration & Production 1.05% | |
Novatek OAO, GDR | | | 3,099 | | | | 317,062 | |
Societatea Nationala de Gaze Naturale ROMGAZ | | | 21,000 | | | | 129,454 | |
| | | | | | | | 446,516 | |
| | | | | | | | | |
Oil Companies - Integrated 20.65% | |
Gazprom OAO, Sponsored ADR | | | 576,000 | | | | 2,489,853 | |
Lukoil PJSC, Sponsored ADR | | | 66,800 | | | | 2,787,564 | |
MOL Hungarian Oil & Gas plc | | | 9,000 | | | | 521,019 | |
Polskie Gornictwo Naftowe i Gazownictwo S.A. | | | 359,000 | | | | 511,803 | |
Rosneft OAO, GDR | | | 192,000 | | | | 987,800 | |
Surgutneftegas OAO, Sponsored ADR | | | 44,160 | | | | 226,541 | |
See notes to portfolios of investments and notes to financial statements.
47
Emerging Europe Fund
Portfolio of Investments (unaudited) | June 30, 2016 |
Common Stocks (cont’d) | | Shares | | | Value | |
| | | | | | | |
Oil Companies - Integrated (cont’d) | |
Tatneft PAO, Sponsored ADR | | | 40,000 | | | $ | 1,218,800 | |
| | | | | | | | 8,743,380 | |
| | | | | | | | | |
Oil Refining & Marketing 3.73% | |
Aygaz A.S. | | | 68,500 | | | | 266,185 | |
Motor Oil Hellas Corinth Refineries S.A. | | | 37,500 | | | | 410,298 | |
Polski Koncern Naftowy Orlen S.A. | | | 37,200 | | | | 653,436 | |
Tupras Turkiye Petrol Rafinerileri A.S. | | | 11,300 | | | | 250,858 | |
| | | | | | | | 1,580,777 | |
| | | | | | | | | |
Precious Metals 0.43% | |
Polymetal International PLC | | | 13,000 | | | | 182,179 | |
| | | | | | | | | |
Property/Casualty Insurance 0.49% | |
Powszechny Zaklad Ubezpieczen S.A. | | | 28,300 | | | | 206,229 | |
| | | | | | | | | |
Regional Banks - Non US 0.90% | |
Moneta Money Bank A.S., 144A | | | 130,000 | | | | 382,765 | * |
| | | | | | | | | |
Retail - Jewelry 0.62% | |
Pandora A/S | | | 1,915 | | | | 260,822 | |
| | | | | | | | | |
Retail - Restaurants 0.64% | |
AmRest Holdings S.E. | | | 4,900 | | | | 272,123 | * |
| | | | | | | | | |
Rubber - Tires 0.41% | |
Goodyear Lastikleri A.S. | | | 151,791 | | | | 175,584 | |
| | | | | | | | | |
Steel - Producers 1.99% | |
Eregli Demir ve Celik Fabrikalari T.A.S. | | | 396,500 | | | | 560,885 | |
Severstal PAO PJSC, GDR | | | 25,700 | | | | 283,006 | |
| | | | | | | | 843,891 | |
| | | | | | | | | |
Telecom Services 2.66% | |
Netia S.A. | | | 355,000 | | | | 371,534 | |
O2 Czech Republic a.s. | | | 16,100 | | | | 143,258 | |
Sistema, GDR | | | 60,300 | | | | 454,562 | |
Turk Telekomunikasyon A.S. | | | 75,200 | | | | 158,509 | |
| | | | | | | | 1,127,863 | |
| | | | | | | | | |
Telephone - Integrated 2.96% | |
Hellenic Telecommunications Organization S.A. | | | 57,100 | | | | 521,707 | |
Magyar Telekom Telecommunications | | | 181,500 | | | | 284,664 | |
Rostelecom PJSC | | | 310,000 | | | | 446,687 | |
| | | | | | | | 1,253,058 | |
See notes to portfolios of investments and notes to financial statements.
48
Emerging Europe Fund
Portfolio of Investments (unaudited) | June 30, 2016 |
Common Stocks (cont’d) | | Shares | | | Value | |
| | | | | | | |
Tobacco 0.53% | |
Philip Morris CR A.S. | | | 440 | | | $ | 222,425 | |
| | | | | | | | | |
Transportation - Services 0.92% | |
Oesterreichische Post AG | | | 12,050 | | | | 389,136 | |
| | | | | | | | | |
Web Portals/ISP 0.62% | |
Yandex, Class A | | | 12,000 | | | | 262,200 | * |
| |
Total Common Stocks | | | | 39,926,052 | |
(cost $42,603,618) | | | | | | | | |
| | | | | | | | | |
Exchange-Traded Fund 1.72% | | | | | | | | |
| | | | | | | | | |
Direxion Daily Russia Bull 3x Shares | | | 12,400 | | | | 727,632 | |
(cost $814,946) | | | | | | | | |
| | | | | | | | | |
Purchased Call Option 0.48% | | Contracts | | | | | |
| | | | | | | | |
Exchange - Traded Fund 0.48% | |
VanEck Vectors Russia ETF, Strike Price 18.00, Expiration Jan. 2017 | | | 1,500 | | | | 201,000 | * |
(cost $266,688) | | | | | | | | |
| | | | | | | | | |
Corporate Note 0.16% | | Principal Amount | | | | | |
| | | | | | | | |
Transportation - Services 0.16% | |
Baghlan Group FZCO, 14.75%, maturity 06/27/15 | | $ | 1,345,845 | | | 69,307 | *^#@ |
(cost $1,350,345) | | | | | | | | |
| |
Total Investments 96.67% | | | | 40,923,991 | |
(cost $45,035,597) | | | | | | | | |
Other assets and liabilities, net 3.33% | | | | | | | 1,410,235 | |
| | | | | | | | | |
Net Assets 100.0% | | | | | | $ | 42,334,226 | |
See notes to portfolios of investments and notes to financial statements.
49
Emerging Europe Fund
Portfolio of Investments (unaudited) | June 30, 2016 |
Country Distribution* Based on Total Investments | June 30, 2016 |
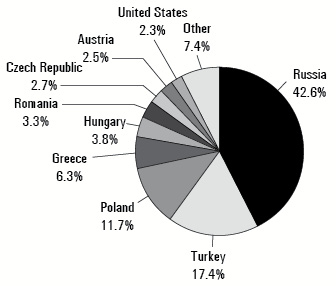 |
* | Country distribution shown is based on domicile. The locale of company operations may be different. |
See notes to portfolios of investments and notes to financial statements.
50
China Region Fund
Portfolio of Investments (unaudited) | June 30, 2016 |
Common Stocks 78.31% | | Shares | | | Value | |
| | | | | | | |
Airlines 0.92% | |
Air China Ltd., H shares | | | 220,000 | | | $ | 151,248 | |
| | | | | | | | | |
Apparel Manufacturers 1.39% | |
Cosmo Lady China Holdings Co., Ltd., 144A | | | 182,000 | | | | 93,429 | |
Regina Miracle International Holdings Ltd., 144A | | | 101,000 | | | | 134,026 | * |
| | | | | | | | 227,455 | |
| | | | | | | | | |
Automotive - Cars & Light Trucks 6.61% | |
Geely Automobile Holdings Ltd. | | | 866,000 | | | | 472,353 | |
Great Wall Motor Co., Ltd., H shares | | | 34,500 | | | | 28,844 | |
Guangzhou Automobile Group Co., Ltd., H shares | | | 485,000 | | | | 582,000 | |
| | | | | | | | 1,083,197 | |
| | | | | | | | | |
Automotive/Truck Parts & Equipment - Original 0.09% | |
Nexteer Automotive Group Ltd. | | | 16,000 | | | | 14,642 | |
| | | | | | | | | |
Batteries/Battery Systems 0.34% | |
Tianneng Power International Ltd. | | | 82,000 | | | | 55,747 | |
| | | | | | | | | |
Cellular Telecommunication 1.91% | |
SmarTone Telecommunications Holdings Ltd. | | | 175,000 | | | | 312,688 | |
| | | | | | | | | |
Commercial Banks - Non US 3.62% | |
Bank Mandiri Persero Tbk PT | | | 94,000 | | | | 68,024 | |
Bank Rakyat Indonesia Persero Tbk PT | | | 165,000 | | | | 135,767 | |
China Merchants Bank Co., Ltd., H shares | | | 35,000 | | | | 78,964 | |
Huishang Bank Corp., Ltd., H shares | | | 685,000 | | | | 310,368 | |
| | | | | | | | 593,123 | |
| | | | | | | | | |
Commercial Services 0.30% | |
Goldpac Group Ltd. | | | 173,000 | | | | 48,803 | |
| | | | | | | | | |
Computers 0.46% | |
Foxconn Technology Co., Ltd. | | | 32,000 | | | | 75,590 | |
| | | | | | | | | |
Cosmetics & Toiletries 1.04% | |
AMOREPACIFIC Group | | | 585 | | | | 85,845 | |
L'Occitane International S.A. | | | 41,000 | | | | 83,979 | |
| | | | | | | | 169,824 | |
| | | | | | | | | |
Diversified Financial Services 0.62% | |
China Galaxy Securities Co., Ltd., H shares | | | 113,000 | | | | 101,978 | |
| | | | | | | | | |
Electric - Generation 0.41% | |
Energy Development Corp. | | | 576,000 | | | | 67,982 | |
See notes to portfolios of investments and notes to financial statements.
51
China Region Fund
Portfolio of Investments (unaudited) | June 30, 2016 |
Common Stocks (cont’d) | | Shares | | | Value | |
| | | | | | | |
Electronic Components - Miscellaneous 2.03% | |
Cowell e Holdings, Inc. | | | 260,000 | | | $ | 91,336 | * |
Hon Hai Precision Industry Co., Ltd. | | | 60,000 | | | | 154,577 | |
Micro-Star International Co. | | | 47,000 | | | | 86,809 | |
| | | | | | | | 332,722 | |
| | | | | | | | | |
Electronic Components - Semiconductors 0.48% | |
Phison Electronics Corp. | | | 9,000 | | | | 78,010 | |
| | | | | | | | | |
Energy - Alternate Sources 0.38% | |
Gigasolar Materials Corp. | | | 4,000 | | | | 62,044 | |
| | | | | | | | | |
Enterprise Software/Services 0.72% | |
Silverlake Axis Ltd. | | | 160,000 | | | | 61,407 | |
Sinosoft Technology Group Ltd. | | | 100,000 | | | | 56,938 | |
| | | | | | | | 118,345 | |
| | | | | | | | | |
Entertainment Software 0.59% | |
NetEase, Inc., Sponsored ADR | | | 500 | | | | 96,610 | |
| | | | | | | | | |
Finance - Investment Banker/Broker 4.73% | |
Central China Securities Co., Ltd., H shares | | | 282,000 | | | | 122,197 | |
CITIC Securities Co., Ltd., H shares | | | 225,000 | | | | 499,253 | |
Haitong Securities Co., Ltd., H shares | | | 90,000 | | | | 153,349 | |
| | | | | | | | 774,799 | |
| | | | | | | | | |
Food - Confectionery 0.85% | |
Dali Foods Group Co., Ltd., 144A | | | 244,000 | | | | 139,029 | |
| | | | | | | | | |
Food - Dairy Products 0.90% | |
China Shengmu Organic Milk Ltd., 144A | | | 710,000 | | | | 148,125 | * |
| | | | | | | | | |
Gas - Distribution 1.11% | |
China Resources Gas Group Ltd. | | | 60,000 | | | | 182,468 | |
| | | | | | | | | |
Internet Application Software 6.16% | |
Tencent Holdings Ltd. | | | 44,000 | | | | 1,009,346 | |
| | | | | | | | | |
Internet Content - Entertainment 0.87% | |
Com2uS Corp. | | �� | 1,242 | | | | 142,705 | * |
| | | | | | | | | |
Internet Financial Services 0.24% | |
China Finance Online Co., Ltd., Sponsored ADR | | | 8,500 | | | | 39,780 | * |
| | | | | | | | | |
Investment Management/Advisory Services 2.66% | |
GF Securities Co., Ltd., H shares | | | 190,000 | | | | 435,773 | |
See notes to portfolios of investments and notes to financial statements.
52
China Region Fund
Portfolio of Investments (unaudited) | June 30, 2016 |
Common Stocks (cont’d) | | Shares | | | Value | |
| | | | | | | |
Life/Health Insurance 1.99% | |
Bangkok Life Assurance PCL NVDR | | | 66,000 | | | $ | 70,202 | |
China Life Insurance Co., Ltd. | | | 20,000 | | | | 15,570 | |
China Pacific Insurance Group Co., Ltd., H shares | | | 71,000 | | | | 240,630 | |
| | | | | | | | 326,402 | |
| | | | | | | | | |
Medical - Biomedical/Gene 0.69% | |
3SBio, Inc., 144A | | | 109,000 | | | | 112,475 | * |
| | | | | | | | | |
Medical - Drugs 1.70% | |
Livzon Pharmaceutical Group, Inc., H shares | | | 33,000 | | | | 149,258 | |
Sino Biopharmaceutical Ltd. | | | 196,000 | | | | 128,639 | |
| | | | | | | | 277,897 | |
| | | | | | | | | |
Medical - Hospitals 2.26% | |
Phoenix Healthcare Group Co., Ltd. | | | 266,000 | | | | 370,003 | |
| | | | | | | | | |
Metal Processors & Fabricators 0.90% | |
Catcher Technology Co., Ltd. | | | 10,000 | | | | 74,562 | |
STP & I PCL NVDR | | | 256,000 | | | | 73,167 | |
| | | | | | | | 147,729 | |
| | | | | | | | | |
Non - Ferrous Metals 0.08% | |
Sterling Group Ventures, Inc. | | | 500,000 | | | | 12,550 | * |
| | | | | | | | | |
Optical Supplies 0.41% | |
St. Shine Optical | | | 3,000 | | | | 67,794 | |
| | | | | | | | | |
Photo Equipment & Supplies 3.37% | |
Sunny Optical Technology Group Co., Ltd. | | | 157,000 | | | | 552,773 | |
| | | | | | | | | |
Power Converters/Supply Equipment 4.05% | |
Boer Power Holdings Ltd. | | | 253,000 | | | | 111,096 | |
China High Speed Transmission Equipment Group Co., Ltd. | | | 354,000 | | | | 285,203 | |
Xinjiang Goldwind Science & Technology Co., Ltd., H shares | | | 195,000 | | | | 268,263 | |
| | | | | | | | 664,562 | |
| | | | | | | | | |
Property/Casualty Insurance 4.83% | |
Dongbu Insurance Co., Ltd. | | | 1,700 | | | | 102,324 | |
Hyundai Marine & Fire Insurance Co., Ltd. | | | 2,581 | | | | 65,814 | |
Meritz Fire & Marine Insurance Co., Ltd. | | | 5,357 | | | | 68,628 | |
People's Insurance Group of China Ltd., H shares | | | 357,000 | | | | 137,439 | |
PICC Property & Casualty Co., Ltd., H shares | | | 265,000 | | | | 417,811 | |
| | | | | | | | 792,016 | |
See notes to portfolios of investments and notes to financial statements.
53
China Region Fund
Portfolio of Investments (unaudited) | June 30, 2016 |
Common Stocks (cont’d) | | Shares | | | Value | |
| | | | | | | |
Public Thoroughfares 1.23% | |
Zhejiang Expressway Co., Ltd., H shares | | | 214,000 | | | $ | 202,450 | |
| | | | | | | | | |
Real Estate Operating/Development 5.99% | |
China Vanke Co., Ltd., H shares | | | 35,000 | | | | 69,118 | |
Farglory Land Development Co. | | | 64,000 | | | | 74,093 | |
Future Land Development Holdings Ltd. | | | 1,060,000 | | | | 137,424 | |
Highwealth Construction Corp. | | | 75,000 | | | | 124,079 | |
Pakuwon Jati Tbk PT | | | 12,285,000 | | | | 576,672 | |
| | | | | | | | 981,386 | |
| | | | | | | | | |
Reinsurance 0.40% | |
Korean Reinsurance Co. | | | 6,145 | | | | 65,375 | |
| | | | | | | | | |
Retail - Apparel/Shoe 1.54% | |
ANTA Sports Products Ltd. | | | 125,000 | | | | 251,893 | |
| | | | | | | | | |
Retail - Building Products 0.54% | |
Home Product Center PCL NVDR | | | 313,000 | | | | 88,485 | |
| | | | | | | | | |
Semiconductor Components - Integrated Circuits 0.86% | |
Powertech Technology, Inc. | | | 32,000 | | | | 71,449 | |
Semiconductor Manufacturing International Corp. | | | 857,000 | | | | 69,031 | * |
| | | | | | | | 140,480 | |
| | | | | | | | | |
Semiconductor Equipment 0.71% | |
Wonik IPS Co., Ltd. | | | 8,999 | | | | 116,204 | * |
| | | | | | | | | |
Telecom Services 3.48% | |
PCCW Ltd. | | | 850,000 | | | | 571,158 | |
| | | | | | | | | |
Textile - Apparel 1.55% | |
Eclat Textile Ltd. | | | 5,000 | | | | 48,489 | |
Texhong Textile Group Ltd. | | | 218,000 | | | | 206,222 | |
| | | | | | | | 254,711 | |
| | | | | | | | | |
Therapeutics 0.89% | |
Dawnrays Pharmaceutical (Holdings) Ltd. | | | 190,000 | | | | 145,798 | |
| | | | | | | | | |
Water Treatment Systems 0.90% | |
CT Environmental Group Ltd. | | | 510,000 | | | | 148,378 | |
See notes to portfolios of investments and notes to financial statements.
54
China Region Fund
Portfolio of Investments (unaudited) | June 30, 2016 |
Common Stocks (cont’d) | | Shares | | | Value | |
| | | | | | | |
Web Portals/ISP 0.51% | |
NAVER Corp. | | | 134 | | | $ | 83,015 | |
| | |
Total Common Stocks | | | | 12,835,567 | |
(cost $12,509,163) | | | | | | | | |
| | | | | | | | | |
Exchange-Traded Fund 0.01% | | | | | | | | |
| | | | | | | | | |
iShares MSCI Hong Kong ETF | | | 100 | | | | 1,958 | |
(cost $2,022) | | | | | | | | |
| |
Total Investments 78.32% | | | | 12,837,525 | |
(cost $12,511,185) | | | | | | | | |
Other assets and liabilities, net 21.68% | | | | | | | 3,553,565 | |
| | | | | | | | | |
Net Assets 100.0% | | | | | | $ | 16,391,090 | |
Country Distribution* Based on Total Investments | June 30, 2016 |
 |
* | Country distribution shown is based on domicile and not intended to conform to the China region definition in the prospectus. The locale of company operations may be different. |
See notes to portfolios of investments and notes to financial statements.
55
Notes to Portfolios of Investments (unaudited) | June 30, 2016 |
Legend
| * | Non-income producing security. |
| + | Affiliated company (see following) |
| # | Illiquid Security |
| ^ | In default on interest payments and/or principal payments. Rate shown represents the last coupon rate prior to default. |
| ADR | American Depositary Receipt |
| AGC | Assured Guaranty Corporation |
| AGM | Assured Guaranty Municipal |
| AMBAC | American Municipal Bond Assurance Corporation |
| BAM | Build America Mutual Assurance Company |
| BHAC | Berkshire Hathaway Insurance Corporation |
| CIFG | CIFG Assurance North America Incorporated |
| GDR | Global Depositary Receipt |
| GO | General Obligation Bond |
| NATL | National Public Finance Guarantee Corporation |
| NVDR | Non-voting Depositary Receipt |
| PSF-GTD | Texas Public School Fund Guarantee |
| Q-SBLF | Qualified School Bond Loan Fund |
| RS | Restricted Security. See further information and detail on restricted securities in the Restricted Securities section of these Notes to Portfolios of Investments. |
| ZCB | Zero Coupon Bond |
| @ | Security was fair valued at June 30, 2016, by U.S. Global Investors, Inc. (Adviser) (other than international securities fair valued pursuant to systematic fair value models) in accordance with valuation procedures approved by the Board of Trustees. These securities, as a percentage of net assets at June 30, 2016, were 0.04% of All American Equity Fund, 1.55% of Holmes Macro Trends Fund, 10.41% of Global Resources Fund, 5.85% of World Precious Minerals Fund, 4.50% of Gold and Precious Metals Fund, and 0.16% of Emerging Europe Fund, respectively. See the Fair Valuation of Securities section of these Notes to Portfolios of Investments for further discussion of fair valued securities. |
| 144A | Pursuant to Rule 144A of the Securities Act of 1933, these securities may be resold in transactions exempt from registration, normally to qualified institutional buyers. The market value of these securities and percentage of net assets as of June 30, 2016 amounted to $9, 0.00%, of Holmes Macro Trends Fund, $690,958, 0.69%, of Global Resources Fund, $4,314,307, 2.40%, of World Precious Minerals Fund, $1,307, 0.00%, of Gold and Precious Metals Fund, $710,836, 1.68%, of Emerging Europe Fund and $627,084, 3.83%, of China Region Fund. |
General
The yields reflect the effective yield from the date of purchase.
Variable Rate Notes have periodic reset features, which effectively shorten the maturity dates and reset the interest rates as tied to various interest-bearing instruments. Rates shown are current rates at June 30, 2016.
Principal amounts are in U.S. dollars unless otherwise noted.
Fair Valuation of Securities
For the Funds’ policies regarding the valuation of investments and other significant accounting policies, please refer to the Notes to Financial Statements.
The Funds are required to disclose information regarding the fair value measurements of a Fund’s assets and liabilities. Fair value is the price that would be received to sell an asset or paid to transfer a liability in an orderly transaction between market participants at the measurement date. The measurement requirements established a three-tier hierarchy to maximize the use of observable market data and
56
Notes to Portfolios of Investments (unaudited) | June 30, 2016 |
minimize the use of unobservable inputs and to establish classification of fair value measurements for disclosure purposes. Inputs refer broadly to the assumptions that market participants would use in pricing the asset or liability, including assumptions about risk, for example, the risk inherent in a particular valuation technique used to measure fair value including such a pricing model and/or the risk inherent in the inputs to the valuation technique. Inputs may be observable or unobservable. Observable inputs are inputs that reflect the assumptions market participants would use in pricing the asset or liability developed based on market data obtained from sources independent of the reporting entity. Unobservable inputs are inputs that reflect the reporting entity’s own assumptions about the assumptions market participants would use in pricing the asset or liability developed based on the best information available in the circumstances.
The inputs or methodology used for valuing securities are not necessarily an indication of the risk associated with investing in those securities. For example, short term U.S. government obligations maturing in sixty days or less are valued using amortized cost. Generally, amortized cost reflects the current fair value of a security, but since the value is not obtained from a quoted price in an active market, such securities are reflected as Level 2. Because of the inherent uncertainties of valuation, the values reflected in the portfolios may materially differ from the values received upon actual sale of those investments.
The three levels defined by the fair value hierarchy are as follows:
Level 1 – Quoted prices in active markets for identical securities.
Level 2 – Prices determined using significant other observable inputs (including quoted prices for similar securities, interest rates, prepayment speeds, credit risk, etc.). Short-term securities with maturities of sixty days or less are valued at amortized cost, which approximates market value, and are categorized as Level 2 in the hierarchy. Municipal securities, long-term U.S. government obligations and corporate debt securities are valued in accordance with the evaluated price supplied by the pricing service and generally categorized as Level 2 in the hierarchy. Other securities that are categorized as Level 2 in the hierarchy include, but are not limited to, warrants that do not trade on an exchange, securities valued at the mean between the last reported bid and ask quotation and international equity securities valued by an independent third party in order to adjust for stale pricing.
Level 3 – Prices determined using significant unobservable inputs (including the Fund’s own assumptions). For restricted equity securities and private placements where observable inputs are limited, assumptions about market activity and risk are used in determining fair value.
57
Notes to Portfolios of Investments (unaudited) | June 30, 2016 |
The following table summarizes the valuation of each Fund’s securities as of June 30, 2016, using the fair value hierarchy:
| | | Quoted Prices in Active Markets for Identical Investments (Level 1) | | | Significant Other Observable Inputs
(Level 2) | | | Significant Unobservable Inputs
(Level 3) | | | Total | |
U.S. Government Securities Ultra-Short Bond Fund | | | | | | | |
Investments in Securities* | | | | | | | | | | | | |
United States Government and Agency Obligations | | $ | — | | | $ | 56,854,826 | | | $ | — | | | $ | 56,854,826 | |
Total | | $ | — | | | $ | 56,854,826 | | | $ | — | | | $ | 56,854,826 | |
Near-Term Tax Free Fund | | | | | | | | | | | | | | | | |
Investments in Securities* | | | | | | | | | | | | | | | | |
Municipal Bonds | | $ | — | | | $ | 108,581,059 | | | $ | — | | | $ | 108,581,059 | |
Total | | $ | — | | | $ | 108,581,059 | | | $ | — | | | $ | 108,581,059 | |
All American Equity Fund | | | | | | | | | | | | | | | | |
Investments in Securities* | | | | | | | | | | | | | | | | |
Common Stocks | | $ | 14,955,050 | | | $ | — | | | $ | — | | | $ | 14,955,050 | |
Exchange-Traded Fund | | | 82,284 | | | | — | | | | — | | | | 82,284 | |
Rights | | | — | | | | — | | | | 7,659 | | | | 7,659 | |
Total | | $ | 15,037,334 | | | $ | — | | | $ | 7,659 | | | $ | 15,044,993 | |
Holmes Macro Trends Fund | | | | | | | | | | | | | | | | |
Investments in Securities* | | | | | | | | | | | | | | | | |
Common Stocks: | | | | | | | | | | | | | | | | |
Energy - Alternate Sources | | $ | — | | | $ | — | | | $ | 43,820 | | | $ | 43,820 | |
Medical - Hospitals | | | — | | | | — | | | | — | | | | — | |
Real Estate Operating/Development | | | — | | | | — | | | | 318,492 | | | | 318,492 | |
All Other Common Stocks | | | 33,725,845 | | | | — | | | | — | | | | 33,725,845 | |
Exchange-Traded Funds | | | 103,237 | | | | — | | | | — | | | | 103,237 | |
Warrants | | | — | | | | 9 | | | | — | | | | 9 | |
Convertible Debentures | | | — | | | | 472,938 | | | | — | | | | 472,938 | |
Corporate Note | | | — | | | | — | | | | 212,500 | | | | 212,500 | |
Total | | $ | 33,829,082 | | | $ | 472,947 | | | $ | 574,812 | | | $ | 34,876,841 | |
Global Resources Fund | | | | | | | | | | | | | | | | |
Investments in Securities* | | | | | | | | | | | | | | | | |
Common Stocks: | | | | | | | | | | | | | | | | |
Agricultural Chemicals | | $ | 2,305,015 | | | $ | 1,806,350 | | | $ | — | | | $ | 4,111,365 | |
Agricultural Operations | | | — | | | | 1,749,331 | | | | — | | | | 1,749,331 | |
Chemicals - Plastics | | | — | | | | 1,055,214 | | | | — | | | | 1,055,214 | |
Coal | | | 343 | | | | 63,768 | | | | 16,448 | | | | 80,559 | |
Diversified Minerals | | | 3,131,369 | | | | 23,821 | | | | — | | | | 3,155,190 | |
Energy - Alternate Sources | | | 950,208 | | | | 849,618 | | | | 1,051,680 | | | | 2,851,506 | |
Forestry | | | 1,840,288 | | | | 20,678 | | | | — | | | | 1,860,966 | |
Gold Mining | | | 12,117,585 | | | | 4,845,764 | | | | 746 | | | | 16,964,095 | |
Investment Companies | | | — | | | | 424,398 | | | | — | | | | 424,398 | |
Machinery - General Industrial | | | 1,126,871 | | | | — | | | | — | | | | 1,126,871 | |
Medical - Hospitals | | | — | | | | — | | | | — | | | | — | |
Metal - Copper | | | 2,426,647 | | | | 1,230,784 | | | | — | | | | 3,657,431 | |
Metal - Diversified | | | 2,285 | | | | 337,059 | | | | 1,114,457 | | | | 1,453,801 | |
58
Notes to Portfolios of Investments (unaudited) | June 30, 2016 |
| | Quoted Prices in Active Markets for Identical Investments (Level 1) | | | Significant Other Observable Inputs
(Level 2) | | | Significant Unobservable Inputs
(Level 3) | | | Total | |
Global Resources Fund (cont’d) | | | | | | | | | | | | |
Investments in Securities* (cont’d) | | | | | | | | | | | | |
Common Stocks: (cont’d) | | | | | | | | | | | | |
Mining Services | | $ | — | | | $ | — | | | $ | — | | | $ | — | |
Natural Resource Technology | | | — | | | | — | | | | 137,351 | | | | 137,351 | |
Non - Ferrous Metals | | | — | | | | 12,550 | | | | — | | | | 12,550 | |
Oil Companies - Integrated | | | 271,846 | | | | 910,791 | | | | — | | | | 1,182,637 | |
Paper & Related Products | | | — | | | | 1,230,847 | | | | — | | | | 1,230,847 | |
Power Converters/Supply Equipment | | | — | | | | 970,305 | | | | — | | | | 970,305 | |
Real Estate Operating/Development | | | — | | | | — | | | | 5,558,094 | | | | 5,558,094 | |
Steel - Producers | | | 1,134,750 | | | | 1,084,231 | | | | — | | | | 2,218,981 | |
Steel - Specialty | | | — | | | | 964,367 | | | | — | | | | 964,367 | |
Textile - Products | | | — | | | | 1,071,640 | | | | — | | | | 1,071,640 | |
All Other Common Stocks | | | 24,114,150 | | | | — | | | | — | | | | 24,114,150 | |
Warrants | | | — | | | | 59,375 | | | | — | | | | 59,375 | |
Purchased Call Option | | | — | | | | 123,000 | | | | — | | | | 123,000 | |
Convertible Debentures | | | — | | | | 10,147,981 | | | | — | | | | 10,147,981 | |
Corporate Note | | | — | | | | — | | | | 2,550,000 | | | | 2,550,000 | |
Total | | $ | 49,421,357 | | | $ | 28,981,872 | | | $ | 10,428,776 | | | $ | 88,832,005 | |
World Precious Minerals Fund | | | | | | | | | | | | | | | | |
Investments in Securities* | | | | | | | | | | | | | | | | |
Common Stocks: | | | | | | | | | | | | | | | | |
Agricultural Operations | | $ | — | | | $ | 52,945 | | | $ | — | | | $ | 52,945 | |
Capital Pools | | | — | | | | 16,642 | | | | — | | | | 16,642 | |
Coal | | | — | | | | — | | | | 3,870 | | | | 3,870 | |
Diamonds/Precious Stones | | | 2,622,915 | | | | 339,256 | | | | — | | | | 2,962,171 | |
Diversified Minerals | | | 13,655,604 | | | | 493,488 | | | | 17,899 | | | | 14,166,991 | |
Gold Mining | | | 74,909,940 | | | | 8,745,375 | | | | 107,851 | | | | 83,763,166 | |
Medical - Hospitals | | | — | | | | — | | | | — | | | | — | |
Metal - Diversified | | | 13,603,570 | | | | 3,007,036 | | | | 1,528,524 | | | | 18,139,130 | |
Mining Services | | | — | | | | 384,203 | | | | — | | | | 384,203 | |
Oil Companies - Exploration & Production | | | — | | | | — | | | | — | | | | — | |
Precious Metals | | | 13,330,743 | | | | 1,941,846 | | | | — | | | | 15,272,589 | |
All Other Common Stocks | | | 6,476,867 | | | | — | | | | — | | | | 6,476,867 | |
Subscription Receipts | | | — | | | | 1,352,994 | | | | — | | | | 1,352,994 | |
Units | | | — | | | | 1,102,984 | | | | — | | | | 1,102,984 | |
Warrants: | | | | | | | | | | | | | | | | |
Diversified Minerals | | | — | | | | 41,765 | | | | — | | | | 41,765 | |
Gold Mining | | | 42,146 | | | | 1,487,967 | | | | — | | | | 1,530,113 | |
Metal - Copper | | | — | | | | — | | | | — | | | | — | |
Metal - Diversified | | | — | | | | 662,525 | | | | — | | | | 662,525 | |
Precious Metals | | | — | | | | 644,375 | | | | — | | | | 644,375 | |
Silver Mining | | | — | | | | — | | | | — | | | | — | |
Special Warrant | | | — | | | | — | | | | — | | | | — | |
Rights | | | 178,992 | | | | — | | | | — | | | | 178,992 | |
Purchased Call Option | | | — | | | | 36,000 | | | | — | | | | 36,000 | |
59
Notes to Portfolios of Investments (unaudited) | June 30, 2016 |
| | Quoted Prices in Active Markets for Identical Investments (Level 1) | | | Significant Other Observable Inputs
(Level 2) | | | Significant Unobservable Inputs
(Level 3) | | | Total | |
World Precious Minerals Fund (cont’d) | | | | | | | | | | | | |
Investments in Securities* (cont’d) | | | | | | | | | | | | |
Convertible Debentures | | $ | — | | | $ | 8,685,969 | | | $ | — | | | $ | 8,685,969 | |
Corporate Note | | | — | | | | — | | | | 680,000 | | | | 680,000 | |
Total | | $ | 124,820,777 | | | $ | 28,995,370 | | | $ | 2,338,144 | | | $ | 156,154,291 | |
Gold and Precious Metals Fund | | | | | | | | | | | | | | | | |
Investments in Securities* | | | | | | | | | | | | | | | | |
Common Stocks: | | | | | | | | | | | | | | | | |
Gold Mining | | $ | 65,056,685 | | | $ | 13,346,698 | | | $ | — | | | $ | 78,403,383 | |
Medical - Hospitals | | | — | | | | — | | | | — | | | | — | |
Metal - Diversified | | | 1,927,193 | | | | 2,251,441 | | | | — | | | | 4,178,634 | |
All Other Common Stocks | | | 11,494,430 | | | | — | | | | — | | | | 11,494,430 | |
Exchange Traded Fund | | | 1,499,402 | | | | — | | | | — | | | | 1,499,402 | |
Subscription Receipts | | | — | | | | 3,382,484 | | | | — | | | | 3,382,484 | |
Warrants | | | — | | | | 455,381 | | | | — | | | | 455,381 | |
Purchased Call Option | | | — | | | | 27,000 | | | | — | | | | 27,000 | |
Convertible Debentures | | | — | | | | 4,481,834 | | | | — | | | | 4,481,834 | |
Corporate Notes | | | — | | | | — | | | | 700,974 | | | | 700,974 | |
Total | | $ | 79,977,710 | | | $ | 23,944,838 | | | $ | 700,974 | | | $ | 104,623,522 | |
Emerging Europe Fund | | | | | | | | | | | | | | | | |
Investments in Securities* | | | | | | | | | | | | | | | | |
Common Stocks: | | | | | | | | | | | | | | | | |
Agricultural Chemicals | | $ | 49,128 | | | $ | 530,125 | | | $ | — | | | $ | 579,253 | |
Airlines | | | 160,081 | | | | 1,184,149 | | | | — | | | | 1,344,230 | |
Cellular Telecommunication | | | 871,748 | | | | 438,646 | | | | — | | | | 1,310,394 | |
Commercial Banks - Non US | | | 3,591,400 | | | | 4,902,546 | | | | — | | | | 8,493,946 | |
Computer Services | | | 213,282 | | | | 327,591 | | | | — | | | | 540,873 | |
Food - Retail | | | 110,019 | | | | 715,178 | | | | — | | | | 825,197 | |
Gold Mining | | | 188,243 | | | | 37,689 | | | | — | | | | 225,932 | |
Metal - Diversified | | | 309,654 | | | | 168,767 | | | | — | | | | 478,421 | |
Oil Companies - Integrated | | | 4,700,545 | | | | 4,042,835 | | | | — | | | | 8,743,380 | |
Steel - Producers | | | 283,006 | | | | 560,885 | | | | — | | | | 843,891 | |
Telecom Services | | | 207,304 | | | | 920,559 | | | | — | | | | 1,127,863 | |
Web Portals/ISP | | | 262,200 | | | | — | | | | — | | | | 262,200 | |
All Other Common Stocks | | | — | | | | 15,150,472 | | | | — | | | | 15,150,472 | |
Exchange-Traded Fund | | | 727,632 | | | | — | | | | — | | | | 727,632 | |
Purchased Call Option | | | — | | | | 201,000 | | | | — | | | | 201,000 | |
Corporate Note | | | — | | | | — | | | | 69,307 | | | | 69,307 | |
Total | | $ | 11,674,242 | | | $ | 29,180,442 | | | $ | 69,307 | | | $ | 40,923,991 | |
China Region Fund | | | | | | | | | | | | | | | | |
Investments in Securities* | | | | | | | | | | | | | | | | |
Common Stocks: | | | | | | | | | | | | | | | | |
Entertainment Software | | $ | 96,610 | | | $ | — | | | $ | — | | | $ | 96,610 | |
Internet Financial Services | | | 39,780 | | | | — | | | | — | | | | 39,780 | |
All Other Common Stocks | | | — | | | | 12,699,177 | | | | — | | | | 12,699,177 | |
Exchange-Traded Fund | | | 1,958 | | | | — | | | | — | | | | 1,958 | |
Total | | $ | 138,348 | | | $ | 12,699,177 | | | $ | — | | | $ | 12,837,525 | |
* | Refer to the Portfolio of Investments for a detailed list of the Fund’s investments. |
60
Notes to Portfolios of Investments (unaudited) | June 30, 2016 |
The following table shows transfers between Level 1 and Level 2 of the fair value hierarchy during the period January 1, 2016, through June 30, 2016:
Fund | | Transfers From Level 1 to Level 2* | | | Transfers From Level 2 to Level 1* | |
Global Resources Fund | | $ | — | | | $ | 246,620 | (1) |
World Precious Minerals Fund | | | — | | | | 2,440,086 | (1) |
Gold and Precious Metals Fund | | | — | | | | 424,419 | (1) |
Emerging Europe Fund | | | — | | | | 445,239 | (1) |
* | The Funds’ policy is to recognize transfers in and transfers out as of the end of the reporting period. |
(1) | Securities were valued at a quoted price at the end of the current period, but at the mean between bid and ask quotations at the end of the prior fiscal year. |
The following is a reconciliation of assets for which unobservable inputs (Level 3) were used in determining fair value during the period January 1, 2016, through June 30, 2016:
| | Rights | | | Total | |
All American Equity Fund | | | | | | |
Beginning Balance 12/31/15 | | $ | 7,659 | | | $ | 7,659 | |
Ending Balance 06/30/16 | | $ | 7,659 | | | $ | 7,659 | |
| | | | | | | | | |
Net change in unrealized appreciation (depreciation) from Investments held as of 06/30/16(1) | | $ | — | | | $ | — | |
| | | Common
Stocks | | | Convertible Debentures | | | Corporate
Note | | | Total | |
Holmes Macro Trends Fund | | | | | | | | | | | | |
Beginning Balance 12/31/15 | | $ | 349,510 | | | $ | 190,575 | | | $ | 212,500 | | | $ | 752,585 | |
Purchases | | | — | | | | 211,750 | | | | — | | | | 211,750 | |
Sales | | | — | | | | (211,750 | ) | | | — | | | | (211,750 | ) |
Total realized gain (loss) | | | — | | | | (167,750 | ) | | | — | | | | (167,750 | ) |
Net change in unrealized appreciation (depreciation) | | | 12,802 | | | | 249,835 | | | | — | | | | 262,637 | |
Transfers out of Level 3* | | | — | | | | (272,660 | ) | | | — | | | | (272,660 | ) |
Ending Balance 06/30/16 | | $ | 362,312 | | | $ | — | | | $ | 212,500 | | | $ | 574,812 | |
| | | | | | | | | | | | | | | | | |
Net change in unrealized appreciation (depreciation) from Investments held as of 06/30/16(1) | | $ | 12,802 | | | $ | — | | | $ | — | | | $ | 12,802 | |
61
Notes to Portfolios of Investments (unaudited) | June 30, 2016 |
| | Common
Stocks | | | Convertible Debentures | | | Corporate
Note | | | Total | |
Global Resources Fund | | | | | | | | | | | | |
Beginning Balance 12/31/15 | | $ | 6,751,495 | | | $ | 4,428,765 | | | $ | 2,550,000 | | | $ | 13,730,260 | |
Purchases | | | 1,114,457 | | | | 4,941,764 | | | | — | | | | 6,056,221 | |
Sales | | | — | | | | (4,920,850 | ) | | | — | | | | (4,920,850 | ) |
Total realized gain (loss) | | | — | | | | (3,901,360 | ) | | | — | | | | (3,901,360 | ) |
Net change in unrealized appreciation (depreciation) | | | (3,624 | ) | | | 5,811,838 | | | | — | | | | 5,808,214 | |
Transfers into Level 3* | | | 16,448 | | | | — | | | | — | | | | 16,448 | |
Transfers out of Level 3* | | | — | | | | (6,360,157 | ) | | | — | | | | (6,360,157 | ) |
Ending Balance 06/30/16 | | $ | 7,878,776 | | | $ | — | | | $ | 2,550,000 | | | $ | 10,428,776 | |
| | | | | | | | | | | | | | | | | |
Net change in unrealized appreciation (depreciation) from Investments held as of 06/30/16(1) | | $ | (3,624 | ) | | $ | — | | | $ | — | | | $ | (3,624 | ) |
| | | Common Stocks | | | Warrants | | | Special Warrants | | | Convertible Debentures | | | Corporate Note | | | Total | |
World Precious Minerals Fund | |
Beginning Balance 12/31/15 | | $ | 72,013 | | | $ | — | | | $ | — | | | $ | 2,999,700 | | | $ | 680,000 | | | $ | 3,751,713 | |
Purchases | | | 1,528,524 | | | | — | | | | — | | | | 3,333,000 | | | | — | | | | 4,861,524 | |
Sales | | | — | | | | — | | | | — | | | | (3,333,000 | ) | | | — | | | | (3,333,000 | ) |
Total realized gain (loss) | | | — | | | | — | | | | — | | | | (2,644,400 | ) | | | — | | | | (2,644,400 | ) |
Net change in unrealized appreciation (depreciation) | | | 53,737 | | | | — | | | | — | | | | 3,936,454 | | | | — | | | | 3,990,191 | |
Transfers into Level 3* | | | 3,870 | | | | — | | | | — | | | | — | | | | — | | | | 3,870 | |
Transfers out of Level 3* | | | — | | | | — | | | | — | | | | (4,291,754 | ) | | | — | | | | (4,291,754 | ) |
Ending Balance 06/30/16 | | $ | 1,658,144 | | | $ | — | | | $ | — | | | $ | — | | | $ | 680,000 | | | $ | 2,338,144 | |
| | | | | | | | | | | | | | | | | | | | | | | | | |
Net change in unrealized appreciation (depreciation) from Investments held as of 06/30/16(1) | | $ | 53,737 | | | $ | — | | | $ | — | | | $ | — | | | $ | — | | | $ | 53,737 | |
| | Common Stocks | | | Warrants | | | Convertible Debentures | | | Corporate
Notes | | | Total | |
Gold and Precious Metals Fund | | | | | | | | | | | | | | | |
Beginning Balance 12/31/15 | | $ | — | | | $ | — | | | $ | 1,517,175 | | | $ | 740,766 | | | $ | 2,257,941 | |
Purchases | | | — | | | | — | | | | 1,685,750 | | | | — | | | | 1,685,750 | |
Sales | | | — | | | | — | | | | (1,685,750 | ) | | | — | | | | (1,685,750 | ) |
Total realized gain (loss) | | | — | | | | — | | | | (1,333,310 | ) | | | — | | | | (1,333,310 | ) |
Net change in unrealized appreciation (depreciation) | | | — | | | | — | | | | 1,986,800 | | | | (39,792 | ) | | | 1,947,008 | |
Transfers out of Level 3* | | | — | | | | — | | | | (2,170,665 | ) | | | — | | | | (2,170,665 | ) |
Ending Balance 06/30/16 | | $ | — | | | $ | — | | | $ | — | | | $ | 700,974 | | | $ | 700,974 | |
| | | | | | | | | | | | | | | | | | | | | |
Net change in unrealized appreciation (depreciation) from Investments held as of 06/30/16(1) | | $ | — | | | $ | — | | | $ | — | | | $ | (39,792 | ) | | $ | (39,792 | ) |
62
Notes to Portfolios of Investments (unaudited) | June 30, 2016 |
| | Corporate
Note | | | Total | |
Emerging Europe Fund | | | | | | |
Beginning Balance 12/31/15 | | $ | 60,525 | | | $ | 60,525 | |
Net change in unrealized appreciation (depreciation) | | | 8,782 | | | | 8,782 | |
Ending Balance 06/30/16 | | $ | 69,307 | | | $ | 69,307 | |
| | | | | | | | | |
Net change in unrealized appreciation (depreciation) from Investments held as of 06/30/16(1) | | $ | 8,782 | | | $ | 8,782 | |
| | Common
Stocks | | | Total | |
China Region Fund | | | | | | |
Beginning Balance 12/31/15 | | $ | 233,670 | | | $ | 233,670 | |
Sales | | | (91,764 | ) | | | (91,764 | ) |
Total realized gain (loss) | | | (4,549 | ) | | | (4,549 | ) |
Net change in unrealized appreciation (depreciation) | | | (51,469 | ) | | | (51,469 | ) |
Transfers out of Level 3* | | | (85,888 | ) | | | (85,888 | ) |
Ending Balance 06/30/16 | | $ | — | | | $ | — | |
| | | | | | | | | |
Net change in unrealized appreciation (depreciation) from Investments held as of 06/30/16(1) | | $ | — | | | $ | — | |
* | The Funds’ policy is to recognize transfers in and transfers out as of the end of the reporting period. |
(1) | The amounts shown represent the net change in unrealized appreciation (depreciation) attributable to only those investments still held and classified as Level 3 at June 30, 2016. |
Significant unobservable inputs developed by the Valuation Committee for Level 3 investments held at period-end are as follows:
| | | Fair Value at 06/30/16 | | Valuation Technique(s) | Unobservable Input | Range (Weighted Average) | |
All American Equity Fund | | | | | |
Investments in Securities | | | | | |
Rights | | $ | 7,659 | | Market Transaction(1) | Discount | 0% | |
| | | | | | | | | |
Holmes Macro Trends Fund | | | | | |
Investments in Securities | | | | | |
Common Stocks | | | 43,820 | | Market Transaction(1) | Discount | 56% - 100% discount (58% discount) | |
Common Stocks | | | 318,492 | | Method of Comparables Pricing(2) | Multiples | 4.1 - 12.3(6.3) | |
Corporate Note | | | 212,500 | | Market Transaction(1) | Discount | 0% | |
63
Notes to Portfolios of Investments (unaudited) | June 30, 2016 |
| | Fair Value at 06/30/16 | | Valuation Technique(s) | Unobservable Input | Range (Weighted Average) | |
Global Resources Fund | | | | | |
Investments in Securities | | | | | |
Common Stocks | | $ | 2,320,682 | | Market Transaction(1) | Discount | 100% discount - 13% premum (40% discount) | |
Common Stocks | | | 5,558,094 | | Method of Comparables Pricing(2) | Multiples | 4.1 - 12.3(6.3) | |
Corporate Note | | | 2,550,000 | | Market Transaction(1) | Discount | 0% | |
| | | | | | | | | |
World Precious Minerals Fund | | | | | |
Investments in Securities | | | | | |
Common Stocks | | | 1,658,144 | | Market Transaction(1) | Discount | 100% discount - 96% premium (44% discount) | |
Warrants | | | — | | Market Transaction(1) | Discount | 100% | |
Special Warrants | | | — | | Market Transaction(1) | Discount | 100% | |
Corporate Note | | | 680,000 | | Market Transaction(1) | Discount | 0% | |
| | | | | | | | | |
Gold and Precious Metals Fund | | | | | |
Investments in Securities | | | | | |
Common Stocks | | | — | | Market Transaction(1) | Discount | 100% | |
Warrants | | | — | | Market Transaction(1) | Discount | 100% | |
Corporate Notes | | | 700,974 | | Market Transaction(1) | Discount | 0% - 8% discount (5% discount) | |
| | | | | | | | | |
Emerging Europe Fund | | | | | |
Investments in Securities | | | | | |
Corporate Note | | | 69,307 | | Market Transaction(1) | Discount | 95% | |
(1) | Market Transaction refers to most recent known market transaction, including transactions in which the fund participated, as adjusted for any discount or premium as discussed below. |
(2) | The Method of Comparables Pricing valuation technique involves determining a comparable group of companies that exhibit similar characteristics to that of the Level 3 security (the Comparables), gathering information about the Comparables to determine their range of valuation multiples and selecting the appropriate multiple within the determined range of the Comparables to apply in valuing the Level 3 security. |
The majority of securities classified as Level 3 are private companies. The initial valuation is usually cost, which is then adjusted as determined by the Valuation Committee for subsequent known market transactions and evaluated for progress against anticipated milestones and current operations. An evaluation that the holding no longer meets expectations could result in the application of discounts and a significantly lower fair valuation. For certain securities, the last known market transaction is increased or decreased by changes in a market index or industry peers as approved by the Valuation Committee.
64
Notes to Portfolios of Investments (unaudited) | June 30, 2016 |
Affiliated Companies - Indicated in Portfolio of Investments as “+”
The Investment Company Act of 1940 defines affiliates as companies in which the Fund owns at least 5% of the outstanding voting securities. The following is a summary of transactions with each affiliated company during the period ended June 30, 2016.
| | | Shares of Affiliated Companies | |
Global Resources Fund | | December 31,
2015 | | | Additions | | | Reductions | | | June 30,
2016 | |
Agriterra Ltd. | | | 69,849,776 | | | | — | | | | — | | | | 69,849,776 | |
Atlas African Industries Ltd.(a) | | | 42,993,083 | | | | 212,861,538 | | | | — | | | | 255,854,621 | |
Caribbean Resources Corp.(b) | | | 4,362,314 | | | | — | | | | (4,362,297 | ) | | | 17 | |
Pacific Green Energy Corp. | | | 2,400,000 | | | | — | | | | — | | | | 2,400,000 | |
At June 30, 2016, the value of investments in affiliated companies was $1,646,328, representing 1.64% of net assets, and the total cost was $39,515,467. Net realized losses on transactions were $24,070 and there was no income earned for the period.
| | | Shares of Affiliated Companies | |
World Precious Minerals Fund | | December 31,
2015 | | | Additions | | | Redemptions | | | June 30,
2016 | |
Argent Minerals Ltd. | | | 17,100,000 | | | | — | | | | — | | | | 17,100,000 | |
Barsele Minerals Corp. | | | 9,411,500 | | | | 331,500 | | | | (500,000 | ) | | | 9,243,000 | |
Barsele Minerals Corp., Warrants | | | 1,850,000 | | | | — | | | | — | | | | 1,850,000 | |
Candente Gold Corp. | | | 4,875,000 | | | | — | | | | — | | | | 4,875,000 | |
Canyon Resources Ltd. | | | 10,006,593 | | | | — | | | | — | | | | 10,006,593 | |
Canyon Resources Ltd., Warrants | | | 6,168,864 | | | | — | | | | — | | | | 6,168,864 | |
Cardinal Resources Ltd. | | | 9,000,000 | | | | 4,493,454 | | | | (2,700 | ) | | | 13,490,754 | (c) |
Cardinal Resources Ltd., Rights | | | 1,500,000 | | | | — | | | | — | | | | 1,500,000 | (c) |
Mammoth Resources Corp. | | | 2,818,000 | | | | 2,000,000 | | | | — | | | | 4,818,000 | |
Minera Alamos, Inc. | | | — | | | | 4,450,000 | | | | — | | | | 4,450,000 | |
Mineral Mountain Resources Ltd. | | | 10,000,000 | | | | — | | | | (8,000,000 | ) | | | 2,000,000 | (c) |
Mineral Mountain Resources Ltd., Warrants | | | 3,500,000 | | | | — | | | | (2,800,000 | ) | | | 700,000 | (c) |
Nano One Materials Corp. | | | — | | | | 3,000,000 | | | | — | | | | 3,000,000 | |
Orex Minerals, Inc. | | | 9,510,000 | | | | 1,338,500 | | | | (1,659,500 | ) | | | 9,189,000 | |
Orex Minerals, Inc., Warrants | | | 1,850,000 | | | | — | | | | (600,000 | ) | | | 1,250,000 | |
Red Pine Exploration, Inc. | | | — | | | | 12,000,000 | | | | — | | | | 12,000,000 | |
Redstar Gold Corp. | | | 8,797,714 | | | | 6,202,286 | | | | — | | | | 15,000,000 | |
Redstar Gold Corp., Warrants | | | — | | | | 2,500,000 | | | | — | | | | 2,500,000 | |
Source Exploration Corp. | | | 4,975,000 | | | | — | | | | — | | | | 4,975,000 | |
Source Exploration Corp., Warrants | | | 2,500,000 | | | | — | | | | — | | | | 2,500,000 | |
TriStar Gold, Inc. | | | 17,994,000 | | | | 6,248,500 | | | | (234,500 | ) | | | 24,008,000 | |
65
Notes to Portfolios of Investments (unaudited) | June 30, 2016 |
At June 30, 2016, the value of investments in affiliated companies was $23,734,149, representing 13.21% of net assets, and the total cost was $12,475,078. Net realized gains on transactions were $458,566, and there was no income earned for the period.
| | | Shares of Affiliated Companies | |
Gold and Precious Metals Fund | | December 31,
2015 | | | Additions | | | Redemptions | | | June 30,
2016 | |
Jaguar Mining, Inc. | | | — | | | | 6,550,000 | | | | — | | | | 6,550,000 | |
At June 30, 2016, the total value of investments in affiliated companies was $2,534,928 representing 1.92% of net assets, and the total cost was $1,691,245. There was no realized gain (loss) on transactions and no income earned for the period.
(a) | Effective March 17, 2016, Atlas Development & Support Services Ltd.’s name was changed to Atlas African Industries Ltd. |
(b) | Effective February 10, 2016, Pacific Coal Resources Ltd.’s name was changed to Caribbean Resources Corp. |
(c) | At June 30, 2016, the company is no longer defined as an affiliate, although it was an affiliated company during the period. |
Restricted Securities - Indicated in Portfolio of Investments as “RS”
The following securities are subject to contractual and regulatory restrictions, other than Rule 144A Securities, on resale or transfer. These investments may involve a high degree of business and financial risk. Because of the thinly traded markets for these investments, a Fund may be unable to liquidate its securities in a timely manner, especially if there is negative news regarding the specific securities or the markets overall. These securities could decline significantly in value before the Fund could liquidate these securities. The issuer bears the cost of registration, if any, involved in the disposition of these securities.
Holmes Macro Trends Fund | Acquisition
Date | | Cost per
Share/Unit | |
Pacific Infrastructure Ventures, Inc. | 08/06/10-11/22/10 | | $ | 1.00 | |
Pacific Power Generation Corp., Corporate Note (April 2017) | 05/25/12 | | $ | 100.00 | |
As of June 30, 2016, the total cost of restricted securities was $639,125, and the total value was $530,992, representing 1.43% of net assets.
Global Resources Fund | Acquisition
Date | | Cost per
Share/Unit | |
I-Pulse, Inc. | 10/04/07 | | $ | 1.88 | |
Neo Lithium Corp. | 05/12/16 | | $ | 0.77 | |
Pacific Infrastructure Ventures, Inc. | 08/06/10-11/22/10 | | $ | 1.00 | |
Pacific Power Generation Corp., Corporate Note (April 2017) | 05/25/12 | | $ | 100.00 | |
As of June 30, 2016, the total cost of restricted securities was $11,009,245, and the total value was $9,359,902, representing 9.35% of net assets.
66
Notes to Portfolios of Investments (unaudited) | June 30, 2016 |
World Precious Minerals Fund | Acquisition
Date | | Cost per
Share/Unit | |
Algold Resources Ltd., Warrants (April 2018) | 03/29/16 | | $ | 0.00 | |
Anfield Gold Corp. | 05/20/16 | | $ | 0.63 | |
Neo Lithium Corp. | 05/12/16 | | $ | 0.77 | |
Pacific Power Generation Corp., Corporate Note (April 2017) | 05/25/12 | | $ | 100.00 | |
Red Pine Exploration, Inc. | 06/02/16 | | $ | 0.05 | |
Redstar Gold Corp., Warrants (May 2019) | 05/24/16 | | $ | 0.00 | |
Rye Patch Gold Corp., Subscription Receipts | 06/07/16 | | $ | 0.17 | |
Terrax Minerals, Inc. | 04/14/16 | | $ | 0.23 | |
TMAC Resources, Inc. | 03/18/16 | | $ | 6.14 | |
Toachi Mining, Inc., Units | 06/14/16 | | $ | 0.15 | |
As of June 30, 2016, the total cost of restricted securities was $5,564,901, and the total value was $9,186,332, representing 5.11% of net assets.
Gold and Precious Metals Fund | Acquisition
Date | | Cost per
Share/Unit | |
AuRico Metals, Inc. | 04/05/16 | | $ | 0.54 | |
Pacific Power Generation Corp., Corporate Note (April 2017) | 05/25/12 | | $ | 100.00 | |
Rye Patch Gold Corp., Subscription Receipts | 06/07/16 | | $ | 0.35 | |
As of June 30, 2016, the total cost of restricted securities was $3,307,895, and the total value was $5,494,174, representing 4.16% of net assets.
67
Statements of Assets and Liabilities (unaudited) | |
| | | U.S. Government Securities
Ultra-Short Bond Fund | |
| | | | |
Investments, at identified cost | | $ | 56,583,010 | |
| | | | | |
Assets | | | | |
Investments, at value: | | | | |
Securities of unaffiliated issuers | | $ | 56,854,826 | |
Cash | | | 1,329,806 | |
Receivables: | | | | |
Dividends and interest | | | 97,087 | |
Capital shares sold | | | 37,986 | |
From adviser | | | 1,936 | |
Investments sold | | | — | |
Other assets | | | 16,396 | |
Total Assets | | | 58,338,037 | |
| | | | | |
Liabilities | | | | |
Payables: | | | | |
Capital shares redeemed | | | 10,996 | |
Adviser | | | — | |
Investments purchased | | | — | |
Accounts payable and accrued expenses | | | 49,790 | |
Total Liabilities | | | 60,786 | |
| | | | | |
Net Assets | | $ | 58,277,251 | |
| | | | | |
Net Assets Consist of: | | | | |
Paid-in-capital | | $ | 57,989,266 | |
Accumulated undistributed (distributions in excess of) net investment income/accumulated net investment loss | | | 32 | |
Accumulated net realized gains (losses) from investment transactions and other assets and liabilities denominated in foreign currencies | | | 16,137 | |
Net unrealized appreciation of investments and other assets and liabilities denominated in foreign currencies | | | 271,816 | |
Net assets applicable to capital shares outstanding | | $ | 58,277,251 | |
| | | | | |
By share class | | | | |
| | | | | |
Net Assets | | | | |
Investor Class | | $ | 58,277,251 | |
| | | | | |
Capital shares outstanding, an unlimited number of no par shares authorized | | | | |
Investor Class | | | 29,025,275 | |
| | | | | |
Net Asset Value, Public Offering Price, Redemption Price, per share | | | | |
Investor Class | | $ | 2.01 | |
* | Redemption price per share may vary depending on length of time shares are held. See Note 1 H. |
See accompanying notes to financial statements.
68
| | Near-Term
Tax Free Fund | | | All American Equity Fund | | | Holmes Macro Trends Fund | |
| | | | | | | | | |
| | $ | 106,810,116 | | | $ | 14,692,878 | | | $ | 34,827,148 | |
| | | | | | | | | | | | |
| | | | | | | | | | | | |
| | | | | | | | | | | | |
| | $ | 108,581,059 | | | $ | 15,044,993 | | | $ | 34,876,841 | |
| | | 9,285,136 | | | | 3,312,968 | | | | 1,168,460 | |
| | | | | | | | | | | | |
| | | 1,197,038 | | | | 14,642 | | | | 28,706 | |
| | | 430,596 | | | | 1,096 | | | | 698 | |
| | | — | | | | — | | | | — | |
| | | — | | | | 506,033 | | | | 1,035,661 | |
| | | 23,841 | | | | 12,814 | | | | 13,909 | |
| | | 119,517,670 | | | | 18,892,546 | | | | 37,124,275 | |
| | | | | | | | | | | | |
| | | | | | | | | | | | |
| | | | | | | | | | | | |
| | | 89,602 | | | | 550 | | | | 1,275 | |
| | | 1,291 | | | | 8,727 | | | | 23,595 | |
| | | 401,500 | | | | 490,968 | | | | 6,703 | |
| | | 60,504 | | | | 52,789 | | | | 72,956 | |
| | | 552,897 | | | | 553,034 | | | | 104,529 | |
| | | | | | | | | | | | |
| | $ | 118,964,773 | | | $ | 18,339,512 | | | $ | 37,019,746 | |
| | | | | | | | | | | | |
| | | | | | | | | | | | |
| | $ | 117,576,530 | | | $ | 19,011,408 | | | $ | 36,997,508 | |
| | | (7 | ) | | | 27,972 | | | | (99,493 | ) |
| | | (382,693 | ) | | | (1,051,983 | ) | | | 72,038 | |
| | | 1,770,943 | | | | 352,115 | | | | 49,693 | |
| | $ | 118,964,773 | | | $ | 18,339,512 | | | $ | 37,019,746 | |
| | | | | | | | | | | | |
| | | | | | | | | | | | |
| | | | | | | | | | | | |
| | | | | | | | | | | | |
| | $ | 118,964,773 | | | $ | 18,339,512 | | | $ | 37,019,746 | |
| | | | | | | | | | | | |
| | | | | | | | | | | | |
| | | 52,684,704 | | | | 772,848 | | | | 2,087,175 | |
| | | | | | | | | | | | |
| | | | | | | | | | | | |
| | $ | 2.26 | | | $ | 23.73 | * | | $ | 17.74 | * |
69
Statements of Assets and Liabilities (unaudited) | |
| | | Global
Resources Fund | |
| | | | |
Investments, at identified cost | | $ | 159,377,714 | |
Assets | | | | |
Investments, at value: | | | | |
Securities of unaffiliated issuers | | $ | 87,185,677 | |
Securities of affiliated issuers | | | 1,646,328 | |
Cash | | | 8,822,023 | |
Foreign currencies (Cost $476,221, $0, $1,305,458, $349,982 and $110,079) | | | 475,356 | |
Unrealized gain on spot foreign currency contracts | | | 747 | |
Unrealized gain on forward foreign currency contacts | | | — | |
Receivables: | | | | |
Dividends and interest | | | 268,307 | |
Capital shares sold | | | 10,063 | |
Investments sold | | | 5,241,273 | |
Other assets | | | 25,531 | |
Total Assets | | | 103,675,305 | |
| | | | | |
Liabilities | | | | |
Unrealized loss on spot foreign currency contracts | | | — | |
Unrealized loss on forward foreign currency contacts | | | — | |
Payables: | | | | |
Capital shares redeemed | | | 44,115 | |
Adviser | | | 80,504 | |
Investments purchased | | | 3,240,523 | |
Accounts payable and accrued expenses | | | 170,990 | |
Total Liabilities | | | 3,536,132 | |
| | | | | |
Net Assets | | $ | 100,139,173 | |
| | | | | |
Net Assets Consist of: | | | | |
Paid-in-capital | | $ | 636,974,833 | |
Accumulated undistributed net investment income/accumulated net investment loss | | | 2,949,328 | |
Accumulated net realized losses from investment transactions and other assets and liabilities denominated in foreign currencies | | | (469,254,203 | ) |
Net unrealized appreciation (depreciation) of investments and other assets and liabilities denominated in foreign currencies | | | (70,530,785 | ) |
Net assets applicable to capital shares outstanding | | $ | 100,139,173 | |
| | | | | |
By share class | | | | |
| | | | | |
Net Assets | | | | |
Investor Class | | $ | 99,543,725 | |
Institutional Class | | | 595,448 | |
| | | | | |
Capital shares outstanding, an unlimited number of no par shares authorized | | | | |
Investor Class | | | 19,516,622 | |
Institutional Class | | | 115,993 | |
| | | | | |
Net Asset Value, Public Offering Price, Redemption Price, per share* | | | | |
Investor Class | | $ | 5.10 | |
Institutional Class | | | 5.13 | |
* | Redemption price per share may vary depending on length of time shares are held. See Note 1 H. |
See accompanying notes to financial statements.
70
| | World Precious Minerals Fund | | | Gold and Precious Metals Fund | | | Emerging Europe
Fund | | | China Region
Fund | |
| | | | | | | | | | | | |
| | $ | 154,676,666 | | | $ | 72,501,027 | | | $ | 45,035,597 | | | $ | 12,511,185 | |
| | | | | | | | | | | | | | | | |
| | | | | | | | | | | | | | | | |
| | $ | 132,420,142 | | | $ | 102,088,594 | | | $ | 40,923,991 | | | $ | 12,837,525 | |
| | | 23,734,149 | | | | 2,534,928 | | | | — | | | | — | |
| | | 11,695,669 | | | | 14,735,331 | | | | 517,745 | | | | 1,924,276 | |
| | | — | | | | 1,318,738 | | | | 350,156 | | | | 110,459 | |
| | | — | | | | — | | | | 2,530 | | | | — | |
| | | — | | | | — | | | | 99,788 | | | | — | |
| | | | | | | | | | | | | | | | |
| | | 46,674 | | | | 30,119 | | | | 200,399 | | | | 126,091 | |
| | | 611,489 | | | | 920,231 | | | | 1,749 | | | | 980,697 | |
| | | 15,455,370 | | | | 15,409,982 | | | | 903,007 | | | | 692,364 | |
| | | 24,706 | | | | 25,523 | | | | 16,397 | | | | 12,554 | |
| | | 183,988,199 | | | | 137,063,446 | | | | 43,015,762 | | | | 16,683,966 | |
| | | | | | | | | | | | | | | | |
| | | | | | | | | | | | | | | | |
| | | 3,460 | | | | 18,362 | | | | 2,876 | | | | 2 | |
| | | — | | | | — | | | | 185,232 | | | | — | |
| | | | | | | | | | | | | | | | |
| | | 137,816 | | | | 99,678 | | | | 22,304 | | | | 200 | |
| | | 156,672 | | | | 109,793 | | | | 46,586 | | | | 6,969 | |
| | | 3,905,205 | | | | 4,653,680 | | | | 285,167 | | | | 191,055 | |
| | | 160,656 | | | | 111,948 | | | | 139,371 | | | | 94,650 | |
| | | 4,363,809 | | | | 4,993,461 | | | | 681,536 | | | | 292,876 | |
| | | | | | | | | | | | | | | | |
| | $ | 179,624,390 | | | $ | 132,069,985 | | | $ | 42,334,226 | | | $ | 16,391,090 | |
| | | | | | | | | | | | | | | | |
| | | | | | | | | | | | | | | | |
| | $ | 514,562,640 | | | $ | 197,177,416 | | | $ | 375,225,920 | | | $ | 36,039,273 | |
| | | (2,901,850 | ) | | | (1,456,667 | ) | | | 147,115 | | | | 102,310 | |
| | | (333,508,399 | ) | | | (95,791,135 | ) | | | (328,830,326 | ) | | | (20,077,245 | ) |
| | | 1,471,999 | | | | 32,140,371 | | | | (4,208,483 | ) | | | 326,752 | |
| | $ | 179,624,390 | | | $ | 132,069,985 | | | $ | 42,334,226 | | | $ | 16,391,090 | |
| | | | | | | | | | | | | | | | |
| | | | | | | | | | | | | | | | |
| | | | | | | | | | | | | | | | |
| | | | | | | | | | | | | | | | |
| | $ | 175,680,290 | | | $ | 132,069,985 | | | $ | 42,334,226 | | | $ | 16,391,090 | |
| | | 3,944,100 | | | | — | | | | — | | | | — | |
| | | | | | | | | | | | | | | | |
| | | | | | | | | | | | | | | | |
| | | 22,707,235 | | | | 14,431,590 | | | | 7,964,504 | | | | 2,322,920 | |
| | | 507,604 | | | | — | | | | — | | | | — | |
| | | | | | | | | | | | | | | | |
| | | | | | | | | | | | | | | | |
| | $ | 7.74 | | | $ | 9.15 | | | $ | 5.32 | | | $ | 7.06 | |
| | | 7.77 | | | | — | | | | — | | | | — | |
71
Statements of Operations (unaudited) | |
| | | U.S. Government Securities
Ultra-Short Bond Fund | |
| | | | |
Net Investment Income | | | |
| | | | |
Income | | | |
Dividends from unaffiliated issuers | | $ | — | |
Net dividends | | | — | |
Interest and other | | | 271,601 | |
Total income | | | 271,601 | |
| | | | | |
Expenses: | | | | |
Management fee | | | 152,177 | |
Administrative services fee | | | 29,499 | |
Accounting service fees and expenses | | | 42,557 | |
Distribution plan fee | | | — | |
Transfer agent fees and expenses | | | 28,382 | |
Professional fees | | | 20,380 | |
Custodian fees | | | 4,293 | |
Shareholder reporting expenses | | | 6,292 | |
Registration fees | | | 9,320 | |
Trustee fees and expenses | | | 13,624 | |
Chief compliance officer fees | | | 8,682 | |
Miscellaneous expenses | | | 3,665 | |
Total expenses before reductions | | | 318,871 | |
Expenses offset - Note 1 H | | | — | |
Expenses reimbursed - Note 3 | | | (181,909 | ) |
Net expenses | | | 136,962 | |
| | | | |
Net Investment Income (Loss) | | | 134,639 | |
| | | | | |
Net Realized and Unrealized Gain (Loss) on Investments | | | | |
Realized gain (loss) from: | | | | |
Securities from unaffiliated issuers | | | 14,797 | |
Foreign currency transactions | | | — | |
Net realized gain (loss) | | | 14,797 | |
Net change in unrealized appreciation (depreciation) of: | | | | |
Investments | | | 244,275 | |
Net unrealized appreciation (depreciation) | | | 244,275 | |
| | | | |
Net Realized and Unrealized Gain (Loss) on Investments | | | 259,072 | |
| | | | | |
Net Increase (Decrease) In Net Assets Resulting From Operations | | $ | 393,711 | |
See accompanying notes to financial statements.
72
For the Six Months Ended June 30, 2016 |
| | Near-Term
Tax Free Fund | | | All American Equity Fund | | | Holmes Macro Trends Fund | |
| | | | | | | | | |
| | $ | — | | | $ | 182,593 | | | $ | 213,238 | |
| | | — | | | | 182,593 | | | | 213,238 | |
| | | 945,475 | | | | — | | | | 34,999 | |
| | | 945,475 | | | | 182,593 | | | | 248,237 | |
| | | | | | | | | | | | |
| | | | | | | | | | | | |
| | | 279,803 | | | | 56,172 | | | | 152,618 | |
| | | 49,127 | | | | 17,024 | | | | 21,853 | |
| | | 88,758 | | | | 12,810 | | | | 26,456 | |
| | | — | | | | 22,755 | | | | 46,901 | |
| | | 46,978 | | | | 19,605 | | | | 27,289 | |
| | | 27,775 | | | | 17,875 | | | | 25,312 | |
| | | 17,863 | | | | 4,944 | | | | 11,439 | |
| | | 6,715 | | | | 4,786 | | | | 6,611 | |
| | | 13,395 | | | | 8,649 | | | | 8,632 | |
| | | 13,724 | | | | 13,539 | | | | 13,583 | |
| | | 11,804 | | | | 5,396 | | | | 7,043 | |
| | | 4,378 | | | | 3,239 | | | | 3,403 | |
| | | 560,320 | | | | 186,794 | | | | 351,140 | |
| | | (12,295 | ) | | | (1,089 | ) | | | (3,366 | ) |
| | | (296,212 | ) | | | (3,909 | ) | | | — | |
| | | 251,813 | | | | 181,796 | | | | 347,774 | |
| | | | | | | | | | | | |
| | | 693,662 | | | | 797 | | | | (99,537 | ) |
| | | | | | | | | | | | |
| | | | | | | | | | | | |
| | | | | | | | | | | | |
| | | 3,908 | | | | 306,777 | | | | (2,571,702 | ) |
| | | — | | | | — | | | | (32 | ) |
| | | 3,908 | | | | 306,777 | | | | (2,571,734 | ) |
| | | | | | | | | | | | |
| | | 619,870 | | | | (228,432 | ) | | | 729,323 | |
| | | 619,870 | | | | (228,432 | ) | | | 729,323 | |
| | | | | | | | | | | | |
| | | 623,778 | | | | 78,345 | | | | (1,842,411 | ) |
| | | | | | | | | | | | |
| | $ | 1,317,440 | | | $ | 79,142 | | | $ | (1,941,948 | ) |
73
Statements of Operations (unaudited) | |
| | | Global
Resources Fund | |
| | | | |
Net Investment Income | | | |
| | | | |
Income | | | |
Dividends from unaffiliated issuers | | $ | 1,073,083 | |
Foreign tax withheld on dividends | | | (41,749 | ) |
Net dividends | | | 1,031,334 | |
Interest and other | | | 611,582 | |
Total income | | | 1,642,916 | |
| | | | | |
Expenses: | | | | |
Management fee | | | 470,014 | |
Administrative services fee | | | 32,023 | |
Administrative services fee - Investor Class | | | 12,216 | |
Administrative services fee - Institutional Class | | | 106 | |
Accounting service fees and expenses | | | 72,103 | |
Distribution plan fee | | | 122,159 | |
Transfer agent fees and expenses | | | — | |
Transfer agent fees and expenses - Investor Class | | | 96,306 | |
Transfer agent fees and expenses - Institutional Class | | | 6,834 | |
Professional fees | | | 42,912 | |
Custodian fees | | | 25,352 | |
Shareholder reporting expenses | | | — | |
Shareholder reporting expenses - Investor Class | | | 30,292 | |
Shareholder reporting expenses - Institutional Class | | | 4,045 | |
Registration fees | | | 515 | |
Registration fees - Investor Class | | | 10,243 | |
Registration fees - Institutional Class | | | 6,131 | |
Trustee fees and expenses | | | 13,715 | |
Chief compliance officer fees | | | 11,239 | |
Miscellaneous expenses | | | 3,344 | |
Total expenses before reductions | | | 959,549 | |
Expenses offset - Note 1 H | | | (5,569 | ) |
Expenses reimbursed - Note 3 | | | (23,829 | ) |
Net expenses | | | 930,151 | |
| | | | |
Net Investment Income (Loss) | | | 712,765 | |
| | | | | |
Net Realized and Unrealized Gain (Loss) on Investments | | | | |
Realized gain (loss) from: | | | | |
Securities from unaffiliated issuers | | | (12,088,383 | ) |
Securities from affiliated issuers | | | (24,070 | ) |
Foreign currency transactions | | | (81,792 | ) |
Net realized gain (loss) | | | (12,194,245 | ) |
Net change in unrealized appreciation (depreciation) of: | | | | |
Investments | | | 19,107,168 | |
Other assets and liabilities denominated in foreign currencies | | | 1,221 | |
Net unrealized appreciation (depreciation) | | | 19,108,389 | |
| | | | |
Net Realized and Unrealized Gain (Loss) on Investments | | | 6,914,144 | |
| | | | | |
Net Increase (Decrease) In Net Assets Resulting From Operations | | $ | 7,626,909 | |
See accompanying notes to financial statements.
74
For the Six Months Ended June 30, 2016 |
| | World Precious Minerals Fund | | | Gold and Precious Metals Fund | | | Emerging Europe
Fund | | | China Region
Fund | |
| | | | | | | | | | | | |
| | $ | 83,477 | | | $ | 178,842 | | | $ | 1,079,275 | | | $ | 275,515 | |
| | | (11,045 | ) | | | (18,045 | ) | | | (120,841 | ) | | | (18,252 | ) |
| | | 72,432 | | | | 160,797 | | | | 958,434 | | | | 257,263 | |
| | | 378,660 | | | | 186,787 | | | | — | | | | — | |
| | | 451,092 | | | | 347,584 | | | | 958,434 | | | | 257,263 | |
| | | | | | | | | | | | | | | | |
| | | | | | | | | | | | | | | | |
| | | 700,117 | | | | 477,114 | | | | 252,544 | | | | 89,578 | |
| | | 39,106 | | | | 43,924 | | | | 23,510 | | | | 16,056 | |
| | | 14,616 | | | | — | | | | — | | | | — | |
| | | 45 | | | | — | | | | — | | | | — | |
| | | 85,959 | | | | 63,744 | | | | 37,991 | | | | 18,922 | |
| | | 146,162 | | | | 113,881 | | | | 55,189 | | | | 17,915 | |
| | | — | | | | 52,807 | | | | 55,002 | | | | 20,718 | |
| | | 74,884 | | | | — | | | | — | | | | — | |
| | | 6,109 | | | | — | | | | — | | | | — | |
| | | 38,677 | | | | 28,715 | | | | 25,878 | | | | 24,152 | |
| | | 28,960 | | | | 27,375 | | | | 44,936 | | | | 19,812 | |
| | | — | | | | 14,859 | | | | 15,567 | | | | 5,429 | |
| | | 21,137 | | | | — | | | | — | | | | — | |
| | | 1,157 | | | | — | | | | — | | | | — | |
| | | 491 | | | | 10,490 | | | | 7,702 | | | | 8,840 | |
| | | 9,290 | | | | — | | | | — | | | | — | |
| | | 5,144 | | | | — | | | | — | | | | — | |
| | | 13,717 | | | | 13,667 | | | | 13,600 | | | | 13,539 | |
| | | 10,063 | | | | 8,440 | | | | 7,361 | | | | 5,156 | |
| | | 4,334 | | | | 3,628 | | | | 3,148 | | | | 3,721 | |
| | | 1,199,968 | | | | 858,644 | | | | 542,428 | | | | 243,838 | |
| | | (4,523 | ) | | | (7,693 | ) | | | (2,422 | ) | | | (765 | ) |
| | | (23,742 | ) | | | (6,653 | ) | | | — | | | | (60,379 | ) |
| | | 1,171,703 | | | | 844,298 | | | | 540,006 | | | | 182,694 | |
| | | | | | | | | | | | | | | | |
| | | (720,611 | ) | | | (496,714 | ) | | | 418,428 | | | | 74,569 | |
| | | | | | | | | | | | | | | | |
| | | | | | | | | | | | | | | | |
| | | | | | | | | | | | | | | | |
| | | (7,346,221 | ) | | | 9,951,485 | | | | (1,691,950 | ) | | | (1,662,755 | ) |
| | | — | | | | — | | | | — | | | | — | |
| | | (1,193,522 | ) | | | (648,543 | ) | | | (621,866 | ) | | | (3,168 | ) |
| | | (8,539,743 | ) | | | 9,302,942 | | | | (2,313,816 | ) | | | (1,665,923 | ) |
| | | | | | | | | | | | | | | | |
| | | 98,290,269 | | | | 46,449,554 | | | | 2,927,447 | | | | 803,126 | |
| | | (5,385 | ) | | | 18,170 | | | | (51,808 | ) | | | 1,730 | |
| | | 98,284,884 | | | | 46,467,724 | | | | 2,875,639 | | | | 804,856 | |
| | | | | | | | | | | | | | | | |
| | | 89,745,141 | | | | 55,770,666 | | | | 561,823 | | | | (861,067 | ) |
| | | | | | | | | | | | | | | | |
| | $ | 89,024,530 | | | $ | 55,273,952 | | | $ | 980,251 | | | $ | (786,498 | ) |
75
Statements of Changes in Net Assets | |
| | | U.S. Government Securities Ultra-Short Bond Fund | |
| | | Six Months Period Ended June 30, 2016 (unaudited) | | | Year Ended
December 31,
2015 | |
| | | | | | | |
Increase (Decrease) in Net Assets | | | | | | |
| | | | | | | |
From operations: | | | | | | |
Net investment income | | $ | 134,639 | | | $ | 199,412 | |
Net realized gains (losses) | | | 14,797 | | | | 5,413 | |
Net unrealized appreciation (depreciation) | | | 244,275 | | | | (49,997 | ) |
Net increase (decrease) in net assets from operations | | | 393,711 | | | | 154,828 | |
| | | | | | | | | |
Distributions to shareholders | | | | | | | | |
From net investment income | | | | | | | | |
Investor Class | | | (134,618 | ) | | | (199,409 | ) |
From net realized gains | | | | | | | | |
Investor Class | | | — | | | | (4,251 | ) |
Total distributions to shareholders | | | (134,618 | ) | | | (203,660 | ) |
| | | | | | | | | |
From capital share transactions: | | | | | | | | |
Proceeds from shares sold | | | | | | | | |
Investor Class | | | 5,061,183 | | | | 14,907,060 | |
Distributions reinvested | | | | | | | | |
Investor Class | | | 112,509 | | | | 159,674 | |
Proceeds from short-term trading fees | | | | | | | | |
Investor Class | | | — | | | | — | |
| | | | 5,173,692 | | | | 15,066,734 | |
Cost of shares redeemed | | | | | | | | |
Investor Class | | | (9,717,069 | ) | | | (16,476,556 | ) |
Net increase (decrease) in net assets from capital share transactions | | | (4,543,377 | ) | | | (1,409,822 | ) |
| | | | | | | | |
Net Increase (Decrease) in Net Assets | | | (4,284,284 | ) | | | (1,458,654 | ) |
| | | | | | | | | |
Net Assets | | | | | | | | |
Beginning of period | | | 62,561,535 | | | | 64,020,189 | |
| | | | | | | | | |
End of period | | $ | 58,277,251 | | | $ | 62,561,535 | |
| | | | | | | | | |
Accumulated undistributed net investment income (distributions in excess of net investment income), end of period | | $ | 32 | | | $ | 11 | |
| | | | | | | | | |
Capital Share Activity | | | | | | | | |
Investor Class: | | | | | | | | |
Shares sold | | | 2,524,320 | | | | 7,448,636 | |
Shares reinvested | | | 56,023 | | | | 79,605 | |
Shares redeemed | | | (4,839,255 | ) | | | (8,222,981 | ) |
Net share activity | | | (2,258,912 | ) | | | (694,740 | ) |
See accompanying notes to financial statements.
76
| Near-Term Tax Free Fund | | | | All American Equity Fund | |
Six Months Period Ended June 30, 2016 (unaudited) | | | Year Ended
December 31,
2015 | | | | Six Months Period Ended June 30, 2016 (unaudited) | | | Year Ended
December 31,
2015 | |
| | | | | | | | | | | | |
| | | | | | | | | | | | |
| | | | | | | | | | | | |
| $ | 693,662 | | | $ | 1,424,739 | | | | $ | 797 | | | $ | 64,612 | |
| | 3,908 | | | | (27,203 | ) | | | | 306,777 | | | | (1,276,414 | ) |
| | 619,870 | | | | (297,263 | ) | | | | (228,432 | ) | | | 377,292 | |
| | 1,317,440 | | | | 1,100,273 | | | | | 79,142 | | | | (834,510 | ) |
| | | | | | | | | | | | | | | | |
| | | | | | | | | | | | | | | | |
| | | | | | | | | | | | | | | | |
| | (756,695 | ) | | | (1,361,713 | ) | | | | — | | | | (43,038 | ) |
| | | | | | | | | | | | | | | | |
| | — | | | | — | | | | | — | | | | (2,220,987 | ) |
| | (756,695 | ) | | | (1,361,713 | ) | | | | — | | | | (2,264,025 | ) |
| | | | | | | | | | | | | | | | |
| | | | | | | | | | | | | | | | |
| | | | | | | | | | | | | | | | |
| | 35,780,554 | | | | 71,543,252 | | | | | 587,849 | | | | 2,501,699 | |
| | | | | | | | | | | | | | | | |
| | 646,732 | | | | 1,116,722 | | | | | — | | | | 2,101,779 | |
| | | | | | | | | | | | | | | | |
| | — | | | | — | | | | | 52 | | | | 100 | |
| | 36,427,286 | | | | 72,659,974 | | | | | 587,901 | | | | 4,603,578 | |
| | | | | | | | | | | | | | | | |
| | (24,791,903 | ) | | | (55,225,263 | ) | | | | (1,444,835 | ) | | | (4,323,344 | ) |
| | 11,635,383 | | | | 17,434,711 | | | | | (856,934 | ) | | | 280,234 | |
| | | | | | | | | | | | | | | | |
| | 12,196,128 | | | | 17,173,271 | | | | | (777,792 | ) | | | (2,818,301 | ) |
| | | | | | | | | | | | | | | | |
| | | | | | | | | | | | | | | | |
| | 106,768,645 | | | | 89,595,374 | | | | | 19,117,304 | | | | 21,935,605 | |
| | | | | | | | | | | | | | | | |
| $ | 118,964,773 | | | $ | 106,768,645 | | | | $ | 18,339,512 | | | $ | 19,117,304 | |
| | | | | | | | | | | | | | | | |
| $ | (7 | ) | | $ | 63,026 | | | | $ | 27,972 | | | $ | 27,175 | |
| | | | | | | | | | | | | | | | |
| | | | | | | | | | | | | | | | |
| | | | | | | | | | | | | | | | |
| | 15,869,972 | | | | 31,811,923 | | | | | 25,581 | | | | 91,535 | |
| | 286,729 | | | | 496,931 | | | | | — | | | | 88,125 | |
| | (10,994,369 | ) | | | (24,584,374 | ) | | | | (62,708 | ) | | | (157,508 | ) |
| | 5,162,332 | | | | 7,724,480 | | | | | (37,127 | ) | | | 22,152 | |
77
Statements of Changes in Net Assets | |
| | | Holmes Macro Trends Fund | |
| | | Six Months Period Ended June 30, 2016 (unaudited) | | | Year Ended
December 31,
2015 | |
| | | | | | | |
Increase (Decrease) in Net Assets | | | | | | |
| | | | | | | |
From operations: | | | | | | |
Net investment income (loss) | | $ | (99,537 | ) | | $ | (245,909 | ) |
Net realized gains (losses) | | | (2,571,734 | ) | | | 4,636,788 | |
Net unrealized appreciation (depreciation) | | | 729,323 | | | | (4,709,061 | ) |
Net increase (decrease) in net assets from operations | | | (1,941,948 | ) | | | (318,182 | ) |
| | | | | | | | | |
Distributions to shareholders | | | | | | | | |
From net investment income | | | | | | | | |
Investor Class | | | — | | | | — | |
Institutional Class | | | — | | | | — | |
From net realized gains | | | | | | | | |
Investor Class | | | — | | | | (3,075,742 | ) |
Total distributions to shareholders | | | — | | | | (3,075,742 | ) |
| | | | | | | | | |
From capital share transactions: | | | | | | | | |
Proceeds from shares sold | | | | | | | | |
Investor Class | | | 538,190 | | | | 2,614,600 | |
Institutional Class | | | n/a | | | | n/a | |
Distributions reinvested | | | | | | | | |
Investor Class | | | — | | | | 2,906,576 | |
Institutional Class | | | n/a | | | | n/a | |
Proceeds from short-term trading fees | | | | | | | | |
Investor Class | | | 27 | | | | 305 | |
| | | | 538,217 | | | | 5,521,481 | |
Cost of shares redeemed | | | | | | | | |
Investor Class | | | (2,711,215 | ) | | | (7,242,945 | ) |
Institutional Class | | | n/a | | | | n/a | |
Net increase (decrease) in net assets from capital share transactions | | | (2,172,998 | ) | | | (1,721,464 | ) |
| | | | | | | | |
Net Increase (Decrease) in Net Assets | | | (4,114,946 | ) | | | (5,115,388 | ) |
| | | | | | | | | |
Net Assets | | | | | | | | |
Beginning of period | | | 41,134,692 | | | | 46,250,080 | |
| | | | | | | | |
End of period | | $ | 37,019,746 | | | $ | 41,134,692 | |
| | | | | | | | | |
Accumulated undistributed net investment income (distributions in excess of net investment income)/accumulated net investment loss , end of period | | $ | (99,493 | ) | | $ | 44 | |
| | | | | | | | | |
Capital Share Activity | | | | | | | | |
Investor Class: | | | | | | | | |
Shares sold | | | 30,771 | | | | 126,790 | |
Shares reinvested | | | — | | | | 154,277 | |
Shares redeemed | | | (156,059 | ) | | | (352,634 | ) |
Net share activity | | | (125,288 | ) | | | (71,567 | ) |
Institutional Class: | | | | | | | | |
Shares sold | | | n/a | | | | n/a | |
Shares reinvested | | | n/a | | | | n/a | |
Shares redeemed | | | n/a | | | | n/a | |
Net share activity | | | n/a | | | | n/a | |
See accompanying notes to financial statements.
78
| Global Resources Fund | | | | World Precious Minerals Fund | |
Six Months Period Ended June 30, 2016 (unaudited) | | | Year Ended
December 31,
2015 | | | | Six Months Period Ended June 30, 2016 (unaudited) | | | Year Ended
December 31,
2015 | |
| | | | | | | | | | | | |
| | | | | | | | | | | | |
| | | | | | | | | | | | |
| $ | 712,765 | | | $ | 2,421,024 | | | | $ | (720,611 | ) | | $ | (660,652 | ) |
| | (12,194,245 | ) | | | (76,696,259 | ) | | | | (8,539,743 | ) | | | (53,557,002 | ) |
| | 19,108,389 | | | | 26,850,852 | | | | | 98,284,884 | | | | 38,597,787 | |
| | 7,626,909 | | | | (47,424,383 | ) | | | | 89,024,530 | | | | (15,619,867 | ) |
| | | | | | | | | | | | | | | | |
| | | | | | | | | | | | | | | | |
| | | | | | | | | | | | | | | | |
| | — | | | | (1,094,201 | ) | | | | — | | | | (7,134,044 | ) |
| | — | | | | (33,954 | ) | | | | — | | | | (8,001 | ) |
| | | | | | | | | | | | | | | | |
| | — | | | | — | | | | | — | | | | — | |
| | — | | | | (1,128,155 | ) | | | | — | | | | (7,142,045 | ) |
| | | | | | | | | | | | | | | | |
| | | | | | | | | | | | | | | | |
| | | | | | | | | | | | | | | | |
| | 2,463,021 | | | | 8,877,256 | | | | | 29,076,409 | | | | 19,227,284 | |
| | 4,372 | | | | 5,787,569 | | | | | 3,573,338 | | | | 2,885 | |
| | | | | | | | | | | | | | | | |
| | — | | | | 1,044,971 | | | | | — | | | | 6,735,209 | |
| | — | | | | 33,792 | | | | | — | | | | 7,771 | |
| | | | | | | | | | | | | | | | |
| | 28 | | | | 30 | | | | | 151 | | | | 122 | |
| | 2,467,421 | | | | 15,743,618 | | | | | 32,649,898 | | | | 25,973,271 | |
| | | | | | | | | | | | | | | | |
| | (8,591,047 | ) | | | (37,739,926 | ) | | | | (20,215,208 | ) | | | (28,492,715 | ) |
| | (1,371,783 | ) | | | (10,849,018 | ) | | | | (60,684 | ) | | | (59,118 | ) |
| | (7,495,409 | ) | | | (32,845,326 | ) | | | | 12,374,006 | | | | (2,578,562 | ) |
| | | | | | | | | | | | | | | | |
| | 131,500 | | | | (81,397,864 | ) | | | | 101,398,536 | | | | (25,340,474 | ) |
| | | | | | | | | | | | | | | | |
| | | | | | | | | | | | | | | | |
| | 100,007,673 | | | | 181,405,537 | | | | | 78,225,854 | | | | 103,566,328 | |
| | | | | | | | | | | | | | | | |
| $ | 100,139,173 | | | $ | 100,007,673 | | | | $ | 179,624,390 | | | $ | 78,225,854 | |
| | | | | | | | | | | | | | | | |
| $ | 2,949,328 | | | $ | 2,236,563 | | | | $ | (2,901,850 | ) | | $ | (2,181,239 | ) |
| | | | | | | | | | | | | | | | |
| | | | | | | | | | | | | | | | |
| | | | | | | | | | | | | | | | |
| | 507,845 | | | | 1,567,275 | | | | | 4,600,215 | | | | 4,406,357 | |
| | — | | | | 224,725 | | | | | — | | | | 1,897,242 | |
| | (1,775,562 | ) | | | (6,748,854 | ) | | | | (3,366,513 | ) | | | (6,586,395 | ) |
| | (1,267,717 | ) | | | (4,956,854 | ) | | | | 1,233,702 | | | | (282,796 | ) |
| | | | | | | | | | | | | | | | |
| | 902 | | | | 912,723 | | | | | 498,439 | | | | 686 | |
| | — | | | | 7,236 | | | | | — | | | | 2,183 | |
| | (281,758 | ) | | | (1,981,786 | ) | | | | (11,565 | ) | | | (14,336 | ) |
| | (280,856 | ) | | | (1,061,827 | ) | | | | 486,874 | | | | (11,467 | ) |
79
Statements of Changes in Net Assets | |
| | | Gold and Precious Metals Fund | |
| | | Six Months Period Ended June 30, 2016 (unaudited) | | | Year Ended
December 31,
2015 | |
| | | | | | | |
Increase (Decrease) in Net Assets | | | | | | |
| | | | | | | |
From operations: | | | | | | |
Net investment income (loss) | | $ | (496,714 | ) | | $ | (522,899 | ) |
Net realized gains (losses) | | | 9,302,942 | | | | (29,177,581 | ) |
Net unrealized appreciation (depreciation) | | | 46,467,724 | | | | 26,975,320 | |
Net increase (decrease) in net assets from operations | | | 55,273,952 | | | | (2,725,160 | ) |
| | | | | | | | | |
Distributions to shareholders | | | | | | | | |
From net investment income | | | | | | | | |
Investor Class | | | — | | | | (269,790 | ) |
Total distributions to shareholders | | | — | | | | (269,790 | ) |
| | | | | | | | | |
From capital share transactions: | | | | | | | | |
Proceeds from shares sold | | | | | | | | |
Investor Class | | | 44,388,894 | | | | 20,024,811 | |
Distributions reinvested | | | | | | | | |
Investor Class | | | — | | | | 248,899 | |
Proceeds from short-term trading fees | | | | | | | | |
Investor Class | | | 1,651 | | | | 460 | |
| | | | 44,390,545 | | | | 20,274,170 | |
Cost of shares redeemed | | | | | | | | |
Investor Class | | | (25,892,164 | ) | | | (21,758,486 | ) |
Net increase (decrease) in net assets from capital share transactions | | | 18,498,381 | | | | (1,484,316 | ) |
| | | | | | | | |
Net Increase (Decrease) in Net Assets | | | 73,772,333 | | | | (4,479,266 | ) |
| | | | | | | | | |
Net Assets | | | | | | | | |
Beginning of period | | | 58,297,652 | | | | 62,776,918 | |
| | | | | | | | |
End of period | | $ | 132,069,985 | | | $ | 58,297,652 | |
| | | | | | | | | |
Accumulated undistributed net investment income (distributions in excess of net investment income)/accumulated net investment loss , end of period | | $ | (1,456,667 | ) | | $ | (959,953 | ) |
| | | | | | | | | |
Capital Share Activity | | | | | | | | |
Investor Class: | | | | | | | | |
Shares sold | | | 6,116,166 | | | | 3,863,087 | |
Shares reinvested | | | — | | | | 51,319 | |
Shares redeemed | | | (3,611,819 | ) | | | (4,144,783 | ) |
Net share activity | | | 2,504,347 | | | | (230,377 | ) |
See accompanying notes to financial statements.
80
| Emerging Europe Fund | | | | China Region Fund | |
Six Months Period Ended June 30, 2016 (unaudited) | | | Year Ended
December 31,
2015 | | | | Six Months Period Ended June 30, 2016 (unaudited) | | | Year Ended
December 31,
2015 | |
| | | | | | | | | | | | |
| | | | | | | | | | | | |
| | | | | | | | | | | | |
| $ | 418,428 | | | $ | 366,541 | | | | $ | 74,569 | | | $ | 46,579 | |
| | (2,313,816 | ) | | | (15,611,113 | ) | | | | (1,665,923 | ) | | | 6,347 | |
| | 2,875,639 | | | | 2,578,365 | | | | | 804,856 | | | | (1,584,324 | ) |
| | 980,251 | | | | (12,666,207 | ) | | | | (786,498 | ) | | | (1,531,398 | ) |
| | | | | | | | | | | | | | | | |
| | | | | | | | | | | | | | | | |
| | | | | | | | | | | | | | | | |
| | — | | | | — | | | | | — | | | | (187,603 | ) |
| | — | | | | — | | | | | — | | | | (187,603 | ) |
| | | | | | | | | | | | | | | | |
| | | | | | | | | | | | | | | | |
| | | | | | | | | | | | | | | | |
| | 788,908 | | | | 3,580,763 | | | | | 2,238,503 | | | | 2,429,974 | |
| | | | | | | | | | | | | | | | |
| | — | | | | — | | | | | — | | | | 173,643 | |
| | | | | | | | | | | | | | | | |
| | 2 | | | | 28 | | | | | — | | | | 20 | |
| | 788,910 | | | | 3,580,791 | | | | | 2,238,503 | | | | 2,603,637 | |
| | | | | | | | | | | | | | | | |
| | (4,100,513 | ) | | | (15,314,877 | ) | | | | (1,244,244 | ) | | | (5,709,295 | ) |
| | (3,311,603 | ) | | | (11,734,086 | ) | | | | 994,259 | | | | (3,105,658 | ) |
| | | | | | | | | | | | | | | | |
| | (2,331,352 | ) | | | (24,400,293 | ) | | | | 207,761 | | | | (4,824,659 | ) |
| | | | | | | | | | | | | | | | |
| | | | | | | | | | | | | | | | |
| | 44,665,578 | | | | 69,065,871 | | | | | 16,183,329 | | | | 21,007,988 | |
| | | | | | | | | | | | | | | | |
| $ | 42,334,226 | | | $ | 44,665,578 | | | | $ | 16,391,090 | | | $ | 16,183,329 | |
| | | | | | | | | | | | | | | | |
| $ | 147,115 | | | $ | (271,313 | ) | | | $ | 102,310 | | | $ | 27,741 | |
| | | | | | | | | | | | | | | | |
| | | | | | | | | | | | | | | | |
| | | | | | | | | | | | | | | | |
| | 142,049 | | | | 569,033 | | | | | 322,180 | | | | 268,194 | |
| | — | | | | — | | | | | — | | | | 22,969 | |
| | (763,859 | ) | | | (2,513,600 | ) | | | | (182,007 | ) | | | (671,842 | ) |
| | (621,810 | ) | | | (1,944,567 | ) | | | | 140,173 | | | | (380,679 | ) |
81
Notes to Financial Statements (unaudited) | June 30, 2016 |
Note 1: Organization and Significant Accounting Policies
U.S. Global Investors Funds (Trust), consisting of the nine separate funds (Funds) included in this report, is organized as a Delaware statutory trust. Each Fund is an open-end management investment company registered under the Investment Company Act of 1940, as amended, and follows the specialized accounting and reporting guidance in FASB Accounting Standards Codification 946. All funds are diversified with the exception of Global Resources, World Precious Minerals, Gold and Precious Metals, Emerging Europe and China Region. A nondiversified fund may invest a greater percentage of its assets in a particular issuer in comparison to a diversified fund.
The following is a summary of significant accounting policies consistently followed by the Funds in the preparation of their financial statements. The policies are in conformity with U.S. generally accepted accounting principles.
The Funds value investments traded on national or international securities exchanges or over-the-counter at the last sales price reported by the security’s primary exchange of its market at the time of daily valuation. Options and securities for which no sale was reported are valued at the mean between the last reported bid and asked quotation. Debt securities having 60 days or less to maturity that are expected to be valued at par at maturity may be priced by the amortized cost method if the Valuation Committee determines it would approximate market value. Municipal securities, long-term U.S. government obligations and corporate debt securities are valued by an independent pricing service using an evaluated quote based on such factors as institutional-size trading in similar groups of securities, yield, quality, maturity, coupon rate, type of issue, individual trading characteristics and other market data. For more information please see Notes to Portfolio of Investments
| | B. | Fair Valued Securities |
Securities for which market quotations are not readily available or which are subject to legal restrictions are valued at their fair value as determined in good faith by the Valuation Committee of U.S. Global Investors, Inc. (Adviser), under policies and procedures established by the Funds’ Board of Trustees. Fair value is the price that would be received to sell an asset or paid to transfer a liability in an orderly transaction between market participants at the measurement date. The Valuation Committee meets on a regular basis to review securities which may not have readily available market prices and considers a number of factors in determining fair value, including nature and duration of any trading restrictions, trading volume, market values of unrestricted shares of the same or similar class, investment management’s judgment regarding the market experience of the issuer, financial status and other operational and market factors affecting the issuer, issuer’s management, quality of the underlying property based on review of independent geological studies and other relevant matters. The fair values may differ from what would have been used had a broader market for these securities existed. The Valuation Committee
82
Notes to Financial Statements (unaudited) | June 30, 2016 |
regularly reviews inputs and assumptions and performs transactional back-testing and disposition analysis. The Valuation Committee reports quarterly to the Funds’ Board of Trustees.
For securities traded on international exchanges, if events which may materially affect the value of a Fund’s securities occur after the close of the primary exchange and before a Fund’s net asset value is next determined, then those securities will be valued at their fair value as determined in good faith in accordance with the policies approved by the Board of Trustees. The Funds use a systematic fair value model provided by an independent third party to value international securities primarily traded on an exchange or market outside the Western Hemisphere in order to adjust for stale pricing, which may occur between the close of certain foreign exchanges and the New York Stock Exchange.
| | C. | Security Transactions and Investment Income |
Security transactions are accounted for on trade date. Realized gains and losses from security transactions are determined on an identified cost basis. Dividend income is recorded on the ex-dividend date except that certain dividends from foreign securities where the ex-dividend date may have passed are recorded as soon as the Fund has confirmed the ex-dividend date. Interest income, which may include original issue discount, is recorded on an accrual basis. Discounts and premiums on securities purchased are accreted and amortized, respectively, on a yield-to-maturity basis as adjustments to interest income. Investment income is recorded net of foreign taxes withheld where recovery of such taxes is uncertain. Investment income and realized and unrealized gains (losses) are allocated to each Fund’s share class based on their respective net assets.
The Funds may purchase securities on a when-issued or delayed-delivery basis and segregate collateral on their books with a value at least equal to the amount of the commitment. Losses may arise due to the changes in the value of the underlying securities or if the counterparty does not perform under the contract.
| | D. | Foreign Currency Transactions |
Some Funds may invest in securities of foreign issuers. The accounting records of these Funds are maintained in U.S. dollars. At each net asset value determination date, the value of assets and liabilities denominated in foreign currencies are translated into U.S. dollars using the current prevailing exchange rate. Security transactions, income and expenses are converted at the prevailing rate of exchange on the respective dates of the transactions. The effect of changes in foreign exchange rates on foreign denominated securities is included with the net realized and unrealized gain or loss on securities. Other foreign currency gains or losses are reported separately.
The Funds intend to continue to comply with the requirements of Subchapter M of the Internal Revenue Code applicable to regulated investment companies and to distribute substantially all of their taxable income to shareholders. Accordingly, no provision for federal income taxes is required. Each Fund may be subject to foreign
83
Notes to Financial Statements (unaudited) | June 30, 2016 |
taxes on income and gains on investments, which are accrued based on the Fund’s understanding of the tax rules and regulations in the foreign markets.
The Funds recognize the tax benefits of uncertain tax positions only where the position is “more likely than not” to be sustained assuming examination by tax authorities. Management has analyzed the Funds’ tax positions, and has concluded that no liability for unrecognized tax benefits should be recorded related to uncertain tax positions taken on returns filed for open tax years or expected to be taken in 2015 tax returns. The Funds’ 2012, 2013, 2014 and 2015 (when filed) tax returns are open to examination by the federal and applicable state tax authorities. The Funds have no examinations in progress.
| | F. | Dividends and Distributions to Shareholders |
The Funds record dividends and distributions to shareholders on the ex-dividend date. Distributions are determined in accordance with income tax regulations, which may differ from accounting principles generally accepted in the United States. Accordingly, periodic reclassifications related to permanent book and tax basis differences are made within the Funds’ capital accounts to reflect income and gains available for distribution under income tax regulations.
The Funds, except as noted below, generally pay income dividends and distribute capital gains, if any, annually. The U.S. Government Securities Ultra-Short Bond Fund and the Near-Term Tax Free Fund accrue and pay dividends monthly. A Fund may elect to designate a portion of the earnings and profits distributed to shareholders on the redemption of fund shares during the year as distributions for federal income tax purposes. Differences in per share dividend rates for multiclass funds generally result from the relative weightings of pro rata income and realized gain allocations and from differences in separate class expenses.
Fund specific expenses are allocated to that Fund and pro rata across share classes. Expenses that are not fund specific are allocated among Funds and pro rata across share classes. Class specific expenses (including, but not limited to, distribution plan fees, if any, a portion of the administrative services fees, transfer agency fees and expenses, shareholder reporting expenses and certain legal and registration fees) are allocated to the class that incurs such expense. Except for the U.S. Government Securities Ultra-Short Bond Fund, expense offset arrangements have been made with the Funds’ custodian so the custodian fees may be paid indirectly by credits earned on the Funds’ cash balances. Such deposit arrangements are an alternative to overnight investments. Custodian fees are presented in the Statements of Operations gross of such credits, and the credits are presented as offsets to expenses. For the U.S. Government Securities Ultra-Short Bond Fund, credits earned on its cash balance are included in interest and other income.
| | H. | Short-Term Trading (Redemption) Fees |
Short-term trading (redemption) fees are assessed on the All American, Holmes Macro Trends, Global Resources, World Precious Minerals, Gold and Precious Metals, Emerging Europe and China Region Funds (Equity Funds). These fees,
84
Notes to Financial Statements (unaudited) | June 30, 2016 |
which are retained by the Funds, are accounted for as an addition to paid-in capital. The fee for each of the Equity Funds is 0.05% of the amount redeemed on shares held seven days or less.
| | I. | Use of Estimates in Financial Statement Preparation |
The Funds are investment companies accounted for in conformity with accounting principles generally accepted in the United States of America (“GAAP”). Therefore they follow the accounting and reporting guidelines for investment companies. The preparation of financial statements in conformity with GAAP requires management to make estimates and assumptions that affect the reported amounts of assets and liabilities and disclosure of contingent assets and liabilities at the date of the financial statements and the reported amounts of income and expenses during the reporting period. Actual results could differ from those estimates.
| | J. | Subsequent Events Evaluation |
Management has evaluated subsequent events after the balance sheet date of June 30, 2016, through the date that the financial statements were issued and determined that there were no events or transactions that would require adjustments to or disclosure in the financial statements.
Note 2: Financial Derivative Instruments
Equity Funds may purchase or write (sell) options on securities to manage their exposure to stock or commodity markets as well as fluctuations in interest and currency conversion rates. The use of options carries the risks of a change in value of the underlying instruments, an illiquid secondary market, or failure of the counterparty to perform its obligations.
A put option gives the purchaser of the option, upon payment of a premium, the right to sell, and the issuer of the option the obligation to buy, the underlying security, commodity, index, currency or other instrument at the exercise price. A call option, upon payment of a premium, gives the purchaser of the option the right to buy, and the issuer the obligation to sell, the underlying instrument at the exercise price.
Purchasing a put option tends to decrease a Fund’s exposure to the underlying instrument, whereas purchasing a call option tends to increase a Fund’s exposure to the underlying instrument. A Fund pays a premium which is included in the Statement of Assets and Liabilities as an investment and subsequently marked to market to reflect the current value of the option. Premiums paid to purchase options which expire are treated as realized losses. Premiums paid to purchase options which are exercised or closed are added to the cost of securities acquired or the proceeds from securities sold. The risk associated with purchasing put and call options is limited to the premium paid.
85
Notes to Financial Statements (unaudited) | June 30, 2016 |
The Funds will realize a loss equal to all or a part of the premium paid for an option if the price of the underlying security or other instrument decreases or does not increase by more than the premium (in the case of a call option), or if the price of the underlying security or other instrument increases or does not decrease by more than the premium (in the case of a put option).
Writing a put option tends to increase a Fund’s exposure to the underlying instrument, whereas writing a call option tends to decrease a Fund’s exposure to the underlying instrument. The premium received is recorded as a liability in the Statement of Assets and Liabilities and subsequently marked to market to reflect the current value of the option written. Premiums received from writing options which expire are treated as realized gains. Premiums received from options which are exercised or closed are added to the proceeds or offset against amounts paid on the underlying transaction to determine the realized gain or loss. Written options include a risk of loss in excess of the option premium. A Fund as a writer of an option has no control over whether the underlying instrument may be sold (call) or purchased (put) and thus bears the market risk of an unfavorable change in the price of the instrument underlying the written option. There is also the risk a Fund may not be able to enter into a closing transaction because of an illiquid market.
A Fund’s ability to close out its position as a purchaser or seller of a put or call option is dependent, in part, upon the liquidity of the market for that particular option. There can be no guarantee that a fund will be able to close out an option position when desired. An inability to close out its options positions may reduce a Fund’s anticipated profits or increase its losses.
As of June 30, 2016, there were no securities held in escrow by the custodian as cover for call options written.
There were no transactions in written call options during the period ended June 30, 2016.
| | B. | Forward Foreign Currency Contracts |
The Funds enter into forward foreign currency contracts to lock in the U.S. dollar cost of purchase and sale transactions or to hedge the portfolio against currency fluctuations. A forward foreign currency contract is a commitment to purchase or sell a foreign currency at a future date at a negotiated rate. These contracts are valued daily, and the Fund’s net equity therein, representing unrealized gain or loss on the contracts as measured by the difference between the forward foreign exchange rates at the dates of entry into the contracts and the forward rates at the reporting date, is included in the statement of assets and liabilities. Realized and unrealized gains and losses are included in the statement of operations. Risks may arise upon entering into these contracts from the potential inability of counterparties to meet the terms of the contracts and from unanticipated movements in the value of foreign currencies relative to the U.S. dollar.
86
Notes to Financial Statements (unaudited) | June 30, 2016 |
Open forward foreign currency contracts as of June 30, 2016, were as follows:
Fund
Contract | Counterparty | Currency to
Deliver | Currency to
Receive | Settlement Date | | Value | | | Unrealized Appreciation (Depreciation) | |
Emerging Europe Fund | Brown Brothers Harriman | EUR | 2,500,000 | USD | 2,783,215 | 7/20/2016-7/28/2016 | | $ | 2,790,031 | | | $ | 6,816 | |
| Brown Brothers Harriman | GBP | 1,050,000 | USD | 1,460,235 | 7/20/2016-7/28/2016 | | | 1,522,400 | | | | 62,165 | |
| | Brown Brothers Harriman | PLN | 8,500,000 | USD | 2,124,043 | 7/20/2016-7/28/2016 | | | 2,094,655 | | | | (29,388 | ) |
| | Brown Brothers Harriman | TRY | 10,000,000 | USD | 3,376,140 | 7/20/2016-7/28/2016 | | | 3,293,019 | | | | (83,121 | ) |
| | Brown Brothers Harriman | USD | 1,036,003 | GBP | 725,000 | 7/20/2016-7/28/2016 | | | 654,316 | | | | (70,684 | ) |
| | Brown Brothers Harriman | USD | 3,435,748 | TRY | 10,000,000 | 7/20/2016-7/28/2016 | | | 10,023,512 | | | | 23,512 | |
| | Brown Brothers Harriman | USD | 1,112,800 | EUR | 1,000,000 | 7/28/2016 | | | 997,961 | | | | (2,039 | ) |
| | Brown Brothers Harriman | USD | 879,298 | PLN | 3,500,000 | 7/28/2016 | | | 3,507,295 | | | | 7,295 | |
| C. | Summary of Derivative Instruments |
The following is a summary of the valuations of derivative instruments categorized by location in the Statements of Assets and Liabilities as of June 30, 2016:
| | Location | | Global Resources Fund | | | World Precious Minerals Fund | | | Gold and Precious Metals Fund | | | Emerging Europe Fund | |
| | Asset derivatives | | | | | | | | | | | | |
| | Investments, at value | | | | | | | | | | | | |
| | Purchased options | | $ | 123,000 | | | $ | 36,000 | | | $ | 27,000 | | | $ | 201,000 | |
| | Unrealized gain on forward foreign currency contracts | | | — | | | | — | | | | — | | | | 99,788 | |
| | Liability derivatives | | | | | | | | | | | | | | | | |
| | Unrealized loss on forward foreign currency contracts | | | — | | | | — | | | | — | | | | (185,232 | ) |
| | Total | | $ | 123,000 | | | $ | 36,000 | | | $ | 27,000 | | | $ | 115,556 | |
87
Notes to Financial Statements (unaudited) | June 30, 2016 |
The following is a summary of the effect of derivative instruments on the Statements of Operations for the period ended June 30, 2016:
| | Location | | Holmes
Macro
Trends Fund | | | Global Resources
Fund | | | World Precious Minerals
Fund | |
| | Realized gain (loss) on derivatives recognized in income | | | | | | | | | |
| | Realized gain (loss) from securities | | | | | | | | | |
| | Purchased options | | $ | (50,435 | ) | | $ | — | | | $ | (1,212,926 | ) |
| | Net realized gain (loss) from foreign currency transactions | | | | | | | | | | | | |
| | Foreign exchange contracts | | | — | | | | (27,812 | ) | | | (1,270,581 | ) |
| | | | | (50,435 | ) | | | (27,812 | ) | | | (2,483,507 | ) |
| | | | | | | | | | | | | | |
| | Change in unrealized appreciation (depreciation) on derivatives recognized in income | | | | | | | | | | | | |
| | Net change in unrealized appreciation (depreciation) of investments | | | | | | | | | | | | |
| | Purchased options | | | 49,635 | | | | (124,500 | ) | | | 1,443,789 | |
| | Net change in unrealized gain (loss) from foreign currency transactions | | | | | | | | | | | | |
| | Foreign exchange contracts | | | — | | | | — | | | | 93 | |
| | | | | 49,635 | | | | (124,500 | ) | | | 1,443,882 | |
| | Total | | $ | (800 | ) | | $ | (152,312 | ) | | $ | (1,039,625 | ) |
| | Location | | Gold and Precious Metals
Fund | | | Emerging Europe
Fund | | | China
Region
Fund | |
| | Realized gain (loss) on derivatives recognized in income | | | | | | | | | |
| | Realized gain (loss) from securities | | | | | | | | | |
| | Purchased options | | $ | (670,915 | ) | | $ | — | | | $ | (90,420 | ) |
| | Net realized gain (loss) from foreign currency transactions | | | | | | | | | | | | |
| | Foreign exchange contracts | | | (698,643 | ) | | | (612,106 | ) | | | — | |
| | | | | (1,369,558 | ) | | | (612,106 | ) | | | (90,420 | ) |
| | | | | | | | | | | | | | |
| | Change in unrealized appreciation (depreciation) on derivatives recognized in income | | | | | | | | | | | | |
| | Net change in unrealized appreciation (depreciation) of investments | | | | | | | | | | | | |
| | Purchased options | | | 945,715 | | | | 63,000 | | | | 81,595 | |
| | Net change in unrealized gain (loss) from foreign currency transactions | | | | | | | | | | | | |
| | Foreign exchange contracts | | | 70 | | | | 30,380 | | | | (85,444 | ) |
| | | | | 945,785 | | | | 93,380 | | | | (3,849 | ) |
| | Total | | $ | (423,773 | ) | | $ | (518,726 | ) | | $ | (94,269 | ) |
88
Notes to Financial Statements (unaudited) | June 30, 2016 |
The average notional amounts of written options, purchased options and forward currency contracts outstanding during the period ended June 30, 2016, were approximately as follows:
| | Fund | | Purchased
Options | | | Forward
Currency
Contracts | |
| | Holmes Macro Trends | | $ | 114 | | | $ | — | |
| | Global Resources | | | 204,429 | | | | 92,075 | |
| | World Precious Minerals | | | 128,394 | | | | 828,817 | |
| | Gold and Precious Metals | | | 99,604 | | | | 921,582 | |
| | Emerging Europe | | | 179,786 | | | | (413,761 | ) |
| | China Region | | | 2,300 | | | | — | |
Note 3: Investment Advisory and Other Agreements
The Adviser, under an investment advisory agreement with the Trust in effect through October 1, 2016, furnishes management and investment advisory services and, subject to the supervision of the trustees, directs the investments of each Fund according to each Fund’s investment objectives, policies and limitations.
For the services of the Adviser, each Fund pays a base management or advisory fee based upon its net assets. Fees are accrued daily and paid monthly. The contractual management fee for each fund is:
| | Fund | Annual Percentage of
Average Daily Net Assets |
| | U.S. Government Securities Ultra-Short Bond | .50% of the first $250,000,000
and .375% of the excess |
| | Near-Term Tax Free | .50% |
| | All American Equity | .80% of the first $500,000,000
and .75% of the excess |
| | Holmes Macro Trends | 1.00% |
| | Global Resources | .95% of the first $500,000,000;
.90% of $500,000,001 to $1,000,000,000 and .85% of the excess |
| | World Precious Minerals | 1.00% of the first $500,000,000;
.95% of $500,000,001 to $1,000,000,000 and .90% of the excess |
| | Gold and Precious Metals | .90% of the first $500,000,000
and .85% of the excess |
| | Emerging Europe | 1.25% |
| | China Region | 1.25% |
89
Notes to Financial Statements (unaudited) | June 30, 2016 |
The advisory agreement also provides that the base advisory fee of the Equity Funds will be adjusted upwards or downwards by 0.25 percent if there is a performance difference of 5 percent or more between a Fund’s performance and that of its designated benchmark index over the prior 12 months. The performance adjustment is calculated separately for each share class. The benchmarks are as follows:
| | Fund | Benchmark Index |
| | All American Equity | S&P 500 Index |
| | Holmes Macro Trends | S&P Composite 1500 Index |
| | Global Resources | S&P Global Natural Resources Index (Net Total Return) |
| | World Precious Minerals | NYSE Arca Gold Miners Index |
| | Gold and Precious Metals | FTSE Gold Mines Index |
| | Emerging Europe | MSCI Emerging Markets Europe 10/40 Index (Net Total Return) |
| | China Region | Hang Seng Composite Index |
No performance adjustment is applied unless the difference between the class’s investment performance and the benchmark is 5 percent or greater (positive or negative) during the applicable performance measurement period. The performance fee adjustment is calculated monthly in arrears and is accrued ratably during the month. The management fee, net of any performance fee adjustment, is paid monthly in arrears.
The Funds’ prospectus and statement of additional information contain additional information about the performance adjustment. The amounts shown as management fees on the Statements of Operations reflects the base fee plus/minus any performance adjustment. During the period ended June 30, 2016, the Funds recorded performance adjustments as follows:
| | Fund | | Investor Class Performance Fee Adjustment | | | Institutional Class Performance Fee Adjustment | |
| | All American Equity | | $ | (16,648 | ) | | | N/A | |
| | Holmes Macro Trends | | | (34,990 | ) | | | N/A | |
| | Global Resources | | | — | | | | 648 | |
| | World Precious Minerals | | | 113,015 | | | | 132 | |
| | Gold and Precious Metals | | | 67,129 | | | | N/A | |
| | Emerging Europe | | | (23,408 | ) | | | N/A | |
On December 9, 2015, the Trust entered into an Amended Administrative Services Agreement with the Adviser and a Services Agreement with Atlantic Fund Administration, LLC (d/b/a Atlantic Fund Services) (“Atlantic”). Pursuant to these agreements, Atlantic and the Adviser act as co-administrators to the Trust. Atlantic’s services to the Trust include provision of certain officers as well as assistance with certain Trust and fund administration tasks. The Funds compensate Atlantic with a fee structure based on average net assets of each fund, subject to minimum fees.
90
Notes to Financial Statements (unaudited) | June 30, 2016 |
The U.S. Government Securities Ultra-Short Bond, Near-Term Tax Free, All American Equity, Holmes Macro Trends, Gold and Precious Metals, Emerging Europe and China Region Funds compensate the Adviser at an annual rate of 0.05% of the average daily net assets of each Fund for administrative services provided, of which half is a fund-level fee and half is a class-level fee. The Global Resources and World Precious Minerals Funds compensate the Adviser at an annual rate of 0.05% of the average daily net assets for the Investor Class and 0.04% of the average daily net assets for the Institutional Class for administrative services provided, of which half is a fund-level fee and half is a class-level fee.
The Investor Class shares for Equity Funds in the Trust have adopted a distribution plan pursuant to Rule 12b-1 of the Investment Company Act of 1940 in which the Distributor is paid a fee at an annual rate of 0.25% of the average daily net assets of the Investor Class for sales and promotional services related to the distribution of Investor Class shares. The Institutional Class does not incur distribution plan fees.
The Adviser has voluntarily agreed to reimburse specific funds so that their total operating expenses will not exceed certain annual percentages of average net assets. The expenses for the period ended June 30, 2016, were limited as follows for the Investor Class: U.S. Government Securities Ultra-Short Bond Fund at 0.45%, All American Equity Fund and Holmes Macro Trends Fund at 2.20%, Global Resources, World Precious Minerals, and Gold and Precious Metals Funds at 1.90%, Emerging Europe Fund at 2.85% and China Region Fund at 2.55%. These expense limitations are exclusive of any performance fee adjustments and will continue on a voluntary basis at the Adviser’s discretion. The Adviser may temporarily agree to additional reimbursements or limitations.
The Adviser has contractually limited the total operating expenses of the Near-Term Tax Free Fund at 0.45% on an annualized basis through April 30, 2017.
The Adviser has voluntarily agreed to waive all class specific expenses for the Institutional Class of the Global Resources Fund and the World Precious Minerals Fund. These expense waivers are exclusive of any performance fee adjustments, and the Adviser can modify or terminate this arrangement at any time.
Under an agreement entered into while the U.S. Government Securities Ultra-Short Bond Fund was a money market fund, the Adviser had voluntarily agreed to waive fees and/or reimburse the Fund to the extent necessary to maintain the yield at a certain level as determined by the Adviser (Minimum Yield). The Adviser may recapture any fees waived and/or expenses reimbursed within three years after the end of the fiscal year of such waiver and/or reimbursement to the extent that such recapture would not cause the Fund’s yield to fall below the Minimum Yield. The Adviser may seek reimbursement of previously waived and reimbursed fees of $498,342 until December 31, 2016.
U.S. Bancorp Fund Services, LLC is the transfer agent for the Funds. Each Fund’s share class pays an annual fee based on the number of shareholder accounts, certain base fees and transaction- and activity-based fees for transfer agency services.
91
Notes to Financial Statements (unaudited) | June 30, 2016 |
Certain account fees are paid directly by shareholders to the transfer agent, which, in turn, reduces its charge to the Funds.
Atlantic was paid for Chief Compliance Officer services during the six months ended June 30, 2016 in the amount of $62,295.
Brown Brothers Harriman & Co. (BBH) serves as the custodian. SEI Investments Global Funds Services serves as fund accounting and administration service agent with a fee structure based on average net assets of the Trust, subject to minimum fees.
Under a Distribution Agreement with the Trust dated December 10, 2015, Foreside Fund Services, LLC (the “Distributor”) acts as the agent of the Trust in connection with the continuous offering of shares of the Funds. The Distributor continually distributes shares of the Funds on a best efforts basis.
On December 9, 2015, the shareholders of the Funds elected five new trustees to the Board of Trustees. On December 9, 2015, the Board approved new trustee compensation under which Independent Trustees of the Trust each receive an annual fee of $15,000 for service to the Trust. The Chairman of the Board is paid an additional annual fee of $20,000. The trustees and Chairman may receive additional fees for special Board meetings. Each trustee is also reimbursed for all reasonable out-of-pocket expenses incurred in connection with his duties as a trustee, including travel and related expenses incurred in attending Board meetings. The Trust has no pension or retirement plan. No other entity affiliated with the Trust pays any compensation to the trustees.
Note 4: Investments
Cost of purchases and proceeds from sales of long-term securities for the period ended June 30, 2016, are summarized as follows:
| | Fund | | Purchases | | | Sales | |
| | U.S. Government Securities Ultra-Short Bond Fund | | $ | — | | | $ | 3,634,820 | |
| | Near-Term Tax Free Fund | | | 15,920,834 | | | | 6,435,000 | |
| | All American Equity Fund | | | 22,075,180 | | | | 25,834,221 | |
| | Holmes Macro Trends Fund | | | 51,832,040 | | | | 52,273,334 | |
| | Global Resources Fund | | | 136,213,206 | | | | 143,392,076 | |
| | World Precious Minerals Fund | | | 88,307,412 | | | | 95,400,942 | |
| | Gold and Precious Metals Fund | | | 97,223,227 | | | | 99,636,840 | |
| | Emerging Europe Fund | | | 34,194,145 | | | | 34,467,541 | |
| | China Region Fund | | | 16,501,483 | | | | 17,433,480 | |
92
Notes to Financial Statements (unaudited) | June 30, 2016 |
Note 5: Tax Information
The following table presents the income tax basis of securities owned at June 30, 2016, and the tax basis components of net unrealized appreciation (depreciation):
| | Fund | | Aggregate Tax Cost | | | Gross Unrealized Appreciation | | | Gross Unrealized Depreciation | | | Net Unrealized Appreciation (Depreciation) | |
| | U.S. Government Securities Ultra-Short Bond Fund | | $ | 56,583,010 | | | $ | 279,054 | | | $ | (7,238 | ) | | $ | 271,816 | |
| | Near-Term Tax Free Fund | | | 106,810,116 | | | | 1,979,355 | | | | (208,412 | ) | | | 1,770,943 | |
| | All American Equity Fund | | | 14,692,878 | | | | 730,810 | | | | (378,695 | ) | | | 352,115 | |
| | Holmes Macro Trends Fund | | | 34,827,148 | | | | 1,856,429 | | | | (1,806,736 | ) | | | 49,693 | |
| | Global Resources Fund | | | 159,377,714 | | | | 9,790,544 | | | | (80,336,253 | ) | | | (70,545,709 | ) |
| | World Precious Minerals Fund | | | 154,676,666 | | | | 61,843,244 | | | | (60,365,619 | ) | | | 1,477,625 | |
| | Gold and Precious Metals Fund | | | 72,501,027 | | | | 39,692,202 | | | | (7,569,707 | ) | | | 32,122,495 | |
| | Emerging Europe Fund | | | 45,035,597 | | | | 2,473,775 | | | | (6,585,381 | ) | | | (4,111,606 | ) |
| | China Region Fund | | | 12,511,185 | | | | 1,275,306 | | | | (948,966 | ) | | | 326,340 | |
As of December 31, 2015, the components of distributable earnings on a tax basis were as follows:
| | Fund | | Undistributed Tax-Exempt Income | | | Undistributed Ordinary Income | | | Undistributed Long-Term Capital Gains | | | Capital Loss Carryforwards | |
| | U.S. Government Securities Ultra-Short Bond | | $ | — | | | $ | 1,340 | | | $ | — | | | $ | — | |
| | Near-Term Tax Free | | | 60,910 | | | | 2,107 | | | | — | | | | (386,601 | ) |
| | All American Equity | | | — | | | | 27,175 | | | | — | | | | (1,331,255 | ) |
| | Holmes Macro Trends | | | — | | | | — | | | | 3,169,942 | | | | (461,463 | ) |
| | Global Resources | | | — | | | | 3,036,353 | | | | — | | | | (450,231,671 | ) |
| | World Precious Minerals | | | — | | | | 675,876 | | | | — | | | | (304,344,963 | ) |
| | Gold and Precious Metals | | | — | | | | — | | | | — | | | | (98,001,704 | ) |
| | Emerging Europe | | | — | | | | — | | | | — | | | | (326,435,996 | ) |
| | China Region | | | — | | | | 27,741 | | | | — | | | | (18,290,597 | ) |
| | Fund | | Post October Losses | | | Current Year Late-Year Loss Deferral | | | Net Unrealized Appreciation (Depreciation) | | | Other Temporary Differences | | | Total | |
| | U.S. Government Securities Ultra-Short Bond | | $ | — | | | $ | — | | | $ | 27,541 | | | $ | — | | | $ | 28,881 | |
| | Near-Term Tax Free | | | — | | | | — | | | | 1,151,073 | | | | — | | | | 827,489 | |
| | All American Equity | | | — | | | | — | | | | 553,043 | | | | (1 | ) | | | (751,038 | ) |
| | Holmes Macro Trends | | | — | | | | — | | | | (744,335 | ) | | | (2 | ) | | | 1,964,142 | |
| | Global Resources | | | (613,075 | ) | | | — | | | | (96,654,175 | ) | | | (1 | ) | | | (544,462,569 | ) |
| | World Precious Minerals | | | (13,305,056 | ) | | | — | | | | (106,988,726 | ) | | | 89 | | | | (423,962,780 | ) |
| | Gold and Precious Metals | | | (5,850,927 | ) | | | (838,814 | ) | | | (15,626,576 | ) | | | (63,362 | ) | | | (120,381,383 | ) |
| | Emerging Europe | | | — | | | | (301,693 | ) | | | (7,164,635 | ) | | | 30,379 | | | | (333,871,945 | ) |
| | China Region | | | — | | | | — | | | | (598,829 | ) | | | — | | | | (18,861,685 | ) |
93
Notes to Financial Statements (unaudited) | June 30, 2016 |
The differences between book-basis and tax-basis unrealized appreciation (depreciation) for All American Equity, Holmes Macro Trends, Global Resources, World Precious Minerals, Gold and Precious Metals, Emerging Europe and China Region Funds are attributable primarily to the tax deferral of losses on wash sales, investment in passive foreign investment companies (PFIC), forwards marked to markets, adjustments for partnerships, tax straddle loss deferrals on written options, and adjustments for grantor trusts.
The tax character of distributions paid during the fiscal year ended December 31, 2015, were as follows:
| | Fund | | Tax-Exempt Income | | | Ordinary Income | | | Long-Term Capital Gains | | | Total | |
| | U.S. Government Securities Ultra-Short Bond | | $ | — | | | $ | 199,425 | | | $ | 4,235 | | | $ | 203,660 | |
| | Near-Term Tax Free | | | 1,316,177 | | | | 45,536 | | | | — | | | | 1,361,713 | |
| | All American Equity | | | — | | | | 653,208 | | | | 1,610,817 | | | | 2,264,025 | |
| | Holmes Macro Trends | | | — | | | | — | | | | 3,075,742 | | | | 3,075,742 | |
| | Global Resources | | | — | | | | 1,128,155 | | | | — | | | | 1,128,155 | |
| | World Precious Minerals | | | — | | | | 7,142,045 | | | | — | | | | 7,142,045 | |
| | Gold and Precious Metals | | | — | | | | 269,790 | | | | — | | | | 269,790 | |
| | Emerging Europe | | | — | | | | — | | | | — | | | | — | |
| | China Region | | | — | | | | 187,603 | | | | — | | | | 187,603 | |
Capital loss carryforwards may be used to offset current or future taxable capital gains until expiration. The Fund’s tax-basis capital gains and losses are determined only at the end of each fiscal year. Under the Regulated Investment Company Modernization Act of 2010, the Funds are permitted to carry forward capital losses incurred in taxable years beginning after December 22, 2010, for an unlimited period. Losses incurred during these years are required to be utilized prior to the losses incurred in pre-enactment tax years. As a result of this ordering rule, pre-enactment capital loss carryforwards may be more likely to expire unused. In addition, post-enactment capital losses that are carried forward retain their character as either short-term or long-term capital losses rather than being considered all short-term as under previous law. The loss carryforwards and related expiration dates for each fund, as of December 31, 2015, are as follows:
| | | | No Expiration | |
| | Fund | | Short-Term | | | Long-Term | |
| | Near-Term Tax Free | | $ | 151,678 | | | $ | 231,557 | |
| | All American Equity | | | 1,331,255 | | | | — | |
| | Holmes Macro Trends | | | — | | | | — | |
| | Global Resources | | | 162,040,410 | | | | 28,978,749 | |
| | World Precious Minerals | | | 75,572,552 | | | | 164,992,899 | |
| | Gold and Precious Metals | | | 41,610,403 | | | | 56,391,301 | |
| | Emerging Europe | | | 13,372,996 | | | | 11,568,837 | |
| | China Region | | | 3,270,330 | | | | — | |
94
Notes to Financial Statements (unaudited) | June 30, 2016 |
| | | | Expiration Date | | | | |
| | Fund | | 2016 | | | 2017 | | | 2018 | | | Total | |
| | Near-Term Tax Free | | $ | 112 | | | $ | 722 | | | $ | 2,532 | | | $ | 386,601 | |
| | All American Equity | | | — | | | | — | | | | — | | | | 1,331,255 | |
| | Holmes Macro Trends | | | 461,463 | | | | — | | | | — | | | | 461,463 | |
| | Global Resources | | | — | | | | 259,212,512 | | | | — | | | | 450,231,671 | |
| | World Precious Minerals | | | — | | | | 63,779,512 | | | | — | | | | 304,344,963 | |
| | Gold and Precious Metals | | | — | | | | — | | | | — | | | | 98,001,704 | |
| | Emerging Europe | | | 28,524,678 | | | | 257,523,539 | | | | 15,445,946 | | | | 326,435,996 | |
| | China Region | | | 15,020,267 | | | | — | | | | — | | | | 18,290,597 | |
| (a) | Utilization of capital loss carryovers is subject to annual limitations. |
During the year ended December 31, 2015, the following funds utilized capital loss carryforwards to offset capital gains amounting to:
| | Fund | | | |
| | Holmes Macro Trends | | $ | 461,463 | |
| | China Region | | | 8,706 | |
In accordance with tax rules, the following net capital losses and ordinary losses (currency and late year losses) incurred after October 31, within each Fund’s tax year, are deemed to arise on the first day of the Fund’s next tax year if the Fund elects to defer such losses.
The Funds elected to defer losses incurred after October 31, 2015, as follows:
| | Fund | | Post
October 31, 2015
Capital Loss Deferral | | | Post
October 31, 2015
Ordinary Loss Deferral | |
| | Global Resources | | $ | 613,075 | | | $ | — | |
| | World Precious Minerals | | | 13,305,056 | | | | — | |
| | Gold and Precious Metals | | | 5,850,927 | | | | 838,814 | |
| | Emerging Europe | | | — | | | | 301,693 | |
Note 6: Risks of Concentrations and Foreign Investments
The Near-Term Tax Free Fund may be exposed to risks related to concentration of investments in a particular state or geographic area. These investments present risks resulting from changes in economic conditions of the region or the issuer.
The Global Resources Fund, which concentrates its investments in a specific industry, may be subject to greater risks and fluctuations than a portfolio representing a broader range of industries.
The World Precious Minerals and Gold and Precious Metals Funds concentrate their investments in gold and other precious metals and minerals and, therefore, may be subject to greater risks and market fluctuations than a portfolio representing a broader range of industries. The funds invest in securities that typically respond to
95
Notes to Financial Statements (unaudited) | June 30, 2016 |
changes in the price of gold and other precious metals and minerals, which can be influenced by a variety of global economic, financial and political factors; increased environmental and labor costs in mining; and changes in laws relating to mining or gold production or sales. Fluctuations in the prices of gold and other precious metals and minerals will affect the market values of the securities held by these funds.
The Emerging Europe Fund invests more than 25% of its investments in companies principally engaged in the oil, gas or banking industries. The risk of concentrating investments in this group of industries will make the fund more susceptible to risk in these industries than funds which do not concentrate their investments in an industry.
The Emerging Europe Fund may be exposed to risks not typically associated with investment in the United States due to its concentration of investments in emerging markets. These risks include possible revaluation of currencies, less public information about companies, disruptive political or economic conditions and the possible imposition of adverse governmental laws or currency exchange restrictions. Moreover, securities of many foreign issuers, including sovereign nations, and their markets may be less liquid and their prices more volatile than those securities of comparable U.S. issuers.
The China Region Fund may be exposed to risks not typically associated with investments in the United States, due to its concentration of investments in foreign issuers in the region. These investments present risks resulting from disruptive political or economic conditions and the potential imposition of adverse governmental laws or currency exchange restrictions affecting the area.
Note 7: Credit Arrangements
Each of the Funds has a revolving credit facility with BBH. Borrowings of each Fund are collateralized by any or all of the securities held by BBH as the Fund’s custodian up to the amount of the borrowing. Interest on borrowings is charged at the current overnight Federal Funds Rate plus 2 percent. Each Fund has a maximum borrowing limit of 10 percent of qualified assets. The aggregate of borrowings by all Funds under the agreement cannot exceed $10,000,000 at any one time. There were no borrowings under the revolving credit facility during the period ended June 30, 2016. The Funds paid BBH a total of $11,250 in commitment fees for the period ended June 30, 2016, under this arrangement.
Note 8: Change of Independent Registered Public Accounting Firm
The Fund has selected BBD, LLP (“BBD”) to serve as the Fund’s independent registered public accounting firm for the Fund’s fiscal year ended December 31, 2016. The decision to select BBD was recommended by the Fund’s Audit Committee on March 24, 2016 and was approved by the Fund’s Board of Directors on March 24, 2016. During the Fund’s fiscal year ended December 31, 2015, neither the Fund, nor anyone on their behalf, consulted with BBD on items which: (i) concerned the application of accounting principles to a specified transaction, either completed or proposed, or the type of audit opinion that might be rendered
96
Notes to Financial Statements (unaudited) | June 30, 2016 |
on the Fund’s financial statements; or (ii) concerned the subject of a disagreement (as defined in paragraph (a)(1)(iv) of said Item 304). The selection of BBD does not reflect any disagreements with or dissatisfaction by the Fund or the Fund’s Board of Directors with the performance of the Fund’s prior independent registered public accounting firm, KPMG, LLP (“KPMG”). The decision not to renew the engagement of KPMG, effective upon its completion of its audit for the fiscal year ended December 31, 2015, and to select BBD was recommended by the Fund’s Audit Committee and approved by the Fund’s Board of Directors. KPMG’s report on the Fund’s financial statement for the fiscal year ended December 31, 2015 contained no adverse opinion or disclaimer of opinion, nor were they qualified or modified as to uncertainty, audit scope, or accounting principles. During the Fund’s fiscal year ended 2015 (i) there were no disagreements with KPMG on any matter of accounting principles or practices, financial statement disclosure, or auditing scope or procedure, which disagreements, if not resolved to the satisfaction of KPMG, would have caused them to make reference to the subject matter of the disagreements in connection with their reports on the Fund’s financial statements for such years; and (ii) there were no “reportable events” of the kind described in Item 304(a)(1)(v) of Regulation S-K.
Note 9: Subsequent Events
The Funds have evaluated the need for additional disclosures and/or adjustments resulting from subsequent events. Based on this evaluation, no additional disclosures or adjustments were required to the financial statements as of the date the financial statements were issued, except as follows:
Effective August 29, 2016, Atlantic Fund Services will become the transfer agent for the Funds.
97
U.S. Government Securities Ultra-Short Bond Fund
For a capital share outstanding during the
| | | Investor Class | |
| | | Six Months Ended
June 30,
2016 (unaudited) | | |
Year Ended December 31,
| |
| | | | 2015 | | | | 2014 | | | | 2013* | | | | 2012* | | | | 2011* | |
Net asset value, beginning of period | | $ | 2.00 | | | $ | 2.00 | | | $ | 2.00 | | | $ | 2.00 | | | $ | 2.00 | | | $ | 2.00 | |
| | | | | | | | | | | | | | | | | | | | | | | | | |
Investment Activities | | | | | | | | | | | | | | | | | | | | | | | | |
Net investment income | | | —(a | ) | | | .01 | | | | .01 | | | | —(a | ) | | | —(a | ) | | | —(a | ) |
Net realized and unrealized gain | | | .01 | | | | —(a | ) | | | —(a | ) | | | —(a | ) | | | — | | | | — | |
Total from investment activities | | | .01 | | | | .01 | | | | .01 | | | | — | | | | — | | | | — | |
Distributions | | | | | | | | | | | | | | | | | | | | | | | | |
From net investment income | | | —(a | ) | | | (.01 | ) | | | (.01 | ) | | | —(a | ) | | | —(a | ) | | | —(a | ) |
From net realized gains | | | — | | | | —(a | ) | | | — | | | | — | | | | — | | | | — | |
| | | | | | | | | | | | | | | | | | | | | | | | |
Net asset value, end of period | | $ | 2.01 | | | $ | 2.00 | | | $ | 2.00 | | | $ | 2.00 | | | $ | 2.00 | | | $ | 2.00 | |
| | | | | | | | | | | | | | | | | | | | | | | | | |
Total Return (excluding account fees) (b) | | | .72 | % | | | .34 | % | | | .36 | % | | | .02 | % | | | .01 | % | | | .01 | % |
Ratios to Average Net Assets: (c) | | | | | | | | | | | | | | | | | | | | | | | | |
Net investment income | | | .44 | % | | | .33 | % | | | .35 | % | | | .01 | % | | | .01 | % | | | .01 | % |
Total expenses | | | 1.05 | % | | | 1.13 | % | | | 1.07 | % | | | .97 | % | | | .87 | % | | | .81 | % |
Expenses waived or reimbursed (d) | | | (.60 | )% | | | (.68 | )% | | | (.74 | )% | | | (.91 | )% | | | (.74 | )% | | | (.74 | )% |
Net expenses (e) | | | .45 | % | | | .45 | % | | | .33 | % | | | .06 | % | | | .13 | % | | | .07 | % |
Portfolio turnover rate (f) | | | 0 | % | | | 60 | % | | | 33 | % | | | | | | | | | | | | |
| | | | | | | | | | | | | | | | | | | | | | | | | |
Net assets, end of period (in thousands) | | $ | 58,277 | | | $ | 62,562 | | | $ | 64,020 | | | $ | 75,227 | | | $ | 140,425 | | | $ | 171,664 | |
* | The per share amounts for the periods have been adjusted to reflect a 1-for-2 reverse stock split, which was effective December 20, 2013. In addition, on December 20, 2013, the Fund changed from a constant $1.00 net asset value per share money market fund to a U.S. Government ultra-short bond fund (that is not a money market fund) with an objective of total return with current income. |
(a) | The per share amount does not round to a full penny. |
(b) | Assumes investment at the net asset value at the beginning of the period, reinvestment of all distributions and a complete redemption of the investment at the net asset value at the end of the period. |
(c) | Ratios are annualized for periods of less than one year. |
(d) | Expenses waived or reimbursed reflect reductions to total expenses, as discussed in the notes to the financial statements. These amounts would increase the net investment loss ratio or decrease the net investment income ratio, as applicable, and decrease total returns had such reductions not occurred. During 2011, 2012 and 2013, the Adviser waived fees and/or reimbursed expenses under the Minimum Yield Agreement in the amount of $736,531, $509,874 and $498,342, respectively. The waivers/reimbursements from 2013 are subject to recapture in 2016. |
(e) | The net expense ratios shown above reflect expenses after waivers and reimbursements but exclude the effect of reductions to total expenses for any expenses offset. Expense offset arrangements reduce total expenses, as discussed in the notes to the financial statements. These amounts would decrease the net investment income ratio had such reductions not occurred. The effect of expenses offset are as follows: |
| | | | Investor Class | |
| | | | Six Months Ended
June 30,
2016 | | |
Year Ended December 31,
| |
| | | | (unaudited) | | | 2015 | | | 2014 | | | | 2013 | * | | | 2012 | * | | | 2011 | * |
| | Ratios to Average Net Assets: | | | | | | | | | | | | | | | | | | | | | |
| | Expense offset (g) | | | — | | | | — | | | | — | | | | — | | | | — | | | | — | |
(f) | Portfolio turnover is not shown for periods that the Fund was a money market fund. |
(g) | Effect on the expense ratio was not greater than 0.005%. |
See accompanying notes to financial statements.
98
Near-Term Tax Free Fund
For a capital share outstanding during the
| | | Investor Class | |
| | | Six Months Ended
June 30,
2016 (unaudited) | | |
Year Ended December 31,
| |
| | | | 2015 | | | | 2014 | | | | 2013 | | | | 2012 | | | | 2011 | |
Net asset value, beginning of period | | $ | 2.25 | | | $ | 2.25 | | | $ | 2.23 | | | $ | 2.27 | | | $ | 2.26 | | | $ | 2.22 | |
| | | | | | | | | | | | | | | | | | | | | | | | | |
Investment Activities | | | | | | | | | | | | | | | | | | | | | | | | |
Net investment income | | | .02 | | | | .03 | | | | .05 | | | | .05 | | | | .05 | | | | .05 | |
Net realized and unrealized gain (loss) | | | .01 | | | | —(a | ) | | | .02 | | | | (.04 | ) | | | .01 | | | | .04 | |
Total from investment activities | | | .03 | | | | .03 | | | | .07 | | | | .01 | | | | .06 | | | | .09 | |
Distributions from net investment income | | | (.02 | ) | | | (.03 | ) | | | (.05 | ) | | | (.05 | ) | | | (.05 | ) | | | (.05 | ) |
| | | | | | | | | | | | | | | | | | | | | | | | |
Net asset value, end of period | | $ | 2.26 | | | $ | 2.25 | | | $ | 2.25 | | | $ | 2.23 | | | $ | 2.27 | | | $ | 2.26 | |
| | | | | | | | | | | | | | | | | | | | | | | | | |
Total Return (excluding account fees) (b) | | | 1.12 | % | | | 1.45 | % | | | 3.07 | % | | | 0.31 | % | | | 2.67 | % | | | 4.24 | % |
Ratios to Average Net Assets: (c) | | | | | | | | | | | | | | | | | | | | | | | | |
Net investment income | | | 1.24 | % | | | 1.52 | % | | | 2.13 | % | | | 2.08 | % | | | 2.21 | % | | | 2.39 | % |
Total expenses | | | .98 | % | | | 1.09 | % | | | 1.08 | % | | | 1.21 | % | | | 1.25 | % | | | 1.26 | % |
Expenses waived or reimbursed (d) | | | (.53 | )% | | | (.64 | )% | | | (.63 | )% | | | (.76 | )% | | | (.80 | )% | | | (.81 | )% |
Net expenses (e) | | | .45 | % | | | .45 | % | | | .45 | % | | | .45 | % | | | .45 | % | | | .45 | % |
Portfolio turnover rate | | | 7 | % | | | 15 | % | | | 12 | % | | | 6 | % | | | 7 | % | | | —(f | ) |
| | | | | | | | | | | | | | | | | | | | | | | | | |
Net assets, end of period (in thousands) | | $ | 118,965 | | | $ | 106,769 | | | $ | 89,595 | | | $ | 61,884 | | | $ | 44,509 | | | $ | 35,014 | |
(a) | The per share amount does not round to a full penny. |
(b) | Assumes investment at the net asset value at the beginning of the period, reinvestment of all distributions and a complete redemption of the investment at the net asset value at the end of the period. |
(c) | Ratios are annualized for periods of less than one year. |
(d) | Expenses waived or reimbursed reflect reductions to total expenses, as discussed in the notes to the financial statements. These amounts would increase the net investment loss ratio or decrease the net investment income ratio, as applicable, and decrease total returns had such reductions not occurred. |
(e) | The net expense ratios shown above reflect expenses after waivers and reimbursements but exclude the effect of reductions to total expenses for any expenses offset. Expense offset arrangements reduce total expenses, as discussed in the notes to the financial statements. These amounts would decrease the net investment income ratio had such reductions not occurred. The effect of expenses offset are as follows: |
| | | | Investor Class | |
| | | | Six Months Ended
June 30,
2016 (unaudited) | | |
Year Ended December 31,
| |
| | | | 2015 | | | 2014 | | | 2013 | | | 2012 | | | 2011 | |
| | Ratios to Average Net Assets: | | | | | | | | | | | | | | | | | | |
| | Expense offset | | | (.02 | )% | | | —(g | ) | | | —(g | ) | | | —(g | ) | | | —(g | ) | | | —(g | ) |
(f) | Portfolio turnover rate was not greater than 0.5%. |
(g) | Effect on the expense ratio was not greater than 0.005%. |
See accompanying notes to financial statements.
99
All American Equity Fund
For a capital share outstanding during the
| | | Investor Class | |
| | | Six Months Ended
June 30,
2016 (unaudited) | | |
Year Ended December 31,
| |
| | | | 2015 | | | | 2014 | | | | 2013 | | | | 2012 | | | | 2011 | |
Net asset value, beginning of period | | $ | 23.60 | | | $ | 27.84 | | | $ | 32.18 | | | $ | 25.40 | | | $ | 22.72 | | | $ | 22.72 | |
| | | | | | | | | | | | | | | | | | | | | | | | | |
Investment Activities | | | | | | | | | | | | | | | | | | | | | | | | |
Net investment income (loss) | | | —(a | ) | | | .09 | | | | (.16 | ) | | | (.12 | ) | | | .07 | | | | (.07 | ) |
Net realized and unrealized gain (loss) | | | .13 | | | | (1.23 | ) | | | .84 | | | | 9.08 | | | | 2.61 | | | | .10 | |
Total from investment activities | | | .13 | | | | (1.14 | ) | | | .68 | | | | 8.96 | | | | 2.68 | | | | .03 | |
Distributions | | | | | | | | | | | | | | | | | | | | | | | | |
From net investment income | | | — | | | | (.06 | ) | | | — | | | | (.07 | ) | | | — | | | | (.03 | ) |
From net realized gains | | | — | | | | (3.04 | ) | | | (5.02 | ) | | | (2.11 | ) | | | — | | | | — | |
Total distributions | | | — | | | | (3.10 | ) | | | (5.02 | ) | | | (2.18 | ) | | | — | | | | (.03 | ) |
Short -Term Trading Fees* (a) | | | — | | | | — | | | | — | | | | — | | | | — | | | | — | |
| | | | | | | | | | | | | | | | | | | | | | | | |
Net asset value, end of period | | $ | 23.73 | | | $ | 23.60 | | | $ | 27.84 | | | $ | 32.18 | | | $ | 25.40 | | | $ | 22.72 | |
| | | | | | | | | | | | | | | | | | | | | | | | | |
Total Return (excluding account fees) (b) | | | .55 | % | | | (4.20 | )% | | | 1.94 | % | | | 35.55 | % | | | 11.80 | % | | | .14 | % |
Ratios to Average Net Assets: (c) | | | | | | | | | | | | | | | | | | | | | | | | |
Net investment income (loss) | | | .01 | % | | | .31 | % | | | (.54 | )% | | | (.45 | )% | | | .28 | % | | | (.32 | )% |
Total expenses | | | 2.04 | % | | | 1.94 | % | | | 2.16 | % | | | 2.44 | % | | | 2.72 | % | | | 2.42 | % |
Expenses waived or reimbursed (d) | | | (.04 | )% | | | (.02 | )% | | | (.03 | )% | | | (.28 | )% | | | (.52 | )% | | | (.24 | )% |
Net expenses (e) | | | 2.00 | % | | | 1.92 | % | | | 2.13 | % | | | 2.16 | % | | | 2.20 | % | | | 2.18 | % |
Portfolio turnover rate | | | 130 | % | | | 109 | %(g) | | | 253 | % | | | 150 | % | | | 221 | % | | | 223 | % |
| | | | | | | | | | | | | | | | | | | | | | | | | |
Net assets, end of period (in thousands) | | $ | 18,340 | | | $ | 19,117 | | | $ | 21,936 | | | $ | 23,388 | | | $ | 16,846 | | | $ | 16,399 | |
* | Based on average monthly shares outstanding. |
(a) | The per share amount does not round to a full penny. |
(b) | Assumes investment at the net asset value at the beginning of the period, reinvestment of all distributions and a complete redemption of the investment at the net asset value at the end of the period. |
(c) | Ratios are annualized for periods of less than one year. |
(d) | Expenses waived or reimbursed reflect reductions to total expenses, as discussed in the notes to the financial statements. These amounts would increase the net investment loss ratio or decrease the net investment income ratio, as applicable, and decrease total returns had such reductions not occurred. |
(e) | The net expense ratios shown above reflect expenses after waivers and reimbursements but exclude the effect of reductions to total expenses for any expenses offset. Expense offset arrangements reduce total expenses, as discussed in the notes to the financial statements. These amounts would decrease the net investment income (loss) ratio had such reductions not occurred. The effect of expenses offset are as follows: |
| | | | Investor Class | |
| | | | Six Months Ended
June 30,
2016 (unaudited) | | |
Year Ended December 31,
| |
| | | | 2015 | | | 2014 | | | 2013 | | | 2012 | | | 2011 | |
| | Ratios to Average Net Assets: | | | | | | | | | | | | | | | | | | |
| | Expense offset | | | (.01 | )% | | | —(f | ) | | | —(f | ) | | | —(f | ) | | | —(f | ) | | | —(f | ) |
(f) | Effect on the expense ratio was not greater than 0.005%. |
(g) | Excludes option transactions. |
See accompanying notes to financial statements.
100
Holmes Macro Trends Fund
For a capital share outstanding during the
| | | Investor Class | |
| | | Six Months Ended
June 30,
2016 (unaudited) | | |
Year Ended December 31,
| |
| | | | 2015 | | | | 2014 | | | | 2013 | | | | 2012 | | | | 2011 | |
Net asset value, beginning of period | | $ | 18.59 | | | $ | 20.25 | | | $ | 24.24 | | | $ | 18.51 | | | $ | 17.62 | | | $ | 18.65 | |
| | | | | | | | | | | | | | | | | | | | | | | | | |
Investment Activities | | | | | | | | | | | | | | | | | | | | | | | | |
Net investment loss | | | (.05 | ) | | | (.11 | ) | | | (.26 | ) | | | (.18 | ) | | | (.10 | ) | | | (.26 | ) |
Net realized and unrealized gain (loss) | | | (.80 | ) | | | (.06 | ) | | | (1.36 | ) | | | 7.42 | | | | 1.29 | | | | (.77 | ) |
Total from investment activities | | | (.85 | ) | | | (.17 | ) | | | (1.62 | ) | | | 7.24 | | | | 1.19 | | | | (1.03 | ) |
Distributions from net realized gains | | | — | | | | (1.49 | ) | | | (2.37 | ) | | | (1.51 | ) | | | (.30 | ) | | | — | |
Short -Term Trading Fees*(a) | | | — | | | | — | | | | — | | | | — | | | | — | | | | — | |
| | | | | | | | | | | | | | | | | | | | | | | | |
Net asset value, end of period | | $ | 17.74 | | | $ | 18.59 | | | $ | 20.25 | | | $ | 24.24 | | | $ | 18.51 | | | $ | 17.62 | |
| | | | | | | | | | | | | | | | | | | | | | | | | |
Total Return (excluding account fees) (b) | | | (4.57 | )% | | | (.94 | )% | | | (6.74 | )% | | | 39.38 | % | | | 6.77 | % | | | (5.52 | )% |
Ratios to Average Net Assets: (c) | | | | | | | | | | | | | | | | | | | | | | | | |
Net investment loss | | | (.53 | )% | | | (.55 | )% | | | (1.17 | )% | | | (1.11 | )% | | | (.51 | )% | | | (1.25 | )% |
Total expenses | | | 1.85 | % | | | 1.81 | % | | | 1.94 | % | | | 2.00 | % | | | 1.85 | % | | | 2.00 | % |
Expenses waived or reimbursed (d) | | | — | | | | — | | | | — | | | | (.04 | )% | | | —(e | ) | | | — | |
Net expenses (e) | | | 1.85 | % | | | 1.81 | % | | | 1.94 | % | | | 1.96 | % | | | 1.85 | % | | | 2.00 | % |
Portfolio turnover rate | | | 153 | %(g) | | | 320 | %(g) | | | 183 | %(g) | | | 109 | % | | | 214 | % | | | 210 | % |
| | | | | | | | | | | | | | | | | | | | | | | | | |
Net assets, end of period (in thousands) | | $ | 37,020 | | | $ | 41,135 | | | $ | 46,250 | | | $ | 55,926 | | | $ | 34,639 | | | $ | 35,316 | |
* | Based on average monthly shares outstanding. |
(a) | The per share amount does not round to a full penny. |
(b) | Assumes investment at the net asset value at the beginning of the period, reinvestment of all distributions and a complete redemption of the investment at the net asset value at the end of the period. |
(c) | Ratios are annualized for periods of less than one year. |
(d) | Expenses waived or reimbursed reflect reductions to total expenses, as discussed in the notes to the financial statements. These amounts would increase the net investment loss ratio or decrease the net investment income ratio, as applicable, and decrease total returns had such reductions not occurred. |
(e) | The net expense ratios shown above reflect expenses after waivers and reimbursements but exclude the effect of reductions to total expenses for any expenses offset. Expense offset arrangements reduce total expenses, as discussed in the notes to the financial statements. These amounts would decrease the net investment income ratio had such reductions not occurred. The effect of expenses offset are as follows: |
| | | | Investor Class | |
| | | | Six Months Ended
June 30,
2016 (unaudited) | | |
Year Ended December 31,
| |
| | | | 2015 | | | 2014 | | | 2013 | | | 2012 | | | 2011 | |
| | Ratios to Average Net Assets: | | | | | | | | | | | | | | | | | | |
| | Expense offset | | | (.02 | )% | | | —(f | ) | | | —(f | ) | | | —(f | ) | | | —(f | ) | | | —(f | ) |
(f) | Effect on the expense ratio was not greater than 0.005%. |
(g) | Excludes option transactions. |
See accompanying notes to financial statements.
101
Global Resources Fund
For a capital share outstanding during the
| | | Investor Class | |
| | | Six Months Ended
June 30,
2016 (unaudited) | | |
Year Ended December 31,
| |
| | | | 2015 | | | | 2014 | | | | 2013 | | | | 2012 | | | | 2011 | |
Net asset value, beginning of period | | $ | 4.72 | | | $ | 6.67 | | | $ | 9.36 | | | $ | 9.79 | | | $ | 9.36 | | | $ | 11.91 | |
| | | | | | | | | | | | | | | | | | | | | | | | | |
Investment Activities | | | | | | | | | | | | | | | | | | | | | | | | |
Net investment income (loss) | | | .03 | * | | | .10 | * | | | .04 | * | | | .02 | * | | | .04 | * | | | (.19 | ) |
Net realized and unrealized gain (loss) | | | .35 | * | | | (2.00 | )* | | | (2.73 | )* | | | (.10 | )* | | | .61 | * | | | (2.02 | ) |
Total from investment activities | | | .38 | | | | (1.90 | ) | | | (2.69 | ) | | | (.08 | ) | | | .65 | | | | (2.21 | ) |
Distributions from net investment income | | | — | | | | (.05 | ) | | | — | | | | (.35 | ) | | | (.22 | ) | | | (.34 | ) |
Short -Term Trading Fees*(a) | | | — | | | | — | | | | — | | | | — | | | | — | | | | — | |
| | | | | | | | | | | | | | | | | | | | | | | | |
Net asset value, end of period | | $ | 5.10 | | | $ | 4.72 | | | $ | 6.67 | | | $ | 9.36 | | | $ | 9.79 | | | $ | 9.36 | |
| | | | | | | | | | | | | | | | | | | | | | | | | |
Total Return (excluding account fees) (b) | | | 8.05 | % | | | (28.43 | )% | | | (28.74 | )% | | | (.72 | )% | | | 6.93 | % | | | (18.69 | )% |
Ratios to Average Net Assets: (c) | | | | | | | | | | | | | | | | | | | | | | | | |
Net investment income (loss) | | | 1.26 | % | | | 1.72 | % | | | .44 | % | | | .16 | % | | | .44 | % | | | (.79 | )% |
Total expenses | | | 1.90 | % | | | 1.58 | % | | | 1.45 | % | | | 1.59 | % | | | 1.57 | % | | | 1.72 | % |
Expenses waived or reimbursed (d) | | | (.01 | )% | | | (.06 | )% | | | —(e | ) | | | — | | | | — | | | | — | |
Net expenses (e) | | | 1.89 | % | | | 1.52 | % | | | 1.45 | % | | | 1.59 | % | | | 1.57 | % | | | 1.72 | % |
Portfolio turnover rate (g) | | | 149 | %(h) | | | 445 | %(h) | | | 444 | %(h) | | | 138 | % | | | 117 | % | | | 232 | % |
| | | | | | | | | | | | | | | | | | | | | | | | | |
Net assets, end of period (in thousands) | | $ | 99,544 | | | $ | 98,126 | | | $ | 171,673 | | | $ | 326,320 | | | $ | 438,372 | | | $ | 551,793 | |
* | Based on average monthly shares outstanding. |
(a) | The per share amount does not round to a full penny. |
(b) | Assumes investment at the net asset value at the beginning of the period, reinvestment of all distributions and a complete redemption of the investment at the net asset value at the end of the period. |
(c) | Ratios are annualized for periods of less than one year. |
(d) | Expenses waived or reimbursed reflect reductions to total expenses, as discussed in the notes to the financial statements. These amounts would increase the net investment loss ratio or decrease the net investment income ratio, as applicable, and decrease total returns had such reductions not occurred. |
(e) | The net expense ratios shown above reflect expenses after waivers and reimbursements but exclude the effect of reductions to total expenses for any expenses offset. Expense offset arrangements reduce total expenses, as discussed in the notes to the financial statements. These amounts would decrease the net investment income ratio had such reductions not occurred. The effect of expenses offset are as follows: |
| | | | Investor Class | |
| | | | Six Months Ended
June 30,
2016 (unaudited) | | |
Year Ended December 31,
| |
| | | | 2015 | | | 2014 | | | 2013 | | | 2012 | | | 2011 | |
| | Ratios to Average Net Assets: | | | | | | | | | | | | | | | | | | |
| | Expense offset | | | (.01 | )% | | | —(f | ) | | | —(f | ) | | | —(f | ) | | | —(f | ) | | | —(f | ) |
(f) | Effect on the expense ratio was not greater than 0.005%. |
(g) | Portfolio turnover is calculated at the fund level. |
(h) | Excludes option transactions. |
See accompanying notes to financial statements.
102
Global Resources Fund
For a capital share outstanding during the
| | | Institutional Class | |
| | | Six Months Ended
June 30,
2016 (unaudited) | | |
Year Ended December 31,
| |
| | | | 2015 | | | | 2014 | | | | 2013 | | | | 2012 | | | | 2011 | |
Net asset value, beginning of period | | $ | 4.74 | | | $ | 6.67 | | | $ | 9.30 | | | $ | 9.74 | | | $ | 9.39 | | | $ | 11.98 | |
| | | | | | | | | | | | | | | | | | | | | | | | | |
Investment Activities | | | | | | | | | | | | | | | | | | | | | | | | |
Net investment income (loss) | | | .04 | * | | | .17 | * | | | .08 | * | | | .07 | * | | | .10 | * | | | —* | (a) |
Net realized and unrealized gain (loss) | | | .35 | * | | | (2.02 | )* | | | (2.71 | )* | | | (.10 | )* | | | .60 | * | | | (2.17 | )* |
Total from investment activities | | | .39 | | | | (1.85 | ) | | | (2.63 | ) | | | (.03 | ) | | | .70 | | | | (2.17 | ) |
Distributions from net investment income | | | — | | | | (.08 | ) | | | — | | | | (.41 | ) | | | (.35 | ) | | | (.42 | ) |
Short -Term Trading Fees* | | | — | | | | — | | | | — | | | | —(a | ) | | | —(a | ) | | | —(a | ) |
| | | | | | | | | | | | | | | | | | | | | | | | |
Net asset value, end of period | | $ | 5.13 | | | $ | 4.74 | | | $ | 6.67 | | | $ | 9.30 | | | $ | 9.74 | | | $ | 9.39 | |
| | | | | | | | | | | | | | | | | | | | | | | | | |
Total Return (excluding account fees) (b) | | | 8.23 | % | | | (27.73 | )% | | | (28.28 | )% | | | (0.15 | )% | | | 7.44 | % | | | (18.23 | )% |
Ratios to Average Net Assets: (c) | | | | | | | | | | | | | | | | | | | | | | | | |
Net investment income (loss) | | | 1.73 | % | | | 2.92 | % | | | .85 | % | | | .68 | % | | | 1.02 | % | | | (.02 | )% |
Total expenses | | | 4.61 | % | | | 1.35 | % | | | 1.13 | % | | | 1.25 | % | | | 1.21 | % | | | 1.29 | % |
Expenses waived or reimbursed (d) | | | (3.29 | )% | | | (.61 | )% | | | (.27 | )% | | | (.22 | )% | | | (.14 | )% | | | (.20 | )% |
Net expenses (e) | | | 1.32 | % | | | .74 | % | | | .86 | % | | | 1.03 | % | | | 1.07 | % | | | 1.09 | % |
Portfolio turnover rate (g) | | | 149 | %(h) | | | 445 | %(h) | | | 444 | %(h) | | | 138 | % | | | 117 | % | | | 232 | % |
| | | | | | | | | | | | | | | | | | | | | | | | | |
Net assets, end of period (in thousands) | | $ | 595 | | | $ | 1,882 | | | $ | 9,733 | | | $ | 51,122 | | | $ | 94,076 | | | $ | 55,985 | |
* | Based on average monthly shares outstanding. |
(a) | The per share amount does not round to a full penny. |
(b) | Assumes investment at the net asset value at the beginning of the period, reinvestment of all distributions and a complete redemption of the investment at the net asset value at the end of the period. |
(c) | Ratios are annualized for periods of less than one year. |
(d) | Expenses waived or reimbursed reflect reductions to total expenses, as discussed in the notes to the financial statements. These amounts would increase the net investment loss ratio or decrease the net investment income ratio, as applicable, and decrease total returns had such reductions not occurred. |
(e) | The net expense ratios shown above reflect expenses after waivers and reimbursements but exclude the effect of reductions to total expenses for any expenses offset. Expense offset arrangements reduce total expenses, as discussed in the notes to the financial statements. These amounts would decrease the net investment income (loss) ratio had such reductions not occurred. The effect of expenses offset are as follows: |
| | | | Institutional Class | |
| | | | Six Months Ended
June 30,
2016 (unaudited) | | |
Year Ended December 31,
| |
| | | | 2015 | | | 2014 | | | 2013 | | | 2012 | | | 2011 | |
| | Ratios to Average Net Assets: | | | | | | | | | | | | | | | | | | |
| | Expense offset | | | (.01 | )% | | | —(f | ) | | | —(f | ) | | | —(f | ) | | | —(f | ) | | | —(f | ) |
(f) | Effect on the expense ratio was not greater than 0.005%. |
(g) | Portfolio turnover rate is calculated at the fund level. |
(h) | Excludes option transactions. |
See accompanying notes to financial statements.
103
World Precious Minerals Fund
For a capital share outstanding during the
| | | Investor Class | |
| | | Six Months Ended
June 30,
2016 (unaudited) | | |
Year Ended December 31,
| |
| | | | 2015 | | | | 2014 | | | | 2013 | | | | 2012 | | | | 2011 | |
Net asset value, beginning of period | | $ | 3.64 | | | $ | 4.75 | | | $ | 5.69 | | | $ | 11.70 | | | $ | 13.18 | | | $ | 22.28 | |
| | | | | | | | | | | | | | | | | | | | | | | | | |
Investment Activities | | | | | | | | | | | | | | | | | | | | | | | | |
Net investment loss | | | (.03 | )* | | | (.03 | )* | | | (.06 | )* | | | (.07 | )* | | | (.11 | )* | | | (.32 | ) |
Net realized and unrealized gain (loss) | | | 4.13 | * | | | (.72 | )* | | | (.88 | )* | | | (5.94 | )* | | | (1.37 | )* | | | (6.76 | ) |
Total from investment activities | | | 4.10 | | | | (.75 | ) | | | (.94 | ) | | | (6.01 | ) | | | (1.48 | ) | | | (7.08 | ) |
Distributions from net investment income | | | — | | | | (.36 | ) | | | — | | | | — | | | | — | | | | (2.02 | ) |
Short -Term Trading Fees*(a) | | | — | | | | — | | | | — | | | | — | | | | — | | | | — | |
| | | | | | | | | | | | | | | | | | | | | | | | |
Net asset value, end of period | | $ | 7.74 | | | $ | 3.64 | | | $ | 4.75 | | | $ | 5.69 | | | $ | 11.70 | | | $ | 13.18 | |
| | | | | | | | | | | | | | | | | | | | | | | | | |
Total Return (excluding account fees) (b) | | | 112.64 | % | | | (15.64 | )% | | | (16.52 | )% | | | (51.37 | )% | | | (11.23 | )% | | | (32.58 | )% |
Ratios to Average Net Assets: (c) | | | | | | | | | | | | | | | | | | | | | | | | |
Net investment loss | | | (1.23 | )% | | | (.71 | )% | | | (.91 | )% | | | (.90 | )% | | | (.85 | )% | | | (1.43 | )% |
Total expenses | | | 2.01 | % | | | 1.96 | % | | | 1.99 | % | | | 1.85 | % | | | 1.45 | % | | | 1.67 | % |
Expenses waived or reimbursed (d) | | | (.01 | )% | | | (.15 | )% | | | (.03 | )% | | | (.02 | )% | | | — | | | | — | |
Net expenses (e) | | | 2.00 | % | | | 1.81 | % | | | 1.96 | % | | | 1.83 | % | | | 1.45 | % | | | 1.67 | % |
Portfolio turnover rate (g) | | | 79 | %(h) | | | 71 | %(h) | | | 61 | %(h) | | | 34 | % | | | 44 | % | | | 96 | % |
| | | | | | | | | | | | | | | | | | | | | | | | | |
Net assets, end of period (in thousands) | | $ | 175,680 | | | $ | 78,150 | | | $ | 103,413 | | | $ | 134,065 | | | $ | 319,052 | | | $ | 436,504 | |
* | Based on average monthly shares outstanding. |
(a) | The per share amount does not round to a full penny. |
(b) | Assumes investment at the net asset value at the beginning of the period, reinvestment of all distributions and a complete redemption of the investment at the net asset value at the end of the period. |
(c) | Ratios are annualized for periods of less than one year. |
(d) | Expenses waived or reimbursed reflect reductions to total expenses, as discussed in the notes to the financial statements. These amounts would increase the net investment loss ratio or decrease the net investment income ratio, as applicable, and decrease total returns had such reductions not occurred. |
(e) | The net expense ratios shown above reflect expenses after waivers and reimbursements but exclude the effect of reductions to total expenses for any expenses offset. Expense offset arrangements reduce total expenses, as discussed in the notes to the financial statements. These amounts would decrease the net investment income ratio had such reductions not occurred. The effect of expenses offset are as follows: |
| | | | Investor Class | |
| | | | Six Months Ended
June 30,
2016 (unaudited) | | |
Year Ended December 31,
| |
| | | | 2015 | | | 2014 | | | 2013 | | | 2012 | | | 2011 | |
| | Ratios to Average Net Assets: | | | | | | | | | | | | | | | | | | |
| | Expense offset | | | (.01 | )% | | | —(f | ) | | | —(f | ) | | | —(f | ) | | | —(f | ) | | | —(f | ) |
(f) | Effect on the expense ratio was not greater than 0.005%. |
(g) | Portfolio turnover rate is calculated at the fund level. |
(h) | Excludes option transactions. |
See accompanying notes to financial statements.
104
World Precious Minerals Fund
For a capital share outstanding during the
| | | Institutional Class | |
| | | Six Months Ended
June 30,
2016 (unaudited) | | |
Year Ended December 31,
| |
| | | | 2015 | | | | 2014 | | | | 2013 | | | | 2012 | | | | 2011 | |
Net asset value, beginning of period | | $ | 3.65 | | | $ | 4.78 | | | $ | 5.72 | | | $ | 11.69 | | | $ | 13.10 | | | $ | 22.29 | |
| | | | | | | | | | | | | | | | | | | | | | | | | |
Investment Activities | | | | | | | | | | | | | | | | | | | | | | | | |
Net investment loss | | | (.02 | )* | | | (.01 | )* | | | (.05 | )* | | | (.01 | )* | | | (.04 | )* | | | (.16 | )* |
Net realized and unrealized gain (loss) | | | 4.14 | * | | | (.72 | )* | | | (.89 | )* | | | (5.96 | )* | | | (1.37 | )* | | | (6.84 | )* |
Total from investment activities | | | 4.12 | | | | (.73 | ) | | | (.94 | ) | | | (5.97 | ) | | | (1.41 | ) | | | (7.00 | ) |
Distributions from net investment income | | | — | | | | (.40 | ) | | | — | | | | — | | | | — | | | | (2.19 | ) |
Short -Term Trading Fees* | | | — | | | | — | | | | — | | | | — | | | | — | | | | — | |
| | | | | | | | | | | | | | | | | | | | | | | | |
Net asset value, end of period | | $ | 7.77 | | | $ | 3.65 | | | $ | 4.78 | | | $ | 5.72 | | | $ | 11.69 | | | $ | 13.10 | |
| | | | | | | | | | | | | | | | | | | | | | | | | |
Total Return (excluding account fees) (a) | | | 112.88 | % | | | (15.07 | )% | | | (16.43 | )% | | | (51.07 | )% | | | (10.76 | )% | | | (32.28 | )% |
Ratios to Average Net Assets: (b) | | | | | | | | | | | | | | | | | | | | | | | | |
Net investment loss | | | (.63 | )% | | | (.15 | )% | | | (.71 | )% | | | (.15 | )% | | | (.32 | )% | | | (.87 | )% |
Total expenses | | | 7.05 | % | | | 20.51 | % | | | 4.86 | % | | | 3.30 | % | | | 3.56 | % | | | 2.38 | % |
Expenses waived or reimbursed (c) | | | (5.95 | )% | | | (19.31 | )% | | | (3.23 | )% | | | (1.97 | )% | | | (2.69 | )% | | | (1.27 | )% |
Net expenses (d) | | | 1.10 | % | | | 1.20 | % | | | 1.63 | % | | | 1.33 | % | | | .87 | % | | | 1.11 | % |
Portfolio turnover rate (f) | | | 79 | %(g) | | | 71 | %(g) | | | 61 | %(g) | | | 34 | % | | | 44 | % | | | 96 | % |
| | | | | | | | | | | | | | | | | | | | | | | | | |
Net assets, end of period (in thousands) | | $ | 3,944 | | | $ | 76 | | | $ | 154 | | | $ | 3,660 | | | $ | 769 | | | $ | 1,683 | |
* | Based on average monthly shares outstanding. |
(a) | Assumes investment at the net asset value at the beginning of the period, reinvestment of all distributions and a complete redemption of the investment at the net asset value at the end of the period. |
(b) | Ratios are annualized for periods of less than one year. |
(c) | Expenses waived or reimbursed reflect reductions to total expenses, as discussed in the notes to the financial statements. These amounts would increase the net investment loss ratio or decrease the net investment income ratio, as applicable, and decrease total returns had such reductions not occurred. |
(d) | The net expense ratios shown above reflect expenses after waivers and reimbursements but exclude the effect of reductions to total expenses for any expenses offset. Expense offset arrangements reduce total expenses, as discussed in the notes to the financial statements. These amounts would decrease the net investment income ratio had such reductions not occurred. The effect of expenses offset are as follows: |
| | | | Institutional Class | |
| | | | Six Months Ended
June 30,
2016 (unaudited) | | |
Year Ended December 31,
| |
| | | | 2015 | | | 2014 | | | 2013 | | | 2012 | | | 2011 | |
| | Ratios to Average Net Assets: | | | | | | | | | | | | | | | | | | |
| | Expense offset | | | (.01 | )% | | | —(e | ) | | | —(e | ) | | | —(e | ) | | | —(e | ) | | | —(e | ) |
(e) | Effect on the expense ratio was not greater than 0.005%. |
(f) | Portfolio turnover rate is calculated at the fund level. |
(g) | Excludes option transactions. |
See accompanying notes to financial statements.
105
Gold and Precious Metals Fund
For a capital share outstanding during the
| | | Investor Class | |
| | | Six Months Ended
June 30,
2016 (unaudited) | | |
Year Ended December 31,
| |
| | | | 2015 | | | | 2014 | | | | 2013 | | | | 2012 | | | | 2011 | |
Net asset value, beginning of period | | $ | 4.89 | | | $ | 5.16 | | | $ | 6.00 | | | $ | 11.78 | | | $ | 12.61 | | | $ | 19.60 | |
| | | | | | | | | | | | | | | | | | | | | | | | | |
Investment Activities | | | | | | | | | | | | | | | �� | | | | | | | | | |
Net investment loss | | | (.02 | ) | | | (.04 | ) | | | (.05 | ) | | | (.06 | ) | | | (.09 | ) | | | (.17 | ) |
Net realized and unrealized gain (loss) | | | 4.28 | | | | (.21 | ) | | | (.79 | ) | | | (5.72 | ) | | | (.72 | ) | | | (4.28 | ) |
Total from investment activities | | | 4.26 | | | | (.25 | ) | | | (.84 | ) | | | (5.78 | ) | | | (.81 | ) | | | (4.45 | ) |
Distributions | | | | | | | | | | | | | | | | | | | | | | | | |
From net investment income | | | — | | | | (.02 | ) | | | — | | | | — | | | | (.02 | ) | | | — | |
From net realized gains | | | — | | | | — | | | | — | | | | — | | | | — | | | | (2.54 | ) |
Total distributions | | | — | | | | (.02 | ) | | | — | | | | — | | | | (.02 | ) | | | (2.54 | ) |
Short -Term Trading Fees* (a) | | | — | | | | — | | | | — | | | | — | | | | — | | | | — | |
| | | | | | | | | | | | | | | | | | | | | | | | |
Net asset value, end of period | | $ | 9.15 | | | $ | 4.89 | | | $ | 5.16 | | | $ | 6.00 | | | $ | 11.78 | | | $ | 12.61 | |
| | | | | | | | | | | | | | | | | | | | | | | | | |
Total Return (excluding account fees) (b) | | | 87.12 | % | | | (4.78 | )% | | | (14.00 | )% | | | (49.07 | )% | | | (6.44 | )% | | | (23.97 | )% |
Ratios to Average Net Assets: (c) | | | | | | | | | | | | | | | | | | | | | | | | |
Net investment loss | | | (1.09 | )% | | | (.83 | )% | | | (.67 | )% | | | (.48 | )% | | | (.60 | )% | | | (1.06 | )% |
Total expenses | | | 1.87 | % | | | 2.13 | % | | | 1.93 | % | | | 2.12 | % | | | 1.61 | % | | | 1.56 | % |
Expenses waived or reimbursed (d) | | | (.02 | )% | | | (.08 | )% | | | (.05 | )% | | | (.06 | )% | | | — | | | | — | |
Net expenses (e) | | | 1.85 | % | | | 2.05 | % | | | 1.88 | % | | | 2.06 | % | | | 1.61 | % | | | 1.56 | % |
Portfolio turnover rate | | | 124 | %(g) | | | 106 | %(g) | | | 99 | %(g) | | | 64 | % | | | 95 | % | | | 155 | % |
| | | | | | | | | | | | | | | | | | | | | | | | | |
Net assets, end of period (in thousands) | | $ | 132,070 | | | $ | 58,298 | | | $ | 62,777 | | | $ | 74,627 | | | $ | 166,524 | | | $ | 195,087 | |
* | Based on average monthly shares outstanding. |
(a) | The per share amount does not round to a full penny. |
(b) | Assumes investment at the net asset value at the beginning of the period, reinvestment of all distributions and a complete redemption of the investment at the net asset value at the end of the period. |
(c) | Ratios are annualized for periods of less than one year. |
(d) | Expenses waived or reimbursed reflect reductions to total expenses, as discussed in the notes to the financial statements. These amounts would increase the net investment loss ratio or decrease the net investment income ratio, as applicable, and decrease total returns had such reductions not occurred. |
(e) | The net expense ratios shown above reflect expenses after waivers and reimbursements but exclude the effect of reductions to total expenses for any expenses offset. Expense offset arrangements reduce total expenses, as discussed in the notes to the financial statements. These amounts would decrease the net investment loss ratio had such reductions not occurred. The effect of expenses offset are as follows: |
| | | | Investor Class | |
| | | | Six Months Ended
June 30,
2016 (unaudited) | | |
Year Ended December 31,
| |
| | | | 2015 | | | 2014 | | | 2013 | | | 2012 | | | 2011 | |
| | Ratios to Average Net Assets: | | | | | | | | | | | | | | | | | | |
| | Expense offset (e) | | | (.01 | )% | | | —(f | ) | | | —(f | ) | | | —(f | ) | | | —(f | ) | | | —(f | ) |
(f) | Effect on the expense ratio was not greater than 0.005%. |
(g) | Excludes option transactions. |
See accompanying notes to financial statements.
106
Emerging Europe Fund
For a capital share outstanding during the
| | | Investor Class | |
| | | Six Months Ended
June 30,
2016 (unaudited) | | |
Year Ended December 31,
| |
| | | | 2015 | | | | 2014 | | | | 2013 | | | | 2012 | | | | 2011 | |
Net asset value, beginning of period | | $ | 5.20 | | | $ | 6.56 | | | $ | 8.82 | | | $ | 9.23 | | | $ | 7.79 | | | $ | 10.81 | |
| | | | | | | | | | | | | | | | | | | | | | | | | |
Investment Activities | | | | | | | | | | | | | | | | | | | | | | | | |
Net investment income | | | .05 | | | | .04 | | | | .06 | | | | .19 | | | | .15 | | | | .03 | |
Net realized and unrealized gain (loss) | | | .07 | | | | (1.40 | ) | | | (2.11 | ) | | | (.46 | ) | | | 1.35 | | | | (3.05 | ) |
Total from investment activities | | | .12 | | | | (1.36 | ) | | | (2.05 | ) | | | (.27 | ) | | | 1.50 | | | | (3.02 | ) |
Distributions from net investment income | | | — | | | | — | | | | (.21 | ) | | | (.14 | ) | | | (.06 | ) | | | — | |
Short -Term Trading Fees*(a) | | | — | | | | — | | | | — | | | | — | | | | — | | | | — | |
| | | | | | | | | | | | | | | | | | | | | | | | |
Net asset value, end of period | | $ | 5.32 | | | $ | 5.20 | | | $ | 6.56 | | | $ | 8.82 | | | $ | 9.23 | | | $ | 7.79 | |
| | | | | | | | | | | | | | | | | | | | | | | | | |
Total Return (excluding account fees) (b) | | | 2.31 | % | | | (20.73 | )% | | | (23.22 | )% | | | (2.93 | )% | | | 19.27 | % | | | (27.94 | )% |
Ratios to Average Net Assets: (c) | | | | | | | | | | | | | | | | | | | | | | | | |
Net investment income | | | 1.90 | % | | | .63 | % | | | .23 | % | | | 1.59 | % | | | 1.39 | % | | | .25 | % |
Total expenses | | | 2.45 | % | | | 2.60 | % | | | 2.28 | % | | | 2.13 | % | | | 2.15 | % | | | 1.98 | % |
Expenses waived or reimbursed (d) | | | — | | | | — | | | | — | | | | — | | | | — | | | | — | |
Net expenses (e) | | | 2.45 | % | | | 2.60 | % | | | 2.28 | % | | | 2.13 | % | | | 2.15 | % | | | 1.98 | % |
Portfolio turnover rate | | | 83 | %(g) | | | 137 | %(g) | | | 93 | %(g) | | | 74 | % | | | 85 | % | | | 85 | % |
| | | | | | | | | | | | | | | | | | | | | | | | | |
Net assets, end of period (in thousands) | | $ | 42,334 | | | $ | 44,666 | | | $ | 69,066 | | | $ | 122,570 | | | $ | 173,687 | | | $ | 193,599 | |
* | Based on average monthly shares outstanding. |
(a) | The per share amount does not round to a full penny. |
(b) | Assumes investment at the net asset value at the beginning of the period, reinvestment of all distributions and a complete redemption of the investment at the net asset value at the end of the period. |
(c) | Ratios are annualized for periods of less than one year. |
(d) | Expenses waived or reimbursed reflect reductions to total expenses, as discussed in the notes to the financial statements. These amounts would increase the net investment loss ratio or decrease the net investment income ratio, as applicable, and decrease total returns had such reductions not occurred. |
(e) | The net expense ratios shown above reflect expenses after waivers and reimbursements but exclude the effect of reductions to total expenses for any expenses offset. Expense offset arrangements reduce total expenses, as discussed in the notes to the financial statements. These amounts would decrease the net investment income (loss) ratio had such reductions not occurred. The effect of expenses offset are as follows: |
| | | | Investor Class | |
| | | | Six Months Ended
June 30,
2016 (unaudited) | | |
Year Ended December 31,
| |
| | | | 2015 | | | 2014 | | | 2013 | | | 2012 | | | 2011 | |
| | Ratios to Average Net Assets: | | | | | | | | | | | | | | | | | | |
| | Expense offset | | | (.01 | )% | | | —(f | ) | | | —(f | ) | | | —(f | ) | | | —(f | ) | | | —(f | ) |
(f) | Effect on the expense ratio was not greater than 0.005%. |
(g) | Excludes option transactions. |
See accompanying notes to financial statements.
107
China Region Fund
For a capital share outstanding during the
| | | Investor Class | |
| | | Six Months Ended
June 30,
2016 (unaudited) | | |
Year Ended December 31,
| |
| | | | 2015 | | | | 2014 | | | | 2013 | | | | 2012 | | | | 2011 | |
Net asset value, beginning of period | | $ | 7.41 | | | $ | 8.20 | | | $ | 8.28 | | | $ | 7.61 | | | $ | 6.81 | | | $ | 9.47 | |
| | | | | | | | | | | | | | | | | | | | | | | | | |
Investment Activities | | | | | | | | | | | | | | | | | | | | | | | | |
Net investment income (loss) | | | .03 | | | | .02 | | | | —(a | ) | | | (.01 | ) | | | .04 | | | | (.08 | ) |
Net realized and unrealized gain (loss) | | | (.38 | ) | | | (.72 | ) | | | (.08 | ) | | | .70 | | | | .78 | | | | (2.59 | ) |
Total from investment activities | | | (.35 | ) | | | (.70 | ) | | | (.08 | ) | | | .69 | | | | .82 | | | | (2.67 | ) |
Distributions from net investment income | | | — | | | | (.09 | ) | | | — | | | | (.02 | ) | | | (.02 | ) | | | — | |
Short -Term Trading Fees* | | | —(a | ) | | | —(a | ) | | | —(a | ) | | | —(a | ) | | | —(a | ) | | | .01 | |
| | | | | | | | | | | | | | | | | | | | | | | | |
Net asset value, end of period | | $ | 7.06 | | | $ | 7.41 | | | $ | 8.20 | | | $ | 8.28 | | | $ | 7.61 | | | $ | 6.81 | |
| | | | | | | | | | | | | | | | | | | | | | | | | |
Total Return (excluding account fees) (b) | | | (4.72 | )% | | | (8.60 | )% | | | (.97 | )% | | | 9.07 | % | | | 12.00 | % | | | (28.09 | )% |
Ratios to Average Net Assets: (c) | | | | | | | | | | | | | | | | | | | | | | | | |
Net investment income (loss) | | | 1.04 | % | | | .24 | % | | | .08 | % | | | (.12 | )% | | | .60 | % | | | (.64 | )% |
Total expenses | | | 3.39 | % | | | 3.03 | % | | | 2.94 | % | | | 2.75 | % | | | 2.64 | % | | | 2.49 | % |
Expenses waived or reimbursed (d) | | | (.84 | )% | | | (.51 | )% | | | (.43 | )% | | | (.37 | )% | | | (.39 | )% | | | (.08 | )% |
Net expenses (e) | | | 2.55 | % | | | 2.52 | % | | | 2.51 | % | | | 2.38 | % | | | 2.25 | % | | | 2.41 | % |
Portfolio turnover rate | | | 122 | %(g) | | | 210 | %(g) | | | 235 | %(g) | | | 201 | % | | | 374 | % | | | 426 | % |
| | | | | | | | | | | | | | | | | | | | | | | | | |
Net assets, end of period (in thousands) | | $ | 16,391 | | | $ | 16,183 | | | $ | 21,008 | | | $ | 26,386 | | | $ | 29,160 | | | $ | 30,635 | |
* | Based on average monthly shares outstanding. |
(a) | The per share amount does not round to a full penny. |
(b) | Assumes investment at the net asset value at the beginning of the period, reinvestment of all distributions and a complete redemption of the investment at the net asset value at the end of the period. |
(c) | Ratios are annualized for periods of less than one year. |
(d) | Expenses waived or reimbursed reflect reductions to total expenses, as discussed in the notes to the financial statements. These amounts would increase the net investment loss ratio or decrease the net investment income ratio, as applicable, and decrease total returns had such reductions not occurred. |
(e) | The net expense ratios shown above reflect expenses after waivers and reimbursements but exclude the effect of reductions to total expenses for any expenses offset. Expense offset arrangements reduce total expenses, as discussed in the notes to the financial statements. These amounts would decrease the net investment income ratio had such reductions not occurred. The effect of expenses offset are as follows: |
| | | | Investor Class | |
| | | | Six Months Ended
June 30,
2016 (unaudited) | | |
Year Ended December 31,
| |
| | | | 2015 | | | 2014 | | | 2013 | | | 2012 | | | 2011 | |
| | Ratios to Average Net Assets: | | | | | | | | | | | | | | | | | | |
| | Expense offset | | | (.01 | )% | | | —(f | ) | | | —(f | ) | | | —(f | ) | | | —(f | ) | | | —(f | ) |
(f) | Effect on the expense ratio was not greater than 0.005%. |
(g) | Excludes option transactions. |
See accompanying notes to financial statements.
108
Additional Information (unaudited) |
Proxy Voting
A description of the policies and procedures that the Funds use to determine how to vote proxies relating to portfolio securities is available without charge, upon request, by calling 1-800-US-FUNDS (1-800-873-8637). It also appears in the Funds’ statement of additional information (Form 485B), which can be found on the SEC’s website at www.sec.gov.
Information regarding how the Funds voted proxies relating to portfolio securities during the most recent 12-month period ended June 30 is available without charge, upon request, by calling 1-800-US-FUNDS (1-800-873-8637) or accessing the Funds’ Form N-PX on the SEC’s website at www.sec.gov.
Availability of Quarterly Portfolio Schedules
The Funds provide complete lists of holdings four times in each fiscal year, at the quarter-ends. For the second and fourth quarters, the lists appear in the Funds’ semi-annual and annual reports to shareholders. For the first and third quarters, the Funds file the lists with the SEC on Form N-Q. The Funds’ Forms N-Q are available on the SEC’s website at http://www.sec.gov. The Funds’ Forms N-Q may also be reviewed and copied at the SEC’s Public Room in Washington D.C. Information on the operation of the Public Reference Room may be obtained by calling 1-800-SEC-0330.
109
Expense Example (unaudited) | June 30, 2016 |
As a shareholder of the funds, you incur two types of costs: (1) transaction costs, including short-term trading fees and exchange fees; and (2) ongoing costs, including management fees, distribution plan fees, shareholder reports (like this one), and other fund expenses. This example is intended to help you understand your ongoing costs (in dollars) of investing in other mutual funds.
The example is based on an investment of $1,000 invested at the beginning of the period and held for the entire period (January 1, 2016 to June 30, 2016) as indicated below.
● | Actual Expenses. The first line of the following table for each fund provides information about actual account values and actual expenses. You may use the information in this line, together with the amount you invested, to estimate the expenses you paid over the period. Simply divide your account value by $1,000 (for example, an $8,600 account value divided by $1,000 = 8.6), then multiply the result by the number in the first line under the heading ‘‘Expenses Paid During Period’’ to estimate the expenses you paid on your account during this period. |
● | Hypothetical Example for Comparison Purposes. The second line of the following table for each fund provides information about hypothetical account values and hypothetical expenses based on the fund’s actual expense ratio and an assumed rate of return of 5 percent per year before expenses, which is not the fund’s actual return. The hypothetical account values and expenses may not be used to estimate the actual ending account balance or expenses you paid for the period. You may use this information to compare the ongoing costs of investing in these funds and other funds. To do so, compare this 5 percent hypothetical example with the 5 percent hypothetical examples that appear in the shareholder reports of other funds. |
Please note that the expenses shown in the table are meant to highlight your ongoing costs only and do not reflect any direct or transactional costs, such as small account, exchange or short-term trading fees. Therefore, the second line of the table is useful in comparing ongoing costs only, and will not help you determine the relative total costs of owning different funds. In addition, if these direct or transactional costs were included, your costs would have been higher.
110
Expense Example (unaudited) | June 30, 2016 |
| | Beginning Account Value
January 1,
2016 | Ending
Account Value
June 30,
2016 | Expenses
Paid During Period* |
U.S. Government Securities Ultra-Short Bond Fund | | |
Based on Actual Fund Return | $ 1,000.00 | $ 1,007.20 | $ 2.25 |
Based on Hypothetical 5% Yearly Return | $ 1,000.00 | $ 1,022.63 | $ 2.26 |
Near-Term Tax Free Fund | | | |
Based on Actual Fund Return | $ 1,000.00 | $ 1,011.20 | $ 2.25 |
Based on Hypothetical 5% Yearly Return | $ 1,000.00 | $ 1,022.63 | $ 2.26 |
All American Equity Fund | | | |
Based on Actual Fund Return | $ 1,000.00 | $ 1,005.50 | $ 9.97 |
Based on Hypothetical 5% Yearly Return | $ 1,000.00 | $ 1,014.92 | $ 10.02 |
Holmes Macro Trends Fund | | | |
Based on Actual Fund Return | $ 1,000.00 | $ 953.70 | $ 8.99 |
Based on Hypothetical 5% Yearly Return | $ 1,000.00 | $ 1,015.66 | $ 9.27 |
Global Resources Fund Investor Class | | | |
Based on Actual Fund Return | $ 1,000.00 | $ 1,080.50 | $ 9.78 |
Based on Hypothetical 5% Yearly Return | $ 1,000.00 | $ 1,015.47 | $ 9.47 |
Global Resources Fund Institutional Class | | | |
Based on Actual Fund Return | $ 1,000.00 | $ 1,082.30 | $ 6.83 |
Based on Hypothetical 5% Yearly Return | $ 1,000.00 | $ 1,018.30 | $ 6.62 |
World Precious Minerals Fund Investor Class | | |
Based on Actual Fund Return | $ 1,000.00 | $ 2,126.40 | $ 15.55 |
Based on Hypothetical 5% Yearly Return | $ 1,000.00 | $ 1,014.92 | $ 10.02 |
World Precious Minerals Fund Institutional Class | | |
Based on Actual Fund Return | $ 1,000.00 | $ 2,128.80 | $ 8.56 |
Based on Hypothetical 5% Yearly Return | $ 1,000.00 | $ 1,019.39 | $ 5.52 |
Gold and Precious Metals Fund | | | |
Based on Actual Fund Return | $ 1,000.00 | $ 1,871.20 | $ 13.21 |
Based on Hypothetical 5% Yearly Return | $ 1,000.00 | $ 1,015.66 | $ 9.27 |
Emerging Europe Fund | | | |
Based on Actual Fund Return | $ 1,000.00 | $ 1,023.10 | $ 12.32 |
Based on Hypothetical 5% Yearly Return | $ 1,000.00 | $ 1,012.68 | $ 12.26 |
China Region Fund | | | |
Based on Actual Fund Return | $ 1,000.00 | $ 952.80 | $ 12.38 |
Based on Hypothetical 5% Yearly Return | $ 1,000.00 | $ 1,012.18 | $ 12.76 |
* | These calculations are based on expenses incurred in the most recent fiscal half-year. The funds’ Investor Class’ annualized expense ratios (after reimbursements and offsets) for the six month period ended June 30, 2016, were 0.45%, 0.45%, 2.00%, 1.85%, 1.89%, 2.00%, 1.85%, 2.45% and 2.55%, respectively, for the U.S. Government Securities Ultra-Short Bond, Near-Term Tax Free, All American Equity, Holmes Macro Trends, Global Resources, World Precious Minerals, Gold and Precious Metals, Emerging Europe and China Region Funds. The funds’ Institutional Class’ annualized expense ratios (after reimbursements and offsets) for the six month period ended June 30, 2016, were 1.32% and 1.10%, respectively, for the Global Resources and World Precious Minerals Funds. The dollar amounts shown as “Expenses Paid” are equal to the annualized expense ratio multiplied by the average account value over the period, multiplied by 182, the number of days in the period, then divided by 366 days in the current fiscal year. |
111
Rev. 08/2016 |
| |
FACTS | WHAT DOES U.S. GLOBAL INVESTORS DO WITH YOUR PERSONAL INFORMATION? |
| | |
Why? | Financial companies choose how they share your personal information. Federal law gives consumers the right to limit some but not all sharing. Federal law also requires us to tell you how we collect, share, and protect your personal information. Please read this notice carefully to understand what we do. |
| | |
What? | The types of personal information we collect and share depend on the product or service you have with us. This information can include: ● Social Security number and account balances ● retirement assets and checking account information ● account transactions and wire transfer instructions When you are no longer our customer, we continue to share your information as described in this notice. |
| | |
How? | All financial companies need to share customers’ personal information to run their everyday business. In the section below, we list the reasons financial companies can share their customers’ personal information; the reasons U.S. Global Investors chooses to share; and whether you can limit this sharing. |
| | | | |
Reasons we can share your
personal information | Does U.S. Global Investors share? | Can you limit this sharing? |
For our everyday business purposes —
Such as to process your transactions, maintain your account(s), respond to court orders and legal investigations, or report to credit bureaus | Yes | No |
For our marketing purposes —
to offer our products and services to you | Yes | No |
For joint marketing with other
financial companies | No | We don’t share |
For our affiliates’ everyday
business purposes —
information about your transactions and experiences | No | We don’t share |
For our affiliates’ everyday
business purposes —
information about your creditworthiness | No | We don’t share |
For nonaffiliates to market to you | No | We don’t share |
| | |
Questions? | Call 1-800-US-FUNDS (1-800-873-8637) or go to www.usfunds.com |
Who we are |
Who is providing this notice? | U.S. Global Investors, Inc. and U.S. Global Investors Funds (collectively known as U.S. Global Investors) |
| | |
What we do |
How does U.S. Global Investors protect my personal information? | To protect your personal information from unauthorized access and use, we use security measures that comply with federal law. These measures include computer safeguards and secured files and buildings. |
How does U.S. Global Investors collect my personal information? | We collect your personal information, for example, when you ● open an account or provide account information ● make deposits or withdrawals from your account ● make a wire transfer ● tell us where to send the money We also collect your personal information from other companies |
Why can’t I limit all sharing? | Federal law gives you the right to limit only ● sharing for affiliates’ everyday business purposes — information about your creditworthiness ● affiliates from using your information to market to you ● sharing for nonaffiliates to market to you State laws and individual companies may give you additional rights to limit sharing. |
| | |
Definitions |
Affiliates | Companies related by common ownership or control. They can be financial and nonfinancial companies. ● Our affiliates include U.S. Global Investors, Inc. and U.S. Global Investors Funds. |
Nonaffiliates | Companies not related by common ownership or control. They can be financial and nonfinancial companies. ● Nonaffiliates we share personal information with include companies that perform marketing on our behalf, printing and mailing companies, and companies that service your account(s). |
Joint marketing | A formal agreement between nonaffiliated financial companies that together market financial products or services to you. ● U.S. Global Investors doesn’t jointly market. |
[THIS PAGE INTENTIONALLY LEFT BLANK]
[THIS PAGE INTENTIONALLY LEFT BLANK]
 |
Atlantic Fund Services
3 Canal Plaza, Suite 600
Portland, ME
04101 |
Want to reduce paper waste? You can receive this report and other important documents electronically. Please visit www.usfunds.com and sign up at Access My Account. If you need further assistance, please call us at 800-873-8637. |
ITEM 2. CODE OF ETHICS.
Not applicable.
ITEM 3. AUDIT COMMITTEE FINANCIAL EXPERT.
Not applicable.
ITEM 4. PRINCIPAL ACCOUNTANT FEES AND SERVICES.
Not applicable.
ITEM 5. AUDIT COMMITTEE OF LISTED REGISTRANTS.
ITEM 6. INVESTMENTS.
ITEM 7. DISCLOSURE OF PROXY VOTING POLICIES AND PROCEDURES FOR CLOSED-END MANAGEMENT INVESTMENT COMPANIES.
Not applicable.
ITEM 8. PORTFOLIO MANAGERS OF CLOSED-END MANAGEMENT INVESTMENT COMPANIES.
Not applicable.
ITEM 9. PURCHASES OF EQUITY SECURITIES BY CLOSED-END MANAGEMENT INVESTMENT COMPANY AND AFFILIATED PURCHASERS.
Not applicable.
ITEM 10. SUBMISSION OF MATTERS TO A VOTE OF SECURITY HOLDERS
The Registrant does not accept nominees to the board of trustees from shareholders.
ITEM 11. CONTROLS AND PROCEDURES
(a) The Registrant’s Principal Executive Officer and Principal Financial Officer have concluded that the Registrant’s disclosure controls and procedures (as defined in Rule 30a-3(c) under the Act are effective, based on their evaluation of the controls and procedures required by Rule 30a-3(b) under the Act and Rules 13a-15(b) or 15d-15(b) under the Securities Exchange Act of 1934, as of a date within 90 days of the filing date of this report.
(b) There were no changes in the Registrant’s internal control over financial reporting (as defined in Rule 30a-3(d) under the Act) that occurred during the second fiscal quarter of the period covered by this report that have materially affected, or are reasonably likely to materially affect, the Registrant’s internal control over financial reporting.
ITEM 12. EXHIBITS.
Pursuant to the requirements of the Securities Exchange Act of 1934 and the Investment Company Act of 1940, the Registrant has duly caused this report to be signed on its behalf by the undersigned, thereunto duly authorized.
Pursuant to the requirements of the Securities Exchange Act of 1934 and the Investment Company Act of 1940, this report has been signed below by the following persons on behalf of the Registrant and in the capacities and on the dates indicated.