As filed with the Securities and Exchange Commission on August 30, 2018
UNITED STATES
SECURITIES AND EXCHANGE COMMISSION
WASHINGTON, D.C. 20549
FORM N-CSR
CERTIFIED SHAREHOLDER REPORT OF REGISTERED MANAGEMENT
INVESTMENT COMPANIES
Investment Company Act file number 811-01800
U.S. GLOBAL INVESTORS FUNDS
Three Canal Plaza, Suite 600
Portland, Maine 04101
Jessica Chase, Principal Executive Officer
Three Canal Plaza, Suite 600
Portland, Maine 04101
207-347-2000
Date of fiscal year end: December 31
Date of reporting period: January 1, 2018 – June 30, 2018
ITEM 1. REPORT TO STOCKHOLDERS.
U.S. Global Investors Funds
Semi-Annual Report
June 30, 2018
(Unaudited)

U.S. Global Investors Funds
Semi-Annual Report
June 30, 2018
(unaudited)
Table of Contents
| Letter to Shareholders | 1 |
| Portfolios of Investments | 2 |
| Notes to Portfolios of Investments | 53 |
| Statements of Assets and Liabilities | 70 |
| Statements of Operations | 74 |
| Statements of Changes in Net Assets | 78 |
| Notes to Financial Statements | 84 |
| Financial Highlights | 98 |
| Additional Information | 109 |
| Expense Example | 110 |
| Privacy Policy | 114 |
Nasdaq Symbols
U.S. Global Investors Funds
| Investor Class | |
| U.S. Government Securities Ultra-Short Bond Fund | UGSDX |
| Near-Term Tax Free Fund | NEARX |
| All American Equity Fund | GBTFX |
| Holmes Macro Trends Fund | MEGAX |
| Global Resources Fund | PSPFX |
| World Precious Minerals Fund | UNWPX |
| Gold and Precious Metals Fund | USERX |
| Emerging Europe Fund | EUROX |
| China Region Fund | USCOX |
| | |
| Institutional Class | |
| Global Resources Fund | PIPFX |
| World Precious Minerals Fund | UNWIX |
 | Atlantic Fund Services 3 Canal Plaza, Suite 600 Portland, ME 04101 |
| U.S. Global Investors Funds | (unaudited) |

Dear Fellow Shareholder,
Did you know? The best way to receive timely updates on the events that impact your investments is to subscribe to our FREE newsletter, the Investor Alert. There’s no need to wait for dated publications like the Semi-Annual Report!
With a balanced analysis of the markets over the past week, the Investor Alert is written for you by the U.S. Global investments team, featuring a special commentary by me. You can sign up for the Investor Alert—awarded Best Electronic Newsletter by the Mutual Fund Education Alliance (MFEA)—by visiting usfunds.com/ subscribe.
While you’re on the website, be sure to take advantage of additional resources, prepared especially for our fund shareholders:
| ● | My CEO blog, Frank Talk, where I comment on current market topics |
| ● | Frank Talk Live, my weekly video roundup of gold, oil, bitcoin, emerging markets and other asset classes |
| ● | Quarterly fund commentaries, straight from the portfolio managers themselves |
| ● | Up-to-date fund performance, including quarterly performance charts |
We hope you enjoy having these timely resources at your fingertips.
Thank you for investing in U.S. Global Investors Funds!
Sincerely,
Frank E. Holmes
CEO and Chief Investment Officer
U.S. Global Investors, Inc.
Please consider carefully a fund’s investment objectives, risks, charges and expenses. For this and other important information, obtain a fund prospectus by visiting www.usfunds.com or by calling 1-800-US-FUNDS (1-800-874-8637). Read it carefully before investing. Foreside Fund Services, LLC, Distributor. U.S. Global Investors, Inc. is the investment adviser.
All opinions expressed and data provided are subject to change without notice. Some of these opinions may not be appropriate to every investor.
The Mutual Fund Education Alliance (MFEA) is a national industry association committed to investor education, and its STAR Awards program recognizes marketing communications efforts in the mutual fund industry. The awards competition is judged by industry professionals, and based on criteria including educational value, content, design and functionality.
| U.S. Government Securities Ultra-Short Bond Fund | |
| Portfolio of Investments (unaudited) | June 30, 2018 |
| United States Government and Agency | | Coupon | | | Maturity | | Principal | | | | |
| Obligations 92.06% | | Rate % | | | Date | | Amount | | | Value | |
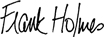
| Federal Farm Credit Bank 50.24% | | | | | | | | | | | |
| Fixed Rates: | | | | | | | | | | | | | | |
| | | | 1.95 | | | 08/28/18 | | $ | 100,000 | | | $ | 99,996 | |
| Floating Rates: | | | | | | | | | | | | | | |
| (Federal Reserve Bank Effective Rate + 0.12%) | | | 2.03 | | | 02/18/20 | | | 3,000,000 | | | | 2,998,768 | |
| (Federal Reserve Bank Prime Loan + (3.08)%) | | | 1.92 | | | 03/11/19 | | | 7,000,000 | | | | 6,998,145 | |
| (U.S. Treasury 3 Month Bill Money Market Yield + 0.15%) | | | 2.06 | | | 04/12/19 | | | 3,000,000 | | | | 3,003,618 | |
| (U.S. Treasury 3 Month Bill Money Market Yield + 0.09%) | | | 2.01 | | | 06/19/19 | | | 8,000,000 | | | | 8,003,079 | |
| (USD 1 Month LIBOR + 0.05%) | | | 2.14 | | | 02/21/20 | | | 3,000,000 | | | | 3,005,460 | |
| | | | | | | | | | | | | | 24,109,066 | |
| Federal Home Loan Bank 37.29% | | | | | | | | | | | | | | |
| Fixed Rates: | | | | | | | | | | | | | | |
| | | | 5.38 | | | 08/15/18 | | | 480,000 | | | | 481,912 | |
| | | | 1.00 | | | 08/28/18 | | | 4,000,000 | | | | 3,993,576 | |
| | | | 1.75 | | | 12/14/18 | | | 3,000,000 | | | | 2,993,982 | |
| | | | 1.50 | | | 03/08/19 | | | 4,000,000 | | | | 3,979,992 | |
| | | | 1.50 | | | 04/26/19 | | | 5,500,000 | | | | 5,463,634 | |
| | | | 1.20 | | | 05/23/19 | | | 1,000,000 | | | | 989,794 | |
| | | | | | | | | | | | | | 17,902,890 | |
| Tennessee Valley Authority 4.53% | | | | | | | | | | | | | | |
| Fixed Rates: | | | | | | | | | | | | | | |
| | | | 1.75 | | | 10/15/18 | | | 2,174,000 | | | | 2,171,683 | |
| | | | | | | | | | | | | | | |
| Investments, at value 92.06% | | | | | | | | | | | | | 44,183,639 | |
| (cost $44,248,443) | | | | | | | | | | | | | | |
| Other assets and liabilities, net 7.94% | | | | | | | | | | | | | 3,812,959 | |
| | | | | | | | | | | | | | | |
| Net Assets 100.00% | | | | | | | | | | | | $ | 47,996,598 | |
See notes to portfolios of investments and notes to financial statements.
| U.S. Government Securities Ultra-Short Bond Fund | |
| Portfolio of Investments (unaudited) | June 30, 2018 |
Portfolio Allocation by Issuer Based on Total Investments | June 30, 2018 |
| Portfolio Allocation by Maturity | | | | | June 30, 2018 | |
| 1-3 Months | | $ | 4,575,484 | | | | 10.3 | % |
| 3-12 Months | | | 33,603,927 | | | | 76.1 | % |
| 1-3 Years | | | 6,004,228 | | | | 13.6 | % |
| | | $ | 44,183,639 | | | | 100.0 | % |
See notes to portfolios of investments and notes to financial statements.
| Near-Term Tax Free Fund | |
| Portfolio of Investments (unaudited) | June 30, 2018 |
| | | Coupon | | | Maturity | | Principal | | | | |
| Municipal Bonds 92.09% | | Rate % | | | Date | | Amount | | | Value | |
| Alabama 1.04% | | | | | | | | | | | |
| City of Bessemer Electric Revenue, Alabama, Refunding, RB AGM | | | 3.10 | | | 12/01/21 | | $ | 100,000 | | | $ | 102,148 | |
| University of South Alabama, Alabama, Refunding, RB | | | 5.00 | | | 11/01/18 | | | 500,000 | | | | 505,670 | |
| | | | | | | | | | | | | | 607,818 | |
| Arizona 0.72% | | | | | | | | | | | | | | |
| City of Tempe, Arizona, GO Unlimited, Series A | | | 2.00 | | | 07/01/19 | | | 220,000 | | | | 221,060 | |
| McAllister Academic Village, LLC, Arizona State University Hassayampa, Arizona, Refunding, RB | | | 5.75 | | | 07/01/18 | | | 200,000 | | | | 200,000 | |
| | | | | | | | | | | | | | 421,060 | |
| Arkansas 2.06% | | | | | | | | | | | | | | |
| Atkins School District No. 18, Arkansas, Refunding, GO Limited | | | 1.00 | | | 02/01/19 | | | 420,000 | | | | 417,644 | |
| Cave City School District No. 2-A, Arkansas, Refunding, GO Limited | | | 1.00 | | | 02/01/19 | | | 260,000 | | | | 258,315 | |
| City of Hot Springs Wastewater Revenue, Arkansas, RB | | | 4.00 | | | 12/01/19 | | | 510,000 | | | | 525,632 | |
| | | | | | | | | | | | | | 1,201,591 | |
| California 1.16% | | | | | | | | | | | | | | |
| California Statewide Communities Development Authority, Enloe Medical Center, California, RB, Series A | | | 5.25 | | | 08/15/18 | | | 340,000 | | | | 341,588 | |
| Newman-Crows Landing Unified School District, California, Refunding, GO Unlimited AGM | | | 4.00 | | | 08/01/19 | | | 115,000 | | | | 118,148 | |
| Riverside County Redevelopment Successor Agency, California, Refunding, Tax Allocation Bond | | | 5.00 | | | 10/01/19 | | | 200,000 | | | | 208,492 | |
| State of California, California, GO Unlimited | | | 5.00 | | | 12/01/19 | | | 5,000 | | | | 5,014 | |
| | | | | | | | | | | | | | 673,242 | |
| Colorado 2.04% | | | | | | | | | | | | | | |
| City & County of Denver Airport System Revenue, Colorado, RB, Series B | | | 5.00 | | | 11/15/27 | | | 300,000 | | | | 333,198 | |
| City of Glendale, Colorado, Refunding, COP AGM | | | 5.00 | | | 12/01/25 | | | 750,000 | | | | 855,683 | |
| | | | | | | | | | | | | | 1,188,881 | |
See notes to portfolios of investments and notes to financial statements.
| Near-Term Tax Free Fund | |
| Portfolio of Investments (unaudited) | June 30, 2018 |
| | | Coupon | | | Maturity | | Principal | | | | |
| Municipal Bonds (cont’d) | | Rate % | | | Date | | Amount | | | Value | |
| Florida 8.06% | | | | | | | | | | | |
| City of Jacksonville, Florida, Refunding, RB, Series C | | | 5.00 | | | 10/01/20 | | $ | 270,000 | | | $ | 289,100 | |
| City of Leesburg, Florida, Refunding, RB | | | 5.00 | | | 10/01/21 | | | 405,000 | | | | 441,239 | |
| City of Margate Water & Sewer Revenue, Florida, Refunding, RB AGM | | | 4.00 | | | 10/01/19 | | | 250,000 | | | | 256,952 | |
| City of Miramar, Florida, Refunding, RB | | | 5.00 | | | 10/01/22 | | | 305,000 | | | | 340,859 | |
| County of St. Johns, Florida, Refunding, RB AGM | | | 5.00 | | | 10/01/20 | | | 310,000 | | | | 330,727 | |
| Escambia County Health Facilities Authority, Baptist Hospital, Inc. Project, Florida, RB, Series A | | | 5.00 | | | 08/15/19 | | | 290,000 | | | | 300,338 | |
| Florida Department of Management Services, Florida, Refunding, COP, Series A | | | 5.00 | | | 08/01/19 | | | 500,000 | | | | 518,580 | |
| Florida Department of Management Services, Florida, COP, Series A | | | 5.00 | | | 08/01/24 | | | 340,000 | | | | 344,774 | |
| Orlando Utilities Commission, Florida, RB ‡ | | | 1.53 | | | 10/01/33 | | | 870,000 | | | | 870,000 | |
| Pinellas County Health Facilities Authority, Florida, RB ‡ | | | 1.55 | | | 11/01/38 | | | 1,000,000 | | | | 1,000,000 | |
| | | | | | | | | | | | | | 4,692,569 | |
| Georgia 1.97% | | | | | | | | | | | | | | |
| Carroll City-County Hospital Authority, Tanner Medical Center, Inc. Project, Georgia, RB | | | 5.00 | | | 07/01/18 | | | 600,000 | | | | 600,000 | |
| Cobb County Hospital Authority, Georgia, RB ‡ | | | 1.51 | | | 04/01/36 | | | 300,000 | | | | 300,000 | |
| Gwinnett County Hospital Authority, Georgia, RB, Series B AGM | | | 5.00 | | | 07/01/18 | | | 250,000 | | | | 250,000 | |
| | | | | | | | | | | | | | 1,150,000 | |
| Idaho 0.42% | | | | | | | | | | | | | | |
| Idaho Housing & Finance Association, Grant & Revenue Anticipation, Federal Highway Trust Fund, Idaho, RB, Series A | | | 5.00 | | | 07/15/21 | | | 225,000 | | | | 244,769 | |
| | | | | | | | | | | | | | | |
| Illinois 4.47% | | | | | | | | | | | | | | |
| Chicago Board of Education, Illinois, GO Unlimited, Series A NATL | | | 5.25 | | | 12/01/19 | | | 300,000 | | | | 309,672 | |
| Clinton Bond Fayette Etc Counties Community College District No. 501 Kaskaskia, Illinois, Refunding, GO Unlimited | | | 5.75 | | | 12/01/19 | | | 500,000 | | | | 526,310 | |
| County of Du Page, Jail Project, Illinois, Refunding, GO Unlimited | | | 5.60 | | | 01/01/21 | | | 210,000 | | | | 221,895 | |
| Du Page County School District No. 33 West Chicago, Illinois, Refunding, GO Unlimited, Series B | | | 4.00 | | | 12/01/21 | | | 1,000,000 | | | | 1,060,180 | |
See notes to portfolios of investments and notes to financial statements.
| Near-Term Tax Free Fund | |
| Portfolio of Investments (unaudited) | June 30, 2018 |
| | | Coupon | | | Maturity | | Principal | | | | |
| Municipal Bonds (cont’d) | | Rate % | | | Date | | Amount | | | Value | |
| Illinois (cont’d) | | | | | | | | | | | |
| Regional Transportation Authority, Illinois, RB, Series A, AMBAC | | | 7.20 | | | 11/01/20 | | $ | 95,000 | | | $ | 101,745 | |
| Village of Fox Lake, Debt Certificates, Illinois, RB, Series B | | | 3.00 | | | 11/01/19 | | | 265,000 | | | | 269,359 | |
| Will Grundy Etc Counties Community College District No. 525, Joliet Junior College, Illinois, GO Unlimited | | | 6.25 | | | 06/01/22 | | | 115,000 | | | | 115,232 | |
| | | | | | | | | | | | | | 2,604,393 | |
| Indiana 1.12% | | | | | | | | | | | | | | |
| Clark-Pleasant School Building Corp., Indiana, Refunding, RB | | | 5.00 | | | 01/15/19 | | | 275,000 | | | | 279,928 | |
| Merrillville Redevelopment Authority, Indiana, Tax Allocation Bond | | | 5.00 | | | 08/15/20 | | | 350,000 | | | | 372,099 | |
| | | | | | | | | | | | | | 652,027 | |
| Iowa 1.10% | | | | | | | | | | | | | | |
| City of Clive, Iowa, Refunding, GO Unlimited, Series A | | | 2.00 | | | 06/01/19 | | | 235,000 | | | | 236,058 | |
| Iowa State Board of Regents, University of Iowa Hospitals and Clinics, Iowa, Refunding, RB, Series A | | | 3.00 | | | 09/01/19 | | | 400,000 | | | | 406,040 | |
| | | | | | | | | | | | | | 642,098 | |
| Kentucky 0.95% | | | | | | | | | | | | | | |
| Louisville & Jefferson County Metropolitan Sewer District, Kentucky, RB, Series A | | | 5.00 | | | 05/15/23 | | | 500,000 | | | | 550,825 | |
| | | | | | | | | | | | | | | |
| Louisiana 1.54% | | | | | | | | | | | | | | |
| State of Louisiana, Louisiana, Prefunding, GO Unlimited, Series A | | | 5.00 | | | 08/01/26 | | | 800,000 | | | | 895,856 | |
| | | | | | | | | | | | | | | |
| Massachusetts 0.52% | | | | | | | | | | | | | | |
| Massachusetts Transportation Trust Fund Metropolitan Highway System Revenue, Massachusetts, RB ‡ | | | 1.49 | | | 01/01/37 | | | 300,000 | | | | 300,000 | |
See notes to portfolios of investments and notes to financial statements.
| Near-Term Tax Free Fund | |
| Portfolio of Investments (unaudited) | June 30, 2018 |
| | | Coupon | | | Maturity | | Principal | | | | |
| Municipal Bonds (cont’d) | | Rate % | | | Date | | Amount | | | Value | |
| Michigan 2.56% | | | | | | | | | | | |
| City of Wyoming, Water Supply System, Michigan, Refunding, RB | | | 4.00 | | | 06/01/20 | | $ | 215,000 | | | $ | 224,009 | |
| Michigan Public Power Agency, AFEC Project, Michigan, RB, Series A | | | 4.50 | | | 01/01/19 | | | 280,000 | | | | 283,564 | |
| Michigan State Hospital Finance Authority, Trinity Health, Michigan, RB, Series A | | | 6.00 | | | 12/01/18 | | | 200,000 | | | | 203,638 | |
| Oxford Area Community School District, Michigan, Refunding, GO Unlimited, Series A Q-SBLF | | | 5.00 | | | 05/01/22 | | | 365,000 | | | | 405,289 | |
| State of Michigan Trunk Line Revenue, Michigan, Refunding, RB | | | 4.50 | | | 11/01/26 | | | 105,000 | | | | 108,420 | |
| Wayne County Airport Authority, Detroit Metropolitan Airport, Michigan, Refunding, RB, Series C | | | 4.00 | | | 12/01/19 | | | 255,000 | | | | 263,068 | |
| | | | | | | | | | | | | | 1,487,988 | |
| Minnesota 0.55% | | | | | | | | | | | | | | |
| City of Minneapolis MN/St Paul Housing & Redevelopment Authority, Minnesota, RB AGM ‡ | | | 1.52 | | | 08/15/25 | | | 320,000 | | | | 320,000 | |
| | | | | | | | | | | | | | | |
| Missouri 4.21% | | | | | | | | | | | | | | |
| City of Kansas City, Missouri, Refunding, RB, Series B | | | 5.00 | | | 08/01/19 | | | 650,000 | | | | 673,016 | |
| City of Kansas City Water Revenue, Missouri, RB, Series F AGM | | | 4.00 | | | 12/01/22 | | | 250,000 | | | | 270,458 | |
| County of Jackson, Truman Sports Complex Project, Special Obligation, Missouri, Refunding, RB | | | 5.00 | | | 12/01/18 | | | 215,000 | | | | 217,952 | |
| Missouri State Board of Public Buildings, Missouri, RB, Series A | | | 3.00 | | | 04/01/26 | | | 750,000 | | | | 768,900 | |
| Missouri State Regional Convention & Sports Complex Authority, Missouri, Refunding, RB, Series A | | | 5.00 | | | 08/15/19 | | | 500,000 | | | | 519,070 | |
| | | | | | | | | | | | | | 2,449,396 | |
| Nevada 0.56% | | | | | | | | | | | | | | |
| Las Vegas Valley Water District, Nevada, Refunding, GO Limited, Series D | | | 5.00 | | | 06/01/27 | | | 315,000 | | | | 324,614 | |
See notes to portfolios of investments and notes to financial statements.
| Near-Term Tax Free Fund | |
| Portfolio of Investments (unaudited) | June 30, 2018 |
| | | Coupon | | | Maturity | | Principal | | | | |
| Municipal Bonds (cont’d) | | Rate % | | | Date | | Amount | | | Value | |
| New Jersey 2.40% | | | | | | | | | | | |
| City of Atlantic City, Tax Appeal, New Jersey, Refunding, GO Unlimited | | | 4.00 | | | 11/01/18 | | $ | 500,000 | | | $ | 498,685 | |
| Hudson County Improvement Authority, North Hudson Regional Fire, New Jersey, Refunding, RB, Series A AGM | | | 5.63 | | | 09/01/18 | | | 400,000 | | | | 402,620 | |
| Middlesex County Improvement Authority, New Jersey, RB | | | 5.00 | | | 07/01/25 | | | 425,000 | | | | 498,746 | |
| | | | | | | | | | | | | | 1,400,051 | |
| New York 12.36% | | | | | | | | | | | | | | |
| City of New York, New York, GO Unlimited ‡ | | | 1.58 | | | 08/01/44 | | | 1,000,000 | | | | 1,000,000 | |
| City of New York, New York, GO Unlimited, Series B | | | 5.00 | | | 08/01/19 | | | 400,000 | | | | 414,864 | |
| City of New York, New York, GO Unlimited, Series E | | | 5.25 | | | 08/01/22 | | | 875,000 | | | | 987,280 | |
| City of New York, New York, GO Unlimited, Series I | | | 5.00 | | | 08/01/22 | | | 1,000,000 | | | | 1,118,570 | |
| Long Island Power Authority, New York, RB, Series B | | | 5.00 | | | 09/01/21 | | | 465,000 | | | | 508,561 | |
| Metropolitan Transportation Authority, New York, RB ‡ | | | 1.54 | | | 11/01/35 | | | 325,000 | | | | 325,000 | |
| Nassau County Industrial Development Agency, New York Institute of Technology Project, New York, Refunding, RB, Series A | | | 5.00 | | | 03/01/21 | | | 350,000 | | | | 369,009 | |
| New York City Water & Sewer System, New York, RB ‡ | | | 1.51 | | | 06/15/38 | | | 200,000 | | | | 200,000 | |
| New York State Dormitory Authority, New York, Refunding, RB, Series B | | | 5.00 | | | 02/15/26 | | | 750,000 | | | | 884,415 | |
| New York State Housing Finance Agency, New York, RB ‡ | | | 1.50 | | | 05/15/37 | | | 500,000 | | | | 500,000 | |
| New York State Urban Development Corp., New York, RB, Series A-2 NATL | | | 5.50 | | | 03/15/19 | | | 615,000 | | | | 632,798 | |
| New York State Urban Development Corp., New York, Refunding, RB, Series D | | | 5.50 | | | 01/01/19 | | | 250,000 | | | | 255,020 | |
| | | | | | | | | | | | | | 7,195,517 | |
| North Carolina 2.21% | | | | | | | | | | | | | | |
| City of Charlotte, Equipment Acquisition & Public Facilities, North Carolina, COP, Series A | | | 5.00 | | | 10/01/21 | | | 1,000,000 | | | | 1,072,110 | |
| County of Beaufort, North Carolina, RB | | | 5.00 | | | 06/01/21 | | | 200,000 | | | | 216,646 | |
| | | | | | | | | | | | | | 1,288,756 | |
See notes to portfolios of investments and notes to financial statements.
| Near-Term Tax Free Fund | |
| Portfolio of Investments (unaudited) | June 30, 2018 |
| | | Coupon | | | Maturity | | Principal | | | | |
| Municipal Bonds (cont’d) | | Rate % | | | Date | | Amount | | | Value | |
| Ohio 1.25% | | | | | | | | | | | |
| City of Cleveland Parking Facility Revenue, Ohio, Refunding, RB AGM | | | 5.25 | | | 09/15/22 | | $ | 130,000 | | | $ | 146,767 | |
| County of Hamilton, Ohio, Refunding, GO Limited, Series A | | | 5.00 | | | 12/01/24 | | | 500,000 | | | | 580,360 | |
| | | | | | | | | | | | | | 727,127 | |
| Oregon 0.36% | | | | | | | | | | | | | | |
| Oregon State Facilities Authority, Legacy Health Project, Oregon, Refunding, RB, Series A | | | 4.50 | | | 05/01/20 | | | 200,000 | | | | 209,700 | |
| | | | | | | | | | | | | | | |
| Pennsylvania 2.96% | | | | | | | | | | | | | | |
| Allegheny County Sanitary Authority, Pennsylvania, Refunding, RB AGM | | | 5.00 | | | 06/01/19 | | | 700,000 | | | | 721,238 | |
| Delaware Valley Regional Finance Authority, Permanently Fixed Business Development Services, Pennsylvania, RB, AMBAC | | | 5.50 | | | 08/01/18 | | | 295,000 | | | | 295,917 | |
| Reading School District, Pennsylvania, GO Unlimited, Series A | | | 5.00 | | | 04/01/20 | | | 400,000 | | | | 419,192 | |
| Wilkes-Barre Finance Authority, University of Scranton, Pennsylvania, Refunding, RB, Series A | | | 5.00 | | | 11/01/19 | | | 275,000 | | | | 286,044 | |
| | | | | | | | | | | | | | 1,722,391 | |
| Rhode Island 2.06% | | | | | | | | | | | | | | |
| Rhode Island Housing & Mortgage Finance Corp., Rhode Island, RB ‡ | | | 1.59 | | | 04/01/39 | | | 1,200,000 | | | | 1,200,000 | |
| | | | | | | | | | | | | | | |
| South Carolina 3.32% | | | | | | | | | | | | | | |
| City of Columbia SC Waterworks & Sewer System Revenue, South Carolina, RB ‡ | | | 1.51 | | | 02/01/38 | | | 100,000 | | | | 100,000 | |
| City of North Charleston SC, South Carolina, Tax Allocation Bond ‡ | | | 1.53 | | | 12/01/18 | | | 435,000 | | | | 435,000 | |
| City of North Charleston SC, South Carolina, Tax Allocation Bond ‡ | | | 1.53 | | | 09/01/37 | | | 480,000 | | | | 480,000 | |
| Spartanburg Regional Health Services District, South Carolina, Refunding, RB, Series A | | | 5.00 | | | 04/15/19 | | | 600,000 | | | | 615,324 | |
| Spartanburg Sanitation Sewer District, South Carolina, RB, Series A AGC | | | 3.50 | | | 03/01/19 | | | 300,000 | | | | 303,768 | |
| | | | | | | | | | | | | | 1,934,092 | |
See notes to portfolios of investments and notes to financial statements.
| Near-Term Tax Free Fund | |
| Portfolio of Investments (unaudited) | June 30, 2018 |
| | | Coupon | | | Maturity | | Principal | | | | |
| Municipal Bonds (cont’d) | | Rate % | | | Date | | Amount | | | Value | |
| Tennessee 0.97% | | | | | | | | | | | |
| City of Memphis Sanitary Sewerage System Revenue, Tennessee, Refunding, RB AGM | | | 5.00 | | | 05/01/20 | | $ | 200,000 | | | $ | 211,898 | |
| The Public Building Authority of Sevier County TN, Tennessee, RB ‡ | | | 1.52 | | | 06/01/32 | | | 350,000 | | | | 350,000 | |
| | | | | | | | | | | | | | 561,898 | |
| Texas 22.78% | | | | | | | | | | | | | | |
| Bryan Independent School District, Texas, GO Unlimited, Series A PSF-GTD | | | 5.00 | | | 02/15/22 | | | 410,000 | | | | 453,001 | |
| City of Arlington, Certificates of Obligation, Texas, GO Limited, Series B | | | 2.00 | | | 08/15/19 | | | 500,000 | | | | 502,645 | |
| City of Austin/TX, Texas, Refunding, RB ‡ | | | 1.51 | | | 11/15/29 | | | 1,000,000 | | | | 1,000,000 | |
| City of Cedar Hill, Texas, Refunding, GO Limited | | | 5.00 | | | 02/15/22 | | | 800,000 | | | | 881,256 | |
| City of Center, Certificates of Obligation, Texas, GO Limited AGM ◊ | | | 3.07 | | | 02/15/20 | | | 150,000 | | | | 145,437 | |
| City of Fort Worth Water & Sewer System Revenue, Texas, Refunding, RB | | | 5.00 | | | 02/15/19 | | | 800,000 | | | | 817,056 | |
| City of Longview Waterworks & Sewer System Revenue, Texas, Refunding, RB | | | 3.00 | | | 03/01/22 | | | 610,000 | | | | 626,848 | |
| City of Pharr, Texas, Refunding, GO Limited, Series A | | | 5.00 | | | 08/15/20 | | | 285,000 | | | | 302,932 | |
| City of Plano, Texas, Refunding, GO Limited | | | 5.00 | | | 09/01/19 | | | 1,000,000 | | | | 1,039,880 | |
| City of Round Rock, Texas, Refunding, GO Limited | | | 2.00 | | | 08/15/19 | | | 465,000 | | | | 466,841 | |
| City of Texarkana Waterworks & Sanitary Sewer System Revenue, Texas, RB | | | 3.00 | | | 08/01/19 | | | 90,000 | | | | 91,379 | |
| City of Texarkana Waterworks & Sanitary Sewer System Revenue, Texas, RB | | | 3.00 | | | 08/01/20 | | | 95,000 | | | | 97,001 | |
| Clear Lake City Water Authority, Waterworks & Sewer System, Texas, GO Unlimited | | | 3.00 | | | 03/01/19 | | | 125,000 | | | | 126,244 | |
| Corpus Christi Business & Job Development Corp., Seawall Project, Texas, Refunding, RB | | | 5.00 | | | 03/01/20 | | | 350,000 | | | | 368,477 | |
| Dimmitt Independent School District, Texas, GO Unlimited PSF-GTD | | | 3.00 | | | 02/15/22 | | | 305,000 | | | | 313,863 | |
| Harris County Municipal Utility District No. 382, Texas, Refunding, GO Unlimited BAM | | | 3.00 | | | 04/01/22 | | | 305,000 | | | | 309,014 | |
| Lower Colorado River Authority, LCRA Transmission Services Corp., Texas, Refunding, RB, Series A | | | 5.00 | | | 05/15/21 | | | 500,000 | | | | 543,180 | |
| Lubbock-Cooper Independent School District, Texas, GO Unlimited PSF-GTD | | | 3.00 | | | 02/15/22 | | | 755,000 | | | | 781,470 | |
See notes to portfolios of investments and notes to financial statements.
| Near-Term Tax Free Fund | |
| Portfolio of Investments (unaudited) | June 30, 2018 |
| | | Coupon | | | Maturity | | Principal | | | | |
| Municipal Bonds (cont’d) | | Rate % | | | Date | | Amount | | | Value | |
| Texas (cont’d) | | | | | | | | | | | |
| Olmos Park Higher Education Facilities Corp., University of the Incarnate Word, Texas, Refunding, RB | | | 5.00 | | | 12/01/21 | | $ | 500,000 | | | $ | 544,895 | |
| Red River Education Finance Corp., Texas, RB ‡ | | | 1.52 | | | 03/15/35 | | | 700,000 | | | | 700,000 | |
| San Antonio Water System, Texas, Refunding, RB | | | 4.50 | | | 05/15/21 | | | 400,000 | | | | 429,456 | |
| State of Texas, Texas, Refunding, GO Unlimited | | | 5.00 | | | 10/01/20 | | | 550,000 | | | | 589,539 | |
| Texas State Public Finance Authority Charter School Finance Corp., Texas, Prefunding, RB, Series A | | | 6.20 | | | 02/15/40 | | | 2,000,000 | | | | 2,137,560 | |
| | | | | | | | | | | | | | 13,267,974 | |
| Utah 0.94% | | | | | | | | | | | | | | |
| County of Davis, Utah, Refunding, GO Unlimited | | | 5.00 | | | 02/01/19 | | | 200,000 | | | | 204,080 | |
| Utah State Building Ownership Authority, State Facilities Master Lease Program, Utah, Refunding, RB, Series C AGM | | | 5.50 | | | 05/15/19 | | | 35,000 | | | | 36,206 | |
| Washington County-St George Interlocal Agency, Utah, Refunding, RB, Series A | | | 4.00 | | | 12/01/19 | | | 300,000 | | | | 309,576 | |
| | | | | | | | | | | | | | 549,862 | |
| Washington 5.43% | | | | | | | | | | | | | | |
| County of Thurston, Washington, Refunding, GO Limited | | | 5.00 | | | 12/01/20 | | | 1,625,000 | | | | 1,750,726 | |
| Spokane Public Facilities District, Washington, Refunding, RB, Series B | | | 5.00 | | | 12/01/21 | | | 950,000 | | | | 1,042,844 | |
| Tacoma Metropolitan Park District, Washington, Refunding, GO Unlimited, Series B | | | 4.00 | | | 12/01/19 | | | 355,000 | | | | 366,988 | |
| | | | | | | | | | | | | | 3,160,558 | |
| | | | | | | | | | | | | | | |
| Investments, at value 92.09% | | | | | | | | | | | | | 53,625,053 | |
| (cost $53,920,096) | | | | | | | | | | | | | | |
| Other assets and liabilities, net 7.91% | | | | | | | | | | | | | 4,608,477 | |
| | | | | | | | | | | | | | | |
| Net Assets 100.00% | | | | | | | | | | | | $ | 58,233,530 | |
See notes to portfolios of investments and notes to financial statements.
| Near-Term Tax Free Fund | |
| Portfolio of Investments (unaudited) | June 30, 2018 |
Municipal Bond Ratings* Based on Total Municipal Bonds | June 30, 2018 |

| * | Credit quality ratings are measured on a scale that generally ranges from AAA (highest) to D (lowest). “Not Rated” is used to classify securities for which a rating is not available. Credit quality ratings for each issue are obtained from Moody’s and S&P, and the higher rating for each issue is used. |
See notes to portfolios of investments and notes to financial statements.
| All American Equity Fund | |
| Portfolio of Investments (unaudited) | June 30, 2018 |
| Common Stocks 94.11% | | Shares | | | Value | |
| | | | | | | |
| Aerospace/Defense 2.84% | | | | | | |
| The Boeing Co. | | | 1,300 | | | $ | 436,163 | |
| | | | | | | | | |
| Apparel Manufacturers 3.33% | | | | | | | | |
| Hanesbrands, Inc. | | | 23,200 | | | | 510,864 | |
| | | | | | | | | |
| Beverages - Wine/Spirits 3.14% | | | | | | | | |
| Constellation Brands, Inc., Class A | | | 2,200 | | | | 481,514 | |
| | | | | | | | | |
| Chemicals - Diversified 2.70% | | | | | | | | |
| PPG Industries, Inc. | | | 4,000 | | | | 414,920 | |
| | | | | | | | | |
| Commercial Banks 3.29% | | | | | | | | |
| Zions Bancorp. | | | 9,600 | | | | 505,824 | |
| | | | | | | | | |
| Commercial Services - Finance 2.81% | | | | | | | | |
| Total System Services, Inc. | | | 5,100 | | | | 431,052 | |
| | | | | | | | | |
| Computer Services 2.26% | | | | | | | | |
| DXC Technology Co. | | | 4,300 | | | | 346,623 | |
| | | | | | | | | |
| Cosmetics & Toiletries 3.34% | | | | | | | | |
| The Estee Lauder Cos., Inc. | | | 3,600 | | | | 513,684 | |
| | | | | | | | | |
| Cruise Lines 4.61% | | | | | | | | |
| Carnival Corp. | | | 6,200 | | | | 355,322 | |
| Royal Caribbean Cruises, Ltd. | | | 3,400 | | | | 352,240 | |
| | | | | | | | 707,562 | |
| | | | | | | | | |
| Diversified Manufacturing Operations 3.04% | | | | | | | | |
| Ingersoll-Rand PLC | | | 5,200 | | | | 466,596 | |
| | | | | | | | | |
| Electronic Components - Semiconductors 6.03% | | | | | | | | |
| Broadcom, Inc. | | | 1,820 | | | | 441,605 | |
| Texas Instruments, Inc. | | | 4,400 | | | | 485,100 | |
| | | | | | | | 926,705 | |
| | | | | | | | | |
| Enterprise Software/Services 2.73% | | | | | | | | |
| Oracle Corp. | | | 9,500 | | | | 418,570 | |
| | | | | | | | | |
| Fiduciary Banks 3.51% | | | | | | | | |
| The Bank of New York Mellon Corp. | | | 10,000 | | | | 539,300 | |
See notes to portfolios of investments and notes to financial statements.
| All American Equity Fund | |
| Portfolio of Investments (unaudited) | June 30, 2018 |
| Common Stocks (cont’d) | | Shares | | | Value | |
| | | | | | | |
| Finance - Credit Card 3.62% | | | | | | |
| Visa, Inc., Class A | | | 4,200 | | | $ | 556,290 | |
| | | | | | | | | |
| Medical - Biomedical/Genetics 3.25% | | | | | | | | |
| Amgen, Inc. | | | 2,700 | | | | 498,393 | |
| | | | | | | | | |
| Medical - Drugs 3.11% | | | | | | | | |
| Zoetis, Inc. | | | 5,600 | | | | 477,064 | |
| | | | | | | | | |
| Medical - HMO 2.91% | | | | | | | | |
| Humana, Inc. | | | 1,500 | | | | 446,445 | |
| | | | | | | | | |
| Medical Products 3.80% | | | | | | | | |
| Baxter International, Inc. | | | 7,900 | | | | 583,336 | |
| | | | | | | | | |
| Oil Companies - Exploration & Production 2.90% | | | | | | | | |
| Cabot Oil & Gas Corp. | | | 18,700 | | | | 445,060 | |
| | | | | | | | | |
| Oil Refining & Marketing 6.49% | | | | | | | | |
| Marathon Petroleum Corp. | | | 6,000 | | | | 420,960 | |
| Valero Energy Corp. | | | 5,200 | | | | 576,316 | |
| | | | | | | | 997,276 | |
| | | | | | | | | |
| REITS - Diversified 2.72% | | | | | | | | |
| American Tower Corp. REIT | | | 2,900 | | | | 418,093 | |
| | | | | | | | | |
| Retail - Building Products 3.68% | | | | | | | | |
| The Home Depot, Inc. | | | 2,900 | | | | 565,790 | |
| | | | | | | | | |
| Retail - Discount 2.86% | | | | | | | | |
| Costco Wholesale Corp. | | | 2,100 | | | | 438,858 | |
| | | | | | | | | |
| Super-Regional Banks-US 3.28% | | | | | | | | |
| KeyCorp | | | 25,800 | | | | 504,132 | |
| | | | | | | | | |
| Supranational Bank 2.90% | | | | | | | | |
| Comerica, Inc. | | | 4,900 | | | | 445,508 | |
| | | | | | | | | |
| Telephone - Integrated 2.75% | | | | | | | | |
| Verizon Communications, Inc. | | | 8,400 | | | | 422,604 | |
| | | | | | | | | |
| Tools - Hand Held 3.04% | | | | | | | | |
| Snap-on, Inc. | | | 2,900 | | | | 466,088 | |
See notes to portfolios of investments and notes to financial statements.
| All American Equity Fund | |
| Portfolio of Investments (unaudited) | June 30, 2018 |
| Common Stocks (cont’d) | | Shares | | | Value | |
| | | | | | | |
| Water 3.17% | | | | | | |
| American Water Works Co., Inc. | | | 5,700 | | | $ | 486,666 | |
| | | | | | | | | |
| Total Common Stocks | | | | | | | 14,450,980 | |
| (cost $13,842,605) | | | | | | | | |
| | | | | | | | | |
| Exchange Traded Funds 0.95% | | | | | | | | |
| Consumer Discretionary Select Sector SPDR Fund ETF | | | 700 | | | | 76,510 | |
| Innovator IBD 50 ETF | | | 2,000 | | | | 70,200 | |
| | | | | | | | | |
| Total Exchange Traded Funds | | | | | | | 146,710 | |
| (cost $148,279) | | | | | | | | |
| | | | | | | | Notional | | | | | | | |
| | | Strike | | | Exp. | | Contract | | | | | | | |
| Put Option Purchased 0.70% | | Price | | | Date | | Value | | | Contracts | | | | |
| | | | | | | | | | | | | | | |
| Exchange Traded Fund 0.70% | | | | | | | | | | | | | | |
| SPDR S&P 500 ETF Trust | | $ | 270.00 | | | 01/19 | | $ | 2,658,544 | | | | 98 | | | | 107,310 | |
| (premiums paid $134,820) | | | | | | | | | | | | | | | | | | |
| | | | | | | | | | | | | | | | | | | |
| Investments, at value 95.76% | | | | | | | | | | | | | | | | | 14,705,000 | |
| (cost $14,125,704) | | | | | | | | | | | | | | | | | | |
| Other assets and liabilities, net 4.24% | | | | | | | | | | | | | | | | | 650,326 | |
| | | | | | | | | | | | | | | | | | | |
| Net Assets 100.00% | | | | | | | | | | | | | | | | $ | 15,355,326 | |
See notes to portfolios of investments and notes to financial statements.
| All American Equity Fund | |
| Portfolio of Investments (unaudited) | June 30, 2018 |
Portfolio Allocation by Industry Sector* Based on Total Investments | June 30, 2018 |

| * | Summary information above may differ from the portfolio schedule included in the financial statements due to the use of different classifications of securities for presentation purposes. |
See notes to portfolios of investments and notes to financial statements.
| Holmes Macro Trends Fund | |
| Portfolio of Investments (unaudited) | June 30, 2018 |
| Common Stocks 91.81% | | Shares | | | Value | |
| | | | | | | |
| Airlines 4.01% | | | | | | |
| Hawaiian Holdings, Inc. | | | 44,000 | | | $ | 1,581,800 | |
| | | | | | | | | |
| Batteries/Battery Systems 3.26% | | | | | | | | |
| Energizer Holdings, Inc. | | | 20,400 | | | | 1,284,384 | |
| | | | | | | | | |
| Beverages - Non-alcoholic 2.19% | | | | | | | | |
| Coca-Cola Bottling Co. Consolidated | | | 6,400 | | | | 864,832 | |
| | | | | | | | | |
| Building - Residential/Commercial 2.33% | | | | | | | | |
| LGI Homes, Inc. * | | | 15,900 | | | | 917,907 | |
| | | | | | | | | |
| Casino Hotels 4.96% | | | | | | | | |
| Wynn Resorts, Ltd. | | | 11,700 | | | | 1,957,878 | |
| | | | | | | | | |
| Chemicals - Specialty 3.59% | | | | | | | | |
| The Chemours Co. | | | 31,900 | | | | 1,415,084 | |
| | | | | | | | | |
| Commercial Services 3.57% | | | | | | | | |
| Medifast, Inc. | | | 8,800 | | | | 1,409,408 | |
| | | | | | | | | |
| Commercial Services - Finance 7.54% | | | | | | | | |
| S&P Global, Inc. | | | 14,600 | | | | 2,976,794 | |
| | | | | | | | | |
| Consumer Products - Miscellaneous 3.04% | | | | | | | | |
| Kimberly-Clark Corp. | | | 11,400 | | | | 1,200,876 | |
| | | | | | | | | |
| Diversified Manufacturing Operations 2.59% | | | | | | | | |
| EnPro Industries, Inc. | | | 14,600 | | | | 1,021,270 | |
| | | | | | | | | |
| Electronic Secure Devices 3.39% | | | | | | | | |
| Allegion PLC | | | 17,300 | | | | 1,338,328 | |
| | | | | | | | | |
| Energy - Alternate Sources 0.00% | | | | | | | | |
| Pacific Green Energy Corp. #*@ | | | 100,000 | | | | 0 | |
| | | | | | | | | |
| Food - Miscellaneous/Diversified 2.96% | | | | | | | | |
| B&G Foods, Inc. | | | 39,000 | | | | 1,166,100 | |
| | | | | | | | | |
| Home Furnishings 2.01% | | | | | | | | |
| Sleep Number Corp. * | | | 27,400 | | | | 795,148 | |
See notes to portfolios of investments and notes to financial statements.
| Holmes Macro Trends Fund | |
| Portfolio of Investments (unaudited) | June 30, 2018 |
| Common Stocks (cont’d) | | Shares | | | Value | |
| | | | | | | |
| Medical - Drugs 7.60% | | | | | | |
| Corcept Therapeutics, Inc. * | | | 95,000 | | | $ | 1,493,400 | |
| Mallinckrodt PLC * | | | 80,600 | | | | 1,503,996 | |
| | | | | | | | 2,997,396 | |
| | | | | | | | | |
| Medical - Hospitals 0.00% | | | | | | | | |
| African Medical Investments PLC #*@ | | | 1,000,000 | | | | 0 | |
| | | | | | | | | |
| Medical Laser Systems 2.60% | | | | | | | | |
| Cutera, Inc. * | | | 25,500 | | | | 1,027,650 | |
| | | | | | | | | |
| Office Automation & Equipment 3.02% | | | | | | | | |
| Pitney Bowes, Inc. | | | 139,000 | | | | 1,191,230 | |
| | | | | | | | | |
| Oil Companies - Exploration & Production 0.08% | | | | | | | | |
| PentaNova Energy Corp., 144A #*∆ | | | 500,000 | | | | 30,426 | |
| | | | | | | | | |
| Pastoral & Agricultural 3.85% | | | | | | | | |
| Phibro Animal Health Corp. | | | 33,000 | | | | 1,519,650 | |
| | | | | | | | | |
| Power Conversion/Supply Equipment 3.94% | | | | | | | | |
| SPX Corp. * | | | 44,300 | | | | 1,552,715 | |
| | | | | | | | | |
| Real Estate Operating/Development 0.82% | | | | | | | | |
| Pacific Infrastructure Ventures, Inc. #*@+ | | | 426,533 | | | | 322,118 | |
| | | | | | | | | |
| REITS - Diversified 3.85% | | | | | | | | |
| Potlatch Corp. REIT | | | 29,900 | | | | 1,520,415 | |
| | | | | | | | | |
| REITS - Regional Malls 4.14% | | | | | | | | |
| Taubman Centers, Inc. REIT | | | 27,800 | | | | 1,633,528 | |
| | | | | | | | | |
| Semiconductor Equipment 2.39% | | | | | | | | |
| Axcelis Technologies, Inc. * | | | 47,600 | | | | 942,480 | |
| | | | | | | | | |
| Telecom Equipment Fiber Optics 2.90% | | | | | | | | |
| Ciena Corp. * | | | 43,097 | | | | 1,142,502 | |
| | | | | | | | | |
| Television 4.35% | | | | | | | | |
| AMC Networks, Inc., Class A * | | | 27,600 | | | | 1,716,720 | |
| | | | | | | | | |
| Transportation - Services 4.63% | | | | | | | | |
| United Parcel Service, Inc., Class B | | | 17,200 | | | | 1,827,156 | |
See notes to portfolios of investments and notes to financial statements.
| Holmes Macro Trends Fund | |
| Portfolio of Investments (unaudited) | June 30, 2018 |
| Common Stocks (cont’d) | | Shares | | | Value | |
| | | | | | | |
| Web Hosting/Design 2.20% | | | | | | |
| NIC, Inc. | | | 55,811 | | | $ | 867,861 | |
| | | | | | | | | |
| Total Common Stocks | | | | | | | 36,221,656 | |
| (cost $35,135,834) | | | | | | | | |
| | | Coupon | | | Maturity | | Principal | | | | |
| Corporate Non-Convertible Bond 0.59% | | Rate % | | | Date | | Amount | | | | |
| | | | | | | | | | | | |
| Electric - Generation 0.59% | | | | | | | | | | | |
| | | | | | | | | | | | | | | |
| Interamerican Energy Corp. #@+ | | | 15.00 | | | 11/08/21 | | $ | 233,829 | | | | 233,829 | |
| (cost $233,829) | | | | | | | | | | | | | | |
| Exchange Traded Funds 0.99% | | Shares | | | | |
| Consumer Discretionary Select Sector SPDR Fund ETF | | | 1,800 | | | | 196,740 | |
| Innovator IBD 50 ETF | | | 5,500 | | | | 193,050 | |
| | | | | | | | | |
| Total Exchange Traded Funds | | | | | | | 389,790 | |
| (cost $394,214) | | | | | | | | |
| | | Exercise | | | Exp. | | | | | | |
| Warrants 0.00% | | Price | | | Date | | | | | | |
| | | | | | | | | | | | |
| Gold Mining 0.00% | | | | | | | | | | | |
| Gran Colombia Gold Corp. * | | $ | 48.75 | | | 03/18/19 | | | 250 | | | | 8 | |
| | | | | | | | | | | | | | | |
| Oil Companies - Exploration & Production 0.00% | | | | | | | | | | | | | | |
| PentaNova Energy Corp., 144A #*@∆ | | | 1.05 | | | 07/31/22 | | | 500,000 | | | | 0 | |
| | | | | | | | | | | | | | | |
| Total Warrants | | | | | | | | | | | | | 8 | |
| (cost $0) | | | | | | | | | | | | | | |
| | | | | | | | Notional | | | | | | | |
| | | Strike | | | Exp. | | Contract | | | | | | | |
| Put Option Purchased 0.71% | | Price | | | Date | | Value | | | Contracts | | | Value | |
| | | | | | | | | | | | | | | |
| Exchange Traded Fund 0.71% | | | | | | | | | | | | | | |
| SPDR S&P 500 ETF Trust | | $ | 270.00 | | | 01/19 | | $ | 6,944,768 | | | | 256 | | | | 280,320 | |
| (premiums paid $352,064) | | | | | | | | | | | | | | | | | | |
See notes to portfolios of investments and notes to financial statements.
| Holmes Macro Trends Fund | |
| Portfolio of Investments (unaudited) | June 30, 2018 |
| Investments, at value 94.10% | | $ | 37,125,603 | |
| (cost $36,115,941) | | | | |
| Other assets and liabilities, net 5.90% | | | 2,327,275 | |
| | | | | |
| Net Assets 100.00% | | $ | 39,452,878 | |
Portfolio Allocation by Industry Sector* Based on Total Investments | June 30, 2018 |

| * | Summary information above may differ from the portfolio schedule included in the financial statements due to the use of different classifications of securities for presentation purposes. |
See notes to portfolios of investments and notes to financial statements.
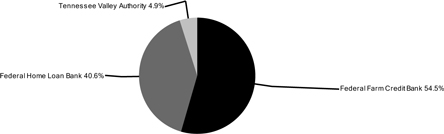
| Global Resources Fund | |
| Portfolio of Investments (unaudited) | June 30, 2018 |
| Common Stocks 87.67% | | Shares | | | Value | |
| | | | | | | |
| Building & Construction Products - Miscellaneous 1.24% | | | | | | |
| Louisiana-Pacific Corp. | | | 38,600 | | | $ | 1,050,692 | |
| | | | | | | | | |
| Building Products - Wood 1.47% | | | | | | | | |
| Norbord, Inc. | | | 30,400 | | | | 1,250,085 | |
| | | | | | | | | |
| Chemicals - Diversified 7.36% | | | | | | | | |
| Braskem SA, ADR | | | 42,800 | | | | 1,112,800 | |
| Covestro AG | | | 11,200 | | | | 995,496 | |
| Dongyue Group, Ltd. | | | 1,124,500 | | | | 941,310 | |
| Huchems Fine Chemical Corp. | | | 42,900 | | | | 1,125,851 | |
| LyondellBasell Industries NV, Class A | | | 11,000 | | | | 1,208,350 | |
| Tosoh Corp. | | | 55,650 | | | | 860,471 | |
| | | | | | | | 6,244,278 | |
| | | | | | | | | |
| Chemicals - Specialty 3.36% | | | | | | | | |
| China Sanjiang Fine Chemicals Co., Ltd. | | | 2,684,700 | | | | 894,009 | |
| Daicel Corp. | | | 101,700 | | | | 1,123,466 | |
| Daqo New Energy Corp., ADR * | | | 23,400 | | | | 831,636 | |
| | | | | | | | 2,849,111 | |
| | | | | | | | | |
| Coal 5.53% | | | | | | | | |
| Arch Coal, Inc. | | | 14,200 | | | | 1,113,706 | |
| Caribbean Resources Corp. #*@~ | | | 17 | | | | 0 | |
| China Shenhua Energy Co., Ltd., H Shares | | | 439,700 | | | | 1,039,999 | |
| Jastrzebska Spolka Weglowa SA * | | | 48,900 | | | | 994,663 | |
| Peabody Energy Corp. | | | 33,900 | | | | 1,541,772 | |
| Walter Energy, Inc., 144A #*∆ | | | 4,293 | | | | 0 | |
| | | | | | | | 4,690,140 | |
| | | | | | | | | |
| Commercial Service - Finance 0.39% | | | | | | | | |
| BIG Blockchain Intelligence Group, Inc. * | | | 2,000,000 | | | | 327,083 | |
| | | | | | | | | |
| Diamonds/Precious Stones 0.29% | | | | | | | | |
| Barksdale Capital Corp. * | | | 400,000 | | | | 243,411 | |
| Rockwell Diamonds, Inc., 144A #*@∆ | | | 63,333 | | | | 0 | |
| | | | | | | | 243,411 | |
See notes to portfolios of investments and notes to financial statements.
| Global Resources Fund | |
| Portfolio of Investments (unaudited) | June 30, 2018 |
| Common Stocks (cont’d) | | Shares | | | Value | |
| | | | | | | |
| Diversified Minerals 6.85% | | | | | | |
| Anglo American PLC | | | 59,300 | | | $ | 1,316,516 | |
| Caledonia Mining Corp. PLC | | | 62,911 | | | | 530,906 | |
| Encanto Potash Corp., 144A *∆ | | | 300,000 | | | | 50,203 | |
| Golden Reign Resources, Ltd. * | | | 1,148,600 | | | | 166,002 | |
| Libero Copper Corp. *~ | | | 3,250,000 | | | | 228,673 | |
| Lumina Gold Corp. * | | | 804,100 | | | | 464,851 | |
| Lundin Mining Corp. | | | 193,800 | | | | 1,077,608 | |
| Niocan, Inc., 144A *∆ | | | 362,069 | | | | 19,279 | |
| Salazar Resources, Ltd. * | | | 3,000,000 | | | | 296,657 | |
| Teck Resources, Ltd. | | | 33,900 | | | | 863,584 | |
| Teck Resources, Ltd. | | | 18,000 | | | | 458,100 | |
| VR Resources, Ltd. * | | | 1,125,000 | | | | 333,739 | |
| | | | | | | | 5,806,118 | |
| | | | | | | | | |
| Electronics - Military 0.17% | | | | | | | | |
| Global UAV Technologies, Ltd. * | | | 2,225,000 | | | | 143,860 | |
| | | | | | | | | |
| Energy - Alternate Sources 4.38% | | | | | | | | |
| Pacific Green Energy Corp. #*@~ | | | 2,400,000 | | | | 0 | |
| Polaris Infrastructure, Inc. | | | 50,000 | | | | 535,504 | |
| Siemens Gamesa Renewable Energy SA | | | 65,400 | | | | 874,212 | |
| TPI Composites, Inc. * | | | 46,700 | | | | 1,365,508 | |
| Vestas Wind Systems A/S | | | 15,200 | | | | 938,392 | |
| | | | | | | | 3,713,616 | |
| | | | | | | | | |
| Finance - Investment Banker/Broker 0.52% | | | | | | | | |
| GoldMoney, Inc. * | | | 200,000 | | | | 441,182 | |
| | | | | | | | | |
| Forestry 4.25% | | | | | | | | |
| Canfor Corp. * | | | 51,600 | | | | 1,241,870 | |
| Interfor Corp. * | | | 61,800 | | | | 1,186,970 | |
| West Fraser Timber Co., Ltd. | | | 17,100 | | | | 1,177,027 | |
| | | | | | | | 3,605,867 | |
| | | | | | | | | |
| Gold Mining 10.93% | | | | | | | | |
| Centerra Gold, Inc. * | | | 181,100 | | | | 1,006,991 | |
| Chesapeake Gold Corp., 144A *∆ | | | 52,400 | | | | 79,717 | |
| Continental Gold, Inc. * | | | 82,800 | | | | 238,704 | |
| CopperBank Resources Corp. * | | | 1,300,000 | | | | 84,053 | |
See notes to portfolios of investments and notes to financial statements.
| Global Resources Fund | |
| Portfolio of Investments (unaudited) | June 30, 2018 |
| Common Stocks (cont’d) | | Shares | | | Value | |
| | | | | | | |
| Gold Mining (cont’d) | | | | | | |
| Corona Minerals, Ltd. #*@ | | | 5,000 | | | $ | 0 | |
| Evolution Mining, Ltd. | | | 193,866 | | | | 507,084 | |
| Gran Colombia Gold Corp. * | | | 4,100 | | | | 8,982 | |
| Highland Gold Mining, Ltd. | | | 563,000 | | | | 1,061,974 | |
| NGEx Resources, Inc. * | | | 461,000 | | | | 387,825 | |
| NGEx Resources, Inc. * | | | 255,900 | | | | 202,439 | |
| Northern Star Resources, Ltd. | | | 102,100 | | | | 552,739 | |
| OceanaGold Corp., 144A ∆ | | | 395,500 | | | | 1,098,068 | |
| Radisson Mining Resources, Inc. * | | | 1,160,900 | | | | 105,966 | |
| Ramelius Resources, Ltd. * | | | 729,200 | | | | 315,756 | |
| Red Pine Exploration, Inc. * | | | 1,500,000 | | | | 68,459 | |
| Revival Gold, Inc. * | | | 434,000 | | | | 274,005 | |
| Royal Road Minerals, Ltd. * | | | 5,750,000 | | | | 393,641 | |
| Sandstorm Gold, Ltd. * | | | 115,000 | | | | 517,500 | |
| St Barbara, Ltd. | | | 338,000 | | | | 1,215,498 | |
| Teranga Gold Corp. * | | | 321,300 | | | | 1,146,234 | |
| | | | | | | | 9,265,635 | |
| | | | | | | | | |
| Information Technology 0.43% | | | | | | | | |
| Abaxx Technologies, Inc., 144A #*@+∆ | | | 1,250,000 | | | | 361,313 | |
| | | | | | | | | |
| Medical - Hospitals 0.00% | | | | | | | | |
| African Medical Investments PLC #*@ | | | 2,507,500 | | | | 0 | |
| | | | | | | | | |
| Metal - Aluminum 1.35% | | | | | | | | |
| Alcoa Corp. * | | | 24,400 | | | | 1,143,872 | |
| | | | | | | | | |
| Metal - Copper 2.50% | | | | | | | | |
| Hudbay Minerals, Inc. | | | 168,500 | | | | 939,493 | |
| OZ Minerals, Ltd. | | | 168,700 | | | | 1,176,367 | |
| | | | | | | | 2,115,860 | |
| | | | | | | | | |
| Metal - Diversified 5.43% | | | | | | | | |
| Aguia Resources, Ltd. * | | | 2,949,500 | | | | 438,247 | |
| Aguia Resources, Ltd. * | | | 714,286 | | | | 93,724 | |
| Chakana Copper Corp. #* | | | 320,000 | | | | 138,744 | |
| Filo Mining Corp. * | | | 134,650 | | | | 244,790 | |
| Filo Mining Corp. * | | | 115,250 | | | | 195,743 | |
| Galway Metals, Inc. * | | | 500,000 | | | | 76,066 | |
See notes to portfolios of investments and notes to financial statements.
| Global Resources Fund | |
| Portfolio of Investments (unaudited) | June 30, 2018 |
| Common Stocks (cont’d) | | Shares | | | Value | |
| | | | | | | |
| Metal - Diversified (cont’d) | | | | | | |
| Glencore PLC | | | 25,300 | | | $ | 120,119 | |
| GoviEx Uranium, Inc. * | | | 2,100,000 | | | | 367,398 | |
| GoviEx Uranium, Inc., 144A #*∆ | | | 58,000 | | | | 10,147 | |
| Ivanhoe Mines, Ltd. * | | | 305,900 | | | | 628,251 | |
| NorthIsle Copper & Gold, Inc. * | | | 1,000,000 | | | | 95,082 | |
| Novo Resources Corp. * | | | 138,600 | | | | 448,066 | |
| Orsu Metals Corp., 144A #*∆ | | | 14,761 | | | | 2,190 | |
| Sandfire Resources NL | | | 214,900 | | | | 1,455,111 | |
| Troilus Gold Corp. * | | | 294,000 | | | | 292,960 | |
| | | | | | | | 4,606,638 | |
| | | | | | | | | |
| Metal - Iron 1.41% | | | | | | | | |
| Consolidated Growth Holdings, Ltd. #*@ | | | 19,859,173 | | | | 0 | |
| Vale SA, ADR | | | 93,000 | | | | 1,192,260 | |
| WAI Capital Investment Corp., 144A #*@∆ | | | 292,500 | | | | 0 | |
| | | | | | | | 1,192,260 | |
| | | | | | | | | |
| Mining Services 2.00% | | | | | | | | |
| Bounty Mining, Ltd. * | | | 1,692,307 | | | | 488,433 | |
| Eramet | | | 9,200 | | | | 1,206,944 | |
| | | | | | | | 1,695,377 | |
| | | | | | | | | |
| Natural Resource Technology 0.02% | | | | | | | | |
| I-Pulse, Inc., 144A #*@+∆ | | | 15,971 | | | | 14,875 | |
| | | | | | | | | |
| Non-Ferrous Metals 0.49% | | | | | | | | |
| Giyani Metals Corp. * | | | 727,272 | | | | 120,322 | |
| Group Eleven Resources Corp. * | | | 650,000 | | | | 82,817 | |
| InZinc Mining, Ltd. * | | | 2,000,000 | | | | 182,558 | |
| Sterling Group Ventures, Inc., 144A #*∆ | | | 500,000 | | | | 32,500 | |
| | | | | | | | 418,197 | |
| | | | | | | | | |
| Oil - Field Services 3.31% | | | | | | | | |
| Atlas African Industries, Ltd. #*@~ | | | 255,854,621 | | | | 0 | |
| Petrofac, Ltd. | | | 157,900 | | | | 1,212,996 | |
| TGS NOPEC Geophysical Co. ASA | | | 43,300 | | | | 1,590,191 | |
| | | | | | | | 2,803,187 | |
See notes to portfolios of investments and notes to financial statements.
| Global Resources Fund | |
| Portfolio of Investments (unaudited) | June 30, 2018 |
| Common Stocks (cont’d) | | Shares | | | Value | |
| | | | | | | |
| Oil Companies - Exploration & Production 5.80% | | | | | | |
| Africa Energy Corp., 144A *∆ | | | 2,110,889 | | | $ | 256,907 | |
| Aker BP ASA | | | 43,700 | | | | 1,607,425 | |
| Beach Energy, Ltd. | | | 1,105,900 | | | | 1,431,450 | |
| CNOOC, Ltd., ADR | | | 7,200 | | | | 1,232,928 | |
| Ivanhoe Energy, Inc. * | | | 18,719 | | | | 6 | |
| PentaNova Energy Corp. * | | | 2,750,000 | | | | 167,345 | |
| PentaNova Energy Corp. #*@+ | | | 750,000 | | | | 42,673 | |
| PentaNova Energy Corp., 144A #*∆ | | | 2,000,000 | | | | 121,705 | |
| Range Energy Resources, Inc., 144A *∆ | | | 15,000,000 | | | | 57,049 | |
| U.S. Oil Sands, Inc., 144A #*@∆ | | | 198,000 | | | | 0 | |
| | | | | | | | 4,917,488 | |
| | | | | | | | | |
| Oil Companies - Integrated 2.52% | | | | | | | | |
| China Petroleum & Chemical Corp., ADR | | | 12,400 | | | | 1,114,016 | |
| LUKOIL PJSC, ADR | | | 15,000 | | | | 1,025,700 | |
| | | | | | | | 2,139,716 | |
| | | | | | | | | |
| Oil Companies - US Royalty Trusts 0.01% | | | | | | | | |
| San Juan Basin Royalty Trust | | | 2,000 | | | | 11,580 | |
| | | | | | | | | |
| Oil Refining & Marketing 2.75% | | | | | | | | |
| Grupa Lotos SA | | | 72,900 | | | | 1,104,516 | |
| Saras SpA | | | 509,000 | | | | 1,230,216 | |
| | | | | | | | 2,334,732 | |
| | | | | | | | | |
| Petrochemicals 0.96% | | | | | | | | |
| Lotte Chemical Corp. | | | 2,600 | | | | 810,501 | |
| | | | | | | | | |
| Poultry 1.02% | | | | | | | | |
| Pilgrim's Pride Corp. * | | | 43,000 | | | | 865,590 | |
| | | | | | | | | |
| Real Estate Operating/Development 6.63% | | | | | | | | |
| Pacific Infrastructure Ventures, Inc. #*@+ | | | 7,443,544 | | | | 5,621,364 | |
| | | | | | | | | |
| Silver Mining 1.21% | | | | | | | | |
| Silvercorp Metals, Inc. | | | 389,600 | | | | 1,028,344 | |
See notes to portfolios of investments and notes to financial statements.
| Global Resources Fund | |
| Portfolio of Investments (unaudited) | June 30, 2018 |
| Common Stocks (cont’d) | | Shares | | | Value | |
| | | | | | | |
| Steel - Producers 3.09% | | | | | | |
| China Oriental Group Co., Ltd. | | | 1,656,100 | | | $ | 1,162,478 | |
| Evraz PLC | | | 218,800 | | | | 1,460,365 | |
| | | | | | | | 2,622,843 | |
| | | | | | | | | |
| Total Common Stocks | | | | | | | 74,334,815 | |
| (cost $129,707,715) | | | | | | | | |
| | | Coupon | | | Maturity | | Principal | | | | |
| Corporate Non-Convertible Bond 3.31% | | Rate % | | | Date | | Amount | | | | |
| | | | | | | | | | | | |
| Electric - Generation 3.31% | | | | | | | | | | | |
| | | | | | | | | | | | | | | |
| Interamerican Energy Corp. #@+ | | | 15.00 | | | 11/08/21 | | $ | 2,805,938 | | | | 2,805,938 | |
| (cost $2,805,938) | | | | | | | | | | | | | | |
| | | Exercise | | | Exp. | | | | | | |
| Warrants 0.00% | | Price | | | Date | | Shares | | | | |
| | | | | | | | | | | | |
| Diversified Minerals 0.00% | | | | | | | | | | | |
| VR Resources, Ltd. *@ | | $ | 0.60 | | | 03/21/19 | | | 562,500 | | | | 0 | |
| | | | | | | | | | | | | | | |
| Gold Mining 0.00% | | | | | | | | | | | | | | |
| Gran Colombia Gold Corp. * | | | 48.75 | | | 03/18/19 | | | 59,500 | | | | 1,924 | |
| Troilus Gold Corp. #*@ | | | 2.50 | | | 11/21/20 | | | 294,000 | | | | 0 | |
| | | | | | | | | | | | | | 1,924 | |
| | | | | | | | | | | | | | | |
| Metal - Diversified 0.00% | | | | | | | | | | | | | | |
| Aguia Resources, Ltd., 144A #*@∆ | | | 0.65 | | | 06/30/20 | | | 1,450,000 | | | | 0 | |
| | | | | | | | | | | | | | | |
| Non-Ferrous Metals 0.00% | | | | | | | | | | | | | | |
| Giyani Metals Corp., 144A #*@∆ | | | 0.40 | | | 08/07/19 | | | 174,318 | | | | 0 | |
| Group Eleven Resources Corp., 144A #*@∆ | | | 0.60 | | | 12/15/18 | | | 650,000 | | | | 0 | |
| | | | | | | | | | | | | | 0 | |
See notes to portfolios of investments and notes to financial statements.
| Global Resources Fund | |
| Portfolio of Investments (unaudited) | June 30, 2018 |
| | | Exercise | | | Exp. | | | | | | |
| Warrants (cont’d) | | Price | | | Date | | Shares | | | Value | |
| | | | | | | | | |
| Oil Companies - Exploration & Production 0.00% | | | | | | | | | | | | | | |
| PentaNova Energy Corp., 144A #*@∆ | | $ | 1.05 | | | 07/31/22 | | | 2,000,000 | | | $ | 0 | |
| | | | | | | | | | | | | | | |
| Total Warrants | | | | | | | | | | | | | 1,924 | |
| (cost $0) | | | | | | | | | | | | | | |
| | | | | | | | Notional | | | | | | | |
| | | Strike | | | Exp. | | Contract | | | | | | | |
| Call Options Purchased 1.34% | | Price | | | Date | | Value | | | Contracts | | | Value | |
| | | | | �� | | | | | | | | | | |
| Agricultural Chemicals 0.13% | | | | | | | | | | | | | | | | | | |
| Nutrien, Ltd. | | $ | 55.00 | | | 01/19 | | $ | 1,650,000 | | | | 300 | | | | 111,000 | |
| | | | | | | | | | | | | | | | | | | |
| Diversified Minerals 0.20% | | | | | | | | | | | | | | | | | | |
| BHP Billiton, Ltd. | | | 50.00 | | | 01/19 | | | 2,300,000 | | | | 460 | | | | 168,820 | |
| | | | | | | | | | | | | | | | | | | |
| Exchange Traded Fund 0.32% | | | | | | | | | | | | | | | | | | |
| SPDR S&P Global Natural | | | | | | | | | | | | | | | | | | |
| Resources ETF | | | 53.00 | | | 09/18 | | | 5,830,000 | | | | 1,100 | | | | 55,000 | |
| SPDR S&P Global Natural | | | | | | | | | | | | | | | | | | |
| Resources ETF | | | 52.00 | | | 09/18 | | | 7,280,000 | | | | 1,400 | | | | 101,500 | |
| SPDR S&P Global Natural | | | | | | | | | | | | | | | | | | |
| Resources ETF | | | 51.00 | | | 09/18 | | | 5,100,000 | | | | 1,000 | | | | 112,500 | |
| | | | | | | | | | | | | | | | | | 269,000 | |
| | | | | | | | | | | | | | | | | | | |
| Gold Mining 0.02% | | | | | | | | | | | | | | | | | | |
| Franco-Nevada Corp. | | | 85.00 | | | 01/19 | | | 1,275,000 | | | | 150 | | | | 20,250 | |
| | | | | | | | | | | | | | | | | | | |
| Metal - Copper 0.12% | | | | | | | | | | | | | | | | | | |
| Freeport-McMoRan, Inc. | | | 20.00 | | | 08/18 | | | 600,000 | | | | 300 | | | | 8,400 | |
| Freeport-McMoRan, Inc. | | | 22.00 | | | 01/19 | | | 880,000 | | | | 400 | | | | 22,000 | |
| Freeport-McMoRan, Inc. | | | 20.00 | | | 01/19 | | | 1,400,000 | | | | 700 | | | | 74,200 | |
| | | | | | | | | | | | | | | | | | 104,600 | |
| | | | | | | | | | | | | | | | | | | |
| Oil Companies - Integrated 0.55% | | | | | | | | | | | | | | | | | | |
| BP PLC | | | 45.00 | | | 01/19 | | | 2,295,000 | | | | 510 | | | | 153,510 | |
| Chevron Corp. | | | 135.00 | | | 01/19 | | | 2,160,000 | | | | 160 | | | | 64,000 | |
| Exxon Mobil Corp. | | | 85.00 | | | 07/18 | | | 2,550,000 | | | | 300 | | | | 15,000 | |
| Royal Dutch Shell PLC | | | 70.00 | | | 01/19 | | | 1,960,000 | | | | 280 | | | | 91,000 | |
See notes to portfolios of investments and notes to financial statements.
| Global Resources Fund | |
| Portfolio of Investments (unaudited) | June 30, 2018 |
| | | | | | | | Notional | | | | | | | |
| Call Options | | Strike | | | Exp. | | Contract | | | | | | | |
| Purchased (cont’d) | | Price | | | Date | | Value | | | Contracts | | | Value | |
| | | | | | | | | | | | | | | |
| Oil Companies - Integrated (cont’d) | | | | | | | | | | | | | | | | | | |
| TOTAL SA | | $ | 62.50 | | | 01/19 | | $ | 3,750,000 | | | | 600 | | | $ | 142,500 | |
| | | | | | | | | | | | | | | | | | 466,010 | |
| | | | | | | | | | | | | | | | | | | |
| Total Purchased Call Options | | | | | | | | | | | | | | | | | 1,139,680 | |
| (premiums paid $1,608,174) | | | | | | | | | | | | | | | | | | |
| | | | | | | | | | | | | | | | | | | |
| Investments, at value 92.32% | | | | | | | | | | | | | | | | | 78,282,357 | |
| (cost $134,121,827) | | | | | | | | | | | | | | | | | | |
| Other assets and liabilities, net 7.68% | | | | | | | | | | | | | | | | | 6,508,827 | |
| | | | | | | | | | | | | | | | | | | |
| Net Assets 100.00% | | | | | | | | | | | | | | | | $ | 84,791,184 | |
Portfolio Allocation by Industry Sector* Based on Total Investments | June 30, 2018 |
| * | Summary information above may differ from the portfolio schedule included in the financial statements due to the use of different classifications of securities for presentation purposes. |
See notes to portfolios of investments and notes to financial statements.
| World Precious Minerals Fund | |
| Portfolio of Investments (unaudited) | June 30, 2018 |
| Common Stocks 91.30% | | Shares | | | Value | |
| | | | | | | |
| Advanced Materials/Production 3.05% | | | | | | | | |
| Nano One Materials Corp. * | | | 3,000,000 | | | $ | 2,989,389 | |
| | | | | | | | | |
| Capital Pools 0.07% | | | | | | | | |
| Pinecrest Resources, Ltd. * | | | 400,000 | | | | 66,938 | |
| | | | | | | | | |
| Coal 0.13% | | | | | | | | |
| Caribbean Resources Corp. #*@ | | | 4 | | | | 0 | |
| Draig Resources, Ltd. * | | | 1,000,000 | | | | 125,985 | |
| | | | | | | | 125,985 | |
| | | | | | | | | |
| Diamonds/Precious Stones 1.38% | | | | | | | | |
| Barksdale Capital Corp. *~ | | | 2,233,000 | | | | 1,358,841 | |
| Rockwell Diamonds, Inc., 144A #*@∆ | | | 171,667 | | | | 0 | |
| | | | | | | | 1,358,841 | |
| | | | | | | | | |
| Diversified Minerals 5.52% | | | | | | | | |
| Adamera Minerals Corp., 144A #*∆ | | | 1,492,543 | | | | 65,281 | |
| Argo Gold, Inc. *~ | | | 2,342,500 | | | | 231,640 | |
| Auryn Resources, Inc. * | | | 1,250,000 | | | | 1,350,169 | |
| Bluebird Battery Metals, Inc. * | | | 1,993,500 | | | | 492,821 | |
| Calibre Mining Corp. * | | | 4,500,000 | | | | 188,263 | |
| Erdene Resource Development Corp. * | | | 300,000 | | | | 87,856 | |
| Golden Predator Mining Corp. * | | | 1,200,000 | | | | 383,372 | |
| Golden Reign Resources, Ltd. * | | | 1,500,000 | | | | 216,788 | |
| Indochine Mining, Ltd. #*@ | | | 10,000 | | | | 0 | |
| Lithium Power International, Ltd. * | | | 500,000 | | | | 101,542 | |
| Lithoquest Diamonds, Inc. * | | | 750,000 | | | | 282,394 | |
| Lumina Gold Corp. * | | | 1,000,000 | | | | 578,101 | |
| Rubicon Minerals Corp. * | | | 500,000 | | | | 418,362 | |
| Salazar Resources, Ltd. * | | | 1,500,000 | | | | 148,328 | |
| VR Resources, Ltd. *~ | | | 2,950,000 | | | | 875,138 | |
| | | | | | | | 5,420,055 | |
| | | | | | | | | |
| Gold Mining 51.35% | | | | | | | | |
| Alamos Gold, Inc. | | | 200,000 | | | | 1,138,000 | |
| Alexandria Minerals Corp. * | | | 6,500,000 | | | | 197,771 | |
| Algold Resources, Ltd. #* | | | 5,400,000 | | | | 328,605 | |
| Alio Gold, Inc. * | | | 359,999 | | | | 523,028 | |
| Alio Gold, Inc., 144A ∆ | | | 132,924 | | | | 193,120 | |
See notes to portfolios of investments and notes to financial statements.
| World Precious Minerals Fund | |
| Portfolio of Investments (unaudited) | June 30, 2018 |
| Common Stocks (cont’d) | | Shares | | | Value | |
| | | | | | | |
| Gold Mining (cont’d) | | | | | | | | |
| Allegiant Gold, Ltd. * | | | 2,000,000 | | | $ | 722,626 | |
| Aurelius Minerals, Inc. * | | | 1,250,000 | | | | 38,033 | |
| Barkerville Gold Mines, Ltd. * | | | 500,000 | | | | 173,050 | |
| Black Dragon Gold Corp. * | | | 4,000,000 | | | | 502,035 | |
| Bonterra Resources, Inc. * | | | 3,000,000 | | | | 924,200 | |
| Canyon Resources, Ltd. * | | | 15,000,000 | | | | 1,076,784 | |
| Chesapeake Gold Corp., 144A *∆ | | | 192,199 | | | | 292,396 | |
| Comstock Mining, Inc. * | | | 533,000 | | | | 138,580 | |
| Contact Gold Corp. * | | | 500,000 | | | | 136,919 | |
| CopperBank Resources Corp. *~ | | | 15,805,418 | | | | 1,021,915 | |
| CopperBank Resources Corp., 144A #*~∆ | | | 174,000 | | | | 11,250 | |
| Coral Gold Resources, Ltd. * | | | 750,000 | | | | 208,230 | |
| Corona Minerals, Ltd. #*@ | | | 81,250 | | | | 0 | |
| Eastmain Resources, Inc. * | | | 1,000,000 | | | | 148,328 | |
| Enforcer Gold Corp. * | | | 3,000,000 | | | | 119,804 | |
| Fiore Gold, Ltd. * | | | 2,000,000 | | | | 715,019 | |
| Fremont Gold, Ltd. * | | | 2,000,000 | | | | 182,558 | |
| Gascoyne Resources, Ltd. * | | | 1,600,000 | | | | 589,059 | |
| Gold Standard Ventures Corp. * | | | 1,000,000 | | | | 1,365,000 | |
| Golden Star Resources, Ltd. * | | | 750,000 | | | | 506,250 | |
| GoldQuest Mining Corp. * | | | 1,500,000 | | | | 216,788 | |
| IDM Mining, Ltd. * | | | 5,000,000 | | | | 266,231 | |
| IDM Mining, Ltd., 144A #*∆ | | | 95,000 | | | | 5,058 | |
| Jaguar Mining, Inc. * | | | 2,000,000 | | | | 555,281 | |
| K92 Mining, Inc. * | | | 1,250,000 | | | | 855,741 | |
| Kirkland Lake Gold, Ltd. | | | 55,000 | | | | 1,161,600 | |
| Klondex Mines, Ltd. * | | | 3,747,174 | | | | 8,655,972 | |
| Klondike Gold Corp. * | | | 2,250,000 | | | | 402,198 | |
| Leagold Mining Corp. * | | | 200,000 | | | | 394,021 | |
| Leagold Mining Corp., 144A #∆ | | | 333,000 | | | | 656,045 | |
| Lundin Gold, Inc. * | | | 500,000 | | | | 1,741,908 | |
| Malbex Resources, Inc., 144A #*∆ | | | 133,333 | | | | 30,426 | |
| Mammoth Resources Corp. *~ | | | 2,171,200 | | | | 74,319 | |
| McEwen Mining, Inc. | | | 134,764 | | | | 278,826 | |
| Mirasol Resources, Ltd. * | | | 2,000,000 | | | | 2,616,666 | |
| NGEx Resources, Inc. * | | | 1,500,000 | | | | 1,186,628 | |
See notes to portfolios of investments and notes to financial statements.
| World Precious Minerals Fund | |
| Portfolio of Investments (unaudited) | June 30, 2018 |
| Common Stocks (cont’d) | | Shares | | | Value | |
| | | | | | | |
| Gold Mining (cont’d) | | | | | | | | |
| Nighthawk Gold Corp. * | | | 1,855,000 | | | $ | 592,629 | |
| Northern Empire Resources Corp. * | | | 1,000,000 | | | | 912,790 | |
| NV Gold Corp. * | | | 1,000,000 | | | | 152,132 | |
| OceanaGold Corp., 144A ∆ | | | 5,348 | | | | 14,848 | |
| Oklo Resources, Ltd. * | | | 4,000,000 | | | | 889,129 | |
| Orca Gold, Inc. * | | | 4,010,000 | | | | 1,891,150 | |
| Otis Gold Corp. * | | | 1,500,000 | | | | 211,083 | |
| Petaquilla Minerals, Ltd., 144A #*@∆ | | | 2,660,000 | | | | 0 | |
| Pretium Resources, Inc. * | | | 200,000 | | | | 1,468,000 | |
| Pure Gold Mining, Inc. * | | | 3,200,000 | | | | 1,630,852 | |
| Radisson Mining Resources, Inc. * | | | 6,000,000 | | | | 547,674 | |
| Radius Gold, Inc., 144A #*∆ | | | 125,000 | | | | 9,508 | |
| Red Pine Exploration, Inc. * | | | 8,000,000 | | | | 365,116 | |
| Redstar Gold Corp. * | | | 15,000,000 | | | | 399,346 | |
| Revival Gold, Inc. * | | | 1,029,000 | | | | 649,656 | |
| Rise Gold Corp. * | | | 2,000,000 | | | | 136,919 | |
| Royal Gold, Inc. | | | 12,000 | | | | 1,114,080 | |
| Seabridge Gold, Inc. * | | | 45,000 | | | | 501,750 | |
| Seafield Resources, Ltd., 144A #*@∆ | | | 1,300,000 | | | | 0 | |
| Silver Lake Resources, Ltd. * | | | 1,000,000 | | | | 447,609 | |
| Strikepoint Gold, Inc. * | | | 1,100,000 | | | | 204,998 | |
| Taurus Gold, Ltd., 144A #*@∆ | | | 2,448,381 | | | | 0 | |
| TMAC Resources, Inc. * | | | 100,000 | | | | 425,969 | |
| Tolima Gold, Inc., 144A #*∆ | | | 4,100,000 | | | | 31,187 | |
| TriStar Gold, Inc. *~ | | | 27,110,500 | | | | 3,918,149 | |
| Wesdome Gold Mines, Ltd. * | | | 1,500,000 | | | | 3,502,833 | |
| | | | | | | | 50,367,675 | |
| | | | | | | | | |
| Medical - Hospitals 0.00% | | | | | | | | |
| African Medical Investments PLC #*@ | | | 4,637,500 | | | | 0 | |
| | | | | | | | | |
| Metal - Copper 0.30% | | | | | | | | |
| Aston Bay Holdings, Ltd. #* | | | 825,000 | | | | 125,509 | |
| Highland Copper Co., Inc. * | | | 2,986,000 | | | | 170,349 | |
| | | | | | | | 295,858 | |
See notes to portfolios of investments and notes to financial statements.
| World Precious Minerals Fund | |
| Portfolio of Investments (unaudited) | June 30, 2018 |
| Common Stocks (cont’d) | | Shares | | | Value | |
| | | | | | | |
| Metal - Diversified 10.23% | | | | | | | | |
| Cardinal Resources, Ltd. * | | | 7,100,000 | | | $ | 2,252,784 | |
| Cardinal Resources, Ltd. * | | | 5,025,000 | | | | 1,758,263 | |
| Cartier Resources, Inc. * | | | 1,000,000 | | | | 91,279 | |
| Chakana Copper Corp. #*~ | | | 4,525,000 | | | | 1,961,929 | |
| Columbus Gold Corp. * | | | 750,000 | | | | 139,771 | |
| Filo Mining Corp. * | | | 400,000 | | | | 727,190 | |
| Genesis Metals Corp. * | | | 583,000 | | | | 31,042 | |
| Genesis Metals Corp., 144A #*∆ | | | 2,917,000 | | | | 155,319 | |
| Ivanhoe Mines, Ltd. * | | | 400,000 | | | | 821,511 | |
| Kaizen Discovery, Inc. * | | | 8,250,000 | | | | 345,149 | |
| New Age Metals, Inc., 144A #*∆ | | | 143,518 | | | | 8,188 | |
| Novo Resources Corp. * | | | 100,000 | | | | 323,280 | |
| Orex Minerals, Inc. * | | | 5,000,000 | | | | 494,428 | |
| Orsu Metals Corp., 144A #*∆ | | | 186,922 | | | | 27,726 | |
| Rockcliff Metals Corp., 144A #*∆ | | | 2,620,000 | | | | 59,788 | |
| RTG Mining, Inc. * | | | 2,289,378 | | | | 212,244 | |
| Sirios Resources, Inc. #* | | | 1,600,000 | | | | 243,411 | |
| Torq Resources, Inc. * | | | 1,000,000 | | | | 380,329 | |
| | | | | | | | 10,033,631 | |
| | | | | | | | | |
| Mining Services 0.34% | | | | | | | | |
| Argent Minerals, Ltd. * | | | 21,100,000 | | | | 329,337 | |
| | | | | | | | | |
| Non-Ferrous Metals 1.10% | | | | | | | | |
| Adventus Zinc Corp. * | | | 627,500 | | | | 448,675 | |
| InZinc Mining, Ltd. * | | | 3,000,000 | | | | 273,837 | |
| NextSource Materials, Inc. * | | | 4,710,000 | | | | 358,270 | |
| | | | | | | | 1,080,782 | |
| | | | | | | | | |
| Oil Companies - Exploration & Production 0.00% | | | | | | | | |
| Big Sky Energy Corp. #*@ | | | 2,000,000 | | | | 0 | |
| | | | | | | | | |
| Optical Recognition Equipment 0.01% | | | | | | | | |
| Nexoptic Technology Corp., 144A *∆ | | | 12,083 | | | | 9,191 | |
| | | | | | | | | |
| Precious Metals 17.42% | | | | | | | | |
| Amani Gold, Ltd. * | | | 54,500,000 | | | | 364,326 | |
| Barsele Minerals Corp. #*~ | | | 7,250,000 | | | | 3,529,456 | |
| Brixton Metals Corp. * | | | 2,500,000 | | | | 408,854 | |
See notes to portfolios of investments and notes to financial statements.
| World Precious Minerals Fund | |
| Portfolio of Investments (unaudited) | June 30, 2018 |
| Common Stocks (cont’d) | | Shares | | | Value | |
| | | | | | | |
| Precious Metals (cont’d) | | | | | | | | |
| Candente Gold Corp., 144A #*∆ | | | 4,875,000 | | | $ | 120,517 | |
| Corvus Gold, Inc. * | | | 250,000 | | | | 490,625 | |
| Dolly Varden Silver Corp. #*~ | | | 8,000,000 | | | | 3,103,488 | |
| GFG Resources, Inc. * | | | 2,000,000 | | | | 349,903 | |
| Kootenay Silver, Inc. * | | | 1,000,000 | | | | 114,099 | |
| Liberty Gold Corp. * | | | 500,000 | | | | 167,345 | |
| Metalla Royalty & Streaming, Ltd. | | | 1,000,000 | | | | 585,707 | |
| New Pacific Metals Corp. * | | | 1,000,000 | | | | 1,201,841 | |
| Probe Metals, Inc. #* | | | 1,000,000 | | | | 988,856 | |
| Roxgold, Inc. * | | | 2,500,000 | | | | 2,129,844 | |
| Silver Viper Minerals Corp. * | | | 1,300,000 | | | | 138,440 | |
| SilverCrest Metals, Inc. * | | | 650,000 | | | | 1,354,733 | |
| Terrax Minerals, Inc. * | | | 1,000,000 | | | | 292,854 | |
| Toachi Mining, Inc. *~ | | | 4,000,000 | | | | 425,969 | |
| Toachi Mining, Inc., 144A #~∆ | | | 2,000,000 | | | | 212,984 | |
| Wheaton Precious Metals Corp. | | | 50,000 | | | | 1,103,000 | |
| | | | | | | | 17,082,841 | |
| | | | | | | | | |
| Silver Mining 0.40% | | | | | | | | |
| Americas Silver Corp. * | | | 100,000 | | | | 312,631 | |
| Santacruz Silver Mining, Ltd. * | | | 1,000,000 | | | | 76,066 | |
| | | | | | | | 388,697 | |
| | | | | | | | | |
| Total Common Stocks | | | | | | | 89,549,220 | |
| (cost $136,294,374) | | | | | | | | |
| | | Coupon | | | Maturity | | Principal | | | | |
| Corporate Non-Convertible Bond 0.76% | | Rate % | | | Date | | Amount | | | | |
| | | | | | | | | | | | |
| Electric - Generation 0.76% | | | | | | | | | | | | | | |
| Interamerican Energy Corp. #@+ | | | 15.00 | | | 11/08/21 | | $ | 748,250 | | | | 748,250 | |
| (cost $748,250) | | | | | | | | | | | | | | |
| | | | | | | | | | | | | | | |
| Right 0.32% | | | | | | | | Shares | | | | | |
| | | | | | | | | | | | | | | |
| Metal - Diversified 0.32% | | | | | | | | | | | | | | |
| Cardinal Resources, Ltd. * | | | | | | | | | 1,500,000 | | | | 310,821 | |
| (cost $13,109) | | | | | | | | | | | | | | |
See notes to portfolios of investments and notes to financial statements.
| World Precious Minerals Fund | |
| Portfolio of Investments (unaudited) | June 30, 2018 |
| Exchange Traded Funds 4.07% | | Shares | | | Value | |
| Direxion Daily Gold Miners Index Bull 3X Shares ETF | | | 80,000 | | | $ | 1,946,400 | |
| Direxion Daily Junior Gold Miners Index Bull 3x Shares | | | | | | | | |
| ETF * | | | 150,000 | | | | 2,047,500 | |
| | | | | | | | | |
| Total Exchange Traded Funds | | | | | | | 3,993,900 | |
| (cost $4,624,402) | | | | | | | | |
| | | Exercise | | | Exp. | | | | | | |
| Warrants 0.22% | | Price | | | Date | | | | | | |
| | | | | | | | | | | | |
| Diversified Minerals 0.00% | | | | | | | | | | | |
| VR Resources, Ltd. *@~ | | $ | 0.60 | | | 03/21/19 | | | 862,500 | | | | 0 | |
| | | | | | | | | | | | | | | |
| Gold Mineral Exploration & Development 0.00% | | | | | | | | | | | | | | |
| Western Exploration & Development, Ltd., 144A #*@∆ | | | 0.50 | | | 12/31/49 | | | 600,000 | | | | 0 | |
| | | | | | | | | | | | | | | |
| Gold Mining 0.22% | | | | | | | | | | | | | | |
| Alexandria Minerals Corp., 144A #*@∆ | | | 0.10 | | | 06/20/19 | | | 1,256,195 | | | | 0 | |
| Bonterra Resources, Inc. #*@ | | | 0.30 | | | 07/06/18 | | | 625,000 | | | | 47,541 | |
| Fiore Gold, Ltd. #*@ | | | 0.45 | | | 09/26/20 | | | 1,300,000 | | | | 0 | |
| Gran Colombia Gold Corp. * | | | 48.75 | | | 03/18/19 | | | 96,250 | | | | 3,112 | |
| Osisko Gold Royalties, Ltd. * | | | 36.50 | | | 02/18/22 | | | 177,200 | | | | 150,289 | |
| Osisko Mining, Inc. * | | | 3.00 | | | 08/25/18 | | | 1,000,000 | | | | 3,803 | |
| Redstar Gold Corp. #*@ | | | 0.14 | | | 05/03/19 | | | 2,500,000 | | | | 0 | |
| Revival Gold, Inc., 144A #*@∆ | | | 0.90 | | | 10/19/19 | | | 482,500 | | | | 0 | |
| TriStar Gold, Inc., 144A #*@~∆ | | | 0.45 | | | 04/28/19 | | | 1,000,000 | | | | 0 | |
| Westgold Resources, Ltd. * | | | 2.00 | | | 06/30/19 | | | 100,000 | | | | 14,061 | |
| | | | | | | | | | | | | | 218,806 | |
| | | | | | | | | | | | | | | |
| Metal - Diversified 0.00% | | | | | | | | | | | | | | |
| Genesis Metals Corp., 144A #*@∆ | | | 0.23 | | | 06/05/19 | | | 1,604,500 | | | | 0 | |
| Minera Alamos, Inc. #*@ | | | 0.15 | | | 05/13/19 | | | 2,225,000 | | | | 0 | |
| Murchison Minerals, Ltd., 144A #*@∆ | | | 0.30 | | | 08/31/18 | | | 1,500,000 | | | | 0 | |
| | | | | | | | | | | | | | 0 | |
| | | | | | | | | | | | | | | |
| Total Warrants | | | | | | | | | | | | | 218,806 | |
| (cost $558,898) | | | | | | | | | | | | | | |
| | | | | | | | | | | | | | | |
| Investments, at value 96.67% | | | | | | | | | | | | | 94,820,997 | |
| (cost $142,239,033) | | | | | | | | | | | | | | |
| Other assets and liabilities, net 3.33% | | | | | | | | | | | | | 3,267,613 | |
| | | | | | | | | | | | | | | |
| Net Assets 100.00% | | | | | | | | | | | | $ | 98,088,610 | |
See notes to portfolios of investments and notes to financial statements.
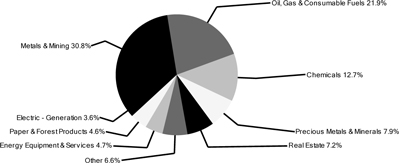
| World Precious Minerals Fund | |
| Portfolio of Investments (unaudited) | June 30, 2018 |
Portfolio Allocation by Industry* Based on Total Investments | June 30, 2018 |
| * | Summary information above may differ from the portfolio schedule included in the financial statements due to the use of different classifications of securities for presentation purposes. |
See notes to portfolios of investments and notes to financial statements.
| Gold and Precious Metals Fund | |
| Portfolio of Investments (unaudited) | June 30, 2018 |
| Common Stocks 89.96% | | Shares | | | Value | |
| | | | | | | |
| Capital Pools 0.11% | | | | | | | | |
| Hut 8 Mining Corp. #*@+ | | | 48,000 | | | $ | 104,825 | |
| | | | | | | | | |
| Gold Mining 69.48% | | | | | | | | |
| Acacia Mining PLC * | | | 700,000 | | | | 1,156,393 | |
| Alamos Gold, Inc. | | | 350,000 | | | | 1,991,500 | |
| Alio Gold, Inc. * | | | 740,000 | | | | 1,075,115 | |
| Argonaut Gold, Inc. * | | | 500,000 | | | | 878,561 | |
| Centerra Gold, Inc. * | | | 175,000 | | | | 973,073 | |
| Comstock Mining, Inc. * | | | 924,329 | | | | 240,325 | |
| Dundee Precious Metals, Inc. * | | | 550,000 | | | | 1,313,658 | |
| Evolution Mining, Ltd. | | | 32,000 | | | | 83,700 | |
| Golden Star Resources, Ltd. * | | | 2,500,000 | | | | 1,687,500 | |
| Guyana Goldfields, Inc. * | | | 300,000 | | | | 1,120,450 | |
| Harmony Gold Mining Co., Ltd., ADR | | | 375,000 | | | | 585,000 | |
| IAMGOLD Corp. * | | | 50,388 | | | | 292,754 | |
| Jaguar Mining, Inc. * | | | 7,375,000 | | | | 2,047,598 | |
| K92 Mining, Inc. * | | | 1,650,000 | | | | 1,129,578 | |
| Kirkland Lake Gold, Ltd. | | | 200,000 | | | | 4,224,000 | |
| Klondex Mines, Ltd. * | | | 3,341,984 | | | | 7,719,983 | |
| Leagold Mining Corp. * | | | 1,680,000 | | | | 3,309,778 | |
| Marlin Gold Mining, Ltd. * | | | 1,400,000 | | | | 292,853 | |
| Newmont Mining Corp. | | | 50,000 | | | | 1,885,500 | |
| Northern Empire Resources Corp. * | | | 695,600 | | | | 634,937 | |
| Northern Star Resources, Ltd. | | | 600,000 | | | | 3,248,221 | |
| Pantoro, Ltd. * | | | 2,000,000 | | | | 443,439 | |
| Premier Gold Mines, Ltd. * | | | 500,000 | | | | 992,660 | |
| Pretium Resources, Inc. * | | | 200,000 | | | | 1,468,000 | |
| Royal Gold, Inc. | | | 10,000 | | | | 928,400 | |
| Sandstorm Gold, Ltd. * | | | 600,000 | | | | 2,700,000 | |
| Silver Lake Resources, Ltd. * | | | 3,000,000 | | | | 1,342,827 | |
| St Barbara, Ltd. | | | 3,000,000 | | | | 10,788,442 | |
| Wesdome Gold Mines, Ltd. * | | | 2,500,000 | | | | 5,838,056 | |
| Westgold Resources, Ltd. * | | | 1,000,000 | | | | 1,379,657 | |
| Yamana Gold, Inc. | | | 600,000 | | | | 1,740,000 | |
| Zijin Mining Group Co., Ltd., H Shares | | | 147,000 | | | | 56,355 | |
| | | | | | | | 63,568,313 | |
See notes to portfolios of investments and notes to financial statements.
| Gold and Precious Metals Fund | |
| Portfolio of Investments (unaudited) | June 30, 2018 |
| Common Stocks (cont’d) | | Shares | | | Value | |
| | | | | | | |
| Medical - Hospitals 0.00% | | | | | | | | |
| African Medical Investments PLC #*@ | | | 2,000,000 | | | $ | 0 | |
| | | | | | | | | |
| Metal - Diversified 1.14% | | | | | | | | |
| Nevsun Resources, Ltd. | | | 300,000 | | | | 1,041,000 | |
| | | | | | | | | |
| Precious Metals 7.86% | | | | | | | | |
| Maverix Metals, Inc. * | | | 1,480,000 | | | | 1,925,075 | |
| Metalla Royalty & Streaming, Ltd. | | | 500,000 | | | | 292,854 | |
| Roxgold, Inc. * | | | 1,750,000 | | | | 1,490,891 | |
| Sailfish Royalty Corp. #* | | | 300,000 | | | | 285,247 | |
| SSR Mining, Inc. * | | | 100,000 | | | | 987,000 | |
| Wheaton Precious Metals Corp. | | | 100,000 | | | | 2,206,000 | |
| | | | | | | | 7,187,067 | |
| | | | | | | | | |
| Recycling 2.29% | | | | | | | | |
| Tomra Systems ASA | | | 100,000 | | | | 2,096,275 | |
| | | | | | | | | |
| Retail - Jewelry 2.19% | | | | | | | | |
| Mene, Inc., 144A #*@~∆ | | | 5,714,285 | | | | 2,000,000 | |
| | | | | | | | | |
| Silver Mining 6.89% | | | | | | | | |
| Americas Silver Corp. * | | | 250,000 | | | | 781,577 | |
| Excellon Resources, Inc. * | | | 850,700 | | | | 899,458 | |
| Great Panther Silver, Ltd. * | | | 750,000 | | | | 877,500 | |
| Pan American Silver Corp. | | | 150,000 | | | | 2,685,000 | |
| Santacruz Silver Mining, Ltd. * | | | 2,500,000 | | | | 190,165 | |
| Silvercorp Metals, Inc. | | | 325,000 | | | | 867,750 | |
| | | | | | | | 6,301,450 | |
| | | | | | | | | |
| Total Common Stocks | | | | | | | 82,298,930 | |
| (cost $69,678,488) | | | | | | | | |
| | | Coupon | | | Maturity | | Principal | | | | |
| Corporate Non-Convertible Bonds 0.31% | | Rate % | | | Date | | Amount | | | | |
| | | | | | | | | | | | |
| Coal 0.00% | | | | | | | | | | | | | | |
| Caribbean Resources Corp. #@^ | | | 19.25 | | | 06/15/15 | | $ | 485,766 | | | | 0 | |
See notes to portfolios of investments and notes to financial statements.
| Gold and Precious Metals Fund | |
| Portfolio of Investments (unaudited) | June 30, 2018 |
| | | Coupon | | | Maturity | | Principal | | | | |
| Corporate Non-Convertible Bonds (cont’d) | | Rate % | | | Date | | Amount | | | Value | |
| | | | | | | | | | | | |
| Electric - Generation 0.31% | | | | | | | | | | | | | | |
| Interamerican Energy Corp. #@+ | | | 15.00 | | | 11/08/21 | | $ | 280,594 | | | $ | 280,594 | |
| | | | | | | | | | | | | | | |
| Total Corporate Non-Convertible Bonds | | | | | | | | | | | | | 280,594 | |
| (cost $766,360) | | | | | | | | | | | | | | |
| Exchange Traded Funds 3.59% | | Shares | | | | |
| Direxion Daily Gold Miners Index Bull 3X Shares ETF | | | 65,000 | | | | 1,581,450 | |
| Direxion Daily Junior Gold Miners Index Bull 3x Shares | | | | | | | | |
| ETF * | | | 125,000 | | | | 1,706,250 | |
| | | | | | | | | |
| Total Exchange Traded Funds | | | | | | | 3,287,700 | |
| (cost $3,779,201) | | | | | | | | |
| | | Exercise | | | Exp. | | | | | | |
| Warrants 0.21% | | Price | | | Date | | | | | | |
| | | | | | | | | | | | |
| Gold Mining 0.20% | | | | | | | | | | | |
| Alio Gold, Inc., 144A *@∆ | | $ | 3.44 | | | 01/31/20 | | | 240,000 | | | | 0 | |
| Gran Colombia Gold Corp. * | | | 48.75 | | | 03/18/19 | | | 37,500 | | | | 1,212 | |
| Osisko Gold Royalties, Ltd. * | | | 36.50 | | | 02/18/22 | | | 132,900 | | | | 112,717 | |
| Westgold Resources, Ltd. * | | | 2.00 | | | 06/30/19 | | | 500,000 | | | | 70,305 | |
| | | | | | | | | | | | | | 184,234 | |
| | | | | | | | | | | | | | | |
| Retail - Jewelry 0.00% | | | | | | | | | | | | | | |
| Mene, Inc., 144A #*@~∆ | | | 0.70 | | | 12/19/19 | | | 5,714,285 | | | | 0 | |
| | | | | | | | | | | | | | | |
| Silver Mining 0.01% | | | | | | | | | | | | | | |
| Excellon Resources, Inc. * | | | 2.80 | | | 12/31/18 | | | 325,000 | | | | 13,597 | |
| | | | | | | | | | | | | | | |
| Total Warrants | | | | | | | | | | | | | 197,831 | |
| (cost $194,174) | | | | | | | | | | | | | | |
| | | | | | | | | | | | | | | |
| Investments, at value 94.07% | | | | | | | | | | | | | 86,065,055 | |
| (cost $74,418,223) | | | | | | | | | | | | | | |
| Other assets and liabilities, net 5.93% | | | | | | | | | | | | | 5,421,261 | |
| | | | | | | | | | | | | | | |
| Net Assets 100.00% | | | | | | | | | | | | $ | 91,486,316 | |
See notes to portfolios of investments and notes to financial statements.
| Gold and Precious Metals Fund | |
| Portfolio of Investments (unaudited) | June 30, 2018 |
Portfolio Allocation by Industry* Based on Total Investments | June 30, 2018 |
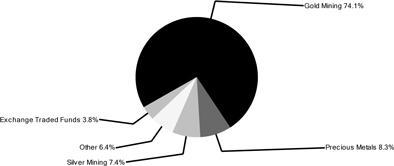
| * | Summary information above may differ from the portfolio schedule included in the financial statements due to the use of different classifications of securities for presentation purposes. |
See notes to portfolios of investments and notes to financial statements.
| Emerging Europe Fund | |
| Portfolio of Investments (unaudited) | June 30, 2018 |
| Common Stocks 95.38% | | Shares | | | Value | |
| | | | | | | |
| Agricultural Operations 0.98% | | | | | | | | |
| Kernel Holding SA | | | 30,000 | | | $ | 380,306 | |
| | | | | | | | | |
| Airlines 7.25% | | | | | | | | |
| Aegean Airlines SA | | | 57,000 | | | | 560,861 | |
| Aeroflot PJSC | | | 351,000 | | | | 782,028 | |
| Deutsche Lufthansa AG | | | 19,950 | | | | 477,955 | |
| Pegasus Hava Tasimaciligi AS * | | | 53,500 | | | | 287,124 | |
| Ryanair Holdings PLC, ADR * | | | 2,150 | | | | 245,594 | |
| Turk Hava Yollari AO * | | | 79,000 | | | | 232,990 | |
| Wizz Air Holdings PLC * | | | 4,610 | | | | 218,311 | |
| | | | | | | | 2,804,863 | |
| | | | | | | | | |
| Appliances 0.56% | | | | | | | | |
| Vestel Beyaz Esya Sanayi ve Ticaret AS | | | 89,000 | | | | 217,914 | |
| | | | | | | | | |
| Automotive - Cars & Light Trucks 2.63% | | | | | | | | |
| Ford Otomotiv Sanayi AS | | | 44,700 | | | | 594,860 | |
| Tofas Turk Otomobil Fabrikasi AS | | | 81,000 | | | | 423,906 | |
| | | | | | | | 1,018,766 | |
| | | | | | | | | |
| Automotive/Truck Parts & Equipment - Original 0.97% | | | | | | | | |
| Brembo SpA | | | 15,650 | | | | 211,068 | |
| EGE Endustri VE Ticaret AS | | | 2,600 | | | | 165,873 | |
| | | | | | | | 376,941 | |
| | | | | | | | | |
| Brewery 0.27% | | | | | | | | |
| Anadolu Efes Biracilik Ve Malt Sanayii AS | | | 20,000 | | | | 102,799 | |
| | | | | | | | | |
| Cellular Telecommunication 1.03% | | | | | | | | |
| MegaFon PJSC | | | 24,000 | | | | 192,589 | |
| Mobile TeleSystems PJSC, ADR | | | 23,200 | | | | 204,856 | |
| | | | | | | | 397,445 | |
| | | | | | | | | |
| Chemicals - Diversified 1.30% | | | | | | | | |
| Ciech SA | | | 26,100 | | | | 372,719 | |
| Petkim Petrokimya Holding AS | | | 124,000 | | | | 130,610 | |
| | | | | | | | 503,329 | |
| | | | | | | | | |
| Chemicals - Fibers 0.40% | | | | | | | | |
| Aksa Akrilik Kimya Sanayii AS | | | 62,000 | | | | 154,760 | |
See notes to portfolios of investments and notes to financial statements.
| Emerging Europe Fund | |
| Portfolio of Investments (unaudited) | June 30, 2018 |
| Common Stocks (cont’d) | | Shares | | | Value | |
| | | | | | | |
| Chemicals - Specialty 0.06% | | | | | | | | |
| Soda Sanayii AS | | | 18,000 | | | $ | 24,285 | |
| | | | | | | | | |
| Coal 1.11% | �� | | | | | | | |
| Jastrzebska Spolka Weglowa SA * | | | 21,200 | | | | 431,224 | |
| | | | | | | | | |
| Commercial Banks Non-US 16.91% | | | | | | | | |
| Akbank Turk AS | | | 265,000 | | | | 433,116 | |
| Alior Bank SA * | | | 6,500 | | | | 115,103 | |
| Alpha Bank AE * | | | 185,700 | | | | 413,810 | |
| Banca Transilvania SA | | | 297,218 | | | | 178,465 | |
| Bank Polska Kasa Opieki SA | | | 7,000 | | | | 210,696 | |
| Eurobank Ergasias SA * | | | 229,000 | | | | 238,109 | |
| National Bank of Greece SA * | | | 728,000 | | | | 222,167 | |
| OTP Bank PLC | | | 11,900 | | | | 429,652 | |
| Piraeus Bank SA * | | | 36,000 | | | | 121,814 | |
| Powszechna Kasa Oszczednosci Bank Polski SA * | | | 31,000 | | | | 304,551 | |
| Sberbank of Russia PJSC, ADR | | | 240,280 | | | | 3,449,219 | |
| Turkiye Garanti Bankasi AS | | | 235,000 | | | | 428,676 | |
| | | | | | | | 6,545,378 | |
| | | | | | | | | |
| Computer Services 0.61% | | | | | | | | |
| Asseco Poland SA | | | 6,300 | | | | 67,116 | |
| Luxoft Holding, Inc. * | | | 4,600 | | | | 169,510 | |
| | | | | | | | 236,626 | |
| | | | | | | | | |
| Cosmetics & Toiletries 0.61% | | | | | | | | |
| Unilever PLC | | | 4,300 | | | | 237,534 | |
| | | | | | | | | |
| Diamonds/Precious Stones 0.54% | | | | | | | | |
| Alrosa PJSC | | | 132,000 | | | | 210,474 | |
| | | | | | | | | |
| Diversified Operations 1.50% | | | | | | | | |
| Tekfen Holding AS | | | 153,500 | | | | 579,198 | |
| | | | | | | | | |
| Electric - Generation 1.61% | | | | | | | | |
| CEZ AS | | | 7,800 | | | | 184,808 | |
| Inter RAO UES PJSC | | | 6,660,000 | | | | 436,515 | |
| | | | | | | | 621,323 | |
See notes to portfolios of investments and notes to financial statements.
| Emerging Europe Fund | |
| Portfolio of Investments (unaudited) | June 30, 2018 |
| Common Stocks (cont’d) | | Shares | | | Value | |
| | | | | | | |
| Electric - Integrated 0.93% | | | | | | | | |
| PGE Polska Grupa Energetyczna SA * | | | 145,000 | | | $ | 360,331 | |
| | | | | | | | | |
| Energy - Alternate Sources 0.21% | | | | | | | | |
| Blockchain Power Trust * | | | 525,000 | | | | 79,869 | |
| | | | | | | | | |
| Enterprise Software/Services 0.10% | | | | | | | | |
| Logo Yazilim Sanayi Ve Ticaret AS * | | | 4,300 | | | | 39,320 | |
| | | | | | | | | |
| Entertainment Software 0.57% | | | | | | | | |
| CD Projekt SA * | | | 5,130 | | | | 219,995 | |
| | | | | | | | | |
| Food - Retail 2.39% | | | | | | | | |
| BIM Birlesik Magazalar AS | | | 11,000 | | | | 160,645 | |
| Dino Polska SA * | | | 8,150 | | | | 225,036 | |
| Magnit PJSC, GDR | | | 7,500 | | | | 134,405 | |
| Migros Ticaret AS * | | | 32,500 | | | | 145,029 | |
| X5 Retail Group NV, GDR | | | 9,800 | | | | 258,822 | |
| | | | | | | | 923,937 | |
| | | | | | | | | |
| Food - Wholesale/Distribution 1.26% | | | | | | | | |
| Eurocash SA | | | 84,500 | | | | 488,104 | |
| | | | | | | | | |
| Gold Mining 0.53% | | | | | | | | |
| Dundee Precious Metals, Inc. * | | | 31,500 | | | | 75,237 | |
| Petropavlovsk PLC * | | | 1,244,000 | | | | 130,599 | |
| | | | | | | | 205,836 | |
| Home Furnishings 0.32% | | | | | | | | |
| Yatas Yatak ve Yorgan Sanayi ve Ticaret AS * | | | 27,000 | | | | 125,247 | |
| | | | | | | | | |
| Housewares 0.20% | | | | | | | | |
| Turkiye Sise ve Cam Fabrikalari AS | | | 82,000 | | | | 75,487 | |
| | | | | | | | | |
| Human Resources 0.59% | | | | | | | | |
| Benefit Systems SA * | | | 812 | | | | 227,023 | |
| | | | | | | | | |
| Machinery - Farm 0.64% | | | | | | | | |
| Turk Traktor ve Ziraat Makineleri AS | | | 22,000 | | | | 249,075 | |
See notes to portfolios of investments and notes to financial statements.
| Emerging Europe Fund | |
| Portfolio of Investments (unaudited) | June 30, 2018 |
| Common Stocks (cont’d) | | Shares | | | Value | |
| | | | | | | |
| Metal - Diversified 0.64% | | | | | | | | |
| KGHM Polska Miedz SA | | | 8,100 | | | $ | 189,872 | |
| Orsu Metals Corp., 144A #*∆ | | | 402,500 | | | | 59,702 | |
| | | | | | | | 249,574 | |
| | | | | | | | | |
| Metal - Iron 1.01% | | | | | | | | |
| Novolipetsk Steel PJSC, GDR | | | 16,100 | | | | 390,105 | |
| | | | | | | | | |
| Miscellaneous Manufacturing 0.50% | | | | | | | | |
| Trakya Cam Sanayii AS | | | 211,763 | | | | 191,559 | |
| | | | | | | | | |
| Multi-line Insurance 2.73% | | | | | | | | |
| Allianz SE | | | 1,950 | | | | 401,807 | |
| UNIQA Insurance Group AG | | | 34,700 | | | | 318,799 | |
| Vienna Insurance Group AG Wiener Versicherung Gruppe | | | 12,300 | | | | 334,591 | |
| | | | | | | | 1,055,197 | |
| | | | | | | | | |
| Oil Companies - Exploration & Production 0.88% | | | | | | | | |
| Novatek PJSC, GDR | | | 1,475 | | | | 200,611 | |
| Societatea Nationala de Gaze Naturale ROMGAZ SA | | | 15,000 | | | | 140,039 | |
| | | | | | | | 340,650 | |
| | | | | | | | | |
| Oil Companies - Integrated 21.53% | | | | | | | | |
| Gazprom PJSC, ADR | | | 545,000 | | | | 2,388,273 | |
| LUKOIL PJSC, ADR | | | 55,400 | | | | 3,818,722 | |
| MOL Hungarian Oil & Gas PLC | | | 58,860 | | | | 566,387 | |
| OMV Petrom SA, GDR | | | 28,000 | | | | 327,206 | |
| Surgutneftegas OJSC, ADR | | | 100,000 | | | | 447,000 | |
| Tatneft PJSC, ADR | | | 12,250 | | | | 785,225 | |
| | | | | | | | 8,332,813 | |
| | | | | | | | | |
| Oil Refining & Marketing 3.90% | | | | | | | | |
| Grupa Lotos SA | | | 28,000 | | | | 424,231 | |
| Polski Koncern Naftowy ORLEN SA | | | 28,850 | | | | 646,154 | |
| Tupras Turkiye Petrol Rafinerileri AS | | | 18,600 | | | | 438,446 | |
| | | | | | | | 1,508,831 | |
| | | | | | | | | |
| Property/Casualty Insurance 1.02% | | | | | | | | |
| Powszechny Zaklad Ubezpieczen SA | | | 38,000 | | | | 393,966 | |
See notes to portfolios of investments and notes to financial statements.
| Emerging Europe Fund | |
| Portfolio of Investments (unaudited) | June 30, 2018 |
| Common Stocks (cont’d) | | Shares | | | Value | |
| | | | | | | |
| Real Estate Operating/Development 0.73% | | | | | | | | |
| GEK Terna Holding Real Estate Construction SA * | | | 47,000 | | | $ | 280,965 | |
| | | | | | | | | |
| Regional Banks - Non US 1.57% | | | | | | | | |
| TCS Group Holding PLC, GDR | | | 29,500 | | | | 607,410 | |
| | | | | | | | | |
| Retail - Jewelry 0.33% | | | | | | | | |
| Pandora A/S | | | 1,815 | | | | 126,501 | |
| | | | | | | | | |
| Retail - Major Dept Store 1.59% | | | | | | | | |
| Detsky Mir PJSC | | | 420,000 | | | | 613,809 | |
| | | | | | | | | |
| Steel - Producers 6.29% | | | | | | | | |
| Eregli Demir ve Celik Fabrikalari TAS | | | 151,500 | | | | 335,997 | |
| Evraz PLC | | | 98,600 | | | | 658,099 | |
| Kardemir Karabuk Demir Celik Sanayi ve Ticaret AS * | | | 215,000 | | | | 206,664 | |
| Magnitogorsk Iron & Steel Works PJSC, GDR | | | 58,600 | | | | 514,410 | |
| Mechel PJSC, ADR * | | | 46,000 | | | | 143,980 | |
| Severstal PAO PJSC, GDR | | | 38,900 | | | | 577,023 | |
| | | | | | | | 2,436,173 | |
| | | | | | | | | |
| Telecom Services 1.25% | | | | | | | | |
| O2 Czech Republic AS | | | 16,100 | | | | 184,925 | |
| Sistema PJSFC, GDR | | | 79,000 | | | | 215,279 | |
| Turk Telekomunikasyon AS * | | | 78,200 | | | | 85,011 | |
| | | | | | | | 485,215 | |
| | | | | | | | | |
| Telephone - Integrated 1.62% | | | | | | | | |
| Magyar Telekom Telecommunications PLC | | | 261,000 | | | | 371,189 | |
| Rostelecom PJSC | | | 220,000 | | | | 256,612 | |
| | | | | | | | 627,801 | |
| | | | | | | | | |
| Textile - Apparel 0.53% | | | | | | | | |
| LPP SA | | | 91 | | | | 205,261 | |
| | | | | | | | | |
| Tobacco 0.47% | | | | | | | | |
| Philip Morris CR AS | | | 265 | | | | 181,953 | |
| | | | | | | | | |
| Transport Support Services 0.29% | | | | | | | | |
| Tallinna Sadam AS * | | | 50,000 | | | | 113,861 | |
See notes to portfolios of investments and notes to financial statements.
| Emerging Europe Fund | |
| Portfolio of Investments (unaudited) | June 30, 2018 |
| Common Stocks (cont’d) | | Shares | | | Value | |
| | | | | | | |
| Transportation - Rail 1.54% | | | | | | | | |
| Globaltrans Investment PLC, GDR | | | 58,399 | | | $ | 595,436 | |
| | | | | | | | | |
| Transportation - Services 0.46% | | | | | | | | |
| Oesterreichische Post AG | | | 3,900 | | | | 177,732 | |
| | | | | | | | | |
| Travel Services 0.42% | | | | | | | | |
| TUI AG | | | 7,400 | | | | 161,853 | |
| | | | | | | | | |
| Total Common Stocks | | | | | | | 36,914,054 | |
| (cost $37,024,237) | | | | | | | | |
| | | | | | | | | |
| Exchange Traded Funds 0.83% | | | | | | | | |
| Direxion Daily Russia Bull 3x Shares ETF | | | 7,600 | | | | 323,000 | |
| (cost $329,882) | | | | | | | | |
| | | Exercise | | | Exp. | | | | | | |
| Warrant 0.00% | | Price | | | Date | | | | | | |
| | | | | | | | | | | | |
| Energy - Alternate Sources 0.00% | | | | | | | | | | | | | | |
| Blockchain Power Trust #*@ | | $ | 0.80 | | | 01/09/20 | | | 262,500 | | | | 0 | |
| (cost $0) | | | | | | | | | | | | | | |
| | | | | | | | | | | | | | | |
| Investments, at value 96.21% | | | | | | | | | | | | | 37,237,054 | |
| (cost $37,354,119) | | | | | | | | | | | | | | |
| Other assets and liabilities, net 3.79% | | | | | | | | | | | | | 1,466,950 | |
| | | | | | | | | | | | | | | |
| Net Assets 100.00% | | | | | | | | | | | | $ | 38,704,004 | |
See notes to portfolios of investments and notes to financial statements.
| Emerging Europe Fund | |
| Portfolio of Investments (unaudited) | June 30, 2018 |
Country Distribution* Based on Total Investments | June 30, 2018 |

| * | Country distribution shown is based on domicile. The locale of company operations may be different. |
See notes to portfolios of investments and notes to financial statements.
| China Region Fund | |
| Portfolio of Investments (unaudited) | June 30, 2018 |
| Common Stocks 93.28% | | Shares | | | Value | |
| | | | | | | |
| Airlines 0.94% | | | | | | | | |
| AirAsia Bhd | | | 250,000 | | | $ | 185,293 | |
| Cebu Air, Inc. | | | 14,000 | | | | 18,188 | |
| | | | | | | | 203,481 | |
| | | | | | | | | |
| Apparel Manufacturers 0.18% | | | | | | | | |
| Crystal International Group, Ltd. | | | 55,000 | | | | 38,245 | |
| | | | | | | | | |
| Appliances 1.14% | | | | | | | | |
| Haier Electronics Group Co., Ltd. | | | 72,000 | | | | 245,644 | |
| | | | | | | | | |
| Automotive - Cars & Light Trucks 10.39% | | | | | | | | |
| Geely Automobile Holdings, Ltd. | | | 866,000 | | | | 2,228,125 | |
| Guangzhou Automobile Group Co., Ltd., H Shares | | | 16,800 | | | | 16,345 | |
| | | | | | | | 2,244,470 | |
| | | | | | | | | |
| Automotive - Medium & Heavy Duty Trucks 1.56% | | | | | | | | |
| Sinotruk Hong Kong, Ltd. | | | 205,000 | | | | 336,065 | |
| | | | | | | | | |
| Automotive/Truck Parts & Equipment - Replacement 1.37% | | | | | | | | |
| Weichai Power Co., Ltd. | | | 216,000 | | | | 296,758 | |
| | | | | | | | | |
| Batteries/Battery Systems 0.59% | | | | | | | | |
| Tianneng Power International, Ltd. | | | 82,000 | | | | 127,284 | |
| | | | | | | | | |
| Building - Heavy Construction 0.08% | | | | | | | | |
| Wijaya Karya Beton Tbk PT | | | 600,000 | | | | 17,065 | |
| | | | | | | | | |
| Building & Construction Products - Miscellaneous 0.22% | | | | | | | | |
| China Machinery Engineering Corp. | | | 46,000 | | | | 21,999 | |
| HDC Holdings Co., Ltd. | | | 267 | | | | 6,851 | |
| HDC Hyundai Development Co.-Engineering & Construction * | | | 374 | | | | 18,088 | |
| | | | | | | | 46,938 | |
| | | | | | | | | |
| Building Products - Cement 2.96% | | | | | | | | |
| Anhui Conch Cement Co., Ltd. | | | 112,000 | | | | 638,725 | |
| | | | | | | | | |
| Casino Hotels 3.74% | | | | | | | | |
| Galaxy Entertainment Group, Ltd. | | | 45,000 | | | | 346,880 | |
| Wynn Macau, Ltd. | | | 144,000 | | | | 461,469 | |
| | | | | | | | 808,349 | |
See notes to portfolios of investments and notes to financial statements.
| China Region Fund | |
| Portfolio of Investments (unaudited) | June 30, 2018 |
| Common Stocks (cont’d) | | Shares | | | Value | |
| | | | | | | |
| Chemicals - Diversified 0.13% | | | | | | | | |
| Huchems Fine Chemical Corp. | | | 1,100 | | | $ | 28,868 | |
| | | | | | | | | |
| Chemicals - Specialty 0.63% | | | | | | | | |
| Daqo New Energy Corp., ADR * | | | 1,905 | | | | 67,704 | |
| Kingboard Laminates Holdings, Ltd. | | | 55,000 | | | | 67,625 | |
| | | | | | | | 135,329 | |
| | | | | | | | | |
| Coal 2.07% | | | | | | | | |
| Adaro Energy Tbk PT | | | 598,000 | | | | 74,616 | |
| China Shenhua Energy Co., Ltd., H Shares | | | 105,000 | | | | 248,351 | |
| Indo Tambangraya Megah Tbk PT | | | 80,000 | | | | 124,778 | |
| | | | | | | | 447,745 | |
| | | | | | | | | |
| Computers - Integrated System 0.29% | | | | | | | | |
| Posiflex Technology, Inc. | | | 16,724 | | | | 63,578 | |
| | | | | | | | | |
| Consumer Products - Miscellaneous 0.00% | | | | | | | | |
| Tongda Hong Tai Holdings, Ltd. * | | | 2,000 | | | | 371 | |
| | | | | | | | | |
| Containers - Paper/Plastic 0.09% | | | | | | | | |
| Lee & Man Paper Manufacturing, Ltd. | | | 20,000 | | | | 20,178 | |
| | | | | | | | | |
| Electronic Components - Miscellaneous 0.46% | | | | | | | | |
| AAC Technologies Holdings, Inc. | | | 7,000 | | | | 98,303 | |
| | | | | | | | | |
| Electronic Components - Semiconductors 0.40% | | | | | | | | |
| Sino-American Silicon Products, Inc. | | | 14,000 | | | | 56,220 | |
| SK Hynix, Inc. | | | 400 | | | | 30,704 | |
| | | | | | | | 86,924 | |
| | | | | | | | | |
| Electronic Measuring Instruments 0.55% | | | | | | | | |
| Chroma ATE, Inc. | | | 22,000 | | | | 118,120 | |
| | | | | | | | | |
| Enterprise Software/Services 0.28% | | | | | | | | |
| Sinosoft Technology Group, Ltd. | | | 162,000 | | | | 61,156 | |
| | | | | | | | | |
| Entertainment Software 0.18% | | | | | | | | |
| IGG, Inc. | | | 30,000 | | | | 38,184 | |
| | | | | | | | | |
| Finance - Investment Banker/Broker 0.08% | | | | | | | | |
| Guotai Junan International Holdings, Ltd. | | | 80,000 | | | | 17,243 | |
See notes to portfolios of investments and notes to financial statements.
| China Region Fund | |
| Portfolio of Investments (unaudited) | June 30, 2018 |
| Common Stocks (cont’d) | | Shares | | | Value | |
| | | | | | | |
| Finance - Other Services 1.08% | | | | | | | | |
| Hong Kong Exchanges & Clearing, Ltd. | | | 7,800 | | | $ | 233,435 | |
| | | | | | | | | |
| Gold Mining 2.90% | | | | | | | | |
| Zijin Mining Group Co., Ltd., H Shares | | | 1,636,000 | | | | 627,191 | |
| | | | | | | | | |
| Industrial Audio & Video Production 0.16% | | | | | | | | |
| Merry Electronics Co., Ltd. | | | 5,000 | | | | 21,716 | |
| Q Technology Group Co., Ltd. | | | 18,000 | | | | 13,577 | |
| | | | | | | | 35,293 | |
| | | | | | | | | |
| Internet Application Software 11.63% | | | | | | | | |
| Tencent Holdings, Ltd. | | | 50,000 | | | | 2,510,770 | |
| | | | | | | | | |
| Internet Content - Entertainment 0.11% | | | | | | | | |
| NCSoft Corp. | | | 70 | | | | 23,295 | |
| | | | | | | | | |
| Investment Management/Advisory Services 0.09% | | | | | | | | |
| Value Partners Group, Ltd. | | | 25,000 | | | | 19,657 | |
| | | | | | | | | |
| Life/Health Insurance 0.48% | | | | | | | | |
| China Life Insurance Co., Ltd. | | | 98,972 | | | | 104,079 | |
| | | | | | | | | |
| Machinery - Construction & Mining 2.74% | | | | | | | | |
| Lonking Holdings, Ltd. | | | 1,175,000 | | | | 538,122 | |
| United Tractors Tbk PT | | | 24,000 | | | | 52,846 | |
| | | | | | | | 590,968 | |
| | | | | | | | | |
| Machinery - General Industrial 0.10% | | | | | | | | |
| Haitian International Holdings, Ltd. | | | 9,000 | | | | 21,210 | |
| | | | | | | | | |
| Medical - Drugs 2.27% | | | | | | | | |
| China Pioneer Pharma Holdings, Ltd. | | | 100,000 | | | | 28,005 | |
| Consun Pharmaceutical Group, Ltd. | | | 421,000 | | | | 392,688 | |
| SSY Group, Ltd. | | | 62,000 | | | | 68,646 | |
| | | | | | | | 489,339 | |
| | | | | | | | | |
| Metal Processors & Fabricators 1.55% | | | | | | | | |
| Catcher Technology Co., Ltd. | | | 30,000 | | | | 334,959 | |
See notes to portfolios of investments and notes to financial statements.
| China Region Fund | |
| Portfolio of Investments (unaudited) | June 30, 2018 |
| Common Stocks (cont’d) | | Shares | | | Value | |
| | | | | | | |
| Multi-line Insurance 6.18% | | | | | | | | |
| China Taiping Insurance Holdings Co., Ltd. | | | 8,000 | | | $ | 24,873 | |
| Ping An Insurance Group Co. of China, Ltd., H shares | | | 143,000 | | | | 1,309,547 | |
| | | | | | | | 1,334,420 | |
| | | | | | | | | |
| Non-Ferrous Metals 0.15% | | | | | | | | |
| Sterling Group Ventures, Inc., 144A #*∆ | | | 500,000 | | | | 32,500 | |
| | | | | | | | | |
| Oil Companies - Exploration & Production 0.43% | | | | | | | | |
| United Energy Group, Ltd. | | | 700,000 | | | | 92,614 | |
| | | | | | | | | |
| Oil Refining & Marketing 0.27% | | | | | | | | |
| Thai Oil PCL, NVDR | | | 25,000 | | | | 58,607 | |
| | | | | | | | | |
| Paper & Related Products 0.11% | | | | | | | | |
| Nine Dragons Paper Holdings, Ltd. | | | 18,000 | | | | 22,839 | |
| | | | | | | | | |
| Petrochemicals 3.37% | | | | | | | | |
| Lotte Chemical Corp. | | | 118 | | | | 36,784 | |
| Sinopec Shanghai Petrochemical Co., Ltd., ADR | | | 11,500 | | | | 689,770 | |
| | | | | | | | 726,554 | |
| | | | | | | | | |
| Photo Equipment & Supplies 12.54% | | | | | | | | |
| Sunny Optical Technology Group Co., Ltd. | | | 146,000 | | | | 2,707,915 | |
| | | | | | | | | |
| Property/Casualty Insurance 0.20% | | | | | | | | |
| Meritz Fire & Marine Insurance Co., Ltd. | | | 1,300 | | | | 22,387 | |
| PICC Property & Casualty Co., Ltd., H shares | | | 19,500 | | | | 20,973 | |
| | | | | | | | 43,360 | |
| | | | | | | | | |
| Real Estate Operating/Development 13.07% | | | | | | | | |
| Central China Real Estate, Ltd. | | | 875,000 | | | | 407,608 | |
| China Merchants Land, Ltd. | | | 300,000 | | | | 51,467 | |
| China Vanke Co., Ltd., H Shares | | | 63,000 | | | | 219,711 | |
| Country Garden Holdings Co., Ltd. | | | 849,000 | | | | 1,488,295 | |
| Country Garden Services Holdings Co., Ltd. * | | | 97,586 | | | | 125,129 | |
| Kerry Properties, Ltd. | | | 5,000 | | | | 23,895 | |
| Longfor Properties Co., Ltd. | | | 20,000 | | | | 53,773 | |
| Sino-Ocean Group Holding, Ltd. | | | 405,000 | | | | 234,368 | |
| Sunac China Holdings, Ltd. | | | 5,000 | | | | 17,390 | |
See notes to portfolios of investments and notes to financial statements.
| China Region Fund | |
| Portfolio of Investments (unaudited) | June 30, 2018 |
| Common Stocks (cont’d) | | Shares | | | Value | |
| | | | | | | |
| Real Estate Operating/Development (cont’d) | | | | | | | | |
| Yuzhou Properties Co., Ltd. | | | 340,000 | | | $ | 199,807 | |
| | | | | | | | 2,821,443 | |
| | | | | | | | | |
| Retail - Automobile 2.39% | | | | | | | | |
| Zhongsheng Group Holdings, Ltd. | | | 172,000 | | | | 514,970 | |
| | | | | | | | | |
| Retail - Home Furnishings 0.11% | | | | | | | | |
| Man Wah Holdings, Ltd. | | | 30,000 | | | | 23,482 | |
| | | | | | | | | |
| Retail - Hypermarkets 0.28% | | | | | | | | |
| Ruentex Industries, Ltd. * | | | 30,000 | | | | 61,122 | |
| | | | | | | | | |
| Semiconductor Equipment 0.58% | | | | | | | | |
| ASM Pacific Technology, Ltd. | | | 10,000 | | | | 126,035 | |
| | | | | | | | | |
| Telecom Equipment Fiber Optics 2.06% | | | | | | | | |
| Yangtze Optical Fibre and Cable Joint Stock, Ltd. Co. * | | | 110,500 | | | | 445,195 | |
| | | | | | | | | |
| Telecom Services 0.10% | | | | | | | | |
| Tower Bersama Infrastructure Tbk PT | | | 60,000 | | | | 20,886 | |
| | | | | | | | | |
| Investments, at value 93.28% | | | | | | | 20,141,161 | |
| (cost $14,355,778) | | | | | | | | |
| Other assets and liabilities, net 6.72% | | | | | | | 1,452,068 | |
| | | | | | | | | |
| Net Assets 100.00% | | | | | | $ | 21,593,229 | |
See notes to portfolios of investments and notes to financial statements.
| China Region Fund | |
| Portfolio of Investments (unaudited) | June 30, 2018 |
Country Distribution* Based on Total Investments | June 30, 2018 |

| * | Country distribution shown is based on domicile. The locale of company operations may be different. |
See notes to portfolios of investments and notes to financial statements.
| Notes to Portfolios of Investments (unaudited) | June 30, 2018 |
Legend
| ‡ | Adjustable rate security, the interest rate of which adjusts periodically based on changes in the current interest rates. Rate represented is as of June 30, 2018. |
| ◊ | Zero coupon bond. Interest rate presented is yield to maturity. |
| * | Non-income producing security. |
| @ | Security was fair valued at June 30, 2018, by U.S. Global Investors, Inc. (Adviser) (other than international securities fair valued pursuant to systematic fair value models) in accordance with valuation procedures approved by the Board of Trustees. These securities, as a percentage of net assets at June 30, 2018, were 1.41% of Holmes Macro Trends Fund, 10.43% of Global Resources Fund, 0.81% of World Precious Minerals Fund, 2.61% of Gold And Precious Metals Fund and 0.00% of Emerging Europe Fund, respectively. See the Fair Valuation of Securities section of these Notes to Portfolios of Investments for further discussion of fair valued securities. See further information and detail on restricted securities in the Restricted Securities section of these Notes to Portfolios of Investments. |
| ∆ | Pursuant to Rule 144A of the Securities Act of 1933, these securities may be resold in transactions exempt from registration, normally to qualified institutional buyers. The market value of these securities and percentage of net assets as of June 30, 2018 amounted to $30,426, 0.08%, of Holmes Macro Trends Fund, $2,103,953, 2.48%, of Global Resources Fund, $1,902,832, 1.94%, of World Precious Minerals Fund, $2,000,000, 2.19%, of Gold And Precious Metals Fund, $59,702, 0.15%, of Emerging Europe Fund and $32,500, 0.15%, of China Region Fund. |
| + | See "Restricted Securities" in Notes to Portfolios of Investments. |
| ~ | Affiliated Company. (see following) |
| ^ | Security is currently in default and is on scheduled interest or principal payment. |
| ADR | American Depositary Receipt |
| AGC | Assured Guaranty Corporation |
| AGM | Assured Guaranty Municipal |
| AMBAC | American Municipal Bond Assurance Corporation |
| BAM | Build American Mutual Assurance Company |
| COP | Certificate of Participation |
| GDR | Global Depositary Receipt |
| LIBOR | London Interbank Offered Rate |
| LLC | Limited Liability Company |
| NATL | National Public Finance Guarantee Corporation |
| NVDR | Non-Voting Depositary Receipt |
| OJSC | Open Joint Stock Company |
| PCL | Public Company Limited |
| PJSC | Public Joint Stock Company |
| PLC | Public Limited Company |
| PSF-GTD | Public School Fund Guarantee |
| Q-SBLF | Qualified School Bond Loan Fund |
| REIT | Real Estate Investment Trust |
| SPDR | Standard & Poor’s Depositary Receipt |
General
The yields reflect the effective yield from the date of purchase.
Variable and Floating Rate Notes have periodic reset features, which effectively shorten the maturity dates and reset the interest rates as tied to various interest-bearing instruments. Rates shown are current rates at June 30, 2018.
| Notes to Portfolios of Investments (unaudited) | June 30, 2018 |
Fair Valuation of Securities
For the Funds’ policies regarding the valuation of investments and other significant accounting policies, please refer to the Notes to Financial Statements.
The Funds are required to disclose information regarding the fair value measurements of a Fund’s assets and liabilities. Fair value is the price that would be received to sell an asset or paid to transfer a liability in an orderly transaction between market participants at the measurement date. The measurement requirements established a three-tier hierarchy to maximize the use of observable market data and minimize the use of unobservable inputs and to establish classification of fair value measurements for disclosure purposes. Inputs refer broadly to the assumptions that market participants would use in pricing the asset or liability, including assumptions about risk, for example, the risk inherent in a particular valuation technique used to measure fair value including such a pricing model and/or the risk inherent in the inputs to the valuation technique. Inputs may be observable or unobservable. Observable inputs are inputs that reflect the assumptions market participants would use in pricing the asset or liability developed based on market data obtained from sources independent of the reporting entity. Unobservable inputs are inputs that reflect the reporting entity’s own assumptions about the assumptions market participants would use in pricing the asset or liability developed based on the best information available in the circumstances.
The inputs or methodology used for valuing securities are not necessarily an indication of the risk associated with investing in those securities. Because of the inherent uncertainties of valuation, the values reflected in the portfolios may materially differ from the values received upon actual sale of those investments.
The three levels defined by the fair value hierarchy are as follows:
Level 1 – Quoted prices in active markets for identical securities.
Level 2 – Prices determined using significant other observable inputs (including quoted prices for similar securities, interest rates, prepayment speeds, credit risk, etc.). Short-term securities with maturities of sixty days or less are valued at amortized cost, which approximates market value, and are categorized as Level 2 in the hierarchy. Municipal securities, long-term U.S. government obligations and corporate debt securities are valued in accordance with the evaluated price supplied by the pricing service and generally categorized as Level 2 in the hierarchy. Other securities that are categorized as Level 2 in the hierarchy include, but are not limited to, warrants that do not trade on an exchange, securities valued at the mean between the last reported bid and ask quotation and international equity securities valued by an independent third party in order to adjust for stale pricing.
Level 3 – Prices determined using significant unobservable inputs (including the Fund’s own assumptions). For restricted equity securities and private placements where observable inputs are limited, assumptions about market activity and risk are used in determining fair value.
| Notes to Portfolios of Investments (unaudited) | June 30, 2018 |
The following table summarizes the valuation of each Fund’s securities as of June 30, 2018, using the fair value hierarchy:
| | | Quoted Prices in | | | Significant | | | | | | | |
| | | Active Markets | | | Other | | | Significant | | | | |
| | | for Identical | | | Observable | | | Unobservable | | | | |
| | | Investments | | | Inputs | | | Inputs | | | | |
| | | (Level 1) | | | (Level 2) | | | (Level 3) | | | Total | |
| U.S. Government Securities Ultra-Short Bond Fund | | | | | | | | | | | | | | | | |
| Investments in Securities* | | | | | | | | | | | | | | | | |
| United States Government and Agency Obligations | | $ | – | | | $ | 44,183,639 | | | $ | – | | | $ | 44,183,639 | |
| Investments, at Value | | $ | – | | | $ | 44,183,639 | | | $ | – | | | $ | 44,183,639 | |
| | | Quoted Prices in | | | Significant | | | | | | | |
| | | Active Markets | | | Other | | | Significant | | | | |
| | | for Identical | | | Observable | | | Unobservable | | | | |
| | | Investments | | | Inputs | | | Inputs | | | | |
| | | (Level 1) | | | (Level 2) | | | (Level 3) | | | Total | |
| Near-Term Tax Free Fund | | | | | | | | | | | | | | | | |
| Investments in Securities* | | | | | | | | | | | | | | | | |
| Municipal Bonds | | $ | – | | | $ | 53,625,053 | | | $ | – | | | $ | 53,625,053 | |
| Investments, at Value | | $ | – | | | $ | 53,625,053 | | | $ | – | | | $ | 53,625,053 | |
| | | Quoted Prices in | | | Significant | | | | | | | |
| | | Active Markets | | | Other | | | Significant | | | | |
| | | for Identical | | | Observable | | | Unobservable | | | | |
| | | Investments | | | Inputs | | | Inputs | | | | |
| | | (Level 1) | | | (Level 2) | | | (Level 3) | | | Total | |
| All American Equity Fund | | | | | | | | | | | | | | | | |
| Investments in Securities* | | | | | | | | | | | | | | | | |
| Common Stocks | | | | | | | | | | | | | | | | |
| Aerospace/Defense | | $ | 436,163 | | | $ | – | | | $ | – | | | $ | 436,163 | |
| Apparel Manufacturers | | | 510,864 | | | | – | | | | – | | | | 510,864 | |
| Beverages - Wine/Spirits | | | 481,514 | | | | – | | | | – | | | | 481,514 | |
| Chemicals - Diversified | | | 414,920 | | | | – | | | | – | | | | 414,920 | |
| Commercial Banks | | | 505,824 | | | | – | | | | – | | | | 505,824 | |
| Commercial Services - Finance | | | 431,052 | | | | – | | | | – | | | | 431,052 | |
| Computer Services | | | 346,623 | | | | – | | | | – | | | | 346,623 | |
| Cosmetics & Toiletries | | | 513,684 | | | | – | | | | – | | | | 513,684 | |
| Cruise Lines | | | 707,562 | | | | – | | | | – | | | | 707,562 | |
| Diversified Manufacturing Operations | | | 466,596 | | | | – | | | | – | | | | 466,596 | |
| Electronic Components - Semiconductors | | | 926,705 | | | | – | | | | – | | | | 926,705 | |
| Enterprise Software/Services | | | 418,570 | | | | – | | | | – | | | | 418,570 | |
| Notes to Portfolios of Investments (unaudited) | June 30, 2018 |
| | | Quoted Prices in | | | Significant | | | | | | | |
| | | Active Markets | | | Other | | | Significant | | | | |
| | | for Identical | | | Observable | | | Unobservable | | | | |
| | | Investments | | | Inputs | | | Inputs | | | | |
| | | (Level 1) | | | (Level 2) | | | (Level 3) | | | Total | |
| All American Equity Fund (continued) | | | | | | | | | | | | | | | | |
Investments in Securities*
(continued) | | | | | | | | | | | | | | | | |
| Fiduciary Banks | | $ | 539,300 | | | $ | – | | | $ | – | | | $ | 539,300 | |
| Finance - Credit Card | | | 556,290 | | | | – | | | | – | | | | 556,290 | |
| Medical - Biomedical/Genetics | | | 498,393 | | | | – | | | | – | | | | 498,393 | |
| Medical - Drugs | | | 477,064 | | | | – | | | | – | | | | 477,064 | |
| Medical - HMO | | | 446,445 | | | | – | | | | – | | | | 446,445 | |
| Medical Products | | | 583,336 | | | | – | | | | – | | | | 583,336 | |
| Oil Companies - Exploration & Production | | | 445,060 | | | | – | | | | – | | | | 445,060 | |
| Oil Refining & Marketing | | | 997,276 | | | | – | | | | – | | | | 997,276 | |
| REITS - Diversified | | | 418,093 | | | | – | | | | – | | | | 418,093 | |
| Retail - Building Products | | | 565,790 | | | | – | | | | – | | | | 565,790 | |
| Retail - Discount | | | 438,858 | | | | – | | | | – | | | | 438,858 | |
| Super-Regional Banks-US | | | 504,132 | | | | – | | | | – | | | | 504,132 | |
| Supranational Bank | | | 445,508 | | | | – | | | | – | | | | 445,508 | |
| Telephone - Integrated | | | 422,604 | | | | – | | | | – | | | | 422,604 | |
| Tools - Hand Held | | | 466,088 | | | | – | | | | – | | | | 466,088 | |
| Water | | | 486,666 | | | | – | | | | – | | | | 486,666 | |
| Exchange Traded Funds | | | 146,710 | | | | – | | | | – | | | | 146,710 | |
| Put Option | | | 107,310 | | | | – | | | | – | | | | 107,310 | |
| Investments, at Value | | $ | 14,705,000 | | | $ | – | | | $ | – | | | $ | 14,705,000 | |
| | | Quoted Prices in | | | Significant | | | | | | | |
| | | Active Markets | | | Other | | | Significant | | | | |
| | | for Identical | | | Observable | | | Unobservable | | | | |
| | | Investments | | | Inputs | | | Inputs | | | | |
| | | (Level 1) | | | (Level 2) | | | (Level 3) | | | Total | |
| Holmes Macro Trends Fund | | | | | | | | | | | | | | | | |
| Investments in Securities* | | | | | | | | | | | | | | | | |
| Common Stocks | | | | | | | | | | | | | | | | |
| Airlines | | $ | 1,581,800 | | | $ | – | | | $ | – | | | $ | 1,581,800 | |
| Batteries/Battery Systems | | | 1,284,384 | | | | – | | | | – | | | | 1,284,384 | |
| Beverages - Non-alcoholic | | | 864,832 | | | | – | | | | – | | | | 864,832 | |
| Building - Residential/Commercial | | | 917,907 | | | | – | | | | – | | | | 917,907 | |
| Casino Hotels | | | 1,957,878 | | | | – | | | | – | | | | 1,957,878 | |
| Chemicals - Specialty | | | 1,415,084 | | | | – | | | | – | | | | 1,415,084 | |
| Commercial Services | | | 1,409,408 | | | | – | | | | – | | | | 1,409,408 | |
| Commercial Services - Finance | | | 2,976,794 | | | | – | | | | – | | | | 2,976,794 | |
| Consumer Products - Miscellaneous | | | 1,200,876 | | | | – | | | | – | | | | 1,200,876 | |
| Notes to Portfolios of Investments (unaudited) | June 30, 2018 |
| | | Quoted Prices in | | | Significant | | | | | | | |
| | | Active Markets | | | Other | | | Significant | | | | |
| | | for Identical | | | Observable | | | Unobservable | | | | |
| | | Investments | | | Inputs | | | Inputs | | | | |
| | | (Level 1) | | | (Level 2) | | | (Level 3) | | | Total | |
| Holmes Macro Trends Fund (continued) | | | | | | | | | | | | | | | | |
| Investments in Securities* (continued) | | | | | | | | | | | | | | | | |
| Diversified Manufacturing Operations | | $ | 1,021,270 | | | $ | – | | | $ | – | | | $ | 1,021,270 | |
| Electronic Secure Devices | | | 1,338,328 | | | | – | | | | – | | | | 1,338,328 | |
| Energy - Alternate Sources | | | – | | | | – | | | | 0 | | | | 0 | |
| Food - Miscellaneous/ Diversified | | | 1,166,100 | | | | – | | | | – | | | | 1,166,100 | |
| Home Furnishings | | | 795,148 | | | | – | | | | – | | | | 795,148 | |
| Medical - Drugs | | | 2,997,396 | | | | – | | | | – | | | | 2,997,396 | |
| Medical - Hospitals | | | – | | | | – | | | | 0 | | | | 0 | |
| Medical Laser Systems | | | 1,027,650 | | | | – | | | | – | | | | 1,027,650 | |
| Office Automation & Equipment | | | 1,191,230 | | | | – | | | | – | | | | 1,191,230 | |
| Oil Companies - Exploration & Production | | | 30,426 | | | | – | | | | – | | | | 30,426 | |
| Pastoral & Agricultural | | | 1,519,650 | | | | – | | | | – | | | | 1,519,650 | |
| Power Conversion/Supply Equipment | | | 1,552,715 | | | | – | | | | – | | | | 1,552,715 | |
| Real Estate Operating/ Development | | | – | | | | – | | | | 322,118 | | | | 322,118 | |
| REITS - Diversified | | | 1,520,415 | | | | – | | | | – | | | | 1,520,415 | |
| REITS - Regional Malls | | | 1,633,528 | | | | – | | | | – | | | | 1,633,528 | |
| Semiconductor Equipment | | | 942,480 | | | | – | | | | – | | | | 942,480 | |
| Telecom Equipment Fiber Optics | | | 1,142,502 | | | | – | | | | – | | | | 1,142,502 | |
| Television | | | 1,716,720 | | | | – | | | | – | | | | 1,716,720 | |
| Transportation - Services | | | 1,827,156 | | | | – | | | | – | | | | 1,827,156 | |
| Web Hosting/Design | | | 867,861 | | | | – | | | | – | | | | 867,861 | |
| Corporate Non-Convertible Bond | | | – | | | | – | | | | 233,829 | | | | 233,829 | |
| Exchange Traded Funds | | | 389,790 | | | | – | | | | – | | | | 389,790 | |
| Warrants | | | | | | | | | | | | | | | | |
| Gold Mining | | | 8 | | | | – | | | | – | | | | 8 | |
| Oil Companies - Exploration & Production | | | – | | | | 0 | | | | – | | | | 0 | |
| Put Option | | | 280,320 | | | | – | | | | – | | | | 280,320 | |
| Investments, at Value | | $ | 36,569,656 | | | $ | – | | | $ | 555,947 | | | $ | 37,125,603 | |
| Notes to Portfolios of Investments (unaudited) | June 30, 2018 |
| | | Quoted Prices in | | | Significant | | | | | | | |
| | | Active Markets | | | Other | | | Significant | | | | |
| | | for Identical | | | Observable | | | Unobservable | | | | |
| | | Investments | | | Inputs | | | Inputs | | | | |
| | | (Level 1) | | | (Level 2) | | | (Level 3) | | | Total | |
| Global Resources Fund | | | | | | | | | | | | | | | | |
| Investments in Securities* | | | | | | | | | | | | | | | | |
| Common Stocks | | | | | | | | | | | | | | | | |
| Building & Construction Products - Miscellaneous | | $ | 1,050,692 | | | $ | – | | | $ | – | | | $ | 1,050,692 | |
| Building Products - Wood | | | 1,250,085 | | | | – | | | | – | | | | 1,250,085 | |
| Chemicals - Diversified | | | 2,321,150 | | | | 3,923,128 | | | | – | | | | 6,244,278 | |
| Chemicals - Specialty | | | 831,636 | | | | 2,017,475 | | | | – | | | | 2,849,111 | |
| Coal | | | 2,655,478 | | | | 2,034,662 | | | | – | | | | 4,690,140 | |
| Commercial Service - Finance | | | 327,083 | | | | – | | | | – | | | | 327,083 | |
| Diamonds/Precious Stones | | | 243,411 | | | | – | | | | 0 | | | | 243,411 | |
| Diversified Minerals | | | 4,489,602 | | | | 1,316,516 | | | | – | | | | 5,806,118 | |
| Electronics - Military | | | 143,860 | | | | – | | | | – | | | | 143,860 | |
| Energy - Alternate Sources | | | 1,901,012 | | | | 1,812,604 | | | | 0 | | | | 3,713,616 | |
| Finance - Investment Banker/Broker | | | 441,182 | | | | – | | | | – | | | | 441,182 | |
| Forestry | | | 3,605,867 | | | | – | | | | – | | | | 3,605,867 | |
| Gold Mining | | | 5,224,759 | | | | 4,040,876 | | | | – | | | | 9,265,635 | |
| Information Technology | | | – | | | | – | | | | 361,313 | | | | 361,313 | |
| Medical - Hospitals | | | – | | | | – | | | | 0 | | | | 0 | |
| Metal - Aluminum | | | 1,143,872 | | | | – | | | | – | | | | 1,143,872 | |
| Metal - Copper | | | 939,493 | | | | 1,176,367 | | | | – | | | | 2,115,860 | |
| Metal - Diversified | | | 2,397,418 | | | | 2,209,220 | | | | – | | | | 4,606,638 | |
| Metal - Iron | | | 1,192,260 | | | | – | | | | 0 | | | | 1,192,260 | |
| Mining Services | | | 488,433 | | | | 1,206,944 | | | | – | | | | 1,695,377 | |
| Natural Resource Technology | | | – | | | | – | | | | 14,875 | | | | 14,875 | |
| Non-Ferrous Metals | | | 418,197 | | | | – | | | | – | | | | 418,197 | |
| Oil - Field Services | | | – | | | | 2,803,187 | | | | – | | | | 2,803,187 | |
| Oil Companies - Exploration & Production | | | 1,835,940 | | | | 3,081,548 | | | | 0 | | | | 4,917,488 | |
| Oil Companies - Integrated | | | 2,139,716 | | | | – | | | | – | | | | 2,139,716 | |
| Oil Companies - US Royalty Trusts | | | 11,580 | | | | – | | | | – | | | | 11,580 | |
| Oil Refining & Marketing | | | – | | | | 2,334,732 | | | | – | | | | 2,334,732 | |
| Petrochemicals | | | – | | | | 810,501 | | | | – | | | | 810,501 | |
| Poultry | | | 865,590 | | | | – | | | | – | | | | 865,590 | |
| Real Estate Operating/ Development | | | – | | | | – | | | | 5,621,364 | | | | 5,621,364 | |
| Silver Mining | | | 1,028,344 | | | | – | | | | – | | | | 1,028,344 | |
| Steel - Producers | | | – | | | | 2,622,843 | | | | – | | | | 2,622,843 | |
| Corporate Non-Convertible Bond | | | – | | | | – | | | | 2,805,938 | | | | 2,805,938 | |
| Warrants | | | | | | | | | | | | | | | | |
| Diversified Minerals | | | – | | | | 0 | | | | – | | | | 0 | |
| Gold Mining | | | 1,924 | | | | 0 | | | | – | | | | 1,924 | |
| Metal - Diversified | | | – | | | | 0 | | | | – | | | | 0 | |
| Notes to Portfolios of Investments (unaudited) | June 30, 2018 |
| | | Quoted Prices in | | | Significant | | | | | | | |
| | | Active Markets | | | Other | | | Significant | | | | |
| | | for Identical | | | Observable | | | Unobservable | | | | |
| | | Investments | | | Inputs | | | Inputs | | | | |
| | | (Level 1) | | | (Level 2) | | | (Level 3) | | | Total | |
| Global Resources Fund (continued) | | | | | | | | | | | | | | | | |
| Investments in Securities* (continued) | | | | | | | | | | | | | | | | |
| Non-Ferrous Metals | | $ | – | | | $ | 0 | | | $ | – | | | $ | 0 | |
| Oil Companies - Exploration & Production | | | – | | | | 0 | | | | – | | | | 0 | |
| Purchased Call Options | | | 483,670 | | | | 656,010 | | | | – | | | | 1,139,680 | |
| Investments, at Value | | $ | 37,432,254 | | | $ | 32,046,613 | | | $ | 8,803,490 | | | $ | 78,282,357 | |
| | | Quoted Prices in | | | Significant | | | | | | | |
| | | Active Markets | | | Other | | | Significant | | | | |
| | | for Identical | | | Observable | | | Unobservable | | | | |
| | | Investments | | | Inputs | | | Inputs | | | | |
| | | (Level 1) | | | (Level 2) | | | (Level 3) | | | Total | |
| World Precious Minerals Fund | | | | | | | | | | | | | | | | |
| Investments in Securities* | | | | | | | | | | | | | | | | |
| Common Stocks | | | | | | | | | | | | | | | | |
| Advanced Materials/ Production | | $ | 2,989,389 | | | $ | – | | | $ | – | | | $ | 2,989,389 | |
| Capital Pools | | | 66,938 | | | | – | | | | – | | | | 66,938 | |
| Coal | | | – | | | | 125,985 | | | | – | | | | 125,985 | |
| Diamonds/Precious Stones | | | 1,358,841 | | | | – | | | | 0 | | | | 1,358,841 | |
| Diversified Minerals | | | 5,318,513 | | | | 101,542 | | | | – | | | | 5,420,055 | |
| Gold Mining | | | 47,365,094 | | | | 3,002,581 | | | | – | | | | 50,367,675 | |
| Medical - Hospitals | | | – | | | | – | | | | 0 | | | | 0 | |
| Metal - Copper | | | 295,858 | | | | – | | | | – | | | | 295,858 | |
| Metal - Diversified | | | 7,568,603 | | | | 2,465,028 | | | | – | | | | 10,033,631 | |
| Mining Services | | | – | | | | 329,337 | | | | – | | | | 329,337 | |
| Non-Ferrous Metals | | | 1,080,782 | | | | – | | | | – | | | | 1,080,782 | |
| Oil Companies - Exploration & Production | | | – | | | | – | | | | 0 | | | | 0 | |
| Optical Recognition Equipment | | | 9,191 | | | | – | | | | – | | | | 9,191 | |
| Precious Metals | | | 16,718,515 | | | | 364,326 | | | | – | | | | 17,082,841 | |
| Silver Mining | | | 388,697 | | | | – | | | | – | | | | 388,697 | |
| Corporate Non-Convertible Bond | | | – | | | | – | | | | 748,250 | | | | 748,250 | |
| Right | | | 310,821 | | | | – | | | | – | | | | 310,821 | |
| Exchange Traded Funds | | | 3,993,900 | | | | – | | | | – | | | | 3,993,900 | |
| Warrants | | | | | | | | | | | | | | | | |
| Diversified Minerals | | | – | | | | 0 | | | | – | | | | 0 | |
| Gold Mineral Exploration & Development | | | – | | | | – | | | | 0 | | | | 0 | |
| Gold Mining | | | 171,265 | | | | 47,541 | | | | – | | | | 218,806 | |
| Notes to Portfolios of Investments (unaudited) | June 30, 2018 |
| | | Quoted Prices in | | | Significant | | | | | | | |
| | | Active Markets | | | Other | | | Significant | | | | |
| | | for Identical | | | Observable | | | Unobservable | | | | |
| | | Investments | | | Inputs | | | Inputs | | | | |
| | | (Level 1) | | | (Level 2) | | | (Level 3) | | | Total | |
| World Precious Minerals Fund (continued) | | | | | | | | | | | | | | | | |
| Investments in Securities* (continued) | | | | | | | | | | | | | | | | |
| Metal - Diversified | | $ | – | | | $ | 0 | | | $ | – | | | $ | 0 | |
| Investments, at Value | | $ | 87,636,407 | | | $ | 6,436,340 | | | $ | 748,250 | | | $ | 94,820,997 | |
| | | Quoted Prices in | | | Significant | | | | | | | |
| | | Active Markets | | | Other | | | Significant | | | | |
| | | for Identical | | | Observable | | | Unobservable | | | | |
| | | Investments | | | Inputs | | | Inputs | | | | |
| | | (Level 1) | | | (Level 2) | | | (Level 3) | | | Total | |
| Gold And Precious Metals Fund | | | | | | | | | | | | | | | | |
| Investments in Securities* | | | | | | | | | | | | | | | | |
| Common Stocks | | | | | | | | | | | | | | | | |
| Capital Pools | | $ | – | | | $ | 104,825 | | | $ | – | | | $ | 104,825 | |
| Gold Mining | | | 45,069,279 | | | | 18,499,034 | | | | – | | | | 63,568,313 | |
| Medical - Hospitals | | | – | | | | – | | | | 0 | | | | 0 | |
| Metal - Diversified | | | 1,041,000 | | | | – | | | | – | | | | 1,041,000 | |
| Precious Metals | | | 7,187,067 | | | | – | | | | – | | | | 7,187,067 | |
| Recycling | | | – | | | | 2,096,275 | | | | – | | | | 2,096,275 | |
| Retail - Jewelry | | | – | | | | – | | | | 2,000,000 | | | | 2,000,000 | |
| Silver Mining | | | 6,301,450 | | | | – | | | | – | | | | 6,301,450 | |
| Corporate Non-Convertible | | | | | | | | | | | | | | | | |
| Bonds | | | – | | | | – | | | | 280,594 | | | | 280,594 | |
| Exchange Traded Funds | | | 3,287,700 | | | | – | | | | – | | | | 3,287,700 | |
| Warrants | | | | | | | | | | | | | | | | |
| Gold Mining | | | 184,234 | | | | 0 | | | | – | | | | 184,234 | |
| Retail - Jewelry | | | – | | | | – | | | | 0 | | | | 0 | |
| Silver Mining | | | 13,597 | | | | – | | | | – | | | | 13,597 | |
| Investments, at Value | | $ | 63,084,327 | | | $ | 20,700,134 | | | $ | 2,280,594 | | | $ | 86,065,055 | |
| | | Quoted Prices in | | | Significant | | | | | | | |
| | | Active Markets | | | Other | | | Significant | | | | |
| | | for Identical | | | Observable | | | Unobservable | | | | |
| | | Investments | | | Inputs | | | Inputs | | | | |
| | | (Level 1) | | | (Level 2) | | | (Level 3) | | | Total | |
| Emerging Europe Fund | | | | | | | | | | | | | | | | |
| Investments in Securities* | | | | | | | | | | | | | | | | |
| Common Stocks | | | | | | | | | | | | | | | | |
| Agricultural Operations | | $ | – | | | $ | 380,306 | | | $ | – | | | $ | 380,306 | |
| Airlines | | | 245,594 | | | | 2,559,269 | | | | – | | | | 2,804,863 | |
| Appliances | | | – | | | | 217,914 | | | | – | | | | 217,914 | |
| Notes to Portfolios of Investments (unaudited) | June 30, 2018 |
| | | Quoted Prices in | | | Significant | | | | | | | |
| | | Active Markets | | | Other | | | Significant | | | | |
| | | for Identical | | | Observable | | | Unobservable | | | | |
| | | Investments | | | Inputs | | | Inputs | | | | |
| | | (Level 1) | | | (Level 2) | | | (Level 3) | | | Total | |
| Emerging Europe Fund (continued) | | | | | | | | | | | | | | | | |
| Investments in Securities* (continued) | | | | | | | | | | | | | | | | |
| Automotive - Cars & Light Trucks | | $ | – | | | $ | 1,018,766 | | | $ | – | | | $ | 1,018,766 | |
| Automotive/Truck Parts & Equipment - Original | | | – | | | | 376,941 | | | | – | | | | 376,941 | |
| Brewery | | | – | | | | 102,799 | | | | – | | | | 102,799 | |
| Cellular Telecommunication | | | 204,856 | | | | 192,589 | | | | – | | | | 397,445 | |
| Chemicals - Diversified | | | – | | | | 503,329 | | | | – | | | | 503,329 | |
| Chemicals - Fibers | | | – | | | | 154,760 | | | | – | | | | 154,760 | |
| Chemicals - Specialty | | | – | | | | 24,285 | | | | – | | | | 24,285 | |
| Coal | | | – | | | | 431,224 | | | | – | | | | 431,224 | |
| Commercial Banks Non-US | | | 3,449,219 | | | | 3,096,159 | | | | – | | | | 6,545,378 | |
| Computer Services | | | 169,510 | | | | 67,116 | | | | – | | | | 236,626 | |
| Cosmetics & Toiletries | | | – | | | | 237,534 | | | | – | | | | 237,534 | |
| Diamonds/Precious Stones | | | – | | | | 210,474 | | | | – | | | | 210,474 | |
| Diversified Operations | | | – | | | | 579,198 | | | | – | | | | 579,198 | |
| Electric - Generation | | | – | | | | 621,323 | | | | – | | | | 621,323 | |
| Electric - Integrated | | | – | | | | 360,331 | | | | – | | | | 360,331 | |
| Energy - Alternate Sources | | | 79,869 | | | | – | | | | – | | | | 79,869 | |
| Enterprise Software/Services | | | – | | | | 39,320 | | | | – | | | | 39,320 | |
| Entertainment Software | | | – | | | | 219,995 | | | | – | | | | 219,995 | |
| Food - Retail | | | 393,227 | | | | 530,710 | | | | – | | | | 923,937 | |
| Food - Wholesale/Distribution | | | – | | | | 488,104 | | | | – | | | | 488,104 | |
| Gold Mining | | | 75,237 | | | | 130,599 | | | | – | | | | 205,836 | |
| Home Furnishings | | | – | | | | 125,247 | | | | – | | | | 125,247 | |
| Housewares | | | – | | | | 75,487 | | | | – | | | | 75,487 | |
| Human Resources | | | – | | | | 227,023 | | | | – | | | | 227,023 | |
| Machinery - Farm | | | – | | | | 249,075 | | | | – | | | | 249,075 | |
| Metal - Diversified | | | 59,702 | | | | 189,872 | | | | – | | | | 249,574 | |
| Metal - Iron | | | 390,105 | | | | – | | | | – | | | | 390,105 | |
| Miscellaneous Manufacturing | | | – | | | | 191,559 | | | | – | | | | 191,559 | |
| Multi-line Insurance | | | – | | | | 1,055,197 | | | | – | | | | 1,055,197 | |
| Oil Companies - Exploration & Production | | | 200,611 | | | | 140,039 | | | | – | | | | 340,650 | |
| Oil Companies - Integrated | | | 7,766,426 | | | | 566,387 | | | | – | | | | 8,332,813 | |
| Oil Refining & Marketing | | | – | | | | 1,508,831 | | | | – | | | | 1,508,831 | |
| Property/Casualty Insurance | | | – | | | | 393,966 | | | | – | | | | 393,966 | |
| Real Estate Operating/Development | | | – | | | | 280,965 | | | | – | | | | 280,965 | |
| Regional Banks - Non US | | | 607,410 | | | | – | | | | – | | | | 607,410 | |
| Retail - Jewelry | | | – | | | | 126,501 | | | | – | | | | 126,501 | |
| Retail - Major Dept Store | | | – | | | | 613,809 | | | | – | | | | 613,809 | |
| Notes to Portfolios of Investments (unaudited) | June 30, 2018 |
| | | Quoted Prices in | | | Significant | | | | | | | |
| | | Active Markets | | | Other | | | Significant | | | | |
| | | for Identical | | | Observable | | | Unobservable | | | | |
| | | Investments | | | Inputs | | | Inputs | | | | |
| | | (Level 1) | | | (Level 2) | | | (Level 3) | | | Total | |
| Emerging Europe Fund (continued) | | | | | | | | | | | | | | | | |
| Investments in Securities* (continued) | | | | | | | | | | | | | | | | |
| Steel - Producers | | $ | 1,235,413 | | | $ | 1,200,760 | | | $ | – | | | $ | 2,436,173 | |
| Telecom Services | | | 215,279 | | | | 269,936 | | | | – | | | | 485,215 | |
| Telephone - Integrated | | | – | | | | 627,801 | | | | – | | | | 627,801 | |
| Textile - Apparel | | | – | | | | 205,261 | | | | – | | | | 205,261 | |
| Tobacco | | | – | | | | 181,953 | | | | – | | | | 181,953 | |
| Transport Support Services | | | 113,861 | | | | – | | | | – | | | | 113,861 | |
| Transportation - Rail | | | 595,436 | | | | – | | | | – | | | | 595,436 | |
| Transportation - Services | | | – | | | | 177,732 | | | | – | | | | 177,732 | |
| Travel Services | | | – | | | | 161,853 | | | | – | | | | 161,853 | |
| Exchange Traded Funds | | | 323,000 | | | | – | | | | – | | | | 323,000 | |
| Warrant | | | – | | | | 0 | | | | – | | | | 0 | |
| Investments, at Value | | $ | 16,124,755 | | | $ | 21,112,299 | | | $ | – | | | $ | 37,237,054 | |
| | | Quoted Prices in | | | Significant | | | | | | | |
| | | Active Markets | | | Other | | | Significant | | | | |
| | | for Identical | | | Observable | | | Unobservable | | | | |
| | | Investments | | | Inputs | | | Inputs | | | | |
| | | (Level 1) | | | (Level 2) | | | (Level 3) | | | Total | |
| China Region Fund | | | | | | | | | | | | | | | | |
| Investments in Securities* | | | | | | | | | | | | | | | | |
| Common Stocks | | | | | | | | | | | | | | | | |
| Airlines | | $ | – | | | $ | 203,481 | | | $ | – | | | $ | 203,481 | |
| Apparel Manufacturers | | | – | | | | 38,245 | | | | – | | | | 38,245 | |
| Appliances | | | – | | | | 245,644 | | | | – | | | | 245,644 | |
| Automotive - Cars & Light Trucks | | | – | | | | 2,244,470 | | | | – | | | | 2,244,470 | |
| Automotive - Medium & Heavy Duty Trucks | | | – | | | | 336,065 | | | | – | | | | 336,065 | |
| Automotive/Truck Parts & Equipment - Replacement | | | – | | | | 296,758 | | | | – | | | | 296,758 | |
| Batteries/Battery Systems | | | – | | | | 127,284 | | | | – | | | | 127,284 | |
| Building - Heavy Construction | | | – | | | | 17,065 | | | | – | | | | 17,065 | |
| Building & Construction Products - Miscellaneous | | | 18,088 | | | | 28,850 | | | | – | | | | 46,938 | |
| Building Products - Cement | | | – | | | | 638,725 | | | | – | | | | 638,725 | |
| Casino Hotels | | | – | | | | 808,349 | | | | – | | | | 808,349 | |
| Chemicals - Diversified | | | – | | | | 28,868 | | | | – | | | | 28,868 | |
| Chemicals - Specialty | | | 67,704 | | | | 67,625 | | | | – | | | | 135,329 | |
| Coal | | | – | | | | 447,745 | | | | – | | | | 447,745 | |
| Computers - Integrated System | | | – | | | | 63,578 | | | | – | | | | 63,578 | |
| Notes to Portfolios of Investments (unaudited) | June 30, 2018 |
| | | Quoted Prices in | | | Significant | | | | | | | |
| | | Active Markets | | | Other | | | Significant | | | | |
| | | for Identical | | | Observable | | | Unobservable | | | | |
| | | Investments | | | Inputs | | | Inputs | | | | |
| | | (Level 1) | | | (Level 2) | | | (Level 3) | | | Total | |
| China Region Fund (continued) | | | | | | | | | | | | | | | | |
Investments in Securities*
(continued) | | | | | | | | | | | | | | | | |
| Consumer Products - Miscellaneous | | $ | – | | | $ | 371 | | | $ | – | | | $ | 371 | |
| Containers - Paper/Plastic | | | – | | | | 20,178 | | | | – | | | | 20,178 | |
| Electronic Components - Miscellaneous | | | – | | | | 98,303 | | | | – | | | | 98,303 | |
| Electronic Components - Semiconductors | | | – | | | | 86,924 | | | | – | | | | 86,924 | |
| Electronic Measuring Instruments | | | – | | | | 118,120 | | | | – | | | | 118,120 | |
| Enterprise Software/Services | | | – | | | | 61,156 | | | | – | | | | 61,156 | |
| Entertainment Software | | | – | | | | 38,184 | | | | – | | | | 38,184 | |
| Finance - Investment Banker/Broker | | | – | | | | 17,243 | | | | – | | | | 17,243 | |
| Finance - Other Services | | | – | | | | 233,435 | | | | – | | | | 233,435 | |
| Gold Mining | | | – | | | | 627,191 | | | | – | | | | 627,191 | |
| Industrial Audio & Video Production | | | – | | | | 35,293 | | | | – | | | | 35,293 | |
| Internet Application Software | | | – | | | | 2,510,770 | | | | – | | | | 2,510,770 | |
| Internet Content - Entertainment | | | – | | | | 23,295 | | | | – | | | | 23,295 | |
| Investment Management/Advisory Services | | | – | | | | 19,657 | | | | – | | | | 19,657 | |
| Life/Health Insurance | | | – | | | | 104,079 | | | | – | | | | 104,079 | |
| Machinery - Construction & Mining | | | – | | | | 590,968 | | | | – | | | | 590,968 | |
| Machinery - General Industrial | | | – | | | | 21,210 | | | | – | | | | 21,210 | |
| Medical - Drugs | | | – | | | | 489,339 | | | | – | | | | 489,339 | |
| Metal Processors & Fabricators | | | – | | | | 334,959 | | | | – | | | | 334,959 | |
| Multi-line Insurance | | | – | | | | 1,334,420 | | | | – | | | | 1,334,420 | |
| Non-Ferrous Metals | | | 32,500 | | | | – | | | | – | | | | 32,500 | |
| Oil Companies - Exploration & Production | | | – | | | | 92,614 | | | | – | | | | 92,614 | |
| Oil Refining & Marketing | | | – | | | | 58,607 | | | | – | | | | 58,607 | |
| Paper & Related Products | | | – | | | | 22,839 | | | | – | | | | 22,839 | |
| Petrochemicals | | | 689,770 | | | | 36,784 | | | | – | | | | 726,554 | |
| Photo Equipment & Supplies | | | – | | | | 2,707,915 | | | | – | | | | 2,707,915 | |
| Property/Casualty Insurance | | | – | | | | 43,360 | | | | – | | | | 43,360 | |
| Real Estate Operating/Development | | | 125,129 | | | | 2,696,314 | | | | – | | | | 2,821,443 | |
| Retail - Automobile | | | – | | | | 514,970 | | | | – | | | | 514,970 | |
| Retail - Home Furnishings | | | – | | | | 23,482 | | | | – | | | | 23,482 | |
| Notes to Portfolios of Investments (unaudited) | June 30, 2018 |
| | | Quoted Prices in | | | Significant | | | | | | | |
| | | Active Markets | | | Other | | | Significant | | | | |
| | | for Identical | | | Observable | | | Unobservable | | | | |
| | | Investments | | | Inputs | | | Inputs | | | | |
| | | (Level 1) | | | (Level 2) | | | (Level 3) | | | Total | |
| China Region Fund (continued) | | | | | | | | | | | | | | | | |
Investments in Securities*
(continued) | | | | | | | | | | | | | | | | |
| Retail - Hypermarkets | | $ | – | | | $ | 61,122 | | | $ | – | | | $ | 61,122 | |
| Semiconductor Equipment | | | – | | | | 126,035 | | | | – | | | | 126,035 | |
| Telecom Equipment Fiber Optics | | | – | | | | 445,195 | | | | – | | | | 445,195 | |
| Telecom Services | | | – | | | | 20,886 | | | | – | | | | 20,886 | |
| Investments, at Value | | $ | 933,191 | | | $ | 19,207,970 | | | $ | – | | | $ | 20,141,161 | |
| * | Refer to the Portfolio of Investments for a detailed list of the Fund’s investments. |
| † | Other Financial Instruments are derivatives not reflected in the Portfolio of Investments, such as Currency Contracts, which are valued at the unrealized appreciation (depreciation) at period end. |
The following table shows transfers between Level 1 and Level 2 of the fair value hierarchy during the period January 1, 2018 through June 30, 2018:
| | | Transfers From | | | Transfers from | |
| Fund | | Level 1 to Level 2* | | | Level 2 to Level 1* | |
| World Precious Minerals Fund | | $ | — | | | $ | 2,239,399 | (1) |
| Gold and Precious Metals Fund | | | — | | | | 13,597 | (1) |
| Emerging Europe Fund | | | — | | | | 2,784,251 | (1) |
| China Region Fund | | | — | | | | 32,500 | (1) |
| * | The Funds’ policy is to recognize transfers in and transfers out as of the end of the reporting period. |
| (1) | Securities were valued at a quoted price at the end of the period, but at the mean between bid and ask quotations at the end of the prior fiscal year. |
The following is a reconciliation of assets for which unobservable inputs (Level 3) were used in determining fair value during the period January 1, 2018 through June 30, 2018:
| | | | | | Corporate | | | | |
| | | | | | Non- | | | | |
| | | Common | | | Convertible | | | | |
| | | Stocks | | | Bond | | | Total | |
| Holmes Macro Trends Fund | | | | | | | | | | | | |
| Beginning Balance 12/31/17 | | $ | 394,500 | | | $ | 233,829 | | | $ | 628,329 | |
| Net change in unrealized appreciation (depreciation) | | | 72,382 | | | | — | | | | 72,382 | |
| Ending Balance 06/30/18 | | $ | 322,118 | | | $ | 233,829 | | | $ | 555,947 | |
Net change in unrealized appreciation (depreciation)
from Investments held as of 06/30/18 (1) | | $ | 72,382 | | | $ | — | | | $ | 72,382 | |
| Notes to Portfolios of Investments (unaudited) | June 30, 2018 |
| | | | | | Corporate | | | | | | | |
| | | | | | Non- | | | | | | | |
| | | Common | | | Convertible | | | Subscription | | | | |
| | | Stocks | | | Bond | | | Receipt | | | Total | |
| Global Resources Fund | | | | | | | | | | | | | | | | |
| Beginning Balance 12/31/17 | | $ | 6,900,515 | | | $ | 2,805,938 | | | $ | 485,324 | | | $ | 10,191,777 | |
| Purchases | | | 388,470 | | | | — | | | | — | | | | 388,470 | |
| Transfers out of Level 3 | | | — | | | | — | | | | (431,704 | ) | | | (431,704 | ) |
| Net change in unrealized appreciation (depreciation) | | | (1,291,433 | ) | | | — | | | | (53,620 | ) | | | (1,345,053 | ) |
| Ending Balance 06/30/18 | | $ | 5,997,552 | | | $ | 2,805,938 | | | $ | — | | | $ | 8,803,490 | |
| Net change in unrealized appreciation (depreciation) from Investments held as of 06/30/18 (1) | | $ | (1,291,433 | ) | | $ | — | | | $ | — | | | $ | (1,291,433 | ) |
| | | Common
Stock | | | Corporate
Non-
Convertible
Bond | | | Subscription
Receipt | | | Warrants | | | Total | |
| World Precious Minerals Fund | | | | | | | | | | | | | | | | | | | | |
| Beginning Balance 12/31/2017 | | $ | 2,048 | | | $ | 748,250 | | | $ | 453,461 | | | $ | 0 | | | $ | 1,203,759 | |
| Purchases | | | — | | | | — | | | | 2,194,063 | | | | 0 | | | | 2,194,063 | |
| Transfers out of Level 3 | | | — | | | | — | | | | (1,961,929 | ) | | | 0 | | | | (1,961,929 | ) |
| Net change in unrealized appreciation (depreciation) | | | (2,048 | ) | | | — | | | | (685,595 | ) | | | 0 | | | | (687,643 | ) |
| Ending Balance 06/30/18 | | $ | 0 | | | $ | 748,250 | | | $ | — | | | $ | 0 | | | $ | 748,250 | |
| Net change in unrealized appreciation (depreciation) from Investments held as of 06/30/18 (1) | | $ | (2,048 | ) | | $ | — | | | $ | — | | | $ | — | | | $ | (2,048 | ) |
| | | Common
Stocks | | | Corporate
Non-
Convertible
Bond | | | Units | | | Warrants | | | Total | |
| Gold and Precious Metals Fund | | | | | | | | | | | | | | | | | | | | |
| Beginning Balance 12/31/17 | | $ | 477,327 | | | $ | 280,594 | | | $ | 2,000,000 | | | $ | — | | | $ | 2,757,921 | |
| Transfers out of Level 3 | | | (104,825 | ) | | | — | | | | — | | | | 0 | | | | (104,825 | ) |
| Conversion to Common Stock | | | 2,000,000 | | | | — | | | | (2,000,000 | ) | | | 0 | | | | — | |
| Net change in unrealized appreciation (depreciation) | | | (372,502 | ) | | | — | | | | — | | | | 0 | | | | (372,502 | ) |
| Ending Balance 06/30/18 | | $ | 2,000,000 | | | $ | 280,594 | | | $ | — | | | $ | 0 | | | $ | 2,280,594 | |
| Net change in unrealized appreciation (depreciation) from Investments held as of 06/30/18 (1) | | $ | — | | | $ | — | | | $ | — | | | $ | 0 | | | $ | — | |
| * | The Funds’ policy is to recognize transfers in and transfers out as of the end of the reporting period. |
| (1) | The amounts shown represent the net change in unrealized appreciation (depreciation) attributable to only those investments still held and classified as Level 3 at June 30, 2018. |
| Notes to Portfolios of Investments (unaudited) | June 30, 2018 |
Significant unobservable inputs developed by the Valuation Committee (“Valuation Committee”) for Level 3 investments held at period end are as follows:
| | | Fair Value at | | | Valuation | | Unobservable | | Range (Weighted |
| | | 06/30/18 | | | Technique(s) | | Input | | Average) |
| Holmes Macro Trends Fund | | | | | | | | | | |
| Investments in Securities | | | | | | | | | | 10% - 100% discount |
| Common Stocks | | | 322,118 | | | Market Transaction(1) | | Discount | | (48% discount) |
| Corporate Non-Convertible Bond | | | 233,829 | | | Market Transaction(1) | | Discount | | 0% |
| | | | | | | | | | | |
| Global Resources Fund | | | | | | | | | | |
| Investments in Securities | | | | | | | | | | 0% - 100% discount |
| Common Stocks | | | 5,997,552 | | | Market Transaction(1) | | Discount | | (87% discount) |
| Corporate Non-Convertible Bonds | | | 2,805,938 | | | Market Transaction(1) | | Discount | | 0% |
| | | | | | | | | | | |
| World Precious Minerals Fund | | | | | | | | | | |
| Investments in Securities | | | | | | | | | | |
| Common Stocks | | | - | | | Market Transaction(1) | | Discount | | 100% discount |
| Special Warrants | | | - | | | Market Transaction(1) | | Discount | | 100% |
| Corporate Non-Convertible Bonds | | | 748,250 | | | Market Transaction(1) | | Discount | | 0% |
| | | | | | | | | | | |
| Gold and Precious Metals Fund | | | | | | | | | | |
| Investments in Securities | | | | | | | | | | 0%-100% discount |
| Common Stocks | | | 2,000,000 | | | Market Transaction(1) | | Discount | | (14% discount) |
| Corporate Non-Convertible Bonds | | | 280,594 | | | Market Transaction(1) | | Discount | | 0% - 100% discount
(63% discount) |
| Warrants | | | - | | | Market Transaction(1) | | Discount | | 0% |
| (1) | Market Transaction refers to most recent known market transaction, including transactions in which the fund participated, as adjusted for any discount or premium as discussed below. |
The majority of securities classified as Level 3 are private companies. The initial valuation is usually cost, which is then adjusted as determined by the Valuation Committee for subsequent known market transactions and evaluated for progress against anticipated milestones and current operations. An evaluation that the holding no longer meets expectations could result in the application of discounts and a significantly lower fair valuation. For certain securities, the last known market transaction is increased or decreased by changes in a market index or industry peers as approved by the Valuation Committee.
Affiliated Companies
The Investment Company Act of 1940 defines affiliates as companies in which the Fund owns at least 5% of the outstanding voting securities. The following is a summary of transactions with each affiliated company during the period ended June 30, 2018.
| Notes to Portfolios of Investments (unaudited) | June 30, 2018 |
| | | | | Shares of Affiliated Companies | | | | |
| Global Resources Fund | December 31,
2017 | | | Additions | | | Reductions | | | June 30, 2018 | |
| Atlas African Industries, Ltd. | 255,854,621 | | | | — | | | | — | | | | 255,854,621 | |
| Bravern Ventures, Ltd. | 254,431 | | | | — | | | | 254,431 | | | | — | (a) |
| Caribbean Resources Corp. | 17 | | | | — | | | | — | | | | 17 | |
| Libero Copper Corp. | — | | | | 3,250,000 | | | | — | | | | 3,250,000 | |
| Pacific Green Energy Corp. | 2,400,000 | | | | — | | | | — | | | | 2,400,000 | |
At June 30, 2018, the value of investments in affiliated companies was $228,673, representing 0.27% of net assets, and the total cost was $32,079,136. Net realized loss on transactions was $(2,935,628) and there was no income earned for the period.
| | | | | Shares of Affiliated Companies | | | | |
| World Precious Minerals Fund | December 31,
2017 | | | Additions | | | Reductions | | | June 30, 2018 | |
| Argo Gold, Inc. | 1,825,000 | | | | 517,500 | | | | — | | | | 2,342,500 | |
| Barksdale Capital Corp | — | | | | 2,233,000 | | | | — | | | | 2,233,000 | |
| Barsele Minerals Corp. | 7,871,299 | | | | 603,701 | | | | (1,225,000 | ) | | | 7,250,000 | |
| Barsele Minerals Corp., Warrants | 600,000 | | | | — | | | | (600,000 | ) | | | — | (a) |
| Bluebird Battery Metals, Inc. (formerly Golden Peak Minerals, Inc.) | 2,299,998 | | | | — | | | | (306,498 | ) | | | 1,993,500 | (a) |
| Chakana Copper Corp. | — | | | | 4,525,000 | | | | — | | | | 4,525,000 | |
| CopperBank Resources Corp. | 15,979,418 | | | | — | | | | — | | | | 15,979,418 | |
| Dolly Varden Silver Corp. | 8,000,000 | | | | — | | | | — | | | | 8,000,000 | |
| Mammoth Resources Corp. | 2,171,200 | | | | — | | | | — | | | | 2,171,200 | |
| Toachi Mining, Inc. | 6,000,000 | | | | — | | | | — | | | | 6,000,000 | |
| TriStar Gold, Inc. | 27,110,500 | | | | — | | | | — | | | | 27,110,500 | |
| TriStar Gold, Inc., Warrants | 1,000,000 | | | | — | | | | — | | | | 1,000,000 | |
| VR Resources, Ltd. | 1,750,000 | | | | 1,200,000 | | | | — | | | | 2,950,000 | |
| VR Resources, Ltd. Warrants | 862,500 | | | | — | | | | — | | | | 862,500 | |
At June 30, 2018, the value of investments in affiliated companies was $16,725,078, representing 17.05% of net assets, and the total cost was $17,813,882. Net realized gain on transactions was $93,887 and there was no income earned for the period.
| | | | | Shares of Affiliated Companies | | | | |
| Gold And Precious Metals Fund | December 31,
2017 | | | Additions | | | Reductions | | | June 30, 2018 | |
| Mene, Inc. | 5,714,285 | | | | — | | | | — | | | | 5,714,285 | |
| Mene, Inc., Warrants | — | | | | 5,714,285 | | | | — | | | | 5,714,285 | |
At June 30, 2018, the value of investments in affiliated companies was $2,000,000, representing 2.19% of net assets, and the total cost was $2,000,000. There was no realized gain (loss) on transactions and no income earned for the period.
| (a) | At June 30, 2018, the company was no longer defined as an affiliate, although it was an affiliated company during the year. |
Restricted Securities
The following securities are subject to contractual and regulatory restrictions on resale or transfer. These investments may involve a high degree of business and financial risk. Because of the thinly traded markets for these investments, a Fund may be unable to liquidate its
| Notes to Portfolios of Investments (unaudited) | June 30, 2018 |
securities in a timely manner, especially if there is negative news regarding the specific securities or the markets overall. These securities could decline significantly in value before the Fund could liquidate these securities. The issuer bears the cost of registration, if any, involved in the disposition of these securities.
| | | Acquisition | | Cost per | |
| Holmes Macro Trends Fund | | Date | | Share/Unit | |
| Interamerican Energy Corp., Corporate Note (November 2021) | | 05/25/12 | | $ | 100.00 | |
| Pacific Infrastructure Ventures, Inc. | | 08/06/10-11/22/10 | | $ | 1.00 | |
As of June 30, 2018, the total cost of restricted securities was $660,454, and the total value was $555,947, representing 1.41% of net assets.
| | | Acquisition | | Cost per | |
| Global Resources Fund | | Date | | Share/Unit | |
| Abaxx Technologies, Inc., 144A | | 03/23/18 | | $ | 0.31 | |
| Interamerican Energy Corp., Corporate Note (November 2021) | | 05/25/12 | | $ | 100.00 | |
| I-Pulse, Inc., 144A | | 10/04/07 | | $ | 1.88 | |
| Pacific Infrastructure Ventures, Inc. | | 08/06/10-11/22/10 | | $ | 1.00 | |
| PentaNova Energy Corp. | | 08/30/17 | | $ | 0.08 | |
As of June 30, 2018, the total cost of restricted securities was $10,727,374, and the total value was $8,846,163, representing 10.43% of net assets.
| | | Acquisition | | | Cost per | |
| World Precious Minerals Fund | | Date | | | Share/Unit | |
| Interamerican Energy Corp., Corporate Note (November 2021) | | | 05/25/12 | | | $ | 100.00 | |
As of June 30, 2018, the total cost of restricted securities was $748,250, and the total value was $748,250, representing 0.76% of net assets.
| | | Acquisition | | | Cost per | |
| Gold and Precious Metals Fund | | Date | | | Share/Unit | |
| Hut 8 Mining Corp. | | | 12/20/17 | | | $ | 1.94 | |
| Interamerican Energy Corp., Corporate Note (November 2021) | | | 05/25/12 | | | $ | 100.00 | |
As of June 30, 2018, the total cost of restricted securities was $373,642, and the total value was $385,419, representing 0.42% of net assets.
| Statements of Assets and Liabilities (Unaudited) |
| | | U.S. Government Securities | |
| | | Ultra-Short Bond Fund | |
| Investments, at identified cost | | $ | 44,248,443 | |
| | | | | |
| Assets | | | | |
| Investments, at value: | | | | |
| Securities of unaffiliated issuers | | $ | 44,183,639 | |
| Cash | | | 3,714,705 | |
| Receivables: | | | | |
| Dividends and interest | | | 104,170 | |
| Capital shares sold | | | 3,343 | |
| From adviser | | | 1,405 | |
| Prepaid expenses | | | 16,877 | |
| Total Assets | | | 48,024,139 | |
| | | | | |
| Liabilities | | | | |
| Payables: | | | | |
| Capital shares redeemed | | | 1,000 | |
| Distributions payable | | | 5,395 | |
| Accrued expenses and other payables: | | | | |
| Adviser | | | – | |
| Administration and Transfer Agent fees | | | 9,588 | |
| Trustees | | | 36 | |
| Other expenses | | | 11,522 | |
| Total Liabilities | | | 27,541 | |
| | | | | |
| Net Assets | | $ | 47,996,598 | |
| | | | | |
| Net Assets Consist of: | | | | |
| Paid-in capital | | $ | 48,060,517 | |
| Accumulated undistributed (distributions in excess of) net investment income | | | 1,543 | |
| Accumulated net realized gain (loss) from investment transactions and other assets and liabilities denominated in foreign currencies | | | (658 | ) |
| Net unrealized appreciation (depreciation) of investments and other assets and liabilities denominated in foreign currencies | | | (64,804 | ) |
| Net assets applicable to capital shares outstanding | | $ | 47,996,598 | |
| By share class | | | | |
| Net Assets | | | | |
| Investor Class | | $ | 47,996,598 | |
| Capital shares outstanding, an unlimited number of no par shares authorized | | | | |
| Investor Class | | | 24,057,983 | |
| Net Asset Value, Public Offering Price and Redemption Price per share | | | | |
| Investor Class | | $ | 2.00 | |
See accompanying notes to financial statements.
| Near-Term Tax Free Fund | | | All American Equity Fund | | | Holmes Macro Trends Fund | |
| $ | 53,920,096 | | | $ | 14,125,704 | | | $ | 36,115,941 | |
| | | | | | | | | | | |
| | | | | | | | | | | |
| $ | 53,625,053 | | | $ | 14,705,000 | | | $ | 37,125,603 | |
| | 4,067,155 | | | | 655,376 | | | | 2,345,110 | |
| | | | | | | | | | | |
| | 546,658 | | | | 10,149 | | | | 37,356 | |
| | 1,247 | | | | 5,764 | | | | 749 | |
| | | | | | | | | | | |
| | – | | | | – | | | | – | |
| | 22,075 | | | | 14,903 | | | | 15,114 | |
| | 58,262,188 | | | | 15,391,192 | | | | 39,523,932 | |
| | | | | | | | | | | |
| | | | | | | | | | | |
| | 9,730 | | | | 8,750 | | | | 780 | |
| | 3,489 | | | | – | | | | – | |
| | | | | | | | | | | |
| | 2,731 | | | | 3,605 | | | | 33,250 | |
| | 8,286 | | | | 5,999 | | | | 9,281 | |
| | 34 | | | | 17 | | | | 32 | |
| | 4,388 | | | | 17,495 | | | | 27,711 | |
| | 28,658 | | | | 35,866 | | | | 71,054 | |
| | | | | | | | | | | |
| $ | 58,233,530 | | | $ | 15,355,326 | | | $ | 39,452,878 | |
| | | | | | | | | | | |
| $ | 59,638,904 | | | $ | 15,024,876 | | | $ | 35,699,085 | |
| | 1,869 | | | | 63,462 | | | | (253,715 | ) |
| | | | | | | | | | | |
| | (1,112,200 | ) | | | (312,308 | ) | | | 2,997,846 | |
| | | | | | | | | | | |
| | (295,043 | ) | | | 579,296 | | | | 1,009,662 | |
| $ | 58,233,530 | | | $ | 15,355,326 | | | $ | 39,452,878 | |
| | | | | | | | | | | |
| $ | 58,233,530 | | | $ | 15,355,326 | | | $ | 39,452,878 | |
| | | | | | | | | | | |
| | 26,527,681 | | | | 607,873 | | | | 2,020,542 | |
| | | | | | | | | | | |
| $ | 2.20 | | | $ | 25.26 | | | $ | 19.53 | |
| Statements of Assets and Liabilities (Unaudited) |
| | | Global Resources Fund | |
| Investments, at identified cost | | $ | 134,121,827 | |
| Assets | | | | |
| Investments, at value: | | | | |
| Securities of unaffiliated issuers | | $ | 78,053,684 | |
| Securities of affiliated issuers | | | 228,673 | |
| Cash | | | 5,385,718 | |
| Foreign currencies (Cost $987,930, $557,435, $7,078, $215,379 and $24,750) | | | 991,826 | |
| Receivables: | | | | |
| Dividends and interest | | | 220,525 | |
| Capital shares sold | | | 5,624 | |
| Investments sold | | | – | |
| Prepaid expenses | | | 33,432 | |
| Total Assets | | | 84,919,482 | |
| | | | | |
| Liabilities | | | | |
| Payables: | | | | |
| Capital shares redeemed | | | 4,385 | |
| Investments purchased | | | 39,205 | |
| Foreign capital gains tax payable | | | – | |
| Accrued expenses and other payables: | | | | |
| Adviser | | | 25,962 | |
| Administration and Transfer Agent fees | | | 15,940 | |
| Trustees | | | 52 | |
| Other expenses | | | 42,754 | |
| Total Liabilities | | | 128,298 | |
| | | | | |
| Net Assets | | $ | 84,791,184 | |
| | | | | |
| Net Assets Consist of: | | | | |
| Paid-in capital | | $ | 349,916,085 | |
| Accumulated undistributed (distributions in excess of) net investment income | | | 2,065,464 | |
| Accumulated net realized loss from investment transactions and other assets and liabilities denominated in foreign currencies | | | (211,370,556 | ) |
| Net unrealized appreciation (depreciation) of investments and other assets and liabilities denominated in foreign currencies | | | (55,819,809 | ) |
| Net assets applicable to capital shares outstanding | | $ | 84,791,184 | |
| By share class | | | | |
| Net Assets | | | | |
| Investor Class | | $ | 84,339,453 | |
| Institutional Class | | $ | 451,731 | |
| Capital shares outstanding, an unlimited number of no par shares authorized | | | | |
| Investor Class | | | 14,625,201 | |
| Institutional Class | | | 77,215 | |
| Net Asset Value, Public Offering Price and Redemption Price per share | | | | |
| Investor Class | | $ | 5.77 | |
| Institutional Class | | $ | 5.85 | |
See accompanying notes to financial statements.
| World Precious | | | Gold and Precious | | | | | | | |
| Minerals Fund | | | Metals Fund | | | Emerging Europe Fund | | | China Region Fund | |
| $ | 142,239,033 | | | $ | 74,418,223 | | | $ | 37,354,119 | | | $ | 14,355,778 | |
| | | | | | | | | | | | | | | |
| | | | | | | | | | | | | | | |
| $ | 78,095,919 | | | $ | 84,065,055 | | | $ | 37,237,054 | | | $ | 20,141,161 | |
| | 16,725,078 | | | | 2,000,000 | | | | – | | | | – | |
| | 2,996,994 | | | | 5,718,624 | | | | 582,048 | | | | 340,851 | |
| | 557,435 | | | | 8,371 | | | | 210,228 | | | | 24,724 | |
| | | | | | | | | | | | | | | |
| | 12,436 | | | | 21,691 | | | | 368,891 | | | | 234,178 | |
| | 126,605 | | | | 371,180 | | | | 42,753 | | | | 18,634 | |
| | 300,673 | | | | 155,053 | | | | 447,247 | | | | 887,020 | |
| | 34,717 | | | | 18,911 | | | | 20,112 | | | | 15,262 | |
| | 98,849,857 | | | | 92,358,885 | | | | 38,908,333 | | | | 21,661,830 | |
| | | | | | | | | | | | | | | |
| | | | | | | | | | | | | | | |
| | 81,878 | | | | 176,781 | | | | 38,476 | | | | 10,599 | |
| | 573,136 | | | | 521,424 | | | | 82,420 | | | | – | |
| | – | | | | – | | | | 3,318 | | | | – | |
| | | | | | | | | | | | | | | |
| | 29,996 | | | | 106,450 | | | | 40,433 | | | | 27,763 | |
| | 21,288 | | | | 19,901 | | | | 7,431 | | | | 4,789 | |
| | 85 | | | | 64 | | | | 22 | | | | 6 | |
| | 54,864 | | | | 47,949 | | | | 32,229 | | | | 25,444 | |
| | 761,247 | | | | 872,569 | | | | 204,329 | | | | 68,601 | |
| | | | | | | | | | | | | | | |
| $ | 98,088,610 | | | $ | 91,486,316 | | | $ | 38,704,004 | | | $ | 21,593,229 | |
| | | | | | | | | | | | | | | |
| $ | 457,874,819 | | | $ | 179,568,624 | | | $ | 73,862,665 | | | $ | 17,327,001 | |
| | (11,833,659 | ) | | | (4,699,017 | ) | | | 276,691 | | | | 187,830 | |
| | | | | | | | | | | | | | | |
| | (300,534,938 | ) | | | (95,031,258 | ) | | | (35,301,007 | ) | | | (1,706,839 | ) |
| | | | | | | | | | | | | | | |
| | (47,417,612 | ) | | | 11,647,967 | | | | (134,345 | ) | | | 5,785,237 | |
| $ | 98,088,610 | | | $ | 91,486,316 | | | $ | 38,704,004 | | | $ | 21,593,229 | |
| | | | | | | | | | | | | | | |
| $ | 95,842,159 | | | $ | 91,486,316 | | | $ | 38,704,004 | | | $ | 21,593,229 | |
| $ | 2,246,451 | | | $ | – | | | $ | – | | | $ | – | |
| | | | | | | | | | | | | | | |
| | 25,214,283 | | | | 11,973,722 | | | | 5,718,146 | | | | 2,016,932 | |
| | 586,134 | | | | – | | | | – | | | | – | |
| | | | | | | | | | | | | | | |
| $ | 3.80 | | | $ | 7.64 | | | $ | 6.77 | | | $ | 10.71 | |
| $ | 3.83 | | | $ | – | | | $ | – | | | $ | – | |
| Statements of Operations (unaudited) |
| | | U.S. Government | |
| | | Securities Ultra-Short | |
| | | Bond Fund | |
| Net Investment Income | | | | |
| | | | | |
| Income | | | | |
| Dividends from unaffiliated issuers | | $ | – | |
| Net dividends | | | – | |
| Interest and other | | | 350,708 | |
| Total income | | | 350,708 | |
| | | | | |
| Expenses: | | | | |
| Management fee | | | 120,442 | |
| Administrative services fee | | | 43,811 | |
| Distribution plan fee | | | – | |
| Transfer agent fees and expenses | | | 19,093 | |
| Professional fees | | | 12,541 | |
| Custodian fees | | | 2,646 | |
| Shareholder reporting expenses | | | 4,066 | |
| Registration fees | | | 11,063 | |
| Trustee fees and expenses | | | 2,885 | |
| Chief compliance officer fees | | | 2,449 | |
| Miscellaneous expenses | | | 14,536 | |
| Total expenses before reductions | | | 233,532 | |
| Expenses offset - Note 1 H | | | – | |
| Expenses reimbursed - Note 3 | | | (125,135 | ) |
| Net expenses | | | 108,397 | |
| | | | | |
| Net Investment Income (Loss) | | | 242,311 | |
| | | | | |
| Net Realized and Unrealized Gain (Loss) on Investments | | | | |
| Realized gain (loss) from: | | | | |
| Securities from unaffiliated issuers | | | – | |
| Foreign currency transactions | | | – | |
| Written options | | | – | |
| Net realized gain (loss) | | | – | |
| Net change in unrealized depreciation of: | | | | |
| Investments in unaffiliated issuers | | | (3,025 | ) |
| Net change in unrealized depreciation | | | (3,025 | ) |
| | | | | |
| Net Realized and Unrealized Gain (Loss) on Investments | | | (3,025 | ) |
| | | | | |
| Net Increase (Decrease) In Net Assets Resulting From Operations | | $ | 239,286 | |
See accompanying notes to financial statements.
| For the Six Months Ended June 30, 2018 |
| Near-Term Tax Free Fund | | | All American Equity Fund | | | Holmes Macro Trends Fund | |
| | | | | | | | |
| $ | – | | | $ | 135,359 | | | $ | 242,032 | |
| | – | | | | 135,359 | | | | 242,032 | |
| | 516,682 | | | | – | | | | 25,990 | |
| | 516,682 | | | | 135,359 | | | | 268,022 | |
| | | | | | | | | | | |
| | 157,809 | | | | 42,790 | | | | 202,311 | |
| | 53,194 | | | | 26,523 | | | | 44,824 | |
| | – | | | | 19,671 | | | | 50,577 | |
| | 9,998 | | | | 10,877 | | | | 13,871 | |
| | 13,233 | | | | 10,286 | | | | 12,203 | |
| | 7,457 | | | | 7,249 | | | | 5,767 | |
| | 4,097 | | | | 3,923 | | | | 4,083 | |
| | 11,362 | | | | 10,565 | | | | 11,173 | |
| | 3,341 | | | | 1,879 | | | | 2,632 | |
| | 3,232 | | | | 800 | | | | 2,046 | |
| | 40,049 | | | | 9,204 | | | | 17,308 | |
| | 303,772 | | | | 143,767 | | | | 366,795 | |
| | (20,420 | ) | | | (7,612 | ) | | | (7,848 | ) |
| | (141,324 | ) | | | – | | | | – | |
| | 142,028 | | | | 136,155 | | | | 358,947 | |
| | | | | | | | | | | |
| | 374,654 | | | | (796 | ) | | | (90,925 | ) |
| | | | | | | | | | | |
| | (232,153 | ) | | | 283,569 | | | | 3,143,146 | |
| | – | | | | – | | | | 85 | |
| | – | | | | 4,760 | | | | 46,227 | |
| | (232,153 | ) | | | 288,329 | | | | 3,189,458 | |
| | | | | | | | | | | |
| | (114,449 | ) | | | (60,592 | ) | | | (3,072,104 | ) |
| | (114,449 | ) | | | (60,592 | ) | | | (3,072,104 | ) |
| | | | | | | | | | | |
| | (346,602 | ) | | | 227,737 | | | | 117,354 | |
| $ | 28,052 | | | $ | 226,941 | | | $ | 26,429 | |
| Statements of Operations (unaudited) |
| | | Global Resources Fund | |
| Net Investment Income | | | | |
| | | | | |
| Income | | | | |
| Dividends from unaffiliated issuers | | $ | 1,343,939 | |
| Foreign tax withheld on dividends | | | (166,508 | ) |
| Net dividends | | | 1,177,431 | |
| Interest and other | | | 412,404 | |
| Total income | | | 1,589,835 | |
| | | | | |
| Expenses: | | | | |
| Management fee | | | 340,692 | |
| Administrative services fee | | | 62,126 | |
| Administrative services fee - Investor Class | | | 22,978 | |
| Administrative services fee - Institutional Class | | | 97 | |
| Distribution plan fee | | | 114,806 | |
| Transfer agent fees and expenses | | | – | |
| Transfer agent fees and expenses - Investor Class | | | 30,370 | |
| Transfer agent fees and expenses - Institutional Class | | | 7,960 | |
| Professional fees | | | 18,384 | |
| Custodian fees | | | 27,323 | |
| Shareholder reporting expenses | | | – | |
| Shareholder reporting expenses - Investor Class | | | 5,028 | |
| Shareholder reporting expenses - Institutional Class | | | 24 | |
| Registration fees | | | – | |
| Registration fees - Investor | | | 14,185 | |
| Registration fees - Institutional | | | 7,254 | |
| Trustee fees and expenses | | | 4,244 | |
| Chief compliance officer fees | | | 4,688 | |
| Miscellaneous expenses | | | 82,015 | |
| Total expenses before reductions | | | 742,174 | |
| Expenses offset - Note 1 H | | | (17,499 | ) |
| Expenses reimbursed - Note 3 | | | (16,706 | ) |
| Net expenses | | | 707,969 | |
| | | | | |
| Net Investment Income (Loss) | | | 881,866 | |
| | | | | |
| Net Realized and Unrealized Gain (Loss) on Investments | | | | |
| Realized gain (loss) from: | | | | |
| Securities from unaffiliated issuers | | | (2,402,038 | ) |
| Securities from affiliated issuers | | | (2,935,628 | ) |
| Foreign currency transactions | | | (55,897 | ) |
| Foreign capital gains taxes | | | – | |
| Net realized gain (loss) | | | (5,393,563 | ) |
| Net change in unrealized appreciation (depreciation) of: | | | | |
| Investments in unaffiliated issuers | | | (3,311,492 | ) |
| Investments in affiliated issuers | | | 2,950,677 | |
| Other assets and liabilities denominated in foreign currencies | | | 6,476 | |
| Deferred foreign capital gains taxes | | | – | |
| Net change in unrealized depreciation | | | (354,339 | ) |
| | | | | |
| Net Realized and Unrealized Gain (Loss) on Investments | | | (5,747,902 | ) |
| | | | | |
| Net Increase (Decrease) In Net Assets Resulting From Operations | | $ | (4,866,036 | ) |
See accompanying notes to financial statements.
| For the Six Months Ended June 30, 2018 |
| World Precious | | | Gold and Precious | | | | | | | |
| Minerals Fund | | | Metals Fund | | | Emerging Europe Fund | | | China Region Fund | |
| | | | | | | | | | | |
| $ | 206,465 | | | $ | 285,203 | | | $ | 1,118,442 | | | $ | 549,561 | |
| | (1,821 | ) | | | (66,600 | ) | | | (142,592 | ) | | | (20,703 | ) |
| | 204,644 | | | | 218,603 | | | | 975,850 | | | | 528,858 | |
| | 83,031 | | | | 59,705 | | | | – | | | | – | |
| | 287,675 | | | | 278,308 | | | | 975,850 | | | | 528,858 | |
| | | | | | | | | | | | | | | |
| | 377,597 | | | | 424,070 | | | | 275,288 | | | | 187,660 | |
| | 67,887 | | | | 81,317 | | | | 50,567 | | | | 38,706 | |
| | 25,959 | | | | – | | | | – | | | | – | |
| | 522 | | | | – | | | | – | | | | – | |
| | 129,794 | | | | 112,362 | | | | 55,057 | | | | 33,201 | |
| | – | | | | 41,256 | | | | 11,230 | | | | 10,457 | |
| | 42,914 | | | | – | | | | – | | | | – | |
| | 7,254 | | | | – | | | | – | | | | – | |
| | 18,276 | | | | 16,675 | | | | 17,795 | | | | 17,247 | |
| | 28,482 | | | | 13,250 | | | | 37,700 | | | | 6,112 | |
| | – | | | | 5,366 | | | | 4,127 | | | | 3,710 | |
| | 5,784 | | | | – | | | | – | | | | – | |
| | 75 | | | | – | | | | – | | | | – | |
| | – | | | | 12,298 | | | | 11,016 | | | | 11,755 | |
| | 15,049 | | | | – | | | | – | | | | – | |
| | 7,417 | | | | – | | | | – | | | | – | |
| | 4,726 | | | | 4,143 | | | | 2,751 | | | | 2,205 | |
| | 5,477 | | | | 4,577 | | | | 2,249 | | | | 1,345 | |
| | 78,886 | | | | 63,731 | | | | 54,118 | | | | 33,428 | |
| | 816,099 | | | | 779,045 | | | | 521,898 | | | | 345,826 | |
| | (12,970 | ) | | | (13,778 | ) | | | (7,069 | ) | | | (2,603 | ) |
| | (21,290 | ) | | | – | | | | – | | | | (2,195 | ) |
| | 781,839 | | | | 765,267 | | | | 514,829 | | | | 341,028 | |
| | | | | | | | | | | | | | | |
| | (494,164 | ) | | | (486,959 | ) | | | 461,021 | | | | 187,830 | |
| | | | | | | | | | | | | | | |
| | 727,941 | | | | 5,149,766 | | | | 2,253,996 | | | | 1,631,713 | |
| | 93,887 | | | | – | | | | – | | | | – | |
| | 1,436,336 | | | | 492,562 | | | | 559,453 | | | | (2,985 | ) |
| | – | | | | – | | | | (6,594 | ) | | | – | |
| | 2,258,164 | | | | 5,642,328 | | | | 2,806,855 | | | | 1,628,728 | |
| | | | | | | | | | | | | | | |
| | (20,416,575 | ) | | | (9,256,309 | ) | | | (6,400,177 | ) | | | (3,378,314 | ) |
| | (3,951,231 | ) | | | – | | | | – | | | | – | |
| | 291 | | | | 975 | | | | 112,020 | | | | (1,699 | ) |
| | – | | | | – | | | | 1,562 | | | | 4,591 | |
| | (24,367,515 | ) | | | (9,255,334 | ) | | | (6,286,595 | ) | | | (3,375,422 | ) |
| | | | | | | | | | | | | | | |
| | (22,109,351 | ) | | | (3,613,006 | ) | | | (3,479,740 | ) | | | (1,746,694 | ) |
| | | | | | | | | | | | | | | |
| $ | (22,603,515 | ) | | $ | (4,099,965 | ) | | $ | (3,018,719 | ) | | $ | (1,558,864 | ) |
| Statements of Changes in Net Assets |
| | | U.S. Government Securities | |
| | | Ultra-Short Bond Fund | |
| | | For the Six Months | | | Year Ended | |
| | | Ended | | | December 31, | |
| | | June 30, 2018 | | | 2017 | |
| Increase (Decrease) in Net Assets | | (Unaudited) | | | | |
| From operations: | | | | | | | | |
| Net investment income (loss) | | $ | 242,311 | | | $ | 361,363 | |
| Net realized gain (loss) | | | – | | | | (614 | ) |
| Net change in unrealized appreciation (depreciation) | | | (3,025 | ) | | | (139,355 | ) |
| Net increase in net assets from operations | | | 239,286 | | | | 221,394 | |
| | | | | | | | | |
| Distributions to shareholders | | | | | | | | |
| From net investment income | | | | | | | | |
| Investor Class | | | (239,655 | ) | | | (362,476 | ) |
| Total distributions to shareholders | | | (239,655 | ) | | | (362,476 | ) |
| | | | | | | | | |
| From capital share transactions: | | | | | | | | |
| Proceeds from shares sold | | | | | | | | |
| Investor Class | | | 4,239,093 | | | | 12,743,407 | |
| Distributions reinvested | | | | | | | | |
| Investor Class | | | 204,719 | | | | 313,298 | |
| | | | 4,443,812 | | | | 13,056,705 | |
| Cost of shares redeemed | | | | | | | | |
| Investor Class | | | (5,873,586 | ) | | | (20,282,493 | ) |
| | | | | | | | | |
| Net decrease in net assets from capital share transactions | | | (1,429,774 | ) | | | (7,225,788 | ) |
| | | | | | | | | |
| Net Decrease in Net Assets | | | (1,430,143 | ) | | | (7,366,870 | ) |
| | | | | | | | | |
| Net Assets | | | | | | | | |
| Beginning of period | | | 49,426,741 | | | | 56,793,611 | |
| End of period | | $ | 47,996,598 | | | $ | 49,426,741 | |
| | | | | | | | | |
| Accumulated undistributed net investment income (distributions in excess of net investment income), end of period | | $ | 1,543 | | | $ | (1,113 | ) |
| | | | | | | | | |
| Capital Share Activity | | | | | | | | |
| Investor Class | | | | | | | | |
| Shares sold | | | 2,125,159 | | | | 6,371,703 | |
| Shares reinvested | | | 102,803 | | | | 156,649 | |
| Shares redeemed | | | (2,945,152 | ) | | | (10,141,246 | ) |
| Net capital share activity | | | (717,190 | ) | | | (3,612,894 | ) |
See accompanying notes to financial statements.
| Near-Term Tax Free Fund | | | All American Equity Fund | |
| For the Six Months | | | Year Ended | | | For the Six Months | | | Year Ended | |
| Ended | | | December 31, | | | Ended | | | December 31, | |
| June 30, 2018 | | | 2017 | | | June 30, 2018 | | | 2017 | |
| (Unaudited) | | | | | | (Unaudited) | | | | |
| | | | | | | | | | | |
| $ | 374,654 | | | $ | 972,881 | | | $ | (796 | ) | | $ | 64,257 | |
| | (232,153 | ) | | | (235,301 | ) | | | 288,329 | | | | 394,644 | |
| | (114,449 | ) | | | 414,855 | | | | (60,592 | ) | | | 477,781 | |
| | 28,052 | | | | 1,152,435 | | | | 226,941 | | | | 936,682 | |
| | | | | | | | | | | | | | | |
| | | | | | | | | | | | | | | |
| | (369,356 | ) | | | (977,375 | ) | | | – | | | | (11,077 | ) |
| | (369,356 | ) | | | (977,375 | ) | | | – | | | | (11,077 | ) |
| | | | | | | | | | | | | | | |
| | | | | | | | | | | | | | | |
| | 6,108,164 | | | | 21,459,051 | | | | 2,395,120 | | | | 2,362,418 | |
| | | | | | | | | | | | | | | |
| | 343,850 | | | | 895,633 | | | | – | | | | 10,314 | |
| | 6,452,014 | | | | 22,354,684 | | | | 2,395,120 | | | | 2,372,732 | |
| | | | | | | | | | | | | | | |
| | (16,996,917 | ) | | | (48,710,575 | ) | | | (3,198,648 | ) | | | (4,716,185 | ) |
| | | | | | | | | | | | | | | |
| | (10,544,903 | ) | | | (26,355,891 | ) | | | (803,528 | ) | | | (2,343,453 | ) |
| | (10,886,207 | ) | | | (26,180,831 | ) | | | (576,587 | ) | | | (1,417,848 | ) |
| | | | | | | | | | | | | | | |
| | 69,119,737 | | | | 95,300,568 | | | | 15,931,913 | | | | 17,349,761 | |
| $ | 58,233,530 | | | $ | 69,119,737 | | | $ | 15,355,326 | | | $ | 15,931,913 | |
| | | | | | | | | | | | | | | |
| $ | 1,869 | | | $ | (3,429 | ) | | $ | 63,462 | | | $ | 76,995 | |
| | | | | | | | | | | | | | | |
| | | | | | | | | | | | | | | |
| | 2,775,989 | | | | 9,658,012 | | | | 94,871 | | | | 97,117 | |
| | 156,638 | | | | 403,359 | | | | – | | | | 415 | |
| | (7,733,140 | ) | | | (21,934,446 | ) | | | (126,724 | ) | | | (195,073 | ) |
| | (4,800,513 | ) | | | (11,873,075 | ) | | | (31,853 | ) | | | (97,541 | ) |
| Statements of Changes in Net Assets |
| | | Holmes Macro Trends Fund | |
| | | For the Six Months | | | Year Ended | |
| | | Ended | | | December 31, | |
| | | June 30, 2018 | | | 2017 | |
| Increase (Decrease) in Net Assets | | (Unaudited) | | | | |
| From operations: | | | | | | | | |
| Net investment income (loss) | | $ | (90,925 | ) | | $ | (162,790 | ) |
| Net realized gain (loss) | | | 3,189,458 | | | | 4,093,856 | |
| Net change in unrealized appreciation (depreciation) | | | (3,072,104 | ) | | | 3,047,423 | |
| Net increase (decrease) in net assets from operations | | | 26,429 | | | | 6,978,489 | |
| | | | | | | | | |
| Distributions to shareholders | | | | | | | | |
| From net investment income | | | | | | | | |
| Investor Class | | | – | | | | – | |
| Institutional Class | | | – | | | | – | |
| From net realized gains | | | | | | | | |
| Investor Class | | | – | | | | (5,106,810 | ) |
| Total distributions to shareholders | | | – | | | | (5,106,810 | ) |
| | | | | | | | | |
| From capital share transactions: | | | | | | | | |
| Proceeds from shares sold | | | | | | | | |
| Investor Class | | | 835,166 | | | | 4,012,800 | |
| Institutional Class | | | – | | | | – | |
| Distributions reinvested | | | | | | | | |
| Investor Class | | | – | | | | 4,818,939 | |
| Institutional Class | | | – | | | | – | |
| Proceeds from short-term trading fees | | | | | | | | |
| Investor Class | | | – | | | | 3 | |
| Institutional Class | | | – | | | | – | |
| | | | 835,166 | | | | 8,831,742 | |
| Cost of shares redeemed | | | | | | | | |
| Investor Class | | | (3,005,978 | ) | | | (9,812,182 | ) |
| Institutional Class | | | – | | | | – | |
| Net increase (decrease) in net assets from capital share transactions | | | (2,170,812 | ) | | | (980,440 | ) |
| Net Increase (Decrease) in Net Assets | | | (2,144,383 | ) | | | 891,239 | |
| | | | | | | | | |
| Net Assets | | | | | | | | |
| Beginning of period | | | 41,597,261 | | | | 40,706,022 | |
| | | | | | | | | |
| End of period | | $ | 39,452,878 | | | $ | 41,597,261 | |
| | | | | | | | | |
| Accumulated undistributed net investment income (distributions in excess of net investment income), end of period | | $ | (253,715 | ) | | $ | – | |
| | | | | | | | | |
| Capital Share Activity | | | | | | | | |
| Investor Class | | | | | | | | |
| Shares sold | | | 42,887 | | | | 201,917 | |
| Shares reinvested | | | – | | | | 246,745 | |
| Shares redeemed | | | (153,289 | ) | | | (499,768 | ) |
| Net capital share activity | | | (110,402 | ) | | | (51,106 | ) |
| Institutional Class | | | | | | | | |
| Shares sold | | | – | | | | – | |
| Shares reinvested | | | – | | | | – | |
| Shares redeemed | | | – | | | | – | |
| Net capital share activity | | | – | | | | – | |
See accompanying notes to financial statements.
| Global Resources Fund | | | World Precious Minerals Fund | |
| For the Six Months | | | Year Ended | | | For the Six Months | | | Year Ended | |
| Ended | | | December 31, | | | Ended | | | December 31, | |
| June 30, 2018 | | | 2017 | | | June 30, 2018 | | | 2017 | |
| (Unaudited) | | | | | | (Unaudited) | | | | |
| | | | | | | | | | | | | | | |
| $ | 881,866 | | | $ | 1,854,022 | | | $ | (494,164 | ) | | $ | (2,058,341 | ) |
| | (5,393,563 | ) | | | 3,787,922 | | | | 2,258,164 | | | | 11,713,452 | |
| | (354,339 | ) | | | 11,184,375 | | | | (24,367,515 | ) | | | (15,377,492 | ) |
| | (4,866,036 | ) | | | 16,826,319 | | | | (22,603,515 | ) | | | (5,722,381 | ) |
| | | | | | | | | | | | | | | |
| | | | | | | | | | | | | | | |
| | – | | | | (2,820,970 | ) | | | – | | | | (25,786,058 | ) |
| | – | | | | (17,624 | ) | | | – | | | | (706,446 | ) |
| | – | | | | – | | | | – | | | | – | |
| | – | | | | (2,838,594 | ) | | | – | | | | (26,492,504 | ) |
| | | | | | | | | | | | | | | |
| | | | | | | | | | | | | | | |
| | 5,334,213 | | | | 3,820,335 | | | | 21,549,373 | | | | 43,215,850 | |
| | 19,368 | | | | 1,393,643 | | | | 118,617 | | | | 1,164,153 | |
| | – | | | | 2,710,005 | | | | – | | | | 24,321,600 | |
| | – | | | | 16,716 | | | | – | | | | 685,819 | |
| | – | | | | 54 | | | | – | | | | 482 | |
| | – | | | | – | | | | – | | | | 3 | |
| | 5,353,581 | | | | 7,940,753 | | | | 21,667,990 | | | | 69,387,907 | |
| | | | | | | | | | | | | | | |
| | (11,895,687 | ) | | | (21,753,696 | ) | | | (18,403,893 | ) | | | (58,534,541 | ) |
| | (65,389 | ) | | | (1,935,931 | ) | | | (344,874 | ) | | | (2,024,363 | ) |
| | | | | | | | | | | | | | | |
| | (6,607,495 | ) | | | (15,748,874 | ) | | | 2,919,223 | | | | 8,829,003 | |
| | (11,473,531 | ) | | | (1,761,149 | ) | | | (19,684,292 | ) | | | (23,385,882 | ) |
| | | | | | | | | | | | | | | |
| | 96,264,715 | | | | 98,025,864 | | | | 117,772,902 | | | | 141,158,784 | |
| $ | 84,791,184 | | | $ | 96,264,715 | | | $ | 98,088,610 | | | $ | 117,772,902 | |
| | | | | | | | | | | | | | | |
| $ | 2,065,464 | | | $ | 1,183,598 | | | $ | (11,833,659 | ) | | $ | (11,339,495 | ) |
| | | | | | | | | | | | | | | |
| | | | | | | | | | | | | | | |
| | 864,152 | | | | 670,921 | | | | 5,017,441 | | | | 6,640,756 | |
| | – | | | | 454,695 | | | | (261 | ) | | | 5,404,357 | |
| | (1,964,935 | ) | | | (3,870,155 | ) | | | (4,274,553 | ) | | | (9,187,898 | ) |
| | (1,100,783 | ) | | | (2,744,539 | ) | | | 742,627 | | | | 2,857,215 | |
| | | | | | | | | | | | | | | |
| | 3,160 | | | | 249,133 | | | | 26,378 | | | | 174,505 | |
| | – | | | | 2,786 | | | | – | | | | 151,730 | |
| | (10,483 | ) | | | (361,840 | ) | | | (78,729 | ) | | | (286,385 | ) |
| | (7,323 | ) | | | (109,921 | ) | | | (52,351 | ) | | | 39,850 | |
| Statements of Changes in Net Assets |
| | | Gold and Precious Metals Fund | |
| | | For the Six Months | | | Year Ended | |
| | | Ended | | | December 31, | |
| | | June 30, 2018 | | | 2017 | |
| Increase (Decrease) in Net Assets | | (Unaudited) | | | | |
| From operations: | | | | | | | | |
| Net investment income (loss) | | $ | (486,959 | ) | | $ | (856,026 | ) |
| Net realized gain | | | 5,642,328 | | | | 5,126,757 | |
| Net change in unrealized appreciation (depreciation) | | | (9,255,334 | ) | | | 6,800,473 | |
| Net increase (decrease) in net assets from operations | | | (4,099,965 | ) | | | 11,071,204 | |
| | | | | | | | | |
| Distributions to shareholders | | | | | | | | |
| From net investment income | | | | | | | | |
| Investor Class | | | – | | | | – | |
| Total distributions to shareholders | | | – | | | | – | |
| | | | | | | | | |
| From capital share transactions: | | | | | | | | |
| Proceeds from shares sold | | | | | | | | |
| Investor Class | | | 13,744,507 | | | | 49,647,272 | |
| Distributions reinvested | | | | | | | | |
| Investor Class | | | – | | | | – | |
| Proceeds from short-term trading fees | | | | | | | | |
| Investor Class | | | – | | | | 465 | |
| | | | 13,744,507 | | | | 49,647,737 | |
| Cost of shares redeemed | | | | | | | | |
| Investor Class | | | (18,898,035 | ) | | | (53,967,222 | ) |
| Net increase (decrease) in net assets from capital share transactions | | | (5,153,528 | ) | | | (4,319,485 | ) |
| | | | | | | | | |
| Net Increase (Decrease) in Net Assets | | | (9,253,493 | ) | | | 6,751,719 | |
| | | | | | | | | |
| Net Assets | | | | | | | | |
| Beginning of period | | | 100,739,809 | | | | 93,988,090 | |
| | | | | | | | | |
| End of period | | $ | 91,486,316 | | | $ | 100,739,809 | |
| | | | | | | | | |
| Accumulated undistributed net investment income (distributions in excess of net investment income), end of period | | $ | (4,699,017 | ) | | $ | (4,212,058 | ) |
| | | | | | | | | |
| Capital Share Activity | | | | | | | | |
| Investor Class | | | | | | | | |
| Shares sold | | | 1,833,968 | | | | 6,404,488 | |
| Shares reinvested | | | – | | | | – | |
| Shares redeemed | | | (2,516,870 | ) | | | (7,105,060 | ) |
| Net capital share activity | | | (682,902 | ) | | | (700,572 | ) |
See accompanying notes to financial statements.
| Emerging Europe Fund | | | China Region Fund | |
| For the Six Months | | | Year Ended | | | For the Six Months | | | Year Ended | |
| Ended | | | December 31, | | | Ended | | | December 31, | |
| June 30, 2018 | | | 2017 | | | June 30, 2018 | | | 2017 | |
| (Unaudited) | | | | | | (Unaudited) | | | | |
| | | | | | | | | | | |
| $ | 461,021 | | | $ | 574,468 | | | $ | 187,830 | | | $ | (143,814 | ) |
| | 2,806,855 | | | | 3,334,426 | | | | 1,628,728 | | | | 1,585,811 | |
| | (6,286,595 | ) | | | 5,507,965 | | | | (3,375,422 | ) | | | 8,257,725 | |
| | (3,018,719 | ) | | | 9,416,859 | | | | (1,558,864 | ) | | | 9,699,722 | |
| | | | | | | | | | | | | | | |
| | | | | | | | | | | | | | | |
| | – | | | | – | | | | – | | | | (29,602 | ) |
| | – | | | | – | | | | – | | | | (29,602 | ) |
| | | | | | | | | | | | | | | |
| | | | | | | | | | | | | | | |
| | 2,148,444 | | | | 7,150,395 | | | | 2,494,116 | | | | 18,143,688 | |
| | | | | | | | | | | | | | | |
| | – | | | | – | | | | – | | | | 27,491 | |
| | | | | | | | | | | | | | | |
| | – | | | | 19 | | | | – | | | | – | |
| | 2,148,444 | | | | 7,150,414 | | | | 2,494,116 | | | | 18,171,179 | |
| | | | | | | | | | | | | | | |
| | (5,727,590 | ) | | | (13,538,508 | ) | | | (9,117,256 | ) | | | (14,575,981 | ) |
| | | | | | | | | | | | | | | |
| | (3,579,146 | ) | | | (6,388,094 | ) | | | (6,623,140 | ) | | | 3,595,198 | |
| | (6,597,865 | ) | | | 3,028,765 | | | | (8,182,004 | ) | | | 13,265,318 | |
| | | | | | | | | | | | | | | |
| | 45,301,869 | | | | 42,273,104 | | | | 29,775,233 | | | | 16,509,915 | |
| $ | 38,704,004 | | | $ | 45,301,869 | | | $ | 21,593,229 | | | $ | 29,775,233 | |
| | | | | | | | | | | | | | | |
| $ | 276,691 | | | $ | (184,330 | ) | | $ | 187,830 | | | $ | – | |
| | | | | | | | | | | | | | | |
| | | | | | | | | | | | | | | |
| | 283,080 | | | | 1,125,093 | | | | 210,007 | | | | 1,683,280 | |
| | – | | | | – | | | | – | | | | 2,429 | |
| | (779,314 | ) | | | (2,033,015 | ) | | | (776,037 | ) | | | (1,358,352 | ) |
| | (496,234 | ) | | | (907,922 | ) | | | (566,030 | ) | | | 327,357 | |
| Notes to Financial Statements (unaudited) | June 30, 2018 |
Note 1: Organization and Significant Accounting Policies
U.S. Global Investors Funds (“Trust”), consisting of the nine separate funds (“Funds”) included in this report, is organized as a Delaware statutory trust. Each Fund is an open-end management investment company registered under the Investment Company Act of 1940, as amended, and follows the specialized accounting and reporting guidance in FASB Accounting Standards Codification Topic 946. All Funds are diversified with the exception of Global Resources, World Precious Minerals, Gold and Precious Metals, Emerging Europe and China Region. A nondiversified fund may invest a greater percentage of its assets in a particular issuer in comparison to a diversified fund.
The following is a summary of significant accounting policies consistently followed by the Funds in the preparation of their financial statements. The policies are in conformity with U.S. generally accepted accounting principles.
A. Security Valuations
The Funds value investments traded on national or international securities exchanges or over-the-counter at the last sales price reported by the security’s primary exchange of its market at the time of daily valuation. Options and securities for which no sale was reported are valued at the mean between the last reported bid and asked quotation. Debt securities having 60 days or less to maturity that are expected to be valued at par at maturity may be priced by the amortized cost method if the Valuation Committee determines it would approximate market value. Municipal securities, long-term U.S. government obligations and corporate debt securities are valued by an independent pricing service using an evaluated quote based on such factors as institutional-size trading in similar groups of securities, yield, quality, maturity, coupon rate, type of issue, individual trading characteristics and other market data. For more information please see Notes to Portfolio of Investments.
B. Cash-Concentration in Uninsured Account
For cash management purposes the Funds may concentrate cash with the Funds’ custodian. This typically results in cash balances exceeding the Federal Deposit Insurance Corporation (“FDIC”) insurance limits. As of June 30, 2018, The U.S. Government Securities Ultra-Short Bond Fund, Near-Term Tax Free Fund, All American Equity Fund, Holmes Macro Trends Fund, Global Resources Fund, World Precious Minerals Fund, Gold and Precious Metals Fund, Emerging Europe Fund and China Region Fund held $3,464,705, $3,817,155, $405,376, $2,095,110, $5,135,718, $2,746,994, $5,468,624, $332,048 and $90,851, respectively, as cash reserves at Brown Brothers Harriman & Co. (BBH) that exceeded the FDIC insurance limit.
C. Fair Valued Securities
Securities for which market quotations are not readily available or which are subject to legal restrictions are valued at their fair value as determined in good faith by the Valuation Committee of U.S. Global Investors, Inc. (Adviser), under policies and procedures established by the Trust’s Board of Trustees. Fair value is the price that would be received to sell an asset or paid to transfer a liability in an orderly transaction between market participants at the measurement date. The Valuation Committee meets on a regular basis to review securities which may not have readily available market prices and considers a number of factors in determining fair value, including nature and duration of any trading restrictions, trading volume, market values of unrestricted shares of the same or similar class, investment management’s judgment regarding the market experience of the issuer,
| Notes to Financial Statements (unaudited) | June 30, 2018 |
financial status and other operational and market factors affecting the issuer, issuer’s management, quality of the underlying property based on review of independent geological studies and other relevant matters. The fair values may differ from what would have been used had a broader market for these securities existed. The Valuation Committee regularly reviews inputs and assumptions and performs transactional back-testing and disposition analysis. The Valuation Committee reports quarterly to the Trust’s Board of Trustees.
For securities traded on international exchanges, if events which may materially affect the value of a Fund’s securities occur after the close of the primary exchange and before a Fund’s net asset value is next determined, then those securities will be valued at their fair value as determined in good faith in accordance with the policies approved by the Board of Trustees. The Funds use a systematic fair value model provided by an independent third party to value international securities primarily traded on an exchange or market outside the Western Hemisphere in order to adjust for stale pricing, which may occur between the close of certain foreign exchanges and the New York Stock Exchange.
D. Security Transactions and Investment Income
Security transactions are accounted for on trade date. Realized gains and losses from security transactions are determined on an identified cost basis. Dividend income is recorded on the ex-dividend date except that certain dividends from foreign securities where the ex-dividend date may have passed are recorded as soon as the Fund has confirmed the ex-dividend date. Interest income, which may include original issue discount, is recorded on an accrual basis. Discounts and premiums on securities purchased are accreted and amortized, respectively, on a yield-to-maturity basis as adjustments to interest income. Investment income is recorded net of foreign taxes withheld where recovery of such taxes is uncertain. Investment income and realized and unrealized gains (losses) are allocated to each Fund’s share class based on their respective net assets.
The Funds may purchase securities on a when-issued or delayed-delivery basis and segregate collateral on their books with a value at least equal to the amount of the commitment. Losses may arise due to the changes in the value of the underlying securities or if the counterparty does not perform under the contract.
E. Foreign Currency Transactions
Some Funds may invest in securities of foreign issuers. The accounting records of these Funds are maintained in U.S. dollars. At each net asset value determination date, the value of assets and liabilities denominated in foreign currencies are translated into U.S. dollars using the current prevailing exchange rate. Security transactions, income and expenses are converted at the prevailing rate of exchange on the respective dates of the transactions. The effect of changes in foreign exchange rates on foreign denominated securities is included with the net realized and unrealized gain or loss on securities. Other foreign currency gains or losses are reported separately.
F. Federal Income Taxes
The Funds intend to continue to comply with the requirements of Subchapter M of the Internal Revenue Code applicable to regulated investment companies and to distribute substantially all of their taxable income to shareholders. Accordingly, no provision for federal income taxes is required. Each Fund may be subject to foreign taxes on income and gains on investments, which are accrued based on the Fund’s understanding of the tax rules and regulations in the foreign markets.
| Notes to Financial Statements (unaudited) | June 30, 2018 |
The Funds recognize the tax benefits of uncertain tax positions only where the position is “more likely than not” to be sustained assuming examination by tax authorities. Management has analyzed the Funds’ tax positions, and has concluded that no liability for unrecognized tax benefits should be recorded related to uncertain tax positions taken on returns filed for open tax years or expected to be taken in 2017 tax returns. The Funds file U.S. federal and excise tax returns as required. The Funds’ 2014, 2015, 2016 and 2017 (when filed) tax returns are open to examination by the federal and applicable state tax authorities. The Funds have no examinations in progress.
G. Dividends and Distributions to Shareholders
The Funds record dividends and distributions to shareholders on the ex-dividend date. Distributions are determined in accordance with income tax regulations, which may differ from accounting principles generally accepted in the United States. Accordingly, periodic reclassifications related to permanent book and tax basis differences are made within the Funds’ capital accounts to reflect income and gains available for distribution under income tax regulations.
The Funds, except as noted below, generally pay income dividends and distribute capital gains, if any, annually. The U.S. Government Securities Ultra-Short Bond Fund and the Near-Term Tax Free Fund pay dividends monthly. A Fund may elect to designate a portion of the earnings and profits distributed to shareholders on the redemption of fund shares during the year as distributions for federal income tax purposes. Differences in per share dividend rates for multiclass funds generally result from the relative weightings of pro rata income and realized gain allocations and from differences in separate class expenses.
H. Expenses
Fund specific expenses are allocated to that Fund and pro rata across share classes. Expenses that are not fund specific are allocated among Funds and pro rata across share classes. Class specific expenses (including, but not limited to, distribution plan fees, if any, a portion of the administrative services fees, transfer agency fees and expenses, shareholder reporting expenses and certain legal and registration fees) are allocated to the class that incurs such expense. Except for the U.S. Government Securities Ultra-Short Bond Fund, expense offset arrangements have been made with the Funds’ custodian so the custodian fees may be paid indirectly by credits earned on the Funds’ cash balances. Such deposit arrangements are an alternative to overnight investments. Custodian fees are presented in the Statements of Operations gross of such credits, and the credits are presented as offsets to expenses. For the U.S. Government Securities Ultra-Short Bond Fund, credits earned on its cash balance are included in interest and other income.
I. Use of Estimates in Financial Statement Preparation
The Funds are investment companies accounted for in conformity with accounting principles generally accepted in the United States of America (“GAAP”). Therefore they follow the accounting and reporting guidelines for investment companies. The preparation of financial statements in conformity with GAAP requires management to make estimates and assumptions that affect the reported amounts of assets and liabilities and disclosure of contingent assets and liabilities at the date of the financial statements and the reported amounts of income and expenses during the reporting period. Actual results could differ from those estimates.
| Notes to Financial Statements (unaudited) | June 30, 2018 |
Note 2: Financial Derivative Instruments
A. Options Contracts
Equity Funds may purchase or write (sell) options on securities to manage their exposure to stock or commodity markets as well as fluctuations in interest and currency conversion rates. The use of options carries the risks of a change in value of the underlying instruments, an illiquid secondary market, or failure of the counterparty to perform its obligations.
A put option gives the purchaser of the option, upon payment of a premium, the right to sell, and the issuer of the option the obligation to buy, the underlying security, commodity, index, currency or other instrument at the exercise price. A call option, upon payment of a premium, gives the purchaser of the option the right to buy, and the issuer the obligation to sell, the underlying instrument at the exercise price.
Purchasing a put option tends to decrease a Fund’s exposure to the underlying instrument, whereas purchasing a call option tends to increase a Fund’s exposure to the underlying instrument. A Fund pays a premium which is included in the Statement of Assets and Liabilities as an investment and subsequently marked to market to reflect the current value of the option. Premiums paid to purchase options which expire are treated as realized losses. Premiums paid to purchase options which are exercised or closed are added to the cost of securities acquired or the proceeds from securities sold. The risk associated with purchasing put and call options is limited to the premium paid.
The Funds will realize a loss equal to all or a part of the premium paid for an option if the price of the underlying security or other instrument decreases or does not increase by more than the premium (in the case of a call option), or if the price of the underlying security or other instrument increases or does not decrease by more than the premium (in the case of a put option).
Writing a put option tends to increase a Fund’s exposure to the underlying instrument, whereas writing a call option tends to decrease a Fund’s exposure to the underlying instrument. The premium received is recorded as a liability in the Statement of Assets and Liabilities and subsequently marked to market to reflect the current value of the option written. Premiums received from writing options which expire are treated as realized gains. Premiums received from options which are exercised or closed are added to the proceeds or offset against amounts paid on the underlying transaction to determine the realized gain or loss. Written options include a risk of loss in excess of the option premium. A Fund as a writer of an option has no control over whether the underlying instrument may be sold (call) or purchased (put) and thus bears the market risk of an unfavorable change in the price of the instrument underlying the written option. There is also the risk a Fund may not be able to enter into a closing transaction because of an illiquid market.
A Fund’s ability to close out its position as a purchaser or seller of a put or call option is dependent, in part, upon the liquidity of the market for that particular option. There can be no guarantee that a fund will be able to close out an option position when desired. An inability to close out its options positions may reduce a Fund’s anticipated profits or increase its losses.
As of June 30, 2018, there were no securities held in escrow by the custodian as cover for call options written.
| Notes to Financial Statements (unaudited) | June 30, 2018 |
B. Forward Foreign Currency Contracts
The Funds enter into forward foreign currency contracts to lock in the U.S. dollar cost of purchase and sale transactions or to hedge the portfolio against currency fluctuations. A forward foreign currency contract is a commitment to purchase or sell a foreign currency at a future date at a negotiated rate. These contracts are valued daily, and the Fund’s net equity therein, representing unrealized gain or loss on the contracts as measured by the difference between the forward foreign exchange rates at the dates of entry into the contracts and the forward rates at the reporting date, is included in the Statement of Assets and Liabilities. Realized and unrealized gains and losses are included in the Statement of Operations. Risks may arise upon entering into these contracts from the potential inability of counterparties to meet the terms of the contracts and from unanticipated movements in the value of foreign currencies relative to the U.S. dollar.
There were no open forward foreign currency contracts as of June 30, 2018.
C. Summary of Derivative Instruments
The following is a summary of the valuations of derivative instruments categorized by location in the Statements of Assets and Liabilities as of June 30, 2018:
| | | All American | | | Holmes Macro | | | Global | |
| Location | | Equity Fund | | | Trends Fund | | | Resources Fund | |
| Asset derivatives | | | | | | | | | | | | |
| Investments, at value | | | | | | | | | | | | |
| Purchased options | | $ | 107,310 | | | $ | 280,320 | | | $ | 1,139,680 | |
| Total | | $ | 107,310 | | | $ | 280,320 | | | $ | 1,139,680 | |
| Notes to Financial Statements (unaudited) | June 30, 2018 |
The following is a summary of the effect of derivative instruments on the Statements of Operations as of June 30, 2018:
| | | | | | | | | Global | |
| | | All American | | | Holmes Macro | | | Resources | |
| Location | | Equity Fund | | | Trends Fund | | | Fund | |
| Realized gain (loss) on derivatives recognized in income | | | | | | | | | | | | |
| Realized gain (loss) from securities | | | | | | | | | | | | |
| Purchased options | | $ | 25,308 | | | $ | 80,622 | | | $ | 1,778,477 | |
| Net realized gain (loss) from foreign currency transactions | | | | | | | | | | | | |
| Foreign exchange contracts | | | – | | | | – | | | | – | |
| Realized gain (loss) from written options | | | 4,760 | | | | 46,227 | | | | – | |
| | | | 30,068 | | | | 126,849 | | | | 1,778,477 | |
| Change in unrealized appreciation (depreciation) on derivatives recognized in income | | | | | | | | | | | | |
| Net change in unrealized appreciation (depreciation) of investments | | | | | | | | | | | | |
| Purchased options | | | (27,510 | ) | | | (71,744 | ) | | | (1,339,615 | ) |
| Net change in unrealized gain (loss) from foreign currency transactions | | | | | | | | | | | | |
| Foreign exchange contracts | | | – | | | | – | | | | – | |
| | | | (27,510 | ) | | | (71,744 | ) | | | (1,339,615 | ) |
| Total | | $ | 2,558 | | | $ | 55,105 | | | $ | 438,862 | |
| | | Emerging | | | China Region | |
| Location | | Europe Fund | | | Fund | |
| Realized gain (loss) on derivatives recognized in income | | | | | | | | |
| Realized gain (loss) from securities | | | | | | | | |
| Purchased options | | $ | – | | | $ | (112,735 | ) |
| Net realized gain (loss) from foreign currency transactions | | | | | | | | |
| Foreign exchange contracts | | | 614,253 | | | | – | |
| Realized gain (loss) from written options | | | – | | | | 0 | |
| | | | 614,253 | | | | (112,735 | ) |
| Change in unrealized appreciation (depreciation) on derivatives recognized in income | | | | | | | | |
| Net change in unrealized appreciation (depreciation) of investments | | | | | | | | |
| Purchased options | | | – | | | | (160,049 | ) |
| Net change in unrealized gain (loss) from foreign currency transactions | | | | | | | | |
| Foreign exchange contracts | | | – | | | | – | |
| | | | – | | | | (160,049 | ) |
| Total | | $ | 614,253 | | | $ | (272,784 | ) |
| Notes to Financial Statements (unaudited) | June 30, 2018 |
The total value of transactions in written options, purchased options and forward currency contracts outstanding during the period ended June 30, 2018, were approximately as follows:
| | | | | | Written | | | Forward Currency | |
| Fund | | Purchased Options | | | Options | | | Contracts | |
| All American Equity Fund | | $ | 178,511 | | | $ | (50,911 | ) | | $ | – | |
| Holmes Macro Trends Fund | | | 545,775 | | | | (79,397 | ) | | | – | |
| Global Resources Fund | | | 2,113,850 | | | | – | | | | – | |
| Emerging Europe Fund | | | – | | | | – | | | | 31,715,691 | |
Asset (Liability) amounts shown in the table below represent amounts for derivative related instruments at June 30, 2018. These amounts may be collateralized by cash or financial instruments.
| | | Gross Asset | | | | | | | | | | |
| | | (Liability) as | | | | | | | | | | |
| | | Presented in | | | | | | | | | | |
| | | the Statement | | | | | | Cash Collateral | | | | |
| | | of Assets and | | | Financial Instruments | | | (Received) | | | | |
| | | Liabilities | | | (Received) Pledged* | | | Pledged* | | | Net Amount | |
| All American Equity | | | | | | | | | | | | | | | | |
| Assets: | | | | | | | | | | | | | | | | |
| Over-the-counter derivatives | | $ | 107,310 | | | $ | – | | | $ | – | | | $ | 107,310 | |
| Holmes Macro Trends | | | | | | | | | | | | | | | | |
| Assets: | | | | | | | | | | | | | | | | |
| Over-the-counter derivatives | | | 280,320 | | | | – | | | | – | | | | 280,320 | |
| Global Resources | | | | | | | | | | | | | | | | |
| Assets: | | | | | | | | | | | | | | | | |
| Over-the-counter derivatives | | | 1,139,680 | | | | – | | | | – | | | | 1,139,680 | |
| * | The actual financial instruments and cash collateral (received) pledged may be in excess of the amounts shown in the table. The table only reflects collateral amounts up to the amount of the financial instrument disclosed on the Statement of Assets and Liabilities. |
Note 3: Investment Advisory and Other Agreements
The Adviser, under an investment advisory agreement with the Trust in effect through October 1, 2018, furnishes management and investment advisory services and, subject to the supervision of the trustees, directs the investments of each Fund according to each Fund’s investment objectives, policies and limitations.
For the services of the Adviser, each Fund pays a base management or advisory fee based upon its net assets. Fees are accrued daily and paid monthly. The contractual management fee for each fund is:
| Fund | | Average Percentage of
Average Daily Net Assets |
| U.S. Government Securities Ultra-Short Bond | | .50% of the first $250,000,000 and .375% of the excess |
| Notes to Financial Statements (unaudited) | June 30, 2018 |
| Fund | | Average Percentage of
Average Daily Net Assets |
| Near-Term Tax Free | | .50% |
| All American Equity | | .80% of the first $500,000,000 and .75% of the excess |
| Holmes Macro Trends | | 1.00% |
| Global Resources | | .95% of the first $500,000,000; .90% of $500,000,001 to $1,000,000,000 and .85% of the excess |
| World Precious Minerals | | 1.00% of the first $500,000,000; .95% of $500,000,001 to $1,000,000,000 and .90% of the excess |
| Gold and Precious Metals | | .90% of the first $500,000,000 and .85% of the excess |
| Emerging Europe | | 1.25% |
| China Region | | 1.25% |
The advisory agreement also provides that the base advisory fee of the Equity Funds will be adjusted upwards or downwards by 0.25 percent if there is a performance difference of 5 percent or more between a Fund’s performance and that of its designated benchmark index over the prior 12 months. The performance adjustment is calculated separately for each share class. The benchmarks are as follows:
| Fund | | Benchmark Index |
| All American Equity | | S&P 500 Index |
| Holmes Macro Trends | | S&P Composite 1500 Index |
| Global Resources | | S&P Global Natural Resources Index (Net Total Return) |
| World Precious Minerals | | NYSE Arca Gold Miners Index |
| Gold and Precious Metals | | FTSE Gold Mines Index |
| Emerging Europe | | MSCI Emerging Markets Europe 10/40 Index (Net Total Return) |
| China Region | | Hang Seng Composite Index |
No performance adjustment is applied unless the difference between the class’s investment performance and the benchmark is 5 percent or greater (positive or negative) during the applicable performance measurement period. The performance fee adjustment is calculated monthly in arrears and is accrued ratably during the month. The management fee, net of any performance fee adjustment, is paid monthly in arrears.
The amounts shown as Management fee on the Statements of Operations reflects the base fee plus/minus any performance adjustment. During the period ended June 30, 2018, the Funds recorded performance adjustments as follows:
| | | Investor Class | | | Institutional Class | |
| | | Performance Fee | | | Performance Fee | |
| Fund | | Adjustment | | | Adjustment | |
| All American Equity | | $ | (20,156 | ) | | | N/A | |
| Global Resources | | | (97,633 | ) | | $ | (247 | ) |
| World Precious Minerals | | | (150,957 | ) | | | (3,686 | ) |
| Gold and Precious Metals | | | 19,565 | | | | N/A | |
| China Region | | | 21,655 | | | | N/A | |
Atlantic Fund Administration, LLC (d/b/a Atlantic Fund Services) (“Atlantic”) and the Adviser act as co-administrators to the Trust. Atlantic provides a Principal Executive Officer, a Principal Financial Officer, a Chief Compliance Officer and and Anti-Money Laundering Officer to each Fund, as well as certain additional compliance and administrative support functions. Atlantic also provides fund accounting services to each Fund. The fees related to these services are included in Administration Fees within the Statement of Operations. Atlantic also provides certain shareholder report production and EDGAR conversion
| Notes to Financial Statements (unaudited) | June 30, 2018 |
and filing services. Pursuant to an Atlantic services agreement, each Fund pays Atlantic customary fees for its services.
The U.S. Government Securities Ultra-Short Bond, Near-Term Tax Free, All American Equity, Holmes Macro Trends, Gold and Precious Metals, Emerging Europe and China Region Funds compensate the Adviser at an annual rate of 0.05% of the average daily net assets of each Fund for administrative services provided, of which half is a fund-level fee and half is a class-level fee. The Global Resources and World Precious Minerals Funds compensate the Adviser at an annual rate of 0.05% of the average daily net assets for the Investor Class and 0.04% of the average daily net assets for the Institutional Class for administrative services provided, of which half is a fund-level fee and half is a class-level fee.
The Investor Class shares for Equity Funds in the Trust have adopted a distribution plan pursuant to Rule 12b-1 of the Investment Company Act of 1940 in which the Distributor is paid a fee at an annual rate of 0.25% of the average daily net assets of the Investor Class for sales and promotional services related to the distribution of Investor Class shares. The Institutional Class does not incur distribution plan fees.
The Adviser has voluntarily agreed to reimburse specific funds so that their total operating expenses will not exceed certain annual percentages of average net assets. The expenses for the period ended June 30, 2018, were limited as follows for the Investor Class: U.S. Government Securities Ultra-Short Bond Fund at 0.45%, All American Equity Fund and Holmes Macro Trends Fund at 2.20%, Global Resources, World Precious Minerals, and Gold and Precious Metals Funds at 1.90%, Emerging Europe Fund at 2.85% and China Region Fund at 2.55%. These expense limitations are exclusive of any performance fee adjustments and will continue on a voluntary basis at the Adviser’s discretion. The Adviser may temporarily agree to additional reimbursements or limitations.
The Adviser has contractually limited the total operating expenses of the Near- Term Tax Free Fund at 0.45% on an annualized basis through April 30, 2019.
The Adviser has voluntarily agreed to waive all class specific expenses for the Institutional Class of the Global Resources Fund and the World Precious Minerals Fund. These expense waivers are exclusive of any performance fee adjustments, and the Adviser can modify or terminate this arrangement at any time.
Atlantic is the transfer agent for the Funds. Each Fund’s share class pays an annual fee based on the number of shareholder accounts, certain base fees and transaction- and activity-based fees for transfer agency services. Certain account fees are paid directly by shareholders to the transfer agent, which, in turn, reduces its charge to the Funds.
Brown Brothers Harriman & Co. (BBH) serves as the custodian.
Foreside Fund Services, LLC (the “Distributor”) acts as the agent of the Trust in connection with the continuous offering of shares of the Funds. The Distributor continually distributes shares of the Funds on a best efforts basis.
| Notes to Financial Statements (unaudited) | June 30, 2018 |
Note 4: Investments
Cost of purchases and proceeds from sales of long-term securities for the period ended June 30, 2018, are summarized as follows:
| Fund | | Purchases | | | Sales | |
| U.S. Government Securities Ultra-Short Bond | | $ | 6,005,159 | | | $ | 5,250,000 | |
| Near-Term Tax Free | | | 8,745,000 | | | | 22,696,152 | |
| All American Equity | | | 15,407,075 | | | | 16,779,012 | |
| Holmes Macro Trends | | | 42,994,367 | | | | 45,282,080 | |
| Global Resources | | | 46,842,653 | | | | 53,728,869 | |
| World Precious Minerals | | | 38,032,552 | | | | 36,200,510 | |
| Gold and Precious Metals | | | 35,781,906 | | | | 46,253,726 | |
| Emerging Europe | | | 19,369,518 | | | | 22,475,092 | |
| China Region | | | 8,539,878 | | | | 14,240,901 | |
Note 5: Tax Information
The following table presents the income tax basis of securities owned at June 30, 2018, and the tax basis components of net unrealized appreciation (depreciation):
| | | | | | Gross | | | Gross | | | Net Unrealized | |
| | | | | | Unrealized | | | Unrealized | | | Appreciation | |
| Fund | | Aggregate Tax Cost | | | Appreciation | | | Depreciation | | | (Depreciation) | |
| U.S. Government Securities Ultra-Short Bond | | $ | 44,248,443 | | | $ | 5,150 | | | $ | (69,954 | ) | | $ | (64,804 | ) |
| Near-Term Tax Free | | | 53,920,096 | | | | 162,126 | | | | (457,170 | ) | | | (295,044 | ) |
| All American Equity | | | 14,125,704 | | | | 899,681 | | | | (320,386 | ) | | | 579,295 | |
| Holmes Macro Trends | | | 36,115,941 | | | | 3,923,119 | | | | (2,913,457 | ) | | | 1,009,662 | |
| Global Resources | | | 134,121,827 | | | | 7,689,994 | | | | (63,529,464 | ) | | | (55,839,470 | ) |
| World Precious Minerals | | | 142,239,033 | | | | 15,819,272 | | | | (63,237,308 | ) | | | (47,418,036 | ) |
| Gold and Precious Metals | | | 74,418,223 | | | | 24,187,951 | | | | (12,541,120 | ) | | | 11,646,831 | |
| Emerging Europe | | | 37,354,119 | | | | 4,715,743 | | | | (4,832,808 | ) | | | (117,065 | ) |
| China Region | | | 14,355,778 | | | | 6,549,303 | | | | (763,920 | ) | | | 5,785,383 | |
As of December 31, 2017, the components of distributable earnings on a tax basis were as follows:
| | | Undistributed | | | Undistributed | | | Undistributed | | | | |
| | | Tax-Exempt | | | Ordinary | | | Long-Term | | | Capital and | |
| Fund | | Income | | | Income | | | Capital Gains | | | Other Losses | |
| U.S. Government Securities Ultra-Short Bond | | $ | – | | | $ | 4,713 | | | $ | – | | | $ | (658 | ) |
| Near-Term Tax Free | | | 2,541 | | | | 1,091 | | | | – | | | | (880,047 | ) |
| All American Equity | | | – | | | | 76,995 | | | | – | | | | (588,634 | ) |
| Holmes Macro Trends | | | – | | | | – | | | | – | | | | (204,896 | ) |
| Global Resources | | | – | | | | 2,616,198 | | | | – | | | | (205,707,296 | ) |
| World Precious Minerals | | | – | | | | 10,699,245 | | | | – | | | | (301,841,208 | ) |
| Gold and Precious Metals | | | – | | | | 1,486,189 | | | | – | | | | (100,637,254 | ) |
| Emerging Europe | | | – | | | | – | | | | – | | | | (38,216,001 | ) |
| China Region | | | – | | | | – | | | | – | | | | (3,330,618 | ) |
| Notes to Financial Statements (unaudited) | June 30, 2018 |
| | | Net Unrealized | | | Other | | | | |
| | | Appreciation | | | Temporary | | | | |
| Fund (continued) | | (Depreciation) | | | Differences | | | Total | |
| U.S. Government Securities Ultra-Short Bond | | $ | (61,779 | ) | | $ | (5,826 | ) | | $ | (63,550 | ) |
| Near-Term Tax Free | | | (180,594 | ) | | | (7,061 | ) | | | (1,064,070 | ) |
| All American Equity | | | 615,148 | | | | – | | | | 103,509 | |
| Holmes Macro Trends | | | 3,979,502 | | | | – | | | | 3,774,606 | |
| Global Resources | | | (57,167,767 | ) | | | – | | | | (260,258,865 | ) |
| World Precious Minerals | | | (46,040,731 | ) | | | – | | | | (337,182,694 | ) |
| Gold and Precious Metals | | | 15,168,722 | | | | – | | | | (83,982,343 | ) |
| Emerging Europe | | | 6,076,059 | | | | – | | | | (32,139,942 | ) |
| China Region | | | 9,155,710 | | | | – | | | | 5,825,092 | |
The differences between book-basis and tax-basis unrealized appreciation (depreciation) for All American Equity, Holmes Macro Trends, Global Resources, World Precious Minerals, Gold and Precious Metals, Emerging Europe and China Region Funds are attributable primarily to the tax deferral of losses on wash sales, investment in passive foreign investment companies (PFIC), section 988 forward currency contracts, and equity return of capital.
Reclassifications are made to the Funds’ capital accounts to reflect income and gains available for distribution (or available capital loss carryovers) under income tax regulations. For the year ended December 31, 2017, the Funds recorded the following reclassifications to increase (decrease) the accounts listed below:
| | | Accumulated | | | | | | | |
| | | Net Investment | | | Accumulated Net | | | | |
| Fund | | Income | | | Realized Gain | | | Paid in Capital | |
| U.S. Government Securities Ultra-Short Bond | | $ | (11 | ) | | $ | – | | | $ | 11 | |
| Near-Term Tax Free | | | (8 | ) | | | 722 | | | | (714 | ) |
| All American Equity | | | 12,737 | | | | (12,737 | ) | | | – | |
| Holmes Macro Trends | | | 162,790 | | | | (115,548 | ) | | | (47,242 | ) |
| Global Resources | | | 573,544 | | | | 258,639,062 | | | | (259,212,606 | ) |
| World Precious Minerals | | | 12,364,083 | | | | 51,415,417 | | | | (63,779,500 | ) |
| Gold and Precious Metals | | | (578,598 | ) | | | 571,312 | | | | 7,286 | |
| Emerging Europe | | | (758,798 | ) | | | 258,599,537 | | | | (257,840,739 | ) |
| China Region | | | 157,157 | | | | (28,017 | ) | | | (129,140 | ) |
| Notes to Financial Statements (unaudited) | June 30, 2018 |
The tax character of distributions paid during the fiscal year ended December 31, 2017, were as follows:
| | | Tax-Exempt | | | Ordinary | | | Long-Term | | | Return of | | | | |
| Fund | | Income | | | Income | | | Capital Gains | | | Capital | | | Total | |
| U.S. Government Securities Ultra-Short Bond | | $ | – | | | $ | 356,650 | | | $ | – | | | $ | – | | | $ | 356,650 | |
| Near-Term Tax Free | | | 960,480 | | | | 9,834 | | | | – | | | | – | | | | 970,314 | |
| All American Equity | | | – | | | | 11,077 | | | | – | | | | – | | | | 11,077 | |
| Holmes Macro Trends | | | – | | | | 4,147,876 | | | | 958,934 | | | | – | | | | 5,106,810 | |
| Global Resources | | | – | | | | 2,838,594 | | | | – | | | | – | | | | 2,838,594 | |
| World Precious Minerals | | | – | | | | 26,492,504 | | | | – | | | | – | | | | 26,492,504 | |
| Gold and Precious Metals | | | – | | | | – | | | | – | | | | – | | | | – | |
| Emerging Europe | | | – | | | | – | | | | – | | | | – | | | | – | |
| China Region | | | – | | | | 29,602 | | | | – | | | | – | | | | 29,602 | |
The tax character of distributions paid during the fiscal year ended December 31, 2016, were as follows:
| | | Tax-Exempt | | | Ordinary | | | Long-Term | | | Return of | | | | |
| Fund | | Income | | | Income | | | Capital Gains | | | Capital | | | Total | |
| U.S. Government Securities Ultra-Short Bond | | $ | – | | | $ | 261,314 | | | $ | 15,960 | | | $ | 2,047 | | | $ | 279,321 | |
| Near-Term Tax Free | | | 1,476,349 | | | | 19,933 | | | | – | | | | 13,758 | | | | 1,510,040 | |
| All American Equity | | | – | | | | 27,184 | | | | – | | | | – | | | | 27,184 | |
| Holmes Macro Trends | | | – | | | | – | | | | 3,169,616 | | | | – | | | | 3,169,616 | |
| Global Resources | | | – | | | | 3,221,240 | | | | – | | | | – | | | | 3,221,240 | |
| World Precious Minerals | | | – | | | | 476,963 | | | | – | | | | – | | | | 476,963 | |
| Gold and Precious Metals | | | – | | | | 799,465 | | | | – | | | | – | | | | 799,465 | |
| Emerging Europe | | | – | | | | – | | | | – | | | | – | | | | – | |
| China Region | | | – | | | | 27,847 | | | | – | | | | – | | | | 27,847 | |
Capital loss carryforwards may be used to off set current or future taxable capital gains until expiration. The Fund’s tax-basis capital gains and losses are determined only at the end of each fiscal year. Under the Regulated Investment Company Modernization Act of 2010, the Funds are permitted to carry forward capital losses incurred in taxable years beginning after December 22, 2010, for an unlimited period. Losses incurred during these years are required to be utilized prior to the losses incurred in pre-enactment tax years. As a result of this ordering rule, pre-enactment capital loss carryforwards may be more likely to expire unused. In addition, post-enactment capital losses that are carried forward retain their character as either short-term or long-term capital losses rather than being considered all short-term as under previous law. The loss carryforwards and related expiration dates for each fund, as of December 31, 2017, are as follows:
| | | No Expiration | | | Expiration Date | | | | |
| Fund | | Short-Term | | | Long-Term | | | 2018 | | | Total | |
| U.S. Government Securities Ultra-Short Bond | | $ | 658 | | | $ | – | | | $ | – | | | $ | 658 | |
| Near-Term Tax Free (a) | | | 531,173 | | | | 346,342 | | | | 2,532 | | | | 880,047 | |
| All American Equity | | | 331,815 | | | | 256,819 | | | | – | | | | 588,634 | |
| Holmes Macro Trends (a) | | | – | | | | – | | | | – | | | | – | |
| Notes to Financial Statements (unaudited) | June 30, 2018 |
| | | No Expiration | | | Expiration Date | | | | |
| Fund | | Short-Term | | | Long-Term | | | 2018 | | | Total | |
| Global Resources | | $ | 155,607,152 | | | $ | 50,100,144 | | | $ | – | | | $ | 205,707,296 | |
| World Precious Minerals | | | 82,982,057 | | | | 218,859,151 | | | | – | | | | 301,841,208 | |
| Gold and Precious Metals | | | 38,864,443 | | | | 61,772,811 | | | | – | | | | 100,637,254 | |
| Emerging Europe | | | 11,501,846 | | | | 10,962,059 | | | | 15,445,946 | | | | 37,909,851 | |
| China Region | | | 3,330,618 | | | | – | | | | – | | | | 3,330,618 | |
| (a) | Utilization of capital loss carryforwards is subject to annual limitations. |
During the year ended December 31, 2017, the following Funds utilized capital loss carryforwards to offset capital gains amounting to:
| Fund | | | |
| All American Equity | | $ | 349,769 | |
| Global Resources | | | 131,454 | |
| Gold and Precious Metals | | | 2,682,333 | |
| Emerging Europe | | | 4,258,272 | |
| China Region | | | 1,491,681 | |
In accordance with tax rules, the following net capital losses and ordinary losses (currency and late year losses) incurred after October 31, within each Fund’s tax year, are deemed to arise on the first day of the Fund’s next tax year if the Fund elects to defer such losses.
The Funds elected to defer losses incurred after October 31, 2017, as follows:
| | | Post | | | Post | |
| | | October 31, 2017 | | | October 31, 2017 | |
| | | Capital Loss | | | Ordinary Loss | |
| Fund | | Deferral | | | Deferral | |
| Holmes Macro Trends | | $ | 204,896 | | | $ | – | |
| Emerging Europe | | | – | | | | 306,150 | |
Note 6: Risks of Concentrations and Foreign Investments
The Near-Term Tax Free Fund may be exposed to risks related to concentration of investments in a particular state or geographic area. These investments present risks resulting from changes in economic conditions of the region or the issuer.
The Global Resources Fund concentrates its investments in the natural resources industries and may be subject to greater risks and fluctuations than a portfolio representing a broader range of industries.
The World Precious Minerals and Gold and Precious Metals Funds concentrate their investments in gold and other precious metals and minerals and, therefore, may be subject to greater risks and market fluctuations than a portfolio representing a broader range of industries. The funds invest in securities that typically respond to changes in the price of gold and other precious metals and minerals, which can be influenced by a variety of global economic, financial and political factors; increased environmental and labor costs in mining; and changes in laws relating to mining or gold production or sales. Fluctuations in the prices of gold and other precious metals and minerals will affect the market values of the securities held by these funds.
| Notes to Financial Statements (unaudited) | June 30, 2018 |
The Emerging Europe Fund invests more than 25% of its investments in companies principally engaged in the oil, gas or banking industries. Oil and gas companies are a large part of the Russian economy, and banks typically are a significant component of emerging market economics, such as those in Russia and other Eastern European countries. The risk of concentrating investments in this group of industries will make the fund more susceptible to risk in these industries than funds which do not concentrate their investments in an industry.
The Emerging Europe Fund may be exposed to risks not typically associated with investment in the United States due to its concentration of investments in emerging markets. These risks include possible revaluation of currencies, less public information about companies, disruptive political or economic conditions and the possible imposition of adverse governmental laws or currency exchange restrictions. Moreover, securities of many foreign issuers, including sovereign nations, and their markets may be less liquid and their prices more volatile than those securities of comparable U.S. issuers.
The China Region Fund may be exposed to risks not typically associated with investments in the United States, due to its concentration of investments in foreign issuers in the region. These investments present risks resulting from disruptive political or economic conditions and the potential imposition of adverse governmental laws or currency exchange restrictions affecting the area.
Note 7: Credit Arrangements
Each of the Funds has a revolving credit facility with BBH. Borrowings of each Fund are collateralized by any or all of the securities held by BBH as the Fund’s custodian up to the amount of the borrowing. Interest on borrowings is charged at the current overnight Federal Funds Rate plus 2 percent. Each Fund has a maximum borrowing limit of 10 percent of qualified assets. The aggregate of borrowings by all Funds under the agreement cannot exceed $10,000,000 at any one time. There were no borrowings under the revolving credit facility during the period ended June 30, 2018. The Funds paid BBH a total of $7,542 in commitment fees for the period ended June 30, 2018, under this arrangement.
Note 8: Commitments and Contingencies
In the normal course of business, each Fund enters into contracts that provide general indemnifications by each Fund to the counterparty to the contract. Each Fund’s maximum exposure under these arrangements is dependent on future claims that may be made against each Fund and, therefore, cannot be estimated; however, based on experience, the risk of loss from such claims is considered remote. Each Fund has determined that none of these arrangements requires disclosure on each Fund’s balance sheet.
Note 9: Subsequent Events
The Funds have evaluated the need for additional disclosures and/or adjustments resulting from subsequent events. Based on this evaluation, no additional disclosures or adjustments were required to the financial statements as of the date the financial statements were issued.
U.S. Government Securities Ultra-Short Bond Fund
For a capital share outstanding during the
| | | Investor Class | |
| | | Six Months | | | Year Ended December 31, | |
| | | Ended | | | | | | | | | | | | | | | | |
| | | June 30, | | | | | | | | | | | | | | | | |
| | | 2018 | | | | | | | | | | | | | | | | |
| | | (unaudited) | | | 2017 | | | 2016 | | | 2015 | | | 2014 | | | 2013+ | |
| Net asset value, beginning of period | | $ | 2.00 | | | $ | 2.00 | | | $ | 2.00 | | | $ | 2.00 | | | $ | 2.00 | | | $ | 2.00 | |
| Investment Activities | | | | | | | | | | | | | | | | | | | | | | | | |
| Net investment income | | | 0.01 | * | | | 0.01 | * | | | 0.01 | | | | 0.01 | | | | 0.01 | | | | 0.00 | (a) |
| Net realized and unrealized gain(a) | | | (0.00 | ) | | | (0.00 | ) | | | 0.00 | | | | 0.00 | | | | 0.00 | | | | 0.00 | |
| Total from investment activities | | | 0.01 | | | | 0.01 | | | | 0.01 | | | | 0.01 | | | | 0.01 | | | | – | |
| Distributions | | | | | | | | | | | | | | | | | | | | | | | | |
| From net investment income | | | (0.01 | ) | | | (0.01 | ) | | | (0.01 | ) | | | (0.01 | ) | | | (0.01 | ) | | | 0.00 | (a) |
| From return of capital | | | – | | | | – | | | | (0.00 | )(a) | | | – | | | | – | | | | – | |
| From net realized gains | | | – | | | | – | | | | (0.00 | )(a) | | | (0.00 | )(a) | | | – | | | | – | |
| Net asset value, end of period | | $ | 2.00 | | | $ | 2.00 | | | $ | 2.00 | | | $ | 2.00 | | | $ | 2.00 | | | $ | 2.00 | |
| Total Return (b) | | | 0.50 | % | | | 0.69 | % | | | 0.47 | % | | | 0.34 | % | | | 0.36 | % | | | 0.02 | % |
| Ratios to Average Net Assets: | | | | | | | | | | | | | | | | | | | | | | | | |
| Net investment income | | | 1.01 | % | | | 0.68 | % | | | 0.43 | % | | | 0.33 | % | | | 0.35 | % | | | 0.01 | % |
| Total expenses | | | 0.97 | % | | | 1.03 | % | | | 1.00 | % | | | 1.13 | % | | | 1.07 | % | | | 0.97 | % |
| Expenses waived or reimbursed (c) | | | (0.52 | )% | | | (0.58 | )% | | | (0.55 | )% | | | (0.68 | )% | | | (0.74 | )% | | | (0.91 | )% |
| Net expenses (d) | | | 0.45 | % | | | 0.45 | % | | | 0.45 | % | | | 0.45 | % | | | 0.33 | % | | | 0.06 | % |
| Portfolio turnover rate (e) | | | 12 | % | | | 52 | % | | | 18 | % | | | 60 | % | | | 33 | % | | | | |
| Net assets, end of period (in thousands) | | $ | 47,997 | | | $ | 49,427 | | | $ | 56,794 | | | $ | 62,562 | | | $ | 64,020 | | | $ | 75,227 | |
| + | The per share amounts for the period have been adjusted to reflect a 1-for-2 reverse stock split, which was effective December 20, 2013. In addition, on December 20, 2013, the Fund changed from a constant $1.00 net asset value per share money market fund to a U.S. Government ultra-short bond fund (that is not a money market fund) with an objective of total return with current income. |
| * | Based on average shares outstanding. |
| (a) | The per share amount does not round to a full penny. |
| (b) | Assumes investment at the net asset value at the beginning of the period, reinvestment of all distributions and a complete redemption of the investment at the net asset value at the end of the period. |
| (c) | Expenses waived or reimbursed reflect reductions to total expenses, as discussed in the notes to the financial statements. These amounts would increase the net investment loss ratio or decrease the net investment income ratio, as applicable, and decrease the total returns had such reductions not occurred. |
| (d) | The net expense ratios shown above reflect expenses after waivers and reimbursements and include the effect of reductions to total expenses for any expenses offset. Expense offset arrangements reduce total expenses, as discussed in the notes to the financial statements. These amounts would decrease the net investment income (loss) ratio had such reductions not occurred. The effect of expenses offset are as follows: |
| | | Investor Class | |
| | | Six Months | | | Year Ended December 31, | |
| | | Ended | | | | | | | | | | | | | | | | |
| | | June 30, | | | | | | | | | | | | | | | | |
| | | 2018 | | | | | | | | | | | | | | | | |
| | | (unaudited) | | | 2017 | | | 2016 | | | 2015 | | | 2014 | | | 2013+ | |
| Ratios to Average Net Assets: | | | | | | | | | | | | | | | | | | | | | | | | |
| Expense offset (f) | | | – | | | | – | | | | – | | | | – | | | | – | | | | – | |
| (e) | Portfolio turnover is not shown for periods that the Fund was a money market fund. |
| (f) | Effect on the expense ratio was not greater than 0.005%. |
See accompanying notes to financial statements.
Near-Term Tax Free Fund
For a capital share outstanding during the
| | | Investor Class | |
| | | Six Months | | | Year Ended December 31, | |
| | | Ended | | | | | | | | | | | | | | | | |
| | | June 30, | | | | | | | | | | | | | | | | |
| | | 2018 | | | | | | | | | | | | | | | | |
| | | (unaudited) | | | 2017 | | | 2016 | | | 2015 | | | 2014 | | | 2013 | |
| Net asset value, beginning of period | | $ | 2.21 | | | $ | 2.21 | | | $ | 2.25 | | | $ | 2.25 | | | $ | 2.23 | | | $ | 2.27 | |
| Investment Activities | | | | | | | | | | | | | | | | | | | | | | | | |
| Net investment income | | | 0.01 | * | | | 0.03 | * | | | 0.03 | | | | 0.03 | | | | 0.05 | | | | 0.05 | |
| Net realized and unrealized gain (loss) | | | (0.01 | ) | | | – | | | | (0.04 | ) | | | 0.00 | (a) | | | 0.02 | | | | (0.04 | ) |
| Total from investment activities | | | 0.00 | | | | 0.03 | | | | (0.01 | ) | | | 0.03 | | | | 0.07 | | | | 0.01 | |
| Distributions | | | | | | | | | | | | | | | | | | | | | | | | |
| From net investment income | | | (0.01 | ) | | | (0.03 | ) | | | (0.03 | ) | | | (0.03 | ) | | | (0.05 | ) | | | (0.05 | ) |
| From return of capital | | | – | | | | – | | | | (0.00 | )(a) | | | – | | | | – | | | | – | |
| Net asset value, end of period | | $ | 2.20 | | | $ | 2.21 | | | $ | 2.21 | | | $ | 2.25 | | | $ | 2.25 | | | $ | 2.23 | |
| Total Return (b) | | | 0.13 | % | | | 1.20 | % | | | (0.45 | )% | | | 1.45 | % | | | 3.07 | % | | | 0.31 | % |
| Ratios to Average Net Assets: | | | | | | | | | | | | | | | | | | | | | | | | |
| Net investment income | | | 1.19 | % | | | 1.16 | % | | | 1.25 | % | | | 1.52 | % | | | 2.13 | % | | | 2.08 | % |
| Total expenses | | | 0.96 | % | | | 1.03 | % | | | 0.97 | % | | | 1.09 | % | | | 1.08 | % | | | 1.21 | % |
| Expenses waived or reimbursed (c) | | | (0.51 | )% | | | (0.58 | )% | | | (0.52 | )% | | | (0.64 | )% | | | (0.63 | )% | | | (0.76 | )% |
| Net expenses (d) | | | 0.45 | % | | | 0.45 | % | | | 0.45 | % | | | 0.45 | % | | | 0.45 | % | | | 0.45 | % |
| Portfolio turnover rate | | | 15 | % | | | 14 | % | | | 33 | % | | | 15 | % | | | 12 | % | | | 6 | % |
| Net assets, end of period (in thousands) | | $ | 58,234 | | | $ | 69,120 | | | $ | 95,301 | | | $ | 106,769 | | | $ | 89,595 | | | $ | 61,884 | |
| * | Based on average shares outstanding. |
| (a) | The per share amount does not round to a full penny. |
| (b) | Assumes investment at the net asset value at the beginning of the period, reinvestment of all distributions and a complete redemption of the investment at the net asset value at the end of the period. |
| (c) | Expenses waived or reimbursed reflect reductions to total expenses, as discussed in the notes to the financial statements. These amounts would increase the net investment loss ratio or decrease the net investment income ratio, as applicable, and decrease the total returns had such reductions not occurred. |
| (d) | The net expense ratios shown above reflect expenses after waivers and reimbursements and include the effect of reductions to total expenses for any expenses offset. Expense offset arrangements reduce total expenses, as discussed in the notes to the financial statements. These amounts would decrease the net investment income (loss) ratio had such reductions not occurred. The effect of expenses offset are as follows: |
| | | Investor Class | |
| | | Six Months | | | Year Ended December 31, | |
| | | Ended | | | | | | | | | | | | | | | | |
| | | June 30, | | | | | | | | | | | | | | | | |
| | | 2018 | | | | | | | | | | | | | | | | |
| | | (unaudited) | | | 2017 | | | 2016 | | | 2015 | | | 2014 | | | 2013 | |
| Ratios to Average Net Assets: | | | | | | | | | | | | | | | | | | | | | | | | |
| Expense offset | | | (0.06 | )% | | | (0.04 | )% | | | (0.02 | )% | | | – | (e) | | | – | (e) | | | – | (e) |
| (e) | Effect on the expense ratio was not greater than 0.005%. |
See accompanying notes to financial statements.
All American Equity Fund
For a capital share outstanding during the
| | | Investor Class | |
| | | Six Months | | | Year Ended December 31, | |
| | | Ended | | | | | | | | | | | | | | | | |
| | | June 30, | | | | | | | | | | | | | | | | |
| | | 2018 | | | | | | | | | | | | | | | | |
| | | (unaudited) | | | 2017 | | | 2016 | | | 2015 | | | 2014 | | | 2013 | |
| Net asset value, beginning of period | | $ | 24.90 | | | $ | 23.53 | | | $ | 23.60 | | | $ | 27.84 | | | $ | 32.18 | | | $ | 25.40 | |
| Investment Activities | | | | | | | | | | | | | | | | | | | | | | | | |
| Net investment income (loss) | | | (0.00 | )(a)* | | | 0.09 | * | | | 0.02 | | | | 0.09 | | | | (0.16 | ) | | | (0.12 | ) |
| Net realized and unrealized gain (loss) | | | 0.36 | | | | 1.30 | | | | (0.05 | ) | | | (1.23 | ) | | | 0.84 | | | | 9.08 | |
| Total from investment activities | | | 0.36 | | | | 1.39 | | | | (0.03 | ) | | | (1.14 | ) | | | 0.68 | | | | 8.96 | |
| Distributions | | | | | | | | | | | | | | | | | | | | | | | | |
| From net investment income | | | – | | | | (0.02 | ) | | | (0.04 | ) | | | (0.06 | ) | | | – | | | | (0.07 | ) |
| From net realized gains | | | – | | | | – | | | | – | | | | (3.04 | ) | | | (5.02 | ) | | | (2.11 | ) |
| Short-Term Trading Fees* | | | – | | | | – | | | | 0.00 | (a) | | | 0.00 | (a) | | | 0.00 | (a) | | | 0.00 | (a) |
| Net asset value, end of period | | $ | 25.26 | | | $ | 24.90 | | | $ | 23.53 | | | $ | 23.60 | | | $ | 27.84 | | | $ | 32.18 | |
| Total Return (b) | | | 1.45 | % | | | 5.90 | % | | | (0.14 | )% | | | (4.20 | )% | | | 1.94 | % | | | 35.55 | % |
| Ratios to Average Net Assets: | | | | | | | | | | | | | | | | | | | | | | | | |
| Net investment income (loss) | | | (0.01 | )% | | | 0.38 | % | | | 0.06 | % | | | 0.31 | % | | | (0.54 | )% | | | (0.45 | )% |
| Total expenses | | | 1.83 | % | | | 1.79 | % | | | 1.75 | % | | | 1.94 | % | | | 2.16 | % | | | 2.44 | % |
| Expenses waived or reimbursed (c) | | | (0.10 | )% | | | (0.04 | )% | | | (0.02 | )% | | | (0.02 | )% | | | (0.03 | )% | | | (0.28 | )% |
| Net expenses (d) | | | 1.73 | % | | | 1.75 | % | | | 1.73 | % | | | 1.92 | % | | | 2.13 | % | | | 2.16 | % |
| Portfolio turnover rate | | | 106 | % | | | 346 | % | | | 303 | % | | | 109 | %(e) | | | 253 | % | | | 150 | % |
| Net assets, end of period (in thousands) | | $ | 15,355 | | | $ | 15,932 | | | $ | 17,350 | | | $ | 19,117 | | | $ | 21,936 | | | $ | 23,388 | |
| * | Based on average shares outstanding. |
| (a) | The per share amount does not round to a full penny. |
| (b) | Assumes investment at the net asset value at the beginning of the period, reinvestment of all distributions and a complete redemption of the investment at the net asset value at the end of the period. |
| (c) | Expenses waived or reimbursed reflect reductions to total expenses, as discussed in the notes to the financial statements. These amounts would increase the net investment loss ratio or decrease the net investment income ratio, as applicable, and decrease the total returns had such reductions not occurred. |
| (d) | The net expense ratios shown above reflect expenses after waivers and reimbursements and include the effect of reductions to total expenses for any expenses offset. Expense offset arrangements reduce total expenses, as discussed in the notes to the financial statements. These amounts would decrease the net investment income (loss) ratio had such reductions not occurred. The effect of expenses offset are as follows: |
| | | Investor Class | |
| | | Six Months | | | Year Ended December 31, | |
| | | Ended | | | | | | | | | | | | | | | | |
| | | June 30, | | | | | | | | | | | | | | | | |
| | | 2018 | | | | | | | | | | | | | | | | |
| | | (unaudited) | | | 2017 | | | 2016 | | | 2015 | | | 2014 | | | 2013 | |
| Ratios to Average Net Assets: | | | | | | | | | | | | | | | | | | | | | | | | |
| Expense offset | | | (0.10 | )% | | | (0.04 | )% | | | (0.02 | )% | | | – | (f) | | | – | (f) | | | – | (f) |
| (e) | Excludes option transactions. |
| (f) | Effect on the expense ratio was not greater than 0.005%. |
See accompanying notes to financial statements.
Holmes Macro Trends Fund
For a capital share outstanding during the
| | | Investor Class | |
| | | Six Months | | | Year Ended December 31, | |
| | | Ended | | | | | | | | | | | | | | | | |
| | | June 30, | | | | | | | | | | | | | | | | |
| | | 2018 | | | | | | | | | | | | | | | | |
| | | (unaudited) | | | 2017 | | | 2016 | | | 2015 | | | 2014 | | | 2013 | |
| Net asset value, beginning of period | | $ | 19.52 | | | $ | 18.65 | | | $ | 18.59 | | | $ | 20.25 | | | $ | 24.24 | | | $ | 18.51 | |
| Investment Activities | | | | | | | | | | | | | | | | | | | | | | | | |
| Net investment loss | | | (0.04 | )* | | | (0.08 | )* | | | (0.06 | ) | | | (0.11 | ) | | | (0.26 | ) | | | (0.18 | ) |
| Net realized and unrealized gain (loss) | | | 0.05 | | | | 3.66 | | | | 1.68 | | | | (0.06 | ) | | | (1.36 | ) | | | 7.42 | |
| Total from investment activities | | | 0.01 | | | | 3.58 | | | | 1.62 | | | | (0.17 | ) | | | (1.62 | ) | | | 7.24 | |
| Distributions | | | | | | | | | | | | | | | | | | | | | | | | |
| From net realized gains | | | – | | | | (2.71 | ) | | | (1.56 | ) | | | (1.49 | ) | | | (2.37 | ) | | | (1.51 | ) |
| Short-Term Trading Fees* | | | – | | | | 0.00 | (a) | | | 0.00 | (a) | | | 0.00 | (a) | | | 0.00 | (a) | | | 0.00 | (a) |
| Net asset value, end of period | | $ | 19.53 | | | $ | 19.52 | | | $ | 18.65 | | | $ | 18.59 | | | $ | 20.25 | | | $ | 24.24 | |
| Total Return (b) | | | 0.05 | % | | | 19.17 | % | | | 8.66 | % | | | (0.94 | )% | | | (6.74 | )% | | | 39.38 | % |
| Ratios to Average Net Assets: | | | | | | | | | | | | | | | | | | | | | | | | |
| Net investment loss | | | (0.45 | )% | | | (0.41 | )% | | | (0.34 | )% | | | (0.55 | )% | | | (1.17 | )% | | | (1.11 | )% |
| Total expenses | | | 1.81 | % | | | 1.86 | % | | | 1.67 | % | | | 1.81 | % | | | 1.94 | % | | | 2.00 | % |
| Expenses waived or reimbursed (c) | | | (0.04 | )% | | | (0.04 | )% | | | – | | | | – | | | | – | | | | (0.04 | )% |
| Net expenses (d) | | | 1.77 | % | | | 1.82 | % | | | 1.67 | % | | | 1.81 | % | | | 1.94 | % | | | 1.96 | % |
| Portfolio turnover rate | | | 112 | % | | | 264 | %(e) | | | 275 | %(e) | | | 320 | %(e) | | | 183 | %(e) | | | 109 | % |
| Net assets, end of period (in thousands) | | $ | 39,453 | | | $ | 41,597 | | | $ | 40,706 | | | $ | 41,135 | | | $ | 46,250 | | | $ | 55,926 | |
| * | Based on average shares outstanding. |
| (a) | The per share amount does not round to a full penny. |
| (b) | Assumes investment at the net asset value at the beginning of the period, reinvestment of all distributions and a complete redemption of the investment at the net asset value at the end of the period. |
| (c) | Expenses waived or reimbursed reflect reductions to total expenses, as discussed in the notes to the financial statements. These amounts would increase the net investment loss ratio or decrease the net investment income ratio, as applicable, and decrease the total returns had such reductions not occurred. |
| (d) | The net expense ratios shown above reflect expenses after waivers and reimbursements and include the effect of reductions to total expenses for any expenses offset. Expense offset arrangements reduce total expenses, as discussed in the notes to the financial statements. These amounts would decrease the net investment income (loss) ratio had such reductions not occurred. The effect of expenses offset are as follows: |
| | | Investor Class | |
| | | Six Months | | | Year Ended December 31, | |
| | | Ended | | | | | | | | | | | | | | | | |
| | | June 30, | | | | | | | | | | | | | | | | |
| | | 2018 | | | | | | | | | | | | | | | | |
| | | (unaudited) | | | 2017 | | | 2016 | | | 2015 | | | 2014 | | | 2013 | |
| Ratios to Average Net Assets: | | | | | | | | | | | | | | | | | | | | | | | | |
| Expense offset | | | (0.04 | )% | | | (0.04 | )% | | | (0.02 | )% | | | – | (f) | | | – | (f) | | | – | (f) |
| (e) | Excludes option transactions. |
| (f) | Effect on the expense ratio was not greater than 0.005%. |
See accompanying notes to financial statements.
Global Resources Fund
For a capital share outstanding during the
| | | Investor Class | |
| | | Six Months | | | Year Ended December 31, | |
| | | Ended | | | | | | | | | | | | | | | | |
| | | June 30, | | | | | | | | | | | | | | | | |
| | | 2018 | | | | | | | | | | | | | | | | |
| | | (unaudited) | | | 2017 | | | 2016 | | | 2015 | | | 2014 | | | 2013 | |
| Net asset value, beginning of period | | $ | 6.09 | | | $ | 5.25 | | | $ | 4.72 | | | $ | 6.67 | | | $ | 9.36 | | | $ | 9.79 | |
| Investment Activities | | | | | | | | | | | | | | | | | | | | | | | | |
| Net investment income* | | | 0.06 | | | | 0.11 | | | | 0.06 | | | | 0.10 | | | | 0.04 | | | | 0.02 | |
| Net realized and unrealized gain (loss) | | | (0.38 | ) | | | 0.91 | | | | 0.64 | * | | | (2.00 | )* | | | (2.73 | )* | | | (0.10 | )* |
| Total from investment activities | | | (0.32 | ) | | | 1.02 | | | | 0.70 | | | | (1.90 | ) | | | (2.69 | ) | | | (0.08 | ) |
| Distributions | | | | | | | | | | | | | | | | | | | | | | | | |
| From net investment income | | | – | | | | (0.18 | ) | | | (0.17 | ) | | | (0.05 | ) | | | – | | | | (0.35 | ) |
| Short-Term Trading Fees* | | | – | | | | 0.00 | (a) | | | 0.00 | (a) | | | 0.00 | (a) | | | 0.00 | (a) | | | 0.00 | (a) |
| Net asset value, end of period | | $ | 5.77 | | | $ | 6.09 | | | $ | 5.25 | | | $ | 4.72 | | | $ | 6.67 | | | $ | 9.36 | |
| Total Return (b) | | | (5.25 | )% | | | 19.57 | % | | | 14.99 | % | | | (28.43 | )% | | | (28.74 | )% | | | (0.72 | )% |
| Ratios to Average Net Assets: | | | | | | | | | | | | | | | | | | | | | | | | |
| Net investment income | | | 1.91 | % | | | 1.94 | % | | | 1.13 | % | | | 1.72 | % | | | 0.44 | % | | | 0.16 | % |
| Total expenses | | | 1.57 | % | | | 1.61 | % | | | 1.85 | % | | | 1.58 | % | | | 1.45 | % | | | 1.59 | % |
| Expenses waived or reimbursed (c) | | | (0.03 | )% | | | (0.02 | )% | | | (0.01 | )% | | | (0.06 | )% | | | – | (d) | | | – | |
| Net expenses (e) | | | 1.54 | % | | | 1.59 | % | | | 1.84 | % | | | 1.52 | % | | | 1.45 | % | | | 1.59 | % |
| Portfolio turnover rate (f) | | | 55 | % | | | 131 | %(g) | | | 255 | %(g) | | | 445 | %(g) | | | 444 | %(g) | | | 138 | % |
| Net assets, end of period (in thousands) | | $ | 84,339 | | | $ | 95,747 | | | $ | 97,005 | | | $ | 98,126 | | | $ | 171,673 | | | $ | 326,320 | |
| * | Based on average shares outstanding. |
| (a) | The per share amount does not round to a full penny. |
| (b) | Assumes investment at the net asset value at the beginning of the period, reinvestment of all distributions and a complete redemption of the investment at the net asset value at the end of the period. |
| (c) | Expenses waived or reimbursed reflect reductions to total expenses, as discussed in the notes to the financial statements. These amounts would increase the net investment loss ratio or decrease the net investment income ratio, as applicable, and decrease the total returns had such reductions not occurred. |
| (d) | Effect on the expense ratio was not greater than 0.005%. |
| (e) | The net expense ratios shown above reflect expenses after waivers and reimbursements and include the effect of reductions to total expenses for any expenses offset. Expense offset arrangements reduce total expenses, as discussed in the notes to the financial statements. These amounts would decrease the net investment income (loss) ratio had such reductions not occurred. The effect of expenses offset are as follows: |
| | | Investor Class | |
| | | Six Months | | | Year Ended December 31, | |
| | | Ended | | | | | | | | | | | | | | | | |
| | | June 30, | | | | | | | | | | | | | | | | |
| | | 2018 | | | | | | | | | | | | | | | | |
| | | (unaudited) | | | 2017 | | | 2016 | | | 2015 | | | 2014 | | | 2013 | |
| Ratios to Average Net Assets: | | | | | | | | | | | | | | | | | | |
| Expense offset | | | (0.03 | )% | | | (0.02 | )% | | | (0.01 | )% | | | – | (d) | | | – | (d) | | | – | (d) |
| (f) | Portfolio turnover is calculated at the fund level. |
| (g) | Excludes option transactions. |
See accompanying notes to financial statements.
Global Resources Fund
For a capital share outstanding during the
| | | Institutional Class | |
| | | Six Months | | | Year Ended December 31, | |
| | | Ended | | | | | | | | | | | | | | | | |
| | | June 30, | | | | | | | | | | | | | | | | |
| | | 2018 | | | | | | | | | | | | | | | | |
| | | (unaudited) | | | 2017 | | | 2016 | | | 2015 | | | 2014 | | | 2013 | |
| Net asset value, beginning of period | | $ | 6.13 | | | $ | 5.25 | | | $ | 4.74 | | | $ | 6.67 | | | $ | 9.30 | | | $ | 9.74 | |
| Investment Activities | | | | | | | | | | | | | | | | | | | | | | | | |
| Net investment income* | | | 0.07 | | | | 0.14 | | | | 0.08 | | | | 0.17 | | | | 0.08 | | | | 0.07 | |
| Net realized and unrealized gain (loss) | | | (0.35 | ) | | | 0.96 | | | | 0.65 | * | | | (2.02 | )* | | | (2.71 | )* | | | (0.10 | )* |
| Total from investment activities | | | (0.28 | ) | | | 1.10 | | | | 0.73 | | | | (1.85 | ) | | | (2.63 | ) | | | (0.03 | ) |
| Distributions | | | | | | | | | | | | | | | | | | | | | | | | |
| From net investment income | | | – | | | | (0.22 | ) | | | (0.22 | ) | | | (0.08 | ) | | | – | | | | (0.41 | ) |
| Short-Term Trading Fees* | | | – | | | | – | | | | – | | | | – | | | | – | | | | 0.00 | (a) |
| Net asset value, end of period | | $ | 5.85 | | | $ | 6.13 | | | $ | 5.25 | | | $ | 4.74 | | | $ | 6.67 | | | $ | 9.30 | |
| Total Return (b) | | | (4.57 | )% | | | 20.95 | % | | | 15.43 | % | | | (27.73 | )% | | | (28.28 | )% | | | (0.15 | )% |
| Ratios to Average Net Assets: | | | | | | | | | | | | | | | | | | | | | | | | |
| Net investment income | | | 2.25 | % | | | 2.43 | % | | | 1.61 | % | | | 2.92 | % | | | 0.85 | % | | | 0.68 | % |
| Total expenses | | | 8.11 | % | | | 3.56 | % | | | 5.41 | % | | | 1.35 | % | | | 1.13 | % | | | 1.25 | % |
| Expenses waived or reimbursed (c) | | | (6.91 | )% | | | (2.46 | )% | | | (4.05 | )% | | | (0.61 | )% | | | (0.27 | )% | | | (0.22 | )% |
| Net expenses (e) | | | 1.20 | % | | | 1.10 | % | | | 1.36 | % | | | 0.74 | % | | | 0.86 | % | | | 1.03 | % |
| Portfolio turnover rate (f) | | | 55 | % | | | 131 | %(g) | | | 255 | %(g) | | | 445 | %(g) | | | 444 | %(g) | | | 138 | % |
| Net assets, end of period (in thousands) | | $ | 452 | | | $ | 518 | | | $ | 1,021 | | | $ | 1,882 | | | $ | 9,733 | | | $ | 51,122 | |
| * | Based on average shares outstanding. |
| (a) | The per share amount does not round to a full penny. |
| (b) | Assumes investment at the net asset value at the beginning of the period, reinvestment of all distributions and a complete redemption of the investment at the net asset value at the end of the period. |
| (c) | Expenses waived or reimbursed reflect reductions to total expenses, as discussed in the notes to the financial statements. These amounts would increase the net investment loss ratio or decrease the net investment income ratio, as applicable, and decrease the total returns had such reductions not occurred. |
| (e) | The net expense ratios shown above reflect expenses after waivers and reimbursements and include the effect of reductions to total expenses for any expenses offset. Expense offset arrangements reduce total expenses, as discussed in the notes to the financial statements. These amounts would decrease the net investment income (loss) ratio had such reductions not occurred. The effect of expenses offset are as follows: |
| | | Institutional Class | |
| | | Six Months | | | Year Ended December 31, | |
| | | Ended | | | | | | | | | | | | | | | | |
| | | June 30, | | | | | | | | | | | | | | | | |
| | | 2018 | | | | | | | | | | | | | | | | |
| | | (unaudited) | | | 2017 | | | 2016 | | | 2015 | | | 2014 | | | 2013 | |
| Ratios to Average Net Assets: | | | | | | | | | | | | | | | | | | |
| Expense offset | | | (0.04 | )% | | | (0.02 | )% | | | (0.01 | )% | | | – | (d) | | | – | (d) | | | – | (d) |
| (f) | Portfolio turnover is calculated at the fund level. |
| (g) | Excludes option transactions. |
(d) Effect on the expense ratio was not greater than 0.005%.
See accompanying notes to financial statements.
World Precious Minerals Fund
For a capital share outstanding during the
| | | Investor Class | |
| | | Six Months | | | Year Ended December 31, | |
| | | Ended | | | | | | | | | | | | | | | | |
| | | June 30, | | | | | | | | | | | | | | | | |
| | | 2018 | | | | | | | | | | | | | | | | |
| | | (unaudited) | | | 2017 | | | 2016 | | | 2015 | | | 2014 | | | 2013 | |
| Net asset value, beginning of period | | $ | 4.69 | | | $ | 6.35 | | | $ | 3.64 | | | $ | 4.75 | | | $ | 5.69 | | | $ | 11.70 | |
| Investment Activities | | | | | | | | | | | | | | | | | | | | | | | | |
| Net investment loss* | | | (0.02 | ) | | | (0.10 | ) | | | (0.09 | ) | | | (0.03 | ) | | | (0.06 | ) | | | (0.07 | ) |
| Net realized and unrealized gain (loss) | | | (0.87 | ) | | | (0.22 | ) | | | 2.82 | * | | | (0.72 | )* | | | (0.88 | )* | | | (5.94 | )* |
| Total from investment activities | | | (0.89 | ) | | | (0.32 | ) | | | 2.73 | | | | (0.75 | ) | | | (0.94 | ) | | | (6.01 | ) |
| Distributions | | | | | | | | | | | | | | | | | | | | | | | | |
| From net investment income | | | – | | | | (1.34 | ) | | | (0.02 | ) | | | (0.36 | ) | | | – | | | | – | |
| Short-Term Trading Fees* | | | – | | | | 0.00 | (a) | | | 0.00 | (a) | | | 0.00 | (a) | | | 0.00 | (a) | | | 0.00 | (a) |
| Net asset value, end of period | | $ | 3.80 | | | $ | 4.69 | | | $ | 6.35 | | | $ | 3.64 | | | $ | 4.75 | | | $ | 5.69 | |
| Total Return (b) | | | (18.98 | )% | | | (4.16 | )% | | | 75.08 | % | | | (15.64 | )% | | | (16.52 | )% | | | (51.37 | )% |
| Ratios to Average Net Assets: | | | | | | | | | | | | | | | | | | | | | | | | |
| Net investment loss | | | (0.95 | )% | | | (1.51 | )% | | | (1.28 | )% | | | (0.71 | )% | | | (0.91 | )% | | | (0.90 | )% |
| Total expenses | | | 1.51 | % | | | 1.84 | % | | | 1.99 | % | | | 1.96 | % | | | 1.99 | % | | | 1.85 | % |
| Expenses waived or reimbursed (c) | | | (0.02 | )% | | | (0.02 | )% | | | (0.04 | )% | | | (0.15 | )% | | | (0.03 | )% | | | (0.02 | )% |
| Net expenses (d) | | | 1.49 | % | | | 1.82 | % | | | 1.95 | % | | | 1.81 | % | | | 1.96 | % | | | 1.83 | % |
| Portfolio turnover rate (e) | | | 35 | % | | | 36 | %(f) | | | 136 | %(f) | | | 71 | %(f) | | | 61 | %(f) | | | 34 | % |
| Net assets, end of period (in thousands) | | $ | 95,842 | | | $ | 114,766 | | | $ | 137,338 | | | $ | 78,150 | | | $ | 103,413 | | | $ | 134,065 | |
| * | Based on average shares outstanding. |
| (a) | The per share amount does not round to a full penny. |
| (b) | Assumes investment at the net asset value at the beginning of the period, reinvestment of all distributions and a complete redemption of the investment at the net asset value at the end of the period. |
| (c) | Expenses waived or reimbursed reflect reductions to total expenses, as discussed in the notes to the financial statements. These amounts would increase the net investment loss ratio or decrease the net investment income ratio, as applicable, and decrease the total returns had such reductions not occurred. |
| (d) | The net expense ratios shown above reflect expenses after waivers and reimbursements and include the effect of reductions to total expenses for any expenses offset. Expense offset arrangements reduce total expenses, as discussed in the notes to the financial statements. These amounts would decrease the net investment income (loss) ratio had such reductions not occurred. The effect of expenses offset are as follows: |
| | | Investor Class | |
| | | Six Months | | | Year Ended December 31, | |
| | | Ended | | | | | | | | | | | | | | | | |
| | | June 30, | | | | | | | | | | | | | | | | |
| | | 2018 | | | | | | | | | | | | | | | | |
| | | (unaudited) | | | 2017 | | | 2016 | | | 2015 | | | 2014 | | | 2013 | |
| Ratios to Average Net Assets: | | | | | | | | | | | | | | | | | | |
| Expense offset | | | (0.02 | )% | | | (0.02 | )% | | | (0.01 | )% | | | – | (g) | | | – | (g) | | | – | (g) |
| (e) | Portfolio turnover is calculated at the fund level. |
| (f) | Excludes option transactions. |
| (g) | Effect on the expense ratio was not greater than 0.005%. |
See accompanying notes to financial statements.
World Precious Minerals Fund
For a capital share outstanding during the
| | | Institutional Class | |
| | | Six Months | | | Year Ended December 31, | |
| | | Ended | | | | | | | | | | | | | | | | |
| | | June 30, | | | | | | | | | | | | | | | | |
| | | 2018 | | | | | | | | | | | | | | | | |
| | | (unaudited) | | | 2017 | | | 2016 | | | 2015 | | | 2014 | | | 2013 | |
| Net asset value, beginning of period | | $ | 4.71 | | | $ | 6.38 | | | $ | 3.65 | | | $ | 4.78 | | | $ | 5.72 | | | $ | 11.69 | |
| Investment Activities | | | | | | | | | | | | | | | | | | | | | | | | |
| Net investment loss* | | | (0.00 | )(a) | | | (0.06 | ) | | | (0.05 | ) | | | (0.01 | ) | | | (0.05 | ) | | | (0.01 | ) |
| Net realized and unrealized gain (loss) | | | (0.88 | ) | | | (0.23 | ) | | | 2.82 | * | | | (0.72 | )* | | | (0.89 | )* | | | (5.96 | )* |
| Total from investment activities | | | (0.88 | ) | | | (0.29 | ) | | | 2.77 | | | | (0.73 | ) | | | (0.94 | ) | | | (5.97 | ) |
| Distributions | | | | | | | | | | | | | | | | | | | | | | | | |
| From net investment income | | | – | | | | (1.38 | ) | | | (0.04 | ) | | | (0.40 | ) | | | – | | | | – | |
| Short-Term Trading Fees* | | | – | | | | 0.00 | (a) | | | – | | | | – | | | | – | | | | – | |
| Net asset value, end of period | | $ | 3.83 | | | $ | 4.71 | | | $ | 6.38 | | | $ | 3.65 | | | $ | 4.78 | | | $ | 5.72 | |
| Total Return (b) | | | (18.68 | )% | | | (3.71 | )% | | | 75.97 | % | | | (15.07 | )% | | | (16.43 | )% | | | (51.07 | )% |
| Ratios to Average Net Assets: | | | | | | | | | | | | | | | | | | | | | | | | |
| Net investment loss | | | (0.21 | )% | | | (0.99 | )% | | | (0.69 | )% | | | (0.15 | )% | | | (0.71 | )% | | | (0.15 | )% |
| Total expenses | | | 2.40 | % | | | 2.21 | % | | | 2.60 | % | | | 20.51 | % | | | 4.86 | % | | | 3.30 | % |
| Expenses waived or reimbursed (c) | | | (1.65 | )% | | | (0.91 | )% | | | (1.33 | )% | | | (19.31 | )% | | | (3.23 | )% | | | (1.97 | )% |
| Net expenses (d) | | | 0.75 | % | | | 1.30 | % | | | 1.27 | % | | | 1.20 | % | | | 1.63 | % | | | 1.33 | % |
| Portfolio turnover rate (e) | | | 35 | % | | | 36 | %(f) | | | 136 | %(f) | | | 71 | %(f) | | | 61 | %(f) | | | 34 | % |
| Net assets, end of period (in thousands) | | $ | 2,246 | | | $ | 3,007 | | | $ | 3,821 | | | $ | 76 | | | $ | 154 | | | $ | 3,660 | |
| * | Based on average shares outstanding. |
| (a) | The per share amount does not round to a full penny. |
| (b) | Assumes investment at the net asset value at the beginning of the period, reinvestment of all distributions and a complete redemption of the investment at the net asset value at the end of the period. |
| (c) | Expenses waived or reimbursed reflect reductions to total expenses, as discussed in the notes to the financial statements. These amounts would increase the net investment loss ratio or decrease the net investment income ratio, as applicable, and decrease the total returns had such reductions not occurred. |
| (d) | The net expense ratios shown above reflect expenses after waivers and reimbursements and include the effect of reductions to total expenses for any expenses offset. Expense offset arrangements reduce total expenses, as discussed in the notes to the financial statements. These amounts would decrease the net investment income (loss) ratio had such reductions not occurred. The effect of expenses offset are as follows: |
| | | Institutional Class | |
| | | Six Months | | | Year Ended December 31, | |
| | | Ended | | | | | | | | | | | | | | | | |
| | | June 30, | | | | | | | | | | | | | | | | |
| | | 2018 | | | | | | | | | | | | | | | | |
| | | (unaudited) | | | 2017 | | | 2016 | | | 2015 | | | 2014 | | | 2013 | |
| Ratios to Average Net Assets: | | | | | | | | | | | | | | | | | | |
| Expense offset | | | (0.03 | )% | | | (0.02 | )% | | | (0.01 | )% | | | – | (g) | | | – | (g) | | | – | (g) |
| (e) | Portfolio turnover is calculated at the fund level. |
| (f) | Excludes option transactions. |
| (g) | Effect on the expense ratio was not greater than 0.005%. |
See accompanying notes to financial statements.
Gold and Precious Metals Fund
For a capital share outstanding during the
| | | Investor Class | |
| | | Six Months | | | Year Ended December 31, | |
| | | Ended | | | | | | | | | | | | | | | | |
| | | June 30, | | | | | | | | | | | | | | | | |
| | | 2018 | | | | | | | | | | | | | | | | |
| | | (unaudited) | | | 2017 | | | 2016 | | | 2015 | | | 2014 | | | 2013 | |
| Net asset value, beginning of period | | $ | 7.96 | | | $ | 7.04 | | | $ | 4.89 | | | $ | 5.16 | | | $ | 6.00 | | | $ | 11.78 | |
| Investment Activities | | | | | | | | | | | | | | | | | | | | | | | | |
| Net investment loss | | | (0.04 | )* | | | (0.06 | )* | | | (0.07 | ) | | | (0.04 | ) | | | (0.05 | ) | | | (0.06 | ) |
| Net realized and unrealized gain (loss) | | | (0.28 | ) | | | 0.98 | | | | 2.28 | | | | (0.21 | ) | | | (0.79 | ) | | | (5.72 | ) |
| Total from investment activities | | | (0.32 | ) | | | 0.92 | | | | 2.21 | | | | (0.25 | ) | | | (0.84 | ) | | | (5.78 | ) |
| Distributions | | | | | | | | | | | | | | | | | | | | | | | | |
| From net investment income | | | – | | | | – | | | | (0.06 | ) | | | (0.02 | ) | | | – | | | | – | |
| Short-Term Trading Fees* | | | – | | | | 0.00 | (a) | | | (0.00 | )(a) | | | (0.00 | )(a) | | | (0.00 | )(a) | | | (0.00 | )(a) |
| Net asset value, end of period | | $ | 7.64 | | | $ | 7.96 | | | $ | 7.04 | | | $ | 4.89 | | | $ | 5.16 | | | $ | 6.00 | |
| Total Return (b) | | | (4.02 | )% | | | 13.07 | % | | | 45.36 | % | | | (4.78 | )% | | | (14.00 | )% | | | (49.07 | )% |
| Ratios to Average Net Assets: | | | | | | | | | | | | | | | | | | | | | | | | |
| Net investment loss | | | (1.08 | )% | | | (0.84 | )% | | | (1.02 | )% | | | (0.83 | )% | | | (0.67 | )% | | | (0.48 | )% |
| Total expenses | | | 1.73 | % | | | 1.68 | % | | | 1.73 | % | | | 2.13 | % | | | 1.93 | % | | | 2.12 | % |
| Expenses waived or reimbursed (c) | | | (0.03 | )% | | | (0.03 | )% | | | (0.02 | )% | | | (0.08 | )% | | | (0.05 | )% | | | (0.06 | )% |
| Net expenses (d) | | | 1.70 | % | | | 1.65 | % | | | 1.71 | % | | | 2.05 | % | | | 1.88 | % | | | 2.06 | % |
| Portfolio turnover rate | | | 41 | % | | | 67 | %(e) | | | 181 | %(e) | | | 106 | %(e) | | | 99 | %(e) | | | 64 | % |
| Net assets, end of period (in thousands) | | $ | 91,486 | | | $ | 100,740 | | | $ | 93,988 | | | $ | 58,298 | | | $ | 62,777 | | | $ | 74,627 | |
| * | Based on average shares outstanding. |
| (a) | The per share amount does not round to a full penny. |
| (b) | Assumes investment at the net asset value at the beginning of the period, reinvestment of all distributions and a complete redemption of the investment at the net asset value at the end of the period. |
| (c) | Expenses waived or reimbursed reflect reductions to total expenses, as discussed in the notes to the financial statements. These amounts would increase the net investment loss ratio or decrease the net investment income ratio, as applicable, and decrease the total returns had such reductions not occurred. |
| (d) | The net expense ratios shown above reflect expenses after waivers and reimbursements and include the effect of reductions to total expenses for any expenses offset. Expense offset arrangements reduce total expenses, as discussed in the notes to the financial statements. These amounts would decrease the net investment income (loss) ratio had such reductions not occurred. The effect of expenses offset are as follows: |
| | | Investor Class | |
| | | Six Months | | | Year Ended December 31, | |
| | | Ended | | | | | | | | | | | | | | | | |
| | | June 30, | | | | | | | | | | | | | | | | |
| | | 2018 | | | | | | | | | | | | | | | | |
| | | (unaudited) | | | 2017 | | | 2016 | | | 2015 | | | 2014 | | | 2013 | |
| Ratios to Average Net Assets: | | | | | | | | | | | | | | | | | | |
| Expense offset | | | (0.03 | )% | | | (0.03 | )% | | | (0.01 | )% | | | – | (f) | | | – | (f) | | | – | (f) |
| (e) | Excludes option transactions. |
| (f) | Effect on the expense ratio was not greater than 0.005%. |
See accompanying notes to financial statements.
Emerging Europe Fund
For a capital share outstanding during the
| | | Investor Class | |
| | | Six Months | | | Year Ended December 31, | |
| | | Ended | | | | | | | | | | | | | | | | |
| | | June 30, | | | | | | | | | | | | | | | | |
| | | 2018 | | | | | | | | | | | | | | | | |
| | | (unaudited) | | | 2017 | | | 2016 | | | 2015 | | | 2014 | | | 2013 | |
| Net asset value, beginning of period | | $ | 7.29 | | | $ | 5.94 | | | $ | 5.20 | | | $ | 6.56 | | | $ | 8.82 | | | $ | 9.23 | |
| Investment Activities | | | | | | | | | | | | | | | | | | | | | | | | |
| Net investment income | | | 0.08 | * | | | 0.08 | * | | | 0.07 | | | | 0.04 | | | | 0.06 | | | | 0.19 | |
| Net realized and unrealized gain (loss) | | | (0.60 | ) | | | 1.27 | | | | 0.67 | | | | (1.40 | ) | | | (2.11 | ) | | | (0.46 | ) |
| Total from investment activities | | | (0.52 | ) | | | 1.35 | | | | 0.74 | | | | (1.36 | ) | | | (2.05 | ) | | | (0.27 | ) |
| Distributions | | | | | | | | | | | | | | | | | | | | | | | | |
| From net investment income | | | – | | | | – | | | | – | | | | – | | | | (0.21 | ) | | | (0.14 | ) |
| Short-Term Trading Fees* | | | – | | | | 0.00 | (a) | | | 0.00 | (a) | | | 0.00 | (a) | | | 0.00 | (a) | | | 0.00 | (a) |
| Net asset value, end of period | | $ | 6.77 | | | $ | 7.29 | | | $ | 5.94 | | | $ | 5.20 | | | $ | 6.56 | | | $ | 8.82 | |
| Total Return (b) | | | (7.13 | )% | | | 22.73 | % | | | 14.23 | % | | | (20.73 | )% | | | (23.22 | )% | | | (2.93 | )% |
| Ratios to Average Net Assets: | | | | | | | | | | | | | | | | | | | | | | | | |
| Net investment income | | | 2.09 | % | | | 1.26 | % | | | 1.19 | % | | | 0.63 | % | | | 0.23 | % | | | 1.59 | % |
| Total expenses | | | 2.37 | % | | | 2.32 | % | | | 2.31 | % | | | 2.60 | % | | | 2.28 | % | | | 2.13 | % |
| Expenses waived or reimbursed (c) | | | (0.03 | )% | | | (0.02 | )% | | | – | (f) | | | – | | | | – | | | | – | |
| Net expenses (d) | | | 2.34 | % | | | 2.30 | % | | | 2.31 | % | | | 2.60 | % | | | 2.28 | % | | | 2.13 | % |
| Portfolio turnover rate | | | 46 | % | | | 97 | %(e) | | | 164 | %(e) | | | 137 | %(e) | | | 93 | %(e) | | | 74 | % |
| Net assets, end of period (in thousands) | | $ | 38,704 | | | $ | 45,302 | | | $ | 42,273 | | | $ | 44,666 | | | $ | 69,066 | | | $ | 122,570 | |
| * | Based on average shares outstanding. |
| (a) | The per share amount does not round to a full penny. |
| (b) | Assumes investment at the net asset value at the beginning of the period, reinvestment of all distributions and a complete redemption of the investment at the net asset value at the end of the period. |
| (c) | Expenses waived or reimbursed reflect reductions to total expenses, as discussed in the notes to the financial statements. These amounts would increase the net investment loss ratio or decrease the net investment income ratio, as applicable, and decrease the total returns had such reductions not occurred. |
| (d) | The net expense ratios shown above reflect expenses after waivers and reimbursements and include the effect of reductions to total expenses for any expenses offset. Expense offset arrangements reduce total expenses, as discussed in the notes to the financial statements. These amounts would decrease the net investment income (loss) ratio had such reductions not occurred. The effect of expenses offset are as follows: |
| | | Investor Class | |
| | | Six Months | | | Year Ended December 31, | |
| | | Ended | | | | | | | | | | | | | | | | |
| | | June 30, | | | | | | | | | | | | | | | | |
| | | 2018 | | | | | | | | | | | | | | | | |
| | | (unaudited) | | | 2017 | | | 2016 | | | 2015 | | | 2014 | | | 2013 | |
| Ratios to Average Net Assets: | | | | | | | | | | | | | | | | | | |
| Expense offset | | | (0.03 | )% | | | (0.02 | )% | | | – | (f) | | | – | (f) | | | – | (f) | | | – | (f) |
| (e) | Excludes option transactions. |
| (f) | Effect on the expense ratio was not greater than 0.005%. |
See accompanying notes to financial statements.
China Region Fund
For a capital share outstanding during the
| | | Investor Class | |
| | | Six Months | | | Year Ended December 31, | |
| | | Ended | | | | | | | | | | | | | | | | |
| | | June 30, | | | | | | | | | | | | | | | | |
| | | 2018 | | | | | | | | | | | | | | | | |
| | | (unaudited) | | | 2017 | | | 2016 | | | 2015 | | | 2014 | | | 2013 | |
| Net asset value, beginning of period | | $ | 11.53 | | | $ | 7.32 | | | $ | 7.41 | | | $ | 8.20 | | | $ | 8.28 | | | $ | 7.61 | |
| Investment Activities | | | | | | | | | | | | | | | | | | | | | | | | |
| Net investment income (loss) | | | 0.08 | * | | | (0.06 | )* | | | 0.01 | | | | 0.02 | | | | 0.00 | (a) | | | (0.01 | ) |
| Net realized and unrealized gain (loss) | | | (0.90 | ) | | | 4.28 | | | | (0.09 | ) | | | (0.72 | ) | | | (0.08 | ) | | | 0.70 | |
| Total from investment activities | | | (0.82 | ) | | | 4.22 | | | | (0.08 | ) | | | (0.70 | ) | | | (0.08 | ) | | | 0.69 | |
| Distributions | | | | | | | | | | | | | | | | | | | | | | | | |
| From net investment income | | | – | | | | (0.01 | ) | | | (0.01 | ) | | | (0.09 | ) | | | – | | | | (0.02 | ) |
| Short-Term Trading Fees* | | | – | | | | – | | | | 0.00 | (a) | | | 0.00 | (a) | | | 0.00 | (a) | | | 0.00 | (a) |
| Net asset value, end of period | | $ | 10.71 | | | $ | 11.53 | | | $ | 7.32 | | | $ | 7.41 | | | $ | 8.20 | | | $ | 8.28 | |
| Total Return (b) | | | (7.11 | )% | | | 57.67 | % | | | (1.05 | )% | | | (8.60 | )% | | | (0.97 | )% | | | 9.07 | % |
| Ratios to Average Net Assets: | | | | | | | | | | | | | | | | | | | | | | | | |
| Net investment income (loss) | | | 1.41 | % | | | (0.60 | )% | | | 0.12 | % | | | 0.24 | % | | | 0.08 | % | | | (0.12 | )% |
| Total expenses | | | 2.60 | % | | | 2.60 | % | | | 2.74 | % | | | 3.03 | % | | | 2.94 | % | | | 2.75 | % |
| Expenses waived or reimbursed (c) | | | (0.03 | )% | | | (0.09 | )% | | | (0.38 | )% | | | (0.51 | )% | | | (0.43 | )% | | | (0.37 | )% |
| Net expenses (d) | | | 2.57 | % | | | 2.51 | % | | | 2.36 | % | | | 2.52 | % | | | 2.51 | % | | | 2.38 | % |
| Portfolio turnover rate | | | 34 | % | | | 102 | %(e) | | | 165 | %(e) | | | 210 | %(e) | | | 235 | %(e) | | | 201 | % |
| Net assets, end of period (in thousands) | | $ | 21,593 | | | $ | 29,775 | | | $ | 16,510 | | | $ | 16,183 | | | $ | 21,008 | | | $ | 26,386 | |
| * | Based on average shares outstanding. |
| (a) | The per share amount does not round to a full penny. |
| (b) | Assumes investment at the net asset value at the beginning of the period, reinvestment of all distributions and a complete redemption of the investment at the net asset value at the end of the period. |
| (c) | Expenses waived or reimbursed reflect reductions to total expenses, as discussed in the notes to the financial statements. These amounts would increase the net investment loss ratio or decrease the net investment income ratio, as applicable, and decrease the total returns had such reductions not occurred. |
| (d) | The net expense ratios shown above reflect expenses after waivers and reimbursements and include the effect of reductions to total expenses for any expenses offset. Expense offset arrangements reduce total expenses, as discussed in the notes to the financial statements. These amounts would decrease the net investment income (loss) ratio had such reductions not occurred. The effect of expenses offset are as follows: |
| | | | Investor Class | |
| | | | Six Months | | | Year Ended December 31, | |
| | | | Ended | | | | | | | | | | | | | | | | |
| | | | June 30, | | | | | | | | | | | | | | | | |
| | | | 2018 | | | | | | | | | | | | | | | | |
| | | | (unaudited) | | | 2017 | | | 2016 | | | 2015 | | | 2014 | | | 2013 | |
| | Ratios to Average Net Assets: | | | | | | | | | | | | | | | | | | |
| Expense offset | | | (0.02 | )% | | | (0.05 | )% | | | (0.01 | )% | | | – | (f) | | | – | (f) | | | – | (f) |
| (e) | Excludes option transactions. |
| (f) | Effect on the expense ratio was not greater than 0.005%. |
See accompanying notes to financial statements.
| Additional Information (unaudited) |
Proxy Voting
A description of the policies and procedures that the Funds use to determine how to vote proxies relating to portfolio securities is available without charge, upon request, by calling 1-800-US-FUNDS (1-800-873-8637). It also appears in the Funds’ statement of additional information (Form 485B), which can be found on the SEC’s website at www.sec.gov.
Information regarding how the Funds voted proxies relating to portfolio securities during the most recent 12-month period ended June 30 is available without charge, upon request, by calling 1-800-US-FUNDS (1-800-873-8637) or accessing the Funds’ Form N-PX on the SEC’s website at www.sec.gov.
Availability of Quarterly Portfolio Schedules
The Funds provide complete lists of holdings four times in each fiscal year, at the quarter-ends. For the second and fourth quarters, the lists appear in the Fund’s semi-annual and annual reports to shareholders. For the first and third quarters, the Funds file the lists with the SEC on Form N-Q. The Funds’ Form N-Qs are available on the SEC’s website at http://www.sec. gov. The Funds’ Forms N-Q may also be reviewed and copied at the SEC’s Public Room in Washington D.C. Information on the operation of the Public Reference Room may be obtained by calling 1-800-SEC-0330.
| Expense Example (unaudited) | June 30, 2018 |
As a shareholder of the funds, you incur two types of costs: (1) transaction costs, including short-term trading fees and exchange fees; and (2) ongoing costs, including management fees, distribution plan fees, shareholder reports (like this one), and other fund expenses. This example is intended to help you understand your ongoing costs (in dollars) of investing in other mutual funds.
The example is based on an investment of $1,000 invested at the beginning of the period and held for the entire period (January 1, 2018 to June 30, 2018) as indicated below.
| ● | Actual Expenses. The first line of the following table for each fund provides information about actual account values and actual expenses. You may use the information in this line, together with the amount you invested, to estimate the expenses you paid over the period. Simply divide your account value by $1,000 (for example, an $8,600 account value divided by $1,000 = 8.6), then multiply the result by the number in the first line under the heading “Expenses Paid During Period” to estimate the expenses you paid on your account during this period. |
| ● | Hypothetical Example for Comparison Purposes. The second line of the following table for each fund provides information about hypothetical account values and hypothetical expenses based on the fund’s actual expense ratio and an assumed rate of return of 5 percent per year before expenses, which is not the fund’s actual return. The hypothetical account values and expenses may not be used to estimate the actual ending account balance or expenses you paid for the period. You may use this information to compare the ongoing costs of investing in these funds and other funds. To do so, compare this 5 percent hypothetical example with the 5 percent hypothetical examples that appear in the shareholder reports of other funds. |
Please note that the expenses shown in the table are meant to highlight your ongoing costs only and do not reflect any direct or transactional costs, such as small account, exchange or short-term trading fees. Therefore, the second line of the table is useful in comparing ongoing costs only, and will not help you determine the relative total costs of owning different funds. In addition, if these direct or transactional costs were included, your costs would have been higher.
| Expense Example (unaudited) | June 30, 2018 |
| | | Beginning | | | Ending | | | Expenses | |
| | | Account Value | | | Account Value | | | Paid During | |
| | | January 1, 2018 | | | June 30, 2018 | | | Period* | |
| U.S. Government Securities Ultra-Short Bond Fund | | | | | | | | | | | | |
| Based on Actual Fund Return | | $ | 1,000.00 | | | $ | 1,004.97 | | | $ | 2.24 | |
| Based on Hypothetical 5% Yearly Return | | $ | 1,000.00 | | | $ | 1,022.56 | | | $ | 2.26 | |
| Near-Term Tax Free Fund | | | | | | | | | | | | |
| Based on Actual Fund Return | | $ | 1,000.00 | | | $ | 1,001.33 | | | $ | 2.23 | |
| Based on Hypothetical 5% Yearly Return | | $ | 1,000.00 | | | $ | 1,022.56 | | | $ | 2.26 | |
| All American Equity Fund | | | | | | | | | | | | |
| Based on Actual Fund Return | | $ | 1,000.00 | | | $ | 1,000.00 | | | $ | 8.58 | |
| Based on Hypothetical 5% Yearly Return | | $ | 1,000.00 | | | $ | 1,016.22 | | | $ | 8.65 | |
| Holmes Macro Trends Fund | | | | | | | | | | | | |
| Based on Actual Fund Return | | $ | 1,000.00 | | | $ | 1,000.01 | | | $ | 8.78 | |
| Based on Hypothetical 5% Yearly Return | | $ | 1,000.00 | | | $ | 1,016.02 | | | $ | 8.85 | |
| Global Resources Fund Investor Class | | | | | | | | | | | | |
| Based on Actual Fund Return | | $ | 1,000.00 | | | $ | 1,000.00 | | | $ | 7.64 | |
| Based on Hypothetical 5% Yearly Return | | $ | 1,000.00 | | | $ | 1,017.16 | | | $ | 7.70 | |
| Global Resources Fund Institutional Class | | | | | | | | | | | | |
| Based on Actual Fund Return | | $ | 1,000.00 | | | $ | 1,000.00 | | | $ | 5.95 | |
| Based on Hypothetical 5% Yearly Return | | $ | 1,000.00 | | | $ | 1,018.84 | | | $ | 6.01 | |
| World Precious Minerals Fund Investor Class | | | | | | | | | | | | |
| Based on Actual Fund Return | | $ | 1,000.00 | | | $ | 1,000.00 | | | $ | 7.39 | |
| Based on Hypothetical 5% Yearly Return | | $ | 1,000.00 | | | $ | 1,017.41 | | | $ | 7.45 | |
| World Precious Minerals Fund Institutional Class | | | | | | | | | | | | |
| Based on Actual Fund Return | | $ | 1,000.00 | | | $ | 1,000.00 | | | $ | 3.72 | |
| Based on Hypothetical 5% Yearly Return | | $ | 1,000.00 | | | $ | 1,021.08 | | | $ | 3.76 | |
| Gold and Precious Metals Fund | | | | | | | | | | | | |
| Based on Actual Fund Return | | $ | 1,000.00 | | | $ | 1,000.00 | | | $ | 8.43 | |
| Based on Hypothetical 5% Yearly Return | | $ | 1,000.00 | | | $ | 1,016.36 | | | $ | 8.50 | |
| Emerging Europe Fund | | | | | | | | | | | | |
| Based on Actual Fund Return | | $ | 1,000.00 | | | $ | 928.67 | | | $ | 11.19 | |
| Based on Hypothetical 5% Yearly Return | | $ | 1,000.00 | | | $ | 1,013.19 | | | $ | 11.68 | |
| China Region Fund | | | | | | | | | | | | |
| Based on Actual Fund Return | | $ | 1,000.00 | | | $ | 928.88 | | | $ | 12.29 | |
| Based on Hypothetical 5% Yearly Return | | $ | 1,000.00 | | | $ | 1,012.05 | | | $ | 12.82 | |
| * | These calculations are based on expenses incurred in the most recent fiscal half-year. The Funds' Investor Class' annualized expense ratios (after reimbursements and offsets) for the six month period ended June 30, 2018, were 0.45%, 0.45%, 1.73%, 1.77%, 1.54%, 1.49%, 1.70%, 2.34% and 2.57%, respectively, for the U.S. Government Securities Ultra-Short Bond, Near-Term Tax Free, All American Equity, Holmes Macro Trends, Global Resources, World Precious Minerals, Gold and Precious Metals, Emerging Europe and China Region Funds. The funds' Institutional Class' annualized expense ratios (after reimbursements and offsets) for the six month period ended June 30, 2018, were 1.20% and 0.75%, respectively, for the Global Resources and World Precious Minerals Funds. The dollar amounts shown as "Expenses Paid" are equal to the annualized expense ratio multiplied by the average account value over the period, multiplied by 181, the number of days in the period, then divided by 365 days in the current fiscal year. |
Rev. 08/2016
| FACTS | WHAT DOES U.S. GLOBAL INVESTORS DO WITH YOUR PERSONAL INFORMATION? |
| | |
| Why? | Financial companies choose how they share your personal information. Federal law gives consumers the right to limit some but not all sharing. Federal law also requires us to tell you how we collect, share, and protect your personal information. Please read this notice carefully to understand what we do. |
| What? | The types of personal information we collect and share depend on the product or service you have with us. This information can include: |
| | ● Social Security number and account balances ● retirement assets and checking account information ● account transactions and wire transfer instructions |
| | When you are no longer our customer, we continue to share your information as described in this notice. |
| How? | All financial companies need to share customers’ personal information to run their everyday business. In the section below, we list the reasons financial companies can share their customers’ personal information; the reasons U.S. Global Investors chooses to share; and whether you can limit this sharing. |
| Reasons we can share your personal information | Does U.S. Global
Investors share? | Can you limit
this sharing? |
| For our everyday business purposes — Such as to process your transactions, maintain your account(s), respond to court orders and legal investigations, or report to credit bureaus | Yes | No |
| For our marketing purposes — to offer our products and services to you | Yes | No |
| For joint marketing with other financial companies | No | We don’t share |
| For our affiliates’ everyday business purposes — information about your transactions and experiences | No | We don’t share |
| For our affiliates’ everyday business purposes — information about your creditworthiness | No | We don’t share |
| For nonaffiliates to market to you | No | We don’t share |
| Questions? | Call 1-800-US-FUNDS (1-800-873-8637) or go to www.usfunds.com |
| Who we are | |
| Who is providing this notice? | U.S. Global Investors, Inc. and U.S. Global Investors Funds (collectively known as U.S. Global Investors) |
| What we do | |
| How does U.S. Global Investors protect my personal information? | To protect your personal information from unauthorized access and use, we use security measures that comply with federal law. These measures include computer safeguards and secured files and buildings. |
How does
U.S. Global
Investors collect
my personal
information? | We collect your personal information, for example, when you
● open an account or provide account information ● make deposits or withdrawals from your account ● make a wire transfer ● tell us where to send the money We also collect your personal information from other companies |
| Why can’t I limit all sharing? | Federal law gives you the right to limit only ● sharing for affiliates’ everyday business purposes — information about your creditworthiness ● affiliates from using your information to market to you ● sharing for nonaffiliates to market to you State laws and individual companies may give you additional rights to limit sharing. |
| Definitions | |
| Affiliates | Companies related by common ownership or control. They can be financial and nonfinancial companies. |
| | ● Our affiliates include U.S. Global Investors, Inc. and U.S. Global Investors Funds. |
| Nonaffiliates | Companies not related by common ownership or control. They can be financial and nonfinancial companies. |
| | ● Nonaffiliates we share personal information with include companies that perform marketing on our behalf, printing and mailing companies, and companies that service your account(s). |
| Joint marketing | A formal agreement between nonaffiliated financial companies that together market financial products or services to you. |
| | ● U.S. Global Investors doesn’t jointly market. |

Atlantic Fund Services
3 Canal Plaza, Suite 600
Portland, ME
04101
| Want to reduce paper waste? You can receive this report and other important documents electronically. Please visit www.usfunds.com and sign up at Access My Account. If you need further assistance, please call us at 800-873-8637. |
ITEM 2. CODE OF ETHICS.
Not applicable.
ITEM 3. AUDIT COMMITTEE FINANCIAL EXPERT.
Not applicable.
ITEM 4. PRINCIPAL ACCOUNTANT FEES AND SERVICES.
Not applicable.
ITEM 5. AUDIT COMMITTEE OF LISTED REGISTRANTS.
Not applicable.
ITEM 6. INVESTMENTS.
| (a) | Included as part of report to shareholders under Item 1. |
ITEM 7. DISCLOSURE OF PROXY VOTING POLICIES AND PROCEDURES FOR CLOSED-END
MANAGEMENT INVESTMENT COMPANIES.
Not applicable.
ITEM 8. PORTFOLIO MANAGERS OF CLOSED-END MANAGEMENT INVESTMENT COMPANIES.
Not applicable.
ITEM 9. PURCHASES OF EQUITY SECURITIES BY CLOSED-END MANAGEMENT INVESTMENT COMPANY AND AFFILIATED PURCHASERS.
Not applicable.
ITEM 10. SUBMISSION OF MATTERS TO A VOTE OF SECURITY HOLDERS
The Registrant does not accept nominees to the board of trustees from shareholders.
ITEM 11. CONTROLS AND PROCEDURES
(a) The Registrant's Principal Executive Officer and Principal Financial Officer have concluded that the Registrant's disclosure controls and procedures (as defined in Rule 30a-3(c) under the Act are effective, based on their evaluation of the controls and procedures required by Rule 30a-3(b) under the Act and Rules 13a-15(b) or 15d-15(b) under the Securities Exchange Act of 1934, as of a date within 90 days of the filing date of this report.
(b) There were no changes in the Registrant's internal control over financial reporting (as defined in
Rule 30a-3(d) under the Act) that occurred during the second fiscal quarter of the period covered by this report that have materially affected, or are reasonably likely to materially affect, the Registrant's internal control over financial reporting.
ITEM 12. DISCLOSURE OF SECURITIES LENDING ACTIVITIES FOR CLOSED-END MANAGEMENT INVESTMENT COMPANIES
Not applicable.
ITEM 13. EXHIBITS.
(a)(1) Not applicable.
(a)(2) Certifications pursuant to Rule 30a-2(a) of the Act, and Section 302 of the Sarbanes-Oxley Act of 2002. (Exhibits filed herewith)
(a)(3) Not applicable.
(b) Certifications pursuant to Rule 30a-2(b) of the Act, and Section 906 of the Sarbanes-Oxley Act of 2002. (Exhibit filed herewith)
SIGNATURES
Pursuant to the requirements of the Securities Exchange Act of 1934 and the Investment Company Act of 1940, the Registrant has duly caused this report to be signed on its behalf by the undersigned, thereunto duly authorized.
Registrant U.S. Global Investors Funds
By /s/ Jessica Chase
Jessica Chase, Principal Executive Officer
Date August 28, 2018
Pursuant to the requirements of the Securities Exchange Act of 1934 and the Investment Company Act of 1940, this report has been signed below by the following persons on behalf of the Registrant and in the capacities and on the dates indicated.
By /s/ Jessica Chase
Jessica Chase, Principal Executive Officer
Date August 28, 2018
By /s/ Karen Shaw
Karen Shaw, Principal Financial Officer
Date August 28, 2018