UNITED STATES
SECURITIES AND EXCHANGE COMMISSION
Washington, D.C. 20549
FORM N-CSR
CERTIFIED SHAREHOLDER REPORT OF REGISTERED
MANAGEMENT INVESTMENT COMPANIES
Investment Company Act file number | 811-1800 |
|
U.S. GLOBAL INVESTORS FUNDS |
(Exact name of registrant as specified in charter) |
|
7900 CALLAGHAN ROAD SAN ANTONIO, TX | | 78229 |
(Address of principal executive offices) | | (Zip code) |
|
SUSAN B. MCGEE, ESQ. 7900 CALLAGHAN ROAD SAN ANTONIO, TX 78229 |
(Name and address of agent for service) |
|
Registrant’s telephone number, including area code: | 210-308-1234 | |
|
Date of fiscal year end: | DECEMBER 31, 2015 | |
|
Date of reporting period: | JUNE 30, 2015 | |
| | | | | | | | |
ITEM 1. REPORTS TO STOCKHOLDERS.
U.S. Global Investors Funds
Semi-Annual Report
June 30, 2015

U.S. Global Investors Funds
Semi-Annual Report
June 30, 2015
(unaudited)
Table of Contents
Message to Shareholders | 1 |
| |
Portfolio of Investments | 2 |
| |
Notes to Portfolios of Investments | 61 |
| |
Statements of Assets and Liabilities | 72 |
| |
Statements of Operations | 76 |
| |
Statements of Changes in Net Assets | 80 |
| |
Notes to Financial Statements | 86 |
| |
Financial Highlights | 102 |
| |
Additional Information | 113 |
| |
Expense Example | 114 |
| |
Privacy Policy | |
Nasdaq Symbols
U.S. Global Investors Funds
Investor Class
U.S. Government Securities Ultra-Short Bond Fund | | UGSDX |
| | |
Near-Term Tax Free Fund | | NEARX |
| | |
All American Equity Fund | | GBTFX |
| | |
Holmes Macro Trends Fund | | MEGAX |
| | |
Global Resources Fund | | PSPFX |
| | |
World Precious Minerals Fund | | UNWPX |
| | |
Gold and Precious Metals Fund | | USERX |
| | |
Emerging Europe Fund | | EUROX |
| | |
China Region Fund | | USCOX |
Institutional Class
Global Resources Fund | | PIPFX |
| | |
World Precious Minerals Fund | | UNWIX |
| | |
Gold and Precious Metals Fund* | | USEIX |
| | |
Emerging Europe Fund* | | EURIX |
* The Institutional Class shares of the Gold and Precious Metals and Emerging Europe Funds have not commenced operations and currently are closed to investors. A notice will be issued when each class commences operations and opens to investors.

Fund Services, LLC
PO Box 701
Milwaukee, WI
53201-0701
Tel 1.800.US.FUNDS
www.usfunds.com
U.S. Global Investors Funds
Dear Fellow Shareholder,

Did you know? The best way to receive timely updates on the events that impact your investments is to subscribe to our free e-newsletter, the Investor Alert.
With a balanced analysis of the markets over the week, the Investor Alert is written for you by the investment team with a special commentary from me.
There’s no need to wait for dated publications like the Semi-Annual Report. Your time is important, so read the newsletter awarded the Best Electronic Newsletter by the Mutual Fund Education Alliance! Sign up at www.usfunds.com/subscribe.
While you are visiting our website, www.usfunds.com, be sure to take a look at additional resources, prepared especially for our fund shareholders:
· My CEO Blog, Frank Talk, where I comment on current market topics
· Monthly fund commentaries, straight from the portfolio managers
· Up-to-date fund performance, including quarterly performance charts
· The Shareholder Report magazine, awarded the Best Shareholder Magazine for eight years!
We hope you enjoy all the resources at your fingertips.
Thank you for investing in U.S. Global Investors Funds!
Happy Investing,

Frank Holmes
CEO and Chief Investment Officer
U.S. Global Investors, Inc.
1
U.S. Government Securities Ultra-Short Bond Fund
Portfolio of Investments (unaudited) | | June 30, 2015 |
| | Coupon
Rate % | | Maturity
Date | | Principal
Amount | | Value | |
| | | | | | | | | |
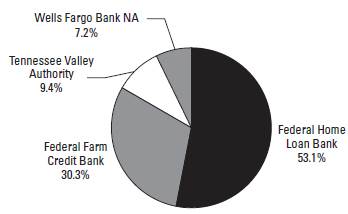
United States Government and Agency Obligations 92.68% | | | | | | | | | |
| | | | | | | | | |
Federal Farm Credit Bank 30.25% | | | | | | | | | |
Fixed Rates: | | | | | | | | | |
| | 1.93 | | 12/02/19 | | $ | 3,984,000 | | $ | 4,003,048 | |
Variable Rates: | | | | | | | | | |
| | 0.14 | | 07/08/16 | | 2,000,000 | | 1,999,372 | |
| | 0.15 | | 01/30/17 | | 1,650,000 | | 1,649,733 | |
| | 0.18 | | 04/27/17 | | 10,000,000 | | 9,994,640 | |
| | | | | | | | 17,646,793 | |
| | | | | | | | | |
Federal Home Loan Bank 53.01% | | | | | | | | | |
Discount Notes: | | | | | | | | | |
Yield | | 0.13 | | 08/19/15 | | 1,000,000 | | 999,959 | |
Fixed Rates: | | | | | | | | | |
| | 2.88 | | 09/11/15 | | 1,000,000 | | 1,005,083 | |
| | 1.10 | | 12/22/16 | | 10,000,000 | | 10,062,709 | |
| | 5.13 | | 03/10/17 | | 1,000,000 | | 1,074,607 | |
| | 0.88 | | 09/27/17 | | 3,000,000 | | 3,003,192 | |
| | 1.13 | | 03/29/18 | | 750,000 | | 752,862 | |
| | 0.75 | | 06/29/18 | | 5,000,000 | | 5,002,820 | |
| | 1.70 | | 07/26/18 | | 3,000,000 | | 3,021,570 | |
| | 1.50 | | 03/08/19 | | 4,000,000 | | 4,023,916 | |
| | 1.22 | | 04/11/19 | | 2,000,000 | | 1,971,078 | |
| | | | | | | | 30,917,796 | |
| | | | | | | | | |
Tennessee Valley Authority 9.42% | | | | | | | | | |
Fixed Rates: | | | | | | | | | |
| | 6.25 | | 12/15/17 | | 2,930,000 | | 3,302,901 | |
| | 1.75 | | 10/15/18 | | 2,174,000 | | 2,194,010 | |
| | | | | | | | 5,496,911 | |
| | | | | | | | | |
Total United States Government and Agency Obligations | | | | | | | | | |
(cost $53,891,692) | | | | | | | | 54,061,500 | |
| | | | | | | | | | | |
See notes to portfolios of investments and notes to financial statements.
2
U.S. Government Securities Ultra-Short Bond Fund
Portfolio of Investments (unaudited) | | June 30, 2015 |
| | Coupon
Rate % | | Maturity
Date | | Principal
Amount | | Value | |
Overnight Cash Deposit 7.18% | | | | | | | | | |
| | | | | | | | | |
Wells Fargo Bank NA | | | | | | | | | |
(cost $4,190,186) | | 0.03 | | 07/01/15 | | $ | 4,190,186 | | $ | 4,190,186 | |
| | | | | | | | | |
Total Investments 99.86% | | | | | | | | | |
(cost $58,081,878) | | | | | | | | 58,251,686 | |
Other assets and liabilities, net 0.14% | | | | | | | | 80,117 | |
| | | | | | | | | |
Net Assets 100.0% | | | | | | | | $ | 58,331,803 | |
| | | | | | | | | | | |
Portfolio Allocation by Issuer | | June 30, 2015 |
Based on Total Investments | |
Portfolio Allocation by Maturity | | June 30, 2015 |
1 - 3 Months | | $ | 6,195,228 | | 10.6 | % |
1 - 3 Years | | 36,842,836 | | 63.3 | % |
3 - 5 Years | | 15,213,622 | | 26.1 | % |
| | $ | 58,251,686 | | 100.0 | % |
See notes to portfolios of investments and notes to financial statements.
3
Near-Term Tax Free Fund
Portfolio of Investments (unaudited) | | June 30, 2015 |
| | Coupon
Rate % | | Maturity
Date | | Principal
Amount | | Value | |
Municipal Bonds 96.64% | | | | | | | | | |
| | | | | | | | | |
Alabama 2.31% | | | | | | | | | |
Alabama Public School & College Authority | | 5.00 | | 12/01/16 | | $ | 290,000 | | $ | 308,090 | |
Bessemer, Alabama Electric Revenue, Refunding | | 3.10 | | 12/01/21 | | 100,000 | | 103,886 | |
Bessemer, Alabama Water Revenue | | 4.00 | | 01/01/16 | | 500,000 | | 502,440 | |
Huntsville City, Alabama Electric System Revenue | | 4.00 | | 12/01/16 | | 60,000 | | 62,906 | |
Jasper Alabama Water Works & Sewer Board, Inc., Utilities Revenue, Series A | | 3.00 | | 06/01/16 | | 90,000 | | 92,016 | |
Limestone County, Water & Sewer Authority | | 2.25 | | 12/01/21 | | 365,000 | | 357,507 | |
Mobile Alabama, Refunding, Series B | | 5.00 | | 02/15/17 | | 45,000 | | 48,127 | |
University of Alabama at Birmingham, Hospital Revenue, Series A | | 5.00 | | 09/01/15 | | 600,000 | | 604,488 | |
| | | | | | | | 2,079,460 | |
| | | | | | | | | |
Alaska 0.39% | | | | | | | | | |
Alaska Municipal Bond Bank Authority, Unrefunded, Series A-2015 | | 4.00 | | 02/01/16 | | 125,000 | | 127,680 | |
Alaska Municipal Bond Bank Authority, Prerefunded, Series A-2015 | | 4.00 | | 02/01/16 | | 70,000 | | 71,485 | |
Alaska Municipal Bond Bank Authority, Prefunded, Series A | | 4.00 | | 02/01/16 | | 105,000 | | 107,227 | |
Valdez Alaska, School District, GO Unlimited | | 4.00 | | 06/30/17 | | 40,000 | | 42,278 | |
| | | | | | | | 348,670 | |
| | | | | | | | | |
Arizona 2.11% | | | | | | | | | |
Arizona Board of Regents Certificates of Participation, Series B | | 4.50 | | 06/01/16 | | 200,000 | | 207,178 | |
Arizona State School Facilities Board Certificates of Participation, Series A-1 | | 5.00 | | 09/01/17 | | 325,000 | | 327,428 | |
Arizona State Transportation Board Excise Tax Revenue | | 5.00 | | 07/01/17 | | 175,000 | | 189,744 | |
Flagstaff, Arizona, Revenue, Refunding | | 3.00 | | 07/01/15 | | 600,000 | | 600,000 | |
McAllister Academic Village LLC, Arizona State University Hassayampa Revenue, Refunding | | 5.75 | | 07/01/18 | | 200,000 | | 225,356 | |
Page, Arizona, Pledged Revenue, Refunding | | 3.00 | | 07/01/16 | | 350,000 | | 358,981 | |
| | | | | | | | 1,908,687 | |
| | | | | | | | | |
California 3.84% | | | | | | | | | |
California State, GO Unlimited | | 5.00 | | 03/01/32 | | 300,000 | | 309,108 | |
California State, GO Unlimited | | 4.75 | | 03/01/34 | | 205,000 | | 209,918 | |
California State, Recreational Facility, Refunding, GO Unlimited | | 5.00 | | 12/01/19 | | 5,000 | | 5,017 | |
| | | | | | | | | | | |
See notes to portfolios of investments and notes to financial statements.
4
Near-Term Tax Free Fund
Portfolio of Investments (unaudited) | | June 30, 2015 |
| | Coupon
Rate % | | Maturity
Date | | Principal
Amount | | Value | |
Municipal Bonds (cont’d) | | | | | | | | | |
| | | | | | | | | |
California (cont’d) | | | | | | | | | |
California State, Health Facilities Financing Authority, Cedars Sinai Medical Center | | 5.00 | | 08/15/15 | | $ | 500,000 | | $ | 502,875 | |
California State, Statewide Communities Development Authority, Enloe Medical Center Revenue, Series A | | 5.25 | | 08/15/18 | | 340,000 | | 382,218 | |
Chaffey Community College District, GO Unlimited, Series C | | 5.00 | | 06/01/32 | | 300,000 | | 324,696 | |
Delano, California Union High School District, Refunding, GO Unlimited, Series A | | 4.75 | | 02/01/17 | | 200,000 | | 212,360 | |
Fresno Unified School District, GO Unlimited | | 4.00 | | 08/01/15 | | 200,000 | | 200,620 | |
Los Angeles Unified School District, Election 2004, GO Unlimited, Series H | | 5.00 | | 07/01/32 | | 200,000 | | 213,566 | |
Santa Clara County, California Financing Authority Revenue, Obstetrics and Gynecology, El Camino Hospital | | 5.00 | | 02/01/18 | | 350,000 | | 380,940 | |
Santa Clara Valley Transportation Authority, Series A | | 5.00 | | 04/01/27 | | 370,000 | | 398,608 | |
Santa Paula Schools Financing Authority, Santa Paula Elementary School District Revenue | | 4.25 | | 11/01/22 | | 300,000 | | 320,721 | |
| | | | | | | | 3,460,647 | |
| | | | | | | | | |
Colorado 2.06% | | | | | | | | | |
Colorado State Department of Transportation, Series B | | 5.00 | | 12/15/15 | | 490,000 | | 500,422 | |
Denver, Colorado, Health & Hospital Authority, Healthcare Revenue, Series A | | 5.00 | | 12/01/16 | | 265,000 | | 279,612 | |
Pueblo County, School District No. 70, GO Unlimited | | 4.00 | | 12/01/24 | | 990,000 | | 1,086,267 | |
| | | | | | | | 1,866,301 | |
| | | | | | | | | |
Connecticut 1.51% | | | | | | | | | |
Connecticut State Health & Educational Facilities Authority Revenue, Bridgeport Hospital, Series D | | 5.00 | | 07/01/19 | | 395,000 | | 442,440 | |
Connecticut State Health & Educational Facilities Authority Revenue, William Backus Hospital, Series G | | 5.00 | | 07/01/25 | | 500,000 | | 500,000 | |
Connecticut State Health & Educational Facilities Authority Revenue, William Backus Hospital, Series G | | 4.00 | | 07/01/20 | | 425,000 | | 425,000 | |
| | | | | | | | 1,367,440 | |
| | | | | | | | | | | |
See notes to portfolios of investments and notes to financial statements.
5
Near-Term Tax Free Fund
Portfolio of Investments (unaudited) | | June 30, 2015 |
| | Coupon
Rate % | | Maturity
Date | | Principal
Amount | | Value | |
Municipal Bonds (cont’d) | | | | | | | | | |
| | | | | | | | | |
District of Columbia 0.67% | | | | | | | | | |
District of Columbia Income Tax Revenue, Series A | | 5.25 | | 12/01/27 | | $ | 300,000 | | $ | 345,678 | |
Washington D.C. Convention Center Authority Dedicated Tax Revenue, Refunding, Series A | | 5.00 | | 10/01/16 | | 250,000 | | 263,398 | |
| | | | | | | | 609,076 | |
| | | | | | | | | |
Florida 9.97% | | | | | | | | | |
Broward County, Florida, Civic Arena Project, Refunding, Series A | | 5.00 | | 09/01/20 | | 500,000 | | 524,875 | |
Broward County, Florida School Board Certificates of Participation, Series A | | 5.00 | | 07/01/15 | | 325,000 | | 325,000 | |
Cape Coral, Florida Gas Tax Revenue, Series A | | 4.00 | | 10/01/16 | | 255,000 | | 265,401 | |
Citizens Property Insurance Co., Senior Secured, Coastal Account, Revenue, Series A-1 | | 4.00 | | 06/01/18 | | 100,000 | | 107,429 | |
Delray Beach Florida, Utilities Tax Revenue, Refunding | | 5.00 | | 06/01/23 | | 505,000 | | 602,202 | |
Escambia County, Florida, Health Facilities Authority Revenue, Baptist Hospital, Inc. Project, Series A | | 5.00 | | 08/15/19 | | 290,000 | | 323,417 | |
Florida Gulf Coast University Financing Corp., Capital Improvement Revenue, Series B | | 3.00 | | 02/01/16 | | 365,000 | | 370,161 | |
Florida State Board of Education Lottery Revenue, Series B | | 5.00 | | 07/01/26 | | 100,000 | | 108,765 | |
Florida State Board of Governors Parking Facility Revenue, Series A | | 3.00 | | 07/01/17 | | 300,000 | | 312,555 | |
Florida State Department of Management Services Certificates of Participation, Refunding, Series A | | 5.00 | | 08/01/19 | | 500,000 | | 572,450 | |
Florida State Department of Management Services Certificates of Participation, Series A | | 5.00 | | 08/01/24 | | 340,000 | | 381,987 | |
Florida State Municipal Power Agency, Stanton Project Revenue, Refunding | | 5.13 | | 10/01/17 | | 300,000 | | 327,363 | |
Fort Pierce, Florida Stormwater Utilities Revenue | | 4.50 | | 10/01/17 | | 255,000 | | 257,420 | |
Hillsborough County, Florida School Board, Refunding, Series A | | 4.25 | | 07/01/25 | | 300,000 | | 325,347 | |
Hillsborough County, Florida School Board, Certificates of Participation, Refunding | | 4.00 | | 07/01/19 | | 100,000 | | 105,560 | |
Jacksonville Florida Special Revenue, Series C | | 5.00 | | 10/01/20 | | 270,000 | | 312,836 | |
Kissimmee Utility Authority, Revenue, Refunding | | 4.00 | | 10/01/15 | | 475,000 | | 479,156 | |
| | | | | | | | | | | |
See notes to portfolios of investments and notes to financial statements.
6
Near-Term Tax Free Fund
Portfolio of Investments (unaudited) | | June 30, 2015 |
| | Coupon
Rate % | | Maturity
Date | | Principal
Amount | | Value | |
Municipal Bonds (cont’d) | | | | | | | | | |
| | | | | | | | | |
Florida (cont’d) | | | | | | | | | |
Leesburg, Florida Capital Improvement Revenue Bonds, Refunding | | 5.00 | | 10/01/21 | | $ | 405,000 | | $ | 458,367 | |
Manatee County, Florida, Revenue, Refunding | | 5.00 | | 10/01/15 | | 420,000 | | 424,796 | |
Margate, Florida Water & Sewer Revenue, Refunding | | 4.00 | | 10/01/19 | | 250,000 | | 264,563 | |
Miami - Dade County, Florida Expressway Authority Toll System Revenue, Series A | | 5.00 | | 07/01/21 | | 430,000 | | 501,909 | |
Miami - Dade County, Florida Water & Sewer Revenue System, Series A | | 4.00 | | 10/01/16 | | 235,000 | | 245,032 | |
Orlando, Florida Community Redevelopment Agency Tax Increment Revenue, Downtown District, Series A | | 4.00 | | 09/01/17 | | 275,000 | | 284,710 | |
Polk County, Florida School District Revenue | | 5.00 | | 10/01/17 | | 215,000 | | 233,417 | |
Reedy Creek, Florida Improvement District Utilities Revenue, Refunding, Series 2 | | 5.00 | | 10/01/16 | | 300,000 | | 303,201 | |
Saint Johns County, Florida Transportation Revenue, Refunding | | 5.00 | | 10/01/20 | | 310,000 | | 361,711 | |
Volusia County, Florida School Board Sales Tax Revenue | | 4.20 | | 10/01/16 | | 200,000 | | 208,522 | |
| | | | | | | | 8,988,152 | |
| | | | | | | | | |
Georgia 2.38% | | | | | | | | | |
Atlanta Downtown Development Authority, Series A | | 4.25 | | 12/01/16 | | 250,000 | | 257,880 | |
Carroll City-County, Georgia Hospital Authority, Tanner Medical Center, Inc. Project | | 5.00 | | 07/01/18 | | 600,000 | | 666,870 | |
Georgia State Municipal Electric Authority Revenue, Unrefunded | | 5.50 | | 01/01/20 | | 80,000 | | 85,637 | |
Georgia State Municipal Gas Authority, Toccoa Project, Refunding | | 5.00 | | 06/01/22 | | 600,000 | | 692,508 | |
Glynn-Brunswick Memorial Hospital Authority, Southeast Georgia Health System and Affiliates Revenue, Anticipation Certificates, Series A | | 4.50 | | 08/01/17 | | 150,000 | | 160,470 | |
Gwinnett County, Georgia, Hospital Authority, Gwinnett Hospital Systems Revenue, Series B | | 5.00 | | 07/01/18 | | 250,000 | | 277,395 | |
| | | | | | | | 2,140,760 | |
| | | | | | | | | |
Guam 0.28% | | | | | | | | | |
Guam Education Financing Foundation Certificate of Participation, Series A | | 4.25 | | 10/01/18 | | 250,000 | | 257,045 | |
| | | | | | | | | | | |
See notes to portfolios of investments and notes to financial statements.
7
Near-Term Tax Free Fund
Portfolio of Investments (unaudited) | | June 30, 2015 |
| | Coupon
Rate % | | Maturity
Date | | Principal
Amount | | Value | |
Municipal Bonds (cont’d) | | | | | | | | | |
| | | | | | | | | |
Idaho 0.29% | | | | | | | | | |
Idaho Housing & Finance Association, Grant & Revenue Anticipation, Federal Highway Trust Fund, Series A | | 5.00 | | 07/15/21 | | $ | 225,000 | | $ | 259,133 | |
| | | | | | | | | |
Illinois 8.47% | | | | | | | | | |
Aurora, Illinois, GO Unlimited, Series B | | 3.00 | | 12/30/15 | | 200,000 | | 202,382 | |
Chicago Board of Education, GO Unlimited | | 5.25 | | 12/01/19 | | 300,000 | | 324,549 | |
Chicago Board of Education, Dedicated Revenues, GO Unlimited, Series F | | 5.00 | | 12/01/16 | | 300,000 | | 306,138 | |
Chicago, Illinois, City Colleges, GO Unlimited | | 5.00 | | 01/01/17 | | 115,000 | | 118,725 | |
Chicago, Illinois, Direct Access Bond, GO Unlimited, Series E-1 B | | 4.00 | | 01/01/19 | | 200,000 | | 200,542 | |
Chicago, Illinois, O’Hare International Airport Revenue, Gen - Third Lien, Series C | | 5.25 | | 01/01/23 | | 250,000 | | 284,235 | |
Clinton Bond Fayette Etc Counties Community College District No. 501 Kaskaskia, GO Unlimited | | 5.75 | | 12/01/19 | | 500,000 | | 576,125 | |
Du Page County, Refunding, GO Unlimited | | 5.60 | | 01/01/21 | | 385,000 | | 431,531 | |
Du Page County School District No. 33 West Chicago, Refunding, Series B | | 4.00 | | 12/01/21 | | 1,000,000 | | 1,096,289 | |
Illinois Finance Authority, Shedd Aquarium Society Project, Refunding | | 5.00 | | 07/01/16 | | 390,000 | | 391,256 | |
Illinois Metropolitan Pier & Exposition Authority, Unrefunded (ZCB) | | 1.71 | (1) | 06/15/18 | | 415,000 | | 395,993 | |
Illinois Regional Transportation Authority, Series A | | 7.20 | | 11/01/20 | | 165,000 | | 190,144 | |
Illinois State, Refunding, GO Unlimited | | 5.00 | | 01/01/16 | | 300,000 | | 305,952 | |
Illinois State, GO Unlimited | | 5.00 | | 03/01/16 | | 340,000 | | 348,935 | |
Illinois State, GO Unlimited | | 5.00 | | 05/01/18 | | 1,000,000 | | 1,062,839 | |
Illinois State Toll Highway Authority, Toll Highway Revenue, Series A | | 5.00 | | 01/01/16 | | 200,000 | | 200,000 | |
Lake & McHenry County, Fox Lake, Illinois, Debt Certificates, Series B | | 3.00 | | 11/01/19 | | 265,000 | | 273,353 | |
Springfield, Illinois Metropolitan Sanitation District, Sewer Revenue, Senior Lien, Series A | | 4.00 | | 01/01/17 | | 570,000 | | 596,374 | |
Will Grundy Etc Counties Community College District No. 525, Joliet Junior College Project, GO Unlimited | | 6.25 | | 06/01/22 | | 300,000 | | 342,903 | |
| | | | | | | | 7,648,265 | |
| | | | | | | | | |
Indiana 2.41% | | | | | | | | | |
Fort Wayne, Indiana Waterworks Utility Revenue | | 2.00 | | 12/01/16 | | 585,000 | | 596,092 | |
| | | | | | | | | | | |
See notes to portfolios of investments and notes to financial statements.
8
Near-Term Tax Free Fund
Portfolio of Investments (unaudited) | | June 30, 2015 |
| | Coupon
Rate % | | Maturity
Date | | Principal
Amount | | Value | |
Municipal Bonds (cont’d) | | | | | | | | | |
| | | | | | | | | |
Indiana (cont’d) | | | | | | | | | |
Indianapolis Local Public Improvement Bond Bank, Waterworks Project, Series 2007 L | | 5.25 | | 01/01/33 | | $ | 305,000 | | $ | 329,620 | |
Merrillville Redevelopment Authority | | 5.00 | | 08/15/20 | | 350,000 | | 400,925 | |
Tri-Creek 2002 High School Building | | 5.00 | | 07/15/19 | | 800,000 | | 851,080 | |
| | | | | | | | 2,177,717 | |
| | | | | | | | | |
Iowa 0.68% | | | | | | | | | |
Johnston Community School District, GO Unlimited | | 4.00 | | 06/01/16 | | 190,000 | | 190,460 | |
University of Iowa Hospitals and Clinics, Iowa State Board of Regents, Hospital Revenue, Series A | | 3.00 | | 09/01/19 | | 400,000 | | 424,896 | |
| | | | | | | | 615,356 | |
| | | | | | | | | |
Kansas 2.32% | | | | | | | | | |
Douglas County, Kansas, Unified School District No. 497 Lawrence, GO Unlimited, Series A | | 3.00 | | 09/01/15 | | 1,225,000 | | 1,230,426 | |
Johnson County Public Building Commission, Series B | | 2.00 | | 09/01/15 | | 355,000 | | 355,994 | |
Kansas State Development Finance Authority Revenue | | 4.00 | | 10/01/15 | | 450,000 | | 454,086 | |
Sedgwick County, Kansas, Unified School District No. 266 Maize, GO Unlimited | | 5.00 | | 09/01/17 | | 50,000 | | 53,748 | |
| | | | | | | | 2,094,254 | |
| | | | | | | | | |
Kentucky 3.70% | | | | | | | | | |
Bowling Green, Kentucky, GO Unlimited, Series B | | 4.00 | | 09/01/16 | | 215,000 | | 223,714 | |
Jefferson County School District Finance, Refunding, Series B | | 4.00 | | 12/01/22 | | 500,000 | | 555,030 | |
Kentucky Asset Liability Commission, University of Kentucky Project, Series A | | 5.00 | | 10/01/15 | | 1,000,000 | | 1,011,419 | |
Kentucky Asset Liability Commission, Federal Highway Trust Fund | | 5.00 | | 09/01/17 | | 450,000 | | 487,832 | |
Kentucky Municipal Power Agency, Power System Revenue, Prairie State Project, Series A | | 5.25 | | 09/01/22 | | 440,000 | | 480,414 | |
Louisville & Jefferson County Metropolitan Sewer District, Series A | | 5.00 | | 05/15/23 | | 500,000 | | 588,805 | |
| | | | | | | | 3,347,214 | |
| | | | | | | | | | | |
See notes to portfolios of investments and notes to financial statements.
9
Near-Term Tax Free Fund
Portfolio of Investments (unaudited) | | June 30, 2015 |
| | Coupon
Rate % | | Maturity
Date | | Principal
Amount | | Value | |
Municipal Bonds (cont’d) | | | | | | | | | |
| | | | | | | | | |
Louisiana 3.30% | | | | | | | | | |
Louisiana State, Citizens Property Insurance Corp., Revenue Bonds, Series B | | 5.00 | | 06/01/21 | | $ | 245,000 | | $ | 254,033 | |
Shreveport, Louisiana, Refunding | | 5.00 | | 05/01/16 | | 2,620,000 | | 2,716,939 | |
| | | | | | | | 2,970,972 | |
| | | | | | | | | |
Massachusetts 0.26% | | | | | | | | | |
Stoughton, Massachusetts Public Improvement, GO Limited | | 4.00 | | 05/01/17 | | 225,000 | | 231,487 | |
| | | | | | | | | |
Michigan 4.22% | | | | | | | | | |
Detroit, Michigan Local Development Financing Authority, Refunding, Series A | | 5.38 | | 05/01/18 | | 105,000 | | 105,239 | |
Detroit, Michigan Sewer Disposal Revenue, Refunding, Series C-1 | | 5.25 | | 07/01/15 | | 400,000 | | 400,000 | |
Gibraltar, Michigan School District, Refunding | | 5.00 | | 05/01/21 | | 475,000 | | 546,991 | |
Michigan Public Power Agency AFEC Project Revenue, Series A | | 4.50 | | 01/01/19 | | 280,000 | | 299,550 | |
Michigan State, Trunk Line Revenue, Refunding | | 4.50 | | 11/01/26 | | 105,000 | | 116,913 | |
Michigan State Grant Anticipation Bonds | | 5.00 | | 09/15/16 | | 200,000 | | 210,308 | |
Michigan State Hospital Finance Authority, Trinity Health, Series A | | 6.00 | | 12/01/18 | | 200,000 | | 230,608 | |
Michigan Strategic Fund, Series A | | 5.00 | | 10/15/17 | | 200,000 | | 218,326 | |
Portage Public Schools, School Building & Site, GO Unlimited | | 5.00 | | 05/01/20 | | 300,000 | | 331,155 | |
Romeo Community School District, Refunding, GO Unlimited | | 3.00 | | 05/01/18 | | 500,000 | | 525,585 | |
Wayne County, Michigan Airport Authority Revenue, Detroit Metropolitan Airport, Refunding, Series C | | 4.00 | | 12/01/19 | | 255,000 | | 277,063 | |
Zeeland Public Schools, Refunding, GO Unlimited | | 5.00 | | 05/01/18 | | 490,000 | | 538,304 | |
| | | | | | | | 3,800,042 | |
| | | | | | | | | |
Minnesota 0.72% | | | | | | | | | |
Minneapolis & St Paul, Minnesota Housing & Redevelopment Authority Health Care Systems, Children’s Health Care, Series B | | 4.00 | | 08/15/16 | | 250,000 | | 258,865 | |
Minneapolis & St Paul, Minnesota Metropolitan Airports Commission, Airport Revenue, Airport Revenue, Refunding, Series B | | 5.00 | | 01/01/19 | | 255,000 | | 270,596 | |
Royalton Independent School District No. 485, GO Unlimited, Series A | | 5.00 | | 02/01/17 | | 110,000 | | 117,459 | |
| | | | | | | | 646,920 | |
| | | | | | | | | | | |
See notes to portfolios of investments and notes to financial statements.
10
Near-Term Tax Free Fund
Portfolio of Investments (unaudited) | | June 30, 2015 |
| | Coupon
Rate % | | Maturity
Date | | Principal
Amount | | Value | |
Municipal Bonds (cont’d) | | | | | | | | | |
| | | | | | | | | |
Mississippi 0.33% | | | | | | | | | |
Madison County School District, Refunding | | 3.75 | | 08/01/15 | | $ | 300,000 | | $ | 300,780 | |
| | | | | | | | | |
Missouri 0.90% | | | | | | | | | |
Kansas City, Missouri Water Revenue, Series F | | 4.00 | | 12/01/22 | | 250,000 | | 282,955 | |
Missouri Development Finance Board, Eastland Center Project, Tax Allocation, Series A | | 5.00 | | 04/01/17 | | 250,000 | | 264,698 | |
Missouri State Health & Educational Facilities Authority, Southwestern Baptist University Revenue | | 3.00 | | 10/01/17 | | 265,000 | | 268,609 | |
| | | | | | | | 816,262 | |
| | | | | | | | | |
Nevada 0.12% | | | | | | | | | |
Clark County, Nevada, GO Limited | | 5.00 | | 11/01/18 | | 100,000 | | 106,061 | |
| | | | | | | | | |
New Hampshire 0.48% | | | | | | | | | |
New Hampshire Health & Education Facilities Authority Revenue, Southern New Hampshire University Project | | 5.00 | | 01/01/18 | | 400,000 | | 429,768 | |
| | | | | | | | | |
New Jersey 3.67% | | | | | | | | | |
Atlantic City, New Jersey, Refunding Tax Appeal, GO Limited | | 4.00 | | 11/01/18 | | 500,000 | | 422,715 | |
Atlantic City, New Jersey Municipal Utilities Authority Revenue, Refunding | | 5.00 | | 06/01/17 | | 150,000 | | 153,020 | |
Elizabeth, New Jersey Parking Authority Project Revenue, Elizabethtown Plaza Redevelopment, Series B | | 4.00 | | 11/01/17 | | 255,000 | | 265,906 | |
Hudson County, New Jersey Improvement Authority Lease Revenue, North Hudson Regional Fire, Refunding, Series A | | 5.63 | | 09/01/18 | | 400,000 | | 436,640 | |
New Jersey Economic Development Authority Revenue, School Facilities Construction, Refunding | | 5.00 | | 12/15/18 | | 710,000 | | 766,473 | |
New Jersey Health Care Facilities Financing Authority Revenue, Holy Name Medical Center, Refunding | | 5.00 | | 07/01/19 | | 215,000 | | 239,768 | |
New Jersey Transportation Trust Fund Authority, Series A | | 5.00 | | 06/15/16 | | 440,000 | | 454,929 | |
Passaic Valley, New Jersey, Sewage Commissioners Revenue, Series G | | 5.75 | | 12/01/21 | | 500,000 | | 582,075 | |
| | | | | | | | 3,321,526 | |
| | | | | | | | | | | |
See notes to portfolios of investments and notes to financial statements.
11
Near-Term Tax Free Fund
Portfolio of Investments (unaudited) | | June 30, 2015 |
| | Coupon
Rate % | | Maturity
Date | | Principal
Amount | | Value | |
Municipal Bonds (cont’d) | | | | | | | | | |
| | | | | | | | | |
New Mexico 0.82% | | | | | | | | | |
Clayton, New Mexico, Jail Project Revenue | | 4.00 | | 11/01/17 | | $ | 235,000 | | $ | 239,268 | |
Los Alamos County, New Mexico, Sales Tax Revenue | | 5.75 | | 06/01/16 | | 470,000 | | 492,240 | |
| | | | | | | | 731,508 | |
| | | | | | | | | |
New York 5.91% | | | | | | | | | |
Arlington Central School District, GO Unlimited | | 5.00 | | 12/15/25 | | 1,000,000 | | 1,186,699 | |
Buffalo, New York, Refunding, Series C | | 4.00 | | 12/01/15 | | 400,000 | | 405,936 | |
Ithaca, New York, Refunding, GO Limited, Series A | | 3.00 | | 01/15/16 | | 750,000 | | 761,010 | |
Long Island Power Authority Revenue, New York Electric Systems, Series E | | 5.00 | | 12/01/17 | | 330,000 | | 349,054 | |
Long Island Power Authority Revenue, Series B | | 5.00 | | 09/01/21 | | 465,000 | | 535,480 | |
Metropolitan Transportation Authority, Series D | | 5.00 | | 11/15/15 | | 375,000 | | 381,375 | |
Nassau County Industrial Development Agency, New York Institute of Technology Project Revenue, Refunding, Remarketing, Series A | | 5.00 | | 03/01/21 | | 350,000 | | 386,092 | |
New York State Dormitory Authority, Series A | | 2.00 | | 10/01/15 | | 500,000 | | 502,040 | |
New York State Dormitory Authority, Nonconstruction Supported Debt, Municipal Facilities Health Lease, Series 1 | | 5.00 | | 01/15/17 | | 300,000 | | 319,059 | |
Patchogue-Medford Union Free School District, GO Unlimited | | 5.00 | | 10/01/17 | | 465,000 | | 506,999 | |
| | | | | | | | 5,333,744 | |
| | | | | | | | | |
North Carolina 3.06% | | | | | | | | | |
Beaufort County, North Carolina, GO Limited | | 5.00 | | 06/01/21 | | 200,000 | | 228,812 | |
Charlotte, North Carolina Certificates of Participation, Series A | | 5.00 | | 10/01/21 | | 1,000,000 | | 1,168,999 | |
North Carolina State, Capital Improvement Limited Obligation, Series 2011A | | 5.00 | | 05/01/16 | | 300,000 | | 311,454 | |
North Carolina State Grant Anticipation, Series 2015 | | 5.00 | | 03/01/16 | | 590,000 | | 606,803 | |
North Carolina State Municipal Power Agency #1, Catawba Electric Revenue, Refunding, Series A | | 5.25 | | 01/01/20 | | 400,000 | | 442,160 | |
| | | | | | | | 2,758,228 | |
| | | | | | | | | |
Ohio 1.37% | | | | | | | | | |
Cleveland, Ohio, Parking Facility Revenue, Prefunding, Refunding | | 5.25 | | 09/15/22 | | 130,000 | | 157,778 | |
| | | | | | | | | | | |
See notes to portfolios of investments and notes to financial statements.
12
Near-Term Tax Free Fund
Portfolio of Investments (unaudited) | | June 30, 2015 |
| | Coupon
Rate % | | Maturity
Date | | Principal
Amount | | Value | |
Municipal Bonds (cont’d) | | | | | | | | | |
| | | | | | | | | |
Ohio (cont’d) | | | | | | | | | |
Lorain County, Ohio, Community College District, Revenue | | 3.25 | | 12/01/17 | | $ | 650,000 | | $ | 680,830 | |
Marion County, Ohio, Variable Refunding, GO Limited | | 4.00 | | 12/01/20 | | 150,000 | | 156,746 | |
Springfield City School District, GO Unlimited | | 3.75 | | 12/01/15 | | 250,000 | | 253,593 | |
| | | | | | | | 1,248,947 | |
| | | | | | | | | |
Oklahoma 1.10% | | | | | | | | | |
Edmond Public Works Authority, Revenue, Refunding | | 5.00 | | 07/01/23 | | 300,000 | | 350,523 | |
Oklahoma Capital Improvement Authority, Series A | | 4.00 | | 07/01/15 | | 300,000 | | 300,000 | |
Oklahoma State Agricultural & Mechanical Colleges, Oklahoma State University, Series A | | 5.00 | | 08/01/21 | | 300,000 | | 347,256 | |
| | | | | | | | 997,779 | |
| | | | | | | | | |
Oregon 0.25% | | | | | | | | | |
Oregon State Facilities Authority, Legacy Health Project Revenue, Refunding, Series A | | 4.50 | | 05/01/20 | | 200,000 | | 225,506 | |
| | | | | | | | | |
Pennsylvania 2.95% | | | | | | | | | |
Allegheny County, Pennsylvania Sanitary Authority | | 5.00 | | 06/01/19 | | 700,000 | | 794,234 | |
Commonwealth of Pennsylvania | | 5.00 | | 07/01/15 | | 250,000 | | 250,000 | |
Delaware Valley, Pennsylvania, Regional Financial Authority Revenue, Permanently Fixed Business Development Services | | 5.50 | | 08/01/18 | | 295,000 | | 328,946 | |
Lycoming County, Pennsylvania Authority Health System, Susquehanna Health Systems Project, Series A | | 5.10 | | 07/01/20 | | 140,000 | | 155,243 | |
Philadelphia School District, Pennsylvania, Refunding, GO Unlimited, Series E | | 5.25 | | 09/01/24 | | 625,000 | | 694,175 | |
Reading, Pennsylvania School District, GO Unlimited, Series A | | 5.00 | | 04/01/20 | | 400,000 | | 438,760 | |
| | | | | | | | 2,661,358 | |
| | | | | | | | | |
Puerto Rico 0.75% | | | | | | | | | |
Commonwealth of Puerto Rico, GO Unlimited, Series A | | 5.00 | | 07/01/15 | | 225,000 | | 225,000 | |
Puerto Rico Infrastructure Financing Authority, Special Tax Revenue, Refunding, Series C | | 5.50 | | 07/01/17 | | 445,000 | | 448,734 | |
| | | | | | | | 673,734 | |
| | | | | | | | | | | |
See notes to portfolios of investments and notes to financial statements.
13
Near-Term Tax Free Fund
Portfolio of Investments (unaudited) | | June 30, 2015 |
| | Coupon
Rate % | | Maturity
Date | | Principal
Amount | | Value | |
Municipal Bonds (cont’d) | | | | | | | | | |
| | | | | | | | | |
Rhode Island 0.29% | | | | | | | | | |
Rhode Island State Economic Development Corporation Revenue, Series A | | 5.00 | | 06/15/17 | | $ | 250,000 | | $ | 260,070 | |
| | | | | | | | | |
South Carolina 1.28% | | | | | | | | | |
Piedmont Municipal Power Agency, Series A-3 | | 5.00 | | 01/01/16 | | 150,000 | | 153,236 | |
Spartanburg County, South Carolina Regional Health Services District, Hospital Revenue, Refunding, Series A | | 5.00 | | 04/15/19 | | 600,000 | | 675,600 | |
Spartanburg County, South Carolina Sanitation Sewer District, Series A | | 3.50 | | 03/01/19 | | 300,000 | | 321,687 | |
| | | | | | | | 1,150,523 | |
| | | | | | | | | |
Tennessee 0.26% | | | | | | | | | |
Memphis, Tennessee Sanitary Sewage System Revenue, Refunding | | 5.00 | | 05/01/20 | | 200,000 | | 231,818 | |
| | | | | | | | | |
Texas 15.08% | | | | | | | | | |
Addison, Texas Certificates of Obligation, GO Limited | | 4.50 | | 02/15/28 | | 140,000 | | 149,772 | |
Addison, Texas Certificates of Obligation, GO Unlimited | | 4.00 | | 02/15/20 | | 250,000 | | 266,920 | |
Annetta, Texas Certificates of Obligation, GO Limited | | 4.00 | | 08/01/16 | | 200,000 | | 207,260 | |
Beaumont Independent School District, GO Unlimited | | 5.00 | | 02/15/23 | | 1,000,000 | | 1,065,809 | |
Brownsville Independent School District, GO Unlimited | | 5.00 | | 08/15/17 | | 455,000 | | 457,434 | |
Brownwood Independent School District, GO Unlimited | | 4.00 | | 02/15/24 | | 730,000 | | 801,854 | |
Center, Texas Certificates of Obligation, GO Limited (ZCB) | | 3.39 | (1) | 02/15/20 | | 150,000 | | 135,366 | |
Clear Lake, Texas, Waterworks & Sewer System, GO Unlimited | | 3.00 | | 03/01/19 | | 125,000 | | 129,291 | |
Conroe Independent School District, GO Unlimited | | 4.00 | | 02/15/17 | | 55,000 | | 57,934 | |
Corpus Christi, Texas Business & Job Development Corporation, Seawall Project, Sales Tax Revenue, Refunding | | 5.00 | | 03/01/20 | | 350,000 | | 398,591 | |
Dallas, Texas Waterworks & Sewer System Revenue, Prerefunded | | 4.50 | | 10/01/19 | | 60,000 | | 64,937 | |
Dallas, Texas Waterworks & Sewer System Revenue, Unrefunded | | 4.50 | | 10/01/19 | | 165,000 | | 177,698 | |
Denton County, Texas Fresh Water Supply District No. 10, GO Limited | | 2.00 | | 09/01/15 | | 150,000 | | 150,383 | |
Forney, Texas, GO Limited | | 5.00 | | 02/15/27 | | 500,000 | | 535,075 | |
| | | | | | | | | | | |
See notes to portfolios of investments and notes to financial statements.
14
Near-Term Tax Free Fund
Portfolio of Investments (unaudited) | | June 30, 2015 |
| | Coupon
Rate % | | Maturity
Date | | Principal
Amount | | Value | |
Municipal Bonds (cont’d) | | | | | | | | | |
| | | | | | | | | |
Texas (cont’d) | | | | | | | | | |
Frisco, Texas Independent School District, School Building, GO Unlimited, Series A | | 4.50 | | 08/15/25 | | $ | 180,000 | | $ | 192,640 | |
Garland, Texas, GO Limited | | 5.00 | | 02/15/25 | | 650,000 | | 744,991 | |
Goose Creek, Texas Independent School District, GO Unlimited, Series A | | 5.25 | | 02/15/18 | | 370,000 | | 397,247 | |
Grand Prairie, Texas Independent School District, Refunding, GO Unlimited (ZCB) | | 4.83 | (1) | 08/15/16 | | 400,000 | | 390,372 | |
Greenville, Texas Independent School District, Refunding, GO Unlimited | | 4.00 | | 08/15/17 | | 120,000 | | 124,582 | |
Harris County, Texas Municipal Utility District No. 382, GO Unlimited | | 3.00 | | 04/01/22 | | 305,000 | | 310,966 | |
Houston Texas, Hotel Occupancy Tax, Unrefunded, Series B | | 5.00 | | 09/01/19 | | 45,000 | | 47,068 | |
Houston Texas, Hotel Occupancy Tax, Prerefunded, Series B | | 5.00 | | 09/01/19 | | 250,000 | | 262,675 | |
Katy, Texas Independent School District, School Building, GO Unlimited, Series D | | 4.50 | | 02/15/19 | | 325,000 | | 333,450 | |
Laredo, Texas, Waterworks & Sewer System Revenue | | 4.25 | | 03/01/18 | | 100,000 | | 105,228 | |
Lavaca-Navidad River Authority, Series A | | 4.00 | | 08/01/22 | | 270,000 | | 295,726 | |
Lavaca-Navidad River Authority, Series B | | 4.00 | | 08/01/22 | | 420,000 | | 460,018 | |
Lewisville, Texas Independent School District, Refunding, GO Unlimited (ZCB) | | 5.45 | (1) | 08/15/15 | | 400,000 | | 399,872 | |
Lockhart, Texas Certificates of Obligation | | 4.00 | | 08/01/23 | | 830,000 | | 917,266 | |
Lower Colorado River Authority, Transmission Contract Revenue, Refunding, Series A | | 5.00 | | 05/15/21 | | 500,000 | | 581,020 | |
North Texas Tollway Authority Revenue, Series F | | 5.75 | | 01/01/38 | | 300,000 | | 334,431 | |
Prosper, Texas Independent School District, Capital Appreciation, School Building, GO Unlimited (ZCB) | | 12.84 | (1) | 08/15/33 | | 1,000,000 | | 389,940 | |
Round Rock Independent School District, GO Unlimited, Series A | | 3.50 | | 08/01/15 | | 250,000 | | 250,678 | |
San Antonio, Texas, Water Revenue, Refunding | | 4.50 | | 05/15/21 | | 400,000 | | 458,348 | |
San Marcos, Texas Tax & Toll Revenue, GO Limited | | 5.10 | | 08/15/27 | | 400,000 | | 436,504 | |
San Patricio, Texas Municipal Water District, Refunding | | 4.00 | | 07/10/18 | | 200,000 | | 200,086 | |
Texarkana, Texas Waterworks & Sanitary Sewer System Revenue | | 3.00 | | 08/01/19 | | 90,000 | | 93,357 | |
Texarkana, Texas Waterworks & Sanitary Sewer System Revenue | | 3.00 | | 08/01/20 | | 95,000 | | 97,980 | |
Texarkana, Texas, Refunding, GO Limited | | 5.00 | | 02/15/21 | | 320,000 | | 366,115 | |
Texas Municipal Power Agency Revenue, Refunding | | 5.00 | | 09/01/17 | | 250,000 | | 270,740 | |
Travis County, Texas, GO Limited | | 1.50 | | 03/01/16 | | 250,000 | | 252,070 | |
| | | | | | | | | | | |
See notes to portfolios of investments and notes to financial statements.
15
Near-Term Tax Free Fund
Portfolio of Investments (unaudited) | | June 30, 2015 |
| | Coupon
Rate % | | Maturity
Date | | Principal
Amount | | Value | |
Municipal Bonds (cont’d) | | | | | | | | | |
| | | | | | | | | |
Texas (cont’d) | | | | | | | | | |
White Settlement, Texas Independent School District, Prerefunded, GO Unlimited | | 4.13 | | 08/15/15 | | $ | 240,000 | | $ | 241,030 | |
White Settlement, Texas Independent School District, Unrefunded, GO Unlimited | | 4.13 | | 08/15/15 | | 60,000 | | 60,283 | |
| | | | | | | | 13,613,007 | |
| | | | | | | | | |
Utah 1.56% | | | | | | | | | |
Salt Lake County, Utah, Westminster College Project Revenue | | 5.00 | | 10/01/24 | | 235,000 | | 248,372 | |
Tooele City, Utah Municipal Building Authority, Municipal Building Authority Lease Revenue, Refunding | | 3.75 | | 12/01/17 | | 285,000 | | 288,326 | |
Utah State Building Ownership Authority, Lease Revenue, Refunding, Series C | | 5.50 | | 05/15/19 | | 500,000 | | 545,780 | |
Washington County-St George Interlocal Agency, Lease Revenue, Refunding, Series A | | 4.00 | | 12/01/19 | | 300,000 | | 327,546 | |
| | | | | | | | 1,410,024 | |
| | | | | | | | | |
Virginia 0.33% | | | | | | | | | |
Virginia College Building Authority Educational Facilities Revenue, Unrefunded, Series A | | 5.00 | | 09/01/15 | | 290,000 | | 292,239 | |
Virginia College Building Authority Educational Facilities Revenue, Prerefunded, Series A | | 5.00 | | 09/01/15 | | 10,000 | | 10,075 | |
| | | | | | | | 302,314 | |
| | | | | | | | | |
Washington 1.68% | | | | | | | | | |
Kent, Washington, Refunding, GO Limited | | 2.00 | | 12/01/15 | | 400,000 | | 402,928 | |
Spokane County, Washington Public Facilities District, Refunding, Series B | | 5.00 | | 12/01/21 | | 950,000 | | 1,112,981 | |
| | | | | | | | 1,515,909 | |
| | | | | | | | | |
Wisconsin 2.56% | | | | | | | | | |
Milwaukee, Wisconsin Sewerage System Revenue, Series S5 | | 5.00 | | 06/01/23 | | 500,000 | | 598,230 | |
New Holstein, Wisconsin Electric System Revenue | | 4.25 | | 05/01/18 | | 270,000 | | 278,335 | |
Waunakee Community School District, Series A | | 5.00 | | 04/01/18 | | 250,000 | | 276,205 | |
Wisconsin State Health & Educational Facilities Authority, Luther Hospital Project | | 5.00 | | 11/15/21 | | 1,000,000 | | 1,130,309 | |
| | | | | | | | | | | |
See notes to portfolios of investments and notes to financial statements.
16
Near-Term Tax Free Fund
Portfolio of Investments (unaudited) | | June 30, 2015 |
| | Coupon
Rate % | | Maturity
Date | | Principal
Amount | | Value | |
Municipal Bonds (cont’d) | | | | | | | | | |
| | | | | | | | | |
Wisconsin (cont’d) | | | | | | | | | |
Wisconsin State, Refunding, GO Unlimited, Series 2 | | 4.13 | | 11/01/16 | | $ | 25,000 | | $ | 25,504 | |
| | | | | | | | 2,308,583 | |
Total Municipal Bonds
(cost $86,352,846) | | | | | | | | 87,215,047 | |
| | | | | | | | | |
Overnight Cash Deposit 2.38% | | | | | | | | | |
| | | | | | | | | |
Wells Fargo Bank NA
(cost $2,147,636) | | 0.03 | | 07/01/15 | | 2,147,636 | | 2,147,636 | |
| | | | | | | | | |
Total Investments 99.02%
(cost $88,500,482) | | | | | | | | 89,362,683 | |
Other assets and liabilities, net 0.98% | | | | | | | | 888,570 | |
| | | | | | | | | |
Net Assets 100.0% | | | | | | | | $ | 90,251,253 | |
| | | | | | | | | | | |
(1)Represents Yield on zero coupon bond.
Municipal Bond Ratings* | June 30, 2015 |
Based on Total Municipal Bonds |

* Credit quality ratings are measured on a scale that generally ranges from AAA (highest) to D (lowest). “Not Rated” is used to classify securities for which a rating is not available. Credit-quality ratings for each issue are obtained from Moody’s and S&P, and the higher rating for each issue is used.
See notes to portfolios of investments and notes to financial statements.
17
All American Equity Fund | |
Portfolio of Investments (unaudited) | June 30, 2015 |
| | Shares | | Value | |
Common Stocks 98.09% | | | | | |
| | | | | |
Aerospace/Defense 3.55% | | | | | |
Boeing Co. | | 1,600 | | $ | 221,952 | |
General Dynamics Corp. | | 1,900 | | 269,211 | |
Northrop Grumman Corp. | | 1,600 | | 253,808 | |
| | | | 744,971 | |
Agricultural Operations 1.11% | | | | | |
Archer-Daniels-Midland Co. | | 4,800 | | 231,456 | |
| | | | | |
Applications Software 1.01% | | | | | |
Microsoft Corp. | | 4,800 | | 211,920 | |
| | | | | |
Automotive - Cars & Light Trucks 2.25% | | | | | |
Ford Motor Co. | | 16,800 | | 252,168 | |
General Motors Co. | | 6,600 | | 219,978 | |
| | | | 472,146 | |
Beverages - Non-alcoholic 1.16% | | | | | |
PepsiCo, Inc. | | 2,600 | | 242,684 | |
| | | | | |
Building Products - Cement/Aggregates 1.20% | | | | | |
Vulcan Materials Co. | | 3,000 | | 251,790 | |
| | | | | |
Cable/Satellite TV 1.26% | | | | | |
Comcast Corp., Class A | | 4,400 | | 264,616 | |
| | | | | |
Chemicals - Diversified 2.57% | | | | | |
Dow Chemical Co. | | 5,700 | | 291,669 | |
LyondellBasell Industries N.V., Class A | | 2,400 | | 248,448 | |
| | | | 540,117 | |
Computer Services 2.02% | | | | | |
Computer Sciences Corp. | | 3,500 | | 229,740 | |
International Business Machines Corp. | | 1,200 | | 195,192 | |
| | | | 424,932 | |
Computers 3.91% | | | | | |
Apple, Inc. | | 5,200 | | 652,210 | |
Hewlett-Packard Co. | | 5,600 | | 168,056 | |
| | | | 820,266 | |
| | | | | | |
See notes to portfolios of investments and notes to financial statements.
18
All American Equity Fund | |
Portfolio of Investments (unaudited) | June 30, 2015 |
| | Shares | | Value | |
Common Stocks (cont’d) | | | | | |
| | | | | |
Computers - Memory Devices 1.69% | | | | | |
EMC Corp. | | 7,500 | | $ | 197,925 | |
Western Digital Corp. | | 2,000 | | 156,840 | |
| | | | 354,765 | |
Cosmetics & Toiletries 1.01% | | | | | |
Procter & Gamble Co. | | 2,700 | | 211,248 | |
| | | | | |
Cruise Lines 1.34% | | | | | |
Carnival Corp. | | 5,700 | | 281,523 | |
| | | | | |
Data Processing/Management 1.03% | | | | | |
Fidelity National Information Services, Inc. | | 3,500 | | 216,300 | |
| | | | | |
Diagnostic Equipment 1.22% | | | | | |
Danaher Corp. | | 3,000 | | 256,770 | |
| | | | | |
Diversified Banking Institutions 2.97% | | | | | |
Citigroup, Inc. | | 6,000 | | 331,440 | |
JPMorgan Chase & Co. | | 4,300 | | 291,368 | |
| | | | 622,808 | |
Diversified Manufacturing Operations 2.34% | | | | | |
3M Co. | | 1,500 | | 231,450 | |
General Electric Co. | | 9,800 | | 260,386 | |
| | | | 491,836 | |
Electric - Integrated 0.97% | | | | | |
Entergy Corp. | | 2,900 | | 204,450 | |
| | | | | |
Electronic Components - Miscellaneous 1.03% | | | | | |
Corning, Inc. | | 11,000 | | 217,030 | |
| | | | | |
Electronic Components - Semiconductors 4.13% | | | | | |
Intel Corp. | | 6,200 | | 188,573 | |
Microchip Technology, Inc. | | 5,000 | | 237,125 | |
NVIDIA Corp. | | 11,200 | | 225,232 | |
Texas Instruments, Inc. | | 4,200 | | 216,342 | |
| | | | 867,272 | |
Enterprise Software/Services 1.03% | | | | | |
CA, Inc. | | 7,400 | | 216,746 | |
| | | | | | |
See notes to portfolios of investments and notes to financial statements.
19
All American Equity Fund | |
Portfolio of Investments (unaudited) | June 30, 2015 |
| | Shares | | Value | |
Common Stocks (cont’d) | | | | | |
| | | | | |
Fiduciary Banks 1.12% | | | | | |
Bank of New York Mellon Corp. | | 5,600 | | $ | 235,032 | |
| | | | | |
Food - Confectionery 1.08% | | | | | |
J.M. Smucker Co. | | 2,100 | | 227,661 | |
| | | | | |
Gold Mining 1.19% | | | | | |
Newmont Mining Corp. | | 10,700 | | 249,952 | |
| | | | | |
Investment Management/Advisory Services 2.20% | | | | | |
BlackRock, Inc., Class A | | 600 | | 207,588 | |
Invesco Ltd. | | 6,800 | | 254,932 | |
| | | | 462,520 | |
Life/Health Insurance 1.25% | | | | | |
Prudential Financial, Inc. | | 3,000 | | 262,560 | |
| | | | | |
Medical - Drugs 5.77% | | | | | |
Abbott Laboratories | | 5,600 | | 274,848 | |
AbbVie, Inc. | | 3,400 | | 228,446 | |
Johnson & Johnson | | 2,400 | | 233,904 | |
Merck & Co, Inc. | | 4,500 | | 256,185 | |
Pfizer, Inc. | | 6,500 | | 217,945 | |
| | | | 1,211,328 | |
Medical - HMO 4.34% | | | | | |
Aetna, Inc. | | 2,200 | | 280,412 | |
Anthem, Inc. | | 2,000 | | 328,280 | |
UnitedHealth Group, Inc. | | 2,500 | | 305,000 | |
| | | | 913,692 | |
Medical - Wholesale Drug Distribution 1.08% | | | | | |
Cardinal Health, Inc. | | 2,700 | | 225,855 | |
| | | | | |
Medical Instruments 2.24% | | | | | |
Medtronic plc | | 3,100 | | 229,710 | |
St. Jude Medical, Inc. | | 3,300 | | 241,131 | |
| | | | 470,841 | |
Medical Labs & Testing Services 1.31% | | | | | |
Quest Diagnostics, Inc. | | 3,800 | | 275,576 | |
| | | | | | |
See notes to portfolios of investments and notes to financial statements.
20
All American Equity Fund | |
Portfolio of Investments (unaudited) | June 30, 2015 |
| | Shares | | Value | |
Common Stocks (cont’d) | | | | | |
| | | | | |
Multi-line Insurance 3.71% | | | | | |
Allstate Corp. | | 3,900 | | $ | 252,993 | |
MetLife, Inc. | | 5,000 | | 279,950 | |
XL Group plc | | 6,600 | | 245,520 | |
| | | | 778,463 | |
Multimedia 1.47% | | | | | |
Walt Disney Co. | | 2,700 | | 308,178 | |
| | | | | |
Networking Products 1.05% | | | | | |
Cisco Systems, Inc. | | 8,000 | | 219,680 | |
| | | | | |
Non-hazardous Waste Disposal 2.41% | | | | | |
Republic Services, Inc., Class A | | 6,700 | | 262,439 | |
Waste Management, Inc. | | 5,300 | | 245,655 | |
| | | | 508,094 | |
Office Automation & Equipment 0.82% | | | | | |
Xerox Corp. | | 16,200 | | 172,368 | |
| | | | | |
Oil - Field Services 1.19% | | | | | |
Schlumberger Ltd. | | 2,900 | | 249,951 | |
| | | | | |
Oil & Gas Drilling 1.17% | | | | | |
Helmerich & Payne | | 3,500 | | 246,470 | |
| | | | | |
Oil Companies - Exploration & Production 3.52% | | | | | |
Anadarko Petroleum Corp. | | 3,000 | | 234,180 | |
EOG Resources, Inc. | | 3,000 | | 262,650 | |
Occidental Petroleum Corp. | | 3,100 | | 241,087 | |
| | | | 737,917 | |
Oil Companies - Integrated 1.07% | | | | | |
Exxon Mobil Corp. | | 2,700 | | 224,640 | |
| | | | | |
Oil Refining & Marketing 3.83% | | | | | |
Marathon Petroleum Corp. | | 5,200 | | 272,012 | |
Tesoro Corp. | | 3,000 | | 253,230 | |
Valero Energy Corp. | | 4,500 | | 281,700 | |
| | | | 806,942 | |
Publishing - Newspapers 0.22% | | | | | |
Gannett Co., Inc. | | 3,300 | | 46,167 | * |
| | | | | | |
See notes to portfolios of investments and notes to financial statements.
21
All American Equity Fund | |
Portfolio of Investments (unaudited) | June 30, 2015 |
| | Shares | | Value | |
Common Stocks (cont’d) | | | | | |
| | | | | |
Retail - Apparel/Shoe 1.14% | | | | | |
Coach, Inc. | | 6,900 | | $ | 238,809 | |
| | | | | |
Retail - Computer Equipment 1.23% | | | | | |
GameStop Corp., Class A | | 6,000 | | 257,760 | |
| | | | | |
Retail - Consumer Electronics 0.09% | | | | | |
Best Buy Companies, Inc. | | 600 | | 19,566 | |
| | | | | |
Retail - Discount 0.98% | | | | | |
Wal-Mart Stores, Inc. | | 2,900 | | 205,697 | |
| | | | | |
Retail - Drug Store 1.30% | | | | | |
CVS Health Corp. | | 2,600 | | 272,688 | |
| | | | | |
Retail - Regional Department Store 1.25% | | | | | |
Kohl’s Corp. | | 4,200 | | 262,962 | |
| | | | | |
Security Services 0.90% | | | | | |
ADT Corp. | | 5,600 | | 187,992 | |
| | | | | |
Semiconductor Components - Integrated Circuits 0.98% | | | | | |
Analog Devices, Inc. | | 3,200 | | 205,392 | |
| | | | | |
Super-Regional Banks - US 4.92% | | | | | |
Capital One Financial Corp. | | 3,000 | | 263,910 | |
Fifth Third Bancorp | | 11,000 | | 229,020 | |
Huntington Bancshares, Inc. | | 25,800 | | 291,798 | |
PNC Financial Services Group, Inc. | | 2,600 | | 248,690 | |
| | | | 1,033,418 | |
Telephone - Integrated 2.10% | | | | | |
AT&T, Inc. | | 7,200 | | 255,744 | |
CenturyLink, Inc. | | 6,300 | | 185,094 | |
| | | | 440,838 | |
Television 1.01% | | | | | |
TEGNA, Inc. | | 6,600 | | 211,662 | |
| | | | | |
Toys 1.35% | | | | | |
Hasbro, Inc. | | 3,800 | | 284,202 | |
| | | | | |
Total Common Stocks
(cost $20,328,961) | | | | 20,600,519 | |
| | | | | | |
See notes to portfolios of investments and notes to financial statements.
22
All American Equity Fund | |
Portfolio of Investments (unaudited) | June 30, 2015 |
| | Shares | | Value | |
Rights 0.04% | | | | | |
| | | | | |
Food - Retail 0.04% | | | | | |
Casa Ley, S.A. de C.V., Contingent Value Right | | 7,200 | | $ | 7,308 | *#@ |
Property Development Centers, LLC, Contingent Value Right | | 7,200 | | 351 | *#@ |
| | | | | |
Total Rights
(cost $—) | | | | 7,659 | |
| | | | | |
Total Investments 98.13%
(cost $20,328,961) | | | | 20,608,178 | |
Other assets and liabilities, net 1.87% | | | | 392,213 | |
| | | | | |
Net Assets 100.0% | | | | $ | 21,000,391 | |
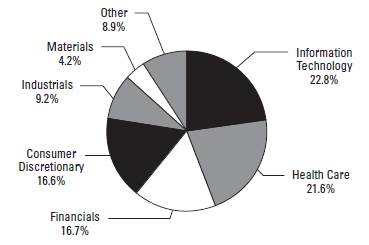
Portfolio Allocation by Industry Sector* | June 30, 2015 |
Based on Total Investments |
* Summary information above may differ from the portfolio schedule included in the financial statements due to the use of different classifications of securities for presentation purposes.
See notes to portfolios of investments and notes to financial statements.
23
Holmes Macro Trends Fund | |
Portfolio of Investments (unaudited) | June 30, 2015 |
| | Shares | | Value | |
Common Stocks 96.94% | | | | | |
| | | | | |
Aerospace/Defense 2.56% | | | | | |
Boeing Co. | | 5,000 | | $ | 693,600 | |
Spirit AeroSystems Holdings, Inc., Class A | | 9,000 | | 495,990 | * |
| | | | 1,189,590 | |
Aerospace/Defense - Equipment 1.07% | | | | | |
Astronics Corp. | | 7,000 | | 496,230 | * |
| | | | | |
Applications Software 1.61% | | | | | |
Paycom Software, Inc. | | 22,000 | | 751,300 | * |
| | | | | |
Athletic Footwear 2.33% | | | | | |
NIKE, Inc., Class B | | 10,000 | | 1,080,200 | |
| | | | | |
Audio/Video Products 1.03% | | | | | |
Harman International Industries, Inc. | | 4,000 | | 475,760 | |
| | | | | |
Building Products - Cement/Aggregates 2.07% | | | | | |
U.S. Concrete, Inc. | | 12,000 | | 454,680 | * |
Vulcan Materials Co. | | 6,000 | | 503,580 | |
| | | | 958,260 | |
Chemicals - Diversified 0.89% | | | | | |
Westlake Chemical Corp. | | 6,000 | | 411,540 | |
| | | | | |
Coal 0.00% | | | | | |
Pacific Coal Resources Ltd. | | 39,830 | | 957 | * |
| | | | | |
Commercial Banks - Eastern US 1.10% | | | | | |
Signature Bank | | 3,500 | | 512,365 | * |
| | | | | |
Commercial Banks - Southern US 2.92% | | | | | |
Bank of the Ozarks, Inc. | | 12,000 | | 549,000 | |
Home BancShares, Inc. | | 22,000 | | 804,320 | |
| | | | 1,353,320 | |
Commercial Banks - Western US 1.09% | | | | | |
Western Alliance Bancorp | | 15,000 | | 506,400 | * |
| | | | | |
Commercial Services - Finance 3.27% | | | | | |
MasterCard, Inc., Class A | | 7,000 | | 654,360 | |
Moody’s Corp. | | 8,000 | | 863,680 | |
| | | | 1,518,040 | |
| | | | | | |
See notes to portfolios of investments and notes to financial statements.
24
Holmes Macro Trends Fund | |
Portfolio of Investments (unaudited) | June 30, 2015 |
| | Shares | | Value | |
Common Stocks (cont’d) | | | | | |
| | | | | |
Computers 4.46% | | | | | |
Apple, Inc. | | 16,500 | | $ | 2,069,513 | |
| | | | | |
Computers - Peripheral Equipment 1.12% | | | | | |
Synaptics, Inc. | | 6,000 | | 520,410 | * |
| | | | | |
Consumer Products - Miscellaneous 1.05% | | | | | |
Helen of Troy Ltd. | | 5,000 | | 487,450 | * |
| | | | | |
Electric - Generation 0.57% | | | | | |
Pacific Power Generation Corp. (RS) | | 349,057 | | 264,585 | *#@ |
| | | | | |
Electronic Components - Miscellaneous 7.44% | | | | | |
Ambarella, Inc. | | 7,800 | | 800,982 | * |
Avago Technologies Ltd. | | 4,000 | | 531,720 | |
Cavium, Inc. | | 8,000 | | 550,480 | * |
Skyworks Solutions, Inc. | | 15,000 | | 1,561,499 | |
| | | | 3,444,681 | |
Energy - Alternate Sources 0.09% | | | | | |
Pacific Green Energy Corp. (RS) | | 100,000 | | 43,460 | *#@ |
| | | | | |
Entertainment Software 1.15% | | | | | |
Electronic Arts, Inc. | | 8,000 | | 532,000 | * |
| | | | | |
Finance - Commercial 1.48% | | | | | |
IOU Financial, Inc. | | 1,709,000 | | 684,147 | * |
| | | | | |
Gold Mining 0.00% | | | | | |
Gran Colombia Gold Corp. | | 2,032 | | 521 | * |
| | | | | |
Human Resources 0.77% | | | | | |
TrueBlue, Inc. | | 12,000 | | 358,800 | * |
| | | | | |
Internet Content - Entertainment 2.22% | | | | | |
Facebook, Inc., Class A | | 12,000 | | 1,029,180 | * |
| | | | | |
Internet Infrastructure Software 1.30% | | | | | |
F5 Networks, Inc. | | 5,000 | | 601,750 | * |
| | | | | |
Internet Security 0.98% | | | | | |
VASCO Data Security International, Inc. | | 15,000 | | 452,850 | * |
| | | | | | |
See notes to portfolios of investments and notes to financial statements.
25
Holmes Macro Trends Fund | |
Portfolio of Investments (unaudited) | June 30, 2015 |
| | Shares | | Value | |
Common Stocks (cont’d) | | | | | |
| | | | | |
Life/Health Insurance 3.02% | | | | | |
Lincoln National Corp. | | 8,000 | | $ | 473,760 | |
Manulife Financial Corp. | | 50,000 | | 929,500 | |
| | | | 1,403,260 | |
Machinery - General Industrial 2.47% | | | | | |
Middleby Corp. | | 6,000 | | 673,380 | * |
Wabtec Corp. | | 5,000 | | 471,200 | |
| | | | 1,144,580 | |
Medical - Biomedical/Gene 4.40% | | | | | |
Cambrex Corp. | | 13,000 | | 571,220 | * |
Gilead Sciences, Inc. | | 8,000 | | 936,640 | |
NewLink Genetics Corp. | | 12,000 | | 531,240 | * |
| | | | 2,039,100 | |
Medical - Drugs 5.67% | | | | | |
Akorn, Inc. | | 11,000 | | 480,260 | * |
Jazz Pharmaceuticals plc | | 2,000 | | 352,140 | * |
Lannett Company, Inc. | | 15,000 | | 891,600 | * |
Merus Labs International, Inc. | | 100,000 | | 235,388 | * |
Valeant Pharmaceuticals International, Inc. | | 3,000 | | 666,450 | * |
| | | | 2,625,838 | |
Medical - Generic Drugs 2.61% | | | | | |
Allergan plc | | 4,000 | | 1,213,840 | * |
| | | | | |
Medical - HMO 2.77% | | | | | |
Aetna, Inc. | | 5,000 | | 637,300 | |
Cigna Corp. | | 4,000 | | 648,000 | |
| | | | 1,285,300 | |
Medical - Hospitals 2.35% | | | | | |
African Medical Investments plc | | 1,000,000 | | 0 | *#@ |
HCA Holdings, Inc. | | 12,000 | | 1,088,640 | * |
| | | | 1,088,640 | |
Medical - Wholesale Drug Distribution 2.42% | | | | | |
McKesson Corp. | | 5,000 | | 1,124,050 | |
| | | | | |
Medical Instruments 1.54% | | | | | |
Edwards Lifesciences Corp. | | 5,000 | | 712,150 | * |
| | | | | |
Multi-line Insurance 1.13% | | | | | |
American Financial Group, Inc. | | 8,000 | | 520,320 | |
| | | | | | |
See notes to portfolios of investments and notes to financial statements.
26
Holmes Macro Trends Fund | |
Portfolio of Investments (unaudited) | June 30, 2015 |
| | Shares | | Value | |
Common Stocks (cont’d) | | | | | |
| | | | | |
Multimedia 2.21% | | | | | |
Walt Disney Co. | | 9,000 | | $ | 1,027,260 | |
| | | | | |
Oil & Gas Drilling 0.94% | | | | | |
Parsley Energy, Inc., Class A | | 25,000 | | 435,500 | * |
| | | | | |
Oil - Field Services 0.80% | | | | | |
Oceaneering International, Inc. | | 8,000 | | 372,720 | |
| | | | | |
Precious Metals 0.92% | | | | | |
Tahoe Resources, Inc. | | 35,000 | | 424,550 | |
| | | | | |
Property/Casualty Insurance 2.13% | | | | | |
Heritage Insurance Holdings, Inc. | | 22,000 | | 505,780 | * |
Universal Insurance Holdings, Inc. | | 20,000 | | 484,000 | |
| | | | 989,780 | |
Real Estate Management/Services 2.11% | | | | | |
HFF, Inc., Class A | | 12,000 | | 500,760 | |
Jones Lang LaSalle, Inc. | | 2,800 | | 478,800 | |
| | | | 979,560 | |
Real Estate Operating/Development 0.78% | | | | | |
Pacific Infrastructure Ventures, Inc. (RS) | | 426,533 | | 359,823 | *#@ |
| | | | | |
Retail - Apparel/Shoe 0.92% | | | | | |
Cato Corp., Class A | | 11,000 | | 426,360 | |
| | | | | |
Retail - Building Products 2.16% | | | | | |
Lowe’s Companies, Inc. | | 15,000 | | 1,004,550 | |
| | | | | |
Retail - Drug Store 2.26% | | | | | |
CVS Health Corp. | | 10,000 | | 1,048,800 | |
| | | | | |
Retail - Major Department Store 2.00% | | | | | |
TJX Companies, Inc. | | 14,000 | | 926,380 | |
| | | | | |
Retail - Perfume & Cosmetics 1.00% | | | | | |
Ulta Salon, Cosmetics & Fragrance, Inc. | | 3,000 | | 463,350 | * |
| | | | | |
Retail - Restaurants 1.85% | | | | | |
Starbucks Corp. | | 16,000 | | 857,840 | |
| | | | | | |
See notes to portfolios of investments and notes to financial statements.
27
Holmes Macro Trends Fund | |
Portfolio of Investments (unaudited) | June 30, 2015 |
| | Shares | | Value | |
Common Stocks (cont’d) | | | | | |
| | | | | |
Retail - Video Rental 1.15% | | | | | |
Outerwall, Inc. | | 7,000 | | $ | 532,770 | |
| | | | | |
Semiconductor Equipment 1.31% | | | | | |
Tessera Technologies, Inc. | | 16,000 | | 607,680 | |
| | | | | |
Television 1.06% | | | | | |
AMC Networks, Inc., Class A | | 6,000 | | 491,100 | * |
| | | | | |
Transport - Services 2.39% | | | | | |
FedEx Corp. | | 6,500 | | 1,107,600 | |
| | | | | |
Total Common Stocks
(cost $39,697,983) | | | | 44,956,010 | |
| | | | | |
Warrants 0.00% | | | | | |
| | | | | |
Gold Mining 0.00% | | | | | |
Gran Colombia Gold Corp., 144A, Warrants (October 2017) | | 3,700 | | 0 | *#@ |
Gran Colombia Gold Corp., 144A, Warrants (March 2019) | | 250 | | 11 | * |
| | | | | |
Total Warrants
(cost $0) | | | | 11 | |
| | | | | | |
| | Principal
Amount | | | |
Gold-Linked Notes 0.19% | | | | | |
| | | | | |
Gold Mining 0.19% | | | | | |
Gran Colombia Gold Corp., 10.00%, maturity 10/31/17 | | $ | 15,000 | | 3,338 | #^@ |
Gran Colombia Gold Corp., 144A, 10.00%, maturity 10/31/17 | | 370,000 | | 82,325 | #^@ |
| | | | | |
Total Gold-Linked Notes
(cost $379,500) | | | | 85,663 | |
| | | | | |
Silver-Linked Notes 0.11% | | | | | |
| | | | | |
Gold Mining 0.11% | | | | | |
Gran Colombia Gold Corp., 5.00%, maturity 08/11/18
(cost $340,261) | | 424,000 | | 51,940 | ^ |
| | | | | | |
See notes to portfolios of investments and notes to financial statements.
28
Holmes Macro Trends Fund | |
Portfolio of Investments (unaudited) | June 30, 2015 |
| | Principal
Amount | | Value | |
Corporate Note 0.49% | | | | | |
| | | | | |
Electric - Generation 0.49% | | | | | |
Pacific Power Generation Corp., 15.00%, maturity 04/03/17 (RS)
(cost $225,000) | | $ | 225,000 | | $ | 225,000 | #@ |
| | | | | |
Overnight Cash Deposit 3.04% | | | | | |
| | | | | |
Wells Fargo Bank NA, 0.03%, maturity 07/01/15
(cost $1,409,688) | | 1,409,688 | | 1,409,688 | |
| | | | | |
Total Investments 100.77%
(cost $42,052,432) | | | | 46,728,312 | |
Other assets and liabilities, net (0.77)% | | | | (355,207 | ) |
| | | | | | |
Net Assets 100.0% | | | | $ | 46,373,105 | |
| | | | | | | | |
Portfolio Allocation by Industry Sector* | | June 30, 2015 |
Based on Total Investments | |
* Summary information above may differ from the portfolio schedule included in the financial statements due to the use of different classifications of securities for presentation purposes.
See notes to portfolios of investments and notes to financial statements.
29
Global Resources Fund
Portfolio of Investments (unaudited) | | June 30, 2015 |
| | Shares | | Value | |
Common Stocks 92.48% | | | | | |
| | | | | |
Agricultural Chemicals 3.55% | | | | | |
CF Industries Holdings, Inc. | | 75,000 | | $ | 4,821,000 | |
| | | | | |
Agricultural Operations 0.55% | | | | | |
Agriterra Ltd. | | 69,849,776 | | 754,207 | *+ |
| | | | | |
Building Products - Cement/Aggregates 8.00% | | | | | |
Martin Marietta Materials, Inc. | | 30,000 | | 4,245,300 | |
U.S. Concrete, Inc. | | 64,000 | | 2,424,960 | * |
Vulcan Materials Co. | | 50,000 | | 4,196,500 | |
| | | | 10,866,760 | |
Chemicals - Diversified 6.31% | | | | | |
Dow Chemical Co. | | 55,000 | | 2,814,350 | |
LyondellBasell Industries N.V., Class A | | 41,000 | | 4,244,320 | |
Westlake Chemical Corp. | | 22,000 | | 1,508,980 | |
| | | | 8,567,650 | |
Chemicals - Specialty 2.01% | | | | | |
Cytec Industries, Inc. | | 45,000 | | 2,723,850 | |
| | | | | |
Coal 0.34% | | | | | |
Pacific Coal Resources Ltd. | | 4,362,314 | | 104,779 | *+ |
Sable Mining Africa Ltd. | | 28,061,000 | | 363,483 | * |
Walter Energy, Inc., 144A | | 4,293 | | 936 | * |
| | | | 469,198 | |
Containers - Paper/Plastic 2.27% | | | | | |
Sealed Air Corp. | | 60,000 | | 3,082,800 | |
| | | | | |
Diamonds/Precious Stones 0.02% | | | | | |
Diamond Fields International Ltd. | | 1,800,000 | | 21,617 | * |
Rockwell Diamonds, Inc., 144A | | 63,333 | | 11,916 | * |
| | | | 33,533 | |
Diversified Minerals 2.61% | | | | | |
African Potash Ltd. | | 7,965,799 | | 46,998 | * |
Canada Zinc Metals Corp. | | 1,000,000 | | 180,144 | * |
Dundee Sustainable Technologies, Inc. | | 3,587,500 | | 301,591 | * |
Encanto Potash Corp., 144A | | 3,000,000 | | 228,183 | * |
Lundin Mining Corp. | | 600,000 | | 2,464,372 | * |
Niocan, Inc., 144A | | 362,069 | | 45,657 | * |
Woulfe Mining Corp. | | 5,585,100 | | 290,658 | * |
| | | | 3,557,603 | |
| | | | | | |
See notes to portfolios of investments and notes to financial statements.
30
Global Resources Fund
Portfolio of Investments (unaudited) | | June 30, 2015 |
| | Shares | | Value | |
Common Stocks (cont’d) | | | | | |
| | | | | |
Electric - Generation 2.72% | | | | | |
Pacific Power Generation Corp. (RS) | | 4,868,396 | | $ | 3,690,244 | *#@ |
| | | | | |
Energy - Alternate Sources 5.05% | | | | | |
Pacific Ethanol, Inc. | | 127,500 | | 1,315,800 | * |
Pacific Green Energy Corp. (RS) | | 2,400,000 | | 1,043,040 | *+#@ |
SunEdison, Inc. | | 150,000 | | 4,486,500 | * |
| | | | 6,845,340 | |
Food - Meat Products 3.14% | | | | | |
Tyson Foods, Class A | | 100,000 | | 4,263,000 | |
| | | | | |
Food - Miscellaneous/Diversified 1.92% | | | | | |
Cal-Maine Foods, Inc. | | 50,000 | | 2,610,000 | |
| | | | | |
Forestry 0.01% | | | | | |
Bravern Ventures Ltd. | | 254,431 | | 13,241 | * |
| | | | | |
Gold Mining 5.14% | | | | | |
Chesapeake Gold Corp., 144A | | 52,400 | | 83,907 | * |
Corona Minerals Ltd. | | 100,000 | | 386 | *#@ |
Gran Colombia Gold Corp. | | 560,590 | | 143,626 | * |
Kinross Gold Corp. | | 1 | | 0 | * |
Klondex Mines Ltd. | | 1,700,000 | | 4,627,702 | * |
NGEx Resources, Inc. | | 600,000 | | 422,738 | * |
Rusoro Mining Ltd. | | 3,000,000 | | 108,086 | * |
Sunridge Gold Corp. | | 4,600,000 | | 662,930 | *+ |
Sunridge Gold Corp., 144A | | 6,333,788 | | 912,796 | *+ |
| | | | 6,962,171 | |
Medical - Hospitals 0.00% | | | | | |
African Medical Investments plc | | 2,507,500 | | 0 | *#@ |
| | | | | |
Metal - Aluminum 0.92% | | | | | |
Kaiser Aluminum Corp. | | 15,000 | | 1,246,200 | |
| | | | | |
Metal - Copper 3.38% | | | | | |
Catalyst Copper Corp., 144A | | 166,666 | | 25,354 | * |
First Quantum Minerals Ltd. | | 125,000 | | 1,634,307 | |
Southern Copper Corp. | | 100,000 | | 2,941,000 | |
Verona Development Corp. | | 708,800 | | 0 | *#@ |
| | | | 4,600,661 | |
| | | | | | |
See notes to portfolios of investments and notes to financial statements.
31
Global Resources Fund
Portfolio of Investments (unaudited) | | June 30, 2015 |
| | Shares | | Value | |
Common Stocks (cont’d) | | | | | |
| | | | | |
Metal - Diversified 3.44% | | | | | |
Glencore plc, ADR | | 250,000 | | $ | 2,008,750 | |
GoviEx Uranium, Inc., Class A | | 755,000 | | 66,493 | * |
GoviEx Uranium, Inc., 144A, Class A | | 58,000 | | 5,108 | * |
Mandalay Resources Corp. | | 1,109,500 | | 852,778 | |
Orsu Metals Corp., 144A | | 147,605 | | 2,364 | * |
Trevali Mining Corp. | | 2,500,000 | | 1,741,393 | * |
| | | | 4,676,886 | |
| | | | | |
Metal - Iron 0.01% | | | | | |
Oceanic Iron Ore Corp. | | 200,000 | | 17,214 | * |
WAI Capital Investment Corp., 144A | | 292,500 | | 5,855 | * |
| | | | 23,069 | |
| | | | | |
Mining Services 0.25% | | | | | |
Bounty Mining Ltd. | | 22,000,000 | | 339,482 | *#@ |
| | | | | |
Natural Resource Technology 0.10% | | | | | |
I-Pulse, Inc., 144A (RS) | | 15,971 | | 137,351 | *#@ |
| | | | | |
Non - Ferrous Metals 0.01% | | | | | |
Sterling Group Ventures, Inc., 144A | | 500,000 | | 13,000 | * |
| | | | | |
Office Supplies & Forms 2.24% | | | | | |
Avery Dennison Corp. | | 50,000 | | 3,047,000 | |
| | | | | |
Oil - Field Services 2.77% | | | | | |
Atlas Development & Support Services Ltd. | | 63,890,983 | | 3,064,045 | *+ |
RPC, Inc. | | 50,000 | | 691,500 | |
| | | | 3,755,545 | |
| | | | | |
Oil & Gas Drilling 2.43% | | | | | |
Helmerich & Payne, Inc. | | 11,000 | | 774,620 | |
Parsley Energy, Inc., Class A | | 145,000 | | 2,525,900 | * |
| | | | 3,300,520 | |
| | | | | |
Oil Companies - Exploration & Production 23.19% | | | | | |
Africa Energy Corp., 144A | | 2,110,889 | | 236,609 | * |
Bankers Petroleum Ltd. | | 650,000 | | 1,613,291 | * |
BNK Petroleum, Inc. | | 2,800,000 | | 1,165,733 | * |
Diamondback Energy, Inc. | | 50,000 | | 3,769,000 | * |
Ivanhoe Energy, Inc. | | 18,719 | | 0 | *#@ |
Laredo Petroleum, Inc. | | 100,000 | | 1,258,000 | * |
Newfield Exploration Co. | | 120,000 | | 4,334,400 | * |
| | | | | | |
See notes to portfolios of investments and notes to financial statements.
32
Global Resources Fund
Portfolio of Investments (unaudited) | | June 30, 2015 |
| | Shares | | Value | |
Common Stocks (cont’d) | | | | | |
| | | | | |
Oil Companies - Exploration & Production (cont’d) | | | | | |
PDC Energy, Inc. | | 80,000 | | $ | 4,291,200 | * |
Petroamerica Oil Corp. | | 11,158,000 | | 938,022 | * |
Peyto Exploration & Development Corp. | | 60,000 | | 1,466,613 | |
Raging River Exploration, Inc. | | 250,000 | | 1,747,398 | * |
Range Energy Resources, Inc., 144A | | 15,000,000 | | 210,168 | * |
RMP Energy, Inc. | | 800,000 | | 1,498,799 | * |
Royalite Petroleum Co., Inc. | | 2,266,333 | | 1,586 | * |
RSP Permian, Inc. | | 100,000 | | 2,811,000 | * |
Synergy Resources Corp. | | 245,000 | | 2,800,350 | * |
U.S. Oil Sands, Inc. | | 7,777,777 | | 684,992 | * |
U.S. Oil Sands, Inc., 144A | | 9,900,000 | | 871,898 | * |
Whitecap Resources, Inc. | | 170,000 | | 1,793,916 | |
| | | | 31,492,975 | |
| | | | | |
Oil Field Machinery & Equipment 1.24% | | | | | |
Dril-Quip, Inc. | | 11,000 | | 827,750 | * |
Forum Energy Technologies, Inc. | | 42,000 | | 851,760 | * |
| | | | 1,679,510 | |
| | | | | |
Pipelines 3.21% | | | | | |
Energy Transfer Equity, L.P. | | 68,000 | | 4,363,559 | |
| | | | | |
Precious Metals 1.03% | | | | | |
Tahoe Resources, Inc. | | 115,000 | | 1,394,950 | |
| | | | | |
Real Estate Operating/Development 4.62% | | | | | |
Pacific Infrastructure Ventures, Inc. (RS) | | 7,434,544 | | 6,279,374 | *#@ |
| | | | | |
Total Common Stocks
(cost $214,520,100) | | | | 125,610,679 | |
| | | | | |
Master Limited Partnership 2.30% | | | | | |
| | | | | |
Oil - Field Services 2.30% | | | | | |
Rice Midstream Partners LP
(cost $2,575,246) | | 180,000 | | 3,124,799 | |
| | | | | |
Warrants 0.24% | | | | | |
| | | | | |
Diversified Minerals 0.00% | | | | | |
Encanto Potash Corp., 144A, Warrants (October 2015) | | 1,500,000 | | 0 | *#@ |
| | | | | | |
See notes to portfolios of investments and notes to financial statements.
33
Global Resources Fund
Portfolio of Investments (unaudited) | | June 30, 2015 |
| | Shares | | Value | |
Warrants (cont’d) | | | | | |
| | | | | |
Gold Mining 0.24% | | | | | |
Dundee Precious Metals, Inc., Warrants (November 2015) | | 742,895 | | $ | 71,375 | * |
Gran Colombia Gold Corp., 144A, Warrants (October 2017) | | 86,150 | | 0 | *#@ |
Gran Colombia Gold Corp., 144A, Warrants (March 2019) | | 59,500 | | 2,501 | * |
New Gold, Inc., 144A, Warrants (June 2017) | | 822,570 | | 125,131 | * |
Sunridge Gold Corp., 144A, Warrants (October 2017) | | 6,333,788 | | 126,777 | *+ |
| | | | 325,784 | |
| | | | | |
Metal - Copper 0.00% | | | | | |
Catalyst Copper Corp., 144A, Warrants (February 2017) | | 83,333 | | 0 | *#@ |
| | | | | |
Metal - Iron 0.00% | | | | | |
WAI Capital Investment Corp., 144A, Warrants (March 2016) | | 292,500 | | 0 | *#@ |
| | | | | |
Total Warrants
(cost $944,160) | | | | 325,784 | |
| | | | | |
| | Contracts | | | |
Purchased Call Options 1.28% | | | | | |
| | | | | |
Agricultural Chemicals 0.10% | | | | | |
Syngenta AG, Strike Price 90.00, Expiration Dec. 2015 | | 400 | | 134,000 | * |
| | | | | |
Metal - Copper 0.36% | | | | | |
Freeport-McMoRan Copper & Gold, Inc., Strike Price 20.00, Expiration Jan. 2017 | | 1,699 | | 484,215 | * |
| | | | | |
Oil Refining & Marketing 0.82% | | | | | |
Marathon Petroleum Corp., Strike Price 55.00, Expiration Jan. 2016 | | 1,000 | | 292,500 | * |
Phillips 66, Strike Price 82.50, Expiration Jan. 2017 | | 550 | | 437,250 | * |
Valero Energy Corp., Strike Price 65.00, Expiration Jan. 2016 | | 1,000 | | 385,000 | * |
| | | | 1,114,750 | |
| | | | | |
Total Purchased Call Options
(cost $1,913,907) | | | | 1,732,965 | |
| | | | | |
| | Principal
Amount | | | |
Convertible Bond 0.04% | | | | | |
| | | | | |
Diversified Minerals 0.04% | | | | | |
Great Western Minerals Group Ltd., 144A, 8.00%, maturity 04/06/17
(cost $1,000,000) | | $ | 1,000,000 | | 50,000 | *^ |
| | | | | | | |
See notes to portfolios of investments and notes to financial statements.
34
Global Resources Fund
Portfolio of Investments (unaudited) | | June 30, 2015 |
| | Principal
Amount | | Value | |
Gold-Linked Notes 1.47% | | | | | |
| | | | | |
Gold Mining 1.47% | | | | | |
Gran Colombia Gold Corp., 10.00%, maturity 10/31/17 | | $ | 332,000 | | $ | 73,870 | #^@ |
Gran Colombia Gold Corp., 144A, 10.00%, maturity 10/31/17 | | 8,615,000 | | 1,916,838 | #^@ |
| | | | 1,990,708 | |
| | | | | |
Total Gold-Linked Notes
(cost $8,822,210) | | | | 1,990,708 | |
| | | | | |
Silver-Linked Notes 0.60% | | | | | |
| | | | | |
Gold Mining 0.60% | | | | | |
Gran Colombia Gold Corp., 5.00%, maturity 08/11/18 | | 2,000,000 | | 245,000 | ^ |
Gran Colombia Gold Corp., 144A, 5.00%, maturity 08/11/18 | | 4,705,000 | | 576,363 | ^ |
| | | | | |
Total Silver-Linked Notes
(cost $5,786,165) | | | | 821,363 | |
| | | | | |
Corporate Note 1.99% | | | | | |
| | | | | |
Electric - Generation 1.99% | | | | | |
Pacific Power Generation Corp., 15.00%, maturity 04/03/17 (RS)
(cost $2,700,000) | | 2,700,000 | | 2,700,000 | #@ |
| | | | | |
Overnight Cash Deposit 2.75% | | | | | |
JPMorgan Chase Bank NA, 0.03%, maturity 07/01/15
(cost $3,735,013) | | 3,735,013 | | 3,735,013 | |
| | | | | |
Total Investments 103.15%
(cost $241,996,801) | | | | 140,091,311 | |
Other assets and liabilities, net (3.15)% | | | | (4,274,864 | ) |
| | | | | |
Net Assets 100.0% | | | | $ | 135,816,447 | |
| | | | | | | |
See notes to portfolios of investments and notes to financial statements.
35
Global Resources Fund
Portfolio of Investments (unaudited) | | June 30, 2015 |
Portfolio Allocation by Industry Sector* | |
Based on Total Investments | June 30, 2015 |

* Summary information above may differ from the portfolio schedule included in the financial statement due to the use of different classifications of securities for presentation purposes.
See notes to portfolios of investments and notes to financial statements.
36
World Precious Minerals Fund | |
Portfolio of Investments (unaudited) | June 30, 2015 |
| | Shares | | Value | |
Common Stocks 89.84% | | | | | |
| | | | | |
Agricultural Operations 0.44% | | | | | |
Agriterra Ltd. | | 38,536,200 | | $ | 416,097 | * |
| | | | | |
Capital Pools 0.16% | | | | | |
Eagle Hill Exploration Corp. | | 200,000 | | 144,115 | * |
Pinecrest Resources Ltd. | | 25,000 | | 2,202 | * |
Pinecrest Resources Ltd. (RS) | | 75,000 | | 6,275 | *#@ |
| | | | 152,592 | |
| | | | | |
Coal 0.26% | | | | | |
Pacific Coal Resources Ltd. | | 1,182,764 | | 28,409 | * |
Sable Mining Africa Ltd. | | 17,014,032 | | 220,388 | * |
| | | | 248,797 | |
| | | | | |
Diamonds/Precious Stones 1.96% | | | | | |
Lucapa Diamond Co., Ltd. | | 1,000,000 | | 154,374 | * |
Lucara Diamond Corp. | | 1,000,000 | | 1,593,275 | |
Northern Superior Resources, Inc. | | 1,510,900 | | 42,339 | * |
Olivut Resources Ltd. | | 645,000 | | 43,895 | * |
Rockwell Diamonds, Inc., 144A | | 171,667 | | 32,299 | * |
| | | | 1,866,182 | |
| | | | | |
Diversified Minerals 1.40% | | | | | |
Adamera Minerals Corp. | | 119,543 | | 3,350 | * |
African Potash Ltd. | | 1,352,917 | | 7,982 | * |
Amarc Resources Ltd. | | 695,545 | | 51,512 | * |
Burey Gold Ltd. | | 7,000,000 | | 151,224 | * |
Calibre Mining Corp. | | 4,650,000 | | 521,217 | * |
Duketon Mining Ltd. | | 2,250,000 | | 225,420 | * |
Indochine Mining Ltd. | | 4,000,000 | | 18,517 | *#@ |
Riverside Resources, Inc. | | 956,000 | | 145,428 | * |
Rubicon Minerals Corp. | | 200,000 | | 208,167 | * |
| | | | 1,332,817 | |
| | | | | |
Gold Mining 64.95% | | | | | |
ABM Resources NL | | 1,125,000 | | 217,275 | * |
Agnico Eagle Mines Ltd. | | 30,000 | | 851,100 | |
Alacer Gold Corp. | | 300,000 | | 703,763 | |
Algold Resources Ltd. | | 1,000,000 | | 138,110 | * |
Almaden Minerals Ltd. | | 400,000 | | 326,661 | * |
Argonaut Gold, Inc. | | 475,000 | | 638,911 | * |
Atlantic Gold Corp. | | 1,000,000 | | 204,163 | * |
Bonterra Resources, Inc. | | 1,250,000 | | 180,144 | * |
Canyon Resources Ltd. | | 10,006,593 | | 324,265 | *+ |
CB Gold, Inc. | | 8,500,000 | | 238,191 | *+ |
| | | | | | |
See notes to portfolios of investments and notes to financial statements.
37
World Precious Minerals Fund | |
Portfolio of Investments (unaudited) | June 30, 2015 |
| | Shares | | Value | |
Common Stocks (cont’d) | | | | | |
| | | | | |
Gold Mining (cont’d) | | | | | |
Chesapeake Gold Corp., 144A | | 192,199 | | $ | 307,765 | * |
Claude Resources, Inc. | | 1,250,000 | | 670,536 | * |
Comstock Mining, Inc. | | 2,165,000 | | 1,266,525 | * |
CopperBank Resources Corp. | | 195,000 | | 5,464 | * |
CopperBank Resources Corp., 144A | | 174,000 | | 4,876 | * |
Corona Minerals Ltd. | | 1,625,000 | | 6,269 | *#@ |
Doray Minerals Ltd. | | 1,500,000 | | 549,921 | * |
Dundee Precious Metals, Inc. | | 350,000 | | 711,769 | * |
Eastmain Resources, Inc. | | 1,779,500 | | 598,391 | * |
Gold Standard Ventures Corp. | | 2,000,000 | | 948,000 | * |
Gran Colombia Gold Corp. | | 998,149 | | 255,731 | * |
Guyana Goldfields, Inc. | | 150,000 | | 475,580 | * |
IDM Mining Ltd. | | 95,000 | | 9,508 | * |
Integra Gold Corp. | | 2,069,000 | | 530,088 | * |
Kaminak Gold Corp., Class A | | 750,000 | | 474,380 | * |
Kilo Goldmines Ltd. | | 251,000 | | 15,072 | * |
Kirkland Lake Gold, Inc. | | 335,000 | | 1,510,048 | * |
Klondex Mines Ltd. | | 6,045,000 | | 16,455,563 | * |
Lake Shore Gold Corp. | | 1,900,000 | | 1,947,158 | * |
Lexam VG Gold, Inc., 144A | | 2,406,501 | | 154,139 | * |
Malbex Resources, Inc., 144A | | 1,333,333 | | 32,026 | * |
Mammoth Resources Corp. | | 818,000 | | 4,912 | * |
Mirasol Resources Ltd. | | 2,000,000 | | 1,393,114 | * |
NGEx Resources, Inc. | | 2,375,000 | | 1,673,339 | * |
Northern Star Resources Ltd. | | 275,000 | | 471,124 | |
OceanaGold Corp. | | 155,348 | | 384,328 | |
Osisko Gold Royalties Ltd. | | 690,000 | | 8,684,387 | |
Petaquilla Minerals Ltd., 144A | | 2,660,000 | | 53,243 | * |
Pilot Gold, Inc. | | 1,000,000 | | 496,397 | * |
Pretium Resources, Inc. | | 600,000 | | 3,249,699 | * |
Pure Gold Mining, Inc. | | 2,500,000 | | 290,232 | * |
Radius Gold, Inc. | | 3,950,000 | | 268,815 | * |
Radius Gold, Inc., 144A | | 125,000 | | 8,507 | * |
Randgold Resources Ltd., Sponsored ADR | | 20,000 | | 1,339,000 | |
Redstar Gold Corp. | | 5,797,714 | | 208,885 | * |
Richmont Mines, Inc. | | 575,000 | | 1,822,750 | * |
Romarco Minerals, Inc. | | 1,949,000 | | 663,191 | * |
Royal Gold, Inc. | | 15,000 | | 923,850 | |
Rusoro Mining Ltd. | | 6,000,000 | | 216,173 | * |
Rye Patch Gold Corp. | | 4,750,000 | | 570,456 | * |
Rye Patch Gold Corp., 144A | | 1,800,000 | | 216,173 | * |
Seafield Resources Ltd., 144A | | 1,300,000 | | 5,204 | *#@ |
Silver Lake Resources Ltd. | | 251,690 | | 27,368 | * |
Skeena Resources Ltd. | | 8,184,000 | | 425,909 | * |
Solvista Gold Corp. | | 50,000 | | 1,601 | * |
Solvista Gold Corp., 144A | | 2,620,000 | | 83,907 | * |
| | | | | | |
See notes to portfolios of investments and notes to financial statements.
38
World Precious Minerals Fund | |
Portfolio of Investments (unaudited) | June 30, 2015 |
| | Shares | | Value | |
Common Stocks (cont’d) | | | | | |
| | | | | |
Gold Mining (cont’d) | | | | | |
St Barbara Ltd. | | 2,206,852 | | $ | 979,193 | * |
Sunridge Gold Corp. | | 2,250,000 | | 324,259 | * |
Sunridge Gold Corp., 144A | | 1,900,000 | | 273,819 | * |
Taurus Gold Ltd., 144A (RS) | | 2,448,381 | | 1,295,194 | *#@ |
Teranga Gold Corp. | | 2,500,000 | | 1,421,137 | * |
Tolima Gold, Inc., 144A | | 4,100,000 | | 16,413 | * |
TriStar Gold, Inc. | | 16,000,000 | | 2,305,845 | *+ |
Wesdome Gold Mines Ltd. | | 800,000 | | 659,728 | * |
Yamana Gold, Inc. | | 60,000 | | 180,000 | |
| | | | 61,689,544 | |
| | | | | |
Medical - Hospitals 0.00% | | | | | |
African Medical Investments plc | | 4,637,500 | | 0 | *#@ |
| | | | | |
Metal - Copper 0.02% | | | | | |
Catalyst Copper Corp. | | 52,133 | | 7,931 | * |
Catalyst Copper Corp., 144A | | 66,667 | | 10,142 | * |
Verona Development Corp. | | 48,500 | | 0 | *#@ |
| | | | 18,073 | |
| | | | | |
Metal - Diversified 10.30% | | | | | |
Atico Mining Corp. | | 460,000 | | 195,196 | * |
Balmoral Resources Ltd. | | 1,485,000 | | 820,376 | * |
Calico Resources Corp. | | 3,895,500 | | 280,701 | * |
Cardinal Resources Ltd. | | 3,976,907 | | 153,367 | * |
Dalradian Resources, Inc. | | 1,800,000 | | 1,412,330 | * |
Elissa Resources Ltd. | | 12,083 | | 1,548 | * |
Falco Resources Ltd. | | 1,953,700 | | 617,863 | * |
First Point Minerals Corp. | | 2,000,000 | | 112,090 | * |
Ivanhoe Mines Ltd., Class A | | 100,000 | | 72,058 | * |
Mandalay Resources Corp. | | 3,012,300 | | 2,315,299 | |
Mineral Mountain Resources Ltd. | | 10,000,000 | | 320,256 | *+ |
Nevada Sunrise Gold Corp. | | 325,000 | | 55,945 | * |
Novo Resources Corp. | | 1,100,000 | | 484,388 | * |
Orex Minerals, Inc. | | 9,411,500 | | 1,507,046 | *+ |
Orsu Metals Corp. | | 69,220 | | 1,108 | * |
Orsu Metals Corp., 144A | | 1,800,000 | | 28,823 | * |
Reservoir Minerals, Inc. | | 191,100 | | 659,440 | * |
Silver Bull Resources, Inc. | | 2,350,000 | | 258,500 | * |
Temex Resources Corp. | | 2,500,000 | | 130,104 | * |
Trevali Mining Corp. | | 500,000 | | 348,279 | * |
| | | | 9,774,717 | |
| | | | | | |
See notes to portfolios of investments and notes to financial statements.
39
World Precious Minerals Fund | |
Portfolio of Investments (unaudited) | June 30, 2015 |
| | Shares | | Value | |
Common Stocks (cont’d) | | | | | |
| | | | | |
Mining Services 0.46% | | | | | |
Argent Minerals Ltd. | | 17,100,000 | | $ | 314,811 | *+ |
Energold Drilling Corp. | | 200,000 | | 124,900 | * |
| | | | 439,711 | |
| | | | | |
Oil Companies - Exploration & Production 0.00% | | | | | |
Big Sky Energy Corp. | | 2,000,000 | | 0 | *#@ |
| | | | | |
Platinum 0.62% | | | | | |
Pacific North West Capital Corp. | | 430,555 | | 4,309 | * |
Platinum Group Metals Ltd. | | 1,500,000 | | 588,471 | * |
| | | | 592,780 | |
| | | | | |
Precious Metals 6.38% | | | | | |
Candente Gold Corp., 144A | | 4,875,000 | | 136,609 | *+ |
Lundin Gold, Inc. | | 760,000 | | 2,394,395 | * |
Lundin Gold, Inc., 144A | | 70,000 | | 220,536 | * |
Pan African Resources plc | | 1,832,451 | | 271,385 | |
Roxgold, Inc. | | 3,500,000 | | 2,157,726 | * |
Sabina Gold & Silver Corp. | | 625,000 | | 220,176 | * |
Santana Minerals Ltd. | | 2,400,000 | | 31,400 | * |
Solitario Exploration & Royalty Corp. | | 1,000,000 | | 630,000 | * |
| | | | 6,062,227 | |
| | | | | |
Silver Mining 2.89% | | | | | |
Fortuna Silver Mines, Inc. | | 570,000 | | 2,086,200 | * |
MAG Silver Corp. | | 25,000 | | 195,957 | * |
Santacruz Silver Mining Ltd. | | 1,100,000 | | 149,720 | * |
Silver Wheaton Corp. | | 8,823 | | 152,991 | |
Source Exploration Corp. | | 4,975,000 | | 159,327 | *+ |
| | | | 2,744,195 | |
| | | | | |
Total Common Stocks
(cost $181,186,100) | | | | 85,337,732 | |
| | | | | |
Exchange-Traded Funds 0.00% | | | | | |
Market Vectors Gold Miners ETF | | 20 | | 355 | |
Market Vectors Junior Gold Miners ETF | | 8 | | 193 | |
| | | | | |
Total Exchange-Traded Funds
(cost $2,195) | | | | 548 | |
| | | | | | |
See notes to portfolios of investments and notes to financial statements.
40
World Precious Minerals Fund | |
Portfolio of Investments (unaudited) | June 30, 2015 |
| | Shares | | Value | |
Warrants 1.31% | | | | | |
| | | | | |
Diamonds/Precious Stones 0.00% | | | | | |
Lucapa Diamond Co., Ltd., Warrants (August 2015) | | 500,000 | | $ | 3,086 | * |
| | | | | |
Gold Mining 1.09% | | | | | |
Alamos Gold, Inc., Warrants (August 2018) | | 110,000 | | 20,256 | * |
Algold Resources Ltd., Warrants (December 2016) (RS) | | 500,000 | | 0 | *#@ |
Canyon Resources Ltd., Warrants (January 2017) | | 6,168,864 | | 71,394 | *+ |
Dundee Precious Metals, Inc., Warrants (November 2015) | | 1,495,039 | | 143,640 | * |
Gran Colombia Gold Corp., 144A, Warrants (October 2017) | | 58,450 | | 0 | *#@ |
Gran Colombia Gold Corp., 144A, Warrants (March 2019) | | 96,250 | | 4,046 | * |
New Gold, Inc., Warrants (June 2017) | | 147,100 | | 22,377 | * |
New Gold, Inc., 144A, Warrants (June 2017) | | 352,530 | | 53,627 | * |
Osisko Gold Royalties Ltd., Warrants (February 2022) | | 377,500 | | 680,044 | * |
Skeena Resources Ltd., Warrants (October 2016) | | 10,000,000 | | 0 | *#@ |
Sunridge Gold Corp., 144A, Warrants (October 2017) | | 1,900,000 | | 38,030 | * |
Tolima Gold, Inc., 144A, Warrants (March 2016) | | 1,625,000 | | 0 | *#@ |
Tolima Gold, Inc., 144A, Warrants (December 2016) | | 425,000 | | 0 | *#@ |
Veris Gold Corp., Warrants (August 2016) | | 250,000 | | 0 | *#@ |
Veris Gold Corp., Warrants (December 2016) | | 282,200 | | 0 | *#@ |
| | | | 1,033,414 | |
| | | | | |
Metal - Copper 0.00% | | | | | |
Catalyst Copper Corp., 144A, Warrants (February 2017) | | 33,333 | | 0 | *#@ |
| | | | | |
Metal - Diversified 0.22% | | | | | |
Calico Resources Corp., Warrants (October 2015) | | 1,250,000 | | 0 | *#@ |
Dalradian Resources, Inc., Warrants (July 2017) | | 1,094,000 | | 190,509 | * |
HudBay Minerals, Inc., Warrants (July 2018) | | 17,000 | | 15,516 | * |
Mineral Mountain Resources Ltd., Warrants (October 2016) | | 3,500,000 | | 0 | *+#@ |
Orex Minerals, Inc., 144A, Warrants (November 2015) | | 1,250,000 | | 0 | *+#@ |
Orex Minerals, Inc., 144A, Warrants (March 2016) | | 600,000 | | 0 | *+#@ |
| | | | 206,025 | |
| | | | | |
Precious Metals 0.00% | | | | | |
Primero Mining Corp., Warrants (July 2015) | | 60,000 | | 240 | * |
Santana Minerals, Ltd., Warrants (March 2016) | | 400,000 | | 0 | *#@ |
| | | | 240 | |
| | | | | |
Silver Mining 0.00% | | | | | |
Source Exploration Corp., Warrants (February 2017) | | 2,500,000 | | 0 | *+#@ |
| | | | | |
Total Warrants
(cost $3,562,961) | | | | 1,242,765 | |
| | | | | | |
See notes to portfolios of investments and notes to financial statements.
41
World Precious Minerals Fund | |
Portfolio of Investments (unaudited) | June 30, 2015 |
| | Shares | | Value | |
Special Warrants 0.00% | | | | | |
| | | | | |
Gold/Mineral Exploration & Development 0.00% | | | | | |
Western Exploration & Development Ltd., 144A, Special Warrants (RS)
(cost $300,000) | | 600,000 | | $ | 0 | *#@ |
| | | | | |
Rights 0.02% | | | | | |
| | | | | |
Metal - Diversified 0.02% | | | | | |
Cardinal Resources Ltd.
(cost $13,109) | | 1,500,000 | | 19,096 | * |
| | | | | |
| | Contracts | | | |
Purchased Call Options 0.45% | | | | | |
| | | | | |
Gold Mining 0.31% | | | | | |
AngloGold Ashanti Ltd., Strike Price 10.00, Expiration Jan. 2016 | | 525 | | 44,625 | * |
Barrick Gold Corp., Strike Price 13.00, Expiration Jan. 2016 | | 650 | | 30,225 | * |
Eldorado Gold Corp., Strike Price 7.00, Expiration Jan. 2016 | | 1,800 | | 18,000 | * |
Gold Fields Ltd., Strike Price 5.00, Expiration Jan. 2016 | | 1,000 | | 10,500 | * |
IAMGOLD Corp., Strike Price 4.00, Expiration Jan. 2016 | | 270 | | 2,700 | * |
Newmont Mining Corp., Strike Price 25.00, Expiration Jan. 2016 | | 375 | | 54,750 | * |
NovaGold Resources, Inc., Strike Price 4.50, Expiration Jan. 2016 | | 1,500 | | 30,000 | * |
Randgold Resources Ltd., Strike Price 65.00, Expiration Jan. 2016 | | 110 | | 77,000 | * |
Seabridge Gold, Inc., Strike Price 7.00, Expiration Jan. 2016 | | 425 | | 26,563 | * |
Yamana Gold, Inc., Strike Price 8.00, Expiration Jan. 2016 | | 314 | | 628 | * |
| | | | 294,991 | |
| | | | | |
Silver Mining 0.14% | | | | | |
First Majestic Silver Corp., Strike Price 10.00, Expiration Jan. 2016 | | 328 | | 2,460 | * |
Pan American Silver Corp., Strike Price 10.00, Expiration Jan. 2016 | | 263 | | 14,465 | * |
Silver Standard Resources, Inc., Strike Price 5.00, Expiration Jan. 2016 | | 598 | | 104,650 | * |
Silver Wheaton Corp., Strike Price 20.00, Expiration Jan. 2016 | | 154 | | 11,935 | * |
| | | | 133,510 | |
| | | | | |
Total Purchased Call Options
(cost $1,608,717) | | | | 428,501 | |
| | | | | | |
See notes to portfolios of investments and notes to financial statements.
42
World Precious Minerals Fund | |
Portfolio of Investments (unaudited) | June 30, 2015 |
| | Principal
Amount | | Value | |
Gold-Linked Notes 1.42% | | | | | |
| | | | | |
Gold Mining 1.42% | | | | | |
Gran Colombia Gold Corp., 10.00%, maturity 10/31/17 | | $ | 215,000 | | $ | 47,838 | #^@ |
Gran Colombia Gold Corp., 144A, 10.00%, maturity 10/31/17 | | 5,845,000 | | 1,300,512 | #^@ |
| | | | | |
Total Gold-Linked Notes
(cost $5,977,400) | | | | 1,348,350 | |
| | | | | |
Silver-Linked Notes 1.13% | | | | | |
| | | | | |
Gold Mining 1.13% | | | | | |
Gran Colombia Gold Corp., 5.00%, maturity 08/11/18 | | 655,000 | | 80,238 | ^ |
Gran Colombia Gold Corp., 144A, 5.00%, maturity 08/11/18 | | 8,150,000 | | 998,375 | ^ |
| | | | | |
Total Silver-Linked Notes
(cost $8,616,219) | | | | 1,078,613 | |
| | | | | |
Corporate Note 0.76% | | | | | |
| | | | | |
Electric - Generation 0.76% | | | | | |
Pacific Power Generation Corp., 15.00%, maturity 04/03/17 (RS)
(cost $720,000) | | 720,000 | | 720,000 | #@ |
| | | | | |
Overnight Cash Deposit 2.31% | | | | | |
Wells Fargo Bank NA, 0.03%, maturity 07/01/15
(cost $2,191,381) | | 2,191,381 | | 2,191,381 | |
| | | | | |
Total Investments 97.24%
(cost $204,178,082) | | | | 92,366,986 | |
Other assets and liabilities, net 2.76% | | | | 2,620,192 | |
| | | | | |
Net Assets 100.0% | | | | $ | 94,987,178 | |
| | | | | | | |
See notes to portfolios of investments and notes to financial statements.
43
World Precious Minerals Fund | |
Portfolio of Investments (unaudited) | June 30, 2015 |
Portfolio Allocation by Industry* | |
Based on Total Investments | June 30, 2015 |
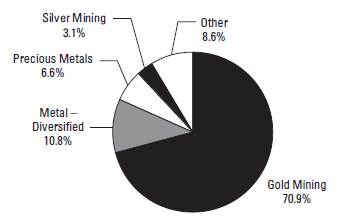
* Summary information above may differ from the portfolio schedule included in the financial statements due to the use of different classifications of securities for presentation purposes.
See notes to portfolios of investments and notes to financial statements.
44
Gold and Precious Metals Fund | |
Portfolio of Investments (unaudited) | June 30, 2015 |
| | Shares | | Value | |
Common Stocks 86.45% | | | | | |
| | | | | |
Diamonds/Precious Stones 2.13% | | | | | |
Lucara Diamond Corp. | | 450,000 | | $ | 716,974 | |
Petra Diamonds Ltd. | | 275,000 | | 643,759 | * |
| | | | 1,360,733 | |
| | | | | |
Diversified Minerals 0.32% | | | | | |
Lundin Mining Corp. | | 50,000 | | 205,364 | * |
| | | | | |
Gold Mining 73.70% | | | | | |
Acacia Mining plc | | 550,000 | | 2,607,812 | |
Agnico Eagle Mines Ltd. | | 60,000 | | 1,702,200 | |
Alacer Gold Corp. | | 800,000 | | 1,876,701 | |
Argonaut Gold, Inc. | | 325,000 | | 437,150 | * |
Centamin plc | | 875,000 | | 850,082 | |
Cia de Minas Buenaventura S.A., Sponsored ADR | | 75,000 | | 778,500 | |
Claude Resources, Inc. | | 1,900,000 | | 1,019,215 | * |
Comstock Mining, Inc. | | 2,172,077 | | 1,270,665 | * |
Doray Minerals Ltd. | | 1,000,000 | | 366,614 | * |
DRDGOLD Ltd., Sponsored ADR | | 150,000 | | 277,500 | |
Dundee Precious Metals, Inc. | | 250,000 | | 508,407 | * |
Gran Colombia Gold Corp. | | 397,658 | | 101,882 | * |
Kirkland Lake Gold, Inc. | | 815,000 | | 3,673,699 | * |
Klondex Mines Ltd. | | 3,805,000 | | 10,357,885 | * |
Lake Shore Gold Corp. | | 3,000,000 | | 3,074,460 | * |
Marlin Gold Mining Ltd. | | 1,416,050 | | 583,880 | * |
Newmont Mining Corp. | | 30,000 | | 700,800 | |
Northern Star Resources Ltd. | | 1,500,000 | | 2,569,764 | |
OceanaGold Corp. | | 350,000 | | 865,893 | |
Osisko Gold Royalties Ltd. | | 315,000 | | 3,964,612 | |
Randgold Resources Ltd., Sponsored ADR | | 20,000 | | 1,339,000 | |
Richmont Mines, Inc. | | 575,000 | | 1,822,750 | * |
Royal Gold, Inc. | | 25,000 | | 1,539,750 | |
SEMAFO, Inc. | | 225,000 | | 605,284 | * |
Silver Lake Resources Ltd. | | 3,056,600 | | 332,361 | * |
St Barbara Ltd. | | 3,493,100 | | 1,549,910 | * |
Teranga Gold Corp. | | 3,500,000 | | 1,989,592 | * |
Yamana Gold, Inc. | | 150,000 | | 450,000 | |
| | | | 47,216,368 | |
| | | | | |
Medical - Hospitals 0.00% | | | | | |
African Medical Investments plc | | 2,000,000 | | 0 | *#@ |
| | | | | |
Metal - Diversified 4.67% | | | | | |
Atico Mining Corp. | | 540,000 | | 229,143 | * |
Mandalay Resources Corp. | | 2,718,000 | | 2,089,095 | |
| | | | | | |
See notes to portfolios of investments and notes to financial statements.
45
Gold and Precious Metals Fund | |
Portfolio of Investments (unaudited) | June 30, 2015 |
| | Shares | | Value | |
Common Stocks (cont’d) | | | | | |
| | | | | |
Metal - Diversified (cont’d) | | | | | |
Metals X Ltd. | | 635,000 | | $ | 674,153 | |
| | | | 2,992,391 | |
| | | | | |
Precious Metals 1.21% | | | | | |
Pan African Resources plc | | 1,221,568 | | 180,914 | |
Primero Mining Corp. | | 75,000 | | 291,750 | * |
Tahoe Resources, Inc. | | 25,000 | | 303,250 | |
| | | | 775,914 | |
| | | | | |
Retail - Jewelry 0.60% | | | | | |
Signet Jewelers Ltd. | | 3,000 | | 384,720 | |
| | | | | |
Silver Mining 3.82% | | | | | |
Fortuna Silver Mines, Inc. | | 400,000 | | 1,464,000 | * |
Silver Wheaton Corp. | | 19,608 | | 340,003 | |
SilverCrest Mines, Inc. | | 650,000 | | 645,316 | * |
| | | | 2,449,319 | |
| | | | | |
Total Common Stocks
(cost $69,351,732) | | | | 55,384,809 | |
| | | | | |
Exchange-Traded Funds 1.70% | | | | | |
| | | | | |
ETFS Palladium Trust | | 9,193 | | 598,924 | |
ETFS Platinum Trust | | 2,500 | | 260,500 | |
Market Vectors Gold Miners ETF | | 20 | | 355 | |
Market Vectors Junior Gold Miners ETF | | 8 | | 193 | |
SPDR Gold Trust | | 2,049 | | 230,246 | |
| | | | | |
Total Exchange-Traded Funds
(cost $1,431,685) | | | | 1,090,218 | |
| | | | | |
Warrants 0.78% | | | | | |
| | | | | |
Gold Mining 0.78% | | | | | |
Dundee Precious Metals, Inc., Warrants (November 2015) | | 1,630,047 | | 156,610 | * |
Gran Colombia Gold Corp., 144A, Warrants (October 2017) | | 29,400 | | 0 | *# |
Gran Colombia Gold Corp., 144A, Warrants (March 2019) | | 37,500 | | 1,576 | * |
New Gold, Inc., Warrants (June 2017) | | 57,900 | | 8,808 | * |
Osisko Gold Royalties Ltd., Warrants (February 2022) | | 183,900 | | 331,286 | * |
| | | | | | |
See notes to portfolios of investments and notes to financial statements.
46
Gold and Precious Metals Fund | |
Portfolio of Investments (unaudited) | June 30, 2015 |
| | Shares | | Value | |
Warrants (cont’d) | | | | | |
| | | | | |
Gold Mining (cont’d) | | | | | |
Veris Gold Corp., Warrants (August 2016) | | 250,000 | | $ | 0 | *#@ |
Veris Gold Corp., Warrants (December 2016) | | 195,300 | | 0 | *#@ |
| | | | 498,280 | |
| | | | | |
Precious Metals 0.00% | | | | | |
Primero Mining Corp., Warrants (July 2015) | | 100,000 | | 400 | * |
| | | | | |
Total Warrants
(cost $3,602,833) | | | | 498,680 | |
| | | | | |
| | Contracts | | | |
Purchased Call Options 0.39% | | | | | |
| | | | | |
Gold Mining 0.25% | | | | | |
AngloGold Ashanti Ltd., Strike Price 10.00, Expiration Jan. 2016 | | 325 | | 27,625 | |
Barrick Gold Corp., Strike Price 13.00, Expiration Jan. 2016 | | 425 | | 19,763 | |
Eldorado Gold Corp., Strike Price 7.00, Expiration Jan. 2016 | | 1,200 | | 12,000 | |
Gold Fields Ltd., Strike Price 5.00, Expiration Jan. 2016 | | 500 | | 5,250 | |
IAMGOLD Corp., Strike Price 4.00, Expiration Jan. 2016 | | 180 | | 1,800 | |
Newmont Mining Corp., Strike Price 25.00, Expiration Jan. 2016 | | 250 | | 36,500 | |
Randgold Resources Ltd., Strike Price 65.00, Expiration Jan. 2016 | | 80 | | 56,000 | |
Yamana Gold, Inc., Strike Price 8.00, Expiration Jan. 2016 | | 314 | | 628 | |
| | | | 159,566 | |
| | | | | |
Silver Mining 0.14% | | | | | |
First Majestic Silver Corp., Strike Price 10.00, Expiration Jan. 2016 | | 249 | | 1,868 | |
Pan American Silver Corp., Strike Price 10.00, Expiration Jan. 2016 | | 365 | | 20,075 | |
Silver Standard Resources, Inc., Strike Price 5.00, Expiration Jan. 2016 | | 352 | | 61,599 | |
Silver Wheaton Corp., Strike Price 20.00, Expiration Jan. 2016 | | 116 | | 8,990 | |
| | | | 92,532 | |
| | | | | |
Total Purchased Call Options
(cost $1,015,563) | | | | 252,098 | |
| | | | | |
| | Principal
Amount | | | |
Gold-Linked Notes 1.07% | | | | | |
| | | | | |
Gold Mining 1.07% | | | | | |
Gran Colombia Gold Corp., 10.00%, maturity 10/31/17 | | $ | 125,000 | | 27,813 | #^@ |
Gran Colombia Gold Corp., 144A, 10.00%, maturity 10/31/17 | | 2,940,000 | | 654,150 | #^@ |
| | | | | |
Total Gold-Linked Notes
(cost $3,019,060) | | | | 681,963 | |
| | | | | | | |
See notes to portfolios of investments and notes to financial statements.
47
Gold and Precious Metals Fund | |
Portfolio of Investments (unaudited) | June 30, 2015 |
| | Principal
Amount | | Value | |
Silver-Linked Notes 0.88% | | | | | |
| | | | | |
Gold Mining 0.88% | | | | | |
Gran Colombia Gold Corp., 5.00%, maturity 08/11/18 | | $ | 4,250,000 | | $ | 520,625 | ^ |
Gran Colombia Gold Corp., 144A, 5.00%, maturity 08/11/18 | | 373,000 | | 45,693 | ^ |
| | | | | |
Total Silver-Linked Notes
(cost $4,520,041) | | | | 566,318 | |
| | | | | |
Corporate Notes 1.18% | | | | | |
| | | | | |
Coal 0.76% | | | | | |
Pacific Coal Resources Ltd., 19.20%, maturity 06/15/15 (RS) | | 485,766 | | 485,766 | #@ |
| | | | | |
Electric - Generation 0.42% | | | | | |
Pacific Power Generation Corp., 15.00%, maturity 04/03/17 (RS) | | 270,000 | | 270,000 | #@ |
| | | | | |
Total Corporate Notes
(cost $755,766) | | | | 755,766 | |
| | | | | |
Overnight Cash Deposit 4.38% | | | | | |
Wells Fargo Bank NA, 0.03%, maturity 07/01/15
(cost $2,808,645) | | 2,808,645 | | 2,808,645 | |
| | | | | |
Total Investments 96.83%
(cost $86,505,325) | | | | 62,038,497 | |
Other assets and liabilities, net 3.17% | | | | 2,028,780 | |
| | | | | |
Net Assets 100.0% | | | | $ | 64,067,277 | |
| | | | | | | |
See notes to portfolios of investments and notes to financial statements.
48
Gold and Precious Metals Fund | |
Portfolio of Investments (unaudited) | June 30, 2015 |
Portfolio Allocation by Industry* | |
Based on Total Investments | June 30, 2015 |

* Summary information above may differ from the portfolio schedule included in the financial statements due to the use of different classifications of securities for presentation purposes.
See notes to portfolios of investments and notes to financial statements.
49
Emerging Europe Fund | |
Portfolio of Investments (unaudited) | June 30, 2015 |
| | Shares | | Value | |
Common Stocks 87.08% | | | | | |
| | | | | |
Airlines 0.50% | | | | | |
Pegasus Hava Tasimaciligi A.S. | | 32,000 | | $ | 289,968 | * |
| | | | | |
Airport Development/Maintenance 1.09% | | | | | |
TAV Havalimanlari Holding A.S. | | 75,000 | | 636,715 | |
| | | | | |
Automotive - Cars & Light Trucks 2.47% | | | | | |
Bayerische Motoren Werke AG | | 5,500 | | 602,331 | |
Ford Otomotiv Sanayi A.S. | | 50,000 | | 668,887 | |
Tofas Turk Otomobil Fabrikasi A.S. | | 25,000 | | 170,606 | |
| | | | 1,441,824 | |
| | | | | |
Automotive Truck Parts & Equipment 1.84% | | | | | |
Brembo S.p.A. | | 25,000 | | 1,066,509 | |
| | | | | |
Building & Construction - Miscellaneous 1.23% | | | | | |
Budimex S.A. | | 15,000 | | 650,401 | |
Enka Insaat ve Sanayi A.S. | | 34,000 | | 64,680 | |
| | | | 715,081 | |
| | | | | |
Cellular Telecommunication 2.97% | | | | | |
Mobile TeleSystems OJSC, Sponsored ADR | | 170,000 | | 1,662,600 | |
Turkcell Iletisim Hizmetleri A.S. | | 14,000 | | 64,408 | |
| | | | 1,727,008 | �� |
| | | | | |
Chemicals - Specialty 0.15% | | | | | |
Grupa Azoty S.A. | | 4,000 | | 87,847 | |
| | | | | |
Commercial Banks - Non US 21.15% | | | | | |
Alpha Bank AE | | 2,000,000 | | 603,378 | * |
Erste Group Bank AG | | 85,000 | | 2,421,778 | |
Komercni Banka A.S. | | 11,000 | | 2,437,711 | |
National Bank of Greece, Sponsored ADR | | 530,000 | | 556,500 | * |
OTP Bank plc | | 40,000 | | 790,561 | |
Piraeus Bank S.A. | | 1,300,000 | | 479,885 | * |
Powszechna Kasa Oszczednosci Bank Polski S.A. | | 140,000 | | 1,157,516 | |
Sberbank of Russia, Sponsored ADR | | 290,000 | | 1,527,511 | |
Turkiye Garanti Bankasi A.S. | | 750,000 | | 2,339,141 | |
| | | | 12,313,981 | |
| | | | | |
Computer Services 2.36% | | | | | |
Asseco Poland S.A. | | 45,000 | | 692,381 | |
Luxoft Holding, Inc., Class A | | 12,000 | | 678,600 | * |
| | | | 1,370,981 | |
| | | | | | |
See notes to portfolios of investments and notes to financial statements.
50
Emerging Europe Fund | |
Portfolio of Investments (unaudited) | June 30, 2015 |
| | Shares | | Value | |
Common Stocks (cont’d) | | | | | |
| | | | | |
Distribution/Wholesale 0.46% | | | | | |
Fourlis Holdings S.A. | | 90,000 | | $ | 267,054 | * |
| | | | | |
Diversified Banking Institutions 1.15% | | | | | |
UniCredit S.p.A. | | 100,000 | | 672,089 | |
| | | | | |
Diversified Operations 2.56% | | | | | |
Haci Omer Sabanci Holding A.S. | | 395,000 | | 1,488,000 | |
| | | | | |
Electric - Distribution 0.84% | | | | | |
Enea S.A. | | 100,000 | | 424,059 | |
Energa S.A. | | 11,000 | | 66,560 | |
| | | | 490,619 | |
| | | | | |
Electric - Integrated 1.54% | | | | | |
PGE S.A. | | 182,000 | | 892,540 | |
| | | | | |
Entertainment Software 1.09% | | | | | |
CD Projekt S.A. | | 100,000 | | 632,471 | * |
| | | | | |
Finance - Investment Banker/Broker 3.81% | | | | | |
Turkiye Sinai Kalkinma Bankasi A.S. | | 3,499,999 | | 2,216,093 | |
| | | | | |
Finance - Other Services 1.30% | | | | | |
Warsaw Stock Exchange | | 60,000 | | 756,144 | |
| | | | | |
Food - Confectionery 1.56% | | | | | |
Ulker Biskuvi Sanayi A.S. | | 130,000 | | 906,429 | |
| | | | | |
Food - Retail 2.58% | | | | | |
Magnit PJSC, Sponsored GDR | | 27,000 | | 1,501,849 | |
| | | | | |
Human Resources 0.40% | | | | | |
Work Service S.A. | | 50,000 | | 235,417 | |
| | | | | |
Medical - Drugs 4.27% | | | | | |
Krka dd Novo mesto | | 20,000 | | 1,449,306 | |
Richter Gedeon Nyrt | | 69,000 | | 1,036,497 | |
| | | | 2,485,803 | |
| | | | | |
Metal - Diversified 4.27% | | | | | |
KGHM Polska Miedz S.A. | | 50,000 | | 1,416,269 | |
MMC Norilsk Nickel OJSC, Sponsored ADR | | 60,000 | | 1,010,957 | |
Orsu Metals Corp., 144A | | 4,025,000 | | 64,452 | * |
| | | | 2,491,678 | |
| | | | | | |
See notes to portfolios of investments and notes to financial statements.
51
Emerging Europe Fund | |
Portfolio of Investments (unaudited) | June 30, 2015 |
| | Shares | | Value | |
Common Stocks (cont’d) | | | | | |
| | | | | |
Oil Companies - Exploration & Production 1.07% | | | | | |
Bankers Petroleum Ltd. | | 200,000 | | $ | 496,397 | * |
BNK Petroleum, Inc. | | 300,000 | | 124,900 | * |
| | | | 621,297 | |
| | | | | |
Oil Companies - Integrated 12.50% | | | | | |
Gazprom OAO, Sponsored ADR | | 520,000 | | 2,715,258 | |
Lukoil OAO, Sponsored ADR | | 63,000 | | 2,786,817 | |
Rosneft OAO, GDR | | 275,000 | | 1,135,094 | |
Tatneft OAO, Sponsored ADR | | 20,000 | | 640,379 | |
| | | | 7,277,548 | |
| | | | | |
Oil Refining & Marketing 1.45% | | | | | |
Grupa Lotos S.A. | | 10,000 | | 79,678 | * |
Polski Koncern Naftowy Orlen | | 35,000 | | 687,440 | |
Tupras Turkiye Petrol Rafinerileri A.S. | | 3,000 | | 76,001 | |
| | | | 843,119 | |
| | | | | |
Property/Casualty Insurance 2.17% | | | | | |
Powszechny Zaklad Ubezpieczen S.A. | | 11,000 | | 1,265,726 | |
| | | | | |
Retail - Apparel/Shoe 0.80% | | | | | |
CCC S.A. | | 10,000 | | 463,070 | |
| | | | | |
Retail - Jewelry 1.20% | | | | | |
Pandora A/S | | 6,500 | | 697,477 | |
| | | | | |
Retail - Miscellaneous/Diversified 1.53% | | | | | |
FF Group | | 35,000 | | 896,178 | |
| | | | | |
Retail - Toy Store 0.83% | | | | | |
JUMBO S.A. | | 65,363 | | 484,541 | |
| | | | | |
Steel - Producers 1.20% | | | | | |
Eregli Demir ve Celik Fabrikalari T.A.S. | | 40,000 | | 64,715 | |
Severstal PAO, GDR | | 60,000 | | 633,902 | |
| | | | 698,617 | |
| | | | | |
Telecom Services 0.11% | | | | | |
Orange Polska S.A. | | 30,000 | | 64,974 | |
| | | | | |
Telephone - Integrated 0.87% | | | | | |
Hellenic Telecommunications Organization S.A. | | 60,000 | | 505,661 | |
| | | | | | |
See notes to portfolios of investments and notes to financial statements.
52
Emerging Europe Fund | |
Portfolio of Investments (unaudited) | June 30, 2015 |
| | Shares | | Value | |
Common Stocks (cont’d) | | | | | |
| | | | | |
Textile - Products 1.83% | | | | | |
Pegas Nonwovens S.A. | | 31,622 | | $ | 1,067,500 | |
| | | | | |
Tobacco 1.93% | | | | | |
Philip Morris CR A.S. | | 2,610 | | 1,122,842 | |
| | | | | |
Total Common Stocks
(cost $55,459,832) | | | | 50,694,650 | |
| | | | | |
Closed-End Investment Company 2.08% | | | | | |
| | | | | |
Fondul Proprietatea S.A.
(cost $1,414,333) | | 6,124,074 | | 1,212,278 | |
| | | | | |
Warrants 0.10% | | | | | |
| | | | | |
Gold Mining 0.10% | | | | | |
Dundee Precious Metals, Inc., Warrants (November 2015)
(cost $770,116) | | 623,259 | | 59,881 | * |
| | | | | | |
| | Contracts | | | |
Purchased Call Options 1.35% | | | | | |
| | | | | |
Exchange-Traded Funds 1.35% | | | | | |
Market Vectors Russia ETF, Strike Price 18.00, Expiration Jan. 2016 | | 3,000 | | 495,000 | |
Market Vectors Russia ETF, Strike Price 19.00, Expiration Jan. 2016 | | 2,500 | | 293,750 | |
| | | | | |
Total Purchased Call Options
(cost $1,011,715) | | | | 788,750 | |
| | Principal | | | |
| | Amount | | | |
Corporate Note 0.16% | | | | | |
| | | | | |
Transportation - Services 0.16% | | | | | |
Baghlan Group FZCO, 14.75%, maturity 06/27/15
(cost $1,350,345) | | $ | 1,345,845 | | 95,558 | *#^@ |
| | | | | | |
See notes to portfolios of investments and notes to financial statements.
53
Emerging Europe Fund | |
Portfolio of Investments (unaudited) | June 30, 2015 |
| | Principal | | | |
| | Amount | | Value | |
Overnight Cash Deposit 8.75% | | | | | |
| | | | | | | |
Wells Fargo Bank NA, 0.03%, maturity 07/01/15
(cost $5,091,870) | | $ | 5,091,870 | | $ | 5,091,870 | |
| | | | | |
Total Investments 99.52%
(cost $65,098,211) | | | | 57,942,987 | |
Other assets and liabilities, net 0.48% | | | | 281,433 | |
| | | | | |
Net Assets 100.0% | | | | $ | 58,224,420 | |
Country Distribution* | |
Based on Total Investments | June 30, 2015 |

* Country distribution shown is based on domicile. The locale of company operations may be different.
See notes to portfolios of investments and notes to financial statements.
54
China Region Fund | |
Portfolio of Investments (unaudited) | June 30, 2015 |
| | Shares | | Value | |
Common Stocks 82.48% | | | | | |
| | | | | |
Airlines 1.22% | | | | | |
Air China Ltd., H shares | | 142,000 | | $ | 160,474 | |
Cebu Air, Inc. | | 57,700 | | 108,718 | |
| | | | 269,192 | |
| | | | | |
Alternative Waste Technology 0.55% | | | | | |
China Everbright International Ltd. | | 68,000 | | 121,788 | |
| | | | | |
Automotive - Cars & Light Trucks 0.90% | | | | | |
Great Wall Motor Co., Ltd., H shares | | 40,500 | | 198,541 | #@ |
| | | | | |
Automotive/Truck Parts & Equipment - Original 1.06% | | | | | |
Nexteer Automotive Group Ltd. | | 225,000 | | 234,283 | |
| | | | | |
Building - Heavy Construction 2.20% | | | | | |
China Railway Construction Corp., Ltd., H shares | | 313,100 | | 483,392 | |
| | | | | |
Building & Construction - Miscellaneous 0.46% | | | | | |
China Machinery Engineering Corp., H shares | | 94,000 | | 101,215 | |
| | | | | |
Building Products - Cement/Aggregates 1.29% | | | | | |
West China Cement Ltd. | | 1,464,000 | | 282,869 | |
| | | | | |
Cellular Telecommunication 3.34% | | | | | |
China Mobile Ltd., Sponsored ADR | | 11,450 | | 733,831 | |
| | | | | |
Chemicals - Specialty 1.25% | | | | | |
Fufeng Group Co., Ltd. | | 370,000 | | 274,530 | |
| | | | | |
Circuit Boards 0.54% | | | | | |
Zhen Ding Technology Holding Ltd. | | 34,000 | | 119,117 | * |
| | | | | |
Commercial Banks - Non US 19.54% | | | | | |
Agricultural Bank of China Ltd., H shares | | 1,146,000 | | 615,648 | |
Bank of China Ltd., H shares | | 1,181,800 | | 766,966 | |
Bank of Communications Co., Ltd., H shares | | 174,000 | | 181,113 | |
BOC Hong Kong Holdings Ltd. | | 29,500 | | 122,781 | |
China Construction Bank Corp., H shares | | 1,407,400 | | 1,283,768 | |
Chongqing Rural Commercial Bank Co., Ltd., H shares | | 489,000 | | 391,137 | |
Industrial & Commercial Bank of China Ltd., H shares | | 1,183,000 | | 938,741 | |
| | | | 4,300,154 | |
| | | | | |
Computers - Memory Devices 0.65% | | | | | |
ASPEED Technology, Inc. | | 13,000 | | 142,676 | * |
| | | | | | |
See notes to portfolios of investments and notes to financial statements.
55
China Region Fund | |
Portfolio of Investments (unaudited) | June 30, 2015 |
| | Shares | | Value | |
Common Stocks (cont’d) | | | | | |
| | | | | |
Diversified Financial Services 0.44% | | | | | |
China Everbright Ltd. | | 28,000 | | $ | 96,959 | |
| | | | | |
Diversified Minerals 0.07% | | | | | |
Woulfe Mining Corp. | | 300,000 | | 15,612 | * |
| | | | | |
Electric - Generation 1.33% | | | | | |
Huadian Power International Corp., Ltd., H shares | | 264,000 | | 291,701 | |
| | | | | |
Electric - Integrated 0.28% | | | | | |
CGN Power Co., Ltd., H shares | | 119,000 | | 62,193 | |
| | | | | |
Electronic Components - Miscellaneous 4.28% | | | | | |
Avago Technologies Ltd. | | 3,800 | | 505,134 | |
Pegatron Corp. | | 40,000 | | 117,038 | |
SK Hynix, Inc. | | 2,400 | | 90,964 | |
Tongda Group Holdings Ltd. | | 1,190,000 | | 229,840 | |
| | | | 942,976 | |
| | | | | |
Energy - Alternate Sources 0.52% | | | | | |
GCL-Poly Energy Holdings Ltd. | | 492,000 | | 113,371 | |
| | | | | |
Entertainment Software 0.66% | | | | | |
NetEase, Inc., Sponsored ADR | | 1,000 | | 144,865 | |
| | | | | |
Finance - Investment Banker/Broker 4.57% | | | | | |
CITIC Securities Co., Ltd., H shares | | 61,000 | | 219,417 | |
Guotai Junan International Holdings Ltd. | | 717,000 | | 466,096 | |
Haitong Securities Co., Ltd., H shares | | 77,200 | | 203,617 | |
Meritz Securities Co., Ltd. | | 18,100 | | 115,540 | |
| | | | 1,004,670 | |
| | | | | |
Finance - Other Services 2.26% | | | | | |
Hong Kong Exchanges and Clearing Ltd. | | 14,100 | | 496,807 | |
| | | | | |
Food - Dairy Products 0.55% | | | | | |
Lotte Food Co., Ltd. | | 150 | | 121,704 | |
| | | | | |
Gold Mining 0.60% | | | | | |
Zijin Mining Group Co., Ltd., H shares | | 378,000 | | 133,057 | |
| | | | | |
Internet Application Software 6.51% | | | | | |
Tencent Holdings Ltd. | | 71,700 | | 1,433,751 | |
| | | | | | |
See notes to portfolios of investments and notes to financial statements.
56
China Region Fund | |
Portfolio of Investments (unaudited) | June 30, 2015 |
| | Shares | | Value | |
Common Stocks (cont’d) | | | | | |
| | | | | |
Internet Content - Entertainment 0.49% | | | | | |
Com2uS Corp. | | 970 | | $ | 107,533 | * |
| | | | | |
Investment Management/Advisory Services 0.51% | | | | | |
Value Partners Group Ltd. | | 71,000 | | 111,825 | |
| | | | | |
Life/Health Insurance 3.34% | | | | | |
AIA Group Ltd. | | 64,700 | | 423,051 | |
China Life Insurance Co., Ltd., H shares | | 72,000 | | 312,497 | |
| | | | 735,548 | |
| | | | | |
Machine Tools & Related Products 1.03% | | | | | |
Techtronic Industries Co., Ltd. | | 69,500 | | 227,239 | |
| | | | | |
Medical - Biomedical/Gene 0.49% | | | | | |
China Biologic Products, Inc. | | 930 | | 107,099 | * |
| | | | | |
Medical - Drugs 1.67% | | | | | |
Daewon Pharmaceutical Co., Ltd. | | 6,300 | | 151,990 | |
SSY Group Ltd. | | 588,000 | | 213,913 | #@ |
| | | | 365,903 | �� |
| | | | | |
Medical - Wholesale Drug Distribution 0.61% | | | | | |
Sinopharm Group Co., Ltd., H shares | | 30,000 | | 133,220 | |
| | | | | |
Metal Processors & Fabricators 0.57% | | | | | |
Catcher Technology Co., Ltd. | | 10,000 | | 125,020 | |
| | | | | |
Multi-line Insurance 3.28% | | | | | |
Ping An Insurance Group Co of China Ltd., H shares | | 53,500 | | 722,011 | |
| | | | | |
Non - Ferrous Metals 0.06% | | | | | |
Sterling Group Ventures, Inc. | | 500,000 | | 13,000 | * |
| | | | | |
Petrochemicals 0.00% | | | | | |
Danhua Chemical Technology Co., Ltd., B shares | | 2 | | 2 | * |
| | | | | |
Photo Equipment & Supplies 1.04% | | | | | |
Largan Precision Co., Ltd. | | 2,000 | | 228,301 | |
| | | | | |
Power Converters/Supply Equipment 0.44% | | | | | |
Dongfang Electric Corp., Ltd., H shares | | 51,800 | | 96,483 | |
| | | | | | |
See notes to portfolios of investments and notes to financial statements.
57
China Region Fund | |
Portfolio of Investments (unaudited) | June 30, 2015 |
| | Shares | | Value | |
Common Stocks (cont’d) | | | | | |
| | | | | |
Property/Casualty Insurance 0.57% | | | | | |
Dongbu Insurance Co., Ltd. | | 2,500 | | $ | 126,419 | |
| | | | | |
Public Thoroughfares 0.75% | | | | | |
Yuexiu Transport Infrastructure Ltd. | | 230,000 | | 165,444 | |
| | | | | |
Real Estate Operating/Development 7.35% | | | | | |
China Overseas Land & Investment Ltd. | | 62,000 | | 218,247 | |
China Resources Land Ltd. | | 136,444 | | 441,582 | |
Highwealth Construction Corp. | | 46,000 | | 109,669 | |
KWG Property Holding Ltd. | | 154,500 | | 129,995 | |
Longfor Properties Co., Ltd. | | 139,000 | | 220,886 | |
Sunac China Holdings Ltd. | | 157,000 | | 171,690 | |
Yuzhou Properties Co., Ltd. | | 1,261,000 | | 323,983 | |
| | | | 1,616,052 | |
| | | | | |
Retail - Apparel/Shoe 0.57% | | | | | |
ANTA Sports Products Ltd. | | 52,000 | | 126,063 | |
| | | | | |
Retail - Jewelry 0.00% | | | | | |
Lao Feng Xiang Co., Ltd., B shares | | 1 | | 5 | |
| | | | | |
Semiconductor Components - Integrated Circuits 1.23% | | | | | |
Taiwan Semiconductor Manufacturing Co., Ltd., Sponsored ADR | | 11,900 | | 270,250 | |
| | | | | |
Textile - Apparel 2.00% | | | | | |
Eclat Textile Co., Ltd. | | 7,000 | | 114,858 | |
Shenzhou International Group Holdings Ltd. | | 67,000 | | 325,741 | |
| | | | 440,599 | |
| | | | | |
Transportation - Services 0.89% | | | | | |
Tianjin Port Development Holdings Ltd. | | 822,000 | | 194,761 | |
| | | | | |
Water Treatment Systems 0.52% | | | | | |
CT Environmental Group Ltd. | | 86,000 | | 114,289 | |
| | | | | |
Total Common Stocks
(cost $15,804,917) | | | | 18,146,320 | |
| | | | | | |
Exchange-Traded Funds 7.65%
Deutsche X-trackers Harvest CSI 300 China A-Shares ETF | | 8,230 | | 378,662 | |
Direxion Daily FTSE China Bull 3X Shares | | 6,750 | | 299,430 | |
See notes to portfolios of investments and notes to financial statements.
58
China Region Fund | |
Portfolio of Investments (unaudited) | June 30, 2015 |
| | Shares | | Value | |
Exchange-Traded Funds (cont’d) | | | | | |
| | | | | |
Direxion Daily CSI 300 China A Share Bull 2X Shares | | 6,200 | | $ | 247,380 | |
iShares China Large-Capital ETF | | 7,200 | | 331,920 | |
iShares MSCI Philippines ETF | | 2,700 | | 103,950 | |
iShares MSCI Singapore ETF | | 8,400 | | 105,588 | |
iShares MSCI Thailand Capped ETF | | 1,400 | | 104,244 | |
Market Vectors Vietnam ETF | | 6,000 | | 111,840 | |
| | | | | |
Total Exchange-Traded Funds
(cost $1,640,482) | | | | 1,683,014 | |
| | | | | | |
| | Contracts | | | |
Purchased Call Options 0.11% | | | | | |
| | | | | |
Diversified Banking Institutions 0.11% | | | | | |
HSBC Holdings plc, Strike Price 48.00, Expiration Sep. 2015
(cost $96,020) | | 500 | | 24,000 | * |
Rights 0.01% | | | | | |
| | | | | |
Internet Content - Entertainment 0.01% | | | | | |
Com2uS Corp.
(cost $—) | | 158 | | 1,586 | *#@ |
| | Principal | | | |
| | Amount | | | |
Overnight Cash Deposit 9.02% | | | | | |
| | | | | |
Wells Fargo Bank NA, 0.03%, maturity 07/01/15
(cost $1,984,046) | | $ | 1,984,046 | | 1,984,046 | |
| | | | | |
Total Investments 99.27%
(cost $19,525,465) | | | | 21,838,966 | |
Other assets and liabilities, net 0.73% | | | | 160,435 | |
| | | | | |
Net Assets 100.0% | | | | $ | 21,999,401 | |
| | | | | | | |
See notes to portfolios of investments and notes to financial statements.
59
China Region Fund | |
Portfolio of Investments (unaudited) | June 30, 2015 |
Country Distribution* | |
Based on Total Investments | June 30, 2015 |

* Country distribution shown is based on domicile and not intended to conform to the China region definition in the prospectus. The locale of company operations may be different.
See notes to portfolios of investments and notes to financial statements.
60
Notes to Portfolios of Investments (unaudited) | June 30, 2015 |
Legend
* | Non-income producing security. |
+ | Affiliated company (see following) |
# | Illiquid Security |
^ | In default on interest and/or principal payments. Rate shown represents the last coupon rate prior to default. |
ADR | American Depositary Receipt |
ETF | Exchange Traded Fund |
GDR | Global Depositary Receipt |
GO | General Obligation Bond |
RS | Restricted Security (see following) |
ZCB | Zero Coupon Bond |
| |
@ | Security was fair valued at June 30, 2015, by U.S. Global Investors, Inc. (Adviser) (other than international securities fair valued pursuant to systematic fair value models) in accordance with valuation procedures approved by the Board of Trustees. These securities, as a percentage of net assets at June 30, 2015, were 0.04% of All American Equity Fund, 2.11% of Holmes Macro Trends Fund, 11.91% of Global Resources Fund, 3.58% of World Precious Minerals Fund, 2.24% of Gold and Precious Metals Fund, 0.16% of Emerging Europe Fund and 1.88% of the China Region Fund, respectively. See the Fair Valuation of Securities section of these Notes to Portfolios of Investments for further discussion of fair valued securities. See further information and detail on restricted securities in the Restricted Securities section of these Notes to Portfolios of Investments. |
144A | Pursuant to Rule 144A of the Securities Act of 1933, these securities may be resold in transactions exempt from registration, normally to qualified institutional buyers. |
General
The yields reflect the effective yield from the date of purchase.
Variable Rate Notes have periodic reset features, which effectively shorten the maturity dates and reset the interest rates as tied to various interest-bearing instruments. Rates shown are current rates at June 30, 2015.
Principal amounts are in U.S. dollars unless otherwise noted.
Fair Valuation of Securities
For the Funds’ policies regarding the valuation of investments and other significant accounting policies, please refer to the Notes to Financial Statements.
The Funds are required to disclose information regarding the fair value measurements of a Fund’s assets and liabilities. Fair value is the price that would be received to sell an asset or paid to transfer a liability in an orderly transaction between market participants at the measurement date. The measurement requirements established a three-tier hierarchy to maximize the use of observable market data and minimize the use of unobservable inputs and to establish classification of fair value measurements for disclosure purposes. Inputs refer broadly to the assumptions the market participants would use in pricing the asset or liability, including assumptions about risk, for example, the risk inherent in a particular valuation technique used to measure fair value including such a pricing model and/or the risk inherent in the inputs to the valuation technique. Inputs may be observable or unobservable. Observable inputs are inputs that reflect the assumptions market participants would use in pricing the asset or liability developed based on market data obtained from sources independent of the reporting entity. Unobservable inputs are inputs that reflect the reporting entity’s own assumptions about the assumptions market
61
Notes to Portfolios of Investments (unaudited) | June 30, 2015 |
participants would use in pricing the asset or liability developed based on the best information available in the circumstances.
The inputs or methodology used for valuing securities are not necessarily an indication of the risk associated with investing in those securities. For example, short term U.S. government obligations maturing in sixty days or less are valued using amortized cost. Generally, amortized cost reflects the current fair value of a security, but since the value is not obtained from a quoted price in an active market, such securities are reflected as Level 2. Because of the inherent uncertainties of valuation, the values reflected in the portfolios may materially differ from the values received upon actual sale of those investments.
The three levels defined by the fair value hierarchy are as follows:
Level 1 — Quoted prices in active markets for identical securities.
Level 2 — Prices determined using significant other observable inputs (including quoted prices for similar securities, interest rates, prepayment speeds, credit risk, etc.). Short-term securities with maturities of sixty days or less are valued at amortized cost, which approximates market value, and are categorized as Level 2 in the hierarchy. Municipal securities, long-term U.S. government obligations and corporate debt securities are valued in accordance with the evaluated price supplied by a pricing service and generally categorized as Level 2 in the hierarchy. Other securities that are categorized as Level 2 in the hierarchy include, but are not limited to, warrants that do not trade on an exchange, securities valued at the mean between the last reported bid and ask quotation and international equity securities valued by an independent third party in order to adjust for stale pricing.
Level 3 — Prices determined using significant unobservable inputs (including the Fund’s own assumptions). For restricted equity securities and private placements where observable inputs are limited, assumptions about market activity and risk are used in determining fair value.
The following table summarizes the valuation of each Fund’s securities as of June 30, 2015, using the fair value hierarchy:
| | Quoted Prices
in Active
Markets for
Identical
Investments
(Level 1) | | Significant
Other
Observable
Inputs
(Level 2) | | Significant
Unobservable
Inputs
(Level 3) | | Total | |
| | | | | | | | | |
U.S. Government Securities Ultra-Short Bond Fund | | | | | | | | | |
Investments in Securities* | | | | | | | | | |
United States Government and Agency Obligations | | $ | — | | $ | 54,061,500 | | $ | — | | $ | 54,061,500 | |
Overnight Cash Deposit | | — | | 4,190,186 | | — | | 4,190,186 | |
Total | | $ | — | | $ | 58,251,686 | | $ | — | | $ | 58,251,686 | |
62
Notes to Portfolios of Investments (unaudited) | June 30, 2015 |
| | Quoted Prices
in Active
Markets for
Identical
Investments
(Level 1) | | Significant
Other
Observable
Inputs
(Level 2) | | Significant
Unobservable
Inputs
(Level 3) | | Total | |
| | | | | | | | | |
Near-Term Tax Free Fund | | | | | | | | | |
Investments in Securities* | | | | | | | | | |
Municipal Bonds | | $ | — | | $ | 87,215,047 | | $ | — | | $ | 87,215,047 | |
Overnight Cash Deposit | | — | | 2,147,636 | | — | | 2,147,636 | |
Total | | $ | — | | $ | 89,362,683 | | $ | — | | $ | 89,362,683 | |
| | | | | | | | | |
All American Equity Fund | | | | | | | | | |
Investments in Securities* | | | | | | | | | |
Common Stocks | | $ | 20,600,519 | | $ | — | | $ | — | | $ | 20,600,519 | |
Rights | | — | | — | | 7,659 | | 7,659 | |
Total | | $ | 20,600,519 | | $ | — | | $ | 7,659 | | $ | 20,608,178 | |
| | | | | | | | | |
Holmes Macro Trends Fund | | | | | | | | | |
Investments in Securities* | | | | | | | | | |
Common Stocks | | | | | | | | | |
Coal | | $ | — | | $ | 957 | | $ | — | | $ | 957 | |
Electric - Generation | | — | | — | | 264,585 | | 264,585 | |
Energy - Alternate Sources | | — | | — | | 43,460 | | 43,460 | |
Real Estate Operating/Development | | — | | — | | 359,823 | | 359,823 | |
All Other Common Stocks | | 44,287,185 | | — | | — | | 44,287,185 | |
Warrants | | — | | 11 | | — | | 11 | |
Gold-Linked Notes | | — | | — | | 85,663 | | 85,663 | |
Silver-Linked Notes | | — | | 51,940 | | — | | 51,940 | |
Corporate Note | | — | | — | | 225,000 | | 225,000 | |
Overnight Cash Deposit | | — | | 1,409,688 | | — | | 1,409,688 | |
Total | | $ | 44,287,185 | | $ | 1,462,596 | | $ | 978,531 | | $ | 46,728,312 | |
| | | | | | | | | |
Global Resources Fund | | | | | | | | | |
Investments in Securities* | | | | | | | | | |
Common Stocks: | | | | | | | | | |
Agricultural Operations | | $ | — | | $ | 754,207 | | $ | — | | $ | 754,207 | |
Coal | | 936 | | 468,262 | | — | | 469,198 | |
Diversified Minerals | | 3,464,948 | | 92,655 | | — | | 3,557,603 | |
Electric - Generation | | — | | — | | 3,690,244 | | 3,690,244 | |
Energy - Alternate Sources | | 5,802,300 | | — | | 1,043,040 | | 6,845,340 | |
Forestry | | — | | 13,241 | | — | | 13,241 | |
Gold Mining | | 6,961,785 | | — | | 386 | | 6,962,171 | |
Medical - Hospitals | | — | | — | | — | | — | |
Metal - Copper | | 4,600,661 | | — | | — | | 4,600,661 | |
Metal - Diversified | | 4,602,921 | | 73,965 | | — | | 4,676,886 | |
Metal - Iron | | 5,855 | | 17,214 | | — | | 23,069 | |
Mining Services | | — | | — | | 339,482 | | 339,482 | |
Natural Resource Technology | | — | | — | | 137,351 | | 137,351 | |
Non - Ferrous Metals | | — | | 13,000 | | — | | 13,000 | |
Oil - Field Services | | 691,500 | | 3,064,045 | | — | | 3,755,545 | |
Oil Companies - Exploration & Production | | 31,282,807 | | 210,168 | | — | | 31,492,975 | |
Real Estate Operating/Development | | — | | — | | 6,279,374 | | 6,279,374 | |
All Other Common Stocks | | 52,000,332 | | — | | — | | 52,000,332 | |
Master Limited Partnership | | 3,124,799 | | — | | — | | 3,124,799 | |
Warrants: | | | | | | | | | |
Diversified Minerals | | — | | — | | — | | — | |
Gold Mining | | — | | 325,784 | | — | | 325,784 | |
Metal - Copper | | — | | — | | — | | — | |
63
Notes to Portfolios of Investments (unaudited) | June 30, 2015 |
| | Quoted Prices
in Active
Markets for
Identical
Investments
(Level 1) | | Significant
Other
Observable
Inputs
(Level 2) | | Significant
Unobservable
Inputs
(Level 3) | | Total | |
| | | | | | | | | |
Global Resources Fund (cont’d) | | | | | | | | | |
Investments in Securities* (cont’d) | | | | | | | | | |
Warrants: (cont’d) | | | | | | | | | |
Metal - Iron | | $ | — | | $ | — | | $ | — | | $ | — | |
Purchased Call Options | | — | | 1,732,965 | | — | | 1,732,965 | |
Convertible Bond | | — | | 50,000 | | — | | 50,000 | |
Gold-Linked Notes | | — | | — | | 1,990,708 | | 1,990,708 | |
Silver-Linked Notes | | — | | 821,363 | | — | | 821,363 | |
Corporate Note | | — | | — | | 2,700,000 | | 2,700,000 | |
Overnight Cash Deposit | | — | | 3,735,013 | | — | | 3,735,013 | |
Total | | $ | 112,538,844 | | $ | 11,371,882 | | $ | 16,180,585 | | $ | 140,091,311 | |
| | | | | | | | | |
World Precious Minerals Fund | | | | | | | | | |
Investments in Securities* | | | | | | | | | |
Common Stocks: | | | | | | | | | |
Agricultural Operations | | $ | — | | $ | 416,097 | | $ | — | | $ | 416,097 | |
Capital Pools | | 146,317 | | 6,275 | | — | | 152,592 | |
Coal | | — | | 248,797 | | — | | 248,797 | |
Diamonds/Precious Stones | | 1,669,469 | | 196,713 | | — | | 1,866,182 | |
Diversified Minerals | | 1,029,386 | | 284,914 | | 18,517 | | 1,332,817 | |
Gold Mining | | 57,654,296 | | 2,728,581 | | 1,306,667 | | 61,689,544 | |
Medical - Hospitals | | — | | — | | — | | — | |
Metal - Copper | | 18,073 | | — | | — | | 18,073 | |
Metal - Diversified | | 9,535,474 | | 239,243 | | — | | 9,774,717 | |
Mining Services | | 124,900 | | 314,811 | | — | | 439,711 | |
Oil Companies - Exploration & Production | | — | | — | | — | | — | |
Platinum | | 588,471 | | 4,309 | | — | | 592,780 | |
Precious Metals | | 3,144,511 | | 2,917,716 | | — | | 6,062,227 | |
All Other Common Stocks | | 2,744,195 | | — | | — | | 2,744,195 | |
Exchange-Traded Funds | | 548 | | — | | — | | 548 | |
Warrants: | | | | | | | | | |
Diamonds/Precious Stones | | — | | 3,086 | | — | | 3,086 | |
Gold Mining | | 20,256 | | 1,013,158 | | — | | 1,033,414 | |
Metal - Copper | | — | | — | | — | | — | |
Metal - Diversified | | — | | 206,025 | | — | | 206,025 | |
Precious Metals | | — | | 240 | | — | | 240 | |
Silver Mining | | — | | — | | — | | — | |
Special Warrants | | — | | — | | — | | — | |
Rights | | — | | 19,096 | | — | | 19,096 | |
Purchased Call Options | | — | | 428,501 | | — | | 428,501 | |
Gold-Linked Notes | | — | | — | | 1,348,350 | | 1,348,350 | |
Silver-Linked Notes | | — | | 1,078,613 | | — | | 1,078,613 | |
Corporate Notes | | — | | — | | 720,000 | | 720,000 | |
Overnight Cash Deposit | | — | | 2,191,381 | | — | | 2,191,381 | |
Total | | $ | 76,675,896 | | $ | 12,297,556 | | $ | 3,393,534 | | $ | 92,366,986 | |
| | | | | | | | | |
Gold and Precious Metals Fund | | | | | | | | | |
Investments in Securities* | | | | | | | | | |
Common Stocks: | | | | | | | | | |
Diamonds/Precious Stones | | $ | 716,974 | | $ | 643,759 | | $ | — | | $ | 1,360,733 | |
Gold Mining | | 38,355,945 | | 8,860,423 | | — | | 47,216,368 | |
Medical - Hospitals | | — | | — | | — | | — | |
Metal - Diversified | | 2,318,238 | | 674,153 | | — | | 2,992,391 | |
Precious Metals | | 595,000 | �� | 180,914 | | — | | 775,914 | |
64
Notes to Portfolios of Investments (unaudited) | June 30, 2015 |
| | Quoted Prices
in Active
Markets for
Identical
Investments
(Level 1) | | Significant
Other
Observable
Inputs
(Level 2) | | Significant
Unobservable
Inputs
(Level 3) | | Total | |
| | | | | | | | | |
Gold and Precious Metals Fund (cont’d) | | | | | | | | | |
Investments in Securities* (cont’d) | | | | | | | | | |
Common Stocks: (cont’d) | | | | | | | | | |
All Other Common Stocks | | $ | 3,039,403 | | $ | — | | $ | — | | $ | 3,039,403 | |
Exchange-Traded Funds | | 1,090,218 | | — | | — | | 1,090,218 | |
Warrants | | — | | 498,680 | | — | | 498,680 | |
Purchased Call Options | | — | | 252,098 | | — | | 252,098 | |
Gold-Linked Notes | | — | | — | | 681,963 | | 681,963 | |
Silver-Linked Notes | | — | | 566,318 | | — | | 566,318 | |
Corporate Notes | | — | | — | | 755,766 | | 755,766 | |
Overnight Cash Deposit | | — | | 2,808,645 | | — | | 2,808,645 | |
Total | | $ | 46,115,778 | | $ | 14,484,990 | | $ | 1,437,729 | | $ | 62,038,497 | |
| | | | | | | | | |
Emerging Europe Fund | | | | | | | | | |
Investments in Securities* | | | | | | | | | |
Common Stocks: | | | | | | | | | |
Cellular Telecommunication | | $ | 1,662,600 | | $ | 64,408 | | $ | — | | $ | 1,727,008 | |
Commercial Banks - Non US | | 1,406,100 | | 10,907,881 | | — | | 12,313,981 | |
Computer Services | | 678,600 | | 692,381 | | — | | 1,370,981 | |
Medical - Drugs | | 1,449,306 | | 1,036,497 | | — | | 2,485,803 | |
Oil Companies - Exploration & Production | | 621,297 | | — | | — | | 621,297 | |
Oil Companies - Integrated | | 1,110,830 | | 6,166,718 | | — | | 7,277,548 | |
All Other Common Stocks | | — | | 24,898,032 | | — | | 24,898,032 | |
Closed-End Investment Company | | — | | 1,212,278 | | — | | 1,212,278 | |
Warrants | | — | | 59,881 | | — | | 59,881 | |
Purchased Call Options | | — | | 788,750 | | — | | 788,750 | |
Corporate Notes | | — | | — | | 95,558 | | 95,558 | |
Overnight Cash Deposit | | — | | 5,091,870 | | — | | 5,091,870 | |
Total | | $ | 6,928,733 | | $ | 50,918,696 | | $ | 95,558 | | $ | 57,942,987 | |
| | | | | | | | | |
China Region Fund | | | | | | | | | |
Investments in Securities* | | | | | | | | | |
Common Stocks: | | | | | | | | | |
Airlines | | $ | 160,474 | | $ | 108,718 | | $ | — | | $ | 269,192 | |
Automotive - Cars & Light Trucks | | — | | — | | 198,541 | | 198,541 | |
Cellular Telecommunication | | 733,831 | | — | | — | | 733,831 | |
Diversified Minerals | | 15,612 | | — | | — | | 15,612 | |
Electronic Components - Miscellaneous | | 505,134 | | 437,842 | | — | | 942,976 | |
Entertainment Software | | 144,865 | | — | | — | | 144,865 | |
Medical - Biomedical/Gene | | 107,099 | | — | | — | | 107,099 | |
Medical - Drugs | | — | | 151,990 | | 213,913 | | 365,903 | |
Semiconductor Components - Integrated Circuits | | 270,250 | | — | | — | | 270,250 | |
All Other Common Stocks | | — | | 15,098,051 | | — | | 15,098,051 | |
Exchange-Traded Funds | | 1,683,014 | | — | | — | | 1,683,014 | |
Purchased Call Options | | — | | 24,000 | | — | | 24,000 | |
Rights | | — | | 1,586 | | — | | 1,586 | |
Overnight Cash Deposit | | — | | 1,984,046 | | — | | 1,984,046 | |
Total | | $ | 3,620,279 | | $ | 17,806,233 | | $ | 412,454 | | $ | 21,838,966 | |
* Refer to the Portfolio of Investments for a detailed list of the Fund’s investments.
65
Notes to Portfolios of Investments (unaudited) | June 30, 2015 |
The following table shows transfers between Level 1 and Level 2 of the fair value hierarchy during the period January 1, 2015, through June 30, 2015:
Fund | | Transfers From
Level 1 to Level 2* | | Transfers From
Level 2 to Level 1* | |
Holmes Macro Trends | | $ | 957 | (1) | $ | — | |
Global Resources | | 464,783 | (1) | 11,916 | (2) |
World Precious Minerals | | 2,867,798 | (1) | 69,201 | (2) |
| | 533,162 | (3) | 428,110 | (4) |
Gold and Precious Metals | | 583,880 | (1) | — | |
Emerging Europe | | 64,452 | (1) | — | |
China Region | | 13,000 | (1) | 160,474 | (5) |
| | | | | | | |
(1) Securities were valued at the mean between bid and ask quotations at the end of the current period, but at a quoted price at the end of the prior fiscal year.
(2) Securities were valued at a quoted price at the end of the current period, but at the mean between bid and ask quotations at the end of the prior fiscal year.
(3) Securities were valued using a foreign fair value adjustment factor at the end of the current period, but at a quoted price at the end of the prior fiscal year.
(4) Transfer resulted from the expiration of a regulatory hold.
(5) Securities were valued using a quoted price at the end of the period, but using a foreign fair value adjustment factor at the end of the prior fiscal year.
The following is a reconciliation of assets for which unobservable inputs (Level 3) were used in determining fair value during the period January 1, 2015, through June 30, 2015:
| | Rights | | Total | |
| | | | | |
All American Equity Fund | | | | | |
Beginning Balance 12/31/14 | | $ | — | | $ | — | |
Purchases | | 7,659 | | 7,659 | |
Ending Balance 06/30/15 | | $ | 7,659 | | $ | 7,659 | |
Net change in unrealized appreciation (depreciation) from Investments held as of 06/30/15(1) | | $ | — | | $ | — | |
| | Common Stocks | | Gold-Linked
Notes | | Corporate
Notes | | Total | |
| | | | | | | | | |
Holmes Macro Trends Fund | | | | | | | | | |
Beginning Balance 12/31/14 | | $ | 1,380,287 | | $ | — | | $ | 237,500 | | $ | 1,617,787 | |
Sales | | (439,838 | ) | — | | — | | (439,838 | ) |
Total realized gain (loss) | | (460,162 | ) | — | | — | | (460,162 | ) |
Net change in unrealized appreciation (depreciation) | | 187,581 | | — | | — | | 187,581 | |
Pay downs/Maturities | | — | | — | | (12,500 | ) | (12,500 | ) |
Transfers into Level 3* | | — | | 85,663 | | — | | 85,663 | |
Ending Balance 06/30/15 | | $ | 667,868 | | $ | 85,663 | | $ | 225,000 | | $ | 978,531 | |
Net change in unrealized appreciation (depreciation) from Investments held as of 06/30/15(1) | | $ | (68,516 | ) | $ | — | | $ | — | | $ | (68,516 | ) |
66
Notes to Portfolios of Investments (unaudited) | June 30, 2015 |
| | Common Stocks | | Gold-Linked
Notes | | Corporate
Notes | | Total | |
| | | | | | | | | |
Global Resources Fund | | | | | | | | | |
Beginning Balance 12/31/14 | | $ | 16,029,746 | | $ | — | | $ | 2,850,000 | | $ | 18,879,746 | |
Sales | | (2,394,590 | ) | — | | — | | (2,394,590 | ) |
Total realized gain (loss) | | (2,504,762 | ) | — | | — | | (2,504,762 | ) |
Net change in unrealized appreciation (depreciation) | | 359,483 | | — | | — | | 359,483 | |
Pay downs/Maturities | | — | | — | | (150,000 | ) | (150,000 | ) |
Transfers into Level 3* | | — | | 1,990,708 | | — | | 1,990,708 | |
Ending Balance 06/30/15 | | $ | 11,489,877 | | $ | 1,990,708 | | $ | 2,700,000 | | $ | 16,180,585 | |
Net change in unrealized appreciation (depreciation) from Investments held as of 06/30/15(1) | | $ | (1,034,295 | ) | $ | — | | $ | — | | $ | (1,034,295 | ) |
| | Common
Stocks | | Warrants | | Special
Warrants | | Gold-Linked
Notes | | Corporate
Notes | | Total | |
| | | | | | | | | | | | | |
World Precious Minerals Fund | | | | | | | | | | | | | |
Beginning Balance 12/31/14 | | $ | 1,418,548 | | $ | — | | $ | — | | $ | — | | $ | 760,000 | | $ | 2,178,548 | |
Sales | | (24,830 | ) | — | | — | | — | | — | | (24,830 | ) |
Total realized gain (loss) | | (353,342 | ) | — | | — | | — | | — | | (353,342 | ) |
Net change in unrealized appreciation (depreciation) | | 266,291 | | — | | — | | — | | — | | 266,291 | |
Pay downs/Maturities | | — | | — | | — | | — | | (40,000 | ) | (40,000 | ) |
Transfers into Level 3* | | 18,517 | | — | | — | | 1,348,350 | | — | | 1,366,867 | |
Ending Balance 06/30/15 | | $ | 1,325,184 | | $ | — | | $ | — | | $ | 1,348,350 | | $ | 720,000 | | $ | 3,393,534 | |
Net change in unrealized appreciation (depreciation) from Investments held as of 06/30/15(1) | | $ | 103,302 | | $ | — | | $ | — | | $ | — | | $ | — | | $ | 103,302 | |
| | Common
Stocks | | Warrants | | Gold-Linked
Notes | | Corporate
Notes | | Total | |
| | | | | | | | | | | |
Gold and Precious Metals Fund | | | | | | | | | | | |
Beginning Balance 12/31/14 | | $ | — | | $ | — | | $ | — | | $ | 770,766 | | $ | 770,766 | |
Pay downs/Maturities | | — | | — | | — | | (15,000 | ) | (15,000 | ) |
Transfers into Level 3* | | — | | — | | 681,963 | | — | | 681,963 | |
Ending Balance 06/30/15 | | $ | — | | $ | — | | $ | 681,963 | | $ | 755,766 | | $ | 1,437,729 | |
Net change in unrealized appreciation (depreciation) from Investments held as of 06/30/15(1) | | $ | — | | $ | — | | $ | — | | $ | — | | $ | — | |
| | | | | | | | | | | | | | | | |
| | Corporate
Notes | | Total | |
| | | | | |
Emerging Europe Fund | | | | | |
Beginning Balance 12/31/14 | | $ | — | | $ | — | |
Transfers into Level 3* | | 95,558 | | 95,558 | |
Ending Balance 06/30/15 | | $ | 95,558 | | $ | 95,558 | |
Net change in unrealized appreciation (depreciation) from Investments held as of 06/30/15(1) | | $ | — | | $ | — | |
67
Notes to Portfolios of Investments (unaudited) | June 30, 2015 |
| | | | | | | | | | | | | | | | |
| | Common
Stocks | | Total | |
| | | | | |
China Region Fund | | | | | |
Beginning Balance 12/31/14 | | $ | — | | $ | — | |
Transfers into Level 3* | | 412,454 | | 412,454 | |
Ending Balance 06/30/15 | | $ | 412,454 | | $ | 412,454 | |
Net change in unrealized appreciation (depreciation) from Investments held as of 06/30/15(1) | | $ | — | | $ | — | |
* The Funds’ policy is to recognize transfers in and transfers out as of the end of the reporting period.
(1) The amounts shown represent the net change in unrealized appreciation (depreciation) attributable to only those investments still held and classified as Level 3 at June 30, 2015.
Significant unobservable inputs developed by the Valuation Committee for Level 3 investments held at year-end are as follows:
| | Fair Value at
06/30/15 | | Valuation
Technique(s) | | Unobservable
Input | | Range
(Weighted
Average) | |
| | | | | | | | | |
All American Equity Fund | | | | | | | | | |
Investments in Securities Rights | | $ | 7,659 | | Market Transaction | (1) | Discount | | 0% | |
| | | | | | | | | |
Holmes Macro Trends Fund | | | | | | | | | |
Investments in Securities | | | | | | | | | |
Common Stocks | | 43,460 | | Market Transaction | (1) | Discount | | 57%-100% discount (58% discount) | |
Common Stocks | | 624,408 | | Method of Comparables Pricing | (2) | Multiples | | 1.9-35.6 (7.9) | |
Gold-Linked Notes | | 85,663 | | Market Transaction | (1) | Discount | | 65%-78% discount (77% discount) | |
Corporate Notes | | 225,000 | | Market Transaction | (1) | Discount | | 0% | |
| | | | | | | | | |
Global Resources Fund | | | | | | | | | |
Investments in Securities | | | | | | | | | |
Common Stocks | | 1,520,259 | | Market Transaction | (1) | Discount | | 0%-100% discount (58% discount) | |
Common Stocks | | 9,969,618 | | Method of Comparables Pricing | (2) | Multiples | | 1.9-35.6 (7.7) | |
Gold-Linked Notes | | 1,990,708 | | Market Transaction | (1) | Discount | | 64%-78% discount (77% discount) | |
Corporate Notes | | 2,700,000 | | Market Transaction | (1) | Discount | | 0% | |
| | | | | | | | | |
World Precious Minerals Fund | | | | | | | | | |
Investments in Securities | | | | | | | | | |
Common Stocks | | 1,325,184 | | Market Transaction | (1) | Discount | | 0%-100% discount (67% discount) | |
Warrants | | — | | Market Transaction | (1) | Discount | | 0%-100% discount (100% discount) | |
Special Warrants | | — | | Market Transaction | (1) | Discount | | 100% | |
Gold-Linked Notes | | 1,348,350 | | Market Transaction | (1) | Discount | | 64%-78% discount (77% discount) | |
Corporate Notes | | 720,000 | | Market Transaction | (1) | Discount | | 0% | |
| | | | | | | | | | |
68
Notes to Portfolios of Investments (unaudited) | June 30, 2015 |
| | Fair Value at
06/30/15 | | Valuation
Technique(s) | | Unobservable
Input | | Range
(Weighted
Average) | |
| | | | | | | | | |
Gold and Precious Metals Fund | | | | | | | | | |
Investments in Securities Common Stocks | | $ | — | | Market Transaction | (1) | Discount | | 100% | |
Warrants | | — | | Market Transaction | (1) | Discount | | 100% | |
Gold-Linked Notes | | 681,963 | | Market Transaction | (1) | Discount | | 65%-78% discount (77% discount) | |
Corporate Notes | | 755,766 | | Market Transaction | (1) | Discount | | 0% | |
| | | | | | | | | |
Emerging Europe Fund | | | | | | | | | |
Investments in Securities Corporate Note | | 95,558 | | Market Transaction | (1) | Discount | | 93% | |
| | | | | | | | | |
China Region Fund | | | | | | | | | |
Investments in Securities Common Stocks | | 412,454 | | Market Transaction | (1) | Discount | | 0% | |
| | | | | | | | | | |
(1) Market Transaction refers to most recent known market transaction, including transactions in which the fund participated, as adjusted for any discount or premium as discussed below.
(2) The Method of Comparables Pricing valuation technique involves determining a comparable group of companies that exhibit similar characteristics to that of the Level 3 security (the Comparables), gathering information about the Comparables to determine their range of valuation multiples and selecting the appropriate multiple within the determined range of the Comparables to apply in valuing the Level 3 security.
The majority of securities classified as Level 3 are private companies. The initial valuation is usually cost, which is then adjusted as determined by the Valuation Committee for subsequent known market transactions and evaluated for progress against anticipated milestones and current operations. An evaluation that the holding no longer meets expectations could result in the application of discounts and a significantly lower fair valuation. For certain securities, the last known market transaction is increased or decreased by changes in a market index or industry peers as approved by the Valuation Committee.
Affiliated Companies - Indicated in Portfolio of Investments as “+”
The Investment Company Act of 1940 defines affiliates as companies in which the Fund owns at least 5% of the outstanding voting securities. The following is a summary of transactions with each affiliated company during the period ended June 30, 2015.
| | Shares of Affiliated Companies | |
Global Resources Fund | | December 31, 2014 | | Additions | | Reductions | | June 30, 2015 | |
| | | | | | | | | |
Agriterra Ltd. | | 69,849,776 | | — | | — | | 69,849,776 | |
Atlas Development & Support Services Ltd. | | 67,534,983 | | — | | (3,644,000 | ) | 63,890,983 | |
Pacific Coal Resources Ltd. | | 4,362,314 | | — | | — | | 4,362,314 | |
Pacific Green Energy Corp. | | 2,400,000 | | — | | — | | 2,400,000 | |
Pacific Stone Tech, Inc. | | 22,659 | | — | | (22,659 | ) | — | (a) |
Sunridge Gold Corp. | | 10,933,788 | | — | | — | | 10,933,788 | |
Sunridge Gold Corp., Warrants | | 6,333,788 | | — | | — | | 6,333,788 | |
At June 30, 2015, the value of investments in affiliated companies was $6,668,574, representing 4.91% of net assets, and the total cost was $42,227,170. Net realized losses on transactions were $2,587,163, and there was no income earned for the period.
69
Notes to Portfolios of Investments (unaudited) | June 30, 2015 |
| | Shares/Par of Holdings in Affiliated Companies | |
World Precious Minerals Fund | | December 31, 2014 | | Additions | | Reductions | | June 30, 2015 | |
Argent Minerals Ltd. | | 7,100,000 | | 10,000,000 | | — | | 17,100,000 | |
Candente Gold Corp. | | 5,640,000 | | — | | (765,000 | ) | 4,875,000 | |
Canyon Resources Ltd. | | 10,006,593 | | — | | — | | 10,006,593 | |
Canyon Resources Ltd., Warrants | | 6,168,864 | | — | | — | | 6,168,864 | |
CB Gold, Inc. | | 8,562,858 | | — | | (62,858 | ) | 8,500,000 | |
Gran Colombia Gold Corp. | | 1,224,762 | | 287 | | (226,900 | ) | 998,149 | (a) |
Gran Colombia Gold Corp., Warrants | | 154,700 | | — | | — | | 154,700 | (a) |
Gran Colombia Gold Corp., Gold-Linked Notes | | $ | 6,060,000 | | — | | — | | $ | 6,060,000 | (a) |
Gran Colombia Gold Corp., Silver-Linked Notes | | $ | 8,805,000 | | — | | — | | $ | 8,805,000 | (a) |
Mammoth Resources Corp. | | 3,641,800 | | — | | (2,823,800 | ) | 818,000 | (a) |
Mineral Mountain Resources Ltd. | | 11,000,000 | | — | | (1,000,000 | ) | 10,000,000 | |
Mineral Mountain Resources Ltd., Warrants | | 3,500,000 | | — | | — | | 3,500,000 | |
Orex Minerals, Inc. | | 8,614,500 | | 797,000 | | — | | 9,411,500 | |
Orex Minerals, Inc., Warrants | | 1,850,000 | | — | | — | | 1,850,000 | |
Skeena Resources Ltd. | | 10,088,000 | | — | | (1,904,000 | ) | 8,184,000 | (a) |
Skeena Resources Ltd., Warrants | | 10,000,000 | | — | | — | | 10,000,000 | (a) |
Source Exploration Corp. | | — | | 5,000,000 | | (25,000 | ) | 4,975,000 | |
Source Exploration Corp., Warrants | | — | | 2,500,000 | | — | | 2,500,000 | |
TriStar Gold, Inc. | | 8,100,000 | | 8,000,000 | | (100,000 | ) | 16,000,000 | |
Zandor Capital, S.A., Corporate Note (b) | | — | | $ | 600,000 | | $ | (600,000 | ) | — | (a) |
| | | | | | | | | | | | | |
At June 30, 2015, the value of investments in affiliated companies was $5,377,744, representing 5.66% of net assets, and the total cost was $10,368,815. Net realized losses on transactions were $7,473,174, and interest income of $262,478 was earned for the period.
(a) At June 30, 2015, the company is no longer defined as an affiliate, although it was an affiliated company during the year.
(b) Zandor Capital, S.A. is a subsidiary of Gran Colombia Gold Corp.
Restricted Securities - Indicated in Portfolio of Investments as “RS”
The following securities are subject to contractual and regulatory restrictions on resale or transfer. These investments may involve a high degree of business and financial risk. Because of the thinly traded markets for these investments, a Fund may be unable to liquidate its securities in a timely manner, especially if there is negative news regarding the specific securities or the markets overall. These securities could decline significantly in value before the Fund could liquidate these securities. The issuer bears the cost of registration, if any, involved in the disposition of these securities.
Holmes Macro Trends Fund | | Acquisition
Date | | Cost per
Share/Unit | |
Pacific Green Energy Corp. | | 03/24/11 | | $ | 1.00 | |
Pacific Infrastructure Ventures, Inc. | | 08/06/10-11/22/10 | | $ | 1.00 | |
Pacific Power Generation Corp. | | 08/06/10 | | $ | 0.07 | |
Pacific Power Generation Corp., Corporate Note (April 2017) | | 05/25/12 | | $ | 100.00 | |
As of June 30, 2015, the total cost of restricted securities was $775,000, and the total value was $892,868, representing 1.93% of net assets.
70
Notes to Portfolios of Investments (unaudited) | June 30, 2015 |
Global Resources Fund | | Acquisition
Date | | Cost per
Share/Unit | |
I-Pulse, Inc. | | 10/04/07 | | $ | 1.88 | |
Pacific Green Energy Corp. | | 03/24/11 | | $ | 1.00 | |
Pacific Infrastructure Ventures, Inc. | | 08/06/10-11/22/10 | | $ | 1.00 | |
Pacific Power Generation Corp. | | 08/06/10 | | $ | 0.07 | |
Pacific Power Generation Corp., Corporate Note (April 2017) | | 05/25/12 | | $ | 100.00 | |
As of June 30, 2015, the total cost of restricted securities was $12,899,324, and the total value was $13,850,009, representing 10.20% of net assets.
World Precious Minerals Fund | | Acquisition
Date | | Cost per
Share/Unit | |
Algold Resources Ltd., Warrants | | 06/09/15 | | $ | 0.00 | |
Pacific Power Generation Corp., Corporate Note (April 2017) | | 05/25/12 | | $ | 100.00 | |
Pinecrest Resources Ltd. | | 12/18/14 | | $ | 0.16 | |
Taurus Gold Ltd. | | 05/31/11-05/29/13 | | $ | 1.17 | |
Western Exploration & Development Ltd., 144A, Special Warrants | | 08/04/97 | | $ | 0.50 | |
As of June 30, 2015, the total cost of restricted securities was $3,899,508, and the total value was $2,021,469, representing 2.13% of net assets.
Gold and Precious Metals Fund | | Acquisition
Date | | Cost per
Share/Unit | |
Pacific Coal Resources Ltd., Corporate Note (June 2015) | | 12/15/14 | | $ | 100.00 | |
Pacific Power Generation Corp., Corporate Note (April 2017) | | 05/25/12 | | $ | 100.00 | |
As of June 30, 2015, the total cost of restricted securities was $755,766, and the total value was $755,766, representing 1.18% of net assets.
71
Statements of Assets and Liabilities (unaudited) | |
| | U.S. Government
Securities
Ultra-Short
Bond Fund | |
| | | |
Investments, at identified cost | | $ | 58,081,878 | |
| | | |
Assets | | | |
Investments, at value: | | | |
Securities | | $ | 58,251,686 | |
Cash | | — | |
Receivables: | | | |
Dividends and interest | | 100,050 | |
Capital shares sold | | 25,687 | |
From adviser | | 192 | |
Other assets | | 19,980 | |
Total Assets | | 58,397,595 | |
| | | |
Liabilities | | | |
Payables: | | | |
Capital shares redeemed | | 3,794 | |
Adviser and affiliates | | — | |
Investments purchased | | — | |
Dividends and distributions | | 13,786 | |
Accounts payable and accrued expenses | | 48,212 | |
Total Liabilities | | 65,792 | |
| | | |
Net Assets | | $ | 58,331,803 | |
| | | |
Net Assets Consist of: | | | |
Paid-in-capital | | $ | 58,156,356 | |
Accumulated undistributed net investment income (distributions in excess of net investment income) /accumulated net investment loss | | 40 | |
Accumulated net realized gains (losses) from investment transactions and other assets and liabilities denominated in foreign currencies | | 5,599 | |
Net unrealized appreciation of investments and other assets and liabilities denominated in foreign currencies | | 169,808 | |
Net assets applicable to capital shares outstanding | | $ | 58,331,803 | |
| | | |
By share class | | | |
| | | |
Net Assets | | | |
Investor Class | | $ | 58,331,803 | |
| | | |
Capital shares outstanding, an unlimited number of no par shares authorized | | | |
Investor Class | | 29,094,671 | |
| | | |
Net Asset Value, Public Offering Price, Redemption Price, per share | | | |
Investor Class | | $ | 2.00 | |
*Redemption price per share may vary depending on length of time shares are held. See Note 1 H.
See accompanying notes to financial statements.
72
| | Near-Term
Tax Free Fund | | All American
Equity Fund | | Holmes Macro
Trends Fund | |
| | | | | | | |
Investments, at identified cost | | $ | 88,500,482 | | $ | 20,328,961 | | $ | 42,052,432 | |
| | | | | | | |
Assets | | | | | | | |
Investments, at value: | | | | | | | |
Securities | | $ | 89,362,683 | | $ | 20,608,178 | | $ | 46,728,312 | |
Cash | | — | | 408,975 | | — | |
Receivables: | | | | | | | |
Dividends and interest | | 1,007,890 | | 28,408 | | 17,116 | |
Capital shares sold | | 141,892 | | 2,021 | | 2,242 | |
From adviser | | — | | — | | — | |
Other assets | | 24,567 | | 16,167 | | 18,838 | |
Total Assets | | 90,537,032 | | 21,063,749 | | 46,766,508 | |
| | | | | | | |
Liabilities | | | | | | | |
Payables: | | | | | | | |
Capital shares redeemed | | 106,386 | | 13,534 | | — | |
Adviser and affiliates | | 3,171 | | 16,686 | | 43,827 | |
Investments purchased | | — | | — | | 299,892 | |
Dividends and distributions | | 132,495 | | — | | — | |
Accounts payable and accrued expenses | | 43,727 | | 33,138 | | 49,684 | |
Total Liabilities | | 285,779 | | 63,358 | | 393,403 | |
| | | | | | | |
Net Assets | | $ | 90,251,253 | | $ | 21,000,391 | | $ | 46,373,105 | |
| | | | | | | |
Net Assets Consist of: | | | | | | | |
Paid-in-capital | | $ | 89,756,966 | | $ | 18,728,497 | | $ | 39,084,205 | |
Accumulated undistributed net investment income (distributions in excess of net investment income) /accumulated net investment loss | | (8 | ) | 94,949 | | (4,911 | ) |
Accumulated net realized gains (losses) from investment transactions and other assets and liabilities denominated in foreign currencies | | (367,906 | ) | 1,897,728 | | 2,617,931 | |
Net unrealized appreciation of investments and other assets and liabilities denominated in foreign currencies | | 862,201 | | 279,217 | | 4,675,880 | |
Net assets applicable to capital shares outstanding | | $ | 90,251,253 | | $ | 21,000,391 | | $ | 46,373,105 | |
| | | | | | | |
By share class | | | | | | | |
| | | | | | | |
Net Assets | | | | | | | |
Investor Class | | $ | 90,251,253 | | $ | 21,000,391 | | $ | 46,373,105 | |
| | | | | | | |
Capital shares outstanding, an unlimited number of no par shares authorized | | | | | | | |
Investor Class | | 40,323,536 | | 757,724 | | 2,185,597 | |
| | | | | | | |
Net Asset Value, Public Offering Price, Redemption Price, per share | | | | | | | |
Investor Class | | $ | 2.24 | | $ | 27.72 | * | $ | 21.22 | * |
73
Statements of Assets and Liabilities (unaudited)
| | Global
Resources Fund | |
| | | |
Investments, at identified cost | | $ | 241,996,801 | |
| | | |
Assets | | | |
Investments, at value: | | | |
Securities of unaffiliated issuers | | $ | 133,422,737 | |
Securities of affiliated issuers | | 6,668,574 | |
Foreign currencies (Cost $33,911, $128,441, $6,930, $293,936 and $109,980) | | 33,930 | |
Unrealized gain on forward foreign currency contracts | | — | |
Receivables: | | | |
Investments sold | | 7,941,193 | |
Dividends and interest | | 152,245 | |
Capital shares sold | | 32,433 | |
Other assets | | 64,069 | |
Total Assets | | 148,315,181 | |
| | | |
Liabilities | | | |
Unrealized loss on forward foreign currency contracts | | — | |
Payables: | | | |
Capital shares redeemed | | 1,422,835 | |
Adviser and affiliates | | 104,324 | |
Investments purchased | | 10,780,213 | |
Accounts payable and accrued expenses | | 191,362 | |
Total Liabilities | | 12,498,734 | |
Net Assets | | $ | 135,816,447 | |
| | | |
Net Assets Consist of: | | | |
Paid-in-capital | | $ | 662,204,247 | |
Accumulated undistributed net investment income/accumulated net investment loss | | 1,510,705 | |
Accumulated net realized losses from investment transactions and other assets and liabilities denominated in foreign currencies | | (426,003,092 | ) |
Net unrealized appreciation (depreciation) of investments and other assets and liabilities denominated in foreign currencies | | (101,895,413 | ) |
Net assets applicable to capital shares outstanding | | $ | 135,816,447 | |
| | | |
By share class | | | |
| | | |
Net Assets | | | |
Investor Class | | $ | 125,966,941 | |
Institutional Class | | 9,849,506 | |
| | | |
Capital shares outstanding, an unlimited number of no par shares authorized | | | |
Investor Class | | 22,866,680 | |
Institutional Class | | 1,781,260 | |
| | | |
Net Asset Value, Public Offering Price, Redemption Price, per share* | | | |
Investor Class | | $ | 5.51 | |
Institutional Class | | 5.53 | |
* Redemption price per share may vary depending on length of time shares are held. See Note 1 H.
See accompanying notes to financial statements.
74
| | World Precious
Minerals Fund | | Gold and Precious
Metals Fund | | Emerging Europe
Fund | | China Region
Fund | |
| | | | | | | | | |
Investments, at identified cost | | $ | 204,178,082 | | $ | 86,505,325 | | $ | 65,098,211 | | $ | 19,525,465 | |
| | | | | | | | | |
Assets | | | | | | | | | |
Investments, at value: | | | | | | | | | |
Securities of unaffiliated issuers | | $ | 83,871,681 | | $ | 62,038,497 | | $ | 57,942,987 | | $ | 21,838,966 | |
Securities of affiliated issuers | | 8,495,305 | | — | | — | | — | |
Foreign currencies (Cost $33,911, $128,441, $6,930, $293,936 and $109,980) | | 128,318 | | 6,839 | | 291,980 | | 109,951 | |
Unrealized gain on forward foreign currency contracts | | 207,077 | | 138,051 | | — | | — | |
Receivables: | | | | | | | | | |
Investments sold | | 2,437,741 | | 1,673,194 | | 414,929 | | 242,268 | |
Dividends and interest | | 44,687 | | 28,947 | | 151,253 | | 261,766 | |
Capital shares sold | | 8,920 | | 331,955 | | 29,122 | | 1,266 | |
Other assets | | 48,194 | | 34,265 | | 27,135 | | 18,326 | |
Total Assets | | 95,241,923 | | 64,251,748 | | 58,857,406 | | 22,472,543 | |
| | | | | | | | | |
Liabilities | | | | | | | | | |
Unrealized loss on forward foreign currency contracts | | — | | — | | 183,646 | | — | |
Payables: | | | | | | | | | |
Capital shares redeemed | | 22,388 | | 5,350 | | 25,644 | | 5,907 | |
Adviser and affiliates | | 78,454 | | 70,416 | | 81,187 | | 25,110 | |
Investments purchased | | 6,724 | | 6,046 | | 245,773 | | 384,540 | |
Accounts payable and accrued expenses | | 147,179 | | 102,659 | | 96,736 | | 57,585 | |
Total Liabilities | | 254,745 | | 184,471 | | 632,986 | | 473,142 | |
Net Assets | | $ | 94,987,178 | | $ | 64,067,277 | | $ | 58,224,420 | | $ | 21,999,401 | |
| | | | | | | | | |
Net Assets Consist of: | | | | | | | | | |
Paid-in-capital | | $ | 500,514,474 | | $ | 177,002,615 | | $ | 383,874,716 | | $ | 36,638,419 | |
Accumulated undistributed net investment income/accumulated net investment loss | | (3,054,799 | ) | (1,500,510 | ) | 397,009 | | 281,980 | |
Accumulated net realized losses from investment transactions and other assets and liabilities denominated in foreign currencies | | (290,867,784 | ) | (87,105,870 | ) | (318,695,901 | ) | (17,234,507 | ) |
Net unrealized appreciation (depreciation) of investments and other assets and liabilities denominated in foreign currencies | | (111,604,713 | ) | (24,328,958 | ) | (7,351,404 | ) | 2,313,509 | |
Net assets applicable to capital shares outstanding | | $ | 94,987,178 | | $ | 64,067,277 | | $ | 58,224,420 | | $ | 21,999,401 | |
| | | | | | | | | |
By share class | | | | | | | | | |
| | | | | | | | | |
Net Assets | | | | | | | | | |
Investor Class | | $ | 94,855,692 | | $ | 64,067,277 | | $ | 58,224,420 | | $ | 21,999,401 | |
Institutional Class | | 131,486 | | — | | — | | — | |
| | | | | | | | | |
Capital shares outstanding, an unlimited number of no par shares authorized | | | | | | | | | |
Investor Class | | 20,865,340 | | 11,668,602 | | 9,527,045 | | 2,388,113 | |
Institutional Class | | 28,744 | | — | | — | | — | |
| | | | | | | | | |
Net Asset Value, Public Offering Price, Redemption Price, per share* | | | | | | | | | |
Investor Class | | $ | 4.55 | | $ | 5.49 | | $ | 6.11 | | $ | 9.21 | |
Institutional Class | | 4.57 | | — | | — | | — | |
75
Statements of Operations (unaudited) | |
| | U.S. Government
Securities
Ultra-Short
Bond Fund | |
| | | |
Net Investment Income | | | |
Income | | | |
Dividends from unaffiliated issuers | | $ | — | |
Foreign tax withheld on dividends | | — | |
Net dividends | | — | |
Interest and other | | 214,032 | |
Total income | | 214,032 | |
| | | |
Expenses: | | | |
Management fee | | 152,281 | |
Administrative services fee | | 33,928 | |
Accounting service fees and expenses | | 39,544 | |
Distribution plan fee | | — | |
Transfer agent fees and expenses | | 31,849 | |
Professional fees | | 25,799 | |
Custodian fees | | 6,528 | |
Shareholder reporting expenses | | 6,904 | |
Registration fees | | 9,381 | |
Trustee fees and expenses | | 13,694 | |
Miscellaneous expenses | | 16,803 | |
Total expenses before reductions | | 336,711 | |
Expenses offset - Note 1 G | | — | |
Expenses reimbursed - Note 3 | | (202,641 | ) |
Net expenses | | 134,070 | |
| | | |
Net Investment Income (Loss) | | 79,962 | |
| | | |
Net Realized and Unrealized Gain (Loss) on Investments | | | |
Realized gain (loss) from: | | | |
Securities from unaffiliated issuers | | 5,413 | |
Foreign currency transactions | | — | |
Net realized gain (loss) | | 5,413 | |
Net change in unrealized appreciation (depreciation) of: | | | |
Investments | | 92,270 | |
Net unrealized appreciation (depreciation) | | 92,270 | |
| | | |
Net Realized and Unrealized Gain (Loss) on Investments | | 97,683 | |
| | | |
Net Increase (Decrease) In Net Assets Resulting From Operations | | $ | 177,645 | |
See accompanying notes to financial statements.
76
| For the Six Months Ended June 30, 2015 |
| | Near-Term
Tax Free Fund | | All American
Equity Fund | | Holmes Macro
Trends Fund | |
| | | | | | | |
Net Investment Income | | | | | | | |
Income | | | | | | | |
Dividends from unaffiliated issuers | | $ | — | | $ | 275,704 | | $ | 303,660 | |
Foreign tax withheld on dividends | | — | | — | | (2,446 | ) |
Net dividends | | — | | 275,704 | | 301,214 | |
Interest and other | | 958,603 | | 15,939 | | 63,106 | |
Total income | | 958,603 | | 291,643 | | 364,320 | |
| | | | | | | |
Expenses: | | | | | | | |
Management fee | | 229,398 | | 58,188 | | 168,460 | |
Administrative services fee | | 49,354 | | 14,304 | | 26,470 | |
Accounting service fees and expenses | | 71,138 | | 14,148 | | 30,007 | |
Distribution plan fee | | — | | 27,082 | | 57,498 | |
Transfer agent fees and expenses | | 39,143 | | 21,910 | | 31,355 | |
Professional fees | | 32,700 | | 22,079 | | 30,486 | |
Custodian fees | | 6,300 | | 4,260 | | 7,688 | |
Shareholder reporting expenses | | 4,444 | | 4,628 | | 6,097 | |
Registration fees | | 14,131 | | 8,089 | | 10,207 | |
Trustee fees and expenses | | 13,694 | | 13,694 | | 13,694 | |
Miscellaneous expenses | | 12,322 | | 8,372 | | 16,496 | |
Total expenses before reductions | | 472,624 | | 196,754 | | 398,458 | |
Expenses offset - Note 1 G | | (1,368 | ) | (60 | ) | (247 | ) |
Expenses reimbursed - Note 3 | | (264,823 | ) | — | | — | |
Net expenses | | 206,433 | | 196,694 | | 398,211 | |
| | | | | | | |
Net Investment Income (Loss) | | 752,170 | | 94,949 | | (33,891 | ) |
| | | | | | | |
Net Realized and Unrealized Gain (Loss) on Investments | | | | | | | |
Realized gain (loss) from: | | | | | | | |
Securities from unaffiliated issuers | | 4,677 | | (246,514 | ) | 1,553,612 | |
Foreign currency transactions | | — | | — | | 75 | |
Net realized gain (loss) | | 4,677 | | (246,514 | ) | 1,553,687 | |
Net change in unrealized appreciation (depreciation) of: | | | | | | | |
Investments | | (586,135 | ) | 75,962 | | 646,449 | |
Net unrealized appreciation (depreciation) | | (586,135 | ) | 75,962 | | 646,449 | |
| | | | | | | |
Net Realized and Unrealized Gain (Loss) on Investments | | (581,458 | ) | (170,552 | ) | 2,200,136 | |
| | | | | | | |
Net Increase (Decrease) In Net Assets Resulting From Operations | | $ | 170,712 | | $ | (75,603 | ) | $ | 2,166,245 | |
77
Statements of Operations (unaudited)
| | Global
Resources Fund | |
Net Investment Income | | | |
| | | |
Income | | | |
Dividends from unaffiliated issuers | | $ | 2,789,071 | |
Foreign tax withheld on dividends | | (113,800 | ) |
Net dividends | | 2,675,271 | |
Interest and other | | 537,180 | |
Interest from affiliated issuers | | — | |
Total income | | 3,212,451 | |
| | | |
Expenses: | | | |
Management fee | | 414,891 | |
Administrative services fee | | 42,795 | |
Administrative services fee - Investor Class | | 37,013 | |
Administrative services fee - Institutional Class | | 2,310 | |
Accounting service fees and expenses | | 105,843 | |
Distribution plan fee | | 185,069 | |
Transfer agent fees and expenses | | — | |
Transfer agent fees and expenses - Investor Class | | 166,833 | |
Transfer agent fees and expenses - Institutional Class | | 13,764 | |
Professional fees | | 57,984 | |
Custodian fees | | 56,597 | |
Shareholder reporting expenses | | — | |
Shareholder reporting expenses - Investor Class | | 35,074 | |
Shareholder reporting expenses - Institutional Class | | 5,466 | |
Registration fees | | 4,447 | |
Registration fees - Investor Class | | 7,209 | |
Registration fees - Institutional Class | | 4,434 | |
Trustee fees and expenses | | 13,694 | |
Miscellaneous expenses | | 55,627 | |
Total expenses before reductions | | 1,209,050 | |
Expenses offset - Note 1 G | | (721 | ) |
Expenses reimbursed - Note 3 | | (73,442 | ) |
Net expenses | | 1,134,887 | |
| | | |
Net Investment Income (Loss) | | 2,077,564 | |
| | | |
Net Realized and Unrealized Gain (Loss) on Investments | | | |
Realized gain (loss) from: | | | |
Securities from unaffiliated issuers | | (44,571,146 | ) |
Securities from affiliated issuers | | (2,587,163 | ) |
Foreign currency transactions | | 8,651 | |
Net realized gain (loss) | | (47,149,658 | ) |
Net change in unrealized appreciation (depreciation) of: | | | |
Investments | | 14,598,835 | |
Other assets and liabilities denominated in foreign currencies | | (4,222 | ) |
Net unrealized appreciation (depreciation) | | 14,594,613 | |
| | | |
Net Realized and Unrealized Gain (Loss) on Investments | | (32,555,045 | ) |
| | | |
Net Increase (Decrease) In Net Assets Resulting From Operations | | $ | (30,477,481 | ) |
See accompanying notes to financial statements.
78
| For the Six Months Ended June 30, 2015 |
| | World Precious
Minerals Fund | | Gold and Precious
Metals Fund | | Emerging Europe
Fund | | China Region
Fund | |
Net Investment Income | | | | | | | | | |
| | | | | | | | | |
Income | | | | | | | | | |
Dividends from unaffiliated issuers | | $ | 145,618 | | $ | 199,711 | | $ | 1,520,021 | | $ | 445,601 | |
Foreign tax withheld on dividends | | (19,775 | ) | (17,948 | ) | (209,777 | ) | (34,242 | ) |
Net dividends | | 125,843 | | 181,763 | | 1,310,244 | | 411,359 | |
Interest and other | | 47,623 | | 191,895 | | — | | — | |
Interest from affiliated issuers | | 262,478 | | — | | — | | — | |
Total income | | 435,944 | | 373,658 | | 1,310,244 | | 411,359 | |
| | | | | | | | | |
Expenses: | | | | | | | | | |
Management fee | | 374,787 | | 284,495 | | 443,695 | | 113,291 | |
Administrative services fee | | 28,953 | | 36,995 | | 35,921 | | 14,400 | |
Administrative services fee - Investor Class | | 25,453 | | — | | — | | — | |
Administrative services fee - Institutional Class | | 29 | | — | | — | | — | |
Accounting service fees and expenses | | 71,739 | | 45,272 | | 48,349 | | 22,203 | |
Distribution plan fee | | 127,265 | | 83,810 | | 81,124 | | 27,323 | |
Transfer agent fees and expenses | | — | | 61,544 | | 76,159 | | 25,614 | |
Transfer agent fees and expenses - Investor Class | | 99,432 | | — | | — | | — | |
Transfer agent fees and expenses - Institutional Class | | 6,135 | | — | | — | | — | |
Professional fees | | 46,350 | | 34,627 | | 33,445 | | 27,655 | |
Custodian fees | | 45,393 | | 29,515 | | 48,053 | | 24,148 | |
Shareholder reporting expenses | | — | | 17,441 | | 18,637 | | 6,244 | |
Shareholder reporting expenses - Investor Class | | 24,524 | | — | | — | | — | |
Shareholder reporting expenses - Institutional Class | | 1,350 | | — | | — | | — | |
Registration fees | | 2,791 | | 9,878 | | 8,018 | | 6,428 | |
Registration fees - Investor Class | | 8,588 | | — | | — | | — | |
Registration fees - Institutional Class | | 2,427 | | — | | — | | — | |
Trustee fees and expenses | | 13,694 | | 13,694 | | 13,694 | | 13,694 | |
Miscellaneous expenses | | 39,434 | | 30,119 | | 23,582 | | 12,347 | |
Total expenses before reductions | | 918,344 | | 647,390 | | 830,677 | | 293,347 | |
Expenses offset - Note 1 G | | (791 | ) | (767 | ) | (360 | ) | (112 | ) |
Expenses reimbursed - Note 3 | | (84,167 | ) | (28,940 | ) | — | | (37,894 | ) |
Net expenses | | 833,386 | | 617,683 | | 830,317 | | 255,341 | |
| | | | | | | | | |
Net Investment Income (Loss) | | (397,442 | ) | (244,025 | ) | 479,927 | | 156,018 | |
| | | | | | | | | |
Net Realized and Unrealized Gain (Loss) on Investments | | | | | | | | | |
Realized gain (loss) from: | | | | | | | | | |
Securities from unaffiliated issuers | | (19,091,879 | ) | (12,092,219 | ) | (7,115,989 | ) | 1,144,929 | |
Securities from affiliated issuers | | (7,473,174 | ) | — | | — | | — | |
Foreign currency transactions | | (1,169,892 | ) | (547,030 | ) | (18,164 | ) | (4,570 | ) |
Net realized gain (loss) | | (27,734,945 | ) | (12,639,249 | ) | (7,134,153 | ) | 1,140,359 | |
Net change in unrealized appreciation (depreciation) of: | | | | | | | | | |
Investments | | 23,599,570 | | 16,835,831 | | 2,492,696 | | 1,207,700 | |
Other assets and liabilities denominated in foreign currencies | | 206,389 | | 137,884 | | (181,613 | ) | (411 | ) |
Net unrealized appreciation (depreciation) | | 23,805,959 | | 16,973,715 | | 2,311,083 | | 1,207,289 | |
| | | | | | | | | |
Net Realized and Unrealized Gain (Loss) on Investments | | (3,928,986 | ) | 4,334,466 | | (4,823,070 | ) | 2,347,648 | |
| | | | | | | | | |
Net Increase (Decrease) In Net Assets Resulting From Operations | | $ | (4,326,428 | ) | $ | 4,090,441 | | $ | (4,343,143 | ) | $ | 2,503,666 | |
79
Statements of Changes in Net Assets | |
| | U.S. Government Securities
Ultra-Short Bond Fund | |
| | Six Months Ended | | Year Ended | |
| | June 30, 2015
(unaudited) | | December 31,
2014 | |
Increase (Decrease) in Net Assets | | | | | |
| | | | | |
From operations: | | | | | |
Net investment income (loss) | | $ | 79,962 | | $ | 244,055 | |
Net realized gains (losses) | | 5,413 | | 193 | |
Net unrealized appreciation (depreciation) | | 92,270 | | 157,029 | |
Net increase (decrease) in net assets from operations | | 177,645 | | 401,277 | |
| | | | | |
Distributions to shareholders: | | | | | |
From net investment income | | | | | |
Investor Class | | (79,922 | ) | (246,094 | ) |
From net realized gains | | | | | |
Investor Class | | — | | — | |
Total distributions to shareholders | | (79,922 | ) | (246,094 | ) |
| | | | | |
From capital share transactions: | | | | | |
Proceeds from shares sold | | | | | |
Investor Class | | 2,062,323 | | 4,512,617 | |
Distributions reinvested | | | | | |
Investor Class | | 61,686 | | 192,302 | |
Proceeds from short-term trading fees | | | | | |
Investor Class | | — | | — | |
| | 2,124,009 | | 4,704,919 | |
Cost of shares redeemed | | | | | |
Investor Class | | (7,910,118 | ) | (16,066,999 | ) |
Net increase (decrease) in net assets from capital share transactions | | (5,786,109 | ) | (11,362,080 | ) |
| | | | | |
Net Increase (Decrease) in Net Assets | | (5,688,386 | ) | (11,206,897 | ) |
| | | | | |
Net Assets | | | | | |
Beginning of year | | 64,020,189 | | 75,227,086 | |
| | | | | |
End of period | | $ | 58,331,803 | | $ | 64,020,189 | |
| | | | | | | |
Accumulated undistributed net investment income (distributions in excess of net investment income), end of period | | $ | 40 | | $ | — | |
| | | | | |
Capital Share Activity | | | | | |
Investor Class: | | | | | |
Shares sold | | 1,028,065 | | 2,253,880 | |
Shares reinvested | | 30,735 | | 96,087 | |
Shares redeemed | | (3,943,056 | ) | (8,024,578 | ) |
Net share activity | | (2,884,256 | ) | (5,674,611 | ) |
See accompanying notes to financial statements.
80
June 30, 2015
| | Near-Term Tax Free Fund | | All American Equity Fund | |
| | Six Months Ended | | Year Ended | | Six Months Ended | | Year Ended | |
| | June 30, 2015
(unaudited) | | December 31,
2014 | | June 30, 2015
(unaudited) | | December 31,
2014 | |
Increase (Decrease) in Net Assets | | | | | | | | | |
| | | | | | | | | |
From operations: | | | | | | | | | |
Net investment income (loss) | | $ | 752,170 | | $ | 1,421,238 | | $ | 94,949 | | $ | (126,354 | ) |
Net realized gains (losses) | | 4,677 | | (9,951 | ) | (246,514 | ) | 4,958,378 | |
Net unrealized appreciation (depreciation) | | (586,135 | ) | 622,619 | | 75,962 | | (4,371,450 | ) |
Net increase (decrease) in net assets from operations | | 170,712 | | 2,033,906 | | (75,603 | ) | 460,574 | |
| | | | | | | | | |
Distributions to shareholders: | | | | | | | | | |
From net investment income | | | | | | | | | |
Investor Class | | (752,178 | ) | (1,435,770 | ) | — | | — | |
From net realized gains | | | | | | | | | |
Investor Class | | — | | — | | — | | (3,451,336 | ) |
Total distributions to shareholders | | (752,178 | ) | (1,435,770 | ) | — | | (3,451,336 | ) |
| | | | | | | | | |
From capital share transactions: | | | | | | | | | |
Proceeds from shares sold | | | | | | | | | |
Investor Class | | 37,031,151 | | 45,225,356 | | 1,490,044 | | 3,388,992 | |
Distributions reinvested | | | | | | | | | |
Investor Class | | 606,820 | | 1,175,524 | | 61 | | 3,284,819 | |
Proceeds from short-term trading fees | | | | | | | | | |
Investor Class | | — | | — | | 38 | | 50 | |
| | 37,637,971 | | 46,400,880 | | 1,490,143 | | 6,673,861 | |
Cost of shares redeemed | | | | | | | | | |
Investor Class | | (36,400,626 | ) | (19,287,158 | ) | (2,349,754 | ) | (5,135,517 | ) |
Net increase (decrease) in net assets from capital share transactions | | 1,237,345 | | 27,113,722 | | (859,611 | ) | 1,538,344 | |
| | | | | | | | | |
Net Increase (Decrease) in Net Assets | | 655,879 | | 27,711,858 | | (935,214 | ) | (1,452,418 | ) |
| | | | | | | | | |
Net Assets | | | | | | | | | |
Beginning of year | | 89,595,374 | | 61,883,516 | | 21,935,605 | | 23,388,023 | |
| | | | | | | | | |
End of period | | $ | 90,251,253 | | $ | 89,595,374 | | $ | 21,000,391 | | $ | 21,935,605 | |
| | | | | | | | | | | | | |
Accumulated undistributed net investment income (distributions in excess of net investment income), end of period | | $ | (8 | ) | $ | — | | $ | 94,949 | | $ | — | |
| | | | | | | | | |
Capital Share Activity | | | | | | | | | |
Investor Class: | | | | | | | | | |
Shares sold | | 16,451,290 | | 20,041,597 | | 53,197 | | 104,908 | |
Shares reinvested | | 269,943 | | 522,037 | | 2 | | 116,731 | |
Shares redeemed | | (16,195,589 | ) | (8,568,071 | ) | (83,298 | ) | (160,673 | ) |
Net share activity | | 525,644 | | 11,995,563 | | (30,099 | ) | 60,966 | |
81
Statements of Changes in Net Assets
| | Holmes Macro Trends Fund | |
| | Six Months Ended | | Year Ended | |
| | June 30, 2015
(unaudited) | | December 31,
2014 | |
Increase (Decrease) in Net Assets | | | | | |
| | | | | |
From operations: | | | | | |
Net investment income (loss) | | $ | (33,891 | ) | $ | (602,956 | ) |
Net realized gains (losses) | | 1,553,687 | | 4,824,855 | |
Net unrealized appreciation (depreciation) | | 646,449 | | (7,727,457 | ) |
Net increase (decrease) in net assets from operations | | 2,166,245 | | (3,505,558 | ) |
| | | | | |
Distributions to shareholders: | | | | | |
From net realized gains | | | | | |
Investor Class | | — | | (4,895,166 | ) |
Total distributions to shareholders | | — | | (4,895,166 | ) |
| | | | | |
From capital share transactions: | | | | | |
Proceeds from shares sold | | | | | |
Investor Class | | 1,413,729 | | 2,829,629 | |
Institutional Class | | — | | — | |
Distributions reinvested | | | | | |
Investor Class | | — | | 4,645,006 | |
Proceeds from short-term trading fees | | | | | |
Investor Class | | 66 | | 110 | |
| | 1,413,795 | | 7,474,745 | |
Cost of shares redeemed | | | | | |
Investor Class | | (3,457,015 | ) | (8,749,961 | ) |
Institutional Class | | — | | — | |
Net decrease in net assets from capital share transactions | | (2,043,220 | ) | (1,275,216 | ) |
| | | | | |
Net Increase (Decrease) in Net Assets | | 123,025 | | (9,675,940 | ) |
| | | | | |
Net Assets | | | | | |
Beginning of year | | 46,250,080 | | 55,926,020 | |
| | | | | |
End of period | | $ | 46,373,105 | | $ | 46,250,080 | |
| | | | | |
Accumulated undistributed net investment income (distributions in excess of net investment income)/accumulated net investment loss, end of period | | $ | (4,911 | ) | $ | 29,980 | |
| | | | | |
Capital Share Activity | | | | | |
Investor Class: | | | | | |
Shares sold | | 67,678 | | 119,782 | |
Shares reinvested | | — | | 228,368 | |
Shares redeemed | | (166,111 | ) | (370,933 | ) |
Net share activity | | (98,433 | ) | (22,783 | ) |
| | | | | |
Institutional Class: | | | | | |
Shares sold | | — | | — | |
Shares redeemed | | — | | — | |
Net share activity | | — | | — | |
See accompanying notes to financial statements.
82
June 30, 2015
| | Global Resources Fund | | World Precious Minerals Fund | |
| | Six Months Ended | | Year Ended | | Six Months Ended | | Year Ended | |
| | June 30, 2015
(unaudited) | | December 31,
2014 | | June 30, 2015
(unaudited) | | December 31,
2014 | |
Increase (Decrease) in Net Assets | | | | | | | | | |
| | | | | | | | | |
From operations: | | | | | | | | | |
Net investment income (loss) | | $ | 2,077,564 | | $ | 1,524,440 | | $ | (397,442 | ) | $ | (1,310,476 | ) |
Net realized gains (losses) | | (47,149,658 | ) | (22,394,012 | ) | (27,734,945 | ) | (41,777,706 | ) |
Net unrealized appreciation (depreciation) | | 14,594,613 | | (58,501,902 | ) | 23,805,959 | | 23,715,203 | |
Net increase (decrease) in net assets from operations | | (30,477,481 | ) | (79,371,474 | ) | (4,326,428 | ) | (19,372,979 | ) |
| | | | | | | | | |
Distributions to shareholders: | | | | | | | | | |
From net realized gains | | | | | | | | | |
Investor Class | | — | | — | | — | | — | |
Total distributions to shareholders | | — | | — | | — | | — | |
| | | | | | | | | |
From capital share transactions: | | | | | | | | | |
Proceeds from shares sold | | | | | | | | | |
Investor Class | | 5,669,674 | | 15,810,878 | | 9,692,034 | | 32,514,206 | |
Institutional Class | | 5,686,992 | | 13,601,289 | | — | | 329,728 | |
Distributions reinvested | | | | | | | | | |
Investor Class | | — | | — | | — | | — | |
Proceeds from short-term trading fees | | | | | | | | | |
Investor Class | | 29 | | 3 | | 35 | | 1,107 | |
| | 11,356,695 | | 29,412,170 | | 9,692,069 | | 32,845,041 | |
Cost of shares redeemed | | | | | | | | | |
Investor Class | | (23,759,618 | ) | (96,715,552 | ) | (13,928,207 | ) | (43,496,939 | ) |
Institutional Class | | (2,708,686 | ) | (49,361,941 | ) | (16,584 | ) | (4,133,556 | ) |
Net decrease in net assets from capital share transactions | | (15,111,609 | ) | (116,665,323 | ) | (4,252,722 | ) | (14,785,454 | ) |
| | | | | | | | | |
Net Increase (Decrease) in Net Assets | | (45,589,090 | ) | (196,036,797 | ) | (8,579,150 | ) | (34,158,433 | ) |
| | | | | | | | | |
Net Assets | | | | | | | | | |
Beginning of year | | 181,405,537 | | 377,442,334 | | 103,566,328 | | 137,724,761 | |
| | | | | | | | | |
End of period | | $ | 135,816,447 | | $ | 181,405,537 | | $ | 94,987,178 | | $ | 103,566,328 | |
| | | | | | | | | |
Accumulated undistributed net investment income (distributions in excess of net investment income)/accumulated net investment loss, end of period | | $ | 1,510,705 | | $ | (566,859 | ) | $ | (3,054,799 | ) | $ | (2,657,357 | ) |
| | | | | | | | | |
Capital Share Activity | | | | | | | | | |
Investor Class: | | | | | | | | | |
Shares sold | | 913,639 | | 1,771,672 | | 2,020,748 | | 5,169,068 | |
Shares reinvested | | — | | — | | — | | — | |
Shares redeemed | | (3,788,152 | ) | (10,892,243 | ) | (2,911,737 | ) | (6,972,038 | ) |
Net share activity | | (2,874,513 | ) | (9,120,571 | ) | (890,989 | ) | (1,802,970 | ) |
| | | | | | | | | |
Institutional Class: | | | | | | | | | |
Shares sold | | 902,924 | | 1,541,347 | | — | | 47,824 | |
Shares redeemed | | (580,340 | ) | (5,576,888 | ) | (3,453 | ) | (655,506 | ) |
Net share activity | | 322,584 | | (4,035,541 | ) | (3,453 | ) | (607,682 | ) |
83
Statements of Changes in Net Assets
| | Gold and Precious Metals Fund | |
| | Six Months Ended | | Year Ended | |
| | June 30, 2015
(unaudited) | | December 31,
2014 | |
Increase (Decrease) in Net Assets | | | | | |
| | | | | |
From operations: | | | | | |
Net investment income (loss) | | $ | (244,025 | ) | $ | (562,983 | ) |
Net realized gains (losses) | | (12,639,249 | ) | (16,260,231 | ) |
Net unrealized appreciation (depreciation) | | 16,973,715 | | 6,591,222 | |
Net increase (decrease) in net assets from operations | | 4,090,441 | | (10,231,992 | ) |
| | | | | |
Distributions to shareholders: | | | | | |
From net investment income | | | | | |
Investor Class | | — | | — | |
Total distributions to shareholders | | — | | — | |
| | | | | |
From capital share transactions: | | | | | |
Proceeds from shares sold | | | | | |
Investor Class | | 8,246,021 | | 30,616,079 | |
Distributions reinvested | | | | | |
Investor Class | | — | | — | |
Proceeds from short-term trading fees | | | | | |
Investor Class | | 83 | | 1,241 | |
Cost of shares redeemed | | 8,246,104 | | 30,617,320 | |
Investor Class | | (11,046,186 | ) | (32,235,266 | ) |
| | | | | |
Net decrease in net assets from capital share transactions | | (2,800,082 | ) | (1,617,946 | ) |
| | | | | |
Net Increase (Decrease) in Net Assets | | 1,290,359 | | (11,849,938 | ) |
| | | | | |
Net Assets | | | | | |
Beginning of year | | 62,776,918 | | 74,626,856 | |
| | | | | | | |
End of period | | $ | 64,067,277 | | $ | 62,776,918 | |
| | | | | | | |
Accumulated undistributed net investment income (distributions in excess of net investment income)/accumulated net investment loss, end of period | | $ | (1,500,510 | ) | $ | (1,256,485 | ) |
| | | | | |
Capital Share Activity | | | | | |
Investor Class: | | | | | |
Shares sold | | 1,465,718 | | 4,547,671 | |
Shares reinvested | | — | | — | |
Shares redeemed | | (1,954,736 | ) | (4,828,108 | ) |
Net share activity | | (489,018 | ) | (280,437 | ) |
See accompanying notes to financial statements.
84
June 30, 2015
| | Emerging Europe Fund | | China Region Fund | |
| | Six Months Ended | | Year Ended | | Six Months Ended | | Year Ended | |
| | June 30, 2015
(unaudited) | | December 31,
2014 | | June 30, 2015
(unaudited) | | December 31,
2014 | |
Increase (Decrease) in Net Assets | | | | | | | | | |
| | | | | | | | | |
From operations: | | | | | | | | | |
Net investment income (loss) | | $ | 479,927 | | $ | 215,408 | | $ | 156,018 | | $ | 18,029 | |
Net realized gains (losses) | | (7,134,153 | ) | 1,129,655 | | 1,140,359 | | 3,460,252 | |
Net unrealized appreciation (depreciation) | | 2,311,083 | | (25,688,600 | ) | 1,207,289 | | (3,790,675 | ) |
Net increase (decrease) in net assets from operations | | (4,343,143 | ) | (24,343,537 | ) | 2,503,666 | | (312,394 | ) |
| | | | | | | | | |
Distributions to shareholders: | | | | | | | | | |
From net investment income | | | | | | | | | |
Investor Class | | — | | (2,243,528 | ) | — | | — | |
Total distributions to shareholders | | — | | (2,243,528 | ) | — | | — | |
| | | | | | | | | |
From capital share transactions: | | | | | | | | | |
Proceeds from shares sold | | | | | | | | | |
Investor Class | | 2,410,009 | | 6,672,598 | | 1,991,377 | | 1,378,719 | |
Distributions reinvested | | | | | | | | | |
Investor Class | | — | | 2,048,780 | | — | | — | |
Proceeds from short-term trading fees | | | | | | | | | |
Investor Class | | 28 | | 3 | | 20 | | 39 | |
Cost of shares redeemed | | 2,410,037 | | 8,721,381 | | 1,991,397 | | 1,378,758 | |
Investor Class | | (8,908,345 | ) | (35,638,573 | ) | (3,503,650 | ) | (6,444,792 | ) |
| | | | | | | | | |
Net decrease in net assets from capital share transactions | | (6,498,308 | ) | (26,917,192 | ) | (1,512,253 | ) | (5,066,034 | ) |
| | | | | | | | | |
Net Increase (Decrease) in Net Assets | | (10,841,451 | ) | (53,504,257 | ) | 991,413 | | (5,378,428 | ) |
| | | | | | | | | |
Net Assets | | | | | | | | | |
Beginning of year | | 69,065,871 | | 122,570,128 | | 21,007,988 | | 26,386,416 | |
| | | | | | | | | | | | | |
End of period | | $ | 58,224,420 | | $ | 69,065,871 | | $ | 21,999,401 | | $ | 21,007,988 | |
| | | | | | | | | | | | | |
Accumulated undistributed net investment income (distributions in excess of net investment income)/accumulated net investment loss, end of period | | $ | 397,009 | | $ | (82,918 | ) | $ | 281,980 | | $ | 125,962 | |
| | | | | | | | | |
Capital Share Activity | | | | | | | | | |
Investor Class: | | | | | | | | | |
Shares sold | | 363,248 | | 857,860 | | 211,396 | | 170,915 | |
Shares reinvested | | — | | 310,418 | | — | | — | |
Shares redeemed | | (1,367,084 | ) | (4,539,463 | ) | (386,709 | ) | (795,193 | ) |
Net share activity | | (1,003,836 | ) | (3,371,185 | ) | (175,313 | ) | (624,278 | ) |
85
Notes to Financial Statements (unaudited) | June 30, 2015 |
Note 1: Organization and Significant Accounting Policies
U.S. Global Investors Funds (Trust), consisting of the nine separate funds (Funds) included in this report, is organized as a Delaware statutory trust. Each Fund is an open-end management investment company registered under the Investment Company Act of 1940, as amended, and follows the specialized accounting and reporting guidance in FASB Accounting Standards Codification 946. All funds are diversified with the exception of Global Resources, World Precious Minerals, Gold and Precious Metals, Emerging Europe and China Region. A nondiversified fund may invest a greater percentage of its assets in a particular issuer in comparison to a diversified fund.
The following is a summary of significant accounting policies consistently followed by the Funds in the preparation of their financial statements. The policies are in conformity with U.S. generally accepted accounting principles.
A. Security Valuations
The Funds value investments traded on national or international securities exchanges or over-the-counter at the last sales price reported by the security’s primary exchange of its market at the time of daily valuation. Options and securities for which no sale was reported are valued at the mean between the last reported bid and asked quotation. Short-term investments with effective maturities of sixty days or less at the date of purchase are valued at amortized cost, which approximates market value. Municipal securities, long-term U.S. government obligations and corporate debt securities are valued by an independent pricing service using an evaluated quote based on such factors as institutional-size trading in similar groups of securities, yield, quality, maturity, coupon rate, type of issue, individual trading characteristics and other market data.
B. Fair Valued Securities
Securities for which market quotations are not readily available or which are subject to legal restrictions are valued at their fair value as determined in good faith by the Valuation Committee of U.S. Global Investors, Inc. (Adviser), under policies and procedures established by the Funds’ Board of Trustees. Fair value is the price that would be received to sell an asset or paid to transfer a liability in an orderly transaction between market participants at the measurement date. The Valuation Committee meets on a regular basis to review securities which may not have readily available market prices and considers a number of factors in determining fair value, including nature and duration of any trading restrictions, trading volume, market values of unrestricted shares of the same or similar class, investment management’s judgment regarding the market experience of the issuer, financial status and other operational and market factors affecting the issuer, issuer’s management, quality of the underlying property based on review of independent geological studies and other relevant matters. The fair values may differ from what would have been used had a broader market for these securities existed. The Valuation Committee regularly reviews inputs and assumptions and performs transactional back-testing and
86
Notes to Financial Statements (unaudited) | June 30, 2015 |
disposition analysis. The Valuation Committee reports quarterly to the Funds’ Board of Trustees.
For securities traded on international exchanges, if events which may materially affect the value of a Fund’s securities occur after the close of the primary exchange and before a Fund’s net asset value is next determined, then those securities will be valued at their fair value as determined in good faith under the supervision of the Board of Trustees. The Funds use a systematic fair value model provided by an independent third party to value international securities primarily traded on an exchange or market outside the Western Hemisphere in order to adjust for stale pricing, which may occur between the close of certain foreign exchanges and the New York Stock Exchange.
C. Security Transactions and Investment Income
Security transactions are accounted for on trade date. Realized gains and losses from security transactions are determined on an identified cost basis. Dividend income is recorded on the ex-dividend date except that certain dividends from foreign securities where the ex-dividend date may have passed are recorded as soon as the Fund has confirmed the ex-dividend date. Interest income, which may include original issue discount, is recorded on an accrual basis. Discounts and premiums on securities purchased are accreted and amortized, respectively, on a yield-to-maturity basis as adjustments to interest income. Investment income is recorded net of foreign taxes withheld where recovery of such taxes is uncertain. Investment income and realized and unrealized gains (losses) are allocated to each Fund’s share class based on their respective net assets.
The Funds may purchase securities on a when-issued or delayed-delivery basis and segregate collateral on their books with a value at least equal to the amount of the commitment. Losses may arise due to the changes in the value of the underlying securities or if the counterparty does not perform under the contract.
D. Foreign Currency Transactions
Some Funds may invest in securities of foreign issuers. The accounting records of these Funds are maintained in U.S. dollars. At each net asset value determination date, the value of assets and liabilities denominated in foreign currencies are translated into U.S. dollars using the current prevailing exchange rate. Security transactions, income and expenses are converted at the prevailing rate of exchange on the respective dates of the transactions. The effect of changes in foreign exchange rates on foreign denominated securities is included with the net realized and unrealized gain or loss on securities. Other foreign currency gains or losses are reported separately.
E. Federal Income Taxes
The Funds intend to continue to comply with the requirements of Subchapter M of the Internal Revenue Code applicable to regulated investment companies and to distribute substantially all of their taxable income to shareholders. Accordingly, no
87
Notes to Financial Statements (unaudited) | June 30, 2015 |
provision for federal income taxes is required. Each Fund may be subject to foreign taxes on income and gains on investments, which are accrued based on the Fund’s understanding of the tax rules and regulations in the foreign markets.
The Funds recognize the tax benefits of uncertain tax positions only where the position is “more likely than not” to be sustained assuming examination by tax authorities. Management has analyzed the Funds’ tax positions, and has concluded that no liability for unrecognized tax benefits should be recorded related to uncertain tax positions taken on returns filed for open tax years or expected to be taken in 2014 tax returns. The Funds’ 2011, 2012, 2013 and 2014 tax returns are open to examination by the federal and applicable state tax authorities. The Funds have no examinations in progress.
F. Dividends and Distributions to Shareholders
The Funds record dividends and distributions to shareholders on the ex-dividend date. Distributions are determined in accordance with income tax regulations, which may differ from accounting principles generally accepted in the United States. Accordingly, periodic reclassifications related to permanent book and tax basis differences are made within the Funds’ capital accounts to reflect income and gains available for distribution under income tax regulations.
The Funds, except as noted below, generally pay income dividends and distribute capital gains, if any, annually. The U.S. Government Securities Ultra-Short Bond Fund and the Near-Term Tax Free Fund accrue and pay dividends monthly. A Fund may elect to designate a portion of the earnings and profits distributed to shareholders on the redemption of fund shares during the year as distributions for federal income tax purposes. Differences in per share dividend rates for multiclass funds generally result from the relative weightings of pro rata income and realized gain allocations and from differences in separate class expenses.
G. Expenses
Fund specific expenses are allocated to that Fund and pro rata across share classes. Expenses that are not fund specific are allocated among Funds and pro rata across share classes. Class specific expenses (including, but not limited to, distribution plan fees, if any, a portion of the administrative services fees, transfer agency fees and expenses, shareholder reporting expenses and certain legal and registration fees) are allocated to the class that incurs such expense. Except for the U.S. Government Securities Ultra-Short Bond Fund, expense offset arrangements have been made with the Funds’ custodian so the custodian fees may be paid indirectly by credits earned on the Funds’ cash balances. Such deposit arrangements are an alternative to overnight investments. Custodian fees are presented in the Statements of Operations gross of such credits, and the credits are presented as offsets to expenses. For the U.S. Government Securities Ultra-Short Bond Fund, credits earned on its cash balance are included in interest and other income.
88
Notes to Financial Statements (unaudited) | June 30, 2015 |
H. Short-Term Trading (Redemption) Fees
Short-term trading (redemption) fees are assessed on the All American, Homes Macro Trends, Global Resources, World Precious Minerals, Gold and Precious Metals, Emerging Europe and China Region Funds (Equity Funds). These fees, which are retained by the Funds, are accounted for as an addition to paid-in capital. The fee for each of the Equity Funds is 0.05% of the amount redeemed on shares held seven days or less.
I. Use of Estimates in Financial Statement Preparation
The Funds are investment companies accounted for in conformity with accounting principles generally accepted in the United States of America (GAAP). Therefore they follow the accounting and reporting guidelines for investment companies. The preparation of financial statements in conformity with GAAP requires management to make estimates and assumptions that affect the reported amounts of assets and liabilities and disclosure of contingent assets and liabilities at the date of the financial statements and the reported amounts of income and expenses during the reporting period. Actual results could differ from those estimates.
J. Subsequent Events Evaluation
Management has evaluated subsequent events after the balance sheet date of June 30, 2015, through the date that the financial statements were issued and determined that there were no events or transactions that would require adjustments to or disclosure in the financial statements.
Note 2: Financial Derivative Instruments
A. Options Contracts
Equity Funds may purchase or write (sell) options on securities to manage their exposure to stock or commodity markets as well as fluctuations in interest and currency conversion rates. The use of options carries the risks of a change in value of the underlying instruments, an illiquid secondary market, or failure of the counterparty to perform its obligations.
A put option gives the purchaser of the option, upon payment of a premium, the right to sell, and the issuer of the option the obligation to buy, the underlying security, commodity, index, currency or other instrument at the exercise price. A call option, upon payment of a premium, gives the purchaser of the option the right to buy, and the issuer the obligation to sell, the underlying instrument at the exercise price.
Purchasing a put option tends to decrease a Fund’s exposure to the underlying instrument, whereas purchasing a call option tends to increase a Fund’s exposure to the underlying instrument. A Fund pays a premium which is included in the Statement of Assets and Liabilities as an investment and subsequently marked to market to reflect the current value of the option. Premiums paid to purchase options which expire are treated as realized losses. Premiums paid to purchase options
89
Notes to Financial Statements (unaudited) | June 30, 2015 |
which are exercised or closed are added to the cost of securities acquired or the proceeds from securities sold. The risk associated with purchasing put and call options is limited to the premium paid.
The Funds will realize a loss equal to all or a part of the premium paid for an option if the price of the underlying security or other instrument decreases or does not increase by more than the premium (in the case of a call option), or if the price of the underlying security or other instrument increases or does not decrease by more than the premium (in the case of a put option).
Writing a put option tends to increase a Fund’s exposure to the underlying instrument, whereas writing a call option tends to decrease a Fund’s exposure to the underlying instrument. The premium received is recorded as a liability in the Statement of Assets and Liabilities and subsequently marked to market to reflect the current value of the option written. Premiums received from writing options which expire are treated as realized gains. Premiums received from options which are exercised or closed are added to the proceeds or offset against amounts paid on the underlying transaction to determine the realized gain or loss. Written options include a risk of loss in excess of the option premium. A Fund as a writer of an option has no control over whether the underlying instrument may be sold (call) or purchased (put) and thus bears the market risk of an unfavorable change in the price of the instrument underlying the written option. There is also the risk a Fund may not be able to enter into a closing transaction because of an illiquid market.
A Fund’s ability to close out its position as a purchaser or seller of a put or call option is dependent, in part, upon the liquidity of the market for that particular option. There can be no guarantee that a fund will be able to close out an option position when desired. An inability to close out its options positions may reduce a Fund’s anticipated profits or increase its losses.
As of June 30, 2015, there were no securities held in escrow by the custodian as cover for call options written.
During the six months ended June 30, 2015, there were no transactions in written call options.
B. Forward Foreign Currency Contracts
The Funds enter into forward foreign currency contracts to lock in the U.S. dollar cost of purchase and sale transactions or to hedge the portfolio against currency fluctuations. A forward foreign currency contract is a commitment to purchase or sell a foreign currency at a future date at a negotiated rate. These contracts are valued daily, and the Fund’s net equity therein, representing unrealized gain or loss on the contracts as measured by the difference between the forward foreign exchange rates at the dates of entry into the contracts and the forward rates at the reporting date, is included in the Statement of Assets and Liabilities on a gross basis as the Funds do not have master netting agreements with the counterparties of the forward foreign currency contracts. Realized and unrealized gains and losses are
90
Notes to Financial Statements (unaudited) | June 30, 2015 |
included in the Statement of Operations. Risks may arise upon entering into these contracts from the potential inability of counterparties to meet the terms of the contracts and from unanticipated movements in the value of foreign currencies relative to the U.S. dollar.
Open forward foreign currency contracts as of June 30, 2015, were as follows:
Fund Contract | | Currency to
Deliver | | Currency to
Receive | | Settlement
Date | | Value | | Unrealized
Appreciation
(Depreciation) | |
World Precious Minerals | | CAD | 24,750,000 | | USD | 20,015,365 | | 7/29/2015 | | $ | 20,222,442 | | $ | 207,077 | |
Gold and Precious Metals | | CAD | 16,500,000 | | USD | 13,343,577 | | 7/29/2015 | | 13,481,628 | | 138,051 | |
Emerging Europe | | TRY | 18,000,000 | | USD | 6,509,240 | | 7/13/2015 | | 6,325,594 | | (183,646 | ) |
| | | | | | | | | | | | | | | |
C. Summary of Derivative Instruments
The following is a summary of the valuations of derivative instruments categorized by location in the Statements of Assets and Liabilities as of June 30, 2015:
Location | | Global
Resources
Fund | | World
Precious
Minerals
Fund | | Gold and
Precious
Metals
Fund | | Emerging
Europe
Fund | | China
Region
Fund | |
Asset derivatives | | | | | | | | | | | |
Investments, at value Purchased options | | $ | 1,732,965 | | $ | 428,501 | | $ | 252,098 | | $ | 788,750 | | $ | 24,000 | |
Unrealized gain on forward foreign currency contracts | | — | | 207,077 | | 138,051 | | — | | — | |
Liability derivatives | | | | | | | | | | | |
Unrealized loss on forward foreign currency contracts | | — | | — | | — | | (183,646 | ) | — | |
Total | | $ | 1,732,965 | | $ | 635,578 | | $ | 390,149 | | $ | 605,104 | | $ | 24,000 | |
The following is a summary of the effect of derivative instruments on the Statements of Operations for the six months ended June 30, 2015:
Location | | Holmes
Macro
Trends
Fund | | Global
Resources
Fund | | World
Precious
Minerals
Fund | |
Realized gain (loss) on derivatives recognized in income | | | | | | | |
Realized gain (loss) from securities Purchased options | | $ | (290,652 | ) | $ | (10,029,827 | ) | $ | (3,360,031 | ) |
Net realized gain (loss) from foreign currency transactions Foreign exchange contracts | | — | | — | | (92,125 | ) |
| | (290,652 | ) | (10,029,827 | ) | (3,452,156 | ) |
Change in unrealized appreciation (depreciation) on derivatives recognized in income | | | | | | | |
Net change in unrealized appreciation (depreciation) of investments Purchased options | | — | | 2,488,588 | | 2,607,442 | |
| | — | | 2,488,588 | | 2,607,442 | |
Total | | $ | (290,652 | ) | $ | (7,541,239 | ) | $ | (844,714 | ) |
91
Notes to Financial Statements (unaudited) | June 30, 2015 |
Location | | Gold and
Precious
Metals
Fund | | Emerging
Europe
Fund | | China
Region
Fund | |
Realized gain (loss) on derivatives recognized in income | | | | | | | |
Realized gain (loss) from securities | | | | | | | | | | |
Purchased options | | $ | (2,561,566 | ) | $ | 896,232 | | $ | (76,697 | ) |
Net realized gain (loss) from foreign currency transactions | | | | | | | | | | |
Foreign exchange contracts | | (59,599 | ) | 31,742 | | (393 | ) |
| | (2,621,165 | ) | 927,974 | | (77,090 | ) |
Change in unrealized appreciation (depreciation) on derivatives recognized in income | | | | | | | |
Net change in unrealized appreciation (depreciation) of investments | | | | | | | |
Purchased options | | 2,129,250 | | (222,965 | ) | 3,777 | |
| | 2,129,250 | | (222,965 | ) | 3,777 | |
Total | | $ | (491,915 | ) | $ | 705,009 | | $ | (73,313 | ) |
The average notional amounts of purchased options and forward currency contracts outstanding during the six months ended June 30, 2015, were approximately as follows:
Fund | | Purchased
Options | | Forward
Currency
Contracts | |
Holmes Macro Trends | | $ | 59,840 | | $ | — | |
Global Resources | | 3,875,347 | | — | |
World Precious Minerals | | 984,407 | | 7,354,512 | |
Gold and Precious Metals | | 633,322 | | 4,829,283 | |
Emerging Europe | | 760,036 | | 3,098,714 | |
China Region | | 39,200 | | (56 | ) |
| | | | | | | |
Note 3: Investment Advisory and Other Agreements
The Adviser, under an investment advisory agreement with the Trust in effect through October 1, 2015, furnishes management and investment advisory services and, subject to the supervision of the trustees, directs the investments of each Fund according to each Fund’s investment objectives, policies and limitations. The Adviser also furnishes all necessary office facilities, business equipment and personnel for administering the affairs of the Trust. Frank E. Holmes, a trustee of the Funds, is the controlling owner of the Adviser.
92
Notes to Financial Statements (unaudited) | June 30, 2015 |
For the services of the Adviser, each Fund pays a base management or advisory fee based upon its net assets. Fees are accrued daily and paid monthly. The contractual management fee for each fund is:
Fund | | Annual Percentage of
Average Daily Net Assets |
| | |
U.S. Government Securities Ultra-Short Bond | | .50% of the first $250,000,000 and .375% of the excess |
| | |
Near-Term Tax Free | | .50% |
| | |
All American Equity | | .80% of the first $500,000,000 and .75% of the excess |
| | |
Holmes Macro Trends | | 1.00% |
| | |
Global Resources | | .95% of the first $500,000,000;
.90% of $500,000,001 to $1,000,000,000 and .85% of the excess |
| | |
World Precious Minerals | | 1.00% of the first $500,000,000;
.95% of $500,000,001 to $1,000,000,000 and .90% of the excess |
| | |
Gold and Precious Metals | | .90% of the first $500,000,000 and .85% of the excess |
| | |
Emerging Europe | | 1.25% |
| | |
China Region | | 1.25% |
The advisory agreement also provides that the base advisory fee of the Equity Funds will be adjusted upwards or downwards by 0.25 percent if there is a performance difference of 5 percent or more between a Fund’s performance and that of its designated benchmark index over the prior 12 months. The performance adjustment is calculated separately for each share class. The benchmarks are as follows:
Fund | | Benchmark Index |
| | |
All American Equity | | S&P 500 Index |
| | |
Holmes Macro Trends | | S&P Composite 1500 Index |
| | |
Global Resources | | S&P Global Natural Resources Index (Net Total Return)(1) |
| | |
World Precious Minerals | | NYSE Arca Gold Miners Index |
| | |
Gold and Precious Metals | | FTSE Gold Mines Index |
| | |
Emerging Europe | | MSCI Emerging Markets Europe 10/40 Index (Net Total Return) |
| | |
China Region | | Hang Seng Composite Index |
(1) On July 4, 2014, Morgan Stanley discontinued its Morgan Stanley Commodity Related Index (“CRX”), which was the benchmark used by the Global Resources Fund to calculate its performance
93
Notes to Financial Statements (unaudited) | June 30, 2015 |
fee adjustment. The Fund replaced the CRX with the S&P Global Natural Resources Index (Net Total Return). Because the Global Resources Fund’s monthly performance fee adjustment is based on a rolling 12-month period, the Fund’s performance will be compared for a period of time to a blend of the CRX and the S&P Global Natural Resources Index (Net Total Return), using the performance of the CRX through June 30, 2014, and the performance of the S&P Global Natural Resources Index (Net Total Return) after June 30, 2014. As each month passes, a month of the CRX performance will roll off and a month of the S&P Global Natural Resources Index (Net Total Return) will be added until the Fund’s performance eventually will be compared exclusively to the S&P Global Natural Resources Index (Net Total Return) for determining the Fund’s monthly performance fee adjustment.
No performance adjustment is applied unless the difference between the class’s investment performance and the benchmark is 5 percent or greater (positive or negative) during the applicable performance measurement period. The performance fee adjustment is calculated monthly in arrears and is accrued ratably during the month. The management fee, net of any performance fee adjustment, is paid monthly in arrears.
The Funds’ prospectus and statement of additional information contain additional information about the performance adjustment. The amounts shown as management fees on the Statements of Operations reflects the base fee plus/minus any performance adjustment. During the six months ended June 30, 2015, the Funds recorded performance adjustments as follows:
Fund | | Investor Class
Performance Fee
Adjustment | | Institutional Class
Performance Fee
Adjustment | |
All American Equity | | $ | (28,476 | ) | N/A | |
Holmes Macro Trends | | (61,538 | ) | N/A | |
Global Resources | | (310,321 | ) | $ | (32,926 | ) |
World Precious Minerals | | (134,597 | ) | (405 | ) |
Gold and Precious Metals | | (17,230 | ) | N/A | |
Emerging Europe | | 38,053 | | N/A | |
China Region | | (23,341 | ) | N/A | |
| | | | | | | |
Under an administrative services agreement, the U.S. Government Securities Ultra-Short Bond, Near-Term Tax Free, All American Equity, Holmes Macro Trends, Gold and Precious Metals, Emerging Europe and China Region Funds compensate the Adviser at an annual rate of 0.10% of the average daily net assets of each Fund for administrative services provided, of which half is a fund-level fee and half is a class-level fee. The Global Resources and World Precious Minerals Funds compensate the Adviser at an annual rate of 0.10% of the average daily net assets for the Investor Class and 0.08% of the average daily net assets for the Institutional Class for administrative services provided, of which half is a fund-level fee and half is a class-level fee.
In addition, each fund pays an annual base administrative services fee of $7,000. This is a fund-level fee.
94
Notes to Financial Statements (unaudited) | June 30, 2015 |
The Investor Class shares for Equity Funds in the Trust have adopted a distribution plan pursuant to Rule 12b-1 of the Investment Company Act of 1940 in which a subsidiary of the Adviser is paid a fee at an annual rate of 0.25% of the average daily net assets of the Investor Class for sales and promotional services related to the distribution of Investor Class shares. The Institutional Class does not incur distribution plan fees.
The Adviser has voluntarily agreed to reimburse specific funds so that their total operating expenses will not exceed certain annual percentages of average net assets. The expenses for the six months ended June 30, 2015, were limited as follows for the Investor Class: U.S. Government Securities Ultra-Short Bond Fund at 0.45%, All American Equity Fund at 2.20%, Holmes Macro Trends Fund at 2.20%, Global Resources, World Precious Minerals, and Gold and Precious Metals Funds at 1.90%, Emerging Europe Fund at 2.85% and China Region Fund at 2.55%. These expense limitations are exclusive of any performance fee adjustments and will continue on a voluntary basis at the Adviser’s discretion. The Adviser may temporarily agree to additional reimbursements or limitations.
The Adviser has contractually limited the total operating expenses of the Near-Term Tax Free Fund at 0.45% on an annualized basis through April 30, 2016.
The Adviser has voluntarily agreed to waive all class specific expenses for the Institutional Class of the Global Resources Fund and the World Precious Minerals Fund. These expense waivers are exclusive of any performance fee adjustments, and the Adviser can modify or terminate this arrangement at any time.
Under an agreement entered into while the U.S. Government Securities Ultra-Short Bond Fund was a money market fund, the Adviser had voluntarily agreed to waive fees and/or reimburse the Fund to the extent necessary to maintain the yield at a certain level as determined by the Adviser (Minimum Yield). The Adviser may recapture any fees waived and/or expenses reimbursed within three years after the end of the fiscal year of such waiver and/or reimbursement to the extent that such recapture would not cause the Fund’s yield to fall below the Minimum Yield. At June 30, 2015, the Adviser may seek reimbursement of previously waived and reimbursed fees as follows: $509,874 (expires 12/31/2015) and $498,342 (expires 12/31/2016).
U.S. Bancorp Fund Services, LLC is the transfer agent for the Funds. Each Fund’s share class pays an annual fee based on the number of shareholder accounts, certain base fees and transaction- and activity-based fees for transfer agency services. Certain account fees are paid directly by shareholders to the transfer agent, which, in turn, reduces its charge to the Funds.
Pursuant to a Shareholder Services Plan, each fund pays to the Adviser a monthly fee up to an annual rate of 0.20% of the value of shares of the fund held in accounts at broker-dealers, banks, trust companies and similar institutions providing administrative services and transfer agent functions to beneficial shareowners. The fee is
95
Notes to Financial Statements (unaudited) | June 30, 2015 |
paid to the Adviser to help offset charges from those institutions and is included in transfer agent fees in the Statement of Operations.
The Adviser was reimbursed for services of the Funds’ Chief Compliance Officer during the six months ended June 30, 2015, in the amount of $71,311.
Brown Brothers Harriman & Co. (BBH) serves as the custodian. SEI Investments Global Funds Services serves as fund accounting and administration service agent with a fee structure based on average net assets of the Trust, subject to minimum fees.
The independent Trustees receive compensation for serving on the Board. Trustees serving as Chairman of the Board or a special committee or as a member of a committee receive additional compensation. Trustees are also reimbursed for out-of-pocket expenses incurred while attending meetings. Frank E. Holmes receives no compensation from the Funds for serving on the Board.
Note 4: Investments
Cost of purchases and proceeds from sales of long-term securities for the six months ended June 30, 2015, are summarized as follows:
Fund | | Purchases | | Sales | |
U.S. Government Securities Ultra-Short Bond | | $ | 14,809,035 | | $ | 15,510,000 | |
Near-Term Tax Free | | 16,218,342 | | 5,078,000 | |
All American Equity | | 6,608,494 | | 7,243,381 | |
Holmes Macro Trends | | 66,972,709 | | 67,829,020 | |
Global Resources | | 476,956,287 | | 487,059,036 | |
World Precious Minerals | | 34,904,400 | | 42,996,084 | |
Gold and Precious Metals | | 23,398,705 | | 29,886,634 | |
Emerging Europe | | 30,782,909 | | 38,761,583 | |
China Region | | 25,618,622 | | 28,820,933 | |
| | | | | | | |
96
Notes to Financial Statements (unaudited) | June 30, 2015 |
Note 5: Tax Information
The following table presents the income tax basis of securities owned at June 30, 2015, and the tax basis components of net unrealized appreciation (depreciation):
Fund | | Aggregate
Tax Cost | | Gross
Unrealized
Appreciation | | Gross
Unrealized
Depreciation | | Net Unrealized
Appreciation
(Depreciation) | |
U.S. Government Securities Ultra-Short Bond | | $ | 58,081,878 | | $ | 191,959 | | $ | (22,151 | ) | $ | 169,808 | |
Near-Term Tax Free | | 88,500,482 | | 1,211,112 | | (348,911 | ) | 862,201 | |
All American Equity | | 20,328,961 | | 1,242,404 | | (963,187 | ) | 279,217 | |
Holmes Macro Trends | | 42,052,432 | | 6,281,128 | | (1,605,248 | ) | 4,675,880 | |
Global Resources | | 241,996,801 | | 6,321,949 | | (108,227,439 | ) | (101,905,490 | ) |
World Precious Minerals | | 204,178,082 | | 10,176,153 | | (121,987,249 | ) | (111,811,096 | ) |
Gold and Precious Metals | | 86,505,325 | | 7,527,029 | | (31,993,857 | ) | (24,466,828 | ) |
Emerging Europe | | 65,098,211 | | 2,619,769 | | (9,774,993 | ) | (7,155,224 | ) |
China Region | | 19,525,465 | | 2,877,767 | | (564,266 | ) | 2,313,501 | |
| | | | | | | | | | | | | |
As of December 31, 2014, the components of distributable earnings on a tax basis were as follows:
Fund | | Undistributed
Ordinary
Income | | Undistributed
Long-Term
Capital Gains | | Capital Loss
Carryforwards | | Post
October
Losses | | Net Unrealized
Appreciation
(Depreciation) | | Other
Temporary
Differences | | Total | |
U.S. Government Securities Ultra-Short Bond | | $ | 186 | | $ | — | | $ | — | | $ | — | | $ | 77,538 | | $ | — | | $ | 77,724 | |
Near-Term Tax Free | | — | | — | | (372,583 | ) | — | | 1,448,336 | | — | | 1,075,753 | |
All American Equity | | 622,334 | | 1,604,254 | | — | | — | | 120,909 | | — | | 2,347,497 | |
Holmes Macro Trends | | — | | 2,014,392 | | (922,926 | ) | — | | 4,031,190 | | (1 | ) | 5,122,655 | |
Global Resources | | 307,341 | | — | | (327,746,325 | ) | (44,027,179 | ) | (124,444,141 | ) | (15 | ) | (495,910,319 | ) |
World Precious Minerals | | 7,140,621 | | — | | (244,612,245 | ) | (9,820,234 | ) | (153,909,003 | ) | (7 | ) | (401,200,868 | ) |
Gold and Precious Metals | | — | | — | | (72,951,260 | ) | (1,301,608 | ) | (42,748,071 | ) | (24,840 | ) | (117,025,779 | ) |
Emerging Europe | | — | | — | | (309,814,955 | ) | (1,745,353 | ) | (9,746,844 | ) | (1 | ) | (321,307,153 | ) |
China Region | | 187,577 | | — | | (18,299,303 | ) | — | | 969,042 | | — | | (17,142,684 | ) |
| | | | | | | | | | | | | | | | | | | | | | |
The differences between book-basis and tax-basis unrealized appreciation (depreciation) for All American Equity, Holmes Macro Trends, Global Resources, World Precious Minerals, Gold and Precious Metals, Emerging Europe and China Region Funds are attributable primarily to the tax deferral of losses on wash sales, investment in passive foreign investment companies (PFIC), forwards marked to markets, adjustments for partnerships, tax straddle loss deferrals on written options, and adjustments for grantor trusts.
97
Notes to Financial Statements (unaudited) | June 30, 2015 |
The tax character of distributions paid during the six months ended June 30, 2015, were as follows:
Fund | | Tax-Exempt
Income | | Ordinary
Income | | Long-Term
Capital Gains | | Total | |
U.S. Government Securities Ultra-Short Bond | | $ | — | | $ | 79,922 | | $ | — | | $ | 79,922 | |
Near-Term Tax Free | | 714,720 | | 37,458 | | — | | 752,178 | |
| | | | | | | | | | | | | |
The tax character of distributions paid during the fiscal year ended December 31, 2014, were as follows:
Fund | | Tax-Exempt
Income | | Ordinary
Income | | Long-Term
Capital Gains | | Total | |
U.S. Government Securities Ultra-Short Bond | | $ | — | | $ | 246,094 | | $ | — | | $ | 246,094 | |
Near-Term Tax Free | | 1,382,047 | | 53,723 | | — | | 1,435,770 | |
All American Equity | | — | | 817,613 | | 2,633,723 | | 3,451,336 | |
Holmes Macro Trends | | — | | 750,789 | | 4,144,377 | | 4,895,166 | |
Global Resources - Investor Class | | — | | — | | — | | — | |
Global Resources - Institutional Class | | — | | — | | — | | — | |
World Precious Minerals - Investor Class | | — | | — | | — | | — | |
World Precious Minerals - Institutional Class | | — | | — | | — | | — | |
Gold and Precious Metals | | — | | — | | — | | — | |
Emerging Europe | | — | | 2,243,528 | | — | | 2,243,528 | |
China Region | | — | | — | | — | | — | |
| | | | | | | | | | | | | |
Capital loss carryforwards may be used to offset current or future taxable capital gains until expiration. The Fund’s tax-basis capital gains and losses are determined only at the end of each fiscal year. Under the Regulated Investment Company Modernization Act of 2010, the Funds are permitted to carry forward capital losses incurred in taxable years beginning after December 22, 2010, for an unlimited period. Losses incurred during these years are required to be utilized prior to the losses incurred in pre-enactment tax years. As a result of this ordering rule, pre-enactment capital loss carryforwards may be more likely to expire unused. In addition, post-enactment capital losses that are carried forward retain their character as either short-term or long-term capital losses rather than being considered all short-term
98
Notes to Financial Statements (unaudited) | June 30, 2015 |
as under previous law. The loss carryforwards and related expiration dates for each fund, as of December 31, 2014, are as follows:
| | Expiration Date | |
Fund | | 2015 | | 2016 | | 2017 | | 2018 | |
U.S. Government Securities Ultra-Short Bond | | $ | — | | $ | — | | $ | — | | $ | — | |
Near-Term Tax Free (a) | | 2,488 | | 10,809 | | 722 | | 2,532 | |
All American Equity | | — | | — | | — | | — | |
Holmes Macro Trends (a) | | — | | 922,926 | | — | | — | |
Global Resources | | — | | — | | 259,212,512 | | — | |
World Precious Minerals | | — | | — | | 63,779,512 | | — | |
Gold and Precious Metals | | — | | — | | — | | — | |
Emerging Europe | | — | | 28,524,678 | | 257,523,539 | | 15,445,946 | |
China Region | | — | | 15,020,267 | | — | | — | |
| | | | | | | | | | | | | |
| | No Expiration | | | |
Fund | | Short-Term | | Long-Term | | Total | |
U.S. Government Securities Ultra-Short Bond | | $ | — | | $ | — | | $ | — | |
Near-Term Tax Free (a) | | 151,673 | | 204,359 | | 372,583 | |
All American Equity | | — | | — | | — | |
Holmes Macro Trends (a) | | — | | — | | 922,926 | |
Global Resources | | 68,533,813 | | — | | 327,746,325 | |
World Precious Minerals | | 63,812,247 | | 117,020,486 | | 244,612,245 | |
Gold and Precious Metals | | 34,819,498 | | 38,131,762 | | 72,951,260 | |
Emerging Europe | | 3,969,483 | | 4,351,309 | | 309,814,955 | |
China Region | | 3,279,036 | | — | | 18,299,303 | |
| | | | | | | | | | |
(a) Utilization of capital loss carryovers is subject to annual limitations.
In accordance with tax rules, the following net capital losses and ordinary losses (currency and late year losses) incurred after October 31, within each Fund’s tax year, are deemed to arise on the first day of the Fund’s next tax year if the Fund elects to defer such losses.
The Funds elected to defer losses incurred after October 31, 2014, as follows:
Fund | | Post October 31, 2014
Capital Loss Deferral | | Post October 31, 2014
Ordinary Loss Deferral |
Global Resources | | $ | 44,027,179 | | $ | — |
World Precious Minerals | | 9,820,234 | | — |
Gold and Precious Metals | | 1,301,608 | | — |
Emerging Europe | | 1,745,353 | | — |
| | | | | | |
99
Notes to Financial Statements (unaudited) | June 30, 2015 |
Note 6: Risks of Concentrations
The Near-Term Tax Free Fund may be exposed to risks related to concentration of investments in a particular state or geographic area. These investments present risks resulting from changes in economic conditions of the region or the issuer.
Because the Global Resources Fund concentrates its investments in a specific industry, the fund may be subject to greater risks and fluctuations than a portfolio representing a broader range of industries.
The World Precious Minerals and Gold and Precious Metals Funds concentrate their investments in gold and other precious metals and minerals and, therefore, may be subject to greater risks and market fluctuations than a portfolio representing a broader range of industries. The funds invest in securities that typically respond to changes in the price of gold and other precious metals and minerals, which can be influenced by a variety of global economic, figures and political factors; increased environmental and labor costs in mining; and changes in laws relating to mining or gold production or sales. Fluctuations in the prices of gold and other precious metals and minerals will affect the market values of the securities held by these funds.
The Emerging Europe Fund invests more than 25% of its investments in companies principally engaged in the oil & gas or banking industries. The risk of concentrating investments in this group of industries will make the fund more susceptible to risk in these industries than funds which do not concentrate their investments in an industry.
The Emerging Europe Fund may be exposed to risks not typically associated with investment in the United States due to their concentration of investments in emerging markets. These risks include possible revaluation of currencies, less public information about companies, disruptive political or economic conditions and the possible imposition of adverse governmental laws or currency exchange restrictions. Moreover, securities of many foreign issuers, including sovereign nations, and their markets may be less liquid and their prices more volatile than those securities of comparable U.S. issuers.
The China Region Fund may be exposed to risks not typically associated with investments in the United States, due to concentration of investments in foreign issuers in the region. These investments present risks resulting from disruptive political or economic conditions and the potential imposition of adverse governmental laws or currency exchange restrictions affecting the area.
Note 7: Credit Arrangements
Each of the Funds has a revolving credit facility with BBH. Borrowings of each Fund are collateralized by any or all of the securities held by BBH as the Fund’s custodian up to the amount of the borrowing. Interest on borrowings is charged at the current overnight Federal Funds Rate plus 2%. Each Fund has a maximum borrowing limit of 10% of qualified assets. The aggregate of borrowings by all Funds
100
Notes to Financial Statements (unaudited) | June 30, 2015 |
under the agreement cannot exceed $20,000,000 at any one time. There were no borrowings under the revolving credit facility during the period ended June 30, 2015. The U.S. Global Investors Funds paid BBH a total of $15,083 in commitment fees for the period ended June 30, 2015, under this arrangement.
Note 8: Shares of Beneficial Interest
At June 30, 2015, individual shareholders holding more than 5% of outstanding shares comprised 7.73% of the Institutional Class of the Global Resources Fund and 69.01% of the Institutional Class of the World Precious Minerals Fund. In addition, the Adviser held 19.89% of the U.S. Government Securities Ultra-Short Bond Fund. Control is defined by the 1940 Act as the beneficial ownership, either directly or through one or more controlled companies, of more than 25% of the voting securities of a company. Investment activities of these shareholders could have a material impact on the Funds.
101
Financial Highlights
U.S. Government Securities Ultra-Short Bond Fund
For a capital share outstanding during the
| | Investor Class | |
| | Six Months | | | | | | | | | | | |
| | Ended | | | | | | | | | | | |
| | June 30, 2015 | | Year Ended December 31, | |
| | (unaudited) | | 2014 | | 2013* | | 2012* | | 2011* | | 2010* | |
Net asset value, beginning of period | | $ | 2.00 | | $ | 2.00 | | $ | 2.00 | | $ | 2.00 | | $ | 2.00 | | $ | 2.00 | |
Investment Activities | | | | | | | | | | | | | |
Net investment income | | — | (a) | .01 | | — | (a) | — | (a) | — | (a) | — | (a) |
Net realized and unrealized gain | | — | (a) | — | (a) | — | (a) | — | | — | | — | (a) |
Total from investment activities | | — | | .01 | | — | | — | | — | | — | |
Distributions from net investment income | | — | (a) | (.01 | ) | — | (a) | — | (a) | — | (a) | — | (a) |
Net asset value, end of period | | $ | 2.00 | | $ | 2.00 | | $ | 2.00 | | $ | 2.00 | | $ | 2.00 | | $ | 2.00 | |
Total Return (excluding account fees) (b) | | .13 | % | .36 | % | .02 | % | .01 | % | .01 | % | .01 | % |
Ratios to Average Net Assets: (c) | | | | | | | | | | | | | |
Net investment income | | .26 | % | .35 | % | .01 | % | .01 | % | .01 | % | .01 | % |
Total expenses | | 1.11 | % | 1.07 | % | .97 | % | .87 | % | .81 | % | .82 | % |
Expenses waived or reimbursed (d) | | (.67 | )% | (.74 | )% | (.91 | )% | (.74 | )% | (.74 | )% | (.67 | )% |
Net expenses (e) | | .44 | % | .33 | % | .06 | % | .13 | % | .07 | % | .15 | % |
Portfolio turnover rate (f) | | 65 | % | 33 | % | | | | | | | | |
Net assets, end of period (in thousands) | | $ | 58,332 | | $ | 64,020 | | $ | 75,227 | | $ | 140,425 | | $ | 171,664 | | $ | 203,835 | |
* The per share amounts for the periods have been adjusted to reflect a 1-for-2 reverse stock split, which was effective December 20, 2013. In addition, on December 20, 2013, the Fund changed from a constant $1.00 net asset value per share money market fund to a U.S. Government ultra-short bond fund (that is not a money market fund) with an objective of total return with current income.
(a) The per share amount does not round to a full penny.
(b) Total returns for periods less than one year are not annualized. Assumes investment at the net asset value at the beginning of the period, reinvestment of all distributions and a complete redemption of the investment at the net asset value at the end of the period.
(c) Ratios are annualized for periods of less than one year.
(d) Expenses waived or reimbursed reflect reductions to total expenses, as discussed in the notes to the financial statements. These amounts would increase the net investment loss ratio or decrease the net investment income ratio, as applicable, and decrease total returns had such reductions not occurred. During 2010, 2011, 2012 and 2013, the Adviser waived fees and/or reimbursed expenses under the Minimum Yield Agreement in the amount of $678,107, $736,531, $509,874 and $498,342, respectively. The waivers/reimbursements from 2012-2013 are subject to recapture in future periods.
(e) The net expense ratios shown above reflect expenses after waivers and reimbursements but exclude the effect of reductions to total expenses for any expenses offset. Expense offset arrangements reduce total expenses, as discussed in the notes to the financial statements. These amounts would decrease the net investment income ratio had such reductions not occurred. The effect of expenses offset are as follows:
| | Investor Class | |
| | Six Months
Ended
June 30, 2015 | | Year Ended December 31, | |
| | (unaudited) | | 2014 | | 2013* | | 2012* | | 2011* | | 2010* | |
Ratios to Average Net Assets: (c) | | | | | | | | | | | | | |
Expense offset (g) | | — | | — | | — | | — | | — | | — | |
(f) Portfolio turnover is not shown for periods that the Fund was a money market fund.
(g) Effect on the expense ratio was not greater than 0.005%.
See accompanying notes to financial statements.
102
Financial Highlights
Near-Term Tax Free Fund
For a capital share outstanding during the
| | Investor Class | |
| | Six Months
Ended
June 30, 2015 | | Year Ended December 31, | |
| | (unaudited) | | 2014 | | 2013 | | 2012 | | 2011 | | 2010 | |
Net asset value, beginning of period | | $ | 2.25 | | $ | 2.23 | | $ | 2.27 | | $ | 2.26 | | $ | 2.22 | | $ | 2.21 | |
Investment Activities | | | | | | | | | | | | | |
Net investment income | | .02 | | .05 | | .05 | | .05 | | .05 | | .06 | |
Net realized and unrealized gain (loss) | | (.01 | ) | .02 | | (.04 | ) | .01 | | .04 | | .01 | |
Total from investment activities | | .01 | | .07 | | .01 | | .06 | | .09 | | .07 | |
Distributions from net investment income | | (.02 | ) | (.05 | ) | (.05 | ) | (.05 | ) | (.05 | ) | (.06 | ) |
Net asset value, end of period | | $ | 2.24 | | $ | 2.25 | | $ | 2.23 | | $ | 2.27 | | $ | 2.26 | | $ | 2.22 | |
Total Return (excluding account fees) (a) | | .36 | % | 3.07 | % | 0.31 | % | 2.67 | % | 4.24 | % | 2.95 | % |
Ratios to Average Net Assets: (c) | | | | | | | | | | | | | |
Net investment income | | 1.64 | % | 2.13 | % | 2.08 | % | 2.21 | % | 2.39 | % | 2.46 | % |
Total expenses | | 1.03 | % | 1.08 | % | 1.21 | % | 1.25 | % | 1.26 | % | 1.30 | % |
Expenses waived or reimbursed (b) | | (.58 | )% | (.63 | )% | (.76 | )% | (.80 | )% | (.81 | )% | (.85 | )% |
Net expenses (d) | | .45 | % | .45 | % | .45 | % | .45 | % | .45 | % | .45 | % |
Portfolio turnover rate | | 7 | % | 12 | % | 6 | % | 7 | % | — | (e) | 1 | % |
Net assets, end of period (in thousands) | | $ | 90,251 | | $ | 89,595 | | $ | 61,884 | | $ | 44,509 | | $ | 35,014 | | $ | 29,138 | |
(a) Total returns for periods less than one year are not annualized. Assumes investment at the net asset value at the beginning of the period, reinvestment of all distributions and a complete redemption of the investment at the net asset value at the end of the period.
(b) Expenses waived or reimbursed reflect reductions to total expenses, as discussed in the notes to the financial statements. These amounts would increase the net investment loss ratio or decrease the net investment income ratio, as applicable, and decrease total returns had such reductions not occurred.
(c) Ratios are annualized for periods of less than one year.
(d) The net expense ratios shown above reflect expenses after waivers and reimbursements but exclude the effect of reductions to total expenses for any expenses offset. Expense offset arrangements reduce total expenses, as discussed in the notes to the financial statements. These amounts would decrease the net investment income ratio had such reductions not occurred. The effect of expenses offset are as follows:
| | Investor Class | |
| | Six Months
Ended
June 30, 2015 | | Year Ended December 31, | |
| | (unaudited) | | 2014 | | 2013 | | 2012 | | 2011 | | 2010 | |
Ratios to Average Net Assets: (c) | | | | | | | | | | | | | |
Expense offset (f) | | — | | — | | — | | — | | — | | — | |
(e) Portfolio turnover rate was not greater than 0.5%.
(f) Effect on the expense ratio was not greater than 0.005%.
See accompanying notes to financial statements.
103
Financial Highlights
All American Equity Fund
For a capital share outstanding during the
| | Investor Class | |
| | Six Months
Ended
June 30, 2015 | | Year Ended December 31, | |
| | (unaudited) | | 2014 | | 2013 | | 2012 | | 2011 | | 2010 | |
Net asset value, beginning of period | | $ | 27.84 | | $ | 32.18 | | $ | 25.40 | | $ | 22.72 | | $ | 22.72 | | $ | 19.60 | |
Investment Activities | | | | | | | | | | | | | |
Net investment income (loss) | | .13 | | (.16 | ) | (.12 | ) | .07 | | (.07 | ) | .02 | |
Net realized and unrealized gain (loss) | | (.25 | ) | .84 | | 9.08 | | 2.61 | | .10 | | 3.10 | |
Total from investment activities | | (.12 | ) | .68 | | 8.96 | | 2.68 | | .03 | | 3.12 | |
Distributions | | | | | | | | | | | | | |
From net investment income | | — | | — | | (.07 | ) | — | | (.03 | ) | — | |
From net realized gains | | — | | (5.02 | ) | (2.11 | ) | — | | — | | — | |
Total distributions | | — | | (5.02 | ) | (2.18 | ) | — | | (.03 | ) | — | |
Short-Term Trading Fees *(a) | | — | | — | | — | | — | | — | | — | |
Net asset value, end of period | | $ | 27.72 | | $ | 27.84 | | $ | 32.18 | | $ | 25.40 | | $ | 22.72 | | $ | 22.72 | |
Total Return (excluding account fees) (b) | | (.43 | )% | 1.94 | % | 35.55 | % | 11.80 | % | 0.14 | % | 15.92 | % |
Ratios to Average Net Assets: (c) | | | | | | | | | | | | | |
Net investment income (loss) | | .88 | % | (.54 | )% | (.45 | )% | .28 | % | (.32 | )% | .10 | % |
Total expenses | | 1.82 | % | 2.16 | % | 2.44 | % | 2.72 | % | 2.42 | % | 2.56 | % |
Expenses waived or reimbursed (d) | | — | | (.03 | )% | (.28 | )% | (.52 | )% | (.24 | )% | (.48 | )% |
Net expenses (e) | | 1.82 | % | 2.13 | % | 2.16 | % | 2.20 | % | 2.18 | % | 2.08 | % |
Portfolio turnover rate | | 31 | % | 253 | % | 150 | % | 221 | % | 223 | % | 299 | % |
Net assets, end of period (in thousands) | | $ | 21,000 | | $ | 21,936 | | $ | 23,388 | | $ | 16,846 | | $ | 16,399 | | $ | 17,760 | |
* Based on average monthly shares outstanding.
(a) The per share amount does not round to a full penny.
(b) Total returns for periods less than one year are not annualized. Assumes investment at the net asset value at the beginning of the period, reinvestment of all distributions and a complete redemption of the investment at the net asset value at the end of the period.
(c) Ratios are annualized for periods of less than one year.
(d) Expenses waived or reimbursed reflect reductions to total expenses, as discussed in the notes to the financial statements. These amounts would increase the net investment loss ratio or decrease the net investment income ratio, as applicable, and decrease total returns had such reductions not occurred.
(e) The net expense ratios shown above reflect expenses after waivers and reimbursements but exclude the effect of reductions to total expenses for any expenses offset. Expense offset arrangements reduce total expenses, as discussed in the notes to the financial statements. These amounts would decrease the net investment income (loss) ratio had such reductions not occurred. The effect of expenses offset are as follows:
| | Investor Class | |
| | Six Months
Ended
June 30, 2015 | | Year Ended December 31, | |
| | (unaudited) | | 2014 | | 2013 | | 2012 | | 2011 | | 2010 | |
Ratios to Average Net Assets: (c) | | | | | | | | | | | | | |
Expense offset (f) | | — | | — | | — | | — | | — | | — | |
(f) Effect on the expense ratio was not greater than 0.005%.
See accompanying notes to financial statements.
104
Financial Highlights
Holmes Macro Trends Fund
For a capital share outstanding during the
| | Investor Class | |
| | Six Months
Ended
June 30, 2015 | | Year Ended December 31, | |
| | (unaudited) | | 2014 | | 2013 | | 2012 | | 2011 | | 2010 | |
Net asset value, beginning of period | | $ | 20.25 | | $ | 24.24 | | $ | 18.51 | | $ | 17.62 | | $ | 18.65 | | $ | 15.54 | |
Investment Activities | | | | | | | | | | | | | |
Net investment loss | | (.02 | ) | (.26 | ) | (.18 | ) | (.10 | ) | (.26 | ) | (.22 | ) |
Net realized and unrealized gain (loss) | | .99 | | (1.36 | ) | 7.42 | | 1.29 | | (.77 | ) | 3.54 | |
Total from investment activities | | .97 | | (1.62 | ) | 7.24 | | 1.19 | | (1.03 | ) | 3.32 | |
Distributions | | | | | | | | | | | | | |
From net investment income | | — | | — | | — | | — | | — | | (.21 | ) |
From net realized gains | | — | | (2.37 | ) | (1.51 | ) | (.30 | ) | — | | — | |
Total distributions | | — | | (2.37 | ) | (1.51 | ) | (.30 | ) | — | | (.21 | ) |
Short-Term Trading Fees *(a) | | — | | — | | — | | — | | — | | — | |
Net asset value, end of period | | $ | 21.22 | | $ | 20.25 | | $ | 24.24 | | $ | 18.51 | | $ | 17.62 | | $ | 18.65 | |
Total Return (excluding account fees) (b) | | 4.79 | % | (6.74 | )% | 39.38 | % | 6.77 | % | (5.52 | )% | 21.35 | % |
Ratios to Average Net Assets: (c) | | | | | | | | | | | | | |
Net investment loss | | (.15 | )% | (1.17 | )% | (1.11 | )% | (.51 | )% | (1.25 | )% | (1.29 | )% |
Total expenses | | 1.73 | % | 1.94 | % | 2.00 | % | 1.85 | % | 2.00 | % | 1.93 | % |
Expenses waived or reimbursed (d) | | — | | — | | (.04 | )% | — | (f) | — | | — | (f) |
Net expenses (e) | | 1.73 | % | 1.94 | % | 1.96 | % | 1.85 | % | 2.00 | % | 1.93 | % |
Portfolio turnover rate | | 151 | %(g) | 183 | %(g) | 109 | % | 214 | % | 210 | % | 160 | % |
Net assets, end of period (in thousands) | | $ | 46,373 | | $ | 46,250 | | $ | 55,926 | | $ | 34,639 | | $ | 35,316 | | $ | 40,604 | |
* Based on average monthly shares outstanding.
(a) The per share amount does not round to a full penny.
(b) Total returns for periods less than one year are not annualized. Assumes investment at the net asset value at the beginning of the period, reinvestment of all distributions and a complete redemption of the investment at the net asset value at the end of the period.
(c) Ratios are annualized for periods of less than one year.
(d) Expenses waived or reimbursed reflect reductions to total expenses, as discussed in the notes to the financial statements. These amounts would increase the net investment loss ratio or decrease the net investment income ratio, as applicable, and decrease total returns had such reductions not occurred.
(e) The net expense ratios shown above reflect expenses after waivers and reimbursements but exclude the effect of reductions to total expenses for any expenses offset. Expense offset arrangements reduce total expenses, as discussed in the notes to the financial statements. These amounts would decrease the net investment income ratio had such reductions not occurred. The effect of expenses offset are as follows:
| | Investor Class | |
| | Six Months
Ended
June 30, 2015 | | Year Ended December 31, | |
| | (unaudited) | | 2014 | | 2013 | | 2012 | | 2011 | | 2010 | |
Ratios to Average Net Assets: (c) | | | | | | | | | | | | | |
Expense offset (f) | | — | | — | | — | | — | | — | | — | |
(f) Effect on the expense ratio was not greater than 0.005%.
(g) Excludes option transactions.
See accompanying notes to financial statements.
105
Financial Highlights
Global Resources Fund
For a capital share outstanding during the
| | Investor Class | |
| | Six Months
Ended
June 30, 2015 | | Year Ended December 31, | |
| | (unaudited) | | 2014 | | 2013 | | 2012 | | 2011 | | 2010 | |
Net asset value, beginning of period | | $ | 6.67 | | $ | 9.36 | | $ | 9.79 | | $ | 9.36 | | $ | 11.91 | | $ | 8.85 | |
Investment Activities | | | | | | | | | | | | | |
Net investment income (loss) | | .07 | * | .04 | * | .02 | * | .04 | * | (.19 | ) | (.09 | ) |
Net realized and unrealized gain (loss) | | (1.23 | )* | (2.73 | )* | (.10 | )* | .61 | * | (2.02 | ) | 3.44 | |
Total from investment activities | | (1.16 | ) | (2.69 | ) | (.08 | ) | .65 | | (2.21 | ) | 3.35 | |
Distributions from net investment income | | — | | — | | (.35 | ) | (.22 | ) | (.34 | ) | (.29 | ) |
Short-Term Trading Fees *(a) | | — | | — | | — | | — | | — | | — | |
Net asset value, end of period | | $ | 5.51 | | $ | 6.67 | | $ | 9.36 | | $ | 9.79 | | $ | 9.36 | | $ | 11.91 | |
Total Return (excluding account fees) (b) | | (17.39 | )% | (28.74 | )% | (.72 | )% | 6.93 | % | (18.69 | )% | 38.00 | % |
Ratios to Average Net Assets: (c) | | | | | | | | | | | | | |
Net investment income (loss) | | 2.44 | % | .44 | % | .16 | % | .44 | % | (.79 | )% | (1.04 | )% |
Total expenses | | 1.53 | % | 1.45 | % | 1.59 | % | 1.57 | % | 1.72 | % | 1.73 | % |
Expenses waived or reimbursed (d) | | (.06 | )% | — | (f) | — | | — | | — | | — | |
Net expenses (e) | | 1.47 | % | 1.45 | % | 1.59 | % | 1.57 | % | 1.72 | % | 1.73 | % |
Portfolio turnover rate (g) | | 313 | %(h) | 444 | %(h) | 138 | % | 117 | % | 232 | % | 145 | % |
Net assets, end of period (in thousands) | | $ | 125,967 | | $ | 171,673 | | $ | 326,320 | | $ | 438,372 | | $ | 551,793 | | $ | 911,559 | |
* Based on average monthly shares outstanding.
(a) The per share amount does not round to a full penny.
(b) Total returns for periods less than one year are not annualized. Assumes investment at the net asset value at the beginning of the period, reinvestment of all distributions and a complete redemption of the investment at the net asset value at the end of the period.
(c) Ratios are annualized for periods of less than one year.
(d) Expenses waived or reimbursed reflect reductions to total expenses, as discussed in the notes to the financial statements. These amounts would increase the net investment loss ratio or decrease the net investment income ratio, as applicable, and decrease total returns had such reductions not occurred.
(e) The net expense ratios shown above reflect expenses after waivers and reimbursements but exclude the effect of reductions to total expenses for any expenses offset. Expense offset arrangements reduce total expenses, as discussed in the notes to the financial statements. These amounts would decrease the net investment income ratio had such reductions not occurred. The effect of expenses offset are as follows:
| | Investor Class | |
| | Six Months
Ended
June 30, 2015 | | Year Ended December 31, | |
| | (unaudited) | | 2014 | | 2013 | | 2012 | | 2011 | | 2010 | |
Ratios to Average Net Assets: (c) | | | | | | | | | | | | | |
Expense offset (f) | | — | | — | | — | | — | | — | | — | |
(f) Effect on the expense ratio was not greater than 0.005%.
(g) Portfolio turnover is calculated at the fund level.
(h) Excludes option transactions.
See accompanying notes to financial statements.
106
Financial Highlights
Global Resources Fund
For a capital share outstanding during the
| | Institutional Class | |
| | Six Months
Ended
June 30, 2015 | | Year Ended December 31, | | Period
Ended
December 31, | |
| | (unaudited) | | 2014 | | 2013 | | 2012 | | 2011 | | 2010 (a) | |
Net asset value, beginning of period | | $ | 6.67 | | $ | 9.30 | | $ | 9.74 | | $ | 9.39 | | $ | 11.98 | | $ | 8.87 | |
Investment Activities | | | | | | | | | | | | | |
Net investment income (loss) | | .10 | * | .08 | * | .07 | * | .10 | * | — | *(b) | (.01 | ) |
Net realized and unrealized gain (loss) | | (1.24 | )* | (2.71 | )* | (.10 | )* | .60 | * | (2.17 | )* | 3.41 | |
Total from investment activities | | (1.14 | ) | (2.63 | ) | (.03 | ) | .70 | | (2.17 | ) | 3.40 | |
Distributions from net investment income | | — | | — | | (.41 | ) | (.35 | ) | (.42 | ) | (.29 | ) |
Short-Term Trading Fees * | | — | | — | | — | (b) | — | (b) | — | (b) | — | (b) |
Net asset value, end of period | | $ | 5.53 | | $ | 6.67 | | $ | 9.30 | | $ | 9.74 | | $ | 9.39 | | $ | 11.98 | |
Total Return (excluding account fees) (c) | | (17.09 | )% | (28.28 | )% | (0.15 | )% | 7.44 | % | (18.23 | )% | 38.53 | % |
Ratios to Average Net Assets: (d) | | | | | | | | | | | | | |
Net investment income (loss) | | 3.21 | % | .85 | % | .68 | % | 1.02 | % | (.02 | )% | (.35 | )% |
Total expenses | | 1.25 | % | 1.13 | % | 1.25 | % | 1.21 | % | 1.29 | % | 1.74 | % |
Expenses waived or reimbursed (e) | | (.45 | )% | (.27 | )% | (.22 | )% | (.14 | )% | (.20 | )% | (.66 | )% |
Net expenses (f) | | .80 | % | .86 | % | 1.03 | % | 1.07 | % | 1.09 | % | 1.08 | % |
Portfolio turnover rate (h) | | 313 | %(i) | 444 | %(i) | 138 | % | 117 | % | 232 | % | 145 | % |
Net assets, end of period (in thousands) | | $ | 9,850 | | $ | 9,733 | | $ | 51,122 | | $ | 94,076 | | $ | 55,985 | | $ | 17,923 | |
* Based on average monthly shares outstanding.
(a) From March 1, 2010, commencement of operations.
(b) The per share amount does not round to a full penny.
(c) Total returns for periods less than one year are not annualized. Assumes investment at the net asset value at the beginning of the period, reinvestment of all distributions and a complete redemption of the investment at the net asset value at the end of the period.
(d) Ratios are annualized for periods of less than one year.
(e) Expenses waived or reimbursed reflect reductions to total expenses, as discussed in the notes to the financial statements. These amounts would increase the net investment loss ratio or decrease the net investment income ratio, as applicable, and decrease total returns had such reductions not occurred.
(f) The net expense ratios shown above reflect expenses after waivers and reimbursements but exclude the effect of reductions to total expenses for any expenses offset. Expense offset arrangements reduce total expenses, as discussed in the notes to the financial statements. These amounts would decrease the net investment income (loss) ratio had such reductions not occurred. The effect of expenses offset are as follows:
| | Institutional Class | |
| | Six Months
Ended
June 30, 2015 | | Year Ended December 31, | | Period
Ended
December 31, | |
| | (unaudited) | | 2014 | | 2013 | | 2012 | | 2011 | | 2010 (a) | |
Ratios to Average Net Assets: (d) | | | | | | | | | | | | | |
Expense offset (g) | | — | | — | | — | | — | | — | | — | |
(g) Effect on the expense ratio was not greater than 0.005%.
(h) Portfolio turnover rate is calculated at the fund level.
(i) Excludes option transactions.
See accompanying notes to financial statements.
107
Financial Highlights
World Precious Minerals Fund
For a capital share outstanding during the
| | Investor Class | |
| | Six Months
Ended
June 30, 2015 | | Year Ended December 31, | |
| | (unaudited) | | 2014 | | 2013 | | 2012 | | 2011 | | 2010 | |
Net asset value, beginning of period | | $ | 4.75 | | $ | 5.69 | | $ | 11.70 | | $ | 13.18 | | $ | 22.28 | | $ | 17.42 | |
Investment Activities | | | | | | | | | | | | | |
Net investment loss | | (.02 | )* | (.06 | )* | (.07 | )* | (.11 | )* | (.32 | ) | (.32 | )* |
Net realized and unrealized gain (loss) | | (.18 | )* | (.88 | )* | (5.94 | )* | (1.37 | )* | (6.76 | ) | 8.16 | * |
Total from investment activities | | (.20 | ) | (.94 | ) | (6.01 | ) | (1.48 | ) | (7.08 | ) | 7.84 | |
Distributions from net investment income | | — | | — | | — | | — | | (2.02 | ) | (2.98 | ) |
Short-Term Trading Fees *(a) | | — | | — | | — | | — | | — | | — | |
Net asset value, end of period | | $ | 4.55 | | $ | 4.75 | | $ | 5.69 | | $ | 11.70 | | $ | 13.18 | | $ | 22.28 | |
Total Return (excluding account fees) (b) | | (4.21 | )% | (16.52 | )% | (51.37 | )% | (11.23 | )% | (32.58 | )% | 45.38 | % |
Ratios to Average Net Assets: (c) | | | | | | | | | | | | | |
Net investment loss | | (.79 | )% | (.91 | )% | (.90 | )% | (.85 | )% | (1.43 | )% | (1.68 | )% |
Total expenses | | 1.78 | % | 1.99 | % | 1.85 | % | 1.45 | % | 1.67 | % | 1.84 | % |
Expenses waived or reimbursed (d) | | (.14 | )% | (.03 | )% | (.02 | )% | — | | — | | — | |
Net expenses (e) | | 1.64 | % | 1.96 | % | 1.83 | % | 1.45 | % | 1.67 | % | 1.84 | % |
Portfolio turnover rate (g) | | 36 | %(h) | 61 | %(h) | 34 | % | 44 | % | 96 | % | 68 | % |
Net assets, end of period (in thousands) | | $ | 94,856 | | $ | 103,413 | | $ | 134,065 | | $ | 319,052 | | $ | 436,504 | | $ | 826,598 | |
* Based on average monthly shares outstanding.
(a) The per share amount does not round to a full penny.
(b) Total returns for periods less than one year are not annualized. Assumes investment at the net asset value at the beginning of the period, reinvestment of all distributions and a complete redemption of the investment at the net asset value at the end of the period.
(c) Ratios are annualized for periods of less than one year.
(d) Expenses waived or reimbursed reflect reductions to total expenses, as discussed in the notes to the financial statements. These amounts would increase the net investment loss ratio or decrease the net investment income ratio, as applicable, and decrease total returns had such reductions not occurred.
(e) The net expense ratios shown above reflect expenses after waivers and reimbursements but exclude the effect of reductions to total expenses for any expenses offset. Expense offset arrangements reduce total expenses, as discussed in the notes to the financial statements. These amounts would decrease the net investment income ratio had such reductions not occurred. The effect of expenses offset are as follows:
| | Investor Class | |
| | Six Months
Ended
June 30, 2015 | | Year Ended December 31, | |
| | (unaudited) | | 2014 | | 2013 | | 2012 | | 2011 | | 2010 | |
Ratios to Average Net Assets: (c) | | | | | | | | | | | | | |
Expense offset (f) | | — | | — | | — | | — | | — | | — | |
(f) Effect on the expense ratio was not greater than 0.005%.
(g) Portfolio turnover rate is calculated at the fund level.
(h) Excludes option transactions.
See accompanying notes to financial statements.
108
Financial Highlights
World Precious Minerals Fund
For a capital share outstanding during the
| | Institutional Class | |
| | Six Months
Ended
June 30, 2015 | | Year Ended December 31, | | Period
Ended
December 31, | |
| | (unaudited) | | 2014 | | 2013 | | 2012 | | 2011 | | 2010 (a) | |
Net asset value, beginning of period | | $ | 4.78 | | $ | 5.72 | | $ | 11.69 | | $ | 13.10 | | $ | 22.29 | | $ | 17.36 | |
Investment Activities | | | | | | | | | | | | | |
Net investment loss | | (.01 | )* | (.05 | )* | (.01 | )* | (.04 | )* | (.16 | )* | (.10 | )* |
Net realized and unrealized gain (loss) | | (.20 | )* | (.89 | )* | (5.96 | )* | (1.37 | )* | (6.84 | )* | 8.14 | * |
Total from investment activities | | (.21 | ) | (.94 | ) | (5.97 | ) | (1.41 | ) | (7.00 | ) | 8.04 | |
Distributions from net investment income | | — | | — | | — | | — | | (2.19 | ) | (3.11 | ) |
Short-Term Trading Fees * | | — | | — | | — | | — | | — | | — | |
Net asset value, end of period | | $ | 4.57 | | $ | 4.78 | | $ | 5.72 | | $ | 11.69 | | $ | 13.10 | | $ | 22.29 | |
Total Return (excluding account fees) (b) | | (4.39 | )% | (16.43 | )% | (51.07 | )% | (10.76 | )% | (32.28 | )% | 46.72 | % |
Ratios to Average Net Assets: (c) | | | | | | | | | | | | | |
Net investment loss | | (.50 | )% | (.71 | )% | (.15 | )% | (.32 | )% | (.87 | )% | (.86 | )% |
Total expenses | | 15.23 | % | 4.86 | % | 3.30 | % | 3.56 | % | 2.38 | % | 15.19 | % |
Expenses waived or reimbursed (d) | | (13.89 | )% | (3.23 | )% | (1.97 | )% | (2.69 | )% | (1.27 | )% | (14.06 | )% |
Net expenses (e) | | 1.34 | % | 1.63 | % | 1.33 | % | .87 | % | 1.11 | % | 1.13 | % |
Portfolio turnover rate (g) | | 36 | %(h) | 61 | %(h) | 34 | % | 44 | % | 96 | % | 68 | % |
Net assets, end of period (in thousands) | | $ | 131 | | $ | 154 | | $ | 3,660 | | $ | 769 | | $ | 1,683 | | $ | 2,233 | |
* Based on average monthly shares outstanding.
(a) From March 1, 2010, commencement of operations.
(b) Total returns for periods less than one year are not annualized. Assumes investment at the net asset value at the beginning of the period, reinvestment of all distributions and a complete redemption of the investment at the net asset value at the end of the period.
(c) Ratios are annualized for periods of less than one year.
(d) Expenses waived or reimbursed reflect reductions to total expenses, as discussed in the notes to the financial statements. These amounts would increase the net investment loss ratio or decrease the net investment income ratio, as applicable, and decrease total returns had such reductions not occurred.
(e) The net expense ratios shown above reflect expenses after waivers and reimbursements but exclude the effect of reductions to total expenses for any expenses offset. Expense offset arrangements reduce total expenses, as discussed in the notes to the financial statements. These amounts would decrease the net investment income ratio had such reductions not occurred. The effect of expenses offset are as follows:
| | Institutional Class | |
| | Six Months
Ended
June 30, 2015 | | Year Ended December 31, | | Period
Ended
December 31, | |
| | (unaudited) | | 2014 | | 2013 | | 2012 | | 2011 | | 2010 (a) | |
Ratios to Average Net Assets: (c) | | | | | | | | | | | | | |
Expense offset (f) | | — | | — | | — | | — | | — | | — | |
(f) Effect on the expense ratio was not greater than 0.005%.
(g) Portfolio turnover rate is calculated at the fund level.
(h) Excludes option transactions.
See accompanying notes to financial statements.
109
Financial Highlights
Gold and Precious Metals Fund
For a capital share outstanding during the
| | Investor Class | |
| | Six Months | | | |
| | Ended | | | | | | | | | | | |
| | June 30, 2015 | | Year Ended December 31, | |
| | (unaudited) | | 2014 | | 2013 | | 2012 | | 2011 | | 2010 | |
Net asset value, beginning of period | | $ | 5.16 | | $ | 6.00 | | $ | 11.78 | | $ | 12.61 | | $ | 19.60 | | $ | 15.46 | |
Investment Activities | | | | | | | | | | | | | |
Net investment loss | | (.03 | ) | (.05 | ) | (.06 | ) | (.09 | ) | (.17 | ) | (.21 | ) |
Net realized and unrealized gain (loss) | | .36 | | (.79 | ) | (5.72 | ) | (.72 | ) | (4.28 | ) | 5.91 | |
Total from investment activities | | .33 | | (.84 | ) | (5.78 | ) | (.81 | ) | (4.45 | ) | 5.70 | |
Distributions | | | | | | | | | | | | | |
From net investment income | | — | | — | | — | | (.02 | ) | — | | (.26 | ) |
From net realized gains | | — | | — | | — | | — | | (2.54 | ) | (1.31 | ) |
Total distributions | | — | | — | | — | | (.02 | ) | (2.54 | ) | (1.57 | ) |
Short-Term Trading Fees * | | — | (a) | — | (a) | — | (a) | — | (a) | — | (a) | 0.01 | |
Net asset value, end of period | | $ | 5.49 | | $ | 5.16 | | $ | 6.00 | | $ | 11.78 | | $ | 12.61 | | $ | 19.60 | |
Total Return (excluding account fees) (b) | | 6.40 | % | (14.00 | )% | (49.07 | )% | (6.44 | )% | (23.97 | )% | 36.88 | % |
Ratios to Average Net Assets: (c) | | | | | | | | | | | | | |
Net investment loss | | (.73 | )% | (.67 | )% | (.48 | )% | (.60 | )% | (1.06 | )% | (1.46 | )% |
Total expenses | | 1.93 | % | 1.93 | % | 2.12 | % | 1.61 | % | 1.56 | % | 1.80 | % |
Expenses waived or reimbursed (d) | | (.09 | )% | (.05 | )% | (.06 | )% | — | | — | | — | |
Net expenses (e) | | 1.84 | % | 1.88 | % | 2.06 | % | 1.61 | % | 1.56 | % | 1.80 | % |
Portfolio turnover rate | | 38 | %(g) | 99 | %(g) | 64 | % | 95 | % | 155 | % | 103 | % |
Net assets, end of period (in thousands) | | $ | 64,067 | | $ | 62,777 | | $ | 74,627 | | $ | 166,524 | | $ | 195,087 | | $ | 300,949 | |
* Based on average monthly shares outstanding.
(a) The per share amount does not round to a full penny.
(b) Total returns for periods less than one year are not annualized. Assumes investment at the net asset value at the beginning of the period, reinvestment of all distributions and a complete redemption of the investment at the net asset value at the end of the period.
(c) Ratios are annualized for periods of less than one year.
(d) Expenses waived or reimbursed reflect reductions to total expenses, as discussed in the notes to the financial statements. These amounts would increase the net investment loss ratio or decrease the net investment income ratio, as applicable, and decrease total returns had such reductions not occurred.
(e) The net expense ratios shown above reflect expenses after waivers and reimbursements but exclude the effect of reductions to total expenses for any expenses offset. Expense offset arrangements reduce total expenses, as discussed in the notes to the financial statements. These amounts would decrease the net investment loss ratio had such reductions not occurred. The effect of expenses offset are as follows:
| | Investor Class | |
| | Six Months
Ended
June 30, 2015 | | Year Ended December 31, | |
| | (unaudited) | | 2014 | | 2013 | | 2012 | | 2011 | | 2010 | |
Ratios to Average Net Assets: (c) | | | | | | | | | | | | | |
Expense offset (f) | | — | | — | | — | | — | | — | | — | |
(f) Effect on the expense ratio was not greater than 0.005%.
(g) Excludes option transactions.
See accompanying notes to financial statements.
110
Financial Highlights
Emerging Europe Fund
For a capital share outstanding during the
| | Investor Class | |
| | Six Months
Ended
June 30, 2015 | | Year Ended December 31, | |
| | (unaudited) | | 2014 | | 2013 | | 2012 | | 2011 | | 2010 | |
Net asset value, beginning of period | | $ | 6.56 | | $ | 8.82 | | $ | 9.23 | | $ | 7.79 | | $ | 10.81 | | $ | 9.11 | |
Investment Activities | | | | | | | | | | | | | |
Net investment income (loss) | | .05 | | .06 | | .19 | | .15 | | .03 | | (.04 | ) |
Net realized and unrealized gain (loss) | | (.50 | ) | (2.11 | ) | (.46 | ) | 1.35 | | (3.05 | ) | 1.74 | |
Total from investment activities | | (.45 | ) | (2.05 | ) | (.27 | ) | 1.50 | | (3.02 | ) | 1.70 | |
Distributions from net investment income | | — | | (.21 | ) | (.14 | ) | (.06 | ) | — | | — | |
Short-Term Trading Fees *(a) | | — | | — | | — | | — | | — | | — | |
Net asset value, end of period | | $ | 6.11 | | $ | 6.56 | | $ | 8.82 | | $ | 9.23 | | $ | 7.79 | | $ | 10.81 | |
Total Return (excluding account fees) (b) | | (6.86 | )% | (23.22 | )% | (2.93 | )% | 19.27 | % | (27.94 | )% | 18.66 | % |
Ratios to Average Net Assets: (c) | | | | | | | | | | | | | |
Net investment income (loss) | | 1.48 | % | .23 | % | 1.59 | % | 1.39 | % | .25 | % | (.36 | )% |
Total expenses | | 2.56 | % | 2.28 | % | 2.13 | % | 2.15 | % | 1.98 | % | 1.91 | % |
Expenses waived or reimbursed (d) | | — | | — | | — | | — | | — | | — | |
Net expenses (e) | | 2.56 | % | 2.28 | % | 2.13 | % | 2.15 | % | 1.98 | % | 1.91 | % |
Portfolio turnover rate | | 51 | %(g) | 93 | %(g) | 74 | % | 85 | % | 85 | % | 69 | % |
Net assets, end of period (in thousands) | | $ | 58,224 | | $ | 69,066 | | $ | 122,570 | | $ | 173,687 | | $ | 193,599 | | $ | 440,037 | |
* Based on average monthly shares outstanding.
(a) The per share amount does not round to a full penny.
(b) Total returns for periods less than one year are not annualized. Assumes investment at the net asset value at the beginning of the period, reinvestment of all distributions and a complete redemption of the investment at the net asset value at the end of the period.
(c) Ratios are annualized for periods of less than one year.
(d) Expenses waived or reimbursed reflect reductions to total expenses, as discussed in the notes to the financial statements. These amounts would increase the net investment loss ratio or decrease the net investment income ratio, as applicable, and decrease total returns had such reductions not occurred.
(e) The net expense ratios shown above reflect expenses after waivers and reimbursements but exclude the effect of reductions to total expenses for any expenses offset. Expense offset arrangements reduce total expenses, as discussed in the notes to the financial statements. These amounts would decrease the net investment income (loss) ratio had such reductions not occurred. The effect of expenses offset are as follows:
| | Investor Class | |
| | Six Months
Ended
June 30, 2015 | | Year Ended December 31, | |
| | (unaudited) | | 2014 | | 2013 | | 2012 | | 2012 | | 2010 | |
Ratios to Average Net Assets: (c) | | | | | | | | | | | | | |
Expense offset (f) | | — | | — | | — | | — | | — | | — | |
(f) Effect on the expense ratio was not greater than 0.005%.
(g) Excludes option transactions.
See accompanying notes to financial statements.
111
Financial Highlights
China Region Fund
For a capital share outstanding during the
| | Investor Class | |
| | Six Months
Ended
June 30, 2015 | | Year Ended December 31, | |
| | (unaudited) | | 2014 | | 2013 | | 2012 | | 2011 | | 2010 | |
Net asset value, beginning of period | | $ | 8.20 | | $ | 8.28 | | $ | 7.61 | | $ | 6.81 | | $ | 9.47 | | $ | 8.36 | |
Investment Activities | | | | | | | | | | | | | |
Net investment income (loss) | | 0.07 | | — | (a) | (.01 | ) | .04 | | (.08 | ) | (.12 | ) |
Net realized and unrealized gain (loss) | | 0.94 | | (.08 | ) | .70 | | .78 | | (2.59 | ) | 1.22 | |
Total from investment activities | | 1.01 | | (.08 | ) | .69 | | .82 | | (2.67 | ) | 1.10 | |
Distributions from net investment income | | — | | — | | (.02 | ) | (.02 | ) | — | | — | |
Short-Term Trading Fees * | | — | (a) | — | (a) | — | (a) | — | (a) | .01 | | .01 | |
Net asset value, end of period | | $ | 9.21 | | $ | 8.20 | | $ | 8.28 | | $ | 7.61 | | $ | 6.81 | | $ | 9.47 | |
Total Return (excluding account fees) (b) | | 12.32 | % | (.97 | )% | 9.07 | % | 12.00 | % | (28.09 | )% | 13.28 | % |
Ratios to Average Net Assets: (c) | | | | | | | | | | | | | |
Net investment income (loss) | | 1.43 | % | .08 | % | (.12 | )% | .60 | % | (.64 | )% | (1.02 | )% |
Total expenses | | 2.68 | % | 2.94 | % | 2.75 | % | 2.64 | % | 2.49 | % | 2.39 | % |
Expenses waived or reimbursed (d) | | (.34 | )% | (.43 | )% | (.37 | )% | (.39 | )% | (.08 | )% | — | |
Net expenses (e) | | 2.34 | % | 2.51 | % | 2.38 | % | 2.25 | % | 2.41 | % | 2.39 | % |
Portfolio turnover rate | | 122 | %(g) | 235 | %(g) | 201 | % | 374 | % | 426 | % | 242 | % |
Net assets, end of period (in thousands) | | $ | 21,999 | | $ | 21,008 | | $ | 26,386 | | $ | 29,160 | | $ | 30,635 | | $ | 51,843 | |
* Based on average monthly shares outstanding.
(a) The per share amount does not round to a full penny.
(b) Total returns for periods less than one year are not annualized. Assumes investment at the net asset value at the beginning of the period, reinvestment of all distributions and a complete redemption of the investment at the net asset value at the end of the period.
(c) Ratios are annualized for periods of less than one year.
(d) Expenses waived or reimbursed reflect reductions to total expenses, as discussed in the notes to the financial statements. These amounts would increase the net investment loss ratio or decrease the net investment income ratio, as applicable, and decrease total returns had such reductions not occurred.
(e) The net expense ratios shown above reflect expenses after waivers and reimbursements but exclude the effect of reductions to total expenses for any expenses offset. Expense offset arrangements reduce total expenses, as discussed in the notes to the financial statements. These amounts would decrease the net investment income ratio had such reductions not occurred. The effect of expenses offset are as follows:
| | Investor Class | |
| | Six Months
Ended
June 30, 2015 | | Year Ended December 31, | |
| | (unaudited) | | 2014 | | 2013 | | 2012 | | 2011 | | 2010 | |
Ratios to Average Net Assets: (c) | | | | | | | | | | | | | |
Expense offset (f) | | — | | — | | — | | — | | — | | — | |
(f) Effect on the expense ratio was not greater than 0.005%.
(g) Excludes option transactions.
See accompanying notes to financial statements.
112
Additional Information (unaudited)
Proxy Voting
A description of the policies and procedures that the Funds use to determine how to vote proxies relating to portfolio securities is available without charge, upon request, by calling 1-800-US-FUNDS (1-800-873-8637). It also appears in the Funds’ statement of additional information (Form 485B), which can be found on the SEC’s website at www.sec.gov.
Information regarding how the Funds voted proxies relating to portfolio securities during the most recent 12-month period ended June 30 is available without charge, upon request, by calling 1-800-US-FUNDS (1-800-873-8637) or accessing the Funds’ Form N-PX on the SEC’s website at www.sec.gov.
Availability of Quarterly Portfolio Schedules
The Funds provide complete lists of holdings four times in each fiscal year, at the quarter-ends. For the second and fourth quarters, the lists appear in the Funds’ semi-annual and annual reports to shareholders. For the first and third quarters, the Funds file the lists with the SEC on Form N-Q. The Funds’ Forms N-Q are available on the SEC’s website at http://www.sec.gov. The Funds’ Forms N-Q may also be reviewed and copied at the SEC’s Public Room in Washington D.C. Information on the operation of the Public Reference Room may be obtained by calling 1-800-SEC-0330.
113
Expense Example (unaudited)
As a shareholder of the funds, you incur two types of costs: (1) transaction costs, including short-term trading fees and exchange fees; and (2) ongoing costs, including management fees, distribution plan fees, shareholder reports (like this one), and other fund expenses. This example is intended to help you understand your ongoing costs (in dollars) of investing in other mutual funds.
The example is based on an investment of $1,000 invested at the beginning of the period and held for the entire period (January 1, 2015 to June 30, 2015) as indicated below.
· Actual Expenses. The first line of the following table for each fund provides information about actual account values and actual expenses. You may use the information in this line, together with the amount you invested, to estimate the expenses you paid over the period. Simply divide your account value by $1,000 (for example, an $8,600 account value divided by $1,000 = 8.6), then multiply the result by the number in the first line under the heading “Expenses Paid During Period” to estimate the expenses you paid on your account during this period.
· Hypothetical Example for Comparison Purposes. The second line of the following table for each fund provides information about hypothetical account values and hypothetical expenses based on the fund’s actual expense ratio and an assumed rate of return of 5 percent per year before expenses, which is not the fund’s actual return. The hypothetical account values and expenses may not be used to estimate the actual ending account balance or expenses you paid for the period. You may use this information to compare the ongoing costs of investing in these funds and other funds. To do so, compare this 5 percent hypothetical example with the 5 percent hypothetical examples that appear in the shareholder reports of other funds.
Please note that the expenses shown in the table are meant to highlight your ongoing costs only and do not reflect any direct or transactional costs, such as small account, exchange or short-term trading fees. Therefore, the second line of the table is useful in comparing ongoing costs only, and will not help you determine the relative total costs of owning different funds. In addition, if these direct or transactional costs were included, your costs would have been higher.
114
| | Beginning
Account Value
January 1,
2015 | | Ending
Account Value
June 30,
2015 | | Expenses
Paid During
Period* | |
U.S. Government Securities Ultra-Short Bond Fund | | | | | | | |
Based on Actual Fund Return | | $ | 1,000.00 | | $ | 1,001.30 | | $ | 2.18 | |
Based on Hypothetical 5% Yearly Return | | $ | 1,000.00 | | $ | 1,022.61 | | $ | 2.21 | |
Near-Term Tax Free Fund | | | | | | | |
Based on Actual Fund Return | | $ | 1,000.00 | | $ | 1,003.60 | | $ | 2.24 | |
Based on Hypothetical 5% Yearly Return | | $ | 1,000.00 | | $ | 1,022.56 | | $ | 2.26 | |
All American Equity Fund | | | | | | | |
Based on Actual Fund Return | | $ | 1,000.00 | | $ | 995.70 | | $ | 8.98 | |
Based on Hypothetical 5% Yearly Return | | $ | 1,000.00 | | $ | 1,015.79 | | $ | 9.07 | |
Holmes Macro Trends Fund | | | | | | | |
Based on Actual Fund Return | | $ | 1,000.00 | | $ | 1,047.90 | | $ | 8.79 | |
Based on Hypothetical 5% Yearly Return | | $ | 1,000.00 | | $ | 1,016.21 | | $ | 8.66 | |
Global Resources Fund Investor Class | | | | | | | |
Based on Actual Fund Return | | $ | 1,000.00 | | $ | 826.10 | | $ | 6.66 | |
Based on Hypothetical 5% Yearly Return | | $ | 1,000.00 | | $ | 1,017.50 | | $ | 7.35 | |
Global Resources Fund Institutional Class | | | | | | | |
Based on Actual Fund Return | | $ | 1,000.00 | | $ | 829.10 | | $ | 3.65 | |
Based on Hypothetical 5% Yearly Return | | $ | 1,000.00 | | $ | 1,020.81 | | $ | 4.03 | |
World Precious Minerals Fund Investor Class | | | | | | | |
Based on Actual Fund Return | | $ | 1,000.00 | | $ | 957.90 | | $ | 7.94 | |
Based on Hypothetical 5% Yearly Return | | $ | 1,000.00 | | $ | 1,016.69 | | $ | 8.18 | |
World Precious Minerals Fund Institutional Class | | | | | | | |
Based on Actual Fund Return | | $ | 1,000.00 | | $ | 956.10 | | $ | 6.52 | |
Based on Hypothetical 5% Yearly Return | | $ | 1,000.00 | | $ | 1,018.13 | | $ | 6.73 | |
Gold and Precious Metals Fund | | | | | | | |
Based on Actual Fund Return | | $ | 1,000.00 | | $ | 1,064.00 | | $ | 9.43 | |
Based on Hypothetical 5% Yearly Return | | $ | 1,000.00 | | $ | 1,015.66 | | $ | 9.21 | |
Emerging Europe Fund | | | | | | | |
Based on Actual Fund Return | | $ | 1,000.00 | | $ | 931.40 | | $ | 12.25 | |
Based on Hypothetical 5% Yearly Return | | $ | 1,000.00 | | $ | 1,012.11 | | $ | 12.76 | |
China Region Fund | | | | | | | |
Based on Actual Fund Return | | $ | 1,000.00 | | $ | 1,123.20 | | $ | 12.30 | |
Based on Hypothetical 5% Yearly Return | | $ | 1,000.00 | | $ | 1,013.21 | | $ | 11.66 | |
* These calculations are based on expenses incurred in the most recent fiscal half-year. The funds’ Investor Class’ annualized expense ratios (after reimbursements and offsets) for the six-month period ended June 30, 2015, were 0.44%, 0.45%, 1.82%, 1.73%, 1.47%, 1.64%, 1.84%, 2.56% and 2.34%, respectively, for the U.S. Government Securities Ultra-Short Bond, Near-Term Tax Free, All American Equity, Holmes Macro Trends, Global Resources, World Precious Minerals, Gold and Precious Metals, Emerging Europe and China Region Funds. The funds’ Institutional Class’ annualized expense ratios (after reimbursements and offsets) for the six-month period ended June 30, 2015, were 0.80% and 1.34%, respectively, for the Global Resources and World Precious Minerals Funds. The dollar amounts shown as “Expenses Paid” are equal to the annualized expense ratio multiplied by the average account value over the period, multiplied by 181, the number of days in the period, then divided by 365 days in the current fiscal year.
115
Rev. 06/2014
FACTS | WHAT DOES U.S. GLOBAL INVESTORS DO WITH YOUR PERSONAL INFORMATION? |
| |
Why? | Financial companies choose how they share your personal information. Federal law gives consumers the right to limit some but not all sharing. Federal law also requires us to tell you how we collect, share, and protect your personal information. Please read this notice carefully to understand what we do. |
| |
What? | The types of personal information we collect and share depend on the product or service you have with us. This information can include: · Social Security number and account balances · transaction history and checking account information · account transactions and wire transfer instructions When you are no longer our customer, we continue to share your information as described in this notice. |
| |
How? | All financial companies need to share customers’ personal information to run their everyday business. In the section below, we list the reasons financial companies can share their customers’ personal information; the reasons U.S. Global Investors chooses to share; and whether you can limit this sharing. |
Reasons we can share your
personal information | | Does U.S.Global
Investors share? | | Can you limit
this sharing? |
For our everyday business purposes —
such as to process your transactions, maintain your account(s), respond to court orders and legal investigations, or report to credit bureaus | | Yes | | No |
| | | | |
For our marketing purposes —
to offer our products and services to you | | Yes | | No |
| | | | |
For joint marketing with other financial companies | | No | | We don’t share |
| | | | |
For our affiliates’ everyday business purposes —
information about your transactions and experiences | | No | | We don’t share |
| | | | |
For our affiliates’ everyday business purposes —
information about your creditworthiness | | No | | We don’t share |
| | | | |
For nonaffiliates to market to you | | No | | We don’t share |
Questions? | Call 1-800-US-FUNDS (1-800-873-8637) or go to www.usfunds.com |
Who we are | |
| |
Who is providing this notice? | U.S. Global Investors, Inc., U.S. Global Investors Funds, and U.S. Global Brokerage, Inc. (collectively known as U.S. Global Investors) |
| |
What we do | |
| |
How does U.S. Global Investors protect my personal information? | To protect your personal information from unauthorized access and use, we use security measures that comply with federal law. These measures include computer safeguards and secured files and buildings. |
| |
How does U.S. Global Investors collect my personal information? | We collect your personal information, for example, when you · open an account or buy securities from us · direct us to sell your securities or give us your contact information · tell us where to send the money |
| |
Why can’t I limit all sharing? | Federal law gives you the right to limit only · sharing for affiliates’ everyday business purposes — information about your creditworthiness · affiliates from using your information to market to you · sharing for nonaffiliates to market to you State laws and individual companies may give you additional rights to limit sharing. |
| |
Definitions | |
| |
Affiliates | Companies related by common ownership or control. They can be financial and nonfinancial companies. · Our affiliates include U.S. Global Investors, Inc., U.S. Global Investors Funds, and U.S. Global Brokerage, Inc. |
| |
Nonaffiliates | Companies not related by common ownership or control. They can be financial and nonfinancial companies. · Nonaffiliates we share personal information with include companies that perform marketing on our behalf, printing and mailing companies, and companies that service your account(s). |
| |
Joint marketing | A formal agreement between nonaffiliated financial companies that together market financial products or services to you. · U.S. Global Investors doesn’t jointly market. |
[THIS PAGE INTENTIONALLY LEFT BLANK]

Fund Services, LLC
PO Box 701
Milwaukee WI
53201-0701
Want to reduce paper waste?
You can receive this report and other important documents electronically. Please visit www.usfunds.com and sign up at Access My Account. If you need further assistance, please call us at 800-873-8637.
ITEM 2. CODE OF ETHICS.
Required only in annual report on Form N-CSR.
ITEM 3. AUDIT COMMITTEE FINANCIAL EXPERT.
Required only in annual report on Form N-CSR.
ITEM 4. PRINCIPAL ACCOUNTANT FEES AND SERVICES.
Required only in annual report on Form N-CSR.
ITEM 5. AUDIT COMMITTEE OF LISTED REGISTRANTS.
Required only in annual report on Form N-CSR.
ITEM 6. SCHEDULE OF INVESTMENTS.
Not applicable. The complete schedule of investments is included in Item 1 of this Form N-CSR.
ITEM 7. DISCLOSURE OF PROXY VOTING POLICIES AND PROCEDURES FOR CLOSED-END MANAGEMENT INVESTMENT COMPANIES.
Not applicable.
ITEM 8. PORTFOLIO MANAGERS OF CLOSED-END MANAGEMENT INVESTMENT COMPANIES.
Not applicable.
ITEM 9. PURCHASE OF EQUITY SECURITIES BY CLOSED-END MANAGEMENT INVESTMENT COMPANY AND AFFILIATED PURCHASERS.
Not applicable.
ITEM 10. SUBMISSION OF MATTERS TO A VOTE OF SECURITY HOLDERS.
Not applicable.
ITEM 11. CONTROLS AND PROCEDURES.
(a) The registrant’s president and treasurer have determined that the registrant’s disclosure controls and procedures are effective based on their evaluation of the disclosure controls and procedures as of a date within 90 days of the filing date of this report.
(b) There was no change in the registrant’s internal control over financial reporting that occurred in the registrant’s second fiscal quarter of the period covered by this report that has materially affected, or is reasonably likely to materially affect, the registrant’s internal control over financial reporting.
ITEM 12. EXHIBITS.
(a)(1) Required only in annual report on Form N-CSR.
(a)(2) Certifications of principal executive officer and principal financial officer pursuant to Rule 30a-2(a) under the Investment Company Act of 1940 (17CFR 270.30a-2(a)) and Section 302 of the Sarbanes-Oxley Act of 2002 are filed as exhibits to this report.
(b) Certifications of principal executive officer and principal financial officer pursuant to Rule 30a-2(b) under the Investment Company Act of 1940 (17CFR 270.30a-2(b)) and Section 906 of the Sarbanes-Oxley Act of 2002 are filed as exhibits to this report.
SIGNATURES
Pursuant to the requirements of the Securities Exchange Act of 1934 and the Investment Company Act of 1940, the registrant has duly caused this report to be signed on its behalf by the undersigned, thereunto duly authorized.
U.S. GLOBAL INVESTORS FUNDS | |
| | |
| | |
By: | /s/ Frank E. Holmes | |
| Frank E. Holmes | |
| President, Chief Executive Officer | |
| | |
Date: | September 8, 2015 | |
| | |
| | |
Pursuant to the requirements of the Securities Exchange Act of 1934 and the Investment Company Act of 1940, this report has been signed below by the following persons on behalf of the registrant and in the capacities and on the dates indicated. |
| | |
| | |
By: | /s/ Frank E. Holmes | |
| Frank E. Holmes | |
| President, Chief Executive Officer | |
| | |
Date: | September 8, 2015 | |
| | |
| | |
By: | /s/ Lisa C. Callicotte | |
| Lisa C. Callicotte | |
| Treasurer | |
| | |
Date: | September 8, 2015 | |