UNITED STATES
SECURITIES AND EXCHANGE COMMISSION
Washington, D.C. 20549
FORM N-CSR
CERTIFIED SHAREHOLDER REPORT OF REGISTERED
MANAGEMENT INVESTMENT COMPANIES
Investment Company Act file number | 811-1800 |
|
U.S. GLOBAL INVESTORS FUNDS |
(Exact name of registrant as specified in charter) |
|
7900 CALLAGHAN ROAD SAN ANTONIO, TX | | 78229 |
(Address of principal executive offices) | | (Zip code) |
|
SUSAN B. MCGEE, ESQ. 7900 CALLAGHAN ROAD SAN ANTONIO, TX 78229 |
(Name and address of agent for service) |
|
Registrant’s telephone number, including area code: | 210-308-1234 | |
|
Date of fiscal year end: | DECEMBER 31, 2012 | |
|
Date of reporting period: | JUNE 30, 2012 | |
| | | | | | | | |
ITEM 1. REPORTS TO STOCKHOLDERS.
U.S. Global Investors Funds
Semi-Annual Report
June 30, 2012

U.S. Global Investors Funds
Semi-Annual Report
June 30, 2012
(unaudited)
Table of Contents
Letter to Shareholders | 1 |
| |
Definitions for Management Teams’ Perspectives | 14 |
| |
Management Teams’ Perspectives | 16 |
| |
Expense Example | 70 |
| |
Portfolios of Investments | 73 |
| |
Notes to Portfolios of Investments | 145 |
| |
Statements of Assets and Liabilities | 161 |
| |
Statements of Operations | 164 |
| |
Statements of Changes in Net Assets | 167 |
| |
Notes to Financial Statements | 172 |
| |
Financial Highlights | 192 |
| |
Additional Information | 208 |
| |
Privacy Policy | |
Nasdaq Symbols
U.S. Global Investors Funds
Investor Class
U.S. Treasury Securities Cash Fund | | USTXX |
| | |
U.S. Government Securities Savings Fund | | UGSXX |
| | |
Near-Term Tax Free Fund | | NEARX |
| | |
Tax Free Fund | | USUTX |
| | |
All American Equity Fund | | GBTFX |
| | |
Holmes Growth Fund | | ACBGX |
| | |
Global MegaTrends Fund | | MEGAX |
| | |
Global Resources Fund | | PSPFX |
| | |
World Precious Minerals Fund | | UNWPX |
| | |
Gold and Precious Metals Fund | | USERX |
| | |
Eastern European Fund | | EUROX |
| | |
Global Emerging Markets Fund | | GEMFX |
| | |
China Region Fund | | USCOX |
Institutional Class
Global MegaTrends Fund | | MEGIX |
| | |
Global Resources Fund | | PIPFX |
| | |
World Precious Minerals Fund | | UNWIX |

P.O. Box 659405 San Antonio, Texas 78265-9604 Tel 1.800.US.FUNDS Fax 1.210.308.1217 www.usfunds.com | |
U.S. Global Investors Funds
Dear Fellow Shareholder,

This summer, the world watched in awe as Michael Phelps became the most decorated Olympian. He has been training in the pool for an average of six hours a day, six days per week, which equates to about 30,000 hours of swimming since age 13. It’s inspiring to see the incredible results of his tremendous sacrifice and commitment.
Investing in global markets requires a similar drive, and we truly appreciate the resiliency and loyalty of our shareholders. During the first half of 2012, as fears of slowing global growth and its effect on commodities have continued, many dug their heels in the ground and resisted owning resources and emerging markets stocks. Negative investor sentiment was perpetuated by the 24/7 news cycle punctuated with pessimism. A commodity bull like me is about as rare as a positive story in the media.
One such fellow is Jeremy Grantham of GMO, who pounded the table for an investment in resources at a conference lately, but you wouldn’t know it by reading the headline of the CNN piece that covered the topic. In its article called, “Our planet will truly be toast,” CNN discussed Grantham’s comments on a global commodities shortage, saying he was “bearish on human resources... but bullish on natural resources investments.”
His argument focused on the swelling population in China, and the fact that the world experienced a “great paradigm shift” around 2000, when commodity prices, which were negative for decades, “abruptly reversed course.” He told the crowd, “in the long run, you can’t afford to miss this opportunity.” We agree.
The beginning of the past decade was clearly a tipping point for resources. When I became the chief investment officer of U.S. Global Investors in 1999, no one wanted to touch resources. Yet we recognized the significance of China and Eastern Europe ushering in free markets, believing this to be a positive change, with emerging markets as big beneficiaries of this massive shift.
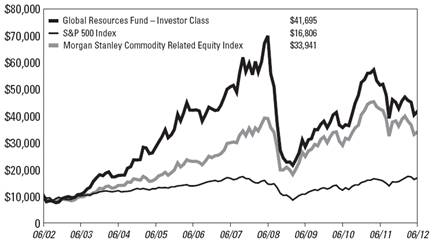
This position has paid off for long-term Global Resources Fund (PSPFX) shareholders: As of June 30, 2012, the fund climbed an annualized 15.33 percent over the past 10 years, outperforming its benchmark, the Morgan Stanley Commodity Related Equity Index, which increased 12.98 percent. A hypothetical $10,000 invested in
1
the fund would have grown to $41,695, compared to a growth of $33,941 in the benchmark.
This outperformance helped the fund earn the top ranking among 32 Lipper global natural resources peers for the 10-year timeframe as of June 30, 2012. For the 1- and 5-year periods, the fund ranked 51 out of 141 and 45 out of 78 Lipper global natural resources funds for total return as of June 30, 2012.
Among Lipper’s entire universe of 9,314 total funds, the fund is ranked 48 for the 10-year period, making it among the top 1 percent as of June 30, 2012. For the 1-year period, the fund is ranked 21,979 out of 22,904 total funds and for the 5-year period, the fund is ranked 13,887 out of 15,767 as of June 30, 2012.
As highlighted in Financial Planning magazine, investors have historically benefited from the inclusion of natural resources as part of a balanced portfolio because of their low correlation to the overall market. Among natural resources funds that had 10-year returns, U.S. Global Investors’ Global Resources Fund added the most return when included in a diversified portfolio and rebalanced annually.
We believe the world is only in the middle of its supercycle with several stages to come. Supercycles, or what we call S-curves, are long, continuous waves of boom and bust inherent in human history. While the overall trend is up, periods of volatility are an intrinsic part of this supergrowth. Not every down period is a sign of permanent demise — even a broken clock is right twice a day.
Investment Strategist Keith Fitz-Gerald noted in a commentary earlier this year that “people forget that world markets dropped 40 to 80 percent in 1987,” and the secular bull market continued. He says, the U.S. has endured some terrible events over the past century, including world wars, the Great Depression, multiple recessions, presidential assassinations, and the September 11 attacks. Still, the stock market has “been the best place to invest for the last 100 years,” Keith concludes.
I like to use the metaphor of an ice cube to explain how new equilibriums can have significant effects. We all understand what happens when you take ice out of the freezer. Above 32 degrees, ice changes form, from solid to liquid, but it’s still made up of hydrogen and oxygen.
2
A change in something the size of an ice cube does not have much impact — it’ll only leave a puddle of water on your counter. Picture a glacier thawing and how this huge chunk of ice drastically affects the world’s ocean level.
Or take H2O in steam form. At 211 degrees, water is way too hot to dip a finger, but it’s still one degree below the boiling point. As explained in the motivational book, 212: The Extra Degree, “Applying one extra degree of temperature to water means the difference between something that is simply very hot and something that generates enough force to power a machine.”
The significance of the changes in states of matter — whether it’s a chunk of melting ice or a steam engine — is that there is a tipping point that significantly alters the dynamics.
This metaphor can be applied to money, with trends including tremendous population growth, urbanization rates, changes in government policies, innovation and discoveries, and development of new technologies having potentially significant changes in the velocity of money. As global investors, we watch for trends like these to know how to invest in commodities and markets, find new opportunities and adjust for risk.
In 1989 when the Berlin Wall fell, famous investors Stanley Druckenmiller and George Soros recognized this event as a significant inflection point in government policies and invested in severely undervalued German marks. This decision paid off, resulting in an investment worth millions of dollars.
Smart investors look past the rampant negativity to see these patterns and anomalies to determine where the opportunities and threats lie. At the heart of James Surowieki’s book, The Wisdom of Crowds, is the idea that “under the right circumstances,” groups of people can make “remarkably intelligent” decisions compared to a single person on his or her own. Surowieki believes that people are “programmed to be collectively smart.”
Over the past decade, the “wise crowd” has been investing in Apple’s stock, as they recognized the tremendous effect that iPods, iPhones and iPads would have on the company’s growth. Now Apple’s market capitalization of around $500 billion is a greater market cap than the market cap of all of the utilities companies in the S&P 500, greater than all of the S&P 500 materials companies combined and greater
3
than the telecommunications companies. Apple also generates more profit on an earnings before interest, taxes, depreciation and amortization (EBITDA) basis than any of those sectors.
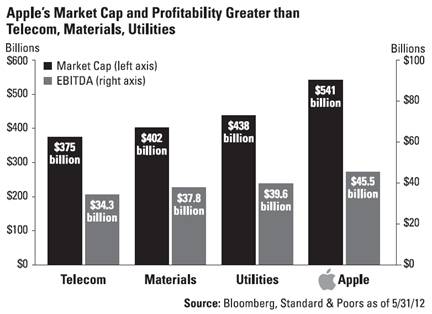
Clearly, Apple is an admirable company and some of our funds have benefited from holding shares at times. The company’s products are quickly becoming as common as toasters, with a survey by CNBC finding that half of all U.S. households own at least one Apple device! If a household has children, that number jumps to 60 percent.
However, while iPhones are flying off the shelf, natural resources that manufacture, charge and transmit data and voices for the devices seem to be overlooked. To make an iPhone, you need materials like plastics and metals; utilities to charge the device; and telecom companies to allow your phone to function as a mini-computer so you can surf the web and send emails.
Apple’s products cater to our “wants” because we have many choices. Some use BlackBerrys, others prefer Androids. Global resources supply our “needs.” Wants flourish, then fade; needs must always be met. We need companies to grow our food. We need oil, natural gas and coal to fuel our cities. We need to drive to work and school each day, and we need to keep our house warm in the winter and cool in the summer. And so do the other seven billion people on the planet.
4
Research shows that the vast majority of investors do not have exposure to these tremendous needs: According to Investment Company Institute, there is $11 trillion invested in mutual funds around the world. About 45 percent is invested in equity funds, or about $5 trillion. Yet only $50 billion is in natural resources mutual funds, or about 1 percent.
Compare this 1 percent weighting of all equity funds in the world to the fact that about 15 percent of the S&P 500 Index is made of energy and materials. This tells us that global resources are tremendously underappreciated and underweighted in individuals’ portfolios, especially when it comes to natural resources mutual funds.
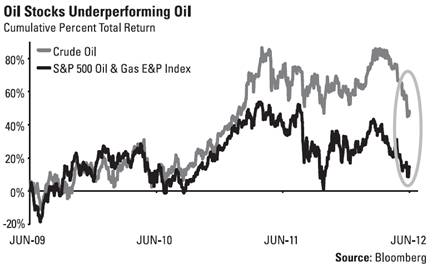
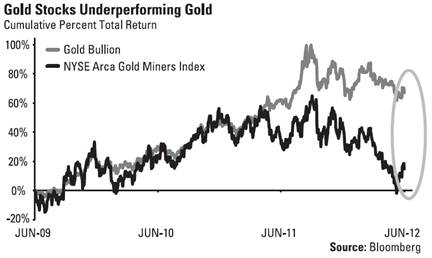
Resources stocks are also underappreciated compared to their underlying commodities. As you can see in the following charts, there’s been a growing disparity between oil and gold compared to oil stocks and gold miners. While the commodities have seen considerable growth over the past three and a half years, oil and gold companies have languished.
In the first half of 2012 alone, the price of gold rose 2.16 percent, but the FTSE Gold Mines Index fell 15.83 percent and the NYSE Arca Gold Miners Index declined 12.72 percent. At one point in the last six months, the spread between the NYSE Arca Gold Miners Index and gold bullion reached the same extreme level it was during the 2008 credit crisis.
5
We believe either the price of gold should come down or gold stocks should rise, or a combination of both. There are naysayers who think gold is a bubble, but consider the total assets held in gold and gold stocks. The efficient frontier portfolio has historically found that a 90 percent allocation in the S&P 500 Index along with a maximum 10 percent allocation in gold stocks(1) increased return with no additional volatility.
We have always suggested a 5 to 10 percent weighting in gold and gold stocks and if U.S. mutual fund investors followed that recommendation, gold ETF and mutual fund assets would reach $600 billion to $1.2 trillion. As of June 30, 2012, the total assets held in all gold funds and ETFs was $121 billion — that’s only a 1 percent allocation to gold and gold stocks in their mutual fund portfolios.
Adam Hamilton from Zeal Intelligence finds that “beaten-down gold stocks are an incredible fundamental bargain.” Although gold miners have taken on additional mining costs due to rising energy costs, reduced supply and currency swings, he found that profit margins have been growing faster because of the ongoing bull market in gold.
Hamilton’s research discovered that gold companies are “super-cheap” relative to not only the price of gold, but also on an earnings and dividends basis. When he weighted the price-to-earnings ratios of the stocks in the NYSE Arca Gold BUGS Index (HUI) by market capitalization, he found that gold stocks are at the lowest levels that
6
they have been during gold’s entire bull market. Gold companies are also cheaper than the overall stock market, as “a dollar of gold-stock profits costs investors $12, but the same dollar is going for $18 in the general markets,” according to Zeal’s research.
Hamilton says, “Like the rest of the markets, sentiment flows and ebbs in the gold stocks. Sometimes investors love them and bid them up to dizzying heights as greed reigns. But then the great sentiment pendulum starts swinging towards the opposite extreme of fear. And gold stocks are crushed to ridiculous unsustainable lows like we saw last month. Realize neither excessive greed nor excessive fear can persist for long.”
Gold stocks aren’t the only victims of today’s great sentiment swing. Hype over recent tech initial public offerings caused investors to rush into Groupon and Facebook. While the stocks appeared to be positioned to the public as a mainstream investment, I believe people were unaware of the risks involved when they purchased shares. Since the peak on their respective IPO days, these two companies lost a total of $74 billion in market capitalization, which is more than the total assets in Morningstar’s equity precious metals category as of June 30, 2012.

7
Tax Free Opportunities
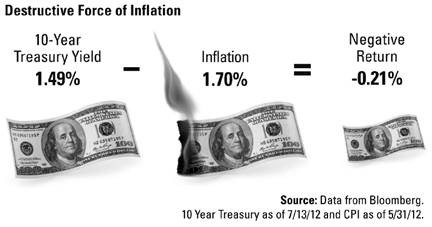
Global investors need to be watchful of biases and impaired thinking that can adversely affect a portfolio. An overreaction to perceived risk has driven down the 10-year Treasury to as low as 1.49 percent. However, inflation burned at 1.7 percent. This means that after you factor in what you’ve lost from the destructive force of inflation, you are left with a negative return.
Instead of being stuck with this potentially losing proposition, we believe there are plenty of opportunities out there. One trend for income along with the potential for capital appreciation is dividend-paying companies. With Treasuries at historic lows, the dividend yield on the S&P 500 is actually higher than the 10-Year Treasury. This is a divergence from the past decade, as “the 10-Year Treasury bond yield has traded well in excess of the S&P 500 dividend yield, with an average yield premium of 222 basis points since 2000,” according to CLSA’s special dividend report. As shown below, the S&P 500 dividend yield is 60 basis points higher than the 10-year Treasury.
| | Dividend Yield | |
10-Year Treasury | | 1.49 | % |
S&P 500 Index | | 2.12 | % |
S&P 500 Energy Sector | | 2.13 | % |
S&P 500 Materials Sector | | 2.33 | % |
S&P 500 Utilities Sector | | 3.87 | % |
10-Year Treasury as of 7/13/12; dividend yields as of 07/23/12. Source: Bloomberg
8
To take advantage of this tremendous opportunity for shareholders, U.S. Global’s equity funds, including the All American Equity Fund (GBTFX), the Eastern European Fund (EUROX), the Global Emerging Markets Fund (GEMFX) and the China Region Fund (USCOX), seek to invest a portion of their assets in well-run, growing companies that pay dividends.
Stocks in the Following Portfolios Have Average Dividend Yield of...
| | Dividend Yield | |
China Region Fund (USCOX) | | 3.38 | % |
All American Equity Fund (GBTFX) | | 4.15 | % |
Eastern European Fund (EUROX) | | 4.60 | % |
Global Emerging Markets Fund (GEMFX) | | 5.79 | % |
Past performance does not guarantee future results. Dividend yields are as of 6-29-2012. These figures do not represent the funds’ yields, which may be materially different from the average yields of the stocks held in the funds.
Source: Bloomberg
If you need to park some money for a few years, you may have noticed that 3-year certificates of deposit (CDs) offered at a bank were yielding an average of 0.99 percent in July. These CDs lock up your cash for three years and generally come with a penalty for early withdrawal, which can greatly lower returns.
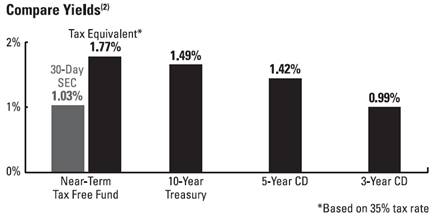
There may be better-yielding alternatives out there for those who can take on some risk as they seek higher returns. For example, U.S. Global Investors’ Near-Term Tax Free Fund (NEARX), which
9
has an overall Morningstar rating of 4 stars, had a higher 30-day SEC yield on a tax-equivalent basis based on a 35 percent tax rate as of June 30, 2012. Also, the fund invests in bonds that have an average maturity of just over 3 years, which is about the same holding period as a 3-year CD.
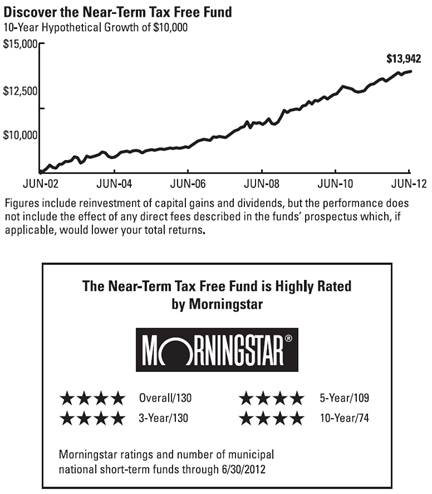
Over the past decade, the fund has provided what we believe to be “peace of mind,” producing positive results every year. As of June 30, 2012, a 10-year hypothetical $10,000 investment in the Near-Term Tax Free Fund has grown to nearly $14,000. The fund shows that sometimes the turtle wins the race.
10
Unlike a CD, the fund is not FDIC insured, but it does provide the flexibility of daily liquidity that comes with a mutual fund.
With the Fed likely keeping interest rates low through 2014, investors’ portfolios cannot afford to remain sidelined. As I like to say, anticipate before you participate, and understand the drivers of the Supercycle growth that will be punctuated with moments of tremendous rises along with temporary setbacks. Global investors who have persevered through these ups and downs have historically been rewarded.
Sincerely,

Frank Holmes
CEO and Chief Investment Officer
U.S. Global Investors, Inc.
(1)Time series for Toronto Gold & Precious Minerals Index is a composite of this index’s returns from 1970 to 2000. Thereafter, the S&P/TSX Gold Index is used. Both series are analyzed based on their returns achieved in U.S. dollar terms.
(2)Near-Term Tax Free Fund data as of 6/30/12; 10-year Treasury yield as of 7/13/12; and CD rates from Bankrate.com site average as of 7/24/2012.
Please consider carefully a fund’s investment objectives, risks, charges and expenses. For this and other important information, obtain a fund prospectus by visiting www.usfunds.com or by calling 1-800-US-FUNDS (1-800-873-8637). Read it carefully before investing. Distributed by U.S. Global Brokerage, Inc.
11
Unlike bank savings accounts, an investment in a municipal bond fund is neither insured nor guaranteed by the Federal Deposit Insurance Corporation or any other government agency.
Compare | | Near-Term Tax Free Fund | | Bank CD |
Type of Investment and Objective | | Municipal bond fund; seeks current income that is exempt from federal income tax and seeks preservation of capital | | Certificate of deposit; entitles the bearer to receive interest |
Primary Investments | | Investment grade municipal bonds with relatively short maturity | | A promissory note issued by a bank |
Stable share price? | | No, but seeks minimal fluctuations | | Yes |
Penalty free withdrawals? | | Yes | | No, withdrawal before the maturity date usually incurs a penalty |
Though the Near-Term Tax Free Fund seeks minimal fluctuations in share price, it is subject to the risk that a decline in the credit quality of a portfolio holding could cause a fund’s share price to decline. Tax-exempt income is federal income tax free. A portion of this income may be subject to state and local income taxes, and if applicable, may subject certain investors to the Alternative Minimum Tax as well. The Near-Term Tax Free Fund may invest up to 20% of its assets in securities that pay taxable interest. Income or fund distributions attributable to capital gains are usually subject to both state and federal income taxes. Bond funds are subject to interest-rate risk; their value declines as interest rates rise.
The CD interest rate is typically a fixed rate of interest, and payable on a set maturity date. The 30-day yield is used for bond funds, balanced funds, and stock funds. It consists of the interest income the fund pays over a 30-day period, net of expenses, expressed as an annualized percentage of the fund’s share price. Tax Equivalent Yield is the before-tax yield you would have to get from a higher-paying but taxable investment to equal the yield from a tax-exempt investment and was computed assuming a 35% tax rate.
Morningstar Ratings are based on risk-adjusted return.The Overall Morningstar Rating for a fund is derived from a weighted-average of the performance figures associated with its three-, five- and ten-year (if applicable) Morningstar Rating metrics. Past performance does not guarantee future results. For each fund with at least a three-year history, Morningstar calculates a Morningstar RatingTM based on a Morningstar Risk-Adjusted Return measure that accounts for variation in a fund’s monthly performance (including the effects of sales charges, loads, and redemption fees), placing more emphasis on downward variations and rewarding consistent performance. The top 10% of funds in each category receive 5 stars, the next 22.5% receive 4 stars, the next 35% receive 3 stars, the next 22.5% receive 2 stars and the bottom 10% receive 1 star. (Each share class is counted as a fraction of one fund within this scale and rated separately, which may cause slight variations in the distribution percentages.)
12
Although Lipper makes reasonable efforts to ensure the accuracy and reliability of the data contained herein, the accuracy is not guaranteed by Lipper. Users acknowledge that they have not relied upon any warranty, condition, guarantee, or representation made by Lipper. Any use of the data for analyzing, managing, or trading financial instruments is at the user’s own risk. This is not an offer to buy or sell securities.
The Toronto Stock Exchange Gold and Precious Minerals Total Return Index is the total return version of the Toronto Stock Exchange Gold and Precious Minerals Index with dividends reinvested. The S&P/TSX Global Gold Index is an international benchmark tracking the world’s leading gold companies with the intent to provide an investable representative index of publicly-traded international gold companies. The S&P 500 Oil & Gas Exploration & Production Index is a capitalization-weighted Index. The index is comprised of six stocks whose primary function is exploring for natural gas and oil resources on land or at sea. The NYSE Arca Gold BUGS (Basket of Unhedged Gold Stocks) Index (HUI) is a modified equal dollar weighted index of companies involved in gold mining. The HUI Index was designed to provide significant exposure to near term movements in gold prices by including companies that do not hedge their gold production beyond 1.5 years.
13
Definitions for Management Teams’ Perspectives
Benchmark Index Definitions
Returns for indexes reflect no deduction for fees, expenses or taxes, unless noted.
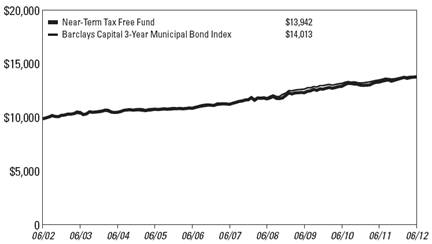
The Barclays Capital 3-Year Municipal Bond Index is a total return benchmark designed for municipal assets. The index includes bonds with a minimum credit rating of BAA3, are issued as part of a deal of at least $50 million, have an amount outstanding of at least $5 million and have a maturity of two to four years.
The Barclays Capital 10-Year Municipal Bond Index is a total return benchmark designed for long-term municipal assets. The index includes bonds with a minimum credit rating of BAA3, are issued as part of a deal of at least $50 million, have an amount outstanding of at least $5 million and have a maturity of 8 to 12 years.
The FTSE Gold Mines Index encompasses all gold mining companies that have a sustainable and attributable gold production of at least 300,000 ounces a year and that derive 75% or more of their revenue from mined gold.
The Hang Seng Composite Index is a market-capitalization weighted index that covers about 95% of the total market capitalization of companies listed on the Main Board of the Hong Kong Stock Exchange.
The MSCI Emerging Markets Europe 10/40 Index (Net Total Return) is a free float-adjusted market capitalization index that is designed to measure equity performance in the emerging market countries of Europe (Czech Republic, Hungary, Poland, Russia and Turkey). The index is calculated on a net return basis (i.e., reflects the minimum possible dividend reinvestment after deduction of the maximum rate withholding tax). The index is periodically rebalanced relative to the constituents’ weights in the parent index.
The MSCI Emerging Markets Net Total Return Index is a free float-adjusted market capitalization index that is designed to measure equity market performance in emerging market countries on a net return basis (i.e., reflects the minimum possible dividend reinvestment after deduction of the maximum rate withholding tax).
The Morgan Stanley Commodity Related Equity Index (CRX) is an equal-dollar weighted index of 20 stocks involved in commodity-related industries such as energy, non-ferrous metals, agriculture and forest products.
The NYSE Arca Gold Miners Index is a modified market capitalization-weighted index comprised of publicly-traded companies involved primarily in the mining for gold and silver.
The S&P 500 Index is a widely recognized capitalization-weighted index of 500 common stock prices in U.S. companies.
14
The S&P Composite 1500 Index is a broad-based capitalization-weighted index of 1500 U.S. companies and is comprised of the S&P 400, S&P 500 and the S&P 600.
Other Index Definitions
The Barclays Capital Municipal Bond Index is an unmanaged index representative of the tax-exempt bond market.
The ISM Manufacturing Composite Index is a diffusion index calculated from five of the eight sub-components of a monthly survey of purchasing managers at roughly 300 manufacturing firms from 21 industries in all 50 states.
The Istanbul Stock Exchange National 100 Index (XU100) is a capitalization-weighted index composed of National Market companies except investment trusts.
The MSCI All Country Far East Free ex Japan Index is a free float-adjusted market capitalization-weighted index that is designed to measure the equity market performance of the Far East, excluding Japan. The index consists of the following developed and emerging market country indices: China, Hong Kong, Indonesia, Korea, Malaysia, Philippines, Singapore, Taiwan and Thailand.
The MSCI China Index is a free-float weighted equity index that monitors the performance of stocks in the Chinese market.
The MSCI Emerging Markets Index is a free float-adjusted market capitalization index that is designed to measure equity market performance in the global emerging markets.
The S&P 100 Index is a market capitalization-weighted index consisting of 100 large blue chip stocks covering a broad-range of industries that is used as a benchmark to measure the performance of large cap stocks.
The S&P GSCI Total Return Index is calculated primarily on a world production weighted basis and is comprised of the principal physical commodities that are the subject of active, liquid futures markets.
The S&P/TSX Venture Composite Index is a broad market indicator for the Canadian venture capital market. The index is market capitalization weighted and, at its inception, included 531 companies. A quarterly revision process is used to remove companies that comprise less than 0.05% of the weight of the index, and add companies whose weight, when included, will be greater than 0.05% of the index.
The U.S. Trade Weighted Dollar Index provides a general indication of the international value of the U.S. dollar.
15
Money Market Funds
Management Team’s Perspective
Introduction
The U.S. Treasury Securities Cash Fund (USTXX) seeks to obtain a high level of current income while maintaining the highest degree of safety of principal and liquidity. The U.S. Government Securities Savings Fund (UGSXX) seeks to achieve a consistently high yield with safety of principal.
Performance
U.S. Treasury Securities Cash Fund | | As of June 30, 2012 | |
7-Day Yield | | 0.01 | % |
7-Day Effective Yield | | 0.01 | % |
U.S. Government Securities Savings Fund | | As of June 30, 2012 | |
7-Day Yield | | 0.01 | % |
7-Day Effective Yield | | 0.01 | % |
An investment in either the U.S. Treasury Securities Cash Fund or the U.S. Government Securities Savings Fund is neither insured nor guaranteed by the Federal Deposit Insurance Corporation (FDIC) or by any other government agency. Although the funds seek to preserve the value of your investments at $1.00 per share, it is possible to lose money by investing in these funds.
Pursuant to a voluntary arrangement, the Adviser has agreed to limit total fund operating expenses to not exceed 1.00% for the U.S. Treasury Securities Cash Fund and 0.45% for the U.S. Government Securities Savings Fund on an annualized basis. In addition, the yields reported above include the effects of the Adviser’s voluntary waiver of fees and/or reimbursement of expenses to maintain a minimum net yield for the funds. The Adviser can modify or terminate these arrangements at any time.
The Six-Month Period In Review - Economic And Political Issues That Affected The Funds
The economy began the year with some positive economic momentum as unemployment was falling, the consumer was spending and manufacturing remained relatively robust. In the first quarter of 2012, the global economy appeared stronger and, as a result, investor sentiment improved. As the year progressed, the economic slowdown in Europe and China proved too much to bear and negatively affected the U.S. economy. In June, the ISM Manufacturing Composite Index fell to 49.7, the lowest level in three years,
16
indicating a modest contraction in the manufacturing sector. This was a surprising reading and was confirmed by a lower global trend for similar manufacturing readings. Consumer confidence fell, even though gasoline prices have been lower.
The ongoing European financial crisis continues without an obvious endpoint in the near future. China has been weak this year as policymakers attempted an economic “soft landing” that became more difficult with Europe’s economic activity deteriorating quicker than expected.
The Federal Reserve maintained its position for the first half of the year by not providing additional stimulus. We believe the Fed is allowing central banks around the world to do the heavy lifting this time as the European Central Bank and the Bank of China will likely be key players.
Inflation in the U.S. decelerated during the first six months of the year and the global trend is for lower inflation, allowing central bankers to comfortably shift to pro-growth policies. The Fed remains inclined to ease more if necessary and has committed to maintaining the extremely low interest rate environment through late-2014.
Fiscal austerity remains in vogue to address long-term fiscal imbalances in the developed world and will likely be a significant drag on growth in the U.S. and Europe for some time. Spending cuts and higher taxes are a stiff headwind to economic growth.
Yields on the three-month Treasury bill rose 7 basis points to 0.08 percent, while yields on the six-month bills rose 10 basis points to 0.16 percent. One-year agency discount note yields climbed 8 basis points to 0.22 percent. The market was still influenced by periodic bouts of risk aversion or other disruptions, with investors, at times, seeking to own short-term Treasury securities, at almost any cost.
Investment Highlights
The U.S. Treasury Securities Cash Fund performed in line with Lipper’s Treasury money market funds for the six months ending June 30, 2012, returning 0.00 percent, the same as the peer group. The U.S. Government Securities Savings Fund performed marginally below the Lipper government-only money market funds, returning 0.00 percent versus 0.01 percent for the peer group.
The U.S. Treasury Securities Cash Fund had a weighted average maturity of 2 days over the six-month period, as overnight repurchase agreements
17
were some of the highest yielding options with the least amount of interest rate risk in the Treasury money market universe.
The U.S. Government Securities Savings Fund followed a short-laddered approach for much of the period and had a weighted average maturity of 17 days over the period. The fund took advantage of higher yields by selectively extending its ladder, but overall the six months continued to be a very difficult environment for money market fund investors.
Current Outlook
The Fed continues its stance to keep interest rates low for an extended period; recent developments reinforced this position. We continue to believe that the Fed will unlikely change course before 2014, with monetary policy likely to remain easy for some time.
18
Tax Free Funds
Management Team’s Perspective
Introduction
The Near-Term Tax Free Fund (NEARX) and the Tax Free Fund (USUTX) seek to provide a high level of current income exempt from federal income taxation and to preserve capital. However, a portion of any distribution may be subject to federal and/or state income taxes. The Near-Term Tax Free Fund will maintain a weighted average maturity of less than five years, while the Tax Free Fund will generally maintain a longer weighted average maturity.
Performance Graphs
Near-Term Tax Free Fund
Average Annual Performance | | For the Periods Ended June 30, 2012 |
| | Six Month | | One Year | | Five Year | | Ten Year | |
Near-Term Tax Free Fund | | 1.55 | % | 3.60 | % | 4.14 | % | 3.38 | % |
Barclays Capital 3-Year Municipal
Bond Index | | 1.29 | % | 2.56 | % | 4.30 | % | 3.43 | % |
Performance data quoted above is historical. Past performance is no guarantee of future results. Current performance may be higher or lower than the performance data quoted. The principal value and investment return of an investment will fluctuate so that an investor’s shares, when redeemed, may be worth more or less than their original cost. The graph and table do not reflect the deduction of taxes that a shareholder would pay on fund distributions or the redemption of fund shares.
Pursuant to a voluntary arrangement, the Adviser has agreed to limit total fund operating expenses (exclusive of any acquired fund fees and expenses, performance fees, taxes, brokerage commissions and interest) to not exceed 0.45%. The Adviser can modify or terminate this arrangement at any time.
See Definitions for Management Teams’ Perspectives for index definitions.
Please visit our website at www.usfunds.com for updated performance information for different time periods.
19
Tax Free Fund

Average Annual Performance | | For the Periods Ended June 30, 2012 |
| | Six Month | | One Year | | Five Year | | Ten Year | |
Tax Free Fund | | 2.81 | % | 7.52 | % | 5.07 | % | 4.26 | % |
Barclays Capital 10-Year Municipal
Bond Index | | 2.68 | % | 10.30 | % | 6.88 | % | 5.62 | % |
Performance data quoted above is historical. Past performance is no guarantee of future results. Current performance may be higher or lower than the performance data quoted. The principal value and investment return of an investment will fluctuate so that an investor’s shares, when redeemed, may be worth more or less than their original cost. The graph and table do not reflect the deduction of taxes that a shareholder would pay on fund distributions or the redemption of fund shares.
Pursuant to a voluntary arrangement, the Adviser has agreed to limit total fund operating expenses (exclusive of any acquired fund fees and expenses, performance fees, taxes, brokerage commissions and interest) to not exceed 0.70%. The Adviser can modify or terminate this arrangement at any time.
See Definitions for Management Teams’ Perspectives for index definitions.
Please visit our website at www.usfunds.com for updated performance information for different time periods.
The Six-Month Period In Review - Economic And Political Issues That Affected The Funds
The municipal bond market exhibited solid performance over the past six months as the Barclays Capital Municipal Bond Index rose 3.66 percent.
Even with more high profile municipal defaults during the first half of this year along with increased media attention to the issue, municipals have performed very well, with a lower number of defaults so far this year compared to the first half of 2011. Most municipal governments are making the tough but necessary changes to balance their budgets.
20
While yields have steadily declined over the first six months, the very long end of the yield curve has been the standout performer, as bonds with maturities of 22 years or more rose by 6.56 percent. Municipal market performance was consistent throughout the yield curve, as returns were more or less tied to maturity. Returns in the first quarter of 2012 roughly matched the returns in the second quarter. We began 2012 with high hopes for the economy but as the months wore on, economic data deteriorated. The constantly ongoing European financial crisis and fears of an economic hard landing in China drove interest rates lower.
Revenue-backed municipals outperformed general obligation credits by a wide margin, driven by hospital and industrial development issues. Credit factors played a sizable role in performance as low-quality outperformed high-quality bonds. AAA-rated municipals rose by 2.21 percent during the year versus 6.71 percent for BBB-rated bonds. High-yield (“junk”) bonds rose an eye-popping 9.65 percent over the past six months.
In specialty state trading, California and Illinois outperformed, while New York and Ohio underperformed.
The Federal Reserve has continued its plan to keep interest rates low through late-2014 and monetary policy loose for an extended period of time. Globally, central banks continue to cut interest rates and ease monetary policy as inflation has slowed considerably and the focus remains on stimulating growth.
Investment Highlights
Over the six months ended June 30, 2012, the Near-Term Tax Free Fund returned 1.55 percent, outperforming its benchmark, the Barclays Capital 3-Year Municipal Bond Index, which returned 1.29 percent. The Tax Free Fund returned 2.81 percent, also outperforming its benchmark, the Barclays Capital 10-Year Municipal Bond Index, which returned 2.68 percent.
The Near-Term Tax Free Fund modestly outperformed the Short-Intermediate Lipper peer group for the past six months, while the Tax Free Fund trailed its respective Lipper peer group. The underperformance of the Tax Free Fund compared to its peers was primarily driven by fund credit and maturity preferences relative to the Lipper peer group. As discussed above, the long-end of the yield curve experienced significant outperformance and low quality and junk bonds significantly outperformed; the fund was positioned more conservatively.
Strengths
· The Tax Free Fund maintained significant exposure to hospital-backed municipals, which outperformed.
21
· The Tax Free Fund benefited from significant exposure to California, Illinois and Texas, which all outperformed.
· The Near-Term Tax Free Fund benefited from significant exposure to Illinois, Texas and Florida which all outperformed.
· From a maturity perspective, the Near-Term Tax Free Fund benefited from a longer maturity profile than its benchmark.
Weaknesses
· Historically, the conservative credit profile of both funds proved to be an asset during volatile periods, but negatively impacted performance in the first six months of the year when bond markets were strong.
· The Tax Free Fund maintained a relatively short maturity/duration profile. This negatively affected performance in relation to its benchmark and peer group, as longer maturities outperformed.
· Bond structure also played a role in performance as the Tax Free Fund had little exposure to long maturities with discount coupon structures, which significantly outperformed.
Current Outlook
Opportunities
· The long-intermediate portion of the yield curve appears to offer the best opportunity in the current market, as the Fed appears sidelined for an extended period. Globally, other central banks have begun easing aggressively, broadly supporting fixed income markets.
Threats
· Continued outperformance of low-quality bonds is the most significant threat on a relative basis.
· When the Fed reverses its monetary policy stance and begins to raise interest rates, the macro environment could become more difficult.
22
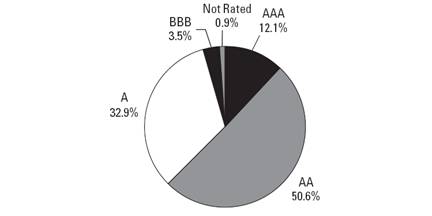
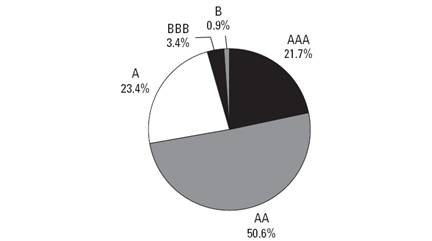
Near-Term Tax Free Fund | | |
Municipal Bond Ratings | | June 30, 2012 |
(Based on Total Municipal Bonds) | | |
Tax Free Fund | | |
Municipal Bond Ratings | | June 30, 2012 |
(Based on Total Municipal Bonds) | | |
23
All American Equity Fund
Management Team’s Perspective
Introduction
The principal objective of the All American Equity Fund (GBTFX) is to seek capital appreciation by investing primarily in a broadly diversified portfolio of domestic common stocks. The fund invests in large-capitalization stocks, while retaining the flexibility to seek out promising individual stock opportunities, including stocks with meaningful dividend yields.
Performance Graph
All American Equity Fund
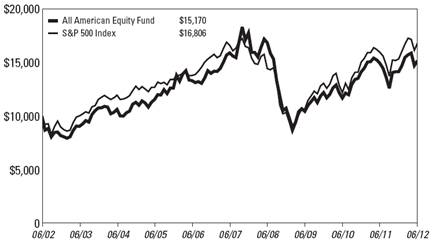
Average Annual Performance | | For the Periods Ended June 30, 2012 |
| | Six Month | | One Year | | Five Year | | Ten Year | |
All American Equity Fund | | 7.17 | % | 1.68 | % | (0.95 | )% | 4.25 | % |
S&P 500 Index | | 9.49 | % | 5.45 | % | 0.22 | % | 5.32 | % |
Performance data quoted above is historical. Past performance is no guarantee of future results. Current performance may be higher or lower than the performance data quoted.The principal value and investment return of an investment will fluctuate so that an investor’s shares, when redeemed, may be worth more or less than their original cost. The graph and table do not reflect the deduction of taxes that a shareholder would pay on fund distributions or the redemption of fund shares.
Pursuant to a voluntary arrangement, the Adviser has agreed to limit total fund operating expenses (exclusive of any acquired fund fees and expenses, performance fees, taxes, brokerage commissions and interest) to not exceed 2.20%. The Adviser can modify or terminate this arrangement at any time.
See Definitions for Management Teams’ Perspectives for index definitions.
Please visit our website at www.usfunds.com for updated performance information for different time periods.
24
The Six-Month Period In Review - Economic And Political Issues That Affected The Fund
U.S. real GDP grew 1.9 percent in the first quarter and 1.5 percent in the second quarter. This weak growth has been driven largely by a rapidly slowing European economy and also a larger than expected slowdown in China. Manufacturing indicators in the U.S. had held up well and have been a source of strength until recently when the ISM Manufacturing Composite Index fell into contraction territory for the first time in three years.
After showing some improvement early in the year, the employment picture deteriorated quickly, with a sharp slowdown in nonfarm payroll growth in the second quarter of 2012. America’s unemployment rate in June 2012 was 8.2 percent. There were bright spots for the economy, including the fact that a housing recovery appears to be underway.
Inflation in the U.S. has trended lower through the first six months of the years and this has been a global phenomenon. The Federal Reserve remains much more concerned about deflation as economic weakness in Europe and Asia is likely to put downward pressure on global inflation. The Fed has kept its short-term interest rate target in a range of zero to 0.25 percent, which is unchanged for 2012.
The political environment in the U.S. remained one of strongly divided partisan debates, with the Democrats controlling the Presidency and the Senate, while the Republicans controlled the House of Representatives.
However, extreme volatility, fears of an economic hard landing in China, and the deteriorating European financial crisis provided a headwind throughout the first half of 2012. The S&P 500 Index rose 9.49 percent in the first six months of the year.
Investment Highlights
Overview
The All American Equity Fund returned 7.17 percent for the six months ended June 30, 2012, underperforming the 9.49 percent return for the benchmark S&P 500 Index.
Because the fund is actively managed and holding period is generally not a consideration in investment decisions, the portfolio turnover rate may fluctuate from year to year as the fund adjusts its portfolio composition. The fund’s annual portfolio turnover was, and is expected to continue to be, more than 100 percent.
25
Strengths
· The fund’s allocations to energy, consumer staples and telecommunication services sectors positively contributed to relative performance. The fund’s stock selection in energy, consumer staples and materials was particularly strong.
· Industry groups that were standout performers for the fund included chemicals, machinery and pharmaceuticals.
· Apple, Inc.,(1) Monster Beverage Corp.(2) and Starbucks Corp.(3) were among the best positive contributors to performance.
Weaknesses
· The fund’s allocations to financials and technology were negative contributors to relative performance. The fund’s stock selection within the financial sector was the primary driver of underperformance.
· The fund’s exposure to dividend-paying stocks over the past six months, while positive, trailed the broader market, which appreciated sharply in the first half of the year.
· Defensive option strategies did not aid fund performance over the past six months as the market rallied strongly, particularly during the first few months of the period.
· Las Vegas Sands Corp.,(4)��F5 Networks, Inc.(5) and Seagate Technology plc(6) were among the worst individual contributors to performance.
Current Outlook
Opportunities
· The U.S. economy has been surprisingly resilient during the past six months, and the global monetary easing cycle continues, which should be positive for equities in 2012.
· Corporate cash levels continue to remain high, providing corporations the ability to pursue mergers and acquisitions (M&A). An increase in M&A activity holds promise for both portfolio gains and an increase in overall market valuations.
· Low interest rates, if continued throughout 2012, should provide a favorable backdrop for the economy and stock prices.
· Dividend-paying stocks remain attractive as higher yielding investments. As of June 30, 2012, half of the companies in the S&P 500 Index pay a dividend at an annualized rate greater than the yield on the 10-year Treasury.
26
Threats
· Europe is widely believed to be in a recession, and fiscal austerity both at home and abroad will continue to be headwinds in the second half of 2012.
· An economic “hard landing” remains a risk as China has been a significant driver of global growth in recent years.
· Government policy delays or outright missteps are a threat to global equity markets.
The fund ended the period with higher-than-normal cash positions that should enable the fund to take advantage of opportunities as they arise. The fund maintains an emphasis on dividend-paying stocks.
(1)This security comprised 3.43% of the fund’s total net assets as of 06/30/12.
(2)This security comprised 1.64% of the fund’s total net assets as of 06/30/12.
(3)This security comprised 1.88% of the fund’s total net assets as of 06/30/12.
(4)This security comprised 2.54% of the fund’s total net assets as of 06/30/12.
(5)The fund did not hold this security as of 06/30/12.
(6)This security comprised 0.87% of the fund’s total net assets as of 06/30/12.
27
Top 10 Holdings Based on Net Assets | | June 30, 2012 |
(excluding repurchase agreement) | |
MasterCard, Inc.
Commercial Services - Financial | | 3.79 | % |
Apple, Inc.
Computers | | 3.43 | % |
Intel Corp.
Electronic Components - Semiconductors | | 2.66 | % |
Las Vegas Sands Corp.
Casino Hotels | | 2.54 | % |
Questcor Pharmaceuticals, Inc.
Therapeutics | | 2.50 | % |
The Fresh Market, Inc.
Food - Retail | | 1.89 | % |
Starbucks Corp.
Retail - Restaurants | | 1.88 | % |
Tangoe, Inc.
Applications Software | | 1.88 | % |
Bally Technologies, Inc.
Casino Services | | 1.65 | % |
Monster Beverage Corp.
Beverages - Non-alcoholic | | 1.64 | % |
TOTAL TOP TEN HOLDINGS | | 23.86 | % |
Portfolio Allocation by Industry Sector* | | June 30, 2012 |
Based on Total Investments | |
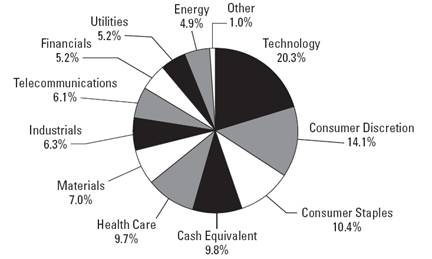
* Summary information above may differ from the portfolio schedule included in the financial statements due to the use of different classifications of securities for presentation purposes.
28
Holmes Growth Fund
Management Team’s Perspective
Introduction
The Holmes Growth Fund (ACBGX) invests in companies with good growth prospects and strong positive earnings momentum. The fund’s primary objective is to seek long-term capital appreciation.
Performance Graph
Holmes Growth Fund
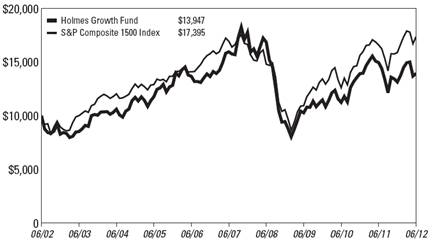
Average Annual Performance | | For the Periods Ended June 30, 2012 |
| | Six Month | | One Year | | Five Year | | Ten Year | |
Holmes Growth Fund | | 6.07 | % | (6.88 | )% | (2.66 | )% | 3.38 | % |
S&P Composite 1500 Index | | 9.33 | % | 4.66 | % | 0.49 | % | 5.69 | % |
Performance data quoted above is historical. Past performance is no guarantee of future results. Current performance may be higher or lower than the performance data quoted. The principal value and investment return of an investment will fluctuate so that an investor’s shares, when redeemed, may be worth more or less than their original cost. The graph and table do not reflect the deduction of taxes that a shareholder would pay on fund distributions or the redemption of fund shares.
Pursuant to a voluntary arrangement, the Adviser has agreed to limit total fund operating expenses (exclusive of any acquired fund fees and expenses, performance fees, taxes, brokerage commissions and interest) to not exceed 2.20%. The Adviser can modify or terminate this arrangement at any time.
See Definitions for Management Teams’ Perspectives for index definitions.
Please visit our website at www.usfunds.com for updated performance information for different time periods.
29
The Six-Month Period In Review - Economic And Political Issues That Affected The Fund
The economy began the year with some positive momentum as employment indicators were improving, retail sales were generally better than expected, housing-related activity was picking up and manufacturing was resilient.
Over the past couple of months, there has been a marked deceleration in economic activity with sharply slower growth out of Europe which has caused negative reverberations across the globe, particularly in China. We live in a global marketplace today and disruptions around the world have impacted many U.S.-based companies. This was reflected in the stock market in May.
Economic activity began faltering in the second quarter, with poor employment readings, weakening retail sales and the ISM Manufacturing Composite Index falling into contraction territory for the first time in three years.
After peaking in late summer 2011, U.S. inflation has trended lower for the past six months. Generally speaking, this has also been the case on a global basis, allowing central bankers around the world to shift their focus from fighting inflation to stabilizing and promoting economic growth. We have seen broad-based easing policies from the world’s central banks, which recognize that the margin for error in preventing a broad-based global recession is very low.
The Federal Reserve has kept its short-term interest rate target in a range of zero to 0.25 percent, unchanged during the past six months. The Fed remains committed to continuing its current accommodative policies and may even provide additional stimulus in the second half of 2012.
The U.S. political environment remains strongly divided and the sunset of Bush-era tax rates and spending cuts looming on January 1, 2013, may cause a significant negative fiscal shock to the U.S. economy unless action is taken. With the upcoming presidential election adding to uncertainty, it is difficult to determine whether a resolution can be reached by year end.
Despite the uncertainty, the fund’s benchmark, the S&P Composite 1500 Index, rose 9.33 percent over the past six months.
30
Investment Highlights
Overview
The fund rose 6.07 percent over the past six months, underperforming the benchmark, the S&P Composite 1500 Index, which returned 9.33 percent. The fund performed well early in the year, but growth-oriented stocks underperformed over the past couple of months. Defensive areas of the market outperformed, allowing the benchmark to catch up and surpass the fund’s performance.
Because the fund is actively managed and holding period is generally not a consideration in investment decisions, the portfolio turnover rate may fluctuate from year to year as the fund adjusts its portfolio composition. The fund’s annual portfolio turnover was, and is expected to continue to be, more than 100 percent.
Strengths
· The fund benefited from being underweight in the consumer staples, utilities and energy sectors, as those areas underperformed.
· Industry groups that were standout performers for the fund included pharmaceuticals, aerospace & defense and beverages.
· Apple, Inc.,(1) Ulta Salon Cosmetics & Fragrance, Inc.(2) and Monster Beverage Corp.(3) were among the best positive contributors to performance.
Weaknesses
· Mega-capitalization stocks outperformed over the past six months, with the S&P 100 Index rising by 10.56 percent. The fund was relatively underweight this market cap group, as its holdings include mid- and small-cap companies, which underperformed not only the S&P 100 but the S&P 1500.
· Cash and defensive option positions were a drag on performance as the market rallied strongly during the past six months.
· Investments in Body Central Corp.(2) and Las Vegas Sands Corp.(4) failed to live up to expectations and were among the worst contributors to the fund’s performance. The fund’s largest holding, Newfoundland Capital Corp., Ltd.(5) also underperformed, falling by 2.95 percent during the period.
31
Current Outlook
Opportunities
· The U.S. economy has been the relative bright spot in the global economy; companies with domestic exposure could outperform. We are now six months or so into a global easing cycle, which should be good for equities for the remainder of 2012.
· Corporate cash levels are high, providing corporations the ability to pursue mergers and acquisitions (M&A). An increase in M&A activity holds promise for both portfolio gains and an increase in overall market valuations.
· At the end of the period, the fund maintained a higher than normal level of cash, which the fund can opportunistically deploy.
Threats
· Fiscal austerity in the U.S. and abroad will continue to create economic headwinds.
· China’s decelerating economic growth remains a risk to the global economy.
· Continued outperformance of mega-cap stocks is a threat to the fund’s relative performance as the fund is relatively underweight this market cap group.
(1)This security comprised 4.08% of the fund’s total net assets as of 06/30/12.
(2)The fund did not hold this security as of 06/30/12.
(3)This security comprised 1.56% of the fund’s total net assets as of 06/30/12.
(4)This security comprised 2.65% of the fund’s total net assets as of 06/30/12.
(5)This security comprised 7.02% of the fund’s total net assets as of 06/30/12.
32
Top 10 Holdings Based on Net Assets | | June 30, 2012 |
(excluding repurchase agreement) | |
Newfoundland Capital Corp., Ltd.
Radio | | 7.02 | % |
Apple, Inc.
Computers | | 4.08 | % |
MasterCard, Inc.
Commercial Services - Financial | | 3.24 | % |
Intel Corp.
Electronic Components - Semiconductors | | 2.90 | % |
Polaris Industries, Inc.
Recreational Vehicles | | 2.87 | % |
Alexion Pharmaceuticals, Inc.
Medical - Biomedical/Gene | | 2.77 | % |
Dunkin’ Brands Group, Inc.
Retail - Restaurants | | 2.69 | % |
Tangoe, Inc.
Applications Software | | 2.68 | % |
Questcor Pharmaceuticals, Inc.
Therapeutics | | 2.68 | % |
Las Vegas Sands Corp.
Casino Hotels | | 2.65 | % |
TOTAL TOP TEN HOLDINGS | | 33.58 | % |
Portfolio Allocation by Industry Sector* | | June 30, 2012 |
Based on Total Investments | |
* Summary information above may differ from the portfolio schedule included in the financial statements due to the use of different classifications of securities for presentation purposes.
33
Global MegaTrends Fund
Management Team’s Perspective
Introduction
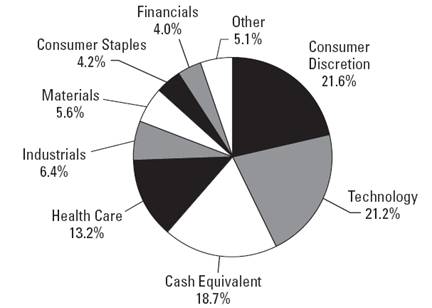
The Global MegaTrends Fund (MEGAX and MEGIX) focuses on companies that are well positioned to benefit from substantial and sustainable growth that may occur over a multi-year time frame. The fund considers a broad range of investable opportunities, many of which are created by government policies, technological innovations and/or changes in market fundamentals for a product, service or commodity. The fund has the flexibility to invest globally and within any sector of the economy.
Performance Graph
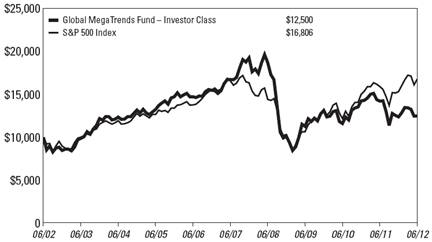
Global MegaTrends Fund
Average Annual Performance | | For the Periods Ended June 30, 2012 |
| | Six Month | | One Year | | Five Year | | Ten Year | | Since Inception
(Institutional
Class) | |
Global MegaTrends Fund - Investor Class | | 0.78 | % | (12.24 | )% | (5.71 | )% | 2.25 | % | n/a | |
Global MegaTrends Fund - Institutional Class (Inception 3/1/10) | | 0.79 | % | (12.12 | )% | n/a | | n/a | | (0.22 | )% |
S&P 500 Index | | 9.49 | % | 5.45 | % | 0.22 | % | 5.32 | % | 11.20 | % |
Performance data quoted above is historical. Past performance is no guarantee of future results. Current performance may be higher or lower than the performance data quoted. The principal value and investment return of an investment will fluctuate so that an investor’s shares, when redeemed, may be worth more or less than their original cost. The graph and table do not reflect the deduction of taxes that a shareholder would pay on fund distributions or the redemption of fund shares.
Pursuant to a voluntary arrangement, the Adviser has agreed to limit total fund operating expenses (exclusive of any acquired fund fees and expenses, performance fees, taxes, brokerage commissions and interest) to not exceed 2.35% for the Investor Class. Also pursuant to a voluntary agreement, the Adviser has agreed to waive all class specific expenses of the Institutional Class. The Adviser can modify or terminate these arrangements at any time.
See Definitions for Management Teams’ Perspectives for index definitions.
Please visit our website at www.usfunds.com for updated performance information for different time periods.
34
The Six-Month Period In Review - Economic And Political Issues That Affected The Fund
Political and economic considerations are very influential on the investment climate in which the Global MegaTrends Fund operates.
Continuing negative news surrounding the European sovereign debt crisis and weakening global growth negatively affected market sentiment in the first half of the year. This further increased investor risk-aversion, especially toward emerging markets equities and foreign currencies. This was a significant driver for the underperformance of international equities compared to domestic stocks in the fund’s portfolio during the period.
Additionally, commodity- and infrastructure-related companies lagged the broader U.S. market as uncertainty regarding future capital spending plans increased and fears over slowing growth in China gained momentum. In response, China cut its bank reserve requirements and one-year lending rate twice by the middle of the year to avoid further economic deterioration.
Moreover, there has been a global synchronized effort to increase economic stimulus across the globe to offset Europe’s economic contagion.
Investment Highlights
Overview
In the first six months of 2012, the Investor Class of the fund returned 0.78 percent and the Institutional Class posted a return of 0.79 percent. The benchmark S&P 500 Index returned 9.49 percent.
Because the fund is actively managed and holding period is generally not a consideration in investment decisions, the portfolio turnover rate may fluctuate from year to year as the fund adjusts its portfolio composition. The fund’s annual portfolio turnover was, and is expected to continue to be, more than 100 percent.
Strengths
· Top contributors to fund performance in the first half the year included telecommunications and utility stocks as investors sought high dividend yields. AT&T, Inc.,(1) Verizon Communications, Inc.,(2) Suez Environment S.A.(3) and National Grid plc(3) provided strong contributions to fund performance.
35
· In energy, the fund benefited from exposure to Master Limited Partnerships (MLPs) with holdings in Enterprise Products Partners, L.P.(4) and Atlas Energy L.P.(5) The addition of an oil services and equipment stock, National-Oilwell Varco, Inc.,(3) also contributed to fund returns.
· Select international stocks such as Life Healthcare Group Holdings Ltd.,(3) based in South Africa, and PetroMagdalena Energy Corp.(3) from Colombia outperformed the S&P 500 Index.
· Early positions in the period involving cyclical stocks such as Caterpillar, Inc.,(3) Cummins, Inc.,(3) Freeport-McMoRan Copper & Gold, Inc.(3) and CF Industries Holdings, Inc.(3) added to performance.
Weaknesses
· The fund’s underperformance compared to the benchmark S&P 500 Index was mainly a result of sector allocation and stock selection in both domestic and international areas.
· The most negative impact for the fund came from exposure to the industrials sector, which was the third worst performer in the S&P 500. Vitran Corp., Inc.,(3) PT United Tractors Tbk,(3) Primoris Services Corp.(3) and Cascade Corp.(3) were industrials that underperformed for the fund.
· Foreign equities underperformed the S&P 500 Index in the first half of 2012. Historically, the portfolio carries significant exposure to developing economies because of their long-term growth opportunities, but this exposure created a short-term headwind for performance during the period.
· Poor performance relative to the S&P 500 Index was also partially due to the fund’s underweight allocation to the U.S. consumer staples and technology, which outperformed the benchmark.
Current Outlook
Opportunities
· At present, we believe the following investable trends will be multi-year themes:
1. Real Estate Investment Trusts (REITs) and Master Limited Partnerships (MLPs) are in a primary uptrend. Investors are searching for yield and dividend growth in an environment of sub-two percent Treasury yields.
2. The telecom and utility sectors are capitalizing on the current trends of high dividend income, pricing power and visible revenue growth in a competitive global economy.
36
3. The consumer staples sector is benefiting from the globalization of U.S. brand name products abroad, above-average returns on capital and consistent growth.
· A number of government policy actions initiated recently involving rate cuts from the European Central Bank and the Bank of China, along with more quantitative easing from the Bank of England, should be supportive for the economy and equities heading into the second half of the year.
Threats
· While policymakers in Europe have made strides to stabilize the current debt crisis, contagion risks remain, which could lead to a liquidity shock similar to 2008.
· China cut interest rates for the second time as of July 5, 2012, likely indicating that conditions on the ground remain challenging to restart its country’s economic growth.
(1)This security comprised 2.05% of the fund’s total net assets as of 06/30/12.
(2)This security comprised 2.03% of the fund’s total net assets as of 06/30/12.
(3)The fund did not hold this security as of 06/30/12.
(4)This security comprised 1.65% of the fund’s total net assets as of 06/30/12.
(5)This security comprised 1.08% of the fund’s total net assets as of 06/30/12.
37
Top 10 Holdings Based on Net Assets | | June 30, 2012 |
(excluding repurchase agreement) | |
Pacific Stone Tech, Inc.
Quarrying | | 3.96 | % |
TJX Cos, Inc.
Retail - Major Department Store | | 2.59 | % |
Ross Stores, Inc.
Retail - Apparel/Shoe | | 2.51 | % |
Pacific Infrastructure, Inc.
Real Estate Operating/Development | | 2.49 | % |
Southern Co.
Electric - Integrated | | 2.36 | % |
NuStar Energy L.P.
Pipelines | | 2.22 | % |
AES Corp.
Electric - Generation | | 2.15 | % |
Exelon Corp.
Electric - Integrated | | 2.07 | % |
AT&T, Inc.
Telephone - Integrated | | 2.05 | % |
PPL Corp.
Electric - Integrated | | 2.04 | % |
TOTAL TOP TEN HOLDINGS | | 24.44 | % |
Portfolio Allocation by Industry Sector* | | June 30, 2012 |
Based on Total Investments | |

* Summary information above may differ from the portfolio schedule included in the financial statements due to the use of different classifications of securities for presentation purposes.
38
Global Resources Fund
Management Team’s Perspective
Introduction
The Global Resources Fund (PSPFX and PIPFX) is a non-diversified natural resources fund with the principal objective of achieving long-term growth of capital while providing protection against inflation and monetary instability. The fund invests globally in companies involved in the exploration, production, transportation and processing of petroleum, natural gas, industrial commodities, metals, minerals and forestry.
Performance Graph
Global Resources Fund
Average Annual Performance | | For the Periods Ended June 30, 2012 |
| | Six Month | | One Year | | Five Year | | Ten Year | | Since Inception
(Institutional
Class) | |
Global Resources Fund - Investor Class | | (2.35 | )% | (19.03 | )% | (3.90 | )% | 15.33 | % | n/a | |
Global Resources Fund - Institutional Class (Inception 3/1/10) | | (2.13 | )% | (18.62 | )% | n/a | | n/a | | 4.52 | % |
S&P 500 Index | | 9.49 | % | 5.45 | % | 0.22 | % | 5.32 | % | 11.20 | % |
Morgan Stanley Commodity Related Equity Index | | (6.14 | )% | (20.31 | )% | 2.56 | % | 12.98 | % | 1.79 | % |
Performance data quoted above is historical. Past performance is no guarantee of future results. Current performance may be higher or lower than the performance data quoted. The principal value and investment return of an investment will fluctuate so that an investor’s shares, when redeemed, may be worth more or less than their original cost. The graph and table do not reflect the deduction of taxes that a shareholder would pay on fund distributions or the redemption of fund shares.
Pursuant to a voluntary arrangement, the Adviser has agreed to limit total fund operating expenses (exclusive of any acquired fund fees and expenses, performance fees, taxes, brokerage commissions and interest) to not exceed 1.90% for the Investor Class. Also pursuant to a voluntary agreement, the Adviser has agreed to waive all class specific expenses of the Institutional Class. The Adviser can modify or terminate these arrangements at any time.
See Definitions for Management Teams’ Perspectives for index definitions.
Please visit our website at www.usfunds.com for updated performance information for different time periods.
39
The Six Month Period In Review - Economic And Political Issues That Affected The Fund
Similar to last year, early equity market gains came under pressure by mid-year, as investor risk aversion to the possibility of a sovereign debt default in Europe increased. Additionally, a series of data points indicating a deceleration in China’s economy pressured emerging market stocks. Consequently, capital flowed out of risky assets and strengthened the U.S. dollar, which weighed on commodity prices. This was a significant driver for the underperformance of international equities versus U.S. stocks in the portfolio during the period. The S&P 500 Index gained 9.49 percent in the first half of 2012. The MSCI Emerging Markets Index underperformed the S&P 500 Index by over 500 basis points in the period, and the S&P GSCI Total Return Index declined 7.23 percent.
Given the ongoing global economic headwinds, as well as heightened investor risk aversion, the fund maintained a relatively balanced weighting between the energy and basic materials sectors in the portfolio. Fund management also held a higher weighting in large capitalization domestic resource companies.
Investment Highlights
Overview
For the six-month period ended June 30, 2012, the Investor Class of the Global Resources Fund declined 2.35 percent and the Institutional Class declined 2.13 percent, outperforming the fund’s benchmark, the Morgan Stanley Commodity Related Equity Index (CRX), which declined 6.14 percent.
Because the fund is actively managed and holding period is generally not a consideration in investment decisions, the portfolio turnover rate may fluctuate from year to year as the fund adjusts its portfolio composition. The fund’s annual portfolio turnover was, and is expected to continue to be, more than 100 percent.
Strengths
· Stock selection in the oil exploration industry boosted returns in the quarter with junior oil company Africa Oil Corp.(1) gaining nearly 400% on news of a sizeable oil discovery in a new basin in Kenya.
· The U.S. housing market appears to be recovering and the fund’s holdings in the new housing construction area performed well in the first half of the year. The fund benefited from gains in timber and forest stocks
40
including Weyerhaeuser Co.,(2) Plum Creek Timber Co., Inc.(3) and West Fraser Timber Co., Ltd.(4)
· Merger and acquisition activity in the natural resources sector slowed in the first half of 2012. However, the fund benefited from several transactions including the Glencore International plc(5) bid for Viterra, Inc.,(5) a Canadian-based grains processor, and a junior oil and gas exploration company in Colombia, PetroMagdelena Energy Corp.,(5) which was acquired by Pacific Rubiales Energy Corp.(6)
Weaknesses
· After a strong start to the year, oil prices fell to multi-year lows by May on economic slowdown concerns and easing of geo-political risk related to Iran. Natural gas prices in the U.S. also fell to 12-year lows on oversupply. Both of these factors weighed on upstream oil and gas stocks and oil services and equipment stocks in the first half, including Nabors Industries Ltd.,(7) SM Energy Co.(8) and HRT Participacoes Em Petroleo S.A.(5)
· Investor risk aversion continued to weigh on performance of junior exploration stocks through the first half. The S&P/TSX Venture Composite Index declined 19.85 percent, well below the 6.14 percent losses of the CRX Index. The portfolio has meaningful exposure to junior exploration stocks, and this overweighting created underperformance relative to the benchmark.
· Despite gold prices gaining more than 2 percent, precious metals stocks fell in the first six months, with the NYSE Arca Gold Miners Index down 12.72 percent. Our holdings in Coeur d’Alene Mines Corp.,(5) Randgold Resources Ltd.(5) and Gran Colombia Gold Corp.(9) contributed to losses.
Current Outlook
Opportunities
· Copper looks relatively attractive versus many other base metals as the refined copper industry is expected to be short in supply for another consecutive year in 2012. While demand growth expectations have been tempered, bringing on new capacity has been a challenge to the industry in recent years. Usage of copper stockpiles in China, the world’s largest copper consumer, has whittled down inventories to low levels, and the global stocks-to-use ratio remains tight, at roughly two weeks. Any unanticipated increase in demand for the remainder of 2012 could quickly tighten the market and push prices higher. We remain bullish on copper miners with solid balance sheets that can fund growth projects from cash flow.
41
· With the rapid development of North American oil and gas shale basins, including the Marcellus in Pennsylvania, the Eagle Ford in Texas and the Bakken in North Dakota, infrastructure constraints are being alleviated with new investment in assets to gather, process and transport growing oil and gas volumes. We believe certain Master Limited Partnerships (MLPs) with attractive assets and geographic locations will continue to allow investors to reap the benefits of the prolific development of shale plays in the U.S. and Canada.
· The agricultural and fertilizer sector remains promising. The growing middle class through emerging markets continues to consume more grains, principally through the production of more meat. While we have seen a surge in the production of grains, no additional farmland has been created. Therefore, one of the key ways we’re seeing increased yields out of crop lands is through the increased application of fertilizers. This has provided a boost in demand for nutrients such as potash, nitrogen and phosphate. The stock prices of agricultural chemicals companies were mixed in the first half of 2012 as expectations of volume growth were trimmed. However, recent price spikes in corn, wheat, and soy beans due to global drought conditions in key farming regions have provided a boost to potential application volumes. Farming economics remain very healthy given historically high grain prices, and we think earnings estimates will begin to move higher in 2012, driving the stocks higher as well.
Threats
· Further deterioration of the European debt crisis could result in a significant decline in global economic activity.
· A potential “hard landing” in China concerning economic growth could negatively impact incremental demand for many commodities. These risks include a chronic power shortage, auto sales deceleration, weak manufacturing sector data, property market corrections and monetary tightening.
(1)This security comprised 0.69% of the total net assets of the fund as of 06/30/12.
(2)This security comprised 0.10% of the total net assets of the fund as of 06/30/12.
(3)This security comprised 2.02% of the total net assets of the fund as of 06/30/12.
(4)This security comprised 2.47% of the total net assets of the fund as of 06/30/12.
(5)The fund did not hold this security at 06/30/12.
(6)This security comprised 0.04% of the total net assets of the fund as of 06/30/12.
(7)This security comprised 0.27 % of the total net assets of the fund as of 06/30/12.
(8)This security comprised 0.01% of the total net assets of the fund as of 06/30/12.
(9)This security comprised 1.40% of the total net assets of the fund as of 06/30/12.
42
Top 10 Holdings Based on Net Assets | | June 30, 2012 |
(excluding repurchase agreement) | |
Tyson Foods, Inc.
Food - Meat Products | | 2.78 | % |
HollyFrontier Corp.
Oil Refining & Marketing | | 2.65 | % |
West Fraser Timber Co., Ltd.
Forestry | | 2.47 | % |
Marathon Petroleum Corp.
Oil Companies - Integrated | | 2.33 | % |
Weyerhaeuser Co.
Real Estate Investment Trusts | | 2.22 | % |
Compass Minerals International, Inc.
Quarrying | | 2.20 | % |
Monsanto Co.
Agricultural Chemicals | | 2.19 | % |
Yamana Gold, Inc.
Gold Mining | | 2.18 | % |
Enterprise Products Partners, L.P.
Pipelines | | 2.16 | % |
Southern Copper Corp.
Metal - Copper | | 2.10 | % |
TOTAL TOP TEN HOLDINGS | | 23.28 | % |
43
Portfolio Allocation by Industry Sector* | | June 30, 2012 |
Based on Total Investments | |
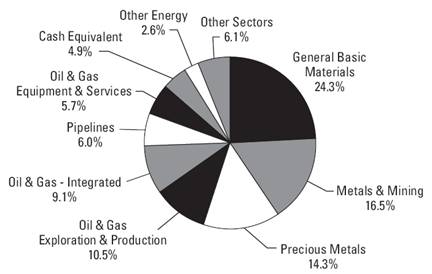
Energy: | | | | | |
Oil & Gas Exploration & Production | | 10.5 | % | | |
Oil & Gas - Integrated (includes Refining and Marketing) | | 9.1 | % | | |
Pipelines | | 6.0 | % | | |
Oil & Gas Equipment & Services | | 5.7 | % | | |
Other Energy | | 2.6 | % | | |
Total Energy | | | | 33.9 | % |
Basic Materials: | | | | | |
Precious Metals (includes Gold/Silver Mining and Platinum) | | 14.3 | % | | |
General Basic Materials | | 24.3 | % | | |
Metals & Mining (includes Copper and Coal) | | 16.5 | % | | |
Total Basic Materials | | | | 55.1 | % |
Other Sectors | | | | 6.1 | % |
Repurchase Agreement | | | | 4.9 | % |
| | | | 100.0 | % |
* Summary information above may differ from the portfolio schedule included in the financial statements due to the use of different classifications of securities for presentation purposes.
44
Precious Metals and Minerals Funds
Management Team’s Perspective
Introduction
The World Precious Minerals Fund (UNWPX and UNWIX) and the Gold and Precious Metals Fund (USERX) pursue an objective of long-term capital growth through investments in gold, precious metals and minerals companies. The Gold and Precious Metals Fund focuses on the equity securities of established gold and precious metals companies and pursues current income as a secondary objective. The World Precious Minerals Fund focuses on equity securities of companies principally engaged in the exploration, mining and processing of precious minerals such as gold, silver, platinum and diamonds. Although this fund has the latitude to invest in a broad range of precious minerals, it currently remains focused on the gold sector.
Performance Graphs
World Precious Minerals Fund
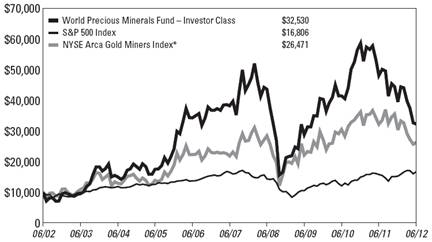
Average Annual Performance | For the Periods Ended June 30, 2012 |
| | Six Month | | One Year | | Five Year | | Ten Year | | Since Inception
(Institutional
Class) | |
World Precious Minerals Fund - Investor Class | | (18.29 | )% | (32.81 | )% | (3.31 | )% | 12.51 | % | n/a | |
World Precious Minerals Fund - Institutional Class (Inception 3/1/10) | | (18.02 | )% | (32.45 | )% | n/a | | n/a | | (8.41 | )% |
S&P 500 Index | | 9.49 | % | 5.45 | % | 0.22 | % | 5.32 | % | 11.20 | % |
NYSE Arca Gold Miners Index* | | (13.42 | )% | (18.33 | )% | 3.75 | % | 10.21 | % | 0.15 | % |
* These are not total returns. These returns reflect simple appreciation only and do not reflect dividend reinvestment.
Performance data quoted above is historical. Past performance is no guarantee of future results. Current performance may be higher or lower than the performance data quoted. The principal value and investment return of an investment will fluctuate so that an investor’s shares, when redeemed, may be worth more or less than their original cost. The graph and table do not reflect the deduction of taxes that a shareholder would pay on fund distributions or the redemption of fund shares.
Pursuant to a voluntary arrangement, the Adviser has agreed to limit total fund operating expenses (exclusive of any acquired fund fees and expenses, performance fees, taxes, brokerage commissions and interest) to not exceed 1.90% for the Investor Class. Also pursuant to a voluntary agreement, the Adviser has agreed to waive all class specific expenses of the Institutional Class. The Adviser can modify or terminate these arrangements at any time.
See Definitions for Management Teams’ Perspectives for index definitions.
Please visit our website at www.usfunds.com for updated performance information for different time periods.
45
Gold and Precious Metals Fund
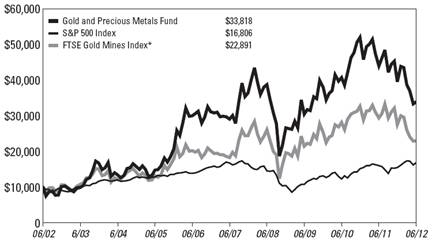
Average Annual Performance | For the Periods Ended June 30, 2012 |
| | Six Month | | One Year | | Five Year | | Ten Year | |
Gold and Precious Metals Fund | | (14.27 | )% | (22.95 | )% | 3.14 | % | 12.95 | % |
S&P 500 Index | | 9.49 | % | 5.45 | % | 0.22 | % | 5.32 | % |
FTSE Gold Mines Index* | | (16.56 | )% | (21.88 | )% | 4.72 | % | 8.62 | % |
* These are not total returns. These returns reflect simple appreciation only and do not reflect dividend reinvestment.
Performance data quoted above is historical. Past performance is no guarantee of future results. Current performance may be higher or lower than the performance data quoted. The principal value and investment return of an investment will fluctuate so that an investor’s shares, when redeemed, may be worth more or less than their original cost. The graph and table do not reflect the deduction of taxes that a shareholder would pay on fund distributions or the redemption of fund shares.
Pursuant to a voluntary arrangement, the Adviser has agreed to limit total fund operating expenses (exclusive of any acquired fund fees and expenses, performance fees, taxes, brokerage commissions and interest) to not exceed 1.90%. The Adviser can modify or terminate this arrangement at any time.
See Definitions for Management Teams’ Perspectives for index definitions.
Please visit our website at www.usfunds.com for updated performance information for different time periods.
The Six-Month Period In Review - Economic And Political Issues That Affected The Funds
Gold markets started the year very strong: through February 28, gold bullion gained 14.1 percent and the NYSE Arca Gold Miners Index climbed 11.4 percent. Sentiment improved enough that Pan American Silver Corp.(1) announced it was going to acquire Minefinders Corp.(2) for C$1.5 billion, representing a 36 percent premium.
46
However, on February 29, Federal Reserve Chairman Ben Bernanke’s address hinted to the markets that a new round of quantitative easing was not in the cards for the short-term as the economy appeared to be improving. The news sent gold plummeting nearly 5 percent in one day and seemed to set the tone for the next four months, as successive rallies in gold only fell to new lows.
Gold’s decline during March was also exacerbated by India’s nationwide jewelers’ strike to protest a tax on non-branded ornaments. The country was the world’s second-largest bullion consumer in the fourth quarter of 2011. Gold imports into India tumbled more than 55 percent in March. The Bombay Bullion Association noted that the country imported just 15 to 20 tons of gold in March as compared to the 45 to 55 tons that is usually imported on a monthly basis. The high price of the precious metal in rupee terms also deterred from new purchases in the first quarter.
The combined jewelers’ strike in India plus the comments from the Federal Reserve sent many gold stocks to 52-week lows in April. In addition, a large fund complex in Canada had a change in ownership, and subsequently, sold off its shares of gold-mining and oil stocks.
After reversing a trend of selling gold for about a decade, central banks were strong accumulators of bullion during the first half of the year. The World Gold Council estimates that, as of the end of the first quarter of 2012, central banks have purchased almost 300 tons of gold over the trailing year, led by the central banks of Turkey (93 tons), Russia (85 tons) and Thailand (44 tons). This equates to approximately 11 percent of world mine production and continues to be a significant change from the past, when central banks were net sellers of 400-500 tons annually.
Chinese gold imports from Hong Kong totaled 239 tons in the first four months of the year, up a staggering 782 percent year-over-year. David Rosenberg of Gluskin Sheff astutely observed that the central banks know that the need to inflate massively in coming years is going to make the yellow metal an increasingly desirable asset.
The deputy chief executive officer of Turkey’s biggest bank by assets said it planned to collect $1 billion of gold in its deposit accounts by the end of the year. It is believed that as much as 5,000 metric tons of gold are stored in homes in Turkey. Gold deposit accounts have surged to 13.6 billion liras ($7.4 billion) from 3.1 billion liras within the past year, according to data released by the banking regulator. Gold has always been seen as money and as a store of wealth in Turkey, and now the country is leading the way with regards to the remonetization of gold in the 21st century.
47
Share prices of many gold companies continue to trade at depressed levels. Fred Hickey, who writes The High-Tech Strategist investment newsletter, noted recently that while China is a major buyer of gold bullion, the country rarely buys gold mining stocks. He attributed this as one of the main reasons for the record gap in the performance of gold versus the gold mining stocks. While many believe that the U.S. dollar is a haven today, Mr. Hickey believes that eventually investors will be searching for ways to own gold and the cheapest way to own gold is by owning gold stocks.
Investment Highlights
For the six months ended June 30, 2012, the World Precious Minerals Fund Investor Class declined 18.29 percent and the Institutional Class lost 18.02 percent. The fund’s benchmark, the NYSE Arca Gold Miners Index, decreased 12.72 percent on a total return basis. The Gold and Precious Metals Fund fell 14.27 percent for the six months ended June 30, 2012. The fund’s benchmark, the FTSE Gold Mines Index, decreased 15.83 percent on a total return basis.
Spot gold finished the period at $1,563.70 per ounce, up $33.70, or 2.16 percent for the year. The S&P 500 Index posted a positive return of 9.49 percent, the U.S. Trade Weighted Dollar Index rose 1.81 percent and the yield on a 90-day Treasury bill finished the period at 0.08 percent.
The strategy of the World Precious Minerals Fund favors junior (exploration and development) stocks and mid-tiered producing stocks. These lower-capitalization stocks have historically outperformed senior gold mining companies over longer time periods as senior gold miners have typically acquired proven assets of junior gold companies rather than explored for new mining projects with capital-constrained budgets. However, the World Precious Mineral Fund’s junior stock holdings negatively affected its performance to its benchmark of North American senior gold stocks during the period.
While focusing on established, producing gold companies, the Gold and Precious Metals Fund holds a higher weighting of mid-tier stocks compared to its benchmark. To some extent, we are starting to see some rotation in the relative performance of senior and mid-tier gold stocks. In the first half of the year, the Gold and Precious Metals Fund outperformed its benchmark, the FTSE Gold Mines Index, where the top five members of the index account for 58 percent of the benchmark and represent the mega-cap names in the gold space.
48
Because the funds are actively managed and holding period is generally not a consideration in investment decisions, the portfolio turnover rate may fluctuate from year to year as each fund adjusts its portfolio composition. The annual portfolio turnover for Gold and Precious Minerals Fund was, and is expected to continue to be, more than 100 percent.
Strengths
· | The biggest contributor to performance in the first half of the year for the Gold and Precious Metals Fund and the second best for World Precious Minerals Fund was Franco-Nevada Corp.,(3) a mining royalty company. Franco-Nevada had raised money in November of 2011 and was in the enviable position in the first half of 2012 to make strategic investments to acquire additional royalty interests, such as its Lake Shore Gold Corp.(4) transaction. |
| |
· | Both the Gold and Precious Metals Fund and the World Precious Minerals Fund took larger positions in Agnico-Eagle Mines Ltd.(5) in the first half of the year and this paid off, with Agnico-Eagle yielding the largest contribution to the World Precious Minerals Fund and being the third best performer for the Gold and Precious Metals Fund. After having a difficulty in the prior year, Agnico-Eagle offered very good value to investors and handily beat earnings and production guidance in the first quarter. The second biggest success for the Gold and Precious Metals Fund was our investment in Royal Gold, Inc.,(6) which benefited from its low risk exposure to rising industry costs due to the company’s royalty income model. |
| |
· | The third largest contributor to performance to the World Precious Minerals Fund was MAG Silver Corp.,(7) which is likely to enlarge its resource base at the Cinco de Mayo property from additional drill results released in the first quarter. In the second quarter, MAG Silver released positive economic results from its preliminary economic assessment report on the Juanicipio Project, which is a joint venture with Fresnillo plc.(2) Given Fresnillo’s operations around Juancipio, there are number of incentives to consolidate the ownership of project. MAG Silver was one of the few silver companies to deliver positive returns in the first half of the year. |
Weaknesses
· | The worst performer for the Gold and Precious Metals Fund was Goldcorp, Inc.,(8) a larger relative position. |
| |
· | Gran Colombia Gold Corp.(9) continued to face difficulty getting traction in a market where investors largely shunned any small capitalization gold producer. This resulted in Gran Colombia being the worst and second |
49
| worst performer for the World Precious Minerals Fund and the Gold and Precious Metals Fund, respectively. |
| |
· | Mirasol Resources Ltd.,(10) a silver explorer in Argentina, was the second worst contributor to the performance of the World Precious Minerals Fund. Mirasol’s performance was heavily influenced by the deteriorating economic situation in Argentina, where tighter currency controls have made new investment in the country more problematic. Eventually, Mirasol will need additional funding to carry on with its exploration program. Coeur d’Alene Mines Corp.(11) has a joint venture agreement with Mirasol on their Joaquin silver project and has stated this will be their next new mine to develop. |
| |
· | The third worst performer for both the Gold and Precious Metals and World Precious Minerals Funds was Richmont Mines, Inc.(12) After delivering a 111 percent return in the prior year, some abrupt management and board changes at Richmont knocked the stock down more than its peers. Richmont’s president and CEO Martin Rivard announced his resignation in February in what appeared to be a disagreement on the strategic direction of the company with its board members. Mr. Rivard was believed to have been critical to the success of the company. |
Current Outlook
Opportunities
· | According to JP Morgan Asset Management, capital expenditures required to build new projects now far exceed what miners could purchase. With a drop of as much as 50 percent in mining company valuations since last year and capital spending costs gaining as much as 25 percent, the balance has shifted in favor of acquisitions and mergers. |
| |
· | China’s largest bullion bank noted that gold investment demand in China may gain more than 10 percent this year as buyers seek a haven from Europe’s debt crisis and the prospect of weakening currencies. A spokesperson for the bank noted investors in China want to hold part of their assets in gold to hedge for the risks, especially now that the financial crisis has evolved into a sovereign crisis. China, speculated to outpace India in the next few years as the largest gold consumer, recently added more reason to this prediction. Some of the country’s leading banks offer accounts that accumulate gold, which are quickly gaining attention. One bank, the Industrial and Commercial Bank of China, launched the accounts in April 2010 and drew 2.33 million investors holding 22 tons of gold by the end of November 2011, just 19 months after the launch. Investors buy as little as a gram a month through the accounts, which |
50
| quickly add up. The Industrial and Commercial Bank of China has more than 200 million prospective accounts to market their gold products to. |
| |
· | As the half year came to a close, gold analyst Martin Murenbeeld says that gold is poised to benefit from what he believes needs to be done to set the economy on a better course, including more liquidity in Europe, quantitative easing, dollar devaluation, fiscal expansion in the U.S., etc. He laments that gold will likely not benefit from a worsening recession in Europe, a further slide in U.S. growth or weak growth in India and China. We agree that the headwind has been the lack of will for politicians to take the necessary actions that must be addressed. |
Threats
· | The African National Congress delegates will begin debating proposals for a mining windfall tax of 50 percent as an alternative to nationalizing mines in the world’s largest producer of platinum, chrome and manganese. South Africa’s President Zuma, who is seeking a second five-year term in a party election in December, is under pressure from his labor union allies and a growing number of jobless young people to do more to combat poverty and unemployment in Africa’s largest economy. The 100-year-old ANC was pushed by its Youth League in 2010 to investigate the viability of nationalizing mines to help distribute more wealth to the black majority. While an ANC-appointed panel ruled out nationalization as an economic “disaster,” it recommends a 50 percent tax on profits of mining companies that earn returns of more than 15 percent. |
| |
· | A recent paper from the African Development Bank (ADB) titled “Gold Mining in Africa: Maximizing Economic Returns for Countries,” points out that gold mining is a significant activity in at least 34 of the continent’s 54 countries. The paper notes that Africa’s annual gold production is 480 metric tons, 20 percent of annual global output, but concession agreements signed by the governments are seen as unfair. This particularly applies to the royalty rate stated in these agreements. Despite spiraling prices for precious metals, the ADB believes Africa is not cashing in enough from its large gold resources. These agreements severely limit gains from gold mining activity in gold producing countries. However, only a limited number of African countries have actually taken equity stakes in the mines within their borders. It’s worth pointing out that one can only gain access to market returns by risking capital to invest while other countries have sought higher economic royalties, taxes and fees. |
| |
· | Mark Bristow, CEO of Randgold Resources Ltd,(13) noted that in much of the gold industry, the mined grade, which is the actual processing grade, is running higher than the reserve grade at the mines. Many companies have also been citing higher costs as a reason margins have not expanded. |
51
| What they have not been clear on is that costs are not rising as fast as the processed grade has been dropping. Essentially, just running lower-grade ores through the plant makes the costs on percentage bases look like it is rising while, in reality, the costs may be flat but spread over a smaller quantity of gold. Higher gold prices are being used to calculate lower cut-off points for break-even economics. Some companies believe that by adding these additional ounces to the resource base, the value of the company should be rising. However, those additional ounces are very low margin and do not significantly increase the value of the company. Higher gold prices will be needed to make increased gold production economical. |
(1) | This security comprised 0.00% of the total net assets of the World Precious Minerals Fund and 2.20% of the Gold and Precious Metals Fund as of 06/30/12. |
(2) | Neither fund held this security as of 06/30/12. |
(3) | This security comprised 2.85% of the total net assets of the World Precious Minerals Fund and 6.30% of the Gold and Precious Metals Fund as of 06/30/12. |
(4) | This security comprised 0.00% of the total net assets of the World Precious Minerals Fund and 0.57% of the Gold and Precious Metals Fund as of 06/30/12. |
(5) | This security comprised 4.95% of the total net assets of the World Precious Minerals Fund and 4.57% of the Gold and Precious Metals Fund as of 06/30/12. |
(6) | This security comprised 0.00% of the total net assets of the World Precious Minerals Fund and 3.68% of the Gold and Precious Metals Fund as of 06/30/12. |
(7) | This security comprised 1.99% of the total net assets of the World Precious Minerals Fund and 0.00% of the Gold and Precious Metals Fund as of 06/30/12. |
(8) | This security comprised 1.81% of the total net assets of the World Precious Minerals Fund and 2.48% of the Gold and Precious Metals Fund as of 06/30/12. |
(9) | This security comprised 4.92% of the total net assets of the World Precious Minerals Fund and 4.60% of the Gold and Precious Metals Fund as of 06/30/12. |
(10) | This security comprised 1.07% of the total net assets of the World Precious Minerals Fund and 0.00% of the Gold and Precious Metals Fund as of 06/30/12. |
(11) | This security comprised 1.55% of the total net assets of the World Precious Minerals Fund and 1.47% of the Gold and Precious Metals Fund as of 06/30/12. |
(12) | This security comprised 0.76% of the total net assets of the World Precious Minerals Fund and 0.71% of the Gold and Precious Metals Fund as of 06/30/12. |
(13) | This security comprised 0.86% of the total net assets of the World Precious Minerals Fund and 0.84% of the Gold and Precious Metals Fund as of 06/30/12. |
52
World Precious Minerals Fund
Top 10 Holdings Based on Net Assets
(excluding repurchase agreement) | | June 30, 2012 |
| | | |
Agnico-Eagle Mines Ltd.
Gold Mining | | 4.95 | % |
Gran Colombia Gold Corp.
Gold Mining | | 4.92 | % |
Yamana Gold, Inc.
Gold Mining | | 3.13 | % |
Harmony Gold Mining Co., Ltd.
Gold Mining | | 3.00 | % |
Franco-Nevada Corp.
Gold/Mineral Royalty Companies | | 2.85 | % |
Dundee Precious Metals, Inc.
Gold Mining | | 2.84 | % |
Freeport-McMoRan Copper & Gold, Inc.
Metal - Copper | | 2.28 | % |
Virginia Mines, Inc.
Gold Mining | | 2.16 | % |
MAG Silver Corp.
Silver Mining | | 1.99 | % |
PMI Gold Corp.
Gold Mining | | 1.90 | % |
TOTAL TOP TEN HOLDINGS | | 30.02 | % |
Portfolio Allocation by Industry* | June 30, 2012 |
Based on Total Investments |
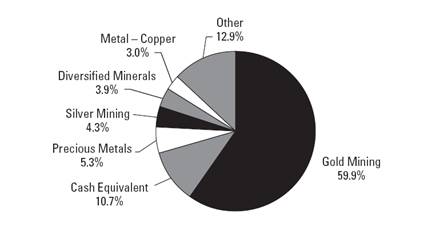
* | Summary information above may differ from the portfolio schedule included in the financial statements due to the use of different classifications of securities for presentation purposes. |
53
Gold and Precious Metals Fund
Top 10 Holdings Based on Net Assets
(excluding repurchase agreement) | | June 30, 2012 |
| | | |
Franco-Nevada Corp.
Gold/Mineral Royalty Companies | | 6.30 | % |
Dundee Precious Metals, Inc.
Gold Mining | | 5.31 | % |
Harmony Gold Mining Co., Ltd.
Gold Mining | | 5.16 | % |
Gran Colombia Gold Corp.
Gold Mining | | 4.60 | % |
Agnico-Eagle Mines Ltd.
Gold Mining | | 4.57 | % |
Royal Gold, Inc.
Gold Mining | | 3.68 | % |
Yamana Gold, Inc.
Gold Mining | | 3.26 | % |
Freeport-McMoRan Copper & Gold, Inc.
Metal - Copper | | 3.16 | % |
AuRico Gold, Inc.
Gold Mining | | 3.02 | % |
Barrick Gold Corp.
Gold Mining | | 2.59 | % |
TOTAL TOP TEN HOLDINGS | | 41.65 | % |
Portfolio Allocation by Industry* | June 30, 2012 |
Based on Total Investments |
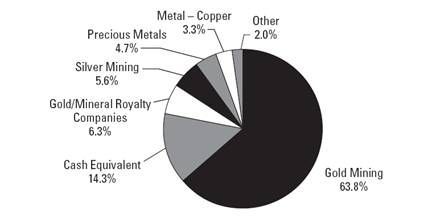
* | Summary information above may differ from the portfolio schedule included in the financial statements due to the use of different classifications of securities for presentation purposes. |
54
Eastern European Fund
Management Team’s Perspective
Introduction
The investment objective of the Eastern European Fund (EUROX) is to achieve long-term capital growth by investing in a non-diversified portfolio of equity securities of companies located in the emerging markets of Eastern Europe.(1)
Performance Graph
Eastern European Fund

Average Annual Performance | | For the Periods Ended June 30, 2012 |
| | | | | | | | | |
| | Six Month | | One Year | | Five Year | | Ten Year | |
Eastern European Fund | | 5.01 | % | (24.68 | )% | (10.06 | )% | 12.90 | % |
S&P 500 Index | | 9.49 | % | 5.45 | % | 0.22 | % | 5.32 | % |
MSCI Emerging Markets Europe 10/40 Index (Net Total Return) | | 8.06 | % | (23.87 | )% | (6.06 | )% | 15.60 | % |
Performance data quoted above is historical. Past performance is no guarantee of future results. Current performance may be higher or lower than the performance data quoted. The principal value and investment return of an investment will fluctuate so that an investor’s shares, when redeemed, may be worth more or less than their original cost. The graph and table do not reflect the deduction of taxes that a shareholder would pay on fund distributions or the redemption of fund shares.
Pursuant to a voluntary arrangement, the Adviser has agreed to limit total fund operating expenses (exclusive of any acquired fund fees and expenses, performance fees, taxes, brokerage commissions and interest) to not exceed 2.85%. The Adviser can modify or terminate this arrangement at any time.
See Definitions for Management Teams’ Perspectives for index definitions.
Please visit our website at www.usfunds.com for updated performance information for different time periods.
55
The Six-Month Period In Review - Economic And Political Issues That Affected The Fund
Geopolitical events caused the price of oil to rise sharply at the beginning of 2012. As an energy exporter of crude oil and natural gas, Russia is one of the few large economies in the world that directly benefits from higher energy prices. Political and investment climate took a turn for the worse after the March election produced a pre-determined swap of Dmitry Medvedev with Vladimir Putin back into the presidential seat, amid serious concerns about political legitimacy amid public protest. While the protests have been largely peaceful, there are signs of authorities cracking down against public dissent. Russia’s commitment to democratic and economic reform remains an open question.
Meanwhile, Turkey managed a soft landing after a breakneck pace of growth last year, following tightening by the central bank, as well as prudent macro measures. Its current account deficit is on the decline, as is inflation. Quality of financing has improved through foreign direct investment, as well as lengthening maturity of external debt. The country continues on a path of attaining investment grade, which should further lower the cost of financing.
Central European countries’ fortunes are tied to economic activity in Germany, which is showing signs of weakening. Still, Polish GDP expanded 3.5 percent in the first quarter, boosted by the Euro 2012 Soccer Cup. Before the quarterfinals were over, however, one of the major construction firms filed for bankruptcy, creating a ripple effect throughout the industry and impacting banks. Historically high valuation multiples applied to Polish banks (relative to other banks in the region) underwent significant contraction as loan growth became sluggish.
While the U.S. Federal Reserve was quick to turn on the money printing press when equity markets dropped in 2008, the European Central Bank (ECB) has been slow to respond to the eurozone crisis. With likely sources of funding insufficient to cover the size of the European bailout fund, the ECB had no choice but to follow in the footsteps of the Federal Reserve and expand its balance sheet. In December, the ECB instituted the Long Term Refinancing Operation (LTRO) to facilitate the rollover of long-term banking debt. Mario Draghi, the ECB’s president, said the LTRO prevented a credit contraction that would have been far more serious.
56
Investment Highlights
Overview
The fund gained 5.01 percent for the six-month period ended June 30, 2012, compared to a 8.06 percent rise for the benchmark MSCI Emerging Markets Europe 10/40 Index (Net Total Return).
Turkey was by far the best performer, with the Istanbul Stock Exchange National 100 Index gaining more than 30 percent in U.S. dollar terms. Poland and Hungary were distant second and third, while Czech and Russian equities lagged the index. Financials, consumer discretionary and staples outperformed the index, while energy, utilities, and telecommunication services underperformed the index.
Strengths
· | An underweight in telecommunications contributed positively to the relative performance of the fund, as the sector underperformed. Local shares in Mobile TeleSystems OJSC,(2) our largest holding in the sector, outperformed both the sector and the index. |
| |
· | Avoiding exposure to the Russian utility sector had a positive impact on the performance of the fund relative to the index. Because it was an election year, the regulator reneged on tariff increases that had been promised as compensation for the capital investment. |
| |
· | The covered call writing strategy during the first half of the year enhanced the fund’s overall return. |
Weaknesses
· | Energy exposure was the largest detractor from the performance of the fund. Despite recent record realized prices on Urals crude, Russian energy stocks underperformed. |
| |
· | An underweight in financials had a negative impact on the relative performance of the fund. Turkish banks, in particular, staged a very strong performance of the recent lows as the central bank navigated the narrow straits defending the currency while warding off inflation. |
| |
· | Canadian-listed holdings in the energy and basic materials sectors underperformed by a wide margin, creating a drag on fund performance. |
57
Current Outlook
Opportunities
· | A number of companies in emerging Europe will pay an annual dividend in excess of 10 percent in 2012, as earnings yield is at the highest level since the last crisis. |
| |
· | Turkey’s credit rating was raised to a notch below investment grade by Moody’s. In its report, Moody’s cited “significant” improvement in public finances and policies to cut the current account deficit. |
| |
· | The ECB president’s new proposal, which includes bond purchases, rate cuts and new LTRO, extends the lifeline to the eurozone while policymakers grapple with a way to shore up the confidence in the single currency. |
Threats
· | Regulatory changes in Turkey will have a negative effect on reported net income this year. One percent provisions for consumer loans, and four percent provisions for general purpose loans must be made in the quarter when new loans are originated. Fees and commissions generated at origination now have to be amortized over the life of the loans. |
| |
· | Minority shareholders in the state-owned companies within the Russian utility sector are at risk of significant dilution in the case of a proposed capital injection by the government. |
| |
· | A financial transaction tax as proposed by Hungarian Prime Minister Viktor Orban would have a negative impact on banks’ fees and commission income. The fact that bureaucrats in Brussels like the idea could make this a dangerous precedent within European Union. |
(1)The following countries are considered to be in the Eastern European region: Albania, Armenia, Azerbaijan, Belarus, Bulgaria, Croatia, Czech Republic, Estonia, FYR Macedonia, Georgia, Hungary, Latvia, Lithuania, Moldova, Poland, Romania, Russia, Slovakia, Slovenia, Turkey and Ukraine.
(2)This security comprised 3.60% of the fund’s total net assets as of 06/30/12.
58
Top 10 Holdings Based on Net Assets (excluding repurchase agreement) | | June 30, 2012 |
| | | |
Lukoil OAO
Oil Companies - Integrated | | 9.45 | % |
Gazprom OAO
Oil Companies - Exploration & Production | | 6.97 | % |
Sberbank of Russia
Commercial Banks - Non US | | 6.83 | % |
TNK-BP Holding
Oil Companies - Integrated | | 6.67 | % |
NovaTek OAO
Oil Companies - Exploration & Production | | 4.97 | % |
Uralkali OJSC
Agricultural Chemicals | | 4.24 | % |
Mobile TeleSystems OJSC
Cellular Telecommunications | | 3.60 | % |
Kernel Holding S.A.
Agricultural Operations | | 3.11 | % |
Synthos S.A.
Chemicals - Diversified | | 2.93 | % |
Tupras Turkiye Petrol Rafinerileri A.S.
Oil Refining & Marketing | | 2.79 | % |
TOTAL TOP TEN HOLDINGS | | 51.56 | % |
Country Distribution* | |
Based on Total Investments | June 30, 2012 |
(excluding repurchase agreement) | |
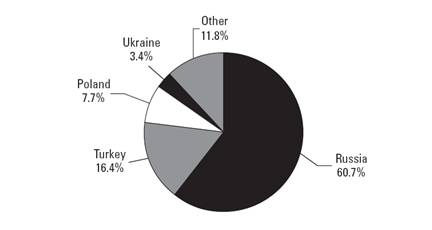
* Country distribution shown is based on domicile. The locale of company operations may be different.
59
Global Emerging Markets Fund
Management Team’s Perspective
Introduction
The investment objective of the Global Emerging Markets Fund (GEMFX) is to achieve long-term capital growth by investing in a non-diversified portfolio of the equity securities of companies located in or with a significant business presence in emerging market countries.(1)
Performance Graph
Global Emerging Markets Fund
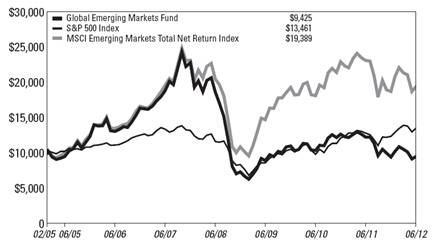
Average Annual Performance | | For the Periods Ended June 30, 2012 |
| | | | | | | | | |
| | Six Month | | One Year | | Five Year | | Inception | |
Global Emerging Markets Fund (Inception 2/24/05) | | 0.59 | % | (22.75 | )% | (12.82 | )% | (0.80 | )% |
S&P 500 Index | | 9.49 | % | 5.45 | % | 0.22 | % | 4.13 | % |
MSCI Emerging Markets Net Total Return Index | | 3.93 | % | (15.95 | )% | (0.09 | )% | 9.43 | % |
Performance data quoted above is historical. Past performance is no guarantee of future results. Current performance may be higher or lower than the performance data quoted. The principal value and investment return of an investment will fluctuate so that an investor’s shares, when redeemed, may be worth more or less than their original cost. The graph and table do not reflect the deduction of taxes that a shareholder would pay on fund distributions or the redemption of fund shares.
Pursuant to a voluntary arrangement, the Adviser has agreed to limit total fund operating expenses (exclusive of any acquired fund fees and expenses, performance fees, taxes, brokerage commissions and interest) to not exceed 3.15%. The Adviser can modify or terminate this arrangement at any time.
See Definitions for Management Teams’ Perspectives for index definitions.
Please visit our website at www.usfunds.com for updated performance information for different time periods.
60
The Six-Month Period In Review - Economic And Political Issues That Affected The Fund
Further bad news surrounding the European sovereign debt crisis, and weakening global growth negatively impacted market sentiment in the first half of the year. This further increased investor risk-aversion toward equities, emerging markets and foreign currencies.
Uncertainty regarding future capital spending plans increased, and fears over slowing growth in China gained momentum. In response, China cut its bank reserve requirements and one-year lending rate twice by the middle of the year to avoid further economic deterioration.
Across Asia, South Korea and Taiwan economies were relatively weak, affected by slower global demand, particularly from China, while Association of Southeast Asian Nations (ASEAN) countries were in general consistently strong. The risk for ASEAN countries is the fluctuation of their currency exchange rates due to the eurozone sovereign crisis and credit withdrawal from the area.
In Latin America, Brazil’s equity market is still overvalued, which makes it particularly vulnerable given its exposure to commodity prices, in addition to its weakening currency.
Although the Federal Reserve in the U.S. was quick to turn on the money printing press when equity markets dropped in 2008, the European Central Bank (ECB) has been slow to respond to the eurozone crisis. With likely sources of funding insufficient to cover the size of the European bailout fund, the ECB had no choice but to follow in the footsteps of the Fed and expand its balance sheet.
Last December, the ECB instituted the Long Term Refinancing Operation (LTRO) to facilitate the rollover of long-term banking debt and prevented a credit contraction that may have been far more serious. We expect there to be further action from the ECB.
Investment Highlights
Overview
The fund gained 0.59 percent for the six-month period ended June 30, 2012. This compares to a 3.93 percent return for the MSCI Emerging Markets Net Total Return Index, the fund’s benchmark.
61
Because the fund is actively managed and holding period is generally not a consideration in investment decisions, the portfolio turnover rate may fluctuate from year to year as the fund adjusts its portfolio composition. The fund’s annual portfolio turnover was, and is expected to continue to be, more than 100 percent.
During the six-month period, the fund’s portfolio composition was changed to emphasize small-cap companies. While the fund management team considers companies of all sizes, the focus is on $200 million to $2 billion U.S. dollar market capitalization.
Strengths
· | The fund’s overweighting in India, Malaysia, Turkey and underweighting in Brazil, South Africa, Russia, as well as stock selection in China and Thailand positively contributed to performance. |
| |
· | An overweight in financials, consumer discretionary and underweight in energy and telecommunication services had a positive effect on the fund’s performance. |
| |
· | The largest positive contributions to the fund in the six-month period came from TNK-BP Holding(2) in Russia and Yes Bank Ltd.(2) in India. |
Weaknesses
· | An underweight in Taiwan and South Korea, and an overweight in Indonesia and Mexico negatively affected performance. |
| |
· | An underweight in healthcare, information technology and utilities, and an overweight in industrials and materials created a drag on performance. |
| |
· | The worst performers included Sintex Industries Ltd.(2) in India and PBG S.A.(2) in Poland. |
Current Outlook
Opportunities
· | A significant portion of global equity returns comes from the local market currencies effect. From that perspective, China, Taiwan, and Emerging Europe markets look undervalued, while Indonesia, South Korea, and Latin America look overvalued. |
| |
· | In the second quarter of 2012, China intensified monetary stimulus and accelerated infrastructure spending. This policy reversal in China should lead to improved liquidity and increased corporate investment. |
62
· | Capital spending and investment in machinery and equipment has ramped up in Turkey in recent years, resulting in a much better outlook for productivity gains in Turkey compared to other developing nations. This spending is contrary to what has taken place in countries such as Brazil, Mexico, Russia and South Africa, which have failed to achieve higher investment ratios. |
Threats
· | Colombia’s central bank is likely to increase banks’ minimum reserve requirements in a cautionary measure as loan quality shows signs of deterioration. |
| |
· | South Africa’s power supply constraint is likely to act as a drag on domestic economic expansion during 2012 and 2013. |
| |
· | Continued instability in the Middle East does not provide comfort for investors as numerous companies have exposure to the region. |
(1)Emerging market countries are those countries defined as such by the World Bank, the International Finance Corporation, the United Nations or the European Bank for Reconstruction and Development or included in the MSCI Emerging Markets Index.
(2)The fund did not hold this security as of 06/30/12.
63
Top 10 Holdings Based on Net Assets (excluding repurchase agreement) | | June 30, 2012 |
| | | |
Sansiri PCL
Real Estate Operating/Development | | 2.24 | % |
Guan Chong Bhd
Food - Confectionery | | 1.34 | % |
Dena Bank
Commercial Banks - Non US | | 1.32 | % |
Alexandria Mineral Oils Co.
Petrochemicals | | 1.30 | % |
Pacific Iron Corp.
Metal - Iron | | 1.26 | % |
KrisAssets Holdings Bhd
Real Estate Operating/Development | | 1.24 | % |
Luthai Textile Co., Ltd.
Textile - Apparel | | 1.24 | % |
Jaypee Infratech Ltd.
Public Thoroughfares | | 1.22 | % |
UCO Bank
Commercial Banks - Non US | | 1.16 | % |
PT Bank Bukopin Tbk
Commercial Banks - Non US | | 1.14 | % |
TOTAL TOP TEN HOLDINGS | | 13.46 | % |
Country Distribution* | |
Based on Total Investments | June 30, 2012 |
(excluding repurchase agreement) | |
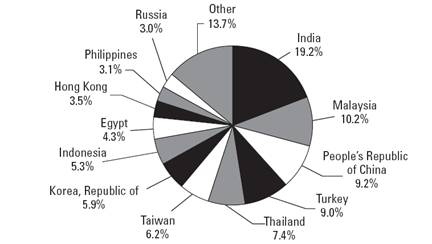
* Country distribution shown is based on domicile. The locale of company operations may be different.
64
China Region Fund
Management Team’s Perspective
Introduction
The China Region Fund (USCOX) seeks long-term growth of capital. The fund invests in both established and emerging companies registered and operating in the China region.(1)
Performance Graph
China Region Fund
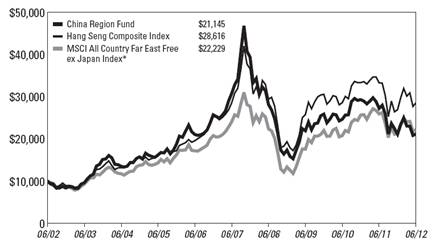
Average Annual Performance | | For the Periods Ended June 30, 2012 |
| | | | | | | | | |
| | Six Month | | One Year | | Five Year | | Ten Year | |
China Region Fund | | 0.29 | % | (22.47 | )% | (7.23 | )% | 7.77 | % |
Hang Seng Composite Index | | 6.20 | % | (14.12 | )% | 0.04 | % | 11.07 | % |
MSCI All Country Far East Free ex Japan Index* | | 4.19 | % | (14.27 | )% | (1.55 | )% | 8.31 | % |
* These are not total returns. These returns reflect simple appreciation only and do not reflect dividend reinvestment.
Performance data quoted above is historical. Past performance is no guarantee of future results. Current performance may be higher or lower than the performance data quoted. The principal value and investment return of an investment will fluctuate so that an investor’s shares, when redeemed, may be worth more or less than their original cost. The graph and table do not reflect the deduction of taxes that a shareholder would pay on fund distributions or the redemption of fund shares.
Pursuant to a voluntary arrangement, the Adviser has agreed to limit total fund operating expenses (exclusive of any acquired fund fees and expenses, performance fees, taxes, brokerage commissions and interest) to not exceed 2.55%. The Adviser can modify or terminate this arrangement at any time.
See Definitions for Management Teams’ Perspectives for index definitions.
Please visit our website at www.usfunds.com for updated performance information for different time periods.
65
The Six-Month Period In Review - Economic And Political Issues That Affected The Fund
As we entered 2012, economic growth in China was slowing as a result of the central bank’s monetary tightening that began in early 2010. Also, sharply slower growth from Europe caused negative reverberations with its largest trading partner, China. In the first quarter, China experienced a GDP growth rate of 8.1 percent; in the second quarter, GDP grew 7.6 percent.
Growth in consumer spending also slowed from 18.1 percent in December of 2011 to only 13.7 percent in June, although it continues to be a high growth rate.
Industrial production expanded at a slower rate of 9.5 percent in June, down 1.9 percent from 11.4 percent in the January-February period. Power output also showed a trend on the downside, dropping to flat in June from 12 percent in December 2011.
China’s exports and imports have slowed to 11.3 percent and 6.3 percent, respectively, in June, reflecting weak external and internal demand.
Fixed asset investment (FAI) continued to show strength during the first half of the year, growing 20.4 percent, versus an estimated 20 percent.
After first quarter economic statistics had clearly shown that growth decelerated, China’s central bank began a monetary easing cycle to maintain and stabilize the economy. The People’s Bank of China (PBOC) reduced the required reserve ratio to 20 percent from 21 percent at the beginning of the year, and cut interest rates twice. The PBOC lowered the benchmark one-year lending rate to 6 percent and its one-year deposit rate to 3 percent. The PBOC also encouraged banks to lend to first-time homebuyers with a discount on the maximum mortgage rate set at 30 percent below the benchmark rate. We believe those rate cuts will significantly improve market liquidity and reduce corporate borrowing costs.
The market has already seen the effect of government policy direction change. Housing sales have improved dramatically from the lows in the second half of 2011, and liquidity of property developers have also improved. Since the beginning of June 2012, infrastructure project approvals accelerated, with the Ministry of Railway resuming railway construction, which had stalled in July 2011.
66
China’s Independent Power Producers (IPP) sector has turned to positive earning momentum benefiting from a coal price fall and a government interest rate cut.
The rest of Asia, including ex-Japan, South Korea and Taiwan, are relatively weak as these countries have been affected by slower global demand. Countries in the Association of Southeast Asian Nations (ASEAN), in general, are consistently strong, although the risk is the fluctuation of their currency exchange rates due to the eurozone sovereign crisis and credit withdrawal from the area.
Investment Highlights
Overview
For the six months ended June 30, 2012, the fund returned 0.29 percent, while the benchmark Hang Seng Composite Index (HSCI) returned 6.20 percent.
Because the fund is actively managed and holding period is generally not a consideration in investment decisions, the portfolio turnover rate may fluctuate from year to year as the fund adjusts its portfolio composition. The fund’s annual portfolio turnover was, and is expected to continue to be, more than 100 percent.
Strengths
· | Allocations to Thailand, Philippines and Taiwan provided positive contributions to the fund’s relative performance against its benchmark, the HSCI. Shin Corp. PCL,(2) a Thai telecommunication company, rose 53.39 percent. Thai Union Frozen Products PCL,(3) a Thai company specializing in frozen fish, increased 31.54 percent over the first six months. In the Philippines, Universal Robina Corp.,(4) a snack company, climbed 40.79 percent. |
| |
· | The fund’s overweighting in telecommunications and underweighting in energy also contributed to the fund’s relative performance. |
Weaknesses
· | Worries about a possible hard landing for China’s economy in the first half of 2012 caused the industrial goods and basic materials sectors to be the worst performers in the HSCI. Industrial goods decreased 6.07 percent and basic materials declined 10.84 percent. These sectors had overweight positions in the fund, which negatively impacted the fund’s performance compared to the benchmark. |
67
· | Allocation to information technology was hurt due to market sentiment toward Chinese ADRs in the U.S., though it was the best sector in HSCI for the period. |
Current Outlook
Opportunities
· | China’s intensified easing monetary policy and accelerated infrastructure spending since the middle of the second quarter should lead to improved liquidity and corporate investments. |
| |
· | Construction, manufacturing and infrastructure activity in China should improve in the second half of 2012. Improved sales and liquidity for property developers will help increase new housing starts. The property and construction sector in HSCI has seen increased sales and showed strong stock performance on a relative and absolute basis. |
| |
· | The IPP sector also showed strong performance due to falling coal prices and interest rate cuts. |
| |
· | There appear to be investment opportunities in Chinese equities listed in Hong Kong after being sold off in the last three years. The MSCI China Index, for example, has a price-to-earnings multiple that is almost as low as it was during the 2008 financial crisis, with an attractive dividend yield of 3.5 percent. |
Threats
· | Although China’s government has been easing money supply and expanding fiscal stimulus, it is facing weakened global demand and its own economic structural limitation. At the moment, the market believes that China will manage a soft landing, but the country will likely not grow as fast as it did prior to the financial crisis in 2008. |
| |
· | China’s weak power generation and imports all point to slower domestic demand, and hence, slower corporate sales and less pricing power for its products. It may see further weakness in corporate sales growth before things can stabilize. |
(1)The China region is defined as any country that either shares a border with China or is located in the South China Sea or the East China Sea and includes: the People’s Republic of China (PRC or China), Bangladesh, Hong Kong, India, Indonesia, Kazakhstan, Korea, Kyrgyzstan, Laos, Malaysia, Mongolia, Nepal, Pakistan, Philippines, Singapore, Taiwan, Tajikistan, Thailand and Vietnam.
(2)This security comprised 2.36% of the fund’s total net assets as of 06/30/12.
(3)This security comprised 1.03% of the fund’s total net assets as of 06/30/12.
(4)This security comprised 1.22% of the fund’s total net assets as of 06/30/12.
68
Top 10 Holdings Based on Net Assets (excluding repurchase agreement) | | June 30, 2012 |
| | | |
Baidu, Inc.
Web Portals/Internet Service Providers | | 3.43 | % |
HSBC Holdings plc
Diversified Banking Institutions | | 3.35 | % |
Sina Corp.
Web Portals/Internet Service Providers | | 2.75 | % |
Tencent Holdings Ltd.
Internet Application Software | | 2.67 | % |
China Mobile Ltd.
Cellular Telecommunications | | 2.53 | % |
Shin Corp. PCL
Telecom Services | | 2.36 | % |
PetroChina Co., Ltd.
Oil Companies - Integrated | | 2.28 | % |
Security Bank Corp.
Commercial Banks - Non US | | 2.17 | % |
Bank of China Ltd.
Commercial Banks - Non US | | 2.17 | % |
China Construction Bank Corp.
Commercial Banks - Non US | | 1.95 | % |
TOTAL TOP TEN HOLDINGS | | 25.66 | % |
Country Distribution* | |
Based on Total Investments | June 30, 2012 |
(excluding repurchase agreement) | |
* | Country distribution shown is based on domicile and not intended to conform to the China region definition in the prospectus. The locale of company operations may be different. |
69
Expense Example (unaudited) | June 30, 2012 |
As a shareholder of the funds, you incur two types of costs: (1) transaction costs, including short-term trading fees and exchange fees; and (2) ongoing costs, including management fees and other fund expenses. This example is intended to help you understand your ongoing costs (in dollars) of investing in other mutual funds.
The example is based on an investment of $1,000 invested at the beginning of the period and held for the entire period as indicated below.
· | Actual Expenses. The first line of the following table for each fund provides information about actual account values and actual expenses. You may use the information in this line, together with the amount you invested, to estimate the expenses you paid over the period. Simply divide your account value by $1,000 (for example, an $8,600 account value divided by $1,000 = 8.6), then multiply the result by the number in the first line under the heading “Expenses Paid During Period” to estimate the expenses you paid on your account during this period. |
| |
· | Hypothetical Example for Comparison Purposes. The second line of the following table for each fund provides information about hypothetical account values and hypothetical expenses based on the fund’s actual expense ratio and an assumed rate of return of 5 percent per year before expenses, which is not the fund’s actual return. The hypothetical account values and expenses may not be used to estimate the actual ending account balance or expenses you paid for the period. You may use this information to compare the ongoing costs of investing in these funds and other funds. To do so, compare this 5 percent hypothetical example with the 5 percent hypothetical examples that appear in the shareholder reports of other funds. |
Please note that the expenses shown in the table are meant to highlight your ongoing costs only and do not reflect any direct or transactional costs, such as small account, exchange or short-term trading fees. Therefore, the second line of the table is useful in comparing ongoing costs only, and will not help you determine the relative total costs of owning different funds. In addition, if these direct or transactional costs were included, your costs would have been higher.
70
Six Months Ended June 30, 2012 | | Beginning
Account Value
January 1,
2012 | | Ending
Account Value
June 30,
2012 | | Expenses
Paid During
Period* | |
U.S. Treasury Securities Cash Fund | | | | | | | |
Based on Actual Fund Return | | $ | 1,000.00 | | $ | 1,000.00 | | $ | 0.55 | |
Based on Hypothetical 5% Yearly Return | | $ | 1,000.00 | | $ | 1,024.32 | | $ | 0.55 | |
U.S. Government Securities Savings Fund | | | | | | | |
Based on Actual Fund Return | | $ | 1,000.00 | | $ | 1,000.00 | | $ | 0.55 | |
Based on Hypothetical 5% Yearly Return | | $ | 1,000.00 | | $ | 1,024.32 | | $ | 0.55 | |
Near-Term Tax Free Fund | | | | | | | |
Based on Actual Fund Return | | $ | 1,000.00 | | $ | 1,015.50 | | $ | 2.26 | |
Based on Hypothetical 5% Yearly Return | | $ | 1,000.00 | | $ | 1,022.63 | | $ | 2.26 | |
Tax Free Fund | | | | | | | |
Based on Actual Fund Return | | $ | 1,000.00 | | $ | 1,028.10 | | $ | 3.53 | |
Based on Hypothetical 5% Yearly Return | | $ | 1,000.00 | | $ | 1,021.38 | | $ | 3.52 | |
All American Equity Fund | | | | | | | |
Based on Actual Fund Return | | $ | 1,000.00 | | $ | 1,071.70 | | $ | 11.33 | |
Based on Hypothetical 5% Yearly Return | | $ | 1,000.00 | | $ | 1,013.92 | | $ | 11.02 | |
Holmes Growth Fund | | | | | | | |
Based on Actual Fund Return | | $ | 1,000.00 | | $ | 1,060.70 | | $ | 9.12 | |
Based on Hypothetical 5% Yearly Return | | $ | 1,000.00 | | $ | 1,016.01 | | $ | 8.92 | |
Global MegaTrends Fund Investor Class | | | | | | | |
Based on Actual Fund Return | | $ | 1,000.00 | | $ | 1,007.80 | | $ | 10.33 | |
Based on Hypothetical 5% Yearly Return | | $ | 1,000.00 | | $ | 1,014.57 | | $ | 10.37 | |
Global MegaTrends Fund Institutional Class | | | | | | | |
Based on Actual Fund Return | | $ | 1,000.00 | | $ | 1,007.90 | | $ | 9.14 | |
Based on Hypothetical 5% Yearly Return | | $ | 1,000.00 | | $ | 1,015.76 | | $ | 9.17 | |
Global Resources Fund Investor Class | | | | | | | |
Based on Actual Fund Return | | $ | 1,000.00 | | $ | 976.50 | | $ | 7.27 | |
Based on Hypothetical 5% Yearly Return | | $ | 1,000.00 | | $ | 1,017.50 | | $ | 7.42 | |
Global Resources Fund Institutional Class | | | | | | | |
Based on Actual Fund Return | | $ | 1,000.00 | | $ | 978.70 | | $ | 4.92 | |
Based on Hypothetical 5% Yearly Return | | $ | 1,000.00 | | $ | 1,019.89 | | $ | 5.02 | |
World Precious Minerals Fund Investor Class | | | | | | | |
Based on Actual Fund Return | | $ | 1,000.00 | | $ | 817.10 | | $ | 6.23 | |
Based on Hypothetical 5% Yearly Return | | $ | 1,000.00 | | $ | 1,018.00 | | $ | 6.92 | |
World Precious Minerals Fund Institutional Class | | | | | | | |
Based on Actual Fund Return | | $ | 1,000.00 | | $ | 819.80 | | $ | 3.66 | |
Based on Hypothetical 5% Yearly Return | | $ | 1,000.00 | | $ | 1,020.84 | | $ | 4.07 | |
Gold and Precious Metals Fund | | | | | | | |
Based on Actual Fund Return | | $ | 1,000.00 | | $ | 857.30 | | $ | 6.65 | |
Based on Hypothetical 5% Yearly Return | | $ | 1,000.00 | | $ | 1,017.70 | | $ | 7.22 | |
Eastern European Fund | | | | | | | |
Based on Actual Fund Return | | $ | 1,000.00 | | $ | 1,050.10 | | $ | 11.06 | |
Based on Hypothetical 5% Yearly Return | | $ | 1,000.00 | | $ | 1,014.07 | | $ | 10.87 | |
71
Six Months Ended June 30, 2012 | | Beginning
Account Value
January 1,
2012 | | Ending
Account Value
June 30,
2012 | | Expenses
Paid During
Period* | |
Global Emerging Markets Fund | | | | | | | |
Based on Actual Fund Return | | $ | 1,000.00 | | $ | 1,005.90 | | $ | 14.21 | |
Based on Hypothetical 5% Yearly Return | | $ | 1,000.00 | | $ | 1,010.69 | | $ | 14.25 | |
China Region Fund | | | | | | | |
Based on Actual Fund Return | | $ | 1,000.00 | | $ | 1,002.90 | | $ | 11.11 | |
Based on Hypothetical 5% Yearly Return | | $ | 1,000.00 | | $ | 1,013.77 | | $ | 11.17 | |
* | These calculations are based on expenses incurred in the most recent fiscal half-year. The funds’ Investor Class’ annualized expense ratios (after reimbursements and offsets) for the six-month period ended June 30, 2012, were 0.11%, 0.11%, 0.45%, 0.70%, 2.20%, 1.78%, 2.07%, 1.48%, 1.38%, 1.44%, 2.17%, 2.85% and 2.23%, respectively, for the U.S. Treasury Securities Cash, U.S. Government Securities Savings, Near-Term Tax Free, Tax Free, All American Equity, Holmes Growth, Global MegaTrends, Global Resources, World Precious Minerals, Gold and Precious Metals, Eastern European, Global Emerging Markets and China Region Funds. The funds’ Institutional Class’ annualized expense ratios (after reimbursements and offsets) for the six-month period ended June 30, 2012, were 1.83%, 1.00% and 0.81%, respectively, for the Global MegaTrends, Global Resources and World Precious Minerals Funds. The dollar amounts shown as “Expenses Paid” are equal to the annualized expense ratio multiplied by the average account value over the period, multiplied by 182, the number of days in the period, then divided by 366 days in the current fiscal year. |
72
U.S. Treasury Securities Cash Fund | |
Portfolio of Investments (unaudited) | June 30, 2012 |
| | Coupon
Rate | | Maturity
Date | | Principal
Amount | | Value | |
Repurchase Agreements 99.45% | | | | | | | | | |
| | | | | | | | | |
Joint Tri-Party Repurchase Agreements, 06/29/12, collateralized by U.S. Treasury securities held in joint tri-party repurchase accounts: | | | | | | | | | |
Banc of America Securities LLC Merrill Lynch, repurchase price $48,000,480 | | 0.12 | % | 07/02/12 | | $ | 48,000,000 | | $ | 48,000,000 | |
Credit Suisse Securities USA LLC, repurchase price $16,954,166 | | 0.14 | % | 07/02/12 | | 16,953,968 | | 16,953,968 | |
Morgan Stanley, repurchase price $20,000,200 | | 0.12 | % | 07/02/12 | | 20,000,000 | | 20,000,000 | |
| | | | | | | | | |
Total Investments 99.45%
(cost $84,953,968) | | | | | | | | 84,953,968 | |
Other assets and liabilities, net 0.55% | | | | | | | | 473,038 | |
| | | | | | | | | |
Net Assets 100% | | | | | | | | $ | 85,427,006 | |
| | | | | | | | | | | |
See notes to portfolios of investments and notes to financial statements.
73
U.S. Government Securities Savings Fund | |
Portfolio of Investments (unaudited) | June 30, 2012 |
| | Coupon
Rate | | Maturity
Date | | Principal
Amount | | Value | |
| | | | | | | | | |
United States Government and Agency Obligations 73.47% | | | | | | | | | |
| | | | | | | | | |
Federal Farm Credit Bank 31.20% | | | | | | | | | |
Discount Note: | | | | | | | | | |
Yield | | 0.01 | % | 07/02/12 | | $ | 20,000,000 | | $ | 19,999,995 | |
Fixed Rate: | | | | | | | | | |
| | 0.55 | % | 07/25/13 | | 3,000,000 | | 3,000,699 | |
Variable Rates: | | | | | | | | | |
| | 0.20 | % | 07/27/12 | | 5,000,000 | | 5,000,000 | |
| | 0.26 | % | 08/15/12 | | 5,000,000 | | 5,000,000 | |
| | 0.25 | % | 08/20/12 | | 4,625,000 | | 4,625,192 | |
| | 0.31 | % | 09/17/12 | | 1,350,000 | | 1,350,143 | |
| | 0.27 | % | 09/20/12 | | 1,000,000 | | 1,000,225 | |
| | 0.20 | % | 09/24/12 | | 3,800,000 | | 3,799,559 | |
| | 0.21 | % | 02/21/13 | | 5,000,000 | | 5,000,000 | |
| | | | | | | | 48,775,813 | |
| | | | | | | | | |
Federal Home Loan Bank 39.07% | | | | | | | | | |
Discount Notes: | | | | | | | | | |
Yield | | 0.05 | % | 07/02/12 | | 21,000,000 | | 20,999,972 | |
Yield | | 0.05 | % | 07/03/12 | | 10,000,000 | | 9,999,972 | |
Yield | | 0.12 | % | 07/10/12 | | 1,100,000 | | 1,099,967 | |
Fixed Rates: | | | | | | | | | |
| | 0.07 | % | 07/18/12 | | 5,955,000 | | 5,954,950 | |
| | 0.19 | % | 10/26/12 | | 5,000,000 | | 5,000,598 | |
Variable Rates: | | | | | | | | | |
| | 0.20 | % | 07/18/12 | | 5,000,000 | | 5,000,000 | |
| | 0.22 | % | 09/04/12 | | 5,000,000 | | 4,999,737 | |
| | 0.34 | % | 05/17/13 | | 5,000,000 | | 5,006,176 | |
| | 0.26 | % | 07/22/13 | | 3,000,000 | | 3,001,272 | |
| | | | | | | | 61,062,644 | |
| | | | | | | | | |
United States Treasury Bill 3.20% | | | | | | | | | |
Yield | | 0.12 | % | 10/18/12 | | 5,000,000 | | 4,998,221 | |
| | | | | | | | | |
Total Securities
(cost $114,836,678) | | | | | | | | 114,836,678 | |
| | | | | | | | | | | |
See notes to portfolios of investments and notes to financial statements.
74
| | Coupon
Rate | | Maturity
Date | | Principal
Amount | | Value | |
Repurchase Agreements 26.73% | | | | | | | | | |
| | | | | | | | | |
Joint Tri-Party Repurchase Agreements, 06/29/12, collateralized by U.S. Treasury securities held in joint tri-party repurchase accounts: | | | | | | | | | |
Banc of America Securities LLC Merrill Lynch, repurchase price $31,776,777 | | 0.12 | % | 07/02/12 | | $ | 31,776,460 | | $ | 31,776,460 | |
Barclays Capital, Inc., repurchase price $10,000,100 | | 0.12 | % | 07/02/12 | | 10,000,000 | | 10,000,000 | |
| | | | | | | | | |
Total Repurchase Agreements
(cost $41,776,460) | | | | | | | | 41,776,460 | |
| | | | | | | | | |
Total Investments 100.20%
(cost $156,613,138) | | | | | | | | 156,613,138 | |
Other assets and liabilities, net (0.20)% | | | | | | | | (307,831 | ) |
| | | | | | | | | |
Net Assets 100% | | | | | | | | $ | 156,305,307 | |
| | | | | | | | | | | |
See notes to portfolios of investments and notes to financial statements.
75
Near-Term Tax Free Fund | |
Portfolio of Investments (unaudited) | June 30, 2012 |
| | Coupon
Rate | | Maturity
Date | | Principal
Amount | | Value | |
Municipal Bonds 92.45% | | | | | | | | | |
| | | | | | | | | |
Alabama 3.63% | | | | | | | | | |
Alabama State Public School & College Authority | | 5.00 | % | 12/01/16 | | $ | 290,000 | | $ | 340,828 | |
Bessemer, Alabama Water Revenue | | 4.00 | % | 01/01/16 | | 300,000 | | 309,465 | |
Jasper Alabama Water Works & Sewer Board, Inc., Utilities Revenue, Series A | | 3.00 | % | 06/01/15 | | 90,000 | | 93,797 | |
Jasper Alabama Water Works & Sewer Board, Inc., Utilities Revenue, Series A | | 3.00 | % | 06/01/16 | | 90,000 | | 94,542 | |
Mountain Brook City Board of Education Capital Outlay | | 4.00 | % | 02/15/15 | | 200,000 | | 216,180 | |
University of Alabama at Birmingham, Hospital Revenue, Series A | | 5.00 | % | 09/01/15 | | 300,000 | | 333,417 | |
| | | | | | | | 1,388,229 | |
| | | | | | | | | |
Alaska 0.87% | | | | | | | | | |
Alaska Municipal Bond Bank Authority, Series A | | 4.00 | % | 02/01/16 | | 300,000 | | 332,844 | |
| | | | | | | | | |
Arizona 4.51% | | | | | | | | | |
Arizona Board Regents Certificates of Participation, Series B | | 4.50 | % | 06/01/16 | | 200,000 | | 225,352 | |
Arizona Health Facilities Authority Revenues, Series D | | 5.00 | % | 01/01/14 | | 250,000 | | 266,243 | |
Arizona School Facilities Board Certificates, Series A-1 | | 5.00 | % | 09/01/17 | | 325,000 | | 356,756 | |
Arizona State Transportation Board Excise Tax Revenue | | 5.00 | % | 07/01/17 | | 175,000 | | 208,983 | |
Page, Arizona, Pledged Revenue, Refunding | | 3.00 | % | 07/01/16 | | 350,000 | | 367,199 | |
Pima County Unified School District, GO Unlimited, Refunding | | 3.70 | % | 07/01/12 | | 300,000 | | 300,000 | |
| | | | | | | | 1,724,533 | |
| | | | | | | | | |
California 3.87% | | | | | | | | | |
California State, Refunding, Recreational Facility, GO Unlimited | | 5.00 | % | 12/01/19 | | 250,000 | | 266,520 | |
Delano, California Union High School District, GO Unlimited, Refunding, Series A | | 4.75 | % | 02/01/17 | | 200,000 | | 220,400 | |
San Diego, California Community College District, Capital Appreciation, Election 2002, GO Unlimited (ZCB) | | 4.34 | %(1) | 05/01/15 | | 300,000 | | 292,575 | |
Santa Clara County, California Financing Authority Revenue, Obstetrics and Gynecology, El Camino Hospital | | 5.00 | % | 02/01/18 | | 350,000 | | 394,993 | |
Vernon, California Electric Systems Revenue, Series A | | 3.75 | % | 08/01/13 | | 300,000 | | 305,346 | |
| | | | | | | | 1,479,834 | |
| | | | | | | | | | | |
See notes to portfolios of investments and notes to financial statements.
76
| | Coupon
Rate | | Maturity
Date | | Principal
Amount | | Value | |
Municipal Bonds | | | | | | | | | |
| | | | | | | | | |
Colorado 0.79% | | | | | | | | | |
Denver, Colorado, Health & Hospital Authority, Healthcare Revenue, Series A | | 5.00 | % | 12/01/16 | | $ | 265,000 | | $ | 302,932 | |
| | | | | | | | | |
Connecticut 0.67% | | | | | | | | | |
Connecticut State, Series D, GO Unlimited | | 5.38 | % | 11/15/18 | | 250,000 | | 254,695 | |
| | | | | | | | | |
District of Columbia 1.72% | | | | | | | | | |
District of Columbia Certifications of Participation | | 4.00 | % | 01/01/14 | | 250,000 | | 262,350 | |
Washington D.C. Convention Center Authority Dedicated Tax Revenue, Refunding, Series A | | 5.00 | % | 10/01/13 | | 110,000 | | 114,525 | |
Washington D.C. Convention Center Authority Dedicated Tax Revenue, Refunding, Series A | | 5.00 | % | 10/01/16 | | 250,000 | | 279,788 | |
| | | | | | | | 656,663 | |
| | | | | | | | | |
Florida 11.66% | | | | | | | | | |
Broward County, Florida School Board Certificates of Participation, Series A | | 5.00 | % | 07/01/15 | | 325,000 | | 359,635 | |
Cape Coral, Florida Gas Tax Revenue, Series A | | 4.00 | % | 10/01/16 | | 255,000 | | 271,238 | |
Florida Gulf Coast University Financing Corp., Florida Capital Improvement Revenue, Series B | | 3.00 | % | 02/01/16 | | 365,000 | | 382,024 | |
Florida State Board of Education Lottery Revenue, Series A | | 4.00 | % | 07/01/14 | | 300,000 | | 320,568 | |
Florida State Board of Governors Parking Facilities Revenue, Series A | | 3.00 | % | 07/01/17 | | 300,000 | | 326,835 | |
Florida State Municipal Power Agency, Stanton Project Revenue, Refunding | | 5.13 | % | 10/01/17 | | 300,000 | | 349,647 | |
Fort Pierce, Florida Stormwater Utilities Revenue | | 4.50 | % | 10/01/17 | | 255,000 | | 270,438 | |
Hillsborough County Florida Community Investment Tax Revenue | | 4.00 | % | 05/01/16 | | 300,000 | | 317,829 | |
Lake County, Florida School Board Certificates of Participation, Series A | | 3.70 | % | 06/01/15 | | 400,000 | | 415,532 | |
Miami - Dade County, Florida Water & Sewer Revenue System, Series A | | 4.00 | % | 10/01/16 | | 235,000 | | 262,629 | |
Orange County, Florida Tourist Development Tax Revenue, Refunding | | 5.00 | % | 10/01/14 | | 260,000 | | 284,606 | |
Reedy Creek, Florida Improvement District Utilities Revenue, Refunding, Series 2 | | 5.00 | % | 10/01/16 | | 300,000 | | 332,163 | |
Saint Johns County, Florida Transportation Revenue, Refunding | | 5.00 | % | 10/01/20 | | 310,000 | | 366,358 | |
Volusia County, Florida School Board Sales Tax Revenue | | 4.20 | % | 10/01/16 | | 200,000 | | 202,314 | |
| | | | | | | | 4,461,816 | |
| | | | | | | | | | | |
See notes to portfolios of investments and notes to financial statements.
77
| | Coupon
Rate | | Maturity
Date | | Principal
Amount | | Value | |
Municipal Bonds | | | | | | | | | |
| | | | | | | | | |
Georgia 4.40% | | | | | | | | | |
Atlanta Downtown Development Authority | | 4.25 | % | 12/01/16 | | $ | 250,000 | | $ | 274,485 | |
Atlanta, Georgia Water & Wastewater Revenue, Series B | | 3.50 | % | 11/01/13 | | 400,000 | | 416,716 | |
Emanuel County Georgia Hospital Authority Revenue Anticipation Certificates | | 4.30 | % | 07/01/17 | | 250,000 | | 262,768 | |
Georgia State Municipal Electric Authority Revenue, Unrefunded | | 5.50 | % | 01/01/20 | | 250,000 | | 275,967 | |
Glynn-Brunswick Memorial Hospital Authority, Southeast Georgia Health System and Affiliates Revenue, Anticipation Certificates | | 4.50 | % | 08/01/17 | | 150,000 | | 167,923 | |
Gwinnett County, Georgia, Hospital Authority, Gwinnett Hospital Systems Revenue, Series B | | 5.00 | % | 07/01/18 | | 250,000 | | 285,908 | |
| | | | | | | | 1,683,767 | |
| | | | | | | | | |
Illinois 14.21% | | | | | | | | | |
Aurora, Illinois, Series B, GO Unlimited | | 3.00 | % | 12/30/15 | | 200,000 | | 213,102 | |
Chicago Board of Education, Dedicated Revenues, Series F, GO Unlimited | | 5.00 | % | 12/01/16 | | 300,000 | | 344,736 | |
Chicago Board of Education, Series A | | 5.25 | % | 12/01/13 | | 250,000 | | 260,598 | |
Chicago, Illinois Sales Tax Revenue | | 5.50 | % | 01/01/15 | | 350,000 | | 388,346 | |
Chicago, Illinois, Direct Access Bond, Series E-1 B, GO Unlimited | | 4.00 | % | 01/01/19 | | 200,000 | | 219,114 | |
Chicago, Illinois, Prerefunded Balance, Series B, GO Unlimited | | 5.13 | % | 01/01/15 | | 85,000 | | 94,644 | |
Chicago, Illinois, Unrefunded Balance, Series B, GO Unlimited | | 5.13 | % | 01/01/15 | | 240,000 | | 261,485 | |
Dundee Township, GO Unlimited | | 5.00 | % | 12/01/13 | | 240,000 | | 252,290 | |
Illinois Finance Authority Revenue, Refunding | | 5.00 | % | 07/01/16 | | 390,000 | | 420,716 | |
Illinois State Sales Tax Revenue | | 5.00 | % | 06/15/14 | | 200,000 | | 217,230 | |
Illinois State Toll Highway Authority, Toll Highway Revenue, Series A | | 5.00 | % | 01/01/16 | | 200,000 | | 225,774 | |
Illinois State, Refunding, GO Unlimited | | 5.00 | % | 01/01/16 | | 300,000 | | 331,143 | |
Kaskaskia College, Community College District No. 501, GO Unlimited | | 5.75 | % | 12/01/19 | | 500,000 | | 608,470 | |
Metropolitan Pier & Exposition Authority | | 5.38 | % | 06/01/15 | | 280,000 | | 293,101 | |
Springfield, Illinois Metropolitan Sanitation District, Sewer Revenue, Senior Lien, Series A | | 4.00 | % | 01/01/17 | | 570,000 | | 612,363 | |
State of Illinois, First Series, Refunding, GO Unlimited | | 5.50 | % | 08/01/19 | | 300,000 | | 301,155 | |
Winnebago County Public Safety Sales Tax, Series A, GO Unlimited | | 5.00 | % | 12/30/16 | | 350,000 | | 389,879 | |
| | | | | | | | 5,434,146 | |
| | | | | | | | | | | |
See notes to portfolios of investments and notes to financial statements.
78
| | Coupon
Rate | | Maturity
Date | | Principal
Amount | | Value | |
Municipal Bonds | | | | | | | | | |
| | | | | | | | | |
Indiana 0.84% | | | | | | | | | |
Tippecanoe County, Indiana School Improvements | | 4.00 | % | 01/15/15 | | $ | 300,000 | | $ | 320,388 | |
| | | | | | | | | |
Iowa 2.48% | | | | | | | | | |
Ames, Iowa Hospital Revenue, Refunding | | 5.00 | % | 06/15/15 | | 300,000 | | 305,739 | |
Johnston Community School District, GO Unlimited | | 4.00 | % | 06/01/16 | | 200,000 | | 218,586 | |
University of Iowa Hospitals and Clinics, Iowa State Board of Regents, Hospital Revenue, Refunding, Series A | | 3.00 | % | 09/01/19 | | 400,000 | | 425,712 | |
| | | | | | | | 950,037 | |
| | | | | | | | | |
Kansas 0.58% | | | | | | | | | |
Kansas State Development Finance Authority Revenue | | 4.00 | % | 10/01/15 | | 200,000 | | 221,030 | |
| | | | | | | | | |
Massachusetts 1.60% | | | | | | | | | |
New Bedford, Massachusetts, State Qualified Municipal Loan, GO Limited | | 3.00 | % | 03/01/15 | | 345,000 | | 362,943 | |
Stoughton, Massachusetts Public Improvement, GO Limited | | 4.00 | % | 05/01/17 | | 225,000 | | 248,731 | |
| | | | | | | | 611,674 | |
| | | | | | | | | |
Michigan 3.84% | | | | | | | | | |
Detroit, Michigan Sewer Disposal Revenue, Refunding, Series C-1 | | 5.25 | % | 07/01/15 | | 400,000 | | 436,924 | |
Michigan House of Representatives Facilities, Obligations Revenue, Series A | | 5.00 | % | 10/15/17 | | 200,000 | | 231,208 | |
Michigan State Building Authority Revenue, Refunding, Series I | | 5.25 | % | 10/15/14 | | 300,000 | | 317,490 | |
Michigan State Grant Anticipation Bonds | | 5.00 | % | 09/15/16 | | 200,000 | | 229,668 | |
Michigan State Hospital Finance Authority Revenue, Trinity Health, Series A | | 6.00 | % | 12/01/18 | | 200,000 | | 253,092 | |
| | | | | | | | 1,468,382 | |
| | | | | | | | | |
Minnesota 1.47% | | | | | | | | | |
Minneapolis & St Paul, Minnesota Housing & Redevelopment Authority Health Care Systems, Children’s Health Care, Series B | | 4.00 | % | 08/15/16 | | 250,000 | | 274,405 | |
Minneapolis & St Paul, Minnesota Metropolitan Airports Commission, Airport Revenue, Refunding, Series B | | 5.00 | % | 01/01/19 | | 255,000 | | 287,571 | |
| | | | | | | | 561,976 | |
| | | | | | | | | | | |
See notes to portfolios of investments and notes to financial statements.
79
| | Coupon
Rate | | Maturity
Date | | Principal
Amount | | Value | |
Municipal Bonds | | | | | | | | | |
| | | | | | | | | |
Missouri 0.55% | | | | | | | | | |
Missouri State Health & Educational Facilities Authority Revenue, Series A | | 6.75 | % | 05/15/13 | | $ | 200,000 | | $ | 211,138 | |
| | | | | | | | | |
Nevada 1.34% | | | | | | | | | |
Clark County Nevada School District, Refunding, Series A | | 5.50 | % | 06/15/16 | | 250,000 | | 262,697 | |
Nye County School District, GO Limited | | 4.00 | % | 05/01/15 | | 230,000 | | 249,555 | |
| | | | | | | | 512,252 | |
| | | | | | | | | |
New Hampshire 0.17% | | | | | | | | | |
New Hampshire Health & Education Facilities Authority Revenue | | 5.00 | % | 07/01/14 | | 65,000 | | 66,286 | |
| | | | | | | | | |
New Jersey 3.13% | | | | | | | | | |
Atlantic City, New Jersey Municipal Utilities Authority Revenue, Refunding | | 5.00 | % | 06/01/17 | | 150,000 | | 173,124 | |
Elizabeth, New Jersey Parking Authority Project Revenue, Elizabethtown Plaza Redevelopment, Series B | | 4.00 | % | 11/01/17 | | 255,000 | | 282,798 | |
Hudson County, New Jersey Improvement Authority Lease Revenue, North Hudson Regional Fire, Refunding, Series A | | 5.63 | % | 09/01/18 | | 400,000 | | 473,900 | |
New Jersey State Transportation Trust Fund Authority, Series D | | 4.00 | % | 06/15/14 | | 250,000 | | 267,817 | |
| | | | | | | | 1,197,639 | |
| | | | | | | | | |
New Mexico 0.65% | | | | | | | | | |
Clayton, New Mexico, Jail Project Revenue | | 4.00 | % | 11/01/17 | | 235,000 | | 247,377 | |
| | | | | | | | | |
New York 3.37% | | | | | | | | | |
Long Island Power Authority, New York Electric Systems, Revenue, Series E | | 5.00 | % | 12/01/17 | | 330,000 | | 383,651 | |
New York State Dormitory Authority Revenues, Nonconstruction Supported Debt, Municipal Facilities Health Lease, Series 1 | | 5.00 | % | 01/15/17 | | 300,000 | | 340,581 | |
New York, New York, Series G, GO Unlimited | | 5.00 | % | 08/01/12 | | 125,000 | | 125,435 | |
New York, New York, Subseries L-1, GO Unlimited | | 4.00 | % | 04/01/15 | | 300,000 | | 326,808 | |
Schenectady Metroplex Development Authority Revenue, Series A | | 5.00 | % | 12/15/12 | | 110,000 | | 111,931 | |
| | | | | | | | 1,288,406 | |
| | | | | | | | | | | |
See notes to portfolios of investments and notes to financial statements.
80
| | Coupon
Rate | | Maturity
Date | | Principal
Amount | | Value | |
Municipal Bonds | | | | | | | | | |
| | | | | | | | | |
Ohio 2.36% | | | | | | | | | |
Canton, Ohio, City School District, Refunding, GO Unlimited | | 5.00 | % | 12/01/18 | | $ | 325,000 | | $ | 356,632 | |
Lorain County, Ohio, Community College District, Revenue | | 3.25 | % | 12/01/17 | | 350,000 | | 381,875 | |
Marion County, Ohio, Variable Refunding, GO Limited | | 4.00 | % | 12/01/20 | | 150,000 | | 162,919 | |
| | | | | | | | 901,426 | |
| | | | | | | | | |
Pennsylvania 2.58% | | | | | | | | | |
Delaware Valley, Pennsylvania, Regional Financial Authority Revenue, Permanently Fixed Business Development Services | | 5.50 | % | 08/01/18 | | 295,000 | | 334,604 | |
Philadelphia, Pennsylvania, GO Unlimited | | 4.50 | % | 08/01/12 | | 195,000 | | 195,520 | |
Reading, Pennsylvania School District, GO Unlimited, Series A | | 5.00 | % | 04/01/20 | | 400,000 | | 457,836 | |
| | | | | | | | 987,960 | |
| | | | | | | | | |
Puerto Rico 0.68% | | | | | | | | | |
Commonwealth of Puerto Rico, GO Unlimited | | 6.00 | % | 07/01/13 | | 250,000 | | 262,245 | |
| | | | | | | | | |
Rhode Island 0.75% | | | | | | | | | |
Rhode Island State Economic Development Corporation Revenue, Series A | | 5.00 | % | 06/15/17 | | 250,000 | | 286,075 | |
| | | | | | | | | |
South Carolina 1.35% | | | | | | | | | |
Jasper County School District, GO Unlimited | | 4.00 | % | 03/01/15 | | 195,000 | | 212,062 | |
Piedmont Municipal Power Agency | | 5.00 | % | 01/01/16 | | 150,000 | | 167,781 | |
South Carolina Transportation Infrastructure Bank Revenue, Series A | | 5.25 | % | 10/01/17 | | 125,000 | | 138,084 | |
| | | | | | | | 517,927 | |
| | | | | | | | | |
Tennessee 0.75% | | | | | | | | | |
Metropolitan Government of Nashville & Davidson County, Water & Sewer Revenue | | 6.50 | % | 12/01/14 | | 250,000 | | 286,210 | |
| | | | | | | | | |
Texas 11.97% | | | | | | | | | |
Addison, Texas Certificates of Obligation, GO Unlimited | | 4.00 | % | 02/15/20 | | 250,000 | | 278,943 | |
Annetta, Texas Certificates of Obligation, GO Limited | | 4.00 | % | 08/01/16 | | 200,000 | | 210,988 | |
Frisco, Texas Independent School District, School Building, GO Unlimited, Series A | | 4.50 | % | 08/15/25 | | 180,000 | | 199,355 | |
Grand Prairie Independent School District, Refunding, GO Unlimited (ZCB) | | 3.92 | %(1) | 08/15/16 | | 400,000 | | 367,228 | |
| | | | | | | | | | | |
See notes to portfolios of investments and notes to financial statements.
81
| | Coupon
Rate | | Maturity
Date | | Principal
Amount | | Value | |
Municipal Bonds | | | | | | | | | |
| | | | | | | | | |
Texas (Cont’d) | | | | | | | | | |
Houston, Texas, Public Improvement, Refunding, GO Limited, Series A | | 5.38 | % | 03/01/16 | | $ | 180,000 | | $ | 194,949 | |
Katy, Texas Independent School District, School Building, Series D, GO Unlimited | | 4.50 | % | 02/15/19 | | 325,000 | | 362,911 | |
Lewisville, Texas Independent School District, GO Unlimited, Refunding (ZCB) | | 4.04 | %(1) | 08/15/15 | | 400,000 | | 391,396 | |
Lower Colorado River Authority Texas, Refunding | | 5.25 | % | 05/15/19 | | 240,000 | | 250,380 | |
North Texas Municipal Water District, Regional Solid Waste Disposal Systems Revenue | | 3.00 | % | 09/01/12 | | 300,000 | | 301,134 | |
San Antonio, Texas Municipal Drain Utilities Systems Revenue | | 4.00 | % | 02/01/16 | | 300,000 | | 305,625 | |
San Antonio, Texas, Water Revenue, Refunding | | 4.50 | % | 05/15/21 | | 400,000 | | 478,316 | |
San Patricio, Texas Municipal Water District, Refunding | | 4.00 | % | 07/10/18 | | 200,000 | | 214,130 | |
Texas Municipal Power Agency Revenue, Refunding | | 5.00 | % | 09/01/17 | | 250,000 | | 292,438 | |
Texas State Public Finance Authority Revenue | | 5.00 | % | 10/15/21 | | 300,000 | | 302,949 | |
University of Texas, Texas, Revenue Financing System, Refunding, Series A | | 3.00 | % | 08/15/23 | | 400,000 | | 429,752 | |
| | | | | | | | 4,580,494 | |
| | | | | | | | | |
Utah 1.57% | | | | | | | | | |
Tooele City, Utah Municipal Building Authority Lease Revenue, Refunding | | 3.75 | % | 12/01/17 | | 285,000 | | 299,412 | |
Utah State, Refunding, Series B, GO Unlimited | | 5.38 | % | 07/01/12 | | 300,000 | | 300,000 | |
| | | | | | | | 599,412 | |
| | | | | | | | | |
Virginia 2.62% | | | | | | | | | |
Spotsylvania County, Virginia Economic Development Authority Revenue, Refunding | | 5.00 | % | 06/01/23 | | 300,000 | | 359,274 | |
Virginia College Building Authority Educational Facilities Revenue, Prerefunded, Series A | | 5.00 | % | 09/01/15 | | 10,000 | | 11,400 | |
Virginia College Building Authority Educational Facilities Revenue, Unrefunded, Series A | | 5.00 | % | 09/01/15 | | 290,000 | | 329,434 | |
Virginia State Public Building Authority & Public Facilities Revenue, Refunding, Series A | | 5.00 | % | 08/01/12 | | 300,000 | | 301,047 | |
| | | | | | | | 1,001,155 | |
| | | | | | | | | |
Washington 0.71% | | | | | | | | | |
Energy Northwest, Washington Electric Revenue | | 5.00 | % | 07/01/14 | | 250,000 | | 272,863 | |
| | | | | | | | | | | |
See notes to portfolios of investments and notes to financial statements.
82
| | Coupon
Rate | | Maturity
Date | | Principal
Amount | | Value | |
Municipal Bonds | | | | | | | | | |
| | | | | | | | | |
Wisconsin 0.76% | | | | | | | | | |
Chippewa Valley, Wisconsin, Technical College District Promissory Notes, Series A, GO Unlimited | | 4.00 | % | 04/01/14 | | $ | 250,000 | | $ | 265,310 | |
Wisconsin State, Refunding, Series 2, GO Unlimited | | 4.13 | % | 11/01/16 | | 25,000 | | 26,308 | |
| | | | | | | | 291,618 | |
| | | | | | | | | |
Total Municipal Bonds
(cost $34,035,692) | | | | | | | | 35,363,429 | |
| | | | | | | | | |
Repurchase Agreement 7.32% | | | | | | | | | |
| | | | | | | | | |
Joint Tri-Party Repurchase Agreement, Credit Suisse Securities USA LLC, 6/29/2012, repurchase price $2,801,076, collateralized by U.S. Treasury securities held in a joint tri-party account (cost $2,801,043) | | 0.14 | % | 07/02/12 | | 2,801,043 | | 2,801,043 | |
| | | | | | | | | |
Total Investments 99.77%
(cost $36,836,735) | | | | | | | | 38,164,472 | |
Other assets and liabilities, net 0.23% | | | | | | | | 88,412 | |
| | | | | | | | | |
Net Assets 100% | | | | | | | | $ | 38,252,884 | |
| | | | | | | | | | | |
(1)Represents Yield
See notes to portfolios of investments and notes to financial statements.
83
Tax Free Fund | |
Portfolio of Investments (unaudited) | June 30, 2012 |
| | Coupon
Rate | | Maturity
Date | | Principal
Amount | | Value | |
Municipal Bonds 95.15% | | | | | | | | | |
| | | | | | | | | |
Alabama 4.98% | | | | | | | | | |
Alabama State, GO Unlimited, Series A | | 4.63 | % | 09/01/22 | | $ | 375,000 | | $ | 383,985 | |
Bessemer, Alabama Water Revenue | | 4.00 | % | 01/01/16 | | 200,000 | | 206,310 | |
Mountain Brook City Board of Education Capital Outlay | | 4.00 | % | 02/15/15 | | 195,000 | | 210,776 | |
University of Alabama at Birmingham, Hospital Revenue, Series A | | 5.00 | % | 09/01/15 | | 300,000 | | 333,417 | |
| | | | | | | | 1,134,488 | |
| | | | | | | | | |
Arizona 2.24% | | | | | | | | | |
Scottsdale Arizona Municipal Property Corp., Excise Tax Revenue, Refunding | | 5.00 | % | 07/01/26 | | 180,000 | | 226,766 | |
University of Arizona Certificates of Participation, Series C | | 5.00 | % | 06/01/22 | | 260,000 | | 282,521 | |
| | | | | | | | 509,287 | |
| | | | | | | | | |
California 9.96% | | | | | | | | | |
Anaheim, California City School District, Capital Appreciation, Election 2002, GO Unlimited (ZCB) | | 4.60 | %(1) | 08/01/28 | | 580,000 | | 258,576 | |
California State, GO Unlimited | | 5.00 | % | 03/01/32 | | 300,000 | | 318,264 | |
California State, GO Unlimited | | 4.75 | % | 03/01/34 | | 205,000 | | 208,844 | |
Chaffey Community College District, Series C, GO Unlimited | | 5.00 | % | 06/01/32 | | 300,000 | | 328,320 | |
Imperial Community College District, GO Unlimited | | 5.00 | % | 08/01/29 | | 500,000 | | 524,030 | |
Los Angeles Unified School District, Election 2004, Series H, GO Unlimited | | 5.00 | % | 07/01/32 | | 200,000 | | 220,256 | |
Santa Clara Valley Transportation Authority, Refunding, Series A | | 5.00 | % | 04/01/27 | | 370,000 | | 410,559 | |
| | | | | | | | 2,268,849 | |
| | | | | | | | | |
Colorado 3.21% | | | | | | | | | |
Colorado Health Facilities Authority Revenue | | 5.00 | % | 09/01/16 | | 150,000 | | 154,989 | |
Platte River, Colorado, Power Authority Power Revenue, Series II | | 5.00 | % | 06/01/30 | | 495,000 | | 576,972 | |
| | | | | | | | 731,961 | |
| | | | | | | | | |
Connecticut 2.42% | | | | | | | | | |
Connecticut State, Health & Educational Facility Authority, Sacred Heart University Revenue, Refunding, Series H | | 5.00 | % | 07/01/27 | | 500,000 | | 551,670 | |
| | | | | | | | | | | |
See notes to portfolios of investments and notes to financial statements.
84
| | Coupon
Rate | | Maturity
Date | | Principal
Amount | | Value | |
Municipal Bonds | | | | | | | | | |
| | | | | | | | | |
Delaware 2.05% | | | | | | | | | |
Delaware State Health Facilities Authority, Bayhealth Medical Center Projects, Revenue, Series A | | 5.00 | % | 07/01/39 | | $ | 445,000 | | $ | 466,640 | |
| | | | | | | | | |
District of Columbia 2.73% | | | | | | | | | |
District of Columbia Income Tax Revenue, Series A | | 5.25 | % | 12/01/27 | | 300,000 | | 356,568 | |
District of Columbia Water & Sewer Authority Public Utility Revenue, Subordinate Lien | | 5.00 | % | 10/01/28 | | 250,000 | | 264,680 | |
| | | | | | | | 621,248 | |
| | | | | | | | | |
Florida 3.21% | | | | | | | | | |
Florida Board of Education, GO Unlimited, Refunding, Series C | | 4.50 | % | 06/01/28 | | 300,000 | | 321,687 | |
Florida State Board of Education Lottery Revenue, Series B | | 5.00 | % | 07/01/26 | | 100,000 | | 111,940 | |
Seven Oaks, Florida, Community Development District, Special Assessment Revenue, Refunding, Series A1 | | 5.50 | % | 05/01/33 | | 285,000 | | 297,281 | |
| | | | | | | | 730,908 | |
| | | | | | | | | |
Georgia 3.56% | | | | | | | | | |
Atlanta & Fulton County, Georgia Recreation Authority, Park Implementation Revenue, Series A | | 4.75 | % | 12/01/35 | | 300,000 | | 310,176 | |
Atlanta Development Authority Revenue | | 5.25 | % | 07/01/22 | | 500,000 | | 500,715 | |
| | | | | | | | 810,891 | |
| | | | | | | | | |
Guam 1.11% | | | | | | | | | |
Guam Education Financing Foundation Certificate of Participation, Series A | | 4.25 | % | 10/01/18 | | 250,000 | | 252,013 | |
| | | | | | | | | |
Illinois 8.76% | | | | | | | | | |
Chicago Board of Education, GO Unlimited | | 5.25 | % | 12/01/19 | | 300,000 | | 361,071 | |
Chicago, Illinois Water Revenue, Refunding | | 5.75 | % | 11/01/30 | | 225,000 | | 287,170 | |
City Colleges of Chicago, GO Unlimited | | 5.00 | % | 01/01/17 | | 115,000 | | 132,033 | |
Du Page County, Refunding, GO Unlimited | | 5.60 | % | 01/01/21 | | 490,000 | | 590,910 | |
Illinois Finance Authority, Refunding, Series A | | 5.00 | % | 10/01/14 | | 150,000 | | 162,066 | |
Illinois Regional Transportation Authority Revenue, Series A | | 7.20 | % | 11/01/20 | | 220,000 | | 262,295 | |
State of Illinois, First Series, Refunding, GO Unlimited | | 5.50 | % | 08/01/19 | | 200,000 | | 200,770 | |
| | | | | | | | 1,996,315 | |
| | | | | | | | | | | |
See notes to portfolios of investments and notes to financial statements.
85
| | Coupon
Rate | | Maturity
Date | | Principal
Amount | | Value | |
Municipal Bonds | | | | | | | | | |
| | | | | | | | | |
Indiana 1.45% | | | | | | | | | |
Indianapolis Local Public Improvement Bond Bank, Waterworks Project, Series 2007 L | | 5.25 | % | 01/01/33 | | $ | 305,000 | | $ | 331,285 | |
| | | | | | | | | |
Kansas 3.74% | | | | | | | | | |
Kansas State Development Finance Authority Revenue | | 4.00 | % | 10/01/15 | | 250,000 | | 276,287 | |
University of Kansas Hospital Authority Health Facilities Revenue | | 5.63 | % | 09/01/27 | | 570,000 | | 574,788 | |
| | | | | | | | 851,075 | |
| | | | | | | | | |
Kentucky 1.05% | | | | | | | | | |
Bowling Green, Kentucky, GO Unlimited, Series B | | 4.00 | % | 09/01/16 | | 215,000 | | 239,699 | |
| | | | | | | | | |
Massachusetts 3.81% | | | | | | | | | |
Massachusetts Bay Transportation Authority, Massachusetts Sales Tax Revenue, Refunding, Series A-1 | | 5.25 | % | 07/01/30 | | 285,000 | | 365,345 | |
Massachusetts Bay Transportation Authority, Massachusetts Sales Tax Revenue, Series A | | 5.00 | % | 07/01/31 | | 405,000 | | 502,876 | |
| | | | | | | | 868,221 | |
| | | | | | | | | |
Michigan 4.74% | | | | | | | | | |
Detroit, Michigan Local Development Financing Authority, Refunding, Series A | | 5.38 | % | 05/01/18 | | 215,000 | | 193,625 | |
Detroit, Michigan Water Supply System Revenue, Series B | | 5.00 | % | 07/01/16 | | 430,000 | | 469,031 | |
Macomb County Building Authority, GO Limited | | 4.50 | % | 11/01/23 | | 300,000 | | 302,202 | |
State of Michigan, Trunk Line Revenue, Refunding | | 4.50 | % | 11/01/26 | | 105,000 | | 114,992 | |
| | | | | | | | 1,079,850 | |
| | | | | | | | | |
Missouri 1.32% | | | | | | | | | |
Kansas City Water Revenue | | 4.00 | % | 12/01/22 | | 250,000 | | 300,137 | |
| | | | | | | | | |
Nevada 1.12% | | | | | | | | | |
Nye County School District, GO Limited | | 4.00 | % | 05/01/15 | | 235,000 | | 254,980 | |
| | | | | | | | | |
New Hampshire 2.01% | | | | | | | | | |
Manchester, New Hampshire School Facilities Revenue, Refunding | | 5.50 | % | 06/01/26 | | 300,000 | | 391,947 | |
New Hampshire Health & Education Facilities Authority Revenue | | 5.00 | % | 07/01/14 | | 65,000 | | 66,286 | |
| | | | | | | | 458,233 | |
| | | | | | | | | | | |
See notes to portfolios of investments and notes to financial statements.
86
| | Coupon
Rate | | Maturity
Date | | Principal
Amount | | Value | |
Municipal Bonds | | | | | | | | | |
| | | | | | | | | |
New York 1.92% | | | | | | | | | |
Metropolitan Transportation Authority, New York, Revenue, Series A | | 5.00 | % | 11/15/41 | | $ | 400,000 | | $ | 437,168 | |
| | | | | | | | | |
North Carolina 1.32% | | | | | | | | | |
North Carolina State Medical Care Commission, Health Care Facilities Revenue, Refunding, Series A | | 4.00 | % | 10/01/34 | | 300,000 | | 299,985 | |
| | | | | | | | | |
Ohio 4.42% | | | | | | | | | |
Cleveland, Ohio, Parking Facility Revenue, Prerefunding, Refunding | | 5.25 | % | 09/15/22 | | 130,000 | | 170,608 | |
Lorain County, Ohio, Community College District, Revenue | | 3.25 | % | 12/01/17 | | 300,000 | | 327,321 | |
South Euclid Special Assessment, GO Limited Tax | | 6.70 | % | 12/01/14 | | 70,000 | | 75,224 | |
Summit County, Ohio, Port Authority Revenue Development, Bioinnovation Institution | | 5.38 | % | 12/01/30 | | 390,000 | | 434,721 | |
| | | | | | | | 1,007,874 | |
| | | | | | | | | |
Puerto Rico 1.15% | | | | | | | | | |
Commonwealth of Puerto Rico, GO Unlimited | | 6.00 | % | 07/01/13 | | 250,000 | | 262,245 | |
| | | | | | | | | |
Rhode Island 2.21% | | | | | | | | | |
Rhode Island State Health & Educational Building Corporation Revenue | | 6.50 | % | 08/15/32 | | 500,000 | | 503,515 | |
| | | | | | | | | |
Tennessee 1.09% | | | | | | | | | |
Memphis, Tennessee Sanitary Sewage System Revenue, Refunding | | 5.00 | % | 05/01/20 | | 200,000 | | 247,484 | |
| | | | | | | | | |
Texas 15.71% | | | | | | | | | |
Addison, Texas, Certificates of Obligation, GO Unlimited | | 4.50 | % | 02/15/28 | | 140,000 | | 153,112 | |
Center, Texas, GO Limited (ZCB) | | 3.50 | %(1) | 02/15/20 | | 150,000 | | 125,848 | |
Dallas, Texas Waterworks & Sewer Systems Revenue, Refunding | | 4.50 | % | 10/01/19 | | 225,000 | | 256,687 | |
Forney, Texas, GO Limited | | 5.00 | % | 02/15/27 | | 500,000 | | 542,975 | |
Goose Creek, Texas Independent School District Schoolhouse, Series A | | 5.25 | % | 02/15/18 | | 370,000 | | 439,767 | |
Greenville, Texas Independent School District, GO Unlimited, Refunding | | 4.00 | % | 08/15/17 | | 120,000 | | 134,104 | |
Laredo Independent School District Public Facility Corp., Lease Revenue, Series F | | 5.50 | % | 08/01/24 | | 100,000 | | 100,117 | |
| | | | | | | | | | | |
See notes to portfolios of investments and notes to financial statements.
87
| | Coupon
Rate | | Maturity
Date | | Principal
Amount | | Value | |
Municipal Bonds | | | | | | | | | |
| | | | | | | | | |
Texas (Cont’d) | | | | | | | | | |
North Texas Tollway Authority Revenue, Series F | | 5.75 | % | 01/01/38 | | $ | 250,000 | | $ | 270,090 | |
Prosper, Texas Independent School District, Capital Appreciation, School Building, GO Unlimited (ZCB) | | 6.00 | %(1) | 08/15/33 | | 1,000,000 | | 354,090 | |
San Marcos, Texas Tax & Toll Revenue, GO Limited | | 5.10 | % | 08/15/27 | | 400,000 | | 445,940 | |
Tarrant County, Texas Cultural Education Facilities Finance Corp., Health Resources Revenue, Refunding, Series A | | 5.00 | % | 02/15/36 | | 400,000 | | 425,332 | |
White Settlement, Texas Independent School District, GO Unlimited | | 4.13 | % | 08/15/15 | | 300,000 | | 331,857 | |
| | | | | | | | 3,579,919 | |
Utah 2.60% | | | | | | | | | |
Utah State Building Ownership Authority, Lease Revenue, Refunding, Series C | | 5.50 | % | 05/15/19 | | 500,000 | | 593,105 | |
| | | | | | | | | |
Washington 1.26% | | | | | | | | | |
Spokane County, Washington School District, No. 81, GO Unlimited | | 5.05 | % | 06/01/22 | | 255,000 | | 288,267 | |
| | | | | | | | | |
Total Investments
(cost $20,303,301) | | | | | | | | 21,677,312 | |
Other assets and liabilities, net 4.85% | | | | | | | | 1,105,419 | |
| | | | | | | | | |
Net Assets 100% | | | | | | | | $ | 22,782,731 | |
| | | | | | | | | | | |
(1)Represents Yield
See notes to portfolios of investments and notes to financial statements.
88
All American Equity Fund | |
Portfolio of Investments (unaudited) | June 30, 2012 |
| | Shares | | Value | |
Common Stocks 87.49% | | | | | |
| | | | | |
Aerospace/Defense 1.13% | | | | | |
Northrop Grumman Corp. | | 3,000 | | $ | 191,370 | |
| | | | | |
Agricultural Chemicals 1.13% | | | | | |
The Mosaic Co. | | 3,500 | | 191,660 | |
| | | | | |
Applications Software 1.88% | | | | | |
Tangoe, Inc. | | 15,000 | | 319,650 | * |
| | | | | |
Beverages - Non-alcoholic 3.95% | | | | | |
The Coca-Cola Co. | | 2,800 | | 218,932 | |
Coca-Cola Enterprises, Inc. | | 6,000 | | 168,240 | * |
Monster Beverage Corp. | | 4,000 | | 284,800 | *^ |
| | | | 671,972 | |
Beverages - Wine/Spirits 1.35% | | | | | |
Constellation Brands, Inc., Class A | | 8,500 | | 230,010 | * |
| | | | | |
Building - Residential/Commercial 1.40% | | | | | |
D.R. Horton, Inc. | | 13,000 | | 238,940 | |
| | | | | |
Cable/Satellite TV 1.06% | | | | | |
DIRECTV, Class A | | 3,700 | | 180,634 | * |
| | | | | |
Casino Hotels 2.56% | | | | | |
Las Vegas Sands Corp. | | 10,000 | | 434,900 | ^ |
| | | | | |
Casino Services 1.65% | | | | | |
Bally Technologies, Inc. | | 6,000 | | 279,960 | * |
| | | | | |
Chemicals - Diversified 1.25% | | | | | |
PPG Industries, Inc. | | 2,000 | | 212,240 | |
| | | | | |
Coffee 0.61% | | | | | |
D.E Master Blenders 1753 N.V. | | 9,200 | | 103,740 | * |
| | | | | |
Commercial Services 1.16% | | | | | |
Iron Mountain, Inc. | | 6,000 | | 197,760 | |
| | | | | |
Commercial Services - Financial 3.79% | | | | | |
MasterCard, Inc., Class A | | 1,500 | | 645,165 | |
| | | | | | |
See notes to portfolios of investments and notes to financial statements.
89
| | Shares | | Value | |
Common Stocks | | | | | |
| | | | | |
Computers 4.26% | | | | | |
Apple, Inc. | | 1,000 | | $ | 584,000 | * |
Hewlett-Packard Co. | | 7,000 | | 140,770 | |
| | | | 724,770 | |
Computers - Integrated Systems 1.27% | | | | | |
Teradata Corp. | | 3,000 | | 216,030 | * |
| | | | | |
Computers - Memory Devices 0.87% | | | | | |
Seagate Technology plc | | 6,000 | | 148,380 | * |
| | | | | |
Computers - Peripheral Equipment 0.94% | | | | | |
Lexmark International, Inc., Class A | | 6,000 | | 159,480 | |
| | | | | |
Containers - Metal/Glass 0.99% | | | | | |
Ball Corp. | | 4,100 | | 168,305 | * |
| | | | | |
Containers - Paper/Plastic 1.05% | | | | | |
Bemis Co., Inc. | | 5,700 | | 178,638 | |
| | | | | |
Dental Supplies & Equipment 1.14% | | | | | |
Patterson Companies, Inc. | | 5,600 | | 193,032 | |
| | | | | |
Electric - Integrated 5.21% | | | | | |
Dominion Resources, Inc. | | 3,500 | | 189,000 | |
Entergy Corp. | | 2,700 | | 183,303 | |
Exelon Corp. | | 3,800 | | 142,956 | |
Pepco Holdings, Inc. | | 9,500 | | 185,915 | |
TECO Energy, Inc. | | 10,200 | | 184,212 | |
| | | | 885,386 | |
Electric Products - Miscellaneous 0.96% | | | | | |
Emerson Electric Co. | | 3,500 | | 163,030 | |
| | | | | |
Electronic Components - Semiconductors 2.66% | | | | | |
Intel Corp. | | 17,000 | | 453,050 | |
| | | | | |
Electronics - Military 1.00% | | | | | |
L-3 Communications Holdings, Inc. | | 2,300 | | 170,223 | |
| | | | | |
Food - Meat Products 0.31% | | | | | |
Hillshire Brands Co. | | 1,840 | | 53,341 | * |
| | | | | | |
See notes to portfolios of investments and notes to financial statements.
90
| | Shares | | Value | |
Common Stocks | | | | | |
| | | | | |
Food - Retail 2.81% | | | | | |
The Fresh Market, Inc. | | 6,000 | | $ | 321,780 | * |
Safeway, Inc. | | 8,600 | | 156,090 | |
| | | | 477,870 | |
Hotels & Motels 1.12% | | | | | |
Wyndham Worldwide Corp. | | 3,600 | | 189,864 | |
| | | | | |
Industrial Gases 1.04% | | | | | |
Airgas, Inc. | | 2,100 | | 176,421 | |
| | | | | |
Internet Security 1.20% | | | | | |
VeriSign, Inc. | | 4,700 | | 204,779 | * |
| | | | | |
Investment Management/Advisory Services 2.04% | | | | | |
Ameriprise Financial, Inc. | | 3,400 | | 177,684 | |
BlackRock, Inc., Class A | | 1,000 | | 169,820 | |
| | | | 347,504 | |
Linen Supply & Related Items 1.02% | | | | | |
Cintas Corp. | | 4,500 | | 173,745 | * |
| | | | | |
Medical - Biomedical/Gene 1.95% | | | | | |
Alexion Pharmaceuticals, Inc. | | 1,500 | | 148,950 | * |
Amgen, Inc. | | 2,500 | | 182,600 | |
| | | | 331,550 | |
Medical - HMO 0.91% | | | | | |
Aetna, Inc. | | 4,000 | | 155,080 | |
| | | | | |
Medical Labs & Testing Services 1.06% | | | | | |
Quest Diagnostics, Inc. | | 3,000 | | 179,700 | |
| | | | | |
Medical Products 2.15% | | | | | |
Becton Dickinson & Co. | | 2,300 | | 171,925 | |
Zimmer Holdings, Inc. | | 3,000 | | 193,080 | |
| | | | 365,005 | |
Multi-line Insurance 1.02% | | | | | |
Assurant, Inc. | | 5,000 | | 174,200 | |
| | | | | |
Oil & Gas Drilling 0.87% | | | | | |
Diamond Offshore Drilling, Inc. | | 2,500 | | 147,825 | |
| | | | | | |
See notes to portfolios of investments and notes to financial statements.
91
| | Shares | | Value | |
Common Stocks | | | | | |
| | | | | |
Oil Companies - Exploration & Production 0.75% | | | | | |
Devon Energy Corp. | | 2,200 | | $ | 127,578 | |
| | | | | |
Oil Companies - Integrated 2.12% | | | | | |
Chevron Corp. | | 1,700 | | 179,350 | |
ConocoPhillips | | 2,500 | | 139,700 | |
Phillips 66 | | 1,250 | | 41,550 | * |
| | | | 360,600 | |
Oil Refining & Marketing 1.17% | | | | | |
Sunoco, Inc. | | 4,200 | | 199,500 | |
| | | | | |
Printing - Commercial 0.97% | | | | | |
RR Donnelley & Sons Co. | | 14,000 | | 164,780 | |
| | | | | |
Property/Casualty Insurance 2.17% | | | | | |
The Progressive Corp. | | 8,500 | | 177,055 | |
The Travelers Cos., Inc. | | 3,000 | | 191,520 | |
| | | | 368,575 | |
Retail - Apparel/Shoe 1.87% | | | | | |
Limited Brands, Inc. | | 3,600 | | 153,108 | |
The Gap, Inc. | | 6,000 | | 164,160 | |
| | | | 317,268 | |
Retail - Consumer Electronics 0.88% | | | | | |
Best Buy Co., Inc. | | 7,100 | | 148,816 | |
| | | | | |
Retail - Restaurants 3.50% | | | | | |
Dunkin’ Brands Group, Inc. | | 8,000 | | 274,720 | |
Starbucks Corp. | | 6,000 | | 319,920 | |
| | | | 594,640 | |
Semiconductor Equipment 1.00% | | | | | |
Lam Research Corp. | | 4,500 | | 169,830 | * |
| | | | | |
Silver Mining 1.27% | | | | | |
First Majestic Silver Corp. | | 15,000 | | 216,750 | * |
| | | | | |
Telecommunication Equipment 0.98% | | | | | |
Harris Corp. | | 4,000 | | 167,400 | |
| | | | | | |
See notes to portfolios of investments and notes to financial statements.
92
| | Shares | | Value | |
Common Stocks | | | | | |
| | | | | |
Telephone - Integrated 3.69% | | | | | |
AT&T, Inc. | | 5,000 | | $ | 178,300 | |
Frontier Communications Corp. | | 30,000 | | 114,900 | |
Verizon Communications, Inc. | | 4,500 | | 199,980 | |
Windstream Corp. | | 14,000 | | 135,240 | * |
| | | | 628,420 | |
Therapeutics 2.50% | | | | | |
Questcor Pharmaceuticals, Inc. | | 8,000 | | 425,920 | * |
| | | | | |
Tobacco 1.32% | | | | | |
Lorillard, Inc. | | 1,700 | | 224,315 | |
| | | | | |
Web Portals/Internet Service Providers 1.36% | | | | | |
Google, Inc., Class A | | 400 | | 232,028 | * |
| | | | | |
Wireless Equipment 1.17% | | | | | |
Crown Castle International Corp. | | 3,400 | | 199,444 | * |
| | | | | |
Total Common Stocks
(cost $14,159,215) | | | | 14,881,073 | |
| | | | | |
Real Estate Investment Trust (REIT) 1.23% | | | | | |
| | | | | |
American Tower Corp., Class A
(cost $159,047) | | 3,000 | | 209,730 | |
| | | | | |
Exchange-Traded Funds (ETF) 1.21% | | | | | |
| | | | | |
iShares Silver Trust | | 500 | | 13,325 | * |
ProShares UltraShort QQQ | | 5,000 | | 161,800 | * |
SPDR Gold Trust | | 200 | | 31,038 | * |
| | | | | |
Total Exchange-Traded Funds
(cost $220,309) | | | | 206,163 | |
| | | | | | |
See notes to portfolios of investments and notes to financial statements.
93
| | Contracts | | Value | |
Purchased Option 0.03% | | | | | |
| | | | | |
Casino Hotels 0.03% | | | | | |
Las Vegas Sands Corp., Strike Price 40, Put, Expiration July 2012
(premium $4,526) | | 100 | | $ | 4,500 | |
| | | | | |
Total Securities
(cost $14,543,097) | | | | 15,301,466 | |
| | | | | | |
| | Principal
Amount | | | |
Repurchase Agreement 9.72% | | | | | |
| | | | | |
Joint Tri-Party Repurchase Agreement, Credit Suisse Securities USA LLC, 6/29/2012, 0.14%, due 7/2/2012, repurchase price $1,653,907, collateralized by U.S. Treasury securities held in a joint tri-party account (cost $1,653,888) | | $ | 1,653,888 | | 1,653,888 | |
| | | | | |
Total Investments 99.68%
(cost $16,196,985) | | | | 16,955,354 | |
Other assets and liabilities, net 0.32% | | | | 54,382 | |
| | | | | |
Net Assets 100% | | | | $ | 17,009,736 | |
| | | | | | | |
| | Shares Subject
To Call | | | |
Call Options Written | | | | | |
| | | | | |
Las Vegas Sands Corp., Strike Price 45, Expiration July 2012 | | 10,000 | | $ | 7,500 | |
Monster Beverage Corp., Strike Price 75, Expiration July 2012 | | 4,000 | | 5,840 | |
| | | | | |
Total Call Options Written
(premiums received $24,504) (Note 2A) | | | | $ | 13,340 | |
See notes to portfolios of investments and notes to financial statements.
94
Holmes Growth Fund | |
Portfolio of Investments (unaudited) | June 30, 2012 |
| | Shares | | Value | |
Common Stocks 78.10% | | | | | |
| | | | | |
Aerospace/Defense 2.62% | | | | | |
TransDigm Group, Inc. | | 7,000 | | $ | 940,100 | * |
| | | | | |
Agricultural Chemicals 1.62% | | | | | |
CF Industries Holdings, Inc. | | 3,000 | | 581,220 | ^ |
| | | | | |
Agricultural Operations 0.08% | | | | | |
Agriterra Ltd. | | 556,000 | | 29,348 | * |
| | | | | |
Applications Software 2.68% | | | | | |
Tangoe, Inc. | | 45,000 | | 958,950 | * |
| | | | | |
Beverages - Non-alcoholic 1.59% | | | | | |
Monster Beverage Corp. | | 8,000 | | 569,600 | *^ |
| | | | | |
Building - Residential/Commercial 1.44% | | | | | |
D.R. Horton, Inc. | | 28,000 | | 514,640 | |
| | | | | |
Casino Hotels 2.67% | | | | | |
Las Vegas Sands Corp. | | 22,000 | | 956,780 | ^ |
| | | | | |
Casino Services 2.35% | | | | | |
Bally Technologies, Inc. | | 18,000 | | 839,880 | * |
| | | | | |
Commercial Services - Financial 5.77% | | | | | |
Cardtronics, Inc. | | 30,000 | | 906,300 | * |
MasterCard, Inc., Class A | | 2,700 | | 1,161,297 | |
| | | | 2,067,597 | |
Computers 4.08% | | | | | |
Apple, Inc. | | 2,500 | | 1,460,000 | * |
| | | | | |
Computers - Integrated Systems 1.21% | | | | | |
Teradata Corp. | | 6,000 | | 432,060 | * |
| | | | | |
Computers - Memory Devices 0.86% | | | | | |
Seagate Technology plc | | 12,500 | | 309,125 | * |
| | | | | |
Electronic Components - Semiconductors 2.90% | | | | | |
Intel Corp. | | 39,000 | | 1,039,350 | |
| | | | | |
Finance - Commercial 1.16% | | | | | |
IOU Financial, Inc. | | 38,000 | | 10,265 | *+ |
IOU Financial, Inc. 144A | | 1,500,000 | | 405,186 | *+ |
| | | | 415,451 | |
| | | | | | |
See notes to portfolios of investments and notes to financial statements.
95
| | Shares | | Value | |
Common Stocks | | | | | |
| | | | | |
Food - Retail 2.55% | | | | | |
The Fresh Market, Inc. | | 17,000 | | $ | 911,710 | * |
| | | | | |
Internet Content - Information/Network 2.08% | | | | | |
LinkedIn Corp., Class A | | 7,000 | | 743,890 | * |
| | | | | |
Internet Financial Services 0.01% | | | | | |
Direct Markets Holdings Corp. | | 10,000 | | 3,790 | * |
| | | | | |
Machinery - General Industrial 2.40% | | | | | |
Chart Industries, Inc. | | 12,500 | | 859,500 | * |
| | | | | |
Medical - Biomedical/Gene 2.77% | | | | | |
Alexion Pharmaceuticals, Inc. | | 10,000 | | 993,000 | * |
| | | | | |
Medical - Drugs 1.10% | | | | | |
Akorn, Inc. | | 25,000 | | 394,250 | * |
| | | | | |
Medical - Generic Drugs 1.65% | | | | | |
Perrigo Co. | | 5,000 | | 589,650 | |
| | | | | |
Medical - Hospitals 0.04% | | | | | |
African Medical Investments plc | | 1,000,000 | | 13,705 | * |
| | | | | |
Medical Instruments 2.32% | | | | | |
Intuitive Surgical, Inc. | | 1,500 | | 830,685 | * |
| | | | | |
Medical Products 2.51% | | | | | |
Cyberonics, Inc. | | 20,000 | | 898,800 | * |
| | | | | |
Metal - Iron 0.28% | | | | | |
Pacific Iron Corp. (RS) | | 100,000 | | 100,000 | *@ |
| | | | | |
Oil - Field Services 1.62% | | | | | |
Core Laboratories N.V. | | 5,000 | | 579,500 | |
| | | | | |
Oil Refining & Marketing 2.18% | | | | | |
Western Refining, Inc. | | 35,000 | | 779,450 | |
| | | | | |
Quarrying 1.06% | | | | | |
Pacific Stone Tech, Inc. (RS) | | 1,757 | | 380,000 | @ |
| | | | | |
Radio 7.02% | | | | | |
Newfoundland Capital Corp., Ltd., Class A | | 330,400 | | 2,515,201 | * |
| | | | | | |
See notes to portfolios of investments and notes to financial statements.
96
| | Shares | | Value | |
Common Stocks | | | | | |
| | | | | |
Real Estate Operating/Development 0.28% | | | | | |
Pacific Infrastructure, Inc. (RS) | | 100,000 | | $ | 100,000 | *@ |
| | | | | |
Recreational Vehicles 2.99% | | | | | |
Polaris Industries, Inc. | | 15,000 | | 1,072,200 | *^ |
| | | | | |
Rental Auto/Equipment 1.43% | | | | | |
United Rentals, Inc. | | 15,000 | | 510,600 | * |
| | | | | |
Retail - Restaurants 4.92% | | | | | |
Dunkin’ Brands Group, Inc. | | 28,000 | | 961,520 | |
Starbucks Corp. | | 15,000 | | 799,800 | |
| | | | 1,761,320 | |
Semiconductor Components - Integrated Circuits 1.67% | | | | | |
Cirrus Logic, Inc. | | 20,000 | | 597,600 | * |
| | | | | |
Silver Mining 1.21% | | | | | |
First Majestic Silver Corp. | | 30,000 | | 433,500 | * |
| | | | | |
Therapeutics 2.68% | | | | | |
Questcor Pharmaceuticals, Inc. | | 18,000 | | 958,320 | * |
| | | | | |
Web Hosting/Design 2.30% | | | | | |
Web.com Group, Inc. | | 45,000 | | 824,400 | * |
| | | | | |
Total Common Stocks
(cost $24,786,203) | | | | 27,965,172 | |
| | | | | |
Exchange-Traded Funds (ETF) 1.11% | | | | | |
| | | | | |
iShares Silver Trust | | 1,000 | | 26,650 | * |
ProShares UltraShort QQQ | | 10,000 | | 323,600 | * |
SPDR Gold Trust | | 300 | | 46,557 | * |
| | | | | |
Total Exchange-Traded Funds
(cost $425,201) | | | | 396,807 | |
| | | | | | |
See notes to portfolios of investments and notes to financial statements.
97
| | Shares | | Value | |
Warrants 0.00% | | | | | |
| | | | | |
Medical - Hospitals 0.00% | | | | | |
African Medical Investments plc, Warrants (June 2014)
(cost $0) | | 500,000 | | $ | 0 | *@ |
| | | | | | |
| | Contracts | | | |
Purchased Option 0.03% | | | | | |
| | | | | |
Casino Hotels 0.03% | | | | | |
Las Vegas Sands Corp., Strike Price 40, Put, Expiration July 2012
(premium $9,958) | | 220 | | 9,900 | |
| | Principal
Amount | | | |
Convertible Debenture 0.28% | | | | | |
| | | | | |
Metal - Iron 0.28% | | | | | |
Pacific Iron Corp., 1.00%, maturity 06/07/12 (RS)
(cost $100,000) | | $ | 100,000 | | 100,000 | @ |
| | | | | |
Corporate Notes 1.24% | | | | | |
| | | | | |
Building - Heavy Construction 0.82% | | | | | |
Arendal, S. de R.L. de C.V., 144A, 12.50%, maturity 10/30/12 | | 292,600 | | 292,600 | |
| | | | | |
Electric - Generation 0.42% | | | | | |
Pacific Power Generation Corp., 15.00%, maturity 04/03/17 (RS) | | 150,000 | | 150,000 | @ |
| | | | | |
Total Corporate Notes
(cost $436,748) | | | | 442,600 | |
| | | | | |
Total Securities
(cost $25,758,110) | | | | 28,914,479 | |
| | | | | | |
See notes to portfolios of investments and notes to financial statements.
98
| | Principal
Amount | | Value | |
Repurchase Agreement 18.56% | | | | | |
| | | | | |
Joint Tri-Party Repurchase Agreement, Credit Suisse Securities USA LLC, 6/29/2012, 0.14%, due 7/2/2012, repurchase price $6,646,647, collateralized by U.S. Treasury securities held in a joint tri-party account (cost $6,646,570) | | $ | 6,646,570 | | $ | 6,646,570 | |
| | | | | |
Total Investments 99.32%
(cost $32,404,680) | | | | 35,561,049 | |
Other assets and liabilities, net 0.68% | | | | 244,087 | |
| | | | | |
Net Assets 100% | | | | $ | 35,805,136 | |
| | | | | | | |
| | Shares Subject
To Call | | | |
Call Options Written | | | | | |
| | | | | |
CF Industries Holdings, Inc., Strike Price 190, Expiration July 2012 | | 3,000 | | $ | 24,300 | |
Las Vegas Sands Corp., Strike Price 45, Expiration July 2012 | | 22,000 | | 16,500 | |
Monster Beverage, Strike Price 75, Expiration July 2012 | | 8,000 | | 11,680 | |
Polaris Industries, Inc., Strike Price 70, Expiration July 2012 | | 15,000 | | 43,500 | |
| | | | | |
Total Call Options Written
(premiums received $103,353) (Note 2A) | | | | $ | 95,980 | |
See notes to portfolios of investments and notes to financial statements.
99
Global MegaTrends Fund | |
Portfolio of Investments (unaudited) | June 30, 2012 |
| | Shares | | Value | |
Common Stocks 63.31% | | | | | |
| | | | | |
Agricultural Operations 0.26% | | | | | |
Agriterra Ltd. | | 636,000 | | $ | 33,571 | * |
| | | | | |
Beverages - Non-alcoholic 1.02% | | | | | |
Fomento Economico Mexicano SAB de CV, Sponsored ADR | | 1,500 | | 133,875 | |
| | | | | |
Beverages - Wine/Spirits 1.03% | | | | | |
Brown-Forman Corp., Class B | | 1,400 | | 135,590 | |
| | | | | |
Brewery 1.09% | | | | | |
Anheuser-Busch InBev NV, Sponsored ADR | | 1,800 | | 143,370 | |
| | | | | |
Cellular Telecommunications 4.98% | | | | | |
China Mobile Ltd., Sponsored ADR | | 3,900 | | 213,213 | |
Sprint Nextel Corp. | | 68,000 | | 221,680 | * |
Vodafone Group Plc, Sponsored ADR | | 7,730 | | 217,832 | |
| | | | 652,725 | |
Coal 0.19% | | | | | |
Pacific Coal Resources Ltd. | | 147,111 | | 24,566 | * |
| | | | | |
Consumer Products - Miscellaneous 1.02% | | | | | |
Kimberly-Clark Corp. | | 1,600 | | 134,032 | |
| | | | | |
Electric - Generation 2.33% | | | | | |
AES Corp. | | 22,000 | | 282,260 | * |
Pacific Power Generation Corp. (RS) | | 349,057 | | 23,358 | *@ |
| | | | 305,618 | |
Electric - Integrated 16.24% | | | | | |
Atco Ltd., Class I | | 2,900 | | 205,896 | * |
Compania Energetica de Minas Gerais, Sponsored ADR | | 12,200 | | 224,724 | |
Duke Energy Corp. | | 9,200 | | 212,152 | * |
Exelon Corp. | | 7,200 | | 270,864 | |
NextEra Energy, Inc. | | 3,100 | | 213,311 | |
PPL Corp. | | 9,600 | | 266,976 | |
Progress Energy, Inc. | | 3,520 | | 211,798 | |
Southern Co. | | 6,700 | | 310,210 | |
Wisconsin Energy Corp. | | 5,400 | | 213,678 | |
| | | | 2,129,609 | |
Energy - Alternate Sources 0.76% | | | | | |
Pacific Green Energy Corp. (RS) | | 100,000 | | 100,000 | *@ |
| | | | | | |
See notes to portfolios of investments and notes to financial statements.
100
| | Shares | | Value | |
Common Stocks | | | | | |
| | | | | |
Food - Confectionery 1.04% | | | | | |
Hershey Co. | | 1,900 | | $ | 136,857 | |
| | | | | |
Food - Dairy Products 1.04% | | | | | |
Dean Foods Co. | | 8,000 | | 136,240 | * |
| | | | | |
Food - Retail 1.02% | | | | | |
Whole Foods Market, Inc. | | 1,400 | | 133,448 | |
| | | | | |
Gas - Distribution 1.58% | | | | | |
Sempra Energy | | 3,000 | | 206,640 | |
| | | | | |
Gold Mining 0.18% | | | | | |
Gran Colombia Gold Corp. | | 76,300 | | 23,608 | * |
| | | | | |
Metal - Iron 0.76% | | | | | |
Pacific Iron Corp. (RS) | | 100,000 | | 100,000 | *@ |
| | | | | |
Quarrying 3.96% | | | | | |
Pacific Stone Tech, Inc. (RS) | | 2,405 | | 520,000 | @ |
| | | | | |
Real Estate Operating/Development 2.49% | | | | | |
Pacific Infrastructure, Inc. (RS) | | 326,533 | | 326,533 | *@ |
| | | | | |
Retail - Apparel/Shoe 2.51% | | | | | |
Ross Stores, Inc. | | 5,270 | | 329,217 | * |
| | | | | |
Retail - Discount 2.29% | | | | | |
Family Dollar Stores, Inc. | | 2,525 | | 167,862 | * |
Wal-Mart Stores, Inc. | | 1,900 | | 132,468 | |
| | | | 300,330 | |
Retail - Major Department Store 2.59% | | | | | |
TJX Cos, Inc. | | 7,900 | | 339,147 | |
| | | | | |
Telecom Services 3.28% | | | | | |
PT Telekomunikasi Indonesia Tbk, Sponsored ADR | | 6,120 | | 213,160 | |
Telecom Corp. of New Zealand Ltd., Sponsored ADR | | 23,000 | | 216,890 | * |
| | | | 430,050 | |
Telephone - Integrated 7.31% | | | | | |
AT&T, Inc. | | 7,535 | | 268,698 | |
CenturyLink, Inc. | | 5,445 | | 215,023 | |
Philippine Long Distance Telephone Co., Sponsored ADR | | 3,270 | | 207,972 | |
| | | | | | |
See notes to portfolios of investments and notes to financial statements.
101
| | Shares | | Value | |
Common Stocks | | | | | |
| | | | | |
Telephone - Integrated (Cont’d) | | | | | |
Verizon Communications, Inc. | | 6,000 | | $ | 266,640 | |
| | | | 958,333 | |
Tobacco 1.01% | | | | | |
Altria Group, Inc. | | 3,835 | | 132,499 | |
| | | | | |
Vitamins & Nutrition Products 1.70% | | | | | |
Mead Johnson Nutrition Co., Class A | | 2,770 | | 223,013 | |
| | | | | |
Wireless Equipment 1.63% | | | | | |
Crown Castle International Corp. | | 3,650 | | 214,109 | * |
| | | | | |
Total Common Stocks
(cost $8,284,093) | | | | 8,302,980 | |
| | | | | |
Real Estate Investment Trusts (REIT) 6.10% | | | | | |
| | | | | |
Allied Properties Real Estate Investment Trust | | 4,700 | | 133,883 | |
Artis Real Estate Investment Trust | | 8,115 | | 130,726 | * |
Boardwalk Real Estate Investment Trust | | 2,300 | | 132,413 | |
Dundee Real Estate Investment Trust | | 3,500 | | 131,295 | |
Primaris Retail Real Estate Investment Trust | | 5,661 | | 131,009 | * |
Simon Property Group, Inc. | | 900 | | 140,094 | |
| | | | | |
Total Real Estate Investment Trusts
(cost $775,669) | | | | 799,420 | |
| | | | | |
Exchange-Traded Fund (ETF) 0.86% | | | | | |
| | | | | |
ProShares UltraShort QQQ
(cost $120,995) | | 3,500 | | 113,260 | * |
| | | | | |
Warrants 0.01% | | | | | |
| | | | | |
Coal 0.01% | | | | | |
Pacific Coal Resources Ltd., Warrants (March 2016)
(cost $0) | | 55,555 | | 1,364 | * |
| | | | | | |
See notes to portfolios of investments and notes to financial statements.
102
| | Units | | Value | |
Master Limited Partnerships 6.00% | | | | | |
| | | | | |
Pipelines 6.00% | | | | | |
Atlas Energy L.P. | | 4,640 | | $ | 141,566 | * |
Enterprise Products Partners, L.P. | | 4,225 | | 216,489 | * |
NuStar Energy L.P. | | 5,400 | | 291,006 | * |
Plains All American Pipeline L.P. | | 1,700 | | 137,377 | * |
| | | | | |
Total Master Limited Partnerships
(cost $754,986) | | | | 786,438 | |
| | | | | | |
| | Principal
Amount | | | |
Convertible Debenture 0.76% | | | | | |
| | | | | |
Metal - Iron 0.76% | | | | | |
Pacific Iron Corp., 1.00%, maturity 06/07/13 (RS)
(cost $100,000) | | $ | 100,000 | | 100,000 | @ |
| | | | | |
Silver-Linked Note 0.03% | | | | | |
| | | | | |
Gold Mining 0.03% | | | | | |
Gran Colombia Gold Corp., 144A, 5.00%, maturity 08/11/18
(cost $4,488) | | 5,000 | | 4,300 | |
| | | | | |
Corporate Notes 1.66% | | | | | |
| | | | | |
Building - Heavy Construction 0.90% | | | | | |
Arendal, S. de R.L. de C.V., 144A, 12.50%, maturity 10/30/12 | | 117,800 | | 117,800 | |
| | | | | |
Electric - Generation 0.76% | | | | | |
Pacific Power Generation Corp., 15.00%, maturity 04/03/17 (RS) | | 100,000 | | 100,000 | @ |
| | | | | |
Total Corporate Notes
(cost $215,444) | | | | 217,800 | |
| | | | | |
Total Securities
(cost $10,255,675) | | | | 10,325,562 | |
| | | | | | |
See notes to portfolios of investments and notes to financial statements.
103
| | Principal
Amount | | Value | |
Repurchase Agreement 26.84% | | | | | |
| | | | | |
Joint Tri-Party Repurchase Agreement, Credit Suisse Securities USA LLC, 06/29/2012, 0.14%, due 07/02/2012, repurchase price $3,520,367 collateralized by U.S. Treasury securities held in a joint tri-party account (cost $3,520,326) | | $ | 3,520,326 | | $ | 3,520,326 | |
| | | | | |
Total Investments 105.57%
(cost $13,776,001) | | | | 13,845,888 | |
Other assets and liabilities, net (5.57%) | | | | (730,019 | ) |
| | | | | |
Net Assets 100% | | | | $ | 13,115,869 | |
| | | | | | | |
See notes to portfolios of investments and notes to financial statements.
104
Global Resources Fund | |
Portfolio of Investments (unaudited) | June 30, 2012 |
| | Shares | | Value | |
Common Stocks 79.98% | | | | | |
| | | | | |
Agricultural Chemicals 6.50% | | | | | |
CF Industries Holdings, Inc. | | 59,100 | | $ | 11,450,034 | ^ |
Monsanto Co. | | 143,000 | | 11,837,540 | ^ |
Potash Corporation of Saskatchewan, Inc. | | 254,100 | | 11,101,629 | |
Spur Ventures, Inc. | | 274,867 | | 94,498 | * |
| | | | 34,483,701 | |
Agricultural Operations 2.51% | | | | | |
Agriterra Ltd. | | 67,202,900 | | 3,547,259 | *+ |
Bunge Ltd. | | 156,000 | | 9,787,440 | |
| | | | 13,334,699 | |
Chemicals - Diversified 1.99% | | | | | |
Sociedad Quimica y Minera de Chile S.A., Sponsored ADR | | 189,200 | | 10,532,764 | |
| | | | | |
Coal 6.62% | | | | | |
Exxaro Resources Ltd. | | 410,000 | | 9,584,006 | |
Pacific Coal Resources Ltd. | | 19,686,315 | | 3,287,337 | *+ |
Peabody Energy Corp. | | 384,000 | | 9,415,680 | |
Sable Mining Africa Ltd. | | 31,714,371 | | 4,846,763 | * |
Walter Energy, Inc. | | 181,293 | | 8,005,236 | * |
| | | | 35,139,022 | |
Diamonds/Precious Stones 0.02% | | | | | |
Diamond Fields International Ltd. | | 1,800,000 | | 88,405 | * |
Rockwell Diamonds, Inc., 144A | | 63,333 | | 26,128 | * |
| | | | 114,533 | |
Diversified Minerals 1.11% | | | | | |
African Potash Ltd. | | 15,800,000 | | 1,887,000 | *+ |
Calibre Mining Corp. | | 600,000 | | 88,404 | * |
Canada Zinc Metals Corp. | | 1,000,000 | | 412,553 | * |
Lithium Americas Corp. | | 476,667 | | 421,394 | * |
Melior Resources, Inc. | | 779,661 | | 86,157 | * |
Melior Resources, Inc., 144A | | 4,953,000 | | 547,333 | * |
Sirocco Mining, Inc. | | 1,025,000 | | 855,803 | * |
Woulfe Mining Corp. | | 8,143,000 | | 1,599,725 | * |
| | | | 5,898,369 | |
Electric - Generation 0.06% | | | | | |
Pacific Power Generation Corp. (RS) | | 4,868,396 | | 325,779 | *@ |
| | | | | |
Energy - Alternate Sources 0.45% | | | | | |
Pacific Green Energy Corp. (RS) | | 2,400,000 | | 2,400,000 | *+@ |
| | | | | | |
See notes to portfolios of investments and notes to financial statements.
105
| | Shares | | Value | |
Common Stocks | | | | | |
| | | | | |
Finance - Investment Banker/Broker 0.09% | | | | | |
Aberdeen International, Inc. | | 1,274,750 | | $ | 494,598 | * |
| | | | | |
Food - Meat Products 5.26% | | | | | |
BRF-Brasil Foods S.A., Sponsored ADR | | 565,000 | | 8,582,350 | * |
Smithfield Foods, Inc. | | 215,000 | | 4,650,450 | * |
Tyson Foods, Inc., Class A | | 780,200 | | 14,691,166 | |
| | | | 27,923,966 | |
Forestry 2.52% | | | | | |
Prima Colombia Hardwood, Inc. | | 15,265,832 | | 262,415 | * |
West Fraser Timber Co., Ltd. | | 260,000 | | 13,116,841 | * |
| | | | 13,379,256 | |
Gold Mining 7.84% | | | | | |
Chesapeake Gold Corp. | | 162,400 | | 1,469,185 | * |
Corona Minerals Ltd. | | 50,000 | | 5,118 | *@ |
Eldorado Gold Corp. | | 841,000 | | 10,361,120 | * |
Gran Colombia Gold Corp. | | 9,872,154 | | 3,054,593 | * |
Gran Colombia Gold Corp., 144A | | 5,450,999 | | 1,686,621 | * |
Kinross Gold Corp. | | 1,350,001 | | 11,002,508 | |
NGEx Resources, Inc. | | 1,000,000 | | 1,944,895 | * |
Olympus Pacific Minerals, Inc. | | 265,000 | | 63,774 | * |
Planet Mining Exploration, Inc. | | 160,000 | | 19,646 | * |
Rusoro Mining Ltd. | | 3,119,433 | | 107,244 | * |
Sunridge Gold Corp. | | 1,000,000 | | 275,036 | * |
Yamana Gold, Inc. | | 753,000 | | 11,596,200 | ^ |
| | | | 41,585,940 | |
Medical - Hospitals 0.01% | | | | | |
African Medical Investments plc | | 2,507,500 | | 34,366 | * |
| | | | | |
Metal - Copper 5.68% | | | | | |
Catalyst Copper Corp. | | 1,800,000 | | 88,404 | * |
Catalyst Copper Corp., 144A | | 5,000,000 | | 245,568 | * |
First Quantum Minerals Ltd. | | 474,000 | | 8,380,728 | |
Freeport-McMoRan Copper & Gold, Inc. | | 294,890 | | 10,046,902 | |
Los Andes Copper Ltd. | | 754,000 | | 190,713 | * |
Southern Copper Corp. | | 354,012 | | 11,154,918 | |
Verona Development Corp. | | 708,800 | | 0 | *@ |
| | | | 30,107,233 | |
| | | | | | |
See notes to portfolios of investments and notes to financial statements.
106
| | Shares | | Value | |
Common Stocks | | | | | |
| | | | | |
Metal - Diversified 0.48% | | | | | |
Bell Copper Corp. | | 2,500,000 | | $ | 24,557 | * |
Concordia Resource Corp. | | 1,000,000 | | 240,656 | * |
GoviEx Uranium, Inc. (RS) | | 750,000 | | 2,250,000 | *@ |
Orsu Metals Corp., 144A | | 147,605 | | 13,411 | * |
| | | | 2,528,624 | |
Metal - Iron 2.34% | | | | | |
Cliffs Natural Resources, Inc. | | 195,000 | | 9,611,550 | |
Pacific Iron Corp. (RS) | | 2,600,000 | | 2,600,000 | *@ |
West African Iron Ore Corp. | | 2,925,000 | | 201,120 | * |
| | | | 12,412,670 | |
Mining Services 0.34% | | | | | |
Bounty Mining Ltd. | | 22,000,000 | | 281,490 | *@ |
Natasa Mining Ltd. | | 1,030,550 | | 1,525,372 | * |
| | | | 1,806,862 | |
Natural Resource Technology 0.00% | | | | | |
I-Pulse, Inc. (RS) | | 15,971 | | 7,500 | *@ |
| | | | | |
Non - Ferrous Metals 0.25% | | | | | |
Anfield Nickel Corp., 144A | | 390,000 | | 1,290,997 | * |
Sterling Group Ventures, Inc. | | 500,000 | | 47,500 | * |
| | | | 1,338,497 | |
Oil - Field Services 3.88% | | | | | |
Oceaneering International, Inc. | | 230,000 | | 11,007,800 | |
Oil States International, Inc. | | 144,500 | | 9,565,900 | * |
| | | | 20,573,700 | |
Oil & Gas Drilling 2.12% | | | | | |
Ensco plc, Class A | | 209,000 | | 9,816,730 | |
Nabors Industries Ltd. | | 100,000 | | 1,440,000 | * |
| | | | 11,256,730 | |
Oil Companies - Exploration & Production 8.45% | | | | | |
Africa Oil Corp. | | 475,000 | | 3,657,974 | * |
Anadarko Petroleum Corp. | | 146,950 | | 9,728,090 | |
BNK Petroleum, Inc. | | 931,300 | | 612,908 | * |
Gran Tierra Energy, Inc. | | 1,450,000 | | 7,119,500 | * |
Horn Petroleum Corp., 144A | | 2,110,889 | | 2,757,706 | * |
Ivanhoe Energy, Inc. | | 414,100 | | 197,278 | * |
MEG Energy Corp. | | 170,000 | | 6,093,316 | * |
| | | | | | |
See notes to portfolios of investments and notes to financial statements.
107
| | Shares | | Value | |
Common Stocks | | | | | |
| | | | | |
Oil Companies - Exploration & Production (Cont’d) | | | | | |
Pacific Rubiales Energy Corp. | | 9,288 | | $ | 196,699 | |
Petroamerica Oil Corp. | | 255,000 | | 32,562 | * |
Petroamerica Oil Corp., 144A | | 8,000,000 | | 1,021,561 | * |
Petromanas Energy, Inc. | | 5,544,000 | | 1,170,826 | * |
Pioneer Natural Resources Co. | | 106,600 | | 9,403,186 | |
Range Energy Resources, Inc. | | 15,100,000 | | 667,452 | *+ |
Royalite Petroleum Co., Inc. | | 2,266,333 | | 1,813 | * |
ShaMaran Petroleum Corp. | | 6,100,000 | | 1,018,614 | * |
U.S. Oil Sands, Inc. (RS) | | 7,777,777 | | 1,124,972 | *@ |
| | | | 44,804,457 | |
Oil Companies - Integrated 6.24% | | | | | |
Cenovus Energy, Inc. | | 322,000 | | 10,239,600 | |
Imperial Oil Ltd. | | 252,500 | | 10,534,300 | |
Marathon Petroleum Corp. | | 275,000 | | 12,353,000 | |
| | | | 33,126,900 | |
Oil Field Machinery & Equipment 1.70% | | | | | |
National-Oilwell Varco, Inc. | | 140,000 | | 9,021,600 | |
| | | | | |
Oil Refining & Marketing 2.73% | | | | | |
HollyFrontier Corp. | | 397,000 | | 14,065,710 | |
Value Creation, Inc. (RS) | | 336,880 | | 415,752 | *@ |
| | | | 14,481,462 | |
Paper & Related Products 1.82% | | | | | |
International Paper Co. | | 334,300 | | 9,664,613 | |
| | | | | |
Pipelines 1.75% | | | | | |
Kinder Morgan, Inc. | | 288,600 | | 9,298,692 | |
| | | | | |
Platinum 0.00% | | | | | |
Osmium Holdings S.A. (RS) | | 104 | | 0 | *@ |
| | | | | |
Precious Metals 0.53% | | | | | |
Fortress Minerals Corp. | | 170,071 | | 751,750 | * |
Tahoe Resources, Inc. | | 150,000 | | 2,073,081 | * |
| | | | 2,824,831 | |
Quarrying 3.11% | | | | | |
Compass Minerals International, Inc. | | 152,000 | | 11,594,560 | |
Pacific Stone Tech, Inc. (RS) | | 22,659 | | 4,900,000 | +@ |
| | | | 16,494,560 | |
| | | | | | |
See notes to portfolios of investments and notes to financial statements.
108
| | Shares | | Value | |
Common Stocks | | | | | |
| | | | | |
Real Estate Operating/Development 1.61% | | | | | |
Mongolia Growth Group Ltd. | | 285,000 | | $ | 1,086,194 | * |
Pacific Infrastructure, Inc. (RS) | | 7,443,544 | | 7,443,544 | *@ |
| | | | 8,529,738 | |
Silver Mining 1.97% | | | | | |
First Majestic Silver Corp. | | 722,000 | | 10,432,900 | * |
| | | | | |
Total Common Stocks
(cost $508,223,014) | | | | 424,358,562 | |
| | | | | |
Real Estate Investment Trusts (REIT) 4.24% | | | | | |
| | | | | |
Plum Creek Timber Co., Inc. | | 270,000 | | 10,719,000 | * |
Weyerhaeuser Co. | | 526,600 | | 11,774,776 | |
| | | | | |
Total Real Estate Investment Trusts
(cost $18,807,266) | | | | 22,493,776 | |
| | | | | |
Exchange-Traded Fund (ETF) 0.27% | | | | | |
| | | | | |
ETFS Platinum Trust
(cost $1,427,599) | | 10,000 | | 1,426,600 | * |
| | | | | |
Warrants 1.56% | | | | | |
| | | | | |
Coal 0.04% | | | | | |
Pacific Coal Resources Ltd., Warrants (March 2016) | | 7,907,407 | | 194,180 | * |
| | | | | |
Diversified Minerals 0.00% | | | | | |
Melior Resources, Inc., Warrants (June 2013) | | 3,803,000 | | 18,678 | * |
Niocan, Inc., 144A, Warrants (August 2014) | | 260,000 | | 0 | *@ |
| | | | 18,678 | |
Gold Mining 1.15% | | | | | |
Dundee Precious Metals, Inc., Warrants (November 2015) | | 625,000 | | 2,774,913 | * |
Gran Colombia Gold Corp., Warrants (August 2015) | | 2,622,733 | | 437,959 | * |
Gran Colombia Gold Corp., 144A, Warrants (August 2015) | | 1,594,166 | | 266,203 | * |
New Gold, Inc., 144A, Warrants (June 2017) | | 822,570 | | 2,593,635 | * |
Rusoro Mining Ltd., 144A, Warrants (November 2012) | | 3,150,000 | | 15,471 | * |
| | | | 6,088,181 | |
| | | | | | |
See notes to portfolios of investments and notes to financial statements.
109
| | Shares | | Value | |
Warrants | | | | | |
| | | | | |
Gold/Mineral Royalty Companies 0.05% | | | | | |
Franco-Nevada Corp., Warrants (June 2017) | | 44,000 | | $ | 254,997 | * |
| | | | | |
Medical - Hospitals 0.00% | | | | | |
African Medical Investments plc, Warrants (June 2014) | | 1,162,500 | | 0 | *@ |
| | | | | |
Metal - Copper 0.00% | | | | | |
Catalyst Copper Corp., 144A, Warrants (February 2017) | | 2,500,000 | | 0 | *@ |
| | | | | |
Metal - Iron 0.03% | | | | | |
West African Iron Ore Corp., 144A, Warrants (March 2016) | | 2,925,000 | | 186,754 | * |
| | | | | |
Oil Companies - Exploration & Production 0.29% | | | | | |
Horn Petroleum Corp., Warrants (September 2013) | | 2,110,889 | | 995,263 | * |
Petroamerica Oil Corp., 144A, Warrants (October 2014) | | 8,000,000 | | 550,071 | * |
U.S. Oil Sands, Inc., Warrants (May 2014) (RS) | | 7,777,777 | | 0 | *@ |
| | | | 1,545,334 | |
Total Warrants
(cost $3,673,500) | | | | 8,288,124 | |
| | | | | | |
| | Contracts | | | |
Purchased Call Options 0.39% | | | | | |
| | | | | |
Chemicals - Diversified 0.01% | | | | | |
Sociedad Quimica y Minera de Chile S.A., Strike Price 50, Call, Expiration Oct. 2012
(premium $56,460) | | 90 | | 63,000 | |
| | | | | |
Coal 0.07% | | | | | |
Peabody Energy Corp., Strike Price 22, Call, Expiration Jan. 2013
(premium $274,950) | | 500 | | 247,500 | |
Walter Energy, Inc., Strike Price 50, Call, Expiration Jan. 2013
(premium $233,596) | | 250 | | 127,500 | |
| | | | 375,000 | |
Exchange-Traded Funds 0.02% | | | | | |
Market Vectors Agribusiness ETF, Strike Price 43, Call, Expiration Jan. 2013
(premium $78,430) | | 110 | | 85,250 | |
| | | | | |
Food - Meat Products 0.02% | | | | | |
BRF-Brasil Foods S.A., Strike Price 15, Call, Expiration Dec. 2012
(premium $77,140) | | 290 | | 47,125 | |
Tyson Foods, Inc., Strike Price 17.50, Call, Expiration Jan. 2013
(premium $90,830) | | 310 | | 65,100 | |
| | | | 112,225 | |
See notes to portfolios of investments and notes to financial statements.
110
| | Contracts | | Value | |
Purchased Call Options | | | | | |
| | | | | |
Metal - Copper 0.02% | | | | | |
Freeport-McMoRan Copper & Gold, Inc., Strike Price 29.50, Call, Expiration Jan. 2013
(premium $94,575) | | 150 | | $ | 91,050 | |
| | | | | |
Metal - Iron 0.03% | | | | | |
Cliffs Natural Resources, Inc., Strike Price 45, Call, Expiration Jan. 2013
(premium $191,000) | | 200 | | 163,000 | |
| | | | | |
Oil - Field Services 0.06% | | | | | |
Oil States International, Inc., Strike Price 60, Call, Expiration Dec. 2012
(premium $345,300) | | 300 | | 327,000 | |
| | | | | |
Oil Companies - Exploration & Production 0.03% | | | | | |
Pioneer Natural Resources Co., Strike Price 90, Call, Expiration Jan. 2013
(premium $163,300) | | 100 | | 112,500 | |
SM Energy Co., Strike Price 55, Call, Expiration Nov. 2012
(premium $59,443) | | 60 | | 27,000 | |
| | | | 139,500 | |
Oil Companies - Integrated 0.06% | | | | | |
Cenovus Energy, Inc., Strike Price 25, Call, Expiration Dec. 2012
(premium $214,900) | | 300 | | 226,500 | |
Imperial Oil Ltd., Strike Price 35, Call, Expiration Nov. 2012
(premium $104,390) | | 130 | | 102,050 | |
| | | | 328,550 | |
Oil Field Machinery & Equipment 0.04% | | | | | |
National-Oilwell Varco, Inc., Strike Price 60, Call, Expiration Jan. 2013
(premium $226,380) | | 200 | | 193,500 | |
| | | | | |
Paper & Related Products 0.01% | | | | | |
International Paper Co., Strike Price 26, Call, Expiration Jan. 2013
(premium $83,810) | | 170 | | 71,400 | |
| | | | | |
Pipelines 0.01% | | | | | |
Kinder Morgan, Inc., Strike Price 30, Call, Expiration Jan. 2013
(premium $63,450) | | 150 | | 46,875 | |
| | | | | |
Quarrying 0.01% | | | | | |
Compass Minerals International, Inc., Strike Price 70, Call, Expiration Dec. 2012
(premium $85,040) | | 80 | | 70,000 | |
| | | | | |
Total Purchased Call Options
(cost $2,442,994) | | | | 2,066,350 | |
| | | | | | |
See notes to portfolios of investments and notes to financial statements.
111
| | Contracts | | Value | |
Purchased Put Options 0.18% | | | | | |
| | | | | |
Exchange-Traded Funds 0.18% | | | | | |
Market Vectors Agribusiness ETF, Strike Price 34, Put, Expiration Oct. 2012
(premium $291,662) | | 1,000 | | $ | 190,000 | |
Materials Select Sector SPDR Trust, Strike Price 34, Put, Expiration Dec. 2012
(premium $531,909) | | 2,000 | | 398,000 | |
SPDR S&P Oil & Gas Exploration & Production ETF, Strike Price 46, Put, Expiration Dec. 2012
(premium $510,910) | | 1,000 | | 365,000 | |
| | | | | |
Total Purchased Put Options
(cost $1,334,481) | | | | 953,000 | |
| | | | | | |
| | Units | | | |
Master Limited Partnerships 5.72% | | | | | |
| | | | | |
Oil Companies - Exploration & Production 1.53% | | | | | |
SandRidge Mississippian Trust II | | 428,000 | | 8,089,200 | |
| | | | | |
Pipelines 4.19% | | | | | |
Enterprise Products Partners, L.P. | | 224,000 | | 11,477,760 | * |
Western Gas Partners L.P. | | 247,000 | | 10,776,610 | * |
| | | | 22,254,370 | |
Total Master Limited Partnerships
(cost $30,175,811) | | | | 30,343,570 | |
| | | | | |
| | Principal
Amount | | | |
Silver-Linked Notes 0.37% | | | | | |
| | | | | |
Gold Mining 0.37% | | | | | |
Gran Colombia Gold Corp., 5.00%, maturity 08/11/18 | | $ | 2,000,000 | | 1,720,000 | |
Gran Colombia Gold Corp., 144A, 5.00%, maturity 08/11/18 | | 287,000 | | 246,820 | |
| | | | | |
Total Silver-Linked Notes
(cost $2,244,928) | | | | 1,966,820 | |
| | | | | |
Corporate Notes 1.46% | | | | | |
| | | | | |
Building - Heavy Construction 0.63% | | | | | |
Arendal, S. de R.L. de C.V., 144A, 12.50%, maturity 10/30/12 | | 3,355,400 | | 3,355,400 | |
| | | | | |
Diversified Minerals 0.09% | | | | | |
Niocan, Inc., 144A, 12.00%, maturity 08/27/12 | | 491,135 | | 491,135 | @ |
| | | | | | |
See notes to portfolios of investments and notes to financial statements.
112
| | Principal
Amount | | Value | |
Corporate Notes | | | | | |
| | | | | |
Electric - Generation 0.57% | | | | | |
Pacific Power Generation Corp., 15.00%, maturity 04/03/17 (RS) | | $ | 3,000,000 | | $ | 3,000,000 | @ |
| | | | | |
Mining Services 0.17% | | | | | |
Great Western Minerals Group Ltd., 8.00%, maturity 04/06/17 | | 1,000,000 | | 902,500 | |
| | | | | |
Total Corporate Notes
(cost $7,798,919) | | | | 7,749,035 | |
| | | | | |
Total Securities
(cost $576,128,512) | | | | 499,645,837 | |
| | | | | |
Repurchase Agreement 4.90% | | | | | |
| | | | | |
Joint Tri-Party Repurchase Agreement, Credit Suisse Securities USA LLC, 6/29/2012, 0.14%, due 7/2/2012, repurchase price $25,985,729, collateralized by U.S. Treasury securities held in a joint tri-party account (cost $25,985,426) | | 25,985,426 | | 25,985,426 | |
| | | | | |
Total Investments 99.07%
(cost $602,113,938) | | | | 525,631,263 | |
Other assets and liabilities, net 0.93% | | | | 4,972,855 | |
| | | | | |
Net Assets 100% | | | | $ | 530,604,118 | |
| | | | | |
| | Shares Subject
To Call | | | |
Call Options Written | | | | | |
CF Industries Holdings, Inc., Strike Price 195, Expiration July 2012 | | 59,000 | | $ | 306,800 | |
Monsanto Co., Strike Price 82.50, Expiration July 2012 | | 136,000 | | 224,400 | |
Yamana Gold, Inc., Strike Price 16, Expiration July 2012 | | 150,000 | | 36,000 | |
| | | | | |
Total Call Options Written
(premiums received $545,991) (Note 2A) | | | | $ | 567,200 | |
| | | | | | | |
See notes to portfolios of investments and notes to financial statements.
113
World Precious Minerals Fund | |
Portfolio of Investments (unaudited) | June 30, 2012 |
| | Shares | | Value | |
Common Stocks 78.48% | | | | | |
| | | | | |
Agricultural Operations 0.63% | | | | | |
Agriterra Ltd. | | 38,620,100 | | $ | 2,038,535 | * |
| | | | | |
Coal 1.00% | | | | | |
Pacific Coal Resources Ltd. | | 2,644,222 | | 441,548 | * |
Prophecy Coal Corp., 144A | | 133,400 | | 33,414 | * |
Sable Mining Africa Ltd. | | 18,201,500 | | 2,781,652 | * |
| | | | 3,256,614 | |
Diamonds/Precious Stones 1.13% | | | | | |
Diagem, Inc. | | 406,350 | | 0 | *@ |
Diamonds North Resources Ltd. | | 1,757,400 | | 77,681 | * |
Diamonds North Resources Ltd., 144A | | 1,046,800 | | 46,271 | * |
Gold Standard Ventures Corp. | | 775,000 | | 1,505,756 | * |
Lucara Diamond Corp. | | 1,275,000 | | 851,628 | * |
Northern Superior Resources, Inc., Class A | | 1,510,900 | | 289,402 | * |
Olivut Resources Ltd. | | 645,000 | | 785,619 | * |
Rockwell Diamonds, Inc. | | 66,666 | | 27,503 | * |
Rockwell Diamonds, Inc., 144A | | 171,667 | | 70,822 | * |
| | | | 3,654,682 | |
Diversified Minerals 3.94% | | | | | |
African Potash Ltd. | | 3,000,000 | | 358,291 | * |
Aldridge Minerals, Inc. | | 2,006,000 | | 1,103,443 | * |
Amarc Resources Ltd. | | 695,545 | | 134,935 | * |
Calibre Mining Corp. | | 1,800,000 | | 265,213 | * |
Elissa Resources Ltd., 144A | | 36,250 | | 2,314 | * |
Erdene Resource Development Corp. | | 396,000 | | 85,575 | * |
Global Minerals Ltd. | | 450,000 | | 141,447 | * |
Golden Alliance Resources Corp. | | 235,000 | | 16,158 | * |
Helio Resource Corp. | | 500,000 | | 39,291 | * |
Indochine Mining Ltd. | | 7,785,500 | | 875,126 | * |
Mindoro Resources Ltd. | | 2,984,000 | | 131,899 | * |
Mines Management, Inc. | | 350,000 | | 472,500 | * |
Miocene Metals Ltd. | | 256,833 | | 15,767 | * |
Moss Lake Gold Mines Ltd. | | 3,345,000 | | 706,424 | *+ |
New Pacific Metals Corp. | | 45,380 | | 30,311 | * |
North American Tungsten Corp. | | 950,000 | | 214,626 | * |
Prodigy Gold, Inc. | | 1,350,000 | | 755,857 | * |
Rochester Resources Ltd. | | 1,125,000 | | 55,253 | *+ |
Rochester Resources Ltd., 144A | | 6,630,000 | | 325,623 | *+ |
Rubicon Minerals Corp. | | 1,500,000 | | 4,582,290 | * |
Sirocco Mining, Inc. | | 2,605,000 | | 2,174,991 | * |
Strongbow Exploration, Inc. | | 825,000 | | 64,830 | * |
Wallbridge Mining Co., Ltd. | | 1,541,000 | | 196,778 | * |
| | | | 12,748,942 | |
| | | | | | |
See notes to portfolios of investments and notes to financial statements.
114
| | Shares | | Value | |
Common Stocks | | | | | |
| | | | | |
Finance - Investment Banker/Broker 0.29% | | | | | |
Aberdeen International, Inc. | | 2,396,000 | | $ | 929,639 | * |
| | | | | |
Gold Mining 51.63% | | | | | |
Agnico-Eagle Mines Ltd. | | 350,000 | | 14,161,000 | |
Alamos Gold, Inc. | | 240,000 | | 3,748,342 | *^ |
Almaden Minerals Ltd. | | 570,000 | | 1,198,173 | * |
AngloGold Ashanti Ltd., Sponsored ADR | | 50,000 | | 1,717,000 | ^ |
Atna Resources Ltd. | | 3,000,526 | | 2,917,853 | * |
AuRico Gold, Inc. | | 315,000 | | 2,523,150 | *^ |
B2Gold Corp. | | 1,100,000 | | 3,306,321 | * |
Barrick Gold Corp. | | 50,000 | | 1,878,500 | |
Belo Sun Mining Corp. | | 1,000,000 | | 1,119,788 | * |
Brazilian Gold Corp. | | 500,000 | | 108,050 | * |
Canaco Resources, Inc. | | 800,000 | | 275,036 | * |
Canyon Resources Ltd. | | 826,316 | | 280,467 | * |
Caza Gold Corp. | | 1,150,000 | | 203,330 | * |
CB Gold, Inc. | | 1,115,000 | | 941,899 | * |
Centerra Gold, Inc. | | 175,500 | | 1,227,405 | * |
Chalice Gold Mines Ltd. | | 3,900,000 | | 885,634 | * |
Chesapeake Gold Corp. | | 641,600 | | 5,804,367 | * |
Choice Gold Corp. | | 1,845,000 | | 81,553 | * |
Claude Resources, Inc. | | 1,500,000 | | 957,713 | * |
Colossus Minerals, Inc. | | 499,000 | | 1,735,141 | * |
Comstock Mining, Inc. | | 750,000 | | 1,852,500 | * |
Continental Gold Ltd. | | 630,000 | | 4,078,091 | * |
Corona Minerals Ltd. | | 812,500 | | 83,167 | *@ |
Coventry Resources Ltd. | | 6,000,000 | | 414,497 | * |
Crystallex International Corp. | | 2,150,000 | | 247,250 | * |
Doray Minerals Ltd. | | 1,000,000 | | 779,444 | * |
Dundee Precious Metals, Inc. | | 600,000 | | 3,612,789 | * |
Eastmain Resources, Inc. | | 749,000 | | 640,077 | * |
Eldorado Gold Corp. | | 250,000 | | 3,080,000 | * |
Entree Gold, Inc. | | 2,940,000 | | 1,819,361 | * |
Goldcorp, Inc. | | 150,000 | | 5,637,000 | |
Golden Arrow Resources Corp. | | 2,155,000 | | 534,490 | * |
Golden Predator Corp. | | 2,985,700 | | 1,114,450 | * |
Golden Star Resources Ltd. | | 550,000 | | 638,000 | * |
Gran Colombia Gold Corp. | | 7,164,678 | | 2,216,859 | *+ |
Gran Colombia Gold Corp., 144A | | 17,175,360 | | 5,314,315 | *+ |
Grandview Gold, Inc. | | 1,100,000 | | 37,817 | * |
Great Basin Gold Ltd. | | 1,000,000 | | 677,766 | * |
Guyana Goldfields, Inc. | | 284,000 | | 649,988 | * |
Harmony Gold Mining Co., Ltd., Sponsored ADR | | 1,045,000 | | 9,823,000 | *^ |
IAMGOLD Corp. | | 150,000 | | 1,770,000 | |
Intrepid Mines Ltd. | | 1,650,000 | | 878,646 | * |
Kaminak Gold Corp., Class A | | 100,000 | | 171,897 | * |
| | | | | | |
See notes to portfolios of investments and notes to financial statements.
115
| | Shares | | Value | |
Common Stocks | | | | | |
| | | | | |
Gold Mining (Cont’d) | | | | | |
Kilo Goldmines Ltd. | | 2,500,000 | | $ | 417,465 | * |
Kimber Resources, Inc. | | 1,500,000 | | 1,102,500 | * |
Kirkland Lake Gold, Inc. | | 200,000 | | 2,153,136 | * |
Klondex Mines Ltd. | | 3,186,300 | | 4,381,730 | *+ |
Lexam VG Gold, Inc. | | 2,370,000 | | 477,236 | * |
Lexam VG Gold, Inc., 144A | | 2,406,501 | | 484,586 | * |
Lion One Metals Ltd. | | 300,000 | | 235,745 | * |
Malbex Resources, Inc. | | 470,500 | | 39,283 | * |
Malbex Resources, Inc., 144A | | 1,333,333 | | 111,324 | * |
Midway Gold Corp. | | 265,800 | | 369,462 | * |
Mirasol Resources Ltd. | | 2,160,000 | | 3,458,376 | *+ |
NGEx Resources, Inc. | | 2,400,000 | | 4,667,747 | * |
Olympus Pacific Minerals, Inc. | | 545,590 | | 131,300 | * |
Pacific Rim Mining Corp. | | 133,500 | | 11,146 | * |
Papillon Resources Ltd. | | 750,000 | | 752,786 | * |
Petaquilla Minerals Ltd., 144A | | 2,660,000 | | 1,032,071 | * |
Pilot Gold, Inc. | | 100,000 | | 108,050 | * |
Planet Mining Exploration, Inc. | | 1,030,500 | | 126,529 | * |
PMI Gold Corp. | | 8,016,500 | | 6,142,007 | * |
Premier Gold Mines Ltd. | | 700,000 | | 3,025,392 | * |
Queenston Mining, Inc. | | 350,000 | | 1,175,777 | * |
Radius Gold, Inc. | | 2,165,000 | | 425,323 | * |
Ramelius Resources Ltd. | | 1,300,000 | | 651,052 | * |
Renaissance Gold, Inc. | | 530,000 | | 327,980 | * |
Reunion Gold Corp. | | 1,925,000 | | 888,709 | * |
Revolution Resources Corp., 144A | | 570,000 | | 78,385 | * |
Richmont Mines, Inc. | | 535,000 | | 2,477,050 | * |
Rio Alto Mining Ltd. | | 509,306 | | 2,041,126 | * |
Riverstone Resources, Inc. | | 300,000 | | 110,505 | * |
Romarco Minerals, Inc. | | 1,000,000 | | 520,603 | * |
Rusoro Mining Ltd. | | 6,325,900 | | 217,481 | * |
Rye Patch Gold Corp. | | 5,775,000 | | 3,233,387 | * |
San Gold Corp. | | 2,050,000 | | 1,872,698 | * |
Seafield Resources Ltd., 144A | | 1,300,000 | | 191,543 | * |
SEMAFO, Inc. | | 300,000 | | 1,376,160 | * |
Silver Lake Resources Ltd. | | 500,000 | | 1,444,624 | * |
Solvista Gold Corp. | | 65,000 | | 18,835 | *+ |
Solvista Gold Corp., 144A | | 2,620,000 | | 759,196 | *+ |
St Barbara Ltd. | | 1,500,000 | | 2,727,096 | * |
Sunridge Gold Corp. | | 1,000,000 | | 275,036 | * |
Taurus Gold Ltd. (RS) | | 2,255,169 | | 3,382,754 | *@ |
Tolima Gold, Inc., 144A | | 4,325,000 | | 722,214 | * |
Torex Gold Resources, Inc. | | 2,411,300 | | 3,908,104 | * |
TriStar Gold, Inc. | | 1,377,500 | | 351,800 | * |
Virginia Mines, Inc. | | 792,000 | | 7,009,400 | * |
West Kirkland Mining, Inc. | | 1,500,000 | | 456,756 | * |
Yamana Gold, Inc. | | 660,000 | | 10,164,000 | ^ |
| | | | 167,177,591 | |
| | | | | | |
See notes to portfolios of investments and notes to financial statements.
116
| | Shares | | Value | |
Common Stocks | | | | | |
| | | | | |
Gold/Mineral Royalty Companies 2.65% | | | | | |
Franco-Nevada Corp. | | 190,000 | | $ | 8,592,505 | |
| | | | | |
Investment Companies 0.00% | | | | | |
Invictus Financial, Inc. | | 49,800 | | 4,892 | * |
| | | | | |
Medical - Hospitals 0.02% | | | | | |
African Medical Investments plc | | 4,637,500 | | 63,558 | * |
| | | | | |
Metal - Copper 2.99% | | | | | |
Catalyst Copper Corp. | | 1,564,000 | | 76,813 | * |
Catalyst Copper Corp., 144A | | 2,000,000 | | 98,227 | * |
Freeport-McMoRan Copper & Gold, Inc. | | 225,000 | | 7,665,750 | ^ |
Lumina Copper Corp. | | 30,000 | | 275,527 | * |
Revett Minerals, Inc. | | 481,000 | | 1,578,056 | * |
Verona Development Corp. | | 48,500 | | 0 | *@ |
| | | | 9,694,373 | |
Metal - Diversified 2.80% | | | | | |
Avion Gold Corp. | | 785,000 | | 350,842 | * |
Balmoral Resources Ltd. | | 1,085,000 | | 586,170 | * |
Bearing Resources Ltd. | | 81,250 | | 19,952 | * |
Bell Copper Corp. | | 2,000,000 | | 19,645 | * |
Cerro Resources NL | | 17,658,000 | | 1,322,059 | * |
Cerro Resources NL, 144A | | 2,600,000 | | 217,082 | * |
Dalradian Resources, Inc. | | 1,678,000 | | 1,071,362 | * |
First Point Minerals Corp. | | 2,400,000 | | 1,178,724 | * |
Imperial Metals Corp. | | 254,700 | | 2,321,709 | * |
Mariana Resources Ltd. | | 4,225,000 | | 363,870 | * |
Orsu Metals Corp. | | 289,800 | | 26,331 | * |
Orsu Metals Corp., 144A | | 1,800,000 | | 163,548 | * |
Prophecy Platinum Corp. | | 1 | | 2 | * |
Rackla Metals, Inc. | | 714,999 | | 77,255 | * |
Robust Resources Ltd. | | 600,000 | | 529,875 | * |
South American Silver Corp. | | 540,000 | | 594,077 | * |
Temex Resources Corp. | | 950,000 | | 167,968 | * |
Tigray Resources, Inc. | | 275,000 | | 51,999 | * |
| | | | 9,062,470 | |
Mining Services 1.36% | | | | | |
Argent Minerals Ltd. | | 5,625,000 | | 319,682 | * |
Energold Drilling Corp. | | 390,000 | | 1,497,863 | * |
Geodrill Ltd. | | 320,000 | | 675,802 | * |
Natasa Mining Ltd. | | 1,293,449 | | 1,914,503 | * |
| | | | 4,407,850 | |
| | | | | | |
See notes to portfolios of investments and notes to financial statements.
117
| | Shares | | Value | |
Common Stocks | | | | | |
| | | | | |
Oil Companies - Exploration & Production 0.00% | | | | | |
Big Sky Energy Corp. | | 2,000,000 | | $ | 0 | *@ |
| | | | | |
Platinum 0.61% | | | | | |
Osmium Holdings S.A. (RS) | | 891 | | 0 | *@ |
Pacific North West Capital Corp. | | 1,291,666 | | 101,501 | * |
Platinum Group Metals Ltd. | | 2,265,000 | | 1,891,116 | * |
| | | | 1,992,617 | |
Precious Metals 5.30% | | | | | |
Alexco Resource Corp. | | 350,000 | | 1,543,500 | * |
Atikwa Resources, Inc. | | 1,333,333 | | 39,291 | * |
Candente Gold Corp. | | 765,000 | | 127,744 | *+ |
Candente Gold Corp., 144A | | 4,875,000 | | 814,056 | *+ |
Coeur d’Alene Mines Corp. | | 285,000 | | 5,004,600 | * |
Fortress Minerals Corp. | | 202,000 | | 892,884 | * |
Fortress Minerals Corp., 144A | | 70,000 | | 309,415 | * |
Newstrike Capital, Inc. | | 20,000 | | 28,289 | * |
Pan African Resources plc | | 10,000,000 | | 2,425,009 | * |
Polymetal International plc | | 170,000 | | 2,436,005 | |
Roxgold, Inc. | | 1,105,000 | | 575,267 | * |
Sabina Gold & Silver Corp. | | 899,400 | | 1,758,073 | * |
Solitario Exploration & Royalty Corp. | | 950,000 | | 1,194,440 | * |
| | | | 17,148,573 | |
Silver Mining 4.13% | | | | | |
First Majestic Silver Corp. | | 145,000 | | 2,095,250 | * |
MAG Silver Corp. | | 731,000 | | 6,433,633 | * |
Silver Wheaton Corp. | | 180,000 | | 4,831,200 | |
| | | | 13,360,083 | |
Total Common Stocks
(cost $399,830,938) | | | | 254,132,924 | |
| | | | | |
Exchange-Traded Funds (ETF) 1.53% | | | | | |
| | | | | |
ETFS Palladium Trust | | 5,000 | | 286,650 | * |
Market Vectors Gold Miners ETF | | 20 | | 895 | * |
Market Vectors Junior Gold Miners ETF | | 35 | | 671 | * |
SPDR Gold Trust | | 30,000 | | 4,655,700 | * |
| | | | | |
Total Exchange-Traded Funds
(cost $5,169,281) | | | | 4,943,916 | |
| | | | | | |
See notes to portfolios of investments and notes to financial statements.
118
| | Shares | | Value | |
Warrants 3.98% | | | | | |
| | | | | |
Coal 0.01% | | | | | |
Pacific Coal Resources Ltd., Warrants (March 2016) | | 1,111,111 | | $ | 27,285 | * |
| | | | | |
Gold Mining 3.77% | | | | | |
Choice Gold Corp., Warrants (December 2012) | | 870,000 | | 0 | *@ |
Crystallex International Corp., 144A, Warrants (December 2049) | | 162,500 | | 0 | *@ |
Dundee Precious Metals, Inc., Warrants (November 2015) | | 1,260,000 | | 5,594,224 | * |
Endeavour Mining Corp., Warrants (February 2014) | | 1,030,000 | | 470,458 | * |
Gran Colombia Gold Corp., Warrants (August 2015) | | 2,221,104 | | 370,893 | * |
Gran Colombia Gold Corp., 144A, Warrants (August 2015) | | 4,520,983 | | 754,940 | * |
Kinross Gold Corp., Warrants (September 2013) | | 788,411 | | 298,157 | * |
Kinross Gold Corp., Warrants (September 2014) | | 250,000 | | 98,227 | * |
New Gold, Inc., Warrants (June 2017) | | 1,100,000 | | 3,468,395 | * |
New Gold, Inc., 144A, Warrants (June 2017) | | 352,530 | | 1,111,558 | * |
Petaquilla Minerals Ltd., 144A, Warrants (January 2014) | | 2,660,000 | | 0 | *@ |
Rusoro Mining Ltd., Warrants (November 2012) | | 225,750 | | 1,109 | * |
Rusoro Mining Ltd., 144A, Warrants (November 2012) | | 6,105,000 | | 29,984 | * |
Seafield Resources Ltd., 144A, Warrants (December 2012) | | 1,300,000 | | 6,385 | * |
Solvista Gold Corp., 144A, Warrants (April 2013) | | 1,310,000 | | 0 | *@ |
Tolima Gold, Inc., 144A, Warrants (December 2013) | | 2,050,000 | | 0 | *@ |
| | | | 12,204,330 | |
Gold/Mineral Royalty Companies 0.20% | | | | | |
Franco-Nevada Corp., Warrants (July 2013) | | 42,200 | | 8,083 | * |
Franco-Nevada Corp., 144A, Warrants (July 2013) | | 125,000 | | 23,943 | * |
Franco-Nevada Corp., Warrants (June 2017) | | 105,932 | | 613,918 | * |
| | | | 645,944 | |
Medical - Hospitals 0.00% | | | | | |
African Medical Investments plc, Warrants (June 2014) | | 2,125,000 | | 0 | *@ |
| | | | | |
Metal - Copper 0.00% | | | | | |
Catalyst Copper Corp., 144A, Warrants (February 2017) | | 1,000,000 | | 0 | *@ |
| | | | | |
Metal - Diversified 0.00% | | | | | |
Rackla Metals, Inc., Warrants (June 2013) | | 673,333 | | 23,149 | * |
Rackla Metals, Inc., 144A, Warrants (June 2013) | | 41,666 | | 1,432 | * |
| | | | 24,581 | |
Total Warrants
(cost $10,706,989) | | | | 12,902,140 | |
| | | | | | |
See notes to portfolios of investments and notes to financial statements.
119
| | Shares | | Value | |
Special Warrants 0.00% | | | | | |
| | | | | |
Gold/Mineral Exploration & Development 0.00% | | | | | |
Western Exploration & Development Ltd., 144A, Special Warrants (December 2049) (RS)
(cost $300,000) | | 600,000 | | $ | 0 | *@ |
| | | | | |
| | Contracts | | | |
Purchased Call Options 2.36% | | | | | |
| | | | | |
Gold Mining 2.23% | | | | | |
Agnico-Eagle Mines Ltd., Strike Price 47.50, Call, Expiration Jan. 2013
(premium $917,592) | | 6,842 | | 1,744,710 | |
Agnico-Eagle Mines Ltd., Strike Price 55, Call, Expiration Jan. 2013
(premium $629,470) | | 1,074 | | 108,474 | |
AuRico Gold, Inc., Strike Price 8, Call, Expiration Dec. 2012
(premium $317,450) | | 2,139 | | 256,680 | |
Barrick Gold Corp., Strike Price 50, Call, Expiration Jan. 2013
(premium $782,254) | | 3,737 | | 209,272 | |
Eldorado Gold Corp., Strike Price 12.50, Call, Expiration Jan. 2013
(premium $874,611) | | 3,112 | | 497,920 | |
Gold Fields Ltd., Strike Price 20, Call, Expiration Jan. 2013
(premium $2,385) | | 78 | | 546 | |
Goldcorp, Inc., Strike Price 65, Call, Expiration Jan. 2013
(premium $236,868) | | 3,958 | | 67,286 | |
Goldcorp, Inc., Strike Price 65, Call, Expiration Jan. 2014
(premium $457,429) | | 1,340 | | 160,130 | |
IAMGOLD Corp., Strike Price 15, Call, Expiration Jan. 2013
(premium $58,930) | | 205 | | 11,275 | |
IAMGOLD Corp., Strike Price 17.50, Call, Expiration Jan. 2013
(premium $155,240) | | 2,544 | | 76,320 | |
Kinross Gold Corp., Strike Price 10, Call, Expiration Jan. 2013
(premium $704,797) | | 7,641 | | 389,691 | |
Kinross Gold Corp., Strike Price 12, Call, Expiration Jan. 2014
(premium $283,338) | | 1,715 | | 164,640 | |
Newmont Mining Corp., Strike Price 60, Call, Expiration Jan. 2013
(premium $2,624,644) | | 7,718 | | 771,800 | |
Randgold Resources Ltd., Strike Price 77.50, Call, Expiration Jan. 2013
(premium $2,296,226) | | 1,422 | | 2,772,900 | |
| | | | 7,231,644 | |
Silver Mining 0.13% | | | | | |
Hecla Mining Co., Strike Price 5, Call, Expiration Jan. 2013
(premium $215,655) | | 2,708 | | 167,896 | |
Pan American Silver Corp., Strike Price 30, Call, Expiration Jan. 2013
(premium $11,545) | | 222 | | 5,550 | |
Silver Standard Resources, Inc., Strike Price 15, Call, Expiration Jan. 2013
(premium $1,403,391) | | 3,690 | | 239,850 | |
| | | | 413,296 | |
Total Purchased Call Options
(cost $11,971,825) | | | | 7,644,940 | |
| | | | | | |
See notes to portfolios of investments and notes to financial statements.
120
| | Shares | | Value | |
Purchased Put Options 0.09% | | | | | |
| | | | | |
Exchange-Traded Funds 0.07% | | | | | |
Market Vectors Gold Miners ETF, Strike Price 45, Put, Expiration January 2013
(premium $335,705) | | 475 | | $ | 231,800 | |
| | | | | |
Metal - Copper 0.02% | | | | | |
Freeport-McMoRan Copper & Gold, Inc., Strike Price 30, Put, Expiration July 2012
(premium $110,210) | | 2,250 | | 49,500 | |
| | | | | |
Total Purchased Put Options
(cost $445,915) | | | | 281,300 | |
| | | | | |
| | Principal
Amount | | | |
Convertible Debenture 0.37% | | | | | |
| | | | | |
Metal - Iron 0.37% | | | | | |
Pacific Iron Corp., 1.00%, maturity 06/07/13 (RS)
(cost $1,200,000) | | $ | 1,200,000 | | 1,200,000 | @ |
| | | | | |
Silver-Linked Notes 2.24% | | | | | |
| | | | | |
Gold Mining 2.24% | | | | | |
Gran Colombia Gold Corp., 5.00%, maturity 08/11/18 | | 8,150,000 | | 7,009,000 | |
Gran Colombia Gold Corp., 144A, 5.00%, maturity 08/11/18 | | 298,000 | | 256,280 | |
| | | | | |
Total Silver-Linked Notes
(cost $8,407,186) | | | | 7,265,280 | |
| | | | | |
Corporate Note 0.25% | | | | | |
| | | | | |
Electric - Generation 0.25% | | | | | |
Pacific Power Generation Corp., 15.00%, maturity 04/03/17 (RS)
(cost $800,000) | | 800,000 | | 800,000 | @ |
| | | | | |
Total Securities
(cost $438,832,134) | | | | 289,170,500 | |
| | | | | | | |
See notes to portfolios of investments and notes to financial statements.
121
| | Principal
Amount | | Value | |
Repurchase Agreement 10.70% | | | | | |
| | | | | |
Joint Tri-Party Repurchase Agreement, Credit Suisse Securities USA LLC, 6/29/2012, 0.14%, due 7/2/2012, repurchase price $34,639,410, collateralized by U.S. Treasury securities held in a joint tri-party account (cost $34,639,005) | | $ | 34,639,005 | | $ | 34,639,005 | |
| | | | | |
Total Investments 100.00%
(cost $473,471,140) | | | | 323,809,505 | |
Other assets and liabilities, net 0.00% | | | | (6,675 | ) |
| | | | | |
Net Assets 100% | | | | $ | 323,802,830 | |
| | | | | |
| | Shares Subject
To Call | | | |
Call Options Written | | | | | |
Alamos Gold, Inc., Strike Price 16, Expiration July 2012 | | 120,000 | | $ | 64,830 | |
AngloGold Ashanti Ltd., Strike Price 34, Expiration July 2012 | | 50,000 | | 60,000 | |
AuRico Gold, Inc., Strike Price 8, Expiration July 2012 | | 50,000 | | 17,500 | |
Freeport-McMoRan Copper & Gold, Inc., Strike Price 33, Expiration July 2012 | | 210,000 | | 329,700 | |
Harmony Gold Mining Co., Ltd., Strike Price 9, Expiration July 2012 | | 200,000 | | 110,000 | |
Yamana Gold, Inc., Strike Price 16, Expiration July 2012 | | 130,000 | | 31,200 | |
| | | | | |
Total Call Options Written
(premiums received $513,618) (Note 2A) | | | | $ | 613,230 | |
| | | | | | | |
See notes to portfolios of investments and notes to financial statements.
122
Gold and Precious Metals Fund | | |
Portfolio of Investments (unaudited) | | June 30, 2012 |
| | Shares | | Value | |
Common Stocks 70.25% | | | | | |
| | | | | |
Gold Mining 50.23% | | | | | |
Agnico-Eagle Mines Ltd. | | 150,000 | | $ | 6,069,000 | |
Alacer Gold Corp. | | 250,000 | | 1,353,077 | * |
Alamos Gold, Inc. | | 100,000 | | 1,561,809 | *^ |
Allied Nevada Gold Corp. | | 60,000 | | 1,702,800 | * |
AngloGold Ashanti Ltd., Sponsored ADR | | 85,000 | | 2,918,900 | ^ |
Atna Resources Ltd. | | 1,249,474 | | 1,215,048 | * |
AuRico Gold, Inc. | | 580,000 | | 4,645,800 | *^ |
B2Gold Corp. | | 800,000 | | 2,404,597 | * |
Barrick Gold Corp. | | 50,000 | | 1,878,500 | |
Centerra Gold, Inc. | | 204,500 | | 1,430,224 | * |
Cia de Minas Buenaventura S.A., Sponsored ADR | | 100,000 | | 3,798,000 | |
Claude Resources, Inc. | | 1,000,000 | | 638,476 | * |
DRDGOLD Ltd., Sponsored ADR | | 200,000 | | 1,310,000 | |
Dundee Precious Metals, Inc. | | 340,000 | | 2,047,247 | * |
Eldorado Gold Corp. | | 150,000 | | 1,848,000 | * |
Goldcorp, Inc. | | 100,000 | | 3,758,000 | |
Golden Star Resources Ltd. | | 275,000 | | 319,000 | * |
Gran Colombia Gold Corp. | | 5,070,158 | | 1,568,783 | * |
Gran Colombia Gold Corp., 144A | | 4,150,000 | | 1,284,072 | * |
Great Basin Gold Ltd. | | 350,000 | | 237,218 | * |
Harmony Gold Mining Co., Ltd., Sponsored ADR | | 865,000 | | 8,131,000 | *^ |
IAMGOLD Corp. | | 125,000 | | 1,475,000 | |
Kirkland Lake Gold, Inc. | | 200,000 | | 2,153,136 | * |
Lake Shore Gold Corp. | | 1,000,000 | | 893,866 | * |
Nevsun Resources Ltd. | | 200,000 | | 648,000 | |
New Gold, Inc. | | 200,000 | | 1,900,946 | * |
Richmont Mines, Inc. | | 240,000 | | 1,111,200 | * |
Rio Alto Mining Ltd. | | 254,794 | | 1,021,128 | * |
Royal Gold, Inc. | | 75,000 | | 5,880,000 | ^ |
San Gold Corp. | | 1,050,000 | | 959,187 | * |
Sandstorm Gold Ltd. | | 225,000 | | 1,834,389 | * |
SEMAFO, Inc. | | 275,000 | | 1,261,480 | * |
Silver Lake Resources Ltd. | | 1,000,000 | | 2,889,248 | * |
St Barbara Ltd. | | 500,000 | | 909,032 | * |
Yamana Gold, Inc. | | 330,000 | | 5,082,000 | ^ |
| | | | 78,138,163 | |
Gold/Mineral Royalty Companies 6.06% | | | | | |
Franco-Nevada Corp. | | 208,600 | | 9,433,667 | * |
| | | | | |
Medical - Hospitals 0.02% | | | | | |
African Medical Investments plc | | 2,000,000 | | 27,410 | * |
| | | | | |
Metal - Copper 3.29% | | | | | |
Freeport-McMoRan Copper & Gold, Inc. | | 150,000 | | 5,110,500 | ^ |
| | | | | | |
See notes to portfolios of investments and notes to financial statements.
123
| | Shares | | Value | |
Common Stocks | | | | | |
| | | | | |
Metal - Diversified 0.09% | | | | | |
Avion Gold Corp. | | 310,000 | | $ | 138,549 | * |
| | | | | |
Mining Services 0.37% | | | | | |
Major Drilling Group International, Inc. | | 50,000 | | 578,066 | * |
| | | | | |
Precious Metals 4.73% | | | | | |
Alexco Resource Corp. | | 200,000 | | 882,000 | * |
Coeur d’Alene Mines Corp. | | 130,000 | | 2,282,800 | * |
McEwen Mining, Inc. | | 300,000 | | 903,000 | * |
Pan African Resources plc | | 5,000,000 | | 1,212,505 | * |
Polymetal International plc | | 145,000 | | 2,077,769 | |
| | | | 7,358,074 | |
Silver Mining 5.46% | | | | | |
First Majestic Silver Corp. | | 130,000 | | 1,878,500 | * |
Pan American Silver Corp. | | 200,000 | | 3,378,000 | *^ |
Silver Wheaton Corp. | | 90,000 | | 2,415,600 | |
Silvercorp Metals, Inc. | | 150,000 | | 829,500 | * |
| | | | 8,501,600 | |
Total Common Stocks
(cost $141,589,253) | | | | 109,286,029 | |
| | | | | |
Exchange-Traded Funds (ETF) 1.32% | | | | | |
| | | | | |
ETFS Palladium Trust | | 2,000 | | 114,660 | * |
Market Vectors Gold Miners ETF | | 20 | | 895 | * |
Market Vectors Junior Gold Miners ETF | | 35 | | 671 | * |
SPDR Gold Trust | | 12,500 | | 1,939,875 | * |
| | | | | |
Total Exchange-Traded Funds
(cost $2,221,721) | | | | 2,056,101 | |
| | | | | |
Warrants 5.70% | | | | | |
| | | | | |
Gold Mining 5.46% | | | | | |
Agnico-Eagle Mines Ltd., 144A, Warrants (December 2013) | | 70,000 | | 380,100 | * |
Crystallex International Corp., 144A, Warrants (December 2049) | | 62,500 | | 0 | *@ |
Dundee Precious Metals, Inc., Warrants (November 2015) | | 1,399,000 | | 6,211,365 | * |
Endeavour Mining Corp., Warrants (February 2014) | | 408,000 | | 186,356 | * |
Gran Colombia Gold Corp., Warrants (August 2015) | | 1,947,773 | | 325,251 | * |
| | | | | | |
See notes to portfolios of investments and notes to financial statements.
124
| | Shares | | Value | |
Warrants | | | | | |
| | | | | |
Gold Mining (Cont’d) | | | | | |
Gran Colombia Gold Corp., 144A, Warrants (August 2015) | | 625,000 | | $ | 104,366 | * |
Kinross Gold Corp., Warrants (September 2013) | | 662,394 | | 250,500 | * |
Kinross Gold Corp., Warrants (September 2014) | | 130,000 | | 51,078 | * |
New Gold, Inc., Warrants (June 2017) | | 310,000 | | 977,457 | * |
Rusoro Mining Ltd., Warrants (November 2012) | | 688,750 | | 3,383 | * |
Rusoro Mining Ltd., 144A, Warrants (November 2012) | | 930,000 | | 4,567 | * |
| | | | 8,494,423 | |
Gold/Mineral Royalty Companies 0.24% | | | | | |
Franco-Nevada Corp., 144A, Warrants (July 2013) | | 125,000 | | 23,943 | * |
Franco-Nevada Corp., Warrants (June 2017) | | 59,768 | | 346,379 | * |
| | | | 370,322 | |
Medical - Hospitals 0.00% | | | | | |
African Medical Investments plc, Warrants (June 2014) | | 912,500 | | 0 | *@ |
| | | | | |
Total Warrants
(cost $6,728,631) | | | | 8,864,745 | |
| | | | | | |
| | Contracts | | | |
Purchased Call Options 2.39% | | | | | |
| | | | | |
Gold Mining 2.22% | | | | | |
Agnico-Eagle Mines Ltd., Strike Price 47.50, Call, Expiration Jan. 2013
(premium $299,922) | | 2,348 | | 598,740 | |
Agnico-Eagle Mines Ltd., Strike Price 55, Call, Expiration Jan. 2013
(premium $314,455) | | 536 | | 54,136 | |
Allied Nevada Gold Corp., Strike Price 30, Call, Expiration Sep. 2012
(premium $329,876) | | 650 | | 100,750 | |
AngloGold Ashanti Ltd., Strike Price 50, Call, Expiration Jan. 2013
(premium $338,678) | | 2,029 | | 71,015 | |
AuRico Gold, Inc., Strike Price 8, Call, Expiration Dec. 2012
(premium $114,510) | | 781 | | 93,720 | |
Barrick Gold Corp., Strike Price 50, Call, Expiration Jan. 2013
(premium $116,197) | | 613 | | 34,328 | |
Eldorado Gold Corp., Strike Price 12.50, Call, Expiration Jan. 2013
(premium $511,533) | | 1,778 | | 284,480 | |
Gold Fields Ltd., Strike Price 20, Call, Expiration Jan. 2013 (premium $208,091) | | 2,862 | | 20,034 | |
Goldcorp, Inc., Strike Price 65, Call, Expiration Jan. 2013 (premium $102,627) | | 1,707 | | 29,019 | |
Goldcorp, Inc., Strike Price 65, Call, Expiration Jan. 2014 (premium $226,332) | | 650 | | 77,675 | |
IAMGOLD Corp., Strike Price 15, Call, Expiration Jan. 2013 (premium $58,930) | | 205 | | 11,275 | |
IAMGOLD Corp., Strike Price 17.50, Call, Expiration Jan. 2013
(premium $152,811) | | 2,376 | | 71,280 | |
Kinross Gold Corp., Strike Price 10, Call, Expiration Jan. 2013
(premium $342,246) | | 3,709 | | 189,159 | |
See notes to portfolios of investments and notes to financial statements.
125
| | Shares | | Value | |
Purchased Call Options | | | | | |
| | | | | |
Gold Mining (Cont’d) | | | | | |
Kinross Gold Corp., Strike Price 12, Call, Expiration Jan. 2014
(premium $219,362) | | 1,260 | | $ | 120,960 | |
Newmont Mining Corp., Strike Price 60, Call, Expiration Jan. 2013
(premium $1,313,120) | | 3,852 | | 385,200 | |
Randgold Resources Ltd., Strike Price 77.50, Call, Expiration Jan. 2013
(premium $1,088,963) | | 673 | | 1,312,350 | |
| | | | 3,454,121 | |
Silver Mining 0.17% | | | | | |
Hecla Mining Co., Strike Price 5, Call, Expiration Jan. 2013 (premium $106,102) | | 1,324 | | 82,088 | |
Pan American Silver Corp., Strike Price 30, Call, Expiration Jan. 2013
(premium $375,309) | | 2,768 | | 69,200 | |
Silver Standard Resources, Inc., Strike Price 15, Call, Expiration Jan. 2013
(premium $635,386) | | 1,665 | | 108,225 | |
| | | | 259,513 | |
Total Purchased Call Options
(cost $6,854,450) | | | | 3,713,634 | |
| | | | | |
Purchased Put Options 0.08% | | | | | |
| | | | | |
Exchange-Traded Funds 0.06% | | | | | |
Market Vectors Gold Miners ETF, Strike Price 45, Put, Expiration Jan. 2013
(premium $146,993) | | 208 | | 101,504 | |
| | | | | |
Metal - Copper 0.02% | | | | | |
Freeport-McMoRan Copper & Gold, Inc., Strike Price 30, Put,
Expiration July 2012 (premium $73,473) | | 1,500 | | 33,000 | |
| | | | | |
Total Purchased Put Options
(cost $220,466) | | | | 134,504 | |
| | | | | | |
| | Principal
Amount | | | |
Silver-Linked Notes 2.49% | | | | | |
| | | | | |
Gold Mining 2.49% | | | | | |
Gran Colombia Gold Corp., 5.00%, maturity 08/11/18 | | $ | 4,250,000 | | 3,655,000 | |
Gran Colombia Gold Corp., 144A, 5.00%, maturity 08/11/18 | | 250,000 | | 215,000 | |
| | | | | |
Total Silver-Linked Notes
(cost $4,465,286) | | | | 3,870,000 | |
| | | | | | |
See notes to portfolios of investments and notes to financial statements.
126
| | Principal
Amount | | Value | |
Corporate Notes 3.95% | | | | | |
| | | | | |
Gold Mining 3.76% | | | | | |
Allied Nevada Gold Corp., 144A, 8.75%, maturity 06/01/19 | | $ | 1,473,405 | | $ | 1,440,254 | |
Barrick Gold Corp., 6.95%, maturity 04/01/19 | | 1,700,000 | | 2,118,013 | |
Newmont Mining Corp., 6.25%, maturity 10/01/39 | | 2,000,000 | | 2,284,076 | |
| | | | 5,842,343 | |
Electric - Generation 0.19% | | | | | |
Pacific Power Generation Corp., 15.00%, maturity 04/03/17 (RS) | | 300,000 | | 300,000 | @ |
| | | | | |
Total Corporate Notes
(cost $6,216,657) | | | | 6,142,343 | |
| | | | | |
Total Securities
(cost $168,296,464) | | | | 134,067,356 | |
| | | | | |
Repurchase Agreement 14.33% | | | | | |
| | | | | |
Joint Tri-Party Repurchase Agreement, Credit Suisse Securities USA LLC, 6/29/2012, 0.14%, due 7/2/2012, repurchase price $22,288,971, collateralized by U.S. Treasury securities held in a joint tri-party account (cost $22,288,711) | | 22,288,711 | | 22,288,711 | |
| | | | | |
Total Investments 100.51%
(cost $190,585,175) | | | | 156,356,067 | |
Other assets and liabilities, net (0.51%) | | | | (785,842 | ) |
| | | | | |
Net Assets 100% | | | | $ | 155,570,225 | |
| | | | | | | |
| | Shares Subject
To Call | | | |
Call Options Written | | | | | |
| | | | | |
Alamos Gold, Inc., Strike Price 16, Expiration July 2012 | | 50,000 | | $ | 27,012 | |
AngloGold Ashanti Ltd., Strike Price 34, Expiration July 2012 | | 85,000 | | 102,000 | |
AuRico Gold, Inc., Strike Price 8, Expiration July 2012 | | 100,000 | | 35,000 | |
Freeport-McMoRan Copper & Gold, Inc., Strike Price 33, Expiration July 2012 | | 140,000 | | 219,800 | |
Harmony Gold Mining Co., Ltd., Strike Price 9, Expiration July 2012 | | 200,000 | | 110,000 | |
Pan American Silver Corp., Strike Price 18, Expiration July 2012 | | 100,000 | | 30,000 | |
Royal Gold, Inc., Strike Price 77.50, Expiration July 2012 | | 35,000 | | 94,500 | |
Royal Gold, Inc., Strike Price 80, Expiration July 2012 | | 40,000 | | 56,000 | |
Yamana Gold, Inc., Strike Price 16, Expiration July 2012 | | 65,000 | | 15,600 | |
| | | | | |
Total Call Options Written
(premiums received $717,622) (Note 2A) | | | | $ | 689,912 | |
See notes to portfolios of investments and notes to financial statements.
127
Eastern European Fund | | |
Portfolio of Investments (unaudited) | | June 30, 2012 |
| | Shares | | Value | |
Common Stocks 88.98% | | | | | |
| | | | | |
Agricultural Chemicals 4.24% | | | | | |
Uralkali OJSC, Sponsored GDR | | 194,500 | | $ | 7,503,616 | |
| | | | | |
Agricultural Operations 3.11% | | | | | |
Kernel Holding S.A. | | 300,000 | | 5,498,320 | * |
| | | | | |
Airlines 0.55% | | | | | |
Turk Hava Yollari A.O. | | 550,000 | | 970,276 | * |
| | | | | |
Appliances 0.22% | | | | | |
Arcelik A.S. | | 76,500 | | 387,607 | |
| | | | | |
Automotive - Cars & Light Trucks 2.56% | | | | | |
Ford Otomotiv Sanayi A.S. | | 155,500 | | 1,412,647 | |
Tofas Turk Otomobil Fabrikasi A.S. | | 726,600 | | 3,120,137 | * |
| | | | 4,532,784 | |
Cellular Telecommunications 4.45% | | | | | |
Mobile TeleSystems OJSC | | 880,000 | | 6,370,119 | |
Turkcell Iletisim Hizmetleri A.S. | | 100,000 | | 505,435 | * |
Turkcell Iletisim Hizmetleri A.S., Sponsored ADR | | 80,000 | | 1,004,000 | * |
| | | | 7,879,554 | |
Chemicals - Diversified 2.93% | | | | | |
Synthos S.A. | | 2,900,000 | | 5,177,929 | * |
| | | | | |
Coal 0.01% | | | | | |
Eastcoal, Inc. | | 52,100 | | 16,121 | * |
| | | | | |
Commercial Banks - Non US 13.31% | | | | | |
Bank of Georgia Holdings plc | | 148,478 | | 2,503,806 | * |
Erste Group Bank AG | | 150,000 | | 2,851,819 | * |
Get Bank S.A. | | 730,000 | | 394,283 | * |
Sberbank of Russia, Sponsored ADR | | 1,127,000 | | 12,258,876 | * |
Turkiye Garanti Bankasi A.S. | | 450,000 | | 1,774,537 | |
VTB Bank OJSC, Sponsored GDR | | 1,064,800 | | 3,778,478 | |
| | | | 23,561,799 | |
Electric - Generation 1.16% | | | | | |
CEZ A.S. | | 52,000 | | 1,796,479 | |
E.ON Russia JSC | | 3,501,000 | | 253,970 | * |
| | | | 2,050,449 | |
Electric - Integrated 1.49% | | | | | |
PGE S.A. | | 450,000 | | 2,627,861 | |
| | | | | | |
See notes to portfolios of investments and notes to financial statements.
128
| | Shares | | Value | |
Common Stocks | | | | | |
| | | | | |
Finance - Investment Banker/Broker 1.27% | | | | | |
Turkiye Sinai Kalkinma Bankasi A.S. | | 2,208,313 | | $ | 2,253,069 | * |
| | | | | |
Food - Retail 2.72% | | | | | |
Magnit OJSC | | 40,000 | | 4,809,261 | * |
| | | | | |
Food - Wholesale/Distribution 2.50% | | | | | |
Eurocash S.A. | | 360,000 | | 4,433,276 | * |
| | | | | |
Gold Mining 2.77% | | | | | |
Dundee Precious Metals, Inc. | | 60,000 | | 361,279 | * |
Koza Altin Isletmeleri A.S. | | 234,300 | | 4,543,628 | |
| | | | 4,904,907 | |
Life/Health Insurance 0.26% | | | | | |
Anadolu Hayat Emeklilik A.S. | | 200,000 | | 460,414 | |
| | | | | |
Machinery - Farm 1.33% | | | | | |
Turk Traktor ve Ziraat Makineleri A.S. | | 138,700 | | 2,347,083 | |
| | | | | |
Medical - Generic Drugs 0.43% | | | | | |
Pharmstandard OJSC | | 17,200 | | 760,846 | * |
| | | | | |
Metal - Diversified 2.11% | | | | | |
MMC Norilsk Nickel OJSC, Sponsored ADR | | 200,000 | | 3,313,773 | * |
Orsu Metals Corp. | | 664,240 | | 60,353 | * |
Orsu Metals Corp., 144A | | 4,025,000 | | 365,711 | * |
| | | | 3,739,837 | |
Miscellaneous Manufacturers 0.96% | | | | | |
Trakya Cam Sanayii A.S. | | 1,263,883 | | 1,702,245 | * |
| | | | | |
Oil Companies - Exploration & Production 12.14% | | | | | |
BNK Petroleum, Inc. | | 465,600 | | 306,421 | * |
Gazprom OAO, Sponsored ADR | | 1,304,302 | | 12,346,675 | |
NovaTek OAO, Sponsored GDR | | 83,000 | | 8,836,659 | |
| | | | 21,489,755 | |
Oil Companies - Integrated 20.58% | | | | | |
Lukoil OAO, Sponsored ADR | | 300,000 | | 16,770,526 | |
MOL Hungarian Oil & Gas Nyrt. | | 42,200 | | 3,054,551 | * |
Surgutneftegas OJSC, Sponsored ADR | | 577,200 | | 4,794,800 | * |
TNK-BP Holding | | 5,114,800 | | 11,814,799 | |
| | | | 36,434,676 | |
| | | | | | |
See notes to portfolios of investments and notes to financial statements.
129
| | Shares | | Value | |
Common Stocks | | | | | |
| | | | | |
Oil Refining & Marketing 2.79% | | | | | |
Tupras Turkiye Petrol Rafinerileri A.S. | | 230,500 | | $ | 4,941,758 | |
| | | | | |
Precious Metals 1.82% | | | | | |
Polymetal International plc | | 225,000 | | 3,224,125 | |
| | | | | |
Steel Pipe & Tube 0.27% | | | | | |
OAO TMK, Sponsored GDR | | 40,000 | | 481,402 | * |
| | | | | |
Tobacco 1.10% | | | | | |
Philip Morris CR A.S. | | 3,500 | | 1,953,505 | * |
| | | | | |
Web Portals/Internet Service Providers 1.90% | | | | | |
Yandex N.V., Class A | | 176,300 | | 3,358,515 | * |
| | | | | |
Total Common Stocks
(cost $158,783,944) | | | | 157,500,990 | |
| | | | | |
Preferred Stock 0.90% | | | | | |
| | | | | |
Pipelines 0.90% | | | | | |
AK Transneft OAO
(cost $2,114,120) | | 1,100 | | 1,595,925 | |
| | | | | |
Real Estate Investment Trust (REIT) 0.78% | | | | | |
| | | | | |
Sinpas Gayrimenkul Yatirim Ortakligi A.S.
(cost $1,269,166) | | 2,000,000 | | 1,373,731 | * |
| | | | | |
Exchange-Traded Fund (ETF) 0.19% | | | | | |
| | | | | |
SPDR Gold Trust
(cost $347,137) | | 2,200 | | 341,418 | * |
| | | | | |
Warrants 1.28% | | | | | |
| | | | | |
Gold Mining 1.28% | | | | | |
Dundee Precious Metals, Inc., Warrants (November 2015)
(cost $50,149) | | 510,000 | | 2,264,329 | * |
| | | | | |
Total Securities
(cost $162,564,516) | | | | 163,076,393 | |
| | | | | | |
See notes to portfolios of investments and notes to financial statements.
130
| | Principal
Amount | | Value | |
Repurchase Agreement 6.70% | | | | | |
| | | | | |
Joint Tri-Party Repurchase Agreement, Credit Suisse Securities USA LLC, 6/29/2012, 0.14%, due 7/2/2012, repurchase price $11,865,491, collateralized by U.S. Treasury securities held in a joint tri-party account (cost $11,865,352) | | $ | 11,865,352 | | $ | 11,865,352 | |
| | | | | |
Total Investments 98.83%
(cost $174,429,868) | | | | 174,941,745 | |
Other assets and liabilities, net 1.17% | | | | 2,076,880 | |
| | | | | |
Net Assets 100% | | | | $ | 177,018,625 | |
| | | | | | | |
| | Shares Subject
To Call | | | |
Call Options Written | | | | | |
| | | | | |
Lukoil OAO, Strike Price 56, Expiration July 2012 | | 100,000 | | $ | 45,000 | |
MMC Norilsk Nickel OJSC, Strike Price 16, Expiration July 2012 | | 200,000 | | 192,000 | |
NovaTek OAO, Strike Price 115, Expiration July 2012 | | 23,000 | | 34,224 | |
Sberbank of Russia, Strike Price 10.50, Expiration July 2012 | | 300,000 | | 171,000 | |
Surgutneftegas OJSC, Strike Price 9, Expiration July 2012 | | 200,000 | | 18,000 | |
| | | | | |
Total Call Options Written
(premiums received $527,600) (Note 2A) | | | | $ | 460,224 | |
See notes to portfolios of investments and notes to financial statements.
131
Global Emerging Markets Fund | | |
Portfolio of Investments (unaudited) | | June 30, 2012 |
| | Shares | | Value | |
Common Stocks 89.46% | | | | | |
| | | | | |
Advanced Materials/Products 0.91% | | | | | |
OCI Materials Co., Ltd. | | 2,000 | | $ | 72,674 | * |
| | | | | |
Agricultural Chemicals 2.04% | | | | | |
Acron JSC | | 2,000 | | 71,974 | * |
Gujarat State Fertilisers & Chemicals Ltd. | | 11,900 | | 90,224 | * |
| | | | 162,198 | |
Agricultural Operations 3.68% | | | | | |
Rimbunan Sawit Bhd | | 236,600 | | 77,243 | * |
TDM Bhd | | 58,000 | | 76,562 | * |
Tradewinds Malaysia Bhd | | 27,100 | | 76,662 | * |
Univanich Palm Oil PCL | | 20,000 | | 62,864 | * |
| | | | 293,331 | |
Airlines 0.93% | | | | | |
Shandong Airlines Co., Ltd., Class B | | 60,800 | | 74,040 | * |
| | | | | |
Applications Software 0.88% | | | | | |
Polaris Financial Technology Ltd. | | 30,600 | | 69,949 | * |
| | | | | |
Audio/Video Products 1.02% | | | | | |
TCL Multimedia Technology Holdings Ltd. | | 150,000 | | 81,381 | * |
| | | | | |
Automotive/Truck Parts & Equipment - Original 2.12% | | | | | |
Global & Yuasa Battery Co., Ltd. | | 2,200 | | 89,409 | * |
Ways Technical Corp., Ltd. | | 31,900 | | 79,646 | * |
| | | | 169,055 | |
Beverages - Wine/Spirits 0.96% | | | | | |
Muhak Co., Ltd. | | 7,800 | | 76,677 | * |
| | | | | |
Building - Heavy Construction 1.06% | | | | | |
IRB Infrastructure Development Ltd. | | 37,000 | | 84,485 | * |
| | | | | |
Building - Residential/Commercial 0.99% | | | | | |
Xinyuan Real Estate Co., Ltd., Sponsored ADR | | 26,000 | | 79,040 | * |
| | | | | |
Building & Construction - Miscellaneous 2.23% | | | | | |
Alarko Holding A.S. | | 35,500 | | 80,303 | * |
Budimex S.A. | | 1,000 | | 16,417 | * |
CH. Karnhang PCL | | 359,700 | | 80,895 | * |
| | | | 177,615 | |
| | | | | | |
See notes to portfolios of investments and notes to financial statements.
132
| | Shares | | Value | |
Common Stocks | | | | | |
| | | | | |
Chemicals - Diversified 1.11% | | | | | |
Rain Commodities Ltd. | | 142,300 | | $ | 88,643 | * |
| | | | | |
Chemicals - Specialty 0.99% | | | | | |
Soda Sanayii A.S. | | 46,000 | | 78,520 | * |
| | | | | |
Coal 1.03% | | | | | |
PT Indika Energy Tbk | | 412,300 | | 81,648 | * |
| | | | | |
Commercial Banks - Non US 13.52% | | | | | |
Banregio Grupo Financiero S.A.B. de C.V. | | 30,000 | | 87,698 | * |
City Union Bank Ltd. | | 94,000 | | 88,322 | * |
Dena Bank | | 58,900 | | 105,459 | * |
Entie Commercial Bank | | 89,000 | | 39,573 | * |
Indian Overseas Bank | | 51,100 | | 77,184 | * |
Karnataka Bank Ltd. | | 48,400 | | 82,010 | * |
Kiatnakin Bank PCL | | 71,400 | | 81,419 | * |
Oriental Bank of Commerce | | 16,100 | | 74,055 | * |
PT Bank Bukopin Tbk | | 1,350,000 | | 90,744 | * |
Thanachart Capital PCL | | 91,500 | | 83,327 | * |
UCO Bank | | 63,900 | | 92,504 | * |
Union Bank of the Philippines | | 32,700 | | 78,102 | * |
Vijaya Bank | | 81,700 | | 86,026 | * |
Vozrozhdenie Bank | | 600 | | 9,935 | * |
| | | | 1,076,358 | |
Diversified Financial Services 1.04% | | | | | |
Indiabulls Financial Services Ltd. | | 19,800 | | 82,698 | * |
| | | | | |
Diversified Minerals 0.30% | | | | | |
African Potash Ltd. | | 200,000 | | 23,886 | * |
| | | | | |
Diversified Operations 0.98% | | | | | |
Yazicilar Holding A.S., Class A | | 11,700 | | 78,142 | * |
| | | | | |
Electric - Integrated 2.07% | | | | | |
First Philippine Holdings Corp. | | 47,000 | | 84,837 | |
Mosenergo OAO | | 1,850,000 | | 79,596 | * |
| | | | 164,433 | |
Electric - Transmission 0.93% | | | | | |
KEC International Ltd. | | 74,000 | | 74,150 | * |
| | | | | |
Electronic Components - Miscellaneous 0.90% | | | | | |
China Digital TV Holding Co., Ltd., Sponsored ADR | | 24,500 | | 72,030 | * |
| | | | | | |
See notes to portfolios of investments and notes to financial statements.
133
| | Shares | | Value | |
Common Stocks | | | | | |
| | | | | |
Electronic Components - Semiconductors 1.10% | | | | | |
Spreadtrum Communications, Inc., Sponsored ADR | | 4,976 | | $ | 87,826 | * |
| | | | | |
Engineering/R&D Services 1.06% | | | | | |
Mudajaya Group Bhd | | 98,000 | | 84,754 | * |
| | | | | |
Entertainment Software 0.88% | | | | | |
Shanda Games Ltd., Sponsored ADR | | 17,500 | | 70,000 | * |
| | | | | |
Finance - Leasing Company 0.82% | | | | | |
Woori Financial Co., Ltd. | | 4,800 | | 65,505 | * |
| | | | | |
Finance - Other Services 0.99% | | | | | |
Bursa Malaysia Bhd | | 20,100 | | 39,295 | |
Singapore Exchange Ltd. | | 7,796 | | 39,134 | * |
| | | | 78,429 | |
Fisheries 0.90% | | | | | |
China Fishery Group Ltd. | | 103,000 | | 71,575 | * |
| | | | | |
Food - Confectionery 2.31% | | | | | |
Guan Chong Bhd | | 115,600 | | 106,480 | * |
Ulker Biskuvi Sanayi A.S. | | 20,200 | | 77,683 | * |
| | | | 184,163 | |
Food - Miscellaneous/Diversified 1.00% | | | | | |
PT Tunas Baru Lampung Tbk | | 1,434,000 | | 79,710 | * |
| | | | | |
Gambling (Non-Hotel) 0.81% | | | | | |
Asia Entertainment & Resources Ltd. | | 16,000 | | 64,640 | * |
| | | | | |
Gas - Distribution 0.97% | | | | | |
Samchully Co., Ltd. | | 1,000 | | 77,104 | * |
| | | | | |
Gold Mining 0.30% | | | | | |
Gran Colombia Gold Corp. | | 78,400 | | 24,258 | * |
| | | | | |
Housewares 0.96% | | | | | |
Anadolu Cam Sanayii A.S. | | 52,000 | | 76,117 | * |
| | | | | |
Internet Content - Entertainment 1.98% | | | | | |
Giant Interactive Group, Inc., Sponsored ADR | | 17,100 | | 82,593 | * |
Perfect World Co., Ltd., Sponsored ADR | | 7,500 | | 75,150 | * |
| | | | 157,743 | |
| | | | | | |
See notes to portfolios of investments and notes to financial statements.
134
| | Shares | | Value | |
Common Stocks | | | | | |
| | | | | |
Investment Companies 1.04% | | | | | |
Norte Grande S.A. | | 1,000,000 | | $ | 9,785 | * |
Sociedad de Inversiones Oro Blanco S.A. | | 5,310,207 | | 73,171 | * |
| | | | 82,956 | |
Machinery - Farm 2.06% | | | | | |
CB Industrial Product Holding Bhd | | 110,000 | | 88,751 | * |
Turk Traktor ve Ziraat Makineleri A.S. | | 4,426 | | 74,897 | |
| | | | 163,648 | |
Medical - Drugs 1.87% | | | | | |
Jeil Pharmaceutical Co. | | 510 | | 8,959 | * |
Strides Arcolab Ltd. | | 5,254 | | 70,624 | * |
Veropharm OJSC | | 3,000 | | 69,687 | * |
| | | | 149,270 | |
Medical - Hospitals 0.56% | | | | | |
NMC Health plc | | 15,000 | | 44,924 | * |
| | | | | |
Metal - Diversified 2.31% | | | | | |
Inner Mongolia Eerduosi Resourses Co., Ltd., Class B | | 88,700 | | 80,806 | * |
Orsu Metals Corp. | | 41,083 | | 3,733 | * |
Orsu Metals Corp., 144A | | 200,000 | | 18,172 | * |
PT Aneka Tambang Persero Tbk | | 568,600 | | 81,120 | |
| | | | 183,831 | |
Miscellaneous Manufacturers 2.04% | | | | | |
Trakya Cam Sanayii A.S. | | 59,000 | | 79,464 | * |
Yem Chio Co., Ltd. | | 89,000 | | 82,900 | * |
| | | | 162,364 | |
Oil Companies - Exploration & Production 1.75% | | | | | |
Petrominerales Ltd. | | 5,000 | | 56,481 | * |
PT Medco Energi internasional Tbk | | 433,800 | | 83,134 | * |
| | | | 139,615 | |
Oil Companies - Integrated 0.91% | | | | | |
Refineria La Pampilla S.A. Relapasa | | 310,500 | | 72,223 | * |
| | | | | |
Oil Refining & Marketing 1.13% | | | | | |
Bangchak Petroleum PCL | | 125,300 | | 90,187 | * |
| | | | | |
Patient Monitoring Equipment 1.01% | | | | | |
Opto Circuits India Ltd. | | 28,900 | | 80,177 | * |
| | | | | | |
See notes to portfolios of investments and notes to financial statements.
135
| | Shares | | Value | |
Common Stocks | | | | | |
| | | | | |
Petrochemicals 2.39% | | | | | |
Alexandria Mineral Oils Co. | | 7,200 | | $ | 103,449 | * |
Sidi Kerir Petrochemicals Co. | | 42,000 | | 86,795 | * |
| | | | 190,244 | |
Property/Casualty Insurance 0.62% | | | | | |
Qualitas Compania de Seguros S.A. de C.V., Series C | | 45,984 | | 48,979 | * |
| | | | | |
Public Thoroughfares 1.22% | | | | | |
Jaypee Infratech Ltd. | | 100,700 | | 97,373 | * |
| | | | | |
Real Estate Operating/Development 7.55% | | | | | |
Cathay Real Estate Development Co., Ltd. | | 185,000 | | 85,005 | * |
Hung Poo Real Estate Development Corp. | | 96,400 | | 80,713 | * |
KrisAssets Holdings Bhd | | 40,000 | | 98,734 | * |
Megaworld Corp. | | 1,556,000 | | 81,757 | * |
Run Long Construction Co., Ltd. | | 52,800 | | 76,705 | * |
Sansiri PCL | | 2,642,000 | | 178,206 | * |
| | | | 601,120 | |
Retail - Jewelry 0.95% | | | | | |
Gitanjali Gems Ltd. | | 14,000 | | 75,917 | * |
| | | | | |
Shipbuilding 1.00% | | | | | |
Coastal Contracts Bhd | | 134,000 | | 79,457 | * |
| | | | | |
Steel - Producers 1.03% | | | | | |
Kardemir Karabuk Demir Celik Sanayi ve Ticaret A.S., Class D | | 147,100 | | 81,627 | |
| | | | | |
Steel - Specialty 0.89% | | | | | |
Seah Besteel Corp. | | 2,100 | | 70,578 | * |
| | | | | |
Telecom Services 1.03% | | | | | |
Tulip Telecom Ltd. | | 38,200 | | 81,618 | * |
| | | | | |
Telecommunication Equipment 0.72% | | | | | |
TCL Communication Technology Holdings Ltd. | | 180,500 | | 57,720 | |
| | | | | |
Textile - Apparel 1.24% | | | | | |
Luthai Textile Co., Ltd., Class B | | 115,900 | | 98,526 | * |
| | | | | |
Textile - Home Furnishings 1.01% | | | | | |
Oriental Weavers | | 27,000 | | 80,286 | * |
| | | | | | |
See notes to portfolios of investments and notes to financial statements.
136
| | Shares | | Value | |
Common Stocks | | | | | |
| | | | | |
Textile - Products 0.53% | | | | | |
Taiwan Paiho Ltd. | | 62,000 | | $ | 42,192 | * |
| | | | | |
Tobacco 0.83% | | | | | |
Eastern Tobacco | | 5,000 | | 66,023 | |
| | | | | |
Total Common Stocks
(cost $7,969,485) | | | | 7,123,632 | |
| | | | | |
Preferred Stocks 2.75% | | | | | |
| | | | | |
Commercial Banks - Non US 2.75% | | | | | |
Banco ABC Brasil S.A. | | 13,500 | | 64,185 | * |
Banco Daycoval S.A. | | 16,600 | | 77,849 | * |
Banco Industrial e Comercial S.A. | | 27,000 | | 76,618 | * |
| | | | | |
Total Preferred Stocks
(cost $264,479) | | | | 218,652 | |
| | | | | |
Real Estate Investment Trusts (REIT) 1.89% | | | | | |
| | | | | |
Al-Hadharah Boustead | | 125,000 | | 70,570 | * |
Sinpas Gayrimenkul Yatirim Ortakligi A.S. | | 116,200 | | 79,814 | * |
| | | | | |
Total Real Estate Investment Trusts
(cost $148,382) | | | | 150,384 | |
| | | | | |
Exchange-Traded Funds (ETF) 1.48% | | | | | |
| | | | | |
iShares MSCI Mexico Investable Market Index Fund | | 650 | | 39,943 | |
Market Vectors Indonesia Index ETF | | 1,495 | | 41,038 | * |
ProShares Short FTSE China 25 | | 835 | | 36,748 | * |
| | | | | |
Total Exchange-Traded Funds
(cost $117,037) | | | | 117,729 | |
| | | | | |
Rights 0.03% | | | | | |
| | | | | |
Finance - Leasing Company 0.03% | | | | | |
Woori Financial Co., Ltd. (July 2012)
(cost $0) | | 1,529 | | 2,344 | *@ |
| | | | | | |
See notes to portfolios of investments and notes to financial statements.
137
| | Principal
Amount | | Value | |
Convertible Debenture 1.26% | | | | | |
| | | | | |
Metal - Iron 1.26% | | | | | |
Pacific Iron Corp., 1.00%, maturity 06/07/13 (RS)
(cost $100,000) | | $ | 100,000 | | $ | 100,000 | @ |
| | | | | |
Corporate Notes 1.49% | | | | | |
| | | | | |
Building - Heavy Construction 0.86% | | | | | |
Arendal, S. de R.L. de C.V., 144A, 12.50%, maturity 10/30/12 | | 68,400 | | 68,400 | |
| | | | | |
Electric - Generation 0.63% | | | | | |
Pacific Power Generation Corp., 15.00%, maturity 04/03/17 (RS) | | 50,000 | | 50,000 | @ |
| | | | | |
Total Corporate Notes
(cost $117,032) | | | | 118,400 | |
| | | | | |
Total Investments 98.36%
(cost $8,716,415) | | | | 7,831,141 | |
Other assets and liabilities, net 1.64% | | | | 130,849 | |
| | | | | |
Net Assets 100% | | | | $ | 7,961,990 | |
| | | | | | | |
See notes to portfolios of investments and notes to financial statements.
138
China Region Fund | | |
Portfolio of Investments (unaudited) | | June 30, 2012 |
| | Shares | | Value | |
Common Stocks 92.35% | | | | | |
| | | | | |
Apparel Manufacturers 1.17% | | | | | |
Prada S.p.A. | | 48,400 | | $ | 331,491 | |
| | | | | |
Automotive - Cars & Light Trucks 3.40% | | | | | |
Brilliance China Automotive Holdings Ltd. | | 132,000 | | 116,216 | * |
Dongfeng Motor Group Co., Ltd., H shares | | 178,000 | | 278,896 | |
Great Wall Motor Co., Ltd., H shares | | 135,500 | | 271,953 | * |
Hyundai Motor Co. | | 706 | | 145,224 | |
Kia Motors Corp. | | 2,240 | | 147,941 | |
| | | | 960,230 | |
Batteries/Battery System 1.03% | | | | | |
Chaowei Power Holdings Ltd. | | 576,000 | | 291,668 | * |
| | | | | |
Building - Heavy Construction 1.02% | | | | | |
China Railway Construction Corp., Ltd., H shares | | 343,500 | | 288,999 | |
| | | | | |
Building & Construction - Miscellaneous 2.80% | | | | | |
China Communications Construction Co., Ltd., H shares | | 571,000 | | 506,616 | |
China State Construction International Holdings Ltd. | | 300,000 | | 285,179 | * |
| | | | 791,795 | |
Building Products - Cement/Aggregates 0.52% | | | | | |
PT Indocement Tunggal Prakarsa Tbk | | 79,000 | | 146,295 | * |
| | | | | |
Casino Hotels 1.59% | | | | | |
NagaCorp Ltd. | | 382,000 | | 171,030 | |
SJM Holdings Ltd. | | 149,000 | | 277,241 | |
| | | | 448,271 | |
Casino Services 0.70% | | | | | |
Paradise Co., Ltd. | | 16,306 | | 196,747 | * |
| | | | | |
Cellular Telecommunications 5.57% | | | | | |
Advanced Info Service PCL | | 50,900 | | 298,958 | |
China Mobile Ltd. | | 65,000 | | 715,249 | |
Hutchison Telecommunications Hong Kong Holdings Ltd. | | 610,000 | | 281,501 | |
SmarTone Telecommunications Holdings Ltd. | | 146,000 | | 279,289 | |
| | | | 1,574,997 | |
Commercial Banks - Non US 11.63% | | | | | |
Agricultural Bank of China Ltd., H shares | | 600,000 | | 242,252 | |
Bank of China Ltd., H shares | | 1,600,000 | | 612,245 | |
Bank of the Philippine Islands | | 180,200 | | 321,701 | |
China Citic Bank Corp., Ltd., H shares | | 200,000 | | 103,167 | |
| | | | | | |
See notes to portfolios of investments and notes to financial statements.
139
| | Shares | | Value | |
Common Stocks | | | | | |
| | | | | |
Commercial Banks - Non US (Cont’d) | | | | | |
China Construction Bank Corp., H shares | | 800,000 | | $ | 551,597 | |
China Minsheng Banking Corp., Ltd., H shares | | 178,500 | | 159,621 | |
Industrial and Commercial Bank of China Ltd., H shares | | 500,000 | | 279,597 | |
Kasikornbank PCL | | 20,000 | | 103,168 | |
Krung Thai Bank PCL | | 292,200 | | 149,725 | * |
Security Bank Corp. | | 180,000 | | 613,174 | |
Siam Commercial Bank PCL | | 32,000 | | 150,459 | |
| | | | 3,286,706 | |
Computers 0.45% | | | | | |
Lenovo Group Ltd. | | 150,000 | | 127,790 | |
| | | | | |
Consumer Products - Miscellaneous 1.02% | | | | | |
Biostime International Holdings Ltd. | | 110,500 | | 289,229 | * |
| | | | | |
Containers - Paper/Plastic 0.79% | | | | | |
Greatview Aseptic Packaging Co., Ltd. | | 426,000 | | 224,003 | * |
| | | | | |
Cosmetics & Toiletries 0.38% | | | | | |
Prince Frog International Holdings Ltd. | | 300,000 | | 108,042 | * |
| | | | | |
Distribution/Wholesale 0.79% | | | | | |
PT AKR Corporindo Tbk | | 600,000 | | 223,635 | |
| | | | | |
Diversified Banking Institutions 3.35% | | | | | |
HSBC Holdings plc | | 105,600 | | 946,734 | |
| | | | | |
Diversified Minerals 0.56% | | | | | |
Erdene Resource Development Corp., 144A | | 99,000 | | 21,384 | * |
Woulfe Mining Corp. | | 700,000 | | 137,450 | * |
| | | | 158,834 | |
Diversified Operations 1.59% | | | | | |
Alliance Global Group, Inc. | | 1,065,100 | | 296,187 | * |
Ayala Corp. | | 13,590 | | 153,029 | * |
| | | | 449,216 | |
Electric - Generation 1.00% | | | | | |
Aboitiz Power Corp. | | 346,100 | | 281,882 | |
| | | | | |
Electronic Components - Miscellaneous 1.13% | | | | | |
AAC Technologies Holdings, Inc. | | 110,000 | | 318,537 | |
Yageo Corp., Sponsored GDR | | 1 | | 0 | *@ |
| | | | 318,537 | |
| | | | | | |
See notes to portfolios of investments and notes to financial statements.
140
| | Shares | | Value | |
Common Stocks | | | | | |
| | | | | |
Electronic Components - Semiconductors 1.37% | | | | | |
Samsung Electronics Co., Ltd. | | 194 | | $ | 206,238 | |
Spreadtrum Communications, Inc., Sponsored ADR | | 10,185 | | 179,765 | * |
| | | | 386,003 | |
Finance - Other Services 0.50% | | | | | |
Bursa Malaysia Bhd | | 35,921 | | 70,224 | |
Singapore Exchange Ltd. | | 14,344 | | 71,959 | * |
| | | | 142,183 | |
Food - Canned 1.04% | | | | | |
Thai Union Frozen Products PCL | | 128,557 | | 292,602 | * |
| | | | | |
Food - Miscellaneous/Diversified 2.45% | | | | | |
Charoen Pokphand Foods PCL | | 283,800 | | 347,717 | |
Universal Robina Corp. | | 228,960 | | 346,225 | |
| | | | 693,942 | |
Gold Mining 0.22% | | | | | |
Olympus Pacific Minerals, Inc. | | 264,410 | | 63,601 | * |
| | | | | |
Internet Application Software 2.67% | | | | | |
Tencent Holdings Ltd. | | 25,600 | | 756,005 | |
| | | | | |
Life/Health Insurance 0.93% | | | | | |
China Life Insurance Co., Ltd., H shares | | 100,000 | | 262,070 | |
| | | | | |
Machinery - Construction & Mining 0.95% | | | | | |
Zoomlion Heavy Industry Science and Technology Co., Ltd., H shares | | 210,000 | | 269,874 | * |
| | | | | |
Machinery - General Industrial 1.50% | | | | | |
Haitian International Holdings Ltd. | | 145,000 | | 144,782 | * |
Hangzhou Steam Turbine Co., B shares | | 271,200 | | 278,574 | * |
| | | | 423,356 | |
Medical - Generic Drugs 0.30% | | | | | |
PT Indofarma Tbk | | 4,000,000 | | 84,065 | * |
| | | | | |
Medical Instruments 1.07% | | | | | |
Trauson Holdings Co., Ltd. | | 753,000 | | 301,854 | * |
| | | | | |
Multi-line Insurance 1.01% | | | | | |
Ping An Insurance (Group) Company of China, Ltd., H shares | | 35,500 | | 286,251 | |
| | | | | | |
See notes to portfolios of investments and notes to financial statements.
141
| | Shares | | Value | |
Common Stocks | | | | | |
| | | | | |
Multimedia 0.81% | | | | | |
PT Media Nusantara Citra Tbk | | 1,070,000 | | $ | 227,650 | * |
| | | | | |
Non - Ferrous Metals 0.17% | | | | | |
Sterling Group Ventures, Inc. | | 500,000 | | 47,500 | * |
| | | | | |
Oil Companies - Exploration & Production 2.79% | | | | | |
CNOOC Ltd., Sponsored ADR | | 2,500 | | 503,125 | |
Kunlun Energy Co., Ltd. | | 100,000 | | 160,775 | * |
MIE Holdings Corp. | | 506,000 | | 123,652 | * |
| | | | 787,552 | |
Oil Companies - Integrated 3.21% | | | | | |
China Petroleum & Chemical Corp., Sponsored ADR | | 2,933 | | 261,594 | |
PetroChina Co., Ltd., Sponsored ADR | | 5,000 | | 645,700 | |
| | | | 907,294 | |
Petrochemicals 0.00% | | | | | |
Danhua Chemical Technology Co., Ltd., B shares | | 2 | | 2 | * |
| | | | | |
Real Estate Operating/Development 13.44% | | | | | |
Agile Property Holdings Ltd. | | 218,000 | | 284,340 | |
Cheung Kong Holdings Ltd. | | 22,000 | | 271,869 | |
China Overseas Land & Investment Ltd. | | 130,000 | | 304,975 | |
China Vanke Co., Ltd., B shares | | 238,900 | | 316,320 | * |
Evergrande Real Estate Group Ltd. | | 746,000 | | 385,663 | |
Franshion Properties China Ltd. | | 758,000 | | 230,221 | * |
Guangzhou R&F Properties Co., Ltd., H shares | | 112,000 | | 149,571 | |
K Wah International Holdings Ltd. | | 388,000 | | 152,697 | * |
KWG Property Holding Ltd. | | 467,500 | | 297,406 | * |
LPN Development PCL | | 200,000 | | 109,882 | |
Megaworld Corp. | | 7,106,000 | | 373,373 | * |
Mongolia Growth Group Ltd. | | 125,000 | | 476,167 | * |
SC Asset Corp. PCL | | 280,000 | | 127,877 | * |
Vista Land & Lifescapes, Inc. | | 3,185,000 | | 319,804 | |
| | | | 3,800,165 | |
Retail - Automobile 1.94% | | | | | |
China ZhengTong Auto Services Holdings Ltd. | | 227,000 | | 121,875 | * |
Hotai Motor Co., Ltd. | | 43,000 | | 280,482 | * |
PT Astra International Tbk | | 200,000 | | 146,245 | |
| | | | 548,602 | |
Retail - Building Products 0.80% | | | | | |
Home Product Center PCL | | 570,000 | | 227,494 | * |
| | | | | | |
See notes to portfolios of investments and notes to financial statements.
142
| | Shares | | Value | |
Common Stocks | | | | | |
| | | | | |
Retail - Convenience Store 0.52% | | | | | |
CP ALL PCL | | 131,200 | | $ | 148,406 | |
| | | | | |
Retail - Discount 1.05% | | | | | |
Siam Makro PCL | | 26,000 | | 296,491 | * |
| | | | | |
Retail - Jewelry 0.00% | | | | | |
Lao Feng Xiang Co., Ltd., B shares | | 1 | | 2 | * |
| | | | | |
Steel - Specialty 0.95% | | | | | |
Tiangong International Co., Ltd. | | 1,350,000 | | 268,938 | * |
| | | | | |
Telecom Services 3.30% | | | | | |
Shin Corp. PCL | | 344,200 | | 666,882 | * |
Telecom Corp. of New Zealand Ltd., Sponsored ADR | | 28,295 | | 266,822 | * |
| | | | 933,704 | |
Television 0.53% | | | | | |
PT Surya Citra Media Tbk | | 147,000 | | 149,596 | * |
| | | | | |
Textile - Apparel 0.85% | | | | | |
Shenzhou International Group Holdings Ltd. | | 138,000 | | 240,804 | * |
| | | | | |
Tobacco 0.68% | | | | | |
PT Hanjaya Mandala Sampoerna Tbk | | 35,000 | | 192,794 | * |
| | | | | |
Transportation - Marine 0.63% | | | | | |
China Shipping Container Lines Co., Ltd., H shares | | 729,000 | | 177,989 | * |
| | | | | |
Web Portals/Internet Service Providers 6.18% | | | | | |
Baidu, Inc., Sponsored ADR | | 8,436 | | 969,971 | * |
Sina Corp. | | 15,000 | | 777,150 | * |
| | | | 1,747,121 | |
Total Common Stocks
(cost $25,992,410) | | | | 26,109,011 | |
| | | | | | |
See notes to portfolios of investments and notes to financial statements.
143
| | Shares | | Value | |
Exchange-Traded Funds (ETF) 0.48% | | | | | |
Market Vectors Indonesia Index ETF | | 2,555 | | $ | 70,135 | * |
ProShares Short FTSE China 25 | | 1,495 | | 65,795 | * |
| | | | | |
Total Exchange-Traded Funds
(cost $137,590) | | | | 135,930 | |
| | | | | | |
| | Contracts | | | |
Purchased Option 0.09% | | | | | |
| | | | | |
Exchange-Traded Funds 0.09% | | | | | |
SPDR Gold Trust, Strike Price 160, Call, Expiration Dec. 2012
(premium $32,368) | | 34 | | 23,970 | |
| | | | | |
Total Securities
(cost $26,162,368) | | | | 26,268,911 | |
| | Principal
Amount | | | |
Repurchase Agreement 5.82% | | | | | |
| | | | | |
Joint Tri-Party Repurchase Agreement, Credit Suisse Securities USA LLC, 6/29/2012, 0.14%, due 7/2/2012, repurchase price $1,646,260, collateralized by U.S. Treasury securities held in a joint tri-party account (cost $1,646,241) | | $ | 1,646,241 | | 1,646,241 | |
| | | | | |
Total Investments 98.74%
(cost $27,808,609) | | | | 27,915,152 | |
Other assets and liabilities, net 1.26% | | | | 356,509 | |
| | | | | |
Net Assets 100% | | | | $ | 28,271,661 | |
| | | | | | | |
See notes to portfolios of investments and notes to financial statements.
144
Notes to Portfolios of Investments (unaudited) | | June 30, 2012 |
Legend
* | | Non-income producing security |
+ | | Affiliated company (see following) |
ADR | | American Depositary Receipt |
GDR | | Global Depositary Receipt |
GO | | General Obligation Bond |
RS | | Restricted Security (see following) |
ZCB | | Zero Coupon Bond |
^ | | Security or portion of security segregated as collateral for written options |
| | |
@ | | Security was fair valued at June 30, 2012, by U.S. Global Investors, Inc. (Adviser) in accordance with valuation procedures approved by the Board of Trustees. See the Fair Valuation of Securities section of these Notes to Portfolios of Investments for further discussion of fair valued securities. See further information and detail on restricted securities in the Restricted Securities section of these Notes to Portfolios of Investments. |
General
The yields reflect the effective yield from the date of purchase.
Variable Rate Notes have periodic reset features, which effectively shorten the maturity dates and reset the interest rates as tied to various interest-bearing instruments. Rates shown are current rates at June 30, 2012.
Securities with a 144A designation are exempt from registration under Rule 144A of the Securities Act of 1933.
Joint Tri-Party Repurchase Agreements
The terms of the joint tri-party repurchase agreements and the securities held as collateral at June 30, 2012, were:
Banc of America Securities LLC Merrill Lynch repurchase agreement, 06/29/12, 0.12%, due 07/02/12:
Total principal amount: $79,776,460; Total repurchase price: $79,777,257
Collateral:
$80,312,700 U.S. Treasury Note, 0.875%, 02/28/17
(total collateral market value, including accrued interest, of $81,372,028)
Barclays Capital, Inc. repurchase agreement, 06/29/12, 0.12%, due 07/02/12:
Total principal amount: $10,000,000; Total repurchase price: $10,000,100
Collateral:
$10,067,300 U.S. Treasury Note, 0.875%, 02/28/17
(total collateral market value, including accrued interest, of $10,200,088)
Credit Suisse Securities USA LLC repurchase agreement, 06/29/12, 0.14%, due 07/02/12:
Total principal amount: $128,000,530; Total repurchase price: $128,002,024
Collateral:
$79,830,000 U.S. Treasury Note, 1.000%, 08/31/16
$48,228,300 U.S. Treasury Note, 1.000%, 03/31/17
(total collateral market value, including accrued interest, of $130,561,606)
145
Notes to Portfolios of Investments (unaudited) | | June 30, 2012 |
Morgan Stanley repurchase agreement, 06/29/12, 0.12%, due 07/02/12:
Total principal amount: $20,000,000; Total repurchase price: $20,000,200
Collateral:
$18,190,900 U.S. Treasury Note, 3.250%, 07/31/16
(total collateral market value, including accrued interest, of $20,400,055)
Fair Valuation of Securities
For the Funds’ policies regarding the valuation of investments and other significant accounting policies, please refer to the Notes to Financial Statements.
The Funds are required to disclose information regarding the fair value measurements of a Fund’s assets and liabilities. Fair value is the price that would be received to sell an asset or paid to transfer a liability in an orderly transaction between market participants at the measurement date. The disclosure requirement established a three-tier hierarchy to maximize the use of observable market data and minimize the use of unobservable inputs and to establish classification of fair value measurements for disclosure purposes. Inputs refer broadly to the assumptions that market participants would use in pricing the asset or liability, including assumptions about risk, for example, the risk inherent in a particular valuation technique used to measure fair value including such a pricing model and/or the risk inherent in the inputs to the valuation technique. Inputs may be observable or unobservable. Observable inputs are inputs that reflect the assumptions market participants would use in pricing the asset or liability developed based on market data obtained from sources independent of the reporting entity. Unobservable inputs are inputs that reflect the reporting entity’s own assumptions about the assumptions market participants would use in pricing the asset or liability developed based on the best information available in the circumstances.
The inputs or methodology used for valuing securities are not necessarily an indication of the risk associated with investing in those securities. For example, short term U.S. government obligations are valued using amortized cost, in accordance with the Investment Company Act of 1940. Generally, amortized cost reflects the current fair value of a security, but since the value is not obtained from a quoted price in an active market, such securities are reflected as Level 2. Because of the inherent uncertainties of valuation, the values reflected in the portfolios may materially differ from the value received upon actual sale of those investments.
The three levels defined by the fair value hierarchy are as follows:
Level 1 — Quoted prices in active markets for identical securities.
Level 2 — Prices determined using significant other observable inputs (including quoted prices for similar securities, interest rates, prepayment speeds, credit risk, etc.). Short-term securities with maturities of 60 days or less are valued at amortized cost, which approximates market value, and are categorized as Level 2 in the hierarchy. Municipal securities, long-term U.S. Government obligations and corporate debt
146
Notes to Portfolios of Investments (unaudited) | | June 30, 2012 |
securities are valued in accordance with the evaluated price supplied by the pricing service and generally categorized as Level 2 in the hierarchy. Other securities that are categorized as Level 2 in the hierarchy include, but are not limited to, warrants that do not trade on an exchange, securities for which no sale was reported (valued at the mean between the last reported bid and ask quotation) and international equity securities valued by an independent third party in order to adjust for stale pricing and foreign market holidays.
Level 3 — Prices determined using significant unobservable inputs (including the Fund’s own assumptions). For restricted equity securities and private placements where observable inputs are limited, assumptions about market activity and risk are used in determining fair value.
The following table summarizes the valuation of each Fund’s securities as of June 30, 2012, using the fair value hierarchy:
| | Quoted Prices
in Active
Markets for
Identical
Investments
(Level 1) | | Significant
Other
Observable
Inputs
(Level 2) | | Significant
Unobservable
Inputs
(Level 3) | | Total | |
U.S. Treasury Securities Cash Fund | | | | | | | | | |
Investments in Securities* | | | | | | | | | |
Repurchase Agreements | | $ | 84,953,968 | | $ | — | | $ | — | | $ | 84,953,968 | |
Total | | $ | 84,953,968 | | $ | — | | $ | — | | $ | 84,953,968 | |
| | | | | | | | | |
U.S. Government Securities Savings Fund | | | | | | | | | |
Investments in Securities* | | | | | | | | | |
U.S. Government and Agency Obligations | | $ | — | | $ | 114,836,678 | | $ | — | | $ | 114,836,678 | |
Repurchase Agreements | | 41,776,460 | | — | | — | | 41,776,460 | |
Total | | $ | 41,776,460 | | $ | 114,836,678 | | $ | — | | $ | 156,613,138 | |
| | | | | | | | | |
Near-Term Tax Free Fund | | | | | | | | | |
Investments in Securities* | | | | | | | | | |
Municipal Bonds | | $ | — | | $ | 35,363,429 | | $ | — | | $ | 35,363,429 | |
Repurchase Agreement | | 2,801,043 | | — | | — | | 2,801,043 | |
Total | | $ | 2,801,043 | | $ | 35,363,429 | | $ | — | | $ | 38,164,472 | |
| | | | | | | | | |
Tax Free Fund | | | | | | | | | |
Investments in Securities* | | | | | | | | | |
Municipal Bonds | | $ | — | | $ | 21,677,312 | | $ | — | | $ | 21,677,312 | |
Total | | $ | — | | $ | 21,677,312 | | $ | — | | $ | 21,677,312 | |
| | | | | | | | | |
All American Equity Fund | | | | | | | | | |
Investments in Securities* | | | | | | | | | |
Common Stocks | | $ | 14,881,073 | | $ | — | | $ | — | | $ | 14,881,073 | |
Real Estate Investment Trust | | 209,730 | | — | | — | | 209,730 | |
Exchange-Traded Funds | | 206,163 | | — | | — | | 206,163 | |
Purchased Options | | 4,500 | | — | | — | | 4,500 | |
Repurchase Agreement | | 1,653,888 | | — | | — | | 1,653,888 | |
Total | | $ | 16,955,354 | | $ | — | | $ | — | | $ | 16,955,354 | |
| | | | | | | | | |
Other Financial Instruments** | | | | | | | | | |
Written Options | | $ | 11,164 | | $ | — | | $ | — | | $ | 11,164 | |
147
Notes to Portfolios of Investments (unaudited) | June 30, 2012 |
| | Quoted Prices
in Active
Markets for
Identical
Investments
(Level 1) | | Significant
Other
Observable
Inputs
(Level 2) | | Significant
Unobservable
Inputs
(Level 3) | | Total | |
Holmes Growth Fund | | | | | | | | | |
Investments in Securities* | | | | | | | | | |
Common Stocks: | | | | | | | | | |
Agricultural Operations | | $ | — | | $ | 29,348 | | $ | — | | $ | 29,348 | |
Finance - Commercial | | 405,186 | | 10,265 | | — | | 415,451 | |
Medical - Hospitals | | — | | 13,705 | | — | | 13,705 | |
Metal - Iron | | — | | — | | 100,000 | | 100,000 | |
Quarrying | | — | | — | | 380,000 | | 380,000 | |
Real Estate Operating/Development | | — | | — | | 100,000 | | 100,000 | |
All Other Common Stocks | | 26,926,668 | | — | | — | | 26,926,668 | |
Exchange-Traded Funds | | 396,807 | | — | | — | | 396,807 | |
Warrants: | | | | | | | | | |
Medical - Hospitals | | — | | — | | — | | — | |
Purchased Option | | 9,900 | | — | | — | | 9,900 | |
Convertible Debenture: | | | | | | | | | |
Metal - Iron | | — | | — | | 100,000 | | 100,000 | |
Corporate Notes: | | | | | | | | | |
Building - Heavy Construction | | — | | 292,600 | | — | | 292,600 | |
Electric - Generation | | — | | — | | 150,000 | | 150,000 | |
Repurchase Agreement | | 6,646,570 | | — | | — | | 6,646,570 | |
Total | | $ | 34,385,131 | | $ | 345,918 | | $ | 830,000 | | $ | 35,561,049 | |
Other Financial Instruments** | | | | | | | | | |
Written Options | | $ | 7,373 | | $ | — | | $ | — | | $ | 7,373 | |
| | | | | | | | | |
Global MegaTrends Fund | | | | | | | | | |
Investments in Securities* | | | | | | | | | |
Common Stocks: | | | | | | | | | |
Agricultural Operations | | $ | — | | $ | 33,571 | | $ | — | | $ | 33,571 | |
Electric - Generation | | 282,260 | | — | | 23,358 | | 305,618 | |
Energy - Alternate Sources | | — | | — | | 100,000 | | 100,000 | |
Metal - Iron | | — | | — | | 100,000 | | 100,000 | |
Quarrying | | — | | — | | 520,000 | | 520,000 | |
Real Estate Operating/Development | | — | | — | | 326,533 | | 326,533 | |
All Other Common Stocks | | 6,917,258 | | — | | — | | 6,917,258 | |
Real Estate Investment Trusts | | 799,420 | | — | | — | | 799,420 | |
Exchange-Traded Fund | | 113,260 | | — | | — | | 113,260 | |
Warrants: | | | | | | | | | |
Coal | | — | | 1,364 | | — | | 1,364 | |
Master Limited Partnerships | | 786,438 | | — | | — | | 786,438 | |
Convertible Debenture: | | | | | | | | | |
Metal - Iron | | — | | — | | 100,000 | | 100,000 | |
Silver-Linked Note | | 4,300 | | — | | — | | 4,300 | |
Corporate Notes: | | | | | | | | | |
Building - Heavy Construction | | — | | 117,800 | | — | | 117,800 | |
Electric - Generation | | — | | — | | 100,000 | | 100,000 | |
Repurchase Agreement | | 3,520,326 | | — | | — | | 3,520,326 | |
Total | | $ | 12,423,262 | | $ | 152,735 | | $ | 1,269,891 | | $ | 13,845,888 | |
148
Notes to Portfolios of Investments (unaudited) | June 30, 2012 |
| | Quoted Prices
in Active
Markets for
Identical
Investments
(Level 1) | | Significant
Other
Observable
Inputs
(Level 2) | | Significant
Unobservable
Inputs
(Level 3) | | Total | |
Global Resources Fund | | | | | | | | | |
Investments in Securities* | | | | | | | | | |
Common Stocks: | | | | | | | | | |
Agricultural Operations | | $ | 9,787,440 | | $ | 3,547,259 | | $ | — | | $ | 13,334,699 | |
Coal | | 20,708,253 | | 14,430,769 | | — | | 35,139,022 | |
Diversified Minerals | | 2,965,326 | | 2,933,043 | | — | | 5,898,369 | |
Electric - Generation | | — | | — | | 325,779 | | 325,779 | |
Energy - Alternate Sources | | — | | — | | 2,400,000 | | 2,400,000 | |
Forestry | | 13,116,841 | | 262,415 | | — | | 13,379,256 | |
Gold Mining | | 41,580,822 | | — | | 5,118 | | 41,585,940 | |
Medical - Hospitals | | — | | 34,366 | | — | | 34,366 | |
Metal - Copper | | 29,916,520 | | 190,713 | | — | | 30,107,233 | |
Metal - Diversified | | 24,557 | | 254,067 | | 2,250,000 | | 2,528,624 | |
Metal - Iron | | 9,812,670 | | — | | 2,600,000 | | 12,412,670 | |
Mining Services | | — | | 1,525,372 | | 281,490 | | 1,806,862 | |
Natural Resource Technology | | — | | — | | 7,500 | | 7,500 | |
Non - Ferrous Metals | | 1,290,997 | | 47,500 | | — | | 1,338,497 | |
Oil Companies - Exploration & Production | | 43,677,672 | | 1,126,785 | | — | | 44,804,457 | |
Oil Refining & Marketing | | 14,065,710 | | — | | 415,752 | | 14,481,462 | |
Platinum | | — | | — | | — | | — | |
Precious Metals | | 2,073,081 | | 751,750 | | — | | 2,824,831 | |
Quarrying | | 11,594,560 | | — | | 4,900,000 | | 16,494,560 | |
Real Estate Operating/Development | | 1,086,194 | | — | | 7,443,544 | | 8,529,738 | |
All Other Common Stocks | | 176,924,697 | | — | | — | | 176,924,697 | |
Real Estate Investment Trusts | | 22,493,776 | | — | | — | | 22,493,776 | |
Exchange-Traded Fund | | 1,426,600 | | — | | — | | 1,426,600 | |
Warrants: | | | | | | | | | |
Coal | | — | | 194,180 | | — | | 194,180 | |
Diversified Minerals | | 18,678 | | — | | — | | 18,678 | |
Medical - Hospitals | | — | | — | | — | | — | |
Metal - Copper | | — | | — | | — | | — | |
Oil Companies - Exploration & Production | | 1,545,334 | | — | | — | | 1,545,334 | |
All Other Warrants | | 6,529,932 | | — | | — | | 6,529,932 | |
Purchased Call Options: | | | | | | | | | |
Chemicals - Diversified | | — | | 63,000 | | — | | 63,000 | |
Exchange-Traded Funds | | — | | 85,250 | | — | | 85,250 | |
Food - Meat Products | | 65,100 | | 47,125 | | — | | 112,225 | |
Oil - Field Services | | — | | 327,000 | | — | | 327,000 | |
Oil Companies - Exploration & Production | | 27,000 | | 112,500 | | — | | 139,500 | |
Oil Companies - Integrated | | — | | 328,550 | | — | | 328,550 | |
Oil Field Machinery & Equipment | | — | | 193,500 | | — | | 193,500 | |
Paper & Related Products | | — | | 71,400 | | — | | 71,400 | |
Pipelines | | — | | 46,875 | | — | | 46,875 | |
Quarrying | | — | | 70,000 | | — | | 70,000 | |
All Other Purchased Call Options | | 629,050 | | — | | — | | 629,050 | |
Purchased Put Options: | | | | | | | | | |
Exchange-Traded Funds | | 555,000 | | 398,000 | | — | | 953,000 | |
Master Limited Partnerships | | 30,343,570 | | — | | — | | 30,343,570 | |
Silver-Linked Notes | | 1,966,820 | | — | | — | | 1,966,820 | |
Corporate Notes: | | | | | | | | | |
Building - Heavy Construction | | — | | 3,355,400 | | — | | 3,355,400 | |
Diversified Minerals | | — | | — | | 491,135 | | 491,135 | |
Electric - Generation | | — | | — | | 3,000,000 | | 3,000,000 | |
Mining Services | | — | | 902,500 | | — | | 902,500 | |
Repurchase Agreement | | 25,985,426 | | — | | — | | 25,985,426 | |
Total | | $ | 470,211,626 | | $ | 31,299,319 | | $ | 24,120,318 | | $ | 525,631,263 | |
Other Financial Instruments** | | | | | | | | | |
Written Options | | $ | (21,209 | ) | $ | — | | $ | — | | $ | (21,209 | ) |
149
Notes to Portfolios of Investments (unaudited) | June 30, 2012 |
| | Quoted Prices
in Active
Markets for
Identical
Investments
(Level 1) | | Significant
Other
Observable
Inputs
(Level 2) | | Significant
Unobservable
Inputs
(Level 3) | | Total | |
World Precious Minerals Fund | | | | | | | | | |
Investments in Securities* | | | | | | | | | |
Common Stocks: | | | | | | | | | |
Agricultural Operations | | $ | — | | $ | 2,038,535 | | $ | — | | $ | 2,038,535 | |
Coal | | 474,962 | | 2,781,652 | | — | | 3,256,614 | |
Diamonds/Precious Stones | | 3,365,280 | | 289,402 | | — | | 3,654,682 | |
Diversified Minerals | | 10,261,365 | | 2,487,577 | | — | | 12,748,942 | |
Gold Mining | | 153,262,203 | | 10,449,467 | | 3,465,921 | | 167,177,591 | |
Medical - Hospitals | | — | | 63,558 | | — | | 63,558 | |
Metal - Copper | | 9,694,373 | | — | | — | | 9,694,373 | |
Metal - Diversified | | 6,659,727 | | 2,402,743 | | — | | 9,062,470 | |
Mining Services | | 2,173,665 | | 2,234,185 | | — | | 4,407,850 | |
Oil Companies - Exploration & Production | | — | | — | | — | | — | |
Platinum | | 1,992,617 | | — | | — | | 1,992,617 | |
Precious Metals | | 9,890,820 | | 7,257,753 | | — | | 17,148,573 | |
All Other Common Stocks | | 22,887,119 | | — | | — | | 22,887,119 | |
Exchange-Traded Funds | | 4,943,916 | | — | | — | | 4,943,916 | |
Warrants: | | | | | | | | | |
Coal | | — | | 27,285 | | — | | 27,285 | |
Gold Mining | | 12,204,330 | | — | | — | | 12,204,330 | |
Medical - Hospitals | | — | | — | | — | | — | |
Metal - Copper | | — | | — | | — | | — | |
Metal - Diversified | | — | | 24,581 | | — | | 24,581 | |
All Other Warrants | | 645,944 | | — | | — | | 645,944 | |
Special Warrants: | | | | | | | | | |
Gold/Mineral Exploration & Development | | — | | — | | — | | — | |
Purchased Call Options: | | | | | | | | | |
Gold Mining | | 7,071,514 | | 160,130 | | — | | 7,231,644 | |
All Other Purchased Call Options | | 413,296 | | — | | — | | 413,296 | |
Purchased Put Options | | 281,300 | | — | | — | | 281,300 | |
Convertible Debenture: | | | | | | | | | |
Metal - Iron | | — | | — | | 1,200,000 | | 1,200,000 | |
Silver-Linked Notes | | 7,265,280 | | — | | — | | 7,265,280 | |
Corporate Note: | | | | | | | | | |
Electric - Generation | | — | | — | | 800,000 | | 800,000 | |
Repurchase Agreement | | 34,639,005 | | — | | — | | 34,639,005 | |
Total | | $ | 288,126,716 | | $ | 30,216,868 | | $ | 5,465,921 | | $ | 323,809,505 | |
Other Financial Instruments** | | | | | | | | | |
Written Options | | $ | (140,729 | ) | $ | 41,117 | | $ | — | | $ | (99,612 | ) |
Foreign Currency | | (157 | ) | — | | — | | (157 | ) |
150
Notes to Portfolios of Investments (unaudited) | June 30, 2012 |
| | Quoted Prices
in Active
Markets for
Identical
Investments
(Level 1) | | Significant
Other
Observable
Inputs
(Level 2) | | Significant
Unobservable
Inputs
(Level 3) | | Total | |
Gold and Precious Metals Fund | | | | | | | | | |
Investments in Securities* | | | | | | | | | |
Common Stocks: | | | | | | | | | |
Gold Mining | | $ | 74,339,883 | | $ | 3,798,280 | | $ | — | | $ | 78,138,163 | |
Medical - Hospitals | | — | | 27,410 | | — | | 27,410 | |
Precious Metals | | 4,067,800 | | 3,290,274 | | — | | 7,358,074 | |
All Other Common Stocks | | 23,762,382 | | — | | — | | 23,762,382 | |
Exchange-Traded Funds | | 2,056,101 | | — | | — | | 2,056,101 | |
Warrants: | | | | | | | | | |
Gold Mining | | 8,494,423 | | — | | — | | 8,494,423 | |
Medical - Hospitals | | — | | — | | — | | — | |
All Other Warrants | | 370,322 | | — | | — | | 370,322 | |
Purchased Call Options: | | | | | | | | | |
Gold Mining | | 3,376,446 | | 77,675 | | — | | 3,454,121 | |
All Other Purchased Call Options | | 259,513 | | — | | — | | 259,513 | |
Purchased Put Options | | 134,504 | | — | | — | | 134,504 | |
Silver-Linked Notes | | 3,870,000 | | — | | — | | 3,870,000 | |
Corporate Notes: | | | | | | | | | |
Gold Mining | | — | | 5,842,343 | | — | | 5,842,343 | |
Electric - Generation | | — | | — | | 300,000 | | 300,000 | |
Repurchase Agreement | | 22,288,711 | | — | | — | | 22,288,711 | |
Total | | $ | 143,020,085 | | $ | 13,035,982 | | $ | 300,000 | | $ | 156,356,067 | |
Other Financial Instruments** | | | | | | | | | |
Written Options | | $ | 22,593 | | $ | 5,117 | | $ | — | | $ | 27,710 | |
Foreign Currency | | (244 | ) | — | | — | | (244 | ) |
| | | | | | | | | |
Eastern European Fund | | | | | | | | | |
Investments in Securities* | | | | | | | | | |
Common Stocks: | | | | | | | | | |
Agricultural Chemicals | | $ | — | | $ | 7,503,616 | | $ | — | | $ | 7,503,616 | |
Agricultural Operations | | — | | 5,498,320 | | — | | 5,498,320 | |
Airlines | | — | | 970,276 | | — | | 970,276 | |
Appliances | | — | | 387,607 | | — | | 387,607 | |
Automotive - Cars & Light Trucks | | — | | 4,532,784 | | — | | 4,532,784 | |
Cellular Telecommunications | | 1,004,000 | | 6,875,554 | | — | | 7,879,554 | |
Chemicals - Diversified | | — | | 5,177,929 | | — | | 5,177,929 | |
Commercial Banks - Non US | | — | | 23,561,799 | | — | | 23,561,799 | |
Electric - Generation | | — | | 2,050,449 | | — | | 2,050,449 | |
Electric - Integrated | | — | | 2,627,861 | | — | | 2,627,861 | |
Finance - Investment Banker/Broker | | — | | 2,253,069 | | — | | 2,253,069 | |
Food - Retail | | — | | 4,809,261 | | — | | 4,809,261 | |
Food - Wholesale/Distribution | | — | | 4,433,276 | | — | | 4,433,276 | |
Gold Mining | | 361,279 | | 4,543,628 | | — | | 4,904,907 | |
Life/Health Insurance | | — | | 460,414 | | — | | 460,414 | |
Machinery - Farm | | — | | 2,347,083 | | — | | 2,347,083 | |
Medical - Generic Drugs | | — | | 760,846 | | — | | 760,846 | |
Metal - Diversified | | — | | 3,739,837 | | — | | 3,739,837 | |
Miscellaneous Manufacturers | | — | | 1,702,245 | | — | | 1,702,245 | |
Oil Companies - Exploration & Production | | 306,421 | | 21,183,334 | | — | | 21,489,755 | |
Oil Companies - Integrated | | — | | 36,434,676 | | — | | 36,434,676 | |
Oil Refining & Marketing | | — | | 4,941,758 | | — | | 4,941,758 | |
Precious Metals | | — | | 3,224,125 | | — | | 3,224,125 | |
Steel Pipe & Tube | | — | | 481,402 | | — | | 481,402 | |
151
Notes to Portfolios of Investments (unaudited) | June 30, 2012 |
| | Quoted Prices
in Active
Markets for
Identical
Investments
(Level 1) | | Significant
Other
Observable
Inputs
(Level 2) | | Significant
Unobservable
Inputs
(Level 3) | | Total | |
Eastern European Fund (Cont’d) | | | | | | | | | |
Investments in Securities* | | | | | | | | | |
Common Stocks: (Cont’d) | | | | | | | | | |
Tobacco | | $ | — | | $ | 1,953,505 | | $ | — | | $ | 1,953,505 | |
All Other Common Stocks | | 3,374,636 | | — | | — | | 3,374,636 | |
Preferred Stocks: | | | | | | | | | |
Pipelines | | — | | 1,595,925 | | — | | 1,595,925 | |
Real Estate Investment Trust | | — | | 1,373,731 | | — | | 1,373,731 | |
Exchange-Traded Fund | | 341,418 | | — | | — | | 341,418 | |
Warrants | | 2,264,329 | | — | | — | | 2,264,329 | |
Repurchase Agreement | | 11,865,352 | | | | | | 11,865,352 | |
Total | | $ | 19,517,435 | | $ | 155,424,310 | | $ | — | | $ | 174,941,745 | |
Other Financial Instruments** | | | | | | | | | |
Written Options | | $ | 71,000 | | $ | (33,350 | ) | $ | 29,726 | | $ | 67,376 | |
| | | | | | | | | |
Global Emerging Markets Fund | | | | | | | | | |
Investments in Securities* | | | | | | | | | |
Common Stocks: | | | | | | | | | |
Advanced Materials/Products | | $ | — | | $ | 72,674 | | $ | — | | $ | 72,674 | |
Agricultural Chemicals | | — | | 162,198 | | — | | 162,198 | |
Agricultural Operations | | — | | 293,331 | | — | | 293,331 | |
Airlines | | — | | 74,040 | | — | | 74,040 | |
Applications Software | | — | | 69,949 | | — | | 69,949 | |
Audio/Video Products | | — | | 81,381 | | — | | 81,381 | |
Automotive/Truck Parts & Equipment - Original | | 79,646 | | 89,409 | | — | | 169,055 | |
Beverages - Wine/Spirits | | — | | 76,677 | | — | | 76,677 | |
Chemicals - Diversified | | — | | 88,643 | | — | | 88,643 | |
Chemicals - Specialty | | — | | 78,520 | | — | | 78,520 | |
Commercial Banks - Non US | | 130,927 | | 945,431 | | — | | 1,076,358 | |
Diversified Financial Services | | — | | 82,698 | | — | | 82,698 | |
Diversified Minerals | | — | | 23,886 | | — | | 23,886 | |
Diversified Operations | | — | | 78,142 | | — | | 78,142 | |
Electric - Integrated | | 79,596 | | 84,837 | | — | | 164,433 | |
Electric - Transmission | | — | | 74,150 | | — | | 74,150 | |
Engineering/R&D Services | | — | | 84,754 | | — | | 84,754 | |
Finance - Leasing Company | | — | | 65,505 | | — | | 65,505 | |
Finance - Other Services | | — | | 78,429 | | — | | 78,429 | |
Fisheries | | — | | 71,575 | | — | | 71,575 | |
Food - Confectionery | | — | | 184,163 | | — | | 184,163 | |
Food - Miscellaneous/Diversified | | — | | 79,710 | | — | | 79,710 | |
Housewares | | — | | 76,117 | | — | | 76,117 | |
Investment Companies | | — | | 82,956 | | — | | 82,956 | |
Machinery - Farm | | — | | 163,648 | | — | | 163,648 | |
Medical - Drugs | | 8,959 | | 140,311 | | — | | 149,270 | |
Medical - Hospitals | | — | | 44,924 | | — | | 44,924 | |
Metal - Diversified | | 161,926 | | 21,905 | | — | | 183,831 | |
Miscellaneous Manufacturers | | — | | 162,364 | | — | | 162,364 | |
Oil Refining & Marketing | | — | | 90,187 | | — | | 90,187 | |
Petrochemicals | | — | | 190,244 | | — | | 190,244 | |
Property/Casualty Insurance | | — | | 48,979 | | — | | 48,979 | |
Public Thoroughfares | | — | | 97,373 | | — | | 97,373 | |
Real Estate Operating/Development | | 80,713 | | 520,407 | | — | | 601,120 | |
Retail - Jewelry | | — | | 75,917 | | — | | 75,917 | |
152
Notes to Portfolios of Investments (unaudited) | June 30, 2012 |
| | Quoted Prices
in Active
Markets for
Identical
Investments
(Level 1) | | Significant
Other
Observable
Inputs
(Level 2) | | Significant
Unobservable
Inputs
(Level 3) | | Total | |
Global Emerging Markets Fund (Cont’d) | | | | | | | | | |
Investments in Securities* | | | | | | | | | |
Common Stocks: (Cont’d) | | | | | | | | | |
Steel - Producers | | $ | — | | $ | 81,627 | | $ | — | | $ | 81,627 | |
Steel - Specialty | | — | | 70,578 | | — | | 70,578 | |
Telecom Services | | — | | 81,618 | | — | | 81,618 | |
Telecommunication Equipment | | — | | 57,720 | | — | | 57,720 | |
Textile - Apparel | | — | | 98,526 | | — | | 98,526 | |
Textile - Home Furnishings | | — | | 80,286 | | — | | 80,286 | |
Textile - Products | | — | | 42,192 | | — | | 42,192 | |
Tobacco | | — | | 66,023 | | — | | 66,023 | |
All Other Common Stocks | | 1,347,861 | | — | | — | | 1,347,861 | |
Preferred Stocks: | | | | | | | | | |
Commercial Banks - Non US | | — | | 218,652 | | — | | 218,652 | |
Real Estate Investment Trusts | | — | | 150,384 | | — | | 150,384 | |
Exchange-Traded Funds | | 117,729 | | — | | — | | 117,729 | |
Rights: | | — | | 2,344 | | — | | 2,344 | |
Convertible Debenture: | | | | | | | | | |
Metal - Iron | | — | | — | | 100,000 | | 100,000 | |
Corporate Notes: | | | | | | | | | |
Building - Heavy Construction | | — | | 68,400 | | — | | 68,400 | |
Electric - Generation | | — | | — | | 50,000 | | 50,000 | |
Total | | $ | 2,007,357 | | $ | 5,673,784 | | $ | 150,000 | | $ | 7,831,141 | |
Other Financial Instruments** | | | | | | | | | |
Foreign Currency | | $ | (1 | ) | $ | — | | $ | — | | $ | (1 | ) |
| | | | | | | | | |
China Region Fund | | | | | | | | | |
Investments in Securities* | | | | | | | | | |
Common Stocks: | | | | | | | | | |
Apparel Manufacturers | | $ | — | | $ | 331,491 | | $ | — | | $ | 331,491 | |
Automotive - Cars & Light Trucks | | — | | 960,230 | | — | | 960,230 | |
Batteries/Battery System | | — | | 291,668 | | — | | 291,668 | |
Building - Heavy Construction | | — | | 288,999 | | — | | 288,999 | |
Building & Construction - Miscellaneous | | — | | 791,795 | | — | | 791,795 | |
Building Products - Cement/Aggregates | | — | | 146,295 | | — | | 146,295 | |
Casino Hotels | | — | | 448,271 | | — | | 448,271 | |
Casino Services | | — | | 196,747 | | — | | 196,747 | |
Cellular Telecommunications | | 560,790 | | 1,014,207 | | — | | 1,574,997 | |
Commercial Banks - Non US | | — | | 3,286,706 | | — | | 3,286,706 | |
Computers | | — | | 127,790 | | — | | 127,790 | |
Consumer Products - Miscellaneous | | — | | 289,229 | | — | | 289,229 | |
Containers - Paper/Plastic | | — | | 224,003 | | — | | 224,003 | |
Cosmetics & Toiletries | | — | | 108,042 | | — | | 108,042 | |
Distribution/Wholesale | | — | | 223,635 | | — | | 223,635 | |
Diversified Banking Institutions | | — | | 946,734 | | — | | 946,734 | |
Diversified Operations | | — | | 449,216 | | — | | 449,216 | |
Electronic Components - Miscellaneous | | — | | 318,537 | | — | | 318,537 | |
Electronic Components - Semiconductors | | 179,765 | | 206,238 | | — | | 386,003 | |
Finance - Other Services | | — | | 142,183 | | — | | 142,183 | |
Food - Canned | | — | | 292,602 | | — | | 292,602 | |
Food - Miscellaneous/Diversified | | — | | 693,942 | | — | | 693,942 | |
Internet Application Software | | — | | 756,005 | | — | | 756,005 | |
Life/Health Insurance | | — | | 262,070 | | — | | 262,070 | |
153
Notes to Portfolios of Investments (unaudited) | June 30, 2012 |
| | Quoted Prices
in Active
Markets for
Identical
Investments
(Level 1) | | Significant
Other
Observable
Inputs
(Level 2) | | Significant
Unobservable
Inputs
(Level 3) | | Total | |
China Region Fund (Cont’d) | | | | | | | | | |
Investments in Securities* | | | | | | | | | |
Common Stocks: (Cont’d) | | | | | | | | | |
Machinery - Construction & Mining | | $ | — | | $ | 269,874 | | $ | — | | $ | 269,874 | |
Machinery - General Industrial | | — | | 423,356 | | — | | 423,356 | |
Medical - Generic Drugs | | — | | 84,065 | | — | | 84,065 | |
Medical Instruments | | — | | 301,854 | | — | | 301,854 | |
Multi-line Insurance | | — | | 286,251 | | — | | 286,251 | |
Multimedia | | — | | 227,650 | | — | | 227,650 | |
Non - Ferrous Metals | | — | | 47,500 | | — | | 47,500 | |
Oil Companies - Exploration & Production | | 503,125 | | 284,427 | | — | | 787,552 | |
Petrochemicals | | — | | 2 | | — | | 2 | |
Real Estate Operating/Development | | 476,167 | | 3,323,998 | | — | | 3,800,165 | |
Retail - Automobile | | — | | 548,602 | | — | | 548,602 | |
Retail - Building Products | | — | | 227,494 | | — | | 227,494 | |
Retail - Convenience Store | | — | | 148,406 | | — | | 148,406 | |
Retail - Discount | | — | | 296,491 | | — | | 296,491 | |
Retail - Jewelry | | — | | 2 | | — | | 2 | |
Steel - Specialty | | — | | 268,938 | | — | | 268,938 | |
Telecom Services | | 266,822 | | 666,882 | | — | | 933,704 | |
Television | | — | | 149,596 | | — | | 149,596 | |
Textile - Apparel | | — | | 240,804 | | — | | 240,804 | |
Tobacco | | — | | 192,794 | | — | | 192,794 | |
Transportation - Marine | | — | | 177,989 | | — | | 177,989 | |
All Other Common Stocks | | 3,158,732 | | — | | — | | 3,158,732 | |
Exchange-Traded Funds | | 135,930 | | — | | — | | 135,930 | |
Purchased Option | | 23,970 | | — | | — | | 23,970 | |
Repurchase Agreement | | 1,646,241 | | — | | — | | 1,646,241 | |
Total | | $ | 6,951,542 | | $ | 20,963,610 | | $ | — | | $ | 27,915,152 | |
Other Financial Instruments** | | | | | | | | | |
Foreign Currency | | $ | (20 | ) | $ | — | | $ | — | | $ | (20 | ) |
* | Refer to the Portfolio of Investments for a detailed list of the Fund’s investments. |
** | Other financial instruments include currency contracts and written options. Currency contracts and written options are reported at their unrealized appreciation/depreciation at measurement date, which represents the change in the contract’s value from trade date. |
During the period, Holmes Growth Fund, Global MegaTrends Fund, Global Resources Fund, World Precious Minerals Fund, Gold and Precious Metals Fund, Eastern European Fund, Global Emerging Markets Fund and China Region Fund had transfers from Level 1 to Level 2 in the amount of $53,318, $33,571, $14,395,062, $27,132,663, $7,115,964, $133,025,112, $120,688 and $8,102,115, respectively, due primarily to certain foreign securities being valued using a systematic fair value model at June 30, 2012, but not at the prior period end. World Precious Minerals Fund had transfers from Level 2 to Level 1 in the amount of $684,642, as a result of the expiration of a regulatory hold. The Funds’ policy is to recognize transfers in and transfers out as of the end of the reporting period.
154
Notes to Portfolios of Investments (unaudited) | June 30, 2012 |
The following is a reconciliation of assets and liabilities for which unobservable inputs (Level 3) were used in determining fair value during the period January 1, 2012, through June 30, 2012:
| | Beginning
Balance
12/31/11 | | Purchases | | Sales | | Total
realized
gain (loss) | | Net
change in
unrealized
appreciation
(depreciation) | | Paydowns | | Transfers
out of
Level 3* | | Ending
Balance
06/30/12 | | Net
change in
unrealized
appreciation
(depreciation)
from
Investments
held as of
06/30/12(1) | |
Holmes Growth Fund | | | | | | | | | | | | | | | | | | | |
Investments in Securities | | | | | | | | | | | | | | | | | | | |
Common Stocks: | | | | | | | | | | | | | | | | | | | |
Metal - Iron | | $ | 100,000 | | $ | — | | $ | — | | $ | — | | $ | — | | $ | — | | $ | — | | $ | 100,000 | | $ | — | |
Quarrying | | 380,000 | | — | | — | | — | | — | | — | | — | | 380,000 | | — | |
Real Estate Operating/Development | | 100,000 | | — | | — | | — | | — | | — | | — | | 100,000 | | — | |
Convertible Debenture: | | | | | | | | | | | | | | | | | | | |
Metal - Iron | | 100,000 | | — | | — | | — | | — | | — | | — | | 100,000 | | | |
Corporate Notes: | | | | | | | | | | | | | | | | | | | |
Building - Heavy Construction | | — | | 377,301 | | — | | 1,848 | | 5,851 | | (92,400 | ) | (292,600 | ) | — | | — | |
Electric - Generation | | — | | 150,000 | | — | | — | | — | | — | | — | | 150,000 | | | |
Total Investments in Securities | | $ | 680,000 | | $ | 527,301 | | $ | — | | $ | 1,848 | | $ | 5,851 | | $ | (92,400 | ) | $ | (292,600 | ) | $ | 830,000 | | $ | — | |
| | | | | | | | | | | | | | | | | | | |
Global MegaTrends Fund | | | | | | | | | | | | | | | | | | | |
Investments in Securities | | | | | | | | | | | | | | | | | | | |
Common Stocks: | | | | | | | | | | | | | | | | | | | |
Electric - Generation | | $ | 23,358 | | $ | — | | $ | — | | $ | — | | $ | — | | $ | — | | $ | — | | $ | 23,358 | | $ | — | |
Energy - Alternate Sources | | 100,000 | | — | | — | | — | | — | | — | | — | | 100,000 | | — | |
Metal - Iron | | 100,000 | | — | | — | | ��� | | — | | — | | — | | 100,000 | | — | |
Quarrying | | 520,000 | | — | | — | | — | | — | | — | | — | | 520,000 | | — | |
Real Estate Operating/Development | | 326,533 | | — | | — | | — | | — | | — | | — | | 326,533 | | — | |
Convertible Debenture: | | | | | | | | | | | | | | | | | | | |
Metal - Iron | | 100,000 | | — | | — | | — | | — | | — | | — | | 100,000 | | — | |
Corporate Notes: | | | | | | | | | | | | | | | | | | | |
Building - Heavy Construction | | — | | 151,900 | | — | | 744 | | 2,356 | | (37,200 | ) | (117,800 | ) | — | | — | |
Electric - Generation | | — | | 100,000 | | — | | — | | — | | — | | — | | 100,000 | | — | |
Total Investments in Securities | | $ | 1,169,891 | | $ | 251,900 | | $ | — | | $ | 744 | | $ | 2,356 | | $ | (37,200 | ) | $ | (117,800 | ) | $ | 1,269,891 | | $ | — | |
155
Notes to Portfolios of Investments (unaudited) | June 30, 2012 |
| | Beginning
Balance
12/31/11 | | Purchases | | Sales | | Total
realized
gain (loss) | | Net
change in
unrealized
appreciation
(depreciation) | | Paydowns | | Transfers
out of
Level 3* | | Ending
Balance
06/30/12 | | Net
change in
unrealized
appreciation
(depreciation)
from
Investments
held as of
06/30/12(1) | |
Global Resources Fund | | | | | | | | | | | | | | | | | | | |
Investments in Securities | | | | | | | | | | | | | | | | | | | |
Common Stocks: | | | | | | | | | | | | | | | | | | | |
Electric - Generation | | $ | 325,779 | | $ | — | | $ | — | | $ | — | | $ | — | | $ | — | | $ | — | | $ | 325,779 | | $ | — | |
Energy - Alternate Sources | | 2,400,000 | | — | | (11,378 | ) | (3,511,710 | ) | 3,523,088 | | — | | — | | 2,400,000 | | — | |
Gold Mining | | 5,114 | | — | | — | | — | | 4 | | — | | — | | 5,118 | | 4 | |
Metal - Copper | | — | | — | | — | | — | | — | | — | | — | | — | | — | |
Metal - Diversified | | 2,250,000 | | — | | — | | — | | — | | — | | — | | 2,250,000 | | — | |
Metal - Iron | | 2,600,000 | | — | | — | | — | | — | | — | | — | | 2,600,000 | | — | |
Mining Services | | 281,270 | | — | | — | | — | | 220 | | — | | — | | 281,490 | | 220 | |
Natural Resource Technology | | 7,500 | | — | | — | | — | | — | | — | | — | | 7,500 | | — | |
Oil Refining & Marketing | | 415,466 | | — | | — | | — | | 286 | | — | | — | | 415,752 | | 286 | |
Platinum | | — | | — | | — | | — | | — | | — | | — | | — | | — | |
Quarrying | | 4,900,000 | | — | | — | | — | | — | | — | | — | | 4,900,000 | | — | |
Real Estate Operating/Development | | 7,443,544 | | — | | — | | — | | — | | — | | — | | 7,443,544 | | — | |
Corporate Notes: | | | | | | | | | | | | | | | | | | | |
Building - Heavy Construction | | — | | 4,326,709 | | — | | 21,190 | | 67,101 | | (1,059,600 | ) | (3,355,400 | ) | — | | — | |
Diversified Minerals | | 490,798 | | — | | — | | — | | 337 | | — | | — | | 491,135 | | 337 | |
Electric - Generation | | — | | 3,000,000 | | — | | — | | — | | — | | — | | 3,000,000 | | — | |
Total Investments in Securities | | $ | 21,119,471 | | $ | 7,326,709 | | $ | (11,378 | ) | $ | (3,490,520 | ) | $ | 3,591,036 | | $ | (1,059,600 | ) | $ | (3,355,400 | ) | $ | 24,120,318 | | $ | 847 | |
| | | | | | | | | | | | | | | | | | | |
World Precious Minerals Fund | | | | | | | | | | | | | | | | | | | |
Investments in Securities | | | | | | | | | | | | | | | | | | | |
Common Stocks: | | | | | | | | | | | | | | | | | | | |
Diamonds/Precious Stones | | $ | — | | $ | — | | $ | — | | $ | — | | $ | — | | $ | — | | $ | — | | $ | — | | $ | — | |
Gold Mining | | 3,465,857 | | — | | — | | — | | 64 | | — | | — | | 3,465,921 | | 64 | |
Metal - Copper | | — | | — | | — | | — | | — | | — | | — | | — | | — | |
Oil Companies - Exploration & Production | | — | | — | | — | | — | | — | | — | | — | | — | | — | |
Platinum | | — | | — | | — | | — | | — | | — | | — | | — | | — | |
Warrants: | | | | | | | | | | | | | | | | | | | |
Gold Mining | | — | | — | | — | | — | | — | | — | | — | | — | | — | |
Special Warrants: | | | | | | | | | | | | | | | | | | | |
Gold/Mineral Exploration & Development | | — | | — | | — | | — | | — | | — | | — | | — | | — | |
Convertible Debenture: | | | | | | | | | | | | | | | | | | | |
Metal - Iron | | 1,200,000 | | — | | — | | — | | — | | — | | — | | 1,200,000 | | — | |
Corporate Note: | | | | | | | | | | | | | | | | | | | |
Electric - Generation | | — | | 800,000 | | — | | — | | — | | — | | — | | 800,000 | | — | |
Total Investments in Securities | | $ | 4,665,857 | | $ | 800,000 | | $ | — | | $ | — | | $ | 64 | | $ | — | | $ | — | | $ | 5,465,921 | | $ | 64 | |
156
Notes to Portfolios of Investments (unaudited) | June 30, 2012 |
| | Beginning
Balance
12/31/11 | | Purchases | | Sales | | Total
realized
gain (loss) | | Net
change in
unrealized
appreciation
(depreciation) | | Paydowns | | Transfers
out of
Level 3* | | Ending
Balance
06/30/12 | | Net
change in
unrealized
appreciation
(depreciation)
from
Investments
held as of
06/30/12(1) | |
Gold and Precious Metals Fund | | | | | | | | | | | | | | | | | | | |
Investments in Securities | | | | | | | | | | | | | | | | | | | |
Warrants: | | | | | | | | | | | | | | | | | | | |
Gold Mining | | $ | — | | $ | — | | $ | — | | $ | — | | $ | — | | $ | — | | $ | — | | $ | — | | $ | — | |
Corporate Notes: | | | | | | | | | | | | | | | | | | | |
Electric - Generation | | — | | 300,000 | | — | | — | | — | | — | | — | | 300,000 | | — | |
Total Investments in Securities | | $ | — | | $ | 300,000 | | $ | — | | $ | — | | $ | — | | $ | — | | $ | — | | $ | 300,000 | | $ | — | |
| | | | | | | | | | | | | | | | | | | |
Eastern European Fund | | | | | | | | | | | | | | | | | | | |
Financial Derivatives Liabilities | | | | | | | | | | | | | | | | | | | |
Written Options | | $ | — | | $ | (63,950 | ) | $ | — | | $ | — | | $ | 29,726 | | $ | — | | $ | — | | $ | (34,224 | ) | $ | 29,726 | |
Total | | $ | — | | $ | (63,950 | ) | $ | — | | $ | — | | $ | 29,726 | | $ | — | | $ | — | | $ | (34,224 | ) | $ | 29,726 | |
| | | | | | | | | | | | | | | | | | | |
Global Emerging Markets Fund | | | | | | | | | | | | | | | | | | | |
Investments in Securities | | | | | | | | | | | | | | | | | | | |
Convertible Debenture: | | | | | | | | | | | | | | | | | | | |
Metal - Iron | | $ | 100,000 | | $ | — | | $ | — | | $ | — | | $ | — | | $ | — | | $ | — | | $ | 100,000 | | $ | — | |
Note: | | | | | | | | | | | | | | | | | | | |
Building - Heavy Construction | | — | | 88,200 | | — | | 216 | | 1,584 | | (21,600 | ) | (68,400 | ) | — | | — | |
Electric - Generation | | — | | 50,000 | | — | | — | | — | | — | | — | | 50,000 | | — | |
Total Investments in Securities | | $ | 100,000 | | $ | 138,200 | | $ | — | | $ | 216 | | $ | 1,584 | | $ | (21,600 | ) | $ | (68,400 | ) | $ | 150,000 | | $ | — | |
| | | | | | | | | | | | | | | | | | | |
China Region Fund | | | | | | | | | | | | | | | | | | | |
Investments in Securities | | | | | | | | | | | | | | | | | | | |
Common Stocks: | | | | | | | | | | | | | | | | | | | |
Electronic Components - Miscellaneous | | $ | — | | $ | — | | $ | — | | $ | — | | $ | — | | $ | — | | $ | — | | $ | — | | $ | — | |
Total Investments in Securities | | $ | — | | $ | — | | $ | — | | $ | — | | $ | — | | $ | — | | $ | — | | $ | — | | $ | — | |
* | The Funds’ policy is to recognize transfers in and transfers out as of the end of the reporting period. |
(1) | Any difference between Net change in unrealized appreciation (depreciation) from Investments held as of June 30, 2012 may be due to an investment no longer held or categorized as Level 3 at period end. |
157
Notes to Portfolios of Investments (unaudited) | | June 30, 2012 |
Significant unobservable inputs developed by the Valuation Committee for material Level 3 investments are as follows:
| | Fair Value at
06/30/12 | | Valuation
Technique(s) | | Unobservable
Input | | Range
(Weighted
Average) | |
Holmes Growth Fund | | | | | | | | | |
Investments in Securities | | | | | | | | | | |
Common Stocks | | $ | 580,000 | | Market transaction(1) | | Discount | | 0% | |
Convertible Debenture | | 100,000 | | Market transaction(1) | | Discount | | 0% | |
Corporate Notes | | 150,000 | | Market transaction(1) | | Discount | | 0% | |
Global MegaTrends Fund | | | | | | | | | |
Investments in Securities | | | | | | | | | |
Common Stocks | | 1,069,891 | | Market transaction(1) | | Discount | | 0% | |
Convertible Debenture | | 100,000 | | Market transaction(1) | | Discount | | 0% | |
Corporate Notes | | 100,000 | | Market transaction(1) | | Discount | | 0% | |
Global Resources Fund | | | | | | | | | |
Investments in Securities | | | | | | | | | |
Common Stocks | | 20,629,183 | | Market transaction(1) | | Discount | | 0%-100% (16%) | |
Corporate Notes | | 3,491,135 | | Market transaction(1) | | Discount | | 0% | |
World Precious Minerals Fund | | | | | | | | | |
Investments in Securities | | | | | | | | | |
Common Stocks | | 3,465,921 | | Market transaction(1) | | Discount | | 0%-100% (47%) | |
Warrants | | — | | Market transaction(1) | | Discount | | 0% | |
Special Warrants | | — | | Market transaction(1) | | Discount | | 100% | |
Convertible Debenture | | 1,200,000 | | Market transaction(1) | | Discount | | 0% | |
Corporate Note | | 800,000 | | Market transaction(1) | | Discount | | 0% | |
Global Emerging Markets Fund | | | | | | | | | |
Investments in Securities | | | | | | | | | |
Convertible Debenture | | 100,000 | | Market transaction(1) | | Discount | | 0% | |
Corporate Notes | | 50,000 | | Market transaction(1) | | Discount | | 0% | |
(1) Market transaction refers to most recent known market transaction, including transactions in which the fund participated, as adjusted for any discount as discussed below.
The majority of securities classified as Level 3 are private companies. The initial valuation is usually cost, which is then adjusted as determined by the Valuation Committee for subsequent known market transactions and evaluated for progress against anticipated milestones and current operations. An evaluation that the holding no longer meets expectations could result in the application of discounts and a significantly lower fair valuation.
Affiliated Companies - Indicated in Portfolio of Investments as “+”
The Investment Company Act of 1940 defines affiliates as companies in which the Fund owns at least 5% of the outstanding voting securities. The following is a summary of transactions with each affiliated company during the period ended June 30, 2012.
| | Shares of Affiliated Companies | |
Holmes Growth Fund | | December 31, 2011 | | Additions | | Reductions | | June 30, 2012 | |
IOU Financial, Inc. | | 1,520,000 | | 18,000 | | — | | 1,538,000 | |
158
Notes to Portfolios of Investments (unaudited) | | June 30, 2012 |
At June 30, 2012, the value of investments in affiliated companies was $415,451 representing 1.16% of net assets, and the total cost was $596,721. There were no realized gains or losses on transactions, and there was no income earned for the period.
| | Shares of Affiliated Companies | |
Global Resources Fund | | December 31, 2011 | | Additions | | Reductions | | June 30, 2012 | |
African Potash Ltd. | | 15,800,000 | | — | | — | | 15,800,000 | |
Agriterra Ltd. | | 50,972,900 | | 23,528,000 | | (7,298,000 | ) | 67,202,900 | |
Pacific Coal Resources Ltd. | | 18,793,115 | | 893,200 | | — | | 19,686,315 | |
Pacific Green Energy Corp. | | 2,400,000 | | — | | — | | 2,400,000 | |
Pacific Stone Tech, Inc. | | 22,659 | | — | | — | | 22,659 | |
PetroMagdalena Energy Corp. | | 9,153,485 | | 243,735 | | (9,397,220 | ) | — | (a) |
Range Energy Resources, Inc. | | 15,100,000 | | — | | — | | 15,100,000 | |
At June 30, 2012, the value of investments in affiliated companies was $16,689,048 representing 3.15% of net assets, and the total cost was $43,968,537. Net realized losses on transactions were $6,523,214, and there was no income earned for the period.
| | Shares of Affiliated Companies | |
World Precious Minerals Fund | | December 31, 2011 | | Additions | | Reductions | | June 30, 2012 | |
Aldridge Minerals, Inc. | | 2,000,000 | | 6,000 | | — | | 2,006,000 | (a) |
Candente Gold Corp. | | 5,625,000 | | 15,000 | | — | | 5,640,000 | |
Gran Colombia Gold Corp. | | 23,792,338 | | 586,000 | | (38,300 | ) | 24,340,038 | |
Klondex Mines Ltd. | | 3,060,000 | | 126,300 | | — | | 3,186,300 | |
Mirasol Resources Ltd. | | 2,125,000 | | 35,000 | | — | | 2,160,000 | |
Moss Lake Gold Mines Ltd. | | 3,345,000 | | — | | — | | 3,345,000 | |
PMI Gold Corp. | | 12,560,000 | | 81,500 | | (4,625,000 | ) | 8,016,500 | (a) |
Rochester Resources Ltd. | | 7,755,000 | | — | | — | | 7,755,000 | |
Solvista Gold Corp. | | 2,685,000 | | — | | — | | 2,685,000 | |
West Kirkland Mining, Inc. | | 1,285,000 | | 215,000 | | — | | 1,500,000 | (a) |
At June 30, 2012, the value of investments in affiliated companies was $18,178,411 representing 5.61% of net assets, and the total cost was $45,339,332. Net realized gains on transactions were $3,806,573, and there was no income earned for the period.
(a) At June 30, 2012, the company is no longer defined as an affiliate, although it was an affiliated company during the period.
Restricted Securities - Indicated in Portfolio of Investments as “RS”
The following securities are subject to contractual and regulatory restrictions on resale or transfer. These investments may involve a high degree of business and financial risk. Because of the thinly traded markets for these investments, a Fund may be unable to liquidate its securities in a timely manner, especially if there is negative news regarding the specific securities or the markets overall. These securities could decline significantly in value before the Fund could liquidate these securities. The issuer bears the cost of registration, if any, involved in the disposition of these securities.
Holmes Growth Fund | | Acquisition
Date | | Cost per
Share/Unit | |
Pacific Infrastructure, Inc. | | 11/22/10 | | $ | 1.00 | |
Pacific Iron Corp. | | 10/03/11 | | $ | 1.00 | |
Pacific Iron Corp., Convertible Debenture | | 06/07/11 | | $ | 100.00 | |
Pacific Power Generation Corp., Corporate Note | | 05/25/12 | | $ | 100.00 | |
Pacific Stone Tech, Inc. | | 04/19/10 | | $ | 216.28 | |
159
Notes to Portfolios of Investments (unaudited) | | June 30, 2012 |
As of June 30, 2012, the total cost of restricted securities was $830,000 and the total value was $830,000, representing 2.32% of net assets.
Global MegaTrends Fund | | Acquisition
Date | | Cost per
Share/Unit | |
Pacific Green Energy Corp. | | 03/24/11 | | $ | 1.00 | |
Pacific Infrastructure, Inc. | | 08/06/10-11/22/10 | | $ | 1.00 | |
Pacific Iron Corp. | | 10/03/11 | | $ | 1.00 | |
Pacific Iron Corp., Convertible Debenture | | 06/07/11 | | $ | 100.00 | |
Pacific Power Generation Corp. | | 08/06/10 | | $ | 0.07 | |
Pacific Power Generation Corp., Corporate Note | | 05/25/12 | | $ | 100.00 | |
Pacific Stone Tech, Inc. | | 04/19/10 | | $ | 216.22 | |
As of June 30, 2012, the total cost of restricted securities was $1,270,000 and the total value was $1,269,891, representing 9.68% of net assets.
Global Resources Fund | | Acquisition
Date | | Cost per
Share/Unit | |
GoviEx Uranium, Inc. | | 10/04/07 | | $ | 1.96 | |
I-Pulse, Inc. | | 10/04/07 | | $ | 1.88 | |
Osmium Holdings S.A. | | 10/22/96-01/29/98 | | $ | 987.07 | |
Pacific Green Energy Corp. | | 03/24/11 | | $ | 1.00 | |
Pacific Infrastructure, Inc. | | 08/06/10-11/22/10 | | $ | 1.00 | |
Pacific Iron Corp. | | 10/03/11 | | $ | 1.00 | |
Pacific Power Generation Corp. | | 08/06/10 | | $ | 0.07 | |
Pacific Power Generation Corp., Corporate Note | | 05/25/12 | | $ | 100.00 | |
Pacific Stone Tech, Inc. | | 04/19/10 | | $ | 216.25 | |
U.S. Oil Sands, Inc. | | 05/18/12 | | $ | 0.18 | |
U.S. Oil Sands, Inc., Warrants (May 2014) | | 05/18/12 | | $ | 0.00 | |
Value Creation, Inc. | | 08/11/06 | | $ | 10.60 | |
As of June 30, 2012, the total cost of restricted securities was $27,214,560 and the total value was $24,467,547, representing 4.61% of net assets.
World Precious Minerals Fund | | Acquisition
Date | | Cost per
Share/Unit | |
Osmium Holdings S.A. | | 10/22/96-01/29/98 | | $ | 1,280.75 | |
Pacific Iron Corp., Convertible Debenture | | 06/07/11 | | $ | 100.00 | |
Pacific Power Generation Corp., Corporate Note | | 05/25/12 | | $ | 100.00 | |
Taurus Gold Ltd. | | 05/31/11-12/16/11 | | $ | 1.27 | |
Western Exploration & Development Ltd., 144A, Special Warrants (December 2049) | | 08/14/97 | | $ | 0.50 | |
As of June 30, 2012, the total cost of restricted securities was $6,308,644 and the total value was $5,382,754, representing 1.66% of net assets.
Gold and Precious Metals Fund | | Acquisition
Date | | Cost per
Share/Unit | |
Pacific Power Generation Corp., Corporate Note | | 05/25/12 | | $ | 100.00 | |
| | | | | | |
As of June 30, 2012, the total cost of restricted securities was $300,000 and the total value was $300,000, representing 0.19% of net assets.
Global Emerging Markets Fund | | Acquisition
Date | | Cost per
Share/Unit | |
Pacific Iron Corp., Convertible Debenture | | 06/07/11 | | $ | 100.00 | |
Pacific Power Generation Corp., Corporate Note | | 05/25/12 | | $ | 100.00 | |
As of June 30, 2012, the total cost of restricted securities was $150,000 and the total value was $150,000, representing 1.88% of net assets.
160
Statements of Assets and Liabilities (unaudited) | | June 30, 2012 |
| | U.S. Treasury
Securities
Cash Fund | | U.S. Government
Securities
Savings Fund | | Near-Term
Tax Free Fund | | Tax Free
Fund | |
Investments, at identified cost | | $ | 84,953,968 | | $ | 156,613,138 | | $ | 36,836,735 | | $ | 20,303,301 | |
| | | | | | | | | |
Assets | | | | | | | | | |
Investments, at value: | | | | | | | | | |
Securities | | $ | — | | $ | 114,836,678 | | $ | 35,363,429 | | $ | 21,677,312 | |
Repurchase agreements | | 84,953,968 | | 41,776,460 | | 2,801,043 | | — | |
Cash | | — | | 17 | | 966 | | 804,351 | |
Receivables: | | | | | | | | | |
Investments sold | | — | | — | | 30,000 | | 30,000 | |
Interest | | 585 | | 23,937 | | 436,552 | | 287,090 | |
Capital shares sold | | 787,525 | | 301,243 | | 30,756 | | 15,559 | |
From adviser | | 13,216 | | 7,690 | | 2,228 | | 1,567 | |
Other assets | | 9,528 | | 19,477 | | 3,234 | | 3,071 | |
Total Assets | | 85,764,822 | | 156,965,502 | | 38,668,208 | | 22,818,950 | |
| | | | | | | | | |
Liabilities | | | | | | | | | |
Payables: | | | | | | | | | |
Investments purchased | | — | | — | | 359,322 | | — | |
Capital shares redeemed | | 310,301 | | 627,221 | | 17,023 | | 458 | |
Dividends and distributions | | — | | — | | 9,983 | | 11,253 | |
Accounts payable and accrued expenses | | 27,515 | | 32,974 | | 28,996 | | 24,508 | |
Total Liabilities | | 337,816 | | 660,195 | | 415,324 | | 36,219 | |
Net Assets | | $ | 85,427,006 | | $ | 156,305,307 | | $ | 38,252,884 | | $ | 22,782,731 | |
| | | | | | | | | |
Net Assets Consist of: | | | | | | | | | |
Paid-in capital | | $ | 85,425,913 | | $ | 156,304,270 | | $ | 37,140,424 | | $ | 21,818,501 | |
Accumulated undistributed net investment income | | 1,093 | | 1,037 | | 33,365 | | 40,228 | |
Accumulated net realized loss on investments | | — | | — | | (248,642 | ) | (450,009 | ) |
Net unrealized appreciation of investments | | — | | — | | 1,327,737 | | 1,374,011 | |
Net assets applicable to capital shares outstanding | | $ | 85,427,006 | | $ | 156,305,307 | | $ | 38,252,884 | | $ | 22,782,731 | |
| | | | | | | | | |
By share class | | | | | | | | | |
| | | | | | | | | |
Net Assets | | | | | | | | | |
Investor class | | $ | 85,427,006 | | $ | 156,305,307 | | $ | 38,252,884 | | $ | 22,782,731 | |
| | | | | | | | | | | | | |
Capital shares outstanding, an unlimited number of no par shares authorized | | | | | | | | | |
Investor class | | 85,502,154 | | 156,472,514 | | 16,842,460 | | 1,782,725 | |
| | | | | | | | | |
Net Asset Value, Public Offering Price, Redemption Price, per share | | | | | | | | | |
Investor class | | $ | 1.00 | | $ | 1.00 | | $ | 2.27 | | $ | 12.78 | |
See accompanying notes to financial statements.
161
| | All American
Equity Fund | | Holmes
Growth Fund | | Global
MegaTrends Fund | | Global
Resources Fund | | World Precious
Minerals Fund | |
Investments, at identified cost | | $ | 16,196,985 | | $ | 32,404,680 | | $ | 13,776,001 | | $ | 602,113,938 | | $ | 473,471,140 | |
| | | | | | | | | | | |
Assets | | | | | | | | | | | |
Investments, at value: | | | | | | | | | | | |
Securities of unaffiliated issuers | | $ | 15,301,466 | | $ | 28,499,028 | | $ | 10,325,562 | | $ | 482,956,789 | | $ | 270,992,089 | |
Securities of affiliated issuers | | — | | 415,451 | | — | | 16,689,048 | | 18,178,411 | |
Repurchase agreements | | 1,653,888 | | 6,646,570 | | 3,520,326 | | 25,985,426 | | 34,639,005 | |
Cash | | 258,506 | | 347,087 | | 119,446 | | 51,978 | | 31,936 | |
Foreign currencies (Cost $0, $0, $228,088, $0 and $19,519) | | — | | — | | 224,786 | | — | | 19,539 | |
Receivables: | | | | | | | | | | | |
Investments sold | | — | | 411,104 | | 2,063,394 | | 7,993,873 | | 2,550,502 | |
Dividends and interest | | 12,586 | | 9,752 | | 21,745 | | 404,059 | | 310,725 | |
Capital shares sold | | 1,661 | | 1,059 | | 536 | | 239,224 | | 172,257 | |
Other assets | | 9,396 | | 11,269 | | 10,192 | | 70,896 | | 51,075 | |
Total Assets | | 17,237,503 | | 36,341,320 | | 16,285,987 | | 534,391,293 | | 326,945,539 | |
| | | | | | | | | | | |
Liabilities | | | | | | | | | | | |
Payables: | | | | | | | | | | | |
Investments purchased | | 172,850 | | 346,464 | | 3,127,502 | | 2,110,177 | | 1,782,363 | |
Capital shares redeemed | | 3,602 | | 22,929 | | 2,885 | | 263,173 | | 251,221 | |
Adviser and affiliates | | 11,113 | | 34,440 | | 2,256 | | 598,792 | | 304,744 | |
Accounts payable and accrued expenses | | 26,862 | | 36,371 | | 37,475 | | 247,833 | | 190,994 | |
Written options at value (Premiums $24,504, $103,353, $0, $545,991 and $513,618) | | 13,340 | | 95,980 | | — | | 567,200 | | 613,230 | |
Unrealized depreciation on foreign currency exchange contracts - Note 2 B | | — | | — | | — | | — | | 157 | |
Total Liabilities | | 227,767 | | 536,184 | | 3,170,118 | | 3,787,175 | | 3,142,709 | |
Net Assets | | $ | 17,009,736 | | $ | 35,805,136 | | $ | 13,115,869 | | $ | 530,604,118 | | $ | 323,802,830 | |
| | | | | | | | | | | |
Net Assets Consist of: | | | | | | | | | | | |
Paid-in capital | | $ | 16,926,138 | | $ | 32,583,863 | | $ | 26,305,298 | | $ | 965,958,852 | | $ | 603,942,230 | |
Accumulated undistributed net investment income (distributions in excess of net investment income) | | 10,490 | | (193,098 | ) | 68,139 | | (2,493,662 | ) | (54,852,837 | ) |
Accumulated net realized gain (loss) on investments and foreign currencies | | (696,426 | ) | 250,630 | | (13,327,525 | ) | (356,355,651 | ) | (75,542,804 | ) |
Net unrealized appreciation (depreciation) of investments and other assets and liabilities denominated in foreign currencies | | 769,534 | | 3,163,741 | | 69,957 | | (76,505,421 | ) | (149,743,759 | ) |
Net assets applicable to capital shares outstanding | | $ | 17,009,736 | | $ | 35,805,136 | | $ | 13,115,869 | | $ | 530,604,118 | | $ | 323,802,830 | |
| | | | | | | | | | | |
By share class | | | | | | | | | | | |
| | | | | | | | | | | |
Net Assets | | | | | | | | | | | |
Investor class | | $ | 17,009,736 | | $ | 35,805,136 | | $ | 11,557,163 | | $ | 456,299,956 | | $ | 322,719,413 | |
Institutional class | | N/A | | N/A | | 1,558,706 | | 74,304,162 | | 1,083,417 | |
| | | | | | | | | | | |
Capital shares outstanding, an unlimited number of no par shares authorized | | | | | | | | | | | |
Investor class | | 698,454 | | 1,915,634 | | 1,493,823 | | 49,942,076 | | 29,952,551 | |
Institutional class | | N/A | | N/A | | 202,841 | | 8,088,426 | | 100,869 | |
| | | | | | | | | | | |
Net Asset Value, Public Offering Price, Redemption Price, per share | | | | | | | | | | | |
Investor class | | $ | 24.35 | | $ | 18.69 | | $ | 7.74 | | $ | 9.14 | | $ | 10.77 | |
Institutional class | | N/A | | N/A | | 7.68 | | 9.19 | | 10.74 | |
See accompanying notes to financial statements.
162
| | Gold and Precious
Metals Fund | | Eastern European
Fund | | Global Emerging
Markets Fund | | China Region
Fund | |
Investments, at identified cost | | $ | 190,585,175 | | $ | 174,429,868 | | $ | 8,716,415 | | $ | 27,808,609 | |
| | | | | | | | | |
Assets | | | | | | | | | |
Investments, at value: | | | | | | | | | |
Securities | | $ | 134,067,356 | | $ | 163,076,393 | | $ | 7,831,141 | | $ | 26,268,911 | |
Repurchase agreements | | 22,288,711 | | 11,865,352 | | — | | 1,646,241 | |
Cash | | 10,172 | | — | | 432,242 | | — | |
Foreign currencies (Cost $0, $0, $5,023 and $78,240) | | — | | — | | 5,017 | | 78,250 | |
Receivables: | | | | | | | | | |
Investments sold | | 889,334 | | 59,053 | | 1,057,756 | | 1,321,253 | |
Dividends and interest | | 247,005 | | 3,494,172 | | 40,447 | | 253,814 | |
Capital shares sold | | 119,765 | | 31,625 | | 1,080 | | 1,019 | |
From adviser | | — | | — | | 3,912 | | — | |
Other assets | | 33,164 | | 31,877 | | 12,157 | | 13,918 | |
Total Assets | | 157,655,507 | | 178,558,472 | | 9,383,752 | | 29,583,406 | |
| | | | | | | | | |
Liabilities | | | | | | | | | |
Payables: | | | | | | | | | |
Investments purchased | | 1,050,275 | | 526,252 | | 1,362,480 | | 1,191,839 | |
Capital shares redeemed | | 86,193 | | 165,375 | | 10,168 | | 22,020 | |
Adviser and affiliates | | 164,022 | | 250,126 | | — | | 23,723 | |
Accounts payable and accrued expenses | | 94,636 | | 130,683 | | 49,113 | | 67,687 | |
Written options at value (Premiums $717,622, $527,600, $0 and $0) | | 689,912 | | 460,224 | | — | | — | |
Due to custodian | | — | | 7,187 | | — | | 6,456 | |
Unrealized depreciation on foreign currency exchange contracts - Note 2 B | | 244 | | — | | 1 | | 20 | |
Total Liabilities | | 2,085,282 | | 1,539,847 | | 1,421,762 | | 1,311,745 | |
Net Assets | | $ | 155,570,225 | | $ | 177,018,625 | | $ | 7,961,990 | | $ | 28,271,661 | |
| | | | | | | | | |
Net Assets Consist of: | | | | | | | | | |
Paid-in capital | | $ | 197,725,910 | | $ | 486,651,158 | | $ | 21,520,975 | | $ | 50,442,958 | |
Accumulated undistributed net investment income (distributions in excess of net investment income) | | (2,930,490 | ) | 3,987,468 | | (7,643 | ) | 55,178 | |
Accumulated net realized loss on investments and foreign currencies | | (5,027,275 | ) | (314,004,046 | ) | (12,666,373 | ) | (22,333,499 | ) |
Net unrealized appreciation (depreciation) of investments and other assets and liabilities denominated in foreign currencies | | (34,197,920 | ) | 384,045 | | (884,969 | ) | 107,024 | |
Net assets applicable to capital shares outstanding | | $ | 155,570,225 | | $ | 177,018,625 | | $ | 7,961,990 | | $ | 28,271,661 | |
| | | | | | | | | |
By share class | | | | | | | | | |
| | | | | | | | | |
Net Assets | | | | | | | | | |
Investor class | | $ | 155,570,225 | | $ | 177,018,625 | | $ | 7,961,990 | | $ | 28,271,661 | |
| | | | | | | | | |
Capital shares outstanding, an unlimited number of no par shares authorized | | | | | | | | | |
Investor class | | 14,388,610 | | 21,637,621 | | 1,159,878 | | 4,139,652 | |
| | | | | | | | | |
Net Asset Value, Public Offering Price, Redemption Price, per share | | | | | | | | | |
Investor class | | $ | 10.81 | | $ | 8.18 | | $ | 6.86 | | $ | 6.83 | |
See accompanying notes to financial statements.
163
Statements of Operations (unaudited) | | For the Six Months Ended June 30, 2012 |
| | U.S. Treasury
Securities
Cash Fund | | U.S. Government
Securities
Savings Fund | | Near-Term
Tax Free Fund | | Tax Free
Fund | |
Net Investment Income | | | | | | | | | |
Income: | | | | | | | | | |
Interest and other | | $ | 49,883 | | $ | 95,885 | | $ | 499,341 | | $ | 440,159 | |
| | | | | | | | | |
Expenses: | | | | | | | | | |
Management fee | | 212,565 | | 407,028 | | 91,493 | | 83,379 | |
Administrative services fee | | 34,010 | | 65,125 | | 14,639 | | 8,894 | |
Transfer agent fees and expenses | | 92,564 | | 99,574 | | 31,338 | | 26,070 | |
Accounting service fees and expenses | | 11,783 | | 17,383 | | 27,864 | | 20,907 | |
Professional fees | | 16,950 | | 21,596 | | 19,413 | | 17,763 | |
Custodian fees | | 29,774 | | 23,904 | | 6,553 | | 5,448 | |
Shareholder reporting expenses | | 11,418 | | 12,604 | | 4,258 | | 4,500 | |
Registration fees | | 14,918 | | 12,432 | | 9,200 | | 8,354 | |
Trustee fees and expenses | | 11,563 | | 11,563 | | 11,563 | | 11,563 | |
Miscellaneous expenses | | 15,322 | | 18,911 | | 4,914 | | 4,658 | |
Total expenses before reductions | | 450,867 | | 690,120 | | 221,235 | | 191,536 | |
Expenses offset - Note 1 H | | (5 | ) | — | | (152 | ) | (167 | ) |
Expenses reimbursed - Note 3 | | (405,350 | ) | (602,399 | ) | (138,739 | ) | (113,548 | ) |
Net expenses | | 45,512 | | 87,721 | | 82,344 | | 77,821 | |
| | | | | | | | | |
Net Investment Income | | 4,371 | | 8,164 | | 416,997 | | 362,338 | |
| | | | | | | | | |
Net Realized and Unrealized Gain (Loss) on Investments | | | | | | | | | |
Realized gain (loss) from securities | | — | | — | | (278 | ) | 1,431 | |
Net change in unrealized appreciation of investments | | — | | — | | 95,123 | | 246,764 | |
| | | | | | | | | |
Net Realized and Unrealized Gain on Investments | | — | | — | | 94,845 | | 248,195 | |
| | | | | | | | | |
Net Increase In Net Assets Resulting From Operations | | $ | 4,371 | | $ | 8,164 | | $ | 511,842 | | $ | 610,533 | |
See accompanying notes to financial statements.
164
| | All American
Equity Fund | | Holmes
Growth Fund | | Global
MegaTrends Fund | | Global
Resources Fund | | World Precious
Minerals Fund | |
Net Investment Income | | | | | | | | | | | |
Income: | | | | | | | | | | | |
Dividends from unaffiliated issuers | | $ | 198,011 | | $ | 160,318 | | $ | 157,508 | | $ | 4,949,838 | | $ | 627,934 | |
Foreign tax withheld on dividends | | (366 | ) | (2,856 | ) | (4,028 | ) | (87,969 | ) | (73,302 | ) |
Net dividends | | 197,645 | | 157,462 | | 153,480 | | 4,861,869 | | 554,632 | |
Interest and other | | 304 | | 17,593 | | 7,087 | | 328,017 | | 255,015 | |
Total income | | 197,949 | | 175,055 | | 160,567 | | 5,189,886 | | 809,647 | |
| | | | | | | | | | | |
Expenses: | | | | | | | | | | | |
Management fee | | 68,167 | | 136,455 | | 51,836 | | 2,257,175 | | 1,333,816 | |
Administrative services fee | | 6,817 | | 14,788 | | 2,814 | | 115,454 | | 81,853 | |
Administrative services fee - Investor class | | — | | — | | 2,484 | | 106,402 | | 81,620 | |
Administrative services fee - Institutional class | | — | | — | | 330 | | 9,052 | | 233 | |
Transfer agent fees and expenses - Investor class | | 40,307 | | 39,108 | | 27,265 | | 646,814 | | 429,273 | |
Transfer agent fees and expenses - Institutional class | | — | | — | | 9,449 | | 30,683 | | 9,202 | |
Accounting service fees and expenses | | 13,751 | | 15,922 | | 18,977 | | 102,483 | | 75,271 | |
Professional fees | | 18,895 | | 19,393 | | 18,769 | | 51,164 | | 54,062 | |
Distribution plan fee | | 21,302 | | 46,211 | | 15,527 | | 665,016 | | 510,127 | |
Custodian fees | | 8,779 | | 15,880 | | 19,850 | | 86,388 | | 107,061 | |
Shareholder reporting expenses - Investor class | | 10,243 | | 7,578 | | 5,419 | | 86,316 | | 53,803 | |
Shareholder reporting expenses - Institutional class | | — | | — | | 1,088 | | 1,533 | | 864 | |
Registration fees | | 8,354 | | 8,951 | | 3,580 | | 5,563 | | 5,968 | |
Registration fees - Investor class | | — | | — | | 5,470 | | 13,215 | | 13,974 | |
Registration fees - Institutional class | | — | | — | | 5,072 | | 8,075 | | 5,223 | |
Trustee fees and expenses | | 11,563 | | 11,563 | | 11,563 | | 11,563 | | 11,563 | |
Miscellaneous expenses | | 11,650 | | 13,518 | | 12,277 | | 83,073 | | 61,375 | |
Total expenses before reductions | | 219,828 | | 329,367 | | 211,770 | | 4,279,969 | | 2,835,288 | |
Expenses offset - Note 1 H | | (154 | ) | (109 | ) | (133 | ) | (132 | ) | (24 | ) |
Expenses reimbursed - Note 3 | | (32,215 | ) | (31 | ) | (62,997 | ) | (49,342 | ) | (15,522 | ) |
Net expenses | | 187,459 | | 329,227 | | 148,640 | | 4,230,495 | | (2,819,742 | ) |
| | | | | | | | | | | |
Net Investment Income (Loss) | | 10,490 | | (154,172 | ) | 11,927 | | 959,391 | | (2,010,095 | ) |
| | | | | | | | | | | |
Net Realized and Unrealized Gain (Loss) on Investments | | | | | | | | | | | |
Realized gain (loss) from: | | | | | | | | | | | |
Securities from unaffiliated issuers | | 580,010 | | (369,442 | ) | 698,765 | | 7,522,412 | | (2,695,199 | ) |
Securities from affiliated issuers | | — | | — | | — | | (6,523,214 | ) | 3,806,573 | |
Written options | | 95,393 | | 256,056 | | 19,899 | | 3,740,860 | | 1,302,444 | |
Foreign currency transactions | | — | | 3,113 | | (14,522 | ) | (119,311 | ) | (108,481 | ) |
Net realized gain (loss) | | 675,403 | | (110,273 | ) | 704,142 | | 4,620,747 | | 2,305,337 | |
Net change in unrealized appreciation (depreciation) of: | | | | | | | | | | | |
Investments | | 468,190 | | 2,437,304 | | (527,492 | ) | (16,015,353 | ) | (74,212,627 | ) |
Written options | | 11,745 | | 10,502 | | 7,085 | | (198,871 | ) | (99,612 | ) |
Other assets and liabilities denominated in foreign currencies | | — | | (114 | ) | 71 | | 12,415 | | 15,310 | |
Net unrealized appreciation (depreciation) | | 479,935 | | 2,447,692 | | (520,336 | ) | (16,201,809 | ) | (74,296,929 | ) |
| | | | | | | | | | | |
Net Realized and Unrealized Gain (Loss) on Investments | | 1,155,338 | | 2,337,419 | | 183,806 | | (11,581,062 | ) | (71,991,592 | ) |
| | | | | | | | | | | |
Net Increase (Decrease) In Net Assets Resulting From Operations | | $ | 1,165,828 | | $ | 2,183,247 | | $ | 195,733 | | $ | (10,621,671 | ) | $ | (74,001,687 | ) |
See accompanying notes to financial statements.
165
| | Gold and Precious
Metals Fund | | Eastern European
Fund | | Global Emerging
Markets Fund | | China Region
Fund | |
Net Investment Income | | | | | | | | | |
Income: | | | | | | | | | |
Dividends from unaffiliated issuers | | $ | 567,082 | | $ | 6,508,553 | | $ | 156,985 | | $ | 577,674 | |
Foreign tax withheld on dividends | | (54,360 | ) | (924,206 | ) | (11,171 | ) | (47,312 | ) |
Net dividends | | 512,722 | | 5,584,347 | | 145,814 | | 530,362 | |
Interest and other | | 266,018 | | 4,134 | | 4,077 | | 338 | |
Total income | | 778,740 | | 5,588,481 | | 149,891 | | 530,700 | |
| | | | | | | | | |
Expenses: | | | | | | | | | |
Management fee | | 623,500 | | 1,241,487 | | 45,928 | | 147,731 | |
Administrative services fee | | 73,319 | | 79,455 | | 3,428 | | 12,642 | |
Transfer agent fees and expenses | | 168,990 | | 273,567 | | 26,337 | | 59,279 | |
Accounting service fees and expenses | | 41,313 | | 42,973 | | 18,257 | | 20,471 | |
Professional fees | | 29,222 | | 26,954 | | 24,612 | | 24,650 | |
Distribution plan fee | | 229,120 | | 248,297 | | 10,714 | | 39,505 | |
Custodian fees | | 51,826 | | 144,735 | | 29,526 | | 40,940 | |
Shareholder reporting expenses | | 36,432 | | 40,258 | | 5,376 | | 13,219 | |
Registration fees | | 13,178 | | 10,940 | | 6,215 | | 7,459 | |
Trustee fees and expenses | | 11,563 | | 11,562 | | 11,563 | | 11,562 | |
Miscellaneous expenses | | 37,871 | | 38,681 | | 14,178 | | 16,598 | |
Total expenses before reductions | | 1,316,334 | | 2,158,909 | | 196,134 | | 394,056 | |
Expenses offset - Note 1 H | | (28 | ) | (179 | ) | (53 | ) | (109 | ) |
Expenses reimbursed - Note 3 | | — | | — | | (74,084 | ) | (40,791 | ) |
Net expenses | | 1,316,306 | | 2,158,730 | | 121,997 | | 353,156 | |
| | | | | | | | | |
Net Investment Income (Loss) | | (537,566 | ) | 3,429,751 | | 27,894 | | 177,544 | |
| | | | | | | | | |
Net Realized and Unrealized Gain (Loss) on Investments | | | | | | | | | |
Realized gain (loss) from: | | | | | | | | | |
Securities from unaffiliated issuers | | (1,556,853 | ) | 10,998,082 | | (183,147 | ) | (1,964,105 | ) |
Written options | | 1,093,161 | | 2,628,345 | | — | | 24,115 | |
Foreign currency transactions | | (115,963 | ) | (311,958 | ) | (8,450 | ) | (37,165 | ) |
Net realized gain (loss) | | (579,655 | ) | 13,314,469 | | (191,597 | ) | (1,977,155 | ) |
Net change in unrealized appreciation (depreciation) of: | | | | | | | | | |
Investments | | (25,351,298 | ) | (4,902,380 | ) | 221,151 | | 2,048,518 | |
Written options | | 27,710 | | (761,259 | ) | — | | — | |
Other assets and liabilities denominated in foreign currencies | | 3,394 | | (195,377 | ) | 4,207 | | 1,051 | |
Net unrealized appreciation (depreciation) | | (25,320,194 | ) | (5,859,016 | ) | 225,358 | | 2,049,569 | |
| | | | | | | | | |
Net Realized and Unrealized Gain (Loss) on Investments | | (25,899,849 | ) | 7,455,453 | | 33,761 | | 72,414 | |
| | | | | | | | | |
Net Increase (Decrease) In Net Assets Resulting From Operations | | $ | (26,437,415 | ) | $ | 10,885,204 | | $ | 61,655 | | $ | 249,958 | |
See accompanying notes to financial statements.
166
Statements of Changes in Net Assets
| | U.S. Treasury Securities
Cash Fund | | U.S. Government Securities
Savings Fund | | Near-Term Tax Free Fund | |
| | Six Months Ended
June 30, 2012
(unaudited) | | Year Ended
December 31,
2011 | | Six Months Ended
June 30, 2012
(unaudited) | | Year Ended
December 31,
2011 | | Six Months Ended
June 30, 2012
(unaudited) | | Year Ended
December 31,
2011 | |
| | | | | | | | | | | | | |
Increase (Decrease) in Net Assets | | | | | | | | | | | | | |
| | | | | | | | | | | | | |
From operations: | | | | | | | | | | | | | |
Net investment income | | $ | 4,371 | | $ | 9,581 | | $ | 8,164 | | $ | 19,158 | | $ | 416,997 | | $ | 747,326 | |
Net realized loss | | — | | — | | — | | — | | (278 | ) | (3,345 | ) |
Net unrealized appreciation | | — | | — | | — | | — | | 95,123 | | 625,874 | |
Net increase in net assets from operations | | 4,371 | | 9,581 | | 8,164 | | 19,158 | | 511,842 | | 1,369,855 | |
| | | | | | | | | | | | | |
Distributions to shareholders: | | | | | | | | | | | | | |
From net investment income | | | | | | | | | | | | | |
Investor class | | (4,267 | ) | (9,580 | ) | (8,164 | ) | (19,158 | ) | (408,111 | ) | (740,487 | ) |
Total distributions to shareholders | | (4,267 | ) | (9,580 | ) | (8,164 | ) | (19,158 | ) | (408,111 | ) | (740,487 | ) |
| | | | | | | | | | | | | |
From capital share transactions: | | | | | | | | | | | | | |
Proceeds from shares sold | | | | | | | | | | | | | |
Investor class | | 40,547,093 | | 120,809,457 | | 40,098,657 | | 128,977,341 | | 6,604,382 | | 18,439,087 | |
Distributions reinvested | | | | | | | | | | | | | |
Investor class | | 4,212 | | 9,481 | | 8,044 | | 19,023 | | 347,346 | | 621,654 | |
| | 40,551,305 | | 120,818,938 | | 40,106,701 | | 128,996,364 | | 6,951,728 | | 19,060,741 | |
Cost of shares redeemed | | (45,680,935 | ) | (129,753,637 | ) | (55,464,968 | ) | (161,167,483 | ) | (3,816,226 | ) | (13,814,303 | ) |
Investor class | | | | | | | | | | | | | |
Net increase (decrease) in net assets from capital share transactions | | (5,129,630 | ) | (8,934,699 | ) | (15,358,267 | ) | (32,171,119 | ) | 3,135,502 | | 5,246,438 | |
| | | | | | | | | | | | | |
Net Increase (Decrease) in Net Assets | | (5,129,526 | ) | (8,934,698 | ) | (15,358,267 | ) | (32,171,119 | ) | 3,239,233 | | 5,875,806 | |
| | | | | | | | | | | | | |
Net Assets | | | | | | | | | | | | | |
Beginning of year | | 90,556,532 | | 99,491,230 | | 171,663,574 | | 203,834,693 | | 35,013,651 | | 29,137,845 | |
| | | | | | | | | | | | | |
End of period | | $ | 85,427,006 | | $ | 90,556,532 | | $ | 156,305,307 | | $ | 171,663,574 | | $ | 38,252,884 | | $ | 35,013,651 | |
| | | | | | | | | | | | | |
Accumulated undistributed net investment income, end of period | | $ | 1,093 | | $ | 989 | | $ | 1,037 | | $ | 1,037 | | $ | 33,365 | | $ | 24,479 | |
| | | | | | | | | | | | | |
Capital Share Activity | | | | | | | | | | | | | |
Investor class: | | | | | | | | | | | | | |
Shares sold | | 40,547,093 | | 120,809,457 | | 40,098,657 | | 128,977,341 | | 2,905,023 | | 8,221,829 | |
Shares reinvested | | 4,212 | | 9,481 | | 8,044 | | 19,023 | | 153,046 | | 277,696 | |
Shares redeemed | | (45,680,935 | ) | (129,753,637 | ) | (55,464,968 | ) | (161,167,483 | ) | (1,678,634 | ) | (6,167,294 | ) |
Net share activity | | (5,129,630 | ) | (8,934,699 | ) | (15,358,267 | ) | (32,171,119 | ) | 1,379,435 | | 2,332,231 | |
See accompanying notes to financial statements.
167
| | Tax Free Fund | | All American Equity Fund | | Holmes Growth Fund | |
| | Six Months Ended
June 30, 2012
(unaudited) | | Year Ended
December 31,
2011 | | Six Months Ended
June 30, 2012
(unaudited) | | Year Ended
December 31,
2011 | | Six Months Ended
June 30, 2012
(unaudited) | | Year Ended
December 31,
2011 | |
| | | | | | | | | | | | | |
Increase (Decrease) in Net Assets | | | | | | | | | | | | | |
| | | | | | | | | | | | | |
From operations: | | | | | | | | | | | | | |
Net investment income (loss) | | $ | 362,338 | | $ | 705,597 | | $ | 10,490 | | $ | (55,708 | ) | $ | (154,172 | ) | $ | (497,883 | ) |
Net realized gain (loss) | | 1,431 | | (19,336 | ) | 675,403 | | 2,492,375 | | (110,273 | ) | 5,164,661 | |
Net unrealized appreciation (depreciation) | | 246,764 | | 986,522 | | 479,935 | | (2,387,462 | ) | 2,447,692 | | (6,821,178 | ) |
Net increase (decrease) in net assets from operations | | 610,533 | | 1,672,783 | | 1,165,828 | | 49,205 | | 2,183,247 | | (2,154,400 | ) |
| | | | | | | | | | | | | |
Distributions to shareholders: | | | | | | | | | | | | | |
From net investment income | | | | | | | | | | | | | |
Investor class | | (357,541 | ) | (703,629 | ) | — | | (22,535 | ) | — | | — | |
Total distributions to shareholders | | (357,541 | ) | (703,629 | ) | — | | (22,535 | ) | — | | — | |
| | | | | | | | | | | | | |
From capital share transactions: | | | | | | | | | | | | | |
Proceeds from shares sold | | | | | | | | | | | | | |
Investor class | | 3,836,863 | | 9,687,519 | | 1,129,117 | | 3,210,827 | | 1,463,596 | | 5,414,367 | |
Distributions reinvested | | | | | | | | | | | | | |
Investor class | | 281,970 | | 556,800 | | — | | 22,115 | | — | | — | |
Proceeds from short-term trading fees | | | | | | | | | | | | | |
Investor class | | — | | — | | 285 | | 852 | | — | | 282 | |
| | 4,118,833 | | 10,244,319 | | 1,129,402 | | 3,233,794 | | 1,463,596 | | 5,414,649 | |
Cost of shares redeemed | | | | | | | | | | | | | |
Investor class | | (3,252,416 | ) | (9,344,395 | ) | (1,684,113 | ) | (4,621,747 | ) | (3,157,237 | ) | (8,548,931 | ) |
Net increase (decrease) in net assets from capital share transactions | | 866,417 | | 899,924 | | (554,711 | ) | (1,387,953 | ) | (1,693,641 | ) | (3,134,282 | ) |
| | | | | | | | | | | | | |
Net Increase (Decrease) in Net Assets | | 1,119,409 | | 1,869,078 | | 611,117 | | (1,361,283 | ) | 489,606 | | (5,288,682 | ) |
| | | | | | | | | | | | | |
Net Assets | | | | | | | | | | | | | |
Beginning of year | | 21,663,322 | | 19,794,244 | | 16,398,619 | | 17,759,902 | | 35,315,530 | | 40,604,212 | |
| | | | | | | | | | | | | |
End of period | | $ | 22,782,731 | | $ | 21,663,322 | | $ | 17,009,736 | | $ | 16,398,619 | | $ | 35,805,136 | | $ | 35,315,530 | |
| | | | | | | | | | | | | |
Accumulated undistributed net investment income (distributions in excess of net investment income), end of period | | $ | 40,228 | | $ | 35,431 | | $ | 10,490 | | $ | — | | $ | (193,098 | ) | $ | (38,926 | ) |
| | | | | | | | | | | | | |
Capital Share Activity | | | | | | | | | | | | | |
Investor class: | | | | | | | | | | | | | |
Shares sold | | 300,184 | | 784,189 | | 46,309 | | 141,343 | | 74,908 | | 285,326 | |
Shares reinvested | | 22,056 | | 45,303 | | — | | 974 | | — | | — | |
Shares redeemed | | (254,983 | ) | (761,849 | ) | (69,508 | ) | (202,449 | ) | (164,008 | ) | (457,268 | ) |
Net share activity | | 67,257 | | 67,643 | | (23,199 | ) | (60,132 | ) | (89,100 | ) | (171,942 | ) |
See accompanying notes to financial statements.
168
| | Global MegaTrends Fund | | Global Resources Fund | | World Precious Minerals Fund | |
| | Six Months Ended
June 30, 2012
(unaudited) | | Year Ended
December 31,
2011 | | Six Months Ended
June 30, 2012
(unaudited) | | Year Ended
December 31,
2011 | | Six Months Ended
June 30, 2012
(unaudited) | | Year Ended
December 31,
2011 | |
| | | | | | | | | | | | | |
Increase (Decrease) in Net Assets | | | | | | | | | | | | | |
| | | | | | | | | | | | | |
From operations: | | | | | | | | | | | | | |
Net investment income (loss) | | $ | 11,927 | | $ | 75,605 | | $ | 959,391 | | $ | (6,704,492 | ) | $ | (2,010,095 | ) | $ | (9,183,096 | ) |
Net realized gain | | 704,142 | | 746,616 | | 4,620,747 | | 92,677,766 | | 2,305,337 | | 77,717,916 | |
Net unrealized depreciation | | (520,336 | ) | (3,248,142 | ) | (16,201,809 | ) | (257,110,809 | ) | (74,296,929 | ) | (309,429,697 | ) |
Net increase (decrease) in net assets from operations | | 195,733 | | (2,425,921 | ) | (10,621,671 | ) | (171,137,535 | ) | (74,001,687 | ) | (240,894,877 | ) |
| | | | | | | | | | | | | |
Distributions to shareholders: | | | | | | | | | | | | | |
From net investment income | | | | | | | | | | | | | |
Investor class | | — | | — | | — | | (19,762,685 | ) | — | | (60,523,518 | ) |
Institutional class | | — | | (18,363 | ) | — | | (2,765,455 | ) | — | | (275,428 | ) |
Total distributions to shareholders | | — | | (18,363 | ) | — | | (22,528,140 | ) | — | | (60,798,946 | ) |
| | | | | | | | | | | | | |
From capital share transactions: | | | | | | | | | | | | | |
Proceeds from shares sold | | | | | | | | | | | | | |
Investor class | | 257,897 | | 1,175,368 | | 34,091,739 | | 329,405,494 | | 22,390,454 | | 124,020,055 | |
Institutional class | | 18,618 | | 4,055 | | 26,908,155 | | 65,210,041 | | 31,435 | | 964,702 | |
Distributions reinvested | | | | | | | | | | | | | |
Investor class | | — | | — | | — | | 18,848,694 | | — | | 57,314,672 | |
Institutional class | | — | | 18,294 | | — | | 2,763,078 | | — | | 274,167 | |
Proceeds from short-term trading fees | | | | | | | | | | | | | |
Investor class | | 10 | | 186 | | 3,196 | | 34,386 | | 4,985 | | 33,977 | |
Institutional class | | — | | — | | 77 | | 330 | | — | | — | |
| | 276,525 | | 1,197,903 | | 61,003,167 | | 416,262,023 | | 22,426,874 | | 182,607,573 | |
Cost of shares redeemed | | | | | | | | | | | | | |
Investor class | | (1,297,097 | ) | (3,104,574 | ) | (120,019,221 | ) | (528,179,707 | ) | (62,452,619 | ) | (270,949,550 | ) |
Institutional class | | (966,729 | ) | (1,043,306 | ) | (7,536,152 | ) | (16,119,819 | ) | (356,550 | ) | (608,504 | ) |
Net decrease in net assets from capital share transactions | | (1,987,301 | ) | (2,949,977 | ) | (66,552,206 | ) | (128,037,503 | ) | (40,382,295 | ) | (88,950,481 | ) |
| | | | | | | | | | | | | |
Net Decrease in Net Assets | | (1,791,568 | ) | (5,394,261 | ) | (77,173,877 | ) | (321,703,178 | ) | (114,383,982 | ) | (390,644,304 | ) |
| | | | | | | | | | | | | |
Net Assets | | | | | | | | | | | | | |
Beginning of year | | 14,907,437 | | 20,301,698 | | 607,777,995 | | 929,481,173 | | 438,186,812 | | 828,831,116 | |
| | | | | | | | | | | | | |
End of period | | $ | 13,115,869 | | $ | 14,907,437 | | $ | 530,604,118 | | $ | 607,777,995 | | $ | 323,802,830 | | $ | 438,186,812 | |
| | | | | | | | | | | | | |
Accumulated undistributed net investment income (distributions in excess of net investment income), end of period | | $ | 68,139 | | $ | 56,212 | | $ | (2,493,662 | ) | $ | (3,453,053 | ) | $ | (54,852,837 | ) | $ | (52,842,742 | ) |
| | | | | | | | | | | | | |
Capital Share Activity | | | | | | | | | | | | | |
Investor class: | | | | | | | | | | | | | |
Shares sold | | 31,749 | | 137,469 | | 3,499,984 | | 27,713,544 | | 1,768,922 | | 6,398,124 | |
Shares reinvested | | — | | — | | — | | 1,945,170 | | — | | 3,963,750 | |
Shares redeemed | | (159,411 | ) | (366,522 | ) | (12,495,392 | ) | (47,235,677 | ) | (4,933,395 | ) | (14,339,094 | ) |
Net share activity | | (127,662 | ) | (229,053 | ) | (8,995,408 | ) | (17,576,963 | ) | (3,164,473 | ) | (3,977,220 | ) |
| | | | | | | | | | | | | |
Institutional class: | | | | | | | | | | | | | |
Shares sold | | 2,340 | | 470 | | 2,888,786 | | 5,816,125 | | 2,159 | | 46,404 | |
Shares reinvested | | — | | 2,366 | | — | | 284,267 | | — | | 19,079 | |
Shares redeemed | | (122,166 | ) | (131,987 | ) | (762,737 | ) | (1,634,637 | ) | (29,697 | ) | (37,249 | ) |
Net share activity | | (119,826 | ) | (129,151 | ) | 2,126,049 | | 4,465,755 | | (27,538 | ) | 28,234 | |
See accompanying notes to financial statements.
169
| | Gold and Precious Metals Fund | | Eastern European Fund | | Global Emerging Markets Fund | |
| | Six Months Ended
June 30, 2012
(unaudited) | | Year Ended
December 31,
2011 | | Six Months Ended
June 30, 2012
(unaudited) | | Year Ended
December 31,
2011 | | Six Months Ended
June 30, 2012
(unaudited) | | Year Ended
December 31,
2011 | |
Increase (Decrease) in Net Assets | | | | | | | | | | | | | |
| | | | | | | | | | | | | |
From operations: | | | | | | | | | | | | | |
Net investment income (loss) | | $ | (537,566 | ) | $ | (2,670,423 | ) | $ | 3,429,751 | | $ | 828,165 | | $ | 27,894 | | $ | (76,385 | ) |
Net realized gain (loss) | | (579,655 | ) | 30,987,057 | | 13,314,469 | | 47,395,544 | | (191,597 | ) | (205,090 | ) |
Net unrealized appreciation (depreciation) | | (25,320,194 | ) | (96,434,285 | ) | (5,859,016 | ) | (136,103,572 | ) | 225,358 | | (2,847,479 | ) |
Net increase (decrease) in net assets from operations | | (26,437,415 | ) | (68,117,651 | ) | 10,885,204 | | (87,879,863 | ) | 61,655 | | (3,128,954 | ) |
| | | | | | | | | | | | | |
Distributions to shareholders: | | | | | | | | | | | | | |
From net capital gains | | | | | | | | | | | | | |
Investor class | | — | | (34,374,528 | ) | — | | — | | — | | — | |
Total distributions to shareholders | | — | | (34,374,528 | ) | — | | — | | — | | — | |
| | | | | | | | | | | | | |
From capital share transactions: | | | | | | | | | | | | | |
Proceeds from shares sold | | | | | | | | | | | | | |
Investor class | | 11,584,822 | | 61,594,825 | | 5,566,337 | | 14,570,015 | | 451,391 | | 1,636,143 | |
Distributions reinvested | | | | | | | | | | | | | |
Investor class | | — | | 32,104,658 | | — | | — | | — | | — | |
Proceeds from short-term trading fees | | | | | | | | | | | | | |
Investor class | | 2,974 | | 29,700 | | 43,140 | | 101,769 | | 1,273 | | 4,737 | |
| | 11,587,796 | | 93,729,183 | | 5,609,477 | | 14,671,784 | | 452,664 | | 1,640,880 | |
Cost of shares redeemed | | | | | | | | | | | | | |
Investor class | | (24,667,300 | ) | (97,098,643 | ) | (33,074,872 | ) | (173,230,246 | ) | (776,491 | ) | (3,690,625 | ) |
Net decrease in net assets from capital share transactions | | (13,079,504 | ) | (3,369,460 | ) | (27,465,395 | ) | (158,558,462 | ) | (323,827 | ) | (2,049,745 | ) |
| | | | | | | | | | | | | |
Net Decrease in Net Assets | | (39,516,919 | ) | (105,861,639 | ) | (16,580,191 | ) | (246,438,325 | ) | (262,172 | ) | (5,178,699 | ) |
| | | | | | | | | | | | | |
Net Assets | | | | | | | | | | | | | |
Beginning of year | | 195,087,144 | | 300,948,783 | | 193,598,816 | | 440,037,141 | | 8,224,162 | | 13,402,861 | |
| | | | | | | | | | | | | |
End of period | | $ | 155,570,225 | | $ | 195,087,144 | | $ | 177,018,625 | | $ | 193,598,816 | | $ | 7,961,990 | | $ | 8,224,162 | |
| | | | | | | | | | | | | |
Accumulated undistributed net investment income (distributions in excess of net investment income), end of period | | $ | (2,930,490 | ) | $ | (2,392,924 | ) | $ | 3,987,468 | | $ | 557,717 | | $ | (7,643 | ) | $ | (35,537 | ) |
| | | | | | | | | | | | | |
Capital Share Activity | | | | | | | | | | | | | |
Investor class: | | | | | | | | | | | | | |
Shares sold | | 953,283 | | 3,513,454 | | 627,034 | | 1,388,107 | | 60,416 | | 196,681 | |
Shares reinvested | | — | | 2,293,190 | | — | | — | | — | | — | |
Shares redeemed | | (2,040,517 | ) | (5,686,862 | ) | (3,850,117 | ) | (17,244,772 | ) | (106,586 | ) | (452,700 | ) |
Net share activity | | (1,087,234 | ) | 119,782 | | (3,223,083 | ) | (15,856,665 | ) | (46,170 | ) | (256,019 | ) |
See accompanying notes to financial statements.
170
| | China Region Fund | |
| | Six Months Ended
June 30, 2012
(unaudited) | | Year Ended
December 31,
2011 | |
Increase (Decrease) in Net Assets | | | | | |
| | | | | |
From operations: | | | | | |
Net investment income (loss) | | $ | 177,544 | | $ | (280,687 | ) |
Net realized loss | | (1,977,155 | ) | (5,024,899 | ) |
Net unrealized appreciation (depreciation) | | 2,049,569 | | (8,566,683 | ) |
Net increase (decrease) in net assets from operations | | 249,958 | | (13,872,269 | ) |
| | | | | |
Distributions to shareholders | | — | | — | |
| | | | | |
From capital share transactions: | | | | | |
Proceeds from shares sold | | | | | |
Investor class | | 957,508 | | 9,973,299 | |
Distributions reinvested | | | | | |
Investor class | | — | | — | |
Proceeds from short-term trading fees | | | | | |
Investor class | | 4,808 | | 46,667 | |
| | 962,316 | | 10,019,966 | |
Cost of shares redeemed | | | | | |
Investor class | | (3,575,590 | ) | (17,356,116 | ) |
Net decrease in net assets from capital share transactions | | (2,613,274 | ) | (7,336,150 | ) |
| | | | | |
Net Decrease in Net Assets | | (2,363,316 | ) | (21,208,419 | ) |
| | | | | |
Net Assets | | | | | |
Beginning of year | | 30,634,977 | | 51,843,396 | |
| | | | | |
End of period | | $ | 28,271,661 | | $ | 30,634,977 | |
| | | | | |
Accumulated undistributed net investment income (distributions in excess of net investment income), end of period | | $ | 55,178 | | $ | (122,366 | ) |
| | | | | |
Capital Share Activity | | | | | |
Investor class: | | | | | |
Shares sold | | 130,223 | | 1,142,964 | |
Shares reinvested | | — | | — | |
Shares redeemed | | (490,990 | ) | (2,117,326 | ) |
Net share activity | | (360,767 | ) | (974,362 | ) |
See accompanying notes to financial statements.
171
Notes to Financial Statements (unaudited) | June 30, 2012 |
Note 1: Significant Accounting Policies
U.S. Global Investors Funds (Trust), consisting of thirteen separate funds (Funds), is organized as a Delaware statutory trust. Each Fund is an open-end management investment company registered under the Investment Company Act of 1940, as amended. All funds are diversified with the exception of Global Resources, World Precious Minerals, Gold and Precious Metals, Eastern European, Global Emerging Markets and China Region. A nondiversified fund may invest a greater percentage of its assets in a particular issuer in comparison to a diversified fund.
The following is a summary of significant accounting policies consistently followed by the Funds in the preparation of their financial statements. The policies are in conformity with U.S. generally accepted accounting principles.
A. Security Valuations
The Funds value investments traded on national or international securities exchanges or over-the-counter at the last sales price reported by the security’s primary exchange of its market at the time of daily valuation. Securities for which no sale was reported are valued at the mean between the last reported bid and asked quotation. Short-term investments with effective maturities of sixty days or less at the date of purchase are valued at amortized cost, which approximates market value. Municipal securities, long-term U.S. Government obligations and corporate debt securities are valued by an independent pricing service using an evaluated quote based on such factors as institutional-size trading in similar groups of securities, yield, quality, maturity, coupon rate, type of issue, individual trading characteristics and other market data.
B. Fair Valued Securities
Securities for which market quotations are not readily available or which are subject to legal restrictions are valued at their fair value as determined in good faith by the Adviser’s Valuation Committee, under policies and procedures established by the Funds’ Board of Trustees. Fair value is the price that would be received to sell an asset or paid to transfer a liability in an orderly transaction between market participants at the measurement date. The Valuation Committee meets on a regular basis to review securities which may not have readily available market prices and considers a number of factors in determining fair value, including nature and duration of any trading restrictions, trading volume, market values of unrestricted shares of the same or similar class, investment management’s judgment regarding the market experience of the issuer, financial status and other operational and market factors affecting the issuer, issuer’s management, quality of the underlying property based on review of independent geological studies and other relevant matters. The fair values may differ from what would have been used had a broader market for these securities existed. The Valuation Committee regularly reviews inputs and assumptions and performs transactional back-testing and disposition analysis. The Valuation Committee reports quarterly to the Funds’ Board of Trustees.
172
Notes to Financial Statements (unaudited) | June 30, 2012 |
For securities traded on international exchanges, if events which may materially affect the value of a Fund’s securities occur after the close of the primary exchange and before a Fund’s net asset value is next determined, then those securities will be valued at their fair value as determined in good faith under the supervision of the Board of Trustees. The Funds may use a systematic fair value model provided by an independent third party to value international securities in order to adjust for stale pricing, which may occur between the close of certain foreign exchanges and the New York Stock Exchange, or foreign market holidays.
C. Security Transactions and Investment Income
Security transactions are accounted for on trade date. Realized gains and losses from security transactions are determined on an identified-cost basis. Dividend income is recorded on the ex-dividend date except that certain dividends from foreign securities where the ex-dividend date may have passed are recorded as soon as the Fund has confirmed the ex-dividend date. Interest income, which may include original issue discount, is recorded on an accrual basis. Discounts and premiums on securities purchased are accreted and amortized, respectively, on a yield-to-maturity basis as adjustments to interest income. Investment income is recorded net of foreign taxes withheld where recovery of such taxes is uncertain. Investment income and realized and unrealized gains (losses) are allocated to each Fund’s share class based on their respective net assets.
The Funds may purchase securities on a when-issued or delayed-delivery basis and segregate on their books collateral with a value at least equal to the amount of the commitment. Losses may arise due to the changes in the value of the underlying securities or if the counterparty does not perform under the contract.
D. Repurchase Agreements
The Funds may enter into repurchase agreements with recognized financial institutions or registered broker-dealers and, in all instances, hold as collateral, underlying securities with a value exceeding the principal amount of the repurchase obligation. The Funds use joint tri-party repurchase agreement accounts with other funds under common management where uninvested cash is collectively invested in repurchase agreements, and each participating fund owns an undivided interest in the account.
E. Foreign Currency Transactions
Some Funds may invest in securities of foreign issuers. The accounting records of these Funds are maintained in U.S. dollars. At each net asset value determination date, the value of assets and liabilities denominated in foreign currencies are translated into U.S. dollars using the current prevailing exchange rate. Security transactions, income and expenses are converted at the prevailing rate of exchange on the respective dates of the transactions. The effect of changes in foreign exchange rates on foreign denominated securities is included with the net realized and unrealized gain or loss on securities. Other foreign currency gains or losses are reported separately.
173
Notes to Financial Statements (unaudited) | June 30, 2012 |
F. Federal Income Taxes
The Funds intend to continue to comply with the requirements of Subchapter M of the Internal Revenue Code applicable to regulated investment companies and to distribute substantially all of their taxable income to shareholders. Accordingly, no provision for federal income taxes is required. Each Fund may be subject to foreign taxes on income and gains on investments, which are accrued based on the Fund’s understanding of the tax rules and regulations in the foreign markets.
The Funds recognize the tax benefits of uncertain tax positions only where the position is “more likely than not” to be sustained assuming examination by tax authorities. Management has analyzed the Funds’ tax positions, and has concluded that no liability for unrecognized tax benefits should be recorded related to uncertain tax positions taken on returns filed for open tax years or expected to be taken in 2011 tax returns. The Funds’ 2008, 2009, 2010 and 2011 tax returns are open to examination by the federal and applicable state tax authorities. The Funds have no examinations in progress.
G. Dividends and Distributions to Shareholders
The Funds record dividends and distributions to shareholders on the ex-dividend date. Distributions are determined in accordance with income tax regulations, which may differ from accounting principles generally accepted in the United States. Accordingly, periodic reclassifications related to permanent book and tax basis differences are made within the Funds’ capital accounts to reflect income and gains available for distribution under income tax regulations.
The Funds generally pay income dividends and distribute capital gains, if any, annually. The U.S. Treasury Securities Cash and U.S. Government Securities Savings Funds accrue dividends on a daily basis with payment monthly. The Tax Free and Near-Term Tax Free Funds pay monthly dividends. Dividends and distributions payable at period end are processed for reinvestment on the following business day. A Fund may elect to designate a portion of the earnings and profits distributed to shareholders on the redemption of fund shares during the year as distributions for federal income tax purposes.
H. Expenses
Fund specific expenses are allocated to that Fund and pro rata across share classes. Expenses that are not fund specific are allocated among Funds and pro rata across share classes. Class specific expenses (including, but not limited to, distribution plan fees, if any, a portion of the administrative services fees, transfer agency fees and expenses, shareholder reporting expenses and certain legal and registration fees) are allocated to the class that incurs such expense. Expense offset arrangements have been made with the Funds’ custodian so the custodian fees may be paid indirectly by credits earned on the Funds’ cash balances. Such deposit arrangements are an alternative to overnight investments. Custodian fees are presented in the
174
Notes to Financial Statements (unaudited) | June 30, 2012 |
Statement of Operations gross of such credits, and the credits are presented as offsets to expenses.
I. Short-Term Trading (Redemption) Fees
Shares held in the All American Equity and Holmes Growth Funds 30 days or less are subject to a short-term trading fee equal to 0.10% of the proceeds of the redeemed shares. Shares held in the Global MegaTrends and Global Resources Funds 30 days or less are subject to a short-term trading fee equal to 0.25% of the proceeds of the redeemed shares. Shares held 30 days or less in the World Precious Minerals and Gold and Precious Metals Funds are subject to a short-term trading fee equal to 0.50% of the proceeds of the redeemed shares. Shares held in the Eastern European and Global Emerging Markets Funds 180 days or less are subject to a short-term trading fee equal to 2.00% of the proceeds of the redeemed shares. Shares held in the China Region Fund 180 days or less are subject to a short-term trading fee equal to 1.00% of the proceeds of the redeemed shares. These fees, which are retained by the Funds, are accounted for as an addition to paid-in capital.
J. Use of Estimates in Financial Statement Preparation
The preparation of financial statements in conformity with accounting principles generally accepted in the United States requires management to make estimates and assumptions that affect the reported amounts of assets and liabilities and disclosure of contingent assets and liabilities at the date of the financial statements and the reported amounts of income and expenses during the reporting period. Actual results could differ from those estimates.
K. Subsequent Events Evaluation
Management has evaluated subsequent events after the balance sheet date of June 30, 2012, through the date that the financial statements were issued and determined that there were no events or transactions that would require recognition or disclosure in the financial statements.
L. New Accounting Pronouncements
In April 2011, the Financial Accounting Standards Board (FASB) issued Accounting Standards Update (ASU) No. 2011-03, Transfers and Servicing (Topic 860): Reconsideration of Effective Control for Repurchase Agreements. This ASU is related to the accounting for repurchase agreements and similar agreements that both entitle and obligate a transferor to repurchase or redeem financial assets before their maturity. The ASU modifies the criteria for determining effective control of transferred assets and, as a result, certain agreements may now be accounted for as secured borrowings. The ASU is effective prospectively for new transfers and existing transactions that are modified in the first interim or annual period beginning on or after December 15, 2011. At this time, the Funds do not have any of the transactions that fall under the provisions of this pronouncement and do not intend to enter such transactions in the future. Therefore, this pronouncement did not have a material impact on the financial statements.
175
Notes to Financial Statements (unaudited) | | June 30, 2012 |
In May 2011, the FASB issued ASU No. 2011-04, Fair Value Measurement (Topic 820): Amendments to Achieve Common Fair Value Measurement and Disclosure Requirements in U.S. GAAP and IFRSs. The ASU expands existing disclosure requirements and amends some fair value measurement principles. The provisions of this update have been adopted in this filing.
In December 2011, the FASB issued ASU No. 2011-11, Balance Sheet (Topic 210): Disclosures about Offsetting Assets and Liabilities. The ASU requires an entity to disclose information about offsetting and related arrangements to enable users of its financial statements to understand the effect of those arrangements on its financial position. The ASU is effective for annual reporting periods beginning on or after January 1, 2013, and interim periods within those annual periods. At this time, the Funds do not have netting agreements that will fall under the provisions of this pronouncement and do not intend to enter into such agreements in the future. Therefore, management does not anticipate that this pronouncement will have a material impact on the financial statements.
Note 2: Financial Derivative Instruments
A. Options Contracts
Equity Funds may purchase or write (sell) options on securities to manage their exposure to stock or commodity markets as well as fluctuations in interest and currency conversion rates. The use of options carries the risks of a change in value of the underlying instruments, an illiquid secondary market, or failure of the counterparty to perform its obligations.
A put option gives the purchaser of the option, upon payment of a premium, the right to sell, and the issuer of the option the obligation to buy, the underlying security, commodity, index, currency or other instrument at the exercise price. A call option, upon payment of a premium, gives the purchaser of the option the right to buy, and the issuer the obligation to sell, the underlying instrument at the exercise price.
Purchasing a put option tends to decrease a Fund’s exposure to the underlying instrument, whereas purchasing a call option tends to increase a Fund’s exposure to the underlying instrument. A Fund pays a premium which is included in the Statement of Assets and Liabilities as an investment and subsequently marked to market to reflect the current value of the option. Premiums paid to purchase options which expire are treated as realized losses. Premiums paid to purchase options which are exercised or closed are added to the cost of securities acquired or the proceeds from securities sold. The risk associated with purchasing put and call options is limited to the premium paid.
The Funds will realize a loss equal to all or a part of the premium paid for an option if the price of the underlying security or other instrument decreases or does not increase by more than the premium (in the case of a call option), or if the price of
176
Notes to Financial Statements (unaudited) | | June 30, 2012 |
the underlying security or other instrument increases or does not decrease by more than the premium (in the case of a put option).
Writing a put option tends to increase a Fund’s exposure to the underlying instrument, whereas writing a call option tends to decrease a Fund’s exposure to the underlying instrument. The premium received is recorded as a liability in the Statement of Assets and Liabilities and subsequently marked to market to reflect the current value of the option written. Premiums received from writing options which expire are treated as realized gains. Premiums received from options which are exercised or closed are added to the proceeds or offset against amounts paid on the underlying transaction to determine the realized gain or loss. Written options include a risk of loss in excess of the option premium. A Fund as a writer of an option has no control over whether the underlying instrument may be sold (call) or purchased (put) and thus bears the market risk of an unfavorable change in the price of the instrument underlying the written option. There is also the risk a Fund may not be able to enter into a closing transaction because of an illiquid market.
A Fund’s ability to close out its position as a purchaser or seller of a put or call option is dependent, in part, upon the liquidity of the market for that particular option. There can be no guarantee that a fund will be able to close out an option position when desired. An inability to close out its options positions may reduce a Fund’s anticipated profits or increase its losses.
As of June 30, 2012, portfolio securities valued at $719,700, $3,179,800, $24,998,740, $12,362,571 and $18,477,405 were held in escrow by the custodian as collateral for call options written for the All American Equity Fund, Holmes Growth Fund, Global Resources Fund, World Precious Minerals Fund and Gold and Precious Metals Fund, respectively.
Transactions in written call and put options during the six-month period ended June 30, 2012, were as follows:
| | All American Equity Fund
Call Options | | Holmes Growth Fund
Call Options | |
| | Number of
Contracts | | Premiums
Received | | Number of
Contracts | | Premiums
Received | |
Options outstanding at December 31, 2011 | | 64 | | $ | 20,369 | | 160 | | $ | 67,931 | |
Options written | | 406 | | 101,355 | | 1,435 | | 306,686 | |
Options closed | | (14 | ) | (7,112 | ) | (300 | ) | (44,594 | ) |
Options expired | | (145 | ) | (35,127 | ) | (450 | ) | (96,073 | ) |
Options exercised | | (171 | ) | (54,981 | ) | (365 | ) | (130,597 | ) |
Options outstanding at June 30, 2012 | | 140 | | $ | 24,504 | | 480 | | $ | 103,353 | |
177
Notes to Financial Statements (unaudited) | June 30, 2012 |
| | Global MegaTrends Fund
Call Options | | Global Resources Fund
Call Options | |
| | Number of
Contracts | | Premiums
Received | | Number of
Contracts | | Premiums
Received | |
Options outstanding at December 31, 2011 | | 40 | | $ | 4,615 | | 1,000 | | $ | 179,662 | |
Options written | | 170 | | 29,662 | | 40,909 | | 5,394,578 | |
Options closed | | (30 | ) | (13,115 | ) | (15,357 | ) | (2,699,073 | ) |
Options expired | | (15 | ) | (1,208 | ) | (17,581 | ) | (1,763,258 | ) |
Options exercised | | (165 | ) | (19,954 | ) | (5,521 | ) | (565,918 | ) |
Options outstanding at June 30, 2012 | | — | | $ | — | | 3,450 | | $ | 545,991 | |
| | World Precious Minerals Fund
Call Options | | Gold and Precious Metals Fund
Call Options | |
| | Number of
Contracts | | Premiums
Received | | Number of
Contracts | | Premiums
Received | |
Options outstanding at December 31, 2011 | | — | | $ | — | | — | | $ | — | |
Options written | | 21,230 | | 2,397,013 | | 19,615 | | 2,170,346 | |
Options closed | | (7,650 | ) | (966,390 | ) | (5,700 | ) | (630,206 | ) |
Options expired | | — | | — | | (433 | ) | (52,895 | ) |
Options exercised | | (5,980 | ) | (917,005 | ) | (5,332 | ) | (769,623 | ) |
Options outstanding at June 30, 2012 | | 7,600 | | $ | 513,618 | | 8,150 | | $ | 717,622 | |
| | Eastern European Fund
Call Options | | Eastern European Fund
Put Options | |
| | Number of
Contracts | | Premiums
Received | | Number of
Contracts | | Premiums
Received | |
Options outstanding at December 31, 2011 | | 32,300 | | $ | 1,010,400 | | 5,000 | | $ | 395,485 | |
Options written | | 67,710 | | 4,333,600 | | — | | — | |
Options closed | | (51,480 | ) | (3,459,900 | ) | — | | — | |
Options expired | | (32,000 | ) | (895,800 | ) | (5,000 | ) | (395,485 | ) |
Options exercised | | (8,300 | ) | (460,700 | ) | — | | — | |
Options outstanding at June 30, 2012 | | 8,230 | | $ | 527,600 | | — | | $ | — | |
| | China Region Fund
Call Options | |
| | Number of
Contracts | | Premiums
Received | |
Options outstanding at December 31, 2011 | | — | | $ | — | |
Options written | | 84 | | 24,115 | |
Options closed | | — | | — | |
Options expired | | (26 | ) | (8,658 | ) |
Options exercised | | (58 | ) | (15,457 | ) |
Options outstanding at June 30, 2012 | | — | | $ | — | |
B. Forward Foreign Currency Contracts
The Funds enter into forward foreign currency contracts to lock in the U.S. dollar cost of purchase and sale transactions or to defend the portfolio against currency fluctuations. A forward foreign currency contract is a commitment to purchase or sell a foreign currency at a future date at a negotiated rate. These contracts are valued daily, and the Fund’s net equity therein, representing unrealized gain or loss on the contracts as measured by the difference between the forward foreign exchange rates at the dates of entry into the contracts and the forward rates at the reporting date, is included in the statement of assets and liabilities. Realized and unrealized
178
Notes to Financial Statements (unaudited) | June 30, 2012 |
gains and losses are included in the statement of operations. Risks may arise upon entering into these contracts from the potential inability of counterparties to meet the terms of the contract and from unanticipated movements in the value of foreign currencies relative to the U.S. dollar.
Open forward foreign currency contracts at June 30, 2012, were:
Fund Contract | | Foreign
Currency | | In Exchange
for USD | | Settlement
Date | | Value | | Unrealized
Appreciation | | Unrealized
(Depreciation) | |
World Precious Minerals Fund | | | | | | | | | | | | | |
Purchases: | | | | | | | | | | | | | |
Canadian Dollars | | 89,193 | | $ | 87,737 | | 07/03/12 | | $ | 87,612 | | $ | — | | $ | (125 | ) |
| | | | | | | | | | | | | |
Sales: | | | | | | | | | | | | | |
Canadian Dollars | | 13,493 | | $ | 13,221 | | 07/03/12 | | $ | 13,253 | | $ | — | | $ | (32 | ) |
| | | | | | | | | | | | | |
Gold and Precious Metals Fund | | | | | | | | | | | | | |
Purchases: | | | | | | | | | | | | | |
Canadian Dollars | | 151,773 | | $ | 149,295 | | 07/03/12 | | $ | 149,083 | | $ | — | | $ | (212 | ) |
| | | | | | | | | | | | | |
Sales: | | | | | | | | | | | | | |
Canadian Dollars | | 13,493 | | $ | 13,221 | | 07/03/12 | | $ | 13,253 | | $ | — | | $ | (32 | ) |
| | | | | | | | | | | | | |
Global Emerging Markets Fund | | | | | | | | | | | | | |
Sales: | | | | | | | | | | | | | |
Hong Kong Dollars | | 36,156 | | $ | 4,659 | | 07/05/12 | | $ | 4,660 | | $ | — | | $ | (1 | ) |
| | | | | | | | | | | | | |
China Region Fund | | | | | | | | | | | | | |
Purchases: | | | | | | | | | | | | | |
Hong Kong Dollars | | 475,613 | | $ | 61,325 | | 07/03/12 | | $ | 61,307 | | $ | — | | $ | (18 | ) |
| | | | | | | | | | | | | |
Sales: | | | | | | | | | | | | | |
Hong Kong Dollars | | 69,521 | | $ | 8,960 | | 07/03/12 | | $ | 8,962 | | $ | — | | $ | (2 | ) |
C. Summary of Derivative Instruments
The following is a summary of the valuations of derivative instruments categorized by location in the Statement of Assets and Liabilities as of June 30, 2012:
Location | | All
American
Equity Fund | | Holmes
Growth
Fund | | Global
MegaTrends
Fund | | Global
Resources
Fund | |
Asset derivatives | | | | | | | | | |
Investments, at value | | | | | | | | | |
Equity contracts - Note 2 A | | $ | 4,500 | | $ | 9,900 | | $ | — | | $ | 3,019,350 | |
Total | | $ | 4,500 | | $ | 9,900 | | $ | — | | $ | 3,019,350 | |
| | | | | | | | | |
Liability derivatives | | | | | | | | | |
Written options, at value | | $ | 13,340 | | $ | 95,980 | | $ | — | | $ | 567,200 | |
Total | | $ | 13,340 | | $ | 95,980 | | $ | — | | $ | 567,200 | |
179
Notes to Financial Statements (unaudited) | June 30, 2012 |
Location | | World
Precious
Minerals
Fund | | Gold and
Precious
Metals
Fund | | Eastern
European
Fund | | Global
Emerging
Markets
Fund | | China
Region
Fund | |
Asset derivatives | | | | | | | | | | | |
Investments, at value | | | | | | | | | | | |
Equity contracts - Note 2 A | | $ | 7,926,240 | | $ | 3,848,138 | | $ | — | | $ | — | | $ | 23,970 | |
Total | | $ | 7,926,240 | | $ | 3,848,138 | | $ | — | | $ | — | | $ | 23,970 | |
| | | | | | | | | | | |
Liability derivatives | | | | | | | | | | | |
Written options, at value | | $ | 613,230 | | $ | 689,912 | | $ | 460,224 | | $ | — | | $ | — | |
Total | | $ | 613,230 | | $ | 689,912 | | $ | 460,224 | | $ | — | | $ | — | |
The following is a summary of the effect of derivative instruments on the Statement of Operations for the six-month period ended June 30, 2012:
Location | | All
American
Equity Fund | | Holmes
Growth
Fund | | Global
MegaTrends
Fund | | Global
Resources
Fund | |
Realized Gain (Loss) on derivatives recognized in income | | | | | | | | | |
Realized gain (loss) from securities | | | | | | | | | |
Equity contracts | | $ | (27,426 | ) | $ | (24,271 | ) | $ | (49,899 | ) | $ | (492,226 | ) |
Realized gain (loss) on written options | | | | | | | | | |
Equity contracts | | 95,393 | | 256,056 | | 19,899 | | 3,740,860 | |
Net realized gain (loss) on foreign currency transactions | | | | | | | | | |
Foreign exchange contracts | | — | | — | | 1,723 | | (50,042 | ) |
| | 67,967 | | 231,785 | | (28,277 | ) | 3,198,592 | |
| | | | | | | | | |
Change in Unrealized Appreciation (Depreciation) on derivatives recognized in income | | | | | | | | | |
Net change in unrealized appreciation (depreciation) on investments | | | | | | | | | |
Equity contracts | | 29,526 | | (58 | ) | 31,913 | | 113,541 | |
Net change in unrealized appreciation (depreciation) on options written | | | | | | | | | |
Equity contracts | | 11,745 | | 10,502 | | 7,085 | | (198,871 | ) |
| | 41,271 | | 10,444 | | 38,998 | | (85,330 | ) |
Total | | $ | 109,238 | | $ | 242,229 | | $ | 10,721 | | $ | 3,113,262 | |
180
Notes to Financial Statements (unaudited) | June 30, 2012 |
Location | | World
Precious
Minerals
Fund | | Gold and
Precious
Metals
Fund | | Eastern
European
Fund | | Global
Emerging
Markets
Fund | | China
Region
Fund | |
Realized Gain (Loss) on derivatives recognized in income | | | | | | | | | | | |
Realized gain (loss) from securities | | | | | | | | | | | |
Equity contracts | | $ | (1,749,509 | ) | $ | (802,132 | ) | $ | 2,208 | | $ | (6,601 | ) | $ | (83,482 | ) |
Realized gain (loss) on written options | | | | | | | | | | | |
Equity contracts | | 1,302,444 | | 1,093,161 | | 2,628,345 | | — | | 24,115 | |
Net realized gain (loss) on foreign currency transactions | | | | | | | | | | | |
Foreign exchange contracts | | (69,537 | ) | (47,053 | ) | (167,436 | ) | (829 | ) | (841 | ) |
| | (516,602 | ) | 243,976 | | 2,463,117 | | (7,430 | ) | (60,208 | ) |
Change in Unrealized Appreciation (Depreciation) on derivatives recognized in income | | | | | | | | | | | |
Net change in unrealized appreciation (depreciation) on investments | | | | | | | | | | | |
Equity contracts | | 21,782,173 | | (2,296,506 | ) | — | | — | | 58,954 | |
Net change in unrealized appreciation (depreciation) on options written | | | | | | | | | | | |
Equity contracts | | (99,612 | ) | 27,710 | | (761,259 | ) | — | | — | |
Net change in unrealized appreciation (depreciation) on translation of assets and liabilities denominated in foreign currencies | | | | | | | | | | | |
Foreign exchange contracts | | (157 | ) | (244 | ) | — | | (1 | ) | (20 | ) |
| | 21,682,404 | | (2,269,040 | ) | (761,259 | ) | (1 | ) | 58,934 | |
Total | | $ | 21,165,802 | | $ | (2,025,064 | ) | $ | 1,701,858 | | $ | (7,431 | ) | $ | (1,274 | ) |
The average notional amounts of written options, purchased options and forward currency contracts outstanding during the six-month period ended June 30, 2012, were approximately as follows:
Fund | | Written
Options | | Purchased
Options | | Forward
Currency
Contracts | |
All American Equity | | $ | 14,384 | | $ | 757 | | $ | — | |
Holmes Growth | | 48,853 | | 1,414 | | — | |
Global MegaTrends | | 9,357 | | 214 | | 7,414 | |
Global Resources | | 894,060 | | 1,188,034 | | 122,376 | |
World Precious Minerals | | 288,360 | | 4,305,394 | | 760,648 | |
Gold and Precious Metals | | 285,065 | | 2,328,419 | | 417,552 | |
Eastern European | | 930,568 | | — | | 1,331,520 | |
Global Emerging Markets | | — | | 214 | | 666 | |
China Region | | 1,003 | | 76,016 | | 10,041 | |
| | | | | | | | | | |
181
Notes to Financial Statements (unaudited) | June 30, 2012 |
Note 3: Related Party Transactions
U.S. Global Investors, Inc. (Adviser), under an investment advisory agreement with the Trust in effect through October 1, 2012, furnishes management and investment advisory services and, subject to the supervision of the trustees, directs the investments of each Fund according to each Fund’s investment objectives, policies and limitations. The Adviser also furnishes all necessary office facilities, business equipment and personnel for administering the affairs of the Trust. Frank E. Holmes, a trustee of the Funds, is the controlling owner of the Adviser.
For the services of the Adviser, each Fund pays a base management or advisory fee based upon its net assets. Fees are accrued daily and paid monthly. The contractual management fee for each fund is:
Fund | | Annual Percentage of
Average Daily Net Assets |
| | |
U.S. Treasury Securities Cash and
U.S. Government Securities Savings | | .50% of the first $250,000,000 and .375% of the excess |
| | |
Near-Term Tax Free | | .50% |
| | |
Tax Free | | .75% of the first $250,000,000 and .50% of the excess |
| | |
All American Equity | | .80% of the first $500,000,000 and .75% of the excess |
| | |
Holmes Growth and Global MegaTrends | | 1.00% |
| | |
Global Resources | | .95% of the first $500,000,000; .90% of $500,000,001 to $1,000,000,000 and .85% of the excess |
| | |
World Precious Minerals | | 1.00% of the first $500,000,000; .95% of $500,000,001 to $1,000,000,000 and .90% of the excess |
| | |
Gold and Precious Metals | | .90% of the first $500,000,000 and .85% of the excess |
| | |
Eastern European | | 1.25% |
| | |
Global Emerging Markets | | 1.375% |
| | |
China Region | | 1.25% |
182
Notes to Financial Statements (unaudited) | June 30, 2012 |
The advisory agreement also provides, effective October 1, 2009, that the base advisory fee of the Equity Funds will be adjusted upwards or downwards by 0.25 percent if there is a performance difference of 5 percent or more between a Fund’s performance and that of its designated benchmark index over the prior 12 months. The performance adjustment is calculated separately for each share class. For purposes of calculating the performance adjustment for the Institutional Class, the performance will include the performance of the Investor Class shares for periods prior to March 1, 2011. After such time, for purposes of calculating the performance adjustment, the performance of each class will be calculated based on its respective performance. The benchmarks are as follows:
Fund | | Benchmark Index |
All American Equity | | S&P 500 Index |
| | |
Holmes Growth | | S&P Composite 1500 Index |
| | |
Global MegaTrends | | S&P 500 Index |
| | |
Global Resources | | Morgan Stanley Commodity Related Equity Index |
| | |
World Precious Minerals | | NYSE Arca Gold Miners Index |
| | |
Gold and Precious Metals | | FTSE Gold Mines Index |
| | |
Eastern European | | MSCI Emerging Markets Europe 10/40 Index (Net Total Return) |
| | |
Global Emerging Markets | | MSCI Emerging Markets Total Net Return Index |
| | |
China Region | | Hang Seng Composite Index |
No performance adjustment is applied unless the difference between the class’s investment performance and the benchmark is 5 percent or greater (positive or negative) during the applicable performance measurement period. The performance fee adjustment is calculated monthly in arrears and is accrued ratably during the month. The management fee, net of any performance fee adjustment, is paid monthly in arrears.
183
Notes to Financial Statements (unaudited) | June 30, 2012 |
The Funds’ prospectus and statement of additional information contain additional information about the performance adjustment. The amounts shown as management fees on the Statements of Operations reflects the base fee plus/minus any performance adjustment. During the six months ended June 30, 2012, the Funds recorded performance adjustments as follows:
Fund | | Investor Class
Performance Fee
Adjustment | | Institutional Class
Performance Fee
Adjustment | |
All American Equity | | $ | — | | N/A | |
Holmes Growth | | (48,388 | ) | N/A | |
Global MegaTrends | | (17,355 | ) | $ | (3,897 | ) |
Global Resources | | (506,278 | ) | (26,456 | ) |
World Precious Minerals | | (711,593 | ) | (2,864 | ) |
Gold and Precious Metals | | (201,334 | ) | N/A | |
Eastern European | | — | | N/A | |
Global Emerging Markets | | (13,000 | ) | N/A | |
China Region | | (49,793 | ) | N/A | |
| | | | | | | |
Under an administrative services agreement, the U.S. Treasury Securities Cash, U.S. Government Securities Savings, Near-Term Tax Free, Tax Free, All American Equity, Holmes Growth, Gold and Precious Metals, Eastern European, Global Emerging Markets and China Region Funds compensate the Adviser at an annual rate of 0.08% of the average daily net assets of each Fund for administrative services provided. The Global MegaTrends, Global Resources and World Precious Minerals Funds compensate the Adviser at an annual rate of 0.08% of the average daily net assets for the Investor Class and 0.06% of the average daily net assets for the Institutional Class for administrative services provided, of which half is a fund-level fee and half is a class-level fee.
The Investor Class shares for Equity Funds in the Trust have adopted a distribution plan pursuant to Rule 12b-1 of the Investment Company Act of 1940 in which a subsidiary of the Adviser is paid a fee at an annual rate of 0.25% of the average daily net assets of the Investor Class for sales and promotional services related to the distribution of Investor Class shares. The Institutional Class does not incur distribution plan fees.
The Adviser has voluntarily agreed to reimburse specific funds so that their total operating expenses will not exceed certain annual percentages of average net assets. The expenses for the period ended June 30, 2012, were limited as follows for the Investor Class: U.S. Treasury Securities Cash Fund at 1.00%, U.S. Government Securities Savings Fund at 0.45%, Near-Term Tax Free Fund at 0.45%, Tax Free Fund at 0.70%, All American Equity Fund at 2.20%, Holmes Growth Fund at 2.20%, Global MegaTrends Fund at 2.35%, Global Resources, World Precious Minerals, and Gold and Precious Metals Funds at 1.90%, Eastern European Fund
184
Notes to Financial Statements (unaudited) | June 30, 2012 |
at 2.85%, Global Emerging Markets Fund at 3.15% and China Region Fund at 2.55%. These expense limitations are exclusive of any performance fee adjustments and will continue on a voluntary basis at the Adviser’s discretion.
The Adviser has agreed to waive all class specific expenses for the Institutional Class. The expense waiver is exclusive of performance fees, and the Adviser can modify or terminate this arrangement at any time.
The Adviser has voluntarily agreed to waive fees and/or reimburse U.S. Treasury Securities Cash Fund and U.S. Government Securities Savings Fund to the extent necessary to maintain the respective fund’s yield at a certain level as determined by the Adviser (Minimum Yield). The Adviser may recapture any fees waived and/or expenses reimbursed within three years after the end of the fiscal year of such waiver and/or reimbursement to the extent that such recapture would not cause the fund’s yield to fall below the Minimum Yield. For the six months ended June 30, 2012, fees waived and/or expenses reimbursed as a result of this agreement were $379,619 and $278,605 for the U.S. Treasury Securities Cash Fund and the U.S. Government Securities Savings Fund, respectively. At June 30, 2012, the Adviser may seek reimbursement of previously waived and reimbursed fees as follows:
| | Expires
12/31/2012 | | Expires
12/31/2013 | | Expires
12/31/2014 | | Expires
12/31/2015 | | Total | |
U.S. Treasury Securities Cash | | $ | 789,420 | | $ | 884,850 | | $ | 867,545 | | $ | 379,619 | | $ | 2,921,434 | |
U.S. Government Securities Savings | | 258,561 | | 678,107 | | 736,531 | | 278,605 | | 1,951,804 | |
| | | | | | | | | | | | | | | | |
United Shareholder Services, Inc. (USSI), a wholly-owned subsidiary of the Adviser, is the transfer agent for the Funds. Each Fund’s share class pays an annual fee based on the number of shareholder accounts, certain base fees and transaction-and activity-based fees for transfer agency services. Certain account fees are paid directly by shareholders to the transfer agent, which, in turn, reduces its charge to the Funds.
The Adviser was reimbursed for services of the Funds’ Chief Compliance Officer during the six months ended June 30, 2012, in the amount of $69,512.
Brown Brothers Harriman & Co. (BBH) serves as the custodian, fund accounting and administration service agent with a fee structure based on average net assets of the Funds, certain base fees and transaction-based fees.
The independent Trustees receive compensation for serving on the Board. Trustees serving as Chairman of the Board or a special committee or as a member of a committee receive additional compensation. Trustees are also reimbursed for out-of-pocket expenses incurred while attending meetings. Frank E. Holmes receives no compensation from the Funds for serving on the Board.
185
Notes to Financial Statements (unaudited) | | June 30, 2012 |
Note 4: Investments
Cost of purchases and proceeds from sales of long-term securities for the six months ended June 30, 2012, are summarized as follows:
Fund | | Purchases | | Sales | |
Near-Term Tax Free | | $ | 5,195,642 | | $ | 30,000 | |
Tax Free | | 3,230,357 | | 70,000 | |
All American Equity | | 19,391,153 | | 19,957,957 | |
Holmes Growth | | 40,518,479 | | 42,658,884 | |
Global MegaTrends | | 23,615,662 | | 26,845,203 | |
Global Resources | | 318,451,337 | | 413,784,738 | |
World Precious Minerals | | 76,749,028 | | 136,917,698 | |
Gold and Precious Metals | | 72,128,105 | | 84,849,874 | |
Eastern European | | 77,243,027 | | 88,921,951 | |
Global Emerging Markets | | 18,026,443 | | 18,228,559 | |
China Region | | 38,029,704 | | 41,556,139 | |
| | | | | | | |
U.S. Treasury Securities Cash and U.S. Government Securities Savings held only short-term investments. The Funds neither purchased nor sold long-term U.S. government securities during the period.
Investments in foreign issuers as a percent of total investments at June 30, 2012, were: 2.77% of All American Equity, 14.96% of Holmes Growth, 25.89% of Global MegaTrends, 43.01% of Global Resources, 77.28% of World Precious Minerals, 68.16% of Gold and Precious Metals, 99.63% of Eastern European, 98.50% of Global Emerging Markets and 93.53% of China Region.
186
Notes to Financial Statements (unaudited) | | June 30, 2012 |
Note 5: Tax Information
The following table presents the income tax basis of securities owned at June 30, 2012, and the tax basis components of net unrealized appreciation (depreciation):
Fund | | Aggregate
Tax Cost | | Gross
Unrealized
Appreciation | | Gross
Unrealized
Depreciation | | Net Unrealized
Appreciation
(Depreciation) | |
U.S. Treasury Securities Cash | | $ | 84,953,968 | | $ | — | | $ | — | | $ | — | |
U.S. Government Securities Savings | | 156,613,138 | | — | | — | | — | |
Near-Term Tax Free | | 36,836,735 | | 1,348,678 | | (20,941 | ) | 1,327,737 | |
Tax Free | | 20,303,301 | | 1,429,916 | | (55,905 | ) | 1,374,011 | |
All American Equity | | 16,196,985 | | 1,412,718 | | (654,349 | ) | 758,369 | |
Holmes Growth | | 32,404,680 | | 3,875,305 | | (718,936 | ) | 3,156,369 | |
Global MegaTrends | | 13,776,001 | | 309,633 | | (239,746 | ) | 69,887 | |
Global Resources | | 602,113,938 | | 43,668,919 | | (120,151,594 | ) | (76,482,675 | ) |
World Precious Minerals | | 473,471,140 | | 36,438,391 | | (186,100,026 | ) | (149,661,635 | ) |
Gold and Precious Metals | | 190,585,175 | | 12,182,237 | | (46,411,345 | ) | (34,229,108 | ) |
Eastern European | | 174,429,868 | | 18,588,627 | | (18,076,750 | ) | 511,877 | |
Global Emerging Markets | | 8,716,415 | | 269,805 | | (1,155,079 | ) | (885,274 | ) |
China Region | | 27,808,609 | | 1,673,421 | | (1,566,878 | ) | 106,543 | |
| | | | | | | | | | | | | |
As of December 31, 2011, the components of distributable earnings on a tax basis were as follows:
Fund | | Undistributed
Tax-Exempt
Income | | Undistributed
Ordinary
Income | | Undistributed
Long-Term
Capital Gains | | Net Unrealized
Appreciation
(Depreciation) | |
U.S. Treasury Securities Cash | | $ | — | | $ | 989 | | $ | — | | $ | — | |
U.S. Government Securities Savings | | — | | 1,037 | | — | | — | |
Near-Term Tax Free | | 12,813 | | 11,666 | | — | | 1,232,614 | |
Tax Free | | 7,695 | | 27,736 | | — | | 1,127,247 | |
All American Equity | | — | | — | | — | | 289,599 | |
Holmes Growth | | — | | — | | 568,317 | | 716,049 | |
Global MegaTrends | | — | | 50,614 | | — | | 590,292 | |
Global Resources | | — | | 12,871,744 | | — | | (60,303,612 | ) |
World Precious Minerals | | — | | — | | — | | (75,446,830 | ) |
Gold and Precious Metals | | — | | — | | — | | (8,877,726 | ) |
Eastern European | | — | | 590,340 | | — | | 6,243,061 | |
Global Emerging Markets | | — | | — | | — | | (1,110,327 | ) |
China Region | | — | | — | | — | | (1,942,545 | ) |
| | | | | | | | | | | | | |
The differences between book-basis and tax-basis unrealized appreciation (depreciation) for All American Equity, Holmes Growth, Global MegaTrends, Global Resources, World Precious Minerals, Gold and Precious Metals, Eastern European, Global Emerging Markets and China Region Funds are attributable primarily to the tax deferral of losses on wash sales, investment in passive foreign investment companies (PFIC), forwards marked to markets, unreversed return of capital in Canadian Trusts, adjustments for partnerships, tax straddle loss deferrals on written options, and adjustments for grantor trusts.
187
Notes to Financial Statements (unaudited) | | June 30, 2012 |
The tax character of distributions paid during the six months ended June 30, 2012, were as follows:
Fund | | Tax Exempt
Income | | Ordinary
Income | | Long-Term
Capital Gains | | Total | |
U.S. Treasury Securities Cash | | $ | — | | $ | 4,267 | | $ | — | | $ | 4,267 | |
U.S. Government Securities Savings | | — | | 8,164 | | — | | 8,164 | |
Near-Term Tax Free | | 389,708 | | 18,403 | | — | | 408,111 | |
Tax Free | | 341,441 | | 16,100 | | — | | 357,541 | |
All American Equity | | — | | — | | — | | — | |
Holmes Growth | | — | | — | | — | | — | |
Global MegaTrends - Investor Class | | — | | — | | — | | — | |
Global MegaTrends - Institutional Class | | — | | — | | — | | — | |
Global Resources - Investor Class | | — | | — | | — | | — | |
Global Resources - Institutional Class | | — | | — | | — | | — | |
World Precious Minerals - Investor Class | | — | | — | | — | | — | |
World Precious Minerals - Institutional Class | | — | | — | | — | | — | |
Gold and Precious Metals | | — | | — | | — | | — | |
Eastern European | | — | | — | | — | | — | |
Global Emerging Markets | | — | | — | | — | | — | |
China Region | | — | | — | | — | | — | |
| | | | | | | | | | | | | |
The tax character of distributions paid during the fiscal year ended December 31, 2011, were as follows:
Fund | | Tax Exempt
Income | | Ordinary
Income | | Long-Term
Capital Gains | | Total | |
U.S. Treasury Securities Cash | | $ | — | | $ | 9,580 | | $ | — | | $ | 9,580 | |
U.S. Government Securities Savings | | — | | 19,158 | | — | | 19,158 | |
Near-Term Tax Free | | 706,422 | | 34,065 | | — | | 740,487 | |
Tax Free | | 675,894 | | 27,735 | | — | | 703,629 | |
All American Equity | | — | | 22,535 | | — | | 22,535 | |
Holmes Growth | | — | | — | | — | | — | |
Global MegaTrends - Investor Class | | — | | — | | — | | — | |
Global MegaTrends - Institutional Class | | — | | 18,363 | | — | | 18,363 | |
Global Resources - Investor Class | | — | | 19,762,685 | | — | | 19,762,685 | |
Global Resources - Institutional Class | | — | | 2,765,455 | | — | | 2,765,455 | |
World Precious Minerals - Investor Class | | — | | 60,523,518 | | — | | 60,523,518 | |
World Precious Minerals - Institutional Class | | — | | 275,428 | | — | | 275,428 | |
Gold and Precious Metals | | — | | — | | 34,374,528 | | 34,374,528 | |
Eastern European | | — | | — | | — | | — | |
Global Emerging Markets | | — | | — | | — | | — | |
China Region | | — | | — | | — | | — | |
| | | | | | | | | | | | | |
Capital loss carryforwards may be used to offset current or future taxable capital gains until expiration. The Fund’s tax-basis capital gains and losses are determined only at the end of each fiscal year. Under the Regulated Investment Company
188
Notes to Financial Statements (unaudited) | | June 30, 2012 |
Modernization Act of 2010, the Funds are permitted to carry forward capital losses incurred in taxable years beginning after December 22, 2010, for an unlimited period. However, any losses incurred during those future years are required to be utilized prior to the losses incurred in pre-enactment tax years. As a result of this ordering rule, pre-enactment capital losses that are carried forward retain their character as either short-term or long-term capital losses rather than being considered all short-term as under previous law. The loss carryforwards and related expiration dates for each fund, as of December 31, 2011, are as follows:
| | Post December 31, 2010
Capital Losses
No Expiration | | Expiration Date | |
Fund | | Short Term | | Long Term | | 2012 | | 2013 | | 2014 | |
U.S. Treasury Securities Cash | | $ | — | | $ | — | | $ | — | | $ | — | | $ | — | |
U.S. Government Securities Savings | | — | | — | | — | | — | | — | |
Near-Term Tax Free | | — | | 3,345 | | 33,686 | | 2,760 | | 202,719 | |
Tax Free | | 6,681 | | 12,826 | | 421,236 | | — | | — | |
All American Equity | | — | | — | | — | | — | | — | |
Holmes Growth | | — | | — | | — | | — | | — | |
Global MegaTrends | | — | | — | | — | | — | | — | |
Global Resources | | — | | — | | — | | — | | — | |
World Precious Minerals | | — | | — | | — | | — | | — | |
Gold and Precious Metals | | — | | — | | — | | — | | — | |
Eastern European | | — | | — | | — | | — | | — | |
Global Emerging Markets | | — | | — | | — | | — | | — | |
China Region | | 2,735,031 | | — | | — | | — | | — | |
| | | | | | | | | | | | | | | | |
| | Expiration Date | |
Fund | | 2015 | | 2016 | | 2017 | | 2018 | | Total | |
U.S. Treasury Securities Cash | | $ | — | | $ | — | | $ | — | | $ | — | | $ | — | |
U.S. Government Securities Savings | | — | | — | | — | | — | | — | |
Near-Term Tax Free | | 2,488 | | 112 | | 722 | | 2,532 | | 248,364 | |
Tax Free | | — | | 10,697 | | — | | — | | 451,440 | |
All American Equity | | — | | — | | 1,284,224 | | — | | 1,284,224 | |
Holmes Growth | | — | | — | | — | | — | | — | |
Global MegaTrends | | 6,801,143 | | 5,994,166 | | 995,675 | | — | | 13,790,984 | |
Global Resources | | — | | — | | 259,212,558 | | — | | 259,212,558 | |
World Precious Minerals | | — | | — | | 63,779,512 | | — | | 63,779,512 | |
Gold and Precious Metals | | — | | — | | — | | — | | — | |
Eastern European | | — | | 28,524,678 | | 257,523,539 | | 15,445,946 | | 301,494,163 | |
Global Emerging Markets | | 3,355,127 | | 2,965,929 | | 5,814,949 | | — | | 12,136,005 | |
China Region | | — | | 15,020,267 | | — | | — | | 17,755,298 | |
| | | | | | | | | | | | | | | | |
189
Notes to Financial Statements (unaudited) | | June 30, 2012 |
In accordance with tax rules, the following net capital losses and ordinary losses (currency and late year losses) incurred after October 31, within each Fund’s tax year, are deemed to arise on the first day of the Fund’s next tax year if the Fund elects to defer such losses.
The Funds elected to defer losses incurred after October 31, 2011, as follows:
Fund | | Post October 31, 2011
Capital Loss Deferral | | Post October 31, 2011
Ordinary Loss Deferral | |
Holmes Growth | | $ | 105,624 | | $ | — | |
Global MegaTrends | | 163,657 | | — | |
Global Resources | | 92,900,179 | | — | |
World Precious Minerals | | 11,908,415 | | 7,709,872 | |
Gold and Precious Metals | | 3,886,685 | | — | |
Eastern European | | 8,376,156 | | — | |
Global Emerging Markets | | 264,443 | | 33,016 | |
China Region | | 1,313,556 | | 47,623 | |
| | | | | | | |
Note 6: Risks Of Concentrations
The Near-Term Tax Free Fund and the Tax Free Fund may be exposed to risks related to concentration of investments in a particular state or geographic area. These investments present risks resulting from changes in economic conditions of the region or the issuer.
Because the Global Resources Fund concentrates its investments in a specific industry, the fund may be subject to greater risks and fluctuations than a portfolio representing a broader range of industries.
The investment policies of the World Precious Minerals and Gold and Precious Metals Funds present unique risks to their respective portfolios’ values. The prices of gold and other precious metals may be subject to fluctuations caused by international monetary and political developments including trade or currency restrictions, currency devaluation and revaluation, and social and political conditions within a country. Fluctuations in the prices of gold and other precious metals will affect the market values of the securities held by these funds.
The Eastern European Fund invests more than 25% of its investments in companies principally engaged in the oil & gas or banking industries. The risk of concentrating investments in this group of industries will make the fund more susceptible to risk in these industries than funds which do not concentrate their investments in an industry.
The Eastern European and Global Emerging Markets Funds may be exposed to risks not typically associated with investment in the United States due to their concentration of investments in emerging markets. These risks include possible
190
Notes to Financial Statements (unaudited) | | June 30, 2012 |
revaluation of currencies, less public information about companies, disruptive political or economic conditions and the possible imposition of adverse governmental laws or currency exchange restrictions. Moreover, securities of many foreign issuers, including sovereign nations, and their markets may be less liquid and their prices more volatile than those securities of comparable U.S. issuers.
The China Region Fund may be exposed to risks not typically associated with investments in the United States, due to concentration of investments in foreign issuers in the region. These investments present risks resulting from disruptive political or economic conditions and the potential imposition of adverse governmental laws or currency exchange restrictions affecting the area.
Note 7: Credit Arrangements
Each of the Funds has a revolving credit facility with BBH. Borrowings of each Fund are collateralized by any or all of the securities held by BBH as the Fund’s custodian up to the amount of the borrowing. Interest on borrowings is charged at the current overnight Federal Funds Rate plus 2%. Each Fund has a maximum borrowing limit of 10% of qualified assets. The aggregate of borrowings by all Funds under the agreement cannot exceed $30,000,000 at any one time. There were no borrowings under the revolving credit facility during the period ended June 30, 2012. The U.S. Global Investors Funds paid BBH a total of $22,750 in commitment fees for the six months ended June 30, 2012, under this arrangement.
Note 8: Shares Of Beneficial Interest
At June 30, 2012, individual shareholders holding more than 5% of outstanding Investor Class shares comprised 5.03%, 6.18%, 5.55% and 5.31% of the U.S. Treasury Securities Cash Fund, Near-Term Tax Free Fund, Global MegaTrends Fund and the Global Emerging Markets Fund, respectively. In addition, the Adviser held 12.76%, 6.76% and 7.58% of the Investor Class shares of U.S. Government Securities Savings Fund, Near-Term Tax Free Fund and Tax Free Fund, respectively. Control is defined by the 1940 Act as the beneficial ownership, either directly or through one or more controlled companies, of more than 25% of the voting securities of a company. Investment activities of these shareholders could have a material impact on the Funds.
191
Financial Highlights
U.S. Treasury Securities Cash Fund
For a capital share outstanding during the
| | Investor Class | |
| | Six Months
Ended
June 30, 2012 | | Year Ended December 31, | | Six Months
Ended
December 31, | | Year Ended June 30, | |
| | (unaudited) | | 2011 | | 2010 | | 2009 | | 2008* | | 2008 | | 2007 | |
Net asset value, beginning of period | | $ | 1.00 | | $ | 1.00 | | $ | 1.00 | | $ | 1.00 | | $ | 1.00 | | $ | 1.00 | | $ | 1.00 | |
| | | | | | | | | | | | | | | | | | | | | | |
Investment Activities | | | | | | | | | | | | | | | |
Net investment income | | — | (a) | — | (a) | — | (a) | — | (a) | — | (a) | .02 | | .04 | |
Net realized and unrealized gain | | — | | — | | — | | — | | — | | — | | — | |
Total from investment activities | | — | (a) | — | (a) | — | (a) | — | (a) | — | (a) | .02 | | .04 | |
Distributions from net investment income | | — | (a) | — | (a) | — | (a) | — | (a) | — | (a) | (.02 | ) | (.04 | ) |
| | | | | | | | | | | | | | | |
Net asset value, end of period | | $ | 1.00 | | $ | 1.00 | | $ | 1.00 | | $ | 1.00 | | $ | 1.00 | | $ | 1.00 | | $ | 1.00 | |
| | | | | | | | | | | | | | | | | | | | | | |
Total Return (excluding account fees) (b) | | — | | .01 | % | .01 | % | .01 | % | .23 | % | 2.46 | % | 4.36 | % |
Ratios to Average Net Assets: (c) | | | | | | | | | | | | | | | |
Net investment income | | .01 | % | .01 | % | .01 | % | .01 | % | .44 | % | 2.43 | % | 4.27 | % |
Total expenses | | 1.06 | % | .98 | % | 1.01 | % | 1.01 | % | 1.11 | % | 1.09 | % | .91 | % |
Expenses waived or reimbursed (d)(e) | | (.95 | )% | (.92 | )% | (.86 | )% | (.75 | )% | (.38 | )% | (.09 | )% | (.02 | )% |
Net recouped fees (e) | | — | | — | | — | | — | | — | | — | (g) | — | |
Net expenses (f) | | .11 | % | .06 | % | .15 | % | .26 | % | .73 | % | 1.00 | % | .89 | % |
| | | | | | | | | | | | | | | |
Net assets, end of period (in thousands) | | $ | 85,427 | | $ | 90,557 | | $ | 99,491 | | $ | 103,889 | | $ | 121,410 | | $ | 111,955 | | $ | 116,012 | |
* Effective December 31, 2008, the fiscal year changed to December 31.
(a) The per share amount does not round to a full penny.
(b) Total returns for periods less than one year are not annualized. Assumes investment at the net asset value at the beginning of the period, reinvestment of all distribution and a complete redemption of the investment at the net asset value at the end of the period.
(c) Ratios are annualized for periods of less than one year.
(d) Expenses waived or reimbursed reflect reductions to total expenses, as discussed in the notes to the financial statements. These amounts would decrease the net investment income ratio and total returns had such reductions not occurred.
(e) During the year ended June 30, 2008, the Adviser waived fees and/or reimbursed expenses under the Minimum Yield Agreement in the amount of $4,259. The Fund reimbursed the Adviser the $4,259 during the year ended June 30, 2008. During the six months ended December 31, 2008, the year ended December 31, 2009, the year ended December 31, 2010, the year ended December 31, 2011, and the six months ended June 30, 2012, the Adviser waived fees and/or reimbursed expenses under the Minimum Yield Agreement in the amount of $170,642, $789,420, $884,850, $867,545 and $379,619, respectively. The waivers/reimbursements from 2009-2012 are subject to recapture in future periods.
(f) The net expense ratios shown above reflect expenses after waivers and reimbursements but exclude the effect of reductions to total expenses for any expenses offset. Expense offset arrangements reduce total expenses, as discussed in the notes to the financial statements. These amounts would decrease the net investment income ratio had such reductions not occurred. The effects of expenses offset are as follows:
| | Investor Class | |
| | Six Months
Ended
June 30, 2012 | | Year Ended December 31, | | Six Months
Ended
December 31, | | Year Ended June 30, | |
| | (unaudited) | | 2011 | | 2010 | | 2009 | | 2008* | | 2008 | | 2007 | |
Ratios to Average Net Assets: (c) | | | | | | | | | | | | | | | |
Expenses offset (g) | | — | | — | | — | | — | | — | | — | | — | |
(g) Effect on the expense ratio was not greater than 0.005%.
See accompanying notes to financial statements.
192
Financial Highlights
U.S. Government Securities Savings Fund
For a capital share outstanding during the
| | Investor Class | |
| | Six Months
Ended
June 30, 2012 | | Year Ended December 31, | | Six Months
Ended
December 31, | | Year Ended June 30, | |
| | (unaudited) | | 2011 | | 2010 | | 2009 | | 2008* | | 2008 | | 2007 | |
Net asset value, beginning of period | | $ | 1.00 | | $ | 1.00 | | $ | 1.00 | | $ | 1.00 | | $ | 1.00 | | $ | 1.00 | | $ | 1.00 | |
Investment Activities | | | | | | | | | | | | | | | |
Net investment income | | — | (a) | — | (a) | — | (a) | — | (a) | .01 | | .03 | | .05 | |
Net realized and unrealized gain | | — | | — | | — | (a) | — | | — | (a) | — | (a) | — | (a) |
Total from investment activities | | — | (a) | — | (a) | — | (a) | — | (a) | .01 | | .03 | | .05 | |
Distributions from net investment income | | — | (a) | — | (a) | — | (a) | — | (a) | (.01 | ) | (.03 | ) | (.05 | ) |
Net asset value, end of period | | $ | 1.00 | | $ | 1.00 | | $ | 1.00 | | $ | 1.00 | | $ | 1.00 | | $ | 1.00 | | $ | 1.00 | |
Total Return (excluding account fees) (b) | | — | | .01 | % | .01 | % | .10 | % | .67 | % | 3.47 | % | 4.86 | % |
Ratios to Average Net Assets: (c) | | | | | | | | | | | | | | | |
Net investment income | | .01 | % | .01 | % | .01 | % | .11 | % | 1.36 | % | 3.42 | % | 4.75 | % |
Total expenses | | .85 | % | .81 | % | .82 | % | .78 | % | .73 | % | .65 | % | .62 | % |
Expenses waived or reimbursed (d) | | (.74 | )% | (.74 | )% | (.67 | )% | (.42 | )% | (.26 | )% | (.20 | )% | (.17 | )% |
Net expenses (e) | | .11 | % | .07 | % | .15 | % | .36 | % | .47 | %(g) | .45 | % | .45 | % |
Net assets, end of period (in thousands) | | $ | 156,305 | | $ | 171,664 | | $ | 203,835 | | $ | 263,232 | | $ | 357,910 | | $ | 446,208 | | $ | 469,095 | |
* Effective December 31, 2008, the fiscal year changed to December 31.
(a) The per share amount does not round to a full penny.
(b) Total returns for periods less than one year are not annualized. Assumes investment at the net asset value at the beginning of the period, reinvestment of all distributions and a complete redemption of the investment at the net asset value at the end of the period.
(c) Ratios are annualized for periods of less than one year.
(d) Expenses waived or reimbursed reflect reductions to total expenses, as discussed in the notes to the financial statements. These amounts would decrease the net investment income ratio and total returns had such reductions not occurred. During the year ended December 31, 2009, the year ended December 31, 2010, the year ended December 31, 2011, and the six months ended June 30, 2012, the Adviser waived fees and/or reimbursed expenses under the Minimum Yield Agreement in the amount of $258,561, $678,107, $736,531 and $278,605, respectively. These waivers/reimbursements are subject to recapture in future periods.
(e) The net expense ratios shown above reflect expenses after waivers and reimbursements but exclude the effect of reductions to total expenses for any expenses offset. Expense offset arrangements reduce total expenses, as discussed in the notes to the financial statements. These amounts would decrease the net investment income ratio had such reductions not occurred. The effect of expenses offset are as follows:
| | Investor Class | |
| | Six Months
Ended
June 30, 2012 | | Year Ended December 31, | | Six Months
Ended
December 31, | | Year Ended June 30, | |
| | (unaudited) | | 2011 | | 2010 | | 2009 | | 2008* | | 2008 | | 2007 | |
Ratios to Average Net Assets: (c) | | | | | | | | | | | | | | | |
Expenses offset (f) | | — | | — | | — | | — | | — | | — | | — | |
(f) Effect on the expense ratio was not greater than 0.005%.
(g) The annualized net expense ratio for the six months ended December 31, 2008, exceeded the limitation for the period due to the cost of participating in the U.S. Treasury Guarantee Program for the Money Market Funds. The cost to participate was without regard to the expense limitation.
See accompanying notes to financial statements.
193
Financial Highlights
Near-Term Tax Free Fund
For a capital share outstanding during the
| | Investor Class | |
| | Six Months
Ended
June 30, 2012 | | Year Ended December 31, | | Six Months
Ended
December 31, | | Year Ended June 30, | |
| | (unaudited) | | 2011 | | 2010 | | 2009 | | 2008* | | 2008 | | 2007 | |
Net asset value, beginning of period | | $ | 2.26 | | $ | 2.22 | | $ | 2.21 | | $ | 2.16 | | $ | 2.14 | | $ | 2.12 | | $ | 2.12 | |
Investment Activities | | | | | | | | | | | | | | | |
Net investment income | | .03 | | .05 | | .06 | | .06 | | .03 | | .07 | | .07 | |
Net realized and unrealized gain | | .01 | | .04 | | .01 | | .05 | | .02 | | .02 | | — | (a) |
Total from investment activities | | .04 | | .09 | | .07 | | .11 | | .05 | | .09 | | .07 | |
Distributions from net investment income | | (.03 | ) | (.05 | ) | (.06 | ) | (.06 | ) | (.03 | ) | (.07 | ) | (.07 | ) |
Net asset value, end of period | | $ | 2.27 | | $ | 2.26 | | $ | 2.22 | | $ | 2.21 | | $ | 2.16 | | $ | 2.14 | | $ | 2.12 | |
Total Return (excluding account fees) (b) | | 1.55 | % | 4.24 | % | 2.95 | % | 5.00 | % | 2.55 | % | 4.42 | % | 3.51 | % |
Ratios to Average Net Assets: (c) | | | | | | | | | | | | | | | |
Net investment income | | 2.28 | % | 2.39 | % | 2.46 | % | 2.63 | % | 3.15 | % | 3.41 | % | 3.43 | % |
Total expenses | | 1.21 | % | 1.26 | % | 1.30 | % | 1.53 | % | 1.82 | % | 1.91 | % | 1.63 | % |
Expenses waived or reimbursed (d) | | (.76 | )% | (.81 | )% | (.85 | )% | (1.08 | )% | (1.37 | )% | (1.46 | )% | (1.18 | )% |
Net expenses (e) | | .45 | % | .45 | % | .45 | % | .45 | % | .45 | % | .45 | % | .45 | % |
Portfolio turnover rate | | — | (g) | — | (g) | 1 | % | — | (g) | 8 | % | 8 | % | 22 | % |
Net assets, end of period (in thousands) | | $ | 38,253 | | $ | 35,014 | | $ | 29,138 | | $ | 23,337 | | $ | 13,989 | | $ | 13,603 | | $ | 13,383 | |
* Effective December 31, 2008, the fiscal year changed to December 31.
(a) The per share amount does not round to a full penny.
(b) Total returns for periods less than one year are not annualized. Assumes investment at the net asset value at the beginning of the period, reinvestment of all distributions and a complete redemption of the investment at the net asset value at the end of the period.
(c) Ratios are annualized for periods of less than one year.
(d) Expenses waived or reimbursed reflect reductions to total expenses, as discussed in the notes to the financial statements. These amounts would decrease the net investment income ratio and total returns had such reductions not occurred.
(e) The net expense ratios shown above reflect expenses after waivers and reimbursements but exclude the effect of reductions to total expenses for any expenses offset. Expense offset arrangements reduce total expenses, as discussed in the notes to the financial statements. These amounts would decrease the net investment income ratio had such reductions not occurred. The effect of expenses offset are as follows:
| | Investor Class | |
| | Six Months
Ended
June 30, 2012 | | Year Ended December 31, | | Six Months
Ended
December 31, | | Year Ended June 30, | |
| | (unaudited) | | 2011 | | 2010 | | 2009 | | 2008* | | 2008 | | 2007 | |
Ratios to Average Net Assets: (c) | | | | | | | | | | | | | | | |
Expenses offset (f) | | — | | — | | — | | — | | — | | — | | — | |
(f) Effect on the expense ratio was not greater than 0.005%.
(g) Portfolio turnover rate was not greater than 0.5%.
See accompanying notes to financial statements.
194
Financial Highlights
Tax Free Fund
For a capital share outstanding during the
| | Investor Class | |
| | Six Months
Ended
June 30, 2012 | | Year Ended December 31, | | Six Months
Ended
December 31, | | Year Ended June 30, | |
| | (unaudited) | | 2011 | | 2010 | | 2009 | | 2008* | | 2008 | | 2007 | |
Net asset value, beginning of period | | $ | 12.63 | | $ | 12.01 | | $ | 12.20 | | $ | 11.72 | | $ | 11.93 | | $ | 11.98 | | $ | 11.98 | |
Investment Activities | | | | | | | | | | | | | | | |
Net investment income | | .20 | | .43 | | .44 | | .45 | | .23 | | .47 | | .50 | |
Net realized and unrealized gain (loss) | | .15 | | .62 | | (.19 | ) | .48 | | (.21 | ) | (.05 | ) | — | (a) |
Total from investment activities | | .35 | | 1.05 | | .25 | | .93 | | .02 | | .42 | | .50 | |
Distributions from net investment income | | (.20 | ) | (.43 | ) | (.44 | ) | (.45 | ) | (.23 | ) | (.47 | ) | (.50 | ) |
Net asset value, end of period | | $ | 12.78 | | $ | 12.63 | | $ | 12.01 | | $ | 12.20 | | $ | 11.72 | | $ | 11.93 | | $ | 11.98 | |
Total Return (excluding account fees) (b) | | 2.81 | % | 8.94 | % | 2.04 | % | 8.03 | % | .22 | % | 3.54 | % | 4.15 | % |
Ratios to Average Net Assets: (c) | | | | | | | | | | | | | | | |
Net investment income | | 3.26 | % | 3.53 | % | 3.55 | % | 3.73 | % | 3.92 | % | 3.91 | % | 4.09 | % |
Total expenses | | 1.72 | % | 1.74 | % | 1.66 | % | 1.75 | % | 1.91 | % | 1.94 | % | 1.86 | % |
Expenses waived or reimbursed (d) | | (1.02 | )% | (1.04 | )% | (.96 | )% | (1.05 | )% | (1.21 | )% | (1.24 | )% | (1.16 | )% |
Net expenses (e) | | .70 | % | .70 | % | .70 | % | .70 | % | .70 | % | .70 | % | .70 | % |
Portfolio turnover rate | | — | (g) | 10 | % | 15 | % | — | (g) | 6 | % | 11 | % | 6 | % |
Net assets, end of period (in thousands) | | $ | 22,783 | | $ | 21,663 | | $ | 19,794 | | $ | 22,102 | | $ | 16,946 | | $ | 18,380 | | $ | 15,940 | |
* Effective December 31, 2008, the fiscal year changed to December 31.
(a) The per share amount does not round to a full penny.
(b) Total returns for periods less than one year are not annualized. Assumes investment at the net asset value at the beginning of the period, reinvestment of all distributions and a complete redemption of the investment at the net asset value at the end of the period.
(c) Ratios are annualized for periods of less than one year.
(d) Expenses waived or reimbursed reflect reductions to total expenses, as discussed in the notes to the financial statements. These amounts would decrease the net investment income ratio and total returns had such reductions not occurred.
(e) The net expense ratios shown above reflect expenses after waivers and reimbursements but exclude the effect of reductions to total expenses for any expenses offset. Expense offset arrangements reduce total expenses, as discussed in the notes to the financial statements. These amounts would decrease the net investment income ratio had such reductions not occurred. The effect of expenses offset are as follows:
| | Investor Class | |
| | Six Months
Ended
June 30, 2012 | | Year Ended December 31, | | Six Months
Ended
December 31, | | Year Ended June 30, | |
| | (unaudited) | | 2011 | | 2010 | | 2009 | | 2008* | | 2008 | | 2007 | |
Ratios to Average Net Assets: (c) | | | | | | | | | | | | | | | |
Expenses offset (f) | | — | | — | | — | | — | | — | | — | | — | |
(f) Effect on the expense ratio was not greater than 0.005%.
(g) Portfolio turnover rate was not greater than 0.5%.
See accompanying notes to financial statements.
195
Financial Highlights
All American Equity Fund
For a capital share outstanding during the
| | Investor Class | |
| | Six Months
Ended
June 30, 2012 | | Year Ended December 31, | | Six Months
Ended
December 31, | | Year Ended June 30, | |
| | (unaudited) | | 2011 | | 2010 | | 2009 | | 2008* | | 2008 | | 2007 | |
Net asset value, beginning of period | | $ | 22.72 | | $ | 22.72 | | $ | 19.60 | | $ | 17.33 | | $ | 27.27 | | $ | 28.58 | | $ | 27.59 | |
Investment Activities | | | | | | | | | | | | | | | |
Net investment income (loss) | | .02 | | (.07 | ) | .02 | | (.13 | ) | .04 | | (.15 | ) | (.08 | ) |
Net realized and unrealized gain (loss) | | 1.61 | | .10 | | 3.10 | | 2.51 | | (9.97 | ) | 1.98 | | 4.94 | |
Total from investment activities | | 1.63 | | .03 | | 3.12 | | 2.38 | | (9.93 | ) | 1.83 | | 4.86 | |
Distributions | | | | | | | | | | | | | | | |
From net investment income | | — | | (.03 | ) | — | | (.11 | ) | (.01 | ) | — | | — | |
From net realized gains | | — | | — | | — | | — | | — | | (3.01 | ) | (3.87 | ) |
From tax return of capital | | — | | — | | — | | — | | — | | (.13 | ) | — | |
Total distributions | | — | | (.03 | ) | — | | (.11 | ) | (.01 | ) | (3.14 | ) | (3.87 | ) |
Short-Term Trading Fees **(a) | | — | | — | | — | | — | | — | | — | | — | |
Net asset value, end of period | | $ | 24.35 | | $ | 22.72 | | $ | 22.72 | | $ | 19.60 | | $ | 17.33 | | $ | 27.27 | | $ | 28.58 | |
Total Return (excluding account fees) (b) | | 7.17 | % | .14 | % | 15.92 | % | 13.75 | % | (36.42 | )% | 5.99 | % | 19.59 | % |
Ratios to Average Net Assets: (c) | | | | | | | | | | | | | | | |
Net investment income (loss) | | .12 | % | (.32 | )% | .10 | % | (.74 | )% | .35 | % | (.55 | )% | (.28 | )% |
Total expenses | | 2.58 | % | 2.42 | % | 2.56 | % | 2.79 | % | 2.37 | % | 1.98 | % | 2.01 | % |
Expenses waived or reimbursed (d) | | (.38 | )% | (.24 | )% | (.48 | )% | (.96 | )% | (.62 | )% | (.23 | )% | (.26 | )% |
Net expenses (e) | | 2.20 | % | 2.18 | % | 2.08 | % | 1.83 | % | 1.75 | % | 1.75 | % | 1.75 | % |
Portfolio turnover rate | | 124 | % | 223 | % | 299 | % | 343 | % | 205 | % | 225 | % | 223 | % |
Net assets, end of period (in thousands) | | $ | 17,010 | | $ | 16,399 | | $ | 17,760 | | $ | 16,436 | | $ | 16,234 | | $ | 26,513 | | $ | 23,479 | |
* Effective December 31, 2008, the fiscal year changed to December 31.
** Based on average monthly shares outstanding.
(a) The per share amount does not round to a full penny.
(b) Total returns for periods less than one year are not annualized. Assumes investment at the net asset value at the beginning of the period, reinvestment of all distribution and a complete redemption of the investment at the net asset value at the end of the period.
(c) Ratios are annualized for periods of less than one year.
(d) Expenses waived or reimbursed reflect reductions to total expenses, as discussed in the notes to the financial statements. These amounts would increase the net investment loss ratio or decrease the net investment income ratio, as applicable, and decrease total returns had such reductions not occurred.
(e) The net expense ratios shown above reflect expenses after waivers and reimbursements but exclude the effect of reductions to total expenses for any expenses offset. Expense offset arrangements reduce total expenses, as discussed in the notes to the financial statements. These amounts would increase the net investment loss ratio, or decrease the net investment income ratio, as applicable, had such reductions not occurred. The effect of expenses offset are as follows:
| | Investor Class | |
| | Six Months
Ended
June 30, 2012 | | Year Ended December 31, | | Six Months
Ended
December 31, | | Year Ended June 30, | |
| | (unaudited) | | 2011 | | 2010 | | 2009 | | 2008* | | 2008 | | 2007 | |
Ratios to Average Net Assets: (c) | | | | | | | | | | | | | | | |
Expenses offset (f) | | — | | — | | — | | — | | — | | — | | — | |
(f) Effect on the expense ratio was not greater than 0.005%.
See accompanying notes to financial statements.
196
Financial Highlights
Holmes Growth Fund
For a capital share outstanding during the
| | Investor Class | |
| | Six Months
Ended
June 30, 2012 | | Year Ended December 31, | | Two Months
Ended
December 31, | | Year Ended October 31, | |
| | (unaudited) | | 2011 | | 2010 | | 2009 | | 2008* | | 2008 | | 2007 | |
Net asset value, beginning of period | | $ | 17.62 | | $ | 18.65 | | $ | 15.54 | | $ | 12.79 | | $ | 14.14 | | $ | 24.78 | | $ | 18.34 | |
Investment Activities | | | | | | | | | | | | | | | |
Net investment loss | | (.08 | ) | (.26 | ) | (.22 | ) | (.13 | ) | (.01 | ) | (.15 | ) | (.14 | ) |
Net realized and unrealized gain (loss) | | 1.15 | | (.77 | ) | 3.54 | | 2.88 | | (1.34 | ) | (10.49 | ) | 6.58 | |
Total from investment activities | | 1.07 | | (1.03 | ) | 3.32 | | 2.75 | | (1.35 | ) | (10.64 | ) | 6.44 | |
Distributions from net investment income | | — | | — | | (.21 | ) | — | | — | | — | | — | |
Short-Term Trading Fees **(a) | | — | | — | | — | | — | | — | | — | | — | |
Net asset value, end of period | | $ | 18.69 | | $ | 17.62 | | $ | 18.65 | | $ | 15.54 | | $ | 12.79 | | $ | 14.14 | | $ | 24.78 | |
Total Return (excluding account fees) (b) | | 6.07 | % | (5.52 | )% | 21.35 | % | 21.50 | % | (9.55 | )% | (42.94 | )% | 35.11 | % |
Ratios to Average Net Assets: (c) | | | | | | | | | | | | | | | |
Net investment loss | | (.83 | )% | (1.25 | )% | (1.29 | )% | (.93 | )% | (.27 | )% | (.65 | )% | (.62 | )% |
Total expenses | | 1.78 | % | 2.00 | % | 1.93 | % | 2.10 | % | 2.51 | % | 1.74 | % | 1.72 | % |
Expenses waived or reimbursed (d) | | — | (f) | — | | — | (f) | (.33 | )% | (.76 | )% | — | | — | |
Net expenses (e) | | 1.78 | % | 2.00 | % | 1.93 | % | 1.77 | % | 1.75 | % | 1.74 | % | 1.72 | % |
Portfolio turnover rate | | 127 | % | 210 | % | 160 | % | 219 | % | 20 | % | 140 | % | 98 | % |
Net assets, end of period (in thousands) | | $ | 35,805 | | $ | 35,316 | | $ | 40,604 | | $ | 37,149 | | $ | 32,488 | | $ | 36,231 | | $ | 68,881 | |
* Effective December 31, 2008, the fiscal year changed to December 31.
** Based on average monthly shares outstanding.
(a) The per share amount does not round to a full penny.
(b) Total returns for periods less than one year are not annualized. Assumes investment at the net asset value at the beginning of the period, reinvestment of all distributions and a complete redemption of the investment at the net asset value at the end of the period.
(c) Ratios are annualized for periods of less than one year.
(d) Expenses waived or reimbursed reflect reductions to total expenses, as discussed in the notes to the financial statements. These amounts would increase the net investment loss ratio or decrease the net investment income ratio, as applicable, and decrease total returns had such reductions not occurred.
(e) The net expense shown above reflect expenses after waivers and reimbursements but exclude the effect of reductions to total expenses for any expenses offset. Expense offset arrangements reduce total expenses, as discussed in the notes to the financial statements. These amounts would increase the net investment loss ratio, or decrease the net investment income ratio, as applicable, had such reductions not occurred. The effect of expenses offset are as follows:
| | Investor Class | |
| | Six Months
Ended
June 30, 2012 | | Year Ended December 31, | | Two Months
Ended
December 31, | | Year Ended October 31, | |
| | (unaudited) | | 2011 | | 2010 | | 2009 | | 2008* | | 2008 | | 2007 | |
Ratios to Average Net Assets: (c) | | | | | | | | | | | | | | | |
Expenses offset (f) | | — | | — | | — | | — | | — | | — | | — | |
(f) Effect on the expense ratio was not greater than 0.005%.
See accompanying notes to financial statements.
197
Financial Highlights
Global MegaTrends Fund
For a capital share outstanding during the
| | Investor Class | |
| | Six Months
Ended
June 30, 2012 | | Year Ended December 31, | | Two Months
Ended
December 31, | | Year Ended October 31, | |
| | (unaudited) | | 2011 | | 2010 | | 2009 | | 2008* | | 2008 | | 2007** | |
Net asset value, beginning of period | | $ | 7.68 | | $ | 8.83 | | $ | 8.15 | | $ | 6.28 | | $ | 6.60 | | $ | 12.75 | | $ | 11.07 | |
Investment Activities | | | | | | | | | | | | | | | |
Net investment income (loss) | | .01 | | .04 | | .06 | | .03 | | — | (a) | — | (a) | (.11 | ) |
Net realized and unrealized gain (loss) | | .05 | | (1.19 | ) | .63 | | 1.86 | | (.31 | ) | (5.30 | ) | 2.63 | |
Total from investment activities | | .06 | | (1.15 | ) | .69 | | 1.89 | | (.31 | ) | (5.30 | ) | 2.52 | |
Distributions | | | | | | | | | | | | | | | |
From net investment income | | — | | — | | (.01 | ) | (.02 | ) | — | | — | | — | |
From net realized gains | | — | | — | | — | | — | | — | | (.85 | ) | (.84 | ) |
From tax return of capital | | — | | — | | — | | — | | (.01 | ) | — | | — | |
Total distributions | | — | | — | | (.01 | ) | (.02 | ) | (.01 | ) | (.85 | ) | (.84 | ) |
Short-Term Trading Fees ***(a) | — | | — | | — | | — | | — | | — | | — | |
Net asset value, end of period | | $ | 7.74 | | $ | 7.68 | | $ | 8.83 | | $ | 8.15 | | $ | 6.28 | | $ | 6.60 | | $ | 12.75 | |
Total Return (excluding account fees) (b) | | .78 | % | (13.02 | )% | 8.43 | % | 30.15 | % | (4.74 | )% | (44.50 | )% | 24.49 | % |
Ratios to Average Net Assets: (c) | | | | | | | | | | | | | | | |
Net investment income (loss) | | .13 | % | .35 | % | .43 | % | .45 | % | (.20 | )% | (.06 | )% | (.93 | )% |
Total expenses | | 2.83 | % | 2.56 | % | 2.44 | % | 2.43 | % | 2.96 | % | 2.21 | % | 2.49 | % |
Expenses waived or reimbursed (d) | | (.76 | )% | (.41 | )% | (.22 | )% | (.48 | )% | (1.11 | )% | (.21 | )% | — | |
Net expenses (e) | | 2.07 | % | 2.15 | % | 2.22 | % | 1.95 | % | 1.85 | % | 2.00 | % | 2.49 | % |
Portfolio turnover rate (g) | | 177 | % | 163 | % | 104 | % | 100 | % | 29 | % | 92 | % | 65 | % |
Net assets, end of period (in thousands) | | $ | 11,557 | | $ | 12,450 | | $ | 16,332 | | $ | 28,557 | | $ | 22,035 | | $ | 25,387 | | $ | 17,723 | |
* Effective December 31, 2008, the fiscal year changed to December 31.
** Effective October 1, 2007, U.S. Global Investors, Inc. assumed management of Global MegaTrends Fund from the former subadviser.
*** Based on average monthly shares outstanding.
(a) The per share amount does not round to a full penny.
(b) Total returns for periods less than one year are not annualized. Assumes investment at the net asset value at the beginning of the period, reinvestment of all distributions and a complete redemption of the investment at the net asset value at the end of the period.
(c) Ratios are annualized for periods of less than one year.
(d) Expenses waived or reimbursed reflect reductions to total expenses, as discussed in the notes to the financial statements. These amounts would increase the net investment loss ratio or decrease the net investment income ratio, as applicable, and decrease total returns had such reductions not occurred.
(e) The expense ratios shown above exclude the effect of reductions to total expenses for any expenses offset. Expense offset arrangements reduce total expenses, as discussed in the notes to financial statements. These amounts would increase the net investment loss ratio, or decrease the net investment income ratio, as applicable, had such reductions not occurred. The effect of expenses offset are as follows:
| | Investor Class | |
| | Six Months
Ended
June 30, 2012 | | Year Ended December 31, | | Two Months
Ended
December 31, | | Year Ended October 31, | |
| | (unaudited) | | 2011 | | 2010 | | 2009 | | 2008* | | 2008 | | 2007 | |
Ratios to Average Net Assets: (c) | | | | | | | | | | | | | | | |
Expenses offset (f) | | — | | — | | — | | — | | — | | — | | — | |
(f) Effect on the expense ratio was not greater than 0.005%
(g) Portfolio turnover rate is calculated at the fund level.
See accompanying notes to financial statements.
198
| | Institutional Class | |
| | Six Months
Ended
June 30, 2012
(unaudited) | | Year
Ended
December 31,
2011 | | Period
Ended
December 31,
2010 (a) | |
Net asset value, beginning of period | | $ | 7.62 | | $ | 8.79 | | $ | 7.84 | |
Investment Activities | | | | | | | |
Net investment income (loss) | | (.06 | ) | .04 | | .01 | |
Net realized and unrealized gain (loss) | | .12 | | (1.16 | ) | 1.02 | |
Total from investment activities | | .06 | | (1.12 | ) | 1.03 | |
Distributions from net investment income | | — | | (.05 | ) | (.08 | ) |
Short-Term Trading Fees | | — | | — | | — | |
Net asset value, end of period | | $ | 7.68 | | $ | 7.62 | | $ | 8.79 | |
Total Return (excluding account fees) (b) | | .79 | % | (12.70 | )% | 13.08 | % |
Ratios to Average Net Assets: (c) | | | | | | | |
Net investment income | | .33 | % | .70 | % | .51 | % |
Total expenses | | 3.28 | % | 2.81 | % | 8.09 | % |
Expenses waived or reimbursed (d) | | (1.45 | )% | (1.00 | )% | (6.48 | )% |
Net expenses (e) | | 1.83 | % | 1.81 | % | 1.61 | % |
Portfolio turnover rate (g) | | 177 | % | 163 | % | 104 | % |
Net assets, end of period (in thousands) | | $ | 1,559 | | $ | 2,458 | | $ | 3,970 | |
(a) | From March 1, 2010, commencement of operations. |
(b) | Total returns for periods less than one year are not annualized. Assumes investment at the net asset value at the beginning of the period, reinvestment of all distributions and a complete redemption of the investment at the net asset value at the end of the period. |
(c) | Ratios are annualized for periods of less than one year. |
(d) | Expenses waived or reimbursed reflect reductions to total expenses, as discussed in the notes to the financial statements. These amounts would increase the net investment loss ratio or decrease the net investment income ratio, as applicable, and decrease total returns had such reductions not occurred. |
(e) | The expense ratios shown above exclude the effect of reductions to total expenses for any expenses offset. Expense offset arrangements reduce total expenses, as discussed in the notes to financial statements. These amounts would increase the net investment loss ratio, or decrease the net investment income ratio, as applicable, had such reductions not occurred. The effect of expenses offset are as follows: |
| | Institutional Class | |
| | Six Months
Ended
June 30, 2012
(unaudited) | | Year
Ended
December 31,
2011 | | Period
Ended
December 31,
2010 (a) | |
Ratios to Average Net Assets: (c) | | | | | | | |
Expenses offset (f) | | — | | — | | — | |
(f) | Effect on the expense ratio was not greater than 0.005%. |
(g) | Portfolio turnover rate is calculated at the fund level. |
See accompanying notes to financial statements.
199
Financial Highlights
Global Resources Fund
For a capital share outstanding during the
| | Investor Class | |
| | Six Months
Ended
June 30, 2012 | | Year Ended December 31, | | Six Months
Ended
December 31, | | Year Ended June 30, | |
| | (unaudited) | | 2011 | | 2010 | | 2009 | | 2008* | | 2008 | | 2007 | |
Net asset value, beginning of period | | $ | 9.36 | | $ | 11.91 | | $ | 8.85 | | $ | 5.26 | | $ | 20.52 | | $ | 17.70 | | $ | 17.22 | |
Investment Activities | | | | | | | | | | | | | | | |
Net investment income (loss) | | .01 | | (.19 | ) | (.09 | ) | (.01 | ) | (.02 | )** | .05 | ** | .21 | |
Net realized and unrealized gain (loss) | | (.23 | ) | (2.02 | ) | 3.44 | | 3.60 | | (13.92 | )** | 5.86 | ** | 2.86 | |
Total from investment activities | | (.22 | ) | (2.21 | ) | 3.35 | | 3.59 | | (13.94 | ) | 5.91 | | 3.07 | |
Distributions | | | | | | | | | | | | | | | |
From net investment income | | — | | (.34 | ) | (.29 | ) | — | | — | | (.95 | ) | (.88 | ) |
From net realized gains | | — | | — | | — | | — | | (1.32 | ) | (2.14 | ) | (1.71 | ) |
Total distributions | | — | | (.34 | ) | (.29 | ) | — | | (1.32 | ) | (3.09 | ) | (2.59 | ) |
Short-Term Trading Fees **(a) | | — | | — | | — | | — | | — | | — | | — | |
Net asset value, end of period | | $ | 9.14 | | $ | 9.36 | | $ | 11.91 | | $ | 8.85 | | $ | 5.26 | | $ | 20.52 | | $ | 17.70 | |
Total Return (excluding account fees) (b) | | (2.35 | )% | (18.69 | )% | 38.00 | % | 68.25 | % | (67.70 | )% | 37.59 | % | 20.94 | % |
Ratios to Average Net Assets: (c) | | | | | | | | | | | | | | | |
Net investment income (loss) | | .28 | % | (.79 | )% | (1.04 | )% | (.08 | )% | (.34 | )% | .28 | % | .74 | % |
Total expenses | | 1.48 | % | 1.72 | % | 1.73 | % | 1.64 | % | 1.20 | % | .88 | % | .95 | % |
Expenses waived or reimbursed (d) | | — | | — | | — | | (.17 | )% | (.12 | )% | — | | — | |
Net expenses (e) | | 1.48 | % | 1.72 | % | 1.73 | % | 1.47 | % | 1.08 | % | .88 | % | .95 | % |
Portfolio turnover rate (g) | | 56 | % | 232 | % | 145 | % | 189 | % | 100 | % | 133 | % | 122 | % |
Net assets, end of period (in thousands) | | $ | 456,300 | | $ | 551,793 | | $ | 911,559 | | $ | 740,072 | | $ | 464,524 | | $ | 2,010,581 | | $ | 1,383,250 | |
* | Effective December 31, 2008, the fiscal year changed to December 31. |
** | Based on average monthly shares outstanding. |
(a) | The per share amount does not round to a full penny. |
(b) | Total returns for periods less than one year are not annualized. Assumes investment at the net asset value at the beginning of the period, reinvestment of all distributions and a complete redemption of the investment at the net asset value at the end of the period. |
(c) | Ratios are annualized for periods of less than one year. |
(d) | Expenses waived or reimbursed reflect reductions to total expenses, as discussed in the notes to the financial statements. These amounts would increase the net investment loss ratio or decrease the net investment income ratio, as applicable, and decrease total returns had such reductions not occurred. |
(e) | The net expense ratios shown above reflect expenses after waivers and reimbursements but exclude the effect of reductions to total expenses for any expenses offset. Expense offset arrangements reduce total expenses, as discussed in the notes to the financial statements. These amounts would increase the net investment loss ratio, or decrease the net investment income ratio, as applicable, had such reductions not occurred. The effect of expenses offset are as follows: |
| | Investor Class | |
| | Six Months
Ended
June 30, 2012 | | Year Ended December 31, | | Six Months
Ended
December 31, | | Year Ended June 30, | |
| | (unaudited) | | 2011 | | 2010 | | 2009 | | 2008* | | 2008 | | 2007 | |
Ratios to Average Net Assets: (c) | | | | | | | | | | | | | | | |
Expenses offset | | — | (f) | — | (f) | — | (f) | — | (f) | — | (f) | (0.01 | )% | (0.01 | )% |
(f) | Effect on the expense ratio was not greater than 0.005%. |
(g) | Portfolio turnover rate is calculated at the fund level. |
See accompanying notes to financial statements.
200
| | Institutional Class | |
| | Six Months
Ended
June 30, 2012
(unaudited) | | Year
Ended
December 31,
2011 | | Period
Ended
December 31,
2010 (a) | |
Net asset value, beginning of period | | $ | 9.39 | | $ | 11.98 | | $ | 8.87 | |
Investment Activities | | | | | | | |
Net investment income (loss) | | .08 | | — | *(b) | (.01 | ) |
Net realized and unrealized gain (loss) | | (.28 | ) | (2.17 | )* | 3.41 | |
Total from investment activities | | (.20 | ) | (2.17 | ) | 3.40 | |
Distributions from net investment income | | — | | (.42 | ) | (.29 | ) |
Short-Term Trading Fees *(b) | | — | | — | | — | |
Net asset value, end of period | | $ | 9.19 | | $ | 9.39 | | $ | 11.98 | |
Total Return (excluding account fees) (c) | | (2.13 | )% | (18.23 | )% | 38.53 | % |
Ratios to Average Net Assets: (d) | | | | | | | |
Net investment income (loss) | | .73 | % | (.02 | )% | (.35 | )% |
Total expenses | | 1.16 | % | 1.29 | % | 1.74 | % |
Expenses waived or reimbursed (e) | | (.16 | )% | (.20 | )% | (.66 | )% |
Net expenses (f) | | 1.00 | % | 1.09 | % | 1.08 | % |
Portfolio turnover rate (h) | | 56 | % | 232 | % | 145 | % |
Net assets, end of period (in thousands) | | $ | 74,304 | | $ | 55,985 | | $ | 17,923 | |
* | Based on average monthly shares outstanding. |
(a) | From March 1, 2010, commencement of operations. |
(b) | The per share amount does not round to a full penny. |
(c) | Total returns for periods less than one year are not annualized. Assumes investment at the net asset value at the beginning of the period, reinvestment of all distributions and a complete redemption of the investment at the net asset value at the end of the period. |
(d) | Ratios are annualized for periods of less than one year. |
(e) | Expenses waived or reimbursed reflect reductions to total expenses, as discussed in the notes to the financial statements. These amounts would increase the net investment loss ratio or decrease the net investment income ratio, as applicable, and decrease total returns had such reductions not occurred. |
(f) | The net expense ratios shown above reflect expenses after waivers and reimbursements but exclude the effect of reductions to total expenses for any expenses offset. Expense offset arrangements reduce total expenses, as discussed in the notes to the financial statements. These amounts would increase the net investment loss ratio, or decrease the net investment income ratio, as applicable, had such reductions not occurred. The effect of expenses offset are as follows: |
| | Institutional Class | |
| | Six Months
Ended
June 30, 2012
(unaudited) | | Year
Ended
December 31,
2011 | | Period
Ended
December 31,
2010 (a) | |
Ratios to Average Net Assets: (d) | | | | | | | |
Expenses offset (g) | | — | | — | | — | |
(g) | Effect on the expense ratio was not greater than 0.005%. |
(h) | Portfolio turnover rate is calculated at the fund level. |
See accompanying notes to financial statements.
201
Financial Highlights
World Precious Minerals Fund
For a capital share outstanding during the
| | Investor Class | |
| | Six Months
Ended
June 30, 2012 | | Year Ended December 31, | | Six Months
Ended
December 31, | | Year Ended June 30, | |
| | (unaudited) | | 2011 | | 2010 | | 2009 | | 2008* | | 2008 | | 2007 | |
Net asset value, beginning of period | | $ | 13.18 | | $ | 22.28 | | $ | 17.42 | | $ | 9.56 | | $ | 25.32 | | $ | 28.34 | | $ | 28.86 | |
Investment Activities | | | | | | | | | | | | | | | |
Net investment income (loss) | | (.24 | ) | (.32 | ) | (.32 | )** | (.18 | ) | (.06 | )** | (.13 | )** | — | ** |
Net realized and unrealized gain (loss) | | (2.17 | ) | (6.76 | ) | 8.16 | ** | 8.71 | | (13.65 | )** | 3.70 | ** | 3.02 | |
Total from investment activities | | (2.41 | ) | (7.08 | ) | 7.84 | | 8.53 | | (13.71 | ) | 3.57 | | 3.02 | |
Distributions | | | | | | | | | | | | | | | |
From net investment income | | — | | (2.02 | ) | (2.98 | ) | (.67 | ) | — | | (3.25 | ) | (1.52 | ) |
From net realized gains | | — | | — | | — | | — | | (2.05 | ) | (3.35 | ) | (2.04 | ) |
Total distributions | | — | | (2.02 | ) | (2.98 | ) | (.67 | ) | (2.05 | ) | (6.60 | ) | (3.56 | ) |
Short-Term Trading Fees ** | | — | (a) | — | (a) | — | (a) | — | (a) | — | (a) | .01 | | .02 | |
Net asset value, end of period | | $ | 10.77 | | $ | 13.18 | | $ | 22.28 | | $ | 17.42 | | $ | 9.56 | | $ | 25.32 | | $ | 28.34 | |
Total Return (excluding account fees) (b) | | (18.29 | )% | (32.58 | )% | 45.38 | % | 89.50 | % | (51.23 | )% | 14.14 | % | 11.48 | % |
Ratios to Average Net Assets: (c) | | | | | | | | | | | | | | | |
Net investment income (loss) | | (.98 | )% | (1.43 | )% | (1.68 | )% | (1.32 | )% | (.80 | )% | (.43 | )% | .06 | % |
Total expenses | | 1.38 | % | 1.67 | % | 1.84 | % | 1.75 | % | 1.36 | % | .97 | % | .99 | % |
Expenses waived or reimbursed (d) | | — | | — | | — | | (.17 | )% | (.11 | )% | — | | — | |
Net expenses (e) | | 1.38 | % | 1.67 | % | 1.84 | % | 1.58 | % | 1.25 | % | .97 | % | .99 | % |
Portfolio turnover rate (g) | | 21 | % | 96 | % | 68 | % | 72 | % | 27 | % | 58 | % | 54 | % |
Net assets, end of period (in thousands) | | $ | 322,719 | | $ | 436,504 | | $ | 826,598 | | $ | 639,035 | | $ | 359,120 | | $ | 949,014 | | $ | 923,779 | |
* | Effective December 31, 2008, the fiscal year changed to December 31. |
** | Based on average monthly shares outstanding. |
(a) | The per share amount does not round to a full penny. |
(b) | Total returns for periods less than one year are not annualized. Assumes investment at the net asset value at the beginning of the period, reinvestment of all distributions and a complete redemption of the investment at the net asset value at the end of the period. |
(c) | Ratios are annualized for periods of less than one year. |
(d) | Expenses waived or reimbursed reflect reductions to total expenses, as discussed in the notes to the financial statements. These amounts would increase the net investment loss ratio or decrease the net investment income ratio, as applicable, and decrease total returns had such reductions not occurred. |
(e) | The net expense ratios shown above reflect expenses after waivers and reimbursements but exclude the effect of reductions to total expenses for any expenses offset. Expense offset arrangements reduce total expenses, as discussed in the notes to the financial statements. These amounts would increase the net investment loss ratio, or decrease the net investment income ratio, as applicable, had such reductions not occurred. The effect of expenses offset are as follows: |
| | Investor Class | |
| | Six Months
Ended
June 30, 2012 | | Year Ended December 31, | | Six Months
Ended
December 31, | | Year Ended June 30, | |
| | (unaudited) | | 2011 | | 2010 | | 2009 | | 2008* | | 2008 | | 2007 | |
Ratios to Average Net Assets: (c) | | | | | | | | | | | | | | | |
Expenses offset (f) | | — | | — | | — | | — | | — | | — | | — | |
(f) | Effect on the expense ratio was not greater than 0.005%. |
(g) | Portfolio turnover rate is calculated at the fund level. |
See accompanying notes to financial statements.
202
| | Institutional Class | |
| | Six Months
Ended
June 30, 2012
(unaudited) | | Year
Ended
December 31,
2011 | | Period
Ended
December 31,
2010 (a) | |
Net asset value, beginning of period | | $ | 13.10 | | $ | 22.29 | | $ | 17.36 | |
Investment Activities | | | | | | | |
Net investment loss | | (.33 | ) | (.16 | )* | (.10 | )* |
Net realized and unrealized gain (loss) | | (2.03 | ) | (6.84 | )* | 8.14 | * |
Total from investment activities | | (2.36 | ) | (7.00 | ) | 8.04 | |
Distributions from net investment income | | — | | (2.19 | ) | (3.11 | ) |
Short-Term Trading Fees | | — | | — | | — | |
Net asset value, end of period | | $ | 10.74 | | $ | 13.10 | | $ | 22.29 | |
Total Return (excluding account fees) (b) | | (18.02 | )% | (32.28 | )% | 46.72 | % |
Ratios to Average Net Assets: (c) | | | | | | | |
Net investment loss | | (.42 | )% | (.87 | )% | (.86 | )% |
Total expenses | | 2.81 | % | 2.38 | % | 15.19 | % |
Expenses waived or reimbursed (d) | | (2.00 | )% | (1.27 | )% | (14.06 | )% |
Net expenses (e) | | .81 | % | 1.11 | % | 1.13 | % |
Portfolio turnover rate (g) | | 21 | % | 96 | % | 68 | % |
Net assets, end of period (in thousands) | | $ | 1,084 | | $ | 1,683 | | $ | 2,233 | |
* | Based on average monthly shares outstanding. |
(a) | From March 1, 2010, commencement of operations. |
(b) | Total returns for periods less than one year are not annualized. Assumes investment at the net asset value at the beginning of the period, reinvestment of all distributions and a complete redemption of the investment at the net asset value at the end of the period. |
(c) | Ratios are annualized for periods of less than one year. |
(d) | Expenses waived or reimbursed reflect reductions to total expenses, as discussed in the notes to the financial statements. These amounts would increase the net investment loss ratio or decrease the net investment income ratio, as applicable, and decrease total returns had such reductions not occurred. |
(e) | The net expense ratios shown above reflect expenses after waivers and reimbursements but exclude the effect of reductions to total expenses for any expenses offset. Expense offset arrangements reduce total expenses, as discussed in the notes to the financial statements. These amounts would increase the net investment loss ratio, or decrease the net investment income ratio, as applicable, had such reductions not occurred. The effect of expenses offset are as follows: |
| | Institutional Class | |
| | Six Months
Ended
June 30, 2012
(unaudited) | | Year
Ended
December 31,
2011 | | Period
Ended
December 31,
2010 (a) | |
Ratios to Average Net Assets: (c) | | | | | | | |
Expenses offset (f) | | — | | — | | — | |
(f) | Effect on the expense ratio was not greater than 0.005%. |
(g) | Portfolio turnover rate is calculated at the fund level. |
See accompanying notes to financial statements.
203
Financial Highlights
Gold and Precious Metals Fund
For a capital share outstanding during the
| | Investor Class | |
| | Six Months
Ended
June 30, 2012 | | Year Ended December 31, | | Six Months
Ended
December 31, | | Year Ended June 30, | |
| | (unaudited) | | 2011 | | 2010 | | 2009 | | 2008* | | 2008 | | 2007 | |
Net asset value, beginning of period | | $ | 12.61 | | $ | 19.60 | | $ | 15.46 | | $ | 10.83 | | $ | 17.18 | | $ | 14.99 | | $ | 15.48 | |
Investment Activities | | | | | | | | | | | | | | | |
Net investment income (loss) | | (.05 | ) | (.17 | ) | (.21 | ) | (.17 | )** | (.03 | ) | (.08 | )** | .05 | |
Net realized and unrealized gain (loss) | | (1.75 | ) | (4.28 | ) | 5.91 | | 4.84 | | (5.59 | ) | 4.69 | | (.56 | ) |
Total from investment activities | | (1.80 | ) | (4.45 | ) | 5.70 | | 4.67 | | (5.62 | ) | 4.61 | | (.51 | ) |
Distributions | | | | | | | | | | | | | | | |
From net investment income | | — | | — | | (.26 | ) | (.04 | ) | — | | — | | — | |
From net realized gains | | — | | (2.54 | ) | (1.31 | ) | — | | (.73 | ) | (2.43 | ) | — | |
Total distributions | | — | | (2.54 | ) | (1.57 | ) | (.04 | ) | (.73 | ) | (2.43 | ) | — | |
Short-Term Trading Fees ** | | — | (a) | — | (a) | .01 | | — | (a) | — | (a) | .01 | | .02 | |
Net asset value, end of period | | $ | 10.81 | | $ | 12.61 | | $ | 19.60 | | $ | 15.46 | | $ | 10.83 | | $ | 17.18 | | $ | 14.99 | |
Total Return (excluding account fees) (b) | | (14.27 | )% | (23.97 | )% | 36.88 | % | 43.11 | % | (31.51 | )% | 33.49 | % | (3.17 | )% |
Ratios to Average Net Assets: (c) | | | | | | | | | | | | | | | |
Net investment income (loss) | | (.59 | )% | (1.06 | )% | (1.46 | )% | (1.16 | )% | (.66 | )% | (.41 | )% | .31 | % |
Total expenses | | 1.44 | % | 1.56 | % | 1.80 | % | 1.69 | % | 1.54 | % | 1.27 | % | 1.29 | % |
Expenses waived or reimbursed (d) | | — | | — | | — | | (.15 | )% | (.15 | )% | — | | — | |
Net expenses (e) | | 1.44 | % | 1.56 | % | 1.80 | % | 1.54 | % | 1.39 | % | 1.27 | % | 1.29 | % |
Portfolio turnover rate | | 45 | % | 155 | % | 103 | % | 135 | % | 61 | % | 93 | % | 72 | % |
Net assets, end of period (in thousands) | | $ | 155,570 | | $ | 195,087 | | $ | 300,949 | | $ | 234,393 | | $ | 192,206 | | $ | 259,022 | | $ | 178,762 | |
* | Effective December 31, 2008, the fiscal year changed to December 31. |
** | Based on average monthly shares outstanding. |
(a) | The per share amount does not round to a full penny. |
(b) | Total returns for periods less than one year are not annualized. Assumes investment at the net asset value at the beginning of the period, reinvestment of all distributions and a complete redemption of the investment at the net asset value at the end of the period. |
(c) | Ratios are annualized for periods of less than one year. |
(d) | Expenses waived or reimbursed reflect reductions to total expenses, as discussed in the notes to the financial statements. These amounts would increase the net investment loss ratio or decrease the net investment income ratio, as applicable, and decrease total returns had such reductions not occurred. |
(e) | The net expense ratios shown above reflect expenses after waivers and reimbursements but exclude the effect of reductions to total expenses for any expenses offset. Expense offset arrangements reduce total expenses, as discussed in the notes to the financial statements. These amounts would increase the net investment loss ratio, or decrease the net investment income ratio, as applicable, had such reductions not occurred. The effect of expenses offset are as follows: |
| | Investor Class | |
| | Six Months
Ended
June 30, 2012 | | Year Ended December 31, | | Six Months
Ended
December 31, | | Year Ended June 30, | |
| | (unaudited) | | 2011 | | 2010 | | 2009 | | 2008* | | 2008 | | 2007 | |
Ratios to Average Net Assets: (c) | | | | | | | | | | | | | | | |
Expenses offset | | — | (f) | — | (f) | — | (f) | — | (f) | — | (f) | — | (f) | (0.01 | )% |
(f) | Effect on the expense ratio was not greater than 0.005%. |
See accompanying notes to financial statements.
204
Financial Highlights
Eastern European Fund
For a capital share outstanding during the
| | Investor Class | |
| | Six Months
Ended
June 30, 2012 | | Year Ended December 31, | | Two Months
Ended
December 31, | | Year Ended October 31, | |
| | (unaudited) | | 2011 | | 2010 | | 2009 | | 2008*/** | | 2008*** | | 2007*** | |
Net asset value, beginning of period | | $ | 7.79 | | $ | 10.81 | | $ | 9.11 | | $ | 5.12 | | $ | 6.35 | | $ | 19.91 | | $ | 15.44 | |
Investment Activities | | | | | | | | | | | | | | | |
Net investment income (loss) | | .16 | | .03 | | (.04 | ) | — | (a) | (.03 | ) | (.03 | ) | (.10 | ) |
Net realized and unrealized gain (loss) | | .23 | | (3.05 | ) | 1.74 | | 3.99 | | (1.20 | ) | (10.10 | ) | 6.83 | |
Total from investment activities | | .39 | | (3.02 | ) | 1.70 | | 3.99 | | (1.23 | ) | (10.13 | ) | 6.73 | |
Distributions | | | | | | | | | | | | | | | |
From net investment income | | — | | — | | — | | — | | — | | — | | (.29 | ) |
From net realized gains | | — | | — | | — | | — | | — | | (3.46 | ) | (1.98 | ) |
Total distributions | | — | | — | | — | | — | | — | | (3.46 | ) | (2.27 | ) |
Short-Term Trading Fees **** | | — | (a) | — | (a) | — | (a) | — | (a) | — | (a) | .03 | | .01 | |
Net asset value, end of period | | $ | 8.18 | | $ | 7.79 | | $ | 10.81 | | $ | 9.11 | | $ | 5.12 | | $ | 6.35 | | $ | 19.91 | |
Total Return (excluding account fees) (b) | | 5.01 | % | (27.94 | )% | 18.66 | % | 77.93 | % | (19.37 | )% | (61.36 | )% | 48.74 | % |
Ratios to Average Net Assets: (c) | | | | | | | | | | | | | | | |
Net investment income (loss) | | 3.45 | % | .25 | % | (.36 | )% | — | (f) | (3.02 | )% | (.15 | )% | (.61 | )% |
Total expenses | | 2.17 | % | 1.98 | % | 1.91 | % | 2.04 | % | 2.37 | % | 1.96 | % | 1.98 | % |
Expenses waived or reimbursed (d) | | — | | — | | — | | (.08 | )% | (.27 | )% | — | (f) | — | |
Net expenses (e) | | 2.17 | % | 1.98 | % | 1.91 | % | 1.96 | % | 2.10 | % | 1.96 | % | 1.98 | % |
Portfolio turnover rate | | 41 | % | 85 | % | 69 | % | 80 | % | 11 | % | 82 | % | 54 | % |
Net assets, end of period (in thousands) | | $ | 177,019 | | $ | 193,599 | | $ | 440,037 | | $ | 464,409 | | $ | 317,320 | | $ | 415,494 | | $ | 1,582,707 | |
| | | | | | | | | | | | | | | | | | | | | | | |
* Effective December 31, 2008, the fiscal year changed to December 31.
** Effective November 7, 2008, U.S. Global Investors, Inc. assumed management of the fund from the former subadviser.
*** The per share amounts shown were adjusted to reflect the 3-for-1 stock split which was effective on May 27, 2008.
**** Based on average monthly shares outstanding.
(a) The per share amount does not round to a full penny.
(b) Total returns for periods less than one year are not annualized. Assumes investment at the net asset value at the beginning of the period, reinvestment of all distributions and a complete redemption of the investment at the net asset value at the end of the period.
(c) Ratios are annualized for periods of less than one year.
(d) Expenses waived or reimbursed reflect reductions to total expenses, as discussed in the notes to the financial statements. These amounts would increase the net investment loss ratio or decrease the net investment income ratio, as applicable, and decrease total returns had such reductions not occurred.
(e) The net expense ratios shown above reflect expenses after waivers and reimbursements but exclude the effect of reductions to total expenses for any expenses offset. Expense offset arrangements reduce total expenses, as discussed in the notes to the financial statements. These amounts would increase the net investment loss ratio, or decrease the net investment income ratio, as applicable, had such reductions not occurred. The effect of expenses offset are as follows:
| | Investor Class | |
| | Six Months
Ended
June 30, 2012 | | Year Ended December 31, | | Two Months
Ended
December 31, | | Year Ended October 31, | |
| | (unaudited) | | 2011 | | 2010 | | 2009 | | 2008*/** | | 2008*** | | 2007*** | |
Ratios to Average Net Assets: (c) | | | | | | | | | | | | | | | |
Expenses offset | | — | (f) | — | (f) | — | (f) | — | (f) | — | (f) | (0.01 | )% | (0.01 | )% |
(f) Effect on the ratio was not greater than 0.005%.
See accompanying notes to financial statements.
205
Financial Highlights
Global Emerging Markets Fund
For a capital share outstanding during the
| | Investor Class | |
| | Six Months
Ended
June 30, 2012 | | Year Ended December 31, | | Two Months
Ended
December 31, | | Year Ended October 31, | |
| | (unaudited) | | 2011 | | 2010 | | 2009 | | 2008*/** | | 2008 | | 2007 | |
Net asset value, beginning of period | | $ | 6.82 | | $ | 9.17 | | $ | 7.95 | | $ | 5.29 | | $ | 5.94 | | $ | 21.88 | | $ | 13.93 | |
Investment Activities | | | | | | | | | | | | | | | |
Net investment income (loss) | | .02 | | (.07 | ) | (.11 | ) | (.05 | ) | (.01 | ) | (.43 | ) | (.13 | ) |
Net realized and unrealized gain (loss) | | .02 | | (2.28 | ) | 1.32 | | 2.71 | | (.56 | ) | (11.98 | ) | 9.18 | |
Total from investment activities | | .04 | | (2.35 | ) | 1.21 | | 2.66 | | (.57 | ) | (12.41 | ) | 9.05 | |
Distributions | | | | | | | | | | | | | | | |
From net investment income | | — | | — | | — | | — | | — | | (.46 | ) | — | |
From net realized gains | | — | | — | | — | | — | | — | | (3.11 | ) | (1.13 | ) |
From tax return of capital | | — | | — | | — | | — | | (.08 | ) | — | | — | |
Total distributions | | — | | — | | — | | — | | (.08 | ) | (3.57 | ) | (1.13 | ) |
Short-Term Trading Fees *** | | — | (a) | — | (a) | .01 | | — | (a) | — | (a) | .04 | | .03 | |
Net asset value, end of period | | $ | 6.86 | | $ | 6.82 | | $ | 9.17 | | $ | 7.95 | | $ | 5.29 | | $ | 5.94 | | $ | 21.88 | |
Total Return (excluding account fees) (b) | | .59 | % | (25.63 | )% | 15.35 | % | 50.28 | % | (9.59 | )% | (66.81 | )% | 69.52 | % |
Ratios to Average Net Assets (c): | | | | | | | | | | | | | | | |
Net investment income (loss) | | .65 | % | (.68 | )% | (1.22 | )% | (.77 | )% | (1.16 | )% | (1.01 | )% | (.92 | )% |
Total expenses | | 4.58 | % | 3.97 | % | 3.76 | % | 4.02 | % | 6.83 | % | 2.80 | % | 2.75 | % |
Expenses waived or reimbursed (d) | | (1.73 | )% | (1.01 | )% | (.77 | )% | (1.38 | )% | (4.33 | )% | (.30 | )% | (.39 | )% |
Net expenses (e) | | 2.85 | % | 2.96 | % | 2.99 | % | 2.64 | % | 2.50 | % | 2.50 | % | 2.36 | % |
Portfolio turnover rate | | 225 | % | 250 | % | 190 | % | 166 | % | 21 | % | 83 | % | 125 | % |
Net assets, end of period (in thousands) | | $ | 7,962 | | $ | 8,224 | | $ | 13,403 | | $ | 13,819 | | $ | 9,663 | | $ | 11,708 | | $ | 59,621 | |
* Effective December 31, 2008, the fiscal year changed to December 31.
** Effective November 7, 2008, U.S. Global Investors, Inc. assumed management of the fund from the former subadviser.
*** Based on average monthly shares outstanding.
(a) The per share amount does not round to a full penny.
(b) Total returns for periods less than one year are not annualized. Assumes investment at the net asset value at the beginning of the period, reinvestment of all distributions and a complete redemption of the investment at the net asset value at the end of the period.
(c) Ratios are annualized for periods of less than one year.
(d) Expenses waived or reimbursed reflect reductions to total expenses, as discussed in the notes to the financial statements. These amounts would increase the net investment loss ratio or decrease the net investment income ratio, as applicable, and decrease total returns had such reductions not occurred.
(e) The net expense ratios shown above reflect expenses after waivers and reimbursements but exclude the effect of reductions to total expenses for any expenses offset. Expense offset arrangements reduce total expenses, as discussed in the notes to the financial statements. These amounts would increase the net investment loss ratio, or decrease the net investment income ratio, as applicable, had such reductions not occurred. The effect of expenses offset are as follows:
| | Investor Class | |
| | Six Months
Ended
June 30, 2012 | | Year Ended December 31, | | Two Months
Ended
December 31, | | Year Ended October 31, | |
| | (unaudited) | | 2011 | | 2010 | | 2009 | | 2008*/** | | 2008 | | 2007 | |
Ratios to Average Net Assets: (c) | | | | | | | | | | | | | | | |
Expenses offset | | — | (f) | — | (f) | — | (f) | — | (f) | — | (f) | — | (f) | n/a | |
(f) Effect on the expense ratio was not greater than 0.005%.
See accompanying notes to financial statements.
206
Financial Highlights
China Region Fund
For a capital share outstanding during the
| | Investor Class | |
| | Six Months
Ended
June 30, 2012 | | Year Ended December 31, | | Six Months
Ended
December 31, | | Year Ended June 30, | |
| | (unaudited) | | 2011 | | 2010 | | 2009 | | 2008* | | 2008 | | 2007 | |
Net asset value, beginning of period | | $ | 6.81 | | $ | 9.47 | | $ | 8.36 | | $ | 5.59 | | $ | 9.09 | | $ | 12.55 | | $ | 8.71 | |
Investment Activities | | | | | | | | | | | | | | | |
Net investment income (loss) | | .04 | | (.08 | ) | (.12 | ) | (.05 | ) | (.02 | )** | (.03 | )** | — | ** |
Net realized and unrealized gain (loss) | | (.02 | ) | (2.59 | ) | 1.22 | | 2.81 | | (3.49 | )** | (.27 | )** | 3.98 | ** |
Total from investment activities | | .02 | | (2.67 | ) | 1.10 | | 2.76 | | (3.51 | ) | (.30 | ) | 3.98 | |
Distributions | | | | | | | | | | | | | | | |
From net investment income | | — | | — | | — | | — | | — | | (.10 | ) | (.16 | ) |
From net realized gains | | — | | — | | — | | — | | — | | (2.93 | ) | — | |
From tax return of capital | | — | | — | | — | | — | | — | | (.17 | ) | — | |
Total distributions | | — | | — | | — | | — | | — | | (3.20 | ) | (.16 | ) |
Short-Term Trading Fees ** | | — | (a) | .01 | | .01 | | .01 | | .01 | | .04 | | .02 | |
Net asset value, end of period | | $ | 6.83 | | $ | 6.81 | | $ | 9.47 | | $ | 8.36 | | $ | 5.59 | | $ | 9.09 | | $ | 12.55 | |
Total Return (excluding account fees) (b) | | .29 | % | (28.09 | )% | 13.28 | % | 49.55 | % | (38.50 | )% | (8.58 | )% | 46.34 | % |
Ratios to Average Net Assets: (c) | | | | | | | | | | | | | | | |
Net investment income (loss) | | 1.12 | % | (.64 | )% | (1.02 | )% | (.79 | )% | (.47 | )% | (.26 | )% | .02 | % |
Total expenses | | 2.49 | % | 2.49 | % | 2.39 | % | 2.47 | % | 2.46 | % | 1.95 | % | 2.02 | % |
Expenses waived or reimbursed (d) | | (.26 | )% | (.08 | )% | — | | (.45 | )% | (.27 | )% | — | | — | |
Net expenses (e) | | 2.23 | % | 2.41 | % | 2.39 | % | 2.02 | % | 2.19 | % | 1.95 | % | 2.02 | % |
Portfolio turnover rate | | 126 | % | 426 | % | 242 | % | 327 | % | 117 | % | 208 | % | 208 | % |
Net assets, end of period (in thousands) | | $ | 28,272 | | $ | 30,635 | | $ | 51,843 | | $ | 56,323 | | $ | 38,348 | | $ | 81,109 | | $ | 93,805 | |
* Effective December 31, 2008, the fiscal year changed to December 31.
** Based on average monthly shares outstanding.
(a) The per share amount does not round to a full penny.
(b) Total returns for periods less than one year are not annualized. Assumes investment at the net asset value at the beginning of the period, reinvestment of all distributions and a complete redemption of the investment at the net asset value at the end of the period.
(c) Ratios are annualized for periods of less than one year.
(d) Expenses waived or reimbursed reflect reductions to total expenses, as discussed in the notes to the financial statements. These amounts would increase the net investment loss ratio or decrease the net investment income ratio, as applicable, and decrease total returns had such reduction not occurred.
(e) The net expense ratios shown above reflect expenses after waivers and reimbursements but exclude the effect of reductions to total expenses for any expenses offset. Expense offset arrangements reduce total expenses, as discussed in the notes to financial statements. These amounts would increase the net investment loss ratio, or decrease the net investment income ratio, as applicable, had such reductions not occurred. The effect of expenses offset are as follows:
| | Investor Class | |
| | Six Months
Ended
June 30, 2012 | | Year Ended December 31, | | Six Months
Ended
December 31, | | Year Ended June 30, | |
| | (unaudited) | | 2011 | | 2010 | | 2009 | | 2008* | | 2008 | | 2007 | |
Ratios to Average Net Assets: (c) | | | | | | | | | | | | | | | |
Expenses offset (f) | | — | | — | | — | | — | | — | | — | | — | |
(f) Effect on the expense ratio was not greater than 0.005%.
See accompanying notes to financial statements.
207
Additional Information (unaudited)
Proxy Voting
A description of the policies and procedures that the Funds use to determine how to vote proxies relating to portfolio securities is available without charge, upon request, by calling 1-800-US-FUNDS (1-800-873-8637). It also appears in the Funds’ statement of additional information (Form 485B), which can be found on the SEC’s website at www.sec.gov.
Information regarding how the Funds voted proxies relating to portfolio securities during the most recent 12-month period ended June 30 is available without charge, upon request, by calling 1-800-US-FUNDS (1-800-873-8637) or accessing the Funds’ Form N-PX on the SEC’s website at www.sec.gov.
Availability of Quarterly Portfolio Schedules
The Funds provide complete lists of holdings four times in each fiscal year, at the quarter-ends. For the second and fourth quarters, the lists appear in the Funds’ semi-annual and annual reports to shareholders. For the first and third quarters, the Funds file the lists with the SEC on Form N-Q. Shareholders can look up the Funds’ Forms N-Q on the SEC’s website at www.sec.gov. You may also visit or call the SEC’s Public Room in Washington, D.C. (1-202-942-8090) or send a request plus a duplicating fee to the SEC, Public Reference Section, Washington, DC 20549-0102 or by electronic request at the following e-mail address: publicinfo@sec.gov.
208
Rev. 08/2010
FACTS | | WHAT DOES U.S. GLOBAL INVESTORS DO WITH YOUR PERSONAL INFORMATION? |
| | |
Why? | | Financial companies choose how they share your personal information. Federal law gives consumers the right to limit some but not all sharing. Federal law also requires us to tell you how we collect, share, and protect your personal information. Please read this notice carefully to understand what we do. |
| | |
What? | | The types of personal information we collect and share depend on the product or service you have with us. This information can include: · Social Security number and account balances · transaction history and checking account information · account transactions and wire transfer instructions When you are no longer our customer, we continue to share your information as described in this notice. |
| | |
How? | | All financial companies need to share customers’ personal information to run their everyday business. In the section below, we list the reasons financial companies can share their customers’ personal information; the reasons U.S. Global Investors chooses to share; and whether you can limit this sharing. |
Reasons we can share your
personal information | | Does U.S.Global
Investors share? | | Can you limit
this sharing? |
For our everyday business purposes —
such as to process your transactions, maintain your account(s), respond to court orders and legal investigations, or report to credit bureaus | | Yes | | No |
| | | | |
For our marketing purposes —
to offer our products and services to you | | Yes | | No |
| | | | |
For joint marketing with other financial companies | | No | | We don’t share |
| | | | |
For our affiliates’ everyday business purposes —
information about your transactions and experiences | | No | | We don’t share |
| | | | |
For our affiliates’ everyday business purposes —
information about your creditworthiness | | No | | We don’t share |
| | | | |
For nonaffiliates to market to you | | No | | We don’t share |
Questions? | | Call 1-800-US-Funds (1-800-873-8637) or go to www.usfunds.com |
Who we are | | |
| | |
Who is providing this notice? | | U.S. Global Investors, Inc., U.S. Global Investors Funds, United Shareholder Services, Inc., and U.S. Global Brokerage, Inc. (collectively known as U.S. Global Investors) |
| | |
What we do | | |
| | |
How does U.S. Global Investors protect my personal information? | | To protect your personal information from unauthorized access and use, we use security measures that comply with federal law. These measures include computer safeguards and secured files and buildings. |
| | |
How does U.S. Global Investors collect my personal information? | | We collect your personal information, for example, when you
· open an account or buy securities from us
· direct us to sell your securities or give us your contact information
· tell us where to send the money |
| | |
Why can’t I limit all sharing? | | Federal law gives you the right to limit only · sharing for affiliates’ everyday business purposes — information about your creditworthiness · affiliates from using your information to market to you · sharing for nonaffiliates to market to you State laws and individual companies may give you additional rights to limit sharing. |
| | |
Definitions | | |
| | |
Affiliates | | Companies related by common ownership or control. They can be financial and nonfinancial companies. · Our affiliates include U.S. Global Investors, Inc., U.S. Global Investors Funds, United Shareholder Services, Inc., and U.S. Global Brokerage, Inc. |
| | |
Nonaffiliates | | Companies not related by common ownership or control. They can be financial and nonfinancial companies. · Nonaffiliates we share personal information with include companies that perform marketing on our behalf, printing and mailing companies, and companies that service your account(s). |
| | |
Joint marketing | | A formal agreement between nonaffiliated financial companies that together market financial products or services to you. · U.S. Global Investors doesn’t jointly market. |
2

P.O. Box 659405
San Antonio, Texas
78265-9604
Want to reduce paper waste?
You can receive this report and other important documents electronically. Please visit www.usfunds.com and sign up at Access My Account. If you need further assistance, please call us at 800-873-8637.
ITEM 2. CODE OF ETHICS.
Required only in annual report on Form N-CSR.
ITEM 3. AUDIT COMMITTEE FINANCIAL EXPERT.
Required only in annual report on Form N-CSR.
ITEM 4. PRINCIPAL ACCOUNTANT FEES AND SERVICES.
Required only in annual report on Form N-CSR.
ITEM 5. AUDIT COMMITTEE OF LISTED REGISTRANTS.
Required only in annual report on Form N-CSR.
ITEM 6. SCHEDULE OF INVESTMENTS.
Not applicable. The complete schedule of investments is included in Item 1 of this Form N-CSR.
ITEM 7. DISCLOSURE OF PROXY VOTING POLICIES AND PROCEDURES FOR CLOSED-END MANAGEMENT INVESTMENT COMPANIES.
Not applicable.
ITEM 8. PORTFOLIO MANAGERS OF CLOSED-END MANAGEMENT INVESTMENT COMPANIES.
Not applicable.
ITEM 9. PURCHASE OF EQUITY SECURITIES BY CLOSED-END MANAGEMENT INVESTMENT COMPANY AND AFFILIATED PURCHASERS.
Not applicable.
ITEM 10. SUBMISSION OF MATTERS TO A VOTE OF SECURITY HOLDERS.
Not applicable.
ITEM 11. CONTROLS AND PROCEDURES.
(a) The registrant’s president and treasurer have determined that the registrant’s disclosure controls and procedures are effective based on their evaluation of the disclosure controls and procedures as of a date within 90 days of the filing date of this report.
(b) There was no change in the registrant’s internal control over financial reporting that occurred in the registrant’s second fiscal quarter of the period covered by this report that has materially affected, or is reasonably likely to materially affect, the registrant’s internal control over financial reporting.
ITEM 12. EXHIBITS.
(a)(1) Required only in annual report on Form N-CSR.
(a)(2) Certifications of principal executive officer and principal financial officer pursuant to Rule 30a-2(a) under the Investment Company Act of 1940 (17CFR 270.30a-2(a)) and Section 302 of the Sarbanes-Oxley Act of 2002.
(b) Certifications of principal executive officer and principal financial officer pursuant to Rule 30a-2(b) under the Investment Company Act of 1940 (17CFR 270.30a-2(b)) and Section 906 of the Sarbanes-Oxley Act of 2002.
SIGNATURES
Pursuant to the requirements of the Securities Exchange Act of 1934 and the Investment Company Act of 1940, the registrant has duly caused this report to be signed on its behalf by the undersigned, thereunto duly authorized.
U.S. GLOBAL INVESTORS FUNDS
By: | /s/ Frank E. Holmes | |
| Frank E. Holmes |
| President, Chief Executive Officer |
| |
Date: | August 31, 2012 |
Pursuant to the requirements of the Securities Exchange Act of 1934 and the Investment Company Act of 1940, this report has been signed below by the following persons on behalf of the registrant and in the capacities and on the dates indicated.
By: | /s/ Frank E. Holmes | |
| Frank E. Holmes |
| President, Chief Executive Officer |
| |
Date: | August 31, 2012 |
| |
| |
By: | /s/ Catherine A. Rademacher | |
| Catherine A. Rademacher |
| Treasurer |
| |
Date: | August 31, 2012 |