As filed with the Securities and Exchange Commission on September 5, 2017
UNITED STATES
SECURITIES AND EXCHANGE COMMISSION
WASHINGTON, D.C. 20549
FORM N-CSR
CERTIFIED SHAREHOLDER REPORT OF REGISTERED MANAGEMENT
INVESTMENT COMPANIES
Investment Company Act file number 811-01800
U.S. GLOBAL INVESTORS FUNDS
Three Canal Plaza, Suite 600
Portland, Maine 04101
Jessica Chase, Principal Executive Officer
Three Canal Plaza, Suite 600
Portland, Maine 04101
207-347-2000
Date of fiscal year end: December 31
Date of reporting period: January 1, 2017 – June 30, 2017
ITEM 1. REPORT TO STOCKHOLDERS.
U.S. Global Investors Funds Semi-Annual Report
June 30, 2017

U.S. Global Investors Funds
Semi-Annual Report
June 30, 2017
(unaudited)
Table of Contents
Letter to Shareholders | 1 |
Portfolios of Investments | 10 |
Notes to Portfolios of Investments | 58 |
Statements of Assets and Liabilities | 68 |
Statements of Operations | 72 |
Statements of Changes in Net Assets | 76 |
Notes to Financial Statements | 82 |
Financial Highlights | 99 |
Additional Information | 110 |
Expense Example | 111 |
Privacy Policy | |
Nasdaq Symbols
U.S. Global Investors Funds
Investor Class | |
U.S. Government Securities Ultra-Short Bond Fund | UGSDX |
Near-Term Tax Free Fund | NEARX |
All American Equity Fund | GBTFX |
Holmes Macro Trends Fund | MEGAX |
Global Resources Fund | PSPFX |
World Precious Minerals Fund | UNWPX |
Gold and Precious Metals Fund | USERX |
Emerging Europe Fund | EUROX |
China Region Fund | USCOX |
| | |
Institutional Class | |
Global Resources Fund | PIPFX |
World Precious Minerals Fund | UNWIX |
| Atlantic Fund Services
3 Canal Plaza, Suite 600
Portland, ME
04101 |
U.S. Global Investors Funds | (unaudited) |
Dear Fellow Shareholder,
Thank you for your investment in U.S. Global Investors Funds. If you joined our investment family recently, welcome! And if you are a long-time shareholder, I want to especially thank you for your commitment.
We want to keep in touch with you!
If you aren’t already receiving our emails, please share your email address with us. This is a convenient way to be notified of fund updates, such as when quarterly fund fact sheets are published. Also, we like hearing from our shareholders so drop us a line at info@usfunds.com or give us a call at 1-800-US-FUNDS (1-800-873-8637).
Don’t Miss Out on Investor Alert!
The best way to receive timely updates on the events that impact your investments is to subscribe to our free e-newsletter, the Investor Alert. With a balanced analysis of the markets over the week that is comprehensive yet concise, the Investor Alert is written for you by the investment team with a special commentary from me. Your time is important, so read the newsletter that has won multiple awards from the Mutual Fund Education Alliance! Sign up at www.usfunds.com/subscribe. While you are there, also sign up for my CEO blog, Frank Talk, where I comment on current market topics.
Learning from the Past and Looking Ahead
The mid-year point is a good time to take another look at what we are doing with U.S. Global Investors Funds. We often discuss our investment process which combines a top-down, macro perspective with bottom-up, fundamental stock selection. This remains true with the ongoing trend in the asset management industry in using artificial intelligence and quantitative analysis. Industry influencers have been talking about something called “quantamental” investing. I believe this is more than a catchy phrase, but actually a term that formalizes what we have been diving into for some time—the combination of fundamental stock selection with computing power to screen and analyze large quantities of information. If you have attended one of the conferences where I’ve spoken in the last year, you may have heard my presentation titled “What’s Driving Gold: The Invasion of the Quants.”
If you are a regular reader of Frank Talk, you’ll recognize that we are using quantamental models in managing our funds. I’d like to take a look back and remind readers and shareholders of what we are doing.
Global Debt on Alert
Recently I wrote a blog post, “Mother of All Bubbles Keeps Gold in Focus,” which resonated with many of my readers. The record amount of global debt could potentially spell trouble for the investor who hasn’t adequately prepared with some allocation in a “safe haven.”
1
U.S. Global Investors Funds | (unaudited) |
According to the highly-respected Institute of International Finance (IIF), global debt levels reached an astronomical $217 trillion in the first quarter of 2017—that’s 327 percent of world gross domestic product (GDP). Notice that before the financial crisis, global debt was “only” around $150 trillion, meaning we’ve added close to $120 trillion in as little as a decade. Much of the leveraging occurred in emerging markets, specifically China, which is spending big on international infrastructure projects.
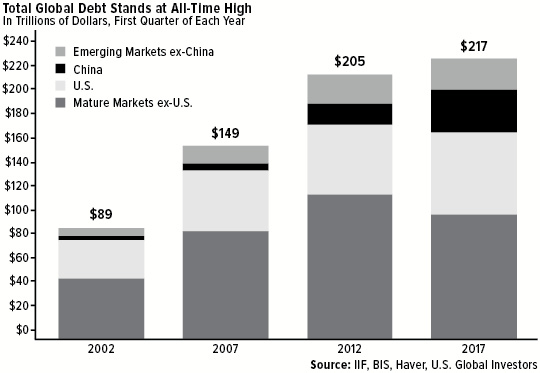
It goes without saying that this is a huge risk. Some are calling this mountain of debt “the mother of all bubbles,” and we all remember how the last two bubbles ended, in 2000 (the tech or dotcom bubble) and 2007 (the housing bubble).
And now big changes could be coming in the Federal Reserve’s monetary policy. In a recent address to the Economic Club of Las Vegas, President and CEO of the Federal Reserve Bank of San Francisco John Williams said the Fed will likely begin the process of monetary normalization as soon as next quarter. This includes unwinding the Fed’s $4.5 trillion balance sheet, composed of long-term Treasuries and mortgage-backed securities (MBS). The process could take up to four years to complete.
With the Fed removing the punchbowl of easy money, and investors facing the potential risk of recession, it is just prudent to have gold in your portfolio.
2
U.S. Global Investors Funds | (unaudited) |
Gold Prices Have Beaten the Market So Far this Century
You won’t want to miss this chart that I shared with readers recently. The price of gold has outperformed the S&P 500 Index so far this century, returning 86 percent more than the market if we index both asset classes at 100 on December 31, 1999. Over the past 17 years, the S&P 500 has undergone two major contractions, both of them resulting in a loss of around 40 percent. Gold, meanwhile, has held its value well, boosting its appeal as a portfolio diversifier.
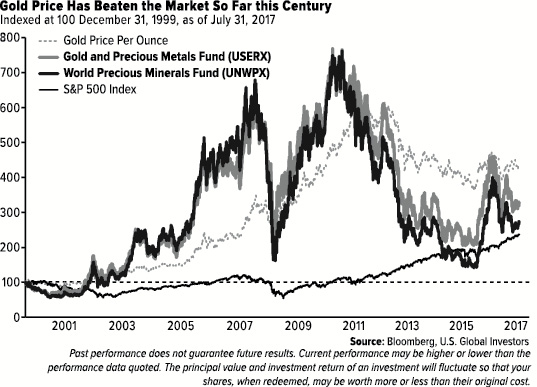
Our two gold funds have similarly outperformed the market so far this century, as you can see above. The Gold and Precious Metals Fund (USERX) and World Precious Minerals Fund (UNWPX) are co-managed by myself and precious metals expert Ralph Aldis. Not only do Ralph and I rely on fundamentals to make stock selection and weighting decisions, but we also maintain close, productive relationships with mining company management teams across the globe.
I have long advocated for a basic 10 percent allocation into gold—5 percent in physical gold such as bullion, and 5 percent in quality gold stocks and funds. And it is important to set your calendar to rebalance each year.
3
U.S. Global Investors Funds | (unaudited) |
New Year, New Models for Our Domestic Equity Funds
Back in January I introduced readers to a new investment methodology for our domestic equity funds, the All American Equity Fund (GBTFX) and the Holmes Macro Trends Fund (MEGAX).
For the All American Equity Fund, we seek to capture the performance of the “growthiest” companies in the fund’s benchmark, the S&P 500, by focusing on those whose most recent quarter’s sales per share is greater than the average of the previous four quarters. So if a company’s average sales per share for the past four quarters is $30, let’s say, it needs to show something higher than that in the current quarter to be considered for inclusion in the fund. In addition, we screen for companies whose cash flow return on invested capital (CFROIC) is above the average for the S&P 500 over the past 12 months.
Small- and mid-cap stocks have been an exciting place to be since the presidential election in November. These are the kinds of stocks that the Holmes Macro Trends Fund is focused on. Mid-cap companies are especially attractive because they’ve reached a point in their enterprise life cycle where the challenges inherent to smaller companies—raising capital early on and managing capacity growth, for example—are mostly behind them. At the same time, they remain dynamic enough for rapid growth to be possible.
That’s why mid-cap stocks account for 40 percent of our new MEGAX model. Meanwhile, 36 percent is in small caps, the remaining 24 percent in large caps.
To screen for the very best companies, we take a similar approach as GBTFX, focusing on those whose sales per share is greater than their average for the past four quarters.
Looking for Regulatory and Tax Reform
I’ve commented many times in my blog that in order for economic growth to occur, U.S. businesses need to see reform coming out of Washington, D.C. I mentioned in May in “Hedge Fund Managers Pour SALT on U.S. Stocks, Look to Europe” that I attended the SkyBridge Alternatives (SALT) hedge fund conference, where I heard former Federal Reserve Chair Ben Bernanke. He said there are really three parties jockeying for control in the capital—Republicans, Democrats... and the “beltway party.” It’s this last group, composed of deeply entrenched lobbyists and career bureaucrats, that gives Washington outsiders such as Trump the hardest time and actively tries to sabotage agendas that shake up the status quo.
So far Congress has had little success in delivering on President Donald Trump’s political agenda, but I still remain hopeful that Trump will enact some much-needed reforms to alleviate the regulatory and tax burdens that cost this country $1.9 trillion each year, according to the Competitive Enterprise Institute.
4
U.S. Global Investors Funds | (unaudited) |
Don’t Miss Opportunities in Energy and Emerging Markets
I’ve been writing about the transition that’s taking place in the energy sector. In June I highlighted the growth of opportunities in natural gas and renewable energy in “Does Coal Stand a Chance Against Renewable Energy?” In the past year, we’ve overweighted renewable energy stocks in our Global Resources Fund (PSPFX), and the allocation is now a core driver of the fund’s performance.
Also remember, China’s middle class is already larger than that found here in the U.S., according to Credit Suisse. In October 2015, the investment bank reported that, for the first time, the size of China’s middle class had exceeded that of America’s middle class, 109 million to 92 million. As incomes rise, so too does demand for durables, luxury goods, vehicles, air travel, energy and more.
One of the best ways to take advantage of this growth in spending power, I believe, is with our China Region Fund (USCOX), which invests in securities in the authorized China securities markets (Hong Kong, Shenzhen and Shanghai) as well as the surrounding countries, including India. For the six months from the start of the year through June 30, the fund has returned an impressive 28.83 percent.
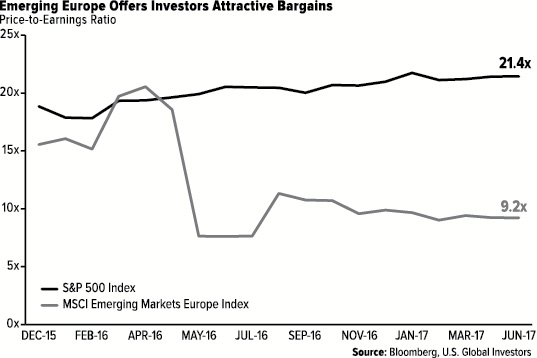
And looking to our European neighbors, I believe one of the most attractive destinations for your investment dollars right now is emerging European countries. Below you can see a valuation comparison between U.S. and emerging European equities. Trading at 9.2 times earnings, the latter are offering a potential bargain for investors seeking a “better bang for the buck.”
5
U.S. Global Investors Funds | (unaudited) |
More than that, though, “core” Central and Eastern Europe (CEE) countries—including Poland, the Czech Republic, Romania and Hungary—are currently among the fastest growing in the world. In a recent series on the region, the Financial Times put it succinctly: “The former communist countries that have joined the European Union (EU) since 2004 offer superior growth to western Europe and many other emerging markets, combined with the benefits and protections of EU membership.”
These are key markets in the Emerging Europe Fund (EUROX), which has returned 6.73 percent for the first half of the year.
Stay Calm with Municipal Bonds
I also urge investors to remember that shorter-duration, tax-free munis have a history of delivering positive returns even during economic downturns and in environments of rising and lowering interest rates. This is why we like to think of the Near-Term Tax Free Fund (NEARX) as a calm place in the midst of stormy markets.

I urge shareholders to take a closer look at your investment goals and plans. If you are curious about one of our funds that you are not already invested in, remember that our ABC Investment Plan makes it easy and affordable to invest. For those who commit to investing monthly with us, we reduce our minimum initial investment to just $1,000. This dollar-cost averaging plan can be a great tool to encourage younger family members to invest as well. You can learn more about this by vising our website at www.usfunds.com or calling 1-800-US-FUNDS (1-800-873-8637).
6
U.S. Global Investors Funds | (unaudited) |
Thank you for investing in U.S. Global Investors Funds!
Happy investing!

Frank Holmes
CEO and Chief Investment Officer
U.S. Global Investors, Inc.
Please consider carefully a fund’s investment objectives, risks, charges and expenses. For this and other important information, obtain a fund prospectus by visiting www.usfunds.com or by calling 1-800-US-FUNDS (1-800-873-8637). Read it carefully before investing. Foreside Fund Services, LLC, Distributor. U.S. Global Investors is the investment adviser.
Total Annualized Returns as of 6/30/2017
Fund | One-Year | Five-Year | Ten-Year | Gross
Expense Ratio |
Near-Term Tax Free Fund | -0.52% | 1.30% | 2.72% | 0.97% |
All American Equity Fund | 2.56% | 7.33% | 3.11% | 1.76% |
Holmes Macro Trends Fund | 21.07% | 8.41% | 2.72% | 1.68% |
Global Resources Fund | 9.26% | -8.13% | -6.04% | 1.85% |
World Precious Metals Fund | -19.09% | -8.55% | -5.98% | 2.10% |
Gold and Precious Metals Fund | -20.33% | -7.46% | -2.30% | 1.86% |
Emerging Europe Fund | 19.17% | -3.93% | -7.05% | 2.33% |
China Region Fund | 33.80% | 7.01% | -0.35% | 2.76% |
S&P 500 Index | 17.90% | 14.63% | 7.18% | N/A |
Bloomberg Barclays 3-Year Municipal Bond Index | 0.43% | 1.24% | 2.76% | N/A |
Expense ratios as stated in the most recent prospectus.
The Adviser of the World Precious Minerals Fund has voluntarily limited total fund operating expenses (exclusive of acquired fund fees and expenses of 0.11%, extraordinary expenses, taxes, brokerage commissions and interest, and advisory fee performance adjustments) to not exceed 1.90%. With the voluntary expense waiver amount of 0.04%, total annual expenses after reimbursement were 1.95%.
The Adviser of the China Region Fund has voluntarily limited total fund operating expenses (exclusive of acquired fund fees and expenses of 0.02%, extraordinary expenses, taxes, brokerage commissions and interest, and advisory fee performance adjustments) to not exceed 2.55%. With the voluntary expense waiver amount of 0.38%, total annual expenses after reimbursement were 2.36%.
U.S. Global Investors, Inc. can modify or terminate the voluntary limits at any time, which may lower a fund’s yield or return.
7
U.S. Global Investors Funds | (unaudited) |
The Adviser of the Near-Term Tax Free Fund has contractually limited, through April 30, 2018, the total fund operating expenses (exclusive of acquired fund fees and expenses, extraordinary expenses, taxes, brokerage commissions and interest) to not exceed 0.45%. Total annual expenses after the waiver of 0.60% were 0.45%.
Performance data quoted above is historical. Past performance is no guarantee of future results. Results reflect the reinvestment of dividends and other earnings. For a portion of periods, the fund had expense limitations, without which returns would have been lower. Current performance may be higher or lower than the performance data quoted. The principal value and investment return of an investment will fluctuate so that your shares, when redeemed, may be worth more or less than their original cost. Performance does not include the effect of any direct fees described in the fund’s prospectus which, if applicable, would lower your total returns. Performance quoted for periods of one year or less is cumulative and not annualized. Obtain performance data current to the most recent month-end at www.usfunds.com or 1-800-US-FUNDS.
Gold, precious metals, and precious minerals funds may be susceptible to adverse economic, political or regulatory developments due to concentrating in a single theme. The prices of gold, precious metals, and precious minerals are subject to substantial price fluctuations over short periods of time and may be affected by unpredicted international monetary and political policies. We suggest investing no more than 5% to 10% of your portfolio in these sectors.
Stock markets can be volatile and share prices can fluctuate in response to sector-related and other risks as described in the fund prospectus.
Foreign and emerging market investing involves special risks such as currency fluctuation and less public disclosure, as well as economic and political risk. By investing in a specific geographic region, a regional fund’s returns and share price may be more volatile than those of a less concentrated portfolio. The Emerging Europe Fund invests more than 25% of its investments in companies principally engaged in the oil & gas or banking industries. The risk of concentrating investments in this group of industries will make the fund more susceptible to risk in these industries than funds which do not concentrate their investments in an industry and may make the fund’s performance more volatile. Because the Global Resources Fund concentrates its investments in specific industries, the fund may be subject to greater risks and fluctuations than a portfolio representing a broader range of industries.
Bond funds are subject to interest-rate risk; their value declines as interest rates rise. Though the Near-Term Tax Free Fund seeks minimal fluctuations in share price, it is subject to the risk that the credit quality of a portfolio holding could decline, as well as risk related to changes in the economic conditions of a state, region or issuer. These risks could cause the fund’s share price to decline. Tax-exempt income is federal income tax free. A portion of this income may be subject to state and local taxes and at times the alternative minimum tax. The Near-Term Tax Free Fund may invest up to 20% of its assets in securities that pay taxable interest. Income or fund distributions attributable to capital gains are usually subject to both state and federal income taxes.
Diversification does not protect an investor from market risks and does not assure a profit.
A program of regular investing doesn’t assure a profit or protect against loss in a declining market. You should evaluate your ability to continue in such a program in view of the possibility that you may have to redeem fund shares in periods of declining share prices as well as in periods of rising prices.
The S&P 500 Stock Index is a widely recognized capitalization-weighted index of 500 common stock prices in U.S. companies.
8
U.S. Global Investors Funds | (unaudited) |
The Bloomberg Barclays 3-Year Municipal Bond Index is a total return benchmark designed for short-term municipal assets. The index includes bonds with a minimum credit rating BAA3, are issued as part of a deal of at least $50 million, have an amount outstanding of at least $5 million and have a maturity of 2 to 4 years.
The MSCI Emerging Markets Europe Index is a free float-adjusted market capitalization index that is designed to measure equity market performance in the emerging markets countries of Europe (Czech Republic, Hungary, Poland, Russia, and Turkey).
Cash Flow Return on Invested Capital (CFROIC) is defined as consolidated cash flow from operating activities minus capital expenditures, the difference of which is divided by the difference between total assets and non-interest bearing current liabilities.
Price-Earnings Ratio (P/E Ratio) is determined by dividing the price of the stock by the company’s forecasted earnings per share.
9
U.S. Government Securities Ultra-Short Bond Fund
Portfolio of Investments (unaudited) | June 30, 2017 |
United States Government and Agency Obligations 97.32% | | Coupon Rate % | | Maturity Date | | Principal Amount | | | Value | |
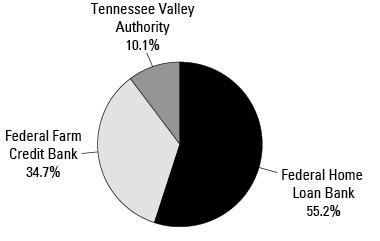
Federal Farm Credit Bank 33.72% | |
Fixed Rates: | | | | | | | | | | |
| | | | 1.13 | | 09/22/17 | | $ | 2,000,000 | | | $ | 1,999,824 | |
| | | | 1.16 | | 10/23/17 | | | 1,000,000 | | | | 1,000,260 | |
| | | | 5.05 | | 06/22/18 | | | 500,000 | | | | 518,817 | |
| | | | 1.95 | | 08/28/18 | | | 100,000 | | | | 100,691 | |
Variable Rates: | | | | | | | | | | | | | |
| | | | 1.14 | | 10/13/17 | | | 4,100,000 | | | | 4,101,722 | |
| | | | 1.25 | | 03/22/18 | | | 3,000,000 | | | | 3,003,054 | |
| | | | 1.17 | | 03/11/19 | | | 7,000,000 | | | | 6,998,221 | |
| | | | | | | | | | | | | 17,722,589 | |
Federal Home Loan Bank 53.74% | |
Fixed Rates: | | | | | | | | | | | | | |
| | | | 0.88 | | 09/27/17 | | | 3,000,000 | | | | 2,997,918 | |
| | | | 1.00 | | 12/19/17 | | | 7,000,000 | | | | 6,993,819 | |
| | | | 1.13 | | 03/29/18 | | | 750,000 | | | | 749,327 | |
| | | | 1.13 | | 04/25/18 | | | 5,000,000 | | | | 4,994,535 | |
| | | | 1.00 | | 06/12/18 | | | 1,000,000 | | | | 996,367 | |
| | | | 5.38 | | 08/15/18 | | | 480,000 | | | | 501,441 | |
| | | | 1.00 | | 08/28/18 | | | 4,000,000 | | | | 3,984,560 | |
| | | | 1.75 | | 12/14/18 | | | 3,000,000 | | | | 3,016,164 | |
| | | | 1.50 | | 03/08/19 | | | 4,000,000 | | | | 4,005,572 | |
| | | | | | | | | | | | | 28,239,703 | |
Tennessee Valley Authority 9.86% | |
Fixed Rates: | | | | | | | | | | | | | |
| | | | 6.25 | | 12/15/17 | | | 2,930,000 | | | | 2,996,174 | |
| | | | 1.75 | | 10/15/18 | | | 2,174,000 | | | | 2,185,505 | |
| | | | | | | | | | | | | 5,181,679 | |
| |
Total Investments 97.32% | | | | 51,143,971 | |
(cost $51,129,888) | | | | | | | | | | | | | |
Other assets and liabilities, net 2.68% | | | | | | | | | 1,411,031 | |
| | | | | | | | | | | | | | |
Net Assets 100.0% | | | | | | | | | | | $ | 52,555,002 | |
See notes to portfolios of investments and notes to financial statements.
10
U.S. Government Securities Ultra-Short Bond Fund
Portfolio of Investments (unaudited) | June 30, 2017 |
Portfolio Allocation by Issuer
Based on Total Investments | June 30, 2017 |
|
Portfolio Allocation by Maturity | | June 30, 2017 | | |
1-3 Months | | $ | 4,997,742 | | | | 9.8 | % | |
3-12 Months | | | 25,354,075 | | | | 49.6 | % | |
1-3 Years | | | 20,792,154 | | | | 40.6 | % | |
| | | $ | 51,143,971 | | | | 100.0 | % | |
| | | | | | | | | | |
See notes to portfolios of investments and notes to financial statements.
11
Near-Term Tax Free Fund
Portfolio of Investments (unaudited) | June 30, 2017 |
Municipal Bonds 90.31% | | Coupon Rate % | | Maturity Date | | Principal Amount | | | Value | |
Alabama 1.34% | |
Bessemer, Alabama Electric Revenue, Refunding, AGM | | | 3.10 | | 12/01/21 | | $ | 100,000 | | | $ | 104,339 | |
Limestone County, Water & Sewer Authority | | | 2.25 | | 12/01/21 | | | 365,000 | | | | 366,069 | |
Pelham, Alabama, GO Unlimited | | | 2.00 | | 02/01/18 | | | 130,000 | | | | 130,825 | |
University of South Alabama, University Revenue, Refunding | | | 5.00 | | 11/01/18 | | | 500,000 | | | | 525,060 | |
| | | | | | | | | | | | | 1,126,293 | |
| | | | | | | | | | | | | | |
Arizona 0.72% | |
Arizona State Transportation Board Excise Tax Revenue | | | 5.00 | | 07/01/17 | | | 175,000 | | | | 175,000 | |
McAllister Academic Village LLC, Arizona State University Hassayampa Revenue, Refunding | | | 5.75 | | 07/01/18 | | | 200,000 | | | | 209,156 | |
Tempe, Arizona, GO Unlimited, Series A | | | 2.00 | | 07/01/19 | | | 220,000 | | | | 224,011 | |
| | | | | | | | | | | | | 608,167 | |
| | | | | | | | | | | | | | |
Arkansas 1.63% | |
Atkins School District No. 18, Refunding, GO Limited | | | 1.00 | | 02/01/19 | | | 420,000 | | | | 417,526 | |
Cave City School District No. 2-A, Refunding, GO Limited | | | 1.00 | | 02/01/19 | | | 260,000 | | | | 257,860 | |
Hot Springs, Arizona Wastewater Revenue | | | 4.00 | | 12/01/19 | | | 510,000 | | | | 539,600 | |
Paris School District No. 7, Refunding, GO Limited | | | 1.00 | | 06/01/18 | | | 150,000 | | | | 150,041 | |
| | | | | | | | | | | | | 1,365,027 | |
| | | | | | | | | | | | | | |
California 1.85% | |
California State, Recreational Facility, Refunding, GO Unlimited | | | 5.00 | | 12/01/19 | | | 5,000 | | | | 5,014 | |
California State, Statewide Communities Development Authority, Enloe Medical Center Revenue, Series A | | | 5.25 | | 08/15/18 | | | 340,000 | | | | 356,079 | |
Los Angeles Unified School District, Election 2004, GO Unlimited, Series H, AGM | | | 5.00 | | 07/01/32 | | | 200,000 | | | | 200,000 | |
Newman-Crows Landing Unified School District, GO Unlimited, AGM | | | 4.00 | | 08/01/19 | | | 115,000 | | | | 121,464 | |
Riverside County, California Redevelopment Successor Agency, Refunding, Tax Allocation | | | 5.00 | | 10/01/19 | | | 200,000 | | | | 216,346 | |
See notes to portfolios of investments and notes to financial statements.
12
Near-Term Tax Free Fund
Portfolio of Investments (unaudited) | June 30, 2017 |
Municipal Bonds (cont’d) | | Coupon Rate % | | Maturity Date | | Principal Amount | | | Value | |
California (cont’d) | |
Santa Clara County, California Financing Authority Revenue, Obstetrics and Gynecology, El Camino Hospital, AMBAC | | | 5.00 | | 02/01/18 | | $ | 350,000 | | | $ | 351,005 | |
Santa Paula Schools Financing Authority, Santa Paula Elementary School District Revenue, AGM | | | 4.25 | | 11/01/22 | | | 300,000 | | | | 302,970 | |
| | | | | | | | | | | | | 1,552,878 | |
| | | | | | | | | | | | | | |
District of Columbia 0.39% | |
District of Columbia Income Tax Revenue, Series A | | | 5.25 | | 12/01/27 | | | 300,000 | | | | 328,239 | |
| | | | | | | | | | | | | | |
Florida 5.90% | |
Citizens Property Insurance Co., Senior Secured, Coastal Account, Revenue, Series A-1 | | | 4.00 | | 06/01/18 | | | 100,000 | | | | 102,625 | |
Escambia County, Florida, Health Facilities Authority Revenue, Baptist Hospital, Inc. Project, Series A | | | 5.00 | | 08/15/19 | | | 290,000 | | | | 307,374 | |
Florida State Board of Education Lottery Revenue, Series B, BHAC | | | 5.00 | | 07/01/26 | | | 100,000 | | | | 101,000 | |
Florida State Board of Governors Parking Facility Revenue, Series A | | | 3.00 | | 07/01/17 | | | 300,000 | | | | 300,000 | |
Florida State Department of Management Services, Certificates of Participation, Refunding, Series A | | | 5.00 | | 08/01/19 | | | 500,000 | | | | 538,715 | |
Florida State Department of Management Services, Certificates of Participation, Series A | | | 5.00 | | 08/01/24 | | | 340,000 | | | | 357,153 | |
Florida State Municipal Power Agency, Stanton Project Revenue, Refunding | | | 5.13 | | 10/01/17 | | | 300,000 | | | | 302,919 | |
Hillsborough County, Florida School Board, Refunding, Certificates of Participation, Series A | | | 4.25 | | 07/01/25 | | | 300,000 | | | | 323,547 | |
Hillsborough County, Florida School Board, Certificates of Participation, Refunding, NATL | | | 4.00 | | 07/01/19 | | | 100,000 | | | | 100,000 | |
Jacksonville Florida Special Revenue, Series C | | | 5.00 | | 10/01/20 | | | 270,000 | | | | 300,915 | |
Leesburg, Florida Capital Improvement Revenue Bonds, Refunding | | | 5.00 | | 10/01/21 | | | 405,000 | | | | 457,974 | |
See notes to portfolios of investments and notes to financial statements.
13
Near-Term Tax Free Fund
Portfolio of Investments (unaudited) | June 30, 2017 |
Municipal Bonds (cont’d) | | Coupon Rate % | | Maturity Date | | Principal Amount | | | Value | |
Florida (cont’d) | |
Margate, Florida Water & Sewer Revenue, Refunding, AGM | | | 4.00 | | 10/01/19 | | $ | 250,000 | | | $ | 263,633 | |
Miami - Dade County, Florida Expressway Authority Toll System Revenue, Series A | | | 5.00 | | 07/01/21 | | | 430,000 | | | | 488,377 | |
Orange County School Board, Certificates of Participation, Series A, NATL | | | 5.00 | | 08/01/32 | | | 275,000 | | | | 275,784 | |
Orlando, Florida Community Redevelopment Agency Tax Increment Revenue, Downtown District, Tax Allocation, Series A | | | 4.00 | | 09/01/17 | | | 170,000 | | | | 170,534 | |
Polk County, Florida School District Revenue, AGM | | | 5.00 | | 10/01/17 | | | 215,000 | | | | 217,004 | |
Saint Johns County, Florida Transportation Revenue, Refunding, AGM | | | 5.00 | | 10/01/20 | | | 310,000 | | | | 346,227 | |
| | | | | | | | | | | | | 4,953,781 | |
| | | | | | | | | | | | | | |
Georgia 2.03% | |
Carroll City-County, Georgia Hospital Authority, Tanner Medical Center, Inc. Project | | | 5.00 | | 07/01/18 | | | 600,000 | | | | 623,070 | |
Georgia State Municipal Gas Authority, Toccoa Project, Refunding, AGM | | | 5.00 | | 06/01/22 | | | 600,000 | | | | 674,208 | |
Glynn-Brunswick Memorial Hospital Authority, Southeast Georgia Health System and Affiliates Revenue, Certificates of Participation, Series A | | | 4.50 | | 08/01/17 | | | 150,000 | | | | 150,359 | |
Gwinnett County, Georgia, Hospital Authority, Gwinnett Hospital Systems Revenue, Series B, AGM | | | 5.00 | | 07/01/18 | | | 250,000 | | | | 259,485 | |
| | | | | | | | | | | | | 1,707,122 | |
| | | | | | | | | | | | | | |
Idaho 0.30% | |
Idaho Housing & Finance Association, Grant & Revenue Anticipation, Federal Highway Trust Fund, Series A | | | 5.00 | | 07/15/21 | | | 225,000 | | | | 255,364 | |
| | | | | | | | | | | | | | |
Illinois 4.34% | |
Chicago Board of Education, GO Unlimited, NATL | | | 5.25 | | 12/01/19 | | | 300,000 | | | | 319,044 | |
Chicago, Illinois, O’Hare International Airport Revenue, Gen - Third Lien, Series C, AGC | | | 5.25 | | 01/01/23 | | | 250,000 | | | | 271,515 | |
See notes to portfolios of investments and notes to financial statements.
14
Near-Term Tax Free Fund
Portfolio of Investments (unaudited) | June 30, 2017 |
Municipal Bonds (cont’d) | | Coupon Rate % | | Maturity Date | | Principal Amount | | | Value | |
Illinois (cont’d) | |
Clinton Bond Fayette Etc Counties Community College District No. 501 Kaskaskia, GO Unlimited | | | 5.75 | | 12/01/19 | | $ | 500,000 | | | $ | 544,255 | |
Du Page County, Refunding, GO Unlimited | | | 5.60 | | 01/01/21 | | | 270,000 | | | | 294,627 | |
Du Page County School District No. 33 West Chicago, Redunding, GO Unlimited, Series B | | | 4.00 | | 12/01/21 | | | 1,000,000 | | | | 1,093,149 | |
Illinois Metropolitan Pier & Exposition Authority, Unrefunded, NATL (ZCB) | | | 1.78(1) | | 06/15/18 | | | 415,000 | | | | 405,289 | |
Illinois Regional Transportation Authority, Series A, AMBAC | | | 7.20 | | 11/01/20 | | | 120,000 | | | | 131,576 | |
Lake & McHenry County, Fox Lake, Illinois, Debt Certificates, Series B | | | 3.00 | | 11/01/19 | | | 265,000 | | | | 273,472 | |
Will Grundy Etc Counties Community College District No. 525, Joliet Junior College Project, GO Unlimited | | | 6.25 | | 06/01/22 | | | 300,000 | | | | 313,365 | |
| | | | | | | | | | | | | 3,646,292 | |
| | | | | | | | | | | | | | |
Indiana 1.18% | |
Clark-Pleasant, Indiana School Building | | | 5.00 | | 01/15/19 | | | 275,000 | | | | 290,829 | |
Indianapolis Local Public Improvement Bond Bank, Waterworks Project, Series 2007 L, NATL | | | 5.25 | | 01/01/33 | | | 305,000 | | | | 311,466 | |
Merrillville Redevelopment Authority, Tax Allocation | | | 5.00 | | 08/15/20 | | | 350,000 | | | | 385,714 | |
| | | | | | | | | | | | | 988,009 | |
| | | | | | | | | | | | | | |
Iowa 0.78% | |
Clive, Iowa, GO Unlimited, Series A | | | 2.00 | | 06/01/19 | | | 235,000 | | | | 239,016 | |
University of Iowa Hospitals and Clinics, Iowa State Board of Regents, Hospital Revenue, Series A | | | 3.00 | | 09/01/19 | | | 400,000 | | | | 414,300 | |
| | | | | | | | | | | | | 653,316 | |
| | | | | | | | | | | | | | |
Kansas 1.43% | |
Sedgwick County, Kansas, Unified School District No. 261 Haysville, GO Unlimited | | | 5.00 | | 11/01/17 | | | 885,000 | | | | 896,505 | |
Sedgwick County, Kansas, Unified School District No. 266 Maize, GO Unlimited, NATL | | | 5.00 | | 09/01/17 | | | 50,000 | | | | 50,313 | |
Wichita, Kansas, Refunding, GO Unlimited, Series A | | | 5.00 | | 12/01/17 | | | 250,000 | | | | 254,160 | |
| | | | | | | | | | | | | 1,200,978 | |
See notes to portfolios of investments and notes to financial statements.
15
Near-Term Tax Free Fund
Portfolio of Investments (unaudited) | June 30, 2017 |
Municipal Bonds (cont’d) | | Coupon Rate % | | Maturity Date | | Principal Amount | | | Value | |
Kentucky 1.76% | |
Fort Thomas Independent School District Finance Corp., Series C | | | 2.00 | | 11/01/17 | | $ | 465,000 | | | $ | 466,535 | |
Kentucky Municipal Power Agency, Power System Revenue, Prairie State Project, Series A, NATL | | | 5.25 | | 09/01/22 | | | 440,000 | | | | 442,917 | |
Louisville & Jefferson County Metropolitan Sewer District, Series A | | | 5.00 | | 05/15/23 | | | 500,000 | | | | 571,735 | |
| | | | | | | | | | | | | 1,481,187 | |
| | | | | | | | | | | | | | |
Louisiana 1.96% | |
Louisiana Office Facilities Corp, Refunding | | | 5.00 | | 11/01/17 | | | 700,000 | | | | 708,806 | |
Louisiana State, GO Unlimited, Series A | | | 5.00 | | 08/01/26 | | | 800,000 | | | | 939,176 | |
| | | | | | | | | | | | | 1,647,982 | |
| | | | | | | | | | | | | | |
Michigan 4.31% | |
Detroit, Michigan Local Development Financing Authority, Refunding, Tax Allocation, Series A | | | 5.38 | | 05/01/18 | | | 35,000 | | | | 35,032 | |
Gibraltar, Michigan School District, Refunding, GO Unlimited, AGM | | | 5.00 | | 05/01/21 | | | 475,000 | | | | 520,994 | |
Michigan Public Power Agency AFEC Project Revenue, Series A | | | 4.50 | | 01/01/19 | | | 280,000 | | | | 292,256 | |
Michigan State, Trunk Line Revenue, Refunding | | | 4.50 | | 11/01/26 | | | 105,000 | | | | 112,028 | |
Michigan State Hospital Finance Authority, Trinity Health, Series A | | | 6.00 | | 12/01/18 | | | 200,000 | | | | 213,312 | |
Michigan Strategic Fund, Series A, AGC | | | 5.00 | | 10/15/17 | | | 200,000 | | | | 202,148 | |
Oxford Area Community School District, GO Unlimited, Series A, Q-SBLF | | | 5.00 | | 05/01/22 | | | 365,000 | | | | 420,867 | |
Portage Public Schools, School Building & Site, GO Unlimited, AGM | | | 5.00 | | 05/01/20 | | | 300,000 | | | | 309,891 | |
Romeo Community School District, Refunding, GO Unlimited, Q-SBLF | | | 3.00 | | 05/01/18 | | | 500,000 | | | | 507,520 | |
Wayne County, Michigan Airport Authority Revenue, Detroit Metropolitan Airport, Refunding, Series C | | | 4.00 | | 12/01/19 | | | 255,000 | | | | 270,236 | |
Wyoming, Michigan, Water Supply System, Refunding | | | 4.00 | | 06/01/20 | | | 215,000 | | | | 230,020 | |
Zeeland Public Schools, Refunding, GO Unlimited | | | 5.00 | | 05/01/18 | | | 490,000 | | | | 506,155 | |
| | | | | | | | | | | | | 3,620,459 | |
See notes to portfolios of investments and notes to financial statements.
16
Near-Term Tax Free Fund
Portfolio of Investments (unaudited) | June 30, 2017 |
Municipal Bonds (cont’d) | | Coupon Rate % | | Maturity Date | | Principal Amount | | | Value | |
Minnesota 0.89% | |
Chaska, Minnesota Electric Revenue, Refunding, Series A | | | 3.00 | | 10/01/17 | | $ | 535,000 | | | $ | 537,472 | |
Lake Washington Sanitary District, GO Unlimited, Series A, AGM | | | 2.00 | | 02/01/18 | | | 205,000 | | | | 206,302 | |
| | | | | | | | | | | | | 743,774 | |
| | | | | | | | | | | | | | |
Mississippi 0.48% | |
Rankin County School District, GO Limited | | | 2.00 | | 08/01/19 | | | 400,000 | | | | 405,944 | |
| | | | | | | | | | | | | | |
Missouri 2.39% | |
Jackson County, Missouri, Special Obligation Refunding, Truman Sports Complex Project | | | 5.00 | | 12/01/18 | | | 215,000 | | | | 226,358 | |
Kansas City, Missouri, Refunding, Series B | | | 5.00 | | 08/01/19 | | | 650,000 | | | | 696,592 | |
Kansas City, Missouri Water Revenue, Series F, AGM | | | 4.00 | | 12/01/22 | | | 250,000 | | | | 282,733 | |
Missouri State Health & Educational Facilities Authority, Southwestern Baptist University Revenue | | | 3.00 | | 10/01/17 | | | 265,000 | | | | 266,004 | |
Missouri State Regional Convention & Sports Complex Authority | | | 5.00 | | 08/15/19 | | | 500,000 | | | | 537,045 | |
| | | | | | | | | | | | | 2,008,732 | |
| | | | | | | | | | | | | | |
New Hampshire 0.72% | |
New Hampshire, Federal Highway Grant Anticipation Bonds | | | 5.00 | | 09/01/17 | | | 200,000 | | | | 201,202 | |
New Hampshire Health & Education Facilities Authority Revenue, Southern New Hampshire University Project | | | 5.00 | | 01/01/18 | | | 400,000 | | | | 407,404 | |
| | | | | | | | | | | | | 608,606 | |
| | | | | | | | | | | | | | |
New Jersey 3.46% | |
Atlantic City, New Jersey, Refunding Tax Appeal, GO Unlimited | | | 4.00 | | 11/01/18 | | | 500,000 | | | | 485,755 | |
Camden County, New Jersey Improvement Authority, Refunding | | | 4.00 | | 01/15/18 | | | 600,000 | | | | 609,654 | |
Cumberland County, New Jersey Improvement Authority, Technical High School Project, AGM | | | 3.00 | | 09/01/17 | | | 550,000 | | | | 551,722 | |
Elizabeth, New Jersey Parking Authority Project Revenue, Elizabethtown Plaza Redevelopment, Series B | | | 4.00 | | 11/01/17 | | | 255,000 | | | | 257,504 | |
See notes to portfolios of investments and notes to financial statements.
17
Near-Term Tax Free Fund
Portfolio of Investments (unaudited) | June 30, 2017 |
Municipal Bonds (cont’d) | | Coupon Rate % | | Maturity Date | | Principal Amount | | | Value | |
New Jersey (cont’d) | |
Hudson County, New Jersey Improvement Authority Lease Revenue, North Hudson Regional Fire, Refunding, Series A, AGM | | | 5.63 | | 09/01/18 | | $ | 400,000 | | | $ | 420,244 | |
Passaic Valley, New Jersey, Sewage Commissioners Revenue, Series G | | | 5.75 | | 12/01/21 | | | 500,000 | | | | 585,310 | |
| | | | | | | | | | | | | 2,910,189 | |
| | | | | | | | | | | | | | |
New York 9.08% | |
Greece, New York Central School District, GO Unlimited | | | 2.00 | | 06/15/19 | | | 455,000 | | | | 463,022 | |
Long Island Power Authority Revenue, Series B | | | 5.00 | | 09/01/21 | | | 465,000 | | | | 531,690 | |
Nassau County Industrial Development Agency, New York Institute of Technology Project Revenue, Refunding, Remarketing, Series A | | | 5.00 | | 03/01/21 | | | 350,000 | | | | 384,717 | |
New York City, GO Unlimited, Series E | | | 5.25 | | 08/01/22 | | | 875,000 | | | | 1,034,591 | |
New York City, GO Unlimited, Series B | | | 5.00 | | 08/01/19 | | | 400,000 | | | | 431,572 | |
New York City, GO Unlimited, Series I | | | 5.00 | | 08/01/22 | | | 1,000,000 | | | | 1,170,229 | |
New York State Thruway Authority, Series B | | | 5.00 | | 04/01/27 | | | 1,335,000 | | | | 1,347,949 | |
New York State Urban Development,
Series D | | | 5.50 | | 01/01/19 | | | 250,000 | | | | 266,363 | |
New York State Urban Development, NATL | | | 5.50 | | 03/15/19 | | | 615,000 | | | | 661,297 | |
North Castle, New York, Public Improvement, GO Unlimited | | | 3.88 | | 12/01/22 | | | 210,000 | | | | 212,581 | |
Patchogue-Medford Union Free School District, GO Unlimited | | | 5.00 | | 10/01/17 | | | 465,000 | | | | 469,390 | |
Sodus, New York Central School District, Refunding, GO Unlimited | | | 3.00 | | 06/15/18 | | | 640,000 | | | | 651,603 | |
| | | | | | | | | | | | | 7,625,004 | |
| | | | | | | | | | | | | | |
North Carolina 2.58% | |
Beaufort County, North Carolina, GO Limited | | | 5.00 | | 06/01/21 | | | 200,000 | | | | 224,978 | |
Charlotte, North Carolina, Certificates of Participation, Series A | | | 5.00 | | 10/01/21 | | | 1,000,000 | | | | 1,114,499 | |
North Carolina Medical Care Commission, Firsthealth Carolina Project, Refunding, Series C | | | 4.00 | | 10/01/17 | | | 420,000 | | | | 423,079 | |
North Carolina State Municipal Power Agency #1, Catawba Electric Revenue, Refunding, Series A | | | 5.25 | | 01/01/20 | | | 400,000 | | | | 408,480 | |
| | | | | | | | | | | | | 2,171,036 | |
See notes to portfolios of investments and notes to financial statements.
18
Near-Term Tax Free Fund
Portfolio of Investments (unaudited) | June 30, 2017 |
Municipal Bonds (cont’d) | | Coupon Rate % | | Maturity Date | | Principal Amount | | | Value | |
Ohio 0.96% | |
Cleveland, Ohio, Parking Facility Revenue, Prefunding, Refunding, AGM | | | 5.25 | | 09/15/22 | | $ | 130,000 | | | $ | 154,330 | |
Lorain County, Ohio, Community College District, Revenue | | | 3.25 | | 12/01/17 | | | 650,000 | | | | 655,883 | |
| | | | | | | | | | | | | 810,213 | |
| | | | | | | | | | | | | | |
Oklahoma 0.40% | |
Oklahoma State Agricultural & Mechanical Colleges, Oklahoma State University, Series A | | | 5.00 | | 08/01/21 | | | 300,000 | | | | 331,953 | |
| | | | | | | | | | | | | | |
Oregon 0.26% | |
Oregon State Facilities Authority, Legacy Health Project Revenue, Refunding, Series A | | | 4.50 | | 05/01/20 | | | 200,000 | | | | 217,136 | |
| | | | | | | | | | | | | | |
Pennsylvania 3.27% | |
Allegheny County, Pennsylvania Sanitary Authority, AGM | | | 5.00 | | 06/01/19 | | | 700,000 | | | | 749,749 | |
Delaware Valley, Pennsylvania, Regional Financial Authority Revenue, Permanently Fixed Business Development Services, AMBAC | | | 5.50 | | 08/01/18 | | | 295,000 | | | | 308,824 | |
Muhlenberg Township, Pennsylvania, GO Unlimited, AGM | | | 3.00 | | 11/01/17 | | | 280,000 | | | | 280,403 | |
Philadelphia School District, Pennsylvania, Refunding, GO Unlimited, Series E | | | 5.25 | | 09/01/24 | | | 625,000 | | | | 678,556 | |
Reading, Pennsylvania School District, GO Unlimited, Series A | | | 5.00 | | 04/01/20 | | | 400,000 | | | | 433,008 | |
Wilkes-Barre Finance Authority, University of Scranton, Refunding, Series A | | | 5.00 | | 11/01/19 | | | 275,000 | | | | 294,247 | |
| | | | | | | | | | | | | 2,744,787 | |
| | | | | | | | | | | | | | |
South Carolina 1.13% | |
Spartanburg County, South Carolina Regional Health Services District, Hospital Revenue, Refunding, Series A | | | 5.00 | | 04/15/19 | | | 600,000 | | | | 638,820 | |
Spartanburg County, South Carolina Sanitation Sewer District, Series A, AGC | | | 3.50 | | 03/01/19 | | | 300,000 | | | | 311,304 | |
| | | | | | | | | | | | | 950,124 | |
See notes to portfolios of investments and notes to financial statements.
19
Near-Term Tax Free Fund
Portfolio of Investments (unaudited) | June 30, 2017 |
Municipal Bonds (cont’d) | | Coupon Rate % | | Maturity Date | | Principal Amount | | | Value | |
Tennessee 0.26% | |
Memphis, Tennessee Sanitary Sewage System Revenue, Refunding, AGM | | | 5.00 | | 05/01/20 | | $ | 200,000 | | | $ | 220,242 | |
| | | | | | | | | | | | | | |
Texas 24.80% | |
Addison, Texas Certificates of Obligation, GO Limited | | | 4.50 | | 02/15/28 | | | 140,000 | | | | 143,067 | |
Addison, Texas Certificates of Obligation, GO Limited | | | 4.00 | | 02/15/20 | | | 250,000 | | | | 254,720 | |
Arlington, Texas, GO Limited, Series B | | | 2.00 | | 08/15/19 | | | 500,000 | | | | 508,930 | |
Bryan Independent School District, GO Unlimited, Series A, PSF-GTD | | | 5.00 | | 02/15/22 | | | 410,000 | | | | 473,858 | |
Cedar Hill Texas, Refunding, GO Limited | | | 5.00 | | 02/15/22 | | | 800,000 | | | | 926,144 | |
Center, Texas Certificates of Obligation, GO Limited, AGM (ZCB) | | | 3.63(1) | | 02/15/20 | | | 150,000 | | | | 142,745 | |
Clear Lake, Texas, Waterworks & Sewer System, GO Unlimited | | | 3.00 | | 03/01/19 | | | 125,000 | | | | 128,879 | |
Corpus Christi, Texas Business & Job Development Corporation, Seawall Project, Sales Tax Revenue, Refunding | | | 5.00 | | 03/01/20 | | | 350,000 | | | | 381,161 | |
Culberson County-Allamoore Independent School District, GO Unlimited, PSF-GTD | | | 3.00 | | 02/15/19 | | | 860,000 | | | | 885,834 | |
Dallas, Texas Waterworks & Sewer System Revenue, Unrefunded, AMBAC | | | 4.50 | | 10/01/19 | | | 165,000 | | | | 166,416 | |
Dallas, Texas Waterworks & Sewer System Revenue, Prerefunded, AMBAC | | | 4.50 | | 10/01/19 | | | 60,000 | | | | 60,508 | |
Denton, Texas, Refunding, GO Limited | | | 5.00 | | 02/15/19 | | | 500,000 | | | | 531,410 | |
Dimmitt Independent School District, GO Unlimited, PSF-GTD | | | 3.00 | | 02/15/22 | | | 305,000 | | | | 325,014 | |
Fort Worth, Texas Water & Sewer System Revenue | | | 5.00 | | 02/15/19 | | | 800,000 | | | | 849,856 | |
Frisco, Texas Independent School District, School Building, GO Unlimited, Series A, PSF-GTD | | | 4.50 | | 08/15/25 | | | 180,000 | | | | 180,713 | |
Garland, Texas, GO Limited | | | 5.00 | | 02/15/25 | | | 650,000 | | | | 711,503 | |
Harris County, Texas Municipal Utility District No 290, GO Unlimited, Series A, BAM | | | 1.50 | | 09/01/17 | | | 200,000 | | | | 200,142 | |
Harris County, Texas Municipal Utility District No. 382, GO Unlimited, BAM | | | 3.00 | | 04/01/22 | | | 305,000 | | | | 314,586 | |
Hays County, Texas, GO Limited | | | 5.00 | | 02/15/23 | | | 500,000 | | | | 512,155 | |
Houston Community College System, GO Limited | | | 5.00 | | 02/15/19 | | | 755,000 | | | | 802,429 | |
Houston, Texas, Hotel Occupancy Tax, Unrefunded, Series B | | | 5.00 | | 09/01/19 | | | 45,000 | | | | 45,113 | |
See notes to portfolios of investments and notes to financial statements.
20
Near-Term Tax Free Fund
Portfolio of Investments (unaudited) | June 30, 2017 |
Municipal Bonds (cont’d) | | Coupon Rate % | | Maturity Date | | Principal Amount | | | Value | |
Texas (cont’d) | |
Houston, Texas Combined Utility System Revenue, Prerefunded, AGM | | | 5.00 | | 11/15/27 | | $ | 150,000 | | | $ | 152,189 | |
Hutto Independent School District, GO Unlimited, AGC | | | 4.75 | | 08/01/31 | | | 600,000 | | | | 601,602 | |
Longview, Texas Waterworks & Sewer System Revenue, Refunding | | | 3.00 | | 03/01/22 | | | 610,000 | | | | 652,102 | |
Lower Colorado River Authority, Transmission Contract Revenue, Refunding, Series A | | | 5.00 | | 05/15/21 | | | 500,000 | | | | 565,960 | |
Lubbock-Cooper Independent School District, GO Unlimited, PSF-GTD | | | 3.00 | | 02/15/22 | | | 755,000 | | | | 805,932 | |
Montgomery County, Texas Municipal Utility District No 113, GO Unlimited, BAM | | | 2.00 | | 09/01/17 | | | 260,000 | | | | 260,361 | |
Montgomery County, Texas Municipal Utility District No 119, GO Unlimited, Series A, AGM | | | 4.00 | | 04/01/18 | | | 315,000 | | | | 321,253 | |
North Texas Tollway Authority Revenue, Series F | | | 5.75 | | 01/01/38 | | | 300,000 | | | | 307,011 | |
Olmos Park Higher Education Facilities Corp, University of the Incarnate Word, Refunding | | | 5.00 | | 12/01/21 | | | 500,000 | | | | 564,935 | |
Pharr, Texas, Refunding, GO Limited, Series A | | | 5.00 | | 08/15/20 | | | 285,000 | | | | 314,446 | |
Plano, Texas, Refunding, GO Limited | | | 5.00 | | 09/01/19 | | | 1,000,000 | | | | 1,082,059 | |
Round Rock, Texas, GO Limited | | | 2.00 | | 08/15/19 | | | 465,000 | | | | 472,524 | |
San Antonio, Texas, Water Revenue, Refunding | | | 4.50 | | 05/15/21 | | | 400,000 | | | | 447,688 | |
San Marcos, Texas Tax & Toll Revenue, GO Limited, AGM | | | 5.10 | | 08/15/27 | | | 400,000 | | | | 401,820 | |
Texarkana, Texas Waterworks & Sanitary Sewer System Revenue | | | 3.00 | | 08/01/19 | | | 90,000 | | | | 92,610 | |
Texarkana, Texas Waterworks & Sanitary Sewer System Revenue | | | 3.00 | | 08/01/20 | | | 95,000 | | | | 98,677 | |
Texarkana, Texas, Refunding, GO Limited | | | 5.00 | | 02/15/21 | | | 320,000 | | | | 360,154 | |
Texas Municipal Power Agency Revenue, Refunding, AGC | | | 5.00 | | 09/01/17 | | | 250,000 | | | | 251,508 | |
Texas State Public, Finance Authority Charter School Finance, Series A | | | 6.20 | | 02/15/40 | | | 2,000,000 | | | | 2,241,719 | |
Texas State, Public Finance Authority, Refunding, GO Unlimited | | | 5.00 | | 10/01/20 | | | 1,150,000 | | | | 1,287,505 | |
Travis County, Texas Water Control & Improvement District No. 10, GO Unlimited | | | 2.00 | | 08/15/19 | | | 500,000 | | | | 507,670 | |
See notes to portfolios of investments and notes to financial statements.
21
Near-Term Tax Free Fund
Portfolio of Investments (unaudited) | June 30, 2017 |
Municipal Bonds (cont’d) | | Coupon Rate % | | Maturity Date | | Principal Amount | | | Value | |
Texas (cont’d) | |
Waxahachie, Texas, Refunding, GO Limited, AMBAC | | | 4.20 | | 08/01/22 | | $ | 500,000 | | | $ | 501,420 | |
| | | | | | | | | | | | | 20,836,328 | |
| | | | | | | | | | | | | | |
Utah 1.43% | |
Davis County, Utah, GO Unlimited | | | 5.00 | | 02/01/19 | | | 200,000 | | | | 212,232 | |
Utah State Building Ownership Authority, Lease Revenue, Refunding, Series C, AGM | | | 5.50 | | 05/15/19 | | | 180,000 | | | | 187,412 | |
Washington County-St George Interlocal Agency, Lease Revenue, Refunding, Series A | | | 4.00 | | 12/01/19 | | | 300,000 | | | | 317,265 | |
Weber County, Utah, GO Unlimited | | | 4.00 | | 01/15/22 | | | 430,000 | | | | 480,056 | |
| | | | | | | | | | | | | 1,196,965 | |
| | | | | | | | | | | | | | |
Virginia 0.68% | |
Lynchburg, Virginia, Refunding, GO Unlimited | | | 5.00 | | 02/01/19 | | | 540,000 | | | | 573,199 | |
| | | | | | | | | | | | | | |
Washington 7.29% | |
Cowlitz County, Washington, Refunding, GO Limited, Series A | | | 3.00 | | 04/01/18 | | | 195,000 | | | | 197,952 | |
Snohomish County, Washington Public Utility District No 1, Refunding | | | 5.00 | | 12/01/17 | | | 550,000 | | | | 558,927 | |
Spokane County, Washington Public Facilities District, Refunding, Series B | | | 5.00 | | 12/01/21 | | | 950,000 | | | | 1,077,243 | |
Tacoma, Washington Metropolitan Park District, GO Unlimited, Series B | | | 4.00 | | 12/01/19 | | | 355,000 | | | | 379,168 | |
Thurston County, Washington, Refunding, GO Limited | | | 5.00 | | 12/01/20 | | | 1,625,000 | | | | 1,821,023 | |
Washington State Health Care Facilities Authority, Seattle Children's Hospital Project | | | 5.00 | | 10/01/17 | | | 150,000 | | | | 151,470 | |
Washington State, Motor Vehicle Fuel Tax, GO Unlimited, Series C | | | 5.00 | | 02/01/19 | | | 830,000 | | | | 881,161 | |
Washington State, Refunding, GO Unlimited, Series A | | | 5.00 | | 01/01/19 | | | 1,000,000 | | | | 1,058,550 | |
| | | | | | | | | | | | | 6,125,494 | |
See notes to portfolios of investments and notes to financial statements.
22
Near-Term Tax Free Fund
Portfolio of Investments (unaudited) | June 30, 2017 |
Municipal Bonds (cont’d) | | Coupon Rate % | | Maturity Date | | Principal Amount | | | Value | |
Wisconsin 0.31% | |
Waunakee Community School District, GO Unlimited, Series A | | | 5.00 | | 04/01/18 | | $ | 250,000 | | | $ | 257,388 | |
| |
Total Investments 90.31% | | | | 75,872,208 | |
(cost $75,580,461) | | | | | | | | | | | | | |
Other assets and liabilities, net 9.69% | | | | | | | 8,137,204 | |
| | | | | | | | | | | | | | |
Net Assets 100.0% | | | | | | | | | | | $ | 84,009,412 | |
(1) | Represents Yield on zero coupon bond. |
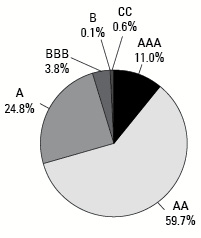
Municipal Bond Ratings*
Based on Total Municipal Bonds | June 30, 2017 |
|
* | Credit quality ratings are measured on a scale that generally ranges from AAA (highest) to D (lowest). “Not Rated” is used to classify securities for which a rating is not available. Credit-quality ratings for each issue are obtained from Moody’s and S&P, and the higher rating for each issue is used |
See notes to portfolios of investments and notes to financial statements.
23
All American Equity Fund
Portfolio of Investments (unaudited) | June 30, 2017 |
Common Stocks 89.19% | | Shares | | | Value | |
Airlines 4.39% | |
Southwest Airlines Co. | | | 11,779 | | | $ | 731,947 | |
| | | | | | | | | |
Beverages - Wine/Spirits 2.99% | |
Brown-Forman Corp., Class B | | | 10,249 | | | | 498,101 | |
| | | | | | | | | |
Chemicals - Diversified 2.48% | |
LyondellBasell Industries N.V., Class A | | | 4,900 | | | | 413,511 | |
| | | | | | | | | |
Computers 2.74% | |
Apple, Inc. | | | 3,174 | | | | 457,120 | |
| | | | | | | | | |
Computers - Memory Devices 1.90% | |
NetApp, Inc. | | | 7,897 | | | | 316,275 | |
| | | | | | | | | |
Cruise Lines 3.19% | |
Carnival Corp. | | | 8,090 | | | | 530,461 | |
| | | | | | | | | |
Distribution/Wholesale 1.57% | |
WW Grainger, Inc. | | | 1,451 | | | | 261,949 | |
| | | | | | | | | |
Electric - Integrated 2.58% | |
Entergy Corp. | | | 5,605 | | | | 430,296 | |
| | | | | | | | | |
Electronic Components - Miscellaneous 6.42% | |
Corning, Inc. | | | 18,468 | | | | 554,964 | |
TE Connectivity Ltd. | | | 6,540 | | | | 514,567 | |
| | | | | | | | 1,069,531 | |
| | | | | | | | | |
Electronic Components - Semiconductors 3.26% | |
Xilinx, Inc. | | | 8,452 | | | | 543,633 | |
| | | | | | | | | |
Food - Meat Products 3.37% | |
Tyson Foods, Inc., Class A | | | 8,967 | | | | 561,603 | |
| | | | | | | | | |
Food - Miscellaneous/Diversified 2.33% | |
Kraft Heinz Co. | | | 4,526 | | | | 387,607 | |
| | | | | | | | | |
Investment Management/Advisory Services 2.63% | |
Ameriprise Financial, Inc. | | | 3,438 | | | | 437,623 | |
| | | | | | | | | |
Medical - Drugs 2.02% | |
Pfizer, Inc. | | | 10,000 | | | | 335,900 | |
| | | | | | | | | |
Medical - Generic Drugs 2.90% | |
Allergan plc | | | 1,990 | | | | 483,749 | |
See notes to portfolios of investments and notes to financial statements.
24
All American Equity Fund
Portfolio of Investments (unaudited) | June 30, 2017 |
Common Stocks (cont’d) | | Shares | | | Value | |
Medical - Wholesale Drug Distribution 3.09% | |
Cardinal Health, Inc. | | | 6,611 | | | $ | 515,129 | |
| | | | | | | | | |
Medical Labs & Testing Services 3.39% | |
Quest Diagnostics, Inc. | | | 5,074 | | | | 564,026 | |
| | | | | | | | | |
Multi-line Insurance 5.66% | |
American International Group, Inc. | | | 7,265 | | | | 454,208 | |
Hartford Financial Services Group, Inc. | | | 9,283 | | | | 488,007 | |
| | | | | | | | 942,215 | |
Oil Companies - Exploration & Production 3.32% | |
Occidental Petroleum Corp. | | | 9,236 | | | | 552,959 | |
| | | | | | | | | |
Oil Companies - Integrated 2.70% | |
ExxonMobil Corp. | | | 5,572 | | | | 449,828 | |
| | | | | | | | | |
Oil Refining & Marketing 2.98% | |
Valero Energy Corp. | | | 7,355 | | | | 496,168 | |
| | | | | | | | | |
Property/Casualty Insurance 3.15% | |
Travelers Co., Inc. | | | 4,140 | | | | 523,834 | |
| | | | | | | | | |
REITS - Regional Malls 2.44% | |
Macerich Co. | | | 6,997 | | | | 406,246 | |
| | | | | | | | | |
Retail - Bedding 2.46% | |
Bed Bath & Beyond, Inc. | | | 13,467 | | | | 409,397 | |
| | | | | | | | | |
Retail - Discount 3.83% | |
Target Corp. | | | 12,215 | | | | 638,722 | |
| | | | | | | | | |
Retail - Regional Department Store 3.17% | |
Kohl's Corp. | | | 13,645 | | | | 527,652 | |
| | | | | | | | | |
Semiconductor Components - Integrated Circuits 2.10% | |
QUALCOMM, Inc. | | | 6,343 | | | | 350,260 | |
| | | | | | | | | |
Telephone - Integrated 2.03% | |
AT&T, Inc. | | | 8,970 | | | | 338,438 | |
| | | | | | | | | |
Transportation - Rail 4.10% | |
Union Pacific Corp. | | | 6,266 | | | | 682,430 | |
| |
Total Common Stocks | | | | | | | 14,856,610 | |
(cost $14,359,784) | | | | | | | | |
See notes to portfolios of investments and notes to financial statements.
25
All American Equity Fund
Portfolio of Investments (unaudited) | June 30, 2017 |
Exchange-Traded Funds 4.31% | | Shares | | | Value | |
| | | | | | | |
Direxion Daily Technology Bull 3X Shares | | | 2,300 | | | $ | 165,347 | |
Financial Select Sector SPDR Fund | | | 3,300 | | | | 81,411 | |
Health Care Select Sector SPDR Fund | | | 2,200 | | | | 174,328 | |
Industrial Select Sector SPDR Fund | | | 700 | | | | 47,677 | |
ProShares Ultra Financial | | | 800 | | | | 83,152 | |
ProShares Ultra Real Estate | | | 700 | | | | 87,941 | |
Utilities Select Sector SPDR Fund | | | 1,500 | | | | 77,940 | |
| |
Total Exchange-Traded Funds | | | | | | | 717,796 | |
(cost $709,814) | | | | | | | | |
| | | | | | | | | |
Rights 0.00% | | | | | | | | |
| | | | | | | | | |
Food - Retail 0.00% | |
Casa Ley, S.A. de C.V., Contingent Value Right | | | 7,200 | | | 0 | *#@ |
Property Development Centers, LLC, Contingent Value Right | | | 7,200 | | | 0 | *#@ |
| |
Total Rights | | | | | | | 0 | |
(cost $—) | | | | | | | | |
| |
Total Investments 93.50% | | | | | | | 15,574,406 | |
(cost $15,069,598) | | | | | | | | |
Other assets and liabilities, net 6.50% | | | | | | | 1,083,579 | |
| | | | | | | | | |
Net Assets 100.0% | | | | | | $ | 16,657,985 | |
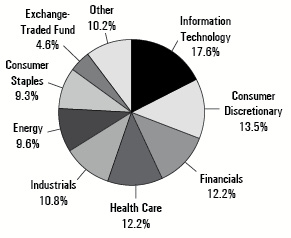
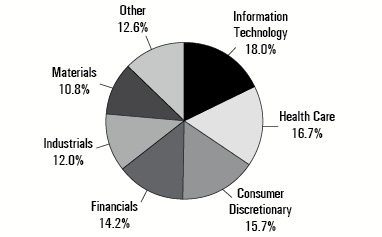
Portfolio Allocation by Industry Sector* Based on Total Investments | June 30, 2017 |
|
* | Summary information above may differ from the portfolio schedule included in the financial statements due to the use of different classifications of securities for presentation purposes. |
See notes to portfolios of investments and notes to financial statements.
26
Holmes Macro Trends Fund
Portfolio of Investments (unaudited) | June 30, 2017 |
Common Stocks 84.58% | | Shares | | | Value | |
Aerospace/Defense 1.66% | |
Rockwell Collins, Inc. | | | 6,332 | | | $ | 665,337 | |
| | | | | | | | | |
Airlines 2.45% | |
Allegiant Travel Co., Class A | | | 7,255 | | | | 983,778 | |
| | | | | | | | | |
Athletic Equipment 3.28% | |
Nautilus, Inc. | | | 68,741 | | | | 1,316,390 | * |
| | | | | | | | | |
Bicycle Manufacturing 1.98% | |
Fox Factory Holding Corp. | | | 22,333 | | | | 795,055 | * |
| | | | | | | | | |
Building - Residential/Commercial 2.89% | |
LGI Homes, Inc. | | | 28,959 | | | | 1,163,573 | * |
| | | | | | | | | |
Building Products - Air & Heating 3.85% | |
Lennox International, Inc. | | | 8,421 | | | | 1,546,432 | |
| | | | | | | | | |
Chemicals - Fibers 3.85% | |
Rayonier Advanced Materials | | | 98,315 | | | | 1,545,512 | |
| | | | | | | | | |
Chemicals - Specialty 2.83% | |
Kraton Corp. | | | 32,969 | | | | 1,135,452 | * |
| | | | | | | | | |
Commercial Services - Finance 6.74% | |
S&P Global, Inc. | | | 18,558 | | | | 2,709,282 | |
| | | | | | | | | |
Containers - Paper/Plastic 3.31% | |
Sealed Air Corp. | | | 29,726 | | | | 1,330,536 | |
| | | | | | | | | |
Data Processing/Management 3.25% | |
CSG Systems International, Inc. | | | 32,231 | | | | 1,307,934 | |
| | | | | | | | | |
E-Commerce/Products 5.29% | |
eBay, Inc. | | | 60,907 | | | | 2,126,872 | * |
| | | | | | | | | |
Electronic Security Devices 3.18% | |
Allegion plc | | | 15,752 | | | | 1,277,802 | |
| | | | | | | | | |
Energy - Alternate Sources 0.00% | |
Pacific Green Energy Corp. | | | 100,000 | | | 0 | *#@ |
| | | | | | | | | |
Finance - Commercial 0.40% | |
IOU Financial, Inc. | | | 1,099,000 | | | | 161,019 | * |
See notes to portfolios of investments and notes to financial statements.
27
Holmes Macro Trends Fund
Portfolio of Investments (unaudited) | June 30, 2017 |
Common Stocks (cont’d) | | Shares | | | Value | |
Finance - Investment Banker/Broker 0.96% | |
Greenhill & Co., Inc. | | | 19,224 | | | $ | 386,402 | |
| | | | | | | | | |
Finance - Other Services 5.06% | |
CBOE Holdings, Inc. | | | 22,239 | | | | 2,032,645 | |
| | | | | | | | | |
Home Furnishings 4.29% | |
Select Comfort Corp. | | | 48,633 | | | | 1,725,985 | * |
| | | | | | | | | |
Medical - Drugs 12.48% | |
AbbVie, Inc. | | | 27,663 | | | | 2,005,844 | |
Eagle Pharmaceuticals, Inc. | | | 13,900 | | | | 1,096,571 | * |
Supernus Pharmaceuticals, Inc. | | | 44,409 | | | | 1,914,028 | * |
| | | | | | | | 5,016,443 | |
| | | | | | | | | |
Medical - Hospitals 0.00% | |
African Medical Investments plc | | | 1,000,000 | | | 0 | *#@ |
| | | | | | | | | |
Protection - Safety 2.96% | |
Landauer, Inc. | | | 22,746 | | | | 1,189,616 | |
| | | | | | | | | |
Real Estate Operating/Development 0.83% | |
Pacific Infrastructure Ventures, Inc. (RS) | | | 426,533 | | | 333,464 | *#@ |
| | | | | | | | | |
REITS - Regional Malls 2.85% | |
Taubman Centers, Inc. | | | 19,240 | | | | 1,145,742 | |
| | | | | | | | | |
Retail - Discount 2.07% | |
HSN, Inc. | | | 26,030 | | | | 830,357 | |
| | | | | | | | | |
Semiconductor Equipment 4.06% | |
KLA-Tencor Corp. | | | 17,846 | | | | 1,633,088 | |
| | | | | | | | | |
Web Hosting/Design 1.17% | |
NIC, Inc. | | | 24,911 | | | | 472,064 | |
| | | | | | | | | |
Wireless Equipment 2.89% | |
InterDigital, Inc. | | | 15,020 | | | | 1,161,046 | |
| |
Total Common Stocks | | | | | | | 33,991,826 | |
(cost $31,885,496) | | | | | | | | |
Exchange-Traded Funds 5.28%
| | | | | | | | |
Consumer Staples Select Sector SPDR Fund | | | 3,500 | | | | 192,290 | |
Direxion Daily Technology Bull 3X Shares | | | 8,000 | | | | 575,120 | |
See notes to portfolios of investments and notes to financial statements.
28
Holmes Macro Trends Fund
Portfolio of Investments (unaudited) | June 30, 2017 |
Exchange-Traded Funds (cont’d) | | Shares | | | Value | |
| | | | | | | |
Financial Select Sector SPDR Fund | | | 7,900 | | | $ | 194,893 | |
Health Care Select Sector SPDR Fund | | | 5,200 | | | | 412,048 | |
Industrial Select Sector SPDR Fund | | | 1,600 | | | | 108,976 | |
ProShares Ultra Financial | | | 2,000 | | | | 207,880 | |
ProShares Ultra Real Estate | | | 1,500 | | | | 188,445 | |
USCF Restaurant Leaders Fund | | | 2,400 | | | | 42,720 | |
Utilities Select Sector SPDR Fund | | | 3,800 | | | | 197,448 | |
| |
Total Exchange-Traded Funds | | | | | | | 2,119,820 | |
(cost $2,102,247) | | | | | | | | |
| | | | | | | | | |
Subscription Receipts 1.41% | | | | | | | | |
| | | | | | | | | |
Oil Companies - Exploration & Production 1.41% | |
PentaNova Energy Corp. (RS) | | | 1,000,000 | | | 566,780 | *#@ |
(cost $379,694) | | | | | | | | |
| | | | | | | | | |
Warrants 0.00% | | | | | | | | |
| | | | | | | | | |
Gold Mining 0.00% | |
Gran Colombia Gold Corp., 144A, Warrants (October 2017) | | | 3,700 | | | 0 | *#@ |
Gran Colombia Gold Corp., Warrants (March 2019) | | | 250 | | | | 4 | * |
| |
Total Warrants | | | | | | | 4 | |
(cost $0) | | | | | | | | |
| | | | | | | | | |
| | | Principal
Amount | | | | | |
Convertible Debenture 0.70% | | | | | | | | |
| | | | | | | | | |
Gold Mining 0.70% | |
Gran Colombia Gold Corp., 8.00%, maturity 01/02/24, 144A | | $ | 332,971 | | | | 283,026 | |
(cost $175,839) | | | | | | | | |
| | | | | | | | | |
Corporate Note 0.58% | | | | | | | | |
| | | | | | | | | |
Electric Generation 0.58% | |
Interamerican Energy Corp., 15.00%, maturity 11/08/21 (RS) | | | 233,829 | | | 233,829 | #@ |
(cost $233,829) | | | | | | | | |
| |
Total Investments 92.55% | | | | | | | 37,195,285 | |
(cost $34,777,105) | | | | | | | | |
Other assets and liabilities, net 7.45% | | | | | | | 2,994,838 | |
| | | | | | | | | |
Net Assets 100.0% | | | | | | $ | 40,190,123 | |
See notes to portfolios of investments and notes to financial statements.
29
Holmes Macro Trends Fund
Portfolio of Investments (unaudited) | June 30, 2017 |
Portfolio Allocation by Industry Sector* Based on Total Investments | June 30, 2017 |
|
* | Summary information above may differ from the portfolio schedule included in the financial statements due to the use of different classifications of securities for presentation purposes. |
See notes to portfolios of investments and notes to financial statements.
30
Global Resources Fund
Portfolio of Investments (unaudited) | June 30, 2017 |
Common Stocks 75.62% | | Shares | | | Value | |
Agricultural Chemicals 1.55% | |
PhosAgro PJSC, GDR | | | 20,540 | | | $ | 265,808 | |
Terra Nitrogen Company, L.P. | | | 13,300 | | | | 1,141,938 | |
| | | | | | | | 1,407,746 | |
| | | | | | | | | |
Agricultural Operations 0.20% | |
Agriterra Ltd. | | | 69,849,776 | | | | 184,227 | *+ |
| | |
Automotive Truck Parts & Equipment - Original 2.40% | |
Lear Corp. | | | 7,900 | | | | 1,122,432 | |
Magna International, Inc. | | | 22,800 | | | | 1,056,324 | |
| | | | | | | | 2,178,756 | |
| | | | | | | | | |
Chemicals - Diversified 5.24% | |
Dongyue Group, Ltd. | | | 2,364,500 | | | | 1,138,723 | * |
Kanto Denka Kogyo Co., Ltd. | | | 174,700 | | | | 1,541,924 | |
Kuraray Co., Ltd. | | | 51,800 | | | | 943,228 | |
Tosoh Corp. | | | 109,900 | | | | 1,132,653 | |
| | | | | | | | 4,756,528 | |
| | | | | | | | | |
Chemicals - Fibers 1.11% | |
Rayonier Advanced Materials, Inc. | | | 64,200 | | | | 1,009,224 | |
| | | | | | | | | |
Chemicals - Specialty 1.47% | |
Kingboard Laminates Holdings Ltd. | | | 1,107,400 | | | | 1,335,385 | |
| | |
Coal 3.58% | |
Alliance Holdings GP | | | 40,800 | | | | 966,960 | |
Caribbean Resources Corp. | | | 17 | | | 0 | *+#@ |
China Shenhua Energy Co., Ltd. H shares | | | 464,700 | | | | 1,033,899 | |
Consolidated Growth Holdings, Ltd. | | | 19,859,173 | | | 0 | *#@ |
Jastrzebska Spolka Weglowa SA | | | 62,300 | | | | 1,243,588 | * |
Walter Energy, Inc., 144A | | | 4,293 | | | | 172 | * |
| | | | | | | | 3,244,619 | |
| | | | | | | | | |
Diamonds/Precious Stones 1.23% | |
Diamond Fields International Ltd. | | | 360,000 | | | | 37,477 | * |
Lucara Diamond Corp. | | | 506,100 | | | | 1,077,141 | |
Rockwell Diamonds, Inc., 144A | | | 63,333 | | | 2,442 | *#@ |
| | | | | | | | 1,117,060 | |
| | | | | | | | | |
Diversified Minerals 1.29% | |
Ciner Resources LP | | | 23,592 | | | | 646,421 | |
Dundee Sustainable Technologies, Inc. | | | 3,587,500 | | | | 138,321 | * |
Encanto Potash Corp., 144A | | | 3,000,000 | | | | 150,370 | * |
Niocan, Inc., 144A | | | 362,069 | | | | 34,202 | *# |
See notes to portfolios of investments and notes to financial statements.
31
Global Resources Fund
Portfolio of Investments (unaudited) | June 30, 2017 |
Common Stocks (cont’d) | | Shares | | | Value | |
Diversified Minerals (cont’d) | |
VR Resources Ltd. | | | 1,125,000 | | | $ | 199,530 | * |
| | | | | | | | 1,168,844 | |
| | | | | | | | | |
Energy - Alternate Sources 3.49% | |
Pacific Green Energy Corp. | | | 2,400,000 | | | 0 | *+#@ |
SolarEdge Technologies, Inc. | | | 45,700 | | | | 914,000 | * |
VERBIO Vereinigte BioEnergie AG | | | 91,900 | | | | 1,037,275 | |
Vestas Wind Systems A.S. | | | 13,100 | | | | 1,210,012 | |
| | | | | | | | 3,161,287 | |
| | | | | | | | | |
Forestry 3.77% | |
Bravern Ventures Ltd. | | | 254,431 | | | | 19,130 | * |
Canfor Corp. | | | 75,800 | | | | 1,145,066 | * |
West Fraser Timber Co., Ltd. | | | 25,300 | | | | 1,197,497 | |
Western Forest Products, Inc. | | | 587,000 | | | | 1,059,207 | |
| | | | | | | | 3,420,900 | |
| | | | | | | | | |
Gold Mining 12.07% | |
Centerra Gold, Inc. | | | 225,800 | | | | 1,232,776 | |
Chesapeake Gold Corp., 144A | | | 52,400 | | | | 127,283 | * |
Continental Gold, Inc. | | | 180,000 | | | | 530,228 | * |
Corona Minerals Ltd. | | | 100,000 | | | 0 | *#@ |
Doray Minerals Ltd. | | | 2,113,000 | | | | 495,151 | * |
Evolution Mining Ltd. | | | 79,666 | | | | 147,864 | |
Highland Gold Mining Ltd. | | | 595,300 | | | | 1,097,893 | |
Kinross Gold Corp. | | | 1 | | | | 4 | * |
Leagold Mining Corp. | | | 500,000 | | | | 909,932 | * |
NGEx Resources, Inc. | | | 720,500 | | | | 467,719 | |
Northern Star Resources Ltd. | | | 433,400 | | | | 1,585,577 | |
Radisson Mining Resources, Inc. | | | 2,100,000 | | | | 267,196 | * |
Ramelius Resources Ltd. | | | 3,489,800 | | | | 1,208,642 | * |
Regis Resources Ltd. | | | 373,900 | | | | 1,088,119 | |
Rye Patch Gold Corp. | | | 2,334,000 | | | | 413,957 | * |
St Barbara Ltd. | | | 616,000 | | | | 1,380,089 | * |
| | | | | | | | 10,952,430 | |
| | | | | | | | | |
Medical - Hospitals 0.00% | |
African Medical Investments plc | | | 2,507,500 | | | 0 | *#@ |
| | | | | | | | | |
Metal - Copper 0.09% | |
Highland Copper Co., Inc. | | | 1,000,000 | | | | 80,969 | * |
| | | | | | | | | |
Metal - Diversified 4.96% | |
Aguia Resources Ltd. | | | 500,000 | | | | 161,347 | * |
Aguia Resources Ltd., 144A | | | 2,900,000 | | | | 936,152 | *# |
See notes to portfolios of investments and notes to financial statements.
32
Global Resources Fund
Portfolio of Investments (unaudited) | June 30, 2017 |
Common Stocks (cont’d) | | Shares | | | Value | |
Metal - Diversified (cont’d) | |
Filo Mining Corp. | | | 230,000 | | | $ | 369,172 | |
Glencore plc | | | 54,300 | | | | 203,475 | |
GoviEx Uranium, Inc., Class A | | | 1,956,100 | | | | 286,597 | * |
GoviEx Uranium, Inc., Class A, 144A | | | 58,000 | | | | 8,498 | *# |
Ivanhoe Mines Ltd., Class A | | | 354,300 | | | | 1,139,290 | * |
Mandalay Resources Corp. | | | 837,300 | | | | 242,125 | |
Orsu Metals Corp., 144A | | | 147,605 | | | | 2,845 | *# |
Sandfire Resources NL | | | 264,300 | | | | 1,147,176 | |
| | | | | | | | 4,496,677 | |
| | | | | | | | | |
Metal - Iron 2.72% | |
Ferrexpo plc | | | 447,000 | | | | 1,203,890 | |
Fortescue Metals Group Ltd. | | | 316,300 | | | | 1,266,176 | |
WAI Capital Investment Corp., 144A | | | 292,500 | | | 0 | *#@ |
| | | | | | | | 2,470,066 | |
| | | | | | | | | |
Mining Services 0.00% | |
Bounty Mining Ltd. | | | 1,692,308 | | | 0 | *#@ |
| | | | | | | | | |
Natural Resource Technology 0.15% | |
I-Pulse, Inc, 144A (RS) | | | 15,971 | | | 137,351 | *#@ |
| | | | | | | | | |
Non - Ferrous Metals 0.03% | |
Sterling Group Ventures, Inc. | | | 500,000 | | | | 30,000 | * |
| | | | | | | | | |
Oil - Field Services 1.19% | |
Atlas African Industries Ltd. | | | 255,854,621 | | | 0 | *+#@ |
Subsea 7 SA | | | 79,700 | | | | 1,074,630 | |
| | | | | | | | 1,074,630 | |
| | | | | | | | | |
Oil Companies - Exploration & Production 2.93% | |
Africa Energy Corp., 144A | | | 2,110,889 | | | | 292,998 | *# |
Beach Energy Ltd. | | | 2,296,000 | | | | 1,013,452 | |
Ivanhoe Energy, Inc. | | | 18,719 | | | | 328 | * |
Range Energy Resources, Inc., 144A | | | 15,000,000 | | | | 260,256 | *# |
SVT Capital Corp. | | | 23,626 | | | 1,913 | *#@ |
U.S. Oil Sands, Inc., 144A | | | 198,000 | | | 4,580 | *#@ |
Ultra Petroleum Corp. | | | 99,600 | | | | 1,080,660 | * |
| | | | | | | | 2,654,187 | |
| | | | | | | | | |
Oil Companies - Integrated 1.29% | |
Chevron Corp. | | | 1,300 | | | | 135,629 | |
China Petroleum & Chemical Corp., Sponsored ADR | | | 13,200 | | | | 1,037,520 | |
| | | | | | | | 1,173,149 | |
See notes to portfolios of investments and notes to financial statements.
33
Global Resources Fund
Portfolio of Investments (unaudited) | June 30, 2017 |
Common Stocks (cont’d) | | Shares | | | Value | |
Oil Refining & Marketing 1.14% | |
CVR Refining LP | | | 108,800 | | | $ | 1,033,600 | |
| | |
Oil-Field Services 3.55% | |
Maire Tecnimont S.p.A. | | | 206,800 | | | | 962,299 | |
Petrofac Ltd. | | | 195,100 | | | | 1,121,825 | |
TGS NOPEC Geophysical Co. ASA | | | 55,200 | | | | 1,132,558 | |
| | | | | | | | 3,216,682 | |
| | | | | | | | | |
Petrochemicals 2.31% | |
Braskem, Sponsored ADR | | | 49,900 | | | | 1,033,928 | |
Sinopec Shanghai Petrochemical Co., Ltd., H shares | | | 1,980,700 | | | | 1,059,940 | |
| | | | | | | | 2,093,868 | |
| | | | | | | | | |
Power Converters/Supply Equipment 1.10% | |
Gamesa Tecnologica S.A. | | | 46,800 | | | | 1,001,314 | |
| | | | | | | | | |
Precious Metals 1.33% | |
Silver Standard Resources, Inc. | | | 123,700 | | | | 1,201,127 | * |
| | | | | | | | | |
Real Estate Operating/Development 6.42% | |
Pacific Infrastructure Ventures, Inc. (RS) | | | 7,443,544 | | | 5,819,363 | *#@ |
| | | | | | | | | |
Rubber - Tires 1.30% | |
Goodyear Tire & Rubber Co. | | | 33,800 | | | | 1,181,648 | |
| | | | | | | | | |
Rubber/Plastic Products 0.71% | |
Hyundai Engineering Plastics Co., Ltd. | | | 92,816 | | | | 641,586 | |
| | | | | | | | | |
Steel - Producers 5.52% | |
BlueScope Steel Ltd. | | | 113,200 | | | | 1,146,041 | |
Magnitogorsk Iron & Steel Works OJSC, GDR | | | 166,500 | | | | 1,230,018 | |
Ternium, Sponsored ADR | | | 48,900 | | | | 1,373,601 | |
Tokyo Steel Manufacturing Co., Ltd. | | | 148,700 | | | | 1,260,253 | |
| | | | | | | | 5,009,913 | |
| | | | | | | | | |
Steel - Specialty 1.48% | |
Sanyo Special Steel Co., Ltd. | | | 236,700 | | | | 1,343,313 | |
| |
Total Common Stocks | | | | | | | 68,596,449 | |
(cost $139,156,336) | | | | | | | | |
See notes to portfolios of investments and notes to financial statements.
34
Global Resources Fund
Portfolio of Investments (unaudited) | June 30, 2017 |
Subscription Receipts 3.75% | | Shares | | | Value | |
Oil Companies - Exploration & Production 3.75% | |
PentaNova Energy Corp. (RS) | | | 6,000,000 | | | $ 3,400,679 | *#@ |
(cost $2,278,164) | | | | | | | |
Warrants 0.00%
| | | | | | | |
Diversified Minerals 0.00% | |
VR Resources Ltd., Warrants (March 2019) | | | 562,500 | | | 0 | *#@ |
| | | | | | | | |
Gold Mining 0.00% | |
Gran Colombia Gold Corp., Warrants (October 2017) | | | 86,150 | | | 0 | *#@ |
Gran Colombia Gold Corp., Warrants (March 2019) | | | 59,500 | | | | 1,032 | * |
| |
Total Warrants | | | | | | | 1,032 | |
(cost $0) | | | | | | | | |
Purchased Call Options 1.62%
| | Contracts | | | | | |
Exchange-Traded Fund 0.10% | |
SPDR S&P Oil & Gas Exploration & Production ETF, Strike Price 44.00, Expiration Jan. 2018 | | | 1,890 | | | | 38,745 | * |
VanEck Vectors Junior Gold Miners ETF, Strike Price 35.00, Expiration Aug. 2017 | | | 550 | | | | 56,650 | * |
| | | | | | | | 95,395 | |
| | | | | | | | | |
Gold Mining 0.48% | |
Franco-Nevada Corp., Strike Price 65.00, Expiration Jan. 2018 | | | 140 | | | | 147,700 | * |
Sandstorm Gold Ltd., Strike Price 4.00, Expiration Jan. 2018 | | | 6,100 | | | | 289,750 | * |
| | | | | | | | 437,450 | |
| | | | | | | | | |
Metal - Copper 0.26% | |
Freeport-McMoRan, Inc., Strike Price 15.00, Expiration Jan. 2018 | | | 1,340 | | | | 69,680 | * |
Freeport-McMoRan, Inc., Strike Price 13.00, Expiration Jan. 2018 | | | 700 | | | | 71,750 | * |
Turquoise Hill Resources Ltd., Strike Price 2.00, Expiration Jan. 2018 | | | 1,400 | | | | 91,000 | * |
| | | | | | | | 232,430 | |
| | | | | | | | | |
Metal - Diversified 0.40% | |
BHP Billiton Ltd., Strike Price 37.50, Expiration Jan. 2018 | | | 500 | | | | 89,000 | * |
BHP Billiton Ltd., Strike Price 40.00, Expiration Jan. 2018 | | | 2,420 | | | | 256,520 | * |
BHP Billiton Ltd., Strike Price 45.00, Expiration Jan. 2018 | | | 410 | | | | 13,940 | * |
| | | | | | | | 359,460 | |
See notes to portfolios of investments and notes to financial statements.
35
Global Resources Fund
Portfolio of Investments (unaudited) | June 30, 2017 |
Purchased Call Options (cont’d) | | Contracts | | | Value | |
Oil Companies - Integrated 0.38% | |
BP plc, Strike Price 35.00, Expiration Jan. 2018 | | | 730 | | | $ | 104,755 | * |
ExxonMobil Corp., Strike Price 90.00, Expiration Jan. 2018 | | | 2,010 | | | | 110,550 | * |
Royal Dutch Shell plc, Strike Price 55.00, Expiration Jan. 2018 | | | 400 | | | | 58,000 | * |
TOTAL S.A., Strike Price 52.50, Expiration Jan. 2018 | | | 660 | | | | 74,250 | * |
| | | | | | | | 347,555 | |
| |
Total Purchased Call Options | | | | | | | 1,472,290 | |
(cost $2,730,963) | | | | | | | | |
Purchased Put Option 0.35%
| | | | | | | | |
Exchange-Traded Fund 0.35% | |
SPDR Gold Shares, Strike Price 116.00, Expiration Dec. 2017 | | | 1,200 | | | | 318,000 | * |
(cost $307,941) | | | | | | | | |
| | | | | | | | | |
Convertible Debenture 7.49% | | Principal Amount | | | | | |
Gold Mining 7.49% | |
Gran Colombia Gold Corp., 8.00%, maturity 01/02/24, 144A | | $ | 7,989,710 | | | | 6,791,254 | |
(cost $4,242,488) | | | | | | | | |
| | | | | | | | | |
Corporate Note 3.09% | | | | | | | | |
Electric Generation 3.09% | |
Interamerican Energy Corp., 15.00%, maturity 11/08/21 (RS) | | | 2,805,938 | | | 2,805,938 | #@ |
(cost $2,805,938) | | | | | | | | |
| |
Total Investments 91.92% | | | | | | | 83,385,642 | |
(cost $151,521,830) | | | | | | | | |
Other assets and liabilities, net 8.08% | | | | | | | 7,325,310 | |
| | | | | | | | | |
Net Assets 100.0% | | | | | | $ | 90,710,952 | |
See notes to portfolios of investments and notes to financial statements.
36
Global Resources Fund
Portfolio of Investments (unaudited) | June 30, 2017 |
Portfolio Allocation by Industry Sector* Based on Total Investments | June 30, 2017 |
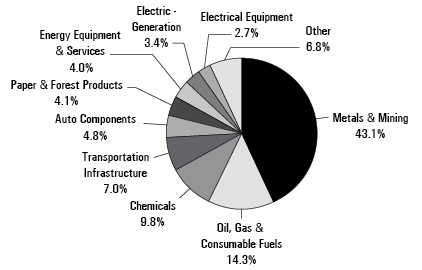
|
* | Summary information above may differ from the portfolio schedule included in the financial statements due to the use of different classifications of securities for presentation purposes. |
See notes to portfolios of investments and notes to financial statements.
37
World Precious Minerals Fund
Portfolio of Investments (unaudited) | June 30, 2017 |
Common Stocks 91.20% | | Shares | | | Value | |
Advanced Materials/Products 1.36% | |
Nano One Materials Corp. | | | 3,100,000 | | | $ | 1,768,970 | *+ |
| | | | | | | | | |
Capital Pools 0.08% | |
Pinecrest Resources Ltd. | | | 400,000 | | | | 111,043 | * |
| | | | | | | | | |
Coal 0.00% | |
Caribbean Resources Corp. | | | 4 | | | 0 | *#@ |
| | | | | | | | | |
Diamonds/Precious Stones 0.00% | |
Rockwell Diamonds, Inc., 144A | | | 171,667 | | | 6,619 | *#@ |
| | | | | | | | | |
Diversified Minerals 8.94% | |
Adamera Minerals Corp., 144A | | | 119,543 | | | | 15,210 | * |
Auryn Resources, Inc. | | | 1,475,000 | | | | 3,469,116 | * |
Bacanora Minerals Ltd. | | | 429,923 | | | | 446,930 | * |
Calibre Mining Corp. | | | 4,500,000 | | | | 520,512 | * |
Golden Peak Minerals, Inc. | | | 2,299,998 | | | | 514,342 | *+ |
Golden Predator Mining Corp. | | | 1,250,000 | | | | 1,204,889 | * |
Golden Reign Resources Ltd. | | | 1,500,000 | | | | 277,606 | * |
Indochine Mining Ltd. | | | 10,000 | | | 0 | *#@ |
Lithium Americas Corp. | | | 750,000 | | | | 503,162 | * |
Lithium X Energy Corp. | | | 2,275,000 | | | | 3,420,921 | * |
Rubicon Minerals Corp. | | | 475,000 | | | | 582,395 | * |
Terrax Minerals, Inc. | | | 1,000,000 | | | | 393,276 | * |
VR Resources Ltd. | | | 1,725,000 | | | | 305,945 | * |
| | | | | | | | 11,654,304 | |
| | | | | | | | | |
Gold Mining 53.57% | |
Alexandria Minerals Corp. | | | 6,500,000 | | | | 375,925 | * |
Algold Resources Ltd. | | | 5,400,000 | | | | 874,460 | * |
Anfield Gold Corp. | | | 1,000,000 | | | | 339,297 | * |
Anfield Gold Corp., 144A | | | 500,000 | | | | 169,648 | * |
Argo Gold, Inc. | | | 1,825,000 | | | | 253,316 | *+ |
Bonterra Resources, Inc. | | | 4,000,000 | | | | 1,418,877 | * |
Canyon Resources Ltd. | | | 16,175,457 | | | | 833,805 | *+ |
Chesapeake Gold Corp., 144A | | | 192,199 | | | | 466,862 | * |
Comstock Mining, Inc. | | | 2,665,000 | | | | 487,162 | * |
CopperBank Resources Corp. | | | 15,805,418 | | | | 1,401,622 | *+ |
CopperBank Resources Corp., 144A | | | 174,000 | | | | 15,430 | *+# |
Corona Minerals Ltd. | | | 1,625,000 | | | 0 | *#@ |
Dacian Gold, Inc. | | | 500,000 | | | | 761,724 | * |
Doray Minerals Ltd. | | | 1,500,000 | | | | 351,503 | * |
Eastmain Resources, Inc. | | | 1,500,000 | | | | 381,709 | * |
Gold Standard Ventures Corp. | | | 1,200,000 | | | | 2,052,000 | * |
IDM Mining Ltd. | | | 5,000,000 | | | | 520,512 | * |
See notes to portfolios of investments and notes to financial statements.
38
World Precious Minerals Fund
Portfolio of Investments (unaudited) | June 30, 2017 |
Common Stocks (cont’d) | | Shares | | | Value | |
Gold Mining (cont’d) | |
IDM Mining Ltd., 144A | | | 95,000 | | | $ | 9,890 | * |
K92 Mining Ltd. | | | 1,500,000 | | | | 902,221 | * |
Kirkland Lake Gold Ltd. | | | 470,001 | | | | 4,447,029 | * |
Klondex Mines Ltd. | | | 6,000,000 | | | | 20,219,001 | * |
Klondike Gold Corp. | | | 1,000,000 | | | | 269,895 | * |
Leagold Mining Corp. | | | 700,000 | | | | 1,273,905 | |
Leagold Mining Corp., 144A | | | 333,000 | | | | 606,015 | |
Lexam VG Gold, Inc. | | | 134,764 | | | | 353,329 | * |
Malbex Resources, Inc., 144A | | | 133,333 | | | | 35,986 | *# |
Mammoth Resources Corp. | | | 1,454,500 | | | | 89,728 | *+ |
Marathon Gold Corp. | | | 280,000 | | | | 226,712 | * |
Mirasol Resources Ltd. | | | 2,000,000 | | | | 2,452,190 | * |
NGEx Resources, Inc. | | | 1,500,000 | | | | 925,355 | * |
Nighthawk Gold Corp. | | | 1,500,000 | | | | 936,922 | * |
NV Gold Corp. | | | 1,800,000 | | | | 485,811 | *+ |
OceanaGold Corp., 144A | | | 5,348 | | | | 16,125 | |
Orca Gold, Inc. | | | 3,950,000 | | | | 1,172,694 | * |
Osisko Mining, Inc. | | | 300,000 | | | | 948,489 | * |
Petaquilla Minerals Ltd., 144A | | | 2,660,000 | | | 0 | *#@ |
Pretium Resources, Inc. | | | 200,000 | | | | 1,921,827 | * |
Pure Gold Mining, Inc. | | | 3,250,000 | | | | 1,353,331 | * |
Radisson Mining Resources, Inc. | | | 5,200,000 | | | | 661,629 | * |
Radius Gold, Inc., 144A | | | 125,000 | | | | 11,567 | * |
Red Pine Exploration, Inc. | | | 8,331,000 | | | | 578,185 | * |
Redstar Gold Corp. | | | 15,000,000 | | | | 1,735,040 | *+ |
Rise Gold Corp. | | | 2,500,000 | | | | 327,730 | * |
Rye Patch Gold Corp. | | | 8,316,873 | | | | 1,475,078 | * |
Rye Patch Gold Corp., 144A | | | 1,800,000 | | | | 319,247 | * |
Seabridge Gold, Inc. | | | 45,000 | | | | 484,076 | * |
Seafield Resources Ltd., 144A | | | 1,300,000 | | | 0 | *#@ |
Skeena Resources Ltd. | | | 3,000,000 | | | | 115,669 | * |
St Barbara Ltd. | | | 500,000 | | | | 1,120,202 | * |
Strikepoint Gold Corp. (RS) | | | 1,100,000 | | | 350,536 | *#@ |
Taurus Gold Ltd., 144A | | | 2,448,381 | | | 0 | *#@ |
TMAC Resources, Inc. | | | 150,000 | | | | 1,679,519 | * |
Tolima Gold, Inc. | | | 850,000 | | | | 6,555 | * |
Tolima Gold, Inc., 144A | | | 3,250,000 | | | | 25,062 | *# |
TriStar Gold, Inc. | | | 27,308,000 | | | | 7,896,746 | *+ |
Victoria Gold Corp. | | | 1,500,000 | | | | 670,882 | * |
Wesdome Gold Mines Ltd. | | | 1,000,000 | | | | 2,351,943 | * |
Westgold Resources Ltd. | | | 500,000 | | | | 708,447 | * |
| | | | | | | | 69,868,420 | |
| | | | | | | | | |
Medical - Hospitals 0.00% | |
African Medical Investments plc | | | 4,637,500 | | | 0 | *#@ |
See notes to portfolios of investments and notes to financial statements.
39
World Precious Minerals Fund
Portfolio of Investments (unaudited) | June 30, 2017 |
Common Stocks (cont’d) | | Shares | | | Value | |
Metal - Copper 0.40% | |
Highland Copper Co., Inc. | | | 5,000,000 | | | $ | 404,843 | * |
Rockcliff Copper Corp., 144A | | | 2,620,000 | | | | 121,221 | *# |
| | | | | | | | 526,064 | |
| | | | | | | | | |
Metal - Diversified 7.56% | |
Cardinal Resources Ltd. | | | 14,000,000 | | | | 5,701,449 | * |
Columbus Gold Corp. | | | 1,750,000 | | | | 958,128 | * |
Filo Mining Corp. | | | 400,000 | | | | 647,748 | * |
Genesis Metals Corp. | | | 583,000 | | | | 83,170 | * |
Genesis Metals Corp. (RS) | | | 2,917,000 | | | 395,329 | *#@ |
Ivanhoe Mines Ltd., Class A | | | 100,000 | | | | 321,561 | * |
Murchison Minerals Ltd. | | | 2,248,500 | | | | 273,087 | *+ |
Nemaska Lithium, Inc. | | | 400,000 | | | | 302,282 | * |
New Age Metals, Inc., 144A | | | 143,518 | | | | 11,067 | * |
Novo Resources Corp. | | | 1,000,000 | | | | 632,326 | * |
Orex Minerals, Inc. | | | 5,000,000 | | | | 501,234 | * |
Orsu Metals Corp., 144A | | | 1,869,220 | | | | 36,035 | *# |
| | | | | | | | 9,863,416 | |
| | | | | | | | | |
Mining Services 0.40% | |
Argent Minerals Ltd. | | | 21,100,000 | | | | 518,374 | *+ |
| | | | | | | | | |
Non-Ferrous Metals 0.46% | |
NextSource Materials, Inc. | | | 12,000,000 | | | | 601,481 | * |
| | | | | | | | | |
Oil Companies - Exploration & Production 0.00% | |
Big Sky Energy Corp. | | | 2,000,000 | | | 0 | *#@ |
SVT Capital Corp. | | | 1,616 | | | 131 | *#@ |
| | | | | | | | 131 | |
| | | | | | | | | |
Optical Recognition Equipment 0.01% | |
Nexoptic Technology Corp., 144A | | | 12,083 | | | | 12,951 | * |
| | | | | | | | | |
Precious Metals 17.81% | |
Amani Gold Ltd. | | | 54,500,000 | | | | 1,800,916 | * |
Barsele Minerals Corp. | | | 10,121,299 | | | | 5,307,282 | *+ |
Brixton Metals Corp. | | | 2,500,000 | | | | 626,542 | *+ |
Candente Gold Corp., 144A | | | 4,875,000 | | | | 131,574 | *# |
Dolly Varden Silver Corp. | | | 5,628,500 | | | | 2,256,956 | *+ |
Enforcer Gold Corp. (RS) | | | 3,000,000 | | | 395,589 | *+#@ |
Fiore Exploration Ltd. | | | 7,746,800 | | | 2,359,644 | *+#@ |
GFG Resources, Inc. | | | 2,000,000 | | | | 1,079,580 | * |
Kootenay Silver, Inc. | | | 1,000,000 | | | | 185,071 | * |
Liberty Gold Corp. | | | 500,000 | | | | 154,226 | * |
Lundin Gold, Inc. | | | 500,000 | | | | 2,120,604 | * |
See notes to portfolios of investments and notes to financial statements.
40
World Precious Minerals Fund
Portfolio of Investments (unaudited) | June 30, 2017 |
Common Stocks (cont’d) | | Shares | | | Value | |
Precious Metals (cont’d) | |
Lundin Gold, Inc., 144A | | | 70,000 | | | $ | 296,885 | * |
Metalla Royalty & Streaming Ltd. | | | 1,000,000 | | | | 408,698 | * |
Probe Metals, Inc. | | | 1,250,000 | | | | 1,291,641 | * |
Roxgold, Inc. | | | 3,000,000 | | | | 2,590,993 | * |
SilverCrest Metals, Inc. | | | 250,000 | | | | 358,575 | * |
Toachi Mining, Inc. | | | 4,000,000 | | | | 1,241,518 | *+ |
Toachi Mining, Inc., 144A | | | 2,000,000 | | | | 620,759 | *+# |
| | | | | | | | 23,227,053 | |
| | | | | | | | | |
Silver Mining 0.61% | |
MAG Silver Corp. | | | 50,000 | | | | 652,000 | * |
Santacruz Silver Mining Ltd. | | | 1,000,000 | | | | 142,659 | * |
| | | | | | | | 794,659 | |
| |
Total Common Stocks | | | | | | | 118,953,485 | |
(cost $133,507,159) | | | | | | | | |
| | | | | | | | | |
Warrants 1.32% | | | | | | | | |
Diversified Minerals 0.00% | |
Amani Gold Ltd., Warrants (July 2017) | | | 3,500,000 | | | | 5,380 | * |
VR Resources Ltd., Warrants (March 2019) | | | 862,500 | | | 0 | *#@ |
| | | | | | | | 5,380 | |
| | | | | | | | | |
Gold Mining 0.81% | |
Alexandria Minerals Corp., 144A, Warrants (June 2019) | | | 1,256,195 | | | 0 | *#@ |
Algold Resources Ltd., Warrants (April 2018) | | | 1,250,000 | | | 53,015 | *#@ |
Bonterra Resources, Inc., Warrants (December 2017) | | | 625,000 | | | 77,113 | *#@ |
Bonterra Resources, Inc., Warrants (July 2018) | | | 625,000 | | | 77,113 | *#@ |
Gran Colombia Gold Corp., 144A, Warrants (October 2017) | | | 58,450 | | | 0 | *#@ |
Gran Colombia Gold Corp., Warrants (March 2019) | | | 96,250 | | | | 1,670 | * |
Osisko Gold Royalties Ltd., Warrants (February 2022) | | | 377,500 | | | | 778,696 | * |
Osisko Mining, Inc., Warrants (August 2018) | | | 1,000,000 | | | | 53,979 | * |
Redstar Gold Corp., Warrants (May 2019) | | | 2,500,000 | | | 19,278 | *+#@ |
TriStar Gold, Inc., 144A, Warrants (April 2017) | | | 1,000,000 | | | 0 | *+#@ |
| | | | | | | | 1,060,864 | |
| | | | | | | | | |
Metal - Diversified 0.07% | |
Genesis Metals Corp., 144A, Warrants (June 2019) (RS) | | | 1,458,500 | | | 0 | *#@ |
Minera Alamos, Inc., Warrants (May 2019) | | | 2,225,000 | | | 85,788 | *#@ |
Murchison Minerals Ltd., 144A, Warrants (December 2018) | | | 1,500,000 | | | 0 | *+#@ |
Orex Minerals, Inc., 144A, Warrants (November 2017) | | | 1,250,000 | | | 0 | *#@ |
| | | | | | | | 85,788 | |
See notes to portfolios of investments and notes to financial statements.
41
World Precious Minerals Fund
Portfolio of Investments (unaudited) | June 30, 2017 |
Warrants (cont’d) | | Shares | | | Value | |
Precious Metals 0.44% | |
Barsele Minerals Corp., 144A, Warrants (November 2017) | | | 1,250,000 | | | $ | 385,564 | *+#@ |
Barsele Minerals Corp., 144A, Warrants (March 2018) | | | 600,000 | | | | 185,071 | *+#@ |
Probe Metals, Inc., Warrants (February 2018) | | | 625,000 | | | | 0 | *#@ |
| | | | | | | | 570,635 | |
| |
Total Warrants | | | | | | | 1,722,667 | |
(cost $564,494) | | | | | | | | |
| | | | | | | | | |
Special Warrant 0.00% | | | | | | | | |
Gold/Mineral Exploration & Development 0.00% | |
Western Exploration & Development Ltd., 144A, Special Warrants | | | 600,000 | | | | 0 | *#@ |
(cost $300,000) | | | | | | | | |
| | | | | | | | | |
Right 0.34% | | | | | | | | |
Metal - Diversified 0.34% | |
Cardinal Resources Ltd. | | | 1,500,000 | | | | 438,101 | * |
(cost $13,109) | | | | | | | | |
Convertible Debenture 2.19% | | Principal Amount | | | | |
Gold Mining 2.19% | |
Gran Colombia Gold Corp., 8.00%, maturity 01/02/24, 144A | | $ | 3,365,613 | | | | 2,860,771 | |
(cost $1,777,353) | | | | | | | | |
| | | | | | | | | |
Corporate Note 0.58% | | | | | | | | |
Electric Generation 0.58% | |
Interamerican Energy Corp., 15.00%, maturity 11/08/21 (RS) | | | 748,250 | | | 748,250 | #@ |
(cost $748,250) | | | | | | | | |
| |
Total Investments 95.63% | | | | | | | 124,723,274 | |
(cost $136,910,365) | | | | | | | | |
Other assets and liabilities, net 4.37% | | | | | | | 5,702,943 | |
| | | | | | | | | |
Net Assets 100.0% | | | | | | $ | 130,426,217 | |
See notes to portfolios of investments and notes to financial statements.
42
World Precious Minerals Fund
Portfolio of Investments (unaudited) | June 30, 2017 |
Portfolio Allocation by Industry* Based on Total Investments | June 30, 2017 |
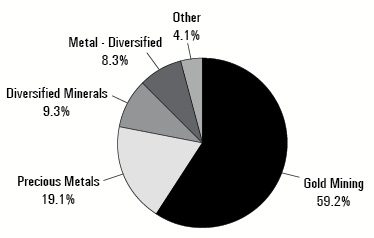
|
* | Summary information above may differ from the portfolio schedule included in the financial statements due to the use of different classifications of securities for presentation purposes. |
See notes to portfolios of investments and notes to financial statements.
43
Gold and Precious Metals Fund
Portfolio of Investments (unaudited) | June 30, 2017 |
Common Stocks 94.08% | | Shares | | | Value | |
Diamonds/Precious Stones 0.86% | |
Lucara Diamond Corp. | | | 400,000 | | | $ | 851,327 | |
| | | | | | | | | |
Gold Mining 82.59% | |
Agnico Eagle Mines Ltd. | | | 50,000 | | | | 2,256,000 | |
Alio Gold, Inc. | | | 200,000 | | | | 905,305 | * |
Barrick Gold Corp. | | | 50,000 | | | | 795,500 | |
Beadell Resources Ltd. | | | 4,000,000 | | | | 662,590 | * |
Centerra Gold, Inc. | | | 10,000 | | | | 54,596 | |
Comstock Mining, Inc. | | | 4,621,648 | | | | 844,837 | * |
Doray Minerals Ltd. | | | 1,000,000 | | | | 234,336 | * |
Dundee Precious Metals, Inc. | | | 550,000 | | | | 1,026,373 | * |
Eldorado Gold Corp. | | | 300,000 | | | | 792,000 | |
Evolution Mining Ltd. | | | 32,000 | | | | 59,394 | |
Golden Star Resources Ltd. | | | 2,500,000 | | | | 1,625,250 | * |
Harmony Gold Mining Co. Ltd., Sponsored ADR | | | 375,000 | | | | 618,750 | |
Highland Gold Mining Ltd. | | | 28,000 | | | | 51,639 | |
Jaguar Mining, Inc. | | | 6,536,000 | | | | 1,990,839 | * |
K92 Mining Ltd. | | | 2,250,000 | | | | 1,353,331 | * |
Kirkland Lake Gold Ltd. | | | 1,445,000 | | | | 13,672,234 | * |
Klondex Mines Ltd. | | | 4,950,000 | | | | 16,680,675 | * |
Koza Altin Isletmeleri A.S. | | | 11,000 | | | | 64,020 | * |
Leagold Mining Corp. | | | 1,900,000 | | | | 3,457,742 | * |
Marlin Gold Mining Ltd. | | | 1,375,200 | | | | 1,124,084 | * |
Newmont Mining Corp. | | | 75,000 | | | | 2,429,250 | |
Northern Star Resources Ltd. | | | 650,000 | | | | 2,377,999 | |
OceanaGold Corp. | | | 700,000 | | | | 2,110,580 | |
Pantoro Ltd. | | | 2,000,000 | | | | 384,164 | * |
Petropavlovsk plc | | | 567,000 | | | | 50,724 | * |
Premier Gold Mines Ltd. | | | 500,000 | | | | 1,129,704 | * |
Richmont Mines, Inc. | | | 600,000 | | | | 4,680,000 | * |
Rye Patch Gold Corp. | | | 12,670,794 | | | | 2,247,288 | * |
Sandstorm Gold Ltd. | | | 600,000 | | | | 2,322,000 | * |
Sibanye Gold Ltd., Sponsored ADR | | | 114,285 | | | | 529,140 | |
Silver Lake Resources Ltd. | | | 3,000,000 | | | | 1,085,623 | * |
St Barbara Ltd. | | | 3,000,000 | | | | 6,721,213 | * |
Wesdome Gold Mines Ltd. | | | 1,500,000 | | | | 3,527,915 | * |
Westgold Resources Ltd. | | | 2,500,000 | | | | 3,542,234 | * |
Zijin Mining Group Co., Ltd., H shares | | | 147,000 | | | | 48,578 | |
| | | | | | | | 81,455,907 | |
| | | | | | | | | |
Medical - Hospitals 0.00% | |
African Medical Investments plc | | | 2,000,000 | | | 0 | *#@ |
See notes to portfolios of investments and notes to financial statements.
44
Gold and Precious Metals Fund
Portfolio of Investments (unaudited) | June 30, 2017 |
Common Stocks (cont’d) | | Shares | | | Value | |
Metal - Diversified 3.14% | |
AuRico Metals, Inc. | | | 3,000,000 | | | $ | 2,637,261 | * |
AuRico Metals, Inc. (RS) | | | 200,000 | | | 167,027 | *#@ |
Mandalay Resources Corp. | | | 1,000,000 | | | | 289,173 | |
| | | | | | | | 3,093,461 | |
| | | | | | | | | |
Precious Metals 5.00% | |
Coeur Mining, Inc. | | | 100,000 | | | | 858,000 | * |
Maverix Metals, Inc. | | | 1,050,000 | | | | 1,222,625 | * |
Roxgold, Inc. | | | 1,000,000 | | | | 863,664 | * |
Wheaton Precious Metals Corp. | | | 100,000 | | | | 1,989,000 | |
| | | | | | | | 4,933,289 | |
| | | | | | | | | |
Silver Mining 2.49% | |
Pan American Silver Corp. | | | 125,000 | | | | 2,102,500 | |
Santacruz Silver Mining Ltd. | | | 2,500,000 | | | | 356,647 | * |
| | | | | | | | 2,459,147 | |
| |
Total Common Stocks | | | | | | | 92,793,131 | |
(cost $76,421,774) | | | | | | | | |
| | | | | | | | | |
Warrants 0.39% | | | | | | | | |
Gold Mining 0.39% | |
Gran Colombia Gold Corp., 144A, Warrants (October 2017) | | | 29,400 | | | 0 | *#@ |
Gran Colombia Gold Corp., Warrants (March 2019) | | | 37,500 | | | | 651 | * |
Osisko Gold Royalties Ltd., Warrants (February 2022) | | | 183,900 | | | | 379,343 | * |
| |
Total Warrants | | | | | | | 379,994 | |
(cost $271,712) | | | | | | | | |
| | | | | | | | | |
Convertible Debenture 1.47% | | Principal Amount | | | | | |
Gold Mining 1.47% | |
Gran Colombia Gold Corp., 8.00%, maturity 01/02/24, 144A | | $ | 1,702,944 | | | | 1,447,502 | |
(cost $899,311) | | | | | | | | |
| | | | | | | | | |
Corporate Notes 0.28% | | | | | | | | |
Coal 0.00% | |
Caribbean Resources Corp., 19.25%, maturity 06/15/15 | | | 485,766 | | | 0 | *#^@ |
See notes to portfolios of investments and notes to financial statements.
45
Gold and Precious Metals Fund
Portfolio of Investments (unaudited) | June 30, 2017 |
Corporate Notes (cont’d) | | Principal Amount | | | Value | |
Electric Generation 0.28% | |
Interamerican Energy Corp., 15.00%, maturity 11/08/21 (RS) | | $ | 280,594 | | | $ | 280,594 | #@ |
| | |
Total Corporate Notes | | | | | | | 280,594 | |
(cost $766,359) | | | | | | | | |
| | |
Total Investments 96.22% | | | | | | | 94,901,221 | |
(cost $78,359,156) | | | | | | | | |
Other assets and liabilities, net 3.78% | | | | | | | 3,729,653 | |
| | | | | | | | | |
Net Assets 100.0% | | | | | | $ | 98,630,874 | |
Portfolio Allocation by Industry* Based on Total Investments | June 30, 2017 |
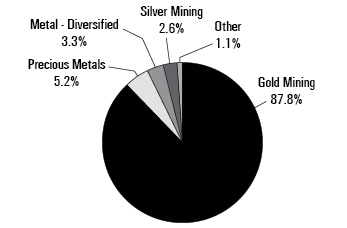
|
* | Summary information above may differ from the portfolio schedule included in the financial statements due to the use of different classifications of securities for presentation purposes. |
See notes to portfolios of investments and notes to financial statements.
46
Emerging Europe Fund
Portfolio of Investments (unaudited) | June 30, 2017 |
Common Stocks 90.71% | | Shares | | | Value | |
Agricultural Chemicals 1.95% | |
Gubre Fabrikalari T.A.S. | | | 478,000 | | | $ | 678,401 | |
PhosAgro PJSC, GDR | | | 15,900 | | | | 211,008 | |
| | | | | | | | 889,409 | |
| | | | | | | | | |
Airlines 5.44% | |
Aegean Airlines S.A. | | | 57,000 | | | | 540,197 | |
Aeroflot PJSC | | | 247,000 | | | | 818,219 | |
Deutsche Lufthansa AG | | | 25,200 | | | | 574,298 | |
Ryanair Holdings plc, Sponsored ADR | | | 1,600 | | | | 172,176 | * |
Wizz Air Holdings plc | | | 11,950 | | | | 376,838 | * |
| | | | | | | | 2,481,728 | |
| | | | | | | | | |
Airport Development/Maintenance 0.45% | |
TAV Havalimanlari Holding A.S. | | | 38,700 | | | | 207,548 | |
| | | | | | | | | |
Appliances 1.49% | |
Arcelik A.S. | | | 40,200 | | | | 297,678 | |
Vestel Beyaz Esya Sanayi ve Ticaret A.S. | | | 118,000 | | | | 381,264 | |
| | | | | | | | 678,942 | |
| | | | | | | | | |
Automotive - Cars & Light Trucks 1.37% | |
Ford Otomotiv Sanayi A.S. | | | 51,300 | | | | 626,165 | |
| | | | | | | | | |
Automotive - Med & Heavy Duty Trucks 0.42% | |
Otokar Otomotiv Ve Savunma Sanayi A.S. | | | 6,100 | | | | 192,080 | |
| | | | | | | | | |
Automotive Truck Parts & Equipment - Original 0.49% | |
Brembo S.p.A | | | 15,150 | | | | 221,993 | |
| | | | | | | | | |
Beverages - Non-alcoholic 0.36% | |
Coca-Cola Icecek A.S. | | | 14,500 | | | | 166,379 | |
| | | | | | | | | |
Building & Construction - Miscellaneous 0.64% | |
Budimex S.A. | | | 4,550 | | | | 292,219 | |
| | | | | | | | | |
Building & Construction Products - Miscellaneous 0.46% | |
Wienerberger AG | | | 9,200 | | | | 209,293 | |
| | | | | | | | | |
Cellular Telecommunication 1.12% | |
MegaFon PJSC, GDR | | | 16,600 | | | | 151,773 | |
Mobile TeleSystems OJSC, Sponsored ADR | | | 42,700 | | | | 357,826 | |
| | | | | | | | 509,599 | |
See notes to portfolios of investments and notes to financial statements.
47
Emerging Europe Fund
Portfolio of Investments (unaudited) | June 30, 2017 |
Common Stocks (cont’d) | | Shares | | | Value | |
Chemicals - Diversified 2.01% | |
Ciech S.A. | | | 28,600 | | | $ | 471,387 | * |
Koninklijke DSM | | | 6,150 | | | | 447,306 | |
| | | | | | | | 918,693 | |
| | | | | | | | | |
Chemicals - Fibers 2.13% | |
Aksa Akrilik Kimya Sanayii A.S. | | | 111,000 | | | | 422,178 | |
Lenzing AG | | | 3,079 | | | | 551,435 | |
| | | | | | | | 973,613 | |
| | | | | | | | | |
Coal 1.32% | |
Lubelski Wegiel Bogdanka S.A. | | | 33,400 | | | | 601,582 | |
| | | | | | | | | |
Commercial Banks - Non US 17.90% | |
Akbank T.A.S. | | | 213,000 | | | | 593,294 | |
Akbank T.A.S., Sponsored ADR | | | 7,500 | | | | 42,300 | |
Alpha Bank AE | | | 213,700 | | | | 526,726 | * |
Banca Transilvania S.A. | | | 300,001 | | | | 201,828 | * |
BGEO Group plc | | | 2,600 | | | | 118,282 | |
BRD-Groupe Societe Generale S.A. | | | 118,000 | | | | 398,926 | |
Eurobank Ergasias S.A. | | | 202,000 | | | | 225,861 | * |
National Bank of Greece S.A. | | | 757,000 | | | | 288,071 | * |
OTP Bank plc | | | 17,050 | | | | 570,654 | |
Piraeus Bank S.A. | | | 880,000 | | | | 215,717 | * |
Powszechna Kasa Oszczednosci Bank Polski S.A. | | | 14,000 | | | | 130,161 | |
Sberbank of Russia, Sponsored ADR | | | 383,000 | | | | 3,979,370 | |
Turkiye Garanti Bankasi A.S. | | | 230,000 | | | | 640,172 | |
Yapi ve Kredi Bankasi A.S. | | | 190,000 | | | | 242,401 | |
| | | | | | | | 8,173,763 | |
| | | | | | | | | |
Communications Software 0.56% | |
LiveChat Software S.A. | | | 16,000 | | | | 254,687 | |
| | | | | | | | | |
Computer Services 1.15% | |
Asseco Poland S.A. | | | 19,000 | | | | 250,062 | |
Luxoft Holding, Inc., Class A | | | 4,500 | | | | 273,825 | * |
| | | | | | | | 523,887 | |
| | | | | | | | | |
Cosmetics & Toiletries 0.12% | |
Unilever | | | 1,000 | | | | 54,118 | |
| | | | | | | | | |
Diamonds/Precious Stones 0.43% | |
Alrosa PJSC | | | 133,000 | | | | 195,266 | |
| | | | | | | | | |
Distribution/Wholesale 0.89% | |
Neuca S.A. | | | 3,850 | | | | 404,995 | |
See notes to portfolios of investments and notes to financial statements.
48
Emerging Europe Fund
Portfolio of Investments (unaudited) | June 30, 2017 |
Common Stocks (cont’d) | | Shares | | | Value | |
Diversified Operations 1.81% | |
Dogan Sirketler Grubu Holding A.S. | | | 273,000 | | | $ | 57,423 | * |
KOC Holding A.S. | | | 105,456 | | | | 484,807 | |
Tekfen Holding A.S. | | | 114,500 | | | | 283,796 | |
| | | | | | | | 826,026 | |
| | | | | | | | | |
Electric - Generation 1.58% | |
Alarko Holding A.S. | | | 35,000 | | | | 56,907 | |
Inter RAO UES PJSC | | | 6,660,000 | | | | 432,914 | |
Unipro PJSC | | | 5,410,688 | | | | 229,923 | |
| | | | | | | | 719,744 | |
| | | | | | | | | |
Electric - Integrated 1.11% | |
OGK-2 PJSC | | | 70,000,000 | | | | 504,715 | |
| | | | | | | | | |
Electronics - Military 0.76% | |
Aselsan Elektronik Sanayi Ve Ticaret | | | 20,500 | | | | 127,351 | |
Safran S.A. | | | 2,410 | | | | 221,013 | |
| | | | | | | | 348,364 | |
| | | | | | | | | |
Enterprise Software/Services 0.47% | |
Logo Yazilim Sanayi Ve Ticaret | | | 12,700 | | | | 213,007 | * |
| | | | | | | | | |
Entertainment Software 0.80% | |
CD Projekt S.A. | | | 15,800 | | | | 366,783 | |
| | | | | | | | | |
Food - Confectionery 0.38% | |
Ulker Biskuvi Sanayi A.S. | | | 27,500 | | | | 173,517 | |
| | | | | | | | | |
Food - Miscellaneous/Diversified 0.11% | |
Tat Gida Sanayi | | | 25,000 | | | | 50,667 | |
| | | | | | | | | |
Food - Retail 1.19% | |
BIM Birlesik Magazalar A.S. | | | 13,500 | | | | 250,298 | |
Migros Ticaret A.S. | | | 8,500 | | | | 66,592 | * |
X5 Retail Group, GDR | | | 6,500 | | | | 225,037 | * |
| | | | | | | | 541,927 | |
| | | | | | | | | |
Food - Wholesale/Distribution 0.62% | |
Eurocash S.A. | | | 34,000 | | | | 284,427 | |
| | | | | | | | | |
Gold Mining 1.46% | |
Dundee Precious Metals, Inc. | | | 240,000 | | | | 447,871 | * |
Eldorado Gold Corp. | | | 65,000 | | | | 171,600 | |
Koza Altin Isletmeleri A.S. | | | 8,500 | | | | 49,470 | * |
| | | | | | | | 668,941 | |
See notes to portfolios of investments and notes to financial statements.
49
Emerging Europe Fund
Portfolio of Investments (unaudited) | June 30, 2017 |
Common Stocks (cont’d) | | Shares | | | Value | |
Human Resources 0.54% | |
Benefit Systems S.A. | | | 825 | | | $ | 247,143 | * |
| | | | | | | | | |
Medical - Drugs 0.55% | |
Richter Gedeon Nyrt | | | 9,600 | | | | 250,977 | |
| | | | | | | | | |
Metal - Diversified 0.54% | |
MMC Norilsk Nickel PJSC, Sponsored ADR | | | 12,200 | | | | 167,506 | |
Orsu Metals Corp., 144A | | | 4,025,000 | | | | 77,595 | *# |
| | | | | | | | 245,101 | |
| | | | | | | | | |
Metal - Iron 0.89% | |
Novolipetsk Steel PJSC, GDR | | | 21,000 | | | | 406,111 | |
| | | | | | | | | |
Miscellaneous Manufacturing 1.84% | |
RHI AG | | | 15,250 | | | | 565,585 | |
Trakya Cam Sanayii | | | 250,000 | | | | 275,054 | |
| | | | | | | | 840,639 | |
| | | | | | | | | |
Multi-line Insurance 1.68% | |
Allianz | | | 1,350 | | | | 266,412 | |
UNIQA Insurance Group AG | | | 53,700 | | | | 500,893 | |
| | | | | | | | 767,305 | |
| | | | | | | | | |
Oil Companies - Integrated 16.30% | |
Gazprom OAO, Sponsored ADR | | | 663,000 | | | | 2,630,670 | |
Lukoil PJSC, Sponsored ADR | | | 61,600 | | | | 3,005,464 | |
MOL Hungarian Oil & Gas plc | | | 6,620 | | | | 519,950 | |
OMV Petrom S.A., GDR | | | 28,000 | | | | 340,118 | |
Polskie Gornictwo Naftowe i Gazownictwo S.A. | | | 304,500 | | | | 519,500 | |
Surgutneftegas OAO, Sponsored, Sponsored ADR | | | 100,000 | | | | 429,000 | |
| | | | | | | | 7,444,702 | |
| | | | | | | | | |
Oil Refining & Marketing 4.15% | |
Aygaz A.S. | | | 43,000 | | | | 190,703 | |
Grupa Lotos S.A. | | | 16,000 | | | | 220,297 | * |
Motor Oil Hellas Corinth Refineries S.A. | | | 24,100 | | | | 524,592 | |
Polski Koncern Naftowy Orlen S.A. | | | 14,900 | | | | 450,067 | |
Tupras Turkiye Petrol Rafinerileri A.S. | | | 17,700 | | | | 509,221 | |
| | | | | | | | 1,894,880 | |
| | | | | | | | | |
Precious Metals 0.49% | |
Polymetal International PLC | | | 20,000 | | | | 224,287 | |
| | | | | | | | | |
Property/Casualty Insurance 0.49% | |
Powszechny Zaklad Ubezpieczen S.A. | | | 18,600 | | | | 223,789 | |
See notes to portfolios of investments and notes to financial statements.
50
Emerging Europe Fund
Portfolio of Investments (unaudited) | June 30, 2017 |
Common Stocks (cont’d) | | Shares | | | Value | |
Real Estate Operating/Development 0.36% | |
GEK Terna Holding Real Estate Construction | | | 35,000 | | | $ | 162,334 | * |
| | | | | | | | | |
Regional Banks - Non US 0.91% | |
Moneta Money Bank A.S. | | | 124,000 | | | | 415,167 | |
| | | | | | | | | |
Retail - Appliances 1.09% | |
M.Video PJSC | | | 75,000 | | | | 499,117 | |
| | | | | | | | | |
Retail - Jewelry 0.31% | |
Pandora A/S | | | 1,515 | | | | 141,387 | |
| | | | | | | | | |
Steel - Producers 3.90% | |
Eregli Demir ve Celik Fabrikalari T.A.S. | | | 256,000 | | | | 512,823 | |
Evraz plc | | | 225,500 | | | | 607,365 | * |
Magnitogorsk Iron & Steel Works OJSC, GDR | | | 62,600 | | | | 462,457 | |
Severstal PAO PJSC, GDR | | | 15,300 | | | | 200,321 | |
| | | | | | | | 1,782,966 | |
| | | | | | | | | |
Telecom Services 1.50% | |
O2 Czech Republic a.s. | | | 16,100 | | | | 190,994 | |
Orange Polska S.A. | | | 110,000 | | | | 152,319 | |
Sistema PJSC FC, GDR | | | 49,000 | | | | 204,966 | |
Turk Telekomunikasyon A.S. | | | 78,200 | | | | 138,637 | |
| | | | | | | | 686,916 | |
| | | | | | | | | |
Telephone - Integrated 1.80% | |
Hellenic Telecommunications Organization S.A. | | | 30,600 | | | | 368,323 | |
Magyar Telekom Telecommunications | | | 260,500 | | | | 454,825 | |
| | | | | | | | 823,148 | |
| | | | | | | | | |
Textile - Apparel 0.34% | |
LPP S.A. | | | 80 | | | | 154,408 | * |
| | | | | | | | | |
Tobacco 0.49% | |
Philip Morris CR A.S. | | | 340 | | | | 224,238 | |
| | | | | | | | | |
Transportation - Services 0.53% | |
Oesterreichische Post AG | | | 5,550 | | | | 241,139 | |
| | | | | | | | | |
Travel Services 0.48% | |
TUI | | | 15,000 | | | | 218,669 | |
See notes to portfolios of investments and notes to financial statements.
51
Emerging Europe Fund
Portfolio of Investments (unaudited) | June 30, 2017 |
Common Stocks (cont’d) | | Shares | | | Value | |
Web Portals/ISP 0.54% | |
Yandex, Class A | | | 9,450 | | | $ | 247,968 | * |
| |
Total Common Stocks | | | | | | | 41,416,468 | |
(cost $38,324,658) | | | | | | | | |
| | | | | | | | | |
Exchange-Traded Funds 3.38% | |
Direxion Daily Russia Bull 3x Shares | | | 32,500 | | | | 1,114,100 | |
iShares MSCI Poland Capped ETF | | | 17,750 | | | | 430,970 | |
| |
Total Exchange-Traded Funds | | | | | | | 1,545,070 | |
(cost $1,814,495) | | | | | | | | |
| |
Total Investments 94.09% | | | | | | | 42,961,538 | |
(cost $40,139,153) | | | | | | | | |
Other assets and liabilities, net 5.91% | | | | | | | 2,697,510 | |
| | | | | | | | | |
Net Assets 100.0% | | | | | | $ | 45,659,048 | |
Country Distribution* Based on Total Investments | June 30, 2017 |

|
* | Country distribution shown is based on domicile. The locale of company operations may be different. |
See notes to portfolios of investments and notes to financial statements.
52
China Region Fund
Portfolio of Investments (unaudited) | June 30, 2017 |
Common Stocks 91.88% | | Shares | | | Value | |
Airlines 3.55% | |
Air China Ltd., H shares | | | 330,000 | | | $ | 340,147 | |
AirAsia Berhad | | | 250,000 | | | | 189,264 | |
Asia Aviation PCL NVDR | | | 350,000 | | | | 64,353 | |
Cebu Air, Inc. | | | 75,000 | | | | 145,462 | |
| | | | | | | | 739,226 | |
| | | | | | | | | |
Applications Software 3.34% | |
TravelSky Technology Ltd., H shares | | | 236,000 | | | | 695,139 | |
| | | | | | | | | |
Automotive - Cars & Light Trucks 15.08% | |
Geely Automobile Holdings Ltd. | | | 866,000 | | | | 1,866,484 | |
Great Wall Motor Co., Ltd., H shares | | | 170,500 | | | | 210,420 | |
Guangzhou Automobile Group Co., Ltd., H shares | | | 550,000 | | | | 964,652 | |
Yadea Group Holdings Ltd. | | | 400,000 | | | | 96,821 | |
| | | | | | | | 3,138,377 | |
| | | | | | | | | |
Automotive/Truck Parts & Equipment - Original 2.08% | |
Nexteer Automotive Group Ltd. | | | 276,000 | | | | 432,370 | |
| | | | | | | | | |
Automotive/Truck Parts & Equipment - Replacement 1.04% | |
Tung Thih Electronic Co., Ltd. | | | 3,000 | | | | 18,643 | |
Xinyi Glass Holdings Ltd. | | | 200,000 | | | | 197,965 | |
| | | | | | | | 216,608 | |
| | | | | | | | | |
Batteries/Battery Systems 0.32% | |
Tianneng Power International Ltd. | | | 82,000 | | | | 67,283 | |
| | | | | | | | | |
Beverages - Non-alcoholic 0.22% | |
Vitasoy International Holdings Ltd. | | | 22,000 | | | | 45,283 | |
| | | | | | | | | |
Building - Heavy Construction 3.15% | |
China Communications Services, H shares | | | 332,000 | | | | 191,241 | |
China Railway Group Ltd., H shares | | | 590,000 | | | | 464,687 | |
| | | | | | | | 655,928 | |
| | | | | | | | | |
Coal 0.98% | |
Semirara Mining & Power Co., Class A | | | 64,000 | | | | 203,460 | |
| | | | | | | | | |
Commercial Banks - Non US 1.86% | |
Bank Mandiri Persero Tbk PT | | | 94,000 | | | | 90,101 | |
Bank Rakyat Indonesia Persero Tbk PT | | | 260,000 | | | | 296,669 | |
| | | | | | | | 386,770 | |
See notes to portfolios of investments and notes to financial statements.
53
China Region Fund
Portfolio of Investments (unaudited) | June 30, 2017 |
Common Stocks (cont’d) | | Shares | | | Value | |
Computers - Integrated System 0.81% | |
PAX Global Technology Ltd. | | | 125,000 | | | $ | 80,247 | |
Posiflex Technology, Inc. | | | 16,399 | | | | 88,945 | |
| | | | | | | | 169,192 | |
| | | | | | | | | |
Computers - Memory Devices 0.75% | |
ASPEED Technology Ltd. | | | 7,000 | | | | 155,459 | |
| | | | | | | | | |
Cosmetics & Toiletries 0.32% | |
AMOREPACIFIC Group | | | 585 | | | | 66,477 | |
| | | | | | | | | |
Diversified Operations 1.54% | |
Melco International Development Ltd. | | | 120,000 | | | | 321,044 | |
| | | | | | | | | |
Electronic Components - Miscellaneous 3.91% | |
AAC Technologies Holdings, Inc. | | | 50,000 | | | | 624,558 | |
Micro-Star International Co. | | | 47,000 | | | | 109,097 | |
Pegatron Corp. | | | 12,000 | | | | 37,538 | |
Silicon Motion Technology Corp., ADR | | | 900 | | | | 43,407 | |
| | | | | | | | 814,600 | |
| | | | | | | | | |
Electronic Components - Semiconductors 0.89% | |
Phison Electronics Corp. | | | 15,000 | | | | 185,308 | |
| | | | | | | | | |
Energy - Alternate Sources 1.47% | |
China Longyuan Power Group, H shares | | | 295,000 | | | | 214,563 | |
Xinyi Solar Holdings Ltd. | | | 320,000 | | | | 91,367 | |
| | | | | | | | 305,930 | |
| | | | | | | | | |
Engineering/R&D Services 0.78% | |
CTCI Corp. | | | 95,000 | | | | 161,733 | |
| | | | | | | | | |
Enterprise Software/Services 0.18% | |
Sinosoft Technology Group Ltd. | | | 120,000 | | | | 37,181 | |
| | | | | | | | | |
Entertainment Software 0.72% | |
NetEase, Inc., ADR | | | 500 | | | | 150,315 | |
| | | | | | | | | |
Finance - Investment Banker/Broker 1.06% | |
China International Capital, H shares | | | 150,000 | | | | 221,379 | |
| | | | | | | | | |
Gas - Distribution 1.80% | |
China Resources Gas Group Ltd. | | | 110,000 | | | | 375,142 | |
| | | | | | | | | |
Internet Application Software 6.21% | |
Tencent Holdings Ltd. | | | 36,000 | | | | 1,291,499 | |
See notes to portfolios of investments and notes to financial statements.
54
China Region Fund
Portfolio of Investments (unaudited) | June 30, 2017 |
Common Stocks (cont’d) | | Shares | | | Value | |
Life/Health Insurance 0.56% | |
Bangkok Life Assurance PCL, NVDR | | | 20,000 | | | $ | 26,186 | |
China Life Insurance Co., Ltd. | | | 90,800 | | | | 90,517 | |
| | | | | | | | 116,703 | |
| | | | | | | | | |
Medical - Drugs 4.95% | |
Consun Pharmaceutical Group Ltd. | | | 80,000 | | | | 62,108 | |
CSPC Pharmaceutical Group Ltd. | | | 504,000 | | | | 736,147 | |
Livzon Pharmaceutical Group, Inc., H shares | | | 33,000 | | | | 232,489 | |
| | | | | | | | 1,030,744 | |
| | | | | | | | | |
Medical - Wholesale Drug Distribution 1.09% | |
Sinopharm Group Co., Ltd., H shares | | | 50,000 | | | | 225,896 | |
| | | | | | | | | |
Medical Products 1.66% | |
China Medical System Holdings Ltd. | | | 200,000 | | | | 345,813 | |
| | | | | | | | | |
Multi-line Insurance 1.74% | |
Ping An Insurance Group Co of China Ltd., H shares | | | 55,000 | | | | 362,307 | |
| | | | | | | | | |
Non - Ferrous Metals 0.14% | |
Sterling Group Ventures, Inc. | | | 500,000 | | | | 30,000 | * |
| | | | | | | | | |
Non-hazardous Waste Disposal 0.38% | |
China Water Affairs Group Ltd. | | | 130,000 | | | | 78,093 | |
| | | | | | | | | |
Oil - Field Services 0.48% | |
Sinopec Kantons Holdings Ltd. | | | 180,000 | | | | 99,313 | |
| | | | | | | | | |
Oil Companies - Integrated 1.68% | |
China Petroleum & Chemical Corp., ADR | | | 4,456 | | | | 350,242 | |
| | | | | | | | | |
Petrochemicals 1.83% | |
Lotte Chemical Corp. | | | 518 | | | | 155,906 | |
Sinopec Shanghai Petrochemical Co., Ltd., Sponsored ADR | | | 4,200 | | | | 224,742 | |
| | | | | | | | 380,648 | |
| | | | | | | | | |
Photo Equipment & Supplies 6.76% | |
Sunny Optical Technology Group Co., Ltd. | | | 157,000 | | | | 1,405,940 | |
| | | | | | | | | |
Property/Casualty Insurance 2.34% | |
Dongbu Insurance Co., Ltd. | | | 1,700 | | | | 101,027 | |
Hyundai Marine & Fire Insurance Co., Ltd. | | | 2,581 | | | | 88,774 | |
Meritz Fire & Marine Insurance Co., Ltd. | | | 2,727 | | | | 47,820 | |
PICC Property & Casualty Co., Ltd., H shares | | | 149,000 | | | | 248,846 | |
| | | | | | | | 486,467 | |
See notes to portfolios of investments and notes to financial statements.
55
China Region Fund
Portfolio of Investments (unaudited) | June 30, 2017 |
Common Stocks (cont’d) | | Shares | | | Value | |
Real Estate Management/Service 0.22% | |
China Overseas Property Holdings Ltd. | | | 240,000 | | | $ | 46,732 | |
| | | | | | | | | |
Real Estate Operating/Development 4.31% | |
China Overseas Grand Oceans Group Ltd. | | | 500,000 | | | | 266,976 | |
China Overseas Land & Investment Ltd. | | | 28,000 | | | | 81,944 | |
China Resources Land Ltd. | | | 50,000 | | | | 145,663 | |
China Vanke Co., Ltd., H shares | | | 35,000 | | | | 99,000 | * |
Farglory Land Development Co. Ltd. | | | 140,000 | | | | 179,456 | |
Highwealth Construction Corp. | | | 75,000 | | | | 124,139 | |
| | | | | | | | 897,178 | |
| | | | | | | | | |
Rental Auto/Equipment 0.15% | |
CAR, Inc. | | | 35,000 | | | | 32,145 | * |
| | | | | | | | | |
Retail - Apparel/Shoe 2.57% | |
ANTA Sports Products Ltd. | | | 162,000 | | | | 535,189 | |
| | | | | | | | | |
Retail - Home Furnishings 2.07% | |
Man Wah Holdings Ltd. | | | 480,000 | | | | 430,881 | |
| | | | | | | | | |
Semiconductor Components - Integrated Circuits 0.96% | |
Taiwan Semiconductor Manufacturing Co., Ltd., Sponsored ADR | | | 5,700 | | | | 199,272 | |
| | | | | | | | | |
Telecom Services 0.20% | |
Tower Bersama Infrastructure Tbk PT | | | 80,000 | | | | 40,598 | |
| | | | | | | | | |
Telecommunication Equipment 3.86% | |
BYD Electronic International Co., Ltd. | | | 405,000 | | | | 802,809 | |
| | | | | | | | | |
Textile - Apparel 1.74% | |
Best Pacific International Holdings Ltd. | | | 110,000 | | | | 98,585 | |
Shenzhou International Group Holdings Ltd. | | | 14,000 | | | | 92,055 | |
Texhong Textile Group Ltd. | | | 138,000 | | | | 171,589 | |
| | | | | | | | 362,229 | |
| | | | | | | | | |
Water Treatment Systems 0.13% | |
CT Environmental Group Ltd. | | | 160,000 | | | | 27,858 | |
| |
Total Investments 91.88% | | | | | | | 19,122,760 | |
(cost $13,592,369) | | | | | | | | |
Other assets and liabilities, net 8.12% | | | | | | | 1,690,724 | |
| | | | | | | | | |
Net Assets 100.0% | | | | | | $ | 20,813,484 | |
See notes to portfolios of investments and notes to financial statements.
56
China Region Fund
Portfolio of Investments (unaudited) | June 30, 2017 |
Country Distribution* Based on Total Investments | June 30, 2017 |

|
* | Country distribution shown is based on domicile. The locale of company operations may be different. |
See notes to portfolios of investments and notes to financial statements.
57
Notes to Portfolios of Investments (unaudited) | June 30, 2017 |
Legend
| * | Non-income producing security. |
| + | Affiliated company (see following) |
| # | Illiquid Security |
| ^ | In default on interest payments. Rate shown represents the last coupon rate prior to default. |
| ADR | American Depositary Receipt |
| AGC | Assured Guaranty Corporation |
| AGM | Assured Guaranty Municipal |
| AMBAC | American Municipal Bond Assurance Corporation |
| BAM | Build America Mutual Assurance Company |
| BHAC | Berkshire Hathaway Insurance Corporation |
| ETF | Exchange-Traded Fund |
| GDR | Global Depositary Receipt |
| GO | General Obligation Bond |
| LLC | Limited Liability Company |
| NATL | National Public Finance Guarantee Corporation |
| NVDR | Non-voting Depositary Receipt |
| OJSC | Open Joint Stock Company |
| PCL | Public Company Limited |
| PJSC | Public Joint Stock Company |
| PSF-GTD | Texas Public School Fund Guarantee |
| Q-SBLF | Qualifi ed School Bond Loan Fund |
| RS | Restricted Security (see following) |
| S&P | Standard & Poor’s |
| SPDR | Standard & Poor’s Depository Receipt |
| ZCB | Zero Coupon Bond |
@ | Security was fair valued at June 30, 2017, by U.S. Global Investors, Inc. (Adviser) (other than international securities fair valued pursuant to systematic fair value models) in accordance with valuation procedures approved by the Board of Trustees. These securities, as a percentage of net assets at June 30, 2017, were 0.00% of All American Equity Fund, 2.82% of Holmes Macro Trends Fund, 13.42% of Global Resources Fund, 3.94% of World Precious Minerals Fund and 0.45% of Gold and Precious Metals Fund, respectively. See the Fair Valuation of Securities section of these Notes to Portfolios of Investments for further discussion of fair valued securities. See further information and detail on restricted securities in the Restricted Securities section of these Notes to Portfolios of Investments. |
144A | Pursuant to Rule 144A of the Securities Act of 1933, these securities may be resold in transactions exempt from registration, normally to qualified institutional buyers. The market value of these securities and percentage of net assets as of June 30, 2017 amounted to $283,026, 0.70%, of Holmes Macro Trends Fund, $8,748,403, 9.64%, of Global Resources Fund, $6,359,559, 4.88%, of World Precious Minerals Fund, $1,447,502, 1.47%, of Gold and Precious Metals Fund, and $77,595, 0.17% of Emerging Europe Fund. |
General
The yields reflect the effective yield from the date of purchase.
Variable Rate Notes have periodic reset features, which effectively shorten the maturity dates and reset the interest rates as tied to various interest-bearing instruments. Rates shown are current rates at June 30, 2017.
Principal amounts are in U.S. dollars unless otherwise noted.
Fair Valuation of Securities
For the Funds’ policies regarding the valuation of investments and other significant accounting policies, please refer to the Notes to Financial Statements.
58
Notes to Portfolios of Investments (unaudited) | June 30, 2017 |
The Funds are required to disclose information regarding the fair value measurements of a Fund’s assets and liabilities. Fair value is the price that would be received to sell an asset or paid to transfer a liability in an orderly transaction between market participants at the measurement date. The measurement requirements established a three-tier hierarchy to maximize the use of observable market data and minimize the use of unobservable inputs and to establish classification of fair value measurements for disclosure purposes. Inputs refer broadly to the assumptions that market participants would use in pricing the asset or liability, including assumptions about risk, for example, the risk inherent in a particular valuation technique used to measure fair value including such a pricing model and/or the risk inherent in the inputs to the valuation technique. Inputs may be observable or unobservable. Observable inputs are inputs that reflect the assumptions market participants would use in pricing the asset or liability developed based on market data obtained from sources independent of the reporting entity. Unobservable inputs are inputs that reflect the reporting entity’s own assumptions about the assumptions market participants would use in pricing the asset or liability developed based on the best information available in the circumstances.
The inputs or methodology used for valuing securities are not necessarily an indication of the risk associated with investing in those securities. For example, short term U.S. government obligations maturing in sixty days or less are valued using amortized cost. Generally, amortized cost reflects the current fair value of a security, but since the value is not obtained from a quoted price in an active market, such securities are reflected as Level 2. Because of the inherent uncertainties of valuation, the values reflected in the portfolios may materially differ from the values received upon actual sale of those investments.
The three levels defined by the fair value hierarchy are as follows:
Level 1 – Quoted prices in active markets for identical securities.
Level 2 – Prices determined using significant other observable inputs (including quoted prices for similar securities, interest rates, prepayment speeds, credit risk, etc.). Short-term securities with maturities of sixty days or less are valued at amortized cost, which approximates market value, and are categorized as Level 2 in the hierarchy. Municipal securities, long-term U.S. government obligations and corporate debt securities are valued in accordance with the evaluated price supplied by the pricing service and generally categorized as Level 2 in the hierarchy. Other securities that are categorized as Level 2 in the hierarchy include, but are not limited to, warrants that do not trade on an exchange, securities valued at the mean between the last reported bid and ask quotation and international equity securities valued by an independent third party in order to adjust for stale pricing.
Level 3 – Prices determined using significant unobservable inputs (including the Fund’s own assumptions). For restricted equity securities and private placements where observable inputs are limited, assumptions about market activity and risk are used in determining fair value.
59
Notes to Portfolios of Investments (unaudited) | June 30, 2017 |
The following table summarizes the valuation of each Fund’s securities as of June 30, 2017, using the fair value hierarchy:
| | Quoted Prices in Active Markets for Identical Investments (Level 1) | | | Significant Other Observable Inputs
(Level 2) | | | Significant Unobservable Inputs
(Level 3) | | | Total | |
U.S. Government Securities Ultra-Short Bond Fund | | | | | | | |
Investments in Securities* | | | | | | | | | | | | |
United States Government and Agency Obligations | | $ | — | | | $ | 51,143,971 | | | $ | — | | | $ | 51,143,971 | |
Total | | $ | — | | | $ | 51,143,971 | | | $ | — | | | $ | 51,143,971 | |
Near-Term Tax Free Fund | | | | | | | | | | | | | | | | |
Investments in Securities* | | | | | | | | | | | | | | | | |
Municipal Bonds | | $ | — | | | $ | 75,872,208 | | | $ | — | | | $ | 75,872,208 | |
Total | | $ | — | | | $ | 75,872,208 | | | $ | — | | | $ | 75,872,208 | |
All American Equity Fund | | | | | | | | | | | | | | | | |
Investments in Securities* | | | | | | | | | | | | | | | | |
Common Stocks | | $ | 14,856,610 | | | $ | — | | | $ | — | | | $ | 14,856,610 | |
Exchange-Traded Funds | | | 717,796 | | | | — | | | | — | | | | 717,796 | |
Rights | | | — | | | | — | | | | — | | | | — | |
Total | | $ | 15,574,406 | | | $ | — | | | $ | — | | | $ | 15,574,406 | |
Holmes Macro Trends Fund | | | | | | | | | | | | | | | | |
Investments in Securities* | | | | | | | | | | | | | | | | |
Common Stocks: | | | | | | | | | | | | | | | | |
Energy - Alternate Sources | | $ | — | | | $ | — | | | $ | — | | | $ | — | |
Real Estate Operating/Development | | | — | | | | — | | | | 333,464 | | | | 333,464 | |
All Other Common Stocks | | | 33,658,362 | | | | — | | | | — | | | | 33,658,362 | |
Exchange-Traded Funds | | | 2,119,820 | | | | — | | | | — | | | | 2,119,820 | |
Subscription Receipts | | | — | | | | — | | | | 566,780 | | | | 566,780 | |
Warrants: | | | | | | | | | | | | | | | | |
Gold Mining | | | — | | | | 4 | | | | — | | | | 4 | |
Convertible Debenture | | | 283,026 | | | | — | | | | — | | | | 283,026 | |
Corporate Note | | | — | | | | — | | | | 233,829 | | | | 233,829 | |
Total | | $ | 36,061,208 | | | $ | 4 | | | $ | 1,134,073 | | | $ | 37,195,285 | |
Global Resources Fund | | | | | | | | | | | | | | | | |
Investments in Securities* | | | | | | | | | | | | | | | | |
Common Stocks: | | | | | | | | | | | | | | | | |
Agricultural Chemicals | | $ | 1,141,938 | | | $ | 265,808 | | | $ | — | | | $ | 1,407,746 | |
Agricultural Operations | | | — | | | | 184,227 | | | | — | | | | 184,227 | |
Chemicals - Diversified | | | — | | | | 4,756,528 | | | | — | | | | 4,756,528 | |
Chemicals - Specialty | | | — | | | | 1,335,385 | | | | — | | | | 1,335,385 | |
Coal | | | 967,132 | | | | 2,277,487 | | | | — | | | | 3,244,619 | |
Diamonds/Precious Stones | | | 1,114,618 | | | | 2,442 | | | | — | | | | 1,117,060 | |
Diversified Minerals | | | 1,134,642 | | | | 34,202 | | | | — | | | | 1,168,844 | |
Energy - Alternate Sources | | | 1,951,275 | | | | 1,210,012 | | | | — | | | | 3,161,287 | |
Forestry | | | 3,401,770 | | | | 19,130 | | | | — | | | | 3,420,900 | |
Gold Mining | | | 3,641,462 | | | | 7,310,968 | | | | — | | | | 10,952,430 | |
Metal - Diversified | | | 2,801,330 | | | | 1,695,347 | | | | — | | | | 4,496,677 | |
Metal - Iron | | | — | | | | 2,470,066 | | | | — | | | | 2,470,066 | |
Natural Resource Technology | | | — | | | | — | | | | 137,351 | | | | 137,351 | |
Oil - Field Services | | | — | | | | 1,074,630 | | | | — | | | | 1,074,630 | |
60
Notes to Portfolios of Investments (unaudited) | June 30, 2017 |
| | Quoted Prices in Active Markets for Identical Investments (Level 1) | | | Significant Other Observable Inputs
(Level 2) | | | Significant Unobservable Inputs
(Level 3) | | | Total | |
Global Resources Fund (cont’d) | | | | | | | | | | | | |
Investments in Securities* (cont’d) | | | | | | | | | | | | |
Common Stocks: (cont’d) | | | | | | | | | | | | |
Oil Companies - Exploration & Production | | $ | 1,373,986 | | | $ | 1,275,621 | | | $ | 4,580 | | | $ | 2,654,187 | |
Oil-Field Services | | | — | | | | 3,216,682 | | | | — | | | | 3,216,682 | |
Petrochemicals | | | 1,033,928 | | | | 1,059,940 | | | | — | | | | 2,093,868 | |
Power Converters/Supply Equipment | | | — | | | | 1,001,314 | | | | — | | | | 1,001,314 | |
Real Estate Operating/Development | | | — | | | | — | | | | 5,819,363 | | | | 5,819,363 | |
Rubber/Plastic Products | | | — | | | | 641,586 | | | | — | | | | 641,586 | |
Steel - Producers | | | 1,373,601 | | | | 3,636,312 | | | | — | | | | 5,009,913 | |
Steel - Specialty | | | — | | | | 1,343,313 | | | | — | | | | 1,343,313 | |
All Other Common Stocks | | | 7,888,473 | | | | — | | | | — | | | | 7,888,473 | |
Subscription Receipts | | | — | | | | — | | | | 3,400,679 | | | | 3,400,679 | |
Warrants: | | | | | | | | | | | | | | | | |
Diversified Minerals | | | — | | | | — | | | | — | | | | — | |
Gold Mining | | | — | | | | 1,032 | | | | — | | | | 1,032 | |
Purchased Call Options | | | — | | | | 1,472,290 | | | | — | | | | 1,472,290 | |
Purchased Put Option | | | — | | | | 318,000 | | | | — | | | | 318,000 | |
Convertible Debenture | | | 6,791,254 | | | | — | | | | — | | | | 6,791,254 | |
Corporate Note | | | — | | | | — | | | | 2,805,938 | | | | 2,805,938 | |
Total | | $ | 34,615,409 | | | $ | 36,602,322 | | | $ | 12,167,911 | | | $ | 83,385,642 | |
World Precious Minerals Fund | | | | | | | | | | | | | | | | |
Investments in Securities* | | | | | | | | | | | | | | | | |
Common Stocks: | | | | | | | | | | | | | | | | |
Coal | | $ | — | | | $ | — | | | $ | — | | | $ | — | |
Diamonds/Precious Stones | | | — | | | | 6,619 | | | | — | | | | 6,619 | |
Diversified Minerals | | | 10,957,144 | | | | 697,160 | | | | — | | | | 11,654,304 | |
Gold Mining | | | 65,742,203 | | | | 4,126,217 | | | | — | | | | 69,868,420 | |
Metal - Diversified | | | 3,410,381 | | | | 6,453,035 | | | | — | | | | 9,863,416 | |
Mining Services | | | — | | | | 518,374 | | | | — | | | | 518,374 | |
Oil Companies - Exploration & Production | | | — | | | | 131 | | | | — | | | | 131 | |
Precious Metals | | | 18,670,904 | | | | 4,556,149 | | | | — | | | | 23,227,053 | |
All Other Common Stocks | | | 3,815,168 | | | | — | | | | — | | | | 3,815,168 | |
Warrants: | | | | | | | | | | | | | | | | |
Diversified Minerals | | | — | | | | 5,380 | | | | — | | | | 5,380 | |
Gold Mining | | | — | | | | 1,060,864 | | | | — | | | | 1,060,864 | |
Metal - Diversified | | | — | | | | 85,788 | | | | — | | | | 85,788 | |
Precious Metals | | | — | | | | 570,635 | | | | — | | | | 570,635 | |
Special Warrant | | | — | | | | — | | | | — | | | | — | |
Right | | | — | | | | 438,101 | | | | — | | | | 438,101 | |
Convertible Debenture | | | 2,860,771 | | | | — | | | | — | | | | 2,860,771 | |
Corporate Note | | | — | | | | — | | | | 748,250 | | | | 748,250 | |
Total | | $ | 105,456,571 | | | $ | 18,518,453 | | | $ | 748,250 | | | $ | 124,723,274 | |
61
Notes to Portfolios of Investments (unaudited) | June 30, 2017 |
| | Quoted Prices in Active Markets for Identical Investments (Level 1) | | | Significant Other Observable Inputs
(Level 2) | | | Significant Unobservable Inputs
(Level 3) | | | Total | |
Gold and Precious Metals Fund | | | | | | | | | | | | |
Investments in Securities* | | | | | | | | | | | | |
Common Stocks: | | | | | | | | | | | | |
Gold Mining | | $ | 66,173,393 | | | $ | 15,282,514 | | | $ | — | | | $ | 81,455,907 | |
All Other Common Stocks | | | 11,337,224 | | | �� | — | | | | — | | | | 11,337,224 | |
Warrants: | | | | | | | | | | | | | | | | |
Gold Mining | | | — | | | | 379,994 | | | | — | | | | 379,994 | |
Convertible Debenture | | | 1,447,502 | | | | — | | | | — | | | | 1,447,502 | |
Corporate Notes | | | — | | | | — | | | | 280,594 | | | | 280,594 | |
Total | | $ | 78,958,119 | | | $ | 15,662,508 | | | $ | 280,594 | | | $ | 94,901,221 | |
Emerging Europe Fund | | | | | | | | | | | | | | | | |
Investments in Securities* | | | | | | | | | | | | | | | | |
Common Stocks: | | | | | | | | | | | | | | | | |
Airlines | | $ | 172,176 | | | $ | 2,309,552 | | | $ | — | | | $ | 2,481,728 | |
Cellular Telecommunications | | | 357,826 | | | | 151,773 | | | | — | | | | 509,599 | |
Commercial Banks – Non US | | | 4,021,670 | | | | 4,152,093 | | | | — | | | | 8,173,763 | |
Computer Services | | | 273,825 | | | | 250,062 | | | | — | | | | 523,887 | |
Gold Mining | | | 619,471 | | | | 49,470 | | | | — | | | | 668,941 | |
Metal - Diversified | | | 245,101 | | | | — | | | | — | | | | 245,101 | |
Oil Companies - Integrated | | | 4,211,539 | | | | 3,233,163 | | | | — | | | | 7,444,702 | |
Web Portal/ISP | | | 247,968 | | | | — | | | | — | | | | 247,968 | |
All Other Common Stocks | | | — | | | | 21,120,779 | | | | — | | | | 21,120,779 | |
Exchange-Traded Funds | | | 1,545,070 | | | | — | | | | — | | | | 1,545,070 | |
Total | | $ | 11,694,646 | | | $ | 31,266,892 | | | $ | — | | | $ | 42,961,538 | |
China Region Fund | | | | | | | | | | | | | | | | |
Investments in Securities* | | | | | | | | | | | | | | | | |
Common Stocks: | | | | | | | | | | | | | | | | |
Electronic Components - Miscellaneous | | $ | 43,407 | | | $ | 771,193 | | | $ | — | | | $ | 814,600 | |
Entertainment Software | | | 150,315 | | | | — | | | | — | | | | 150,315 | |
Non – Ferrous Metals | | | 30,000 | | | | — | | | | — | | | | 30,000 | |
Oil Companies - Integrated | | | 350,242 | | | | — | | | | — | | | | 350,242 | |
Petrochemicals | | | 224,742 | | | | 155,906 | | | | — | | | | 380,648 | |
Semiconductor Components - Integrated Circuits | | | 199,272 | | | | — | | | | — | | | | 199,272 | |
All Other Common Stocks | | | — | | | | 17,197,683 | | | | — | | | | 17,197,683 | |
Total | | $ | 997,978 | | | $ | 18,124,782 | | | $ | — | | | $ | 19,122,760 | |
* | Refer to the Portfolio of Investments for a detailed list of the Fund’s investments. |
62
Notes to Portfolios of Investments (unaudited) | June 30, 2017 |
The following table shows transfers between Level 1 and Level 2 of the fair value hierarchy during the period January 1, 2017, through June 30, 2017:
Fund | | Transfers From Level 1 to Level 2* | | | Transfers From Level 2 to Level 1* | |
Global Resources Fund | | $ | 2,442 | (3) | | $ | 1,177,128 | (1) |
World Precious Minerals Fund | | | 438,101 | (2) | | | 6,167,489 | (1) |
| | | | 2,366,263 | (3) | | | — | |
Gold and Precious Metals Fund | | | — | | | | 5,133,549 | (1) |
* | The Funds’ policy is to recognize transfers in and transfers out as of the end of the reporting period. |
(1) | Securities were valued at a quoted price at the end of the current period, but at the mean between bid and ask quotations at the end of the prior fiscal year. |
(2) | Securities were valued at a IDC fair value price at the end of the current period, but at at a quoted price at the end of the prior fiscal year. |
(3) | Transfers resulted from a regulatory hold. |
The following is a reconciliation of assets for which unobservable inputs (Level 3) were used in determining fair value during the period January 1, 2017, through June 30, 2017.
| | Rights | | | Total | |
All American Equity Fund | | | | | | |
Beginning Balance 12/31/16 | | $ | — | | | $ | — | |
Ending Balance 06/30/17 | | $ | — | | | $ | — | |
| | | | | | | | | |
Net change in unrealized appreciation (depreciation) from Investments held as of 06/30/17(1) | | $ | — | | | $ | — | |
| | Common
Stocks | | | Subscription
Receipts | | | Corporate
Note | | | Total | |
Holmes Macro Trends Fund | | | | | | | | | | | | |
Beginning Balance 12/31/16 | | $ | 293,796 | | | $ | — | | | $ | 233,829 | | | $ | 527,625 | |
Purchases | | | — | | | | 379,694 | | | | — | | | | 379,694 | |
Net change in unrealized appreciation (depreciation) | | | 39,668 | | | | 187,086 | | | | — | | | | 226,754 | |
Ending Balance 06/30/17 | | $ | 333,464 | | | $ | 566,780 | | | $ | 233,829 | | | $ | 1,134,073 | |
| | | | | | | | | | | | | | | | | |
Net change in unrealized appreciation (depreciation) from Investments held as of 06/30/17(1) | | $ | 39,668 | | | $ | 187,086 | | | $ | — | | | $ | 226,754 | |
| | Common
Stocks | | | Subscription
Receipts | | | Corporate
Note | | | Total | |
Global Resources Fund | | | | | | | | | | | | |
Beginning Balance 12/31/16 | | $ | 5,264,464 | | | $ | — | | | $ | 2,805,938 | | | $ | 8,070,402 | |
Purchases | | | — | | | | 2,278,164 | | | | — | | | | 2,278,164 | |
Net change in unrealized appreciation (depreciation) | | | 692,250 | | | | 1,122,515 | | | | — | | | | 1,814,765 | |
Transfers into Level 3* | | | 4,580 | | | | — | | | | — | | | | 4,580 | |
Ending Balance 06/30/17 | | $ | 5,961,294 | | | $ | 3,400,679 | | | $ | 2,805,938 | | | $ | 12,167,911 | |
| | | | | | | | | | | | | | | | | |
Net change in unrealized appreciation (depreciation) from Investments held as of 06/30/17(1) | | $ | 692,250 | | | $ | 1,122,515 | | | $ | — | | | $ | 1,814,765 | |
63
Notes to Portfolios of Investments (unaudited) | June 30, 2017 |
| | Common
Stocks | | | Special
Warrants | | | Corporate
Note | | | Total | |
World Precious Minerals Fund | |
Beginning Balance 12/31/16 | | $ | — | | | $ | — | | | $ | 748,250 | | | $ | 748,250 | |
Ending Balance 06/30/17 | | $ | — | | | $ | — | | | $ | 748,250 | | | $ | 748,250 | |
| | | | | | | | | | | | | | | | | |
Net change in unrealized appreciation (depreciation) from Investments held as of 06/30/17(1) | | $ | — | | | $ | — | | | $ | — | | | $ | — | |
| | Common
Stocks | | | Corporate
Notes | | | Total | |
Gold and Precious Metals Fund | | | | | | | | | |
Beginning Balance 12/31/16 | | $ | — | | | $ | 280,594 | | | $ | 280,594 | |
Ending Balance 06/30/17 | | $ | — | | | $ | 280,594 | | | $ | 280,594 | |
| | | | | | | | | | | | | |
Net change in unrealized appreciation (depreciation) from Investments held as of 06/30/17(1) | | $ | — | | | $ | — | | | $ | — | |
* | The Funds’ policy is to recognize transfers in and transfers out as of the end of the reporting period. |
(1) | The amounts shown represent the net change in unrealized appreciation (depreciation) attributable to only those investments still held and classified as Level 3 at June 30, 2017. |
Significant unobservable inputs developed by the Valuation Committee for Level 3 investments held at year-end are as follows:
| | Fair Value at 06/30/17 | | Valuation Technique(s) | Unobservable Input | Range (Weighted Average) |
All American Equity Fund | | | | |
Investments in Securities | | | | |
Rights | | $ | — | | Market Transaction(1) | Discount | 100% |
| | | | | | | | |
Holmes Macro Trends Fund | | | | |
Investments in Securities | | | | |
Common Stocks | | | 566,780 | | Market Transaction(1) | Discount | 0% - 100% discount (47% discount) |
Common Stocks | | | 333,464 | | Method of Comparables Pricing(2) | Multiples | 5.0 - 19.7 (10.1) |
Corporate Note | | | 233,829 | | Market Transaction(1) | Discount | 0% |
| | | | | | | | |
Global Resources Fund | | | | |
Investments in Securities | | | | |
Common Stocks | | | 3,542,610 | | Market Transaction(1) | Discount | 0% - 100% discount (90% discount) |
Common Stocks | | | 5,819,363 | | Method of Comparables Pricing(2) | Multiples | 5.0 - 19.7 (10.1) |
Corporate Note | | | 2,805,938 | | Market Transaction(1) | Discount | 0% |
| | | | | | | | |
World Precious Minerals Fund | | | | |
Investments in Securities | | | | |
Common Stocks | | | — | | Market Transaction(1) | Discount | 100% |
Special Warrants | | | — | | Market Transaction(1) | Discount | 100% |
64
Notes to Portfolios of Investments (unaudited) | June 30, 2017 |
| | Fair Value at 06/30/17 | | Valuation Technique(s) | Unobservable Input | Range (Weighted Average) |
Corporate Note | | $ | 748,250 | | Market Transaction(1) | Discount | 0% |
| | | | | | | | |
Gold and Precious Metals Fund | | | | |
Investments in Securities | | | | |
Common Stocks | | | — | | Market Transaction(1) | Discount | 100% |
Corporate Notes | | | 280,594 | | Market Transaction(1) | Discount | 0% - 100% discount (63% discount) |
(1) | Market Transaction refers to most recent known market transaction, including transactions in which the fund participated, as adjusted for any discount or premium as discussed below. |
(2) | The Method of Comparables Pricing valuation technique involves determining a comparable group of companies that exhibit similar characteristics to that of the Level 3 security (the Comparables), gathering information about the Comparables to determine their range of valuation multiples and selecting the appropriate multiple within the determined range of the Comparables to apply in valuing the Level 3 security. |
The majority of securities classified as Level 3 are private companies. The initial valuation is usually cost, which is then adjusted as determined by the Valuation Committee for subsequent known market transactions and evaluated for progress against anticipated milestones and current operations. An evaluation that the holding no longer meets expectations could result in the application of discounts and a significantly lower fair valuation. For certain securities, the last known market transaction is increased or decreased by changes in a market index or industry peers as approved by the Valuation Committee.
Affiliated Companies - Indicated in Portfolio of Investments as “+”
The Investment Company Act of 1940 defines affiliates as companies in which the Fund owns at least 5% of the outstanding voting securities. The following is a summary of transactions with each affiliated company during the period ended June 30, 2017.
| | Shares of Affiliated Companies |
Global Resources Fund | December 31, 2016 | Additions | Redemptions | June 30, 2017 |
Agriterra Ltd. | 69,849,776 | — | — | 69,849,776 |
Atlas African Industries Ltd. | 255,854,621 | — | — | 255,854,621 |
Caribbean Resources Corp. | 17 | — | — | 17 |
Pacific Green Energy Corp. | 2,400,000 | — | — | 2,400,000 |
65
Notes to Portfolios of Investments (unaudited) | June 30, 2017 |
At June 30, 2017, the value of investments in affiliated companies was $184,227, representing 0.20% of net assets, and the total cost was $39,515,467. There was no realized gain (loss) on transactions and no income earned for the period.
| | Shares of Affiliated Companies |
World Precious Minerals Fund | December 31, 2016 | Additions | Redemptions | June 30, 2017 |
Argent Minerals Ltd. | 17,100,000 | 4,000,000 | — | 21,100,000 |
Argo Gold, Inc. | — | 1,825,000 | — | 1,825,000 |
Barsele Minerals Corp. | 10,169,000 | 103,000 | (150,701) | 10,121,299 |
Barsele Minerals Corp., Warrants | 1,850,000 | — | — | 1,850,000 |
Bonterra Resources, Inc. | 6,500,000 | — | (2,500,000) | 4,000,000(a) |
Bonterra Resources, Inc., Warrants | 1,250,000 | — | — | 1,250,000(a) |
Brixton Metals Corp. | 2,500,000 | — | — | 2,500,000 |
Canyon Resources Ltd. | 10,006,593 | 6,168,864 | — | 16,175,457 |
CopperBank Resources Corp. | 6,979,418 | 9,000,000 | — | 15,979,418 |
Dolly Varden Silver Corp. | 5,628,500 | — | — | 5,628,500 |
Enforcer Gold Corp. | — | 3,000,000 | — | 3,000,000 |
Fiore Exploration Ltd. | 7,746,800 | — | — | 7,746,800 |
Golden Peak Minerals, Inc. | 1,999,998 | 300,000 | — | 2,299,998 |
Mammoth Resources Corp. | 4,818,000 | — | (3,363,500) | 1,454,500 |
Minera Alamos, Inc. | 4,450,000 | — | (4,450,000) | —(a) |
Minera Alamos, Inc., Warrant | 2,225,000 | — | — | 2,225,000(a) |
Murchison Minerals Ltd. | 3,000,000 | — | (751,500) | 2,248,500 |
Murchison Minerals Ltd., Warrants | 1,500,000 | — | — | 1,500,000 |
Nano One Materials Corp. | 3,100,000 | — | — | 3,100,000 |
NV Gold Corp. | 1,800,000 | — | — | 1,800,000 |
Orex Minerals, Inc. | 8,173,000 | — | (3,173,000) | 5,000,000(a) |
Orex Minerals, Inc., Warrants | 1,250,000 | — | — | 1,250,000(a) |
Red Pine Exploration, Inc. | 10,000,000 | — | (1,669,000) | 8,331,000(a) |
Redstar Gold Corp. | 15,000,000 | — | — | 15,000,000 |
Redstar Gold Corp., Warrants | 2,500,000 | — | — | 2,500,000 |
Toachi Mining, Inc. | 6,350,000 | 4,000,000 | (4,350,000) | 6,000,000 |
TriStar Gold, Inc. | 25,308,000 | 2,000,000 | — | 27,308,000 |
TriStar Gold, Inc., Warrants | — | 1,000,000 | — | 1,000,000 |
At June 30, 2017, the value of investments in affiliated companies was $29,184,474, representing 22.38% of net assets, and the total cost was $23,228,115. Net realized gains on transactions were $1,818,774, and there was no income earned for the period.
(a) | At June 30, 2017, the company was no longer defined as an affiliate, although it was an affiliate company during the year. |
66
Notes to Portfolios of Investments (unaudited) | June 30, 2017 |
Restricted Securities - Indicated in Portfolio of Investments as “RS”
The following securities are subject to contractual and regulatory restrictions on resale or transfer. These investments may involve a high degree of business and financial risk. Because of the thinly traded markets for these investments, a Fund may be unable to liquidate its securities in a timely manner, especially if there is negative news regarding the specific securities or the markets overall. These securities could decline significantly in value before the Fund could liquidate these securities. The issuer bears the cost of registration, if any, involved in the disposition of these securities.
Holmes Macro Trends Fund | Acquisition
Date | | Cost per
Share/Unit | |
Interamerican Energy Corp., Corporate Note (November 2021) | 05/25/12 | | $ | 100.00 | |
Pacific Infrastructure Ventures, Inc. | 08/06/10-11/22/10 | | $ | 1.00 | |
PentaNova Energy Corp., Subscription Receipts | 02/07/17 | | $ | 0.38 | |
As of June 30, 2017, the total cost of restricted securities was $1,040,148, and the total value was $1,134,073, representing 2.82% of net assets.
Global Resources Fund | Acquisition
Date | | Cost per
Share/Unit | |
Interamerican Energy Corp., Corporate Note (November 2021) | 05/25/12 | | $ | 100.00 | |
I-Pulse, Inc. | 10/04/07 | | $ | 1.88 | |
Pacific Infrastructure Ventures, Inc. | 08/06/10-11/22/10 | | $ | 1.00 | |
PentaNova Energy Corp., Subscription Receipts | 02/07/17 | | $ | 0.38 | |
As of June 30, 2017, the total cost of restricted securities was $12,557,646, and the total value was $12,163,331, representing 13.41% of net assets.
World Precious Minerals Fund | Acquisition
Date | | Cost per
Share/Unit | |
Enforcer Gold Corp. | 04/25/17 | | $ | 0.11 | |
Genesis Metals Corp. | 06/05/17 | | $ | 0.07 | |
Genesis Metals Corp., Warrants | 06/05/17 | | $ | 0.00 | |
Interamerican Energy Corp., Corporate Note (November 2021) | 05/25/12 | | $ | 100.00 | |
Strikepoint Gold Corp. | 04/27/17 | | $ | 0.21 | |
As of June 30, 2017, the total cost of restricted securities was $1,527,769, and the total value was $1,889,704, representing 1.45% of net assets.
Gold and Precious Metals Fund | Acquisition
Date | | Cost per
Share/Unit | |
AuRico Metals, Inc. | 06/28/17 | | $ | 0.81 | |
Interamerican Energy Corp., Corporate Note (November 2021) | 05/25/12 | | $ | 100.00 | |
As of June 30, 2017, the total cost of restricted securities was $441,742, and the total value was $447,621, representing 0.45% of net assets.
67
Statements of Assets and Liabilities (unaudited) | |
| | | U.S. Government Securities
Ultra-Short Bond Fund | |
| | | | | |
Investments, at identified cost | | $ | 51,129,888 | |
| | | | | |
Assets | | | | |
Investments, at value: | | | | |
Securities of unaffiliated issuers | | $ | 51,143,971 | |
Cash | | | 1,326,685 | |
Receivables: | | | | |
Dividends and interest | | | 100,254 | |
Capital shares sold | | | 27,583 | |
From adviser | | | 6,045 | |
Other assets | | | 15,018 | |
Total Assets | | | 52,619,556 | |
| | | | | |
Liabilities | | | | |
Payables: | | | | |
Capital shares redeemed | | | 32,140 | |
Investments purchased | | | — | |
Accrued expenses and other payables: | | | | |
Adviser | | | — | |
Admistration and Transfer Agent fees | | | 11,308 | |
Trustees | | | 2,207 | |
Other expenses | | | 18,899 | |
Total Liabilities | | | 64,554 | |
| | | | | |
Net Assets | | $ | 52,555,002 | |
| | | | | |
Net Assets Consist of: | | | | |
Paid-in-capital | | $ | 52,539,668 | |
Accumulated undistributed net investment income/accumulated net
investment loss | | | 1,732 | |
Accumulated net realized gains (losses) from investment transactions and other assets and liabilities denominated in foreign currencies | | | (481 | ) |
Net unrealized appreciation of investments and other assets and liabilities denominated in foreign currencies | | | 14,083 | |
Net assets applicable to capital shares outstanding | | $ | 52,555,002 | |
| | | | | |
By share class | | | | |
| | | | | |
Net Assets | | | | |
Investor Class | | $ | 52,555,002 | |
| | | | | |
Capital shares outstanding, an unlimited number of no par shares authorized | | | | |
Investor Class | | | 26,299,867 | |
| | | | | |
Net Asset Value, Public Offering Price, Redemption Price, per share* | | | | |
* | Redemption price per Share may vary depending on length of time Shares are held. See Note 1I. |
See accompanying notes to financial statements.
68
| | | Near-Term Tax Free Fund | | | All American Equity Fund | | | Holmes Macro Trends Fund | |
| | | | | | | | | | | | | |
| | $ | 75,580,461 | | | $ | 15,069,598 | | | $ | 34,777,105 | |
| | | | | | | | | | | | |
| | | | | | | | | | | | |
| | $ | 75,872,208 | | | $ | 15,574,406 | | | $ | 37,195,285 | |
| | | 7,142,713 | | | | 1,104,970 | | | | 3,046,281 | |
| | | | | | | | | | | | |
| | | 927,850 | | | | 16,035 | | | | 14,334 | |
| | | 167,832 | | | | 1,068 | | | | 543 | |
| | | 8,508 | | | | — | | | | — | |
| | | 20,096 | | | | 13,740 | | | | 10,757 | |
| | | 84,139,207 | | | | 16,710,219 | | | | 40,267,200 | |
| | | | | | | | | | | | |
| | | | | | | | | | | | |
| | | 66,501 | | | | 22,316 | | | | 500 | |
| | | — | | | | — | | | | 5,388 | |
| | | | | | | | | | | | |
| | | — | | | | 7,422 | | | | 32,897 | |
| | | 30,560 | | | | 5,050 | | | | 7,152 | |
| | | 142 | | | | — | | | | — | |
| | | 32,592 | | | | 17,446 | | | | 31,140 | |
| | | 129,795 | | | | 52,234 | | | | 77,077 | |
| | | | | | | | | | | | | |
| | $ | 84,009,412 | | | $ | 16,657,985 | | | $ | 40,190,123 | |
| | | | | | | | | | | | |
| | $ | 84,514,046 | | | $ | 16,938,036 | | | $ | 35,882,662 | |
| | | 17,045 | | | | 70,519 | | | | (79,223 | ) |
| | | (813,426 | ) | | | (855,378 | ) | | | 1,968,504 | |
| | | 291,747 | | | | 504,808 | | | | 2,418,180 | |
| | $ | 84,009,412 | | | $ | 16,657,985 | | | $ | 40,190,123 | |
| | | | | | | | | | | | |
| | $ | 84,009,412 | | | $ | 16,657,985 | | | $ | 40,190,123 | |
| | | | | | | | | | | | |
| | | 37,785,449 | | | | 685,419 | | | | 2,026,259 | |
| | | | | | | | | | | | |
69
Statements of Assets and Liabilities (unaudited) | |
| | | Global
Resources Fund | |
| | | | | |
Investments, at identified cost | | $ | 151,521,830 | |
| | | | | |
Assets | | | | |
Investments, at value: | | | | |
Securities of unaffiliated issuers | | $ | 83,201,415 | |
Securities of affiliated issuers | | | 184,227 | |
Cash | | | 4,462,170 | |
Foreign currencies (Cost $137,363, $120,507, $168,044, $218,646 and $117,250) | | | 138,315 | |
Unrealized gain on forward foreign currency contracts | | | 288 | |
Receivables: | | | | |
Dividends and interest | | | 389,822 | |
Capital shares sold | | | 59,478 | |
Investments sold | | | 23,215,658 | |
Other assets | | | 22,643 | |
Total Assets | | | 111,674,016 | |
| | | | | |
Liabilities | | | | |
Unrealized loss on forward foreign currency contracts | | | 4,683 | |
Payables: | | | | |
Capital shares redeemed | | | 21,116 | |
Investments purchased | | | 20,786,470 | |
Accrued expenses and other payables: | | | | |
Adviser | | | 46,793 | |
Administration and Transfer Agent fees | | | 26,685 | |
Trustees | | | 207 | |
Other expenses | | | 77,110 | |
Total Liabilities | | | 20,963,064 | |
| | | | | |
Net Assets | | $ | 90,710,952 | |
| | | | | |
Net Assets Consist of: | | | | |
Paid-in-capital | | $ | 621,525,163 | |
Accumulated undistributed net investment income/accumulated net
investment loss | | | 2,810,553 | |
Accumulated net realized losses from investment transactions and other assets and liabilities denominated in foreign currencies | | | (465,501,431 | ) |
Net unrealized appreciation (depreciation) of investments and other assets and liabilities denominated in foreign currencies | | | (68,123,333 | ) |
Net assets applicable to capital shares outstanding | | $ | 90,710,952 | |
| | | | | |
By share class | | | | |
| | | | | |
Net Assets | | | | |
Investor Class | | $ | 90,528,932 | |
Institutional Class | | $ | 182,020 | |
| | | | | |
Capital shares outstanding, an unlimited number of no par shares authorized | | | | |
Investor Class | | | 16,799,543 | |
Institutional Class | | | 33,545 | |
| | | | | |
Net Asset Value, Public Offering Price, Redemption Price, per share* | | | | |
Investor Class | | $ | 5.39 | |
Institutional Class | | | 5.43 | |
* | Redemption price per Share may vary depending on length of time Shares are held. See Note 1I. |
See accompanying notes to financial statements.
70
| | | World Precious Minerals Fund | | | Gold and Precious Metals Fund | | | Emerging Europe Fund | | | China Region Fund | |
| | | | | | | | | | | | | | | | | |
| | | $ | 136,910,365 | | | $ | 78,359,156 | | | $ | 40,139,153 | | | $ | 13,592,369 | |
| | | | | | | | | | | | | | | | | |
| | | | | | | | | | | | | | | | | |
| | | $ | 95,538,800 | | | $ | 94,901,221 | | | $ | 42,961,538 | | | $ | 19,122,760 | |
| | | | 29,184,474 | | | | — | | | | — | | | | — | |
| | | | 3,886,589 | | | | 3,916,924 | | | | 960,346 | | | | 743,582 | |
| | | | 121,024 | | | | 168,524 | | | | 218,855 | | | | 116,329 | |
| | | | — | | | | — | | | | — | | | | — | |
| | | | | | | | | | | | | | | | | |
| | | | 13,116 | | | | 15,886 | | | | 277,019 | | | | 85,854 | |
| | | | 1,438 | | | | 12,544 | | | | 31,880 | | | | 10,288 | |
| | | | 2,371,415 | | | | — | | | | 2,308,216 | | | | 814,664 | |
| | | | 30,471 | | | | 20,967 | | | | 14,761 | | | | 11,874 | |
| | | | 131,147,327 | | | | 99,036,066 | | | | 46,772,615 | | | | 20,905,351 | |
| | | | | | | | | | | | | | | | | |
| | | | — | | | | — | | | | 62,396 | | | | — | |
| | | | | | | | | | | | | | | | | |
| | | | 45,962 | | | | 101,833 | | | | 7,677 | | | | 20,053 | |
| | | | 473,045 | | | | 161,937 | | | | 921,964 | | | | 5,076 | |
| | | | | | | | | | | | | | | | | |
| | | | 69,536 | | | | 48,158 | | | | 46,605 | | | | 21,065 | |
| | | | 34,542 | | | | 23,933 | | | | 5,803 | | | | 5,735 | |
| | | | 488 | | | | 23 | | | | — | | | | — | |
| | | | 97,537 | | | | 69,308 | | | | 69,122 | | | | 39,938 | |
| | | | 721,110 | | | | 405,192 | | | | 1,113,567 | | | | 91,867 | |
| | | | | | | | | | | | | | | | | |
| | | $ | 130,426,217 | | | $ | 98,630,874 | | | $ | 45,659,048 | | | $ | 20,813,484 | |
| | | | | | | | | | | | | | | | | |
| | | $ | 501,420,173 | | | $ | 191,859,541 | | | $ | 342,073,948 | | | $ | 20,076,187 | |
| | | | 3,596,319 | | | | (3,444,309 | ) | | | 348,763 | | | | (19,838 | ) |
) | | | (362,404,361 | ) | | | (106,326,150 | ) | | | (299,514,766 | ) | | | (4,772,211 | ) |
) | | | (12,185,914 | ) | | | 16,541,792 | | | | 2,751,103 | | | | 5,529,346 | |
| | | $ | 130,426,217 | | | $ | 98,630,874 | | | $ | 45,659,048 | | | $ | 20,813,484 | |
| | | | | | | | | | | | | | | | | |
| | | $ | 127,455,447 | | | $ | 98,630,874 | | | $ | 45,659,048 | | | $ | 20,813,484 | |
| | | $ | 2,970,770 | | | $ | — | | | $ | — | | | $ | — | |
| | | | | | | | | | | | | | | | | |
| | | | 20,440,368 | | | | 13,651,657 | | | | 7,203,123 | | | | 2,206,275 | |
| | | | 473,141 | | | | — | | | | — | | | | — | |
| | | | | | | | | | | | | | | | | |
| | | $ | 6.24 | | | $ | 7.22 | | | $ | 6.34 | | | $ | 9.43 | |
| | | | 6.28 | | | | — | | | | — | | | | — | |
71
Statements of Operations (unaudited) | |
| | | U.S. Government Securities
Ultra-Short Bond Fund | |
Net Investment Income | | | |
| | | | |
Income | | | |
Dividends from unaffiliated issuers | | $ | — | |
Net dividends | | | — | |
Interest and other | | | 280,202 | |
Total income | | | 280,202 | |
| | | | | |
Expenses: | | | | |
Management fee | | | 135,001 | |
Administrative services fee | | | 22,308 | |
Accounting service fees and expenses | | | 36,385 | |
Distribution plan fee | | | — | |
Transfer agent fees and expenses | | | 32,672 | |
Professional fees | | | 16,339 | |
Custodian fees | | | 7,686 | |
Shareholder reporting expenses | | | 6,313 | |
Registration fees | | | 9,481 | |
Trustee fees and expenses | | | 3,469 | |
Chief compliance officer fees | | | 6,539 | |
Miscellaneous expenses | | | 8,037 | |
Total expenses before reductions | | | 284,230 | |
Expenses offset - Note 1 H | | | (4,573 | ) |
Expenses reimbursed - Note 3 | | | (157,155 | ) |
Net expenses | | | 122,502 | |
| | | | |
Net Investment Income (Loss) | | | 157,700 | |
| | | | | |
Net Realized and Unrealized Gain (Loss) on Investments | | | | |
Realized gain (loss) from: | | | | |
Securities from unaffiliated issuers | | | (437 | ) |
Written options | | | — | |
Foreign currency transactions | | | — | |
Net realized gain (loss) | | | (437 | ) |
Net change in unrealized appreciation (depreciation) of: | | | | |
Investments | | | (63,493 | ) |
Other assets and liabilities denominated in foreign currencies | | | — | |
Net unrealized appreciation (depreciation) | | | (63,493 | ) |
| | | | |
Net Realized and Unrealized Gain (Loss) on Investments | | | (63,930 | ) |
| | | | | |
Net Increase In Net Assets Resulting From Operations | | $ | 93,770 | |
See accompanying notes to financial statements.
72
For the Six Months Ended June 30, 2017 |
| | Near-Term
Tax Free Fund | | | All American Equity Fund | | | Holmes Macro Trends Fund | |
| | | | | | | | | |
| | $ | — | | | $ | 208,988 | | | $ | 248,215 | |
| | | — | | | | 208,988 | | | | 248,215 | |
| | | 738,543 | | | | — | | | | 34,056 | |
| | | 738,543 | | | | 208,988 | | | | 282,271 | |
| | | | | | | | | | | | |
| | | 219,748 | | | | 46,879 | | | | 191,748 | |
| | | 44,142 | | | | 13,117 | | | | 18,806 | |
| | | 70,718 | | | | 11,693 | | | | 27,080 | |
| | | — | | | | 21,548 | | | | 49,992 | |
| | | 56,214 | | | | 15,495 | | | | 24,519 | |
| | | 18,361 | | | | 13,633 | | | | 15,731 | |
| | | 15,243 | | | | 3,741 | | | | 9,183 | |
| | | 8,773 | | | | 4,479 | | | | 5,964 | |
| | | 15,963 | | | | 9,377 | | | | 9,164 | |
| | | 4,437 | | | | 2,464 | | | | 3,076 | |
| | | 10,801 | | | | 2,126 | | | | 4,812 | |
| | | 9,308 | | | | 7,413 | | | | 7,862 | |
| | | 473,708 | | | | 151,965 | | | | 367,937 | |
| | | (13,498 | ) | | | (2,418 | ) | | | (6,443 | ) |
| | | (260,937 | ) | | | — | | | | — | |
| | | 199,273 | | | | 149,547 | | | | 361,494 | |
| | | | | | | | | | | | |
| | | 539,270 | | | | 59,441 | | | | (79,223 | ) |
| | | | | | | | | | | | |
| | | (167,958 | ) | | | 135,782 | | | | 1,135,867 | |
| | | — | | | | 4,121 | | | | 11,221 | |
| | | — | | | | — | | | | 74 | |
| | | (167,958 | ) | | | 139,903 | | | | 1,147,162 | |
| | | | | | | | | | | | |
| | | 887,196 | | | | 342,701 | | | | 1,383,833 | |
| | | — | | | | — | | | | 4 | |
| | | 887,196 | | | | 342,701 | | | | 1,383,837 | |
| | | | | | | | | | | | |
| | | 719,238 | | | | 482,604 | | | | 2,530,999 | |
| | | | | | | | | | | | |
| | $ | 1,258,508 | | | $ | 542,045 | | | $ | 2,451,776 | |
73
Statements of Operations (unaudited) | |
| | | Global
Resources Fund | |
Net Investment Income | | | |
| | | | |
Income | | | |
Dividends from unaffiliated issuers | | $ | 1,508,749 | |
Foreign tax withheld on dividends | | | (98,466 | ) |
Net dividends | | | 1,410,283 | |
Interest and other | | | 561,748 | |
Total income | | | 1,972,031 | |
| | | | | |
Expenses: | | | | |
Management fee | | | 332,348 | |
Administrative services fee | | | 36,562 | |
Administrative services fee - Investor Class | | | 11,963 | |
Administrative services fee - Institutional Class | | | 128 | |
Accounting service fees and expenses | | | 68,328 | |
Distribution plan fee | | | 119,628 | |
Transfer agent fees and expenses | | | — | |
Transfer agent fees and expenses - Investor Class | | | 88,590 | |
Transfer agent fees and expenses - Institutional Class | | | 9,178 | |
Professional fees | | | 21,272 | |
Custodian fees | | | 30,807 | |
Shareholder reporting expenses | | | — | |
Shareholder reporting expenses - Investor Class | | | 17,819 | |
Shareholder reporting expenses - Institutional Class | | | 938 | |
Registration fees | | | 3,311 | |
Registration fees - Institutional Class | | | 6,095 | |
Registration fees - Investor Class | | | 6,507 | |
Trustee fees and expenses | | | 4,728 | |
Chief compliance officer fees | | | 12,006 | |
Miscellaneous expenses | | | 10,319 | |
Total expenses before reductions | | | 780,527 | |
Expenses offset - Note 1 H | | | (7,914 | ) |
Expenses reimbursed - Note 3 | | | (16,509 | ) |
Net expenses | | | 756,104 | |
| | | | |
Net Investment Income (Loss) | | | 1,215,927 | |
| | | | | |
Net Realized and Unrealized Gain (Loss) on Investments | | | | |
Realized gain (loss) from: | | | | |
Securities from unaffiliated issuers | | | 2,984,919 | |
Securities from affiliated issuers | | | — | |
Foreign currency transactions | | | (82,373 | ) |
Net realized gain (loss) | | | 2,902,546 | |
Net change in unrealized appreciation (depreciation) of: | | | | |
Investments | | | (1,476,163 | ) |
Other assets and liabilities denominated in foreign currencies | | | 2,675 | |
Net unrealized appreciation (depreciation) | | | (1,473,488 | ) |
| | | | |
Net Realized and Unrealized Gain (Loss) on Investments | | | 1,429,058 | |
| | | | | |
Net Increase (Decrease) In Net Assets Resulting From Operations | | $ | 2,644,985 | |
See accompanying notes to financial statements.
74
For the Six Months Ended June 30, 2017 |
| | World Precious Minerals Fund | | | Gold and Precious Metals Fund | | | Emerging Europe
Fund | | | China Region
Fund | |
| | | | | | | | | | | | |
| | $ | 20,032 | | | $ | 138,844 | | | $ | 975,338 | | | $ | 213,567 | |
| | | (2,075 | ) | | | (15,525 | ) | | | (121,697 | ) | | | (16,015 | ) |
| | | 17,957 | | | | 123,319 | | | | 853,641 | | | | 197,552 | |
| | | 190,506 | | | | 87,084 | | | | — | | | | 2 | |
| | | 208,463 | | | | 210,403 | | | | 853,641 | | | | 197,554 | |
| | | | | | | | | | | | | | | | |
| | | 866,957 | | | | 446,582 | | | | 253,644 | | | | 109,590 | |
| | | 55,171 | | | | 52,384 | | | | 20,024 | | | | 13,457 | |
| | | 17,859 | | | | — | | | | — | | | | — | |
| | | 346 | | | | — | | | | — | | | | — | |
| | | 103,014 | | | | 71,209 | | | | 37,517 | | | | 21,114 | |
| | | 178,581 | | | | 130,272 | | | | 56,081 | | | | 23,251 | |
| | | — | | | | 84,185 | | | | 36,895 | | | | 18,366 | |
| | | 109,325 | | | | — | | | | — | | | | — | |
| | | 12,218 | | | | — | | | | — | | | | — | |
| | | 26,359 | | | | 20,147 | | | | 18,863 | | | | 19,739 | |
| | | 40,880 | | | | 25,659 | | | | 47,041 | | | | 10,953 | |
| | | — | | | | 15,571 | | | | 11,247 | | | | 5,668 | |
| | | 20,707 | | | | — | | | | — | | | | — | |
| | | 1,256 | | | | — | | | | — | | | | — | |
| | | 4,004 | | | | 18,114 | | | | 9,486 | | | | 9,058 | |
| | | 11,020 | | | | — | | | | — | | | | — | |
| | | 5,795 | | | | — | | | | — | | | | — | |
| | | 6,164 | | | | 4,865 | | | | 3,194 | | | | 2,472 | |
| | | 18,044 | | | | 12,354 | | | | 5,301 | | | | — | |
| | | 10,805 | | | | 9,188 | | | | 8,922 | | | | 9,880 | |
| | | 1,488,505 | | | | 890,530 | | | | 508,215 | | | | 243,548 | |
| | | (8,994 | ) | | | (13,252 | ) | | | (3,337 | ) | | | (1,532 | ) |
| | | (20,100 | ) | | | — | | | | — | | | | (8,365 | ) |
| | | 1,459,411 | | | | 877,278 | | | | 504,878 | | | | 233,651 | |
| | | | | | | | | | | | | | | | |
| | | (1,250,948 | ) | | | (666,875 | ) | | | 348,763 | | | | (36,097 | ) |
| | | | | | | | | | | | | | | | |
| | | 1,923,413 | | | | 193,322 | | | | 1,247,162 | | | | 115,134 | |
| | | 1,818,774 | | | | — | | | | — | | | | — | |
| | | (224,577 | ) | | | (147,817 | ) | | | (720,103 | ) | | | 6,016 | |
| | | 3,517,610 | | | | 45,505 | | | | 527,059 | | | | 121,150 | |
| | | | | | | | | | | | | | | | |
| | | (4,513,884 | ) | | | 2,439,204 | | | | 2,165,709 | | | | 4,625,950 | |
| | | 575 | | | | (240 | ) | | | (58,891 | ) | | | 462 | |
| | | (4,513,309 | ) | | | 2,438,964 | | | | 2,106,818 | | | | 4,626,412 | |
| | | | | | | | | | | | | | | | |
| | | (995,699 | ) | | | 2,484,469 | | | | 2,633,877 | | | | 4,747,562 | |
| | | | | | | | | | | | | | | | |
| | $ | (2,246,647 | ) | | $ | 1,817,594 | | | $ | 2,982,640 | | | $ | 4,711,465 | |
75
Statements of Changes in Net Assets | |
| | | U.S. Government Securities Ultra-Short Bond Fund | |
| | | Six Months
Period Ended
June 30, 2017
(unaudited) | | | Year Ended
December 31,
2016 | |
Increase (Decrease) in Net Assets | | | | | | |
| | | | | | | |
From operations: | | | | | | |
Net investment income | | $ | 157,700 | | | $ | 259,443 | |
Net realized gains (losses) | | | (437 | ) | | | 16,447 | |
Net unrealized appreciation (depreciation) | | | (63,493 | ) | | | 50,035 | |
Net increase (decrease) in net assets from operations | | | 93,770 | | | | 325,925 | |
| | | | | | | | | |
Distributions to shareholders | | | | | | | | |
From net investment income | | | | | | | | |
Investor Class | | | (155,979 | ) | | | (259,648 | ) |
From return of capital | | | | | | | | |
Investor Class | | | — | | | | (2,047 | ) |
From net realized gains | | | | | | | | |
Investor Class | | | — | | | | (17,626 | ) |
Total distributions to shareholders | | | (155,979 | ) | | | (279,321 | ) |
| | | | | | | | | |
From capital share transactions: | | | | | | | | |
Proceeds from shares sold | | | | | | | | |
Investor Class | | | 8,299,024 | | | | 12,372,975 | |
Distributions reinvested | | | | | | | | |
Investor Class | | | 135,589 | | | | 238,566 | |
Proceeds from short-term trading fees | | | | | | | | |
Investor Class | | | — | | | | — | |
| | | | 8,434,613 | | | | 12,611,541 | |
Cost of shares redeemed | | | | | | | | |
Investor Class | | | (12,611,013 | ) | | | (18,426,069 | ) |
Net decrease in net assets from
capital share transactions | | | (4,176,400 | ) | | | (5,814,528 | ) |
| | | | | | | | |
Net Decrease in Net Assets | | | (4,238,609 | ) | | | (5,767,924 | ) |
| | | | | | | | | |
Net Assets | | | | | | | | |
Beginning of period | | | 56,793,611 | | | | 62,561,535 | |
| | | | | | | | |
End of period | | $ | 52,555,002 | | | $ | 56,793,611 | |
| | | | | | | | | |
Accumulated undistributed net investment income,
end of period | | $ | 1,732 | | | $ | 11 | |
| | | | | | | | | |
Capital Share Activity | | | | | | | | |
Investor Class | | | | | | | | |
Shares sold | | | 4,149,512 | | | | 6,168,822 | |
Shares reinvested | | | 67,794 | | | | 118,920 | |
Shares redeemed | | | (6,305,506 | ) | | | (9,183,862 | ) |
Net share activity | | | (2,088,200 | ) | | | (2,896,120 | ) |
See accompanying notes to financial statements.
76
| | Near-Term Tax Free Fund | | | | All American Equity Fund | |
| | Six Months
Period Ended
June 30, 2017
(unaudited) | | | Year Ended
December 31,
2016 | | | | Six Months
Period Ended
June 30, 2017
(unaudited) | | | Year Ended
December 31,
2016 | |
| | | | | | | | | | | | | |
| | $ | 539,270 | | | $ | 1,431,075 | | | | $ | 59,441 | | | $ | 10,546 | |
| | | (167,958 | ) | | | (258,979 | ) | | | | 139,903 | | | | 364,020 | |
| | | 887,196 | | | | (1,746,522 | ) | | | | 342,701 | | | | (418,440 | ) |
| | | 1,258,508 | | | | (574,426 | ) | | | | 542,045 | | | | (43,874 | ) |
| | | | | | | | | | | | | | | | | |
| | | | | | | | | | | | | | | | | |
| | | (523,298 | ) | | | (1,496,282 | ) | | | | — | | | | (27,184 | ) |
| | | | | | | | | | | | | | | | | |
| | | — | | | | (13,758 | ) | | | | — | | | | — | |
| | | | | | | | | | | | | | | | | |
| | | — | | | | — | | | | | — | | | | — | |
| | | (523,298 | ) | | | (1,510,040 | ) | | | | — | | | | (27,184 | ) |
| | | | | | | | | | | | | | | | | |
| | | | | | | | | | | | | | | | | |
| | | 12,221,275 | | | | 55,084,675 | | | | | 1,773,793 | | | | 1,190,494 | |
| | | | | | | | | | | | | | | | | |
| | | 475,745 | | | | 1,318,777 | | | | | — | | | | 25,370 | |
| | | | | | | | | | | | | | | | | |
| | | — | | | | — | | | | | — | | | | 53 | |
| | | 12,697,020 | | | | 56,403,452 | | | | | 1,773,793 | | | | 1,215,917 | |
| | | | | | | | | | | | | | | | | |
| | | (24,723,386 | ) | | | (65,787,063 | ) | | | | (3,007,614 | ) | | | (2,912,402 | ) |
| | | (12,026,366 | ) | | | (9,383,611 | ) | | | | (1,233,821 | ) | | | (1,696,485 | ) |
| | | | | | | | | | | | | | | | | |
| | | (11,291,156 | ) | | | (11,468,077 | ) | | | | (691,776 | ) | | | (1,767,543 | ) |
| | | | | | | | | | | | | | | | | |
| | | 95,300,568 | | | | 106,768,645 | | | | | 17,349,761 | | | | 19,117,304 | |
| | | | | | | | | | | | | | | | | |
| | $ | 84,009,412 | | | $ | 95,300,568 | | | | $ | 16,657,985 | | | $ | 17,349,761 | |
| | | | | | | | | | | | | | | | | |
| | $ | 17,045 | | | $ | 1,073 | | | | $ | 70,519 | | | $ | 11,078 | |
| | | | | | | | | | | | | | | | | |
| | | | | | | | | | | | | | | | | |
| | | 5,502,009 | | | | 24,456,367 | | | | | 72,918 | | | | 51,424 | |
| | | 214,137 | | | | 587,206 | | | | | — | | | | 1,071 | |
| | | (11,131,966 | ) | | | (29,364,676 | ) | | | | (124,766 | ) | | | (125,203 | ) |
| | | (5,415,820 | ) | | | (4,321,103 | ) | | | | (51,848 | ) | | | (72,708 | ) |
77
Statements of Changes in Net Assets | |
| | | Holmes Macro Trends Fund | |
| | | Six Months
Period Ended
June 30, 2017
(unaudited) | | | Year Ended
December 31,
2016 | |
Increase (Decrease) in Net Assets | | | | | | |
| | | | | | | |
From operations: | | | | | | |
Net investment income (loss) | | $ | (79,223 | ) | | $ | (131,503 | ) |
Net realized gains (losses) | | | 1,147,162 | | | | 1,479,047 | |
Net unrealized appreciation (depreciation) | | | 1,383,837 | | | | 1,713,973 | |
Net increase (decrease) in net assets from operations | | | 2,451,776 | | | | 3,061,517 | |
| | | | | | | | | |
Distributions to shareholders | | | | | | | | |
From net investment income | | | | | | | | |
Investor Class | | | — | | | | — | |
Institutional Class | | | — | | | | — | |
From net realized gains | | | | | | | | |
Investor Class | | | — | | | | (3,169,616 | ) |
Total distributions to shareholders | | | — | | | | (3,169,616 | ) |
| | | | | | | | | |
From capital share transactions: | | | | | | | | |
Proceeds from shares sold | | | | | | | | |
Investor Class | | | 1,578,908 | | | | 2,661,174 | |
Institutional Class | | | — | | | | — | |
Distributions reinvested | | | | | | | | |
Investor Class | | | — | | | | 2,976,381 | |
Institutional Class | | | — | | | | — | |
Proceeds from short-term trading fees | | | | | | | | |
Investor Class | | | 3 | | | | 28 | |
Institutional Class | | | — | | | | — | |
| | | | 1,578,911 | | | | 5,637,583 | |
Cost of shares redeemed | | | | | | | | |
Investor Class | | | (4,546,586 | ) | | | (5,958,154 | ) |
Institutional Class | | | — | | | | — | |
Net increase (decrease) in net assets from capital share transactions | | | (2,967,675 | ) | | | (320,571 | ) |
| | | | | | | | |
Net Increase (Decrease) in Net Assets | | | (515,899 | ) | | | (428,670 | ) |
| | | | | | | | | |
Net Assets | | | | | | | | |
Beginning of period | | | 40,706,022 | | | | 41,134,692 | |
| | | | | | | | |
End of period | | $ | 40,190,123 | | | $ | 40,706,022 | |
| | | | | | | | | |
Accumulated undistributed net investment income/accumulated net investment loss, end of period | | $ | (79,223 | ) | | $ | — | |
| | | | | | | | | |
Capital Share Activity | | | | | | | | |
Investor Class | | | | | | | | |
Shares sold | | | 82,453 | | | | 136,703 | |
Shares reinvested | | | — | | | | 158,825 | |
Shares redeemed | | | (238,244 | ) | | | (325,941 | ) |
Net share activity | | | (155,791 | ) | | | (30,413 | ) |
Institutional Class | | | | | | | | |
Shares sold | | | — | | | | — | |
Shares reinvested | | | — | | | | — | |
Shares redeemed | | | — | | | | — | |
Net share activity | | | — | | | | — | |
See accompanying notes to financial statements.
78
| | Global Resources Fund | | | | World Precious Minerals Fund | |
| | Six Months
Period Ended
June 30, 2017
(unaudited) | | | Year Ended
December 31,
2016 | | | | Six Months
Period Ended
June 30, 2017
(unaudited) | | | Year Ended
December 31,
2016 | |
| | | | | | | | | | | | | |
| | $ | 1,215,927 | | | $ | 1,162,442 | | | | $ | (1,250,948 | ) | | $ | (1,950,968 | ) |
| | | 2,902,546 | | | | (9,927,687 | ) | | | | 3,517,610 | | | | (31,496,878 | ) |
| | | (1,473,488 | ) | | | 22,989,329 | | | | | (4,513,309 | ) | | | 89,140,280 | |
| | | 2,644,985 | | | | 14,224,084 | | | | | (2,246,647 | ) | | | 55,692,434 | |
| | | | | | | | | | | | | | | | | |
| | | | | | | | | | | | | | | | | |
| | | — | | | | (3,178,190 | ) | | | | — | | | | (454,372 | ) |
| | | — | | | | (43,050 | ) | | | | — | | | | (22,591 | ) |
| | | | | | | | | | | | | | | | | |
| | | — | | | | — | | | | | — | | | | — | |
| | | — | | | | (3,221,240 | ) | | | | — | | | | (476,963 | ) |
| | | | | | | | | | | | | | | | | |
| | | | | | | | | | | | | | | | | |
| | | 2,087,530 | | | | 6,726,486 | | | | | 25,578,165 | | | | 82,725,215 | |
| | | 1,066,830 | | | | 876,722 | | | | | 741,231 | | | | 5,416,648 | |
| | | | | | | | | | | | | | | | | |
| | | — | | | | 3,039,897 | | | | | — | | | | 430,049 | |
| | | — | | | | 42,805 | | | | | — | | | | 22,459 | |
| | | | | | | | | | | | | | | | | |
| | | 54 | | | | 28 | | | | | 482 | | | | 688 | |
| | | — | | | | — | | | | | 3 | | | | — | |
| | | 3,154,414 | | | | 10,685,938 | | | | | 26,319,881 | | | | 88,595,059 | |
| | | | | | | | | | | | | | | | | |
| | | (11,223,868 | ) | | | (21,821,448 | ) | | | | (33,070,816 | ) | | | (79,820,997 | ) |
| | | (1,890,443 | ) | | | (1,849,143 | ) | | | | (1,734,985 | ) | | | (1,056,603 | ) |
| | | (9,959,897 | ) | | | (12,984,653 | ) | | | | (8,485,920 | ) | | | 7,717,459 | |
| | | | | | | | | | | | | | | | | |
| | | (7,314,912 | ) | | | (1,981,809 | ) | | | | (10,732,567 | ) | | | 62,932,930 | |
| | | | | | | | | | | | | | | | | |
| | | 98,025,864 | | | | 100,007,673 | | | | | 141,158,784 | | | | 78,225,854 | |
| | | | | | | | | | | | | | | | | |
| | $ | 90,710,952 | | | $ | 98,025,864 | | | | $ | 130,426,217 | | | $ | 141,158,784 | |
| | | | | | | | | | | | | | | | | |
| | $ | 2,810,553 | | | $ | 1,594,626 | | | | $ | 3,596,319 | | | $ | 4,847,267 | |
| | | | | | | | | | | | | | | | | |
| | | | | | | | | | | | | | | | | |
| | | 376,966 | | | | 1,271,267 | | | | | 3,756,080 | | | | 11,000,585 | |
| | | — | | | | 589,127 | | | | | — | | | | 73,765 | |
| | | (2,047,946 | ) | | | (4,174,210 | ) | | | | (4,930,152 | ) | | | (10,933,443 | ) |
| | | (1,670,980 | ) | | | (2,313,816 | ) | | | | (1,174,072 | ) | | | 140,907 | |
| | | | | | | | | | | | | | | | | |
| | | 193,304 | | | | 158,239 | | | | | 107,961 | | | | 724,341 | |
| | | — | | | | 8,312 | | | | | — | | | | 3,833 | |
| | | (354,218 | ) | | | (368,941 | ) | | | | (233,456 | ) | | | (150,268 | ) |
| | | (160,914 | ) | | | (202,390 | ) | | | | (125,495 | ) | | | 577,906 | |
79
Statements of Changes in Net Assets | |
| | | Gold and Precious Metals Fund | |
| | | Six Months
Period Ended
June 30, 2017
(unaudited) | | | Year Ended
December 31,
2016 | |
Increase (Decrease) in Net Assets | | | | | | |
| | | | | | | |
From operations: | | | | | | |
Net investment income (loss) | | $ | (666,875 | ) | | $ | (1,103,338 | ) |
Net realized gains (losses) | | | 45,505 | | | | (1,192,256 | ) |
Net unrealized appreciation (depreciation) | | | 2,438,964 | | | | 28,430,181 | |
Net increase (decrease) in net assets from operations | | | 1,817,594 | | | | 26,134,587 | |
| | | | | | | | | |
Distributions to shareholders | | | | | | | | |
From net investment income | | | | | | | | |
Investor Class | | | — | | | | (799,465 | ) |
Total distributions to shareholders | | | — | | | | (799,465 | ) |
| | | | | | | | | |
From capital share transactions: | | | | | | | | |
Proceeds from shares sold | | | | | | | | |
Investor Class | | | 31,077,897 | | | | 82,773,853 | |
Distributions reinvested | | | | | | | | |
Investor Class | | | 465 | | | | 743,031 | |
Proceeds from short-term trading fees | | | | | | | | |
Investor Class | | | 2,692 | | | | 2,692 | |
| | | | 31,081,054 | | | | 83,519,576 | |
Cost of shares redeemed | | | | | | | | |
Investor Class | | | (28,255,864 | ) | | | (73,164,260 | ) |
Net increase (decrease) in net assets from capital share transactions | | | 2,825,190 | | | | 10,355,316 | |
| | | | | | | | |
Net Increase (Decrease) in Net Assets | | | 4,642,784 | | | | 35,690,438 | |
| | | | | | | | | |
Net Assets | | | | | | | | |
Beginning of period | | | 93,988,090 | | | | 58,297,652 | |
| | | | | | | | |
End of period | | $ | 98,630,874 | | | $ | 93,988,090 | |
| | | | | | | | | |
Accumulated undistributed net investment income (distributions in excess of net investment income)/accumulated net investment loss, end of period | | $ | (3,444,309 | ) | | $ | (2,777,434 | ) |
| | | | | | | | | |
Capital Share Activity | | | | | | | | |
Investor Class | | | | | | | | |
Shares sold | | | 3,963,280 | | | | 10,461,783 | |
Shares reinvested | | | — | | | | 115,737 | |
Shares redeemed | | | (3,668,819 | ) | | | (9,147,567 | ) |
Net share activity | | | 294,461 | | | | 1,429,953 | |
See accompanying notes to financial statements.
80
| | Emerging Europe Fund | | | | China Region Fund | |
| | Six Months
Period Ended
June 30, 2017
(unaudited) | | | Year Ended
December 31,
2016 | | | | Six Months
Period Ended
June 30, 2017
(unaudited) | | | Year Ended
December 31,
2016 | |
| | | | | | | | | | | | | |
| | $ | 348,763 | | | $ | 513,486 | | | | $ | (36,097 | ) | | $ | 19,302 | |
| | | 527,059 | | | | (2,602,615 | ) | | | | 121,150 | | | | (1,505,243 | ) |
| | | 2,106,818 | | | | 7,728,407 | | | | | 4,626,412 | | | | 1,381,038 | |
| | | 2,982,640 | | | | 5,639,278 | | | | | 4,711,465 | | | | (104,903 | ) |
| | | | | | | | | | | | | | | | | |
| | | | | | | | | | | | | | | | | |
| | | — | | | | — | | | | | — | | | | (27,847 | ) |
| | | — | | | | — | | | | | — | | | | (27,847 | ) |
| | | | | | | | | | | | | | | | | |
| | | | | | | | | | | | | | | | | |
| | | 4,579,920 | | | | 1,519,657 | | | | | 1,390,176 | | | | 3,784,734 | |
| | | | | | | | | | | | | | | | | |
| | | — | | | | — | | | | | — | | | | 25,858 | |
| | | | | | | | | | | | | | | | | |
| | | 19 | | | | 4 | | | | | — | | | | 16 | |
| | | 4,579,939 | | | | 1,519,661 | | | | | 1,390,176 | | | | 3,810,608 | |
| | | | | | | | | | | | | | | | | |
| | | (4,176,635 | ) | | | (9,551,413 | ) | | | | (1,798,072 | ) | | | (3,351,272 | ) |
| | | 403,304 | | | | (8,031,752 | ) | | | | (407,896 | ) | | | 459,336 | |
| | | | | | | | | | | | | | | | | |
| | | 3,385,944 | | | | (2,392,474 | ) | | | | 4,303,569 | | | | 326,586 | |
| | | | | | | | | | | | | | | | | |
| | | 42,273,104 | | | | 44,665,578 | | | | | 16,509,915 | | | | 16,183,329 | |
| | | | | | | | | | | | | | | | | |
| | $ | 45,659,048 | | | $ | 42,273,104 | | | | $ | 20,813,484 | | | $ | 16,509,915 | |
| | | | | | | | | | | | | | | | | |
| | $ | 348,763 | | | $ | — | | | | $ | (19,838 | ) | | $ | 16,259 | |
| | | | | | | | | | | | | | | | | |
| | | | | | | | | | | | | | | | | |
| | | 757,490 | | | | 272,190 | | | | | 164,605 | | | | 528,806 | |
| | | — | | | | — | | | | | — | | | | 3,572 | |
| | | (676,669 | ) | | | (1,736,202 | ) | | | | (213,935 | ) | | | (459,520 | ) |
| | | 80,821 | | | | (1,464,012 | ) | | | | (49,330 | ) | | | 72,858 | |
81
Notes to Financial Statements (unaudited) | June 30, 2017 |
Note 1: Organization and Significant Accounting Policies
U.S. Global Investors Funds (Trust), consisting of the nine separate funds (Funds) included in this report, is organized as a Delaware statutory trust. Each Fund is an open-end management investment company registered under the Investment Company Act of 1940, as amended, and follows the specialized accounting and reporting guidance in FASB Accounting Standards Codification 946. All funds are diversified with the exception of Global Resources, World Precious Minerals, Gold and Precious Metals, Emerging Europe and China Region. A nondiversified fund may invest a greater percentage of its assets in a particular issuer in comparison to a diversified fund.
The following is a summary of significant accounting policies consistently followed by the Funds in the preparation of their financial statements. The policies are in conformity with U.S. generally accepted accounting principles.
The Funds value investments traded on national or international securities exchanges or over-the-counter at the last sales price reported by the security’s primary exchange of its market at the time of daily valuation. Options and securities for which no sale was reported are valued at the mean between the last reported bid and asked quotation. Debt securities having 60 days or less to maturity that are expected to be valued at par at maturity may be priced by the amortized cost method if the Valuation Committee determines it would approximate market value. Municipal securities, long-term U.S. government obligations and corporate debt securities are valued by an independent pricing service using an evaluated quote based on such factors as institutional-size trading in similar groups of securities, yield, quality, maturity, coupon rate, type of issue, individual trading characteristics and other market data. For more information please see Notes to Portfolio of Investments.
| | B. | Cash-Concentration in Uninsured Account |
For cash management purposes the Funds may concentrate cash with the Funds’ custodian. This typically results in cash balances exceeding the Federal Deposit Insurance Corporation (“FDIC”) insurance limits. As of June 30, 2017, The U.S. Government Securities Ultra-Short Bond Fund, Near-Term Tax Free Fund, All American Equity Fund, Holmes Macro Trends Fund, Global Resources Fund, World Precious Minerals Fund, Gold and Precious Metals Fund, Emerging Europe Fund and China Region Fund held $1,357,609, $7,226,241, $11,104,970, $32,655,128, $4,376,213, $3,864,459, $3,905,727, $946,075 and $743,582, respectively, as cash reserves at Brown Brothers Harriman & Co. (BBH) that exceeded the FDIC insurance limit.
Securities for which market quotations are not readily available or which are subject to legal restrictions are valued at their fair value as determined in good faith by the Valuation Committee of U.S. Global Investors, Inc. (Adviser), under policies and procedures established by the Funds’ Board of Trustees. Fair value is the price
82
Notes to Financial Statements (unaudited) | June 30, 2017 |
that would be received to sell an asset or paid to transfer a liability in an orderly transaction between market participants at the measurement date. The Valuation Committee meets on a regular basis to review securities which may not have readily available market prices and considers a number of factors in determining fair value, including nature and duration of any trading restrictions, trading volume, market values of unrestricted shares of the same or similar class, investment management’s judgment regarding the market experience of the issuer, financial status and other operational and market factors affecting the issuer, issuer’s management, quality of the underlying property based on review of independent geological studies and other relevant matters. The fair values may differ from what would have been used had a broader market for these securities existed. The Valuation Committee regularly reviews inputs and assumptions and performs transactional back-testing and disposition analysis. The Valuation Committee reports quarterly to the Funds’ Board of Trustees.
For securities traded on international exchanges, if events which may materially affect the value of a Fund’s securities occur after the close of the primary exchange and before a Fund’s net asset value is next determined, then those securities will be valued at their fair value as determined in good faith in accordance with the policies approved by the Board of Trustees. The Funds use a systematic fair value model provided by an independent third party to value international securities primarily traded on an exchange or market outside the Western Hemisphere in order to adjust for stale pricing, which may occur between the close of certain foreign exchanges and the New York Stock Exchange.
| | D. | Security Transactions and Investment Income |
Security transactions are accounted for on trade date. Realized gains and losses from security transactions are determined on an identified cost basis. Dividend income is recorded on the ex-dividend date except that certain dividends from foreign securities where the ex-dividend date may have passed are recorded as soon as the Fund has confirmed the ex-dividend date. Interest income, which may include original issue discount, is recorded on an accrual basis. Discounts and premiums on securities purchased are accreted and amortized, respectively, on a yield-to-maturity basis as adjustments to interest income. Investment income is recorded net of foreign taxes withheld where recovery of such taxes is uncertain. Investment income and realized and unrealized gains (losses) are allocated to each Fund’s share class based on their respective net assets.
The Funds may purchase securities on a when-issued or delayed-delivery basis and segregate collateral on their books with a value at least equal to the amount of the commitment. Losses may arise due to the changes in the value of the underlying securities or if the counterparty does not perform under the contract.
| | E. | Foreign Currency Transactions |
Some Funds may invest in securities of foreign issuers. The accounting records of these Funds are maintained in U.S. dollars. At each net asset value determination date, the value of assets and liabilities denominated in foreign currencies are
83
Notes to Financial Statements (unaudited) | June 30, 2017 |
translated into U.S. dollars using the current prevailing exchange rate. Security transactions, income and expenses are converted at the prevailing rate of exchange on the respective dates of the transactions. The effect of changes in foreign exchange rates on foreign denominated securities is included with the net realized and unrealized gain or loss on securities. Other foreign currency gains or losses are reported separately.
The Funds intend to continue to comply with the requirements of Subchapter M of the Internal Revenue Code applicable to regulated investment companies and to distribute substantially all of their taxable income to shareholders. Accordingly, no provision for federal income taxes is required. Each Fund may be subject to foreign taxes on income and gains on investments, which are accrued based on the Fund’s understanding of the tax rules and regulations in the foreign markets.
The Funds recognize the tax benefits of uncertain tax positions only where the position is “more likely than not” to be sustained assuming examination by tax authorities. Management has analyzed the Funds’ tax positions, and has concluded that no liability for unrecognized tax benefits should be recorded related to uncertain tax positions taken on returns filed for open tax years or expected to be taken in 2016 tax returns. The Funds file U.S. federal and excise tax returns as required. The Funds’ 2013, 2014, 2015 and 2016 (when filed) tax returns are open to examination by the federal and applicable state tax authorities. The Funds have no examinations in progress.
| | G. | Dividends and Distributions to Shareholders |
The Funds record dividends and distributions to shareholders on the ex-dividend date. Distributions are determined in accordance with income tax regulations, which may differ from accounting principles generally accepted in the United States. Accordingly, periodic reclassifications related to permanent book and tax basis differences are made within the Funds’ capital accounts to reflect income and gains available for distribution under income tax regulations.
The Funds, except as noted below, generally pay income dividends and distribute capital gains, if any, annually. The U.S. Government Securities Ultra-Short Bond Fund and the Near-Term Tax Free Fund pay dividends monthly. A Fund may elect to designate a portion of the earnings and profits distributed to shareholders on the redemption of fund shares during the year as distributions for federal income tax purposes. Differences in per share dividend rates for multiclass funds generally result from the relative weightings of pro rata income and realized gain allocations and from differences in separate class expenses.
Fund specific expenses are allocated to that Fund and pro rata across share classes. Expenses that are not fund specific are allocated among Funds and pro rata across share classes. Class specific expenses (including, but not limited to, distribution plan fees, if any, a portion of the administrative services fees, transfer agency fees and expenses, shareholder reporting expenses and certain legal and registration
84
Notes to Financial Statements (unaudited) | June 30, 2017 |
fees) are allocated to the class that incurs such expense. Except for the U.S. Government Securities Ultra-Short Bond Fund, expense offset arrangements have been made with the Funds’ custodian so the custodian fees may be paid indirectly by credits earned on the Funds’ cash balances. Such deposit arrangements are an alternative to overnight investments. Custodian fees are presented in the Statements of Operations gross of such credits, and the credits are presented as offsets to expenses. For the U.S. Government Securities Ultra-Short Bond Fund, credits earned on its cash balance are included in interest and other income.
| | I. | Short-Term Trading (Redemption) Fees |
Through April 30, 2017, short-term trading (redemption) fees were assessed on the All American, Holmes Macro Trends, Global Resources, World Precious Minerals, Gold and Precious Metals, Emerging Europe and China Region Funds (Equity Funds). These fees, which were retained by the Funds, were accounted for as an addition to paid-in capital. The fee for each of the Equity Funds was 0.05% of the amount redeemed on shares held seven days or less. Effective May 1, 2017, this fee is no longer assessed on any fund.
| | J. | Use of Estimates in Financial Statement Preparation |
The Funds are investment companies accounted for in conformity with accounting principles generally accepted in the United States of America (“GAAP”). Therefore they follow the accounting and reporting guidelines for investment companies. The preparation of financial statements in conformity with GAAP requires management to make estimates and assumptions that affect the reported amounts of assets and liabilities and disclosure of contingent assets and liabilities at the date of the financial statements and the reported amounts of income and expenses during the reporting period. Actual results could differ from those estimates.
Note 2: Financial Derivative Instruments
Equity Funds may purchase or write (sell) options on securities to manage their exposure to stock or commodity markets as well as fluctuations in interest and currency conversion rates. The use of options carries the risks of a change in value of the underlying instruments, an illiquid secondary market, or failure of the counterparty to perform its obligations.
A put option gives the purchaser of the option, upon payment of a premium, the right to sell, and the issuer of the option the obligation to buy, the underlying security, commodity, index, currency or other instrument at the exercise price. A call option, upon payment of a premium, gives the purchaser of the option the right to buy, and the issuer the obligation to sell, the underlying instrument at the exercise price.
Purchasing a put option tends to decrease a Fund’s exposure to the underlying instrument, whereas purchasing a call option tends to increase a Fund’s exposure to the underlying instrument. A Fund pays a premium which is included in the Statement of Assets and Liabilities as an investment and subsequently marked
85
Notes to Financial Statements (unaudited) | June 30, 2017 |
to market to reflect the current value of the option. Premiums paid to purchase options which expire are treated as realized losses. Premiums paid to purchase options which are exercised or closed are added to the cost of securities acquired or the proceeds from securities sold. The risk associated with purchasing put and call options is limited to the premium paid.
The Funds will realize a loss equal to all or a part of the premium paid for an option if the price of the underlying security or other instrument decreases or does not increase by more than the premium (in the case of a call option), or if the price of the underlying security or other instrument increases or does not decrease by more than the premium (in the case of a put option).
Writing a put option tends to increase a Fund’s exposure to the underlying instrument, whereas writing a call option tends to decrease a Fund’s exposure to the underlying instrument. The premium received is recorded as a liability in the Statement of Assets and Liabilities and subsequently marked to market to reflect the current value of the option written. Premiums received from writing options which expire are treated as realized gains. Premiums received from options which are exercised or closed are added to the proceeds or offset against amounts paid on the underlying transaction to determine the realized gain or loss. Written options include a risk of loss in excess of the option premium. A Fund as a writer of an option has no control over whether the underlying instrument may be sold (call) or purchased (put) and thus bears the market risk of an unfavorable change in the price of the instrument underlying the written option. There is also the risk a Fund may not be able to enter into a closing transaction because of an illiquid market.
A Fund’s ability to close out its position as a purchaser or seller of a put or call option is dependent, in part, upon the liquidity of the market for that particular option. There can be no guarantee that a fund will be able to close out an option position when desired. An inability to close out its options positions may reduce a Fund’s anticipated profits or increase its losses.
As of June 30, 2017, there were no securities held in escrow by the custodian as cover for call options written.
Transactions in written call options during the period ended June 30, 2017 were as follows:
| | | All American Equity Fund Call Options | | | Holmes Macro Trends Fund Call Options | |
| | | Number of Contracts | | | Premiums Received | | | Number of Contracts | | | Premiums Received | |
Options outstanding at December 31, 2016 | | $ | — | | | $ | — | | | $ | — | | | $ | — | |
Options written | | | 62 | | | | 6,298 | | | | 240 | | | | 19,136 | |
Options expired | | | (27 | ) | | | (4,121 | ) | | | (140 | ) | | | (11,220 | ) |
Options exercised | | | (35 | ) | | | (2,177 | ) | | | (100 | ) | | | (7,916 | ) |
Options outstanding at June 30, 2017 | | | — | | | | — | | | | — | | | | — | |
86
Notes to Financial Statements (unaudited) | June 30, 2017 |
| | B. | Forward Foreign Currency Contracts |
The Funds enter into forward foreign currency contracts to lock in the U.S. dollar cost of purchase and sale transactions or to hedge the portfolio against currency fluctuations. A forward foreign currency contract is a commitment to purchase or sell a foreign currency at a future date at a negotiated rate. These contracts are valued daily, and the Fund’s net equity therein, representing unrealized gain or loss on the contracts as measured by the difference between the forward foreign exchange rates at the dates of entry into the contracts and the forward rates at the reporting date, is included in the statement of assets and liabilities. Realized and unrealized gains and losses are included in the statement of operations. Risks may arise upon entering into these contracts from the potential inability of counterparties to meet the terms of the contracts and from unanticipated movements in the value of foreign currencies relative to the U.S. dollar.
Open forward foreign currency contracts as of June 30, 2017, were as follows:
Fund Contract | Counterparty | Currency
to Deliver | | Currency
to Receive | | Settlement
Date | | Value | | | Unrealized Appreciation (Depreciation) | |
Global Resources Fund | Brown Brothers Harriman | JPY | 8,533,335 | | USD | 76,157 | | 7/5/2017 | | $ | 76,445 | | | $ | 288 | |
| Brown Brothers Harriman | CAD | 1,001,119 | | USD | 767,309 | | 7/5/17-7/6/17 | | | 762,626 | | | | (4,683 | ) |
Emerging Europe Fund | Brown Brothers Harriman | TRY | 8,000,000 | | USD | 2,245,614 | | 7/6/2017 | | | 2,218,159 | | | | (27,455 | ) |
| Brown Brothers Harriman | EUR | 1,300,000 | | USD | 1,204,819 | | 7/14/2017 | | | 1,179,361 | | | | (25,458 | ) |
| Brown Brothers Harriman | PLN | 4,500,000 | | USD | 1,460,095 | | 7/14/2017 | | | 1,450,612 | | | | (9,483 | ) |
87
Notes to Financial Statements (unaudited) | June 30, 2017 |
| | C. | Summary of Derivative Instruments |
The following is a summary of the valuations of derivative instruments categorized by location in the Statements of Assets and Liabilities as of June 30, 2017:
Location | | Global Resources Fund | | | Emerging Europe Fund | |
Asset derivatives | | | | | | |
Investments, at value | | | | | | |
Purchased options | | $ | 1,790,290 | | | $ | — | |
Unrealized gain on forward foreign currency contracts | | | 288 | | | | — | |
| | | | | | | | | |
Liability derivatives | | | | | | | | |
Unrealized loss on forward foreign currency contracts | | | (4,683 | ) | | | (62,396 | ) |
Total | | $ | 1,785,895 | | | $ | (62,396 | ) |
The following is a summary of the effect of derivative instruments on the Statements of Operations for the period ended June 30, 2017:
Location | | All American Equity Fund | | | Holmes Macro
Trends Fund | | | Global Resources Fund | | | World Precious Minerals Fund | |
Realized gain (loss) on derivatives recognized in income | | | | | | | | | | | | |
Realized gain (loss) from securities | | | | | | | | | | | | |
Purchased options | | $ | — | | | $ | — | | | $ | (978,650 | ) | | $ | — | |
Net realized gain (loss) from foreign currency transactions | | | | | | | | | | | | | | | | |
Foreign exchange contracts | | | — | | | | — | | | | (46,718 | ) | | | (213,949 | ) |
Realized gain (loss) from written options | | | 4,121 | | | | 11,221 | | | | — | | | | — | |
| | | | 4,121 | | | | 11,221 | | | | (1,025,368 | ) | | | (213,949 | ) |
| | | | | | | | | | | | | | | | | |
Change in unrealized appreciation (depreciation) on derivatives recognized in income | | | | | | | | | | | | | | | | |
Net change in unrealized appreciation (depreciation) of investments | | | | | | | | | | | | | | | | |
Purchased options | | | — | | | | — | | | | (1,233,104 | ) | | | — | |
Net change in unrealized gain (loss) from foreign currency transactions | | | | | | | | | | | | | | | | |
Foreign exchange contracts | | | — | | | | — | | | | (4,395 | ) | | | — | |
| | | | — | | | | — | | | | (1,237,499 | ) | | | — | |
Total | | $ | 4,121 | | | $ | 11,221 | | | $ | (2,262,867 | ) | | $ | (213,949 | ) |
88
Notes to Financial Statements (unaudited) | June 30, 2017 |
Location | | Gold and Precious Metals fund | | | Emerging Europe Fund | | | China
Region Fund | |
Realized gain (loss) on derivatives recognized in income | | | | | | | | | |
Realized gain (loss) from securities | | | | | | | | | |
Purchased options | | $ | — | | | $ | — | | | $ | 110,061 | |
Net realized gain (loss) from foreign currency transactions | | | | | | | | | | | | |
Foreign exchange contracts | | | (133,838 | ) | | | (781,436 | ) | | | — | |
Realized gain (loss) from written options | | | — | | | | — | | | | — | |
| | | | (133,838 | ) | | | (781,436 | ) | | | 110,061 | |
| | | | | | | | | | | | | |
Change in unrealized appreciation (depreciation) on derivatives recognized in income | | | | | | | | | | | | |
Net change in unrealized appreciation (depreciation) of investments | | | | | | | | | | | | |
Purchased options | | | — | | | | — | | | | (93,784 | ) |
Net change in unrealized gain (loss) from foreign currency transactions | | | | | | | | | | | | |
Foreign exchange contracts | | | — | | | | (62,396 | ) | | | — | |
| | | | — | | | | (62,396 | ) | | | (93,784 | ) |
Total | | $ | (133,838 | ) | | $ | (843,832 | ) | | $ | 16,277 | |
The average notional amounts of written options, purchased options and forward currency contracts outstanding during the period ended June 30, 2017, were approximately as follows:
Fund | | Purchased
Options | | | Written
Options | | | Forward
Currency
Contracts | |
All American Equity | | $ | — | | | $ | (704 | ) | | $ | — | |
Holmes Macro Trends | | | — | | | | (2,250 | ) | | | — | |
Global Resources | | | 1,522,126 | | | | — | | | | 68,894 | |
World Precious Minerals | | | — | | | | — | | | | 168,760 | |
Gold and Precious Metals | | | — | | | | — | | | | (19,120 | ) |
Emerging Europe | | | — | | | | — | | | | 3,811,947 | |
China Region | | | 104,429 | | | | — | | | | — | |
Note 3: Investment Advisory and Other Agreements
The Adviser, under an investment advisory agreement with the Trust in effect through October 1, 2017, furnishes management and investment advisory services and, subject to the supervision of the trustees, directs the investments of each Fund according to each Fund’s investment objectives, policies and limitations.
89
Notes to Financial Statements (unaudited) | June 30, 2017 |
For the services of the Adviser, each Fund pays a base management or advisory fee based upon its net assets. Fees are accrued daily and paid monthly. The contractual management fee for each fund is:
Fund | Annual Percentage of
Average Daily Net Assets |
U.S. Government Securities Ultra-Short Bond | .50% of the first $250,000,000 and .375% of the excess |
Near-Term Tax Free | .50% |
All American Equity | .80% of the first $500,000,000 and .75% of the excess |
Holmes Macro Trends | 1.00% |
Global Resources | .95% of the first $500,000,000; .90% of $500,000,001 to $1,000,000,000 and .85% of the excess |
World Precious Minerals | 1.00% of the first $500,000,000; .95% of $500,000,001 to $1,000,000,000 and .90% of the excess |
Gold and Precious Metals | .90% of the first $500,000,000 and .85% of the excess |
Emerging Europe | 1.25% |
China Region | 1.25% |
The advisory agreement also provides that the base advisory fee of the Equity Funds will be adjusted upwards or downwards by 0.25 percent if there is a performance difference of 5 percent or more between a Fund’s performance and that of its designated benchmark index over the prior 12 months. The performance adjustment is calculated separately for each share class. The benchmarks are as follows:
Fund | Benchmark Index |
All American Equity | S&P 500 Index |
Holmes Macro Trends | S&P Composite 1500 Index |
Global Resources | S&P Global Natural Resources Index (Net Total Return) |
World Precious Minerals | NYSE Arca Gold Miners Index |
Gold and Precious Metals | FTSE Gold Mines Index |
Emerging Europe | MSCI Emerging Markets Europe 10/40 Index (Net Total Return) |
China Region | Hang Seng Composite Index |
No performance adjustment is applied unless the difference between the class’s investment performance and the benchmark is 5 percent or greater (positive or negative) during the applicable performance measurement period. The performance fee adjustment is calculated monthly in arrears and is accrued ratably during the month. The management fee, net of any performance fee adjustment, is paid monthly in arrears.
90
Notes to Financial Statements (unaudited) | June 30, 2017 |
The amounts shown as Management fee on the Statements of Operations reflects the base fee plus/minus any performance adjustment. During the period ended June 30, 2017, the Funds recorded performance adjustments as follows:
Fund | | Investor Class Performance Fee Adjustment | | | Institutional Class Performance Fee Adjustment | |
All American Equity | | $ | (22,077 | ) | | | N/A | |
Holmes Macro Trends Fund | | | (8,226 | ) | | | N/A | |
Global Resources | | | (127,261 | ) | | $ | (1,080 | ) |
World Precious Minerals | | | 132,800 | | | | 2,495 | |
Gold and Precious Metals | | | (22,468 | ) | | | N/A | |
Emerging Europe | | | (26,770 | ) | | | N/A | |
China Region Fund | | | (6,668 | ) | | | N/A | |
Atlantic Fund Administration, LLC (d/b/a Atlantic Fund Services) (“Atlantic”) and the Adviser act as co-administrators to the Trust. Atlantic’s services to the Trust include provision of certain officers as well as assistance with certain Trust and fund administration tasks. The Funds compensate Atlantic with a fee structure based on average net assets of each fund, subject to minimum fees. The expenses payable to Atlantic are disclosed on the Statements of Assets and Liabilities.
The U.S. Government Securities Ultra-Short Bond, Near-Term Tax Free, All American Equity, Holmes Macro Trends, Gold and Precious Metals, Emerging Europe and China Region Funds compensate the Adviser at an annual rate of 0.05% of the average daily net assets of each Fund for administrative services provided, of which half is a fund-level fee and half is a class-level fee. The Global Resources and World Precious Minerals Funds compensate the Adviser at an annual rate of 0.05% of the average daily net assets for the Investor Class and 0.04% of the average daily net assets for the Institutional Class for administrative services provided, of which half is a fund-level fee and half is a class-level fee.
The Investor Class shares for Equity Funds in the Trust have adopted a distribution plan pursuant to Rule 12b-1 of the Investment Company Act of 1940 in which the Distributor is paid a fee at an annual rate of 0.25% of the average daily net assets of the Investor Class for sales and promotional services related to the distribution of Investor Class shares. The Institutional Class does not incur distribution plan fees.
The Adviser has voluntarily agreed to reimburse specific funds so that their total operating expenses will not exceed certain annual percentages of average net assets. The expenses for the period ended June 30, 2017, were limited as follows for the Investor Class: U.S. Government Securities Ultra-Short Bond Fund at 0.45%, All American Equity Fund and Holmes Macro Trends Fund at 2.20%, Global Resources, World Precious Minerals, and Gold and Precious Metals Funds at 1.90%, Emerging Europe Fund at 2.85% and China Region Fund at 2.55%. These expense limitations are exclusive of any performance fee adjustments and will continue on
91
Notes to Financial Statements (unaudited) | June 30, 2017 |
a voluntary basis at the Adviser’s discretion. The Adviser may temporarily agree to additional reimbursements or limitations.
The Adviser has contractually limited the total operating expenses of the Near-Term Tax Free Fund at 0.45% on an annualized basis through April 30, 2018.
The Adviser has voluntarily agreed to waive all class specific expenses for the Institutional Class of the Global Resources Fund and the World Precious Minerals Fund. These expense waivers are exclusive of any performance fee adjustments, and the Adviser can modify or terminate this arrangement at any time.
Atlantic Fund Services is the transfer agent for the Funds as of August 29, 2016. Prior to August 29, 2016, U.S. Bancorp Fund Services, LLC served as the transfer agent. Each Fund’s share class pays an annual fee based on the number of shareholder accounts, certain base fees and transaction- and activity-based fees for transfer agency services.
Certain account fees are paid directly by shareholders to the transfer agent, which, in turn, reduces its charge to the Funds.
Brown Brothers Harriman & Co. (BBH) serves as the custodian. SEI Investments Global Funds Services serves as fund accounting and administration service agent with a fee structure based on average net assets of the Trust, subject to minimum fees.
Foreside Fund Services, LLC (the “Distributor”) acts as the agent of the Trust in connection with the continuous offering of shares of the Funds. The Distributor continually distributes shares of the Funds on a best efforts basis.
The Independent Trustees of the Trust each receive an annual fee of $15,000 for service to the Trust. The Chairman of the Board is paid an additional annual fee of $20,000. The trustees and Chairman may receive additional fees for special Board meetings. Each trustee is also reimbursed for all reasonable out-of-pocket expenses incurred in connection with his duties as a trustee, including travel and related expenses incurred in attending Board meetings. The Trust has no pension or retirement plan. No other entity affiliated with the Trust pays any compensation to the trustees.
92
Notes to Financial Statements (unaudited) | June 30, 2017 |
Note 4: Investments
Cost of purchases and proceeds from sales of long-term securities for the period ended June 30, 2017, are summarized as follows:
Fund | | Purchases | | | Sales | |
U.S. Government Securities Ultra-Short Bond Fund | | $ | 5,148,037 | | | $ | 1,000,474 | |
Near-Term Tax Free Fund | | | 2,271,380 | | | | 13,511,024 | |
All American Equity Fund | | | 16,486,695 | | | | 16,877,845 | |
Holmes Macro Trends Fund | | | 42,484,285 | | | | 44,093,592 | |
Global Resources Fund | | | 78,128,701 | | | | 93,324,530 | |
World Precious Minerals Fund | | | 26,232,035 | | | | 36,096,605 | |
Gold and Precious Metals Fund | | | 41,495,574 | | | | 35,246,017 | |
Emerging Europe Fund | | | 18,372,358 | | | | 19,629,695 | |
China Region Fund | | | 10,011,340 | | | | 9,717,832 | |
Note 5: Tax Information
The following table presents the income tax basis of securities owned at June 30, 2017, and the tax basis components of net unrealized appreciation (depreciation):
Fund | | Aggregate Tax Cost | | | Gross Unrealized Appreciation | | | Gross Unrealized Depreciation | | | Net Unrealized Appreciation (Depreciation) | |
U.S. Government Securities Ultra-Short Bond Fund | | $ | 51,129,888 | | | $ | 51,642 | | | $ | (37,559 | ) | | $ | 14,083 | |
Near-Term Tax Free Fund | | | 75,580,461 | | | | 648,419 | | | | (356,672 | ) | | | 291,747 | |
All American Equity Fund | | | 15,069,598 | | | | 921,322 | | | | (416,514 | ) | | | 504,808 | |
Holmes Macro Trends Fund | | | 34,777,105 | | | | 3,881,379 | | | | (1,463,199 | ) | | | 2,418,180 | |
Global Resources Fund | | | 151,521,830 | | | | 6,935,574 | | | | (75,071,762 | ) | | | (68,136,188 | ) |
World Precious Minerals Fund | | | 136,910,365 | | | | 39,326,101 | | | | (51,513,192 | ) | | | (12,187,091 | ) |
Gold and Precious Metals Fund | | | 78,359,156 | | | | 28,643,884 | | | | (12,101,819 | ) | | | 16,542,065 | |
Emerging Europe Fund | | | 40,139,153 | | | | 5,832,303 | | | | (3,009,918 | ) | | | 2,822,385 | |
China Region Fund | | | 13,592,369 | | | | 6,050,300 | | | | (519,909 | ) | | | 5,530,391 | |
As of December 31, 2016, the components of distributable earnings on a tax basis were as follows:
Fund | | Undistributed Tax-Exempt Income | | | Undistributed Ordinary Income | | | Undistributed Long-Term Capital Gains | | | Capital Loss Carryforwards | |
U.S. Government Securities Ultra-Short Bond | | $ | — | | | $ | 11 | | | $ | — | | | $ | — | |
Near-Term Tax Free | | | — | | | | 1,065 | | | | — | | | | (354,180 | ) |
All American Equity | | | — | | | | 11,076 | | | | — | | | | (938,403 | ) |
Holmes Macro Trends | | | — | | | | 832,950 | | | | 157,660 | | | | — | |
Global Resources | | | — | | | | 2,703,819 | | | | — | | | | (464,892,032 | ) |
World Precious Minerals | | | — | | | | 25,987,816 | | | | — | | | | (347,584,197 | ) |
Gold and Precious Metals | | | — | | | | — | | | | — | | | | (103,319,587 | ) |
Emerging Europe | | | — | | | | — | | | | — | | | | (299,691,662 | ) |
China Region | | | — | | | | 16,260 | | | | — | | | | (4,822,299 | ) |
93
Notes to Financial Statements (unaudited) | June 30, 2017 |
Fund (continued) | | Post October Losses | | | Current Year Late-Year Loss Deferral | | | Net Unrealized Appreciation (Depreciation) | | | Other Temporary Differences | | | Total | |
U.S. Government Securities Ultra-Short Bond | | $ | (44 | ) | | $ | — | | | $ | 77,576 | | | $ | — | | | $ | 77,543 | |
Near-Term Tax Free | | | (291,288 | ) | | | — | | | | (595,449 | ) | | | 8 | | | | (1,239,844 | ) |
All American Equity | | | — | | | | — | | | | 105,231 | | | | — | | | | (822,096 | ) |
Holmes Macro Trends | | | — | | | | — | | | | 874,078 | | | | (3 | ) | | | 1,855,685 | |
Global Resources | | | — | | | | — | | | | (71,270,979 | ) | | | (4 | ) | | | (533,459,196 | ) |
World Precious Minerals | | | (6,304,769 | ) | | | — | | | | (40,846,153 | ) | | | (6 | ) | | | (368,747,309 | ) |
Gold and Precious Metals | | | — | | | | (193,994 | ) | | | 8,467,324 | | | | (4 | ) | | | (95,046,261 | ) |
Emerging Europe | | | — | | | | — | | | | 294,123 | | | | (1 | ) | | | (299,397,540 | ) |
China Region | | | — | | | | — | | | | 831,872 | | | | (1 | ) | | | (3,974,168 | ) |
The differences between book-basis and tax-basis unrealized appreciation (depreciation) for All American Equity, Holmes Macro Trends, Global Resources, World Precious Minerals, Gold and Precious Metals, Emerging Europe and China Region Funds are attributable primarily to the tax deferral of losses on wash sales, investment in passive foreign investment companies (PFIC), adjustments for partnerships, and adjustments for grantor trusts.
Reclassifications are made to the Funds’ capital accounts to reflect income and gains available for distribution (or available capital loss carryovers) under income tax regulations. For the year ended December 31, 2016, the Funds recorded the following reclassifications to increase (decrease) the accounts listed below:
Fund | | Accumulated
Net Investment Income | | | Accumulated
Net Realized
Gain | | | Paid in
Capital | |
U.S. Government Securities Ultra-Short Bond | | $ | 205 | | | $ | (205 | ) | | $ | — | |
Near-Term Tax Free | | | 3,254 | | | | 112 | | | | (3,366 | ) |
All American Equity | | | 541 | | | | (541 | ) | | | — | |
Holmes Macro Trends | | | 131,459 | | | | (131,861 | ) | | | 402 | |
Global Resources | | | 1,416,861 | | | | (1,416,332 | ) | | | (529 | ) |
World Precious Minerals | | | 9,456,437 | | | | (9,456,437 | ) | | | — | |
Gold and Precious Metals | | | 85,322 | | | | (85,322 | ) | | | — | |
Emerging Europe | | | (242,173 | ) | | | 29,077,300 | | | | (28,835,127 | ) |
China Region | | | (2,937 | ) | | | 15,023,204 | | | | (15,020,267 | ) |
94
Notes to Financial Statements (unaudited) | June 30, 2017 |
The tax character of distributions paid during the fiscal year ended December 31, 2016, were as follows:
Fund | | Tax-Exempt Income | | | Ordinary Income | | | Long-Term Capital Gains | | | Return of
Capital | | | Total | |
U.S. Government Securities Ultra-Short Bond | | $ | — | | | $ | 261,314 | | | $ | 15,960 | | | $ | 2,047 | | | $ | 279,321 | |
Near-Term Tax Free | | | 1,476,349 | | | | 19,933 | | | | — | | | | 13,758 | | | | 1,510,040 | |
All American Equity | | | — | | | | 27,184 | | | | — | | | | — | | | | 27,184 | |
Holmes Macro Trends | | | — | | | | — | | | | 3,169,616 | | | | — | | | | 3,169,616 | |
Global Resources | | | — | | | | 3,221,240 | | | | — | | | | — | | | | 3,221,240 | |
World Precious Minerals | | | — | | | | 476,963 | | | | — | | | | — | | | | 476,963 | |
Gold and Precious Metals | | | — | | | | 799,465 | | | | — | | | | — | | | | 799,465 | |
Emerging Europe | | | — | | | | — | | | | — | | | | — | | | | — | |
China Region | | | — | | | | 27,847 | | | | — | | | | — | | | | 27,847 | |
The tax character of distributions paid during the fiscal year ended December 31, 2015, were as follows:
Fund | | Tax-Exempt Income | | | Ordinary Income | | | Long-Term Capital Gains | | | Total | |
U.S. Government Securities Ultra-Short Bond | | $ | — | | | $ | 199,425 | | | $ | 4,235 | | | $ | 203,660 | |
Near-Term Tax Free | | | 1,316,177 | | | | 45,536 | | | | — | | | | 1,361,713 | |
All American Equity | | | — | | | | 653,208 | | | | 1,610,817 | | | | 2,264,025 | |
Holmes Macro Trends | | | — | | | | — | | | | 3,075,742 | | | | 3,075,742 | |
Global Resources | | | — | | | | 1,128,155 | | | | — | | | | 1,128,155 | |
World Precious Minerals | | | — | | | | 7,142,045 | | | | — | | | | 7,142,045 | |
Gold and Precious Metals | | | — | | | | 269,790 | | | | — | | | | 269,790 | |
Emerging Europe | | | — | | | | — | | | | — | | | | — | |
China Region | | | — | | | | 187,603 | | | | — | | | | 187,603 | |
Capital loss carryforwards may be used to offset current or future taxable capital gains until expiration. The Fund’s tax-basis capital gains and losses are determined only at the end of each fiscal year. Under the Regulated Investment Company Modernization Act of 2010, the Funds are permitted to carry forward capital losses incurred in taxable years beginning after December 22, 2010, for an unlimited period. Losses incurred during these years are required to be utilized prior to the losses incurred in pre-enactment tax years. As a result of this ordering rule, pre-enactment capital loss carryforwards may be more likely to expire unused. In addition, post-enactment capital losses that are carried forward retain their character as either short-term or long-term capital losses rather than being
95
Notes to Financial Statements (unaudited) | June 30, 2017 |
considered all short-term as under previous law. The loss carryforwards and related expiration dates for each fund, as of December 31, 2016, are as follows:
| | | No Expiration | | | Expiration Date | | | | |
Fund | | Short-Term | | | Long-Term | | | 2017 | | | 2018 | | | Total | |
Near-Term Tax Free (a) | | $ | 154,542 | | | $ | 196,384 | | | $ | 722 | | | $ | 2,532 | | | $ | 354,180 | |
All American Equity | | | 938,403 | | | | — | | | | — | | | | — | | | | 938,403 | |
Holmes Macro Trends (a) | | | — | | | | — | | | | — | | | | — | | | | — | |
Global Resources | | | 157,911,652 | | | | 47,767,868 | | | | 259,212,512 | | | | — | | | | 464,892,032 | |
World Precious Minerals | | | 67,035,669 | | | | 216,769,016 | | | | 63,779,512 | | | | — | | | | 347,584,197 | |
Gold and Precious Metals | | | 36,635,685 | | | | 66,683,902 | | | | — | | | | — | | | | 103,319,587 | |
Emerging Europe | | | 14,051,309 | | | | 12,670,868 | | | | 257,523,539 | | | | 15,445,946 | | | | 299,691,662 | |
China Region | | | 4,822,299 | | | | — | | | | — | | | | — | | | | 4,822,299 | |
| | (a) | Utilization of capital loss carryovers is subject to annual limitations. |
During the year ended December 31, 2016, the following funds utilized capital loss carryforwards to offset capital gains amounting to:
Fund | | | |
Near-Term Tax Free | | $ | 35,173 | |
All American Equity | | | 392,852 | |
Holmes Macro Trends | | | 461,463 | |
World Precious Minerals | | | 8,536,883 | |
In accordance with tax rules, the following net capital losses and ordinary losses (currency and late year losses) incurred after October 31, within each Fund’s tax year, are deemed to arise on the first day of the Fund’s next tax year if the Fund elects to defer such losses.
The Funds elected to defer losses incurred after October 31, 2016, as follows:
Fund | | Post
October 31, 2016
Capital Loss
Deferral | | | Post
October 31, 2016
Ordinary Loss
Deferral | |
U.S. Government Securities Ultra-Short Bond | | $ | 44 | | | $ | — | |
Near-Term Tax Free | | | 291,288 | | | | — | |
World Precious Minerals | | | 6,304,769 | | | | — | |
Gold and Precious Metals | | | — | | | | 193,994 | |
Note 6: Risks of Concentrations and Foreign Investments
The Near-Term Tax Free Fund may be exposed to risks related to concentration of investments in a particular state or geographic area. These investments present risks resulting from changes in economic conditions of the region or the issuer.
The Global Resources Fund concentrates its investments in the natural resources industries and may be subject to greater risks and fluctuations than a portfolio representing a broader range of industries.
96
Notes to Financial Statements (unaudited) | June 30, 2017 |
The World Precious Minerals and Gold and Precious Metals Funds concentrate their investments in gold and other precious metals and minerals and, therefore, may be subject to greater risks and market fluctuations than a portfolio representing a broader range of industries. The funds invest in securities that typically respond to changes in the price of gold and other precious metals and minerals, which can be influenced by a variety of global economic, financial and political factors; increased environmental and labor costs in mining; and changes in laws relating to mining or gold production or sales. Fluctuations in the prices of gold and other precious metals and minerals will affect the market values of the securities held by these funds.
The Emerging Europe Fund invests more than 25% of its investments in companies principally engaged in the oil, gas or banking industries. Oil and gas companies are a large part of the Russian economy, and banks typically are a significant component of emerging market economics, such as those in Russia and other Eastern European countries. The risk of concentrating investments in this group of industries will make the fund more susceptible to risk in these industries than funds which do not concentrate their investments in an industry.
The Emerging Europe Fund may be exposed to risks not typically associated with investment in the United States due to its concentration of investments in emerging markets. These risks include possible revaluation of currencies, less public information about companies, disruptive political or economic conditions and the possible imposition of adverse governmental laws or currency exchange restrictions. Moreover, securities of many foreign issuers, including sovereign nations, and their markets may be less liquid and their prices more volatile than those securities of comparable U.S. issuers.
The China Region Fund may be exposed to risks not typically associated with investments in the United States, due to its concentration of investments in foreign issuers in the region. These investments present risks resulting from disruptive political or economic conditions and the potential imposition of adverse governmental laws or currency exchange restrictions affecting the area.
Note 7: Credit Arrangements
Each of the Funds has a revolving credit facility with BBH. Borrowings of each Fund are collateralized by any or all of the securities held by BBH as the Fund’s custodian up to the amount of the borrowing. Interest on borrowings is charged at the current overnight Federal Funds Rate plus 2 percent. Each Fund has a maximum borrowing limit of 10 percent of qualified assets. The aggregate of borrowings by all Funds under the agreement cannot exceed $10,000,000 at any one time. There were no borrowings under the revolving credit facility during the six months ended June 30, 2017. The Funds paid BBH a total of $7,542 in commitment fees for the period ended June 30, 2017, under this arrangement.
97
Notes to Financial Statements (unaudited) | June 30, 2017 |
Note 8: New Accounting Pronouncement
In October 2016, the Securities and Exchange Commission (the “SEC”) released its Final Rule on Investment Company Reporting Modernization (the “Rule”). The Rule which introduces two new regulatory reporting forms for investment companies – Form N-PORT and Form N-CEN – also contains amendments to Regulation S-X which impact financial statement presentation, particularly the presentation of derivative investments. Although still evaluating the impact of the Rule, management believes that many of the Regulation S-X amendments are consistent with the Fund’s current financial statement presentation and expects that the Fund will be able to comply with the Rule’s Regulation S-X amendments by the August 1, 2017 compliance date.
Note 9: Subsequent Events
The Funds have evaluated the need for additional disclosures and/or adjustments resulting from subsequent events. Based on this evaluation, no additional disclosures or adjustments were required to the financial statements as of the date the financial statements were issued.
98
U.S. Government Securities Ultra-Short Bond Fund
For a capital share outstanding during the
| | | Investor Class | |
| | | Six Months Ended
June 30,
2017 (unaudited) | | |
Year Ended December 31,
| |
| | | | 2016 | | | | 2015 | | | | 2014 | | | | 2013 | * | | | 2012 | * |
| | | | | | | | | | | | | | | | | | | | | | | | |
Net asset value, beginning of period/year | | $ | 2.00 | | | $ | 2.00 | | | $ | 2.00 | | | $ | 2.00 | | | $ | 2.00 | | | $ | 2.00 | |
| | | | | | | | | | | | | | | | | | | | | | | | | |
Investment Activities | | | | | | | | | | | | | | | | | | | | | | | | |
Net investment income | | | .01 | | | | .01 | | | | .01 | | | | .01 | | | | — | (a) | | | — | (a) |
Net realized and unrealized gain | | | .00 | | | | — | (a) | | | — | (a) | | | — | (a) | | | — | (a) | | | — | |
Total from investment activities | | | .01 | | | | .01 | | | | .01 | | | | .01 | | | | — | | | | — | |
Distributions | | | | | | | | | | | | | | | | | | | | | | | | |
From net investment income | | | (.01 | ) | | | (.01 | ) | | | (.01 | ) | | | (.01 | ) | | | — | (a) | | | — | (a) |
From return of capital | | | — | | | | — | (a) | | | — | | | | — | | | | — | | | | — | |
From net realized gains | | | — | | | | — | (a) | | | — | (a) | | | — | | | | — | | | | — | |
| | | | | | | | | | | | | | | | | | | | | | | | |
Net asset value, end of period/year | | $ | 2.00 | | | $ | 2.00 | | | $ | 2.00 | | | $ | 2.00 | | | $ | 2.00 | | | $ | 2.00 | |
| | | | | | | | | | | | | | | | | | | | | | | | | |
Total Return (b) | | | .29 | % | | | .47 | % | | | .34 | % | | | .36 | % | | | .02 | % | | | .01 | % |
Ratios to Average Net Assets: | | | | | | | | | | | | | | | | | | | | | | | | |
Net investment income | | | .58 | % | | | .43 | % | | | .33 | % | | | .35 | % | | | .01 | % | | | .01 | % |
Total expenses | | | 1.05 | % | | | 1.00 | % | | | 1.13 | % | | | 1.07 | % | | | .97 | % | | | .87 | % |
Expenses waived or reimbursed (c) | | | (.60 | )% | | | (.55 | )% | | | (.68 | )% | | | (.74 | )% | | | (.91 | )% | | | (.74 | )% |
Net expenses (d) | | | .45 | % | | | .45 | % | | | .45 | % | | | .33 | % | | | .06 | % | | | .13 | % |
Portfolio turnover rate (e) | | | 4 | % | | | 18 | % | | | 60 | % | | | 33 | % | | | | | | | | |
| | | | | | | | | | | | | | | | | | | | | | | | | |
Net assets, end of year (in thousands) | | $ | 52,555 | | | $ | 56,794 | | | $ | 62,562 | | | $ | 64,020 | | | $ | 75,227 | | | $ | 140,425 | |
* | The per share amounts for the periods have been adjusted to reflect a 1-for-2 reverse stock split, which was effective December 20, 2013. In addition, on December 20, 2013, the Fund changed from a constant $1.00 net asset value per share money market fund to a U.S. Government ultra-short bond fund (that is not a money market fund) with an objective of total return with current income. |
(a) | The per share amount does not round to a full penny. |
(b) | Assumes investment at the net asset value at the beginning of the period, reinvestment of all distributions and a complete redemption of the investment at the net asset value at the end of the period. |
(c) | Expenses waived or reimbursed reflect reductions to total expenses, as discussed in the notes to the financial statements. These amounts would increase the net investment loss ratio or decrease the net investment income ratio, as applicable, and decrease total returns had such reductions not occurred. |
(d) | The net expense ratios shown above reflect expenses after waivers and reimbursements but exclude the effect of reductions to total expenses for any expenses offset. Expense offset arrangements reduce total expenses, as discussed in the notes to the financial statements. These amounts would decrease the net investment income ratio had such reductions not occurred. The effect of expenses offset are as follows: |