UNITED STATES
SECURITIES AND EXCHANGE COMMISSION
Washington, D.C. 20549
FORM N-CSR
CERTIFIED SHAREHOLDER REPORT OF REGISTERED
MANAGEMENT INVESTMENT COMPANIES
Investment Company Act file number | 811-1800 |
|
U.S. GLOBAL INVESTORS FUNDS |
(Exact name of registrant as specified in charter) |
|
7900 CALLAGHAN ROAD SAN ANTONIO, TX | | 78229 |
(Address of principal executive offices) | | (Zip code) |
|
SUSAN B. MCGEE, ESQ. 7900 CALLAGHAN ROAD SAN ANTONIO, TX 78229 |
(Name and address of agent for service) |
|
Registrant’s telephone number, including area code: | 210-308-1234 | |
|
Date of fiscal year end: | DECEMBER 31, 2011 | |
|
Date of reporting period: | DECEMBER 31, 2011 | |
| | | | | | | | |
ITEM 1. REPORTS TO STOCKHOLDERS.
U.S. Global Investors Funds
Annual Report
December 31, 2011

U.S. Global Investors Funds
Annual Report
December 31, 2011
Table of Contents
| Letter to Shareholders | | | 1 | | |
|
| Definitions for Management Teams' Perspectives | | | 11 | | |
|
| Management Teams' Perspectives | | | 14 | | |
|
| Expense Example | | | 73 | | |
|
| Portfolios of Investments | | | 76 | | |
|
| Notes to Portfolios of Investments | | | 148 | | |
|
| Statements of Assets and Liabilities | | | 162 | | |
|
| Statements of Operations | | | 168 | | |
|
| Statements of Changes in Net Assets | | | 174 | | |
|
| Notes to Financial Statements | | | 183 | | |
|
| Financial Highlights | | | 203 | | |
|
| Additional Information | | | 223 | | |
|
Nasdaq Symbols
U.S. Global Investors Funds
Investor Class
| U.S. Treasury Securities Cash Fund | | USTXX | |
| U.S. Government Securities Savings Fund | | UGSXX | |
| Near-Term Tax Free Fund | | NEARX | |
| Tax Free Fund | | USUTX | |
| All American Equity Fund | | GBTFX | |
| Holmes Growth Fund | | ACBGX | |
| Global MegaTrends Fund | | MEGAX | |
| Global Resources Fund | | PSPFX | |
| World Precious Minerals Fund | | UNWPX | |
| Gold and Precious Metals Fund | | USERX | |
| Eastern European Fund | | EUROX | |
| Global Emerging Markets Fund | | GEMFX | |
| China Region Fund | | USCOX | |
Institutional Class
| Global MegaTrends Fund | | MEGIX | |
| Global Resources Fund | | PIPFX | |
| World Precious Minerals Fund | | UNWIX | |
P.O. Box 659405
San Antonio, Texas 78265-9604
Tel 1.800.US.FUNDS
Fax 1.210.308.1217
www.usfunds.com
U.S. Global Investors Funds
Dear Fellow Shareholder,

Investing, like life, is about managing expectations and we believe understanding market cycles helps investors navigate the volatility of different asset classes.
Throughout 2011, the S&P 500 Index was particularly volatile. Most of the daily movement was concentrated in the latter half of the year, as seen in the number of days the S&P 500 Index increased or decreased at least 1 or 2 percent during the first half of the year compared to the volatility during the last six months of the year.

During our recent webcast with Jeffrey Hirsch of Stock Trader's Almanac, Hirsch noted an increase in severe moves since the 1999 repeal of the Glass-Steagall Act that removed the separation between investment banking and commercial banking and the implementation of safe harbor rules. Hirsch referred to a blog post at the Stock Trader's Almanac website that looked at the number of daily moves over the last century. Moves of 3 percent or more on a daily basis in either direction were rare, but since 2000, there have been 125 in nearly 3,000 trading days. "Perhaps regulation (or the lack of) does contribute greatly to overall market volatility," suggests the blog post.
At U.S. Global Investors, we believe government policies are precursors to change, which is why our investment team continually monitors and tracks the fiscal, monetary and regulatory policies of
1
U.S. Global Investors Funds
countries. As active managers, tracking this information helps us anticipate how markets might react so we may adjust our investment strategy accordingly.
The rule of three could explain about 80 percent of 2011's market behavior. The ongoing debt crisis in Europe and the downgrading of U.S. debt were two significant issues weighing down the market. Japan's government policy intervention of its currency was likely the third.
To gain a yield advantage, large investors use the carry trade to advantageously borrow in yen (because interest rates are low), convert it to a stronger currency and invest in higher-return, higher-risk assets, including commodities and emerging markets stocks paying dividends.
When the yen began to strengthen against the dollar in August and again in October, Japan intervened to weaken its currency. The yen quickly reversed, as did the S&P 500.

The phenomenon experienced last year is built into the DNA of volatility of these asset classes. The table below illustrates the movement in both directions over any given rolling period going back 10 years. You'll see that the average increase or decrease over any 12-month period for the NYSE Arca Gold BUGS Index was around 38 percent whereas the MSCI Emerging Markets Index has moved about 31 percent in either direction. The S&P 500 has less volatility, historically experiencing a 19 percent swing in either direction over any rolling one-year period.
2
U.S. Global Investors Funds
Standard Deviation (as of 12/30/2011) based on 10-Year Data
| | | Rolling 12-Month Period | |
| NYSE Arca Gold BUGS Index (HUI) | | | 38.1 | % | |
| WTI Crude Oil | | | 35.7 | % | |
| MSCI Emerging Markets Index (MXEF) | | | 30.6 | % | |
| S&P 500 Index (SPX) | | | 19.2 | % | |
| Gold Bullion | | | 13.2 | % | |
12-month rolling volatility of price action over 10-year period.
Source: Bloomberg
Despite the strong swings in gold and commodity-related stocks, our research has shown these equities can enhance returns with reduced risk when combined with a less volatile asset class.
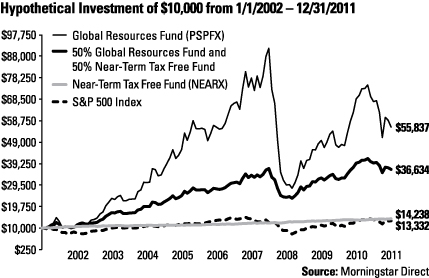
Over the past 10 years as of December 31, 2011, the S&P 500 has increased 2.92 percent and the Near-Term Tax Free Fund (NEARX) rose 3.59 percent. The Global Resources Fund (PSPFX) performed considerably better, rising 18.75 percent. However, the Global Resources Fund experienced the most volatility, as you can see in the hypothetical growth chart below.
If you had invested $10,000 with half of the assets in the Global Resources Fund and half in the Near-Term Tax Free Fund, and rebalanced once a year, you would have captured most of the outperformance of the Global Resources Fund with less risk. Over the past 10 years, this simple "couch potato" portfolio would have grown to $36,634, with significantly less volatility. This is substantially more than a 10-year hypothetical investment in the S&P 500, which grew to $13,332.
3
U.S. Global Investors Funds
Past performance does not guarantee future results. It is not possible to invest in an index. The chart illustrates the performance of a hypothetical $10,000 investment made during the depicted time frame, compared to a broad market index. Figures include reinvestment of capital gains and dividends, but the performance does not include the effect of any direct fees described in the fund's prospectus (e.g., short-term trading fees) which, if applicable, would lower your total returns.
Total Annualized Returns as of 12/31/2011
| Fund | | One-Year | | Five-Year | | Ten-Year | | Gross
Expense
Ratio | | Expense
After
Waivers | |
| Global Resources Fund (PSPFX) | | | -18.69 | % | | | 0.01 | % | | | 18.75 | % | | | 1.74 | % | | | n/a | | |
| Near-Term Tax Free Fund (NEARX) | | | 4.24 | % | | | 3.99 | % | | | 3.59 | % | | | 1.30 | % | | | 0.45 | % | |
| S&P 500 Index | | | 2.11 | % | | | -0.25 | % | | | 2.92 | % | | | n/a | | | | n/a | | |
Expense ratios as stated in the most recent prospectus. The expense ratio after waivers is a voluntary limit on total fund operating expenses (exclusive of any acquired fund fees and expenses, performance fees, taxes, brokerage commissions and interest) that U.S. Global Investors, Inc. can modify or terminate at any time, which may lower a fund's yield or return. Performance data quoted above is historical. Past performance is no guarantee of future results. Results reflect the reinvestment of dividends and other earnings. Current performance may be higher or lower than the performance data quoted. The principal value and investment return of an investment will fluctuate so that your shares, when redeemed, may be worth more or less than their original cost. Performance does not include the effect of any direct fees described in the fund's prospectus (e.g., short-term trading fees of up to 0.25%) which, if applicable, would lower your total returns. Performance quoted for periods of one year or less is cumulative and not annualized. Obtain performance data current to the most recent month-end at www.usfunds.com or 1-800-US-FUNDS.
Gold Stocks Poised to Outperform the Metal
In 2011, while gold bullion grew 10 percent, gold stock investors were left out of this rally as precious metals stocks experienced a record disparity compared to the price of gold. Global portfolio strategist Don Coxe said that 2011 represented the "greatest devaluation of precious metal stocks."
Short-term aberrations in markets are common, and last year wasn't the first time gold bullion and gold equity prices have diverged. Gold equities underperformed gold bullion in 2000 and 2008 during times of extreme market negativity and uncertainty. These previous instances have been merely temporary setbacks and markets generally reverted back to their long-term trends.
4
U.S. Global Investors Funds
Gold stocks have historically outperformed gold by roughly a 3-to-1 ratio. This means that a 5 percent rise in the price of gold generally translated to a 15 percent rise in the miners. At one point in 2011, this leverage eroded to about a 1-to-1 ratio, or lower at times, according to Bank of America-Merrill Lynch.
Last year's record disparity was due partially to the underperformance of the smallest gold stocks, the explorers and developers, which were hit the hardest. However, we believe this presents opportunity, and looking over the next year or so, we believe these small miners are especially poised to outperform.
The World Precious Minerals Fund is designed to take advantage of these types of opportunities – nearly half of the fund's holdings are typically in smaller gold companies. This caused the fund to lag many of its peers throughout 2011, but we believe knowledge and expertise on the lesser-known names in the gold sector have fueled the long-term outperformance of the fund compared to its benchmark over the past decade.
The American Dream Trade
In my global travels over the past several years, I have witnessed many emerging countries create policies to emulate America's free markets. In China, for example, I have been very fortunate to have seen the country during various stages of economic transformation. During earlier visits, China was a rural land with more bicycles on the roads than cars. Around that time, the country used only about 10 percent of the world's energy.
When I visited places such as Shanghai and Beijing in the fall of 2011, China's development and escalating use of global resources was evident. The country now boasts the largest automobile market, surpassing even the U.S. By 2025, it is anticipated that 350 million people will be added to the urban population, which is a trend McKinsey Global Institute believes "will be one of this century's biggest drivers of global economic growth." The International Energy Agency expects China to consume nearly 70 percent more energy than the U.S. by 2025, even though the per-capita energy consumption will be "still less than half the level of the U.S."
Emerging markets' use of natural resources and consumer goods has grown so dramatically that in 2012, The Economist reports that more than half of the world's imports will likely be purchased by
5
U.S. Global Investors Funds
emerging countries. This should "keep many Western firms busy for years to come," says the magazine.
Years ago, several of America's largest and oldest companies outgrew the U.S. border and recognized emerging markets' rising incomes and urbanization rate as an opportunity to export the American Dream. From automobile manufacturers to consumer products, U.S. companies shipped capital overseas, riding the wave of China's growth all the way to the bank.
Whereas 90 percent of cars sold in America are financed, most people in China pay cash. This allows them to be loyal to car companies, and the Chinese love American products. For the seventh consecutive year, General Motors has been the sales leader in China. The car company sold a record 2.3 million vehicles in China in 2010 and an additional 2.5 million vehicles in 2011. Growth is expected to continue, expanding by as much as 10 percent in 2012, according to Bloomberg.

GM in Shanghai topped October's list of the top-ten largest automakers in China with more than 100,000 cars sold in this city alone, according to data from the China Passenger Car Association. With the help of a joint venture with China's SGM Wuling, GM is expanding its operations into emerging markets such as China and India.
I read in The New York Times that "American carmaker General Motors has found the Chinese market to be a life-saving opportunity for the reinvention of the Buick brand." Buick, once called a "damaged brand" by a GM executive, leads China in luxury and subcompact car sales and the Buick Excelle is the country's top-selling sedan.
Car companies from the U.S. aren't the only businesses seeking growth in China: this fall, industrial bellwether Caterpillar reported a "record-breaking third quarter," with sales and revenues jumping 38 percent in the Asia-Pacific region.
6
U.S. Global Investors Funds
Beverage companies such as Starbucks, Coca-Cola and PepsiCo have sought to appeal to a nation of traditional tea drinkers. Starbucks recently reported a total of 800 stores in Greater China, and its strategy to sell cappuccinos and lattes appears to be successful: The Financial Times indicated that sales in China grew between 30 and 40 percent during the third quarter alone.
Coca-Cola and PepsiCo together have more than 90 percent market share in China, says CLSA. Over the past 10 years, the volume of carbonated drinks in China has increased an average of 8 percent per year, and Coca-Cola still experiences growth in volume. Over the third quarter, the company reported that worldwide volumes grew by 5 percent primarily driven by operations in India and China. In a very fragmented fruit and vegetable juice market, CLSA data shows that Coca-Cola has grown from virtually no market share in China's fruit and vegetable juice category, to a 10 percent market share, over the past 10 years.
To support additional growth, Coca-Cola expects to invest $7 billion in China between 2009 and 2014. Muhtar Kent, chairman and CEO of The Coca-Cola Company, stated, "China is one of our most important growth markets in the world as we work to achieve our 2020 Vision goal of doubling system revenues and servings this decade."
The country that existed when I first traveled to China over two decades ago has long gone the way of the dodo bird. Years ago, low-cost manufacturing fueled explosive growth in exported goods. Now, China is a hot destination for those goods. Back then, the Pudong district of Shanghai was a marsh. Today, the district is home to some of the world's most jaw-dropping architecture.
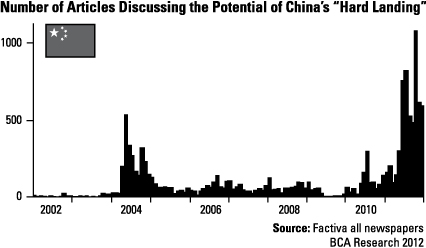
Despite the long-term potential of this emerging country, there was a parabolic rise in the number of newspaper articles predicting a "hard landing" in China after the country adopted monetary tightened measures to control inflation. Last fall, more than 1,000 articles questioned the possibility of a "China crash," according to data from BCA Research. This is twice as high as the number in 2004, when fear articles reached 500.
7
U.S. Global Investors Funds
Investment strategist Keith Fitz-Gerald, a long-time friend of mine, recently compared today's doomsday sentiment of China to the naysayers who forecasted the demise of the U.S. during the market bottom of March 2009.
Since the beginning of the twentieth century, U.S. stocks went through many secular bear markets. During the 1929-1932 period, the Dow Jones Industrial Average declined by nearly 90 percent. From 1937 to 1942, the Dow lost more than 52 percent. Also, beginning in 1901, 1906, 1916 and 1973, the market experienced more than 40 percent declines, according to Fitz-Gerald.
Americans have also endured devastating events, including two world wars, the Great Depression, presidential assassinations and the deadliest terrorist attack ever seen on U.S. soil.
What's important for investors to remember is that each significant market decline presented a "great buying opportunity" with U.S. stocks rising double-, or in some cases, triple-digits, writes Fitz-Gerald.
And, over the same 100 years, the Dow gained an outstanding 24,000 percent.
So despite setbacks in China including inflation, the Tiananmen Square protests, the Asian financial crisis of 1997 and the SARS
8
U.S. Global Investors Funds
scare, over the last 30 years, the country's average annual real GDP has grown 10 percent.
We believe many bearish articles last fall relied on generalities taken out of context. They offer anecdotes of ghost cities, empty shopping malls, robber barons, worker suicides and citizen protests as reasons the country as a whole is headed for a crash. These efforts to highlight China's economic imperfections are akin to saying the U.S. is a poor nation because impoverished areas still exist. At U.S. Global Investors, it is our job to research and make a rational determination whether the facts are material or superfluous.
As our team continuously weighs the evidence of China's economy, I believe moments such as these offer buying opportunities for global investors.
Thank you for your continued confidence in U.S. Global Investors. As we continue our mission to maximize the growth, protection and service of your wealth with only the highest ethical standards, we are committed to building your trust during these turbulent times.
Wishing you peace and prosperity in 2012.
Sincerely,

Frank Holmes
CEO and Chief Investment Officer
U.S. Global Investors, Inc.
Please consider carefully a fund's investment objectives, risks, charges and expenses. For this and other important information, obtain a fund prospectus by visiting www.usfunds.com or by calling 1-800-US-FUNDS (1-800-873-8637). Read it carefully before investing. Distributed by U.S. Global Brokerage, Inc.
Foreign and emerging market investing involves special risks such as currency fluctuation and less public disclosure, as well as economic and political risk. Because the Global Resources Fund concentrates its investments in a specific industry, the fund may be subject to greater risks and fluctuations than a portfolio representing a broader range of industries.
9
U.S. Global Investors Funds
Gold, precious metals, and precious minerals funds may be susceptible to adverse economic, political or regulatory developments due to concentrating in a single theme. The prices of gold, precious metals, and precious minerals are subject to substantial price fluctuations over short periods of time and may be affected by unpredicted international monetary and political policies. We suggest investing no more than 5% to 10% of your portfolio in these sectors.
Tax-exempt income is federal income tax free. A portion of this income may be subject to state and local income taxes, and if applicable, may subject certain investors to the Alternative Minimum Tax as well. Each tax free fund may invest up to 20% of its assets in securities that pay taxable interest. Income or fund distributions attributable to capital gains are usually subject to both state and federal income taxes. Bond funds are subject to interest-rate risk; their value declines as interest rates rise. The tax free funds may be exposed to risks related to a concentration of investments in a particular state or geographic area. These investments present risks resulting from changes in economic conditions of the region or issuer.
All opinions expressed and data provided are subject to change without notice. Some of these opinions may not be appropriate to every investor. Holdings in the Global Resources Fund, Near-Term Tax Free Fund and World Precious Minerals Fund as a percentage of net assets as of December 31, 2011: Caterpillar, Inc. (World Precious Minerals Fund 1.10%), General Motors 0.00%, PepsiCo 0.00%, Starbucks Corp. 0.00%, The Coca-Cola Co. 0.00%.
The Dow Jones Industrial Average is a price-weighted average of 30 blue chip stocks that are generally leaders in their industry. The NYSE Arca Gold BUGS (Basket of Unhedged Gold Stocks) Index (HUI) is a modified equal dollar weighted index of companies involved in gold mining. The HUI Index was designed to provide significant exposure to near term movements in gold prices by including companies that do not hedge their gold production beyond 1.5 years.
All blends are presented for educational purposes only and do not constitute an offer to sell or the solicitation of an offer to buy any blended investment products or services. The presentation of these blends does not constitute a recommendation.
10
Definitions for Management Teams' Perspectives
Benchmark Index Definitions
Returns for indexes reflect no deduction for fees, expenses or taxes, unless noted.
The Barclays Capital 3-Year Municipal Bond Index is a total return benchmark designed for municipal assets. The index includes bonds with a minimum credit rating of BAA3, are issued as part of a deal of at least $50 million, have an amount outstanding of at least $5 million and have a maturity of two to four years.
The Barclays Capital 10-Year Municipal Bond Index is a total return benchmark designed for long-term municipal assets. The index includes bonds with a minimum credit rating of BAA3, are issued as part of a deal of at least $50 million, have an amount outstanding of at least $5 million and have a maturity of 8 to 12 years.
The FTSE Gold Mines Index encompasses all gold mining companies that have a sustainable and attributable gold production of at least 300,000 ounces a year and that derive 75% or more of their revenue from mined gold.
The Hang Seng Composite Index is a market-capitalization weighted index that comprises the top 200 companies listed on the Stock Exchange of Hong Kong, based on average market capitalization for the twelve months.
The MSCI Emerging Markets Europe 10/40 Index (Net Total Return) is a free float-adjusted market capitalization index that is designed to measure equity performance in the emerging market countries of Europe (Czech Republic, Hungary, Poland, Russia and Turkey). The index is calculated on a net return basis (i.e., reflects the minimum possible dividend reinvestment after deduction of the maximum rate withholding tax). The index is periodically rebalanced relative to the constituents' weights in the parent index.
The MSCI Emerging Markets Net Total Return Index is a free float-adjusted market capitalization index that is designed to measure equity market performance in emerging market countries on a net return basis (i.e., reflects the minimum possible dividend reinvestment after deduction of the maximum rate withholding tax).
The Morgan Stanley Commodity Related Equity Index (CRX) is an equal-dollar weighted index of 20 stocks involved in commodity-related industries such as energy, non-ferrous metals, agriculture and forest products.
The NYSE Arca Gold Miners Index is a modified market capitalization-weighted index comprised of publicly-traded companies involved primarily in the mining for gold and silver.
The S&P 500 Index is a widely recognized capitalization-weighted index of 500 common stock prices in U.S. companies.
11
Definitions for Management Teams' Perspectives
The S&P Composite 1500 Index is a broad-based capitalization-weighted index of 1500 U.S. companies and is comprised of the S&P 400, S&P 500 and the S&P 600.
Other Index Definitions
The Barclays Capital Municipal Bond Index is an unmanaged index representative of the tax-exempt bond market.
The Citi Macro Risk Index is an equally-weighted index of emerging market sovereign spreads, U.S. credit spreads, U.S. swap spreads and implied FX, equity and swap rate volatility. The index is expressed in a rolling historical percentile and ranges between zero (low risk aversion) and one (high risk aversion). The index is intended to measure risk aversion in global financial markets.
The Consumer Price Index (CPI) is one of the most widely recognized price measures for tracking the price of a market basket of goods and services purchased by individuals. The weights of components are based on consumer spending patterns.
The ISM Manufacturing Composite Index is a diffusion index calculated from five of the eight sub-components of a monthly survey of purchasing managers at roughly 300 manufacturing firms from 21 industries in all 50 states.
The Istanbul Stock Exchange National 100 Index (XU100) is a capitalization-weighted index composed of National Market companies except investment trusts.
The JP Morgan Global Manufacturing PMI Index is an indicator of global economic and business conditions derived monthly from data produced using internationally comparable methodologies covering around 10,000 survey respondents in over twenty countries.
The MSCI All Country Far East Free ex Japan Index is a free float-adjusted market capitalization-weighted index that is designed to measure the equity market performance of the Far East, excluding Japan. The index consists of the following developed and emerging market country indices: China, Hong Kong, Indonesia, Korea, Malaysia, New Zealand, Philippines, Singapore, Taiwan and Thailand.
The Purchasing Manager's Index (PMI) is an indicator of the economic health of the manufacturing sector. The PMI index is based on five major indicators: new orders, inventory levels, production, supplier deliveries and the employment environment.
12
Definitions for Management Teams' Perspectives
The Russell 2000 Index is a U.S. equity index measuring the performance of the 2,000 smallest companies in the Russell 3000. The Russell 3000 Index consists of the 3,000 largest U.S. companies as determined by total market capitalization.
The S&P Global Infrastructure Index provides liquid and tradable exposure to 75 companies from around the world that represent the listed infrastructure universe. To create diversified exposure across the global listed infrastructure market, the index has balanced weights across three distinct infrastructure clusters: Utilities, Transportation and Energy.
The S&P GSCI Total Return Index is calculated primarily on a world production weighted basis and is comprised of the principal physical commodities that are the subject of active, liquid futures markets.
The S&P MidCap 400 Index is a capitalization-weighted index, which measures the performance of the mid-range sector of the U.S. stock market.
The S&P/TSX Venture Composite Index is a broad market indicator for the Canadian venture capital market. The index is market capitalization weighted and, at its inception, included 531 companies. A quarterly revision process is used to remove companies that comprise less than 0.05% of the weight of the index, and add companies whose weight, when included, will be greater than 0.05% of the index.
The U.S. Trade Weighted Dollar Index provides a general indication of the international value of the U.S. dollar.
Terms Used
M1 and M2 are measures of total money supplies. M1 money supply includes funds that are readily accessible for spending. M2 includes everything in M1 and also all time-related deposits, savings deposits, and non-institutional money-market funds.
13
Money Market Funds
Management Team's Perspective
Introduction
The U.S. Treasury Securities Cash Fund (USTXX) seeks to obtain a high level of current income while maintaining the highest degree of safety of principal and liquidity. The U.S. Government Securities Savings Fund (UGSXX) seeks to achieve a consistently high yield with safety of principal.
Performance
| U.S. Treasury Securities Cash Fund | | As of December 31, 2011 | |
| 7-Day Yield | | | 0.01 | % | |
| 7-Day Effective Yield | | | 0.01 | % | |
| Weighted Average Days to Maturity | | | 3 | | |
| U.S. Government Securities Savings Fund | | As of December 31, 2011 | |
| 7-Day Yield | | | 0.01 | % | |
| 7-Day Effective Yield | | | 0.01 | % | |
| Weighted Average Days to Maturity | | | 23 | | |
An investment in either the U.S. Treasury Securities Cash Fund or the U.S. Government Securities Savings Fund is neither insured nor guaranteed by the Federal Deposit Insurance Corporation (FDIC) or by any other government agency. Although the funds seek to preserve the value of your investments at $1.00 per share, it is possible to lose money by investing in these funds.
Pursuant to a voluntary arrangement, the Adviser has agreed to limit total fund operating expenses to not exceed 1.00% for the U.S. Treasury Securities Cash Fund and 0.45% for the U.S. Government Securities Savings Fund on an annualized basis. In addition, the yields and returns for these two funds include the effects of the Adviser's voluntary waiver of fees and/or reimbursement of expenses to maintain a minimum net yield for the funds. The Adviser can modify or terminate these arrangements at any time.
The Year In Review - Economic And Political Issues That Affected The Funds
The economy hit a soft patch in the first half of 2011 as first and second quarter GDP grew at an anemic 0.4 and 1.3 percent, respectively, but began to pick up some in the second half as third quarter GDP rose 1.8 percent and fourth quarter GDP rose 2.8 percent. Unemployment as of December 2011 was 8.5 percent, down from the 9.4 percent at the end of 2010, but much of the gain came from a smaller work force as many people
14
Money Market Funds
just stopped looking for jobs. After a very strong beginning of the year, manufacturing indicators generally deteriorated but most bottomed in the late third quarter or early fourth quarter and experienced a nice bounce into year end. The ISM Manufacturing Composite Index finished 2011 at 53.9, which is a healthy level indicating economic expansion. Consumer confidence deteriorated sharply through the first ten months of the year as global concerns continued surrounding the European financial crisis and the dysfunction in Washington led to a downgrade of the U.S. credit rating in August. Consumer confidence bounced back sharply in the last two months of 2011 as the U.S. economy outperformed many of its global peers. The Federal Reserve largely remained on the sidelines during the first half of the year. The Fed allowed quantitative easing (QE2) to end as scheduled at the end of June. We believe the Fed is allowing central banks around the world to do the heavy lifting this time as the European Central Bank cut interest rates twice late in 2011 after raising interest rates earlier in the year.
Inflation accelerated during the first nine months of the year but appears to have turned a corner and is likely headed lower in the near term. The Fed remains inclined to ease more if necessary and has committed to maintain the extremely low interest rate environment through late-2014.
Fiscal austerity remains in vogue to address long-term fiscal imbalances in the developed world and will likely be a significant drag on growth in the U.S. and Europe for some time. Spending cuts and higher taxes are a stiff headwind to economic growth.
Yields on the three-month Treasury bill fell 11 basis points to 0.01 percent, while yields on the six-month bills fell 13 basis points to 0.06 percent. One-year agency discount note yields fell 10 basis points to 0.14 percent. The market was still influenced by periodic bouts of risk aversion or other disruptions, with investors at times seeking to own short-term Treasury securities at almost any cost.
Investment Highlights
The U.S. Treasury Securities Cash Fund performed in line with the Lipper Treasury money market funds for the year ending December 31, 2011, returning 0.01 percent, the same as the peer group. The U.S. Government Securities Savings Fund also performed in line with the Lipper government-only money market funds for the year, returning 0.01 percent versus 0.01 percent for the peer group.
The U.S. Treasury Securities Cash Fund took a laddered approach by buying fixed-rate securities across the money market spectrum early in the year
15
Money Market Funds
but stayed very short during the second half of the year as overnight repurchase agreements were some of the highest yielding options with the least amount of interest rate risk. The fund's weighted average maturity was 8 days over the period.
The U.S. Government Securities Savings Fund followed a similar laddered approach for much of the year and had a weighted average maturity of 18 days. The fund took advantage of higher yields by selectively extending its ladder, but overall the past year continued to be a very difficult environment for money market fund investors.
Current Outlook
The Fed continues to emphasize that it will keep interest rates low for an extended period, and recent developments have reinforced this position. The Fed appears unlikely to change course before 2014, and monetary policy is likely to remain easy for some time.
16
Tax Free Funds
Management Team's Perspective
Introduction
The Near-Term Tax Free Fund (NEARX) and the Tax Free Fund (USUTX) seek to provide a high level of current income exempt from federal income taxation and to preserve capital. However, a portion of any distribution may be subject to federal and/or state income taxes. The Near-Term Tax Free Fund will maintain a weighted average maturity of less than five years, while the Tax Free Fund will generally maintain a longer weighted average maturity.
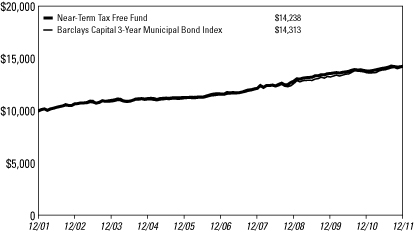
Performance Graphs
Near-Term Tax Free Fund
Average Annual Performance For the Years Ended
December 31, 2011
| | | One Year | | Five Year | | Ten Year | |
| Near-Term Tax Free Fund | | | 4.24 | % | | | 3.99 | % | | | 3.59 | % | |
Barclays Capital 3-Year Municipal Bond
Index | | | 3.46 | % | | | 4.30 | % | | | 3.65 | % | |
Performance data quoted above is historical. Past performance is no guarantee of future results. Current performance may be higher or lower than the performance data quoted. The principal value and investment return of an investment will fluctuate so that an investor's shares, when redeemed, may be worth more or less than their original cost. The graph and table do not reflect the deduction of taxes that a shareholder would pay on fund distributions or the redemption of fund shares.
Pursuant to a voluntary arrangement, the Adviser has agreed to limit total fund operating expenses (exclusive of any acquired fund fees and expenses, performance fees, taxes, brokerage commissions and interest) to not exceed 0.45%. The Adviser can modify or terminate this arrangement at any time, which may lower the fund's yield or return.
See Definitions for Management Teams' Perspectives for index definitions.
Please visit our website at www.usfunds.com for updated performance information for different time periods.
17
Tax Free Funds
Tax Free Fund
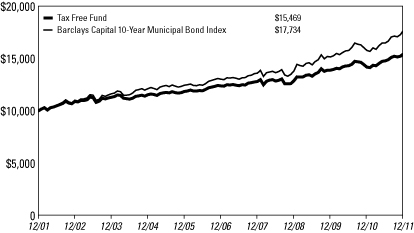
Average Annual Performance For the Years Ended
December 31, 2011
| | | One Year | | Five Year | | Ten Year | |
| Tax Free Fund | | | 8.94 | % | | | 4.52 | % | | | 4.46 | % | |
Barclays Capital 10-Year Municipal Bond
Index | | | 12.32 | % | | | 6.33 | % | | | 5.89 | % | |
Performance data quoted above is historical. Past performance is no guarantee of future results. Current performance may be higher or lower than the performance data quoted. The principal value and investment return of an investment will fluctuate so that an investor's shares, when redeemed, may be worth more or less than their original cost. The graph and table do not reflect the deduction of taxes that a shareholder would pay on fund distributions or the redemption of fund shares.
Pursuant to a voluntary arrangement, the Adviser has agreed to limit total fund operating expenses (exclusive of any acquired fund fees and expenses, performance fees, taxes, brokerage commissions and interest) to not exceed 0.70%. The Adviser can modify or terminate this arrangement at any time, which may lower the fund's yield or return.
See Definitions for Management Teams' Perspectives for index definitions.
Please visit our website at www.usfunds.com for updated performance information for different time periods.
The Year In Review - Economic And Political Issues That Affected The Funds
The municipal bond market exhibited strong performance over the past year as the Barclays Capital Municipal Bond Index rose 10.70 percent.
During the first quarter of 2011, the market exhibited mixed performance and overall returns were muted. This followed a difficult fourth quarter of
18
Tax Free Funds
2010 with municipal bond analyst Meredith Whitney scaring bond investors by telling 60 Minutes that she anticipated substantial municipal defaults during 2011.
Many of those fears subsided and the market gained confidence as the year progressed and actual defaults remained very low. Most municipal governments appeared to be making tough but necessary changes. This was particularly true for low-quality and long-duration bonds that outperformed during 2011.
The very long end of the yield curve benefited the most, as bonds with maturities of 22 years or more rose by 14.9 percent. Municipal market performance was consistent throughout the yield curve as returns were more or less tied to maturity. Municipals followed the general trend in Treasuries as yields steadily declined during the year. Economic growth was much slower than expected in the first half of the year, but began to pick up as the year progressed. Overriding concerns surrounding the constantly evolving European financial crisis and fears of an economic hard landing in China kept a lid on interest rates.
Revenue-backed municipals modestly outperformed the overall municipal index, driven by hospital and transportation issues. Credit factors also played a role in performance as low quality bonds outperformed high quality bonds. AAA-rated municipals rose by 8.75 percent during the year versus 11.84 percent for BBB-rated bonds. High-yield ("junk") bonds bucked this trend, rising just 9.25 percent.
In specialty state trading, California and Illinois outperformed, while New York and Ohio underperformed.
The Federal Reserve stayed the course during 2011 and has pledged to keep interest rates low through late-2014 and monetary policy loose for an extended period of time.
Investment Highlights
Over the year ended December 31, 2011, the Near-Term Tax Free Fund returned 4.24 percent, outperforming its benchmark, the Barclays Capital 3-Year Municipal Bond Index, which returned 3.46 percent. The Tax Free Fund returned 8.94 percent and trailed the performance of its benchmark, the Barclays Capital 10-Year Municipal Bond Index, which returned 12.32 percent.
19
Tax Free Funds
Both the Near-Term Tax Free Fund and the Tax Free Fund trailed their respective Lipper peer groups for the past year. The performance difference for the funds was primarily driven by fund credit and maturity preferences relative to their benchmarks and peer groups.
Strengths
• The Tax Free Fund maintained significant exposure to hospital-backed municipals, which outperformed.
• The Tax Free Fund benefited from significant exposure to California, Illinois and Michigan, which all outperformed.
• Both funds benefited from no exposure to the housing sector, which underperformed.
• From a maturity perspective, the Near-Term Tax Free Fund benefited from a longer maturity profile than its benchmark.
Weaknesses
• The conservative credit profile of both funds proved to be an asset during the first quarter but negatively impacted performance during the remainder of the year.
• The Tax Free Fund maintained a relatively short maturity/duration profile. This negatively impacted performance in relation to its benchmark, as longer maturities outperformed.
• The Tax Free Fund had little exposure to long maturities with discount coupon structures, which significantly outperformed.
Current Outlook
Opportunities
• The long end of the yield curve appears to offer the best opportunity in the current market, as the Fed appears sidelined for an extended period. Globally, other central banks have begun a new easing cycle, potentially allowing the long-end of the yield curve to rally.
Threats
• Continued outperformance of low-quality bonds is the most significant threat on a relative basis.
• When the Fed reverses its monetary policy stance and begins to raise interest rates, the macro environment could become more difficult.
20
Tax Free Funds
Near-Term Tax Free Fund
Municipal Bond Ratings December 31, 2011
(Based on Total Municipal Bonds)

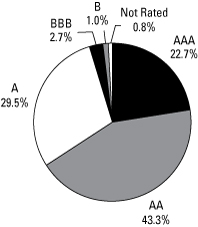
Tax Free Fund
Municipal Bond Ratings December 31, 2011
(Based on Total Municipal Bonds)
21
All American Equity Fund
Management Team's Perspective
Introduction
The principal objective of the All American Equity Fund (GBTFX) is to seek capital appreciation by investing primarily in a broadly diversified portfolio of domestic common stocks. The fund invests in large-capitalization stocks, while retaining the flexibility to seek out promising individual stock opportunities, including stocks with meaningful dividend yields.
Performance Graph
All American Equity Fund
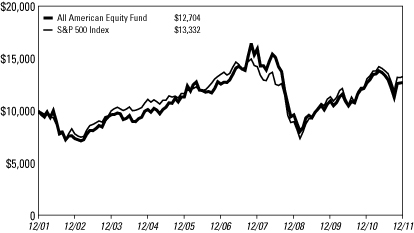
Average Annual Performance For the Years Ended
December 31, 2011
| | | One Year | | Five Year | | Ten Year | |
| All American Equity Fund | | | 0.14 | % | | | 0.22 | % | | | 2.42 | % | |
| S&P 500 Index | | | 2.11 | % | | | (0.25 | )% | | | 2.92 | % | |
Performance data quoted above is historical. Past performance is no guarantee of future results. Current performance may be higher or lower than the performance data quoted.The principal value and investment return of an investment will fluctuate so that an investor's shares, when redeemed, may be worth more or less than their original cost. The graph and table do not reflect the deduction of taxes that a shareholder would pay on fund distributions or the redemption of fund shares.
Pursuant to a voluntary arrangement, the Adviser has agreed to limit total fund operating expenses (exclusive of any acquired fund fees and expenses, performance fees, taxes, brokerage commissions and interest) to not exceed 2.20%. The Adviser can modify or terminate this arrangement at any time, which may lower the fund's yield or return.
See Definitions for Management Teams' Perspectives for index definitions.
Please visit our website at www.usfunds.com for updated performance information for different time periods.
22
All American Equity Fund
The Year In Review - Economic And Political Issues That Affected The Fund
U.S. real GDP growth was disappointing in 2011 with growth of about 1 percent during the first half of the year. Real GDP growth picked up in the third quarter but remained below 2 percent. However, fourth quarter GDP was reported at 2.8 percent and would indicate that the economy is picking up steam as we move into 2012.
To aid a struggling economy, the Federal Reserve kept its short-term interest rate target in a range of zero to 0.25 percent, unchanged for 2011. In an effort to stimulate the economy, the Fed continued its second round of quantitative easing (QE2) to purchase $600 billion in U.S. Treasury bonds. The Fed concluded the QE2 program on June 30, 2011. The 10-year U.S. Treasury note yield began 2011 at 3.30 percent, rose to a high of 3.74 percent on February 8 and ended the year at a yield of 1.88 percent.
Inflation remained relatively contained with year-over-year changes in the Consumer Price Index (CPI) ranging from 1.6 percent in January, peaking at 3.9 percent in September and ending the year at 3.0. The Fed remains much more concerned about deflation than inflation as economic weakness in Europe and Asia is likely to put downward pressure on global inflation.
The employment picture in the U.S. remained weak but is showing some signs of improvement. America's unemployment rate ended 2011 at 8.5 percent, down nearly a full percentage point from the same time a year ago. However, extreme volatility, fears of an economic hard landing in China, and the deteriorating European financial crisis provided a headwind during the second half of the year. The S&P 500 Index finished 2011 with a 2.11 percent return for the year.
The political environment in the U.S. was one of strongly divided partisan debates, with the Democrats controlling the Presidency and the Senate, while the Republicans controlled the House of Representatives. Issues debated included national health care legislation, financial regulatory reform, the federal budget and the national debt. This dysfunctional environment in Washington resulted in the U.S. debt being downgraded in August by Standard & Poor's, which cited the failure of political leadership to craft a reasonable plan to cure America's ever-increasing debt burden.
23
All American Equity Fund
Investment Highlights
Overview
The fund returned 0.14 percent for the year ended December 31, 2011, underperforming the 2.11 percent return for the benchmark S&P 500 Index.
Because the fund is actively managed and holding period is generally not a consideration in investment decisions, the portfolio turnover rate may fluctuate from year to year as the fund adjusts its portfolio composition. The fund's annual portfolio turnover was, and is expected to continue to be, more than 100 percent.
Strengths
• The fund's allocations to consumer staples, financials and technology all positively contributed to relative performance. The fund's stock selection with consumer staples and technology was the primary driver of outperformance in these groups, while underweighting financials proved to be the correct call as the sector underperformed.
• The fund's exposure to dividend paying stocks over the past year was beneficial as stocks with defensive characteristics tended to outperform.
• NVIDIA Corp.,(1) Lorillard, Inc.(2) and Starbucks Corp.(3) were among the best positive contributors to performance.
• Defensive option strategies also aided the fund performance. The fund took advantage of the high volatility, particularly in the second half of the year, through covered call writing. This helped mitigate some of the downdrafts in performance.
Weaknesses
• The fund's allocations to energy, health care and industrials were negative contributors to relative performance. The fund's stock selection within these sectors was the primary driver of underperformance.
• The fund's underperformance in health care was largely driven by relative performance of names that the fund did not own, such as Pfizer Inc.,(1) Abbott Laboratories(1) and Johnson & Johnson.(1)
• Bank of America Corp.,(1) Halliburton Co.(4) and Hewlett-Packard Co.(5) were among the worst individual contributors to performance.
24
All American Equity Fund
Current Outlook
Opportunities
• The U.S. economy has been surprisingly resilient during the past six months, and globally we have just begun a new monetary easing cycle, which should be good for equities in 2012.
• Corporate cash levels are high, providing corporations the ability to pursue mergers and acquisitions (M&A). An increase in M&A activity holds promise for both portfolio gains and an increase in overall market valuations.
• Low interest rates, if continued throughout 2012, should provide a favorable backdrop for the economy and stock prices.
Threats
• Europe is widely believed to already be in recession, and fiscal austerity both at home and abroad will be headwinds in the first half of 2012.
• An escalation in concerns over sovereign debt obligations in Europe would be negative for stocks.
• While inflation has moderated in recent months, equities would be negatively affected if inflation pressures were to reaccelerate and force a response from the Fed.
The fund ended the period overweight in materials, telecommunications and technology, and it maintained an emphasis on dividend paying stocks.
(1)The fund did not hold this security as of 12/31/11.
(2)This security comprised 1.18% of the fund's total net assets as of 12/31/11.
(3)This security comprised 3.09% of the fund's total net assets as of 12/31/11.
(4)This security comprised 2.21% of the fund's total net assets as of 12/31/11.
(5)This security comprised 0.79% of the fund's total net assets as of 12/31/11.
25
All American Equity Fund
Top 10 Holdings Based on Net Assets
(excluding repurchase agreement) December 31, 2011
MasterCard, Inc.
Commercial Services - Financial | | | 3.41 | % | |
Apple, Inc.
Computers | | | 3.36 | % | |
Starbucks Corp.
Retail - Restaurants | | | 3.09 | % | |
Halliburton Co.
Oil - Field Services | | | 2.21 | % | |
Intel Corp.
Electronic Components - Semiconductors | | | 2.07 | % | |
Hansen Natural Corp.
Beverages - Non-alcoholic | | | 1.69 | % | |
Honeywell International, Inc.
Instruments - Controls | | | 1.63 | % | |
QUALCOMM, Inc.
Semiconductors Components/Integrated Circuts | | | 1.60 | % | |
Google, Inc.
Web Portals/Internet Service Providers | | | 1.58 | % | |
Novellus Systems, Inc.
Semiconductor Equipment | | | 1.38 | % | |
| TOTAL TOP TEN HOLDINGS | | | 22.02 | % | |
Portfolio Allocation by Industry Sector*
Based on Total Investments December 31, 2011
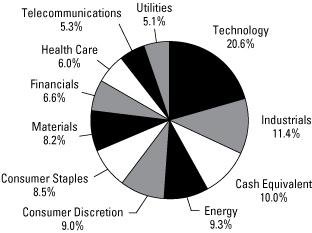
* Summary information above may differ from the portfolio schedule included in the financial statements due to the use of different classifications of securities for presentation purposes.
26
Holmes Growth Fund
Management Team's Perspective
Introduction
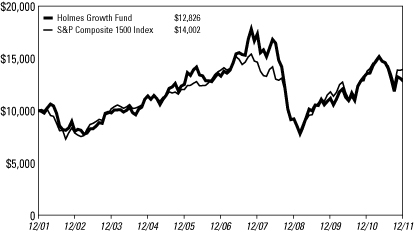
The Holmes Growth Fund (ACBGX) invests in companies with good growth prospects and strong positive earnings momentum. The fund's primary objective is to seek long-term capital appreciation.
Performance Graph
Holmes Growth Fund
Average Annual Performance For the Years Ended
December 31, 2011
| | | One Year | | Five Year | | Ten Year | |
| Holmes Growth Fund | | | (5.52 | )% | | | (0.75 | )% | | | 2.52 | % | |
| S&P Composite 1500 Index | | | 1.77 | % | | | 0.15 | % | | | 3.42 | % | |
Performance data quoted above is historical. Past performance is no guarantee of future results. Current performance may be higher or lower than the performance data quoted. The principal value and investment return of an investment will fluctuate so that an investor's shares, when redeemed, may be worth more or less than their original cost. The graph and table do not reflect the deduction of taxes that a shareholder would pay on fund distributions or the redemption of fund shares.
Pursuant to a voluntary arrangement, the Adviser has agreed to limit total fund operating expenses (exclusive of any acquired fund fees and expenses, performance fees, taxes, brokerage commissions and interest) to not exceed 2.20%. The Adviser can modify or terminate this arrangement at any time, which may lower the fund's yield or return.
See Definitions for Management Teams' Perspectives for index definitions.
Please visit our website at www.usfunds.com for updated performance information for different time periods.
27
Holmes Growth Fund
The Year in Review - Economic And Political Issues that Affected The Fund
During the first half of 2011, U.S. real GDP growth was only about 1 percent. Real GDP growth picked up slightly in the third quarter. By the fourth quarter, GDP was reported at 2.8 percent, indicating that the economy was picking up steam as we moved into 2012.
The Federal Reserve kept its short-term interest rate target in a range of zero to 0.25 percent, unchanged for 2011. In an effort to stimulate the economy, the Fed continued its second round of quantitative easing (QE2) to purchase $600 billion in U.S. Treasury bonds. The QE2 program ended on June 30, 2011. While the 10-year U.S. Treasury note yield began 2011 at 3.30 percent, it ended the year at a yield of 1.88 percent.
Year-over-year changes in the Consumer Price Index (CPI) ranged from 1.6 percent in January, peaked at 3.9 percent in September and ended the year at 3.0. The Fed remains much more concerned about deflation as economic weakness in Europe and Asia is likely to put downward pressure on global inflation.
The employment picture in the U.S. remained weak but is showing some signs of improvement. At the end of 2011, the unemployment rate was 8.5 percent, down nearly a full percentage point from the same time a year ago.
The U.S. political environment was strongly divided, with the Democrats controlling the Presidency and the Senate, and the Republicans controlling the House of Representatives. The dysfunctional environment in Washington resulted in U.S. debt being downgraded in August by Standard & Poor's, which cited the failure of political leadership to craft a reasonable plan to cure America's ever-increasing debt burden.
The fund's benchmark, the S&P Composite 1500 Index, bounced around during the first six months of the year, ultimately rising 6.29 percent through June 30. However, extreme volatility, fears of an economic hard landing in China, and the deteriorating European financial crisis provided a headwind during the second half of the year. The S&P Composite 1500 Index finished 2011 with a 1.77 percent return for the year.
28
Holmes Growth Fund
Investment Highlights
Overview
The fund fell 5.52 percent during 2011, underperforming the benchmark, the S&P Composite 1500 Index, which returned 1.77 percent.
Because the fund is actively managed and holding period is generally not a consideration in investment decisions, the portfolio turnover rate may fluctuate from year to year as the fund adjusts its portfolio composition. The fund's annual portfolio turnover was, and is expected to continue to be, more than 100 percent.
Strengths
• The fund benefited from being underweight the financials sector as the ongoing European financial crisis weighed on the largest names in the sector. The fund also benefited from stock selection within telecommunications.
• Stock selection that benefited performance included the fund's largest holding, Newfoundland Capital Corp. Ltd.,(1) which rose 14.9 percent. Other standouts were Alexion Pharmaceuticals, Inc.(2) and Body Central Corp.(3)
• Defensive option strategies also aided the fund performance. The fund took advantage of the high volatility, particularly in the second half of the year, through covered call writing, which helped mitigate some of the downdrafts in performance.
Weaknesses
• The investment model we follow that emphasizes growth in earnings, revenues and high returns on capital underperformed in 2011. The model also has a higher portion of small- and mid-capitalization names. The S&P MidCap 400 Index fell 1.7 percent and the Russell 2000 Index, which is comprised of small-cap companies, fell 4.2 percent during 2011.
• Relative fund performance was diminished by investments in the energy, materials and technology sectors.
• Investments in PetroMagdalena Energy Corp.(4) and Wabco Holdings, Inc.(2) failed to live up to expectations and were among the worst contributors to the fund's performance.
29
Holmes Growth Fund
Current Outlook
Opportunities
• The U.S. economy has been surprisingly resilient during the past six months, and globally we have just begun a new monetary easing cycle, which should be good for equities in 2012.
• Corporate cash levels are high, providing corporations the ability to pursue mergers and acquisitions (M&A). An increase in M&A activity holds promise for both portfolio gains and an increase in overall market valuations.
• Low interest rates, if continued throughout 2012, should provide a favorable backdrop for the economy and stock prices.
Threats
• Europe is widely believed to already be in recession, and fiscal austerity both at home and abroad will be headwinds in the first half of 2012.
• An escalation in concerns over sovereign debt obligations in Europe would be negative for stocks.
• While inflation has moderated in recent months, equities would be negatively affected if inflation pressures were to reaccelerate and force a response from the Fed.
(1)This security comprised 7.28% of the fund's total net assets as of 12/31/11.
(2)The fund did not hold this security as of 12/31/11.
(3)This security comprised 3.04% of the fund's total net assets as of 12/31/11.
(4)This security comprised 1.16% of the fund's total net assets as of 12/31/11.
30
Holmes Growth Fund
Top 10 Holdings Based on Net Assets
(excluding repurchase agreement) December 31, 2011
Newfoundland Capital Corp., Ltd.
Radio | | | 7.28 | % | |
Apple, Inc.
Computers | | | 4.46 | % | |
Starbucks Corp.
Retail - Restaurants | | | 3.45 | % | |
Core Laboratories N.V.
Oil - Field Services | | | 3.23 | % | |
Body Central Corp.
Retail - Apparel/Shoe | | | 3.04 | % | |
Halliburton Co.
Oil - Field Services | | | 2.93 | % | |
MasterCard, Inc.
Commercial Services - Financial | | | 2.85 | % | |
C&J Energy Services, Inc.
Oil - Field Services | | | 2.37 | % | |
Intel Corp.
Electronic Components - Semiconductors | | | 2.34 | % | |
Ulta Salon Cosmetics & Fragrance, Inc.
Retail - Perfume & Cosmetics | | | 2.30 | % | |
| TOTAL TOP TEN HOLDINGS | | | 34.25 | % | |
Portfolio Allocation by Industry Sector*
Based on Total Investments December 31, 2011
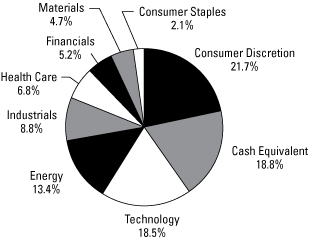
* Summary information above may differ from the portfolio schedule included in the financial statements due to the use of different classifications of securities for presentation purposes.
31
Global MegaTrends Fund
Management Team's Perspective
Introduction
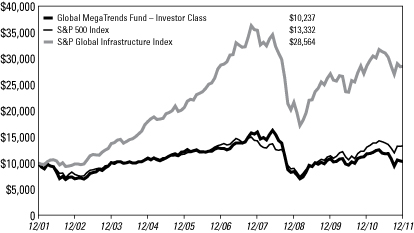
The Global MegaTrends Fund (MEGAX and MEGIX) focuses on companies that are well positioned to benefit from future investments in global infrastructure, both in the private and public sectors. The fund considers a broad range of investable opportunities, including publicly traded infrastructure assets (such as airports and toll roads), select utilities, construction and engineering firms, telecom operators, select companies in the alternative energy space, and companies in the steel, cement and raw materials sectors.
Performance Graph
Global MegaTrends Fund
Average Annual Performance For the Periods Ended December 31, 2011
| | | One Year | | Five Year | | Ten Year | | Since Inception
(Institutional
Class) | |
Global MegaTrends Fund -
Investor Class | | | (13.02 | )% | | | (4.36 | )% | | | 0.23 | % | | | n/a | | |
Global MegaTrends Fund -
Institutional Class (Inception 3/1/10) | | | (12.70 | )% | | | n/a | | | | n/a | | | | (0.70 | )% | |
| S&P 500 Index | | | 2.11 | % | | | (0.25 | )% | | | 2.92 | % | | | 8.94 | % | |
| S&P Global Infrastructure Index | | | (0.39 | )% | | | (0.16 | )% | | | 11.06 | % | | | 5.41 | % | |
Performance data quoted above is historical. Past performance is no guarantee of future results. Current performance may be higher or lower than the performance data quoted. The principal value and investment return of an investment will fluctuate so that an investor's shares, when redeemed, may be worth more or less than their original cost. The graph and table do not reflect the deduction of taxes that a shareholder would pay on fund distributions or the redemption of fund shares.
Pursuant to a voluntary arrangement, the Adviser has agreed to limit total fund operating expenses (exclusive of any acquired fund fees and expenses, performance fees, taxes, brokerage commissions and interest) to not exceed 2.35% for the Investor Class. Also pursuant to a voluntary agreement, the Adviser has agreed to waive all class specific expenses of the Institutional Class. The Adviser can modify or terminate these arrangements at any time, which may lower the fund's yield or return.
See Definitions for Management Teams' Perspectives for index definitions.
Please visit our website at www.usfunds.com for updated performance information for different time periods.
32
Global MegaTrends Fund
The Year In Review - Economic And Political Issues That Affected The Fund
Political and economic considerations are very influential on the investment climate in which the Global MegaTrends Fund operates.
Persistent gloomy news from Europe concerning the sovereign debt crisis and the financial health of the regional banks negatively impacted market sentiment during 2011. The chilling effect this negativity had on markets was similar to that experienced in 2010. As a result, infrastructure-related companies declined during the period as uncertainty regarding future capital spending plans increased, particularly as fiscal borrowing costs escalated abroad. In the second half of the year, gridlock among European policy makers raised fears that the global economy was headed toward a severe recession. This further increased investor risk-aversion towards equities, emerging markets and foreign currencies. Capital flows out of risky assets also resulted in a stronger U.S. dollar as the global "carry trade" was unwound and repatriated toward U.S. assets. This was a significant driver of international equities in the fund's portfolio lagging domestic stocks during the year.
At the start of 2011, many emerging market countries were taking measures to deal with rising price inflation, overheated property markets and rising food prices. Accordingly, market participants became concerned that China would experience a "hard" economic landing that would negatively impact global growth and restrain infrastructure projects. However, China proactively cut its bank reserve requirements in the fourth quarter, which may have signaled to the market a more pro-growth policy change. In fact, China's Purchasing Manager's Index (PMI) actually expanded in December after a brief decline below the key 50 level. Additionally, the JP Morgan Global Manufacturing PMI Index also improved by year end following three consecutive months of contraction.
Investment Highlights
Overview
For the year ended December 31, 2011, the Investor Class of the fund had a negative 13.02 percent return and the Institutional Class posted a negative 12.70 percent return. The benchmark S&P 500 Index returned 2.11 percent, while the S&P Global Infrastructure Index lost 0.39 percent.
33
Global MegaTrends Fund
Strengths
• Top contributors to fund performance for calendar year 2011 included domestic energy infrastructure stocks such as El Paso Corp.,(1) ONEOK Partners L.P.(2) and Primoris Services Corp.(3) Several international holdings contributed positive performance including Brazilian telecom operator Telefonica Brazil S.A.(1) and Kolon Industries, Inc.,(1) both of which had double-digit gains for the fund.
• The fund benefited from exceptional performance of stocks in the information technology sector including Mastercard, Inc.,(4) Rackspace Hosting, Inc.(1) and Toshiba Corp.(1)
• The fund also benefited from investments in emerging market health care facility stocks including Bumrungrad Hospital PCL(5) in Thailand and Life Healthcare Group Holdings Ltd.(6) based in South Africa.
Weaknesses
• The fund's underperformance compared to the benchmark S&P 500 Index was mainly a result of sector allocation and stock selection in both domestic and international areas.
• The most negative impact for the fund during 2011 came from exposure to cyclical sectors including industrials, basic materials and energy. After strong performance in 2010, these sectors fell sharply in the second half of 2011 as slowing global economic growth due to the European financial crisis and a self-induced slowdown in China heightened concerns about the global economy.
• Emerging market equities underperformed the S&P 500 Index in 2011 as investors eliminated risk from their portfolios and sought liquidity for reasons mentioned previously. Historically, the portfolio carries significant exposure to developing economies because of their long-term growth opportunities for infrastructure investment, but this exposure created a short-term headwind for performance in 2011.
• Poor performance relative to the S&P 500 Index was also partially due to the fund's underweight allocation to the U.S. utilities sector, which outperformed for the year.
Current Outlook
We believe population growth and rapid urbanization, particularly in emerging nations, will drive a global infrastructure buildout for several years. In developed countries, decades of neglect and underinvestment in infrastructure assets has resulted in a significant deterioration of existing infrastructure.
34
Global MegaTrends Fund
We remain encouraged by the awareness of the political leaders around the world that investments in infrastructure are needed to sustain economic growth and competitiveness.
Opportunities
• With the rapid development of North American oil and gas shale basins such as the Marcellus in Pennsylvania, the Eagle Ford in Texas and the Bakken in North Dakota, infrastructure constraints are being alleviated with new investment in assets to gather, process and transport growing oil and gas volumes. We think that certain Master Limited Partnerships (MLPs) that have the right type of assets in the right geographic locations will allow investors to reap the benefits of the prolific development of shale plays in the U.S. and Canada.
• The Indonesian government is placing a greater emphasis on infrastructure investment and development as insufficient roads, rails and ports have constrained the country's economic growth. We believe opportunities in building materials companies are an attractive investment in this infrastructure theme within Indonesia.
• Above average global growth in passenger air traffic in various developing countries presents an interesting opportunity to invest in the stocks of companies that own and operate airports. Additionally, the rise of the middle class consumer in these countries has been a catalyst for automobile sales and a large increase in miles driven for certain developing countries. We see opportunity in the stocks of toll-road operators in these higher growth regions.
Threats
• While many countries remain committed to improving their infrastructure, delays due to tight credit conditions and legal impediments appear to affect numerous projects.
• Government subsidies are still required for sustainable development of alternative energy and this support could change as the political climate evolves. There appears to be growing opposition from nearby residents of wind farm developments in various parts of the world because of health and aesthetic concerns.
• Further deterioration of the European debt crisis could result in a significant decline in global economic activity or have a negative impact on the funding of infrastructure-related projects.
(1)The fund did not hold this security as of 12/31/11.
(2)This security comprised 1.55% of the fund's total net assets as of 12/31/11.
(3)This security comprised 1.50% of the fund's total net assets as of 12/31/11.
(4)This security comprised 3.75% of the fund's total net assets as of 12/31/11.
(5)This security comprised 1.09% of the fund's total net assets as of 12/31/11.
(6)This security comprised 1.20% of the fund's total net assets as of 12/31/11.
35
Global MegaTrends Fund
Top 10 Holdings Based on Net Assets
(excluding repurchase agreement) December 31, 2011
MasterCard, Inc.
Commercial Services - Financial | | | 3.75 | % | |
CCR S.A.
Public Thoroughfares | | | 3.57 | % | |
Pacific Stone Tech, Inc.
Quarrying | | | 3.49 | % | |
General Electric Co.
Diversified Manufacturing Operations | | | 3.00 | % | |
National-Oilwell Varco, Inc.
Oil Field Machinery & Equipment | | | 2.74 | % | |
Chart Industries, Inc.
Machinery - General Industrial | | | 2.72 | % | |
TransCanada Corp.
Pipelines | | | 2.49 | % | |
Freeport-McMoRan Copper & Gold, Inc.
Metal - Copper | | | 2.47 | % | |
Keyera Corp.
Gas - Distribution | | | 2.30 | % | |
Core Laboratories N.V.
Oil - Field Services | | | 2.29 | % | |
| TOTAL TOP TEN HOLDINGS | | | 28.82 | % | |
Portfolio Allocation by Industry Sector*
Based on Total Investments December 31, 2011

* Summary information above may differ from the portfolio schedule included in the financial statements due to the use of different classifications of securities for presentation purposes.
36
Global Resources Fund
Management Team's Perspective
Introduction
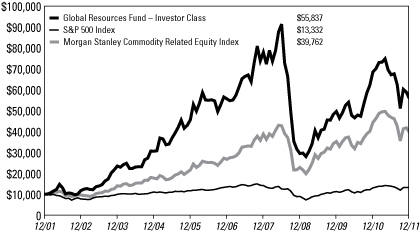
The Global Resources Fund (PSPFX and PIPFX) is a non-diversified natural resources fund with the principal objective of achieving long-term growth of capital while providing protection against inflation and monetary instability. The fund invests globally in companies involved in the exploration, production, transportation and processing of petroleum, natural gas, industrial commodities, metals, minerals and forestry.
Performance Graph
Global Resources Fund
Average Annual Performance For the Periods Ended December 31, 2011
| | | One Year | | Five Year | | Ten Year | | Since Inception
(Institutional
Class) | |
Global Resources Fund -
Investor Class | | | (18.69 | )% | | | 0.01 | % | | | 18.75 | % | | | n/a | | |
Global Resources Fund -
Institutional Class (Inception 3/1/10) | | | (18.23 | )% | | | n/a | | | | n/a | | | | 7.03 | % | |
| S&P 500 Index | | | 2.11 | % | | | (0.25 | )% | | | 2.92 | % | | | 8.94 | % | |
Morgan Stanley Commodity Related
Equity Index | | | (10.50 | )% | | | 8.24 | % | | | 14.80 | % | | | 5.87 | % | |
Performance data quoted above is historical. Past performance is no guarantee of future results. Current performance may be higher or lower than the performance data quoted. The principal value and investment return of an investment will fluctuate so that an investor's shares, when redeemed, may be worth more or less than their original cost. The graph and table do not reflect the deduction of taxes that a shareholder would pay on fund distributions or the redemption of fund shares.
Pursuant to a voluntary arrangement, the Adviser has agreed to limit total fund operating expenses (exclusive of any acquired fund fees and expenses, performance fees, taxes, brokerage commissions and interest) to not exceed 1.90% for the Investor Class. Also pursuant to a voluntary agreement, the Adviser has agreed to waive all class specific expenses of the Institutional Class. The Adviser can modify or terminate these arrangements at any time, which may lower the fund's yield or return.
See Definitions for Management Teams' Perspectives for index definitions.
Please visit our website at www.usfunds.com for updated performance information for different time periods.
37
Global Resources Fund
The Year In Review - Economic And Political Issues That Affected The Fund
After strong gains early in the year, the global economy and equity markets came under pressure in the second half of 2011. Risk aversion gained popularity through the third and fourth quarters as the possibility of a sovereign debt default in Europe increased. Fear of a replay of the post-Lehman Brothers bankruptcy spooked investors and stock markets sold off rapidly into the first week of October. However, markets quickly rebounded as a series of temporary funding schemes in Europe was proposed. The S&P 500 Index gained 15 percent from its October low and finished the year with just a modest gain. Additionally, a series of data points indicating a deceleration in China's economy weighed on emerging market stocks and commodity prices. The MSCI Emerging Markets Net Total Return Index fell 18.42 percent in 2011, and the S&P GSCI Total Return Index declined 1.18 percent.
Given the global economic headwinds described above, as well as heightened investor risk aversion, the fund increased its portfolio weighting in large capitalization companies at the expense of smaller capitalization companies through the second and third quarters as a defensive measure. The fund also maintained a relatively balanced weighting between the energy and basic materials sectors in the portfolio.
Investment Highlights
Overview
For the year ended December 31, 2011, the Investor Class of the Global Resources Fund declined 18.69 percent and the Institutional Class declined 18.23 percent, underperforming the fund's benchmark, the Morgan Stanley Commodity Related Equity Index (CRX), which declined 10.50 percent.
Because the fund is actively managed and holding period is generally not a consideration in investment decisions, the portfolio turnover rate may fluctuate from year to year as the fund adjusts its portfolio composition. The fund's annual portfolio turnover was, and is expected to continue to be, more than 100 percent.
Strengths
• Gold prices surged to a nominal record high price of over $1,900 per ounce in September 2011, which provided a catalyst for larger capitalization gold mining stocks. The fund benefited from its holdings of Newmont Mining Corp.(1) and Barrick Gold Corp.(1)
38
Global Resources Fund
• In the first three quarters of 2011, the U.S. energy refining industry benefited from rising export opportunities of refined products. In addition, wide discounts of West Texas Intermediate crude oil relative to international benchmarks provided a profit boost to certain companies with the right geographic footprint. Fund holdings in this sector such as Holly Corp.,(1) Frontier Oil Corp.(1) and Tesoro Corp.(1) all meaningfully contributed to the fund's return in 2011.
• Merger and acquisition activity in the natural resources sector was robust in 2011, and the fund benefited from several transactions including the Walter Energy Inc.(2) takeover of Western Coal Corp.,(1) the merger of refiners Holly Corp.(1) and Frontier Oil Corp.,(1) the acquisition of Consolidated Thompson Iron Mines Ltd.(1) by Cliffs Natural Resources, Inc.(3) and Stillwater Mining Co.'s(1) takeover of junior copper explorer Peregrine Metals Ltd.(1)
Weaknesses
• After a strong performance in 2010, large capitalization metals and mining shares drifted lower through 2011 on concerns of an economic slowdown due to the financial crisis in Europe and a self-induced slowdown in China. Bellwether stocks such as BHP Billiton Ltd.,(4) Alcoa, Inc.(1) and United States Steel Corp.(1) underperformed the benchmark in 2011.
• Investor risk aversion undermined performance of junior exploration stocks through 2011. The S&P/TSX Venture Composite Index declined 35.11 percent in 2011, nearly 2.5 percent under the CRX Index. The portfolio holds meaningful exposure of junior exploration stocks, and this overweighting created underperformance compared to the benchmark.
• Emerging market equities underperformed the S&P 500 in 2011 as investors eliminated risk from their portfolios and sought liquidity. This resulted in negative contribution to the fund from international oil exploration companies such as Niko Resources Ltd.,(1) Pacific Rubiales Energy Corp.,(5) PetroMagdalena Energy Corp.(6) and ShaMaran Petroleum Corp.,(7) which all underperformed the benchmark.
• U.S. natural gas prices fell to multi-year lows by the end of 2011, which negatively impacted shares of companies that produce natural gas including Apache Corp.,(1) Devon Energy Corp.(1) and Nabors Industries Ltd.(1)
Current Outlook
Opportunities
• Copper looks relatively attractive versus most other base metals as the refined copper industry is expected to remain in deficit for another
39
Global Resources Fund
consecutive year in 2012. Demand growth expectations have been tempered for 2012, but bringing new capacity on has been a challenge to the industry in recent years. Usage of copper stockpiles in China, the world's largest copper consumer, has whittled down inventories to low levels, and the global stocks-to-use ratio remains tight at roughly two weeks. Any unanticipated jump in demand in 2012 could further tighten the market quickly and push prices higher. We remain bullish on copper miners that can fund growth projects from cash flow and have solid balance sheets.
• With the rapid development of North American oil and gas shale basins such as the Marcellus in Pennsylvania, the Eagle Ford in Texas and the Bakken in North Dakota, infrastructure constraints are being alleviated with new investment in assets to gather, process and transport growing oil and gas volumes. We think that certain master limited partnerships (MLPs) that have the right type of assets in the right geographic locations will allow investors to reap the benefits of the prolific development of shale plays in the U.S. and Canada.
• The agricultural and fertilizer sector also looks promising. The emerging middle class continues to consume more grains, principally through the production of more meat. While we have seen a surge in the production of grains, no additional farmland has been created. Therefore, one of the key ways we're seeing increased yields out of crop lands is through the increased application of fertilizers. This has provided a boost in demand for nutrients such as potash, nitrogen and phosphate. The stock prices of fertilizer companies slumped in the second half of 2011 as expectations of volume growth were trimmed. Farming economics remain very healthy given historically high grain prices, and we think earnings estimates will begin to move higher in 2012, driving the stocks higher as well.
Threats
• Further deterioration of the European debt crisis could result in a significant decline in global economic activity.
• A potential "hard landing" in China concerning economic growth could negatively impact incremental demand for many commodities. These risks include a chronic power shortage, auto sales deceleration, weak manufacturing sector data, property market corrections and monetary tightening.
(1)The fund did not hold this security at 12/31/11.
(2)This security comprised 2.05% of the total net assets of the fund as of 12/31/11.
(3)This security comprised 2.00% of the total net assets of the fund as of 12/31/11.
(4)This security comprised 1.99% of the total net assets of the fund as of 12/31/11.
(5)This security comprised 0.15% of the total net assets of the fund as of 12/31/11.
(6)This security comprised 1.93% of the total net assets of the fund as of 12/31/11.
(7)This security comprised 0.35% of the total net assets of the fund as of 12/31/11.
40
Global Resources Fund
Top 10 Holdings Based on Net Assets
(excluding repurchase agreement) December 31, 2011
Walter Energy, Inc.
Coal | | | 2.05 | % | |
Viterra, Inc.
Transportation - Services | | | 2.04 | % | |
Labrador Iron Ore Royalty Corp.
Metal - Iron | | | 2.02 | % | |
Plains All American Pipeline L.P.
Pipelines | | | 2.02 | % | |
First Majestic Silver Corp.
Silver Mining | | | 2.02 | % | |
First Quantum Minerals Ltd.
Metal - Copper | | | 2.01 | % | |
Cenovus Energy, Inc.
Oil Companies - Integrated | | | 2.01 | % | |
Kinder Morgan, Inc.
Pipelines | | | 2.01 | % | |
Imperial Oil Ltd.
Oil Companies - Integrated | | | 2.01 | % | |
Cliffs Natural Resources, Inc.
Metal - Iron | | | 2.00 | % | |
| TOTAL TOP TEN HOLDINGS | | | 20.19 | % | |
41
Global Resources Fund
Portfolio Allocation by Industry Sector*
Based on Total Investments December 31, 2011

| Energy: | |
| Oil & Gas Exploration & Production | | | 18.7 | % | | | |
| Oil & Gas Equipment & Services | | | 11.5 | % | | | |
Oil & Gas - Integrated (includes Refining and
Marketing) | | | 5.9 | % | | | |
| Other Energy | | | 2.3 | % | | | |
| Total Energy | | | | | 38.4 | % | |
| Basic Materials: | |
Precious Metals (includes Gold/Silver Mining and
Platinum) | | | 13.7 | % | | | |
| General Basic Materials | | | 25.2 | % | | | |
| Metals & Mining (includes Copper and Coal) | | | 15.8 | % | | | |
| Total Basic Materials | | | | | 54.7 | % | |
| Other Sectors | | | | | 2.2 | % | |
| Repurchase Agreement | | | | | 4.7 | % | |
| | | | 100.0 | % | |
* Summary information above may differ from the portfolio schedule included in the financial statements due to the use of different classifications of securities for presentation purposes.
42
Precious Metals and Minerals Funds
Management Team's Perspective
Introduction
The World Precious Minerals Fund (UNWPX and UNWIX) and the Gold and Precious Metals Fund (USERX) pursue an objective of long-term capital growth through investments in gold, precious metals and minerals companies. The Gold and Precious Metals Fund focuses on the equity securities of established gold and precious metals companies and pursues current income as a secondary objective. The World Precious Minerals Fund focuses on equity securities of companies principally engaged in the exploration, mining and processing of precious minerals such as gold, silver, platinum and diamonds. Although this fund has the latitude to invest in a broad range of precious minerals, it currently remains focused on the gold sector.
Performance Graphs
World Precious Minerals Fund
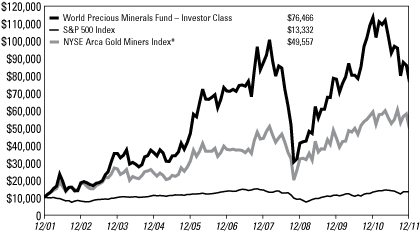
Average Annual Performance For the Periods Ended December 31, 2011
| | | One Year | | Five Year | | Ten Year | | Since Inception
(Institutional
Class) | |
World Precious Minerals Fund -
Investor Class | | | (32.58 | )% | | | 1.46 | % | | | 22.55 | % | | | n/a | | |
World Precious Minerals Fund -
Institutional Class (Inception 3/1/10) | | | (32.28 | )% | | | n/a | | | | n/a | | | | (0.35 | )% | |
| S&P 500 Index | | | 2.11 | % | | | (0.25 | )% | | | 2.92 | % | | | 8.94 | % | |
| NYSE Arca Gold Miners Index* | | | (16.21 | )% | | | 5.67 | % | | | 17.35 | % | | | 8.38 | % | |
* These are not total returns. These returns reflect simple appreciation only and do not reflect dividend reinvestment.
Performance data quoted above is historical. Past performance is no guarantee of future results. Current performance may be higher or lower than the performance data quoted. The principal value and investment return of an investment will fluctuate so that an investor's shares, when redeemed, may be worth more or less than their original cost. The graph and table do not reflect the deduction of taxes that a shareholder would pay on fund distributions or the redemption of fund shares.
Pursuant to a voluntary arrangement, the Adviser has agreed to limit total fund operating expenses (exclusive of any acquired fund fees and expenses, performance fees, taxes, brokerage commissions and interest) to not exceed 1.90% for the Investor Class. Also pursuant to a voluntary agreement, the Adviser has agreed to waive all class specific expenses of the Institutional Class. The Adviser can modify or terminate these arrangements at any time, which may lower the fund's yield or return.
See Definitions for Management Teams' Perspectives for index definitions.
Please visit our website at www.usfunds.com for updated performance information for different time periods.
43
Precious Metals and Minerals Funds
Gold and Precious Metals Fund
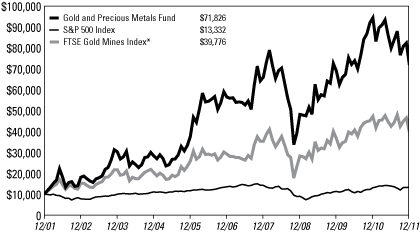
Average Annual Performance For the Years Ended
December 31, 2011
| | | One Year | | Five Year | | Ten Year | |
| Gold and Precious Metals Fund | | | (23.97 | )% | | | 4.90 | % | | | 21.78 | % | |
| S&P 500 Index | | | 2.11 | % | | | (0.25 | )% | | | 2.92 | % | |
| FTSE Gold Mines Index* | | | (15.88 | )% | | | 6.41 | % | | | 14.80 | % | |
* These are not total returns. These returns reflect simple appreciation only and do not reflect dividend reinvestment.
Performance data quoted above is historical. Past performance is no guarantee of future results. Current performance may be higher or lower than the performance data quoted. The principal value and investment return of an investment will fluctuate so that an investor's shares, when redeemed, may be worth more or less than their original cost. The graph and table do not reflect the deduction of taxes that a shareholder would pay on fund distributions or the redemption of fund shares.
Pursuant to a voluntary arrangement, the Adviser has agreed to limit total fund operating expenses (exclusive of any acquired fund fees and expenses, performance fees, taxes, brokerage commissions and interest) to not exceed 1.90%. The Adviser can modify or terminate this arrangement at any time, which may lower the fund's yield or return.
See Definitions for Management Teams' Perspectives for index definitions.
Please visit our website at www.usfunds.com for updated performance information for different time periods.
The Year in Review - Economic And Political Issues That Affected The Funds
One of 2011's biggest developments was the apparent realization by investors around the world that gold is money. A survey of 80 central bank reserve managers predicted that the most significant change in their
44
Precious Metals and Minerals Funds
reserves over the next 10 years would be the addition of more gold. Furthermore, the respondents forecasted that gold would be the best performing asset class in the upcoming year, citing sovereign debt defaults as the principal risk to the global economic landscape. In addition to boosting overall performance, gold can also lower the volatility of a currency portfolio, according to a study completed earlier in the year by Bank of America Merrill-Lynch. This has significant implications for central bankers around the world that have been in the process of selling off their gold reserves for decades. However, for the first time in 20 years, central bankers became net buyers of gold, a historic shift in the relative attractiveness of gold as an asset.
Gold is gradually becoming recognized as a necessary investment for those with wealth to conserve. Net central bank purchases are estimated to have totaled 430 tons in 2011, more than a five-fold increase from 2010 levels and the highest recorded level since 1964, according to Gold Fields Mineral Services. No longer is the U.S. dollar the de facto currency for a country's reserve base. Mexico beefed up its gold reserves during the first quarter of 2011 by buying over $4 billion in gold bullion, the third-largest off-market purchase of gold by any country over the past decade. The purchase took Mexico's reserves from just 6.84 tons at the end of January to 100.15 tons by the end of March.
It wasn't only central banks that were interested in gold. India's gold and silver imports rose 222 percent on a year-over-year basis between April and May 2011. India's gold imports were a staggering $9 billion, up 500 percent on a year-over-year basis during the month of May alone. To put this into perspective, the annual average of gold imports by India is $22 billion and May's imports alone comprised 40 percent of that average.
During the first two months of 2011, China imported more gold than it did in all of 2010. At this pace, Chinese consumers could buy half of the new mine supply produced annually. Looking ahead, overall Chinese gold demand could rise over 22 percent in the next three years and sharply outpace domestic production, according to the head of China National Gold Group Corp., the country's largest state-owned gold miner. This is a signal that China's gold imports will need to increase dramatically. China's gold production should reach 400 tons by 2014, a gain of nearly 19 percent from 2010, but consumption is set to grow to 700 tons. The China Gold Association indicated that China's gold production is expected to rise by more than 10 percent in 2011 from the previous year and expects world gold prices to continue their climb in the second half of the year. Despite the price of gold having quadrupled in the past ten years, the gold industry
45
Precious Metals and Minerals Funds
struggles to sustain new mine production of bullion at the same level as 2001.
While the world's commodity market is generally priced in U.S. dollars, Hong Kong's Chinese Gold & Silver Exchange Society, a century-old bullion trading bourse, announced plans to start trading gold quoted in yuan, China's currency. This subtle change has big implications, as the plan is to expand the role of the yuan in global trade. China is working to reduce its dependence on the dollar as its functional foreign exchange currency. As 2011 came to a close, China and Japan, the world's second- and third-largest economies, announced plans to start direct trade of yuan and yen in order to bypass the U.S. dollar in the foreign exchange market. Japan also noted it intends to buy Chinese bonds next year. In addition, China has also initiated currency swap agreements with Thailand in the hopes of promoting a free trade zone in Asia, which uses the yuan as its base currency. Some oil-producing nations such as Nigeria are also planning to buy yuan-denominated assets. While the global price of oil is currently set in dollars, it isn't unthinkable that the world's largest energy consumer may push to have oil priced in yuan. British Petroleum forecasts China is set to become the world's top oil importer by 2018.
In contrast, the United States Mint reported slower sales of U.S. gold and silver bullion coins during the fourth quarter as precious metal prices fell from their highs. This could be a signal that U.S. investor interest in physical metal purchases may be waning. Seasonally slow jewelry demand in India, the world's largest gold consumer, and a ban on all non-official gold trading exchanges by the People's Bank of China (PBOC) contributed to weaker demand. The PBOC ordered the closure of all gold trading platforms and services outside of the Shanghai Gold Exchange and Shanghai Futures Exchange. In India, the Bombay Bullion Association also said that December's gold imports will likely stand 50 percent below December 2010 levels as the country's currency weakened and gold prices soared in rupee terms.
The second half of 2011 was reminiscent of the second half of 2008, when the credit crisis shocked the world. However, this time investors have had ample time to assess the situation. The Citi Macro Risk Index – which encompasses emerging market sovereign spreads, U.S. credit spreads, U.S. swap spreads and implied foreign exchange, equity and swap rate volatility – showed risk aversion accelerated in August. The index, which ranges from 0 to 1, jumped to 0.98 during the second week of August and remained above 0.90 until the middle of September. Prior to this, the index had only gone above 0.95 for a total of 20 days during the previous 10 years.
46
Precious Metals and Minerals Funds
One result of this volatility was that the share prices of many gold companies traded at depressed levels. This made the fourth quarter of 2011 an opportune time for merger and acquisition (M&A) activity. A number of transactions took place during the fourth quarter: Agnico-Eagle Mines Ltd.(1) acquired Grayd Resource Corp.(2) for a 41 percent premium to the company's share price at the time; B2Gold Corp.(2) acquired Auryx Gold Corp.(2) for a 92 percent premium; New Gold, Inc.(3) bought Silver Quest Resources Ltd.(2) for a 27 percent premium; IAMGOLD Corp.(4) announced that it would spend around $23 million buying minority stakes in three Colombian-focused exploration companies: Bellhaven Copper & Gold Inc.,(2) Tolima Gold Corp.(5) and Colombia Crest Gold Corp.;(2) AngloGold Ashanti Ltd.(6) took a 19.9 percent stake in London-listed Mariana Resources Ltd.(7) through a private placement at a 41 percent premium; Eldorado Gold Corp.(8) announced it would acquire European Goldfields Ltd.(2) for a friendly $2.5 billion (Canadian) cash-and-share plan; and Luxor Capital Group,(2) a major hedge fund, said it would buy Crocodile Gold Corp.(2) for a 60 percent premium over the previous day's close. In addition, China's Shangdong Gold(2) allegedly made a cash offer to purchase Jaguar Mining, Inc.(2) for $785 million, but the deal has not yet materialized. This increased M&A activity could boost investor interest in the sector and lift equity prices even for companies not directly involved in a deal.
Investment Highlights
For the year ended December 31, 2011, the World Precious Minerals Fund Investor Class declined 32.58 percent and the Institutional Class lost 32.28 percent. The fund's benchmark, the NYSE Arca Gold Miners Index, decreased 15.48 percent on a total return basis. The Gold and Precious Metals Fund fell 23.97 percent for the year ended December 31, 2011. The fund's benchmark, the FTSE Gold Mines Index, decreased 14.99 percent on a total return basis.
Spot gold finished the period at $1,563.70 per ounce, up $142.92, or 10.06 percent for the year. The S&P 500 Index posted a positive return of 2.11 percent, the U.S. Trade Weighted Dollar Index rose 1.46 percent and the yield on 90-day Treasury bill finished the year at 0.01 percent.
The underperformance of junior and mid-tiered names caused the funds to underperform their relative benchmarks. However, these lower-capitalization stocks have historically outperformed senior gold mining companies over longer time periods due to the natural inclination of the senior gold miners to acquire proven assets versus explore for new mining projects with capital-constrained budgets.
47
Precious Metals and Minerals Funds
In times of turmoil, investors tend to focus on the largest, most liquid assets. The price of gold broke through $1,900 per ounce in the first week of September due to heightened fear over the European debt crisis but plummeted more than $336 by year end as the margin requirements on gold futures trading were aggressively raised, which negatively impacted the funds' junior and mid-tiered stock holdings in relation to their benchmarks. These junior and mid-tier miners are particularly sensitive to turmoil in financial markets because they depend on funding for their projects. During this window, investors largely focused on buying the large and liquid companies which dominate the benchmarks. The largest five companies in the NYSE Arca Gold Miners Index and the FTSE Gold Mines Index, as measured by market capitalization, comprise 50 percent and 60 percent weightings for these indexes, respectively.
Because the funds are actively managed and holding period is generally not a consideration in investment decisions, the portfolio turnover rate may fluctuate from year to year as each fund adjusts its portfolio composition. The annual portfolio turnover for the Gold and Precious Minerals Fund was, and is expected to continue to be, more than 100 percent.
Strengths
• The biggest success in the World Precious Minerals Fund was our holding in PMI Gold Corp.,(9) which soared over 118 percent in October as the company released a resource update that grew the gold resource base by 250 percent. The takeover of Grayd Resource Corp.(2) by Agnico-Eagle Mines Ltd.(1) added to the World Precious Minerals Fund's performance. We took profits early in the year on First Majestic Silver Corp.,(10) adding to the performance of the Gold and Precious Metals Fund, before the Chicago Merchantile Exchange attacked the silver market with a half dozen margin hikes in a matter of just a week or so. Additionally, holding the gold and silver bullion exchange traded funds proved beneficial to both funds.
• Both funds benefited from their holdings in Yamana Gold, Inc.,(11) up 16 percent for the year. The company is focused on delivering on guidance with no stumbles. Operational improvements and exploration success led Richmont Mines, Inc.(12) to be one of the few gold companies to deliver triple-digit returns in 2011, up 111 percent for the year, which added to the performance of both funds.
• The Gold and Precious Metals Fund favored Goldcorp, Inc.(13) over Barrick Gold Corp.(14) and Newmont Mining Corp.,(15) which benefited the fund because Goldcorp outperformed. Newmont closed the performance gap relative to Goldcorp by the end of the year as it announced a dividend policy which would be linked to the gold price.
48
Precious Metals and Minerals Funds
While this gave Newmont a lift, management's plan for a gold-price-linked dividend implies the only value-added proposition the company could bring to the table was dependent upon higher gold prices versus operational improvements. As opposed to owning just the common shares of Newmont Mining Corp. and Barrick Gold Corp., which had negative returns for the year, the fund held bonds in both companies. These bond holdings returned 15 percent and 7 percent for the year, respectively, and far outpaced the dividend yields for the common stock.
Weaknesses
• The worst performer for both funds was Gran Colombia Gold Corp.,(16) which fell 77 percent and trimmed over 400 basis points from both funds. The company merged with Medoro Resources Ltd.(2) over the past year, and the combined company should emerge as the largest publicly-traded gold producer in Colombia. Gold production will come from the company's high-grade gold mine in Segovia and a large future development project at Marmato. It is believed Marmato contains 12.4 million ounces of gold and 75 million ounces of silver. Colombia is a country that is open for business by western standards but neighboring countries like Ecuador, Peru and Venezuela have controversial social agendas which have overshadowed investor perceptions of the region. A tremendous amount of wealth has been created in the Colombian oil and coal sectors, and the country is encouraging the gold mining sector to develop its rich asset base as well. However, this requires risk capital, which has been in short supply in 2011.
• Our second-worst performer was Kinross Gold Corp.(17) which cost the World Precious Minerals Fund over 200 basis points of performance and the Gold and Precious Metals Fund over 300 basis points of performance. Following the acquisition of Red Back Mining, Inc.(2) in late 2010, which clearly set Kinross on a growth path, its progress in proving up additional resources and crystallizing the timeline for development and production has been slower than expected. Kinross' performance has also been hurt by the Ecuadorian government, which effectively put a halt to any progress being made on the Fruta del Norte deposit within the country. Fruta del Norta is arguably one of the best new gold discoveries over the last decade but the government's efforts to extract additional revenue out of the proposed mine renders the development unattractive under the currently proposed terms.
• Agnico-Eagle Mines Ltd.(1) was our third-worst performer, costing the World Precious Minerals Fund over 200 basis points and the Gold and Precious Metals Fund over 300 basis points in performance. Agnico-Eagle suffered a fire at its Meadowbank Mine in March, which set back the pace of work at the operation. This setback caused the company to scale back
49
Precious Metals and Minerals Funds
production expectations, which increases costs. However, the real blow came in October when Agnico-Eagle abruptly announced it was halting all production at Goldex in Quebec and writing off the asset due to unstable ground conditions.
Current Outlook
Opportunities
• Despite tough gold markets, we continue to see strength from Asia. Recent government statistics showed that Chinese gold imports were up in October and November. The Chinese New Year in February 2012, a time when traditional gold buying for gift giving occurs, also caused Chinese gold imports to surge. Additionally, we've seen political support as the head of research at China's Central Bank was quoted as saying that the country should buy gold because it is the only safe place for risk adverse investors when other assets are losing value. Japanese Finance Minister Jun Azumi also announced that he will be rewarding investors who buy reconstruction bonds with half an ounce of gold, an added incentive that could boost the return by nearly six times. India also is reported to be considering freeing gold doré imports, which up until this point, has only been undertaken by India's central bank.
• Maintaining the rising dividend trend among gold companies, Goldcorp, Inc.,(13) IAMGold Corp.,(4) Barrick Gold Corp.(14) and Newmont Mining Corp.(15) announced increases in their dividends in the fourth quarter of 2011. Following Newmont's lead, Eldorado Gold Corp.(8) also announced an enhanced dividend policy that links its payout to the gold price and the number of ounces sold. It is anticipated the company's next payout will be 67 percent higher. With companies having higher-than-usual cash levels, dividend payments are becoming more and more common and should raise the appeal of gold mining companies for investors seeking safety and income from their investments.
• We would expect there to be renewed interest in picking up many of the beaten down gold stocks with the start of the new year as the selloff was exacerbated by tax loss selling in both the U.S. and Canada during the fourth quarter of 2011. Seasonally, the "January Effect" should be in play and gold prices typically see seasonal strength going up through the April/May window. While world gold-mine production is growing, it will not be able to keep pace with the expected growth in global gold demand. Furthermore, the underperformance of junior miners has left many companies with valuations at levels similar to 2008. This means there is room for a strong year ahead in mergers and acquisitions activity and for share prices to reverse in a similar manner as 2009, one of the best years to own gold stocks. Donald Coxe, a noted market historian and global
50
Precious Metals and Minerals Funds
portfolio strategist, recommends that investors maintain a heavy weighting in precious metals, particularly through gold mining companies. He pointed out that the gold miners are the cheapest relative to bullion that the market has ever seen.
Threats
• Resource nationalism remains the number one concern in the mining space. As many governments struggle with budget deficits, the continuing boom in commodity prices has made the mining and metals sector an easy target for potentially raising government revenue. Zimbabwe, India, Zambia, Eritrea, Ghana, Argentina, Australia, Tanzania, Canada and South Africa were all in the news regarding policy changes on mining royalties, profit sharing and taxes. Country and political risk continued to affect mining companies' day-to-day business.
• The colossal failure of socialism in Europe, whereby countries borrow to finance generous government payrolls and retirement programs, is still falling on deaf ears. In the U.S., Senator Harry Reid noted that it is more important to protect government jobs versus private sector jobs. This is ironic considering that the U.S. Bureau of Labor Statistics shows government workers have the lowest unemployment rate of any industry or class recorded at 4.7 percent, while the national unemployment rate is running at 8.5 percent. A weakened global economy may make it a tough market for equity investors.
• A recent study by the Federal Reserve Bank of San Francisco titled "Boomer Retirement: Headwinds for the U.S. Equity Markets?" outlines a less positive view on equity returns in the broader market. Essentially, the study notes historic data suggesting a strong link between age distribution and stock market performance. A key demographic trend is the aging baby boom generation, which is likely to shift from buying equities to selling equities to fund their retirement. The Fed noted that its statistical models on this relationship suggest this shift in asset allocation could suppress equity valuations of the general market for the next two decades as investors move to income-generating strategies. A push for yield-generating products should keep interest rates low, however, which is historically positive for firmer gold prices.
(1) This security comprised 3.56% of the total net assets of the World Precious Minerals Fund and 4.09% of the Gold and Precious Metals Fund as of 12/31/11.
(2) Neither fund held this security as of 12/31/11.
(3) This security comprised 1.12% of the total net assets of the World Precious Minerals Fund and 1.94% of the Gold and Precious Metals Fund as of 12/31/11.
(4) This security comprised 1.10% of the total net assets of the World Precious Minerals Fund and 3.01% of the Gold and Precious Metals Fund as of 12/31/11.
51
Precious Metals and Minerals Funds
(5) This security comprised 0.48% of the total net assets of the World Precious Minerals Fund and 0.00% of the Gold and Precious Metals Fund as of 12/31/11.
(6) This security comprised 0.73% of the total net assets of the World Precious Minerals Fund and 2.94% of the Gold and Precious Metals Fund as of 12/31/11.
(7) This security comprised 0.15% of the total net assets of the World Precious Minerals Fund and 0.00% of the Gold and Precious Metals Fund as of 12/31/11.
(8) This security comprised 1.25% of the total net assets of the World Precious Minerals Fund and 1.41% of the Gold and Precious Metals Fund as of 12/31/11.
(9) This security comprised 2.64% of the total net assets of the World Precious Minerals Fund and 0.00% of the Gold and Precious Metals Fund as of 12/31/11.
(10)This security comprised 0.56% of the total net assets of the World Precious Minerals Fund and 0.56% of the Gold and Precious Metals Fund as of 12/31/11.
(11)This security comprised 2.68% of the total net assets of the World Precious Minerals Fund and 3.77% of the Gold and Precious Metals Fund as of 12/31/11.
(12)This security comprised 1.92% of the total net assets of the World Precious Minerals Fund and 2.06% of the Gold and Precious Metals Fund as of 12/31/11.
(13)This security comprised 1.01% of the total net assets of the World Precious Minerals Fund and 2.27% of the Gold and Precious Metals Fund as of 12/31/11.
(14)This security comprised 0.82% of the total net assets of the World Precious Minerals Fund and 3.84% of the Gold and Precious Metals Fund as of 12/31/11.
(15)This security comprised 0.00% of the total net assets of the World Precious Minerals Fund and 2.14% of the Gold and Precious Metals Fund as of 12/31/11.
(16)This security comprised 4.57% of the total net assets of the World Precious Minerals Fund and 4.38% of the Gold and Precious Metals Fund as of 12/31/11.
(17)This security comprised 1.48% of the total net assets of the World Precious Minerals Fund and 1.73% of the Gold and Precious Metals Fund as of 12/31/11.
52
Precious Metals and Minerals Funds
World Precious Minerals Fund
Top 10 Holdings Based on Net Assets
(excluding repurchase agreement) December 31, 2011
Randgold Resources Ltd.
Gold Mining | | | 4.89 | % | |
Gran Colombia Gold Corp.
Gold Mining | | | 4.57 | % | |
Agnico-Eagle Mines Ltd.
Gold Mining | | | 3.56 | % | |
Coeur d'Alene Mines Corp.
Precious Metals | | | 3.42 | % | |
Dundee Precious Metals, Inc.
Gold Mining | | | 3.29 | % | |
Harmony Gold Mining Co., Ltd.
Gold Mining | | | 2.78 | % | |
Yamana Gold, Inc.
Gold Mining | | | 2.68 | % | |
PMI Gold Corp.
Gold Mining | | | 2.64 | % | |
Continental Gold Ltd.
Gold Mining | | | 2.43 | % | |
Silver Wheaton Corp.
Silver Mining | | | 1.98 | % | |
| TOTAL TOP TEN HOLDINGS | | | 32.24 | % | |
Portfolio Allocation by Industry*
Based on Total Investments December 31, 2011
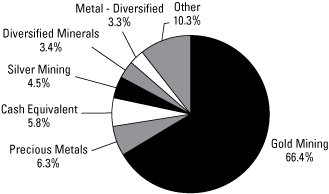
* Summary information above may differ from the portfolio schedule included in the financial statements due to the use of different classifications of securities for presentation purposes.
53
Precious Metals and Minerals Funds
Gold and Precious Metals Fund
Top 10 Holdings Based on Net Assets
(excluding repurchase agreement) December 31, 2011
Dundee Precious Metals, Inc.
Gold Mining | | | 6.81 | % | |
Randgold Resources Ltd.
Gold Mining | | | 5.23 | % | |
Harmony Gold Mining Co., Ltd.
Gold Mining | | | 5.16 | % | |
Franco-Nevada Corp.
Gold/Mineral Royalty Companies | | | 5.00 | % | |
Gran Colombia Gold Corp.
Gold Mining | | | 4.38 | % | |
Coeur d'Alene Mines Corp.
Precious Metals | | | 4.30 | % | |
Agnico-Eagle Mines Ltd.
Gold Mining | | | 4.09 | % | |
Barrick Gold Corp.
Gold Mining | | | 3.84 | % | |
Yamana Gold, Inc.
Gold Mining | | | 3.77 | % | |
Royal Gold, Inc.
Gold Mining | | | 3.46 | % | |
| TOTAL TOP TEN HOLDINGS | | | 46.04 | % | |
Portfolio Allocation by Industry*
Based on Total Investments December 31, 2011

* Summary information above may differ from the portfolio schedule included in the financial statements due to the use of different classifications of securities for presentation purposes.
54
Eastern European Fund
Management Team's Perspective
Introduction
The investment objective of the Eastern European Fund (EUROX) is to achieve long-term capital growth by investing in a non-diversified portfolio of equity securities of companies located in the emerging markets of Eastern Europe.(1)
Performance Graph
Eastern European Fund
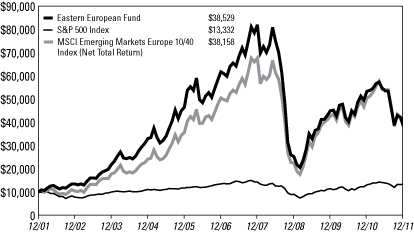
Average Annual Performance For the Years Ended
December 31, 2011
| | | One Year | | Five Year | | Ten Year | |
| Eastern European Fund | | | (27.94 | )% | | | (9.04 | )% | | | 14.43 | % | |
| S&P 500 Index | | | 2.11 | % | | | (0.25 | )% | | | 2.92 | % | |
MSCI Emerging Markets Europe
10/40 Index (Net Total Return) | | | (24.46 | )% | | | (5.49 | )% | | | 14.32 | % | |
Performance data quoted above is historical. Past performance is no guarantee of future results. Current performance may be higher or lower than the performance data quoted. The principal value and investment return of an investment will fluctuate so that an investor's shares, when redeemed, may be worth more or less than their original cost. The graph and table do not reflect the deduction of taxes that a shareholder would pay on fund distributions or the redemption of fund shares.
Pursuant to a voluntary arrangement, the Adviser has agreed to limit total fund operating expenses (exclusive of any acquired fund fees and expenses, performance fees, taxes, brokerage commissions and interest) to not exceed 2.85%. The Adviser can modify or terminate this arrangement at any time, which may lower the fund's yield or return.
See Definitions for Management Teams' Perspectives for index definitions.
Please visit our website at www.usfunds.com for updated performance information for different time periods.
55
Eastern European Fund
The Year In Review - Economic And Political Issues That Affected The Fund
Geopolitical events and several natural disasters caused the price of oil to rise sharply at the beginning of 2011. As an energy exporter of crude oil and natural gas, Russia is one of the few large economies in the world that directly benefits from higher energy prices. At the same time, Russia is relatively safe from the type of political uprising seen in the Middle East and North Africa. Russia is also the world's top exporter of natural gas, and Italy turned to Russia for gas supplies after the uprising in Libya shut down 11 billion cubic-meters of natural gas flow.
While higher energy prices may slow consumer spending in the U.S., Western Europe and certain emerging market countries, it has the opposite effect for the Russian economy. Russia is the world's largest oil producer and it's estimated that government revenue rises $20 billion for every $10 increase in the average annual price of oil. Since Russia is not a member of OPEC, it is not bound by production caps and can increase production as it sees fit while prices are at elevated levels. With increased cash flow from its natural gas and crude oil exports, the Russian government has the much-needed capital to invest in the country's aging infrastructure and to support domestic consumption.
The Turkish economy surged 11 percent in the first quarter, outpacing China. Growth remained domestically driven, with private consumption expanding 12.1 percent and gross fixed capital formation growing 36.6 percent. Turkey's hot economy stood in contrast to its neighbors in the European Union. Signs of overheating led the Turkish Central Bank to raise reserve requirements for banks in an effort to stem loan growth, which reached more than 35 percent in the first quarter. As a result, financials, which comprise more than half of the Istanbul Stock Exchange National 100 Index, underwent a significant correction.
Similarly, early in the year, Central European countries' sails caught the wind of economic activity in Germany. Industrial production in the Czech Republic and Hungary rose by double-digit percentages, boosted by strong sales from German carmakers. However, by May, the Purchasing Manager's Index (PMI) showed a slowdown in orders and stock performance reversed previous gains.
While the U.S. Federal Reserve was quick to turn on the money printing press when equity markets dropped in 2008, the European Central Bank (ECB) has been slow to respond to the eurozone crisis. European banks are facing long-term refinancing needs in 2012, but bond issuance by
56
Eastern European Fund
European banks plunged in the second half of 2011. These markets froze up in July and European banks had to turn to borrowing through short-term interbank markets.
With likely sources of funding insufficient to cover the size of the European bailout fund, the ECB had no choice but to follow in the footsteps of the Federal Reserve and expand its balance sheet. In December, the ECB instituted the Long Term Refinancing Operation (LTRO) to facilitate the rollover of long-term banking debt. Mario Draghi, the ECB's president, said the LTRO prevented a credit contraction that would have been far more serious.
Investment Highlights
Overview
The fund declined 27.94 percent for the year ended December 31, 2011, compared to a 24.46 percent decline for the benchmark MSCI Emerging Markets Europe 10/40 Index (Net Total Return).
Across the fund's peer universe, most funds were negatively affected in 2011 by the convergence between Russian-listed shares and London-listed global depository receipts (GDRs). Historically, local shares traded at a wide discount to GDRs due to a limit imposed on GDRs as a percentage of shares outstanding. In some cases, the discount was as wide as 25 to 35 percent. With the limit removed, local shares closed the pricing gap and lifted the MSCI Index, which is calculated using local shares.
Strengths
• Contagion concerns in the eurozone drove the financial sector to be one of the worst performing sectors in 2011. The fund carried an underweight allocation to this sector, which aided its performance relative to its benchmark.
• Stock selection within the industrial sector also contributed positively to the performance of the fund. Turkish airport operator TAV Havalimanlari Holding A.S.(2) was down 11.71 percent for the year but outperformed the benchmark and core benchmark holding, flagship airline Turk Hava Yollari Anonim Ortakligi (THY),(3) which was down 61.40 percent in 2011.
• Even though Turkey was one of the weakest among the emerging markets for the second half of the year, the fund's positioning within the country had a positive contribution to the performance relative to the benchmark. Going forward, we expect the overall performance of
57
Eastern European Fund
Turkish stocks to improve as the country has the highest secular growth potential in the region.
• The fund's significant underweighting in the utility sector positively contributed to performance relative to the benchmark. A populist move to cap tariff increases by the Russian government ahead of upcoming elections negatively impacted the sector.
• The fund's portfolio managers implemented a covered call writing strategy during the second half of the year as volatility increased and the market headed south. In addition, put options on Mechel Steel Group(4) and Turkcell Iletisim Hizmet A.S.(5) were sold to capture the height of market volatility as premium. This defensive strategy enhanced the fund's overall return.
Weaknesses
• Currencies were weaker across the Eastern European region. The Turkish lira depreciated 22.48 percent against the U.S. dollar. Similarly, the Hungarian forint declined 16.75 percent, the Polish zloty declined 16.31 percent, the Czech koruna declined 5.61 percent and the Russian ruble lost 5.24 percent.
• After mediocre performance in 2010, energy was the best-performing sector during the period. While our stock selection in the sector was robust, with core holdings TNK-BP Holding(6) and NovaTek OAO(7) both up for the year, underweighting in this sector relative to the benchmark hurt the fund.
• Basic materials underperformed despite healthy demand and a positive pricing environment. We expected higher prices and announced infrastructure spending to benefit vertically integrated steel companies in Russia, but the stock returns were disappointing, and Russian steel names underperformed the benchmark index and the sector.
• The Turkish equity market was one of the weakest performers among emerging markets. Signs of the economy overheating, such as its rising current account deficit, led the central bank to raise reserve requirements for the banks.
58
Eastern European Fund
Current Outlook
Opportunities
• Debt jitters in the eurozone could facilitate a banking consolidation process in Eastern Europe, giving healthier banks a larger market share. Some of the Western European banks directly affected by the eurozone debt crisis have already sold their Polish subsidiaries to preserve capital for their core domestic operations.
• Amid declining brownfield production in West Siberia and elsewhere in Russia, greenfield production is becoming ever more important. The next big hope for Russian oil is in East Siberia, with output set to account for 80 percent of growth and 15 percent of total overall production by 2018. Our focus remains on companies with resources in that area.
• Capital spending and investment in machinery and equipment has ramped up in Turkey in recent years. This is contrary to what has taken place in countries such as Brazil, Mexico, Russia and South Africa, which have failed to achieve higher investment ratios. This has resulted in a much better outlook for productivity gains in Turkey compared to many other developing nations.
• With the second phase of the LTRO program due in February, the ECB's balance sheet is expected to expand by 1 trillion euros, an amount almost identical to the U.S. Federal Reserve's $1.4 trillion balance sheet expansion from 2008 to 2009.
Threats
• Public sector wages in Poland have grown faster than those in the private sector since 2004. Higher wages, combined with better social benefits and stable employment, led many Poles to cast a wary eye toward privatization plans. However, powerful unions were recently able to block or delay IPO plans.
• Domestic demand for natural gas has remained flat since 2007, but natural gas sales for Russia's Gazprom OAO(8) have experienced a similar fall as Western Europe, dropping 19 billion cubic meters. The state giant is coming under increased pressure from independent gas producers, which are on track to double their production to 116 billion cubic meters by 2015.
59
Eastern European Fund
• A rate increase in Russia's new social contribution tax may have caused a spike in "informal" employment and wages. This could explain the country's acceleration in retail sales amid stagnant real wage and disposable income growth.
(1)The following countries are considered to be in the Eastern European region: Albania, Armenia, Azerbaijan, Belarus, Bulgaria, Croatia, Czech Republic, Estonia, FYR Macedonia, Georgia, Hungary, Latvia, Lithuania, Moldova, Poland, Romania, Russia, Slovakia, Slovenia, Turkey and Ukraine.
(2)This security comprised 1.63% of the fund's total net assets as of 12/31/11.
(3)The fund did not hold this security as of 12/31/11.
(4)This security comprised -0.11% of the fund's total net assets as of 12/31/11.
(5)This security comprised -0.01% of the fund's total net assets as of 12/31/11.
(6)This security comprised 6.61% of the fund's total net assets as of 12/31/11.
(7)This security comprised 7.82% of the fund's total net assets as of 12/31/11.
(8)This security comprised 9.32% of the fund's total net assets as of 12/31/11.
60
Eastern European Fund
Top 10 Holdings Based on Net Assets
(excluding repurchase agreement) December 31, 2011
Gazprom OAO
Oil Companies - Exploration & Production | | | 9.32 | % | |
NovaTek OAO
Oil Companies - Exploration & Production | | | 7.82 | % | |
Lukoil OAO
Oil Companies - Integrated | | | 7.36 | % | |
TNK-BP Holding
Oil Companies - Integrated | | | 6.61 | % | |
Rosneft Oil Co. OJSC
Oil Companies - Integrated | | | 6.35 | % | |
Sberbank of Russia
Commercial Banks - Non US | | | 5.72 | % | |
Uralkali OJSC
Agricultural Chemicals | | | 3.20 | % | |
Powszechny Zaklad Ubezpieczen S.A.
Property/Casualty Insurance | | | 2.88 | % | |
Surgutneftegas OJSC
Oil Companies - Integrated | | | 2.72 | % | |
X5 Retail Group N.V.
Food - Retail | | | 2.31 | % | |
| TOTAL TOP TEN HOLDINGS | | | 54.29 | % | |
Country Distribution*
Based on Total Investments December 31, 2011
(excluding repurchase agreement)
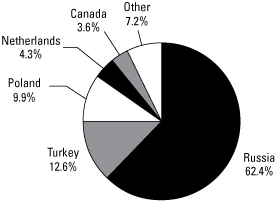
* Country distribution shown is based on domicile. The locale of company operations may be different.
61
Global Emerging Markets Fund
Management Team's Perspective
Introduction
The investment objective of the Global Emerging Markets Fund (GEMFX) is to achieve long-term capital growth by investing in a non-diversified portfolio of the equity securities of companies located in or with a significant business presence in emerging market countries.(1)
Performance Graph
Global Emerging Markets Fund

Average Annual Performance For the Periods Ended
December 31, 2011
| | | One Year | | Five Year | | Inception | |
Global Emerging Markets Fund
(Inception 2/24/05) | | | (25.63 | )% | | | (10.48 | )% | | | (0.95 | )% | |
| S&P 500 Index | | | 2.11 | % | | | (0.25 | )% | | | 3.06 | % | |
MSCI Emerging Markets Net Total
Return Index | | | (18.42 | )% | | | 2.40 | % | | | 9.53 | % | |
Performance data quoted above is historical. Past performance is no guarantee of future results. Current performance may be higher or lower than the performance data quoted. The principal value and investment return of an investment will fluctuate so that an investor's shares, when redeemed, may be worth more or less than their original cost. The graph and table do not reflect the deduction of taxes that a shareholder would pay on fund distributions or the redemption of fund shares.
Pursuant to a voluntary arrangement, the Adviser has agreed to limit total fund operating expenses (exclusive of any acquired fund fees and expenses, performance fees, taxes, brokerage commissions and interest) to not exceed 3.15%. The Adviser can modify or terminate this arrangement at any time, which may lower the fund's yield or return.
See Definitions for Management Teams' Perspectives for index definitions.
Please visit our website at www.usfunds.com for updated performance information for different time periods.
62
Global Emerging Markets Fund
The Year In Review - Economic And Political Issues That Affected The Fund
China continued its monetary tightening policy during the first six months of 2011 in an effort to control inflation at the expense of economic growth. The People's Bank of China (PBOC) raised the required reserve ratio (RRR) every month for the first six months and the RRR for major banks reached 21.5 percent. The PBOC also raised the country's interest rate three times during the year, 25 basis points each time, pushing the one-year deposit rate to 3.5 percent. After peaking in July at 6.5 percent, China's inflation rate fell each following month to rest at 4.1 percent at the end of the year, a 15-month low.
The Chinese economy was showing signs of a slowdown, due to the tightening measures throughout the year, and it will take time for the policy shift to take full effect. China's Purchasing Managers Index (PMI) declined throughout 2011, hitting 49 in November and confirming a contraction in the country's industrial activities. However, the Chinese government foresaw the economic slowdown and began fine-tuning its policies in October. As a result, December's PMI reading went back above 50, which indicates industrial expansion. China's industrial production growth followed a similar pattern as PMI, declining to a low of 12.4 percent in November before improving to 12.8 percent in December.
Southeast Asia was one of the few emerging regions to post positive gains in 2011 with Thailand, Malaysia, Indonesia and the Philippines posting gains. In addition, South Africa saw an increase. The majority of emerging markets decreased during 2011, led by Argentina, India, Turkey and Hungary all falling more than 20 percent. This was in sharp contrast to 2010 and 2009 when all emerging market countries experienced gains.
Inflation concerns declined over the year throughout Asia, but so did GDP growth rates for many of these countries. However, growth rates for these countries are still much higher than developed countries. With 6.5 percent GDP growth, Indonesia is one of very few countries to have steady GDP growth throughout the year. Indonesia's central bank cut the country's benchmark interest rate twice during the fourth quarter of 2011 in an effort to defend the country's economy from external turmoil such as the sovereign debt crisis in Europe.
63
Global Emerging Markets Fund
Investment Highlights
Overview
The fund declined 25.63 percent for the year ended December 31, 2011. This compares to an 18.42 percent negative return for the MSCI Emerging Markets Net Total Return Index, the fund's benchmark.
Strengths
• The fund's investments in Thailand positively contributed to performance, while investments in Brazil, China, Argentina, Chile, Peru and Turkey all outperformed the benchmark.
• A higher than normal cash position also had a positive effect on the fund's performance.
• The best-performing stock for the fund was Brazilian telecom operator Telefonica Brazil S.A.(2)
Weaknesses
• Investments in Russia, Taiwan, South Korea, India, Hong Kong, South Africa, Mexico and Poland negatively attributed to performance.
• The performance of Asian stocks was uneven and negatively impacted the fund's return. The biggest disappointment was Evergreen Marine Corp.,(2) a Taiwanese shipping company.
• The fund underweighted its exposure to South Korea in the first half of 2011. This adversely impacted performance as this market turned out to be among the best performers in the emerging markets universe.
Current Outlook
Opportunities
• China and Asian countries are at the beginning of an easing monetary cycle, which will be the primary driver for the stock markets within the region in 2012.
• During the year, Chinese leadership fine-tuned the country's economy for the medium term and embarked on recalibrating the economy away from fixed-asset formation and toward domestic consumption in the long term. Accordingly, the fund's portfolio was redesigned to capture this trend.
• Growth of per capita incomes around the world has created opportunities for protein producers, particularly in agriculturally rich countries such as
64
Global Emerging Markets Fund
Brazil and Australia. Demand for poultry and, to a lesser extent, pork and beef is likely to remain strong for years to come.
• For the first time in the country's history, China's urban population has surpassed rural population due to the country's rapid rate of urbanization. The country is expected to see 90 million people move to cities by 2015. This should be a positive demand driver for natural resources such as iron ore and copper, as those resources will be needed to construct the infrastructure necessary to meet the needs of this increased urban population. Chile's state-owned Corporación Nacional del Cobre de Chile,(2) the largest copper producer in the world, announced a record $16.3 billion in planned capital expenditures by 2015 as a result of strong global demand for copper.
• Capital spending and investment in machinery and equipment has ramped up in Turkey in recent years. This is contrary to what has taken place in countries such as Brazil, Mexico, Russia and South Africa, which have failed to achieve higher investment ratios. This has resulted in a much better outlook for productivity gains in Turkey compared to many other developing nations.
Threats
• Although China's government is fine-tuning the economy with easing money supply, it insists on continuing to curb growth in the country's housing sector. Sales transactions have slowed across China, but year-over-year prices only started to fall for the first time in November. We don't believe the government wants to see the housing market drag down the country's economy, but we think housing prices have to fall further or the European debt crisis would have to take a turn for the worse in order for the government to switch gears.
• It's possible China could see its GDP growth decline further in 2012 as demand for exports weakens due to the European recession.
• Although the sovereign debt crisis in Europe has been centered on Portugal, Ireland, Greece and Spain, the fiscal situation in Hungary remains a precarious one. A deterioration of conditions in Hungary would negatively impact sentiment for other countries in the region.
• Continued instability in the Middle East does not provide comfort for investors as numerous western companies have exposure to the region.
(1)Emerging market countries are those countries defined as such by the World Bank, the International Finance Corporation, the United Nations or the European Bank for Reconstruction and Development or included in the MSCI Emerging Markets Index.
(2)The fund did not hold this security as of 12/31/11.
65
Global Emerging Markets Fund
Top 10 Holdings Based on Net Assets
(excluding repurchase agreement) December 31, 2011
TNK-BP Holding
Oil Companies - Integrated | | | 2.89 | % | |
BR Malls Participacoes S.A.
Real Estate Management/Services | | | 2.36 | % | |
Bank of China Ltd.
Commercial Banks - Non US | | | 2.24 | % | |
Taiwan Glass Industrial Corp.
Building & Construction Products - Miscellaneous | | | 2.07 | % | |
Arcos Dorados Holdings, Inc.
Retail - Restaurants | | | 2.00 | % | |
Credicorp Ltd.
Commercial Banks - Non US | | | 2.00 | % | |
El Puerto de Liverpool SAB de CV
Retail - Major Department Store | | | 1.99 | % | |
CCR S.A.
Public Thoroughfares | | | 1.98 | % | |
Formosa Chemicals & Fibre Corp.
Petrochemicals | | | 1.92 | % | |
Vodacom Group Ltd.
Cellular Telecommunications | | | 1.88 | % | |
| TOTAL TOP TEN HOLDINGS | | | 21.33 | % | |
Country Distribution*
Based on Total Investments December 31, 2011
(excluding repurchase agreement)

* Country distribution shown is based on domicile. The locale of company operations may be different.
66
China Region Fund
Management Team's Perspective
Introduction
The China Region Fund (USCOX) seeks long-term growth of capital. The fund invests in both established and emerging companies registered and operating in the China region.(1)
Performance Graph
China Region Fund
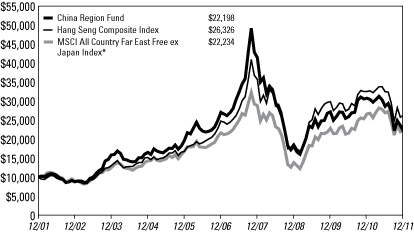
Average Annual Performance For the Years Ended
December 31, 2011
| | | One Year | | Five Year | | Ten Year | |
| China Region Fund | | | (28.09 | )% | | | (3.90 | )% | | | 8.30 | % | |
| Hang Seng Composite Index | | | (19.27 | )% | | | 1.20 | % | | | 10.16 | % | |
MSCI All Country Far East Free
ex Japan Index* | | | (16.78 | )% | | | 0.53 | % | | | 8.32 | % | |
* These are not total returns. These returns reflect simple appreciation only and do not reflect dividend reinvestment.
Performance data quoted above is historical. Past performance is no guarantee of future results. Current performance may be higher or lower than the performance data quoted. The principal value and investment return of an investment will fluctuate so that an investor's shares, when redeemed, may be worth more or less than their original cost. The graph and table do not reflect the deduction of taxes that a shareholder would pay on fund distributions or the redemption of fund shares.
Pursuant to a voluntary arrangement, the Adviser has agreed to limit total fund operating expenses (exclusive of any acquired fund fees and expenses, performance fees, taxes, brokerage commissions and interest) to not exceed 2.55%. The Adviser can modify or terminate this arrangement at any time, which may lower the fund's yield or return.
See Definitions for Management Teams' Perspectives for index definitions.
Please visit our website at www.usfunds.com for updated performance information for different time periods.
67
China Region Fund
The Year In Review - Economic And Political Issues That Affected The Fund
China continued its monetary tightening policy during the first six months of 2011 in an effort to control inflation at the expense of economic growth. The People's Bank of China (PBOC) raised the required reserve ratio (RRR) every month for the first six months and the RRR for major banks reached 21.5 percent. The PBOC also raised the country's interest rate three times during the year, 25 basis points each time, pushing the one-year deposit rate to 3.5 percent. After peaking in July at 6.5 percent, China's inflation fell each following month to rest at 4.1 percent at the end of the year, a 15-month low.
Money supply (M2) in China declined over the year from 17.2 percent in January to 12.7 percent in November, the country's lowest level of monthly money supply growth since 2001. However, the PBOC surprisingly cut the RRR by 50 basis points in early December, which effectively indicated China's monetary cycle had reached an inflection point and was now moving toward easing measures. This was confirmed in January 2012 when data released showed China's M2 grew 13.6 percent during December, a signal to the market that monetary easing has begun.
The Chinese economy was showing signs of a slowdown, due to the tightening measures throughout the year, and it will take time for the policy shift to take full effect. China's Purchasing Managers Index (PMI) declined throughout 2011, hitting 49 in November and confirming a contraction in the country's industrial activities. However, the Chinese government foresaw the economic slowdown and began fine-tuning its policies in October. As a result, December's PMI reading went back above 50, which indicates industrial expansion. China's industrial production growth followed a similar pattern as PMI, declining to a low of 12.4 percent in November before improving to 12.8 percent in December.
China's economic growth of 8.9 percent in December 2011 exceeded market expectations and the country's 9.2 percent yearly average GDP growth rate was the highest in the world. Despite delivering these better-than-expected economic results for each quarter of 2011, market sentiment remains extremely bearish on China. On the contrary, we believe the results prove that the Chinese government can successfully engineer a soft landing.
Fixed asset investment (FAI) continued to show strength during the first half of the year, growing 25.6 percent. However, monetary tightening measures and a temporary overhaul of high-speed rail projects following the
68
China Region Fund
deadly Wenzhou train accident in July slowed FAI growth to 23.8 percent during the second half of 2011.
The amount of China's exports grew 20.3 percent on a year-over-year basis in 2011, while imports grew 24.9 percent from the previous year. However, both export and import growth rates declined throughout the year as the European sovereign debt crisis and softening demand in the U.S. caused a slowdown.
The strength of the Chinese consumer continues to be a bright spot for the country's economy. Retail sales increased 17.1 percent in 2011.
Credit supply was tightened over the year as new loans totaled Rmb 7.45 trillion, falling short of the Rmb 7.5 trillion target and below the prior year. This also reversed course in December as new loans reached a higher-than-expected total of Rmb 640.5 billion, which is historically in line with a monetary easing cycle in China.
Performance of the various sectors in the Hang Seng Composite Index (HSCI), the fund's benchmark, was mixed in 2011 as utilities rose 2.86 percent and telecommunications increased slightly. The other sectors declined dramatically as the HSCI decreased 21.54 percent on a simple price appreciation basis. The industrial goods sector was the worst performer, down 44.68 percent.
Other countries in the region in which the fund invests posting positive gains in 2011 included the Phillippines, Indonesia, Malaysia and Thailand, while South Korea and Taiwan posted losses.
Investment Highlights
Overview
The fund underperformed its benchmark, decreasing 28.09 percent for the year ended December 30, 2011. The HSCI declined 19.27 percent for the year on a total return basis.
Because the fund is actively managed and holding period is generally not a consideration in investment decisions, the portfolio turnover rate may fluctuate from year to year as the fund adjusts its portfolio composition. The fund's annual portfolio turnover was, and is expected to continue to be, more than 100 percent.
69
China Region Fund
Strengths
• Country allocations to Indonesia, Thailand and South Korea provided positive contributions to the fund while Taiwan, a disappointing market in 2011, was largely avoided. On a company-specific level, positive contributors to performance from Indonesia included PT Astra International Tbk,(2) Bank Mandiri Tbk PT,(3) and PT Gudang Garam Tbk.(4) In Thailand, Shin Corp. PCL(5) and Bumrungrad Hospital PCL(6) were two of the best performing stocks, while Hyundai Heavy Industries Co., Ltd.(3) and Posco Chemtech Co., Ltd.(3) were two of the best contributors from South Korea.
• The fund was underweight financials and overweight in consumer staples, which proved to be beneficial to relative performance. Financials finished in the bottom half of the HSCI sectors for the year while the staples group outperformed.
Weaknesses
• Worries about a possible hard landing for China's economy drove industrial goods and basic materials to the bottom of performance among the sectors of the HSCI in 2011, down 44.68 and 42.34 percent, respectively. Industrial goods and basic material stocks were overweighted in the fund, which negatively impacted the fund's performance compared to the benchmark.
Current Outlook
Opportunities
• A global easing monetary cycle led by China and other Asian countries will be the primary driver for a possible stock market rally in 2012.
• China's construction and manufacturing activity should improve in 2012. Expectations are that the massive high-speed rail project, which has been on hold since the July accident, will resume in 2012 and local governments will build 5 million new social housing units. In addition, they will be required to complete social housing projects started in 2010 and 2011.
• If the market follows a similar pattern as the 2009-2010 recovery, banks and economically cyclical companies should do very well since many are priced at low valuations comparable to 2008.
• After suffering through severe drought in the spring and floods during the summer of 2011, China is expected to significantly invest in improving the country's water system and agricultural infrastructure.
70
China Region Fund
• China is in the process of an economic structural change through which emphasis will be focused on consumer consumption and enhancing the country's industrial value chain. Additionally, there will be initiatives to appreciate the country's currency (Rmb) and increase its use within the globalized economy. Opportunities should arise from companies that are the leaders in related sectors.
Threats
• Although China's government is fine-tuning the country's economy by easing money supply, it continues to curb growth in the overheated housing sector. Residential sales transactions slowed across China throughout the year, but prices only began to fall for the first time in November. We don't believe the government wants to see the housing market drag down the economy, but we think housing prices have further to fall before the government switches gears on housing. Further deterioration of the European debt crisis could also trigger a change in policy.
• Weakening export growth due to the European recession and shrinking demand for goods could push China's GDP growth to decline further in 2012.
(1)The China region is defined as any country that either shares a border with China or is located in the South China Sea or the East China Sea and includes: the People's Republic of China (PRC or China), Bangladesh, Hong Kong, India, Indonesia, Kazakhstan, Korea, Kyrgyzstan, Laos, Malaysia, Mongolia, Nepal, Pakistan, Philippines, Singapore, Taiwan, Tajikistan, Thailand and Vietnam.
(2)This security comprised 2.25% of the fund's total net assets as of 12/31/11.
(3)The fund did not hold this security as of 12/31/11.
(4)This security comprised 2.23% of the fund's total net assets as of 12/31/11.
(5)This security comprised 1.27% of the fund's total net assets as of 12/31/11.
(6)This security comprised 1.33% of the fund's total net assets as of 12/31/11.
71
China Region Fund
Top 10 Holdings Based on Net Assets
(excluding repurchase agreement) December 31, 2011
Baidu, Inc.
Web Portals/Internet Service Providers | | | 4.56 | % | |
Industrial and Commercial Bank of China Ltd.
Commercial Banks - Non US | | | 2.95 | % | |
Tencent Holdings Ltd.
Internet Application Software | | | 2.82 | % | |
Sina Corp.
Web Portals/Internet Service Providers | | | 2.74 | % | |
Bank of China Ltd.
Commercial Banks - Non US | | | 2.44 | % | |
PT Astra International Tbk
Retail - Automobile | | | 2.25 | % | |
PT Gudang Garam Tbk
Tobacco | | | 2.23 | % | |
Netease.com
Internet Content - Entertainment | | | 2.15 | % | |
PetroChina Co., Ltd.
Oil Companies - Integrated | | | 2.03 | % | |
China Shenhua Energy Co., Ltd.
Coal | | | 1.88 | % | |
| TOTAL TOP TEN HOLDINGS | | | 26.05 | % | |
Country Distribution*
Based on Total Investments December 31, 2011
(excluding repurchase agreement)

* Country distribution shown is based on domicile and not intended to conform to the China region definition in the prospectus. The locale of company operations may be different.
72
Expense Example (unaudited) December 31, 2011
As a shareholder of the funds, you incur two types of costs: (1) transaction costs, including short-term trading fees and exchange fees; and (2) ongoing costs, including management fees and other fund expenses. This example is intended to help you understand your ongoing costs (in dollars) of investing in other mutual funds.
The example is based on an investment of $1,000 invested at the beginning of the period and held for the entire period as indicated below.
• Actual Expenses. The first line of the following table for each fund provides information about actual account values and actual expenses. You may use the information in this line, together with the amount you invested, to estimate the expenses you paid over the period. Simply divide your account value by $1,000 (for example, an $8,600 account value divided by $1,000 = 8.6), then multiply the result by the number in the first line under the heading "Expenses Paid During Period" to estimate the expenses you paid on your account during this period.
• Hypothetical Example for Comparison Purposes. The second line of the following table for each fund provides information about hypothetical account values and hypothetical expenses based on the fund's actual expense ratio and an assumed rate of return of 5 percent per year before expenses, which is not the fund's actual return. The hypothetical account values and expenses may not be used to estimate the actual ending account balance or expenses you paid for the period. You may use this information to compare the ongoing costs of investing in these funds and other funds. To do so, compare this 5 percent hypothetical example with the 5 percent hypothetical examples that appear in the shareholder reports of other funds.
Please note that the expenses shown in the table are meant to highlight your ongoing costs only and do not reflect any direct or transactional costs, such as small account, exchange or short-term trading fees. Therefore, the second line of the table is useful in comparing ongoing costs only, and will not help you determine the relative total costs of owning different funds. In addition, if these direct or transactional costs were included, your costs would have been higher.
73
Expense Example (unaudited) December 31, 2011
| Six Months Ended December 31, 2011 | | Beginning
Account Value
July 1,
2011 | | Ending
Account Value
December 31,
2011 | | Expenses
Paid During
Period* | |
| U.S. Treasury Securities Cash Fund | |
| Based on Actual Fund Return | | $ | 1,000.00 | | | $ | 1,000.10 | | | $ | 0.20 | | |
| Based on Hypothetical 5% Yearly Return | | $ | 1,000.00 | | | $ | 1,025.00 | | | $ | 0.20 | | |
| U.S. Government Securities Savings Fund | |
| Based on Actual Fund Return | | $ | 1,000.00 | | | $ | 1,000.10 | | | $ | 0.25 | | |
| Based on Hypothetical 5% Yearly Return | | $ | 1,000.00 | | | $ | 1,024.95 | | | $ | 0.26 | | |
| Near-Term Tax Free Fund | |
| Based on Actual Fund Return | | $ | 1,000.00 | | | $ | 1,020.20 | | | $ | 2.29 | | |
| Based on Hypothetical 5% Yearly Return | | $ | 1,000.00 | | | $ | 1,022.94 | | | $ | 2.29 | | |
| Tax Free Fund | |
| Based on Actual Fund Return | | $ | 1,000.00 | | | $ | 1,045.80 | | | $ | 3.61 | | |
| Based on Hypothetical 5% Yearly Return | | $ | 1,000.00 | | | $ | 1,021.68 | | | $ | 3.57 | | |
| All American Equity Fund | |
| Based on Actual Fund Return | | $ | 1,000.00 | | | $ | 948.70 | | | $ | 10.56 | | |
| Based on Hypothetical 5% Yearly Return | | $ | 1,000.00 | | | $ | 1,014.37 | | | $ | 10.92 | | |
| Holmes Growth Fund | |
| Based on Actual Fund Return | | $ | 1,000.00 | | | $ | 877.90 | | | $ | 9.14 | | |
| Based on Hypothetical 5% Yearly Return | | $ | 1,000.00 | | | $ | 1,015.48 | | | $ | 9.80 | | |
| Global MegaTrends Fund Investor Class | |
| Based on Actual Fund Return | | $ | 1,000.00 | | | $ | 870.70 | | | $ | 9.90 | | |
| Based on Hypothetical 5% Yearly Return | | $ | 1,000.00 | | | $ | 1,014.62 | | | $ | 10.66 | | |
| Global MegaTrends Fund Institutional Class | |
| Based on Actual Fund Return | | $ | 1,000.00 | | | $ | 872.00 | | | $ | 8.54 | | |
| Based on Hypothetical 5% Yearly Return | | $ | 1,000.00 | | | $ | 1,016.08 | | | $ | 9.20 | | |
| Global Resources Fund Investor Class | |
| Based on Actual Fund Return | | $ | 1,000.00 | | | $ | 829.20 | | | $ | 7.93 | | |
| Based on Hypothetical 5% Yearly Return | | $ | 1,000.00 | | | $ | 1,016.53 | | | $ | 8.74 | | |
| Global Resources Fund Institutional Class | |
| Based on Actual Fund Return | | $ | 1,000.00 | | | $ | 831.60 | | | $ | 5.03 | | |
| Based on Hypothetical 5% Yearly Return | | $ | 1,000.00 | | | $ | 1,019.71 | | | $ | 5.55 | | |
| World Precious Minerals Fund Investor Class | |
| Based on Actual Fund Return | | $ | 1,000.00 | | | $ | 822.20 | | | $ | 6.94 | | |
| Based on Hypothetical 5% Yearly Return | | $ | 1,000.00 | | | $ | 1,017.59 | | | $ | 7.68 | | |
World Precious Minerals Fund
Institutional Class | |
| Based on Actual Fund Return | | $ | 1,000.00 | | | $ | 823.90 | | | $ | 4.83 | | |
| Based on Hypothetical 5% Yearly Return | | $ | 1,000.00 | | | $ | 1,019.91 | | | $ | 5.35 | | |
| Gold and Precious Metals Fund | |
| Based on Actual Fund Return | | $ | 1,000.00 | | | $ | 898.80 | | | $ | 6.84 | | |
| Based on Hypothetical 5% Yearly Return | | $ | 1,000.00 | | | $ | 1,018.00 | | | $ | 7.27 | | |
| Eastern European Fund | |
| Based on Actual Fund Return | | $ | 1,000.00 | | | $ | 717.30 | | | $ | 8.66 | | |
| Based on Hypothetical 5% Yearly Return | | $ | 1,000.00 | | | $ | 1,015.12 | | | $ | 10.16 | | |
| Global Emerging Markets Fund | |
| Based on Actual Fund Return | | $ | 1,000.00 | | | $ | 768.00 | | | $ | 12.88 | | |
| Based on Hypothetical 5% Yearly Return | | $ | 1,000.00 | | | $ | 1,010.64 | | | $ | 14.65 | | |
74
Expense Example (unaudited) December 31, 2011
| Six Months Ended December 31, 2011 | | Beginning
Account Value
July 1,
2011 | | Ending
Account Value
December 31,
2011 | | Expenses
Paid During
Period* | |
| China Region Fund | |
| Based on Actual Fund Return | | $ | 1,000.00 | | | $ | 773.00 | | | $ | 10.73 | | |
| Based on Hypothetical 5% Yearly Return | | $ | 1,000.00 | | | $ | 1,013.11 | | | $ | 12.18 | | |
* These calculations are based on expenses incurred in the most recent fiscal half-year. The funds' Investor Class' annualized expense ratios (after reimbursements and offsets) for the six-month period ended December 31, 2011, were 0.04%, 0.05%, 0.45%, 0.70%, 2.15%, 1.93%, 2.10%, 1.72%, 1.51%, 1.43%, 2.00%, 2.89% and 2.40%, respectively, for the U.S. Treasury Securities Cash, U.S. Government Securities Savings, Near-Term Tax Free, Tax Free, All American Equity, Holmes Growth, Global MegaTrends, Global Resources, World Precious Minerals, Gold and Precious Metals, Eastern European, Global Emerging Markets and China Region Funds. The funds' Institutional Class' annualized expense ratios (after reimbursements and offsets) for the six-month period ended December 31, 2011, were 1.81%, 1.09% and 1.05%, respectively, for the Global MegaTrends, Global Resources and World Precious Minerals Funds. The dollar amounts shown as "Expenses Paid" are equal to the annualized expense ratio multiplied by the average account value over the period, multiplied by 184, the number of days in the period, then divided by 365 days in the current fiscal year.
75
Portfolio of Investments December 31, 2011
U.S. Treasury Securities Cash Fund
Repurchase
Agreements 99.93% | | Coupon
Rate | | Maturity
Date | | Principal
Amount | | Value | |
Joint Tri-Party Repurchase Agreements,
12/30/11, collateralized by U.S. Treasury
securities held in joint tri-party
repurchase accounts: | |
0.01% Banc of America Securities
LLC Merrill Lynch, repurchase
price $22,500,025 | | | 0.01 | % | | 01/03/12 | | $ | 22,500,000 | | | $ | 22,500,000 | | |
0.02% Credit Suisse Securities USA LLC,
repurchase price $45,493,352 | | | 0.02 | % | | 01/03/12 | | | 45,493,251 | | | | 45,493,251 | | |
0.00% Morgan Stanley, repurchase price
$22,500,000 | | | 0.00 | % | | 01/03/12 | | | 22,500,000 | | | | 22,500,000 | | |
| Total Investments 99.93% | | | 90,493,251 | | |
| (cost $90,493,251) | |
| Other assets and liabilities, net 0.07% | | | 63,281 | | |
| Net Assets 100% | | $ | 90,556,532 | | |
See notes to portfolios of investments and notes to financial statements.
76
Portfolio of Investments December 31, 2011
U.S. Government Securities Savings Fund
United States
Government and Agency
Obligations 99.40% | | Coupon
Rate | | Maturity
Date | | Principal
Amount | | Value | |
| Federal Farm Credit Bank 32.84% | |
| Discount Note: | |
| | Yield | | | | 0.01 | % | | 01/03/12 | | $ | 30,000,000 | | | $ | 29,999,983 | | |
| Variable Rates: | |
| | | | 0.29 | % | | 02/13/12 | | | 3,950,000 | | | | 3,950,330 | | |
| | | | 0.20 | % | | 05/23/12 | | | 1,650,000 | | | | 1,650,490 | | |
| | | | 0.13 | % | | 07/27/12 | | | 5,000,000 | | | | 5,000,000 | | |
| | | | 0.18 | % | | 08/15/12 | | | 5,000,000 | | | | 5,000,000 | | |
| | | | 0.17 | % | | 08/20/12 | | | 4,625,000 | | | | 4,625,891 | | |
| | | | 0.24 | % | | 09/17/12 | | | 1,350,000 | | | | 1,350,477 | | |
| | | | 0.32 | % | | 09/20/12 | | | 1,000,000 | | | | 1,000,731 | | |
| | | | 0.13 | % | | 09/24/12 | | | 3,800,000 | | | | 3,798,615 | | |
| | | | 56,376,517 | | |
| Federal Home Loan Bank 43.75% | |
| Discount Notes: | |
| | Yield | | | | 0.02 | % | | 01/04/12 | | | 10,000,000 | | | | 9,999,983 | | |
| | Yield | | | | 0.00 | % | | 01/06/12 | | | 28,000,000 | | | | 28,000,000 | | |
| | Yield | | | | 0.01 | % | | 01/20/12 | | | 1,600,000 | | | | 1,599,992 | | |
| | Yield | | | | 0.01 | % | | 02/29/12 | | | 10,000,000 | | | | 9,999,869 | | |
| Fixed Rates: | |
| | | | | | 0.32 | % | | 02/01/12 | | | 3,000,000 | | | | 3,000,548 | | |
| | | | | | 0.12 | % | | 02/27/12 | | | 5,000,000 | | | | 4,999,662 | | |
| | | | | | 1.38 | % | | 06/08/12 | | | 2,000,000 | | | | 2,009,710 | | |
| | | | | | 0.28 | % | | 09/07/12 | | | 2,000,000 | | | | 2,000,000 | | |
| Variable Rates: | |
| | | | 0.20 | % | | 03/23/12 | | | 3,500,000 | | | | 3,500,831 | | |
| | | | 0.12 | % | | 07/18/12 | | | 5,000,000 | | | | 5,000,000 | | |
| | | | 0.15 | % | | 09/04/12 | | | 5,000,000 | | | | 4,998,998 | | |
| | | | 75,109,593 | | |
| Tennessee Valley Authority 5.85% | |
| Fixed Rate: | | | 6.79 | % | | 05/23/12 | | | 9,785,000 | | | | 10,039,636 | | |
See notes to portfolios of investments and notes to financial statements.
77
Portfolio of Investments December 31, 2011
U.S. Government Securities Savings Fund
United States
Government and
Agency Obligations | | Coupon
Rate | | Maturity
Date | | Principal
Amount | | Value | |
| United States Treasury Bills 16.96% | |
| Discount Note: | |
| | Yield | | | | (0.03 | )% | | 01/19/12 | | $ | 25,000,000 | | | $ | 25,000,375 | | |
| Fixed Rates: | |
| | | | 1.13 | % | | 01/15/12 | | | 3,100,000 | | | | 3,101,320 | | |
| | | | 4.75 | % | | 01/31/12 | | | 1,000,000 | | | | 1,003,868 | | |
| | | | 29,105,563 | | |
| Total Investments 99.40% | | | 170,631,309 | | |
| (cost $170,631,309) | |
| Other assets and liabilities, net 0.60% | | | 1,032,265 | | |
| Net Assets 100% | | $ | 171,663,574 | | |
See notes to portfolios of investments and notes to financial statements.
78
Portfolio of Investments December 31, 2011
Near-Term Tax Free Fund
| Municipal Bonds 89.02% | | Coupon
Rate | | Maturity
Date | | Principal
Amount | | Value | |
| Alabama 3.95% | |
Alabama State Public School & College
Authority | | | 5.00 | % | | 12/01/16 | | $ | 290,000 | | | $ | 344,477 | | |
| Bessemer, Alabama Water Revenue | | | 4.00 | % | | 01/01/16 | | | 300,000 | | | | 304,308 | | |
Jasper Alabama Water Works & Sewer Board,
Inc., Utilities Revenue, Series A | | | 3.00 | % | | 06/01/15 | | | 90,000 | | | | 93,581 | | |
Jasper Alabama Water Works & Sewer Board,
Inc., Utilities Revenue, Series A | | | 3.00 | % | | 06/01/16 | | | 90,000 | | | | 94,164 | | |
Mountain Brook City Board of Education Capital
Outlay | | | 4.00 | % | | 02/15/15 | | | 200,000 | | | | 217,562 | | |
University of Alabama at Birmingham, Hospital
Revenue, Series A | | | 5.00 | % | | 09/01/15 | | | 300,000 | | | | 329,118 | | |
| | | | 1,383,210 | | |
| Alaska 0.95% | |
Alaska Municipal Bond Bank Authority,
Series A | | | 4.00 | % | | 02/01/16 | | | 300,000 | | | | 331,269 | | |
| Arizona 4.92% | |
Arizona Board Regents Certificates of
Participation, Series B | | | 4.50 | % | | 06/01/16 | | | 200,000 | | | | 220,006 | | |
Arizona Health Facilities Authority Revenues,
Series D | | | 5.00 | % | | 01/01/14 | | | 250,000 | | | | 267,082 | | |
Arizona School Facilities Board Certificates,
Series A-1 | | | 5.00 | % | | 09/01/17 | | | 325,000 | | | | 356,187 | | |
Arizona State Transportation Board Excise Tax
Revenue | | | 5.00 | % | | 07/01/17 | | | 175,000 | | | | 209,400 | | |
| Page, Arizona, Pledged Revenue, Refunding | | | 3.00 | % | | 07/01/16 | | | 350,000 | | | | 365,722 | | |
Pima County Unified School District, GO
Unlimited, Refunding | | | 3.70 | % | | 07/01/12 | | | 300,000 | | | | 304,458 | | |
| | | | 1,722,855 | | |
| California 4.20% | |
California State, Refunding, Recreational
Facility, GO Unlimited | | | 5.00 | % | | 12/01/19 | | | 250,000 | | | | 272,208 | | |
Delano, California Union High School District,
GO Unlimited, Refunding, Series A | | | 4.75 | % | | 02/01/17 | | | 200,000 | | | | 221,712 | | |
San Diego, California Community College
District, Capital Appreciation, Election 2002,
GO Unlimited (ZCB) | | | 4.34 | %(1) | | 05/01/15 | | | 300,000 | | | | 278,418 | | |
Santa Clara County, California Financing
Authority Revenue, Obstetrics and
Gynecology, El Camino Hospital | | | 5.00 | % | | 02/01/18 | | | 350,000 | | | | 392,535 | | |
See notes to portfolios of investments and notes to financial statements.
79
Portfolio of Investments December 31, 2011
Near-Term Tax Free Fund
| Municipal Bonds | | Coupon
Rate | | Maturity
Date | | Principal
Amount | | Value | |
| California (Cont'd) | |
Vernon, California Electric Systems Revenue,
Series A | | | 3.75 | % | | 08/01/13 | | $ | 300,000 | | | $ | 306,909 | | |
| | | | 1,471,782 | | |
| Connecticut 0.75% | |
| Connecticut State, Series D, GO Unlimited | | | 5.38 | % | | 11/15/18 | | | 250,000 | | | | 261,058 | | |
| District of Columbia 1.88% | |
District of Columbia Certifications of
Participation | | | 4.00 | % | | 01/01/14 | | | 250,000 | | | | 262,000 | | |
Washington D.C. Convention Center Authority
Dedicated Tax Revenue, Refunding, Series A | | | 5.00 | % | | 10/01/13 | | | 110,000 | | | | 116,133 | | |
Washington D.C. Convention Center Authority
Dedicated Tax Revenue, Refunding, Series A | | | 5.00 | % | | 10/01/16 | | | 250,000 | | | | 280,252 | | |
| | | | 658,385 | | |
| Florida 11.09% | |
Broward County, Florida School Board
Certificates of Participation, Series A | | | 5.00 | % | | 07/01/15 | | | 325,000 | | | | 357,006 | | |
| Cape Coral, Florida Gas Tax Revenue, Series A | | | 4.00 | % | | 10/01/16 | | | 255,000 | | | | 269,877 | | |
Florida Gulf Coast University Financing Corp.,
Florida Capital Improvement Revenue,
Series B | | | 3.00 | % | | 02/01/16 | | | 365,000 | | | | 380,512 | | |
Florida State Board of Education Lottery
Revenue, Series A | | | 4.00 | % | | 07/01/14 | | | 300,000 | | | | 321,609 | | |
Florida State Board of Governors Parking
Facilities Revenue, Series A | | | 3.00 | % | | 07/01/17 | | | 300,000 | | | | 325,605 | | |
Florida State Municipal Power Agency,
Stanton Project Revenue, Refunding | | | 5.13 | % | | 10/01/17 | | | 300,000 | | | | 348,639 | | |
Fort Pierce, Florida Stormwater Utilities
Revenue | | | 4.50 | % | | 10/01/17 | | | 255,000 | | | | 270,463 | | |
Hillsborough Country Florida Community
Investment Tax Revenue | | | 4.00 | % | | 05/01/16 | | | 300,000 | | | | 317,802 | | |
Lake County, Florida School Board
Certificates of Participation, Series A | | | 3.70 | % | | 06/01/15 | | | 400,000 | | | | 414,244 | | |
Miami - Dade County, Florida Water &
Sewer Revenue System, Series A | | | 4.00 | % | | 10/01/16 | | | 235,000 | | | | 260,636 | | |
Orange County, Florida Tourist Development
Tax Revenue, Refunding | | | 5.00 | % | | 10/01/14 | | | 260,000 | | | | 284,838 | | |
Reedy Creek, Florida Improvement District
Utilities Revenue, Refunding, Series 2 | | | 5.00 | % | | 10/01/16 | | | 300,000 | | | | 333,060 | | |
| | | | 3,884,291 | | |
See notes to portfolios of investments and notes to financial statements.
80
Portfolio of Investments December 31, 2011
Near-Term Tax Free Fund
| Municipal Bonds | | Coupon
Rate | | Maturity
Date | | Principal
Amount | | Value | |
| Georgia 3.57% | |
| Atlanta Downtown Development Authority | | | 4.25 | % | | 12/01/16 | | $ | 250,000 | | | $ | 275,047 | | |
Atlanta, Georgia Water & Wastewater
Revenue, Series B | | | 3.50 | % | | 11/01/13 | | | 400,000 | | | | 421,888 | | |
Emanuel County Georgia Hospital Authority
Revenue Anticipation Certificates | | | 4.30 | % | | 07/01/17 | | | 250,000 | | | | 265,390 | | |
Gwinnett County, Georgia, Hospital Authority,
Gwinnett Hospital Systems Revenue,
Series B | | | 5.00 | % | | 07/01/18 | | | 250,000 | | | | 286,255 | | |
| | | | 1,248,580 | | |
| Illinois 13.81% | |
| Aurora, Illinois, Series B, GO Unlimited | | | 3.00 | % | | 12/30/15 | | | 200,000 | | | | 211,566 | | |
Chicago Board of Education, Dedicated
Revenues, Series F, GO Unlimited | | | 5.00 | % | | 12/01/16 | | | 300,000 | | | | 341,697 | | |
| Chicago Board of Education, Series A | | | 5.25 | % | | 12/01/13 | | | 250,000 | | | | 262,735 | | |
| Chicago, Illinois Sales Tax Revenue | | | 5.50 | % | | 01/01/15 | | | 350,000 | | | | 390,443 | | |
Chicago, Illinois, Direct Access Bond,
Series E-1 B, GO Unlimited | | | 4.00 | % | | 01/01/19 | | | 200,000 | | | | 211,888 | | |
| Chicago, Illinois, Unrefunded Balance, Series B | | | 5.13 | % | | 01/01/15 | | | 325,000 | | | | 350,070 | | |
| Dundee Township, GO Unlimited | | | 5.00 | % | | 12/01/13 | | | 240,000 | | | | 255,811 | | |
| Illinois Finance Authority Revenue, Refunding | | | 5.00 | % | | 07/01/16 | | | 390,000 | | | | 423,333 | | |
| Illinois State Sales Tax Revenue | | | 5.00 | % | | 06/15/14 | | | 200,000 | | | | 217,594 | | |
Illinois State Toll Highway Authority,
Toll Highway Revenue, Series A | | | 5.00 | % | | 01/01/16 | | | 200,000 | | | | 227,658 | | |
| Illinois State, Refunding, GO Unlimited | | | 5.00 | % | | 01/01/16 | | | 300,000 | | | | 333,123 | | |
| Metropolitan Pier & Exposition Authority | | | 5.38 | % | | 06/01/15 | | | 280,000 | | | | 292,589 | | |
Springfield, Illinois Metropolitan Sanitation
District, Sewer Revenue, Senior Lien,
Series A | | | 4.00 | % | | 01/01/17 | | | 570,000 | | | | 613,753 | | |
State of Illinois, First Series, Refunding,
GO Unlimited | | | 5.50 | % | | 08/01/19 | | | 300,000 | | | | 307,053 | | |
Winnebago County Public Safety Sales Tax,
Series A, GO Unlimited | | | 5.00 | % | | 12/30/16 | | | 350,000 | | | | 394,380 | | |
| | | | 4,833,693 | | |
| Indiana 1.93% | |
Indiana State Finance Authority Revenue,
Refunding | | | 4.00 | % | | 05/01/12 | | | 350,000 | | | | 353,878 | | |
Tippecanoe County, Indiana School
Improvements | | | 4.00 | % | | 01/15/15 | | | 300,000 | | | | 323,136 | | |
| | | | 677,014 | | |
See notes to portfolios of investments and notes to financial statements.
81
Portfolio of Investments December 31, 2011
Near-Term Tax Free Fund
| Municipal Bonds | | Coupon
Rate | | Maturity
Date | | Principal
Amount | | Value | |
| Iowa 2.69% | |
| Ames, Iowa Hospital Revenue, Refunding | | | 5.00 | % | | 06/15/15 | | $ | 300,000 | | | $ | 304,668 | | |
Johnston Community School District,
GO Unlimited | | | 4.00 | % | | 06/01/16 | | | 200,000 | | | | 215,294 | | |
University of Iowa Hospitals and Clinics,
Iowa State Board of Regents, Hospital
Revenue, Refunding, Series A | | | 3.00 | % | | 09/01/19 | | | 400,000 | | | | 423,296 | | |
| | | | 943,258 | | |
| Kansas 0.63% | |
Kansas State Development Finance
Authority Revenue | | | 4.00 | % | | 10/01/15 | | | 200,000 | | | | 220,876 | | |
| Massachusetts 1.76% | |
New Bedford, Massachusetts, State Qualified
Municipal Loan, GO Limited | | | 3.00 | % | | 03/01/15 | | | 345,000 | | | | 364,279 | | |
Stoughton, Massachusetts Public
Improvement, GO Limited | | | 4.00 | % | | 05/01/17 | | | 225,000 | �� | | | 250,049 | | |
| | | | 614,328 | | |
| Michigan 4.19% | |
Detroit, Michigan Sewer Disposal Revenue,
Refunding, Series C-1 | | | 5.25 | % | | 07/01/15 | | | 400,000 | | | | 435,552 | | |
Michigan House of Representatives Facilities,
Obligations Revenue, Series A | | | 5.00 | % | | 10/15/17 | | | 200,000 | | | | 230,574 | | |
Michigan State Building Authority Revenue,
Refunding, Series I | | | 5.25 | % | | 10/15/14 | | | 300,000 | | | | 322,683 | | |
| Michigan State Grant Anticipation Bonds | | | 5.00 | % | | 09/15/16 | | | 200,000 | | | | 229,946 | | |
Michigan State Hospital Finance Authority
Revenue, Trinity Health, Series A | | | 6.00 | % | | 12/01/18 | | | 200,000 | | | | 248,004 | | |
| | | | 1,466,759 | | |
| Minnesota 1.60% | |
Minneapolis & St Paul, Minnesota Housing &
Redevelopment Authority Health Care
Systems, Children's Health Care, Series B | | | 4.00 | % | | 08/15/16 | | | 250,000 | | | | 274,578 | | |
Minneapolis & St Paul, Minnesota Metropolitan
Airports Commission, Airport Revenue,
Refunding, Series B | | | 5.00 | % | | 01/01/19 | | | 255,000 | | | | 287,020 | | |
| | | | 561,598 | | |
See notes to portfolios of investments and notes to financial statements.
82
Portfolio of Investments December 31, 2011
Near-Term Tax Free Fund
| Municipal Bonds | | Coupon
Rate | | Maturity
Date | | Principal
Amount | | Value | |
| Missouri 0.62% | |
Missouri State Health & Educational Facilities
Authority Revenue, Series A | | | 6.75 | % | | 05/15/13 | | $ | 200,000 | | | $ | 217,336 | | |
| Nevada 1.48% | |
Clark County Nevada School District,
Refunding, Series A | | | 5.50 | % | | 06/15/16 | | | 250,000 | | | | 267,953 | | |
| Nye County School District, GO Limited | | | 4.00 | % | | 05/01/15 | | | 230,000 | | | | 251,461 | | |
| | | | 519,414 | | |
| New Hampshire 0.28% | |
New Hampshire Health & Education Facilities
Authority Revenue | | | 5.00 | % | | 07/01/14 | | | 95,000 | | | | 97,392 | | |
| New Jersey 1.27% | |
Atlantic City, New Jersey Municipal Utilities
Authority Revenue, Refunding | | | 5.00 | % | | 06/01/17 | | | 150,000 | | | | 173,946 | | |
New Jersey State Transportation Trust Fund
Authority, Series D | | | 4.00 | % | | 06/15/14 | | | 250,000 | | | | 271,168 | | |
| | | | 445,114 | | |
| New York 3.70% | |
Long Island Power Authority, New York
Electric Systems, Revenue, Series E | | | 5.00 | % | | 12/01/17 | | | 330,000 | | | | 382,727 | | |
New York State Dormitory Authority Revenues,
Nonconstruction Supported Debt, Municipal
Facilities Health Lease, Series 1 | | | 5.00 | % | | 01/15/17 | | | 300,000 | | | | 343,617 | | |
| New York, New York, Series G, GO Unlimited | | | 5.00 | % | | 08/01/12 | | | 125,000 | | | | 128,393 | | |
New York, New York, Subseries L-1,
GO Unlimited | | | 4.00 | % | | 04/01/15 | | | 300,000 | | | | 328,308 | | |
Schenectady Metroplex Development
Authority Revenue, Series A | | | 5.00 | % | | 12/15/12 | | | 110,000 | | | | 113,818 | | |
| | | | 1,296,863 | | |
| Ohio 2.55% | |
Canton, Ohio City School District, Refunding,
GO Unlimited | | | 5.00 | % | | 12/01/18 | | | 325,000 | | | | 355,813 | | |
Lorain County Community College District,
Ohio, Revenue | | | 3.25 | % | | 12/01/17 | | | 350,000 | | | | 373,646 | | |
Marion County, Ohio, Variable Refunding,
GO Limited | | | 4.00 | % | | 12/01/20 | | | 150,000 | | | | 163,436 | | |
| | | | 892,895 | | |
See notes to portfolios of investments and notes to financial statements.
83
Portfolio of Investments December 31, 2011
Near-Term Tax Free Fund
| Municipal Bonds | | Coupon
Rate | | Maturity
Date | | Principal
Amount | | Value | |
| Pennsylvania 0.57% | |
| Philadelphia, Pennsylvania, GO Unlimited | | | 4.50 | % | | 08/01/12 | | $ | 195,000 | | | $ | 198,939 | | |
| Puerto Rico 0.76% | |
| Commonwealth of Puerto Rico, GO Unlimited | | | 6.00 | % | | 07/01/13 | | | 250,000 | | | | 266,235 | | |
| Rhode Island 0.81% | |
Rhode Island State Economic Development
Corporation Revenue, Series A | | | 5.00 | % | | 06/15/17 | | | 250,000 | | | | 284,250 | | |
| South Carolina 2.35% | |
| Jasper County School District, GO Unlimited | | | 4.00 | % | | 03/01/15 | | | 195,000 | | | | 213,701 | | |
| Piedmont Municipal Power Agency | | | 5.00 | % | | 01/01/16 | | | 150,000 | | | | 168,519 | | |
South Carolina Transportation Infrastructure
Bank Revenue, Series A | | | 5.25 | % | | 10/01/17 | | | 125,000 | | | | 138,097 | | |
| Spartanburg County School District | | | 3.88 | % | | 04/01/12 | | | 300,000 | | | | 302,478 | | |
| | | | 822,795 | | |
| Tennessee 0.84% | |
Metropolitan Government of Nashville &
Davidson County, Water & Sewer Revenue | | | 6.50 | % | | 12/01/14 | | | 250,000 | | | | 292,183 | | |
| Texas 9.94% | |
Addison, Texas Certificates of Obligation,
GO Unlimited | | | 4.00 | % | | 02/15/20 | | | 250,000 | | | | 277,560 | | |
Annetta, Texas Certificates of Obligation,
GO Limited | | | 4.00 | % | | 08/01/16 | | | 200,000 | | | | 210,054 | | |
Grand Prairie Independent School District,
Refunding, GO Unlimited (ZCB) | | | 3.92 | %(1) | | 08/15/16 | | | 400,000 | | | | 359,476 | | |
Houston, Texas, Public Improvement,
Refunding, GO Limited, Series A | | | 5.38 | % | | 03/01/16 | | | 180,000 | | | | 198,747 | | |
Katy, Texas Independent School District,
School Building, Series D, GO Unlimited | | | 4.50 | % | | 02/15/19 | | | 325,000 | | | | 368,313 | | |
Lewisville, Texas Independent School District,
GO Unlimited, Refunding (ZCB) | | | 4.04 | %(1) | | 08/15/15 | | | 400,000 | | | | 383,912 | | |
Lower Colorado River Authority Texas,
Refunding | | | 5.25 | % | | 05/15/19 | | | 240,000 | | | | 256,090 | | |
North Texas Municipal Water District, Regional
Solid Waste Disposal Systems Revenue | | | 3.00 | % | | 09/01/12 | | | 300,000 | | | | 304,683 | | |
San Antonio, Texas Municipal Drain Utilities
Systems Revenue | | | 4.00 | % | | 02/01/16 | | | 300,000 | | | | 308,889 | | |
San Patricio, Texas Municipal Water District,
Refunding | | | 4.00 | % | | 07/10/18 | | | 200,000 | | | | 210,860 | | |
See notes to portfolios of investments and notes to financial statements.
84
Portfolio of Investments December 31, 2011
Near-Term Tax Free Fund
| Municipal Bonds | | Coupon
Rate | | Maturity
Date | | Principal
Amount | | Value | |
| Texas (Cont'd) | |
Texas Municipal Power Agency Revenue,
Refunding | | | 5.00 | % | | 09/01/17 | | $ | 250,000 | | | $ | 294,447 | | |
| Texas State Public Finance Authority Revenue | | | 5.00 | % | | 10/15/21 | | | 300,000 | | | | 308,082 | | |
| | | | 3,481,113 | | |
| Utah 1.74% | |
Tooele City, Utah Municipal Building
Authority Lease Revenue, Refunding | | | 3.75 | % | | 12/01/17 | | | 285,000 | | | | 299,911 | | |
| Utah State, Refunding, Series B, GO Unlimited | | | 5.38 | % | | 07/01/12 | | | 300,000 | | | | 307,629 | | |
| | | | 607,540 | | |
| Virginia 1.86% | |
Virginia College Building Authority Educational
Facilities Revenue, Prerefunded, Series A | | | 5.00 | % | | 09/01/15 | | | 10,000 | | | | 11,526 | | |
Virginia College Building Authority Educational
Facilities Revenue, Unrefunded, Series A | | | 5.00 | % | | 09/01/15 | | | 290,000 | | | | 331,307 | | |
Virginia State Public Building Authority & Public
Facilities Revenue, Refunding, Series A | | | 5.00 | % | | 08/01/12 | | | 300,000 | | | | 308,178 | | |
| | | | 651,011 | | |
| Washington 1.49% | |
Energy Northwest, Washington Electric
Revenue | | | 5.00 | % | | 07/01/14 | | | 250,000 | | | | 276,215 | | |
King County, Washington School District
No. 401 Highline Public Schools,
GO Unlimited | | | 5.50 | % | | 12/01/13 | | | 240,000 | | | | 245,124 | | |
| | | | 521,339 | | |
| Wisconsin 0.84% | |
Chippewa Valley, Wisconsin, Technical
College District Promissory Notes,
Series A, GO Unlimited | | | 4.00 | % | | 04/01/14 | | | 250,000 | | | | 267,887 | | |
Wisconsin State, Refunding, Series 2,
GO Unlimited | | | 4.13 | % | | 11/01/16 | | | 25,000 | | | | 26,219 | | |
| | | | 294,106 | | |
| Total Municipal Bonds | | | 31,167,481 | | |
| (cost $29,934,867) | |
See notes to portfolios of investments and notes to financial statements.
85
Portfolio of Investments December 31, 2011
Near-Term Tax Free Fund
Repurchase
Agreement 9.61% | | Coupon
Rate | | Maturity
Date | | Principal
Amount | | Value | |
Joint Tri-Party Repurchase Agreement, Credit
Suisse Securities USA LLC, 12/30/2011,
0.02%, due 1/3/2012, repurchase
price $3,366,025, collateralized
by U.S. Treasury securities held in a joint
tri-party account (cost $3,366,017) | | | 0.02 | % | | 01/03/12 | | $ | 3,366,017 | | | $ | 3,366,017 | | |
| Total Investments 98.63% | | | 34,533,498 | | |
| (cost $33,300,884) | |
| Other assets and liabilities, net 1.37% | | | 480,153 | | |
| Net Assets 100% | | $ | 35,013,651 | | |
(1)Represents Yield
See notes to portfolios of investments and notes to financial statements.
86
Portfolio of Investments December 31, 2011
Tax Free Fund
| Municipal Bonds 89.92% | | Coupon
Rate | | Maturity
Date | | Principal
Amount | | Value | |
| Alabama 6.51% | |
Alabama 21st Century Authority, Tobacco
Settlement Revenue | | | 5.75 | % | | 12/01/19 | | $ | 275,000 | | | $ | 278,009 | | |
| Alabama State, GO Unlimited, Series A | | | 4.63 | % | | 09/01/22 | | | 375,000 | | | | 388,395 | | |
| Bessemer, Alabama Water Revenue | | | 4.00 | % | | 01/01/16 | | | 200,000 | | | | 202,872 | | |
Mountain Brook City Board of Education
Capital Outlay | | | 4.00 | % | | 02/15/15 | | | 195,000 | | | | 212,123 | | |
University of Alabama at Birmingham,
Hospital Revenue, Series A | | | 5.00 | % | | 09/01/15 | | | 300,000 | | | | 329,118 | | |
| | | | 1,410,517 | | |
| Arizona 2.29% | |
Scottsdale Arizona Municipal Property Corp.,
Excise Tax Revenue, Refunding | | | 5.00 | % | | 07/01/26 | | | 180,000 | | | | 221,096 | | |
University of Arizona Certificates of
Participation, Series C | | | 5.00 | % | | 06/01/22 | | | 260,000 | | | | 274,807 | | |
| | | | 495,903 | | |
| California 10.11% | |
Anaheim, California City School District,
Capital Appreciation, Election 2002,
GO Unlimited (ZCB) | | | 4.60 | %(1) | | 08/01/28 | | | 580,000 | | | | 220,893 | | |
| California State, GO Unlimited | | | 5.00 | % | | 03/01/32 | | | 300,000 | | | | 308,127 | | |
| California State, GO Unlimited | | | 4.75 | % | | 03/01/34 | | | 205,000 | | | | 207,532 | | |
Chaffey Community College District, Series C,
GO Unlimited | | | 5.00 | % | | 06/01/32 | | | 300,000 | | | | 315,186 | | |
Imperial Community College District,
GO Unlimited | | | 5.00 | % | | 08/01/29 | | | 500,000 | | | | 521,550 | | |
Los Angeles Unified School District,
Election 2004, Series H, GO Unlimited | | | 5.00 | % | | 07/01/32 | | | 200,000 | | | | 209,568 | | |
Santa Clara Valley Transportation Authority,
Refunding, Series A | | | 5.00 | % | | 04/01/27 | | | 370,000 | | | | 406,552 | | |
| | | | 2,189,408 | | |
| Colorado 0.72% | |
| Colorado Health Facilities Authority Revenue | | | 5.00 | % | | 09/01/16 | | | 150,000 | | | | 155,544 | | |
| Delaware 2.07% | |
Delaware State Health Facilities Authority,
Bayhealth Medical Center Projects,
Revenue, Series A | | | 5.00 | % | | 07/01/39 | | | 445,000 | | | | 449,148 | | |
See notes to portfolios of investments and notes to financial statements.
87
Portfolio of Investments December 31, 2011
Tax Free Fund
| Municipal Bonds | | Coupon
Rate | | Maturity
Date | | Principal
Amount | | Value | |
| District of Columbia 2.80% | |
District of Columbia Income Tax Revenue,
Series A | | | 5.25 | % | | 12/01/27 | | $ | 300,000 | | | $ | 346,500 | | |
District of Columbia Water & Sewer Authority
Public Utility Revenue, Subordinate Lien | | | 5.00 | % | | 10/01/28 | | | 250,000 | | | | 259,305 | | |
| | | | 605,805 | | |
| Florida 2.78% | |
Florida Board of Education, GO Unlimited,
Refunding, Series C | | | 4.50 | % | | 06/01/28 | | | 300,000 | | | | 318,573 | | |
Seven Oaks, Florida, Community Development
District, Special Assessment Revenue,
Refunding, Series A1 | | | 5.50 | % | | 05/01/33 | | | 285,000 | | | | 283,207 | | |
| | | | 601,780 | | |
| Georgia 2.33% | |
| Atlanta Development Authority Revenue | | | 5.25 | % | | 07/01/22 | | | 500,000 | | | | 504,855 | | |
| Guam 1.16% | |
Guam Education Financing Foundation
Certificate of Participation, Series A | | | 4.25 | % | | 10/01/18 | | | 250,000 | | | | 252,015 | | |
| Illinois 9.17% | |
| Chicago Board of Education, GO Unlimited | | | 5.25 | % | | 12/01/19 | | | 300,000 | | | | 356,472 | | |
| Chicago, Illinois Water Revenue, Refunding | | | 5.75 | % | | 11/01/30 | | | 225,000 | | | | 268,119 | | |
| City Colleges of Chicago, GO Unlimited | | | 5.00 | % | | 01/01/17 | | | 115,000 | | | | 131,128 | | |
| Du Page County, Refunding, GO Unlimited | | | 5.60 | % | | 01/01/21 | | | 490,000 | | | | 598,550 | | |
| Illinois Finance Authority, Refunding, Series A | | | 5.00 | % | | 10/01/14 | | | 150,000 | | | | 163,525 | | |
Illinois Regional Transportation Authority
Revenue, Series A | | | 7.20 | % | | 11/01/20 | | | 220,000 | | | | 264,618 | | |
State of Illinois, First Series, Refunding,
GO Unlimited | | | 5.50 | % | | 08/01/19 | | | 200,000 | | | | 204,702 | | |
| | | | 1,987,114 | | |
| Indiana 1.50% | |
Indianapolis Local Public Improvement
Bond Bank, Waterworks Project,
Series 2007 L | | | 5.25 | % | | 01/01/33 | | | 305,000 | | | | 325,459 | | |
See notes to portfolios of investments and notes to financial statements.
88
Portfolio of Investments December 31, 2011
Tax Free Fund
| Municipal Bonds | | Coupon
Rate | | Maturity
Date | | Principal
Amount | | Value | |
| Kansas 5.20% | |
Kansas State Development Finance Authority
Revenue | | | 4.00 | % | | 10/01/15 | | $ | 250,000 | | | $ | 276,095 | | |
Kansas State Development Finance Authority,
Hospital Revenue, Series Z | | | 5.00 | % | | 12/15/12 | | | 260,000 | | | | 260,289 | | |
University of Kansas Hospital Authority
Health Facilities Revenue | | | 5.63 | % | | 09/01/27 | | | 570,000 | | | | 589,938 | | |
| | | | 1,126,322 | | |
| Kentucky 1.11% | |
Bowling Green, Kentucky, GO Unlimited,
Series B | | | 4.00 | % | | 09/01/16 | | | 215,000 | | | | 241,034 | | |
| Massachusetts 1.62% | |
Massachusetts Bay Transportation Authority,
Massachusetts Sales Tax Revenue,
Refunding, Series A-1 | | | 5.25 | % | | 07/01/30 | | | 285,000 | | | | 350,271 | | |
| Michigan 4.52% | |
Detroit, Michigan Local Development Financing
Authority, Refunding, Series A | | | 5.38 | % | | 05/01/18 | | | 255,000 | | | | 201,662 | | |
Detroit, Michigan Water Supply System
Revenue, Series B | | | 5.00 | % | | 07/01/16 | | | 430,000 | | | | 471,353 | | |
| Macomb County Building Authority, GO Limited | | | 4.50 | % | | 11/01/23 | | | 300,000 | | | | 305,238 | | |
| | | | 978,253 | | |
| Missouri 1.38% | |
| Kansas City Water Revenue | | | 4.00 | % | | 12/01/22 | | | 250,000 | | | | 298,770 | | |
| Nevada 1.19% | |
| Nye County School District, GO Limited | | | 4.00 | % | | 05/01/15 | | | 235,000 | | | | 256,928 | | |
| New Hampshire 2.22% | |
Manchester, New Hampshire School Facilities
Revenue, Refunding | | | 5.50 | % | | 06/01/26 | | | 300,000 | | | | 383,943 | | |
New Hampshire Health & Education Facilities
Authority Revenue | | | 5.00 | % | | 07/01/14 | | | 95,000 | | | | 97,392 | | |
| | | | 481,335 | | |
| New York 1.93% | |
Metropolitan Transportation Authority,
New York, Revenue, Series A | | | 5.00 | % | | 11/15/41 | | | 400,000 | | | | 418,036 | | |
See notes to portfolios of investments and notes to financial statements.
89
Portfolio of Investments December 31, 2011
Tax Free Fund
| Municipal Bonds | | Coupon
Rate | | Maturity
Date | | Principal
Amount | | Value | |
| Ohio 1.83% | |
Lorain County, Ohio, Community College
District Revenue | | | 3.25 | % | | 12/01/17 | | $ | 300,000 | | | $ | 320,268 | | |
South Euclid Special Assessment,
GO Limited Tax | | | 6.70 | % | | 12/01/14 | | | 70,000 | | | | 76,915 | | |
| | | | 397,183 | | |
| Puerto Rico 1.23% | |
| Commonwealth of Puerto Rico, GO Unlimited | | | 6.00 | % | | 07/01/13 | | | 250,000 | | | | 266,235 | | |
| Rhode Island 2.39% | |
Rhode Island State Health & Educational
Building Corporation Revenue | | | 6.50 | % | | 08/15/32 | | | 500,000 | | | | 518,340 | | |
| South Carolina 0.69% | |
South Carolina Jobs Economic Development
Authority Revenue | | | 5.00 | % | | 11/01/23 | | | 150,000 | | | | 149,196 | | |
| Tennessee 1.15% | |
Memphis, Tennessee Sanitary Sewage
System Revenue, Refunding | | | 5.00 | % | | 05/01/20 | | | 200,000 | | | | 248,904 | | |
| Texas 17.98% | |
| Center, Texas, GO Limited (ZCB) | | | 3.50 | %(1) | | 02/15/20 | | | 150,000 | | | | 122,917 | | |
Dallas, Texas Waterworks & Sewer Systems
Revenue, Refunding | | | 4.50 | % | | 10/01/19 | | | 225,000 | | | | 259,436 | | |
Duncanville, Texas Independent School District,
GO Unlimited, Prerefunded, Series B | | | 5.25 | % | | 02/15/32 | | | 495,000 | | | | 497,802 | | |
Duncanville, Texas Independent School District,
GO Unlimited, Unrefunded, Series B | | | 5.25 | % | | 02/15/32 | | | 5,000 | | | | 5,028 | | |
| Forney, Texas, GO Limited | | | 5.00 | % | | 02/15/27 | | | 500,000 | | | | 540,395 | | |
Goose Creek, Texas Independent School District
Schoolhouse, Series A | | | 5.25 | % | | 02/15/18 | | | 370,000 | | | | 445,495 | | |
Greenville, Texas Independent School District,
GO Unlimited, Refunding | | | 4.00 | % | | 08/15/17 | | | 120,000 | | | | 134,741 | | |
Laredo Independent School District Public
Facility Corp., Lease Revenue, Series F | | | 5.50 | % | | 08/01/24 | | | 100,000 | | | | 100,108 | | |
North Texas Tollway Authority Revenue,
Series F | | | 5.75 | % | | 01/01/38 | | | 250,000 | | | | 260,650 | | |
Prosper, Texas Independent School District,
Capital Appreciation, School Building,
GO Unlimited (ZCB) | | | 6.00 | %(1) | | 08/15/33 | | | 1,000,000 | | | | 341,890 | | |
San Marcos, Texas Tax & Toll Revenue,
GO Limited | | | 5.10 | % | | 08/15/27 | | | 400,000 | | | | 443,944 | | |
See notes to portfolios of investments and notes to financial statements.
90
Portfolio of Investments December 31, 2011
Tax Free Fund
| Municipal Bonds | | Coupon
Rate | | Maturity
Date | | Principal
Amount | | Value | |
| Texas (Cont'd) | |
Tarrant County, Texas Cultural Education
Facilities Finance Corp., Health Resources
Revenue, Refunding, Series A | | | 5.00 | % | | 02/15/36 | | $ | 400,000 | | | $ | 408,108 | | |
White Settlement, Texas Independent School
District, GO Unlimited | | | 4.13 | % | | 08/15/15 | | | 300,000 | | | | 334,410 | | |
| | | | 3,894,924 | | |
| Utah 2.75% | |
Utah State Building Ownership Authority,
Lease Revenue, Refunding, Series C | | | 5.50 | % | | 05/15/19 | | | 500,000 | | | | 596,860 | | |
| Washington 1.29% | |
Spokane County, Washington School District,
No. 81, GO Unlimited | | | 5.05 | % | | 06/01/22 | | | 255,000 | | | | 279,419 | | |
| Total Municipal Bonds | | | 19,479,558 | | |
| (cost $18,352,311) | |
Repurchase Agreement 9.09%
Joint Tri-Party Repurchase Agreement, Credit
Suisse Securities USA LLC, 12/30/2011, 0.02%,
due 1/3/2012, repurchase price $1,969,174,
collateralized by U.S. Treasury securities
held in a joint tri-party account
(cost $1,969,170) | | | 0.02 | % | | 01/03/12 | | | 1,969,170 | | | | 1,969,170 | | |
| Total Investments 99.01% | | | 21,448,728 | | |
| (cost $20,321,481) | |
| Other assets and liabilities, net 0.99% | | | 214,594 | | |
| Net Assets 100% | | $ | 21,663,322 | | |
(1)Represents Yield
See notes to portfolios of investments and notes to financial statements.
91
Portfolio of Investments December 31, 2011
All American Equity Fund
| Common Stocks 89.54% | | Shares | | Value | |
| Aerospace/Defense 2.20% | |
| Lockheed Martin Corp. | | | 2,300 | | | $ | 186,070 | | |
| Northrop Grumman Corp. | | | 3,000 | | | | 175,440 | | |
| | | | 361,510 | | |
| Agricultural Chemicals 1.33% | |
| CF Industries Holdings, Inc. | | | 1,500 | | | | 217,470 | | |
| Applications Software 0.91% | |
| Compuware Corp. | | | 18,000 | | | | 149,760 | * | |
| Beverages - Non-alcoholic 4.08% | |
| The Coca-Cola Co. | | | 2,800 | | | | 195,916 | | |
| Dr Pepper Snapple Group, Inc. | | | 5,000 | | | | 197,400 | | |
| Hansen Natural Corp. | | | 3,000 | | | | 276,420 | * | |
| | | | 669,736 | | |
| Cable/Satellite TV 0.96% | |
| DIRECTV, Class A | | | 3,700 | | | | 158,212 | * | |
| Chemicals - Diversified 1.90% | |
| Dow Chemical Co. | | | 5,000 | | | | 143,800 | | |
| PPG Industries, Inc. | | | 2,000 | | | | 166,980 | | |
| | | | 310,780 | | |
| Coatings/Paint 1.09% | |
| Sherwin-Williams Co. | | | 2,000 | | | | 178,540 | | |
| Commercial Services - Financial 3.41% | |
| MasterCard, Inc., Class A | | | 1,500 | | | | 559,230 | | |
| Computers 4.24% | |
| Apple, Inc. | | | 1,400 | | | | 567,000 | *^ | |
| Hewlett-Packard Co. | | | 5,000 | | | | 128,800 | | |
| | | | 695,800 | | |
| Containers - Metal/Glass 1.09% | |
| Ball Corp. | | | 5,000 | | | | 178,550 | * | |
| Containers - Paper/Plastic 1.05% | |
| Bemis Co., Inc. | | | 5,700 | | | | 171,456 | | |
| Data Processing/Management 0.97% | |
| Fidelity National Information Services, Inc. | | | 6,000 | | | | 159,540 | * | |
See notes to portfolios of investments and notes to financial statements.
92
Portfolio of Investments December 31, 2011
All American Equity Fund
| Common Stocks | | Shares | | Value | |
| Disposable Medical Products 1.04% | |
| CR Bard, Inc. | | | 2,000 | | | $ | 171,000 | | |
| Diversified Manufacturing Operations 1.09% | |
| General Electric Co. | | | 10,000 | | | | 179,100 | | |
| Electric - Integrated 3.24% | |
| Dominion Resources, Inc. | | | 3,200 | | | | 169,856 | | |
| Entergy Corp. | | | 2,700 | | | | 197,235 | | |
| Exelon Corp. | | | 3,800 | | | | 164,806 | | |
| | | | 531,897 | | |
| Electric Products - Miscellaneous 0.99% | |
| Emerson Electric Co. | | | 3,500 | | | | 163,065 | | |
| Electronic Components - Semiconductors 2.07% | |
| Intel Corp. | | | 14,000 | | | | 339,500 | | |
| Electronic Measuring Instruments 1.07% | |
| Agilent Technologies, Inc. | | | 5,000 | | | | 174,650 | * | |
| Electronics - Military 0.94% | |
| L-3 Communications Holdings, Inc. | | | 2,300 | | | | 153,364 | | |
| Engines - Internal Combustion 1.07% | |
| Cummins, Inc. | | | 2,000 | | | | 176,040 | | |
| Enterprise Software/Services 1.02% | |
| Oracle Corp. | | | 6,500 | | | | 166,725 | | |
| Finance - Other Services 2.09% | |
| CME Group, Inc., Class A | | | 700 | | | | 170,569 | | |
| The NASDAQ OMX Group, Inc. | | | 7,000 | | | | 171,570 | * | |
| | | | 342,139 | | |
| Food - Miscellaneous/Diversified 2.11% | |
| ConAgra Foods, Inc. | | | 6,500 | | | | 171,600 | | |
| Sara Lee Corp. | | | 9,200 | | | | 174,064 | | |
| | | | 345,664 | | |
| Food - Retail 1.10% | |
| Safeway, Inc. | | | 8,600 | | | | 180,944 | | |
See notes to portfolios of investments and notes to financial statements.
93
Portfolio of Investments December 31, 2011
All American Equity Fund
| Common Stocks | | Shares | | Value | |
| Gas - Distribution 1.01% | |
| Sempra Energy | | | 3,000 | | | $ | 165,000 | | |
| Independent Power Producer 0.91% | |
| NRG Energy, Inc. | | | 8,200 | | | | 148,584 | * | |
| Industrial Gases 1.00% | |
| Airgas, Inc. | | | 2,100 | | | | 163,968 | | |
| Instruments - Controls 1.66% | |
| Honeywell International, Inc. | | | 5,000 | | | | 271,750 | ^ | |
| Internet Security 1.20% | |
| VeriSign, Inc. | | | 5,500 | | | | 196,460 | | |
| Life/Health Insurance 1.09% | |
| Torchmark Corp. | | | 4,100 | | | | 177,899 | | |
| Linen Supply & Related Items 1.17% | |
| Cintas Corp. | | | 5,500 | | | | 191,455 | * | |
| Machinery - Construction & Mining 1.38% | |
| Caterpillar, Inc. | | | 2,500 | | | | 226,500 | | |
| Medical - Biomedical/Gene 0.82% | |
| Celgene Corp. | | | 2,000 | | | | 135,200 | * | |
| Medical - HMO 2.04% | |
| Aetna, Inc. | | | 4,000 | | | | 168,760 | | |
| WellPoint, Inc. | | | 2,500 | | | | 165,625 | | |
| | | | 334,385 | | |
| Medical Labs & Testing Services 1.13% | |
| Quest Diagnostics, Inc. | | | 3,200 | | | | 185,792 | | |
| Multi-line Insurance 1.25% | |
| Assurant, Inc. | | | 5,000 | | | | 205,300 | | |
| Oil - Field Services 2.21% | |
| Halliburton Co. | | | 10,500 | | | | 362,355 | | |
| Oil & Gas Drilling 0.84% | |
| Diamond Offshore Drilling, Inc. | | | 2,500 | | | | 138,150 | | |
See notes to portfolios of investments and notes to financial statements.
94
Portfolio of Investments December 31, 2011
All American Equity Fund
| Common Stocks | | Shares | | Value | |
| Oil Companies - Exploration & Production 1.75% | |
| Denbury Resources, Inc. | | | 10,000 | | | $ | 151,000 | * | |
| Devon Energy Corp. | | | 2,200 | | | | 136,400 | | |
| | | | 287,400 | | |
| Oil Companies - Integrated 2.25% | |
| ConocoPhillips | | | 2,500 | | | | 182,175 | | |
| Exxon Mobil Corp. | | | 2,200 | | | | 186,472 | | |
| | | | 368,647 | | |
| Oil Field Machinery & Equipment 1.20% | |
| Cameron International Corp. | | | 4,000 | | | | 196,760 | * | |
| Oil Refining & Marketing 1.05% | |
| Sunoco, Inc. | | | 4,200 | | | | 172,284 | | |
| Pharmacy Services 1.02% | |
| Medco Health Solutions, Inc. | | | 3,000 | | | | 167,700 | * | |
| Printing - Commercial 0.92% | |
| RR Donnelley & Sons Co. | | | 10,400 | | | | 150,072 | | |
| Property/Casualty Insurance 2.10% | |
| Chubb Corp. | | | 2,400 | | | | 166,128 | | |
| The Travelers Cos., Inc. | | | 3,000 | | | | 177,510 | | |
| | | | 343,638 | | |
| Publishing - Newspapers 1.98% | |
| Gannett Co., Inc. | | | 13,000 | | | | 173,810 | | |
| The Washington Post Co., Class B | | | 400 | | | | 150,724 | | |
| | | | 324,534 | | |
| Retail - Apparel/Shoe 1.02% | |
| The Gap, Inc. | | | 9,000 | | | | 166,950 | | |
| Retail - Auto Parts 0.99% | |
| AutoZone, Inc. | | | 500 | | | | 162,485 | * | |
| Retail - Regional Department Stores 1.05% | |
| Kohl's Corp. | | | 3,500 | | | | 172,725 | | |
| Retail - Restaurants 3.09% | |
| Starbucks Corp. | | | 11,000 | | | | 506,110 | | |
See notes to portfolios of investments and notes to financial statements.
95
Portfolio of Investments December 31, 2011
All American Equity Fund
| Common Stocks | | Shares | | Value | |
| Semiconductor Equipment 1.38% | |
| Novellus Systems, Inc. | | | 5,500 | | | $ | 227,095 | * | |
| Semiconductors Components/Integrated Circuts 1.60% | |
| QUALCOMM, Inc. | | | 4,800 | | | | 262,560 | | |
| Software Tools 1.27% | |
| VMware, Inc., Class A | | | 2,500 | | | | 207,975 | * | |
| Telephone - Integrated 4.24% | |
| AT&T, Inc. | | | 6,500 | | | | 196,560 | | |
| Frontier Communications Corp. | | | 30,000 | | | | 154,500 | | |
| Verizon Communications, Inc. | | | 4,500 | | | | 180,540 | | |
| Windstream Corp. | | | 14,000 | | | | 164,360 | | |
| | | | 695,960 | | |
| Tobacco 1.18% | |
| Lorillard, Inc. | | | 1,700 | | | | 193,800 | | |
| Web Portals/Internet Service Providers 1.58% | |
| Google, Inc., Class A | | | 400 | | | | 258,360 | * | |
| Wireless Equipment 1.10% | |
| American Tower Corp., Class A | | | 3,000 | | | | 180,030 | | |
| Total Common Stocks | | | 14,682,555 | | |
| (cost $14,352,825) | |
Exchange-Traded Funds (ETF) 0.82%
| iShares Silver Trust | | | 500 | | | | 13,470 | * | |
| SPDR Gold Trust | | | 800 | | | | 121,592 | * | |
| Total Exchange-Traded Funds | | | 135,062 | | |
| (cost $145,113) | |
See notes to portfolios of investments and notes to financial statements.
96
Portfolio of Investments December 31, 2011
All American Equity Fund
| Purchased Option 0.00% | | Contracts | | Value | |
| Diversified Banking Institutions 0.00% | |
| Citigroup, Inc., Strike Price 7.5, Call, Expiration Jan. 2012 | | | 800 | | | $ | 800 | | |
| (premium $30,300) | |
| Total Securities | | | 14,818,417 | | |
| (cost $14,528,238) | |
| Repurchase Agreement 10.00% | | Principal
Amount | | | |
Joint Tri-Party Repurchase Agreement, Credit Suisse Securities USA LLC,
12/30/2011, 0.02%, due 1/3/2012, repurchase price $1,639,169,
collateralized by U.S. Treasury securities held in a joint tri-party
account (cost $1,639,166) | | $ | 1,639,166 | | | | 1,639,166 | | |
| Total Investments 100.36% | | | 16,457,583 | | |
| (cost $16,167,404) | |
| Other assets and liabilities, net (0.36%) | | | (58,964 | ) | |
| Net Assets 100% | | $ | 16,398,619 | | |
| Call Options Written | | Shares Subject
To Call | | | |
| Apple, Inc., Strike Price 405, Expiration Jan. 2012 | | | 1,400 | | | $ | 15,750 | | |
| Honeywell International, Inc., Strike Price 55, Expiration Jan. 2012 | | | 5,000 | | | | 5,200 | | |
| Total Call Options Written | | $ | 20,950 | | |
| (premiums received $20,369) (Note 2A) | |
See notes to portfolios of investments and notes to financial statements.
97
Portfolio of Investments December 31, 2011
Holmes Growth Fund
| Common Stocks 80.05% | | Shares | | Value | |
| Agricultural Chemicals 1.23% | |
| CF Industries Holdings, Inc. | | | 3,000 | | | $ | 434,940 | | |
| Agricultural Operations 0.06% | |
| Agriterra Ltd. | | | 500,000 | | | | 22,715 | * | |
| Beverages - Non-alcoholic 1.70% | |
| Hansen Natural Corp. | | | 6,500 | | | | 598,910 | * | |
| Building - Heavy Construction 1.07% | |
| Chicago Bridge & Iron Co. N.V., Class NY | | | 10,000 | | | | 378,000 | | |
| Chemicals - Diversified 1.04% | |
| EI du Pont de Nemours & Co. | | | 8,000 | | | | 366,240 | | |
| Commercial Services - Financial 5.92% | |
| Cardtronics, Inc. | | | 20,000 | | | | 541,200 | * | |
| DFC Global Corp. | | | 30,000 | | | | 541,800 | * | |
| MasterCard, Inc., Class A | | | 2,700 | | | | 1,006,614 | | |
| | | | 2,089,614 | | |
| Computers 4.59% | |
| Apple, Inc. | | | 4,000 | | | | 1,620,000 | *^ | |
| Electronic Components - Semiconductors 2.34% | |
| Intel Corp. | | | 34,000 | | | | 824,500 | | |
| Electronic Design Automation 1.77% | |
| Cadence Design Systems, Inc. | | | 60,000 | | | | 624,000 | * | |
| Electronic Measuring Instruments 1.48% | |
| Agilent Technologies, Inc. | | | 15,000 | | | | 523,950 | * | |
| Engineering/R&D Services 1.07% | |
| ABB Ltd., Sponsored ADR | | | 20,000 | | | | 376,600 | | |
| Engines - Internal Combustion 0.87% | |
| Cummins, Inc. | | | 3,500 | | | | 308,070 | | |
| Enterprise Software/Services 2.54% | |
| Open Text Corp. | | | 10,000 | | | | 511,400 | * | |
| Oracle Corp. | | | 15,000 | | | | 384,750 | | |
| | | | 896,150 | | |
See notes to portfolios of investments and notes to financial statements.
98
Portfolio of Investments December 31, 2011
Holmes Growth Fund
| Common Stocks | | Shares | | Value | |
| Finance - Commercial 0.93% | |
| IOU Financial, Inc. | | | 20,000 | | | $ | 4,319 | *+ | |
| IOU Financial, Inc., 144A | | | 1,500,000 | | | | 323,926 | *+ | |
| | | | 328,245 | | |
| Finance - Investment Banker/Broker 0.01% | |
| Rodman & Renshaw Capital Group, Inc. | | | 10,000 | | | | 4,105 | * | |
| Finance - Leasing Company 1.05% | |
| SeaCube Container Leasing Ltd. | | | 25,000 | | | | 370,250 | * | |
| Footwear & Related Apparel 0.98% | |
| Steven Madden Ltd. | | | 10,000 | | | | 345,000 | * | |
| Gold Mining 0.47% | |
| Endeavour Mining Corp. | | | 70,000 | | | | 166,969 | * | |
| Instruments - Controls 1.69% | |
| Honeywell International, Inc. | | | 11,000 | | | | 597,850 | ^ | |
| Machinery - Construction & Mining 1.03% | |
| Caterpillar, Inc. | | | 4,000 | | | | 362,400 | | |
| Medical - Biomedical/Gene 0.86% | |
| Celgene Corp. | | | 4,500 | | | | 304,200 | * | |
| Medical - Drugs 1.09% | |
| Jazz Pharmaceuticals, Inc. | | | 10,000 | | | | 386,300 | * | |
| Medical - Generic Drugs 1.38% | |
| Perrigo Co. | | | 5,000 | | | | 486,500 | | |
| Medical - Hospitals 2.12% | |
| African Medical Investments plc | | | 1,000,000 | | | | 48,536 | * | |
| Health Management Associates, Inc., Class A | | | 95,000 | | | | 700,150 | * | |
| | | | 748,686 | | |
| Medical Instruments 1.31% | |
| Intuitive Surgical, Inc. | | | 1,000 | | | | 463,010 | *^ | |
| Metal - Iron 0.28% | |
| Pacific Iron Corp. (RS) | | | 100,000 | | | | 100,000 | *@ | |
See notes to portfolios of investments and notes to financial statements.
99
Portfolio of Investments December 31, 2011
Holmes Growth Fund
| Common Stocks | | Shares | | Value | |
| Oil - Field Services 11.05% | |
| C&J Energy Services, Inc. | | | 40,000 | | | $ | 837,200 | * | |
| CARBO Ceramics, Inc. | | | 5,000 | | | | 616,650 | | |
| Core Laboratories N.V. | | | 10,000 | | | | 1,139,500 | | |
| Halliburton Co. | | | 30,000 | | | | 1,035,300 | | |
| RPC, Inc. | | | 15,000 | | | | 273,750 | | |
| | | | 3,902,400 | | |
| Oil Companies - Exploration & Production 2.23% | |
| Gulfport Energy Corp. | | | 14,000 | | | | 412,300 | * | |
| PetroMagdalena Energy Corp. | | | 121,600 | | | | 145,622 | * | |
| PetroMagdalena Energy Corp., 144A | | | 192,857 | | | | 230,955 | * | |
| | | | 788,877 | | |
| Property/Casualty Insurance 0.67% | |
| Amtrust Financial Services, Inc. | | | 10,000 | | | | 237,500 | | |
| Quarrying 1.08% | |
| Pacific Stone Tech, Inc. (RS) | | | 1,757 | | | | 380,000 | @ | |
| Radio 7.28% | |
| Newfoundland Capital Corp., Ltd., Class A | | | 328,700 | | | | 2,571,523 | * | |
| Real Estate Operating/Development 0.28% | |
| Pacific Infrastructure, Inc. (RS) | | | 100,000 | | | | 100,000 | *@ | |
| Recreational Vehicles 1.90% | |
| Polaris Industries, Inc. | | | 12,000 | | | | 671,760 | * | |
| Retail - Apparel/Shoe 3.04% | |
| Body Central Corp. | | | 43,000 | | | | 1,073,280 | * | |
| Retail - Gardening Products 0.99% | |
| Tractor Supply Co. | | | 5,000 | | | | 350,750 | | |
| Retail - Perfume & Cosmetics 2.30% | |
| Ulta Salon Cosmetics & Fragrance, Inc. | | | 12,500 | | | | 811,500 | * | |
| Retail - Restaurants 5.20% | |
| Arcos Dorados Holdings, Inc., Class A | | | 30,000 | | | | 615,900 | | |
| Starbucks Corp. | | | 26,500 | | | | 1,219,265 | | |
| | | | 1,835,165 | | |
See notes to portfolios of investments and notes to financial statements.
100
Portfolio of Investments December 31, 2011
Holmes Growth Fund
| Common Stocks | | Shares | | Value | |
| Semiconductors Components/Integrated Circuits 1.55% | |
| QUALCOMM, Inc. | | | 10,000 | | | $ | 547,000 | | |
| Software Tools 1.41% | |
| VMware, Inc., Class A | | | 6,000 | | | | 499,140 | * | |
| Transportation - Marine 1.75% | |
| CAI International, Inc. | | | 40,000 | | | | 618,400 | * | |
| Vitamins & Nutrition Products 0.44% | |
| Herbalife Ltd. | | | 3,000 | | | | 155,010 | | |
| Total Common Stocks | | | 28,269,509 | | |
| (cost $27,556,715) | |
Exchange-Traded Funds (ETF) 0.81%
| iShares Silver Trust | | | 1,000 | | | | 26,940 | * | |
| SPDR Gold Trust | | | 1,700 | | | | 258,383 | * | |
| Total Exchange-Traded Funds | | | 285,323 | | |
| (cost $311,235) | |
Warrants 0.09%
| Finance - Commercial 0.00% | |
| IOU Financial, Inc., 144A, Warrants (February 2012) | | | 1,250,000 | | | | 0 | *@ | |
| Medical - Hospitals 0.00% | |
| African Medical Investments plc, Warrants (June 2014) | | | 500,000 | | | | 0 | *@ | |
| Oil Companies - Exploration & Production 0.09% | |
| PetroMagdalena Energy Corp., 144A, Warrants (February 2016) | | | 96,429 | | | | 32,183 | * | |
| Total Warrants | | | 32,183 | | |
| (cost $0) | |
See notes to portfolios of investments and notes to financial statements.
101
Portfolio of Investments December 31, 2011
Holmes Growth Fund
| Convertible Debenture 0.28% | | Principal
Amount | | Value | |
| Metal - Iron 0.28% | |
| Pacific Iron Corp., 1.00%, maturity 06/07/12 (RS) | | $ | 100,000 | | | $ | 100,000 | @ | |
| (cost $100,000) | |
| Total Securities | | | 28,687,015 | | |
| (cost $27,967,950) | |
Repurchase Agreement 18.80%
Joint Tri-Party Repurchase Agreement, Credit Suisse Securities USA LLC,
12/30/2011, 0.02%, due 1/3/2012, repurchase price $6,637,749,
collateralized by U.S. Treasury securities held in a joint tri-party
account (cost $6,637,735) | | | 6,637,735 | | | | 6,637,735 | | |
| Total Investments 100.03% | | | 35,324,750 | | |
| (cost $34,605,685) | |
| Other assets and liabilities, net (0.03%) | | | (9,220 | ) | |
| Net Assets 100% | | $ | 35,315,530 | | |
| Call Options Written | | Shares Subject
To Call | | | |
| Apple, Inc., Strike Price 405, Expiration Jan. 2012 | | | 4,000 | | | $ | 45,000 | | |
| Honeywell International, Inc., Strike Price 55, Expiration Jan. 2012 | | | 11,000 | | | | 11,440 | | |
| Intuitive Surgical, Inc., Strike Price 470, Expiration Jan. 2012 | | | 1,000 | | | | 14,620 | | |
| Total Call Options Written | | $ | 71,060 | | |
| (premiums received $67,931) (Note 2A) | |
See notes to portfolios of investments and notes to financial statements.
102
Portfolio of Investments December 31, 2011
Global MegaTrends Fund
| Common Stocks 78.63% | | Shares | | Value | |
| Advanced Materials/Products 1.99% | |
| POSCO Chemtech Co., Ltd. | | | 1,869 | | | $ | 296,188 | * | |
| Agricultural Chemicals 1.46% | |
| CF Industries Holdings, Inc. | | | 1,500 | | | | 217,470 | | |
| Agricultural Operations 0.15% | |
| Agriterra Ltd. | | | 500,000 | | | | 22,715 | * | |
| Airport Development/Maintenance 1.20% | |
| TAV Havalimanlari Holding A.S. | | | 41,700 | | | | 178,304 | * | |
| Automotive - Cars & Light Trucks 0.54% | |
| Great Wall Motor Co., Ltd., H shares | | | 55,000 | | | | 80,305 | | |
| Building - Heavy Construction 1.57% | |
| Chicago Bridge & Iron Co. N.V., Class NY | | | 4,500 | | | | 170,100 | | |
| China Railway Construction Corp. Ltd., H shares | | | 115,000 | | | | 63,226 | | |
| | | | 233,326 | | |
| Building Products - Cement/Aggregates 2.70% | |
| PT Holcim Indonesia Tbk | | | 1,011,700 | | | | 242,674 | | |
| PT Indocement Tunggal Prakarsa Tbk | | | 85,000 | | | | 159,829 | * | |
| | | | 402,503 | | |
| Cellular Telecommunications 0.48% | |
| Vodacom Group Ltd. | | | 6,500 | | | | 71,662 | | |
| Coal 0.40% | |
| Pacific Coal Resources Ltd. | | | 29,600 | | | | 12,494 | * | |
| Pacific Coal Resources Ltd., 144A | | | 111,111 | | | | 46,898 | * | |
| | | | 59,392 | | |
| Commercial Services - Financial 3.75% | |
| MasterCard, Inc., Class A | | | 1,500 | | | | 559,230 | | |
| Diversified Manufacturing Operations 3.00% | |
| General Electric Co. | | | 25,000 | | | | 447,750 | | |
| Diversified Operations 2.48% | |
| Guangdong Investment Ltd. | | | 240,000 | | | | 145,237 | | |
| Primoris Services Corp. | | | 15,000 | | | | 223,950 | | |
| | | | 369,187 | | |
See notes to portfolios of investments and notes to financial statements.
103
Portfolio of Investments December 31, 2011
Global MegaTrends Fund
| Common Stocks | | Shares | | Value | |
| Electric - Generation 0.16% | |
| Pacific Power Generation Corp. (RS) | | | 349,057 | | | $ | 23,358 | *@ | |
| Electric - Integrated 2.53% | |
| PPL Corp. | | | 6,500 | | | | 191,230 | | |
| Southern Co. | | | 4,000 | | | | 185,160 | | |
| | | | 376,390 | | |
| Electric Products - Miscellaneous 0.44% | |
| Zhuzhou CSR Times Electric Co., Ltd., H shares | | | 30,000 | | | | 65,743 | * | |
| Energy - Alternate Sources 0.67% | |
| Pacific Green Energy Corp. (RS) | | | 100,000 | | | | 100,000 | *@ | |
| Engines - Internal Combustion 1.77% | |
| Cummins, Inc. | | | 3,000 | | | | 264,060 | | |
| Gas - Distribution 3.05% | |
| Indraprastha Gas Ltd. | | | 8,500 | | | | 60,029 | * | |
| Keyera Corp. | | | 7,000 | | | | 343,558 | * | |
| NGL Energy Partners L.P. | | | 2,500 | | | | 51,625 | * | |
| | | | 455,212 | | |
| Gold Mining 0.26% | |
| Gran Colombia Gold Corp. | | | 77,100 | | | | 39,354 | * | |
| Investment Companies 1.45% | |
| NGP Capital Resources Co. | | | 30,000 | | | | 215,700 | * | |
| Machinery - Construction & Mining 4.13% | |
| Caterpillar, Inc. | | | 3,000 | | | | 271,800 | | |
| Joy Global, Inc. | | | 2,500 | | | | 187,425 | | |
| PT United Tractors Tbk | | | 54,000 | | | | 156,923 | | |
| | | | 616,148 | | |
| Machinery - General Industrial 2.72% | |
| Chart Industries, Inc. | | | 7,500 | | | | 405,525 | * | |
| Marine Services 1.07% | |
| Teekay Offshore Partners L.P. | | | 6,000 | | | | 159,600 | * | |
See notes to portfolios of investments and notes to financial statements.
104
Portfolio of Investments December 31, 2011
Global MegaTrends Fund
| Common Stocks | | Shares | | Value | |
| Medical - Hospitals 2.29% | |
| Bumrungrad Hospital PCL | | | 110,000 | | | $ | 162,046 | * | |
| Life Healthcare Group Holdings Ltd. | | | 70,000 | | | | 178,976 | | |
| | | | 341,022 | | |
| Metal - Copper 2.47% | |
| Freeport-McMoRan Copper & Gold, Inc. | | | 10,000 | | | | 367,900 | | |
| Metal - Diversified 0.24% | |
| Ivanhoe Mines Ltd. | | | 2,000 | | | | 35,440 | * | |
| Metal - Iron 0.67% | |
| Pacific Iron Corp. (RS) | | | 100,000 | | | | 100,000 | *@ | |
| Oil - Field Services 5.27% | |
| CARBO Ceramics, Inc. | | | 1,500 | | | | 184,995 | | |
| Core Laboratories N.V. | | | 3,000 | | | | 341,850 | | |
| Halliburton Co. | | | 7,500 | | | | 258,825 | | |
| | | | 785,670 | | |
| Oil - US Royalty Trusts 0.76% | |
| San Juan Basin Royalty Trust | | | 5,000 | | | | 113,800 | * | |
| Oil & Gas Drilling 0.60% | |
| Seadrill Ltd. | | | 2,700 | | | | 89,586 | | |
| Oil Companies - Exploration & Production 1.09% | |
| PetroMagdalena Energy Corp. | | | 36,071 | | | | 43,197 | * | |
| PetroMagdalena Energy Corp., 144A | | | 100,000 | | | | 119,754 | * | |
| | | | 162,951 | | |
| Oil Field Machinery & Equipment 5.30% | |
| Cameron International Corp. | | | 6,000 | | | | 295,140 | * | |
| Mitcham Industries, Inc. | | | 4,000 | | | | 87,360 | * | |
| National-Oilwell Varco, Inc. | | | 6,000 | | | | 407,940 | | |
| | | | 790,440 | | |
| Pipelines 2.49% | |
| TransCanada Corp. | | | 8,500 | | | | 371,195 | * | |
| Public Thoroughfares 3.57% | |
| CCR S.A. | | | 81,200 | | | | 531,940 | | |
See notes to portfolios of investments and notes to financial statements.
105
Portfolio of Investments December 31, 2011
Global MegaTrends Fund
| Common Stocks | | Shares | | Value | |
| Quarrying 3.49% | |
| Pacific Stone Tech, Inc. (RS) | | | 2,405 | | | $ | 520,000 | @ | |
| Real Estate Management/Services 1.43% | |
| BR Malls Participacoes S.A. | | | 22,000 | | | | 213,565 | | |
| Real Estate Operating/Development 5.08% | |
| Mongolia Growth Group Ltd. | | | 49,000 | | | | 187,583 | * | |
| Pacific Infrastructure, Inc. (RS) | | | 326,533 | | | | 326,533 | *@ | |
| PT Alam Sutera Realty Tbk | | | 3,188,000 | | | | 161,729 | * | |
| Renhe Commercial Holdings Co., Ltd. | | | 708,000 | | | | 81,132 | | |
| | | | 756,977 | | |
| Transportation - Marine 2.22% | |
| Genco Shipping & Trading Ltd. | | | 10,000 | | | | 67,600 | * | |
| Kirby Corp. | | | 4,000 | | | | 263,360 | * | |
| | | | 330,960 | | |
| Transportation - Rail 3.69% | |
| CSX Corp. | | | 12,300 | | | | 259,038 | | |
| Norfolk Southern Corp. | | | 4,000 | | | | 291,440 | | |
| | | | 550,478 | | |
| Total Common Stocks | | | 11,721,046 | | |
| (cost $11,219,815) | |
Exchange-Traded Funds (ETF) 1.57%
| Alerian MLP ETF | | | 6,000 | | | | 99,720 | * | |
| iShares Silver Trust | | | 500 | | | | 13,470 | * | |
| SPDR Gold Trust | | | 800 | | | | 121,592 | * | |
| Total Exchange-Traded Funds | | | 234,782 | | |
| (cost $233,693) | |
Warrants 0.13%
| Coal 0.02% | |
| Pacific Coal Resources Ltd., 144A, Warrants (March 2016) | | | 55,555 | | | | 2,727 | * | |
See notes to portfolios of investments and notes to financial statements.
106
Portfolio of Investments December 31, 2011
Global MegaTrends Fund
| Warrants | | Shares | | Value | |
| Oil Companies - Exploration & Production 0.11% | |
| PetroMagdalena Energy Corp., 144A, Warrants (February 2016) | | | 50,000 | | | $ | 16,687 | * | |
| Total Warrants | | | 19,414 | | |
| (cost $0) | |
| Purchased Option 0.01% | | Contracts | | | |
| Exchange-Traded Funds (ETF) 0.01% | |
Oil Services Holders Trust, Strike Price 129.1, Call, Expiration Jan. 2012
(premium $33,413) | | | 25 | | | | 1,500 | | |
| Master Limited Partnerships 7.90% | | Units | | | |
| Pipelines 6.42% | |
| El Paso Pipeline Partners, L.P. | | | 7,000 | | | | 242,340 | * | |
| Enterprise Products Partners, L.P. | | | 4,300 | | | | 199,434 | * | |
| NuStar Energy L.P. | | | 5,000 | | | | 283,300 | * | |
| ONEOK Partners, L.P. | | | 4,000 | | | | 230,960 | *^ | |
| | | | 956,034 | | |
| Transportation - Marine 1.48% | |
| Navios Maritime Partners L.P. | | | 15,000 | | | | 221,100 | * | |
| Total Master Limited Partnerships | | | 1,177,134 | | |
| (cost $1,069,576) | |
| Convertible Debenture 0.67% | | Principal
Amount | | | |
| Metal - Iron 0.67% | |
| Pacific Iron Corp., 1.00%, maturity 06/07/12 (RS) | | $ | 100,000 | | | | 100,000 | @ | |
| (cost $100,000) | |
| Total Securities | | | 13,253,876 | | |
| (cost $12,656,497) | |
See notes to portfolios of investments and notes to financial statements.
107
Portfolio of Investments December 31, 2011
Global MegaTrends Fund
| Repurchase Agreement 11.56% | | Principal
Amount | | Value | |
Joint Tri-Party Repurchase Agreement, Credit Suisse Securities USA LLC,
12/30/2011, 0.02%, due 1/3/2012, repurchase price $1,723,738,
collateralized by U.S. Treasury securities held in a joint tri-party
account (cost $1,723,735) | | $ | 1,723,735 | | | $ | 1,723,735 | | |
| Total Investments 100.47% | | | 14,977,611 | | |
| (cost $14,380,232) | |
| Other assets and liabilities, net (0.47%) | | | (70,174 | ) | |
| Net Assets 100% | | $ | 14,907,437 | | |
| Call Options Written | | Shares Subject
To Call | | | |
| ONEOK Partners L.P., Strike Price 55, Expiration Jan. 2012 | | | 4,000 | | | $ | 11,700 | | |
| (premiums received $4,615) (Note 2A) | |
See notes to portfolios of investments and notes to financial statements.
108
Portfolio of Investments December 31, 2011
Global Resources Fund
| Common Stocks 80.65% | | Shares | | Value | |
| Agricultural Chemicals 5.97% | |
| CF Industries Holdings, Inc. | | | 83,000 | | | $ | 12,033,340 | | |
| Monsanto Co. | | | 172,000 | | | | 12,052,040 | | |
| Potash Corporation of Saskatchewan, Inc. | | | 293,600 | | | | 12,119,808 | | |
| Spur Ventures, Inc. | | | 274,867 | | | | 75,546 | * | |
| | | | 36,280,734 | | |
| Agricultural Operations 2.38% | |
| Agriterra Ltd. | | | 50,972,900 | | | | 2,315,680 | *+ | |
| Bunge Ltd. | | | 212,000 | | | | 12,126,400 | | |
| | | | 14,442,080 | | |
| Chemicals - Diversified 1.99% | |
| Sociedad Quimica y Minera de Chile S.A., Sponsored ADR | | | 225,000 | | | | 12,116,250 | | |
| Coal 4.27% | |
| Pacific Coal Resources Ltd. | | | 578,300 | | | | 244,092 | *+ | |
| Pacific Coal Resources Ltd., 144A | | | 18,214,815 | | | | 7,688,216 | *+ | |
| Sable Mining Africa Ltd. | | | 32,248,500 | | | | 5,572,152 | * | |
| Walter Energy, Inc. | | | 205,293 | | | | 12,432,732 | * | |
| | | | 25,937,192 | | |
| Diamonds/Precious Stones 0.04% | |
| Diamond Fields International Ltd. | | | 1,800,000 | | | | 220,859 | * | |
| Rockwell Diamonds, Inc., 144A | | | 63,333 | | | | 34,192 | * | |
| | | | 255,051 | | |
| Diversified Minerals 3.09% | |
| African Potash Ltd. | | | 15,800,000 | | | | 2,024,531 | *+ | |
| Atacama Minerals Corp. | | | 1,025,000 | | | | 1,157,055 | * | |
| BHP Billiton Ltd., Sponsored ADR | | | 171,500 | | | | 12,113,045 | | |
| Calibre Mining Corp. | | | 550,000 | | | | 89,080 | * | |
| Canada Zinc Metals Corp. | | | 1,000,000 | | | | 539,878 | * | |
| Lithium Americas Corp. | | | 476,667 | | | | 603,583 | * | |
| Melior Resources, Inc. | | | 5,732,661 | | | | 703,394 | * | |
| Woulfe Mining Corp. | | | 8,343,900 | | | | 1,515,211 | * | |
| | | | 18,745,777 | | |
| Electric - Generation 0.05% | |
| Pacific Power Generation Corp. (RS) | | | 4,868,396 | | | | 325,779 | *@ | |
| Energy - Alternate Sources 0.40% | |
| Infinity Bio-Energy Ltd. | | | 682,400 | | | | 0 | *@ | |
| Pacific Green Energy Corp. (RS) | | | 2,400,000 | | | | 2,400,000 | *+@ | |
| | | | 2,400,000 | | |
See notes to portfolios of investments and notes to financial statements.
109
Portfolio of Investments December 31, 2011
Global Resources Fund
| Common Stocks | | Shares | | Value | |
| Finance - Investment Banker/Broker 0.13% | |
| Aberdeen International, Inc. | | | 1,274,750 | | | $ | 813,337 | * | |
| Food - Meat Products 1.98% | |
| Tyson Foods, Inc., Class A | | | 582,200 | | | | 12,016,608 | | |
| Forestry 0.10% | |
| Prima Colombia Hardwood, Inc. | | | 15,265,832 | | | | 599,395 | * | |
| Gold Mining 4.72% | |
| Chesapeake Gold Corp. | | | 170,000 | | | | 1,692,074 | * | |
| Corona Minerals Ltd. | | | 50,000 | | | | 5,114 | *@ | |
| Dundee Precious Metals, Inc. | | | 134,816 | | | | 1,087,791 | * | |
| Endeavour Mining Corp. | | | 1,100,000 | | | | 2,623,804 | * | |
| Euromax Resources Ltd., 144A | | | 540,840 | | | | 111,486 | * | |
| Gran Colombia Gold Corp. | | | 9,460,554 | | | | 4,828,945 | * | |
| Gran Colombia Gold Corp., 144A | | | 5,450,999 | | | | 2,782,350 | * | |
| Kinross Gold Corp. | | | 1 | | | | 11 | | |
| NGEx Resources, Inc. | | | 1,000,000 | | | | 2,650,307 | * | |
| Olympus Pacific Minerals, Inc. | | | 265,000 | | | | 68,933 | * | |
| Planet Exploration, Inc. | | | 160,000 | | | | 25,129 | * | |
| Randgold Resources Ltd., Sponsored ADR | | | 119,000 | | | | 12,149,900 | | |
| Rusoro Mining Ltd. | | | 3,119,433 | | | | 275,582 | * | |
| Sunridge Gold Corp. | | | 1,000,000 | | | | 407,362 | * | |
| | | | 28,708,788 | | |
| Medical - Hospitals 0.02% | |
| African Medical Investments plc | | | 2,495,000 | | | | 121,097 | * | |
| Metal - Copper 6.59% | |
| Augusta Resource Corp. | | | 1,065,690 | | | | 3,303,639 | * | |
| Catalyst Copper Corp. | | | 1,800,000 | | | | 141,350 | * | |
| First Quantum Minerals Ltd. | | | 621,000 | | | | 12,221,890 | | |
| Freeport-McMoRan Copper & Gold, Inc. | | | 328,790 | | | | 12,096,184 | | |
| Los Andes Copper Ltd. | | | 754,000 | | | | 225,737 | * | |
| Southern Copper Corp. | | | 400,000 | | | | 12,072,000 | | |
| Verona Development Corp. | | | 708,800 | | | | 0 | *@ | |
| | | | 40,060,800 | | |
| Metal - Diversified 0.70% | |
| Bell Copper Corp. | | | 2,500,000 | | | | 245,399 | * | |
| Concordia Resource Corp. | | | 1,000,000 | | | | 426,994 | * | |
| GoviEx Uranium, Inc. (RS) | | | 750,000 | | | | 2,250,000 | *@ | |
| Ivanhoe Mines Ltd. | | | 75,000 | | | | 1,329,000 | * | |
| Orsu Metals Corp., 144A | | | 147,605 | | | | 15,937 | * | |
| | | | 4,267,330 | | |
See notes to portfolios of investments and notes to financial statements.
110
Portfolio of Investments December 31, 2011
Global Resources Fund
| Common Stocks | | Shares | | Value | |
| Metal - Iron 2.49% | |
| Cliffs Natural Resources, Inc. | | | 195,000 | | | $ | 12,158,250 | | |
| Pacific Iron Corp. (RS) | | | 2,600,000 | | | | 2,600,000 | *@ | |
| West African Iron Ore Corp. | | | 2,925,000 | | | | 344,540 | * | |
| | | | 15,102,790 | | |
| Mining Services 0.27% | |
| Bounty Mining Ltd. | | | 22,000,000 | | | | 281,270 | *@ | |
| Natasa Mining Ltd. | | | 1,028,050 | | | | 1,341,241 | * | |
| | | | 1,622,511 | | |
| Natural Resource Technology 0.00% | |
| I-Pulse, Inc. (RS) | | | 15,971 | | | | 7,500 | *@ | |
| Non - Ferrous Metals 0.36% | |
| Anfield Nickel Corp., 144A | | | 390,000 | | | | 2,166,773 | * | |
| Sterling Group Ventures, Inc. | | | 500,000 | | | | 25,000 | * | |
| | | | 2,191,773 | | |
| Oil - Field Services 3.96% | |
| CARBO Ceramics, Inc. | | | 97,300 | | | | 12,000,009 | | |
| Oil States International, Inc. | | | 158,000 | | | | 12,066,460 | * | |
| | | | 24,066,469 | | |
| Oil & Gas Drilling 1.98% | |
| Transocean Ltd. | | | 314,000 | | | | 12,054,460 | | |
| Oil Companies - Exploration & Production 16.60% | |
| Africa Oil Corp. | | | 3,592,430 | | | | 5,571,572 | * | |
| Anadarko Petroleum Corp. | | | 159,200 | | | | 12,151,736 | | |
| Aurora Oil & Gas Ltd. | | | 1,038,511 | | | | 3,598,472 | * | |
| BNK Petroleum, Inc. | | | 1,000,000 | | | | 1,521,472 | * | |
| EQT Corp. | | | 219,300 | | | | 12,015,447 | * | |
| HRT Participacoes Em Petroleo S.A. | | | 30,030 | | | | 9,131,201 | * | |
| Ivanhoe Energy, Inc. | | | 414,100 | | | | 455,256 | * | |
| Madalena Ventures, Inc. | | | 4,500,000 | | | | 4,019,632 | * | |
| Occidental Petroleum Corp. | | | 129,000 | | | | 12,087,300 | | |
| Pacific Rubiales Energy Corp. | | | 49,288 | | | | 906,174 | | |
| Petroamerica Oil Corp. | | | 220,000 | | | | 22,675 | * | |
| Petroamerica Oil Corp., 144A | | | 8,000,000 | | | | 824,540 | * | |
| PetroMagdalena Energy Corp. | | | 2,577,342 | | | | 3,086,486 | *+ | |
| PetroMagdalena Energy Corp., 144A | | | 6,576,143 | | | | 7,875,234 | *+ | |
| Petromanas Energy, Inc. | | | 5,644,000 | | | | 858,719 | * | |
| Pioneer Natural Resources Co. | | | 135,400 | | | | 12,115,592 | | |
See notes to portfolios of investments and notes to financial statements.
111
Portfolio of Investments December 31, 2011
Global Resources Fund
| Common Stocks | | Shares | | Value | |
| Oil Companies - Exploration & Production (Cont'd) | |
| Range Energy Resources, Inc. | | | 15,100,000 | | | $ | 666,994 | *+ | |
| Royalite Petroleum Co., Inc. | | | 2,266,333 | | | | 4,533 | * | |
| ShaMaran Petroleum Corp. | | | 6,100,000 | | | | 2,125,644 | * | |
| SM Energy Co. | | | 162,300 | | | | 11,864,130 | | |
| | | | 100,902,809 | | |
| Oil Companies - Integrated 6.00% | |
| Cenovus Energy, Inc. | | | 368,000 | | | | 12,217,600 | | |
| Hess Corp. | | | 212,038 | | | | 12,043,758 | | |
| Imperial Oil Ltd. | | | 274,500 | | | | 12,209,760 | * | |
| | | | 36,471,118 | | |
| Oil Field Machinery & Equipment 1.98% | |
| National-Oilwell Varco, Inc. | | | 177,100 | | | | 12,041,029 | | |
| Oil Refining & Marketing 0.07% | |
| Value Creation, Inc. (RS) | | | 336,880 | | | | 415,466 | *@ | |
| Paper & Related Products 1.99% | |
| International Paper Co. | | | 408,300 | | | | 12,085,680 | | |
| Pipelines 2.01% | |
| Kinder Morgan, Inc. | | | 379,600 | | | | 12,211,732 | * | |
| Platinum 0.02% | |
| Anooraq Resources Corp. | | | 268,325 | | | | 102,721 | * | |
| Osmium Holdings S.A. (RS) | | | 104 | | | | 0 | *@ | |
| | | | 102,721 | | |
| Precious Metals 2.11% | |
| Coeur d'Alene Mines Corp. | | | 503,000 | | | | 12,142,420 | * | |
| Fortress Minerals Corp. | | | 170,071 | | | | 688,631 | * | |
| | | | 12,831,051 | | |
| Quarrying 2.80% | |
| Compass Minerals International, Inc. | | | 176,000 | | | | 12,117,600 | | |
| Pacific Stone Tech, Inc. (RS) | | | 22,659 | | | | 4,900,000 | +@ | |
| | | | 17,017,600 | | |
| Real Estate Operating/Development 1.40% | |
| Mongolia Growth Group Ltd. | | | 285,000 | | | | 1,091,043 | * | |
| Pacific Infrastructure, Inc. (RS) | | | 7,443,544 | | | | 7,443,544 | *@ | |
| | | | 8,534,587 | | |
See notes to portfolios of investments and notes to financial statements.
112
Portfolio of Investments December 31, 2011
Global Resources Fund
| Common Stocks | | Shares | | Value | |
| Silver Mining 2.02% | |
| First Majestic Silver Corp. | | | 728,000 | | | $ | 12,259,520 | * | |
| Transportation - Marine 0.13% | |
| Genco Shipping & Trading Ltd. | | | 115,000 | | | | 777,400 | * | |
| Transportation - Services 2.04% | |
| Viterra, Inc. | | | 1,175,000 | | | | 12,387,239 | * | |
| Total Common Stocks | | | 490,173,673 | | |
| (cost $562,342,330) | |
Real Estate Investment Trusts (REIT) 5.91%
| Plum Creek Timber Co., Inc. | | | 328,000 | | | | 11,991,680 | * | |
| Rayonier, Inc. | | | 269,000 | | | | 12,005,470 | * | |
| Weyerhaeuser Co. | | | 638,600 | | | | 11,922,662 | | |
| Total Real Estate Investment Trusts (REIT) | | | 35,919,812 | | |
| (cost $34,249,848) | |
Exchange-Traded Fund (ETF) 1.88%
| SPDR Gold Trust | | | 75,200 | | | | 11,429,648 | * | |
| (cost $11,951,565) | |
Warrants 2.41%
| Coal 0.06% | |
| Pacific Coal Resources Ltd., 144A, Warrants (March 2016) | | | 7,907,407 | | | | 388,094 | * | |
| Diversified Minerals 0.00% | |
| Lithium Americas Corp., 144A, Warrants (May 2012) | | | 283,333 | | | | 0 | *@ | |
| Melior Resources, Inc., Warrants (June 2013) | | | 3,803,000 | | | | 18,665 | * | |
| Niocan, Inc., 144A, Warrants (August 2014) | | | 260,000 | | | | 0 | *@ | |
| | | | 18,665 | | |
| Finance - Investment Banker/Broker 0.01% | |
| Aberdeen International, Inc., 144A, Warrants (June 2012) | | | 500,000 | | | | 51,534 | * | |
See notes to portfolios of investments and notes to financial statements.
113
Portfolio of Investments December 31, 2011
Global Resources Fund
| Warrants | | Shares | | Value | |
| Gold Mining 1.12% | |
| Chesapeake Gold Corp., Warrants (February 2012) | | | 52,400 | | | $ | 126,017 | * | |
| Dundee Precious Metals, Inc., Warrants (November 2015) | | | 625,000 | | | | 3,190,184 | * | |
| Gran Colombia Gold Corp., Warrants (August 2015) | | | 2,622,733 | | | | 399,042 | * | |
| Gran Colombia Gold Corp., 144A, Warrants (August 2015) | | | 1,594,166 | | | | 242,548 | * | |
| New Gold, Inc., Warrants (November 2012) | | | 269,000 | | | | 182,194 | * | |
| New Gold, Inc., 144A, Warrants (June 2017) | | | 822,570 | | | | 2,632,224 | * | |
| Rusoro Mining Ltd., 144A, Warrants (November 2012) | | | 3,150,000 | | | | 30,920 | * | |
| | | | 6,803,129 | | |
| Gold/Mineral Royalty Companies 0.04% | |
| Franco-Nevada Corp., 144A, Warrants (June 2017) | | | 44,000 | | | | 246,184 | * | |
| Medical - Hospitals 0.00% | |
| African Medical Investments plc, Warrants (June 2014) | | | 1,162,500 | | | | 0 | *@ | |
| Metal - Iron 0.02% | |
| West African Iron Ore Corp., 144A, Warrants (March 2016) | | | 2,925,000 | | | | 143,558 | * | |
| Oil Companies - Exploration & Production 1.16% | |
| Gran Tierra Energy, Inc., Warrants (June 2012) | | | 1,550,000 | | | | 5,812,500 | *@ | |
| Horn Petroleum Corp., Warrants (September 2013) | | | 2,110,889 | | | | 62,161 | * | |
| Petroamerica Oil Corp., 144A, Warrants (October 2014) | | | 8,000,000 | | | | 373,006 | * | |
| PetroMagdalena Energy Corp., 144A, Warrants (February 2016) | | | 2,303,357 | | | | 768,728 | * | |
| | | | 7,016,395 | | |
| Total Warrants | | | 14,667,559 | | |
| (cost $3,679,163) | |
Units 2.02%
| Metal - Iron 2.02% | |
| Labrador Iron Ore Royalty Corp. | | | 334,000 | | | | 12,294,478 | * | |
| (cost $11,955,495) | |
Subscription Receipts 0.26%
| Oil Companies - Exploration & Production 0.26% | |
| Horn Petroleum Corp., 144A | | | 2,110,889 | | | | 1,554,029 | * | |
| (cost $2,010,690) | |
See notes to portfolios of investments and notes to financial statements.
114
Portfolio of Investments December 31, 2011
Global Resources Fund
| Purchased Option 0.01% | | Contracts | | Value | |
| Gold Mining 0.01% | |
| Agnico-Eagle Mines Ltd., Strike Price 40, Call, Expiration Jan. 2012 | | | 1,000 | | | $ | 39,000 | | |
| (premium $910,666) | |
| Master Limited Partnerships 5.44% | | Units | | | |
| Pipelines 5.44% | |
| Enterprise Products Partners, L.P. | | | 262,000 | | | | 12,151,560 | * | |
| Plains All American Pipeline L.P. | | | 167,000 | | | | 12,266,150 | * | |
| Spectra Energy Partners L.P. | | | 271,118 | | | | 8,664,931 | * | |
| Total Master Limited Partnerships | | | 33,082,641 | | |
| (cost $32,198,382) | |
| Debenture 0.08% | | Principal
Amount | | | |
| Diversified Minerals 0.08% | |
| Niocan, Inc., 12.00%, maturity 08/27/12 | | $ | 500,000 | | | | 490,798 | @ | |
| (cost $510,621) | |
Silver-Linked Note 0.28%
| Gold Mining 0.28% | |
| Gran Colombia Gold Corp., 5.00%, maturity 08/11/18 | | | 2,000,000 | | | | 1,689,800 | | |
| (cost $2,000,000) | |
| Total Securities | | | 601,341,438 | | |
| (cost $661,808,760) | |
Repurchase Agreement 4.89%
Joint Tri-Party Repurchase Agreement, Credit Suisse Securities USA
LLC, 12/30/2011, 0.02%, due 1/3/2012, repurchase price $29,689,143,
collateralized by U.S. Treasury securities held in a joint tri-party
account (cost $29,689,077) | | | 29,689,077 | | | | 29,689,077 | | |
| Total Investments 103.83% | | | 631,030,515 | | |
| (cost $691,497,837) | |
| Other assets and liabilities, net (3.83%) | | | (23,252,520 | ) | |
| Net Assets 100% | | $ | 607,777,995 | | |
See notes to portfolios of investments and notes to financial statements.
115
Portfolio of Investments December 31, 2011
Global Resources Fund
| Call Options Written | | Shares Subject
To Call | | Value | |
Agnico-Eagle Mines Ltd., Strike Price 55, Expiration Jan. 2012
(premiums received $179,662)(Note 2A) | | | 100,000 | | | $ | 2,000 | | |
See notes to portfolios of investments and notes to financial statements.
116
Portfolio of Investments December 31, 2011
World Precious Minerals Fund
| Common Stocks 86.53% | | Shares | | Value | |
| Agricultural Operations 0.31% | |
| Agriterra Ltd. | | | 29,602,100 | | | $ | 1,344,813 | * | |
| Coal 0.97% | |
| Pacific Coal Resources Ltd. | | | 141,900 | | | | 59,894 | * | |
| Pacific Coal Resources Ltd., 144A | | | 2,222,222 | | | | 937,969 | * | |
| Prophecy Coal Corp., 144A | | | 133,400 | | | | 53,687 | * | |
| Sable Mining Africa Ltd. | | | 18,421,500 | | | | 3,183,013 | * | |
| | | | 4,234,563 | | |
| Diamonds/Precious Stones 0.60% | |
| Diagem, Inc. | | | 406,350 | | | | 0 | *@ | |
| Diamonds North Resources Ltd. | | | 1,757,400 | | | | 112,129 | * | |
| Diamonds North Resources Ltd., 144A | | | 1,046,800 | | | | 66,790 | * | |
| Lucara Diamond Corp. | | | 1,250,000 | | | | 1,055,215 | * | |
| Northern Superior Resources, Inc., Class A | | | 1,492,900 | | | | 424,973 | * | |
| Olivut Resources Ltd. | | | 643,500 | | | | 865,369 | * | |
| Rockwell Diamonds, Inc. | | | 66,666 | | | | 35,991 | * | |
| Rockwell Diamonds, Inc., 144A | | | 171,667 | | | | 92,679 | * | |
| | | | 2,653,146 | | |
| Diversified Minerals 3.33% | |
| African Potash Ltd. | | | 3,000,000 | | | | 384,405 | * | |
| Aldridge Minerals, Inc. | | | 2,000,000 | | | | 1,374,233 | *+ | |
| Amarc Resources Ltd. | | | 695,545 | | | | 279,925 | * | |
| Atacama Minerals Corp. | | | 56,100 | | | | 63,328 | * | |
| Azumah Resources Ltd. | | | 5,150,000 | | | | 2,159,642 | * | |
| Calibre Mining Corp. | | | 900,000 | | | | 145,767 | * | |
| Elissa Resources Ltd., 144A | | | 36,250 | | | | 6,939 | * | |
| Erdene Resource Development Corp. | | | 396,000 | | | | 145,767 | * | |
| Golden Alliance Resources Corp. | | | 235,000 | | | | 26,528 | * | |
| Helio Resource Corp. | | | 500,000 | | | | 157,055 | * | |
| Indochine Mining Ltd. | | | 5,785,500 | | | | 754,469 | * | |
| Mindoro Resources Ltd. | | | 2,984,000 | | | | 307,553 | * | |
| Mines Management, Inc. | | | 350,000 | | | | 700,000 | * | |
| Miocene Metals Ltd. | | | 256,833 | | | | 32,774 | * | |
| Moss Lake Gold Mines Ltd. | | | 3,345,000 | | | | 705,939 | *+ | |
| New Pacific Metals Corp. | | | 45,380 | | | | 44,990 | * | |
| North American Tungsten Corp. | | | 950,000 | | | | 251,779 | * | |
| Prodigy Gold, Inc. | | | 1,000,000 | | | | 814,724 | * | |
| Rochester Resources Ltd. | | | 1,125,000 | | | | 49,693 | *+ | |
| Rochester Resources Ltd., 144A | | | 6,630,000 | | | | 292,859 | *+ | |
| Rubicon Minerals Corp. | | | 1,460,000 | | | | 5,546,208 | * | |
| Strongbow Exploration, Inc. | | | 825,000 | | | | 129,570 | * | |
| Wallbridge Mining Co., Ltd. | | | 1,541,000 | | | | 226,896 | * | |
| | | | 14,601,043 | | |
See notes to portfolios of investments and notes to financial statements.
117
Portfolio of Investments December 31, 2011
World Precious Minerals Fund
| Common Stocks | | Shares | | Value | |
| Finance - Investment Banker/Broker 0.35% | |
| Aberdeen International, Inc. | | | 2,396,000 | | | $ | 1,528,736 | * | |
| Gold Mining 60.45% | |
| Agnico-Eagle Mines Ltd. | | | 400,000 | | | | 14,528,000 | | |
| Almaden Minerals Ltd. | | | 560,000 | | | | 1,412,712 | * | |
| AngloGold Ashanti Ltd., Sponsored ADR | | | 75,000 | | | | 3,183,750 | | |
| AuRico Gold, Inc. | | | 135,000 | | | | 1,081,350 | * | |
| Barrick Gold Corp. | | | 79,000 | | | | 3,574,750 | | |
| Belo Sun Mining Corp. | | | 1,275,000 | | | | 1,239,018 | * | |
| Brazilian Gold Corp. | | | 510,000 | | | | 215,264 | * | |
| Canaco Resources, Inc. | | | 700,000 | | | | 996,319 | * | |
| Canyon Resources Ltd. | | | 826,316 | | | | 354,965 | * | |
| CB Gold, Inc. | | | 1,115,000 | | | | 1,368,098 | * | |
| Chalice Gold Mines Ltd. | | | 4,000,000 | | | | 1,084,168 | * | |
| Chesapeake Gold Corp. | | | 675,000 | | | | 6,718,528 | * | |
| Claude Resources, Inc. | | | 2,100,000 | | | | 2,803,436 | * | |
| Colossus Minerals, Inc. | | | 402,500 | | | | 2,382,405 | * | |
| Continental Gold Ltd. | | | 1,440,000 | | | | 10,629,497 | * | |
| Corona Minerals Ltd. | | | 812,500 | | | | 83,103 | *@ | |
| Crystallex International Corp. | | | 2,150,000 | | | | 138,245 | * | |
| Doray Minerals Ltd. | | | 500,000 | | | | 700,618 | * | |
| Dundee Precious Metals, Inc. | | | 1,047,630 | | | | 8,453,024 | * | |
| Eastmain Resources, Inc. | | | 700,000 | | | | 693,988 | * | |
| Eldorado Gold Corp. | | | 400,000 | | | | 5,484,000 | | |
| Endeavour Mining Corp. | | | 1,200,000 | | | | 2,862,331 | * | |
| Entree Gold, Inc. | | | 2,940,000 | | | | 3,607,362 | * | |
| Extorre Gold Mines Ltd. | | | 1,023,400 | | | | 7,559,881 | * | |
| Goldcorp, Inc. | | | 100,000 | | | | 4,425,000 | | |
| Golden Arrow Resources Corp. | | | 2,150,000 | | | | 559,264 | * | |
| Golden Predator Corp. | | | 2,985,700 | | | | 1,699,834 | * | |
| Golden Star Resources Ltd. | | | 750,000 | | | | 1,237,500 | * | |
| Gran Colombia Gold Corp. | | | 6,616,978 | | | | 3,377,500 | *+ | |
| Gran Colombia Gold Corp., 144A | | | 17,175,360 | | | | 8,766,810 | *+ | |
| Grandview Gold, Inc. | | | 1,100,000 | | | | 37,791 | * | |
| Great Basin Gold Ltd. | | | 1,000,000 | | | | 932,515 | * | |
| Guyana Goldfields, Inc. | | | 300,000 | | | | 2,208,589 | * | |
| Harmony Gold Mining Co., Ltd., Sponsored ADR | | | 1,045,000 | | | | 12,163,800 | * | |
| IAMGOLD Corp. | | | 305,000 | | | | 4,834,250 | | |
| Intrepid Mines Ltd. | | | 1,650,000 | | | | 1,839,506 | * | |
| Kaminak Gold Corp., Class A | | | 100,000 | | | | 208,098 | * | |
| Kilo Goldmines Ltd. | | | 2,525,000 | | | | 421,350 | * | |
| Kimber Resources, Inc. | | | 1,145,000 | | | | 984,700 | * | |
| Kinross Gold Corp. | | | 475,000 | | | | 5,415,000 | | |
| Kirkland Lake Gold, Inc. | | | 150,000 | | | | 2,270,429 | * | |
| Klondex Mines Ltd. | | | 3,060,000 | | | | 6,788,319 | *+ | |
| Lexam VG Gold, Inc. | | | 2,370,000 | | | | 697,914 | * | |
See notes to portfolios of investments and notes to financial statements.
118
Portfolio of Investments December 31, 2011
World Precious Minerals Fund
| Common Stocks | | Shares | | Value | |
| Gold Mining (Cont'd) | |
| Lexam VG Gold, Inc., 144A | | | 2,406,501 | | | $ | 708,663 | * | |
| Lion One Metals Ltd. | | | 425,000 | | | | 467,239 | * | |
| Malbex Resources, Inc. | | | 470,500 | | | | 170,881 | * | |
| Malbex Resources, Inc., 144A | | | 1,333,333 | | | | 484,253 | * | |
| Midway Gold Corp. | | | 265,800 | | | | 560,838 | * | |
| Mirasol Resources Ltd. | | | 2,125,000 | | | | 6,883,436 | *+ | |
| NGEx Resources, Inc. | | | 2,380,000 | | | | 6,307,730 | * | |
| Olympus Pacific Minerals, Inc. | | | 460,590 | | | | 119,810 | * | |
| Pacific Rim Mining Corp. | | | 133,500 | | | | 17,036 | * | |
| Pan African Resources plc | | | 12,110,000 | | | | 2,775,252 | * | |
| Petaquilla Minerals Ltd., 144A | | | 2,660,000 | | | | 1,540,515 | * | |
| Pilot Gold, Inc. | | | 100,000 | | | | 126,626 | * | |
| Planet Exploration, Inc. | | | 1,030,500 | | | | 161,845 | * | |
| PMI Gold Corp. | | | 12,560,000 | | | | 11,589,104 | *+ | |
| Premier Gold Mines Ltd. | | | 700,000 | | | | 3,105,767 | * | |
| Queenston Mining, Inc. | | | 305,000 | | | | 1,475,975 | * | |
| Radius Gold, Inc. | | | 2,145,000 | | | | 484,270 | * | |
| Ramelius Resources Ltd. | | | 1,300,000 | | | | 1,416,066 | * | |
| Randgold Resources Ltd., Sponsored ADR | | | 210,000 | | | | 21,441,000 | | |
| Renaissance Gold, Inc. | | | 530,000 | | | | 509,840 | * | |
| Reunion Gold Corp. | | | 1,915,000 | | | | 1,691,779 | * | |
| Revolution Resources Corp., 144A | | | 570,000 | | | | 201,423 | * | |
| Richmont Mines, Inc. | | | 781,000 | | | | 8,403,560 | * | |
| Rio Alto Mining Ltd. | | | 475,000 | | | | 1,487,362 | * | |
| Riverstone Resources, Inc. | | | 400,000 | | | | 282,699 | * | |
| Romarco Minerals, Inc. | | | 7,490,000 | | | | 7,940,319 | * | |
| Royal Gold, Inc. | | | 40,000 | | | | 2,697,200 | | |
| Rusoro Mining Ltd. | | | 6,325,900 | | | | 558,853 | * | |
| Rye Patch Gold Corp. | | | 5,700,000 | | | | 3,860,613 | * | |
| San Gold Corp. | | | 1,400,000 | | | | 2,597,301 | * | |
| Seafield Resources Ltd., 144A | | | 1,300,000 | | | | 185,031 | * | |
| SEMAFO, Inc. | | | 200,000 | | | | 1,295,706 | * | |
| Solvista Gold Corp. | | | 65,000 | | | | 29,669 | * | |
| Solvista Gold Corp., 144A | | | 2,620,000 | | | | 1,195,877 | * | |
| St Barbara Ltd. | | | 1,500,000 | | | | 2,976,348 | * | |
| Sunridge Gold Corp. | | | 1,000,000 | | | | 407,362 | * | |
| Taurus Gold Ltd. (RS) | | | 2,255,169 | | | | 3,382,754 | *@ | |
| Tolima Gold Inc. | | | 20,000 | | | | 10,798 | * | |
| Tolima Gold Inc. (RS) | | | 850,000 | | | | 435,951 | *@ | |
| Tolima Gold Inc., 144A (RS) | | | 3,250,000 | | | | 1,666,871 | *@ | |
| Torex Gold Resources, Inc. | | | 1,300,000 | | | | 2,182,086 | * | |
| Trelawney Mining & Exploration, Inc. | | | 338,000 | | | | 978,748 | * | |
| TriStar Gold, Inc. | | | 1,342,500 | | | | 790,675 | * | |
| Virginia Mines, Inc. | | | 761,000 | | | | 6,349,448 | * | |
| West Kirkland Mining, Inc. | | | 1,285,000 | | | | 1,166,748 | * | |
| Yamana Gold, Inc. | | | 800,000 | | | | 11,752,000 | | |
| | | | 264,896,308 | | |
See notes to portfolios of investments and notes to financial statements.
119
Portfolio of Investments December 31, 2011
World Precious Minerals Fund
| Common Stocks | | Shares | | Value | |
| Gold/Mineral Royalty Companies 1.52% | |
| Franco-Nevada Corp. | | | 175,000 | | | $ | 6,661,595 | | |
| Investment Companies 0.00% | |
| Invictus Financial, Inc. | | | 996,000 | | | | 4,888 | * | |
| Machinery - Construction & Mining 1.10% | |
| Caterpillar, Inc. | | | 53,000 | | | | 4,801,800 | | |
| Medical - Hospitals 0.05% | |
| African Medical Investments plc | | | 4,600,000 | | | | 223,265 | * | |
| Metal - Copper 1.02% | |
| Augusta Resource Corp. | | | 552,500 | | | | 1,712,750 | * | |
| Catalyst Copper Corp. | | | 1,564,000 | | | | 122,817 | * | |
| Lumina Copper Corp. | | | 30,000 | | | | 388,417 | * | |
| Revett Minerals, Inc. | | | 476,600 | | | | 2,245,576 | * | |
| Verona Development Corp. | | | 48,500 | | | | 0 | *@ | |
| | | | 4,469,560 | | |
| Metal - Diversified 3.24% | |
| Avion Gold Corp. | | | 785,000 | | | | 1,248,294 | * | |
| Balmoral Resources Ltd. | | | 1,050,000 | | | | 824,540 | * | |
| Bearing Resources Ltd. | | | 81,250 | | | | 42,270 | * | |
| Bell Copper Corp. | | | 2,000,000 | | | | 196,319 | * | |
| Cerro Resources NL | | | 18,658,000 | | | | 2,004,140 | * | |
| Cerro Resources NL, 144A | | | 2,600,000 | | | | 280,736 | * | |
| Dalradian Resources, Inc. | | | 1,672,000 | | | | 3,118,331 | * | |
| First Point Minerals Corp. | | | 2,400,000 | | | | 965,890 | * | |
| Imperial Metals Corp. | | | 200,000 | | | | 2,453,988 | * | |
| Mariana Resources Ltd. | | | 4,075,000 | | | | 640,820 | * | |
| Orsu Metals Corp. | | | 289,800 | | | | 31,291 | * | |
| Orsu Metals Corp., 144A | | | 1,800,000 | | | | 194,356 | * | |
| Prophecy Platinum Corp. | | | 1 | | | | 2 | * | |
| Rackla Metals, Inc. | | | 714,999 | | | | 161,423 | * | |
| Robust Resources Ltd. | | | 600,000 | | | | 822,331 | * | |
| South American Silver Corp. | | | 500,000 | | | | 677,301 | * | |
| Temex Resources Corp. | | | 950,000 | | | | 186,503 | * | |
| Tigray Resources, Inc. | | | 275,000 | | | | 345,521 | * | |
| | | | 14,194,056 | | |
| Mining Services 1.10% | |
| Argent Minerals Ltd. | | | 5,625,000 | | | | 661,623 | * | |
| Energold Drilling Corp. | | | 390,000 | | | | 1,745,669 | * | |
| Geodrill Ltd. | | | 320,000 | | | | 722,454 | * | |
| Natasa Mining Ltd. | | | 1,293,449 | | | | 1,687,493 | * | |
| | | | 4,817,239 | | |
See notes to portfolios of investments and notes to financial statements.
120
Portfolio of Investments December 31, 2011
World Precious Minerals Fund
| Common Stocks | | Shares | | Value | |
| Oil Companies - Exploration & Production 1.22% | |
| Big Sky Energy Corp. | | | 2,000,000 | | | $ | 0 | *@ | |
| PetroMagdalena Energy Corp. | | | 880,671 | | | | 1,054,644 | * | |
| PetroMagdalena Energy Corp., 144A | | | 3,592,857 | | | | 4,302,612 | * | |
| | | | 5,357,256 | | |
| Platinum 0.49% | |
| Anooraq Resources Corp. | | | 498,175 | | | | 190,712 | * | |
| Osmium Holdings S.A. (RS) | | | 891 | | | | 0 | *@ | |
| Pacific North West Capital Corp. | | | 1,291,666 | | | | 139,468 | * | |
| Platinum Group Metals Ltd. | | | 2,010,000 | | | | 1,815,166 | * | |
| | | | 2,145,346 | | |
| Precious Metals 6.28% | |
| Atikwa Resources, Inc. | | | 1,333,333 | | | | 65,440 | * | |
| Candente Gold Corp. | | | 750,000 | | | | 173,006 | *+ | |
| Candente Gold Corp., 144A | | | 4,875,000 | | | | 1,124,540 | *+ | |
| Coeur d'Alene Mines Corp. | | | 620,000 | | | | 14,966,800 | * | |
| Fortress Minerals Corp. | | | 202,000 | | | | 817,914 | * | |
| Fortress Minerals Corp., 144A | | | 70,000 | | | | 283,436 | * | |
| Newstrike Capital, Inc. | | | 20,000 | | | | 52,613 | * | |
| Polymetal, Sponsored GDR | | | 117,000 | | | | 1,927,375 | *@ | |
| Polymetal International plc | | | 85,500 | | | | 1,452,770 | * | |
| Roxgold, Inc. | | | 620,000 | | | | 937,227 | * | |
| Sabina Gold & Silver Corp. | | | 899,400 | | | | 3,390,131 | * | |
| Solitario Exploration & Royalty Corp. | | | 945,000 | | | | 1,261,546 | * | |
| Tahoe Resources, Inc. | | | 60,000 | | | | 1,041,276 | * | |
| | | | 27,494,074 | | |
| Silver Mining 4.50% | |
| First Majestic Silver Corp. | | | 145,000 | | | | 2,445,252 | * | |
| Fortuna Silver Mines, Inc. | | | 600,000 | | | | 3,292,270 | * | |
| MAG Silver Corp. | | | 805,000 | | | | 5,294,233 | * | |
| Silver Wheaton Corp. | | | 300,000 | | | | 8,688,000 | | |
| | | | 19,719,755 | | |
| Total Common Stocks | | | 379,147,443 | | |
| (cost $455,863,703) | |
Exchange-Traded Fund (ETF) 0.69%
| SPDR Gold Trust | | | 19,800 | | | | 3,009,402 | * | |
| (cost $3,211,592) | |
See notes to portfolios of investments and notes to financial statements.
121
Portfolio of Investments December 31, 2011
World Precious Minerals Fund
| Warrants 4.06% | | Shares | | Value | |
| Coal 0.01% | |
| Pacific Coal Resources Ltd., 144A, Warrants (March 2016) | | | 1,111,111 | | | $ | 54,533 | * | |
| Diversified Minerals 0.02% | |
| Mines Management, Inc., Warrants (April 2012) | | | 950,300 | | | | 104,533 | * | |
| Gold Mining 3.60% | |
| Agnico-Eagle Mines Ltd., Warrants (December 2013) | | | 35,700 | | | | 215,985 | * | |
| Agnico-Eagle Mines Ltd., 144A, Warrants (December 2013) | | | 110,000 | | | | 665,500 | * | |
| Argonaut Gold, Inc., 144A, Warrants (December 2012) | | | 250,000 | | | | 672,393 | * | |
| Chesapeake Gold Corp., Warrants (February 2012) | | | 192,199 | | | | 462,221 | * | |
| Crystallex International Corp., 144A, Warrants (December 2049) | | | 162,500 | | | | 0 | *@ | |
| Dundee Precious Metals, Inc., Warrants (November 2015) | | | 1,166,000 | | | | 5,951,607 | * | |
| Endeavour Mining Corp., Warrants (February 2014) | | | 1,030,000 | | | | 707,730 | * | |
| Gran Colombia Gold Corp., Warrants (August 2015) | | | 2,121,104 | | | | 322,720 | * | |
| Gran Colombia Gold Corp., 144A, Warrants (August 2015) | | | 4,520,983 | | | | 687,855 | * | |
| Kinross Gold Corp., Warrants (September 2013) | | | 777,411 | | | | 732,579 | * | |
| Kinross Gold Corp., Warrants (September 2014) | | | 250,000 | | | | 355,828 | * | |
| New Gold, Inc., Warrants (April 2012) | | | 2,525,100 | | | | 37,179 | * | |
| New Gold, Inc., Warrants (November 2012) | | | 341,000 | | | | 230,960 | * | |
| New Gold, Inc., Warrants (June 2017) | | | 1,100,000 | | | | 3,520,000 | * | |
| New Gold, Inc., 144A, Warrants (June 2017) | | | 352,530 | | | | 1,128,096 | * | |
| Petaquilla Minerals Ltd., 144A, Warrants (January 2014) | | | 2,660,000 | | | | 0 | *@ | |
| Rusoro Mining Ltd., Warrants (November 2012) | | | 225,750 | | | | 2,216 | * | |
| Rusoro Mining Ltd., 144A, Warrants (November 2012) | | | 6,105,000 | | | | 59,926 | * | |
| Seafield Resources Ltd., 144A, Warrants (December 2012) | | | 1,300,000 | | | | 51,043 | * | |
| Solvista Gold Corp., 144A, Warrants (April 2013) | | | 1,310,000 | | | | 0 | *@ | |
| Tolima Gold, Inc., 144A, Warrants (March 2013) (RS) | | | 1,625,000 | | | | 0 | *@ | |
| Tolima Gold, Inc., Warrants (December 2013) (RS) | | | 425,000 | | | | 0 | *@ | |
| | | | 15,803,838 | | |
| Gold/Mineral Royalty Companies 0.28% | |
| Franco-Nevada Corp., Warrants (March 2012) | | | 86,100 | | | | 574,704 | * | |
| Franco-Nevada Corp., Warrants (July 2013) | | | 42,200 | | | | 11,599 | * | |
| Franco-Nevada Corp., 144A, Warrants (July 2013) | | | 125,000 | | | | 34,356 | * | |
| Franco-Nevada Corp., Warrants (June 2017) | | | 68,332 | | | | 382,324 | * | |
| Franco-Nevada Corp., 144A, Warrants (June 2017) | | | 37,000 | | | | 207,018 | * | |
| | | | 1,210,001 | | |
| Medical - Hospitals 0.00% | |
| African Medical Investments plc, Warrants (June 2014) | | | 2,125,000 | | | | 0 | *@ | |
| Metal - Diversified 0.01% | |
| Orsu Metals Corp., 144A, Warrants (April 2012) | | | 900,000 | | | | 0 | *@ | |
| Rackla Metals, Inc., Warrants (June 2013) | | | 714,999 | | | | 35,092 | * | |
| | | | 35,092 | | |
See notes to portfolios of investments and notes to financial statements.
122
Portfolio of Investments December 31, 2011
World Precious Minerals Fund
| Warrants | | Shares | | Value | |
| Oil Companies - Exploration & Production 0.14% | |
| PetroMagdalena Energy Corp., 144A, Warrants (February 2016) | | | 1,796,429 | | | $ | 599,544 | * | |
| Precious Metals 0.00% | |
| Candente Gold Corp., 144A, Warrants (January 2012) | | | 2,437,500 | | | | 0 | *@ | |
| Total Warrants | | | 17,807,541 | | |
| (cost $13,244,071) | |
Special Warrants 0.00%
| Gold/Mineral Exploration & Development 0.00% | |
Western Exploration & Development Ltd., 144A, Special Warrants
(December 2049) (RS) | | | 600,000 | | | | 0 | *@ | |
| (cost $300,000) | |
Units 0.04%
| Gold Mining 0.04% | |
| Choice Gold Corp. (RS) | | | 870,000 | | | | 162,258 | *@ | |
| (cost $254,027) | |
| Purchased Call Options 0.04% | | Contracts | | | |
| Gold Mining 0.04% | |
Agnico-Eagle Mines Ltd., Strike Price 55, Call, Expiration Jan. 2013
(premium $628,091) | | | 1,067 | | | | 182,457 | | |
Market Vectors Gold Miners ETF, Strike Price 61, Call, Expiration Jan. 2012
(premium $1,005,492) | | | 3,500 | | | | 17,500 | | |
| Total Purchased Options | | | 199,957 | | |
| (cost $1,633,583) | |
Purchased Put Option 0.01%
| Gold Mining 0.01% | |
Market Vectors Gold Miners ETF, Strike Price 51, Put, Expiration Feb. 2012
(premium $39,316) | | | 143 | | | | 34,749 | | |
See notes to portfolios of investments and notes to financial statements.
123
Portfolio of Investments December 31, 2011
World Precious Minerals Fund
| Convertible Debenture 0.27% | | Principal
Amount | | Value | |
| Metal - Iron 0.27% | |
| Pacific Iron Corp., 1.00%, maturity 06/07/12 (RS) | | $ | 1,200,000 | | | $ | 1,200,000 | @ | |
| (cost $1,200,000) | |
Silver-Linked Note 1.57%
| Gold Mining 1.57% | |
| Gran Colombia Gold Corp., 5.00%, maturity 08/11/18 | | | 8,150,000 | | | | 6,885,935 | | |
| (cost $8,150,000) | |
| Total Securities | | | 408,447,285 | | |
| (cost $483,896,292) | |
Repurchase Agreement 5.79%
Joint Tri-Party Repurchase Agreement, Credit Suisse Securities USA
LLC, 12/30/2011, 0.02%, due 1/3/2012, repurchase price $25,360,449,
collateralized by U.S. Treasury securities held in a joint tri-party
account (cost $25,360,393) | | | 25,360,393 | | | | 25,360,393 | | |
| Total Investments 99.00% | | | 433,807,678 | | |
| (cost $509,256,685) | |
| Other assets and liabilities, net 1.00% | | | 4,379,134 | | |
| Net Assets 100% | | $ | 438,186,812 | | |
See notes to portfolios of investments and notes to financial statements.
124
Portfolio of Investments December 31, 2011
Gold and Precious Metals Fund
| Common Stocks 74.15% | | Shares | | Value | |
| Gold Mining 57.43% | |
| Agnico-Eagle Mines Ltd. | | | 200,000 | | | $ | 7,264,000 | | |
| Alacer Gold Corp. | | | 185,000 | | | | 1,904,933 | * | |
| AngloGold Ashanti Ltd., Sponsored ADR | | | 135,000 | | | | 5,730,750 | | |
| AuRico Gold, Inc. | | | 220,000 | | | | 1,762,200 | * | |
| Aurizon Mines Ltd. | | | 200,000 | | | | 986,000 | * | |
| Barrick Gold Corp. | | | 119,500 | | | | 5,407,375 | | |
| Centerra Gold, Inc. | | | 45,000 | | | | 795,092 | * | |
| Claude Resources, Inc. | | | 2,710,000 | | | | 3,617,767 | * | |
| DRDGOLD Ltd., Sponsored ADR | | | 245,000 | | | | 1,330,350 | | |
| Dundee Precious Metals, Inc. | | | 767,487 | | | | 6,192,631 | * | |
| Eldorado Gold Corp. | | | 200,000 | | | | 2,742,000 | | |
| Endeavour Mining Corp. | | | 450,000 | | | | 1,073,374 | * | |
| Goldcorp, Inc. | | | 100,000 | | | | 4,425,000 | | |
| Golden Star Resources Ltd. | | | 375,000 | | | | 618,750 | * | |
| Gran Colombia Gold Corp. | | | 4,804,758 | | | | 2,452,490 | * | |
| Gran Colombia Gold Corp., 144A | | | 4,150,000 | | | | 2,118,282 | * | |
| Great Basin Gold Ltd. | | | 300,000 | | | | 279,755 | * | |
| Harmony Gold Mining Co., Ltd., Sponsored ADR | | | 865,000 | | | | 10,068,600 | * | |
| IAMGOLD Corp. | | | 370,000 | | | | 5,864,500 | | |
| Kinross Gold Corp. | | | 225,000 | | | | 2,565,000 | | |
| Kirkland Lake Gold, Inc. | | | 110,000 | | | | 1,664,982 | * | |
| Lake Shore Gold Corp. | | | 500,000 | | | | 628,221 | * | |
| Nevsun Resources Ltd. | | | 100,000 | | | | 553,000 | * | |
| New Gold, Inc. | | | 200,000 | | | | 2,016,270 | * | |
| Newmont Mining Corp. | | | 30,000 | | | | 1,800,300 | | |
| OceanaGold Corp. | | | 757,400 | | | | 1,672,785 | * | |
| Pan African Resources plc | | | 8,400,000 | | | | 1,925,030 | * | |
| Perseus Mining Ltd. | | | 350,000 | | | | 859,152 | * | |
| Randgold Resources Ltd., Sponsored ADR | | | 100,000 | | | | 10,210,000 | | |
| Richmont Mines, Inc. | | | 374,000 | | | | 4,024,240 | * | |
| Royal Gold, Inc. | | | 100,000 | | | | 6,743,000 | | |
| San Gold Corp. | | | 700,000 | | | | 1,298,650 | * | |
| SEMAFO, Inc. | | | 100,000 | | | | 647,853 | * | |
| Silver Lake Resources Ltd. | | | 800,000 | | | | 2,462,902 | * | |
| St Barbara Ltd. | | | 500,000 | | | | 992,116 | * | |
| Yamana Gold, Inc. | | | 500,100 | | | | 7,346,469 | | |
| | | | 112,043,819 | | |
| Gold/Mineral Royalty Companies 4.49% | |
| Franco-Nevada Corp. | | | 230,000 | | | | 8,755,239 | | |
| Machinery - Construction & Mining 1.70% | |
| Caterpillar, Inc. | | | 36,500 | | | | 3,306,900 | | |
See notes to portfolios of investments and notes to financial statements.
125
Portfolio of Investments December 31, 2011
Gold and Precious Metals Fund
| Common Stocks | | Shares | | Value | |
| Medical - Hospitals 0.05% | �� |
| African Medical Investments plc | | | 2,000,000 | | | $ | 97,072 | * | |
| Metal - Diversified 0.25% | |
| Avion Gold Corp. | | | 310,000 | | | | 492,957 | * | |
| Mining Services 0.39% | |
| Major Drilling Group International, Inc. | | | 50,000 | | | | 762,699 | * | |
| Precious Metals 5.65% | |
| Alexco Resource Corp. | | | 17,100 | | | | 116,322 | * | |
| Coeur d'Alene Mines Corp. | | | 347,500 | | | | 8,388,650 | * | |
| Polymetal, Sponsored GDR | | | 77,000 | | | | 1,268,444 | *@ | |
| Polymetal International plc | | | 73,300 | | | | 1,245,474 | * | |
| | | | 11,018,890 | | |
| Silver Mining 4.19% | |
| First Majestic Silver Corp. | | | 65,000 | | | | 1,096,147 | * | |
| Fortuna Silver Mines, Inc. | | | 445,000 | | | | 2,441,767 | * | |
| Scorpio Mining Corp. | | | 153,500 | | | | 293,816 | * | |
| Silver Wheaton Corp. | | | 150,000 | | | | 4,344,000 | | |
| | | | 8,175,730 | | |
| Total Common Stocks | | | 144,653,306 | | |
| (cost $155,375,266) | |
Exchange-Traded Fund (ETF) 0.64%
| SPDR Gold Trust | | | 8,200 | | | | 1,246,318 | * | |
| (cost $1,365,827) | |
Warrants 6.13%
| Gold Mining 5.62% | |
| Agnico-Eagle Mines Ltd., Warrants (December 2013) | | | 32,100 | | | | 194,205 | * | |
| Agnico-Eagle Mines Ltd., 144A, Warrants (December 2013) | | | 70,000 | | | | 423,500 | * | |
| Crystallex International Corp., 144A, Warrants (December 2049) | | | 62,500 | | | | 0 | *@ | |
| Dundee Precious Metals, Inc., Warrants (June 2012) | | | 56,100 | | | | 6,883 | * | |
| Dundee Precious Metals, Inc., Warrants (November 2015) | | | 1,389,100 | | | | 7,090,375 | * | |
| Endeavour Mining Corp., Warrants (February 2014) | | | 407,000 | | | | 279,656 | * | |
| Gran Colombia Gold Corp., Warrants (August 2015) | | | 1,947,773 | | | | 296,348 | * | |
| Gran Colombia Gold Corp., 144A, Warrants (August 2015) | | | 625,000 | | | | 95,092 | * | |
See notes to portfolios of investments and notes to financial statements.
126
Portfolio of Investments December 31, 2011
Gold and Precious Metals Fund
| Warrants | | Shares | | Value | |
| Gold Mining (Cont'd) | |
| Kinross Gold Corp., Warrants (September 2013) | | | 653,394 | | | $ | 615,714 | * | |
| Kinross Gold Corp., Warrants (September 2014) | | | 130,000 | | | | 185,031 | * | |
| New Gold, Inc., Warrants (April 2012) | | | 3,078,400 | | | | 45,326 | * | |
| New Gold, Inc., Warrants (November 2012) | | | 1,116,000 | | | | 755,868 | * | |
| New Gold, Inc., Warrants (June 2017) | | | 305,000 | | | | 976,000 | * | |
| Rusoro Mining Ltd., Warrants (November 2012) | | | 688,750 | | | | 6,761 | * | |
| Rusoro Mining Ltd., 144A, Warrants (November 2012) | | | 930,000 | | | | 9,129 | * | |
| | | | 10,979,888 | | |
| Gold/Mineral Royalty Companies 0.51% | |
| Franco-Nevada Corp., Warrants (March 2012) | | | 97,000 | | | | 647,460 | * | |
| Franco-Nevada Corp., 144A, Warrants (July 2013) | | | 125,000 | | | | 34,356 | * | |
| Franco-Nevada Corp., Warrants (June 2017) | | | 38,568 | | | | 215,791 | * | |
| Franco-Nevada Corp., 144A, Warrants (June 2017) | | | 17,000 | | | | 95,117 | * | |
| | | | 992,724 | | |
| Medical - Hospitals 0.00% | |
| African Medical Investments plc, Warrants (June 2014) | | | 912,500 | | | | 0 | *@ | |
| Total Warrants | | | 11,972,612 | | |
| (cost $8,420,232) | |
| Purchased Call Options 0.05% | | Contracts | | | |
| Gold Mining 0.05% | |
Agnico-Eagle Mines Ltd., Strike Price 55, Call, Expiration Jan. 2013
(premium $313,864) | | | 533 | | | | 91,143 | | |
Market Vectors Gold Miners ETF, Strike Price 61, Call, Expiration Jan. 2012
(premium $718,230) | | | 2,500 | | | | 12,500 | | |
| Total Purchased Call Options | | | 103,643 | | |
| (cost $1,032,094) | |
Purchased Put Option 0.01%
| Gold Mining 0.01% | |
Market Vectors Gold Miners ETF, Strike Price 51, Put, Expiration Feb. 2012
(premium $15,672) | | | 57 | | | | 13,851 | | |
See notes to portfolios of investments and notes to financial statements.
127
Portfolio of Investments December 31, 2011
Gold and Precious Metals Fund
| Notes 2.29% | | Principal
Amount | | Value | |
| Gold Mining 2.29% | |
| Barrick Gold Corp., 6.95%, maturity 04/01/19 | | $ | 1,700,000 | | | $ | 2,090,769 | | |
| Newmont Mining Corp., 6.25%, maturity 10/01/39 | | | 2,000,000 | | | | 2,376,486 | | |
| Total Notes | | | 4,467,255 | | |
| (cost $4,466,528) | |
Silver-Linked Note 1.84%
| Gold Mining 1.84% | |
| Gran Colombia Gold Corp., 5.00%, maturity 08/11/18 | | | 4,250,000 | | | | 3,590,825 | | |
| (cost $4,250,000) | |
| Total Securities | | | 166,047,810 | | |
| (cost $174,925,619) | |
Repurchase Agreement 13.91%
Joint Tri-Party Repurchase Agreement, Credit Suisse Securities USA
LLC, 12/30/2011, 0.02%, due 1/3/2012, repurchase price $27,134,762,
collateralized by U.S. Treasury securities held in a joint tri-party
account (cost $27,134,701) | | | 27,134,701 | | | | 27,134,701 | | |
| Total Investments 99.02% | | | 193,182,511 | | |
| (cost $202,060,321) | |
| Other assets and liabilities, net 0.98% | | | 1,904,633 | | |
| Net Assets 100% | | $ | 195,087,144 | | |
See notes to portfolios of investments and notes to financial statements.
128
Portfolio of Investments December 31, 2011
Eastern European Fund
| Common Stocks 93.29% | | Shares | | Value | |
| Agricultural Chemicals 3.20% | |
| Uralkali OJSC | | | 151,300 | | | $ | 1,097,024 | | |
| Uralkali OJSC, Sponsored GDR | | | 141,400 | | | | 5,090,400 | | |
| | | | 6,187,424 | | |
| Agricultural Operations 2.03% | |
| Kernel Holding S.A. | | | 195,000 | | | | 3,924,411 | * | |
| Airport Development/Maintenance 1.63% | |
| TAV Havalimanlari Holding A.S. | | | 737,100 | | | | 3,151,738 | * | |
| Appliances 1.08% | |
| Arcelik A.S. | | | 646,500 | | | | 2,098,981 | | |
| Automotive - Cars & Light Trucks 1.83% | |
| Ford Otomotiv Sanayi A.S. | | | 155,500 | | | | 1,262,149 | | |
| Tofas Turk Otomobil Fabrikasi A.S. | | | 726,600 | | | | 2,281,948 | | |
| | | | 3,544,097 | | |
| Cellular Telecommunications 2.06% | |
| Mobile TeleSystems OJSC | | | 700,000 | | | | 3,981,679 | | |
| Chemicals - Diversified 1.75% | |
| Synthos S.A. | | | 2,663,776 | | | | 3,396,393 | * | |
| Coal 0.01% | |
| Eastcoal, Inc. | | | 52,100 | | | | 22,246 | * | |
| Commercial Banks - Non US 8.92% | |
| Bank Handlowy w Warszawie S.A. | | | 25,400 | | | | 499,771 | * | |
| Powszechna Kasa Oszczednosci Bank Polski S.A. | | | 200,000 | | | | 1,861,543 | | |
| Sberbank of Russia | | | 3,635,895 | | | | 8,903,449 | | |
| Sberbank of Russia, Sponsored ADR | | | 218,000 | | | | 2,162,560 | * | |
| VTB Bank OJSC, Sponsored GDR | | | 1,064,800 | | | | 3,843,928 | | |
| | | | 17,271,251 | | |
| Finance - Investment Banker/Broker 1.71% | |
| Turkiye Sinai Kalkinma Bankasi A.S. | | | 3,406,046 | | | | 3,306,665 | | |
| Food - Retail 2.31% | |
| X5 Retail Group N.V., Sponsored GDR | | | 196,000 | | | | 4,476,640 | * | |
| Food - Wholesale/Distribution 1.98% | |
| Eurocash S.A. | | | 463,743 | | | | 3,835,297 | * | |
See notes to portfolios of investments and notes to financial statements.
129
Portfolio of Investments December 31, 2011
Eastern European Fund
| Common Stocks | | Shares | | Value | |
| Gold Mining 3.01% | |
| Dundee Precious Metals, Inc. | | | 236,767 | | | $ | 1,910,405 | * | |
| Koza Altin Isletmeleri A.S. | | | 293,500 | | | | 3,908,143 | | |
| | | | 5,818,548 | | |
| Housewares 0.51% | |
| Turkiye Sise ve Cam Fabrikalari A.S. | | | 659,781 | | | | 997,547 | | |
| Investment Companies 0.66% | |
| Getin Holding S.A. | | | 500,000 | | | | 1,021,473 | * | |
| Vostok Nafta Investment Ltd. | | | 65,000 | | | | 247,495 | * | |
| | | | 1,268,968 | | |
| Machinery - Farm 0.30% | |
| Turk Traktor ve Ziraat Makineleri A.S. | | | 32,517 | | | | 583,063 | | |
| Medical - Generic Drugs 0.52% | |
| Pharmstandard OJSC | | | 10,192 | | | | 531,690 | * | |
| Pharmstandard OJSC, Sponsored GDR | | | 33,489 | | | | 472,195 | * | |
| | | | 1,003,885 | | |
| Metal - Diversified 2.96% | |
| KGHM Polska Miedz S.A. | | | 37,400 | | | | 1,198,655 | | |
| MMC Norilsk Nickel OJSC, Sponsored ADR | | | 262,657 | | | | 4,021,279 | | |
| Orsu Metals Corp. | | | 664,240 | | | | 71,722 | * | |
| Orsu Metals Corp., 144A | | | 4,025,000 | | | | 434,601 | * | |
| | | | 5,726,257 | | |
| Miscellaneous Manufacturers 0.87% | |
| Trakya Cam Sanayii A.S. | | | 1,300,000 | | | | 1,682,759 | | |
| Oil - Field Services 1.11% | |
| Trican Well Service Ltd. | | | 124,270 | | | | 2,140,799 | * | |
| Oil Companies - Exploration & Production 17.60% | |
| BNK Petroleum, Inc. | | | 500,000 | | | | 760,736 | * | |
| Gazprom OAO, Sponsored ADR | | | 1,704,302 | | | | 18,167,859 | | |
| NovaTek OAO, Sponsored GDR | | | 120,977 | | | | 15,146,321 | | |
| | | | 34,074,916 | | |
| Oil Companies - Integrated 24.49% | |
| Lukoil OAO, Sponsored ADR | | | 270,610 | | | | 14,328,800 | | |
| MOL Hungarian Oil & Gas Nyrt. | | | 37,200 | | | | 2,650,269 | * | |
See notes to portfolios of investments and notes to financial statements.
130
Portfolio of Investments December 31, 2011
Eastern European Fund
| Common Stocks | | Shares | | Value | |
| Oil Companies - Integrated (Cont'd) | |
| Rosneft Oil Co. OJSC, Sponsored GDR | | | 1,869,309 | | | $ | 12,337,439 | | |
| Surgutneftegas OJSC, Sponsored ADR | | | 677,200 | | | | 5,302,476 | * | |
| TNK-BP Holding | | | 4,964,800 | | | | 12,792,795 | | |
| | | | 47,411,779 | | |
| Oil Refining & Marketing 2.07% | |
| Tupras Turkiye Petrol Rafinerileri A.S. | | | 189,200 | | | | 4,014,854 | | |
| Precious Metals 3.64% | |
| Polymetal, Sponsored GDR | | | 260,000 | | | | 4,283,056 | *@ | |
| Polymetal International plc | | | 162,268 | | | | 2,757,170 | * | |
| | | | 7,040,226 | | |
| Property/Casualty Insurance 2.88% | |
| Powszechny Zaklad Ubezpieczen S.A. | | | 62,300 | | | | 5,578,458 | | |
| Steel - Producers 0.90% | |
| Evraz Plc | | | 300,000 | | | | 1,745,896 | * | |
| Telecom Services 0.50% | |
| Telefonica Czech Republic A.S. | | | 50,000 | | | | 969,530 | | |
| Television 0.46% | |
| TVN S.A. | | | 300,000 | | | | 895,419 | | |
| Tobacco 0.49% | |
| Philip Morris CR A.S. | | | 1,500 | | | | 955,104 | * | |
| Web Portals/Internet Service Providers 1.81% | |
| Yandex N.V., Class A | | | 177,600 | | | | 3,498,720 | * | |
| Total Common Stocks | | | 180,603,550 | | |
| (cost $177,676,151) | |
Exchange-Traded Fund (ETF) 0.76%
| SPDR Gold Trust | | | 9,700 | | | | 1,474,303 | * | |
| (cost $1,539,592) | |
See notes to portfolios of investments and notes to financial statements.
131
Portfolio of Investments December 31, 2011
Eastern European Fund
| Warrants 1.32% | | Shares | | Value | |
| Gold Mining 1.32% | |
| Dundee Precious Metals, Inc., Warrants (November 2015) | | | 500,000 | | | $ | 2,552,147 | * | |
| Metal - Diversified 0.00% | |
| Orsu Metals Corp., 144A, Warrants (April 2012) | | | 2,012,500 | | | | 0 | *@ | |
| Total Warrants | | | 2,552,147 | | |
| (cost $0) | |
| Total Securities | | | 184,630,000 | | |
| (cost $179,215,743) | |
| Repurchase Agreement 2.33% | | Principal
Amount | | | |
Joint Tri-Party Repurchase Agreement, Credit Suisse Securities USA LLC,
12/30/2011, 0.02%, due 1/3/2012, repurchase price $4,510,883, collateralized
by U.S. Treasury securities held in a joint tri-party account (cost $4,510,873) | | $ | 4,510,873 | | | | 4,510,873 | | |
| Total Investments 97.70% | | | 189,140,873 | | |
| (cost $183,726,616) | |
| Other assets and liabilities, net 2.30% | | | 4,457,943 | | |
| Net Assets 100% | | $ | 193,598,816 | | |
| Call Options Written | | Shares Subject
To Call | | | |
| Gazprom OAO, Strike Price 12, Expiration Jan. 2012 | | | 400,000 | | | $ | 44,000 | | |
| Gazprom OAO, Strike Price 12, Expiration Feb. 2012 | | | 400,000 | | | | 80,000 | | |
| Lukoil OAO, Strike Price 56, Expiration Jan. 2012 | | | 230,000 | | | | 86,250 | | |
| MMC Norilsk Nickel OJSC, Strike Price 16, Expiration Jan. 2012 | | | 100,000 | | | | 37,500 | | |
| Rosneft Oil Co. OJSC, Strike Price 7.25, Expiration Jan. 2012 | | | 800,000 | | | | 44,000 | | |
| Surgutneftegas OJSC, Strike Price 8.75, Expiration Jan. 2012 | | | 200,000 | | | | 16,000 | | |
| Surgutneftegas OJSC, Strike Price 9, Expiration Jan. 2012 | | | 300,000 | | | | 24,000 | | |
| VTB Bank OJSC, Strike Price 4.20, Expiration Jan. 2012 | | | 800,000 | | | | 8,000 | | |
| Total Call Options Written | | $ | 339,750 | | |
| (premiums received $1,010,400) (Note 2A) | |
See notes to portfolios of investments and notes to financial statements.
132
Portfolio of Investments December 31, 2011
Eastern European Fund
| Put Options Written | | Shares Subject
To Put | | Value | |
| Mechel Steel Group OAO, Strike Price 9, Expiration Jan. 2012 | | | 250,000 | | | $ | 212,500 | | |
| Turkcell lletisim Hizmet A.S., Strike Price 10, Expiration Jan. 2012 | | | 250,000 | | | | 25,000 | | |
| Total Put Options Written | | $ | 237,500 | | |
| (premiums received $395,485) (Note 2A) | |
See notes to portfolios of investments and notes to financial statements.
133
Portfolio of Investments December 31, 2011
Global Emerging Markets Fund
| Common Stocks 92.36% | | Shares | | Value | |
| Agricultural Chemicals 1.16% | |
| Uralkali OJSC | | | 13,200 | | | $ | 95,709 | * | |
| Airlines 1.57% | |
| Copa Holdings S.A., Class A | | | 2,200 | | | | 129,074 | | |
| Automotive - Cars & Light Trucks 2.89% | |
| Dongfeng Motor Group Co., Ltd., H shares | | | 42,000 | | | | 72,464 | | |
| Great Wall Motor Co., Ltd., H shares | | | 62,500 | | | | 91,256 | | |
| Hyundai Motor Co. | | | 400 | | | | 73,605 | * | |
| | | | 237,325 | | |
| Building - Heavy Construction 0.46% | |
| China Railway Construction Corp., Ltd., H shares | | | 69,500 | | | | 38,210 | | |
| Building & Construction - Miscellaneous 1.41% | |
| China Communications Construction Co., Ltd., H shares | | | 148,000 | | | | 115,860 | | |
| Building & Construction Products - Miscellaneous 3.17% | |
| China National Building Material Co., Ltd., H shares | | | 80,000 | | | | 90,644 | | |
| Taiwan Glass Industrial Corp. | | | 165,380 | | | | 170,377 | * | |
| | | | 261,021 | | |
| Building Products - Cement/Aggregates 2.43% | |
| PT Holcim Indonesia Tbk | | | 457,800 | | | | 109,811 | | |
| PT Indocement Tunggal Prakarsa Tbk | | | 48,000 | | | | 90,257 | * | |
| | | | 200,068 | | |
| Casino Hotels 1.09% | |
| Galaxy Entertainment Group Ltd. | | | 49,000 | | | | 89,589 | * | |
| Cellular Telecommunications 3.83% | |
| Advanced Info Service PCL | | | 9,000 | | | | 40,060 | | |
| Empresa Nacional de Telecomunicaciones S.A. | | | 6,500 | | | | 120,741 | | |
| Vodacom Group Ltd. | | | 14,000 | | | | 154,350 | | |
| | | | 315,151 | | |
| Ceramic Products 0.58% | |
| Dynasty Ceramic PCL | | | 25,000 | | | | 47,917 | * | |
| Chemicals - Diversified 0.84% | |
| Capro Corp. | | | 2,000 | | | | 36,448 | * | |
| Dongyue Group | | | 50,000 | | | | 32,897 | | |
| | | | 69,345 | | |
See notes to portfolios of investments and notes to financial statements.
134
Portfolio of Investments December 31, 2011
Global Emerging Markets Fund
| Common Stocks | | Shares | | Value | |
| Chemicals - Other 0.46% | |
| China Lumena New Materials Corp. | | | 204,000 | | | $ | 37,823 | * | |
| Coal 1.18% | |
| PT Bumi Resources Tbk | | | 405,000 | | | | 97,146 | | |
| Commercial Banks - Non US 7.70% | |
| Agricultural Bank of China Ltd., H shares | | | 195,000 | | | | 84,110 | | |
| Bank of China Ltd., H shares | | | 498,000 | | | | 184,026 | | |
| Credicorp Ltd. | | | 1,500 | | | | 164,205 | | |
| Industrial and Commercial Bank of China Ltd., H shares | | | 148,000 | | | | 88,039 | | |
| Yes Bank Ltd. | | | 25,000 | | | | 112,657 | | |
| | | | 633,037 | | |
| Consumer Products - Miscellaneous 0.84% | |
| Marico Ltd. | | | 25,000 | | | | 68,848 | * | |
| Cosmetics & Toiletries 1.37% | |
| LG Household & Health Care Ltd. | | | 268 | | | | 112,758 | * | |
| Diversified Finanancial Services 0.90% | |
| Bualuang Securities PCL | | | 39,100 | | | | 27,004 | * | |
| Tisco Financial Group PCL | | | 39,000 | | | | 46,951 | * | |
| | | | 73,955 | | |
| Diversified Minerals 0.31% | |
| African Potash Ltd. | | | 200,000 | | | | 25,627 | * | |
| Diversified Operations 1.02% | |
| Guangdong Investment Ltd. | | | 138,000 | | | | 83,511 | | |
| Electric - Generation 1.40% | |
| AES Tiete S.A. | | | 8,000 | | | | 115,270 | | |
| Electric Products - Miscellaneous 0.53% | |
| Zhuzhou CSR Times Electric Co., Ltd., H shares | | | 20,000 | | | | 43,829 | * | |
| Electronic Components - Miscellaneous 1.62% | |
| E Ink Holdings, Inc. | | | 42,000 | | | | 54,780 | * | |
| TPK Holding Co., Ltd. | | | 6,000 | | | | 78,157 | * | |
| | | | 132,937 | | |
See notes to portfolios of investments and notes to financial statements.
135
Portfolio of Investments December 31, 2011
Global Emerging Markets Fund
| Common Stocks | | Shares | | Value | |
| Electronic Components - Semiconductors 1.74% | |
| Samsung Electronics Co., Ltd. | | | 100 | | | $ | 91,278 | | |
| Spreadtrum Communications, Inc., Sponsored ADR | | | 2,500 | | | | 52,200 | * | |
| | | | 143,478 | | |
| Finance - Consumer Loans 1.61% | |
| Capitec Bank Holdings Ltd. | | | 6,000 | | | | 132,299 | * | |
| Food - Canned 1.13% | |
| Thai Union Frozen Products PCL | | | 50,000 | | | | 92,666 | * | |
| Food - Meat Products 1.43% | |
| BRF-Brasil Foods S.A., Sponsored ADR | | | 6,000 | | | | 117,300 | * | |
| Food - Miscellaneous/Diversified 1.01% | |
| Zhongpin, Inc. | | | 9,757 | | | | 83,130 | * | |
| Food - Retail 0.56% | |
| X5 Retail Group N.V., Sponsored GDR | | | 2,000 | | | | 45,680 | * | |
| Gas - Distribution 0.73% | |
| Indraprastha Gas Ltd. | | | 8,500 | | | | 60,028 | * | |
| Gold Mining 2.06% | |
| Gran Colombia Gold Corp. | | | 77,100 | | | | 39,354 | * | |
| Koza Altin Isletmeleri A.S. | | | 9,800 | | | | 130,493 | | |
| | | | 169,847 | | |
| Internet Content - Entertainment 1.48% | |
| Netease.com, Sponsored ADR | | | 2,710 | | | | 121,544 | * | |
| Investment Companies 0.46% | |
| Vostok Nafta Investment Ltd. | | | 10,000 | | | | 38,076 | * | |
| Machinery - Construction & Mining 1.57% | |
| Lonking Holdings Ltd. | | | 120,000 | | | | 40,636 | * | |
| PT United Tractors Tbk | | | 30,500 | | | | 88,632 | | |
| | | | 129,268 | | |
| Machinery - Farm 0.35% | |
| Turk Traktor ve Ziraat Makineleri A.S. | | | 1,626 | | | | 29,156 | | |
| Machinery - General Industrial 1.41% | |
| Haitian International Holdings Ltd. | | | 136,000 | | | | 115,922 | | |
See notes to portfolios of investments and notes to financial statements.
136
Portfolio of Investments December 31, 2011
Global Emerging Markets Fund
| Common Stocks | | Shares | | Value | |
| Medical - Hospitals 2.84% | |
| Bumrungrad Hospital PCL | | | 71,900 | | | $ | 105,919 | * | |
| Life Healthcare Group Holdings Ltd. | | | 50,000 | | | | 127,840 | | |
| | | | 233,759 | | |
| Metal - Diversified 0.53% | |
| Ivanhoe Mines Ltd. | | | 1,000 | | | | 17,720 | * | |
| Orsu Metals Corp. | | | 41,083 | | | | 4,436 | * | |
| Orsu Metals Corp., 144A | | | 200,000 | | | | 21,595 | * | |
| | | | 43,751 | | |
| Multi-line Insurance 0.52% | |
| China Taiping Insurance Holdings Co., Ltd. | | | 23,000 | | | | 42,526 | * | |
| Multimedia 1.44% | |
| Naspers Ltd., Class N | | | 2,700 | | | | 118,130 | | |
| Oil Companies - Exploration & Production 1.86% | |
| MIE Holdings Corp. | | | 162,000 | | | | 40,883 | * | |
| PetroMagdalena Energy Corp. | | | 29,185 | | | | 34,950 | * | |
| PetroMagdalena Energy Corp., 144A | | | 64,286 | | | | 76,986 | * | |
| | | | 152,819 | | |
| Oil Companies - Integrated 5.53% | |
| China Petroleum & Chemical Corp., Sponsored ADR | | | 1,000 | | | | 105,050 | * | |
| PetroChina Co., Ltd., Sponsored ADR | | | 900 | | | | 111,879 | * | |
| TNK-BP Holding | | | 92,200 | | | | 237,572 | | |
| | | | 454,501 | | |
| Paper & Related Products 0.52% | |
| Nine Dragons Paper Holdings Ltd. | | | 67,000 | | | | 42,443 | | |
| Petrochemicals 1.92% | |
| Formosa Chemicals & Fibre Corp. | | | 60,000 | | | | 158,296 | | |
| Photo Equipment & Supplies 1.14% | |
| Largan Precision Co., Ltd. | | | 5,000 | | | | 93,446 | | |
| Public Thoroughfares 1.98% | |
| CCR S.A. | | | 24,800 | | | | 162,464 | | |
| Real Estate Management/Services 2.36% | |
| BR Malls Participacoes S.A. | | | 20,000 | | | | 194,150 | | |
See notes to portfolios of investments and notes to financial statements.
137
Portfolio of Investments December 31, 2011
Global Emerging Markets Fund
| Common Stocks | | Shares | | Value | |
| Real Estate Operating/Development 2.57% | |
| Evergrande Real Estate Group Ltd. | | | 156,000 | | | $ | 64,677 | | |
| PT Alam Sutera Realty Tbk | | | 1,823,500 | | | | 92,507 | * | |
| Renhe Commercial Holdings Co., Ltd. | | | 472,000 | | | | 54,088 | | |
| | | | 211,272 | | |
| Retail - Apparel/Shoe 1.78% | |
| Restoque Comercio e Confeccoes de Roupas S.A. | | | 10,000 | | | | 146,022 | * | |
| Retail - Automobile 1.04% | |
| PT Astra International Tbk | | | 10,500 | | | | 85,691 | | |
| Retail - Discount 0.83% | |
| Siam Makro PCL | | | 9,000 | | | | 68,145 | * | |
| Retail - Jewelry 1.71% | |
| Emperor Watch & Jewellery Ltd. | | | 480,000 | | | | 60,567 | * | |
| Luk Fook Holdings International Ltd. | | | 23,000 | | | | 80,254 | * | |
| | | | 140,821 | | |
| Retail - Major Department Store 1.99% | |
| El Puerto de Liverpool SAB de CV | | | 22,500 | | | | 163,655 | * | |
| Retail - Miscellaneous/Diversified 1.20% | |
| Mr Price Group Ltd. | | | 10,000 | | | | 98,853 | * | |
| Retail - Restaurants 3.03% | |
| Arcos Dorados Holdings, Inc., Class A | | | 8,000 | | | | 164,240 | | |
| Jubilant Foodworks Ltd. | | | 6,000 | | | | 85,227 | * | |
| | | | 249,467 | | |
| Shipbuilding 0.88% | |
| Hyundai Heavy Industries Co., Ltd. | | | 326 | | | | 72,604 | * | |
| Telecom Services 1.04% | |
| Chunghwa Telecom Co., Ltd. | | | 26,000 | | | | 85,851 | | |
| Web Portals/Internet Service Providers 2.09% | |
| Baidu, Inc., Sponsored ADR | | | 800 | | | | 93,176 | * | |
| Yandex N.V., Class A | | | 4,000 | | | | 78,800 | * | |
| | | | 171,976 | | |
See notes to portfolios of investments and notes to financial statements.
138
Portfolio of Investments December 31, 2011
Global Emerging Markets Fund
| Common Stocks | | Shares | | Value | |
| Wireless Equipment 1.26% | |
| HTC Corp. | | | 6,300 | | | $ | 103,388 | | |
| Total Common Stocks | | | 7,596,434 | | |
| (cost $8,701,894) | |
Exchange-Traded Funds (ETF) 2.43%
| Global X FTSE Colombia 20 ETF | | | 1,200 | | | | 21,384 | * | |
| iShares MSCI Malaysia Index Fund | | | 1,650 | | | | 22,110 | * | |
| iShares Silver Trust | | | 500 | | | | 13,470 | * | |
| ProShares UltraShort FTSE China 25 | | | 700 | | | | 21,259 | * | |
| SPDR Gold Trust | | | 800 | | | | 121,592 | * | |
| Total Exchange-Traded Funds | | | 199,815 | | |
| (cost $211,507) | |
Warrants 0.13%
| Metal - Diversified 0.00% | |
| Orsu Metals Corp., 144A, Warrants (April 2012) | | | 100,000 | | | | 0 | *@ | |
| Oil Companies - Exploration & Production 0.13% | |
| PetroMagdalena Energy Corp., 144A, Warrants (February 2016) | | | 32,143 | | | | 10,727 | * | |
| Total Warrants | | | 10,727 | | |
| (cost $0) | |
| Convertible Debenture 1.22% | | Principal
Amount | | | |
| Metal - Iron 1.22% | |
| Pacific Iron Corp., 1.00%, maturity 06/07/12 (RS) | | $ | 100,000 | | | | 100,000 | @ | |
| (cost $100,000) | |
| Total Securities | | | 7,906,976 | | |
| (cost $9,013,401) | |
See notes to portfolios of investments and notes to financial statements.
139
Portfolio of Investments December 31, 2011
Global Emerging Markets Fund
| Repurchase Agreement 3.50% | | Principal
Amount | | Value | |
Joint Tri-Party Repurchase Agreement, Credit Suisse Securities USA LLC,
12/30/2011, 0.02%, due 1/3/2012, repurchase price $287,748, collateralized
by U.S. Treasury securities held in a joint tri-party account (cost $287,747) | | $ | 287,747 | | | $ | 287,747 | | |
| Total Investments 99.64% | | | 8,194,723 | | |
| (cost $9,301,148) | |
| Other assets and liabilities, net 0.36% | | | 29,439 | | |
| Net Assets 100% | | $ | 8,224,162 | | |
See notes to portfolios of investments and notes to financial statements.
140
Portfolio of Investments December 31, 2011
China Region Fund
| Common Stocks 95.51% | | Shares | | Value | |
| Agricultural Chemicals 1.09% | |
| China BlueChemical Ltd., H shares | | | 442,000 | | | $ | 334,633 | | |
| Airlines 1.16% | |
| Air China Ltd., H shares | | | 480,000 | | | | 355,368 | | |
| Appliances 1.11% | |
| Haier Electronics Group Co., Ltd. | | | 378,000 | | | | 339,716 | * | |
| Automotive - Cars & Light Trucks 4.67% | |
| Brilliance China Automotive Holdings Ltd. | | | 162,000 | | | | 174,795 | * | |
| Dongfeng Motor Group Co., Ltd., H shares | | | 318,000 | | | | 548,657 | | |
| Great Wall Motor Co., Ltd., H shares | | | 244,000 | | | | 356,264 | | |
| Hyundai Motor Co. | | | 1,909 | | | | 351,280 | * | |
| | | | 1,430,996 | | |
| Automotive/Truck Parts & Equipment - Original 0.66% | |
| Hyundai Mobis | | | 800 | | | | 201,813 | * | |
| Building - Heavy Construction 0.54% | |
| China Railway Construction Corp., Ltd., H shares | | | 302,500 | | | | 166,311 | | |
| Building & Construction - Miscellaneous 1.54% | |
| China Communications Construction Co., Ltd., H shares | | | 602,000 | | | | 471,269 | | |
| Building & Construction Products - Miscellaneous 0.74% | |
| China National Building Material Co., Ltd., H shares | | | 200,000 | | | | 226,612 | | |
| Building Products - Cement/Aggregates 2.37% | |
| Asia Cement China Holdings Corp. | | | 423,000 | | | | 198,249 | | |
| PT Indocement Tunggal Prakarsa Tbk | | | 280,000 | | | | 526,496 | * | |
| | | | 724,745 | | |
| Casino Hotels 2.20% | |
| Galaxy Entertainment Group Ltd. | | | 187,000 | | | | 341,900 | * | |
| SJM Holdings Ltd. | | | 204,000 | | | | 330,956 | | |
| | | | 672,856 | | |
| Cellular Telecommunications 0.96% | |
| China Mobile Ltd. | | | 30,000 | | | | 293,178 | | |
| Ceramic Products 0.70% | |
| Dynasty Ceramic PCL | | | 112,000 | | | | 214,668 | * | |
See notes to portfolios of investments and notes to financial statements.
141
Portfolio of Investments December 31, 2011
China Region Fund
| Common Stocks | | Shares | | Value | |
| Chemicals - Diversified 1.74% | |
| Capro Corp. | | | 16,000 | | | $ | 291,580 | * | |
| Dongyue Group | | | 365,000 | | | | 240,150 | | |
| | | | 531,730 | | |
| Chemicals - Other 1.08% | |
| China Lumena New Materials Corp. | | | 1,776,000 | | | | 329,287 | * | |
| Coal 4.50% | |
| China Shenhua Energy Co., Ltd., H shares | | | 132,400 | | | | 575,348 | | |
| PT Bumi Resources Tbk | | | 1,000,000 | | | | 239,868 | | |
| Yanzhou Coal Mining Co., H shares | | | 264,500 | | | | 564,650 | | |
| | | | 1,379,866 | | |
| Commercial Banks - Non US 10.70% | |
| Agricultural Bank of China Ltd., H shares | | | 1,166,000 | | | | 502,936 | | |
| Bank of China Ltd., H shares | | | 2,026,000 | | | | 748,670 | | |
| China Construction Bank Corp., H shares | | | 518,000 | | | | 361,491 | | |
| China Minsheng Banking Corp. Ltd., H shares | | | 432,000 | | | | 374,897 | | |
| Chongqing Rural Commercial Bank, H shares | | | 747,000 | | | | 387,610 | * | |
| Industrial and Commercial Bank of China Ltd., H shares | | | 1,517,000 | | | | 902,395 | | |
| | | | 3,277,999 | | |
| Computers 0.51% | |
| Lenovo Group Ltd. | | | 234,000 | | | | 156,068 | | |
| Distribution/Wholesale 1.27% | |
| Digital China Holdings Ltd. | | | 250,000 | | | | 387,557 | * | |
| Diversified Financial Services 0.59% | |
| Tisco Financial Group PCL | | | 150,000 | | | | 180,580 | * | |
| Diversified Minerals 0.60% | |
| Erdene Resource Development Corp. | | | 99,000 | | | | 36,442 | * | |
| Woulfe Mining Corp. | | | 811,900 | | | | 147,437 | * | |
| | | | 183,879 | | |
| Electric Products - Miscellaneous 0.56% | |
| Zhuzhou CSR Times Electric Co., Ltd., H shares | | | 78,000 | | | | 170,932 | * | |
| Electronic Components - Miscellaneous 0.00% | |
| Yageo Corp., Sponsored GDR | | | 1 | | | | 0 | *@ | |
See notes to portfolios of investments and notes to financial statements.
142
Portfolio of Investments December 31, 2011
China Region Fund
| Common Stocks | | Shares | | Value | |
| Electronic Components - Semiconductors 0.68% | |
| Spreadtrum Communications, Inc., Sponsored ADR | | | 10,000 | | | $ | 208,800 | * | |
| Food - Canned 1.21% | |
| Thai Union Frozen Products PCL | | | 200,000 | | | | 370,664 | * | |
| Food - Dairy Products 0.69% | |
| China Mengniu Dairy Co., Ltd. | | | 90,000 | | | | 210,440 | | |
| Food - Miscellaneous/Diversified 2.67% | |
| China Yurun Food Group Ltd. | | | 119,000 | | | | 156,285 | | |
| Universal Robina Corp. | | | 300,000 | | | | 329,578 | | |
| Zhongpin, Inc. | | | 39,000 | | | | 332,280 | * | |
| | | | 818,143 | | |
| Gas - Distribution 1.83% | |
| PT Perusahaan Gas Negara | | | 1,000,000 | | | | 350,152 | | |
| Towngas China Co., Ltd. | | | 390,000 | | | | 210,903 | * | |
| | | | 561,055 | | |
| Gold Mining 0.54% | |
| Euromax Resources Ltd., 144A | | | 473,235 | | | | 97,550 | * | |
| Olympus Pacific Minerals, Inc. | | | 264,410 | | | | 68,779 | * | |
| | | | 166,329 | | |
| Internet Application Software 2.82% | |
| Tencent Holdings Ltd. | | | 43,000 | | | | 863,698 | | |
| Internet Content - Entertainment 2.15% | |
| Netease.com, Sponsored ADR | | | 14,700 | | | | 659,295 | * | |
| Life/Health Insurance 1.22% | |
| AIA Group Ltd. | | | 120,000 | | | | 374,681 | | |
| Machinery - Construction & Mining 1.70% | |
Changsha Zoomlion Heavy Industry Science and Technology
Development Co., Ltd., H shares | | | 162,200 | | | | 174,593 | | |
| PT United Tractors Tbk | | | 119,500 | | | | 347,265 | | |
| | | | 521,858 | | |
| Machinery - General Industrial 1.10% | |
| Haitian International Holdings Ltd. | | | 396,000 | | | | 337,538 | | |
See notes to portfolios of investments and notes to financial statements.
143
Portfolio of Investments December 31, 2011
China Region Fund
| Common Stocks | | Shares | | Value | |
| Medical - Generic Drugs 0.30% | |
| PT Indofarma Tbk | | | 5,038,500 | | | $ | 90,573 | * | |
| Medical - Hospitals 1.33% | |
| Bumrungrad Hospital PCL | | | 277,500 | | | | 408,799 | * | |
| Metal - Copper 1.09% | |
| Jiangxi Copper Co., Ltd., H shares | | | 155,000 | | | | 334,483 | | |
| Metal - Diversified 0.20% | |
| Ivanhoe Mines Ltd. | | | 3,500 | | | | 62,020 | * | |
| Miscellaneous Manufacturers 0.56% | |
| China International Marine Containers Group Co., Ltd., B shares | | | 150,000 | | | | 171,890 | * | |
| Multi-line Insurance 2.04% | |
| China Taiping Insurance Holdings Co., Ltd. | | | 170,000 | | | | 314,320 | * | |
| Ping An Insurance Group Co., H shares | | | 47,000 | | | | 310,445 | | |
| | | | 624,765 | | |
| Non - Ferrous Metals 0.08% | |
| Sterling Group Ventures, Inc. | | | 500,000 | | | | 25,000 | * | |
| Oil Companies - Exploration & Production 1.95% | |
| CNOOC Ltd., Sponsored ADR | | | 2,500 | | | | 436,700 | * | |
| MIE Holdings Corp. | | | 632,000 | | | | 159,493 | * | |
| | | | 596,193 | | |
| Oil Companies - Integrated 2.03% | |
| PetroChina Co., Ltd., Sponsored ADR | | | 5,000 | | | | 621,550 | * | |
| Paper & Related Products 0.56% | |
| Nine Dragons Paper Holdings Ltd. | | | 269,000 | | | | 170,407 | | |
| Petrochemicals 0.52% | |
| Danhua Chemical Technology Co., Ltd., B shares | | | 2 | | | | 1 | * | |
| LG Chem Ltd. | | | 568 | | | | 155,907 | * | |
| | | | 155,908 | | |
| Property/Casualty Insurance 0.12% | |
| PICC Property & Casualty Co. Ltd., H shares | | | 27,600 | | | | 37,456 | | |
| Public Thoroughfares 0.70% | |
| Jiangsu Expressway Co., Ltd., H shares | | | 232,000 | | | | 213,581 | | |
See notes to portfolios of investments and notes to financial statements.
144
Portfolio of Investments December 31, 2011
China Region Fund
| Common Stocks | | Shares | | Value | |
| Real Estate Operating/Development 5.23% | |
| Evergrande Real Estate Group Ltd. | | | 599,000 | | | $ | 248,343 | | |
| LPN Development PCL | | | 500,000 | | | | 202,756 | * | |
| Mongolia Growth Group Ltd. | | | 125,000 | | | | 478,528 | * | |
| PT Alam Sutera Realty Tbk | | | 7,910,000 | | | | 401,279 | * | |
| Renhe Commercial Holdings Co., Ltd. | | | 1,726,000 | | | | 197,788 | | |
| SC Asset Corp. PCL | | | 186,000 | | | | 72,479 | * | |
| | | | 1,601,173 | | |
| Retail - Apparel/Shoe 2.83% | |
| 361 Degrees International Ltd. | | | 714,000 | | | | 284,990 | * | |
| Anta Sports Products Ltd. | | | 196,000 | | | | 234,192 | | |
| Belle International Holdings Ltd., Class A | | | 105,000 | | | | 183,594 | | |
| IT Ltd. | | | 300,000 | | | | 165,323 | * | |
| | | | 868,099 | | |
| Retail - Automobile 2.25% | |
| PT Astra International Tbk | | | 84,500 | | | | 689,606 | | |
| Retail - Consumer Electronics 1.60% | |
| GOME Electrical Appliances Holdings Ltd. | | | 2,118,900 | | | | 491,080 | | |
| Retail - Discount 0.74% | |
| Siam Makro PCL | | | 30,000 | | | | 227,150 | * | |
| Retail - Jewelry 1.97% | |
| Emperor Watch & Jewellery Ltd. | | | 2,110,000 | | | | 266,243 | * | |
| Lao Feng Xiang Co., Ltd., B shares | | | 1 | | | | 2 | * | |
| Luk Fook Holdings International Ltd. | | | 97,000 | | | | 338,462 | * | |
| | | | 604,707 | | |
| Schools 0.29% | |
| CIBT Education Group, Inc. | | | 377,266 | | | | 88,877 | * | |
| Steel - Producers 0.57% | |
| Xingda International Holdings Ltd. | | | 390,000 | | | | 175,753 | | |
| Telecom Services 1.27% | |
| Shin Corp. PCL | | | 286,000 | | | | 389,609 | * | |
| Television 0.32% | |
| PT Surya Citra Media Tbk | | | 114,500 | | | | 99,126 | * | |
| Therapeutics 0.55% | |
| China Shineway Pharmaceutical Group Ltd. | | | 118,000 | | | | 168,645 | | |
See notes to portfolios of investments and notes to financial statements.
145
Portfolio of Investments December 31, 2011
China Region Fund
| Common Stocks | | Shares | | Value | |
| Tobacco 2.47% | |
| PT Gudang Garam Tbk | | | 100,000 | | | $ | 684,312 | | |
| PT Hanjaya Mandala Sampoerna Tbk | | | 17,000 | | | | 73,118 | * | |
| | | | 757,430 | | |
| Web Portals/Internet Service Providers 8.04% | |
| Baidu, Inc., Sponsored ADR | | | 12,000 | | | | 1,397,640 | * | |
| Sina Corp. | | | 15,000 | | | | 780,000 | * | |
| Sohu.com, Inc. | | | 5,721 | | | | 286,050 | * | |
| | | | 2,463,690 | | |
| Total Common Stocks | | | 29,260,134 | | |
| (cost $31,121,349) | |
Exchange-Traded Funds (ETF) 1.04%
| iShares FTSE China 25 Index Fund | | | 4,800 | | | | 167,376 | * | |
| SPDR Gold Trust | | | 1,000 | | | | 151,990 | * | |
| Total Exchange-Traded Funds | | | 319,366 | | |
| (cost $332,774) | |
| Purchased Options 0.28% | | Contracts | | | |
| Electronic Components - Semiconductors 0.07% | |
| SPDR Gold Trust, Strike Price 158, Call, Expiration Jan. 2012 | | | 200 | | | | 19,600 | | |
| (premium $61,112) | |
| Internet Infrastructure Software 0.02% | |
| AsiaInfo-Linkage, Inc., Strike Price 8, Call, Expiration Jan. 2012 | | | 200 | | | | 6,500 | | |
| (premium $31,300) | |
See notes to portfolios of investments and notes to financial statements.
146
Portfolio of Investments December 31, 2011
China Region Fund
| Purchased Options | | Contracts | | Value | |
| Web Portals/Internet Service Providers 0.19% | |
| Sina Corp., Strike Price 60, Call, Expiration June 2012 | | | 80 | | | $ | 59,200 | | |
| (premium $60,240) | |
| Total Purchased Options | | | 85,300 | | |
| (cost $152,652) | |
| Total Investments 96.83% | | | 29,664,800 | | |
| (cost $31,606,775) | |
| Other assets and liabilities, net 3.17% | | | 970,177 | | |
| Net Assets 100% | | $ | 30,634,977 | | |
See notes to portfolios of investments and notes to financial statements.
147
Notes to Portfolios of Investments December 31, 2011
Legend
* Non-income producing security
+ Affiliated company (see following)
ADR American Depositary Receipt
GDR Global Depositary Receipt
GO General Obligation Bond
RS Restricted Security (see following)
ZCB Zero Coupon Bond
^ Security or portion of security segregated as collateral for written options
@ Security was fair valued at December 31, 2011, by U.S. Global Investors, Inc. (Adviser) in accordance with valuation procedures approved by the Board of Trustees. Fair valued securities, which were primarily composed of restricted securities, as a percentage of net assets at December 31, 2011, were 1.93% of Holmes Growth, 7.85% of Global MegaTrends, 4.43% of Global Resources, 2.02% of World Precious Minerals, 0.65% of Gold and Precious Metals, 2.21% of Eastern European, 1.22% of Global Emerging Markets and 0.00% of China Region. See the Fair Valuation of Securities section of these Notes to Portfolios of Investments for further discussion of fair valued securities. See further information and detail on restricted securities in the Restricted Securities section of these Notes to Portfolios of Investments.
General
The yields reflect the effective yield from the date of purchase.
Variable Rate Notes have periodic reset features, which effectively shorten the maturity dates and reset the interest rates as tied to various interest-bearing instruments. Rates shown are current rates at December 31, 2011.
Securities with a 144A designation are exempt from registration under Rule 144A of the Securities Act of 1933.
Joint Tri-Party Repurchase Agreements
The terms of the joint tri-party repurchase agreements and the securities held as collateral at December 31, 2011, were:
Banc of America Securities LLC Merrill Lynch repurchase agreement, 12/30/11, 0.01%, due 01/03/12:
Total principal amount: $22,500,000; Total repurchase price: $22,500,025
Collateral:
$21,222,100 U.S. Treasury Note, 2.375%, 06/30/18
(total collateral market value, including accrued interest, of $22,950,013)
Credit Suisse Securities USA LLC repurchase agreement, 12/30/11, 0.02%, due 01/03/12:
Total principal amount: $147,811,864; Total repurchase price: $147,812,192
Collateral:
$144,975,000 U.S. Treasury Note, 1.875%, 02/28/14
(total collateral market value, including accrued interest, of $150,771,506)
148
Notes to Portfolios of Investments December 31, 2011
Morgan Stanley repurchase agreement, 12/30/11, 0.00%, due 01/03/12:
Total principal amount: $22,500,000; Total repurchase price: $22,500,000
Collateral:
$22,537,500 U.S. Treasury Note, 1.375%, 03/15/13
(total collateral market value, including accrued interest, of $22,950,029)
Fair Valuation of Securities
For the Funds' policies regarding the valuation of investments and other significant accounting policies, please refer to the Notes to Financial Statements.
The Funds are required to disclose information regarding the fair value measurements of a Fund's assets and liabilities. Fair value is the price that would be received to sell an asset or paid to transfer a liability in an orderly transaction between market participants at the measurement date. The disclosure requirement established a three-tier hierarchy to maximize the use of observable market data and minimize the use of unobservable inputs and to establish classification of fair value measurements for disclosure purposes. Inputs refer broadly to the assumptions that market participants would use in pricing the asset or liability, including assumptions about risk, for example, the risk inherent in a particular valuation technique used to measure fair value including such a pricing model and/or the risk inherent in the inputs to the valuation technique. Inputs may be observable or unobservable. Observable inputs are inputs that reflect the assumptions market participants would use in pricing the asset or liability developed based on market data obtained from sources independent of the reporting entity. Unobservable inputs are inputs that reflect the reporting entity's own assumptions about the assumptions market participants would use in pricing the asset or liability developed based on the best information available in the circumstances.
The inputs or methodology used for valuing securities are not necessarily an indication of the risk associated with investing in those securities. For example, money market securities are valued using amortized cost, in accordance with the Investment Company Act of 1940. Generally, amortized cost reflects the current fair value of a security, but since the value is not obtained from a quoted price in an active market, such securities are reflected as Level 2. Fair value determinations are required for securities whose value is affected by a significant event that will materially affect the value of a domestic or foreign equity security and which occurs subsequent to the time of the close of the principal market on which such domestic or foreign security trades but prior to the calculation of the Fund's NAV.
The three levels defined by the fair value hierarchy are as follows:
Level 1 – quoted prices in active markets for identical securities.
Level 2 – significant observable inputs (including quoted prices for similar securities, interest rates, prepayment speeds, credit risk, etc.).
Level 3 – significant unobservable inputs (including the Fund's own assumptions in determining the fair value of investments).
149
Notes to Portfolios of Investments December 31, 2011
In some instances, the inputs used to measure fair value might fall in different levels of the fair value hierarchy. The level in the fair value hierarchy within which the fair value measurement in its entirety falls is determined based on the lowest input level that is significant to the fair value measurement in its entirety. Because of the inherent uncertainties of valuation, the values reflected in the financial statements may materially differ from the value received upon actual sale of those investments.
The following table summarizes the valuation of each Fund's securities as of December 31, 2011, using the fair value hierarchy:
| | | Quoted Prices
in Active
Markets for
Identical
Investments
(Level 1)* | | Significant
Other
Observable
Inputs
(Level 2)* | | Significant
Unobservable
Inputs
(Level 3) | | Total | |
| U.S. Treasury Securities Cash Fund | |
Investments in securities**
Repurchase Agreements | | $ | 90,493,251 | | | $ | — | | | $ | — | | | $ | 90,493,251 | | |
| Total | | $ | 90,493,251 | | | $ | — | | | $ | — | | | $ | 90,493,251 | | |
| U.S. Government Securities Savings Fund | |
Investments in securities**
U.S. Government and Agency Obligations | | $ | — | | | $ | 170,631,309 | | | $ | — | | | $ | 170,631,309 | | |
| Total | | $ | — | | | $ | 170,631,309 | | | $ | — | | | $ | 170,631,309 | | |
| Near-Term Tax Free Fund | |
Investments in securities**
Municipal Bonds | | $ | — | | | $ | 31,167,481 | | | $ | — | | | $ | 31,167,481 | | |
| Repurchase Agreement | | | 3,366,017 | | | | — | | | | — | | | | 3,366,017 | | |
| Total | | $ | 3,366,017 | | | $ | 31,167,481 | | | $ | — | | | $ | 34,533,498 | | |
| Tax Free Fund | |
Investments in securities**
Municipal Bonds | | $ | — | | | $ | 19,479,558 | | | $ | — | | | $ | 19,479,558 | | |
| Repurchase Agreement | | | 1,969,170 | | | | — | | | | — | | | | 1,969,170 | | |
| Total | | $ | 1,969,170 | | | $ | 19,479,558 | | | $ | — | | | $ | 21,448,728 | | |
| All American Equity Fund | |
Investments in securities**
Common Stocks | | $ | 14,682,555 | | | $ | — | | | $ | — | | | $ | 14,682,555 | | |
| Exchange Traded Funds | | | 135,062 | | | | — | | | | — | | | | 135,062 | | |
| Purchased Options | | | 800 | | | | — | | | | — | | | | 800 | | |
| Repurchase Agreement | | | 1,639,166 | | | | — | | | | — | | | | 1,639,166 | | |
| Total | | $ | 16,457,583 | | | $ | — | | | $ | — | | | $ | 16,457,583 | | |
Other Financial Instruments***
Written Options | | $ | (581 | ) | | $ | — | | | $ | — | | | $ | (581 | ) | |
150
Notes to Portfolios of Investments December 31, 2011
| | | Quoted Prices
in Active
Markets for
Identical
Investments
(Level 1)* | | Significant
Other
Observable
Inputs
(Level 2)* | | Significant
Unobservable
Inputs
(Level 3) | | Total | |
| Holmes Growth Fund | |
| Investments in securities** | |
Common Stocks:
Metal - Iron | | $ | — | | | $ | — | | | $ | 100,000 | | | $ | 100,000 | | |
| Quarrying | | | — | | | | — | | | | 380,000 | | | | 380,000 | | |
| Real Estate Operating/Development | | | — | | | | — | | | | 100,000 | | | | 100,000 | | |
| All Other Common Stocks | | | 27,689,509 | | | | — | | | | — | | | | 27,689,509 | | |
| Exchange Traded Funds | | | 285,323 | | | | — | | | | — | | | | 285,323 | | |
| Warrants: | |
| Finance - Commercial | | | — | | | | — | | | | — | | | | — | | |
| Medical - Hospitals | | | — | | | | — | | | | — | | | | — | | |
| All Other Warrants | | | 32,183 | | | | — | | | | — | | | | 32,183 | | |
| Convertible Debenture: | |
| Metal - Iron | | | — | | | | — | | | | 100,000 | | | | 100,000 | | |
| Repurchase Agreement | | | 6,637,735 | | | | — | | | | — | | | | 6,637,735 | | |
| Total | | $ | 34,644,750 | | | $ | — | | | $ | 680,000 | | | $ | 35,324,750 | | |
Other Financial Instruments***
Written Options | | $ | (3,129 | ) | | $ | — | | | $ | — | | | $ | (3,129 | ) | |
| Global MegaTrends Fund | |
Investments in securities**
Common Stocks: | |
| Advanced Materials/Products | | $ | — | | | $ | 296,188 | | | $ | — | | | $ | 296,188 | | |
| Electric - Generation | | | — | | | | — | | | | 23,358 | | | | 23,358 | | |
| Energy - Alternate Sources | | | — | | | | — | | | | 100,000 | | | | 100,000 | | |
| Metal - Iron | | | — | | | | — | | | | 100,000 | | | | 100,000 | | |
| Public Thoroughfares | | | — | | | | 531,940 | | | | — | | | | 531,940 | | |
| Quarrying | | | — | | | | — | | | | 520,000 | | | | 520,000 | | |
| Real Estate Management/Services | | | — | | | | 213,565 | | | | — | | | | 213,565 | | |
| Real Estate Operating/Development | | | 430,444 | | | | — | | | | 326,533 | | | | 756,977 | | |
| All Other Common Stocks | | | 9,179,018 | | | | — | | | | — | | | | 9,179,018 | | |
| Exchange Traded Funds | | | 234,782 | | | | — | | | | — | | | | 234,782 | | |
| Warrants | | | 19,414 | | | | — | | | | — | | | | 19,414 | | |
| Purchased Option | | | 1,500 | | | | — | | | | — | | | | 1,500 | | |
| Master Limited Partnerships | | | 1,177,134 | | | | — | | | | — | | | | 1,177,134 | | |
| Convertible Debenture: | |
| Metal - Iron | | | — | | | | — | | | | 100,000 | | | | 100,000 | | |
| Repurchase Agreement | | | 1,723,735 | | | | — | | | | — | | | | 1,723,735 | | |
| Total | | $ | 12,766,027 | | | $ | 1,041,693 | | | $ | 1,169,891 | | | $ | 14,977,611 | | |
Other Financial Instruments***
Written Options | | $ | (7,085 | ) | | $ | — | | | $ | — | | | $ | (7,085 | ) | |
151
Notes to Portfolios of Investments December 31, 2011
| | | Quoted Prices
in Active
Markets for
Identical
Investments
(Level 1)* | | Significant
Other
Observable
Inputs
(Level 2)* | | Significant
Unobservable
Inputs
(Level 3) | | Total | |
| Global Resources Fund | |
Investments in securities**
Common Stocks: | |
| Electric - Generation | | $ | — | | | $ | — | | | $ | 325,779 | | | $ | 325,779 | | |
| Energy - Alternate Sources | | | — | | | | — | | | | 2,400,000 | | | | 2,400,000 | | |
| Gold Mining | | | 28,703,674 | | | | — | | | | 5,114 | | | | 28,708,788 | | |
| Metal - Copper | | | 40,060,800 | | | | — | | | | — | | | | 40,060,800 | | |
| Metal - Diversified | | | 2,017,330 | | | | — | | | | 2,250,000 | | | | 4,267,330 | | |
| Metal - Iron | | | 12,502,790 | | | | — | | | | 2,600,000 | | | | 15,102,790 | | |
| Mining Services | | | 1,341,241 | | | | — | | | | 281,270 | | | | 1,622,511 | | |
| Natural Resource Technology | | | — | | | | — | | | | 7,500 | | | | 7,500 | | |
| Oil Companies - Exploration & Production | | | 91,771,608 | | | | 9,131,201 | | | | — | | | | 100,902,809 | | |
| Oil Refining & Marketing | | | — | | | | — | | | | 415,466 | | | | 415,466 | | |
| Platinum | | | 102,721 | | | | — | | | | — | | | | 102,721 | | |
| Quarrying | | | 12,117,600 | | | | — | | | | 4,900,000 | | | | 17,017,600 | | |
| Real Estate Operating/Development | | | 1,091,043 | | | | — | | | | 7,443,544 | | | | 8,534,587 | | |
| All Other Common Stocks | | | 270,704,992 | | | | — | | | | — | | | | 270,704,992 | | |
| Real Estate Investment Trusts | | | 35,919,812 | | | | — | | | | — | | | | 35,919,812 | | |
| Exchange Traded Fund | | | 11,429,648 | | | | — | | | | — | | | | 11,429,648 | | |
| Warrants: | |
| Diversified Minerals | | | 18,665 | | | | — | | | | — | | | | 18,665 | | |
| Medical - Hospitals | | | — | | | | — | | | | — | | | | — | | |
| Oil Companies - Exploration & Production | | | 1,203,895 | | | | 5,812,500 | | | | — | | | | 7,016,395 | | |
| All Other Warrants | | | 7,632,499 | | | | — | | | | — | | | | 7,632,499 | | |
| Units | | | 12,294,478 | | | | — | | | | — | | | | 12,294,478 | | |
| Subscription Receipts | | | 1,554,029 | | | | — | | | | — | | | | 1,554,029 | | |
| Purchased Option | | | 39,000 | | | | — | | | | — | | | | 39,000 | | |
| Master Limited Partnerships | | | 33,082,641 | | | | — | | | | — | | | | 33,082,641 | | |
| Debenture: | |
| Diversified Minerals | | | — | | | | — | | | | 490,798 | | | | 490,798 | | |
| Silver-Linked Note | | | 1,689,800 | | | | — | | | | — | | | | 1,689,800 | | |
| Repurchase Agreement | | | 29,689,077 | | | | — | | | | — | | | | 29,689,077 | | |
| Total | | $ | 594,967,343 | | | $ | 14,943,701 | | | $ | 21,119,471 | | | $ | 631,030,515 | | |
Other Financial Instruments***
Written Options | | $ | 177,662 | | | $ | — | | | $ | — | | | $ | 177,662 | | |
��
152
Notes to Portfolios of Investments December 31, 2011
| | | Quoted Prices
in Active
Markets for
Identical
Investments
(Level 1)* | | Significant
Other
Observable
Inputs
(Level 2)* | | Significant
Unobservable
Inputs
(Level 3) | | Total | |
| World Precious Minerals Fund | |
Investments in securities**
Common Stocks: | |
| Diamonds/Precious Stones | | $ | 2,653,146 | | | $ | — | | | $ | — | | | $ | 2,653,146 | | |
| Gold Mining | | | 259,327,629 | | | | 2,102,822 | | | | 3,465,857 | | | | 264,896,308 | | |
| Metal - Copper | | | 4,469,560 | | | | — | | | | — | | | | 4,469,560 | | |
| Oil Companies - Exploration & Production | | | 5,357,256 | | | | — | | | | — | | | | 5,357,256 | | |
| Platinum | | | 2,145,346 | | | | — | | | | — | | | | 2,145,346 | | |
| Precious Metals | | | 25,566,699 | | | | 1,927,375 | | | | — | | | | 27,494,074 | | |
| All Other Common Stocks | | | 72,131,753 | | | | — | | | | — | | | | 72,131,753 | | |
| Exchange Traded Fund | | | 3,009,402 | | | | — | | | | — | | | | 3,009,402 | | |
| Warrants: | |
| Gold Mining | | | 15,803,838 | | | | — | | | | — | | | | 15,803,838 | | |
| Medical - Hospitals | | | — | | | | — | | | | — | | | | — | | |
| Metal - Diversified | | | 35,092 | | | | — | | | | — | | | | 35,092 | | |
| Precious Metals | | | — | | | | — | | | | — | | | | — | | |
| All Other Warrants | | | 1,968,611 | | | | — | | | | — | | | | 1,968,611 | | |
| Special Warrants: | |
| Gold/Mineral Exploration & Development | | | — | | | | — | | | | — | | | | — | | |
| Units: | |
| Gold Mining | | | — | | | | 162,258 | | | | — | | | | 162,258 | | |
| Purchased Call Options | | | 199,957 | | | | — | | | | — | | | | 199,957 | | |
| Purchased Put Option | | | 34,749 | | | | — | | | | — | | | | 34,749 | | |
| Convertible Debenture: | |
| Metal - Iron | | | — | | | | — | | | | 1,200,000 | | | | 1,200,000 | | |
| Silver-Linked Note | | | 6,885,935 | | | | — | | | | — | | | | 6,885,935 | | |
| Repurchase Agreement | | | 25,360,393 | | | | — | | | | — | | | | 25,360,393 | | |
| Total | | $ | 424,949,366 | | | $ | 4,192,455 | | | $ | 4,665,857 | | | $ | 433,807,678 | | |
| Gold and Precious Metals Fund | |
Investments in securities**
Common Stocks: | |
| Precious Metals | | $ | 9,750,446 | | | $ | 1,268,444 | | | $ | — | | | $ | 11,018,890 | | |
| All Other Common Stocks | | | 133,634,416 | | | | — | | | | — | | | | 133,634,416 | | |
| Exchange Traded Funds | | | 1,246,318 | | | | — | | | | — | | | | 1,246,318 | | |
| Warrants: | |
| Gold Mining | | | 10,979,888 | | | | — | | | | — | | | | 10,979,888 | | |
| Medical - Hospitals | | | — | | | | — | | | | — | | | | — | | |
| All Other Warrants | | | 992,724 | | | | — | | | | — | | | | 992,724 | | |
| Purchased Call Options | | | 103,643 | | | | — | | | | — | | | | 103,643 | | |
| Purchased Put Option | | | 13,851 | | | | — | | | | — | | | | 13,851 | | |
| Notes: | |
| Gold Mining | | | — | | | | 4,467,255 | | | | — | | | | 4,467,255 | | |
| Silver-Linked Note | | | 3,590,825 | | | | — | | | | — | | | | 3,590,825 | | |
| Repurchase Agreement | | | 27,134,701 | | | | — | | | | — | | | | 27,134,701 | | |
| Total | | $ | 187,446,812 | | | $ | 5,735,699 | | | $ | — | | | $ | 193,182,511 | | |
153
Notes to Portfolios of Investments December 31, 2011
| | | Quoted Prices
in Active
Markets for
Identical
Investments
(Level 1)* | | Significant
Other
Observable
Inputs
(Level 2)* | | Significant
Unobservable
Inputs
(Level 3) | | Total | |
| Eastern European Fund | |
Investments in securities**
Common Stocks: | |
| Precious Metals | | $ | 2,757,170 | | | $ | 4,283,056 | | | $ | — | | | $ | 7,040,226 | | |
| All Other Common Stocks | | | 173,563,324 | | | | — | | | | — | | | | 173,563,324 | | |
| Exchange Traded Fund | | | 1,474,303 | | | | — | | | | — | | | | 1,474,303 | | |
| Warrants: | |
| Metal - Diversified | | | — | | | | — | | | | — | | | | — | | |
| All Other Warrants | | | 2,552,147 | | | | — | | | | — | | | | 2,552,147 | | |
| Repurchase Agreement | | | 4,510,873 | | | | — | | | | — | | | | 4,510,873 | | |
| Total | | $ | 184,857,817 | | | $ | 4,283,056 | | | $ | — | | | $ | 189,140,873 | | |
| Other Financial Instruments*** | |
| Written Call Options | | $ | 670,650 | | | $ | — | | | $ | — | | | $ | 670,650 | | |
| Written Put Options | | | 157,985 | | | | — | | | | — | | | | 157,985 | | |
| Global Emerging Markets Fund | |
Investments in securities**
Common Stocks: | |
| Automotive - Cars & Light Trucks | | $ | 163,720 | | | $ | 73,605 | | | $ | — | | | $ | 237,325 | | |
| Chemicals - Diversified | | | 32,897 | | | | 36,448 | | | | — | | | | 69,345 | | |
| Cosmetics & Toiletries | | | — | | | | 112,758 | | | | — | | | | 112,758 | | |
| Electric - Generation | | | — | | | | 115,270 | | | | — | | | | 115,270 | | |
| Electronic Components - Semiconductors | | | 52,200 | | | | 91,278 | | | | — | | | | 143,478 | | |
| Public Thoroughfares | | | — | | | | 162,464 | | | | — | | | | 162,464 | | |
| Real Estate Management/Services | | | — | | | | 194,150 | | | | — | | | | 194,150 | | |
| Retail - Apparel/Shoe | | | — | | | | 146,022 | | | | — | | | | 146,022 | | |
| Shipbuilding | | | — | | | | 72,604 | | | | — | | | | 72,604 | | |
| All Other Common Stocks | | | 6,343,018 | | | | — | | | | — | | | | 6,343,018 | | |
| Exchange Traded Funds | | | 199,815 | | | | — | | | | — | | | | 199,815 | | |
| Warrants: | |
| Metal - Diversified | | | — | | | | — | | | | — | | | | — | | |
| All Other Warrants | | | 10,727 | | | | — | | | | — | | | | 10,727 | | |
| Convertible Debenture: | |
| Metal - Iron | | | — | | | | — | | | | 100,000 | | | | 100,000 | | |
| Repurchase Agreement | | | 287,747 | | | | — | | | | — | | | | 287,747 | | |
| Total | | $ | 7,090,124 | | | $ | 1,004,599 | | | $ | 100,000 | | | $ | 8,194,723 | | |
154
Notes to Portfolios of Investments December 31, 2011
| | | Quoted Prices
in Active
Markets for
Identical
Investments
(Level 1)* | | Significant
Other
Observable
Inputs
(Level 2)* | | Significant
Unobservable
Inputs
(Level 3) | | Total | |
| China Region Fund | |
Investments in securities**
Common Stocks: | |
| Automotive - Cars & Light Trucks | | $ | 1,079,716 | | | $ | 351,280 | | | $ | — | | | $ | 1,430,996 | | |
| Automotive/Truck Parts & Equipment - Original | | | — | | | | 201,813 | | | | — | | | | 201,813 | | |
| Chemicals - Diversified | | | 240,150 | | | | 291,580 | | | | — | | | | 531,730 | | |
| Electronic Components - Miscellaneous | | | — | | | | — | | | | — | | | | — | | |
| Food - Miscellaneous/Diversified | | | 488,565 | | | | 329,578 | | | | — | | | | 818,143 | | |
| Petrochemicals | | | 1 | | | | 155,907 | | | | — | | | | 155,908 | | |
| All Other Common Stocks | | | 26,121,544 | | | | — | | | | — | | | | 26,121,544 | | |
| Exchange Traded Funds | | | 319,366 | | | | — | | | | — | | | | 319,366 | | |
| Purchased Options | | | 85,300 | | | | — | | | | — | | | | 85,300 | | |
| Total | | $ | 28,334,642 | | | $ | 1,330,158 | | | $ | — | | | $ | 29,664,800 | | |
* Significant transfers between Levels 1 and 2 included securities valued at $21,943,739 at December 31, 2011, in the Eastern European Fund included in Level 1 that had previously been included in Level 2 at December 31, 2010. These changes were primarily the result of certain foreign securities using a systematic fair value model at the prior period end but not at December 31, 2011.
** Refer to the Portfolio of Investments for a detailed list of the Fund's investments.
*** Other financial instruments include written options. Written options are reported at their unrealized appreciation/depreciation at measurement date, which represents the change in the contract's value from trade date.
The following is a reconciliation of assets for which significant unobservable inputs (Level 3) were used in determining fair value during the period January 1, 2011, through December 31, 2011:
| | | Beginning
Balance
12/31/10 | | Purchases | | Sales | | Total
realized
gain
(loss) | | Net
change in
unrealized
appreciation
(depreciation) | | Reclassifications | | Transfers
out of
Level 3* | | Ending
Balance
12/31/11 | | Net
change in
unrealized
appreciation
(depreciation)
from
Investments
held as of
12/31/11(1) | |
| Holmes Growth Fund | |
Investments in
Securities
Common Stocks: | |
Finance -
Commercial | | $ | 82,723 | | | $ | 508,130 | | | $ | — | | | $ | — | | | $ | (266,927 | ) | | $ | — | | | $ | (323,926 | ) | | $ | — | | | $ | — | | |
| Metal - Iron | | | — | | | | 100,000 | | | | — | | | | — | | | | — | | | | — | | | | — | | | | 100,000 | | | | — | | |
| Quarrying | | | — | | | | — | | | | — | | | | — | | | | — | | | | 380,000 | | | | — | | | | 380,000 | | | | — | | |
Real Estate
Operating/
Development | | | 100,000 | | | | — | | | | — | | | | — | | | | — | | | | — | | | | — | | | | 100,000 | | | | — | | |
Convertible
Debentures: | |
| Metal - Iron | | | — | | | | 100,000 | | | | — | | | | — | | | | — | | | | — | | | | — | | | | 100,000 | | | | — | | |
Metal & Mineral
Mining | | | 380,000 | | | | — | | | | — | | | | — | | | | — | | | | (380,000 | ) | | | — | | | | — | | | | — | | |
Total Investments
in Securities | | $ | 562,723 | | | $ | 708,130 | | | $ | — | | | $ | — | | | $ | (266,927 | ) | | $ | — | | | $ | (323,926 | ) | | $ | 680,000 | | | $ | — | | |
155
Notes to Portfolios of Investments December 31, 2011
| | | Beginning
Balance
12/31/10 | | Purchases | | Sales | | Total
realized
gain
(loss) | | Net
change in
unrealized
appreciation
(depreciation) | | Reclassifications | | Transfers
out of
Level 3* | | Ending
Balance
12/31/11 | | Net
change in
unrealized
appreciation
(depreciation)
from
Investments
held as of
12/31/11(1) | |
| Global MegaTrends Fund | |
Investments in
Securities
Common Stocks: | |
Electric -
Generation | | $ | 23,358 | | | $ | — | | | $ | — | | | $ | — | | | $ | — | | | $ | — | | | $ | — | | | $ | 23,358 | | | $ | — | | |
Energy -
Alternate
Sources | | | — | | | | 100,000 | | | | — | | | | — | | | | — | | | | — | | | | — | | | | 100,000 | | | | — | | |
| Metal - Iron | | | — | | | | 100,000 | | | | — | | | | — | | | | — | | | | — | | | | — | | | | 100,000 | | | | — | | |
| Quarrying | | | — | | | | — | | | | — | | | | — | | | | — | | | | 520,000 | | | | — | | | | 520,000 | | | | — | | |
Real Estate
Operating/
Development | | | 326,533 | | | | — | | | | — | | | | — | | | | — | | | | — | | | | — | | | | 326,533 | | | | — | | |
Convertible
Debentures: | |
| Metal - Iron | | | — | | | | 100,000 | | | | — | | | | — | | | | — | | | | — | | | | — | | | | 100,000 | | | | — | | |
Metal & Mineral
Mining | | | 520,000 | | | | — | | | | — | | | | — | | | | — | | | | (520,000 | ) | | | — | | | | — | | | | — | | |
Total Investments
in Securities | | $ | 869,891 | | | $ | 300,000 | | | $ | — | | | $ | — | | | $ | — | | | $ | — | | | $ | — | | | $ | 1,169,891 | | | $ | — | | |
| Global Resources Fund | |
Investments in
Securities
Common Stocks: | |
| Coal | | $ | 2,400,000 | | | $ | — | | | $ | — | | | $ | — | | | $ | (1,386,994 | ) | | $ | — | | | $ | (1,013,006 | ) | | $ | — | | | $ | — | | |
Electric -
Generation | | | 506,454 | | | | — | | | | (180,675 | ) | | | — | | | | — | | | | — | | | | — | | | | 325,779 | | | | — | | |
Energy -
Alternate
Sources | | | — | | | | 2,400,000 | | | | — | | | | — | | | | — | | | | — | | | | — | | | | 2,400,000 | | | | — | | |
| Gold Mining | | | — | | | | — | | | | — | | | | — | | | | 5,114 | | | | — | | | | — | | | | 5,114 | | | | 5,114 | | |
| Metal - Copper | | | — | | | | — | | | | — | | | | — | | | | — | | | | — | | | | — | | | | — | | | | — | | |
Metal -
Diversified | | | — | | | | — | | | | — | | | | — | | | | — | | | | 2,250,000 | | | | — | | | | 2,250,000 | | | | — | | |
| Metal - Iron | | | — | | | | 2,600,000 | | | | — | | | | — | | | | — | | | | — | | | | — | | | | 2,600,000 | | | | — | | |
| Mining Services | | | 280,995 | | | | — | | | | — | | | | — | | | | 275 | | | | — | | | | — | | | | 281,270 | | | | 275 | | |
Natural
Resource
Technology | | | 7,500 | | | | — | | | | — | | | | — | | | | — | | | | — | | | | — | | | | 7,500 | | | | — | | |
Non - Ferrous
Metals | | | 2,062,500 | | | | — | | | | — | | | | — | | | | 187,500 | | | | (2,250,000 | ) | | | — | | | | — | | | | 187,500 | | |
Oil Companies -
Exploration &
Production | | | 33,930,794 | | | | — | | | | — | | | | — | | | | (24,799,593 | ) | | | — | | | | (9,131,201 | ) | | | — | | | | — | | |
Oil Refining &
Marketing | | | 424,402 | | | | — | | | | — | | | | — | | | | (8,936 | ) | | | — | | | | — | | | | 415,466 | | | | (8,936 | ) | |
| Platinum | | | — | | | | — | | | | — | | | | — | | | | — | | | | — | | | | — | | | | — | | | | — | | |
| Quarrying | | | — | | | | — | | | | — | | | | — | | | | — | | | | 4,900,000 | | | | — | | | | 4,900,000 | | | | — | | |
Real Estate
Operating/
Development | | | 7,443,544 | | | | — | | | | — | | | | — | | | | — | | | | — | | | | — | | | | 7,443,544 | | | | — | | |
156
Notes to Portfolios of Investments December 31, 2011
| | | Beginning
Balance
12/31/10 | | Purchases | | Sales | | Total
realized
gain
(loss) | | Net
change in
unrealized
appreciation
(depreciation) | | Reclassifications | | Transfers
out of
Level 3* | | Ending
Balance
12/31/11 | | Net
change in
unrealized
appreciation
(depreciation)
from
Investments
held as of
12/31/11(1) | |
| Global Resources Fund (Cont'd) | |
| Warrants: | |
| Mining Services | | $ | — | | | $ | — | | | $ | — | | | $ | — | | | $ | — | | | $ | — | | | $ | — | | | $ | — | | | $ | — | | |
Natural
Resource
Technology | | | — | | | | — | | | | — | | | | — | | | | — | | | | — | | | | — | | | | — | | | | — | | |
Oil Companies -
Exploration &
Production | | | 9,165,835 | | | | — | | | | — | | | | — | | | | (9,165,835 | ) | | | — | | | | — | | | | — | | | | — | | |
| Debenture: | |
Diversified
Minerals | | | — | | | | 510,621 | | | | — | | | | — | | | | (19,823 | ) | | | — | | | | — | | | | 490,798 | | | | (19,823 | ) | |
Convertible
Debenture: | |
Metal & Mineral
Mining | | | 4,900,000 | | | | — | | | | — | | | | — | | | | — | | | | (4,900,000 | ) | | | — | | | | — | | | | — | | |
Total Investments
in Securities | | $ | 61,122,024 | | | $ | 5,510,621 | | | $ | (180,675 | ) | | $ | — | | | $ | (35,188,292 | ) | | $ | — | | | $ | (10,144,207 | ) | | $ | 21,119,471 | | | $ | 164,130 | | |
| World Precious Minerals Fund | |
Investments in
Securities
Common Stocks: | |
Diamonds/
Precious
Stones | | $ | — | | | $ | — | | | $ | — | | | $ | — | | | $ | — | | | $ | — | | | $ | — | | | $ | — | | | $ | — | | |
| Gold Mining | | | — | | | | 4,187,832 | | | | — | | | | — | | | | 951,835 | | | | — | | | | (1,673,810 | ) | | | 3,465,857 | | | | 598,357 | | |
| Metal - Copper | | | — | | | | — | | | | — | | | | — | | | | — | | | | — | | | | — | | | | — | | | | — | | |
Metal -
Diversified | | | — | | | | — | | | | — | | | | — | | | | — | | | | — | | | | — | | | | — | | | | — | | |
Oil Companies -
Exploration &
Production | | | — | | | | — | | | | — | | | | — | | | | — | | | | — | | | | — | | | | — | | | | — | | |
| Platinum | | | — | | | | — | | | | — | | | | — | | | | — | | | | — | | | | — | | | | — | | | | — | | |
| Warrants: | |
| Gold Mining | | | — | | | | — | | | | — | | | | — | | | | — | | | | — | | | | — | | | | — | | | | — | | |
Special
Warrants: | |
Gold/Mineral
Exploration &
Development | | | — | | | | — | | | | — | | | | — | | | | 32,774 | | | | — | | | | (32,774 | ) | | | — | | | | — | | |
Subscription
Receipts: | |
| Metal - Iron | | | — | | | | 1,973,981 | | | | — | | | | — | | | | (778,104 | ) | | | — | | | | (1,195,877 | ) | | | — | | | | — | | |
Convertible
Debenture: | |
| Metal - Iron | | | — | | | | 1,200,000 | | | | — | | | | — | | | | — | | | | — | | | | — | | | | 1,200,000 | | | | — | | |
Total Investments
in Securities | | $ | — | | | $ | 7,361,813 | | | $ | — | | | $ | — | | | $ | 206,505 | | | $ | — | | | $ | (2,902,461 | ) | | $ | 4,665,857 | | | $ | 598,357 | | |
| Global Emerging Markets Fund | |
Investments in
Securities | |
Convertible
Debenture: | |
| Metal - Iron | | $ | — | | | $ | 100,000 | | | $ | — | | | $ | — | | | $ | — | | | $ | — | | | $ | — | | | $ | 100,000 | | | $ | — | | |
Total Investments
in Securities | | $ | — | | | $ | 100,000 | | | $ | — | | | $ | — | | | $ | — | | | $ | — | | | $ | — | | | $ | 100,000 | | | $ | — | | |
157
Notes to Portfolios of Investments December 31, 2011
| | | Beginning
Balance
12/31/10 | | Purchases | | Sales | | Total
realized
gain
(loss) | | Net
change in
unrealized
appreciation
(depreciation) | | Reclassifications | | Transfers
out of
Level 3* | | Ending
Balance
12/31/11 | | Net
change in
unrealized
appreciation
(depreciation)
from
Investments
held as of
12/31/11(1) | |
| China Region Fund | |
Investments in
Securities
Common Stocks: | |
Electronic
Components -
Miscellaneous | | $ | — | | | $ | — | | | $ | — | | | $ | — | | | $ | — | | | $ | — | | | $ | — | | | $ | — | | | $ | — | | |
Internet
Telephony | | | — | | | | — | | | | — | | | | (39,797 | ) | | | 39,797 | | | | — | | | | — | | | | — | | | | — | | |
Total Investments
in Securities | | $ | — | | | $ | — | | | $ | — | | | $ | (39,797 | ) | | $ | 39,797 | | | $ | — | | | $ | — | | | $ | — | | | $ | — | | |
* The Funds' policy is to recognize transfers in and transfers out as of the end of the reporting period.
(1) Any difference between Net change in unrealized appreciation (depreciation) on Investments held as of December 31, 2011, may be due to an investment no longer held or categorized as Level 3 at year end.
Affiliated Companies - Indicated in Portfolio of Investments as "+"
The Investment Company Act of 1940 defines affiliates as companies in which the Fund owns at least 5% of the outstanding voting securities. The following is a summary of transactions with each affiliated company during the year ended December 31, 2011.
| | | Shares of Affiliated Companies | |
| Holmes Growth Fund | | December 31, 2010 | | Additions | | Reductions | | December 31, 2011 | |
IOU Financial, Inc.
(formerly MCO Capital, Inc.) | | | 1,000,000 | | | | 520,000 | | | | — | | | | 1,520,000 | | |
At December 31, 2011, the value of investments in affiliated companies was $328,245 representing 0.93% of net assets, and the total cost was $592,442. There were no realized gains or losses on transactions, and there was no income earned for the year.
| | | Shares of Affiliated Companies | |
| Global Resources Fund | | December 31, 2010 | | Additions | | Reductions | | December 31, 2011 | |
| African Potash, Inc. | | | — | | | | 15,800,000 | | | | — | | | | 15,800,000 | | |
| Agriterra Ltd. | | | 46,500,000 | | | | 4,472,900 | | | | — | | | | 50,972,900 | | |
Pacific Coal Resources Ltd.
(formerly Pacific Coal, S.A.) | | | 2,400,000 | | | | 16,471,115 | | | | (78,000 | ) | | | 18,793,115 | | |
| Pacific Green Energy Corp. | | | — | | | | 2,400,000 | | | | — | | | | 2,400,000 | | |
Pacific Power Generation Corp.
(formerly Ronter, Inc.) | | | 7,568,396 | | | | — | | | | (2,700,000 | ) | | | 4,868,396 | (a) | |
Pacific Stone Tech, Inc.
(formerly Grupo Empresarial Ibiza S.A.) | | | — | | | | 22,659 | | | | — | | | | 22,659 | (b) | |
PetroMagdalena Energy Corp.
(formerly Alange Energy Corp.) | | | 26,528,500 | | | | 39,906,157 | | | | (57,281,172 | ) | | | 9,153,485 | | |
| Prima Colombia Hardwood, Inc. | | | 14,965,832 | | | | 300,000 | | | | — | | | | 15,265,832 | (a) | |
| Range Energy Resources, Inc. | | | 15,000,000 | | | | 100,000 | | | | — | | | | 15,100,000 | | |
158
Notes to Portfolios of Investments December 31, 2011
At December 31, 2011, the value of investments in affiliated companies was $31,201,233 representing 5.13% of net assets, and the total cost was $63,428,151. Net realized losses on transactions were $195,979, and there was no income earned for the year.
| | | Shares of Affiliated Companies | |
| World Precious Minerals Fund | | December 31, 2010 | | Additions | | Reductions | | December 31, 2011 | |
| Aldridge Minerals, Inc. | | | 1,315,000 | | | | 685,000 | | | | — | | | | 2,000,000 | | |
| Argent Minerals Ltd. | | | 4,500,000 | | | | 1,125,000 | | | | — | | | | 5,625,000 | (a) | |
| Candente Gold Corp. | | | 5,400,000 | | | | 225,000 | | | | — | | | | 5,625,000 | | |
| Golden Predator Corp. | | | 3,849,000 | | | | 909,813 | | | | (1,773,113 | ) | | | 2,985,700 | (a) | |
| Gran Colombia Gold Corp. | | | 10,813,700 | | | | 13,413,838 | | | | (435,200 | ) | | | 23,792,338 | | |
| Klondex Mines Ltd. | | | 2,620,000 | | | | 440,000 | | | | — | | | | 3,060,000 | | |
| Medoro Resources Ltd. | | | 9,064,174 | | | | 510,000 | | | | (9,574,174 | ) | | | — | (a) | |
| Mirasol Resources Ltd. | | | 1,339,100 | | | | 785,900 | | | | — | | | | 2,125,000 | | |
| Moss Lake Gold Mines Ltd. | | | 3,300,000 | | | | 45,000 | | | | — | | | | 3,345,000 | | |
| PMI Gold Corp. | | | 9,950,000 | | | | 3,323,000 | | | | (713,000 | ) | | | 12,560,000 | | |
| Rochester Resources Ltd. | | | 7,755,000 | | | | — | | | | — | | | | 7,755,000 | | |
| Rockwell Diamonds, Inc. | | | 3,575,000 | | | | — | | | | (3,336,667 | ) | | | 238,333 | (a) | |
| Solvista Gold Corp. | | | — | | | | 2,685,000 | | | | — | | | | 2,685,000 | | |
| Tolima Gold, Inc. | | | — | | | | 4,120,000 | | | | — | | | | 4,120,000 | (a) | |
At December 31, 2011, the value of investments in affiliated companies was $42,350,985 representing 9.67% of net assets, and the total cost was $53,607,720. Net realized gains on transactions were $1,555,159, and there was no income earned for the year.
(a) At December 31, 2011, the company is no longer defined as an affiliate, although it was an affiliated company during the year.
(b) Shares were acquired through the conversion of debentures during the year.
Restricted Securities - Indicated in Portfolio of Investments as "RS"
The following securities are subject to contractual and regulatory restrictions on resale or transfer. These investments may involve a high degree of business and financial risk. Because of the thinly traded markets for these investments, a Fund may be unable to liquidate its securities in a timely manner, especially if there is negative news regarding the specific securities or the markets overall. These securities could decline significantly in value before the Fund could liquidate these securities. The issuer bears the cost of registration, if any, involved in the disposition of these securities.
| Holmes Growth Fund | | Acquisition
Date | | Cost per
Share/Unit | |
| Pacific Infrastructure, Inc. | | 11/22/10 | | $ | 1.00 | | |
| Pacific Iron Corp. | | 10/03/11 | | $ | 1.00 | | |
| Pacific Iron Corp., Convertible Debenture | | 06/07/11 | | $ | 100.00 | | |
| Pacific Stone Tech, Inc. (formerly Grupo Empresarial Ibiza S.A.) | | 04/19/10 | | $ | 216.28 | | |
159
Notes to Portfolios of Investments December 31, 2011
As of December 31, 2011, the total cost of restricted securities was $680,000 and the total value was $680,000, representing 1.93% of net assets.
| Global MegaTrends Fund | | Acquisition
Date | | Cost per
Share/Unit | |
| Pacific Green Energy Corp. | | 03/24/11 | | $ | 1.00 | | |
| Pacific Infrastructure, Inc. | | 08/06/10-11/22/10 | | $ | 1.00 | | |
| Pacific Iron Corp. | | 10/03/11 | | $ | 1.00 | | |
| Pacific Iron Corp., Convertible Debenture | | 06/07/11 | | $ | 100.00 | | |
| Pacific Power Generation Corp. (formerly Ronter, Inc.) | | 08/06/10 | | $ | 0.07 | | |
| Pacific Stone Tech, Inc. (formerly Grupo Empresarial Ibiza S.A.) | | 04/19/10 | | $ | 216.22 | | |
As of December 31, 2011, the total cost of restricted securities was $1,170,000 and the total value was $1,169,891, representing 7.85% of net assets.
| Global Resources Fund | | Acquisition
Date | | Cost per
Share/Unit | |
| GoviEx Uranium, Inc. | | 10/04/07 | | $ | 1.96 | | |
| I-Pulse, Inc. | | 10/04/07 | | $ | 1.88 | | |
| Osmium Holdings S.A. | | 10/22/96-01/29/98 | | $ | 987.07 | | |
| Pacific Green Energy Corp. | | 03/24/11 | | $ | 1.00 | | |
| Pacific Infrastructure, Inc. | | 08/06/10-11/22/10 | | $ | 1.00 | | |
| Pacific Iron Corp. | | 10/03/11 | | $ | 1.00 | | |
| Pacific Power Generation Corp. (formerly Ronter, Inc.) | | 08/06/10 | | $ | 0.07 | | |
| Pacific Stone Tech, Inc. (formerly Grupo Empresarial Ibiza S.A.) | | 04/19/10 | | $ | 216.25 | | |
| Value Creation, Inc. | | 08/11/06 | | $ | 10.60 | | |
As of December 31, 2011, the total cost of restricted securities was $22,843,490 and the total value was $20,342,289, representing 3.35% of net assets.
| World Precious Minerals Fund | | Acquisition
Date | | Cost per
Share/Unit | |
| Choice Gold Corp., Units | | 12/12/11 | | $ | 0.29 | | |
| Osmium Holdings S.A. | | 10/22/96-01/29/98 | | $ | 1,280.75 | | |
| Pacific Iron Corp., Convertible Debenture | | 06/07/11 | | $ | 100.00 | | |
| Taurus Gold Ltd. | | 5/31/11-12/16/11 | | $ | 1.27 | | |
| Tolima Gold Inc. | | 11/15/11 | | $ | 0.64 | | |
| Tolima Gold Inc., 144A | | 03/18/11 | | $ | 0.41 | | |
| Tolima Gold Inc., 144A, Warrants (March 2013) | | 03/18/11 | | $ | 0.00 | | |
| Tolima Gold Inc., Warrants (December 2013) | | 11/15/11 | | $ | 0.00 | | |
Western Exploration & Development Ltd., 144A, Special Warrants
(December 2049) | | 08/14/97 | | $ | 0.50 | | |
As of December 31, 2011, the total cost of restricted securities was $7,622,951 and the total value was $6,847,834, representing 1.56% of net assets.
| Global Emerging Markets Fund | | Acquisition
Date | | Cost per
Share/Unit | |
| Pacific Iron Corp., Convertible Debenture | | 06/07/11 | | $ | 100.00 | | |
As of December 31, 2011, the total cost of restricted securities was $100,000 and the total value was $100,000, representing 1.22% of net assets.
160
[THIS PAGE INTENTIONALLY LEFT BLANK]
Statements of Assets and Liabilities
| | | U.S. Treasury
Securities
Cash Fund | | U.S. Government
Securities
Savings Fund | |
| Investments, at identified cost | | $ | 90,493,251 | | | $ | 170,631,309 | | |
| Assets | |
| Investments, at value: | |
| Securities | | $ | — | | | $ | 170,631,309 | | |
| Repurchase agreements | | | 90,493,251 | | | | — | | |
| Cash | | | — | | | | 601,571 | | |
| Receivables: | |
| Interest | | | 64 | | | | 122,605 | | |
| Capital shares sold | | | 593,534 | | | | 1,113,145 | | |
| From adviser | | | 10,995 | | | | 1,823 | | |
| Other assets | | | 2,720 | | | | 6,214 | | |
| Total Assets | | | 91,100,564 | | | | 172,476,667 | | |
| Liabilities | |
| Payables: | |
| Capital shares redeemed | | | 510,733 | | | | 772,180 | | |
| Adviser and affiliates | | | — | | | | — | | |
| Dividends and distributions | | | — | | | | — | | |
| Accounts payable and accrued expenses | | | 33,299 | | | | 40,913 | | |
| Due to custodian | | | — | | | | — | | |
| Total Liabilities | | | 544,032 | | | | 813,093 | | |
| Net Assets | | $ | 90,556,532 | | | $ | 171,663,574 | | |
| Net Assets Consist of: | |
| Paid-in capital | | $ | 90,555,543 | | | $ | 171,662,537 | | |
| Accumulated undistributed net investment income | | | 989 | | | | 1,037 | | |
| Accumulated net realized gain (loss) on investments | | | — | | | | — | | |
| Net unrealized appreciation of investments | | | — | | | | — | | |
| Net assets applicable to capital shares outstanding | | $ | 90,556,532 | | | $ | 171,663,574 | | |
| By share class | |
| Net Assets | |
| Investor class | | $ | 90,556,532 | | | $ | 171,663,574 | | |
Capital shares outstanding, an unlimited number of
no par shares authorized | |
| Investor class | | | 90,631,784 | | | | 171,830,781 | | |
Net Asset Value, Public Offering Price, Redemption
Price, per share | |
| Investor class | | $ | 1.00 | | | $ | 1.00 | | |
See accompanying notes to financial statements.
162
December 31, 2011
| | | Near-Term
Tax Free Fund | | Tax Free
Fund | |
| Investments, at identified cost | | $ | 33,300,884 | | | $ | 20,321,481 | | |
| Assets | |
| Investments, at value: | |
| Securities | | $ | 31,167,481 | | | $ | 19,479,558 | | |
| Repurchase agreements | | | 3,366,017 | | | | 1,969,170 | | |
| Cash | | | — | | | | — | | |
| Receivables: | |
| Interest | | | 364,040 | | | | 265,575 | | |
| Capital shares sold | | | 259,935 | | | | 11,952 | | |
| From adviser | | | 2,185 | | | | — | | |
| Other assets | | | 963 | | | | 579 | | |
| Total Assets | | | 35,160,621 | | | | 21,726,834 | | |
| Liabilities | |
| Payables: | |
| Capital shares redeemed | | | 94,081 | | | | 15,476 | | |
| Adviser and affiliates | | | — | | | | 940 | | |
| Dividends and distributions | | | 9,612 | | | | 12,737 | | |
| Accounts payable and accrued expenses | | | 40,277 | | | | 34,359 | | |
| Due to custodian | | | 3,000 | | | | — | | |
| Total Liabilities | | | 146,970 | | | | 63,512 | | |
| Net Assets | | $ | 35,013,651 | | | $ | 21,663,322 | | |
| Net Assets Consist of: | |
| Paid-in capital | | $ | 34,004,922 | | | $ | 20,952,084 | | |
| Accumulated undistributed net investment income | | | 24,479 | | | | 35,431 | | |
| Accumulated net realized gain (loss) on investments | | | (248,364 | ) | | | (451,440 | ) | |
| Net unrealized appreciation of investments | | | 1,232,614 | | | | 1,127,247 | | |
| Net assets applicable to capital shares outstanding | | $ | 35,013,651 | | | $ | 21,663,322 | | |
| By share class | |
| Net Assets | |
| Investor class | | $ | 35,013,651 | | | $ | 21,663,322 | | |
Capital shares outstanding, an unlimited number of
no par shares authorized | |
| Investor class | | | 15,463,025 | | | | 1,715,468 | | |
Net Asset Value, Public Offering Price, Redemption
Price, per share | |
| Investor class | | $ | 2.26 | | | $ | 12.63 | | |
163
Statements of Assets and Liabilities
| | | All American
Equity Fund | | Holmes
Growth Fund | | Global
MegaTrends Fund | |
| Investments, at identified cost | | $ | 16,167,404 | | | $ | 34,605,685 | | | $ | 14,380,232 | | |
| Assets | |
| Investments, at value: | |
| Securities of unaffiliated issuers | | $ | 14,818,417 | | | $ | 28,358,770 | | | $ | 13,253,876 | | |
| Securities of affiliated issuers | | | — | | | | 328,245 | | | | — | | |
| Repurchase agreements | | | 1,639,166 | | | | 6,637,735 | | | | 1,723,735 | | |
| Cash | | | — | | | | 619 | | | | 29 | | |
| Foreign currencies (Cost $0, $0, $3,402, $5,554 and $96,749) | | | — | | | | — | | | | 3,371 | | |
| Receivables: | |
| Investments sold | | | 15,242 | | | | 30,485 | | | | 15,243 | | |
| Dividends and interest | | | 16,057 | | | | 26,134 | | | | 17,676 | | |
| Capital shares sold | | | 3,915 | | | | 123,565 | | | | 2,952 | | |
| Other assets | | | 517 | | | | 1,190 | | | | 589 | | |
| Total Assets | | | 16,493,314 | | | | 35,506,743 | | | | 15,017,471 | | |
| Liabilities | |
| Payables: | |
| Investments purchased | | | 15,094 | | | | 32,545 | | | | 19,610 | | |
| Capital shares redeemed | | | 4,963 | | | | 10,092 | | | | 28,105 | | |
| Adviser and affiliates | | | 15,878 | | | | 35,041 | | | | 6,576 | | |
| Accounts payable and accrued expenses | | | 37,810 | | | | 42,475 | | | | 44,043 | | |
| Written options at value (Premiums $20,369, $67,931, $4,615, $179,662 and $0) | | | 20,950 | | | | 71,060 | | | | 11,700 | | |
| Total Liabilities | | | 94,695 | | | | 191,213 | | | | 110,034 | | |
| Net Assets | | $ | 16,398,619 | | | $ | 35,315,530 | | | $ | 14,907,437 | | |
| Net Assets Consist of: | |
| Paid-in capital | | $ | 17,480,849 | | | $ | 34,277,504 | | | $ | 28,292,600 | | |
Accumulated undistributed net investment income (distributions in excess of
net investment income) | | | — | | | | (38,926 | ) | | | 56,212 | | |
| Accumulated net realized gain (loss) on investments and foreign currencies | | | (1,371,829 | ) | | | 360,903 | | | | (14,031,667 | ) | |
Net unrealized appreciation (depreciation) of investments and other assets and
liabilities denominated in foreign currencies | | | 289,599 | | | | 716,049 | | | | 590,292 | | |
| Net assets applicable to capital shares outstanding | | $ | 16,398,619 | | | $ | 35,315,530 | | | $ | 14,907,437 | | |
| By share class | |
| Net Assets | |
| Investor class | | $ | 16,398,619 | | | $ | 35,315,530 | | | $ | 12,449,823 | | |
| Institutional class | | | N/A | | | | N/A | | | | 2,457,614 | | |
Capital shares outstanding, an unlimited number of
no par shares authorized | |
| Investor class | | | 721,653 | | | | 2,004,734 | | | | 1,621,485 | | |
| Institutional class | | | N/A | | | | N/A | | | | 322,667 | | |
Net Asset Value, Public Offering Price, Redemption
Price, per share | |
| Investor class | | $ | 22.72 | | | $ | 17.62 | | | $ | 7.68 | | |
| Institutional class | | | N/A | | | | N/A | | | | 7.62 | | |
See accompanying notes to financial statements.
164
December 31, 2011
| | | Global
Resources Fund | | World Precious
Minerals Fund | |
| Investments, at identified cost | | $ | 691,497,837 | | | $ | 509,256,685 | | |
| Assets | |
| Investments, at value: | |
| Securities of unaffiliated issuers | | $ | 570,140,205 | | | $ | 366,096,300 | | |
| Securities of affiliated issuers | | | 31,201,233 | | | | 42,350,985 | | |
| Repurchase agreements | | | 29,689,077 | | | | 25,360,393 | | |
| Cash | | | 61,816 | | | | — | | |
| Foreign currencies (Cost $0, $0, $3,402, $5,554 and $96,749) | | | 5,544 | | | | 96,583 | | |
| Receivables: | |
| Investments sold | | | 50,114,417 | | | | 4,841,731 | | |
| Dividends and interest | | | 209,482 | | | | 236,176 | | |
| Capital shares sold | | | 360,018 | | | | 2,025,747 | | |
| Other assets | | | 26,579 | | | | 21,301 | | |
| Total Assets | | | 681,808,371 | | | | 441,029,216 | | |
| Liabilities | |
| Payables: | |
| Investments purchased | | | 71,934,162 | | | | 812,468 | | |
| Capital shares redeemed | | | 1,317,930 | | | | 1,408,585 | | |
| Adviser and affiliates | | | 560,423 | | | | 447,372 | | |
| Accounts payable and accrued expenses | | | 215,861 | | | | 173,979 | | |
| Written options at value (Premiums $20,369, $67,931, $4,615, $179,662 and $0) | | | 2,000 | | | | — | | |
| Total Liabilities | | | 74,030,376 | | | | 2,842,404 | | |
| Net Assets | | $ | 607,777,995 | | | $ | 438,186,812 | | |
| Net Assets Consist of: | |
| Paid-in capital | | $ | 1,032,511,058 | | | $ | 644,324,525 | | |
Accumulated undistributed net investment income (distributions in excess of
net investment income) | | | (3,453,053 | ) | | | (52,842,742 | ) | |
| Accumulated net realized gain (loss) on investments and foreign currencies | | | (360,976,398 | ) | | | (77,848,141 | ) | |
Net unrealized appreciation (depreciation) of investments and other assets and
liabilities denominated in foreign currencies | | | (60,303,612 | ) | | | (75,446,830 | ) | |
| Net assets applicable to capital shares outstanding | | $ | 607,777,995 | | | $ | 438,186,812 | | |
| By share class | |
| Net Assets | |
| Investor class | | $ | 551,793,395 | | | $ | 436,504,345 | | |
| Institutional class | | | 55,984,600 | | | | 1,682,467 | | |
Capital shares outstanding, an unlimited number of
no par shares authorized | |
| Investor class | | | 58,937,484 | | | | 33,117,024 | | |
| Institutional class | | | 5,962,377 | | | | 128,407 | | |
Net Asset Value, Public Offering Price, Redemption
Price, per share | |
| Investor class | | $ | 9.36 | | | $ | 13.18 | | |
| Institutional class | | | 9.39 | | | | 13.10 | | |
165
Statements of Assets and Liabilities
| | | Gold and Precious
Metals Fund | | Eastern European
Fund | |
| Investments, at identified cost | | $ | 202,060,321 | | | $ | 183,726,616 | | |
| Assets | |
| Investments, at value: | |
| Securities | | $ | 166,047,810 | | | $ | 184,630,000 | | |
| Repurchase agreements | | | 27,134,701 | | | | 4,510,873 | | |
| Cash | | | — | | | | 4,696,636 | | |
| Foreign currencies (Cost $144,721, $201,144, $157,450 and $87,669) | | | 145,306 | | | | 200,745 | | |
| Receivables: | |
| Investments sold | | | 2,450,709 | | | | 1,712,345 | | |
| Dividends and Interest | | | 206,282 | | | | 107,476 | | |
| Capital shares sold | | | 101,138 | | | | 10,579 | | |
| From adviser | | | — | | | | — | | |
| Other assets | | | 7,839 | | | | 11,848 | | |
| Total Assets | | | 196,093,785 | | | | 195,880,502 | | |
| Liabilities | |
| Payables: | |
| Investments purchased | | | 464,282 | | | | 397,418 | | |
| Capital shares redeemed | | | 277,040 | | | | 950,463 | | |
| Adviser and affiliates | | | 174,114 | | | | 241,098 | | |
| Accounts payable and accrued expenses | | | 91,205 | | | | 115,457 | | |
| Written options at value (Premiums $0, $1,405,885, $0 and $0) | | | — | | | | 577,250 | | |
| Due to custodian | | | — | | | | — | | |
| Total Liabilities | | | 1,006,641 | | | | 2,281,686 | | |
| Net Assets | | $ | 195,087,144 | | | $ | 193,598,816 | | |
| Net Assets Consist of: | |
| Paid-in capital | | $ | 210,805,414 | | | $ | 514,116,553 | | |
Accumulated undistributed net investment income (distributions in excess of
net investment income) | | | (2,392,924 | ) | | | 557,717 | | |
| Accumulated net realized loss on investments and foreign currencies | | | (4,447,620 | ) | | | (327,318,515 | ) | |
Net unrealized appreciation (depreciation) of investments and other assets and
liabilities denominated in foreign currencies | | | (8,877,726 | ) | | | 6,243,061 | | |
| Net assets applicable to capital shares outstanding | | $ | 195,087,144 | | | $ | 193,598,816 | | |
| By share class | |
| Net Assets | |
| Investor class | | $ | 195,087,144 | | | $ | 193,598,816 | | |
Capital shares outstanding, an unlimited number of
no par shares authorized | |
| Investor class | | | 15,475,844 | | | | 24,860,704 | | |
Net Asset Value, Public Offering Price, Redemption
Price, per share | |
| Investor class | | $ | 12.61 | | | $ | 7.79 | | |
See accompanying notes to financial statements.
166
December 31, 2011
| | | Global Emerging
Markets Fund | | China Region
Fund | |
| Investments, at identified cost | | $ | 9,301,148 | | | $ | 31,606,775 | | |
| Assets | |
| Investments, at value: | |
| Securities | | $ | 7,906,976 | | | $ | 29,664,800 | | |
| Repurchase agreements | | | 287,747 | | | | — | | |
| Cash | | | — | | | | — | | |
| Foreign currencies (Cost $144,721, $201,144, $157,450 and $87,669) | | | 153,794 | | | | 87,529 | | |
| Receivables: | |
| Investments sold | | | 89,147 | | | | 1,322,372 | | |
| Dividends and Interest | | | 6,893 | | | | — | | |
| Capital shares sold | | | 2,479 | | | | 2,948 | | |
| From adviser | | | 5,692 | | | | — | | |
| Other assets | | | 2,658 | | | | 1,461 | | |
| Total Assets | | | 8,455,386 | | | | 31,079,110 | | |
| Liabilities | |
| Payables: | |
| Investments purchased | | | 38,317 | | | | 30,641 | | |
| Capital shares redeemed | | | 125,484 | | | | 152,881 | | |
| Adviser and affiliates | | | — | | | | 37,805 | | |
| Accounts payable and accrued expenses | | | 67,423 | | | | 72,862 | | |
| Written options at value (Premiums $0, $1,405,885, $0 and $0) | | | — | | | | — | | |
| Due to custodian | | | — | | | | 149,944 | | |
| Total Liabilities | | | 231,224 | | | | 444,133 | | |
| Net Assets | | $ | 8,224,162 | | | $ | 30,634,977 | | |
| Net Assets Consist of: | |
| Paid-in capital | | $ | 21,844,802 | | | $ | 53,056,232 | | |
Accumulated undistributed net investment income (distributions in excess of
net investment income) | | | (35,537 | ) | | | (122,366 | ) | |
| Accumulated net realized loss on investments and foreign currencies | | | (12,474,776 | ) | | | (20,356,344 | ) | |
Net unrealized appreciation (depreciation) of investments and other assets and
liabilities denominated in foreign currencies | | | (1,110,327 | ) | | | (1,942,545 | ) | |
| Net assets applicable to capital shares outstanding | | $ | 8,224,162 | | | $ | 30,634,977 | | |
| By share class | |
| Net Assets | |
| Investor class | | $ | 8,224,162 | | | $ | 30,634,977 | | |
Capital shares outstanding, an unlimited number of
no par shares authorized | |
| Investor class | | | 1,206,048 | | | | 4,500,419 | | |
Net Asset Value, Public Offering Price, Redemption
Price, per share | |
| Investor class | | $ | 6.82 | | | $ | 6.81 | | |
167
Statement of Operations
| Net Investment Income | | U.S. Treasury
Securities
Cash Fund | | U.S. Government
Securities
Savings Fund | |
| Income: | |
| Interest and other | | $ | 70,617 | | | $ | 144,788 | | |
| Expenses: | |
| Management fee | | | 478,690 | | | | 957,957 | | |
| Administrative services fee | | | 76,590 | | | | 153,273 | | |
| Transfer agent fees and expenses | | | 172,016 | | | | 198,223 | | |
| Accounting service fees and expenses | | | 18,541 | | | | 31,315 | | |
| Professional fees | | | 32,954 | | | | 40,749 | | |
| Custodian fees | | | 57,611 | | | | 49,485 | | |
| Shareholder reporting expenses | | | 24,693 | | | | 28,108 | | |
| Registration fees | | | 23,875 | | | | 19,602 | | |
| Trustee fees and expenses | | | 21,221 | | | | 21,221 | | |
| Miscellaneous expenses | | | 30,648 | | | | 46,896 | | |
| Total expenses before reductions | | | 936,839 | | | | 1,546,829 | | |
| Expenses offset - Note 1 H | | | (2,576 | ) | | | — | | |
| Expenses reimbursed - Note 3 | | | (873,227 | ) | | | (1,421,199 | ) | |
| Net expenses | | | 61,036 | | | | 125,630 | | |
| Net Investment Income | | | 9,581 | | | | 19,158 | | |
Net Realized and Unrealized
Gain (Loss) on Investments | |
| Realized loss from securities | | | — | | | | — | | |
| Net change in unrealized appreciation of investments | | | — | | | | — | | |
| Net Realized and Unrealized Gain on Investments | | | — | | | | — | | |
Net Increase In Net Assets
Resulting From Operations | | $ | 9,581 | | | $ | 19,158 | | |
See accompanying notes to financial statements.
168
For the Year Ended December 31, 2011
| Net Investment Income | | Near-Term
Tax Free Fund | | Tax Free
Fund | |
| Income: | |
| Interest and other | | $ | 888,270 | | | $ | 845,423 | | |
| Expenses: | |
| Management fee | | | 156,604 | | | | 149,813 | | |
| Administrative services fee | | | 25,057 | | | | 15,980 | | |
| Transfer agent fees and expenses | | | 58,140 | | | | 48,160 | | |
| Accounting service fees and expenses | | | 48,045 | | | | 34,360 | | |
| Professional fees | | | 37,994 | | | | 34,927 | | |
| Custodian fees | | | 12,607 | | | | 10,642 | | |
| Shareholder reporting expenses | | | 8,348 | | | | 8,774 | | |
| Registration fees | | | 17,878 | | | | 15,644 | | |
| Trustee fees and expenses | | | 21,221 | | | | 21,221 | | |
| Miscellaneous expenses | | | 8,492 | | | | 8,848 | | |
| Total expenses before reductions | | | 394,386 | | | | 348,369 | | |
| Expenses offset - Note 1 H | | | (532 | ) | | | (306 | ) | |
| Expenses reimbursed - Note 3 | | | (252,910 | ) | | | (208,237 | ) | |
| Net expenses | | | 140,944 | | | | 139,826 | | |
| Net Investment Income | | | 747,326 | | | | 705,597 | | |
Net Realized and Unrealized
Gain (Loss) on Investments | |
| Realized loss from securities | | | (3,345 | ) | | | (19,336 | ) | |
| Net change in unrealized appreciation of investments | | | 625,874 | | | | 986,522 | | |
| Net Realized and Unrealized Gain on Investments | | | 622,529 | | | | 967,186 | | |
Net Increase In Net Assets
Resulting From Operations | | $ | 1,369,855 | | | $ | 1,672,783 | | |
169
Statement of Operations
| Net Investment Income | | All American
Equity Fund | | Holmes
Growth Fund | | Global
MegaTrends Fund | |
| Income: | |
| Dividends from unaffiliated issuers | | $ | 322,986 | | | $ | 261,443 | | | $ | 411,133 | | |
| Foreign tax withheld on dividends | | | — | | | | (6,289 | ) | | | (19,854 | ) | |
| Net dividends | | | 322,986 | | | | 255,154 | | | | 391,279 | | |
| Interest and other | | | 942 | | | | 46,814 | | | | 62,823 | | |
| Total income | | | 323,928 | | | | 301,968 | | | | 454,102 | | |
| Expenses: | |
| Management fee | | | 135,969 | | | | 405,469 | | | | 147,944 | | |
| Administrative services fee | | | 13,962 | | | | 31,929 | | | | 6,932 | | |
| Administrative services fee - Investor class | | | — | | | | — | | | | 5,892 | | |
| Administrative services fee - Institutional class | | | — | | | | — | | | | 1,040 | | |
| Transfer agent fees and expenses - Investor class | | | 74,601 | | | | 81,119 | | | | 57,435 | | |
| Transfer agent fees and expenses - Institutional class | | | — | | | | — | | | | 20,065 | | |
| Accounting service fees and expenses | | | 20,872 | | | | 27,660 | | | | 32,263 | | |
| Professional fees | | | 36,531 | | | | 37,850 | | | | 37,750 | | |
| Professional fees - Investor class | | | — | | | | — | | | | 731 | | |
| Professional fees - Institutional class | | | — | | | | — | | | | 705 | | |
| Distribution plan fee | | | 43,631 | | | | 99,779 | | | | 36,827 | | |
| Custodian fees | | | 17,244 | | | | 37,767 | | | | 45,154 | | |
| Shareholder reporting expenses - Investor class | | | 21,698 | | | | 17,177 | | | | 10,019 | | |
| Shareholder reporting expenses - Institutional class | | | — | | | | — | | | | 2,212 | | |
| Registration fees | | | 15,637 | | | | 15,338 | | | | 223 | | |
| Registration fees - Investor class | | | — | | | | — | | | | 12,538 | | |
| Registration fees - Institutional class | | | — | | | | — | | | | 10,677 | | |
| Trustee fees and expenses | | | 21,221 | | | | 21,221 | | | | 21,535 | | |
| Miscellaneous expenses | | | 21,342 | | | | 25,096 | | | | 24,100 | | |
| Total expenses before reductions | | | 422,708 | | | | 800,405 | | | | 474,042 | | |
| Expenses offset - Note 1 H | | | (279 | ) | | | (554 | ) | | | (357 | ) | |
| Expenses reimbursed - Note 3 | | | (42,793 | ) | | | — | | | | (95,188 | ) | |
| Net expenses | | | 379,636 | | | | 799,851 | | | | 378,497 | | |
| Net Investment Income (Loss) | | | (55,708 | ) | | | (497,883 | ) | | | 75,605 | | |
Net Realized and Unrealized
Gain (Loss) on Investments | |
| Realized gain (loss) from: | |
| Securities from unaffiliated issuers | | | 2,359,456 | | | | 4,431,155 | | | | 636,647 | | |
| Securities from affiliated issuers | | | — | | | | — | | | | — | | |
| Written options | | | 132,917 | | | | 734,380 | | | | 111,016 | | |
| Foreign currency transactions | | | 2 | | | | (874 | ) | | | (1,047 | ) | |
| Net realized gain | | | 2,492,375 | | | | 5,164,661 | | | | 746,616 | | |
| Net change in unrealized appreciation (depreciation) of: | |
| Investments | | | (2,386,881 | ) | | | (6,818,289 | ) | | | (3,241,024 | ) | |
| Written options | | | (581 | ) | | | (3,129 | ) | | | (7,085 | ) | |
| Other assets and liabilities denominated in foreign currencies | | | — | | | | 240 | | | | (33 | ) | |
| Net unrealized depreciation | | | (2,387,462 | ) | | | (6,821,178 | ) | | | (3,248,142 | ) | |
| Net Realized and Unrealized Gain (Loss) on Investments | | | 104,913 | | | | (1,656,517 | ) | | | (2,501,526 | ) | |
Net Increase (Decrease) In Net Assets
Resulting From Operations | | $ | 49,205 | | | $ | (2,154,400 | ) | | $ | (2,425,921 | ) | |
See accompanying notes to financial statements.
170
For the Year Ended December 31, 2011
| Net Investment Income | | Global
Resources Fund | | World Precious
Minerals Fund | |
| Income: | |
| Dividends from unaffiliated issuers | | $ | 7,801,064 | | | $ | 1,458,253 | | |
| Foreign tax withheld on dividends | | | (178,512 | ) | | | (142,399 | ) | |
| Net dividends | | | 7,622,552 | | | | 1,315,854 | | |
| Interest and other | | | 685,488 | | | | 209,944 | | |
| Total income | | | 8,308,040 | | | | 1,525,798 | | |
| Expenses: | |
| Management fee | | | 9,218,438 | | | | 6,486,031 | | |
| Administrative services fee | | | 351,750 | | | | 256,486 | | |
| Administrative services fee - Investor class | | | 339,998 | | | | 255,739 | | |
| Administrative services fee - Institutional class | | | 11,752 | | | | 747 | | |
| Transfer agent fees and expenses - Investor class | | | 1,890,187 | | | | 1,197,429 | | |
| Transfer agent fees and expenses - Institutional class | | | 42,039 | | | | 18,968 | | |
| Accounting service fees and expenses | | | 296,485 | | | | 216,442 | | |
| Professional fees | | | 135,946 | | | | 108,873 | | |
| Professional fees - Investor class | | | — | | | | — | | |
| Professional fees - Institutional class | | | — | | | | — | | |
| Distribution plan fee | | | 2,124,985 | | | | 1,598,370 | | |
| Custodian fees | | | 237,990 | | | | 275,232 | | |
| Shareholder reporting expenses - Investor class | | | 189,157 | | | | 113,784 | | |
| Shareholder reporting expenses - Institutional class | | | 3,854 | | | | 1,830 | | |
| Registration fees | | | 5,184 | | | | 4,268 | | |
| Registration fees - Investor class | | | 50,149 | | | | 28,426 | | |
| Registration fees - Institutional class | | | 19,303 | | | | 9,981 | | |
| Trustee fees and expenses | | | 46,859 | | | | 41,664 | | |
| Miscellaneous expenses | | | 126,261 | | | | 126,787 | | |
| Total expenses before reductions | | | 15,090,337 | | | | 10,741,057 | | |
| Expenses offset - Note 1 H | | | (858 | ) | | | (637 | ) | |
| Expenses reimbursed - Note 3 | | | (76,947 | ) | | | (31,526 | ) | |
| Net expenses | | | 15,012,532 | | | | 10,708,894 | | |
| Net Investment Income (Loss) | | | (6,704,492 | ) | | | (9,183,096 | ) | |
Net Realized and Unrealized
Gain (Loss) on Investments | |
| Realized gain (loss) from: | |
| Securities from unaffiliated issuers | | | 90,365,188 | | | | 74,078,713 | | |
| Securities from affiliated issuers | | | (195,979 | ) | | | 1,555,159 | | |
| Written options | | | 2,876,950 | | | | 2,310,559 | | |
| Foreign currency transactions | | | (368,393 | ) | | | (226,515 | ) | |
| Net realized gain | | | 92,677,766 | | | | 77,717,916 | | |
| Net change in unrealized appreciation (depreciation) of: | |
| Investments | | | (257,275,732 | ) | | | (309,383,145 | ) | |
| Written options | | | 177,662 | | | | — | | |
| Other assets and liabilities denominated in foreign currencies | | | (12,739 | ) | | | (46,552 | ) | |
| Net unrealized depreciation | | | (257,110,809 | ) | | | (309,429,697 | ) | |
| Net Realized and Unrealized Gain (Loss) on Investments | | | (164,433,043 | ) | | | (231,711,781 | ) | |
Net Increase (Decrease) In Net Assets
Resulting From Operations | | $ | (171,137,535 | ) | | $ | (240,894,877 | ) | |
171
Statement of Operations
| Net Investment Income | | Gold and Precious
Metals Fund | | Eastern European
Fund | |
| Income: | |
| Dividends from unaffiliated issuers | | $ | 1,005,552 | | | $ | 8,806,497 | | |
| Foreign tax withheld on dividends | | | (100,042 | ) | | | (1,398,440 | ) | |
| Net dividends | | | 905,510 | | | | 7,408,057 | | |
| Interest and other | | | 350,539 | | | | 9,171 | | |
| Total income | | | 1,256,049 | | | | 7,417,228 | | |
| Expenses: | |
| Management fee | | | 2,208,772 | | | | 3,826,542 | | |
| Administrative services fee | | | 201,834 | | | | 266,591 | | |
| Transfer agent fees and expenses | | | 391,217 | | | | 807,647 | | |
| Accounting service fees and expenses | | | 101,906 | | | | 124,639 | | |
| Professional fees | | | 57,397 | | | | 55,360 | | |
| Distribution plan fee | | | 630,730 | | | | 833,097 | | |
| Custodian fees | | | 126,275 | | | | 463,275 | | |
| Shareholder reporting expenses | | | 77,935 | | | | 82,073 | | |
| Registration fees | | | 27,055 | | | | 21,473 | | |
| Trustee fees and expenses | | | 29,889 | | | | 26,899 | | |
| Miscellaneous expenses | | | 74,144 | | | | 82,268 | | |
| Total expenses before reductions | | | 3,927,154 | | | | 6,589,864 | | |
| Expenses offset - Note 1 H | | | (682 | ) | | | (801 | ) | |
| Expenses reimbursed - Note 3 | | | — | | | | — | | |
| Net expenses | | | 3,926,472 | | | | 6,589,063 | | |
| Net Investment Income (Loss) | | | (2,670,423 | ) | | | 828,165 | | |
Net Realized and Unrealized
Gain (Loss) on Investments | |
| Realized gain (loss) from: | |
| Securities from unaffiliated issuers | | | 29,599,192 | | | | 44,617,813 | | |
| Written options | | | 1,511,305 | | | | 3,326,248 | | |
| Foreign currency transactions | | | (123,440 | ) | | | (548,517 | ) | |
| Net realized gain (loss) | | | 30,987,057 | | | | 47,395,544 | | |
| Net change in unrealized appreciation (depreciation) of: | |
| Investments | | | (96,435,100 | ) | | | (136,916,371 | ) | |
| Written options | | | — | | | | 828,635 | | |
| Other assets and liabilities denominated in foreign currencies | | | 815 | | | | (15,836 | ) | |
| Net unrealized depreciation | | | (96,434,285 | ) | | | (136,103,572 | ) | |
| Net Realized and Unrealized Loss on Investments | | | (65,447,228 | ) | | | (88,708,028 | ) | |
Net Decrease In Net Assets
Resulting From Operations | | $ | (68,117,651 | ) | | $ | (87,879,863 | ) | |
See accompanying notes to financial statements.
172
For the Year Ended December 31, 2011
| Net Investment Income | | Global Emerging
Markets Fund | | China Region
Fund | |
| Income: | |
| Dividends from unaffiliated issuers | | $ | 289,515 | | | $ | 816,431 | | |
| Foreign tax withheld on dividends | | | (31,775 | ) | | | (49,935 | ) | |
| Net dividends | | | 257,740 | | | | 766,496 | | |
| Interest and other | | | 744 | | | | 1,455 | | |
| Total income | | | 258,484 | | | | 767,951 | | |
| Expenses: | |
| Management fee | | | 134,325 | | | | 524,109 | | |
| Administrative services fee | | | 9,039 | | | | 34,838 | | |
| Transfer agent fees and expenses | | | 54,959 | | | | 132,952 | | |
| Accounting service fees and expenses | | | 30,156 | | | | 39,966 | | |
| Professional fees | | | 51,215 | | | | 50,392 | | |
| Distribution plan fee | | | 28,245 | | | | 108,869 | | |
| Custodian fees | | | 63,509 | | | | 91,100 | | |
| Shareholder reporting expenses | | | 11,725 | | | | 31,355 | | |
| Registration fees | | | 13,666 | | | | 13,721 | | |
| Trustee fees and expenses | | | 21,444 | | | | 22,692 | | |
| Miscellaneous expenses | | | 30,332 | | | | 32,308 | | |
| Total expenses before reductions | | | 448,615 | | | | 1,082,302 | | |
| Expenses offset - Note 1 H | | | (157 | ) | | | (322 | ) | |
| Expenses reimbursed - Note 3 | | | (113,589 | ) | | | (33,342 | ) | |
| Net expenses | | | 334,869 | | | | 1,048,638 | | |
| Net Investment Income (Loss) | | | (76,385 | ) | | | (280,687 | ) | |
Net Realized and Unrealized
Gain (Loss) on Investments | |
| Realized gain (loss) from: | |
| Securities from unaffiliated issuers | | | (222,133 | ) | | | (5,521,456 | ) | |
| Written options | | | 27,800 | | | | 489,733 | | |
| Foreign currency transactions | | | (10,757 | ) | | | 6,824 | | |
| Net realized gain (loss) | | | (205,090 | ) | | | (5,024,899 | ) | |
| Net change in unrealized appreciation (depreciation) of: | |
| Investments | | | (2,836,116 | ) | | | (8,566,115 | ) | |
| Written options | | | — | | | | — | | |
| Other assets and liabilities denominated in foreign currencies | | | (11,363 | ) | | | (568 | ) | |
| Net unrealized depreciation | | | (2,847,479 | ) | | | (8,566,683 | ) | |
| Net Realized and Unrealized Loss on Investments | | | (3,052,569 | ) | | | (13,591,582 | ) | |
Net Decrease In Net Assets
Resulting From Operations | | $ | (3,128,954 | ) | | $ | (13,872,269 | ) | |
173
Statement of Changes in Net Assets
| | | U.S. Treasury Securities
Cash Fund | | U.S. Government Securities
Savings Fund | |
| | | Year Ended
December 31,
2011 | | Year Ended
December 31,
2010 | | Year Ended
December 31,
2011 | | Year Ended
December 31,
2010 | |
Increase (Decrease)
in Net Assets | |
| From operations: | |
| Net investment income | | $ | 9,581 | | | $ | 10,459 | | | $ | 19,158 | | | $ | 22,923 | | |
| Net realized gain (loss) | | | — | | | | — | | | | — | | | | 1,037 | | |
| Net unrealized appreciation | | | — | | | | — | | | | — | | | | — | | |
| Net increase in net assets from operations | | | 9,581 | | | | 10,459 | | | | 19,158 | | | | 23,960 | | |
| Distributions to shareholders: | |
| From net investment income | |
| Investor class | | | (9,580 | ) | | | (10,459 | ) | | | (19,158 | ) | | | (22,923 | ) | |
| Total distributions to shareholders | | | (9,580 | ) | | | (10,459 | ) | | | (19,158 | ) | | | (22,923 | ) | |
| From capital share transactions: | |
Proceeds from shares sold
Investor class | | | 120,809,457 | | | | 153,202,824 | | | | 128,977,341 | | | | 144,957,231 | | |
Distributions reinvested
Investor class | | | 9,481 | | | | 10,282 | | | | 19,023 | | | | 22,628 | | |
| | | | 120,818,938 | | | | 153,213,106 | | | | 128,996,364 | | | | 144,979,859 | | |
Cost of shares redeemed
Investor class | | | (129,753,637 | ) | | | (157,611,264 | ) | | | (161,167,483 | ) | | | (194,377,841 | ) | |
Net increase (decrease) in net assets from
capital share transactions | | | (8,934,699 | ) | | | (4,398,158 | ) | | | (32,171,119 | ) | | | (49,397,982 | ) | |
| Net Increase (Decrease) in Net Assets | | | (8,934,698 | ) | | | (4,398,158 | ) | | | (32,171,119 | ) | | | (49,396,945 | ) | |
| Net Assets | |
| Beginning of year | | | 99,491,230 | | | | 103,889,388 | | | | 203,834,693 | | | | 253,231,638 | | |
| End of year | | $ | 90,556,532 | | | $ | 99,491,230 | | | $ | 171,663,574 | | | $ | 203,834,693 | | |
| Accumulated undistributed net investment income, end of year | | $ | 989 | | | $ | 907 | | | $ | 1,037 | | | $ | — | | |
| Capital Share Activity | |
| Investor class: | |
| Shares sold | | | 120,809,457 | | | | 153,202,824 | | | | 128,977,341 | | | | 144,957,231 | | |
| Shares reinvested | | | 9,481 | | | | 10,282 | | | | 19,023 | | | | 22,628 | | |
| Shares redeemed | | | (129,753,637 | ) | | | (157,611,264 | ) | | | (161,167,483 | ) | | | (194,377,841 | ) | |
| Net share activity | | | (8,934,699 | ) | | | (4,398,158 | ) | | | (32,171,119 | ) | | | (49,397,982 | ) | |
See accompanying notes to financial statements.
174
| | | Near-Term Tax Free Fund | |
| | | Year Ended
December 31,
2011 | | Year Ended
December 31,
2010 | |
Increase (Decrease)
in Net Assets | |
| From operations: | |
| Net investment income | | $ | 747,326 | | | $ | 652,612 | | |
| Net realized gain (loss) | | | (3,345 | ) | | | (2,532 | ) | |
| Net unrealized appreciation | | | 625,874 | | | | 21,885 | | |
| Net increase in net assets from operations | | | 1,369,855 | | | | 671,965 | | |
| Distributions to shareholders: | |
| From net investment income | |
| Investor class | | | (740,487 | ) | | | (656,447 | ) | |
| Total distributions to shareholders | | | (740,487 | ) | | | (656,447 | ) | |
| From capital share transactions: | |
Proceeds from shares sold
Investor class | | | 18,439,087 | | | | 15,798,166 | | |
Distributions reinvested
Investor class | | | 621,654 | | | | 566,087 | | |
| | | | 19,060,741 | | | | 16,364,253 | | |
Cost of shares redeemed
Investor class | | | (13,814,303 | ) | | | (10,579,005 | ) | |
Net increase (decrease) in net assets from
capital share transactions | | | 5,246,438 | | | | 5,785,248 | | |
| Net Increase (Decrease) in Net Assets | | | 5,875,806 | | | | 5,800,766 | | |
| Net Assets | |
| Beginning of year | | | 29,137,845 | | | | 23,337,079 | | |
| End of year | | $ | 35,013,651 | | | $ | 29,137,845 | | |
| Accumulated undistributed net investment income, end of year | | $ | 24,479 | | | $ | 17,640 | | |
| Capital Share Activity | |
| Investor class: | |
| Shares sold | | | 8,221,829 | | | | 7,062,013 | | |
| Shares reinvested | | | 277,696 | | | | 253,175 | | |
| Shares redeemed | | | (6,167,294 | ) | | | (4,723,665 | ) | |
| Net share activity | | | 2,332,231 | | | | 2,591,523 | | |
175
Statement of Changes in Net Assets
| | | Tax Free Fund | | All American Equity Fund | |
| | | Year Ended
December 31,
2011 | | Year Ended
December 31,
2010 | | Year Ended
December 31,
2011 | | Year Ended
December 31,
2010 | |
Increase (Decrease)
in Net Assets | |
| From operations: | |
| Net investment income (loss) | | $ | 705,597 | | | $ | 776,106 | | | $ | (55,708 | ) | | $ | 17,214 | | |
| Net realized gain (loss) | | | (19,336 | ) | | | 63,643 | | | | 2,492,375 | | | | 2,306,745 | | |
| Net unrealized appreciation (depreciation) | | | 986,522 | | | | (339,473 | ) | | | (2,387,462 | ) | | | 161,267 | | |
| Net increase (decrease) in net assets from operations | | | 1,672,783 | | | | 500,276 | | | | 49,205 | | | | 2,485,226 | | |
| Distributions to shareholders: | |
| From net investment income | |
| Investor class | | | (703,629 | ) | | | (776,783 | ) | | | (22,535 | ) | | | — | | |
| Total distributions to shareholders | | | (703,629 | ) | | | (776,783 | ) | | | (22,535 | ) | | | — | | |
| From capital share transactions: | |
Proceeds from shares sold
Investor class | | | 9,687,519 | | | | 7,219,358 | | | | 3,210,827 | | | | 2,787,127 | | |
Distributions reinvested
Investor class | | | 556,800 | | | | 629,779 | | | | 22,115 | | | | — | | |
Proceeds from short-term trading fees
Investor class | | | — | | | | — | | | | 852 | | | | 626 | | |
| | | | 10,244,319 | | | | 7,849,137 | | | | 3,233,794 | | | | 2,787,753 | | |
Cost of shares redeemed
Investor class | | | (9,344,395 | ) | | | (9,880,465 | ) | | | (4,621,747 | ) | | | (3,949,320 | ) | |
Net increase (decrease) in net assets from
capital share transactions | | | 899,924 | | | | (2,031,328 | ) | | | (1,387,953 | ) | | | (1,161,567 | ) | |
| Net Increase (Decrease) in Net Assets | | | 1,869,078 | | | | (2,307,835 | ) | | | (1,361,283 | ) | | | 1,323,659 | | |
| Net Assets | |
| Beginning of year | | | 19,794,244 | | | | 22,102,079 | | | | 17,759,902 | | | | 16,436,243 | | |
| End of year | | $ | 21,663,322 | | | $ | 19,794,244 | | | $ | 16,398,619 | | | $ | 17,759,902 | | |
Accumulated undistributed net investment income
(distributions in excess of net investment income),
end of year | | $ | 35,431 | | | $ | 33,463 | | | $ | — | | | $ | 9,718 | | |
| Capital Share Activity | |
| Investor class: | |
| Shares sold | | | 784,189 | | | | 584,696 | | | | 141,343 | | | | 135,491 | | |
| Shares reinvested | | | 45,303 | | | | 51,074 | | | | 974 | | | | — | | |
| Shares redeemed | | | (761,849 | ) | | | (799,442 | ) | | | (202,449 | ) | | | (192,080 | ) | |
| Net share activity | | | 67,643 | | | | (163,672 | ) | | | (60,132 | ) | | | (56,589 | ) | |
See accompanying notes to financial statements.
176
| | | Holmes Growth Fund | |
| | | Year Ended
December 31,
2011 | | Year Ended
December 31,
2010 | |
Increase (Decrease)
in Net Assets | |
| From operations: | |
| Net investment income (loss) | | $ | (497,883 | ) | | $ | (476,827 | ) | |
| Net realized gain (loss) | | | 5,164,661 | | | | 6,200,424 | | |
| Net unrealized appreciation (depreciation) | | | (6,821,178 | ) | | | 1,603,666 | | |
| Net increase (decrease) in net assets from operations | | | (2,154,400 | ) | | | 7,327,263 | | |
| Distributions to shareholders: | |
| From net investment income | |
| Investor class | | | — | | | | (449,513 | ) | |
| Total distributions to shareholders | | | — | | | | (449,513 | ) | |
| From capital share transactions: | |
Proceeds from shares sold
Investor class | | | 5,414,367 | | | | 3,457,830 | | |
Distributions reinvested
Investor class | | | — | | | | 416,688 | | |
Proceeds from short-term trading fees
Investor class | | | 282 | | | | 528 | | |
| | | | 5,414,649 | | | | 3,875,046 | | |
Cost of shares redeemed
Investor class | | | (8,548,931 | ) | | | (7,297,562 | ) | |
Net increase (decrease) in net assets from
capital share transactions | | | (3,134,282 | ) | | | (3,422,516 | ) | |
| Net Increase (Decrease) in Net Assets | | | (5,288,682 | ) | | | 3,455,234 | | |
| Net Assets | |
| Beginning of year | | | 40,604,212 | | | | 37,148,978 | | |
| End of year | | $ | 35,315,530 | | | $ | 40,604,212 | | |
Accumulated undistributed net investment income
(distributions in excess of net investment income),
end of year | | $ | (38,926 | ) | | $ | (386,452 | ) | |
| Capital Share Activity | |
| Investor class: | |
| Shares sold | | | 285,326 | | | | 206,574 | | |
| Shares reinvested | | | — | | | | 22,152 | | |
| Shares redeemed | | | (457,268 | ) | | | (443,142 | ) | |
| Net share activity | | | (171,942 | ) | | | (214,416 | ) | |
177
Statement of Changes in Net Assets
| | | Global MegaTrends Fund | | Global Resources Fund | |
| | | Year Ended
December 31,
2011 | | Year Ended
December 31,
2010 | | Year Ended
December 31,
2011 | | Year Ended
December 31,
2010 | |
Increase (Decrease)
in Net Assets | |
| From operations: | |
| Net investment income (loss) | | $ | 75,605 | | | $ | 97,830 | | | $ | (6,704,492 | ) | | $ | (7,468,819 | ) | |
| Net realized gain | | | 746,616 | | | | 1,200,936 | | | | 92,677,766 | | | | 105,071,300 | | |
| Net unrealized appreciation (depreciation) | | | (3,248,142 | ) | | | (12,461 | ) | | | (257,110,809 | ) | | | 138,954,717 | | |
| Net increase (decrease) in net assets from operations | | | (2,425,921 | ) | | | 1,286,305 | | | | (171,137,535 | ) | | | 236,557,198 | | |
| Distributions to shareholders: | |
| From net investment income | |
| Investor class | | | — | | | | (13,170 | ) | | | (19,762,685 | ) | | | (21,220,358 | ) | |
| Institutional class (a) | | | (18,363 | ) | | | (35,430 | ) | | | (2,765,455 | ) | | | (430,785 | ) | |
| Total distributions to shareholders | | | (18,363 | ) | | | (48,600 | ) | | | (22,528,140 | ) | | | (21,651,143 | ) | |
| From capital share transactions: | |
Proceeds from shares sold
Investor class | | | 1,175,368 | | | | 3,924,530 | | | | 329,405,494 | | | | 226,317,551 | | |
| Institutional class (a) | | | 4,055 | | | | 3,798,205 | | | | 65,210,041 | | | | 15,811,980 | | |
Distributions reinvested
Investor class | | | — | | | | 11,854 | | | | 18,848,694 | | | | 19,867,690 | | |
| Institutional class (a) | | | 18,294 | | | | 35,329 | | | | 2,763,078 | | | | 430,457 | | |
Proceeds from short-term trading fees
Investor class | | | 186 | | | | 189 | | | | 34,386 | | | | 42,821 | | |
| Institutional class (a) | | | — | | | | — | | | | 330 | | | | 2 | | |
| | | | 1,197,903 | | | | 7,770,107 | | | | 416,262,023 | | | | 262,470,501 | | |
Cost of shares redeemed
Investor class | | | (3,104,574 | ) | | | (17,251,944 | ) | | | (528,179,707 | ) | | | (287,376,779 | ) | |
| Institutional class (a) | | | (1,043,306 | ) | | | (11,485 | ) | | | (16,119,819 | ) | | | (590,193 | ) | |
Net increase (decrease) in net assets from
capital share transactions | | | (2,949,977 | ) | | | (9,493,322 | ) | | | (128,037,503 | ) | | | (25,496,471 | ) | |
| Net Increase (Decrease) in Net Assets | | | (5,394,261 | ) | | | (8,255,617 | ) | | | (321,703,178 | ) | | | 189,409,584 | | |
| Net Assets | |
| Beginning of year | | | 20,301,698 | | | | 28,557,315 | | | | 929,481,173 | | | | 740,071,589 | | |
| End of year | | $ | 14,907,437 | | | $ | 20,301,698 | | | $ | 607,777,995 | | | $ | 929,481,173 | | |
Accumulated undistributed net investment income
(distributions in excess of net investment income),
end of year | | $ | 56,212 | | | $ | 69,637 | | | $ | (3,453,053 | ) | | $ | (19,036,655 | ) | |
| Capital Share Activity | |
| Investor class: | |
| Shares sold | | | 137,469 | | | | 493,451 | | | | 27,713,544 | | | | 22,219,873 | | |
| Shares reinvested | | | — | | | | 1,374 | | | | 1,945,170 | | | | 1,735,173 | | |
| Shares redeemed | | | (366,522 | ) | | | (2,146,538 | ) | | | (47,235,677 | ) | | | (31,066,105 | ) | |
| Net share activity | | | (229,053 | ) | | | (1,651,713 | ) | | | (17,576,963 | ) | | | (7,111,059 | ) | |
| Institutional class: (a) | |
| Shares sold | | | 470 | | | | 449,052 | | | | 5,816,125 | | | | 1,511,708 | | |
| Shares reinvested | | | 2,366 | | | | 4,113 | | | | 284,267 | | | | 37,398 | | |
| Shares redeemed | | | (131,987 | ) | | | (1,347 | ) | | | (1,634,637 | ) | | | (52,484 | ) | |
| Net share activity | | | (129,151 | ) | | | 451,818 | | | | 4,465,755 | | | | 1,496,622 | | |
(a) Institutional class commenced operations on March 1, 2010.
See accompanying notes to financial statements.
178
| | | World Precious Minerals Fund | |
| | | Year Ended
December 31,
2011 | | Year Ended
December 31,
2010 | |
Increase (Decrease)
in Net Assets | |
| From operations: | |
| Net investment income (loss) | | $ | (9,183,096 | ) | | $ | (11,314,271 | ) | |
| Net realized gain | | | 77,717,916 | | | | 90,766,417 | | |
| Net unrealized appreciation (depreciation) | | | (309,429,697 | ) | | | 184,900,146 | | |
| Net increase (decrease) in net assets from operations | | | (240,894,877 | ) | | | 264,352,292 | | |
| Distributions to shareholders: | |
| From net investment income | |
| Investor class | | | (60,523,518 | ) | | | (99,236,093 | ) | |
| Institutional class (a) | | | (275,428 | ) | | | (209,612 | ) | |
| Total distributions to shareholders | | | (60,798,946 | ) | | | (99,445,705 | ) | |
| From capital share transactions: | |
Proceeds from shares sold
Investor class | | | 124,020,055 | | | | 176,168,966 | | |
| Institutional class (a) | | | 964,702 | | | | 2,132,887 | | |
Distributions reinvested
Investor class | | | 57,314,672 | | | | 95,387,525 | | |
| Institutional class (a) | | | 274,167 | | | | 207,819 | | |
Proceeds from short-term trading fees
Investor class | | | 33,977 | | | | 106,901 | | |
| Institutional class (a) | | | — | | | | — | | |
| | | | 182,607,573 | | | | 274,004,098 | | |
Cost of shares redeemed
Investor class | | | (270,949,550 | ) | | | (249,079,298 | ) | |
| Institutional class (a) | | | (608,504 | ) | | | (35,589 | ) | |
Net increase (decrease) in net assets from
capital share transactions | | | (88,950,481 | ) | | | 24,889,211 | | |
| Net Increase (Decrease) in Net Assets | | | (390,644,304 | ) | | | 189,795,798 | | |
| Net Assets | |
| Beginning of year | | | 828,831,116 | | | | 639,035,318 | | |
| End of year | | $ | 438,186,812 | | | $ | 828,831,116 | | |
Accumulated undistributed net investment income
(distributions in excess of net investment income),
end of year | | $ | (52,842,742 | ) | | $ | 71,805,230 | | |
| Capital Share Activity | |
| Investor class: | |
| Shares sold | | | 6,398,124 | | | | 9,059,127 | | |
| Shares reinvested | | | 3,963,750 | | | | 4,369,562 | | |
| Shares redeemed | | | (14,339,094 | ) | | | (13,011,737 | ) | |
| Net share activity | | | (3,977,220 | ) | | | 416,952 | | |
| Institutional class: (a) | |
| Shares sold | | | 46,404 | | | | 92,296 | | |
| Shares reinvested | | | 19,079 | | | | 9,520 | | |
| Shares redeemed | | | (37,249 | ) | | | (1,643 | ) | |
| Net share activity | | | 28,234 | | | | 100,173 | | |
179
Statement of Changes in Net Assets
| | | Gold and Precious Metals Fund | | Eastern European Fund | |
| | | Year Ended
December 31,
2011 | | Year Ended
December 31,
2010 | | Year Ended
December 31,
2011 | | Year Ended
December 31,
2010 | |
Increase (Decrease)
in Net Assets | |
| From operations: | |
| Net investment income (loss) | | $ | (2,670,423 | ) | | $ | (3,557,657 | ) | | $ | 828,165 | | | $ | (1,545,558 | ) | |
| Net realized gain (loss) | | | 30,987,057 | | | | 32,921,158 | | | | 47,395,544 | | | | 10,945,987 | | |
| Net unrealized appreciation (depreciation) | | | (96,434,285 | ) | | | 50,218,663 | | | | (136,103,572 | ) | | | 61,400,906 | | |
| Net increase (decrease) in net assets from operations | | | (68,117,651 | ) | | | 79,582,164 | | | | (87,879,863 | ) | | | 70,801,335 | | |
| Distributions to shareholders: | |
| From net investment income | |
| Investor class | | | — | | | | (3,708,191 | ) | | | — | | | | — | | |
| From net capital gains | |
| Investor class | | | (34,374,528 | ) | | | (18,871,531 | ) | | | — | | | | — | | |
| Total distributions to shareholders | | | (34,374,528 | ) | | | (22,579,722 | ) | | | — | | | | — | | |
| From capital share transactions: | |
Proceeds from shares sold
Investor class | | | 61,594,825 | | | | 106,304,844 | | | | 14,570,015 | | | | 32,629,184 | | |
Distributions reinvested
Investor class | | | 32,104,658 | | | | 21,269,596 | | | | — | | | | — | | |
Proceeds from short-term trading fees
Investor class | | | 29,700 | | | | 158,455 | | | | 101,769 | | | | 164,174 | | |
| | | | 93,729,183 | | | | 127,732,895 | | | | 14,671,784 | | | | 32,793,358 | | |
Cost of shares redeemed
Investor class | | | (97,098,643 | ) | | | (118,179,940 | ) | | | (173,230,246 | ) | | | (127,966,431 | ) | |
Net increase (decrease) in net assets from
capital share transactions | | | (3,369,460 | ) | | | 9,552,955 | | | | (158,558,462 | ) | | | (95,173,073 | ) | |
| Net Increase (Decrease) in Net Assets | | | (105,861,639 | ) | | | 66,555,397 | | | | (246,438,325 | ) | | | (24,371,738 | ) | |
| Net Assets | |
| Beginning of year | | | 300,948,783 | | | | 234,393,386 | | | | 440,037,141 | | | | 464,408,879 | | |
| End of year | | $ | 195,087,144 | | | $ | 300,948,783 | | | $ | 193,598,816 | | | $ | 440,037,141 | | |
Accumulated undistributed net investment income
(distributions in excess of net investment income),
end of year | | $ | (2,392,924 | ) | | $ | (4,185,270 | ) | | $ | 557,717 | | | $ | (449,559 | ) | |
| Capital Share Activity | |
| Investor class: | |
| Shares sold | | | 3,513,454 | | | | 6,055,096 | | | | 1,388,107 | | | | 3,355,448 | | |
| Shares reinvested | | | 2,293,190 | | | | 1,079,127 | | | | — | | | | — | | |
| Shares redeemed | | | (5,686,862 | ) | | | (6,936,401 | ) | | | (17,244,772 | ) | | | (13,620,205 | ) | |
| Net share activity | | | 119,782 | | | | 197,822 | | | | (15,856,665 | ) | | | (10,264,757 | ) | |
See accompanying notes to financial statements.
180
| | | Global Emerging Markets Fund | |
| | | Year Ended
December 31,
2011 | | Year Ended
December 31,
2010 | |
Increase (Decrease)
in Net Assets | |
| From operations: | |
| Net investment income (loss) | | $ | (76,385 | ) | | $ | (159,135 | ) | |
| Net realized gain (loss) | | | (205,090 | ) | | | 1,062,696 | | |
| Net unrealized appreciation (depreciation) | | | (2,847,479 | ) | | | 854,121 | | |
| Net increase (decrease) in net assets from operations | | | (3,128,954 | ) | | | 1,757,682 | | |
| Distributions to shareholders: | |
| From net investment income | |
| Investor class | | | — | | | | — | | |
| From net capital gains | |
| Investor class | | | — | | | | — | | |
| Total distributions to shareholders | | | — | | | | — | | |
| From capital share transactions: | |
Proceeds from shares sold
Investor class | | | 1,636,143 | | | | 2,208,443 | | |
Distributions reinvested
Investor class | | | — | | | | — | | |
Proceeds from short-term trading fees
Investor class | | | 4,737 | | | | 9,357 | | |
| | | | 1,640,880 | | | | 2,217,800 | | |
Cost of shares redeemed
Investor class | | | (3,690,625 | ) | | | (4,391,819 | ) | |
Net increase (decrease) in net assets from
capital share transactions | | | (2,049,745 | ) | | | (2,174,019 | ) | |
| Net Increase (Decrease) in Net Assets | | | (5,178,699 | ) | | | (416,337 | ) | |
| Net Assets | |
| Beginning of year | | | 13,402,861 | | | | 13,819,198 | | |
| End of year | | $ | 8,224,162 | | | $ | 13,402,861 | | |
Accumulated undistributed net investment income
(distributions in excess of net investment income),
end of year | | $ | (35,537 | ) | | $ | (58,730 | ) | |
| Capital Share Activity | |
| Investor class: | |
| Shares sold | | | 196,681 | | | | 259,919 | | |
| Shares reinvested | | | — | | | | — | | |
| Shares redeemed | | | (452,700 | ) | | | (536,473 | ) | |
| Net share activity | | | (256,019 | ) | | | (276,554 | ) | |
181
Statement of Changes in Net Assets
| | | China Region Fund | |
| | | Year Ended
December 31,
2011 | | Year Ended
December 31,
2010 | |
Increase (Decrease)
in Net Assets | |
| From operations: | |
| Net investment loss | | $ | (280,687 | ) | | $ | (534,225 | ) | |
| Net realized gain (loss) | | | (5,024,899 | ) | | | 10,072,744 | | |
| Net unrealized depreciation | | | (8,566,683 | ) | | | (3,504,321 | ) | |
| Net increase (decrease) in net assets from operations | | | (13,872,269 | ) | | | 6,034,198 | | |
| Distributions to shareholders | | | — | | | | — | | |
| From capital share transactions: | |
Proceeds from shares sold
Investor class | | | 9,973,299 | | | | 9,110,783 | | |
Distributions reinvested
Investor class | | | — | | | | — | | |
Proceeds from short-term trading fees
Investor class | | | 46,667 | | | | 38,856 | | |
| | | | 10,019,966 | | | | 9,149,639 | | |
Cost of shares redeemed
Investor class | | | (17,356,116 | ) | | | (19,663,761 | ) | |
Net decrease in net assets from
capital share transactions | | | (7,336,150 | ) | | | (10,514,122 | ) | |
| Net Decrease in Net Assets | | | (21,208,419 | ) | | | (4,479,924 | ) | |
| Net Assets | |
| Beginning of year | | | 51,843,396 | | | | 56,323,320 | | |
| End of year | | $ | 30,634,977 | | | $ | 51,843,396 | | |
| Distributions in excess of net investment income, end of year | | $ | (122,366 | ) | | $ | (454,818 | ) | |
| Capital Share Activity | |
| Investor class: | |
| Shares sold | | | 1,142,964 | | | | 1,060,010 | | |
| Shares reinvested | | | — | | | | — | | |
| Shares redeemed | | | (2,117,326 | ) | | | (2,325,277 | ) | |
| Net share activity | | | (974,362 | ) | | | (1,265,267 | ) | |
See accompanying notes to financial statements.
182
Notes to Financial Statements December 31, 2011
Note 1: Significant Accounting Policies
U.S. Global Investors Funds (Trust), consisting of thirteen separate funds (Funds), is organized as a Delaware statutory trust. Each Fund is an open-end management investment company registered under the Investment Company Act of 1940, as amended. All funds are diversified with the exception of Global Resources, World Precious Minerals, Gold and Precious Metals, Eastern European, Global Emerging Markets and China Region. A nondiversified fund may invest a greater percentage of its assets in a particular issuer in comparison to a diversified fund.
Effective March 1, 2010, Global MegaTrends, Global Resources and World Precious Minerals Funds offered a new Institutional class of shares ("Institutional Class"). For all funds, the class existing prior to March 1, 2010, was renamed the Investor Class ("Investor Class").
The following is a summary of significant accounting policies consistently followed by the Funds in the preparation of their financial statements. The policies are in conformity with U.S. generally accepted accounting principles.
A. Security Valuations
The Funds value investments traded on national or international securities exchanges or over-the-counter at the last sales price reported by the security's primary exchange of its market at the time of daily valuation. Securities for which no sale was reported are valued at the mean between the last reported bid and asked quotation. Short-term investments with effective maturities of sixty days or less at the date of purchase are valued at amortized cost, which approximates market value. An independent pricing service values municipal securities, long-term U.S. Government obligations and corporate debt securities using a system based on such factors as credit rating, maturity, coupon and type of security to determine fair value.
B. Fair Valued Securities
Securities for which market quotations are not readily available or which are subject to legal restrictions are valued at their fair value as determined in good faith under consistently applied procedures under the general supervision of the Board of Trustees. The following factors are generally considered in determining fair value: nature and duration of any trading restrictions, trading volume, market values of unrestricted shares of the same or similar class, investment management's judgment regarding the market experience of the issuer, financial status and other operational and market factors affecting the issuer, issuer's management, quality of the underlying property based on review of independent geological studies, the extent of a Fund's investment in the trading securities of the issuer; and other relevant matters. The fair values may differ from what would have been used had a broader market for these securities existed. Refer to the Notes to Portfolios of Investments for the percentages of net assets composed of these securities.
183
Notes to Financial Statements December 31, 2011
For securities traded on international exchanges, if events which may materially affect the value of a Fund's securities occur after the close of the primary exchange and before a Fund's net asset value is next determined, then those securities will be valued at their fair value as determined in good faith under the supervision of the Board of Trustees. The Funds may use a systematic fair value model provided by an independent third party to value international equity securities. At December 31, 2011, this model was used to value certain foreign securities in Global MegaTrends, Global Resources, Global Emerging Markets and China Region Funds.
C. Security Transactions and Investment Income
Security transactions are accounted for on trade date. Realized gains and losses from security transactions are determined on an identified-cost basis. Dividend income is recorded on the ex-dividend date except that certain dividends from foreign securities where the ex-dividend date may have passed are recorded as soon as the Fund has confirmed the ex-dividend date. Interest income, which may include original issue discount, is recorded on an accrual basis. Discounts and premiums on securities purchased are accreted and amortized, respectively, on a yield-to-maturity basis as adjustments to interest income. Investment income is recorded net of foreign taxes withheld where recovery of such taxes is uncertain. Investment income and realized and unrealized gains (losses) are allocated to each Fund's share class based on their respective net assets.
The Funds may purchase securities on a when-issued or delayed-delivery basis and segregate on their books collateral with a value at least equal to the amount of the commitment. Losses may arise due to the changes in the value of the underlying securities or if the counterparty does not perform under the contract.
D. Repurchase Agreements
The Funds may enter into repurchase agreements with recognized financial institutions or registered broker-dealers and, in all instances, hold as collateral, underlying securities with a value exceeding the principal amount of the repurchase obligation. The Funds use joint tri-party repurchase agreement accounts with other funds under common management where uninvested cash is collectively invested in repurchase agreements, and each participating fund owns an undivided interest in the account.
E. Foreign Currency Transactions
Some Funds may invest in securities of foreign issuers. The accounting records of these Funds are maintained in U.S. dollars. At each net asset value determination date, the value of assets and liabilities denominated in foreign currencies are translated into U.S. dollars using the current prevailing exchange rate. Security transactions, income and expenses are converted at the prevailing rate of exchange on the respective dates of the transactions. The effect of changes in foreign exchange rates on foreign denominated securities is included with the net realized and
184
Notes to Financial Statements December 31, 2011
unrealized gain or loss on securities. Other foreign currency gains or losses are reported separately.
F. Federal Income Taxes
The Funds intend to continue to comply with the requirements of Subchapter M of the Internal Revenue Code applicable to regulated investment companies and to distribute substantially all of their taxable income to shareholders. Accordingly, no provision for federal income taxes is required. Each Fund may be subject to foreign taxes on income and gains on investments, which are accrued based on the Fund's understanding of the tax rules and regulations in the foreign markets.
The Funds recognize the tax benefits of uncertain tax positions only where the position is "more likely than not" to be sustained assuming examination by tax authorities. Management has analyzed the Funds' tax positions, and has concluded that no liability for unrecognized tax benefits should be recorded related to uncertain tax positions taken on returns filed for open tax years or expected to be taken in 2011 tax returns. The Funds' 2008, 2009, 2010 and 2011 tax returns are open to examination by the federal and applicable state tax authorities. The Funds have no examinations in progress.
G. Dividends and Distributions to Shareholders
The Funds record dividends and distributions to shareholders on the ex-dividend date. Distributions are determined in accordance with income tax regulations, which may differ from accounting principles generally accepted in the United States. Accordingly, periodic reclassifications related to permanent book and tax basis differences are made within the Funds' capital accounts to reflect income and gains available for distribution under income tax regulations.
The Funds generally pay income dividends and distribute capital gains, if any, annually. The U.S. Treasury Securities Cash and U.S. Government Securities Savings Funds accrue dividends on a daily basis with payment monthly. The Tax Free and Near-Term Tax Free Funds pay monthly dividends. Dividends and distributions payable at period end are processed for reinvestment on the following business day. A Fund may elect to designate a portion of the earnings and profits distributed to shareholders on the redemption of fund shares during the year as distributions for federal income tax purposes.
H. Expenses
Fund specific expenses are allocated to that Fund and pro rata across share classes. Expenses that are not fund specific are allocated among Funds and pro rata across share classes. Class specific expenses (including, but not limited to, distribution plan fees, if any, a portion of the administrative services fees, transfer agency fees and expenses, shareholder reporting expenses and certain legal and registration fees) are allocated to the class that incurs such expense. Expense offset arrangements have been made with the Funds' custodian so the custodian fees may be paid
185
Notes to Financial Statements December 31, 2011
indirectly by credits earned on the Funds' cash balances. Such deposit arrangements are an alternative to overnight investments. Custodian fees are presented in the Statement of Operations gross of such credits, and the credits are presented as offsets to expenses.
I. Short-Term Trading (Redemption) Fees
Shares held in the All American Equity and Holmes Growth Funds 30 days or less are subject to a short-term trading fee equal to 0.10% of the proceeds of the redeemed shares. Shares held in the Global MegaTrends and Global Resources Funds 30 days or less are subject to a short-term trading fee equal to 0.25% of the proceeds of the redeemed shares. Shares held 30 days or less in the World Precious Minerals and Gold and Precious Metals Funds are subject to a short-term trading fee equal to 0.50% of the proceeds of the redeemed shares. Shares held in the Eastern European and Global Emerging Markets Funds 180 days or less are subject to a short-term trading fee equal to 2.00% of the proceeds of the redeemed shares. Shares held in the China Region Fund 180 days or less are subject to a short-term trading fee equal to 1.00% of the proceeds of the redeemed shares. These fees, which are retained by the Funds, are accounted for as an addition to paid-in capital.
J. Use of Estimates in Financial Statement Preparation
The preparation of financial statements in conformity with accounting principles generally accepted in the United States requires management to make estimates and assumptions that affect the reported amounts of assets and liabilities and disclosure of contingent assets and liabilities at the date of the financial statements and the reported amounts of income and expenses during the reporting period. Actual results could differ from those estimates.
K. Subsequent Events Evaluation
Management has evaluated subsequent events after the balance sheet date of December 31, 2011, through the date that the financial statements were issued and determined that there were no events or transactions that would require recognition or disclosure in the financial statements.
L. New Accounting Pronouncements
In April 2011, the Financial Accounting Standards Board (FASB) issued Accounting Standards Update (ASU) No. 2011-03, Transfers and Servicing (Topic 860): Reconsideration of Effective Control for Repurchase Agreements. This ASU is related to the accounting for repurchase agreements and similar agreements that both entitle and obligate a transferor to repurchase or redeem financial assets before their maturity. The ASU modifies the criteria for determining effective control of transferred assets and, as a result, certain agreements may now be accounted for as secured borrowings. The ASU is effective prospectively for new transfers and existing transactions that are modified in the first interim or annual period beginning on or after December 15, 2011. At this time, the Funds do not have any of the
186
Notes to Financial Statements December 31, 2011
transactions that fall under the provisions of this pronouncement and do not intend to enter such transactions in the future. Therefore, management does not anticipate that this pronouncement will have a material impact on the financial statements.
In May 2011, the FASB issued ASU No. 2011-04, Fair Value Measurement (Topic 820): Amendments to Achieve Common Fair Value Measurement and Disclosure Requirements in U.S. GAAP and IFRSs. The ASU expands existing disclosure requirements and amends some fair value measurement principles. The ASU is effective for interim and annual periods beginning on or after December 15, 2011, with early adoption prohibited and prospective application required. Management is in the process of evaluating the impact of this guidance on financial statement disclosures.
In December 2011, the FASB issued ASU No. 2011-11, Balance Sheet (Topic 210): Disclosures about Offsetting Assets and Liabilities. The ASU requires an entity to disclose information about offsetting and related arrangements to enable users of its financial statements to understand the effect of those arrangements on its financial position. The ASU is effective for annual reporting periods beginning on or after January 1, 2013, and interim periods within those annual periods. At this time, the Funds do not have netting agreements that will fall under the provisions of this pronouncement and do not intend to enter into such agreements in the future. Therefore, management does not anticipate that this pronouncement will have a material impact on the financial statements.
Note 2: Financial Derivative Instruments
A. Options Contracts
Equity Funds may purchase or write (sell) options on securities to manage their exposure to stock or commodity markets as well as fluctuations in interest and currency conversion rates. The use of options carries the risks of a change in value of the underlying instruments, an illiquid secondary market, or failure of the counterparty to perform its obligations.
A put option gives the purchaser of the option, upon payment of a premium, the right to sell, and the issuer of the option the obligation to buy, the underlying security, commodity, index, currency or other instrument at the exercise price. A call option, upon payment of a premium, gives the purchaser of the option the right to buy, and the issuer the obligation to sell, the underlying instrument at the exercise price.
Purchasing a put option tends to decrease a Fund's exposure to the underlying instrument, whereas purchasing a call option tends to increase a Fund's exposure to the underlying instrument. A Fund pays a premium which is included in the Statement of Assets and Liabilities as an investment and subsequently marked to market to reflect the current value of the option. Premiums paid to purchase options which expire are treated as realized losses. Premiums paid to purchase options
187
Notes to Financial Statements December 31, 2011
which are exercised or closed are added to the cost of securities acquired or the proceeds from securities sold. The risk associated with purchasing put and call options is limited to the premium paid.
The Funds will realize a loss equal to all or a part of the premium paid for an option if the price of the underlying security or other instrument decreases or does not increase by more than the premium (in the case of a call option), or if the price of the underlying security or other instrument increases or does not decrease by more than the premium (in the case of a put option).
Writing a put option tends to increase a Fund's exposure to the underlying instrument, whereas writing a call option tends to decrease a Fund's exposure to the underlying instrument. The premium received is recorded as a liability in the Statement of Assets and Liabilities and subsequently marked to market to reflect the current value of the option written. Premiums received from writing options which expire are treated as realized gains. Premiums received from options which are exercised or closed are added to the proceeds or offset against amounts paid on the underlying transaction to determine the realized gain or loss. Written options include a risk of loss in excess of the option premium. A Fund as a writer of an option has no control over whether the underlying instrument may be sold (call) or purchased (put) and thus bears the market risk of an unfavorable change in the price of the instrument underlying the written option. There is also the risk a Fund may not be able to enter into a closing transaction because of an illiquid market.
A Fund's ability to close out its position as a purchaser or seller of a put or call option is dependent, in part, upon the liquidity of the market for that particular option. There can be no guarantee that a fund will be able to close out an option position when desired. An inability to close out its options positions may reduce a Fund's anticipated profits or increase its losses.
As of December 31, 2011, portfolio securities valued at $838,750, $2,680,860 and $230,960 were held in escrow by the custodian as cover for call options written for the All American Equity Fund, Holmes Growth Fund and Global MegaTrends Fund, respectively. Cash in the amount of $4,750,000 was segregated by the custodian as cover for put options written for the Eastern European Fund.
188
Notes to Financial Statements December 31, 2011
Transactions in written call and put options during the year ended December 31, 2011, were as follows:
| | | All American Equity Fund
Call Options | | Holmes Growth Fund
Call Options | |
| | | Number of
Contracts | | Premiums
Received | | Number of
Contracts | | Premiums
Received | |
| Options outstanding at December 31, 2010 | | | — | | | $ | — | | | | — | | | $ | — | | |
| Options written | | | 508 | | | | 154,600 | | | | 4,067 | | | | 841,388 | | |
| Options closed | | | (65 | ) | | | (23,980 | ) | | | (680 | ) | | | (96,832 | ) | |
| Options expired | | | (294 | ) | | | (86,226 | ) | | | (2,357 | ) | | | (481,737 | ) | |
| Options exercised | | | (85 | ) | | | (24,025 | ) | | | (870 | ) | | | (194,888 | ) | |
| Options outstanding at December 31, 2011 | | | 64 | | | $ | 20,369 | | | | 160 | | | $ | 67,931 | | |
| | | Global MegaTrends Fund
Call Options | | Global Resources Fund
Call Options | |
| | | Number of
Contracts | | Premiums
Received | | Number of
Contracts | | Premiums
Received | |
| Options outstanding at December 31, 2010 | | | — | | | $ | — | | | | — | | | $ | — | | |
| Options written | | | 654 | | | | 113,744 | | | | 31,146 | | | | 3,555,065 | | |
| Options closed | | | (60 | ) | | | (4,000 | ) | | | (25,676 | ) | | | (2,325,200 | ) | |
| Options expired | | | (532 | ) | | | (102,335 | ) | | | (3,220 | ) | | | (852,707 | ) | |
| Options exercised | | | (22 | ) | | | (2,794 | ) | | | (1,250 | ) | | | (197,496 | ) | |
| Options outstanding at December 31, 2011 | | | 40 | | | $ | 4,615 | | | | 1,000 | | | $ | 179,662 | | |
| | | World Precious Minerals Fund
Call Options | | Gold and Precious Metals Fund
Call Options | |
| | | Number of
Contracts | | Premiums
Received | | Number of
Contracts | | Premiums
Received | |
| Options outstanding at December 31, 2010 | | | — | | | $ | — | | | | — | | | $ | — | | |
| Options written | | | 47,436 | | | | 5,274,071 | | | | 35,694 | | | | 4,106,608 | | |
| Options closed | | | (33,328 | ) | | | (3,811,625 | ) | | | (27,598 | ) | | | (3,135,607 | ) | |
| Options expired | | | (5,619 | ) | | | (528,109 | ) | | | (2,765 | ) | | | (255,162 | ) | |
| Options exercised | | | (8,489 | ) | | | (934,337 | ) | | | (5,331 | ) | | | (715,839 | ) | |
| Options outstanding at December 31, 2011 | | | — | | | $ | — | | | | — | | | $ | — | | |
| | | Eastern European Fund
Call Options | | Eastern European Fund
Put Options | |
| | | Number of
Contracts | | Premiums
Received | | Number of
Contracts | | Premiums
Received | |
| Options outstanding at December 31, 2010 | | | — | | | $ | — | | | | — | | | $ | — | | |
| Options written | | | 119,975 | | | | 4,606,876 | | | | 5,000 | | | | 395,485 | | |
| Options closed | | | (32,732 | ) | | | (1,139,456 | ) | | | — | | | | — | | |
| Options expired | | | (46,243 | ) | | | (2,084,343 | ) | | | — | | | | — | | |
| Options exercised | | | (8,700 | ) | | | (372,677 | ) | | | — | | | | — | | |
| Options outstanding at December 31, 2011 | | | 32,300 | | | $ | 1,010,400 | | | | 5,000 | | | $ | 395,485 | | |
189
Notes to Financial Statements December 31, 2011
| | | Global Emerging Markets Fund
Call Options | | China Region Fund
Call Options | |
| | | Number of
Contracts | | Premiums
Received | | Number of
Contracts | | Premiums
Received | |
| Options outstanding at December 31, 2010 | | | — | | | $ | — | | | | — | | | $ | — | | |
| Options written | | | 157 | | | | 35,277 | | | | 1,425 | | | | 724,450 | | |
| Options closed | | | (78 | ) | | | (9,990 | ) | | | (1,011 | ) | | | (461,142 | ) | |
| Options expired | | | (60 | ) | | | (17,174 | ) | | | (275 | ) | | | (203,283 | ) | |
| Options exercised | | | (19 | ) | | | (8,113 | ) | | | (139 | ) | | | (60,025 | ) | |
| Options outstanding at December 31, 2011 | | | — | | | $ | — | | | | — | | | $ | — | | |
B. Forward Foreign Currency Contracts
The Funds enter into forward foreign currency contracts to lock in the U.S. dollar cost of purchase and sale transactions or to defend the portfolio against currency fluctuations. A forward foreign currency contract is a commitment to purchase or sell a foreign currency at a future date at a negotiated rate. These contracts are valued daily, and the Fund's net equity therein, representing unrealized gain or loss on the contracts as measured by the difference between the forward foreign exchange rates at the dates of entry into the contracts and the forward rates at the reporting date, is included in the statement of assets and liabilities. Realized and unrealized gains and losses are included in the statement of operations. Risks may arise upon entering into these contracts from the potential inability of counterparties to meet the terms of the contract and from unanticipated movements in the value of foreign currencies relative to the U.S. dollar.
There were no open forward foreign currency contracts at December 31, 2011.
C. Summary of Derivative Instruments
The following is a summary of the valuations of derivative instruments categorized by location in the Statement of Assets and Liabilities as of December 31, 2011:
| Location | | All
American
Equity Fund | | Holmes
Growth
Fund | | Global
MegaTrends
Fund | | Global
Resources
Fund | |
| Asset derivatives | |
Investments, at value
Equity contracts - Note 2 A | | $ | 800 | | | $ | — | | | $ | 1,500 | | | $ | 39,000 | | |
| Total | | $ | 800 | | | $ | — | | | $ | 1,500 | | | $ | 39,000 | | |
| Liability derivatives | |
| Written options, at value | | $ | 20,950 | | | $ | 71,060 | | | $ | 11,700 | | | $ | 2,000 | | |
| Total | | $ | 20,950 | | | $ | 71,060 | | | $ | 11,700 | | | $ | 2,000 | | |
190
Notes to Financial Statements December 31, 2011
| Location | | World
Precious
Minerals
Fund | | Gold and
Precious
Metals
Fund | | Eastern
European
Fund | | Global
Emerging
Markets
Fund | | China
Region
Fund | |
| Asset derivatives | |
Investments, at value
Equity contracts - Note 2 A | | $ | 234,706 | | | $ | 117,494 | | | $ | — | | | $ | — | | | $ | 85,300 | | |
| Total | | $ | 234,706 | | | $ | 117,494 | | | $ | — | | | $ | — | | | $ | 85,300 | | |
| Liability derivatives | |
| Written options, at value | | $ | — | | | $ | — | | | $ | 577,250 | | | $ | — | | | $ | — | | |
| Total | | $ | — | | | $ | — | | | $ | 577,250 | | | $ | — | | | $ | — | | |
The following is a summary of the effect of derivative instruments on the Statement of Operations for the year ended December 31, 2011:
| Location | | All
American
Equity Fund | | Holmes
Growth
Fund | | Global
MegaTrends
Fund | | Global
Resources
Fund | |
Realized Gain (Loss) on derivatives
recognized in income | |
Realized gain (loss) from securities
Equity contracts | | $ | 29,423 | | | $ | 107,172 | | | $ | 21,443 | | | $ | 1,650,780 | | |
Realized gain (loss) on written options
Equity contracts | | | 132,917 | | | | 734,380 | | | | 111,016 | | | | 2,876,950 | | |
Net realized gain (loss) on foreign
currency transactions
Foreign exchange contracts | | | — | | | | 1,381 | | | | (691 | ) | | | (111,164 | ) | |
| | | | 162,340 | | | | 842,933 | | | | 131,768 | | | | 4,416,566 | | |
Change in Unrealized Appreciation
(Depreciation) on derivatives
recognized in income | |
Net change in unrealized appreciation
(depreciation) on investments
Equity contracts | | $ | (8,800 | ) | | $ | 53,515 | | | $ | (31,898 | ) | | $ | (782,973 | ) | |
Net change in unrealized appreciation
(depreciation) on options written
Equity contracts | | | (581 | ) | | | (3,129 | ) | | | (7,085 | ) | | | 177,662 | | |
| | | | (9,381 | ) | | | 50,386 | | | | (38,983 | ) | | | (605,311 | ) | |
| Total | | $ | 152,959 | | | $ | 893,319 | | | $ | 92,785 | | | $ | 3,811,255 | | |
191
Notes to Financial Statements December 31, 2011
| Location | | World
Precious
Minerals
Fund | | Gold and
Precious
Metals
Fund | | Eastern
European
Fund | | Global
Emerging
Markets
Fund | | China
Region
Fund | |
Realized Gain (Loss) on derivatives
recognized in income | |
Realized gain (loss) from securities
Equity contracts | | $ | (7,351,578 | ) | | $ | (2,108,519 | ) | | $ | (1,152,320 | ) | | $ | (131,436 | ) | | $ | (134,475 | ) | |
Realized gain (loss) on written options
Equity contracts | | | 2,310,559 | | | | 1,511,305 | | | | 3,326,248 | | | | 27,800 | | | | 489,733 | | |
Net realized gain (loss) on foreign
currency transactions
Foreign exchange contracts | | | (244,546 | ) | | | (57,102 | ) | | | 1,111,547 | | | | (444 | ) | | | 5 | | |
| | | | (5,285,565 | ) | | | (654,316 | ) | | | 3,285,475 | | | | (104,080 | ) | | | 355,263 | | |
Change in Unrealized Appreciation
(Depreciation) on derivatives
recognized in income | |
Net change in unrealized appreciation
(depreciation) on investments
Equity contracts | | | (585,009 | ) | | | (628,399 | ) | | | 54,500 | | | | 17,891 | | | | (67,352 | ) | |
Net change in unrealized appreciation
(depreciation) on options written
Equity contracts | | | — | | | | — | | | | 828,635 | | | | — | | | | — | | |
Net change in unrealized appreciation
(depreciation) on translation of assets
and liabilities denominated in foreign
currencies
Foreign exchange contracts | | | (22,186 | ) | | | — | | | | — | | | | — | | | | — | | |
| | | | (607,195 | ) | | | (628,399 | ) | | | 883,135 | | | | 17,891 | | | | (67,352 | ) | |
| Total | | $ | (5,892,760 | ) | | $ | (1,282,715 | ) | | $ | 4,168,610 | | | $ | (86,189 | ) | | $ | 287,911 | | |
The average notional amounts of written options, purchased options and forward currency contracts outstanding during the year ended December 31, 2011, were approximately as follows:
| Fund | | Written
Options | | Purchased
Options | | Forward
Currency
Contracts | |
| All American Equity | | $ | 12,567 | | | $ | 3,078 | | | $ | — | | |
| Holmes Growth | | | 67,965 | | | | 7,604 | | | | 31,389 | | |
| Global MegaTrends | | | 8,933 | | | | 7,552 | | | | 16,276 | | |
| Global Resources | | | 169,788 | | | | 3,110,322 | | | | 1,537,496 | | |
| World Precious Minerals | | | 161,570 | | | | 3,355,795 | | | | 1,393,569 | | |
| Gold and Precious Metals | | | 163,031 | | | | 1,654,491 | | | | 245,080 | | |
| Eastern European | | | 387,666 | | | | 151,560 | | | | — | | |
| Global Emerging Markets | | | 2,881 | | | | 7,327 | | | | 10,463 | | |
| China Region | | | 20,783 | | | | 34,492 | | | | — | | |
192
Notes to Financial Statements December 31, 2011
Note 3: Related Party Transactions
U.S. Global Investors, Inc. (Adviser), under an investment advisory agreement with the Trust in effect through October 1, 2012, furnishes management and investment advisory services and, subject to the supervision of the trustees, directs the investments of each Fund according to each Fund's investment objectives, policies and limitations. The Adviser also furnishes all necessary office facilities, business equipment and personnel for administering the affairs of the Trust. Frank E. Holmes, a trustee of the Funds, is the controlling owner of the Adviser.
For the services of the Adviser, each Fund pays a base management or advisory fee based upon its net assets. Fees are accrued daily and paid monthly. The contractual management fee for each fund is:
| Fund | | Annual Percentage of
Average Daily Net Assets | |
U.S. Treasury Securities Cash and
U.S. Government Securities Savings
Near-Term Tax Free
Tax Free | | .50% of the first $250,000,000 and
.375% of the excess
.50%
.75% of the first $250,000,000 and
.50% of the excess | |
|
| All American Equity | | .80% of the first $500,000,000 and
.75% of the excess | |
|
| Holmes Growth and Global MegaTrends | | 1.00% | |
|
| Global Resources | | .95% of the first $500,000,000;
.90% of $500,000,001 to $1,000,000,000
and .85% of the excess | |
|
| World Precious Minerals | | 1.00% of the first $500,000,000;
.95% of $500,000,001 to $1,000,000,000
and .90% of the excess | |
|
| Gold and Precious Metals | | .90% of the first $500,000,000
and .85% of the excess | |
|
| Eastern European | | 1.25% | |
|
| Global Emerging Markets | | 1.375% | |
|
| China Region | | 1.25% | |
|
The advisory agreement also provides, effective October 1, 2009, that the base advisory fee of the Equity Funds will be adjusted upwards or downwards by 0.25 percent if there is a performance difference of 5 percent or more between a Fund's performance and that of its designated benchmark index over the prior 12 months. The performance adjustment is calculated separately for each share class. For purposes of calculating the performance adjustment for the Institutional Class, the performance will include the performance of the Investor Class shares for periods prior to
193
Notes to Financial Statements December 31, 2011
March 1, 2011. After such time, for purposes of calculating the performance adjustment, the performance of each class will be calculated based on its respective performance. The benchmarks are as follows:
| Fund | | Benchmark Index | |
| All American Equity | | S&P 500 Index | |
|
| Holmes Growth | | S&P Composite 1500 Index | |
|
| Global MegaTrends | | S&P 500 Index | |
|
| Global Resources | | Morgan Stanley Commodity Related Equity Index | |
|
| World Precious Minerals | | NYSE Arca Gold Miners Index | |
|
| Gold and Precious Metals | | FTSE Gold Mines Index | |
|
| Eastern European | | MSCI Emerging Markets Europe 10/40 Index (Net Total Return) | |
|
| Global Emerging Markets | | MSCI Emerging Markets Total Net Return Index | |
|
| China Region | | Hang Seng Composite Index | |
|
No performance adjustment is applied unless the difference between the class's investment performance and the benchmark is 5 percent or greater (positive or negative) during the applicable performance measurement period. The performance fee adjustment is calculated monthly in arrears and is accrued ratably during the month. The management fee, net of any performance fee adjustment, is paid monthly in arrears.
The Funds' prospectus and statement of additional information contain additional information about the performance adjustment. The amounts shown as management fees on the Statements of Operations reflects the base fee plus/minus any performance adjustment. During the year ended December 31, 2011, the Funds recorded performance adjustments as follows:
| Fund | | Investor Class
Performance Fee
Adjustment | | Institutional Class
Performance Fee
Adjustment | |
| All American Equity | | $ | (3,649 | ) | | | N/A | | |
| Holmes Growth | | | 6,353 | | | | N/A | | |
| Global MegaTrends | | | (30,286 | ) | | $ | (3,728 | ) | |
| Global Resources | | | 974,928 | | | | 8,583 | | |
| World Precious Minerals | | | 141,185 | | | | (661 | ) | |
| Gold and Precious Metals | | | (61,856 | ) | | | N/A | | |
| Eastern European | | | (338,943 | ) | | | N/A | | |
| Global Emerging Markets | | | (21,024 | ) | | | N/A | | |
| China Region | | | (20,235 | ) | | | N/A | | |
194
Notes to Financial Statements December 31, 2011
Under an administrative services agreement, the U.S. Treasury Securities Cash, U.S. Government Securities Savings, Near-Term Tax Free, Tax Free, All American Equity, Holmes Growth, Gold and Precious Metals, Eastern European, Global Emerging Markets and China Region Funds compensate the Adviser at an annual rate of 0.08% of the average daily net assets of each Fund for administrative services provided. The Global MegaTrends, Global Resources and World Precious Minerals Funds compensate the Adviser at an annual rate of 0.08% of the average daily net assets for the Investor Class and 0.06% of the average daily net assets for the Institutional Class for administrative services provided, of which half is a fund-level fee and half is a class-level fee.
The Investor Class shares for Equity Funds in the Trust have adopted a distribution plan pursuant to Rule 12b-1 of the Investment Company Act of 1940 in which a subsidiary of the Adviser is paid a fee at an annual rate of 0.25% of the average daily net assets of the Investor Class for sales and promotional services related to the distribution of Investor Class shares. The Institutional Class does not incur distribution plan fees.
The Adviser has voluntarily agreed to reimburse specific funds so that their total operating expenses will not exceed certain annual percentages of average net assets. The expenses for the year ended December 31, 2011, were limited as follows for the Investor Class: U.S. Treasury Securities Cash Fund at 1.00%, U.S. Government Securities Savings Fund at 0.45%, Near-Term Tax Free Fund at 0.45%, Tax Free Fund at 0.70%, All American Equity Fund at 2.20%, Holmes Growth Fund at 2.20%, Global MegaTrends Fund at 2.35%, Global Resources, World Precious Minerals, and Gold and Precious Metals Funds at 1.90%, Eastern European Fund at 2.85%, Global Emerging Markets Fund at 3.15% and China Region Fund at 2.55%. These expense limitations are exclusive of any performance fee adjustments and will continue on a voluntary basis at the Adviser's discretion.
The Adviser has agreed to waive all class specific expenses for the Institutional Class. The expense waiver is exclusive of performance fees, and the Adviser can modify or terminate this arrangement at any time.
The Adviser has voluntarily agreed to waive fees and/or reimburse U.S. Treasury Securities Cash Fund and U.S. Government Securities Savings Fund to the extent necessary to maintain the respective fund's yield at a certain level as determined by the Adviser (Minimum Yield). The Adviser may recapture any fees waived and/or expenses reimbursed within three years after the end of the fiscal year of such waiver and/or reimbursement to the extent that such recapture would not cause the fund's yield to fall below the Minimum Yield. For the year ended December 31, 2011, fees waived and/or expenses reimbursed as a result of this agreement were $867,545 and $736,531 for the U.S. Treasury Securities Cash Fund and the U.S. Government Securities Savings Fund, respectively. At December 31,
195
Notes to Financial Statements December 31, 2011
2011, the Adviser may seek reimbursement of previously waived and reimbursed fees as follows:
| | | Expires
12/31/2012 | | Expires
12/31/2013 | | Expires
12/31/2014 | | Total | |
| U.S. Treasury Securities Cash | | $ | 789,420 | | | $ | 884,850 | | | $ | 867,545 | | | $ | 2,541,815 | | |
| U.S. Government Securities Savings | | | 258,561 | | | | 678,107 | | | | 736,531 | | | | 1,673,199 | | |
United Shareholder Services, Inc. (USSI), a wholly-owned subsidiary of the Adviser, is the transfer agent for the Funds. Each Fund's share class pays an annual fee based on the number of shareholder accounts, certain base fees and transaction-and activity-based fees for transfer agency services. Certain account fees are paid directly by shareholders to the transfer agent, which, in turn, reduces its charge to the Funds.
The Adviser was reimbursed for services of the Funds' Chief Compliance Officer during the year ended December 31, 2011, in the amount of $154,724.
Brown Brothers Harriman & Co. (BBH) serves as the custodian, fund accounting and administration service agent with a fee structure based on average net assets of the Funds, certain base fees and transaction-based fees.
The independent Trustees receive compensation for serving on the Board. Trustees serving as Chairman of the Board or a special committee or as a member of a committee receive additional compensation. Trustees are also reimbursed for out-of-pocket expenses incurred while attending meetings. Frank E. Holmes receives no compensation from the Funds for serving on the Board.
Note 4: Investments
Cost of purchases and proceeds from sales of long-term securities for the year ended December 31, 2011, are summarized as follows:
| Fund | | Purchases | | Sales | |
| Near-Term Tax Free | | $ | 6,537,066 | | | $ | 120,000 | | |
| Tax Free | | | 2,680,497 | | | | 1,954,153 | | |
| All American Equity | | | 36,846,384 | | | | 38,930,106 | | |
| Holmes Growth | | | 77,287,594 | | | | 85,032,730 | | |
| Global MegaTrends | | | 27,165,822 | | | | 31,465,502 | | |
| Global Resources | | | 1,976,691,325 | | | | 2,080,734,782 | | |
| World Precious Minerals | | | 564,189,585 | | | | 704,182,559 | | |
| Gold and Precious Metals | | | 340,283,045 | | | | 382,887,519 | | |
| Eastern European | | | 270,159,085 | | | | 424,071,769 | | |
| Global Emerging Markets | | | 26,399,936 | | | | 28,626,434 | | |
| China Region | | | 176,325,070 | | | | 183,953,386 | | |
196
Notes to Financial Statements December 31, 2011
U.S. Treasury Securities Cash and U.S. Government Securities Savings held only short-term investments. The Funds neither purchased nor sold long-term U.S. government securities during the period.
Investments in foreign issuers as a percent of total investments at December 31, 2011, were: 20.67% of Holmes Growth, 39.50% of Global MegaTrends, 40.80% of Global Resources, 84.99% of World Precious Minerals, 72.23% of Gold and Precious Metals, 96.43% of Eastern European, 94.05% of Global Emerging Markets and 98.64% of China Region.
Note 5: Tax Information
The following table presents the income tax basis of securities owned at December 31, 2011, and the tax basis components of net unrealized appreciation (depreciation):
| Fund | | Aggregate
Tax Cost | | Gross
Unrealized
Appreciation | | Gross
Unrealized
Depreciation | | Net Unrealized
Appreciation
(Depreciation) | |
| U.S. Treasury Securities Cash | | $ | 90,493,251 | | | $ | — | | | $ | — | | | $ | — | | |
| U.S. Government Securities Savings | | | 170,631,309 | | | | — | | | | — | | | | — | | |
| Near-Term Tax Free | | | 33,300,884 | | | | 1,233,931 | | | | (1,317 | ) | | | 1,232,614 | | |
| Tax Free | | | 20,321,481 | | | | 1,233,064 | | | | (105,817 | ) | | | 1,127,247 | | |
| All American Equity | | | 16,255,009 | | | | 1,066,977 | | | | (864,403 | ) | | | 202,574 | | |
| Holmes Growth | | | 34,746,401 | | | | 2,625,214 | | | | (2,046,865 | ) | | | 578,349 | | |
| Global MegaTrends | | | 14,451,660 | | | | 1,301,179 | | | | (775,228 | ) | | | 525,951 | | |
| Global Resources | | | 716,686,295 | | | | 47,234,190 | | | | (132,889,970 | ) | | | (85,655,780 | ) | |
| World Precious Minerals | | | 556,549,769 | | | | 68,580,809 | | | | (191,322,900 | ) | | | (122,742,091 | ) | |
| Gold and Precious Metals | | | 205,014,180 | | | | 20,931,740 | | | | (32,763,409 | ) | | | (11,831,669 | ) | |
| Eastern European | | | 201,207,435 | | | | 29,344,143 | | | | (41,410,705 | ) | | | (12,066,562 | ) | |
| Global Emerging Markets | | | 9,377,997 | | | | 309,464 | | | | (1,492,738 | ) | | | (1,183,274 | ) | |
| China Region | | | 32,969,008 | | | | 1,032,600 | | | | (4,336,808 | ) | | | (3,304,208 | ) | |
As of December 31, 2011, the components of distributable earnings on a tax basis were as follows:
| Fund | | Undistributed
Tax-Exempt
Income | | Undistributed
Ordinary
Income | | Undistributed
Long-Term
Capital Gains | | Net Unrealized
Appreciation
(Depreciation) | |
| U.S. Treasury Securities Cash | | $ | — | | | $ | 989 | | | $ | — | | | $ | — | | |
| U.S. Government Securities Savings | | | — | | | | 1,037 | | | | — | | | | — | | |
| Near-Term Tax Free | | | 12,813 | | | | 11,666 | | | | — | | | | 1,232,614 | | |
| Tax Free | | | 7,695 | | | | 27,736 | | | | — | | | | 1,127,247 | | |
| All American Equity | | | — | | | | — | | | | — | | | | 289,599 | | |
| Holmes Growth | | | — | | | | — | | | | 568,317 | | | | 716,049 | | |
| Global MegaTrends | | | — | | | | 50,614 | | | | — | | | | 590,292 | | |
| Global Resources | | | — | | | | 12,871,744 | | | | — | | | | (60,303,612 | ) | |
| World Precious Minerals | | | — | | | | — | | | | — | | | | (75,446,830 | ) | |
| Gold and Precious Metals | | | — | | | | — | | | | — | | | | (8,877,726 | ) | |
| Eastern European | | | — | | | | 590,340 | | | | — | | | | 6,243,061 | | |
| Global Emerging Markets | | | — | | | | — | | | | — | | | | (1,110,327 | ) | |
| China Region | | | — | | | | — | | | | — | | | | (1,942,545 | ) | |
197
Notes to Financial Statements December 31, 2011
The differences between book-basis and tax-basis unrealized appreciation (depreciation) for All American Equity, Holmes Growth, Global MegaTrends, Global Resources, World Precious Minerals, Gold and Precious Metals, Eastern European, Global Emerging Markets and China Region Funds are attributable primarily to the tax deferral of losses on wash sales, investment in passive foreign investment companies (PFIC), forwards marked to markets, unreversed return of capital in Canadian Trusts, adjustments for partnerships, tax straddle loss deferrals on written options, and adjustments for grantor trusts.
Reclassifications are made to the Funds' capital accounts to reflect income and gains available for distribution (or available capital loss carryovers) under income tax regulations. For the year ended December 31, 2011, the Funds recorded the following reclassifications to increase (decrease) the accounts listed below:
| Fund | | Accumulated Net
Investment Income | | Accumulated Net
Realized Gain | | Paid-in
Capital | |
| U.S. Treasury Securities Cash | | $ | 81 | | | $ | — | | | $ | (81 | ) | |
| U.S. Government Securities Savings | | | 1,037 | | | | (1,037 | ) | | | — | | |
| Near-Term Tax Free | | | — | | | | 46,218 | | | | (46,218 | ) | |
| Tax Free | | | — | | | | 25,127 | | | | (25,127 | ) | |
| All American Equity | | | 68,525 | | | | (11,032 | ) | | | (57,493 | ) | |
| Holmes Growth | | | 845,409 | | | | (353,321 | ) | | | (492,088 | ) | |
| Global MegaTrends | | | (70,667 | ) | | | 70,755 | | | | (88 | ) | |
| Global Resources | | | 44,816,234 | | | | (44,816,234 | ) | | | — | | |
| World Precious Minerals | | | 88,944,530 | | | | (61,578,337 | ) | | | (27,366,193 | ) | |
| Gold and Precious Metals | | | 4,462,769 | | | | 373,636 | | | | (4,836,405 | ) | |
| Eastern European | | | 179,111 | | | | (179,112 | ) | | | 1 | | |
| Global Emerging Markets | | | 99,578 | | | | 5,914 | | | | (105,492 | ) | |
| China Region | | | 613,139 | | | | (251,552 | ) | | | (361,587 | ) | |
198
Notes to Financial Statements December 31, 2011
The tax character of distributions paid during the fiscal year ended December 31, 2011, were as follows:
| Fund | | Tax Exempt
Income | | Ordinary
Income | | Long-Term
Capital Gains | | Total | |
| U.S. Treasury Securities Cash | | $ | — | | | $ | 9,580 | | | $ | — | | | $ | 9,580 | | |
| U.S. Government Securities Savings | | | — | | | | 19,158 | | | | — | | | | 19,158 | | |
| Near-Term Tax Free | | | 706,422 | | | | 34,065 | | | | — | | | | 740,487 | | |
| Tax Free | | | 675,894 | | | | 27,735 | | | | — | | | | 703,629 | | |
| All American Equity | | | — | | | | 22,535 | | | | — | | | | 22,535 | | |
| Holmes Growth | | | — | | | | — | | | | — | | | | — | | |
| Global MegaTrends - Investor Class | | | — | | | | — | | | | — | | | | — | | |
| Global MegaTrends - Institutional Class | | | — | | | | 18,363 | | | | — | | | | 18,363 | | |
| Global Resources - Investor Class | | | — | | | | 19,762,685 | | | | — | | | | 19,762,685 | | |
| Global Resources - Institutional Class | | | — | | | | 2,765,455 | | | | — | | | | 2,765,455 | | |
World Precious Minerals - Investor
Class | | | — | | | | 60,523,518 | | | | — | | | | 60,523,518 | | |
World Precious Minerals - Institutional
Class | | | — | | | | 275,428 | | | | — | | | | 275,428 | | |
| Gold and Precious Metals | | | — | | | | — | | | | 34,374,528 | | | | 34,374,528 | | |
| Eastern European | | | — | | | | — | | | | — | | | | — | | |
| Global Emerging Markets | | | — | | | | — | | | | — | | | | — | | |
| China Region | | | — | | | | — | | | | — | | | | — | | |
The tax character of distributions paid during the fiscal year ended December 31, 2010, were as follows:
| Fund | | Tax Exempt
Income | | Ordinary
Income | | Long-Term
Capital Gains | | Total | |
| U.S. Treasury Securities Cash | | $ | — | | | $ | 10,459 | | | $ | — | | | $ | 10,459 | | |
| U.S. Government Securities Savings | | | — | | | | 22,923 | | | | — | | | | 22,923 | | |
| Near-Term Tax Free | | | 619,205 | | | | 37,242 | | | | — | | | | 656,447 | | |
| Tax Free | | | 737,171 | | | | 39,612 | | | | — | | | | 776,783 | | |
| All American Equity | | | — | | | | — | | | | — | | | | — | | |
| Holmes Growth | | | — | | | | 449,513 | | | | — | | | | 449,513 | | |
| Global MegaTrends - Investor Class | | | — | | | | 13,170 | | | | — | | | | 13,170 | | |
| Global MegaTrends - Institutional Class | | | — | | | | 35,430 | | | | — | | | | 35,430 | | |
| Global Resources - Investor Class | | | — | | | | 21,220,358 | | | | — | | | | 21,220,358 | | |
| Global Resources - Institutional Class | | | — | | | | 430,785 | | | | — | | | | 430,785 | | |
World Precious Minerals - Investor
Class | | | — | | | | 99,236,093 | | | | — | | | | 99,236,093 | | |
World Precious Minerals - Institutional
Class | | | — | | | | 209,612 | | | | — | | | | 209,612 | | |
| Gold and Precious Metals | | | — | | | | 3,708,191 | | | | 18,871,531 | | | | 22,579,722 | | |
| Eastern European | | | — | | | | — | | | | — | | | | — | | |
| Global Emerging Markets | | | — | | | | — | | | | — | | | | — | | |
| China Region | | | — | | | | — | | | | — | | | | — | | |
Capital loss carryforwards may be used to offset current or future taxable capital gains until expiration. The Fund's tax-basis capital gains and losses are determined only at the end of each fiscal year. Under the Regulated Investment Company
199
Notes to Financial Statements December 31, 2011
Modernization Act of 2010, the Funds are permitted to carry forward capital losses incurred in taxable years beginning after December 22, 2010, for an unlimited period. However, any losses incurred during those future years are required to be utilized prior to the losses incurred in pre-enactment tax years. As a result of this ordering rule, pre-enactment capital losses that are carried forward retain their character as either short-term or long-term capital losses rather than being considered all short-term as under previous law. The loss carryforwards and related expiration dates for each fund, as of December 31, 2011, are as follows:
| | | Post December 31, 2010
Capital Losses
No Expiration | | Expiration Date | |
| Fund | | Short Term | | Long Term | | 2012 | | 2013 | | 2014 | |
| U.S. Treasury Securities Cash | | $ | — | | | $ | — | | | $ | — | | | $ | — | | | $ | — | | |
| U.S. Government Securities Savings | | | — | | | | — | | | | — | | | | — | | | | — | | |
| Near-Term Tax Free | | | — | | | | 3,345 | | | | 33,686 | | | | 2,760 | | | | 202,719 | | |
| Tax Free | | | 6,681 | | | | 12,826 | | | | 421,236 | | | | — | | | | — | | |
| All American Equity | | | — | | | | — | | | | — | | | | — | | | | — | | |
| Holmes Growth | | | — | | | | — | | | | — | | | | — | | | | — | | |
| Global MegaTrends | | | — | | | | — | | | | — | | | | — | | | | — | | |
| Global Resources | | | — | | | | — | | | | — | | | | — | | | | — | | |
| World Precious Minerals | | | — | | | | — | | | | — | | | | — | | | | — | | |
| Gold and Precious Metals | | | — | | | | — | | | | — | | | | — | | | | — | | |
| Eastern European | | | — | | | | — | | | | — | | | | — | | | | — | | |
| Global Emerging Markets | | | — | | | | — | | | | — | | | | — | | | | — | | |
| China Region | | | 2,735,031 | | | | — | | | | — | | | | — | | | | — | | |
| | | Expiration Date | |
| Fund | | 2015 | | 2016 | | 2017 | | 2018 | | Total | |
| U.S. Treasury Securities Cash | | $ | — | | | $ | — | | | $ | — | | | $ | — | | | $ | — | | |
U.S. Government Securities
Savings | | | — | | | | — | | | | — | | | | — | | | | — | | |
| Near-Term Tax Free | | | 2,488 | | | | 112 | | | | 722 | | | | 2,532 | | | | 248,364 | | |
| Tax Free | | | — | | | | 10,697 | | | | — | | | | — | | | | 451,440 | | |
| All American Equity | | | — | | | | — | | | | 1,284,224 | | | | — | | | | 1,284,224 | | |
| Holmes Growth | | | — | | | | — | | | | — | | | | — | | | | — | | |
| Global MegaTrends | | | 6,801,143 | | | | 5,994,166 | | | | 995,675 | | | | — | | | | 13,790,984 | | |
| Global Resources | | | — | | | | — | | | | 259,212,558 | | | | — | | | | 259,212,558 | | |
| World Precious Minerals | | | — | | | | — | | | | 63,779,512 | | | | — | | | | 63,779,512 | | |
| Gold and Precious Metals | | | — | | | | — | | | | — | | | | — | | | | — | | |
| Eastern European | | | — | | | | 28,524,678 | | | | 257,523,539 | | | | 15,445,946 | | | | 301,494,163 | | |
| Global Emerging Markets | | | 3,355,127 | | | | 2,965,929 | | | | 5,814,949 | | | | — | | | | 12,136,005 | | |
| China Region | | | — | | | | 15,020,267 | | | | — | | | | — | | | | 17,755,298 | | |
200
Notes to Financial Statements December 31, 2011
In accordance with tax rules, the following net capital losses and ordinary losses (currency and late year losses) incurred after October 31, within each Fund's tax year, are deemed to arise on the first day of the Fund's next tax year if the Fund elects to defer such losses.
The Funds elected to defer losses incurred after October 31, 2011, as follows:
| Fund | | Post October 31, 2011
Capital Loss Deferral | | Post October 31, 2011
Ordinary Loss Deferral | |
| Holmes Growth | | $ | 105,624 | | | $ | — | | |
| Global MegaTrends | | | 163,657 | | | | — | | |
| Global Resources | | | 92,900,179 | | | | — | | |
| World Precious Minerals | | | 11,908,415 | | | | 7,709,872 | | |
| Gold and Precious Metals | | | 3,886,685 | | | | — | | |
| Eastern European | | | 8,376,156 | | | | — | | |
| Global Emerging Markets | | | 264,443 | | | | 33,016 | | |
| China Region | | | 1,313,556 | | | | 47,623 | | |
Note 6: Risks Of Concentrations
The Near-Term Tax Free Fund and the Tax Free Fund may be exposed to risks related to concentration of investments in a particular state or geographic area. These investments present risks resulting from changes in economic conditions of the region or the issuer.
Because the Global Resources Fund concentrates its investments in a specific industry, the fund may be subject to greater risks and fluctuations than a portfolio representing a broader range of industries.
The investment policies of the World Precious Minerals and Gold and Precious Metals Funds present unique risks to their respective portfolios' values. The prices of gold and other precious metals may be subject to fluctuations caused by international monetary and political developments including trade or currency restrictions, currency devaluation and revaluation, and social and political conditions within a country. Fluctuations in the prices of gold and other precious metals will affect the market values of the securities held by these funds.
The Eastern European Fund invests more than 25% of its investments in companies principally engaged in the oil & gas or banking industries. The risk of concentrating investments in this group of industries will make the fund more susceptible to risk in these industries than funds which do not concentrate their investments in an industry.
The Eastern European and Global Emerging Markets Funds may be exposed to risks not typically associated with investment in the United States due to their concentration of investments in emerging markets. These risks include possible
201
Notes to Financial Statements December 31, 2011
revaluation of currencies, less public information about companies, disruptive political or economic conditions and the possible imposition of adverse governmental laws or currency exchange restrictions. Moreover, securities of many foreign issuers, including sovereign nations, and their markets may be less liquid and their prices more volatile than those securities of comparable U.S. issuers.
The China Region Fund may be exposed to risks not typically associated with investments in the United States, due to concentration of investments in foreign issuers in the region. These investments present risks resulting from disruptive political or economic conditions and the potential imposition of adverse governmental laws or currency exchange restrictions affecting the area.
Note 7: Credit Arrangements
Each of the Funds has a revolving credit facility with BBH. Borrowings of each Fund are collateralized by any or all of the securities held by BBH as the Fund's custodian up to the amount of the borrowing. Interest on borrowings is charged at the current overnight Federal Funds Rate plus 2%. Each Fund has a maximum borrowing limit of 10% of qualified assets. The aggregate of borrowings by all Funds under the agreement cannot exceed $30,000,000 at any one time. There were no borrowings under the revolving credit facility during the year ended December 31, 2011. The U.S. Global Investors Funds paid BBH a total of $45,625 in commitment fees for the year ended December 31, 2011, under this arrangement.
Note 8: Shares Of Beneficial Interest
At December 31, 2011, individual shareholders holding more than 5% of outstanding Investor Class shares comprised 6.45%, 5.12% and 5.11% of the Near-Term Tax Free Fund, Global MegaTrends Fund and the Global Emerging Markets Fund, respectively. In addition, the Adviser held 13.30%, 7.37% and 7.88% of the Investor Class shares of U.S. Government Securities Savings Fund, Near-Term Tax Free Fund and Tax Free Fund, respectively. Control is defined by the 1940 Act as the beneficial ownership, either directly or through one or more controlled companies, of more than 25% of the voting securities of a company. Investment activities of these shareholders could have a material impact on the Funds.
202
Financial Highlights
U.S. Treasury Securities Cash Fund
For a capital share outstanding during the
| | | Investor Class | |
| | | Year Ended December 31, | | Six Months
Ended
December 31, | | Year Ended June 30, | |
| | | 2011 | | 2010 | | 2009 | | 2008* | | 2008 | | 2007 | |
| Net asset value, beginning of period | | $ | 1.00 | | | $ | 1.00 | | | $ | 1.00 | | | $ | 1.00 | | | $ | 1.00 | | | $ | 1.00 | | |
| Investment Activities | |
| Net investment income | | | — | (a) | | | — | (a) | | | — | (a) | | | — | (a) | | | .02 | | | | .04 | | |
| Net realized and unrealized gain | | | — | | | | — | | | | — | | | | — | | | | — | | | | — | | |
| Total from investment activities | | | — | (a) | | | — | (a) | | | — | (a) | | | — | (a) | | | .02 | | | | .04 | | |
| Distributions from net investment income | | | — | (a) | | | — | (a) | | | — | (a) | | | — | (a) | | | (.02 | ) | | | (.04 | ) | |
| Net asset value, end of period | | $ | 1.00 | | | $ | 1.00 | | | $ | 1.00 | | | $ | 1.00 | | | $ | 1.00 | | | $ | 1.00 | | |
| Total Return (excluding account fees) (b) | | | .01 | % | | | .01 | % | | | .01 | % | | | .23 | % | | | 2.46 | % | | | 4.36 | % | |
| Ratios to Average Net Assets: (c) | |
| Net investment income | | | .01 | % | | | .01 | % | | | .01 | % | | | .44 | % | | | 2.43 | % | | | 4.27 | % | |
| Total expenses | | | .98 | % | | | 1.01 | % | | | 1.01 | % | | | 1.11 | % | | | 1.09 | % | | | .91 | % | |
| Expenses waived or reimbursed (d)(e) | | | (.92 | )% | | | (.86 | )% | | | (.75 | )% | | | (.38 | )% | | | (.09 | )% | | | (.02 | )% | |
| Net recouped fees (e) | | | — | | | | — | | | | — | | | | — | | | | — | (g) | | | — | | |
| Net expenses (f) | | | .06 | % | | | .15 | % | | | .26 | % | | | .73 | % | | | 1.00 | % | | | .89 | % | |
| Net assets, end of period (in thousands) | | $ | 90,557 | | | $ | 99,491 | | | $ | 103,889 | | | $ | 121,410 | | | $ | 111,955 | | | $ | 116,012 | | |
* Effective December 31, 2008, the fiscal year changed to December 31.
(a) The per share amount does not round to a full penny.
(b) Total returns for periods less than one year are not annualized. Assumes investment at the net asset value at the beginning of the period, reinvestment of all distribution and a complete redemption of the investment at the net asset value at the end of the period.
(c) Ratios are annualized for periods of less than one year.
(d) Expenses waived or reimbursed reflect reductions to total expenses, as discussed in the notes to the financial statements. These amounts would decrease the net investment income ratio and total returns had such reductions not occurred.
(e) During the year ended June 30, 2008, the Adviser waived fees and/or reimbursed expenses under the Minimum Yield Agreement in the amount of $4,259. The Fund reimbursed the Adviser the $4,259 during the year ended June 30, 2008. During the six months ended December 31, 2008, the year ended December 31, 2009, the year ended December 31, 2010, and the year ended December 31, 2011, the Adviser waived fees and/or reimbursed expenses under the Minimum Yield Agreement in the amount of $170,642, $789,420, $884,850 and $867,545, respectively. The waivers/reimbursements from 2009-2011 are subject to recapture in future periods.
(f) The net expense ratios shown above reflect expenses after waivers and reimbursements but exclude the effect of reductions to total expenses for any expenses offset. Expense offset arrangements reduce total expenses, as discussed in the notes to the financial statements. These amounts would decrease the net investment income ratio had such reductions not occurred. The effects of expenses offset are as follows:
| | | Investor Class | |
| | | Year Ended December 31, | | Six Months
Ended
December 31, | | Year Ended June 30, | |
| | | 2011 | | 2010 | | 2009 | | 2008* | | 2008 | | 2007 | |
| Ratios to Average Net Assets: (c) | |
| Expenses offset (g) | | | — | | | | — | | | | — | | | | — | | | | — | | | | — | | |
(g) Effect on the expense ratio was not greater than 0.005%.
See accompanying notes to financial statements.
203
Financial Highlights
U.S. Government Securities Savings Fund
For a capital share outstanding during the
| | | Investor Class | |
| | | Year Ended December 31, | | Six Months
Ended
December 31, | | Year Ended June 30, | |
| | | 2011 | | 2010 | | 2009 | | 2008* | | 2008 | | 2007 | |
| Net asset value, beginning of period | | $ | 1.00 | | | $ | 1.00 | | | $ | 1.00 | | | $ | 1.00 | | | $ | 1.00 | | | $ | 1.00 | | |
| Investment Activities | |
| Net investment income | | | — | (a) | | | — | (a) | | | — | (a) | | | .01 | | | | .03 | | | | .05 | | |
| Net realized and unrealized gain | | | — | | | | — | (a) | | | — | | | | — | (a) | | | — | (a) | | | — | (a) | |
| Total from investment activities | | | — | (a) | | | — | (a) | | | — | (a) | | | .01 | | | | .03 | | | | .05 | | |
| Distributions from net investment income | | | — | (a) | | | — | (a) | | | — | (a) | | | (.01 | ) | | | (.03 | ) | | | (.05 | ) | |
| Net asset value, end of period | | $ | 1.00 | | | $ | 1.00 | | | $ | 1.00 | | | $ | 1.00 | | | $ | 1.00 | | | $ | 1.00 | | |
| Total Return (excluding account fees) (b) | | | .01 | % | | | .01 | % | | | .10 | % | | | .67 | % | | | 3.47 | % | | | 4.86 | % | |
| Ratios to Average Net Assets: (c) | |
| Net investment income | | | .01 | % | | | .01 | % | | | .11 | % | | | 1.36 | % | | | 3.42 | % | | | 4.75 | % | |
| Total expenses | | | .81 | % | | | .82 | % | | | .78 | % | | | .73 | % | | | .65 | % | | | .62 | % | |
| Expenses waived or reimbursed (d) | | | (.74 | )% | | | (.67 | )% | | | (.42 | )% | | | (.26 | )% | | | (.20 | )% | | | (.17 | )% | |
| Net expenses (e) | | | .07 | % | | | .15 | % | | | .36 | % | | | .47 | %(g) | | | .45 | % | | | .45 | % | |
| Net assets, end of period (in thousands) | | $ | 171,664 | | | $ | 203,835 | | | $ | 263,232 | | | $ | 357,910 | | | $ | 446,208 | | | $ | 469,095 | | |
* Effective December 31, 2008, the fiscal year changed to December 31.
(a) The per share amount does not round to a full penny.
(b) Total returns for periods less than one year are not annualized. Assumes investment at the net asset value at the beginning of the period, reinvestment of all distributions and a complete redemption of the investment at the net asset value at the end of the period.
(c) Ratios are annualized for periods of less than one year.
(d) Expenses waived or reimbursed reflect reductions to total expenses, as discussed in the notes to the financial statements. These amounts would decrease the net investment income ratio and total returns had such reductions not occurred. During the year ended December 31, 2009, the year ended December 31, 2010, and the year ended December 31, 2011, the Adviser waived fees and/or reimbursed expenses under the Minimum Yield Agreement in the amount of $258,561, $678,107 and $736,531, respectively. These waivers/reimbursements are subject to recapture in future periods.
(e) The net expense ratios shown above reflect expenses after waivers and reimbursements but exclude the effect of reductions to total expenses for any expenses offset. Expense offset arrangements reduce total expenses, as discussed in the notes to the financial statements. These amounts would decrease the net investment income ratio had such reductions not occurred. The effect of expenses offset are as follows:
| | | Investor Class | |
| | | Year Ended December 31, | | Six Months
Ended
December 31, | | Year Ended June 30, | |
| | | 2011 | | 2010 | | 2009 | | 2008* | | 2008 | | 2007 | |
| Ratios to Average Net Assets: (c) | |
| Expenses offset (f) | | | — | | | | — | | | | — | | | | — | | | | — | | | | — | | |
(f) Effect on the expense ratio was not greater than 0.005%.
(g) The annualized net expense ratio for the six months ended December 31, 2008, exceeded the limitation for the period due to the cost of participating in the U.S. Treasury Guarantee Program for the Money Market Funds. The cost to participate was without regard to the expense limitation.
See accompanying notes to financial statements.
204
Financial Highlights
Near-Term Tax Free Fund
For a capital share outstanding during the
| | | Investor Class | |
| | | Year Ended December 31, | | Six Months
Ended
December 31, | | Year Ended June 30, | |
| | | 2011 | | 2010 | | 2009 | | 2008* | | 2008 | | 2007 | |
| Net asset value, beginning of period | | $ | 2.22 | | | $ | 2.21 | | | $ | 2.16 | | | $ | 2.14 | | | $ | 2.12 | | | $ | 2.12 | | |
| Investment Activities | |
| Net investment income | | | .05 | | | | .06 | | | | .06 | | | | .03 | | | | .07 | | | | .07 | | |
| Net realized and unrealized gain | | | .04 | | | | .01 | | | | .05 | | | | .02 | | | | .02 | | | | — | (a) | |
| Total from investment activities | | | .09 | | | | .07 | | | | .11 | | | | .05 | | | | .09 | | | | .07 | | |
| Distributions from net investment income | | | (.05 | ) | | | (.06 | ) | | | (.06 | ) | | | (.03 | ) | | | (.07 | ) | | | (.07 | ) | |
| Net asset value, end of period | | $ | 2.26 | | | $ | 2.22 | | | $ | 2.21 | | | $ | 2.16 | | | $ | 2.14 | | | $ | 2.12 | | |
| Total Return (excluding account fees) (b) | | | 4.24 | % | | | 2.95 | % | | | 5.00 | % | | | 2.55 | % | | | 4.42 | % | | | 3.51 | % | |
| Ratios to Average Net Assets: (c) | |
| Net investment income | | | 2.39 | % | | | 2.46 | % | | | 2.63 | % | | | 3.15 | % | | | 3.41 | % | | | 3.43 | % | |
| Total expenses | | | 1.26 | % | | | 1.30 | % | | | 1.53 | % | | | 1.82 | % | | | 1.91 | % | | | 1.63 | % | |
| Expenses waived or reimbursed (d) | | | (.81 | )% | | | (.85 | )% | | | (1.08 | )% | | | (1.37 | )% | | | (1.46 | )% | | | (1.18 | )% | |
| Net expenses (e) | | | .45 | % | | | .45 | % | | | .45 | % | | | .45 | % | | | .45 | % | | | .45 | % | |
| Portfolio turnover rate | | | — | (g) | | | 1 | % | | | — | (g) | | | 8 | % | | | 8 | % | | | 22 | % | |
| Net assets, end of period (in thousands) | | $ | 35,014 | | | $ | 29,138 | | | $ | 23,337 | | | $ | 13,989 | | | $ | 13,603 | | | $ | 13,383 | | |
* Effective December 31, 2008, the fiscal year changed to December 31.
(a) The per share amount does not round to a full penny.
(b) Total returns for periods less than one year are not annualized. Assumes investment at the net asset value at the beginning of the period, reinvestment of all distributions and a complete redemption of the investment at the net asset value at the end of the period.
(c) Ratios are annualized for periods of less than one year.
(d) Expenses waived or reimbursed reflect reductions to total expenses, as discussed in the notes to the financial statements. These amounts would decrease the net investment income ratio and total returns had such reductions not occurred.
(e) The net expense ratios shown above reflect expenses after waivers and reimbursements but exclude the effect of reductions to total expenses for any expenses offset. Expense offset arrangements reduce total expenses, as discussed in the notes to the financial statements. These amounts would decrease the net investment income ratio had such reductions not occurred. The effect of expenses offset are as follows:
| | | Investor Class | |
| | | Year Ended December 31, | | Six Months
Ended
December 31, | | Year Ended June 30, | |
| | | 2011 | | 2010 | | 2009 | | 2008* | | 2008 | | 2007 | |
| Ratios to Average Net Assets: (c) | |
| Expenses offset (f) | | | — | | | | — | | | | — | | | | — | | | | — | | | | — | | |
(f) Effect on the expense ratio was not greater than 0.005%.
(g) Portfolio turnover rate was not greater than 0.5%.
See accompanying notes to financial statements.
205
Financial Highlights
Tax Free Fund
For a capital share outstanding during the
| | | Investor Class | |
| | | Year Ended December 31, | | Six Months
Ended
December 31, | | Year Ended June 30, | |
| | | 2011 | | 2010 | | 2009 | | 2008* | | 2008 | | 2007 | |
| Net asset value, beginning of period | | $ | 12.01 | | | $ | 12.20 | | | $ | 11.72 | | | $ | 11.93 | | | $ | 11.98 | | | $ | 11.98 | | |
| Investment Activities | |
| Net investment income | | | .43 | | | | .44 | | | | .45 | | | | .23 | | | | .47 | | | | .50 | | |
| Net realized and unrealized gain (loss) | | | .62 | | | | (.19 | ) | | | .48 | | | | (.21 | ) | | | (.05 | ) | | | — | (a) | |
| Total from investment activities | | | 1.05 | | | | .25 | | | | .93 | | | | .02 | | | | .42 | | | | .50 | | |
| Distributions from net investment income | | | (.43 | ) | | | (.44 | ) | | | (.45 | ) | | | (.23 | ) | | | (.47 | ) | | | (.50 | ) | |
| Net asset value, end of period | | $ | 12.63 | | | $ | 12.01 | | | $ | 12.20 | | | $ | 11.72 | | | $ | 11.93 | | | $ | 11.98 | | |
| Total Return (excluding account fees) (b) | | | 8.94 | % | | | 2.04 | % | | | 8.03 | % | | | .22 | % | | | 3.54 | % | | | 4.15 | % | |
| Ratios to Average Net Assets: (c) | |
| Net investment income | | | 3.53 | % | | | 3.55 | % | | | 3.73 | % | | | 3.92 | % | | | 3.91 | % | | | 4.09 | % | |
| Total expenses | | | 1.74 | % | | | 1.66 | % | | | 1.75 | % | | | 1.91 | % | | | 1.94 | % | | | 1.86 | % | |
| Expenses waived or reimbursed (d) | | | (1.04 | )% | | | (.96 | )% | | | (1.05 | )% | | | (1.21 | )% | | | (1.24 | )% | | | (1.16 | )% | |
| Net expenses (e) | | | .70 | % | | | .70 | % | | | .70 | % | | | .70 | % | | | .70 | % | | | .70 | % | |
| Portfolio turnover rate | | | 10 | % | | | 15 | % | | | — | (g) | | | 6 | % | | | 11 | % | | | 6 | % | |
| Net assets, end of period (in thousands) | | $ | 21,663 | | | $ | 19,794 | | | $ | 22,102 | | | $ | 16,946 | | | $ | 18,380 | | | $ | 15,940 | | |
* ��Effective December 31, 2008, the fiscal year changed to December 31.
(a) The per share amount does not round to a full penny.
(b) Total returns for periods less than one year are not annualized. Assumes investment at the net asset value at the beginning of the period, reinvestment of all distributions and a complete redemption of the investment at the net asset value at the end of the period.
(c) Ratios are annualized for periods of less than one year.
(d) Expenses waived or reimbursed reflect reductions to total expenses, as discussed in the notes to the financial statements. These amounts would decrease the net investment income ratio and total returns had such reductions not occurred.
(e) The net expense ratios shown above reflect expenses after waivers and reimbursements but exclude the effect of reductions to total expenses for any expenses offset. Expense offset arrangements reduce total expenses, as discussed in the notes to the financial statements. These amounts would decrease the net investment income ratio had such reductions not occurred. The effect of expenses offset are as follows:
| | | Investor Class | |
| | | Year Ended December 31, | | Six Months
Ended
December 31, | | Year Ended June 30, | |
| | | 2011 | | 2010 | | 2009 | | 2008* | | 2008 | | 2007 | |
| Ratios to Average Net Assets: (c) | |
| Expenses offset (f) | | | — | | | | — | | | | — | | | | — | | | | — | | | | — | | |
(f) Effect on the expense ratio was not greater than 0.005%.
(g) Portfolio turnover rate was not greater than 0.5%.
See accompanying notes to financial statements.
206
Financial Highlights
All American Equity Fund
For a capital share outstanding during the
| | | Investor Class | |
| | | Year Ended December 31, | | Six Months
Ended
December 31, | | Year Ended June 30, | |
| | | 2011 | | 2010 | | 2009 | | 2008* | | 2008 | | 2007 | |
| Net asset value, beginning of period | | $ | 22.72 | | | $ | 19.60 | | | $ | 17.33 | | | $ | 27.27 | | | $ | 28.58 | | | $ | 27.59 | | |
| Investment Activities | |
| Net investment income (loss) | | | (.07 | ) | | | .02 | | | | (.13 | ) | | | .04 | | | | (.15 | ) | | | (.08 | ) | |
| Net realized and unrealized gain (loss) | | | .10 | | | | 3.10 | | | | 2.51 | | | | (9.97 | ) | | | 1.98 | | | | 4.94 | | |
| Total from investment activities | | | .03 | | | | 3.12 | | | | 2.38 | | | | (9.93 | ) | | | 1.83 | | | | 4.86 | | |
| Distributions | |
| From net investment income | | | (.03 | ) | | | — | | | | (.11 | ) | | | (.01 | ) | | | — | | | | — | | |
| From net realized gains | | | — | | | | — | | | | — | | | | — | | | | (3.01 | ) | | | (3.87 | ) | |
| From tax return of capital | | | — | | | | — | | | | — | | | | — | | | | (.13 | ) | | | — | | |
| Total distributions | | | (.03 | ) | | | — | | | | (.11 | ) | | | (.01 | ) | | | (3.14 | ) | | | (3.87 | ) | |
| Short-Term Trading Fees **(a) | | | — | | | | — | | | | — | | | | — | | | | — | | | | — | | |
| Net asset value, end of period | | $ | 22.72 | | | $ | 22.72 | | | $ | 19.60 | | | $ | 17.33 | | | $ | 27.27 | | | $ | 28.58 | | |
| Total Return (excluding account fees) (b) | | | .14 | % | | | 15.92 | % | | | 13.75 | % | | | (36.42 | )% | | | 5.99 | % | | | 19.59 | % | |
| Ratios to Average Net Assets: (c) | |
| Net investment income (loss) | | | (.32 | )% | | | .10 | % | | | (.74 | )% | | | .35 | % | | | (.55 | )% | | | (.28 | )% | |
| Total expenses | | | 2.42 | % | | | 2.56 | % | | | 2.79 | % | | | 2.37 | % | | | 1.98 | % | | | 2.01 | % | |
| Expenses waived or reimbursed (d) | | | (.24 | )% | | | (.48 | )% | | | (.96 | )% | | | (.62 | )% | | | (.23 | )% | | | (.26 | )% | |
| Net expenses (e) | | | 2.18 | % | | | 2.08 | % | | | 1.83 | % | | | 1.75 | % | | | 1.75 | % | | | 1.75 | % | |
| Portfolio turnover rate | | | 223 | % | | | 299 | % | | | 343 | % | | | 205 | % | | | 225 | % | | | 223 | % | |
| Net assets, end of period (in thousands) | | $ | 16,399 | | | $ | 17,760 | | | $ | 16,436 | | | $ | 16,234 | | | $ | 26,513 | | | $ | 23,479 | | |
* Effective December 31, 2008, the fiscal year changed to December 31.
** Based on average monthly shares outstanding.
(a) The per share amount does not round to a full penny.
(b) Total returns for periods less than one year are not annualized. Assumes investment at the net asset value at the beginning of the period, reinvestment of all distribution and a complete redemption of the investment at the net asset value at the end of the period.
(c) Ratios are annualized for periods of less than one year.
(d) Expenses waived or reimbursed reflect reductions to total expenses, as discussed in the notes to the financial statements. These amounts would increase the net investment loss ratio or decrease the net investment income ratio, as applicable, and decrease total returns had such reductions not occurred.
(e) The net expense ratios shown above reflect expenses after waivers and reimbursements but exclude the effect of reductions to total expenses for any expenses offset. Expense offset arrangements reduce total expenses, as discussed in the notes to the financial statements. These amounts would increase the net investment loss ratio, or decrease the net investment income ratio, as applicable, had such reductions not occurred. The effect of expenses offset are as follows:
| | | Investor Class | |
| | | Year Ended December 31, | | Six Months
Ended
December 31, | | Year Ended June 30, | |
| | | 2011 | | 2010 | | 2009 | | 2008* | | 2008 | | 2007 | |
| Ratios to Average Net Assets: (c) | |
| Expenses offset (f) | | | — | | | | — | | | | — | | | | — | | | | — | | | | — | | |
(f) Effect on the expense ratio was not greater than 0.005%.
See accompanying notes to financial statements.
207
Financial Highlights
Holmes Growth Fund
For a capital share outstanding during the
| | | Investor Class | |
| | | Year Ended December 31, | | Two Months
Ended
December 31, | | Year Ended
October 31, | |
| | | 2011 | | 2010 | | 2009 | | 2008* | | 2008 | | 2007 | |
| Net asset value, beginning of period | | $ | 18.65 | | | $ | 15.54 | | | $ | 12.79 | | | $ | 14.14 | | | $ | 24.78 | | | $ | 18.34 | | |
| Investment Activities | |
| Net investment loss | | | (.26 | ) | | | (.22 | ) | | | (.13 | ) | | | (.01 | ) | | | (.15 | ) | | | (.14 | ) | |
| Net realized and unrealized gain (loss) | | | (.77 | ) | | | 3.54 | | | | 2.88 | | | | (1.34 | ) | | | (10.49 | ) | | | 6.58 | | |
| Total from investment activities | | | (1.03 | ) | | | 3.32 | | | | 2.75 | | | | (1.35 | ) | | | (10.64 | ) | | | 6.44 | | |
| Distributions from net investment income | | | — | | | | (.21 | ) | | | — | | | | — | | | | — | | | | — | | |
| Short-Term Trading Fees **(a) | | | — | | | | — | | | | — | | | | — | | | | — | | | | — | | |
| Net asset value, end of period | | $ | 17.62 | | | $ | 18.65 | | | $ | 15.54 | | | $ | 12.79 | | | $ | 14.14 | | | $ | 24.78 | | |
| Total Return (excluding account fees) (b) | | | (5.52 | )% | | | 21.35 | % | | | 21.50 | % | | | (9.55 | )% | | | (42.94 | )% | | | 35.11 | % | |
| Ratios to Average Net Assets: (c) | |
| Net investment loss | | | (1.25 | )% | | | (1.29 | )% | | | (.93 | )% | | | (.27 | )% | | | (.65 | )% | | | (.62 | )% | |
| Total expenses | | | 2.00 | % | | | 1.93 | % | | | 2.10 | % | | | 2.51 | % | | | 1.74 | % | | | 1.72 | % | |
| Expenses waived or reimbursed (d) | | | — | | | | — | (f) | | | (.33 | )% | | | (.76 | )% | | | — | | | | — | | |
| Net expenses (e) | | | 2.00 | % | | | 1.93 | % | | | 1.77 | % | | | 1.75 | % | | | 1.74 | % | | | 1.72 | % | |
| Portfolio turnover rate | | | 210 | % | | | 160 | % | | | 219 | % | | | 20 | % | | | 140 | % | | | 98 | % | |
| Net assets, end of period (in thousands) | | $ | 35,316 | | | $ | 40,604 | | | $ | 37,149 | | | $ | 32,488 | | | $ | 36,231 | | | $ | 68,881 | | |
* Effective December 31, 2008, the fiscal year changed to December 31.
** Based on average monthly shares outstanding.
(a) The per share amount does not round to a full penny.
(b) Total returns for periods less than one year are not annualized. Assumes investment at the net asset value at the beginning of the period, reinvestment of all distributions and a complete redemption of the investment at the net asset value at the end of the period.
(c) Ratios are annualized for periods of less than one year.
(d) Expenses waived or reimbursed reflect reductions to total expenses, as discussed in the notes to the financial statements. These amounts would increase the net investment loss ratio or decrease the net investment income ratio, as applicable, and decrease total returns had such reductions not occurred.
(e) The net expense shown above reflect expenses after waivers and reimbursements but exclude the effect of reductions to total expenses for any expenses offset. Expense offset arrangements reduce total expenses, as discussed in the notes to the financial statements. These amounts would increase the net investment loss ratio, or decrease the net investment income ratio, as applicable, had such reductions not occurred. The effect of expenses offset are as follows:
| | | Investor Class | |
| | | Year Ended December 31, | | Two Months
Ended
December 31, | | Year Ended
October 31, | |
| | | 2011 | | 2010 | | 2009 | | 2008* | | 2008 | | 2007 | |
| Ratios to Average Net Assets: (c) | |
| Expenses offset (f) | | | — | | | | — | | | | — | | | | — | | | | — | | | | — | | |
(f) Effect on the expense ratio was not greater than 0.005%.
See accompanying notes to financial statements.
208
Financial Highlights
Global MegaTrends Fund
For a capital share outstanding during the
| | | Investor Class | |
| | | Year Ended December 31, | | Two Months
Ended
December 31, | | Year Ended
October 31, | |
| | | 2011 | | 2010 | | 2009 | | 2008* | | 2008 | | 2007** | |
| Net asset value, beginning of period | | $ | 8.83 | | | $ | 8.15 | | | $ | 6.28 | | | $ | 6.60 | | | $ | 12.75 | | | $ | 11.07 | | |
| Investment Activities | |
| Net investment income (loss) | | | .04 | | | | .06 | | | | .03 | | | | — | (a) | | | — | (a) | | | (.11 | ) | |
| Net realized and unrealized gain (loss) | | | (1.19 | ) | | | .63 | | | | 1.86 | | | | (.31 | ) | | | (5.30 | ) | | | 2.63 | | |
| Total from investment activities | | | (1.15 | ) | | | .69 | | | | 1.89 | | | | (.31 | ) | | | (5.30 | ) | | | 2.52 | | |
| Distributions | |
| From net investment income | | | — | | | | (.01 | ) | | | (.02 | ) | | | — | | | | — | | | | — | | |
| From net realized gains | | | — | | | | — | | | | — | | | | — | | | | (.85 | ) | | | (.84 | ) | |
| From tax return of capital | | | — | | | | — | | | | — | | | | (.01 | ) | | | — | | | | — | | |
| Total distributions | | | — | | | | (.01 | ) | | | (.02 | ) | | | (.01 | ) | | | (.85 | ) | | | (.84 | ) | |
| Short-Term Trading Fees ***(a) | | | — | | | | — | | | | — | | | | — | | | | — | | | | — | | |
| Net asset value, end of period | | $ | 7.68 | | | $ | 8.83 | | | $ | 8.15 | | | $ | 6.28 | | | $ | 6.60 | | | $ | 12.75 | | |
| Total Return (excluding account fees) (b) | | | (13.02 | )% | | | 8.43 | % | | | 30.15 | % | | | (4.74 | )% | | | (44.50 | )% | | | 24.49 | % | |
| Ratios to Average Net Assets: (c) | |
| Net investment income (loss) | | | .35 | % | | | .43 | % | | | .45 | % | | | (.20 | )% | | | (.06 | )% | | | (.93 | )% | |
| Total expenses | | | 2.56 | % | | | 2.44 | % | | | 2.43 | % | | | 2.96 | % | | | 2.21 | % | | | 2.49 | % | |
| Expenses waived or reimbursed (d) | | | (.41 | )% | | | (.22 | )% | | | (.48 | )% | | | (1.11 | )% | | | (.21 | )% | | | — | | |
| Net expenses (e) | | | 2.15 | % | | | 2.22 | % | | | 1.95 | % | | | 1.85 | % | | | 2.00 | % | | | 2.49 | % | |
| Portfolio turnover rate (h) | | | 163 | % | | | 104 | % | | | 100 | % | | | 29 | % | | | 92 | % | | | 65 | % | |
| Net assets, end of period (in thousands) | | $ | 12,450 | | | $ | 16,332 | | | $ | 28,557 | | | $ | 22,035 | | | $ | 25,387 | | | $ | 17,723 | | |
* Effective December 31, 2008, the fiscal year changed to December 31.
** Effective October 1, 2007, U.S. Global Investors, Inc. assumed management of Global MegaTrends Fund from the former subadviser.
*** Based on average monthly shares outstanding.
(a) The per share amount does not round to a full penny.
(b) Total returns for periods less than one year are not annualized. Assumes investment at the net asset value at the beginning of the period, reinvestment of all distributions and a complete redemption of the investment at the net asset value at the end of the period.
(c) Ratios are annualized for periods of less than one year.
(d) Expenses waived or reimbursed reflect reductions to total expenses, as discussed in the notes to the financial statements. These amounts would increase the net investment loss ratio or decrease the net investment income ratio, as applicable, and decrease total returns had such reductions not occurred.
(e) The expense ratios shown above exclude the effect of reductions to total expenses for any expenses offset. Expense offset arrangements reduce total expenses, as discussed in the notes to financial statements. These amounts would increase the net investment loss ratio, or decrease the net investment income ratio, as applicable, had such reductions not occurred. The effect of expenses offset are as follows:
| | | Investor Class | |
| | | Year Ended December 31, | | Two Months
Ended
December 31, | | Year Ended
October 31, | |
| | | 2011 | | 2010 | | 2009 | | 2008* | | 2008 | | 2007** | |
| Ratios to Average Net Assets: (c) | |
| Expenses offset (g) | | | — | | | | — | | | | — | | | | — | | | | — | | | | — | | |
(g) Effect on the expense ratio was not greater than 0.005%
(h) Portfolio turnover rate is calculated at the fund level.
See accompanying notes to financial statements.
209
Financial Highlights
Global MegaTrends Fund
For a capital share outstanding during the
| | | Institutional Class | |
| | | Year
Ended
December 31,
2011 | | Period
Ended
December 31,
2010 (d) | |
| Net asset value, beginning of period | | $ | 8.79 | | | $ | 7.84 | | |
| Investment Activities | |
| Net investment income | | | .04 | | | | .01 | | |
| Net realized and unrealized gain (loss) | | | (1.16 | ) | | | 1.02 | | |
| Total from investment activities | | | (1.12 | ) | | | 1.03 | | |
| Distributions from net investment income | | | (.05 | ) | | | (.08 | ) | |
| Short-Term Trading Fees | | | — | | | | — | | |
| Net asset value, end of period | | $ | 7.62 | | | $ | 8.79 | | |
| Total Return (excluding account fees) (a) | | | (12.70 | )% | | | 13.08 | % | |
| Ratios to Average Net Assets: (b) | |
| Net investment income | | | .70 | % | | | .51 | % | |
| Total expenses | | | 2.81 | % | | | 8.09 | % | |
| Expenses waived or reimbursed (c) | | | (1.00 | )% | | | (6.48 | )% | |
| Net expenses (e) | | | 1.81 | % | | | 1.61 | % | |
| Portfolio turnover rate (g) | | | 163 | % | | | 104 | % | |
| Net assets, end of period (in thousands) | | $ | 2,458 | | | $ | 3,970 | | |
(a) Total returns for periods less than one year are not annualized. Assumes investment at the net asset value at the beginning of the period, reinvestment of all distributions and a complete redemption of the investment at the net asset value at the end of the period.
(b) Ratios are annualized for periods of less than one year.
(c) Expenses waived or reimbursed reflect reductions to total expenses, as discussed in the notes to the financial statements. These amounts would increase the net investment loss ratio or decrease the net investment income ratio, as applicable, and decrease total returns had such reductions not occurred.
(d) From March 1, 2010, commencement of operations.
(e) The expense ratios shown above exclude the effect of reductions to total expenses for any expenses offset. Expense offset arrangements reduce total expenses, as discussed in the notes to financial statements. These amounts would increase the net investment loss ratio, or decrease the net investment income ratio, as applicable, had such reductions not occurred. The effect of expenses offset are as follows:
| | | Institutional Class | |
| | | Year
Ended
December 31,
2011 | | Period
Ended
December 31,
2010 (d) | |
| Ratios to Average Net Assets: (b) | |
| Expenses offset (f) | | | — | | | | — | | |
(f) Effect on the expense ratio was not greater than 0.005%.
(g) Portfolio turnover rate is calculated at the fund level.
See accompanying notes to financial statements.
210
Financial Highlights
Global Resources Fund
For a capital share outstanding during the
| | | Investor Class | |
| | | Year Ended December 31, | | Six Months
Ended
December 31, | | Year Ended June 30, | |
| | | 2011 | | 2010 | | 2009 | | 2008* | | 2008 | | 2007 | |
| Net asset value, beginning of period | | $ | 11.91 | | | $ | 8.85 | | | $ | 5.26 | | | $ | 20.52 | | | $ | 17.70 | | | $ | 17.22 | | |
| Investment Activities | |
| Net investment income (loss) | | | (.19 | ) | | | (.09 | ) | | | (.01 | ) | | | (.02 | )** | | | .05 | ** | | | .21 | | |
| Net realized and unrealized gain (loss) | | | (2.02 | ) | | | 3.44 | | | | 3.60 | | | | (13.92 | )** | | | 5.86 | ** | | | 2.86 | | |
| Total from investment activities | | | (2.21 | ) | | | 3.35 | | | | 3.59 | | | | (13.94 | ) | | | 5.91 | | | | 3.07 | | |
| Distributions | |
| From net investment income | | | (.34 | ) | | | (.29 | ) | | | — | | | | — | | | | (.95 | ) | | | (.88 | ) | |
| From net realized gains | | | — | | | | — | | | | — | | | | (1.32 | ) | | | (2.14 | ) | | | (1.71 | ) | |
| Total distributions | | | (.34 | ) | | | (.29 | ) | | | — | | | | (1.32 | ) | | | (3.09 | ) | | | (2.59 | ) | |
| Short-Term Trading Fees **(a) | | | — | | | | — | | | | — | | | | — | | | | — | | | | — | | |
| Net asset value, end of period | | $ | 9.36 | | | $ | 11.91 | | | $ | 8.85 | | | $ | 5.26 | | | $ | 20.52 | | | $ | 17.70 | | |
| Total Return (excluding account fees) (b) | | | (18.69 | )% | | | 38.00 | % | | | 68.25 | % | | | (67.70 | )% | | | 37.59 | % | | | 20.94 | % | |
| Ratios to Average Net Assets: (c) | |
| Net investment income (loss) | | | (.79 | )% | | | (1.04 | )% | | | (.08 | )% | | | (.34 | )% | | | .28 | % | | | .74 | % | |
| Total expenses | | | 1.72 | % | | | 1.73 | % | | | 1.64 | % | | | 1.20 | % | | | .88 | % | | | .95 | % | |
| Expenses waived or reimbursed (d) | | | — | | | | — | | | | (.17 | )% | | | (.12 | )% | | | — | | | | — | | |
| Net expenses (e) | | | 1.72 | % | | | 1.73 | % | | | 1.47 | % | | | 1.08 | % | | | .88 | % | | | .95 | % | |
| Portfolio turnover rate (g) | | | 232 | % | | | 145 | % | | | 189 | % | | | 100 | % | | | 133 | % | | | 122 | % | |
| Net assets, end of period (in thousands) | | $ | 551,793 | | | $ | 911,559 | | | $ | 740,072 | | | $ | 464,524 | | | $ | 2,010,581 | | | $ | 1,383,250 | | |
* Effective December 31, 2008, the fiscal year changed to December 31.
** Based on average monthly shares outstanding.
(a) The per share amount does not round to a full penny.
(b) Total returns for periods less than one year are not annualized. Assumes investment at the net asset value at the beginning of the period, reinvestment of all distributions and a complete redemption of the investment at the net asset value at the end of the period.
(c) Ratios are annualized for periods of less than one year.
(d) Expenses waived or reimbursed reflect reductions to total expenses, as discussed in the notes to the financial statements. These amounts would increase the net investment loss ratio or decrease the net investment income ratio, as applicable, and decrease total returns had such reductions not occurred.
(e) The net expense ratios shown above reflect expenses after waivers and reimbursements but exclude the effect of reductions to total expenses for any expenses offset. Expense offset arrangements reduce total expenses, as discussed in the notes to the financial statements. These amounts would increase the net investment loss ratio, or decrease the net investment income ratio, as applicable, had such reductions not occurred. The effect of expenses offset are as follows:
| | | Investor Class | |
| | | Year Ended December 31, | | Six Months
Ended
December 31, | | Year Ended June 30, | |
| | | 2011 | | 2010 | | 2009 | | 2008* | | 2008 | | 2007 | |
| Ratios to Average Net Assets: (c) | |
| Expenses offset | | | — | (f) | | | — | (f) | | | — | (f) | | | — | (f) | | | (0.01 | )% | | | (0.01 | )% | |
(f) Effect on the expense ratio was not greater than 0.005%.
(g) Portfolio turnover rate is calculated at the fund level.
See accompanying notes to financial statements.
211
Financial Highlights
Global Resources Fund
For a capital share outstanding during the
| | | Institutional Class | |
| | | Year
Ended
December 31,
2011 | | Period
Ended
December 31,
2010 (e) | |
| Net asset value, beginning of period | | $ | 11.98 | | | $ | 8.87 | | |
| Investment Activities | |
| Net investment loss | | | — | *(a) | | | (.01 | ) | |
| Net realized and unrealized gain (loss) | | | (2.17 | )* | | | 3.41 | | |
| Total from investment activities | | | (2.17 | ) | | | 3.40 | | |
| Distributions from net investment income | | | (.42 | ) | | | (.29 | ) | |
| Short-Term Trading Fees *(a) | | | — | | | | — | | |
| Net asset value, end of period | | $ | 9.39 | | | $ | 11.98 | | |
| Total Return (excluding account fees) (b) | | | (18.23 | )% | | | 38.53 | % | |
| Ratios to Average Net Assets: (c) | |
| Net investment loss | | | (.02 | )% | | | (.35 | )% | |
| Total expenses | | | 1.29 | % | | | 1.74 | % | |
| Expenses waived or reimbursed (d) | | | (.20 | )% | | | (.66 | )% | |
| Net expenses (f) | | | 1.09 | % | | | 1.08 | % | |
| Portfolio turnover rate (h) | | | 232 | % | | | 145 | % | |
| Net assets, end of period (in thousands) | | $ | 55,985 | | | $ | 17,923 | | |
* Based on average monthly shares outstanding.
(a) The per share amount does not round to a full penny.
(b) Total returns for periods less than one year are not annualized. Assumes investment at the net asset value at the beginning of the period, reinvestment of all distributions and a complete redemption of the investment at the net asset value at the end of the period.
(c) Ratios are annualized for periods of less than one year.
(d) Expenses waived or reimbursed reflect reductions to total expenses, as discussed in the notes to the financial statements. These amounts would increase the net investment loss ratio or decrease the net investment income ratio, as applicable, and decrease total returns had such reductions not occurred.
(e) From March 1, 2010, commencement of operations.
(f) The net expense ratios shown above reflect expenses after waivers and reimbursements but exclude the effect of reductions to total expenses for any expenses offset. Expense offset arrangements reduce total expenses, as discussed in the notes to the financial statements. These amounts would increase the net investment loss ratio, or decrease the net investment income ratio, as applicable, had such reductions not occurred. The effect of expenses offset are as follows:
| | | Institutional Class | |
| | | Year
Ended
December 31,
2011 | | Period
Ended
December 31,
2010 (e) | |
| Ratios to Average Net Assets: (c) | |
| Expenses offset (g) | | | — | | | | — | | |
(g) Effect on the expense ratio was not greater than 0.005%.
(h) Portfolio turnover rate is calculated at the fund level.
See accompanying notes to financial statements.
212
Financial Highlights
World Precious Minerals Fund
For a capital share outstanding during the
| | | Investor Class | |
| | | Year Ended December 31, | | Six Months
Ended
December 31, | | Year Ended June 30, | |
| | | 2011 | | 2010 | | 2009 | | 2008* | | 2008 | | 2007 | |
| Net asset value, beginning of period | | $ | 22.28 | | | $ | 17.42 | | | $ | 9.56 | | | $ | 25.32 | | | $ | 28.34 | | | $ | 28.86 | | |
| Investment Activities | |
| Net investment income (loss) | | | (.32 | ) | | | (.32 | )** | | | (.18 | ) | | | (.06 | )** | | | (.13 | )** | | | — | ** | |
| Net realized and unrealized gain (loss) | | | (6.76 | ) | | | 8.16 | ** | | | 8.71 | | | | (13.65 | )** | | | 3.70 | ** | | | 3.02 | | |
| Total from investment activities | | | (7.08 | ) | | | 7.84 | | | | 8.53 | | | | (13.71 | ) | | | 3.57 | | | | 3.02 | | |
| Distributions | |
| From net investment income | | | (2.02 | ) | | | (2.98 | ) | | | (.67 | ) | | | — | | | | (3.25 | ) | | | (1.52 | ) | |
| From net realized gains | | | — | | | | — | | | | — | | | | (2.05 | ) | | | (3.35 | ) | | | (2.04 | ) | |
| Total distributions | | | (2.02 | ) | | | (2.98 | ) | | | (.67 | ) | | | (2.05 | ) | | | (6.60 | ) | | | (3.56 | ) | |
| Short-Term Trading Fees ** | | | — | (a) | | | — | (a) | | | — | (a) | | | — | (a) | | | .01 | | | | .02 | | |
| Net asset value, end of period | | $ | 13.18 | | | $ | 22.28 | | | $ | 17.42 | | | $ | 9.56 | | | $ | 25.32 | | | $ | 28.34 | | |
| Total Return (excluding account fees) (b) | | | (32.58 | )% | | | 45.38 | % | | | 89.50 | % | | | (51.23 | )% | | | 14.14 | % | | | 11.48 | % | |
| Ratios to Average Net Assets: (c) | |
| Net investment income (loss) | | | (1.43 | )% | | | (1.68 | )% | | | (1.32 | )% | | | (.80 | )% | | | (.43 | )% | | | .06 | % | |
| Total expenses | | | 1.67 | % | | | 1.84 | % | | | 1.75 | % | | | 1.36 | % | | | .97 | % | | | .99 | % | |
| Expenses waived or reimbursed (d) | | | — | | | | — | | | | (.17 | )% | | | (.11 | )% | | | — | | | | — | | |
| Net expenses (e) | | | 1.67 | % | | | 1.84 | % | | | 1.58 | % | | | 1.25 | % | | | .97 | % | | | .99 | % | |
| Portfolio turnover rate (g) | | | 96 | % | | | 68 | % | | | 72 | % | | | 27 | % | | | 58 | % | | | 54 | % | |
| Net assets, end of period (in thousands) | | $ | 436,504 | | | $ | 826,598 | | | $ | 639,035 | | | $ | 359,120 | | | $ | 949,014 | | | $ | 923,779 | | |
* Effective December 31, 2008, the fiscal year changed to December 31.
** Based on average monthly shares outstanding.
(a) The per share amount does not round to a full penny.
(b) Total returns for periods less than one year are not annualized. Assumes investment at the net asset value at the beginning of the period, reinvestment of all distributions and a complete redemption of the investment at the net asset value at the end of the period.
(c) Ratios are annualized for periods of less than one year.
(d) Expenses waived or reimbursed reflect reductions to total expenses, as discussed in the notes to the financial statements. These amounts would increase the net investment loss ratio or decrease the net investment income ratio, as applicable, and decrease total returns had such reductions not occurred.
(e) The net expense ratios shown above reflect expenses after waivers and reimbursements but exclude the effect of reductions to total expenses for any expenses offset. Expense offset arrangements reduce total expenses, as discussed in the notes to the financial statements. These amounts would increase the net investment loss ratio, or decrease the net investment income ratio, as applicable, had such reductions not occurred. The effect of expenses offset are as follows:
| | | Investor Class | |
| | | Year Ended December 31, | | Six Months
Ended
December 31, | | Year Ended June 30, | |
| | | 2011 | | 2010 | | 2009 | | 2008* | | 2008 | | 2007 | |
| Ratios to Average Net Assets: (c) | |
| Expenses offset (f) | | | — | | | | — | | | | — | | | | — | | | | — | | | | — | | |
(f) Effect on the expense ratio was not greater than 0.005%.
(g) Portfolio turnover rate is calculated at the fund level.
See accompanying notes to financial statements.
213
Financial Highlights
World Precious Minerals Fund
For a capital share outstanding during the
| | �� | Institutional Class | |
| | | Year
Ended
December 31,
2011 | | Period
Ended
December 31,
2010 (d) | |
| Net asset value, beginning of period | | $ | 22.29 | | | $ | 17.36 | | |
| Investment Activities | |
| Net investment loss | | | (.16 | )* | | | (.10 | )* | |
| Net realized and unrealized gain (loss) | | | (6.84 | )* | | | 8.14 | * | |
| Total from investment activities | | | (7.00 | ) | | | 8.04 | | |
| Distributions from net investment income | | | (2.19 | ) | | | (3.11 | ) | |
| Short-Term Trading Fees | | | — | | | | — | | |
| Net asset value, end of period | | $ | 13.10 | | | $ | 22.29 | | |
| Total Return (excluding account fees) (a) | | | (32.28 | )% | | | 46.72 | % | |
| Ratios to Average Net Assets: (b) | |
| Net investment loss | | | (.87 | )% | | | (.86 | )% | |
| Total expenses | | | 2.38 | % | | | 15.19 | % | |
| Expenses waived or reimbursed (c) | | | (1.27 | )% | | | (14.06 | )% | |
| Net expenses (e) | | | 1.11 | % | | | 1.13 | % | |
| Portfolio turnover rate (g) | | | 96 | % | | | 68 | % | |
| Net assets, end of period (in thousands) | | $ | 1,683 | | | $ | 2,233 | | |
* Based on average monthly shares outstanding.
(a) Total returns for periods less than one year are not annualized. Assumes investment at the net asset value at the beginning of the period, reinvestment of all distributions and a complete redemption of the investment at the net asset value at the end of the period.
(b) Ratios are annualized for periods of less than one year.
(c) Expenses waived or reimbursed reflect reductions to total expenses, as discussed in the notes to the financial statements. These amounts would increase the net investment loss ratio or decrease the net investment income ratio, as applicable, and decrease total returns had such reductions not occurred.
(d) From March 1, 2010, commencement of operations.
(e) The net expense ratios shown above reflect expenses after waivers and reimbursements but exclude the effect of reductions to total expenses for any expenses offset. Expense offset arrangements reduce total expenses, as discussed in the notes to the financial statements. These amounts would increase the net investment loss ratio, or decrease the net investment income ratio, as applicable, had such reductions not occurred. The effect of expenses offset are as follows:
| | | Institutional Class | |
| | | Year
Ended
December 31,
2011 | | Period
Ended
December 31,
2010 (d) | |
| Ratios to Average Net Assets: (b) | |
| Expenses offset (f) | | | — | | | | — | | |
(f) Effect on the expense ratio was not greater than 0.005%.
(g) Portfolio turnover rate is calculated at the fund level.
See accompanying notes to financial statements.
214
Financial Highlights
Gold and Precious Metals Fund
For a capital share outstanding during the
| | | Investor Class | |
| | | Year Ended December 31, | | Six Months
Ended
December 31, | | Year Ended June 30, | |
| | | 2011 | | 2010 | | 2009 | | 2008* | | 2008 | | 2007 | |
| Net asset value, beginning of period | | $ | 19.60 | | | $ | 15.46 | | | $ | 10.83 | | | $ | 17.18 | | | $ | 14.99 | | | $ | 15.48 | | |
| Investment Activities | |
| Net investment income (loss) | | | (.17 | ) | | | (.21 | ) | | | (.17 | )** | | | (.03 | ) | | | (.08 | )** | | | .05 | | |
| Net realized and unrealized gain (loss) | | | (4.28 | ) | | | 5.91 | | | | 4.84 | | | | (5.59 | ) | | | 4.69 | | | | (.56 | ) | |
| Total from investment activities | | | (4.45 | ) | | | 5.70 | | | | 4.67 | | | | (5.62 | ) | | | 4.61 | | | | (.51 | ) | |
| Distributions | |
| From net investment income | | | — | | | | (.26 | ) | | | (.04 | ) | | | — | | | | — | | | | — | | |
| From net realized gains | | | (2.54 | ) | | | (1.31 | ) | | | — | | | | (.73 | ) | | | (2.43 | ) | | | — | | |
| Total distributions | | | (2.54 | ) | | | (1.57 | ) | | | (.04 | ) | | | (.73 | ) | | | (2.43 | ) | | | — | | |
| Short-Term Trading Fees ** | | | — | (a) | | | .01 | | | | — | (a) | | | — | (a) | | | .01 | | | | .02 | | |
| Net asset value, end of period | | $ | 12.61 | | | $ | 19.60 | | | $ | 15.46 | | | $ | 10.83 | | | $ | 17.18 | | | $ | 14.99 | | |
| Total Return (excluding account fees) (b) | | | (23.97 | )% | | | 36.88 | % | | | 43.11 | % | | | (31.51 | )% | | | 33.49 | % | | | (3.17 | )% | |
| Ratios to Average Net Assets: (c) | |
| Net investment income (loss) | | | (1.06 | )% | | | (1.46 | )% | | | (1.16 | )% | | | (.66 | )% | | | (.41 | )% | | | .31 | % | |
| Total expenses | | | 1.56 | % | | | 1.80 | % | | | 1.69 | % | | | 1.54 | % | | | 1.27 | % | | | 1.29 | % | |
| Expenses waived or reimbursed (d) | | | — | | | | — | | | | (.15 | )% | | | (.15 | )% | | | — | | | | — | | |
| Net expenses (e) | | | 1.56 | % | | | 1.80 | % | | | 1.54 | % | | | 1.39 | % | | | 1.27 | % | | | 1.29 | % | |
| Portfolio turnover rate | | | 155 | % | | | 103 | % | | | 135 | % | | | 61 | % | | | 93 | % | | | 72 | % | |
| Net assets, end of period (in thousands) | | $ | 195,087 | | | $ | 300,949 | | | $ | 234,393 | | | $ | 192,206 | | | $ | 259,022 | | | $ | 178,762 | | |
* Effective December 31, 2008, the fiscal year changed to December 31.
** Based on average monthly shares outstanding.
(a) The per share amount does not round to a full penny.
(b) Total returns for periods less than one year are not annualized. Assumes investment at the net asset value at the beginning of the period, reinvestment of all distributions and a complete redemption of the investment at the net asset value at the end of the period.
(c) Ratios are annualized for periods of less than one year.
(d) Expenses waived or reimbursed reflect reductions to total expenses, as discussed in the notes to the financial statements. These amounts would increase the net investment loss ratio or decrease the net investment income ratio, as applicable, and decrease total returns had such reductions not occurred.
(e) The net expense ratios shown above reflect expenses after waivers and reimbursements but exclude the effect of reductions to total expenses for any expenses offset. Expense offset arrangements reduce total expenses, as discussed in the notes to the financial statements. These amounts would increase the net investment loss ratio, or decrease the net investment income ratio, as applicable, had such reductions not occurred. The effect of expenses offset are as follows:
| | | Investor Class | |
| | | Year Ended December 31, | | Six Months
Ended
December 31, | | Year Ended June 30, | |
| | | 2011 | | 2010 | | 2009 | | 2008* | | 2008 | | 2007 | |
| Ratios to Average Net Assets: (c) | |
| Expenses offset | | | — | (f) | | | — | (f) | | | — | (f) | | | — | (f) | | | — | (f) | | | (0.01 | )% | |
(f) Effect on the expense ratio was not greater than 0.005%.
See accompanying notes to financial statements.
215
Financial Highlights
Eastern European Fund
For a capital share outstanding during the
| | | Investor Class | |
| | | Year Ended December 31, | | Two Months
Ended
December 31, | | Year Ended October 31, | |
| | | 2011 | | 2010 | | 2009 | | 2008*/** | | 2008*** | | 2007*** | |
| Net asset value, beginning of period | | $ | 10.81 | | | $ | 9.11 | | | $ | 5.12 | | | $ | 6.35 | | | $ | 19.91 | | | $ | 15.44 | | |
| Investment Activities | |
| Net investment income (loss) | | | .03 | | | | (.04 | ) | | | — | (a) | | | (.03 | ) | | | (.03 | ) | | | (.10 | ) | |
| Net realized and unrealized gain (loss) | | | (3.05 | ) | | | 1.74 | | | | 3.99 | | | | (1.20 | ) | | | (10.10 | ) | | | 6.83 | | |
| Total from investment activities | | | (3.02 | ) | | | 1.70 | | | | 3.99 | | | | (1.23 | ) | | | (10.13 | ) | | | 6.73 | | |
| Distributions | |
| From net investment income | | | — | | | | — | | | | — | | | | — | | | | — | | | | (.29 | ) | |
| From net realized gains | | | — | | | | — | | | | — | | | | — | | | | (3.46 | ) | | | (1.98 | ) | |
| Total distributions | | | — | | | | — | | | | — | | | | — | | | | (3.46 | ) | | | (2.27 | ) | |
| Short-Term Trading Fees **** | | | — | (a) | | | — | (a) | | | — | (a) | | | — | (a) | | | .03 | | | | .01 | | |
| Net asset value, end of period | | $ | 7.79 | | | $ | 10.81 | | | $ | 9.11 | | | $ | 5.12 | | | $ | 6.35 | | | $ | 19.91 | | |
| Total Return (excluding account fees) (b) | | | (27.94 | )% | | | 18.66 | % | | | 77.93 | % | | | (19.37 | )% | | | (61.36 | )% | | | 48.74 | % | |
| Ratios to Average Net Assets: (c) | |
| Net investment income (loss) | | | .25 | % | | | (.36 | )% | | | — | (f) | | | (3.02 | )% | | | (.15 | )% | | | (.61 | )% | |
| Total expenses | | | 1.98 | % | | | 1.91 | % | | | 2.04 | % | | | 2.37 | % | | | 1.96 | % | | | 1.98 | % | |
| Expenses waived or reimbursed (d) | | | — | | | | — | | | | (.08 | )% | | | (.27 | )% | | | — | (f) | | | — | | |
| Net expenses (e) | | | 1.98 | % | | | 1.91 | % | | | 1.96 | % | | | 2.10 | % | | | 1.96 | % | | | 1.98 | % | |
| Portfolio turnover rate | | | 85 | % | | | 69 | % | | | 80 | % | | | 11 | % | | | 82 | % | | | 54 | % | |
| Net assets, end of period (in thousands) | | $ | 193,599 | | | $ | 440,037 | | | $ | 464,409 | | | $ | 317,320 | | | $ | 415,494 | | | $ | 1,582,707 | | |
* Effective December 31, 2008, the fiscal year changed to December 31.
** Effective November 7, 2008, U.S. Global Investors, Inc. assumed management of the fund from the former subadviser.
*** The per share amounts shown were adjusted to reflect the 3-for-1 stock split which was effective on May 27, 2008.
**** Based on average monthly shares outstanding.
(a) The per share amount does not round to a full penny.
(b) Total returns for periods less than one year are not annualized. Assumes investment at the net asset value at the beginning of the period, reinvestment of all distributions and a complete redemption of the investment at the net asset value at the end of the period.
(c) Ratios are annualized for periods of less than one year.
(d) Expenses waived or reimbursed reflect reductions to total expenses, as discussed in the notes to the financial statements. These amounts would increase the net investment loss ratio or decrease the net investment income ratio, as applicable, and decrease total returns had such reductions not occurred.
(e) The net expense ratios shown above reflect expenses after waivers and reimbursements but exclude the effect of reductions to total expenses for any expenses offset. Expense offset arrangements reduce total expenses, as discussed in the notes to the financial statements. These amounts would increase the net investment loss ratio, or decrease the net investment income ratio, as applicable, had such reductions not occurred. The effect of expenses offset are as follows:
| | | Investor Class | |
| | | Year Ended December 31, | | Two Months
Ended
December 31, | | Year Ended October 31, | |
| | | 2011 | | 2010 | | 2009 | | 2008*/** | | 2008*** | | 2007*** | |
| Ratios to Average Net Assets: (c) | |
| Expenses offset | | | — | (f) | | | — | (f) | | | — | (f) | | | — | (f) | | | (0.01 | )% | | | (0.01 | )% | |
(f) Effect on the ratio was not greater than 0.005%.
See accompanying notes to financial statements.
216
Financial Highlights
Global Emerging Markets Fund
For a capital share outstanding during the
| | | Investor Class | |
| | | Year Ended December 31, | | Two Months
Ended
December 31, | | Year Ended
October 31, | |
| | | 2011 | | 2010 | | 2009 | | 2008*/** | | 2008 | | 2007 | |
| Net asset value, beginning of period | | $ | 9.17 | | | $ | 7.95 | | | $ | 5.29 | | | $ | 5.94 | | | $ | 21.88 | | | $ | 13.93 | | |
| Investment Activities | |
| Net investment loss | | | (0.07 | ) | | | (.11 | ) | | | (.05 | ) | | | (.01 | ) | | | (.43 | ) | | | (.13 | ) | |
| Net realized and unrealized gain (loss) | | | (2.28 | ) | | | 1.32 | | | | 2.71 | | | | (.56 | ) | | | (11.98 | ) | | | 9.18 | | |
| Total from investment activities | | | (2.35 | ) | | | 1.21 | | | | 2.66 | | | | (.57 | ) | | | (12.41 | ) | | | 9.05 | | |
| Distributions | |
| From net investment income | | | — | | | | — | | | | — | | | | — | | | | (.46 | ) | | | — | | |
| From net realized gains | | | — | | | | — | | | | — | | | | — | | | | (3.11 | ) | | | (1.13 | ) | |
| From tax return of capital | | | — | | | | — | | | | — | | | | (.08 | ) | | | — | | | | — | | |
| Total distributions | | | — | | | | — | | | | — | | | | (.08 | ) | | | (3.57 | ) | | | (1.13 | ) | |
| Short-Term Trading Fees *** | | | — | (a) | | | .01 | | | | — | (a) | | | — | (a) | | | .04 | | | | .03 | | |
| Net asset value, end of period | | $ | 6.82 | | | $ | 9.17 | | | $ | 7.95 | | | $ | 5.29 | | | $ | 5.94 | | | $ | 21.88 | | |
| Total Return (excluding account fees) (b) | | | (25.63 | )% | | | 15.35 | % | | | 50.28 | % | | | (9.59 | )% | | | (66.81 | )% | | | 69.52 | % | |
| Ratios to Average Net Assets (c): | |
| Net investment loss | | | (.68 | )% | | | (1.22 | )% | | | (.77 | )% | | | (1.16 | )% | | | (1.01 | )% | | | (.92 | )% | |
| Total expenses | | | 3.97 | % | | | 3.76 | % | | | 4.02 | % | | | 6.83 | % | | | 2.80 | % | | | 2.75 | % | |
| Expenses waived or reimbursed (d) | | | (1.01 | )% | | | (.77 | )% | | | (1.38 | )% | | | (4.33 | )% | | | (.30 | )% | | | (.39 | )% | |
| Net expenses (e) | | | 2.96 | % | | | 2.99 | % | | | 2.64 | % | | | 2.50 | % | | | 2.50 | % | | | 2.36 | % | |
| Portfolio turnover rate | | | 250 | % | | | 190 | % | | | 166 | % | | | 21 | % | | | 83 | % | | | 125 | % | |
| Net assets, end of period (in thousands) | | $ | 8,224 | | | $ | 13,403 | | | $ | 13,819 | | | $ | 9,663 | | | $ | 11,708 | | | $ | 59,621 | | |
* Effective December 31, 2008, the fiscal year changed to December 31.
** Effective November 7, 2008, U.S. Global Investors, Inc. assumed management of the fund from the former subadviser.
*** Based on average monthly shares outstanding.
(a) The per share amount does not round to a full penny.
(b) Total returns for periods less than one year are not annualized. Assumes investment at the net asset value at the beginning of the period, reinvestment of all distributions and a complete redemption of the investment at the net asset value at the end of the period.
(c) Ratios are annualized for periods of less than one year.
(d) Expenses waived or reimbursed reflect reductions to total expenses, as discussed in the notes to the financial statements. These amounts would increase the net investment loss ratio or decrease the net investment income ratio, as applicable, and decrease total returns had such reductions not occurred.
(e) The net expense ratios shown above reflect expenses after waivers and reimbursements but exclude the effect of reductions to total expenses for any expenses offset. Expense offset arrangements reduce total expenses, as discussed in the notes to the financial statements. These amounts would increase the net investment loss ratio, or decrease the net investment income ratio, as applicable, had such reductions not occurred. The effect of expenses offset are as follows:
| | | Investor Class | |
| | | Year Ended December 31, | | Two Months
Ended
December 31, | | Year Ended
October 31, | |
| | | 2011 | | 2010 | | 2009 | | 2008*/** | | 2008 | | 2007 | |
| Ratios to Average Net Assets: (c) | |
| Expenses offset | | | — | (f) | | | — | (f) | | | — | (f) | | | — | (f) | | | — | (f) | | | n/a | | |
(f) Effect on the expense ratio was not greater than 0.005%.
See accompanying notes to financial statements.
217
Financial Highlights
China Region Fund
For a capital share outstanding during the
| | | Investor Class | |
| | | Year Ended December 31, | | Six Months
Ended
December 31, | | Year Ended June 30, | |
| | | 2011 | | 2010 | | 2009 | | 2008* | | 2008 | | 2007 | |
| Net asset value, beginning of period | | $ | 9.47 | | | $ | 8.36 | | | $ | 5.59 | | | $ | 9.09 | | | $ | 12.55 | | | $ | 8.71 | | |
| Investment Activities | |
| Net investment income (loss) | | | (.08 | ) | | | (.12 | ) | | | (.05 | ) | | | (.02 | )** | | | (.03 | )** | | | — | ** | |
| Net realized and unrealized gain (loss) | | | (2.59 | ) | | | 1.22 | | | | 2.81 | | | | (3.49 | )** | | | (.27 | )** | | | 3.98 | ** | |
| Total from investment activities | | | (2.67 | ) | | | 1.10 | | | | 2.76 | | | | (3.51 | ) | | | (.30 | ) | | | 3.98 | | |
| Distributions | |
| From net investment income | | | — | | | | — | | | | — | | | | — | | | | (.10 | ) | | | (.16 | ) | |
| From net realized gains | | | — | | | | — | | | | — | | | | — | | | | (2.93 | ) | | | — | | |
| From tax return of capital | | | — | | | | — | | | | — | | | | — | | | | (.17 | ) | | | — | | |
| Total distributions | | | — | | | | — | | | | — | | | | — | | | | (3.20 | ) | | | (.16 | ) | |
| Short-Term Trading Fees ** | | | .01 | | | | .01 | | | | .01 | | | | .01 | | | | .04 | | | | .02 | | |
| Net asset value, end of period | | $ | 6.81 | | | $ | 9.47 | | | $ | 8.36 | | | $ | 5.59 | | | $ | 9.09 | | | $ | 12.55 | | |
| Total Return (excluding account fees) (b) | | | (28.09 | )% | | | 13.28 | % | | | 49.55 | % | | | (38.50 | )% | | | (8.58 | )% | | | 46.34 | % | |
| Ratios to Average Net Assets: (c) | |
| Net investment income (loss) | | | (.64 | )% | | | (1.02 | )% | | | (.79 | )% | | | (.47 | )% | | | (.26 | )% | | | .02 | % | |
| Total expenses | | | 2.49 | % | | | 2.39 | % | | | 2.47 | % | | | 2.46 | % | | | 1.95 | % | | | 2.02 | % | |
| Expenses waived or reimbursed (d) | | | (.08 | )% | | | — | | | | (.45 | )% | | | (.27 | )% | | | — | | | | — | | |
| Net expenses (e) | | | 2.41 | % | | | 2.39 | % | | | 2.02 | % | | | 2.19 | % | | | 1.95 | % | | | 2.02 | % | |
| Portfolio turnover rate | | | 426 | % | | | 242 | % | | | 327 | % | | | 117 | % | | | 208 | % | | | 208 | % | |
| Net assets, end of period (in thousands) | | $ | 30,635 | | | $ | 51,843 | | | $ | 56,323 | | | $ | 38,348 | | | $ | 81,109 | | | $ | 93,805 | | |
* Effective December 31, 2008, the fiscal year changed to December 31.
** Based on average monthly shares outstanding.
(a) The per share amount does not round to a full penny.
(b) Total returns for periods less than one year are not annualized. Assumes investment at the net asset value at the beginning of the period, reinvestment of all distributions and a complete redemption of the investment at the net asset value at the end of the period.
(c) Ratios are annualized for periods of less than one year.
(d) Expenses waived or reimbursed reflect reductions to total expenses, as discussed in the notes to the financial statements. These amounts would increase the net investment loss ratio or decrease the net investment income ratio, as applicable, and decrease total returns had such reduction not occurred.
(e) The net expense ratios shown above reflect expenses after waivers and reimbursements but exclude the effect of reductions to total expenses for any expenses offset. Expense offset arrangements reduce total expenses, as discussed in the notes to financial statements. These amounts would increase the net investment loss ratio, or decrease the net investment income ratio, as applicable, had such reductions not occurred. The effect of expenses offset are as follows:
| | | Investor Class | |
| | | Year Ended December 31, | | Six Months
Ended
December 31, | | Year Ended June 30, | |
| | | 2011 | | 2010 | | 2009 | | 2008* | | 2008 | | 2007 | |
| Ratios to Average Net Assets: (c) | |
| Expenses offset (f) | | | — | | | | — | | | | — | | | | — | | | | — | | | | — | | |
(f) Effect on the expense ratio was not greater than 0.005%.
See accompanying notes to financial statements.
218
Report of Independent Registered Public Accounting Firm
The Board of Trustees and Shareholders
of U.S. Global Investors Funds:
We have audited the accompanying statements of assets and liabilities, including the portfolios of investments, of the U.S Treasury Securities Cash Fund, U.S. Government Securities Savings Fund, Near-Term Tax Free Fund, Tax Free Fund, All American Equity Fund, Holmes Growth Fund, Global MegaTrends Fund, Global Resources Fund, World Precious Minerals Fund, Gold and Precious Metals Fund, Eastern European Fund, Global Emerging Markets Fund, and China Region Fund, each a fund within the U.S. Global Investors Funds (the Trust) as of December 31, 2011 and the related statements of operations for the year then ended, statements of changes in net assets for each of the years in the two-year period then ended, and the financial highlights for each of the years or periods in the five-year period then ended. These financial statements and financial highlights are the responsibility of the Trust's management. Our responsibility is to express an opinion on these financial statements and financial highlights based on our audits.
We conducted our audits in accordance with the standards of the Public Company Accounting Oversight Board (United States). Those standards require that we plan and perform the audit to obtain reasonable assurance about whether the financial statements and financial highlights are free of material misstatement. An audit includes examining, on a test basis, evidence supporting the amounts and disclosures in the financial statements. Our procedures included confirmation of securities owned as of December 31, 2011, by correspondence with the custodian and brokers or by other appropriate auditing procedures where replies from brokers were not received. An audit also includes assessing the accounting principles used and significant estimates made by management, as well as evaluating the overall financial statement presentation. We believe that our audits provide a reasonable basis for our opinion.
In our opinion, the financial statements and financial highlights referred to above present fairly, in all material respects, the financial position of each of the respective funds within the U.S. Global Investors Funds, as of December 31, 2011, and the results of their operations, the changes in their net assets and financial highlights for the periods described above, in conformity with U.S. generally accepted accounting principles.
Boston, Massachusetts
February 27, 2012
219
Trustees and Officers (unaudited) December 31, 2011
The following table presents information about the Trustees as of December 31, 2011, together with a brief description of their principal occupations during the last five years. The Agreement and Declaration of Trust provides that each trustee shall serve as a trustee of the Trust during the lifetime of this Trust and until its termination except as such trustee sooner dies, resigns or is removed. In addition, each trustee who is not an "interested person" of the Trust shall be required to retire in accordance with the terms of any retirement policy then in effect that has been approved by a majority vote of all independent trustees. The current retirement policy provides that the retirement age for non-interested trustees is 75 years of age. If you would like more information about the Trustees, you may call 1-800-US-FUNDS (1-800-873-8637) to request a free copy of the Statement of Additional Information.
| Non-Interested Trustees | |
|
Name (Age)
Address
Positions Held with Trust
Length of Time Served*
Number of Portfolios in Fund
Complex Overseen by Trustee | | Principal Occupation(s) and Previous Positions
During Past 5 Years and Other Directorships Held | |
J. Michael Belz (58)
7900 Callaghan Road
San Antonio, TX 78229
Trustee
November 1998 to present
Thirteen portfolios | | Principal Occupation: President and Chief Executive Officer of Catholic Life Insurance since 1984.
Other Directorships Held: Director, Broadway National Bank from October 2003 to present. | |
|
James F. Gaertner (68)
7900 Callaghan Road
San Antonio, TX 78229
Trustee
November 2002 to present
Thirteen portfolios | | Principal Occupation: President Emeritus of Sam Houston State University. Served as President from August 2001 to August 2010.
Other Directorships Held: Chairman of the Audit Committee, Tandy Brands Accessories, Inc. since 2008; Director from 1990 to present. | |
|
Clark R. Mandigo (68)
7900 Callaghan Road
San Antonio, TX 78229
Trustee
May 1993 to present
Thirteen portfolios | | Principal Occupation: Restaurant operator, business consultant from 1991 to present. | |
|
Joe C. McKinney (65)
7900 Callaghan Road
San Antonio, TX 78229
Trustee
October 2008 to present
Thirteen portfolios | | Principal Occupation: Vice Chairman, Broadway National Bank from October 2002 to present.
Other Directorships Held: Director, Broadway National Bank from October 2002 to present; Director, USAA Real Estate Company from September 2004 to present; Director, Luby's, Inc. from January 2003 to present. | |
|
* These dates include service for a predecessor trust.
220
Trustees and Officers (unaudited) December 31, 2011
| Interested Trustee | |
|
Name (Age)
Address
Positions Held with Trust
Length of Time Served*
Number of Portfolios in Fund
Complex Overseen by Trustee | | Principal Occupation(s) and Previous Positions
During Past 5 Years and Other Directorships Held | |
Frank Holmes ** (56)
7900 Callaghan Road
San Antonio, TX 78229
Trustee, Chief Executive
Officer, Chief Investment
Officer, President
January 1990 to present
Thirteen portfolios | | Principal Occupation: Director, Chief Executive Officer, and Chief Investment Officer of the Adviser. Since October 1989, Mr. Holmes has served and continues to serve in various positions with the Adviser, its subsidiaries, and the investment companies it sponsors. | |
|
* These dates include service for a predecessor trust.
** Mr. Holmes is an "interested person" of the Trust by virtue of his positions with U.S. Global Investors, Inc.
The following table presents information about each Officer of the Trust as of December 31, 2011, together with a brief description of their principal occupations during the last five years. Each holds office until his or her successor is duly elected and qualified.
| Officers | |
|
Name (Age)
Address
Positions Held with Trust
Length of Time Served* | | Principal Occupation(s) During Past 5 Years | |
Frank E. Holmes (56)
7900 Callaghan Road
San Antonio, TX 78229
Trustee, Chief Executive
Officer, Chief Investment
Officer, President
January 1990 to present | | Director, Chief Executive Officer, and Chief Investment Officer of the Adviser. Since October 1989, Mr. Holmes has served and continues to serve in various positions with the Adviser, its subsidiaries, and the investment companies it sponsors. | |
|
Susan B. McGee (52)
7900 Callaghan Road
San Antonio, TX 78229
Executive Vice President,
Secretary, General Counsel
March 1997 to present | | President and General Counsel of the Adviser. Since September 1992, Ms. McGee has served and continues to serve in various positions with the Adviser, its subsidiaries, and the investment companies it sponsors. | |
|
Catherine A. Rademacher (51)
7900 Callaghan Road
San Antonio, TX 78229
Treasurer
July 2004 to present | | Chief Financial Officer of the Adviser. Since April 2004, Ms. Rademacher has served and continues to serve in various positions with the Adviser, its subsidiaries, and the investment companies it sponsors. | |
|
221
Trustees and Officers (unaudited) December 31, 2011
Name (Age)
Address
Positions Held with Trust
Length of Time Served* | | Principal Occupation(s) During Past 5 Years | |
James L. Love, Jr. (43)
7900 Callaghan Road
San Antonio, TX 78229
Chief Compliance Officer
September 2007 to present | | Chief Compliance Officer and Associate General Counsel of the Adviser since September 2007. Executive Director Executive Attorney from January 2003 to September 2007, Senior Counsel May 2002 to January 2003 with USAA. | |
|
T. Kelly Niland (49)
7900 Callaghan Road
San Antonio, TX 78229
Vice President, Investment
Operations
December 2008 to present;
Assistant Treasurer from May
2006 to December 2008. | | Vice President of Investment Operations of the Adviser since January 2006. Fund Accounting Manager with AIM Investments from June 1992 to January 2006. | |
|
Susan K. Filyk (42)
7900 Callaghan Road
San Antonio, TX 78229
Vice President, Marketing
December 2008 to present | | Director of Marketing of the Adviser since August 2007. Sr. VP Marketing with Frost National Bank from May 1998 to August 2007. | |
|
* These dates include service for a predecessor trust.
222
Additional Information (unaudited)
Additional Federal Tax Information
The percentage of tax-exempt dividends paid by the Funds for the year ended December 31, 2011, was:
| Near-Term Tax Free | | | 95.47 | % | |
| Tax Free | | | 96.54 | % | |
The percentage of ordinary income dividends paid by the Funds during the year ended December 31, 2011, which qualify as Qualified Dividends Income (QDI) and the Dividends Received Deduction (DRD) available to corporate shareholders was:
| | | Qualified Dividend
Income | | Dividend Receivable
Deduction | |
| All American Equity | | | 100.00 | % | | | 100.00 | % | |
| Global Resources | | | 17.84 | % | | | 11.18 | % | |
| World Precious Metals | | | 1.57 | % | | | 0.11 | % | |
The amounts which represent foreign source income and foreign taxes paid during the year ended December 31, 2011, are as follows:
| | | Foreign Source
Income | | Foreign Tax
Credit | |
| Global Resources | | $ | 2,374,946 | | | $ | 194,791 | | |
| World Precious Minerals | | | 1,458,253 | | | | 177,472 | | |
During the year ended December 31, 2011, the Gold and Precious Metals Fund declared $34,374,528 in distributions that were designated as long-term capital gain distributions.
In January 2012, the Funds reported on Form 1099-DIV the tax status of all distributions made during the calendar year 2011. The funds intend to distribute the maximum amount of qualified dividend income allowable. The amount of qualified dividend income distributed by each fund will be reported to shareholders on their Form 1099-DIV. Shareholders should use the information on Form 1099-DIV for their income tax returns.
Proxy Voting
A description of the policies and procedures that the Funds use to determine how to vote proxies relating to portfolio securities is available without charge, upon request, by calling 1-800-US-FUNDS (1-800-873-8637). It also appears in the Funds' statement of additional information (Form 485B), which can be found on the SEC's website at www.sec.gov.
Information regarding how the Funds voted proxies relating to portfolio securities during the most recent 12-month period ended June 30 is available without charge, upon request, by calling 1-800-US-FUNDS (1-800-873-8637) or accessing the Funds' Form N-PX on the SEC's website at www.sec.gov.
223
Additional Information (unaudited)
Availability of Quarterly Portfolio Schedules
The Funds provide complete lists of holdings four times in each fiscal year, at the quarter-ends. For the second and fourth quarters, the lists appear in the Funds' semi-annual and annual reports to shareholders. For the first and third quarters, the Funds file the lists with the SEC on Form N-Q. Shareholders can look up the Funds' Forms N-Q on the SEC's website at www.sec.gov. You may also visit or call the SEC's Public Room in Washington, D.C. (1-202-942-8090) or send a request plus a duplicating fee to the SEC, Public Reference Section, Washington, DC 20549-0102 or by electronic request at the following e-mail address: publicinfo@sec.gov.
Approval of the Advisory Agreement for Each Fund
On August 23, 2011, the Board of Trustees (the "Board") of U.S. Global Investors Funds (the "Trust"), including all the trustees who are not "interested persons" of the Trust (the "Independent Trustees"), approved continuation of the advisory agreement with U.S. Global Investors, Inc. (the "Adviser") for each fund for an additional one-year term ending October 1, 2012.
In considering approval of the agreement, the Board reviewed a variety of materials relating to each fund and the Adviser, including (i) the nature, extent and quality of services provided; (ii) a comparison of services rendered and amounts paid to other registered investment companies, including other registered investment companies managed by the Adviser, and other accounts managed by the Adviser; (iii) the investment performance of the fund measured against appropriate benchmarks; (iv) the costs of services provided and estimated profits realized by the Adviser (and its affiliates); (v) the extent to which economies of scale are realized as the fund grows; (vi) whether fee levels reflect any possible economies of scale for the benefit of fund shareholders; and (vii) benefits realized by the Adviser (and its affiliates) from its relationship with the fund.
The Independent Trustees began their process of reviewing information, which they had previously requested, and considering approval of the agreement at the Board's May 25, 2011 meeting. The Independent Trustees were represented by independent legal counsel throughout the process. After the May 25, 2011 Board meeting, at the direction of the Independent Trustees, independent legal counsel requested additional information from the Adviser. The Independent Trustees also had separate meetings among themselves and with independent legal counsel during this period. In addition, the Independent Trustees received materials from their independent legal counsel discussing the legal standards applicable to their consideration of the agreement. After their review of the information received, the Independent Trustees presented their findings and recommendations to the full Board.
The Board reviewed the functions performed by the Adviser, the portfolio management team and support staff of the Adviser, the Adviser's investment strategy and process for each fund, and the Adviser's financial condition, and considered the quality of services provided. The Board also reviewed information on the performance of each fund, along with the performance information of a relevant securities index,
224
Additional Information (unaudited)
a peer group and a peer universe, using information supplied by Lipper Inc. ("Lipper").
For the All American Equity Fund, the information showed that for the one-, two-, three-, four and five-year periods ended December 31, 2010, the fund's performance was in the 3rd, 5th, 4th, 4th and 4th quintile, respectively, of its applicable Lipper peer group and for the one-, two-, three-, four- and five-year periods ended December 31, 2010, the fund's performance was in the 4th, 5th, 5th, 4th and 4th quintile, respectively, of its applicable Lipper peer universe (the 1st quintile being the best performers and the 5th quintile being the worst performers). In addition, this information showed that the fund outperformed its benchmark index for the one-year period ended December 31, 2010. In response to questions from the Independent Trustees, the Adviser provided supplemental information, noting that performance was significantly affected by poor performance in 2009 and that the fund had outperformed its benchmark index from June 2006-December 2008 and from January 2010-June 2011. The Board noted that the fund's advisory fee includes a performance incentive adjustment based on the performance of the fund during the prior 12-month period.
For the Holmes Growth Fund, the information showed that for the one-, two-, three-, four- and five-year periods ended December 31, 2010, the fund's performance was in the 2nd, 3rd, 4th, 3rd and 5th quintile, respectively, of its applicable Lipper peer group, and for the one-, two-, three-, four- and five-year periods ended December 31, 2010, the fund's performance was in the 2nd, 5th, 5th, 4th and 4th quintile, respectively, of its applicable Lipper peer universe. The Board noted that the Fund's short-term performance has improved and that the fund outperformed its benchmark index for the one-year period ended December 31, 2010. The Board noted that the fund's advisory fee includes a performance incentive adjustment based on the performance of the fund during the prior 12-month period.
For the Global MegaTrends Fund, the information showed that for the one-, two-, three-, four- and five-year periods ended December 31, 2010 (the Adviser assumed management of the fund effective October 1, 2007), the fund's investor class performance was in the 5th, 5th, 5th, 3rd and 5th quintile, respectively, of its applicable Lipper peer group and for each of the one-, two-, three-, four- and five-year periods ended December 31, 2010, the fund's investor class performance was in the 5th quintile of its applicable Lipper peer universe. In addition, the information showed that for the period since inception (March 1, 2010) through December 31, 2010, the fund's institutional class performance was in the 4th quintile of its applicable Lipper peer group and Lipper peer universe. This information also showed that the fund outperformed its benchmark index for the one-year period ended December 31, 2010. In response to questions from the Independent Trustees regarding the fund's investor class, the Adviser provided supplemental information noting that the fund's performance was significantly impacted by the financial crisis in 2008 and by its emphasis on infrastructure related equities, but that the fund outperformed the S&P Global Infrastructure Index, an index that focuses on global infrastructure companies, in both 2009 and
225
Additional Information (unaudited)
2010. The Board took into consideration that the fund's advisory fee includes a performance incentive adjustment based on the performance of the fund during the prior 12-month period.
For the Global Resources Fund, the information showed that for the one-, two-, three-, four- and five-year periods ended December 31, 2010, the fund's investor class performance was in the 1st, 1st, 3rd, 3rd and 2nd quintile, respectively, of its applicable Lipper peer group and Lipper peer universe. In addition, the information showed that for the period since inception (March 1, 2010) through December 31, 2010, the fund's institutional class performance was in the 1st quintile of its applicable Lipper peer group and Lipper peer universe. This information also showed that the fund outperformed its benchmark index for the one-year period ended December 31, 2010. The Board noted that the fund's advisory fee includes a performance incentive adjustment based on the performance of the fund during the prior 12-month period.
For the World Precious Minerals Fund, the information showed that for the one-, two-, three-, four- and five-year periods ended December 31, 2010, the fund's investor class performance was in the 2nd, 1st, 5th, 4th and 3rd quintile, respectively, of its applicable Lipper peer group and for the one-, two-, three-, four- and five-year periods ended December 31, 2010, the fund's investor class performance was in the 2nd, 1st, 5th, 5th and 3rd quintile, respectively, of its applicable Lipper peer universe. In addition, the information showed that for the period since inception (March 1, 2010) through December 31, 2010, the fund's institutional class performance was in the 2nd quintile of its applicable Lipper peer group and Lipper peer universe. This information also showed that the fund outperformed its benchmark index for the one-year period ended December 31, 2010. The Board noted that the fund's advisory fee includes a performance incentive adjustment based on the performance of the fund during the prior 12-month period.
For the Gold and Precious Metals Fund, the information showed that for the one-, two-, three-, four- and five-year periods ended December 31, 2010, the fund's performance was in the 4th, 4th, 2nd, 2nd and 1st quintile, respectively, of its applicable Lipper peer group, and for the one-, two-, three-, four- and five-year periods ended December 31, 2010, the fund's performance was in the 4th, 4th, 4th, 4th and 2nd quintile, respectively, of its applicable Lipper peer universe. The Board noted that the fund outperformed its benchmark index for the one-year period ended December 31, 2010. The Board also took into consideration that the fund's advisory fee includes a performance incentive adjustment based on the performance of the fund during the prior 12-month period.
For the Eastern European Fund, the information showed that for the one-, two-, three-, four- and five-year periods ended December 31, 2010, the fund's performance was in the 3rd, 3rd, 5th, 5th and 5th quintile, respectively, of its applicable Lipper peer group and for the one-, two-, three-, four- and five-year periods ended December 31, 2010, the fund's performance was in the 3rd, 2nd, 5th, 5th and 5th quintile, respectively,
226
Additional Information (unaudited)
of its applicable Lipper peer universe. In addition, the information showed that the fund underperformed its benchmark index for the one-year period ended December 31, 2010. The Board noted that the fund's performance had improved and that the Adviser assumed management of the fund effective November 7, 2008. The Board also took into consideration that the fund's advisory fee includes a performance incentive adjustment based on the performance of the fund during the prior 12-month period.
For the Global Emerging Markets Fund, the information showed that for the one- and two-year periods ended December 31, 2010, the fund's performance was in the 4th and 5th quintile, respectively, of its applicable Lipper peer group and for each of the one-, two-, three-, four- and five- year periods ended December 31, 2010, the fund's performance was in the 5th quintile of its applicable Lipper peer universe. In addition, this information showed that the fund underperformed its benchmark index for the one-year period ended December 31, 2010. In response to questions from the Independent Trustees, the Adviser provided supplemental information noting the change in portfolio management and other corrective action it has taken to address underperformance issues. The Board took into consideration that that the fund's advisory fee includes a performance incentive adjustment based on the performance of the fund during the prior 12-month period.
For the China Region Fund, the information showed that for the one-year period ended December 31, 2010, the fund's performance was in the 3rd quintile of its applicable Lipper peer group and Lipper peer universe. In addition, this information showed that for each of the two-, three-, four- and five-year periods ended December 31, 2010, the fund's performance was in the 5th quintile of its applicable Lipper peer group and Lipper peer universe. The Board noted that the fund's short-term performance has improved and that the fund outperformed its benchmark for the one-year period ended December 31, 2010. The Board also noted that that the fund's advisory fee includes a performance incentive adjustment based on the performance of the fund during the prior 12-month period.
For the Tax Free Fund, the information showed that for the one-, two-, three-, four- and five-year periods ended December 31, 2010, the fund's performance was in the 2nd, 4th, 1st, 1st and 1st quintile, respectively, of its applicable Lipper peer group and for the one-, two-, three-, four- and five-year periods ended December 31, 2010, the fund's performance was in the 3rd, 5th, 2nd, 1st and 1st quintile, respectively, of its applicable Lipper peer universe. The Board noted that while the information also showed that the fund underperformed its benchmark index for the one-year period ended December 31, 2010, it outperformed its benchmark index for the year-to-date period through March 31, 2011.
For the Near-Term Tax Free Fund, the information showed that for the one-, two-, three-, four-, and five year periods ended December 31, 2010, the fund's performance was in the 1st, 3rd, 4th, 2nd and 2nd quintile, respectively, of its applicable Lipper
227
Additional Information (unaudited)
peer group and for the one-, two-, three-, four- and five-year periods ended December 31, 2010, the fund's performance was in the 1st, 3rd, 2nd, 1st and 2nd quintile, respectively, of its applicable Lipper peer universe. This information also showed that the fund outperformed its benchmark index for the one-year period ended December 31, 2010.
For the U.S. Government Securities Savings Fund, the information showed that for the one-, two-, three-, four- and five-year periods ended December 31, 2010, the fund's performance was in the 3rd, 4th, 5th, 5th and 5th quintile, respectively, of its applicable Lipper peer group, and for the one-, two-, three-, four- and five-year periods ended December 31, 2010, the fund's performance was in the 3rd, 2nd, 2nd, 2nd and 2nd quintile, respectively, of its applicable Lipper peer universe. In addition, this information showed that the fund underperformed its benchmark index for the one-year period ended December 31, 2010.
For the U.S. Treasury Securities Cash Fund, the information showed that for the one-, two-, three-, four-, and five year periods ended December 31, 2010, the fund's performance was in the 2nd, 2nd, 5th, 5th and 5th quintile, respectively, of its applicable Lipper peer group and for the one-, two-, three-, four- and five-year periods ended December 31, 2010, the fund's performance was in the 1st, 3rd, 4th, 4th and 4th quintile, respectively, of its applicable Lipper peer universe. In addition, this information showed that the fund performed at its benchmark index for the one-year period ended December 31, 2010.
On the basis of this evaluation and the ongoing review of performance by the Board, the Board concluded that the nature, quality and extent of services provided by the Adviser historically have been and continue to be satisfactory.
The Board also reviewed information on each fund's advisory fee and expense ratio (on both a net basis (giving effect to any expense cap) compared to the expenses of a peer group of funds based upon information prepared by Lipper. The Board also compared the advisory fees to the fees charged by the Adviser to two non-U.S. registered funds managed by the Adviser. (The Board noted that, although these non-U.S. registered funds may have investment objectives and policies that are similar to some of the funds, the contractual fees payable to the Adviser for managing those client assets are the same as or higher than the advisory fees of the similar funds.)
For the All American Equity Fund, the information showed that, with respect to the fund's advisory fee, the fund is in the 2nd quintile of its applicable Lipper peer group and in the 5th quintile of its applicable Lipper peer group with respect to its net expenses.
For the Holmes Growth Fund, the information showed that, with respect to the fund's advisory fee, the fund is in the 4th quintile of its applicable Lipper peer group and in the 5th quintile of its applicable Lipper peer group with respect to its net expenses.
228
Additional Information (unaudited)
For the Global MegaTrends Fund's investor class, the information showed that, with respect to the advisory fee, it is in the 4th quintile of its applicable Lipper peer group and in the 5th quintile of its applicable Lipper peer group with respect to its net expenses. In addition, the information showed that, with respect to the fund's institutional class, it is in the 5th quintile of its applicable Lipper peer group with respect to its advisory fee and net expenses.
For the Global Resources Fund's investor class, the information showed that, with respect to the advisory fee, it is in the 5th quintile of its applicable Lipper peer group and in the 4th quintile of its applicable Lipper peer group with respect to its net expenses. In addition, for the fund's institutional class, the information showed that, with respect to the advisory fee, it is in the 3rd quintile of its applicable Lipper peer group and in the 2nd quintile of its applicable Lipper peer group, respectively, with respect to its net expenses.
For the World Precious Minerals Fund's investor class and institutional class, the information showed that, with respect to the advisory fee and net expenses, the fund is in the 5th quintile of its applicable Lipper peer group.
For the Gold and Precious Metals Fund, the information showed that, with respect to the fund's advisory fee, the fund is in the 4th quintile of its applicable Lipper peer group and in the 5th quintile of its applicable Lipper peer group with respect to its net expenses.
For the Eastern European Fund, the information showed that, with respect to the fund's advisory fee and net expenses, the fund is in the 3rd quintile of its applicable Lipper peer group.
For the Global Emerging Markets Fund, the information showed that, with respect to the fund's advisory fee and net expenses, the fund is in the 5th quintile of its applicable Lipper peer group.
For the China Region Fund, the information showed that, with respect to the fund's advisory fee and net expenses, the fund is in the 5th quintile of its applicable Lipper peer group.
For the Tax Free Fund, the information showed that, with respect to the fund's advisory fee, the fund is in the 5th quintile of its applicable Lipper peer group and, with respect to the fund's net expenses, the fund is in the 3rd quintile of its applicable Lipper peer group.
For the Near-Term Tax Free Fund, the information showed that, with respect to the fund's advisory fee, the fund is in the 4th quintile of its applicable Lipper peer group and, with respect to net expenses, the fund is in the 1st quintile of its applicable Lipper peer group.
For the U.S. Government Securities Savings Fund and U.S. Treasury Securities Cash Fund, the information showed that, with respect to each fund's advisory fee, each
229
Additional Information (unaudited)
fund is in the 5th quintile of its applicable Lipper peer group and, with respect to net expenses, the U.S. Government Securities Savings Fund and U.S. Treasury Securities Cash Fund are in the 1st and 2nd quintile, respectively, of their applicable Lipper peer group.
The Board considered the Adviser's belief that higher expenses are inherent in small fund complexes, such as the U.S. Global Funds, and that it could not operate effectively at a lower level of fees or with the burden of contractual expense caps. However, the Board noted that the Adviser is currently voluntarily limiting expenses at the following levels (the expense limitation may be modified or removed by the Adviser at any time):
| Fund | | Voluntary Expense Limitation
(% of Average Net Assets) | |
| All American Equity Fund | | | 2.20 | % | |
| Holmes Growth Fund | | | 2.20 | % | |
| Global MegaTrends Fund | | | 2.35 | % | |
| Global Resources Fund | | | 1.90 | % | |
| World Precious Minerals Fund | | | 1.90 | % | |
| Gold and Precious Metals Fund | | | 1.90 | % | |
| Eastern European Fund | | | 2.85 | % | |
| Global Emerging Markets Fund | | | 3.15 | % | |
| China Region Fund | | | 2.55 | % | |
| Tax Free Fund | | | 0.70 | % | |
| U.S. Treasury Securities Cash Fund | | | 1.00 | % | |
| Near-Term Tax Free Fund | | | 0.45 | % | |
| U.S. Government Securities Savings Fund | | | 0.45 | % | |
In each case, the Board concluded that the advisory fee was reasonable and appropriate in amount, given the quality of services provided.
The Board considered the fee structure of the agreement, including the costs of the services provided and the profits realized by the Adviser and its affiliates from their relationship with the funds. For all funds except the World Precious Minerals Fund, Global Resources Fund and Gold and Precious Metals Fund, the net income generated from the advisory relationship was negative. The Board concluded for each fund that the profits realized by the Adviser were reasonable in comparison with the costs of providing investment advisory services to the fund.
As part of its review of the agreement, the Board considered whether there will be economies of scale with respect to the management of each fund and whether each fund will benefit from any economies of scale. The Board considered that the advisory fees for the All American Equity Fund, Gold and Precious Metals Fund, World Precious Minerals Fund, Global Resources Fund, Tax Free Fund, U.S. Government Securities Savings Fund and U.S. Treasury Securities Cash Fund include a breakpoint. For the remaining funds, the Board reviewed each fund's asset size and whether the Adviser was realizing economies of scale. The Board noted that, in all cases, the
230
Additional Information (unaudited)
Adviser did not believe, with respect to the investment advisory services provided, that it was realizing significant economies of scale, and that the current fees represent an appropriate sharing of economies of scale. Based upon its review of all available information, the Board concluded for the funds with a flat advisory fee that such fee was reasonable and appropriate.
The Board considered that the Adviser engages in soft-dollar arrangements in connection with brokerage transactions for the funds. The Board also considered benefits derived by the Adviser from its relationship with the funds, including the other services provided and fees received by the Adviser and its affiliates for providing such services, and concluded for each fund that the direct and indirect benefits accruing to the Adviser were reasonable in comparison with the costs of providing advisory services, the advisory fee charged to each fund, and the benefits to each fund.
Based on all the above-mentioned factors and related conclusions, with no single factor or conclusion being determinative and with each Trustee not necessarily attributing the same weight to each factor, the Board, including the Independent Trustees, concluded that approval of the advisory agreement would be in the interests of each fund.
231
[THIS PAGE INTENTIONALLY LEFT BLANK]
[THIS PAGE INTENTIONALLY LEFT BLANK]
[THIS PAGE INTENTIONALLY LEFT BLANK]
[THIS PAGE INTENTIONALLY LEFT BLANK]
[THIS PAGE INTENTIONALLY LEFT BLANK]
[THIS PAGE INTENTIONALLY LEFT BLANK]
[THIS PAGE INTENTIONALLY LEFT BLANK]
P.O. Box 659405
San Antonio, Texas
78265-9604
Want to reduce paper waste? You can receive this report and other important documents electronically. Please visit www.usfunds.com and sign up at Access My Account. If you need further assistance, please call us at 800-873-8637.
ITEM 2. CODE OF ETHICS.
(a) The registrant has adopted a code of ethics that applies to its principal executive officer and principal financial officer.
(b) During the period covered by this report, no material amendments were made to the provisions of the code of ethics adopted in 2(a) above.
(c) During the period covered by this report, no implicit or explicit waivers to the provisions of the code of ethics adopted in 2(a) above were granted.
(d) Not applicable.
(e) Not applicable.
(f) The registrant has posted such code of ethics on its Internet website at www.usfunds.com.
ITEM 3. AUDIT COMMITTEE FINANCIAL EXPERT.
For the covered period, the registrant’s Board of Trustees designated three independent trustees as audit committee financial experts: Mr. Clark Mandigo, Dr. James F. Gaertner, and Mr. Joe C. McKinney.
An “audit committee financial expert” is not an “expert” for any purpose, including for purposes of Section 11 of the Securities Act of 1933, as a result of being designated as an “audit committee financial expert.” Further, the designation of a person as an “audit committee financial expert” does not mean that the person has any greater duties, obligations, or liability than those imposed on the person without the “audit committee financial expert” designation. Similarly, the designation of a person as an “audit committee financial expert” does not affect the duties, obligations, or liability of any other member of the audit committee or Board of Trustees.
ITEM 4. PRINCIPAL ACCOUNTANT FEES AND SERVICES.
(A) AUDIT FEES
The aggregate fees billed to the registrant for professional services rendered by the registrant’s principal accountant for the audit of the registrant’s annual financial statements or for services that are normally provided by the accountant in connection with statutory or regulatory filings or engagements were $291,731 and $275,216 for the fiscal years ended December 31, 2011, and 2010, respectively.
(B) AUDIT-RELATED FEES
There were no fees billed for assurance and related services by the registrant’s principal accountant that were reasonably related to the performance of the audit of the registrant’s financial statements and were not reported under paragraph (a) of this Item for the last two fiscal years.
(C) TAX FEES
The aggregate fees billed for professional services rendered by the registrant’s principal accountant for tax compliance, tax advice and tax planning were $68,558 and $65,293 for the fiscal years ended December 31,
2011, and 2010, respectively. The nature of the services comprising the tax fees included the review of the registrant’s income and excise tax returns and distribution requirements.
(D) ALL OTHER FEES
There were no other fees during the last two fiscal years billed to the registrant.
(E)(1) The registrant’s audit committee is directly responsible for approving the services to be provided by the auditors, including approval in advance of audit and non-audit services at regularly scheduled audit committee meetings. If non-audit services are required between regularly scheduled audit committee meetings, approval may be authorized by the chairman of the audit committee for non-prohibited services for engagements of less than $3,500 with notification of other audit committee members at the next scheduled audit committee meeting.
(2) No services included in (b) - (d) above were approved pursuant to paragraph (c)(7)(i)(C) of Rule 2-01 of Regulation S-X.
(F) Less than 50 percent of the hours expended on the principal accountant’s engagement to audit the registrant’s financial statements for the most recent fiscal year were attributed to work performed by persons other than the principal accountant’s full-time, permanent employees.
(G) The aggregate fees billed by the registrant’s principal accountant for non-audit services rendered to the registrant, its investment adviser, and any entity controlling, controlled by, or under common control with the investment adviser that provides ongoing services to the registrant were $128,758 and $122,623 for the fiscal years ended December 31, 2011, and 2010, respectively. These fees related to tax services rendered to the registrant and the issuance of a report on internal controls for an entity controlled by the investment adviser.
(H) All non-audit services rendered in (g) above were considered by the registrant’s audit committee in maintaining the principal accountant’s independence.
ITEM 5. AUDIT COMMITTEE OF LISTED REGISTRANTS.
Not applicable to the registrant.
ITEM 6. SCHEDULE OF INVESTMENTS.
Not applicable. The complete schedule of investments is included in Item 1 of this Form N-CSR.
ITEM 7. DISCLOSURE OF PROXY VOTING POLICIES AND PROCEDURES FOR CLOSED-END MANAGEMENT INVESTMENT COMPANIES.
Not applicable.
ITEM 8. PORTFOLIO MANAGERS OF CLOSED-END MANAGEMENT INVESTMENT COMPANIES.
Not applicable.
ITEM 9. PURCHASES OF EQUITY SECURITIES BY CLOSED-END MANAGEMENT INVESTMENT COMPANY AND AFFILIATED PURCHASERS.
Not applicable.
ITEM 10. SUBMISSION OF MATTERS TO A VOTE OF SECURITY HOLDERS.
Not applicable.
ITEM 11. CONTROLS AND PROCEDURES.
(a) The registrant’s president and treasurer have determined that the registrant’s disclosure controls and procedures are effective based on their evaluation of the disclosure controls and procedures as of a date within 90 days of the filing date of this report.
(b) There was no change in the registrant’s internal control over financial reporting that occurred in the registrant’s fourth fiscal quarter of the period covered by this report that has materially affected, or is reasonably likely to materially affect, the registrant’s internal control over financial reporting.
ITEM 12. EXHIBITS.
(a)(1) Code of ethics is posted on registrant’s Internet website at www.usfunds.com.
(a)(2) Certifications of principal executive officer and principal financial officer pursuant to section 302 of the Sarbanes-Oxley Act of 2002.
(a)(3) Not applicable.
(b) Certifications of principal executive officer and principal financial officer pursuant to section 906 of the Sarbanes-Oxley Act of 2002.
SIGNATURES
Pursuant to the requirements of the Securities Exchange Act of 1934 and the Investment Company Act of 1940, the registrant has duly caused this report to be signed on its behalf by the undersigned, thereunto duly authorized.
U.S. GLOBAL INVESTORS FUNDS
By: | /s/ Frank E. Holmes | |
| Frank E. Holmes | |
| President, Chief Executive Officer | |
| | |
Date: | March 6, 2012 | |
Pursuant to the requirements of the Securities Exchange Act of 1934 and the Investment Company Act of 1940, this report has been signed below by the following persons on behalf of the registrant and in the capacities and on the dates indicated.
By: | /s/ Frank E. Holmes | |
| Frank E. Holmes | |
| President, Chief Executive Officer | |
| | |
Date: | March 6, 2012 | |
| | |
| | |
By: | /s/ Catherine A. Rademacher | |
| Catherine A. Rademacher | |
| Treasurer | |
| | |
Date: | March 6, 2012 | |