UNITED STATES
SECURITIES AND EXCHANGE COMMISSION
Washington, D.C. 20549
FORM N-CSR
CERTIFIED SHAREHOLDER REPORT OF REGISTERED
MANAGEMENT INVESTMENT COMPANIES
Investment Company Act file number | 811-1800 |
|
U.S. GLOBAL INVESTORS FUNDS |
(Exact name of registrant as specified in charter) |
|
7900 CALLAGHAN ROAD SAN ANTONIO, TX | | 78229 |
(Address of principal executive offices) | | (Zip code) |
|
SUSAN B. MCGEE, ESQ. 7900 CALLAGHAN ROAD SAN ANTONIO, TX 78229 |
(Name and address of agent for service) |
|
Registrant’s telephone number, including area code: | 210-308-1234 | |
|
Date of fiscal year end: | DECEMBER 31, 2013 | |
|
Date of reporting period: | DECEMBER 31, 2013 | |
| | | | | | | | |
ITEM 1. REPORTS TO STOCKHOLDERS.
U.S. Global Investors Funds
Annual Report
December 31, 2013

U.S. Global Investors Funds
Annual Report
December 31, 2013
Letter to Shareholders | | | 1 | | |
Definitions for Management Teams' Perspectives | | | 9 | | |
Management Teams' Perspectives | | | 11 | | |
Expense Example | | | 55 | | |
Portfolios of Investments | | | 57 | | |
Notes to Portfolios of Investments | | | 117 | | |
Statements of Assets and Liabilities | | | 134 | | |
Statements of Operations | | | 138 | | |
Statements of Changes in Net Assets | | | 142 | | |
Notes to Financial Statements | | | 148 | | |
Financial Highlights | | | 168 | | |
Additional Information | | | 182 | | |
U.S. Global Investors Funds
Investor Class
U.S. Government Securities Ultra-Short Bond Fund | | UGSDX | |
Near-Term Tax Free Fund | | NEARX | |
All American Equity Fund | | GBTFX | |
Holmes Macro Trends Fund | | ACBGX | |
Global Resources Fund | | PSPFX | |
World Precious Minerals Fund | | UNWPX | |
Gold and Precious Metals Fund | | USERX | |
Emerging Europe Fund | | EUROX | |
China Region Fund | | USCOX | |
Institutional Class
Global Resources Fund | | PIPFX | |
World Precious Minerals Fund | | UNWIX | |
Gold and Precious Metals Fund* | | USEIX | |
Emerging Europe Fund* | | EURIX | |
* The Institutional Class shares of the Gold and Precious Metals and Emerging Europe Funds have not commenced operations and currently are closed to investors. A notice will be issued when each class commences operations and opens to investors.
Fund Services, LLC
PO Box 701
Milwaukee WI
53201-0701
Tel 1.800.US.FUNDS
www.usfunds.com
U.S. Global Investors Funds

After a little more than a decade of positive annual returns, gold declined 28 percent in 2013. Gold companies also experienced a challenging year, with the NYSE Arca Gold Miners Index falling nearly 54 percent.
Oftentimes, we find that investors get swept up in the sentiment of the market rather than focusing on the long-term advantages of gold and gold equities. Consider that over the past five years, the precious metal grew 37 percent on a cumulative basis; bonds increased only 20 percent. Yet over that timeframe, many investors poured money into bond mutual funds while selling their gold and gold equity holdings.
We have always advocated that shareholders allocate a modest weighting of 5 to 10 percent of their overall portfolios to gold and gold stocks and rebalance annually. One of the most opportune times to rebalance into an asset class is when the market hates it. In 2013, pessimism about gold and gold stocks seemed to reach a maximum level. Historically, when consensus is this strong, it has been a turning point in the market.
We find a consistent investment discipline so important that we created an investment plan to help you fund your financial goals. It's called the ABC Investment Plan, which uses the advantages of dollar-cost averaging by allowing you to invest a fixed amount in a fund at regular intervals.
Looking ahead to 2014, now is the time to make sure you are allocated appropriately, as chances are good gold stocks will see a gain in 2014. Take a look at 30 years of annual returns of the Philadelphia Gold & Silver Index (XAU) in the chart on the next page. As you can see, it has now been three years in a row that gold stocks declined. Since the beginning of 2011, gold stocks decreased more than 60 percent.
However, these consecutive periods of declines are rare. There were only three times in three decades that gold stocks had a losing streak of three years.
1
U.S. Global Investors Funds

The first period that the XAU saw a three-year period of losses was back in the early 1990s, when the index fell 19.09 percent, 16.75 percent and 11.75 percent in 1990, 1991 and 1992, respectively.
What's striking about this period is the incredible rebound that followed. The XAU rallied 85 percent in 1993. U.S. Global Investors' Gold and Precious Metals Fund (USERX) climbed even more, increasing a whopping 124 percent in 1993.
Take a closer look at the other period of weakness. This three-year loss occurred in the late 1990s, with a muted rebound in 1999. However, at that time, the Bank of England (BOE) was auctioning off a significant amount of its gold reserves when bullion prices were at their lowest in 20 years. From 1999 to 2002, the central bank in England sold off 400 tonnes at a value of about $3.5 billion.
Following the period when the BOE sold its gold, the XAU rebounded. While the index gained only about 6 percent in 2001, gold stocks rose 41 percent in 2002 and about 42 percent in 2003.
During this period, gold and gold stocks were again influenced by a change in government policy. In this case, the liberalization of gold purchases was occurring in China, which was positive for gold.
Although there's no guarantee that we'll see a bounce in 2014, gold stocks are approaching the historical limits of multi-year declines.
Spectacular U.S. Market Performance
While commodities had a challenging environment, U.S. stocks were very strong. Over 2013, my consistent message was to "follow the money." I
2
U.S. Global Investors Funds
believe if you find the root of what is driving higher market prices, it may reveal the best investments. For example, I often say that government policies are precursors to change. Even with all the drama over Obamacare and Washington dysfunction, the S&P 500 Index rose an astounding 32 percent last year. Health care was the second-best performing sector in the index due to the changing policies of the health care reform.
All American Equity Fund and Holmes Macro Trends Fund
With the strong U.S. market performance, we're pleased shareholders in the All American Equity Fund (GBTFX) and Holmes Macro Trends Fund (ACBGX) were along for the ride and even more, as both funds outperformed their respective benchmarks.

3
U.S. Global Investors Funds
One of the biggest factors driving the U.S. market in 2013 was the increasing number of share buybacks and rising dividend payouts. For example, during the third quarter of 2013, the companies in the S&P 500 repurchased $128 billion of their own shares and paid $79 billion in dividends. This total is the highest since the third quarter of 2007.

We believe the All American Equity Fund benefited from this trend, as the fund commits a portion of its assets to stocks with superior shareholder yield metrics, seeking companies that pay cash dividends, repurchase stock and reduce their debt.
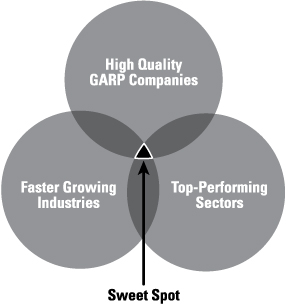
For the Holmes Macro Trends Fund, our goal is to find fast-growing and shareholder-focused companies and to focus on the best stocks in the sectors experiencing positive momentum. In addition, we want to find the stocks that offer growth-at-a-reasonable price (GARP).
Fast-growing and shareholder-focused companies are bred with distinct strands of DNA that drive their success. These businesses typically have revenues growing at more than 10 percent, generate a high 20 percent earnings growth rate and have at least 20 percent return on equity.
4
U.S. Global Investors Funds
Research shows that companies with these superior growth qualities historically have outperformed over time.
However, depending on the market cycle, certain sectors can be in or out of favor. Sometimes cyclical stocks in sectors such as information technology, industrial, materials, and consumer discretionary outperform; other times, defensive stocks rise in value. Often, there are factors that drive or inhibit their performance. It could be government policies, such as Obamacare boosting many health care companies. Or it could be the falling price of a resource that narrows the profit margins of miners.
The result is wide price fluctuations among sectors from year-to-year. If you look at the annual returns over the past decade of each of the 10 sectors in the S&P 500 Index, in any given year the average difference between the best-performing sector and the worst-performing sector has been around 36 percent.
Identifying and overweighting stocks with robust fundamentals in faster growing industries and sectors increases the odds that the portfolio will outperform its benchmark. Alternatively, it is just as important to minimize investing in the bottom sectors.
The goal is to tactically overweight holdings to those stronger performing sectors and industries. We've found that once a sector begins outperforming more than half of the other sectors, it tends to sustain leadership over an extended period of time. Based on a sector ranking over the past three months and 12 months, even though individual sector leadership changed positions, the top five sectors remained the same.
Our proprietary model currently tells us the top sectors are consumer discretionary, health care and industrials. The data is backed by several familiar trends. For consumer discretionary, we see growth in retailers and consumer Internet companies. In health care, there are new products, favorable demographics and visible growth. The synchronized global economic recovery and energy infrastructure are driving industrials.
To stay abreast of the stronger and weaker areas of the market, we invite you to get weekly updates from the portfolio managers in your email inbox. For your free subscription, go to www.usfunds.com/subscribe.
The Importance of Short-Term Bond Funds in a Diversified Portfolio
Similar to commodities' performance, bonds also suffered a setback in 2013 following the Federal Reserve's announcement of its intention to taper its bond purchases. Yields rose quickly and municipal bonds experienced their
5
U.S. Global Investors Funds
worst decline since September 2008. The long end of the yield curve was hit the hardest, as bonds with maturities of 22 years or more fell by more than 6 percent for the year.
We were pleased that the Near-Term Tax Free Fund (NEARX), which invests in municipal bonds with relatively short maturities, posted a modest gain of 0.31 percent in 2013. That makes it 13 years in a row the fund provided positive annual returns for shareholders.
While long-term rates are expected to keep rising over the next few years, we believe the Fed will keep short-term rates low, which will continue to make money market funds less attractive to investors who are thirsty for higher yields but do not want the risk of a long-term bond fund.
Instead of money market funds, shorter-term bond funds give investors the opportunity to earn income and add some stability to a diversified portfolio.
This is why we asked shareholders of the U.S. Government Securities Savings Fund to approve the conversion of the fund from a money market fund to an ultra-short government bond fund. The fund, now named the U.S. Government Securities Ultra-Short Bond Fund (UGSDX), is designed as an investment that takes advantage of the security of U.S. Government bonds and obligations, while simultaneously pursuing a higher level of income than money market funds.
If longer-term rates rise over 2014, we believe the Near-Term Tax Free Fund and the U.S. Government Securities Ultra-Short Bond Fund will be able to weather the storm better than funds that invest in bonds with longer maturities.
In addition, a distinctive feature of the funds is the floating $2 share price, which reduces the penny-move volatility in the investor's portfolio.
Global Purchasing Manager's Index Building Momentum
One of the big indicators for global investors to watch in 2014 is the global purchasing manager's index (PMI). PMI gives investors a reliable indication of the manufacturing sector's well-being, as it gathers data such as global output, new orders, exports, prices, and employment. And because recessions tend to start and end with manufacturing activity, PMI can also be counted on as a measure of how well the economy is doing.
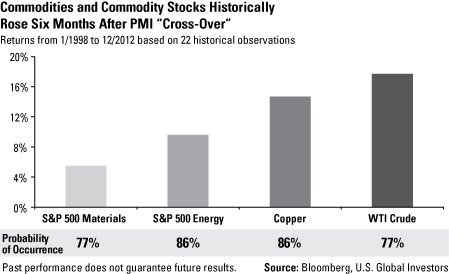
Research shows that with the positive momentum of PMI, commodities and commodity stocks typically build momentum as well. Over the following six months after the PMI rose above its three-month trendline, there was an
6
U.S. Global Investors Funds
86 percent probability that copper would rise, resulting in a median return of 14.7 percent; the S&P Energy Index rose about 86 percent of the time and had a median return of 9.6 percent; typically, WTI crude oil rose 77 percent of the time, with a median return of 17.7 percent; and the S&P 500 Materials Index rose 77 percent of the time, with a modest median return of 5.5 percent.
With the global synchronized monetary cycle continuing in China, Japan and the U.S., we anticipate strong market activity over 2014 and offer our shareholders a variety of ways to participate.
In 2013, we made several changes to the funds, providing our shareholders with streamlined products and services, which allow us to focus on our core competencies for you. We thank you for your patience and loyalty as these changes were occurring at the end of the year. The one thing that will never change at U.S. Global is our appreciation for our shareholders.
Many changes take place every day in global markets as well, so remember to subscribe to the Investor Alert at www.usfunds.com/subscribe.
7
U.S. Global Investors Funds
Thank you for your continued trust and confidence in U.S. Global Investors.
Sincerely,

Frank Holmes
CEO and Chief Investment Officer
U.S. Global Investors, Inc.
Please consider carefully a fund's investment objectives, risks, charges and expenses. For this and other important information, obtain a fund prospectus by visiting www.usfunds.com or by calling 1-800-US-FUNDS (1-800-873-8637). Read it carefully before investing. Distributed by U.S. Global Brokerage, Inc.
All opinions expressed and data provided are subject to change without notice. Some of these opinions may not be appropriate to every investor.
Bond funds are subject to interest-rate risk; their value declines as interest rates rise. Tax-exempt income is federal income tax free. A portion of this income may be subject to state and local income taxes, and if applicable, may subject certain investors to the Alternative Minimum Tax as well. The Near-Term Tax Free Fund may invest up to 20% of its assets in securities that pay taxable interest. Income or fund distributions attributable to capital gains are usually subject to both state and federal income taxes. The Near-Term Tax Free Fund may be exposed to risks related to a concentration of investments in a particular state or geographic area. These investments present risks resulting from changes in economic conditions of the region or issuer. Though the Near-Term Tax Free Fund and the U.S. Government Securities Ultra-Short Bond Fund seek minimal fluctuations in share price, they are subject to the risk that a decline in the credit quality of a portfolio holding could cause a fund's share price to decline.
Gold, precious metals, and precious minerals funds may be susceptible to adverse economic, political or regulatory developments due to concentrating in a single theme. The prices of gold, precious metals, and precious minerals are subject to substantial price fluctuations over short periods of time and may be affected by unpredicted international monetary and political policies. We suggest investing no more than 5% to 10% of your portfolio in these sectors.
A program of regular investing doesn't assure a profit or protect against loss in a declining market. You should evaluate your ability to continue in such a program in view of the possibility that you may have to redeem fund shares in periods of declining share prices as well as in periods of rising prices. Diversification does not protect an investor from market risks and does not assure a profit.
The S&P 500 Energy Index is a capitalization-weighted index that tracks the companies in the energy sector as a subset of the S&P 500. The S&P 500 Materials Index is a capitalization-weighted index that tracks the companies in the material sector as a subset of the S&P 500. The J.P. Morgan Global Purchasing Manager's Index is an indicator of the economic health of the global manufacturing sector. The PMI index is based on five major indicators: new orders, inventory levels, production, supplier deliveries and the employment environment. The Philadelphia Stock Exchange Gold and Silver Index (XAU) is a capitalization-weighted index that includes the leading companies involved in the mining of gold and silver.
8
Definitions for Management Teams' Perspectives
Benchmark Index Definitions
Returns for indices reflect no deduction for fees, expenses or taxes, unless noted.
The Barclays U.S. Treasury Bills 6-9 Months Total Return Index tracks the performance of U.S. Treasury Bills with a maturity of six to nine months.
The Barclays 3-Year Municipal Bond Index is a total return benchmark designed for municipal assets. The index includes bonds with a minimum credit rating of BAA3, are issued as part of a deal of at least $50 million, have an amount outstanding of at least $5 million and have a maturity of two to four years.
The FTSE Gold Mines Index encompasses all gold mining companies that have a sustainable and attributable gold production of at least 300,000 ounces a year and that derive 75% or more of their revenue from mined gold.
The Hang Seng Composite Index is a market-capitalization weighted index that covers about 95% of the total market capitalization of companies listed on the Main Board of the Hong Kong Stock Exchange.
The MSCI Emerging Markets Europe 10/40 Index (Net Total Return) is a free float-adjusted market capitalization index that is designed to measure equity performance in the emerging market countries of Europe (Czech Republic, Hungary, Poland, Russia and Turkey). The index is calculated on a net return basis (i.e., reflects the minimum possible dividend reinvestment after deduction of the maximum rate withholding tax). The index is periodically rebalanced relative to the constituents' weights in the parent index.
The Morgan Stanley Commodity Related Equity Index (CRX) is an equal-dollar weighted index of 20 stocks involved in commodity-related industries such as energy, non-ferrous metals, agriculture and forest products.
The NYSE Arca Gold Miners Index is a modified market capitalization-weighted index comprised of publicly-traded companies involved primarily in the mining for gold and silver.
The S&P 500 Index is a widely recognized capitalization-weighted index of 500 common stock prices in U.S. companies.
The S&P Composite 1500 Index is a broad-based capitalization-weighted index of 1500 U.S. companies and is comprised of the S&P 400, the S&P 500 and the S&P 600.
9
Definitions for Management Teams' Perspectives
Other Index Definitions
The Barclays Municipal Bond Index is an unmanaged index representative of the tax-exempt bond market.
The Dow Jones UBS Commodity Index is composed of futures contracts on physical commodities, and includes commodities traded on U.S. exchanges, with the exception of aluminum, nickel and zinc, which trade on the London Metal Exchange (LME).
The MICEX Index is the real-time cap-weighted Russian composite index. It comprises the 30 most liquid stocks of Russian largest and most developed companies from 10 main economy sectors. The MICEX Index is calculated and disseminated by the MICEX Stock Exchange, the main Russian stock exchange.
The MSCI All Country Far East Free ex Japan Index is a free float-adjusted market capitalization-weighted index that is designed to measure the equity market performance of the Far East, excluding Japan. The index consists of the following developed and emerging market country indices: China, Hong Kong, Indonesia, Korea, Malaysia, Philippines, Singapore, Taiwan and Thailand.
The S&P High Yield Dividend Aristocrats Index is designed to measure the performance of the 50 highest dividend yielding S&P Composite 1500 constituents which have followed a managed dividends policy of consistently increasing dividends every year for at least 25 years.
The S&P/Case-Shiller Index tracks changes in home prices throughout the United States by following price movements in the value of homes in 20 major metropolitan areas.
The S&P/TSX Venture Composite Index is a broad market indicator for the Canadian venture capital market. The index is market capitalization weighted and, at its inception, included 531 companies. A quarterly revision process is used to remove companies that comprise less than 0.05% of the weight of the index, and add companies whose weight, when included, will be greater than 0.05% of the index.
The U.S. Trade Weighted Dollar Index provides a general indication of the international value of the U.S. dollar.
10
U.S. Government Securities Ultra-Short Bond Fund
Management Team's Perspective
Introduction
The U.S. Government Securities Ultra-Short Bond Fund (UGSDX) is designed to be used as an investment that takes advantage of the security of U.S. Government bonds and obligations, while simultaneously pursuing a higher level of current income than money market funds offer.
Performance Graph
U.S. Government Securities Ultra-Short Bond Fund
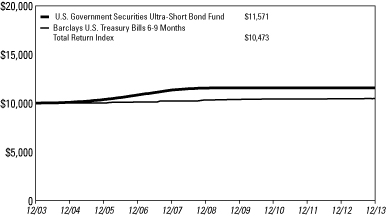
Average Annual Performance For the Years Ended
December 31, 2013
| | | One Year | | Five Year | | Ten Year | |
U.S. Government Securities Ultra-Short Bond Fund | | | 0.02 | % | | | 0.03 | % | | | 1.47 | % | |
Barclays U.S. Treasury Bills 6-9 Months
Total Return Index | | | 0.14 | % | | | 0.27 | % | | | 0.46 | % | |
Performance data quoted above is historical. Past performance is no guarantee of future results. Current performance may be higher or lower than the performance data quoted. The principal value and investment return of an investment will fluctuate so that an investor's shares, when redeemed, may be worth more or less than their original cost. The graph and table do not reflect the deduction of taxes that a shareholder would pay on fund distributions or the redemption of fund shares. For all or a portion of the periods, the fund had expense limitations and reimbursements to maintain a minimum yield, without which returns would have been lower.
The above returns for the U.S. Government Securities Ultra-Short Bond Fund include the fund's results as a money market fund through the date of its conversion (December 20, 2013) to an ultra-short bond fund, and therefore are not representative of the fund's results had it operated as an ultra-short bond fund for the full term of the periods shown.
Pursuant to a voluntary arrangement, the Adviser has agreed to limit total fund operating expenses (exclusive of any acquired fund fees and expenses, performance fees, taxes, brokerage commissions and interest) to not exceed 0.45%. The Adviser can modify or terminate this arrangement at any time. In addition, returns include the effects of additional voluntary waivers of fees and reimbursements of expenses by the Adviser, including waivers and reimbursements to maintain a minimum net yield for the fund.
See Definitions for Management Teams' Perspectives for index definitions.
Please visit our website at www.usfunds.com for updated performance information for different time periods.
11
U.S. Government Securities Ultra-Short Bond Fund
Fund Conversion
The fund was formerly a money market fund called the U.S. Government Securities Savings Fund. In December 2013, the fund's shareholders approved a proposal resulting in the conversion of the fund to a U.S. Government ultra-short bond fund that is not a money market fund (the "Conversion"). The Conversion occurred after the close of business on December 20, 2013. The fund's investment policy, which required it to maintain a constant net asset value (NAV) of $1.00 per share, was eliminated as part of the Conversion.
The following changes also took effect as part of the Conversion:
(1) The fund was renamed the U.S. Government Securities Ultra-Short Bond Fund.
(2) The fund's investment objective was changed to seek to achieve a total return with current income.
(3) The fund's dollar-weighted average effective maturity will be two years or less.
The Year In Review - Economic And Political Issues That Affected The Fund
The U.S. economy experienced lackluster growth during the first six months of 2013, but picked up as the year progressed. Third quarter GDP grew a surprisingly strong 4.1 percent followed by 3.2 percent in the fourth quarter, and manufacturing indicators began to improve mid-year, remaining strong through year-end. The same general trend of improving manufacturing could be seen on a global basis.
The employment situation remains stable, but real growth remains elusive and needs to improve to confirm the strength we have seen in other economic indicators.
After a strong start to the year, housing activity slowed with higher mortgage rates, even though house prices continued to climb. The S&P/Case-Shiller Index indicates housing prices were up 13.7 percent on a year-over-year basis through November. Higher housing prices along with a strong stock market have created a "wealth effect," improving consumers' attitudes toward their financial situations. Increasing consumer confidence has driven very strong auto sales, which has many positive effects in the manufacturing sector.
In May, Federal Reserve Chairman Ben Bernanke indicated an inclination to begin reducing the quantitative easing stimulus program as soon as September 2013 in a process that has been widely described as "tapering." After disappointing the market in September by maintaining the status quo, the Fed tapered by $10 billion in December. By the end of 2013, the Fed was purchasing $75 billion, down from $85 billion, in Treasuries and mortgage-backed securities each month in an effort to continue to stimulate the economy.
12
U.S. Government Securities Ultra-Short Bond Fund
Inflation in the U.S. oscillated between 1 and 2 percent all year, which allows the Fed plenty of room to maneuver, although deflation still remains a threat. Global inflation, in general, remained low, allowing global central bankers to comfortably maintain pro-growth policies. And while we have seen some countries begin to tighten monetary policy, the vast majority remains engaged in synchronized global monetary easing. Key global economies participating in this trend include Japan, China, and Europe.
Japan is committed to an aggressive reflation policy, and the country has been one of the few bright spots in the global economic context. China appears comfortable with a stable growth policy. The current administration has focused on addressing domestic imbalances and, thus, has not been the global growth catalyst it was after the financial crisis. Europe is improving and has finally emerged from a slow shallow recession. Optimism is picking up with regards to the global growth outlook as all major economic areas of the world are showing stable-to-improving economic growth for 2014.
Since the financial crisis, Fed policy has needed to be more sensitive to developments in other parts of the world and a lack of aggressive easing in Europe and Japan in recent years has likely helped keep the Fed funds rate pegged near zero. A change in tone from Japan and Europe is a welcome development for the Fed and will likely make the tapering decision a little easier.
Yields on the three-month Treasury bill rose 3 basis points to 0.07 percent, while yields on the six-month bills fell 2 basis points to 0.09 percent. One-year agency discount note yields rose 4 basis points to 0.16 percent. The market was still influenced by periodic bouts of risk aversion or other disruptions, with investors at times seeking to own short-term Treasury securities at almost any cost.
Investment Highlights
Prior to the conversion of the fund from a money market fund to an ultra-short government bond fund on December 20, 2013, the fund's returns for the year were in line with the Lipper government-only money market funds, returning 0.01 percent versus 0.01 percent for the peer group. Since the conversion, the fund's benchmark is the Barclays U.S. Treasury Bills 6-9 Months Total Return Index, which returned 0.14 percent for the year.
The fund followed a very short laddered approach for much of the period. The fund took advantage of higher yields by selectively extending its ladder, but it also took advantage of relatively higher repurchase agreement rates.
13
U.S. Government Securities Ultra-Short Bond Fund
Current Outlook
The Fed continues to remain accommodative in an attempt to offset fiscal tightening and spur employment growth. We believe the U.S. will maintain an accommodative monetary policy but will continue to taper the quantitative easing program as the year progresses. Short-term yields could be higher over the next six to twelve months, but it currently appears unlikely that the Fed will take aggressive action or raise the Fed funds rate in 2014.
Portfolio Allocation by Issuer* December 31, 2013

Portfolio Allocation by Maturity* December 31, 2013
Cash | | $ | 13,336,547 | | | | 17.6 | % | |
| 1 - 3 Months | | | 44,302,287 | | | | 58.4 | % | |
| 3 - 12 Months | | | 2,200,871 | | | | 2.9 | % | |
| 1 - 3 Years | | | — | | | | 0.0 | % | |
| 3 - 5 Years | | | 16,005,720 | | | | 21.1 | % | |
| | $ | 75,845,425 | | | | 100.0 | % | |
* Including cash, which is not included in the fund's Portfolio of Investments.
14
Management Team's Perspective
Introduction
The Near-Term Tax Free Fund (NEARX) seeks to provide a high level of current income exempt from federal income taxation and to preserve capital. However, a portion of any distribution may be subject to federal and/or state income taxes. The Near-Term Tax Free Fund will maintain a weighted average maturity of less than five years.
Performance Graph
Near-Term Tax Free Fund
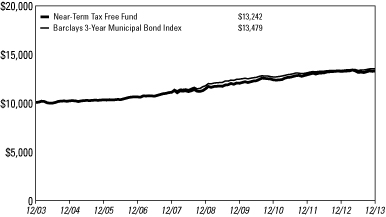
Average Annual Performance For the Years Ended
December 31, 2013
| | | One Year | | Five Year | | Ten Year | |
Near-Term Tax Free Fund | | | 0.31 | % | | | 3.02 | % | | | 2.85 | % | |
Barclays 3-Year Municipal Bond Index | | | 1.33 | % | | | 2.82 | % | | | 3.03 | % | |
Performance data quoted above is historical. Past performance is no guarantee of future results. Current performance may be higher or lower than the performance data quoted. The principal value and investment return of an investment will fluctuate so that an investor's shares, when redeemed, may be worth more or less than their original cost. The graph and table do not reflect the deduction of taxes that a shareholder would pay on fund distributions or the redemption of fund shares. For all or a portion of the periods, the fund had expense limitations, without which returns would have been lower.
The Adviser has contractually agreed to limit total fund operating expenses (exclusive of any acquired fund fees and expenses, performance fees, taxes, brokerage commissions and interest) to not exceed 0.45% on an annualized basis through December 31, 2014.
See Definitions for Management Teams' Perspectives for index definitions.
Please visit our website at www.usfunds.com for updated performance information for different time periods.
15
The Year In Review - Economic And Political Issues That Affected The Fund
As a measure of the general municipal bond market, the Barclays Municipal Bond Index fell 2.55 percent in 2013; this was the worst performance since 2008 when the index experienced similar losses. Most of the action took place in June, during which the index fell 2.83 percent, wiping out the small gains in the market up to that point and offsetting the small gain the index generated in the past six months.
The long end of the yield curve was hit the hardest, as bonds with maturities of 22 years or more fell by more than 6 percent for the year. Returns were generally as expected in a rising rate environment, with returns progressively getting worse further out the yield curve.
The key inflection point for the market was in May when Federal Reserve Chairman Ben Bernanke introduced the idea of tapering the Fed's quantitative easing stimulus program. At that time, the Fed was spending $85 billion per month to buy Treasuries and mortgage-backed securities in an attempt to stimulate the economy. This announcement roiled the market, sending yields higher through early September. The Fed was widely expected to begin tapering in September but refrained, and the market rallied through October. Expectations for tapering began building again, and yields rose in November and December. The Fed followed through at the December Federal Open Markets Committee meeting, announcing a $10 billion reduction in the quantitative easing program and setting expectations for more to come in 2014.
The economy generally cooperated with the Fed, improving as the year progressed and supporting the Fed's thesis on the need to introduce tapering. The economy remains weak enough that higher interest rates are unlikely in 2014.
Revenue-backed municipals underperformed general obligation credits, with specific weakness in electric utilities and water and sewer issues. Credit factors also played a significant role as performance differences between low-quality and high-quality bonds were large. AAA-rated municipals fell 1.61 percent, while BBB-rated municipals fell 7.17 percent. There were specific credit events that exacerbated the BBB returns, such as very poor performance for Puerto Rico-backed debt, but the overall trend still holds. High-yield, or "junk bonds," also underperformed, falling 5.51 percent over the past year.
In specialty state trading, California was a standout performer, while Puerto Rico underperformed by a wide margin.
16
Investment Highlights
For the twelve months ended December 31, 2013, the Near-Term Tax Free Fund returned 0.31 percent, underperforming its benchmark, the Barclays 3-Year Municipal Bond Index, which gained 1.33 percent.
The Near-Term Tax Free Fund outperformed the Short-Intermediate Lipper peer group for the past twelve months. The Near-Term Tax Free Fund remained true to form, investing in traditional, high-quality municipals which tended to weather the market turbulence better than most. Bond structure also played a role as the fund tends to own higher coupons and more defensively structured securities than many competitors.
Strengths
• Historically, the conservative credit profile of the fund proved to be an asset during volatile periods, but negatively affected performance when low-quality issues significantly outperformed. The market experienced significant interest rate volatility this year and the fund benefited from this positioning.
• The fund was able to generate a positive total return in 2013, even as many competing funds suffered losses.
• The fund benefited from significant exposure to Florida and Texas, which both outperformed. The fund did have exposure to Puerto Rico, which was the worst performer, but the fund had an underweight position and avoided the other poor performers.
Weaknesses
• The fund had exposure to the intermediate portion of the yield curve, which underperformed the three-year part of the curve.
• Bonds that are subject to the alternative minimum tax (AMT) also outperformed; however, the fund has no exposure to these bonds.
Current Outlook
Opportunities
• The Fed's tapering program that began in December is likely to continue in fits and starts based on incoming economic data. The fund will look to take advantage of volatility in the marketplace to add to positions.
Threats
• Continued outperformance of low-quality bonds is the most significant threat on a relative basis.
• When the Fed reverses its monetary policy stance and begins to raise interest rates, the macro environment could become more difficult.
17
Top 10 Area Concentrations
(Based on Net Assets) December 31, 2013
Texas | | | 14.20 | % | |
Florida | | | 12.41 | % | |
Illinois | | | 9.76 | % | |
California | | | 5.32 | % | |
Michigan | | | 5.22 | % | |
New Jersey | | | 4.03 | % | |
New York | | | 3.87 | % | |
Alabama | | | 3.50 | % | |
Arizona | | | 3.04 | % | |
Pennsylvania | | | 2.56 | % | |
Total Top 10 Areas | | | 63.91 | % | |
Municipal Bond Ratings*
(Based on Total Municipal Bonds) December 31, 2013
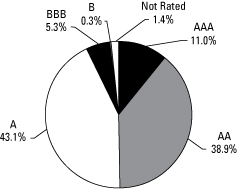
* Credit-quality ratings are measured on a scale that generally ranges from AAA (highest) to D (lowest). "Not Rated" is used to classify securities for which a rating is not available. Credit-quality ratings for each issue are obtained from Moody's and S&P, and the higher rating for each issue is used.
18
Management Team's Perspective
Introduction
The principal objective of the All American Equity Fund (GBTFX) is to seek capital appreciation by investing primarily in a broadly diversified portfolio of domestic common stocks. The fund invests in large-capitalization stocks, while retaining the flexibility to seek out promising individual stock opportunities, including stocks with meaningful dividend yields.
Performance Graph
All American Equity Fund

Average Annual Performance For the Years Ended
December 31, 2013
| | | One Year | | Five Year | | Ten Year | |
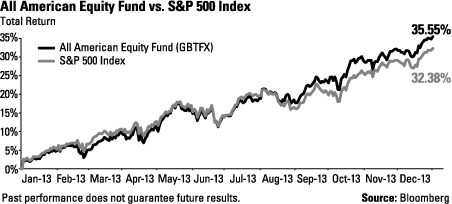
All American Equity Fund | | | 35.55 | % | | | 14.87 | % | | | 7.16 | % | |
S&P 500 Index | | | 32.38 | % | | | 17.91 | % | | | 7.39 | % | |
Performance data quoted above is historical. Past performance is no guarantee of future results. Current performance may be higher or lower than the performance data quoted.The principal value and investment return of an investment will fluctuate so that an investor's shares, when redeemed, may be worth more or less than their original cost. The graph and table do not reflect the deduction of taxes that a shareholder would pay on fund distributions or the redemption of fund shares. For all or a portion of the periods, the fund had expense limitations, without which returns would have been lower.
Pursuant to a voluntary arrangement, the Adviser has agreed to limit total fund operating expenses (exclusive of any acquired fund fees and expenses, performance fees, taxes, brokerage commissions and interest) to not exceed 2.20%. The Adviser can modify or terminate this arrangement at any time.
See Definitions for Management Teams' Perspectives for index definitions.
Please visit our website at www.usfunds.com for updated performance information for different time periods.
19
The Year In Review - Economic And Political Issues That Affected The Fund
In the first half of 2013, the U.S. economy experienced lackluster growth, as real GDP rose less than a 2 percent annualized rate. That weak growth was largely driven by Europe, as its economy was mired in a mild recession, as well as a larger-than-expected slowdown in China. That changed in the second half of the year as third quarter GDP rose 4.1 percent, fourth quarter GDP rose 3.2 percent, Europe emerged from recession, China's growth stabilized, and Japan's economy grew 2 percent in the third quarter, which was the best growth in three years.
Global manufacturing indicators weakened during the first half of 2013, but similar to GDP, finished the year strong. The automotive sector has also been a bright spot, with annualized sales ranging from 15 to 16 million vehicles all year.
The U.S. housing market started the year strong, but as interest rates spiked on the Federal Reserve's tapering talk during the early summer, mortgage rates followed and housing activity declined as the year progressed. Home prices continued to climb, which, combined with a rising equity market, boosted the wealth effect for consumers.
The Fed maintained its quantitative easing (QE) program during the first half of the year, purchasing $85 billion in Treasuries and mortgage-backed securities per month in an effort to stimulate the economy. In May and June, the Fed started to express a preference for a gradual reduction in this program that most Fed watchers believed would begin in September. The Fed did not actually taper its bond purchases until December, and only by $10 billion, which caused a fair amount of interest rate volatility in the second half of the year.
In addition to the Fed, central banks around the world continued their massive synchronized easing cycle. The Bank of Japan has been particularly aggressive in this regard, and its QE program is almost as large as the Fed's but in a much smaller economy.
Inflation in the U.S. is not really a concern in the short term and has consistently been below 2 percent. The global trend for inflation also remains low, which allows global central bankers to comfortably maintain pro-growth policies.
U.S. stocks were very strong during 2013, with the S&P 500 Index rising 32.38 percent. Dividend-paying stocks modestly underperformed the broad market (as measured by the S&P 500 Index), with the S&P High Yield Dividend Aristocrats Index gaining 30.57 percent.
20
Investment Highlights
Overview
The All American Equity Fund returned 35.55 percent for the year ended December 31, 2013, outperforming the 32.38 percent return for the benchmark S&P 500 Index.
Because the fund is actively managed and holding period is generally not a consideration in investment decisions, the portfolio turnover rate may fluctuate from year to year as the fund adjusts its portfolio composition. The fund's annual portfolio turnover was, and is expected to continue to be, more than 100 percent.
Strengths
• The fund's stock selection in consumer discretion, consumer staples and industrials sectors were particularly strong relative to the benchmark. These three sectors provided the bulk of the outperformance compared to the benchmark.
• The fund had an underweight position in the outperforming financial sector, but was able to make up that performance gap through superior stock selection.
• MasterCard Inc.,(1) Celgene Corp.(2) and Wabtec Corp.(3) were among the best positive contributors to fund performance.
Weaknesses
• The fund's exposure to dividend-paying stocks over the past year was a modest drag on relative performance, but did provide volatility-dampening attributes.
• Cash and defensive option strategies did not aid fund performance over the past year as the market rallied strongly.
• Apple, Inc.,(4) Cliffs Natural Resources, Inc.(2) and Ulta Salon, Cosmetics & Fragrance, Inc.(2) were among the worst individual contributors to performance.
Current Outlook
Opportunities
• The global economy is in the midst of a synchronized economic recovery, which bodes particularly well for cyclical and growth sectors. We believe the global outlook is the best it has been in some time.
• Corporate cash levels continue to remain high, providing corporations the ability to pursue mergers and acquisitions (M&A). An increase in M&A activity holds promise for both portfolio gains and an increase in overall market valuations.
21
Threats
• We believe Europe remains the largest wildcard. If the continent remains committed to austerity and political volatility continues, the continent will likely fall back into recession. China's leaders appear comfortable with slower growth. China has been a significant driver of global growth over the past decade and if this is an era for new government policy, it puts global growth at risk.
• The market was very strong in 2013 and a short-term pullback wouldn't be a surprise.
• Global government policy delays or outright missteps are a threat to global equity markets.
(1)This security comprised 5.36% of the fund's total net assets as of 12/31/13.
(2)The fund did not hold this security as of 12/31/13.
(3)This security comprised 2.22% of the fund's total net assets as of 12/31/13.
(4)This security comprised 2.40% of the fund's total net assets as of 12/31/13.
22
Top 10 Holdings Based on Net Assets December 31, 2013
MasterCard, Inc.
Commercial Services - Financial | | | 5.36 | % | |
Biogen Idec, Inc.
Medical - Biomedical/Gene | | | 3.59 | % | |
Bank of America Corp.
Diversified Banking Institutions | | | 3.00 | % | |
Westlake Chemical Corp.
Chemicals - Diversified | | | 2.61 | % | |
QUALCOMM, Inc.
Semiconductors Components/Integrated Circuits | | | 2.54 | % | |
Starbucks Corp.
Retail - Restaurants | | | 2.51 | % | |
Chicago Bridge & Iron Co. N.V.
Building - Heavy Construction | | | 2.49 | % | |
priceline.com, Inc.
E-Commerce/Services | | | 2.49 | % | |
Apple, Inc.
Computers | | | 2.40 | % | |
Las Vegas Sands Corp.
Casino Hotels | | | 2.36 | % | |
Total Top 10 Holdings | | | 29.35 | % | |
Portfolio Allocation by Industry Sector*
Based on Total Investments December 31, 2013
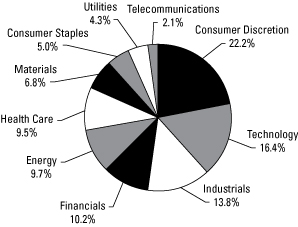
* Summary information above may differ from the portfolio schedule included in the financial statements due to the use of different classifications of securities for presentation purposes.
23
Management Team's Perspective
Introduction
The Holmes Macro Trends Fund (ACBGX) (formerly the Holmes Growth Fund) invests in companies with good growth prospects and strong positive earnings momentum. The fund's primary objective is to seek long-term capital appreciation.
At a shareholder meeting on December 20, 2013, the shareholders of the MegaTrends Fund approved the reorganization of the MegaTrends Fund into the Holmes Growth Fund. The reorganization occurred after the close of business on December 20, 2013. In connection with the reorganization, the Holmes Growth Fund's name changed to the Holmes Macro Trends Fund and the fund no longer has an investment policy to emphasize small- and mid-sized companies.
Performance Graph
Holmes Macro Trends Fund
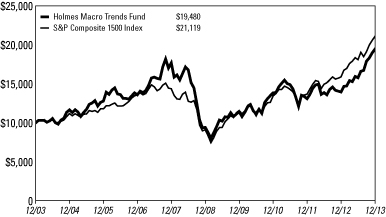
Average Annual Performance For the Years Ended
December 31, 2013
| | | One Year | | Five Year | | Ten Year | |
Holmes Macro Trends Fund | | | 39.38 | % | | | 15.69 | % | | | 6.89 | % | |
S&P Composite 1500 Index | | | 32.79 | % | | | 18.35 | % | | | 7.76 | % | |
Performance data quoted above is historical. Past performance is no guarantee of future results. Current performance may be higher or lower than the performance data quoted. The principal value and investment return of an investment will fluctuate so that an investor's shares, when redeemed, may be worth more or less than their original cost. The graph and table do not reflect the deduction of taxes that a shareholder would pay on fund distributions or the redemption of fund shares. For all or a portion of the periods, the fund had expense limitations, without which returns would have been lower.
Pursuant to a voluntary arrangement, the Adviser has agreed to limit total fund operating expenses (exclusive of any acquired fund fees and expenses, performance fees, taxes, brokerage commissions and interest) to not exceed 2.20%. The Adviser can modify or terminate this arrangement at any time.
See Definitions for Management Teams' Perspectives for index definitions.
Please visit our website at www.usfunds.com for updated performance information for different time periods.
24
The Year In Review - Economic And Political Issues That Affected The Fund
The U.S. economy muddled through the first half of 2013 but gained strength and momentum as the year progressed. Third quarter GDP rose 4.1 percent, fourth quarter GDP rose 3.2 percent, Europe emerged from recession, China's growth stabilized and Japan's economy experienced its best growth in three years. Global manufacturing indicators followed a similar path, indicating a strengthening global economy as we exited 2013.
The U.S. housing market was initially strong in 2013, but activity waned as mortgage rates moved higher on the Federal Reserve's tapering talk beginning in early summer and never really recovered as interest rates remained elevated.
The automotive sector demonstrated consistent performance all year and was a key contributor to the strength in manufacturing in the United States. Auto sales in the U.S. experienced their best year since 2007, and in China nearly 22 million cars were sold in 2013, setting a new world record.
Central banks around the world continued with their massive synchronized easing in 2013, especially Japan, the U.S. and Europe.
The Federal Reserve maintained its quantitative easing (QE) program for the first eleven months of the year, purchasing $85 billion in Treasuries and mortgage-backed securities per month in an effort to stimulate the economy. The Fed announced in May that it was considering tapering the QE program but did not actually begin until December, when it reduced its bond purchases by $10 billion. This uncertainty as to when or if tapering would occur led to considerable interest rate volatility in the second half of the year.
Inflation in the U.S. has consistently been below 2 percent, and the global trend for inflation is similar, which allows global central bankers to comfortably maintain pro-growth policies.
Investment Highlights
Overview
The Holmes Macro Trends Fund rose 39.38 percent over the past year, outperforming its benchmark, the S&P Composite 1500 Index, which returned 32.79 percent. Overall, growth-oriented stocks outperformed the market during the second half of the year, reversing the trend from the first half of the year.
25
Because the fund is actively managed and holding period is generally not a consideration in investment decisions, the portfolio turnover rate may fluctuate from year to year as the fund adjusts its portfolio composition. The fund's annual portfolio turnover was, and is expected to continue to be, more than 100 percent.
Strengths
• Stock selection was very strong, especially in industrials, energy and consumer discretionary sectors.
• The fund's meaningful overweight in consumer discretion and its underweight position in telecommunications and utility sectors added to positive relative fund performance.
• MasterCard, Inc.,(1) Celgene Corp.(2) and Wabtec Corp.(3) were among the best positive contributors to fund performance.
Weaknesses
• The fund was underweight the financials sector, which outperformed.
• Cash was a drag on performance as the market rallied strongly.
• Investments in Apple, Inc.,(4) Peregrine Semiconductor Corp.(2) and Gran Colombia Gold Corp.(5) failed to live up to expectations and were among the worst contributors to the fund's performance.
Current Outlook
Opportunities
• The global economy is in the midst of a synchronized economic recovery, which bodes particularly well for cyclical and growth sectors. It appears the global outlook is the best it has been in some time.
• Corporate cash levels are high, providing corporations the ability to pursue mergers and acquisitions (M&A). An increase in M&A activity holds promise for both portfolio gains and an increase in overall market valuations.
Threats
• We believe Europe remains the largest wildcard. If the continent remains committed to austerity and political volatility continues, the continent will likely fall back into recession. China's leaders appear comfortable with slower growth. China has been a significant driver of global growth over the past decade, and if this is an era for new government policy, it puts global growth at risk.
26
• The market was very strong in 2013 and a short-term pullback wouldn't be a surprise.
• Deep value and price reversals led the market in 2012 and early 2013. If this trend were to reemerge, it would be a threat to relative performance.
(1)This security comprised 4.03% of the fund's total net assets as of 12/31/13.
(2)The fund did not hold this security as of 12/31/13.
(3)This security comprised 2.39% of the fund's total net assets as of 12/31/13.
(4)This security comprised 2.27% of the fund's total net assets as of 12/31/13.
(5)This security comprised 0.79% of the fund's total net assets as of 12/31/13.
27
Top 10 Holdings Based on Net Assets December 31, 2013
MasterCard, Inc.
Commercial Services - Financial | | | 4.03 | % | |
Chicago Bridge & Iron Co. N.V.
Building - Heavy Construction | | | 2.77 | % | |
Biogen Idec, Inc.
Medical - Biomedical/Gene | | | 2.75 | % | |
Michael Kors Holdings Ltd.
Apparel Manufacturers | | | 2.53 | % | |
Wabtec Corp.
Machinery - General Industrial | | | 2.39 | % | |
Apple, Inc.
Computers | | | 2.27 | % | |
Westlake Chemical Corp.
Chemicals - Diversified | | | 2.18 | % | |
Pacific Stone Tech, Inc.
Quarrying | | | 2.12 | % | |
Las Vegas Sands Corp.
Casino Hotels | | | 2.12 | % | |
Starbucks Corp.
Retail - Restaurants | | | 2.10 | % | |
Total Top 10 Holdings | | | 25.26 | % | |
Portfolio Allocation by Industry Sector*
Based on Total Investments December 31, 2013

* Summary information above may differ from the portfolio schedule included in the financial statements due to the use of different classifications of securities for presentation purposes.
28
Management Team's Perspective
Introduction
The Global Resources Fund (PSPFX and PIPFX) is a non-diversified natural resources fund with the principal objective of seeking long-term growth of capital while providing protection against inflation and monetary instability. The fund invests in companies involved in the exploration, production and processing of petroleum, natural gas, coal, alternative energies, chemicals, mining, iron and steel, and paper and forest products around the globe.
Performance Graph
Global Resources Fund
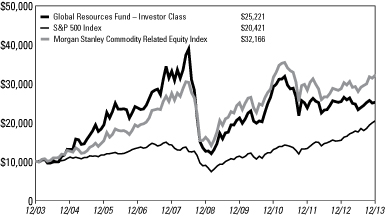
Average Annual Performance For the Periods Ended December 31, 2013
| | | One Year | | Five Year | | Ten Year | | Since Inception
(Institutional
Class) | |
Global Resources Fund - Investor Class | | | (0.72 | )% | | | 14.91 | % | | | 9.68 | % | | | n/a | | |
Global Resources Fund - Institutional Class
(Inception 3/1/10) | | | (0.15 | )% | | | n/a | | | | n/a | | | | 5.21 | % | |
S&P 500 Index | | | 32.38 | % | | | 17.91 | % | | | 7.39 | % | | | 16.54 | % | |
Morgan Stanley Commodity Related
Equity Index | | | 11.95 | % | | | 14.73 | % | | | 12.38 | % | | | 6.38 | % | |
Performance data quoted above is historical. Past performance is no guarantee of future results. Current performance may be higher or lower than the performance data quoted. The principal value and investment return of an investment will fluctuate so that an investor's shares, when redeemed, may be worth more or less than their original cost. The graph and table do not reflect the deduction of taxes that a shareholder would pay on fund distributions or the redemption of fund shares. For all or a portion of the periods, the fund had expense limitations, without which returns would have been lower.
Pursuant to a voluntary arrangement, the Adviser has agreed to limit total fund operating expenses (exclusive of any acquired fund fees and expenses, performance fees, taxes, brokerage commissions and interest) to not exceed 1.90% for the Investor Class. The Adviser can modify or terminate this arrangement at any time. The Adviser has contractually agreed to waive all class specific expenses of the Institutional Class through April 30, 2014.
See Definitions for Management Teams' Perspectives for index definitions.
Please visit our website at www.usfunds.com for updated performance information for different time periods.
29
The Year In Review - Economic And Political Issues That Affected The Fund
Commodities had a challenging year in 2013, as measured by the Dow Jones UBS Commodity Index, which posted a loss of 9.52% in 2013. This is its third consecutive annual decline, due in part to higher real interest rates and a stronger U.S. dollar, all of which led money flows away from hard assets and into stocks and other financial instruments. Consequently, the energy and basic materials sectors suffered, with the sectors trailing the S&P 500 Index by an average of 700 basis points during the year.
In the second quarter, the Federal Reserve hinted that policymakers could start to unwind the $85 billion per month bond-buying stimulus program, which induced a stock and bond market sell-off in June. However, this proved to be an overreaction, as the broader equity market recovered to new all-time highs by year-end despite a modest $10 billion-per-month trimming of the stimulus.
Ongoing concern over the U.S. government's federal budget deficit reached a boiling point this year and prompted the first partial government shutdown in 17 years. As many as 800,000 federal workers were furloughed at the start of the 16-day shutdown, causing a loss of as much as $24 billion or 0.6 percent of GDP to the world's largest economy.
China, the world's second largest economy and largest commodity importer, posted growth of 7.7 percent in 2013, just beating the government's 7.5 percent target, but far off the fast paced double-digit growth of the past. China's leadership during the year was preoccupied with controlling unbalanced growth in the country's economy in an effort to curb excessive fixed asset investment and an overheated property market. The new government is now attempting to switch the focus to domestic consumption, rather than fueling consumption growth abroad.
Investment Highlights
Overview
For the year ended December 31, 2013, the Investor Class of the Global Resources Fund declined 0.72 percent and the Institutional Class declined 0.15 percent, trailing the fund's benchmark, the Morgan Stanley Commodity Related Equity Index (CRX), which gained 11.95 percent.
Because the fund is actively managed and holding period is generally not a consideration in investment decisions, the portfolio turnover rate may fluctuate from year to year as the fund adjusts its portfolio composition. The fund's annual portfolio turnover was, and is expected to continue to be, more than 100 percent.
30
Strengths
• On an absolute basis, the precious metals group was the worst performing sub-sector in the natural resources area during the year. However, relative to the benchmark, the fund's overall holdings in gold, silver and platinum outperformed the three senior gold stocks that are included in the benchmark index. In particular, Franco-Nevada Corp.(1) added to fund performance in the year.
• Despite a spike in interest rates in 2013, the fund's holdings in master limited partnerships generated solid returns to the fund. Enterprise Products Partners L.P.,(2) Western Gas Partners L.P.(1) and Access Midstream Partners L.P.(3) were positive contributors to performance.
• The portfolio benefited from an allocation to oil & gas exploration and production stocks in the period as many of the companies in the portfolio profited from new unconventional drilling technologies that materially increased reserves and production. Pioneer Natural Resources Corp.,(4) Continental Resources, Inc.,(5) Gran Tierra Energy, Inc.(6) and BNK Petroleum, Inc.(7) were all positive contributors to performance.
Weaknesses
• Despite positive absolute performance within the food products sub-sector, the fund's underweighting throughout much of the year impaired relative performance. The fund's positions in BRF S.A.(8) and Minerva S.A.(9) materially underperformed the three food stocks in the CRX. Notably, Tyson Foods, Inc.(10) and Smithfield Foods, Inc.(1) were strong individual contributors to fund performance.
• The fund had an overweight position in junior natural resources stocks, which performed poorly as measured by a 28 percent decline in the S&P/TSX Venture Composite Index. Holdings that negatively affected performance included Gran Colombia Gold Corp.,(11) NGEx Resources, Inc.,(12) Pacific Coal Resources Ltd.(13) and Woulfe Mining Corp.(14)
• Concern over slowing economic growth in China weighed on the price of copper and related equities in 2013. Accordingly, copper equities were negatively impacted, including the fund's positions in Southern Copper Corp.,(1) First Quantum Minerals Ltd.(1) and Lundin Mining Corp.(1)
Current Outlook
Opportunities
• For 2014, we anticipate global growth will follow the U.S. economy's lead and accelerate as signs of growth have begun to emerge in Europe following its deepest recession in decades. Moreover, we believe the secular long-term trend of urbanization in China and other emerging market countries remains intact and will continue to support per-capita commodity consumption well into the next decade.
31
• The International Energy Agency estimated in its recent oil market report that demand will increase by 1.2 million barrels a day, or 1.3 percent, to 92.4 million barrels a day in 2014, increasing its projection from a prior report by 240,000 a day. U.S. fuel use rose above 20 million barrels a day in November for the first time since 2008.
• U.S. refiners, especially those with access to heavily discounted domestic crude oil, should continue to be some of the main beneficiaries of increasing U.S. crude oil production. By buying cheap domestic crude, refining it and selling the product at more expensive global prices, domestic refiners have been able to gain market share and earn higher profit margins.
• According to the American Chemicals Council (ACC), U.S. chemicals exports will increase 45 percent over the next five years. An increase in the production of shale gas is the primary reason for the resurgence of the U.S. chemicals sector, as lower natural gas prices give U.S. producers a cost advantage over global counterparts. The ACC report indicates that more than 50 projects worth $40 billion will be operational in the next few years.
Threats
• Capital flight out of emerging markets due to rising real interest rates in the U.S. and a strengthening dollar may cause further distress to emerging market countries with large current account deficits, which could disrupt global growth.
• Easy Fed policy supported the U.S. housing recovery and has provided a catalyst for the timber and forest sector. However, the Fed's recent $10 billion reduction in monthly bond purchases and the corresponding increase in interest rates could put an economic recovery at risk if the economy is not strong enough to weather higher rates.
• Growth expectations for China have softened given the government's efforts to curb unproductive growth through excess liquidity. Any further dip in expectations could have a detrimental impact on commodities and related equities.
(1) The fund did not hold this security as of 12/31/13.
(2) This security comprised 1.76% of the fund's total net assets as of 12/31/13.
(3) This security comprised 0.90% of the fund's total net assets as of 12/31/13.
(4) This security comprised 2.19% of the fund's total net assets as of 12/31/13.
(5) This security comprised 2.15% of the fund's total net assets as of 12/31/13.
(6) This security comprised 1.16% of the fund's total net assets as of 12/31/13.
(7) This security comprised 0.21% of the fund's total net assets as of 12/31/13.
(8) This security comprised 1.02% of the fund's total net assets as of 12/31/13.
(9) This security comprised 0.94% of the fund's total net assets as of 12/31/13.
(10)This security comprised 2.58% of the fund's total net assets as of 12/31/13.
(11)This security comprised 2.48% of the fund's total net assets as of 12/31/13.
(12)This security comprised 0.56% of the fund's total net assets as of 12/31/13.
(13)This security comprised 0.36% of the fund's total net assets as of 12/31/13.
(14)This security comprised 0.23% of the fund's total net assets as of 12/31/13.
32
Top 10 Holdings Based on Net Assets December 31, 2013
BHP Billiton Ltd.
Diversified Minerals | | | 3.34 | % | |
Freeport-McMoRan Copper & Gold, Inc.
Metal - Copper | | | 2.75 | % | |
International Paper Co.
Paper & Related Products | | | 2.60 | % | |
Tyson Foods, Inc.
Food - Meat Products | | | 2.58 | % | |
Pacific Infrastructure Ventures, Inc.
Real Estate Operating/Development | | | 2.57 | % | |
Gran Colombia Gold Corp.
Gold Mining | | | 2.48 | % | |
Pioneer Natural Resources Co.
Oil Companies - Exploration & Production | | | 2.19 | % | |
Continental Resources, Inc.
Oil Companies - Exploration & Production | | | 2.15 | % | |
Randgold Resources Ltd.
Gold Mining | | | 2.00 | % | |
EQT Corp.
Oil Companies - Exploration & Production | | | 1.90 | % | |
Total Top 10 Holdings | | | 24.56 | % | |
33
Portfolio Allocation by Industry Sector*
Based on Total Investments December 31, 2013
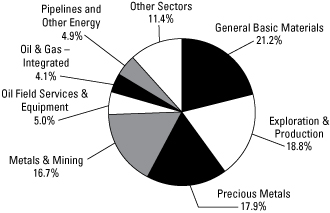
Energy: | |
Oil & Gas Exploration & Production | | | 18.8 | % | | | |
Oil & Gas Equipment & Services | | | 5.0 | % | | | |
Oil & Gas - Integrated (includes Refining and
Marketing) | | | 4.1 | % | | | |
Pipelines and Other Energy | | | 4.9 | % | | | |
Total Energy | | | | | 32.8 | % | |
Basic Materials: | |
Precious Metals (includes Gold/Silver Mining and
Platinum) | | | 17.9 | % | | | |
General Basic Materials | | | 21.2 | % | | | |
Metals & Mining (includes Copper and Coal) | | | 16.7 | % | | | |
Total Basic Materials | | | | | 55.8 | % | |
Other Sectors | | | | | 11.4 | % | |
| | | | 100.0 | % | |
* Summary information above may differ from the portfolio schedule included in the financial statements due to the use of different classifications of securities for presentation purposes.
34
Precious Metals and Minerals Funds
Management Team's Perspective
Introduction
The World Precious Minerals Fund (UNWPX and UNWIX) and the Gold and Precious Metals Fund (USERX) pursue an objective of long-term capital growth through investments in gold, precious metals and mining companies. The Gold and Precious Metals Fund focuses on the equity securities of established gold and precious metals companies and pursues current income as a secondary objective. The World Precious Minerals Fund focuses on equity securities of companies principally engaged in the exploration, mining and processing of precious minerals such as gold, silver, platinum and diamonds. Although this fund has the latitude to invest in a broad range of precious minerals, it currently remains focused on the gold sector.
Performance Graphs
World Precious Minerals Fund

Average Annual Performance For the Periods Ended December 31, 2013
| | | One Year | | Five Year | | Ten Year | | Since Inception
(Institutional
Class) | |
World Precious Minerals Fund - Investor Class | | | (51.37 | )% | | | (4.32 | )% | | | (0.68 | )% | | | n/a | | |
World Precious Minerals Fund - Institutional
Class (Inception 3/1/10) | | | (51.07 | )% | | | n/a | | | | n/a | | | | (19.55 | )% | |
S&P 500 Index | | | 32.38 | % | | | 17.91 | % | | | 7.39 | % | | | 16.54 | % | |
NYSE Arca Gold Miners Index* | | | (54.42 | )% | | | (8.73 | )% | | | (2.57 | )% | | | (17.57 | )% | |
* These are not total returns. These returns reflect simple appreciation only and do not reflect dividend reinvestment.
Performance data quoted above is historical. Past performance is no guarantee of future results. Current performance may be higher or lower than the performance data quoted. The principal value and investment return of an investment will fluctuate so that an investor's shares, when redeemed, may be worth more or less than their original cost. The graph and table do not reflect the deduction of taxes that a shareholder would pay on fund distributions or the redemption of fund shares. For all or a portion of the periods, the fund had expense limitations, without which returns would have been lower.
Pursuant to a voluntary arrangement, the Adviser has agreed to limit total fund operating expenses (exclusive of any acquired fund fees and expenses, performance fees, taxes, brokerage commissions and interest) to not exceed 1.90% for the Investor Class. Also pursuant to a voluntary agreement, the Adviser has agreed to waive all class specific expenses of the Institutional Class. The Adviser can modify or terminate these arrangements at any time.
See Definitions for Management Teams' Perspectives for index definitions.
Please visit our website at www.usfunds.com for updated performance information for different time periods.
35
Precious Metals and Minerals Funds
Gold and Precious Metals Fund
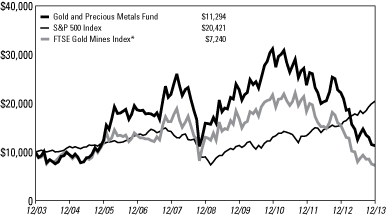
Average Annual Performance For the Years Ended
December 31, 2013
| | | One Year | | Five Year | | Ten Year | |
Gold and Precious Metals Fund | | | (49.07 | )% | | | (6.62 | )% | | | 1.22 | % | |
S&P 500 Index | | | 32.38 | % | | | 17.91 | % | | | 7.39 | % | |
FTSE Gold Mines Index* | | | (53.17 | )% | | | (11.03 | )% | | | (3.18 | )% | |
* These are not total returns. These returns reflect simple appreciation only and do not reflect dividend reinvestment.
Performance data quoted above is historical. Past performance is no guarantee of future results. Current performance may be higher or lower than the performance data quoted. The principal value and investment return of an investment will fluctuate so that an investor's shares, when redeemed, may be worth more or less than their original cost. The graph and table do not reflect the deduction of taxes that a shareholder would pay on fund distributions or the redemption of fund shares. For all or a portion of the periods, the fund had expense limitations, without which returns would have been lower.
Pursuant to a voluntary arrangement, the Adviser has agreed to limit total fund operating expenses (exclusive of any acquired fund fees and expenses, performance fees, taxes, brokerage commissions and interest) to not exceed 1.90%. The Adviser can modify or terminate this arrangement at any time.
See Definitions for Management Teams' Perspectives for index definitions.
Please visit our website at www.usfunds.com for updated performance information for different time periods.
The Year In Review - Economic And Political Issues That Affected The Funds
Gold bullion lost 28.04 percent for the year, which was its first annual decline since 2000 and its worst yearly decline since 1981, in what marked a very turbulent year for precious metals. In contrast to the negative price action in gold, total assets of the Federal Reserve's balance sheet have surpassed $4 trillion, a previously inconceivable size. The historical correlation between the expansion of the U.S. balance sheet and the price of gold over the past decade suggests we should see much higher prices for gold.
36
Precious Metals and Minerals Funds
Despite reports that some investors lost faith in gold, total consumer demand for gold is estimated to exceed a record-breaking 3,300 tonnes in 2013. In addition, the sales of gold jewelry pieces rose 20 percent from the previous year, largely due to increased demand from China. Similarly, central banks purchased almost 300 tonnes during the first nine months of the year.
Initial incorrect reports of weak demand in China during the Chinese New Year celebrations set gold prices on a slippery footing early in the year. This weakness was further exacerbated on February 15 when SEC filings showed that Soros Fund Management and Moore Capital had liquidated a significant amount of their U.S.-held ETF gold investments in the fourth quarter of 2012. The ensuing sell-off sent gold prices crashing down below $1,600 per ounce.
In April, information concerning gold ETF liquidations for the first quarter garnered headlines, with investors redeeming a record $9.16 billion from gold ETFs. In concert, the major brokerage houses in the U.S. repeatedly pronounced that the gold cycle had run its course and that it was now time to invest aggressively in the broader markets as the U.S. economy was de-risked. The sell-off intensified during the second quarter of 2013 as investors saw one of the biggest quarterly price declines of this 10-plus year cycle in gold bullion and gold equity prices, as ETF holdings of bullion fell another 16.5 percent. For the year in review, total known gold ETF holdings had their first ever decline at 33 percent after nine consecutive years of increases.
Likely the biggest story for the year, other than the price decline, was the intense demand for physical gold following the significant price declines in the second quarter. In April, the Chinese Gold & Silver Society in Hong Kong reported it had sold out of all of its spot gold and placed orders to Switzerland four times larger than normal to keep up with demand. Most bearish analysts expected this physical demand to be short-lived, but the physical buyers, mostly from China, stood by gold and were instrumental in holding the prices above the $1,200 per ounce level. This thesis is supported by the fact that Chinese net gold imports from Hong Kong roughly doubled from 2012, to 1,043 tonnes through November. Premiums for gold physical delivery in Shanghai jumped to a staggering $34.82 per ounce. India saw physical delivery premiums soar above $100 per ounce. The likely conclusion is that Asia has been buying the dip in large amounts.
During the fourth quarter, unusual gold trades on the futures markets were reported almost daily. Market orders representing up to 2 million ounces each, or around $2.6 billion, were shown to the markets only to be later cancelled. It is safe to say no one has anywhere near that amount of physical gold for delivery, apart from the big central banks, so the trades were likely placed by entities trading gold they cannot deliver. The sort of decoupling between physical demand and investor demand seen over the course of the year in review is unsustainable going forward.
37
Precious Metals and Minerals Funds
Investment Highlights
For the year ended December 31, 2013, the World Precious Minerals Fund's Investor Class declined 51.37 percent and the Institutional Class lost 51.07 percent. The fund's benchmark, the NYSE Arca Gold Miners Index, decreased 53.62 percent on a total return basis. The strategy of the World Precious Minerals Fund favors junior (exploration and development) stocks and mid-tiered producing stocks. These lower-capitalization stocks have historically outperformed senior gold mining companies over longer time periods, as senior gold miners have typically acquired proven assets of junior gold companies rather than explored for new mining projects with capital-constrained budgets. Small capitalization stocks, having less access to capital in turbulent markets when investor confidence is lower, underperformed in the prior year. However, this trend reversed in 2013, perhaps signaling a shift in the hierarchy back to more normal markets where small capitalization stocks tend to outperform the biggest companies of the industry. In fact, two of the fund's largest holdings, Klondex Mines Ltd.(1) and Virginia Mines, Inc.,(2) gained 20.57 percent and 6.33 percent, respectively, for the year.
The Gold and Precious Metals Fund fell 49.07 percent in 2013, outperforming its benchmark, the FTSE Gold Mines Index, which decreased 52.21 percent on a total return basis. While focusing on established, producing gold companies, the Gold and Precious Metals Fund holds a higher weighting of mid-tier stocks compared to its benchmark. The fund strongly outperformed its benchmark in the first half of the year as the senior gold mining companies reduced their production guidance and faced significant write downs in the carrying value of certain assets from prior acquisitions due to the steep decline in gold prices. The difference gained over this period was maintained in the second portion of the year.
Both funds maintained a defensive investment position throughout much of the past year with higher-than-average cash balances on hand to protect the liquidity of the funds. However, to maintain varying degrees of investment exposure to the gold market, the funds employed a number of rolling call option positions that helped hedge the funds' benchmark risk and provide optionality to upswings to gold stocks.
Spot gold finished the period at $1,205.65 per ounce, down $469.70, or 28.04 percent for the year. The S&P 500 Index posted a positive return of 32.38 percent, the U.S. Trade Weighted Dollar Index rose 0.33 percent and the yield on a 90-day Treasury bill finished the period at 0.07 percent.
Strengths
• Klondex Mines Ltd. was the largest contributor to performance for the World Precious Minerals Fund, as well as the second-best performing position for the Gold and Precious Metals Fund. Under new management, Klondex continued to develop one of the highest grade undeveloped mines in the world, in Nevada, one
38
Precious Metals and Minerals Funds
of the safest mining jurisdictions. In addition, the company initially began production of very high grade material being refined by third parties, but most recently the company entered into an agreement to purchase the Midas Mine and Mill from Newmont Mining Corp.,(3) allowing it to refine its own ore.
• SEMAFO, Inc.(4) was the largest contributor to performance for the Gold and Precious Metals Fund and contributed positively to the World Precious Minerals Fund. In the third quarter, the company announced a higher-grade discovery at its flagship property in Burkina Faso, which management claims would enhance the overall production grade and lower costs in coming years.
• Virginia Mines, Inc. was the second-largest contributor to performance for the World Precious Minerals Fund. The company continues to receive payments from Goldcorp, Inc.(5) as part of the royalty agreement through which it ceded control of the Eleanore asset to Goldcorp. Goldcorp is advancing rapidly toward production. These royalty payments have allowed Virginia Mines to continue investing in its exploration assets, which produced encouraging results during 2013.
Weaknesses
• Dundee Precious Metals, Inc.(6) was the worst performer for the Gold and Precious Minerals Fund and the second-worst performer for the World Precious Minerals Fund. Despite posting slightly acceptable operating results, the company lowered its future earnings guidance. In addition, the company faced delays in the refurbishment of the Tsumeb smelter in Namibia and uncertainty with respect to permitting on its Krumovgrad project in Bulgaria.
• Gran Colombia Gold Corp.(7) was the second-worst performer for the Gold and Precious Minerals Fund and the worst performer for the World Precious Minerals Fund. Despite the successful implementation of cost-cutting plans, positive drilling results and visibly improved execution, the company continues to be a high-cost producer and is struggling to regain investors' faith in a depressed gold sector.
• NGEx Resources, Inc.(8) was another significant detractor to the performance of the World Precious Minerals Fund. NGEx is a copper exploration and development company with a flagship project in the Chilean Andes. Despite excellent exploration results, the company has been under pressure due to tax loss selling. The shares are expected to rebound since its discovery is in close proximity to a Japanese milling facility, and NGEx's ore body is double the gold and copper content of the milling facility's current source for ore.
• Both funds were negatively affected by Yamana Gold, Inc.(9) The company performed in-line with the majority of the gold names; however, the effect on the funds' performance was larger due to the position size in the funds.
39
Precious Metals and Minerals Funds
Current Outlook
Opportunities
• The debasement of the U.S. dollar seems to be the path of least resistance. With the U.S. federal debt exceeding $16 trillion and the off-balance sheet liabilities exceeding $60 trillion, the country is attempting to service $76 trillion in debt with $2.5 trillion in revenue, while spending $3.6 trillion annually. It is no surprise that Goldman Sachs believes the dollar will no longer be among the best performing currencies in 2014. Fed tapering is already priced in, and there seems to be no other sources of dollar strength in sight, according to Goldman Sachs.
• On a related note, the Chinese yuan overtook the euro to become the second-most-used currency in global trade finance in 2013. The announcement bodes well for gold in the long term as the People's Bank of China is likely to continue strengthening its foreign reserves with gold. This action should give a stronger backing to the Asian nation's currency. The news comes after The Wall Street Journal published an article saying China's reforms may boost gold investments in the country by introducing policies that make it easier for investors to access gold investments. The implications are substantial. Despite China becoming the largest global gold consumer in 2013, the per capita consumption is 4.5 grams, compared with a 24 gram global average.
• Randgold Resources Ltd.'s(10) CEO Mark Bristow, one of the most respected executives in the sector, argues that the industry must move its cut-off grades higher to return to profitability. The mining and reserve grades have halved, forcing gold producers to increase their inputs by 50 percent to keep their output rates stable. On a different note, Paradigm Capital illustrated how global total cash costs for gold producers dropped 27 percent from 1996 to 1999 in response to a 28 percent decrease in the average gold price during those years. Paradigm estimates that a $150 to $200 per ounce reduction in all-in costs should be possible by the end of 2014.
Threats
• According to David Rosenberg of Gluskin Sheff, wage inflation is a key source of upside risks to U.S. growth in 2014 and is not on the radar screen. The recent Beige Book had abundant anecdotal evidence highlighting shortages in high skilled jobs. With the Fed still consumed with deflation fears and job firings already 20 percent below 2007 levels, Rosenberg argues that inflation is likely to surprise to the upside. In such an environment, gold is likely to regain strength on the basis of its hedging qualities. In addition, the areas of consumer spending that showed the greatest positive sensitivity to periods of rising wage growth include jewelry and electronics. Both are sectors that may provide incremental demand for gold and silver.
40
Precious Metals and Minerals Funds
• Fred Hickey, editor of The High-Tech Strategist newsletter, says, "fear has simply left the building" when it comes to the broad equity market. The Investors Intelligence Sentiment survey reports that only 14.4 percent of respondents are bearish on the market, a level only seen leading into the 1987 crash. In addition, the Shiller P/E ratio for the S&P 500 is now over 25, a level seen only three times in the past: 1929, 2000 and 2007.
• ABN AMRO, the largest Dutch bank, announced in Spring 2013 that it would be unable to deliver physical gold on customers' gold claims and would instead offer a paper gold claim to its customers. The bank made the paper gold claim appear as valuable as the physical gold claim without telling investors the new "product" is subject to the bank's credit risk as well as to market speculation. In the same vein, but on a much more ominous scale, Germany, which requested the return of its gold, was told by the Fed that it will take some seven years before its 300 tonnes held by the U.S. could be mobilized for a return. By year-end, total gold available for delivery at the COMEX was at record low levels, with deliverable gold down nearly 80 percent for the year.
(1) This security comprised 6.46% of the total net assets of the World Precious Minerals Fund and 6.16% of the Gold and Precious Metals Fund as of 12/31/13.
(2) This security comprised 6.62% of the total net assets of the World Precious Minerals Fund and 0.00% of the Gold and Precious Metals Fund as of 12/31/13.
(3) This security comprised 0.16% of the total net assets of the World Precious Minerals Fund and 0.18% of the Gold and Precious Metals Fund as of 12/31/13.
(4) This security comprised 1.53% of the total net assets of the World Precious Minerals Fund and 3.52% of the Gold and Precious Metals Fund as of 12/31/13.
(5) This security comprised 0.19% of the total net assets of the World Precious Minerals Fund and 0.21% of the Gold and Precious Metals Fund as of 12/31/13.
(6) This security comprised 2.18% of the total net assets of the World Precious Minerals Fund and 3.90% of the Gold and Precious Metals Fund as of 12/31/13.
(7) This security comprised 6.27% of the total net assets of the World Precious Minerals Fund and 5.80% of the Gold and Precious Metals Fund as of 12/31/13.
(8) This security comprised 2.43% of the total net assets of the World Precious Minerals Fund and 0.00% of the Gold and Precious Metals Fund as of 12/31/13.
(9) This security comprised 1.02% of the total net assets of the World Precious Minerals Fund and 2.40% of the Gold and Precious Metals Fund as of 12/31/13.
(10)This security comprised 1.05% of the total net assets of the World Precious Minerals Fund and 1.83% of the Gold and Precious Metals Fund as of 12/31/13.
41
Precious Metals and Minerals Funds
World Precious Minerals Fund
Top 10 Holdings Based on Net Assets December 31, 2013
Virginia Mines, Inc.
Gold Mining | | | 6.62 | % | |
Klondex Mines Ltd.
Gold Mining | | | 6.46 | % | |
Gran Colombia Gold Corp.
Gold Mining | | | 6.27 | % | |
MAG Silver Corp.
Silver Mining | | | 3.07 | % | |
Imperial Metals Corp.
Metal - Diversified | | | 2.81 | % | |
Pretium Resources, Inc.
Gold Mining | | | 2.43 | % | |
NGEx Resources, Inc.
Gold Mining | | | 2.43 | % | |
Comstock Mining, Inc.
Gold Mining | | | 2.43 | % | |
Alamos Gold, Inc.
Gold Mining | | | 2.25 | % | |
Dundee Precious Metals, Inc.
Gold Mining | | | 2.18 | % | |
Total Top 10 Holdings | | | 36.95 | % | |
Portfolio Allocation by Industry*
Based on Total Investments December 31, 2013
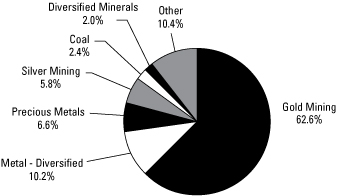
* Summary information above may differ from the portfolio schedule included in the financial statements due to the use of different classifications of securities for presentation purposes.
42
Precious Metals and Minerals Funds
Gold and Precious Metals Fund
Top 10 Holdings Based on Net Assets December 31, 2013
Klondex Mines Ltd.
Gold Mining | | | 6.16 | % | |
Gran Colombia Gold Corp.
Gold Mining | | | 5.80 | % | |
Comstock Mining, Inc.
Gold Mining | | | 4.36 | % | |
Dundee Precious Metals, Inc.
Gold Mining | | | 3.90 | % | |
SPDR Gold Trust
Exchange-Traded Fund | | | 3.88 | % | |
SEMAFO, Inc.
Gold Mining | | | 3.52 | % | |
Atlas Energy L.P.
Pipelines | | | 3.45 | % | |
Nevsun Resources Ltd.
Gold Mining | | | 3.11 | % | |
Osisko Mining Corp.
Gold Mining | | | 3.00 | % | |
Barrick Gold Corp.
Gold Mining | | | 2.96 | % | |
Total Top 10 Holdings | | | 40.14 | % | |
Portfolio Allocation by Industry*
Based on Total Investments December 31, 2013

* Summary information above may differ from the portfolio schedule included in the financial statements due to the use of different classifications of securities for presentation purposes.
43
Management Team's Perspective
Introduction
The investment objective of the Emerging Europe Fund (EUROX) is to achieve long-term capital growth by investing in a non-diversified portfolio of equity securities of companies located in the emerging markets of Europe.(1)
Performance Graph
Emerging Europe Fund
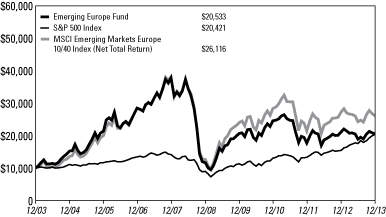
Average Annual Performance For the Years Ended
December 31, 2013
| | | One Year | | Five Year | | Ten Year | |
Emerging Europe Fund | | | (2.93 | )% | | | 11.98 | % | | | 7.45 | % | |
S&P 500 Index | | | 32.38 | % | | | 17.91 | % | | | 7.39 | % | |
MSCI Emerging Markets Europe 10/40 Index
(Net Total Return) | | | (4.36 | )% | | | 15.59 | % | | | 10.07 | % | |
Performance data quoted above is historical. Past performance is no guarantee of future results. Current performance may be higher or lower than the performance data quoted. The principal value and investment return of an investment will fluctuate so that an investor's shares, when redeemed, may be worth more or less than their original cost. The graph and table do not reflect the deduction of taxes that a shareholder would pay on fund distributions or the redemption of fund shares. For all or a portion of the periods, the fund had expense limitations, without which returns would have been lower.
Pursuant to a voluntary arrangement, the Adviser has agreed to limit total fund operating expenses (exclusive of any acquired fund fees and expenses, performance fees, taxes, brokerage commissions and interest) to not exceed 2.85%. The Adviser can modify or terminate this arrangement at any time.
See Definitions for Management Teams' Perspectives for index definitions.
Please visit our website at www.usfunds.com for updated performance information for different time periods.
44
The Year In Review - Economic And Political Issues That Affected The Fund
Russian inflation decelerated slightly in the second half of the year after rising at the fastest pace since 2010 in the first half of 2013. The official consumer price index measure rose to 6.5 percent in December from a year ago, 50 basis points above the 6 percent cap of the central bank's target range. Throughout 2013, the official consumer price index measure stayed above the 6 percent top of the channel guided by the central bank. Persistently high inflation continues to limit the ability of the central bank to ease monetary conditions, which are deemed necessary to spur anemic economic growth. As a result, the government has pressed private banks to ease lending conditions by compressing their net interest margins to help spur a credit-driven economic expansion.
In the Czech Republic, the worst flooding in at least a decade left damage totaling as much as $1.78 billion. This resulted in a further 0.7 percent decrease in GDP growth for 2013 in an economy which has recorded negative GDP for seven consecutive quarters. On a positive note, the negative GDP trend appears to be reversing on the back of a stronger-than-expected recovery in Germany and other developed nations in the continent. The Czech Republic is a major exporter to the Eurozone, with roughly 80 percent of its trade being absorbed by the common-currency area. In addition, low inflation enabled the central bank to institute a monetary easing policy, including a steady depreciation of the Czech koruna, providing a boost to the export sector.
With economic growth below 1 percent at the beginning of the year and inflation dropping quickly, Poland introduced several cuts to its benchmark rate, thus easing credit growth conditions. The resulting upswing in GDP led to an outperformance of Polish stocks over the course of the year. On the negative side, the Polish government has introduced a plan to overhaul its pension system to curb the country's public debt as tax revenues fall short. Poland's finance minister recommended transferring 16.2 million Poles back to the state-run pension system in an effort to relieve mounting pressure on the fiscal budget. The reform, however, increases longer-term fiscal risks and puts less pressure on the administration to press ahead with much-needed structural reforms.
In Hungary, an aggressive monetary easing program, which brought benchmark rates down to 3 percent from 5.75 percent at the beginning of the year, helped the country exit its second recession in the last 5 years.
Moody's Investors Service upgraded Turkey's credit rating from Ba1 to Baa3 with a stable outlook, bringing about the long-awaited second investment grade rating, following Fitch's upgrade in November 2012. The agency highlighted the recent and expected improvements in finance metrics as well as noticeable progress on structural and institutional reforms.
45
Unfortunately for the Turkish market, the nation's large current account deficit was an impediment to its currency, which depreciated over 20 percent for the year. In addition, Turkey had largely non-violent protests over the summer as protesters in Istanbul and other cities opposed what they perceive as government encroachment on their private lives. The same social issues, such as the role of religion in public life, are part of the fabric of the debate in the United States and Europe, and young Turks are standing up for the secular lifestyle they have taken for granted before. A third situation that weighed heavily on the market and heightened political tensions was the confrontation between Prime Minister Recep Tayyip Erdogan and his cabinet and the police chiefs who raided and arrested members of their families under a corruption investigation.
Investment Highlights
Overview
For the year ended December 31, 2013, the fund declined 2.93 percent, while the benchmark MSCI Emerging Markets Europe 10/40 Index (Net Total Return) lost 4.36 percent.
Greece, Hungary and Poland outperformed the index, while the Czech Republic and Turkey underperformed. Russian equities, which comprise more than half of the index, also outperformed the index. On a sector basis, consumer discretionary and staples, telecom, healthcare and energy were the best-performing sectors, while utilities, materials and information technology underperformed.
Strengths
• Stock selection in Russia had the most positive effect on the performance of the fund relative to the benchmark. Two top holdings, grocery chain Magnit OJSC(2) and Mobile Telesystems OJSC,(3) beat both the benchmark and the Russian MICEX Index.
• The fund's holdings in the frontier markets, such as Georgia and Kazakhstan, had positive total returns.
• The fund's overweight position in European-listed stocks with direct exposure to emerging Europe had a positive effect on the performance of the fund relative to the benchmark.
Weaknesses
• The fund's Canadian-listed securities (with operations in emerging Europe), such as Dundee Precious Metals, Inc.(4) and Orsu Metals Corp.,(5) underperformed the benchmark index and, on the aggregate, were the largest negative contributor to the performance of the fund.
46
• Turkish stocks had a negative impact on the fund's absolute performance. After the social unrest over the summer, the country also found itself immersed in a political crisis over corruption claims at the top levels of government.
• The fund's holdings in the Czech Republic underperformed their peers in the benchmark. The effect of this underperformance, however, was partially offset by a currency hedge against the expected Czech koruna devaluation, which took place in November.
Current Outlook
Opportunities
• The European Central Bank (ECB) is committed to "low interest rates for an extended period of time," which should be positive for emerging markets in the periphery. In addition, after almost six years of crisis, the European Commission announced it expected the 27-nation European Union (EU) to emerge from recession as of the fourth quarter of 2013, with economic expansion accelerating to 1.4 percent in 2014. The Commission stated that easy monetary policies and the scaling back of austerity measures bode well for a recovery.
• China's premier, Li Keqiang, announced the reaching of an agreement with Hungary and Serbia to assist in building a railway between the two Eastern European countries. The project is set to jumpstart greater cooperation between China and Central and Eastern European countries. China, which now boasts the world's second-largest railway network and the longest mileage of high-speed rail tracks, can assist in the needs of Central and Eastern European countries for modern transportation and infrastructure.
• In the short term, Turkey will continue to show vulnerability to higher U.S. interest rates due to its large external financing needs; however, the long-term prospects for the economy are among the more favorable in the emerging world. Deutsche Bank strategists believe the Eastern European country is well placed to ascend the rankings of the world's largest economies over the next 15 years. Aided by a young and growing population, a well-diversified exports sector and relatively low levels of public and private leverage, the Turkish economy is set to overtake Spain, Canada and Italy to become the world's thirteenth largest economy as measured by purchasing power parity.
Threats
• Bank of America Merrill Lynch's double upgrade of Turkish stocks from underweight to overweight fell on deaf ears as the Turkish lira tumbled to a record against the dollar when Prime Minister Erdogan's government purged police leadership in a fight back against a probe into official corruption. In addition, EU Enlargement Commissioner Stefan Fule said he was concerned by "the removal of a large number of police officers from their duties" and urged Turkey to "take all the necessary measures to ensure that allegations of wrongdoing are addressed
47
without discrimination." The EU warning threatens Turkey's ambitions of joining the common-market union.
• The European Commission lowered its 2014 Eurozone economic growth forecast to 1.1 percent, as it expects unemployment to remain high at 12.2 percent. The Commission anticipates that the majority of core countries will gain momentum in 2014; however, it warned that Spain, Greece, Italy and Portugal will continue to experience much weaker growth.
• Russia's Economic Ministry officially downgraded the country's GDP growth rate for 2013 and 2014. According to the Kremlin, economic growth for 2013 is now expected to reach only 1.4 percent, compared to the previous 1.8 percent, and 2014 growth has been cut by 50 basis points to 2.5 percent, significantly below the global economic growth of roughly 3.5 percent. Concurrently, Russia's central bank left interest rates unchanged for the fifteenth consecutive month after inflation continued to breach above the central bank target of 5 percent to 6 percent.
(1)The following countries are considered to be in the emerging Europe region: Albania, Armenia, Azerbaijan, Belarus, Bulgaria, Croatia, Czech Republic, Estonia, FYR Macedonia, Georgia, Hungary, Latvia, Lithuania, Moldova, Poland, Romania, Russia, Slovakia, Slovenia, Turkey and Ukraine.
(2)This security comprised 5.28% of the fund's total net assets as of 12/31/13.
(3)This security comprised 5.22% of the fund's total net assets as of 12/31/13.
(4)This security comprised 0.71% of the fund's total net assets as of 12/31/13.
(5)This security comprised 0.20% of the fund's total net assets as of 12/31/13.
48
Top 10 Holdings Based on Net Assets December 31, 2013
Sberbank of Russia
Commercial Banks - Non US | | | 5.44 | % | |
Magnit OJSC
Food - Retail | | | 5.28 | % | |
Mobile TeleSystems OJSC
Cellular Telecommunication | | | 5.22 | % | |
Lukoil OAO
Oil Companies - Integrated | | | 5.04 | % | |
Erste Group Bank AG
Commercial Banks - Non US | | | 4.51 | % | |
NovaTek OAO
Oil Companies - Exploration & Production | | | 4.31 | % | |
Gazprom OAO
Oil Companies - Integrated | | | 4.24 | % | |
Mail.ru Group Ltd.
Web Portals/Internet Service Providers | | | 3.64 | % | |
Tofas Turk Otomobil Fabrikasi A.S.
Automotive - Cars & Light Trucks | | | 3.63 | % | |
Yandex N.V.
Web Portals/Internet Service Providers | | | 3.10 | % | |
Total Top 10 Holdings | | | 44.41 | % | |
Country Distribution*
Based on Total Investments December 31, 2013
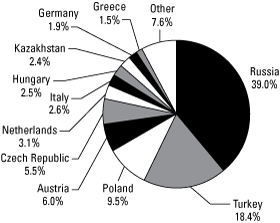
* Country distribution shown is based on domicile. The locale of company operations may be different.
49
Management Team's Perspective
Introduction
The China Region Fund (USCOX) seeks long-term growth of capital. The fund invests in both established and emerging companies registered and operating in the China region.(1)
Performance Graph
China Region Fund
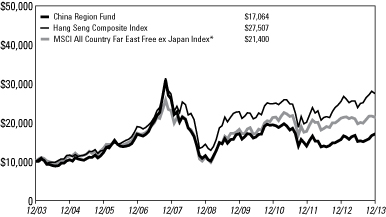
Average Annual Performance For the Years Ended
December 31, 2013
| | | One Year | | Five Year | | Ten Year | |
China Region Fund | | | 9.07 | % | | | 8.27 | % | | | 5.48 | % | |
Hang Seng Composite Index | | | 8.11 | % | | | 13.77 | % | | | 10.64 | % | |
MSCI All Country Far East Free ex Japan Index* | | | 1.28 | % | | | 14.06 | % | | | 7.90 | % | |
* These are not total returns. These returns reflect simple appreciation only and do not reflect dividend reinvestment.
Performance data quoted above is historical. Past performance is no guarantee of future results. Current performance may be higher or lower than the performance data quoted. The principal value and investment return of an investment will fluctuate so that an investor's shares, when redeemed, may be worth more or less than their original cost. The graph and table do not reflect the deduction of taxes that a shareholder would pay on fund distributions or the redemption of fund shares. For all or a portion of the periods, the fund had expense limitations, without which returns would have been lower.
Pursuant to a voluntary arrangement, the Adviser has agreed to limit total fund operating expenses (exclusive of any acquired fund fees and expenses, performance fees, taxes, brokerage commissions and interest) to not exceed 2.55%. The Adviser can modify or terminate this arrangement at any time.
See Definitions for Management Teams' Perspectives for index definitions.
Please visit our website at www.usfunds.com for updated performance information for different time periods.
50
The Year In Review - Economic And Political Issues That Affected The Fund
The year 2013 saw a brand new Chinese leadership team, led by President Xi Jinping and Prime Minister Li Keqiang, who were officially sworn in. Both are advocates of systemic reform and rebalancing growth. The key message from the Third Plenary of the 18th Party Congress in November was to allow the market to play a more decisive role in allocating resources.
A high profile, top down anti-corruption campaign nationwide has resulted in more than 180,000 party officials of various levels being investigated and punished in 2013. Sales at high-end restaurants and catering services suffered as a consequence. Industries featuring prominent police arrests exhibited rising volatility during the year.
The pollution issue was elevated on the government's agenda since January's media exposure of severe atmospheric contamination in Beijing and the official rollout of standard air quality forecasts. In December, at the Central Economic Work Conference attended by top leadership, environmental degradation was emphasized twice and associated with social stability.
While Prime Minister Keqiang indicated in July that the country's reform effort would be combined with a growth floor below which policy intervention is necessary, the new policymaking team seemed to have a higher tolerance for slower growth in exchange for better quality, a stark departure from the growth-at-any-cost mentality characterizing previous administrations.
With GDP growth stable at 7.7 percent, slightly exceeding the full-year target of 7.5 percent, the new government has concentrated on reform measures including local government debt supervision, interest rate liberalization, environmental protection, housing supply increase, industry consolidation and innovation, technology upgrades, and food supply safety.
For years after the global financial crisis, countries in Southeast Asia have been primary beneficiaries of capital inflows because of the quantitative easing programs initiated by the U.S. Federal Reserve. Local consumers grew increasingly more confident than their counterparts in developed countries, which, over time, manifested itself in the form of a current account deficit. This, coupled with rising inflationary pressure, weakened those countries' currencies. Rising fear of the Fed's intention to taper its quantitative easing program in May eventually brought about a vicious sell-off in Southeast Asian stock markets in the third quarter.
51
Investment Highlights
Overview
For the year ended December 31, 2013, the China Region Fund returned 9.07 percent, outperforming the benchmark Hang Seng Composite Index (HSCI), which gained 8.11 percent.
Because the fund is actively managed and holding period is generally not a consideration in investment decisions, the portfolio turnover rate may fluctuate from year to year as the fund adjusts its portfolio composition. The fund's annual portfolio turnover was, and is expected to continue to be, more than 100 percent.
Strengths
• The fund's country allocation to Hong Kong and China made the most positive contribution to overall outperformance against the benchmark for the year.
• Equally successful was industry allocation in consumer goods, consumer services and technology, all of which the fund overweighted. The fund had underweight positions in energy and telecommunications, which were among the worst performers in the benchmark for the year.
• Galaxy Entertainment Group Ltd.,(2) Tencent Holdings Ltd.(3) and Biostime International Holdings Ltd.(4) finished the year as the top three positive contributors to fund performance.
Weaknesses
• Country allocation in the Philippines, Indonesia and Thailand proved the largest detraction from fund performance for the year.
• Industry allocation in conglomerates and industrials failed to generate positive alpha for the fund.
• Investments in Anton Oilfield Services Group,(5) China National Building Material Co., Ltd.(5) and Security Bank Corp.(5) detracted the most from fund performance.
Current Outlook
Opportunities
• Following the Third Plenary meeting, government policy priorities have officially shifted toward structural reform and quality growth. Industries which benefit from decisive reform measures are likely to continue their outperformance. These include healthcare, insurance and pollution control.
• China's middle class consumers have evolved from emerging to growing, and their preference for goods has evolved from low prices to quality and safety. Thematic
52
plays of this transformation remain mobile Internet, casinos and gaming, and product safety.
• China's new policy-making team is bent on promoting less regulation and more entrepreneurship. Private sector activity may see further policy support, and innovative private companies who tap into latent consumer demand will be tomorrow's winners.
Threats
• Large state-owned banks in China face secular margin pressure due to interest rate deregulation, lingering asset quality concerns led by rapid credit growth in recent years, and higher regulatory risk because of tighter supervision on shadow banking. Allowing the private sector to have easier entry is another structural challenge to the de facto state monopoly.
• Polluting businesses, such as thermal power, industrial metals, building materials and coal, may lose from authorities' determination to address China's environmental issues, especially when local government officials' performance review is linked to pollution reduction.
• If the Fed accelerates its taper treatment for its quantitative easing program, investor sentiment toward Southeast Asian countries, especially Indonesia, might turn bearish again in anticipation of further capital flight and slower recovery of economic fundamentals.
(1)The China region is defined as any country that either shares a border with China or is located in the South China Sea or the East China Sea and includes: the People's Republic of China (PRC or China), Bangladesh, Cambodia, Hong Kong, India, Indonesia, Kazakhstan, Korea, Kyrgyzstan, Laos, Malaysia, Mongolia, Myanmar, Nepal, Pakistan, Philippines, Singapore, Taiwan, Tajikistan, Thailand and Vietnam.
(2)This security comprised 5.10% of the fund's total net assets as of 12/31/13.
(3)This security comprised 4.04% of the fund's total net assets as of 12/31/13.
(4)This security comprised 3.17% of the fund's total net assets as of 12/31/13.
(5)The fund did not hold this security as of 12/31/13.
53
Top 10 Holdings Based on Net Assets December 31, 2013
Galaxy Entertainment Group Ltd.
Casino Hotels | | | 5.10 | % | |
NetEase, Inc.
Internet Content - Entertainment | | | 4.42 | % | |
Tencent Holdings Ltd.
Internet Application Software | | | 4.04 | % | |
Sands China Ltd.
Casino Hotels | | | 3.20 | % | |
Biostime International Holdings Ltd.
Consumer Products - Miscellaneous | | | 3.17 | % | |
China Construction Bank Corp.
Commercial Banks - Non US | | | 2.84 | % | |
Qihoo 360 Technology Co., Ltd.
Internet Security | | | 2.80 | % | |
NagaCorp Ltd.
Casino Hotels | | | 2.74 | % | |
Bank of China Ltd.
Commercial Banks - Non US | | | 2.48 | % | |
HSBC Holdings plc
Diversified Banking Institutions | | | 2.33 | % | |
Total Top 10 Holdings | | | 33.12 | % | |
Country Distribution*
Based on Total Investments December 31, 2013
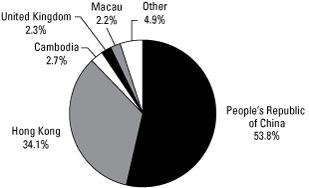
* Country distribution shown is based on domicile and not intended to conform to the China region definition in the prospectus. The locale of company operations may be different.
54
Expense Example (unaudited) December 31, 2013
As a shareholder of the funds, you incur two types of costs: (1) transaction costs, including short-term trading fees and exchange fees; and (2) ongoing costs, including management fees and other fund expenses. This example is intended to help you understand your ongoing costs (in dollars) of investing in other mutual funds.
The example is based on an investment of $1,000 invested at the beginning of the period and held for the entire period as indicated below.
• Actual Expenses. The first line of the following table for each fund provides information about actual account values and actual expenses. You may use the information in this line, together with the amount you invested, to estimate the expenses you paid over the period. Simply divide your account value by $1,000 (for example, an $8,600 account value divided by $1,000 = 8.6), then multiply the result by the number in the first line under the heading "Expenses Paid During Period" to estimate the expenses you paid on your account during this period.
• Hypothetical Example for Comparison Purposes. The second line of the following table for each fund provides information about hypothetical account values and hypothetical expenses based on the fund's actual expense ratio and an assumed rate of return of 5 percent per year before expenses, which is not the fund's actual return. The hypothetical account values and expenses may not be used to estimate the actual ending account balance or expenses you paid for the period. You may use this information to compare the ongoing costs of investing in these funds and other funds. To do so, compare this 5 percent hypothetical example with the 5 percent hypothetical examples that appear in the shareholder reports of other funds.
Please note that the expenses shown in the table are meant to highlight your ongoing costs only and do not reflect any direct or transactional costs, such as small account, exchange or short-term trading fees. Therefore, the second line of the table is useful in comparing ongoing costs only, and will not help you determine the relative total costs of owning different funds. In addition, if these direct or transactional costs were included, your costs would have been higher.
55
Expense Example (unaudited) December 31, 2013
Six Months Ended December 31, 2013 | | Beginning
Account Value
July 1,
2013 | | Ending
Account Value
December 31,
2013 | | Expenses
Paid During
Period* | |
U.S. Government Securities Ultra-Short
Bond Fund | |
Based on Actual Fund Return | | $ | 1,000.00 | | | $ | 1,000.10 | | | $ | 0.15 | | |
Based on Hypothetical 5% Yearly Return | | $ | 1,000.00 | | | $ | 1,025.05 | | | $ | 0.15 | | |
Near-Term Tax Free Fund | |
Based on Actual Fund Return | | $ | 1,000.00 | | | $ | 1,011.30 | | | $ | 2.28 | | |
Based on Hypothetical 5% Yearly Return | | $ | 1,000.00 | | | $ | 1,022.94 | | | $ | 2.29 | | |
All American Equity Fund | |
Based on Actual Fund Return | | $ | 1,000.00 | | | $ | 1,190.10 | | | $ | 12.14 | | |
Based on Hypothetical 5% Yearly Return | | $ | 1,000.00 | | | $ | 1,014.12 | | | $ | 11.17 | | |
Holmes Macro Trends Fund | |
Based on Actual Fund Return | | $ | 1,000.00 | | | $ | 1,233.80 | | | $ | 11.65 | | |
Based on Hypothetical 5% Yearly Return | | $ | 1,000.00 | | | $ | 1,014.77 | | | $ | 10.51 | | |
Global Resources Fund Investor Class | |
Based on Actual Fund Return | | $ | 1,000.00 | | | $ | 1,082.30 | | | $ | 7.56 | | |
Based on Hypothetical 5% Yearly Return | | $ | 1,000.00 | | | $ | 1,017.95 | | | $ | 7.32 | | |
Global Resources Fund Institutional Class | |
Based on Actual Fund Return | | $ | 1,000.00 | | | $ | 1,085.40 | | | $ | 4.26 | | |
Based on Hypothetical 5% Yearly Return | | $ | 1,000.00 | | | $ | 1,021.12 | | | $ | 4.13 | | |
World Precious Minerals Fund Investor Class | |
Based on Actual Fund Return | | $ | 1,000.00 | | | $ | 948.30 | | | $ | 9.28 | | |
Based on Hypothetical 5% Yearly Return | | $ | 1,000.00 | | | $ | 1,015.68 | | | $ | 9.60 | | |
World Precious Minerals Fund
Institutional Class | |
Based on Actual Fund Return | | $ | 1,000.00 | | | $ | 951.70 | | | $ | 6.64 | | |
Based on Hypothetical 5% Yearly Return | | $ | 1,000.00 | | | $ | 1,018.40 | | | $ | 6.87 | | |
Gold and Precious Metals Fund | |
Based on Actual Fund Return | | $ | 1,000.00 | | | $ | 905.00 | | | $ | 10.37 | | |
Based on Hypothetical 5% Yearly Return | | $ | 1,000.00 | | | $ | 1,014.32 | | | $ | 10.97 | | |
Emerging Europe Fund | |
Based on Actual Fund Return | | $ | 1,000.00 | | | $ | 1,084.70 | | | $ | 11.56 | | |
Based on Hypothetical 5% Yearly Return | | $ | 1,000.00 | | | $ | 1,014.12 | | | $ | 11.17 | | |
China Region Fund | |
Based on Actual Fund Return | | $ | 1,000.00 | | | $ | 1,127.80 | | | $ | 12.71 | | |
Based on Hypothetical 5% Yearly Return | | $ | 1,000.00 | | | $ | 1,013.26 | | | $ | 12.03 | | |
* These calculations are based on expenses incurred in the most recent fiscal half-year. The funds' Investor Class' annualized expense ratios (after reimbursements and offsets) for the six-month period ended December 31, 2013, were 0.03%, 0.45%, 2.20%, 2.07%, 1.44%, 1.89%, 2.16%, 2.20% and 2.37%, respectively, for the U.S. Government Securities Ultra-Short Bond, Near-Term Tax Free, All American Equity, Holmes Macro Trends, Global Resources, World Precious Minerals, Gold and Precious Metals, Emerging Europe and China Region Funds. The funds' Institutional Class' annualized expense ratios (after reimbursements and offsets) for the six-month period ended December 31, 2013, were 0.81% and 1.35%, respectively, for the Global Resources and World Precious Minerals Funds. The dollar amounts shown as "Expenses Paid" are equal to the annualized expense ratio multiplied by the average account value over the period, multiplied by 184, the number of days in the period, then divided by 365 days in the current fiscal year.
56
Portfolio of Investments December 31, 2013
U.S. Government Securities Ultra-Short Bond Fund
United States
Government and Agency
Obligations 83.09% | | Coupon
Rate | | Maturity
Date | | Principal
Amount | | Value | |
Federal Farm Credit Bank 39.18% | | | |
Discount Notes: | |
Yield | | | 0.01 | % | | 01/02/14 | | $ | 10,000,000 | | | $ | 9,999,997 | | |
Yield | | | 0.03 | % | | 01/08/14 | | | 5,000,000 | | | | 4,999,971 | | |
Fixed Rates: | |
| | | | | | 3.75 | % | | 02/05/14 | | | 1,000,000 | | | | 1,003,429 | | |
| | | | | | 1.27 | % | | 12/18/17 | | | 1,310,000 | | | | 1,303,433 | | |
| | | | | | 1.87 | % | | 12/26/18 | | | 5,000,000 | | | | 4,967,190 | | |
Variable Rates: | |
| | | | | | 0.13 | % | | 03/18/14 | | | 5,000,000 | | | | 4,999,710 | | |
| | | | | | 0.24 | % | | 07/16/14 | | | 2,200,000 | | | | 2,200,871 | | |
| | | | 29,474,601 | | |
Federal Home Loan Bank 36.43% | | | |
Discount Notes: | |
Yield | | | 0.04 | % | | 01/02/14 | | | 5,000,000 | | | | 4,999,995 | | |
Yield | | | 0.05 | % | | 01/03/14 | | | 10,000,000 | | | | 9,999,975 | | |
Yield | | | 0.05 | % | | 02/05/14 | | | 1,000,000 | | | | 999,951 | | |
Yield | | | 0.07 | % | | 02/28/14 | | | 5,000,000 | | | | 4,999,436 | | |
Yield | | | 0.07 | % | | 03/12/14 | | | 2,300,000 | | | | 2,299,823 | | |
Fixed Rates: | |
| | | | | | 5.13 | % | | 03/10/17 | | | 1,000,000 | | | | 1,130,774 | | |
| | | | | | 1.70 | % | | 07/26/18 | | | 3,000,000 | | | | 2,976,591 | | |
| | | | 27,406,545 | | |
Tennessee Valley Authority 7.48% | | | |
Fixed Rates: | |
| | | | | | 6.25 | % | | 12/15/17 | | | 2,930,000 | | | | 3,467,239 | | |
| | | | | | 1.75 | % | | 10/15/18 | | | 2,174,000 | | | | 2,160,493 | | |
| | | | 5,627,732 | | |
Total Investments 83.09% | | | 62,508,878 | | |
(cost $62,588,369) | |
Other assets and liabilities, net 16.91% | | | 12,718,208 | | |
Net Assets 100% | | $ | 75,227,086 | | |
See notes to portfolios of investments and notes to financial statements.
57
Portfolio of Investments December 31, 2013
Municipal Bonds 94.42% | | Coupon
Rate | | Maturity
Date | | Principal
Amount | | Value | |
Alabama 3.50% | |
Alabama State Public School & College
Authority | | | 5.00 | % | | 12/01/16 | | $ | 290,000 | | | $ | 326,215 | | |
Bessemer, Alabama Electric Revenue,
Refunding | | | 3.10 | % | | 12/01/21 | | | 100,000 | | | | 99,929 | | |
Bessemer, Alabama Water Revenue | | | 4.00 | % | | 01/01/16 | | | 500,000 | | | | 504,660 | | |
Jasper Alabama Water Works & Sewer Board,
Inc., Utilities Revenue, Series A | | | 3.00 | % | | 06/01/15 | | | 90,000 | | | | 92,182 | | |
Jasper Alabama Water Works & Sewer Board,
Inc., Utilities Revenue, Series A | | | 3.00 | % | | 06/01/16 | | | 90,000 | | | | 93,109 | | |
Mountain Brook City Board of Education Capital
Outlay | | | 4.00 | % | | 02/15/15 | | | 395,000 | | | | 409,947 | | |
University of Alabama at Birmingham, Hospital
Revenue, Series A | | | 5.00 | % | | 09/01/15 | | | 600,000 | | | | 641,700 | | |
| | | | 2,167,742 | | |
Alaska 0.52% | |
Alaska Municipal Bond Bank Authority,
Prerefunded, Series A | | | 4.00 | % | | 02/01/16 | | | 105,000 | | | | 112,783 | | |
Alaska Municipal Bond Bank Authority,
Unrefunded, Series A | | | 4.00 | % | | 02/01/16 | | | 195,000 | | | | 209,215 | | |
| | | | 321,998 | | |
Arizona 3.04% | |
Arizona Board of Regents Certificates of
Participation, Series B | | | 4.50 | % | | 06/01/16 | | | 200,000 | | | | 218,038 | | |
Arizona Health Facilities Authority Revenue,
Series D | | | 5.00 | % | | 01/01/14 | | | 250,000 | | | | 250,000 | | |
Arizona State School Facilities Board
Certificates of Participation, Series A-1 | | | 5.00 | % | | 09/01/17 | | | 325,000 | | | | 346,807 | | |
Arizona State Transportation Board Excise Tax
Revenue | | | 5.00 | % | | 07/01/17 | | | 175,000 | | | | 199,757 | | |
McAllister Academic Village LLC, Arizona State
University Hassayampa Revenue, Refunding | | | 5.75 | % | | 07/01/18 | | | 200,000 | | | | 231,098 | | |
Page, Arizona, Pledged Revenue, Refunding | | | 3.00 | % | | 07/01/16 | | | 350,000 | | | | 363,027 | | |
University of Arizona Certificates of
Participation, Series C | | | 5.00 | % | | 06/01/22 | | | 260,000 | | | | 271,469 | | |
| | | | 1,880,196 | | |
California 5.32% | |
California State, GO Unlimited | | | 5.00 | % | | 03/01/32 | | | 300,000 | | | | 311,430 | | |
California State, GO Unlimited | | | 4.75 | % | | 03/01/34 | | | 205,000 | | | | 206,242 | | |
California State, Refunding, Recreational
Facility, GO Unlimited | | | 5.00 | % | | 12/01/19 | | | 250,000 | | | | 254,300 | | |
See notes to portfolios of investments and notes to financial statements.
58
Portfolio of Investments December 31, 2013
Municipal Bonds (cont'd) | | Coupon
Rate | | Maturity
Date | | Principal
Amount | | Value | |
California (cont'd) | |
California State, Statewide Communities
Development Authority, Enloe Medical
Center Revenue, Series A | | | 5.25 | % | | 08/15/18 | | $ | 340,000 | | | $ | 389,052 | | |
Chaffey Community College District,
GO Unlimited, Series C | | | 5.00 | % | | 06/01/32 | | | 300,000 | | | | 316,713 | | |
Delano, California Union High School District,
GO Unlimited, Refunding, Series A | | | 4.75 | % | | 02/01/17 | | | 200,000 | | | | 215,342 | | |
Los Angeles Unified School District,
Election 2004, Series H, GO Unlimited | | | 5.00 | % | | 07/01/32 | | | 200,000 | | | | 210,324 | | |
San Diego, California Community College
District, Capital Appreciation, Election 2002,
GO Unlimited (ZCB) | | | 4.34 | %(1) | | 05/01/15 | | | 300,000 | | | | 297,426 | | |
Santa Clara County, California Financing
Authority Revenue, Obstetrics and
Gynecology, El Camino Hospital | | | 5.00 | % | | 02/01/18 | | | 350,000 | | | | 382,074 | | |
Santa Clara Valley Transportation Authority,
Refunding, Series A | | | 5.00 | % | | 04/01/27 | | | 370,000 | | | | 396,662 | | |
Santa Paula Schools Financing Authority,
Santa Paula Elementary School District
Revenue | | | 4.25 | % | | 11/01/22 | | | 300,000 | | | | 310,815 | | |
| | | | 3,290,380 | | |
Colorado 0.71% | |
Colorado Health Facilities Authority Revenue | | | 5.00 | % | | 09/01/16 | | | 150,000 | | | | 150,443 | | |
Denver, Colorado, Health & Hospital Authority,
Healthcare Revenue, Series A | | | 5.00 | % | | 12/01/16 | | | 265,000 | | | | 286,605 | | |
| | | | 437,048 | | |
Connecticut 0.72% | |
Connecticut State Health & Educational
Facilities Authority Revenue, Bridgeport
Hospital, Series D | | | 5.00 | % | | 07/01/19 | | | 395,000 | | | | 444,683 | | |
District of Columbia 1.39% | |
District of Columbia Certifications of
Participation | | | 4.00 | % | | 01/01/14 | | | 250,000 | | | | 250,000 | | |
District of Columbia Income Tax Revenue,
Series A | | | 5.25 | % | | 12/01/27 | | | 300,000 | | | | 333,855 | | |
Washington D.C. Convention Center Authority
Dedicated Tax Revenue, Refunding, Series A | | | 5.00 | % | | 10/01/16 | | | 250,000 | | | | 275,990 | | |
| | | | 859,845 | | |
Florida 12.41% | |
Broward County, Florida School Board
Certificates of Participation, Series A | | | 5.00 | % | | 07/01/15 | | | 325,000 | | | | 346,596 | | |
See notes to portfolios of investments and notes to financial statements.
59
Portfolio of Investments December 31, 2013
Municipal Bonds (cont'd) | | Coupon
Rate | | Maturity
Date | | Principal
Amount | | Value | |
Florida (cont'd) | |
Cape Coral, Florida Gas Tax Revenue, Series A | | | 4.00 | % | | 10/01/16 | | $ | 255,000 | | | $ | 265,560 | | |
Citizens Property Insurance Corp., Senior
Secured, Coastal Account, Revenue,
Series A-1 | | | 4.00 | % | | 06/01/18 | | | 100,000 | | | | 108,607 | | |
Escambia County, Florida, Health Facilities
Authority Revenue, Baptist Hospital, Inc.
Project, Series A | | | 5.00 | % | | 08/15/19 | | | 290,000 | | | | 315,973 | | |
Florida Board of Education, GO Unlimited,
Refunding, Series C | | | 4.50 | % | | 06/01/28 | | | 300,000 | | | | 310,692 | | |
Florida Gulf Coast University Financing Corp.,
Florida Capital Improvement Revenue,
Series B | | | 3.00 | % | | 02/01/16 | | | 365,000 | | | | 374,833 | | |
Florida State Board of Education Lottery
Revenue, Series A | | | 4.00 | % | | 07/01/14 | | | 300,000 | | | | 305,535 | | |
Florida State Board of Education Lottery
Revenue, Series B | | | 5.00 | % | | 07/01/26 | | | 100,000 | | | | 112,357 | | |
Florida State Board of Governors Parking
Facilities Revenue, Series A | | | 3.00 | % | | 07/01/17 | | | 300,000 | | | | 319,806 | | |
Florida State Department of Management
Services Certificates of Participation | | | 5.00 | % | | 08/01/24 | | | 340,000 | | | | 373,017 | | |
Florida State Municipal Power Agency,
Stanton Project Revenue, Refunding | | | 5.13 | % | | 10/01/17 | | | 300,000 | | | | 342,891 | | |
Fort Pierce, Florida Stormwater Utilities
Revenue | | | 4.50 | % | | 10/01/17 | | | 255,000 | | | | 262,943 | | |
Hillsborough County, Florida School Board,
Refunding, Certificates of Participation | | | 4.00 | % | | 07/01/19 | | | 100,000 | | | | 107,016 | | |
Jacksonville Florida Special Revenue, Series C | | | 5.00 | % | | 10/01/20 | | | 270,000 | | | | 314,561 | | |
Lake County, Florida School Board Certificates
of Participation, Series A | | | 3.70 | % | | 06/01/15 | | | 400,000 | | | | 413,808 | | |
Leesburg, Florida Capital Improvement
Revenue Bonds, Refunded | | | 5.00 | % | | 10/01/21 | | | 405,000 | | | | 452,822 | | |
Margate, Florida Water & Sewer Revenue,
Refunding | | | 4.00 | % | | 10/01/19 | | | 250,000 | | | | 264,970 | | |
Miami - Dade County, Florida Expressway
Authority Toll System Revenue, Series A | | | 5.00 | % | | 07/01/21 | | | 430,000 | | | | 482,378 | | |
Miami - Dade County, Florida Water & Sewer
Revenue System, Series A | | | 4.00 | % | | 10/01/16 | | | 235,000 | | | | 255,645 | | |
Orange County, Florida Tourist Development
Tax Revenue, Refunding | | | 5.00 | % | | 10/01/14 | | | 260,000 | | | | 269,058 | | |
Orlando, Florida Community Redevelopment
Agency Tax Increment Revenue, Downtown
District, Series A | | | 4.00 | % | | 09/01/17 | | | 325,000 | | | | 350,880 | | |
Polk County, Florida School District Revenue | | | 5.00 | % | | 10/01/17 | | | 215,000 | | | | 238,839 | | |
Port St. Lucie, Florida, Southwest Annexation
Special Assessment District No 1, Revenue,
Series B | | | 4.13 | % | | 07/01/17 | | | 200,000 | | | | 212,160 | | |
See notes to portfolios of investments and notes to financial statements.
60
Portfolio of Investments December 31, 2013
Municipal Bonds (cont'd) | | Coupon
Rate | | Maturity
Date | | Principal
Amount | | Value | |
Florida (cont'd) | |
Reedy Creek, Florida Improvement District
Utilities Revenue, Refunding, Series 2 | | | 5.00 | % | | 10/01/16 | | $ | 300,000 | | | $ | 321,030 | | |
Saint Johns County, Florida Transportation
Revenue, Refunding | | | 5.00 | % | | 10/01/20 | | | 310,000 | | | | 344,587 | | |
Volusia County, Florida School Board Sales
Tax Revenue | | | 4.20 | % | | 10/01/16 | | | 200,000 | | | | 212,094 | | |
| | | | 7,678,658 | | |
Georgia 2.29% | |
Atlanta Development Authority Revenue | | | 5.25 | % | | 07/01/22 | | | 500,000 | | | | 501,290 | | |
Atlanta Downtown Development Authority | | | 4.25 | % | | 12/01/16 | | | 250,000 | | | | 269,302 | | |
Georgia State Municipal Electric Authority
Revenue, Unrefunded | | | 5.50 | % | | 01/01/20 | | | 190,000 | | | | 205,267 | | |
Glynn-Brunswick Memorial Hospital Authority,
Southeast Georgia Health System and
Affiliates Revenue, Anticipation Certificates | | | 4.50 | % | | 08/01/17 | | | 150,000 | | | | 164,211 | | |
Gwinnett County, Georgia, Hospital Authority,
Gwinnett Hospital Systems Revenue,
Series B | | | 5.00 | % | | 07/01/18 | | | 250,000 | | | | 275,585 | | |
| | | | 1,415,655 | | |
Guam 0.40% | |
Guam Education Financing Foundation
Certificate of Participation, Series A | | | 4.25 | % | | 10/01/18 | | | 250,000 | | | | 248,715 | | |
Idaho 0.40% | |
Idaho Housing & Finance Association, Grant &
Revenue Anticipation, Federal Highway
Trust Fund, Series A | | | 5.00 | % | | 07/15/21 | | | 225,000 | | | | 250,936 | | |
Illinois 9.76% | |
Aurora, Illinois, Series B, GO Unlimited | | | 3.00 | % | | 12/30/15 | | | 200,000 | | | | 209,122 | | |
Chicago Board of Education, Dedicated
Revenues, Series F, GO Unlimited | | | 5.00 | % | | 12/01/16 | | | 300,000 | | | | 322,413 | | |
Chicago Board of Education, GO Unlimited | | | 5.25 | % | | 12/01/19 | | | 300,000 | | | | 336,306 | | |
Chicago, Illinois Sales Tax Revenue | | | 5.50 | % | | 01/01/15 | | | 350,000 | | | | 366,800 | | |
Chicago, Illinois, Direct Access Bond,
Series E-1 B, GO Unlimited | | | 4.00 | % | | 01/01/19 | | | 200,000 | | | | 204,610 | | |
Chicago, Illinois, O'Hare International Airport
Revenue, Gen - Third Lien, Series C | | | 5.25 | % | | 01/01/23 | | | 250,000 | | | | 271,475 | | |
Chicago, Illinois, Prerefunded Balance,
Series B, GO Unlimited | | | 5.13 | % | | 01/01/15 | | | 85,000 | | | | 85,000 | | |
Chicago, Illinois, Unrefunded Balance,
Series B, GO Unlimited | | | 5.13 | % | | 01/01/15 | | | 240,000 | | | | 247,514 | | |
City Colleges of Chicago, GO Unlimited | | | 5.00 | % | | 01/01/17 | | | 115,000 | | | | 123,382 | | |
See notes to portfolios of investments and notes to financial statements.
61
Portfolio of Investments December 31, 2013
Municipal Bonds (cont'd) | | Coupon
Rate | | Maturity
Date | | Principal
Amount | | Value | |
Illinois (cont'd) | |
Du Page County, Refunding, GO Unlimited | | | 5.60 | % | | 01/01/21 | | $ | 490,000 | | | $ | 548,962 | | |
Illinois Finance Authority, Revenue, Refunding | | | 5.00 | % | | 07/01/16 | | | 390,000 | | | | 411,586 | | |
Illinois Finance Authority, Refunding, Series A | | | 5.00 | % | | 10/01/14 | | | 150,000 | | | | 155,055 | | |
Illinois Regional Transportation Authority
Revenue, Series A | | | 7.20 | % | | 11/01/20 | | | 185,000 | | | | 208,205 | | |
Illinois State Sales Tax Revenue | | | 5.00 | % | | 06/15/14 | | | 200,000 | | | | 204,272 | | |
Illinois State Toll Highway Authority, Toll
Highway Revenue, Series A | | | 5.00 | % | | 01/01/16 | | | 200,000 | | | | 213,432 | | |
Illinois State, Refunding, GO Unlimited | | | 5.00 | % | | 01/01/16 | | | 300,000 | | | | 322,338 | | |
Kaskaskia Community College District No. 501,
GO Unlimited | | | 5.75 | % | | 12/01/19 | | | 500,000 | | | | 573,665 | | |
Lake & McHenry County, Fox Lake, Illinois,
Debt Certificates, Series B | | | 3.00 | % | | 11/01/19 | | | 265,000 | | | | 268,111 | | |
Springfield, Illinois Metropolitan Sanitation
District, Sewer Revenue, Senior Lien,
Series A | | | 4.00 | % | | 01/01/17 | | | 570,000 | | | | 594,955 | | |
Winnebago County Public Safety Sales Tax,
Series A, GO Unlimited | | | 5.00 | % | | 12/30/16 | | | 350,000 | | | | 374,437 | | |
| | | | 6,041,640 | | |
Indiana 1.01% | |
Indianapolis Local Public Improvement Bond
Bank, Waterworks Project, Series 2007 L | | | 5.25 | % | | 01/01/33 | | | 305,000 | | | | 316,639 | | |
Tippecanoe County, Indiana School
Improvements | | | 4.00 | % | | 01/15/15 | | | 300,000 | | | | 311,157 | | |
| | | | 627,796 | | |
Iowa 1.00% | |
Johnston Community School District,
GO Unlimited | | | 4.00 | % | | 06/01/16 | | | 200,000 | | | | 209,164 | | |
University of Iowa Hospitals and Clinics, Iowa
State Board of Regents, Hospital Revenue,
Refunding, Series A | | | 3.00 | % | | 09/01/19 | | | 400,000 | | | | 412,180 | | |
| | | | 621,344 | | |
Kansas 0.77% | |
Kansas State Development Finance Authority
Revenue | | | 4.00 | % | | 10/01/15 | | | 450,000 | | | | 478,863 | | |
Kentucky 1.65% | |
Bowling Green, Kentucky, GO Unlimited,
Series B | | | 4.00 | % | | 09/01/16 | | | 215,000 | | | | 232,483 | | |
Kentucky Municipal Power Agency, Power
System Revenue, Prairie State Project,
Series A | | | 5.25 | % | | 09/01/22 | | | 440,000 | | | | 482,623 | | |
See notes to portfolios of investments and notes to financial statements.
62
Portfolio of Investments December 31, 2013
Municipal Bonds (cont'd) | | Coupon
Rate | | Maturity
Date | | Principal
Amount | | Value | |
Kentucky (cont'd) | |
Louisville & Jefferson County, Louisville
Medical Center, Metropolitan Government
Revenue, Refunding | | | 3.00 | % | | 05/01/19 | | $ | 305,000 | | | $ | 306,397 | | |
| | | | 1,021,503 | | |
Louisiana 0.42% | |
Louisiana State, Citizens Property Insurance
Corp., Revenue Bonds, Series B | | | 5.00 | % | | 06/01/21 | | | 245,000 | | | | 262,275 | | |
Massachusetts 1.51% | |
Massachusetts State Special Obligation,
Dedicated Tax Revenue | | | 5.25 | % | | 01/01/26 | | | 340,000 | | | | 340,000 | | |
New Bedford, Massachusetts, State Qualified
Municipal Loan, GO Limited | | | 3.00 | % | | 03/01/15 | | | 345,000 | | | | 355,912 | | |
Stoughton, Massachusetts Public Improvement,
GO Limited | | | 4.00 | % | | 05/01/17 | | | 225,000 | | | | 239,900 | | |
| | | | 935,812 | | |
Michigan 5.22% | |
Detroit, Michigan Local Development Financing
Authority, Refunding, Series A | | | 5.38 | % | | 05/01/18 | | | 175,000 | | | | 161,854 | | |
Detroit, Michigan Sewer Disposal Revenue,
Refunding, Series C-1 | | | 5.25 | % | | 07/01/15 | | | 400,000 | | | | 403,064 | | |
Detroit, Michigan Water Supply System
Revenue, Series B | | | 5.00 | % | | 07/01/16 | | | 430,000 | | | | 432,189 | | |
Gibraltar, Michigan School District, Refunding,
GO Unlimited | | | 5.00 | % | | 05/01/21 | | | 475,000 | | | | 532,560 | | |
Michigan House of Representatives Facilities,
Obligations Revenue, Series A | | | 5.00 | % | | 10/15/17 | | | 200,000 | | | | 221,168 | | |
Michigan Public Power Agency AFEC Project
Revenue, Series 2012-A | | | 4.50 | % | | 01/01/19 | | | 280,000 | | | | 303,909 | | |
Michigan State Grant Anticipation Bonds | | | 5.00 | % | | 09/15/16 | | | 200,000 | | | | 221,304 | | |
Michigan State Hospital Finance Authority
Revenue, Trinity Health, Series A | | | 6.00 | % | | 12/01/18 | | | 200,000 | | | | 239,558 | | |
Portage Public Schools, School Building & Site,
GO Unlimited | | | 5.00 | % | | 05/01/20 | | | 300,000 | | | | 333,177 | | |
State of Michigan, Trunk Line Revenue,
Refunding | | | 4.50 | % | | 11/01/26 | | | 105,000 | | | | 109,195 | | |
Wayne County, Michigan Airport Authority
Revenue, Detroit Metropolitan Airport,
Refunding, Series C | | | 4.00 | % | | 12/01/19 | | | 255,000 | | | | 272,396 | | |
| | | | 3,230,374 | | |
See notes to portfolios of investments and notes to financial statements.
63
Portfolio of Investments December 31, 2013
Municipal Bonds (cont'd) | | Coupon
Rate | | Maturity
Date | | Principal
Amount | | Value | |
Minnesota 0.88% | |
Minneapolis & St Paul, Minnesota Housing &
Redevelopment Authority Health Care
Systems, Children's Health Care, Series B | | | 4.00 | % | | 08/15/16 | | $ | 250,000 | | | $ | 266,720 | | |
Minneapolis & St Paul, Minnesota Metropolitan
Airports Commission, Airport Revenue,
Refunding, Series B | | | 5.00 | % | | 01/01/19 | | | 255,000 | | | | 280,418 | | |
| | | | 547,138 | | |
Missouri 1.31% | |
Kansas City Water Revenue | | | 4.00 | % | | 12/01/22 | | | 250,000 | | | | 275,770 | | |
Missouri Development Finance Board, Eastland
Center Project, Tax Allocation, Series A | | | 5.00 | % | | 04/01/17 | | | 250,000 | | | | 273,875 | | |
Missouri State Health & Educational Facilities
Authority, Southwestern Baptist University
Revenue | | | 3.00 | % | | 10/01/17 | | | 265,000 | | | | 262,310 | | |
| | | | 811,955 | | |
Nevada 0.78% | |
Nye County School District, GO Limited | | | 4.00 | % | | 05/01/15 | | | 465,000 | | | | 485,051 | | |
New Hampshire 0.80% | |
New Hampshire Health & Education Facilities
Authority Revenue | | | 5.00 | % | | 07/01/14 | | | 65,000 | | | | 66,340 | | |
New Hampshire Health & Education Facilities
Authority Revenue | | | 5.00 | % | | 01/01/18 | | | 400,000 | | | | 426,280 | | |
| | | | 492,620 | | |
New Jersey 4.03% | |
Atlantic City, New Jersey Municipal Utilities
Authority Revenue, Refunding | | | 5.00 | % | | 06/01/17 | | | 150,000 | | | | 163,849 | | |
Atlantic City, New Jersey, Refunding Tax
Appeal, GO Unlimited | | | 4.00 | % | | 11/01/18 | | | 500,000 | | | | 535,305 | | |
Elizabeth, New Jersey Parking Authority
Project Revenue, Elizabethtown Plaza
Redevelopment, Series B | | | 4.00 | % | | 11/01/17 | | | 255,000 | | | | 273,658 | | |
Hudson County, New Jersey Improvement
Authority Lease Revenue, North Hudson
Regional Fire, Refunding, Series A | | | 5.63 | % | | 09/01/18 | | | 400,000 | | | | 453,720 | | |
New Jersey Health Care Facilities Financing
Authority Revenue, Holy Name Medical
Center, Refunding | | | 5.00 | % | | 07/01/19 | | | 215,000 | | | | 233,204 | | |
New Jersey State Transportation Trust Fund
Authority, Series D | | | 4.00 | % | | 06/15/14 | | | 250,000 | | | | 254,248 | | |
See notes to portfolios of investments and notes to financial statements.
64
Portfolio of Investments December 31, 2013
Municipal Bonds (cont'd) | | Coupon
Rate | | Maturity
Date | | Principal
Amount | | Value | |
New Jersey (cont'd) | |
Passaic Valley, New Jersey, Sewage
Commissioners Revenue, Series G | | | 5.75 | % | | 12/01/21 | | $ | 500,000 | | | $ | 578,560 | | |
| | | | 2,492,544 | | |
New Mexico 0.39% | |
Clayton, New Mexico, Jail Project Revenue | | | 4.00 | % | | 11/01/17 | | | 235,000 | | | | 239,456 | | |
New York 3.87% | |
Long Island Power Authority Revenue, Series B | | | 5.00 | % | | 09/01/21 | | | 465,000 | | | | 519,391 | | |
Long Island Power Authority, New York Electric
Systems, Revenue, Series E | | | 5.00 | % | | 12/01/17 | | | 330,000 | | | | 362,188 | | |
Nassau County Industrial Development Agency,
New York Institute of Technology Project
Revenue, Refunding, Remarketing, Series A | | | 5.00 | % | | 03/01/21 | | | 350,000 | | | | 363,871 | | |
Nassau County, New York, Series A, GO Limited | | | 2.00 | % | | 02/05/14 | | | 500,000 | | | | 500,832 | | |
New York State Dormitory Authority Revenues,
Nonconstruction Supported Debt, Municipal
Facilities Health Lease, Series 1 | | | 5.00 | % | | 01/15/17 | | | 300,000 | | | | 332,820 | | |
New York, New York, Subseries L-1,
GO Unlimited | | | 4.00 | % | | 04/01/15 | | | 300,000 | | | | 314,067 | | |
| | | | 2,393,169 | | |
North Carolina 1.09% | |
Beaufort County, North Carolina, GO Limited | | | 5.00 | % | | 06/01/21 | | | 200,000 | | | | 227,938 | | |
North Carolina State Municipal Power
Agency #1, Catawba Electric Revenue,
Refunding, Series A | | | 5.25 | % | | 01/01/20 | | | 400,000 | | | | 444,860 | | |
| | | | 672,798 | | |
Ohio 2.19% | |
Canton, Ohio, City School District, Refunding,
GO Unlimited | | | 5.00 | % | | 12/01/18 | | | 325,000 | | | | 346,460 | | |
Cleveland, Ohio, Parking Facility Revenue,
Prerefunding, Refunding | | | 5.25 | % | | 09/15/22 | | | 130,000 | | | | 156,417 | | |
Lorain County, Ohio, Community College
District, Revenue | | | 3.25 | % | | 12/01/17 | | | 650,000 | | | | 690,924 | | |
Marion County, Ohio, Variable Refunding,
GO Limited | | | 4.00 | % | | 12/01/20 | | | 150,000 | | | | 159,537 | | |
| | | | 1,353,338 | | |
Oklahoma 0.55% | |
Oklahoma State Agricultural & Mechanical
Colleges, Oklahoma State University,
Revenue, Series A | | | 5.00 | % | | 08/01/21 | | | 300,000 | | | | 339,156 | | |
See notes to portfolios of investments and notes to financial statements.
65
Portfolio of Investments December 31, 2013
Municipal Bonds (cont'd) | | Coupon
Rate | | Maturity
Date | | Principal
Amount | | Value | |
Oregon 0.35% | |
Oregon State Facilities Authority, Legacy
Health Project Revenue, Refunding, Series A | | | 4.50 | % | | 05/01/20 | | $ | 200,000 | | | $ | 218,712 | | |
Pennsylvania 2.56% | |
Delaware Valley, Pennsylvania, Regional
Financial Authority Revenue, Permanently
Fixed Business Development Services | | | 5.50 | % | | 08/01/18 | | | 295,000 | | | | 329,338 | | |
Lycoming County, Pennsylvania Authority
Health System, Susquehanna Health
Systems Project Revenue, Series A | | | 5.10 | % | | 07/01/20 | | | 140,000 | | | | 151,455 | | |
Philadelphia School District, Pennsylvania,
Refunding, GO Unlimited, Series E | | | 5.25 | % | | 09/01/24 | | | 625,000 | | | | 671,769 | | |
Reading, Pennsylvania School District,
GO Unlimited, Series A | | | 5.00 | % | | 04/01/20 | | | 400,000 | | | | 433,372 | | |
| | | | 1,585,934 | | |
Puerto Rico 1.05% | |
Commonwealth of Puerto Rico, Series A,
GO Unlimited | | | 5.00 | % | | 07/01/15 | | | 225,000 | | | | 225,718 | | |
Puerto Rico Infrastructure Financing Authority,
Special Tax Revenue, Refunding, Series C | | | 5.50 | % | | 07/01/17 | | | 445,000 | | | | 426,510 | | |
| | | | 652,228 | | |
Rhode Island 0.85% | |
Rhode Island State & Providence Plantations,
Consolidated Capital Development Loan,
GO Unlimited, Series B | | | 3.50 | % | | 02/01/14 | | | 250,000 | | | | 250,657 | | |
Rhode Island State Economic Development
Corporation Revenue, Series A | | | 5.00 | % | | 06/15/17 | | | 250,000 | | | | 273,043 | | |
| | | | 523,700 | | |
South Carolina 2.40% | |
Jasper County School District, GO Unlimited | | | 4.00 | % | | 03/01/15 | | | 195,000 | | | | 203,566 | | |
Piedmont Municipal Power Agency | | | 5.00 | % | | 01/01/16 | | | 150,000 | | | | 162,513 | | |
South Carolina Transportation Infrastructure
Bank Revenue, Series A | | | 5.25 | % | | 10/01/17 | | | 125,000 | | | | 129,640 | | |
Spartanburg County, South Carolina Regional
Health Services District, Hospital Revenue,
Refunding, Series A | | | 5.00 | % | | 04/15/19 | | | 600,000 | | | | 669,906 | | |
Spartanburg County, South Carolina Sanitation
Sewer District Revenue, Series A | | | 3.50 | % | | 03/01/19 | | | 300,000 | | | | 316,794 | | |
| | | | 1,482,419 | | |
See notes to portfolios of investments and notes to financial statements.
66
Portfolio of Investments December 31, 2013
Municipal Bonds (cont'd) | | Coupon
Rate | | Maturity
Date | | Principal
Amount | | Value | |
Tennessee 0.80% | |
Memphis, Tennessee Sanitary Sewage System
Revenue, Refunding | | | 5.00 | % | | 05/01/20 | | $ | 200,000 | | | $ | 231,458 | | |
Metropolitan Government of Nashville &
Davidson County, Water & Sewer Revenue | | | 6.50 | % | | 12/01/14 | | | 250,000 | | | | 264,150 | | |
| | | | 495,608 | | |
Texas 14.20% | |
Addison, Texas Certificates of Obligation,
GO Limited | | | 4.50 | % | | 02/15/28 | | | 140,000 | | | | 145,974 | | |
Addison, Texas Certificates of Obligation,
GO Unlimited | | | 4.00 | % | | 02/15/20 | | | 250,000 | | | | 268,635 | | |
Annetta, Texas Certificates of Obligation,
GO Limited | | | 4.00 | % | | 08/01/16 | | | 200,000 | | | | 207,442 | | |
Center, Texas, GO Limited (ZCB) | | | 3.10 | %(1) | | 02/15/20 | | | 150,000 | | | | 128,154 | | |
City of Texarkana, Texas, Refunding, GO Limited | | | 5.00 | % | | 02/15/21 | | | 320,000 | | | | 364,467 | | |
City of Texarkana, Texas, Waterworks &
Sanitary Sewer System Revenue | | | 3.00 | % | | 08/01/19 | | | 90,000 | | | | 92,751 | | |
City of Texarkana, Texas, Waterworks &
Sanitary Sewer System Revenue | | | 3.00 | % | | 08/01/20 | | | 95,000 | | | | 96,017 | | |
Clear Lake, Texas, Waterworks & Sewer
System, GO Unlimited | | | 3.00 | % | | 03/01/19 | | | 125,000 | | | | 129,232 | | |
Corpus Christi, Texas Business & Job
Development Corporation, Seawall Project,
Sales Tax Revenue, Refunding | | | 5.00 | % | | 03/01/20 | | | 350,000 | | | | 395,553 | | |
Dallas, Texas Waterworks & Sewer Systems
Revenue, Refunding | | | 4.50 | % | | 10/01/19 | | | 225,000 | | | | 247,878 | | |
Forney, Texas, GO Limited | | | 5.00 | % | | 02/15/27 | | | 500,000 | | | | 516,270 | | |
Frisco, Texas Independent School District,
School Building, GO Unlimited, Series A | | | 4.50 | % | | 08/15/25 | | | 180,000 | | | | 191,281 | | |
Goose Creek, Texas Independent School
District Schoolhouse, Series A | | | 5.25 | % | | 02/15/18 | | | 370,000 | | | | 418,374 | | |
Grand Prairie Independent School District,
Refunding, GO Unlimited (ZCB) | | | 3.92 | %(1) | | 08/15/16 | | | 400,000 | | | | 378,916 | | |
Greenville, Texas Independent School District,
GO Unlimited, Refunding | | | 4.00 | % | | 08/15/17 | | | 120,000 | | | | 129,630 | | |
Houston, Texas, Hotel Occupancy Tax &
Special Revenue, Refunding, Series B | | | 5.00 | % | | 09/01/19 | | | 295,000 | | | | 320,299 | | |
Houston, Texas, Public Improvement,
Refunding, GO Limited, Series A | | | 5.38 | % | | 03/01/16 | | | 180,000 | | | | 181,436 | | |
Katy, Texas Independent School District,
School Building, Series D, GO Unlimited | | | 4.50 | % | | 02/15/19 | | | 325,000 | | | | 346,216 | | |
Laredo Independent School District Public
Facility Corp., Lease Revenue, Series F | | | 5.50 | % | | 08/01/24 | | | 100,000 | | | | 100,416 | | |
Laredo, Texas, Waterworks & Sewer System
Revenue | | | 4.25 | % | | 03/01/18 | | | 100,000 | | | | 107,794 | | |
See notes to portfolios of investments and notes to financial statements.
67
Portfolio of Investments December 31, 2013
Municipal Bonds (cont'd) | | Coupon
Rate | | Maturity
Date | | Principal
Amount | | Value | |
Texas (cont'd) | |
Lewisville, Texas Independent School District,
GO Unlimited, Refunding (ZCB) | | | 4.04 | %(1) | | 08/15/15 | | $ | 400,000 | | | $ | 397,232 | | |
Lower Colorado River Authority Texas,
Transmission Contract Revenue, Refunding,
Series A | | | 5.00 | % | | 05/15/21 | | | 500,000 | | | | 567,690 | | |
North Texas Tollway Authority Revenue,
Series F | | | 5.75 | % | | 01/01/38 | | | 300,000 | | | | 311,328 | | |
Prosper, Texas Independent School District,
Capital Appreciation, School Building,
GO Unlimited (ZCB) | | | 6.00 | %(1) | | 08/15/33 | | | 1,000,000 | | | | 369,090 | | |
Richardson, Texas Independent School District,
GO Unlimited | | | 5.00 | % | | 02/15/25 | | | 275,000 | | | | 276,460 | | |
San Antonio, Texas, Water Revenue, Refunding | | | 4.50 | % | | 05/15/21 | | | 400,000 | | | | 454,028 | | |
San Marcos, Texas Tax & Toll Revenue,
GO Limited | | | 5.10 | % | | 08/15/27 | | | 400,000 | | | | 431,424 | | |
San Patricio, Texas Municipal Water District,
Refunding | | | 4.00 | % | | 07/10/18 | | | 200,000 | | | | 206,956 | | |
Texas Municipal Power Agency Revenue,
Refunding | | | 5.00 | % | | 09/01/17 | | | 250,000 | | | | 282,698 | | |
University of Texas Revenue Financing System,
Refunding, Series A | | | 3.00 | % | | 08/15/23 | | | 400,000 | | | | 404,000 | | |
White Settlement, Texas Independent School
District, Prerefunded, GO Unlimited | | | 4.13 | % | | 08/15/15 | | | 240,000 | | | | 254,597 | | |
White Settlement, Texas Independent School
District, Unrefunded, GO Unlimited | | | 4.13 | % | | 08/15/15 | | | 60,000 | | | | 63,739 | | |
| | | | 8,785,977 | | |
Utah 1.91% | |
Tooele City, Utah Municipal Building Authority
Lease Revenue, Refunding | | | 3.75 | % | | 12/01/17 | | | 285,000 | | | | 293,992 | | |
Utah State Building Ownership Authority,
Lease Revenue, Refunding, Series C | | | 5.50 | % | | 05/15/19 | | | 500,000 | | | | 563,265 | | |
Washington County-St George Interlocal
Agency Lease Revenue, Refunding, Series A | | | 4.00 | % | | 12/01/19 | | | 300,000 | | | | 321,990 | | |
| | | | 1,179,247 | | |
Virginia 1.07% | |
Spotsylvania County, Virginia Economic
Development Authority Revenue, Refunding | | | 5.00 | % | | 06/01/23 | | | 300,000 | | | | 336,804 | | |
Virginia College Building Authority Educational
Facilities Revenue, Prerefunded, Series A | | | 5.00 | % | | 09/01/15 | | | 10,000 | �� | | | 10,778 | | |
Virginia College Building Authority Educational
Facilities Revenue, Unrefunded, Series A | | | 5.00 | % | | 09/01/15 | | | 290,000 | | | | 312,365 | | |
| | | | 659,947 | | |
See notes to portfolios of investments and notes to financial statements.
68
Portfolio of Investments December 31, 2013
Municipal Bonds (cont'd) | | Coupon
Rate | | Maturity
Date | | Principal
Amount | | Value | |
Washington 0.85% | |
Energy Northwest, Washington Electric
Revenue | | | 5.00 | % | | 07/01/14 | | $ | 250,000 | | | $ | 255,978 | | |
Spokane County, Washington School District,
No. 81, GO Unlimited | | | 5.05 | % | | 06/01/22 | | | 255,000 | | | | 272,016 | | |
| | | | 527,994 | | |
Wisconsin 0.45% | |
Chippewa Valley, Wisconsin, Technical
College District Promissory Notes, Series A,
GO Unlimited | | | 4.00 | % | | 04/01/14 | | | 250,000 | | | | 252,362 | | |
Wisconsin State, Refunding, Series 2,
GO Unlimited | | | 4.13 | % | | 11/01/16 | | | 25,000 | | | | 25,901 | | |
| | | | 278,263 | | |
Total Investments 94.42% | | | 58,432,717 | | |
(cost $57,607,000) | |
Other assets and liabilities, net 5.58% | | | 3,450,799 | | |
Net Assets 100% | | $ | 61,883,516 | | |
(1)Represents Yield
See notes to portfolios of investments and notes to financial statements.
69
Portfolio of Investments December 31, 2013
Common Stocks 96.51% | | Shares | | Value | |
Aerospace/Defense 0.98% | |
Northrop Grumman Corp. | | | 2,000 | | | $ | 229,220 | | |
Agricultural Chemicals 1.00% | |
CF Industries Holdings, Inc. | | | 1,000 | | | | 233,040 | | |
Beverages - Non-alcoholic 1.92% | |
Coca-Cola Enterprises, Inc. | | | 5,000 | | | | 220,650 | | |
Dr Pepper Snapple Group, Inc. | | | 4,700 | | | | 228,984 | | |
| | | | 449,634 | | |
Building - Heavy Construction 2.49% | |
Chicago Bridge & Iron Co. N.V., Class NY | | | 7,000 | | | | 581,980 | | |
Casino Hotels 3.85% | |
Las Vegas Sands Corp. | | | 7,000 | | | | 552,090 | | |
Wynn Resorts Ltd. | | | 1,800 | | | | 349,578 | | |
| | | | 901,668 | | |
Chemicals - Diversified 4.69% | |
LyondellBasell Industries N.V., Class A | | | 3,000 | | | | 240,840 | | |
PPG Industries, Inc. | | | 1,300 | | | | 246,558 | | |
Westlake Chemical Corp. | | | 5,000 | | | | 610,350 | | |
| | | | 1,097,748 | | |
Commercial Services - Financial 6.24% | |
MasterCard, Inc., Class A | | | 1,500 | | | | 1,253,190 | | |
Western Union Co. | | | 12,000 | | | | 207,000 | | |
| | | | 1,460,190 | | |
Computers 2.40% | |
Apple, Inc. | | | 1,000 | | | | 561,110 | | |
Computers - Memory Devices 1.58% | |
Seagate Technology plc | | | 6,600 | | | | 370,656 | | |
Containers - Metal/Glass 0.91% | |
Ball Corp. | | | 4,100 | | | | 211,806 | | |
Data Processing/Management 1.05% | |
The Dun & Bradstreet Corp. | | | 2,000 | | | | 245,500 | | |
Diversified Banking Institutions 3.00% | |
Bank of America Corp. | | | 45,000 | | | | 700,650 | | |
See notes to portfolios of investments and notes to financial statements.
70
Portfolio of Investments December 31, 2013
Common Stocks (cont'd) | | Shares | | Value | |
Diversified Manufacturing Operations 1.02% | |
General Electric Co. | | | 8,500 | | | $ | 238,255 | | |
E-Commerce/Services 2.49% | |
priceline.com, Inc. | | | 500 | | | | 581,200 | * | |
Electric - Integrated 4.15% | |
Entergy Corp. | | | 3,600 | | | | 227,772 | | |
Exelon Corp. | | | 6,800 | | | | 186,252 | | |
FirstEnergy Corp. | | | 5,100 | | | | 168,198 | | |
TECO Energy, Inc. | | | 10,000 | | | | 172,400 | | |
Wisconsin Energy Corp. | | | 5,200 | | | | 214,968 | | |
| | | | 969,590 | | |
Electronics - Military 1.05% | |
L-3 Communications Holdings, Inc. | | | 2,300 | | | | 245,778 | | |
Finance - Consumer Loans 0.97% | |
SLM Corp. | | | 8,600 | | | | 226,008 | | |
Finance - Investment Banker/Broker 1.79% | |
Evercore Partners, Inc., Class A | | | 7,000 | | | | 418,460 | | |
Hotels & Motels 1.57% | |
Wyndham Worldwide Corp. | | | 5,000 | | | | 368,450 | | |
Internet Content - Entertainment 1.17% | |
Facebook, Inc., Class A | | | 5,000 | | | | 273,300 | * | |
Internet Security 1.02% | |
VeriSign, Inc. | | | 4,000 | | | | 239,120 | * | |
Investment Management/Advisory Services 1.08% | |
Legg Mason, Inc. | | | 5,800 | | | | 252,184 | | |
Machinery - General Industrial 2.22% | |
Wabtec Corp. | | | 7,000 | | | | 519,890 | | |
Machinery - Pumps 1.21% | |
Flowserve Corp. | | | 3,600 | | | | 283,788 | | |
Medical - Biomedical/Gene 4.42% | |
Amgen, Inc. | | | 1,700 | | | | 194,072 | | |
Biogen Idec, Inc. | | | 3,000 | | | | 839,250 | * | |
| | | | 1,033,322 | | |
See notes to portfolios of investments and notes to financial statements.
71
Portfolio of Investments December 31, 2013
Common Stocks (cont'd) | | Shares | | Value | |
Medical - Drugs 1.83% | |
Eli Lilly & Co. | | | 4,500 | | | $ | 229,500 | | |
Pfizer, Inc. | | | 6,500 | | | | 199,095 | | |
| | | | 428,595 | | |
Medical - HMO 1.07% | |
WellPoint, Inc. | | | 2,700 | | | | 249,453 | | |
Medical Instruments 1.01% | �� |
St. Jude Medical, Inc. | | | 3,800 | | | | 235,410 | | |
Medical Labs & Testing Services 0.82% | |
Quest Diagnostics, Inc. | | | 3,600 | | | | 192,744 | | |
Multi-line Insurance 2.05% | |
American International Group, Inc. | | | 4,200 | | | | 214,410 | | |
Assurant, Inc. | | | 4,000 | | | | 265,480 | | |
| | | | 479,890 | | |
Multimedia 1.05% | |
Viacom, Inc., Class B | | | 2,800 | | | | 244,552 | | |
Oil - Field Services 1.01% | |
Oceaneering International, Inc. | | | 3,000 | | | | 236,640 | | |
Oil & Gas Drilling 0.61% | |
Diamond Offshore Drilling, Inc. | | | 2,500 | | | | 142,300 | | |
Oil Companies - Exploration & Production 4.32% | |
Continental Resources, Inc. | | | 4,000 | | | | 450,080 | * | |
Denbury Resources, Inc. | | | 13,600 | | | | 223,448 | * | |
Rosetta Resources, Inc. | | | 7,000 | | | | 336,280 | * | |
| | | | 1,009,808 | | |
Oil Companies - Integrated 2.11% | |
Exxon Mobil Corp. | | | 2,500 | | | | 253,000 | | |
Murphy Oil Corp. | | | 3,700 | | | | 240,056 | | |
| | | | 493,056 | | |
Oil Refining & Marketing 1.33% | |
Marathon Petroleum Corp. | | | 3,400 | | | | 311,882 | | |
Rental Auto/Equipment 2.33% | |
United Rentals, Inc. | | | 7,000 | | | | 545,650 | * | |
See notes to portfolios of investments and notes to financial statements.
72
Portfolio of Investments December 31, 2013
Common Stocks (cont'd) | | Shares | | Value | |
Retail - Apparel/Shoe 0.87% | |
Abercrombie & Fitch Co., Class A | | | 6,200 | | | $ | 204,042 | | |
Retail - Building Products 1.00% | |
Lowe's Companies, Inc. | | | 4,700 | | | | 232,885 | | |
Retail - Gardening Products 1.33% | |
Tractor Supply Co. | | | 4,000 | | | | 310,320 | | |
Retail - Major Department Store 1.63% | |
TJX Companies, Inc. | | | 6,000 | | | | 382,380 | | |
Retail - Regional Department Stores 0.90% | |
Kohl's Corp. | | | 3,700 | | | | 209,975 | | |
Retail - Restaurants 3.65% | |
Chipotle Mexican Grill, Inc., Class A | | | 500 | | | | 266,390 | * | |
Starbucks Corp. | | | 7,500 | | | | 587,925 | | |
| | | | 854,315 | | |
Saving & Loan/Thrifts - Eastern US 0.98% | |
People's United Financial, Inc. | | | 15,100 | | | | 228,312 | | |
Security Services 0.97% | |
The ADT Corp. | | | 5,600 | | | | 226,632 | | |
Semiconductor Equipment 0.95% | |
Lam Research Corp. | | | 4,100 | | | | 223,245 | * | |
Semiconductors Components/Integrated Circuits 2.54% | |
QUALCOMM, Inc. | | | 8,000 | | | | 594,000 | | |
Telephone - Integrated 2.03% | |
AT&T, Inc. | | | 7,200 | | | | 253,152 | | |
Verizon Communications, Inc. | | | 4,500 | | | | 221,130 | | |
| | | | 474,282 | | |
Tobacco 2.86% | |
Lorillard, Inc. | | | 5,100 | | | | 258,468 | | |
Philip Morris International, Inc. | | | 2,300 | | | | 200,399 | | |
Reynolds American, Inc. | | | 4,200 | | | | 209,958 | | |
| | | | 668,825 | | |
See notes to portfolios of investments and notes to financial statements.
73
Portfolio of Investments December 31, 2013
Common Stocks (cont'd) | | Shares | | Value | |
Web Portals/Internet Service Providers 2.99% | |
Google, Inc., Class A | | | 400 | | | $ | 448,284 | * | |
Yahoo!, Inc. | | | 6,200 | | | | 250,728 | * | |
| | | | 699,012 | | |
Total Investments 96.51% | | | 22,570,752 | | |
(cost $17,996,047) | |
Other assets and liabilities, net 3.49% | | | 817,271 | | |
Net Assets 100% | | $ | 23,388,023 | | |
See notes to portfolios of investments and notes to financial statements.
74
Portfolio of Investments December 31, 2013
Common Stocks 93.87% | | Shares | | Value | |
Airlines 0.47% | |
United Continental Holdings, Inc. | | | 7,000 | | | $ | 264,810 | * | |
Apparel Manufacturers 2.53% | |
Michael Kors Holdings Ltd. | | | 17,430 | | | | 1,415,142 | * | |
Applications Software 0.27% | |
Microsoft Corp. | | | 4,000 | | | | 149,720 | | |
Athletic Footwear 0.49% | |
NIKE, Inc., Class B | | | 3,500 | | | | 275,240 | | |
Automotive - Truck Trailers 0.66% | |
Wabash National Corp. | | | 30,000 | | | | 370,500 | * | |
Automotive/Truck Parts & Equipment - Original 0.34% | |
Visteon Corp. | | | 2,290 | | | | 187,528 | * | |
Building - Heavy Construction 2.77% | |
Chicago Bridge & Iron Co. N.V., Class NY | | | 18,600 | | | | 1,546,404 | | |
Building Products - Cement/Aggregates 1.38% | |
Eagle Materials, Inc. | | | 10,000 | | | | 774,300 | | |
Cable/Satellite TV 0.49% | |
Comcast Corp., Class A | | | 5,300 | | | | 275,414 | | |
Casino Hotels 2.12% | |
Las Vegas Sands Corp. | | | 15,000 | | | | 1,183,050 | | |
Chemicals - Diversified 2.18% | |
Westlake Chemical Corp. | | | 10,000 | | | | 1,220,700 | | |
Chemicals - Specialty 0.25% | |
Eastman Chemical Co. | | | 1,750 | | | | 141,225 | | |
Coal 0.03% | |
Pacific Coal Resources Ltd. | | | 39,830 | | | | 15,560 | * | |
Commercial Services - Financial 4.03% | |
MasterCard, Inc., Class A | | | 2,700 | | | | 2,255,742 | | |
Computer Services 1.01% | |
FleetMatics Group plc | | | 13,000 | | | | 562,250 | * | |
See notes to portfolios of investments and notes to financial statements.
75
Portfolio of Investments December 31, 2013
Common Stocks (cont'd) | | Shares | | Value | |
Computers 2.27% | |
Apple, Inc. | | | 2,260 | | | $ | 1,268,109 | | |
Computers - Memory Devices 0.22% | |
EMC Corp. | | | 5,000 | | | | 125,750 | | |
Diversified Banking Institutions 2.66% | |
Bank of America Corp. | | | 75,000 | | | | 1,167,750 | | |
Citigroup, Inc. | | | 3,000 | | | | 156,330 | | |
JPMorgan Chase & Co. | | | 2,800 | | | | 163,744 | | |
| | | | 1,487,824 | | |
Diversified Manufacturing Operations 0.51% | |
Danaher Corp. | | | 3,700 | | | | 285,640 | | |
E-Commerce/Products 0.53% | |
Amazon.com, Inc. | | | 740 | | | | 295,105 | * | |
E-Commerce/Services 3.50% | |
OpenTable, Inc. | | | 10,000 | | | | 793,700 | * | |
priceline.com, Inc. | | | 1,000 | | | | 1,162,400 | * | |
| | | | 1,956,100 | | |
Electric - Generation 0.46% | |
Pacific Power Generation Corp. (RS) | | | 349,057 | | | | 254,672 | *@# | |
Electronic Components - Semiconductors 1.63% | |
Ambarella, Inc. | | | 10,000 | | | | 339,300 | * | |
ARM Holdings plc, Sponsored ADR | | | 8,000 | | | | 437,920 | | |
Broadcom Corp., Class A | | | 4,500 | | | | 133,425 | | |
| | | | 910,645 | | |
Energy - Alternate Sources 0.12% | |
Pacific Green Energy Corp. (RS) | | | 100,000 | | | | 66,990 | *@# | |
Engineering/Research & Development Services 0.53% | |
Fluor Corp. | | | 3,700 | | | | 297,073 | | |
Finance - Commercial 2.01% | |
IOU Financial, Inc. | | | 1,836,500 | | | | 1,123,717 | * | |
Finance - Investment Banker/Broker 1.88% | |
Canaccord Financial, Inc. | | | 10,000 | | | | 65,424 | | |
Difference Capital Financial, Inc. | | | 12,000 | | | | 31,065 | * | |
See notes to portfolios of investments and notes to financial statements.
76
Portfolio of Investments December 31, 2013
Common Stocks (cont'd) | | Shares | | Value | |
Finance - Investment Banker/Broker (cont'd) | |
Evercore Partners, Inc., Class A | | | 16,000 | | | $ | 956,480 | | |
| | | | 1,052,969 | | |
Finance - Other Services 1.39% | |
CBOE Holdings, Inc. | | | 15,000 | | | | 779,400 | | |
Food - Meat Products 0.30% | |
Tyson Foods, Inc., Class A | | | 5,000 | | | | 167,300 | | |
Food - Miscellaneous/Diversified 0.21% | |
ConAgra Foods, Inc. | | | 3,400 | | | | 114,580 | | |
Gold Mining 0.54% | |
Gran Colombia Gold Corp. | | | 2,848 | | | | 2,064 | * | |
Nevsun Resources Ltd. | | | 40,000 | | | | 132,800 | | |
Rio Alto Mining Ltd. | | | 100,000 | | | | 167,000 | * | |
| | | | 301,864 | | |
Hazardous Waste Disposal 0.33% | |
U.S. Ecology, Inc. | | | 5,000 | | | | 185,950 | | |
Hotels & Motels 1.19% | |
Wyndham Worldwide Corp. | | | 9,000 | | | | 663,210 | | |
Human Resources 0.73% | |
Team Health Holdings, Inc. | | | 9,000 | | | | 409,950 | * | |
Instruments - Controls 0.49% | |
Honeywell International, Inc. | | | 3,000 | | | | 274,110 | | |
Internet Application Software 1.35% | |
Splunk, Inc. | | | 11,000 | | | | 755,370 | * | |
Internet Content - Entertainment 1.59% | |
Facebook, Inc., Class A | | | 9,000 | | | | 491,940 | * | |
Pandora Media, Inc. | | | 15,000 | | | | 399,000 | * | |
| | | | 890,940 | | |
Internet Financial Services 0.00% | |
Direct Markets Holdings Corp. | | | 10,000 | | | | 9 | * | |
Investment Management/Advisory Services 0.95% | |
WisdomTree Investments, Inc. | | | 30,000 | | | | 531,300 | * | |
See notes to portfolios of investments and notes to financial statements.
77
Portfolio of Investments December 31, 2013
Common Stocks (cont'd) | | Shares | | Value | |
Machinery - General Industrial 4.79% | |
Chart Industries, Inc. | | | 8,000 | | | $ | 765,120 | * | |
DXP Enterprises, Inc. | | | 5,000 | | | | 576,000 | * | |
Wabtec Corp. | | | 18,000 | | | | 1,336,860 | | |
| | | | 2,677,980 | | |
Machinery - Pumps 0.52% | |
Flowserve Corp. | | | 3,700 | | | | 291,671 | | |
Medical - Biomedical/Gene 3.66% | |
Amgen, Inc. | | | 2,300 | | | | 262,568 | | |
Biogen Idec, Inc. | | | 5,500 | | | | 1,538,625 | * | |
Regeneron Pharmaceuticals, Inc. | | | 900 | | | | 247,716 | * | |
| | | | 2,048,909 | | |
Medical - Drugs 1.50% | |
AbbVie, Inc. | | | 5,500 | | | | 290,455 | | |
Bristol-Myers Squibb Co. | | | 5,000 | | | | 265,750 | | |
Forest Laboratories, Inc. | | | 4,700 | | | | 282,141 | * | |
| | | | 838,346 | | |
Medical - Generic Drugs 1.92% | |
Mylan, Inc. | | | 24,700 | | | | 1,071,980 | * | |
Medical - HMO 0.54% | |
UnitedHealth Group, Inc. | | | 4,000 | | | | 301,200 | | |
Medical - Hospitals 0.01% | |
African Medical Investments plc | | | 1,000,000 | | | | 3,726 | *@# | |
Medical - Wholesale Drug Distribution 1.03% | |
Cardinal Health, Inc. | | | 4,400 | | | | 293,964 | | |
McKesson Corp. | | | 1,750 | | | | 282,450 | | |
| | | | 576,414 | | |
Medical Instruments 0.37% | |
St. Jude Medical, Inc. | | | 3,360 | | | | 208,152 | | |
Metal - Iron 0.69% | |
Andean Iron Corp., 144A (RS) | | | 880,000 | | | | 385,264 | *@# | |
Metal Processors & Fabricators 1.20% | |
Precision Castparts Corp. | | | 2,500 | | | | 673,250 | | |
See notes to portfolios of investments and notes to financial statements.
78
Portfolio of Investments December 31, 2013
Common Stocks (cont'd) | | Shares | | Value | |
Multi-line Insurance 1.62% | |
The Hartford Financial Services Group, Inc. | | | 25,000 | | | $ | 905,750 | | |
Multimedia 0.50% | |
Twenty-First Century Fox, Inc., Class A | | | 8,000 | | | | 281,440 | | |
Oil - Field Services 3.08% | |
CARBO Ceramics, Inc. | | | 5,000 | | | | 582,650 | | |
Core Laboratories N.V. | | | 3,000 | | | | 572,850 | | |
Halliburton Co. | | | 2,600 | | | | 131,950 | | |
Oceaneering International, Inc. | | | 5,500 | | | | 433,840 | | |
| | | | 1,721,290 | | |
Oil & Gas Drilling 0.23% | |
Atwood Oceanics, Inc. | | | 2,400 | | | | 128,136 | * | |
Oil Companies - Exploration & Production 5.00% | |
Continental Resources, Inc. | | | 8,000 | | | | 900,160 | * | |
Oasis Petroleum, Inc. | | | 15,000 | | | | 704,550 | * | |
QEP Resources, Inc. | | | 4,200 | | | | 128,730 | | |
Rosetta Resources, Inc. | | | 15,000 | | | | 720,600 | * | |
Sanchez Energy Corp. | | | 14,000 | | | | 343,140 | * | |
| | | | 2,797,180 | | |
Oil Field Machinery & Equipment 0.72% | |
Flotek Industries, Inc. | | | 20,000 | | | | 401,400 | * | |
Oil Refining & Marketing 0.25% | |
Tesoro Corp. | | | 2,400 | | | | 140,400 | | |
Quarrying 2.12% | |
Pacific Stone Tech, Inc. (RS) | | | 4,162 | | | | 1,185,130 | *@# | |
Real Estate Operating/Development 0.99% | |
Pacific Infrastructure Ventures, Inc. (RS) | | | 426,533 | | | | 556,028 | *@# | |
Recreational Vehicles 0.78% | |
Polaris Industries, Inc. | | | 3,000 | | | | 436,920 | | |
Rental Auto/Equipment 2.09% | |
United Rentals, Inc. | | | 15,000 | | | | 1,169,250 | * | |
Retail - Auto Parts 0.51% | |
AutoZone, Inc. | | | 600 | | | | 286,764 | * | |
See notes to portfolios of investments and notes to financial statements.
79
Portfolio of Investments December 31, 2013
Common Stocks (cont'd) | | Shares | | Value | |
Retail - Drug Store 0.51% | |
CVS Caremark Corp. | | | 4,000 | | | $ | 286,280 | | |
Retail - Gardening Products 1.39% | |
Tractor Supply Co. | | | 10,000 | | | | 775,800 | | |
Retail - Major Department Store 1.94% | |
TJX Companies, Inc. | | | 17,000 | | | | 1,083,410 | | |
Retail - Restaurants 3.06% | |
Chipotle Mexican Grill, Inc., Class A | | | 1,000 | | | | 532,780 | * | |
Starbucks Corp. | | | 15,000 | | | | 1,175,850 | | |
| | | | 1,708,630 | | |
Retail - Vitamins/Nutritional Supplements 1.25% | |
GNC Holdings, Inc., Class A | | | 12,000 | | | | 701,400 | | |
Security Services 0.73% | |
LifeLock, Inc. | | | 25,000 | | | | 410,250 | * | |
Seismic Data Collection 0.24% | |
ION Geophysical Corp. | | | 40,000 | | | | 132,000 | * | |
Semiconductor Equipment 0.24% | |
Teradyne, Inc. | | | 7,500 | | | | 132,150 | * | |
Semiconductors Components/Integrated Circuits 1.57% | |
QUALCOMM, Inc. | | | 11,800 | | | | 876,150 | | |
Storage/Warehousing 0.27% | |
Wesco Aircraft Holdings, Inc. | | | 7,000 | | | | 153,440 | * | |
Television 0.49% | |
CBS Corp., Class B | | | 4,300 | | | | 274,082 | | |
Transportation - Rail 0.95% | |
Canadian Pacific Railway Ltd. | | | 1,800 | | | | 272,376 | | |
Kansas City Southern | | | 2,100 | | | | 260,043 | | |
| | | | 532,419 | | |
Transportation - Services 0.54% | |
FedEx Corp. | | | 2,100 | | | | 301,917 | | |
See notes to portfolios of investments and notes to financial statements.
80
Portfolio of Investments December 31, 2013
Common Stocks (cont'd) | | Shares | | Value | |
Transportation - Truck 1.42% | |
Old Dominion Freight Line, Inc. | | | 15,000 | | | $ | 795,300 | * | |
Web Hosting/Design 0.24% | |
Equinix, Inc. | | | 750 | | | | 133,087 | * | |
Web Portals/Internet Service Providers 0.50% | |
Google, Inc., Class A | | | 250 | | | | 280,178 | * | |
Total Common Stocks | | | 52,499,235 | | |
(cost $40,464,761) | |
Real Estate Investment Trust (REIT) 0.26%
American Tower Corp., Class A | | | 1,800 | | | | 143,676 | | |
(cost $141,749) | |
Warrants 0.00%
Gold Mining 0.00% | |
Gran Colombia Gold Corp., 144A, Warrants (October 2017) | | | 3,700 | | | | 0 | *@# | |
Medical - Hospitals 0.00% | |
African Medical Investments plc, Warrants (June 2014) | | | 500,000 | | | | 0 | *@# | |
Total Warrants | | | 0 | | |
(cost $0) | |
Gold-Linked Notes 0.45% | | Principal
Amount | | | |
Gold Mining 0.45% | |
Gran Colombia Gold Corp., 10.00%, maturity 10/31/17 | | $ | 10,000 | | | | 6,700 | | |
Gran Colombia Gold Corp., 144A, 10.00%, maturity 10/31/17 | | | 370,000 | | | | 247,900 | | |
Total Gold-Linked Notes | | | 254,600 | | |
(cost $375,700) | |
See notes to portfolios of investments and notes to financial statements.
81
Portfolio of Investments December 31, 2013
Silver-Linked Note 0.33% | | Principal
Amount | | Value | |
Gold Mining 0.33% | |
Gran Colombia Gold Corp., 5.00%, maturity 08/11/18 | | $ | 425,000 | | | $ | 182,750 | | |
(cost $341,159) | |
Corporate Note 0.45%
Electric - Generation 0.45% | |
Pacific Power Generation Corp., 15.00%, maturity 04/03/17 (RS) | | | 250,000 | | | | 250,000 | @# | |
(cost $250,000) | |
Total Investments 95.36% | | | 53,330,261 | | |
(cost $41,573,369) | |
Other assets and liabilities, net 4.64% | | | 2,595,759 | | |
Net Assets 100% | | $ | 55,926,020 | | |
See notes to portfolios of investments and notes to financial statements.
82
Portfolio of Investments December 31, 2013
Common Stocks 89.14% | | Shares | | Value | |
Agricultural Chemicals 2.19% | |
Agrium, Inc. | | | 45,000 | | | $ | 4,116,600 | | |
Monsanto Co. | | | 35,000 | | | | 4,079,250 | | |
Spur Ventures, Inc. | | | 274,867 | | | | 86,680 | * | |
| | | | 8,282,530 | | |
Agricultural Operations 2.31% | |
Agriterra Ltd. | | | 68,588,600 | | | | 2,646,115 | *+ | |
Archer-Daniels-Midland Co. | | | 45,000 | | | | 1,953,000 | | |
Bunge Ltd. | | | 50,000 | | | | 4,105,500 | | |
| | | | 8,704,615 | | |
Building Products - Cement/Aggregates 1.03% | |
Eagle Materials, Inc. | | | 50,000 | | | | 3,871,500 | | |
Chemicals - Diversified 1.17% | |
LyondellBasell Industries N.V., Class A | | | 55,000 | | | | 4,415,400 | | |
Chemicals - Specialty 1.02% | |
Methanex Corp. | | | 65,000 | | | | 3,850,600 | | |
Coal 2.78% | |
Consol Energy, Inc. | | | 125,000 | | | | 4,755,000 | | |
Pacific Coal Resources Ltd. | | | 3,522,061 | | | | 1,375,935 | *+ | |
Sable Mining Africa Ltd. | | | 27,942,270 | | | | 4,288,535 | * | |
Walter Energy, Inc., 144A | | | 4,293 | | | | 71,368 | * | |
| | | | 10,490,838 | | |
Containers - Metal/Glass 1.04% | |
Owens-Illinois, Inc. | | | 110,000 | | | | 3,935,800 | * | |
Containers - Paper/Plastic 1.08% | |
Sealed Air Corp. | | | 120,000 | | | | 4,086,000 | | |
Diamonds/Precious Stones 0.01% | |
Diamond Fields International Ltd. | | | 1,800,000 | | | | 29,653 | * | |
Rockwell Diamonds, Inc., 144A | | | 63,333 | | | | 22,059 | * | |
| | | | 51,712 | | |
Diversified Minerals 5.36% | |
African Potash Ltd. | | | 14,967,500 | | | | 959,316 | *+ | |
BHP Billiton Ltd., Sponsored ADR | | | 185,000 | | | | 12,617,000 | | |
Calibre Mining Corp. | | | 592,000 | | | | 25,078 | * | |
Canada Zinc Metals Corp. | | | 1,000,000 | | | | 400,075 | * | |
See notes to portfolios of investments and notes to financial statements.
83
Portfolio of Investments December 31, 2013
Common Stocks (cont'd) | | Shares | | Value | |
Diversified Minerals (cont'd) | |
Lithium Americas Corp. | | | 476,667 | | | $ | 219,869 | * | |
Meryllion Resources Corp. | | | 200,000 | | | | 21,651 | * | |
Niocan, Inc., 144A | | | 362,069 | | | | 68,167 | * | |
Sirocco Mining, Inc. | | | 2,255,000 | | | | 806,646 | * | |
U.S. Silica Holdings, Inc. | | | 125,000 | | | | 4,263,750 | | |
Woulfe Mining Corp. | | | 9,111,600 | | | | 857,724 | * | |
| | | | 20,239,276 | | |
Electric - Generation 0.94% | |
Pacific Power Generation Corp. (RS) | | | 4,868,396 | | | | 3,551,982 | *@# | |
Energy - Alternate Sources 0.43% | |
Pacific Green Energy Corp. (RS) | | | 2,400,000 | | | | 1,607,760 | *+@# | |
Engineering/R&D Services 1.09% | |
Foster Wheeler AG | | | 125,000 | | | | 4,127,500 | * | |
Finance - Investment Banker/Broker 0.04% | |
Aberdeen International, Inc. | | | 1,274,750 | | | | 137,999 | * | |
Food - Flour & Grain 0.92% | |
Amira Nature Foods Ltd. | | | 220,000 | | | | 3,467,200 | * | |
Food - Meat Products 4.54% | |
BRF S.A., Sponsored ADR | | | 185,000 | | | | 3,860,950 | | |
Minerva S.A. | | | 725,000 | | | | 3,532,723 | * | |
Tyson Foods, Inc., Class A | | | 291,400 | | | | 9,750,244 | | |
| | | | 17,143,917 | | |
Forestry 2.66% | |
International Forest Products Ltd., Class A | | | 325,000 | | | | 4,111,833 | * | |
Prima Colombia Hardwood, Inc. | | | 15,265,832 | | | | 71,853 | * | |
West Fraser Timber Co., Ltd. | | | 60,000 | | | | 5,851,454 | | |
| | | | 10,035,140 | | |
Gold Mining 9.69% | |
Alacer Gold Corp. | | | 1,625,000 | | | | 3,319,448 | | |
B2Gold Corp. | | | 2,400,000 | | | | 4,848,000 | * | |
Besra Gold, Inc. | | | 295,000 | | | | 12,497 | * | |
Chesapeake Gold Corp. | | | 104,300 | | | | 276,877 | * | |
Chesapeake Gold Corp., 144A | | | 52,400 | | | | 139,102 | * | |
Corona Minerals Ltd. | | | 50,000 | | | | 1,116 | *@# | |
Gran Colombia Gold Corp. | | | 740,394 | | | | 536,669 | * | |
Kinross Gold Corp., 144A | | | 1 | | | | 4 | | |
See notes to portfolios of investments and notes to financial statements.
84
Portfolio of Investments December 31, 2013
Common Stocks (cont'd) | | Shares | | Value | |
Gold Mining (cont'd) | |
Klondex Mines Ltd. | | | 2,700,000 | | | $ | 4,092,064 | * | |
Nevsun Resources Ltd. | | | 1,750,000 | | | | 5,810,000 | | |
NGEx Resources, Inc. | | | 1,575,106 | | | | 2,120,307 | * | |
Pretium Resources, Inc. | | | 300,000 | | | | 1,548,000 | * | |
Randgold Resources Ltd., Sponsored ADR | | | 120,000 | | | | 7,537,200 | | |
Regis Resources Ltd. | | | 1,750,000 | | | | 4,580,286 | * | |
Rusoro Mining Ltd. | | | 3,119,433 | | | | 80,753 | * | |
Sunridge Gold Corp. | | | 4,500,000 | | | | 698,955 | *+ | |
Sunridge Gold Corp., 144A (RS) | | | 6,333,788 | | | | 983,785 | *+ | |
| | | | 36,585,063 | | |
Medical - Hospitals 0.00% | |
African Medical Investments plc | | | 2,507,500 | | | | 9,344 | *@# | |
Metal - Aluminum 1.13% | |
Alcoa, Inc. | | | 400,000 | | | | 4,252,000 | | |
Metal - Copper 4.76% | |
Antofagasta plc | | | 500,000 | | | | 6,861,469 | | |
Augusta Resource Corp. | | | 400,700 | | | | 573,001 | * | |
Catalyst Copper Corp. | | | 180,000 | | | | 10,167 | * | |
Catalyst Copper Corp., 144A | | | 500,000 | | | | 28,241 | * | |
Freeport-McMoRan Copper & Gold, Inc. | | | 275,000 | | | | 10,378,500 | | |
Los Andes Copper Ltd. | | | 754,000 | | | | 127,760 | * | |
Verona Development Corp. | | | 708,800 | | | | 0 | *@# | |
| | | | 17,979,138 | | |
Metal - Diversified 3.23% | |
Bell Copper Corp. | | | 500,000 | | | | 4,707 | * | |
Capstone Mining Corp. | | | 1,725,000 | | | | 4,871,505 | * | |
GoviEx Uranium, Inc., 144A (RS) | | | 750,000 | | | | 1,053,525 | *@# | |
Ivanhoe Mines Ltd. | | | 1,000,000 | | | | 1,760,331 | * | |
Kaizen Discovery, Inc. | | | 200,000 | | | | 118,611 | * | |
Mandalay Resources Corp. | | | 5,050,000 | | | | 3,707,992 | | |
Orsu Metals Corp., 144A | | | 147,605 | | | | 7,642 | * | |
Turquoise Hill Resources Ltd. | | | 200,000 | | | | 660,000 | * | |
| | | | 12,184,313 | | |
Metal - Iron 0.39% | |
Andean Iron Corp., 144A (RS) | | | 2,860,000 | | | | 1,252,108 | *@# | |
Oceanic Iron Ore Corp. | | | 2,000,000 | | | | 169,444 | * | |
West African Iron Ore Corp., 144A | | | 2,925,000 | | | | 68,836 | * | |
| | | | 1,490,388 | | |
See notes to portfolios of investments and notes to financial statements.
85
Portfolio of Investments December 31, 2013
Common Stocks (cont'd) | | Shares | | Value | |
Mining Services 0.25% | |
Bounty Mining Ltd. | | | 22,000,000 | | | $ | 245,561 | *@# | |
Natasa Mining Ltd. | | | 1,036,350 | | | | 695,143 | * | |
| | | | 940,704 | | |
Natural Resource Technology 0.01% | |
I-Pulse, Inc., 144A (RS) | | | 15,971 | | | | 50,947 | *@# | |
Non - Ferrous Metals 0.02% | |
Anfield Nickel Corp. | | | 25,300 | | | | 35,487 | * | |
Sterling Group Ventures, Inc., 144A | | | 500,000 | | | | 32,500 | * | |
| | | | 67,987 | | |
Oil - Field Services 5.68% | |
Baker Hughes, Inc. | | | 120,000 | | | | 6,631,200 | | |
CARBO Ceramics, Inc. | | | 36,000 | | | | 4,195,080 | | |
Halliburton Co. | | | 75,000 | | | | 3,806,250 | | |
Pioneer Energy Services Corp. | | | 340,000 | | | | 2,723,400 | * | |
Superior Energy Services, Inc. | | | 153,000 | | | | 4,071,330 | * | |
| | | | 21,427,260 | | |
Oil Companies - Exploration & Production 18.30% | |
Africa Oilfield Logistics Ltd. | | | 54,624,983 | | | | 7,011,417 | *+ | |
Anadarko Petroleum Corp. | | | 25,000 | | | | 1,983,000 | | |
Antero Resources Corp. | | | 5,000 | | | | 317,200 | * | |
Bellatrix Exploration Ltd. | | | 405,000 | | | | 2,977,549 | * | |
Birchcliff Energy Ltd. | | | 150,000 | | | | 1,026,546 | * | |
BNK Petroleum, Inc. | | | 491,300 | | | | 786,228 | * | |
Canacol Energy Ltd. | | | 300,000 | | | | 2,013,555 | * | |
Continental Resources, Inc. | | | 72,000 | | | | 8,101,440 | * | |
EQT Corp. | | | 80,000 | | | | 7,182,400 | | |
Gran Tierra Energy, Inc. | | | 600,000 | | | | 4,386,000 | * | |
Gulfport Energy Corp. | | | 75,000 | | | | 4,736,250 | * | |
Horn Petroleum Corp., 144A | | | 2,110,889 | | | | 387,483 | * | |
Ivanhoe Energy, Inc. | | | 138,033 | | | | 83,160 | * | |
Pacific Rubiales Energy Corp. | | | 36,188 | | | | 624,765 | | |
Parex Resources, Inc. | | | 250,000 | | | | 1,548,527 | * | |
Petroamerica Oil Corp. | | | 6,768,000 | | | | 2,198,023 | * | |
Petromanas Energy, Inc. | | | 1,000,000 | | | | 150,617 | * | |
Pioneer Natural Resources Co. | | | 45,000 | | | | 8,283,150 | | |
Range Energy Resources, Inc. | | | 100,000 | | | | 2,353 | * | |
Range Energy Resources, Inc., 144A | | | 15,000,000 | | | | 353,008 | * | |
Royalite Petroleum Co., Inc. | | | 2,266,333 | | | | 2,720 | * | |
Sanchez Energy Corp. | | | 135,000 | | | | 3,308,850 | * | |
ShaMaran Petroleum Corp. | | | 4,700,000 | | | | 2,035,207 | * | |
Triangle Petroleum Corp. | | | 340,000 | | | | 2,828,800 | * | |
See notes to portfolios of investments and notes to financial statements.
86
Portfolio of Investments December 31, 2013
Common Stocks (cont'd) | | Shares | | Value | |
Oil Companies - Exploration & Production (cont'd) | |
U.S. Oil Sands, Inc. | | | 7,777,777 | | | $ | 1,098,245 | * | |
U.S. Oil Sands, Inc., 144A (RS) | | | 9,900,000 | | | | 1,328,015 | *@# | |
Unit Corp. | | | 50,000 | | | | 2,581,000 | * | |
Vaalco Energy, Inc. | | | 250,000 | | | | 1,722,500 | * | |
| | | | 69,058,008 | | |
Oil Companies - Integrated 0.61% | |
Phillips 66 | | | 30,000 | | | | 2,313,900 | | |
Oil Refining & Marketing 2.76% | |
HollyFrontier Corp. | | | 50,000 | | | | 2,484,500 | | |
Marathon Petroleum Corp. | | | 50,000 | | | | 4,586,500 | | |
Tesoro Corp. | | | 55,000 | | | | 3,217,500 | | |
Value Creation, Inc. (RS) | | | 336,880 | | | | 145,877 | *@# | |
| | | | 10,434,377 | | |
Paper & Related Products 2.60% | �� |
International Paper Co. | | | 200,000 | | | | 9,806,000 | | |
Platinum 0.65% | |
Platinum Group Metals Ltd. | | | 2,100,000 | | | | 2,457,000 | * | |
Poultry 0.65% | |
Pilgrim's Pride Corp. | | | 150,000 | | | | 2,437,500 | * | |
Precious Metals 0.19% | |
Fortress Minerals Corp. | | | 170,200 | | | | 703,359 | * | |
Quarrying 1.71% | |
Pacific Stone Tech, Inc. (RS) | | | 22,659 | | | | 6,452,150 | *+@# | |
Real Estate Operating/Development 2.68% | |
Mongolia Growth Group Ltd. | | | 186,200 | | | | 397,886 | * | |
Pacific Infrastructure Ventures, Inc. (RS) | | | 7,443,544 | | | | 9,703,404 | *@# | |
| | | | 10,101,290 | | |
Retail - Jewelry 1.20% | |
Dominion Diamond Corp. | | | 315,000 | | | | 4,523,400 | * | |
Seismic Data Collection 0.53% | |
ION Geophysical Corp. | | | 604,781 | | | | 1,995,777 | * | |
See notes to portfolios of investments and notes to financial statements.
87
Portfolio of Investments December 31, 2013
Common Stocks (cont'd) | | Shares | | Value | |
Silver Mining 1.46% | |
First Majestic Silver Corp. | | | 380,000 | | | $ | 3,724,000 | * | |
MAG Silver Corp. | | | 350,000 | | | | 1,806,000 | * | |
| | | | 5,530,000 | | |
Steel - Producers 0.73% | |
Gerdau S.A., Sponsored ADR | | | 350,000 | | | | 2,744,000 | | |
Transportation - Marine 1.30% | |
Ardmore Shipping Corp. | | | 50,000 | | | | 778,000 | | |
Diana Shipping, Inc. | | | 100,000 | | | | 1,329,000 | * | |
Horizon North Logistics, Inc. | | | 300,000 | | | | 2,809,941 | | |
| | | | 4,916,941 | | |
Total Common Stocks | | | 336,460,615 | | |
(cost $392,618,478) | |
Real Estate Investment Trust (REIT) 1.17%
Weyerhaeuser Co. | | | 140,000 | | | | 4,419,800 | | |
(cost $2,840,278) | |
Warrants 0.59%
Diversified Minerals 0.00% | |
Niocan, Inc., 144A, Warrants (August 2014) | | | 260,000 | | | | 0 | *@# | |
Gold Mining 0.56% | |
Dundee Precious Metals, Inc., Warrants (November 2015) | | | 735,036 | | | | 1,030,974 | * | |
Gran Colombia Gold Corp., 144A, Warrants (October 2017) | | | 86,150 | | | | 0 | *@# | |
New Gold, Inc., 144A, Warrants (June 2017) | | | 822,570 | | | | 820,789 | * | |
Sunridge Gold Corp., 144A, Warrants (October 2017) (RS) | | | 6,333,788 | | | | 253,399 | * | |
| | | | 2,105,162 | | |
Medical - Hospitals 0.00% | |
African Medical Investments plc, Warrants (June 2014) | | | 1,162,500 | | | | 0 | *@# | |
Metal - Copper 0.00% | |
Catalyst Copper Corp., 144A, Warrants (February 2017) | | | 2,500,000 | | | | 0 | *@# | |
See notes to portfolios of investments and notes to financial statements.
88
Portfolio of Investments December 31, 2013
Warrants (cont'd) | | Shares | | Value | |
Metal - Iron 0.01% | |
West African Iron Ore Corp., 144A, Warrants (March 2016) | | | 2,925,000 | | | $ | 27,535 | * | |
Oil Companies - Exploration & Production 0.02% | |
Petroamerica Oil Corp., 144A, Warrants (October 2014) | | | 8,000,000 | | | | 75,308 | * | |
U.S. Oil Sands, Inc., 144A, Warrants (May 2014) | | | 7,777,777 | | | | 0 | *@# | |
| | | | 75,308 | | |
Total Warrants | | | 2,208,005 | | |
(cost $931,372) | |
Rights 0.05%
Metal - Diversified 0.05% | |
Turquoise Hill Resources Ltd. (January 2014) | | | 200,000 | | | | 192,000 | * | |
(cost $241,662) | |
Purchased Call Options 1.09% | | Contracts | | | |
Agricultural Operations 0.09% | |
Archer-Daniels-Midland Co., Strike Price 43, Expiration June 2014 | | | 1,000 | | | | 330,000 | | |
Oil - Field Services 0.01% | |
Halliburton Co., Strike Price 53, Expiration Jan. 2014 | | | 1,250 | | | | 46,250 | | |
Oil Companies - Exploration & Production 0.26% | |
Anadarko Petroleum Corp., Strike Price 80, Expiration May 2014 | | | 500 | | | | 275,000 | | |
Anadarko Petroleum Corp., Strike Price 87.50, Expiration Jan. 2015 | | | 275 | | | | 159,500 | | |
Energen Corp., Strike Price 65, Expiration July 2014 | | | 500 | | | | 510,000 | | |
Pacific Rubiales Energy Corp., Strike Price 18, Expiration Jan. 2014 | | | 500 | | | | 37,654 | | |
| | | | 982,154 | | |
Oil Refining & Marketing 0.15% | |
HollyFrontier Corp., Strike Price 45, Expiration Mar. 2014 | | | 1,000 | | | | 580,000 | | |
Steel - Producers 0.58% | |
United States Steel Corp., Strike Price 30, Expiration Jan. 2015 | | | 5,000 | | | | 2,175,000 | | |
Total Purchased Call Options | | | 4,113,404 | | |
(cost $4,070,327) | |
See notes to portfolios of investments and notes to financial statements.
89
Portfolio of Investments December 31, 2013
Master Limited Partnerships 3.71% | | Units | | Value | |
Pipelines 3.71% | |
Access Midstream Partners L.P. | | | 60,000 | | | $ | 3,394,800 | | |
Atlas Energy L.P. | | | 85,000 | | | | 3,982,250 | | |
Enterprise Products Partners L.P. | | | 100,000 | | | | 6,630,000 | | |
Total Master Limited Partnerships | | | 14,007,050 | | |
(cost $12,395,833) | |
Convertible Bond 0.12% | | Principal
Amount | | | |
Mining Services 0.12% | |
Great Western Minerals Group Ltd., 8.00%, maturity 04/06/17 | | $ | 1,000,000 | | | | 435,000 | | |
(cost $1,000,000) | |
Gold-Linked Notes 1.57%
Gold Mining 1.57% | |
Gran Colombia Gold Corp., 10.00%, maturity 10/31/17 | | | 247,000 | | | | 165,490 | | |
Gran Colombia Gold Corp., 144A, 10.00%, maturity 10/31/17 | | | 8,615,000 | | | | 5,772,050 | | |
Total Gold-Linked Notes | | | 5,937,540 | | |
(cost $8,757,610) | |
Silver-Linked Notes 0.77%
Gold Mining 0.77% | |
Gran Colombia Gold Corp., 5.00%, maturity 08/11/18 | | | 4,711,000 | | | | 2,025,730 | | |
Gran Colombia Gold Corp., 144A, 5.00%, maturity 08/11/18 | | | 2,000,000 | | | | 860,000 | | |
Total Silver-Linked Notes | | | 2,885,730 | | |
(cost $5,791,599) | |
See notes to portfolios of investments and notes to financial statements.
90
Portfolio of Investments December 31, 2013
Corporate Note 0.79% | | Principal
Amount | | Value | |
Electric - Generation 0.79% | |
Pacific Power Generation Corp., 15.00%, maturity 04/03/17 (RS) | | $ | 3,000,000 | | | $ | 3,000,000 | @# | |
(cost $3,000,000) | |
Total Investments 99.00% | | | 373,659,144 | | |
(cost $431,647,159) | |
Other assets and liabilities, net 1.00% | | | 3,783,190 | | |
Net Assets 100% | | $ | 377,442,334 | | |
See notes to portfolios of investments and notes to financial statements.
91
Portfolio of Investments December 31, 2013
World Precious Minerals Fund
Common Stocks 83.55% | | Shares | | Value | |
Agricultural Operations 1.08% | |
Agriterra Ltd. | | | 38,536,200 | | | $ | 1,486,708 | * | |
Coal 2.30% | |
Pacific Coal Resources Ltd. | | | 838,664 | | | | 327,634 | * | |
Sable Mining Africa Ltd. | | | 18,495,000 | | | | 2,838,583 | * | |
| | | | 3,166,217 | | |
Diamonds/Precious Stones 1.76% | |
Lucara Diamond Corp. | | | 1,357,262 | | | | 2,210,358 | * | |
Northern Superior Resources, Inc., Class A | | | 1,510,900 | | | | 42,669 | * | |
Olivut Resources Ltd. | | | 645,000 | | | | 112,327 | * | |
Rockwell Diamonds, Inc., 144A | | | 171,667 | | | | 59,792 | * | |
| | | | 2,425,146 | | |
Diversified Minerals 1.93% | |
Adamera Minerals Corp. | | | 119,543 | | | | 4,501 | * | |
African Potash Ltd. | | | 2,663,125 | | | | 170,688 | * | |
Aldridge Minerals, Inc. | | | 2,100,000 | | | | 355,832 | * | |
Amarc Resources Ltd. | | | 695,545 | | | | 22,916 | * | |
Calibre Mining Corp. | | | 4,028,900 | | | | 170,668 | * | |
Elissa Resources Ltd., 144A | | | 36,250 | | | | 683 | * | |
Indochine Mining Ltd. | | | 7,785,500 | | | | 299,905 | * | |
Moss Lake Gold Mines Ltd. | | | 3,354,500 | | | | 323,672 | *+ | |
Sirocco Mining, Inc. | | | 3,635,000 | | | | 1,300,292 | * | |
| | | | 2,649,157 | | |
Finance - Investment Banker/Broker 0.37% | |
Aberdeen International, Inc. | | | 2,425,000 | | | | 262,520 | * | |
Difference Capital Financial, Inc. | | | 96,900 | | | | 250,847 | * | |
| | | | 513,367 | | |
Gold Mining 50.10% | |
Agnico-Eagle Mines Ltd. | | | 65,000 | | | | 1,714,700 | | |
Alamos Gold, Inc. | | | 245,000 | | | | 2,968,229 | | |
Almaden Minerals Ltd. | | | 600,000 | | | | 700,367 | * | |
Americas Bullion Royalty Corp. | | | 2,970,200 | | | | 181,741 | * | |
B2Gold Corp. | | | 1,275,000 | | | | 2,606,847 | * | |
Banro Corp. | | | 125,919 | | | | 70,011 | * | |
Belo Sun Mining Corp. | | | 500,000 | | | | 157,677 | * | |
Besra Gold, Inc. | | | 605,390 | | | | 25,645 | * | |
Brazil Resources, Inc. | | | 47,900 | | | | 22,320 | * | |
Canyon Resources Ltd. | | | 4,337,729 | | | | 267,263 | * | |
Caza Gold Corp. | | | 471,500 | | | | 42,166 | * | |
CB Gold, Inc. | | | 1,135,000 | | | | 117,528 | * | |
See notes to portfolios of investments and notes to financial statements.
92
Portfolio of Investments December 31, 2013
World Precious Minerals Fund
Common Stocks (cont'd) | | Shares | | Value | |
Gold Mining (cont'd) | |
Centerra Gold, Inc. | | | 200,000 | | | $ | 813,330 | | |
Chalice Gold Mines Ltd. | | | 3,900,000 | | | | 470,483 | * | |
Chesapeake Gold Corp. | | | 418,300 | | | | 1,110,426 | * | |
Chesapeake Gold Corp., 144A | | | 192,199 | | | | 510,215 | * | |
China Gold International Resources Corp., Ltd. | | | 125,000 | | | | 317,707 | * | |
Choice Gold Corp. | | | 975,000 | | | | 6,884 | * | |
Choice Gold Corp., 144A | | | 870,000 | | | | 6,142 | * | |
Comstock Mining, Inc. | | | 1,910,902 | | | | 3,344,079 | * | |
Corona Minerals Ltd. | | | 812,500 | | | | 18,138 | *@# | |
Coventry Resources, Inc. | | | 1,810,000 | | | | 102,231 | * | |
Doray Minerals Ltd. | | | 1,200,000 | | | | 599,314 | * | |
Dundee Precious Metals, Inc. | | | 321,274 | | | | 928,468 | * | |
Eastmain Resources, Inc. | | | 1,071,000 | | | | 272,211 | * | |
Eastmain Resources, Inc., 144A (RS) | | | 1,000,000 | | | | 241,457 | *@# | |
Edgewater Exploration Ltd. | | | 500,000 | | | | 35,301 | * | |
Giyani Gold Corp. | | | 500,000 | | | | 150,617 | * | |
Gold Standard Ventures Corp. | | | 1,601,400 | | | | 1,088,952 | * | |
Gran Colombia Gold Corp. | | | 1,182,849 | | | | 857,379 | *+ | |
Guyana Goldfields, Inc. | | | 150,000 | | | | 231,573 | * | |
Harmony Gold Mining Co., Ltd., Sponsored ADR | | | 480,000 | | | | 1,214,400 | | |
Kilo Goldmines Ltd. | | | 2,510,000 | | | | 59,070 | * | |
Klondex Mines Ltd. | | | 5,868,208 | | | | 8,893,735 | *+ | |
Koza Altin Isletmeleri A.S. | | | 30,000 | | | | 311,145 | | |
Lexam VG Gold, Inc. | | | 2,380,000 | | | | 224,042 | * | |
Lexam VG Gold, Inc., 144A | | | 2,406,501 | | | | 226,537 | * | |
Luna Gold Corp. | | | 567,284 | | | | 774,322 | * | |
Malbex Resources, Inc. | | | 450,000 | | | | 5,295 | * | |
Malbex Resources, Inc., 144A | | | 1,333,333 | | | | 15,689 | * | |
Mammoth Resources Corp. | | | 1,600,000 | | | | 56,481 | *+ | |
Midway Gold Corp. | | | 610,000 | | | | 494,100 | * | |
Mirasol Resources Ltd. | | | 2,274,900 | | | | 1,884,507 | *+ | |
Nevsun Resources Ltd. | | | 500,000 | | | | 1,660,000 | | |
NGEx Resources, Inc. | | | 2,485,843 | | | | 3,346,282 | * | |
OceanaGold Corp. | | | 1,180,348 | | | | 1,822,245 | * | |
Osisko Mining Corp. | | | 310,000 | | | | 1,374,471 | * | |
Petaquilla Minerals Ltd., 144A | | | 2,660,000 | | | | 613,480 | * | |
Pilot Gold, Inc. | | | 1,592,000 | | | | 1,288,826 | * | |
Premier Gold Mines Ltd. | | | 145,000 | | | | 204,744 | * | |
Pretium Resources, Inc. | | | 649,700 | | | | 3,351,554 | * | |
Radius Gold, Inc. | | | 3,580,500 | | | | 370,757 | * | |
Radius Gold, Inc., 144A | | | 125,000 | | | | 12,943 | * | |
Randgold Resources Ltd., Sponsored ADR | | | 20,000 | | | | 1,256,200 | | |
Renaissance Gold, Inc. | | | 600,000 | | | | 129,907 | * | |
Revolution Resources Corp., 144A | | | 570,000 | | | | 8,049 | * | |
Romarco Minerals, Inc. | | | 1,500,000 | | | | 529,511 | * | |
Royal Gold, Inc. | | | 17,000 | | | | 783,190 | | |
See notes to portfolios of investments and notes to financial statements.
93
Portfolio of Investments December 31, 2013
World Precious Minerals Fund
Common Stocks (cont'd) | | Shares | | Value | |
Gold Mining (cont'd) | |
Rusoro Mining Ltd. | | | 6,325,900 | | | $ | 163,760 | * | |
Rye Patch Gold Corp. | | | 4,250,000 | | | | 620,117 | * | |
Rye Patch Gold Corp., 144A | | | 1,800,000 | | | | 262,638 | * | |
Seafield Resources Ltd., 144A | | | 1,300,000 | | | | 24,475 | * | |
SEMAFO, Inc. | | | 800,000 | | | | 2,101,101 | | |
Solvista Gold Corp., 144A | | | 2,620,000 | | | | 271,298 | * | |
Sulliden Gold Corp., Ltd. | | | 1,500,000 | | | | 1,016,662 | * | |
Sunridge Gold Corp. | | | 2,400,921 | | | | 372,919 | | |
Sunridge Gold Corp., 144A (RS) | | | 1,900,000 | | | | 295,115 | * | |
Taurus Gold Ltd., 144A (RS) | | | 2,448,381 | | | | 592,019 | *@# | |
Tolima Gold, Inc., 144A | | | 4,100,000 | | | | 86,840 | * | |
Torex Gold Resources, Inc. | | | 1,285,000 | | | | 1,137,061 | * | |
TriStar Gold, Inc. | | | 1,392,000 | | | | 131,036 | * | |
True Gold Mining, Inc. | | | 1,000,000 | | | | 376,541 | * | |
Veris Gold Corp. | | | 800,000 | | | | 237,221 | * | |
Virginia Mines, Inc. | | | 845,500 | | | | 9,113,221 | * | |
West Kirkland Mining, Inc. | | | 1,550,000 | | | | 65,659 | * | |
Yamana Gold, Inc. | | | 142,500 | | | | 1,228,350 | | |
| | | | 68,986,916 | | |
Gold/Mineral Royalty Companies 0.22% | |
Franco-Nevada Corp. | | | 7,500 | | | | 305,550 | | |
Investment Companies 0.00% | |
Invictus Financial, Inc. | | | 49,800 | | | | 3,750 | *@# | |
Medical - Hospitals 0.01% | |
African Medical Investments plc | | | 4,637,500 | | | | 17,281 | *@# | |
Metal - Copper 0.55% | |
Catalyst Copper Corp. | | | 156,400 | | | | 8,834 | * | |
Catalyst Copper Corp., 144A | | | 200,000 | | | | 11,296 | * | |
Lumina Copper Corp. | | | 30,000 | | | | 177,633 | * | |
Nevada Copper Corp. | | | 450,000 | | | | 571,872 | * | |
Verona Development Corp. | | | 48,500 | | | | 0 | *@# | |
| | | | 769,635 | | |
Metal - Diversified 9.85% | |
Atico Mining Corp. | | | 1,352,300 | | | | 776,525 | * | |
Balmoral Resources Ltd. | | | 1,300,000 | | | | 477,266 | * | |
Balmoral Resources Ltd., 144A (RS) | | | 1,000,000 | | | | 348,772 | *@# | |
Bell Copper Corp. | | | 400,000 | | | | 3,766 | * | |
Cardinal Resources Ltd. | | | 1,866,308 | | | | 48,329 | * | |
Dalradian Resources, Inc. | | | 1,761,500 | | | | 1,077,827 | * | |
First Point Minerals Corp. | | | 2,400,000 | | | | 406,665 | * | |
See notes to portfolios of investments and notes to financial statements.
94
Portfolio of Investments December 31, 2013
World Precious Minerals Fund
Common Stocks (cont'd) | | Shares | | Value | |
Metal - Diversified (cont'd) | |
Foran Mining Corp. | | | 1,000,000 | | | $ | 197,684 | * | |
Imperial Metals Corp. | | | 257,500 | | | | 3,875,953 | * | |
Ivanhoe Mines Ltd. | | | 100,000 | | | | 176,033 | * | |
Mandalay Resources Corp. | | | 2,550,000 | | | | 1,872,353 | | |
Mariana Resources Ltd. | | | 4,300,000 | | | | 292,002 | * | |
Novo Resources Corp. | | | 1,199,100 | | | | 835,295 | * | |
Orex Minerals, Inc. | | | 2,584,000 | | | | 559,465 | * | |
Orsu Metals Corp. | | | 289,800 | | | | 15,004 | * | |
Orsu Metals Corp., 144A | | | 1,800,000 | | | | 93,194 | * | |
Reservoir Minerals, Inc. | | | 151,400 | | | | 708,329 | * | |
Silver Bull Resources, Inc. | | | 2,275,000 | | | | 773,500 | * | |
Temex Resources Corp. | | | 950,000 | | | | 76,014 | * | |
Trevali Mining Corp. | | | 1,000,000 | | | | 950,767 | * | |
| | | | 13,564,743 | | |
Metal - Iron 1.26% | |
Andean Iron Corp., 144A (RS) | | | 3,960,000 | | | | 1,733,688 | *@# | |
Mining Services 1.28% | |
Argent Minerals Ltd. | | | 5,625,000 | | | | 251,142 | * | |
Energold Drilling Corp. | | | 410,000 | | | | 636,826 | * | |
Natasa Mining Ltd. | | | 1,300,849 | | | | 872,559 | * | |
| | | | 1,760,527 | | |
Oil Companies - Exploration & Production 0.00% | |
Big Sky Energy Corp. | | | 2,000,000 | | | | 0 | *@# | |
Platinum 1.56% | |
Pacific North West Capital Corp., 144A | | | 1,291,666 | | | | 24,318 | * | |
Platinum Group Metals Ltd. | | | 1,776,800 | | | | 2,124,199 | * | |
| | | | 2,148,517 | | |
Precious Metals 6.13% | |
Candente Gold Corp. | | | 765,000 | | | | 57,611 | *+ | |
Candente Gold Corp., 144A | | | 4,875,000 | | | | 367,128 | *+ | |
Fortress Minerals Corp. | | | 204,400 | | | | 844,692 | * | |
Fortress Minerals Corp., 144A | | | 70,000 | | | | 289,278 | * | |
Pan African Resources plc | | | 6,500,000 | | | | 1,391,883 | | |
Polymetal International plc | | | 185,000 | | | | 1,759,538 | | |
Roxgold, Inc. | | | 2,610,000 | | | | 1,093,335 | * | |
Santana Minerals Ltd. | | | 1,600,000 | | | | 150,063 | * | |
Solitario Exploration & Royalty Corp. | | | 975,000 | | | | 828,750 | * | |
Tahoe Resources, Inc. | | | 100,000 | | | | 1,664,000 | * | |
| | | | 8,446,278 | | |
See notes to portfolios of investments and notes to financial statements.
95
Portfolio of Investments December 31, 2013
World Precious Minerals Fund
Common Stocks (cont'd) | | Shares | | Value | |
Silver Mining 5.15% | |
First Majestic Silver Corp. | | | 115,000 | | | $ | 1,127,000 | * | |
MAG Silver Corp. | | | 817,300 | | | | 4,231,526 | * | |
Santacruz Silver Mining Ltd. | | | 1,016,500 | | | | 928,180 | * | |
SilverCrest Mines, Inc. | | | 472,416 | | | | 804,926 | * | |
| | | | 7,091,632 | | |
Total Common Stocks | | | 115,069,112 | | |
(cost $255,825,017) | |
Exchange-Traded Funds (ETF) 0.62% | |
ETFS Palladium Trust | | | 6,500 | | | | 453,765 | * | |
ETFS Platinum Trust | | | 3,000 | | | | 401,670 | * | |
Market Vectors Gold Miners ETF | | | 20 | | | | 423 | | |
Market Vectors Junior Gold Miners ETF | | | 8 | | | | 248 | | |
Total Exchange-Traded Funds | | | 856,106 | | |
(cost $960,079) | |
Warrants 3.09% | |
Finance - Investment Banker/Broker 0.00% | |
Difference Capital Financial, Inc., 144A, Warrants (October 2014) | | | 50,000 | | | | 0 | *@# | |
Gold Mining 2.68% | |
Alamos Gold, Inc., Warrants (August 2018) | | | 100,000 | | | | 126,141 | * | |
Crystallex International Corp., 144A, Warrants (December 2049) | | | 162,500 | | | | 0 | *@# | |
Dundee Precious Metals, Inc., Warrants (November 2015) | | | 1,481,482 | | | | 2,077,952 | * | |
Endeavour Mining Corp., Warrants (February 2014) | | | 1,030,000 | | | | 2,424 | * | |
Gran Colombia Gold Corp., 144A, Warrants (October 2017) | | | 58,450 | | | | 0 | *@# | |
Kinross Gold Corp., Warrants (September 2014) | | | 250,000 | | | | 3,530 | * | |
New Gold, Inc., Warrants (June 2017) | | | 1,032,500 | | | | 1,030,265 | * | |
New Gold, Inc., 144A, Warrants (June 2017) | | | 352,530 | | | | 351,767 | * | |
Petaquilla Minerals Ltd., 144A, Warrants (January 2014) | | | 2,660,000 | | | | 0 | *@# | |
Solvista Gold Corp., 144A, Warrants (April 2014) | | | 1,310,000 | | | | 0 | *@# | |
Sunridge Gold Corp., 144A, Warrants (October 2017) (RS) | | | 1,900,000 | | | | 76,014 | * | |
Tolima Gold, Inc., Warrants (March 2016) | | | 1,625,000 | | | | 0 | *@# | |
Tolima Gold, Inc., Warrants (December 2016) | | | 425,000 | | | | 0 | *@# | |
Veris Gold Corp., Warrants (August 2016) | | | 250,000 | | | | 0 | *@# | |
Veris Gold Corp., Warrants (December 2016) | | | 282,200 | | | | 17,267 | * | |
| | | | 3,685,360 | | |
See notes to portfolios of investments and notes to financial statements.
96
Portfolio of Investments December 31, 2013
World Precious Minerals Fund
Warrants (cont'd) | | Shares | | Value | |
Gold/Mineral Royalty Companies 0.41% | |
Franco-Nevada Corp., Warrants (June 2017) | | | 133,549 | | | $ | 566,983 | * | |
Medical - Hospitals 0.00% | |
African Medical Investments plc, Warrants (June 2014) | | | 2,125,000 | | | | 0 | *@# | |
Metal - Copper 0.00% | |
Catalyst Copper Corp., 144A, Warrants (February 2017) | | | 1,000,000 | | | | 0 | *@# | |
Metal - Diversified 0.00% | |
Cardinal Resources Ltd., Warrants (June 2014) | | | 2,799,462 | | | | 6,249 | * | |
Orex Minerals, Inc., 144A, Warrants (November 2015) (RS) | | | 1,250,000 | | | | 0 | *@# | |
Silver Bull Resources, Inc., Warrants (August 2014) | | | 500,000 | | | | 0 | *@# | |
| | | | 6,249 | | |
Total Warrants | | | 4,258,592 | | |
(cost $5,737,569) | |
Special Warrants 0.00%
Gold/Mineral Exploration & Development 0.00% | |
Western Exploration & Development Ltd., 144A, Special Warrants
(December 2049) (RS) | | | 600,000 | | | | 0 | *@# | |
(cost $300,000) | |
Purchased Call Options 2.55% | | Contracts | | | |
Exchange-Traded Funds 0.23% | |
Market Vectors Gold Miners ETF, Strike Price 23, Expiration Jan. 2014 | | | 1,000 | | | | 15,500 | | |
Market Vectors Gold Miners ETF, Strike Price 25, Expiration Jan. 2014 | | | 2,000 | | | | 7,000 | | |
Market Vectors Gold Miners ETF, Strike Price 28, Expiration Jan. 2014 | | | 3,325 | | | | 1,663 | | |
Market Vectors Gold Miners ETF, Strike Price 30, Expiration Jan. 2014 | | | 979 | | | | 490 | | |
Market Vectors Gold Miners ETF, Strike Price 38, Expiration Jan. 2014 | | | 1,274 | | | | 637 | | |
Market Vectors Gold Miners ETF, Strike Price 21, Expiration Jan. 2015 | | | 425 | | | | 140,250 | | |
Market Vectors Gold Miners ETF, Strike Price 30, Expiration Jan. 2015 | | | 225 | | | | 139,500 | | |
Market Vectors Junior Gold Miners ETF, Strike Price 12,
Expiration Jan. 2014 | | | 4,681 | | | | 11,702 | | |
Market Vectors Junior Gold Miners ETF, Strike Price 16,
Expiration Jan. 2014 | | | 849 | | | | 2,122 | | |
| | | | 318,864 | | |
See notes to portfolios of investments and notes to financial statements.
97
Portfolio of Investments December 31, 2013
World Precious Minerals Fund
Purchased Call Options (cont'd) | | Contracts | | Value | |
Gold Mining 1.71% | |
Agnico-Eagle Mines Ltd., Strike Price 32.50, Expiration Jan. 2014 | | | 591 | | | $ | 2,364 | | |
Agnico-Eagle Mines Ltd., Strike Price 25, Expiration Jan. 2015 | | | 600 | | | | 306,000 | | |
Agnico-Eagle Mines Ltd., Strike Price 27.50, Expiration Jan. 2016 | | | 250 | | | | 143,750 | | |
AngloGold Ashanti Ltd., Strike Price 25, Expiration Jan. 2014 | | | 641 | | | | 1,602 | | |
AngloGold Ashanti Ltd., Strike Price 13, Expiration Jan. 2015 | | | 250 | | | | 51,250 | | |
AuRico Gold, Inc., Strike Price 5, Expiration Jan. 2014 | | | 2,999 | | | | 7,497 | | |
Barrick Gold Corp., Strike Price 15, Expiration Jan. 2015 | | | 1,110 | | | | 480,075 | | |
Barrick Gold Corp., Strike Price 17, Expiration Jan. 2016 | | | 350 | | | | 157,500 | | |
Cia de Minas Buenaventura S.A., Strike Price 14, Expiration Mar. 2014 | | | 500 | | | | 7,500 | | |
Eldorado Gold Corp., Strike Price 8, Expiration Jan. 2014 | | | 1,865 | | | | 4,662 | | |
Eldorado Gold Corp., Strike Price 13, Expiration Jan. 2014 | | | 740 | | | | 1,850 | | |
Eldorado Gold Corp., Strike Price 8, Expiration Jan. 2015 | | | 975 | | | | 51,188 | | |
Eldorado Gold Corp., Strike Price 5, Expiration Jan. 2016 | | | 123 | | | | 24,600 | | |
Fotuna Silver Mines, Inc., Strike Price 5, Expiration Mar. 2014 | | | 2,122 | | | | 10,610 | | |
Gold Fields Ltd., Strike Price 8, Expiration Jan. 2014 | | | 575 | | | | 575 | | |
Gold Fields Ltd., Strike Price 5, Expiration Jan. 2015 | | | 500 | | | | 33,250 | | |
Goldcorp, Inc., Strike Price 30, Expiration Jan. 2014 | | | 1,088 | | | | 544 | | |
Goldcorp, Inc., Strike Price 65, Expiration Jan. 2014 | | | 1,460 | | | | 730 | | |
Goldcorp, Inc., Strike Price 25, Expiration Jan. 2015 | | | 1,280 | | | | 262,400 | | |
Harmony Gold Mining Co., Ltd., Strike Price 4, Expiration Feb. 2014 | | | 1,500 | | | | 3,750 | | |
IAMGOLD Corp., Strike Price 4, Expiration Jan. 2015 | | | 891 | | | | 51,233 | | |
IAMGOLD Corp., Strike Price 4, Expiration Jan. 2016 | | | 60 | | | | 5,250 | | |
Kinross Gold Corp., Strike Price 12, Expiration Jan. 2014 | | | 1,264 | | | | 632 | | |
Kinross Gold Corp., Strike Price 3, Expiration Jan. 2015 | | | 650 | | | | 104,325 | | |
Newmont Mining Corp., Strike Price 30, Expiration Jan. 2014 | | | 932 | | | | 1,864 | | |
Newmont Mining Corp., Strike Price 25, Expiration Jan. 2015 | | | 822 | | | | 220,296 | | |
Randgold Resources Ltd., Strike Price 67.50, Expiration Jan. 2015 | | | 223 | | | | 188,435 | | |
Royal Gold, Inc., Strike Price 50, Expiration Jan. 2015 | | | 100 | | | | 59,500 | | |
Yamana Gold, Inc., Strike Price 10, Expiration Jan. 2015 | | | 1,509 | | | | 162,218 | | |
Yamana Gold, Inc., Strike Price 8, Expiration Jan. 2016 | | | 50 | | | | 12,600 | | |
| | | | 2,358,050 | | |
Platinum 0.05% | |
Stillwater Mining Co., Strike Price 12, Expiration Jan. 2015 | | | 270 | | | | 61,425 | | |
Precious Metals 0.17% | |
Tahoe Resources, Inc., Strike Price 15, Expiration Mar. 2014 | | | 1,000 | | | | 240,000 | | |
Silver Mining 0.39% | |
First Majestic Silver Corp., Strike Price 12.50, Expiration Jan. 2014 | | | 274 | | | | 685 | | |
First Majestic Silver Corp., Strike Price 12.50, Expiration Jan. 2015 | | | 600 | | | | 81,000 | | |
First Majestic Silver Corp., Strike Price 10, Expiration Jan. 2016 | | | 85 | | | | 26,350 | | |
Pan American Silver Corp., Strike Price 13, Expiration Jan. 2014 | | | 797 | | | | 1,993 | | |
Pan American Silver Corp., Strike Price 13, Expiration Jan. 2015 | | | 402 | | | | 55,275 | | |
Pan American Silver Corp., Strike Price 10, Expiration Jan. 2016 | | | 83 | | | | 28,220 | | |
See notes to portfolios of investments and notes to financial statements.
98
Portfolio of Investments December 31, 2013
World Precious Minerals Fund
Purchased Call Options (cont'd) | | Contracts | | Value | |
Silver Mining (cont'd) | |
Silver Standard Resources, Inc., Strike Price 8, Expiration Jan. 2015 | | | 1,167 | | | $ | 157,545 | | |
Silver Wheaton Corp., Strike Price 25, Expiration Jan. 2014 | | | 405 | | | | 202 | | |
Silver Wheaton Corp., Strike Price 23, Expiration Jan. 2015 | | | 752 | | | | 171,456 | | |
Silver Wheaton Corp., Strike Price 20, Expiration Jan. 2016 | | | 29 | | | | 14,065 | | |
| | | | 536,791 | | |
Total Purchased Call Options | | | 3,515,130 | | |
(cost $13,238,336) | |
Convertible Bond 0.09% | | Principal
Amount | | | |
Gold Mining 0.09% | |
Lake Shore Gold Corp., 6.25%, maturity 09/30/17 | | CAD | 175,000 | | | | 127,029 | | |
(cost $145,029) | |
Gold-Linked Notes 2.93%
Gold Mining 2.93% | |
Gran Colombia Gold Corp., 10.00%, maturity 10/31/17 | | $ | 170,000 | | | | 113,900 | | |
Gran Colombia Gold Corp., 144A, 10.00%, maturity 10/31/17 | | | 5,845,000 | | | | 3,916,150 | | |
Total Gold-Linked Notes | | | 4,030,050 | | |
(cost $5,943,200) | |
Silver-Linked Notes 2.73%
Gold Mining 2.73% | |
Gran Colombia Gold Corp., 5.00%, maturity 08/11/18 | | | 576,000 | | | | 247,680 | | |
Gran Colombia Gold Corp., 144A, 5.00%, maturity 08/11/18 | | | 8,150,000 | | | | 3,504,500 | | |
Total Silver-Linked Notes | | | 3,752,180 | | |
(cost $8,583,919) | |
See notes to portfolios of investments and notes to financial statements.
99
Portfolio of Investments December 31, 2013
World Precious Minerals Fund
Corporate Note 0.58% | | Principal
Amount | | Value | |
Electric - Generation 0.58% | |
Pacific Power Generation Corp., 15.00%, maturity 04/03/17 (RS) | | $ | 800,000 | | | $ | 800,000 | @# | |
(cost $800,000) | |
Total Investments 96.14% | | | 132,408,199 | | |
(cost $291,533,149) | |
Other assets and liabilities, net 3.86% | | | 5,316,562 | | |
Net Assets 100% | | $ | 137,724,761 | | |
See notes to portfolios of investments and notes to financial statements.
100
Portfolio of Investments December 31, 2013
Gold and Precious Metals Fund
Common Stocks 64.28% | | Shares | | Value | |
Gold Mining 51.87% | |
Agnico-Eagle Mines Ltd. | | | 35,000 | | | $ | 923,300 | | |
Alacer Gold Corp. | | | 300,000 | | | | 612,821 | | |
Alamos Gold, Inc. | | | 140,000 | | | | 1,696,131 | | |
B2Gold Corp. | | | 950,000 | | | | 1,940,702 | * | |
Banro Corp. | | | 144,081 | | | | 80,109 | * | |
Barrick Gold Corp. | | | 100,000 | | | | 1,763,000 | | |
Centerra Gold, Inc. | | | 200,000 | | | | 813,330 | | |
China Gold International Resources Corp., Ltd. | | | 300,000 | | | | 762,496 | * | |
Comstock Mining, Inc. | | | 1,861,086 | | | | 3,256,901 | * | |
DRDGOLD Ltd., Sponsored ADR | | | 150,000 | | | | 553,500 | | |
Dundee Precious Metals, Inc. | | | 224,252 | | | | 648,078 | * | |
Eldorado Gold Corp. | | | 110,000 | | | | 625,900 | | |
Endeavour Mining Corp. | | | 150,000 | | | | 67,777 | * | |
Gran Colombia Gold Corp. | | | 461,037 | | | | 334,179 | * | |
Harmony Gold Mining Co., Ltd., Sponsored ADR | | | 300,000 | | | | 759,000 | | |
Klondex Mines Ltd. | | | 3,035,192 | | | | 4,600,074 | * | |
Koza Altin Isletmeleri A.S. | | | 70,000 | | | | 726,005 | | |
Luna Gold Corp. | | | 378,116 | | | | 516,114 | * | |
McEwen Mining, Inc. | | | 320,000 | | | | 627,200 | * | |
Medusa Mining Ltd. | | | 311,305 | | | | 570,667 | * | |
Nevsun Resources Ltd. | | | 700,000 | | | | 2,324,000 | | |
Newcrest Mining Ltd. | | | 200,000 | | | | 1,399,106 | | |
Newcrest Mining Ltd., Sponsored ADR | | | 76,000 | | | | 535,040 | | |
OceanaGold Corp. | | | 1,000,000 | | | | 1,543,820 | * | |
Osisko Mining Corp. | | | 505,000 | | | | 2,239,057 | * | |
Randgold Resources Ltd., Sponsored ADR | | | 20,000 | | | | 1,256,200 | | |
Regis Resources Ltd. | | | 150,000 | | | | 392,596 | | |
Rio Alto Mining Ltd. | | | 300,000 | | | | 499,859 | * | |
Royal Gold, Inc. | | | 36,500 | | | | 1,681,555 | | |
SEMAFO, Inc. | | | 1,000,000 | | | | 2,626,377 | | |
Teranga Gold Corp. | | | 834,600 | | | | 416,397 | * | |
Veris Gold Corp. | | | 1,022,000 | | | | 303,050 | * | |
Yamana Gold, Inc. | | | 187,500 | | | | 1,616,250 | | |
| | | | 38,710,591 | | |
Gold/Mineral Royalty Companies 1.09% | |
Franco-Nevada Corp. | | | 20,000 | | | | 814,800 | | |
Medical - Hospitals 0.01% | |
African Medical Investments plc | | | 2,000,000 | | | | 7,453 | *@# | |
Metal - Diversified 5.39% | |
Atico Mining Corp. | | | 1,473,700 | | | | 846,237 | * | |
Imperial Metals Corp. | | | 121,700 | | | | 1,831,858 | * | |
Mandalay Resources Corp. | | | 1,825,000 | | | | 1,340,017 | | |
| | | | 4,018,112 | | |
See notes to portfolios of investments and notes to financial statements.
101
Portfolio of Investments December 31, 2013
Gold and Precious Metals Fund
Common Stocks (cont'd) | | Shares | | Value | |
Mining Services 0.49% | |
Major Drilling Group International, Inc. | | | 50,000 | | | $ | 361,950 | | |
Precious Metals 3.59% | |
Pan African Resources plc | | | 3,300,000 | | | | 706,648 | | |
Polymetal International plc | | | 155,000 | | | | 1,474,208 | | |
Tahoe Resources, Inc. | | | 30,000 | | | | 499,200 | * | |
| | | | 2,680,056 | | |
Retail - Jewelry 0.37% | |
Tiffany & Co. | | | 3,000 | | | | 278,340 | | |
Silver Mining 1.47% | |
First Majestic Silver Corp. | | | 67,500 | | | | 661,500 | * | |
SilverCrest Mines, Inc. | | | 254,884 | | | | 434,284 | * | |
| | | | 1,095,784 | | |
Total Common Stocks | | | 47,967,086 | | |
(cost $83,423,782) | |
Exchange-Traded Funds (ETF) 8.01%
ETFS Palladium Trust | | | 14,000 | | | | 977,340 | * | |
ETFS Physical Silver Shares | | | 40,000 | | | | 768,000 | * | |
ETFS Platinum Trust | | | 10,000 | | | | 1,338,900 | * | |
Market Vectors Gold Miners ETF | | | 20 | | | | 423 | | |
Market Vectors Junior Gold Miners ETF | | | 8 | | | | 248 | * | |
SPDR Gold Trust | | | 24,900 | | | | 2,892,633 | * | |
Total Exchange-Traded Funds | | | 5,977,544 | | |
(cost $7,838,203) | |
Warrants 3.94%
Gold Mining 3.49% | |
Crystallex International Corp., 144A, Warrants (December 2049) | | | 62,500 | | | | 0 | *@# | |
Dundee Precious Metals, Inc., Warrants (November 2015) | | | 1,614,333 | | | | 2,264,291 | * | |
Endeavour Mining Corp., Warrants (February 2014) | | | 382,500 | | | | 900 | * | |
Gran Colombia Gold Corp., 144A, Warrants (October 2017) | | | 29,400 | | | | 0 | *@# | |
Kinross Gold Corp., Warrants (September 2014) | | | 130,000 | | | | 1,836 | * | |
New Gold, Inc., Warrants (June 2017) | | | 326,500 | | | | 325,793 | * | |
See notes to portfolios of investments and notes to financial statements.
102
Portfolio of Investments December 31, 2013
Gold and Precious Metals Fund
Warrants (cont'd) | | Shares | | Value | |
Gold Mining (cont'd) | |
Veris Gold Corp., Warrants (August 2016) | | | 250,000 | | | $ | 0 | *@# | |
Veris Gold Corp., Warrants (December 2016) | | | 195,300 | | | | 11,950 | * | |
| | | | 2,604,770 | | |
Gold/Mineral Royalty Companies 0.45% | |
Franco-Nevada Corp., Warrants (June 2017) | | | 78,528 | | | | 333,391 | * | |
Medical - Hospitals 0.00% | |
African Medical Investments plc, Warrants (June 2014) | | | 912,500 | | | | 0 | *@# | |
Total Warrants | | | 2,938,161 | | |
(cost $4,374,270) | |
Purchased Call Options 3.35% | | Contracts | | | |
Exchange-Traded Funds 0.23% | |
Market Vectors Gold Miners ETF, Strike Price 23, Expiration Jan. 2014 | | | 600 | | | | 9,300 | | |
Market Vectors Gold Miners ETF, Strike Price 25, Expiration Jan. 2014 | | | 600 | | | | 2,100 | | |
Market Vectors Gold Miners ETF, Strike Price 28, Expiration Jan. 2014 | | | 1,000 | | | | 500 | | |
Market Vectors Gold Miners ETF, Strike Price 30, Expiration Jan. 2014 | | | 971 | | | | 486 | | |
Market Vectors Gold Miners ETF, Strike Price 38, Expiration Jan. 2014 | | | 749 | | | | 374 | | |
Market Vectors Gold Miners ETF, Strike Price 21, Expiration Jan. 2015 | | | 225 | | | | 74,250 | | |
Market Vectors Gold Miners ETF, Strike Price 30, Expiration Jan. 2015 | | | 125 | | | | 77,500 | | |
Market Vectors Junior Gold Miners ETF, Strike Price 12,
Expiration Jan. 2014 | | | 2,319 | | | | 5,798 | | |
Market Vectors Junior Gold Miners ETF, Strike Price 16,
Expiration Jan. 2014 | | | 475 | | | | 1,187 | | |
| | | | 171,495 | | |
Gold Mining 2.30% | |
Agnico-Eagle Mines Ltd., Strike Price 32.50, Expiration Jan. 2014 | | | 296 | | | | 1,184 | | |
Agnico-Eagle Mines Ltd., Strike Price 25, Expiration Jan. 2015 | | | 300 | | | | 153,000 | | |
Agnico-Eagle Mines Ltd., Strike Price 27.50, Expiration Jan. 2016 | | | 150 | | | | 86,250 | | |
AngloGold Ashanti Ltd., Strike Price 25, Expiration Jan. 2014 | | | 322 | | | | 805 | | |
AngloGold Ashanti Ltd., Strike Price 13, Expiration Jan. 2015 | | | 150 | | | | 30,750 | | |
AuRico Gold, Inc., Strike Price 5, Expiration Jan. 2014 | | | 2,750 | | | | 6,875 | | |
Barrick Gold Corp., Strike Price 15, Expiration Jan. 2015 | | | 740 | | | | 320,050 | | |
Barrick Gold Corp., Strike Price 17, Expiration Jan. 2016 | | | 275 | | | | 123,750 | | |
Cia de Minas Buenaventura S.A., Strike Price 14, Expiration Mar. 2014 | | | 600 | | | | 9,000 | | |
Eldorado Gold Corp., Strike Price 8, Expiration Jan. 2014 | | | 1,129 | | | | 2,822 | | |
Eldorado Gold Corp., Strike Price 13, Expiration Jan. 2014 | | | 626 | | | | 1,565 | | |
Eldorado Gold Corp., Strike Price 8, Expiration Jan. 2015 | | | 595 | | | | 31,238 | | |
Eldorado Gold Corp., Strike Price 5, Expiration Jan. 2016 | | | 74 | | | | 14,800 | | |
See notes to portfolios of investments and notes to financial statements.
103
Portfolio of Investments December 31, 2013
Gold and Precious Metals Fund
Purchased Call Options (cont'd) | | Contracts | | Value | |
Gold Mining (cont'd) | |
Fotuna Silver Mines, Inc., Strike Price 5, Expiration Mar. 2014 | | | 1,241 | | | $ | 6,205 | | |
Gold Fields Ltd., Strike Price 8, Expiration Jan. 2014 | | | 500 | | | | 500 | | |
Gold Fields Ltd., Strike Price 5, Expiration Jan. 2015 | | | 300 | | | | 19,950 | | |
Goldcorp, Inc., Strike Price 30, Expiration Jan. 2014 | | | 650 | | | | 325 | | |
Goldcorp, Inc., Strike Price 65, Expiration Jan. 2014 | | | 708 | | | | 354 | | |
Goldcorp, Inc., Strike Price 25, Expiration Jan. 2015 | | | 759 | | | | 155,595 | | |
Harmony Gold Mining Co., Ltd., Strike Price 4, Expiration Feb. 2014 | | | 850 | | | | 2,125 | | |
IAMGOLD Corp., Strike Price 4, Expiration Jan. 2015 | | | 557 | | | | 32,028 | | |
IAMGOLD Corp., Strike Price 4, Expiration Jan. 2016 | | | 40 | | | | 3,500 | | |
Kinross Gold Corp., Strike Price 12, Expiration Jan. 2014 | | | 938 | | | | 469 | | |
Kinross Gold Corp., Strike Price 3, Expiration Jan. 2015 | | | 1,075 | | | | 172,537 | | |
New Gold, Inc., Strike Price 8, Expiration Jan. 2015 | | | 700 | | | | 28,000 | | |
Newmont Mining Corp., Strike Price 30, Expiration Jan. 2014 | | | 574 | | | | 1,148 | | |
Newmont Mining Corp., Strike Price 25, Expiration Jan. 2015 | | | 498 | | | | 133,464 | | |
Randgold Resources Ltd., Strike Price 67.50, Expiration Jan. 2015 | | | 132 | | | | 111,540 | | |
Royal Gold, Inc., Strike Price 50, Expiration Jan. 2015 | | | 150 | | | | 89,250 | | |
Yamana Gold, Inc., Strike Price 10, Expiration Jan. 2015 | | | 1,509 | | | | 162,217 | | |
Yamana Gold, Inc., Strike Price 8, Expiration Jan. 2016 | | | 50 | | | | 12,600 | | |
| | | | 1,713,896 | | |
Platinum 0.04% | |
Stillwater Mining Co., Strike Price 12, Expiration Jan. 2015 | | | 133 | | | | 30,258 | | |
Precious Metals 0.19% | |
Tahoe Resources, Inc., Strike Price 15, Expiration Mar. 2014 | | | 600 | | | | 144,000 | | |
Silver Mining 0.59% | |
First Majestic Silver Corp., Strike Price 12.50, Expiration Jan. 2014 | | | 206 | | | | 515 | | |
First Majestic Silver Corp., Strike Price 12.50, Expiration Jan. 2015 | | | 450 | | | | 60,750 | | |
First Majestic Silver Corp., Strike Price 10, Expiration Jan. 2016 | | | 65 | | | | 20,150 | | |
Pan American Silver Corp., Strike Price 13, Expiration Jan. 2014 | | | 1,003 | | | | 2,507 | | |
Pan American Silver Corp., Strike Price 13, Expiration Jan. 2015 | | | 567 | | | | 77,963 | | |
Pan American Silver Corp., Strike Price 10, Expiration Jan. 2016 | | | 116 | | | | 39,440 | | |
Silver Standard Resources, Inc., Strike Price 8, Expiration Jan. 2015 | | | 698 | | | | 94,230 | | |
Silver Wheaton Corp., Strike Price 25, Expiration Jan. 2014 | | | 295 | | | | 147 | | |
Silver Wheaton Corp., Strike Price 23, Expiration Jan. 2015 | | | 573 | | | | 130,644 | | |
Silver Wheaton Corp., Strike Price 20, Expiration Jan. 2016 | | | 21 | | | | 10,185 | | |
| | | | 436,531 | | |
Total Purchased Call Options | | | 2,496,180 | | |
(cost $8,972,113) | |
See notes to portfolios of investments and notes to financial statements.
104
Portfolio of Investments December 31, 2013
Gold and Precious Metals Fund
Master Limited Partnership 3.45% | | Units | | Value | |
Pipelines 3.45% | |
Atlas Energy L.P. | | | 55,000 | | | $ | 2,576,750 | | |
(cost $1,726,513) | |
Convertible Bond 0.17% | | Principal
Amount | | | |
Gold Mining 0.17% | |
Lake Shore Gold Corp., 6.25%, maturity 09/30/17 | | CAD | 175,000 | | | | 127,029 | | |
(cost $145,029) | |
Corporate Bond 0.10%
Gold Mining 0.10% | |
IAMGOLD Corp., 6.75%, maturity 10/01/20 | | $ | 90,000 | | | | 77,850 | | |
(cost $79,350) | |
Gold-Linked Notes 2.72%
Gold Mining 2.72% | |
Gran Colombia Gold Corp., 10.00%, maturity 10/31/17 | | | 88,000 | | | | 58,960 | | |
Gran Colombia Gold Corp., 144A, 10.00%, maturity 10/31/17 | | | 2,940,000 | | | | 1,969,800 | | |
Total Gold-Linked Notes | | | 2,028,760 | | |
(cost $2,990,940) | |
Silver-Linked Notes 2.63%
Gold Mining 2.63% | |
Gran Colombia Gold Corp., 5.00%, maturity 08/11/18 | | | 321,000 | | | | 138,030 | | |
Gran Colombia Gold Corp., 144A, 5.00%, maturity 08/11/18 | | | 4,250,000 | | | | 1,827,500 | | |
Total Silver-Linked Notes | | | 1,965,530 | | |
(cost $4,498,156) | |
See notes to portfolios of investments and notes to financial statements.
105
Portfolio of Investments December 31, 2013
Gold and Precious Metals Fund
Corporate Note 0.40% | | Principal
Amount | | Value | |
Electric - Generation 0.40% | |
Pacific Power Generation Corp., 15.00%, maturity 04/03/17 (RS) | | $ | 300,000 | | | $ | 300,000 | @# | |
(cost $300,000) | |
Total Investments 89.05% | | | 66,454,890 | | |
(cost $114,348,356) | |
Other assets and liabilities, net 10.95% | | | 8,171,966 | | |
Net Assets 100% | | $ | 74,626,856 | | |
See notes to portfolios of investments and notes to financial statements.
106
Portfolio of Investments December 31, 2013
Common Stocks 93.91% | | Shares | | Value | |
Airlines 0.74% | |
Turk Hava Yollari A.O. | | | 300,000 | | | $ | 904,951 | | |
Automotive - Cars & Light Trucks 5.52% | |
Bayerische Motoren Werke AG | | | 19,800 | | | | 2,322,020 | | |
Tofas Turk Otomobil Fabrikasi A.S. | | | 710,200 | | | | 4,443,949 | | |
| | | | 6,765,969 | | |
Cellular Telecommunication 9.65% | |
KCell JSC, Sponsored GDR | | | 5,697 | | | | 97,436 | | |
KCell JSC, 144A, GDR | | | 120,000 | | | | 2,052,000 | | |
Mobile TeleSystems OJSC | | | 640,114 | | | | 6,396,074 | | |
Turkcell Iletisim Hizmetleri A.S. | | | 263,094 | | | | 1,393,586 | * | |
Turkcell Iletisim Hizmetleri A.S., Sponsored ADR | | | 141,700 | | | | 1,891,695 | * | |
| | | | 11,830,791 | | |
Chemicals - Diversified 2.58% | |
Synthos S.A. | | | 1,741,417 | | | | 3,168,410 | | |
Coal 0.20% | |
Lubelski Wegiel Bogdanka S.A. | | | 6,000 | | | | 250,818 | | |
Commercial Banks - Non US 20.28% | |
Erste Group Bank AG | | | 158,094 | | | | 5,530,835 | | |
Komercni Banka A.S. | | | 15,000 | | | | 3,348,845 | | |
OTP Bank plc | | | 81,700 | | | | 1,556,937 | | |
Powszechna Kasa Oszczednosci Bank Polski S.A. | | | 100,000 | | | | 1,309,338 | | |
Sberbank of Russia | | | 300,000 | | | | 727,680 | | |
Sberbank of Russia, Sponsored ADR | | | 470,800 | | | | 5,945,827 | | |
Turkiye Garanti Bankasi A.S. | | | 800,000 | | | | 2,601,022 | | |
Turkiye Halk Bankasi A.S. | | | 235,000 | | | | 1,334,931 | | |
Turkiye Is Bankasi, Class C | | | 708,600 | | | | 1,534,601 | | |
Turkiye Vakiflar Bankasi T.A.O., Class D | | | 253,100 | | | | 451,581 | | |
Yapi ve Kredi Bankasi A.S. | | | 300,000 | | | | 521,209 | | |
| | | | 24,862,806 | | |
Diamonds/Precious Stones 0.18% | |
Alrosa AO | | | 208,100 | | | | 225,930 | | |
Diversified Banking Institutions 1.82% | |
UniCredit SpA | | | 300,000 | | | | 2,233,891 | | |
Diversified Financial Services 0.78% | |
International Personal Finance plc | | | 115,000 | | | | 952,215 | | |
See notes to portfolios of investments and notes to financial statements.
107
Portfolio of Investments December 31, 2013
Common Stocks (cont'd) | | Shares | | Value | |
Diversified Operations 0.38% | |
Tekfen Holding A.S. | | | 200,000 | | | $ | 468,310 | | |
Electric - Distribution 0.65% | |
Energa S.A. | | | 150,000 | | | | 790,793 | * | |
Finance - Investment Banker/Broker 2.07% | |
Turkiye Sinai Kalkinma Bankasi A.S. | | | 2,964,369 | | | | 2,533,559 | | |
Food - Catering 0.46% | |
DO & CO AG | | | 11,000 | | | | 562,365 | | |
Food - Retail 5.28% | |
Magnit OJSC | | | 23,000 | | | | 6,468,422 | | |
Gold Mining 1.15% | |
Dundee Precious Metals, Inc. | | | 144 | | | | 416 | * | |
Koza Altin Isletmeleri A.S. | | | 136,000 | | | | 1,410,524 | | |
| | | | 1,410,940 | | |
Housewares 0.43% | |
Turkiye Sise ve Cam Fabrikalari A.S. | | | 418,933 | | | | 531,437 | | |
Machinery - Farm 0.96% | |
Turk Traktor ve Ziraat Makineleri A.S. | | | 40,900 | | | | 1,175,298 | | |
Medical - Drugs 1.25% | |
Richter Gedeon Nyrt. | | | 75,000 | | | | 1,528,663 | | |
Metal - Diversified 4.89% | |
KGHM Polska Miedz S.A. | | | 50,800 | | | | 1,997,660 | | |
MMC Norilsk Nickel OJSC, Sponsored ADR | | | 225,000 | | | | 3,749,525 | | |
Orsu Metals Corp. | | | 664,240 | | | | 34,390 | * | |
Orsu Metals Corp., 144A | | | 4,025,000 | | | | 208,392 | * | |
| | | | 5,989,967 | | |
Oil - Field Services 0.45% | |
CAT Oil AG | | | 20,000 | | | | 555,751 | | |
Oil Companies - Exploration & Production 8.20% | |
Bankers Petroleum Ltd. | | | 76,300 | | | | 313,876 | * | |
BNK Petroleum, Inc. | | | 132,800 | | | | 212,520 | * | |
Genel Energy plc | | | 193,339 | | | | 3,450,285 | * | |
KazMunaiGas Exploration Production, Sponsored GDR | | | 50,000 | | | | 786,250 | | |
See notes to portfolios of investments and notes to financial statements.
108
Portfolio of Investments December 31, 2013
Common Stocks (cont'd) | | Shares | | Value | |
Oil Companies - Exploration & Production (cont'd) | |
NovaTek OAO, Sponsored GDR | | | 38,600 | | | $ | 5,286,491 | | |
| | | | 10,049,422 | | |
Oil Companies - Integrated 9.28% | |
Gazprom OAO, Sponsored ADR | | | 607,002 | | | | 5,195,482 | | |
Lukoil OAO, Sponsored ADR | | | 98,800 | | | | 6,175,311 | | |
| | | | 11,370,793 | | |
Property/Casualty Insurance 2.43% | |
Powszechny Zaklad Ubezpieczen S.A. | | | 20,000 | | | | 2,982,838 | | |
Real Estate Management/Services 0.58% | |
CA Immobilien Anlagen AG | | | 40,000 | | | | 709,299 | * | |
Retail - Apparel/Shoe 0.78% | |
Salvatore Ferragamo SpA | | | 25,000 | | | | 954,095 | | |
Retail - Miscellaneous/Diversified 0.53% | |
Folli Follie S.A. | | | 20,000 | | | | 645,288 | * | |
Software Tools 0.57% | |
EPAM Systems, Inc. | | | 20,000 | | | | 698,800 | * | |
Steel - Producers 1.21% | |
Severstal OAO, Sponsored GDR | | | 150,000 | | | | 1,483,401 | | |
Telecom Services 1.67% | |
Telefonica Czech Republic A.S. | | | 82,761 | | | | 1,229,420 | | |
Telekomunikacja Polska S.A. | | | 250,000 | | | | 813,227 | | |
| | | | 2,042,647 | | |
Television 0.35% | |
Cyfrowy Polsat S.A. | | | 65,000 | | | | 426,246 | * | |
Textile - Products 0.45% | |
Pegas Nonwovens S.A. | | | 18,622 | | | | 555,212 | | |
Tobacco 1.40% | |
Philip Morris CR A.S. | | | 3,210 | | | | 1,710,321 | | |
See notes to portfolios of investments and notes to financial statements.
109
Portfolio of Investments December 31, 2013
Common Stocks (cont'd) | | Shares | | Value | |
Web Portals/Internet Service Providers 6.74% | |
Mail.ru Group Ltd., Sponsored GDR | | | 100,000 | | | $ | 4,464,313 | | |
Yandex N.V., Class A | | | 88,000 | | | | 3,797,200 | * | |
| | | | 8,261,513 | | |
Total Common Stocks | | | 115,101,161 | | |
(cost $98,631,933) | |
Preferred Stock 1.54% | |
Oil Companies - Integrated 1.54% | |
Surgutneftegas OJSC | | | 2,390,000 | | | | 1,884,066 | | |
(cost $1,707,718) | |
Real Estate Investment Trusts (REIT) 1.18% | |
Emlak Konut Gayrimenkul Yatirim Ortakligi A.S. | | | 500,000 | | | | 489,307 | | |
Sinpas Gayrimenkul Yatirim Ortakligi A.S. | | | 2,500,000 | | | | 954,581 | | |
Total Real Estate Investment Trusts | | | 1,443,888 | | |
(cost $2,168,125) | |
Closed-End Investment Company 1.17% | |
Fondul Proprietatea S.A. | | | 5,614,796 | | | | 1,441,246 | | |
(cost $1,299,082) | |
Warrants 1.68% | |
Commercial Banks - Non US 0.97% | |
Alpha Bank S.A., Warrants (December 2017) | | | 350,000 | | | | 539,274 | * | |
Piraeus Bank S.A., Warrants (January 2018) | | | 625,000 | | | | 656,037 | * | |
| | | | 1,195,311 | | |
See notes to portfolios of investments and notes to financial statements.
110
Portfolio of Investments December 31, 2013
Warrants (cont'd) | | Shares | | Value | |
Gold Mining 0.71% | |
Dundee Precious Metals, Inc., Warrants (November 2015) | | | 617,489 | | | $ | 866,101 | * | |
Total Warrants | | | 2,061,412 | | |
(cost $2,047,348) | |
Corporate Note 0.94% | | Principal
Amount | | | |
Transportation - Services 0.94% | |
Baghlan Group FZCO, 14.75%, maturity 06/27/15 | | $ | 1,200,000 | | | | 1,158,000 | | |
(cost $1,209,000) | |
Total Investments 100.42% | | | 123,089,773 | | |
(cost $107,063,206) | |
Other assets and liabilities, net (0.42%) | | | (519,645 | ) | |
| Net Assets 100% | | $ | 122,570,128 | | |
See notes to portfolios of investments and notes to financial statements.
111
Portfolio of Investments December 31, 2013
Common Stocks 98.56% | | Shares | | Value | |
Aerospace/Defense - Equipment 1.16% | |
AviChina Industry & Technology Co., Ltd., H shares | | | 524,000 | | | $ | 306,411 | | |
Airlines 0.99% | |
China Southern Airlines Co., Ltd., H shares | | | 668,000 | | | | 261,543 | | |
Apparel Manufacturers 1.73% | |
Prada S.p.A. | | | 51,300 | | | | 455,764 | | |
Appliances 1.98% | |
Haier Electronics Group Co., Ltd. | | | 179,000 | | | | 522,518 | | |
Applications Software 1.08% | |
Travelsky Technology Ltd., H shares | | | 290,000 | | | | 285,412 | | |
Automotive - Cars & Light Trucks 2.94% | |
Dongfeng Motor Group Co., Ltd., H shares | | | 156,000 | | | | 244,743 | | |
Great Wall Motor Co., Ltd., H shares | | | 96,000 | | | | 532,162 | | |
| | | | 776,905 | | |
Automotive/Truck Parts & Equipment - Original 1.94% | |
Minth Group Ltd. | | | 246,000 | | | | 512,311 | | |
Automotive/Truck Parts & Equipment - Replacement 1.01% | |
Xinyi Glass Holdings Ltd. | | | 300,000 | | | | 266,216 | | |
Broadcast Services/Programming 1.10% | |
Phoenix Satellite Television Holdings Ltd. | | | 802,000 | | | | 291,099 | | |
Casino Hotels 14.68% | |
Galaxy Entertainment Group Ltd. | | | 150,000 | | | | 1,346,908 | * | |
MGM China Holdings Ltd. | | | 132,000 | | | | 567,039 | | |
NagaCorp Ltd. | | | 684,000 | | | | 723,098 | | |
Sands China Ltd. | | | 102,800 | | | | 844,775 | | |
SJM Holdings Ltd. | | | 116,000 | | | | 391,245 | | |
| | | | 3,873,065 | | |
Casino Services 1.71% | |
Paradise Co., Ltd. | | | 18,026 | | | | 452,156 | * | |
Chemicals - Specialty 1.03% | |
China Sanjiang Fine Chemicals Co., Ltd. | | | 535,000 | | | | 272,749 | | |
See notes to portfolios of investments and notes to financial statements.
112
Portfolio of Investments December 31, 2013
Common Stocks (cont'd) | | Shares | | Value | |
Commercial Banks - Non US 8.19% | |
Agricultural Bank of China Ltd., H shares | | | 529,000 | | | $ | 261,740 | | |
Bank of China Ltd., H shares | | | 1,412,000 | | | | 654,136 | | |
BOC Hong Kong (Holdings) Ltd. | | | 79,000 | | | | 254,091 | | |
China Construction Bank Corp., H shares | | | 987,000 | | | | 749,531 | | |
Industrial and Commercial Bank of China Ltd., H shares | | | 357,000 | | | | 242,728 | | |
| | | | 2,162,226 | | |
Computers 1.21% | |
Lenovo Group Ltd. | | | 262,000 | | | | 319,831 | | |
Computers - Other 1.36% | |
Ju Teng International Holdings Ltd. | | | 542,000 | | | | 358,367 | | |
Consumer Products - Miscellaneous 3.17% | |
Biostime International Holdings Ltd. | | | 94,000 | | | | 836,820 | | |
Diversified Banking Institutions 1.98% | |
HSBC Holdings plc | | | 48,034 | | | | 523,421 | | |
Diversified Minerals 0.11% | |
Woulfe Mining Corp. | | | 300,000 | | | | 28,241 | * | |
Diversified Operations 1.09% | |
Hutchison Whampoa Ltd. | | | 21,000 | | | | 287,133 | | |
E-Commerce/Products 1.52% | |
E-Commerce China Dangdang, Inc., Class A, Sponsored ADR | | | 41,956 | | | | 400,680 | * | |
E-Commerce/Services 1.60% | |
SouFun Holdings Ltd., Sponsored ADR | | | 5,123 | | | | 422,186 | | |
Electric - Generation 1.28% | |
Huaneng Renewables Corp., Ltd., H shares | | | 704,000 | | | | 338,216 | | |
Energy - Alternate Sources 0.23% | |
Xinyi Solar Holdings Ltd. | | | 300,000 | | | | 61,514 | * | |
Feminine Health Care Products 1.08% | |
Hengan International Group Co., Ltd. | | | 24,000 | | | | 283,936 | | |
Finance - Investment Banker/Broker 1.06% | |
CITIC Securities Co., Ltd., H shares | | | 101,500 | | | | 279,103 | | |
See notes to portfolios of investments and notes to financial statements.
113
Portfolio of Investments December 31, 2013
Common Stocks (cont'd) | | Shares | | Value | |
Food - Dairy Products 0.87% | |
China Huishan Dairy Holdings Co., Ltd. | | | 636,000 | | | $ | 228,912 | * | |
Gas - Distribution 1.27% | |
Beijing Enterprises Holdings Ltd. | | | 33,800 | | | | 334,267 | | |
Gold Mining 0.06% | |
Besra Gold, Inc. | | | 354,110 | | | | 15,000 | * | |
Hotels & Motels 1.09% | |
Home Inns & Hotels Management, Inc., Sponsored ADR | | | 6,559 | | | | 286,235 | * | |
Internet Application Software 4.04% | |
Tencent Holdings Ltd. | | | 16,600 | | | | 1,065,252 | | |
Internet Content - Entertainment 4.42% | |
NetEase, Inc., Sponsored ADR | | | 14,852 | | | | 1,167,367 | | |
Internet Content - Information/Network 1.26% | |
YY, Inc., Sponsored ADR | | | 6,600 | | | | 331,848 | * | |
Internet Security 2.80% | |
Qihoo 360 Technology Co., Ltd., Sponsored ADR | | | 9,000 | | | | 738,450 | * | |
Machine Tools & Related Products 2.14% | |
Techtronic Industries Co., Ltd. | | | 198,500 | | | | 565,280 | | |
Medical - Biomedical/Gene 1.93% | |
Bloomage Biotechnology Corp., Ltd. | | | 230,000 | | | | 510,335 | | |
Medical - Drugs 3.20% | |
CSPC Pharmaceutical Group Ltd. | | | 378,000 | | | | 298,542 | | |
Lijun International Pharmaceutical Holding Co., Ltd. | | | 862,000 | | | | 235,635 | | |
Sino Biopharmaceutical Ltd. | | | 388,000 | | | | 308,767 | | |
| | | | 842,944 | | |
Multi-line Insurance 2.20% | |
China Taiping Insurance Holdings Co., Ltd. | | | 160,600 | | | | 327,781 | * | |
Ping An Insurance (Group) Company of China Ltd., H shares | | | 28,000 | | | | 253,885 | | |
| | | | 581,666 | | |
Non - Ferrous Metals 0.12% | |
Sterling Group Ventures, Inc., 144A | | | 500,000 | | | | 32,500 | * | |
See notes to portfolios of investments and notes to financial statements.
114
Portfolio of Investments December 31, 2013
Common Stocks (cont'd) | | Shares | | Value | |
Oil Companies - Integrated 0.90% | |
PetroChina Co., Ltd., Sponsored ADR | | | 2,157 | | | $ | 236,709 | | |
Oil Field Machinery & Equipment 1.33% | |
CIMC Enric Holdings Ltd. | | | 218,000 | | | | 352,054 | | |
Petrochemicals 0.00% | |
Danhua Chemical Technology Co., Ltd., B shares | | | 2 | | | | 1 | * | |
Power Converters/Supply Equipment 1.36% | |
Boer Power Holdings Ltd. | | | 390,000 | | | | 358,534 | | |
Public Thoroughfares 1.32% | |
Shenzhen International Holdings Ltd. | | | 2,780,000 | | | | 348,565 | | |
Real Estate Operating/Development 3.38% | |
Greentown China Holdings Ltd. | | | 126,000 | | | | 192,702 | | |
Longfor Properties Co., Ltd. | | | 156,000 | | | | 218,221 | | |
Shenzhen Investment Ltd. | | | 574,000 | | | | 216,377 | | |
Shimao Property Holdings Ltd. | | | 115,000 | | | | 263,887 | | |
| | | | 891,187 | | |
Research & Development 2.07% | |
WuXi PharmaTech Cayman, Inc., Sponsored ADR | | | 14,239 | | | | 546,493 | * | |
Retail - Home Furnishings 0.86% | |
Man Wah Holdings Ltd. | | | 144,000 | | | | 225,815 | | |
Retail - Jewelry 0.00% | |
Lao Feng Xiang Co., Ltd., B shares | | | 1 | | | | 2 | | |
Retail - Perfume & Cosmetics 1.54% | |
S.A. S.A. International Holdings Ltd. | | | 346,000 | | | | 406,351 | | |
Therapeutics 1.88% | |
Tong Ren Tang Technologies Co., Ltd., H shares | | | 155,000 | | | | 494,967 | | |
Transportation - Marine 1.43% | |
China Shipping Development Co., Ltd., H shares | | | 484,000 | | | | 376,166 | * | |
See notes to portfolios of investments and notes to financial statements.
115
Portfolio of Investments December 31, 2013
Common Stocks (cont'd) | | Shares | | Value | |
Water Treatment Systems 1.86% | |
Beijing Enterprises Water Group Ltd. | | | 782,000 | | | $ | 491,716 | | |
Total Common Stocks | | | 26,006,439 | | |
(cost $21,130,832) | |
Exchange-Traded Fund (ETF) 0.44%
iShares FTSE A50 China Index ETF | | | 96,600 | | | | 116,464 | | |
(cost $130,053) | |
Purchased Call Options 1.53% | | Contracts | | | |
Diversified Banking Institutions 0.35% | |
HSBC Holdings plc, Strike Price 55, Expiration Jan. 2015 | | | 300 | | | | 92,700 | | |
Exchange-Traded Funds 1.18% | |
iShares FTSE China 25 Index Fund, Strike Price 33, Expiration Jan. 2015 | | | 100 | | | | 63,750 | | |
iShares FTSE China 25 Index Fund, Strike Price 39, Expiration Jan. 2015 | | | 860 | | | | 248,110 | | |
| | | | 311,860 | | |
Total Purchased Call Options | | | 404,560 | | |
(cost $369,683) | |
Total Investments 100.53% | | | 26,527,463 | | |
(cost $21,630,568) | |
Other assets and liabilities, net (0.53%) | | | (141,047 | ) | |
Net Assets 100% | | $ | 26,386,416 | | |
See notes to portfolios of investments and notes to financial statements.
116
Notes to Portfolios of Investments December 31, 2013
Legend
* Non-income producing security
+ Affiliated company (see following)
ADR American Depositary Receipt
GDR Global Depositary Receipt
GO General Obligation Bond
RS Restricted Security (see following)
ZCB Zero Coupon Bond
CAD Principal shown in Canadian dollars
# Illiquid security
@ Security was fair valued at December 31, 2013, by U.S. Global Investors, Inc. (Adviser) (other than international securities fair valued pursuant to systematic fair value models) in accordance with valuation procedures approved by the Board of Trustees. These securities, as a percentage of net assets at December 31, 2013, were 4.83% of Holmes Macro Trends Fund, 7.52% of Global Resources Fund, 2.73% of World Precious Minerals Fund and 0.41% of Gold and Precious Metals Fund, respectively. See the Fair Valuation of Securities section of these Notes to Portfolios of Investments for further discussion of fair valued securities. See further information and detail on restricted securities in the Restricted Securities section of these Notes to Portfolios of Investments.
144A Pursuant to Rule 144A of the Securities Act of 1933, these securities may be resold in transactions exempt from registration, normally to qualified institutional buyers.
General
The yields reflect the effective yield from the date of purchase.
Variable Rate Notes have periodic reset features, which effectively shorten the maturity dates and reset the interest rates as tied to various interest-bearing instruments. Rates shown are current rates at December 31, 2013.
Principal amounts are in U.S. dollars unless otherwise noted.
Fair Valuation of Securities
For the Funds' policies regarding the valuation of investments and other significant accounting policies, please refer to the Notes to Financial Statements.
The Funds are required to disclose information regarding the fair value measurements of a Fund's assets and liabilities. Fair value is the price that would be received to sell an asset or paid to transfer a liability in an orderly transaction between market participants at the measurement date. The measurement requirements established a three-tier hierarchy to maximize the use of observable market data and minimize the use of unobservable inputs and to establish classification of fair value measurements for disclosure purposes. Inputs refer broadly to the assumptions that market participants would use in pricing the asset or liability, including assumptions about risk, for example, the risk inherent in a particular valuation technique used to measure fair value including such a pricing model and/or the risk inherent in the inputs to the valuation technique. Inputs may be observable or unobservable. Observable inputs are inputs that reflect the assumptions market participants would use in pricing the asset or liability developed based on market data obtained from sources independent of the reporting entity. Unobservable inputs are inputs that reflect the reporting entity's own assumptions about the assumptions market
117
Notes to Portfolios of Investments December 31, 2013
participants would use in pricing the asset or liability developed based on the best information available in the circumstances.
The inputs or methodology used for valuing securities are not necessarily an indication of the risk associated with investing in those securities. For example, short term U.S. government obligations maturing in sixty days or less are valued using amortized cost. Generally, amortized cost reflects the current fair value of a security, but since the value is not obtained from a quoted price in an active market, such securities are reflected as Level 2. Because of the inherent uncertainties of valuation, the values reflected in the portfolios may materially differ from the values received upon actual sale of those investments.
The three levels defined by the fair value hierarchy are as follows:
Level 1 – Quoted prices in active markets for identical securities.
Level 2 – Prices determined using significant other observable inputs (including quoted prices for similar securities, interest rates, prepayment speeds, credit risk, etc.). Short-term securities with maturities of sixty days or less are valued at amortized cost, which approximates market value, and are categorized as Level 2 in the hierarchy. Municipal securities, long-term U.S. government obligations and corporate debt securities are valued in accordance with the evaluated price supplied by the pricing service and generally categorized as Level 2 in the hierarchy. Other securities that are categorized as Level 2 in the hierarchy include, but are not limited to, warrants that do not trade on an exchange, securities valued at the mean between the last reported bid and ask quotation and international equity securities valued by an independent third party in order to adjust for stale pricing and foreign market holidays.
Level 3 – Prices determined using significant unobservable inputs (including the Fund's own assumptions). For restricted equity securities and private placements where observable inputs are limited, assumptions about market activity and risk are used in determining fair value.
The following table summarizes the valuation of each Fund's securities as of December 31, 2013, using the fair value hierarchy:
| | | Quoted Prices
in Active
Markets for
Identical
Investments
(Level 1) | | Significant
Other
Observable
Inputs
(Level 2) | | Significant
Unobservable
Inputs
(Level 3) | | Total | |
U.S. Government Securities Ultra-Short Bond Fund | |
Investments in Securities*
U.S. Government and Agency Obligations | | $ | — | | | $ | 62,508,878 | | | $ | — | | | $ | 62,508,878 | | |
Total | | $ | — | | | $ | 62,508,878 | | | $ | — | | | $ | 62,508,878 | | |
118
Notes to Portfolios of Investments December 31, 2013
| | | Quoted Prices
in Active
Markets for
Identical
Investments
(Level 1) | | Significant
Other
Observable
Inputs
(Level 2) | | Significant
Unobservable
Inputs
(Level 3) | | Total | |
Near-Term Tax Free Fund | |
Investments in Securities*
Municipal Bonds | | $ | — | | | $ | 58,432,717 | | | $ | — | | | $ | 58,432,717 | | |
Total | | $ | — | | | $ | 58,432,717 | | | $ | — | | | $ | 58,432,717 | | |
All American Equity Fund | |
Investments in Securities*
Common Stocks | | $ | 22,570,752 | | | $ | — | | | $ | — | | | $ | 22,570,752 | | |
Total | | $ | 22,570,752 | | | $ | — | | | $ | — | | | $ | 22,570,752 | | |
Holmes Macro Trends Fund | |
Investments in Securities*
Common Stocks: | |
Electric - Generation | | $ | — | | | $ | — | | | $ | 254,672 | | | $ | 254,672 | | |
Energy - Alternate Sources | | | — | | | | — | | | | 66,990 | | | | 66,990 | | |
Medical - Hospitals | | | — | | | | — | | | | 3,726 | | | | 3,726 | | |
Metal - Iron | | | — | | | | — | | | | 385,264 | | | | 385,264 | | |
Quarrying | | | — | | | | — | | | | 1,185,130 | | | | 1,185,130 | | |
Real Estate Operating/Development | | | — | | | | — | | | | 556,028 | | | | 556,028 | | |
All Other Common Stocks | | | 50,047,425 | | | | — | | | | — | | | | 50,047,425 | | |
Real Estate Investment Trust | | | 143,676 | | | | — | | | | — | | | | 143,676 | | |
Warrants: | |
Gold Mining | | | — | | | | — | | | | — | | | | — | | |
Medical - Hospitals | | | — | | | | — | | | | — | | | | — | | |
Gold-Linked Notes: | |
Gold Mining | | | — | | | | 254,600 | | | | — | | | | 254,600 | | |
Silver-Linked Note | | | 182,750 | | | | — | | | | — | | | | 182,750 | | |
Corporate Note: | |
Electric - Generation | | | — | | | | — | | | | 250,000 | | | | 250,000 | | |
Total | | $ | 50,373,851 | | | $ | 254,600 | | | $ | 2,701,810 | | | $ | 53,330,261 | | |
Global Resources Fund | |
Investments in Securities*
Common Stocks: | |
Agricultural Operations | | $ | 6,058,500 | | | $ | 2,646,115 | | | $ | — | | | $ | 8,704,615 | | |
Coal | | | 6,202,303 | | | | 4,288,535 | | | | — | | | | 10,490,838 | | |
Diamonds/Precious Stones | | | 29,653 | | | | 22,059 | | | | — | | | | 51,712 | | |
Diversified Minerals | | | 19,279,960 | | | | 959,316 | | | | — | | | | 20,239,276 | | |
Electric - Generation | | | — | | | | — | | | | 3,551,982 | | | | 3,551,982 | | |
Energy - Alternate Sources | | | — | | | | — | | | | 1,607,760 | | | | 1,607,760 | | |
Food - Meat Products | | | 13,611,194 | | | | 3,532,723 | | | | — | | | | 17,143,917 | | |
Gold Mining | | | 31,922,908 | | | | 4,661,039 | | | | 1,116 | | | | 36,585,063 | | |
Medical - Hospitals | | | — | | | | — | | | | 9,344 | | | | 9,344 | | |
Metal - Copper | | | 10,989,909 | | | | 6,989,229 | | | | — | | | | 17,979,138 | | |
Metal - Diversified | | | 11,130,788 | | | | — | | | | 1,053,525 | | | | 12,184,313 | | |
Metal - Iron | | | 238,280 | | | | — | | | | 1,252,108 | | | | 1,490,388 | | |
Mining Services | | | — | | | | 695,143 | | | | 245,561 | | | | 940,704 | | |
Natural Resource Technology | | | — | | | | — | | | | 50,947 | | | | 50,947 | | |
Oil Companies - Exploration & Production | | | 60,718,576 | | | | 8,339,432 | | | | — | | | | 69,058,008 | | |
Oil Refining & Marketing | | | 10,288,500 | | | | — | | | | 145,877 | | | | 10,434,377 | | |
Precious Metals | | | — | | | | 703,359 | | | | — | | | | 703,359 | | |
Quarrying | | | — | | | | — | | | | 6,452,150 | | | | 6,452,150 | | |
Real Estate Operating/Development | | | 397,886 | | | | — | | | | 9,703,404 | | | | 10,101,290 | | |
119
Notes to Portfolios of Investments December 31, 2013
| | | Quoted Prices
in Active
Markets for
Identical
Investments
(Level 1) | | Significant
Other
Observable
Inputs
(Level 2) | | Significant
Unobservable
Inputs
(Level 3) | | Total | |
Global Resources Fund (cont'd) | |
Investments in Securities* (cont'd) | |
Common Stocks: (cont'd) | |
All Other Common Stocks | | $ | 108,681,434 | | | $ | — | | | $ | — | | | $ | 108,681,434 | | |
Real Estate Investment Trust | | | 4,419,800 | | | | — | | | | — | | | | 4,419,800 | | |
Warrants: | |
Diversified Minerals | | | — | | | | — | | | | — | | | | — | | |
Gold Mining | | | 1,851,763 | | | | 253,399 | | | | — | | | | 2,105,162 | | |
Medical - Hospitals | | | — | | | | — | | | | — | | | | — | | |
Metal - Copper | | | — | | | | — | | | | — | | | | — | | |
Oil Companies - Exploration & Production | | | — | | | | 75,308 | | | | — | | | | 75,308 | | |
All Other Warrants | | | 27,535 | | | | — | | | | — | | | | 27,535 | | |
Rights | | | 192,000 | | | | — | | | | — | | | | 192,000 | | |
Purchased Call Options: | |
Agricultural Operations | | | — | | | | 330,000 | | | | — | | | | 330,000 | | |
Oil - Field Services | | | — | | | | 46,250 | | | | — | | | | 46,250 | | |
Oil Companies - Exploration & Production | | | — | | | | 982,154 | | | | — | | | | 982,154 | | |
Oil Refining & Marketing | | | — | | | | 580,000 | | | | — | | | | 580,000 | | |
Steel - Producers | | | — | | | | 2,175,000 | | | | — | | | | 2,175,000 | | |
Master Limited Partnerships | | | 14,007,050 | | | | — | | | | — | | | | 14,007,050 | | |
Convertible Bond: | |
Mining Services | | | — | | | | 435,000 | | | | — | | | | 435,000 | | |
Gold-Linked Notes: | |
Gold Mining | | | — | | | | 5,937,540 | | | | — | | | | 5,937,540 | | |
Silver-Linked Notes | | | 2,885,730 | | | | — | | | | — | | | | 2,885,730 | | |
Corporate Note: | |
Electric - Generation | | | — | | | | — | | | | 3,000,000 | | | | 3,000,000 | | |
Total | | $ | 302,933,769 | | | $ | 43,651,601 | | | $ | 27,073,774 | | | $ | 373,659,144 | | |
World Precious Minerals Fund | |
Investments in Securities*
Common Stocks: | |
Agricultural Operations | | $ | — | | | $ | 1,486,708 | | | $ | — | | | $ | 1,486,708 | | |
Coal | | | 327,634 | | | | 2,838,583 | | | | — | | | | 3,166,217 | | |
Diamonds/Precious Stones | | | 2,365,354 | | | | 59,792 | | | | — | | | | 2,425,146 | | |
Diversified Minerals | | | 1,854,892 | | | | 794,265 | | | | — | | | | 2,649,157 | | |
Gold Mining | | | 66,318,898 | | | | 2,057,861 | | | | 610,157 | | | | 68,986,916 | | |
Investment Companies | | | — | | | | — | | | | 3,750 | | | | 3,750 | | |
Medical - Hospitals | | | — | | | | — | | | | 17,281 | | | | 17,281 | | |
Metal - Copper | | | 769,635 | | | | — | | | | — | | | | 769,635 | | |
Metal - Diversified | | | 12,875,640 | | | | 689,103 | | | | — | | | | 13,564,743 | | |
Metal - Iron | | | — | | | | — | | | | 1,733,688 | | | | 1,733,688 | | |
Mining Services | | | 636,826 | | | | 1,123,701 | | | | — | | | | 1,760,527 | | |
Oil Companies - Exploration & Production | | | — | | | | — | | | | — | | | | — | | |
Platinum | | | 2,124,199 | | | | 24,318 | | | | — | | | | 2,148,517 | | |
Precious Metals | | | 4,010,824 | | | | 4,435,454 | | | | — | | | | 8,446,278 | | |
All Other Common Stocks | | | 7,910,549 | | | | — | | | | — | | | | 7,910,549 | | |
Exchange-Traded Funds | | | 856,106 | | | | — | | | | — | | | | 856,106 | | |
Warrants: | |
Finance - Investment Banker/Broker | | | — | | | | — | | | | — | | | | — | | |
Gold Mining | | | 3,589,655 | | | | 95,705 | | | | — | | | | 3,685,360 | | |
Medical - Hospitals | | | — | | | | — | | | | — | | | | — | | |
Metal - Copper | | | — | | | | — | | | | — | | | | — | | |
120
Notes to Portfolios of Investments December 31, 2013
| | | Quoted Prices
in Active
Markets for
Identical
Investments
(Level 1) | | Significant
Other
Observable
Inputs
(Level 2) | | Significant
Unobservable
Inputs
(Level 3) | | Total | |
World Precious Minerals Fund (cont'd) | |
Investments in Securities* (cont'd) | |
Warrants: (cont'd) | |
Metal - Diversified | | $ | — | | | $ | 6,249 | | | $ | — | | | $ | 6,249 | | |
All Other Warrants | | | 566,983 | | | | — | | | | — | | | | 566,983 | | |
Special Warrants: | |
Gold/Mineral Exploration & Development | | | — | | | | — | | | | — | | | | — | | |
Purchased Call Options: | |
Exchange-Traded Funds | | | — | | | | 318,864 | | | | — | | | | 318,864 | | |
Gold Mining | | | — | | | | 2,358,050 | | | | — | | | | 2,358,050 | | |
Platinum | | | — | | | | 61,425 | | | | — | | | | 61,425 | | |
Precious Metals | | | — | | | | 240,000 | | | | — | | | | 240,000 | | |
Silver Mining | | | — | | | | 536,791 | | | | — | | | | 536,791 | | |
Convertible Bond: | |
Gold Mining | | | — | | | | 127,029 | | | | — | | | | 127,029 | | |
Gold-Linked Notes: | |
Gold Mining | | | — | | | | 4,030,050 | | | | — | | | | 4,030,050 | | |
Silver-Linked Notes | | | 3,752,180 | | | | — | | | | — | | | | 3,752,180 | | |
Corporate Note: | |
Electric - Generation | | | — | | | | — | | | | 800,000 | | | | 800,000 | | |
Total | | $ | 107,959,375 | | | $ | 21,283,948 | | | $ | 3,164,876 | | | $ | 132,408,199 | | |
Gold and Precious Metals Fund | |
Investments in Securities*
Common Stocks: | |
Gold Mining | | $ | 35,622,217 | | | $ | 3,088,374 | | | $ | — | | | $ | 38,710,591 | | |
Medical - Hospitals | | | — | | | | — | | | | 7,453 | | | | 7,453 | | |
Precious Metals | | | 499,200 | | | | 2,180,856 | | | | — | | | | 2,680,056 | | |
All Other Common Stocks | | | 6,568,986 | | | | — | | | | — | | | | 6,568,986 | | |
Exchange-Traded Funds | | | 5,977,544 | | | | — | | | | — | | | | 5,977,544 | | |
Warrants: | |
Gold Mining | | | 2,591,920 | | | | 12,850 | | | | — | | | | 2,604,770 | | |
Medical - Hospitals | | | — | | | | — | | | | — | | | | — | | |
All Other Warrants | | | 333,391 | | | | — | | | | — | | | | 333,391 | | |
Purchased Call Options: | |
Exchange-Traded Funds | | | — | | | | 171,495 | | | | — | | | | 171,495 | | |
Gold Mining | | | — | | | | 1,713,896 | | | | — | | | | 1,713,896 | | |
Platinum | | | — | | | | 30,258 | | | | — | | | | 30,258 | | |
Precious Metals | | | — | | | | 144,000 | | | | — | | | | 144,000 | | |
Silver Mining | | | — | | | | 436,531 | | | | — | | | | 436,531 | | |
Master Limited Partnership | | | 2,576,750 | | | | — | | | | — | | | | 2,576,750 | | |
Convertible Bond: | |
Gold Mining | | | — | | | | 127,029 | | | | — | | | | 127,029 | | |
Corporate Bond: | |
Gold Mining | | | — | | | | 77,850 | | | | — | | | | 77,850 | | |
Gold-Linked Notes: | |
Gold Mining | | | — | | | | 2,028,760 | | | | — | | | | 2,028,760 | | |
Silver-Linked Notes | | | 1,965,530 | | | | — | | | | — | | | | 1,965,530 | | |
Corporate Note: | |
Electric - Generation | | | — | | | | — | | | | 300,000 | | | | 300,000 | | |
Total | | $ | 56,135,538 | | | $ | 10,011,899 | | | $ | 307,453 | | | $ | 66,454,890 | | |
121
Notes to Portfolios of Investments December 31, 2013
| | | Quoted Prices
in Active
Markets for
Identical
Investments
(Level 1) | | Significant
Other
Observable
Inputs
(Level 2) | | Significant
Unobservable
Inputs
(Level 3) | | Total | |
Emerging Europe Fund | |
Investments in Securities*
Common Stocks: | |
Airlines | | $ | — | | | $ | 904,951 | | | $ | — | | | $ | 904,951 | | |
Automotive - Cars & Light Trucks | | | — | | | | 6,765,969 | | | | — | | | | 6,765,969 | | |
Cellular Telecommunication | | | 4,041,131 | | | | 7,789,660 | | | | — | | | | 11,830,791 | | |
Chemicals - Diversified | | | — | | | | 3,168,410 | | | | — | | | | 3,168,410 | | |
Coal | | | — | | | | 250,818 | | | | — | | | | 250,818 | | |
Commercial Banks - Non US | | | — | | | | 24,862,806 | | | | — | | | | 24,862,806 | | |
Diversified Banking Institutions | | | — | | | | 2,233,891 | | | | — | | | | 2,233,891 | | |
Diversified Financial Services | | | — | | | | 952,215 | | | | — | | | | 952,215 | | |
Diversified Operations | | | — | | | | 468,310 | | | | — | | | | 468,310 | | |
Electric - Distribution | | | — | | | | 790,793 | | | | — | | | | 790,793 | | |
Finance - Investment Banker/Broker | | | — | | | | 2,533,559 | | | | — | | | | 2,533,559 | | |
Food - Catering | | | — | | | | 562,365 | | | | — | | | | 562,365 | | |
Food - Retail | | | — | | | | 6,468,422 | | | | — | | | | 6,468,422 | | |
Gold Mining | | | 416 | | | | 1,410,524 | | | | — | | | | 1,410,940 | | |
Housewares | | | — | | | | 531,437 | | | | — | | | | 531,437 | | |
Machinery - Farm | | | — | | | | 1,175,298 | | | | — | | | | 1,175,298 | | |
Medical - Drugs | | | — | | | | 1,528,663 | | | | — | | | | 1,528,663 | | |
Metal - Diversified | | | 660,532 | | | | 5,329,435 | | | | — | | | | 5,989,967 | | |
Oil - Field Services | | | — | | | | 555,751 | | | | — | | | | 555,751 | | |
Oil Companies - Exploration & Production | | | 526,396 | | | | 9,523,026 | | | | — | | | | 10,049,422 | | |
Oil Companies - Integrated | | | — | | | | 11,370,793 | | | | — | | | | 11,370,793 | | |
Property/Casualty Insurance | | | — | | | | 2,982,838 | | | | — | | | | 2,982,838 | | |
Real Estate Management/Services | | | — | | | | 709,299 | | | | — | | | | 709,299 | | |
Retail - Apparel/Shoe | | | — | | | | 954,095 | | | | — | | | | 954,095 | | |
Retail - Miscellaneous/Diversified | | | — | | | | 645,288 | | | | — | | | | 645,288 | | |
Steel - Producers | | | — | | | | 1,483,401 | | | | — | | | | 1,483,401 | | |
Telecom Services | | | — | | | | 2,042,647 | | | | — | | | | 2,042,647 | | |
Television | | | — | | | | 426,246 | | | | — | | | | 426,246 | | |
Textile - Products | | | — | | | | 555,212 | | | | — | | | | 555,212 | | |
Tobacco | | | — | | | | 1,710,321 | | | | — | | | | 1,710,321 | | |
Web Portals/Internet Service Providers | | | 3,797,200 | | | | 4,464,313 | | | | — | | | | 8,261,513 | | |
All Other Common Stocks | | | 924,730 | | | | — | | | | — | | | | 924,730 | | |
Preferred Stock: | |
Oil Companies - Integrated | | | — | | | | 1,884,066 | | | | — | | | | 1,884,066 | | |
Real Estate Investment Trusts | | | — | | | | 1,443,888 | | | | — | | | | 1,443,888 | | |
Closed-End Investment Company | | | — | | | | 1,441,246 | | | | — | | | | 1,441,246 | | |
Warrants | | | 2,061,412 | | | | — | | | | — | | | | 2,061,412 | | |
Corporate Note: | |
Transportation - Services | | | — | | | | 1,158,000 | | | | — | | | | 1,158,000 | | |
Total | | $ | 12,011,817 | | | $ | 111,077,956 | | | $ | — | | | $ | 123,089,773 | | |
China Region Fund | |
Investments in Securities*
Common Stocks: | |
Aerospace/Defense - Equipment | | $ | — | | | $ | 306,411 | | | $ | — | | | $ | 306,411 | | |
Airlines | | | — | | | | 261,543 | | | | — | | | | 261,543 | | |
Apparel Manufacturers | | | — | | | | 455,764 | | | | — | | | | 455,764 | | |
Appliances | | | — | | | | 522,518 | | | | — | | | | 522,518 | | |
Applications Software | | | — | | | | 285,412 | | | | — | | | | 285,412 | | |
Automotive - Cars & Light Trucks | | | — | | | | 776,905 | | | | — | | | | 776,905 | | |
122
Notes to Portfolios of Investments December 31, 2013
| | | Quoted Prices
in Active
Markets for
Identical
Investments
(Level 1) | | Significant
Other
Observable
Inputs
(Level 2) | | Significant
Unobservable
Inputs
(Level 3) | | Total | |
China Region Fund (cont'd) | |
Investments in Securities* (cont'd) | |
Common Stocks: (cont'd) | |
Automotive/Truck Parts &
Equipment - Original | | $ | — | | | $ | 512,311 | | | $ | — | | | $ | 512,311 | | |
Automotive/Truck Parts &
Equipment - Replacement | | | — | | | | 266,216 | | | | — | | | | 266,216 | | |
Broadcast Services/Programming | | | — | | | | 291,099 | | | | — | | | | 291,099 | | |
Casino Hotels | | | — | | | | 3,873,065 | | | | — | | | | 3,873,065 | | |
Casino Services | | | — | | | | 452,156 | | | | — | | | | 452,156 | | |
Chemicals - Specialty | | | — | | | | 272,749 | | | | — | | | | 272,749 | | |
Commercial Banks - Non US | | | — | | | | 2,162,226 | | | | — | | | | 2,162,226 | | |
Computers | | | — | | | | 319,831 | | | | — | | | | 319,831 | | |
Computers - Other | | | — | | | | 358,367 | | | | — | | | | 358,367 | | |
Consumer Products - Miscellaneous | | | — | | | | 836,820 | | | | — | | | | 836,820 | | |
Diversified Banking Institutions | | | — | | | | 523,421 | | | | — | | | | 523,421 | | |
Diversified Operations | | | — | | | | 287,133 | | | | — | | | | 287,133 | | |
Electric - Generation | | | — | | | | 338,216 | | | | — | | | | 338,216 | | |
Energy - Alternate Sources | | | — | | | | 61,514 | | | | — | | | | 61,514 | | |
Feminine Health Care Products | | | — | | | | 283,936 | | | | — | | | | 283,936 | | |
Finance - Investment Banker/Broker | | | — | | | | 279,103 | | | | — | | | | 279,103 | | |
Food - Dairy Products | | | — | | | | 228,912 | | | | — | | | | 228,912 | | |
Gas - Distribution | | | — | | | | 334,267 | | | | — | | | | 334,267 | | |
Internet Application Software | | | — | | | | 1,065,252 | | | | — | | | | 1,065,252 | | |
Machine Tools & Related Products | | | — | | | | 565,280 | | | | — | | | | 565,280 | | |
Medical - Biomedical/Gene | | | — | | | | 510,335 | | | | — | | | | 510,335 | | |
Medical - Drugs | | | — | | | | 842,944 | | | | — | | | | 842,944 | | |
Multi-line Insurance | | | — | | | | 581,666 | | | | — | | | | 581,666 | | |
Oil Field Machinery & Equipment | | | — | | | | 352,054 | | | | — | | | | 352,054 | | |
Petrochemicals | | | — | | | | 1 | | | | — | | | | 1 | | |
Power Converters/Supply Equipment | | | — | | | | 358,534 | | | | — | | | | 358,534 | | |
Public Thoroughfares | | | — | | | | 348,565 | | | | — | | | | 348,565 | | |
Real Estate Operating/Development | | | — | | | | 891,187 | | | | — | | | | 891,187 | | |
Retail - Home Furnishings | | | — | | | | 225,815 | | | | — | | | | 225,815 | | |
Retail - Jewelry | | | — | | | | 2 | | | | — | | | | 2 | | |
Retail - Perfume & Cosmetics | | | — | | | | 406,351 | | | | — | | | | 406,351 | | |
Therapeutics | | | — | | | | 494,967 | | | | — | | | | 494,967 | | |
Transportation - Marine | | | — | | | | 376,166 | | | | — | | | | 376,166 | | |
Water Treatment Systems | | | — | | | | 491,716 | | | | — | | | | 491,716 | | |
All Other Common Stocks | | | 4,205,709 | | | | — | | | | — | | | | 4,205,709 | | |
Exchange-Traded Fund | | | — | | | | 116,464 | | | | — | | | | 116,464 | | |
Purchased Call Options: | |
Diversified Banking Institutions | | | — | | | | 92,700 | | | | — | | | | 92,700 | | |
Exchange-Traded Funds | | | — | | | | 311,860 | | | | — | | | | 311,860 | | |
Total | | $ | 4,205,709 | | | $ | 22,321,754 | | | $ | — | | | $ | 26,527,463 | | |
* Refer to the Portfolio of Investments for a detailed list of the Fund's investments.
During the year, Global Resources Fund, World Precious Minerals Fund, Gold and Precious Metals Fund, Emerging Europe Fund and China Region Fund had transfers from Level 1 to Level 2 in the amount of $8,589,110, $10,432,807, $3,579,962,
123
Notes to Portfolios of Investments December 31, 2013
$48,218,121 and $10,311,424, respectively, due primarily to certain foreign securities being valued using a systematic fair value model at December 31, 2013, but not at the prior period end. Global Resources Fund, World Precious Minerals Fund and Gold and Precious Metals Fund had transfers from Level 1 to Level 2 in the amount of $933,932, $1,625,538 and $13,319, respectively, due to securities being valued at the mean between bid and ask quotations at December 31, 2013, but at a quoted price at the prior period end. Holmes Macro Trends Fund, Global Resources Fund, World Precious Minerals Fund, Gold and Precious Metals Fund and China Region Fund had transfers from Level 2 to Level 1 in the amount of $1,306,467, $3,742,503, $3,752,180, $1,965,530 and $32,500, respectively, due to securities being valued at a quoted price at December 31, 2013, but at the mean between bid and ask quotations at the prior period end. World Precious Minerals Fund had transfers from Level 2 to Level 1 in the amount of $250,847 resulting from the expiration of a regulatory hold. The Funds' policy is to recognize transfers in and transfers out as of the end of the reporting period.
124
[THIS PAGE INTENTIONALLY LEFT BLANK]
Notes to Portfolios of Investments December 31, 2013
The following is a reconciliation of assets for which unobservable inputs (Level 3) were used in determining fair value during the period January 1, 2013, through December 31, 2013:
| | | Beginning
Balance
12/31/12 | | Total
realized
gain (loss) | | Net
change in
unrealized
appreciation
(depreciation) | | Paydowns/
Maturities | | Reclassifications | |
Holmes Macro Trends Fund | |
Investments in Securities | |
Common Stocks: | |
Electric - Generation | | $ | — | | | $ | — | | | $ | — | | | $ | — | | | $ | — | | |
Energy - Alternate Sources | | | — | | | | — | | | | — | | | | — | | | | — | | |
Medical - Hospitals | | | — | | | | — | | | | — | | | | — | | | | — | | |
Metal - Iron | | | 100,000 | | | | — | | | | (7,368 | ) | | | — | | | | 100,000 | | |
Quarrying | | | 379,951 | | | | — | | | | 120,355 | | | | — | | | | — | | |
Real Estate Operating/Development | | | 100,000 | | | | — | | | | 30,360 | | | | — | | | | — | | |
Convertible Debenture: | |
Metal - Iron | | | 100,000 | | | | — | | | | — | | | | — | | | | (100,000 | ) | |
Gold-Linked Notes: | |
Gold Mining | | | 370,000 | | | | — | | | | (122,100 | ) | | | — | | | | — | | |
Corporate Notes: | |
Electric - Generation | | | 150,000 | | | | — | | | | — | | | | — | | | | — | | |
Transportation - Air Freight | | | 250,000 | | | | — | | | | — | | | | (250,000 | ) | | | — | | |
Total Investments in Securities | | $ | 1,449,951 | | | $ | — | | | $ | 21,247 | | | $ | (250,000 | ) | | $ | — | | |
Global Resources Fund | |
Investments in Securities | |
Common Stocks: | |
Electric - Generation | | $ | 1,460,519 | | | $ | — | | | $ | 2,091,463 | | | $ | — | | | $ | — | | |
Energy - Alternate Sources | | | 2,400,000 | | | | — | | | | (792,240 | ) | | | — | | | | — | | |
Gold Mining | | | 1,300 | | | | — | | | | (184 | ) | | | — | | | | — | | |
Medical - Hospitals | | | — | | | | — | | | | — | | | | — | | | | — | | |
Metal - Copper | | | — | | | | — | | | | — | | | | — | | | | — | | |
Metal - Diversified | | | 1,374,150 | | | | — | | | | (320,625 | ) | | | — | | | | — | | |
Metal - Iron | | | 2,600,000 | | | | — | | | | (1,347,892 | ) | | | — | | | | — | | |
Mining Services | | | 285,890 | | | | — | | | | (40,329 | ) | | | — | | | | — | | |
Natural Resource Technology | | | 50,947 | | | | — | | | | — | | | | — | | | | — | | |
Oil Refining & Marketing | | | 426,390 | | | | — | | | | (280,513 | ) | | | — | | | | — | | |
Platinum | | | — | | | | (102,655 | ) | | | 102,655 | | | | — | | | | — | | |
Quarrying | | | 4,900,009 | | | | — | | | | 1,552,141 | | | | — | | | | — | | |
Real Estate Operating/Development | | | 7,443,544 | | | | — | | | | 2,259,860 | | | | — | | | | — | | |
Convertible Debenture: | |
Diversified Minerals | | | 147,635 | | | | — | | | | 362,986 | | | | — | | | | — | | |
Gold-Linked Notes: | |
Gold Mining | | | 8,615,000 | | | | — | | | | (2,842,950 | ) | | | — | | | | — | | |
Corporate Notes: | |
Electric - Generation | | | 3,000,000 | | | | — | | | | — | | | | — | | | | — | | |
Transportation - Air Freight | | | 500,000 | | | | — | | | | — | | | | (500,000 | ) | | | — | | |
Total Investments in Securities | | $ | 33,205,384 | | | $ | (102,655 | ) | | $ | 744,372 | | | $ | (500,000 | ) | | $ | — | | |
126
Notes to Portfolios of Investments December 31, 2013
| | Transfers
into
Level 3*/** | | Transfers
out of
Level 3* | | Ending
Balance
12/31/13 | | Net
change in
unrealized
appreciation
(depreciation)
from
Investments
held as of
12/31/13(1) | |
Holmes Macro Trends Fund | |
Investments in Securities | |
Common Stocks: | |
Electric - Generation | | $ | 254,672 | | | $ | — | | | $ | 254,672 | | | $ | — | | |
Energy - Alternate Sources | | | 66,990 | | | | — | | | | 66,990 | | | | — | | |
Medical - Hospitals | | | 3,726 | | | | — | | | | 3,726 | | | | — | | |
Metal - Iron | | | 192,632 | | | | — | | | | 385,264 | | | | (7,368 | ) | |
Quarrying | | | 684,824 | | | | — | | | | 1,185,130 | | | | 120,355 | | |
Real Estate Operating/Development | | | 425,668 | | | | — | | | | 556,028 | | | | 30,360 | | |
Convertible Debenture: | |
Metal - Iron | | | — | | | | — | | | | — | | | | — | | |
Gold-Linked Notes: | |
Gold Mining | | | — | | | | (247,900 | ) | | | — | | | | — | | |
Corporate Notes: | |
Electric - Generation | | | 100,000 | | | | — | | | | 250,000 | | | | — | | |
Transportation - Air Freight | | | — | | | | — | | | | — | | | | — | | |
Total Investments in Securities | | $ | 1,728,512 | | | $ | (247,900 | ) | | $ | 2,701,810 | | | $ | 143,347 | | |
Global Resources Fund | |
Investments in Securities | |
Common Stocks: | |
Electric - Generation | | $ | — | | | $ | — | | | $ | 3,551,982 | | | $ | 2,091,463 | | |
Energy - Alternate Sources | | | — | | | | — | | | | 1,607,760 | | | | (792,240 | ) | |
Gold Mining | | | — | | | | — | | | | 1,116 | | | | (184 | ) | |
Medical - Hospitals | | | 9,344 | | | | — | | | | 9,344 | | | | — | | |
Metal - Copper | | | — | | | | — | | | | — | | | | — | | |
Metal - Diversified | | | — | | | | — | | | | 1,053,525 | | | | (320,625 | ) | |
Metal - Iron | | | — | | | | — | | | | 1,252,108 | | | | (1,347,892 | ) | |
Mining Services | | | — | | | | — | | | | 245,561 | | | | (40,329 | ) | |
Natural Resource Technology | | | — | | | | — | | | | 50,947 | | | | — | | |
Oil Refining & Marketing | | | — | | | | — | | | | 145,877 | | | | (280,513 | ) | |
Platinum | | | — | | | | — | | | | — | | | | — | | |
Quarrying | | | — | | | | — | | | | 6,452,150 | | | | 1,552,141 | | |
Real Estate Operating/Development | | | — | | | | — | | | | 9,703,404 | | | | 2,259,860 | | |
Convertible Debenture: | |
Diversified Minerals | | | — | | | | (510,621 | ) | | | — | | | | — | | |
Gold-Linked Notes: | |
Gold Mining | | | — | | | | (5,772,050 | ) | | | — | | | | — | | |
Corporate Notes: | |
Electric - Generation | | | — | | | | — | | | | 3,000,000 | | | | — | | |
Transportation - Air Freight | | | — | | | | — | | | | — | | | | — | | |
Total Investments in Securities | | $ | 9,344 | | | $ | (6,282,671 | ) | | $ | 27,073,774 | | | $ | 3,121,681 | | |
127
Notes to Portfolios of Investments December 31, 2013
| | | Beginning
Balance
12/31/12 | | Total
realized
gain (loss) | | Net
change in
unrealized
appreciation
(depreciation) | | Paydowns/
Maturities | | Reclassifications | |
World Precious Minerals Fund | |
Investments in Securities | |
Common Stocks: | |
Gold Mining | | $ | 1,797,024 | | | $ | — | | | $ | (1,186,867 | ) | | $ | — | | | $ | — | | |
Investment Companies | | | — | | | | — | | | | — | | | | — | | | | — | | |
Medical - Hospitals | | | — | | | | — | | | | — | | | | — | | | | — | | |
Metal - Copper | | | — | | | | — | | | | — | | | | — | | | | — | | |
Metal - Diversified | | | 388,043 | | | | — | | | | 4,908 | | | | — | | | | — | | |
Metal - Iron | | | — | | | | — | | | | 533,688 | | | | — | | | | 1,200,000 | | |
Oil Companies - Exploration & Production | | | — | | | | — | | | | — | | | | — | | | | — | | |
Platinum | | | — | | | | (1,141,145 | ) | | | 1,141,145 | | | | — | | | | — | | |
Warrants: | |
Gold Mining | | | — | | | | — | | | | — | | | | — | | | | — | | |
Metal - Diversified | | | — | | | | — | | | | — | | | | — | | | | — | | |
Special Warrants: | |
Gold/Mineral Exploration & Development | | | — | | | | — | | | | — | | | | — | | | | — | | |
Convertible Debenture: | |
Metal - Iron | | | 1,200,000 | | | | — | | | | — | | | | — | | | | (1,200,000 | ) | |
Gold-Linked Notes: | |
Gold Mining | | | 5,845,000 | | | | — | | | | (1,928,850 | ) | | | — | | | | — | | |
Corporate Notes: | |
Electric - Generation | | | 800,000 | | | | — | | | | — | | | | — | | | | — | | |
Total Investments in Securities | | $ | 10,030,067 | | | $ | (1,141,145 | ) | | $ | (1,435,976 | ) | | $ | — | | | $ | — | | |
Gold and Precious Metals Fund | |
Investments in Securities | |
Common Stocks: | |
Gold Mining | | $ | — | | | $ | — | | | $ | — | | | $ | — | | | $ | — | | |
Warrants: | |
Gold Mining | | | — | | | | — | | | | — | | | | — | | | | — | | |
Gold-Linked Notes: | |
Gold Mining | | | 2,940,000 | | | | — | | | | (970,200 | ) | | | — | | | | — | | |
Corporate Note: | |
Electric - Generation | | | 300,000 | | | | — | | | | — | | | | — | | | | — | | |
Total Investments in Securities | | $ | 3,240,000 | | | $ | — | | | $ | (970,200 | ) | | $ | — | | | $ | — | | |
* The Funds' policy is to recognize transfers in and transfers out as of the end of the reporting period.
** Transfers into Level 3 for Holmes Macro Trends Fund include securities acquired pursuant to the reorganization with MegaTrends Fund (see Note 9 of the Notes to Financial Statements).
(1) The amounts shown represent the net change in unrealized appreciation (depreciation) included in the Statement of Operations attributable to only those investments still held and classified as Level 3 at December 31, 2013.
128
Notes to Portfolios of Investments December 31, 2013
| | | Transfers
into
Level 3*/** | | Transfers
out of
Level 3* | | Ending
Balance
12/31/13 | | Net
change in
unrealized
appreciation
(depreciation)
from
Investments
held as of
12/31/13(1) | |
World Precious Minerals Fund | |
Investments in Securities | |
Common Stocks: | |
Gold Mining | | $ | — | | | $ | — | | | $ | 610,157 | | | $ | (1,186,867 | ) | |
Investment Companies | | | 3,750 | | | | — | | | | 3,750 | | | | — | | |
Medical - Hospitals | | | 17,281 | | | | — | | | | 17,281 | | | | — | | |
Metal - Copper | | | — | | | | — | | | | — | | | | — | | |
Metal - Diversified | | | — | | | | (392,951 | ) | | | — | | | | — | | |
Metal - Iron | | | — | | | | — | | | | 1,733,688 | | | | 533,688 | | |
Oil Companies - Exploration & Production | | | — | | | | — | | | | — | | | | — | | |
Platinum | | | — | | | | — | | | | — | | | | — | | |
Warrants: | |
Gold Mining | | | — | | | | — | | | | — | | | | — | | |
Metal - Diversified | | | — | | | | — | | | | — | | | | — | | |
Special Warrants: | |
Gold/Mineral Exploration & Development | | | — | | | | — | | | | — | | | | — | | |
Convertible Debenture: | |
Metal - Iron | | | — | | | | — | | | | — | | | | — | | |
Gold-Linked Notes: | |
Gold Mining | | | — | | | | (3,916,150 | ) | | | — | | | | — | | |
Corporate Notes: | |
Electric - Generation | | | — | | | | — | | | | 800,000 | | | | — | | |
Total Investments in Securities | | $ | 21,031 | | | $ | (4,309,101 | ) | | $ | 3,164,876 | | | $ | (653,179 | ) | |
Gold and Precious Metals Fund | |
Investments in Securities | |
Common Stocks: | |
Gold Mining | | $ | 7,453 | | | $ | — | | | $ | 7,453 | | | $ | — | | |
Warrants: | |
Gold Mining | | | — | | | | — | | | | — | | | | — | | |
Gold-Linked Notes: | |
Gold Mining | | | — | | | | (1,969,800 | ) | | | — | | | | — | | |
Corporate Note: | |
Electric - Generation | | | — | | | | — | | | | 300,000 | | | | — | | |
Total Investments in Securities | | $ | 7,453 | | | $ | (1,969,800 | ) | | $ | 307,453 | | | $ | — | | |
129
Notes to Portfolios of Investments December 31, 2013
Significant unobservable inputs developed by the Valuation Committee for Level 3 investments held at year-end are as follows:
| | | Fair Value at
12/31/13 | | Valuation
Technique(s) | | Unobservable
Input | | Range
(Weighted
Average) | |
Holmes Macro Trends Fund | |
Investments in Securities
Common Stocks | | $ | 626,744 | | | Market Transaction(1) | | Discount/
Premium | |
33% discount-
4% premium
(2% discount) | |
Common Stocks | | | 1,825,066 | | | Method of Comparables Pricing(2) | | Multiples | | 3.3-25.5 (7.7) | |
Corporate Note | | | 250,000 | | | Market Transaction(1) | | Discount | | 0% | |
Global Resources Fund | |
Investments in Securities
Common Stocks | | | 12,817,534 | | | Market Transaction(1) | | Discount/
Premium | |
100% discount-
4% premium
(31% discount) | |
Common Stocks | | | 11,256,240 | | | Method of Comparables Pricing(2) | | Multiples | | 3.3-25.5 (7.2) | |
Corporate Note | | | 3,000,000 | | | Market Transaction(1) | | Discount | | 0% | |
World Precious Minerals Fund | |
Investments in Securities
Common Stocks | | | 631,188 | | | Market Transaction(1) | | Discount | |
0%-100%
discount
(49% discount) | |
Common Stocks | | | 1,733,688 | | | Method of Comparables Pricing(2) | | Multiples | | 6.4-23.2 (7.5) | |
Warrants | | | — | | | Market Transaction(1) | | Discount | | 0% | |
Special Warrants | | | — | | | Market Transaction(1) | | Discount | | 100% | |
Corporate Note | | | 800,000 | | | Market Transaction(1) | | Discount | | 0% | |
Gold and Precious Metals Fund | |
Investments in Securities
Common Stocks | | | 7,453 | | | Market Transaction(1) | | Discount | | 0% | |
Warrants | | | — | | | Market Transaction(1) | | Discount | | 0% | |
Corporate Note | | | 300,000 | | | Market Transaction(1) | | Discount | | 0% | |
(1) Market Transaction refers to most recent known market transaction, including transactions in which the fund participated, as adjusted for any discount or premium as discussed below.
(2) The Method of Comparables Pricing valuation technique involves determining a comparable group of companies that exhibit similar characteristics to that of the Level 3 security (the Comparables), gathering information about the Comparables to determine their range of valuation multiples and selecting the appropriate multiple within the determined range of the Comparables to apply in valuing the Level 3 security.
The majority of securities classified as Level 3 are private companies. The initial valuation is usually cost, which is then adjusted as determined by the Valuation Committee for subsequent known market transactions and evaluated for progress against anticipated milestones and current operations. An evaluation that the holding no longer meets expectations could result in the application of discounts and a significantly lower fair valuation. For certain securities, the last known market transaction is increased or decreased by changes in a market index or industry peers as approved by the Valuation Committee.
130
Notes to Portfolios of Investments December 31, 2013
Affiliated Companies - Indicated in Portfolio of Investments as "+"
The Investment Company Act of 1940 defines affiliates as companies in which the Fund owns at least 5% of the outstanding voting securities. The following is a summary of transactions with each affiliated company during the year ended December 31, 2013.
| | | Shares of Affiliated Companies | |
Holmes Macro Trends Fund | | December 31, 2012 | | Additions | | Reductions | | December 31, 2013 | |
IOU Financial, Inc. | | | 1,538,000 | | | | 298,500 | | | | — | | | | 1,836,500 | (a) | |
At December 31, 2013, the Holmes Macro Trends Fund had no investments in affiliated companies. There were no realized gains or losses on transactions, and there was no income earned for the year.
| | | Shares of Affiliated Companies | |
Global Resources Fund | | December 31, 2012 | | Additions | | Reductions | | December 31, 2013 | |
Africa Oilfield Logistics Ltd. | | | — | | | | 55,879,483 | | | | (1,254,500 | ) | | | 54,624,983 | | |
African Potash Ltd. | | | 15,825,000 | | | | — | | | | (857,500 | ) | | | 14,967,500 | | |
Agriterra Ltd. | | | 67,888,600 | | | | 700,000 | | | | — | | | | 68,588,600 | | |
Pacific Coal Resources Ltd. | | | 23,039,115 | | | | 238,467 | | | | (19,755,521 | ) | | | 3,522,061 | | |
Pacific Green Energy Corp. | | | 2,400,000 | | | | — | | | | — | | | | 2,400,000 | | |
Pacific Power Generation Corp. | | | 4,868,396 | | | | — | | | | — | | | | 4,868,396 | (a) | |
Pacific Stone Tech, Inc. | | | 22,659 | | | | — | | | | — | | | | 22,659 | | |
Range Energy Resources, Inc. | | | 15,100,000 | | | | — | | | | — | | | | 15,100,000 | (a) | |
Sunridge Gold Corp. | | | 5,000,000 | | | | 7,196,288 | | | | (1,362,500 | ) | | | 10,833,788 | | |
At December 31, 2013, the value of investments in affiliated companies was $21,735,433, representing 5.76% of net assets, and the total cost was $46,162,796. Net realized gains on transactions were $888,428, and there was no income earned for the year.
| | | Shares of Affiliated Companies | |
World Precious Minerals Fund | | December 31, 2012 | | Additions | | Reductions | | December 31, 2013 | |
Candente Gold Corp. | | | 5,640,000 | | | | — | | | | — | | | | 5,640,000 | | |
Canyon Resources Ltd. | | | 826,316 | | | | 3,511,413 | | | | — | | | | 4,337,729 | (a) | |
Golden Arrow Resources Corp. | | | 2,155,000 | | | | — | | | | (2,155,000 | ) | | | — | (a) | |
Gran Colombia Gold Corp. | | | 25,385,838 | | | | 155,956 | | | | (24,358,945 | ) | | | 1,182,849 | | |
Klondex Mines Ltd. | | | 4,488,200 | | | | 1,380,008 | | | | — | | | | 5,868,208 | | |
Mammoth Resources Corp. | | | 702,700 | | | | 897,300 | | | | — | | | | 1,600,000 | | |
Mirasol Resources Ltd. | | | 2,210,000 | | | | 64,900 | | | | — | | | | 2,274,900 | | |
Moss Lake Gold Mines Ltd. | | | 3,345,000 | | | | 9,500 | | | | — | | | | 3,354,500 | | |
Rochester Resources Ltd. | | | 7,000,000 | | | | — | | | | (7,000,000 | ) | | | — | (a) | |
At December 31, 2013, the value of investments in affiliated companies was $12,440,513, representing 9.03% of net assets, and the total cost was $46,719,846. Net realized losses on transactions were $1,016,188, and there was no income earned for the year.
(a) At December 31, 2013, the company is no longer defined as an affiliate, although it was an affiliated company during the year.
Restricted Securities - Indicated in Portfolio of Investments as "RS"
The following securities are subject to contractual and regulatory restrictions on resale or transfer. These investments may involve a high degree of business and financial risk. Because of the thinly traded markets for these investments, a Fund may be unable to liquidate its securities in a timely manner, especially if there is negative news regarding the specific securities or the markets overall. These securities could
131
Notes to Portfolios of Investments December 31, 2013
decline significantly in value before the Fund could liquidate these securities. The issuer bears the cost of registration, if any, involved in the disposition of these securities.
Holmes Macro Trends Fund | | Acquisition
Date | | Cost per
Share/Unit | |
Andean Iron Corp., 144A (formerly Andean Pacific Iron Corp.) | | 06/07/11-10/03/11 | | $ | 0.45 | | |
Pacific Green Energy Corp. | | 03/24/11 | | $ | 1.00 | | |
Pacific Infrastructure Ventures, Inc.
(formerly Pacific Infrastructure, Inc.) | | 08/06/10-11/22/10 | | $ | 1.00 | | |
Pacific Power Generation Corp. | | 08/06/10 | | $ | 0.07 | | |
Pacific Power Generation Corp., Corporate Note | | 05/25/12 | | $ | 100.00 | | |
Pacific Stone Tech, Inc. | | 04/19/10 | | $ | 216.24 | | |
As of December 31, 2013, the total cost of restricted securities was $2,100,000, and the total value was $2,698,084, representing 4.82% of net assets.
Global Resources Fund | | Acquisition
Date | | Cost per
Share/Unit | |
Andean Iron Corp., 144A (formerly Andean Pacific Iron Corp.) | | 10/03/11 | | $ | 0.91 | | |
GoviEx Uranium, Inc., 144A | | 10/04/07 | | $ | 1.96 | | |
I-Pulse, Inc., 144A | | 10/04/07 | | $ | 1.88 | | |
Pacific Green Energy Corp. | | 03/24/11 | | $ | 1.00 | | |
Pacific Infrastructure Ventures, Inc.
(formerly Pacific Infrastructure, Inc.) | | 08/06/10-11/22/10 | | $ | 1.00 | | |
Pacific Power Generation Corp. | | 08/06/10 | | $ | 0.07 | | |
Pacific Power Generation Corp., Corporate Note | | 05/25/12 | | $ | 100.00 | | |
Pacific Stone Tech, Inc. | | 04/19/10 | | $ | 216.22 | | |
Sunridge Gold Corp., 144A | | 10/21/13 | | $ | 0.15 | | |
Sunridge Gold Corp., 144A, Warrants (October 2017) | | 10/21/13 | | $ | 0.04 | | |
U.S. Oil Sands, Inc., 144A | | 10/15/13 | | $ | 0.14 | | |
Value Creation, Inc. | | 08/11/06 | | $ | 10.60 | | |
As of December 31, 2013, the total cost of restricted securities was $28,340,760, and the total value was $29,382,952, representing 7.78% of net assets.
World Precious Minerals Fund | | Acquisition
Date | | Cost per
Share/Unit | |
Andean Iron Corp., 144A (formerly Andean Pacific Iron Corp.) | | 06/07/11 | | $ | 0.30 | | |
Balmoral Resources Ltd., 144A | | 10/23/13 | | $ | 0.33 | | |
Eastmain Resources, Inc., 144A | | 12/03/13 | | $ | 0.25 | | |
Orex Minerals, Inc., 144A, Warrants (November 2015) | | 09/26/13-11/01/13 | | $ | 0.00 | | |
Pacific Power Generation Corp., Corporate Note | | 05/25/12 | | $ | 100.00 | | |
Sunridge Gold Corp., 144A | | 10/21/13 | | $ | 0.15 | | |
Sunridge Gold Corp., 144A, Warrants (October 2017) | | 10/21/13 | | $ | 0.04 | | |
Taurus Gold Ltd., 144A | | 05/31/11-05/29/13 | | $ | 1.17 | | |
Western Exploration & Development Ltd., 144A, Special Warrants
(December 2049) | | 08/14/97 | | $ | 0.50 | | |
As of December 31, 2013, the total cost of restricted securities was $6,096,371, and the total value was $4,087,064, representing 2.97% of net assets.
Gold and Precious Metals Fund | | Acquisition
Date | | Cost per
Share/Unit | |
Pacific Power Generation Corp., Corporate Note | | 05/25/12 | | $ | 100.00 | | |
As of December 31, 2013, the total cost of restricted securities was $300,000, and the total value was $300,000, representing 0.40% of net assets.
132
[THIS PAGE INTENTIONALLY LEFT BLANK]
Statements of Assets and Liabilities
| | | U.S. Government
Securities
Ultra-Short
Bond Fund | | Near-Term
Tax Free Fund | |
Investments, at identified cost | | $ | 62,588,369 | | | $ | 57,607,000 | | |
Assets | |
Investments, at value: | |
Securities | | $ | 62,508,878 | | | $ | 58,432,717 | | |
Cash | | | 13,336,547 | | | | 2,859,767 | | |
Receivables: | |
Dividends and interest | | | 74,198 | | | | 758,084 | | |
Capital shares sold | | | 205,847 | | | | 30,909 | | |
From adviser | | | 73,003 | | | | 24,038 | | |
Other assets | | | 48,068 | | | | 21,953 | | |
Total Assets | | | 76,246,541 | | | | 62,127,468 | | |
Liabilities | |
Payables: | |
Investments purchased | | | — | | | | — | | |
Capital shares redeemed | | | 947,884 | | | | 154,697 | | |
Adviser and affiliates | | | — | | | | — | | |
Dividends and distributions | | | — | | | | 4,242 | | |
Accounts payable and accrued expenses | | | 71,571 | | | | 85,013 | | |
Total Liabilities | | | 1,019,455 | | | | 243,952 | | |
Net Assets | | $ | 75,227,086 | | | $ | 61,883,516 | | |
Net Assets Consist of: | |
Paid-in capital | | $ | 75,304,545 | | | $ | 61,608,625 | | |
Accumulated undistributed net investment income (distributions in excess of
net investment income) | | | 2,032 | | | | 14,525 | | |
Accumulated net realized gain (loss) on investments and foreign currencies | | | — | | | | (565,351 | ) | |
Net unrealized appreciation (depreciation) of investments and other assets and
liabilities denominated in foreign currencies | | | (79,491 | ) | | | 825,717 | | |
Net assets applicable to capital shares outstanding | | $ | 75,227,086 | | | $ | 61,883,516 | | |
By share class | |
Net Assets | |
Investor class | | $ | 75,227,086 | | | $ | 61,883,516 | | |
Capital shares outstanding, an unlimited number of
no par shares authorized | |
Investor class | | | 37,653,538 | | | | 27,802,329 | | |
Net Asset Value, Public Offering Price, Redemption
Price, per share | |
Investor class | | $ | 2.00 | | | $ | 2.23 | | |
See accompanying notes to financial statements.
134
| | | All American
Equity Fund | | Holmes Macro
Trends Fund | |
Investments, at identified cost | | $ | 17,996,047 | | | $ | 41,573,369 | | |
Assets | |
Investments, at value: | |
Securities | | $ | 22,570,752 | | | $ | 53,330,261 | | |
Cash | | | 828,706 | | | | 2,689,110 | | |
Receivables: | |
Dividends and interest | | | 10,672 | | | | 36,600 | | |
Capital shares sold | | | 19,589 | | | | 18,078 | | |
From adviser | | | — | | | | — | | |
Other assets | | | 22,511 | | | | 32,894 | | |
Total Assets | | | 23,452,230 | | | | 56,106,943 | | |
Liabilities | |
Payables: | |
Investments purchased | | | — | | | | 3,604 | | |
Capital shares redeemed | | | 5,714 | | | | 46,705 | | |
Adviser and affiliates | | | 16,242 | | | | 47,709 | | |
Dividends and distributions | | | — | | | | — | | |
Accounts payable and accrued expenses | | | 42,251 | | | | 82,905 | | |
Total Liabilities | | | 64,207 | | | | 180,923 | | |
Net Assets | | $ | 23,388,023 | | | $ | 55,926,020 | | |
Net Assets Consist of: | |
Paid-in capital | | $ | 18,049,764 | | | $ | 42,891,297 | | |
Accumulated undistributed net investment income (distributions in excess of
net investment income) | | | — | | | | (95,667 | ) | |
Accumulated net realized gain (loss) on investments and foreign currencies | | | 763,554 | | | | 1,373,502 | | |
Net unrealized appreciation (depreciation) of investments and other assets and
liabilities denominated in foreign currencies | | | 4,574,705 | | | | 11,756,888 | | |
Net assets applicable to capital shares outstanding | | $ | 23,388,023 | | | $ | 55,926,020 | | |
By share class | |
Net Assets | |
Investor class | | $ | 23,388,023 | | | $ | 55,926,020 | | |
Capital shares outstanding, an unlimited number of
no par shares authorized | |
Investor class | | | 726,857 | | | | 2,306,813 | | |
Net Asset Value, Public Offering Price, Redemption
Price, per share | |
Investor class | | $ | 32.18 | | | $ | 24.24 | | |
135
Statements of Assets and Liabilities
| | | Global
Resources Fund | | World Precious
Minerals Fund | | Gold and Precious
Metals Fund | |
Investments, at identified cost | | $ | 431,647,159 | | | $ | 291,533,149 | | | $ | 114,348,356 | | |
Assets | |
Investments, at value: | |
Securities of unaffiliated issuers | | $ | 351,923,711 | | | $ | 119,967,686 | | | $ | 66,454,890 | | |
Securities of affiliated issuers | | | 21,735,433 | | | | 12,440,513 | | | | — | | |
Cash | | | 9,048,905 | | | | 5,108,827 | | | | 8,496,556 | | |
Foreign currencies (Cost $0, $84,278, $17,153, $2 and $1) | | | — | | | | 83,208 | | | | 17,174 | | |
Receivables: | |
Investments sold | | | 369,745 | | | | 300,912 | | | | 79,261 | | |
Dividends and interest | | | 380,794 | | | | 125,639 | | | | 102,264 | | |
Capital shares sold | | | 305,861 | | | | 323,628 | | | | 103,659 | | |
Other assets | | | 169,941 | | | | 106,120 | | | | 78,620 | | |
Total Assets | | | 383,934,390 | | | | 138,456,533 | | | | 75,332,424 | | |
Liabilities | |
Payables: | |
Investments purchased | | | 2,877,884 | | | | 285,308 | | | | 443,120 | | |
Capital shares redeemed | | | 3,131,899 | | | | 162,811 | | | | 108,479 | | |
Adviser and affiliates | | | 298,316 | | | | 142,744 | | | | 59,581 | | |
Accounts payable and accrued expenses | | | 183,957 | | | | 140,909 | | | | 94,388 | | |
Due to custodian | | | — | | | | — | | | | — | | |
Total Liabilities | | | 6,492,056 | | | | 731,772 | | | | 705,568 | | |
Net Assets | | $ | 377,442,334 | | | $ | 137,724,761 | | | $ | 74,626,856 | | |
Net Assets Consist of: | |
Paid-in capital | | $ | 794,147,279 | | | $ | 519,548,066 | | | $ | 182,414,242 | | |
Accumulated undistributed net investment income (distributions in excess of
net investment income) | | | (2,684,940 | ) | | | (7,320,306 | ) | | | (1,672,755 | ) | |
Accumulated net realized loss on investments and foreign currencies | | | (356,031,881 | ) | | | (215,377,124 | ) | | | (58,220,736 | ) | |
Net unrealized appreciation (depreciation) of investments and other assets and
liabilities denominated in foreign currencies | | | (57,988,124 | ) | | | (159,125,875 | ) | | | (47,893,895 | ) | |
Net assets applicable to capital shares outstanding | | $ | 377,442,334 | | | $ | 137,724,761 | | | $ | 74,626,856 | | |
By share class | |
Net Assets | |
Investor class | | $ | 326,320,457 | | | $ | 134,065,195 | | | $ | 74,626,856 | | |
Institutional class | | | 51,121,877 | | | | 3,659,566 | | | | N/A | | |
Capital shares outstanding, an unlimited number of
no par shares authorized | |
Investor class | | | 34,861,764 | | | | 23,559,299 | | | | 12,438,057 | | |
Institutional class | | | 5,494,217 | | | | 639,879 | | | | N/A | | |
Net Asset Value, Public Offering Price, Redemption
Price, per share | |
Investor class | | $ | 9.36 | | | $ | 5.69 | | | $ | 6.00 | | |
Institutional class | | | 9.30 | | | | 5.72 | | | | N/A | | |
See accompanying notes to financial statements.
136
| | | Emerging Europe
Fund | | China Region
Fund | |
Investments, at identified cost | | $ | 107,063,206 | | | $ | 21,630,568 | | |
Assets | |
Investments, at value: | |
Securities of unaffiliated issuers | | $ | 123,089,773 | | | $ | 26,527,463 | | |
Securities of affiliated issuers | | | — | | | | — | | |
Cash | | | — | | | | — | | |
Foreign currencies (Cost $0, $84,278, $17,153, $2 and $1) | | | 2 | | | | 1 | | |
Receivables: | |
Investments sold | | | 323,190 | | | | — | | |
Dividends and interest | | | 203,192 | | | | — | | |
Capital shares sold | | | 47,560 | | | | 1,582 | | |
Other assets | | | 78,336 | | | | 35,238 | | |
Total Assets | | | 123,742,053 | | | | 26,564,284 | | |
Liabilities | |
Payables: | |
Investments purchased | | | 161 | | | | — | | |
Capital shares redeemed | | | 617,194 | | | | 36,887 | | |
Adviser and affiliates | | | 171,868 | | | | 18,971 | | |
Accounts payable and accrued expenses | | | 101,001 | | | | 62,287 | | |
Due to custodian | | | 281,701 | | | | 59,723 | | |
Total Liabilities | | | 1,171,925 | | | | 177,868 | | |
Net Assets | | $ | 122,570,128 | | | $ | 26,386,416 | | |
Net Assets Consist of: | |
Paid-in capital | | $ | 417,442,856 | | | $ | 43,216,706 | | |
Accumulated undistributed net investment income (distributions in excess of
net investment income) | | | 1,865,410 | | | | (46,259 | ) | |
Accumulated net realized loss on investments and foreign currencies | | | (312,764,251 | ) | | | (21,680,926 | ) | |
Net unrealized appreciation (depreciation) of investments and other assets and
liabilities denominated in foreign currencies | | | 16,026,113 | | | | 4,896,895 | | |
Net assets applicable to capital shares outstanding | | $ | 122,570,128 | | | $ | 26,386,416 | | |
By share class | |
Net Assets | |
Investor class | | $ | 122,570,128 | | | $ | 26,386,416 | | |
Institutional class | | | N/A | | | | N/A | | |
Capital shares outstanding, an unlimited number of
no par shares authorized | |
Investor class | | | 13,902,066 | | | | 3,187,704 | | |
Institutional class | | | N/A | | | | N/A | | |
Net Asset Value, Public Offering Price, Redemption
Price, per share | |
Investor class | | $ | 8.82 | | | $ | 8.28 | | |
Institutional class | | | N/A | | | | N/A | | |
137
Net Investment Income | | U.S. Government
Securities
Ultra-Short
Bond Fund | |
Near-Term
Tax Free Fund | |
Income: | |
Dividends from unaffiliated issuers | | $ | — | | | $ | — | | |
Foreign tax withheld on dividends | | | — | | | | — | | |
Net dividends | | | — | | | | — | | |
Interest and other | | | 93,969 | | | | 1,254,623 | | |
Total income | | | 93,969 | | | | 1,254,623 | | |
Expenses: | |
Management fee | | | 649,135 | | | | 247,697 | | |
Administrative services fee | | | 105,563 | | | | 40,930 | | |
Transfer agent fees and expenses | | | 190,415 | | | | 81,429 | | |
Accounting service fees and expenses | | | 50,708 | | | | 91,702 | | |
Professional fees | | | 93,278 | | | | 45,935 | | |
Distribution plan fee | | | — | | | | — | | |
Custodian fees | | | 43,011 | | | | 16,182 | | |
Shareholder reporting expenses | | | 34,883 | | | | 13,103 | | |
Registration fees | | | 24,273 | | | | 28,815 | | |
Trustee fees and expenses | | | 24,265 | | | | 24,716 | | |
Miscellaneous expenses | | | 45,121 | | | | 11,236 | | |
Total expenses before reductions | | | 1,260,652 | | | | 601,745 | | |
Expenses offset - Note 1 H | | | (23 | ) | | | (633 | ) | |
Expenses reimbursed - Note 3 | | | (1,183,312 | ) | | | (378,185 | ) | |
Net expenses | | | 77,317 | | | | 222,927 | | |
Net Investment Income (Loss) | | | 16,652 | | | | 1,031,696 | | |
Net Realized and Unrealized
Gain (Loss) on Investments | |
Realized gain (loss) from: | |
Securities from unaffiliated issuers | | | — | | | | (5,442 | ) | |
Written options | | | — | | | | — | | |
Foreign currency transactions | | | — | | | | — | | |
Net realized gain (loss) | | | — | | | | (5,442 | ) | |
Net change in unrealized appreciation (depreciation) of: | |
Investments | | | (79,491 | ) | | | (474,896 | ) | |
Other assets and liabilities denominated in foreign currencies | | | — | | | | — | | |
Net unrealized appreciation (depreciation) | | | (79,491 | ) | | | (474,896 | ) | |
Net Realized and Unrealized Gain (Loss) on Investments | | | (79,491 | ) | | | (480,338 | ) | |
Net Increase (Decrease) In Net Assets
Resulting From Operations | | $ | (62,839 | ) | | $ | 551,358 | | |
See accompanying notes to financial statements.
138
For the Year Ended December 31, 2013
Net Investment Income | |
All American
Equity Fund | |
Holmes Macro
Trends Fund | |
Income: | |
Dividends from unaffiliated issuers | | $ | 341,306 | | | $ | 222,965 | | |
Foreign tax withheld on dividends | | | (511 | ) | | | (1,642 | ) | |
Net dividends | | | 340,795 | | | | 221,323 | | |
Interest and other | | | 108 | | | | 101,593 | | |
Total income | | | 340,903 | | | | 322,916 | | |
Expenses: | |
Management fee | | | 151,696 | | | | 326,173 | | |
Administrative services fee | | | 16,820 | | | | 31,533 | | |
Transfer agent fees and expenses | | | 82,256 | | | | 89,400 | | |
Accounting service fees and expenses | | | 55,600 | | | | 56,788 | | |
Professional fees | | | 36,320 | | | | 45,895 | | |
Distribution plan fee | | | 49,701 | | | | 94,730 | | |
Custodian fees | | | 13,932 | | | | 22,924 | | |
Shareholder reporting expenses | | | 17,230 | | | | 18,350 | | |
Registration fees | | | 15,784 | | | | 18,669 | | |
Trustee fees and expenses | | | 24,265 | | | | 24,716 | | |
Miscellaneous expenses | | | 22,295 | | | | 27,311 | | |
Total expenses before reductions | | | 485,899 | | | | 756,489 | | |
Expenses offset - Note 1 H | | | (370 | ) | | | (566 | ) | |
Expenses reimbursed - Note 3 | | | (55,510 | ) | | | (11,952 | ) | |
Net expenses | | | 430,019 | | | | 743,971 | | |
Net Investment Income (Loss) | | | (89,116 | ) | | | (421,055 | ) | |
Net Realized and Unrealized
Gain (Loss) on Investments | |
Realized gain (loss) from: | |
Securities from unaffiliated issuers | | | 2,357,680 | | | | 4,689,068 | | |
Written options | | | (6,522 | ) | | | 24,074 | | |
Foreign currency transactions | | | — | | | | 362 | | |
Net realized gain (loss) | | | 2,351,158 | | | | 4,713,504 | | |
Net change in unrealized appreciation (depreciation) of: | |
Investments | | | 3,753,621 | | | | 9,777,269 | | |
Other assets and liabilities denominated in foreign currencies | | | — | | | | (4 | ) | |
Net unrealized appreciation (depreciation) | | | 3,753,621 | | | | 9,777,265 | | |
Net Realized and Unrealized Gain (Loss) on Investments | | | 6,104,779 | | | | 14,490,769 | | |
Net Increase (Decrease) In Net Assets
Resulting From Operations | | $ | 6,015,663 | | | $ | 14,069,714 | | |
139
Net Investment Income | | Global
Resources Fund | | World Precious
Minerals Fund | | Gold and Precious
Metals Fund | |
Income: | |
Dividends from unaffiliated issuers | | $ | 6,010,138 | | | $ | 727,314 | | | $ | 1,014,409 | | |
Foreign tax withheld on dividends | | | (135,814 | ) | | | (86,045 | ) | | | (110,851 | ) | |
Net dividends | | | 5,874,324 | | | | 641,269 | | | | 903,558 | | |
Interest and other | | | 1,852,584 | | | | 1,181,816 | | | | 849,811 | | |
Total income | | | 7,726,908 | | | | 1,823,085 | | | | 1,753,369 | | |
Expenses: | |
Management fee | | | 3,830,821 | | | | 1,884,651 | | | | 1,260,893 | | |
Administrative services fee | | | 173,710 | | | | 79,460 | | | | 90,542 | | |
Administrative services fee - Investor class | | | 153,943 | | | | 78,314 | | | | — | | |
Administrative services fee - Institutional class | | | 19,137 | | | | 516 | | | | — | | |
Transfer agent fees and expenses | | | — | | | | — | | | | 266,091 | | |
Transfer agent fees and expenses - Investor class | | | 870,029 | | | | 454,510 | | | | — | | |
Transfer agent fees and expenses - Institutional class | | | 89,513 | | | | 17,638 | | | | — | | |
Accounting service fees and expenses | | | 157,601 | | | | 83,551 | | | | 69,010 | | |
Professional fees | | | 98,813 | | | | 93,698 | | | | 61,983 | | |
Distribution plan fee | | | 949,304 | | | | 484,268 | | | | 278,092 | | |
Custodian fees | | | 129,560 | | | | 199,067 | | | | 140,892 | | |
Shareholder reporting expenses | | | — | | | | — | | | | 71,853 | | |
Shareholder reporting expenses - Investor class | | | 138,751 | | | | 92,702 | | | | — | | |
Shareholder reporting expenses - Institutional class | | | 11,050 | | | | 3,270 | | | | — | | |
Registration fees | | | 16,433 | | | | 11,802 | | | | 21,911 | | |
Registration fees - Investor class | | | 14,879 | | | | 13,661 | | | | — | | |
Registration fees - Institutional class | | | 14,571 | | | | 10,975 | | | | — | | |
Trustee fees and expenses | | | 24,265 | | | | 24,265 | | | | 24,265 | | |
Miscellaneous expenses | | | 144,291 | | | | 109,926 | | | | 72,377 | | |
Total expenses before reductions | | | 6,836,671 | | | | 3,642,274 | | | | 2,357,909 | | |
Expenses offset - Note 1 H | | | (1,184 | ) | | | (1,147 | ) | | | (1,449 | ) | |
Expenses reimbursed - Note 3 | | | (134,271 | ) | | | (81,551 | ) | | | (64,473 | ) | |
Net expenses | | | 6,701,216 | | | | 3,559,576 | | | | 2,291,987 | | |
Net Investment Income (Loss) | | | 1,025,692 | | | | (1,736,491 | ) | | | (538,618 | ) | |
Net Realized and Unrealized
Gain (Loss) on Investments | |
Realized gain (loss) from: | |
Securities from unaffiliated issuers | | | 30,432,580 | | | | (86,209,972 | ) | | | (43,877,420 | ) | |
Securities from affiliated issuers | | | 888,428 | | | | (1,016,188 | ) | | | — | | |
Written options | | | 28,798 | | | | — | | | | — | | |
Foreign currency transactions | | | (207,454 | ) | | | (97,348 | ) | | | (69,995 | ) | |
Net realized gain (loss) | | | 31,142,352 | | | | (87,323,508 | ) | | | (43,947,415 | ) | |
Net change in unrealized appreciation (depreciation) of: | |
Investments | | | (36,628,673 | ) | | | (66,537,879 | ) | | | (36,514,205 | ) | |
Written options | | | — | | | | — | | | | — | | |
Other assets and liabilities denominated in foreign currencies | | | (2,032 | ) | | | (192 | ) | | | 435 | | |
Net unrealized appreciation (depreciation) | | | (36,630,705 | ) | | | (66,538,071 | ) | | | (36,513,770 | ) | |
Net Realized and Unrealized Gain (Loss) on Investments | | | (5,488,353 | ) | | | (153,861,579 | ) | | | (80,461,185 | ) | |
Net Increase (Decrease) In Net Assets
Resulting From Operations | | $ | (4,462,661 | ) | | $ | (155,598,070 | ) | | $ | (80,999,803 | ) | |
See accompanying notes to financial statements.
140
For the Year Ended December 31, 2013
Net Investment Income | | Emerging Europe
Fund | | China Region
Fund | |
Income: | |
Dividends from unaffiliated issuers | | $ | 6,004,181 | | | $ | 637,811 | | |
Foreign tax withheld on dividends | | | (834,841 | ) | | | (27,196 | ) | |
Net dividends | | | 5,169,340 | | | | 610,615 | | |
Interest and other | | | 207,533 | | | | 156 | | |
Total income | | | 5,376,873 | | | | 610,771 | | |
Expenses: | |
Management fee | | | 1,734,314 | | | | 291,821 | | |
Administrative services fee | | | 118,031 | | | | 22,666 | | |
Administrative services fee - Investor class | | | — | | | | — | | |
Administrative services fee - Institutional class | | | — | | | | — | | |
Transfer agent fees and expenses | | | 385,678 | | | | 102,326 | | |
Transfer agent fees and expenses - Investor class | | | — | | | | — | | |
Transfer agent fees and expenses - Institutional class | | | — | | | | — | | |
Accounting service fees and expenses | | | 70,201 | | | | 66,800 | | |
Professional fees | | | 62,126 | | | | 50,416 | | |
Distribution plan fee | | | 361,919 | | | | 67,837 | | |
Custodian fees | | | 162,016 | | | | 48,444 | | |
Shareholder reporting expenses | | | 69,809 | | | | 22,464 | | |
Shareholder reporting expenses - Investor class | | | — | | | | — | | |
Shareholder reporting expenses - Institutional class | | | — | | | | — | | |
Registration fees | | | 23,232 | | | | 17,154 | | |
Registration fees - Investor class | | | — | | | | — | | |
Registration fees - Institutional class | | | — | | | | — | | |
Trustee fees and expenses | | | 24,265 | | | | 24,265 | | |
Miscellaneous expenses | | | 65,897 | | | | 32,529 | | |
Total expenses before reductions | | | 3,077,488 | | | | 746,722 | | |
Expenses offset - Note 1 H | | | (1,118 | ) | | | (248 | ) | |
Expenses reimbursed - Note 3 | | | — | | | | (101,902 | ) | |
Net expenses | | | 3,076,370 | | | | 644,572 | | |
Net Investment Income (Loss) | | | 2,300,503 | | | | (33,801 | ) | |
Net Realized and Unrealized
Gain (Loss) on Investments | |
Realized gain (loss) from: | |
Securities from unaffiliated issuers | | | 2,519,400 | | | | 110,952 | | |
Securities from affiliated issuers | | | — | | | | — | | |
Written options | | | 31,229 | | | | — | | |
Foreign currency transactions | | | (138,888 | ) | | | (67,251 | ) | |
Net realized gain (loss) | | | 2,411,741 | | | | 43,701 | | |
Net change in unrealized appreciation (depreciation) of: | |
Investments | | | (9,607,969 | ) | | | 2,218,145 | | |
Written options | | | 32,440 | | | | — | | |
Other assets and liabilities denominated in foreign currencies | | | 835 | | | | 6 | | |
Net unrealized appreciation (depreciation) | | | (9,574,694 | ) | | | 2,218,151 | | |
Net Realized and Unrealized Gain (Loss) on Investments | | | (7,162,953 | ) | | | 2,261,852 | | |
Net Increase (Decrease) In Net Assets
Resulting From Operations | | $ | (4,862,450 | ) | | $ | 2,228,051 | | |
141
Statements of Changes in Net Assets
| | | U.S. Government Securities
Ultra-Short Bond Fund | | Near-Term Tax Free Fund | |
| | | Year Ended
December 31,
2013 | | Year Ended
December 31,
2012 | | Year Ended
December 31,
2013 | | Year Ended
December 31,
2012 | |
Increase (Decrease) in Net Assets | |
From operations: | |
Net investment income (loss) | | $ | 16,652 | | | $ | 15,753 | | | $ | 1,031,696 | | | $ | 859,973 | | |
Net realized income (loss) | | | — | | | | — | | | | (5,442 | ) | | | (278 | ) | |
Net unrealized appreciation (depreciation) | | | (79,491 | ) | | | — | | | | (474,896 | ) | | | 67,999 | | |
Net increase (decrease) in net assets from operations | | | (62,839 | ) | | | 15,753 | | | | 551,358 | | | | 927,694 | | |
Distributions to shareholders: | |
From net investment income | |
Investor class | | | (17,151 | ) | | | (15,792 | ) | | | (1,035,065 | ) | | | (866,558 | ) | |
From net capital gains | |
Investor class | | | — | | | | — | | | | — | | | | — | | |
Total distributions to shareholders | | | (17,151 | ) | | | (15,792 | ) | | | (1,035,065 | ) | | | (866,558 | ) | |
From capital share transactions: | |
Proceeds from shares sold
Investor class | | | 74,906,024 | | | | 79,402,411 | | | | 24,389,380 | | | | 15,981,583 | | |
Issued from fund acquisition
Investor class | | | — | | | | — | | | | 16,401,859 | | | | — | | |
Distributions reinvested
Investor class | | | 16,345 | | | | 15,570 | | | | 913,653 | | | | 739,939 | | |
Proceeds from short-term trading fees
Investor class | | | — | | | | — | | | | — | | | | — | | |
| | | | 74,922,369 | | | | 79,417,981 | | | | 41,704,892 | | | | 16,721,522 | | |
Cost of shares redeemed
Investor class | | | (140,040,374 | ) | | | (110,656,435 | ) | | | (23,846,979 | ) | | | (7,286,999 | ) | |
Net increase (decrease) in net assets from
capital share transactions | | | (65,118,005 | ) | | | (31,238,454 | ) | | | 17,857,913 | | | | 9,434,523 | | |
Net Increase (Decrease) in Net Assets | | | (65,197,995 | ) | | | 31,238,493 | | | | 17,374,206 | | | | 9,495,659 | | |
Net Assets | |
Beginning of year | | | 140,425,081 | | | | 171,663,574 | | | | 44,509,310 | | | | 35,013,651 | | |
End of year | | $ | 75,227,086 | | | $ | 140,425,081 | | | $ | 61,883,516 | | | $ | 44,509,310 | | |
Accumulated undistributed net investment income (distributions
in excess of net investment income), end of year | | $ | 2,032 | | | $ | 2,531 | | | $ | 14,525 | | | $ | 17,894 | | |
Capital Share Activity | |
Investor class: | |
Shares sold | | | 37,369,392 | | | | 39,701,206 | | | | 11,061,407 | | | | 7,020,534 | | |
Shares issued on fund acquisition | | | — | | | | — | | | | 7,361,792 | | | | — | | |
Shares reinvested | | | 8,170 | | | | 7,785 | | | | 406,819 | | | | 325,398 | | |
Shares redeemed | | | (70,020,187 | ) | | | (55,328,218 | ) | | | (10,634,299 | ) | | | (3,202,347 | ) | |
Net share activity | | | (32,642,625 | ) | | | (15,619,227 | ) | | | 8,195,719 | | | | 4,143,585 | | |
See accompanying notes to financial statements.
142
| | | All American Equity Fund | |
| | | Year Ended
December 31,
2013 | | Year Ended
December 31,
2012 | |
Increase (Decrease) in Net Assets | |
From operations: | |
Net investment income (loss) | | $ | (89,116 | ) | | $ | 47,748 | | |
Net realized income (loss) | | | 2,351,158 | | | | 1,308,682 | | |
Net unrealized appreciation (depreciation) | | | 3,753,621 | | | | 531,485 | | |
Net increase (decrease) in net assets from operations | | | 6,015,663 | | | | 1,887,915 | | |
Distributions to shareholders: | |
From net investment income | |
Investor class | | | (45,897 | ) | | | — | | |
From net capital gains | |
Investor class | | | (1,422,808 | ) | | | — | | |
Total distributions to shareholders | | | (1,468,705 | ) | | | — | | |
From capital share transactions: | |
Proceeds from shares sold
Investor class | | | 3,898,820 | | | | 2,230,319 | | |
Issued from fund acquisition
Investor class | | | — | | | | — | | |
Distributions reinvested
Investor class | | | 1,435,360 | | | | — | | |
Proceeds from short-term trading fees
Investor class | | | 171 | | | | 485 | | |
| | | | 5,334,351 | | | | 2,230,804 | | |
Cost of shares redeemed
Investor class | | | (3,339,354 | ) | | | (3,671,270 | ) | |
Net increase (decrease) in net assets from
capital share transactions | | | 1,994,997 | | | | (1,440,466 | ) | |
Net Increase (Decrease) in Net Assets | | | 6,541,955 | | | | 447,449 | | |
Net Assets | |
Beginning of year | | | 16,846,068 | | | | 16,398,619 | | |
End of year | | $ | 23,388,023 | | | $ | 16,846,068 | | |
Accumulated undistributed net investment income (distributions
in excess of net investment income), end of year | | $ | — | | | $ | 43,951 | | |
Capital Share Activity | |
Investor class: | |
Shares sold | | | 130,283 | | | | 90,701 | | |
Shares issued on fund acquisition | | | — | | | | — | | |
Shares reinvested | | | 46,108 | | | | — | | |
Shares redeemed | | | (112,837 | ) | | | (149,051 | ) | |
Net share activity | | | 63,554 | | | | (58,350 | ) | |
143
Statements of Changes in Net Assets
| | | Holmes Macro Trends Fund | | Global Resources Fund | |
| | | Year Ended
December 31,
2013 | | Year Ended
December 31,
2012 | | Year Ended
December 31,
2013 | | Year Ended
December 31,
2012 | |
Increase (Decrease) in Net Assets | |
From operations: | |
Net investment income (loss) | | $ | (421,055 | ) | | $ | (185,170 | ) | | $ | 1,025,692 | | | $ | 2,941,071 | | |
Net realized gain (loss) | | | 4,713,504 | | | | 1,307,292 | | | | 31,142,352 | | | | (3,922,178 | ) | |
Net unrealized appreciation (depreciation) | | | 9,777,265 | | | | 1,263,574 | | | | (36,630,705 | ) | | | 38,946,193 | | |
Net increase (decrease) in net assets from operations | | | 14,069,714 | | | | 2,385,696 | | | | (4,462,661 | ) | | | 37,965,086 | | |
Distributions to shareholders: | |
From net investment income | |
Investor class | | | — | | | | — | | | | (11,927,336 | ) | | | (9,700,159 | ) | |
Institutional class | | | — | | | | — | | | | (2,316,939 | ) | | | (3,187,762 | ) | |
From net capital gains | |
Investor class | | | (2,495,923 | ) | | | (563,945 | ) | | | — | | | | — | | |
Total distributions to shareholders | | | (2,495,923 | ) | | | (563,945 | ) | | | (14,244,275 | ) | | | (12,887,921 | ) | |
From capital share transactions: | |
Proceeds from shares sold
Investor class | | | 2,119,439 | | | | 2,717,164 | | | | 41,069,671 | | | | 51,610,831 | | |
Institutional class | | | — | | | | — | | | | 21,314,286 | | | | 43,381,958 | | |
Issued from fund acquisition
Investor class | | | 13,184,651 | | | | — | | | | — | | | | — | | |
Distributions reinvested
Investor class | | | 2,401,379 | | | | 521,245 | | | | 11,426,683 | | | | 9,250,371 | | |
Institutional class | | | — | | | | — | | | | 2,302,573 | | | | 3,174,978 | | |
Proceeds from short-term trading fees
Investor class | | | 37 | | | | 4 | | | | 733 | | | | 3,980 | | |
Institutional class | | | — | | | | — | | | | 45 | | | | 77 | | |
| | | | 17,705,506 | | | | 3,238,413 | | | | 76,113,991 | | | | 107,422,195 | | |
Cost of shares redeemed
Investor class | | | (7,992,655 | ) | | | (5,736,316 | ) | | | (148,576,808 | ) | | | (196,087,325 | ) | |
Institutional class | | | — | | | | — | | | | (63,835,335 | ) | | | (11,742,608 | ) | |
Net increase (decrease) in net assets from
capital share transactions | | | 9,712,851 | | | | (2,497,903 | ) | | | (136,298,152 | ) | | | (100,407,738 | ) | |
Net Increase (Decrease) in Net Assets | | | 21,286,642 | | | | (676,152 | ) | | | (155,005,088 | ) | | | (75,330,573 | ) | |
Net Assets | |
Beginning of year | | | 34,639,378 | | | | 35,315,530 | | | | 532,447,422 | | | | 607,777,995 | | |
End of year | | $ | 55,926,020 | | | $ | 34,639,378 | | | $ | 377,442,334 | | | $ | 532,447,422 | | |
Accumulated undistributed net investment income (distributions
in excess of net investment income), end of year | | $ | (95,667 | ) | | $ | (25,273 | ) | | $ | (2,684,940 | ) | | $ | 4,847,474 | | |
Capital Share Activity | |
Investor class: | |
Shares sold | | | 155,136 | | | | 139,071 | | | | 4,231,140 | | | | 5,290,383 | | |
Shares issued on fund acquisition | | | 550,754 | | | | — | | | | — | | | | — | | |
Shares reinvested | | | 102,404 | | | | 28,115 | | | | 1,264,014 | | | | 955,617 | | |
Shares redeemed | | | (372,964 | ) | | | (300,437 | ) | | | (15,413,782 | ) | | | (20,403,092 | ) | |
Net share activity | | | 435,330 | | | | (133,251 | ) | | | (9,918,628 | ) | | | (14,157,092 | ) | |
Institutional class: | |
Shares sold | | | — | | | | — | | | | 2,205,943 | | | | 4,563,077 | | |
Shares reinvested | | | — | | | | — | | | | 256,126 | | | | 329,696 | | |
Shares redeemed | | | — | | | | — | | | | (6,624,446 | ) | | | (1,198,556 | ) | |
Net share activity | | | — | | | | — | | | | (4,162,377 | ) | | | 3,694,217 | | |
See accompanying notes to financial statements.
144
| | | World Precious Minerals Fund | |
| | | Year Ended
December 31,
2013 | | Year Ended
December 31,
2012 | |
Increase (Decrease) in Net Assets | |
From operations: | |
Net investment income (loss) | | $ | (1,736,491 | ) | | $ | (3,206,447 | ) | |
Net realized gain (loss) | | | (87,323,508 | ) | | | (25,675,266 | ) | |
Net unrealized appreciation (depreciation) | | | (66,538,071 | ) | | | (17,140,974 | ) | |
Net increase (decrease) in net assets from operations | | | (155,598,070 | ) | | | (46,022,687 | ) | |
Distributions to shareholders: | |
From net investment income | |
Investor class | | | — | | | | — | | |
Institutional class | | | — | | | | — | | |
From net capital gains | |
Investor class | | | — | | | | — | | |
Total distributions to shareholders | | | — | | | | — | | |
From capital share transactions: | |
Proceeds from shares sold
Investor class | | | 36,481,853 | | | | 36,851,148 | | |
Institutional class | | | 6,096,172 | | | | 31,435 | | |
Issued from fund acquisition
Investor class | | | — | | | | — | | |
Distributions reinvested
Investor class | | | — | | | | — | | |
Institutional class | | | — | | | | — | | |
Proceeds from short-term trading fees
Investor class | | | 2,431 | | | | 8,741 | | |
Institutional class | | | — | | | | — | | |
| | | | 42,580,456 | | | | 36,891,324 | | |
Cost of shares redeemed
Investor class | | | (67,001,940 | ) | | | (108,472,249 | ) | |
Institutional class | | | (2,076,310 | ) | | | (762,575 | ) | |
Net increase (decrease) in net assets from
capital share transactions | | | (26,497,794 | ) | | | (72,343,500 | ) | |
Net Increase (Decrease) in Net Assets | | | (182,095,864 | ) | | | (118,366,187 | ) | |
Net Assets | |
Beginning of year | | | 319,820,625 | | | | 438,186,812 | | |
End of year | | $ | 137,724,761 | | | $ | 319,820,625 | | |
Accumulated undistributed net investment income (distributions
in excess of net investment income), end of year | | $ | (7,320,306 | ) | | $ | (25,841,906 | ) | |
Capital Share Activity | |
Investor class: | |
Shares sold | | | 5,307,378 | | | | 2,986,280 | | |
Shares issued on fund acquisition | | | — | | | | — | | |
Shares reinvested | | | — | | | | — | | |
Shares redeemed | | | (9,022,153 | ) | | | (8,829,230 | ) | |
Net share activity | | | (3,714,775 | ) | | | (5,842,950 | ) | |
Institutional class: | |
Shares sold | | | 898,155 | | | | 2,159 | | |
Shares reinvested | | | — | | | | — | | |
Shares redeemed | | | (324,020 | ) | | | (64,822 | ) | |
Net share activity | | | 574,135 | | | | (62,663 | ) | |
145
Statements of Changes in Net Assets
| | | Gold and Precious Metals Fund | | Emerging Europe Fund | |
| | | Year Ended
December 31,
2013 | | Year Ended
December 31,
2012 | | Year Ended
December 31,
2013 | | Year Ended
December 31,
2012 | |
Increase (Decrease) in Net Assets | |
From operations: | |
Net investment income (loss) | | $ | (538,618 | ) | | $ | (1,075,576 | ) | | $ | 2,300,503 | | | $ | 2,631,690 | | |
Net realized gain (loss) | | | (43,947,415 | ) | | | (8,771,938 | ) | | | 2,411,741 | | | | 11,640,064 | | |
Net unrealized appreciation (depreciation) | | | (36,513,770 | ) | | | (2,502,399 | ) | | | (9,574,694 | ) | | | 19,357,746 | | |
Net increase (decrease) in net assets from operations | | | (80,999,803 | ) | | | (12,349,913 | ) | | | (4,862,450 | ) | | | 33,629,500 | | |
Distributions to shareholders: | |
From net investment income | |
Investor class | | | — | | | | (256,589 | ) | | | (1,969,263 | ) | | | (1,152,778 | ) | |
Total distributions to shareholders | | | — | | | | (256,589 | ) | | | (1,969,263 | ) | | | (1,152,778 | ) | |
From capital share transactions: | |
Proceeds from shares sold
Investor class | | | 35,768,131 | | | | 25,898,154 | | | | 9,625,381 | | | | 8,103,453 | | |
Distributions reinvested
Investor class | | | — | | | | 238,024 | | | | 1,853,073 | | | | 1,112,837 | | |
Proceeds from short-term trading fees
Investor class | | | 5,074 | | | | 6,075 | | | | 8,743 | | | | 47,545 | | |
| | | | 35,773,205 | | | | 26,142,253 | | | | 11,487,197 | | | | 9,263,835 | | |
Cost of shares redeemed
Investor class | | | (46,670,561 | ) | | | (42,098,880 | ) | | | (55,772,036 | ) | | | (61,652,693 | ) | |
Net decrease in net assets from
capital share transactions | | | (10,897,356 | ) | | | (15,956,627 | ) | | | (44,284,839 | ) | | | (52,388,858 | ) | |
Net Decrease in Net Assets | | | (91,897,159 | ) | | | (28,563,129 | ) | | | (51,116,552 | ) | | | (19,912,136 | ) | |
Net Assets | |
Beginning of year | | | 166,524,015 | | | | 195,087,144 | | | | 173,686,680 | | | | 193,598,816 | | |
End of year | | $ | 74,626,856 | | | $ | 166,524,015 | | | $ | 122,570,128 | | | $ | 173,686,680 | | |
Accumulated undistributed net investment income (distributions
in excess of net investment income), end of year | | $ | (1,672,755 | ) | | $ | (1,677,267 | ) | | $ | 1,865,410 | | | $ | 1,655,933 | | |
Capital Share Activity | |
Investor class: | |
Shares sold | | | 4,308,473 | | | | 2,126,571 | | | | 1,053,243 | | | | 915,162 | | |
Shares reinvested | | | — | | | | 19,952 | | | | 211,056 | | | | 123,375 | | |
Shares redeemed | | | (6,004,151 | ) | | | (3,488,632 | ) | | | (6,170,181 | ) | | | (7,091,293 | ) | |
Net share activity | | | (1,695,678 | ) | | | (1,342,109 | ) | | | (4,905,882 | ) | | | (6,052,756 | ) | |
See accompanying notes to financial statements.
146
| | | China Region Fund | |
| | | Year Ended
December 31,
2013 | | Year Ended
December 31,
2012 | |
Increase (Decrease) in Net Assets | |
From operations: | |
Net investment income (loss) | | $ | (33,801 | ) | | $ | 179,211 | | |
Net realized gain (loss) | | | 43,701 | | | | (1,458,436 | ) | |
Net unrealized appreciation (depreciation) | | | 2,218,151 | | | | 4,621,289 | | |
Net increase (decrease) in net assets from operations | | | 2,228,051 | | | | 3,342,064 | | |
Distributions to shareholders: | |
From net investment income | |
Investor class | | | (64,297 | ) | | | (65,330 | ) | |
Total distributions to shareholders | | | (64,297 | ) | | | (65,330 | ) | |
From capital share transactions: | |
Proceeds from shares sold
Investor class | | | 4,399,601 | | | | 3,015,349 | | |
Distributions reinvested
Investor class | | | 59,607 | | | | 60,889 | | |
Proceeds from short-term trading fees
Investor class | | | 5,270 | | | | 17,955 | | |
| | | | 4,464,478 | | | | 3,094,193 | | |
Cost of shares redeemed
Investor class | | | (9,401,623 | ) | | | (7,846,097 | ) | |
Net decrease in net assets from
capital share transactions | | | (4,937,145 | ) | | | (4,751,904 | ) | |
Net Decrease in Net Assets | | | (2,773,391 | ) | | | (1,475,170 | ) | |
Net Assets | |
Beginning of year | | | 29,159,807 | | | | 30,634,977 | | |
End of year | | $ | 26,386,416 | | | $ | 29,159,807 | | |
Accumulated undistributed net investment income (distributions
in excess of net investment income), end of year | | $ | (46,259 | ) | | $ | (47,597 | ) | |
Capital Share Activity | |
Investor class: | |
Shares sold | | | 573,138 | | | | 415,996 | | |
Shares reinvested | | | 7,414 | | | | 8,195 | | |
Shares redeemed | | | (1,222,797 | ) | | | (1,094,661 | ) | |
Net share activity | | | (642,245 | ) | | | (670,470 | ) | |
147
Notes to Financial Statements December 31, 2013
Note 1: Organization and Significant Accounting Policies
U.S. Global Investors Funds (Trust), currently consisting of the nine separate funds (Funds) included in this report, is organized as a Delaware statutory trust. Each Fund is an open-end management investment company registered under the Investment Company Act of 1940, as amended. All funds are diversified with the exception of Global Resources, World Precious Minerals, Gold and Precious Metals, Emerging Europe and China Region. A nondiversified fund may invest a greater percentage of its assets in a particular issuer in comparison to a diversified fund.
The following is a summary of organizational changes within the Trust that occurred during the fiscal year ended December 31, 2013.
On March 19, 2013, the name of the Eastern European Fund changed to the Emerging Europe Fund.
On October 15, 2013, the Institutional Class of the MegaTrends Fund was closed and remaining shares of the Institutional Class were converted into shares of the Investor Class. The MegaTrends Fund subsequently merged into the Holmes Growth Fund, as discussed below and in Note 9.
Two Funds within the Trust were liquidated during 2013. On October 31, 2013, the Global Emerging Markets Fund was liquidated. On December 27, 2013, the U.S. Treasury Securities Cash Fund was liquidated. On the respective liquidation date, each remaining shareholder account of the Fund received a liquidating distribution equal to its proportionate interest in the net assets of each of the Funds. Results for these two Funds are not included further in this report.
At a shareholder meeting on December 2, 2013, the shareholders of the U.S. Government Securities Savings Fund approved a proposal resulting in the conversion of the Fund to a U.S. Government ultra-short bond fund that is not a money market fund. The conversion occurred after the close of business on December 20, 2013. The Fund's investment policy which required it to maintain a constant net asset value of $1.00 per share was eliminated as part of the conversion. The following changes also took effect as part of the conversion: (1) the Fund was renamed the U.S. Government Securities Ultra-Short Bond Fund, (2) the Fund's investment objective was changed to seek to achieve a total return with current income and (3) the Fund's dollar-weighted average effective maturity will be two years or less. Concurrent with the conversion, the Fund had a 1-for-2 reverse stock split. All capital share activity and per share data for the current and previous periods presented in these financial statements has been adjusted to reflect the reverse stock split.
Effective after the close of business on December 20, 2013, the Tax Free Fund merged into the Near-Term Tax Free Fund and the MegaTrends Fund merged into the Holmes Growth Fund. In connection with the reorganization, the Holmes Growth Fund was renamed the Holmes Macro Trends Fund. See Note 9 for more details about these mergers.
148
Notes to Financial Statements December 31, 2013
During 2013, Institutional Class shares of the Gold and Precious Metals and Emerging Europe Funds were registered; however, they have not commenced operations and currently are closed to investors.
The following is a summary of significant accounting policies consistently followed by the Funds in the preparation of their financial statements. The policies are in conformity with U.S. generally accepted accounting principles.
A. Security Valuations
The Funds value investments traded on national or international securities exchanges or over-the-counter at the last sales price reported by the security's primary exchange of its market at the time of daily valuation. Options and securities for which no sale was reported are valued at the mean between the last reported bid and asked quotation. Short-term investments with effective maturities of sixty days or less at the date of purchase are valued at amortized cost, which approximates market value. Municipal securities, long-term U.S. government obligations and corporate debt securities are valued by an independent pricing service using an evaluated quote based on such factors as institutional-size trading in similar groups of securities, yield, quality, maturity, coupon rate, type of issue, individual trading characteristics and other market data.
B. Fair Valued Securities
Securities for which market quotations are not readily available or which are subject to legal restrictions are valued at their fair value as determined in good faith by the Adviser's Valuation Committee, under policies and procedures established by the Funds' Board of Trustees. Fair value is the price that would be received to sell an asset or paid to transfer a liability in an orderly transaction between market participants at the measurement date. The Valuation Committee meets on a regular basis to review securities which may not have readily available market prices and considers a number of factors in determining fair value, including nature and duration of any trading restrictions, trading volume, market values of unrestricted shares of the same or similar class, investment management's judgment regarding the market experience of the issuer, financial status and other operational and market factors affecting the issuer, issuer's management, quality of the underlying property based on review of independent geological studies and other relevant matters. The fair values may differ from what would have been used had a broader market for these securities existed. The Valuation Committee regularly reviews inputs and assumptions and performs transactional back-testing and disposition analysis. The Valuation Committee reports quarterly to the Funds' Board of Trustees.
For securities traded on international exchanges, if events which may materially affect the value of a Fund's securities occur after the close of the primary exchange and before a Fund's net asset value is next determined, then those securities will be valued at their fair value as determined in good faith under the supervision of the Board of Trustees. The Funds use a systematic fair value model provided by an independent third party to value international securities primarily traded on an
149
Notes to Financial Statements December 31, 2013
exchange or market outside the Western Hemisphere in order to adjust for stale pricing, which may occur between the close of certain foreign exchanges and the New York Stock Exchange.
C. Security Transactions and Investment Income
Security transactions are accounted for on trade date. Realized gains and losses from security transactions are determined on an identified-cost basis. Dividend income is recorded on the ex-dividend date except that certain dividends from foreign securities where the ex-dividend date may have passed are recorded as soon as the Fund has confirmed the ex-dividend date. Interest income, which may include original issue discount, is recorded on an accrual basis. Discounts and premiums on securities purchased are accreted and amortized, respectively, on a yield-to-maturity basis as adjustments to interest income. Investment income is recorded net of foreign taxes withheld where recovery of such taxes is uncertain. Investment income and realized and unrealized gains (losses) are allocated to each Fund's share class based on their respective net assets.
The Funds may purchase securities on a when-issued or delayed-delivery basis and segregate on their books collateral with a value at least equal to the amount of the commitment. Losses may arise due to the changes in the value of the underlying securities or if the counterparty does not perform under the contract.
D. Repurchase Agreements
The Funds may enter into repurchase agreements with recognized financial institutions or registered broker-dealers and, in all instances, hold as collateral, underlying securities with a value exceeding the principal amount of the repurchase obligation. The Funds use joint tri-party repurchase agreement accounts with other funds under common management where uninvested cash is collectively invested in repurchase agreements, and each participating fund owns an undivided interest in the account. There were no repurchase agreements held at December 31, 2013.
E. Foreign Currency Transactions
Some Funds may invest in securities of foreign issuers. The accounting records of these Funds are maintained in U.S. dollars. At each net asset value determination date, the value of assets and liabilities denominated in foreign currencies are translated into U.S. dollars using the current prevailing exchange rate. Security transactions, income and expenses are converted at the prevailing rate of exchange on the respective dates of the transactions. The effect of changes in foreign exchange rates on foreign denominated securities is included with the net realized and unrealized gain or loss on securities. Other foreign currency gains or losses are reported separately.
F. Federal Income Taxes
The Funds intend to continue to comply with the requirements of Subchapter M of the Internal Revenue Code applicable to regulated investment companies and to distribute substantially all of their taxable income to shareholders. Accordingly, no provision for federal income taxes is required. Each Fund may be subject to foreign
150
Notes to Financial Statements December 31, 2013
taxes on income and gains on investments, which are accrued based on the Fund's understanding of the tax rules and regulations in the foreign markets.
The Funds recognize the tax benefits of uncertain tax positions only where the position is "more likely than not" to be sustained assuming examination by tax authorities. Management has analyzed the Funds' tax positions, and has concluded that no liability for unrecognized tax benefits should be recorded related to uncertain tax positions taken on returns filed for open tax years or expected to be taken in 2013 tax returns. The Funds' 2010, 2011, 2012 and 2013 tax returns are open to examination by the federal and applicable state tax authorities. The Funds have no examinations in progress.
G. Dividends and Distributions to Shareholders
The Funds record dividends and distributions to shareholders on the ex-dividend date. Distributions are determined in accordance with income tax regulations, which may differ from accounting principles generally accepted in the United States. Accordingly, periodic reclassifications related to permanent book and tax basis differences are made within the Funds' capital accounts to reflect income and gains available for distribution under income tax regulations.
The Funds, except as noted below, generally pay income dividends and distribute capital gains, if any, annually. Prior to its conversion from a money market fund to an ultra-short bond fund on December 20, 2013, the U.S. Government Securities Ultra-Short Bond Fund (formerly the U.S. Government Securities Savings Fund) accrued dividends on a daily basis and paid dividends monthly. Subsequent to the conversion, the Fund accrues and pays dividends monthly. The Near-Term Tax Free Fund also accrues and pays dividends monthly. Dividends and distributions payable at period end are processed for reinvestment on the following business day. A Fund may elect to designate a portion of the earnings and profits distributed to shareholders on the redemption of fund shares during the year as distributions for federal income tax purposes. Differences in per share dividend rates for multiclass funds generally result from the relative weightings of pro rata income and realized gain allocations and from differences in separate class expenses.
H. Expenses
Fund specific expenses are allocated to that Fund and pro rata across share classes. Expenses that are not fund specific are allocated among Funds and pro rata across share classes. Class specific expenses (including, but not limited to, distribution plan fees, if any, a portion of the administrative services fees, transfer agency fees and expenses, shareholder reporting expenses and certain legal and registration fees) are allocated to the class that incurs such expense. Expense offset arrangements have been made with the Funds' custodian so the custodian fees may be paid indirectly by credits earned on the Funds' cash balances. Such deposit arrangements are an alternative to overnight investments. Custodian fees are presented in the Statements of Operations gross of such credits, and the credits are presented as offsets to expenses.
151
Notes to Financial Statements December 31, 2013
I. Short-Term Trading (Redemption) Fees
Short-term trading (redemption) fees are assessed on the Equity Funds (listed below). These fees, which are retained by the Funds, are accounted for as an addition to paid-in capital. Prior to March 19, 2013, fees were assessed as follows. Shares held in the All American, Holmes Macro Trends, Global Resources, World Precious Minerals and Gold and Precious Metals Funds for 30 days or less were subject to a short-term trading fee equal to 0.10%, 0.10%, 0.25%, 0.50% and 0.50%, respectively, of the proceeds of the redeemed shares. Shares held in Emerging Europe and China Region Funds for 180 days or less were subject to a short-term trading fee equal to 2.00% and 1.00%, respectively, of the proceeds of the redeemed shares.
Effective March 19, 2013, the fee for each of the Equity Funds was reduced to 0.05% of the amount redeemed on shares held seven days or less.
J. Use of Estimates in Financial Statement Preparation
The preparation of financial statements in conformity with accounting principles generally accepted in the United States requires management to make estimates and assumptions that affect the reported amounts of assets and liabilities and disclosure of contingent assets and liabilities at the date of the financial statements and the reported amounts of income and expenses during the reporting period. Actual results could differ from those estimates.
K. Subsequent Events Evaluation
Management has evaluated subsequent events after the balance sheet date of December 31, 2013, through the date that the financial statements were issued and determined that there were no events or transactions that would require recognition or disclosure in the financial statements.
L. New Accounting Pronouncements
In December 2011, the Financial Accounting Standards Board (FASB) issued Accounting Standards Update (ASU) No. 2011-11, Balance Sheet (Topic 210): Disclosures about Offsetting Assets and Liabilities. The ASU requires an entity to disclose information about offsetting and related arrangements to enable users of its financial statements to understand the effect of those arrangements on its financial position. In January 2013, the FASB issued ASU No. 2013-01, Balance Sheet (Topic 210): Clarifying the Scope of Disclosures about Offsetting Assets and Liabilities. ASU 2013-01 is an amendment to clarify the scope of disclosures required by ASU No. 2011-11. These ASUs are effective for annual reporting periods beginning on or after January 1, 2013, and interim periods within those annual periods. At this time, the Funds do not have netting agreements that will fall under the provisions of these pronouncements and do not intend to enter into such agreements in the future. Therefore, these pronouncements did not have a material impact on the financial statements.
152
Notes to Financial Statements December 31, 2013
Note 2: Financial Derivative Instruments
A. Options Contracts
Equity Funds may purchase or write (sell) options on securities to manage their exposure to stock or commodity markets as well as fluctuations in interest and currency conversion rates. The use of options carries the risks of a change in value of the underlying instruments, an illiquid secondary market, or failure of the counterparty to perform its obligations.
A put option gives the purchaser of the option, upon payment of a premium, the right to sell, and the issuer of the option the obligation to buy, the underlying security, commodity, index, currency or other instrument at the exercise price. A call option, upon payment of a premium, gives the purchaser of the option the right to buy, and the issuer the obligation to sell, the underlying instrument at the exercise price.
Purchasing a put option tends to decrease a Fund's exposure to the underlying instrument, whereas purchasing a call option tends to increase a Fund's exposure to the underlying instrument. A Fund pays a premium which is included in the Statement of Assets and Liabilities as an investment and subsequently marked to market to reflect the current value of the option. Premiums paid to purchase options which expire are treated as realized losses. Premiums paid to purchase options which are exercised or closed are added to the cost of securities acquired or the proceeds from securities sold. The risk associated with purchasing put and call options is limited to the premium paid.
The Funds will realize a loss equal to all or a part of the premium paid for an option if the price of the underlying security or other instrument decreases or does not increase by more than the premium (in the case of a call option), or if the price of the underlying security or other instrument increases or does not decrease by more than the premium (in the case of a put option).
Writing a put option tends to increase a Fund's exposure to the underlying instrument, whereas writing a call option tends to decrease a Fund's exposure to the underlying instrument. The premium received is recorded as a liability in the Statement of Assets and Liabilities and subsequently marked to market to reflect the current value of the option written. Premiums received from writing options which expire are treated as realized gains. Premiums received from options which are exercised or closed are added to the proceeds or offset against amounts paid on the underlying transaction to determine the realized gain or loss. Written options include a risk of loss in excess of the option premium. A Fund as a writer of an option has no control over whether the underlying instrument may be sold (call) or purchased (put) and thus bears the market risk of an unfavorable change in the price of the instrument underlying the written option. There is also the risk a Fund may not be able to enter into a closing transaction because of an illiquid market.
153
Notes to Financial Statements December 31, 2013
A Fund's ability to close out its position as a purchaser or seller of a put or call option is dependent, in part, upon the liquidity of the market for that particular option. There can be no guarantee that a fund will be able to close out an option position when desired. An inability to close out its options positions may reduce a Fund's anticipated profits or increase its losses.
As of December 31, 2013, there were no securities held in escrow by the custodian as cover for call options written.
Transactions in written call options during the year ended December 31, 2013, were as follows:
| | | All American Equity Fund
Call Options | | Holmes Macro Trends Fund
Call Options | |
| | | Number of
Contracts | | Premiums
Received | | Number of
Contracts | | Premiums
Received | |
Options outstanding at December 31, 2012 | | | — | | | $ | — | | | | — | | | $ | — | | |
Options written | | | 75 | | | | 31,599 | | | | 430 | | | | 130,783 | | |
Options closed | | | (30 | ) | | | (18,244 | ) | | | (270 | ) | | | (75,967 | ) | |
Options expired | | | (45 | ) | | | (13,355 | ) | | | (160 | ) | | | (54,816 | ) | |
Options exercised | | | — | | | | — | | | | — | | | | — | | |
Options outstanding at December 31, 2013 | | | — | | | $ | — | | | | — | | | $ | — | | |
| | | Global Resources Fund
Call Options | | Emerging Europe Fund
Call Options | |
| | | Number of
Contracts | | Premiums
Received | | Number of
Contracts | | Premiums
Received | |
Options outstanding at December 31, 2012 | | | — | | | $ | — | | | | 2,000 | | | $ | 291,560 | | |
Options written | | | 18,893 | | | | 1,536,874 | | | | 4,000 | | | | 674,757 | | |
Options closed | | | (8,580 | ) | | | (999,315 | ) | | | (4,000 | ) | | | (697,769 | ) | |
Options expired | | | (4,135 | ) | | | (158,436 | ) | | | (1,000 | ) | | | (72,340 | ) | |
Options exercised | | | (6,178 | ) | | | (379,123 | ) | | | (1,000 | ) | | | (196,208 | ) | |
Options outstanding at December 31, 2013 | | | — | | | $ | — | | | | — | | | $ | — | | |
B. Forward Foreign Currency Contracts
The Funds enter into forward foreign currency contracts to lock in the U.S. dollar cost of purchase and sale transactions or to hedge the portfolio against currency fluctuations. A forward foreign currency contract is a commitment to purchase or sell a foreign currency at a future date at a negotiated rate. These contracts are valued daily, and the Fund's net equity therein, representing unrealized gain or loss on the contracts as measured by the difference between the forward foreign exchange rates at the dates of entry into the contracts and the forward rates at the reporting date, is included in the statement of assets and liabilities. Realized and unrealized gains and losses are included in the statement of operations. Risks may arise upon entering into these contracts from the potential inability of counterparties to meet the terms of the contract and from unanticipated movements in the value of foreign currencies relative to the U.S. dollar.
There were no open forward foreign currency contracts at December 31, 2013.
154
Notes to Financial Statements December 31, 2013
C. Summary of Derivative Instruments
The following is a summary of the valuations of derivative instruments categorized by location in the Statements of Assets and Liabilities as of December 31, 2013:
| Location | | Global
Resources
Fund | | World
Precious
Minerals
Fund | | Gold and
Precious
Metals
Fund | | China
Region
Fund | |
Asset derivatives | |
Investments, at value
Purchased options | | $ | 4,113,404 | | | $ | 3,515,130 | | | $ | 2,496,180 | | | $ | 404,560 | | |
Total | | $ | 4,113,404 | | | $ | 3,515,130 | | | $ | 2,496,180 | | | $ | 404,560 | | |
The following is a summary of the effect of derivative instruments on the Statements of Operations for the year ended December 31, 2013:
| Location | | All
American
Equity Fund | | Holmes
Macro
Trends
Fund | | Global
Resources
Fund | |
Realized gain (loss) on derivatives recognized
in income | |
Realized gain (loss) from securities
Purchased options | | $ | (116,484 | ) | | $ | (233,655 | ) | | $ | 462,209 | | |
Realized gain (loss) from written options | | | (6,522 | ) | | | 24,074 | | | | 28,798 | | |
Net realized gain (loss) from foreign currency
transactions
Foreign exchange contracts | | | — | | | | — | | | | 4,991 | | |
| | | (123,006 | ) | | | (209,581 | ) | | | 495,998 | | |
Change in unrealized appreciation (depreciation)
on derivatives recognized in income | |
Net change in unrealized appreciation
(depreciation) of investments
Purchased options | | | — | | | | — | | | | 43,077 | | |
| | | — | | | | — | | | | 43,077 | | |
Total | | $ | (123,006 | ) | | $ | (209,581 | ) | | $ | 539,075 | | |
155
Notes to Financial Statements December 31, 2013
Location | | World
Precious
Minerals
Fund | | Gold and
Precious
Metals
Fund | | Emerging
Europe
Fund | | China
Region
Fund | |
Realized gain (loss) on derivatives
recognized in income | |
Realized gain (loss) from securities
Purchased options | | $ | (18,617,784 | ) | | $ | (12,066,179 | ) | | $ | 1,466,072 | | | $ | (30,978 | ) | |
Realized gain (loss) from written options | | | — | | | | — | | | | 31,229 | | | | — | | |
Net realized gain (loss) from foreign
currency transactions
Foreign exchange contracts | | | — | | | | — | | | | 35,122 | | | | — | | |
| | | | (18,617,784 | ) | | | (12,066,179 | ) | | | 1,532,423 | | | | (30,978 | ) | |
Change in unrealized appreciation
(depreciation) on derivatives
recognized in income | |
Net change in unrealized appreciation
(depreciation) of investments
Purchased options | | | (1,063,374 | ) | | | (287,860 | ) | | | (1,600,389 | ) | | | 12,966 | | |
Net change in unrealized appreciation
(depreciation) of written options | | | — | | | | — | | | | 32,440 | | | | — | | |
| | | | (1,063,374 | ) | | | (287,860 | ) | | | (1,567,949 | ) | | | 12,966 | | |
Total | | $ | (19,681,158 | ) | | $ | (12,354,039 | ) | | $ | (35,526 | ) | | $ | (18,012 | ) | |
The average notional amounts of written options, purchased options and forward currency contracts outstanding during the year ended December 31, 2013, were approximately as follows:
Fund | | Written
Options | | Purchased
Options | | Forward
Currency
Contracts | |
All American Equity | | $ | 1,798 | | | $ | 14,544 | | | $ | — | | |
Holmes Macro Trends | | | 6,833 | | | | 21,844 | | | | — | | |
Global Resources | | | 99,784 | | | | 1,394,154 | | | | — | * | |
World Precious Minerals | | | — | | | | 5,432,805 | | | | — | | |
Gold and Precious Metals | | | — | | | | 3,751,629 | | | | — | | |
Emerging Europe | | | 124,731 | | | | 383,693 | | | | 1,503,252 | | |
China Region | | | — | | | | 108,678 | | | | — | | |
* For the reporting period, the transactions were minimal.
156
Notes to Financial Statements December 31, 2013
Note 3: Related Party Transactions
U.S. Global Investors, Inc. (Adviser), under an investment advisory agreement with the Trust in effect through October 1, 2014, furnishes management and investment advisory services and, subject to the supervision of the trustees, directs the investments of each Fund according to each Fund's investment objectives, policies and limitations. The Adviser also furnishes all necessary office facilities, business equipment and personnel for administering the affairs of the Trust. Frank E. Holmes, a trustee of the Funds, is the controlling owner of the Adviser.
For the services of the Adviser, each Fund pays a base management or advisory fee based upon its net assets. Fees are accrued daily and paid monthly. The contractual management fee for each fund is:
| Fund | | Annual Percentage of
Average Daily Net Assets | |
U.S. Government Securities Ultra-Short Bond | | .50% of the first $250,000,000
and .375% of the excess | |
Near-Term Tax Free | | .50% | |
All American Equity | | .80% of the first $500,000,000
and .75% of the excess | |
Holmes Macro Trends | | 1.00% | |
Global Resources | | .95% of the first $500,000,000;
.90% of $500,000,001 to $1,000,000,000
and .85% of the excess | |
World Precious Minerals | | 1.00% of the first $500,000,000;
.95% of $500,000,001 to $1,000,000,000
and .90% of the excess | |
Gold and Precious Metals | | .90% of the first $500,000,000
and .85% of the excess | |
Emerging Europe | | 1.25% | |
China Region | | 1.25% | |
157
Notes to Financial Statements December 31, 2013
The advisory agreement also provides that the base advisory fee of the Equity Funds will be adjusted upwards or downwards by 0.25 percent if there is a performance difference of 5 percent or more between a Fund's performance and that of its designated benchmark index over the prior 12 months. The performance adjustment is calculated separately for each share class. The benchmarks are as follows:
| Fund | | Benchmark Index | |
All American Equity | | S&P 500 Index | |
Holmes Macro Trends | | S&P Composite 1500 Index | |
Global Resources | | Morgan Stanley Commodity Related Equity Index | |
World Precious Minerals | | NYSE Arca Gold Miners Index | |
Gold and Precious Metals | | FTSE Gold Mines Index | |
Emerging Europe | | MSCI Emerging Markets Europe 10/40 Index (Net Total Return) | |
China Region | | Hang Seng Composite Index | |
No performance adjustment is applied unless the difference between the class's investment performance and the benchmark is 5 percent or greater (positive or negative) during the applicable performance measurement period. The performance fee adjustment is calculated monthly in arrears and is accrued ratably during the month. The management fee, net of any performance fee adjustment, is paid monthly in arrears.
The Funds' prospectus and statement of additional information contain additional information about the performance adjustment. The amounts shown as management fees on the Statements of Operations reflects the base fee plus/minus any performance adjustment. During the year ended December 31, 2013, the Funds recorded performance adjustments as follows:
Fund | | Investor Class
Performance Fee
Adjustment | | Institutional Class
Performance Fee
Adjustment | |
All American Equity | | $ | (7,346 | ) | | | N/A | | |
Holmes Macro Trends | | | (52,750 | ) | | | N/A | | |
Global Resources | | | (322,235 | ) | | $ | (45,474 | ) | |
World Precious Minerals | | | (68,647 | ) | | | (200 | ) | |
Gold and Precious Metals | | | 260,157 | | | | N/A | | |
Emerging Europe | | | (75,284 | ) | | | N/A | | |
China Region | | | (47,363 | ) | | | N/A | | |
Under an amended administrative services agreement effective December 9, 2013, the U.S. Government Securities Ultra-Short Bond, Near-Term Tax Free, All American Equity, Holmes Macro Trends, Gold and Precious Metals, Emerging
158
Notes to Financial Statements December 31, 2013
Europe and China Region Funds compensate the Adviser at an annual rate of 0.10% of the average daily net assets of each Fund for administrative services provided, of which half is a fund-level fee and half is a class-level fee. Prior to December 9, 2013, the rate was 0.08% of average daily net assets. The Global Resources and World Precious Minerals Funds compensate the Adviser at an annual rate of 0.10% of the average daily net assets for the Investor Class and 0.08% of the average daily net assets for the Institutional Class for administrative services provided, of which half is a fund-level fee and half is a class-level fee. Prior to December 9, 2013, the rates for these funds' Investor and Institutional Classes were 0.08% and 0.06%, respectively, of average daily net assets.
In addition, effective December 9, 2013, a $10,000 annual base administrative services fee is paid by each Fund. This is a fund-level fee.
The Investor Class shares for Equity Funds in the Trust have adopted a distribution plan pursuant to Rule 12b-1 of the Investment Company Act of 1940 in which a subsidiary of the Adviser is paid a fee at an annual rate of 0.25% of the average daily net assets of the Investor Class for sales and promotional services related to the distribution of Investor Class shares. The Institutional Class does not incur distribution plan fees.
The Adviser has voluntarily agreed to reimburse specific funds so that their total operating expenses will not exceed certain annual percentages of average net assets. The expenses for the year ended December 31, 2013, were limited as follows for the Investor Class: U.S. Government Securities Ultra-Short Bond Fund at 0.45%, All American Equity Fund at 2.20%, Holmes Macro Trends Fund at 2.20%, Global Resources, World Precious Minerals, and Gold and Precious Metals Funds at 1.90%, Emerging Europe Fund at 2.85% and China Region Fund at 2.55%. These expense limitations are exclusive of any performance fee adjustments and will continue on a voluntary basis at the Adviser's discretion.
Effective May 1, 2013, the Adviser contractually limited the total operating expenses of the Near-Term Tax Free Fund at 0.45% on an annualized basis through April 30, 2014. In December 2013, this agreement was extended through December 31, 2014. Prior to May 1, 2013, the Adviser had voluntarily limited the expenses of the Fund at the same rate.
The Adviser has voluntarily agreed to waive all class specific expenses for the Institutional Class of the World Precious Minerals Fund; the Adviser can modify or terminate this arrangement at any time. Effective May 1, 2013, the Adviser contractually agreed to waive all class specific expenses for the Institutional Class of the Global Resources Fund until April 30, 2014. Prior to May 1, 2013, the Adviser had voluntarily waived all class specific expenses for the Institutional Class of the Global Resources Fund. These expense waivers are exclusive of any performance fee adjustments.
159
Notes to Financial Statements December 31, 2013
Under an agreement entered into while the U.S. Government Securities Ultra-Short Bond Fund was a money market fund, the Adviser had voluntarily agreed to waive fees and/or reimburse the Fund to the extent necessary to maintain the yield at a certain level as determined by the Adviser (Minimum Yield). The Adviser may recapture any fees waived and/or expenses reimbursed within three years after the end of the fiscal year of such waiver and/or reimbursement to the extent that such recapture would not cause the Fund's yield to fall below the Minimum Yield. For the year ended December 31, 2013, fees waived and/or expenses reimbursed as a result of this agreement were $498,342 for the U.S. Government Securities Ultra-Short Bond Fund. At December 31, 2013, the Adviser may seek reimbursement of previously waived and reimbursed fees as follows: $736,531 (expires 12/31/2014), $509,874 (expires 12/31/2015) and $498,342 (expires 12/31/2016).
Until December 9, 2013, United Shareholder Services, Inc. (USSI), a wholly-owned subsidiary of the Adviser, was the transfer agent for the Funds. Effective December 9, 2013, U.S. Bancorp Fund Services, LLC became the transfer agent for the Funds. Each Fund's share class pays an annual fee based on the number of shareholder accounts, certain base fees and transaction- and activity-based fees for transfer agency services. Certain account fees are paid directly by shareholders to the transfer agent, which, in turn, reduces its charge to the Funds.
The Adviser was reimbursed for services of the Funds' Chief Compliance Officer during the year ended December 31, 2013, in the amount of $138,565.
Brown Brothers Harriman & Co. (BBH) serves as the custodian, fund accounting and administration service agent with a fee structure based on average net assets of the Funds, certain base fees and transaction-based fees.
The independent Trustees receive compensation for serving on the Board. Trustees serving as Chairman of the Board or a special committee or as a member of a committee receive additional compensation. Trustees are also reimbursed for out-of-pocket expenses incurred while attending meetings. Frank E. Holmes receives no compensation from the Funds for serving on the Board.
Prior to the Fund's conversion from a money market fund and reverse stock split, the Adviser made a capital contribution of $167,245 in cash to the U.S. Government Securities Ultra-Short Bond Fund. This contribution represented the difference between the Fund's capital shares outstanding and net assets and was less than $0.002 per share.
160
Notes to Financial Statements December 31, 2013
Note 4: Investments
Cost of purchases and proceeds from sales of long-term securities for the year ended December 31, 2013, are summarized as follows:
Fund | | Purchases | | Sales | |
U.S. Government Savings Ultra-Short Bond | | $ | 21,139,300 | | | $ | 8,000,000 | | |
Near-Term Tax Free | | | 12,974,217 | | | | 2,675,000 | | |
All American Equity | | | 28,750,040 | | | | 28,015,221 | | |
Holmes Macro Trends | | | 38,826,998 | | | | 42,851,624 | | |
Global Resources | | | 574,031,987 | | | | 683,174,587 | | |
World Precious Minerals | | | 62,060,429 | | | | 95,794,088 | | |
Gold and Precious Metals | | | 60,582,012 | | | | 70,618,192 | | |
Emerging Europe | | | 102,163,691 | | | | 140,396,323 | | |
China Region | | | 52,856,036 | | | | 57,993,985 | | |
The amounts shown above for the U.S. Government Securities Ultra-Short Bond Fund are for the period after the Fund's conversion from a money market fund. Previously, the Fund held only short-term investments.
Note 5: Tax Information
The following table presents the income tax basis of securities owned at December 31, 2013, and the tax basis components of net unrealized appreciation (depreciation):
Fund | | Aggregate
Tax Cost | | Gross
Unrealized
Appreciation | | Gross
Unrealized
Depreciation | | Net Unrealized
Appreciation
(Depreciation) | |
U.S. Government Securities
Ultra-Short Bond | | $ | 62,588,369 | | | $ | 136 | | | $ | (79,627 | ) | | $ | (79,491 | ) | |
Near-Term Tax Free | | | 57,607,000 | | | | 1,408,862 | | | | (583,145 | ) | | | 825,717 | | |
All American Equity | | | 17,996,047 | | | | 4,776,665 | | | | (201,960 | ) | | | 4,574,705 | | |
Holmes Macro Trends Fund | | | 41,689,221 | | | | 12,697,209 | | | | (1,056,169 | ) | | | 11,641,040 | | |
Global Resources | | | 437,220,578 | | | | 50,623,354 | | | | (114,184,788 | ) | | | (63,561,434 | ) | |
World Precious Minerals | | | 301,280,048 | | | | 11,441,892 | | | | (180,313,741 | ) | | | (168,871,849 | ) | |
Gold and Precious Metals | | | 116,567,296 | | | | 2,393,167 | | | | (52,505,573 | ) | | | (50,112,406 | ) | |
Emerging Europe | | | 116,445,501 | | | | 28,165,649 | | | | (21,521,377 | ) | | | 6,644,272 | | |
China Region | | | 21,725,206 | | | | 5,499,844 | | | | (697,587 | ) | | | 4,802,257 | | |
161
Notes to Financial Statements December 31, 2013
As of December 31, 2013, the components of distributable earnings on a tax basis were as follows:
| Fund | | Undistributed
Tax-Exempt
Income | | Undistributed
Ordinary
Income | | Undistributed
Long-Term
Capital Gains | | Net Unrealized
Appreciation
(Depreciation) | |
U.S. Government Securities
Ultra-Short Bond | | $ | — | | | $ | 2,032 | | | $ | — | | | $ | (79,491 | ) | |
Near-Term Tax Free | | | — | | | | 11,666 | | | | — | | | | 825,717 | | |
All American Equity | | | — | | | | 444,619 | | | | 318,935 | | | | 4,574,705 | | |
Holmes Macro Trends | | | — | | | | 750,789 | | | | 2,027,287 | | | | 11,641,036 | | |
Global Resources | | | — | | | | — | | | | — | | | | (63,561,543 | ) | |
World Precious Minerals | | | — | | | | — | | | | — | | | | (168,871,909 | ) | |
Gold and Precious Metals | | | — | | | | — | | | | — | | | | (50,112,835 | ) | |
Emerging Europe | | | — | | | | 2,066,927 | | | | — | | | | 6,643,818 | | |
China Region | | | — | | | | — | | | | — | | | | 4,801,477 | | |
The differences between book-basis and tax-basis unrealized appreciation (depreciation) for All American Equity, Holmes Macro Trends, Global Resources, World Precious Minerals, Gold and Precious Metals, Emerging Europe and China Region Funds are attributable primarily to the tax deferral of losses on wash sales, investment in passive foreign investment companies (PFIC), forwards marked to markets, adjustments for partnerships, tax straddle loss deferrals on written options, and adjustments for grantor trusts.
Reclassifications are made to the Funds' capital accounts to reflect income and gains available for distribution (or available capital loss carryovers) under income tax regulations. For the year ended December 31, 2013, the Funds recorded the following reclassifications to increase (decrease) the accounts listed below:
| Fund | | Accumulated Net
Investment Income | | Accumulated Net
Realized Gain | | Paid-in
Capital | |
U.S. Government Securities Ultra-Short Bond | | $ | — | | | $ | — | | | $ | — | | |
Near-Term Tax Free | | | — | | | | (344,953 | ) | | | 344,953 | | |
All American Equity | | | 91,062 | | | | (91,062 | ) | | | — | | |
Holmes Macro Trends | | | 350,661 | | | | (1,802,839 | ) | | | 1,452,178 | | |
Global Resources | | | 5,686,169 | | | | (4,187,360 | ) | | | (1,498,809 | ) | |
World Precious Minerals | | | 20,258,091 | | | | (3,784,045 | ) | | | (16,474,046 | ) | |
Gold and Precious Metals | | | 543,130 | | | | (120,568 | ) | | | (422,562 | ) | |
Emerging Europe | | | (121,763 | ) | | | 121,763 | | | | — | | |
China Region | | | 99,436 | | | | 51,042 | | | | (150,478 | ) | |
162
Notes to Financial Statements December 31, 2013
The tax character of distributions paid during the fiscal year ended December 31, 2013, were as follows:
Fund | | Tax Exempt
Income | | Ordinary
Income | | Long-Term
Capital Gains | | Total | |
U.S. Government Securities
Ultra-Short Bond | | $ | — | | | $ | 17,151 | | | $ | — | | | $ | 17,151 | | |
Near-Term Tax Free | | | 997,227 | | | | 37,838 | | | | — | | | | 1,035,065 | | |
All American Equity | | | — | | | | 641,884 | | | | 826,821 | | | | 1,468,705 | | |
Holmes Macro Trends | | | — | | | | 859,008 | | | | 1,636,915 | | | | 2,495,923 | | |
Global Resources - Investor Class | | | — | | | | 11,927,336 | | | | — | | | | 11,927,336 | | |
Global Resources - Institutional Class | | | — | | | | 2,316,939 | | | | — | | | | 2,316,939 | | |
World Precious Minerals - Investor Class | | | — | | | | — | | | | — | | | | — | | |
World Precious Minerals - Institutional Class | | | — | | | | — | | | | — | | | | — | | |
Gold and Precious Metals | | | — | | | | — | | | | — | | | | — | | |
Emerging Europe | | | — | | | | 1,969,263 | | | | — | | | | 1,969,263 | | |
China Region | | | — | | | | 64,297 | | | | — | | | | 64,297 | | |
The tax character of distributions paid during the fiscal year ended December 31, 2012, were as follows:
Fund | | Tax Exempt
Income | | Ordinary
Income | | Long-Term
Capital Gains | | Total | |
U.S. Government Securities
Ultra-Short Bond | | $ | — | | | $ | 15,792 | | | $ | — | | | $ | 15,792 | | |
Near-Term Tax Free | | | 827,875 | | | | 38,683 | | | | — | | | | 866,558 | | |
All American Equity | | | — | | | | — | | | | — | | | | — | | |
Holmes Macro Trends | | | — | | | | — | | | | 563,945 | | | | 563,945 | | |
Global Resources - Investor Class | | | — | | | | 9,700,159 | | | | — | | | | 9,700,159 | | |
Global Resources - Institutional Class | | | — | | | | 3,187,762 | | | | — | | | | 3,187,762 | | |
World Precious Minerals - Investor Class | | | — | | | | — | | | | — | | | | — | | |
World Precious Minerals - Institutional Class | | | — | | | | — | | | | — | | | | — | | |
Gold and Precious Metals | | | — | | | | 256,589 | | | | — | | | | 256,589 | | |
Emerging Europe | | | — | | | | 1,152,778 | | | | — | | | | 1,152,778 | | |
China Region | | | — | | | | 65,330 | | | | — | | | | 65,330 | | |
Capital loss carryforwards may be used to offset current or future taxable capital gains until expiration. The Fund's tax-basis capital gains and losses are determined only at the end of each fiscal year. Under the Regulated Investment Company Modernization Act of 2010, the Funds are permitted to carry forward capital losses incurred in taxable years beginning after December 22, 2010, for an unlimited period. However, any losses incurred during those future years are required to be utilized prior to the losses incurred in pre-enactment tax years. As a result of this ordering rule, pre-enactment capital losses that are carried forward retain their character as either short-term or long-term capital losses rather than being considered
163
Notes to Financial Statements December 31, 2013
all short-term as under previous law. The loss carryforwards and related expiration dates for each fund, as of December 31, 2013, are as follows:
| | No Expiration | | Expiration Date | |
Fund | | Short-Term | | Long-Term | | 2014 | | 2015 | |
U.S. Government Securities
Ultra-Short Bond | | $ | — | | | $ | — | | | $ | — | | | $ | — | | |
Near-Term Tax Free (a) | | | 147,588 | | | | 198,493 | | | | 202,719 | | | | 2,488 | | |
All American Equity | | | — | | | | — | | | | — | | | | — | | |
Holmes Macro Trends (a) | | | — | | | | — | | | | — | | | | 388,714 | | |
Global Resources | | | 89,307,979 | | | | 1,579,936 | | | | — | | | | — | | |
World Precious Minerals | | | 54,870,262 | | | | 87,692,407 | | | | — | | | | — | | |
Gold and Precious Metals | | | 30,005,639 | | | | 22,755,227 | | | | — | | | | — | | |
Emerging Europe | | | 642,919 | | | | 1,336,381 | | | | — | | | | — | | |
China Region | | | 6,611,500 | | | | — | | | | — | | | | — | | |
| | Expiration Date | |
Fund | | 2016 | | 2017 | | 2018 | | Total | |
U.S. Government Securities
Ultra-Short Bond | | $ | — | | | $ | — | | | $ | — | | | $ | — | | |
Near-Term Tax Free (a) | | | 10,809 | | | | 722 | | | | 2,532 | | | | 565,351 | | |
All American Equity | | | — | | | | — | | | | — | | | | — | | |
Holmes Macro Trends (a) | | | 995,675 | | | | — | | | | — | | | | 1,384,389 | | |
Global Resources | | | — | | | | 259,212,512 | | | | — | | | | 350,100,427 | | |
World Precious Minerals | | | — | | | | 63,779,512 | | | | — | | | | 206,342,181 | | |
Gold and Precious Metals | | | — | | | | — | | | | — | | | | 52,760,866 | | |
Emerging Europe | | | 28,524,678 | | | | 257,523,539 | | | | 15,445,946 | | | | 303,473,463 | | |
China Region | | | 15,020,267 | | | | — | | | | — | | | | 21,631,767 | | |
(a) Utilization of capital loss carryovers is subject to annual limitations.
In accordance with tax rules, the following net capital losses and ordinary losses (currency and late year losses) incurred after October 31, within each Fund's tax year, are deemed to arise on the first day of the Fund's next tax year if the Fund elects to defer such losses.
The Funds elected to defer losses incurred after October 31, 2013, as follows:
Fund | | Post October 31, 2013
Capital Loss Deferral | | Post October 31, 2013
Ordinary Loss Deferral | |
Global Resources | | $ | 1,864,394 | | | $ | 1,178,581 | | |
World Precious Minerals | | | 6,150,444 | | | | 458,771 | | |
Gold and Precious Metals | | | 4,913,685 | | | | — | | |
Emerging Europe | | | 110,010 | | | | — | | |
164
Notes to Financial Statements December 31, 2013
Note 6: Risks of Concentrations
The Near-Term Tax Free Fund may be exposed to risks related to concentration of investments in a particular state or geographic area. These investments present risks resulting from changes in economic conditions of the region or the issuer.
Because the Global Resources Fund concentrates its investments in a specific industry, the fund may be subject to greater risks and fluctuations than a portfolio representing a broader range of industries.
The World Precious Minerals and Gold and Precious Metals Funds concentrate their investments in gold and other precious metals and minerals and, therefore, may be subject to greater risks and market fluctuations than a portfolio representing a broader range of industries. The funds invest in securities that typically respond to changes in the price of gold and other precious metals and minerals, which can be influenced by a variety of global economic, financial and political factors; increased environmental and labor costs in mining; and changes in laws relating to mining or gold production or sales. Fluctuations in the prices of gold and other precious metals and minerals will affect the market values of the securities held by these funds.
The Emerging Europe Fund invests more than 25% of its investments in companies principally engaged in the oil & gas or banking industries. The risk of concentrating investments in this group of industries will make the fund more susceptible to risk in these industries than funds which do not concentrate their investments in an industry.
The Emerging Europe Fund may be exposed to risks not typically associated with investment in the United States due to their concentration of investments in emerging markets. These risks include possible revaluation of currencies, less public information about companies, disruptive political or economic conditions and the possible imposition of adverse governmental laws or currency exchange restrictions. Moreover, securities of many foreign issuers, including sovereign nations, and their markets may be less liquid and their prices more volatile than those securities of comparable U.S. issuers.
The China Region Fund may be exposed to risks not typically associated with investments in the United States, due to concentration of investments in foreign issuers in the region. These investments present risks resulting from disruptive political or economic conditions and the potential imposition of adverse governmental laws or currency exchange restrictions affecting the area.
Note 7: Credit Arrangements
Each of the Funds has a revolving credit facility with BBH. Borrowings of each Fund are collateralized by any or all of the securities held by BBH as the Fund's custodian up to the amount of the borrowing. Interest on borrowings is charged at the current overnight Federal Funds Rate plus 2%. Each Fund has a maximum borrowing limit
165
Notes to Financial Statements December 31, 2013
of 10% of qualified assets. The aggregate of borrowings by all Funds under the agreement cannot exceed $30,000,000 at any one time. There were no borrowings under the revolving credit facility during the period ended December 31, 2013. The U.S. Global Investors Funds paid BBH a total of $45,625 in commitment fees for the period December 31, 2013, under this arrangement.
Note 8: Shares of Beneficial Interest
At December 31, 2013, the Adviser held 18.75% and 7.54% of the U.S. Government Securities Ultra-Short Bond Fund and the Near-Term Tax Free Fund, respectively. Control is defined by the 1940 Act as the beneficial ownership, either directly or through one or more controlled companies, of more than 25% of the voting securities of a company. Investment activities of these shareholders could have a material impact on the Funds.
Note 9: Reorganization Information
On December 20, 2013, the Near-Term Tax Free Fund acquired all of the net assets of the Tax Free Fund, a separate series of the Trust, pursuant to an Agreement and Plan of Reorganization. The Near-Term Tax Free Fund is the legal and accounting survivor. The purpose of the transaction was to combine two funds with the same investment objective and similar strategies and policies, as well as to seek anticipated economies of scale due to the larger asset size of the combined fund after the reorganization.
On December 20, 2013, the Holmes Growth Fund acquired all of the net assets of the MegaTrends Fund, a separate series of the Trust, pursuant to a plan of reorganization approved by the MegaTrends Fund shareholders on December 20, 2013. In connection with the reorganization, the name of the Holmes Growth Fund changed to Holmes Macro Trends Fund. The Holmes Macro Trends Fund is the legal and accounting survivor. The purpose of the transaction was to combine two funds with the same primary investment objective and similar strategies and policies, as well as to seek anticipated economies of scale due to the larger asset size of the combined fund after the reorganization.
The acquisitions were accomplished by a tax-free exchange of the following shares:
Merged Fund | | Shares | | Exchange
Ratio | | Acquiring
Fund | | Shares | | Value | |
Tax Free Fund | | | 1,356,152 | | | | 5.428444 | | | Near-Term Tax Free Fund | | | 7,361,792 | | | $ | 16,401,859 | | |
MegaTrends Fund | | | 1,279,187 | | | | 0.430550 | | | Holmes Growth Fund | | | 550,754 | | | $ | 13,184,651 | | |
166
Notes to Financial Statements December 31, 2013
The net assets and unrealized appreciation immediately before the acquisitions were as follows:
Merged Fund | | Net Assets | | Unrealized
Appreciation | | Acquiring Fund | | Net Assets | |
Tax Free Fund | | $ | 16,401,859 | | | $ | 562,300 | | | Near-Term Tax Free Fund | | $ | 46,718,724 | | |
MegaTrends Fund | | $ | 13,184,651 | | | $ | 1,391,640 | | | Holmes Growth Fund | | $ | 42,046,948 | | |
For financial reporting purposes, assets received and shares issued by each of the acquiring funds were recorded at fair value; however, the cost basis of the investments acquired from each of the merged funds was carried forward to align ongoing reporting of the acquiring funds' realized and unrealized gains and losses with amounts distributable to shareholders for tax purposes.
Assuming the reorganization had been completed on January 1, 2013, the beginning of the annual reporting period, the acquiring funds' results of operations for the year ended December 31, 2013, would have been as follows:
| | | Near-Term
Tax Free Fund | | Holmes Macro
Trends Fund | |
Net investment income (loss) | | $ | 1,709,109 | (a) | | $ | (492,008 | )(c) | |
Net realized and unrealized gain (loss) on investments | | $ | (1,851,554 | )(b) | | $ | 17,471,507 | (d) | |
Net increase (decrease) in net assets resulting
from operations | | $ | (142,445 | ) | | $ | 16,979,499 | | |
(a) $1,031,696 as reported, plus $628,796 from pre-merger Tax Free Fund and $48,617 net benefit from aligning fees, elimination of duplicative expenses and applying the contractual expense limitation of the acquiring fund.
(b) $(480,338) as reported, plus $(1,371,216) from pre-merger Tax Free Fund.
(c) $(421,055) as reported, plus $(105,790) from pre-merger MegaTrends Fund and $34,837 net benefit from aligning fees, elimination of duplicative expenses and applying the voluntary expense limitation of the acquiring fund.
(d) $14,490,769 as reported, plus $2,980,738 from pre-merger MegaTrends Fund.
In the acquisitions, the Near-Term Tax Free Fund acquired $347,713 in capital loss carryforwards from the Tax Free Fund and the Holmes Macro Trends Fund acquired $11,284,894 in capital loss carryforwards from the MegaTrends Fund. The Near-Term Tax Free and Holmes Macro Trends Funds' use of acquired capital loss carryforwards may be limited under certain tax provisions.
For both transactions, because the combined investment portfolios have been managed as a single integrated portfolio since the acquisition was completed, it is not practical to separate the amounts of revenue and earnings of the merged fund that have been included in the acquiring fund's Statement of Operations since December 20, 2013. In addition, because the merged fund and the acquiring fund sold and redeemed shares throughout the period, it is not practicable to provide pro forma information on a per share basis.
167
U.S. Government Securities Ultra-Short Bond Fund*
For a capital share outstanding during the
| | | Investor Class | |
| | | Year Ended December 31, | |
| | | 2013 | | 2012* | | 2011* | | 2010* | | 2009* | |
Net asset value, beginning of period | | $ | 2.00 | | | $ | 2.00 | | | $ | 2.00 | | | $ | 2.00 | | | $ | 2.00 | | |
Investment Activities | |
Net investment income (a) | | | — | | | | — | | | | — | | | | — | | | | — | | |
Net realized and unrealized gain | | | — | (a) | | | — | | | | — | | | | — | (a) | | | — | | |
Total from investment activities (a) | | | — | | | | — | | | | — | | | | — | | | | — | | |
Distributions from net investment income (a) | | | — | | | | — | | | | — | | | | — | | | | — | | |
Net asset value, end of period | | $ | 2.00 | | | $ | 2.00 | | | $ | 2.00 | | | $ | 2.00 | | | $ | 2.00 | | |
| Total Return (excluding account fees) (b) | | | .02 | % | | | .01 | % | | | .01 | % | | | .01 | % | | | .10 | % | |
Ratios to Average Net Assets: | |
Net investment income | | | .01 | % | | | .01 | % | | | .01 | % | | | .01 | % | | | .11 | % | |
Total expenses | | | .97 | % | | | .87 | % | | | .81 | % | | | .82 | % | | | .78 | % | |
Expenses waived or reimbursed (c) | | | (.91 | )% | | | (.74 | )% | | | (.74 | )% | | | (.67 | )% | | | (.42 | )% | |
Net expenses (d) | | | .06 | % | | | .13 | % | | | .07 | % | | | .15 | % | | | .36 | % | |
Net assets, end of period (in thousands) | | $ | 75,227 | | | $ | 140,425 | | | $ | 171,664 | | | $ | 203,835 | | | $ | 263,232 | | |
* The per share amounts for the periods have been adjusted to reflect a 1-for-2 reverse stock split, which was effective December 20, 2013. In addition, on December 20, 2013, the Fund changed from a constant $1.00 net asset value per share money market fund to a U.S. Government ultra-short bond fund (that is not a money market fund) with an objective of total return with current income.
(a) The per share amount does not round to a full penny.
(b) Assumes investment at the net asset value at the beginning of the period, reinvestment of all distributions and a complete redemption of the investment at the net asset value at the end of the period.
(c) Expenses waived or reimbursed reflect reductions to total expenses, as discussed in the notes to the financial statements. These amounts would decrease the net investment income ratio and total returns had such reductions not occurred. During 2009, 2010, 2011, 2012 and 2013, the Adviser waived fees and/or reimbursed expenses under the Minimum Yield Agreement in the amount of $258,561, $678,107, $736,531, $509,874 and $498,342, respectively. The waivers/reimbursements from 2011-2013 are subject to recapture in future periods.
(d) The net expense ratios shown above reflect expenses after waivers and reimbursements but exclude the effect of reductions to total expenses for any expenses offset. Expense offset arrangements reduce total expenses, as discussed in the notes to the financial statements. These amounts would decrease the net investment income ratio had such reductions not occurred. The effect of expenses offset are as follows:
| | | Investor Class | |
| | | Year Ended December 31, | |
| | | 2013 | | 2012* | | 2011* | | 2010* | | 2009* | |
Ratios to Average Net Assets: | |
Expenses offset (e) | | | — | | | | — | | | | — | | | | — | | | | — | | |
(e) Effect on the expense ratio was not greater than 0.005%.
See accompanying notes to financial statements.
168
Near-Term Tax Free Fund
For a capital share outstanding during the
| | | Investor Class | |
| | | Year Ended December 31, | |
| | | 2013 | | 2012 | | 2011 | | 2010 | | 2009 | |
Net asset value, beginning of period | | $ | 2.27 | | | $ | 2.26 | | | $ | 2.22 | | | $ | 2.21 | | | $ | 2.16 | | |
Investment Activities | |
Net investment income | | | .05 | | | | .05 | | | | .05 | | | | .06 | | | | .06 | | |
Net realized and unrealized gain (loss) | | | (.04 | ) | | | .01 | | | | .04 | | | | .01 | | | | .05 | | |
Total from investment activities | | | .01 | | | | .06 | | | | .09 | | | | .07 | | | | .11 | | |
Distributions from net investment income | | | (.05 | ) | | | (.05 | ) | | | (.05 | ) | | | (.06 | ) | | | (.06 | ) | |
Net asset value, end of period | | $ | 2.23 | | | $ | 2.27 | | | $ | 2.26 | | | $ | 2.22 | | | $ | 2.21 | | |
| Total Return (excluding account fees) (a) | | | .31 | % | | | 2.67 | % | | | 4.24 | % | | | 2.95 | % | | | 5.00 | % | |
Ratios to Average Net Assets: | |
Net investment income | | | 2.08 | % | | | 2.21 | % | | | 2.39 | % | | | 2.46 | % | | | 2.63 | % | |
Total expenses | | | 1.21 | % | | | 1.25 | % | | | 1.26 | % | | | 1.30 | % | | | 1.53 | % | |
Expenses waived or reimbursed (b) | | | (.76 | )% | | | (.80 | )% | | | (.81 | )% | | | (.85 | )% | | | (1.08 | )% | |
Net expenses (c) | | | .45 | % | | | .45 | % | | | .45 | % | | | .45 | % | | | .45 | % | |
Portfolio turnover rate | | | 6 | % | | | 7 | % | | | — | (e) | | | 1 | % | | | — | (e) | |
Net assets, end of period (in thousands) | | $ | 61,884 | | | $ | 44,509 | | | $ | 35,014 | | | $ | 29,138 | | | $ | 23,337 | | |
(a) Assumes investment at the net asset value at the beginning of the period, reinvestment of all distributions and a complete redemption of the investment at the net asset value at the end of the period.
(b) Expenses waived or reimbursed reflect reductions to total expenses, as discussed in the notes to the financial statements. These amounts would decrease the net investment income ratio and total returns had such reductions not occurred.
(c) The net expense ratios shown above reflect expenses after waivers and reimbursements but exclude the effect of reductions to total expenses for any expenses offset. Expense offset arrangements reduce total expenses, as discussed in the notes to the financial statements. These amounts would decrease the net investment income ratio had such reductions not occurred. The effect of expenses offset are as follows:
| | | Investor Class | |
| | | Year Ended December 31, | |
| | | 2013 | | 2012 | | 2011 | | 2010 | | 2009 | |
Ratios to Average Net Assets: | |
Expenses offset (d) | | | — | | | | — | | | | — | | | | — | | | | — | | |
(d) Effect on the expense ratio was not greater than 0.005%.
(e) Portfolio turnover rate was not greater than 0.5%.
See accompanying notes to financial statements.
169
All American Equity Fund
For a capital share outstanding during the
| | | Investor Class | |
| | | Year Ended December 31, | |
| | | 2013 | | 2012 | | 2011 | | 2010 | | 2009 | |
Net asset value, beginning of period | | $ | 25.40 | | | $ | 22.72 | | | $ | 22.72 | | | $ | 19.60 | | | $ | 17.33 | | |
Investment Activities | |
Net investment income (loss) | | | (.12 | ) | | | .07 | | | | (.07 | ) | | | .02 | | | | (.13 | ) | |
Net realized and unrealized gain | | | 9.08 | | | | 2.61 | | | | .10 | | | | 3.10 | | | | 2.51 | | |
Total from investment activities | | | 8.96 | | | | 2.68 | | | | .03 | | | | 3.12 | | | | 2.38 | | |
Distributions | |
From net investment income | | | (.07 | ) | | | — | | | | (.03 | ) | | | — | | | | (.11 | ) | |
From net realized gains | | | (2.11 | ) | | | — | | | | — | | | | — | | | | — | | |
Total distributions | | | (2.18 | ) | | | — | | | | (.03 | ) | | | — | | | | (.11 | ) | |
Short-Term Trading Fees *(a) | | | — | | | | — | | | | — | | | | — | | | | — | | |
Net asset value, end of period | | $ | 32.18 | | | $ | 25.40 | | | $ | 22.72 | | | $ | 22.72 | | | $ | 19.60 | | |
| Total Return (excluding account fees) (b) | | | 35.55 | % | | | 11.80 | % | | | .14 | % | | | 15.92 | % | | | 13.75 | % | |
Ratios to Average Net Assets: | |
Net investment income (loss) | | | (.45 | )% | | | .28 | % | | | (.32 | )% | | | .10 | % | | | (.74 | )% | |
Total expenses | | | 2.44 | % | | | 2.72 | % | | | 2.42 | % | | | 2.56 | % | | | 2.79 | % | |
Expenses waived or reimbursed (c) | | | (.28 | )% | | | (.52 | )% | | | (.24 | )% | | | (.48 | )% | | | (.96 | )% | |
Net expenses (d) | | | 2.16 | % | | | 2.20 | % | | | 2.18 | % | | | 2.08 | % | | | 1.83 | % | |
Portfolio turnover rate | | | 150 | % | | | 221 | % | | | 223 | % | | | 299 | % | | | 343 | % | |
Net assets, end of period (in thousands) | | $ | 23,388 | | | $ | 16,846 | | | $ | 16,399 | | | $ | 17,760 | | | $ | 16,436 | | |
* Based on average monthly shares outstanding.
(a) The per share amount does not round to a full penny.
(b) Assumes investment at the net asset value at the beginning of the period, reinvestment of all distribution and a complete redemption of the investment at the net asset value at the end of the period.
(c) Expenses waived or reimbursed reflect reductions to total expenses, as discussed in the notes to the financial statements. These amounts would increase the net investment loss ratio or decrease the net investment income ratio, as applicable, and decrease total returns, had such reductions not occurred.
(d) The net expense ratios shown above reflect expenses after waivers and reimbursements but exclude the effect of reductions to total expenses for any expenses offset. Expense offset arrangements reduce total expenses, as discussed in the notes to the financial statements. These amounts would increase the net investment loss ratio, or decrease the net investment income ratio, as applicable, had such reductions not occurred. The effect of expenses offset are as follows:
| | | Investor Class | |
| | | Year Ended December 31, | |
| | | 2013 | | 2012 | | 2011 | | 2010 | | 2009 | |
Ratios to Average Net Assets: | |
Expenses offset (e) | | | — | | | | — | | | | — | | | | — | | | | — | | |
(e) Effect on the expense ratio was not greater than 0.005%.
See accompanying notes to financial statements.
170
Holmes Macro Trends Fund
For a capital share outstanding during the
| | | Investor Class | |
| | | Year Ended December 31, | |
| | | 2013 | | 2012 | | 2011 | | 2010 | | 2009 | |
Net asset value, beginning of period | | $ | 18.51 | | | $ | 17.62 | | | $ | 18.65 | | | $ | 15.54 | | | $ | 12.79 | | |
Investment Activities | |
Net investment loss | | | (.18 | ) | | | (.10 | ) | | | (.26 | ) | | | (.22 | ) | | | (.13 | ) | |
Net realized and unrealized gain (loss) | | | 7.42 | | | | 1.29 | | | | (.77 | ) | | | 3.54 | | | | 2.88 | | |
Total from investment activities | | | 7.24 | | | | 1.19 | | | | (1.03 | ) | | | 3.32 | | | | 2.75 | | |
Distributions | |
From net investment income | | | — | | | | — | | | | — | | | | (.21 | ) | | | — | | |
From net realized gains | | | (1.51 | ) | | | (.30 | ) | | | — | | | | — | | | | — | | |
Total distributions | | | (1.51 | ) | | | (.30 | ) | | | — | | | | (.21 | ) | | | — | | |
Short-Term Trading Fees *(a) | | | — | | | | — | | | | — | | | | — | | | | — | | |
Net asset value, end of period | | $ | 24.24 | | | $ | 18.51 | | | $ | 17.62 | | | $ | 18.65 | | | $ | 15.54 | | |
| Total Return (excluding account fees) (b) | | | 39.38 | % | | | 6.77 | % | | | (5.52 | )% | | | 21.35 | % | | | 21.50 | % | |
Ratios to Average Net Assets: | |
Net investment loss | | | (1.11 | )% | | | (.51 | )% | | | (1.25 | )% | | | (1.29 | )% | | | (.93 | )% | |
Total expenses | | | 2.00 | % | | | 1.85 | % | | | 2.00 | % | | | 1.93 | % | | | 2.10 | % | |
Expenses waived or reimbursed (c) | | | (.04 | )% | | | — | (e) | | | — | | | | — | (e) | | | (.33 | )% | |
Net expenses (d) | | | 1.96 | % | | | 1.85 | % | | | 2.00 | % | | | 1.93 | % | | | 1.77 | % | |
Portfolio turnover rate | | | 109 | % | | | 214 | % | | | 210 | % | | | 160 | % | | | 219 | % | |
Net assets, end of period (in thousands) | | $ | 55,926 | | | $ | 34,639 | | | $ | 35,316 | | | $ | 40,604 | | | $ | 37,149 | | |
* Based on average monthly shares outstanding.
(a) The per share amount does not round to a full penny.
(b) Assumes investment at the net asset value at the beginning of the period, reinvestment of all distributions and a complete redemption of the investment at the net asset value at the end of the period.
(c) Expenses waived or reimbursed reflect reductions to total expenses, as discussed in the notes to the financial statements. These amounts would increase the net investment loss ratio or decrease the net investment income ratio, as applicable, and decrease total returns had such reductions not occurred.
(d) The net expense ratios shown above reflect expenses after waivers and reimbursements but exclude the effect of reductions to total expenses for any expenses offset. Expense offset arrangements reduce total expenses, as discussed in the notes to the financial statements. These amounts would increase the net investment loss ratio, or decrease the net investment income ratio, as applicable, had such reductions not occurred. The effect of expenses offset are as follows:
| | | Investor Class | |
| | | Year Ended December 31, | |
| | | 2013 | | 2012 | | 2011 | | 2010 | | 2009 | |
Ratios to Average Net Assets: | |
Expenses offset (e) | | | — | | | | — | | | | — | | | | — | | | | — | | |
(e) Effect on the expense ratio was not greater than 0.005%.
See accompanying notes to financial statements.
171
Global Resources Fund
For a capital share outstanding during the
| | | Investor Class | |
| | | Year Ended December 31, | |
| | | 2013 | | 2012 | | 2011 | | 2010 | | 2009 | |
Net asset value, beginning of period | | $ | 9.79 | | | $ | 9.36 | | | $ | 11.91 | | | $ | 8.85 | | | $ | 5.26 | | |
Investment Activities | |
Net investment income (loss) | | | .02 | * | | | .04 | * | | | (.19 | ) | | | (.09 | ) | | | (.01 | ) | |
Net realized and unrealized gain (loss) | | | (.10 | )* | | | .61 | * | | | (2.02 | ) | | | 3.44 | | | | 3.60 | | |
Total from investment activities | | | (.08 | ) | | | .65 | | | | (2.21 | ) | | | 3.35 | | | | 3.59 | | |
Distributions from net investment income | | | (.35 | ) | | | (.22 | ) | | | (.34 | ) | | | (.29 | ) | | | — | | |
Short-Term Trading Fees *(a) | | | — | | | | — | | | | — | | | | — | | | | — | | |
Net asset value, end of period | | $ | 9.36 | | | $ | 9.79 | | | $ | 9.36 | | | $ | 11.91 | | | $ | 8.85 | | |
| Total Return (excluding account fees) (b) | | | (.72 | )% | | | 6.93 | % | | | (18.69 | )% | | | 38.00 | % | | | 68.25 | % | |
Ratios to Average Net Assets: | |
Net investment income (loss) | | | .16 | % | | | .44 | % | | | (.79 | )% | | | (1.04 | )% | | | (.08 | )% | |
Total expenses | | | 1.59 | % | | | 1.57 | % | | | 1.72 | % | | | 1.73 | % | | | 1.64 | % | |
Expenses waived or reimbursed (c) | | | — | | | | — | | | | — | | | | — | | | | (.17 | )% | |
Net expenses (d) | | | 1.59 | % | | | 1.57 | % | | | 1.72 | % | | | 1.73 | % | | | 1.47 | % | |
Portfolio turnover rate (f) | | | 138 | % | | | 117 | % | | | 232 | % | | | 145 | % | | | 189 | % | |
Net assets, end of period (in thousands) | | $ | 326,320 | | | $ | 438,372 | | | $ | 551,793 | | | $ | 911,559 | | | $ | 740,072 | | |
* Based on average monthly shares outstanding.
(a) The per share amount does not round to a full penny.
(b) Assumes investment at the net asset value at the beginning of the period, reinvestment of all distributions and a complete redemption of the investment at the net asset value at the end of the period.
(c) Expenses waived or reimbursed reflect reductions to total expenses, as discussed in the notes to the financial statements. These amounts would increase the net investment loss ratio or decrease the net investment income ratio, as applicable, and decrease total returns had such reductions not occurred.
(d) The net expense ratios shown above reflect expenses after waivers and reimbursements but exclude the effect of reductions to total expenses for any expenses offset. Expense offset arrangements reduce total expenses, as discussed in the notes to the financial statements. These amounts would increase the net investment loss ratio, or decrease the net investment income ratio, as applicable, had such reductions not occurred. The effect of expenses offset are as follows:
| | | Investor Class | |
| | | Year Ended December 31, | |
| | | 2013 | | 2012 | | 2011 | | 2010 | | 2009 | |
Ratios to Average Net Assets: | |
Expenses offset (e) | | | — | | | | — | | | | — | | | | — | | | | — | | |
(e) Effect on the expense ratio was not greater than 0.005%.
(f) Portfolio turnover rate is calculated at the fund level.
See accompanying notes to financial statements.
172
Global Resources Fund
For a capital share outstanding during the
| | | Institutional Class | |
| | | Year Ended December 31, | | Period
Ended
December 31, | |
| | | 2013 | | 2012 | | 2011 | | 2010 (a) | |
Net asset value, beginning of period | | $ | 9.74 | | | $ | 9.39 | | | $ | 11.98 | | | $ | 8.87 | | |
Investment Activities | |
Net investment income (loss) | | | .07 | * | | | .10 | * | | | — | *(b) | | | (.01 | ) | |
Net realized and unrealized gain (loss) | | | (.10 | )* | | | .60 | * | | | (2.17 | )* | | | 3.41 | | |
Total from investment activities | | | (.03 | ) | | | .70 | | | | (2.17 | ) | | | 3.40 | | |
Distributions from net investment income | | | (.41 | ) | | | (.35 | ) | | | (.42 | ) | | | (.29 | ) | |
Short-Term Trading Fees *(b) | | | — | | | | — | | | | — | | | | — | | |
Net asset value, end of period | | $ | 9.30 | | | $ | 9.74 | | | $ | 9.39 | | | $ | 11.98 | | |
| Total Return (excluding account fees) (c) | | | (.15 | )% | | | 7.44 | % | | | (18.23 | )% | | | 38.53 | % | |
Ratios to Average Net Assets: (d) | |
Net investment income (loss) | | | .68 | % | | | 1.02 | % | | | (.02 | )% | | | (.35 | )% | |
Total expenses | | | 1.25 | % | | | 1.21 | % | | | 1.29 | % | | | 1.74 | % | |
Expenses waived or reimbursed (e) | | | (.22 | )% | | | (.14 | )% | | | (.20 | )% | | | (.66 | )% | |
Net expenses (f) | | | 1.03 | % | | | 1.07 | % | | | 1.09 | % | | | 1.08 | % | |
Portfolio turnover rate (h) | | | 138 | % | | | 117 | % | | | 232 | % | | | 145 | % | |
Net assets, end of period (in thousands) | | $ | 51,122 | | | $ | 94,076 | | | $ | 55,985 | | | $ | 17,923 | | |
* Based on average monthly shares outstanding.
(a) From March 1, 2010, commencement of operations.
(b) The per share amount does not round to a full penny.
(c) Total returns for periods less than one year are not annualized. Assumes investment at the net asset value at the beginning of the period, reinvestment of all distributions and a complete redemption of the investment at the net asset value at the end of the period.
(d) Ratios are annualized for periods of less than one year.
(e) Expenses waived or reimbursed reflect reductions to total expenses, as discussed in the notes to the financial statements. These amounts would increase the net investment loss ratio or decrease the net investment income ratio, as applicable, and decrease total returns had such reductions not occurred.
(f) The net expense ratios shown above reflect expenses after waivers and reimbursements but exclude the effect of reductions to total expenses for any expenses offset. Expense offset arrangements reduce total expenses, as discussed in the notes to the financial statements. These amounts would increase the net investment loss ratio, or decrease the net investment income ratio, as applicable, had such reductions not occurred. The effect of expenses offset are as follows:
| | | Institutional Class | |
| | | Year Ended December 31, | | Period
Ended
December 31, | |
| | | 2013 | | 2012 | | 2011 | | 2010 (a) | |
Ratios to Average Net Assets: (d) | |
Expenses offset (g) | | | — | | | | — | | | | — | | | | — | | |
(g) Effect on the expense ratio was not greater than 0.005%.
(h) Portfolio turnover rate is calculated at the fund level.
See accompanying notes to financial statements.
173
World Precious Minerals Fund
For a capital share outstanding during the
| | | Investor Class | |
| | | Year Ended December 31, | |
| | | 2013 | | 2012 | | 2011 | | 2010 | | 2009 | |
Net asset value, beginning of period | | $ | 11.70 | | | $ | 13.18 | | | $ | 22.28 | | | $ | 17.42 | | | $ | 9.56 | | |
Investment Activities | |
Net investment loss | | | (.07 | )* | | | (.11 | )* | | | (.32 | ) | | | (.32 | )* | | | (.18 | ) | |
Net realized and unrealized gain (loss) | | | (5.94 | )* | | | (1.37 | )* | | | (6.76 | ) | | | 8.16 | * | | | 8.71 | | |
Total from investment activities | | | (6.01 | ) | | | (1.48 | ) | | | (7.08 | ) | | | 7.84 | | | | 8.53 | | |
Distributions from net investment income | | | — | | | | — | | | | (2.02 | ) | | | (2.98 | ) | | | (.67 | ) | |
Short-Term Trading Fees *(a) | | | — | | | | — | | | | — | | | | — | | | | — | | |
Net asset value, end of period | | $ | 5.69 | | | $ | 11.70 | | | $ | 13.18 | | | $ | 22.28 | | | $ | 17.42 | | |
| Total Return (excluding account fees) (b) | | | (51.37 | )% | | | (11.23 | )% | | | (32.58 | )% | | | 45.38 | % | | | 89.50 | % | |
Ratios to Average Net Assets: | |
Net investment loss | | | (.90 | )% | | | (.85 | )% | | | (1.43 | )% | | | (1.68 | )% | | | (1.32 | )% | |
Total expenses | | | 1.85 | % | | | 1.45 | % | | | 1.67 | % | | | 1.84 | % | | | 1.75 | % | |
Expenses waived or reimbursed (c) | | | (.02 | )% | | | — | | | | — | | | | — | | | | (.17 | )% | |
Net expenses (d) | | | 1.83 | % | | | 1.45 | % | | | 1.67 | % | | | 1.84 | % | | | 1.58 | % | |
Portfolio turnover rate (f) | | | 34 | % | | | 44 | % | | | 96 | % | | | 68 | % | | | 72 | % | |
Net assets, end of period (in thousands) | | $ | 134,065 | | | $ | 319,052 | | | $ | 436,504 | | | $ | 826,598 | | | $ | 639,035 | | |
* Based on average monthly shares outstanding.
(a) The per share amount does not round to a full penny.
(b) Assumes investment at the net asset value at the beginning of the period, reinvestment of all distributions and a complete redemption of the investment at the net asset value at the end of the period.
(c) Expenses waived or reimbursed reflect reductions to total expenses, as discussed in the notes to the financial statements. These amounts would increase the net investment loss ratio or decrease the net investment income ratio, as applicable, and decrease total returns had such reductions not occurred.
(d) The net expense ratios shown above reflect expenses after waivers and reimbursements but exclude the effect of reductions to total expenses for any expenses offset. Expense offset arrangements reduce total expenses, as discussed in the notes to the financial statements. These amounts would increase the net investment loss ratio, or decrease the net investment income ratio, as applicable, had such reductions not occurred. The effect of expenses offset are as follows:
| | | Investor Class | |
| | | Year Ended December 31, | |
| | | 2013 | | 2012 | | 2011 | | 2010 | | 2009 | |
Ratios to Average Net Assets: | |
Expenses offset (e) | | | — | | | | — | | | | — | | | | — | | | | — | | |
(e) Effect on the expense ratio was not greater than 0.005%.
(f) Portfolio turnover rate is calculated at the fund level.
See accompanying notes to financial statements.
174
World Precious Minerals Fund
For a capital share outstanding during the
| | | Institutional Class | |
| | | Year Ended December 31, | | Period
Ended
December 31, | |
| | | 2013 | | 2012 | | 2011 | | 2010 (a) | |
Net asset value, beginning of period | | $ | 11.69 | | | $ | 13.10 | | | $ | 22.29 | | | $ | 17.36 | | |
Investment Activities | |
Net investment loss | | | (.01 | )* | | | (.04 | )* | | | (.16 | )* | | | (.10 | )* | |
Net realized and unrealized gain (loss) | | | (5.96 | )* | | | (1.37 | )* | | | (6.84 | )* | | | 8.14 | * | |
Total from investment activities | | | (5.97 | ) | | | (1.41 | ) | | | (7.00 | ) | | | 8.04 | | |
Distributions from net investment income | | | — | | | | — | | | | (2.19 | ) | | | (3.11 | ) | |
Short-Term Trading Fees | | | — | | | | — | | | | — | | | | — | | |
Net asset value, end of period | | $ | 5.72 | | | $ | 11.69 | | | $ | 13.10 | | | $ | 22.29 | | |
| Total Return (excluding account fees) (b) | | | (51.07 | )% | | | (10.76 | )% | | | (32.28 | )% | | | 46.72 | % | |
Ratios to Average Net Assets: (c) | |
Net investment loss | | | (.15 | )% | | | (.32 | )% | | | (.87 | )% | | | (.86 | )% | |
Total expenses | | | 3.30 | % | | | 3.56 | % | | | 2.38 | % | | | 15.19 | % | |
Expenses waived or reimbursed (d) | | | (1.97 | )% | | | (2.69 | )% | | | (1.27 | )% | | | (14.06 | )% | |
Net expenses (e) | | | 1.33 | % | | | .87 | % | | | 1.11 | % | | | 1.13 | % | |
Portfolio turnover rate (g) | | | 34 | % | | | 44 | % | | | 96 | % | | | 68 | % | |
Net assets, end of period (in thousands) | | $ | 3,660 | | | $ | 769 | | | $ | 1,683 | | | $ | 2,233 | | |
* Based on average monthly shares outstanding.
(a) From March 1, 2010, commencement of operations.
(b) Total returns for periods less than one year are not annualized. Assumes investment at the net asset value at the beginning of the period, reinvestment of all distributions and a complete redemption of the investment at the net asset value at the end of the period.
(c) Ratios are annualized for periods of less than one year.
(d) Expenses waived or reimbursed reflect reductions to total expenses, as discussed in the notes to the financial statements. These amounts would increase the net investment loss ratio or decrease the net investment income ratio, as applicable, and decrease total returns had such reductions not occurred.
(e) The net expense ratios shown above reflect expenses after waivers and reimbursements but exclude the effect of reductions to total expenses for any expenses offset. Expense offset arrangements reduce total expenses, as discussed in the notes to the financial statements. These amounts would increase the net investment loss ratio, or decrease the net investment income ratio, as applicable, had such reductions not occurred. The effect of expenses offset are as follows:
| | | Institutional Class | |
| | | Year Ended December 31, | | Period
Ended
December 31, | |
| | | 2013 | | 2012 | | 2011 | | 2010 (a) | |
Ratios to Average Net Assets: (c) | |
Expenses offset (f) | | | — | | | | — | | | | — | | | | — | | |
(f) Effect on the expense ratio was not greater than 0.005%.
(g) Portfolio turnover rate is calculated at the fund level.
See accompanying notes to financial statements.
175
Gold and Precious Metals Fund
For a capital share outstanding during the
| | | Investor Class | |
| | | Year Ended December 31, | |
| | | 2013 | | 2012 | | 2011 | | 2010 | | 2009 | |
Net asset value, beginning of period | | $ | 11.78 | | | $ | 12.61 | | | $ | 19.60 | | | $ | 15.46 | | | $ | 10.83 | | |
Investment Activities | |
Net investment loss | | | (.06 | ) | | | (.09 | ) | | | (.17 | ) | | | (.21 | ) | | | (.17 | ) | |
Net realized and unrealized gain (loss) | | | (5.72 | ) | | | (.72 | ) | | | (4.28 | ) | | | 5.91 | | | | 4.84 | | |
Total from investment activities | | | (5.78 | ) | | | (.81 | ) | | | (4.45 | ) | | | 5.70 | | | | 4.67 | | |
Distributions | |
From net investment income | | | — | | | | (.02 | ) | | | — | | | | (.26 | ) | | | (.04 | ) | |
From net realized gains | | | — | | | | — | | | | (2.54 | ) | | | (1.31 | ) | | | — | | |
Total distributions | | | — | | | | (.02 | ) | | | (2.54 | ) | | | (1.57 | ) | | | (.04 | ) | |
Short-Term Trading Fees * | | | — | (a) | | | — | (a) | | | — | (a) | | | .01 | | | | — | (a) | |
Net asset value, end of period | | $ | 6.00 | | | $ | 11.78 | | | $ | 12.61 | | | $ | 19.60 | | | $ | 15.46 | | |
| Total Return (excluding account fees) (b) | | | (49.07 | )% | | | (6.44 | )% | | | (23.97 | )% | | | 36.88 | % | | | 43.11 | % | |
Ratios to Average Net Assets: | |
Net investment loss | | | (.48 | )% | | | (.60 | )% | | | (1.06 | )% | | | (1.46 | )% | | | (1.16 | )% | |
Total expenses | | | 2.12 | % | | | 1.61 | % | | | 1.56 | % | | | 1.80 | % | | | 1.69 | % | |
Expenses waived or reimbursed (c) | | | (.06 | )% | | | — | | | | — | | | | — | | | | (.15 | )% | |
Net expenses (d) | | | 2.06 | % | | | 1.61 | % | | | 1.56 | % | | | 1.80 | % | | | 1.54 | % | |
Portfolio turnover rate | | | 64 | % | | | 95 | % | | | 155 | % | | | 103 | % | | | 135 | % | |
Net assets, end of period (in thousands) | | $ | 74,627 | | | $ | 166,524 | | | $ | 195,087 | | | $ | 300,949 | | | $ | 234,393 | | |
* Based on average monthly shares outstanding.
(a) The per share amount does not round to a full penny.
(b) Assumes investment at the net asset value at the beginning of the period, reinvestment of all distributions and a complete redemption of the investment at the net asset value at the end of the period.
(c) Expenses waived or reimbursed reflect reductions to total expenses, as discussed in the notes to the financial statements. These amounts would increase the net investment loss ratio or decrease the net investment income ratio, as applicable, and decrease total returns had such reductions not occurred.
(d) The net expense ratios shown above reflect expenses after waivers and reimbursements but exclude the effect of reductions to total expenses for any expenses offset. Expense offset arrangements reduce total expenses, as discussed in the notes to the financial statements. These amounts would increase the net investment loss ratio, or decrease the net investment income ratio, as applicable, had such reductions not occurred. The effect of expenses offset are as follows:
| | | Investor Class | |
| | | Year Ended December 31, | |
| | | 2013 | | 2012 | | 2011 | | 2010 | | 2009 | |
Ratios to Average Net Assets: | |
Expenses offset (e) | | | — | | | | — | | | | — | | | | — | | | | — | | |
(e) Effect on the expense ratio was not greater than 0.005%.
See accompanying notes to financial statements.
176
Emerging Europe Fund
For a capital share outstanding during the
| | | Investor Class | |
| | | Year Ended December 31, | |
| | | 2013 | | 2012 | | 2011 | | 2010 | | 2009 | |
Net asset value, beginning of period | | $ | 9.23 | | | $ | 7.79 | | | $ | 10.81 | | | $ | 9.11 | | | $ | 5.12 | | |
Investment Activities | |
Net investment income (loss) | | | .19 | | | | .15 | | | | .03 | | | | (.04 | ) | | | — | (a) | |
Net realized and unrealized gain (loss) | | | (.46 | ) | | | 1.35 | | | | (3.05 | ) | | | 1.74 | | | | 3.99 | | |
Total from investment activities | | | (.27 | ) | | | 1.50 | | | | (3.02 | ) | | | 1.70 | | | | 3.99 | | |
Distributions from net investment income | | | (.14 | ) | | | (.06 | ) | | | — | | | | — | | | | — | | |
Short-Term Trading Fees *(a) | | | — | | | | — | | | | — | | | | — | | | | — | | |
Net asset value, end of period | | $ | 8.82 | | | $ | 9.23 | | | $ | 7.79 | | | $ | 10.81 | | | $ | 9.11 | | |
| Total Return (excluding account fees) (b) | | | (2.93 | )% | | | 19.27 | % | | | (27.94 | )% | | | 18.66 | % | | | 77.93 | % | |
Ratios to Average Net Assets: | |
Net investment income (loss) | | | 1.59 | % | | | 1.39 | % | | | .25 | % | | | (.36 | )% | | | — | (e) | |
Total expenses | | | 2.13 | % | | | 2.15 | % | | | 1.98 | % | | | 1.91 | % | | | 2.04 | % | |
Expenses waived or reimbursed (c) | | | — | | | | — | | | | — | | | | — | | | | (.08 | )% | |
Net expenses (d) | | | 2.13 | % | | | 2.15 | % | | | 1.98 | % | | | 1.91 | % | | | 1.96 | % | |
Portfolio turnover rate | | | 74 | % | | | 85 | % | | | 85 | % | | | 69 | % | | | 80 | % | |
Net assets, end of period (in thousands) | | $ | 122,570 | | | $ | 173,687 | | | $ | 193,599 | | | $ | 440,037 | | | $ | 464,409 | | |
* Based on average monthly shares outstanding.
(a) The per share amount does not round to a full penny.
(b) Assumes investment at the net asset value at the beginning of the period, reinvestment of all distributions and a complete redemption of the investment at the net asset value at the end of the period.
(c) Expenses waived or reimbursed reflect reductions to total expenses, as discussed in the notes to the financial statements. These amounts would increase the net investment loss ratio or decrease the net investment income ratio, as applicable, and decrease total returns had such reductions not occurred.
(d) The net expense ratios shown above reflect expenses after waivers and reimbursements but exclude the effect of reductions to total expenses for any expenses offset. Expense offset arrangements reduce total expenses, as discussed in the notes to the financial statements. These amounts would increase the net investment loss ratio, or decrease the net investment income ratio, as applicable, had such reductions not occurred. The effect of expenses offset are as follows:
| | | Investor Class | |
| | | Year Ended December 31, | |
| | | 2013 | | 2012 | | 2011 | | 2010 | | 2009 | |
Ratios to Average Net Assets: | |
Expenses offset (e) | | | — | | | | — | | | | — | | | | — | | | | — | | |
(e) Effect on the ratio was not greater than 0.005%.
See accompanying notes to financial statements.
177
China Region Fund
For a capital share outstanding during the
| | | Investor Class | |
| | | Year Ended December 31, | |
| | | 2013 | | 2012 | | 2011 | | 2010 | | 2009 | |
Net asset value, beginning of period | | $ | 7.61 | | | $ | 6.81 | | | $ | 9.47 | | | $ | 8.36 | | | $ | 5.59 | | |
Investment Activities | |
Net investment income (loss) | | | (.01 | ) | | | .04 | | | | (.08 | ) | | | (.12 | ) | | | (.05 | ) | |
Net realized and unrealized gain (loss) | | | .70 | | | | .78 | | | | (2.59 | ) | | | 1.22 | | | | 2.81 | | |
Total from investment activities | | | .69 | | | | .82 | | | | (2.67 | ) | | | 1.10 | | | | 2.76 | | |
Distributions from net investment income | | | (.02 | ) | | | (.02 | ) | | | — | | | | — | | | | — | | |
Short-Term Trading Fees * | | | — | (a) | | | — | (a) | | | .01 | | | | .01 | | | | .01 | | |
Net asset value, end of period | | $ | 8.28 | | | $ | 7.61 | | | $ | 6.81 | | | $ | 9.47 | | | $ | 8.36 | | |
| Total Return (excluding account fees) (b) | | | 9.07 | % | | | 12.00 | % | | | (28.09 | )% | | | 13.28 | % | | | 49.55 | % | |
Ratios to Average Net Assets: | |
Net investment income (loss) | | | (.12 | )% | | | .60 | % | | | (.64 | )% | | | (1.02 | )% | | | (.79 | )% | |
Total expenses | | | 2.75 | % | | | 2.64 | % | | | 2.49 | % | | | 2.39 | % | | | 2.47 | % | |
Expenses waived or reimbursed (c) | | | (.37 | )% | | | (.39 | )% | | | (.08 | )% | | | — | | | | (.45 | )% | |
Net expenses (d) | | | 2.38 | % | | | 2.25 | % | | | 2.41 | % | | | 2.39 | % | | | 2.02 | % | |
Portfolio turnover rate | | | 201 | % | | | 374 | % | | | 426 | % | | | 242 | % | | | 327 | % | |
Net assets, end of period (in thousands) | | $ | 26,386 | | | $ | 29,160 | | | $ | 30,635 | | | $ | 51,843 | | | $ | 56,323 | | |
* Based on average monthly shares outstanding.
(a) The per share amount does not round to a full penny.
(b) Assumes investment at the net asset value at the beginning of the period, reinvestment of all distributions and a complete redemption of the investment at the net asset value at the end of the period.
(c) Expenses waived or reimbursed reflect reductions to total expenses, as discussed in the notes to the financial statements. These amounts would increase the net investment loss ratio or decrease the net investment income ratio, as applicable, and decrease total returns had such reduction not occurred.
(d) The net expense ratios shown above reflect expenses after waivers and reimbursements but exclude the effect of reductions to total expenses for any expenses offset. Expense offset arrangements reduce total expenses, as discussed in the notes to financial statements. These amounts would increase the net investment loss ratio, or decrease the net investment income ratio, as applicable, had such reductions not occurred. The effect of expenses offset are as follows:
| | | Investor Class | |
| | | Year Ended December 31, | |
| | | 2013 | | 2012 | | 2011 | | 2010 | | 2009 | |
Ratios to Average Net Assets: | |
Expenses offset (e) | | | — | | | | — | | | | — | | | | — | | | | — | | |
(e) Effect on the expense ratio was not greater than 0.005%.
See accompanying notes to financial statements.
178
Report of Independent Registered Public Accounting Firm
The Board of Trustees and Shareholders
of U.S. Global Investors Funds:
We have audited the accompanying statements of assets and liabilities of the U.S. Government Securities Ultra-Short Bond Fund (formerly U.S. Government Securities Savings Fund), Near-Term Tax Free Fund, All American Equity Fund, Holmes Macro Trends Fund (formerly Holmes Growth Fund), Global Resources Fund, World Precious Minerals Fund, Gold and Precious Metals Fund, Emerging Europe Fund (formerly Eastern European Fund), and China Region Fund, each a fund within the U.S. Global Investors Funds (the Trust), including the portfolios of investments as of December 31, 2013 and the related statements of operations for the year then ended, statements of changes in net assets for each of the years in the two-year period then ended, and the financial highlights for each of the years or periods in the five-year period then ended. These financial statements and financial highlights are the responsibility of the Trust's management. Our responsibility is to express an opinion on these financial statements and financial highlights based on our audits.
We conducted our audits in accordance with the standards of the Public Company Accounting Oversight Board (United States). Those standards require that we plan and perform the audit to obtain reasonable assurance about whether the financial statements and financial highlights are free of material misstatement. An audit includes examining, on a test basis, evidence supporting the amounts and disclosures in the financial statements. Our procedures included confirmation of securities owned as of December 31, 2013, by correspondence with the custodian and brokers or by other appropriate auditing procedures. An audit also includes assessing the accounting principles used and significant estimates made by management, as well as evaluating the overall financial statement presentation. We believe that our audits provide a reasonable basis for our opinion.
In our opinion, the financial statements and financial highlights referred to above present fairly, in all material respects, the financial position of each of the funds within the U.S. Global Investors Funds listed above, as of December 31, 2013, and the results of their operations for the year then ended, the changes in their net assets for each of the years in the two-year period then ended and financial highlights for each of the years or periods in the five-year period then ended, in conformity with U.S. generally accepted accounting principles.
Boston, Massachusetts
February 25, 2014
179
Trustees and Officers (unaudited) December 31, 2013
The following table presents information about the Trustees as of December 31, 2013, together with a brief description of their principal occupations during the last five years. The Agreement and Declaration of Trust provides that each trustee shall serve as a trustee of the Trust during the lifetime of this Trust and until its termination except as such trustee sooner dies, resigns or is removed. In addition, each trustee who is not an "interested person" of the Trust shall be required to retire in accordance with the terms of any retirement policy then in effect that has been approved by a majority vote of all independent trustees. The current retirement policy provides that the retirement age for non-interested trustees is 75 years of age. If you would like more information about the Trustees, you may call 1-800-US-FUNDS (1-800-873-8637) to request a free copy of the Statement of Additional Information.
The business address of each is 7900 Callaghan Road, San Antonio, TX 78229.
Non-Interested Trustees | |
Name (Age)
Positions Held with Trust
Length of Time Served*
Number of Portfolios in Fund
Complex Overseen by Trustee | | Principal Occupation(s) and Previous Positions
During Past 5 Years and Other Directorships Held | |
J. Michael Belz (60)
Trustee
November 1998 to present
Nine portfolios | | Principal Occupation: President and Chief Executive Officer of Catholic Life Insurance since 1984.
Other Directorships Held: Director, Broadway National Bank from October 2003 to present. | |
James F. Gaertner (70)
Trustee
November 2002 to present
Nine portfolios | | Principal Occupation: President Emeritus, Sam Houston State University. Served as President from August 2001 to August 2010.
Other Directorships Held: None. | |
Clark R. Mandigo (70)
Trustee
May 1993 to present
Nine portfolios | | Principal Occupation: Restaurant operator, business consultant from 1991 to present.
Other Directorships Held: None. | |
Joe C. McKinney (67)
Trustee
October 2008 to present
Nine portfolios | | Principal Occupation: Vice Chairman, Broadway National Bank from October 2002 to present.
Other Directorships Held: Director, Broadway National Bank from October 2002 to present; Director, USAA Real Estate Company from September 2004 to present; Director, Luby's, Inc. from January 2003 to present. | |
* These dates include service for a predecessor trust.
180
Trustees and Officers (unaudited) December 31, 2013
Interested Trustee | |
Name (Age)
Positions Held with Trust
Length of Time Served*
Number of Portfolios in Fund
Complex overseen by Trustee | | Principal Occupation(s) and Previous Positions
During Past 5 Years and Other Directorships Held | |
Frank E. Holmes ** (58)
Trustee, Chief Executive
Officer, Chief Investment
Officer, President
January 1990 to present
Nine portfolios | | Principal Occupation: Director, Chief Executive Officer, and Chief Investment Officer of the Adviser. Since October 1989, Mr. Holmes has served and continues to serve in various positions with the Adviser, its subsidiaries, and the investment companies it sponsors.
Other Directorships Held: Director, Galileo Global Equity Advisors Inc. from March 2013 to present. | |
* These dates include service for a predecessor trust.
** Mr. Holmes is an "interested person" of the Trust by virtue of his positions with U.S. Global Investors, Inc.
The following table presents information about each Officer of the Trust as of December 31, 2013, together with a brief description of their principal occupations during the last five years. Each holds office until his or her successor is duly elected and qualified. The business address of each is 7900 Callaghan Road, San Antonio, TX 78229.
Officers | |
Name (Age)
Positions Held with Trust
Length of Time Served* | | Principal Occupation(s) During Past 5 Years | |
Frank E. Holmes (58)
Trustee, Chief Executive
Officer, Chief Investment
Officer, President
January 1990 to present | | Director, Chief Executive Officer, and Chief Investment Officer of the Adviser. Since October 1989, Mr. Holmes has served and continues to serve in various positions with the Adviser, its subsidiaries, and the investment companies it sponsors. | |
Susan B. McGee (54)
Executive Vice President,
Secretary, General Counsel
March 1997 to present | | President and General Counsel of the Adviser. Since September 1992, Ms. McGee has served and continues to serve in various positions with the Adviser, its subsidiaries, and the investment companies it sponsors. | |
Lisa C. Callicotte (40)
Treasurer
July 2013 to present | | Chief Financial Officer of the Adviser. Since July 2009, Ms. Callicotte has served and continues to serve in various positions with the Adviser, its subsidiaries, and the investment companies it sponsors. Auditor with Ernst & Young LLP from January 1997 to July 2009. | |
James L. Love, Jr. (45)
Chief Compliance Officer
September 2007 to present | | Chief Compliance Officer and Deputy General Counsel of the Adviser. Since September 2007, Mr. Love has served and continues to serve in various positions with the Adviser, its subsidiaries, and the investment companies it sponsors. | |
Susan K. Filyk (44)
Vice President, Marketing
December 2008 to present | | Director of Marketing of the Adviser since August 2007. Ms. Filyk has served and continues to serve in various positions with the Adviser, its subsidiaries, and the investment companies it sponsors. | |
* These dates include service for a predecessor trust.
181
Additional Information (unaudited)
Additional Federal Tax Information
The percentage of tax-exempt dividends paid by the Funds for the year ended December 31, 2013, was:
Near-Term Tax Free | | | 96.34 | % | |
Tax Free | | | 88.69 | %* | |
The percentage of ordinary income dividends paid by the Funds during the year ended December 31, 2013, which qualify as Qualified Dividends Income (QDI) and the Dividends Received Deduction (DRD) available to corporate shareholders was:
| | Qualified Dividend
Income | | Dividend Received
Deduction | |
All American Equity | | | 48.30 | % | | | 53.17 | % | |
Holmes Macro Trends | | | 24.06 | % | | | 22.84 | % | |
MegaTrends | | | 100.00 | %* | | | 100.00 | %* | |
Global Resources | | | 52.44 | % | | | 34.60 | % | |
Emerging Europe | | | 100.00 | % | | | 9.37 | % | |
China Region | | | 100.00 | % | | | 14.24 | % | |
The amounts which represent foreign source income and foreign taxes paid during the year ended December 31, 2013, are as follows:
| | Foreign Source
Income | | Foreign Tax
Credit | |
Global Resources | | $ | 1,871,752 | | | $ | 102,839 | | |
Emerging Europe | | $ | 5,982,276 | | | $ | 784,383 | | |
China Region | | $ | 637,811 | | | $ | 25,755 | | |
In early 2014, the Funds reported on Form 1099-DIV the tax status of all distributions made during the 2013 calendar year. The Funds intend to distribute the maximum amount of qualified dividend income allowable. The amount of qualified dividend income distributed by each fund will be reported to shareholders on their Form 1099-DIV. Shareholders should use the information on Form 1099-DIV for their income tax returns.
* The percentage is calculated through the merger date of December 20, 2013.
Proxy Voting
A description of the policies and procedures that the Funds use to determine how to vote proxies relating to portfolio securities is available without charge, upon request, by calling 1-800-US-FUNDS (1-800-873-8637). It also appears in the Funds' statement of additional information (Form 485B), which can be found on the SEC's website at www.sec.gov.
Information regarding how the Funds voted proxies relating to portfolio securities during the most recent 12-month period ended June 30 is available without charge, upon request, by calling 1-800-US-FUNDS (1-800-873-8637) or accessing the Funds' Form N-PX on the SEC's website at www.sec.gov.
182
Additional Information (unaudited)
Availability of Quarterly Portfolio Schedules
The Funds provide complete lists of holdings four times in each fiscal year, at the quarter-ends. For the second and fourth quarters, the lists appear in the Funds' semi-annual and annual reports to shareholders. For the first and third quarters, the Funds file the lists with the SEC on Form N-Q. Shareholders can look up the Funds' Forms N-Q on the SEC's website at www.sec.gov. You may also visit or call the SEC's Public Room in Washington, D.C. (1-202-942-8090) or send a request plus a duplicating fee to the SEC, Public Reference Section, Washington, DC 20549-0102 or by electronic request at the following e-mail address: publicinfo@sec.gov.
Approval of the Advisory Agreement for Each Fund
On August 23, 2013, the Board of Trustees (the "Board") of U.S. Global Investors Funds (the "Trust"), including all the trustees who are not "interested persons" of the Trust (the "Independent Trustees"), approved continuation of the advisory agreement with U.S. Global Investors, Inc. (the "Adviser") for each fund for an additional one-year term ending October 1, 2014.
In considering approval of the agreement, the Board reviewed a variety of materials relating to each fund and the Adviser, including (i) the nature, extent and quality of services provided; (ii) a comparison of services rendered and amounts paid to other registered investment companies, including other registered investment companies managed by the Adviser, and other accounts managed by the Adviser; (iii) the investment performance of the fund measured against appropriate benchmarks; (iv) the costs of services provided and estimated profits realized by the Adviser (and its affiliates); (v) the extent to which economies of scale are realized as the fund grows; (vi) whether fee levels reflect any possible economies of scale for the benefit of fund shareholders; and (vii) benefits realized by the Adviser (and its affiliates) from its relationship with the fund.
The Independent Trustees began their process of reviewing information, which they had previously requested, and considering approval of the agreement at the Board's May 29, 2013 meeting. The Independent Trustees were represented by independent legal counsel throughout the process. After the May 29, 2013 Board meeting, at the direction of the Independent Trustees, independent legal counsel requested additional information from the Adviser. The Independent Trustees also had separate meetings among themselves and with independent legal counsel during this period. In addition, the Independent Trustees received materials from their independent legal counsel discussing the legal standards applicable to their consideration of the agreement. After their review of the information received, the Independent Trustees presented their findings and recommendations to the full Board.
The Board reviewed the functions performed by the Adviser, the portfolio management team and support staff of the Adviser, the Adviser's investment strategy and process for each fund, and the Adviser's financial condition, and considered the quality of services provided. The Board also reviewed information on the performance of each fund, along with the performance information of a relevant securities index, a peer group and a peer universe, using information supplied by Lipper Inc. ("Lipper").
183
Additional Information (unaudited)
For the All American Equity Fund, the information showed that for the one-, two-, three-, four- and five-year periods ended December 31, 2012, the fund's performance was in the 3rd, 2nd, 1st, 3rd and 3rd quintile, respectively, of its applicable Lipper peer group and for the one-, two-, three-, four- and five-year periods ended December 31, 2012, the fund's performance was in the 5th, 3rd, 3rd, 5th and 5th quintile, respectively, of its applicable Lipper peer universe (the 1st quintile being the best performers and the 5th quintile being the worst performers). The Board noted that the fund underperformed its benchmark index for the one-year period ended December 31, 2012. The Board noted that the fund's advisory fee includes a performance incentive adjustment based on the performance of the fund during the prior 12-month period.
For the Holmes Growth Fund, the information showed that for the one-, two-, three-, four- and five-year periods ended December 31, 2012, the fund's performance was in the 5th, 4th, 4th, 5th and 5th quintile, respectively, of its applicable Lipper peer group, and for the one-, two-, three-, four- and five-year periods ended December 31, 2012, the fund's performance was in the 5th quintile of its applicable Lipper peer universe. The Board noted that the fund underperformed its benchmark index for the one-year period ended December 31, 2012. In response to questions from the Independent Trustees regarding the fund's performance, the Adviser noted that since it assumed day-to-day management of the fund in 2004, the fund has outperformed or performed in line with its benchmark index for roughly seven years and has only recently underperformed in this long-term view. The Adviser further stated that it will continue to make incremental improvements to stock selection and portfolio construction to seek to improve performance. The Board noted that the fund's advisory fee includes a performance incentive adjustment based on the performance of the fund during the prior 12-month period.
For the MegaTrends Fund, the information showed that for the one-, two-, three-, four-and five-year periods ended December 31, 2012, the fund's investor class performance was in the 4th, 4th, 5th, 5th and 5th quintile, respectively, of its applicable Lipper peer group and for each of the one-, two-, three-, four- and five-year periods ended December 31, 2012, the fund's investor class performance was in the 5th quintile of its applicable Lipper peer universe. In addition, the information showed that for the one- and two-year periods ended December 31, 2012, the fund's institutional class performance was in the 5th quintile of its applicable Lipper peer group and for the one- and two-year periods ended December 31, 2012, and the period since inception (March 1, 2010) through December 31, 2012, the fund's institutional class performance was in the 5th quintile of its applicable Lipper peer universe. The Board noted that the fund underperformed its benchmark index for the one-year period ended December 31, 2012. The Board considered that, in the interest of seeking to improve relative performance, in December 2012, the fund's name and investment strategy changed to a domestically-oriented fund focused on "megatrends" in the marketplace and in response to questions from the Independent Trustees regarding the fund's performance, the Adviser noted that the fund's year-to-date performance through June 30, 2013 was up 11.26%. The Board also noted that the fund's advisory fee includes a performance incentive adjustment based on the performance of the fund during the prior 12-month period.
184
Additional Information (unaudited)
For the Global Resources Fund, the information showed that for the one-, two-, three-, four- and five-year periods ended December 31, 2012, the fund's investor class performance was in the 2nd, 3rd, 1st, 1st and 3rd quintile, respectively, of its applicable Lipper peer universe. In addition, the information showed that for the one- and two-year periods ended December 31, 2012, and the period since inception (March 1, 2010) through December 31, 2012, the fund's institutional class performance was in the 2nd, 3rd and 2nd quintile, respectively, of its applicable Lipper peer group and in the 2nd, 3rd and 1st quintile, respectively, of its applicable Lipper peer universe. This information also showed that the fund outperformed its benchmark index for the one-year period ended December 31, 2012. The Board noted that the fund's advisory fee includes a performance incentive adjustment based on the performance of the fund during the prior 12-month period.
For the World Precious Minerals Fund, the information showed that for the one-, two-, three-, four- and five-year periods ended December 31, 2012, the fund's investor class performance was in the 5th, 5th, 4th, 1st and 4th quintile, respectively, of its applicable Lipper peer group and for the one-, two-, three-, four- and five-year periods ended December 31, 2012, the fund's investor class performance was in the 4th, 5th, 5th, 2nd and 5th quintile, respectively, of its applicable Lipper peer universe. In addition, the information showed that for the one- and two-year periods ended December 31, 2012, and the period since inception (March 1, 2010) through December 31, 2012, the fund's institutional class performance was in the 5th quintile of its applicable Lipper peer group and for the one- and two-year periods ended December 31, 2012 and the period since inception (March 1, 2010) through December 31, 2012, the Fund's institutional class performance was in the 4th, 5th and 5th quantile, respectively, of its applicable Lipper peer universe. This information also showed that the fund underperformed its benchmark index for the one-year period ended December 31, 2012. The Board noted that the Adviser attributed recent underperformance to the fund's emphasis in junior mining companies, which have significantly underperformed over the past two years, but have historically added value to the fund's portfolio by outperforming senior gold mining companies. The Board also took into consideration that the fund's advisory fee includes a performance incentive adjustment based on the performance of the fund during the prior 12-month period.
For the Gold and Precious Metals Fund, the information showed that for the one-, two-, three-, four- and five-year periods ended December 31, 2012, the fund's performance was in the 3rd, 5th, 4th, 4th and 2nd quintile, respectively, of its applicable Lipper peer group, and for the one-, two-, three-, four- and five-year periods ended December 31, 2012, the funds' performance was in the 2nd, 4th, 5th, 5th and 4th quintile, respectively, of its applicable Lipper peer universe. The information also showed that the fund outperformed its benchmark index for the one-year period ended December 31, 2012. The Board also took into consideration that the fund's advisory fee includes a performance incentive adjustment based on the performance of the fund during the prior 12-month period.
185
Additional Information (unaudited)
For the Emerging Europe Fund, the information showed that for the one-, two- and three-year periods ended December 31, 2012, the fund's performance was in the 4th, 5th, 5th, 5th, 5th and 5th quintile of its applicable Lipper peer group and for the one-, two-, three-, four- and five-year periods ended December 31, 2012, the funds' performance was in the 3rd, 5th, 5th, 4th and 5th quintile, respectively, of its applicable Lipper peer universe. In addition, the information showed that the fund underperformed its benchmark index for the one-year period ended December 31, 2012. The Board noted the Adviser's belief that the funds within the fund's peer group do not necessarily have the same regional focus as the fund, making performance comparisons difficult and, as a result, in response to questions from the Independent Trustees, the Adviser provided supplemental information showing that when the fund is compared to a peer group of funds with an European emerging markets focus, based upon information from Strategic Insight, the fund ranked in the top half of its peer group for the one-, two- and three-year periods and in the bottom half over the four- and five-year periods. The Board also took into consideration that the fund's advisory fee includes a performance incentive adjustment based on the performance of the fund during the prior 12-month period.
For the Global Emerging Markets Fund, the information showed that for the one-, two- and three-year periods ended December 31, 2012, the fund's performance was in the 5th, 5th and 4th quintile, respectively, of its applicable Lipper peer group and for the one-, two-, three-, four- and five-year periods ended December 31, 2012, the fund's performance was in the 5th quintile of its applicable Lipper peer universe. In addition, this information showed that the fund underperformed its benchmark index for the one-year period ended December 31, 2012. The Board considered that management implemented a new model driven process in 2012 to address the fund's historical performance and that, in response to questions from the Independent Trustees regarding the fund's performance, the Adviser noted that the fund outperformed its benchmark index for the year-to-date period ended June 30, 2013. The Board also took into consideration that that the fund's advisory fee includes a performance incentive adjustment based on the performance of the fund during the prior 12-month period.
For the China Region Fund, the information showed that for the one-, two-, three-, four- and five-year periods ended December 31, 2012, the fund's performance was in the 5th quintile of its applicable Lipper peer group and applicable Lipper peer universe. The Board noted that the fund underperformed its benchmark index for the one-year period ended December 31, 2012. The Board considered that the Adviser has made several personnel changes and, in 2012, implemented a new model-driven process to address performance issues and that, in response to questions from the Independent Trustees regarding the fund's performance, the Adviser noted that the fund outperformed its benchmark index and was in the top half of its peer group for the year-to-date period ended June 30, 2013. The Board also noted that that the fund's advisory fee includes a performance incentive adjustment based on the performance of the fund during the prior 12-month period.
186
Additional Information (unaudited)
For the Tax Free Fund, the information showed that for the one-, two-, three-, four- and five-year periods ended December 31, 2012, the fund's performance was in the 3rd, 4th, 4th, 4th and 2nd quintile, respectively, of its applicable Lipper peer group and for the one-, two-, three-, four- and five-year periods ended December 31, 2012, the fund's performance was in the 5th, 5th, 5th, 5th and 4th quintile, respectively, of its applicable Lipper peer universe. The Board noted that the information also showed that the fund underperformed its benchmark index for the one-year period ended December 31, 2012.
For the Near-Term Tax Free Fund, the information showed that for the one-, two-, three-, four- and five-year periods ended December 31, 2012, the fund's performance was in the 2nd, 3rd, 3rd, 3rd and 3rd quintile, respectively, of its applicable Lipper peer universe. This information also showed that the fund outperformed its benchmark index for the one-year period ended December 31, 2012.
For the U.S. Government Securities Savings Fund, the information showed that for the one-, two-, three-, four- and five-year periods ended December 31, 2012, the fund's performance was in the 2nd quintile of its applicable Lipper peer group, and for the one-, two-, three-, four- and five-year periods ended December 31, 2012, the fund's performance was in the 1st, 1st, 2nd, 2nd and 2nd quintile, respectively, of its applicable Lipper peer universe. In addition, this information showed that the fund performed the same as its benchmark index for the one-year period ended December 31, 2012.
For the U.S. Treasury Securities Cash Fund, the information showed that for the one-, two-, three-, four-, and five-year periods ended December 31, 2012, the fund's performance was in the 1st, 1st, 1st, 1st and 5th quintile, respectively, of its applicable Lipper peer group and for the one-, two-, three-, four- and five-year periods ended December 31, 2012, the fund's performance was in the 1st, 1st, 1st, 2nd and 4th quintile, respectively, of its applicable Lipper peer universe. In addition, this information showed that the fund performed the same as its benchmark index for the one-year period ended December 31, 2012.
The Board also reviewed information on each fund's advisory fee and expense ratio (on both a net basis giving effect to any expense cap) compared to the expenses of a peer group of funds based upon information prepared by Lipper. The Board also compared the advisory fees to the fees charged by the Adviser to three non-U.S. registered funds managed by the Adviser. (The Board noted that, although these non-U.S. registered funds may have investment objectives and policies that are similar to some of the funds, the contractual fees payable to the Adviser for managing those client assets are the same as or higher than the advisory fees of the similar funds.)
For the All American Equity Fund, the information showed that, with respect to the fund's advisory fee, the fund is in the 2nd quintile of its applicable Lipper peer group and in the 5th quintile of its applicable Lipper peer group with respect to its net expenses.
187
Additional Information (unaudited)
For the Holmes Growth Fund, the information showed that, with respect to the fund's advisory fee, the fund is in the 4th quintile of its applicable Lipper peer group and in the 5th quintile of its applicable Lipper peer group with respect to its net expenses.
For the MegaTrends Fund's investor class, the information showed that, with respect to the advisory fee and net expenses, it is in the 1st and 5th quintile, respectively, of its applicable Lipper peer group. In addition, the information showed that, with respect to the fund's institutional class, it is in the 4th and 5th quintile, respectively, of its applicable Lipper peer group with respect to its advisory fee and net expenses.
For the Global Resources Fund's investor class, the information showed that, with respect to the advisory fee and net expenses, it is in the 5th and 4th quintile, respectively, of its applicable Lipper peer group. In addition, for the fund's institutional class, the information showed that, with respect to the advisory fee, it is in the 5th quintile of its applicable Lipper peer group and in the 3rd quintile of its applicable Lipper peer group with respect to its net expenses.
For the World Precious Minerals Fund's investor class, the information showed that, with respect to the advisory fee and net expenses, the fund is in the 3rd quintile of its applicable Lipper peer group. In addition, the information showed that, with respect to the fund's institutional class, it is in the 2nd quintile of its applicable Lipper peer group with respect to its advisory fee and net expenses.
For the Gold and Precious Metals Fund, the information showed that, with respect to the fund's advisory fee, the fund is in the 3rd quintile of its applicable Lipper peer group and in the 5th quintile of its applicable Lipper peer group with respect to its net expenses.
For the Emerging Europe Fund, the information showed that, with respect to the fund's advisory fee and net expenses, the fund is in the 5th quintile of its applicable Lipper peer group.
For the Global Emerging Markets Fund, the information showed that, with respect to the fund's advisory fee, the fund is in the 1st quintile of its applicable Lipper peer group and in the 5th quintile of its applicable Lipper peer group with respect to its net expenses.
For the China Region Fund, the information showed that, with respect to the fund's advisory fee, the fund is in the 2nd quintile of its applicable Lipper peer group and in the 5th quintile of its applicable Lipper peer group with respect to its net expenses.
For the Tax Free Fund, the information showed that, with respect to the fund's advisory fee, the fund is in the 1st quintile of its applicable Lipper peer group and in the 3rd quintile of its applicable Lipper peer group with respect to its net expenses.
For the Near-Term Tax Free Fund, the information showed that, with respect to the fund's advisory fee, the fund is in the 1st quintile of its applicable Lipper peer group and in the 2nd quintile of its applicable Lipper peer group with respect to its net expenses.
188
Additional Information (unaudited)
For the U.S. Government Securities Savings Fund, the information showed that, with respect to the fund's advisory fee, the fund is in the 1st quintile of its applicable Lipper peer group and in the 4th quintile of its applicable Lipper peer group with respect to its net expenses.
For the U.S. Treasury Securities Cash Fund, the information showed that, with respect to the fund's advisory fee, the fund is in the 1st quintile of its applicable Lipper peer group and in the 5th quintile of its applicable Lipper peer group with respect to its net expenses.
The Board considered the Adviser's belief that higher expenses are inherent in small fund complexes, such as the U.S. Global Investors Funds, and that it could not operate effectively at a lower level of fees or with the burden of contractual expense caps for most funds. However, the Board noted that the Adviser is contractually limiting expenses on an annualized basis for the Tax Free Fund and Near-Term Tax Free Fund at 0.70% and 0.45% of average net assets, respectively, through April 30, 2014 and is currently voluntarily limiting expenses at the following levels for the other funds (the voluntary expense limitation may be modified or removed by the Adviser at any time):
Fund | | Voluntary Expense Limitation
(% of Average Net Assets) | |
All American Equity Fund | | | 2.20 | % | |
Holmes Growth Fund | | | 2.20 | % | |
MegaTrends Fund (Investor Class) | | | 2.35 | % | |
MegaTrends Fund (Institutional Class) | | | 2.07 | % | |
Global Resources Fund (Investor Class) | | | 2.85 | % | |
World Precious Minerals Fund (Investor Class) | | | 1.90 | % | |
World Precious Minerals Fund (Institutional Class)) | | | 2.70 | % | |
Gold and Precious Metals Fund | | | 1.90 | % | |
Emerging Europe Fund | | | 2.85 | % | |
Global Emerging Markets Fund | | | 3.15 | % | |
China Region Fund | | | 2.55 | % | |
U.S. Treasury Securities Cash Fund | | | 1.00 | % | |
U.S. Government Securities Savings Fund | | | 0.45 | % | |
The Board considered that, at its August 23, 2013 meeting, the Adviser recommended and the Board approved a proposal to reorganize the Tax Free Fund with the Near-Term Tax Fund due to, among other reasons, the fund's current asset level and its failure to achieve critical mass.
The Board also considered that, at its August 23, 2013 meeting, the Adviser recommended and the Board approved a proposal to convert the U.S. Government Securities Savings Fund to an ultra-short bond fund, subject to shareholder approval of the elimination of the fundamental investment policy requiring best efforts to maintain a stable $1.00 net asset value.
189
Additional Information (unaudited)
In addition, the Board considered that, at its August 23, 2013 meeting, the Adviser recommended and the Board approved a proposal to liquidate the U.S. Treasury Securities Cash Fund because the Adviser is no longer interested in managing a money market fund going forward.
The Board considered the fee structure of the agreement, including the costs of the services provided and the profits realized by the Adviser and its affiliates from their relationship with the funds. For all funds except the World Precious Minerals Fund, Global Resources Fund, Gold and Precious Metals Fund and Emerging Europe Fund, the net income generated from the advisory relationship was negative.
As part of its review of the agreement, the Board considered whether there will be economies of scale with respect to the management of each fund and whether each fund will benefit from any economies of scale. The Board considered that the advisory fees for the All American Equity Fund, Gold and Precious Metals Fund, World Precious Minerals Fund, Global Resources Fund, Tax Free Fund, U.S. Government Securities Savings Fund and U.S. Treasury Securities Cash Fund include a breakpoint. For the remaining funds, the Board reviewed each fund's asset size and whether the Adviser was realizing economies of scale. The Board noted that, in all cases, the Adviser did not believe, with respect to the investment advisory services provided, that it was realizing significant economies of scale, and that the current fees represent an appropriate sharing of economies of scale.
The Board considered that the Adviser engages in soft-dollar arrangements in connection with brokerage transactions for the funds. The Board also considered benefits derived by the Adviser from its relationship with the funds, including the other services provided and fees received by the Adviser and its affiliates for providing such services.
Based on all the above-mentioned factors and related conclusions, with no single factor or conclusion being determinative and with each Trustee not necessarily attributing the same weight to each factor, the Board, including the Independent Trustees, concluded that approval of the advisory agreement would be in the interests of each fund.
190
Shareholder Votes (unaudited)
On December 2, 2013, a special meeting of the shareholders of the U.S. Government Securities Savings Fund was held. The following proposal was presented to the shareholders of the U.S. Government Securities Savings Fund:
To approve the elimination of the Fund's fundamental investment policy that requires best efforts to maintain a constant net asset value of one dollar per share.
A total of 67,003,499.417 shares were voted, representing 54.385% of total shares as of the record date. The proposal was approved by the shareholders with the following votes recorded:
For: | | | 51,465,115.989 | | |
Against: | | | 14,406,950.570 | | |
Abstain: | | | 1,131,432.858 | | |
On December 20, 2013, a special meeting of the shareholders of the MegaTrends Fund was held. The following proposal was presented to the shareholders of the MegaTrends Fund:
To approve the reorganization of the MegaTrends Fund into the Holmes Growth Fund (which will be renamed the Holmes Macro Trends Fund on the closing date of the reorganization) and the subsequent dissolution of the MegaTrends Fund.
A total of 703,994.707 shares were voted, representing 55.023% of total shares as of the record date. The proposal was approved by the shareholders with the following votes recorded:
For: | | | 687,770.722 | | |
Against: | | | 11,410.554 | | |
Abstain: | | | 4,813.431 | | |
191
[THIS PAGE INTENTIONALLY LEFT BLANK]
[THIS PAGE INTENTIONALLY LEFT BLANK]
[THIS PAGE INTENTIONALLY LEFT BLANK]
[THIS PAGE INTENTIONALLY LEFT BLANK]
[THIS PAGE INTENTIONALLY LEFT BLANK]
[THIS PAGE INTENTIONALLY LEFT BLANK]
[THIS PAGE INTENTIONALLY LEFT BLANK]

Fund Services, LLC
PO Box 701
Milwaukee WI
53201-0701
Want to reduce paper waste? You can receive this report and other important documents electronically. Please visit www.usfunds.com and sign up at Access My Account. If you need further assistance, please call us at 800-873-8637.
ITEM 2. CODE OF ETHICS.
(a) The registrant has adopted a code of ethics that applies to its principal executive officer and principal financial officer.
(b) During the period covered by this report, no material amendments were made to the provisions of the code of ethics adopted in 2(a) above.
(c) During the period covered by this report, no implicit or explicit waivers to the provisions of the code of ethics adopted in 2(a) above were granted.
(d) Not applicable.
(e) Not applicable.
(f) The registrant has posted such code of ethics on its Internet website at www.usfunds.com.
ITEM 3. AUDIT COMMITTEE FINANCIAL EXPERT.
For the covered period, the registrant’s Board of Trustees designated three independent trustees as audit committee financial experts: Mr. Clark Mandigo, Dr. James F. Gaertner, and Mr. Joe C. McKinney.
An “audit committee financial expert” is not an “expert” for any purpose, including for purposes of Section 11 of the Securities Act of 1933, as a result of being designated as an “audit committee financial expert.” Further, the designation of a person as an “audit committee financial expert” does not mean that the person has any greater duties, obligations, or liability than those imposed on the person without the “audit committee financial expert” designation. Similarly, the designation of a person as an “audit committee financial expert” does not affect the duties, obligations, or liability of any other member of the audit committee or Board of Trustees.
ITEM 4. PRINCIPAL ACCOUNTANT FEES AND SERVICES.
(A) AUDIT FEES
The aggregate fees billed to the registrant for professional services rendered by the registrant’s principal accountant for the audit of the registrant’s annual financial statements or for services that are normally provided by the accountant in connection with statutory or regulatory filings or engagements were $253,400 and $291,731 for the fiscal years ended December 31, 2013, and 2012, respectively.
(B) AUDIT-RELATED FEES
There were no fees billed for assurance and related services by the registrant’s principal accountant that were reasonably related to the performance of the audit of the registrant’s financial statements and were not reported under paragraph (a) of this Item for the last two fiscal years.
(C) TAX FEES
The aggregate fees billed for professional services rendered by the registrant’s principal accountant for tax compliance, tax advice and tax planning were $68,558 and $68,558 for the fiscal years ended December 31,
2013, and 2012, respectively. The nature of the services comprising the tax fees included the review of the registrant’s income and excise tax returns and distribution requirements.
(D) ALL OTHER FEES
There were no other fees during the last two fiscal years billed to the registrant.
(E)(1) The registrant’s audit committee is directly responsible for approving the services to be provided by the auditors, including approval in advance of audit and non-audit services at regularly scheduled audit committee meetings. If non-audit services are required between regularly scheduled audit committee meetings, approval may be authorized by the chairman of the audit committee for non-prohibited services for engagements of less than $3,500 with notification of other audit committee members at the next scheduled audit committee meeting.
(2) No services included in (b) - (d) above were approved pursuant to paragraph (c)(7)(i)(C) of Rule 2-01 of Regulation S-X.
(F) Less than 50 percent of the hours expended on the principal accountant’s engagement to audit the registrant’s financial statements for the most recent fiscal year were attributed to work performed by persons other than the principal accountant’s full-time, permanent employees.
(G) The aggregate fees billed by the registrant’s principal accountant for non-audit services rendered to the registrant, its investment adviser, and any entity controlling, controlled by, or under common control with the investment adviser that provides ongoing services to the registrant were $128,758 and $128,758 for the fiscal years ended December 31, 2013, and 2012, respectively. These fees related to tax services rendered to the registrant and the issuance of a report on internal controls for an entity controlled by the investment adviser.
(H) All non-audit services rendered in (g) above were considered by the registrant’s audit committee in maintaining the principal accountant’s independence.
ITEM 5. AUDIT COMMITTEE OF LISTED REGISTRANTS.
Not applicable to the registrant.
ITEM 6. SCHEDULE OF INVESTMENTS.
Not applicable. The complete schedule of investments is included in Item 1 of this Form N-CSR.
ITEM 7. DISCLOSURE OF PROXY VOTING POLICIES AND PROCEDURES FOR CLOSED-END MANAGEMENT INVESTMENT COMPANIES.
Not applicable.
ITEM 8. PORTFOLIO MANAGERS OF CLOSED-END MANAGEMENT INVESTMENT COMPANIES.
Not applicable.
ITEM 9. PURCHASES OF EQUITY SECURITIES BY CLOSED-END MANAGEMENT INVESTMENT COMPANY AND AFFILIATED PURCHASERS.
Not applicable.
ITEM 10. SUBMISSION OF MATTERS TO A VOTE OF SECURITY HOLDERS.
(a) On December 2, 2013, a special meeting of the shareholders of the U.S. Government Securities Savings Fund was held. The following proposal was presented to the shareholders of the U.S. Government Securities Savings Fund:
To approve the elimination of the Fund’s fundamental investment policy that requires best efforts to maintain a constant net asset value of one dollar per share.
A total of 67,003,499.417 shares were voted, representing 54.385% of total shares as of the record date. The proposal was approved by the shareholders with the following votes recorded:
For: 51,465,115.989 shares
Against: 14,406,950.570 shares
Abstain: 1,131,432.858 shares
(b) On December 20, 2013, a special meeting of the shareholders of the MegaTrends Fund was held. The following proposal was presented to the shareholders of the MegaTrends Fund:
To approve the reorganization of the MegaTrends Fund into the Holmes Growth Fund (which will be renamed the Holmes Macro Trends Fund on the closing date of the reorganization) and the subsequent dissolution of the MegaTrends Fund.
A total of 703,994.707 shares were voted, representing 55.023% of total shares as of the record date. The proposal was approved by the shareholders with the following votes recorded:
For: 687,770.722 shares
Against: 11,410.554 shares
Abstain: 4,813.431 shares
ITEM 11. CONTROLS AND PROCEDURES.
(a) The registrant’s president and treasurer have determined that the registrant’s disclosure controls and procedures are effective based on their evaluation of the disclosure controls and procedures as of a date within 90 days of the filing date of this report.
(b) There was no change in the registrant’s internal control over financial reporting that occurred in the registrant’s fourth fiscal quarter of the period covered by this report that has materially affected, or is reasonably likely to materially affect, the registrant’s internal control over financial reporting.
ITEM 12. EXHIBITS.
(a)(1) Code of ethics is posted on registrant’s Internet website at www.usfunds.com.
(a)(2) Certifications of principal executive officer and principal financial officer pursuant to section 302 of the Sarbanes-Oxley Act of 2002 are filed as exhibits to this report.
(a)(3) Not applicable.
(b) Certifications of principal executive officer and principal financial officer pursuant to section 906 of the Sarbanes-Oxley Act of 2002 are filed as exhibits to this report.
SIGNATURES
Pursuant to the requirements of the Securities Exchange Act of 1934 and the Investment Company Act of 1940, the registrant has duly caused this report to be signed on its behalf by the undersigned, thereunto duly authorized.
U.S. GLOBAL INVESTORS FUNDS
By: | /s/ Frank E. Holmes | |
| Frank E. Holmes | |
| President, Chief Executive Officer | |
| | |
Date: | February 28, 2014 | |
Pursuant to the requirements of the Securities Exchange Act of 1934 and the Investment Company Act of 1940, this report has been signed below by the following persons on behalf of the registrant and in the capacities and on the dates indicated.
By: | /s/ Frank E. Holmes | |
| Frank E. Holmes | |
| President, Chief Executive Officer | |
| | |
Date: | February 28, 2014 | |
| | |
| | |
By: | /s/ Lisa C. Callicotte | |
| Lisa C. Callicotte | |
| Treasurer | |
| | |
Date: | February 28, 2014 | |