UNITED STATES
SECURITIES AND EXCHANGE COMMISSION
Washington, D.C. 20549
FORM N-CSR
CERTIFIED SHAREHOLDER REPORT OF REGISTERED
MANAGEMENT INVESTMENT COMPANIES
Investment Company Act file number | 811-1800 |
|
U.S. GLOBAL INVESTORS FUNDS |
(Exact name of registrant as specified in charter) |
|
7900 CALLAGHAN ROAD | | |
SAN ANTONIO, TX | | 78229 |
(Address of principal executive offices) | | (Zip code) |
|
SUSAN B. MCGEE, ESQ. |
7900 CALLAGHAN ROAD |
SAN ANTONIO, TX 78229 |
(Name and address of agent for service) |
|
Registrant’s telephone number, including area code: | 210-308-1234 | |
|
Date of fiscal year end: | DECEMBER 31, 2012 | |
|
Date of reporting period: | DECEMBER 31, 2012 | |
| | | | | | | | |
ITEM 1. REPORTS TO STOCKHOLDERS.
U.S. Global Investors Funds
Annual Report
December 31, 2012

U.S. Global Investors Funds
Annual Report
December 31, 2012
Letter to Shareholders | | | 1 | | |
Definitions for Management Teams' Perspectives | | | 10 | | |
Management Teams' Perspectives | | | 12 | | |
Expense Example | | | 63 | | |
Portfolios of Investments | | | 66 | | |
Notes to Portfolios of Investments | | | 134 | | |
Statements of Assets and Liabilities | | | 148 | | |
Statements of Operations | | | 154 | | |
Statements of Changes in Net Assets | | | 160 | | |
Notes to Financial Statements | | | 169 | | |
Financial Highlights | | | 187 | | |
Additional Information | | | 207 | | |
U.S. Global Investors Funds
Investor Class
U.S. Treasury Securities Cash Fund | | USTXX | |
U.S. Government Securities Savings Fund | | UGSXX | |
Near-Term Tax Free Fund | | NEARX | |
Tax Free Fund | | USUTX | |
All American Equity Fund | | GBTFX | |
Holmes Growth Fund | | ACBGX | |
MegaTrends Fund | | MEGAX | |
Global Resources Fund | | PSPFX | |
World Precious Minerals Fund | | UNWPX | |
Gold and Precious Metals Fund | | USERX | |
Eastern European Fund | | EUROX | |
Global Emerging Markets Fund | | GEMFX | |
China Region Fund | | USCOX | |
Institutional Class
MegaTrends Fund | | MEGIX | |
Global Resources Fund | | PIPFX | |
World Precious Minerals Fund | | UNWIX | |

P.O. Box 659405
San Antonio, Texas 78265-9604
Tel 1.800.US.FUNDS
Fax 1.210.308.1217
www.usfunds.com
U.S. Global Investors Funds

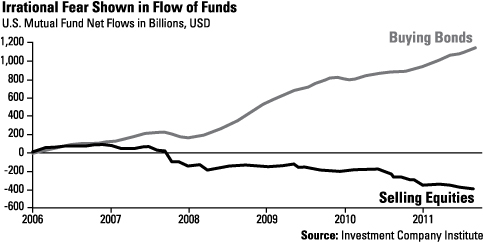
Investor pessimism toward stocks continued during 2012, with uncertainty over many global economic events undermining sentiment. The European crisis was punctuated by footage of unionized government workers organizing anti-austerity riots in the streets of Greece and Spain. Worsening economic data in China led to a rising fear of a hard landing. In the U.S., investors were consumed by the presidential election closely followed by the "fiscal cliff" debate that didn't conclude until New Year's Eve.
In addition to the constant drumbeat of negative news, investors' emotions remained anchored to the distressing experience of 2008, and the selling out of perceived "risky" equity funds to purportedly safe havens in long-term bond funds continued throughout 2012. Data from the Investment Company Institute shows the persistence of this extreme behavior of billions of dollars flowing into bond funds and out of stock funds.
This move has been costing investors, as performance in recent years has been phenomenal for equity and gold bullion investors. Take a look at the following chart, showing the cumulative returns of gold, the S&P 500 Index and the iShares Core Total U.S. Bond ETF from the beginning of 2009 through December 31, 2012. The last four years were better than you may have thought: Gold rose nearly 90 percent and the 500 largest U.S. companies climbed more than 70 percent, while the bond investment increased only 22 percent.
1
U.S. Global Investors Funds
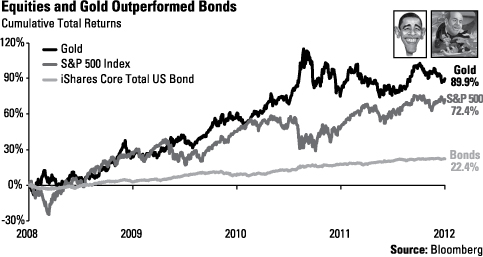
As Bloomberg recently quantified, "Americans have missed out on almost $200 billion of stock gains as they drained money from the market in the past four years."
I often say it's important to follow government policies, not political parties, because of the dramatic effect that monetary and fiscal policies can have on markets and gold. Thanks to President Barack Obama and Federal Reserve Chairman Ben Bernanke, stocks and bullion have had astounding performance as the Fed has been on a massive bond-buying frenzy during three rounds of quantitative easing (QE). This spree has pushed the central bank's balance sheet to nearly $3 trillion by January. As reported in USA Today, this is "more than three times the size of the Fed's holdings before the financial crisis" in the fall of 2008.
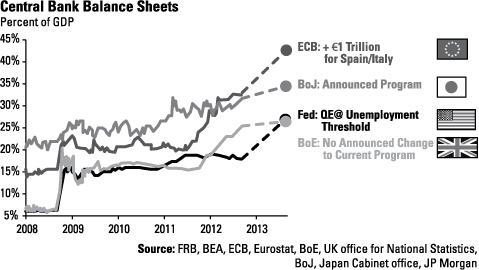
All the excess money in the system, compliments of not only the Fed, but also the European Central Bank (ECB), the Bank of Japan and the Bank of England, should help gold continue its bull run another year. Take a look at the projected rise in the balance sheets as a percent of GDP from the developed countries. The ECB is estimated to have a balance sheet that is nearly 50 percent of its GDP by the end of the year. The Bank of Japan is right behind the ECB, with its balance sheet projected to be nearly 35 percent of GDP.
2
U.S. Global Investors Funds
With developed governments lacking courage for fiscal discipline, emerging markets have continued purchasing gold as a currency hedge, in an effort to diversify away from their dependence on U.S. dollars and the euro. Countries such as Mexico, the Philippines, Russia, Turkey and Ukraine have added gold over the past year. Net official sector purchases of 425 tons, as of November 2012, are a drastic divergence compared to only a few years ago when central banks were net sellers of the precious metal.
Even though gold purchases in India have been subdued because of duties imposed on gold imports, we see sunshine at the end of the tunnel, not a train's headlight. We believe the country's cultural affinity for the precious metal and rising incomes will continue to drive demand. Also, since China's new leadership was announced through the middle of January, about $40 billion has flowed into emerging markets. This emerging trend appears to be a powerful precursor for a stronger 2013, which we believe will help to reignite the gold buying in China and India.
What's important for gold investors to remember is the volatility of the yellow metal. Take a look at the frequency of 10 percent moves up or down over any 20 trading days. The metal is only slightly more volatile than the S&P 500. Gold companies, crude oil and the MSCI Emerging Markets Index have all experienced more up and down moves than gold.
3
U.S. Global Investors Funds
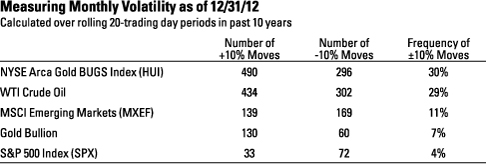
Whereas card counting at a blackjack table can get you booted from casinos and barred for life, as an investor, you are allowed to take full advantage of the 10 percent moves. Over 2013, you can count on gold moving in both directions, but as the metal experiences extreme volatility, dips in price can offer potential buying opportunities. Keep in mind though, that it's prudent to invest only 5 to 10 percent of your total portfolio in gold and gold stocks.
Ideas for Investing in Volatile Markets
Consider the famous words once spoken by boxer Mike Tyson: "Everybody has a plan until they get punched in the face." With the incredible results from gold and the stock markets, an investment plan that sold equities and bought bonds typically was dealt a terrible blow. Life is about managing expectations, and in the ring, a champion quickly shifts his strategy or faces a knockout. Here are three investment strategies to get your money to work for you.
1. Choose Active Management When Investing in Commodities
Commodities have wide price fluctuations from year to year due to the many factors affecting supply and demand, such as government policies, union strikes and currency volatility. The price movement has historically been seasonal and cyclical, which is why we believe investors should hold a diversified basket of commodities actively managed by professionals who understand these specialized assets and the global trends affecting them.
You can see the ebb and flow of commodity prices over the past decade on our Periodic Table of Commodity Returns. As an example, gold's 10-year trend shows a unique record no other commodity can claim, with positive results every year. What's fascinating is the three-year rising pattern relative to other commodities. Over the past 10 years, gold has risen in position compared with the others for three years in a row, and then fallen in relative position in the fourth year before repeating the cycle. You can view the relative returns of the other commodities for yourself by going to www.usfunds.com.
4
U.S. Global Investors Funds

2. Look for Gold Stocks to Rebound
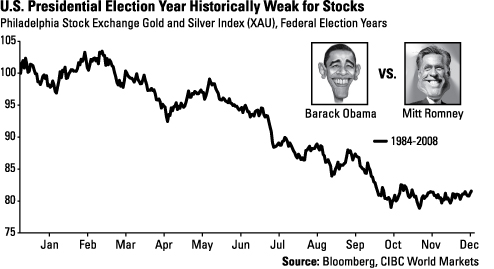
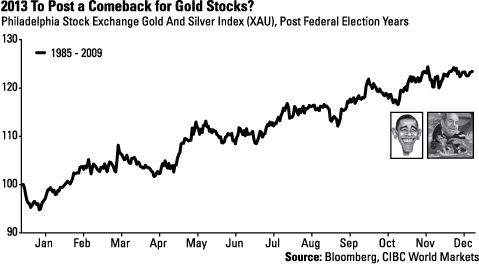
One potential opportunity awaiting investors is the historical trend favoring gold stocks, according to research from the highly respected gold analyst, Barry Cooper from CIBC World Markets. One chart shows the returns of the Philadelphia Stock Exchange Gold and Silver Index during the year of a U.S. presidential election and one illustrates the returns of the index the year after the election.
Regardless of which party is in the White House and which party wants to take it back, going back to 1984, the index of gold and silver stocks has historically performed poorly during the year Americans are headed to the voting polls.
5
U.S. Global Investors Funds
However, the math suggests gold stocks may stage a significant comeback during 2013. Historically, the index of gold and silver stocks has seen significant gains in the year following a federal election.
6
U.S. Global Investors Funds
3. Implement a Simple Asset Allocation Approach
Money fund yields have been disappointing investors, and as long as they remain low, are ill-equipped to provide investors with meaningful returns. For those investors willing to take on a little more risk, there may be better-yielding alternatives. For example, take a closer look at U.S. Global Investors' Near-Term Tax Free Fund (NEARX), with an overall Morningstar rating of 4 stars among 135 municipal national short-term funds as of December 31, 2012. NEARX invests in municipal bonds that have an average maturity of about 3 years and, based on a 35 percent tax rate, offers a tax-equivalent yield of 1.49 percent as of the end of 2012.
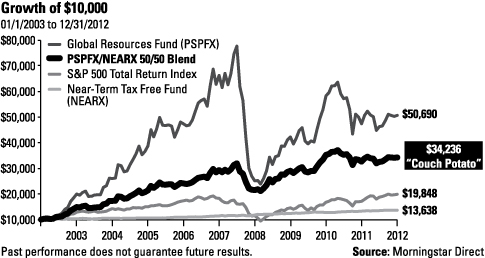
Rather than take the risk of owning assets that may not provide you with enough appreciation to meet your investment goals, consider a simple asset allocation strategy we call the "couch potato" portfolio. The chart on the next page compares three different hypothetical investments:
• $10,000 invested in only NEARX
• $10,000 invested in only the S&P 500 Index of U.S. companies
• $10,000 invested in only the growth-oriented Global Resources Fund (PSPFX)
• $10,000 invested in the "couch potato" portfolio: a 50 percent allocation to NEARX and a 50 percent allocation to PSPFX, rebalanced on a semi-annual basis
Over the past 10 years as of December 31, 2012, the S&P 500 increased about 7 percent while the Near-Term Tax Free Fund rose 3 percent. The Global Resources Fund outperformed these stock and bond investments, rising 17.61 percent. However, the Global Resources Fund also experienced the most volatility, as you can see in the hypothetical growth chart below.
In a hypothetical investment of $10,000 with half of the assets in the Near-Term Tax Free Fund and half in the Global Resources Fund, rebalanced semi-annually, most of the outperformance of the Global Resources Fund is captured, only with less risk. Over the past 10 years, this simple "couch potato" portfolio would have grown to more than $34,000, with significantly less volatility. This is substantially more than a 10-year hypothetical investment in the S&P 500, which grew to $19,848.
7
U.S. Global Investors Funds
With the European crisis appearing in the rear view mirror and global central banks positioning to continue their easing policies, we encourage global investors to resist the negative headlines and make sure to appropriately allocate for long-term growth and income.
Thank you for putting your trust and confidence in U.S. Global Investors. Throughout 2013, we wish you and your family peace and prosperity.
Sincerely,

Frank Holmes
CEO and Chief Investment Officer
U.S. Global Investors, Inc.
Please consider carefully a fund's investment objectives, risks, charges and expenses. For this and other important information, obtain a fund prospectus by visiting www.usfunds.com or by calling 1-800-US-FUNDS (1-800-873-8637). Read it carefully before investing. Distributed by U.S. Global Brokerage, Inc.
Morningstar ratings are based on risk-adjusted return. The overall Morningstar rating for a fund is derived from a weighted average of performance figures associated with its 3-, 5-year and 10-year (if applicable) time periods. Past performance does not guarantee future results. For each fund with at least a three-year history, Morningstar calculates a Morningstar RatingTM based on a Morningstar Risk-Adjusted Return measure that accounts for variation in a fund's
8
U.S. Global Investors Funds
monthly performance (including the effects of sales charges, loads, and redemption fees), placing more emphasis on downward variations and rewarding consistent performance. The top 10% of funds in each category receive 5 stars, the next 22.5% receive 4 stars, the next 35% receive 3 stars, the next 22.5% receive 2 stars and the bottom 10% receive 1 star. (Each share class is counted as a fraction of one fund within this scale and rated separately, which may cause slight variations in the distribution percentages.)
Though the Near-Term Tax Free Fund seeks minimal fluctuations in share price, it is subject to the risk that a decline in the credit quality of a portfolio holding could cause a fund's share price to decline. Tax-exempt income is federal income tax free. A portion of this income may be subject to state and local income taxes, and if applicable, may subject certain investors to the Alternative Minimum Tax as well. The Near-Term Tax Free Fund may invest up to 20% of its assets in securities that pay taxable interest. Income or fund distributions attributable to capital gains are usually subject to both state and federal income taxes. The Near-Term Tax Free Fund is subject to interest-rate risk; its value declines as interest rates rise. The Near-Term Tax Free Fund may be exposed to risks related to a concentration of investments in a particular state or geographic area. These investments present risks resulting from changes in economic conditions of the region or issuer.
Foreign and emerging market investing involves special risks such as currency fluctuation and less public disclosure, as well as economic and political risk. Because the Global Resources Fund concentrates its investments in a specific industry, the fund may be subject to greater risks and fluctuations than a portfolio representing a broader range of industries.
The Philadelphia Stock Exchange Gold and Silver Index (XAU) is a capitalization-weighted index that includes the leading companies involved in the mining of gold and silver.
All opinions expressed and data provided are subject to change without notice. Some of these opinions may not be appropriate to every investor.
9
Definitions for Management Teams' Perspectives
Benchmark Index Definitions
Returns for indices reflect no deduction for fees, expenses or taxes, unless noted.
The Barclays Capital 3-Year Municipal Bond Index is a total return benchmark designed for municipal assets. The index includes bonds with a minimum credit rating of BAA3, are issued as part of a deal of at least $50 million, have an amount outstanding of at least $5 million and have a maturity of two to four years.
The Barclays Capital 10-Year Municipal Bond Index is a total return benchmark designed for long-term municipal assets. The index includes bonds with a minimum credit rating of BAA3, are issued as part of a deal of at least $50 million, have an amount outstanding of at least $5 million and have a maturity of 8 to 12 years.
The FTSE Gold Mines Index encompasses all gold mining companies that have a sustainable and attributable gold production of at least 300,000 ounces a year and that derive 75% or more of their revenue from mined gold.
The Hang Seng Composite Index is a market-capitalization weighted index that covers about 95% of the total market capitalization of companies listed on the Main Board of the Hong Kong Stock Exchange.
The MSCI Emerging Markets Europe 10/40 Index (Net Total Return) is a free float-adjusted market capitalization index that is designed to measure equity performance in the emerging market countries of Europe (Czech Republic, Hungary, Poland, Russia and Turkey). The index is calculated on a net return basis (i.e., reflects the minimum possible dividend reinvestment after deduction of the maximum rate withholding tax). The index is periodically rebalanced relative to the constituents' weights in the parent index.
The MSCI Emerging Markets Net Total Return Index is a free float-adjusted market capitalization index that is designed to measure equity market performance in emerging market countries on a net return basis (i.e., reflects the minimum possible dividend reinvestment after deduction of the maximum rate withholding tax).
The Morgan Stanley Commodity Related Equity Index (CRX) is an equal-dollar weighted index of 20 stocks involved in commodity-related industries such as energy, non-ferrous metals, agriculture and forest products.
The NYSE Arca Gold Miners Index is a modified market capitalization-weighted index comprised of publicly-traded companies involved primarily in the mining for gold and silver.
The S&P 500 Index is a widely recognized capitalization-weighted index of 500 common stock prices in U.S. companies.
The S&P Composite 1500 Index is a broad-based capitalization-weighted index of 1500 U.S. companies and is comprised of the S&P 400, S&P 500 and the S&P 600.
10
Definitions for Management Teams' Perspectives
Other Index Definitions
The Barclays Capital Municipal Bond Index is an unmanaged index representative of the tax-exempt bond market.
The China Purchasing Managers' Index, a gauge of nationwide manufacturing activity, is issued by the China Federation of Logistics & Purchasing and co-compiled by the National Bureau of Statistics.
The ISM Manufacturing Composite Index is a diffusion index calculated from five of the eight sub-components of a monthly survey of purchasing managers at roughly 300 manufacturing firms from 21 industries in all 50 states.
The JP Morgan Global Manufacturing PMI Index is an indicator of global economic and business conditions derived monthly from data produced using internationally comparable methodologies covering around 10,000 survey respondents in over twenty countries.
The Macquarie Global Infrastructure Index is designed to reflect the stock performance of companies within the infrastructure industry, principally those engaged in the management, ownership and or operation of infrastructure and utility assets.
The MSCI All Country Far East Free ex Japan Index is a free float-adjusted market capitalization-weighted index that is designed to measure the equity market performance of the Far East, excluding Japan. The index consists of the following developed and emerging market country indices: China, Hong Kong, Indonesia, Korea, Malaysia, Philippines, Singapore, Taiwan and Thailand.
The MSCI Emerging Markets Index is a free float-adjusted market capitalization index that is designed to measure equity market performance in the global emerging markets.
The Philadelphia Stock Exchange Gold and Silver Index (XAU) is a capitalization-weighted index that includes the leading companies involved in the mining of gold and silver.
The S&P/TSX Venture Composite Index is a broad market indicator for the Canadian venture capital market. The index is market capitalization weighted and, at its inception, included 531 companies. A quarterly revision process is used to remove companies that comprise less than 0.05% of the weight of the index, and add companies whose weight, when included, will be greater than 0.05% of the index.
The Warsaw Stock Exchange Top 20 Index is a modified capitalization-weighted index of twenty Polish stocks which are listed on the main market.
The U.S. Trade Weighted Dollar Index provides a general indication of the international value of the U.S. dollar.
11
Management Team's Perspective
Introduction
The U.S. Treasury Securities Cash Fund (USTXX) seeks to obtain a high level of current income while maintaining the highest degree of safety of principal and liquidity. The U.S. Government Securities Savings Fund (UGSXX) seeks to achieve a consistently high yield with safety of principal.
Performance
U.S. Treasury Securities Cash Fund | | As of December 31, 2012 | |
| 7-Day Yield | | | 0.01 | % | |
7-Day Effective Yield | | | 0.01 | % | |
U.S. Government Securities Savings Fund | | As of December 31, 2012 | |
| 7-Day Yield | | | 0.01 | % | |
7-Day Effective Yield | | | 0.01 | % | |
An investment in either the U.S. Treasury Securities Cash Fund or the U.S. Government Securities Savings Fund is neither insured nor guaranteed by the Federal Deposit Insurance Corporation (FDIC) or by any other government agency. Although the funds seek to preserve the value of your investments at $1.00 per share, it is possible to lose money by investing in these funds.
Pursuant to a voluntary arrangement, U.S. Global Investors, Inc. (Adviser) has agreed to limit total fund operating expenses to not exceed 1.00% for the U.S. Treasury Securities Cash Fund and 0.45% for the U.S. Government Securities Savings Fund on an annualized basis. In addition, the yields reported above include the effects of the Adviser's voluntary waiver of fees and/or reimbursement of expenses to maintain a minimum net yield for the funds. The Adviser can modify or terminate these arrangements at any time.
The Year In Review - Economic And Political Issues That Affected The Funds
At the beginning of 2012, there was positive economic momentum as unemployment was falling, the consumer was spending and manufacturing remained relatively robust. In the first quarter of 2012, the global economy appeared stronger and, as a result, investor sentiment improved.
As the year progressed, the economic slowdown in Europe and China proved too much to bear and negatively affected the U.S. economy. In June, the ISM Manufacturing Composite Index fell to 49.7, the lowest level in three years, indicating a modest contraction in the manufacturing sector. This was a surprising reading and
12
was confirmed by a lower global trend for similar manufacturing readings. Consumer confidence fell, even though gasoline prices had been lower.
After a summer lull, the economy began to pick up again with GDP growing 3.1 percent in the third quarter. In the fourth quarter, the U.S. presidential election and the impending fiscal cliff dominated the news but the economy appeared to be maintaining the momentum that began in the third quarter. Housing remains an area of strength as prices have moved higher, which spurs activity and makes the banks more inclined to lend.
The European financial crisis has largely been diffused over the past six months as European Central Bank (ECB) President Mario Draghi vowed in late July to do "whatever it takes" to save the euro. Essentially, the ECB put its reputation on the line and since then, markets have stabilized.
China was surprisingly weak early in the year as policymakers failed to act decisively, but as the year progressed and a power transition took place, the economy stabilized and policymakers succeeded in an economic "soft landing."
The Federal Reserve maintained its position during the first half of the year of not providing additional stimulus, but began a $40 billion per month open-ended quantitative easing (QE) program in September. In December, the Fed rolled an existing program that was scheduled to end in December into an additional $45 billion per month QE program. In total, the Fed is currently purchasing $85 billion in treasuries and mortgage-backed securities each month in an effort to stimulate the economy.
In addition to the ECB and the U.S., policymakers worldwide are engaged in a synchronized easing cycle.
Inflation in the U.S. decelerated during the first six months of the year and has been oscillating around 2 percent in recent months. The global trend for inflation has also been lower, allowing central bankers to comfortably shift to pro-growth policies.
Fiscal austerity is being implemented across the developed world to address long-term imbalances and is expected to be a drag on growth in the U.S. and Europe for some time. Spending cuts and higher taxes are a headwind to economic growth.
Yields on the three-month Treasury bill rose 3 basis points to 0.04 percent, while yields on the six-month bills rose 5 basis points to 0.11 percent. One-year agency discount note yields fell 2 basis points to 0.12 percent. The market was still influenced by periodic bouts of risk aversion or other disruptions, with investors, at times, seeking to own short-term Treasury securities at almost any cost.
13
Investment Highlights
The U.S. Treasury Securities Cash Fund performed in line with Lipper's Treasury money market funds for the year ending December 31, 2012, returning 0.01 percent, the same as the peer group. The U.S. Government Securities Savings Fund also performed in line with the Lipper government-only money market funds, returning 0.01 percent versus 0.01 percent for the peer group.
The U.S. Treasury Securities Cash Fund had a weighted average maturity of 2 days over the 12-month period, as overnight repurchase agreements were some of the highest yielding options with the least amount of interest rate risk in the Treasury money market universe.
The U.S. Government Securities Savings Fund followed a very short-laddered approach for much of the period and had a weighted average maturity of 14 days over the period. The fund took advantage of higher yields by selectively extending its ladder but also took advantage of relatively higher repo rates. Overall, it remained a very difficult environment for money market fund investors.
Current Outlook
The Fed continues to remain accommodative in an attempt to offset fiscal tightening and spur employment growth. We continue to believe that it is unlikely that the Fed will meaningfully change course during 2013, with monetary policy expected to remain very easy during this time.
14
Management Team's Perspective
Introduction
The Near-Term Tax Free Fund (NEARX) and the Tax Free Fund (USUTX) seek to provide a high level of current income exempt from federal income taxation and to preserve capital. However, a portion of any distribution may be subject to federal and/or state income taxes. The Near-Term Tax Free Fund will maintain a weighted average maturity of less than five years, while the Tax Free Fund will generally maintain a longer weighted average maturity.
Performance Graphs
Near-Term Tax Free Fund

Average Annual Performance For the Years Ended
December 31, 2012
| | | One Year | | Five Year | | Ten Year | |
Near-Term Tax Free Fund | | | 2.67 | % | | | 3.62 | % | | | 3.15 | % | |
Barclays Capital 3-Year Municipal Bond
Index | | | 1.86 | % | | | 3.66 | % | | | 3.17 | % | |
Performance data quoted above is historical. Past performance is no guarantee of future results. Current performance may be higher or lower than the performance data quoted. The principal value and investment return of an investment will fluctuate so that an investor's shares, when redeemed, may be worth more or less than their original cost. The graph and table do not reflect the deduction of taxes that a shareholder would pay on fund distributions or the redemption of fund shares.
Pursuant to a voluntary arrangement, the Adviser has agreed to limit total fund operating expenses (exclusive of any acquired fund fees and expenses, performance fees, taxes, brokerage commissions and interest) to not exceed 0.45%. The Adviser can modify or terminate this arrangement at any time.
See Definitions for Management Teams' Perspectives for index definitions.
Please visit our website at www.usfunds.com for updated performance information for different time periods.
15
Tax Free Fund
Average Annual Performance For the Years Ended
December 31, 2012
| | | One Year | | Five Year | | Ten Year | |
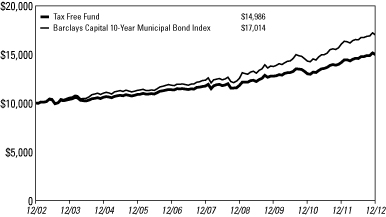
Tax Free Fund | | | 5.60 | % | | | 4.97 | % | | | 4.12 | % | |
Barclays Capital 10-Year Municipal Bond
Index | | | 5.70 | % | | | 6.60 | % | | | 5.45 | % | |
Performance data quoted above is historical. Past performance is no guarantee of future results. Current performance may be higher or lower than the performance data quoted. The principal value and investment return of an investment will fluctuate so that an investor's shares, when redeemed, may be worth more or less than their original cost. The graph and table do not reflect the deduction of taxes that a shareholder would pay on fund distributions or the redemption of fund shares.
Pursuant to a voluntary arrangement, the Adviser has agreed to limit total fund operating expenses (exclusive of any acquired fund fees and expenses, performance fees, taxes, brokerage commissions and interest) to not exceed 0.70%. The Adviser can modify or terminate this arrangement at any time.
See Definitions for Management Teams' Perspectives for index definitions.
Please visit our website at www.usfunds.com for updated performance information for different time periods.
The Year In Review - Economic And Political Issues That Affected The Funds
The municipal bond market exhibited solid performance over the past year as the Barclays Capital Municipal Bond Index rose 6.78 percent.
Despite more high profile municipal defaults during the first half of the year and increased media scrutiny, municipals have performed very well and overall defaults were not unusually high. Most municipal governments are making the tough but necessary changes to balance their budgets.
16
Yields steadily declined over the course of the year, with the very long end of the yield curve outperforming, as bonds with maturities of 22 years or more rose by 11.26 percent. Municipal market performance was consistent throughout the yield curve, as returns were relatively tied to maturity.
At the beginning of 2012, there was a growing sense of optimism for the economy but as the months wore on, economic data deteriorated. The ongoing European financial crisis and fears of an economic hard landing in China drove interest rates lower. This reached a tipping point in late July when European Central Bank (ECB) President Mario Draghi stated that the ECB would do "whatever it takes" to save the euro.
Since that time, markets in Europe have stabilized and global policymakers remain supportive of economic growth. The Federal Reserve also helped stabilize the global markets by implementing another round of quantitative easing in September and then adding to the program in December. In total, $85 billion per month is being used to buy Treasuries and mortgage-backed securities to help boost the economy. This will continue until the Fed is satisfied that the economy is on solid footing.
Revenue-backed municipals outperformed general obligation credits by a wide margin, driven by hospital and industrial development issues. Credit factors played a sizable role in performance as low-quality outperformed high-quality bonds. AAA-rated municipals rose by 4.52 percent during the year compared to BBB-rated bonds, which rose 9.80 percent. High-yield, or junk, bonds rose an eye-popping 18.14 percent over the past year.
In specialty state trading, California and Illinois outperformed, while New York and Puerto Rico underperformed.
Investment Highlights
For the year ended December 31, 2012, the Near-Term Tax Free Fund returned 2.67 percent, outperforming its benchmark, the Barclays Capital 3-Year Municipal Bond Index, which returned 1.86 percent. The Tax Free Fund returned 5.60 percent, slightly underperforming its benchmark, the Barclays Capital 10-Year Municipal Bond Index, which returned 5.70 percent.
The Near-Term Tax Free Fund modestly underperformed the Short-Intermediate Lipper peer group for the past year. The Tax Free Fund also trailed its respective Lipper peer group. The underperformance of the Tax Free Fund compared to its peers was primarily driven by fund credit and maturity preferences relative to the Lipper peer group. As discussed above, the long end of the yield curve experienced significant outperformance and low quality and junk bonds significantly outperformed; the fund was positioned more conservatively. The Near-Term Tax Free Fund outperformed more than half of the funds in the Lipper peer group but, due to very strong
17
outlier performance by a handful of funds, the overall peer group average was skewed higher.
Strengths
• The Tax Free Fund maintained significant exposure to hospital-backed municipals, which outperformed.
• The Tax Free Fund benefited from significant exposure to California, Illinois and Texas, which all outperformed.
• The Near-Term Tax Free Fund benefited from significant exposure to Illinois, Texas and Florida, which all outperformed.
• From a maturity perspective, the Near-Term Tax Free Fund benefited from a longer maturity profile than its benchmark.
Weaknesses
• Historically, the conservative credit profile of both funds proved to be an asset during volatile periods, but negatively affected performance this year when low quality credits significantly outperformed.
• The Tax Free Fund maintained a relatively short maturity/duration profile. This negatively affected performance in relation to its benchmark and peer group, as longer maturities outperformed.
• Bond structure also played a role in performance as the Tax Free Fund had little exposure to long maturities with discount coupon structures, which significantly outperformed.
Current Outlook
Opportunities
• The long-intermediate portion of the yield curve appears to offer the best opportunity in the current market, as the Fed remains accommodative and, globally, other central banks are following a similar path.
Threats
• Continued outperformance of low-quality bonds is the most significant threat on a relative basis.
• When the Fed reverses its monetary policy stance and begins to raise interest rates, the macro environment could become more difficult.
18
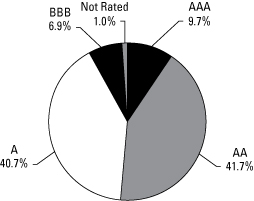
Near-Term Tax Free Fund
Municipal Bond Ratings December 31, 2012
(Based on Total Municipal Bonds)
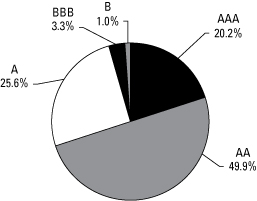
Tax Free Fund
Municipal Bond Ratings December 31, 2012
(Based on Total Municipal Bonds)
19
Management Team's Perspective
Introduction
The principal objective of the All American Equity Fund (GBTFX) is to seek capital appreciation by investing primarily in a broadly diversified portfolio of domestic common stocks. The fund invests in large-capitalization stocks, while retaining the flexibility to seek out promising individual stock opportunities, including stocks with meaningful dividend yields.
Performance Graph
All American Equity Fund
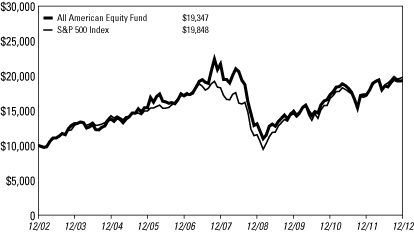
Average Annual Performance For the Years Ended
December 31, 2012
| | | One Year | | Five Year | | Ten Year | |
All American Equity Fund | | | 11.80 | % | | | (2.30 | )% | | | 6.82 | % | |
S&P 500 Index | | | 16.00 | % | | | 1.66 | % | | | 7.09 | % | |
Performance data quoted above is historical. Past performance is no guarantee of future results. Current performance may be higher or lower than the performance data quoted.The principal value and investment return of an investment will fluctuate so that an investor's shares, when redeemed, may be worth more or less than their original cost. The graph and table do not reflect the deduction of taxes that a shareholder would pay on fund distributions or the redemption of fund shares.
Pursuant to a voluntary arrangement, the Adviser has agreed to limit total fund operating expenses (exclusive of any acquired fund fees and expenses, performance fees, taxes, brokerage commissions and interest) to not exceed 2.20%. The Adviser can modify or terminate this arrangement at any time.
See Definitions for Management Teams' Perspectives for index definitions.
Please visit our website at www.usfunds.com for updated performance information for different time periods.
20
The Year In Review - Economic And Political Issues That Affected The Fund
U.S. real GDP grew at an annualized rate of 2.0 percent in the first quarter and 1.3 percent in the second quarter. This weak growth has been driven largely by a rapidly slowing European economy and also a larger-than-expected slowdown in China. Manufacturing indicators in the U.S. had held up well and were a source of strength until mid-year when the ISM Manufacturing Composite Index fell into contraction territory for the first time in three years. The economy bottomed during the summer and third quarter GDP was surprisingly strong at 3.1 percent. In the fourth quarter, the U.S. presidential election and the impending "fiscal cliff" dominated the news, but the real economy powered ahead. As the year ended, housing remained an area of strength as prices moved higher, spurring activity across many sectors of the economy.
The European financial crisis was a significant source of volatility and uncertainty during the first half of the year but has largely been diffused over the past six months. The European Central Bank President Mario Draghi vowed in late July to do "whatever it takes" to save the euro and preserve the eurozone from collapse, and since that time, markets have stabilized, allowing policymakers to focus on the real economic issues. China was weak early in the year as the government failed to act decisively. However, after the power transition took place, the economy stabilized.
The Federal Reserve maintained its policy during the first half of the year but began a $40 billion per month open-ended quantitative easing (QE) program in September. In December, the Fed rolled an existing program scheduled to end in December into an additional $45 billion per month QE program. In total, the Fed is currently purchasing $85 billion in treasuries and mortgage backed securities per month in an effort to stimulate the economy.
In addition to the ECB and the Fed, central banks around the world have continued a massive easing cycle.
Inflation in the U.S. decelerated during the first six months of the year and has been oscillating around 2 percent in recent months. The global trend for inflation has also been lower, allowing central bankers to comfortably shift to pro-growth policies.
In many developed countries, fiscal austerity is being implemented to address long-term imbalances. We believe this will be a drag on growth in the U.S. and Europe for some time, as spending cuts and higher taxes tend to be a headwind to economic growth.
The political environment in the U.S. remained one of strongly divided partisan debates, with the Democrats controlling the Presidency and the Senate, while the
21
Republicans controlled the House of Representatives. The debt ceiling debate will take center stage early in the new year.
The markets in 2012 could be described as "better than it felt." The S&P 500 Index rose 16.00 percent for the year along with most equity markets around the world. Even though the first half of the year was volatile and the partisan political process in the second half of the year was difficult and often left investors with negative connotations, the market produced solid returns, climbing the proverbial "wall of worry."
Investment Highlights
Overview
The All American Equity Fund returned 11.80 percent for the year ended December 31, 2012, underperforming the 16.00 percent return for the benchmark S&P 500 Index.
Because the fund is actively managed and holding period is generally not a consideration in investment decisions, the portfolio turnover rate may fluctuate from year to year as the fund adjusts its portfolio composition. The fund's annual portfolio turnover was, and is expected to continue to be, more than 100 percent.
Strengths
• The fund's allocations to materials, consumer staples and energy sectors positively contributed to relative performance. The fund's stock selection in these three sectors was particularly strong.
• Industry groups that were standout performers for the fund included metals and mining, beverages and chemicals.
• The fund's exposure to dividend-paying stocks over the past year performed in-line with the other portfolio components.
• MasterCard, Inc.,(1) Monster Beverage Corp.(2) and The Gap, Inc.(2) were among the best positive contributors to performance.
Weaknesses
• The fund's allocations to the financials and consumer discretion sectors were negative contributors to relative performance. While financials was the best performing sector in the S&P 500 in 2012, the fund was underweight, and stock selection within the sector was subpar.
• Cash and defensive option strategies did not aid fund performance over the past year as the market rallied strongly.
22
• Tangoe, Inc.,(2) F5 Networks, Inc.(2) and Best Buy Co., Inc.,(3) were among the worst individual contributors to performance.
Current Outlook
Opportunities
• The U.S. economy has been surprisingly resilient during the past six months and may prove to be a positive surprise for equities in 2013.
• Corporate cash levels continue to remain high, providing corporations the ability to pursue mergers and acquisitions (M&A). An increase in M&A activity holds promise for both portfolio gains and an increase in overall market valuations.
• Low interest rates, if continued throughout 2013, should provide a favorable backdrop for the economy and stock prices.
• Dividend-paying stocks remain attractive. As of December 31, 2012, the S&P 500 Index dividend yield was 2.24 percent, which is greater than the 1.76 percent yield on the 10-year Treasury. The fund maintains an emphasis on dividend-paying stocks.
Threats
• We believe Europe remains the largest wildcard. If the continent is in recession and employs much-needed fiscal austerity, these actions will severely crimp growth.
• China's economy appears to have turned a corner, but with new leadership in place, it may increase the risk of a policy misstep.
• Global government policy delays or outright missteps are a threat to global equity markets.
(1)This security comprised 4.37% of the fund's total net assets as of 12/31/12.
(2)The fund did not hold this security as of 12/31/12.
(3)This security comprised 0.50% of the fund's total net assets as of 12/31/12.
23
Top 10 Holdings Based on Net Assets
(excluding repurchase agreement) December 31, 2012
Apple, Inc.
Computers | | | 5.70 | % | |
MasterCard, Inc.
Commercial Services - Financial | | | 4.37 | % | |
Wabtec Corp.
Machinery - General Industrial | | | 2.60 | % | |
Celgene Corp.
Medical - Biomedical/Gene | | | 2.34 | % | |
Union Pacific Corp.
Transportation - Rail | | | 2.24 | % | |
Watson Pharmaceuticals, Inc.
Medical - Generic Drugs | | | 2.04 | % | |
Gartner, Inc.
Consulting Services | | | 1.91 | % | |
D.R. Horton, Inc.
Building - Residential/Commercial | | | 1.88 | % | |
eBay, Inc.
E-Commerce/Products | | | 1.82 | % | |
Google, Inc.
Web Portals/Internet Service Providers | | | 1.68 | % | |
Total Top 10 Holdings | | | 26.58 | % | |
Portfolio Allocation by Industry Sector*
Based on Total Investments December 31, 2012
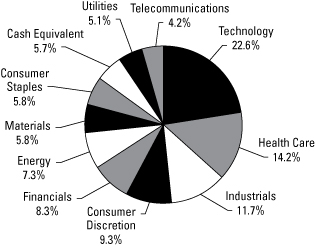
* Summary information above may differ from the portfolio schedule included in the financial statements due to the use of different classifications of securities for presentation purposes.
24
Management Team's Perspective
Introduction
The Holmes Growth Fund (ACBGX) invests in companies with good growth prospects and strong positive earnings momentum. The fund's primary objective is to seek long-term capital appreciation.
Performance Graph
Holmes Growth Fund

Average Annual Performance For the Years Ended
December 31, 2012
| | | One Year | | Five Year | | Ten Year | |
Holmes Growth Fund | | | 6.77 | % | | | (4.63 | )% | | | 5.45 | % | |
S&P Composite 1500 Index | | | 16.30 | % | | | 2.11 | % | | | 7.54 | % | |
Performance data quoted above is historical. Past performance is no guarantee of future results. Current performance may be higher or lower than the performance data quoted. The principal value and investment return of an investment will fluctuate so that an investor's shares, when redeemed, may be worth more or less than their original cost. The graph and table do not reflect the deduction of taxes that a shareholder would pay on fund distributions or the redemption of fund shares.
Pursuant to a voluntary arrangement, the Adviser has agreed to limit total fund operating expenses (exclusive of any acquired fund fees and expenses, performance fees, taxes, brokerage commissions and interest) to not exceed 2.20%. The Adviser can modify or terminate this arrangement at any time.
See Definitions for Management Teams' Perspectives for index definitions.
Please visit our website at www.usfunds.com for updated performance information for different time periods.
25
The Year In Review - Economic And Political Issues That Affected The Fund
The U.S. economy grew at a sluggish pace in the first half of the year with real GDP growing at an annualized rate of 2.0 percent in the first quarter and 1.3 percent in the second quarter. One of the drivers of slow growth was continued uncertainty in Europe. In late December 2011, the European Central Bank (ECB) implemented the long-term refinancing operation (LTRO) program in which banks could borrow funds for three years. This was a key step in dealing with the crisis and the market rallied sharply early in the year, but it did not last.
Manufacturing indicators in the U.S. held up well and were a source of strength until mid-year when the ISM Manufacturing Composite Index fell into contraction territory for the first time in three years.
In Europe, a mini-crisis seemed to erupt every couple of months until ECB President Mario Draghi pledged in late July to do "whatever it takes" to save the euro. The U.S. economy bottomed during the summer and third quarter GDP was surprisingly strong at 3.1 percent. In the fourth quarter, the U.S. presidential election and the impending fiscal cliff dominated the news, but the economy powered ahead. Housing remains an area of strength as prices have moved higher, which spurs activity across many sectors of the economy. While inflation in the U.S. decelerated during the first six months of the year, it has been oscillating around 2 percent in recent months.
The European slowdown impacted China more than many had expected. However, as the year progressed and a power transition took place, its economy stabilized and policymakers succeeded in an economic "soft landing" in 2012, which was a very positive development from a global growth perspective.
The Federal Reserve maintained its policy during the first half of the year but began a $40 billion per month open-ended quantitative easing (QE) program in September. In December, the Fed rolled an existing program that was scheduled to end in December into an additional $45 billion per month QE program. In total, the Fed is currently purchasing $85 billion in treasuries and mortgage backed securities per month in an effort to stimulate the economy. Since global inflation has slowed, policy makers throughout the world are engaged in a synchronized global easing cycle.
The global trend for inflation has also been lower, allowing central bankers to comfortably shift to pro-growth policies.
Fiscal austerity is being implemented across the developed world to address long-term fiscal imbalances and will be a drag on growth in the U.S. and Europe for some time. Spending cuts and higher taxes are a headwind to economic growth.
26
The political environment in the U.S. remained one of strongly divided partisan debates, with the Democrats controlling the Presidency and the Senate, while the Republicans controlled the House of Representatives. The debt ceiling debate will take center stage early in the year.
The markets in 2012 could be described as "better than it felt." The S&P 500 Index gained 16.00 percent along with most equity markets around the world. Even though the first half of the year was volatile and the partisan political process in the second half of the year was difficult and often left investors with negative connotations, the market continued to produce solid results.
Investment Highlights
Overview
The Holmes Growth Fund rose 6.77 percent over the past year, underperforming the benchmark, the S&P Composite 1500 Index, which returned 16.30 percent. The fund performed well early in the year, but growth-oriented stocks underperformed overall. The fund emphasizes sustainable growth and relative strength. Stocks geared to classic value factors such as deep value and price reversals outperformed.
Because the fund is actively managed and holding period is generally not a consideration in investment decisions, the portfolio turnover rate may fluctuate from year to year as the fund adjusts its portfolio composition. The fund's annual portfolio turnover was, and is expected to continue to be, more than 100 percent.
Strengths
• The fund benefited from its exposure to energy, materials and staples.
• Industry groups that were standout performers for the fund included oil and gas producers, aerospace & defense and precious metals miners.
• Gulfport Energy Corp.,(1) Ulta Salon Cosmetics & Fragrance, Inc.(2) and MasterCard, Inc.(3) were among the best positive contributors to performance.
Weaknesses
• The fund's exposure to consumer discretion, financials and health care were relative drags on the portfolio.
• Cash and defensive option positions were a drag on performance as the market rallied strongly for the year.
• Investments in Body Central Corp.,(4) Tangoe, Inc.(4) and F5 Networks, Inc.(4) failed to live up to expectations and were among the worst contributors to the fund's performance.
27
Current Outlook
Opportunities
• The U.S. economy has been resilient and the economy appears to have picked up momentum in the second half of the year. The Fed remains extremely accommodative and is likely to maintain this stance for much of 2013.
• Corporate cash levels are high, providing corporations the ability to pursue mergers and acquisitions (M&A). An increase in M&A activity holds promise for both portfolio gains and an increase in overall market valuations.
• At the end of the period, the fund maintained a higher than normal level of cash, which the fund can opportunistically deploy.
Threats
• Fiscal austerity in the U.S. and abroad will continue to create economic headwinds.
• While Europe and China appear to be on improving trends, policy missteps cannot be ruled out.
• Deep value and price reversals have led the market. If this trend persists, it is a threat to relative performance.
(1)This security comprised 2.65% of the fund's total net assets as of 12/31/12.
(2)This security comprised 1.99% of the fund's total net assets as of 12/31/12.
(3)This security comprised 3.83% of the fund's total net assets as of 12/31/12.
(4)The fund did not hold this security as of 12/31/12.
28
Top 10 Holdings Based on Net Assets
(excluding repurchase agreement) December 31, 2012
Apple, Inc.
Computers | | | 6.77 | % | |
MasterCard, Inc.
Commercial Services - Financial | | | 3.83 | % | |
Wabtec Corp.
Machinery - General Industrial | | | 3.03 | % | |
United Rentals, Inc.
Rental Auto/Equipment | | | 2.89 | % | |
CommVault Systems, Inc.
Data Processing/Management | | | 2.82 | % | |
Watson Pharmaceuticals, Inc.
Medical - Generic Drugs | | | 2.73 | % | |
Gulfport Energy Corp.
Oil Companies - Exploration & Production | | | 2.65 | % | |
eBay, Inc.
E-Commerce/Products | | | 2.50 | % | |
Celgene Corp.
Medical - Biomedical/Gene | | | 2.50 | % | |
Polaris Industries, Inc.
Recreational Vehicles | | | 2.43 | % | |
Total Top 10 Holdings | | | 32.15 | % | |
Portfolio Allocation by Industry Sector*
Based on Total Investments December 31, 2012
* Summary information above may differ from the portfolio schedule included in the financial statements due to the use of different classifications of securities for presentation purposes.
29
Management Team's Perspective
Introduction
The MegaTrends Fund (MEGAX and MEGIX) focuses on companies that are well positioned to benefit from substantial and sustainable growth that may occur over a multi-year time frame. The fund considers a broad range of investable opportunities, many of which are created by government policies, technological innovations and/or changes in market fundamentals for a product, service or commodity. The fund has the flexibility to invest globally and within any sector of the economy.
Performance Graph
MegaTrends Fund

Average Annual Performance For the Periods Ended December 31, 2012
| | | One Year | | Five Year | | Ten Year | | Since Inception
(Institutional
Class) | |
MegaTrends Fund - Investor Class | | | 5.67 | % | | | (7.44 | )% | | | 4.47 | % | | | n/a | | |
MegaTrends Fund - Institutional Class
(Inception 3/1/10) | | | 5.95 | % | | | n/a | | | | n/a | | | | 1.59 | % | |
S&P 500 Index | | | 16.00 | % | | | 1.66 | % | | | 7.09 | % | | | 11.36 | % | |
Performance data quoted above is historical. Past performance is no guarantee of future results. Current performance may be higher or lower than the performance data quoted. The principal value and investment return of an investment will fluctuate so that an investor's shares, when redeemed, may be worth more or less than their original cost. The graph and table do not reflect the deduction of taxes that a shareholder would pay on fund distributions or the redemption of fund shares.
Pursuant to a voluntary arrangement, the Adviser has agreed to limit total fund operating expenses (exclusive of any acquired fund fees and expenses, performance fees, taxes, brokerage commissions and interest) to not exceed 2.35% for the Investor Class. Also pursuant to a voluntary agreement, the Adviser has agreed to waive all class specific expenses of the Institutional Class. The Adviser can modify or terminate these arrangements at any time.
See Definitions for Management Teams' Perspectives for index definitions.
Please visit our website at www.usfunds.com for updated performance information for different time periods.
30
The Year In Review - Economic And Political Issues That Affected The Fund
Political and economic considerations are very influential on the investment climate in which the MegaTrends Fund operates.
In the first half of the year, inaction by European policymakers raised fears that the global economy was headed toward a severe recession, and weighed heavily on equity markets during the summer months. After European Central Bank (ECB) President Mario Draghi publicly made the statement that the ECB would do "whatever it takes" to protect the eurozone from collapsing, officials were able to stabilize the global credit markets via political measures and a series of financial support programs. The ECB lowered interest rates to aid the economy, and provided inexpensive loans to maintain money flows in the European banks.
In the fall, the U.S. presidential election consumed the financial headlines. However, immediately following the election, it did not take long for investors' fears over the U.S. "fiscal cliff" to arise. There was a lack of clarity surrounding the repeal of $600 billion worth of tax and fiscal spending initiatives, which slowed market gains as 2012 ended.
Conversely, China gained economic momentum in the fourth quarter, as prior pro-growth policy changes spurred the economy and ignited demand for commodities and basic materials.
Investment Highlights
Overview
For the year ended December 31, 2012, the Investor Class of the fund returned 5.67 percent and the Institutional Class returned 5.95 percent. The benchmark S&P 500 Index returned 16.00 percent during the year.
Because the fund is actively managed and holding period is generally not a consideration in investment decisions, the portfolio turnover rate may fluctuate from year to year as the fund adjusts its portfolio composition. The fund's annual portfolio turnover was, and is expected to continue to be, more than 100 percent.
In mid-2012, the fund expanded on its previous emphasis of the global infrastructure theme to align the holdings toward broader top-down investment themes. The fund seeks to deploy capital into the most robust areas of the economy by ranking sector performance on a relative strength basis. The fund dynamically identifies themes and adapts to market trends that appear to be emerging.
31
Strengths
• Management's de-emphasis of the global infrastructure theme in the second half of the year proved successful, as the fund outperformed the Macquarie Global Infrastructure Index by 142 basis points. The index holds companies located around the world that are within the infrastructure industry.
• Top contributors to fund performance for 2012 included Sprint Nextel Corp.,(1) PulteGroup, Inc.(2) Lennar Corp.,(3) Atlas Energy L.P.(1) and Life Healthcare Group Holdings Ltd.(1)
• The fund benefited from owning certain securities in the telecommunications and financial sectors, with outperformance from Crown Castle International Corp.,(1) Verizon Communications, Inc.,(1) Bank of America Corp.(4) and the Royal Bank of Scotland Group plc.(5)
• Select international equities also contributed meaningfully to performance such as Suez Environment SA,(1) CCR S.A.(1) and PetroMagdalena Energy Corp.(1)
Weaknesses
• The fund's underperformance compared to the benchmark S&P 500 was mainly a result of sector allocation and stock selection in both domestic and international areas.
• The fund's emphasis on the infrastructure theme in the first six months of the year was a detriment to performance. The technology, telecommunication and financial sectors all outperformed the benchmark S&P 500 by an average of 682 basis points. The Macquarie Global Infrastructure Index underperformed the S&P 500 Index by 693 basis points during this period.
• Primary negative contributors to fund performance in 2012 included Dalian Port (PDA) Co., Ltd.,(1) Cementos Pacasmayo S.A.A.,(1) Golar LNG Ltd.(1) and Spirit Airlines, Inc.(1)
• From a sector standpoint, exposure to the U.S. utilities sector proved to be an opportunity cost, as this sector underperformed the S&P 500 Index by 1,472 basis points.
Current Outlook
Opportunities
Our investment process has identified the following investable trends that could prove to be multi-year megatrends:
• The basic materials and industrial sectors appear to be on the mend, and may be within the early stages of an uptrend given the economic rebound in China and the pro-growth synchronized monetary easing cycle taking place around the globe.
32
• The financial sector is steadily recovering from the 2008 financial crisis and is beginning to see signs of incremental credit demand, partially in response to an improving labor and housing market.
• The discretionary sector appears to have captured two trends involving the nascent recovery in the U.S. housing sector and the growing market share of discount retailing.
Threats
• While policymakers in Europe have made strides to stabilize the current debt crisis, many contagion risks remain, which could lead to a liquidity shock similar to 2008.
• If China's recovery proves to be fleeting, recent strength in cyclical sectors of the economy could be at risk of a reversal.
(1)The fund did not hold this security as of 12/31/12.
(2)This security comprised 2.43% of the fund's total net assets as of 12/31/12.
(3)This security comprised 2.22% of the fund's total net assets as of 12/31/12.
(4)This security comprised 2.55% of the fund's total net assets as of 12/31/12.
(5)This security comprised 2.48% of the fund's total net assets as of 12/31/12.
33
Top 10 Holdings Based on Net Assets
(excluding repurchase agreement) December 31, 2012
Pacific Stone Tech, Inc.
Quarrying | | | 4.97 | % | |
Pacific Infrastructure, Inc.
Real Estate Operating/Development | | | 3.12 | % | |
Toyota Motor Corp.
Automotive - Cars & Light Trucks | | | 2.68 | % | |
McKesson Corp.
Medical - Wholesale Drug Distribution | | | 2.60 | % | |
VF Corp.
Apparel Manufacturers | | | 2.56 | % | |
Bank of America Corp.
Diversified Banking Institutions | | | 2.55 | % | |
Royal Bank of Scotland Group plc
Diversified Banking Institutions | | | 2.48 | % | |
InterContinental Hotels Group plc
Hotels & Motels | | | 2.45 | % | |
News Corp.
Multimedia | | | 2.44 | % | |
PulteGroup, Inc.
Building - Residential/Commercial | | | 2.43 | % | |
Total Top 10 Holdings | | | 28.28 | % | |
Portfolio Allocation by Industry Sector*
Based on Total Investments December 31, 2012

* Summary information above may differ from the portfolio schedule included in the financial statements due to the use of different classifications of securities for presentation purposes.
34
Management Team's Perspective
Introduction
The Global Resources Fund (PSPFX and PIPFX) is a non-diversified natural resources fund with the principal objective of achieving long-term growth of capital while providing protection against inflation and monetary instability. The fund invests globally in companies involved in the exploration, production, transportation and processing of petroleum, natural gas, coal, alternative energies, chemicals, mining, iron and steel, and paper and forest products.
Performance Graph
Global Resources Fund
Average Annual Performance For the Periods Ended December 31, 2012
| | | One Year | | Five Year | | Ten Year | | Since Inception
(Institutional
Class) | |
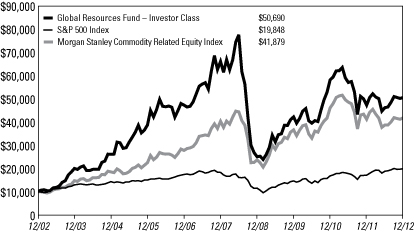
Global Resources Fund - Investor Class | | | 6.93 | % | | | (5.22 | )% | | | 17.61 | % | | | n/a | | |
Global Resources Fund - Institutional Class
(Inception 3/1/10) | | | 7.44 | % | | | n/a | | | | n/a | | | | 7.17 | % | |
S&P 500 Index | | | 16.00 | % | | | 1.66 | % | | | 7.09 | % | | | 11.36 | % | |
Morgan Stanley Commodity Related
Equity Index | | | 1.36 | % | | | 0.75 | % | | | 15.38 | % | | | 4.27 | % | |
Performance data quoted above is historical. Past performance is no guarantee of future results. Current performance may be higher or lower than the performance data quoted. The principal value and investment return of an investment will fluctuate so that an investor's shares, when redeemed, may be worth more or less than their original cost. The graph and table do not reflect the deduction of taxes that a shareholder would pay on fund distributions or the redemption of fund shares.
Pursuant to a voluntary arrangement, the Adviser has agreed to limit total fund operating expenses (exclusive of any acquired fund fees and expenses, performance fees, taxes, brokerage commissions and interest) to not exceed 1.90% for the Investor Class. Also pursuant to a voluntary agreement, the Adviser has agreed to waive all class specific expenses of the Institutional Class. The Adviser can modify or terminate these arrangements at any time.
See Definitions for Management Teams' Perspectives for index definitions.
Please visit our website at www.usfunds.com for updated performance information for different time periods.
35
The Year In Review - Economic And Political Issues That Affected The Fund
In 2012, market sentiment was dominated by fear-inducing economic headlines related to the ongoing European sovereign debt crisis, the U.S. presidential election and the U.S. "fiscal cliff." However, despite generally negative news flow, the S&P 500 Index climbed a "wall of worry" and posted a positive double-digit return for the year.
In the first half of the year, gridlock among European policymakers raised fears that the global economy was heading toward a severe recession. This weighed heavily on equity markets during the summer months. Fortunately, officials were able to stabilize the European bond market via political measures and a series of financial support programs. The European Central Bank (ECB) lowered interest rates to aid the economy, and provided loans to maintain money flows among European banks. In the fall of 2012, the market's attention focused on the U.S. presidential election and Barack Obama's victory over Mitt Romney. However, after the election, investors' fears over the U.S. "fiscal cliff" weighed on sentiment as the year ended.
This environment of "risk on/risk off" drove volatility in commodities, with prices falling as much as 10 percent into mid-year before rallying in the third quarter and then declining in the fourth quarter. This volatility created a headwind for the commodity-related stocks in general.
Also, as a significant consumer of commodities, China faced a weakening trend in its economy in the first three quarters of 2012 as GDP growth decelerated and inventories of goods were destocked. This weighed on commodity prices. Sentiment began to turn as the Chinese government proactively cut its bank reserve requirements in the fourth quarter, which may have signaled to the market a more pro-growth policy change. In fact, the China Purchasing Managers' Index expanded in December after a brief decline below the key level of 50. Moreover, the JP Morgan Global Manufacturing PMI Index also improved by the end of the year following three consecutive months of contraction.
Investment Highlights
Overview
For the year ended December 31, 2012, the Investor Class of the Global Resources Fund returned 6.93 percent and the Institutional Class gained 7.44 percent. These results were well ahead of the fund's benchmark, the Morgan Stanley Commodity Related Equity Index (CRX), which returned 1.36 percent.
36
Because the fund is actively managed and a holding period is generally not a consideration in investment decisions, the portfolio turnover rate may fluctuate from year to year as the fund adjusts its portfolio composition. The fund's annual portfolio turnover was, and is expected to continue to be, more than 100 percent.
Strengths
• Lumber prices surged to a six-year high by the end of the year as a recovery in the U.S. housing sector continued to unfold. Several stocks in the forest and paper industry contributed to fund performance, including West Fraser Timber Co., Ltd.,(1) Weyerhaeuser Co.(2) and International Paper Co.(3)
• The U.S. oil refining industry benefited from rising export opportunities of refined product and wide basin discounts of crude oil relative to international benchmarks, which provided significantly elevated profits for the industry. The fund held several stocks in this sector, such as HollyFrontier Corp.,(4) Valero Energy Corp.(5) and Marathon Petroleum Corp.,(6) which were top performers for the fund in 2012.
• Record drought conditions in the U.S. this past summer boosted corn and soybean prices to record levels and drove agricultural-related shares higher. The fund benefited from positions in Viterra, Inc.,(7) CF Industries Holdings, Inc.,(8) Monsanto Co.(9) and Bunge Ltd.(10)
Weaknesses
• Gold stocks performed poorly in 2012 as they fell in absolute terms and underperformed relative to gold bullion, which posted its twelfth consecutive year of positive returns. Several gold and silver mining stocks contributed negatively to performance, including Coeur d'Alene Mines Corp.,(7) Randgold Resources Ltd.(11) and Gran Colombia Gold Corp.(12)
• Junior exploration stocks were also a headwind for performance as the S&P/TSX Venture Composite Index fell 15.53 percent during 2012. The fund was negatively affected by holdings in several junior exploration companies, including Pacific Coal Resources Ltd.,(13) Horn Petroleum Corp.(14) and African Potash Ltd.(15)
• U.S. natural gas prices fell to multi-year lows in mid-2012, negatively impacting shares of companies that produce natural gas, including SM Energy Co.(7) and Newfield Exploration Corp.(16)
Current Outlook
Opportunities
• With the U.S. Federal Reserve continuing its policy of an open-ended quantitative easing program, the portfolio managers remain constructive on the likelihood that rising commodities prices resulting from global central bank easing will be a
37
catalyst for relative performance of commodity-related stocks. Under this scenario, gold and precious metals stocks continue to look attractive.
• The U.S. housing recovery remains a catalyst for the timber and forest sector, as the construction industry slowly recovers.
• Record high prices for agricultural commodities provide a incentive for fertilizer companies, seed companies and agricultural processors.
• Additionally, recent data show an uptick in growth prospects for the Chinese economy, which is bullish for natural resources.
Threats
• Further deterioration of the European debt crisis could result in a significant decline in global economic activity.
(1) This security comprised 1.92% of the total net assets of the fund as of 12/31/12.
(2) This security comprised 1.93% of the total net assets of the fund as of 12/31/12.
(3) This security comprised 2.02% of the total net assets of the fund as of 12/31/12.
(4) This security comprised 1.53% of the total net assets of the fund as of 12/31/12.
(5) This security comprised 1.28% of the total net assets of the fund as of 12/31/12.
(6) This security comprised 1.48% of the total net assets of the fund as of 12/31/12.
(7) The fund did not hold this security at 12/31/12.
(8) This security comprised 1.16% of the total net assets of the fund as of 12/31/12.
(9) This security comprised 1.96% of the total net assets of the fund as of 12/31/12.
(10)This security comprised 1.84% of the total net assets of the fund as of 12/31/12.
(11)This security comprised 1.86% of the total net assets of the fund as of 12/31/12.
(12)This security comprised 3.99% of the total net assets of the fund as of 12/31/12.
(13)This security comprised 0.78% of the total net assets of the fund as of 12/31/12.
(14)This security comprised 0.14% of the total net assets of the fund as of 12/31/12.
(15)This security comprised 0.14% of the total net assets of the fund as of 12/31/12.
(16)This security comprised 0.73% of the total net assets of the fund as of 12/31/12.
38
Top 10 Holdings Based on Net Assets
(excluding repurchase agreement) December 31, 2012
Gran Colombia Gold Corp.
Gold Mining | | | 3.99 | % | |
Sociedad Quimica y Minera de Chile S.A.
Chemicals - Diversified | | | 2.76 | % | |
Kinder Morgan, Inc.
Pipelines | | | 2.18 | % | |
Martin Marietta Materials, Inc.
Building Products - Cement/Aggregates | | | 2.16 | % | |
Consol Energy, Inc.
Coal | | | 2.14 | % | |
Pioneer Natural Resources Co.
Oil Companies - Exploration & Production | | | 2.13 | % | |
Oil States International, Inc.
Oil - Field Services | | | 2.08 | % | |
National-Oilwell Varco, Inc.
Oil Field Machinery & Equipment | | | 2.05 | % | |
Plum Creek Timber Co., Inc.
Real Estate Investment Trusts | | | 2.04 | % | |
BHP Billiton Ltd.
Diversified Minerals | | | 2.03 | % | |
Total Top 10 Holdings | | | 23.56 | % | |
39
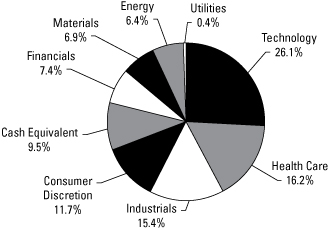
Portfolio Allocation by Industry Sector*
Based on Total Investments December 31, 2012
Energy: | |
Oil & Gas Exploration & Production | | | 9.7 | % | | | |
Pipelines | | | 8.3 | % | | | |
Oil & Gas Equipment & Services | | | 7.7 | % | | | |
Oil & Gas - Integrated (includes Refining and
Marketing) | | | 6.0 | % | | | |
Other Energy | | | 1.7 | % | | | |
Total Energy | | | | | 33.4 | % | |
Basic Materials: | |
Precious Metals (includes Gold/Silver Mining and
Platinum) | | | 14.7 | % | | | |
General Basic Materials | | | 26.6 | % | | | |
Metals & Mining (includes Copper and Coal) | | | 15.9 | % | | | |
Total Basic Materials | | | | | 57.2 | % | |
Other Sectors | | | | | 7.2 | % | |
Repurchase Agreement | | | | | 2.2 | % | |
| | | 100.0 | % | |
* Summary information above may differ from the portfolio schedule included in the financial statements due to the use of different classifications of securities for presentation purposes.
40
Precious Metals and Minerals Funds
Management Team's Perspective
Introduction
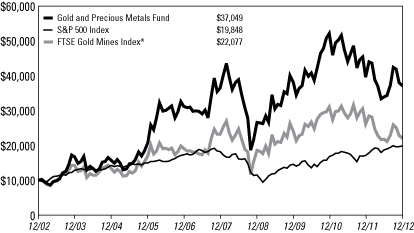
The World Precious Minerals Fund (UNWPX and UNWIX) and the Gold and Precious Metals Fund (USERX) pursue an objective of long-term capital growth through investments in gold, precious metals and mining companies. The Gold and Precious Metals Fund focuses on the equity securities of established gold and precious metals companies and pursues current income as a secondary objective. The World Precious Minerals Fund focuses on equity securities of companies principally engaged in the exploration, mining and processing of precious minerals such as gold, silver, platinum and diamonds. Although this fund has the latitude to invest in a broad range of precious minerals, it currently remains focused on the gold sector.
Performance Graphs
World Precious Minerals Fund
Average Annual Performance For the Periods Ended December 31, 2012
| | | One Year | | Five Year | | Ten Year | | Since Inception
(Institutional
Class) | |
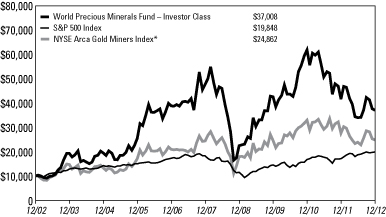
World Precious Minerals Fund - Investor Class | | | (11.23 | )% | | | (4.95 | )% | | | 13.97 | % | | | n/a | | |
World Precious Minerals Fund -
Institutional Class (Inception 3/1/10) | | | (10.76 | )% | | | n/a | | | | n/a | | | | (4.15 | )% | |
S&P 500 Index | | | 16.00 | % | | | 1.66 | % | | | 7.09 | % | | | 11.36 | % | |
NYSE Arca Gold Miners Index* | | | (9.85 | )% | | | 0.34 | % | | | 9.53 | % | | | 1.56 | % | |
* These are not total returns. These returns reflect simple appreciation only and do not reflect dividend reinvestment.
Performance data quoted above is historical. Past performance is no guarantee of future results. Current performance may be higher or lower than the performance data quoted. The principal value and investment return of an investment will fluctuate so that an investor's shares, when redeemed, may be worth more or less than their original cost. The graph and table do not reflect the deduction of taxes that a shareholder would pay on fund distributions or the redemption of fund shares.
Pursuant to a voluntary arrangement, the Adviser has agreed to limit total fund operating expenses (exclusive of any acquired fund fees and expenses, performance fees, taxes, brokerage commissions and interest) to not exceed 1.90% for the Investor Class. Also pursuant to a voluntary agreement, the Adviser has agreed to waive all class specific expenses of the Institutional Class. The Adviser can modify or terminate these arrangements at any time.
See Definitions for Management Teams' Perspectives for index definitions.
Please visit our website at www.usfunds.com for updated performance information for different time periods.
41
Precious Metals and Minerals Funds
Gold and Precious Metals Fund
Average Annual Performance For the Years Ended
December 31, 2012
| | | One Year | | Five Year | | Ten Year | |
Gold and Precious Metals Fund | | | (6.44 | )% | | | 0.33 | % | | | 13.98 | % | |
S&P 500 Index | | | 16.00 | % | | | 1.66 | % | | | 7.09 | % | |
FTSE Gold Mines Index* | | | (15.43 | )% | | | (0.95 | )% | | | 8.23 | % | |
* These are not total returns. These returns reflect simple appreciation only and do not reflect dividend reinvestment.
Performance data quoted above is historical. Past performance is no guarantee of future results. Current performance may be higher or lower than the performance data quoted. The principal value and investment return of an investment will fluctuate so that an investor's shares, when redeemed, may be worth more or less than their original cost. The graph and table do not reflect the deduction of taxes that a shareholder would pay on fund distributions or the redemption of fund shares.
Pursuant to a voluntary arrangement, the Adviser has agreed to limit total fund operating expenses (exclusive of any acquired fund fees and expenses, performance fees, taxes, brokerage commissions and interest) to not exceed 1.90%. The Adviser can modify or terminate this arrangement at any time.
See Definitions for Management Teams' Perspectives for index definitions.
Please visit our website at www.usfunds.com for updated performance information for different time periods.
The Year In Review - Economic And Political Issues That Affected The Funds
The price of gold completed its twelfth consecutive annual gain, although it was a turbulent year. Gold markets started the year very strong: through February, gold bullion gained 14.1 percent and the NYSE Arca Gold Miners Index climbed 11.4 percent.
However, after Federal Reserve Chairman Ben Bernanke hinted that the economy appeared to be improving and there would not be a new round of quantitative easing
42
Precious Metals and Minerals Funds
(QE), gold plummeted nearly 5 percent in one day. With Bernanke stalling on any new stimulus measures, gold became the fast money's favorite short with each ensuing Fed meeting.
Gold's decline early in the year was further exacerbated by India's nationwide jewelers' strike in March to protest a tax on non-branded ornaments. The country was the world's second-largest bullion consumer in the fourth quarter of 2011. Gold imports into India tumbled more than 55 percent in March. The combined jewelers' strike in India plus the comments from the Federal Reserve sent many gold stocks to 52-week lows by May.
By early fall, an improvement in the U.S. economy proved to be ephemeral and the Fed introduced a new, open-ended QE program with the intention of keeping interest rates very low. Even if the economy appears to be turning around, the Fed has suggested that stimulus will not be withdrawn prematurely.
Central banks around the world continued to be active buyers in the gold market with a number of nations reporting new gold purchases over the year to diversify their reserve base. David Rosenberg of Gluskin Sheff astutely observed that the central banks know that the need to inflate massively in coming years is going to make the yellow metal an increasingly desirable asset.
However, since QE3 was confirmed on September 13, the Fed's balance sheet is actually down compared to levels at the beginning of the year and generally flat versus levels for most of 2012. With no growth in the balance sheet, gold prices languished.
Analysts' outlook for precious metals remains bullish. Francisco Blanch, head of commodities research for Bank of America Merrill Lynch, forecasts that the gold price will rise to $2,000 an ounce by the end of 2013. According to GFMS, silver prices may rise as much as 38 percent in 2013 from current levels. Platinum and palladium will return to the biggest shortages in at least a decade this year as strikes and safety stoppages in South Africa and falling sales from Russia cut supplies. According to UBS, platinum and palladium supply will decline ten percent, which should keep prices elevated.
Investment Highlights
For the year ended December 31, 2012, the World Precious Minerals Fund Investor Class declined 11.23 percent and the Institutional Class lost 10.76 percent. The fund's benchmark, the NYSE Arca Gold Miners Index, decreased 8.46 percent on a total return basis. The Gold and Precious Metals Fund fell 6.44 percent for the year ended December 31, 2012, outperforming its benchmark, the FTSE Gold Mines Index, which decreased 13.94 percent on a total return basis.
Spot gold finished the period at $1,675.35 per ounce, up $111.65, or 7.14 percent for the year. The S&P 500 Index posted a positive return of 16.00 percent, the U.S. Trade
43
Precious Metals and Minerals Funds
Weighted Dollar Index lost 0.51 percent and the yield on a 90-day Treasury bill finished the period at 0.04 percent.
The strategy of the World Precious Minerals Fund favors junior (exploration and development) stocks and mid-tiered producing stocks. These lower-capitalization stocks have historically outperformed senior gold mining companies over longer time periods as senior gold miners have typically acquired proven assets of junior gold companies rather than explored for new mining projects with capital-constrained budgets. However, the World Precious Mineral Fund's junior stock holdings negatively affected the fund's performance relative to its benchmark of North American senior gold stocks during the period due to small capitalization stocks having less access to capital in turbulent markets when investor confidence is lower.
While focusing on established, producing gold companies, the Gold and Precious Metals Fund holds a higher weighting of mid-tier stocks compared to its benchmark. Toward year-end, we saw a rotation in the relative performance of senior versus mid-tier gold stocks, and the fund significantly outperformed its benchmark.
Both funds may hold elevated levels of cash when market volatility increases to maintain a higher level of liquidity in the fund. In conjunction with this strategy, the funds may use options or warrants to maintain market exposure to gold equities.
Strengths
• Agnico-Eagle Mines Ltd.(1) yielded the largest contribution for both funds in 2012. After several operational difficulties in the prior year, Agnico-Eagle offered very good value to investors and handily beat earnings and production guidance throughout 2012.
• The second-best contributor to performance for both funds was Franco-Nevada Corp.,(2) a mining royalty company. Franco-Nevada had raised money in November of 2011 and was in the enviable position in 2012 to make strategic investments to acquire additional royalty interests.
• The third-best performing stock for both funds was Dundee Precious Metals, Inc.(3) Dundee is an asset-rich company with a management team that understands capital markets. We were early into the stock before some of the larger brokerage firms picked up on the investment potential, and we believe there is still a very strong value proposition to be realized in the coming year.
Weaknesses
• The worst performer for the World Precious Minerals Fund and the second-worst for the Gold and Precious Metals Funds was Richmont Mines, Inc.(4) After delivering a 111 percent return in the prior year, some unexpected management and board changes at Richmont knocked the stock down abruptly. Richmont's president and CEO Martin Rivard announced his resignation in February in what appeared to be
44
Precious Metals and Minerals Funds
a disagreement on the strategic direction of the company with its board members. Mr. Rivard was believed to have been critical to the success of the company.
• Of three major North American gold miners, Barrick Gold Corp.,(5) Goldcorp Inc.(6) and Newmont Mining Corp.,(7) Goldcorp declined the least but still was the worst performer for the Gold and Precious Metals Fund due to its position size in the fund. Goldcorp also had a negative effect for the World Precious Minerals Fund.
• Other holdings that had a detrimental effect on performance for both funds included Gran Colombia Gold Corp.(8) and Harmony Gold Mining Co., Ltd.(9) Equity markets were not kind to junior mining companies in 2012. To fund the modernization of its milling facilities, Gran Colombia eventually raised money in the debt market. This will allow the company to double its gold production over the coming year, creating the largest gold producer in Colombia. Harmony's share price was impacted by negative labor actions within the mining industry in South Africa, although Harmony faired pretty well from an operational viewpoint with only one of its mines being impacted by work stoppages. We view Harmony as a long-term value investment. Klondex Mines Ltd.(10) and Entree Gold, Inc.(11) were also negative performers for the World Precious Minerals Fund in 2012.
Current Outlook
Opportunities
• Gold miners are beginning to change the way they report cash costs, as research indicates that an all-in cost measure is much more indicative of the true cost of mining, as it takes into consideration operating costs, sustaining capital, construction capital, discovery costs and overhead tax along with acceptable profit. When factoring in all these costs, CIBC calculated that a sustainable number for mining an ounce of gold would be $1,700. By the end of 2012, Freeport McMoRan Copper & Gold, Inc.,(12) Goldcorp, Newmont Mining and Yamana Gold, Inc.(13) announced plans to adopt versions of an all-in sustaining cash cost measure, which the companies believe reflect the full cost of gold production. We expect additional gold miners to make a similar change in 2013.
• As miners continue to seek ways to attract investors, we believe more companies will continue or increase their dividends.
• The historical trend of gold stock performance suggests that 2013 will be positive for precious metals miners. Barry Cooper from CIBC World Markets found that, historically, gold miners tend to perform poorly in the year of a U.S. presidential election. Regardless of which party is in the White House and which party wants to take it back, going back to 1984, the Philadelphia Stock Exchange Gold and Silver Index (XAU) has declined an average of 18.4 percent in the year Americans are busy thinking about voting for a leader. However, the year after a U.S. presidential election, going back to 1985, the XAU historically has increased substantially in post-election federal years, rising 23.4 percent on average.
45
Precious Metals and Minerals Funds
Threats
• Miners' outdated use of a cash costs measure has caused governments in many countries to believe miners have seen a windfall profit from the rising price of gold. Throughout 2013, the gold mining industry faces the continued possibility of increased taxes.
• In recent years, gold mining companies have been facing the dilemma of trying to grow their production profile while also depleting their current resource base. No mining company wants to show investors that its production profile is in decline, and, as a result, there has been a huge push to grow gold production. This growth for growth's sake has resulted in a congested intersection of projects in the pipeline and a critical shortage of technically skilled engineers and geologists, driving up the costs of projects and resources. According to George Topping from Stifel Nicolaus, mines that cost $2 billion a few years ago now cost $5 billion.
• Money flows into exchange-traded funds (ETFs) appear to be changing the formation of capital in the gold mining industry. Investors who want an instant exposure to gold stocks as well as the ability to change their investment allocation on an intraday basis are unintentionally directing capital to companies that may not have viable projects. For example, the Market Vectors Junior Gold Miners ETF (GDXJ)(14) holds a basket of gold stocks based primarily on the liquidity of the underlying companies while the merits of the projects could be a secondary consideration. In the last three years, the GDXJ has grown to $3 billion, leaving a plethora of junior mining companies that are not in the index starved for capital.
(1) This security comprised 6.17% of the total net assets of the World Precious Minerals Fund and 5.01% of the Gold and Precious Metals Fund as of 12/31/12.
(2) This security comprised 1.32% of the total net assets of the World Precious Minerals Fund and 3.49% of the Gold and Precious Metals Fund as of 12/31/12.
(3) This security comprised 4.55% of the total net assets of the World Precious Minerals Fund and 6.87% of the Gold and Precious Metals Fund as of 12/31/12.
(4) This security comprised 0.20% of the total net assets of the World Precious Minerals Fund and 0.09% of the Gold and Precious Metals Fund as of 12/31/12.
(5) This security comprised 0.56% of the total net assets of the World Precious Minerals Fund and 2.34% of the Gold and Precious Metals Fund as of 12/31/12.
(6) This security comprised 0.03% of the total net assets of the World Precious Minerals Fund and 0.22% of the Gold and Precious Metals Fund as of 12/31/12.
(7) This security comprised 0.02% of the total net assets of the World Precious Minerals Fund and 1.47% of the Gold and Precious Metals Fund as of 12/31/12.
(8) This security comprised 7.10% of the total net assets of the World Precious Minerals Fund and 6.31% of the Gold and Precious Metals Fund as of 12/31/12.
(9) This security comprised 1.74% of the total net assets of the World Precious Minerals Fund and 2.51% of the Gold and Precious Metals Fund as of 12/31/12.
(10)This security comprised 1.77% of the total net assets of the World Precious Minerals Fund and 0.00% of the Gold and Precious Metals Fund as of 12/31/12.
(11)This security comprised 0.21% of the total net assets of the World Precious Minerals Fund and 0.00% of the Gold and Precious Metals Fund as of 12/31/12.
(12)Neither fund held this security as of 12/31/12.
(13)This security comprised 1.89% of the total net assets of the World Precious Minerals Fund and 3.62% of the Gold and Precious Metals Fund as of 12/31/12.
(14)This security comprised 0.02% of the total net assets of the World Precious Minerals Fund and 0.03% of the Gold and Precious Metals Fund as of 12/31/12.
46
Precious Metals and Minerals Funds
World Precious Minerals Fund
Top 10 Holdings Based on Net Assets
(excluding repurchase agreement) December 31, 2012
Gran Colombia Gold Corp.
Gold Mining | | | 7.10 | % | |
Agnico-Eagle Mines Ltd.
Gold Mining | | | 6.17 | % | |
Dundee Precious Metals, Inc.
Gold Mining | | | 4.55 | % | |
Silver Wheaton Corp.
Silver Mining | | | 3.12 | % | |
NGEx Resources, Inc.
Gold Mining | | | 2.64 | % | |
Virginia Mines, Inc.
Gold Mining | | | 2.63 | % | |
Alamos Gold, Inc.
Gold Mining | | | 2.47 | % | |
MAG Silver Corp.
Silver Mining | | | 2.43 | % | |
Coeur d'Alene Mines Corp.
Precious Metals | | | 1.90 | % | |
Yamana Gold, Inc.
Gold Mining | | | 1.89 | % | |
Total Top 10 Holdings | | | 34.90 | % | |
Portfolio Allocation by Industry*
Based on Total Investments December 31, 2012
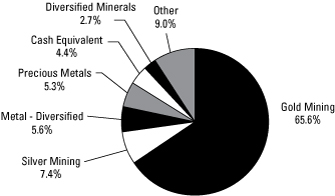
* Summary information above may differ from the portfolio schedule included in the financial statements due to the use of different classifications of securities for presentation purposes.
47
Precious Metals and Minerals Funds
Gold and Precious Metals Fund
Top 10 Holdings Based on Net Assets
(excluding repurchase agreement) December 31, 2012
Dundee Precious Metals, Inc.
Gold Mining | | | 6.87 | % | |
Gran Colombia Gold Corp.
Gold Mining | | | 6.31 | % | |
Agnico-Eagle Mines Ltd.
Gold Mining | | | 5.01 | % | |
Silver Wheaton Corp.
Silver Mining | | | 4.35 | % | |
Yamana Gold, Inc.
Gold Mining | | | 3.62 | % | |
Franco-Nevada Corp.
Gold/Mineral Royalty Companies | | | 3.49 | % | |
Sandstorm Gold Ltd.
Gold Mining | | | 2.90 | % | |
Pan American Silver Corp.
Silver Mining | | | 2.82 | % | |
Alamos Gold, Inc.
Gold Mining | | | 2.74 | % | |
SPDR Gold Trust
Exchange-Traded Funds | | | 2.68 | % | |
Total Top 10 Holdings | | | 40.79 | % | |
Portfolio Allocation by Industry*
Based on Total Investments December 31, 2012
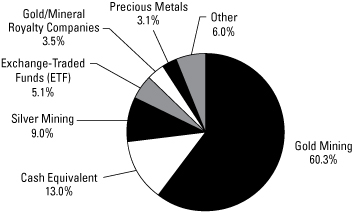
* Summary information above may differ from the portfolio schedule included in the financial statements due to the use of different classifications of securities for presentation purposes.
48
Management Team's Perspective
Introduction
The investment objective of the Eastern European Fund (EUROX) is to achieve long-term capital growth by investing in a non-diversified portfolio of equity securities of companies located in the emerging markets of Eastern Europe.(1)
Performance Graph
Eastern European Fund
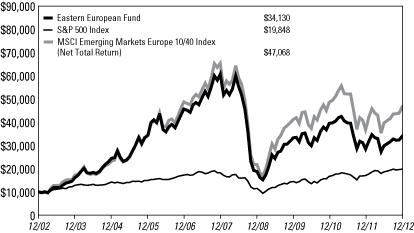
Average Annual Performance For the Years Ended
December 31, 2012
| | | One Year | | Five Year | | Ten Year | |
Eastern European Fund | | | 19.27 | % | | | (10.97 | )% | | | 13.05 | % | |
S&P 500 Index | | | 16.00 | % | | | 1.66 | % | | | 7.09 | % | |
MSCI Emerging Markets Europe 10/40 Index
(Net Total Return) | | | 27.41 | % | | | (6.46 | )% | | | 16.74 | % | |
Performance data quoted above is historical. Past performance is no guarantee of future results. Current performance may be higher or lower than the performance data quoted. The principal value and investment return of an investment will fluctuate so that an investor's shares, when redeemed, may be worth more or less than their original cost. The graph and table do not reflect the deduction of taxes that a shareholder would pay on fund distributions or the redemption of fund shares.
Pursuant to a voluntary arrangement, the Adviser has agreed to limit total fund operating expenses (exclusive of any acquired fund fees and expenses, performance fees, taxes, brokerage commissions and interest) to not exceed 2.85%. The Adviser can modify or terminate this arrangement at any time.
See Definitions for Management Teams' Perspectives for index definitions.
Please visit our website at www.usfunds.com for updated performance information for different time periods.
49
The Year In Review - Economic And Political Issues That Affected The Fund
Geopolitical events caused the price of oil to rise sharply at the beginning of 2012. As an energy exporter of crude oil and natural gas, Russia is one of the few large economies in the world that directly benefits from higher energy prices. The political and investment climate took a turn for the worse after Russia's election in March produced a pre-determined swap of Dmitry Medvedev with Vladimir Putin back into the presidential seat amid serious concerns and public protest about political legitimacy. While the protests were largely peaceful, there were signs of authorities cracking down against public dissent. Russia's commitment to democratic and economic reform remains an open question.
Meanwhile, Turkey managed a soft landing after a breakneck pace of growth in 2012 following a tightening by the central bank and macroprudential measures. Its current account deficit is on the decline, as is inflation. Quality of financing has improved through foreign direct investment, as well as lengthening maturity of external debt. The country continues on a path of attaining an investment grade rating, which should further lower the cost of financing.
Central European countries' fortunes are tied to economic activity in Germany, which is showing signs of weakening. Still, Polish GDP expanded 3.5 percent in the first quarter, boosted by the Euro 2012 Soccer Cup. Before the quarterfinals were over, however, one of the major construction firms filed for bankruptcy, creating a ripple effect throughout the industry and negatively affecting banks. Historically high valuation multiples applied to Polish banks (relative to other banks in the region) underwent significant contraction as loan growth became sluggish.
Investment Highlights
Overview
The fund's return for the year ended December 31, 2012, was 19.27 percent, compared to a 27.41 percent gain for the benchmark MSCI Emerging Markets Europe 10/40 Index (Net Total Return).
Turkey and Poland were the best-performing countries in 2012 in the benchmark index by a wide margin, while Russia, Hungary and Czech Republic underperformed. On a sector basis, industrials, consumer discretionary and staples, financials and materials were the best-performing sectors in the index, while telecommunications, information technology, health care, energy and utilities underperformed.
50
Strengths
• The fund benefited from an underweight position in the underperforming utilities sector. In Russia, utilities produced double-digit negative returns after the government increased tariffs. Utilities also underperformed in Poland and Czech Republic amid falling energy demand.
• The fund benefited from an underweight position in telecommunications. Stock selection was also successful; the weighted-average return of the fund telecom holdings was more than 48 percent for the year.
• The fund uses covered call options as a defensive strategy against market volatility; in 2012, this strategy contributed positively to the fund's performance.
• Austrian financials Erste Group Bank AG(2) and Vienna Insurance Group AG Wiener Versicherung Gruppe,(3) with business operations in Czech Republic, Slovakia, Romania and Hungary, outperformed their Eastern European peers and contributed to fund performance.
Weaknesses
• The fund had an underweight position in the underperforming energy sector, but still underperformed the benchmark because of stock selection. Almost half of the underperformance was due to a single holding, TNK-BP Holding.(4) While Rosneft Oil Co. OJSC(5) offered joint shareholders BP plc(5) and the AAR (Alfa Group, Access Industries and Renova Group) consortium(5) a 30 percent premium for their ownership in TNK-BP's assets, minority shareholders were not included in the tender offer. As a result, TNK-BP Holding shares fell more than 20 percent on the day of the deal, hurting fund performance in the fourth quarter. Also in the fourth quarter, Polish refiners staged a strong performance, but the fund had no exposure to these equities. Hungarian refiner MOL Hungarian Oil & Gas Nyrt.,(6) which is held in the fund, underperformed.
• The fund's weighting in the outperforming financial sector was half of the index weighting, costing the fund performance on a relative basis.
• The fund's holdings in Canadian-listed securities (with operations in the Eastern Europe region) underperformed the benchmark index.
• The fund's overweight position in materials, which outperformed, did not produce a positive outcome because of underperformance in stock selection. The fund had a heavy exposure to gold in a year when base metals outperformed.
Current Outlook
Opportunities
• With the eurozone crisis dissipating, the convergence story is coming back to the fore. Latvia will make a formal eurozone entry application in February, for entry
51
in 2014, and Poland's Prime Minister Donald Tusk recently raised the prospect of relaunching his country's bid to join the eurozone soon.
• Turkey's economy is clearly accelerating: the latest manufacturing purchasing managers' index (PMI) reading of 53 was in expansionary territory, industrial production in December was strong at 11.3 percent year-over-year, and annualized credit growth is around 20 percent.
• Microstructure changes in the Russian domestic equity market, such as ruble settlement, may close the discount gap at which local shares trade relative to the GDR market in London.
Threats
• A significant re-rating has already taken place in Poland, with the market up 28 percent in zloty terms and earnings down 15 percent during the year. The Warsaw Stock Exchange Top 20 Index ended 2012 at a price-to-earnings ratio of 9 times. Forward 2013 multiples based on consensus earnings estimates stands at 12 times.
• Russian GDP has been decelerating since the second quarter of 2012. The December data will likely present a picture similar to the previous month. The fund has significant exposure in Russia.
• Industrial production in Poland dropped 12.2 percent in December, another signal of the need to ease monetary policy. As in the UK, most loans in Poland are not fixed rate but floating, which means banks will be hurt and not helped by lower interest rates.
(1)The following countries are considered to be in the Eastern European region: Albania, Armenia, Azerbaijan, Belarus, Bulgaria, Croatia, Czech Republic, Estonia, FYR Macedonia, Georgia, Hungary, Latvia, Lithuania, Moldova, Poland, Romania, Russia, Slovakia, Slovenia, Turkey and Ukraine.
(2)This security comprised 2.57% of the fund's total net assets as of 12/31/12.
(3)This security comprised 0.55% of the fund's total net assets as of 12/31/12.
(4)This security comprised 4.38% of the fund's total net assets as of 12/31/12.
(5)The fund did not hold this security at 12/31/12.
(6)This security comprised 2.86% of the fund's total net assets as of 12/31/12.
52
Top 10 Holdings Based on Net Assets
(excluding repurchase agreement) December 31, 2012
Sberbank of Russia
Commercial Banks - Non US | | | 5.81 | % | |
Lukoil OAO
Oil Companies - Integrated | | | 5.55 | % | |
Gazprom OAO
Oil Companies - Exploration & Production | | | 5.29 | % | |
KGHM Polska Miedz S.A.
Metal - Diversified | | | 4.75 | % | |
TNK-BP Holding
Oil Companies - Integrated | | | 4.38 | % | |
Tofas Turk Otomobil Fabrikasi A.S.
Automotive - Cars & Light Trucks | | | 3.37 | % | |
Koza Altin Isletmeleri A.S.
Gold Mining | | | 3.26 | % | |
Kernel Holding S.A.
Agricultural Operations | | | 3.12 | % | |
Eurocash S.A.
Food - Wholesale/Distribution | | | 3.00 | % | |
Uralkali OJSC
Agricultural Chemicals | | | 2.93 | % | |
Total Top 10 Holdings | | | 41.46 | % | |
Country Distribution*
Based on Total Investments December 31, 2012
(excluding repurchase agreement)

* Country distribution shown is based on domicile. The locale of company operations may be different.
53
Global Emerging Markets Fund
Management Team's Perspective
Introduction
The investment objective of the Global Emerging Markets Fund (GEMFX) is to achieve long-term capital growth by investing in a non-diversified portfolio of the equity securities of companies located in or with a significant business presence in emerging market countries.(1)
Performance Graph
Global Emerging Markets Fund
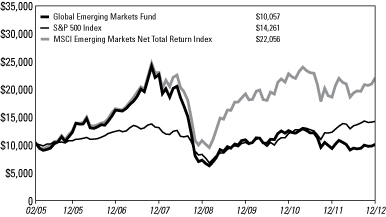
Average Annual Performance For the Periods Ended
December 31, 2012
| | | One Year | | Five Year | | Inception | |
Global Emerging Markets Fund (Inception 2/24/05) | | | 7.33 | % | | | (15.03 | )% | | | 0.07 | % | |
S&P 500 Index | | | 16.00 | % | | | 1.66 | % | | | 4.62 | % | |
MSCI Emerging Markets Net Total Return Index | | | 18.22 | % | | | (0.91 | )% | | | 10.59 | % | |
Performance data quoted above is historical. Past performance is no guarantee of future results. Current performance may be higher or lower than the performance data quoted. The principal value and investment return of an investment will fluctuate so that an investor's shares, when redeemed, may be worth more or less than their original cost. The graph and table do not reflect the deduction of taxes that a shareholder would pay on fund distributions or the redemption of fund shares.
Pursuant to a voluntary arrangement, the Adviser has agreed to limit total fund operating expenses (exclusive of any acquired fund fees and expenses, performance fees, taxes, brokerage commissions and interest) to not exceed 3.15%. The Adviser can modify or terminate this arrangement at any time.
See Definitions for Management Teams' Perspectives for index definitions.
Please visit our website at www.usfunds.com for updated performance information for different time periods.
54
Global Emerging Markets Fund
The Year In Review - Economic And Political Issues That Affected The Fund
Out of the four BRIC countries (Brazil, Russia, India and China), only India outperformed the MSCI Emerging Markets Index in 2012. The slowdown in China had economic implications beyond its own borders, negatively affecting commodity export-dependent countries such as Brazil, South Africa and Russia. However, weaker commodity prices opened a window of opportunity for the emerging economies dependent on energy imports to rein in inflationary pressures. The fund's country positioning reflected such outlook, with underweight positions in Brazil, China, South Africa, and Russia, and significantly overweight positions in India and Turkey.
Quantitative easing from the United States and Europe, and wealth repatriation from countries such as China and Russia drove real estate prices higher in traditional safe havens, as well as in many Southeast Asian countries. Stocks listed on the Hang Seng exchange in Hong Kong outperformed their peers in mainland China.
Investment Highlights
Overview
The fund gained 7.33 percent for the year ended December 31, 2012, compared to 18.22 percent for the MSCI Emerging Markets Net Total Return Index, the fund's benchmark.
Because the fund is actively managed and holding period is generally not a consideration in investment decisions, the portfolio turnover rate may fluctuate from year to year as the fund adjusts its portfolio composition. The fund's annual portfolio turnover was more than 100 percent.
While the fund management team considers companies of all sizes, during the first quarter of 2012, the fund's portfolio composition was changed to emphasize emerging markets small-cap companies, focusing on $200 million to $2 billion U.S. dollar market capitalization, that exhibit traditional value metrics and pay dividends.
Strengths
• Having minimal exposure to Brazilian equities, which have a large weighting in the benchmark, while simultaneously overweighting equities in India, Thailand, Turkey and the Philippines, made a positive contribution to the performance of the fund. Brazil's Bovespa stock exchange declined 2 percent in U.S. dollar terms, while India, Thailand, Turkey, and the Philippines all outperformed the index.
55
Global Emerging Markets Fund
• Overweighting financials and underweighting energy and utilities had a positive effect on the fund's performance relative to the benchmark.
• The fund's equity investments in Brazil, India, Mexico, the Philippines, Russia and Thailand performed better than the respective index constituents. Out of the top five contributors, three were in India: Yes Bank Ltd.,(2) Gitanjali Gems Ltd.(3) and Karnataka Bank Ltd.(2) The other two were TNK-BP Holding(2) in Russia and IGB Real Estate Investment Trust(2) in Malaysia.
Weaknesses
• Underweight positions in Hong Kong and South Korea had a negative effect on the performance of the fund, as equities in those two countries outperformed the index.
• On a sector basis, the fund was underweight in information technology and overweight in materials, which detracted from performance.
• The worst performers in the fund were Opto Circuits India Ltd.,(4) Asia Entertainment & Resources Ltd.(2) and the Colombian oil exploration and production company Petrominerales Ltd.(5)
Current Outlook
Opportunities
• A significant portion of global equity returns comes from the local market currencies effect. From that perspective, China, Taiwan and emerging Europe look undervalued, while Indonesia, South Korea and Latin America look overvalued.
• Historically, emerging markets' dividend yields have been in line with the developed world, but cumulative dividend growth has been stronger in emerging markets. This is a differentiating factor in today's investment environment when yield is scarce.
• Turkey ramped up capital spending in general and investment in machinery and equipment in particular in recent years unlike other countries such as Brazil, Mexico, Russia and South Africa that have failed to achieve higher investment ratios. Hence, the outlook for productivity gains in Turkey is superior to many other developing nations.
Threats
• The outlook for investments in Brazil remains challenged by a high level of bureaucracy, as well as government involvement in what it considers nationally important energy and resource enterprises. The same can be said about Russia, where an anti-corruption campaign pledge by the government has yet to bear any fruit.
56
Global Emerging Markets Fund
• A change in policy by the U.S. Federal Reserve to begin winding down its quantitative easing program may signal an end to the emerging markets rally.
• Continued tensions in the Middle East and Northern Africa make the region inherently unstable, posing a risk of supply disruptions.
(1)Emerging market countries are those countries defined as such by the World Bank, the International Finance Corporation, the United Nations or the European Bank for Reconstruction and Development or included in the MSCI Emerging Markets Index.
(2)The fund did not hold this security as of 12/31/12.
(3)This security comprised 1.34% of the fund's total net assets as of 12/31/12.
(4)This security comprised 0.83% of the fund's total net assets as of 12/31/12.
(5)This security comprised 0.95% of the fund's total net assets as of 12/31/12.
57
Global Emerging Markets Fund
Top 10 Holdings Based on Net Assets
(excluding repurchase agreement) December 31, 2012
Jiangsu Future Land Co., Ltd.
Real Estate Operating/Development | | | 1.42 | % | |
Yazicilar Holding A.S.
Diversified Operations | | | 1.35 | % | |
Kardemir Karabuk Demir Celik Sanayi ve Ticaret A.S.
Steel - Producers | | | 1.35 | % | |
Oriental Bank of Commerce
Commercial Banks - Non US | | | 1.34 | % | |
Gitanjali Gems Ltd.
Retail - Jewelry | | | 1.34 | % | |
Albaraka Turk Katilim Bankasi A.S.
Commercial Banks - Non US | | | 1.32 | % | |
Woori Financial Co., Ltd.
Finance - Leasing Company | | | 1.30 | % | |
Andean Pacific Iron Corp.
Metal - Iron | | | 1.30 | % | |
United Bank of India
Commercial Banks - Non US | | | 1.29 | % | |
Indiabulls Financial Services Ltd.
Diversified Financial Services | | | 1.28 | % | |
Total Top 10 Holdings | | | 13.29 | % | |
Country Distribution*
Based on Total Investments December 31, 2012
(excluding repurchase agreement)
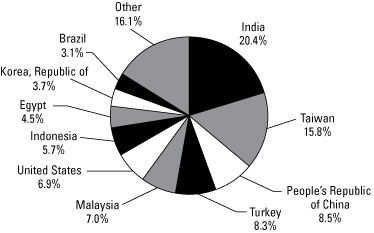
* Country distribution shown is based on domicile. The locale of company operations may be different.
58
Management Team's Perspective
Introduction
The China Region Fund (USCOX) seeks long-term growth of capital. The fund invests in both established and emerging companies registered and operating in the China region.(1)
Performance Graph
China Region Fund

Average Annual Performance For the Years Ended
December 31, 2012
| | | One Year | | Five Year | | Ten Year | |
China Region Fund | | | 12.00 | % | | | (9.74 | )% | | | 10.97 | % | |
Hang Seng Composite Index | | | 26.64 | % | | | (1.41 | )% | | | 14.39 | % | |
MSCI All Country Far East Free ex Japan Index* | | | 19.00 | % | | | (1.74 | )% | | | 11.51 | % | |
* These are not total returns. These returns reflect simple appreciation only and do not reflect dividend reinvestment.
Performance data quoted above is historical. Past performance is no guarantee of future results. Current performance may be higher or lower than the performance data quoted. The principal value and investment return of an investment will fluctuate so that an investor's shares, when redeemed, may be worth more or less than their original cost. The graph and table do not reflect the deduction of taxes that a shareholder would pay on fund distributions or the redemption of fund shares.
Pursuant to a voluntary arrangement, the Adviser has agreed to limit total fund operating expenses (exclusive of any acquired fund fees and expenses, performance fees, taxes, brokerage commissions and interest) to not exceed 2.55%. The Adviser can modify or terminate this arrangement at any time.
See Definitions for Management Teams' Perspectives for index definitions.
Please visit our website at www.usfunds.com for updated performance information for different time periods.
59
The Year In Review - Economic And Political Issues That Affected The Fund
China's economic activities slowed in the first half of the year, but recovered in the second half due to the government's stimulus plans that were first implemented in May 2012.
In the first half of 2012, China continued fine-tuning its economic policy, which was essentially a tightening monetary policy. After a dismal economic performance in the first quarter, the government changed its tone from tightening to stabilizing growth in the month of May. The People's Bank of China, the central bank, also cut the required reserve ratio to 20 percent from 21 percent and cut interest rates twice to lower the benchmark one-year lending rate to 6 percent and one-year deposit rate to 3 percent. In spite of the slightly loosening policy, the demand for loans was still weak, and business activities continued to contract.
During the second half of the year, the economy began to recover after the government started its fiscal stimulus plan by resuming railway and urban infrastructure construction projects. The recovery momentum continued to the end of the year after the new Chinese leadership made urbanization and reforms the policy priorities to maintain stable growth for the next decade while upgrading the quality of growth at the same time.
Investment Highlights
Overview
For the year ended December 31, 2012, the fund returned 12.00 percent, underperforming the benchmark Hang Seng Composite Index (HSCI), which returned 26.64 percent.
Because the fund is actively managed and holding period is generally not a consideration in investment decisions, the portfolio turnover rate may fluctuate from year to year as the fund adjusts its portfolio composition. The fund's annual portfolio turnover was, and is expected to continue to be, more than 100 percent.
Strengths
• Country allocations to China, Thailand, the Philippines and Malaysia provided positive contributions to the fund's relative performance against the benchmark index. On a company-specific level, Sunac China Holdings Ltd.,(2) a high-end property developer in developed regions of China, and Shin Corp. PCL,(3) a telecommunication holding company in Thailand, provided returns of over 90 and 60 percent, respectively, to the fund.
60
• The fund's overweighting in telecommunication and utilities and underweighting in energy proved to be beneficial to the fund's relative performance.
Weaknesses
• The fund's allocations to Hong Kong, Indonesia, South Korea, Taiwan and Singapore underperformed the benchmark HSCI.
• Sector allocations to financials, consumer goods, materials, industrial goods and conglomerates were detrimental to the fund's relative performance against the benchmark index.
• Cash was also a drag on the fund's relative performance compared to the HSCI.
Current Outlook
Opportunities
• China's manufacturing data was up for December, which confirmed China is firmly in a growth recovery after construction projects resumed in the third quarter. Since November, industrial profits also started recovering. As China continues its pro-growth urbanization policies and reforms under its new leadership, economic growth is expected to continue in 2013. Management believes there are plenty of upside opportunities in financials and cyclical stocks driven by earning and price momentum in the first half of 2013.
• New urbanization and reforms under the new leadership in China will likely provide long-term growth opportunities for businesses in construction engineering and materials and consumption.
Threats
• The growth of the Chinese economy relies heavily on fixed asset investments, and the rate of return on those investments is decreasing as more capacity is built. That might result in more local government indebtedness with proportionally fewer resources to pay the debts.
(1)The China region is defined as any country that either shares a border with China or is located in the South China Sea or the East China Sea and includes: the People's Republic of China (PRC or China), Bangladesh, Hong Kong, India, Indonesia, Kazakhstan, Korea, Kyrgyzstan, Laos, Malaysia, Mongolia, Nepal, Pakistan, Philippines, Singapore, Taiwan, Tajikistan, Thailand and Vietnam.
(2)This security comprised 5.36% of the fund's total net assets as of 12/31/12.
(3)The fund did not hold this security at 12/31/12.
61
Top 10 Holdings Based on Net Assets
(excluding repurchase agreement) December 31, 2012
Sunac China Holdings Ltd.
Real Estate Operating/Development | | | 5.36 | % | |
HSBC Holdings plc
Diversified Banking Institutions | | | 4.78 | % | |
Industrial and Commercial Bank of China Ltd.
Commercial Banks - Non US | | | 4.11 | % | |
Bank of China Ltd.
Commercial Banks - Non US | | | 3.37 | % | |
China Minsheng Banking Corp., Ltd.
Commercial Banks - Non US | | | 3.26 | % | |
Hutchison Whampoa Ltd.
Diversified Operations | | | 3.04 | % | |
China Railway Construction Corp., Ltd.
Building - Heavy Construction | | | 2.69 | % | |
Tencent Holdings Ltd.
Internet Application Software | | | 2.56 | % | |
Hopewell Holdings Ltd.
Real Estate Operating/Development | | | 2.49 | % | |
NagaCorp Ltd.
Casino Hotels | | | 2.43 | % | |
Total Top 10 Holdings | | | 34.09 | % | |
Country Distribution*
Based on Total Investments December 31, 2012
(excluding repurchase agreement)
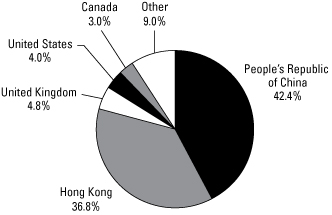
* Country distribution shown is based on domicile and not intended to conform to the China region definition in the prospectus. The locale of company operations may be different.
62
Expense Example (unaudited) December 31, 2012
As a shareholder of the funds, you incur two types of costs: (1) transaction costs, including short-term trading fees and exchange fees; and (2) ongoing costs, including management fees and other fund expenses. This example is intended to help you understand your ongoing costs (in dollars) of investing in other mutual funds.
The example is based on an investment of $1,000 invested at the beginning of the period and held for the entire period as indicated below.
• Actual Expenses. The first line of the following table for each fund provides information about actual account values and actual expenses. You may use the information in this line, together with the amount you invested, to estimate the expenses you paid over the period. Simply divide your account value by $1,000 (for example, an $8,600 account value divided by $1,000 = 8.6), then multiply the result by the number in the first line under the heading "Expenses Paid During Period" to estimate the expenses you paid on your account during this period.
• Hypothetical Example for Comparison Purposes. The second line of the following table for each fund provides information about hypothetical account values and hypothetical expenses based on the fund's actual expense ratio and an assumed rate of return of 5 percent per year before expenses, which is not the fund's actual return. The hypothetical account values and expenses may not be used to estimate the actual ending account balance or expenses you paid for the period. You may use this information to compare the ongoing costs of investing in these funds and other funds. To do so, compare this 5 percent hypothetical example with the 5 percent hypothetical examples that appear in the shareholder reports of other funds.
Please note that the expenses shown in the table are meant to highlight your ongoing costs only and do not reflect any direct or transactional costs, such as small account, exchange or short-term trading fees. Therefore, the second line of the table is useful in comparing ongoing costs only, and will not help you determine the relative total costs of owning different funds. In addition, if these direct or transactional costs were included, your costs would have been higher.
63
Expense Example (unaudited) December 31, 2012
Six Months Ended December 31, 2012 | | Beginning
Account Value
July 1,
2012 | | Ending
Account Value
December 31,
2012 | | Expenses
Paid During
Period* | |
U.S. Treasury Securities Cash Fund | |
Based on Actual Fund Return | | $ | 1,000.00 | | | $ | 1,000.10 | | | $ | 0.75 | | |
Based on Hypothetical 5% Yearly Return | | $ | 1,000.00 | | | $ | 1,024.38 | | | $ | 0.76 | | |
U.S. Government Securities Savings Fund | |
Based on Actual Fund Return | | $ | 1,000.00 | | | $ | 1,000.10 | | | $ | 0.70 | | |
Based on Hypothetical 5% Yearly Return | | $ | 1,000.00 | | | $ | 1,024.43 | | | $ | 0.71 | | |
Near-Term Tax Free Fund | |
Based on Actual Fund Return | | $ | 1,000.00 | | | $ | 1,011.00 | | | $ | 2.27 | | |
Based on Hypothetical 5% Yearly Return | | $ | 1,000.00 | | | $ | 1,022.87 | | | $ | 2.29 | | |
Tax Free Fund | |
Based on Actual Fund Return | | $ | 1,000.00 | | | $ | 1,027.10 | | | $ | 3.57 | | |
Based on Hypothetical 5% Yearly Return | | $ | 1,000.00 | | | $ | 1,021.62 | | | $ | 3.56 | | |
All American Equity Fund | |
Based on Actual Fund Return | | $ | 1,000.00 | | | $ | 1,043.10 | | | $ | 11.30 | | |
Based on Hypothetical 5% Yearly Return | | $ | 1,000.00 | | | $ | 1,014.08 | | | $ | 11.14 | | |
Holmes Growth Fund | |
Based on Actual Fund Return | | $ | 1,000.00 | | | $ | 1,006.60 | | | $ | 9.68 | | |
Based on Hypothetical 5% Yearly Return | | $ | 1,000.00 | | | $ | 1,015.48 | | | $ | 9.73 | | |
MegaTrends Fund Investor Class | |
Based on Actual Fund Return | | $ | 1,000.00 | | | $ | 1,048.50 | | | $ | 10.71 | | |
Based on Hypothetical 5% Yearly Return | | $ | 1,000.00 | | | $ | 1,014.68 | | | $ | 10.53 | | |
MegaTrends Fund Institutional Class | |
Based on Actual Fund Return | | $ | 1,000.00 | | | $ | 1,051.30 | | | $ | 10.52 | | |
Based on Hypothetical 5% Yearly Return | | $ | 1,000.00 | | | $ | 1,014.88 | | | $ | 10.33 | | |
Global Resources Fund Investor Class | |
Based on Actual Fund Return | | $ | 1,000.00 | | | $ | 1,095.00 | | | $ | 8.79 | | |
Based on Hypothetical 5% Yearly Return | | $ | 1,000.00 | | | $ | 1,016.74 | | | $ | 8.47 | | |
Global Resources Fund Institutional Class | |
Based on Actual Fund Return | | $ | 1,000.00 | | | $ | 1,097.80 | | | $ | 5.91 | | |
Based on Hypothetical 5% Yearly Return | | $ | 1,000.00 | | | $ | 1,019.51 | | | $ | 5.69 | | |
World Precious Minerals Fund Investor Class | |
Based on Actual Fund Return | | $ | 1,000.00 | | | $ | 1,086.40 | | | $ | 8.02 | | |
Based on Hypothetical 5% Yearly Return | | $ | 1,000.00 | | | $ | 1,017.44 | | | $ | 7.76 | | |
World Precious Minerals Fund
Institutional Class | |
Based on Actual Fund Return | | $ | 1,000.00 | | | $ | 1,088.50 | | | $ | 5.04 | | |
Based on Hypothetical 5% Yearly Return | | $ | 1,000.00 | | | $ | 1,020.31 | | | $ | 4.88 | | |
Gold and Precious Metals Fund | |
Based on Actual Fund Return | | $ | 1,000.00 | | | $ | 1,091.40 | | | $ | 9.41 | | |
Based on Hypothetical 5% Yearly Return | | $ | 1,000.00 | | | $ | 1,016.14 | | | $ | 9.07 | | |
Eastern European Fund | |
Based on Actual Fund Return | | $ | 1,000.00 | | | $ | 1,135.90 | | | $ | 11.38 | | |
Based on Hypothetical 5% Yearly Return | | $ | 1,000.00 | | | $ | 1,014.48 | | | $ | 10.74 | | |
64
Expense Example (unaudited) December 31, 2012
Six Months Ended December 31, 2012 | | Beginning
Account Value
July 1,
2012 | | Ending
Account Value
December 31,
2012 | | Expenses
Paid During
Period* | |
Global Emerging Markets Fund | |
Based on Actual Fund Return | | $ | 1,000.00 | | | $ | 1,067.10 | | | $ | 14.91 | | |
Based on Hypothetical 5% Yearly Return | | $ | 1,000.00 | | | $ | 1,010.71 | | | $ | 14.51 | | |
China Region Fund | |
Based on Actual Fund Return | | $ | 1,000.00 | | | $ | 1,116.80 | | | $ | 12.03 | | |
Based on Hypothetical 5% Yearly Return | | $ | 1,000.00 | | | $ | 1,013.77 | | | $ | 11.44 | | |
* These calculations are based on expenses incurred in the most recent fiscal half-year. The funds' Investor Class' annualized expense ratios (after reimbursements and offsets) for the six-month period ended December 31, 2012, were 0.15%, 0.14%, 0.45%, 0.70%, 2.20%, 1.92%, 2.08%, 1.67%, 1.53%, 1.79%, 2.12%, 2.87% and 2.26%, respectively, for the U.S. Treasury Securities Cash, U.S. Government Securities Savings, Near-Term Tax Free, Tax Free, All American Equity, Holmes Growth, MegaTrends, Global Resources, World Precious Minerals, Gold and Precious Metals, Eastern European, Global Emerging Markets and China Region Funds. The funds' Institutional Class' annualized expense ratios (after reimbursements and offsets) for the six-month period ended December 31, 2012, were 2.04%, 1.12% and 0.96%, respectively, for the MegaTrends, Global Resources and World Precious Minerals Funds. The dollar amounts shown as "Expenses Paid" are equal to the annualized expense ratio multiplied by the average account value over the period, multiplied by 184, the number of days in the period, then divided by 366 days in the current fiscal year.
65
Portfolio of Investments December 31, 2012
U.S. Treasury Securities Cash Fund
United States
Government
Obligations 12.47% | | Coupon
Rate | | Maturity
Date | | Principal
Amount | | Value | |
United States Treasury Bill 12.47% | |
Yield | | | 0.10 | % | | 01/03/13 | | $ | 10,000,000 | | | $ | 9,999,948 | | |
Total United States Government Obligations | | | 9,999,948 | | |
(cost $9,999,948) | |
Repurchase Agreements 88.86% | |
Joint Tri-Party Repurchase Agreements,
12/31/12, collateralized by U.S. Treasury
securities held in joint tri-party
repurchase accounts: | |
Banc of America Securities LLC Merrill Lynch,
repurchase price $31,255,348 | | | 0.12 | % | | 01/02/13 | | | 31,255,139 | | | | 31,255,139 | | |
Barclays Capital, Inc., repurchase price
$20,000,189 | | | 0.17 | % | | 01/02/13 | | | 20,000,000 | | | | 20,000,000 | | |
Morgan Stanley, repurchase price
$20,000,156 | | | 0.14 | % | | 01/02/13 | | | 20,000,000 | | | | 20,000,000 | | |
Total Repurchase Agreements | | | 71,255,139 | | |
(cost $71,255,139) | |
Total Investments 101.33% | | | 81,255,087 | | |
(cost $81,255,087) | |
Other assets and liabilities, net (1.33)% | | | (1,063,237 | ) | |
Net Assets 100% | | $ | 80,191,850 | | |
See notes to portfolios of investments and notes to financial statements.
66
Portfolio of Investments December 31, 2012
U.S. Government Securities Savings Fund
United States
Government and Agency
Obligations 54.73% | | Coupon
Rate | | Maturity
Date | | Principal
Amount | | Value | |
Federal Farm Credit Bank 17.80% | |
Discount Note: | |
Yield | | | 0.01 | % | | 01/02/13 | | $ | 20,000,000 | | | $ | 19,999,994 | | |
Variable Rate: | |
| | | | 0.20 | % | | 02/21/13 | | | 5,000,000 | | | | 5,000,000 | | |
| | | | 24,999,994 | | |
Federal Home Loan Bank 29.81% | |
Discount Notes: | |
Yield | | | 0.12 | % | | 01/02/13 | | | 10,000,000 | | | | 9,999,968 | | |
Yield | | | 0.10 | % | | 01/04/13 | | | 10,000,000 | | | | 9,999,917 | | |
Fixed Rate: | |
| | | | 0.18 | % | | 02/15/13 | | | 2,000,000 | | | | 1,999,914 | | |
Variable Rates: | |
| | | | 0.28 | % | | 05/17/13 | | | 5,000,000 | | | | 5,002,625 | | |
| | | | 0.20 | % | | 07/12/13 | | | 5,000,000 | | | | 4,999,996 | | |
| | | | 0.25 | % | | 07/22/13 | | | 4,850,000 | | | | 4,851,076 | | |
| | | | 0.19 | % | | 07/25/13 | | | 5,000,000 | | | | 4,999,146 | | |
| | | | 41,852,642 | | |
United States Treasury Bill 7.12% | |
Yield | | | 0.10 | % | | 01/03/13 | | | 10,000,000 | | | | 9,999,947 | | |
Total Securities | | | 76,852,583 | | |
(cost $76,852,583) | |
Repurchase Agreements 45.34% | |
Joint Tri-Party Repurchase Agreements,
12/31/12, collateralized by U.S. Treasury
securities held in joint tri-party
repurchase accounts: | |
Banc of America Securities LLC Merrill Lynch,
repurchase price $53,675,859 | | | 0.12 | % | | 01/02/13 | | | 53,675,502 | | | | 53,675,502 | | |
Credit Suisse Securities USA LLC, repurchase
price $10,000,106 | | | 0.19 | % | | 01/02/13 | | | 10,000,000 | | | | 10,000,000 | | |
Total Repurchase Agreements | | | 63,675,502 | | |
(cost $63,675,502) | |
Total Investments 100.07% | | | 140,528,085 | | |
(cost $140,528,085) | |
Other assets and liabilities, net (0.07)% | | | (103,004 | ) | |
Net Assets 100% | | $ | 140,425,081 | | |
See notes to portfolios of investments and notes to financial statements.
67
Portfolio of Investments December 31, 2012
Municipal Bonds 89.22% | | Coupon
Rate | | Maturity
Date | | Principal
Amount | | Value | |
Alabama 3.32% | |
Alabama State Public School & College
Authority | | | 5.00 | % | | 12/01/16 | | $ | 290,000 | | | $ | 335,437 | | |
Bessemer, Alabama Electric Revenue,
Refunding | | | 3.10 | % | | 12/01/21 | | | 100,000 | | | | 104,426 | | |
Bessemer, Alabama Water Revenue | | | 4.00 | % | | 01/01/16 | | | 300,000 | | | | 309,912 | | |
Jasper Alabama Water Works & Sewer Board,
Inc., Utilities Revenue, Series A | | | 3.00 | % | | 06/01/15 | | | 90,000 | | | | 93,419 | | |
Jasper Alabama Water Works & Sewer Board,
Inc., Utilities Revenue, Series A | | | 3.00 | % | | 06/01/16 | | | 90,000 | | | | 94,163 | | |
Mountain Brook City Board of Education Capital
Outlay | | | 4.00 | % | | 02/15/15 | | | 200,000 | | | | 213,648 | | |
University of Alabama at Birmingham, Hospital
Revenue, Series A | | | 5.00 | % | | 09/01/15 | | | 300,000 | | | | 328,494 | | |
| | | | 1,479,499 | | |
Alaska 0.74% | |
Alaska Municipal Bond Bank Authority,
Prerefunded, Series A | | | 4.00 | % | | 02/01/16 | | | 105,000 | | | | 115,725 | | |
Alaska Municipal Bond Bank Authority,
Unrefunded, Series A | | | 4.00 | % | | 02/01/16 | | | 195,000 | | | | 214,229 | | |
| | | | 329,954 | | |
Arizona 3.17% | |
Arizona Board of Regents Certificates of
Participation, Series B | | | 4.50 | % | | 06/01/16 | | | 200,000 | | | | 221,832 | | |
Arizona Health Facilities Authority Revenue,
Series D | | | 5.00 | % | | 01/01/14 | | | 250,000 | | | | 261,345 | | |
Arizona State School Facilities Board
Certificates of Participation, Series A-1 | | | 5.00 | % | | 09/01/17 | | | 325,000 | | | | 356,583 | | |
Arizona State Transportation Board Excise
Tax Revenue | | | 5.00 | % | | 07/01/17 | | | 175,000 | | | | 205,503 | | |
Page, Arizona, Pledged Revenue, Refunding | | | 3.00 | % | | 07/01/16 | | | 350,000 | | | | 366,212 | | |
| | | | 1,411,475 | | |
California 3.30% | |
California State, Refunding, Recreational
Facility, GO Unlimited | | | 5.00 | % | | 12/01/19 | | | 250,000 | | | | 264,310 | | |
Delano, California Union High School District,
GO Unlimited, Refunding, Series A | | | 4.75 | % | | 02/01/17 | | | 200,000 | | | | 218,102 | | |
San Diego, California Community College
District, Capital Appreciation, Election 2002,
GO Unlimited (ZCB) | | | 4.34 | %(1) | | 05/01/15 | | | 300,000 | | | | 292,986 | | |
Santa Clara County, California Financing
Authority Revenue, Obstetrics and
Gynecology, El Camino Hospital | | | 5.00 | % | | 02/01/18 | | | 350,000 | | | | 392,588 | | |
See notes to portfolios of investments and notes to financial statements.
68
Portfolio of Investments December 31, 2012
Municipal Bonds (cont'd) | | Coupon
Rate | | Maturity
Date | | Principal
Amount | | Value | |
California (cont'd) | |
Vernon, California Electric Systems Revenue,
Series A | | | 3.75 | % | | 08/01/13 | | $ | 300,000 | | | $ | 302,931 | | |
| | | | 1,470,917 | | |
Colorado 0.68% | |
Denver, Colorado, Health & Hospital Authority,
Healthcare Revenue, Series A | | | 5.00 | % | | 12/01/16 | | | 265,000 | | | | 301,265 | | |
Connecticut 1.04% | |
Connecticut State Health & Educational
Facility Authority Revenue, Bridgeport,
Hospital Series D | | | 5.00 | % | | 07/01/19 | | | 395,000 | | | | 460,787 | | |
District of Columbia 1.47% | |
District of Columbia Certifications of
Participation | | | 4.00 | % | | 01/01/14 | | | 250,000 | | | | 258,467 | | |
Washington D.C. Convention Center Authority
Dedicated Tax Revenue, Refunding, Series A | | | 5.00 | % | | 10/01/13 | | | 110,000 | | | | 112,760 | | |
Washington D.C. Convention Center Authority
Dedicated Tax Revenue, Refunding, Series A | | | 5.00 | % | | 10/01/16 | | | 250,000 | | | | 282,790 | | |
| | | | 654,017 | | |
Florida 13.21% | |
Broward County, Florida School Board
Certificates of Participation, Series A | | | 5.00 | % | | 07/01/15 | | | 325,000 | | | | 355,394 | | |
Cape Coral, Florida Gas Tax Revenue, Series A | | | 4.00 | % | | 10/01/16 | | | 255,000 | | | | 268,854 | | |
Escambia County, Florida, Health Facilities
Authority Revenue, Baptist Hospital, Inc.
Project, Series A | | | 5.00 | % | | 08/15/19 | | | 290,000 | | | | 334,126 | | |
Florida, Citizens Property Insurance Corp.,
Senior Secured, Coastal Account, Revenue,
Series A-1 | | | 4.00 | % | | 06/01/18 | | | 100,000 | | | | 110,635 | | |
Florida Gulf Coast University Financing Corp.,
Florida Capital Improvement Revenue,
Series B | | | 3.00 | % | | 02/01/16 | | | 365,000 | | | | 379,042 | | |
Florida State Board of Education Lottery
Revenue, Series A | | | 4.00 | % | | 07/01/14 | | | 300,000 | | | | 315,954 | | |
Florida State Board of Governors Parking
Facilities Revenue, Series A | | | 3.00 | % | | 07/01/17 | | | 300,000 | | | | 326,703 | | |
Florida State Municipal Power Agency,
Stanton Project Revenue, Refunding | | | 5.13 | % | | 10/01/17 | | | 300,000 | | | | 346,611 | | |
Fort Pierce, Florida Stormwater Utilities
Revenue | | | 4.50 | % | | 10/01/17 | | | 255,000 | | | | 267,801 | | |
Hillsborough County, Florida Community
Investment Tax Revenue | | | 4.00 | % | | 05/01/16 | | | 300,000 | | | | 312,285 | | |
See notes to portfolios of investments and notes to financial statements.
69
Portfolio of Investments December 31, 2012
Municipal Bonds (cont'd) | | Coupon
Rate | | Maturity
Date | | Principal
Amount | | Value | |
Florida (cont'd) | |
Hillsborough County, Florida School Board,
Refunding, Certificates of Participation | | | 4.00 | % | | 07/01/19 | | $ | 100,000 | | | $ | 111,975 | | |
Lake County, Florida School Board Certificates
of Participation, Series A | | | 3.70 | % | | 06/01/15 | | | 400,000 | | | | 422,392 | | |
Margate, Florida Water & Sewer Revenue,
Refunding | | | 4.00 | % | | 10/01/19 | | | 250,000 | | | | 277,382 | | |
Miami - Dade County, Florida Water & Sewer
Revenue System, Series A | | | 4.00 | % | | 10/01/16 | | | 235,000 | | | | 262,570 | | |
Orange County, Florida Tourist Development
Tax Revenue, Refunding | | | 5.00 | % | | 10/01/14 | | | 260,000 | | | | 279,412 | | |
Orlando, Florida Community Redevelopment
Agency Tax Increment Revenue, Downtown
District, Series A | | | 4.00 | % | | 09/01/17 | | | 325,000 | | | | 358,644 | | |
Polk County, Florida School District Revenue | | | 5.00 | % | | 10/01/17 | | | 215,000 | | | | 245,603 | | |
Reedy Creek, Florida Improvement District
Utilities Revenue, Refunding, Series 2 | | | 5.00 | % | | 10/01/16 | | | 300,000 | | | | 333,318 | | |
Saint Johns County, Florida Transportation
Revenue, Refunding | | | 5.00 | % | | 10/01/20 | | | 310,000 | | | | 367,586 | | |
Volusia County, Florida School Board Sales
Tax Revenue | | | 4.20 | % | | 10/01/16 | | | 200,000 | | | | 201,644 | | |
| | | | 5,877,931 | | |
Georgia 3.74% | |
Atlanta Downtown Development Authority | | | 4.25 | % | | 12/01/16 | | | 250,000 | | | | 271,975 | | |
Atlanta, Georgia Water & Wastewater Revenue,
Series B | | | 3.50 | % | | 11/01/13 | | | 400,000 | | | | 410,708 | | |
Emanuel County Georgia Hospital Authority
Revenue Anticipation Certificates | | | 4.30 | % | | 07/01/17 | | | 250,000 | | | | 259,977 | | |
Georgia State Municipal Electric Authority
Revenue, Unrefunded | | | 5.50 | % | | 01/01/20 | | | 250,000 | | | | 272,083 | | |
Glynn-Brunswick Memorial Hospital Authority,
Southeast Georgia Health System and
Affiliates Revenue, Anticipation Certificates | | | 4.50 | % | | 08/01/17 | | | 150,000 | | | | 166,107 | | |
Gwinnett County, Georgia, Hospital Authority,
Gwinnett Hospital Systems Revenue,
Series B | | | 5.00 | % | | 07/01/18 | | | 250,000 | | | | 285,885 | | |
| | | | 1,666,735 | | |
Illinois 12.05% | |
Aurora, Illinois, Series B, GO Unlimited | | | 3.00 | % | | 12/30/15 | | | 200,000 | | | | 213,336 | | |
Chicago Board of Education, Dedicated
Revenues, Series F, GO Unlimited | | | 5.00 | % | | 12/01/16 | | | 300,000 | | | | 340,566 | | |
Chicago Board of Education, Series A | | | 5.25 | % | | 12/01/13 | | | 250,000 | | | | 255,107 | | |
Chicago, Illinois Sales Tax Revenue | | | 5.50 | % | | 01/01/15 | | | 350,000 | | | | 381,126 | | |
See notes to portfolios of investments and notes to financial statements.
70
Portfolio of Investments December 31, 2012
Municipal Bonds (cont'd) | | Coupon
Rate | | Maturity
Date | | Principal
Amount | | Value | |
Illinois (cont'd) | |
Chicago, Illinois, Direct Access Bond,
Series E-1 B, GO Unlimited | | | 4.00 | % | | 01/01/19 | | $ | 200,000 | | | $ | 212,842 | | |
Chicago, Illinois, O'Hare International Airport
Revenue, Gen - Third Lien, Series C | | | 5.25 | % | | 01/01/23 | | | 250,000 | | | | 295,962 | | |
Chicago, Illinois, Prerefunded Balance,
Series B, GO Unlimited | | | 5.13 | % | | 01/01/15 | | | 85,000 | | | | 89,023 | | |
Chicago, Illinois, Unrefunded Balance, Series B,
GO Unlimited | | | 5.13 | % | | 01/01/15 | | | 240,000 | | | | 257,498 | | |
Dundee Township, GO Unlimited | | | 5.00 | % | | 12/01/13 | | | 240,000 | | | | 248,124 | | |
Illinois Finance Authority Revenue, Refunding | | | 5.00 | % | | 07/01/16 | | | 390,000 | | | | 416,337 | | |
Illinois State Sales Tax Revenue | | | 5.00 | % | | 06/15/14 | | | 200,000 | | | | 212,690 | | |
Illinois State Toll Highway Authority, Toll
Highway Revenue, Series A | | | 5.00 | % | | 01/01/16 | | | 200,000 | | | | 221,310 | | |
Illinois State, Refunding, GO Unlimited | | | 5.00 | % | | 01/01/16 | | | 300,000 | | | | 331,815 | | |
Kaskaskia Community College District No. 501,
GO Unlimited | | | 5.75 | % | | 12/01/19 | | | 500,000 | | | | 608,520 | | |
Metropolitan Pier & Exposition Authority | | | 5.38 | % | | 06/01/15 | | | 280,000 | | | | 285,922 | | |
Springfield, Illinois Metropolitan Sanitation
District, Sewer Revenue, Senior Lien,
Series A | | | 4.00 | % | | 01/01/17 | | | 570,000 | | | | 607,204 | | |
Winnebago County Public Safety Sales Tax,
Series A, GO Unlimited | | | 5.00 | % | | 12/30/16 | | | 350,000 | | | | 387,069 | | |
| | | | 5,364,451 | | |
Indiana 0.71% | |
Tippecanoe County, Indiana School
Improvements | | | 4.00 | % | | 01/15/15 | | | 300,000 | | | | 316,737 | | |
Iowa 2.14% | |
Ames, Iowa Hospital Revenue, Refunding | | | 5.00 | % | | 06/15/15 | | | 300,000 | | | | 306,309 | | |
Johnston Community School District,
GO Unlimited | | | 4.00 | % | | 06/01/16 | | | 200,000 | | | | 215,684 | | |
University of Iowa Hospitals and Clinics, Iowa
State Board of Regents, Hospital Revenue,
Refunding, Series A | | | 3.00 | % | | 09/01/19 | | | 400,000 | | | | 428,948 | | |
| | | | 950,941 | | |
Kansas 0.49% | |
Kansas State Development Finance Authority
Revenue | | | 4.00 | % | | 10/01/15 | | | 200,000 | | | | 218,176 | | |
Kentucky 0.61% | |
Kentucky Municipal Power Agency,
Power System Revenue, Prairie State
Project, Series A | | | 5.25 | % | | 09/01/22 | | | 240,000 | | | | 272,122 | | |
See notes to portfolios of investments and notes to financial statements.
71
Portfolio of Investments December 31, 2012
Municipal Bonds (cont'd) | | Coupon
Rate | | Maturity
Date | | Principal
Amount | | Value | |
Massachusetts 1.36% | |
New Bedford, Massachusetts, State Qualified
Municipal Loan, GO Limited | | | 3.00 | % | | 03/01/15 | | $ | 345,000 | | | $ | 360,221 | | |
Stoughton, Massachusetts Public Improvement,
GO Limited | | | 4.00 | % | | 05/01/17 | | | 225,000 | | | | 245,781 | | |
| | | | 606,002 | | |
Michigan 4.60% | |
Detroit, Michigan Sewer Disposal Revenue,
Refunding, Series C-1 | | | 5.25 | % | | 07/01/15 | | | 400,000 | | | | 431,952 | | |
Michigan House of Representatives Facilities,
Obligations Revenue, Series A | | | 5.00 | % | | 10/15/17 | | | 200,000 | | | | 226,146 | | |
Michigan Public Power Agency AFEC Project
Revenue, Series 2012-A | | | 4.50 | % | | 01/01/19 | | | 280,000 | | | | 313,130 | | |
Michigan State Building Authority Revenue,
Refunding, Series I | | | 5.25 | % | | 10/15/14 | | | 300,000 | | | | 310,821 | | |
Michigan State Grant Anticipation Bonds | | | 5.00 | % | | 09/15/16 | | | 200,000 | | | | 226,082 | | |
Michigan State Hospital Finance Authority
Revenue, Trinity Health, Series A | | | 6.00 | % | | 12/01/18 | | | 200,000 | | | | 250,574 | | |
Wayne County, Michigan Airport Authority
Revenue, Detroit Metropolitan Airport,
Refunding, Series C | | | 4.00 | % | | 12/01/19 | | | 255,000 | | | | 289,866 | | |
| | | | 2,048,571 | | |
Minnesota 1.27% | |
Minneapolis & St Paul, Minnesota Housing &
Redevelopment Authority Health Care
Systems, Children's Health Care, Series B | | | 4.00 | % | | 08/15/16 | | | 250,000 | | | | 271,535 | | |
Minneapolis & St Paul, Minnesota Metropolitan
Airports Commission, Airport Revenue,
Refunding, Series B | | | 5.00 | % | | 01/01/19 | | | 255,000 | | | | 293,194 | | |
| | | | 564,729 | | |
Missouri 0.46% | |
Missouri State Health & Educational Facilities
Authority Revenue, Series A | | | 6.75 | % | | 05/15/13 | | | 200,000 | | | | 204,718 | | |
Nevada 0.55% | |
Nye County School District, GO Limited | | | 4.00 | % | | 05/01/15 | | | 230,000 | | | | 246,367 | | |
New Hampshire 1.17% | |
New Hampshire Health & Education Facilities
Authority Revenue | | | 5.00 | % | | 07/01/14 | | | 65,000 | | | | 65,668 | | |
New Hampshire Health & Education Facilities
Authority Revenue | | | 5.00 | % | | 01/01/18 | | | 400,000 | | | | 456,328 | | |
| | | | 521,996 | | |
See notes to portfolios of investments and notes to financial statements.
72
Portfolio of Investments December 31, 2012
Municipal Bonds (cont'd) | | Coupon
Rate | | Maturity
Date | | Principal
Amount | | Value | |
New Jersey 5.25% | |
Atlantic City, New Jersey Municipal Utilities
Authority Revenue, Refunding | | | 5.00 | % | | 06/01/17 | | $ | 150,000 | | | $ | 170,730 | | |
Atlantic City, New Jersey Refunding Tax
Appeal, GO Unlimited | | | 4.00 | % | | 11/01/18 | | | 500,000 | | | | 538,720 | | |
Elizabeth, New Jersey Parking Authority
Project Revenue, Elizabethtown Plaza
Redevelopment, Series B | | | 4.00 | % | | 11/01/17 | | | 255,000 | | | | 280,067 | | |
Hudson County, New Jersey Improvement
Authority Lease Revenue, North Hudson
Regional Fire, Refunding, Series A | | | 5.63 | % | | 09/01/18 | | | 400,000 | | | | 471,568 | | |
New Jersey Health Care Facilities Financing
Authority Revenue, Holy Name Medical
Center, Refunding | | | 5.00 | % | | 07/01/19 | | | 215,000 | | | | 244,676 | | |
New Jersey State Transportation Trust Fund
Authority, Series D | | | 4.00 | % | | 06/15/14 | | | 250,000 | | | | 263,422 | | |
Passaic Valley, New Jersey, Sewage
Commissioners Revenue, Series G | | | 5.75 | % | | 12/01/21 | | | 300,000 | | | | 366,954 | | |
| | | | 2,336,137 | | |
New Mexico 0.56% | |
Clayton, New Mexico, Jail Project Revenue | | | 4.00 | % | | 11/01/17 | | | 235,000 | | | | 248,127 | | |
New York 2.33% | |
Long Island Power Authority, New York Electric
Systems, Revenue, Series E | | | 5.00 | % | | 12/01/17 | | | 330,000 | | | | 378,144 | | |
New York State Dormitory Authority Revenues,
Nonconstruction Supported Debt, Municipal
Facilities Health Lease, Series 1 | | | 5.00 | % | | 01/15/17 | | | 300,000 | | | | 337,533 | | |
New York, New York, Subseries L-1,
GO Unlimited | | | 4.00 | % | | 04/01/15 | | | 300,000 | | | | 322,467 | | |
| | | | 1,038,144 | | |
Ohio 2.01% | |
Canton, Ohio, City School District, Refunding,
GO Unlimited | | | 5.00 | % | | 12/01/18 | | | 325,000 | | | | 353,418 | | |
Lorain County, Ohio, Community College
District, Revenue | | | 3.25 | % | | 12/01/17 | | | 350,000 | | | | 379,740 | | |
Marion County, Ohio, Variable Refunding,
GO Limited | | | 4.00 | % | | 12/01/20 | | | 150,000 | | | | 162,753 | | |
| | | | 895,911 | | |
Pennsylvania 1.80% | |
Delaware Valley, Pennsylvania, Regional
Financial Authority Revenue, Permanently
Fixed Business Development Services | | | 5.50 | % | | 08/01/18 | | | 295,000 | | | | 340,285 | | |
See notes to portfolios of investments and notes to financial statements.
73
Portfolio of Investments December 31, 2012
Municipal Bonds (cont'd) | | Coupon
Rate | | Maturity
Date | | Principal
Amount | | Value | |
Pennsylvania (cont'd) | |
Reading, Pennsylvania School District,
GO Unlimited, Series A | | | 5.00 | % | | 04/01/20 | | $ | 400,000 | | | $ | 460,416 | | |
| | | | 800,701 | | |
Puerto Rico 2.16% | |
Commonwealth of Puerto Rico, GO Unlimited | | | 6.00 | % | | 07/01/13 | | | 250,000 | | | | 254,162 | | |
Commonwealth of Puerto Rico, Series A,
GO Unlimited | | | 5.00 | % | | 07/01/15 | | | 225,000 | | | | 233,186 | | |
Puerto Rico Infrastructure Financing Authority,
Special Tax Revenue, Refunding, Series C | | | 5.50 | % | | 07/01/17 | | | 445,000 | | | | 471,820 | | |
| | | | 959,168 | | |
Rhode Island 0.63% | |
Rhode Island State Economic Development
Corporation Revenue, Series A | | | 5.00 | % | | 06/15/17 | | | 250,000 | | | | 281,713 | | |
South Carolina 2.73% | |
Jasper County School District, GO Unlimited | | | 4.00 | % | | 03/01/15 | | | 195,000 | | | | 209,415 | | |
Piedmont Municipal Power Agency | | | 5.00 | % | | 01/01/16 | | | 150,000 | | | | 166,467 | | |
South Carolina Transportation Infrastructure
Bank Revenue, Series A | | | 5.25 | % | | 10/01/17 | | | 125,000 | | | | 135,671 | | |
Spartanburg County, South Carolina Regional
Health Services District, Hospital Revenue,
Refunding, Series A | | | 5.00 | % | | 04/15/19 | | | 600,000 | | | | 701,478 | | |
| | | | 1,213,031 | | |
Tennessee 0.63% | |
Metropolitan Government of Nashville &
Davidson County, Water & Sewer Revenue | | | 6.50 | % | | 12/01/14 | | | 250,000 | | | | 279,165 | | |
Texas 11.55% | |
Addison, Texas Certificates of Obligation,
GO Unlimited | | | 4.00 | % | | 02/15/20 | | | 250,000 | | | | 282,100 | | |
Annetta, Texas Certificates of Obligation,
GO Limited | | | 4.00 | % | | 08/01/16 | | | 200,000 | | | | 209,496 | | |
Laredo, Texas, Waterworks Sewer System
Revenue | | | 4.25 | % | | 03/01/18 | | | 100,000 | | | | 110,703 | | |
Corpus Christi, Texas Business & Job
Development Corporation, Seawall Project,
Sales Tax Revenue, Refunding | | | 5.00 | % | | 03/01/20 | | | 350,000 | | | | 414,316 | | |
Frisco, Texas Independent School District,
School Building, GO Unlimited, Series A | | | 4.50 | % | | 08/15/25 | | | 180,000 | | | | 202,954 | | |
Grand Prairie Independent School District,
Refunding, GO Unlimited (ZCB) | | | 3.92 | %(1) | | 08/15/16 | | | 400,000 | | | | 370,516 | | |
See notes to portfolios of investments and notes to financial statements.
74
Portfolio of Investments December 31, 2012
Municipal Bonds (cont'd) | | Coupon
Rate | | Maturity
Date | | Principal
Amount | | Value | |
Texas (cont'd) | |
Houston, Texas, Hotel Occupancy Tax &
Special Revenue, Refunding, Series B | | | 5.00 | % | | 09/01/19 | | $ | 295,000 | | | $ | 333,303 | | |
Houston, Texas, Public Improvement,
Refunding, GO Limited, Series A | | | 5.38 | % | | 03/01/16 | | | 180,000 | | | | 190,577 | | |
Katy, Texas Independent School District,
School Building, Series D, GO Unlimited | | | 4.50 | % | | 02/15/19 | | | 325,000 | | | | 360,633 | | |
Lewisville, Texas Independent School District,
GO Unlimited, Refunding (ZCB) | | | 4.04 | %(1) | | 08/15/15 | | | 400,000 | | | | 393,476 | | |
Lower Colorado River Authority Texas,
Refunding | | | 5.25 | % | | 05/15/19 | | | 240,000 | | | | 244,397 | | |
San Antonio, Texas Municipal Drain Utilities
Systems Revenue | | | 4.00 | % | | 02/01/16 | | | 300,000 | | | | 300,771 | | |
San Antonio, Texas, Water Revenue, Refunding | | | 4.50 | % | | 05/15/21 | | | 400,000 | | | | 484,196 | | |
San Patricio, Texas Municipal Water District,
Refunding | | | 4.00 | % | | 07/10/18 | | | 200,000 | | | | 212,764 | | |
Texas Municipal Power Agency Revenue,
Refunding | | | 5.00 | % | | 09/01/17 | | | 250,000 | | | | 289,832 | | |
Texas State Public Finance Authority Revenue | | | 5.00 | % | | 10/15/21 | | | 300,000 | | | | 303,186 | | |
University of Texas Revenue Financing
System, Refunding, Series A | | | 3.00 | % | | 08/15/23 | | | 400,000 | | | | 439,280 | | |
| | | | 5,142,500 | | |
Utah 0.67% | |
Tooele City, Utah Municipal Building Authority
Lease Revenue, Refunding | | | 3.75 | % | | 12/01/17 | | | 285,000 | | | | 299,267 | | |
Virginia 1.57% | |
Spotsylvania County, Virginia Economic
Development Authority Revenue, Refunding | | | 5.00 | % | | 06/01/23 | | | 300,000 | | | | 362,364 | | |
Virginia College Building Authority Educational
Facilities Revenue, Prerefunded, Series A | | | 5.00 | % | | 09/01/15 | | | 10,000 | | | | 11,198 | | |
Virginia College Building Authority Educational
Facilities Revenue, Unrefunded, Series A | | | 5.00 | % | | 09/01/15 | | | 290,000 | | | | 323,109 | | |
| | | | 696,671 | | |
Washington 0.60% | |
Energy Northwest, Washington Electric
Revenue | | | 5.00 | % | | 07/01/14 | | | 250,000 | | | | 267,475 | | |
Wisconsin 0.65% | |
Chippewa Valley, Wisconsin, Technical College
District Promissory Notes, Series A,
GO Unlimited | | | 4.00 | % | | 04/01/14 | | | 250,000 | | | | 261,295 | | |
See notes to portfolios of investments and notes to financial statements.
75
Portfolio of Investments December 31, 2012
Municipal Bonds (cont'd) | | Coupon
Rate | | Maturity
Date | | Principal
Amount | | Value | |
Wisconsin (cont'd) | |
Wisconsin State, Refunding, Series 2,
GO Unlimited | | | 4.13 | % | | 11/01/16 | | $ | 25,000 | | | $ | 26,211 | | |
| | | | 287,506 | | |
Total Municipal Bonds | | | 39,712,906 | | |
(cost $38,412,294) | |
Repurchase Agreement 10.22% | |
Joint Tri-Party Repurchase Agreement, Credit
Suisse Securities USA LLC, 12/31/2012,
repurchase price $4,547,078, collateralized
by U.S. Treasury securities held in a joint
tri-party account (cost $4,547,030) | | | 0.19 | % | | 01/02/13 | | | 4,547,030 | | | | 4,547,030 | | |
Total Investments 99.44% | | | 44,259,936 | | |
(cost $42,959,324) | |
Other assets and liabilities, net 0.56% | | | 249,374 | | |
Net Assets 100% | | $ | 44,509,310 | | |
(1)Represents Yield
See notes to portfolios of investments and notes to financial statements.
76
Portfolio of Investments December 31, 2012
Municipal Bonds 94.59% | | Coupon
Rate | | Maturity
Date | | Principal
Amount | | Value | |
Alabama 5.98% | |
Alabama State Board of Education Revenue,
Refunding | | | 4.00 | % | | 07/01/29 | | $ | 250,000 | | | $ | 257,573 | | |
Alabama State, GO Unlimited, Series A | | | 4.63 | % | | 09/01/22 | | | 375,000 | | | | 383,276 | | |
Bessemer, Alabama Water Revenue | | | 4.00 | % | | 01/01/16 | | | 200,000 | | | | 206,608 | | |
Mountain Brook City Board of Education
Capital Outlay | | | 4.00 | % | | 02/15/15 | | | 195,000 | | | | 208,307 | | |
University of Alabama at Birmingham, Hospital
Revenue, Series A | | | 5.00 | % | | 09/01/15 | | | 300,000 | | | | 328,494 | | |
| | | | 1,384,258 | | |
Arizona 2.22% | |
Scottsdale Arizona Municipal Property Corp.,
Excise Tax Revenue, Refunding | | | 5.00 | % | | 07/01/26 | | | 180,000 | | | | 231,982 | | |
University of Arizona Certificates of
Participation, Series C | | | 5.00 | % | | 06/01/22 | | | 260,000 | | | | 281,892 | | |
| | | | 513,874 | | |
California 11.38% | |
Anaheim, California City School District, Capital
Appreciation, Election 2002,
GO Unlimited (ZCB) | | | 4.60 | %(1) | | 08/01/28 | | | 580,000 | | | | 279,183 | | |
California State, GO Unlimited | | | 5.00 | % | | 03/01/32 | | | 300,000 | | | | 325,869 | | |
California State, GO Unlimited | | | 4.75 | % | | 03/01/34 | | | 205,000 | | | | 218,659 | | |
Chaffey Community College District, Series C,
GO Unlimited | | | 5.00 | % | | 06/01/32 | | | 300,000 | | | | 342,558 | | |
Imperial Community College District,
GO Unlimited | | | 5.00 | % | | 08/01/29 | | | 500,000 | | | | 536,650 | | |
Lindsay Unified School District, Election 2002,
Series C, GO Unlimited (ZCB) | | | 5.25 | %(1) | | 08/01/35 | | | 420,000 | | | | 139,268 | | |
Los Angeles Unified School District,
Election 2004, Series H, GO Unlimited | | | 5.00 | % | | 07/01/32 | | | 200,000 | | | | 223,826 | | |
Santee School District, Series D,
GO Unlimited (ZCB) | | | 5.47 | %(1) | | 08/01/43 | | | 745,000 | | | | 144,359 | | |
Santa Clara Valley Transportation Authority,
Refunding, Series A | | | 5.00 | % | | 04/01/27 | | | 370,000 | | | | 423,672 | | |
| | | | 2,634,044 | | |
Colorado 3.22% | |
Colorado Health Facilities Authority Revenue | | | 5.00 | % | | 09/01/16 | | | 150,000 | | | | 154,167 | | |
Platte River, Colorado, Power Authority Power
Revenue, Series II | | | 5.00 | % | | 06/01/30 | | | 495,000 | | | | 590,837 | | |
| | | | 745,004 | | |
See notes to portfolios of investments and notes to financial statements.
77
Portfolio of Investments December 31, 2012
Municipal Bonds (cont'd) | | Coupon
Rate | | Maturity
Date | | Principal
Amount | | Value | |
Connecticut 2.45% | |
Connecticut State, Health & Educational Facility
Authority, Sacred Heart University Revenue,
Refunding, Series H | | | 5.00 | % | | 07/01/27 | | $ | 500,000 | | | $ | 567,475 | | |
Delaware 2.05% | |
Delaware State Health Facilities Authority,
Bayhealth Medical Center Projects,
Revenue, Series A | | | 5.00 | % | | 07/01/39 | | | 445,000 | | | | 473,622 | | |
District of Columbia 2.70% | |
District of Columbia Income Tax Revenue,
Series A | | | 5.25 | % | | 12/01/27 | | | 300,000 | | | | 365,205 | | |
District of Columbia Water & Sewer Authority
Public Utility Revenue, Subordinate Lien | | | 5.00 | % | | 10/01/28 | | | 250,000 | | | | 258,812 | | |
| | | | 624,017 | | |
Florida 3.21% | |
Florida Board of Education, GO Unlimited,
Refunding, Series C | | | 4.50 | % | | 06/01/28 | | | 300,000 | | | | 322,614 | | |
Florida State Board of Education Lottery
Revenue, Series B | | | 5.00 | % | | 07/01/26 | | | 100,000 | | | | 114,484 | | |
Seven Oaks, Florida, Community Development
District, Special Assessment Revenue,
Refunding, Series A1 | | | 5.50 | % | | 05/01/33 | | | 285,000 | | | | 304,922 | | |
| | | | 742,020 | | |
Georgia 3.56% | |
Atlanta & Fulton County, Georgia Recreation
Authority, Park Implementation Revenue,
Series A | | | 4.75 | % | | 12/01/35 | | | 300,000 | | | | 322,575 | | |
Atlanta Development Authority Revenue | | | 5.25 | % | | 07/01/22 | | | 500,000 | | | | 501,690 | | |
| | | | 824,265 | | |
Guam 1.09% | |
Guam Education Financing Foundation
Certificate of Participation, Series A | | | 4.25 | % | | 10/01/18 | | | 250,000 | | | | 252,745 | | |
Illinois 9.10% | |
Chicago Board of Education, GO Unlimited | | | 5.25 | % | | 12/01/19 | | | 300,000 | | | | 360,255 | | |
Chicago, Illinois Water Revenue, Refunding | | | 5.75 | % | | 11/01/30 | | | 225,000 | | | | 294,892 | | |
City Colleges of Chicago, GO Unlimited | | | 5.00 | % | | 01/01/17 | | | 115,000 | | | | 130,347 | | |
Du Page County, Refunding, GO Unlimited | | | 5.60 | % | | 01/01/21 | | | 490,000 | | | | 575,284 | | |
Illinois Finance Authority, Refunding, Series A | | | 5.00 | % | | 10/01/14 | | | 150,000 | | | | 161,035 | | |
See notes to portfolios of investments and notes to financial statements.
78
Portfolio of Investments December 31, 2012
Municipal Bonds (cont'd) | | Coupon
Rate | | Maturity
Date | | Principal
Amount | | Value | |
Illinois (cont'd) | |
Illinois Regional Transportation Authority
Revenue | | | 6.50 | % | | 07/01/26 | | $ | 250,000 | | | $ | 343,805 | | |
Illinois Regional Transportation Authority
Revenue, Series A | | | 7.20 | % | | 11/01/20 | | | 205,000 | | | | 239,553 | | |
| | | | 2,105,171 | | |
Indiana 1.46% | |
Indianapolis Local Public Improvement Bond
Bank, Waterworks Project, Series 2007 L | | | 5.25 | % | | 01/01/33 | | | 305,000 | | | | 337,190 | | |
Kansas 1.18% | |
Kansas State Development Finance Authority
Revenue | | | 4.00 | % | | 10/01/15 | | | 250,000 | | | | 272,720 | | |
Kentucky 2.01% | |
Bowling Green, Kentucky, GO Unlimited,
Series B | | | 4.00 | % | | 09/01/16 | | | 215,000 | | | | 239,095 | | |
Kentucky Municipal Power Agency, Power
System Revenue, Prairie State Project,
Series A | | | 5.25 | % | | 09/01/22 | | | 200,000 | | | | 226,768 | | |
| | | | 465,863 | | |
Massachusetts 3.84% | |
Massachusetts Bay Transportation Authority,
Massachusetts Sales Tax Revenue,
Refunding, Series A-1 | | | 5.25 | % | | 07/01/30 | | | 285,000 | | | | 372,692 | | |
Massachusetts Bay Transportation Authority,
Massachusetts Sales Tax Revenue, Series A | | | 5.00 | % | | 07/01/31 | | | 405,000 | | | | 515,326 | | |
| | | | 888,018 | | |
Michigan 3.47% | |
Detroit, Michigan Local Development Financing
Authority, Refunding, Series A | | | 5.38 | % | | 05/01/18 | | | 215,000 | | | | 213,658 | | |
Detroit, Michigan Water Supply System
Revenue, Series B | | | 5.00 | % | | 07/01/16 | | | 430,000 | | | | 470,859 | | |
State of Michigan, Trunk Line Revenue,
Refunding | | | 4.50 | % | | 11/01/26 | | | 105,000 | | | | 118,379 | | |
| | | | 802,896 | | |
Missouri 1.29% | |
Kansas City Water Revenue | | | 4.00 | % | | 12/01/22 | | | 250,000 | | | | 299,455 | | |
Nevada 1.09% | |
Nye County School District, GO Limited | | | 4.00 | % | | 05/01/15 | | | 235,000 | | | | 251,723 | | |
See notes to portfolios of investments and notes to financial statements.
79
Portfolio of Investments December 31, 2012
Municipal Bonds (cont'd) | | Coupon
Rate | | Maturity
Date | | Principal
Amount | | Value | |
New Hampshire 2.03% | |
Manchester, New Hampshire School Facilities
Revenue, Refunding | | | 5.50 | % | | 06/01/26 | | $ | 300,000 | | | $ | 403,209 | | |
New Hampshire Health & Education Facilities
Authority Revenue | | | 5.00 | % | | 07/01/14 | | | 65,000 | | | | 65,668 | | |
| | | | 468,877 | | |
New Jersey 1.06% | |
Passaic Valley, New Jersey, Sewage
Commissioners Revenue, Series G | | | 5.75 | % | | 12/01/21 | | | 200,000 | | | | 244,636 | | |
New York 1.93% | |
Metropolitan Transportation Authority,
New York, Revenue, Series A | | | 5.00 | % | | 11/15/41 | | | 400,000 | | | | 446,016 | | |
North Carolina 1.30% | |
North Carolina State Medical Care Commission,
Health Care Facilities Revenue, Refunding,
Series A | | | 4.00 | % | | 10/01/34 | | | 300,000 | | | | 302,178 | | |
Ohio 4.29% | |
Cleveland, Ohio, Parking Facility Revenue,
Prerefunding, Refunding | | | 5.25 | % | | 09/15/22 | | | 130,000 | | | | 170,280 | | |
Lorain County, Ohio, Community College
District, Revenue | | | 3.25 | % | | 12/01/17 | | | 300,000 | | | | 325,491 | | |
South Euclid Special Assessment,
GO Limited Tax | | | 6.70 | % | | 12/01/14 | | | 50,000 | | | | 52,446 | | |
Summit County, Ohio, Port Authority Revenue
Development, Bioinnovation Institution | | | 5.38 | % | | 12/01/30 | | | 390,000 | | | | 444,167 | | |
| | | | 992,384 | | |
Puerto Rico 1.10% | |
Commonwealth of Puerto Rico, GO Unlimited | | | 6.00 | % | | 07/01/13 | | | 250,000 | | | | 254,163 | | |
Tennessee 1.07% | |
Memphis, Tennessee Sanitary Sewage System
Revenue, Refunding | | | 5.00 | % | | 05/01/20 | | | 200,000 | | | | 248,696 | | |
Texas 15.65% | |
Addison, Texas, Certificates of Obligation,
GO Unlimited | | | 4.50 | % | | 02/15/28 | | | 140,000 | | | | 156,498 | | |
Center, Texas, GO Limited (ZCB) | | | 3.10 | %(1) | | 02/15/20 | | | 150,000 | | | | 129,649 | | |
Dallas, Texas Waterworks & Sewer Systems
Revenue, Refunding | | | 4.50 | % | | 10/01/19 | | | 225,000 | | | | 260,586 | | |
Forney, Texas, GO Limited | | | 5.00 | % | | 02/15/27 | | | 500,000 | | | | 545,905 | | |
See notes to portfolios of investments and notes to financial statements.
80
Portfolio of Investments December 31, 2012
Municipal Bonds (cont'd) | | Coupon
Rate | | Maturity
Date | | Principal
Amount | | Value | |
Texas (cont'd) | |
Goose Creek, Texas Independent School
District Schoolhouse, Series A | | | 5.25 | % | | 02/15/18 | | $ | 370,000 | | | $ | 435,512 | | |
Greenville, Texas Independent School District,
GO Unlimited, Refunding | | | 4.00 | % | | 08/15/17 | | | 120,000 | | | | 132,745 | | |
Laredo Independent School District Public
Facility Corp., Lease Revenue, Series F | | | 5.50 | % | | 08/01/24 | | | 100,000 | | | | 100,142 | | |
North Texas Tollway Authority Revenue,
Series F | | | 5.75 | % | | 01/01/38 | | | 250,000 | | | | 276,885 | | |
Prosper, Texas Independent School District,
Capital Appreciation, School Building,
GO Unlimited (ZCB) | | | 6.00 | %(1) | | 08/15/33 | | | 1,000,000 | | | | 365,110 | | |
San Marcos, Texas Tax & Toll Revenue,
GO Limited | | | 5.10 | % | | 08/15/27 | | | 400,000 | | | | 462,792 | | |
Tarrant County, Texas Cultural Education
Facilities Finance Corp., Health Resources
Revenue, Refunding, Series A | | | 5.00 | % | | 02/15/36 | | | 400,000 | | | | 427,532 | | |
White Settlement, Texas Independent School
District, GO Unlimited | | | 4.13 | % | | 08/15/15 | | | 300,000 | | | | 327,630 | | |
| | | | 3,620,986 | | |
Utah 3.64% | |
Utah State Building Ownership Authority, Lease
Revenue, Refunding, Series C | | | 5.50 | % | | 05/15/19 | | | 500,000 | | | | 588,145 | | |
Utah Transit Authority, Sales Tax Revenue,
Refunding, Series A | | | 5.00 | % | | 06/15/35 | | | 200,000 | | | | 253,806 | | |
| | | | 841,951 | | |
Washington 1.22% | |
Spokane County, Washington School District,
No. 81, GO Unlimited | | | 5.05 | % | | 06/01/22 | | | 255,000 | | | | 282,999 | | |
Total Investments 94.59% | | | 21,887,246 | | |
(cost $20,272,578) | |
Other assets and liabilities, net 5.41% | | | 1,250,792 | | |
Net Assets 100% | | $ | 23,138,038 | | |
(1)Represents Yield
See notes to portfolios of investments and notes to financial statements.
81
Portfolio of Investments December 31, 2012
Common Stocks 89.61% | | Shares | | Value | |
Aerospace/Defense 1.20% | |
Northrop Grumman Corp. | | | 3,000 | | | $ | 202,740 | | |
Agricultural Chemicals 1.08% | |
Mosaic Co. | | | 3,200 | | | | 181,216 | | |
Beverages - Non-alcoholic 1.13% | |
Coca-Cola Enterprises, Inc. | | | 6,000 | | | | 190,380 | | |
Beverages - Wine/Spirits 1.20% | |
Constellation Brands, Inc., Class A | | | 5,700 | | | | 201,723 | * | |
Building - Residential/Commercial 1.88% | |
D.R. Horton, Inc. | | | 16,000 | | | | 316,480 | | |
Cable/Satellite TV 1.01% | |
DIRECTV | | | 3,400 | | | | 170,544 | * | |
Casino Hotels 2.57% | |
Las Vegas Sands Corp. | | | 5,000 | | | | 230,800 | | |
Wynn Resorts Ltd. | | | 1,800 | | | | 202,482 | | |
| | | | 433,282 | | |
Chemicals - Diversified 1.08% | |
LyondellBasell Industries N.V., Class A | | | 3,200 | | | | 182,688 | | |
Commercial Services 1.20% | |
Iron Mountain, Inc. | | | 6,532 | | | | 202,819 | | |
Commercial Services - Financial 4.37% | |
MasterCard, Inc., Class A | | | 1,500 | | | | 736,920 | | |
Computer Services 1.02% | |
International Business Machines Corp. (IBM) | | | 900 | | | | 172,395 | | |
Computers 6.80% | |
Apple, Inc. | | | 1,800 | | | | 959,454 | | |
Hewlett-Packard Co. | | | 13,000 | | | | 185,250 | | |
| | | | 1,144,704 | | |
Computers - Memory Devices 1.19% | |
Seagate Technology plc | | | 6,600 | | | | 201,168 | | |
See notes to portfolios of investments and notes to financial statements.
82
Portfolio of Investments December 31, 2012
Common Stocks (cont'd) | | Shares | | Value | |
Consulting Services 1.91% | |
Gartner, Inc. | | | 7,000 | | | $ | 322,140 | * | |
Containers - Metal/Glass 1.09% | |
Ball Corp. | | | 4,100 | | | | 183,475 | | |
Dental Supplies & Equipment 1.02% | |
Patterson Companies, Inc. | | | 5,000 | | | | 171,150 | | |
Dialysis Centers 1.31% | |
DaVita Healthcare Partners, Inc. | | | 2,000 | | | | 221,060 | * | |
E-Commerce/Products 1.82% | |
eBay, Inc. | | | 6,000 | | | | 306,120 | * | |
Electric - Integrated 4.00% | |
Ameren Corp. | | | 5,600 | | | | 172,032 | | |
FirstEnergy Corp. | | | 4,000 | | | | 167,040 | | |
Integrys Energy Group, Inc. | | | 3,100 | | | | 161,882 | * | |
Pepco Holdings, Inc. | | | 8,800 | | | | 172,568 | | |
| | | | 673,522 | | |
Electric Products - Miscellaneous 1.10% | |
Emerson Electric Co. | | | 3,500 | | | | 185,360 | | |
Finance - Consumer Loans 1.12% | |
SLM Corp. | | | 11,000 | | | | 188,430 | | |
Food - Retail 2.29% | |
Kroger Co. | | | 6,500 | | | | 169,130 | | |
Safeway, Inc. | | | 12,000 | | | | 217,080 | | |
| | | | 386,210 | | |
Gold Mining 1.18% | |
Randgold Resources Ltd., Sponsored ADR | | | 2,000 | | | | 198,500 | | |
Independent Power Producer 1.11% | |
NRG Energy, Inc. | | | 8,100 | | | | 186,219 | | |
Investment Management/Advisory Services 1.26% | |
Ameriprise Financial, Inc. | | | 3,400 | | | | 212,942 | | |
Machinery - General Industrial 2.60% | |
Wabtec Corp. | | | 5,000 | | | | 437,700 | | |
See notes to portfolios of investments and notes to financial statements.
83
Portfolio of Investments December 31, 2012
Common Stocks (cont'd) | | Shares | | Value | |
Medical - Biomedical/Gene 4.73% | |
Alexion Pharmaceuticals, Inc. | | | 2,000 | | | $ | 187,620 | * | |
Amgen, Inc. | | | 2,500 | | | | 215,800 | | |
Celgene Corp. | | | 5,000 | | | | 393,600 | * | |
| | | | 797,020 | | |
Medical - Generic Drugs 2.04% | |
Watson Pharmaceuticals, Inc. | | | 4,000 | | | | 344,000 | * | |
Medical - HMO 2.98% | |
Aetna, Inc. | | | 4,000 | | | | 185,200 | | |
Coventry Health Care, Inc. | | | 3,800 | | | | 170,354 | | |
WellPoint, Inc. | | | 2,400 | | | | 146,208 | | |
| | | | 501,762 | | |
Medical Labs & Testing Services 1.04% | |
Quest Diagnostics, Inc. | | | 3,000 | | | | 174,810 | | |
Metal - Iron 1.37% | |
Cliffs Natural Resources, Inc. | | | 6,000 | | | | 231,360 | | |
Multi-line Insurance 2.08% | |
American International Group, Inc. | | | 5,000 | | | | 176,500 | * | |
Assurant, Inc. | | | 5,000 | | | | 173,500 | | |
| | | | 350,000 | | |
Office Automation & Equipment 0.97% | |
Xerox Corp. | | | 24,000 | | | | 163,680 | | |
Oil - Field Services 1.02% | |
Hornbeck Offshore Services, Inc. | | | 5,000 | | | | 171,700 | * | |
Oil & Gas Drilling 1.01% | |
Diamond Offshore Drilling, Inc. | | | 2,500 | | | | 169,900 | | |
Oil Companies - Integrated 2.92% | |
Chevron Corp. | | | 1,600 | | | | 173,024 | | |
ConocoPhillips | | | 2,500 | | | | 144,975 | | |
Exxon Mobil Corp. | | | 2,000 | | | | 173,100 | | |
| | | | 491,099 | | |
Oil Refining & Marketing 2.28% | |
Valero Energy Corp. | | | 5,000 | | | | 170,600 | | |
Marathon Petroleum Corp. | | | 3,400 | | | | 214,200 | | |
| | | | 384,800 | | |
See notes to portfolios of investments and notes to financial statements.
84
Portfolio of Investments December 31, 2012
Common Stocks (cont'd) | | Shares | | Value | |
Pharmacy Services 0.96% | |
Express Scripts Holding Co. | | | 3,000 | | | $ | 162,000 | * | |
Printing - Commercial 0.91% | |
RR Donnelley & Sons Co. | | | 17,000 | | | | 153,000 | | |
Rental Auto/Equipment 1.35% | |
United Rentals, Inc. | | | 5,000 | | | | 227,600 | * | |
Retail - Automobile 1.06% | |
AutoNation, Inc. | | | 4,500 | | | | 178,650 | * | |
Retail - Consumer Electronics 0.50% | |
Best Buy Co., Inc. | | | 7,100 | | | | 84,135 | | |
Retail - Discount 1.01% | |
Big Lots, Inc. | | | 6,000 | | | | 170,760 | * | |
Retail - Perfume & Cosmetics 1.17% | |
Ulta Salon Cosmetics & Fragrance, Inc. | | | 2,000 | | | | 196,520 | | |
Saving & Loan/Thrifts - Eastern US 0.98% | |
People's United Financial, Inc. | | | 13,700 | | | | 165,633 | | |
Semiconductor Components - Integrated Circuits 1.55% | |
Analog Devices, Inc. | | | 2,000 | | | | 84,120 | | |
Maxim Integrated Products, Inc. | | | 6,000 | | | | 176,400 | | |
| | | | 260,520 | | |
Telephone - Integrated 2.85% | |
CenturyLink, Inc. | | | 4,000 | | | | 156,480 | | |
Frontier Communications Corp. | | | 30,000 | | | | 128,400 | | |
Verizon Communications, Inc. | | | 4,500 | | | | 194,715 | | |
| | | | 479,595 | | |
Tobacco 1.18% | |
Lorillard, Inc. | | | 1,700 | | | | 198,339 | | |
Transportation - Rail 3.27% | |
Norfolk Southern Corp. | | | 2,800 | | | | 173,152 | | |
Union Pacific Corp. | | | 3,000 | | | | 377,160 | | |
| | | | 550,312 | | |
See notes to portfolios of investments and notes to financial statements.
85
Portfolio of Investments December 31, 2012
Common Stocks (cont'd) | | Shares | | Value | |
Web Portals/Internet Service Providers 1.68% | |
Google, Inc., Class A | | | 400 | | | $ | 283,748 | * | |
Wireless Equipment 1.16% | |
Motorola Solutions, Inc. | | | 3,500 | | | | 194,880 | | |
Total Common Stocks | | | 15,095,710 | | |
(cost $14,361,612) | |
Real Estate Investment Trust (REIT) 1.38% | |
American Tower Corp., Class A | | | 3,000 | | | | 231,810 | | |
(cost $159,047) | |
Exchange-Traded Funds (ETF) 2.79% | |
SPDR S&P Bank ETF | | | 8,000 | | | | 190,640 | | |
SPDR S&P Regional Banking ETF | | | 10,000 | | | | 279,700 | | |
Total Exchange-Traded Funds | | | 470,340 | | |
(cost $456,117) | |
Total Securities | | | 15,797,860 | | |
(cost $14,976,776) | |
Repurchase Agreement 5.70% | | Principal
Amount | | | |
Joint Tri-Party Repurchase Agreement, Credit Suisse Securities USA LLC,
12/31/2012, 0.19%, due 01/02/2013 repurchase price $960,307,
collateralized by U.S. Treasury securities held in a joint tri-party
account (cost $960,296) | | $ | 960,296 | | | | 960,296 | | |
Total Investments 99.48% | | | 16,758,156 | | |
(cost $15,937,072) | |
Other assets and liabilities, net 0.52% | | | 87,912 | | |
Net Assets 100% | | $ | 16,846,068 | | |
See notes to portfolios of investments and notes to financial statements.
86
Portfolio of Investments December 31, 2012
Common Stocks 84.91% | | Shares | | Value | |
Agricultural Chemicals 1.76% | |
CF Industries Holdings, Inc. | | | 3,000 | | | $ | 609,480 | | |
Agricultural Operations 0.11% | |
Agriterra Ltd. | | | 647,600 | | | | 36,831 | * | |
Apparel Manufacturers 1.77% | |
Michael Kors Holdings Ltd. | | | 12,000 | | | | 612,360 | * | |
Building - Residential/Commercial 2.76% | |
D.R. Horton, Inc. | | | 35,000 | | | | 692,300 | | |
M/I Homes, Inc. | | | 10,000 | | | | 265,000 | * | |
| | | | 957,300 | | |
Casino Hotels 1.46% | |
Las Vegas Sands Corp. | | | 11,000 | | | | 507,760 | | |
Commercial Services - Financial 4.86% | |
Cardtronics, Inc. | | | 15,000 | | | | 356,100 | * | |
MasterCard, Inc., Class A | | | 2,700 | | | | 1,326,456 | | |
| | | | 1,682,556 | | |
Computer Data Security 0.91% | |
Fortinet, Inc. | | | 15,000 | | | | 316,050 | * | |
Computers 6.77% | |
Apple, Inc. | | | 4,400 | | | | 2,345,332 | | |
Consulting Services 1.86% | |
Gartner, Inc. | | | 14,000 | | | | 644,280 | * | |
Data Processing/Management 2.82% | |
CommVault Systems, Inc. | | | 14,000 | | | | 975,940 | * | |
Dialysis Centers 2.23% | |
DaVita Healthcare Partners, Inc. | | | 7,000 | | | | 773,710 | * | |
E-Commerce/Products 2.50% | |
eBay, Inc. | | | 17,000 | | | | 867,340 | * | |
Electronic Components - Semiconductors 1.55% | |
Peregrine Semiconductor Corp. | | | 35,000 | | | | 535,850 | * | |
See notes to portfolios of investments and notes to financial statements.
87
Portfolio of Investments December 31, 2012
Common Stocks (cont'd) | | Shares | | Value | |
Finance - Commercial 1.53% | |
IOU Financial, Inc. | | | 38,000 | | | $ | 13,111 | *+ | |
IOU Financial, Inc., 144A | | | 1,500,000 | | | | 517,554 | *+ | |
| | | | 530,665 | | |
Food - Flour & Grain 0.80% | |
Amira Nature Foods Ltd. | | | 35,000 | | | | 278,250 | * | |
Gold Mining 0.72% | |
Randgold Resources Ltd., Sponsored ADR | | | 2,500 | | | | 248,125 | | |
Internet Content - Information/Network 2.32% | |
LinkedIn Corp., Class A | | | 7,000 | | | | 803,740 | * | |
Internet Financial Services 0.00% | |
Direct Markets Holdings Corp. | | | 10,000 | | | | 70 | * | |
Internet Security 0.60% | |
Qihoo 360 Technology Co., Ltd., Sponsored ADR | | | 7,000 | | | | 207,830 | * | |
Investment Management/Advisory Services 1.89% | |
Altisource Asset Management Corp. | | | 350 | | | | 28,700 | * | |
Altisource Portfolio Solutions S.A. | | | 7,000 | | | | 606,585 | * | |
Altisource Residential Corp., Class B | | | 1,166 | | | | 18,470 | * | |
| | | | 653,755 | | |
Machinery - General Industrial 6.31% | |
Chart Industries, Inc. | | | 6,000 | | | | 400,020 | * | |
DXP Enterprises, Inc. | | | 15,000 | | | | 736,050 | * | |
Wabtec Corp. | | | 12,000 | | | | 1,050,480 | | |
| | | | 2,186,550 | | |
Medical - Biomedical/Gene 4.67% | |
Alexion Pharmaceuticals, Inc. | | | 8,000 | | | | 750,480 | * | |
Celgene Corp. | | | 11,000 | | | | 865,920 | * | |
| | | | 1,616,400 | | |
Medical - Generic Drugs 4.88% | |
Mylan, Inc. | | | 12,000 | | | | 329,760 | * | |
Perrigo Co. | | | 4,000 | | | | 416,120 | | |
Watson Pharmaceuticals, Inc. | | | 11,000 | | | | 946,000 | * | |
| | | | 1,691,880 | | |
See notes to portfolios of investments and notes to financial statements.
88
Portfolio of Investments December 31, 2012
Common Stocks (cont'd) | | Shares | | Value | |
Medical - Hospitals 1.75% | |
African Medical Investments plc | | | 1,000,000 | | | $ | 4,063 | * | |
HCA Holdings, Inc. | | | 20,000 | | | | 603,400 | * | |
| | | | 607,463 | | |
Medical Products 1.52% | |
Cyberonics, Inc. | | | 10,000 | | | | 525,300 | * | |
Metal - Iron 0.29% | |
Andean Pacific Iron Corp., 144A (RS) | | | 100,000 | | | | 100,000 | *@ | |
Oil - Field Services 2.77% | |
Core Laboratories N.V. | | | 5,000 | | | | 546,550 | | |
Hornbeck Offshore Services, Inc. | | | 12,000 | | | | 412,080 | * | |
| | | | 958,630 | | |
Oil Companies - Exploration & Production 2.65% | |
Gulfport Energy Corp. | | | 24,000 | | | | 917,280 | * | |
Oil Refining & Marketing 0.98% | |
Valero Energy Corp. | | | 10,000 | | | | 341,200 | | |
Pharmacy Services 1.25% | |
Express Scripts Holding Co. | | | 8,000 | | | | 432,000 | * | |
Quarrying 1.10% | |
Pacific Stone Tech, Inc. (RS) | | | 1,757 | | | | 379,951 | *@ | |
Real Estate Operating/Development 0.29% | |
Pacific Infrastructure, Inc. (RS) | | | 100,000 | | | | 100,000 | *@ | |
Recreational Vehicles 2.43% | |
Polaris Industries, Inc. | | | 10,000 | | | | 841,500 | | |
Rental Auto/Equipment 4.32% | |
Avis Budget Group, Inc. | | | 25,000 | | | | 495,500 | * | |
United Rentals, Inc. | | | 22,000 | | | | 1,001,440 | * | |
| | | | 1,496,940 | | |
Retail - Perfume & Cosmetics 1.98% | |
Ulta Salon Cosmetics & Fragrance, Inc. | | | 7,000 | | | | 687,820 | | |
Retail - Restaurants 1.29% | |
Chuy's Holdings, Inc. | | | 20,000 | | | | 446,800 | * | |
See notes to portfolios of investments and notes to financial statements.
89
Portfolio of Investments December 31, 2012
Common Stocks (cont'd) | | Shares | | Value | |
Semiconductor Components - Integrated Circuits 3.05% | |
Analog Devices, Inc. | | | 5,000 | | | $ | 210,300 | | |
Cirrus Logic, Inc. | | | 15,000 | | | | 434,550 | * | |
Maxim Integrated Products, Inc. | | | 14,000 | | | | 411,600 | | |
| | | | 1,056,450 | | |
Transportation - Rail 2.18% | |
Union Pacific Corp. | | | 6,000 | | | | 754,320 | | |
Transportation - Truck 1.98% | |
Old Dominion Freight Line, Inc. | | | 20,000 | | | | 685,600 | * | |
Total Common Stocks | | | 29,413,308 | | |
(cost $27,488,316) | |
Exchange-Traded Funds (ETF) 2.65% | |
SPDR S&P Bank ETF | | | 15,000 | | | | 357,450 | | |
SPDR S&P Regional Banking ETF | | | 20,000 | | | | 559,400 | | |
Total Exchange-Traded Funds | | | 916,850 | | |
(cost $891,764) | |
Warrants 0.00% | |
Gold Mining 0.00% | |
Gran Colombia Gold Corp., 144A, Warrants (October 2017) (RS) | | | 92,500 | | | | 0 | *@ | |
Medical - Hospitals 0.00% | |
African Medical Investments plc, Warrants (June 2014) | | | 500,000 | | | | 0 | *@ | |
Total Warrants | | | 0 | | |
(cost $0) | |
Convertible Debenture 0.29% | | Principal
Amount | | | |
Metal - Iron 0.29% | |
Andean Pacific Iron Corp., 1.00%, maturity 06/07/13 (RS) | | $ | 100,000 | | | | 100,000 | @ | |
(cost $100,000) | |
See notes to portfolios of investments and notes to financial statements.
90
Portfolio of Investments December 31, 2012
Gold-Linked Note 1.07% | | Principal
Amount | | Value | |
Gold Mining 1.07% | |
Gran Colombia Gold Corp., 144A, 10.00%, maturity 10/31/17 (RS) | | $ | 370,000 | | | $ | 370,000 | @ | |
(cost $370,000) | |
Silver-Linked Note 0.82% | |
Gold Mining 0.82% | |
Gran Colombia Gold Corp., 5.00%, maturity 08/11/18 | | | 316,000 | | | | 282,820 | | |
(cost $253,275) | |
Corporate Notes 1.15% | |
Electric - Generation 0.43% | |
Pacific Power Generation Corp., 15.00%, maturity 04/03/17 (RS) | | | 150,000 | | | | 150,000 | @ | |
Transportation - Air Freight 0.72% | |
Aeroservicios Especializados, S.A. de C.V., 22.00%, maturity 02/28/13 (RS) | | | 250,000 | | | | 250,000 | @ | |
Total Corporate Notes | | | 400,000 | | |
(cost $400,000) | |
Total Securities | | | 31,482,978 | | |
(cost $29,503,355) | |
Repurchase Agreement 9.50% | |
Joint Tri-Party Repurchase Agreement, Credit Suisse Securities USA LLC,
12/31/2012, 0.19%, due 01/02/2013, repurchase price $3,289,293,
collateralized by U.S. Treasury Securities held in a joint tri-party
account (cost $3,289,258) | | | 3,289,258 | | | | 3,289,258 | | |
Total Investments 100.39% | | | 34,772,236 | | |
(cost $32,792,613) | |
Other assets and liabilities, net (0.39)% | | | (132,858 | ) | |
Net Assets 100% | | $ | 34,639,378 | | |
See notes to portfolios of investments and notes to financial statements.
91
Portfolio of Investments December 31, 2012
Common Stocks 99.50% | | Shares | | Value | |
Agricultural Chemicals 1.99% | |
Monsanto Co. | | | 2,200 | | | $ | 208,230 | | |
Agricultural Operations 0.34% | |
Agriterra Ltd. | | | 627,600 | | | | 35,694 | * | |
Apparel Manufacturers 2.56% | |
VF Corp. | | | 1,775 | | | | 267,972 | | |
Automotive - Cars & Light Trucks 2.68% | |
Toyota Motor Corp., Sponsored ADR | | | 3,000 | | | | 279,750 | | |
Broadcast Service/Program 2.43% | |
Discovery Communications, Inc., Class A | | | 4,000 | | | | 253,920 | * | |
Building - Residential/Commercial 7.07% | |
D.R. Horton, Inc. | | | 12,800 | | | | 253,184 | | |
Lennar Corp., Class A | | | 6,000 | | | | 232,020 | | |
PulteGroup, Inc. | | | 14,000 | | | | 254,240 | * | |
| | | | 739,444 | | |
Chemicals - Diversified 3.43% | |
FMC Corp. | | | 3,500 | | | | 204,820 | | |
LyondellBasell Industries N.V., Class A | | | 2,700 | | | | 154,143 | | |
| | | | 358,963 | | |
Chemicals - Specialty 3.97% | |
Ecolab, Inc. | | | 2,900 | | | | 208,510 | | |
International Flavors & Fragrances, Inc. | | | 3,100 | | | | 206,274 | | |
| | | | 414,784 | | |
Coal 0.48% | |
Pacific Coal Resources Ltd. | | | 278,811 | | | | 50,557 | * | |
Commercial Banks - Non US 2.29% | |
ICICI Bank Ltd., Sponsored ADR | | | 5,500 | | | | 239,855 | | |
Commercial Banks - Southern US 2.20% | |
Synovus Financial Corp. | | | 94,000 | | | | 230,300 | | |
Containers - Metal/Glass 1.97% | |
Ball Corp. | | | 4,600 | | | | 205,850 | | |
See notes to portfolios of investments and notes to financial statements.
92
Portfolio of Investments December 31, 2012
Common Stocks (cont'd) | | Shares | | Value | |
Diversified Banking Institutions 5.03% | |
Bank of America Corp. | | | 23,000 | | | $ | 266,800 | | |
Royal Bank of Scotland Group plc, Sponsored ADR | | | 24,000 | | | | 258,960 | * | |
| | | | 525,760 | | |
Diversified Minerals 2.03% | |
BHP Billiton Ltd., Sponsored ADR | | | 2,700 | | | | 211,788 | | |
Electric - Generation 1.00% | |
Pacific Power Generation Corp. (RS) | | | 349,057 | | | | 104,717 | *@ | |
Energy - Alternate Sources 0.96% | |
Pacific Green Energy Corp. (RS) | | | 100,000 | | | | 100,000 | *@ | |
Finance - Credit Card 2.03% | |
Discover Financial Services | | | 5,500 | | | | 212,025 | | |
Gold Mining 0.25% | |
Gran Colombia Gold Corp. | | | 71,200 | | | | 25,822 | * | |
Hotels & Motels 4.84% | |
InterContinental Hotels Group plc, Sponsored ADR | | | 9,200 | | | | 255,944 | | |
Wyndham Worldwide Corp. | | | 4,700 | | | | 250,087 | | |
| | | | 506,031 | | |
Industrial Gases 2.01% | |
Airgas, Inc. | | | 2,300 | | | | 209,967 | | |
Insurance Brokers 2.13% | |
Aon plc | | | 4,000 | | | | 222,400 | | |
Life/Health Insurance 2.13% | |
Prudential plc, Sponsored ADR | | | 7,820 | | | | 223,261 | | |
Medical - Drugs 2.39% | |
Merck & Co., Inc. | | | 6,100 | | | | 249,734 | | |
Medical - Wholesale Drug Distribution 2.60% | |
McKesson Corp. | | | 2,800 | | | | 271,488 | | |
Metal - Diversified 2.00% | |
Rio Tinto plc, Sponsored ADR | | | 3,600 | | | | 209,124 | | |
See notes to portfolios of investments and notes to financial statements.
93
Portfolio of Investments December 31, 2012
Common Stocks (cont'd) | | Shares | | Value | |
Metal - Iron 0.96% | |
Andean Pacific Iron Corp., 144A (RS) | | | 100,000 | | | $ | 100,000 | *@ | |
Multi-line Insurance 4.33% | |
ACE Ltd. | | | 2,850 | | | | 227,430 | | |
The Allstate Corp. | | | 5,600 | | | | 224,952 | | |
| | | | 452,382 | | |
Multimedia 2.44% | |
News Corp., Class A | | | 10,000 | | | | 255,400 | | |
Oil Companies - Integrated 1.27% | |
Phillips 66 | | | 2,500 | | | | 132,750 | | |
Oil Refining & Marketing 1.26% | |
Tesoro Corp. | | | 3,000 | | | | 132,150 | | |
Paper & Related Products 3.96% | |
International Paper Co. | | | 5,200 | | | | 207,168 | | |
MeadWestvaco Corp. | | | 6,500 | | | | 207,155 | | |
| | | | 414,323 | | |
Quarrying 4.97% | |
Pacific Stone Tech, Inc. (RS) | | | 2,405 | | | | 520,081 | *@ | |
Real Estate Operating/Development 3.12% | |
Pacific Infrastructure, Inc. (RS) | | | 326,533 | | | | 326,533 | *@ | |
Rental Auto/Equipment 1.30% | |
United Rentals, Inc. | | | 3,000 | | | | 136,560 | * | |
Retail - Major Department Store 2.23% | |
TJX Companies, Inc. | | | 5,500 | | | | 233,475 | | |
Retail - Restaurants 1.07% | |
Chuy's Holdings, Inc. | | | 5,000 | | | | 111,700 | * | |
Savings & Loan/Thrifts - Eastern US 2.19% | |
Hudson City Bancorp, Inc. | | | 28,200 | | | | 229,266 | | |
Semiconductor Components - Integrated Circuits 1.12% | |
Maxim Integrated Products, Inc. | | | 4,000 | | | | 117,600 | | |
See notes to portfolios of investments and notes to financial statements.
94
Portfolio of Investments December 31, 2012
Common Stocks (cont'd) | | Shares | | Value | |
Steel - Producers 3.97% | |
Nucor Corp. | | | 4,800 | | | $ | 207,264 | | |
United States Steel Corp. | | | 8,700 | | | | 207,669 | | |
| | | | 414,933 | | |
Super-Regional Banks - US 4.50% | |
Capital One Financial Corp. | | | 4,000 | | | | 231,720 | | |
Wells Fargo & Co. | | | 7,000 | | | | 239,260 | | |
| | | | 470,980 | | |
Total Common Stocks | | | 10,405,569 | | |
(cost $10,221,659) | |
Convertible Debenture 0.96% | | Principal
Amount | | | |
Metal - Iron 0.96% | |
Andean Pacific Iron Corp., 1.00%, maturity 06/07/13 (RS) | | $ | 100,000 | | | | 100,000 | @ | |
(cost $100,000) | |
Silver-Linked Note 0.93% | |
Gold Mining 0.93% | |
Gran Colombia Gold Corp., 5.00%, maturity 08/11/18 | | | 109,000 | | | | 97,555 | | |
(cost $87,884) | |
Corporate Note 0.96% | |
Electric - Generation 0.96% | |
Pacific Power Generation Corp., 15.00%, maturity 04/03/17 (RS) | | | 100,000 | | | | 100,000 | @ | |
(cost $100,000) | |
Total Investments 102.35% | | | 10,703,124 | | |
(cost $10,509,543) | |
Other assets and liabilities, net (2.35)% | | | (246,197 | ) | |
Net Assets 100% | | $ | 10,456,927 | | |
See notes to portfolios of investments and notes to financial statements.
95
Portfolio of Investments December 31, 2012
Common Stocks 81.33% | | Shares | | Value | |
Agricultural Chemicals 4.87% | |
CF Industries Holdings, Inc. | | | 30,500 | | | $ | 6,196,380 | | |
Monsanto Co. | | | 110,500 | | | | 10,458,825 | | |
Potash Corporation of Saskatchewan, Inc. | | | 226,100 | | | | 9,200,009 | | |
Spur Ventures, Inc. | | | 274,867 | | | | 99,685 | * | |
| | | | 25,954,899 | | |
Agricultural Operations 2.57% | |
Agriterra Ltd. | | | 67,888,600 | | | | 3,861,045 | *+ | |
Bunge Ltd. | | | 135,000 | | | | 9,813,150 | | |
| | | | 13,674,195 | | |
Building Products - Cement/Aggregates 2.16% | |
Martin Marietta Materials, Inc. | | | 121,900 | | | | 11,492,732 | | |
Chemicals - Diversified 4.88% | |
LyondellBasell Industries N.V., Class A | | | 100,000 | | | | 5,709,000 | | |
Sociedad Quimica y Minera de Chile S.A., Sponsored ADR | | | 255,000 | | | | 14,698,200 | | |
Westlake Chemical Corp. | | | 70,000 | | | | 5,551,000 | | |
| | | | 25,958,200 | | |
Coal 3.77% | |
Consol Energy, Inc. | | | 355,000 | | | | 11,395,500 | | |
Pacific Coal Resources Ltd. | | | 23,039,115 | | | | 4,177,747 | *+ | |
Sable Mining Africa Ltd. | | | 31,789,371 | | | | 4,326,202 | * | |
Walter Energy, Inc., 144A | | | 4,293 | | | | 153,746 | * | |
| | | | 20,053,195 | | |
Diamonds/Precious Stones 0.02% | |
Diamond Fields International Ltd. | | | 1,800,000 | | | | 81,600 | * | |
Rockwell Diamonds, Inc., 144A | | | 63,333 | | | | 12,122 | * | |
| | | | 93,722 | | |
Diversified Minerals 4.05% | |
African Potash Ltd. | | | 15,825,000 | | | | 771,445 | *+ | |
BHP Billiton Ltd., Sponsored ADR | | | 138,000 | | | | 10,824,720 | | |
Calibre Mining Corp. | | | 600,000 | | | | 108,800 | * | |
Canada Zinc Metals Corp. | | | 1,000,000 | | | | 339,999 | * | |
Lithium Americas Corp. | | | 476,667 | | | | 422,573 | * | |
Lundin Mining Corp. | | | 1,025,000 | | | | 5,286,858 | * | |
Sirocco Mining, Inc. | | | 1,035,000 | | | | 761,144 | * | |
Woulfe Mining Corp. | | | 10,015,100 | | | | 3,026,777 | * | |
| | | | 21,542,316 | | |
See notes to portfolios of investments and notes to financial statements.
96
Portfolio of Investments December 31, 2012
Common Stocks (cont'd) | | Shares | | Value | |
Electric - Generation 0.27% | |
Pacific Power Generation Corp. (RS) | | | 4,868,396 | | | $ | 1,460,519 | *+@ | |
Energy - Alternate Sources 0.45% | |
Pacific Green Energy Corp. (RS) | | | 2,400,000 | | | | 2,400,000 | *+@ | |
Finance - Investment Banker/Broker 0.08% | |
Aberdeen International, Inc. | | | 1,274,750 | | | | 417,361 | * | |
Food - Flour & Grain 0.68% | |
Amira Nature Foods Ltd. | | | 455,000 | | | | 3,617,250 | * | |
Food - Meat Products 5.32% | |
BRF-Brasil Foods S.A., Sponsored ADR | | | 330,000 | | | | 6,966,300 | | |
Smithfield Foods, Inc. | | | 500,000 | | | | 10,785,000 | * | |
Tyson Foods, Inc., Class A | | | 546,000 | | | | 10,592,400 | | |
| | | | 28,343,700 | | |
Forestry 1.94% | |
Prima Colombia Hardwood, Inc. | | | 15,265,832 | | | | 76,894 | * | |
West Fraser Timber Co., Ltd. | | | 145,000 | | | | 10,232,459 | | |
| | | | 10,309,353 | | |
Gold Mining 7.28% | |
Besra Gold, Inc. | | | 295,000 | | | | 62,409 | * | |
Centerra Gold, Inc. | | | 675,000 | | | | 6,330,781 | | |
Chesapeake Gold Corp. | | | 100,875 | | | | 909,516 | * | |
Chesapeake Gold Corp., 144A | | | 52,400 | | | | 472,453 | * | |
Continental Gold Ltd. | | | 164,200 | | | | 1,463,930 | * | |
Corona Minerals Ltd. | | | 50,000 | | | | 1,300 | *@ | |
Gran Colombia Gold Corp. | | | 18,214,353 | | | | 6,605,719 | * | |
Kinross Gold Corp., 144A | | | 1 | | | | 10 | | |
NGEx Resources, Inc. | | | 1,175,900 | | | | 4,027,663 | * | |
Planet Mining Exploration, Inc. | | | 84,800 | | | | 8,970 | * | |
Randgold Resources Ltd., Sponsored ADR | | | 100,000 | | | | 9,925,000 | | |
Rusoro Mining Ltd. | | | 3,119,433 | | | | 141,414 | * | |
Sunridge Gold Corp. | | | 5,000,000 | | | | 1,082,960 | * | |
Yamana Gold, Inc. | | | 450,000 | | | | 7,744,500 | | |
| | | | 38,776,625 | | |
Medical - Hospitals 0.00% | |
African Medical Investments plc | | | 2,507,500 | | | | 10,186 | * | |
See notes to portfolios of investments and notes to financial statements.
97
Portfolio of Investments December 31, 2012
Common Stocks (cont'd) | | Shares | | Value | |
Metal - Copper 4.75% | |
Catalyst Copper Corp. | | | 1,800,000 | | | $ | 99,733 | * | |
Catalyst Copper Corp., 144A | | | 5,000,000 | | | | 277,036 | * | |
First Quantum Minerals Ltd. | | | 455,000 | | | | 10,042,865 | | |
Inmet Mining Corp. | | | 55,000 | | | | 4,100,690 | * | |
Los Andes Copper Ltd. | | | 754,000 | | | | 151,917 | * | |
Southern Copper Corp. | | | 280,000 | | | | 10,600,800 | | |
Verona Development Corp. | | | 708,800 | | | | 0 | *@ | |
| | | | 25,273,041 | | |
Metal - Diversified 0.31% | |
Bell Copper Corp. | | | 2,500,000 | | | | 12,592 | * | |
Concordia Resource Corp. | | | 1,000,000 | | | | 241,777 | * | |
GoviEx Uranium, Inc. (RS) | | | 750,000 | | | | 1,374,150 | *@ | |
Orsu Metals Corp., 144A | | | 147,605 | | | | 14,870 | * | |
| | | | 1,643,389 | | |
Metal - Iron 0.51% | |
Andean Pacific Iron Corp., 144A (RS) | | | 2,600,000 | | | | 2,600,000 | *@ | |
West African Iron Ore Corp., 144A | | | 2,925,000 | | | | 132,600 | * | |
| | | | 2,732,600 | | |
Mining Services 0.32% | |
Bounty Mining Ltd. | | | 22,000,000 | | | | 285,890 | *@ | |
Natasa Mining Ltd. | | | 1,036,350 | | | | 1,422,994 | * | |
| | | | 1,708,884 | | |
Natural Resource Technology 0.01% | |
I-Pulse, Inc. (RS) | | | 15,971 | | | | 50,947 | *@ | |
Non - Ferrous Metals 0.28% | |
Anfield Nickel Corp., 144A | | | 390,000 | | | | 1,453,685 | * | |
Sterling Group Ventures, Inc., 144A | | | 500,000 | | | | 26,250 | * | |
| | | | 1,479,935 | | |
Oil - Field Services 6.64% | |
Hornbeck Offshore Services, Inc. | | | 240,000 | | | | 8,241,600 | * | |
Oil States International, Inc. | | | 155,000 | | | | 11,088,700 | * | |
Pioneer Energy Services Corp. | | | 900,000 | | | | 6,534,000 | * | |
Weatherford International Ltd. | | | 850,000 | | | | 9,511,500 | * | |
| | | | 35,375,800 | | |
See notes to portfolios of investments and notes to financial statements.
98
Portfolio of Investments December 31, 2012
Common Stocks (cont'd) | | Shares | | Value | |
Oil Companies - Exploration & Production 9.36% | |
Africa Oil Corp. | | | 401,000 | | | $ | 2,823,744 | * | |
BNK Petroleum, Inc. | | | 931,300 | | | | 469,098 | * | |
Concho Resources, Inc. | | | 100,000 | | | | 8,056,000 | * | |
Gran Tierra Energy, Inc. | | | 1,245,000 | | | | 6,859,950 | * | |
Horn Petroleum Corp., 144A | | | 2,110,889 | | | | 616,690 | * | |
Ivanhoe Energy, Inc. | | | 414,100 | | | | 296,188 | * | |
Newfield Exploration Co. | | | 145,000 | | | | 3,883,100 | * | |
Pacific Rubiales Energy Corp. | | | 9,288 | | | | 216,235 | | |
Petroamerica Oil Corp. | | | 7,081,000 | | | | 2,496,701 | * | |
Petromanas Energy, Inc. | | | 5,544,000 | | | | 977,384 | * | |
Petrominerales Ltd. | | | 100,000 | | | | 866,368 | * | |
Pioneer Natural Resources Co. | | | 106,600 | | | | 11,362,494 | | |
Range Energy Resources, Inc. | | | 100,000 | | | | 1,763 | *+ | |
Range Energy Resources, Inc., 144A | | | 15,000,000 | | | | 264,444 | *+ | |
Royalite Petroleum Co., Inc. | | | 2,266,333 | | | | 906 | * | |
ShaMaran Petroleum Corp. | | | 6,100,000 | | | | 2,396,615 | * | |
Southwestern Energy Co. | | | 210,000 | | | | 7,016,100 | * | |
U.S. Oil Sands, Inc., 144A | | | 7,777,777 | | | | 1,214,482 | * | |
| | | | 49,818,262 | | |
Oil Companies - Integrated 1.49% | |
Phillips 66 | | | 150,000 | | | | 7,965,000 | | |
Oil Field Machinery & Equipment 2.05% | |
National-Oilwell Varco, Inc. | | | 160,000 | | | | 10,936,000 | | |
Oil Refining & Marketing 4.37% | |
HollyFrontier Corp. | | | 175,000 | | | | 8,146,250 | | |
Marathon Petroleum Corp. | | | 125,000 | | | | 7,875,000 | | |
Valero Energy Corp. | | | 200,000 | | | | 6,824,000 | | |
Value Creation, Inc. (RS) | | | 336,880 | | | | 426,390 | *@ | |
| | | | 23,271,640 | | |
Paper & Related Products 2.02% | |
International Paper Co. | | | 270,000 | | | | 10,756,800 | | |
Pipelines 4.06% | |
Kinder Morgan, Inc. | | | 328,600 | | | | 11,609,438 | | |
The Williams Companies, Inc. | | | 306,000 | | | | 10,018,440 | | |
| | | | 21,627,878 | | |
Platinum 0.00% | |
Osmium Holdings S.A. (RS) | | | 104 | | | | 0 | *@ | |
See notes to portfolios of investments and notes to financial statements.
99
Portfolio of Investments December 31, 2012
Common Stocks (cont'd) | | Shares | | Value | |
Precious Metals 1.17% | |
Fortress Minerals Corp. | | | 170,200 | | | $ | 728,706 | * | |
Tahoe Resources, Inc. | | | 300,000 | | | | 5,496,000 | * | |
| | | | 6,224,706 | | |
Quarrying 1.62% | |
Compass Minerals International, Inc. | | | 50,000 | | | | 3,735,500 | | |
Pacific Stone Tech, Inc. (RS) | | | 22,659 | | | | 4,900,009 | *+@ | |
| | | | 8,635,509 | | |
Real Estate Operating/Development 1.61% | |
Mongolia Growth Group Ltd. | | | 285,000 | | | | 1,105,375 | * | |
Pacific Infrastructure, Inc. (RS) | | | 7,443,544 | | | | 7,443,544 | *@ | |
| | | | 8,548,919 | | |
Silver Mining 0.93% | |
First Majestic Silver Corp. | | | 245,000 | | | | 4,946,550 | * | |
Steel - Producers 1.49% | |
Reliance Steel & Aluminum Co. | | | 128,000 | | | | 7,948,800 | | |
Total Common Stocks | | | 433,048,913 | | |
(cost $466,627,398) | |
Real Estate Investment Trusts (REIT) 3.97% | |
Plum Creek Timber Co., Inc. | | | 245,000 | | | | 10,870,650 | | |
Weyerhaeuser Co. | | | 370,000 | | | | 10,293,400 | | |
Total Real Estate Investment Trusts | | | 21,164,050 | | |
(cost $15,484,327) | |
Exchange-Traded Fund (ETF) 0.94% | |
Sprott Physical Platinum & Palladium Trust | | | 500,000 | | | | 4,995,000 | * | |
(cost $5,000,000) | |
See notes to portfolios of investments and notes to financial statements.
100
Portfolio of Investments December 31, 2012
Warrants 1.30% | | Shares | | Value | |
Diversified Minerals 0.01% | |
Melior Resources, Inc., Warrants (June 2013) | | | 3,803,000 | | | $ | 19,156 | * | |
Niocan, Inc., 144A, Warrants (August 2014) | | | 260,000 | | | | 0 | *@ | |
| | | | 19,156 | | |
Gold Mining 1.09% | |
Dundee Precious Metals, Inc., Warrants (November 2015) | | | 589,325 | | | | 3,443,394 | * | |
Gran Colombia Gold Corp., 144A, Warrants (October 2017) (RS) | | | 2,153,750 | | | | 0 | *@ | |
New Gold, Inc., 144A, Warrants (June 2017) | | | 822,570 | | | | 2,378,256 | * | |
| | | | 5,821,650 | | |
Gold/Mineral Royalty Companies 0.09% | |
Franco-Nevada Corp., Warrants (June 2017) | | | 50,380 | | | | 449,164 | * | |
Medical - Hospitals 0.00% | |
African Medical Investments plc, Warrants (June 2014) | | | 1,162,500 | | | | 0 | *@ | |
Metal - Copper 0.00% | |
Catalyst Copper Corp., 144A, Warrants (February 2017) | | | 2,500,000 | | | | 0 | *@ | |
Metal - Iron 0.01% | |
West African Iron Ore Corp., 144A, Warrants (March 2016) | | | 2,925,000 | | | | 58,933 | * | |
Oil Companies - Exploration & Production 0.10% | |
Horn Petroleum Corp., 144A, Warrants (September 2013) | | | 2,110,889 | | | | 106,326 | * | |
Petroamerica Oil Corp., 144A, Warrants (October 2014) | | | 8,000,000 | | | | 443,258 | * | |
U.S. Oil Sands, Inc., 144A, Warrants (May 2014) | | | 7,777,777 | | | | 0 | *@ | |
| | | | 549,584 | | |
Total Warrants | | | 6,898,487 | | |
(cost $1,347,757) | |
| Master Limited Partnerships 3.98% | | Units | | | |
Pipelines 3.98% | |
Enterprise Products Partners, L.P. | | | 215,000 | | | | 10,767,200 | | |
Western Gas Partners L.P. | | | 219,000 | | | | 10,430,970 | | |
Total Master Limited Partnerships | | | 21,198,170 | | |
(cost $19,798,240) | |
See notes to portfolios of investments and notes to financial statements.
101
Portfolio of Investments December 31, 2012
Convertible Debentures 0.17% | | Principal
Amount | | Value | |
Diversified Minerals 0.03% | |
Niocan, Inc., 144A, 12.00%, maturity 02/28/13 | | CAD | 500,000 | | | $ | 147,635 | @ | |
Mining Services 0.14% | |
Great Western Minerals Group Ltd., 8.00%, maturity 04/06/17 | | $ | 1,000,000 | | | | 742,000 | | |
Total Convertible Debentures | | | 889,635 | | |
(cost $1,510,621) | |
Gold-Linked Note 1.62% | |
Gold Mining 1.62% | |
Gran Colombia Gold Corp., 144A, 10.00%, maturity 10/31/17 (RS) | | | 8,615,000 | | | | 8,615,000 | @ | |
(cost $8,615,000) | |
Silver-Linked Note 1.13% | |
Gold Mining 1.13% | |
Gran Colombia Gold Corp., 5.00%, maturity 08/11/18 | | | 6,711,000 | | | | 6,006,345 | | |
(cost $5,791,599) | |
Corporate Notes 0.65% | |
Electric - Generation 0.56% | |
Pacific Power Generation Corp., 15.00%, maturity 04/03/17 (RS) | | | 3,000,000 | | | | 3,000,000 | @ | |
Transportation - Air Freight 0.09% | |
Aeroservicios Especializados, S.A. de C.V., 22.00%, maturity 02/28/13 (RS) | | | 500,000 | | | | 500,000 | @ | |
Total Corporate Notes | | | 3,500,000 | | |
(cost $3,500,000) | |
Total Securities | | | 506,315,600 | | |
(cost $527,674,942) | |
See notes to portfolios of investments and notes to financial statements.
102
Portfolio of Investments December 31, 2012
Repurchase Agreement 2.14% | | Principal
Amount | | Value | |
Joint Tri-Party Repurchase Agreement, Credit Suisse Securities USA LLC,
12/31/2012, 0.19%, due 01/02/2013, repurchase price $11,390,774,
collateralized by U.S. Treasury securities held in a joint tri-party
account (cost $11,390,654) | | $ | 11,390,654 | | | $ | 11,390,654 | | |
Total Investments 97.23% | | | 517,706,254 | | |
(cost $539,065,596) | |
Other assets and liabilities, net 2.77% | | | 14,741,168 | | |
Net Assets 100% | | $ | 532,447,422 | | |
See notes to portfolios of investments and notes to financial statements.
103
Portfolio of Investments December 31, 2012
World Precious Minerals Fund
Common Stocks 81.74% | | Shares | | Value | |
Agricultural Operations 0.68% | |
Agriterra Ltd. | | | 38,476,200 | | | $ | 2,188,267 | * | |
Coal 1.03% | |
Pacific Coal Resources Ltd. | | | 4,544,822 | | | | 824,125 | * | |
Sable Mining Africa Ltd. | | | 18,251,500 | | | | 2,483,839 | * | |
| | | | 3,307,964 | | |
Diamonds/Precious Stones 0.83% | |
Diamonds North Resources Ltd., 144A | | | 1,046,800 | | | | 15,818 | * | |
Gold Standard Ventures Corp. | | | 880,000 | | | | 1,161,600 | * | |
Lucara Diamond Corp. | | | 1,275,000 | | | | 847,731 | * | |
Northern Superior Resources, Inc., Class A | | | 1,510,900 | | | | 152,209 | * | |
Olivut Resources Ltd. | | | 645,000 | | | | 448,345 | * | |
Rockwell Diamonds, Inc., 144A | | | 171,667 | | | | 32,858 | * | |
| | | | 2,658,561 | | |
Diversified Minerals 2.62% | |
African Potash Ltd. | | | 3,000,000 | | | | 146,246 | * | |
Aldridge Minerals, Inc. | | | 2,034,500 | | | | 1,250,234 | * | |
Amarc Resources Ltd. | | | 695,545 | | | | 98,097 | * | |
Calibre Mining Corp. | | | 3,600,000 | | | | 652,798 | * | |
Elissa Resources Ltd., 144A | | | 36,250 | | | | 1,461 | * | |
Global Minerals Ltd. | | | 450,000 | | | | 181,333 | * | |
Golden Alliance Resources Corp. | | | 235,000 | | | | 5,919 | * | |
Indochine Mining Ltd. | | | 7,785,500 | | | | 971,257 | * | |
Moss Lake Gold Mines Ltd. | | | 3,345,000 | | | | 438,070 | *+ | |
North American Tungsten Corp. | | | 950,000 | | | | 143,555 | * | |
Rochester Resources Ltd. | | | 7,000,000 | | | | 317,332 | *+ | |
Rubicon Minerals Corp. | | | 750,000 | | | | 1,926,661 | * | |
Sirocco Mining, Inc. | | | 2,750,000 | | | | 2,022,364 | * | |
Wallbridge Mining Co., Ltd. | | | 1,541,000 | | | | 217,337 | * | |
| | | | 8,372,664 | | |
Finance - Investment Banker/Broker 0.25% | |
Aberdeen International, Inc. | | | 2,396,000 | | | | 784,466 | * | |
Gold Mining 55.34% | |
Agnico-Eagle Mines Ltd. | | | 350,000 | | | | 18,361,000 | | |
Alamos Gold, Inc. | | | 450,000 | | | | 7,910,643 | | |
Almaden Minerals Ltd. | | | 580,000 | | | | 1,858,057 | * | |
Atna Resources Ltd. | | | 3,345,500 | | | | 3,673,596 | * | |
B2Gold Corp. | | | 600,000 | | | | 2,151,816 | * | |
Barrick Gold Corp. | | | 50,000 | | | | 1,750,500 | | |
Belo Sun Mining Corp. | | | 1,000,000 | | | | 1,631,995 | * | |
See notes to portfolios of investments and notes to financial statements.
104
Portfolio of Investments December 31, 2012
World Precious Minerals Fund
Common Stocks (cont'd) | | Shares | | Value | |
Gold Mining (cont'd) | |
Besra Gold, Inc. | | | 605,390 | | | $ | 128,073 | * | |
Brazilian Gold Corp. | | | 500,000 | | | | 100,740 | * | |
Canyon Resources Ltd. | | | 826,316 | | | | 158,922 | * | |
Caza Gold Corp. | | | 1,200,000 | | | | 96,711 | * | |
CB Gold, Inc. | | | 1,115,000 | | | | 954,767 | * | |
Centerra Gold, Inc. | | | 390,000 | | | | 3,657,785 | | |
Chalice Gold Mines Ltd. | | | 3,900,000 | | | | 770,343 | * | |
Chesapeake Gold Corp. | | | 405,000 | | | | 3,651,589 | * | |
Chesapeake Gold Corp., 144A | | | 192,199 | | | | 1,732,918 | * | |
Choice Gold Corp. | | | 975,000 | | | | 12,278 | * | |
Choice Gold Corp., 144A | | | 870,000 | | | | 10,955 | * | |
Claude Resources, Inc. | | | 810,500 | | | | 449,076 | * | |
Colossus Minerals, Inc. | | | 525,000 | | | | 2,438,170 | * | |
Comstock Mining, Inc. | | | 1,025,000 | | | | 2,337,000 | * | |
Continental Gold Ltd. | | | 640,000 | | | | 5,705,939 | * | |
Corona Minerals Ltd. | | | 812,500 | | | | 21,117 | *@ | |
Coventry Resources Ltd. | | | 7,000,000 | | | | 800,492 | * | |
Doray Minerals Ltd. | | | 1,200,000 | | | | 954,353 | * | |
Dundee Precious Metals, Inc. | | | 873,000 | | | | 7,449,061 | * | |
Eastmain Resources, Inc. | | | 839,000 | | | | 633,909 | * | |
Eldorado Gold Corp. | | | 330,000 | | | | 4,250,400 | | |
Entree Gold, Inc. | | | 1,500,000 | | | | 679,998 | * | |
Golden Arrow Resources Corp. | | | 2,155,000 | | | | 607,868 | *+ | |
Golden Predator Corp. | | | 2,985,700 | | | | 1,037,693 | * | |
Golden Star Resources Ltd. | | | 550,000 | | | | 1,012,000 | * | |
Gran Colombia Gold Corp. | | | 25,385,838 | | | | 9,206,570 | *+ | |
Guyana Goldfields, Inc. | | | 300,000 | | | | 945,953 | * | |
Harmony Gold Mining Co., Ltd., Sponsored ADR | | | 600,000 | | | | 5,376,000 | | |
Kilo Goldmines Ltd. | | | 2,510,000 | | | | 303,430 | * | |
Kimber Resources, Inc. | | | 1,500,000 | | | | 570,000 | * | |
Kinross Gold Corp. | | | 115,000 | | | | 1,117,800 | | |
Klondex Mines Ltd. | | | 4,488,200 | | | | 5,651,791 | *+ | |
Lexam VG Gold, Inc. | | | 2,370,000 | | | | 429,759 | * | |
Lexam VG Gold, Inc., 144A | | | 2,406,501 | | | | 436,378 | * | |
Malbex Resources, Inc. | | | 450,000 | | | | 45,333 | * | |
Malbex Resources, Inc., 144A | | | 1,333,333 | | | | 134,321 | * | |
Mammoth Resources Corp. | | | 702,700 | | | | 67,251 | * | |
Midway Gold Corp. | | | 571,863 | | | | 794,890 | * | |
Mirasol Resources Ltd. | | | 2,210,000 | | | | 5,454,591 | *+ | |
NGEx Resources, Inc. | | | 2,468,900 | | | | 8,456,415 | * | |
OceanaGold Corp. | | | 600,000 | | | | 1,722,662 | * | |
Pacific Rim Mining Corp., 144A | | | 133,500 | | | | 10,759 | * | |
Papillon Resources Ltd. | | | 2,000,000 | | | | 3,586,619 | * | |
Petaquilla Minerals Ltd., 144A | | | 2,660,000 | | | | 1,232,660 | * | |
Pilot Gold, Inc. | | | 1,513,800 | | | | 3,248,269 | * | |
Planet Mining Exploration, Inc. | | | 1,016,200 | | | | 107,491 | * | |
See notes to portfolios of investments and notes to financial statements.
105
Portfolio of Investments December 31, 2012
World Precious Minerals Fund
Common Stocks (cont'd) | | Shares | | Value | |
Gold Mining (cont'd) | |
PMI Gold Corp. | | | 5,000,000 | | | $ | 4,029,618 | * | |
Polyus Gold International Ltd. | | | 373,500 | | | | 1,242,666 | * | |
Premier Gold Mines Ltd. | | | 700,000 | | | | 2,961,769 | * | |
Pretium Resources, Inc. | | | 225,000 | | | | 2,971,591 | * | |
Radius Gold, Inc. | | | 2,040,000 | | | | 441,848 | * | |
Radius Gold, Inc., 144A | | | 125,000 | | | | 27,074 | * | |
Redstar Gold Corp. | | | 1,500,000 | | | | 241,777 | * | |
Renaissance Gold, Inc. | | | 550,000 | | | | 310,281 | * | |
Reunion Gold Corp. | | | 1,760,500 | | | | 603,002 | * | |
Revolution Resources Corp., 144A | | | 570,000 | | | | 60,293 | * | |
Richmont Mines, Inc. | | | 210,000 | | | | 632,100 | * | |
Rio Alto Mining Ltd. | | | 751,000 | | | | 3,850,894 | * | |
Riverstone Resources, Inc. | | | 1,200,000 | | | | 737,420 | * | |
Romarco Minerals, Inc. | | | 1,000,000 | | | | 775,701 | * | |
Rusoro Mining Ltd. | | | 6,325,900 | | | | 286,773 | * | |
Rye Patch Gold Corp. | | | 4,045,000 | | | | 1,609,606 | * | |
Rye Patch Gold Corp., 144A | | | 1,800,000 | | | | 716,264 | * | |
Seafield Resources Ltd., 144A | | | 1,300,000 | | | | 170,251 | * | |
SEMAFO, Inc. | | | 150,000 | | | | 516,798 | * | |
Silver Lake Resources Ltd. | | | 500,000 | | | | 1,725,736 | * | |
Solvista Gold Corp., 144A | | | 2,620,000 | | | | 1,636,428 | * | |
St Barbara Ltd. | | | 1,500,000 | | | | 2,253,332 | * | |
Sunridge Gold Corp. | | | 3,300,227 | | | | 714,803 | * | |
Taurus Gold Ltd., 144A (RS) | | | 2,367,876 | | | | 1,775,907 | *@ | |
Timmins Gold Corp. | | | 515,000 | | | | 1,551,252 | * | |
Tolima Gold, Inc. | | | 60,000 | | | | 9,369 | * | |
Tolima Gold, Inc., 144A | | | 4,100,000 | | | | 640,205 | * | |
Torex Gold Resources, Inc. | | | 1,250,000 | | | | 2,770,362 | * | |
TriStar Gold, Inc. | | | 1,392,000 | | | | 532,877 | * | |
Veris Gold Corp. | | | 300,000 | | | | 528,887 | * | |
Virginia Mines, Inc. | | | 828,400 | | | | 8,412,101 | * | |
West Kirkland Mining, Inc. | | | 1,500,000 | | | | 332,443 | * | |
Yamana Gold, Inc. | | | 350,000 | | | | 6,023,500 | | |
| | | | 176,981,634 | | |
Gold/Mineral Royalty Companies 0.95% | |
Franco-Nevada Corp. | | | 53,300 | | | | 3,047,161 | | |
Investment Companies 0.00% | |
Invictus Financial, Inc. | | | 49,800 | | | | 5,017 | * | |
Medical - Hospitals 0.01% | |
African Medical Investments plc | | | 4,637,500 | | | | 18,839 | * | |
See notes to portfolios of investments and notes to financial statements.
106
Portfolio of Investments December 31, 2012
World Precious Minerals Fund
Common Stocks (cont'd) | | Shares | | Value | |
Metal - Copper 0.37% | |
Catalyst Copper Corp. | | | 1,564,000 | | | $ | 86,657 | * | |
Catalyst Copper Corp., 144A | | | 2,000,000 | | | | 110,814 | * | |
Lumina Copper Corp. | | | 30,000 | | | | 284,995 | * | |
Revett Minerals, Inc. | | | 250,000 | | | | 702,665 | * | |
Verona Development Corp. | | | 48,500 | | | | 0 | *@ | |
| | | | 1,185,131 | | |
Metal - Diversified 5.53% | |
Balmoral Resources Ltd. | | | 1,150,000 | | | | 1,251,196 | * | |
Bell Copper Corp. | | | 2,000,000 | | | | 10,074 | * | |
Cerro Resources NL | | | 16,658,000 | | | | 2,255,170 | * | |
Cerro Resources NL, 144A | | | 2,600,000 | | | | 366,695 | * | |
Dalradian Resources, Inc. | | | 1,690,000 | | | | 2,604,846 | * | |
First Point Minerals Corp. | | | 2,400,000 | | | | 1,402,307 | * | |
Imperial Metals Corp. | | | 255,000 | | | | 3,108,346 | * | |
Ivanplats Ltd., Class A | | | 100,000 | | | | 503,702 | * | |
Mandalay Resources Corp. | | | 2,500,000 | | | | 2,896,288 | | |
Mariana Resources Ltd. | | | 4,235,000 | | | | 301,073 | * | |
Novo Resources Corp. | | | 1,080,000 | | | | 815,998 | * | |
Orsu Metals Corp. | | | 289,800 | | | | 29,194 | * | |
Orsu Metals Corp., 144A | | | 1,800,000 | | | | 181,333 | * | |
Ridge Resources Ltd. | | | 1,866,308 | | | | 388,043 | *@ | |
Robust Resources Ltd. | | | 600,000 | | | | 218,316 | * | |
Silver Bull Resources, Inc. | | | 1,054,400 | | | | 453,392 | * | |
Temex Resources Corp. | | | 950,000 | | | | 253,614 | * | |
Tigray Resources, Inc. | | | 275,000 | | | | 55,407 | * | |
Trevali Mining Corp. | | | 550,000 | | | | 592,857 | * | |
| | | | 17,687,851 | | |
Mining Services 1.16% | |
Argent Minerals Ltd. | | | 5,625,000 | | | | 339,169 | * | |
Energold Drilling Corp. | | | 410,000 | | | | 1,239,108 | * | |
Geodrill Ltd. | | | 330,000 | | | | 359,039 | * | |
Natasa Mining Ltd. | | | 1,300,849 | | | | 1,786,173 | * | |
| | | | 3,723,489 | | |
Oil Companies - Exploration & Production 0.00% | |
Big Sky Energy Corp. | | | 2,000,000 | | | | 0 | *@ | |
Platinum 0.60% | |
Osmium Holdings S.A. (RS) | | | 891 | | | | 0 | *@ | |
Pacific North West Capital Corp., 144A | | | 1,291,666 | | | | 65,061 | * | |
Platinum Group Metals Ltd. | | | 2,265,000 | | | | 1,848,235 | * | |
| | | | 1,913,296 | | |
See notes to portfolios of investments and notes to financial statements.
107
Portfolio of Investments December 31, 2012
World Precious Minerals Fund
Common Stocks (cont'd) | | Shares | | Value | |
Precious Metals 5.14% | |
Candente Gold Corp. | | | 765,000 | | | $ | 92,480 | *+ | |
Candente Gold Corp., 144A | | | 4,875,000 | | | | 589,331 | *+ | |
Coeur d'Alene Mines Corp. | | | 241,700 | | | | 5,945,820 | * | |
Fortress Minerals Corp. | | | 203,900 | | | | 872,991 | * | |
Fortress Minerals Corp., 144A | | | 70,000 | | | | 299,703 | * | |
Pan African Resources plc | | | 8,000,000 | | | | 2,289,783 | * | |
Polymetal International plc | | | 65,100 | | | | 1,242,965 | | |
Roxgold, Inc. | | | 1,500,000 | | | | 1,072,886 | * | |
Sabina Gold & Silver Corp. | | | 899,400 | | | | 2,401,058 | * | |
Solitario Exploration & Royalty Corp. | | | 966,200 | | | | 1,623,216 | * | |
| | | | 16,430,233 | | |
Silver Mining 7.23% | |
First Majestic Silver Corp. | | | 160,000 | | | | 3,230,400 | * | |
MAG Silver Corp. | | | 760,000 | | | | 7,786,430 | * | |
Pan American Silver Corp. | | | 50,000 | | | | 936,500 | | |
SantaCruz Silver Mining Ltd. | | | 184,700 | | | | 405,628 | * | |
Silver Wheaton Corp. | | | 275,000 | | | | 9,922,000 | | |
SilverCrest Mines, Inc. | | | 325,000 | | | | 831,612 | * | |
| | | | 23,112,570 | | |
Total Common Stocks | | | 261,417,143 | | |
(cost $349,889,409) | |
Exchange-Traded Funds (ETF) 1.96% | |
Market Vectors Gold Miners ETF | | | 20 | | | | 928 | * | |
Market Vectors Junior Gold Miners ETF | | | 35 | | | | 693 | * | |
SPDR Gold Trust | | | 32,500 | | | | 5,265,325 | * | |
Sprott Physical Platinum & Palladium Trust | | | 100,000 | | | | 999,000 | * | |
Total Exchange-Traded Funds | | | 6,265,946 | | |
(cost $6,254,877) | |
Warrants 4.42% | |
Gold Mining 4.05% | |
Choice Gold Corp., 144A, Warrants (December 2013) | | | 870,000 | | | | 0 | *@ | |
Crystallex International Corp., 144A, Warrants (December 2049) | | | 162,500 | | | | 0 | *@ | |
Dundee Precious Metals, Inc., Warrants (November 2015) | | | 1,217,075 | | | | 7,111,303 | * | |
Endeavour Mining Corp., Warrants (February 2014) | | | 1,030,000 | | | | 352,793 | * | |
Gran Colombia Gold Corp., 144A, Warrants (October 2017) (RS) | | | 1,461,250 | | | | 0 | *@ | |
Kinross Gold Corp., Warrants (September 2013) | | | 788,411 | | | | 9,928 | * | |
Kinross Gold Corp., Warrants (September 2014) | | | 250,000 | | | | 74,296 | * | |
See notes to portfolios of investments and notes to financial statements.
108
Portfolio of Investments December 31, 2012
World Precious Minerals Fund
Warrants (cont'd) | | Shares | | Value | |
Gold Mining (cont'd) | |
New Gold, Inc., Warrants (June 2017) | | | 1,028,600 | | | $ | 2,973,941 | * | |
New Gold, Inc., 144A, Warrants (June 2017) | | | 352,530 | | | | 1,019,253 | * | |
Petaquilla Minerals Ltd., 144A, Warrants (January 2014) | | | 2,660,000 | | | | 0 | *@ | |
Solvista Gold Corp., 144A, Warrants (April 2013) | | | 1,310,000 | | | | 0 | *@ | |
Tolima Gold, Inc., 144A, Warrants (December 2013) | | | 2,050,000 | | | | 0 | *@ | |
Torex Gold Resources, Inc., Warrants (October 2013) | | | 4,686,500 | | | | 1,321,936 | * | |
Veris Gold Corp., Warrants (December 2016) | | | 144,000 | | | | 94,293 | * | |
| | | | 12,957,743 | | |
Gold/Mineral Royalty Companies 0.37% | |
Franco-Nevada Corp., Warrants (July 2013) | | | 60,000 | | | | 23,271 | * | |
Franco-Nevada Corp., 144A, Warrants (July 2013) | | | 125,000 | | | | 48,482 | * | |
Franco-Nevada Corp., Warrants (June 2017) | | | 125,000 | | | | 1,114,441 | * | |
| | | | 1,186,194 | | |
Medical - Hospitals 0.00% | |
African Medical Investments plc, Warrants (June 2014) | | | 2,125,000 | | | | 0 | *@ | |
Metal - Copper 0.00% | |
Catalyst Copper Corp., 144A, Warrants (February 2017) | | | 1,000,000 | | | | 0 | *@ | |
Metal - Diversified 0.00% | |
Rackla Metals, Inc., Warrants (June 2013) | | | 673,333 | | | | 3,391 | * | |
Rackla Metals, Inc., 144A, Warrants (June 2013) | | | 41,666 | | | | 210 | * | |
Ridge Resources Ltd., Warrants (June 2014) | | | 2,799,462 | | | | 0 | *@ | |
| | | | 3,601 | | |
Total Warrants | | | 14,147,538 | | |
(cost $8,537,787) | |
Special Warrants 0.10% | |
Finance - Investment Banker/Broker 0.10% | |
Difference Capital Funding, Inc., 144A, Special Warrants
(October 2014) (RS) | | | 1,000,000 | | | | 325,391 | *@ | |
Gold/Mineral Exploration & Development 0.00% | |
Western Exploration & Development Ltd., 144A, Special Warrants
(December 2049) (RS) | | | 600,000 | | | | 0 | *@ | |
Total Special Warrants | | | 325,391 | | |
(cost $650,333) | |
See notes to portfolios of investments and notes to financial statements.
109
Portfolio of Investments December 31, 2012
World Precious Minerals Fund
Rights 0.03% | | Shares | | Value | |
Precious Metals 0.03% | |
Pan African Resources plc (January 2013) | | | 2,040,000 | | | $ | 91,686 | * | |
(cost $0) | |
Purchased Call Options 1.27% | | Contracts | | | |
Exchange-Traded Funds 0.06% | |
Market Vectors Gold Miners ETF, Strike Price 48, Expiration Jan. 2013 | | | 1,965 | | | | 100,215 | | |
Market Vectors Gold Miners ETF, Strike Price 52, Expiration Jan. 2013 | | | 3,977 | | | | 15,908 | | |
Market Vectors Junior Gold Miners ETF, Strike Price 22.63,
Expiration Jan. 2013 | | | 2,925 | | | | 20,475 | | |
Market Vectors Junior Gold Miners ETF, Strike Price 25.63,
Expiration Jan. 2013 | | | 8,921 | | | | 44,605 | | |
| | | | 181,203 | | |
Gold Mining 1.11% | |
Agnico-Eagle Mines Ltd., Strike Price 47.50, Expiration Jan. 2013 | | | 2,355 | | | | 1,283,475 | | |
Agnico-Eagle Mines Ltd., Strike Price 55, Expiration Jan. 2013 | | | 1,287 | | | | 79,794 | | |
AngloGold Ashanti Ltd., Strike Price 35, Expiration Jan. 2013 | | | 1,037 | | | | 7,778 | | |
AuRico Gold, Inc., Strike Price 8, Expiration Mar. 2013 | | | 2,998 | | | | 242,838 | | |
Barrick Gold Corp., Strike Price 40, Expiration Jan. 2013 | | | 6,188 | | | | 37,128 | | |
Barrick Gold Corp., Strike Price 50, Expiration Jan. 2013 | | | 3,789 | | | | 7,578 | | |
Gold Fields Ltd., Strike Price 12.50, Expiration Jan. 2013 | | | 4,860 | | | | 170,100 | | |
Gold Fields Ltd., Strike Price 20, Expiration Jan. 2013 | | | 78 | | | | 39 | | |
Goldcorp, Inc., Strike Price 41, Expiration Jan. 2013 | | | 1,393 | | | | 11,144 | | |
Goldcorp, Inc., Strike Price 45, Expiration Jan. 2013 | | | 1,000 | | | | 4,000 | | |
Goldcorp, Inc., Strike Price 65, Expiration Jan. 2013 | | | 4,003 | | | | 2,001 | | |
Goldcorp, Inc., Strike Price 65, Expiration Jan. 2014 | | | 1,460 | | | | 63,510 | | |
Harmony Gold Mining Co., Ltd., Strike Price 9, Expiration Jan. 2013 | | | 6,130 | | | | 183,900 | | |
IAMGOLD Corp., Strike Price 12.50, Expiration Jan. 2013 | | | 5,522 | | | | 55,220 | | |
IAMGOLD Corp., Strike Price 15, Expiration Jan. 2013 | | | 233 | | | | 582 | | |
IAMGOLD Corp., Strike Price 17.50, Expiration Jan. 2013 | | | 2,688 | | | | 6,720 | | |
Kinross Gold Corp., Strike Price 10, Expiration Jan. 2013 | | | 5,342 | | | | 117,524 | | |
Kinross Gold Corp., Strike Price 12, Expiration Jan. 2014 | | | 1,901 | | | | 157,783 | | |
Newmont Mining Corp., Strike Price 52.50, Expiration Jan. 2013 | | | 5,753 | | | | 57,530 | | |
Newmont Mining Corp., Strike Price 60, Expiration Jan. 2013 | | | 2,003 | | | | 2,003 | | |
Randgold Resources Ltd., Strike Price 77.50, Expiration Jan. 2013 | | | 497 | | | | 1,033,760 | | |
Randgold Resources Ltd., Strike Price 125, Expiration Jan. 2013 | | | 1,409 | | | | 7,045 | | |
Yamana Gold, Inc., Strike Price 21, Expiration Jan. 2013 | | | 6,790 | | | | 20,370 | | |
| | | | 3,551,822 | | |
Precious Metals 0.04% | |
Coeur d'Alene Mines Corp., Strike Price 26, Expiration Jan. 2013 | | | 2,901 | | | | 130,545 | | |
See notes to portfolios of investments and notes to financial statements.
110
Portfolio of Investments December 31, 2012
World Precious Minerals Fund
Purchased Call Options (cont'd) | | Contracts | | Value | |
Silver Mining 0.06% | |
Golden Minerals Co., Strike Price 5, Expiration Jan. 2013 | | | 3,140 | | | $ | 31,400 | | |
Pan American Silver Corp., Strike Price 30, Expiration Jan. 2013 | | | 230 | | | | 575 | | |
Silver Standard Resources, Inc., Strike Price 15, Expiration Jan. 2013 | | | 2,076 | | | | 134,940 | | |
Silver Wheaton Corp., Strike Price 38, Expiration Jan. 2013 | | | 1,008 | | | | 43,344 | | |
| | | | 210,259 | | |
Total Purchased Call Options | | | 4,073,829 | | |
(cost $12,733,661) | |
Convertible Debenture 0.38% | | Principal
Amount | | | |
Metal - Iron 0.38% | |
Andean Pacific Iron Corp., 1.00%, maturity 06/07/13 (RS) | | $ | 1,200,000 | | | | 1,200,000 | @ | |
(cost $1,200,000) | |
Gold-Linked Note 1.83% | |
Gold Mining 1.83% | |
Gran Colombia Gold Corp., 144A, 10.00%, maturity 10/31/17 (RS) | | | 5,845,000 | | | | 5,845,000 | @ | |
(cost $5,845,000) | |
Silver-Linked Note 2.39% | |
Gold Mining 2.39% | |
Gran Colombia Gold Corp., 5.00%, maturity 08/11/18 | | | 8,550,000 | | | | 7,652,250 | | |
(cost $8,494,787) | |
Corporate Note 0.25% | |
Electric - Generation 0.25% | |
Pacific Power Generation Corp., 15.00%, maturity 04/03/17 (RS) | | | 800,000 | | | | 800,000 | @ | |
(cost $800,000) | |
Total Securities | | | 301,818,783 | | |
(cost $394,405,854) | |
See notes to portfolios of investments and notes to financial statements.
111
Portfolio of Investments December 31, 2012
World Precious Minerals Fund
Repurchase Agreement 4.29% | | Principal
Amount | | Value | |
Joint Tri-Party Repurchase Agreement, Credit Suisse Securities USA LLC,
12/31/2012, 0.19%, due 01/02/2013, repurchase price $13,712,683,
collateralized by U.S. Treasury securities held in a joint tri-party
account (cost $13,712,538) | | $ | 13,712,538 | | | $ | 13,712,538 | | |
Total Investments 98.66% | | | 315,531,321 | | |
(cost $408,118,392) | |
Other assets and liabilities, net 1.34% | | | 4,289,304 | | |
Net Assets 100% | | $ | 319,820,625 | | |
See notes to portfolios of investments and notes to financial statements.
112
Portfolio of Investments December 31, 2012
Gold and Precious Metals Fund
Common Stocks 65.51% | | Shares | | Value | |
Commercial Banks - Non US 0.51% | |
Sprott Resource Lending Corp. | | | 550,000 | | | $ | 853,272 | | |
Gold Mining 45.79% | |
Agnico-Eagle Mines Ltd. | | | 150,000 | | | | 7,869,000 | | |
Alacer Gold Corp. | | | 234,500 | | | | 1,228,429 | * | |
Alamos Gold, Inc. | | | 260,000 | | | | 4,570,594 | | |
Atna Resources Ltd. | | | 1,455,000 | | | | 1,597,693 | * | |
B2Gold Corp. | | | 525,000 | | | | 1,882,839 | * | |
Barrick Gold Corp. | | | 50,000 | | | | 1,750,500 | | |
Centerra Gold, Inc. | | | 420,000 | | | | 3,939,153 | | |
Cia de Minas Buenaventura S.A., Sponsored ADR | | | 40,000 | | | | 1,438,000 | | |
Claude Resources, Inc. | | | 549,500 | | | | 304,463 | * | |
Comstock Mining, Inc. | | | 525,000 | | | | 1,197,000 | * | |
DRDGOLD Ltd., Sponsored ADR | | | 110,000 | | | | 886,600 | | |
Dundee Precious Metals, Inc. | | | 434,500 | | | | 3,707,465 | * | |
Eldorado Gold Corp. | | | 200,000 | | | | 2,576,000 | | |
Goldcorp, Inc. | | | 9,000 | | | | 330,300 | | |
Golden Star Resources Ltd. | | | 275,000 | | | | 506,000 | * | |
Gran Colombia Gold Corp. | | | 9,779,658 | | | | 3,546,745 | * | |
Harmony Gold Mining Co., Ltd., Sponsored ADR | | | 450,000 | | | | 4,032,000 | | |
Kinross Gold Corp. | | | 275,000 | | | | 2,673,000 | | |
McEwen Mining, Inc. | | | 300,000 | | | | 1,149,000 | * | |
Nevsun Resources Ltd. | | | 375,000 | | | | 1,605,000 | | |
New Gold, Inc. | | | 200,000 | | | | 2,206,000 | * | |
Newcrest Mining Ltd. | | | 30,000 | | | | 691,750 | | |
Newcrest Mining Ltd., Sponsored ADR | | | 25,000 | | | | 590,250 | | |
OceanaGold Corp. | | | 550,000 | | | | 1,579,106 | * | |
Orezone Gold Corp. | | | 240,200 | | | | 411,364 | * | |
Polyus Gold International Ltd. | | | 270,000 | | | | 898,313 | * | |
Richmont Mines, Inc. | | | 50,000 | | | | 150,500 | * | |
Rio Alto Mining Ltd. | | | 600,000 | | | | 3,076,613 | * | |
Royal Gold, Inc. | | | 40,000 | | | | 3,252,400 | | |
Sandstorm Gold Ltd. | | | 410,000 | | | | 4,832,519 | * | |
SEMAFO, Inc. | | | 100,000 | | | | 344,532 | * | |
Silver Lake Resources Ltd. | | | 1,000,000 | | | | 3,451,471 | * | |
St Barbara Ltd. | | | 500,000 | | | | 751,111 | * | |
Timmins Gold Corp. | | | 225,000 | | | | 677,731 | * | |
Veris Gold Corp. | | | 300,000 | | | | 528,887 | * | |
Yamana Gold, Inc. | | | 350,000 | | | | 6,023,500 | | |
| | | | 76,255,828 | | |
Gold/Mineral Royalty Companies 3.09% | |
Franco-Nevada Corp. | | | 90,000 | | | | 5,145,300 | | |
See notes to portfolios of investments and notes to financial statements.
113
Portfolio of Investments December 31, 2012
Gold and Precious Metals Fund
Common Stocks (cont'd) | | Shares | | Value | |
Medical - Hospitals 0.01% | |
African Medical Investments plc | | | 2,000,000 | | | $ | 8,125 | * | |
Metal - Diversified 1.75% | |
Imperial Metals Corp. | | | 96,400 | | | | 1,175,077 | * | |
Mandalay Resources Corp. | | | 1,500,000 | | | | 1,737,772 | | |
| | | | 2,912,849 | | |
Mining Services 0.30% | |
Major Drilling Group International, Inc. | | | 50,000 | | | | 493,628 | * | |
Oil Companies - Exploration & Production 2.08% | |
Anadarko Petroleum Corp. | | | 10,000 | | | | 743,100 | | |
Devon Energy Corp. | | | 12,500 | | | | 650,500 | | |
QEP Resources, Inc. | | | 25,000 | | | | 756,750 | | |
SM Energy Co. | | | 25,000 | | | | 1,305,250 | | |
| | | | 3,455,600 | | |
Precious Metals 3.03% | |
Coeur d'Alene Mines Corp. | | | 107,271 | | | | 2,638,867 | * | |
Pan African Resources plc | | | 4,000,000 | | | | 1,144,891 | * | |
Polymetal International plc | | | 66,400 | | | | 1,267,786 | | |
| | | | 5,051,544 | | |
Silver Mining 8.95% | |
First Majestic Silver Corp. | | | 130,000 | | | | 2,624,700 | * | |
Pan American Silver Corp. | | | 250,000 | | | | 4,682,500 | | |
Silver Wheaton Corp. | | | 200,000 | | | | 7,216,000 | | |
SilverCrest Mines, Inc. | | | 150,000 | | | | 383,821 | * | |
| | | | 14,907,021 | | |
Total Common Stocks | | | 109,083,167 | | |
(cost $118,306,465) | |
Exchange-Traded Funds (ETF) 4.94% | |
ETFS Palladium Trust | | | 3,000 | | | | 207,660 | * | |
ETFS Platinum Trust | | | 10,000 | | | | 1,513,600 | * | |
Market Vectors Gold Miners ETF | | | 20 | | | | 928 | * | |
Market Vectors Junior Gold Miners ETF | | | 35 | | | | 693 | * | |
SPDR Gold Trust | | | 27,500 | | | | 4,455,275 | * | |
See notes to portfolios of investments and notes to financial statements.
114
Portfolio of Investments December 31, 2012
Gold and Precious Metals Fund
Exchange-Traded Funds (ETF) (cont'd) | | Shares | | Value | |
Sprott Physical Platinum & Palladium Trust | | | 85,000 | | | $ | 849,150 | * | |
Sprott Physical Silver Trust | | | 100,000 | | | | 1,204,000 | * | |
Total Exchange-Traded Funds | | | 8,231,306 | | |
(cost $8,480,177) | |
Warrants 5.77% | |
Gold Mining 5.37% | |
Crystallex International Corp., 144A, Warrants (December 2049) | | | 62,500 | | | | 0 | *@ | |
Dundee Precious Metals, Inc., Warrants (November 2015) | | | 1,322,040 | | | | 7,724,608 | * | |
Endeavour Mining Corp., Warrants (February 2014) | | | 382,500 | | | | 131,013 | * | |
Gran Colombia Gold Corp., 144A, Warrants (October 2017) (RS) | | | 735,000 | | | | 0 | *@ | |
Kinross Gold Corp., Warrants (September 2013) | | | 662,394 | | | | 8,341 | * | |
Kinross Gold Corp., Warrants (September 2014) | | | 130,000 | | | | 38,634 | * | |
New Gold, Inc., Warrants (June 2017) | | | 321,000 | | | | 928,091 | * | |
Veris Gold Corp., Warrants (December 2016) | | | 161,000 | | | | 105,425 | * | |
| | | | 8,936,112 | | |
Gold/Mineral Royalty Companies 0.40% | |
Franco-Nevada Corp., 144A, Warrants (July 2013) | | | 125,000 | | | | 48,482 | * | |
Franco-Nevada Corp., Warrants (June 2017) | | | 70,000 | | | | 624,087 | * | |
| | | | 672,569 | | |
Medical - Hospitals 0.00% | |
African Medical Investments plc, Warrants (June 2014) | | | 912,500 | | | | 0 | *@ | |
Total Warrants | | | 9,608,681 | | |
(cost $5,328,900) | |
Rights 0.03% | |
Precious Metals 0.03% | |
Pan African Resources plc (January 2013) | | | 1,020,000 | | | | 45,843 | * | |
(cost $0) | |
Purchased Call Options 1.14% | | Contracts | | | |
Exchange-Traded Funds 0.09% | |
Market Vectors Gold Miners ETF, Strike Price 48, Expiration Jan. 2013 | | | 1,965 | | | | 100,215 | | |
Market Vectors Gold Miners ETF, Strike Price 52, Expiration Jan. 2013 | | | 1,988 | | | | 7,952 | | |
See notes to portfolios of investments and notes to financial statements.
115
Portfolio of Investments December 31, 2012
Gold and Precious Metals Fund
Purchased Call Options (cont'd) | | Contracts | | Value | |
Exchange-Traded Funds (cont'd) | |
Market Vectors Junior Gold Miners ETF, Strike Price 22.63,
Expiration Jan. 2013 | | | 2,975 | | | $ | 20,825 | | |
Market Vectors Junior Gold Miners ETF, Strike Price 25.63,
Expiration Jan. 2013 | | | 4,949 | | | | 24,745 | | |
| | | | 153,737 | | |
Gold Mining 0.94% | |
Agnico-Eagle Mines Ltd., Strike Price 47.50, Expiration Jan. 2013 | | | 785 | | | | 427,825 | | |
Agnico-Eagle Mines Ltd., Strike Price 55, Expiration Jan. 2013 | | | 643 | | | | 39,866 | | |
AngloGold Ashanti Ltd., Strike Price 35, Expiration Jan. 2013 | | | 458 | | | | 3,435 | | |
AngloGold Ashanti Ltd., Strike Price 50, Expiration Jan. 2013 | | | 2,044 | | | | 5,110 | | |
AuRico Gold, Inc., Strike Price 8, Expiration Mar. 2013 | | | 1,377 | | | | 111,537 | | |
Barrick Gold Corp., Strike Price 40, Expiration Jan. 2013 | | | 3,342 | | | | 20,052 | | |
Barrick Gold Corp., Strike Price 50, Expiration Jan. 2013 | | | 621 | | | | 1,242 | | |
Gold Fields Ltd., Strike Price 12.50, Expiration Jan. 2013 | | | 1,945 | | | | 68,075 | | |
Gold Fields Ltd., Strike Price 20, Expiration Jan. 2013 | | | 2,862 | | | | 1,431 | | |
Goldcorp, Inc., Strike Price 41, Expiration Jan. 2013 | | | 652 | | | | 5,216 | | |
Goldcorp, Inc., Strike Price 45, Expiration Jan. 2013 | | | 1,000 | | | | 4,000 | | |
Goldcorp, Inc., Strike Price 65, Expiration Jan. 2013 | | | 1,727 | | | | 863 | | |
Goldcorp, Inc., Strike Price 65, Expiration Jan. 2014 | | | 708 | | | | 30,798 | | |
Harmony Gold Mining Co., Ltd., Strike Price 9, Expiration Jan. 2013 | | | 5,020 | | | | 150,600 | | |
IAMGOLD Corp., Strike Price 12.50, Expiration Jan. 2013 | | | 2,878 | | | | 28,780 | | |
IAMGOLD Corp., Strike Price 15, Expiration Jan. 2013 | | | 232 | | | | 580 | | |
IAMGOLD Corp., Strike Price 17.50, Expiration Jan. 2013 | | | 2,512 | | | | 6,280 | | |
Kinross Gold Corp., Strike Price 10, Expiration Jan. 2013 | | | 2,669 | | | | 58,718 | | |
Kinross Gold Corp., Strike Price 12, Expiration Jan. 2014 | | | 1,404 | | | | 116,532 | | |
Newmont Mining Corp., Strike Price 52.50, Expiration Jan. 2013 | | | 2,877 | | | | 28,770 | | |
Newmont Mining Corp., Strike Price 60, Expiration Jan. 2013 | | | 1,002 | | | | 1,002 | | |
Randgold Resources Ltd., Strike Price 77.50, Expiration Jan. 2013 | | | 213 | | | | 443,040 | | |
Randgold Resources Ltd., Strike Price 125, Expiration Jan. 2013 | | | 561 | | | | 2,805 | | |
Yamana Gold, Inc., Strike Price 21, Expiration Jan. 2013 | | | 2,910 | | | | 8,730 | | |
| | | | 1,565,287 | | |
Precious Metals 0.05% | |
Coeur d'Alene Mines Corp., Strike Price 26, Expiration Jan. 2013 | | | 1,919 | | | | 86,355 | | |
Silver Mining 0.06% | |
Pan American Silver Corp., Strike Price 30, Expiration Jan. 2013 | | | 2,870 | | | | 7,175 | | |
Silver Standard Resources, Inc., Strike Price 15, Expiration Jan. 2013 | | | 1,089 | | | | 70,785 | | |
Silver Wheaton Corp., Strike Price 38, Expiration Jan. 2013 | | | 502 | | | | 21,586 | | |
| | | | 99,546 | | |
Total Purchased Call Options | | | 1,904,925 | | |
(cost $8,092,998) | |
See notes to portfolios of investments and notes to financial statements.
116
Portfolio of Investments December 31, 2012
Gold and Precious Metals Fund
Master Limited Partnership 1.15% | | Units | | Value | |
Pipelines 1.15% | |
Atlas Energy L.P. | | | 55,000 | | | $ | 1,910,700 | | |
(cost $1,726,513) | |
Gold-Linked Note 1.76% | | Principal
Amount | | | |
Gold Mining 1.76% | |
Gran Colombia Gold Corp., 144A, 10.00%, maturity 10/31/17 (RS) | | $ | 2,940,000 | | | | 2,940,000 | @ | |
(cost $2,940,000) | |
Silver-Linked Note 2.42% | |
Gold Mining 2.42% | |
Gran Colombia Gold Corp., 5.00%, maturity 08/11/18 | | | 4,500,000 | | | | 4,027,500 | | |
(cost $4,465,286) | |
Corporate Notes 3.86% | |
Electric - Generation 0.18% | |
Pacific Power Generation Corp., 15.00%, maturity 04/03/17 (RS) | | | 300,000 | | | | 300,000 | @ | |
Gold Mining 3.68% | |
Allied Nevada Gold Corp., 144A, 8.75%, maturity 06/01/19 | | CAD | 1,500,000 | | | | 1,590,440 | | |
Barrick Gold Corp., 6.95%, maturity 04/01/19 | | | 1,700,000 | | | | 2,117,952 | | |
Newmont Mining Corp., 6.25%, maturity 10/01/39 | | | 2,000,000 | | | | 2,417,220 | | |
| | | | 6,125,612 | | |
Total Corporate Notes | | | 6,425,612 | | |
(cost $6,216,656) | |
Total Securities | | | 144,177,734 | | |
(cost $155,556,995) | |
See notes to portfolios of investments and notes to financial statements.
117
Portfolio of Investments December 31, 2012
Gold and Precious Metals Fund
Repurchase Agreement 12.92% | | Principal
Amount | | Value | |
Joint Tri-Party Repurchase Agreement, Credit Suisse Securities USA LLC,
12/31/2012, 0.19%, due 01/02/2013, repurchase price $21,515,099,
collateralized by U.S. Treasury securities held in a joint tri-party
account (cost $21,514,872) | | $ | 21,514,872 | | | $ | 21,514,872 | | |
Total Investments 99.50% | | | 165,692,606 | | |
(cost $177,071,867) | |
Other assets and liabilities, net 0.50% | | | 831,409 | | |
Net Assets 100% | | $ | 166,524,015 | | |
See notes to portfolios of investments and notes to financial statements.
118
Portfolio of Investments December 31, 2012
Common Stocks 93.26% | | Shares | | Value | |
Agricultural Chemicals 2.93% | |
Uralkali OJSC, Sponsored GDR | | | 133,000 | | | $ | 5,081,930 | | |
Agricultural Operations 3.12% | |
Kernel Holding S.A. | | | 250,000 | | | | 5,426,724 | * | |
Airlines 0.48% | |
Turk Hava Yollari A.O. | | | 236,800 | | | | 831,903 | * | |
Automotive - Cars & Light Trucks 3.37% | |
Tofas Turk Otomobil Fabrikasi A.S. | | | 998,100 | | | | 5,853,384 | | |
Cellular Telecommunication 6.17% | |
KCell JSC, 144A, GDR | | | 120,000 | | | | 1,410,000 | * | |
Mobile TeleSystems OJSC | | | 600,000 | | | | 4,830,238 | | |
Turkcell Iletisim Hizmetleri A.S. | | | 263,094 | | | | 1,705,335 | * | |
Turkcell Iletisim Hizmetleri A.S., Sponsored ADR | | | 171,700 | | | | 2,771,238 | * | |
| | | | 10,716,811 | | |
Chemicals - Diversified 2.77% | |
Synthos S.A. | | | 2,730,000 | | | | 4,818,623 | | |
Coal 0.01% | |
Eastcoal, Inc. | | | 52,100 | | | | 11,547 | * | |
Commercial Banks - Non US 16.88% | |
Bank of Georgia Holdings plc | | | 250,478 | | | | 4,192,246 | | |
Erste Group Bank AG | | | 140,702 | | | | 4,460,223 | * | |
Komercni Banka A.S. | | | 6,200 | | | | 1,311,452 | | |
Sberbank of Russia, Sponsored ADR | | | 820,800 | | | | 10,095,840 | | |
Turkiye Garanti Bankasi A.S. | | | 900,000 | | | | 4,677,030 | | |
Turkiye Halk Bankasi A.S. | | | 150,000 | | | | 1,473,147 | | |
VTB Bank OJSC, Sponsored GDR | | | 900,000 | | | | 3,114,000 | | |
| | | | 29,323,938 | | |
Electric - Generation 1.21% | |
CEZ A.S. | | | 58,288 | | | | 2,095,836 | | |
Finance - Investment Banker/Broker 1.34% | |
Turkiye Sinai Kalkinma Bankasi A.S. | | | 1,808,313 | | | | 2,323,945 | | |
Food - Retail 2.71% | |
Magnit OJSC | | | 30,000 | | | | 4,699,075 | | |
See notes to portfolios of investments and notes to financial statements.
119
Portfolio of Investments December 31, 2012
Common Stocks (cont'd) | | Shares | | Value | |
Food - Wholesale/Distribution 3.00% | |
Eurocash S.A. | | | 370,000 | | | $ | 5,215,245 | | |
Gold Mining 5.68% | |
Centerra Gold, Inc. | | | 83,809 | | | | 786,039 | | |
Dundee Precious Metals, Inc. | | | 167,500 | | | | 1,429,230 | * | |
Koza Altin Isletmeleri A.S. | | | 234,300 | | | | 5,654,021 | | |
Polyus Gold International Ltd. | | | 600,000 | | | | 1,996,251 | * | |
| | | | 9,865,541 | | |
Machinery - Farm 1.99% | |
Turk Traktor ve Ziraat Makineleri A.S. | | | 105,900 | | | | 3,461,853 | | |
Medical - Drugs 0.90% | |
Richter Gedeon Nyrt. | | | 9,500 | | | | 1,568,355 | | |
Metal - Diversified 7.15% | |
KGHM Polska Miedz S.A. | | | 132,700 | | | | 8,258,693 | | |
MMC Norilsk Nickel OJSC, Sponsored ADR | | | 200,000 | | | | 3,686,000 | | |
Orsu Metals Corp. | | | 664,240 | | | | 66,916 | * | |
Orsu Metals Corp., 144A | | | 4,025,000 | | | | 405,480 | * | |
| | | | 12,417,089 | | |
Miscellaneous Manufacturers 0.48% | |
Trakya Cam Sanayii A.S. | | | 610,465 | | | | 835,925 | * | |
Multi-line Insurance 0.55% | |
Vienna Insurance Group AG Wiener Versicherung Gruppe | | | 17,984 | | | | 958,058 | | |
Oil Companies - Exploration & Production 8.09% | |
BNK Petroleum, Inc. | | | 465,600 | | | | 234,524 | * | |
Gazprom OAO, Sponsored ADR | | | 971,102 | | | | 9,186,625 | | |
NovaTek OAO, Sponsored GDR | | | 38,600 | | | | 4,624,280 | | |
| | | | 14,045,429 | | |
Oil Companies - Integrated 14.97% | |
Lukoil OAO, Sponsored ADR | | | 150,000 | | | | 9,922,500 | | |
MOL Hungarian Oil & Gas Nyrt. | | | 61,100 | | | | 4,962,094 | | |
Surgutneftegas OJSC, Sponsored ADR | | | 397,200 | | | | 3,495,360 | | |
TNK-BP Holding | | | 4,064,800 | | | | 7,610,151 | | |
| | | | 25,990,105 | | |
Oil Refining & Marketing 2.17% | |
Tupras Turkiye Petrol Rafinerileri A.S. | | | 130,500 | | | | 3,771,676 | | |
See notes to portfolios of investments and notes to financial statements.
120
Portfolio of Investments December 31, 2012
Common Stocks (cont'd) | | Shares | | Value | |
Precious Metals 1.03% | |
Polymetal International plc | | | 93,500 | | | $ | 1,785,211 | �� | |
Telecom Services 1.19% | |
Telefonica Czech Republic A.S. | | | 40,000 | | | | 680,611 | | |
Telekomunikacja Polska S.A. | | | 350,000 | | | | 1,387,862 | | |
| | | | 2,068,473 | | |
Telephone - Integrated 1.07% | |
Rostelecom OJSC | | | 630,000 | | | | 1,865,620 | | |
Television 0.64% | |
Cyfrowy Polsat S.A. | | | 100,000 | | | | 532,702 | * | |
TVN S.A. | | | 180,000 | | | | 583,427 | * | |
| | | | 1,116,129 | | |
Tobacco 1.04% | |
Philip Morris CR A.S. | | | 3,200 | | | | 1,800,809 | | |
Transportation - Rail 0.57% | |
Globaltrans Investment plc, 144A, Sponsored GDR | | | 60,000 | | | | 990,600 | * | |
Web Portals/Internet Service Providers 1.75% | |
Yandex N.V., Class A | | | 140,700 | | | | 3,034,899 | * | |
Total Common Stocks | | | 161,974,733 | | |
(cost $141,173,939) | |
Preferred Stock 2.08% | |
Pipelines 2.08% | |
AK Transneft OAO | | | 1,600 | | | | 3,613,647 | | |
(cost $3,239,817) | |
Real Estate Investment Trust (REIT) 0.91% | |
Sinpas Gayrimenkul Yatirim Ortakligi A.S. | | | 2,000,000 | | | | 1,582,580 | | |
(cost $1,269,166) | |
See notes to portfolios of investments and notes to financial statements.
121
Portfolio of Investments December 31, 2012
Exchange-Traded Fund (ETF) 1.15% | | Shares | | Value | |
Sprott Physical Platinum & Palladium Trust | | | 200,000 | | | $ | 1,998,000 | * | |
(cost $2,000,000) | |
Warrants 1.47% | |
Gold Mining 1.47% | |
Dundee Precious Metals, Inc., Warrants (November 2015) | | | 436,100 | | | | 2,548,109 | * | |
(cost $0) | |
Purchased Call Options 1.61% | | Contracts | | | |
Exchange-Traded Funds 1.61% | |
Market Vectors Russia ETF, Strike Price 27, Expiration Feb. 2013 | | | 5,000 | | | | 1,587,500 | | |
Market Vectors Russia ETF, Strike Price 28, Expiration Feb. 2013 | | | 5,267 | | | | 1,211,410 | | |
Total Purchased Call Options | | | 2,798,910 | | |
(cost $1,198,521) | |
Total Investments 100.48% | | | 174,515,979 | | |
(cost $148,881,443) | |
Other assets and liabilities, net (0.48)% | | | (829,299 | ) | |
Net Assets 100% | | $ | 173,686,680 | | |
Call Options Written | | Shares Subject
To Call | | | |
Lukoil OAO, Strike Price 64, Expiration Jan. 2013 | | | 100,000 | | | $ | 280,000 | | |
MMC Norilsk Nickel OJSC, Strike Price 19, Expiration Feb. 2013 | | | 100,000 | | | | 44,000 | | |
Total Call Options Written | | $ | 324,000 | | |
(premiums received $291,560) (Note 2A) | |
See notes to portfolios of investments and notes to financial statements.
122
Portfolio of Investments December 31, 2012
Global Emerging Markets Fund
Common Stocks 76.46% | | Shares | | Value | |
Agricultural Chemicals 3.39% | |
Gujarat State Fertilisers & Chemicals Ltd. | | | 59,500 | | | $ | 72,172 | * | |
United Phosphorus Ltd. | | | 40,500 | | | | 96,000 | | |
Zaklady Azotowe Pulawy S.A. | | | 2,100 | | | | 93,788 | | |
| | | | 261,960 | | |
Agricultural Operations 1.03% | |
Tradewinds Malaysia Bhd | | | 27,100 | | | | 79,226 | | |
Applications Software 0.83% | |
Polaris Financial Technology Ltd. | | | 30,600 | | | | 63,860 | * | |
Audio/Video Products 1.08% | |
TCL Multimedia Technology Holdings Ltd. | | | 150,000 | | | | 83,610 | | |
Building Products - Cement/Aggregates 1.08% | |
Orient Paper & Industries Ltd. | | | 57,400 | | | | 83,069 | | |
Chemicals - Specialty 0.93% | |
Soda Sanayii A.S. | | | 53,010 | | | | 71,993 | * | |
Coal 1.66% | |
PT Indika Energy Tbk | | | 412,300 | | | | 60,619 | * | |
PT Resource Alam Indonesia Tbk | | | 263,400 | | | | 67,535 | * | |
| | | | 128,154 | | |
Commercial Banks - Non US 8.80% | |
Albaraka Turk Katilim Bankasi A.S. | | | 106,500 | | | | 101,605 | * | |
City Union Bank Ltd. | | | 19,300 | | | | 19,699 | * | |
Dena Bank | | | 41,900 | | | | 87,519 | | |
Oriental Bank of Commerce | | | 16,100 | | | | 103,030 | | |
PT Bank Bukopin Tbk | | | 1,350,000 | | | | 86,759 | | |
United Bank of India | | | 68,200 | | | | 99,693 | | |
Vijaya Bank | | | 81,700 | | | | 92,846 | | |
Vozrozhdenie Bank | | | 5,000 | | | | 87,916 | | |
| | | | 679,067 | | |
Computer Services 1.10% | |
Asseco Poland S.A. | | | 5,800 | | | | 84,832 | | |
Computers - Peripheral Equipment 0.95% | |
JCY International Bhd | | | 360,100 | | | | 73,598 | | |
Diversified Financial Services 1.28% | |
Indiabulls Financial Services Ltd. | | | 19,800 | | | | 98,450 | | |
See notes to portfolios of investments and notes to financial statements.
123
Portfolio of Investments December 31, 2012
Global Emerging Markets Fund
Common Stocks (cont'd) | | Shares | | Value | |
Diversified Minerals 1.05% | |
African Potash Ltd. | | | 200,000 | | | $ | 9,750 | * | |
Lanna Resources PCL | | | 93,700 | | | | 71,056 | * | |
| | | | 80,806 | | |
Diversified Operations 2.58% | |
Tekfen Holding A.S. | | | 23,200 | | | | 94,263 | | |
Yazicilar Holding A.S., Class A | | | 11,700 | | | | 104,400 | | |
| | | | 198,663 | | |
Electric - Integrated 0.91% | |
First Philippine Holdings Corp. | | | 32,000 | | | | 70,152 | | |
Electronic Components - Miscellaneous 1.03% | |
Taiwan PCB Techvest Co., Ltd. | | | 54,200 | | | | 79,768 | | |
Electronic Components - Semiconductors 1.78% | |
Eugene Technology Co., Ltd. | | | 5,562 | | | | 73,706 | * | |
Spreadtrum Communications, Inc., Sponsored ADR | | | 3,600 | | | | 63,360 | * | |
| | | | 137,066 | | |
Engineering/R&D Services 1.09% | |
Mudajaya Group Bhd | | | 98,000 | | | | 83,963 | | |
Entertainment Software 0.69% | |
Shanda Games Ltd., Sponsored ADR | | | 17,500 | | | | 53,200 | * | |
Finance - Consumer Loans 1.17% | |
Muthoot Finance Ltd. | | | 24,000 | | | | 90,593 | | |
Finance - Leasing Company 2.22% | |
Manappuram Finance Ltd. | | | 115,300 | | | | 71,136 | * | |
Woori Financial Co., Ltd. | | | 6,329 | | | | 100,102 | | |
| | | | 171,238 | | |
Finance - Mortgage Loan/Banker 1.14% | |
Housing & Development Bank | | | 40,000 | | | | 88,050 | | |
Finance - Other Services 1.59% | |
BM&F Bovespa S.A. | | | 6,200 | | | | 43,257 | | |
Hong Kong Exchanges & Clearing Ltd. | | | 1,990 | | | | 33,867 | | |
Singapore Exchange Ltd. | | | 7,900 | | | | 45,341 | | |
| | | | 122,465 | | |
See notes to portfolios of investments and notes to financial statements.
124
Portfolio of Investments December 31, 2012
Global Emerging Markets Fund
Common Stocks (cont'd) | | Shares | | Value | |
Gas - Distribution 1.00% | |
Busan City Gas Co., Ltd. | | | 4,000 | | | $ | 77,210 | * | |
Gold Mining 0.34% | |
Gran Colombia Gold Corp. | | | 73,300 | | | | 26,583 | * | |
Internet Content - Entertainment 2.43% | |
Giant Interactive Group, Inc., Sponsored ADR | | | 17,100 | | | | 92,511 | | |
Perfect World Co., Ltd., Sponsored ADR | | | 8,900 | | | | 94,607 | * | |
| | | | 187,118 | | |
Machinery - Construction & Mining 1.09% | |
Ferreycorp S.A.A. | | | 98,000 | | | | 84,466 | | |
Machinery - General Industrial 1.21% | |
PT Hexindo Adiperkasa Tbk | | | 110,100 | | | | 93,102 | | |
Metal - Diversified 0.31% | |
Orsu Metals Corp. | | | 41,083 | | | | 4,139 | * | |
Orsu Metals Corp., 144A | | | 200,000 | | | | 20,148 | * | |
| | | | 24,287 | | |
Miscellaneous Manufacturers 0.96% | |
Yem Chio Co., Ltd. | | | 113,826 | | | | 74,002 | * | |
Multi-line Insurance 1.16% | |
Allianz Malaysia Bhd | | | 38,700 | | | | 89,220 | | |
Multimedia 0.93% | |
Lopez Holdings Corp. | | | 467,400 | | | | 71,583 | * | |
Oil Companies - Exploration & Production 0.95% | |
Petrominerales Ltd. | | | 8,500 | | | | 73,641 | * | |
Patient Monitoring Equipment 0.83% | |
Opto Circuits India Ltd. | | | 32,600 | | | | 63,726 | * | |
Petrochemicals 0.84% | |
Alexandria Mineral Oils Co. | | | 5,600 | | | | 64,462 | * | |
Public Thoroughfares 2.26% | |
IL&FS Transportation Networks Ltd. | | | 22,200 | | | | 80,319 | | |
Jaypee Infratech Ltd. | | | 100,700 | | | | 94,065 | | |
| | | | 174,384 | | |
See notes to portfolios of investments and notes to financial statements.
125
Portfolio of Investments December 31, 2012
Global Emerging Markets Fund
Common Stocks (cont'd) | | Shares | | Value | |
Real Estate Operating/Development 11.40% | |
Cathay Real Estate Development Co., Ltd. | | | 185,000 | | | $ | 90,643 | | |
Chong Hong Construction Co. | | | 32,000 | | | | 94,137 | | |
Farglory Land Development Co., Ltd. | | | 43,700 | | | | 79,013 | | |
Huang Hsiang Construction Co. | | | 30,100 | | | | 76,671 | * | |
Hung Poo Real Estate Development Corp. | | | 82,800 | | | | 85,547 | | |
Jiangsu Future Land Co., Ltd., Class B | | | 128,800 | | | | 109,480 | | |
PT Surya Semesta Internusa Tbk | | | 755,000 | | | | 84,805 | | |
Rich Development Co., Ltd. | | | 171,600 | | | | 90,792 | | |
Shanyuan Co., Ltd. | | | 23,000 | | | | 92,049 | | |
Yungshin Construction & Development Co. | | | 42,500 | | | | 76,288 | * | |
| | | | 879,425 | | |
Retail - Automobile 0.98% | |
MBM Resources Bhd | | | 72,100 | | | | 75,684 | * | |
Retail - Jewelry 1.34% | |
Gitanjali Gems Ltd. | | | 10,700 | | | | 102,992 | | |
Semiconductor Components - Integrated Circuits 1.06% | |
RDA Microelectronics, Inc., Sponsored ADR | | | 7,600 | | | | 81,700 | * | |
Steel - Producers 1.35% | |
Kardemir Karabuk Demir Celik Sanayi ve Ticaret A.S., Class D | | | 147,100 | | | | 104,016 | | |
Steel - Specialty 1.08% | |
Gloria Material Technology Corp. | | | 102,000 | | | | 83,539 | | |
Telephone - Integrated 1.14% | |
Oi S.A., Sponsored ADR | | | 22,000 | | | | 88,220 | | |
Textile - Home Furnishings 2.20% | |
Kwong Fong Industries | | | 140,800 | | | | 84,907 | * | |
Oriental Weavers | | | 21,500 | | | | 84,513 | | |
| | | | 169,420 | | |
Tobacco 0.92% | |
Eastern Tobacco | | | 4,500 | | | | 70,755 | | |
Transportation - Marine 1.04% | |
Wisdom Marine Lines Co., Ltd. | | | 55,700 | | | | 80,151 | | |
Travel Services 1.08% | |
Cox & Kings Ltd. | | | 34,100 | | | | 83,595 | | |
See notes to portfolios of investments and notes to financial statements.
126
Portfolio of Investments December 31, 2012
Global Emerging Markets Fund
Common Stocks (cont'd) | | Shares | | Value | |
Water Treatment Systems 1.18% | |
Sound Global Ltd. | | | 190,000 | | | $ | 91,197 | | |
Total Common Stocks | | | 5,898,261 | | |
(cost $6,251,890) | |
Preferred Stock 1.07% | |
Commercial Banks - Non US 1.07% | |
Banco Daycoval S.A. | | | 16,600 | | | | 82,597 | | |
(cost $90,839) | |
Real Estate Investment Trusts (REIT) 2.20% | |
Al-Hadharah Boustead | | | 125,600 | | | | 75,163 | * | |
Sinpas Gayrimenkul Yatirim Ortakligi A.S. | | | 120,000 | | | | 94,955 | | |
Total Real Estate Investment Trusts | | | 170,118 | | |
(cost $168,059) | |
Exchange-Traded Funds (ETF) 6.72% | |
Global X FTSE Colombia 20 ETF | | | 2,200 | | | | 48,928 | * | |
iShares FTSE A50 China Index ETF | | | 30,350 | | | | 43,546 | * | |
iShares MSCI All Peru Capped Index Fund | | | 770 | | | | 35,328 | * | |
iShares MSCI Brazil Index Fund | | | 750 | | | | 42,045 | | |
iShares MSCI Chile Investable Market Index Fund | | | 700 | | | | 44,268 | * | |
iShares MSCI Hong Kong Index Fund | | | 2,040 | | | | 39,617 | | |
iShares MSCI Malaysia Index Fund | | | 2,200 | | | | 33,286 | * | |
iShares MSCI South Korea Index Fund | | | 640 | | | | 40,550 | * | |
iShares MSCI Taiwan Index Fund | | | 2,500 | | | | 34,050 | * | |
iShares MSCI Thailand Index Fund | | | 500 | | | | 41,245 | * | |
iShares MSCI Turkey Index Fund | | | 600 | | | | 40,068 | * | |
Market Vectors Russia ETF | | | 1,390 | | | | 41,658 | * | |
PowerShares India Portfolio | | | 1,850 | | | | 33,966 | * | |
Total Exchange-Traded Funds | | | 518,555 | | |
(cost $494,263) | |
See notes to portfolios of investments and notes to financial statements.
127
Portfolio of Investments December 31, 2012
Global Emerging Markets Fund
Convertible Debenture 1.30% | | Principal
Amount | | Value | |
Metal - Iron 1.30% | |
Andean Pacific Iron Corp., 1.00%, maturity 06/07/13 (RS) | | $ | 100,000 | | | $ | 100,000 | @ | |
(cost $100,000) | |
Corporate Notes 1.30% | |
Electric - Generation 0.65% | |
Pacific Power Generation Corp., 15.00%, maturity 04/03/17 (RS) | | | 50,000 | | | | 50,000 | @ | |
Transportation - Air Freight 0.65% | |
Aeroservicios Especializados, S.A. de C.V., 22.00%, maturity 02/28/13 (RS) | | | 50,000 | | | | 50,000 | @ | |
Total Corporate Notes | | | 100,000 | | |
(cost $100,000) | |
Total Investments 89.05% | | | 6,869,531 | | |
(cost $7,205,051) | |
Other assets and liabilities, net 10.95% | | | 844,960 | | |
Net Assets 100% | | $ | 7,714,491 | | |
See notes to portfolios of investments and notes to financial statements.
128
Portfolio of Investments December 31, 2012
Common Stocks 94.90% | | Shares | | Value | |
Appliances 0.95% | |
Haier Electronics Group Co., Ltd. | | | 189,000 | | | $ | 277,516 | * | |
Audio/Video Products 2.39% | |
TCL Multimedia Technology Holdings Ltd. | | | 1,248,000 | | | | 695,637 | | |
Automotive - Cars & Light Trucks 2.10% | |
Brilliance China Automotive Holdings Ltd. | | | 254,000 | | | | 313,639 | * | |
Great Wall Motor Co., Ltd., H shares | | | 96,000 | | | | 299,758 | | |
| | | | 613,397 | | |
Automotive/Truck Parts & Equipment - Replacement 1.01% | |
Weichai Power Co., Ltd., H shares | | | 66,000 | | | | 293,371 | | |
Building - Heavy Construction 2.69% | |
China Railway Construction Corp., Ltd., H shares | | | 689,500 | | | | 783,780 | | |
Building & Construction - Miscellaneous 2.42% | |
China State Construction International Holdings Ltd. | | | 588,000 | | | | 705,577 | | |
Building & Construction Products - Miscellaneous 3.37% | |
China National Building Material Co., Ltd., H shares | | | 478,000 | | | | 699,399 | | |
China Singyes Solar Technologies Holdings Ltd. | | | 334,000 | | | | 284,861 | | |
| | | | 984,260 | | |
Casino Hotels 6.82% | |
Galaxy Entertainment Group Ltd. | | | 176,000 | | | | 688,081 | * | |
NagaCorp Ltd. | | | 1,170,000 | | | | 709,525 | | |
Sands China Ltd. | | | 72,000 | | | | 315,861 | | |
SJM Holdings Ltd. | | | 119,000 | | | | 276,378 | | |
| | | | 1,989,845 | | |
Casino Services 1.63% | |
Paradise Co., Ltd. | | | 29,376 | | | | 476,756 | | |
Commercial Banks - Non US 13.99% | |
Agricultural Bank of China Ltd., H shares | | | 626,000 | | | | 310,163 | | |
Bank of China Ltd., H shares | | | 2,188,000 | | | | 982,451 | | |
China Minsheng Banking Corp., Ltd., H shares | | | 822,000 | | | | 949,247 | | |
Chongqing Rural Commercial Bank, H shares | | | 1,168,000 | | | | 640,495 | | |
Industrial and Commercial Bank of China Ltd., H shares | | | 1,688,000 | | | | 1,197,897 | | |
| | | | 4,080,253 | | |
See notes to portfolios of investments and notes to financial statements.
129
Portfolio of Investments December 31, 2012
Common Stocks (cont'd) | | Shares | | Value | |
Computers 0.71% | |
Lenovo Group Ltd. | | | 228,000 | | | $ | 206,223 | | |
Computers - Other 2.12% | |
Ju Teng International Holdings Ltd. | | | 1,310,000 | | | | 618,638 | | |
Computers - Peripheral Equipment 0.65% | |
Chicony Electronics Co., Ltd. | | | 82,000 | | | | 190,312 | * | |
Diversified Banking Institutions 4.78% | |
HSBC Holdings plc | | | 132,800 | | | | 1,393,070 | | |
Diversified Manufacturing Operations 1.51% | |
Fosun International Ltd. | | | 692,000 | | | | 439,294 | | |
Diversified Minerals 0.62% | |
Woulfe Mining Corp. | | | 600,000 | | | | 181,333 | * | |
Diversified Operations 4.04% | |
Hutchison Whampoa Ltd. | | | 85,000 | | | | 887,262 | | |
NWS Holdings Ltd. | | | 172,000 | | | | 290,726 | | |
| | | | 1,177,988 | | |
Electronic Components - Semiconductors 1.19% | |
Samsung Electronics Co., Ltd. | | | 240 | | | | 345,734 | | |
Finance - Investment Banker/Broker 1.19% | |
CITIC Securities Co., Ltd., H shares | | | 138,000 | | | | 347,927 | | |
Finance - Other Services 1.04% | |
Hong Kong Exchanges & Clearing Ltd. | | | 8,510 | | | | 144,830 | | |
Singapore Exchange Ltd. | | | 27,800 | | | | 159,553 | | |
| | | | 304,383 | | |
Food - Flour & Grain 0.44% | |
Amira Nature Foods Ltd. | | | 16,000 | | | | 127,200 | * | |
Gold Mining 0.26% | |
Besra Gold, Inc. | | | 354,110 | | | | 74,914 | * | |
Internet Application Software 2.56% | |
Tencent Holdings Ltd. | | | 23,300 | | | | 746,778 | | |
See notes to portfolios of investments and notes to financial statements.
130
Portfolio of Investments December 31, 2012
Common Stocks (cont'd) | | Shares | | Value | |
Internet Content - Entertainment 0.58% | |
NetEase, Inc., Sponsored ADR | | | 4,000 | | | $ | 170,200 | * | |
Machine Tools & Related Products 0.99% | |
Techtronic Industries Co. | | | 154,000 | | | | 288,915 | | |
Machinery - Construction & Mining 1.98% | |
Zoomlion Heavy Industry Science and Technology Co., Ltd., H shares | | | 391,800 | | | | 577,318 | | |
Machinery - General Industrial 0.93% | |
CSR Corp., Ltd., H shares | | | 312,000 | | | | 271,331 | | |
Multi-line Insurance 0.95% | |
Ping An Insurance (Group) Company of China, Ltd., H shares | | | 33,000 | | | | 276,339 | | |
Non - Ferrous Metals 0.09% | |
Sterling Group Ventures, Inc., 144A | | | 500,000 | | | | 26,250 | * | |
Oil Companies - Exploration & Production 1.12% | |
Kunlun Energy Co., Ltd. | | | 156,000 | | | | 325,275 | | |
Paper & Related Products 1.05% | |
Nine Dragons Paper Holdings Ltd. | | | 338,000 | | | | 305,280 | | |
Petrochemicals 0.00% | |
Danhua Chemical Technology Co., Ltd., B shares | | | 2 | | | | 2 | * | |
Photo Equipment & Supplies 1.86% | |
Sunny Optical Technology Group Co., Ltd. | | | 828,000 | | | | 543,791 | | |
Public Thoroughfares 1.01% | |
Shenzhen International Holdings Ltd. | | | 2,780,000 | | | | 294,132 | | |
Real Estate Operating/Development 22.86% | |
China Overseas Grand Oceans Group Ltd. | | | 417,000 | | | | 500,922 | | |
China Overseas Land & Investment Ltd. | | | 220,000 | | | | 655,721 | | |
China Resources Land Ltd. | | | 114,000 | | | | 311,100 | | |
Country Garden Holdings Co., Ltd. | | | 597,000 | | | | 312,741 | | |
Greentown China Holdings Ltd. | | | 226,500 | | | | 414,993 | | |
Hopewell Holdings Ltd. | | | 169,000 | | | | 725,041 | | |
Longfor Properties Co., Ltd. | | | 136,000 | | | | 264,972 | | |
New World China Land Ltd. | | | 480,000 | | | | 231,631 | * | |
Shanghai Industrial Holdings Ltd. | | | 80,000 | | | | 279,217 | | |
Shimao Property Holdings Ltd. | | | 290,000 | | | | 549,298 | | |
Shun Tak Holdings Ltd. | | | 540,000 | | | | 292,636 | | |
See notes to portfolios of investments and notes to financial statements.
131
Portfolio of Investments December 31, 2012
Common Stocks (cont'd) | | Shares | | Value | |
Real Estate Operating/Development (cont'd) | |
Sunac China Holdings Ltd. | | | 2,020,000 | | | $ | 1,563,821 | | |
Yuexiu Property Co., Ltd. | | | 1,788,000 | | | | 565,220 | | |
| | | | 6,667,313 | | |
Retail - Jewelry 0.00% | |
Lao Feng Xiang Co., Ltd., B shares | | | 1 | | | | 2 | * | |
Telecom Services 1.03% | |
PT Tower Bersama Infrastructure Tbk | | | 506,000 | | | | 299,561 | * | |
Transportation - Marine 1.05% | |
SITC International Holdings Co., Ltd. | | | 914,000 | | | | 306,622 | | |
Wireless Equipment 0.92% | |
China Wireless Technologies Ltd. | | | 928,000 | | | | 268,213 | | |
Total Common Stocks | | | 27,674,730 | | |
(cost $25,090,189) | |
Exchange-Traded Funds (ETF) 4.21% | |
iShares FTSE A50 China Index ETF | | | 114,750 | | | | 164,642 | * | |
iShares FTSE China 25 Index Fund | | | 4,100 | | | | 165,968 | * | |
iShares MSCI Hong Kong Index Fund | | | 7,360 | | | | 142,931 | | |
iShares MSCI Malaysia Index Fund | | | 9,500 | | | | 143,735 | * | |
iShares MSCI Singapore Index Fund | | | 11,500 | | | | 157,435 | * | |
iShares MSCI South Korea Index Fund | | | 2,410 | | | | 152,698 | * | |
iShares MSCI Taiwan Index Fund | | | 10,800 | | | | 147,096 | * | |
iShares MSCI Thailand Index Fund | | | 1,850 | | | | 152,607 | * | |
Total Exchange-Traded Funds | | | 1,227,112 | | |
(cost $1,154,814) | |
Purchased Call Options 0.33% | | Contracts | | | |
Exchange-Traded Funds 0.33% | |
iShares FTSE China 25 Index Fund, Strike Price 35.50, Expiration May 2013 | | | 20 | | | | 10,300 | | |
iShares FTSE China 25 Index Fund, Strike Price 36.50, Expiration May 2013 | | | 20 | | | | 9,650 | | |
iShares FTSE China 25 Index Fund, Strike Price 40, Expiration May 2013 | | | 50 | | | | 12,550 | | |
iShares FTSE China 25 Index Fund, Strike Price 42, Expiration May 2013 | | | 300 | | | | 44,100 | | |
Sina Corp., Strike Price 57.50, Expiration Jan. 2013 | | | 30 | | | | 1,260 | | |
See notes to portfolios of investments and notes to financial statements.
132
Portfolio of Investments December 31, 2012
Purchased Call Options (cont'd) | | Contracts | | Value | |
Exchange-Traded Funds (cont'd) | |
SPDR Gold Trust, Strike Price 159, Expiration Mar. 2013 | | | 30 | | | $ | 15,840 | | |
SPDR Gold Trust, Strike Price 165, Expiration Jan. 2013 | | | 30 | | | | 2,130 | | |
Total Purchased Call Options | | | 95,830 | | |
(cost $73,919) | |
Total Investments 99.44% | | | 28,997,672 | | |
(cost $26,318,922) | |
Other assets and liabilities, net 0.56% | | | 162,135 | | |
Net Assets 100% | | $ | 29,159,807 | | |
See notes to portfolios of investments and notes to financial statements.
133
Notes to Portfolios of Investments December 31, 2012
Legend
* Non-income producing security
+ Affiliated company (see following)
ADR American Depositary Receipt
GDR Global Depositary Receipt
GO General Obligation Bond
RS Restricted Security (see following)
ZCB Zero Coupon Bond
CAD Principal shown in Canadian dollars
@ Security was fair valued at December 31, 2012, by U.S. Global Investors, Inc. (Adviser) in accordance with valuation procedures approved by the Board of Trustees. These securities, as a percentage of net assets at December 31, 2012, were 4.16% of Holmes Growth Fund, 12.92% of MegaTrends Fund, 6.24% of Global Resources Fund, 3.24% of World Precious Minerals Fund, 1.95% of Gold and Precious Metals Fund and 2.59% of Global Emerging Markets Fund, respectively. See the Fair Valuation of Securities section of these Notes to Portfolios of Investments for further discussion of fair valued securities. See further information and detail on restricted securities in the Restricted Securities section of these Notes to Portfolios of Investments.
General
The yields reflect the effective yield from the date of purchase.
Variable Rate Notes have periodic reset features, which effectively shorten the maturity dates and reset the interest rates as tied to various interest-bearing instruments. Rates shown are current rates at December 31, 2012.
Principal amounts are in U.S. dollars unless otherwise noted.
Securities with a 144A designation are exempt from registration under Rule 144A of the Securities Act of 1933.
Joint Tri-Party Repurchase Agreements
The terms of the joint tri-party repurchase agreements and the securities held as collateral at December 31, 2012, were:
Banc of America Securities LLC Merrill Lynch repurchase agreement, 12/31/12, 0.12%, due 01/02/13:
Total principal amount: $84,930,641; Total repurchase price: $84,931,207
Collateral:
$86,737,200 U.S. Treasury Bill, 0.000%, 11/14/13
(total collateral market value, including accrued interest, of $86,629,299)
Barclays Capital, Inc. repurchase agreement, 12/31/12, 0.17%, due 01/02/13:
Total principal amount: $20,000,000; Total repurchase price: $20,000,189
Collateral:
$18,499,900 U.S. Treasury Note, 2.625%, 11/15/20
(total collateral market value, including accrued interest, of $20,400,036)
Credit Suisse Securities USA LLC repurchase agreement, 12/31/12, 0.19%, due 01/02/13:
Total principal amount: $65,414,648; Total repurchase price: $65,415,340
Collateral:
$11,290,800 U.S. Treasury Note, 1.500%, 08/31/18
$46,605,000 U.S. Treasury Note, 3.625%, 08/15/19
(total collateral market value, including accrued interest, of $66,725,838)
134
Notes to Portfolios of Investments December 31, 2012
Morgan Stanley repurchase agreement, 12/31/12, 0.14%, due 01/02/13:
Total principal amount: $20,000,000; Total repurchase price: $20,000,156
Collateral:
$18,337,300 U.S. Treasury Note, 3.250%, 07/31/16
(total collateral market value, including accrued interest, of $20,400,104)
Fair Valuation of Securities
For the Funds' policies regarding the valuation of investments and other significant accounting policies, please refer to the Notes to Financial Statements.
The Funds are required to disclose information regarding the fair value measurements of a Fund's assets and liabilities. Fair value is the price that would be received to sell an asset or paid to transfer a liability in an orderly transaction between market participants at the measurement date. The disclosure requirement established a three-tier hierarchy to maximize the use of observable market data and minimize the use of unobservable inputs and to establish classification of fair value measurements for disclosure purposes. Inputs refer broadly to the assumptions that market participants would use in pricing the asset or liability, including assumptions about risk, for example, the risk inherent in a particular valuation technique used to measure fair value including such a pricing model and/or the risk inherent in the inputs to the valuation technique. Inputs may be observable or unobservable. Observable inputs are inputs that reflect the assumptions market participants would use in pricing the asset or liability developed based on market data obtained from sources independent of the reporting entity. Unobservable inputs are inputs that reflect the reporting entity's own assumptions about the assumptions market participants would use in pricing the asset or liability developed based on the best information available in the circumstances.
The inputs or methodology used for valuing securities are not necessarily an indication of the risk associated with investing in those securities. For example, short-term U.S. government obligations are valued using amortized cost, in accordance with the Investment Company Act of 1940. Generally, amortized cost reflects the current fair value of a security, but since the value is not obtained from a quoted price in an active market, such securities are reflected as Level 2. Because of the inherent uncertainties of valuation, the values reflected in the portfolios may materially differ from the values received upon actual sale of those investments.
The three levels defined by the fair value hierarchy are as follows:
Level 1 – Quoted prices in active markets for identical securities.
Level 2 – Prices determined using significant other observable inputs (including quoted prices for similar securities, interest rates, prepayment speeds, credit risk, etc.). Short-term securities with maturities of 60 days or less are valued at amortized cost, which approximates market value, and are categorized as Level 2 in the hierarchy. Municipal securities, long-term U.S. government obligations and corporate debt securities are valued in accordance with the evaluated price supplied by the pricing
135
Notes to Portfolios of Investments December 31, 2012
service and generally categorized as Level 2 in the hierarchy. Other securities that are categorized as Level 2 in the hierarchy include, but are not limited to, warrants that do not trade on an exchange, securities for which no sale was reported (valued at the mean between the last reported bid and ask quotation) and international equity securities valued by an independent third party in order to adjust for stale pricing and foreign market holidays.
Level 3 – Prices determined using significant unobservable inputs (including the Fund's own assumptions). For restricted equity securities and private placements where observable inputs are limited, assumptions about market activity and risk are used in determining fair value.
The following table summarizes the valuation of each Fund's securities as of December 31, 2012, using the fair value hierarchy:
| | | Quoted Prices
in Active
Markets for
Identical
Investments
(Level 1) | | Significant
Other
Observable
Inputs
(Level 2) | | Significant
Unobservable
Inputs
(Level 3) | | Total | |
U.S. Treasury Securities Cash Fund | |
Investments in Securities*
U.S. Government Obligations | | $ | — | | | $ | 9,999,948 | | | $ | — | | | $ | 9,999,948 | | |
Repurchase Agreements | | | 71,255,139 | | | | — | | | | — | | | | 71,255,139 | | |
Total | | $ | 71,255,139 | | | $ | 9,999,948 | | | $ | — | | | $ | 81,255,087 | | |
U.S. Government Securities Savings Fund | |
Investments in Securities*
U.S. Government and Agency Obligations | | $ | — | | | $ | 76,852,583 | | | $ | — | | | $ | 76,852,583 | | |
Repurchase Agreements | | | 63,675,502 | | | | — | | | | — | | | | 63,675,502 | | |
Total | | $ | 63,675,502 | | | $ | 76,852,583 | | | $ | — | | | $ | 140,528,085 | | |
Near-Term Tax Free Fund | |
Investments in Securities*
Municipal Bonds | | $ | — | | | $ | 39,712,906 | | | $ | — | | | $ | 39,712,906 | | |
Repurchase Agreement | | | 4,547,030 | | | | — | | | | — | | | | 4,547,030 | | |
Total | | $ | 4,547,030 | | | $ | 39,712,906 | | | $ | — | | | $ | 44,259,936 | | |
Tax Free Fund | |
Investments in Securities*
Municipal Bonds | | $ | — | | | $ | 21,887,246 | | | $ | — | | | $ | 21,887,246 | | |
Total | | $ | — | | | $ | 21,887,246 | | | $ | — | | | $ | 21,887,246 | | |
All American Equity Fund | |
Investments in Securities*
Common Stocks | | $ | 15,095,710 | | | $ | — | | | $ | — | | | $ | 15,095,710 | | |
Real Estate Investment Trust | | | 231,810 | | | | — | | | | — | | | | 231,810 | | |
Exchange-Traded Funds | | | 470,340 | | | | — | | | | — | | | | 470,340 | | |
Repurchase Agreement | | | 960,296 | | | | — | | | | — | | | | 960,296 | | |
Total | | $ | 16,758,156 | | | $ | — | | | $ | — | | | $ | 16,758,156 | | |
136
Notes to Portfolios of Investments December 31, 2012
| | | Quoted Prices
in Active
Markets for
Identical
Investments
(Level 1) | | Significant
Other
Observable
Inputs
(Level 2) | | Significant
Unobservable
Inputs
(Level 3) | | Total | |
Holmes Growth Fund | |
Investments in Securities*
Common Stocks: | |
Finance - Commercial | | $ | — | | | $ | 530,665 | | | $ | — | | | $ | 530,665 | | |
Metal - Iron | | | — | | | | — | | | | 100,000 | | | | 100,000 | | |
Quarrying | | | — | | | | — | | | | 379,951 | | | | 379,951 | | |
Real Estate Operating/Development | | | — | | | | — | | | | 100,000 | | | | 100,000 | | |
All Other Common Stocks | | | 28,302,692 | | | | — | | | | — | | | | 28,302,692 | | |
Exchange-Traded Funds | | | 916,850 | | | | — | | | | — | | | | 916,850 | | |
Warrants: | |
Gold Mining | | | — | | | | — | | | | — | | | | — | | |
Medical - Hospitals | | | — | | | | — | | | | — | | | | — | | |
Convertible Debenture: | |
Metal - Iron | | | — | | | | — | | | | 100,000 | | | | 100,000 | | |
Gold-Linked Note: | |
Gold Mining | | | — | | | | — | | | | 370,000 | | | | 370,000 | | |
Silver-Linked Note | | | — | | | | 282,820 | | | | — | | | | 282,820 | | |
Corporate Notes: | |
Electric - Generation | | | — | | | | — | | | | 150,000 | | | | 150,000 | | |
Transportation - Air Freight | | | — | | | | — | | | | 250,000 | | | | 250,000 | | |
Repurchase Agreement | | | 3,289,258 | | | | — | | | | — | | | | 3,289,258 | | |
Total | | $ | 32,508,800 | | | $ | 813,485 | | | $ | 1,449,951 | | | $ | 34,772,236 | | |
MegaTrends Fund | |
Investments in Securities*
Common Stocks: | |
Electric - Generation | | $ | — | | | $ | — | | | $ | 104,717 | | | $ | 104,717 | | |
Energy - Alternate Sources | | | — | | | | — | | | | 100,000 | | | | 100,000 | | |
Metal - Iron | | | — | | | | — | | | | 100,000 | | | | 100,000 | | |
Quarrying | | | — | | | | — | | | | 520,081 | | | | 520,081 | | |
Real Estate Operating/Development | | | — | | | | — | | | | 326,533 | | | | 326,533 | | |
All Other Common Stocks | | | 9,254,238 | | | | — | | | | — | | | | 9,254,238 | | |
Convertible Debenture: | |
Metal - Iron | | | — | | | | — | | | | 100,000 | | | | 100,000 | | |
Silver-Linked Note | | | — | | | | 97,555 | | | | — | | | | 97,555 | | |
Corporate Note: | |
Electric - Generation | | | — | | | | — | | | | 100,000 | | | | 100,000 | | |
Total | | $ | 9,254,238 | | | $ | 97,555 | | | $ | 1,351,331 | | | $ | 10,703,124 | | |
Global Resources Fund | |
Investments in Securities*
Common Stocks: | |
Diversified Minerals | | $ | 21,202,317 | | | $ | 339,999 | | | $ | — | | | $ | 21,542,316 | | |
Electric - Generation | | | — | | | | — | | | | 1,460,519 | | | | 1,460,519 | | |
Energy - Alternate Sources | | | — | | | | — | | | | 2,400,000 | | | | 2,400,000 | | |
Gold Mining | | | 38,775,325 | | | | — | | | | 1,300 | | | | 38,776,625 | | |
Metal - Copper | | | 25,273,041 | | | | — | | | | — | | | | 25,273,041 | | |
Metal - Diversified | | | 269,239 | | | | — | | | | 1,374,150 | | | | 1,643,389 | | |
Metal - Iron | | | — | | | | 132,600 | | | | 2,600,000 | | | | 2,732,600 | | |
Mining Services | | | 1,422,994 | | | | — | | | | 285,890 | | | | 1,708,884 | | |
Natural Resource Technology | | | — | | | | — | | | | 50,947 | | | | 50,947 | | |
Non - Ferrous Metals | | | 1,453,685 | | | | 26,250 | | | | — | | | | 1,479,935 | | |
Oil Companies - Exploration & Production | | | 49,552,055 | | | | 266,207 | | | | — | | | | 49,818,262 | | |
Oil Refining & Marketing | | | 22,845,250 | | | | — | | | | 426,390 | | | | 23,271,640 | | |
Platinum | | | — | | | | — | | | | — | | | | — | | |
137
Notes to Portfolios of Investments December 31, 2012
| | | Quoted Prices
in Active
Markets for
Identical
Investments
(Level 1) | | Significant
Other
Observable
Inputs
(Level 2) | | Significant
Unobservable
Inputs
(Level 3) | | Total | |
Global Resources Fund (cont'd) | |
Investments in Securities*
Common Stocks: (cont'd) | |
Quarrying | | $ | 3,735,500 | | | $ | — | | | $ | 4,900,009 | | | $ | 8,635,509 | | |
Real Estate Operating/Development | | | 1,105,375 | | | | — | | | | 7,443,544 | | | | 8,548,919 | | |
All Other Common Stocks | | | 245,706,327 | | | | — | | | | — | | | | 245,706,327 | | |
Real Estate Investment Trusts | | | 21,164,050 | | | | — | | | | — | | | | 21,164,050 | | |
Exchange-Traded Fund | | | 4,995,000 | | | | — | | | | — | | | | 4,995,000 | | |
Warrants: | |
Diversified Minerals | | | 19,156 | | | | — | | | | — | | | | 19,156 | | |
Gold Mining | | | 5,821,650 | | | | — | | | | — | | | | 5,821,650 | | |
Medical - Hospitals | | | — | | | | — | | | | — | | | | — | | |
Metal - Copper | | | — | | | | — | | | | — | | | | — | | |
Oil Companies - Exploration & Production | | | — | | | | 549,584 | | | | — | | | | 549,584 | | |
All Other Warrants | | | 508,097 | | | | — | | | | — | | | | 508,097 | | |
Master Limited Partnerships | | | 21,198,170 | | | | — | | | | — | | | | 21,198,170 | | |
Convertible Debentures: | |
Diversified Minerals | | | — | | | | — | | | | 147,635 | | | | 147,635 | | |
Mining Services | | | — | | | | 742,000 | | | | — | | | | 742,000 | | |
Gold-Linked Note: | |
Gold Mining | | | — | | | | — | | | | 8,615,000 | | | | 8,615,000 | | |
Silver-Linked Note | | | — | | | | 6,006,345 | | | | — | | | | 6,006,345 | | |
Corporate Notes: | |
Electric - Generation | | | — | | | | — | | | | 3,000,000 | | | | 3,000,000 | | |
Transportation - Air Freight | | | — | | | | — | | | | 500,000 | | | | 500,000 | | |
Repurchase Agreement | | | 11,390,654 | | | | — | | | | — | | | | 11,390,654 | | |
Total | | $ | 476,437,885 | | | $ | 8,062,985 | | | $ | 33,205,384 | | | $ | 517,706,254 | | |
World Precious Minerals Fund | |
Investments in Securities*
Common Stocks: | |
Diversified Minerals | | $ | 7,934,594 | | | $ | 438,070 | | | $ | — | | | $ | 8,372,664 | | |
Gold Mining | | | 174,558,375 | | | | 626,235 | | | | 1,797,024 | | | | 176,981,634 | | |
Metal - Copper | | | 1,185,131 | | | | — | | | | — | | | | 1,185,131 | | |
Metal - Diversified | | | 17,299,808 | | | | — | | | | 388,043 | | | | 17,687,851 | | |
Oil Companies - Exploration & Production | | | — | | | | — | | | | — | | | | — | | |
Platinum | | | 1,913,296 | | | | — | | | | — | | | | 1,913,296 | | |
All Other Common Stocks | | | 55,276,567 | | | | — | | | | — | | | | 55,276,567 | | |
Exchange-Traded Funds | | | 6,265,946 | | | | — | | | | — | | | | 6,265,946 | | |
Warrants: | |
Gold Mining | | | 12,947,815 | | | | 9,928 | | | | — | | | | 12,957,743 | | |
Medical - Hospitals | | | — | | | | — | | | | — | | | | — | | |
Metal - Copper | | | — | | | | — | | | | — | | | | — | | |
Metal - Diversified | | | 3,601 | | | | — | | | | — | | | | 3,601 | | |
All Other Warrants | | | 1,186,194 | | | | — | | | | — | | | | 1,186,194 | | |
Special Warrants: | |
Finance - Investment Banker/Broker | | | — | | | | 325,391 | | | | — | | | | 325,391 | | |
Gold/Mineral Exploration & Development | | | — | | | | — | | | | — | | | | — | | |
Rights | | | 91,686 | | | | — | | | | — | | | | 91,686 | | |
Purchased Call Options: | |
Gold Mining | | | 3,464,147 | | | | 87,675 | | | | — | | | | 3,551,822 | | |
Silver Mining | | | 209,684 | | | | 575 | | | | — | | | | 210,259 | | |
All Other Purchased Call Options | | | 311,748 | | | | — | | | | — | | | | 311,748 | | |
Convertible Debenture: | |
Metal - Iron | | | — | | | | — | | | | 1,200,000 | | | | 1,200,000 | | |
Gold-Linked Note: | |
Gold Mining | | | — | | | | — | | | | 5,845,000 | | | | 5,845,000 | | |
Silver-Linked Note | | | — | | | | 7,652,250 | | | | — | | | | 7,652,250 | | |
138
Notes to Portfolios of Investments December 31, 2012
| | | Quoted Prices
in Active
Markets for
Identical
Investments
(Level 1) | | Significant
Other
Observable
Inputs
(Level 2) | | Significant
Unobservable
Inputs
(Level 3) | | Total | |
World Precious Minerals Fund (cont'd) | |
Investments in Securities* (cont'd) | |
Corporate Note: | |
Electric - Generation | | $ | — | | | $ | — | | | $ | 800,000 | | | $ | 800,000 | | |
Repurchase Agreement | | | 13,712,538 | | | | — | | | | — | | | | 13,712,538 | | |
Total | | $ | 296,361,130 | | | $ | 9,140,124 | | | $ | 10,030,067 | | | $ | 315,531,321 | | |
Gold and Precious Metals Fund | |
Investments in Securities*
Common Stocks | | $ | 109,083,167 | | | $ | — | | | $ | — | | | $ | 109,083,167 | | |
Exchange-Traded Funds | | | 8,231,306 | | | | — | | | | — | | | | 8,231,306 | | |
Warrants: | |
Gold Mining | | | 8,927,771 | | | | 8,341 | | | | — | | | | 8,936,112 | | |
Medical - Hospitals | | | — | | | | — | | | | — | | | | — | | |
All Other Warrants | | | 672,569 | | | | — | | | | — | | | | 672,569 | | |
Rights | | | 45,843 | | | | — | | | | — | | | | 45,843 | | |
Purchased Call Options: | |
Gold Mining | | | 1,513,985 | | | | 51,302 | | | | — | | | | 1,565,287 | | |
Silver Mining | | | 92,371 | | | | 7,175 | | | | — | | | | 99,546 | | |
All Other Purchased Call Options | | | 240,092 | | | | — | | | | — | | | | 240,092 | | |
Master Limited Partnership | | | 1,910,700 | | | | — | | | | — | | | | 1,910,700 | | |
Gold-Linked Note: | |
Gold Mining | | | — | | | | — | | | | 2,940,000 | | | | 2,940,000 | | |
Silver-Linked Note | | | — | | | | 4,027,500 | | | | — | | | | 4,027,500 | | |
Corporate Notes: | |
Electric - Generation | | | — | | | | — | | | | 300,000 | | | | 300,000 | | |
Gold Mining | | | — | | | | 6,125,612 | | | | — | | | | 6,125,612 | | |
Repurchase Agreement | | | 21,514,872 | | | | — | | | | — | | | | 21,514,872 | | |
Total | | $ | 152,232,676 | | | $ | 10,219,930 | | | $ | 3,240,000 | | | $ | 165,692,606 | | |
Eastern European Fund | |
Investments in Securities*
Common Stocks: | |
Agricultural Operations | | $ | — | | | $ | 5,426,724 | | | $ | — | | | $ | 5,426,724 | | |
Cellular Telecommunication | | | 5,886,573 | | | | 4,830,238 | | | | — | | | | 10,716,811 | | |
Chemicals - Diversified | | | — | | | | 4,818,623 | | | | — | | | | 4,818,623 | | |
Commercial Banks - Non US | | | 28,012,486 | | | | 1,311,452 | | | | — | | | | 29,323,938 | | |
Electric - Generation | | | — | | | | 2,095,836 | | | | — | | | | 2,095,836 | | |
Food - Retail | | | — | | | | 4,699,075 | | | | — | | | | 4,699,075 | | |
Food - Wholesale/Distribution | | | — | | | | 5,215,245 | | | | — | | | | 5,215,245 | | |
Medical - Drugs | | | — | | | | 1,568,355 | | | | — | | | | 1,568,355 | | |
Metal - Diversified | | | 4,158,396 | | | | 8,258,693 | | | | — | | | | 12,417,089 | | |
Oil Companies - Integrated | | | 13,417,860 | | | | 12,572,245 | | | | — | | | | 25,990,105 | | |
Telecom Services | | | — | | | | 2,068,473 | | | | — | | | | 2,068,473 | | |
Telephone - Integrated | | | — | | | | 1,865,620 | | | | — | | | | 1,865,620 | | |
Television | | | — | | | | 1,116,129 | | | | — | | | | 1,116,129 | | |
Tobacco | | | — | | | | 1,800,809 | | | | — | | | | 1,800,809 | | |
All Other Common Stocks | | | 52,851,901 | | | | — | | | | — | | | | 52,851,901 | | |
Preferred Stock: | |
Pipelines | | | — | | | | 3,613,647 | | | | — | | | | 3,613,647 | | |
Real Estate Investment Trust | | | 1,582,580 | | | | — | | | | — | | | | 1,582,580 | | |
Exchange-Traded Fund | | | 1,998,000 | | | | — | | | | — | | | | 1,998,000 | | |
Warrants | | | 2,548,109 | | | | — | | | | — | | | | 2,548,109 | | |
Purchased Call Options: | |
Exchange-Traded Funds | | | — | | | | 2,798,910 | | | | — | | | | 2,798,910 | | |
Total | | $ | 110,455,905 | | | $ | 64,060,074 | | | $ | — | | | $ | 174,515,979 | | |
Other Financial Instruments
Written Options | | $ | — | | | $ | 324,000 | | | $ | — | | | $ | 324,000 | | |
139
Notes to Portfolios of Investments December 31, 2012
| | | Quoted Prices
in Active
Markets for
Identical
Investments
(Level 1) | | Significant
Other
Observable
Inputs
(Level 2) | | Significant
Unobservable
Inputs
(Level 3) | | Total | |
Global Emerging Markets Fund | |
Investments in Securities*
Common Stocks: | |
Agricultural Chemicals | | $ | 168,172 | | | $ | 93,788 | | | $ | — | | | $ | 261,960 | | |
Coal | | | — | | | | 128,154 | | | | — | | | | 128,154 | | |
Commercial Banks - Non US | | | 504,392 | | | | 174,675 | | | | — | | | | 679,067 | | |
Computer Services | | | — | | | | 84,832 | | | | — | | | | 84,832 | | |
Diversified Minerals | | | 9,750 | | | | 71,056 | | | | — | | | | 80,806 | | |
Electric - Integrated | | | — | | | | 70,152 | | | | — | | | | 70,152 | | |
Electronic Components - Miscellaneous | | | — | | | | 79,768 | | | | — | | | | 79,768 | | |
Electronic Components - Semiconductors | | | 63,360 | | | | 73,706 | | | | — | | | | 137,066 | | |
Finance - Leasing Company | | | 71,136 | | | | 100,102 | | | | — | | | | 171,238 | | |
Finance - Other Services | | | 79,208 | | | | 43,257 | | | | — | | | | 122,465 | | |
Gas - Distribution | | | — | | | | 77,210 | | | | — | | | | 77,210 | | |
Machinery - General Industrial | | | — | | | | 93,102 | | | | — | | | | 93,102 | | |
Miscellaneous Manufacturers | | | — | | | | 74,002 | | | | — | | | | 74,002 | | |
Multimedia | | | — | | | | 71,583 | | | | — | | | | 71,583 | | |
Real Estate Operating/Development | | | 109,480 | | | | 769,945 | | | | — | | | | 879,425 | | |
Steel - Specialty | | | — | | | | 83,539 | | | | — | | | | 83,539 | | |
Textile - Home Furnishings | | | 84,513 | | | | 84,907 | | | | — | | | | 169,420 | | |
Transportation - Marine | | | — | | | | 80,151 | | | | — | | | | 80,151 | | |
All Other Common Stocks | | | 2,554,321 | | | | — | | | | — | | | | 2,554,321 | | |
Preferred Stock: | |
Commercial Banks - Non US | | | — | | | | 82,597 | | | | — | | | | 82,597 | | |
Real Estate Investment Trusts | | | 170,118 | | | | — | | | | — | | | | 170,118 | | |
Exchange-Traded Funds | | | 518,555 | | | | — | | | | — | | | | 518,555 | | |
Convertible Debenture: | |
Metal - Iron | | | — | | | | — | | | | 100,000 | | | | 100,000 | | |
Corporate Notes: | |
Electric - Generation | | | — | | | | — | | | | 50,000 | | | | 50,000 | | |
Transportation - Air Freight | | | — | | | | — | | | | 50,000 | | | | 50,000 | | |
Total | | $ | 4,333,005 | | | $ | 2,336,526 | | | $ | 200,000 | | | $ | 6,869,531 | | |
China Region Fund | |
Investments in Securities*
Common Stocks: | |
Casino Services | | $ | — | | | $ | 476,756 | | | $ | — | | | $ | 476,756 | | |
Computers - Peripheral Equipment | | | — | | | | 190,312 | | | | — | | | | 190,312 | | |
Electronic Components - Semiconductors | | | — | | | | 345,734 | | | | — | | | | 345,734 | | |
Non - Ferrous Metals | | | — | | | | 26,250 | | | | — | | | | 26,250 | | |
Telecom Services | | | — | | | | 299,561 | | | | — | | | | 299,561 | | |
All Other Common Stocks | | | 26,336,117 | | | | — | | | | — | | | | 26,336,117 | | |
Exchange-Traded Funds | | | 1,227,112 | | | | — | | | | — | | | | 1,227,112 | | |
Purchased Call Options | |
Exchange-Traded Funds | | | 86,180 | | | | 9,650 | | | | — | | | | 95,830 | | |
Total | | $ | 27,649,409 | | | $ | 1,348,263 | | | $ | — | | | $ | 28,997,672 | | |
* Refer to the Portfolio of Investments for a detailed list of the Fund's investments.
During the year, the Holmes Growth Fund, Global Resources Fund, World Precious Minerals Fund, Gold and Precious Metals Fund and China Region Fund had transfers from Level 1 to Level 2 in the amount of $530,665, $1,314,639, $1,051,000, $8,341 and
140
Notes to Portfolios of Investments December 31, 2012
$26,250, respectively, due to the absence of a quoted trade at December 31, 2012, which resulted in the securities being valued at the mean between bid and asked quotations. The Eastern European Fund had transfers from Level 1 to Level 2 in the amount of $44,186,616 due to certain foreign securities being valued using a systematic fair value model at December 31, 2012, but not at the prior period end. The World Precious Minerals Fund transferred $640,206 during the year from Level 2 to Level 1 upon expiration of a regulatory hold. The Funds' policy is to recognize transfers in and transfers out as of the end of the reporting period.
The following is a reconciliation of assets and liabilities for which unobservable inputs (Level 3) were used in determining fair value during the period January 1, 2012, through December 31, 2012:
| | | Beginning
Balance
12/31/11 | | Purchases | | Sales | | Total
realized
gain (loss) | | Net
change in
unrealized
appreciation
(depreciation) | | Paydowns | | Transfers
out of
Level 3* | | Ending
Balance
12/31/12 | | Net
change in
unrealized
appreciation
(depreciation)
from
Investments
held as of
12/31/12(1) | |
Holmes Growth Fund | |
Investments in
Securities
Common Stocks: | |
Metal - Iron | | $ | 100,000 | | | $ | — | | | $ | — | | | $ | — | | | $ | — | | | $ | — | | | $ | — | | | $ | 100,000 | | | $ | — | | |
Quarrying | | | 380,000 | | | | — | | | | — | | | | — | | | | (49 | ) | | | — | | | | — | | | | 379,951 | | | | (49 | ) | |
Real Estate
Operating/
Development | | | 100,000 | | | | — | | | | — | | | | — | | | | — | | | | — | | | | — | | | | 100,000 | | | | — | | |
Convertible
Debenture: | |
Metal - Iron | | | 100,000 | | | | — | | | | — | | | | — | | | | — | | | | — | | | | — | | | | 100,000 | | | | — | | |
Gold Linked Note: | |
Gold Mining | | | — | | | | 370,000 | | | | — | | | | — | | | | — | | | | — | | | | — | | | | 370,000 | | | | — | | |
Corporate Notes: | |
Building - Heavy
Construction | | | — | | | | 377,301 | | | | — | | | | 7,699 | | | | — | | | | (385,000 | ) | | | — | | | | — | | | | — | | |
Electric -
Generation | | | — | | | | 150,000 | | | | — | | | | — | | | | — | | | | — | | | | — | | | | 150,000 | | | | — | | |
Transportation -
Air Freight | | | — | | | | 250,000 | | | | — | | | | — | | | | — | | | | — | | | | — | | | | 250,000 | | | | — | | |
Total Investments
in Securities | | $ | 680,000 | | | $ | 1,147,301 | | | $ | — | | | $ | 7,699 | | | $ | (49 | ) | | $ | (385,000 | ) | | $ | — | | | $ | 1,449,951 | | | $ | (49 | ) | |
MegaTrends Fund | |
Investments in
Securities
Common Stocks: | |
Electric -
Generation | | $ | 23,358 | | | $ | — | | | $ | — | | | $ | — | | | $ | 81,359 | | | $ | — | | | $ | — | | | $ | 104,717 | | | $ | 81,359 | | |
Energy -
Alternate
Sources | | | 100,000 | | | | — | | | | — | | | | — | | | | — | | | | — | | | | — | | | | 100,000 | | | | — | | |
Metal - Iron | | | 100,000 | | | | — | | | | — | | | | — | | | | — | | | | — | | | | — | | | | 100,000 | | | | — | | |
Quarrying | | | 520,000 | | | | — | | | | — | | | | — | | | | 81 | | | | — | | | | — | | | | 520,081 | | | | 81 | | |
Real Estate
Operating/
Development | | | 326,533 | | | | — | | | | — | | | | — | | | | — | | | | — | | | | — | | | | 326,533 | | | | — | | |
141
Notes to Portfolios of Investments December 31, 2012
| | | Beginning
Balance
12/31/11 | | Purchases | | Sales | | Total
realized
gain (loss) | | Net
change in
unrealized
appreciation
(depreciation) | | Paydowns | | Transfers
out of
Level 3* | | Ending
Balance
12/31/12 | | Net
change in
unrealized
appreciation
(depreciation)
from
Investments
held as of
12/31/12(1) | |
MegaTrends Fund (cont'd) | |
Investments in
Securities (cont'd) | |
Convertible
Debenture: | |
Metal - Iron | | $ | 100,000 | | | $ | — | | | $ | — | | | $ | — | | | $ | — | | | $ | — | | | $ | — | | | $ | 100,000 | | | $ | — | | |
Corporate Notes: | |
Building - Heavy
Construction | | | — | | | | 151,900 | | | | — | | | | 3,100 | | | | — | | | | (155,000 | ) | | | — | | | | — | | | | — | | |
Electric -
Generation | | | — | | | | 100,000 | | | | — | | | | — | | | | — | | | | — | | | | — | | | | 100,000 | | | | — | | |
Total Investments
in Securities | | $ | 1,169,891 | | | $ | 251,900 | | | $ | — | | | $ | 3,100 | | | $ | 81,440 | | | $ | (155,000 | ) | | $ | — | | | $ | 1,351,331 | | | $ | 81,440 | | |
Global Resources Fund | |
Investments in
Securities
Common Stocks: | |
Electric -
Generation | | $ | 325,779 | | | $ | — | | | $ | — | | | $ | — | | | $ | 1,134,740 | | | $ | — | | | $ | — | | | $ | 1,460,519 | | | $ | 1,134,740 | | |
Energy -
Alternate
Sources | | | 2,400,000 | | | | — | | | | (11,378 | ) | | | (3,511,710 | ) | | | 3,523,088 | | | | — | | | | — | | | | 2,400,000 | | | | — | | |
Gold Mining | | | 5,114 | | | | — | | | | — | | | | — | | | | (3,814 | ) | | | — | | | | — | | | | 1,300 | | | | (3,814 | ) | |
Metal - Copper | | | — | | | | — | | | | — | | | | — | | | | — | | | | — | | | | — | | | | — | | | | — | | |
Metal -
Diversified | | | 2,250,000 | | | | — | | | | — | | | | — | | | | (875,850 | ) | | | — | | | | — | | | | 1,374,150 | | | | (875,850 | ) | |
Metal - Iron | | | 2,600,000 | | | | — | | | | — | | | | — | | | | — | | | | — | | | | — | | | | 2,600,000 | | | | — | | |
Mining Services | | | 281,270 | | | | — | | | | — | | | | — | | | | 4,620 | | | | — | | | | — | | | | 285,890 | | | | 4,620 | | |
Natural
Resource
Technology | | | 7,500 | | | | — | | | | — | | | | — | | | | 43,447 | | | | — | | | | — | | | | 50,947 | | | | 43,447 | | |
Oil Refining &
Marketing | | | 415,466 | | | | — | | | | — | | | | — | | | | 10,924 | | | | — | | | | — | | | | 426,390 | | | | 10,924 | | |
Platinum | | | — | | | | — | | | | — | | | | — | | | | — | | | | — | | | | — | | | | — | | | | — | | |
Quarrying | | | 4,900,000 | | | | — | | | | — | | | | — | | | | 9 | | | | — | | | | — | | | | 4,900,009 | | | | 9 | | |
Real Estate
Operating/
Development | | | 7,443,544 | | | | — | | | | — | | | | — | | | | — | | | | — | | | | — | | | | 7,443,544 | | | | — | | |
Convertible
Debenture: | |
Diversified
Minerals | | | 490,798 | | | | — | | | | — | | | | — | | | | (343,163 | ) | | | — | | | | — | | | | 147,635 | | | | (343,163 | ) | |
Gold Linked Note: | |
Gold Mining | | | — | | | | 8,615,000 | | | | — | | | | — | | | | — | | | | — | | | | — | | | | 8,615,000 | | | | — | | |
Corporate Notes: | |
Building - Heavy
Construction | | | — | | | | 4,326,709 | | | | — | | | | 88,291 | | | | — | | | | (4,415,000 | ) | | | — | | | | — | | | | — | | |
Electric -
Generation | | | — | | | | 3,000,000 | | | | — | | | | — | | | | — | | | | — | | | | — | | | | 3,000,000 | | | | — | | |
Transportation -
Air Freight | | | — | | | | 500,000 | | | | — | | | | — | | | | — | | | | — | | | | — | | | | 500,000 | | | | — | | |
Total Investments
in Securities | | $ | 21,119,471 | | | $ | 16,441,709 | | | $ | (11,378 | ) | | $ | (3,423,419 | ) | | $ | 3,494,001 | | | $ | (4,415,000 | ) | | $ | — | | | $ | 33,205,384 | | | $ | (29,087 | ) | |
142
Notes to Portfolios of Investments December 31, 2012
| | | Beginning
Balance
12/31/11 | | Purchases | | Sales | | Total
realized
gain (loss) | | Net
change in
unrealized
appreciation
(depreciation) | | Paydowns | | Transfers
out of
Level 3* | | Ending
Balance
12/31/12 | | Net
change in
unrealized
appreciation
(depreciation)
from
Investments
held as of
12/31/12(1) | |
World Precious Minerals Fund | |
Investments in
Securities
Common Stocks: | |
Diamonds/
Precious
Stones | | $ | — | | | $ | — | | | $ | — | | | $ | (404,836 | ) | | $ | 404,836 | | | $ | — | | | $ | — | | | $ | — | | | $ | — | | |
Gold Mining | | | 3,465,857 | | | | — | | | | — | | | | — | | | | (1,668,833 | ) | | | — | | | | — | | | | 1,797,024 | | | | (1,668,833 | ) | |
Metal - Copper | | | — | | | | — | | | | — | | | | — | | | | — | | | | — | | | | — | | | | — | | | | — | | |
Metal -
Diversified | | | — | | | | 392,951 | | | | — | | | | — | | | | (4,908 | ) | | | — | | | | — | | | | 388,043 | | | | (4,908 | ) | |
Oil Companies -
Exploration &
Production | | | — | | | | — | | | | — | | | | — | | | | — | | | | — | | | | — | | | | — | | | | — | | |
Platinum | | | — | | | | — | | | | — | | | | — | | | | — | | | | — | | | | — | | | | — | | | | — | | |
Warrants: | |
Metal -
Diversified | | | — | | | | — | | | | — | | | | — | | | | — | | | | — | | | | — | | | | — | | | | — | | |
Special Warrants: | |
Gold/Mineral
Exploration &
Development | | | — | | | | — | | | | — | | | | — | | | | — | | | | — | | | | — | | | | — | | | | — | | |
Convertible
Debenture: | |
Metal - Iron | | | 1,200,000 | | | | — | | | | — | | | | — | | | | — | | | | — | | | | — | | | | 1,200,000 | | | | — | | |
Gold Linked Note: | |
Gold Mining | | | — | | | | 5,845,000 | | | | — | | | | — | | | | — | | | | — | | | | — | | | | 5,845,000 | | | | — | | |
Corporate Note: | |
Electric -
Generation | | | — | | | | 800,000 | | | | — | | | | — | | | | — | | | | — | | | | — | | | | 800,000 | | | | — | | |
Total Investments
in Securities | | $ | 4,665,857 | | | $ | 7,037,951 | | | $ | — | | | $ | (404,836 | ) | | $ | (1,268,905 | ) | | $ | — | | | $ | — | | | $ | 10,030,067 | | | $ | (1,673,741 | ) | |
Gold and Precious Metals Fund | |
Investments in
Securities
Gold Linked Note: | |
Gold Mining | | $ | — | | | $ | 2,940,000 | | | $ | — | | | $ | — | | | $ | — | | | $ | — | | | $ | — | | | $ | 2,940,000 | | | $ | — | | |
Corporate Notes: | |
Electric -
Generation | | | — | | | | 300,000 | | | | — | | | | — | | | | — | | | | — | | | | — | | | | 300,000 | | | | — | | |
Total Investments
in Securities | | $ | — | | | $ | 3,240,000 | | | $ | — | | | $ | — | | | $ | — | | | $ | — | | | $ | — | | | $ | 3,240,000 | | | $ | — | | |
Eastern European Fund | |
Financial
Derivatives
Liabilities | |
Written Options | | $ | — | | | $ | (223,450 | ) | | $ | 86,180 | | | $ | 137,270 | | | $ | — | | | $ | — | | | $ | — | | | $ | — | | | $ | — | | |
Total | | $ | — | | | $ | (223,450 | ) | | $ | 86,180 | | | $ | 137,270 | | | $ | — | | | $ | — | | | $ | — | | | $ | — | | | $ | — | | |
143
Notes to Portfolios of Investments December 31, 2012
| | | Beginning
Balance
12/31/11 | | Purchases | | Sales | | Total
realized
gain (loss) | | Net
change in
unrealized
appreciation
(depreciation) | | Paydowns | | Transfers
out of
Level 3* | | Ending
Balance
12/31/12 | | Net
change in
unrealized
appreciation
(depreciation)
from
Investments
held as of
12/31/12(1) | |
Global Emerging Markets Fund | |
Investments in
Securities
Convertible
Debenture: | | | |
Metal - Iron | | $ | 100,000 | | | $ | — | | | $ | — | | | $ | — | | | $ | — | | | $ | — | | | $ | — | | | $ | 100,000 | | | $ | — | | |
Corporate Notes: | |
Building - Heavy
Construction | | | — | | | | 88,200 | | | | — | | | | 1,584 | | | | (10,584 | ) | | | (79,200 | ) | | | — | | | | — | | | | — | | |
Transportation -
Air Freight | | | — | | | | 50,000 | | | | — | | | | — | | | | — | | | | — | | | | — | | | | 50,000 | | | | — | | |
Electric -
Generation | | | — | | | | 50,000 | | | | — | | | | — | | | | — | | | | — | | | | — | | | | 50,000 | | | | — | | |
Total Investments
in Securities | | $ | 100,000 | | | $ | 188,200 | | | $ | — | | | $ | 1,584 | | | $ | (10,584 | ) | | $ | (79,200 | ) | | $ | — | | | $ | 200,000 | | | $ | — | | |
China Region Fund | |
Investments in
Securities
Common Stocks: | |
Electronic
Components -
Miscellaneous | | $ | — | | | $ | — | | | $ | — | | | $ | (17 | ) | | $ | 17 | | | $ | — | | | $ | — | | | $ | — | | | $ | — | | |
Total Investments
in Securities | | $ | — | | | $ | — | | | $ | — | | | $ | (17 | ) | | $ | 17 | | | $ | — | | | $ | — | | | $ | — | | | $ | — | | |
* The Funds' policy is to recognize transfers in and transfers out as of the end of the reporting period.
(1) Any difference between Net change in unrealized appreciation (depreciation) from Investments held as of December 31, 2012 may be due to an investment no longer held or categorized as Level 3 at year end.
Significant unobservable inputs developed by the Valuation Committee for material Level 3 investments are as follows:
| | Fair Value at
12/31/12 | | Valuation
Technique(s) | | Unobservable
Input | | Range
(Weighted
Average) | |
Holmes Growth Fund | |
Investments in Securities
Common Stocks | | $ | 579,951 | | | Market transaction(1) | | Discount | | | 0 | % | |
Convertible Debenture | | | 100,000 | | | Market transaction(1) | | Discount | | | 0 | % | |
Gold-Linked Note | | | 370,000 | | | Market transaction(1) | | Discount | | | 0 | % | |
Corporate Notes | | | 400,000 | | | Market transaction(1) | | Discount | | | 0 | % | |
MegaTrends Fund | |
Investments in Securities
Common Stocks | | | 1,151,331 | | | Market transaction(1) | | Discount | | | 0 | % | |
Convertible Debenture | | | 100,000 | | | Market transaction(1) | | Discount | | | 0 | % | |
Corporate Note | | | 100,000 | | | Market transaction(1) | | Discount | | | 0 | % | |
Global Resources Fund | |
Investments in Securities
Common Stocks | | | 20,942,749 | | | Market transaction(1) | | Discount | | | 0 | %-100% (19%) | |
Convertible Debenture | | | 147,635 | | | Market transaction(1) | | Discount | | | 71 | % | |
Gold-Linked Note | | | 8,615,000 | | | Market transaction(1) | | Discount | | | 0 | % | |
Corporate Notes | | | 3,500,000 | | | Market transaction(1) | | Discount | | | 0 | % | |
144
Notes to Portfolios of Investments December 31, 2012
| | Fair Value at
12/31/12 | | Valuation
Technique(s) | | Unobservable
Input | | Range
(Weighted
Average) | |
World Precious Minerals Fund | |
Investments in Securities
Common Stocks | | $ | 2,185,067 | | | Market transaction(1) | | Discount | | | 0 | %-100% (55%) | |
Warrants | | | — | | | Market transaction(1) | | Discount | | | 0 | % | |
Special Warrants | | | — | | | Market transaction(1) | | Discount | | | 100 | % | |
Convertible Debenture | | | 1,200,000 | | | Market transaction(1) | | Discount | | | 0 | % | |
Gold-Linked Note | | | 5,845,000 | | | Market transaction(1) | | Discount | | | 0 | % | |
Corporate Note | | | 800,000 | | | Market transaction(1) | | Discount | | | 0 | % | |
Gold and Precious Metals Fund | |
Investments in Securities
Gold-Linked Note | | | 2,940,000 | | | Market transaction(1) | | Discount | | | 0 | % | |
Corporate Note | | | 300,000 | | | Market transaction(1) | | Discount | | | 0 | % | |
Global Emerging Markets Fund | |
Investments in Securities
Convertible Debenture | | | 100,000 | | | Market transaction(1) | | Discount | | | 0 | % | |
Corporate Notes | | | 100,000 | | | Market transaction(1) | | Discount | | | 0 | % | |
(1) Market transaction refers to most recent known market transaction, including transactions in which the fund participated, as adjusted for any discount as discussed below.
The majority of securities classified as Level 3 are private companies. The initial valuation is usually cost, which is then adjusted as determined by the Valuation Committee for subsequent known market transactions and evaluated for progress against anticipated milestones and current operations. An evaluation that the holding no longer meets expectations could result in the application of discounts and a significantly lower fair valuation.
Affiliated Companies - Indicated in Portfolio of Investments as "+"
The Investment Company Act of 1940 defines affiliates as companies in which the Fund owns at least 5% of the outstanding voting securities. The following is a summary of transactions with each affiliated company during the year ended December 31, 2012.
| | | Shares of Affiliated Companies | |
Holmes Growth Fund | | December 31, 2011 | | Additions | | Reductions | | December 31, 2012 | |
IOU Financial, Inc. | | | 1,520,000 | | | | 18,000 | | | | — | | | | 1,538,000 | | |
At December 31, 2012, the value of investments in affiliated companies was $530,665 representing 1.53% of net assets, and the total cost was $596,721. There were no realized gains or losses on transactions, and there was no income earned for the year.
| | | Shares of Affiliated Companies | |
Global Resources Fund | | December 31, 2011 | | Additions | | Reductions | | December 31, 2012 | |
African Potash Ltd. | | | 15,800,000 | | | | 25,000 | | | | — | | | | 15,825,000 | | |
Agriterra Ltd. | | | 50,972,900 | | | | 25,012,000 | | | | (8,096,300 | ) | | | 67,888,600 | | |
Pacific Coal Resources Ltd. | | | 18,793,115 | | | | 4,246,000 | | | | — | | | | 23,039,115 | | |
Pacific Green Energy Corp. | | | 2,400,000 | | | | — | | | | — | | | | 2,400,000 | | |
Pacific Power Generation Corp. | | | 4,868,396 | | | | — | | | | — | | | | 4,868,396 | | |
Pacific Stone Tech, Inc. | | | 22,659 | | | | — | | | | — | | | | 22,659 | | |
PetroMagdalena Energy Corp. | | | 9,153,485 | | | | 243,735 | | | | (9,397,220 | ) | | | — | (a) | |
Range Energy Resources, Inc. | | | 15,100,000 | | | | — | | | | — | | | | 15,100,000 | | |
145
Notes to Portfolios of Investments December 31, 2012
At December 31, 2012, the value of investments in affiliated companies was $17,836,972 representing 3.35% of net assets, and the total cost was $44,639,852. Net realized losses on transactions were $6,610,324, and there was no income earned for the year.
| | | Shares of Affiliated Companies | |
World Precious Minerals Fund | | December 31, 2011 | | Additions | | Reductions | | December 31, 2012 | |
Aldridge Minerals, Inc. | | | 2,000,000 | | | | 34,500 | | | | — | | | | 2,034,500 | (a) | |
Candente Gold Corp. | | | 5,625,000 | | | | 15,000 | | | | — | | | | 5,640,000 | | |
Golden Arrow Resources Corp. | | | 2,150,000 | | | | 5,000 | | | | — | | | | 2,155,000 | | |
Gran Colombia Gold Corp. | | | 23,792,338 | | | | 1,850,300 | | | | (256,800 | ) | | | 25,385,838 | | |
Klondex Mines Ltd. | | | 3,060,000 | | | | 1,428,200 | | | | — | | | | 4,488,200 | | |
Mirasol Resources Ltd. | | | 2,125,000 | | | | 85,000 | | | | — | | | | 2,210,000 | | |
Moss Lake Gold Mines Ltd. | | | 3,345,000 | | | | — | | | | — | | | | 3,345,000 | | |
PMI Gold Corp. | | | 12,560,000 | | | | 119,500 | | | | (7,679,500 | ) | | | 5,000,000 | (a) | |
Rochester Resources Ltd. | | | 7,755,000 | | | | — | | | | (755,000 | ) | | | 7,000,000 | | |
Solvista Gold Corp. | | | 2,685,000 | | | | — | | | | (65,000 | ) | | | 2,620,000 | (a) | |
West Kirkland Mining, Inc. | | | 1,285,000 | | | | 215,000 | | | | — | | | | 1,500,000 | (a) | |
At December 31, 2012, the value of investments in affiliated companies was $22,358,033 representing 6.99% of net assets, and the total cost was $46,008,262. Net realized gains on transactions were $4,045,595, and there was no income earned for the year.
(a) At December 31, 2012, the company is no longer defined as an affiliate, although it was an affiliated company during the year.
Restricted Securities - Indicated in Portfolio of Investments as "RS"
The following securities are subject to contractual and regulatory restrictions on resale or transfer. These investments may involve a high degree of business and financial risk. Because of the thinly traded markets for these investments, a Fund may be unable to liquidate its securities in a timely manner, especially if there is negative news regarding the specific securities or the markets overall. These securities could decline significantly in value before the Fund could liquidate these securities. The issuer bears the cost of registration, if any, involved in the disposition of these securities.
Holmes Growth Fund | | Acquisition
Date | | Cost per
Share/Unit | |
Aeroservicios Especializados, S.A de C.V., Corporate Note | | 12/31/12 | | $ | 100.00 | | |
Andean Pacific Iron Corp., 144A (formerly Pacific Iron Corp.) | | 10/03/11 | | $ | 1.00 | | |
Andean Pacific Iron Corp., Convertible Debenture | | 06/07/11 | | $ | 100.00 | | |
Gran Colombia Gold Corp., 144A, Gold-Linked Note | | 10/26/12 | | $ | 1,000.00 | | |
Gran Colombia Gold Corp., 144A, Warrants (October 2017) | | 10/26/12 | | $ | 0.00 | | |
Pacific Infrastructure, Inc. | | 11/22/10 | | $ | 1.00 | | |
Pacific Power Generation Corp., Corporate Note | | 05/25/12 | | $ | 100.00 | | |
Pacific Stone Tech, Inc. | | 04/19/10 | | $ | 216.28 | | |
As of December 31, 2012, the total cost of restricted securities was $1,450,000 and the total value was $1,449,951, representing 4.19% of net assets.
MegaTrends Fund | | Acquisition
Date | | Cost per
Share/Unit | |
Andean Pacific Iron Corp., 144A (formerly Pacific Iron Corp.) | | 10/03/11 | | $ | 1.00 | | |
Andean Pacific Iron Corp., Convertible Debenture | | 06/07/11 | | $ | 100.00 | | |
Pacific Green Energy Corp. | | 03/24/11 | | $ | 1.00 | | |
Pacific Infrastructure, Inc. | | 08/06/10-11/22/10 | | $ | 1.00 | | |
Pacific Power Generation Corp. | | 08/06/10 | | $ | 0.07 | | |
Pacific Power Generation Corp., Corporate Note | | 05/25/12 | | $ | 100.00 | | |
Pacific Stone Tech, Inc. | | 04/19/10 | | $ | 216.22 | | |
146
Notes to Portfolios of Investments December 31, 2012
As of December 31, 2012, the total cost of restricted securities was $1,270,000 and the total value was $1,351,331, representing 12.92% of net assets.
Global Resources Fund | | Acquisition
Date | | Cost per
Share/Unit | |
Aeroservicios Especializados, S.A de C.V., Corporate Note | | 12/31/12 | | $ | 100.00 | | |
Andean Pacific Iron Corp., 144A (formerly Pacific Iron Corp.) | | 10/03/11 | | $ | 1.00 | | |
GoviEx Uranium, Inc. | | 10/04/07 | | $ | 1.96 | | |
Gran Colombia Gold Corp., 144A, Gold-Linked Note | | 10/26/12 | | $ | 1,000.00 | | |
Gran Colombia Gold Corp., 144A, Warrants (October 2017) | | 10/26/12 | | $ | 0.00 | | |
I-Pulse, Inc. | | 10/04/07 | | $ | 1.88 | | |
Osmium Holdings S.A. | | 10/22/96-01/29/98 | | $ | 987.07 | | |
Pacific Green Energy Corp. | | 03/24/11 | | $ | 1.00 | | |
Pacific Infrastructure, Inc. | | 08/06/10-11/22/10 | | $ | 1.00 | | |
Pacific Power Generation Corp. | | 08/06/10 | | $ | 0.07 | | |
Pacific Power Generation Corp., Corporate Note | | 05/25/12 | | $ | 100.00 | | |
Pacific Stone Tech, Inc. | | 04/19/10 | | $ | 216.22 | | |
Value Creation, Inc. | | 08/11/06 | | $ | 10.60 | | |
As of December 31, 2012, the total cost of restricted securities was $34,957,841 and the total value was $32,770,559, representing 6.15% of net assets.
World Precious Minerals Fund | | Acquisition
Date | | Cost per
Share/Unit | |
Andean Pacific Iron Corp., Convertible Debenture
(formerly Pacific Iron Corp.) | | 06/07/11 | | $ | 100.00 | | |
Difference Capital Funding, Inc., 144A, Special Warrants | | 10/26/12 | | $ | 0.35 | | |
Gran Colombia Gold Corp., 144A, Gold-Linked Note | | 10/26/12 | | $ | 1,000.00 | | |
Gran Colombia Gold Corp., 144A, Warrants (October 2017) | | 10/26/12 | | $ | 0.00 | | |
Osmium Holdings S.A. | | 10/22/96-01/29/98 | | $ | 1,280.75 | | |
Pacific Power Generation Corp., Corporate Note | | 05/25/12 | | $ | 100.00 | | |
Taurus Gold Ltd., 144A | | 05/31/11-12/12/12 | | $ | 1.21 | | |
Western Exploration & Development Ltd., 144A, Special Warrants
(December 2049) | | 08/14/97 | | $ | 0.50 | | |
As of December 31, 2012, the total cost of restricted securities was $12,503,977 and the total value was $9,946,298, representing 3.11% of net assets.
Gold and Precious Metals Fund | | Acquisition
Date | | Cost per
Share/Unit | |
Gran Colombia Gold Corp., 144A, Gold-Linked Note | | 10/26/12 | | $ | 1,000.00 | | |
Gran Colombia Gold Corp., 144A, Warrants (October 2017) | | 10/26/12 | | $ | 0.00 | | |
Pacific Power Generation Corp., Corporate Note | | 05/25/12 | | $ | 100.00 | | |
As of December 31, 2012, the total cost of restricted securities was $3,240,000 and the total value was $3,240,000, representing 1.95% of net assets.
Global Emerging Markets Fund | | Acquisition
Date | | Cost per
Share/Unit | |
Aeroservicios Especializados, S.A de C.V., Corporate Note | | 12/31/12 | | $ | 100.00 | | |
Andean Pacific Iron Corp., Convertible Debenture
(formerly Pacific Iron Corp.) | | 06/07/11 | | $ | 100.00 | | |
Pacific Power Generation Corp., Corporate Note | | 05/25/12 | | $ | 100.00 | | |
As of December 31, 2012, the total cost of restricted securities was $200,000 and the total value was $200,000, representing 2.59% of net assets.
147
Statements of Assets and Liabilities
| | | U.S. Treasury
Securities
Cash Fund | | U.S. Government
Securities
Savings Fund | |
Investments, at identified cost | | $ | 81,255,087 | | | $ | 140,528,085 | | |
Assets | |
Investments, at value: | |
Securities | | $ | 9,999,948 | | | $ | 76,852,583 | | |
Repurchase agreements | | | 71,255,139 | | | | 63,675,502 | | |
Cash | | | — | | | | — | | |
Receivables: | |
Interest | | | 276 | | | | 11,189 | | |
Capital shares sold | | | 913,821 | | | | 368,950 | | |
From adviser | | | 6,436 | | | | — | | |
Other assets | | | 29,491 | | | | 42,474 | | |
Total Assets | | | 82,205,111 | | | | 140,950,698 | | |
Liabilities | |
Payables: | |
Investments purchased | | | — | | | | — | | |
Capital shares redeemed | | | 1,972,874 | | | | 479,025 | | |
Advisor and affiliates | | | — | | | | 59 | | |
Dividends and distributions | | | — | | | | — | | |
Accounts payable and accrued expenses | | | 40,387 | | | | 46,533 | | |
Due to custodian | | | — | | | | — | | |
Total Liabilities | | | 2,013,261 | | | | 525,617 | | |
Net Assets | | $ | 80,191,850 | | | $ | 140,425,081 | | |
Net Assets Consist of: | |
Paid-in capital | | $ | 80,190,699 | | | $ | 140,422,550 | | |
Accumulated undistributed net investment income | | | 1,151 | | | | 2,531 | | |
Accumulated net realized loss on investments | | | — | | | | — | | |
Net unrealized appreciation of investments | | | — | | | | — | | |
Net assets applicable to capital shares outstanding | | $ | 80,191,850 | | | $ | 140,425,081 | | |
By share class | |
Net Assets | |
Investor class | | $ | 80,191,850 | | | $ | 140,425,081 | | |
Capital shares outstanding, an unlimited number of
no par shares authorized | |
Investor class | | | 80,267,021 | | | | 140,592,327 | | |
Net Asset Value, Public Offering Price, Redemption
Price, per share | |
Investor class | | $ | 1.00 | | | $ | 1.00 | | |
See accompanying notes to financial statements.
148
December 31, 2012
| | | Near-Term
Tax Free Fund | | Tax Free
Fund | |
Investments, at identified cost | | $ | 42,959,324 | | | $ | 20,272,578 | | |
Assets | |
Investments, at value: | |
Securities | | $ | 39,712,906 | | | $ | 21,887,246 | | |
Repurchase agreements | | | 4,547,030 | | | | — | | |
Cash | | | — | | | | 938,794 | | |
Receivables: | |
Interest | | | 481,498 | | | | 274,697 | | |
Capital shares sold | | | — | | | | 96,099 | | |
From adviser | | | 5,661 | | | | 3,493 | | |
Other assets | | | 9,061 | | | | 7,511 | | |
Total Assets | | | 44,756,156 | | | | 23,207,840 | | |
Liabilities | |
Payables: | |
Investments purchased | | | 112,015 | | | | — | | |
Capital shares redeemed | | | 53,829 | | | | 15,782 | | |
Advisor and affiliates | | | — | | | | — | | |
Dividends and distributions | | | 13,698 | | | | 11,703 | | |
Accounts payable and accrued expenses | | | 48,234 | | | | 42,317 | | |
Due to custodian | | | 19,070 | | | | — | | |
Total Liabilities | | | 246,846 | | | | 69,802 | | |
Net Assets | | $ | 44,509,310 | | | $ | 23,138,038 | | |
Net Assets Consist of: | |
Paid-in capital | | $ | 43,405,759 | | | $ | 21,516,844 | | |
Accumulated undistributed net investment income | | | 17,894 | | | | 35,391 | | |
Accumulated net realized loss on investments | | | (214,956 | ) | | | (28,865 | ) | |
Net unrealized appreciation of investments | | | 1,300,613 | | | | 1,614,668 | | |
Net assets applicable to capital shares outstanding | | $ | 44,509,310 | | | $ | 23,138,038 | | |
By share class | |
Net Assets | |
Investor class | | $ | 44,509,310 | | | $ | 23,138,038 | | |
Capital shares outstanding, an unlimited number of
no par shares authorized | |
Investor class | | | 19,606,610 | | | | 1,790,505 | | |
Net Asset Value, Public Offering Price, Redemption
Price, per share | |
Investor class | | $ | 2.27 | | | $ | 12.92 | | |
149
Statements of Assets and Liabilities
| | | All American
Equity Fund | | Holmes
Growth Fund | | MegaTrends
Fund | |
Investments, at identified cost | | $ | 15,937,072 | | | $ | 32,792,613 | | | $ | 10,509,543 | | |
Assets | |
Investments, at value: | |
Securities of unaffiliated issuers | | $ | 15,797,860 | | | $ | 30,952,313 | | | $ | 10,703,124 | | |
Securities of affiliated issuers | | | — | | | | 530,665 | | | | — | | |
Repurchase agreements | | | 960,296 | | | | 3,289,258 | | | | — | | |
Cash | | | — | | | | — | | | | 56,439 | | |
Foreign currencies (Cost $0, $0, $0, $19,727 and $66,369) | | | — | | | | — | | | | — | | |
Receivables: | |
Investments sold | | | 53,049 | | | | 491,028 | | | | 2,315,120 | | |
Dividends and interest | | | 11,902 | | | | 19,171 | | | | 14,843 | | |
Capital shares sold | | | 74,085 | | | | 3,559 | | | | 849 | | |
From adviser | | | — | | | | — | | | | 1,324 | | |
Other assets | | | 18,793 | | | | 24,317 | | | | 19,236 | | |
Total Assets | | | 16,915,985 | | | | 35,310,311 | | | | 13,110,935 | | |
Liabilities | |
Payables: | |
Investments purchased | | | — | | | | 548,870 | | | | 2,490,223 | | |
Capital shares redeemed | | | 14,944 | | | | 42,163 | | | | 116,748 | | |
Adviser and affiliates | | | 12,238 | | | | 34,686 | | | | — | | |
Accounts payable and accrued expenses | | | 42,735 | | | | 45,214 | | | | 47,037 | | |
Total Liabilities | | | 69,917 | | | | 670,933 | | | | 2,654,008 | | |
Net Assets | | $ | 16,846,068 | | | $ | 34,639,378 | | | $ | 10,456,927 | | |
Net Assets Consist of: | |
Paid-in capital | | $ | 16,054,767 | | | $ | 31,726,268 | | | $ | 23,290,744 | | |
Accumulated undistributed net investment income (distributions in excess of
net investment income) | | | 43,951 | | | | (25,273 | ) | | | (19,681 | ) | |
Accumulated net realized gain (loss) on investments and foreign currencies | | | (73,734 | ) | | | 958,760 | | | | (13,007,716 | ) | |
Net unrealized appreciation (depreciation) of investments and other assets and
liabilities denominated in foreign currencies | | | 821,084 | | | | 1,979,623 | | | | 193,580 | | |
Net assets applicable to capital shares outstanding | | $ | 16,846,068 | | | $ | 34,639,378 | | | $ | 10,456,927 | | |
By share class | |
Net Assets | |
Investor class | | $ | 16,846,068 | | | $ | 34,639,378 | | | $ | 10,326,664 | | |
Institutional class | | | N/A | | | | N/A | | | | 130,263 | | |
Capital shares outstanding, an unlimited number of
no par shares authorized | |
Investor class | | | 663,303 | | | | 1,871,483 | | | | 1,278,214 | | |
Institutional class | | | N/A | | | | N/A | | | | 16,566 | | |
Net Asset Value, Public Offering Price, Redemption
Price, per share | |
Investor class | | $ | 25.40 | | | $ | 18.51 | | | $ | 8.08 | | |
Institutional class | | | N/A | | | | N/A | | | | 7.86 | | |
See accompanying notes to financial statements.
150
December 31, 2012
| | | Global
Resources Fund | | World Precious
Minerals Fund | |
Investments, at identified cost | | $ | 539,065,596 | | | $ | 408,118,392 | | |
Assets | |
Investments, at value: | |
Securities of unaffiliated issuers | | $ | 488,478,628 | | | $ | 279,460,750 | | |
Securities of affiliated issuers | | | 17,836,972 | | | | 22,358,033 | | |
Repurchase agreements | | | 11,390,654 | | | | 13,712,538 | | |
Cash | | | — | | | | 79,475 | | |
Foreign currencies (Cost $0, $0, $0, $19,727 and $66,369) | | | 19,780 | | | | 66,549 | | |
Receivables: | |
Investments sold | | | 18,708,824 | | | | 5,869,498 | | |
Dividends and interest | | | 178,999 | | | | 136,210 | | |
Capital shares sold | | | 1,236,554 | | | | 150,557 | | |
From adviser | | | — | | | | — | | |
Other assets | | | 137,848 | | | | 104,170 | | |
Total Assets | | | 537,988,259 | | | | 321,937,780 | | |
Liabilities | |
Payables: | |
Investments purchased | | | 3,186,367 | | | | 752,548 | | |
Capital shares redeemed | | | 1,481,815 | | | | 834,598 | | |
Adviser and affiliates | | | 688,196 | | | | 375,475 | | |
Accounts payable and accrued expenses | | | 184,459 | | | | 154,534 | | |
Total Liabilities | | | 5,540,837 | | | | 2,117,155 | | |
Net Assets | | $ | 532,447,422 | | | $ | 319,820,625 | | |
Net Assets Consist of: | |
Paid-in capital | | $ | 931,944,240 | | | $ | 562,519,906 | | |
Accumulated undistributed net investment income (distributions in excess of
net investment income) | | | 4,847,474 | | | | (25,841,906 | ) | |
Accumulated net realized gain (loss) on investments and foreign currencies | | | (382,986,873 | ) | | | (124,269,571 | ) | |
Net unrealized appreciation (depreciation) of investments and other assets and
liabilities denominated in foreign currencies | | | (21,357,419 | ) | | | (92,587,804 | ) | |
Net assets applicable to capital shares outstanding | | $ | 532,447,422 | | | $ | 319,820,625 | | |
By share class | |
Net Assets | |
Investor class | | $ | 438,371,904 | | | $ | 319,051,832 | | |
Institutional class | | | 94,075,518 | | | | 768,793 | | |
Capital shares outstanding, an unlimited number of
no par shares authorized | |
Investor class | | | 44,780,392 | | | | 27,274,074 | | |
Institutional class | | | 9,656,594 | | | | 65,744 | | |
Net Asset Value, Public Offering Price, Redemption
Price, per share | |
Investor class | | $ | 9.79 | | | $ | 11.70 | | |
Institutional class | | | 9.74 | | | | 11.69 | | |
151
Statements of Assets and Liabilities
| | | Gold and Precious
Metals Fund | | Eastern European
Fund | |
Investments, at identified cost | | $ | 177,071,867 | | | $ | 148,881,443 | | |
Assets | |
Investments, at value: | |
Securities | | $ | 144,177,734 | | | $ | 174,515,979 | | |
Repurchase agreements | | | 21,514,872 | | | | — | | |
Cash | | | 1,124 | | | | 693,523 | | |
Foreign currencies (Cost $16,535, $0, $1,205 and $5,352) | | | 16,580 | | | | — | | |
Receivables: | |
Investments sold | | | 15,809 | | | | 1,333,544 | | |
Dividends and interest | | | 162,944 | | | | 145,935 | | |
Capital shares sold | | | 1,744,127 | | | | 191,601 | | |
From adviser | | | — | | | | — | | |
Other assets | | | 68,449 | | | | 61,249 | | |
Total Assets | | | 167,701,639 | | | | 176,941,831 | | |
Liabilities | |
Payables: | |
Investments purchased | | | 637,292 | | | | 1,953,886 | | |
Capital shares redeemed | | | 237,195 | | | | 637,477 | | |
Adviser and affiliates | | | 209,737 | | | | 241,324 | | |
Accounts payable and accrued expenses | | | 93,400 | | | | 98,464 | | |
Written options at value (Premiums $0, $291,560, $0 and $0) | | | — | | | | 324,000 | | |
Total Liabilities | | | 1,177,624 | | | | 3,255,151 | | |
Net Assets | | $ | 166,524,015 | | | $ | 173,686,680 | | |
Net Assets Consist of: | |
Paid-in capital | | $ | 193,734,160 | | | $ | 461,727,695 | | |
Accumulated undistributed net investment income (distributions in excess of
net investment income) | | | (1,677,267 | ) | | | 1,655,933 | | |
Accumulated net realized loss on investments and foreign currencies | | | (14,152,753 | ) | | | (315,297,755 | ) | |
Net unrealized appreciation (depreciation) of investments and other assets and
liabilities denominated in foreign currencies | | | (11,380,125 | ) | | | 25,600,807 | | |
Net assets applicable to capital shares outstanding | | $ | 166,524,015 | | | $ | 173,686,680 | | |
By share class | |
Net Assets | |
Investor class | | $ | 166,524,015 | | | $ | 173,686,680 | | |
Capital shares outstanding, an unlimited number of
no par shares authorized | |
Investor class | | | 14,133,735 | | | | 18,807,948 | | |
Net Asset Value, Public Offering Price, Redemption
Price, per share | |
Investor class | | $ | 11.78 | | | $ | 9.23 | | |
See accompanying notes to financial statements.
152
December 31, 2012
| | | Global Emerging
Markets Fund | | China Region
Fund | |
Investments, at identified cost | | $ | 7,205,051 | | | $ | 26,318,922 | | |
Assets | |
Investments, at value: | |
Securities | | $ | 6,869,531 | | | $ | 28,997,672 | | |
Repurchase agreements | | | — | | | | — | | |
Cash | | | 859,880 | | | | 354,009 | | |
Foreign currencies (Cost $16,535, $0, $1,205 and $5,352) | | | 1,206 | | | | 5,354 | | |
Receivables: | |
Investments sold | | | 161,927 | | | | 1,639,897 | | |
Dividends and interest | | | 20,490 | | | | 2,660 | | |
Capital shares sold | | | 141 | | | | 10,638 | | |
From adviser | | | 14,908 | | | | — | | |
Other assets | | | 21,279 | | | | 28,594 | | |
Total Assets | | | 7,949,362 | | | | 31,038,824 | | |
Liabilities | |
Payables: | |
Investments purchased | | | 108,098 | | | | 1,747,234 | | |
Capital shares redeemed | | | 61,049 | | | | 40,973 | | |
Adviser and affiliates | | | — | | | | 22,895 | | |
Accounts payable and accrued expenses | | | 65,724 | | | | 67,915 | | |
Written options at value (Premiums $0, $291,560, $0 and $0) | | | — | | | | — | | |
Total Liabilities | | | 234,871 | | | | 1,879,017 | | |
Net Assets | | $ | 7,714,491 | | | $ | 29,159,807 | | |
Net Assets Consist of: | |
Paid-in capital | | $ | 20,734,689 | | | $ | 48,304,329 | | |
Accumulated undistributed net investment income (distributions in excess of
net investment income) | | | (12,968 | ) | | | (47,597 | ) | |
Accumulated net realized loss on investments and foreign currencies | | | (12,671,587 | ) | | | (21,775,669 | ) | |
Net unrealized appreciation (depreciation) of investments and other assets and
liabilities denominated in foreign currencies | | | (335,643 | ) | | | 2,678,744 | | |
Net assets applicable to capital shares outstanding | | $ | 7,714,491 | | | $ | 29,159,807 | | |
By share class | |
Net Assets | |
Investor class | | $ | 7,714,491 | | | $ | 29,159,807 | | |
Capital shares outstanding, an unlimited number of
no par shares authorized | |
Investor class | | | 1,053,536 | | | | 3,829,949 | | |
Net Asset Value, Public Offering Price, Redemption
Price, per share | |
Investor class | | $ | 7.32 | | | $ | 7.61 | | |
153
Net Investment Income | | U.S. Treasury
Securities
Cash Fund | | U.S. Government
Securities
Savings Fund | |
Income: | |
Interest and other | | $ | 115,685 | | | $ | 212,750 | | |
Expenses: | |
Management fee | | | 422,281 | | | | 785,411 | | |
Administrative services fee | | | 67,565 | | | | 125,666 | | |
Transfer agent fees and expenses | | | 187,270 | | | | 198,990 | | |
Accounting service fees and expenses | | | 46,032 | | | | 50,950 | | |
Professional fees | | | 34,944 | | | | 43,981 | | |
Custodian fees | | | 64,152 | | | | 51,504 | | |
Shareholder reporting expenses | | | 14,079 | | | | 18,398 | | |
Registration fees | | | 23,440 | | | | 22,302 | | |
Trustee fees and expenses | | | 23,529 | | | | 23,529 | | |
Miscellaneous expenses | | | 25,841 | | | | 40,661 | | |
Total expenses before reductions | | | 909,133 | | | | 1,361,392 | | |
Expenses offset - Note 1 H | | | (6 | ) | | | — | | |
Expenses reimbursed - Note 3 | | | (802,023 | ) | | | (1,164,395 | ) | |
Net expenses | | | 107,104 | | | | 196,997 | | |
Net Investment Income | | | 8,581 | | | | 15,753 | | |
Net Realized and Unrealized
Gain (Loss) on Investments | |
Realized gain (loss) from securities | | | — | | | | — | | |
Net change in unrealized appreciation of investments | | | — | | | | — | | |
Net Realized and Unrealized Gain on Investments | | | — | | | | — | | |
Net Increase In Net Assets
Resulting From Operations | | $ | 8,581 | | | $ | 15,753 | | |
See accompanying notes to financial statements.
154
For the Year Ended December 31, 2012
Net Investment Income | | Near-Term
Tax Free Fund | | Tax Free
Fund | |
Income: | |
Interest and other | | $ | 1,035,508 | | | $ | 876,334 | | |
Expenses: | |
Management fee | | | 195,033 | | | | 169,226 | | |
Administrative services fee | | | 31,205 | | | | 18,051 | | |
Transfer agent fees and expenses | | | 64,770 | | | | 53,231 | | |
Accounting service fees and expenses | | | 79,969 | | | | 67,447 | | |
Professional fees | | | 40,145 | | | | 36,511 | | |
Custodian fees | | | 15,215 | | | | 11,430 | | |
Shareholder reporting expenses | | | 8,743 | | | | 8,483 | | |
Registration fees | | | 17,755 | | | | 17,183 | | |
Trustee fees and expenses | | | 23,529 | | | | 23,529 | | |
Miscellaneous expenses | | | 9,499 | | | | 9,089 | | |
Total expenses before reductions | | | 485,863 | | | | 414,180 | | |
Expenses offset - Note 1 H | | | (160 | ) | | | (253 | ) | |
Expenses reimbursed - Note 3 | | | (310,168 | ) | | | (255,982 | ) | |
Net expenses | | | 175,535 | | | | 157,945 | | |
Net Investment Income | | | 859,973 | | | | 718,389 | | |
Net Realized and Unrealized
Gain (Loss) on Investments | |
Realized gain (loss) from securities | | | (278 | ) | | | 1,339 | | |
Net change in unrealized appreciation of investments | | | 67,999 | | | | 487,421 | | |
Net Realized and Unrealized Gain on Investments | | | 67,721 | | | | 488,760 | | |
Net Increase In Net Assets
Resulting From Operations | | $ | 927,694 | | | $ | 1,207,149 | | |
155
Net Investment Income | | All American
Equity Fund | | Holmes
Growth Fund | | MegaTrends
Fund | |
Income: | |
Dividends from unaffiliated issuers | | $ | 426,225 | | | $ | 447,406 | | | $ | 301,598 | | |
Foreign tax withheld on dividends | | | (2,028 | ) | | | (5,432 | ) | | | (10,006 | ) | |
Net dividends | | | 424,197 | | | | 441,974 | | | | 291,592 | | |
Interest and other | | | 852 | | | | 49,873 | | | | 19,169 | | |
Total income | | | 425,049 | | | | 491,847 | | | | 310,761 | | |
Expenses: | |
Management fee | | | 137,200 | | | | 271,471 | | | | 95,403 | | |
Administrative services fee | | | 13,720 | | | | 29,288 | | | | 5,252 | | |
Administrative services fee - Investor class | | | — | | | | — | | | | 4,806 | | |
Administrative services fee - Institutional class | | | — | | | | — | | | | 446 | | |
Transfer agent fees and expenses - Investor class | | | 82,449 | | | | 80,105 | | | | 54,746 | | |
Transfer agent fees and expenses - Institutional class | | | — | | | | — | | | | 18,121 | | |
Accounting service fees and expenses | | | 52,736 | | | | 53,240 | | | | 63,887 | | |
Professional fees | | | 37,681 | | | | 39,509 | | | | 41,127 | | |
Distribution plan fee | | | 42,875 | | | | 91,526 | | | | 30,036 | | |
Custodian fees | | | 17,432 | | | | 30,374 | | | | 33,977 | | |
Shareholder reporting expenses - Investor class | | | 18,537 | | | | 13,050 | | | | 9,404 | | |
Shareholder reporting expenses - Institutional class | | | — | | | | — | | | | 2,319 | | |
Registration fees | | | 16,466 | | | | 18,963 | | | | 7,352 | | |
Registration fees - Investor class | | | — | | | | — | | | | 10,817 | | |
Registration fees - Institutional class | | | — | | | | — | | | | 9,704 | | |
Trustee fees and expenses | | | 23,529 | | | | 23,529 | | | | 23,529 | | |
Miscellaneous expenses | | | 23,177 | | | | 26,498 | | | | 24,221 | | |
Total expenses before reductions | | | 465,802 | | | | 677,553 | | | | 435,147 | | |
Expenses offset - Note 1 H | | | (234 | ) | | | (119 | ) | | | (171 | ) | |
Expenses reimbursed - Note 3 | | | (88,267 | ) | | | (417 | ) | | | (157,664 | ) | |
Net expenses | | | 377,301 | | | | 677,017 | | | | 277,312 | | |
Net Investment Income (Loss) | | | 47,748 | | | | (185,170 | ) | | | 33,449 | | |
Net Realized and Unrealized
Gain (Loss) on Investments | |
Realized gain (loss) from: | |
Securities from unaffiliated issuers | | | 1,172,945 | | | | 970,936 | | | | 1,134,844 | | |
Securities from affiliated issuers | | | — | | | | — | | | | — | | |
Written options | | | 135,447 | | | | 322,831 | | | | 37,590 | | |
Foreign currency transactions | | | 290 | | | | 13,525 | | | | (16,102 | ) | |
Net realized gain (loss) | | | 1,308,682 | | | | 1,307,292 | | | | 1,156,332 | | |
Net change in unrealized appreciation (depreciation) of: | |
Investments | | | 530,905 | | | | 1,260,558 | | | | (403,798 | ) | |
Written options | | | 580 | | | | 3,129 | | | | 7,085 | | |
Other assets and liabilities denominated in foreign currencies | | | — | | | | (113 | ) | | | 1 | | |
Net unrealized appreciation (depreciation) | | | 531,485 | | | | 1,263,574 | | | | (396,712 | ) | |
Net Realized and Unrealized Gain (Loss) on Investments | | | 1,840,167 | | | | 2,570,866 | | | | 759,620 | | |
Net Increase (Decrease) In Net Assets
Resulting From Operations | | $ | 1,887,915 | | | $ | 2,385,696 | | | $ | 793,069 | | |
See accompanying notes to financial statements.
156
For the Year Ended December 31, 2012
Net Investment Income | | Global
Resources Fund | | World Precious
Minerals Fund | |
Income: | |
Dividends from unaffiliated issuers | | $ | 10,738,241 | | | $ | 1,782,064 | | |
Foreign tax withheld on dividends | | | (253,149 | ) | | | (155,377 | ) | |
Net dividends | | | 10,485,092 | | | | 1,626,687 | | |
Interest and other | | | 983,683 | | | | 660,320 | | |
Total income | | | 11,468,775 | | | | 2,287,007 | | |
Expenses: | |
Management fee | | | 4,947,323 | | | | 2,800,182 | | |
Administrative services fee | | | 219,746 | | | | 151,950 | | |
Administrative services fee - Investor class | | | 197,897 | | | | 151,572 | | |
Administrative services fee - Institutional class | | | 21,849 | | | | 378 | | |
Transfer agent fees and expenses - Investor class | | | 1,137,988 | | | | 734,926 | | |
Transfer agent fees and expenses - Institutional class | | | 55,615 | | | | 18,007 | | |
Accounting service fees and expenses | | | 197,106 | | | | 140,580 | | |
Professional fees | | | 101,722 | | | | 103,710 | | |
Distribution plan fee | | | 1,236,859 | | | | 947,324 | | |
Custodian fees | | | 144,645 | | | | 200,010 | | |
Shareholder reporting expenses - Investor class | | | 130,101 | | | | 85,687 | | |
Shareholder reporting expenses - Institutional class | | | 4,378 | | | | 5,359 | | |
Registration fees | | | 15,974 | | | | 11,573 | | |
Registration fees - Investor class | | | 16,949 | | | | 28,466 | | |
Registration fees - Institutional class | | | 19,380 | | | | 10,174 | | |
Trustee fees and expenses | | | 23,529 | | | | 23,529 | | |
Miscellaneous expenses | | | 158,018 | | | | 113,984 | | |
Total expenses before reductions | | | 8,629,079 | | | | 5,527,411 | | |
Expenses offset - Note 1 H | | | (154 | ) | | | (38 | ) | |
Expenses reimbursed - Note 3 | | | (101,221 | ) | | | (33,919 | ) | |
Net expenses | | | 8,527,704 | | | | 5,493,454 | | |
Net Investment Income (Loss) | | | 2,941,071 | | | | (3,206,447 | ) | |
Net Realized and Unrealized
Gain (Loss) on Investments | |
Realized gain (loss) from: | |
Securities from unaffiliated issuers | | | (1,404,261 | ) | | | (31,246,539 | ) | |
Securities from affiliated issuers | | | (6,610,324 | ) | | | 4,045,595 | | |
Written options | | | 4,264,061 | | | | 1,687,665 | | |
Foreign currency transactions | | | (171,654 | ) | | | (161,987 | ) | |
Net realized gain (loss) | | | (3,922,178 | ) | | | (25,675,266 | ) | |
Net change in unrealized appreciation (depreciation) of: | |
Investments | | | 39,107,980 | | | | (17,138,064 | ) | |
Written options | | | (177,662 | ) | | | — | | |
Other assets and liabilities denominated in foreign currencies | | | 15,875 | | | | (2,910 | ) | |
Net unrealized appreciation (depreciation) | | | 38,946,193 | | | | (17,140,974 | ) | |
Net Realized and Unrealized Gain (Loss) on Investments | | | 35,024,015 | | | | (42,816,240 | ) | |
Net Increase (Decrease) In Net Assets
Resulting From Operations | | $ | 37,965,086 | | | $ | (46,022,687 | ) | |
157
Net Investment Income | | Gold and Precious
Metals Fund | | Eastern European
Fund | |
Income: | |
Dividends from unaffiliated issuers | | $ | 1,255,934 | | | $ | 7,883,326 | | |
Foreign tax withheld on dividends | | | (120,254 | ) | | | (1,208,146 | ) | |
Net dividends | | | 1,135,680 | | | | 6,675,180 | | |
Interest and other | | | 659,828 | | | | 10,630 | | |
Total income | | | 1,795,508 | | | | 6,685,810 | | |
Expenses: | |
Management fee | | | 1,522,280 | | | | 2,360,964 | | |
Administrative services fee | | | 142,842 | | | | 151,102 | | |
Transfer agent fees and expenses | | | 310,683 | | | | 490,150 | | |
Accounting service fees and expenses | | | 81,226 | | | | 83,339 | | |
Professional fees | | | 58,735 | | | | 54,552 | | |
Distribution plan fee | | | 446,381 | | | | 472,193 | | |
Custodian fees | | | 130,208 | | | | 261,148 | | |
Shareholder reporting expenses | | | 58,641 | | | | 64,433 | | |
Registration fees | | | 23,627 | | | | 20,427 | | |
Trustee fees and expenses | | | 23,529 | | | | 23,529 | | |
Miscellaneous expenses | | | 72,990 | | | | 72,521 | | |
Total expenses before reductions | | | 2,871,142 | | | | 4,054,358 | | |
Expenses offset - Note 1 H | | | (58 | ) | | | (238 | ) | |
Expenses reimbursed - Note 3 | | | — | | | | — | | |
Net expenses | | | 2,871,084 | | | | 4,054,120 | | |
Net Investment Income (Loss) | | | (1,075,576 | ) | | | 2,631,690 | | |
Net Realized and Unrealized
Gain (Loss) on Investments | |
Realized gain (loss) from: | |
Securities from unaffiliated issuers | | | (10,484,624 | ) | | | 8,097,428 | | |
Written options | | | 1,874,449 | | | | 3,959,064 | | |
Foreign currency transactions | | | (161,763 | ) | | | (416,428 | ) | |
Net realized gain (loss) | | | (8,771,938 | ) | | | 11,640,064 | | |
Net change in unrealized appreciation (depreciation) of: | |
Investments | | | (2,501,451 | ) | | | 20,220,279 | | |
Written options | | | — | | | | (861,076 | ) | |
Other assets and liabilities denominated in foreign currencies | | | (948 | ) | | | (1,457 | ) | |
Net unrealized appreciation (depreciation) | | | (2,502,399 | ) | | | 19,357,746 | | |
Net Realized and Unrealized Gain (Loss) on Investments | | | (11,274,337 | ) | | | 30,997,810 | | |
Net Increase (Decrease) In Net Assets
Resulting From Operations | | $ | (12,349,913 | ) | | $ | 33,629,500 | | |
See accompanying notes to financial statements.
158
For the Year Ended December 31, 2012
Net Investment Income | | Global Emerging
Markets Fund | | China Region
Fund | |
Income: | |
Dividends from unaffiliated issuers | | $ | 270,884 | | | $ | 924,928 | | |
Foreign tax withheld on dividends | | | (24,083 | ) | | | (75,438 | ) | |
Net dividends | | | 246,801 | | | | 849,490 | | |
Interest and other | | | 9,937 | | | | 680 | | |
Total income | | | 256,738 | | | | 850,170 | | |
Expenses: | |
Management fee | | | 89,279 | | | | 282,708 | | |
Administrative services fee | | | 6,588 | | | | 23,891 | | |
Transfer agent fees and expenses | | | 51,508 | | | | 111,664 | | |
Accounting service fees and expenses | | | 63,743 | | | | 64,122 | | |
Professional fees | | | 54,751 | | | | 51,061 | | |
Distribution plan fee | | | 20,589 | | | | 74,661 | | |
Custodian fees | | | 77,827 | | | | 87,972 | | |
Shareholder reporting expenses | | | 8,992 | | | | 20,178 | | |
Registration fees | | | 17,604 | | | | 17,003 | | |
Trustee fees and expenses | | | 23,529 | | | | 23,529 | | |
Miscellaneous expenses | | | 28,237 | | | | 32,807 | | |
Total expenses before reductions | | | 442,647 | | | | 789,596 | | |
Expenses offset - Note 1 H | | | (99 | ) | | | (171 | ) | |
Expenses reimbursed - Note 3 | | | (207,096 | ) | | | (118,466 | ) | |
Net expenses | | | 235,452 | | | | 670,959 | | |
Net Investment Income (Loss) | | | 21,286 | | | | 179,211 | | |
Net Realized and Unrealized
Gain (Loss) on Investments | |
Realized gain (loss) from: | |
Securities from unaffiliated issuers | | | (207,478 | ) | | | (1,473,887 | ) | |
Written options | | | — | | | | 103,620 | | |
Foreign currency transactions | | | (23,627 | ) | | | (88,169 | ) | |
Net realized gain (loss) | | | (231,105 | ) | | | (1,458,436 | ) | |
Net change in unrealized appreciation (depreciation) of: | |
Investments | | | 770,906 | | | | 4,620,727 | | |
Written options | | | — | | | | — | | |
Other assets and liabilities denominated in foreign currencies | | | 3,778 | | | | 562 | | |
Net unrealized appreciation (depreciation) | | | 774,684 | | | | 4,621,289 | | |
Net Realized and Unrealized Gain (Loss) on Investments | | | 543,579 | | | | 3,162,853 | | |
Net Increase (Decrease) In Net Assets
Resulting From Operations | | $ | 564,865 | | | $ | 3,342,064 | | |
159
Statements of Changes in Net Assets
| | | U.S. Treasury Securities
Cash Fund | | U.S. Government Securities
Savings Fund | |
| | | Year Ended
December 31,
2012 | | Year Ended
December 31,
2011 | | Year Ended
December 31,
2012 | | Year Ended
December 31,
2011 | |
Increase (Decrease) in Net Assets | |
From operations: | |
Net investment income | | $ | 8,581 | | | $ | 9,581 | | | $ | 15,753 | | | $ | 19,158 | | |
Net realized loss | | | — | | | | — | | | | — | | | | — | | |
Net unrealized appreciation | | | — | | | | — | | | | — | | | | — | | |
Net increase in net assets from operations | | | 8,581 | | | | 9,581 | | | | 15,753 | | | | 19,158 | | |
Distributions to shareholders: | |
From net investment income | |
Investor class | | | (8,500 | ) | | | (9,580 | ) | | | (15,792 | ) | | | (19,158 | ) | |
Total distributions to shareholders | | | (8,500 | ) | | | (9,580 | ) | | | (15,792 | ) | | | (19,158 | ) | |
From capital share transactions: | |
Proceeds from shares sold
Investor class | | | 77,104,085 | | | | 120,809,457 | | | | 79,402,411 | | | | 128,977,341 | | |
Distributions reinvested
Investor class | | | 8,382 | | | | 9,481 | | | | 15,570 | | | | 19,023 | | |
| | | | 77,112,467 | | | | 120,818,938 | | | | 79,417,981 | | | | 128,996,364 | | |
Cost of shares redeemed
Investor class | | | (87,477,230 | ) | | | (129,753,637 | ) | | | (110,656,435 | ) | | | (161,167,483 | ) | |
Net increase (decrease) in net assets from
capital share transactions | | | (10,364,763 | ) | | | (8,934,699 | ) | | | (31,238,454 | ) | | | (32,171,119 | ) | |
Net Increase (Decrease) in Net Assets | | | (10,364,682 | ) | | | (8,934,698 | ) | | | (31,238,493 | ) | | | (32,171,119 | ) | |
Net Assets | |
Beginning of year | | | 90,556,532 | | | | 99,491,230 | | | | 171,663,574 | | | | 203,834,693 | | |
End of year | | $ | 80,191,850 | | | $ | 90,556,532 | | | $ | 140,425,081 | | | $ | 171,663,574 | | |
Accumulated undistributed net investment income, end of year | | $ | 1,151 | | | $ | 989 | | | $ | 2,531 | | | $ | 1,037 | | |
Capital Share Activity | |
Investor class: | |
Shares sold | | | 77,104,085 | | | | 120,809,457 | | | | 79,402,411 | | | | 128,977,341 | | |
Shares reinvested | | | 8,382 | | | | 9,481 | | | | 15,570 | | | | 19,023 | | |
Shares redeemed | | | (87,477,230 | ) | | | (129,753,637 | ) | | | (110,656,435 | ) | | | (161,167,483 | ) | |
Net share activity | | | (10,364,763 | ) | | | (8,934,699 | ) | | | (31,238,454 | ) | | | (32,171,119 | ) | |
See accompanying notes to financial statements.
160
| | Near-Term Tax Free Fund | |
| | | Year Ended
December 31,
2012 | | Year Ended
December 31,
2011 | |
Increase (Decrease) in Net Assets | |
From operations: | |
Net investment income | | $ | 859,973 | | | $ | 747,326 | | |
Net realized loss | | | (278 | ) | | | (3,345 | ) | |
Net unrealized appreciation | | | 67,999 | | | | 625,874 | | |
Net increase in net assets from operations | | | 927,694 | | | | 1,369,855 | | |
Distributions to shareholders: | |
From net investment income | |
Investor class | | | (866,558 | ) | | | (740,487 | ) | |
Total distributions to shareholders | | | (866,558 | ) | | | (740,487 | ) | |
From capital share transactions: | |
Proceeds from shares sold
Investor class | | | 15,981,583 | | | | 18,439,087 | | |
Distributions reinvested
Investor class | | | 739,939 | | | | 621,654 | | |
| | | | 16,721,522 | | | | 19,060,741 | | |
Cost of shares redeemed
Investor class | | | (7,286,999 | ) | | | (13,814,303 | ) | |
Net increase (decrease) in net assets from
capital share transactions | | | 9,434,523 | | | | 5,246,438 | | |
Net Increase (Decrease) in Net Assets | | | 9,495,659 | | | | 5,875,806 | | |
Net Assets | |
Beginning of year | | | 35,013,651 | | | | 29,137,845 | | |
End of year | | $ | 44,509,310 | | | $ | 35,013,651 | | |
Accumulated undistributed net investment income, end of year | | $ | 17,894 | | | $ | 24,479 | | |
Capital Share Activity | |
Investor class: | |
Shares sold | | | 7,020,534 | | | | 8,221,829 | | |
Shares reinvested | | | 325,398 | | | | 277,696 | | |
Shares redeemed | | | (3,202,347 | ) | | | (6,167,294 | ) | |
Net share activity | | | 4,143,585 | | | | 2,332,231 | | |
161
Statements of Changes in Net Assets
| | | Tax Free Fund | | All American Equity Fund | |
| | | Year Ended
December 31,
2012 | | Year Ended
December 31,
2011 | | Year Ended
December 31,
2012 | | Year Ended
December 31,
2011 | |
Increase (Decrease) in Net Assets | |
From operations: | |
Net investment income (loss) | | $ | 718,389 | | | $ | 705,597 | | | $ | 47,748 | | | $ | (55,708 | ) | |
Net realized gain (loss) | | | 1,339 | | | | (19,336 | ) | | | 1,308,682 | | | | 2,492,375 | | |
Net unrealized appreciation (depreciation) | | | 487,421 | | | | 986,522 | | | | 531,485 | | | | (2,387,462 | ) | |
Net increase (decrease) in net assets from operations | | | 1,207,149 | | | | 1,672,783 | | | | 1,887,915 | | | | 49,205 | | |
Distributions to shareholders: | |
From net investment income | |
Investor class | | | (718,429 | ) | | | (703,629 | ) | | | — | | | | (22,535 | ) | |
From net capital gains | |
Investor class | | | — | | | | — | | | | — | | | | — | | |
Total distributions to shareholders | | | (718,429 | ) | | | (703,629 | ) | | | — | | | | (22,535 | ) | |
From capital share transactions: | |
Proceeds from shares sold
Investor class | | | 6,942,742 | | | | 9,687,519 | | | | 2,230,319 | | | | 3,210,827 | | |
Distributions reinvested
Investor class | | | 570,049 | | | | 556,800 | | | | — | | | | 22,115 | | |
Proceeds from short-term trading fees
Investor class | | | — | | | | — | | | | 485 | | | | 852 | | |
| | | | 7,512,791 | | | | 10,244,319 | | | | 2,230,804 | | | | 3,233,794 | | |
Cost of shares redeemed
Investor class | | | (6,526,795 | ) | | | (9,344,395 | ) | | | (3,671,270 | ) | | | (4,621,747 | ) | |
Net increase (decrease) in net assets from
capital share transactions | | | 985,996 | | | | 899,924 | | | | (1,440,466 | ) | | | (1,387,953 | ) | |
Net Increase (Decrease) in Net Assets | | | 1,474,716 | | | | 1,869,078 | | | | 447,449 | | | | (1,361,283 | ) | |
Net Assets | |
Beginning of year | | | 21,663,322 | | | | 19,794,244 | | | | 16,398,619 | | | | 17,759,902 | | |
End of year | | $ | 23,138,038 | | | $ | 21,663,322 | | | $ | 16,846,068 | | | $ | 16,398,619 | | |
Accumulated undistributed net investment income (distributions
in excess of net investment income), end of year | | $ | 35,391 | | | $ | 35,431 | | | $ | 43,951 | | | $ | — | | |
Capital Share Activity | |
Investor class: | |
Shares sold | | | 539,707 | | | | 784,189 | | | | 90,701 | | | | 141,343 | | |
Shares reinvested | | | 44,307 | | | | 45,303 | | | | — | | | | 974 | | |
Shares redeemed | | | (508,977 | ) | | | (761,849 | ) | | | (149,051 | ) | | | (202,449 | ) | |
Net share activity | | | 75,037 | | | | 67,643 | | | | (58,350 | ) | | | (60,132 | ) | |
See accompanying notes to financial statements.
162
| | | Holmes Growth Fund | |
| | | Year Ended
December 31,
2012 | | Year Ended
December 31,
2011 | |
Increase (Decrease) in Net Assets | |
From operations: | |
Net investment income (loss) | | $ | (185,170 | ) | | $ | (497,883 | ) | |
Net realized gain (loss) | | | 1,307,292 | | | | 5,164,661 | | |
Net unrealized appreciation (depreciation) | | | 1,263,574 | | | | (6,821,178 | ) | |
Net increase (decrease) in net assets from operations | | | 2,385,696 | | | | (2,154,400 | ) | |
Distributions to shareholders: | |
From net investment income | |
Investor class | | | — | | | | — | | |
From net capital gains | |
Investor class | | | (563,945 | ) | | | — | | |
Total distributions to shareholders | | | (563,945 | ) | | | — | | |
From capital share transactions: | |
Proceeds from shares sold
Investor class | | | 2,717,164 | | | | 5,414,367 | | |
Distributions reinvested
Investor class | | | 521,245 | | | | — | | |
Proceeds from short-term trading fees
Investor class | | | 4 | | | | 282 | | |
| | | | 3,238,413 | | | | 5,414,649 | | |
Cost of shares redeemed
Investor class | | | (5,736,316 | ) | | | (8,548,931 | ) | |
Net increase (decrease) in net assets from
capital share transactions | | | (2,497,903 | ) | | | (3,134,282 | ) | |
Net Increase (Decrease) in Net Assets | | | (676,152 | ) | | | (5,288,682 | ) | |
Net Assets | |
Beginning of year | | | 35,315,530 | | | | 40,604,212 | | |
End of year | | $ | 34,639,378 | | | $ | 35,315,530 | | |
Accumulated undistributed net investment income (distributions
in excess of net investment income), end of year | | $ | (25,273 | ) | | $ | (38,926 | ) | |
Capital Share Activity | |
Investor class: | |
Shares sold | | | 139,071 | | | | 285,326 | | |
Shares reinvested | | | 28,115 | | | | — | | |
Shares redeemed | | | (300,437 | ) | | | (457,268 | ) | |
Net share activity | | | (133,251 | ) | | | (171,942 | ) | |
163
Statements of Changes in Net Assets
| | | MegaTrends Fund | | Global Resources Fund | |
| | | Year Ended
December 31,
2012 | | Year Ended
December 31,
2011 | | Year Ended
December 31,
2012 | | Year Ended
December 31,
2011 | |
Increase (Decrease) in Net Assets | |
From operations: | |
Net investment income (loss) | | $ | 33,449 | | | $ | 75,605 | | | $ | 2,941,071 | | | $ | (6,704,492 | ) | |
Net realized gain (loss) | | | 1,156,332 | | | | 746,616 | | | | (3,922,178 | ) | | | 92,677,766 | | |
Net unrealized appreciation (depreciation) | | | (396,712 | ) | | | (3,248,142 | ) | | | 38,946,193 | | | | (257,110,809 | ) | |
Net increase (decrease) in net assets from operations | | | 793,069 | | | | (2,425,921 | ) | | | 37,965,086 | | | | (171,137,535 | ) | |
Distributions to shareholders: | |
From net investment income | |
Investor class | | | (49,108 | ) | | | — | | | | (9,700,159 | ) | | | (19,762,685 | ) | |
Institutional class | | | (4,806 | ) | | | (18,363 | ) | | | (3,187,762 | ) | | | (2,765,455 | ) | |
Total distributions to shareholders | | | (53,914 | ) | | | (18,363 | ) | | | (12,887,921 | ) | | | (22,528,140 | ) | |
From capital share transactions: | |
Proceeds from shares sold
Investor class | | | 491,825 | | | | 1,175,368 | | | | 51,610,831 | | | | 329,405,494 | | |
Institutional class | | | 18,619 | | | | 4,055 | | | | 43,381,958 | | | | 65,210,041 | | |
Distributions reinvested
Investor class | | | 44,847 | | | | — | | | | 9,250,371 | | | | 18,848,694 | | |
Institutional class | | | 4,536 | | | | 18,294 | | | | 3,174,978 | | | | 2,763,078 | | |
Proceeds from short-term trading fees
Investor class | | | 18 | | | | 186 | | | | 3,980 | | | | 34,386 | | |
Institutional class | | | — | | | | — | | | | 77 | | | | 330 | | |
| | | | 559,845 | | | | 1,197,903 | | | | 107,422,195 | | | | 416,262,023 | | |
Cost of shares redeemed
Investor class | | | (3,306,097 | ) | | | (3,104,574 | ) | | | (196,087,325 | ) | | | (528,179,707 | ) | |
Institutional class | | | (2,443,413 | ) | | | (1,043,306 | ) | | | (11,742,608 | ) | | | (16,119,819 | ) | |
Net decrease in net assets from
capital share transactions | | | (5,189,665 | ) | | | (2,949,977 | ) | | | (100,407,738 | ) | | | (128,037,503 | ) | |
Net Decrease in Net Assets | | | (4,450,510 | ) | | | (5,394,261 | ) | | | (75,330,573 | ) | | | (321,703,178 | ) | |
Net Assets | |
Beginning of year | | | 14,907,437 | | | | 20,301,698 | | | | 607,777,995 | | | | 929,481,173 | | |
End of year | | $ | 10,456,927 | | | $ | 14,907,437 | | | $ | 532,447,422 | | | $ | 607,777,995 | | |
Accumulated undistributed net investment income (distributions
in excess of net investment income), end of year | | $ | (19,681 | ) | | $ | 56,212 | | | $ | 4,847,474 | | | $ | (3,453,053 | ) | |
Capital Share Activity | |
Investor class: | |
Shares sold | | | 61,160 | | | | 137,469 | | | | 5,290,383 | | | | 27,713,544 | | |
Shares reinvested | | | 5,620 | | | | — | | | | 955,617 | | | | 1,945,170 | | |
Shares redeemed | | | (410,051 | ) | | | (366,522 | ) | | | (20,403,092 | ) | | | (47,235,677 | ) | |
Net share activity | | | (343,271 | ) | | | (229,053 | ) | | | (14,157,092 | ) | | | (17,576,963 | ) | |
Institutional class: | |
Shares sold | | | 2,339 | | | | 470 | | | | 4,563,077 | | | | 5,816,125 | | |
Shares reinvested | | | 585 | | | | 2,366 | | | | 329,696 | | | | 284,267 | | |
Shares redeemed | | | (309,025 | ) | | | (131,987 | ) | | | (1,198,556 | ) | | | (1,634,637 | ) | |
Net share activity | | | (306,101 | ) | | | (129,151 | ) | | | 3,694,217 | | | | 4,465,755 | | |
See accompanying notes to financial statements.
164
| | | World Precious Minerals Fund | |
| | | Year Ended
December 31,
2012 | | Year Ended
December 31,
2011 | |
Increase (Decrease) in Net Assets | |
From operations: | |
Net investment income (loss) | | $ | (3,206,447 | ) | | $ | (9,183,096 | ) | |
Net realized gain (loss) | | | (25,675,266 | ) | | | 77,717,916 | | |
Net unrealized appreciation (depreciation) | | | (17,140,974 | ) | | | (309,429,697 | ) | |
Net increase (decrease) in net assets from operations | | | (46,022,687 | ) | | | (240,894,877 | ) | |
Distributions to shareholders: | |
From net investment income | |
Investor class | | | — | | | | (60,523,518 | ) | |
Institutional class | | | — | | | | (275,428 | ) | |
Total distributions to shareholders | | | — | | | | (60,798,946 | ) | |
From capital share transactions: | |
Proceeds from shares sold
Investor class | | | 36,851,148 | | | | 124,020,055 | | |
Institutional class | | | 31,435 | | | | 964,702 | | |
Distributions reinvested
Investor class | | | — | | | | 57,314,672 | | |
Institutional class | | | — | | | | 274,167 | | |
Proceeds from short-term trading fees
Investor class | | | 8,741 | | | | 33,977 | | |
Institutional class | | | — | | | | — | | |
| | | | 36,891,324 | | | | 182,607,573 | | |
Cost of shares redeemed
Investor class | | | (108,472,249 | ) | | | (270,949,550 | ) | |
Institutional class | | | (762,575 | ) | | | (608,504 | ) | |
Net decrease in net assets from
capital share transactions | | | (72,343,500 | ) | | | (88,950,481 | ) | |
Net Decrease in Net Assets | | | (118,366,187 | ) | | | (390,644,304 | ) | |
Net Assets | |
Beginning of year | | | 438,186,812 | | | | 828,831,116 | | |
End of year | | $ | 319,820,625 | | | $ | 438,186,812 | | |
Accumulated undistributed net investment income (distributions
in excess of net investment income), end of year | | $ | (25,841,906 | ) | | $ | (52,842,742 | ) | |
Capital Share Activity | |
Investor class: | |
Shares sold | | | 2,986,280 | | | | 6,398,124 | | |
Shares reinvested | | | — | | | | 3,963,750 | | |
Shares redeemed | | | (8,829,230 | ) | | | (14,339,094 | ) | |
Net share activity | | | (5,842,950 | ) | | | (3,977,220 | ) | |
Institutional class: | |
Shares sold | | | 2,159 | | | | 46,404 | | |
Shares reinvested | | | — | | | | 19,079 | | |
Shares redeemed | | | (64,822 | ) | | | (37,249 | ) | |
Net share activity | | | (62,663 | ) | | | 28,234 | | |
165
Statements of Changes in Net Assets
| | | Gold and Precious Metals Fund | | Eastern European Fund | |
| | | Year Ended
December 31,
2012 | | Year Ended
December 31,
2011 | | Year Ended
December 31,
2012 | | Year Ended
December 31,
2011 | |
Increase (Decrease) in Net Assets | |
From operations: | |
Net investment income (loss) | | $ | (1,075,576 | ) | | $ | (2,670,423 | ) | | $ | 2,631,690 | | | $ | 828,165 | | |
Net realized gain (loss) | | | (8,771,938 | ) | | | 30,987,057 | | | | 11,640,064 | | | | 47,395,544 | | |
Net unrealized appreciation (depreciation) | | | (2,502,399 | ) | | | (96,434,285 | ) | | | 19,357,746 | | | | (136,103,572 | ) | |
Net increase (decrease) in net assets from operations | | | (12,349,913 | ) | | | (68,117,651 | ) | | | 33,629,500 | | | | (87,879,863 | ) | |
Distributions to shareholders: | |
From net investment income | |
Investor class | | | (256,589 | ) | | | — | | | | (1,152,778 | ) | | | — | | |
From net capital gains | |
Investor class | | | — | | | | (34,374,528 | ) | | | — | | | | — | | |
Total distributions to shareholders | | | (256,589 | ) | | | (34,374,528 | ) | | | (1,152,778 | ) | | | — | | |
From capital share transactions: | |
Proceeds from shares sold
Investor class | | | 25,898,154 | | | | 61,594,825 | | | | 8,103,453 | | | | 14,570,015 | | |
Distributions reinvested
Investor class | | | 238,024 | | | | 32,104,658 | | | | 1,112,837 | | | | — | | |
Proceeds from short-term trading fees
Investor class | | | 6,075 | | | | 29,700 | | | | 47,545 | | | | 101,769 | | |
| | | | 26,142,253 | | | | 93,729,183 | | | | 9,263,835 | | | | 14,671,784 | | |
Cost of shares redeemed
Investor class | | | (42,098,880 | ) | | | (97,098,643 | ) | | | (61,652,693 | ) | | | (173,230,246 | ) | |
Net decrease in net assets from
capital share transactions | | | (15,956,627 | ) | | | (3,369,460 | ) | | | (52,388,858 | ) | | | (158,558,462 | ) | |
Net Decrease in Net Assets | | | (28,563,129 | ) | | | (105,861,639 | ) | | | (19,912,136 | ) | | | (246,438,325 | ) | |
Net Assets | |
Beginning of year | | | 195,087,144 | | | | 300,948,783 | | | | 193,598,816 | | | | 440,037,141 | | |
End of year | | $ | 166,524,015 | | | $ | 195,087,144 | | | $ | 173,686,680 | | | $ | 193,598,816 | | |
Accumulated undistributed net investment income (distributions
in excess of net investment income), end of year | | $ | (1,677,267 | ) | | $ | (2,392,924 | ) | | $ | 1,655,933 | | | $ | 557,717 | | |
Capital Share Activity | |
Investor class: | |
Shares sold | | | 2,126,571 | | | | 3,513,454 | | | | 915,162 | | | | 1,388,107 | | |
Shares reinvested | | | 19,952 | | | | 2,293,190 | | | | 123,375 | | | | — | | |
Shares redeemed | | | (3,488,632 | ) | | | (5,686,862 | ) | | | (7,091,293 | ) | | | (17,244,772 | ) | |
Net share activity | | | (1,342,109 | ) | | | 119,782 | | | | (6,052,756 | ) | | | (15,856,665 | ) | |
See accompanying notes to financial statements.
166
| | | Global Emerging Markets Fund | |
| | | Year Ended
December 31,
2012 | | Year Ended
December 31,
2011 | |
Increase (Decrease) in Net Assets | |
From operations: | |
Net investment income (loss) | | $ | 21,286 | | | $ | (76,385 | ) | |
Net realized gain (loss) | | | (231,105 | ) | | | (205,090 | ) | |
Net unrealized appreciation (depreciation) | | | 774,684 | | | | (2,847,479 | ) | |
Net increase (decrease) in net assets from operations | | | 564,865 | | | | (3,128,954 | ) | |
Distributions to shareholders: | |
From net investment income | |
Investor class | | | — | | | | — | | |
From net capital gains | |
Investor class | | | — | | | | — | | |
Total distributions to shareholders | | | — | | | | — | | |
From capital share transactions: | |
Proceeds from shares sold
Investor class | | | 735,081 | | | | 1,636,143 | | |
Distributions reinvested
Investor class | | | — | | | | — | | |
Proceeds from short-term trading fees
Investor class | | | 3,216 | | | | 4,737 | | |
| | | | 738,297 | | | | 1,640,880 | | |
Cost of shares redeemed
Investor class | | | (1,812,833 | ) | | | (3,690,625 | ) | |
Net decrease in net assets from
capital share transactions | | | (1,074,536 | ) | | | (2,049,745 | ) | |
Net Decrease in Net Assets | | | (509,671 | ) | | | (5,178,699 | ) | |
Net Assets | |
Beginning of year | | | 8,224,162 | | | | 13,402,861 | | |
End of year | | $ | 7,714,491 | | | $ | 8,224,162 | | |
Accumulated undistributed net investment income (distributions
in excess of net investment income), end of year | | $ | (12,968 | ) | | $ | (35,537 | ) | |
Capital Share Activity | |
Investor class: | |
Shares sold | | | 100,715 | | | | 196,681 | | |
Shares reinvested | | | — | | | | — | | |
Shares redeemed | | | (253,227 | ) | | | (452,700 | ) | |
Net share activity | | | (152,512 | ) | | | (256,019 | ) | |
167
Statements of Changes in Net Assets
| | | China Region Fund | |
| | | Year Ended
December 31,
2012 | | Year Ended
December 31,
2011 | |
Increase (Decrease) in Net Assets | |
From operations: | |
Net investment income (loss) | | $ | 179,211 | | | $ | (280,687 | ) | |
Net realized loss | | | (1,458,436 | ) | | | (5,024,899 | ) | |
Net unrealized appreciation (depreciation) | | | 4,621,289 | | | | (8,566,683 | ) | |
Net increase (decrease) in net assets from operations | | | 3,342,064 | | | | (13,872,269 | ) | |
Distributions to shareholders: | |
From net investment income | |
Investor class | | | (65,330 | ) | | | — | | |
Total distributions to shareholders | | | (65,330 | ) | | | — | | |
From capital share transactions: | |
Proceeds from shares sold
Investor class | | | 3,015,349 | | | | 9,973,299 | | |
Distributions reinvested
Investor class | | | 60,889 | | | | — | | |
Proceeds from short-term trading fees
Investor class | | | 17,955 | | | | 46,667 | | |
| | | | 3,094,193 | | | | 10,019,966 | | |
Cost of shares redeemed
Investor class | | | (7,846,097 | ) | | | (17,356,116 | ) | |
Net decrease in net assets from
capital share transactions | | | (4,751,904 | ) | | | (7,336,150 | ) | |
Net Decrease in Net Assets | | | (1,475,170 | ) | | | (21,208,419 | ) | |
Net Assets | |
Beginning of year | | | 30,634,977 | | | | 51,843,396 | | |
End of year | | $ | 29,159,807 | | | $ | 30,634,977 | | |
Distributions in excess of net investment income, end of year | | $ | (47,597 | ) | | $ | (122,366 | ) | |
Capital Share Activity | |
Investor class: | |
Shares sold | | | 415,996 | | | | 1,142,964 | | |
Shares reinvested | | | 8,195 | | | | — | | |
Shares redeemed | | | (1,094,661 | ) | | | (2,117,326 | ) | |
Net share activity | | | (670,470 | ) | | | (974,362 | ) | |
See accompanying notes to financial statements.
168
Notes to Financial Statements December 31, 2012
Note 1: Significant Accounting Policies
U.S. Global Investors Funds (Trust), consisting of thirteen separate funds (Funds), is organized as a Delaware statutory trust. Each Fund is an open-end management investment company registered under the Investment Company Act of 1940, as amended. All funds are diversified with the exception of the Global Resources, World Precious Minerals, Gold and Precious Metals, Eastern European, Global Emerging Markets and China Region. A nondiversified fund may invest a greater percentage of its assets in a particular issuer in comparison to a diversified fund.
On December 12, 2012, the name of the Global MegaTrends Fund changed to the MegaTrends Fund.
Each fund has an Investor Class of shares. The MegaTrends, Global Resources and World Precious Minerals Funds also have an Institutional Class of shares that is subject to a higher minimum investment. Each share class has equal rights to assets and earnings, except that each class bears certain class-related expenses specific to the particular class, as detailed further below.
The following is a summary of significant accounting policies consistently followed by the Funds in the preparation of their financial statements. The policies are in conformity with U.S. generally accepted accounting principles.
A. Security Valuations
The Funds value equity investments traded on national or international securities exchanges or over-the-counter at the last sales price reported by the security's primary exchange of its market at the time of daily valuation. Equity securities for which no sale was reported are valued at the mean between the last reported bid and asked quotation. Short-term investments with effective maturities of sixty days or less at the date of purchase are valued at amortized cost, which approximates market value. Municipal securities, long-term U.S. government obligations and corporate debt securities are valued by an independent pricing service using an evaluated quote based on such factors as institutional-size trading in similar groups of securities, yield, quality, maturity, coupon rate, type of issue, individual trading characteristics and other market data.
B. Fair Valued Securities
Securities for which market quotations are not readily available or which are subject to legal restrictions are valued at their fair value as determined in good faith by the Adviser's Valuation Committee, under policies and procedures established by the Funds' Board of Trustees. Fair value is the price that would be received to sell an asset or paid to transfer a liability in an orderly transaction between market participants at the measurement date. The Valuation Committee meets on a regular basis to review securities which may not have readily available market prices and considers a number of factors in determining fair value, including nature and duration of any trading restrictions, trading volume, market values of unrestricted shares of the same or similar class, investment management's judgment regarding the market
169
Notes to Financial Statements December 31, 2012
experience of the issuer, financial status and other operational and market factors affecting the issuer, issuer's management, quality of the underlying property based on review of independent geological studies and other relevant matters. The fair values may differ from what would have been used had a broader market for these securities existed. The Valuation Committee regularly reviews inputs and assumptions and performs transactional back-testing and disposition analysis. The Valuation Committee reports quarterly to the Funds' Board of Trustees.
For securities traded on international exchanges, if events which may materially affect the value of a Fund's securities occur after the close of the primary exchange and before a Fund's net asset value is next determined, then those securities will be valued at their fair value as determined in good faith under the supervision of the Board of Trustees. The Funds may use a systematic fair value model provided by an independent third party to value international securities in order to adjust for stale pricing, which may occur between the close of certain foreign exchanges and the New York Stock Exchange, or foreign market holidays.
C. Security Transactions and Investment Income
Security transactions are accounted for on trade date. Realized gains and losses from security transactions are determined on an identified-cost basis. Dividend income is recorded on the ex-dividend date except that certain dividends from foreign securities where the ex-dividend date may have passed are recorded as soon as the Fund has confirmed the ex-dividend date. Interest income, which may include original issue discount, is recorded on an accrual basis. Discounts and premiums on securities purchased are accreted and amortized, respectively, on a yield-to-maturity basis as adjustments to interest income. Investment income is recorded net of foreign taxes withheld where recovery of such taxes is uncertain. Investment income and realized and unrealized gains (losses) are allocated to each Fund's share class based on their respective net assets.
The Funds may purchase securities on a when-issued or delayed-delivery basis and segregate on their books collateral with a value at least equal to the amount of the commitment. Losses may arise due to the changes in the value of the underlying securities or if the counterparty does not perform under the contract.
D. Repurchase Agreements
The Funds may enter into repurchase agreements with recognized financial institutions or registered broker-dealers and, in all instances, hold as collateral, underlying securities with a value exceeding the principal amount of the repurchase obligation. The Funds use joint tri-party repurchase agreement accounts with other funds under common management where uninvested cash is collectively invested in repurchase agreements, and each participating fund owns an undivided interest in the account.
E. Foreign Currency Transactions
Some Funds may invest in securities of foreign issuers. The accounting records of these Funds are maintained in U.S. dollars. At each net asset value determination
170
Notes to Financial Statements December 31, 2012
date, the value of assets and liabilities denominated in foreign currencies are translated into U.S. dollars using the current prevailing exchange rate. Security transactions, income and expenses are converted at the prevailing rate of exchange on the respective dates of the transactions. The effect of changes in foreign exchange rates on foreign denominated securities is included with the net realized and unrealized gain or loss on securities. Other foreign currency gains or losses are reported separately.
F. Federal Income Taxes
The Funds intend to continue to comply with the requirements of Subchapter M of the Internal Revenue Code applicable to regulated investment companies and to distribute substantially all of their taxable income to shareholders. Accordingly, no provision for federal income taxes is required. Each Fund may be subject to foreign taxes on income and gains on investments, which are accrued based on the Fund's understanding of the tax rules and regulations in the foreign markets.
The Funds recognize the tax benefits of uncertain tax positions only where the position is "more likely than not" to be sustained assuming examination by tax authorities. Management has analyzed the Funds' tax positions, and has concluded that no liability for unrecognized tax benefits should be recorded related to uncertain tax positions taken on returns filed for open tax years or expected to be taken in 2012 tax returns. The Funds' 2009, 2010, 2011 and 2012 tax returns are open to examination by the federal and applicable state tax authorities. The Funds have no examinations in progress.
G. Dividends and Distributions to Shareholders
The Funds record dividends and distributions to shareholders on the ex-dividend date. Distributions are determined in accordance with income tax regulations, which may differ from accounting principles generally accepted in the United States. Accordingly, periodic reclassifications related to permanent book and tax basis differences are made within the Funds' capital accounts to reflect income and gains available for distribution under income tax regulations.
The Funds generally pay income dividends and distribute capital gains, if any, annually. The U.S. Treasury Securities Cash and U.S. Government Securities Savings Funds accrue dividends on a daily basis with payment monthly. The Tax Free and Near-Term Tax Free Funds pay monthly dividends. Dividends and distributions payable at period end are processed for reinvestment on the following business day. A Fund may elect to designate a portion of the earnings and profits distributed to shareholders on the redemption of fund shares during the year as distributions for federal income tax purposes. Differences in per share dividend rates for multiclass funds generally result from the relative weightings of pro rata income and realized gain allocations and from differences in separate class expenses.
171
Notes to Financial Statements December 31, 2012
H. Expenses
Fund specific expenses are allocated to that Fund and pro rata across share classes. Expenses that are not fund specific are allocated among Funds and pro rata across share classes. Class specific expenses (including, but not limited to, distribution plan fees, if any, a portion of the administrative services fees, transfer agency fees and expenses, shareholder reporting expenses and certain legal and registration fees) are allocated to the class that incurs such expense. Expense offset arrangements have been made with the Funds' custodian so the custodian fees may be paid indirectly by credits earned on the Funds' cash balances. Such deposit arrangements are an alternative to overnight investments. Custodian fees are presented in the Statements of Operations gross of such credits, and the credits are presented as offsets to expenses.
I. Short-Term Trading (Redemption) Fees
Shares held in the All American Equity and Holmes Growth Funds 30 days or less are subject to a short-term trading fee equal to 0.10% of the proceeds of the redeemed shares. Shares held in the MegaTrends and Global Resources Funds 30 days or less are subject to a short-term trading fee equal to 0.25% of the proceeds of the redeemed shares. Shares held 30 days or less in the World Precious Minerals and Gold and Precious Metals Funds are subject to a short-term trading fee equal to 0.50% of the proceeds of the redeemed shares. Shares held in the Eastern European and Global Emerging Markets Funds 180 days or less are subject to a short-term trading fee equal to 2.00% of the proceeds of the redeemed shares. Shares held in the China Region Fund 180 days or less are subject to a short-term trading fee equal to 1.00% of the proceeds of the redeemed shares. These fees, which are retained by the Funds, are accounted for as additions to paid-in capital.
J. Use of Estimates in Financial Statement Preparation
The preparation of financial statements in conformity with accounting principles generally accepted in the United States requires management to make estimates and assumptions that affect the reported amounts of assets and liabilities and disclosure of contingent assets and liabilities at the date of the financial statements and the reported amounts of income and expenses during the reporting period. Actual results could differ from those estimates.
K. Subsequent Events Evaluation
Management has evaluated subsequent events after the balance sheet date of December 31, 2012, through the date that the financial statements were issued and determined that there were no events or transactions that would require recognition or disclosure in the financial statements.
L. New Accounting Pronouncements
In December 2011, the Financial Accounting Standards Board (FASB) issued Accounting Standards Update (ASU) No. 2011-11, Balance Sheet (Topic 210): Disclosures about Offsetting Assets and Liabilities. The ASU requires an entity to disclose information about offsetting and related arrangements to enable users of
172
Notes to Financial Statements December 31, 2012
its financial statements to understand the effect of those arrangements on its financial position. In January 2013, the FASB issued ASU No. 2013-01, Balance Sheet (Topic 210): Clarifying the Scope of Disclosures about Offsetting Assets and Liabilities. ASU 2013-01 is an amendment to clarify the scope of disclosures required by ASU No. 2011-11. These ASUs are effective for annual reporting periods beginning on or after January 1, 2013, and interim periods within those annual periods. At this time, the Funds do not have netting agreements that will fall under the provisions of these pronouncements and do not intend to enter into such agreements in the future. Therefore, management does not anticipate that these pronouncements will have a material impact on the financial statements.
Note 2: Financial Derivative Instruments
A. Options Contracts
Equity Funds may purchase or write (sell) options on securities to manage their exposure to stock or commodity markets as well as fluctuations in interest and currency conversion rates. The use of options carries the risks of a change in value of the underlying instruments, an illiquid secondary market, or failure of the counterparty to perform its obligations.
A put option gives the purchaser of the option, upon payment of a premium, the right to sell, and the issuer of the option the obligation to buy, the underlying security, commodity, index, currency or other instrument at the exercise price. A call option, upon payment of a premium, gives the purchaser of the option the right to buy, and the issuer the obligation to sell, the underlying instrument at the exercise price.
Purchasing a put option tends to decrease a Fund's exposure to the underlying instrument, whereas purchasing a call option tends to increase a Fund's exposure to the underlying instrument. A Fund pays a premium which is included in the Statement of Assets and Liabilities as an investment and subsequently marked to market to reflect the current value of the option. Premiums paid to purchase options which expire are treated as realized losses. Premiums paid to purchase options which are exercised or closed are added to the cost of securities acquired or the proceeds from securities sold. The risk associated with purchasing put and call options is limited to the premium paid.
The Funds will realize a loss equal to all or a part of the premium paid for an option if the price of the underlying security or other instrument decreases or does not increase by more than the premium (in the case of a call option), or if the price of the underlying security or other instrument increases or does not decrease by more than the premium (in the case of a put option).
Writing a put option tends to increase a Fund's exposure to the underlying instrument, whereas writing a call option tends to decrease a Fund's exposure to the underlying instrument. The premium received is recorded as a liability in the Statement of Assets and Liabilities and subsequently marked to market to reflect
173
Notes to Financial Statements December 31, 2012
the current value of the option written. Premiums received from writing options which expire are treated as realized gains. Premiums received from options which are exercised or closed are added to the proceeds or offset against amounts paid on the underlying transaction to determine the realized gain or loss. Written options include a risk of loss in excess of the option premium. A Fund as a writer of an option has no control over whether the underlying instrument may be sold (call) or purchased (put) and thus bears the market risk of an unfavorable change in the price of the instrument underlying the written option. There is also the risk a Fund may not be able to enter into a closing transaction because of an illiquid market.
A Fund's ability to close out its position as a purchaser or seller of a put or call option is dependent, in part, upon the liquidity of the market for that particular option. There can be no guarantee that a fund will be able to close out an option position when desired. An inability to close out its option positions may reduce a Fund's anticipated profits or increase its losses.
As of December 31, 2012, there were no securities held in escrow by the custodian as collateral for call and put options written.
Transactions in written call and put options during the year ended December 31, 2012, were as follows:
| | | All American Equity Fund
Call Options | | Holmes Growth Fund
Call Options | |
| | | Number of
Contracts | | Premiums
Received | | Number of
Contracts | | Premiums
Received | |
Options outstanding at December 31, 2011 | | | 64 | | | $ | 20,369 | | | | 160 | | | $ | 67,931 | | |
Options written | | | 641 | | | | 121,771 | | | | 2,485 | | | | 419,228 | | |
Options closed | | | (99 | ) | | | (18,779 | ) | | | (960 | ) | | | (154,230 | ) | |
Options expired | | | (365 | ) | | | (56,178 | ) | | | (1,170 | ) | | | (162,442 | ) | |
Options exercised | | | (241 | ) | | | (67,183 | ) | | | (515 | ) | | | (170,487 | ) | |
Options outstanding at December 31, 2012 | | | — | | | $ | — | | | | — | | | $ | — | | |
| | | MegaTrends Fund
Call Options | | Global Resources Fund
Call Options | |
| | | Number of
Contracts | | Premiums
Received | | Number of
Contracts | | Premiums
Received | |
Options outstanding at December 31, 2011 | | | 40 | | | $ | 4,615 | | | | 1,000 | | | $ | 179,662 | | |
Options written | | | 381 | | | | 48,888 | | | | 44,160 | | | | 5,658,309 | | |
Options closed | | | (103 | ) | | | (16,907 | ) | | | (16,897 | ) | | | (2,912,711 | ) | |
Options expired | | | (62 | ) | | | (8,647 | ) | | | (21,132 | ) | | | (1,948,346 | ) | |
Options exercised | | | (256 | ) | | | (27,949 | ) | | | (7,131 | ) | | | (976,914 | ) | |
Options outstanding at December 31, 2012 | | | — | | | $ | — | | | | — | | | $ | — | | |
174
Notes to Financial Statements December 31, 2012
| | | World Precious Minerals Fund
Call Options | | Gold and Precious Metals Fund
Call Options | |
| | | Number of
Contracts | | Premiums
Received | | Number of
Contracts | | Premiums
Received | |
Options outstanding at December 31, 2011 | | | — | | | $ | — | | | | — | | | $ | — | | |
Options written | | | 27,230 | | | | 2,920,258 | | | | 25,665 | | | | 2,790,269 | | |
Options closed | | | (15,750 | ) | | | (1,648,293 | ) | | | (14,900 | ) | | | (1,587,764 | ) | |
Options expired | | | (3,000 | ) | | | (109,961 | ) | | | (2,597 | ) | | | (150,173 | ) | |
Options exercised | | | (8,480 | ) | | | (1,162,004 | ) | | | (8,168 | ) | | | (1,052,332 | ) | |
Options outstanding at December 31, 2012 | | | — | | | $ | — | | | | — | | | $ | — | | |
| | | Eastern European Fund
Call Options | | Eastern European Fund
Put Options | |
| | | Number of
Contracts | | Premiums
Received | | Number of
Contracts | | Premiums
Received | |
Options outstanding at December 31, 2011 | | | 32,300 | | | $ | 1,010,400 | | | | 5,000 | | | $ | 395,485 | | |
Options written | | | 122,450 | | | | 8,960,434 | | | | — | | | | — | | |
Options closed | | | (83,120 | ) | | | (6,387,780 | ) | | | — | | | | — | | |
Options expired | | | (43,380 | ) | | | (1,576,135 | ) | | | (5,000 | ) | | | (395,485 | ) | |
Options exercised | | | (26,250 | ) | | | (1,715,359 | ) | | | — | | | | — | | |
Options outstanding at December 31, 2012 | | | 2,000 | | | $ | 291,560 | | | | — | | | $ | — | | |
| | | China Region Fund
Call Options | | China Region Fund
Put Options | |
| | | Number of
Contracts | | Premiums
Received | | Number of
Contracts | | Premiums
Received | |
Options outstanding at December 31, 2011 | | | — | | | $ | — | | | | — | | | $ | — | | |
Options written | | | 48 | | | | 9,713 | | | | 658 | | | | 124,947 | | |
Options closed | | | — | | | | — | | | | (245 | ) | | | (48,543 | ) | |
Options expired | | | (48 | ) | | | (9,713 | ) | | | (265 | ) | | | (24,877 | ) | |
Options exercised | | | — | | | | — | | | | (148 | ) | | | (51,527 | ) | |
Options outstanding at December 31, 2012 | | | — | | | $ | — | | | | — | | | $ | — | | |
B. Forward Foreign Currency Contracts
The Funds enter into forward foreign currency contracts to lock in the U.S. dollar cost of purchase and sale transactions or to defend the portfolio against currency fluctuations. A forward foreign currency contract is a commitment to purchase or sell a foreign currency at a future date at a negotiated rate. These contracts are valued daily, and the Fund's net equity therein, representing unrealized gain or loss on the contracts as measured by the difference between the forward foreign exchange rates at the dates of entry into the contracts and the forward rates at the reporting date, is included in the statement of assets and liabilities. Realized and unrealized gains and losses are included in the statement of operations. Risks may arise upon entering into these contracts from the potential inability of counterparties to meet the terms of the contract and from unanticipated movements in the value of foreign currencies relative to the U.S. dollar.
There were no open forward foreign currency contracts at December 31, 2012.
175
Notes to Financial Statements December 31, 2012
C. Summary of Derivative Instruments
The following is a summary of the valuations of derivative instruments categorized by location in the Statements of Assets and Liabilities as of December 31, 2012:
Location | | World
Precious
Minerals
Fund | | Gold and
Precious
Metals
Fund | | Eastern
European
Fund | | China
Region
Fund | |
Asset derivatives | |
Investments, at value
Equity contracts - Note 2 A | | $ | 4,073,829 | | | $ | 1,904,925 | | | $ | 2,798,910 | | | $ | 95,830 | | |
Total | | $ | 4,073,829 | | | $ | 1,904,925 | | | $ | 2,798,910 | | | $ | 95,830 | | |
Liability derivatives | |
Written options, at value | | $ | — | | | $ | — | | | $ | 324,000 | | | $ | — | | |
Total | | $ | — | | | $ | — | | | $ | 324,000 | | | $ | — | | |
The following is a summary of the effect of derivative instruments on the Statements of Operations for the year ended December 31, 2012:
Location | | All
American
Equity Fund | | Holmes
Growth
Fund | | MegaTrends
Fund | | Global
Resources
Fund | |
Realized gain (loss) on derivatives
recognized in income | |
Realized gain (loss) from securities
Equity contracts | | $ | (100,296 | ) | | $ | (170,316 | ) | | $ | (83,483 | ) | | $ | (2,411,811 | ) | |
Realized gain (loss) from written options
Equity contracts | | | 135,447 | | | | 322,831 | | | | 37,590 | | | | 4,264,061 | | |
Net realized gain (loss) from foreign
currency transactions
Foreign exchange contracts | | | — | | | | — | | | | 1,723 | | | | (49,149 | ) | |
| | | | 35,151 | | | | 152,515 | | | | (44,170 | ) | | | 1,803,101 | | |
Change in unrealized appreciation
(depreciation) on derivatives
recognized in income | |
Net change in unrealized appreciation
(depreciation) of investments
Equity contracts | | | 29,500 | | | | — | | | | 31,913 | | | | 871,666 | | |
Net change in unrealized appreciation
(depreciation) of written options
Equity contracts | | | 580 | | | | 3,129 | | | | 7,085 | | | | (177,662 | ) | |
| | | | 30,080 | | | | 3,129 | | | | 38,998 | | | | 694,004 | | |
Total | | $ | 65,231 | | | $ | 155,644 | | | $ | (5,172 | ) | | $ | 2,497,105 | | |
176
Notes to Financial Statements December 31, 2012
Location | | World
Precious
Minerals
Fund | | Gold and
Precious
Metals
Fund | | Eastern
European
Fund | | Global
Emerging
Markets
Fund | | China
Region
Fund | |
Realized gain (loss) on derivatives
recognized in income | |
Realized gain (loss) from securities
Equity contracts | | $ | 1,817,906 | | | $ | 1,807,673 | | | $ | 2,209 | | | $ | (6,601 | ) | | $ | (210,190 | ) | |
Realized gain (loss) from written options
Equity contracts | | | 1,687,665 | | | | 1,874,449 | | | | 3,959,064 | | | | — | | | | 103,620 | | |
Net realized gain (loss) from foreign
currency transactions
Foreign exchange contracts | | | (142,491 | ) | | | (123,786 | ) | | | (167,437 | ) | | | (832 | ) | | | (835 | ) | |
| | | | 3,363,080 | | | | 3,558,336 | | | | 3,793,836 | | | | (7,433 | ) | | | (107,405 | ) | |
Change in unrealized appreciation
(depreciation) on derivatives
recognized in income | |
Net change in unrealized appreciation
(depreciation) of investments
Equity contracts | | | (7,221,639 | ) | | | (5,257,801 | ) | | | 1,600,389 | | | | — | | | | 89,263 | | |
Net change in unrealized appreciation
(depreciation) of written options
Equity contracts | | | — | | | | — | | | | (861,076 | ) | | | — | | | | — | | |
| | | | (7,221,639 | ) | | | (5,257,801 | ) | | | 739,313 | | | | — | | | | 89,263 | | |
Total | | $ | (3,858,559 | ) | | $ | (1,699,465 | ) | | $ | 4,533,149 | | | $ | (7,433 | ) | | $ | (18,142 | ) | |
The average notional amounts of written options, purchased options and forward currency contracts outstanding during the year ended December 31, 2012, were approximately as follows:
Fund | | Written
Options | | Purchased
Options | | Forward
Currency
Contracts | |
All American Equity | | $ | 9,830 | | | $ | 5,323 | | | $ | — | | |
Holmes Growth | | | 37,459 | | | | 10,592 | | | | — | | |
MegaTrends | | | 8,044 | | | | 7,604 | | | | 3,992 | | |
Global Resources | | | 482,812 | | | | 843,754 | | | | 106,415 | | |
World Precious Minerals | | | 174,117 | | | | 6,077,068 | | | | 837,801 | | |
Gold and Precious Metals | | | 175,977 | | | | 3,032,023 | | | | 601,910 | | |
Eastern European | | | 850,466 | | | | 308,495 | | | | 716,973 | | |
Global Emerging Markets | | | — | | | | 115 | | | | 358 | | |
China Region | | | 7,159 | | | | 75,817 | | | | 5,407 | | |
177
Notes to Financial Statements December 31, 2012
Note 3: Related Party Transactions
U.S. Global Investors, Inc. (Adviser), under an investment advisory agreement with the Trust in effect through October 1, 2013, furnishes management and investment advisory services and, subject to the supervision of the trustees, directs the investments of each Fund according to each Fund's investment objectives, policies and limitations. The Adviser also furnishes all necessary office facilities, business equipment and personnel for administering the affairs of the Trust. Frank E. Holmes, a trustee of the Funds, is the controlling owner of the Adviser.
For the services of the Adviser, each Fund pays a base management or advisory fee based upon its net assets. Fees are accrued daily and paid monthly. The contractual management fee for each fund is:
| Fund | | Annual Percentage of
Average Daily Net Assets | |
U.S. Treasury Securities Cash and
U.S. Government Securities Savings
Near-Term Tax Free
Tax Free | | .50% of the first $250,000,000 and
.375% of the excess
.50%
.75% of the first $250,000,000 and
.50% of the excess | |
All American Equity | | .80% of the first $500,000,000 and
.75% of the excess | |
Holmes Growth and MegaTrends | | 1.00% | |
Global Resources | | .95% of the first $500,000,000;
.90% of $500,000,001 to $1,000,000,000
and .85% of the excess | |
World Precious Minerals | | 1.00% of the first $500,000,000;
.95% of $500,000,001 to $1,000,000,000
and .90% of the excess | |
Gold and Precious Metals | | .90% of the first $500,000,000 and
.85% of the excess | |
Eastern European | | 1.25% | |
Global Emerging Markets | | 1.375% | |
China Region | | 1.25% | |
178
Notes to Financial Statements December 31, 2012
The advisory agreement also provides that the base advisory fee of the Equity Funds will be adjusted upwards or downwards by 0.25 percent if there is a performance difference of 5 percent or more between a Fund's performance and that of its designated benchmark index over the prior 12 months. The performance adjustment is calculated separately for each share class. The benchmarks are as follows:
| Fund | | Benchmark Index | |
All American Equity | | S&P 500 Index | |
Holmes Growth | | S&P Composite 1500 Index | |
MegaTrends | | S&P 500 Index | |
Global Resources | | Morgan Stanley Commodity Related Equity Index | |
World Precious Minerals | | NYSE Arca Gold Miners Index | |
Gold and Precious Metals | | FTSE Gold Mines Index | |
Eastern European | | MSCI Emerging Markets Europe 10/40 Index (Net Total Return) | |
Global Emerging Markets | | MSCI Emerging Markets Total Net Return Index | |
China Region | | Hang Seng Composite Index | |
No performance adjustment is applied unless the difference between the class's investment performance and the benchmark is 5 percent or greater (positive or negative) during the applicable performance measurement period. The performance fee adjustment is calculated monthly in arrears and is accrued ratably during the month. The management fee, net of any performance fee adjustment, is paid monthly in arrears.
The Funds' prospectus and statement of additional information contain additional information about the performance adjustment. The amounts shown as management fees on the Statements of Operations reflects the base fee plus/minus any performance adjustment. During the year ended December 31, 2012, the Funds recorded performance adjustments as follows:
Fund | | Investor Class
Performance Fee
Adjustment | | Institutional Class
Performance Fee
Adjustment | |
All American Equity | | $ | — | | | | N/A | | |
Holmes Growth | | | (94,631 | ) | | | N/A | | |
MegaTrends | | | (32,986 | ) | | $ | (6,618 | ) | |
Global Resources | | | (399,270 | ) | | | (11,561 | ) | |
World Precious Minerals | | | (997,712 | ) | | | (3,998 | ) | |
Gold and Precious Metals | | | (84,692 | ) | | | N/A | | |
Eastern European | | | — | | | | N/A | | |
Global Emerging Markets | | | (23,960 | ) | | | N/A | | |
China Region | | | (90,596 | ) | | | N/A | | |
179
Notes to Financial Statements December 31, 2012
Under an administrative services agreement, the U.S. Treasury Securities Cash, U.S. Government Securities Savings, Near-Term Tax Free, Tax Free, All American Equity, Holmes Growth, Gold and Precious Metals, Eastern European, Global Emerging Markets and China Region Funds compensate the Adviser at an annual rate of 0.08% of the average daily net assets of each Fund for administrative services provided. The MegaTrends, Global Resources and World Precious Minerals Funds compensate the Adviser at an annual rate of 0.08% of the average daily net assets for the Investor Class and 0.06% of the average daily net assets for the Institutional Class for administrative services provided, of which half is a fund-level fee and half is a class-level fee.
The Investor Class shares for Equity Funds in the Trust have adopted a distribution plan pursuant to Rule 12b-1 of the Investment Company Act of 1940 in which a subsidiary of the Adviser is paid a fee at an annual rate of 0.25% of the average daily net assets of the Investor Class for sales and promotional services related to the distribution of Investor Class shares. The Institutional Class does not incur distribution plan fees.
The Adviser has voluntarily agreed to reimburse specific funds so that their total operating expenses will not exceed certain annual percentages of average net assets. The expenses for the year ended December 31, 2012, were limited as follows for the Investor Class: U.S. Treasury Securities Cash Fund at 1.00%, U.S. Government Securities Savings Fund at 0.45%, Near-Term Tax Free Fund at 0.45%, Tax Free Fund at 0.70%, All American Equity Fund at 2.20%, Holmes Growth Fund at 2.20%, MegaTrends Fund at 2.35%, Global Resources, World Precious Minerals and Gold and Precious Metals Funds at 1.90%, Eastern European Fund at 2.85%, Global Emerging Markets Fund at 3.15% and China Region Fund at 2.55%. These expense limitations are exclusive of any performance fee adjustments and will continue on a voluntary basis at the Adviser's discretion.
The Adviser has agreed to waive all class specific expenses for the Institutional Class. The expense waiver is exclusive of performance fees, and the Adviser can modify or terminate this arrangement at any time.
The Adviser has voluntarily agreed to waive fees and/or reimburse U.S. Treasury Securities Cash Fund and U.S. Government Securities Savings Fund to the extent necessary to maintain the respective fund's yield at a certain level as determined by the Adviser (Minimum Yield). The Adviser may recapture any fees waived and/or expenses reimbursed within three years after the end of the fiscal year of such waiver and/or reimbursement to the extent that such recapture would not cause the fund's yield to fall below the Minimum Yield. For the year ended December 31, 2012, fees waived and/or expenses reimbursed as a result of this agreement were $735,584 and $509,874 for the U.S. Treasury Securities Cash Fund and the U.S. Government
180
Notes to Financial Statements December 31, 2012
Securities Savings Fund, respectively. At December 31, 2012, the Adviser may seek reimbursement of previously waived and reimbursed fees as follows:
Fund | | Expires
12/31/2013 | | Expires
12/31/2014 | | Expires
12/31/2015 | | Total | |
U.S. Treasury Securities Cash | | $ | 884,850 | | | $ | 867,545 | | | $ | 735,584 | | | $ | 2,487,979 | | |
U.S. Government Securities Savings | | | 678,107 | | | | 736,531 | | | | 509,874 | | | | 1,924,512 | | |
United Shareholder Services, Inc. (USSI), a wholly-owned subsidiary of the Adviser, is the transfer agent for the Funds. Each Fund's share class pays an annual fee based on the number of shareholder accounts, certain base fees and transaction-and activity-based fees for transfer agency services. Certain account fees are paid directly by shareholders to the transfer agent, which, in turn, reduces its charge to the Funds.
The Adviser was reimbursed for services of the Funds' Chief Compliance Officer during the year ended December 31, 2012, in the amount of $139,362.
Brown Brothers Harriman & Co. (BBH) serves as the custodian, fund accounting and administration service agent with a fee structure based on average net assets of the Funds, certain base fees and transaction-based fees.
The independent Trustees receive compensation for serving on the Board. Trustees serving as Chairman of the Board or a special committee or as a member of a committee receive additional compensation. Trustees are also reimbursed for out-of-pocket expenses incurred while attending meetings. Frank E. Holmes receives no compensation from the Funds for serving on the Board.
Note 4: Investments
Cost of purchases and proceeds from sales of long-term securities for the year ended December 31, 2012, are summarized as follows:
Fund | | Purchases | | Sales | |
Near-Term Tax Free | | $ | 12,228,434 | | | $ | 2,310,000 | | |
Tax Free | | | 4,826,522 | | | | 90,000 | | |
All American Equity | | | 35,233,836 | | | | 36,028,239 | | |
Holmes Growth | | | 68,210,426 | | | | 68,059,359 | | |
MegaTrends | | | 50,334,524 | | | | 53,658,600 | | |
Global Resources | | | 631,796,740 | | | | 760,668,291 | | |
World Precious Minerals | | | 151,053,124 | | | | 223,172,092 | | |
Gold and Precious Metals | | | 144,441,470 | | | | 158,339,016 | | |
Eastern European | | | 153,531,026 | | | | 176,802,725 | | |
Global Emerging Markets | | | 27,668,231 | | | | 29,287,021 | | |
China Region | | | 107,233,634 | | | | 111,233,924 | | |
U.S. Treasury Securities Cash and U.S. Government Securities Savings Funds held only short-term investments. The Funds neither purchased nor sold long-term U.S. government securities during the period.
181
Notes to Financial Statements December 31, 2012
Investments in foreign issuers as a percent of total investments at December 31, 2012, were: 3.48% of All American Equity, 13.66% of Holmes Growth, 32.86% of MegaTrends, 45.01% of Global Resources, 85.80% of World Precious Minerals, 70.19% of Gold and Precious Metals, 98.26% of Eastern European, 93.09% of Global Emerging Markets and 96.01% of China Region.
Note 5: Tax Information
The following table presents the income tax basis of securities owned at December 31, 2012, and the tax basis components of net unrealized appreciation (depreciation):
Fund | | Aggregate
Tax Cost | | Gross
Unrealized
Appreciation | | Gross
Unrealized
Depreciation | | Net Unrealized
Appreciation
(Depreciation) | |
U.S. Treasury Securities Cash | | $ | 81,255,087 | | | $ | — | | | $ | — | | | $ | — | | |
U.S. Government Securities Savings | | | 140,528,085 | | | | — | | | | — | | | | — | | |
Near-Term Tax Free | | | 42,959,324 | | | | 1,348,028 | | | | (47,416 | ) | | | 1,300,612 | | |
Tax Free | | | 20,272,578 | | | | 1,629,128 | | | | (14,460 | ) | | | 1,614,668 | | |
All American Equity | | | 15,954,014 | | | | 1,274,306 | | | | (470,164 | ) | | | 804,142 | | |
Holmes Growth | | | 32,833,625 | | | | 2,938,764 | | | | (1,000,153 | ) | | | 1,938,611 | | |
MegaTrends | | | 10,548,710 | | | | 416,219 | | | | (261,805 | ) | | | 154,414 | | |
Global Resources | | | 552,378,014 | | | | 67,597,161 | | | | (102,268,921 | ) | | | (34,671,760 | ) | |
World Precious Minerals | | | 435,045,094 | | | | 47,078,326 | | | | (166,592,099 | ) | | | (119,513,773 | ) | |
Gold and Precious Metals | | | 179,025,873 | | | | 17,752,058 | | | | (31,085,325 | ) | | | (13,333,267 | ) | |
Eastern European | | | 159,667,751 | | | | 34,780,265 | | | | (19,932,037 | ) | | | 14,848,228 | | |
Global Emerging Markets | | | 7,235,770 | | | | 539,160 | | | | (905,399 | ) | | | (366,239 | ) | |
China Region | | | 26,529,288 | | | | 3,051,623 | | | | (583,239 | ) | | | 2,468,384 | | |
As of December 31, 2012, the components of distributable earnings on a tax basis were as follows:
Fund | | Undistributed
Tax-Exempt
Income | | Undistributed
Ordinary
Income | | Undistributed
Long-Term
Capital Gains | | Net Unrealized
Appreciation
(Depreciation) | |
U.S. Treasury Securities Cash | | $ | — | | | $ | 1,151 | | | $ | — | | | $ | — | | |
U.S. Government Securities Savings | | | — | | | | 2,531 | | | | — | | | | — | | |
Near-Term Tax Free | | | 6,229 | | | | 11,667 | | | | — | | | | 1,300,612 | | |
Tax Free | | | 7,655 | | | | 35,391 | | | | — | | | | 1,614,668 | | |
All American Equity | | | — | | | | 43,951 | | | | — | | | | 821,084 | | |
Holmes Growth | | | — | | | | — | | | | 1,061,560 | | | | 1,979,623 | | |
MegaTrends | | | — | | | | 18,079 | | | | — | | | | 193,580 | | |
Global Resources | | | — | | | | 13,521,849 | | | | — | | | | (21,357,419 | ) | |
World Precious Minerals | | | — | | | | — | | | | — | | | | (92,587,804 | ) | |
Gold and Precious Metals | | | — | | | | — | | | | — | | | | (11,380,125 | ) | |
Eastern European | | | — | | | | 1,674,295 | | | | — | | | | 25,600,807 | | |
Global Emerging Markets | | | — | | | | — | | | | — | | | | (335,643 | ) | |
China Region | | | — | | | | 62,355 | | | | — | | | | 2,678,744 | | |
The differences between book-basis and tax-basis unrealized appreciation (depreciation) for All American Equity, Holmes Growth, MegaTrends, Global Resources,
182
Notes to Financial Statements December 31, 2012
World Precious Minerals, Gold and Precious Metals, Eastern European, Global Emerging Markets and China Region Funds are attributable primarily to the tax deferral of losses on wash sales, investment in passive foreign investment companies (PFIC), forwards marked to markets, unreversed return of capital in Canadian Trusts, adjustments for partnerships, tax straddle loss deferrals on written options, and adjustments for grantor trusts.
Reclassifications are made to the Funds' capital accounts to reflect income and gains available for distribution (or available capital loss carryovers) under income tax regulations. For the year ended December 31, 2012, the Funds recorded the following reclassifications to increase (decrease) the accounts listed below:
Fund | | Accumulated
Net Investment
Income | | Accumulated
Net Realized
Gain | | Paid-in
Capital | |
U.S. Treasury Securities Cash | | $ | 81 | | | $ | — | | | $ | (81 | ) | |
U.S. Government Securities Savings | | | 1,533 | | | | — | | | | (1,533 | ) | |
Near-Term Tax Free | | | — | | | | 33,686 | | | | (33,686 | ) | |
Tax Free | | | — | | | | 421,236 | | | | (421,236 | ) | |
All American Equity | | | (3,797 | ) | | | (10,587 | ) | | | 14,384 | | |
Holmes Growth | | | 198,823 | | | | (145,490 | ) | | | (53,333 | ) | |
MegaTrends | | | (55,428 | ) | | | (132,381 | ) | | | 187,809 | | |
Global Resources | | | 18,247,377 | | | | (18,088,297 | ) | | | (159,080 | ) | |
World Precious Minerals | | | 30,207,283 | | | | (20,746,164 | ) | | | (9,461,119 | ) | |
Gold and Precious Metals | | | 2,047,822 | | | | (933,195 | ) | | | (1,114,627 | ) | |
Eastern European | | | (380,696 | ) | | | 380,696 | | | | — | | |
Global Emerging Markets | | | 1,283 | | | | 34,294 | | | | (35,577 | ) | |
China Region | | | (39,112 | ) | | | 39,111 | | | | 1 | | |
The tax character of distributions paid during the fiscal year ended December 31, 2012, were as follows:
Fund | | Tax Exempt
Income | | Ordinary
Income | | Long-Term
Capital Gains | | Total | |
U.S. Treasury Securities Cash | | $ | — | | | $ | 8,500 | | | $ | — | | | $ | 8,500 | | |
U.S. Government Securities Savings | | | — | | | | 15,792 | | | | — | | | | 15,792 | | |
Near-Term Tax Free | | | 827,875 | | | | 38,683 | | | | — | | | | 866,558 | | |
Tax Free | | | 679,446 | | | | 38,983 | | | | — | | | | 718,429 | | |
All American Equity | | | — | | | | — | | | | — | | | | — | | |
Holmes Growth | | | — | | | | — | | | | 563,945 | | | | 563,945 | | |
MegaTrends - Investor Class | | | — | | | | 49,108 | | | | — | | | | 49,108 | | |
MegaTrends - Institutional Class | | | — | | | | 4,806 | | | | — | | | | 4,806 | | |
Global Resources - Investor Class | | | — | | | | 9,700,159 | | | | — | | | | 9,700,159 | | |
Global Resources - Institutional Class | | | — | | | | 3,187,762 | | | | — | | | | 3,187,762 | | |
World Precious Minerals - Investor Class | | | — | | | | — | | | | — | | | | — | | |
World Precious Minerals - Institutional Class | | | — | | | | — | | | | — | | | | — | | |
Gold and Precious Metals | | | — | | | | 256,589 | | | | — | | | | 256,589 | | |
Eastern European | | | — | | | | 1,152,778 | | | | — | | | | 1,152,778 | | |
Global Emerging Markets | | | — | | | | — | | | | — | | | | — | | |
China Region | | | — | | | | 65,330 | | | | — | | | | 65,330 | | |
183
Notes to Financial Statements December 31, 2012
The tax character of distributions paid during the fiscal year ended December 31, 2011, were as follows:
Fund | | Tax Exempt
Income | | Ordinary
Income | | Long-Term
Capital Gains | | Total | |
U.S. Treasury Securities Cash | | $ | — | | | $ | 9,580 | | | $ | — | | | $ | 9,580 | | |
U.S. Government Securities Savings | | | — | | | | 19,158 | | | | — | | | | 19,158 | | |
Near-Term Tax Free | | | 706,422 | | | | 34,065 | | | | — | | | | 740,487 | | |
Tax Free | | | 675,894 | | | | 27,735 | | | | — | | | | 703,629 | | |
All American Equity | | | — | | | | 22,535 | | | | — | | | | 22,535 | | |
Holmes Growth | | | — | | | | — | | | | — | | | | — | | |
MegaTrends - Investor Class | | | — | | | | — | | | | — | | | | — | | |
MegaTrends - Institutional Class | | | — | | | | 18,363 | | | | — | | | | 18,363 | | |
Global Resources - Investor Class | | | — | | | | 19,762,685 | | | | — | | | | 19,762,685 | | |
Global Resources - Institutional Class | | | — | | | | 2,765,455 | | | | — | | | | 2,765,455 | | |
World Precious Minerals - Investor Class | | | — | | | | 60,523,518 | | | | — | | | | 60,523,518 | | |
World Precious Minerals - Institutional Class | | | — | | | | 275,428 | | | | — | | | | 275,428 | | |
Gold and Precious Metals | | | — | | | | — | | | | 34,374,528 | | | | 34,374,528 | | |
Eastern European | | | — | | | | — | | | | — | | | | — | | |
Global Emerging Markets | | | — | | | | — | | | | — | | | | — | | |
China Region | | | — | | | | — | | | | — | | | | — | | |
Capital loss carryforwards may be used to offset current or future taxable capital gains until expiration. The Fund's tax-basis capital gains and losses are determined only at the end of each fiscal year. Under the Regulated Investment Company Modernization Act of 2010, the Funds are permitted to carry forward capital losses incurred in taxable years beginning after December 22, 2010, for an unlimited period. Losses incurred during these years are required to be utilized prior to the losses incurred in pre-enactment tax years. As a result of this ordering rule, pre-enactment capital loss carryforwards may be more likely to expire unused. In addition, post-enactment capital losses that are carried forward retain their character as either short-term or long-term capital losses rather than being considered all short-term as under previous law. The loss carryforwards and related expiration dates for each fund, as of December 31, 2012, are as follows:
| | | No Expiration | | Expiration Date | |
Fund | | Short-Term | | Long-Term | | 2013 | | 2014 | | 2015 | |
U.S. Treasury Securities Cash | | $ | — | | | $ | — | | | $ | — | | | $ | — | | | $ | — | | |
U.S. Government Securities Savings | | | — | | | | — | | | | — | | | | — | | | | — | | |
Near-Term Tax Free | | | — | | | | 3,623 | | | | 2,760 | | | | 202,719 | | | | 2,488 | | |
Tax Free | | | 6,681 | | | | 11,487 | | | | — | | | | — | | | | — | | |
All American Equity | | | — | | | | — | | | | — | | | | — | | | | — | | |
Holmes Growth | | | — | | | | — | | | | — | | | | — | | | | — | | |
MegaTrends | | | — | | | | — | | | | — | | | | — | | | | 6,016,468 | | |
Global Resources | | | 86,321,451 | | | | 21,474,071 | | | | — | | | | — | | | | — | | |
World Precious Minerals | | | 24,662,460 | | | | 16,607,108 | | | | — | | | | — | | | | — | | |
Gold and Precious Metals | | | 7,668,776 | | | | 1,949,089 | | | | — | | | | — | | | | — | | |
Eastern European | | | 2,752,268 | | | | — | | | | — | | | | — | | | | — | | |
Global Emerging Markets | | | 489,614 | | | | — | | | | — | | | | — | | | | 3,355,041 | | |
China Region | | | 6,316,272 | | | | 338,716 | | | | — | | | | — | | | | — | | |
184
Notes to Financial Statements December 31, 2012
| | | Expiration Date | |
Fund | | 2016 | | 2017 | | 2018 | | Total | |
U.S. Treasury Securities Cash | | $ | — | | | $ | — | | | $ | — | | | $ | — | | |
U.S. Government Securities Savings | | | — | | | | — | | | | — | | | | — | | |
Near-Term Tax Free | | | 112 | | | | 722 | | | | 2,532 | | | | 214,956 | | |
Tax Free | | | 10,697 | | | | — | | | | — | | | | 28,865 | | |
All American Equity | | | — | | | | 56,792 | | | | — | | | | 56,792 | | |
Holmes Growth | | | — | | | | — | | | | — | | | | — | | |
MegaTrends | | | 5,994,166 | | | | 995,675 | | | | — | | | | 13,006,309 | | |
Global Resources | | | — | | | | 259,212,512 | | | | — | | | | 367,008,034 | | |
World Precious Minerals | | | — | | | | 63,779,512 | | | | — | | | | 105,049,080 | | |
Gold and Precious Metals | | | — | | | | — | | | | — | | | | 9,617,865 | | |
Eastern European | | | 28,524,678 | | | | 257,523,539 | | | | 15,445,946 | | | | 304,246,431 | | |
Global Emerging Markets | | | 2,965,929 | | | | 5,814,949 | | | | — | | | | 12,625,533 | | |
China Region | | | 15,020,267 | | | | — | | | | — | | | | 21,675,255 | | |
In accordance with tax rules, the following net capital losses and ordinary losses (currency and late year losses) incurred after October 31, within each Fund's tax year, are deemed to arise on the first day of the Fund's next tax year if the Fund elects to defer such losses.
The Funds elected to defer losses incurred after October 31, 2012, as follows:
Fund | | Post October 31, 2012
Capital Loss Deferral | | Post October 31, 2012
Ordinary Loss Deferral | |
Holmes Growth | | $ | 61,788 | | | $ | 25,273 | | |
Global Resources | | | 11,340,796 | | | | — | | |
World Precious Minerals | | | 17,859,133 | | | | 276,562 | | |
Gold and Precious Metals | | | 4,227,291 | | | | 30,858 | | |
Eastern European | | | 265,016 | | | | 18,362 | | |
Global Emerging Markets | | | 21,181 | | | | 7,122 | | |
Note 6: Risks of Concentrations
The Near-Term Tax Free Fund and the Tax Free Fund may be exposed to risks related to concentration of investments in a particular state or geographic area. These investments present risks resulting from changes in economic conditions of the region or the issuer.
Because the Global Resources Fund concentrates its investments in a specific industry, the fund may be subject to greater risks and fluctuations than a portfolio representing a broader range of industries.
The investment policies of the World Precious Minerals and Gold and Precious Metals Funds present unique risks to their respective portfolios' values. The prices of gold and other precious metals may be subject to fluctuations caused by international monetary and political developments including trade or currency restrictions, currency devaluation and revaluation, and social and political conditions within a country. Fluctuations in the prices of gold and other precious metals will affect the market values of the securities held by these funds.
185
Notes to Financial Statements December 31, 2012
The Eastern European Fund invests more than 25% of its investments in companies principally engaged in the oil & gas or banking industries. The risk of concentrating investments in this group of industries will make the fund more susceptible to risk in these industries than funds which do not concentrate their investments in an industry.
The Eastern European and Global Emerging Markets Funds may be exposed to risks not typically associated with investment in the United States due to their concentration of investments in emerging markets. These risks include possible revaluation of currencies, less public information about companies, disruptive political or economic conditions and the possible imposition of adverse governmental laws or currency exchange restrictions. Moreover, securities of many foreign issuers, including sovereign nations, and their markets may be less liquid and their prices more volatile than those securities of comparable U.S. issuers.
The China Region Fund may be exposed to risks not typically associated with investments in the United States, due to concentration of investments in foreign issuers in the region. These investments present risks resulting from disruptive political or economic conditions and the potential imposition of adverse governmental laws or currency exchange restrictions affecting the area.
Note 7: Credit Arrangements
Each of the Funds has a revolving credit facility with BBH. Borrowings of each Fund are collateralized by any or all of the securities held by BBH as the Fund's custodian up to the amount of the borrowing. Interest on borrowings is charged at the current overnight Federal Funds Rate plus 2%. Each Fund has a maximum borrowing limit of 10% of qualified assets. The aggregate of borrowings by all Funds under the agreement cannot exceed $30,000,000 at any one time. There were no borrowings under the revolving credit facility during the year ended December 31, 2012. The U.S. Global Investors Funds paid BBH a total of $45,750 in commitment fees for the year ended December 31, 2012, under this arrangement.
Note 8: Shares of Beneficial Interest
At December 31, 2012, individual shareholders holding more than 5% of outstanding Investor Class shares comprised 5.36%, 6.15% and 5.85% of the U.S. Treasury Securities Cash Fund, Near-Term Tax Free Fund and Global Emerging Markets Fund, respectively. In addition, the Adviser held 12.01%, 5.81% and 7.55% of the Investor Class shares of the U.S. Government Securities Savings Fund, Near-Term Tax Free Fund and Tax Free Fund, respectively, and 7.70% of the Institutional Class shares of the MegaTrends Fund. Control is defined by the 1940 Act as the beneficial ownership, either directly or through one or more controlled companies, of more than 25% of the voting securities of a company. Investment activities of these shareholders could have a material impact on the Funds.
186
U.S. Treasury Securities Cash Fund
For a capital share outstanding during the
| | | Investor Class | |
| | | Year Ended December 31, | | Six Months
Ended
December 31, | | Year
Ended
June 30, | |
| | | 2012 | | 2011 | | 2010 | | 2009 | | 2008* | | 2008 | |
Net asset value, beginning of period | | $ | 1.00 | | | $ | 1.00 | | | $ | 1.00 | | | $ | 1.00 | | | $ | 1.00 | | | $ | 1.00 | | |
Investment Activities | |
Net investment income | | | — | (a) | | | — | (a) | | | — | (a) | | | — | (a) | | | — | (a) | | | .02 | | |
Net realized and unrealized gain | | | — | | | | — | | | | — | | | | — | | | | — | | | | — | | |
Total from investment activities | | | — | (a) | | | — | (a) | | | — | (a) | | | — | (a) | | | — | (a) | | | .02 | | |
Distributions from net investment income | | | — | (a) | | | — | (a) | | | — | (a) | | | — | (a) | | | — | (a) | | | (.02 | ) | |
Net asset value, end of period | | $ | 1.00 | | | $ | 1.00 | | | $ | 1.00 | | | $ | 1.00 | | | $ | 1.00 | | | $ | 1.00 | | |
| Total Return (excluding account fees) (b) | | | .01 | % | | | .01 | % | | | .01 | % | | | .01 | % | | | .23 | % | | | 2.46 | % | |
Ratios to Average Net Assets: (c) | |
Net investment income | | | .01 | % | | | .01 | % | | | .01 | % | | | .01 | % | | | .44 | % | | | 2.43 | % | |
Total expenses | | | 1.08 | % | | | .98 | % | | | 1.01 | % | | | 1.01 | % | | | 1.11 | % | | | 1.09 | % | |
Expenses waived or reimbursed (d)(e) | | | (.95 | )% | | | (.92 | )% | | | (.86 | )% | | | (.75 | )% | | | (.38 | )% | | | (.09 | )% | |
Net recouped fees (e) | | | — | | | | — | | | | — | | | | — | | | | — | | | | — | (g) | |
Net expenses (f) | | | .13 | % | | | .06 | % | | | .15 | % | | | .26 | % | | | .73 | % | | | 1.00 | % | |
Net assets, end of period (in thousands) | | $ | 80,192 | | | $ | 90,557 | | | $ | 99,491 | | | $ | 103,889 | | | $ | 121,410 | | | $ | 111,955 | | |
* Effective December 31, 2008, the fiscal year changed to December 31.
(a) The per share amount does not round to a full penny.
(b) Total returns for periods less than one year are not annualized. Assumes investment at the net asset value at the beginning of the period, reinvestment of all distribution and a complete redemption of the investment at the net asset value at the end of the period.
(c) Ratios are annualized for periods of less than one year.
(d) Expenses waived or reimbursed reflect reductions to total expenses, as discussed in the notes to the financial statements. These amounts would decrease the net investment income ratio and total returns had such reductions not occurred.
(e) During the year ended June 30, 2008, the Adviser waived fees and/or reimbursed expenses under the Minimum Yield Agreement in the amount of $4,259. The Fund reimbursed the Adviser the $4,259 during the year ended June 30, 2008. During the six months ended December 31, 2008, the year ended December 31, 2009, the year ended December 31, 2010, the year ended December 31, 2011, and the year ended December 31, 2012, the Adviser waived fees and/or reimbursed expenses under the Minimum Yield Agreement in the amount of $170,642, $789,420, $884,850, $867,545 and $735,584, respectively. The waivers/reimbursements from 2009-2012 are subject to recapture in future periods.
(f) The net expense ratios shown above reflect expenses after waivers and reimbursements but exclude the effect of reductions to total expenses for any expenses offset. Expense offset arrangements reduce total expenses, as discussed in the notes to the financial statements. These amounts would decrease the net investment income ratio had such reductions not occurred. The effects of expenses offset are as follows:
| | | Investor Class | |
| | | Year Ended December 31, | | Six Months
Ended
December 31, | | Year
Ended
June 30, | |
| | | 2012 | | 2011 | | 2010 | | 2009 | | 2008* | | 2008 | |
Ratios to Average Net Assets: (c) | |
Expenses offset (g) | | | — | | | | — | | | | — | | | | — | | | | — | | | | — | | |
(g) Effect on the expense ratio was not greater than 0.005%.
See accompanying notes to financial statements.
187
U.S. Government Securities Savings Fund
For a capital share outstanding during the
| | | Investor Class | |
| | | Year Ended December 31, | | Six Months
Ended
December 31, | | Year
Ended
June 30, | |
| | | 2012 | | 2011 | | 2010 | | 2009 | | 2008* | | 2008 | |
Net asset value, beginning of period | | $ | 1.00 | | | $ | 1.00 | | | $ | 1.00 | | | $ | 1.00 | | | $ | 1.00 | | | $ | 1.00 | | |
Investment Activities | |
Net investment income | | | — | (a) | | | — | (a) | | | — | (a) | | | — | (a) | | | .01 | | | | .03 | | |
Net realized and unrealized gain | | | — | | | | — | | | | — | (a) | | | — | | | | — | (a) | | | — | (a) | |
Total from investment activities | | | — | (a) | | | — | (a) | | | — | (a) | | | — | (a) | | | .01 | | | | .03 | | |
Distributions from net investment income | | | — | (a) | | | — | (a) | | | — | (a) | | | — | (a) | | | (.01 | ) | | | (.03 | ) | |
Net asset value, end of period | | $ | 1.00 | | | $ | 1.00 | | | $ | 1.00 | | | $ | 1.00 | | | $ | 1.00 | | | $ | 1.00 | | |
| Total Return (excluding account fees) (b) | | | .01 | % | | | .01 | % | | | .01 | % | | | .10 | % | | | .67 | % | | | 3.47 | % | |
Ratios to Average Net Assets: (c) | |
Net investment income | | | .01 | % | | | .01 | % | | | .01 | % | | | .11 | % | | | 1.36 | % | | | 3.42 | % | |
Total expenses | | | .87 | % | | | .81 | % | | | .82 | % | | | .78 | % | | | .73 | % | | | .65 | % | |
Expenses waived or reimbursed (d) | | | (.74 | )% | | | (.74 | )% | | | (.67 | )% | | | (.42 | )% | | | (.26 | )% | | | (.20 | )% | |
Net expenses (e) | | | .13 | % | | | .07 | % | | | .15 | % | | | .36 | % | | | .47 | %(g) | | | .45 | % | |
Net assets, end of period (in thousands) | | $ | 140,425 | | | $ | 171,664 | | | $ | 203,835 | | | $ | 263,232 | | | $ | 357,910 | | | $ | 446,208 | | |
* Effective December 31, 2008, the fiscal year changed to December 31.
(a) The per share amount does not round to a full penny.
(b) Total returns for periods less than one year are not annualized. Assumes investment at the net asset value at the beginning of the period, reinvestment of all distributions and a complete redemption of the investment at the net asset value at the end of the period.
(c) Ratios are annualized for periods of less than one year.
(d) Expenses waived or reimbursed reflect reductions to total expenses, as discussed in the notes to the financial statements. These amounts would decrease the net investment income ratio and total returns had such reductions not occurred. During the year ended December 31, 2009, the year ended December 31, 2010, the year ended December 31, 2011, and the year ended December 31, 2012, the Adviser waived fees and/or reimbursed expenses under the Minimum Yield Agreement in the amount of $258,561, $678,107, $736,531 and $509,874, respectively. These waivers/reimbursements are subject to recapture in future periods.
(e) The net expense ratios shown above reflect expenses after waivers and reimbursements but exclude the effect of reductions to total expenses for any expenses offset. Expense offset arrangements reduce total expenses, as discussed in the notes to the financial statements. These amounts would decrease the net investment income ratio had such reductions not occurred. The effect of expenses offset are as follows:
| | | Investor Class | |
| | | Year Ended December 31, | | Six Months
Ended
December 31, | | Year
Ended
June 30, | |
| | | 2012 | | 2011 | | 2010 | | 2009 | | 2008* | | 2008 | |
Ratios to Average Net Assets: (c) | |
Expenses offset (f) | | | — | | | | — | | | | — | | | | — | | | | — | | | | — | | |
(f) Effect on the expense ratio was not greater than 0.005%.
(g) The annualized net expense ratio for the six months ended December 31, 2008, exceeded the limitation for the period due to the cost of participating in the U.S. Treasury Guarantee Program for the Money Market Funds. The cost to participate was without regard to the expense limitation.
See accompanying notes to financial statements.
188
Near-Term Tax Free Fund
For a capital share outstanding during the
| | | Investor Class | |
| | | Year Ended December 31, | | Six Months
Ended
December 31, | | Year
Ended
June 30, | |
| | | 2012 | | 2011 | | 2010 | | 2009 | | 2008* | | 2008 | |
Net asset value, beginning of period | | $ | 2.26 | | | $ | 2.22 | | | $ | 2.21 | | | $ | 2.16 | | | $ | 2.14 | | | $ | 2.12 | | |
Investment Activities | |
Net investment income | | | .05 | | | | .05 | | | | .06 | | | | .06 | | | | .03 | | | | .07 | | |
Net realized and unrealized gain | | | .01 | | | | .04 | | | | .01 | | | | .05 | | | | .02 | | | | .02 | | |
Total from investment activities | | | .06 | | | | .09 | | | | .07 | | | | .11 | | | | .05 | | | | .09 | | |
Distributions from net investment income | | | (.05 | ) | | | (.05 | ) | | | (.06 | ) | | | (.06 | ) | | | (.03 | ) | | | (.07 | ) | |
Net asset value, end of period | | $ | 2.27 | | | $ | 2.26 | | | $ | 2.22 | | | $ | 2.21 | | | $ | 2.16 | | | $ | 2.14 | | |
| Total Return (excluding account fees) (a) | | | 2.67 | % | | | 4.24 | % | | | 2.95 | % | | | 5.00 | % | | | 2.55 | % | | | 4.42 | % | |
Ratios to Average Net Assets: (b) | |
Net investment income | | | 2.21 | % | | | 2.39 | % | | | 2.46 | % | | | 2.63 | % | | | 3.15 | % | | | 3.41 | % | |
Total expenses | | | 1.25 | % | | | 1.26 | % | | | 1.30 | % | | | 1.53 | % | | | 1.82 | % | | | 1.91 | % | |
Expenses waived or reimbursed (c) | | | (.80 | )% | | | (.81 | )% | | | (.85 | )% | | | (1.08 | )% | | | (1.37 | )% | | | (1.46 | )% | |
Net expenses (d) | | | .45 | % | | | .45 | % | | | .45 | % | | | .45 | % | | | .45 | % | | | .45 | % | |
Portfolio turnover rate | | | 7 | % | | | — | (f) | | | 1 | % | | | — | (f) | | | 8 | % | | | 8 | % | |
Net assets, end of period (in thousands) | | $ | 44,509 | | | $ | 35,014 | | | $ | 29,138 | | | $ | 23,337 | | | $ | 13,989 | | | $ | 13,603 | | |
* Effective December 31, 2008, the fiscal year changed to December 31.
(a) Total returns for periods less than one year are not annualized. Assumes investment at the net asset value at the beginning of the period, reinvestment of all distributions and a complete redemption of the investment at the net asset value at the end of the period.
(b) Ratios are annualized for periods of less than one year.
(c) Expenses waived or reimbursed reflect reductions to total expenses, as discussed in the notes to the financial statements. These amounts would decrease the net investment income ratio and total returns had such reductions not occurred.
(d) The net expense ratios shown above reflect expenses after waivers and reimbursements, but exclude the effect of reductions to total expenses for any expenses offset. Expense offset arrangements reduce total expenses, as discussed in the notes to the financial statements. These amounts would decrease the net investment income ratio had such reductions not occurred. The effect of expenses offset are as follows:
| | | Investor Class | |
| | | Year Ended December 31, | | Six Months
Ended
December 31, | | Year
Ended
June 30, | |
| | | 2012 | | 2011 | | 2010 | | 2009 | | 2008* | | 2008 | |
Ratios to Average Net Assets: (b) | |
Expenses offset (e) | | | — | | | | — | | | | — | | | | — | | | | — | | | | — | | |
(e) Effect on the expense ratio was not greater than 0.005%.
(f) Portfolio turnover rate was not greater than 0.5%.
See accompanying notes to financial statements.
189
Tax Free Fund
For a capital share outstanding during the
| | | Investor Class | |
| | | Year Ended December 31, | | Six Months
Ended
December 31, | | Year
Ended
June 30, | |
| | | 2012 | | 2011 | | 2010 | | 2009 | | 2008* | | 2008 | |
Net asset value, beginning of period | | $ | 12.63 | | | $ | 12.01 | | | $ | 12.20 | | | $ | 11.72 | | | $ | 11.93 | | | $ | 11.98 | | |
Investment Activities | |
Net investment income | | | .41 | | | | .43 | | | | .44 | | | | .45 | | | | .23 | | | | .47 | | |
Net realized and unrealized gain (loss) | | | .29 | | | | .62 | | | | (.19 | ) | | | .48 | | | | (.21 | ) | | | (.05 | ) | |
Total from investment activities | | | .70 | | | | 1.05 | | | | .25 | | | | .93 | | | | .02 | | | | .42 | | |
Distributions from net investment income | | | (.41 | ) | | | (.43 | ) | | | (.44 | ) | | | (.45 | ) | | | (.23 | ) | | | (.47 | ) | |
Net asset value, end of period | | $ | 12.92 | | | $ | 12.63 | | | $ | 12.01 | | | $ | 12.20 | | | $ | 11.72 | | | $ | 11.93 | | |
| Total Return (excluding account fees) (a) | | | 5.60 | % | | | 8.94 | % | | | 2.04 | % | | | 8.03 | % | | | .22 | % | | | 3.54 | % | |
Ratios to Average Net Assets: (b) | |
Net investment income | | | 3.18 | % | | | 3.53 | % | | | 3.55 | % | | | 3.73 | % | | | 3.92 | % | | | 3.91 | % | |
Total expenses | | | 1.84 | % | | | 1.74 | % | | | 1.66 | % | | | 1.75 | % | | | 1.91 | % | | | 1.94 | % | |
Expenses waived or reimbursed (c) | | | (1.14 | )% | | | (1.04 | )% | | | (.96 | )% | | | (1.05 | )% | | | (1.21 | )% | | | (1.24 | )% | |
Net expenses (d) | | | .70 | % | | | .70 | % | | | .70 | % | | | .70 | % | | | .70 | % | | | .70 | % | |
Portfolio turnover rate | | | — | (f) | | | 10 | % | | | 15 | % | | | — | (f) | | | 6 | % | | | 11 | % | |
Net assets, end of period (in thousands) | | $ | 23,138 | | | $ | 21,663 | | | $ | 19,794 | | | $ | 22,102 | | | $ | 16,946 | | | $ | 18,380 | | |
* Effective December 31, 2008, the fiscal year changed to December 31.
(a) Total returns for periods less than one year are not annualized. Assumes investment at the net asset value at the beginning of the period, reinvestment of all distributions and a complete redemption of the investment at the net asset value at the end of the period.
(b) Ratios are annualized for periods of less than one year.
(c) Expenses waived or reimbursed reflect reductions to total expenses, as discussed in the notes to the financial statements. These amounts would decrease the net investment income ratio and total returns had such reductions not occurred.
(d) The net expense ratios shown above reflect expenses after waivers and reimbursements, but exclude the effect of reductions to total expenses for any expenses offset. Expense offset arrangements reduce total expenses, as discussed in the notes to the financial statements. These amounts would decrease the net investment income ratio had such reductions not occurred. The effect of expenses offset are as follows:
| | | Investor Class | |
| | | Year Ended December 31, | | Six Months
Ended
December 31, | | Year
Ended
June 30, | |
| | | 2012 | | 2011 | | 2010 | | 2009 | | 2008* | | 2008 | |
Ratios to Average Net Assets: (b) | |
Expenses offset (e) | | | — | | | | — | | | | — | | | | — | | | | — | | | | — | | |
(e) Effect on the expense ratio was not greater than 0.005%.
(f) Portfolio turnover rate was not greater than 0.5%.
See accompanying notes to financial statements.
190
All American Equity Fund
For a capital share outstanding during the
| | | Investor Class | |
| | | Year Ended December 31, | | Six Months
Ended
December 31, | | Year
Ended
June 30, | |
| | | 2012 | | 2011 | | 2010 | | 2009 | | 2008* | | 2008 | |
Net asset value, beginning of period | | $ | 22.72 | | | $ | 22.72 | | | $ | 19.60 | | | $ | 17.33 | | | $ | 27.27 | | | $ | 28.58 | | |
Investment Activities | |
Net investment income (loss) | | | .07 | | | | (.07 | ) | | | .02 | | | | (.13 | ) | | | .04 | | | | (.15 | ) | |
Net realized and unrealized gain (loss) | | | 2.61 | | | | .10 | | | | 3.10 | | | | 2.51 | | | | (9.97 | ) | | | 1.98 | | |
Total from investment activities | | | 2.68 | | | | .03 | | | | 3.12 | | | | 2.38 | | | | (9.93 | ) | | | 1.83 | | |
Distributions | |
From net investment income | | | — | | | | (.03 | ) | | | — | | | | (.11 | ) | | | (.01 | ) | | | — | | |
From net realized gains | | | — | | | | — | | | | — | | | | — | | | | — | | | | (3.01 | ) | |
From tax return of capital | | | — | | | | — | | | | — | | | | — | | | | — | | | | (.13 | ) | |
Total distributions | | | — | | | | (.03 | ) | | | — | | | | (.11 | ) | | | (.01 | ) | | | (3.14 | ) | |
Short-Term Trading Fees **(a) | | | — | | | | — | | | | — | | | | — | | | | — | | | | — | | |
Net asset value, end of period | | $ | 25.40 | | | $ | 22.72 | | | $ | 22.72 | | | $ | 19.60 | | | $ | 17.33 | | | $ | 27.27 | | |
| Total Return (excluding account fees) (b) | | | 11.80 | % | | | .14 | % | | | 15.92 | % | | | 13.75 | % | | | (36.42 | )% | | | 5.99 | % | |
Ratios to Average Net Assets: (c) | |
Net investment income (loss) | | | .28 | % | | | (.32 | )% | | | .10 | % | | | (.74 | )% | | | .35 | % | | | (.55 | )% | |
Total expenses | | | 2.72 | % | | | 2.42 | % | | | 2.56 | % | | | 2.79 | % | | | 2.37 | % | | | 1.98 | % | |
Expenses waived or reimbursed (d) | | | (.52 | )% | | | (.24 | )% | | | (.48 | )% | | | (.96 | )% | | | (.62 | )% | | | (.23 | )% | |
Net expenses (e) | | | 2.20 | % | | | 2.18 | % | | | 2.08 | % | | | 1.83 | % | | | 1.75 | % | | | 1.75 | % | |
Portfolio turnover rate | | | 221 | % | | | 223 | % | | | 299 | % | | | 343 | % | | | 205 | % | | | 225 | % | |
Net assets, end of period (in thousands) | | $ | 16,846 | | | $ | 16,399 | | | $ | 17,760 | | | $ | 16,436 | | | $ | 16,234 | | | $ | 26,513 | | |
* Effective December 31, 2008, the fiscal year changed to December 31.
** Based on average monthly shares outstanding.
(a) The per share amount does not round to a full penny.
(b) Total returns for periods less than one year are not annualized. Assumes investment at the net asset value at the beginning of the period, reinvestment of all distribution and a complete redemption of the investment at the net asset value at the end of the period.
(c) Ratios are annualized for periods of less than one year.
(d) Expenses waived or reimbursed reflect reductions to total expenses, as discussed in the notes to the financial statements. These amounts would increase the net investment loss ratio or decrease the net investment income ratio, as applicable, and decrease total returns, had such reductions not occurred.
(e) The net expense ratios shown above reflect expenses after waivers and reimbursements, but exclude the effect of reductions to total expenses for any expenses offset. Expense offset arrangements reduce total expenses, as discussed in the notes to the financial statements. These amounts would increase the net investment loss ratio, or decrease the net investment income ratio, as applicable, had such reductions not occurred. The effect of expenses offset are as follows:
| | | Investor Class | |
| | | Year Ended December 31, | | Six Months
Ended
December 31, | | Year
Ended
June 30, | |
| | | 2012 | | 2011 | | 2010 | | 2009 | | 2008* | | 2008 | |
Ratios to Average Net Assets: (c) | |
Expenses offset (f) | | | — | | | | — | | | | — | | | | — | | | | — | | | | — | | |
(f) Effect on the expense ratio was not greater than 0.005%.
See accompanying notes to financial statements.
191
Holmes Growth Fund
For a capital share outstanding during the
| | | Investor Class | |
| | | Year Ended December 31, | | Two Months
Ended
December 31, | | Year
Ended
October 31, | |
| | | 2012 | | 2011 | | 2010 | | 2009 | | 2008* | | 2008 | |
Net asset value, beginning of period | | $ | 17.62 | | | $ | 18.65 | | | $ | 15.54 | | | $ | 12.79 | | | $ | 14.14 | | | $ | 24.78 | | |
Investment Activities | |
Net investment loss | | | (.10 | ) | | | (.26 | ) | | | (.22 | ) | | | (.13 | ) | | | (.01 | ) | | | (.15 | ) | |
Net realized and unrealized gain (loss) | | | 1.29 | | | | (.77 | ) | | | 3.54 | | | | 2.88 | | | | (1.34 | ) | | | (10.49 | ) | |
Total from investment activities | | | 1.19 | | | | (1.03 | ) | | | 3.32 | | | | 2.75 | | | | (1.35 | ) | | | (10.64 | ) | |
Distributions | |
From net investment income | | | — | | | | — | | | | (.21 | ) | | | — | | | | — | | | | — | | |
From net realized gains | | | (.30 | ) | | | — | | | | — | | | | — | | | | — | | | | — | | |
Total distributions | | | (.30 | ) | | | — | | | | (.21 | ) | | | — | | | | — | | | | — | | |
Short-Term Trading Fees **(a) | | | — | | | | — | | | | — | | | | — | | | | — | | | | — | | |
Net asset value, end of period | | $ | 18.51 | | | $ | 17.62 | | | $ | 18.65 | | | $ | 15.54 | | | $ | 12.79 | | | $ | 14.14 | | |
| Total Return (excluding account fees) (b) | | | 6.77 | % | | | (5.52 | )% | | | 21.35 | % | | | 21.50 | % | | | (9.55 | )% | | | (42.94 | )% | |
Ratios to Average Net Assets: (c) | |
Net investment loss | | | (.51 | )% | | | (1.25 | )% | | | (1.29 | )% | | | (.93 | )% | | | (.27 | )% | | | (.65 | )% | |
Total expenses | | | 1.85 | % | | | 2.00 | % | | | 1.93 | % | | | 2.10 | % | | | 2.51 | % | | | 1.74 | % | |
Expenses waived or reimbursed (d) | | | — | (f) | | | — | | | | — | (f) | | | (.33 | )% | | | (.76 | )% | | | — | | |
Net expenses (e) | | | 1.85 | % | | | 2.00 | % | | | 1.93 | % | | | 1.77 | % | | | 1.75 | % | | | 1.74 | % | |
Portfolio turnover rate | | | 214 | % | | | 210 | % | | | 160 | % | | | 219 | % | | | 20 | % | | | 140 | % | |
Net assets, end of period (in thousands) | | $ | 34,639 | | | $ | 35,316 | | | $ | 40,604 | | | $ | 37,149 | | | $ | 32,488 | | | $ | 36,231 | | |
* Effective December 31, 2008, the fiscal year changed to December 31.
** Based on average monthly shares outstanding.
(a) The per share amount does not round to a full penny.
(b) Total returns for periods less than one year are not annualized. Assumes investment at the net asset value at the beginning of the period, reinvestment of all distributions and a complete redemption of the investment at the net asset value at the end of the period.
(c) Ratios are annualized for periods of less than one year.
(d) Expenses waived or reimbursed reflect reductions to total expenses, as discussed in the notes to the financial statements. These amounts would increase the net investment loss ratio or decrease the net investment income ratio, as applicable, and decrease total returns had such reductions not occurred.
(e) The net expense shown above reflect expenses after waivers and reimbursements but exclude the effect of reductions to total expenses for any expenses offset. Expense offset arrangements reduce total expenses, as discussed in the notes to the financial statements. These amounts would increase the net investment loss ratio, or decrease the net investment income ratio, as applicable, had such reductions not occurred. The effect of expenses offset are as follows:
| | | Investor Class | |
| | | Year Ended December 31, | | Two Months
Ended
December 31, | | Year
Ended
October 31, | |
| | | 2012 | | 2011 | | 2010 | | 2009 | | 2008* | | 2008 | |
Ratios to Average Net Assets: (c) | |
Expenses offset (f) | | | — | | | | — | | | | — | | | | — | | | | — | | | | — | | |
(f) Effect on the expense ratio was not greater than 0.005%.
See accompanying notes to financial statements.
192
MegaTrends Fund
For a capital share outstanding during the
| | | Investor Class | |
| | | Year Ended December 31, | | Two Months
Ended
December 31, | | Year
Ended
October 31, | |
| | | 2012 | | 2011 | | 2010 | | 2009 | | 2008* | | 2008 | |
Net asset value, beginning of period | | $ | 7.68 | | | $ | 8.83 | | | $ | 8.15 | | | $ | 6.28 | | | $ | 6.60 | | | $ | 12.75 | | |
Investment Activities | |
Net investment income (loss) | | | .02 | ** | | | .04 | | | | .06 | | | | .03 | | | | — | (a) | | | — | (a) | |
Net realized and unrealized gain (loss) | | | .42 | ** | | | (1.19 | ) | | | .63 | | | | 1.86 | | | | (.31 | ) | | | (5.30 | ) | |
Total from investment activities | | | .44 | | | | (1.15 | ) | | | .69 | | | | 1.89 | | | | (.31 | ) | | | (5.30 | ) | |
Distributions | |
From net investment income | | | (.04 | ) | | | — | | | | (.01 | ) | | | (.02 | ) | | | — | | | | — | | |
From net realized gains | | | — | | | | — | | | | — | | | | — | | | | — | | | | (.85 | ) | |
From tax return of capital | | | — | | | | — | | | | — | | | | — | | | | (.01 | ) | | | — | | |
Total distributions | | | (.04 | ) | | | — | | | | (.01 | ) | | | (.02 | ) | | | (.01 | ) | | | (.85 | ) | |
Short-Term Trading Fees **(a) | | | — | | | | — | | | | — | | | | — | | | | — | | | | — | | |
Net asset value, end of period | | $ | 8.08 | | | $ | 7.68 | | | $ | 8.83 | | | $ | 8.15 | | | $ | 6.28 | | | $ | 6.60 | | |
| Total Return (excluding account fees) (b) | | | 5.67 | % | | | (13.02 | )% | | | 8.43 | % | | | 30.15 | % | | | (4.74 | )% | | | (44.50 | )% | |
Ratios to Average Net Assets: (c) | |
Net investment income (loss) | | | .24 | % | | | .35 | % | | | .43 | % | | | .45 | % | | | (.20 | )% | | | (.06 | )% | |
Total expenses | | | 3.13 | % | | | 2.56 | % | | | 2.44 | % | | | 2.43 | % | | | 2.96 | % | | | 2.21 | % | |
Expenses waived or reimbursed (d) | | | (1.05 | )% | | | (.41 | )% | | | (.22 | )% | | | (.48 | )% | | | (1.11 | )% | | | (.21 | )% | |
Net expenses (e) | | | 2.08 | % | | | 2.15 | % | | | 2.22 | % | | | 1.95 | % | | | 1.85 | % | | | 2.00 | % | |
Portfolio turnover rate (g) | | | 398 | % | | | 163 | % | | | 104 | % | | | 100 | % | | | 29 | % | | | 92 | % | |
Net assets, end of period (in thousands) | | $ | 10,327 | | | $ | 12,450 | | | $ | 16,332 | | | $ | 28,557 | | | $ | 22,035 | | | $ | 25,387 | | |
* Effective December 31, 2008, the fiscal year changed to December 31.
** Based on average monthly shares outstanding.
(a) The per share amount does not round to a full penny.
(b) Total returns for periods less than one year are not annualized. Assumes investment at the net asset value at the beginning of the period, reinvestment of all distributions and a complete redemption of the investment at the net asset value at the end of the period.
(c) Ratios are annualized for periods of less than one year.
(d) Expenses waived or reimbursed reflect reductions to total expenses, as discussed in the notes to the financial statements. These amounts would increase the net investment loss ratio or decrease the net investment income ratio, as applicable, and decrease total returns had such reductions not occurred.
(e) The expense ratios shown above exclude the effect of reductions to total expenses for any expenses offset. Expense offset arrangements reduce total expenses, as discussed in the notes to financial statements. These amounts would increase the net investment loss ratio, or decrease the net investment income ratio, as applicable, had such reductions not occurred. The effect of expenses offset are as follows:
| | | Investor Class | |
| | | Year Ended December 31, | | Two Months
Ended
December 31, | | Year
Ended
October 31, | |
| | | 2012 | | 2011 | | 2010 | | 2009 | | 2008* | | 2008 | |
Ratios to Average Net Assets: (c) | |
Expenses offset (f) | | | — | | | | — | | | | — | | | | — | | | | — | | | | — | | |
(f) Effect on the expense ratio was not greater than 0.005%
(g) Portfolio turnover rate is calculated at the fund level.
See accompanying notes to financial statements.
193
MegaTrends Fund
For a capital share outstanding during the
| | | Institutional Class | |
| | | Year Ended December 31, | | Period
Ended
December 31, | |
| | | 2012 | | 2011 | | 2010 (a) | |
Net asset value, beginning of period | | $ | 7.62 | | | $ | 8.79 | | | $ | 7.84 | | |
Investment Activities | |
Net investment income | | | .03 | * | | | .04 | | | | .01 | | |
Net realized and unrealized gain (loss) | | | .42 | * | | | (1.16 | ) | | | 1.02 | | |
Total from investment activities | | | .45 | | | | (1.12 | ) | | | 1.03 | | |
Distributions from net investment income | | | (.21 | ) | | | (.05 | ) | | | (.08 | ) | |
Short-Term Trading Fees | | | — | | | | — | | | | — | | |
Net asset value, end of period | | $ | 7.86 | | | $ | 7.62 | | | $ | 8.79 | | |
| Total Return (excluding account fees) (b) | | | 5.95 | % | | | (12.70 | )% | | | 13.08 | % | |
Ratios to Average Net Assets: (c) | |
Net investment income | | | .31 | % | | | .70 | % | | | .51 | % | |
Total expenses | | | 3.94 | % | | | 2.81 | % | | | 8.09 | % | |
Expenses waived or reimbursed (d) | | | (2.06 | )% | | | (1.00 | )% | | | (6.48 | )% | |
Net expenses (e) | | | 1.88 | % | | | 1.81 | % | | | 1.61 | % | |
Portfolio turnover rate (g) | | | 398 | % | | | 163 | % | | | 104 | % | |
Net assets, end of period (in thousands) | | $ | 130 | | | $ | 2,458 | | | $ | 3,970 | | |
* Based on average monthly shares outstanding.
(a) From March 1, 2010, commencement of operations.
(b) Total returns for periods less than one year are not annualized. Assumes investment at the net asset value at the beginning of the period, reinvestment of all distributions and a complete redemption of the investment at the net asset value at the end of the period.
(c) Ratios are annualized for periods of less than one year.
(d) Expenses waived or reimbursed reflect reductions to total expenses, as discussed in the notes to the financial statements. These amounts would increase the net investment loss ratio or decrease the net investment income ratio, as applicable, and decrease total returns had such reductions not occurred.
(e) The expense ratios shown above exclude the effect of reductions to total expenses for any expenses offset. Expense offset arrangements reduce total expenses, as discussed in the notes to financial statements. These amounts would increase the net investment loss ratio, or decrease the net investment income ratio, as applicable, had such reductions not occurred. The effect of expenses offset are as follows:
| | | Institutional Class | |
| | | Year Ended December 31, | | Period
Ended
December 31, | |
| | | 2012 | | 2011 | | 2010 (a) | |
Ratios to Average Net Assets: (c) | |
Expenses offset (f) | | | — | | | | — | | | | — | | |
(f) Effect on the expense ratio was not greater than 0.005%.
(g) Portfolio turnover rate is calculated at the fund level.
See accompanying notes to financial statements.
194
Global Resources Fund
For a capital share outstanding during the
| | | Investor Class | |
| | | Year Ended December 31, | | Six Months
Ended
December 31, | | Year
Ended
June 30, | |
| | | 2012 | | 2011 | | 2010 | | 2009 | | 2008* | | 2008 | |
Net asset value, beginning of period | | $ | 9.36 | | | $ | 11.91 | | | $ | 8.85 | | | $ | 5.26 | | | $ | 20.52 | | | $ | 17.70 | | |
Investment Activities | |
Net investment income (loss) | | | .04 | ** | | | (.19 | ) | | | (.09 | ) | | | (.01 | ) | | | (.02 | )** | | | .05 | ** | |
Net realized and unrealized gain (loss) | | | .61 | ** | | | (2.02 | ) | | | 3.44 | | | | 3.60 | | | | (13.92 | )** | | | 5.86 | ** | |
Total from investment activities | | | .65 | | | | (2.21 | ) | | | 3.35 | | | | 3.59 | | | | (13.94 | ) | | | 5.91 | | |
Distributions | |
From net investment income | | | (.22 | ) | | | (.34 | ) | | | (.29 | ) | | | — | | | | — | | | | (.95 | ) | |
From net realized gains | | | — | | | | — | | | | — | | | | — | | | | (1.32 | ) | | | (2.14 | ) | |
Total distributions | | | (.22 | ) | | | (.34 | ) | | | (.29 | ) | | | — | | | | (1.32 | ) | | | (3.09 | ) | |
Short-Term Trading Fees **(a) | | | — | | | | — | | | | — | | | | — | | | | — | | | | — | | |
Net asset value, end of period | | $ | 9.79 | | | $ | 9.36 | | | $ | 11.91 | | | $ | 8.85 | | | $ | 5.26 | | | $ | 20.52 | | |
| Total Return (excluding account fees) (b) | | | 6.93 | % | | | (18.69 | )% | | | 38.00 | % | | | 68.25 | % | | | (67.70 | )% | | | 37.59 | % | |
Ratios to Average Net Assets: (c) | |
Net investment income (loss) | | | .44 | % | | | (.79 | )% | | | (1.04 | )% | | | (.08 | )% | | | (.34 | )% | | | .28 | % | |
Total expenses | | | 1.57 | % | | | 1.72 | % | | | 1.73 | % | | | 1.64 | % | | | 1.20 | % | | | .88 | % | |
Expenses waived or reimbursed (d) | | | — | | | | — | | | | — | | | | (.17 | )% | | | (.12 | )% | | | — | | |
Net expenses (e) | | | 1.57 | % | | | 1.72 | % | | | 1.73 | % | | | 1.47 | % | | | 1.08 | % | | | .88 | % | |
Portfolio turnover rate (g) | | | 117 | % | | | 232 | % | | | 145 | % | | | 189 | % | | | 100 | % | | | 133 | % | |
Net assets, end of period (in thousands) | | $ | 438,372 | | | $ | 551,793 | | | $ | 911,559 | | | $ | 740,072 | | | $ | 464,524 | | | $ | 2,010,581 | | |
* Effective December 31, 2008, the fiscal year changed to December 31.
** Based on average monthly shares outstanding.
(a) The per share amount does not round to a full penny.
(b) Total returns for periods less than one year are not annualized. Assumes investment at the net asset value at the beginning of the period, reinvestment of all distributions and a complete redemption of the investment at the net asset value at the end of the period.
(c) Ratios are annualized for periods of less than one year.
(d) Expenses waived or reimbursed reflect reductions to total expenses, as discussed in the notes to the financial statements. These amounts would increase the net investment loss ratio or decrease the net investment income ratio, as applicable, and decrease total returns had such reductions not occurred.
(e) The net expense ratios shown above reflect expenses after waivers and reimbursements but exclude the effect of reductions to total expenses for any expenses offset. Expense offset arrangements reduce total expenses, as discussed in the notes to the financial statements. These amounts would increase the net investment loss ratio, or decrease the net investment income ratio, as applicable, had such reductions not occurred. The effect of expenses offset are as follows:
| | | Investor Class | |
| | | Year Ended December 31, | | Six Months
Ended
December 31, | | Year
Ended
June 30, | |
| | | 2012 | | 2011 | | 2010 | | 2009 | | 2008* | | 2008 | |
Ratios to Average Net Assets: (c) | |
Expenses offset | | | — | (f) | | | — | (f) | | | — | (f) | | | — | (f) | | | — | (f) | | | (0.01 | )% | |
(f) Effect on the expense ratio was not greater than 0.005%.
(g) Portfolio turnover rate is calculated at the fund level.
See accompanying notes to financial statements.
195
Global Resources Fund
For a capital share outstanding during the
| | | Institutional Class | |
| | | Year Ended December 31, | | Period
Ended
December 31, | |
| | | 2012 | | 2011 | | 2010 (a) | |
Net asset value, beginning of period | | $ | 9.39 | | | $ | 11.98 | | | $ | 8.87 | | |
Investment Activities | |
Net investment income (loss) | | | .10 | * | | | — | *(b) | | | (.01 | ) | |
Net realized and unrealized gain (loss) | | | .60 | * | | | (2.17 | )* | | | 3.41 | | |
Total from investment activities | | | .70 | | | | (2.17 | ) | | | 3.40 | | |
Distributions from net investment income | | | (.35 | ) | | | (.42 | ) | | | (.29 | ) | |
Short-Term Trading Fees *(b) | | | — | | | | — | | | | — | | |
Net asset value, end of period | | $ | 9.74 | | | $ | 9.39 | | | $ | 11.98 | | |
| Total Return (excluding account fees) (c) | | | 7.44 | % | | | (18.23 | )% | | | 38.53 | % | |
Ratios to Average Net Assets: (d) | |
Net investment income (loss) | | | 1.02 | % | | | (.02 | )% | | | (.35 | )% | |
Total expenses | | | 1.21 | % | | | 1.29 | % | | | 1.74 | % | |
Expenses waived or reimbursed (e) | | | (.14 | )% | | | (.20 | )% | | | (.66 | )% | |
Net expenses (f) | | | 1.07 | % | | | 1.09 | % | | | 1.08 | % | |
Portfolio turnover rate (h) | | | 117 | % | | | 232 | % | | | 145 | % | |
Net assets, end of period (in thousands) | | $ | 94,076 | | | $ | 55,985 | | | $ | 17,923 | | |
* Based on average monthly shares outstanding.
(a) From March 1, 2010, commencement of operations.
(b) The per share amount does not round to a full penny.
(c) Total returns for periods less than one year are not annualized. Assumes investment at the net asset value at the beginning of the period, reinvestment of all distributions and a complete redemption of the investment at the net asset value at the end of the period.
(d) Ratios are annualized for periods of less than one year.
(e) Expenses waived or reimbursed reflect reductions to total expenses, as discussed in the notes to the financial statements. These amounts would increase the net investment loss ratio or decrease the net investment income ratio, as applicable, and decrease total returns had such reductions not occurred.
(f) The net expense ratios shown above reflect expenses after waivers and reimbursements but exclude the effect of reductions to total expenses for any expenses offset. Expense offset arrangements reduce total expenses, as discussed in the notes to the financial statements. These amounts would increase the net investment loss ratio, or decrease the net investment income ratio, as applicable, had such reductions not occurred. The effect of expenses offset are as follows:
| | | Institutional Class | |
| | | Year Ended December 31, | | Period
Ended
December 31, | |
| | | 2012 | | 2011 | | 2010 (a) | |
Ratios to Average Net Assets: (d) | |
Expenses offset (g) | | | — | | | | — | | | | — | | |
(g) Effect on the expense ratio was not greater than 0.005%.
(h) Portfolio turnover rate is calculated at the fund level.
See accompanying notes to financial statements.
196
World Precious Minerals Fund
For a capital share outstanding during the
| | | Investor Class | |
| | | Year Ended December 31, | | Six Months
Ended
December 31, | | Year
Ended
June 30, | |
| | | 2012 | | 2011 | | 2010 | | 2009 | | 2008* | | 2008 | |
Net asset value, beginning of period | | $ | 13.18 | | | $ | 22.28 | | | $ | 17.42 | | | $ | 9.56 | | | $ | 25.32 | | | $ | 28.34 | | |
Investment Activities | |
Net investment income (loss) | | | (.11 | )** | | | (.32 | ) | | | (.32 | )** | | | (.18 | ) | | | (.06 | )** | | | (.13 | )** | |
Net realized and unrealized gain (loss) | | | (1.37 | )** | | | (6.76 | ) | | | 8.16 | ** | | | 8.71 | | | | (13.65 | )** | | | 3.70 | ** | |
Total from investment activities | | | (1.48 | ) | | | (7.08 | ) | | | 7.84 | | | | 8.53 | | | | (13.71 | ) | | | 3.57 | | |
Distributions | |
From net investment income | | | — | | | | (2.02 | ) | | | (2.98 | ) | | | (.67 | ) | | | — | | | | (3.25 | ) | |
From net realized gains | | | — | | | | — | | | | — | | | | — | | | | (2.05 | ) | | | (3.35 | ) | |
Total distributions | | | — | | | | (2.02 | ) | | | (2.98 | ) | | | (.67 | ) | | | (2.05 | ) | | | (6.60 | ) | |
Short-Term Trading Fees ** | | | — | (a) | | | — | (a) | | | — | (a) | | | — | (a) | | | — | (a) | | | .01 | | |
Net asset value, end of period | | $ | 11.70 | | | $ | 13.18 | | | $ | 22.28 | | | $ | 17.42 | | | $ | 9.56 | | | $ | 25.32 | | |
| Total Return (excluding account fees) (b) | | | (11.23 | )% | | | (32.58 | )% | | | 45.38 | % | | | 89.50 | % | | | (51.23 | )% | | | 14.14 | % | |
Ratios to Average Net Assets: (c) | |
Net investment income (loss) | | | (.85 | )% | | | (1.43 | )% | | | (1.68 | )% | | | (1.32 | )% | | | (.80 | )% | | | (.43 | )% | |
Total expenses | | | 1.45 | % | | | 1.67 | % | | | 1.84 | % | | | 1.75 | % | | | 1.36 | % | | | .97 | % | |
Expenses waived or reimbursed (d) | | | — | | | | — | | | | — | | | | (.17 | )% | | | (.11 | )% | | | — | | |
Net expenses (e) | | | 1.45 | % | | | 1.67 | % | | | 1.84 | % | | | 1.58 | % | | | 1.25 | % | | | .97 | % | |
Portfolio turnover rate (g) | | | 44 | % | | | 96 | % | | | 68 | % | | | 72 | % | | | 27 | % | | | 58 | % | |
Net assets, end of period (in thousands) | | $ | 319,052 | | | $ | 436,504 | | | $ | 826,598 | | | $ | 639,035 | | | $ | 359,120 | | | $ | 949,014 | | |
* Effective December 31, 2008, the fiscal year changed to December 31.
** Based on average monthly shares outstanding.
(a) The per share amount does not round to a full penny.
(b) Total returns for periods less than one year are not annualized. Assumes investment at the net asset value at the beginning of the period, reinvestment of all distributions and a complete redemption of the investment at the net asset value at the end of the period.
(c) Ratios are annualized for periods of less than one year.
(d) Expenses waived or reimbursed reflect reductions to total expenses, as discussed in the notes to the financial statements. These amounts would increase the net investment loss ratio or decrease the net investment income ratio, as applicable, and decrease total returns had such reductions not occurred.
(e) The net expense ratios shown above reflect expenses after waivers and reimbursements but exclude the effect of reductions to total expenses for any expenses offset. Expense offset arrangements reduce total expenses, as discussed in the notes to the financial statements. These amounts would increase the net investment loss ratio, or decrease the net investment income ratio, as applicable, had such reductions not occurred. The effect of expenses offset are as follows:
| | | Investor Class | |
| | | Year Ended December 31, | | Six Months
Ended
December 31, | | Year
Ended
June 30, | |
| | | 2012 | | 2011 | | 2010 | | 2009 | | 2008* | | 2008 | |
Ratios to Average Net Assets: (c) | |
Expenses offset (f) | | | — | | | | — | | | | — | | | | — | | | | — | | | | — | | |
(f) Effect on the expense ratio was not greater than 0.005%.
(g) Portfolio turnover rate is calculated at the fund level.
See accompanying notes to financial statements.
197
World Precious Minerals Fund
For a capital share outstanding during the
| | | Institutional Class | |
| | | Year Ended December 31, | | Period
Ended
December 31, | |
| | | 2012 | | 2011 | | 2010 (a) | |
Net asset value, beginning of period | | $ | 13.10 | | | $ | 22.29 | | | $ | 17.36 | | |
Investment Activities | |
Net investment loss | | | (.04 | )* | | | (.16 | )* | | | (.10 | )* | |
Net realized and unrealized gain (loss) | | | (1.37 | )* | | | (6.84 | )* | | | 8.14 | * | |
Total from investment activities | | | (1.41 | ) | | | (7.00 | ) | | | 8.04 | | |
Distributions from net investment income | | | — | | | | (2.19 | ) | | | (3.11 | ) | |
Short-Term Trading Fees | | | — | | | | — | | | | — | | |
Net asset value, end of period | | $ | 11.69 | | | $ | 13.10 | | | $ | 22.29 | | |
| Total Return (excluding account fees) (b) | | | (10.76 | )% | | | (32.28 | )% | | | 46.72 | % | |
Ratios to Average Net Assets: (c) | |
Net investment loss | | | (.32 | )% | | | (.87 | )% | | | (.86 | )% | |
Total expenses | | | 3.56 | % | | | 2.38 | % | | | 15.19 | % | |
Expenses waived or reimbursed (d) | | | (2.69 | )% | | | (1.27 | )% | | | (14.06 | )% | |
Net expenses (e) | | | .87 | % | | | 1.11 | % | | | 1.13 | % | |
Portfolio turnover rate (g) | | | 44 | % | | | 96 | % | | | 68 | % | |
Net assets, end of period (in thousands) | | $ | 769 | | | $ | 1,683 | | | $ | 2,233 | | |
* Based on average monthly shares outstanding.
(a) From March 1, 2010, commencement of operations.
(b) Total returns for periods less than one year are not annualized. Assumes investment at the net asset value at the beginning of the period, reinvestment of all distributions and a complete redemption of the investment at the net asset value at the end of the period.
(c) Ratios are annualized for periods of less than one year.
(d) Expenses waived or reimbursed reflect reductions to total expenses, as discussed in the notes to the financial statements. These amounts would increase the net investment loss ratio or decrease the net investment income ratio, as applicable, and decrease total returns had such reductions not occurred.
(e) The net expense ratios shown above reflect expenses after waivers and reimbursements but exclude the effect of reductions to total expenses for any expenses offset. Expense offset arrangements reduce total expenses, as discussed in the notes to the financial statements. These amounts would increase the net investment loss ratio, or decrease the net investment income ratio, as applicable, had such reductions not occurred. The effect of expenses offset are as follows:
| | | Institutional Class | |
| | | Year Ended December 31, | | Period
Ended
December 31, | |
| | | 2012 | | 2011 | | 2010 (a) | |
Ratios to Average Net Assets: (c) | |
Expenses offset (f) | | | — | | | | — | | | | — | | |
(f) Effect on the expense ratio was not greater than 0.005%.
(g) Portfolio turnover rate is calculated at the fund level.
See accompanying notes to financial statements.
198
Gold and Precious Metals Fund
For a capital share outstanding during the
| | | Investor Class | |
| | | Year Ended December 31, | | Six Months
Ended
December 31, | | Year
Ended
June 30, | |
| | | 2012 | | 2011 | | 2010 | | 2009 | | 2008* | | 2008 | |
Net asset value, beginning of period | | $ | 12.61 | | | $ | 19.60 | | | $ | 15.46 | | | $ | 10.83 | | | $ | 17.18 | | | $ | 14.99 | | |
Investment Activities | |
Net investment loss | | | (.09 | ) | | | (.17 | ) | | | (.21 | ) | | | (.17 | )** | | | (.03 | ) | | | (.08 | )** | |
Net realized and unrealized gain (loss) | | | (.72 | ) | | | (4.28 | ) | | | 5.91 | | | | 4.84 | | | | (5.59 | ) | | | 4.69 | | |
Total from investment activities | | | (.81 | ) | | | (4.45 | ) | | | 5.70 | | | | 4.67 | | | | (5.62 | ) | | | 4.61 | | |
Distributions | |
From net investment income | | | (.02 | ) | | | — | | | | (.26 | ) | | | (.04 | ) | | | — | | | | — | | |
From net realized gains | | | — | | | | (2.54 | ) | | | (1.31 | ) | | | — | | | | (.73 | ) | | | (2.43 | ) | |
Total distributions | | | (.02 | ) | | | (2.54 | ) | | | (1.57 | ) | | | (.04 | ) | | | (.73 | ) | | | (2.43 | ) | |
Short-Term Trading Fees ** | | | — | (a) | | | — | (a) | | | .01 | | | | — | (a) | | | — | (a) | | | .01 | | |
Net asset value, end of period | | $ | 11.78 | | | $ | 12.61 | | | $ | 19.60 | | | $ | 15.46 | | | $ | 10.83 | | | $ | 17.18 | | |
| Total Return (excluding account fees) (b) | | | (6.44 | )% | | | (23.97 | )% | | | 36.88 | % | | | 43.11 | % | | | (31.51 | )% | | | 33.49 | % | |
Ratios to Average Net Assets: (c) | |
Net investment loss | | | (.60 | )% | | | (1.06 | )% | | | (1.46 | )% | | | (1.16 | )% | | | (.66 | )% | | | (.41 | )% | |
Total expenses | | | 1.61 | % | | | 1.56 | % | | | 1.80 | % | | | 1.69 | % | | | 1.54 | % | | | 1.27 | % | |
Expenses waived or reimbursed (d) | | | — | | | | — | | | | — | | | | (.15 | )% | | | (.15 | )% | | | — | | |
Net expenses (e) | | | 1.61 | % | | | 1.56 | % | | | 1.80 | % | | | 1.54 | % | | | 1.39 | % | | | 1.27 | % | |
Portfolio turnover rate | | | 95 | % | | | 155 | % | | | 103 | % | | | 135 | % | | | 61 | % | | | 93 | % | |
Net assets, end of period (in thousands) | | $ | 166,524 | | | $ | 195,087 | | | $ | 300,949 | | | $ | 234,393 | | | $ | 192,206 | | | $ | 259,022 | | |
* Effective December 31, 2008, the fiscal year changed to December 31.
** Based on average monthly shares outstanding.
(a) The per share amount does not round to a full penny.
(b) Total returns for periods less than one year are not annualized. Assumes investment at the net asset value at the beginning of the period, reinvestment of all distributions and a complete redemption of the investment at the net asset value at the end of the period.
(c) Ratios are annualized for periods of less than one year.
(d) Expenses waived or reimbursed reflect reductions to total expenses, as discussed in the notes to the financial statements. These amounts would increase the net investment loss ratio or decrease the net investment income ratio, as applicable, and decrease total returns had such reductions not occurred.
(e) The net expense ratios shown above reflect expenses after waivers and reimbursements but exclude the effect of reductions to total expenses for any expenses offset. Expense offset arrangements reduce total expenses, as discussed in the notes to the financial statements. These amounts would increase the net investment loss ratio, or decrease the net investment income ratio, as applicable, had such reductions not occurred. The effect of expenses offset are as follows:
| | | Investor Class | |
| | | Year Ended December 31, | | Six Months
Ended
December 31, | | Year
Ended
June 30, | |
| | | 2012 | | 2011 | | 2010 | | 2009 | | 2008* | | 2008 | |
Ratios to Average Net Assets: (c) | |
Expenses offset (f) | | | — | | | | — | | | | — | | | | — | | | | — | | | | — | | |
(f) Effect on the expense ratio was not greater than 0.005%.
See accompanying notes to financial statements.
199
Eastern European Fund
For a capital share outstanding during the
| | | Investor Class | |
| | | Year Ended December 31, | | Two Months
Ended
December 31, | | Year
Ended
October 31, | |
| | | 2012 | | 2011 | | 2010 | | 2009 | | 2008*/** | | 2008*** | |
Net asset value, beginning of period | | $ | 7.79 | | | $ | 10.81 | | | $ | 9.11 | | | $ | 5.12 | | | $ | 6.35 | | | $ | 19.91 | | |
Investment Activities | |
Net investment income (loss) | | | .15 | | | | .03 | | | | (.04 | ) | | | — | (a) | | | (.03 | ) | | | (.03 | ) | |
Net realized and unrealized gain (loss) | | | 1.35 | | | | (3.05 | ) | | | 1.74 | | | | 3.99 | | | | (1.20 | ) | | | (10.10 | ) | |
Total from investment activities | | | 1.50 | | | | (3.02 | ) | | | 1.70 | | | | 3.99 | | | | (1.23 | ) | | | (10.13 | ) | |
Distributions | |
From net investment income | | | (.06 | ) | | | — | | | | — | | | | — | | | | — | | | | — | | |
From net realized gains | | | — | | | | — | | | | — | | | | — | | | | — | | | | (3.46 | ) | |
Total distributions | | | (.06 | ) | | | — | | | | — | | | | — | | | | — | | | | (3.46 | ) | |
Short-Term Trading Fees **** | | | — | (a) | | | — | (a) | | | — | (a) | | | — | (a) | | | — | (a) | | | .03 | | |
Net asset value, end of period | | $ | 9.23 | | | $ | 7.79 | | | $ | 10.81 | | | $ | 9.11 | | | $ | 5.12 | | | $ | 6.35 | | |
| Total Return (excluding account fees) (b) | | | 19.27 | % | | | (27.94 | )% | | | 18.66 | % | | | 77.93 | % | | | (19.37 | )% | | | (61.36 | )% | |
Ratios to Average Net Assets: (c) | |
Net investment income (loss) | | | 1.39 | % | | | .25 | % | | | (.36 | )% | | | — | (f) | | | (3.02 | )% | | | (.15 | )% | |
Total expenses | | | 2.15 | % | | | 1.98 | % | | | 1.91 | % | | | 2.04 | % | | | 2.37 | % | | | 1.96 | % | |
Expenses waived or reimbursed (d) | | | — | | | | — | | | | — | | | | (.08 | )% | | | (.27 | )% | | | — | (f) | |
Net expenses (e) | | | 2.15 | % | | | 1.98 | % | | | 1.91 | % | | | 1.96 | % | | | 2.10 | % | | | 1.96 | % | |
Portfolio turnover rate | | | 85 | % | | | 85 | % | | | 69 | % | | | 80 | % | | | 11 | % | | | 82 | % | |
Net assets, end of period (in thousands) | | $ | 173,687 | | | $ | 193,599 | | | $ | 440,037 | | | $ | 464,409 | | | $ | 317,320 | | | $ | 415,494 | | |
* Effective December 31, 2008, the fiscal year changed to December 31.
** Effective November 7, 2008, U.S. Global Investors, Inc. assumed management of the fund from the former subadviser.
*** The per share amounts shown were adjusted to reflect the 3-for-1 stock split which was effective on May 27, 2008.
**** Based on average monthly shares outstanding.
(a) The per share amount does not round to a full penny.
(b) Total returns for periods less than one year are not annualized. Assumes investment at the net asset value at the beginning of the period, reinvestment of all distributions and a complete redemption of the investment at the net asset value at the end of the period.
(c) Ratios are annualized for periods of less than one year.
(d) Expenses waived or reimbursed reflect reductions to total expenses, as discussed in the notes to the financial statements. These amounts would increase the net investment loss ratio or decrease the net investment income ratio, as applicable, and decrease total returns had such reductions not occurred.
(e) The net expense ratios shown above reflect expenses after waivers and reimbursements but exclude the effect of reductions to total expenses for any expenses offset. Expense offset arrangements reduce total expenses, as discussed in the notes to the financial statements. These amounts would increase the net investment loss ratio, or decrease the net investment income ratio, as applicable, had such reductions not occurred. The effect of expenses offset are as follows:
| | | Investor Class | |
| | | Year Ended December 31, | | Two Months
Ended
December 31, | | Year
Ended
October 31, | |
| | | 2012 | | 2011 | | 2010 | | 2009 | | 2008*/** | | 2008*** | |
Ratios to Average Net Assets: (c) | |
Expenses offset | | | — | (f) | | | — | (f) | | | — | (f) | | | — | (f) | | | — | (f) | | | (0.01 | )% | |
(f) Effect on the ratio was not greater than 0.005%.
See accompanying notes to financial statements.
200
Global Emerging Markets Fund
For a capital share outstanding during the
| | | Investor Class | |
| | | Year Ended December 31, | | Two Months
Ended
December 31, | | Year
Ended
October 31, | |
| | | 2012 | | 2011 | | 2010 | | 2009 | | 2008*/** | | 2008 | |
Net asset value, beginning of period | | $ | 6.82 | | | $ | 9.17 | | | $ | 7.95 | | | $ | 5.29 | | | $ | 5.94 | | | $ | 21.88 | | |
Investment Activities | |
Net investment income (loss) | | | .02 | | | | (.07 | ) | | | (.11 | ) | | | (.05 | ) | | | (.01 | ) | | | (.43 | ) | |
Net realized and unrealized gain (loss) | | | .48 | | | | (2.28 | ) | | | 1.32 | | | | 2.71 | | | | (.56 | ) | | | (11.98 | ) | |
Total from investment activities | | | .50 | | | | (2.35 | ) | | | 1.21 | | | | 2.66 | | | | (.57 | ) | | | (12.41 | ) | |
Distributions | |
From net investment income | | | — | | | | — | | | | — | | | | — | | | | — | | | | (.46 | ) | |
From net realized gains | | | — | | | | — | | | | — | | | | — | | | | — | | | | (3.11 | ) | |
From tax return of capital | | | — | | | | — | | | | — | | | | — | | | | (.08 | ) | | | — | | |
Total distributions | | | — | | | | — | | | | — | | | | — | | | | (.08 | ) | | | (3.57 | ) | |
Short-Term Trading Fees *** | | | — | (a) | | | — | (a) | | | .01 | | | | — | (a) | | | — | (a) | | | .04 | | |
Net asset value, end of period | | $ | 7.32 | | | $ | 6.82 | | | $ | 9.17 | | | $ | 7.95 | | | $ | 5.29 | | | $ | 5.94 | | |
| Total Return (excluding account fees) (b) | | | 7.33 | % | | | (25.63 | )% | | | 15.35 | % | | | 50.28 | % | | | (9.59 | )% | | | (66.81 | )% | |
Ratios to Average Net Assets (c): | |
Net investment loss | | | .26 | % | | | (.68 | )% | | | (1.22 | )% | | | (.77 | )% | | | (1.16 | )% | | | (1.01 | )% | |
Total expenses | | | 5.37 | % | | | 3.97 | % | | | 3.76 | % | | | 4.02 | % | | | 6.83 | % | | | 2.80 | % | |
Expenses waived or reimbursed (d) | | | (2.51 | )% | | | (1.01 | )% | | | (.77 | )% | | | (1.38 | )% | | | (4.33 | )% | | | (.30 | )% | |
Net expenses (e) | | | 2.86 | % | | | 2.96 | % | | | 2.99 | % | | | 2.64 | % | | | 2.50 | % | | | 2.50 | % | |
Portfolio turnover rate | | | 367 | % | | | 250 | % | | | 190 | % | | | 166 | % | | | 21 | % | | | 83 | % | |
Net assets, end of period (in thousands) | | $ | 7,714 | | | $ | 8,224 | | | $ | 13,403 | | | $ | 13,819 | | | $ | 9,663 | | | $ | 11,708 | | |
* Effective December 31, 2008, the fiscal year changed to December 31.
** Effective November 7, 2008, U.S. Global Investors, Inc. assumed management of the fund from the former subadviser.
*** Based on average monthly shares outstanding.
(a) The per share amount does not round to a full penny.
(b) Total returns for periods less than one year are not annualized. Assumes investment at the net asset value at the beginning of the period, reinvestment of all distributions and a complete redemption of the investment at the net asset value at the end of the period.
(c) Ratios are annualized for periods of less than one year.
(d) Expenses waived or reimbursed reflect reductions to total expenses, as discussed in the notes to the financial statements. These amounts would increase the net investment loss ratio or decrease the net investment income ratio, as applicable, and decrease total returns had such reductions not occurred.
(e) The net expense ratios shown above reflect expenses after waivers and reimbursements but exclude the effect of reductions to total expenses for any expenses offset. Expense offset arrangements reduce total expenses, as discussed in the notes to the financial statements. These amounts would increase the net investment loss ratio, or decrease the net investment income ratio, as applicable, had such reductions not occurred. The effect of expenses offset are as follows:
| | | Investor Class | |
| | | Year Ended December 31, | | Two Months
Ended
December 31, | | Year
Ended
October 31, | |
| | | 2012 | | 2011 | | 2010 | | 2009 | | 2008*/** | | 2008 | |
Ratios to Average Net Assets: (c) | |
Expenses offset (f) | | | — | | | | — | | | | — | | | | — | | | | — | | | | — | | |
(f) Effect on the expense ratio was not greater than 0.005%.
See accompanying notes to financial statements.
201
China Region Fund
For a capital share outstanding during the
| | | Investor Class | |
| | | Year Ended December 31, | | Six Months
Ended
December 31, | | Year
Ended
June 30, | |
| | | 2012 | | 2011 | | 2010 | | 2009 | | 2008* | | 2008 | |
Net asset value, beginning of period | | $ | 6.81 | | | $ | 9.47 | | | $ | 8.36 | | | $ | 5.59 | | | $ | 9.09 | | | $ | 12.55 | | |
Investment Activities | |
Net investment income (loss) | | | .04 | | | | (.08 | ) | | | (.12 | ) | | | (.05 | ) | | | (.02 | )** | | | (.03 | )** | |
Net realized and unrealized gain (loss) | | | .78 | | | | (2.59 | ) | | | 1.22 | | | | 2.81 | | | | (3.49 | )** | | | (.27 | )** | |
Total from investment activities | | | .82 | | | | (2.67 | ) | | | 1.10 | | | | 2.76 | | | | (3.51 | ) | | | (.30 | ) | |
Distributions | |
From net investment income | | | (.02 | ) | | | — | | | | — | | | | — | | | | — | | | | (.10 | ) | |
From net realized gains | | | — | | | | — | | | | — | | | | — | | | | — | | | | (2.93 | ) | |
From tax return of capital | | | — | | | | — | | | | — | | | | — | | | | — | | | | (.17 | ) | |
Total distributions | | | (.02 | ) | | | — | | | | — | | | | — | | | | — | | | | (3.20 | ) | |
Short-Term Trading Fees ** | | | — | (a) | | | .01 | | | | .01 | | | | .01 | | | | .01 | | | | .04 | | |
Net asset value, end of period | | $ | 7.61 | | | $ | 6.81 | | | $ | 9.47 | | | $ | 8.36 | | | $ | 5.59 | | | $ | 9.09 | | |
| Total Return (excluding account fees) (b) | | | 12.00 | % | | | (28.09 | )% | | | 13.28 | % | | | 49.55 | % | | | (38.50 | )% | | | (8.58 | )% | |
Ratios to Average Net Assets: (c) | |
Net investment income (loss) | | | .60 | % | | | (.64 | )% | | | (1.02 | )% | | | (.79 | )% | | | (.47 | )% | | | (.26 | )% | |
Total expenses | | | 2.64 | % | | | 2.49 | % | | | 2.39 | % | | | 2.47 | % | | | 2.46 | % | | | 1.95 | % | |
Expenses waived or reimbursed (d) | | | (.39 | )% | | | (.08 | )% | | | — | | | | (.45 | )% | | | (.27 | )% | | | — | | |
Net expenses (e) | | | 2.25 | % | | | 2.41 | % | | | 2.39 | % | | | 2.02 | % | | | 2.19 | % | | | 1.95 | % | |
Portfolio turnover rate | | | 374 | % | | | 426 | % | | | 242 | % | | | 327 | % | | | 117 | % | | | 208 | % | |
Net assets, end of period (in thousands) | | $ | 29,160 | | | $ | 30,635 | | | $ | 51,843 | | | $ | 56,323 | | | $ | 38,348 | | | $ | 81,109 | | |
* Effective December 31, 2008, the fiscal year changed to December 31.
** Based on average monthly shares outstanding.
(a) The per share amount does not round to a full penny.
(b) Total returns for periods less than one year are not annualized. Assumes investment at the net asset value at the beginning of the period, reinvestment of all distributions and a complete redemption of the investment at the net asset value at the end of the period.
(c) Ratios are annualized for periods of less than one year.
(d) Expenses waived or reimbursed reflect reductions to total expenses, as discussed in the notes to the financial statements. These amounts would increase the net investment loss ratio or decrease the net investment income ratio, as applicable, and decrease total returns had such reduction not occurred.
(e) The net expense ratios shown above reflect expenses after waivers and reimbursements, but exclude the effect of reductions to total expenses for any expenses offset. Expense offset arrangements reduce total expenses, as discussed in the notes to financial statements. These amounts would increase the net investment loss ratio, or decrease the net investment income ratio, as applicable, had such reductions not occurred. The effect of expenses offset are as follows:
| | | Investor Class | |
| | | Year Ended December 31, | | Six Months
Ended
December 31, | | Year
Ended
June 30, | |
| | | 2012 | | 2011 | | 2010 | | 2009 | | 2008* | | 2008 | |
Ratios to Average Net Assets: (c) | |
Expenses offset (f) | | | — | | | | — | | | | — | | | | — | | | | — | | | | — | | |
(f) Effect on the expense ratio was not greater than 0.005%.
See accompanying notes to financial statements.
202
Report of Independent Registered Public Accounting Firm
The Board of Trustees and Shareholders
of U.S. Global Investors Funds:
We have audited the accompanying statements of assets and liabilities of the U.S. Treasury Securities Cash Fund, U.S. Government Securities Savings Fund, Near-Term Tax Free Fund, Tax Free Fund, All American Equity Fund, Holmes Growth Fund, MegaTrends Fund (formerly the Global MegaTrends Fund), Global Resources Fund, World Precious Minerals Fund, Gold and Precious Metals Fund, Eastern European Fund, Global Emerging Markets Fund and China Region Fund, each a fund within the U.S. Global Investors Funds (the Trust), including the portfolios of investments, as of December 31, 2012 and the related statements of operations for the year then ended, the statements of changes in net assets for each of the years in the two-year period then ended, and the financial highlights for each of the years or periods in the five-year period then ended. These financial statements and financial highlights are the responsibility of the Trust's management. Our responsibility is to express an opinion on these financial statements and financial highlights based on our audits.
We conducted our audits in accordance with the standards of the Public Company Accounting Oversight Board (United States). Those standards require that we plan and perform the audit to obtain reasonable assurance about whether the financial statements and financial highlights are free of material misstatement. An audit includes examining, on a test basis, evidence supporting the amounts and disclosures in the financial statements. Our procedures included confirmation of securities owned as of December 31, 2012, by correspondence with the custodian and brokers or by other appropriate auditing procedures. An audit also includes assessing the accounting principles used and significant estimates made by management, as well as evaluating the overall financial statement presentation. We believe that our audits provide a reasonable basis for our opinion.
In our opinion, the financial statements and financial highlights referred to above present fairly, in all material respects, the financial position of each of the respective funds within the U.S. Global Investors Funds as of December 31, 2012, the results of their operations for the year then ended, the changes in their net assets for each of the years in the two-year period then ended and the financial highlights for each of the years or periods in the five-year period then ended, in conformity with U.S. generally accepted accounting principles.
Boston, Massachusetts
February 27, 2013
203
Trustees and Officers (unaudited) December 31, 2012
The following table presents information about the Trustees as of December 31, 2012, together with a brief description of their principal occupations during the last five years. The Agreement and Declaration of Trust provides that each trustee shall serve as a trustee of the Trust during the lifetime of this Trust and until its termination except as such trustee sooner dies, resigns or is removed. In addition, each trustee who is not an "interested person" of the Trust shall be required to retire in accordance with the terms of any retirement policy then in effect that has been approved by a majority vote of all independent trustees. The current retirement policy provides that the retirement age for non-interested trustees is 75 years of age. If you would like more information about the Trustees, you may call 1-800-US-FUNDS (1-800-873-8637) to request a free copy of the Statement of Additional Information.
Non-Interested Trustees | |
Name (Age)
Address
Positions Held with Trust
Length of Time Served*
Number of Portfolios in Fund
Complex Overseen by Trustee | | Principal Occupation(s) and Previous Positions
During Past 5 Years and Other Directorships Held | |
J. Michael Belz (59)
7900 Callaghan Road
San Antonio, TX 78229
Trustee
November 1998 to present
Thirteen portfolios | | Principal Occupation: President and Chief Executive Officer of Catholic Life Insurance since 1984.
Other Directorships Held: Director, Broadway National Bank from October 2003 to present. | |
James F. Gaertner (69)
7900 Callaghan Road
San Antonio, TX 78229
Trustee
November 2002 to present
Thirteen portfolios | | Principal Occupation: President Emeritus, Sam Houston State University. Served as President from August 2001 to August 2010.
Other Directorships Held: None. | |
Clark R. Mandigo (69)
7900 Callaghan Road
San Antonio, TX 78229
Trustee
May 1993 to present
Thirteen portfolios | | Principal Occupation: Restaurant operator, business consultant from 1991 to present.
Other Directorships Held: None. | |
Joe C. McKinney (66)
7900 Callaghan Road
San Antonio, TX 78229
Trustee
October 2008 to present
Thirteen portfolios | | Principal Occupation: Vice Chairman, Broadway National Bank from October 2002 to present.
Other Directorships Held: Director, Broadway National Bank from October 2002 to present; Director, USAA Real Estate Company from September 2004 to present; Director, Luby's, Inc. from January 2003 to present. | |
* These dates include service for a predecessor trust.
204
Trustees and Officers (unaudited) December 31, 2012
Interested Trustee | |
Name (Age)
Address
Positions Held with Trust
Length of Time Served*
Number of Portfolios in Fund
Complex Overseen by Trustee | | Principal Occupation(s) and Previous Positions
During Past 5 Years and Other Directorships Held | |
Frank Holmes ** (57)
7900 Callaghan Road
San Antonio, TX 78229
Trustee, Chief Executive
Officer, Chief Investment
Officer, President
January 1990 to present
Thirteen portfolios | | Principal Occupation: Director, Chief Executive Officer, and Chief Investment Officer of the Adviser. Since October 1989, Mr. Holmes has served and continues to serve in various positions with the Adviser, its subsidiaries, and the investment companies it sponsors.
Other Directorships Held: None. | |
* These dates include service for a predecessor trust.
** Mr. Holmes is an "interested person'' of the Trust by virtue of his positions with U.S. Global Investors, Inc.
The following table presents information about each Officer of the Trust as of December 31, 2012, together with a brief description of their principal occupations during the last five years. Each holds office until his or her successor is duly elected and qualified.
Officers | |
Name (Age)
Address
Positions Held with Trust
Length of Time Served* | | Principal Occupation(s) During Past 5 Years | |
Frank E. Holmes (57)
7900 Callaghan Road
San Antonio, TX 78229
Trustee, Chief Executive
Officer, Chief Investment
Officer, President
January 1990 to present | | Director, Chief Executive Officer, and Chief Investment Officer of the Adviser. Since October 1989, Mr. Holmes has served and continues to serve in various positions with the Adviser, its subsidiaries, and the investment companies it sponsors. | |
Susan B. McGee (53)
7900 Callaghan Road
San Antonio, TX 78229
Executive Vice President,
Secretary, General Counsel
March 1997 to present | | President and General Counsel of the Adviser. Since September 1992, Ms. McGee has served and continues to serve in various positions with the Adviser, its subsidiaries, and the investment companies it sponsors. | |
Catherine A. Rademacher (52)
7900 Callaghan Road
San Antonio, TX 78229
Treasurer
July 2004 to present | | Chief Financial Officer of the Adviser. Since April 2004, Ms. Rademacher has served and continues to serve in various positions with the Adviser, its subsidiaries, and the investment companies it sponsors. | |
205
Trustees and Officers (unaudited) December 31, 2012
Name (Age)
Address
Positions Held with Trust
Length of Time Served* | | Principal Occupation(s) During Past 5 Years | |
James L. Love, Jr. (44)
7900 Callaghan Road
San Antonio, TX 78229
Chief Compliance Officer
September 2007 to present | | Chief Compliance Officer and Deputy General Counsel of the Adviser since September 2007. | |
T. Kelly Niland (50)
7900 Callaghan Road
San Antonio, TX 78229
Vice President, Investment
Operations
December 2008 to present;
Assistant Treasurer from May
2006 to December 2008. | | Vice President of Investment Operations of the Adviser since January 2006. | |
Susan K. Filyk (43)
7900 Callaghan Road
San Antonio, TX 78229
Vice President, Marketing
December 2008 to present | | Director of Marketing of the Adviser since August 2007. | |
* These dates include service for a predecessor trust.
206
Additional Information (unaudited)
Additional Federal Tax Information
The percentage of tax-exempt dividends paid by the Funds for the year ended December 31, 2012, was:
Near-Term Tax Free | | | 94.13 | % | |
Tax Free | | | 95.60 | % | |
The percentage of ordinary income dividends paid by the Funds during the year ended December 31, 2012, which qualify as Qualified Dividends Income (QDI) and the Dividends Received Deduction (DRD) available to corporate shareholders was:
| | | Qualified Dividend
Income | | Dividend Received
Deduction | |
MegaTrends | | | 100.00 | % | | | 100.00 | % | |
Global Resources | | | 46.55 | % | | | 35.67 | % | |
Gold and Precious Metals | | | 100.00 | % | | | 66.31 | % | |
Eastern European | | | 100.00 | % | | | 0.00 | % | |
China Region | | | 100.00 | % | | | 9.63 | % | |
The amounts which represent foreign source income and foreign taxes paid during the year ended December 31, 2012, are as follows:
| | | Foreign Source
Income | | Foreign Tax
Credit | |
MegaTrends | | $ | 280,202 | | | $ | 15,024 | | |
Global Resources | | $ | 2,374,946 | | | $ | 155,438 | | |
Gold and Precious Metals | | $ | 1,009,864 | | | $ | 109,079 | | |
Eastern European | | $ | 7,881,346 | | | $ | 1,110,578 | | |
China Region | | $ | 911,012 | | | $ | 67,782 | | |
In early 2013, the Funds reported on Form 1099-DIV the tax status of all distributions made during the 2012 calendar year. The Funds intend to distribute the maximum amount of qualified dividend income allowable. The amount of qualified dividend income distributed by each fund will be reported to shareholders on their Form 1099-DIV. Shareholders should use the information on Form 1099-DIV for their income tax returns.
Proxy Voting
A description of the policies and procedures that the Funds use to determine how to vote proxies relating to portfolio securities is available without charge, upon request, by calling 1-800-US-FUNDS (1-800-873-8637). It also appears in the Funds' statement of additional information (Form 485B), which can be found on the SEC's website at www.sec.gov.
Information regarding how the Funds voted proxies relating to portfolio securities during the most recent 12-month period ended June 30 is available without charge, upon request, by calling 1-800-US-FUNDS (1-800-873-8637) or accessing the Funds' Form N-PX on the SEC's website at www.sec.gov.
207
Additional Information (unaudited)
Availability of Quarterly Portfolio Schedules
The Funds provide complete lists of holdings four times in each fiscal year, at the quarter-ends. For the second and fourth quarters, the lists appear in the Funds' semi-annual and annual reports to shareholders. For the first and third quarters, the Funds file the lists with the SEC on Form N-Q. Shareholders can look up the Funds' Forms N-Q on the SEC's website at www.sec.gov. You may also visit or call the SEC's Public Room in Washington, D.C. (1-202-942-8090) or send a request plus a duplicating fee to the SEC, Public Reference Section, Washington, DC 20549-0102 or by electronic request at the following e-mail address: publicinfo@sec.gov.
Approval of the Advisory Agreement for Each Fund
On August 22, 2012, the Board of Trustees (the "Board") of U.S. Global Investors Funds (the "Trust"), including all the trustees who are not "interested persons" of the Trust (the "Independent Trustees"), approved continuation of the advisory agreement with U.S. Global Investors, Inc. (the "Adviser") for each fund for an additional one-year term ending October 1, 2013.
In considering approval of the agreement, the Board reviewed a variety of materials relating to each fund and the Adviser, including (i) the nature, extent and quality of services provided; (ii) a comparison of services rendered and amounts paid to other registered investment companies, including other registered investment companies managed by the Adviser, and other accounts managed by the Adviser; (iii) the investment performance of the fund measured against appropriate benchmarks; (iv) the costs of services provided and estimated profits realized by the Adviser (and its affiliates); (v) the extent to which economies of scale are realized as the fund grows; (vi) whether fee levels reflect any possible economies of scale for the benefit of fund shareholders; and (vii) benefits realized by the Adviser (and its affiliates) from its relationship with the fund.
The Independent Trustees began their process of reviewing information, which they had previously requested, and considering approval of the agreement at the Board's June 19, 2012 meeting. The Independent Trustees were represented by independent legal counsel throughout the process. After the June 19, 2012 Board meeting, at the direction of the Independent Trustees, independent legal counsel requested additional information from the Adviser. The Independent Trustees also had separate meetings among themselves and with independent legal counsel during this period. In addition, the Independent Trustees received materials from their independent legal counsel discussing the legal standards applicable to their consideration of the agreement. After their review of the information received, the Independent Trustees presented their findings and recommendations to the full Board.
The Board reviewed the functions performed by the Adviser, the portfolio management team and support staff of the Adviser, the Adviser's investment strategy and process for each fund, and the Adviser's financial condition, and considered the quality of services provided. The Board also reviewed information on the performance of each fund, along with the performance information of a relevant securities index, a peer group and a peer universe, using information supplied by Lipper Inc. ("Lipper").
208
Additional Information (unaudited)
For the All American Equity Fund, the information showed that for the one-, two-, three-, four and five-year periods ended December 31, 2011, the fund's performance was in the 1st, 2nd, 5th, 3rd and 3rd quintile, respectively, of its applicable Lipper peer group and for the one-, two-, three-, four- and five-year periods ended December 31, 2011, the fund's performance was in the 2nd, 3rd, 5th, 5th and 3rd quintile, respectively, of its applicable Lipper peer universe (the 1st quintile being the best performers and the 5th quintile being the worst performers). The Board noted that the fund's short-term performance has improved. In addition, the Board noted that the fund's advisory fee includes a performance incentive adjustment based on the performance of the fund during the prior 12-month period.
For the Holmes Growth Fund, the information showed that for the one-, two-, three-, four- and five-year periods ended December 31, 2011, the fund's performance was in the 4th, 3rd, 5th, 4th and 4th quintile, respectively, of its applicable Lipper peer group, and for the one-, two-, three-, four- and five-year periods ended December 31, 2011, the fund's performance was in the 4th, 3rd, 5th, 5th and 4th quintile, respectively, of its applicable Lipper peer universe. The Board noted that the fund outperformed its benchmark index through the first half of 2011, but that the Adviser attributed volatility during the second half of 2011 as negatively impacting the fund's performance. The Board noted that the fund's advisory fee includes a performance incentive adjustment based on the performance of the fund during the prior 12-month period.
For the MegaTrends Fund (formerly known as the Global MegaTrends Fund), the information showed that for the one-, two-, three- and four-year periods ended December 31, 2011 (the Adviser assumed management of the fund effective October 1, 2007), the fund's investor class performance was in the 3rd, 5th, 5th and 5th quintile, respectively, of its applicable Lipper peer group and for each of the one-, two-, three-, four- and five-year periods ended December 31, 2011, the fund's investor class performance was in the 4th, 5th, 5th, 5th and 5th quintile, respectively, of its applicable Lipper peer universe. In addition, the information showed that for the one-year period ended December 31, 2011, the fund's institutional class performance was in the 5th quintile of its applicable Lipper peer group and for the one-year period ended December 31, 2011, and the period since inception (March 1, 2010) through December 31, 2011, the fund's institutional class performance was in the 4th quintile of its applicable Lipper peer universe. The Board noted that the fund underperformed its benchmark index for the one-year period ended December 31, 2011. In response to questions from the Independent Trustees regarding the fund's performance, the Adviser provided supplemental information noting that the fund's performance was significantly impacted by the financial crisis in 2008 and by the fund's focus on global infrastructure "megatrend" investments, which have lagged the performance of broader peer group funds. The Adviser also noted that it has implemented a new model driven process with respect to stock selection to address underperformance. The Board took into consideration that the fund's advisory fee includes a performance incentive adjustment based on the performance of the fund during the prior 12-month period.
209
Additional Information (unaudited)
For the Global Resources Fund, the information showed that for the one-, two-, three-, four- and five-year periods ended December 31, 2011, the fund's investor class performance was in the 4th, 2nd, 1st, 4th and 5th quintile, respectively, of its applicable Lipper peer group and for each of the one-, two-, three-, four- and five-year periods ended December 31, 2011, the fund's investor class performance was in the 4th, 1st, 1st, 4th and 4th quintile, respectively, of its applicable Lipper peer universe. In addition, the information showed that for the one-year period ended December 31, 2011, and the period since inception (March 1, 2010) through December 31, 2011, the fund's institutional class performance was in the 4th and 2nd quintile, respectively, of its applicable Lipper peer group and in the 4th and 1st quintile, respectively, of its applicable Lipper peer universe. This information also showed that the fund underperformed its benchmark index for the one-year period ended December 31, 2011. The Board noted that the fund's advisory fee includes a performance incentive adjustment based on the performance of the fund during the prior 12-month period.
For the World Precious Minerals Fund, the information showed that for the one-, two-, three-, four- and five-year periods ended December 31, 2011, the fund's investor class performance was in the 5th, 5th, 1st, 5th and 5th quintile, respectively, of its applicable Lipper peer group and for the one-, two-, three-, four- and five-year periods ended December 31, 2011, the fund's investor class performance was in the 5th, 5th, 2nd, 5th and 5th quintile, respectively, of its applicable Lipper peer universe. In addition, the information showed that for the one-year period ended December 31, 2011, and the period since inception (March 1, 2010) through December 31, 2011, the fund's institutional class performance was in the 5th quintile of its applicable Lipper peer group and Lipper peer universe. This information also showed that the fund underperformed its benchmark index for the one-year period ended December 31, 2011. The Board noted that the Adviser attributed recent underperformance to the fund's emphasis in junior mining companies, which have significantly underperformed over the past year, but historically have added value to the fund's portfolio. The Board also took into consideration that the fund's advisory fee includes a performance incentive adjustment based on the performance of the fund during the prior 12-month period.
For the Gold and Precious Metals Fund, the information showed that for the one-, two-, three-, four- and five-year periods ended December 31, 2011, the fund's performance was in the 4th, 4th, 5th, 2nd and 3rd quintile, respectively, of its applicable Lipper peer group, and for the one-, two-, three-, four- and five-year periods ended December 31, 2011, the funds' performance was in the 4th, 5th, 5th, 4th and 4th quintile, respectively, of its applicable Lipper peer universe. The information also showed that the fund underperformed its benchmark index for the one-year period ended December 31, 2011. The Board noted that the Adviser attributed recent underperformance to small to mid-tiered gold stocks which have historically outperformed over longer time periods. The Board also took into consideration that the fund's advisory fee includes a performance incentive adjustment based on the performance of the fund during the prior 12-month period.
210
Additional Information (unaudited)
For the Eastern European Fund, the information showed that for the one-, two-, three-, four- and five-year periods ended December 31, 2011, the fund's performance was in the 5th quintile of its applicable Lipper peer group and applicable Lipper peer universe. In addition, the information showed that the fund underperformed its benchmark index for the one-year period ended December 31, 2011. In response to questions from the Independent Trustees, the Adviser provided supplemental information noting that the funds within the fund's peer group do not necessarily have the same regional focus as the fund, making performance comparisons difficult. In addition, the Adviser noted that when the fund is compared to a peer group of funds with an eastern European emerging markets focus, the fund ranked in the top half of its peer group over the three-year period and in the top quartile for the six-month period ended June 30, 2012. The Board also took into consideration that the fund's advisory fee includes a performance incentive adjustment based on the performance of the fund during the prior 12-month period.
For the Global Emerging Markets Fund, the information showed that for the one-, two-, three-, four- and five-year periods ended December 31, 2011, the fund's performance was in the 5th quintile of its applicable Lipper peer group and applicable Lipper peer universe. In addition, this information showed that the fund underperformed its benchmark index for the one-year period ended December 31, 2011. The Board considered that management has implemented a new model-driven process to address the fund's historical performance issues. The Board also took into consideration that that the fund's advisory fee includes a performance incentive adjustment based on the performance of the fund during the prior 12-month period.
For the China Region Fund, the information showed that for the one-, two-, three-, four-and five-year periods ended December 31, 2011, the fund's performance was in the 4th, 4th, 5th, 5th and 5th quintile, respectively, of its applicable Lipper peer group and for the one-, two-, three-, four- and five-year periods ended December 31, 2011, the fund's performance was in the 5th quintile of its applicable Lipper peer universe. The Board noted that the fund underperformed its benchmark for the one-year period ended December 31, 2011. In response to questions from the Independent Trustees, the Adviser noted that it had changed portfolio managers in 2011 and also adopted a new portfolio construction model which adapts to long-term market trends in the China region to address underperformance. The Board also noted that that the fund's advisory fee includes a performance incentive adjustment based on the performance of the fund during the prior 12-month period.
For the Tax Free Fund, the information showed that for the one-, two-, three-, four- and five-year periods ended December 31, 2011, the fund's performance was in the 5th, 4th, 5th, 3rd and 2nd quintile, respectively, of its applicable Lipper peer universe. The Board noted that the information also showed that the fund underperformed its benchmark index for the one-year period ended December 31, 2011.
For the Near-Term Tax Free Fund, the information showed that for the one-, two- and three-year periods ended December 31, 2011, the fund's performance was in the
211
Additional Information (unaudited)
3rd quintile of its applicable Lipper peer group and for the one-, two-, three-, four- and five-year periods ended December 31, 2011, the fund's performance was in the 4th, 3rd, 3rd, 3rd and 2nd quintile, respectively, of its applicable Lipper peer universe. This information also showed that the fund outperformed its benchmark index for the one-year period ended December 31, 2011.
For the U.S. Government Securities Savings Fund, the information showed that for the one-, two-, three-, four- and five-year periods ended December 31, 2011, the fund's performance was in the 1st, 1st, 2nd, 3rd and 3rd quintile, respectively, of its applicable Lipper peer group, and for the one-, two-, three-, four- and five-year periods ended December 31, 2011, the fund's performance was in the 1st, 2nd, 2nd, 2nd and 2nd quintile, respectively, of its applicable Lipper peer universe. In addition, this information showed that the fund performed at its benchmark index for the one-year period ended December 31, 2011.
For the U.S. Treasury Securities Cash Fund, the information showed that for the one-, two-, three-, four-, and five-year periods ended December 31, 2011, the fund's performance was in the 1st, 1st, 1st, 5th and 5th quintile, respectively, of its applicable Lipper peer group and for the one-, two-, three-, four- and five-year periods ended December 31, 2011, the fund's performance was in the 1st, 1st, 2nd, 4th and 4th quintile, respectively, of its applicable Lipper peer universe. In addition, this information showed that the fund performed at its benchmark index for the one-year period ended December 31, 2011.
On the basis of this evaluation and the ongoing review of performance by the Board, the Board concluded that the nature, quality and extent of services provided by the Adviser historically have been and continue to be satisfactory.
The Board also reviewed information on each fund's advisory fee and expense ratio (on both a net basis giving effect to any expense cap) compared to the expenses of a peer group of funds based upon information prepared by Lipper. The Board also compared the advisory fees to the fees charged by the Adviser to three non-U.S. registered funds managed by the Adviser. (The Board noted that, although these non-U.S. registered funds may have investment objectives and policies that are similar to some of the funds, the contractual fees payable to the Adviser for managing those client assets are the same as or higher than the advisory fees of the similar funds.)
For the All American Equity Fund, the information showed that, with respect to the fund's advisory fee, the fund is in the 2nd quintile of its applicable Lipper peer group and in the 5th quintile of its applicable Lipper peer group with respect to its net expenses.
For the Holmes Growth Fund, the information showed that, with respect to the fund's advisory fee, the fund is in the 4th quintile of its applicable Lipper peer group and in the 5th quintile of its applicable Lipper peer group with respect to its net expenses.
For the MegaTrends Fund's investor class, the information showed that, with respect to the advisory fee and net expenses, it is in the 4th quintile of its applicable Lipper
212
Additional Information (unaudited)
peer group. In addition, the information showed that, with respect to the fund's institutional class, it is in the 5th quintile of its applicable Lipper peer group with respect to its advisory fee and net expenses.
For the Global Resources Fund's investor class, the information showed that, with respect to the advisory fee and net expenses, it is in the 5th quintile of its applicable Lipper peer group. In addition, for the fund's institutional class, the information showed that, with respect to the advisory fee, it is in the 4th quintile of its applicable Lipper peer group and in the 3rd quintile of its applicable Lipper peer group with respect to its net expenses.
For the World Precious Minerals Fund's investor class, the information showed that, with respect to the advisory fee and net expenses, the fund is in the 5th quintile of its applicable Lipper peer group. In addition, the information showed that, with respect to the fund's institutional class, it is in the 5th quintile of its applicable Lipper peer group with respect to its advisory fee and in the 4th quintile of its applicable Lipper peer group with respect to its net expenses.
For the Gold and Precious Metals Fund, the information showed that, with respect to the fund's advisory fee, the fund is in the 4th quintile of its applicable Lipper peer group and in the 5th quintile of its applicable Lipper peer group with respect to its net expenses.
For the Eastern European Fund, the information showed that, with respect to the fund's advisory fee, the fund is in the 4th quintile of its applicable Lipper peer group and in the 5th quintile of its applicable Lipper peer group with respect to its net expenses.
For the Global Emerging Markets Fund, the information showed that, with respect to the fund's advisory fee and net expenses, the fund is in the 5th quintile of its applicable Lipper peer group.
For the China Region Fund, the information showed that, with respect to the fund's advisory fee and net expenses, the fund is in the 5th quintile of its applicable Lipper peer group.
For the Tax Free Fund, the information showed that, with respect to the fund's advisory fee, the fund is in the 5th quintile of its applicable Lipper peer group and in the 2nd quintile of its applicable Lipper peer group with respect to its net expenses.
For the Near-Term Tax Free Fund, the information showed that, with respect to the fund's advisory fee, the fund is in the 3rd quintile of its applicable Lipper peer group and in the 1st quintile of its applicable Lipper peer group with respect to its net expenses.
For the U.S. Government Securities Savings Fund, the information showed that, with respect to the fund's advisory fee, the fund is in the 5th quintile of its applicable Lipper peer group and, with respect to net expenses, the U.S. Government Securities
213
Additional Information (unaudited)
Savings Fund and U.S. Treasury Securities Cash Fund are in the 1st quintile of their applicable Lipper peer group.
The Board considered the Adviser's belief that higher expenses are inherent in small fund complexes, such as the U.S. Global Investors Funds, and that it could not operate effectively at a lower level of fees or with the burden of contractual expense caps. However, the Board noted that the Adviser is currently voluntarily limiting expenses at the following levels (the expense limitation may be modified or removed by the Adviser at any time):
Fund | | Voluntary Expense Limitation
(% of Average Net Assets) | |
All American Equity Fund | | | 2.20 | % | |
Holmes Growth Fund | | | 2.20 | % | |
MegaTrends Fund | | | 2.35 | % | |
Global Resources Fund | | | 1.90 | % | |
World Precious Minerals Fund | | | 1.90 | % | |
Gold and Precious Metals Fund | | | 1.90 | % | |
Eastern European Fund | | | 2.85 | % | |
Global Emerging Markets Fund | | | 3.15 | % | |
China Region Fund | | | 2.55 | % | |
Tax Free Fund | | | 0.70 | % | |
U.S. Treasury Securities Cash Fund | | | 1.00 | % | |
Near-Term Tax Free Fund | | | 0.45 | % | |
U.S. Government Securities Savings Fund | | | 0.45 | % | |
In each case, the Board concluded that the advisory fee was reasonable and appropriate in amount, given the quality of services provided.
The Board considered the fee structure of the agreement, including the costs of the services provided and the profits realized by the Adviser and its affiliates from their relationship with the funds. For all funds except the World Precious Minerals Fund, Global Resources Fund, Gold and Precious Metals Fund and Eastern European Fund, the net income generated from the advisory relationship was negative. The Board concluded for each fund that the profits realized by the Adviser were reasonable in comparison with the costs of providing investment advisory services to the fund.
As part of its review of the agreement, the Board considered whether there will be economies of scale with respect to the management of each fund and whether each fund will benefit from any economies of scale. The Board considered that the advisory fees for the All American Equity Fund, Gold and Precious Metals Fund, World Precious Minerals Fund, Global Resources Fund, Tax Free Fund, U.S. Government Securities Savings Fund and U.S. Treasury Securities Cash Fund include a breakpoint. For the remaining funds, the Board reviewed each fund's asset size and whether the Adviser was realizing economies of scale. The Board noted that, in all cases, the Adviser did not believe, with respect to the investment advisory services provided,
214
Additional Information (unaudited)
that it was realizing significant economies of scale, and that the current fees represent an appropriate sharing of economies of scale. Based upon its review of all available information, the Board concluded for the funds with a flat advisory fee that such fee was reasonable and appropriate.
The Board considered that the Adviser engages in soft-dollar arrangements in connection with brokerage transactions for the funds. The Board also considered benefits derived by the Adviser from its relationship with the funds, including the other services provided and fees received by the Adviser and its affiliates for providing such services, and concluded for each fund that the direct and indirect benefits accruing to the Adviser were reasonable in comparison with the costs of providing advisory services, the advisory fee charged to each fund, and the benefits to each fund.
Based on all the above-mentioned factors and related conclusions, with no single factor or conclusion being determinative and with each Trustee not necessarily attributing the same weight to each factor, the Board, including the Independent Trustees, concluded that approval of the advisory agreement would be in the interests of each fund.
215
[THIS PAGE INTENTIONALLY LEFT BLANK]
[THIS PAGE INTENTIONALLY LEFT BLANK]
[THIS PAGE INTENTIONALLY LEFT BLANK]
[THIS PAGE INTENTIONALLY LEFT BLANK]
[THIS PAGE INTENTIONALLY LEFT BLANK]
[THIS PAGE INTENTIONALLY LEFT BLANK]
[THIS PAGE INTENTIONALLY LEFT BLANK]
P.O. Box 659405
San Antonio, Texas
78265-9604
Want to reduce paper waste? You can receive this report and other important documents electronically. Please visit www.usfunds.com and sign up at Access My Account. If you need further assistance, please call us at 800-873-8637.
ITEM 2. CODE OF ETHICS.
(a) The registrant has adopted a code of ethics that applies to its principal executive officer and principal financial officer.
(b) During the period covered by this report, no material amendments were made to the provisions of the code of ethics adopted in 2(a) above.
(c) During the period covered by this report, no implicit or explicit waivers to the provisions of the code of ethics adopted in 2(a) above were granted.
(d) Not applicable.
(e) Not applicable.
(f) The registrant has posted such code of ethics on its Internet website at www.usfunds.com.
ITEM 3. AUDIT COMMITTEE FINANCIAL EXPERT.
For the covered period, the registrant’s Board of Trustees designated three independent trustees as audit committee financial experts: Mr. Clark Mandigo, Dr. James F. Gaertner, and Mr. Joe C. McKinney.
An “audit committee financial expert” is not an “expert” for any purpose, including for purposes of Section 11 of the Securities Act of 1933, as a result of being designated as an “audit committee financial expert.” Further, the designation of a person as an “audit committee financial expert” does not mean that the person has any greater duties, obligations, or liability than those imposed on the person without the “audit committee financial expert” designation. Similarly, the designation of a person as an “audit committee financial expert” does not affect the duties, obligations, or liability of any other member of the audit committee or Board of Trustees.
ITEM 4. PRINCIPAL ACCOUNTANT FEES AND SERVICES.
(A) AUDIT FEES
The aggregate fees billed to the registrant for professional services rendered by the registrant’s principal accountant for the audit of the registrant’s annual financial statements or for services that are normally provided by the accountant in connection with statutory or regulatory filings or engagements were $291,731 and $291,731 for the fiscal years ended December 31, 2012, and 2011, respectively.
(B) AUDIT-RELATED FEES
There were no fees billed for assurance and related services by the registrant’s principal accountant that were reasonably related to the performance of the audit of the registrant’s financial statements and were not reported under paragraph (a) of this Item for the last two fiscal years.
(C) TAX FEES
The aggregate fees billed for professional services rendered by the registrant’s principal accountant for tax compliance, tax advice and tax planning were $68,558 and $68,558 for the fiscal years ended December 31,
2012, and 2011, respectively. The nature of the services comprising the tax fees included the review of the registrant’s income and excise tax returns and distribution requirements.
(D) ALL OTHER FEES
There were no other fees during the last two fiscal years billed to the registrant.
(E)(1) The registrant’s audit committee is directly responsible for approving the services to be provided by the auditors, including approval in advance of audit and non-audit services at regularly scheduled audit committee meetings. If non-audit services are required between regularly scheduled audit committee meetings, approval may be authorized by the chairman of the audit committee for non-prohibited services for engagements of less than $3,500 with notification of other audit committee members at the next scheduled audit committee meeting.
(2) No services included in (b) - (d) above were approved pursuant to paragraph (c)(7)(i)(C) of Rule 2-01 of Regulation S-X.
(F) Less than 50 percent of the hours expended on the principal accountant’s engagement to audit the registrant’s financial statements for the most recent fiscal year were attributed to work performed by persons other than the principal accountant’s full-time, permanent employees.
(G) The aggregate fees billed by the registrant’s principal accountant for non-audit services rendered to the registrant, its investment adviser, and any entity controlling, controlled by, or under common control with the investment adviser that provides ongoing services to the registrant were $128,758 and $128,758 for the fiscal years ended December 31, 2012, and 2011, respectively. These fees related to tax services rendered to the registrant and the issuance of a report on internal controls for an entity controlled by the investment adviser.
(H) All non-audit services rendered in (g) above were considered by the registrant’s audit committee in maintaining the principal accountant’s independence.
ITEM 5. AUDIT COMMITTEE OF LISTED REGISTRANTS.
Not applicable to the registrant.
ITEM 6. SCHEDULE OF INVESTMENTS.
Not applicable. The complete schedule of investments is included in Item 1 of this Form N-CSR.
ITEM 7. DISCLOSURE OF PROXY VOTING POLICIES AND PROCEDURES FOR CLOSED-END MANAGEMENT INVESTMENT COMPANIES.
Not applicable.
ITEM 8. PORTFOLIO MANAGERS OF CLOSED-END MANAGEMENT INVESTMENT COMPANIES.
Not applicable.
ITEM 9. PURCHASES OF EQUITY SECURITIES BY CLOSED-END MANAGEMENT INVESTMENT COMPANY AND AFFILIATED PURCHASERS.
Not applicable.
ITEM 10. SUBMISSION OF MATTERS TO A VOTE OF SECURITY HOLDERS.
Not applicable.
ITEM 11. CONTROLS AND PROCEDURES.
(a) The registrant’s president and treasurer have determined that the registrant’s disclosure controls and procedures are effective based on their evaluation of the disclosure controls and procedures as of a date within 90 days of the filing date of this report.
(b) There was no change in the registrant’s internal control over financial reporting that occurred in the registrant’s fourth fiscal quarter of the period covered by this report that has materially affected, or is reasonably likely to materially affect, the registrant’s internal control over financial reporting.
ITEM 12. EXHIBITS.
(a)(1) Code of ethics is posted on registrant’s Internet website at www.usfunds.com.
(a)(2) Certifications of principal executive officer and principal financial officer pursuant to section 302 of the Sarbanes-Oxley Act of 2002.
(a)(3) Not Applicable.
(b) Certifications of principal executive officer and principal financial officer pursuant to section 906 of the Sarbanes-Oxley Act of 2002.
SIGNATURES
Pursuant to the requirements of the Securities Exchange Act of 1934 and the Investment Company Act of 1940, the registrant has duly caused this report to be signed on its behalf by the undersigned, thereunto duly authorized.
U.S. GLOBAL INVESTORS FUNDS | |
| |
| |
By: | /s/ Frank E. Holmes | |
| Frank E. Holmes | |
| President, Chief Executive Officer | |
| | |
Date: | March 8, 2013 | |
Pursuant to the requirements of the Securities Exchange Act of 1934 and the Investment Company Act of 1940, this report has been signed below by the following persons on behalf of the registrant and in the capacities and on the dates indicated.
By: | /s/ Frank E. Holmes | |
| Frank E. Holmes | |
| President, Chief Executive Officer | |
| | |
Date: | March 8, 2013 | |
| | |
| | |
By: | /s/ Catherine A. Rademacher | |
| Catherine A. Rademacher | |
| Treasurer | |
| | |
Date: | March 8, 2013 | |