As filed with the Securities and Exchange Commission on March 07, 2016
UNITED STATES
SECURITIES AND EXCHANGE COMMISSION
WASHINGTON, D.C. 20549
FORM N-CSR
CERTIFIED SHAREHOLDER REPORT OF REGISTERED MANAGEMENT
INVESTMENT COMPANIES
Investment Company Act file number 811-01800
U.S. GLOBAL INVESTORS FUNDS
Three Canal Plaza, Suite 600
Portland, Maine 04101
Jessica Chase, Principal Executive Officer
Three Canal Plaza, Suite 600
Portland, Maine 04101
207-347-2000
Date of fiscal year end: December 31
Date of reporting period: January 1, 2015 – December 31, 2015
ITEM 1. REPORT TO STOCKHOLDERS.
U.S. Global Investors Funds Annual Report
December 31, 2015

U.S. Global Investors Fund
Annual Report
December 31, 2015
Table of Contents
Letter to Shareholders | 1 |
Definitions for Management Teams' Perspectives | 10 |
Management Team's Perspective | 12 |
Portfolios of Investments | 52 |
Notes to Portfolios of Investments | 108 |
Statements of Assets and Liabilities | 120 |
Statements of Operations | 124 |
Statements of Changes in Net Assets | 128 |
Notes to Financial Statements | 134 |
Financial Highlights | 151 |
Report of Independent Registered Public Accounting Firm | 162 |
Trustees and Officers | 163 |
Additional Information | 166 |
Expense Example | 175 |
Nasdaq Symbols
U.S. Global Investors Funds
Investor Class | |
U.S. Government Securities Ultra-Short Bond Fund | UGSDX |
Near-Term Tax Free Fund | NEARX |
All American Equity Fund | GBTFX |
Holmes Macro Trends Fund | MEGAX |
Global Resources Fund | PSPFX |
World Precious Minerals Fund | UNWPX |
Gold and Precious Metals Fund | USERX |
Emerging Europe Fund | EUROX |
China Region Fund | USCOX |
| | |
Institutional Class | |
Global Resources Fund | PIPFX |
World Precious Minerals Fund | UNWIX |
Gold and Precious Metals Fund* | USEIX |
Emerging Europe Fund* | EURIX |
* | The Institutional Class shares of the Gold and Precious Metals and Emerging Europe Funds have not commenced operations and currently are closed to investors. A notice will be issued when each class commences operations and opens to investors. |
| Fund Services, LLC
PO Box 701
Milwaukee, WI
53201-0701
Tel 1.800.US.FUNDS
www.usfunds.com |
U.S. Global Investors Funds | (unaudited) |
Dear Fellow Shareholder, | 
|
After much anticipation, the Federal Reserve finally made easy money a little less easy by lifting interest rates in mid-December. It was the first rate hike in nearly a decade.
Over the last few years, many investors, seeking higher yields, had entered riskier investments—corporate junk bonds among them. Because they carry a higher default risk than investment-grade bonds, junk bonds offer higher yields.
But with default rates and liquidity risks beginning to spike in late 2015, and faced with the implications of higher interest rates, many investors turned to investment-grade, short-term municipal bonds. Bond prices move in the opposite direction of interest rates, but shorter-term munis are less sensitive to rate fluctuations than longer-term bonds.
As a result, muni inflows in December came at the fastest pace of the year since January 2015.
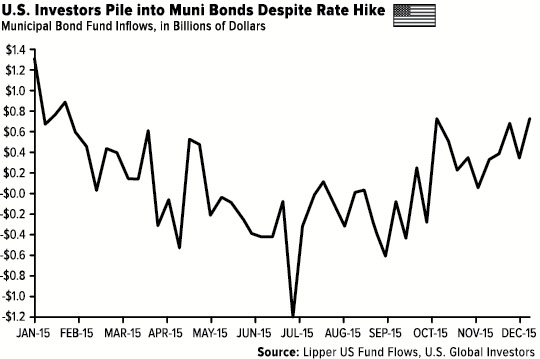
Our Near-Term Tax Free Fund (NEARX), which invests mostly in high-quality munis, ended the year up 1.45 percent, the 21st straight year it has had a positive return. Out of more than 31,000 equity and bond funds, only 39 have had 21 consecutive years of positive annual returns, according to Morningstar data. NEARX is one of those 39.
This is a rare achievement indeed, one we’re especially proud of, and we’re committed to continuing the tradition this year and in the years to come.
1
U.S. Global Investors Funds | (unaudited) |
More significant than the rate hike, however, is the $1.1 trillion deal that Congress voted on, and President Barack Obama signed, in December. The deal includes $680 billion in tax cuts for small businesses over the next decade, which should help accelerate the velocity of money and lead to the creation of jobs.
Equities and Commodities Pressured by Strong U.S. Dollar
If you follow seasonal trading patterns, you might be aware that pre-election years have historically been the best performers in the four-year presidential election cycle. This is a phenomenon first described by Yale Hirsch, founder of the Stock Trader’s Almanac, which is now edited by his son Jeffrey. In pre-election years starting in 1833, annual gains in the Dow Jones Industrial Average averaged over 10 percent, topping the other three years. Not since 1939, when German tanks were rolling into Poland, has a pre-election year ended down.
And yet that’s precisely what happened in 2015, with the Dow Jones declining 2.23 percent. Excluding dividends, the S&P 500 Index fell 0.73 percent for the year. (With dividends reinvested, the index finished with a small gain of 1.38 percent.)
Indeed, 2015 will be remembered as the most challenging year for markets since the 2008 financial crisis.
2
U.S. Global Investors Funds | (unaudited) |
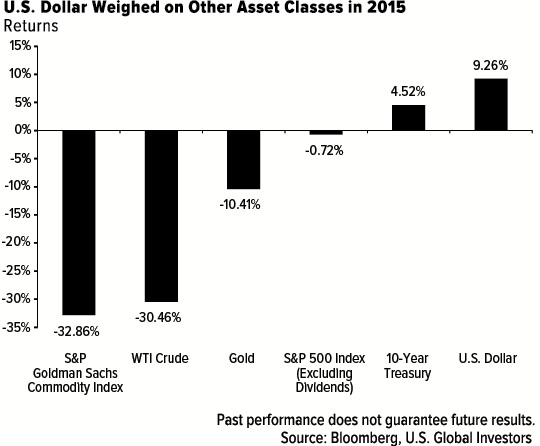
The U.S. dollar extended one of its strongest rallies in 30 years, putting pressure on American exports and global commodities, many of which are priced in dollars.
Commodities were hit especially hard, as you can see below. Year after year, the Periodic Table of Commodity Returns continues to be one of our most popular pieces. You can find the full-color, high-resolution version on our website, www.usfunds.com.

The widely-used S&P Goldman Sachs Commodity Index (GSCI) fell more than 32 percent in 2015, its fourth-largest annual loss since 1970. Of the 24 commodities in the index, only cocoa and cotton ended with a gain. All components were losers, with precious metals as a group losing 11 percent; grains, 19 percent; industrial metals, 24 percent; and energy, 41 percent. Energy and oil and gas companies were among the worst performers in the S&P 500.
3
U.S. Global Investors Funds | (unaudited) |
Among the strongest headwinds facing oil in 2015 was oversupply. Although many American producers significantly cut operations, the Organization of Petroleum Exporting Countries (OPEC), responsible for generating about 40 percent of the world’s oil, chose to maintain its production level of 30 million barrels per day.
While lower oil prices hurt explorers and refiners, the biggest winners were consumers, shipping companies and airlines. According to Credit Suisse, carriers retained between 50 and 75 percent of windfalls from lower fuel costs. This is largely the reason the International Air Transport Association (IATA) predicts the global airlines industry to post a record $33 billion in net profits in 2015.
In a Frank Talk from December 2014, I called the drop in oil prices the “$330 Billion Global Tax Break.” Today, low fuel costs are still helping businesses and consumers save billions.
China Shifts Gears Toward Domestic Consumption
Global growth stalled in 2015, with much of the slowdown led by China, the world’s second-largest economy.
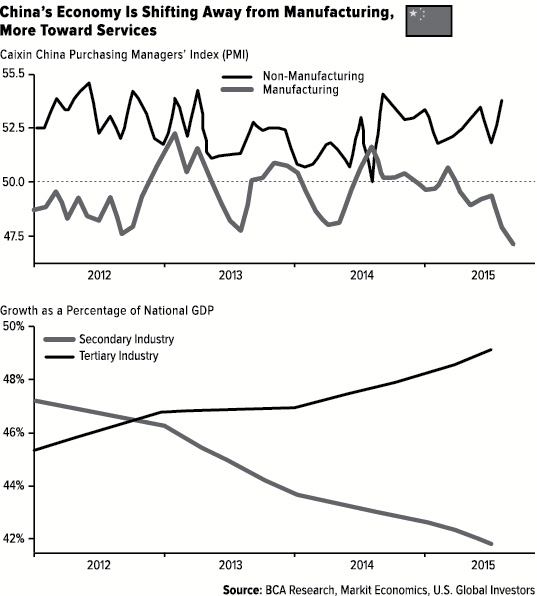
However, as I mentioned in a Frank Talk in August, China’s economy isn’t weakening so much as it’s changing.
For one, the size of China’s middle class overtook the U.S. for the first time in 2015—109 million Chinese compared to 92 million Americans. This is significant for domestic consumption and very important for the country’s airline industry. According to the World Tourism Organization, Chinese tourists are the top spenders in the world—they spent $165 billion abroad in 2014—and now that visa policy has been relaxed between China and the U.S., we should expect to see more Chinese business and leisure travelers arriving in America.
The chart below, courtesy of BCA Research, clearly shows that the Asian giant has begun to shift away from manufacturing (secondary industry) and more toward consumption and the service industries (tertiary industry).
4
U.S. Global Investors Funds | (unaudited) |
5
U.S. Global Investors Funds | (unaudited) |
China’s manufacturing sector, as expressed by its purchasing manager’s index (PMI), contracted in all but one month in 2015. I’ve said several times before that China is the 800-pound commodities gorilla, consuming biblical amounts of nickel, copper, zinc, steel and aluminum, and the PMI is the leading indicator of this activity.
But even as demand for these metals cooled, retail demand for gold in China was exceptionally strong. In 2015, a record 2,596 tonnes of the yellow metal, or 80 percent of total global output for the year, were delivered from the Shanghai Gold Exchange.
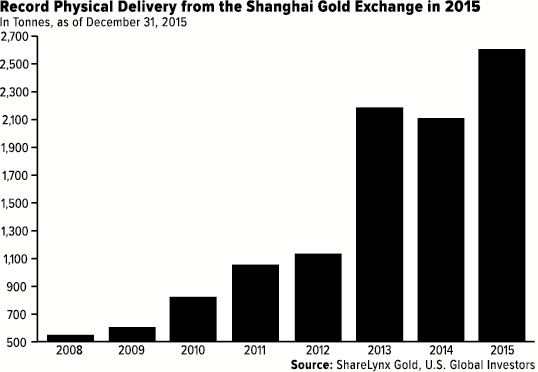
Gold purchased by the People’s Bank of China were also up. The central bank reported adding 19 more tonnes in December, bringing its total amount held in reserves to over 1,762 tonnes.
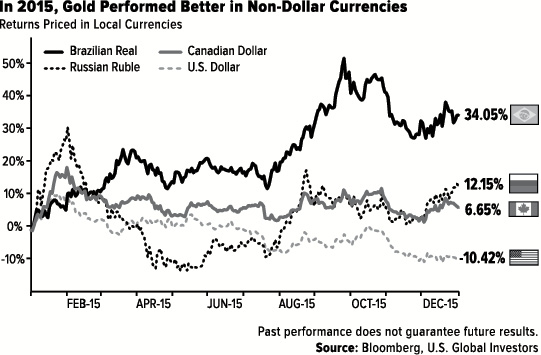
In the U.S., gold ended the year down 10.42 percent, its third straight negative year, but in many non-dollar economies, buyers actually saw either a steady or even rising gold price. The metal was up in Brazil, Russia, Canada and many countries around the globe. There’s always a bull market somewhere.
6
U.S. Global Investors Funds | (unaudited) |
Despite the challenging environment, our Gold and Precious Metals Fund (USERX), expertly managed by Ralph Aldis, ended the year down only 4.78 percent, beating both gold bullion and its benchmark, the FTSE Gold Mines Index, which lost 20.47 percent.
Trans-Pacific Partnership Expected to Eliminate 18,000 Global Tariffs
In the past few years, fiscal drag has intensified as more and more regulations and taxes have impeded progress that not even cheap money can offset. A 2014 report by the National Association of Manufacturers (NAM) revealed that federal regulations in the U.S. alone cost businesses more than $2 trillion a year.
To ignite growth, G20 nations should commit themselves to cutting red tape.
That’s precisely what the Trans-Pacific Partnership (TPP) promises to do.
After nearly seven years of negotiations, representatives from 12 Pacific Rim nations, including the U.S. and Canada, signed the TPP trade pact in early October. Once in effect, it will deliver unprecedented free and fair global trade among the participating nations. As many as 18,000 tariffs are expected to be eliminated. The TPP will remove barriers to foreign investment, streamline customs procedures and create an international investor-state dispute settlement (ISDS) system, among much more.
7
U.S. Global Investors Funds | (unaudited) |
Today, the 12 members control more than a quarter of all global trade. But once the TPP goes live, that percentage could climb to as high as 50 percent, according to CLSA (Credit Lyonnais Securities Asia).
The trade pact couldn’t have come at a better time. As I said, global growth is slowing, and mounting tariffs threaten to suffocate trade ever further. Even though the TPP’s full implementation is some time ahead of us, it’s encouraging to know that positive change is on the way. The world has needed such an agreement for years now to bring unilateral trade liberalization into the 21st century.
For in-depth analysis of gold, energy, emerging markets and more, subscribe to our award-winning newsletter, the Investor Alert, and my personal CEO blog, Frank Talk by visiting www.usfunds.com.
Thank you for your continued trust and confidence in U.S. Global Investors. We wish you and your family good health and prosperity in 2016.
Sincerely,

Frank E. Holmes
CEO and Chief Investment Officer
U.S. Global Investors, Inc.
Please consider carefully a fund’s investment objectives, risks, charges and expenses. For this and other important information, obtain a fund prospectus by visiting www.usfunds.com or by calling 1-800-US-FUNDS (1-800-873-8637). Read it carefully before investing. Foreside Fund Services, LLC, Distributor. U.S. Global Investors, Inc. is the investment adviser.
Gold, precious metals, and precious minerals funds may be susceptible to adverse economic, political or regulatory developments due to concentrating in a single theme. The prices of gold, precious metals, and precious minerals are subject to substantial price fluctuations over short periods of time and may be affected by unpredicted international monetary and political policies. We suggest investing no more than 5% to 10% of your portfolio in these sectors.
Though the Near-Term Tax Free Fund seeks minimal fluctuations in share price, it is subject to the risk that the credit quality of a portfolio holding could decline, as well as risk related to changes in the economic conditions of a state, region or issuer. These risks could cause the fund’s share price to decline. Tax-exempt income is federal income tax free. A portion of this income may be subject to state and local taxes and at times the alternative minimum tax. The Near-Term Tax Free Fund may invest up to 20% of its assets in securities that pay taxable interest. Income or fund distributions attributable to capital gains are usually subject to both state and federal income taxes.
8
U.S. Global Investors Funds | (unaudited) |
The Dow Jones Industrial Average is a price-weighted average of 30 blue chip stocks that are generally leaders in their industry. The S&P 500 Stock Index is a widely recognized capitalization-weighted index of 500 common stock prices in U.S. companies. The S&P GSCI Total Return Index in USD is widely recognized as the leading measure of general commodity price movements and inflation in the world economy. Index is calculated primarily on a world production weighted basis, comprised of the principal physical commodities futures contracts. The FTSE Gold Mines Index Series encompasses all gold mining companies that have a sustainable and attributable gold production of at least 300,000 ounces a year, and that derive 75% or more of their revenue from mined gold.
The Caixin China Manufacturing PMI is a composite indicator designed to provide an overall view of activity in the manufacturing sector and acts as a leading indicator for the whole economy. When the PMI is below 50.0 this indicates that the manufacturing economy is declining and a value above 50.0 indicates an expansion of the manufacturing economy.
The sections labeled Portfolio of Investments contain complete lists of the funds’ holdings.
There is no guarantee that the issuers of any securities will declare dividends in the future or that, if declared, will remain at current levels or increase over time.
All opinions expressed and data provided are subject to change without notice. Some of these opinions may not be appropriate to every investor.
9
Definitions for Management Teams’ Perspectives | (unaudited) |
Benchmark Index Definitions
Returns for indices reflect no deduction for fees, expenses or taxes, unless noted.
The Barclays U.S. Treasury Bills 6-9 Months Total Return Index tracks the performance of U.S. Treasury Bills with a maturity of six to nine months.
The Barclays 3-Year Municipal Bond Index is a total return benchmark designed for municipal assets. The index includes bonds with a minimum credit rating of BAA3, are issued as part of a deal of at least $50 million, have an amount outstanding of at least $5 million and have a maturity of two to four years.
The FTSE Gold Mines Index encompasses all gold mining companies that have a sustainable and attributable gold production of at least 300,000 ounces a year and that derive 75% or more of their revenue from mined gold.
The Hang Seng Composite Index is a market-capitalization weighted index that covers about 95% of the total market capitalization of companies listed on the Main Board of the Hong Kong Stock Exchange.
The MSCI Emerging Markets Europe 10/40 Index (Net Total Return) is a free float-adjusted market capitalization index that is designed to measure equity performance in the emerging market countries of Europe (Czech Republic, Greece, Hungary, Poland, Russia and Turkey). The index is calculated on a net return basis (i.e., reflects the minimum possible dividend reinvestment after deduction of the maximum rate withholding tax). The index is periodically rebalanced relative to the constituents’ weights in the parent index.
The NYSE Arca Gold Miners Index is a modified market capitalization-weighted index comprised of publicly-traded companies involved primarily in the mining for gold and silver.
The S&P Global Natural Resources Index (Net Total Return) includes 90 of the largest publicly-traded companies in natural resources and commodities businesses that meet specific investability requirements, offering investors diversified, liquid and investable equity exposure across 3 primary commodity-related sectors: Agribusiness, Energy, and Metals & Mining. The index is calculated on a net return basis (i.e., reflects the minimum possible dividend reinvestment after deduction of the maximum rate withholding tax).
The S&P 500 Index is a widely recognized capitalization-weighted index of 500 common stock prices in U.S. companies.
The S&P Composite 1500 Index is a broad-based capitalization-weighted index of 1500 U.S. companies and is comprised of the S&P 400, the S&P 500 and the S&P 600.
10
Definitions for Management Teams’ Perspectives | (unaudited) |
Other Index Definitions
The Baltic Dry Freight Index is an economic indicator that portrays an assessed price of moving major raw materials by sea as compiled by the London-based Baltic Exchange.
The Bloomberg Commodity Index is made up of 22 exchange-traded futures on physical commodities. The index represents 20 commodities, which are weighted to account for economic significance and market liquidity.
The Caixin China Manufacturing Purchasing Manager’s Index is a composite indicator designed to provide an overall view of activity in the manufacturing sector and acts as a leading indicator for the whole economy. When the PMI is below 50.0 this indicates that the manufacturing economy is declining and a value above 50.0 indicates an expansion of the manufacturing economy.
The MICEX Index is a capitalization-weighted composite index calculated based on the prices of the 50 most liquid Russian stocks of the largest and dynamically developing Russian issuers presented on the Moscow Exchange. The MICEX Index is calculated in real time and denominated by the Moscow Exchange in Russian rubles.
The MSCI All Country Far East Free ex Japan Index is a free float-adjusted market capitalization-weighted index that is designed to measure the equity market performance of the Far East, excluding Japan. The index consists of the following developed and emerging market country indices: China, Hong Kong, Indonesia, Korea, Malaysia, the Philippines, Singapore, Taiwan and Thailand.
The Purchasing Manager’s Index (PMI) is an indicator of the economic health of the manufacturing sector. The PMI index is based on five major indicators: new orders, inventory levels, production, supplier deliveries and the employment environment.
The Shanghai Composite Index is an index of all stocks that trade on the Shanghai Stock Exchange.
The U.S. Trade Weighted Dollar Index provides a general indication of the international value of the U.S. dollar.
11
U.S. Government Securities Ultra-Short Bond Fund | (unaudited) |
Management Team’s Perspective
Introduction
The U.S. Government Securities Ultra-Short Bond Fund (UGSDX) is designed to be used as an investment that takes advantage of the security of U.S. Government bonds and obligations, while simultaneously pursuing a higher level of current income than money market funds offer. The fund’s dollar-weighted average effective maturity is two years or less.
Performance Graph
U.S. Government Securities Ultra-Short Bond Fund | |
| |
Average Annual Performance | For the Years Ended
December 31, 2015 | |
| | One Year | Five Year | Ten Year | |
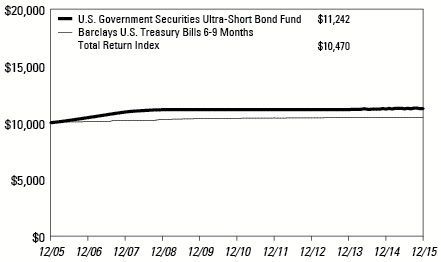
U.S. Government Securities Ultra-Short Bond Fund | 0.34% | 0.15% | 1.18% | |
Barclays U.S. Treasury Bills 6-9 Months Total Return Index | 0.15% | 0.15% | 0.46% | |
Performance data quoted above is historical. Past performance is no guarantee of future results. Current performance may be higher or lower than the performance data quoted. The principal value and investment return of an investment will fluctuate so that an investor’s shares, when redeemed, may be worth more or less than their original cost. The graph and table do not reflect the deduction of taxes that a shareholder would pay on fund distributions or the redemption of fund shares. For all or a portion of the periods, the fund had expense limitations and reimbursements to maintain a minimum yield, without which returns would have been lower. The above returns for the U.S. Government Securities Ultra-Short Bond Fund include the fund’s results as a money market fund through the date of its conversion (December 20, 2013) to an ultra-short bond fund, and therefore are not representative of the fund’s results had it operated as an ultra-short bond fund for the full term of the periods shown. Gross expense ratio as stated in the most recent prospectus is 1.07%. Pursuant to a voluntary arrangement, the Adviser has agreed to limit total fund operating expenses (exclusive of any acquired fund fees and expenses, performance fees, taxes, brokerage commissions and interest) to not exceed 0.45%. The Adviser can modify or terminate this arrangement at any time. In addition, returns may include the effects of additional voluntary waivers of fees and reimbursements of expenses by the Adviser, including waivers and reimbursements to maintain a minimum net yield for the fund. See Definitions for Management Teams’ Perspectives for index definitions. Please visit our website at www.usfunds.com for updated performance information for different time periods. | |
12
U.S. Government Securities Ultra-Short Bond Fund | (unaudited) |
The Year in Review – Economic and Political Issues that Affected the Fund
2015 was a difficult year for most asset classes. U.S. stocks, led by the S&P 500 Index, ended slightly positive for the year. Excluding American securities, stocks and bonds posted negative returns in U.S. dollar terms due to a strengthening U.S. dollar and global growth concerns. Plain vanilla U.S. fixed-income was the best-performing asset class this year, led by municipal debt and intermediate (5- and 10-year) Treasuries. Riskier sectors, notably high-yield debt, underperformed this year as many energy borrowers came under financial stress due to the precipitous drop in energy prices. Global commodities and precious metals came under the most pressure this year, led by a slowdown in commodity consumption—most notably in China—resulting in a glut of oversupply. U.S. real estate investment trusts (REITs) turned in a better year of performance as the asset class benefited from robust industry demand and a benign rate environment. Yields for the one- and two-year bond maturities showed the greatest increase, primarily as a result of the anticipation of the Federal Reserve finally being able to increase interest rates at its December meeting. Yields for the 5-, 10- and 30-year maturities were up only slightly for the year.
The U.S. bond market barely budged in 2015 even as the labor market strengthened and the Fed raised interest rates for the first time in nearly a decade. The yield on the benchmark 10-year Treasury note settled at 2.27 percent at the last trading session of 2015, compared with 2.17 percent at the end of 2014. Many fund managers, rate strategists and bond traders at the beginning of 2015 had predicted that the yield would rise toward 3 percent by the end of 2015. The divergent path of interest rate policy between the U.S. and many other countries further complicated the growth and inflation outlook. A stronger dollar driven by higher interest rates in the U.S. hurt American exports and firms’ corporate earnings from overseas operations. That, along with a sharp decline in commodities prices, generated disinflationary pressures. Inflation ran persistently below targets set by central banks in the U.S., eurozone, U.K. and Japan.
Investment Highlights
The U.S. Government Securities Ultra-Short Bond Fund returned 0.34 percent for the year ended December 31, 2015, outperforming its benchmark, the Barclays U.S. Treasury Bills 6-9 Months Total Return Index, which returned 0.15 percent.
The fund extended its maturity profile toward the latter half of 2015 as interest rates on short-term agency securities moved higher in anticipation of the Fed’s rate hike. This allowed the fund to capture extra yield at a time of market stress.
13
U.S. Government Securities Ultra-Short Bond Fund | (unaudited) |
Current Outlook
The Fed’s move to finally lift off in 2015 after several false starts ushers in the next phase of the post-crisis policy response: normalization. Now that the Fed has achieved liftoff, the outlook for rates going forward is all about the pace of the hikes. The Fed promises a slow pace of normalization and data dependence rather than any sort of prescribed, consecutive meeting hikes as implied by past tightening cycles. However, such guidance of pace is forecast dependent and the Fed has a poor forecasting track record. Hence, the market is pricing a more benign pace of hikes in 2016 than the Fed’s “dots plot” indicates—two hikes next year versus the four implied in the Fed’s Statement of Economic Projections.
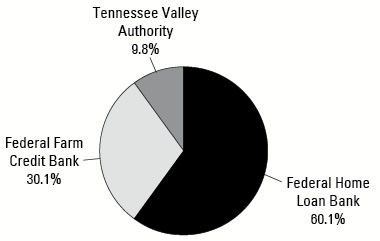
Portfolio Allocation by Issuer
Based on Total Investments | December 31, 2015 |
|
Portfolio Allocation by Maturity | | December 31, 2015 | |
6 – 12 Months | | $ | 12,030,722 | | | | 21.7 | % |
1 – 3 Years | | | 37,341,452 | | | | 67.5 | % |
3 – 5 Years | | | 5,963,586 | | | | 10.8 | % |
| | | $ | 55,335,760 | | | | 100.0 | % |
| | | | | | | | | |
14
Near-Term Tax Free Fund | (unaudited) |
Management Team’s Perspective
Introduction
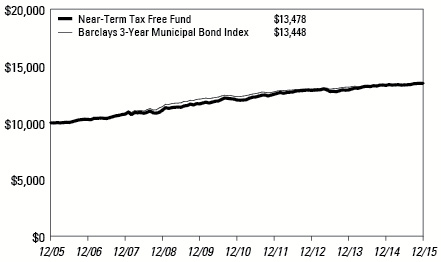
The Near-Term Tax Free Fund (NEARX) seeks to provide a high level of current income exempt from federal income taxation and to preserve capital. However, a portion of any distribution may be subject to federal and/or state income taxes. The Near-Term Tax Free Fund will maintain a weighted average maturity of less than five years.
Performance Graph
Near-Term Tax Free Fund | |
| |
Average Annual Performance | For the Years Ended
December 31, 2015 | |
| | One Year | Five Year | Ten Year | |
Near-Term Tax Free Fund | 1.45% | 2.34% | 3.03% | |
Barclays 3-Year Municipal Bond Index | 1.18% | 1.81% | 3.01% | |
Performance data quoted above is historical. Past performance is no guarantee of future results. Current performance may be higher or lower than the performance data quoted. The principal value and investment return of an investment will fluctuate so that an investor’s shares, when redeemed, may be worth more or less than their original cost. The graph and table do not reflect the deduction of taxes that a shareholder would pay on fund distributions or the redemption of fund shares. For all or a portion of the periods, the fund had expense limitations, without which returns would have been lower. Gross expense ratio as stated in the most recent prospectus is 1.08%. The Adviser has contractually agreed to limit total fund operating expenses (exclusive of any acquired fund fees and expenses, performance fees, taxes, brokerage commissions and interest) to not exceed 0.45% on an annualized basis through April 30, 2016. See Definitions for Management Teams’ Perspectives for index definitions. Please visit our website at www.usfunds.com for updated performance information for different time periods | |
15
Near-Term Tax Free Fund | (unaudited) |
The Year in Review – Economic and Political Issues that Affected the Fund
Avoiding the spread widening that plagued corporate bonds and the volatility that buffeted equities, the municipal bond market finished strong for the year with a 1.18 percent total return, according to the Barclays 3-Year Municipal Bond Index.
As the year began, there was ongoing speculation over when the U.S. Federal Reserve would initiate a cycle of rate hikes after several years of maintaining a zero interest rate policy. However, the Fed remained in a data‐dependent “wait and see” mode for almost the entire period, despite the overall modest upward progress of the U.S. economy. The Fed’s patient stance was supported by a strong dollar and the absence of upward pressures on U.S. inflation and wages, as well as a global backdrop of heightened macroeconomic and geopolitical uncertainty. In early 2015, the European Central Bank (ECB) began a program of sovereign bond purchases in an effort to avert deflation. The next several months in Europe were dominated by the threat of a Greek default and exit from the common currency. The Greek crisis was eventually displaced in global economic headlines by heightened concerns over slowing growth in China, which has for some time been the primary source of incremental demand for the global economy. The Chinese concerns were spotlighted in mid‐August by the government’s devaluation of the renminbi over three days, which raised fears of a global currency war. Against this backdrop, there was little upward pressure on interest rates, outside of some emerging markets impacted by currency weakness.
Municipal bonds faced an increasingly challenging supply backdrop, as issuance rose significantly at the beginning of 2015. From the standpoint of demand, flows into municipal mutual funds were positive for most of the year. Performance was generally strongest for longer‐maturity municipals, based on the incremental income they offered, despite rates moving slightly higher further out on the curve.
16
Near-Term Tax Free Fund | (unaudited) |
Puerto Rico was the biggest story of the year as it had its first technical default and is now months into legal negotiations on how to restructure its $70+ billion outstanding debt. Illinois continued to capture investor attention due to its lack of a budget and inability to successfully implement pension reform following a legal challenge. New Jersey also captured much of the negative spotlight as pension and other post-employment benefits liabilities continue to be hot button topics in the municipal bond market. Pennsylvania has also become a focus more recently, as a budgetary impasse has drawn attention to other existing pressures. Looking ahead and absent a turnaround or at least stabilization in oil prices, Alaska is also worth watching given its reliance on related tax revenue.
Investment Highlights
For the year ended December 31, 2015, the Near-Term Tax Free Fund returned 1.45 percent, outperforming its benchmark, the Barclays 3-Year Municipal Bond Index, which gained 1.18 percent.
The Near-Term Tax Free Fund remained true to form, with a low turnover approach and investing in traditional high-quality municipals. The fund has been able to outperform due to advantageous yield curve positioning.
Strengths
● | Buying opportunistically during multi-standard deviation moves in the municipal bond market and letting the yield advantage work in the fund’s favor over time has proven to be advantageous, as has the fund’s low turnover approach. |
● | The fund benefited from an overweight position in school district bonds. |
● | The fund benefited from significant exposure to Texas, which outperformed. |
Weaknesses
● | The fund was negatively impacted from exposure to New Jersey, which underperformed. |
● | The fund had very little exposure to the industrial development and airport revenue bonds that outperformed. |
● | The fund was hurt by its exposure to the shorter end of the yield curve, which underperformed the longer end. |
17
Near-Term Tax Free Fund | (unaudited) |
Current Outlook
Opportunities
● | Manageable supply, healthy demand and stable credit outlooks should aid U.S. municipal bond performance in 2016. The fund’s barbell positioning further out on the yield curve, coupled with very short-term investments, should continue to be a winning approach. |
Threats
● | Geopolitical concerns and rising interest rates may prove to be a headwind for the municipal market in 2016. |
18
Near-Term Tax Free Fund | (unaudited) |
Top 10 Area Concentrations
(Based on Net Assets) | December 31, 2015 |
Texas | 17.36% |
Florida | 7.36% |
Illinois | 6.36% |
New Jersey | 5.33% |
New York | 4.62% |
Louisiana | 4.53% |
California | 4.44% |
Washington | 3.28% |
Michigan | 3.15% |
Wisconsin | 3.12% |
Total Top 10 Areas | 59.55% |
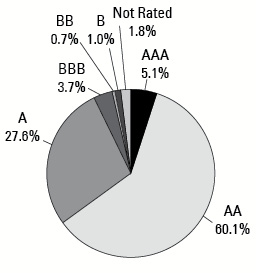
Municipal Bond Ratings*
Based on Total Municipal Bonds | December 31, 2015 |
|
* | Credit quality ratings are measured on a scale that generally ranges from AAA (highest) to D (lowest). “Not Rated” is used to classify securities for which a rating is not available. Credit-quality ratings for each issue are obtained from Moody’s and S&P, and the higher rating for each issue is used. |
19
All American Equity Fund & Holmes Macro Trends Fund | (unaudited) |
Management Team’s Perspective
Introduction
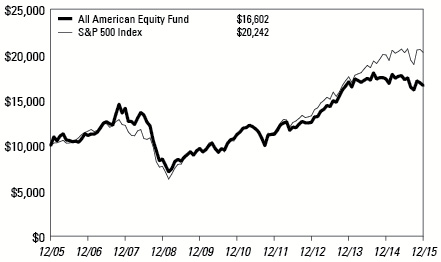
The principal objective of the All American Equity Fund (GBTFX) is to seek capital appreciation by investing primarily in a broadly diversified portfolio of domestic common stocks. The fund invests in large-capitalization stocks while retaining the flexibility to seek out promising individual stock opportunities, including stocks with meaningful dividend yields.
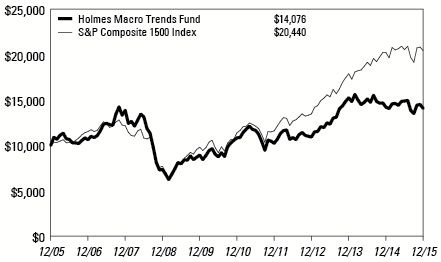
The Holmes Macro Trends Fund (MEGAX) invests in companies with good growth prospects and strong positive earnings momentum. The fund’s primary objective is to seek long-term capital appreciation.
Performance Graphs
All American Equity Fund | |
| |
Average Annual Performance | For the Years Ended
December 31, 2015 | |
| | One Year | Five Year | Ten Year | |
All American Equity Fund - Investor Class | (4.20)% | 8.19% | 5.20% | |
S&P 500 Index | 1.38% | 12.57% | 7.31% | |
Performance data quoted above is historical. Past performance is no guarantee of future results. Current performance may be higher or lower than the performance data quoted. The principal value and investment return of an investment will fluctuate so that an investor’s shares, when redeemed, may be worth more or less than their original cost. The graph and table do not reflect the deduction of taxes that a shareholder would pay on fund distributions or the redemption of fund shares. For all or a portion of the periods, the fund had expense limitations, without which returns would have been lower. Gross expense ratio as stated in the most recent prospectus is 2.16%. Pursuant to a voluntary arrangement, the Adviser has agreed to limit total fund operating expenses (exclusive of any acquired fund fees and expenses, performance fees, taxes, brokerage commissions and interest) to not exceed 2.20%. The Adviser can modify or terminate this arrangement at any time. See Definitions for Management Teams’ Perspectives for index definitions. Please visit our website at www.usfunds.com for updated performance information for different time periods. | |
20
All American Equity Fund & Holmes Macro Trends Fund | (unaudited) |
Holmes Macro Trends Fund | |
| |
Average Annual Performance | For the Years Ended
December 31, 2015 | |
| | One Year | Five Year | Ten Year | |
Holmes Macro Trends Fund | (0.94)% | 5.37% | 3.48% | |
S&P Composite 1500 Index | 1.01% | 12.39% | 7.41% | |
Performance data quoted above is historical. Past performance is no guarantee of future results. Current performance may be higher or lower than the performance data quoted. The principal value and investment return of an investment will fluctuate so that an investor’s shares, when redeemed, may be worth more or less than their original cost. The graph and table do not reflect the deduction of taxes that a shareholder would pay on fund distributions or the redemption of fund shares. For all or a portion of the periods, the fund had expense limitations, without which returns would have been lower. Gross expense ratio as stated in the most recent prospectus is 1.94%. Pursuant to a voluntary arrangement, the Adviser has agreed to limit total fund operating expenses (exclusive of any acquired fund fees and expenses, performance fees, taxes, brokerage commissions and interest) to not exceed 2.20%. The Adviser can modify or terminate this arrangement at any time. See Definitions for Management Teams’ Perspectives for index definitions. Please visit our website at www.usfunds.com for updated performance information for different time periods. | |
The Year in Review – Economic and Political Issues that Affected the Funds
After nine years, it seems the U.S. economic engine might be able to run on its own without the need for “near zero” interest rates. This is evidenced by the unemployment rate declining to nearly 5 percent and GDP increasing at an annual rate of 2 percent in the third quarter. Therefore, the Federal Reserve Board decided to raise rates 25 basis points on December 16, 2015, and hinted toward four additional rate hikes in 2016. The initial hike increased volatility in December and caused markets to decline for a few days before seasonal year-end trading picked up.
21
All American Equity Fund & Holmes Macro Trends Fund | (unaudited) |
The S&P 500 Index rose 1.38 percent in 2015 and did so with a slightly higher level volatility than in 2014. The strongest sector was consumer discretionary, which appreciated 8.4 percent, followed by health care, which rose 5.2 percent. The decline in commodities, coupled with a strong U.S. dollar, caused the energy sector to decline the most, falling 23.5 percent, followed by the basic materials sector, which declined 10.3 percent for the year.
Investment Highlights
Overview
The All American Equity Fund lost 4.20 percent for the year, underperforming its benchmark, the S&P 500, which returned 1.38 percent. The Holmes Macro Trends Fund fell 0.94 percent over 2015, underperforming its benchmark, the S&P Composite 1500 Index, which returned 1.01 percent. Overall, smaller companies and growth-oriented stocks underperformed, while utilities and more defensive areas of the market outperformed. The primary driver of underperformance in 2015 was the fact that the fund has more exposure to smaller and growth-oriented companies than the benchmark. Our investment style was effectively out of favor, and the market did not reward companies demonstrating superior growth metrics. We believe this is transitory and our growth at a reasonable price (GARP) investment style will ultimately be rewarded.
Because the funds are actively managed, and because holding period is generally not a consideration in investment decisions, the portfolios’ turnover rate might fluctuate from year to year as the funds adjust their portfolio composition. The funds’ annual portfolio turnovers were, and are expected to continue to be, more than 100 percent.
All American Equity Fund
Strengths
● | The fund’s underweight position in materials helped fund performance. |
● | Stock selection was better than the index in the energy and materials sectors. |
● | Tesoro, Valero and Marathon were the best contributors to fund performance. |
Weaknesses
● | Sector allocation weightings to health care, consumer staples and information technology were in line with the benchmark, but stock selection caused the fund to lag in these sectors. |
● | Investments in Fidelity National Information Systems, Facebook and Western Digital were the worst contributors to performance |
22
All American Equity Fund & Holmes Macro Trends Fund | (unaudited) |
Holmes Macro Trends Fund
Strengths
● | Stock selection was strong in select energy and consumer staples companies. |
● | The fund’s underweight position in energy was beneficial as the sector underperformed the market. |
● | Alphabet, Starbucks and Facebook were among the best positive contributors to fund performance. |
Weaknesses
● | Sector allocation was a drag, as defensive sectors tended to outperform. Cash and defensive option strategies also held back relative performance as the market rallied strongly. |
● | Stock selection was weak across the board as our growth-oriented investment style was out of favor and the primary driver of underperformance. |
● | Investments in Sun Edison, Microsemi and Five Below failed to live up to expectations and were among the worst contributors to the fund’s performance. |
Current Outlook
Opportunities
● | The global economic outlook should improve as 2016 progresses. Additional government policy support from many areas around the globe should be supportive of an improving global macro outlook. The U.S. has been the single engine of growth in the developed world, and if the European or Chinese markets improved, it would provide a lift to the U.S. equity market. |
● | Falling gasoline and crude prices have given consumers more disposable income, creating an opportunity for many discretionary areas such as restaurants, retailers and airline companies. |
● | The continued dollar strength continues to favor companies that obtain the majority of their revenue domestically. |
Threats
● | Global GDP has been revised down recently, and the surge in the dollar will most likely weigh on exports. |
● | With the S&P 500 Index trading at nearly 18x earnings—the high end of the historical range—earnings growth will be especially critical to keep the bull market moving forward. Expectations for 2015 are in the low single digits, with big cuts coming from the energy sector in recent months. |
23
All American Equity Fund & Holmes Macro Trends Fund | (unaudited) |
● | The market has been trending higher for an unusually long time. A correction should not be dismissed at this point. |
● | As crude continues to decline, many companies in the energy sector may see lower revenues, which could cause concern over their ability to service debt. Ultimately, this could harm investor enthusiasm and hinder future market expectations. |
The section labeled Portfolio of Investments contains a complete list of the funds’ holdings.
24
All American Equity Fund & Holmes Macro Trends Fund | (unaudited) |
All American Equity Fund
Top 10 Equity Holdings (Based on Net Assets) | December 31, 2015 |
Microsoft Corp. | 3.05% |
Applications Software | |
Visa, Inc. | 2.84% |
Finance - Credit Card | |
MasterCard, Inc. | 2.80% |
Finance - Credit Card | |
NIKE, Inc. | 2.62% |
Athletic Footwear | |
JPMorgan Chase & Co. | 2.59% |
Diversified Banking Institutions | |
CVS Health Corp. | 2.56% |
Retail - Drug Store | |
Accenture plc | 2.46% |
Computer Services | |
Altria Group, Inc. | 2.44% |
Tobacco | |
UnitedHealth Group, Inc. | 2.22% |
Medical - HMO | |
Apple, Inc. | 2.20% |
Computers | |
Total Top 10 Equity Holdings | 25.78% |
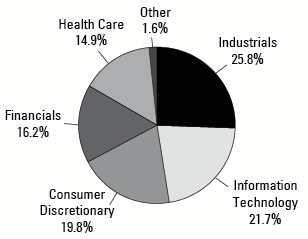
Portfolio Allocation by Industry Sector* Based on Total Investments | December 31, 2015 |

|
* | Summary information above may differ from the portfolio schedule included in the financial statements due to the use of different classifications of securities for presentation purposes. |
25
All American Equity Fund & Holmes Macro Trends Fund | (unaudited) |
Holmes Macro Trends Fund
Top 10 Equity Holdings (Based on Net Assets) | December 31, 2015 |
Regeneron Pharmaceuticals, Inc. | 4.75% |
Medical - Biomedical/Gene | |
Boeing Co. | 4.71% |
Aerospace/Defense | |
Home Depot, Inc. | 4.66% |
Retail - Building Products | |
Starbucks Corp. | 4.66% |
Retail - Restaurants | |
Gilead Sciences, Inc. | 4.58% |
Medical - Biomedical/Gene | |
Southwest Airlines Co. | 4.56% |
Airlines | |
Apple, Inc. | 4.55% |
Computers | |
O'Reilly Automotive, Inc. | 4.50% |
Retail - Auto Parts | |
Skyworks Solutions, Inc. | 4.09% |
Electronic Components - Semiconductors | |
Principal Financial Group, Inc. | 3.98% |
Life/Health Insurance | |
Total Top 10 Equity Holdings | 45.04% |
Portfolio Allocation by Industry Sector* Based on Total Investments | December 31, 2015 |
|
* | Summary information above may differ from the portfolio schedule included in the financial statements due to the use of different classifications of securities for presentation purposes. |
26
Global Resources Fund | (unaudited) |
Management Team’s Perspective
Introduction
The Global Resources Fund (PSPFX and PIPFX) is a non-diversified natural resources fund with the principal objective of seeking long-term growth of capital while providing protection against inflation and monetary instability. The fund invests in companies involved in the exploration, production and processing of petroleum, natural gas, coal, alternative energies, chemicals, mining, iron and steel, and paper and forest products around the globe.
Performance Graph
Global Resources Fund | |
| |
Average Annual Performance | For the Periods Ended
December 31, 2015 | |
| | One Year | Five Year | Ten Year | Since Inception (Institutional Class) | |
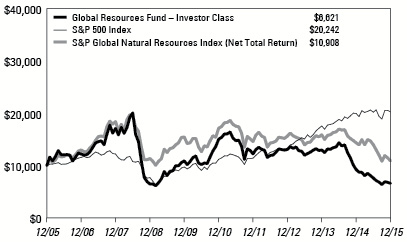
Global Resources Fund - Investor Class | (28.43)% | (15.13)% | (4.04)% | n/a | |
Global Resources Fund - Institutional Class (Inception 3/1/10) | (27.73)% | (14.57)% | n/a | (7.63)% | |
S&P 500 Index | 1.38% | 12.57% | 7.31% | 13.29% | |
S&P Global Natural Resources Index (Net Total Return) | (24.50)% | (9.15)% | 0.37% | (5.25)% | |
Performance data quoted above is historical. Past performance is no guarantee of future results. Current performance may be higher or lower than the performance data quoted. The principal value and investment return of an investment will fluctuate so that an investor’s shares, when redeemed, may be worth more or less than their original cost. The graph and table do not reflect the deduction of taxes that a shareholder would pay on fund distributions or the redemption of fund shares. For all or a portion of the periods, the fund had expense limitations, without which returns would have been lower. Gross expense ratio as stated in the most recent prospectus is 1.45% for the Investor Class and 1.13% for the Institutional Class. Pursuant to a voluntary arrangement, the Adviser has agreed to limit total fund operating expenses (exclusive of any acquired fund fees and expenses, performance fees, taxes, brokerage commissions and interest) to not exceed 1.90% for the Investor Class. Also pursuant to a voluntary agreement the Adviser has agreed to waive all class specific expenses of the Institutional Class. The Adviser can modify or terminate these arrangements at any time. See Definitions for Management Teams’ Perspectives for index definitions. Please visit our website at www.usfunds.com for updated performance information for different time periods. | |
27
Global Resources Fund | (unaudited) |
The Year in Review – Economic and Political Issues that Affected the Fund
The Bloomberg Commodity Index fell 24.70 percent for the year ended December 31, 2015, its worst annual performance since 2008. It was primarily dragged down by the 30.47 decline in crude oil and the 26.10 percent decline in copper. Amid deteriorating global growth prospects in emerging markets, and the speculation of an interest rate hike, the U.S. dollar posted a second consecutive rally, rising 9.26 percent in 2015 and intensifying the current depressed commodity environment. Concerns that the global economy is slowing, particularly due to weaker economic data from China, resulted in growth-oriented energy and basic materials sectors lagging the S&P 500 Index by 23 and 10 percent, respectively.
Energy’s significant relative underperformance to the broader market materialized during the back half of 2015. A surge in supply from the Organization of Petroleum Exporting Countries (OPEC) producers, coupled with resilient supply from U.S. shale producers, intensified a global glut of oil. Declining global GDP growth exacerbated the imbalance between supply and demand. Crude inventories in the U.S., Europe and China have reached unprecedented levels, putting a strain on available storage facilities. In its last meeting of 2015, OPEC un-officially abandoned its self-imposed cap of 31.5 million barrels a day as Middle Eastern producers battle for market share ahead of the expected lifting of Iran’s sanctions, which are set to bring additional crude supply to world markets.
The much anticipated supply cuts did not materialize in 2015, further exacerbating the supply glut. OPEC produced 32.6 million barrels per day of oil in December, significantly above its annual average, and above the previously self-imposed quotas of 31.5 and 30.5 million barrels. U.S. producers ended the year with production levels at a 4 month high and nearly unchanged from December 2014 at 9.2 million barrels. Similarly, Russia, in the last week of 2015 reached a production record of 10.8 million barrels.
Base metals slumped with oil, particularly into the second half of the year after record inventory builds at the London Metals Exchange warehouses, proved the Indonesian export bans of unprocessed ore implemented in 2014 had no tangible impact on the market. Copper posted a 26.10 percent decline, its worst annual performance since 2008. Nickel and zinc also posted their biggest declines since 2008. On the demand side, export volumes to China continued to rise but were outpaced by a continuation of supply growth.
28
Global Resources Fund | (unaudited) |
Investment Highlights
Overview
For the year ended December 31, 2015, the Investor Class of the Global Resources Fund declined 28.43 percent and the Institutional Class declined 27.73 percent, trailing the fund’s benchmark, the S&P Global Natural Resources Index (Net Total Return), which fell 24.50 percent.
The fund employed a defensive investment position from time to time in the past year with higher-than-average cash balances on hand to protect the liquidity of the fund. However, to maintain varying degrees of investment exposure to the commodities market, the fund utilized a number of rolling call option positions to hedge the fund’s benchmark risks and provide optionality to upswings in commodities stocks.
Because the fund is actively managed and holding period is generally not a consideration in investment decisions, the portfolio turnover rate may fluctuate from year to year as the fund adjusts its portfolio composition. The fund’s annual portfolio turnover was, and is expected to continue to be, more than 100 percent.
Strengths
● | The fund’s mining allocation outperformed the mining portion of the S&P Global Natural Resources Index. This was due in part to an underweighting in large underperforming sectors such as iron, steel and copper, especially the underweight in benchmark holdings such as Glencore and Anglo American. Positive absolute contribution came from Kaiser Aluminum. |
● | Despite a sharp decline in the price of agricultural commodities, the fund outperformed the benchmark in the agricultural products industry group. A focus on companies with greater downstream exposure yielded significant absolute gains to the fund. Key contributors included Phosagro OJSC and Kernel Holding. |
● | Construction materials stocks outperformed the broader natural resources complex during the year as economic activity in the sector strengthened and Congress passed a five-year highway bill with marked increases in highway funding. Accordingly, equity positions in Vulcan Materials, Martin Marietta Materials and U.S. Concrete were beneficial to fund performance. |
29
Global Resources Fund | (unaudited) |
Weaknesses
● | The fund’s core weighting in junior natural resources equities underperformed the large-cap-focused S&P benchmark during a period of declining commodity prices and risk aversion typical of a rising dollar. Notable underperformers included Atlas Development & Support Services and Trevali Mining. |
● | An underweight position in paper and forest contributed negatively to the performance of the fund. The integrated nature of many companies in the space allowed them to increase their margins as they maintained retail prices stable while commodity input prices fell. |
● | An underweight position in integrated oil and gas companies adversely affected relative performance for the period as the major global integrated producers significantly outperformed the junior oil space owing to their stronger balance sheets and greater ability to withstand extended oil price declines. |
Current Outlook
Opportunities
● | The seasonality of commodity investing suggests that such investors will have the wind at their sail for the next four months. According to a study published by VTB Capital, over the past 20 years the Bloomberg Commodity Index has posted strong rallies in the first four months of the year. The report goes on to suggest that despite the ongoing negative investor sentiment toward the sector, there is reason to believe the seasonal pattern will play again in 2016. |
● | Ten trillion dollars is the level of investment needed by 2040 to supply the oil and gas market, according to OPEC’s World Oil Outlook for 2015. OPEC expects global oil demand to reach 110 million barrels per day in 2040, a volume that current fields could not come even close to supplying. As a result, the organization believes investments of $10 trillion will be necessary to ensure adequate infrastructure and supply. |
● | Based on latest estimates, the total short exposure in commodities has reached $200 billion. This unprecedented buildup in fund shorts has created a major headwind for commodity prices in the short-term. However, when considering the size of total managed long commodity assets, which has declined to about $200 billion—very close to the total commodity shorts—any partial unwinding of the short trade should bode well for commodities during 2016. |
30
Global Resources Fund | (unaudited) |
Threats
● | Iron ore prices may dip into the $20 range in 2016 before rallying to end the year higher, according to a recent report by Capital Economics. The report suggests prices will drop initially as more low-cost supplies help majors expand their market share. Following this initial response, higher cost production will be cut, aiding a price rebound into year-end. |
● | The Baltic Dry Index, the shipping benchmark that serves as a bellwether for global trade and economic activity, fell to an all-time low in November 2015. The record low suggests China’s demand for commodities continues a downward trend. |
● | The global manufacturing purchasing manager’s index (PMI) slipped back to 50.9 in December 2015, crossing below its three-month moving average of 51.1, as output, exports and new orders all eased lower. China, India, Brazil and Russia all reported PMIs below 50 as manufacturing output in emerging markets remains in contraction. With PMIs having shown to be among the best predictive tools for commodity prices, the outlook for the first few months of the year has turned more challenging. |
The section labeled Portfolio of Investments contains a complete list of the fund’s holdings.
31
Global Resources Fund | (unaudited) |
Top 10 Equity Holdings (Based on Net Assets) | December 31, 2015 |
Pacific Infrastructure Ventures, Inc. | 5.58% |
Real Estate Operating/Development | |
Klondex Mines Ltd. | 3.62% |
Gold Mining | |
Tyson Foods, Inc. | 3.01% |
Food - Meat Products | |
Cal-Maine Foods, Inc. | 2.44% |
Food - Miscellaneous/Diversified | |
Syngenta, AG | 2.44% |
Agricultural Chemicals | |
Rio Tinto plc | 2.04% |
Metal - Diversified | |
LyondellBasell Industries N.V. | 2.02% |
Chemicals - Diversified | |
Western Forest Products, Inc. | 1.74% |
Forestry | |
Parsley Energy, Inc. | 1.64% |
Oil & Gas Drilling | |
DHT Holdings, Inc. | 1.63% |
Transportation - Marine | |
Total Top 10 Equity Holdings | 26.16% |
Portfolio Allocation by Industry Sector* Based on Total Investments | December 31, 2015 |

|
* | Summary information above may differ from the portfolio schedule included in the financial statements due to the use of different classifications of securities for presentation purposes. |
32
Precious Metals and Minerals Funds | (unaudited) |
Management Team’s Perspective
Introduction
The World Precious Minerals Fund (UNWPX and UNWIX) and the Gold and Precious Metals Fund (USERX) pursue an objective of long-term capital growth through investments in gold, precious metals and mining companies. The World Precious Minerals Fund focuses on equity securities of companies principally engaged in the exploration, mining and processing of precious minerals such as gold, silver, platinum and diamonds. Although this fund has the latitude to invest in a broad range of precious minerals, it currently remains focused on the gold sector. The Gold and Precious Metals Fund focuses on the equity securities of established gold and precious metals companies and pursues current income as a secondary objective.
World Precious Minerals Fund | |

| |
Average Annual Performance | For the Periods Ended December 31, 2015 | |
| | One Year | Five Year | Ten Year | Since Inception (Institutional Class) | |
World Precious Minerals Fund - Investor Class | (15.64)% | (27.16)% | (6.75)% | n/a | |
World Precious Minerals Fund - Institutional Class (Inception 3/1/10) | (15.07)% | (26.82)% | n/a | (18.29)% | |
S&P 500 Index | 1.38% | 12.57% | 7.31% | 13.29% | |
NYSE Arca Gold Miners Index | (25.52)% | (25.88)% | (8.11)% | (18.19)% | |
Performance data quoted above is historical. Past performance is no guarantee of future results. Current performance may be higher or lower than the performance data quoted. The principal value and investment return of an investment will fluctuate so that an investor’s shares, when redeemed, may be worth more or less than their original cost. The graph and table do not reflect the deduction of taxes that a shareholder would pay on fund distributions or the redemption of fund shares. For all or a portion of the periods, the fund had expense limitations, without which returns would have been lower. Gross expense ratio as stated in the most recent prospectus is 1.99% for the Investor Class and 4.86% for the Institutional Class. Pursuant to a voluntary arrangement, the Adviser has agreed to limit total fund operating expenses (exclusive of any acquired fund fees and expenses, performance fees, taxes, brokerage commissions and interest) to not exceed 1.90%. The Adviser can modify or terminate this arrangement at any time. See Definitions for Management Teams’ Perspectives for index definitions. Please visit our website at www.usfunds.com for updated performance information for different time periods. | |
33
Precious Metals and Minerals Funds | (unaudited) |
Gold and Precious Metals Fund | |
| |
Average Annual Performance | For the Year Ended
December 31, 2015 | |
| | One Year | Five Year | Ten Year | |
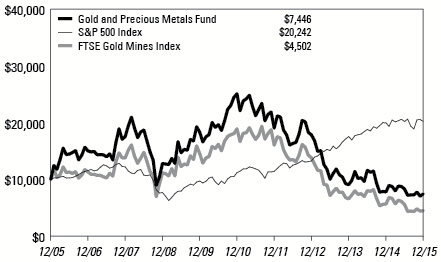
Gold and Precious Metals Fund | (4.78)% | (21.57)% | (2.91)% | |
S&P 500 Index | 1.38% | 12.57% | 7.31% | |
FTSE Gold Mines Index | (20.47)% | (24.95)% | (7.67)% | |
Performance data quoted above is historical. Past performance is no guarantee of future results. Current performance may be higher or lower than the performance data quoted. The principal value and investment return of an investment will fluctuate so that an investor’s shares, when redeemed, may be worth more or less than their original cost. The graph and table do not reflect the deduction of taxes that a shareholder would pay on fund distributions or the redemption of fund shares. For all or a portion of the periods, the fund had expense limitations, without which returns would have been lower. Gross expense ratio as stated in the most recent prospectus is 1.97%. Pursuant to a voluntary arrangement, the Adviser has agreed to limit total fund operating expenses (exclusive of any acquired fund fees and expenses, performance fees, taxes, brokerage commissions and interest) to not exceed 1.90%. The Adviser can modify or terminate this arrangement at any time. See Definitions for Management Teams’ Perspectives for index definitions. Please visit our website at www.usfunds.com for updated performance information for different time periods. | |
34
Precious Metals and Minerals Funds | (unaudited) |
The Year in Review - Economic and Political Issues that Affected the Funds
In anticipation that the Federal Reserve would start raising interest rates, the U.S. dollar began to rally in the middle of 2014 and moved to its highest level during the first quarter of 2015. Thereafter, the value of the dollar receded slightly and remained range-bound in a choppy market as investors began to sense the data the Fed was watching was losing some momentum. With the 9.26 percent gain in the dollar, precious metals had a difficult year. Gold was the best-performing precious metal in 2015 with a loss of 10.42 percent. Silver was off slightly more at 11.75 percent. The worst-performing precious metals for 2015 were platinum and palladium, with losses of 26.07 percent and 29.43 percent, respectively. The platinum mining stocks in southern Africa were off on average by more than 70 percent for the year.
Investors’ appetite for precious metals was dampened by the six-year bull market in U.S. stocks, one of the best price gains since 1999, and a 60 percent surge in the first half of the year for the Shanghai Stock Exchange. According to the World Gold Council, global demand for jewelry, coins and bars fell 5 percent in the first quarter from a year earlier as shoppers in the Middle East, China and the U.S. reigned in purchases. Two straight years of drought in India were also a headwind to gold demand. Chinese stocks began to roll over in the third quarter of the year as economic data came out weaker than expected, and by August, all of their gains achieved earlier in the year were gone. Gold demand finally caught a break. In response to their country’s stock market selloff, Chinese investors began returning to precious metals as a haven. Retail sales of gold and silver in China during August rose 17.4 percent year-over-year, representing about $3.9 billion in sales.
Low gold prices in the third quarter attracted bargain hunters, with U.S. buyers buying up far more coins and bars than they did in any other quarter over the past five years. Demand surged by 207 percent in November from a year ago. The U.S. Mint sold out of its 2015 one-ounce American Eagle gold coins in November, according to Bloomberg.
By December, the Fed finally believed it had a good enough read on the data to lift interest rates from zero to 25 basis points. What might portend a sentiment shift is that for the last three regularly scheduled Fed meetings of 2015, gold was stronger on the day of the announcement for any Fed action. Absent were the manipulative middle-of-the-night $1 billion+ dumping trades of gold bullion to push gold prices down on the Fed meeting dates.
After the Fed’s rate hike, it was reported that some traders closed their bearish positions on the metal before year end on speculation that physical purchases might pick up. Further, Bloomberg notes that the put-to-call ratio on SPDR Gold Shares reached its lowest level since 2008, perhaps indicating that investors who were betting on further declines in gold prices were losing enthusiasm for this trade. Hedge funds
35
Precious Metals and Minerals Funds | (unaudited) |
also reduced bets that the dollar would advance, according to Bloomberg. Despite the bursting of the bubble in Chinese equities, Shanghai Gold Exchange withdrawals totaled a record 2,596 tonnes in 2015, up 19 percent from the previous year.
Investment Highlights
For the year ended December 31, 2015, the World Precious Minerals Fund Investor Class lost 15.64 percent and the Institutional Class lost 15.07 percent. The fund’s benchmark, the NYSE Arca Gold Miners Index, lost 25.52 percent on a total return basis. The strategy of the World Precious Minerals Fund favors junior exploration and development stocks and mid-tiered producing stocks. These lower-capitalization stocks have historically outperformed senior gold mining companies over longer periods, as senior gold miners have typically acquired proven assets of junior gold companies rather than explored for new mining projects with capital-constrained budgets.
The Gold and Precious Metals Fund lost 4.78 percent for the year, outperforming its benchmark, the FTSE Gold Mines Index, which lost 20.47 percent on a total return basis. While focusing on established, gold-producing companies, the Gold and Precious Metals Fund holds a higher weighting of mid-tier stocks compared to its benchmark.
Both funds employed a defensive investment position from time to time in the past year with higher-than-average cash balances on hand to protect the liquidity of the funds. However, to maintain varying degrees of investment exposure to the gold market, the funds utilized a number of call option positions and directional ETFs, which are more liquid than options, to hedge the funds’ benchmark risks and provide optionality to upswings in gold stocks.
Spot gold finished the period at $1,061.42 per ounce, down $123.44, or 10.42 percent. The S&P 500 Index posted a positive return of 1.38 percent, the Trade Weighted U.S. Dollar Index gained 9.26 percent and the yield on a 90-day Treasury bill finished the year at 0.16 percent.
Because the funds are actively managed and holding period is generally not a consideration in investment decisions, the portfolio turnover rate may fluctuate from year to year as each fund adjusts its portfolio composition. The annual portfolio turnover for the Gold and Precious Metals Fund was, and is expected to continue to be, more than 100 percent.
Strengths
● | With Gran Colombia emerging from debt-restructuring near year end, its bond prices began to climb and it delivered the biggest dollar gains for the World Precious Minerals Fund for the year. St. Barbara, the largest contributor to performance for the Gold and Precious Metals Fund and the third best contributor |
36
Precious Metals and Minerals Funds | (unaudited) |
| to the World Precious Minerals Fund, reaped returns for shareholders as new CEO Bob Vassie implemented changes that turned the company around with more than a five-fold gain in the company’s share price. |
● | Klondex Mines was the second and third best performer for World Precious Minerals and Gold and Precious Metals, respectively. Klondex is one of few gold miners to have positive consecutive returns for each of the last three years, compounding at 17.66 percent per year on average. |
● | Northern Star Resources was the second best performer for the World Precious Minerals Funds. Bill Beament, CEO of Northern Star, purchased a significant suite of assets from Barrick Gold and Newmont Mining several years ago, almost on distressed terms, as it cut much of its Australian exposure, a game changing transaction. Northern Star was successful at bringing its culture of ownership to the new assets. |
Weaknesses
● | Underweighting Newcrest Mining and Newmont Mining relative to the benchmark for the Gold and Precious Metals Fund were the two biggest drags on our performance. The fund’s exposure to Australian gold miners largely offset the gains Newcrest would have contributed, as St. Barbara and Northern Star both outperformed Newcrest. The market largely underestimated how fast Newmont seemed to right the ship in 2015. The company sold assets, paid down some of its debt and completed an acquisition of the Cripple Creek Victor mining complex in Colorado, which it believes has significant underground potential to unlock. |
● | Underweighting Newmont Mining and Agnico-Eagle Mines relative to the benchmark for the World Precious Minerals Fund were the two biggest drags on the fund’s performance. Agnico-Eagle had a flawless year in terms of execution and likely added to its resource base with a grassroots discovery of the Amaruq deposit, relatively close to its Meadowbank Mine, which might improve its economics through a shared milling scenario. |
● | Exposure to Dundee Precious Metals relative to the benchmark for the Gold and Precious Metals Fund was reminiscent of a value trap in a challenged gold market. More than 90 percent of its 2015 copper production, about 25 percent of revenue, was hedged at $3.21 per pound, significantly higher than spot. In addition, Dundee Precious operates the Tsumeb copper smelter in northern Namibia, one of only a handful of copper smelters in the world that can safely handle high arsenic copper ores. Demand for such environmental safety in the handling of arsenic is on the rise. For the World Precious Minerals Fund, the third biggest markdown came from Taurus Gold, a private company that has done the necessary work to arrive at a production decision for several projects, but has been unable to secure full funding to start construction. |
37
Precious Metals and Minerals Funds | (unaudited) |
Current Outlook
Opportunities
● | The gold mine supply issue is coming to a head, according to Credit Suisse’s 2015 Year-End Preview report. Reserve life has fallen from 14 to 10 years since 2011, and grades processed are 9 percent above reserve grade in 2015. A worrisome trend coming from presenters at this year’s Denver Gold Show is the slashing of exploration budgets, particularly by junior miners. This has implications for gold production sustainability given long discovery-to-production cycles, currently pegged at 27 years and growing due to increasing regulatory, social and environmental pressures. The latest quarterly update of exploration spending from the Australian Bureau of Statistics shows that spending on mineral exploration in the country hit a near-decade low. The lack of new investment and the long time line to new production should reduce new mine supply in the future. |
● | According to research from Cornerstone Macro, the dollar has historically appreciated before the first hike and depreciated afterwards. If the historical pattern is any indication, the dollar might not strengthen further as many prognosticators have pontificated. In addition, according to Capital Economics, the headwinds for gold could be behind us, pointing to tighter labor markets and perhaps even inflation. The report notes that inflation should snap back in most economies over the next few months as the big declines in oil prices in late 2014 drop out of the annual comparison. The group’s 2016 year-end forecast is $1,400 per ounce. |
● | Klondex Mines announced in mid-December its acquisition of the Rice Lake Mine near Bissett, Manitoba. For the total purchase price of $32 million, Klondex is acquiring a fully operational mine, mill and fleet of equipment that was recently put on care and maintenance as the property went into receivership earlier in the year. Over $375 million of capital improvements have been made on the property since 2007, and the mobile equipment fleet was appraised at close to $20 million. Klondex plans to calculate a new resource for the operation and design a new mine plan for developing the ore in a profitable manner. It will likely be the fourth quarter of 2016 before it resumes production. In our opinion, the previous operator had oversized the mill and dropped the cutoff grade to try and grow the number of ounces produced. To accomplish this, the company also became overextended on the debt side. Klondex has a great opportunity here to do the proper work to remain profitable. The company still offers investors an attractive opportunity to participate in the turnaround of Rice Lake. |
38
Precious Metals and Minerals Funds | (unaudited) |
Threats
● | According to UBS, India’s plan to tap idle gold could exceed expectations. A company survey shows a “significantly large” proportion of respondents are likely, or highly likely, to participate in the government’s monetization plan and aren’t resistant to temple gold being deposited with banks. Nonetheless, the plan should take time to gain traction, especially in rural areas. Also key will be the willingness of women in rural areas to participate. |
● | BCA Research says that deflation now plagues more than half of the industry groups that they cover. In its analysis of the broad U.S. equity market at year end, BCA found industry group pricing power shows that 32 out of 60 industries have had to cut selling prices, up from 26 in BCA’s last update. |
● | According to a recent report, “Unwinding the Great Liquidity Cycle,” by Julien Garran of Macro Strategy Partnership, the decline in global foreign exchange reserves at central banks is almost twice as aggressive today as it was during the Great Recession. The implications are a reversing bid for U.S. Treasuries and credit when the Fed does not want interest rates to rise aggressively, should there be a policy mistake. Garran recommends that investors be positioned short U.S. equities, long cash and long gold and gold equities. Another investor showing confidence in gold is Ray Dalio, founder of Bridgewater Associates, who said in 2015: “If you don’t own gold, you know neither history nor economics.” |
The section labeled Portfolio of Investments contains a complete list of the funds’ holdings.
39
Precious Metals and Minerals Funds | (unaudited) |
World Precious Minerals Fund
Top 10 Equity Holdings (Based on Net Assets) | December 31, 2015 |
Klondex Mines Ltd. | 15.80% |
Gold Mining | |
Osisko Gold Royalties Ltd. | 5.90% |
Gold Mining | |
Pretium Resources, Inc. | 3.86% |
Gold Mining | |
St Barbara Ltd. | 3.07% |
Gold Mining | |
Lundin Gold, Inc. | 2.93% |
Precious Metals | |
TriStar Gold, Inc. | 2.91% |
Gold Mining | |
Lake Shore Gold Corp. | 2.85% |
Gold Mining | |
Claude Resources, Inc. | 2.60% |
Gold Mining | |
Roxgold, Inc. | 2.26% |
Precious Metals | |
Gold Standard Ventures Corp. | 1.87% |
Gold Mining | |
Total Top 10 Equity Holdings | 44.05% |
Portfolio Allocation by Industry* Based on Total Investments | December 31, 2015 |
|
* | Summary information above may differ from the portfolio schedule included in the financial statements due to the use of different classifications of securities for presentation purposes. |
40
Precious Metals and Minerals Funds | (unaudited) |
Gold and Precious Metals Fund
Top 10 Equity Holdings (Based on Net Assets) | December 31, 2015 |
Klondex Mines Ltd. | 14.49% |
Gold Mining | |
Osisko Gold Royalties Ltd. | 10.57% |
Gold Mining | |
St Barbara Ltd. | 6.45% |
Gold Mining | |
Lake Shore Gold Corp. | 5.32% |
Gold Mining | |
Northern Star Resources Ltd. | 5.23% |
Gold Mining | |
Agnico Eagle Mines Ltd. | 4.51% |
Gold Mining | |
Claude Resources, Inc. | 4.07% |
Gold Mining | |
OceanaGold Corp. | 2.45% |
Gold Mining | |
Detour Gold Corp. | 2.23% |
Gold Mining | |
Comstock Mining, Inc. | 2.19% |
Gold Mining | |
Total Top 10 Equity Holdings | 57.51% |
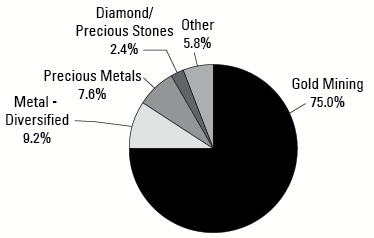
Portfolio Allocation by Industry* Based on Total Investments | December 31, 2015 |
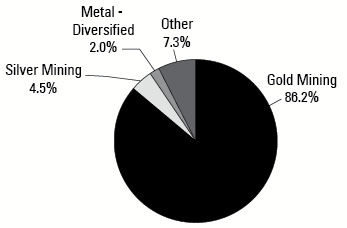
|
* | Summary information above may differ from the portfolio schedule included in the financial statements due to the use of different classifications of securities for presentation purposes. |
41
Emerging Europe Fund | (unaudited) |
Management Team’s Perspective
Introduction
The investment objective of the Emerging Europe Fund (EUROX) is to achieve long-term capital growth by investing in a non-diversified portfolio of equity securities of companies located in the emerging markets of Europe.
Performance Graph
Emerging Europe Fund | |

| |
Average Annual Performance | For the Years Ended
December 31, 2015 | |
| | One Year | Five Year | Ten Year | |
Emerging Europe Fund | (20.73)% | (12.67)% | (5.25)% | |
S&P 500 Index | 1.38% | 12.57% | 7.31% | |
MSCI Emerging Markets Europe 10/40 Index (Net Total Return) | (14.70)% | (11.16)% | (2.43)% | |
* Performance data quoted above is historical. Past performance is no guarantee of future results. Current performance may be higher or lower than the performance data quoted. The principal value and investment return of an investment will fluctuate so that an investor’s shares, when redeemed, may be worth more or less than their original cost. The graph and table do not reflect the deduction of taxes that a shareholder would pay on fund distributions or the redemption of fund shares. For all or a portion of the periods, the fund had expense limitations, without which returns would have been lower. Gross expense ratio as stated in the most recent prospectus is 2.29%. Pursuant to a voluntary arrangement, the Adviser has agreed to limit total fund operating expenses (exclusive of any acquired fund fees and expenses, performance fees, taxes, brokerage commissions and interest) to not exceed 2.85%. The Adviser can modify or terminate this arrangement at any time. See Definitions for Management Teams’ Perspectives for index definitions. Please visit our website at www.usfunds.com for updated performance information for different time periods. | |
42
Emerging Europe Fund | (unaudited) |
The Year in Review – Economic and Political Issues that Affected the Fund
Hungary was the best-performing market within the emerging Europe countries. Its central bank was dovish and supportive of growth, bringing benchmark rates down to 1.35 percent from 2.10 percent at the beginning of 2015. The government announced a reduction in Hungarian banking taxes, more in line with European Union (EU) norms.
Russian was the second best-performing market this year. The MICEX Index, based on the 50 most liquid Russian stocks, rebounded sharply at the beginning of the year after a big selloff in the prior year due to Russia’s intervention in Ukraine and imposed sanctions by the West. Since mid-May, Russian equities have been selling off along with crude oil, Brent and the ruble. Analysts predict the country’s gross domestic product (GDP) to contract 1 percent in 2016, following a 4 percent decline in 2015.
The Czech Republic was one of the best-performing markets in the region. The central bank of Czech Republic has kept its main rate at a record low level of 5 basis points, which stimulated growth. At 4.7 percent, its GDP growth is strongest among emerging Europe countries. It also has the highest purchasing manager’s index (PMI) reading. In December, it came in at 55.6, well above the 50 mark that separates growth form contraction.
Political changes took place in Poland as Andrzej Duda won the presidential runoff held in May against incumbent Bronislaw Komorowski. Later in the year during parliamentary elections, the Eurosceptic Law & Justice party (PiS) won enough seats to hold a majority in the lower and upper houses of the parliament. PiS wants to increase social spending, which could destabilize public finances and increase a budget gap. Since the new government came into power on October 25, the Warsaw Stock Exchange declined 12.7 percent by year end.
The Greek market also underperformed in 2015. At the beginning of the year, Alexis Tsipras of the left-leaning Syriza party became prime minister after winning parliamentary elections and forming a coalition with the national Independent Greeks party. The government negotiated a four-month extension to Greece’s bailout in return for undertaking a Eurozone-approved reform program. In the middle of the year, the European Central Bank (ECB) ended emergency funding, prompting Greece to close banks and impose capital controls. Voters rejected EU bailout terms in July’s referendum. Later, Greece and its creditors agreed on a third bailout, imposing further spending cuts to avoid bankruptcy and an exit from the eurozone.
Turkey was the worst-performing market this year. Political tension remained high in the region. A suicide attack in October, blamed on ISIS, killed more than a hundred people during a peace rally in Ankara, the capital. In November, Turkey shot down a Russian warplane which had been on a bombing mission in Syria. In response, Russia, Turkey’s second largest trading partner, imposed economic sanctions against the
43
Emerging Europe Fund | (unaudited) |
western Asian country. On the positive side, the governing Justice and Development Party (AKP) regained parliamentary majority in a November snap election, but it fell short of the number needed to form a referendum to boost President Recep Erdogan’s powers. The EU reached a deal whereby Turkey will restrict the flow of Syrian migrants into Europe in return for 3 billion euros and an opportunity to reopen talks for Turkey to become a part of eurozone bloc.
Investment Highlights
Overview
For the year ended December 31, 2015, the fund declined 20.73 percent, while the benchmark, the MSCI Emerging Markets Europe 10/40 Index (Net Total Return), declined 14.70 percent.
Hungary, Russia and Czech Republic outperformed the benchmark, while Poland, Greece and Turkey underperformed. On a sector basis, health care, energy and consumer staples were the best-performing sectors, while materials, consumer discretionary, telecommunications, financials, industrials and utilities underperformed.
At the beginning of 2015, the fund was positioned in a defensive mode with no exposure to Russia after its sharp selloff at the end of 2014, while half of the index’s holdings were Russian. Throughout the year, the fund has gradually been increasing its Russian holdings and used call options on the Russian ETF (RSX) as well as directional ETFs to hedge the fund’s benchmark risk.
Because the fund is actively managed and holding period is generally not a consideration in investment decisions, the portfolio turnover rate may fluctuate from year to year as the fund adjusts its portfolio composition. The fund’s annual portfolio turnover was, and is expected to continue to be, more than 100 percent.
Strengths
● | The fund’s overweight of Austria, higher cash levels and good stock selection in Greece and Poland had a positive contribution to the fund’s performance relative to its index. |
● | The fund’s stock selection in industrials as well as an overweight in information technology and underweight of utilities had a positive contribution to the performance of the fund relative to its benchmark. |
● | Call options on the Market Vector Russia ETF, due May 15, 2015, made the single largest contribution to the performance of the fund. These calls worked well for the fund because they were held when Russia was appreciating. |
Weaknesses
● | The fund’s underweight of Russia and overweight of Turkey had a negative impact on the fund’s performance relative to its benchmark. |
44
Emerging Europe Fund | (unaudited) |
● | The fund’s stock selection in energy and materials, as well as an underweight of these sectors, had a negative effect on the fund’s performance. |
● | Call options on the Market Vector Russia ETF, due August 21, 2015, were the single worst contributor to the performance of the fund. These calls worked against the fund, as they were held when Russia was underperforming. |
Current Outlook
Opportunities
● | Election-led uncertainties have ended in Turkey after APK, the socially conservative party of President Erdogan, unexpectedly won more than the 276 seats needed to form a single majority government in November. |
● | At the beginning of 2015, the ECB announced a bond-buying program and proceeded to purchase 60 billion euros worth of bonds a month for a total of 1 trillion euros. Later in the year, the ECB extended the program beyond September 2016 in an attempt to drive up inflation and stimulate eurozone growth. |
● | Greece looks as if it is pushing forward its reforms and is on a path to recovery. Its government approved the 2016 budget, recapitalized its banks and is making plans to sell state-owned assets and deal with the country’s bad debt. The government also expects zero GDP growth in 2015, compared with earlier forecasts of a 2.3 percent contraction. |
Threats
● | Law & Justice, a right-wing, Eurosceptic and anti-liberal party, won an outright majority of seats in the lower and upper chambers of the Polish parliament, marking the first time a party won a majority in Poland since 1989. Moody’s rating agency said that the PiS election victory could jeopardize Poland’s status as a regional safe haven for investors, and it was negative for credit rating. The socially conservative PiS made promises to increase state control of the economy, tax banks and end privatization. |
● | HSBC expects Russia’s economic outlook to remain poor in 2016. Analysts predict its GDP to contract 1 percent in 2016 following a 4 percent decline in 2015, assuming oil prices to be almost 10 percent lower on average. Russia’s economic growth is highly dependent on the price of oil, and with the recent selloff in Brent, further economic weakness is anticipated. |
● | In November, the Turkish air force shot down a Russian fighter jet near the border with Syria after pilots ignored repeated warnings that they were violating Turkish airspace. Russian Foreign Minister Sergei Lavrov described it as a planned act and said it would impact efforts toward a political solution in Syria. Political tensions will remain high in the region. |
The section labeled Portfolio of Investments contains a complete list of the fund’s holdings.
45
Emerging Europe Fund | (unaudited) |
Top 10 Equity Holdings (Based on Net Assets) | December 31, 2015 |
Sberbank of Russia | 5.25% |
Commercial Banks - Non US | |
Gazprom OAO | 3.50% |
Oil Companies - Integrated | |
Magnit PJSC | 3.48% |
Food - Retail | |
Lukoil PJSC | 3.48% |
Oil Companies - Integrated | |
Rosneft OAO | 1.94% |
Oil Companies - Integrated | |
MMC Norilsk Nickel PJSC | 1.71% |
Metal - Diversified | |
Budimex S.A. | 1.66% |
Building & Construction - Miscellaneous | |
Turkcell Iletism Hizmetleri A.S. | 1.48% |
Cellular Telecommunication | |
Mobile TeleSystems OJSC | 1.41% |
Cellular Telecommunication | |
Deutsche Lufthansa | 1.38% |
Airlines | |
Total Top 10 Equity Holdings | 25.29% |
Country Distribution* Based on Total Investments | December 31, 2015 |
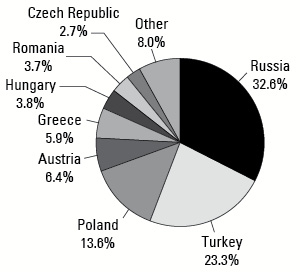
|
* | Country distribution shown is based on domicile. The locale of company operations may be different. |
46
China Region Fund | (unaudited) |
Management Team’s Perspective
Introduction
The China Region Fund (USCOX) seeks long-term growth of capital. The fund invests in both established and emerging companies registered and operating in the China region.
Performance Graph
China Region Fund | |
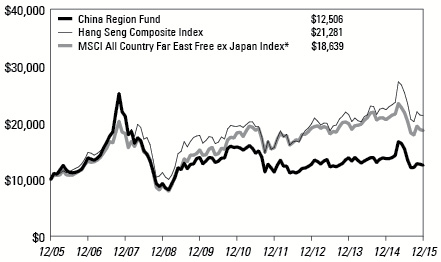
| |
Average Annual Performance | For the Years Ended
December 31, 2015 | |
| | One Year | Five Year | Ten Year | |
China Region Fund - Investor Class | (8.60)% | (4.48)% | 2.26% | |
Hang Seng Composite Index | (4.52)% | 1.91% | 7.84% | |
MSCI All Country Far East Free ex Japan Index* | (9.22)% | 0.45% | 6.42% | |
* These are not total returns. These returns reflect simple appreciation only and do not reflect dividend reinvestment. Performance data quoted above is historical. Past performance is no guarantee of future results. Current performance may be higher or lower than the performance data quoted. The principal value and investment return of an investment will fluctuate so that an investor’s shares, when redeemed, may be worth more or less than their original cost. The graph and table do not reflect the deduction of taxes that a shareholder would pay on fund distributions or the redemption of fund shares. For all or a portion of the periods, the fund had expense limitations, without which returns would have been lower. Gross expense ratio as stated in the most recent prospectus is 2.97%. Pursuant to a voluntary arrangement, the Adviser has agreed to limit total fund operating expenses (exclusive of any acquired fund fees and expenses, performance fees, taxes, brokerage commissions and interest) to not exceed 2.55%. The Adviser can modify or terminate this arrangement at any time. See Definitions for Management Teams’ Perspectives for index definitions. Please visit our website at www.usfunds.com for updated performance information for different time periods.. | |
47
China Region Fund | (unaudited) |
The Year in Review – Economic and Political Issues that Affected the Fund
2015 was a year of tremendous volatility for markets and sentiment in both China and the broader region.
Although the year kicked off with eager anticipation of continued reforms and an ever-increasing domestic participation rate in the “engineered” bull market that was the Shanghai Composite Index, it ended with a fair amount of investor pessimism amid concerns about the efficacy of government economic policies and questions regarding extensive market intervention. Shanghai soared more than 50 percent, with dizzying speed, before collapsing sharply midyear to 2015 lows in August, even as Chinese authorities clamped down on institutional and short sellers, and simply halted trading in scores of securities for weeks on end.
The pace of political reform in China slowed throughout the year, although Xi Jinping’s now-hallmark national anticorruption campaign continues unabated. As in 2014, the perceived excess associated with Macao-based casinos and luxury goods led to operators and producers of such services and goods to be once again priced accordingly in Chinese markets, particularly Hong Kong. Though the Caixin China Manufacturing Purchasing Manager’s Index (formerly the HSBC China Manufacturing Purchasing Manager’s Index) did spike briefly above 50 in February, signaling expansion, it declined immediately thereafter, retreating to new 2015 and multiyear lows of 47.2 by September. China’s GDP growth slowed from 7.2 percent at the end of 2014 to its last print of 6.8 percent in December 2015.
To help offset lower potential domestic growth, China announced a new economic strategy dubbed “One Belt, One Road” early in the year, aimed at boosting trade with emerging markets and specifically geared toward construction and development of overseas transport infrastructure, which in theory should help to export domestic overcapacity in construction. China also launched the Asian Infrastructure Investment Bank (AIIB), which can count among its many founding member countries such U.S. allies as Australia and South Korea, whose depreciating won has been a relative boon to its exporters in the face of a stabilized Japanese yen.
The new AIIB seeks to support the development of infrastructure in the Asia-Pacific region, but notably absent from the bank’s founding members are the United States and Japan. The new Trans-Pacific Partnership (TPP) trade deal, on the other hand, excludes China (at present). The deal marks a compelling new chapter in freer trade across the Pacific Rim, and for some nations like Vietnam, the trade deal appears to have much to offer.
In the fourth quarter, the International Monetary Fund (IMF) announced that the Chinese renminbi (RMB) currency is to be included in its Special Drawing Right (SDR) basket of currencies, putting an end to long speculation and marking another milestone for China’s developing economy. The RMB now takes its place in a
48
China Region Fund | (unaudited) |
basket alongside the U.S. dollar, euro, Japanese yen and British pound, but make no mistake, the move is sure to elevate criticism of and attention to Chinese currency intervention and stability in economic policy.
Investment Highlights
Overview
For the year ended December 31, 2015, the China Region Fund declined 8.60 percent, underperforming its benchmark, the Hang Seng Composite Index, which declined 4.52 percent in total return.
Because the fund is actively managed and holding period is generally not a consideration in investment decisions, the portfolio turnover rate may fluctuate from year to year as the fund adjusts its portfolio composition. The fund’s annual portfolio turnover was, and is expected to continue to be, more than 100 percent.
As a defensive measure, the fund occasionally utilizes call options to hedge the fund’s benchmark risk.
Strengths
● | In addition to solid overall stock selection in Hong Kong, fund allocations to South Korea contributed positively to relative performance against the benchmark, offering some diversification in the face of declining Chinese markets. The decision to underweight HSBC Holdings plc—an underperforming, major diversified bank incorporated in the U.K. and dominant in the benchmark index—also helped relative performance, as did retaining somewhat elevated levels of cash throughout the year’s volatile markets. |
● | In terms of industry and sector allocations, the decision to underweight energy—the worst-performing group within the Hang Seng Composite Index for 2015—afforded helpful relative contribution to performance, while particularly strong stock selection within consumer goods provided the fund’s strongest relative outperformance. |
● | Shenzhou International Group Holdings, ANTA Sports Products, Guotai Junan International Holdings and Value Partners Group constituted the top fund contributors to performance relative to the benchmark. |
Weaknesses
● | Country allocation outside of Hong Kong and South Korea generally detracted from performance, particularly fund allocations to Taiwan and the Philippines. Timing on short-term entries and exits for several U.S.-traded, country-specific exchange-traded funds also detracted from performance, outweighing relative gains from American depositary receipts (ADRs). |
49
China Region Fund | (unaudited) |
● | Industry allocation and stock selection within telecommunications made that sector the largest net detractor from fund performance. |
● | Among single stocks, C.K. Hutchinson Holdings, Great Wall Motor, Sunac China Holdings and Huabao International Holdings constituted the fund’s biggest detractors to fund performance relative to the benchmark index. |
Current Outlook
Opportunities
● | China launched its massive “One Belt, One Road” economic strategy in the first quarter of 2015. The announced strategy seeks to invest in overseas transport infrastructure and boost trade with emerging markets, possibly helping to counter slower domestic growth and potentially creating opportunities for Chinese construction companies. |
● | The Trans-Pacific Partnership (TPP) trade deal, signed early in the fourth quarter, offers new opportunities for the 12 Pacific Rim countries—including the United States—that signed it. Vietnam, in particular, remains well-positioned to gain a boost to its GDP, due to its low manufacturing wages compared to China, which is not presently a member of the historic trade deal. |
● | After heavy declines from midyear onward, undemanding valuations in many of the China region’s investable countries may seem more attractive to investors. From a contrarian standpoint, it may not take much to spark an upside surprise or rally. |
Threats
● | Investor sentiment in China has suffered heavy damage since that country’s equity markets reached frenzied peaks in the second quarter. Both the Shanghai Composite and the Hang Seng Composite indices declined sharply, entering bear markets during a third quarter also marked by a surprise devaluation of the yuan. Despite a deliberate governmental dampening of 2016 growth expectations, continued questions about the near-term efficacy of the policies of the Chinese government and whether it can stabilize markets or sentiment remain central in many investors’ minds. |
● | The pace and scope of the normalization of U.S. interest rate policy may create further headwinds for emerging markets and currencies. |
● | The possibility of a global growth slowdown, an Asia-centric slowdown, or the mere fear of either one, could possibly create higher correlation among assets and country indices, potentially limiting effective avenues for diversification. |
The section labeled Portfolio of Investments contains a complete list of the fund’s holdings.
50
China Region Fund | (unaudited) |
Top 10 Equity Holdings (Based on Net Assets) | December 31, 2015 |
Tencent Holdings Ltd. | 7.86% |
Internet Application Software | |
AIA Group Ltd. | 6.38% |
Life/Health Insurance | |
ANTA Sports Products Ltd. | 3.65% |
Retail - Apparel/Shoe | |
Ping An Insurance Group Co of China Ltd. | 3.60% |
Multi-line Insurance | |
Shenzhou International Group Holdings Ltd. | 3.01% |
Textile - Apparel | |
China Overseas Land & Investment Ltd. | 2.71% |
Real Estate Operating/Development | |
Hong Kong Exchanges and Clearing Ltd. | 2.69% |
Finance - Other Services | |
China Construction Bank Corp. | 2.62% |
Commercial Banks - Non US | |
SmarTone Telecommunications Holdings Ltd. | 2.45% |
Cellular Telecommunication | |
Sino Biopharmaceutical Ltd. | 2.30% |
Medical - Drugs | |
Total Top 10 Equity Holdings | 37.27% |
Country Distribution* Based on Total Investments | December 31, 2015 |
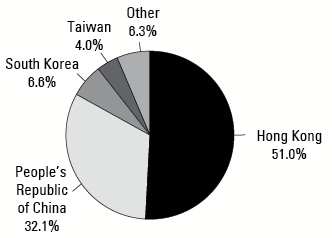
|
* | Country distribution shown is based on domicile and not intended to conform to the China region definition in the prospectus. The locale of company operations may be different. |
51
U.S. Government Securities Ultra-Short Bond Fund
Portfolio of Investments | December 31, 2015 |
United States
Government and Agency
Obligations 88.45% | | Coupon
Rate % | | Maturity
Date | | | Principal Amount | | | | Value | |
Federal Farm Credit Bank 26.62% | |
Fixed Rates: | | | | | | | | | | |
| | | 1.13 | | 09/22/17 | | $ | 2,000,000 | | | $ | 2,000,184 | |
| | | 1.16 | | 10/23/17 | | | 1,000,000 | | | | 1,002,376 | |
Variable Rates: | | | | | | | | | | | | |
| | | 0.38 | | 07/08/16 | | | 2,000,000 | | | | 2,000,492 | |
| | | 0.36 | | 01/30/17 | | | 1,650,000 | | | | 1,649,236 | |
| | | 0.38 | | 04/27/17 | | | 10,000,000 | | | | 10,003,620 | |
| | | | | | | | | | | | 16,655,908 | |
| | | | | | | | | | | | | |
Federal Home Loan Bank 53.18% | |
Fixed Rates: | | | | | | | | | | | | |
| | | 1.10 | | 12/22/16 | | | 10,000,000 | | | | 10,030,230 | |
| | | 5.13 | | 03/10/17 | | | 1,000,000 | | | | 1,049,106 | |
| | | 0.88 | | 09/22/17 | | | 1,500,000 | | | | 1,497,432 | |
| | | 0.88 | | 09/27/17 | | | 3,000,000 | | | | 2,991,804 | |
| | | 1.00 | | 12/19/17 | | | 8,000,000 | | | | 7,980,072 | |
| | | 1.13 | | 03/29/18 | | | 750,000 | | | | 748,779 | |
| | | 1.70 | | 07/26/18 | | | 3,000,000 | | | | 3,009,477 | |
| | | 1.50 | | 03/08/19 | | | 4,000,000 | | | | 3,999,264 | |
| | | 1.22 | | 04/11/19 | | | 2,000,000 | | | | 1,964,322 | |
| | | | | | | | | | | | 33,270,486 | |
| | | | | | | | | | | | | |
Tennessee Valley Authority 8.65% | |
Fixed Rates: | | | | | | | | | | | | |
| | | 6.25 | | 12/15/17 | | | 2,930,000 | | | | 3,212,511 | |
| | | 1.75 | | 10/15/18 | | | 2,174,000 | | | | 2,196,855 | |
| | | | | | | | | | | | 5,409,366 | |
| |
Total Investments 88.45% | | | | 55,335,760 | |
(cost $55,308,219) | | | | | | | | | | | | |
Other assets and liabilities, net 11.55% | | | | | | | | | | | 7,225,775 | |
| | | | | | | | | | | | | |
Net Assets 100.0% | | | | | | | | | | $ | 62,561,535 | |
See notes to portfolios of investments and notes to financial statements.
52
Near-Term Tax Free Fund
Portfolio of Investments | December 31, 2015 |
Municipal Bonds 89.46% | | Coupon
Rate % | | Maturity
Date | | | Principal Amount | | | | Value | |
Alabama 1.50% | |
Alabama Public School & College Authority | | 5.00 | | 12/01/16 | | $ | 290,000 | | | $ | 301,551 | |
Bessemer, Alabama Electric Revenue, Refunding, AGM | | 3.10 | | 12/01/21 | | | 100,000 | | | | 105,112 | |
Bessemer, Alabama Water Revenue, XLCA | | 4.00 | | 01/01/16 | | | 500,000 | | | | 500,000 | |
Huntsville City, Alabama Electric System Revenue, AGM | | 4.00 | | 12/01/16 | | | 60,000 | | | | 61,883 | |
Jasper Alabama Water Works & Sewer Board, Inc., Utilities Revenue, Series A | | 3.00 | | 06/01/16 | | | 90,000 | | | | 90,930 | |
Limestone County, Water & Sewer Authority | | 2.25 | | 12/01/21 | | | 365,000 | | | | 364,595 | |
Mobile Alabama, Refunding, GO Unlimited, Series B | | 5.00 | | 02/15/17 | | | 45,000 | | | | 47,194 | |
Pelham, Alabama, GO Unlimited | | 2.00 | | 02/01/18 | | | 130,000 | | | | 132,467 | |
| | | | | | | | | | | | 1,603,732 | |
| | | | | | | | | | | | | |
Alaska 0.32% | |
Alaska Municipal Bond Bank Authority, Unrefunded, Series A-2015, AMBAC | | 4.00 | | 02/01/16 | | | 125,000 | | | | 125,358 | |
Alaska Municipal Bond Bank Authority, Prerefunded, Series A-2015, AMBAC | | 4.00 | | 02/01/16 | | | 70,000 | | | | 70,183 | |
Alaska Municipal Bond Bank Authority, Prefunded, Series A, AMBAC | | 4.00 | | 02/01/16 | | | 105,000 | | | | 105,275 | |
Valdez Alaska, School District, GO Unlimited | | 4.00 | | 06/30/17 | | | 40,000 | | | | 41,866 | |
| | | | | | | | | | | | 342,682 | |
| | | | | | | | | | | | | |
Arizona 0.90% | |
Arizona Board of Regents Certificates of Participation, Series B, AMBAC | | 4.50 | | 06/01/16 | | | 200,000 | | | | 203,338 | |
Arizona State Transportation Board Excise Tax Revenue | | 5.00 | | 07/01/17 | | | 175,000 | | | | 185,971 | |
McAllister Academic Village LLC, Arizona State University Hassayampa Revenue, Refunding | | 5.75 | | 07/01/18 | | | 200,000 | | | | 221,236 | |
Page, Arizona, Pledged Revenue, Refunding | | 3.00 | | 07/01/16 | | | 350,000 | | | | 354,466 | |
| | | | | | | | | | | | 965,011 | |
| | | | | | | | | | | | | |
Arkansas 0.52% | |
Hot Springs, Arizona Wastewater Revenue | | 4.00 | | 12/01/19 | | | 510,000 | | | | 555,722 | |
| | | | | | | | | | | | | |
California 4.44% | |
California State, GO Unlimited | | 5.00 | | 12/01/26 | | | 150,000 | | | | 155,975 | |
California State, Prerefunded, GO Unlimited | | 5.00 | | 09/01/35 | | | 130,000 | | | | 133,842 | |
See notes to portfolios of investments and notes to financial statements.
53
Near-Term Tax Free Fund
Portfolio of Investments | December 31, 2015 |
Municipal Bonds (cont’d) | | Coupon
Rate % | | Maturity
Date | | | Principal Amount | | | | Value | |
California (cont’d) | |
California State, GO Unlimited | | 5.00 | | 03/01/32 | | $ | 300,000 | | | $ | 302,177 | |
California State, Recreational Facility, Refunding, GO Unlimited | | 5.00 | | 12/01/19 | | | 5,000 | | | | 5,017 | |
California State, GO Unlimited | | 4.75 | | 03/01/34 | | | 205,000 | | | | 206,427 | |
California State, Statewide Communities Development Authority, Enloe Medical Center Revenue, Series A | | 5.25 | | 08/15/18 | | | 340,000 | | | | 375,714 | |
Chaffey Community College District, GO Unlimited, Series C, NATL | | 5.00 | | 06/01/32 | | | 300,000 | | | | 318,234 | |
Delano, California Union High School District, Refunding, GO Unlimited,
Series A, NATL | | 4.75 | | 02/01/17 | | | 200,000 | | | | 208,394 | |
Elk Grove Unified School District, Community Facilities District #1, Refunding, Special Tax Revenue | | 2.00 | | 12/01/16 | | | 310,000 | | | | 312,917 | |
Los Angeles Unified School District, Election 2004, GO Unlimited, Series H, AGM | | 5.00 | | 07/01/32 | | | 200,000 | | | | 211,650 | |
Riverside County, California Redevelopment Successor Agency, Refunding, Tax Allocation | | 5.00 | | 10/01/19 | | | 200,000 | | | | 225,960 | |
San Francisco Municipal Transportation Agency | | 5.00 | | 03/01/27 | | | 1,000,000 | | | | 1,207,879 | |
Santa Clara County, California Financing Authority Revenue, Obstetrics and Gynecology, El Camino Hospital, AMBAC | | 5.00 | | 02/01/18 | | | 350,000 | | | | 373,506 | |
Santa Clara Valley Transportation Authority, Series A, AMBAC | | 5.00 | | 04/01/27 | | | 370,000 | | | | 390,298 | |
Santa Paula Schools Financing Authority, Santa Paula Elementary School District Revenue, AGM | | 4.25 | | 11/01/22 | | | 300,000 | | | | 316,137 | |
| | | | | | | | | | | | 4,744,127 | |
| | | | | | | | | | | | | |
Colorado 1.30% | |
Denver, Colorado, Health & Hospital Authority, Healthcare Revenue, Series A | | 5.00 | | 12/01/16 | | | 265,000 | | | | 274,991 | |
Pueblo County, School District No. 70, GO Unlimited | | 4.00 | | 12/01/24 | | | 990,000 | | | | 1,108,246 | |
| | | | | | | | | | | | 1,383,237 | |
| | | | | | | | | | | | | |
Connecticut 0.70% | |
Bristol, Connecticut, Refunding, GO Unlimited | | 3.00 | | 10/15/16 | | | 180,000 | | | | 183,546 | |
See notes to portfolios of investments and notes to financial statements.
54
Near-Term Tax Free Fund
Portfolio of Investments | December 31, 2015 |
Municipal Bonds (cont’d) | | Coupon
Rate % | | Maturity
Date | | | Principal Amount | | | | Value | |
Connecticut (cont’d) | |
Connecticut State Health & Educational Facilities Authority Revenue, Bridgeport Hospital, Series D | | 5.00 | | 07/01/19 | | $ | 395,000 | | | $ | 438,091 | |
Connecticut State, Refunding, GO Unlimited, Series E | | 5.00 | | 12/15/18 | | | 125,000 | | | | 130,169 | |
| | | | | | | | | | | | 751,806 | |
| | | | | | | | | | | | | |
District of Columbia 0.56% | |
District of Columbia Income Tax Revenue, Series A | | 5.25 | | 12/01/27 | | | 300,000 | | | | 345,072 | |
Washington D.C. Convention Center Authority Dedicated Tax Revenue, Refunding, Series A, AMBAC | | 5.00 | | 10/01/16 | | | 250,000 | | | | 258,028 | |
| | | | | | | | | | | | 603,100 | |
| | | | | | | | | | | | | |
Florida 7.36% | |
Broward County, Florida, Civic Arena Project, Refunding, Series A, AMBAC | | 5.00 | | 09/01/20 | | | 500,000 | | | | 513,940 | |
Cape Coral, Florida Gas Tax Revenue, Series A | | 4.00 | | 10/01/16 | | | 255,000 | | | | 261,299 | |
Citizens Property Insurance Co., Senior Secured, Coastal Account, Revenue, Series A-1 | | 4.00 | | 06/01/18 | | | 100,000 | | | | 106,366 | |
Delray Beach Florida, Utilities Tax Revenue, Refunding | | 5.00 | | 06/01/23 | | | 505,000 | | | | 608,752 | |
Escambia County, Florida, Health Facilities Authority Revenue, Baptist Hospital, Inc. Project, Series A | | 5.00 | | 08/15/19 | | | 290,000 | | | | 320,563 | |
Florida Gulf Coast University Financing Corp., Capital Improvement Revenue, Series B | | 3.00 | | 02/01/16 | | | 365,000 | | | | 365,701 | |
Florida State Board of Education Lottery Revenue, Series B, BHAC-CR, NATL-RE | | 5.00 | | 07/01/26 | | | 100,000 | | | | 107,118 | |
Florida State Board of Governors Parking Facility Revenue, Series A | | 3.00 | | 07/01/17 | | | 300,000 | | | | 309,912 | |
Florida State Department of Management Services Certificates of Participation, Refunding, Series A | | 5.00 | | 08/01/19 | | | 500,000 | | | | 565,065 | |
Florida State Department of Management Services Certificates of Participation, Series A | | 5.00 | | 08/01/24 | | | 340,000 | | | | 375,979 | |
Florida State Municipal Power Agency, Stanton Project Revenue, Refunding | | 5.13 | | 10/01/17 | | | 300,000 | | | | 321,564 | |
See notes to portfolios of investments and notes to financial statements.
55
Near-Term Tax Free Fund
Portfolio of Investments | December 31, 2015 |
Municipal Bonds (cont’d) | | Coupon
Rate % | | Maturity
Date | | | Principal Amount | | | | Value | |
Florida (cont’d) | |
Fort Pierce, Florida Stormwater Utilities Revenue, XLCA | | 4.50 | | 10/01/17 | | $ | 255,000 | | | $ | 255,681 | |
Hillsborough County, Florida School Board, Refunding, Series A | | 4.25 | | 07/01/25 | | | 300,000 | | | | 327,612 | |
Hillsborough County, Florida School Board, Certificates of Participation, Refunding, NATL | | 4.00 | | 07/01/19 | | | 100,000 | | | | 104,097 | |
Jacksonville Florida Special Revenue, Series C | | 5.00 | | 10/01/20 | | | 270,000 | | | | 312,371 | |
Leesburg, Florida Capital Improvement Revenue Bonds, Refunding | | 5.00 | | 10/01/21 | | | 405,000 | | | | 464,373 | |
Margate, Florida Water & Sewer Revenue, Refunding, AGM | | 4.00 | | 10/01/19 | | | 250,000 | | | | 269,123 | |
Miami - Dade County, Florida Expressway Authority Toll System Revenue, Series A | | 5.00 | | 07/01/21 | | | 430,000 | | | | 505,504 | |
Miami - Dade County, Florida School Board Foundation, Series B, AGC-ICC AMBAC | | 5.00 | | 11/01/31 | | | 200,000 | | | | 207,030 | |
Miami - Dade County, Florida Water & Sewer Revenue System, Series A, AGM | | 4.00 | | 10/01/16 | | | 235,000 | | | | 241,070 | |
Orange County School Board, Certificate of Participation, Certificates of Participation, Series A, NATL | | 5.00 | | 08/01/32 | | | 275,000 | | | | 293,290 | |
Orlando, Florida Community Redevelopment Agency Tax Increment Revenue, Downtown District, Series A | | 4.00 | | 09/01/17 | | | 225,000 | | | | 232,065 | |
Polk County, Florida School District Revenue, AGM | | 5.00 | | 10/01/17 | | | 215,000 | | | | 229,801 | |
Saint Johns County, Florida Transportation Revenue, Refunding, AGM | | 5.00 | | 10/01/20 | | | 310,000 | | | | 359,727 | |
Volusia County, Florida School Board Sales Tax Revenue, NATL | | 4.20 | | 10/01/16 | | | 200,000 | | | | 205,158 | |
| | | | | | | | | | | | 7,863,161 | |
| | | | | | | | | | | | | |
Georgia 1.99% | |
Atlanta Downtown Development Authority, Series A, NATL | | 4.25 | | 12/01/16 | | | 250,000 | | | | 253,470 | |
Carroll City-County, Georgia Hospital Authority, Tanner Medical Center, Inc. Project | | 5.00 | | 07/01/18 | | | 600,000 | | | | 656,922 | |
Georgia State Municipal Electric Authority Revenue, Unrefunded, NATL | | 5.50 | | 01/01/20 | | | 80,000 | | | | 84,215 | |
Georgia State Municipal Gas Authority, Toccoa Project, Refunding, AGM | | 5.00 | | 06/01/22 | | | 600,000 | | | | 699,090 | |
See notes to portfolios of investments and notes to financial statements.
56
Near-Term Tax Free Fund
Portfolio of Investments | December 31, 2015 |
Municipal Bonds (cont’d) | | Coupon
Rate % | | Maturity
Date | | | Principal Amount | | | | Value | |
Georgia (cont’d) | |
Glynn-Brunswick Memorial Hospital Authority, Southeast Georgia Health System and Affiliates Revenue, Anticipation Certificates, Series A | | 4.50 | | 08/01/17 | | $ | 150,000 | | | $ | 158,154 | |
Gwinnett County, Georgia, Hospital Authority, Gwinnett Hospital Systems Revenue, Series B, AGM | | 5.00 | | 07/01/18 | | | 250,000 | | | | 273,135 | |
| | | | | | | | | | | | 2,124,986 | |
| | | | | | | | | | | | | |
Guam 0.24% | |
Guam Education Financing Foundation Certificate of Participation, Series A | | 4.25 | | 10/01/18 | | | 250,000 | | | | 254,260 | |
| | | | | | | | | | | | | |
Idaho 0.24% | |
Idaho Housing & Finance Association, Grant & Revenue Anticipation, Federal Highway Trust Fund, Series A | | 5.00 | | 07/15/21 | | | 225,000 | | | | 261,803 | |
| | | | | | | | | | | | | |
Illinois 6.36% | |
Chicago Board of Education, GO Unlimited, NATL-IBC FGIC | | 5.25 | | 12/01/19 | | | 300,000 | | | | 319,437 | |
Chicago Board of Education, Dedicated Revenues, GO Unlimited, Series F | | 5.00 | | 12/01/16 | | | 300,000 | | | | 304,866 | |
Chicago, Illinois, City Colleges, GO Unlimited, AMBAC | | 5.00 | | 01/01/17 | | | 115,000 | | | | 117,432 | |
Chicago, Illinois, Direct Access Bond, GO Unlimited, Series E-1 B, AMBAC | | 4.00 | | 01/01/19 | | | 200,000 | | | | 200,450 | |
Chicago, Illinois, O’Hare International Airport Revenue, Gen - Third Lien, Series C, AGC | | 5.25 | | 01/01/23 | | | 250,000 | | | | 285,413 | |
Clinton Bond Fayette Etc Counties Community College District No. 501 Kaskaskia, GO Unlimited | | 5.75 | | 12/01/19 | | | 500,000 | | | | 570,855 | |
Du Page County, Refunding, GO Unlimited | | 5.60 | | 01/01/21 | | | 385,000 | | | | 427,785 | |
Du Page County School District No. 33 West Chicago, Redunding, Series B | | 4.00 | | 12/01/21 | | | 1,000,000 | | | | 1,108,459 | |
Illinois Metropolitan Pier & Exposition Authority, Unrefunded, NATL (ZCB) | | 1.73(1) | | 06/15/18 | | | 415,000 | | | | 394,553 | |
Illinois Regional Transportation Authority, Series A, AMBAC | | 7.20 | | 11/01/20 | | | 145,000 | | | | 167,822 | |
Illinois State, GO Unlimited | | 5.00 | | 05/01/18 | | | 1,000,000 | | | | 1,058,520 | |
Illinois State, Refunding, GO Unlimited | | 5.00 | | 01/01/16 | | | 300,000 | | | | 300,000 | |
Illinois State, GO Unlimited | | 5.00 | | 03/01/16 | | | 340,000 | | | | 342,149 | |
Lake & McHenry County, Fox Lake, Illinois, Debt Certificates, Series B | | 3.00 | | 11/01/19 | | | 265,000 | | | | 273,310 | |
See notes to portfolios of investments and notes to financial statements.
57
Near-Term Tax Free Fund
Portfolio of Investments | December 31, 2015 |
Municipal Bonds (cont’d) | | Coupon
Rate % | | Maturity
Date | | | Principal Amount | | | | Value | |
Illinois (cont’d) | |
Springfield, Illinois Metropolitan Sanitation District, Sewer Revenue, Senior Lien, Series A | | 4.00 | | 01/01/17 | | $ | 570,000 | | | $ | 586,906 | |
Will Grundy Etc Counties Community College District No. 525, Joliet Junior College Project, GO Unlimited | | 6.25 | | 06/01/22 | | | 300,000 | | | | 335,772 | |
| | | | | | | | | | | | 6,793,729 | |
| | | | | | | | | | | | | |
Indiana 2.21% | |
Fort Wayne, Indiana Waterworks Utility Revenue | | 2.00 | | 12/01/16 | | | 585,000 | | | | 592,523 | |
Indiana State Finance Authority, Refunding | | 5.00 | | 07/01/16 | | | 200,000 | | | | 204,474 | |
Indianapolis Local Public Improvement Bond Bank, Waterworks Project, Series 2007 L, NATL | | 5.25 | | 01/01/33 | | | 305,000 | | | | 324,883 | |
Merrillville Redevelopment Authority | | 5.00 | | 08/15/20 | | | 350,000 | | | | 399,812 | |
Tri-Creek 2002 High School Building, AGM | | 5.00 | | 07/15/19 | | | 800,000 | | | | 834,232 | |
| | | | | | | | | | | | 2,355,924 | |
| | | | | | | | | | | | | |
Iowa 0.40% | |
University of Iowa Hospitals and Clinics, Iowa State Board of Regents, Hospital Revenue, Series A | | 3.00 | | 09/01/19 | | | 400,000 | | | | 424,032 | |
| | | | | | | | | | | | | |
Kansas 0.30% | |
Sedgwick County, Kansas, Unified School District No. 266 Maize, GO Unlimited, NATL | | 5.00 | | 09/01/17 | | | 50,000 | | | | 53,424 | |
Wichita, Kansas, Refunding, GO Unlimited, Series A | | 5.00 | | 12/01/17 | | | 250,000 | | | | 269,638 | |
| | | | | | | | | | | | 323,062 | |
| | | | | | | | | | | | | |
Kentucky 2.63% | |
Bowling Green, Kentucky, GO Unlimited, Series B | | 4.00 | | 09/01/16 | | | 215,000 | | | | 219,954 | |
Fort Thomas Independent School District Finance Corp., Series C | | 2.00 | | 11/01/17 | | | 465,000 | | | | 474,630 | |
Jefferson County School District Finance, Refunding, Series B | | 4.00 | | 12/01/22 | | | 500,000 | | | | 566,930 | |
Kentucky Asset Liability Commission, Federal Highway Trust Fund | | 5.00 | | 09/01/17 | | | 450,000 | | | | 479,043 | |
Kentucky Municipal Power Agency, Power System Revenue, Prairie State Project, Series A, NATL | | 5.25 | | 09/01/22 | | | 440,000 | | | | 471,099 | |
See notes to portfolios of investments and notes to financial statements.
58
Near-Term Tax Free Fund
Portfolio of Investments | December 31, 2015 |
Municipal Bonds (cont’d) | | Coupon
Rate % | | Maturity
Date | | | Principal Amount | | | | Value | |
Kentucky (cont’d) | |
Louisville & Jefferson County Metropolitan Sewer District, Series A | | 5.00 | | 05/15/23 | | $ | 500,000 | | | $ | 594,080 | |
| | | | | | | | | | | | 2,805,736 | |
| | | | | | | | | | | | | |
Louisiana 4.53% | |
Lafayette Consolidated Government, GO Unlimited | | 5.00 | | 03/01/23 | | | 200,000 | | | | 235,016 | |
Louisiana Office Facilities Corp, Refunding | | 5.00 | | 11/01/17 | | | 700,000 | | | | 749,693 | |
Louisiana State, GO Unlimited, Series A | | 5.00 | | 08/01/26 | | | 800,000 | | | | 947,048 | |
Louisiana State, Citizens Property Insurance Corp., Revenue Bonds,
Series B, AMBAC | | 5.00 | | 06/01/21 | | | 245,000 | | | | 249,540 | |
Shreveport, Louisiana, Refunding | | 5.00 | | 05/01/16 | | | 2,620,000 | | | | 2,658,172 | |
| | | | | | | | | | | | 4,839,469 | |
| | | | | | | | | | | | | |
Massachusetts 0.21% | |
Stoughton, Massachusetts Public Improvement, GO Limited, NATL | | 4.00 | | 05/01/17 | | | 225,000 | | | | 227,495 | |
| | | | | | | | | | | | | |
Michigan 3.15% | |
Detroit, Michigan Local Development Financing Authority, Refunding, Series A | | 5.38 | | 05/01/18 | | | 105,000 | | | | 104,371 | |
Gibraltar, Michigan School District, Refunding, AGM | | 5.00 | | 05/01/21 | | | 475,000 | | | | 543,842 | |
Michigan Public Power Agency AFEC Project Revenue, Series A | | 4.50 | | 01/01/19 | | | 280,000 | | | | 300,952 | |
Michigan State, Trunk Line Revenue, Refunding | | 4.50 | | 11/01/26 | | | 105,000 | | | | 115,826 | |
Michigan State Grant Anticipation Bonds, AGM | | 5.00 | | 09/15/16 | | | 200,000 | | | | 206,078 | |
Michigan State Hospital Finance Authority, Trinity Health, Series A | | 6.00 | | 12/01/18 | | | 200,000 | | | | 226,444 | |
Michigan Strategic Fund, Series A, AGC | | 5.00 | | 10/15/17 | | | 200,000 | | | | 214,258 | |
Portage Public Schools, School Building & Site, GO Unlimited, AGM | | 5.00 | | 05/01/20 | | | 300,000 | | | | 325,635 | |
Romeo Community School District, Refunding, GO Unlimited | | 3.00 | | 05/01/18 | | | 500,000 | | | | 521,460 | |
Wayne County, Michigan Airport Authority Revenue, Detroit Metropolitan Airport, Refunding, Series C | | 4.00 | | 12/01/19 | | | 255,000 | | | | 276,752 | |
Zeeland Public Schools, Refunding, GO Unlimited | | 5.00 | | 05/01/18 | | | 490,000 | | | | 529,641 | |
| | | | | | | | | | | | 3,365,259 | |
See notes to portfolios of investments and notes to financial statements.
59
Near-Term Tax Free Fund
Portfolio of Investments | December 31, 2015 |
Municipal Bonds (cont’d) | | Coupon
Rate % | | Maturity
Date | | Principal Amount | | | Value | |
| | | | | | | | | | | |
Minnesota 1.31% | |
Chaska, Minnesota Electric Revenue, Refunding, Series A | | 3.00 | | 10/01/17 | | $ | 535,000 | | | $ | 553,928 | |
Lake Washington Sanitary District, GO Unlimited, Series A, AGM | | 2.00 | | 02/01/18 | | | 205,000 | | | | 207,919 | |
Minneapolis & St Paul, Minnesota Housing & Redevelopment Authority Health Care Systems, Children’s Health Care,
Series B, AGM | | 4.00 | | 08/15/16 | | | 250,000 | | | | 254,843 | |
Minneapolis & St Paul, Minnesota Metropolitan Airports Commission, Airport Revenue, Refunding,
Series B, NATL | | 5.00 | | 01/01/19 | | | 255,000 | | | | 265,628 | |
Royalton Independent School District No. 485, GO Unlimited, Series A | | 5.00 | | 02/01/17 | | | 110,000 | | | | 115,127 | |
| | | | | | | | | | | | 1,397,445 | |
| | | | | | | | | | | | | |
Missouri 1.67% | |
Jackson County, Missouri, Special Obligation Refunding, Truman Sports Complex Project | | 5.00 | | 12/01/18 | | | 215,000 | | | | 238,237 | |
Kansas City, Missouri, Refunding, Series B | | 5.00 | | 08/01/19 | | | 650,000 | | | | 731,192 | |
Kansas City, Missouri Water Revenue, Series F, AGM | | 4.00 | | 12/01/22 | | | 250,000 | | | | 288,885 | |
Missouri Development Finance Board, Eastland Center Project, Tax Allocation, Series A | | 5.00 | | 04/01/17 | | | 250,000 | | | | 260,585 | |
Missouri State Health & Educational Facilities Authority, Southwestern Baptist University Revenue | | 3.00 | | 10/01/17 | | | 265,000 | | | | 267,952 | |
| | | | | | | | | | | | 1,786,851 | |
| | | | | | | | | | | | | |
Nevada 0.10% | |
Clark County, Nevada, GO Limited, AMBAC | | 5.00 | | 11/01/18 | | | 100,000 | | | | 103,734 | |
| | | | | | | | | | | | | |
New Hampshire 0.60% | |
New Hampshire, Federal Highway Grant Anticipation Bonds | | 5.00 | | 09/01/17 | | | 200,000 | | | | 213,352 | |
New Hampshire Health & Education Facilities Authority Revenue, Southern New Hampshire University Project | | 5.00 | | 01/01/18 | | | 400,000 | | | | 424,056 | |
| | | | | | | | | | | | 637,408 | |
See notes to portfolios of investments and notes to financial statements.
60
Near-Term Tax Free Fund
Portfolio of Investments | December 31, 2015 |
Municipal Bonds (cont’d) | | Coupon
Rate % | | Maturity
Date | | Principal Amount | | | Value | |
| | | | | | | | | | | |
New Jersey 5.33% | |
Atlantic City, New Jersey, Refunding Tax Appeal, GO Limited | | 4.00 | | 11/01/18 | | $ | 500,000 | | | $ | 432,855 | |
Atlantic City, New Jersey Municipal Utilities Authority Revenue, Refunding, AMBAC | | 5.00 | | 06/01/17 | | | 150,000 | | | | 152,307 | |
Camden County, New Jersey Improvement Authority, Refunding | | 4.00 | | 01/15/18 | | | 600,000 | | | | 634,872 | |
Cumberland County, New Jersey Improvement Authority, Technical High School Project, AGM | | 3.00 | | 09/01/17 | | | 550,000 | | | | 568,535 | |
Dennis Township, New Jersey, GO Unlimited | | 2.00 | | 10/01/16 | | | 160,000 | | | | 161,606 | |
Elizabeth, New Jersey Parking Authority Project Revenue, Elizabethtown Plaza Redevelopment, Series B | | 4.00 | | 11/01/17 | | | 255,000 | | | | 268,946 | |
Hudson County, New Jersey Improvement Authority Lease Revenue, North Hudson Regional Fire, Refunding, Series A, AGM | | 5.63 | | 09/01/18 | | | 400,000 | | | | 432,200 | |
New Jersey Economic Development Authority Revenue, School Facilities Construction, Refunding | | 5.00 | | 12/15/18 | | | 710,000 | | | | 759,821 | |
New Jersey Educational Facilities Authority, Montclair State University, Series A, AMBAC | | 5.00 | | 07/01/31 | | | 175,000 | | | | 178,915 | |
New Jersey Health Care Facilities Financing Authority Revenue, Holy Name Medical Center, Refunding | | 5.00 | | 07/01/19 | | | 215,000 | | | | 236,691 | |
New Jersey Transportation Trust Fund Authority, Series A, NATL | | 5.00 | | 06/15/16 | | | 440,000 | | | | 447,854 | |
Passaic County Improvement Authority | | 5.00 | | 05/01/24 | | | 700,000 | | | | 829,542 | |
Passaic Valley, New Jersey, Sewage Commissioners Revenue, Series G | | 5.75 | | 12/01/21 | | | 500,000 | | | | 590,760 | |
| | | | | | | | | | | | 5,694,904 | |
| | | | | | | | | | | | | |
New Mexico 0.68% | |
Clayton, New Mexico, Jail Project Revenue, CIFG | | 4.00 | | 11/01/17 | | | 235,000 | | | | 241,834 | |
Los Alamos County, New Mexico, Sales Tax Revenue | | 5.75 | | 06/01/16 | | | 470,000 | | | | 480,049 | |
| | | | | | | | | | | | 721,883 | |
| | | | | | | | | | | | | |
New York 4.62% | |
Arlington Central School District, GO Unlimited | | 5.00 | | 12/15/25 | | | 1,000,000 | | | | 1,207,929 | |
Ithaca, New York, Refunding, GO Limited, Series A | | 3.00 | | 01/15/16 | | | 750,000 | | | | 750,660 | |
See notes to portfolios of investments and notes to financial statements.
61
Near-Term Tax Free Fund
Portfolio of Investments | December 31, 2015 |
Municipal Bonds (cont’d) | | Coupon
Rate % | | Maturity
Date | | | Principal Amount | | | | Value | |
New York (cont’d) | |
Long Island Power Authority Revenue, New York Electric Systems, Series E | | 5.00 | | 12/01/17 | | $ | 330,000 | | | $ | 341,953 | |
Long Island Power Authority Revenue, Series B | | 5.00 | | 09/01/21 | | | 465,000 | | | | 545,171 | |
Nassau County Industrial Development Agency, New York Institute of Technology Project Revenue, Refunding, Remarketing, Series A | | 5.00 | | 03/01/21 | | | 350,000 | | | | 383,285 | |
New York State Dormitory Authority, Nonconstruction Supported Debt, Municipal Facilities Health Lease,
Series 1 | | 5.00 | | 01/15/17 | | | 300,000 | | | | 312,585 | |
North Castle, New York, Public Improvement, GO Unlimited | | 3.88 | | 12/01/22 | | | 210,000 | | | | 222,260 | |
Patchogue-Medford Union Free School District, GO Unlimited | | 5.00 | | 10/01/17 | | | 465,000 | | | | 497,429 | |
Sodus, New York Central School District, Refunding, GO Unlimited | | 3.00 | | 06/15/18 | | | 640,000 | | | | 666,374 | |
| | | | | | | | | | | | 4,927,646 | |
| | | | | | | | | | | | | |
North Carolina 2.97% | |
Beaufort County, North Carolina, GO Limited | | 5.00 | | 06/01/21 | | | 200,000 | | | | 230,136 | |
Charlotte, North Carolina Certificates of Participation, Series A | | 5.00 | | 10/01/21 | | | 1,000,000 | | | | 1,163,389 | |
North Carolina Medical Care Commission, Firsthealth Carolina Project, Refunding, Series C | | 4.00 | | 10/01/17 | | | 420,000 | | | | 441,777 | |
North Carolina State Capital Improvement Limited Obligation, Series 2011A | | 5.00 | | 05/01/16 | | | 300,000 | | | | 304,557 | |
North Carolina State Grant Anticipation, Series 2015A, NATL | | 5.00 | | 03/01/16 | | | 590,000 | | | | 594,053 | |
North Carolina State Municipal Power Agency #1, Catawba Electric Revenue, Refunding, Series A | | 5.25 | | 01/01/20 | | | 400,000 | | | | 434,504 | |
| | | | | | | | | | | | 3,168,416 | |
| | | | | | | | | | | | | |
North Dakota 0.24% | |
North Dakota Public Finance Authority, State Revolving Fund Program, Series A | | 4.00 | | 10/01/16 | | | 250,000 | | | | 256,363 | |
| | | | | | | | | | | | | |
Ohio 0.93% | |
Cleveland, Ohio, Parking Facility Revenue, Prefunding, Refunding, AGM | | 5.25 | | 09/15/22 | | | 130,000 | | | | 160,087 | |
See notes to portfolios of investments and notes to financial statements.
62
Near-Term Tax Free Fund
Portfolio of Investments | December 31, 2015 |
Municipal Bonds (cont’d) | | Coupon
Rate % | | Maturity
Date | | | Principal Amount | | | | Value | |
Ohio (cont’d) | |
Lorain County, Ohio, Community College District, Revenue | | 3.25 | | 12/01/17 | | $ | 650,000 | | | $ | 679,504 | |
Marion County, Ohio, Variable Refunding, GO Limited, CIFG | | 4.00 | | 12/01/20 | | | 150,000 | | | | 154,515 | |
| | | | | | | | | | | | 994,106 | |
| | | | | | | | | | | | | |
Oklahoma 1.09% | |
Edmond Public Works Authority, Revenue, Refunding | | 5.00 | | 07/01/23 | | | 300,000 | | | | 355,896 | |
Oklahoma County, Oklahoma Finance Authority, Jones Public School Project | | 4.00 | | 09/01/16 | | | 200,000 | | | | 204,356 | |
Oklahoma Department of Transportation, Grant Anticipation Notes, NATL | | 5.00 | | 09/01/16 | | | 250,000 | | | | 257,155 | |
Oklahoma State Agricultural & Mechanical Colleges, Oklahoma State University, Series A | | 5.00 | | 08/01/21 | | | 300,000 | | | | 345,627 | |
| | | | | | | | | | | | 1,163,034 | |
| | | | | | | | | | | | | |
Oregon 0.21% | |
Oregon State Facilities Authority, Legacy Health Project Revenue, Refunding, Series A | | 4.50 | | 05/01/20 | | | 200,000 | | | | 225,268 | |
| | | | | | | | | | | | | |
Pennsylvania 3.07% | |
Allegheny County, Pennsylvania Sanitary Authority, AGM | | 5.00 | | 06/01/19 | | | 700,000 | | | | 785,932 | |
Delaware Valley, Pennsylvania, Regional Financial Authority Revenue, Permanently Fixed Business Development Services, AMBAC | | 5.50 | | 08/01/18 | | | 295,000 | | | | 322,282 | |
Lycoming County, Pennsylvania Authority Health System, Susquehanna Health Systems Project, Series A | | 5.10 | | 07/01/20 | | | 140,000 | | | | 153,552 | |
Muhlenberg Township, Pennsylvania, GO Unlimited, AGM | | 3.00 | | 11/01/17 | | | 280,000 | | | | 287,358 | |
Pennsylvania Higher Educational Facilities Authority, State System, Higher Education Project, Refunding, Series AQ | | 5.00 | | 06/15/17 | | | 275,000 | | | | 291,643 | |
Philadelphia School District, Pennsylvania, Refunding, GO Unlimited, Series E | | 5.25 | | 09/01/24 | | | 625,000 | | | | 685,906 | |
Reading, Pennsylvania School District, GO Unlimited, Series A | | 5.00 | | 04/01/20 | | | 400,000 | | | | 439,776 | |
See notes to portfolios of investments and notes to financial statements.
63
Near-Term Tax Free Fund
Portfolio of Investments | December 31, 2015 |
Municipal Bonds (cont’d) | | Coupon
Rate % | | Maturity
Date | | | Principal Amount | | | | Value | |
Pennsylvania (cont’d) | |
Wilkes-Barre Finance Authority, University of Scranton, Refunding, Series A | | 5.00 | | 11/01/19 | | $ | 275,000 | | | $ | 307,117 | |
| | | | | | | | | | | | 3,273,566 | |
| | | | | | | | | | | | | |
Rhode Island 0.24% | |
Rhode Island State Economic Development Corporation Revenue, Series A, NATL | | 5.00 | | 06/15/17 | | | 250,000 | | | | 254,765 | |
| | | | | | | | | | | | | |
South Carolina 1.07% | |
Piedmont Municipal Power Agency,
Series A-3 | | 5.00 | | 01/01/16 | | | 150,000 | | | | 150,000 | |
Spartanburg County, South Carolina Regional Health Services District, Hospital Revenue, Refunding, Series A | | 5.00 | | 04/15/19 | | | 600,000 | | | | 668,280 | |
Spartanburg County, South Carolina Sanitation Sewer District, Series A, AGC | | 3.50 | | 03/01/19 | | | 300,000 | | | | 319,743 | |
| | | | | | | | | | | | 1,138,023 | |
| | | | | | | | | | | | | |
Tennessee 0.67% | |
Haywood County, Tennessee, GO Unlimited, NATL | | 4.05 | | 06/01/27 | | | 475,000 | | | | 481,987 | |
Memphis, Tennessee Sanitary Sewage System Revenue, Refunding, AGM | | 5.00 | | 05/01/20 | | | 200,000 | | | | 230,436 | |
| | | | | | | | | | | | 712,423 | |
| | | | | | | | | | | | | |
Texas 17.36% | |
Addison, Texas Certificates of Obligation, GO Limited | | 4.50 | | 02/15/28 | | | 140,000 | | | | 149,467 | |
Addison, Texas Certificates of Obligation, GO Unlimited | | 4.00 | | 02/15/20 | | | 250,000 | | | | 264,797 | |
Annetta, Texas Certificates of Obligation, GO Limited | | 4.00 | | 08/01/16 | | | 200,000 | | | | 203,974 | |
Beaumont Independent School District, GO Unlimited, PSF-GTD | | 5.00 | | 02/15/23 | | | 1,000,000 | | | | 1,045,670 | |
Bexar, Texas, Venue Project, Refunding, AGM | | 4.00 | | 08/15/16 | | | 1,615,000 | | | | 1,648,785 | |
Brownwood Independent School District, GO Unlimited, BAM | | 4.00 | | 02/15/24 | | | 730,000 | | | | 820,162 | |
Center, Texas Certificates of Obligation, GO Limited, AGM (ZCB) | | 3.47(1) | | 02/15/20 | | | 150,000 | | | | 137,888 | |
Clear Lake, Texas, Waterworks & Sewer System, GO Unlimited | | 3.00 | | 03/01/19 | | | 125,000 | | | | 129,070 | |
Conroe Independent School District, GO Unlimited, PSF-GTD | | 4.00 | | 02/15/17 | | | 55,000 | | | | 57,037 | |
See notes to portfolios of investments and notes to financial statements.
64
Near-Term Tax Free Fund
Portfolio of Investments | December 31, 2015 |
Municipal Bonds (cont’d) | | Coupon
Rate % | | Maturity
Date | | | Principal Amount | | | | Value | |
Texas (cont’d) | |
Corpus Christi, Texas Business & Job Development Corporation, Seawall Project, Sales Tax Revenue, Refunding | | 5.00 | | 03/01/20 | | $ | 350,000 | | | $ | 397,471 | |
Dallas Area Rapid Transit, Senior Lien, AMBAC | | 5.00 | | 12/01/16 | | | 585,000 | | | | 608,570 | |
Dallas, Texas Waterworks & Sewer System Revenue, Unrefunded, AMBAC | | 4.50 | | 10/01/19 | | | 165,000 | | | | 174,913 | |
Dallas, Texas Waterworks & Sewer System Revenue, Prerefunded, AMBAC | | 4.50 | | 10/01/19 | | | 60,000 | | | | 63,895 | |
Forney, Texas, GO Limited, AGM | | 5.00 | | 02/15/27 | | | 500,000 | | | | 524,375 | |
Fort Bend Grand Parkway Toll Road Authority | | 5.00 | | 03/01/25 | | | 1,000,000 | | | | 1,195,209 | |
Frisco, Texas Independent School District, School Building, GO Unlimited, Series A, PSF-GTD | | 4.50 | | 08/15/25 | | | 180,000 | | | | 189,727 | |
Garland, Texas, GO Limited | | 5.00 | | 02/15/25 | | | 650,000 | | | | 747,591 | |
Goose Creek, Texas Independent School District, GO Unlimited, Series A, PSF-GTD | | 5.25 | | 02/15/18 | | | 370,000 | | | | 388,807 | |
Grand Prairie, Texas Independent School District, Refunding, GO Unlimited (ZCB) | | 4.97(1) | | 08/15/16 | | | 400,000 | | | | 398,184 | |
Greenville, Texas Independent School District, Refunding, GO Unlimited, PSF-GTD | | 4.00 | | 08/15/17 | | | 120,000 | | | | 122,503 | |
Harris County, Texas, Refunding, GO Unlimited, Series B | | 4.50 | | 10/01/31 | | | 220,000 | | | | 226,640 | |
Harris County, Texas Municipal Utility District No 290, GO Unlimited, Series A, BAM | | 1.50 | | 09/01/17 | | | 200,000 | | | | 201,470 | |
Harris County, Texas Municipal Utility District No. 382, GO Unlimited, BAM | | 3.00 | | 04/01/22 | | | 305,000 | | | | 316,694 | |
Houston Texas, Hotel Occupancy Tax, Unrefunded, Series B | | 5.00 | | 09/01/19 | | | 45,000 | | | | 46,213 | |
Houston Texas, Hotel Occupancy Tax, Prerefunded, Series B | | 5.00 | | 09/01/19 | | | 250,000 | | | | 257,338 | |
Houston Texas Combined Utility System Revenue, Prerefunded, BAM | | 5.00 | | 11/15/27 | | | 150,000 | | | | 161,510 | |
Katy, Texas Independent School District, School Building, GO Unlimited, Series D, PSF-GTD | | 4.50 | | 02/15/19 | | | 325,000 | | | | 326,524 | |
Laredo, Texas, Waterworks & Sewer System Revenue, AGM | | 4.25 | | 03/01/18 | | | 100,000 | | | | 103,632 | |
Lavaca-Navidad River Authority, Series B | | 4.00 | | 08/01/22 | | | 420,000 | | | | 468,724 | |
Lavaca-Navidad River Authority, Series A | | 4.00 | | 08/01/22 | | | 270,000 | | | | 301,323 | |
Lockhart, Texas Certificates of Obligation, BAM | | 4.00 | | 08/01/23 | | | 830,000 | | | | 936,730 | |
See notes to portfolios of investments and notes to financial statements.
65
Near-Term Tax Free Fund
Portfolio of Investments | December 31, 2015 |
Municipal Bonds (cont’d) | | Coupon
Rate % | | Maturity
Date | | | Principal Amount | | | | Value | |
Texas (cont’d) | |
Lower Colorado River Authority, Transmission Contract Revenue, Refunding, Series A | | 5.00 | | 05/15/21 | | $ | 500,000 | | | $ | 584,990 | |
Montgomery County, Texas Municipal Utility District No 113, GO Unlimited, BAM | | 2.00 | | 09/01/17 | | | 260,000 | | | | 263,778 | |
Montgomery County, Texas Municipal Utility District No 113, GO Unlimited, BAM | | 2.00 | | 09/01/16 | | | 735,000 | | | | 741,350 | |
Montgomery County, Texas Municipal Utility District No 119, GO Unlimited, Series A, AGM | | 4.00 | | 04/01/18 | | | 315,000 | | | | 332,820 | |
North Texas Tollway Authority Revenue, Series F | | 5.75 | | 01/01/38 | | | 300,000 | | | | 328,203 | |
Olmos Park Higher Education Facilities Corp, University of the Incarnate Word, Refunding | | 5.00 | | 12/01/21 | | | 500,000 | | | | 584,330 | |
Pharr, Texas, Refunding, GO Limited,
Series A | | 5.00 | | 08/15/20 | | | 285,000 | | | | 327,468 | |
San Antonio, Texas, Water Revenue, Refunding | | 4.50 | | 05/15/21 | | | 400,000 | | | | 461,780 | |
San Marcos, Texas Tax & Toll Revenue, GO Limited, AGM | | 5.10 | | 08/15/27 | | | 400,000 | | | | 427,560 | |
Texarkana, Texas Waterworks & Sanitary Sewer System Revenue | | 3.00 | | 08/01/20 | | | 95,000 | | | | 98,538 | |
Texarkana, Texas Waterworks & Sanitary Sewer System Revenue | | 3.00 | | 08/01/19 | | | 90,000 | | | | 93,274 | |
Texarkana, Texas, Refunding, GO Limited | | 5.00 | | 02/15/21 | | | 320,000 | | | | 374,531 | |
Texas Municipal Power Agency Revenue, Refunding, AGC | | 5.00 | | 09/01/17 | | | 250,000 | | | | 266,520 | |
Travis County, Texas, GO Limited | | 1.50 | | 03/01/16 | | | 250,000 | | | | 250,525 | |
Victoria County, Texas Junior College District, GO Limited | | 3.00 | | 08/15/16 | | | 250,000 | | | | 253,945 | |
Waxahachie, Texas, Refunding, GO Limited, AMBAC | | 4.20 | | 08/01/22 | | | 500,000 | | | | 526,780 | |
| | | | | | | | | | | | 18,531,285 | |
| | | | | | | | | | | | | |
Utah 1.04% | |
Salt Lake County, Utah, Westminster College Project Revenue | | 5.00 | | 10/01/24 | | | 235,000 | | | | 244,912 | |
Utah State Building Ownership Authority, Lease Revenue, Refunding, Series C, AGM | | 5.50 | | 05/15/19 | | | 500,000 | | | | 534,855 | |
Washington County-St George Interlocal Agency, Lease Revenue, Refunding, Series A | | 4.00 | | 12/01/19 | | | 300,000 | | | | 325,470 | |
| | | | | | | | | | | | 1,105,237 | |
See notes to portfolios of investments and notes to financial statements.
66
Near-Term Tax Free Fund
Portfolio of Investments | December 31, 2015 |
Municipal Bonds (cont’d) | | Coupon
Rate % | | Maturity
Date | | | Principal Amount | | | | Value | |
Washington 3.28% | |
Cowlitz County, Washington, Refunding, GO Limited, Series B | | 3.00 | | 04/01/17 | | $ | 175,000 | | | $ | 179,681 | |
Cowlitz County, Washington, Refunding, GO Limited, Series A | | 3.00 | | 04/01/18 | | | 195,000 | | | | 202,587 | |
Energy Northwest, Columbia Station, Unrefunded | | 5.00 | | 07/01/24 | | | 755,000 | | | | 771,701 | |
Kennewick, Washington, Refunding, GO Limited | | 4.00 | | 12/01/16 | | | 470,000 | | | | 484,711 | |
Snohomish County, Washington Public Utility District No 1, Refunding | | 5.00 | | 12/01/17 | | | 550,000 | | | | 592,658 | |
Spokane County, Washington Public Facilities District, Refunding, Series B | | 5.00 | | 12/01/21 | | | 950,000 | | | | 1,113,114 | |
Washington State Health Care Facilities Authority, Seattle Children's Hospital Project | | 5.00 | | 10/01/17 | | | 150,000 | | | | 160,515 | |
| | | | | | | | | | | | 3,504,967 | |
| | | | | | | | | | | | | |
Wisconsin 3.12% | |
Johnson Creek School District, Bond Anticipation Note | | 3.00 | | 03/01/20 | | | 1,000,000 | | | | 1,024,720 | |
Milwaukee, Wisconsin Sewerage System Revenue, Series S5 | | 5.00 | | 06/01/23 | | | 500,000 | | | | 609,260 | |
New Holstein, Wisconsin Electric System Revenue | | 4.25 | | 05/01/18 | | | 270,000 | | | | 273,297 | |
Waunakee Community School District, Series A | | 5.00 | | 04/01/18 | | | 250,000 | | | | 271,590 | |
Wisconsin State Health & Educational Facilities Authority, Luther Hospital Project | | 5.00 | | 11/15/21 | | | 1,000,000 | | | | 1,126,109 | |
Wisconsin State, Refunding, GO Unlimited, Series 2, AMBAC | | 4.13 | | 11/01/16 | | | 25,000 | | | | 25,302 | |
| | | | | | | | | | | | 3,330,278 | |
| |
Total Investments 89.46% | | | | 95,515,935 | |
(cost $94,364,862) | | | | | | | | | | | | |
Other assets and liabilities, net 10.54% | | | | | | | | | | | 11,252,710 | |
| | | | | | | | | | | | | |
Net Assets 100.0% | | | | | | | | | | $ | 106,768,645 | |
(1) | Represents Yield on zero coupon bond |
See notes to portfolios of investments and notes to financial statements.
67
All American Equity Fund
Portfolio of Investments | December 31, 2015 |
Common Stocks 97.91% | | Shares | | | Value | |
Aerospace/Defense 4.16% | |
Boeing Co. | | | 1,600 | | | $ | 231,344 | |
General Dynamics Corp. | | | 1,900 | | | | 260,984 | |
Northrop Grumman Corp. | | | 1,600 | | | | 302,096 | |
| | | | | | | | 794,424 | |
| | | | | | | | | |
Airlines 1.19% | |
Delta Air Lines, Inc. | | | 4,500 | | | | 228,105 | |
| | | | | | | | | |
Applications Software 3.05% | |
Microsoft Corp. | | | 10,500 | | | | 582,540 | |
| | | | | | | | | |
Athletic Footwear 2.61% | |
NIKE, Inc., Class B | | | 8,000 | | | | 500,000 | |
| | | | | | | | | |
Automotive Truck Parts & Equipment - Original 1.79% | |
Delphi Automotive plc | | | 4,000 | | | | 342,920 | |
| | | | | | | | | |
Beverages - Non-alcoholic 2.65% | |
Coca-Cola Enterprises | | | 5,000 | | | | 246,200 | |
PepsiCo, Inc. | | | 2,600 | | | | 259,792 | |
| | | | | | | | 505,992 | |
| | | | | | | | | |
Cable/Satellite TV 0.78% | |
Time Warner Cable, Inc. | | | 800 | | | | 148,472 | |
| | | | | | | | | |
Chemicals - Diversified 1.09% | |
LyondellBasell Industries N.V., Class A | | | 2,400 | | | | 208,560 | |
| | | | | | | | | |
Commercial Banks - Southern US 1.15% | |
Regions Financial Corp. | | | 23,000 | | | | 220,800 | |
| | | | | | | | | |
Commercial Banks - Western US 2.00% | |
Zions Bancorporation | | | 14,000 | | | | 382,200 | |
| | | | | | | | | |
Computer Services 2.79% | |
Accenture plc, Class A | | | 4,500 | | | | 470,250 | |
Computer Sciences Corp. | | | 1,000 | | | | 32,680 | |
CSRA, Inc. | | | 1,000 | | | | 30,000 | |
| | | | | | | | 532,930 | |
Computers 2.20% | |
Apple, Inc. | | | 4,000 | | | | 421,040 | |
| | | | | | | | | |
Consumer Products - Miscellaneous 0.99% | |
Clorox Co. | | | 1,500 | | | | 190,245 | |
See notes to portfolios of investments and notes to financial statements.
68
All American Equity Fund
Portfolio of Investments | December 31, 2015 |
Common Stocks (cont’d) | | Shares | | | Value | |
Cosmetics & Toiletries 2.08% | |
Procter & Gamble Co. | | | 5,000 | | | $ | 397,050 | |
| | | | | | | | | |
Cruise Lines 1.62% | |
Carnival Corp. | | | 5,700 | | | | 310,536 | |
| | | | | | | | | |
Data Processing/Management 3.59% | |
Broadridge Financial Solutions, Inc. | | | 6,000 | | | | 322,380 | |
Fidelity National Information Services, Inc. | | | 6,000 | | | | 363,600 | |
| | | | | | | | 685,980 | |
| | | | | | | | | |
Diagnostic Equipment 1.46% | |
Danaher Corp. | | | 3,000 | | | | 278,640 | |
| | | | | | | | | |
Disposable Medical Products 0.40% | |
CR Bard, Inc. | | | 400 | | | | 75,776 | |
| | | | | | | | | |
Diversified Banking Institutions 2.59% | |
JPMorgan Chase & Co. | | | 7,500 | | | | 495,225 | |
| | | | | | | | | |
Electric - Integrated 1.13% | |
Xcel Energy, Inc. | | | 6,000 | | | | 215,460 | |
| | | | | | | | | |
Electronic Components - Miscellaneous 1.11% | |
TE Connectivity Ltd. | | | 3,300 | | | | 213,213 | |
| | | | | | | | | |
Electronic Components - Semiconductors 3.82% | |
Avago Technologies Ltd. | | | 2,000 | | | | 290,300 | |
Microchip Technology, Inc. | | | 4,500 | | | | 209,430 | |
Texas Instruments, Inc. | | | 4,200 | | | | 230,202 | |
| | | | | | | | 729,932 | |
| | | | | | | | | |
Finance - Credit Card 5.64% | |
MasterCard, Inc., Class A | | | 5,500 | | | | 535,480 | |
Visa, Inc., Class A | | | 7,000 | | | | 542,850 | |
| | | | | | | | 1,078,330 | |
| | | | | | | | | |
Finance - Other Services 2.86% | |
Intercontinental Exchange, Inc. | | | 1,000 | | | | 256,260 | |
Nasdaq, Inc. | | | 5,000 | | | | 290,850 | |
| | | | | | | | 547,110 | |
| | | | | | | | | |
Life/Health Insurance 1.06% | |
Prudential Financial, Inc. | | | 2,500 | | | | 203,525 | |
See notes to portfolios of investments and notes to financial statements.
69
All American Equity Fund
Portfolio of Investments | December 31, 2015 |
Common Stocks (cont’d) | | Shares | | | Value | |
Medical - Biomedical/Gene 2.27% | |
Amgen, Inc. | | | 1,300 | | | $ | 211,029 | |
Gilead Sciences, Inc. | | | 2,200 | | | | 222,618 | |
| | | | | | | | 433,647 | |
| | | | | | | | | |
Medical - Drugs 5.32% | |
Abbott Laboratories | | | 5,600 | | | | 251,496 | |
Johnson & Johnson | | | 4,000 | | | | 410,880 | |
Pfizer, Inc. | | | 11,000 | | | | 355,080 | |
| | | | | | | | 1,017,456 | |
| | | | | | | | | |
Medical - HMO 5.81% | |
Aetna, Inc. | | | 3,000 | | | | 324,360 | |
Anthem, Inc. | | | 2,600 | | | | 362,544 | |
UnitedHealth Group, Inc. | | | 3,600 | | | | 423,504 | |
| | | | | | | | 1,110,408 | |
| | | | | | | | | |
Multi-line Insurance 3.50% | |
Hartford Financial Services Group, Inc. | | | 5,000 | | | | 217,300 | |
MetLife, Inc. | | | 4,000 | | | | 192,840 | |
XL Group plc, Class A | | | 6,600 | | | | 258,588 | |
| | | | | | | | 668,728 | |
| | | | | | | | | |
Networking Products 1.14% | |
Cisco Systems, Inc. | | | 8,000 | | | | 217,240 | |
| | | | | | | | | |
Non-hazardous Waste Disposal 1.54% | |
Republic Services, Inc., Class A | | | 6,700 | | | | 294,733 | |
| | | | | | | | | |
Office Supplies & Forms 0.98% | |
Avery Dennison Corp. | | | 3,000 | | | | 187,980 | |
| | | | | | | | | |
Oil - Field Services 2.79% | |
Baker Hughes, Inc. | | | 4,000 | | | | 184,600 | |
Schlumberger Ltd. | | | 5,000 | | | | 348,750 | |
| | | | | | | | 533,350 | |
| | | | | | | | | |
Oil Companies - Integrated 2.04% | |
Exxon Mobil Corp. | | | 5,000 | | | | 389,750 | |
| | | | | | | | | |
Oil Refining & Marketing 0.74% | |
Valero Energy Corp. | | | 2,000 | | | | 141,420 | |
| | | | | | | | | |
Retail - Building Products 2.07% | |
Home Depot, Inc. | | | 3,000 | | | | 396,750 | |
See notes to portfolios of investments and notes to financial statements.
70
All American Equity Fund
Portfolio of Investments | December 31, 2015 |
Common Stocks (cont’d) | | Shares | | | Value | |
| | | | | | | |
Retail - Computer Equipment 0.88% | |
GameStop Corp., Class A | | | 6,000 | | | $ | 168,240 | |
| | | | | | | | | |
Retail - Consumer Electronics 0.83% | |
Best Buy Companies, Inc. | | | 5,200 | | | | 158,340 | |
| | | | | | | | | |
Retail - Discount 2.25% | |
Costco Wholesale Corp. | | | 1,500 | | | | 242,250 | |
Target Corp. | | | 2,600 | | | | 188,786 | |
| | | | | | | | 431,036 | |
| | | | | | | | | |
Retail - Drug Store 2.56% | |
CVS Health Corp. | | | 5,000 | | | | 488,850 | |
| | | | | | | | | |
Retail - Major Department Store 1.52% | |
TJX Companies, Inc. | | | 4,100 | | | | 290,731 | |
| | | | | | | | | |
Retail - Restaurants 1.57% | |
Starbucks Corp. | | | 5,000 | | | | 300,150 | |
| | | | | | | | | |
Super-Regional Banks - US 1.30% | |
PNC Financial Services Group, Inc. | | | 2,600 | | | | 247,806 | |
| | | | | | | | | |
Telephone - Integrated 1.21% | |
Verizon Communications, Inc. | | | 5,000 | | | | 231,100 | |
| | | | | | | | | |
Tobacco 2.44% | |
Altria Group, Inc. | | | 8,000 | | | | 465,680 | |
| | | | | | | | | |
Toys 1.34% | |
Hasbro, Inc. | | | 3,800 | | | | 255,968 | |
| |
Total Common Stocks | | | | 18,718,368 | |
(cost $18,145,480) | | | | | | | | |
See notes to portfolios of investments and notes to financial statements.
71
All American Equity Fund
Portfolio of Investments | December 31, 2015 |
Rights 0.04% | | Shares | | | Value | |
| | | | | | | |
Food - Retail 0.04% | |
Casa Ley, S.A. de C.V., Contingent Value Right | | | 7,200 | | | $ 7,307 | *#@ |
Property Development Centers, LLC, Contingent Value Right | | | 7,200 | | | 352 | *#@ |
| |
Total Rights | | | | 7,659 | |
(cost $0) | | | | | | | | |
| |
Total Investments 97.95% | | | | 18,726,027 | |
(cost $18,145,480) | | | | | | | | |
Other assets and liabilities, net 2.05% | | | | | | | 391,277 | |
| | | | | | | | | |
Net Assets 100.0% | | | | | | $ | 19,117,304 | |
See notes to portfolios of investments and notes to financial statements.
72
Holmes Macro Trends Fund
Portfolio of Investments | December 31, 2015 |
Common Stocks 88.93% | | Shares | | | Value | |
| | | | | | | |
Aerospace/Defense 4.71% | |
Boeing Co. | | | 13,400 | | | $ | 1,937,506 | |
| | | | | | | | | |
Airlines 12.49% | |
Alaska Air Group, Inc. | | | 19,600 | | | | 1,577,996 | |
Allegiant Travel Co., Class A | | | 5,600 | | | | 939,848 | |
Hawaiian Holdings, Inc. | | | 21,000 | | | | 741,930 | * |
Southwest Airlines Co. | | | 43,600 | | | | 1,877,416 | |
| | | | | | | | 5,137,190 | |
| | | | | | | | | |
Building Products - Air & Heating 3.70% | |
Lennox International, Inc. | | | 12,200 | | | | 1,523,780 | |
| | | | | | | | | |
Commercial Services 0.87% | |
Nutrisystem, Inc. | | | 16,500 | | | | 357,060 | |
| | | | | | | | | |
Communications Software 3.21% | |
SolarWinds, Inc. | | | 22,400 | | | | 1,319,360 | * |
| | | | | | | | | |
Computer Services 3.25% | |
Manhattan Associates, Inc. | | | 20,200 | | | | 1,336,634 | * |
| | | | | | | | | |
Computer Software 2.68% | |
Rackspace Hosting, Inc. | | | 43,600 | | | | 1,103,952 | * |
| | | | | | | | | |
Computers 4.55% | |
Apple, Inc. | | | 17,800 | | | | 1,873,628 | |
| | | | | | | | | |
E-Commerce/Products 0.64% | |
Blue Nile, Inc. | | | 7,100 | | | | 263,623 | * |
| | | | | | | | | |
Electronic Components - Semiconductors 4.09% | |
Skyworks Solutions, Inc. | | | 21,900 | | | | 1,682,577 | |
| | | | | | | | | |
Energy - Alternate Sources 0.07% | |
Pacific Green Energy Corp. (RS) | | | 100,000 | | | 29,610 | *#@ |
| | | | | | | | | |
Finance - Commercial 0.70% | |
IOU Financial, Inc. | | | 729,800 | | | | 287,447 | * |
| | | | | | | | | |
Finance - Investment Banker/Broker 2.16% | |
Interactive Brokers Group, Inc., Class A | | | 20,400 | | | | 889,440 | |
See notes to portfolios of investments and notes to financial statements.
73
Holmes Macro Trends Fund
Portfolio of Investments | December 31, 2015 |
Common Stocks (cont’d) | | Shares | | | Value | |
| | | | | | | |
Finance - Other Services 6.61% | |
CBOE Holdings, Inc. | | | 22,800 | | | $ | 1,479,720 | |
MarketAxess Holdings, Inc. | | | 11,100 | | | | 1,238,649 | |
| | | | | | | | 2,718,369 | |
| | | | | | | | | |
Gold Mining 0.00% | |
Gran Colombia Gold Corp. | | | 996 | | | | 94 | * |
| | | | | | | | | |
Home Furnishings 1.50% | |
Select Comfort Corp. | | | 28,800 | | | | 616,608 | * |
| | | | | | | | | |
Human Resources 1.60% | |
Insperity, Inc. | | | 13,700 | | | | 659,655 | |
| | | | | | | | | |
Life/Health Insurance 3.98% | |
Principal Financial Group, Inc. | | | 36,400 | | | | 1,637,272 | |
| | | | | | | | | |
Medical - Biomedical/Gene 10.99% | |
Cambrex Corp. | | | 14,500 | | | | 682,805 | * |
Gilead Sciences, Inc. | | | 18,600 | | | | 1,882,134 | |
Regeneron Pharmaceuticals, Inc. | | | 3,600 | | | | 1,954,332 | * |
| | | | | | | | 4,519,271 | |
| | | | | | | | | |
Medical - HMO 2.50% | |
Molina Healthcare, Inc. | | | 17,100 | | | | 1,028,223 | * |
| | | | | | | | | |
Medical - Hospitals 0.00% | |
African Medical Investments plc | | | 1,000,000 | | | 0 | *#@ |
| | | | | | | | | |
Networking Products 1.78% | |
LogMeIn, Inc. | | | 10,900 | | | | 731,390 | * |
| | | | | | | | | |
Property/Casualty Insurance 1.24% | |
Universal Insurance Holdings, Inc. | | | 22,000 | | | | 509,960 | |
| | | | | | | | | |
Real Estate Operating/Development 0.78% | |
Pacific Infrastructure Ventures, Inc. (RS) | | | 426,533 | | | 319,900 | *#@ |
| | | | | | | | | |
Retail - Auto Parts 4.50% | |
O'Reilly Automotive, Inc. | | | 7,300 | | | | 1,849,966 | * |
| | | | | | | | | |
Retail - Building Products 4.66% | |
Home Depot, Inc. | | | 14,500 | | | | 1,917,625 | |
| | | | | | | | | |
Retail - Restaurants 4.66% | |
Starbucks Corp. | | | 31,900 | | | | 1,914,957 | |
See notes to portfolios of investments and notes to financial statements.
74
Holmes Macro Trends Fund
Portfolio of Investments | December 31, 2015 |
Common Stocks (cont’d) | | Shares | | | Value | |
| | | | | | | |
Retail - Video Rental 1.01% | |
Outerwall, Inc. | | | 11,400 | | | $ | 416,556 | |
| |
Total Common Stocks | | | | 36,581,653 | |
(cost $36,849,949) | | | | | | | | |
| | | | | | | | | |
Warrants 0.00% | | | | | | | | |
| | | | | | | | | |
Gold Mining 0.00% | |
Gran Colombia Gold Corp., 144A, Warrants (October 2017) | | | 3,700 | | | 0 | *#@ |
Gran Colombia Gold Corp., 144A, Warrants (March 2019) | | | 250 | | | | 7 | * |
| |
Total Warrants | | | | 7 | |
(cost $0) | | | | | | | | |
Purchased Call Option 0.00% | | Contracts | | | | | |
| | | | | | | | |
Retail - Restaurants 0.00% | |
Chipotle Mexican Grill, Inc., Strike Price 630, Expiration Jan. 2016 | | | 20 | | | | 800 | * |
(cost $50,435) | | | | | | | | |
Gold-Linked Notes 0.46% | | Principal Amount | | | | | |
| | | | | | | | |
Gold Mining 0.46% | |
Gran Colombia Gold Corp., 10.00%, maturity 10/31/17 | | $ | 15,000 | | | 7,425 | #^@ |
Gran Colombia Gold Corp., 144A, 10.00%, maturity 10/31/17 | | | 370,000 | | | 183,150 | #^@ |
| |
Total Gold-Linked Notes | | | | 190,575 | |
(cost $379,500) | | | | | | | | |
| | | | | | | | | |
Silver-Linked Notes 0.41% | | | | | | | | |
| | | | | | | | | |
Gold Mining 0.41% | |
Gran Colombia Gold Corp., 5.00%, maturity 08/11/18 | | | 424,000 | | | 167,480^ | |
(cost $340,261) | | | | | | | | |
See notes to portfolios of investments and notes to financial statements.
75
Holmes Macro Trends Fund
Portfolio of Investments | December 31, 2015 |
Corporate Note 0.52% | | Principal Amount | | | Value | |
| | |
Electric - Generation 0.52% | |
Pacific Power Generation Corp., 15.00%, maturity 04/03/17 (RS) | | $ | 212,500 | | | $ | 212,500 | #@ |
(cost $212,500) | | | | | | | | |
| |
Total Investments 90.32% | | | | 37,153,015 | |
(cost $37,832,645) | | | | | | | | |
Other assets and liabilities, net 9.68% | | | | | | | 3,981,677 | |
| | | | | | | | | |
Net Assets 100.0% | | | | | | $ | 41,134,692 | |
See notes to portfolios of investments and notes to financial statements.
76
Global Resources Fund
Portfolio of Investments | December 31, 2015 |
Common Stocks 80.05% | | Shares | | | Value | |
| | |
Agricultural Chemicals 4.91% | |
PhosAgro OAO, GDR | | | 118,900 | | | $ | 1,525,935 | |
Potash Corporation of Saskatchewan, Inc. | | | 55,000 | | | | 941,600 | |
Syngenta, AG, Sponsored ADR | | | 31,000 | | | | 2,440,630 | |
| | | | | | | | 4,908,165 | |
Agricultural Operations 1.85% | |
Agriterra Ltd. | | | 69,849,776 | | | | 559,865 | *+ |
Archer-Daniels-Midland Co. | | | 21,400 | | | | 784,952 | |
Kernel Holding S.A. | | | 41,000 | | | | 501,081 | |
| | | | | | | | 1,845,898 | |
Automotive Truck Parts & Equipment - Original 0.96% | |
Lear Corp. | | | 7,800 | | | | 958,074 | |
| | | | | | | | | |
Building & Construction - Miscellaneous 0.49% | |
Summit Materials, Inc., Class A | | | 24,350 | | | | 487,974 | * |
| | | | | | | | | |
Building Products - Cement/Aggregates 3.37% | |
Martin Marietta Materials, Inc. | | | 7,000 | | | | 956,060 | |
U.S. Concrete, Inc. | | | 27,300 | | | | 1,437,618 | * |
Vulcan Materials Co. | | | 10,300 | | | | 978,191 | |
| | | | | | | | 3,371,869 | |
| | | | | | | | | |
Building Products - Wood 1.67% | |
Masco Corp. | | | 34,300 | | | | 970,690 | |
Universal Forest Products, Inc. | | | 10,200 | | | | 697,374 | |
| | | | | | | | 1,668,064 | |
| | | | | | | | | |
Chemicals - Diversified 3.95% | |
Dow Chemical Co. | | | 18,800 | | | | 967,824 | |
LyondellBasell Industries N.V., Class A | | | 23,200 | | | | 2,016,080 | |
Westlake Chemical Corp. | | | 17,800 | | | | 966,896 | |
| | | | | | | | 3,950,800 | |
| | | | | | | | | |
Chemicals - Specialty 2.08% | |
Albemarle Corp. | | | 20,000 | | | | 1,120,200 | |
Balchem Corp. | | | 15,800 | | | | 960,640 | |
| | | | | | | | 2,080,840 | |
| | | | | | | | | |
Coal 0.20% | |
Pacific Coal Resources Ltd. | | | 4,362,314 | | | | 31,526 | *+ |
Sable Mining Africa Ltd. | | | 25,898,366 | | | | 169,556 | * |
Walter Energy, Inc., 144A | | | 4,293 | | | | 48 | * |
| | | | | | | | 201,130 | |
| | | | | | | | | |
Coatings/Paint 0.96% | |
Sherwin-Williams Co. | | | 3,700 | | | | 960,520 | |
See notes to portfolios of investments and notes to financial statements.
77
Global Resources Fund
Portfolio of Investments | December 31, 2015 |
Common Stocks (cont’d) | | Shares | | | Value | |
| | | | | | | |
Containers - Paper/Plastic 1.33% | |
Sealed Air Corp. | | | 16,000 | | | $ | 713,600 | |
Winpak Ltd. | | | 18,600 | | | | 612,428 | |
| | | | | | | | 1,326,028 | |
| | | | | | | | | |
Diamonds/Precious Stones 0.48% | |
Diamond Fields International Ltd. | | | 1,800,000 | | | | 19,513 | * |
Lucara Diamond Corp. | | | 278,400 | | | | 452,699 | |
Rockwell Diamonds, Inc., 144A | | | 63,333 | | | | 6,065 | * |
| | | | | | | | 478,277 | |
| | | | | | | | | |
Diversified Minerals 0.45% | |
Canada Zinc Metals Corp. | | | 1,000,000 | | | | 95,758 | * |
Dundee Sustainable Technologies, Inc. | | | 3,587,500 | | | | 194,451 | * |
Encanto Potash Corp., 144A | | | 3,000,000 | | | | 140,926 | * |
Niocan, Inc., 144A | | | 362,069 | | | | 22,242 | * |
| | | | | | | | 453,377 | |
| | | | | | | | | |
Electric - Integrated 1.29% | |
NextEra Energy, Inc. | | | 12,400 | | | | 1,288,236 | |
| | | | | | | | | |
| | | | | | | | | |
Energy - Alternate Sources 1.68% | |
First Solar, Inc. | | | 14,700 | | | | 970,053 | * |
Pacific Green Energy Corp. (RS) | | | 2,400,000 | | | 710,640 | *+#@ |
| | | | | | | | 1,680,693 | |
| | | | | | | | | |
Food - Meat Products 4.02% | |
Hormel Foods Corp. | | | 12,800 | | | | 1,012,224 | |
Tyson Foods, Inc., Class A | | | 56,500 | | | | 3,013,145 | |
| | | | | | | | 4,025,369 | |
| | | | | | | | | |
Food - Miscellaneous/Diversified 4.37% | |
Cal-Maine Foods, Inc. | | | 52,700 | | | | 2,442,118 | |
General Mills, Inc. | | | 16,700 | | | | 962,922 | |
Ingredion, Inc. | | | 10,100 | | | | 967,984 | |
| | | | | | | | 4,373,024 | |
| | | | | | | | | |
Forestry 1.75% | |
Bravern Ventures Ltd. | | | 254,431 | | | | 6,895 | * |
Western Forest Products, Inc. | | | 1,065,000 | | | | 1,739,467 | |
| | | | | | | | 1,746,362 | |
| | | | | | | | | |
Gas - Distribution 0.25% | |
Chesapeake Utilities Corp. | | | 4,400 | | | | 249,700 | |
See notes to portfolios of investments and notes to financial statements.
78
Global Resources Fund
Portfolio of Investments | December 31, 2015 |
Common Stocks (cont’d) | | Shares | | | Value | |
| | | | | | | |
Gold Mining 9.75% | |
Chesapeake Gold Corp., 144A | | | 52,400 | | | $ | 66,650 | * |
Claude Resources, Inc. | | | 1,200,785 | | | | 676,890 | * |
Corona Minerals Ltd. | | | 100,000 | | | 219 | *#@ |
Gran Colombia Gold Corp. | | | 147,047 | | | | 13,815 | * |
Kinross Gold Corp. | | | 1 | | | | 2 | * |
Klondex Mines Ltd. | | | 1,767,800 | | | | 3,615,577 | * |
Newcrest Mining Ltd., Sponsored ADR | | | 41,500 | | | | 387,610 | * |
Newmont Mining Corp. | | | 32,500 | | | | 584,675 | |
NGEx Resources, Inc. | | | 510,000 | | | | 239,575 | * |
Richmont Mines, Inc. | | | 407,500 | | | | 1,307,621 | * |
Royal Gold, Inc. | | | 15,000 | | | | 547,050 | |
Rusoro Mining Ltd. | | | 3,000,000 | | | | 140,926 | * |
Sunridge Gold Corp. | | | 4,600,000 | | | | 914,215 | *+ |
Sunridge Gold Corp., 144A | | | 6,333,788 | | | | 1,258,793 | *+ |
| | | | | | | | 9,753,618 | |
| | | | | | | | | |
Medical - Hospitals 0.00% | |
African Medical Investments plc | | | 2,507,500 | | | 0 | *#@ |
| | | | | | | | | |
Metal - Aluminum 2.88% | |
Alcoa, Inc. | | | 129,000 | | | | 1,273,230 | |
Kaiser Aluminum Corp. | | | 17,000 | | | | 1,422,220 | |
Norsk Hydro ASA, Sponsored ADR | | | 50,000 | | | | 188,250 | |
| | | | | | | | 2,883,700 | |
| | | | | | | | | |
Metal - Copper 4.31% | |
Catalyst Copper Corp., 144A | | | 166,666 | | | | 15,658 | * |
First Quantum Minerals Ltd. | | | 157,000 | | | | 587,743 | |
Freeport-McMoRan, Inc. | | | 135,000 | | | | 913,950 | |
Nevsun Resources Ltd. | | | 400,000 | | | | 1,084,000 | |
Southern Copper Corp. | | | 29,000 | | | | 757,480 | |
Turquoise Hill Resources Ltd. | | | 375,000 | | | | 952,500 | * |
Verona Development Corp. | | | 708,800 | | | 0 | *#@ |
| | | | | | | | 4,311,331 | |
| | | | | | | | | |
Metal - Diversified 2.99% | |
GoviEx Uranium, Inc., Class A | | | 755,000 | | | | 24,554 | * |
GoviEx Uranium, Inc., 144A, Class A | | | 58,000 | | | | 1,886 | * |
Mandalay Resources Corp. | | | 2,000,000 | | | | 925,056 | |
Orsu Metals Corp., 144A | | | 147,605 | | | | 2,400 | * |
Rio Tinto plc, Sponsored ADR | | | 70,000 | | | | 2,038,400 | |
| | | | | | | | 2,992,296 | |
See notes to portfolios of investments and notes to financial statements.
79
Global Resources Fund
Portfolio of Investments | December 31, 2015 |
Common Stocks (cont’d) | | Shares | | | Value | |
| | | | | | | |
Metal - Iron 0.02% | |
Oceanic Iron Ore Corp. | | | 200,000 | | | $ | 12,647 | * |
WAI Capital Investment Corp., 144A | | | 292,500 | | | | 5,285 | * |
| | | | | | | | 17,932 | |
| | | | | | | | | |
Mining Services 0.32% | |
Bounty Mining Ltd. | | | 22,000,000 | | | 320,627 | *#@ |
| | | | | | | | | |
Natural Resource Technology 0.14% | |
I-Pulse, Inc., 144A (RS) | | | 15,971 | | | 137,351 | *#@ |
| | | | | | | | | |
Non - Ferrous Metals 0.04% | |
Almonty Industries, Inc. | | | 159,309 | | | | 32,237 | * |
Sterling Group Ventures, Inc., 144A | | | 500,000 | | | | 6,250 | * |
| | | | | | | | 38,487 | |
| | | | | | | | | |
Office Supplies & Forms 1.44% | |
Avery Dennison Corp. | | | 23,000 | | | | 1,441,180 | |
| | | | | | | | | |
Oil - Field Services 1.76% | |
Atlas Development & Support Services Ltd. | | | 42,993,083 | | | | 348,087 | *+ |
Core Laboratories N.V. | | | 8,800 | | | | 956,912 | |
Oceaneering International, Inc. | | | 12,000 | | | | 450,240 | |
| | | | | | | | 1,755,239 | |
| | | | | | | | | |
Oil - US Royalty Trusts 0.30% | |
BP Prudhoe Bay Royalty Trust | | | 12,000 | | | | 299,280 | |
| | | | | | | | | |
Oil & Gas Drilling 1.64% | |
Parsley Energy, Inc., Class A | | | 88,800 | | | | 1,638,360 | * |
| | | | | | | | | |
Oil Companies - Exploration & Production 4.25% | |
Africa Energy Corp., 144A | | | 2,110,889 | | | | 175,437 | * |
BNK Petroleum, Inc. | | | 2,600,000 | | | | 394,594 | * |
Callon Petroleum Co. | | | 61,000 | | | | 508,740 | * |
Diamondback Energy, Inc. | | | 7,500 | | | | 501,750 | |
Ivanhoe Energy, Inc. | | | 18,719 | | | | 749 | * |
Newfield Exploration Co. | | | 15,100 | | | | 491,656 | * |
PDC Energy, Inc. | | | 8,800 | | | | 469,744 | * |
Raging River Exploration, Inc. | | | 40,000 | | | | 241,960 | * |
Range Energy Resources, Inc., 144A | | | 15,000,000 | | | | 271,013 | * |
Synergy Resources Corp. | | | 25,900 | | | | 220,668 | * |
U.S. Oil Sands, Inc. | | | 7,000,000 | | | | 404,712 | * |
U.S. Oil Sands, Inc., 144A | | | 9,900,000 | | | | 572,378 | * |
| | | | | | | | 4,253,401 | |
See notes to portfolios of investments and notes to financial statements.
80
Global Resources Fund
Portfolio of Investments | December 31, 2015 |
Common Stocks (cont’d) | | Shares | | | Value | |
| | | | | | | |
Oil Companies - Integrated 1.94% | |
Chevron Corp. | | | 10,800 | | | $ | 971,568 | |
Exxon Mobil Corp. | | | 12,400 | | | | 966,580 | |
| | | | | | | | 1,938,148 | |
| | | | | | | | | |
Oil Refining & Marketing 2.24% | |
Marathon Petroleum Corp. | | | 4,000 | | | | 207,360 | |
Tesoro Corp. | | | 7,500 | | | | 790,275 | |
Valero Energy Corp. | | | 16,100 | | | | 1,138,431 | |
Western Refining, Inc. | | | 3,000 | | | | 106,860 | |
| | | | | | | | 2,242,926 | |
| | | | | | | | | |
Poultry 0.96% | |
Pilgrim's Pride Corp. | | | 43,400 | | | | 958,706 | |
| | | | | | | | | |
Power Converters/Supply Equipment 0.24% | |
Gamesa Tecnologica S.A. | | | 14,000 | | | | 239,681 | |
| | | | | | | | | |
Real Estate Operating/Development 5.58% | |
Pacific Infrastructure Ventures, Inc. (RS) | | | 7,443,544 | | | 5,582,658 | *#@ |
| | | | | | | | | |
Retail - Gardening Products 1.02% | |
Tractor Supply Co. | | | 11,900 | | | | 1,017,450 | |
| | | | | | | | | |
Steel - Producers 0.30% | |
Severstal PAO, GDR | | | 15,000 | | | | 125,324 | |
Steel Dynamics, Inc. | | | 10,000 | | | | 178,700 | |
| | | | | | | | 304,024 | |
| | | | | | | | | |
Transportation - Marine 1.63% | |
DHT Holdings, Inc. | | | 202,000 | | | | 1,634,180 | |
| | | | | | | | | |
Water 0.24% | |
American States Water Co. | | | 5,800 | | | | 243,310 | |
| |
Total Common Stocks | | | | 80,058,285 | |
(cost $162,076,395) | | | | | | | | |
| | | | | | | | | |
Exchange-Traded Fund 1.04% | | | | | | | | |
| | | | | | | | | |
Alerian MLP ETF | | | 86,000 | | | | 1,036,300 | |
(cost $1,014,455) | | | | | | | | |
See notes to portfolios of investments and notes to financial statements.
81
Global Resources Fund
Portfolio of Investments | December 31, 2015 |
Warrants 0.10% | | Shares | | | Value | |
| | | | | | | |
Gold Mining 0.10% | |
Gran Colombia Gold Corp., 144A, Warrants (October 2017) | | | 86,150 | | | $ | 0 | *#@ |
Gran Colombia Gold Corp., 144A, Warrants (March 2019) | | | 59,500 | | | | 1,613 | * |
New Gold, Inc., 144A, Warrants (June 2017) | | | 822,570 | | | | 35,668 | * |
Sunridge Gold Corp., 144A, Warrants (October 2017) | | | 6,333,788 | | | | 68,661 | *+ |
| | | | | | | | 105,942 | |
| | | | | | | | | |
Metal - Copper 0.00% | |
Catalyst Copper Corp., 144A, Warrants (February 2017) | | | 83,333 | | | 0 | *#@ |
| | | | | | | | | |
Metal - Iron 0.00% | |
WAI Capital Investment Corp., 144A, Warrants (March 2016) | | | 292,500 | | | 0 | *#@ |
| |
Total Warrants | | | | 105,942 | |
(cost $239,066) | | | | | | | | |
| | | | | | | | | |
Purchased Call Option 0.25% | | Contracts | | | | | |
| | | | | | | | |
Oil Refining & Marketing 0.25% | |
Phillips 66, Strike Price 82.50, Expiration Jan. 2017 | | | 300 | | | | 247,500 | * |
(cost $239,853) | | | | | | | | |
| | | | | | | | | |
Gold-Linked Notes 4.43% | | Principal Amount | | | | | |
| | | | | | | | |
Gold Mining 4.43% | |
Gran Colombia Gold Corp., 10.00%, maturity 10/31/17 | | $ | 332,000 | | | 164,340 | ^#@ |
Gran Colombia Gold Corp., 144A, 10.00%, maturity 10/31/17 | | | 8,615,000 | | | 4,264,425 | ^#@ |
| |
Total Gold-Linked Notes | | | | 4,428,765 | |
(cost $8,822,210) | | | | | | | | |
| | | | | | | | | |
Silver-Linked Notes 2.65% | | | | | | | | |
| | | | | | | | | |
Gold Mining 2.65% | |
Gran Colombia Gold Corp., 5.00%, maturity 08/11/18 | | | 2,000,000 | | | 790,000 | ^ |
Gran Colombia Gold Corp., 144A, 5.00%, maturity 08/11/18 | | | 4,705,000 | | | 1,858,475 | ^ |
| |
Total Silver-Linked Notes | | | | 2,648,475 | |
(cost $5,786,165) | | | | | | | | |
See notes to portfolios of investments and notes to financial statements.
82
Global Resources Fund
Portfolio of Investments | December 31, 2015 |
Corporate Note 2.55% | | | Principal Amount | | | Value | |
| | | | | | | | |
Electric - Generation 2.55% | |
Pacific Power Generation Corp., 15.00%, maturity 04/03/17 (RS) | | $ | 2,550,000 | | | $ | 2,550,000 | #@ |
(cost $2,550,000) | | | | | | | | |
| | | | | | | | | |
Total Investments 91.07% | | | | | | | 91,075,267 | |
(cost $180,728,144) | | | | | | | | |
Other assets and liabilities, net 8.93% | | | | | | | 8,932,406 | |
| | | | | | | | | |
Net Assets 100.0% | | | | | | $ | 100,007,673 | |
See notes to portfolios of investments and notes to financial statements.
83
World Precious Minerals Fund
Portfolio of Investments | December 31, 2015 |
Common Stocks 83.09% | | Shares | | | Value | |
| | | | | | | |
Agricultural Operations 0.39% | |
Agriterra Ltd. | | | 38,536,200 | | | $ | 308,878 | * |
| | | | | | | | | |
Capital Pools 0.00% | |
Pinecrest Resources Ltd. | | | 100,000 | | | | 4,336 | * |
| | | | | | | | | |
Coal 0.14% | |
Pacific Coal Resources Ltd. | | | 1,182,764 | | | | 8,548 | * |
Sable Mining Africa Ltd. | | | 15,132,281 | | | | 99,070 | * |
| | | | | | | | 107,618 | |
| | | | | | | | | |
Diamonds/Precious Stones 2.23% | |
Lucapa Diamond Co., Ltd. | | | 1,000,000 | | | | 201,163 | * |
Lucara Diamond Corp. | | | 900,000 | | | | 1,463,468 | |
Northern Superior Resources, Inc. | | | 1,000,000 | | | | 10,841 | * |
Olivut Resources Ltd. | | | 645,000 | | | | 53,606 | * |
Rockwell Diamonds, Inc., 144A | | | 171,667 | | | | 16,438 | * |
| | | | | | | | 1,745,516 | |
| | | | | | | | | |
Diversified Minerals 1.11% | |
Adamera Minerals Corp. | | | 119,543 | | | | 1,296 | * |
Amarc Resources Ltd. | | | 695,545 | | | | 30,160 | * |
Burey Gold Ltd. | | | 36,000,000 | | | | 406,614 | * |
Calibre Mining Corp. | | | 4,650,000 | | | | 235,239 | * |
Duketon Mining Ltd. | | | 1,950,000 | | | | 124,729 | * |
Indochine Mining Ltd. | | | 4,000,000 | | | 17,489 | *#@ |
Riverside Resources, Inc. | | | 527,000 | | | | 55,225 | * |
| | | | | | | | 870,752 | |
| | | | | | | | | |
Gold Mining 60.88% | |
ABM Resources NL | | | 625,000 | | | | 18,229 | * |
Agnico Eagle Mines Ltd. | | | 30,000 | | | | 788,400 | |
Alacer Gold Corp. | | | 150,000 | | | | 267,760 | * |
Algold Resources Ltd. | | | 1,000,000 | | | | 65,043 | * |
Almaden Minerals Ltd. | | | 400,000 | | | | 274,626 | * |
Atlantic Gold Corp. | | | 1,250,000 | | | | 298,114 | * |
B2Gold Corp. | | | 229,677 | | | | 234,271 | * |
Bonterra Resources, Inc. | | | 2,500,000 | | | | 334,249 | * |
Canyon Resources Ltd. | | | 10,006,593 | | | | 346,360 | *+ |
Chesapeake Gold Corp., 144A | | | 192,199 | | | | 244,468 | * |
Claude Resources, Inc. | | | 3,614,530 | | | | 2,037,532 | * |
Comstock Mining, Inc. | | | 2,665,000 | | | | 1,065,733 | * |
CopperBank Resources Corp. | | | 195,000 | | | | 6,342 | * |
CopperBank Resources Corp., 144A | | | 174,000 | | | | 5,659 | * |
Corona Minerals Ltd. | | | 1,625,000 | | | 3,552 | *#@ |
Detour Gold Corp. | | | 100,000 | | | | 1,041,411 | * |
See notes to portfolios of investments and notes to financial statements.
84
World Precious Minerals Fund
Portfolio of Investments | December 31, 2015 |
Common Stocks (cont’d) | | Shares | | | Value | |
| | | | | | | |
Gold Mining (cont’d) | |
Doray Minerals Ltd. | | | 1,676,470 | | | $ | 713,833 | * |
Eastmain Resources, Inc. | | | 1,800,000 | | | | 442,292 | * |
Gold Fields Ltd., Sponsored ADR | | | 125,000 | | | | 346,250 | |
Gold Standard Ventures Corp. | | | 2,170,000 | | | | 1,466,486 | * |
Gran Colombia Gold Corp. | | | 244,247 | | | | 22,947 | * |
Guyana Goldfields, Inc. | | | 200,000 | | | | 445,183 | * |
IDM Mining Ltd. | | | 3,975,000 | | | | 244,182 | * |
Integra Gold Corp. | | | 3,500,000 | | | | 860,013 | * |
Kaminak Gold Corp., Class A | | | 700,000 | | | | 435,065 | * |
Klondex Mines Ltd. | | | 6,045,000 | | | | 12,363,482 | * |
Lake Shore Gold Corp. | | | 1,806,249 | | | | 1,462,021 | * |
Lake Shore Gold Corp. (RS) | | | 1,000,000 | | | 768,953 | *#@ |
Lexam VG Gold, Inc., 144A | | | 2,406,501 | | | | 113,047 | * |
Malbex Resources, Inc., 144A | | | 1,333,333 | | | | 26,499 | * |
Mammoth Resources Corp. | | | 2,818,000 | | | | 10,183 | *+ |
Mirasol Resources Ltd. | | | 2,000,000 | | | | 1,271,952 | * |
Newmarket Gold, Inc. | | | 1,000,000 | | | | 975,645 | * |
NGEx Resources, Inc. | | | 2,000,000 | | | | 939,510 | * |
Northern Star Resources Ltd. | | | 275,000 | | | | 559,219 | |
Oban Mining Corp. | | | 200,000 | | | | 172,003 | * |
OceanaGold Corp. | | | 205,348 | | | | 391,789 | |
Osisko Gold Royalties Ltd. | | | 415,000 | | | | 4,099,913 | |
Petaquilla Minerals Ltd., 144A | | | 2,660,000 | | | | 4,037 | * |
Pretium Resources, Inc. | | | 300,000 | | | | 1,508,998 | * |
Pretium Resources, Inc. | | | 300,000 | | | | 1,512,000 | * |
Pure Gold Mining, Inc. | | | 2,500,000 | | | | 207,776 | * |
Radius Gold, Inc., 144A | | | 4,075,000 | | | | 176,700 | * |
Red Eagle Mining Corp. | | | 221,920 | | | | 44,105 | * |
Redstar Gold Corp. | | | 8,797,714 | | | | 206,638 | * |
Richmont Mines, Inc. | | | 250,000 | | | | 802,500 | * |
Royal Gold, Inc. | | | 10,000 | | | | 364,700 | |
Rusoro Mining Ltd. | | | 6,000,000 | | | | 281,853 | * |
Rye Patch Gold Corp. | | | 4,750,000 | | | | 446,267 | * |
Rye Patch Gold Corp., 144A | | | 1,800,000 | | | | 169,112 | * |
Seafield Resources Ltd., 144A | | | 1,300,000 | | | 4,698 | *#@ |
Skeena Resources Ltd. | | | 4,000,000 | | | | 180,675 | * |
St Barbara Ltd. | | | 2,300,000 | | | | 2,401,943 | * |
Sunridge Gold Corp. | | | 2,250,000 | | | | 447,171 | * |
Sunridge Gold Corp., 144A | | | 1,900,000 | | | | 377,611 | * |
Taurus Gold Ltd., 144A (RS) | | | 2,448,381 | | | 46,274 | *#@ |
Teranga Gold Corp. | | | 1,875,000 | | | | 663,981 | * |
Tolima Gold, Inc., 144A | | | 4,100,000 | | | | 14,815 | * |
TriStar Gold, Inc. | | | 17,994,000 | | | | 2,275,746 | *+ |
See notes to portfolios of investments and notes to financial statements.
85
World Precious Minerals Fund
Portfolio of Investments | December 31, 2015 |
Common Stocks (cont’d) | | Shares | | | Value | |
| | | | | | | |
Gold Mining (cont’d) | |
Wesdome Gold Mines Ltd. | | | 350,000 | | | $ | 321,240 | * |
| | | | | | | | 47,621,056 | |
| | | | | | | | | |
Medical - Hospitals 0.00% | |
African Medical Investments plc | | | 4,637,500 | | | 0 | *#@ |
| | | | | | | | | |
Metal - Copper 0.07% | |
Catalyst Copper Corp. | | | 52,133 | | | | 4,898 | * |
Catalyst Copper Corp., 144A | | | 66,667 | | | | 6,264 | * |
Rockcliff Copper Corp. | | | 50,000 | | | | 813 | * |
Rockcliff Copper Corp., 144A | | | 2,620,000 | | | | 42,603 | * |
Verona Development Corp. | | | 48,500 | | | 0 | *#@ |
| | | | | | | | 54,578 | |
| | | | | | | | | |
Metal - Diversified 8.32% | |
Balmoral Resources Ltd. | | | 1,000,000 | | | | 310,761 | * |
Calico Resources Corp. | | | 4,178,500 | | | | 249,134 | * |
Cardinal Resources Ltd. | | | 9,000,000 | | | | 920,252 | *+ |
Dalradian Resources, Inc. | | | 1,800,000 | | | | 1,027,679 | * |
Elissa Resources Ltd., 144A | | | 12,083 | | | | 1,223 | * |
Falco Resources Ltd. | | | 1,953,700 | | | | 374,164 | * |
First Point Minerals Corp. | | | 2,000,000 | | | | 72,270 | * |
Ivanhoe Mines Ltd., Class A | | | 100,000 | | | | 44,085 | * |
Mandalay Resources Corp. | | | 2,500,000 | | | | 1,156,320 | |
Mineral Mountain Resources Ltd. | | | 10,000,000 | | | | 180,675 | *+ |
Nevada Sunrise Gold Corp. | | | 325,000 | | | | 49,324 | * |
Novo Resources Corp. | | | 1,100,000 | | | | 461,083 | * |
Orex Minerals, Inc. | | | 9,510,000 | | | | 996,567 | *+ |
Orsu Metals Corp., 144A | | | 1,869,220 | | | | 30,395 | * |
Reservoir Minerals, Inc. | | | 191,100 | | | | 563,480 | * |
Silver Bull Resources, Inc. | | | 2,350,000 | | | | 70,500 | * |
| | | | | | | | 6,507,912 | |
| | | | | | | | | |
Mining Services 0.45% | |
Argent Minerals Ltd. | | | 17,100,000 | | | | 301,699 | *+ |
Energold Drilling Corp. | | | 200,000 | | | | 49,144 | * |
| | | | | | | | 350,843 | |
| | | | | | | | | |
Oil Companies - Exploration & Production 0.00% | |
Big Sky Energy Corp. | | | 2,000,000 | | | 0 | *#@ |
| | | | | | | | | |
Platinum 0.28% | |
Pacific North West Capital Corp. | | | 430,555 | | | | 6,223 | * |
Platinum Group Metals Ltd. | | | 1,500,000 | | | | 211,390 | * |
| | | | | | | | 217,613 | |
See notes to portfolios of investments and notes to financial statements.
86
World Precious Minerals Fund
Portfolio of Investments | December 31, 2015 |
Common Stocks (cont’d) | | Shares | | | Value | |
| | | | | | | |
Precious Metals 7.13% | |
Almadex Minerals Ltd. | | | 240,000 | | | $ | 26,884 | * |
Barsele Minerals Corp. | | | 9,411,500 | | | | 782,195 | *+ |
Candente Gold Corp., 144A | | | 4,875,000 | | | | 61,655 | *+ |
Kootenay Silver, Inc. | | | 1,000,000 | | | | 133,700 | * |
Lundin Gold, Inc. | | | 764,000 | | | | 2,098,143 | * |
Lundin Gold, Inc., 144A | | | 70,000 | | | | 192,238 | * |
Roxgold, Inc. | | | 3,500,000 | | | | 1,770,615 | * |
Santana Minerals Ltd. | | | 2,400,000 | | | | 15,841 | * |
Solitario Exploration & Royalty Corp. | | | 1,000,000 | | | | 494,000 | * |
| | | | | | | | 5,575,271 | |
| | | | | | | | | |
Silver Mining 2.09% | |
Fortuna Silver Mines, Inc. | | | 570,000 | | | | 1,282,500 | * |
MAG Silver Corp. | | | 25,000 | | | | 176,519 | * |
Santacruz Silver Mining Ltd. | | | 1,600,000 | | | | 104,069 | * |
Source Exploration Corp. | | | 4,975,000 | | | | 71,909 | *+ |
| | | | | | | | 1,634,997 | |
| |
Total Common Stocks | | | | 64,999,370 | |
(cost $151,578,363) | | | | | | | | |
| | | | | | | | | |
Exchange-Traded Funds 0.00% | | | | | | | | |
| | | | | | | | | |
Market Vectors Gold Miners ETF | | | 20 | | | | 274 | |
Market Vectors Junior Gold Miners ETF | | | 8 | | | | 154 | |
| |
Total Exchange-Traded Funds | | | | 428 | |
(cost $2,195) | | | | | | | | |
| | | | | | | | | |
Warrants 1.00% | | | | | | | | |
| | | | | | | | | |
Diamonds/Precious Stones 0.01% | |
Lucapa Diamond Co., Ltd., Warrants (April 2016) | | | 250,000 | | | | 6,558 | * |
| | | | | | | | | |
Diversified Minerals 0.01% | |
Burey Gold Ltd., Warrants (August 2017) | | | 3,500,000 | | | | 6,376 | * |
| | | | | | | | | |
Gold Mining 0.81% | |
Alamos Gold, Inc., Warrants (August 2018) | | | 110,000 | | | | 11,527 | |
Algold Resources Ltd., Warrants (December 2016) | | | 500,000 | | | 0 | *#@ |
Bonterra Resources, Inc., Warrants (July 2018) | | | 625,000 | | | 0 | *#@ |
Canyon Resources Ltd., Warrants (January 2017) | | | 6,168,864 | | | | 56,191 | *+ |
Gran Colombia Gold Corp., 144A, Warrants (October 2017) | | | 58,450 | | | 0 | *#@ |
Gran Colombia Gold Corp., 144A, Warrants (March 2019) | | | 96,250 | | | | 2,609 | * |
See notes to portfolios of investments and notes to financial statements.
87
World Precious Minerals Fund
Portfolio of Investments | December 31, 2015 |
Warrants (cont’d) | | Shares | | | Value | |
| | | | | | | |
Gold Mining (cont’d) | |
New Gold, Inc., 144A, Warrants (June 2017) | | | 352,530 | | | $ | 15,286 | * |
Oban Mining Corp., Warrants (August 2018) | | | 1,000,000 | | | | 16,261 | * |
Osisko Gold Royalties Ltd., Warrants (February 2022) | | | 377,500 | | | | 514,264 | * |
Skeena Resources Ltd., Warrants (October 2016) | | | 10,000,000 | | | 0 | *#@ |
Sunridge Gold Corp., 144A, Warrants (October 2017) | | | 1,900,000 | | | | 20,597 | * |
Tolima Gold, Inc., 144A, Warrants (March 2016) | | | 1,625,000 | | | 0 | *#@ |
Tolima Gold, Inc., 144A, Warrants (December 2016) | | | 425,000 | | | 0 | *#@ |
Veris Gold Corp., Warrants (August 2016) | | | 250,000 | | | 0 | *#@ |
Veris Gold Corp., Warrants (December 2016) | | | 282,200 | | | 0 | *#@ |
| | | | | | | | 636,735 | |
| | | | | | | | | |
Metal - Copper 0.00% | |
Catalyst Copper Corp., 144A, Warrants (February 2017) | | | 33,333 | | | 0 | *#@ |
| | | | | | | | | |
Metal - Diversified 0.17% | |
Dalradian Resources, Inc., Warrants (July 2017) | | | 1,500,000 | | | | 130,086 | * |
HudBay Minerals, Inc., Warrants (July 2018) | | | 17,000 | | | | 3,686 | * |
Mineral Mountain Resources Ltd., Warrants (October 2016) | | | 3,500,000 | | | 0 | *+#@ |
Orex Minerals, Inc., 144A, Warrants (March 2016) | | | 600,000 | | | 0 | *+#@ |
Orex Minerals, Inc., 144A, Warrants (November 2017) | | | 1,250,000 | | | 0 | *+#@ |
| | | | | | | | 133,772 | |
| | | | | | | | | |
Precious Metals 0.00% | |
Barsele Minerals Corp., Warrants (March 2016) | | | 600,000 | | | 0 | *+#@ |
Barsele Minerals Corp., Warrants (November 2017) | | | 1,250,000 | | | 0 | *+#@ |
Santana Minerals, Ltd., Warrants (March 2016) | | | 400,000 | | | 0 | *#@ |
| | | | | | | | 0 | |
| | | | | | | | | |
Silver Mining 0.00% | |
Source Exploration Corp, Warrants (February 2017) | | | 2,500,000 | | | 0 | *+#@ |
| |
Total Warrants | | | | 783,441 | |
(cost $1,152,388) | | | | | | | | |
| | | | | | | | | |
Special Warrant 0.00% | | | | | | | | |
| | | | | | | | | |
Gold/Mineral Exploration & Development 0.00% | |
Western Exploration & Development Ltd., 144A, Warrants (RS) | | | 600,000 | | | 0 | *#@ |
(cost $300,000) | | | | | | | | |
See notes to portfolios of investments and notes to financial statements.
88
World Precious Minerals Fund
Portfolio of Investments | December 31, 2015 |
Rights 0.08% | | Shares | | | Value | |
| | | | | | | |
Metal - Diversified 0.08% | |
Cardinal Resources Ltd. | | | 1,500,000 | | | $ | 62,850 | *+ |
(cost $13,109) | | | | | | | | |
| | | | | | | | | |
Purchased Call Options 0.14% | | Contracts | | | | | |
| | | | | | | | |
Gold Mining 0.11% | |
AngloGold Ashanti Ltd., Strike Price 10.00, Expiration Jan. 2016 | | | 525 | | | | 2,625 | * |
Barrick Gold Corp., Strike Price 13.00, Expiration Jan. 2016 | | | 650 | | | | 650 | * |
Eldorado Gold Corp., Strike Price 7.00, Expiration Jan. 2016 | | | 1,800 | | | | 9,000 | * |
Gold Fields Ltd., Strike Price 5.00, Expiration Jan. 2016 | | | 1,000 | | | | 1,000 | * |
IAMGOLD Corp., Strike Price 4.00, Expiration Jan. 2016 | | | 270 | | | | 1,350 | * |
Newmont Mining Corp., Strike Price 25.00, Expiration Jan. 2016 | | | 375 | | | | 1,125 | * |
NovaGold Resources, Inc., Strike Price 4.50, Expiration Jan. 2016 | | | 1,500 | | | | 11,250 | * |
Randgold Resources Ltd., Strike Price 65.00, Expiration Jan. 2016 | | | 110 | | | | 6,875 | * |
Seabridge Gold, Inc., Strike Price 7.00, Expiration Jan. 2016 | | | 425 | | | | 55,250 | * |
Yamana Gold, Inc., Strike Price 8.00, Expiration Jan. 2016 | | | 314 | | | | 314 | * |
| | | | | | | | 89,439 | |
| | | | | | | | | |
Silver Mining 0.03% | |
First Majestic Silver Corp., Strike Price 10.00, Expiration Jan. 2016 | | | 328 | | | | 1,640 | * |
Pan American Silver Corp., Strike Price 10.00, Expiration Jan. 2016 | | | 263 | | | | 1,315 | * |
Silver Standard Resources, Inc., Strike Price 5.00, Expiration Jan. 2016 | | | 598 | | | | 19,435 | * |
Silver Wheaton Corp., Strike Price 20.00, Expiration Jan. 2016 | | | 154 | | | | 154 | * |
| | | | | | | | 22,544 | |
| |
Total Purchased Call Options | | | | 111,983 | |
(cost $1,608,717) | | | | | | | | |
| | | | | | | | | |
Gold-Linked Notes 3.84% | | Principal Amount | | | | | |
| | | | | | | | |
Gold Mining 3.84% | |
Gran Colombia Gold Corp., 10.00%, maturity 10/31/17 | | $ | 215,000 | | | 106,425 | #^@ |
Gran Colombia Gold Corp., 144A, 10.00%, maturity 10/31/17 | | | 5,845,000 | | | 2,893,275 | #^@ |
| |
Total Gold-Linked Notes | | | | 2,999,700 | |
(cost $5,977,400) | | | | | | | | |
See notes to portfolios of investments and notes to financial statements.
89
World Precious Minerals Fund
Portfolio of Investments | December 31, 2015 |
Silver-Linked Notes 4.45% | | Principal Amount | | | Value | |
| | | | | | | |
Gold Mining 4.45% | |
Gran Colombia Gold Corp., 5.00%, maturity 08/11/18 | | $ | 655,000 | | | $ | 258,725 | ^ |
Gran Colombia Gold Corp., 144A, 5.00%, maturity 08/11/18 | | | 8,150,000 | | | 3,219,250 | ^ |
| |
Total Silver-Linked Notes | | | | 3,477,975 | |
(cost $8,616,219) | | | | | | | | |
| | | | | | | | | |
Corporate Note 0.87% | | | | | | | | |
| | | | | | | | | |
Electric - Generation 0.87% | |
Pacific Power Generation Corp., 15.00%, maturity 04/03/17 (RS) | | | 680,000 | | | 680,000 | #@ |
(cost $680,000) | | | | | | | | |
| |
Total Investments 93.47% | | | | 73,115,747 | |
(cost $169,928,391) | | | | | | | | |
Other assets and liabilities, net 6.53% | | | | | | | 5,110,107 | |
| | | | | | | | | |
Net Assets 100.0% | | | | | | $ | 78,225,854 | |
See notes to portfolios of investments and notes to financial statements.
90
Gold and Precious Metals Fund
Portfolio of Investments | December 31, 2015 |
Common Stocks 79.83% | | Shares | | | Value | |
| | | | | | | |
Diamonds/Precious Stones 1.72% | |
Lucara Diamond Corp. | | | 400,000 | | | $ | 650,430 | |
Petra Diamonds Ltd. | | | 275,000 | | | | 352,724 | |
| | | | | | | | 1,003,154 | |
| | | | | | | | | |
Diversified Minerals 0.23% | |
Lundin Mining Corp. | | | 50,000 | | | | 137,313 | * |
| | | | | | | | | |
Gold Mining 69.10% | |
Agnico Eagle Mines Ltd. | | | 100,000 | | | | 2,628,000 | |
Alacer Gold Corp. | | | 500,000 | | | | 892,534 | |
B2Gold Corp. | | | 229,676 | | | | 234,270 | * |
Claude Resources, Inc. | | | 4,209,685 | | | | 2,373,025 | * |
Comstock Mining, Inc. | | | 3,193,077 | | | | 1,276,911 | * |
Detour Gold Corp. | | | 125,000 | | | | 1,301,763 | * |
Doray Minerals Ltd. | | | 1,117,647 | | | | 475,889 | * |
Eldorado Gold Corp. | | | 157,479 | | | | 467,713 | |
Gold Fields Ltd., Sponsored ADR | | | 250,000 | | | | 692,500 | |
Gran Colombia Gold Corp. | | | 95,263 | | | | 8,950 | * |
Guyana Goldfields, Inc. | | | 200,000 | | | | 445,183 | * |
Klondex Mines Ltd. | | | 4,130,000 | | | | 8,446,845 | * |
Lake Shore Gold Corp. | | | 2,501,251 | | | | 2,024,573 | * |
Lake Shore Gold Corp. (RS) | | | 1,400,000 | | | 1,076,534 | *#@ |
Marlin Gold Mining Ltd. | | | 1,091,000 | �� | | | 145,866 | * |
Newmarket Gold, Inc. | | | 1,100,000 | | | | 1,073,210 | * |
Newmont Mining Corp. | | | 30,000 | | | | 539,700 | |
Northern Star Resources Ltd. | | | 1,500,000 | | | | 3,050,283 | |
OceanaGold Corp. | | | 750,000 | | | | 1,430,946 | |
Osisko Gold Royalties Ltd. | | | 315,000 | | | | 3,111,982 | |
Randgold Resources Ltd., Sponsored ADR | | | 10,000 | | | | 619,300 | |
Richmont Mines, Inc. | | | 350,000 | | | | 1,123,500 | * |
Royal Gold, Inc. | | | 25,000 | | | | 911,750 | |
SEMAFO, Inc. | | | 225,000 | | | | 570,752 | * |
Silver Lake Resources Ltd. | | | 3,000,000 | | | | 396,407 | * |
St Barbara Ltd. | | | 3,600,000 | | | | 3,759,563 | * |
Teranga Gold Corp. | | | 2,625,000 | | | | 929,573 | * |
Wesdome Gold Mines Ltd. | | | 300,000 | | | | 275,349 | * |
| | | | | | | | 40,282,871 | |
| | | | | | | | | |
Medical - Hospitals 0.00% | |
African Medical Investments plc | | | 2,000,000 | | | 0 | *#@ |
| | | | | | | | | |
Metal - Copper 0.93% | |
Nevsun Resources Ltd. | | | 200,000 | | | | 542,000 | |
See notes to portfolios of investments and notes to financial statements.
91
Gold and Precious Metals Fund
Portfolio of Investments | December 31, 2015 |
Common Stocks (cont’d) | | Shares | | | Value | |
| | | | | | | |
Metal - Diversified 1.78% | |
Mandalay Resources Corp. | | | 2,250,000 | | | $ | 1,040,688 | |
| |
Precious Metals 1.49% | |
Tahoe Resources, Inc. | | | 100,000 | | | | 867,000 | |
| | | | | | | | | |
Retail - Jewelry 0.64% | |
Signet Jewelers Ltd. | | | 3,000 | | | | 371,070 | |
| | | | | | | | | |
Silver Mining 3.94% | |
Fortuna Silver Mines, Inc. | | | 500,000 | | | | 1,125,000 | * |
Fresnillo plc | | | 100,000 | | | | 1,039,718 | |
Santacruz Silver Mining Ltd. | | | 2,000,000 | | | | 130,086 | * |
| | | | | | | | 2,294,804 | |
| |
Total Common Stocks | | | | 46,538,900 | |
(cost $55,638,766) | | | | | | | | |
| | | | | | | | | |
Exchange-Traded Funds 0.00% | | | | | | | | |
| | | | | | | | | |
Market Vectors Gold Miners ETF | | | 20 | | | | 274 | |
Market Vectors Junior Gold Miners ETF | | | 8 | | | | 154 | |
| |
Total Exchange-Traded Funds | | | | 428 | |
(cost $2,194) | | | | | | | | |
| | | | | | | | | |
Warrants 0.43% | | | | | | | | |
| | | | | | | | | |
Gold Mining 0.43% | |
Gran Colombia Gold Corp., 144A, Warrants (October 2017) | | | 29,400 | | | 0 | *#@ |
Gran Colombia Gold Corp., 144A, Warrants (March 2019) | | | 37,500 | | | | 1,017 | * |
Osisko Gold Royalties Ltd., Warrants (February 2022) | | | 183,900 | | | | 250,525 | * |
Veris Gold Corp., Warrants (August 2016) | | | 250,000 | | | 0 | *#@ |
Veris Gold Corp., Warrants (December 2016) | | | 195,300 | | | 0 | *#@ |
| |
Total Warrants | | | | 251,542 | |
(cost $295,705) | | | | | | | | |
See notes to portfolios of investments and notes to financial statements.
92
Gold and Precious Metals Fund
Portfolio of Investments | December 31, 2015 |
Purchased Call Options 0.05% | | Contracts | | | Value | |
| | | | | | | |
Gold Mining 0.03% | |
AngloGold Ashanti Ltd., Strike Price 10.00, Expiration Jan. 2016 | | | 325 | | | $ | 1,625 | * |
Barrick Gold Corp., Strike Price 13.00, Expiration Jan. 2016 | | | 425 | | | | 425 | * |
Eldorado Gold Corp., Strike Price 7.00, Expiration Jan. 2016 | | | 1,200 | | | | 6,000 | * |
Gold Fields Ltd., Strike Price 5.00, Expiration Jan. 2016 | | | 500 | | | | 500 | * |
IAMGOLD Corp., Strike Price 4.00, Expiration Jan. 2016 | | | 180 | | | | 900 | * |
Newmont Mining Corp., Strike Price 25.00, Expiration Jan. 2016 | | | 250 | | | | 750 | * |
Randgold Resources Ltd., Strike Price 65.00, Expiration Jan. 2016 | | | 80 | | | | 5,000 | * |
Yamana Gold, Inc., Strike Price 8.00, Expiration Jan. 2016 | | | 314 | | | | 314 | * |
| | | | | | | | 15,514 | |
| | | | | | | | | |
Silver Mining 0.02% | |
First Majestic Silver Corp., Strike Price 10.00, Expiration Jan. 2016 | | | 249 | | | | 1,245 | * |
Pan American Silver Corp., Strike Price 10.00, Expiration Jan. 2016 | | | 365 | | | | 1,825 | * |
Silver Standard Resources, Inc., Strike Price 5.00, Expiration Jan. 2016 | | | 352 | | | | 11,440 | * |
Silver Wheaton Corp., Strike Price 20.00, Expiration Jan. 2016 | | | 116 | | | | 116 | * |
| | | | | | | | 14,626 | |
| |
Total Purchased Call Options | | | | 30,140 | |
(cost $1,015,563) | | | | | | | | |
| | | | | | | | | |
Gold-Linked Notes 2.61% | | Principal Amount | | | | | |
| | | | | | | | |
Gold Mining 2.61% | |
Gran Colombia Gold Corp., 10.00%, maturity 10/31/17 | | $ | 125,000 | | | 61,875 | #^@ |
Gran Colombia Gold Corp., 144A, 10.00%, maturity 10/31/17 | | | 2,940,000 | | | 1,455,300 | #^@ |
| |
Total Gold-Linked Notes | | | | 1,517,175 | |
(cost $3,019,060) | | | | | | | | |
| | | | | | | | | |
Silver-Linked Notes 3.13% | | | | | | | | |
| | | | | | | | | |
Gold Mining 3.13% | |
Gran Colombia Gold Corp., 5.00%, maturity 08/11/18 | | | 4,250,000 | | | 1,678,750 | ^ |
Gran Colombia Gold Corp., 144A, 5.00%, maturity 08/11/18 | | | 373,000 | | | 147,335 | ^ |
| |
Total Silver-Linked Notes | | | | 1,826,085 | |
(cost $4,520,041) | | | | | | | | |
See notes to portfolios of investments and notes to financial statements.
93
Gold and Precious Metals Fund
Portfolio of Investments | December 31, 2015 |
Corporate Notes 1.27% | | | Principal Amount | | | | Value | |
| | | | | | | | | |
Coal 0.83% | |
Pacific Coal S.A., 19.25%, maturity 06/15/15 (RS) | | $ | 485,766 | | | $ | 485,766 | #@ |
| | | | | | | | |
Electric - Generation 0.44% | |
Pacific Power Generation Corp., 15.00%, maturity 04/03/17 (RS) | | | 255,000 | | | 255,000 | #@ |
| |
Total Corporate Notes | | | | 740,766 | |
(cost $740,766) | | | | | | | | |
| |
Total Investments 87.32% | | | | 50,905,036 | |
(cost $65,232,095) | | | | | | | | |
Other assets and liabilities, net 12.68% | | | | | | | 7,392,616 | |
| | | | | | | | | |
Net Assets 100.0% | | | | | | $ | 58,297,652 | |
See notes to portfolios of investments and notes to financial statements.
94
Emerging Europe Fund
Portfolio of Investments | December 31, 2015 |
Common Stocks 88.35% | | Shares | | | Value | |
| | | | | | | |
Agricultural Chemicals 1.10% | |
PhosAgro OAO, GDR | | | 20,800 | | | $ | 267,802 | |
Uralkali PJSC | | | 92,000 | | | | 223,088 | |
| | | | | | | | 490,890 | |
| | | | | | | | | |
Agricultural Operations 1.31% | |
Kernel Holding S.A. | | | 48,005 | | | | 586,693 | |
| | | | | | | | | |
Airlines 5.08% | |
Aegean Airlines S.A. | | | 74,500 | | | | 551,631 | |
Deutsche Lufthansa | | | 39,000 | | | | 614,295 | |
easyJet plc | | | 5,200 | | | | 133,365 | |
Pegasus Hava Tasimaciligi A.S. | | | 32,800 | | | | 197,206 | * |
Ryanair Holdings plc, Sponsored ADR | | | 3,802 | | | | 328,721 | |
Turk Hava Yollari AO | | | 105,000 | | | | 265,587 | * |
Wizz Air Holdings plc, 144A | | | 6,700 | | | | 180,287 | * |
| | | | | | | | 2,271,092 | |
| | | | | | | | | |
Airport Development/Maintenance 0.48% | |
TAV Havalimanlari Holding A.S. | | | 34,700 | | | | 216,302 | |
| | | | | | | | | |
Appliances 1.22% | |
Vestel Beyaz Esya Sanayi ve Ticaret A.S. | | | 142,000 | | | | 543,327 | |
| | | | | | | | | |
Automotive - Cars & Light Trucks 1.45% | |
Ford Otomotiv Sanayi A.S. | | | 46,800 | | | | 485,449 | |
Tofas Turk Otomobil Fabrikasi A.S. | | | 25,000 | | | | 162,299 | |
| | | | | | | | 647,748 | |
| | | | | | | | | |
Automotive/Truck Parts & Equipment - Original 1.82% | |
Brembo S.p.A | | | 11,300 | | | | 545,937 | |
Tumosan Motor ve Traktor Sanayi | | | 86,300 | | | | 268,281 | |
| | | | | | | | 814,218 | |
| | | | | | | | | |
Automotive/Truck Parts & Equipment - Replacement 0.82% | |
Ege Endustri ve Ticaret A.S. | | | 3,400 | | | | 365,788 | |
| | | | | | | | | |
Building & Construction - Miscellaneous 1.66% | |
Budimex S.A. | | | 15,000 | | | | 739,742 | |
| | | | | | | | | |
Building & Construction Products - Miscellaneous 1.08% | |
Wienerberger AG | | | 26,008 | | | | 481,992 | |
See notes to portfolios of investments and notes to financial statements.
95
Emerging Europe Fund
Portfolio of Investments | December 31, 2015 |
Common Stocks (cont’d) | | Shares | | | Value | |
| | | | | | | |
Cellular Telecommunication 3.30% | |
MegaFon PJSC, GDR | | | 15,600 | | | $ | 181,478 | |
Mobile TeleSystems OJSC, Sponsored ADR | | | 102,200 | | | | 631,596 | |
Turkcell Iletisim Hizmetleri A.S. | | | 125,000 | | | | 423,722 | |
Turkcell Iletisim Hizmetleri A.S., Sponsored ADR | | | 27,897 | | | | 236,845 | |
| | | | | | | | 1,473,641 | |
| | | | | | | | | |
Chemicals - Diversified 0.28% | |
Ciech S.A. | | | 5,800 | | | | 126,903 | * |
| | | | | | | | | |
Chemicals - Fibers 1.39% | |
Aksa Akrilik Kimya Sanayii A.S. | | | 56,900 | | | | 203,977 | |
Lenzing AG | | | 5,500 | | | | 414,682 | |
| | | | | | | | 618,659 | |
| | | | | | | | | |
Chemicals - Specialty 0.66% | |
Grupa Azoty S.A. | | | 11,600 | | | | 293,713 | |
| | | | | | | | | |
Commercial Banks - Non US 15.23% | |
Akbank T.A.S. | | | 164,000 | | | | 376,056 | |
Akbank T.A.S., Sponsored ADR | | | 17,500 | | | | 80,640 | * |
Albaraka Turk Katilim Bankasi | | | 761,000 | | | | 344,006 | |
Banca Transilvania S.A. | | | 816,000 | | | | 476,429 | * |
BRD-Groupe Societe Generale S.A. | | | 167,000 | | | | 485,985 | * |
Komercni Banka A.S. | | | 2,850 | | | | 565,813 | |
OTP Bank plc | | | 26,300 | | | | 540,764 | |
Raiffeisen Bank International AG | | | 21,622 | | | | 316,877 | * |
Sberbank of Russia, Sponsored ADR | | | 403,000 | | | | 2,343,302 | |
Turkiye Garanti Bankasi A.S. | | | 198,000 | | | | 482,361 | |
Turkiye Is Bankasi, Class C | | | 28,959 | | | | 45,569 | |
Turkiye Vakiflar Bankasi TAO, Class D | | | 180,000 | | | | 235,896 | |
VTB Bank PJSC, GDR | | | 241,867 | | | | 509,142 | |
| | | | | | | | 6,802,840 | |
| | | | | | | | | |
Computer Services 1.84% | |
Asseco Poland S.A. | | | 35,000 | | | | 503,686 | |
Luxoft Holding, Inc., Class A | | | 4,100 | | | | 316,233 | * |
| | | | | | | | 819,919 | |
| | | | | | | | | |
Distribution/Wholesale 0.59% | |
Neuca S.A. | | | 2,900 | | | | 265,069 | |
| | | | | | | | | |
Diversified Operations 1.68% | |
Dogan Sirketler Grubu Holding A.S. | | | 2,447,194 | | | | 477,524 | * |
KOC Holding A.S. | | | 72,456 | | | | 271,365 | |
| | | | | | | | 748,889 | |
See notes to portfolios of investments and notes to financial statements.
96
Emerging Europe Fund
Portfolio of Investments | December 31, 2015 |
Common Stocks (cont’d) | | Shares | | | Value | |
| | | | | | | |
Electric - Distribution 0.37% | |
Electrica S.A. | | | 42,700 | | | $ | 125,025 | |
Energa S.A. | | | 12,200 | | | | 39,274 | |
| | | | | | | | 164,299 | |
| | | | | | | | | |
Electric - Generation 0.19% | |
CEZ A.S. | | | 4,868 | | | | 86,816 | |
| | | | | | | | | |
Electric - Integrated 0.14% | |
RusHydro PJSC, Sponsored ADR | | | 66,942 | | | | 63,973 | |
| | | | | | | | | |
Electric - Transmission 0.87% | |
Transelectrica S.A. | | | 55,400 | | | | 388,733 | |
| | | | | | | | | |
Electronics - Military 1.25% | |
Aselsan Elektronik Sanayi Ve Ticaret | | | 50,000 | | | | 288,918 | |
Safran S.A. | | | 3,900 | | | | 267,942 | |
| | | | | | | | 556,860 | |
| | | | | | | | | |
Enterprise Software/Services 0.15% | |
Logo Yazilim Sanayi Ve Ticaret | | | 4,700 | | | | 68,936 | |
| | | | | | | | | |
Finance - Other Services 0.69% | |
Moscow Exchange MICEX-RTS PJSC | | | 245,000 | | | | 306,315 | |
| | | | | | | | | |
Food - Confectionery 0.32% | |
Ulker Biskuvi Sanayi A.S. | | | 24,000 | | | | 144,851 | |
| | | | | | | | | |
Food - Miscellaneous/Diversified 0.65% | |
Ros Agro plc, GDR | | | 21,000 | | | | 289,678 | |
| | | | | | | | | |
Food - Retail 5.65% | |
BIM Birlesik Magazalar A.S. | | | 26,800 | | | | 471,737 | |
Magnit PJSC, Sponsored GDR | | | 38,700 | | | | 1,556,201 | |
Migros Ticaret A.S. | | | 83,300 | | | | 497,816 | * |
| | | | | | | | 2,525,754 | |
| | | | | | | | | |
Food - Wholesale/Distribution 1.08% | |
Eurocash S.A. | | | 39,000 | | | | 480,616 | |
| | | | | | | | | |
Gambling (Non-Hotel) 0.96% | |
OPAP S.A. | | | 48,700 | | | | 427,358 | |
| | | | | | | | | |
Machinery - Farm 1.25% | |
Turk Traktor ve Ziraat Makineleri A.S. | | | 23,331 | | | | 556,054 | |
See notes to portfolios of investments and notes to financial statements.
97
Emerging Europe Fund
Portfolio of Investments | December 31, 2015 |
Common Stocks (cont’d) | | Shares | | | Value | |
| | | | | | | |
Machinery - General Industrial 1.21% | |
Andritz AG | | | 11,100 | | | $ | 540,221 | |
| | | | | | | | | |
Medical - Drugs 0.40% | |
Richter Gedeon Nyrt | | | 9,400 | | | | 177,420 | |
| | | | | | | | | |
Metal - Diversified 2.39% | |
KGHM Polska Miedz S.A. | | | 15,000 | | | | 241,953 | |
MMC Norilsk Nickel PJSC, Sponsored ADR | | | 60,000 | | | | 761,700 | |
Orsu Metals Corp., 144A | | | 4,025,000 | | | | 65,449 | * |
| | | | | | | | 1,069,102 | |
| | | | | | | | | |
Multi-line Insurance 0.12% | |
Vienna Insurance Group Wiener Versicherung Gruppe AG | | | 2,000 | | | | 54,706 | |
| | | | | | | | | |
Oil Companies - Exploration & Production 0.11% | |
Novatek OAO, GDR | | | 599 | | | | 49,337 | |
| | | | | | | | | |
Oil Companies - Integrated 12.78% | |
Gazprom OAO, Sponsored ADR | | | 420,000 | | | | 1,561,662 | |
Lukoil PJSC, Sponsored ADR | | | 48,000 | | | | 1,555,304 | |
MOL Hungarian Oil & Gas plc | | | 11,200 | | | | 546,255 | |
OMV AG | | | 8,700 | | | | 246,953 | |
Polskie Gornictwo Naftowe i Gazownictwo S.A. | | | 154,000 | | | | 200,996 | |
Rosneft OAO, GDR | | | 248,000 | | | | 864,478 | |
Surgutneftegas OAO, Sponsored ADR | | | 44,160 | | | | 202,243 | |
Tatneft PAO, Sponsored ADR | | | 20,000 | | | | 528,800 | |
| | | | | | | | 5,706,691 | |
| | | | | | | | | |
Oil Refining & Marketing 2.80% | |
Grupa Lotos S.A. | | | 34,000 | | | | 233,872 | * |
Motor Oil Hellas Corinth Refineries S.A. | | | 21,400 | | | | 230,759 | |
Polski Koncern Naftowy Orlen | | | 14,300 | | | | 246,164 | |
Tupras Turkiye Petrol Rafinerileri A.S. | | | 22,600 | | | | 539,016 | * |
| | | | | | | | 1,249,811 | |
| | | | | | | | | |
Property/Casualty Insurance 0.43% | |
Powszechny Zaklad Ubezpieczen S.A. | | | 22,000 | | | | 189,794 | |
| | | | | | | | | |
Retail - Apparel/Shoe 0.39% | |
CCC S.A. | | | 5,000 | | | | 176,014 | |
| | | | | | | | | |
Retail - Jewelry 0.65% | |
Pandora A/S | | | 2,300 | | | | 289,993 | |
See notes to portfolios of investments and notes to financial statements.
98
Emerging Europe Fund
Portfolio of Investments | December 31, 2015 |
Common Stocks (cont’d) | | Shares | | | Value | |
| | | | | | | |
Retail - Restaurants 0.79% | |
AmRest Holdings S.E. | | | 7,400 | | | $ | 354,550 | * |
| | | | | | | | | |
Retail - Toy Store 1.21% | |
JUMBO S.A. | | | 51,363 | | | | 539,870 | |
| | | | | | | | | |
Rubber - Tires 0.57% | |
Goodyear Lastikleri A.S. | | | 9,800 | | | | 256,212 | |
| | | | | | | | | |
Steel - Producers 1.79% | |
Eregli Demir ve Celik Fabrikalari T.A.S. | | | 385,000 | | | | 400,639 | |
Severstal PAO, GDR | | | 48,000 | | | | 401,038 | |
| | | | | | | | 801,677 | |
| | | | | | | | | |
Telecom Services 3.59% | |
Netia S.A. | | | 395,000 | | | | 544,328 | |
O2 Czech Republic a.s. | | | 41,500 | | | | 419,668 | |
Orange Polska S.A. | | | 117,000 | | | | 195,349 | |
Sistema, GDR | | | 37,000 | | | | 217,829 | |
Turk Telekomunikasyon A.S. | | | 121,000 | | | | 226,298 | |
| | | | | | | | 1,603,472 | |
| | | | | | | | | |
Telephone - Integrated 3.05% | |
Hellenic Telecommunications Organization S.A. | | | 60,000 | | | | 600,485 | |
Magyar Telekom Telecommunications | | | 185,000 | | | | 258,218 | |
Rostelecom PJSC | | | 406,000 | | | | 502,763 | |
| | | | | | | | 1,361,466 | |
| | | | | | | | | |
Transportation - Services 1.51% | |
Celebi Hava Servisi A.S. | | | 14,476 | | | | 177,598 | |
Oesterreichische Post AG | | | 13,600 | | | | 496,489 | |
| | | | | | | | 674,087 | |
| |
Total Common Stocks | | | | 39,462,091 | |
(cost $45,070,070) | | | | | | | | |
| | | | | | | | | |
Exchange-Traded Fund 0.68% | | | | | | | | |
| | | | | | | | | |
Direxion Daily Russia Bull 3x Shares | | | 18,900 | | | | 303,338 | |
(cost $315,904) | | | | | | | | |
See notes to portfolios of investments and notes to financial statements.
99
Emerging Europe Fund
Portfolio of Investments | December 31, 2015 |
Purchased Call Option 0.31% | | Contracts | | | Value | |
| | | | | | | |
Exchange-Traded Fund 0.31% | |
Market Vectors Russia ETF, Strike Price , Expiration Jan. 2017 | | | 1,500 | | | $ | 138,000 | * |
(cost $266,688) | | | | | | | | |
| | | | | | | | | |
Corporate Note 0.13% | | Principal Amount | | | | | |
| | | | | | | | |
Transportation - Services 0.13% | |
Baghlan Group FZCO, 14.75%, maturity 06/27/15 | | $ | 1,345,845 | | | 60,525*^#@ | |
(cost $1,350,345) | | | | | | | | |
| |
Total Investments 89.47% | | | | 39,963,954 | |
(cost $47,003,007) | | | | | | | | |
Other assets and liabilities, net 10.53% | | | | | | | 4,701,624 | |
| | | | | | | | | |
Net Assets 100.0% | | | | | | $ | 44,665,578 | |
See notes to portfolios of investments and notes to financial statements.
100
China Region Fund
Portfolio of Investments | December 31, 2015 |
Common Stocks 88.68% | | Shares | | | Value | |
| | | | | | | |
Airlines 0.95% | |
Cebu Air, Inc. | | | 28,600 | | | $ | 50,055 | |
China Southern Airlines Co., Ltd., H shares | | | 134,000 | | | | 103,301 | |
| | | | | | | | 153,356 | |
| | | | | | | | | |
Audio/Video Products 0.22% | |
Skyworth Digital Holdings Ltd. | | | 54,000 | | | | 35,032 | |
| | | | | | | | | |
Automotive - Cars & Light Trucks 0.25% | |
Great Wall Motor Co., Ltd., H shares | | | 34,500 | | | | 39,848 | |
| | | | | | | | | |
Automotive/Truck Parts & Equipment - Original 0.11% | |
Nexteer Automotive Group Ltd. | | | 16,000 | | | | 17,707 | |
| | | | | | | | | |
Building - Heavy Construction 0.57% | |
China Railway Construction Corp., Ltd., H shares | | | 74,600 | | | | 91,815 | |
| | | | | | | | | |
Building & Construction - Miscellaneous 0.51% | |
China Machinery Engineering Corp., H shares | | | 113,000 | | | | 82,450 | |
| | | | | | | | | |
Building & Construction Products - Miscellaneous 1.23% | |
China Lesso Group Holdings Ltd. | | | 287,000 | | | | 199,166 | |
| | | | | | | | | |
Building Products - Cement/Aggregates 0.45% | |
Anhui Conch Cement Co., Ltd., H shares | | | 27,000 | | | | 72,173 | |
| | | | | | | | | |
Casino Hotels 0.10% | |
NagaCorp Ltd. | | | 26,000 | | | | 16,377 | |
| | | | | | | | | |
Cellular Telecommunication 2.45% | |
SmarTone Telecommunications Holdings Ltd. | | | 262,500 | | | | 397,273 | |
| | | | | | | | | |
Circuit Boards 0.18% | |
Zhen Ding Technology Holding Ltd. | | | 13,000 | | | | 29,641 | |
| | | | | | | | | |
Commercial Banks - Non US 3.90% | |
Bank Rakyat Indonesia Persero Tbk PT | | | 64,300 | | | | 52,771 | |
BDO Unibank, Inc. | | | 41,000 | | | | 91,137 | |
China Construction Bank Corp., H shares | | | 621,400 | | | | 423,887 | |
Chongqing Rural Commercial Bank Co., Ltd., H shares | | | 28,000 | | | | 16,817 | |
Huishang Bank Corp., Ltd., H shares | | | 74,000 | | | | 33,424 | |
Kasikornbank PCL | | | 3,200 | | | | 13,301 | |
| | | | | | | | 631,337 | |
| | | | | | | | | |
Cosmetics & Toiletries 0.44% | |
AMOREPACIFIC Group | | | 570 | | | | 71,211 | * |
See notes to portfolios of investments and notes to financial statements.
101
China Region Fund
Portfolio of Investments | December 31, 2015 |
Common Stocks (cont’d) | | Shares | | | Value | |
| | | | | | | |
Diversified Financial Services 0.68% | |
China Everbright Ltd. | | | 28,000 | | | $ | 63,953 | |
Haitong International Securities Group Ltd. | | | 76,000 | | | | 46,341 | |
| | | | | | | | 110,294 | |
| | | | | | | | | |
E-Commerce/Services 0.30% | |
SouFun Holdings Ltd., Sponsored ADR | | | 6,500 | | | | 48,035 | |
| | | | | | | | | |
Electric - Distribution 0.65% | |
Manila Electric Co. | | | 15,400 | | | | 104,589 | |
| | | | | | | | | |
Electric - Generation 0.26% | |
Huadian Power International Corp., Ltd., H shares | | | 66,000 | | | | 42,707 | |
| | | | | | | | | |
Electronic Components - Miscellaneous 2.12% | |
Pegatron Corp. | | | 40,000 | | | | 86,999 | |
Simplo Technology Co., Ltd. | | | 5,000 | | | | 15,880 | |
Tongda Group Holdings Ltd. | | | 1,370,000 | | | | 240,483 | |
| | | | | | | | 343,362 | |
| | | | | | | | | |
Electronic Components - Semiconductors 1.31% | |
Avago Technologies Ltd. | | | 400 | | | | 58,060 | |
Samsung Electronics Co., Ltd. | | | 70 | | | | 74,661 | |
SK Hynix, Inc. | | | 3,100 | | | | 80,082 | * |
| | | | | | | | 212,803 | |
| | | | | | | | | |
Energy - Alternate Sources 1.32% | |
Canadian Solar, Inc. | | | 3,700 | | | | 107,152 | * |
Gigasolar Materials Corp. | | | 4,000 | | | | 87,344 | |
Xinyi Solar Holdings Ltd. | | | 46,000 | | | | 18,649 | |
| | | | | | | | 213,145 | |
| | | | | | | | | |
Enterprise Software/Services 1.21% | |
Sinosoft Technology Group Ltd. | | | 364,000 | | | | 196,145 | |
| | | | | | | | | |
Entertainment Software 0.34% | |
NetEase, Inc., Sponsored ADR | | | 300 | | | | 54,372 | |
| | | | | | | | | |
Finance - Investment Banker/Broker 0.51% | |
CITIC Securities Co., Ltd., H shares | | | 17,500 | | | | 40,550 | |
Haitong Securities Co., Ltd., H shares | | | 24,000 | | | | 42,088 | |
| | | | | | | | 82,638 | |
See notes to portfolios of investments and notes to financial statements.
102
China Region Fund
Portfolio of Investments | December 31, 2015 |
Common Stocks (cont’d) | | Shares | | | Value | |
| | | | | | | |
Finance - Other Services 2.96% | |
Hong Kong Exchanges and Clearing Ltd. | | | 17,100 | | | $ | 435,619 | |
Singapore Exchange Ltd. | | | 7,900 | | | | 42,726 | |
| | | | | | | | 478,345 | |
| | | | | | | | | |
Food - Meat Products 0.29% | |
WH Group Ltd., 144A | | | 83,000 | | | | 46,195 | * |
| | | | | | | | | |
Funeral Services & Related Items 0.23% | |
Fu Shou Yuan International Group Ltd. | | | 49,000 | | | | 38,002 | |
| | | | | | | | | |
Gas - Distribution 0.13% | |
ENN Energy Holdings Ltd. | | | 4,000 | | | | 21,219 | |
| | | | | | | | | |
Gold Mining 0.15% | |
Zhaojin Mining Industry Co., Ltd. | | | 15,500 | | | | 8,784 | |
Zijin Mining Group Co., Ltd., H shares | | | 60,000 | | | | 15,707 | |
| | | | | | | | 24,491 | |
| | | | | | | | | |
Internet Application Software 7.86% | |
Tencent Holdings Ltd. | | | 65,000 | | | | 1,272,699 | |
| | | | | | | | | |
Internet Content - Entertainment 1.08% | |
Com2uS Corp. | | | 1,242 | | | | 124,515 | * |
YY, Inc., Sponsored ADR | | | 800 | | | | 49,976 | * |
| | | | | | | | 174,491 | |
| | | | | | | | | |
Investment Management/Advisory Services 1.61% | |
Noah Holdings Ltd., Sponsored ADR | | | 5,700 | | | | 159,201 | * |
Value Partners Group Ltd. | | | 87,000 | | | | 101,124 | |
| | | | | | | | 260,325 | |
| | | | | | | | | |
Life/Health Insurance 9.61% | |
AIA Group Ltd. | | | 172,900 | | | | 1,033,092 | |
Cathay Financial Holding Co., Ltd. | | | 28,000 | | | | 39,226 | |
China Life Insurance Co., Ltd. | | | 20,000 | | | | 15,272 | |
China Life Insurance Co., Ltd., H shares | | | 79,000 | | | | 253,606 | |
New China Life Insurance Co., Ltd., H shares | | | 51,100 | | | | 213,541 | |
| | | | | | | | 1,554,737 | |
| | | | | | | | | |
Machine Tools & Related Products 2.08% | |
Techtronic Industries Co., Ltd. | | | 83,000 | | | | 336,004 | |
| | | | | | | | | |
Medical - Biomedical/Gene 0.76% | |
Bloomage BioTechnology Corp., Ltd. | | | 50,000 | | | | 123,637 | |
See notes to portfolios of investments and notes to financial statements.
103
China Region Fund
Portfolio of Investments | December 31, 2015 |
Common Stocks (cont’d) | | Shares | | | Value | |
| | | | | | | |
Medical - Drugs 2.55% | |
Daewon Pharmaceutical Co., Ltd. | | | 2,620 | | | $ | 39,071 | * |
Sino Biopharmaceutical Ltd. | | | 412,500 | | | | 372,948 | |
| | | | | | | | 412,019 | |
| | | | | | | | | |
Medical - Wholesale Drug Distribution 1.35% | |
Sinopharm Group Co., Ltd., H shares | | | 54,800 | | | | 218,774 | |
| | | | | | | | | |
Medical Products 0.66% | |
China Medical System Holdings Ltd. | | | 73,000 | | | | 106,986 | |
| | | | | | | | | |
Metal Processors & Fabricators 0.58% | |
Catcher Technology Co., Ltd. | | | 10,000 | | | | 83,364 | |
STP & I PCL | | | 43,300 | | | | 11,254 | |
| | | | | | | | 94,618 | |
| | | | | | | | | |
Miscellaneous Manufacturing 1.30% | |
Zhuzhou CSR Times Electric Co., Ltd., H shares | | | 36,500 | | | | 210,480 | |
| | | | | | | | | |
Multi-line Insurance 3.60% | |
Ping An Insurance Group Co of China Ltd., H shares | | | 105,500 | | | | 581,801 | |
| | | | | | | | | |
Non - Ferrous Metals 0.05% | |
Almonty Industries, Inc. | | | 8,571 | | | | 1,734 | * |
Sterling Group Ventures, Inc. | | | 500,000 | | | | 6,250 | * |
| | | | | | | | 7,984 | |
| | | | | | | | | |
Oil Companies - Integrated 0.26% | |
China Petroleum & Chemical Corp., Sponsored ADR | | | 700 | | | | 41,986 | |
| | | | | | | | | |
Petrochemicals 0.40% | |
AK Holdings, Inc. | | | 1,200 | | | | 64,388 | * |
Danhua Chemical Technology Co., Ltd., B shares | | | 2 | | | | 1 | * |
| | | | | | | | 64,389 | |
| | | | | | | | | |
Photo Equipment & Supplies 0.42% | |
Largan Precision Co., Ltd. | | | 1,000 | | | | 68,425 | |
| | | | | | | | | |
Power Converters/Supply Equipment 0.64% | |
Boer Power Holdings Ltd. | | | 48,000 | | | | 86,236 | |
Xinjiang Goldwind Science & Technology Co., Ltd., H shares | | | 9,400 | | | | 17,921 | |
| | | | | | | | 104,157 | |
See notes to portfolios of investments and notes to financial statements.
104
China Region Fund
Portfolio of Investments | December 31, 2015 |
Common Stocks (cont’d) | | Shares | | | Value | |
| | | | | | | |
Property/Casualty Insurance 3.39% | |
Dongbu Insurance Co., Ltd. | | | 1,700 | | | $ | 101,714 | * |
Hyundai Marine & Fire Insurance Co., Ltd. | | | 6,100 | | | | 186,904 | * |
PICC Property & Casualty Co., Ltd., H shares | | | 132,000 | | | | 260,504 | |
| | | | | | | | 549,122 | |
| | | | | | | | | |
Public Thoroughfares 2.30% | |
Yuexiu Transport Infrastructure Ltd. | | | 302,000 | | | | 188,639 | |
Zhejiang Expressway Co., Ltd., H shares | | | 154,000 | | | | 184,006 | |
| | | | | | | | 372,645 | |
| | | | | | | | | |
Real Estate Management/Services 0.04% | |
China Overseas Property Holdings Ltd. | | | 42,000 | | | | 6,883 | * |
| | | | | | | | | |
Real Estate Operating/Development 8.64% | |
China Overseas Land & Investment Ltd. | | | 126,000 | | | | 438,652 | |
China Resources Land Ltd. | | | 98,444 | | | | 284,868 | |
China Vanke Co., Ltd., H shares | | | 77,900 | | | 233,670 | #@ |
KWG Property Holding Ltd. | | | 154,500 | | | | 113,892 | |
Longfor Properties Co., Ltd. | | | 140,000 | | | | 208,222 | |
LPN Development PCL | | | 36,300 | | | | 16,052 | |
Pakuwon Jati Tbk PT | | | 1,554,500 | | | | 55,313 | |
Sino-Ocean Land Holdings Ltd. | | | 73,500 | | | | 46,864 | |
| | | | | | | | 1,397,533 | |
| | | | | | | | | |
Reinsurance 0.53% | |
Korean Reinsurance Co. | | | 7,100 | | | | 85,368 | * |
| | | | | | | | | |
Retail - Apparel/Shoe 3.65% | |
ANTA Sports Products Ltd. | | | 216,000 | | | | 590,515 | |
| | | | | | | | | |
Retail - Drug Store 2.24% | |
CK Hutchison Holdings Ltd. | | | 27,000 | | | | 362,932 | |
| | | | | | | | | |
Retail - Jewelry 0.00% | |
Lao Feng Xiang Co., Ltd., B shares | | | 1 | | | | 4 | |
| | | | | | | | | |
Schools 0.58% | |
China Distance Education Holdings Ltd., Sponsored ADR | | | 6,400 | | | | 94,016 | |
See notes to portfolios of investments and notes to financial statements.
105
China Region Fund
Portfolio of Investments | December 31, 2015 |
Common Stocks (cont’d) | | Shares | | | Value | |
| | | | | | | |
Semiconductor Components - Integrated Circuits 0.98% | |
Taiwan Semiconductor Manufacturing Co., Ltd., Sponsored ADR | | | 7,000 | | | $ | 159,250 | |
| | | | | | | | | |
Semiconductor Equipment 0.12% | |
Wonik IPS Co., Ltd. | | | 2,100 | | | | 20,026 | * |
| | | | | | | | | |
Shipbuilding 0.10% | |
Yangzijiang Shipbuilding Holdings Ltd. | | | 21,000 | | | | 16,224 | |
| | | | | | | | | |
Telecom Services 0.24% | |
Globe Telecom, Inc. | | | 990 | | | | 38,890 | |
| | | | | | | | | |
Telecommunication Equip 1.24% | |
ZTE Corp., H shares | | | 88,400 | | | | 200,676 | |
| | | | | | | | | |
Textile - Apparel 3.01% | |
Shenzhou International Group Holdings Ltd. | | | 85,000 | | | | 487,116 | |
| | | | | | | | | |
Therapeutics 0.10% | |
Dawnrays Pharmaceutical (Holdings) Ltd. | | | 20,000 | | | | 15,496 | |
| | | | | | | | | |
Tobacco 0.73% | |
KT&G Corp. | | | 1,330 | | | | 118,191 | * |
| | | | | | | | | |
Water Treatment Systems 2.16% | |
CT Environmental Group Ltd. | | | 1,072,000 | | | | 349,476 | |
| |
Total Common Stocks | | | | 14,351,603 | |
(cost $14,647,912) | | | | | | | | |
| | | | | | | | | |
Exchange-Traded Funds 1.66% | | | | | | | | |
| | | | | | | | | |
iShares MSCI Philippines ETF | | | 2,500 | | | | 84,350 | |
Deutsche X-trackers Harvest CSI 300 China A-Shares ETF | | | 1,600 | | | | 44,784 | |
Direxion Daily FTSE China Bull 3X Shares | | | 3,700 | | | | 65,638 | |
Market Vectors Vietnam ETF | | | 5,000 | | | | 73,950 | |
| |
Total Exchange-Traded Funds | | | | 268,722 | |
(cost $367,604) | | | | | | | | |
See notes to portfolios of investments and notes to financial statements.
106
China Region Fund
Portfolio of Investments | December 31, 2015 |
Purchased Call Options 0.06% | | Contracts | | | Value | |
| | | | | | | |
Exchange-Traded Fund 0.03% | |
PowerShares DB US Dollar Index Bullish Fund, Strike Price 25, Expiration Mar. 2016 | | | 50 | | | $ | 3,825 | * |
| | | | | | | | | |
Cellular Telecommunication 0.03% | |
China Mobile Ltd., Strike Price 60, Expiration Jan. 2016 | | | 200 | | | | 5,000 | * |
| |
Total Purchased Call Options | | | | 8,825 | |
(cost $90,420) | | | | | | | | |
| |
Total Investments 90.40% | | | | 14,629,150 | |
(cost $15,105,936) | | | | | | | | |
Other assets and liabilities, net 9.60% | | | | | | | 1,554,179 | |
| | | | | | | | | |
Net Assets 100.0% | | | | | | $ | 16,183,329 | |
See notes to portfolios of investments and notes to financial statements.
107
Notes to Portfolios of Investments | December 31, 2015 |
Legend
* | Non-income producing security. |
+ | Affiliated company (see following) |
# | Illiquid Security |
^ | In default on interest and/or principal payments. Rate shown represents the last coupon rate prior to default. |
ADR | American Depositary Receipt |
AGC | Assured Guaranty Corporation |
AGM | Assured Guaranty Municipal |
AMBAC | American Municipal Bond Assurance Corporation |
BAM | Build America Mutual Assurance Company |
| BHAC | Berkshire Hathaway Assurance Corporation |
CIFG | CIFG Assurance North America Incorporated |
| FGIC | Financial Guaranty Insurance Company |
| GDR | Global Depositary Receipt |
| GO | General Obligation Bond |
| NATL | National Public Finance Guarantee Corporation |
| PSF-GTD | Texas Public School Fund Guarantee |
| RS | Restricted Security (see following) |
| XLCA | XL Capital Assurance |
| ZCB | Zero Coupon Bond |
@ | Security was fair valued at December 31, 2015, by U.S. Global Investors, Inc. (Adviser) (other than international securities fair valued pursuant to systematic fair value models) in accordance with valuation procedures approved by the Board of Trustees. These securities, as a percentage of net assets at December 31, 2015, were 0.04% of All American Equity Fund, 1.83% of Holmes Macro Trends Fund, 13.73% of Global Resources Fund, 5.78% of World Precious Minerals Fund, 5.72% of Gold and Precious Fund, 0.14% of Emerging Europe Fund and 1.44% of China Region Fund, respectively. See the Fair Valuation of Securities section of these Notes to Portfolios of Investments for further discussion of fair valued securities. See further information and detail on restricted securities in the Restricted Securities section of these Notes to Portfolios of Investments. |
144A | Pursuant to Rule 144A of the Securities Act of 1933, these securities may be resold in transactions exempt from registration, normally to qualified institutional buyers. |
General
The yields reflect the effective yield from the date of purchase.
Variable Rate Notes have periodic reset features, which effectively shorten the maturity dates and reset the interest rates as tied to various interest-bearing instruments. Rates shown are current rates at December 31, 2015.
Principal amounts are in U.S. dollars unless otherwise noted.
Fair Valuation of Securities
For the Funds’ policies regarding the valuation of investments and other significant accounting policies, please refer to the Notes to Financial Statements.
The Funds are required to disclose information regarding the fair value measurements of a Fund’s assets and liabilities. Fair value is the price that would be received to sell an asset or paid to transfer a liability in an orderly transaction between market participants at the measurement date. The measurement requirements established a three-tier hierarchy to maximize the use of observable market data and minimize the use of unobservable inputs and to establish classification of fair value measurements for disclosure purposes. Inputs refer broadly to the assumptions that market participants would use in pricing the asset or liability, including assumptions about risk, for example, the risk inherent in a particular valuation technique used to measure
108
Notes to Portfolios of Investments | December 31, 2015 |
fair value including such a pricing model and/or the risk inherent in the inputs to the valuation technique. Inputs may be observable or unobservable. Observable inputs are inputs that reflect the assumptions market participants would use in pricing the asset or liability developed based on market data obtained from sources independent of the reporting entity. Unobservable inputs are inputs that reflect the reporting entity’s own assumptions about the assumptions market participants would use in pricing the asset or liability developed based on the best information available in the circumstances.
The inputs or methodology used for valuing securities are not necessarily an indication of the risk associated with investing in those securities. For example, short term U.S. government obligations maturing in sixty days or less are valued using amortized cost. Generally, amortized cost reflects the current fair value of a security, but since the value is not obtained from a quoted price in an active market, such securities are reflected as Level 2. Because of the inherent uncertainties of valuation, the values reflected in the portfolios may materially differ from the values received upon actual sale of those investments.
The three levels defined by the fair value hierarchy are as follows:
Level 1 – Quoted prices in active markets for identical securities.
Level 2 – Prices determined using significant other observable inputs (including quoted prices for similar securities, interest rates, prepayment speeds, credit risk, etc.). Short-term securities with maturities of sixty days or less are valued at amortized cost, which approximates market value, and are categorized as Level 2 in the hierarchy. Municipal securities, long-term U.S. government obligations and corporate debt securities are valued in accordance with the evaluated price supplied by the pricing service and generally categorized as Level 2 in the hierarchy. Other securities that are categorized as Level 2 in the hierarchy include, but are not limited to, warrants that do not trade on an exchange, securities valued at the mean between the last reported bid and ask quotation and international equity securities valued by an independent third party in order to adjust for stale pricing.
Level 3 – Prices determined using significant unobservable inputs (including the Fund’s own assumptions). For restricted equity securities and private placements where observable inputs are limited, assumptions about market activity and risk are used in determining fair value.
The following table summarizes the valuation of each Fund’s securities as of December 31, 2015, using the fair value hierarchy:
| | Quoted Prices in Active Markets for Identical Investments (Level 1) | | | Significant Other Observable Inputs (Level 2) | | | Significant Unobservable Inputs
(Level 3) | | | Total | |
U.S. Government Securities Ultra-Short Bond Fund | | | | | | | |
Investments in Securities* | | | | | | | | | | | | |
United States Government and Agency Obligations | | $ | — | | | $ | 55,335,760 | | | $ | — | | | $ | 55,335,760 | |
Total | | $ | — | | | $ | 55,335,760 | | | $ | — | | | $ | 55,335,760 | |
109
Notes to Portfolios of Investments | December 31, 2015 |
| | Quoted Prices in Active Markets for Identical Investments (Level 1) | | | Significant Other Observable Inputs (Level 2) | | | Significant Unobservable Inputs
(Level 3) | | | Total | |
Near-Term Tax Free Fund | | | | | | | | | | | | |
Investments in Securities* | | | | | | | | | | | | |
Municipal Bonds | | $ | — | | | $ | 95,515,935 | | | $ | — | | | $ | 95,515,935 | |
Total | | $ | — | | | $ | 95,515,935 | | | $ | — | | | $ | 95,515,935 | |
All American Equity Fund | | | | | | | | | | | | | | | | |
Investments in Securities* | | | | | | | | | | | | | | | | |
Common Stocks | | $ | 18,718,368 | | | $ | — | | | $ | — | | | $ | 18,718,368 | |
Rights | | | — | | | | — | | | | 7,659 | | | | 7,659 | |
Total | | $ | 18,718,368 | | | $ | — | | | $ | 7,659 | | | $ | 18,726,027 | |
Holmes Macro Trends Fund | | | | | | | | | | | | | | | | |
Investments in Securities* | | | | | | | | | | | | | | | | |
Common Stocks: | | | | | | | | | | | | | | | | |
Energy - Alternate Sources | | $ | — | | | $ | — | | | $ | 29,610 | | | $ | 29,610 | |
Medical - Hospitals | | | — | | | | — | | | | — | | | | — | |
Real Estate Operating/Development | | | — | | | | — | | | | 319,900 | | | | 319,900 | |
All Other Common Stocks | | | 36,232,143 | | | | — | | | | — | | | | 36,232,143 | |
Warrants | | | — | | | | 7 | | | | — | | | | 7 | |
Purchased Call Option | | | — | | | | 800 | | | | — | | | | 800 | |
Gold-Linked Notes | | | — | | | | — | | | | 190,575 | | | | 190,575 | |
Silver-Linked Notes | | | — | | | | 167,480 | | | | — | | | | 167,480 | |
Corporate Note | | | — | | | | — | | | | 212,500 | | | | 212,500 | |
Total | | $ | 36,232,143 | | | $ | 168,287 | | | $ | 752,585 | | | $ | 37,153,015 | |
Global Resources Fund | | | | | | | | | | | | | | | | |
Investments in Securities* | | | | | | | | | | | | | | | | |
Common Stocks: | | | | | | | | | | | | | | | | |
Agricultural Chemicals | | $ | 3,625,570 | | | $ | 1,282,595 | | | $ | — | | | $ | 4,908,165 | |
Agricultural Operations | | | 784,952 | | | | 1,060,946 | | | | — | | | | 1,845,898 | |
Coal | | | — | | | | 201,130 | | | | — | | | | 201,130 | |
Diamonds/Precious Stones | | | 452,699 | | | | 25,578 | | | | — | | | | 478,277 | |
Diversified Minerals | | | 431,135 | | | | 22,242 | | | | — | | | | 453,377 | |
Energy - Alternate Sources | | | 970,053 | | | | — | | | | 710,640 | | | | 1,680,693 | |
Forestry | | | 1,739,467 | | | | 6,895 | | | | — | | | | 1,746,362 | |
Gold Mining | | | 9,753,399 | | | | — | | | | 219 | | | | 9,753,618 | |
Medical - Hospitals | | | — | | | | — | | | | — | | | | — | |
Metal - Diversified | | | 2,965,856 | | | | 26,440 | | | | — | | | | 2,992,296 | |
Metal - Iron | | | 5,285 | | | | 12,647 | | | | — | | | | 17,932 | |
Mining Services | | | — | | | | — | | | | 320,627 | | | | 320,627 | |
Natural Resource Technology | | | — | | | | — | | | | 137,351 | | | | 137,351 | |
Non - Ferrous Metals | | | 32,237 | | | | 6,250 | | | | — | | | | 38,487 | |
Oil - Field Services | | | 1,407,152 | | | | 348,087 | | | | — | | | | 1,755,239 | |
Oil Companies - Exploration & Production | | | 4,077,964 | | | | 175,437 | | | | — | | | | 4,253,401 | |
Power Converters/Supply Equipment | | | — | | | | 239,681 | | | | — | | | | 239,681 | |
Real Estate Operating/Development | | | — | | | | — | | | | 5,582,658 | | | | 5,582,658 | |
110
Notes to Portfolios of Investments | December 31, 2015 |
| | Quoted Prices in Active Markets for Identical Investments (Level 1) | | | Significant Other Observable Inputs
(Level 2) | | | Significant Unobservable Inputs
(Level 3) | | | Total | |
Global Resources Fund (cont’d) | | | | | | | | | | | | |
Investments in Securities* (cont’d) | | | | | | | | | | | | |
Common Stocks: (cont’d) | | | | | | | | | | | | |
Steel - Producers | | $ | 178,700 | | | $ | 125,324 | | | $ | — | | | $ | 304,024 | |
All Other Common Stocks | | | 43,349,069 | | | | — | | | | — | | | | 43,349,069 | |
Exchange-Traded Fund | | | 1,036,300 | | | | — | | | | — | | | | 1,036,300 | |
Warrants: | | | | | | | | | | | | | | | | |
Gold Mining | | | 68,661 | | | | 37,281 | | | | — | | | | 105,942 | |
Metal - Copper | | | — | | | | — | | | | — | | | | — | |
Metal - Iron | | | — | | | | — | | | | — | | | | — | |
Purchased Call Option | | | — | | | | 247,500 | | | | — | | | | 247,500 | |
Gold-Linked Notes | | | — | | | | — | | | | 4,428,765 | | | | 4,428,765 | |
Silver-Linked Notes | | | — | | | | 2,648,475 | | | | — | | | | 2,648,475 | |
Corporate Note | | | — | | | | — | | | | 2,550,000 | | | | 2,550,000 | |
Total | | $ | 70,878,499 | | | $ | 6,466,508 | | | $ | 13,730,260 | | | $ | 91,075,267 | |
World Precious Minerals Fund | | | | | | | | | | | | | | | | |
Investments in Securities* | | | | | | | | | | | | | | | | |
Common Stocks: | | | | | | | | | | | | | | | | |
Agricultural Operations | | $ | — | | | $ | 308,878 | | | $ | — | | | $ | 308,878 | |
Capital Pools | | | — | | | | 4,336 | | | | — | | | | 4,336 | |
Coal | | | — | | | | 107,618 | | | | — | | | | 107,618 | |
Diamonds/Precious Stones | | | 1,527,915 | | | | 217,601 | | | | — | | | | 1,745,516 | |
Diversified Minerals | | | 728,534 | | | | 124,729 | | | | 17,489 | | | | 870,752 | |
Gold Mining | | | 43,088,138 | | | | 4,478,394 | | | | 54,524 | | | | 47,621,056 | |
Medical - Hospitals | | | — | | | | — | | | | — | | | | — | |
Metal - Diversified | | | 5,515,937 | | | | 991,975 | | | | — | | | | 6,507,912 | |
Mining Services | | | 49,144 | | | | 301,699 | | | | — | | | | 350,843 | |
Oil Companies - Exploration & Production | | | — | | | | — | | | | — | | | | — | |
Precious Metals | | | 5,425,730 | | | | 149,541 | | | | — | | | | 5,575,271 | |
All Other Common Stocks | | | 1,907,188 | | | | — | | | | — | | | | 1,907,188 | |
Exchange Traded Funds | | | 428 | | | | — | | | | — | | | | 428 | |
Warrants: | | | | | | | | | | | | | | | | |
Diamonds/Precious Stones | | | — | | | | 6,558 | | | | — | | | | 6,558 | |
Diversified Minerals | | | — | | | | 6,376 | | | | — | | | | 6,376 | |
Gold Mining | | | 32,124 | | | | 604,611 | | | | — | | | | 636,735 | |
Metal - Copper | | | — | | | | — | | | | — | | | | — | |
Metal - Diversified | | | — | | | | 133,772 | | | | — | | | | 133,772 | |
Precious Metals | | | — | | | | — | | | | — | | | | — | |
Silver Mining | | | — | | | | — | | | | — | | | | — | |
Special Warrant | | | — | | | | — | | | | — | | | | — | |
Rights | | | 62,850 | | | | — | | | | — | | | | 62,850 | |
Purchased Call Options | | | — | | | | 111,983 | | | | — | | | | 111,983 | |
Gold-Linked Notes | | | — | | | | — | | | | 2,999,700 | | | | 2,999,700 | |
Silver-Linked Notes | | | — | | | | 3,477,975 | | | | — | | | | 3,477,975 | |
Corporate Note | | | — | | | | — | | | | 680,000 | | | | 680,000 | |
Total | | $ | 58,337,988 | | | $ | 11,026,046 | | | $ | 3,751,713 | | | $ | 73,115,747 | |
111
Notes to Portfolios of Investments | December 31, 2015 |
| | Quoted Prices in Active Markets for Identical Investments (Level 1) | | | Significant Other Observable Inputs
(Level 2) | | | Significant Unobservable Inputs
(Level 3) | | | Total | |
Gold and Precious Metals Fund | | | | | | | | | | | | |
Investments in Securities* | | | | | | | | | | | | |
Common Stocks: | | | | | | | | | | | | |
Diamonds/Precious Stones | | $ | 650,430 | | | $ | 352,724 | | | $ | — | | | $ | 1,003,154 | |
Gold Mining | | | 32,600,729 | | | | 7,682,142 | | | | — | | | | 40,282,871 | |
Medical - Hospitals | | | — | | | | — | | | | — | | | | — | |
Silver Mining | | | 1,255,086 | | | | 1,039,718 | | | | — | | | | 2,294,804 | |
All Other Common Stocks | | | 2,958,071 | | | | — | | | | — | | | | 2,958,071 | |
Exchange Traded Funds | | | 428 | | | | — | | | | — | | | | 428 | |
Warrants | | | — | | | | 251,542 | | | | — | | | | 251,542 | |
Purchased Call Options | | | — | | | | 30,140 | | | | — | | | | 30,140 | |
Gold-Linked Notes | | | — | | | | — | | | | 1,517,175 | | | | 1,517,175 | |
Silver-Linked Notes | | | — | | | | 1,826,085 | | | | — | | | | 1,826,085 | |
Corporate Notes | | | — | | | | — | | | | 740,766 | | | | 740,766 | |
Total | | $ | 37,464,744 | | | $ | 11,182,351 | | | $ | 2,257,941 | | | $ | 50,905,036 | |
Emerging Europe Fund | | | | | | | | | | | | | | | | |
Investments in Securities* | | | | | | | | | | | | | | | | |
Common Stocks: | | | | | | | | | | | | | | | | |
Agricultural Chemicals | | $ | 267,802 | | | $ | 223,088 | | | $ | — | | | $ | 490,890 | |
Airlines | | | 328,721 | | | | 1,942,371 | | | | — | | | | 2,271,092 | |
Cellular Telecommunication | | | 868,441 | | | | 605,200 | | | | — | | | | 1,473,641 | |
Commercial Banks - Non US | | | 1,661,310 | | | | 5,141,530 | | | | — | | | | 6,802,840 | |
Computer Services | | | 316,233 | | | | 503,686 | | | | — | | | | 819,919 | |
Metal - Diversified | | | 827,149 | | | | 241,953 | | | | — | | | | 1,069,102 | |
Oil Companies - Integrated | | | 1,101,585 | | | | 4,605,106 | | | | — | | | | 5,706,691 | |
All Other Common Stocks | | | — | | | | 20,827,916 | | | | — | | | | 20,827,916 | |
Exchange Traded Fund | | | 303,338 | | | | — | | | | — | | | | 303,338 | |
Purchased Call Option | | | — | | | | 138,000 | | | | — | | | | 138,000 | |
Corporate Note | | | — | | | | — | | | | 60,525 | | | | 60,525 | |
Total | | $ | 5,674,579 | | | $ | 34,228,850 | | | $ | 60,525 | | | $ | 39,963,954 | |
China Region Fund | | | | | | | | | | | | | | | | |
Investments in Securities* | | | | | | | | | | | | | | | | |
Common Stocks: | | | | | | | | | | | | | | | | |
E-Commerce/Services | | $ | 48,035 | | | $ | — | | | $ | — | | | $ | 48,035 | |
Electronic Components - Semiconductors | | | 58,060 | | | | 154,743 | | | | — | | | | 212,803 | |
Energy - Alternate Sources | | | 107,152 | | | | 105,993 | | | | — | | | | 213,145 | |
Entertainment Software | | | 54,372 | | | | — | | | | — | | | | 54,372 | |
Internet Content - Entertainment | | | 49,976 | | | | 124,515 | | | | — | | | | 174,491 | |
Investment Management/Advisory Services | | | 159,201 | | | | 101,124 | | | | — | | | | 260,325 | |
Non - Ferrous Metals | | | 1,734 | | | | 6,250 | | | | — | | | | 7,984 | |
Oil Companies - Integrated | | | 41,986 | | | | — | | | | — | | | | 41,986 | |
Real Estate Management/Services | | | 6,883 | | | | — | | | | — | | | | 6,883 | |
Real Estate Operating/Development | | | — | | | | 1,163,863 | | | | 233,670 | | | | 1,397,533 | |
Schools | | | 94,016 | | | | — | | | | — | | | | 94,016 | |
112
Notes to Portfolios of Investments | December 31, 2015 |
| | Quoted Prices in Active Markets for Identical Investments (Level 1) | | | Significant Other Observable Inputs
(Level 2) | | | Significant Unobservable Inputs
(Level 3) | | | Total | |
China Region Fund (cont’d) | | | | | | | | | | | | |
Investments in Securities* (cont’d) | | | | | | | | | | | | |
Common Stocks: (cont’d) | | | | | | | | | | | | |
Semiconductor Components - Integrated Circuits | | $ | 159,250 | | | $ | — | | | $ | — | | | $ | 159,250 | |
All Other Common Stocks | | | — | | | | 11,680,780 | | | | — | | | | 11,680,780 | |
Exchange Traded Funds | | | 268,722 | | | | — | | | | — | | | | 268,722 | |
Purchased Call Options | | | — | | | | 8,825 | | | | — | | | | 8,825 | |
Total | | $ | 1,049,387 | | | $ | 13,346,093 | | | $ | 233,670 | | | $ | 14,629,150 | |
* | Refer to the Portfolio of Investments for a detailed list of the Fund’s investments. |
The following table shows transfers between Level 1 and Level 2 of the fair value hierarchy during the period January 1, 2015, through December 31, 2015:
Fund | | Transfers From Level 1 to Level 2* | | | Transfers From Level 2 to Level 1* | |
Global Resources | | $ | 118,618 | (1) | | $ | 68,661 | (2) |
World Precious Minerals | | | 310,685 | (1) | | | 26,256 | (2) |
| | | | 1,246,144 | (3) | | | — | |
Emerging Europe | | | 316,877 | (3) | | | — | |
China Region | | | 6,250 | (1) | | | — | |
* | The Funds’ policy is to recognize transfers in and transfers out as of the end of the reporting period. |
(1) | Securities were valued at the mean between bid and ask quotations at the end of the current period, but at a quoted price at the end of the prior fiscal year. |
(2) | Securities were valued at a quoted price at the end of the current period, but at the mean between bid and ask quotations at the end of the prior fiscal year. |
(3) | Securities were valued using a foreign fair value adjustment factor at the end of the current period, but at a quoted price at the end of the prior fiscal year. |
The following is a reconciliation of assets for which unobservable inputs (Level 3) were used in determining fair value during the period January 1, 2015, through December 31, 2015:
| | Rights | | | Total | |
All American Equity Fund | | | | | | |
Beginning Balance 12/31/14 | | $ | — | | | $ | — | |
Purchases | | | 7,659 | | | | 7,659 | |
Ending Balance 12/31/15 | | $ | 7,659 | | | $ | 7,659 | |
| | | | | | | | | |
Net change in unrealized appreciation (depreciation) from Investments held as of 12/31/15(1) | | $ | — | | | $ | — | |
113
Notes to Portfolios of Investments | December 31, 2015 |
| | Common
Stocks | | | Gold-Linked Notes | | | Corporate
Note | | | Total | |
Holmes Macro Trends Fund | | | | | | | | | | | | |
Beginning Balance 12/31/14 | | $ | 1,380,287 | | | $ | — | | | $ | 237,500 | | | $ | 1,617,787 | |
Sales | | | (582,951 | ) | | | — | | | | — | | | | (582,951 | ) |
Total realized gain (loss) | | | (340,424 | ) | | | — | | | | — | | | | (340,424 | ) |
Net change in unrealized appreciation (depreciation) | | | (107,402 | ) | | | — | | | | — | | | | (107,402 | ) |
Paydowns/Maturities | | | — | | | | — | | | | (25,000 | ) | | | (25,000 | ) |
Transfers into Level 3* | | | — | | | | 190,575 | | | | — | | | | 190,575 | |
Ending Balance 12/31/15 | | $ | 349,510 | | | $ | 190,575 | | | $ | 212,500 | | | $ | 752,585 | |
| | | | | | | | | | | | | | | | | |
Net change in unrealized appreciation (depreciation) from Investments held as of 12/31/15(1) | | $ | (89,757 | ) | | $ | — | | | $ | — | | | $ | (89,757 | ) |
| | Common
Stocks | | | Gold-Linked Notes | | | Corporate Note | | | Total | |
Global Resources Fund | | | | | | | | | | | | |
Beginning Balance 12/31/14 | | $ | 16,029,746 | | | $ | — | | | $ | 2,850,000 | | | $ | 18,879,746 | |
Sales | | | (4,390,632 | ) | | | — | | | | — | | | | (4,390,632 | ) |
Total realized gain (loss) | | | (834,498 | ) | | | — | | | | — | | | | (834,498 | ) |
Net change in unrealized appreciation (depreciation) | | | (4,053,121 | ) | | | — | | | | — | | | | (4,053,121 | ) |
Paydowns/Maturities | | | — | | | | — | | | | (300,000 | ) | | | (300,000 | ) |
Transfers into Level 3* | | | — | | | | 4,428,765 | | | | — | | | | 4,428,765 | |
Ending Balance 12/31/15 | | $ | 6,751,495 | | | $ | 4,428,765 | | | $ | 2,550,000 | | | $ | 13,730,260 | |
| | | | | | | | | | | | | | | | | |
Net change in unrealized appreciation (depreciation) from Investments held as of 12/31/15(1) | | $ | (1,628,699 | ) | | $ | — | | | $ | — | | | $ | (1,628,699 | ) |
| | Common Stocks | | | Warrants | | | Special Warrants | | | Gold-Linked Notes | | | Corporate Note | | | Total | |
World Precious Minerals Fund | |
Beginning Balance 12/31/14 | | $ | 1,418,548 | | | $ | — | | | $ | — | | | $ | — | | | $ | 760,000 | | | $ | 2,178,548 | |
Sales | | | (24,829 | ) | | | — | | | | — | | | | — | | | | — | | | | (24,829 | ) |
Total realized gain (loss) | | | (353,342 | ) | | | — | | | | — | | | | — | | | | — | | | | (353,342 | ) |
Net change in unrealized appreciation (depreciation) | | | (985,853 | ) | | | — | | | | — | | | | — | | | | — | | | | (985,853 | ) |
Paydowns/Maturities | | | — | | | | — | | | | — | | | | — | | | | (80,000 | ) | | | (80,000 | ) |
Transfers into Level 3* | | | 17,489 | | | | — | | | | — | | | | 2,999,700 | | | | — | | | | 3,017,189 | |
Ending Balance 12/31/15 | | $ | 72,013 | | | $ | — | | | $ | — | | | $ | 2,999,700 | | | $ | 680,000 | | | $ | 3,751,713 | |
| | | | | | | | | | | | | | | | | | | | | | | | | |
Net change in unrealized appreciation (depreciation) from Investments held as of 12/31/15(1) | | $ | (1,148,841 | ) | | $ | — | | | $ | — | | | $ | — | | | $ | — | | | $ | (1,148,841 | ) |
114
Notes to Portfolios of Investments | December 31, 2015 |
| | Common Stocks | | | Warrants | | | Gold-Linked Notes | | | Corporate
Note | | | Total | |
Gold and Precious Metals Fund | | | | | | | | | | | | | | | |
Beginning Balance 12/31/14 | | $ | — | | | $ | — | | | $ | — | | | $ | 770,766 | | | $ | 770,766 | |
Paydowns/Maturities | | | — | | | | — | | | | — | | | | (30,000 | ) | | | (30,000 | ) |
Transfers into Level 3* | | | — | | | | — | | | | 1,517,175 | | | | — | | | | 1,517,175 | |
Ending Balance 12/31/15 | | $ | — | | | $ | — | | | $ | 1,517,175 | | | $ | 740,766 | | | $ | 2,257,941 | |
| | | | | | | | | | | | | | | | | | | | | |
Net change in unrealized appreciation (depreciation) from Investments held as of 12/31/15(1) | | $ | — | | | $ | — | | | $ | — | | | $ | — | | | $ | — | |
| | Corporate Note | | | Total | |
Emerging Europe Fund | | | | | | |
Beginning Balance 12/31/14 | | $ | — | | | $ | — | |
Transfers into Level 3* | | | 60,525 | | | | 60,525 | |
Ending Balance 12/31/15 | | $ | 60,525 | | | $ | 60,525 | |
| | | | | | | | | |
Net change in unrealized appreciation (depreciation) from Investments held as of 12/31/15(1) | | $ | — | | | $ | — | |
| | Common Stocks | | | Total | |
China Region Fund | | | | | | |
Beginning Balance 12/31/14 | | $ | — | | | $ | — | |
Transfers into Level 3* | | | 233,670 | | | | 233,670 | |
Ending Balance 12/31/15 | | $ | 233,670 | | | $ | 233,670 | |
| | | | | | | | | |
Net change in unrealized appreciation (depreciation) from Investments held as of 12/31/15(1) | | $ | — | | | $ | — | |
* | The Funds’ policy is to recognize transfers in and transfers out as of the end of the reporting period. |
(1) | The amounts shown represent the net change in unrealized appreciation (depreciation) attributable to only those investments still held and classified as Level 3 at December 31, 2015. |
115
Notes to Portfolios of Investments | December 31, 2015 |
Significant unobservable inputs developed by the Valuation Committee for Level 3 investments held at December 31, 2015, are as follows:
| | Fair Value at 12/31/15 | | Valuation Technique(s) | Unobservable
Input | | Range
(Weighted Average) | |
All American Equity Fund | | | | | | |
Investments in Securities | | | | | | |
Rights | | $ | 7,659 | | Market Transaction (1) | Discount | | 0% | |
| | | | | | | | | | |
Holmes Macro Trends Fund | | | | | | |
Investments in Securities | | | | | | |
Common Stocks | | | 29,610 | | Market Transaction (1) | Discount | | 70% - 100% discount (71% discount) | |
Common Stocks | | | 319,900 | | Method of Comparables Pricing (2) | Multiples | | 4.1 - 12.3(6.3) | |
Gold-Linked Notes | | | 190,575 | | Market Transaction (1) | Discount | | 22% - 51% discount (50% discount) | |
Corporate Note | | | 212,500 | | Market Transaction (1) | Discount | | 0% | |
| | | | | | | | | | |
Global Resources Fund | | | | | | |
Investments in Securities | | | | | | |
Common Stocks | | | 1,168,837 | | Market Transaction (1) | Discount | | 0% - 100% discount (67% discount) | |
Common Stocks | | | 5,582,658 | | Method of Comparables Pricing (2) | Multiples | | 4.1 - 12.3(6.3) | |
Gold-Linked Notes | | | 4,428,765 | | Market Transaction (1) | Discount | | 21% - 51% discount (50% discount) | |
Corporate Note | | | 2,550,000 | | Market Transaction (1) | Discount | | 0% | |
| | | | | | | | | | |
World Precious Minerals Fund | | | | | | |
Investments in Securities | | | | | | |
Common Stocks | | | 72,013 | | Market Transaction (1) | Discount | | 0% - 100% discount (96% discount) | |
Warrants | | | — | | Market Transaction (1) | Discount | | 100% | |
Special Warrants | | | — | | Market Transaction (1) | Discount | | 100% | |
Gold-Linked Notes | | | 2,999,700 | | Market Transaction (1) | Discount | | 20% - 51% discount (50% discount) | |
Corporate Note | | | 680,000 | | Market Transaction (1) | Discount | | 0% | |
| | | | | | | | | | |
Gold and Precious Metals Fund | | | | | | |
Investments in Securities | | | | | | |
Common Stocks | | | — | | Market Transaction (1) | Discount | | 100% | |
Warrants | | | — | | Market Transaction (1) | Discount | | 100% | |
Gold-Linked Notes | | | 1,517,175 | | Market Transaction (1) | Discount | | 22% - 51% discount (50% discount) | |
Corporate Notes | | | 740,766 | | Market Transaction (1) | Discount | | 0% | |
| | | | | | | | | | |
Emerging Europe Fund | | | | | | |
Investments in Securities | | | | | | |
Corporate Note | | | 60,525 | | Market Transaction (1) | Discount | | 96% | |
116
Notes to Portfolios of Investments | December 31, 2015 |
| | Fair Value at 12/31/15 | | Valuation Technique(s) | Unobservable Input | | Range
(Weighted Average) | |
China Region Fund | | | | | | |
Investments in Securities | | | | | | |
Common Stocks | | $ | 233,670 | | Market Transaction (1) | Discount | | 0% | |
(1) | Market Transaction refers to most recent known market transaction, including transactions in which the fund participated, as adjusted for any discount or premium as discussed below. |
(2) | The Method of Comparables Pricing valuation technique involves determining a comparable group of companies that exhibit similar characteristics to that of the Level 3 security (the Comparables), gathering information about the Comparables to determine their range of valuation multiples and selecting the appropriate multiple within the determined range of the Comparables to apply in valuing the Level 3 security. |
The majority of securities classified as Level 3 are private companies. The initial valuation is usually cost, which is then adjusted as determined by the Valuation Committee for subsequent known market transactions and evaluated for progress against anticipated milestones and current operations. An evaluation that the holding no longer meets expectations could result in the application of discounts and a significantly lower fair valuation. For certain securities, the last known market transaction is increased or decreased by changes in a market index or industry peers as approved by the Valuation Committee.
Affiliated Companies - Indicated in Portfolio of Investments as “+”
The Investment Company Act of 1940 defines affiliates as companies in which the Fund owns at least 5% of the outstanding voting securities. The following is a summary of transactions with each affiliated company during the year ended December 31, 2015.
| | | Shares of Affiliated Companies | |
Global Resources Fund | | December 31,
2014 | | | Additions | | | Reductions | | | December 31,
2015 | |
Agriterra Ltd. | | | 69,849,776 | | | | — | | | | — | | | | 69,849,776 | |
Atlas Development & Support Services Ltd. | | | 67,534,983 | | | | — | | | | (24,541,900 | ) | | | 42,993,083 | |
Pacific Coal Resources Ltd. | | | 4,362,314 | | | | — | | | | — | | | | 4,362,314 | |
Pacific Green Energy Corp. | | | 2,400,000 | | | | — | | | | — | | | | 2,400,000 | |
Pacific Stone Tech, Inc. | | | 22,659 | | | | — | | | | (22,659 | ) | | | — | (a) |
Sunridge Gold Corp. | | | 10,933,788 | | | | — | | | | — | | | | 10,933,788 | |
Sunridge Gold Corp., Warrants | | | 6,333,788 | | | | — | | | | — | | | | 6,333,788 | |
At December 31, 2015, the value of investments in affiliated companies was $3,891,787, representing 3.89% of net assets, and the total cost was $40,698,882. Net realized losses on transactions were $3,768,548, and there was no income earned for the year.
117
Notes to Portfolios of Investments | December 31, 2015 |
| | | Shares of Affiliated Companies | |
World Precious Minerals Fund | | December 31,
2014 | | | Additions | | | Reductions | | | December 31,
2015 | |
Argent Minerals Ltd. | | | 7,100,000 | | | | 10,000,000 | | | | — | | | | 17,100,000 | |
Barsele Minerals Corp. | | | — | | | | 9,411,500 | | | | — | | | | 9,411,500 | |
Barsele Minerals Corp., Warrants | | | — | | | | 1,850,000 | | | | — | | | | 1,850,000 | |
Candente Gold Corp. | | | 5,640,000 | | | | — | | | | (765,000 | ) | | | 4,875,000 | |
Canyon Resources Ltd. | | | 10,006,593 | | | | — | | | | — | | | | 10,006,593 | |
Canyon Resources Ltd., Warrants | | | 6,168,864 | | | | — | | | | — | | | | 6,168,864 | |
Cardinal Resources Ltd. | | | 3,000,000 | | | | 6,000,000 | | | | — | | | | 9,000,000 | |
Cardinal Resources Ltd., Rights | | | 1,500,000 | | | | — | | | | — | | | | 1,500,000 | |
CB Gold, Inc. | | | 8,562,858 | | | | — | | | | (8,562,858 | ) | | | — | (a) |
Gran Colombia Gold Corp. | | | 1,224,762 | | | | 287 | | | | (980,802 | ) | | | 244,247 | (a) |
Gran Colombia Gold Corp., Warrants | | | 154,700 | | | | — | | | | — | | | | 154,700 | (a) |
Gran Colombia Gold Corp., Gold-Linked Notes | | | 6,060,000 | | | | — | | | | — | | | | 6,060,000 | (a) |
Gran Colombia Gold Corp., Silver-Linked Notes | | | 8,805,000 | | | | — | | | | — | | | | 8,805,000 | (a) |
Mammoth Resources Corp. | | | 3,641,800 | | | | 2,000,000 | | | | (2,823,800 | ) | | | 2,818,000 | |
Mineral Mountain Resources Ltd. | | | 11,000,000 | | | | 3,438,000 | | | | (4,438,000 | ) | | | 10,000,000 | |
Mineral Mountain Resources Ltd., Warrants | | | 3,500,000 | | | | — | | | | — | | | | 3,500,000 | |
Orex Minerals, Inc. | | | 8,614,500 | | | | 895,500 | | | | — | | | | 9,510,000 | |
Orex Minerals, Inc., Warrants | | | 1,850,000 | | | | — | | | | — | | | | 1,850,000 | |
Skeena Resources Ltd. | | | 10,088,000 | | | | — | | | | (6,088,000 | ) | | | 4,000,000 | (a) |
Skeena Resources Ltd., Warrants | | | 10,000,000 | | | | — | | | | — | | | | 10,000,000 | (a) |
Source Exploration Corp. | | | — | | | | 5,000,000 | | | | (25,000 | ) | | | 4,975,000 | |
Source Exploration Corp., Warrants | | | — | | | | 2,500,000 | | | | — | | | | 2,500,000 | |
TriStar Gold, Inc. | | | 8,100,000 | | | | 10,300,000 | | | | (406,000 | ) | | | 17,994,000 | |
Zandor Capital, S.A., Corporate Note (b) | | | — | | | | 600,000 | | | | (600,000 | ) | | | — | (a) |
At December 31, 2015, the value of investments in affiliated companies was $6,066,282, representing 7.75% of net assets, and the total cost was $9,626,413. Net realized losses on transactions were $2,406,673, and interest income of $89,511 was earned for the period.
(a) | At December 31, 2015, the company is no longer defined as an affiliate, although it was an affiliated company during the year. |
(b) | Zandor Capital, S.A. is a subsidiary of Gran Colombia Gold Corp. |
118
Notes to Portfolios of Investments | December 31, 2015 |
Restricted Securities - Indicated in Portfolio of Investments as “RS”
The following securities are subject to contractual and regulatory restrictions on resale or transfer. These investments may involve a high degree of business and financial risk. Because of the thinly traded markets for these investments, a Fund may be unable to liquidate its securities in a timely manner, especially if there is negative news regarding the specific securities or the markets overall. These securities could decline significantly in value before the Fund could liquidate these securities. The issuer bears the cost of registration, if any, involved in the disposition of these securities.
Holmes Macro Trends Fund | Acquisition
Date | | Cost per
Share/Unit | |
Pacific Green Energy Corp. | 03/24/11 | | $ | 1.00 | |
Pacific Infrastructure Ventures, Inc. | 08/06/10-11/22/10 | | $ | 1.00 | |
Pacific Power Generation Corp., Corporate Note (April 2017) | 05/25/12 | | $ | 100.00 | |
As of December 31, 2015, the total cost of restricted securities was $739,125, and the total value was $562,010, representing 1.37% of net assets.
Global Resources Fund | Acquisition
Date | | Cost per
Share/Unit | |
I-Pulse, Inc., 144A | 10/04/07 | | $ | 1.88 | |
Pacific Green Energy Corp. | 03/24/11 | | $ | 1.00 | |
Pacific Infrastructure Ventures, Inc. | 08/06/10-11/22/10 | | $ | 1.00 | |
Pacific Power Generation Corp., Corporate Note (April 2017) | 05/25/12 | | $ | 100.00 | |
As of December 31, 2015, the total cost of restricted securities was $12,423,544, and the total value was $8,980,649, representing 8.98% of net assets.
World Precious Minerals Fund | Acquisition
Date | | Cost per
Share/Unit | |
Lake Shore Gold Corp. | 11/06/15 | | $ | 0.81 | |
Pacific Power Generation Corp., Corporate Note (April 2017) | 05/25/12 | | $ | 100.00 | |
Taurus Gold Ltd., 144A | 05/31/11-05/29/13 | | $ | 1.17 | |
Western Exploration & Development Ltd., 144A, Special Warrants | 08/04/97 | | $ | 0.50 | |
As of December 31, 2015, the total cost of restricted securities was $4,659,621, and the total value was $1,495,227, representing 1.91% of net assets.
Gold and Precious Metals Fund | Acquisition
Date | | Cost per
Share/Unit | |
Lake Shore Gold Corp. | 11/06/15 | | $ | 0.81 | |
Pacific Coal S.A., Corporate Note (June 2015) | 12/15/14 | | $ | 100.00 | |
Pacific Power Generation Corp., Corporate Note (April 2017) | 05/25/12 | | $ | 100.00 | |
As of December 31, 2015, the total cost of restricted securities was $1,877,736, and the total value was $1,817,300, representing 3.12% of net assets.
119
Statements of Assets and Liabilities | |
| | | U.S. Government Securities
Ultra-Short Bond Fund | |
Investments, at identified cost | | $ | 55,308,219 | |
| | | | | |
Assets | | | | |
Investments, at value: | | | | |
Securities of unaffiliated issuers | | $ | 55,335,760 | |
Cash | | | 7,097,882 | |
Receivables: | | | | |
Dividends and interest | | | 109,139 | |
Capital shares sold | | | 89,247 | |
From adviser | | | 8,426 | |
Investments sold | | | — | |
Other assets | | | 8,730 | |
Total Assets | | | 62,649,184 | |
| | | | | |
Liabilities | | | | |
Payables: | | | | |
Capital shares redeemed | | | 40,801 | |
Adviser and affiliates | | | — | |
Investments purchased | | | — | |
Accounts payable and accrued expenses | | | 46,848 | |
Total Liabilities | | | 87,649 | |
| | | | | |
Net Assets | | $ | 62,561,535 | |
| | | | | |
Net Assets Consist of: | | | | |
Paid-in-capital | | $ | 62,532,643 | |
Accumulated undistributed net investment income | | | 11 | |
Accumulated net realized gains (losses) from investment transactions and other assets and liabilities denominated in foreign currencies | | | 1,340 | |
Net unrealized appreciation (depreciation) of investments and other assets and liabilities denominated in foreign currencies | | | 27,541 | |
Net assets applicable to capital shares outstanding | | $ | 62,561,535 | |
| | | | | |
By share class | | | | |
| | | | | |
Net Assets | | | | |
Investor Class | | $ | 62,561,535 | |
| | | | | |
Capital shares outstanding, an unlimited number of no par shares authorized | | | | |
Investor Class | | | 31,284,187 | |
| | | | | |
Net Asset Value, Public Offering Price, Redemption Price, per share | | | | |
Investor Class | | $ | 2.00 | |
* | Redemption price per share may vary depending on length of time shares are held. See Note 1 H. |
See accompanying notes to financial statements.
120
| | Near-Term
Tax Free Fund | | | All American Equity Fund | | | Holmes Macro Trends Fund | |
| | $ | 94,364,862 | | | $ | 18,145,480 | | | $ | 37,832,645 | |
| | | | | | | | | | | | |
| | | | | | | | | | | | |
| | | | | | | | | | | | |
| | $ | 95,515,935 | | | $ | 18,726,027 | | | $ | 37,153,015 | |
| | | 9,870,619 | | | | 416,982 | | | | 4,040,728 | |
| | | | | | | | | | | | |
| | | 1,050,783 | | | | 19,896 | | | | 18,002 | |
| | | 458,825 | | | | 2,504 | | | | 12,191 | |
| | | 27,302 | | | | — | | | | — | |
| | | — | | | | — | | | | 26,417 | |
| | | 10,579 | | | | 8,083 | | | | 8,939 | |
| | | 106,934,043 | | | | 19,173,492 | | | | 41,259,292 | |
| | | | | | | | | | | | |
| | | | | | | | | | | | |
| | | | | | | | | | | | |
| | | 104,170 | | | | 3,551 | | | | 18,205 | |
| | | — | | | | 11,420 | | | | 41,932 | |
| | | — | | | | — | | | | — | |
| | | 61,228 | | | | 41,217 | | | | 64,463 | |
| | | 165,398 | | | | 56,188 | | | | 124,600 | |
| | | | | | | | | | | | |
| | $ | 106,768,645 | | | $ | 19,117,304 | | | $ | 41,134,692 | |
| | | | | | | | | | | | |
| | | | | | | | | | | | |
| | $ | 105,941,147 | | | $ | 19,868,342 | | | $ | 39,170,506 | |
| | | 63,026 | | | | 27,175 | | | | 44 | |
| | | (386,601 | ) | | | (1,358,760 | ) | | | 2,643,772 | |
| | | 1,151,073 | | | | 580,547 | | | | (679,630 | ) |
| | $ | 106,768,645 | | | $ | 19,117,304 | | | $ | 41,134,692 | |
| | | | | | | | | | | | |
| | | | | | | | | | | | |
| | | | | | | | | | | | |
| | | | | | | | | | | | |
| | $ | 106,768,645 | | | $ | 19,117,304 | | | $ | 41,134,692 | |
| | | | | | | | | | | | |
| | | | | | | | | | | | |
| | | 47,522,372 | | | | 809,975 | | | | 2,212,463 | |
| | | | | | | | | | | | |
| | | | | | | | | | | | |
| | $ | 2.25 | | | $ | 23.60 | * | | $ | 18.59 | * |
121
Statements of Assets and Liabilities | |
| | | Global
Resources Fund | |
Investments, at identified cost | | $ | 180,728,144 | |
| | | | | |
Assets | | | | |
Investments, at value: | | | | |
Securities of unaffiliated issuers | | $ | 87,183,480 | |
Securities of affiliated issuers | | | 3,891,787 | |
Cash | | | 8,706,264 | |
Foreign currencies (Cost $31,841, $115,717, $6,173, $209,545 and $104,755) | | | 31,327 | |
Receivables: | | | | |
Dividends and interest | | | 146,936 | |
Capital shares sold | | | 19,995 | |
Investments sold | | | 1,114,833 | |
Other assets | | | 18,440 | |
Total Assets | | | 101,113,062 | |
| | | | | |
Liabilities | | | | |
Unrealized loss on forward foreign currency contracts | | | — | |
Payables: | | | | |
Capital shares redeemed | | | 203,646 | |
Adviser and affiliates | | | 69,524 | |
Investments purchased | | | 684,561 | |
Accounts payable and accrued expenses | | | 147,658 | |
Total Liabilities | | | 1,105,389 | |
| | | | | |
Net Assets | | $ | 100,007,673 | |
| | | | | |
Net Assets Consist of: | | | | |
Paid-in-capital | | $ | 644,470,242 | |
Accumulated undistributed net investment income (distributions in excess of net investment income)/accumulated net investment loss | | | 2,236,563 | |
Accumulated net realized losses from investment transactions and other assets and liabilities denominated in foreign currencies | | | (457,059,958 | ) |
Net unrealized depreciation of investments and other assets and liabilities denominated in foreign currencies | | | (89,639,174 | ) |
Net assets applicable to capital shares outstanding | | $ | 100,007,673 | |
| | | | | |
By share class | | | | |
| | | | | |
Net Assets | | | | |
Investor Class | | $ | 98,125,732 | |
Institutional Class | | | 1,881,941 | |
| | | | | |
Capital shares outstanding, an unlimited number of no par shares authorized | | | | |
Investor Class | | | 20,784,339 | |
Institutional Class | | | 396,849 | |
| | | | | |
Net Asset Value, Public Offering Price, Redemption Price, per share* | | | | |
Investor Class | | $ | 4.72 | |
Institutional Class | | | 4.74 | |
* | Redemption price per share may vary depending on length of time shares are held. See Note 1 H. |
See accompanying notes to financial statements.
122
| | World Precious Minerals Fund | | | Gold and Precious Metals Fund | | | Emerging Europe
Fund | | | China Region
Fund | |
| | $ | 169,928,391 | | | $ | 65,232,095 | | | $ | 47,003,007 | | | $ | 15,105,936 | |
| | | | | | | | | | | | | | | | |
| | | | | | | | | | | | | | | | |
| | | | | | | | | | | | | | | | |
| | $ | 67,049,465 | | | $ | 50,905,036 | | | $ | 39,963,954 | | | $ | 14,629,150 | |
| | | 6,066,282 | | | | — | | | | — | | | | — | |
| | | 109,848 | | | | 3,832,846 | | | | 4,609,805 | | | | 1,522,118 | |
| | | 115,826 | | | | 6,173 | | | | 206,748 | | | | 103,465 | |
| | | | | | | | | | | | | | | | |
| | | 31,271 | | | | 24,928 | | | | 129,980 | | | | 17,395 | |
| | | 13,941 | | | | 60,258 | | | | 25,856 | | | | 180 | |
| | | 5,153,521 | | | | 5,126,884 | | | | — | | | | — | |
| | | 15,843 | | | | 9,800 | | | | 9,203 | | | | 10,683 | |
| | | 78,555,997 | | | | 59,965,925 | | | | 44,945,546 | | | | 16,282,991 | |
| | | | | | | | | | | | | | | | |
| | | | | | | | | | | | | | | | |
| | | 93 | | | | 70 | | | | 30,380 | | | | — | |
| | | | | | | | | | | | | | | | |
| | | 109,259 | | | | 67,886 | | | | 93,927 | | | | 26,278 | |
| | | 97,155 | | | | 66,602 | | | | 60,951 | | | | 9,572 | |
| | | — | | | | 1,446,521 | | | | — | | | | — | |
| | | 123,636 | | | | 87,194 | | | | 94,710 | | | | 63,812 | |
| | | 330,143 | | | | 1,668,273 | | | | 279,968 | | | | 99,662 | |
| | | | | | | | | | | | | | | | |
| | $ | 78,225,854 | | | $ | 58,297,652 | | | $ | 44,665,578 | | | $ | 16,183,329 | |
| | | | | | | | | | | | | | | | |
| | | | | | | | | | | | | | | | |
| | $ | 502,188,634 | | | $ | 178,679,035 | | | $ | 378,537,523 | | | $ | 35,045,014 | |
| | | (2,181,239 | ) | | | (959,953 | ) | | | (271,313 | ) | | | 27,741 | |
| | | (324,968,656 | ) | | | (105,094,077 | ) | | | (326,516,510 | ) | | | (18,411,322 | ) |
| | | (96,812,885 | ) | | | (14,327,353 | ) | | | (7,084,122 | ) | | | (478,104 | ) |
| | $ | 78,225,854 | | | $ | 58,297,652 | | | $ | 44,665,578 | | | $ | 16,183,329 | |
| | | | | | | | | | | | | | | | |
| | | | | | | | | | | | | | | | |
| | | | | | | | | | | | | | | | |
| | | | | | | | | | | | | | | | |
| | $ | 78,150,280 | | | $ | 58,297,652 | | | $ | 44,665,578 | | | $ | 16,183,329 | |
| | | 75,574 | | | | — | | | | — | | | | — | |
| | | | | | | | | | | | | | | | |
| | | | | | | | | | | | | | | | |
| | | 21,473,533 | | | | 11,927,243 | | | | 8,586,314 | | | | 2,182,747 | |
| | | 20,730 | | | | — | | | | — | | | | — | |
| | | | | | | | | | | | | | | | |
| | | | | | | | | | | | | | | | |
| | $ | 3.64 | | | $ | 4.89 | | | $ | 5.20 | | | $ | 7.41 | |
| | | 3.65 | | | | — | | | | — | | | | — | |
123
| | | U.S. Government Securities
Ultra-Short Bond Fund | |
Net Investment Income | | | |
| | | | |
Income | | | |
Dividends from unaffiliated issuers | | $ | — | |
Foreign tax withheld on dividends | | | — | |
Net dividends | | | — | |
Interest and other | | | 467,784 | |
Total income | | | 467,784 | |
| | | | | |
Expenses: | | | | |
Management fee | | | 299,305 | |
Administrative services fee | | | 66,316 | |
Accounting service fees and expenses | | | 85,535 | |
Distribution plan fee | | | — | |
Transfer agent fees and expenses | | | 57,556 | |
Professional fees | | | 56,626 | |
Custodian fees | | | 6,865 | |
Shareholder reporting expenses | | | 12,958 | |
Registration fees | | | 21,264 | |
Trustee fees and expenses | | | 28,241 | |
Miscellaneous expenses | | | 39,244 | |
Total expenses before reductions | | | 673,910 | |
Expenses offset - Note 1 G | | | — | |
Expenses reimbursed - Note 3 | | | (405,538 | ) |
Net expenses | | | 268,372 | |
| | | | |
Net Investment Income (Loss) | | | 199,412 | |
| | | | | |
Net Realized and Unrealized Gain (Loss) on Investments | | | | |
Realized gain (loss) from: | | | | |
Securities from unaffiliated issuers | | | 5,413 | |
Written options | | | — | |
Foreign currency transactions | | | — | |
Net realized gain (loss) | | | 5,413 | |
Net change in unrealized appreciation (depreciation) of: | | | | |
Investments | | | (49,997 | ) |
Net unrealized appreciation (depreciation) | | | (49,997 | ) |
| | | | |
Net Realized and Unrealized Loss on Investments | | | (44,584 | ) |
| | | | | |
Net Increase (Decrease) In Net Assets Resulting From Operations | | $ | 154,828 | |
See accompanying notes to financial statements.
124
For the Year Ended December 31, 2015 |
| | Near-Term
Tax Free Fund | | | All American Equity Fund | | | Holmes Macro Trends Fund | |
| | | | | | | | | |
| | | | | | | | | |
| | | | | | | | | |
| | $ | — | | | $ | 448,165 | | | $ | 474,724 | |
| | | — | | | | — | | | | (2,061 | ) |
| | | — | | | | 448,165 | | | | 472,663 | |
| | | 1,847,736 | | | | 17,139 | | | | 96,354 | |
| | | 1,847,736 | | | | 465,304 | | | | 569,017 | |
| | | | | | | | | | | | |
| | | | | | | | | | | | |
| | | 470,045 | | | | 111,092 | | | | 339,028 | |
| | | 99,212 | | | | 28,658 | | | | 52,074 | |
| | | 161,935 | | | | 29,955 | | | | 63,955 | |
| | | — | | | | 52,214 | | | | 112,433 | |
| | | 84,761 | | | | 40,389 | | | | 57,423 | |
| | | 73,983 | | | | 47,429 | | | | 65,878 | |
| | | 13,025 | | | | 6,868 | | | | 13,674 | |
| | | 15,119 | | | | 9,645 | | | | 13,627 | |
| | | 29,707 | | | | 19,092 | | | | 20,292 | |
| | | 28,241 | | | | 28,241 | | | | 28,241 | |
| | | 53,379 | | | | 31,455 | | | | 49,032 | |
| | | 1,029,407 | | | | 405,038 | | | | 815,657 | |
| | | (3,213 | ) | | | (304 | ) | | | (731 | ) |
| | | (603,197 | ) | | | (4,042 | ) | | | — | |
| | | 422,997 | | | | 400,692 | | | | 814,926 | |
| | | | | | | | | | | | |
| | | 1,424,739 | | | | 64,612 | | | | (245,909 | ) |
| | | | | | | | | | | | |
| | | | | | | | | | | | |
| | | | | | | | | | | | |
| | | (27,203 | ) | | | (1,280,803 | ) | | | 4,641,118 | |
| | | — | | | | 4,389 | | | | — | |
| | | — | | | | — | | | | (4,330 | ) |
| | | (27,203 | ) | | | (1,276,414 | ) | | | 4,636,788 | |
| | | | | | | | | | | | |
| | | (297,263 | ) | | | 377,292 | | | | (4,709,061 | ) |
| | | (297,263 | ) | | | 377,292 | | | | (4,709,061 | ) |
| | | | | | | | | | | | |
| | | (324,466 | ) | | | (899,122 | ) | | | (72,273 | ) |
| | | | | | | | | | | | |
| | $ | 1,100,273 | | | $ | (834,510 | ) | | $ | (318,182 | ) |
125
| | | Global
Resources Fund | |
Net Investment Income | | | |
| | | | |
Income | | | |
Dividends from unaffiliated issuers | | $ | 3,408,051 | |
Foreign tax withheld on dividends | | | (141,187 | ) |
Net dividends | | | 3,266,864 | |
Interest and other | | | 1,157,057 | |
Interest from affiliated issuers | | | — | |
Total income | | | 4,423,921 | |
| | | | | |
Expenses: | | | | |
Management fee | | | 719,712 | |
Administrative services fee | | | 73,931 | |
Administrative services fee - Investor Class | | | 62,599 | |
Administrative services fee - Institutional Class | | | 2,979 | |
Accounting service fees and expenses | | | 192,070 | |
Distribution plan fee | | | 320,279 | |
Transfer agent fees and expenses | | | — | |
Transfer agent fees and expenses - Investor Class | | | 248,189 | |
Transfer agent fees and expenses - Institutional Class | | | 22,395 | |
Professional fees | | | 123,416 | |
Custodian fees | | | 58,326 | |
Shareholder reporting expenses | | | — | |
Shareholder reporting expenses - Investor Class | | | 60,406 | |
Shareholder reporting expenses - Institutional Class | | | 8,533 | |
Registration fees | | | 4,504 | |
Registration fees - Investor Class | | | 20,401 | |
Registration fees - Institutional Class | | | 12,069 | |
Trustee fees and expenses | | | 28,241 | |
Miscellaneous expenses | | | 167,858 | |
Total expenses before reductions | | | 2,125,908 | |
Expenses offset - Note 1 G | | | (2,453 | ) |
Expenses reimbursed - Note 3 | | | (120,558 | ) |
Net expenses | | | 2,002,897 | |
| | | | |
Net Investment Income (Loss) | | | 2,421,024 | |
| | | | | |
Net Realized and Unrealized Gain (Loss) on Investments | | | | |
Realized gain (loss) from: | | | | |
Securities from unaffiliated issuers | | | (73,577,727 | ) |
Securities from affiliated issuers | | | (3,768,548 | ) |
Foreign currency transactions | | | 650,016 | |
Net realized gain (loss) | | | (76,696,259 | ) |
Net change in unrealized appreciation (depreciation) of: | | | | |
Investments | | | 26,851,448 | |
Other asset and liabilities denominated in foreign currencies | | | (596 | ) |
Net unrealized appreciation (depreciation) | | | 26,850,852 | |
| | | | |
Net Realized and Unrealized Loss on Investments | | | (49,845,407 | ) |
| | | | | |
Net Decrease In Net Assets Resulting From Operations | | $ | (47,424,383 | ) |
See accompanying notes to financial statements.
126
For the Year Ended December 31, 2015 |
| | World Precious Minerals Fund | | | Gold and Precious Metals Fund | | | Emerging Europe
Fund | | | China Region
Fund | |
| | | | | | | | | | | | |
| | | | | | | | | | | | |
| | | | | | | | | | | | |
| | $ | 271,437 | | | $ | 368,798 | | | $ | 2,165,481 | | | $ | 590,989 | |
| | | (30,283 | ) | | | (32,680 | ) | | | (286,512 | ) | | | (46,676 | ) |
| | | 241,154 | | | | 336,118 | | | | 1,878,969 | | | | 544,313 | |
| | | 680,340 | | | | 426,254 | | | | — | | | | — | |
| | | 89,511 | | | | — | | | | — | | | | — | |
| | | 1,011,005 | | | | 762,372 | | | | 1,878,969 | | | | 544,313 | |
| | | | | | | | | | | | | | | | |
| | | | | | | | | | | | | | | | |
| | | 784,959 | | | | 617,185 | | | | 765,533 | | | | 223,288 | |
| | | 53,438 | | | | 69,432 | | | | 65,178 | | | | 27,590 | |
| | | 45,039 | | | | — | | | | — | | | | — | |
| | | 46 | | | | — | | | | — | | | | — | |
| | | 135,949 | | | | 90,834 | | | | 92,759 | | | | 40,759 | |
| | | 230,959 | | | | 156,984 | | | | 145,489 | | | | 49,321 | |
| | | — | | | | 108,717 | | | | 128,661 | | | | 45,440 | |
| | | 170,316 | | | | — | | | | — | | | | — | |
| | | 12,321 | | | | — | | | | — | | | | — | |
| | | 103,034 | | | | 75,549 | | | | 70,621 | | | | 62,233 | |
| | | 58,811 | | | | 33,631 | | | | 84,876 | | | | 49,627 | |
| | | — | | | | 29,357 | | | | 30,963 | | | | 10,965 | |
| | | 42,415 | | | | — | | | | — | | | | — | |
| | | 2,592 | | | | — | | | | — | | | | — | |
| | | 2,995 | | | | 21,900 | | | | 20,839 | | | | 17,218 | |
| | | 24,015 | | | | — | | | | — | | | | — | |
| | | 7,091 | | | | — | | | | — | | | | — | |
| | | 28,241 | | | | 28,241 | | | | 28,241 | | | | 28,241 | |
| | | 131,844 | | | | 103,587 | | | | 80,568 | | | | 43,050 | |
| | | 1,834,065 | | | | 1,335,417 | | | | 1,513,728 | | | | 597,732 | |
| | | (1,283 | ) | | | (1,644 | ) | | | (1,300 | ) | | | (497 | ) |
| | | (161,125 | ) | | | (48,502 | ) | | | — | | | | (99,501 | ) |
| | | 1,671,657 | | | | 1,285,271 | | | | 1,512,428 | | | | 497,734 | |
| | | | | | | | | | | | | | | | |
| | | (660,652 | ) | | | (522,899 | ) | | | 366,541 | | | | 46,579 | |
| | | | | | | | | | | | | | | | |
| | | | | | | | | | | | | | | | |
| | | | | | | | | | | | | | | | |
| | | (52,324,359 | ) | | | (29,870,425 | ) | | | (14,944,870 | ) | | | 19,087 | |
| | | (2,406,673 | ) | | | — | | | | — | | | | — | |
| | | 1,174,030 | | | | 692,844 | | | | (666,243 | ) | | | (12,740 | ) |
| | | (53,557,002 | ) | | | (29,177,581 | ) | | | (15,611,113 | ) | | | 6,347 | |
| | | | | | | | | | | | | | | | |
| | | 38,598,022 | | | | 26,975,600 | | | | 2,608,867 | | | | (1,582,587 | ) |
| | | (235 | ) | | | (280 | ) | | | (30,502 | ) | | | (1,737 | ) |
| | | 38,597,787 | | | | 26,975,320 | | | | 2,578,365 | | | | (1,584,324 | ) |
| | | | | | | | | | | | | | | | |
| | | (14,959,215 | ) | | | (2,202,261 | ) | | | (13,032,748 | ) | | | (1,577,977 | ) |
| | | | | | | | | | | | | | | | |
| | $ | (15,619,867 | ) | | $ | (2,725,160 | ) | | $ | (12,666,207 | ) | | $ | (1,531,398 | ) |
127
Statements of Changes in Net Assets | |
| | | U.S. Government Securities Ultra-Short Bond Fund | |
| | | Year Ended
December 31,
2015 | | | Year Ended
December 31,
2014 | |
Increase (Decrease) in Net Assets | | | | | | |
| | | | | | | |
From operations: | | | | | | |
Net investment income (loss) | | $ | 199,412 | | | $ | 244,055 | |
Net realized gains (losses) | | | 5,413 | | | | 193 | |
Net unrealized appreciation (depreciation) | | | (49,997 | ) | | | 157,029 | |
Net increase (decrease) in net assets from operations | | | 154,828 | | | | 401,277 | |
| | | | | | | | | |
Distributions to shareholders | | | | | | | | |
From net investment income | | | | | | | | |
Investor Class | | | (199,409 | ) | | | (246,094 | ) |
From net realized gains | | | | | | | | |
Investor Class | | | (4,251 | ) | | | — | |
Total distributions to shareholders | | | (203,660 | ) | | | (246,094 | ) |
| | | | | | | | | |
From capital share transactions: | | | | | | | | |
Proceeds from shares sold | | | | | | | | |
Investor Class | | | 14,907,060 | | | | 4,512,617 | |
Distributions reinvested | | | | | | | | |
Investor Class | | | 159,674 | | | | 192,302 | |
Proceeds from short-term trading fees | | | | | | | | |
Investor Class | | | — | | | | — | |
| | | | 15,066,734 | | | | 4,704,919 | |
Cost of shares redeemed | | | | | | | | |
Investor Class | | | (16,476,556 | ) | | | (16,066,999 | ) |
Net increase (decrease) in net assets from capital share transactions | | | (1,409,822 | ) | | | (11,362,080 | ) |
| | | | | | | | |
Net Increase (Decrease) in Net Assets | | | (1,458,654 | ) | | | (11,206,897 | ) |
| | | | | | | | | |
Net Assets | | | | | | | | |
Beginning of year | | | 64,020,189 | | | | 75,227,086 | |
| | | | | | | | |
End of year | | $ | 62,561,535 | | | $ | 64,020,189 | |
| | | | | | | | | |
Accumulated undistributed net investment income, end of year | | $ | 11 | | | $ | — | |
| | | | | | | | | |
Capital Share Activity | | | | | | | | |
Investor Class: | | | | | | | | |
Shares sold | | | 7,448,636 | | | | 2,253,880 | |
Shares reinvested | | | 79,605 | | | | 96,087 | |
Shares redeemed | | | (8,222,981 | ) | | | (8,024,578 | ) |
Net share activity | | | (694,740 | ) | | | (5,674,611 | |
See accompanying notes to financial statements.
128
| | Near-Term Tax Free Fund | | | All American Equity Fund | |
| | Year Ended
December 31,
2015 | | | Year Ended
December 31,
2014 | | | Year Ended
December 31,
2015 | | | Year Ended
December 31,
2014 | |
| | | | | | | | | | | | |
| | | | | | | | | | | | |
| | | | | | | | | | | | |
| | $ | 1,424,739 | | | $ | 1,421,238 | | | $ | 64,612 | | | $ | (126,354 | ) |
| | | (27,203 | ) | | | (9,951 | ) | | | (1,276,414 | ) | | | 4,958,378 | |
| | | (297,263 | ) | | | 622,619 | | | | 377,292 | | | | (4,371,450 | ) |
| | | 1,100,273 | | | | 2,033,906 | | | | (834,510 | ) | | | 460,574 | |
| | | | | | | | | | | | | | | | |
| | | | | | | | | | | | | | | | |
| | | | | | | | | | | | | | | | |
| | | (1,361,713 | ) | | | (1,435,770 | ) | | | (43,038 | ) | | | — | |
| | | | | | | | | | | | | | | | |
| | | — | | | | — | | | | (2,220,987 | ) | | | (3,451,336 | ) |
| | | (1,361,713 | ) | | | (1,435,770 | ) | | | (2,264,025 | ) | | | (3,451,336 | ) |
| | | | | | | | | | | | | | | | |
| | | | | | | | | | | | | | | | |
| | | | | | | | | | | | | | | | |
| | | 71,543,252 | | | | 45,225,356 | | | | 2,501,699 | | | | 3,388,992 | |
| | | | | | | | | | | | | | | | |
| | | 1,116,722 | | | | 1,175,524 | | | | 2,101,779 | | | | 3,284,819 | |
| | | | | | | | | | | | | | | | |
| | | — | | | | — | | | | 100 | | | | 50 | |
| | | 72,659,974 | | | | 46,400,880 | | | | 4,603,578 | | | | 6,673,861 | |
| | | | | | | | | | | | | | | | |
| | | (55,225,263 | ) | | | (19,287,158 | ) | | | (4,323,344 | ) | | | (5,135,517 | ) |
| | | 17,434,711 | | | | 27,113,722 | | | | 280,234 | | | | 1,538,344 | |
| | | | | | | | | | | | | | | | |
| | | 17,173,271 | | | | 27,711,858 | | | | (2,818,301 | ) | | | (1,452,418 | ) |
| | | | | | | | | | | | | | | | |
| | | | | | | | | | | | | | | | |
| | | 89,595,374 | | | | 61,883,516 | | | | 21,935,605 | | | | 23,388,023 | |
| | | | | | | | | | | | | | | | |
| | $ | 106,768,645 | | | $ | 89,595,374 | | | $ | 19,117,304 | | | $ | 21,935,605 | |
| | | | | | | | | | | | | | | | |
| | $ | 63,026 | | | $ | — | | | $ | 27,175 | | | $ | — | |
| | | | | | | | | | | | | | | | |
| | | | | | | | | | | | | | | | |
| | | | | | | | | | | | | | | | |
| | | 31,811,923 | | | | 20,041,597 | | | | 91,535 | | | | 104,908 | |
| | | 496,931 | | | | 522,037 | | | | 88,125 | | | | 116,731 | |
| | | (24,584,374 | ) | | | (8,568,071 | ) | | | (157,508 | ) | | | (160,673 | ) |
| | | 7,724,480 | | | | 11,995,563 | | | | 22,152 | | | | 60,966 | |
129
Statements of Changes in Net Assets | |
| | | Holmes Macro Trends Fund | |
| | | Year Ended
December 31,
2015 | | | Year Ended
December 31,
2014 | |
Increase (Decrease) in Net Assets | | | | | | |
| | | | | | | |
From operations: | | | | | | |
Net investment income (loss) | | $ | (245,909 | ) | | $ | (602,956 | ) |
Net realized gains (losses) | | | 4,636,788 | | | | 4,824,855 | |
Net unrealized appreciation (depreciation) | | | (4,709,061 | ) | | | (7,727,457 | ) |
Net decrease in net assets from operations | | | (318,182 | ) | | | (3,505,558 | ) |
| | | | | | | | | |
Distributions to shareholders | | | | | | | | |
From net investment income | | | | | | | | |
Investor Class | | | — | | | | — | |
Institutional Class | | | — | | | | — | |
From net realized gains | | | | | | | | |
Investor Class | | | (3,075,742 | ) | | | (4,895,166 | ) |
Total distributions to shareholders | | | (3,075,742 | ) | | | (4,895,166 | ) |
| | | | | | | | | |
From capital share transactions: | | | | | | | | |
Proceeds from shares sold | | | | | | | | |
Investor Class | | | 2,614,600 | | | | 2,829,629 | |
Institutional Class | | | — | | | | — | |
Distributions reinvested | | | | | | | | |
Investor Class | | | 2,906,576 | | | | 4,645,006 | |
Institutional Class | | | — | | | | — | |
Proceeds from short-term trading fees | | | | | | | | |
Investor Class | | | 305 | | | | 110 | |
| | | | 5,521,481 | | | | 7,474,745 | |
Cost of shares redeemed | | | | | | | | |
Investor Class | | | (7,242,945 | ) | | | (8,749,961 | ) |
Institutional Class | | | — | | | | — | |
Net decrease in net assets from capital share transactions | | | (1,721,464 | ) | | | (1,275,216 | ) |
| | | | | | | | |
Net Decrease in Net Assets | | | (5,115,388 | ) | | | (9,675,940 | ) |
| | | | | | | | | |
Net Assets | | | | | | | | |
Beginning of year | | | 46,250,080 | | | | 55,926,020 | |
| | | | | | | | |
End of year | | $ | 41,134,692 | | | $ | 46,250,080 | |
| | | | | | | | | |
Accumulated undistributed net investment income (distributions in excess of net investment income)/accumulated net investment loss, end of year | | $ | 44 | | | $ | 28,980 | |
| | | | | | | | | |
Capital Share Activity | | | | | | | | |
Investor Class: | | | | | | | | |
Shares sold | | | 126,790 | | | | 119,782 | |
Shares reinvested | | | 154,277 | | | | 228,368 | |
Shares redeemed | | | (352,634 | ) | | | (370,933 | ) |
Net share activity | | | (71,567 | ) | | | (22,783 | ) |
Institutional Class: | | | | | | | | |
Shares sold | | | — | | | | — | |
Shares reinvested | | | — | | | | — | |
Shares redeemed | | | — | | | | — | |
Net share activity | | | — | | | | — | |
See accompanying notes to financial statements.
130
| | Global Resources Fund | | | World Precious Minerals Fund | |
| | Year Ended
December 31,
2015 | | | Year Ended
December 31,
2014 | | | Year Ended
December 31,
2015 | | | Year Ended
December 31,
2014 | |
| | | | | | | | | | | | |
| | | | | | | | | | | | |
| | | | | | | | | | | | |
| | $ | 2,421,024 | | | $ | 1,524,440 | | | $ | (660,652 | ) | | $ | (1,310,476 | ) |
| | | (76,696,259 | ) | | | (22,394,012 | ) | | | (53,557,002 | ) | | | (41,777,706 | ) |
| | | 26,850,852 | | | | (58,501,902 | ) | | | 38,597,787 | | | | 23,715,203 | |
| | | (47,424,383 | ) | | | (79,371,474 | ) | | | (15,619,867 | ) | | | (19,372,979 | ) |
| | | | | | | | | | | | | | | | |
| | | | | | | | | | | | | | | | |
| | | | | | | | | | | | | | | | |
| | | (1,094,201 | ) | | | — | | | | (7,134,044 | ) | | | — | |
| | | (33,954 | ) | | | — | | | | (8,001 | ) | | | — | |
| | | | | | | | | | | | | | | | |
| | | — | | | | — | | | | — | | | | — | |
| | | (1,128,155 | ) | | | — | | | | (7,142,045 | ) | | | — | |
| | | | | | | | | | | | | | | | |
| | | | | | | | | | | | | | | | |
| | | | | | | | | | | | | | | | |
| | | 8,877,256 | | | | 15,810,878 | | | | 19,227,284 | | | | 32,514,206 | |
| | | 5,787,569 | | | | 13,601,289 | | | | 2,885 | | | | 329,728 | |
| | | | | | | | | | | | | | | | |
| | | 1,044,971 | | | | — | | | | 6,735,209 | | | | — | |
| | | 33,792 | | | | — | | | | 7,771 | | | | — | |
| | | | | | | | | | | | | | | | |
| | | 30 | | | | 3 | | | | 122 | | | | 1,107 | |
| | | 15,743,618 | | | | 29,412,170 | | | | 25,973,271 | | | | 32,845,041 | |
| | | | | | | | | | | | | | | | |
| | | (37,739,926 | ) | | | (96,715,552 | ) | | | (28,492,715 | ) | | | (43,496,939 | ) |
| | | (10,849,018 | ) | | | (49,361,941 | ) | | | (59,118 | ) | | | (4,133,556 | ) |
| | | (32,845,326 | ) | | | (116,665,323 | ) | | | (2,578,562 | ) | | | (14,785,454 | ) |
| | | | | | | | | | | | | | | | |
| | | (81,397,864 | ) | | | (196,036,797 | ) | | | (25,340,474 | ) | | | (34,158,433 | ) |
| | | | | | | | | | | | | | | | |
| | | | | | | | | | | | | | | | |
| | | 181,405,537 | | | | 377,442,334 | | | | 103,566,328 | | | | 137,724,761 | |
| | | | | | | | | | | | | | | | |
| | $ | 100,007,673 | | | $ | 181,405,537 | | | $ | 78,225,854 | | | $ | 103,566,328 | |
| | | | | | | | | | | | | | | | |
| | $ | 2,236,563 | | | $ | (566,859 | ) | | $ | (2,181,239 | ) | | $ | (2,657,357 | ) |
| | | | | | | | | | | | | | | | |
| | | | | | | | | | | | | | | | |
| | | | | | | | | | | | | | | | |
| | | 1,567,275 | | | | 1,771,672 | | | | 4,406,357 | | | | 5,169,068 | |
| | | 224,725 | | | | — | | | | 1,897,242 | | | | — | |
| | | (6,748,854 | ) | | | (10,892,243 | ) | | | (6,586,395 | ) | | | (6,972,038 | ) |
| | | (4,956,854 | ) | | | (9,120,571 | ) | | | (282,796 | ) | | | (1,802,970 | ) |
| | | | | | | | | | | | | | | | |
| | | 912,723 | | | | 1,541,347 | | | | 686 | | | | 47,824 | |
| | | 7,236 | | | | — | | | | 2,183 | | | | — | |
| | | (1,981,786 | ) | | | (5,576,888 | ) | | | (14,336 | ) | | | (655,506 | ) |
| | | (1,061,827 | ) | | | (4,035,541 | ) | | | (11,467 | ) | | | (607,682 | ) |
131
Statements of Changes in Net Assets | |
| | | Gold and Precious Metals Fund | |
| | | Year Ended
December 31,
2015 | | | Year Ended
December 31,
2014 | |
Increase (Decrease) in Net Assets | | | | | | |
| | | | | | | |
From operations: | | | | | | |
Net investment income (loss) | | $ | (522,899 | ) | | $ | (562,983 | ) |
Net realized gains (losses) | | | (29,177,581 | ) | | | (16,260,231 | ) |
Net unrealized appreciation (depreciation) | | | 26,975,320 | | | | 6,591,222 | |
Net decrease in net assets from operations | | | (2,725,160 | ) | | | (10,231,992 | ) |
| | | | | | | | | |
Distributions to shareholders | | | | | | | | |
From net investment income | | | | | | | | |
Investor Class | | | (269,790 | ) | | | — | |
Total distributions to shareholders | | | (269,790 | ) | | | — | |
| | | | | | | | | |
From capital share transactions: | | | | | | | | |
Proceeds from shares sold | | | | | | | | |
Investor Class | | | 20,024,811 | | | | 30,616,079 | |
Distributions reinvested | | | | | | | | |
Investor Class | | | 248,899 | | | | — | |
Proceeds from short-term trading fees | | | | | | | | |
Investor Class | | | 460 | | | | 1,241 | |
| | | | 20,274,170 | | | | 30,617,320 | |
Cost of shares redeemed | | | | | | | | |
Investor Class | | | (21,758,486 | ) | | | (32,235,266 | ) |
Net decrease in net assets from capital share transactions | | | (1,484,316 | ) | | | (1,617,946 | ) |
| | | | | | | | |
Net Decrease in Net Assets | | | (4,479,266 | ) | | | (11,849,938 | ) |
| | | | | | | | | |
Net Assets | | | | | | | | |
Beginning of year | | | 62,776,918 | | | | 74,626,856 | |
| | | | | | | | |
End of year | | $ | 58,297,652 | | | $ | 62,776,918 | |
| | | | | | | | | |
Accumulated undistributed net investment income (distributions in excess of net investment income)/accumulated net investment loss, end of year | | $ | (959,953 | ) | | $ | (1,256,485 | ) |
| | | | | | | | | |
Capital Share Activity | | | | | | | | |
Investor Class: | | | | | | | | |
Shares sold | | | 3,863,087 | | | | 4,547,671 | |
Shares reinvested | | | 51,319 | | | | — | |
Shares redeemed | | | (4,144,783 | ) | | | (4,828,108 | ) |
Net share activity | | | (230,377 | ) | | | (280,437 | ) |
See accompanying notes to financial statements.
132
| | Emerging Europe Fund | | | China Region Fund | |
| | Year Ended
December 31,
2015 | | | Year Ended
December 31,
2014 | | | Year Ended
December 31,
2015 | | | Year Ended
December 31,
2014 | |
| | | | | | | | | | | | |
| | | | | | | | | | | | |
| | | | | | | | | | | | |
| | $ | 366,541 | | | $ | 215,408 | | | $ | 46,579 | | | $ | 18,029 | |
| | | (15,611,113 | ) | | | 1,129,655 | | | | 6,347 | | | | 3,460,252 | |
| | | 2,578,365 | | | | (25,688,600 | ) | | | (1,584,324 | ) | | | (3,790,675 | ) |
| | | (12,666,207 | ) | | | (24,343,537 | ) | | | (1,531,398 | ) | | | (312,394 | ) |
| | | | | | | | | | | | | | | | |
| | | | | | | | | | | | | | | | |
| | | | | | | | | | | | | | | | |
| | | — | | | | (2,243,528 | ) | | | (187,603 | ) | | | — | |
| | | — | | | | (2,243,528 | ) | | | (187,603 | ) | | | — | |
| | | | | | | | | | | | | | | | |
| | | | | | | | | | | | | | | | |
| | | | | | | | | | | | | | | | |
| | | 3,580,763 | | | | 6,672,598 | | | | 2,429,974 | | | | 1,378,719 | |
| | | | | | | | | | | | | | | | |
| | | — | | | | 2,048,780 | | | | 173,643 | | | | — | |
| | | | | | | | | | | | | | | | |
| | | 28 | | | | 3 | | | | 20 | | | | 39 | |
| | | 3,580,791 | | | | 8,721,381 | | | | 2,603,637 | | | | 1,378,758 | |
| | | | | | | | | | | | | | | | |
| | | (15,314,877 | ) | | | (35,638,573 | ) | | | (5,709,295 | ) | | | (6,444,792 | ) |
| | | (11,734,086 | ) | | | (26,917,192 | ) | | | (3,105,658 | ) | | | (5,066,034 | ) |
| | | | | | | | | | | | | | | | |
| | | (24,400,293 | ) | | | (53,504,257 | ) | | | (4,824,659 | ) | | | (5,378,428 | ) |
| | | | | | | | | | | | | | | | |
| | | | | | | | | | | | | | | | |
| | | 69,065,871 | | | | 122,570,128 | | | | 21,007,988 | | | | 26,386,416 | |
| | | | | | | | | | | | | | | | |
| | $ | 44,665,578 | | | $ | 69,065,871 | | | $ | 16,183,329 | | | $ | 21,007,988 | |
| | | | | | | | | | | | | | | | |
| | $ | (271,313 | ) | | $ | (82,918 | ) | | $ | 27,741 | | | $ | 125,962 | |
| | | | | | | | | | | | | | | | |
| | | | | | | | | | | | | | | | |
| | | | | | | | | | | | | | | | |
| | | 569,033 | | | | 857,860 | | | | 268,194 | | | | 170,915 | |
| | | — | | | | 310,418 | | | | 22,969 | | | | — | |
| | | (2,513,600 | ) | | | (4,539,463 | ) | | | (671,842 | ) | | | (795,193 | ) |
| | | (1,944,567 | ) | | | (3,371,185 | ) | | | (380,679 | ) | | | (624,278 | ) |
133
Notes to Financial Statements | December 31, 2015 |
Note 1: Organization and Significant Accounting Policies
U.S. Global Investors Funds (Trust), consisting of the nine separate funds (Funds) included in this report, is organized as a Delaware statutory trust. Each Fund is an open-end management investment company registered under the Investment Company Act of 1940, as amended, and follows the specialized accounting and reporting guidance in FASB Accounting Standards Codification 946. All funds are diversified with the exception of Global Resources, World Precious Minerals, Gold and Precious Metals, Emerging Europe and China Region. A nondiversified fund may invest a greater percentage of its assets in a particular issuer in comparison to a diversified fund.
The following is a summary of significant accounting policies consistently followed by the Funds in the preparation of their financial statements. The policies are in conformity with U.S. generally accepted accounting principles.
The Funds value investments traded on national or international securities exchanges or over-the-counter at the last sales price reported by the security’s primary exchange of its market at the time of daily valuation. Options and securities for which no sale was reported are valued at the mean between the last reported bid and asked quotation. Debt securities having 60 days or less to maturity that are expected to be valued at par at maturity may be priced by the amortized cost method if the Valuation Committee determines it would approximate market value. Municipal securities, long-term U.S. government obligations and corporate debt securities are valued by an independent pricing service using an evaluated quote based on such factors as institutional-size trading in similar groups of securities, yield, quality, maturity, coupon rate, type of issue, individual trading characteristics and other market data. For more information please see Notes to Portfolio of Investments
| | B. | Fair Valued Securities |
Securities for which market quotations are not readily available or which are subject to legal restrictions are valued at their fair value as determined in good faith by the Valuation Committee of U.S. Global Investors, Inc. (Adviser), under policies and procedures established by the Funds’ Board of Trustees. Fair value is the price that would be received to sell an asset or paid to transfer a liability in an orderly transaction between market participants at the measurement date. The Valuation Committee meets on a regular basis to review securities which may not have readily available market prices and considers a number of factors in determining fair value, including nature and duration of any trading restrictions, trading volume, market values of unrestricted shares of the same or similar class, investment management’s judgment regarding the market experience of the issuer, financial status and other operational and market factors affecting the issuer, issuer’s management, quality of the underlying property based on review of independent geological studies and other relevant matters. The fair values may differ from what would have been used had a broader market for these securities existed. The Valuation Committee
134
Notes to Financial Statements | December 31, 2015 |
regularly reviews inputs and assumptions and performs transactional back-testing and disposition analysis. The Valuation Committee reports quarterly to the Funds’ Board of Trustees.
For securities traded on international exchanges, if events which may materially affect the value of a Fund’s securities occur after the close of the primary exchange and before a Fund’s net asset value is next determined, then those securities will be valued at their fair value as determined in good faith in accordance with the policies approved by the Board of Trustees. The Funds use a systematic fair value model provided by an independent third party to value international securities primarily traded on an exchange or market outside the Western Hemisphere in order to adjust for stale pricing, which may occur between the close of certain foreign exchanges and the New York Stock Exchange.
| | C. | Security Transactions and Investment Income |
Security transactions are accounted for on trade date. Realized gains and losses from security transactions are determined on an identified cost basis. Dividend income is recorded on the ex-dividend date except that certain dividends from foreign securities where the ex-dividend date may have passed are recorded as soon as the Fund has confirmed the ex-dividend date. Interest income, which may include original issue discount, is recorded on an accrual basis. Discounts and premiums on securities purchased are accreted and amortized, respectively, on a yield-to-maturity basis as adjustments to interest income. Investment income is recorded net of foreign taxes withheld where recovery of such taxes is uncertain. Investment income and realized and unrealized gains (losses) are allocated to each Fund’s share class based on their respective net assets.
The Funds may purchase securities on a when-issued or delayed-delivery basis and segregate collateral on their books with a value at least equal to the amount of the commitment. Losses may arise due to the changes in the value of the underlying securities or if the counterparty does not perform under the contract.
| | D. | Foreign Currency Transactions |
Some Funds may invest in securities of foreign issuers. The accounting records of these Funds are maintained in U.S. dollars. At each net asset value determination date, the value of assets and liabilities denominated in foreign currencies are translated into U.S. dollars using the current prevailing exchange rate. Security transactions, income and expenses are converted at the prevailing rate of exchange on the respective dates of the transactions. The effect of changes in foreign exchange rates on foreign denominated securities is included with the net realized and unrealized gain or loss on securities. Other foreign currency gains or losses are reported separately.
The Funds intend to continue to comply with the requirements of Subchapter M of the Internal Revenue Code applicable to regulated investment companies and to distribute substantially all of their taxable income to shareholders. Accordingly, no provision for federal income taxes is required. Each Fund may be subject to foreign
135
Notes to Financial Statements | December 31, 2015 |
taxes on income and gains on investments, which are accrued based on the Fund’s understanding of the tax rules and regulations in the foreign markets.
The Funds recognize the tax benefits of uncertain tax positions only where the position is “more likely than not” to be sustained assuming examination by tax authorities. Management has analyzed the Funds’ tax positions, and has concluded that no liability for unrecognized tax benefits should be recorded related to uncertain tax positions taken on returns filed for open tax years or expected to be taken in 2015 tax returns. The Funds’ 2012, 2013, 2014 and 2015 (when filed) tax returns are open to examination by the federal and applicable state tax authorities. The Funds have no examinations in progress.
| | F. | Dividends and Distributions to Shareholders |
The Funds record dividends and distributions to shareholders on the ex-dividend date. Distributions are determined in accordance with income tax regulations, which may differ from accounting principles generally accepted in the United States. Accordingly, periodic reclassifications related to permanent book and tax basis differences are made within the Funds’ capital accounts to reflect income and gains available for distribution under income tax regulations.
The Funds, except as noted below, generally pay income dividends and distribute capital gains, if any, annually. The U.S. Government Securities Ultra-Short Bond Fund and the Near-Term Tax Free Fund accrue and pay dividends monthly. A Fund may elect to designate a portion of the earnings and profits distributed to shareholders on the redemption of fund shares during the year as distributions for federal income tax purposes. Differences in per share dividend rates for multiclass funds generally result from the relative weightings of pro rata income and realized gain allocations and from differences in separate class expenses.
Fund specific expenses are allocated to that Fund and pro rata across share classes. Expenses that are not fund specific are allocated among Funds and pro rata across share classes. Class specific expenses (including, but not limited to, distribution plan fees, if any, a portion of the administrative services fees, transfer agency fees and expenses, shareholder reporting expenses and certain legal and registration fees) are allocated to the class that incurs such expense. Except for the U.S. Government Securities Ultra-Short Bond Fund, expense offset arrangements have been made with the Funds’ custodian so the custodian fees may be paid indirectly by credits earned on the Funds’ cash balances. Such deposit arrangements are an alternative to overnight investments. Custodian fees are presented in the Statements of Operations gross of such credits, and the credits are presented as offsets to expenses. For the U.S. Government Securities Ultra-Short Bond Fund, credits earned on its cash balance are included in interest and other income.
| | H. | Short-Term Trading (Redemption) Fees |
Short-term trading (redemption) fees are assessed on the All American, Holmes Macro Trends, Global Resources, World Precious Minerals, Gold and Precious Metals, Emerging Europe and China Region Funds (Equity Funds). These fees,
136
Notes to Financial Statements | December 31, 2015 |
which are retained by the Funds, are accounted for as an addition to paid-in capital. The fee for each of the Equity Funds is 0.05% of the amount redeemed on shares held seven days or less.
| | I. | Use of Estimates in Financial Statement Preparation |
The Funds are investment companies accounted for in conformity with accounting principles generally accepted in the United States of America (“GAAP”). Therefore they follow the accounting and reporting guidelines for investment companies. The preparation of financial statements in conformity with GAAP requires management to make estimates and assumptions that affect the reported amounts of assets and liabilities and disclosure of contingent assets and liabilities at the date of the financial statements and the reported amounts of income and expenses during the reporting period. Actual results could differ from those estimates.
| | J. | Subsequent Events Evaluation |
Management has evaluated subsequent events after the balance sheet date of December 31, 2015, through the date that the financial statements were issued and determined that there were no events or transactions that would require adjustments to or disclosure in the financial statements.
Note 2: Financial Derivative Instruments
Equity Funds may purchase or write (sell) options on securities to manage their exposure to stock or commodity markets as well as fluctuations in interest and currency conversion rates. The use of options carries the risks of a change in value of the underlying instruments, an illiquid secondary market, or failure of the counterparty to perform its obligations.
A put option gives the purchaser of the option, upon payment of a premium, the right to sell, and the issuer of the option the obligation to buy, the underlying security, commodity, index, currency or other instrument at the exercise price. A call option, upon payment of a premium, gives the purchaser of the option the right to buy, and the issuer the obligation to sell, the underlying instrument at the exercise price.
Purchasing a put option tends to decrease a Fund’s exposure to the underlying instrument, whereas purchasing a call option tends to increase a Fund’s exposure to the underlying instrument. A Fund pays a premium which is included in the Statement of Assets and Liabilities as an investment and subsequently marked to market to reflect the current value of the option. Premiums paid to purchase options which expire are treated as realized losses. Premiums paid to purchase options which are exercised or closed are added to the cost of securities acquired or the proceeds from securities sold. The risk associated with purchasing put and call options is limited to the premium paid.
137
Notes to Financial Statements | December 31, 2015 |
The Funds will realize a loss equal to all or a part of the premium paid for an option if the price of the underlying security or other instrument decreases or does not increase by more than the premium (in the case of a call option), or if the price of the underlying security or other instrument increases or does not decrease by more than the premium (in the case of a put option).
Writing a put option tends to increase a Fund’s exposure to the underlying instrument, whereas writing a call option tends to decrease a Fund’s exposure to the underlying instrument. The premium received is recorded as a liability in the Statement of Assets and Liabilities and subsequently marked to market to reflect the current value of the option written. Premiums received from writing options which expire are treated as realized gains. Premiums received from options which are exercised or closed are added to the proceeds or offset against amounts paid on the underlying transaction to determine the realized gain or loss. Written options include a risk of loss in excess of the option premium. A Fund as a writer of an option has no control over whether the underlying instrument may be sold (call) or purchased (put) and thus bears the market risk of an unfavorable change in the price of the instrument underlying the written option. There is also the risk a Fund may not be able to enter into a closing transaction because of an illiquid market.
A Fund’s ability to close out its position as a purchaser or seller of a put or call option is dependent, in part, upon the liquidity of the market for that particular option. There can be no guarantee that a fund will be able to close out an option position when desired. An inability to close out its options positions may reduce a Fund’s anticipated profits or increase its losses.
As of December 31, 2015, there were no securities held in escrow by the custodian as cover for call options written.
Transactions in written call options during the year ended December 31, 2015, were as follows:
| | | All American Equity Fund Call Options | |
| | | Number of
Contracts | | | Premiums
Received | |
Options outstanding at December 31, 2014 | | | — | | | $ | — | |
Options written | | | 5 | | | | 5,645 | |
Options closed | | | (5 | ) | | | (5,645 | ) |
Options expired | | | — | | | | — | |
Options exercised | | | — | | | | — | |
Options outstanding at December 31, 2015 | | | — | | | $ | — | |
| | B. | Forward Foreign Currency Contracts |
The Funds enter into forward foreign currency contracts to lock in the U.S. dollar cost of purchase and sale transactions or to hedge the portfolio against currency fluctuations. A forward foreign currency contract is a commitment to purchase or sell a foreign currency at a future date at a negotiated rate. These contracts are
138
Notes to Financial Statements | December 31, 2015 |
valued daily, and the Fund’s net equity therein, representing unrealized gain or loss on the contracts as measured by the difference between the forward foreign exchange rates at the dates of entry into the contracts and the forward rates at the reporting date, is included in the statement of assets and liabilities. Realized and unrealized gains and losses are included in the statement of operations. Risks may arise upon entering into these contracts from the potential inability of counterparties to meet the terms of the contracts and from unanticipated movements in the value of foreign currencies relative to the U.S. dollar.
Open forward foreign currency contracts as of December 31, 2015, were as follows:
Fund Contract | Currency to
Deliver | Currency to
Receive | Settlement Date | | Value | | | Unrealized Appreciation (Depreciation) | |
World Precious Minerals | CAD | 95,420 | USD | 68,867 | 1/4/2016-1/5/2016 | | $ | 68,774 | | | $ | (93 | ) |
Gold and Precious Metals | CAD | 69,283 | USD | 50,001 | 1/4/2016-1/5/2016 | | | 49,931 | | | | (70 | ) |
Emerging Europe | EUR | 2,000,000 | USD | 2,163,320 | 1/21/2016 | | | 2,152,191 | | | | (11,129 | ) |
| USD | 2,193,700 | EUR | 2,000,000 | 1/21/2016 | | | 1,980,749 | | | | (19,251 | ) |
China Region | PHP | 8,610 | USD | 183 | 1/4/2016 | | | 183 | | | | — | |
| | C. | Summary of Derivative Instruments |
The following is a summary of the valuations of derivative instruments categorized by location in the Statements of Assets and Liabilities as of December 31, 2015:
Location | | Holmes Macro Trends Fund | | | Global Resources Fund | | | World Precious Minerals Fund | | | Gold and Precious Metals Fund | | | Emerging Europe Fund | | | China Region Fund | |
Asset derivatives | | | | | | | | | | | | | | | | | | |
Investments, at value | | | | | | | | | | | | | | | | | | |
Purchased options | | $ | 800 | | | $ | 247,500 | | | $ | 111,983 | | | $ | 30,140 | | | $ | 138,000 | | | $ | 8,825 | |
Liability derivatives | | | | | | | | | | | | | | | | | | | | | | | | |
Unrealized loss on forward foreign currency contracts | | | — | | | | — | | | | (93 | ) | | | (70 | ) | | | (30,380 | ) | | | — | |
Total | | $ | 800 | | | $ | 247,500 | | | $ | 111,890 | | | $ | 30,070 | | | $ | 107,620 | | | $ | 8,825 | |
139
Notes to Financial Statements | December 31, 2015 |
The following is a summary of the effect of derivative instruments on the Statements of Operations for the year ended December 31, 2015:
Location | | All
American Equity Fund | | | Holmes Macro Trends Fund | | | Global Resources Fund | | | World Precious Minerals
Fund | |
Realized gain (loss) on derivatives recognized in income | | | | | | | | | | | | |
Realized gain (loss) from securities | | | | | | | | | | | | |
Purchased options | | $ | — | | | $ | (290,652 | ) | | $ | (9,825,008 | ) | | $ | (3,461,223 | ) |
Net realized gain (loss) from foreign currency transactions | | | | | | | | | | | | | | | | |
Foreign exchange contracts | | | — | | | | — | | | | 730,879 | | | | 1,521,062 | |
Realized gain (loss) from written options | | | 4,389 | | | | — | | | | — | | | | — | |
| | | | 4,389 | | | | (290,652 | ) | | | (9,094,129 | ) | | | (1,940,161 | ) |
| | | | | | | | | | | | | | | | | |
Change in unrealized appreciation (depreciation) on derivatives recognized in income | | | | | | | | | | | | | | | | |
Net change in unrealized appreciation (depreciation) of investments | | | | | | | | | | | | | | | | |
Purchased options | | | — | | | | (49,635 | ) | | | 2,677,177 | | | | 2,290,924 | |
Net change in unrealized gain (loss) from foreign currency transactions | | | | | | | | | | | | | | | | |
Foreign exchange contracts | | | — | | | | — | | | | — | | | | (93 | ) |
| | | | — | | | | (49,635 | ) | | | 2,677,177 | | | | 2,290,831 | |
Total | | $ | 4,389 | | | $ | (340,287 | ) | | $ | (6,416,952 | ) | | $ | 350,670 | |
Location | | Gold and Precious Metals
Fund | | | Emerging Europe
Fund | | | China
Region
Fund | |
Realized gain (loss) on derivatives recognized in income | | | | | | | | | |
Realized gain (loss) from securities | | | | | | | | | |
Purchased options | | $ | (2,630,232 | ) | | $ | 420,831 | | | $ | (199,592 | ) |
Net realized gain (loss) from foreign currency transactions | | | | | | | | | | | | |
Foreign exchange contracts | | | 646,654 | | | | (402,871 | ) | | | (393 | ) |
| | | | (1,983,578 | ) | | | 17,960 | | | | (199,985 | ) |
| | | | | | | | | | | | | |
Change in unrealized appreciation (depreciation) on derivatives recognized in income | | | | | | | | | | | | |
Net change in unrealized appreciation (depreciation) of investments | | | | | | | | | | | | |
Purchased options | | | 1,907,292 | | | | (128,688 | ) | | | (5,798 | ) |
Net change in unrealized gain (loss) from foreign currency transactions | | | | | | | | | | | | |
Foreign exchange contracts | | | (70 | ) | | | (30,380 | ) | | | — | |
| | | | 1,907,222 | | | | (159,068 | ) | | | (5,798 | ) |
Total | | $ | (76,356 | ) | | $ | (141,108 | ) | | $ | (205,783 | ) |
140
Notes to Financial Statements | December 31, 2015 |
The average notional amounts of written options, purchased options and forward currency contracts outstanding during the year ended December 31, 2015, were approximately as follows:
Fund | | Purchased
Options | | | Forward
Currency
Contracts | |
Holmes Macro Trends | | $ | 61,454 | | | $ | — | |
Global Resources | | | 4,349,761 | | | | 93,691 | |
World Precious Minerals | | | 1,187,255 | | | | 4,832,297 | |
Gold and Precious Metals | | | 728,735 | | | | 3,100,780 | |
Emerging Europe | | | 871,314 | | | | 2,488,281 | |
China Region | | | 69,925 | | | | (56 | ) |
Note 3: Investment Advisory and Other Agreements
The Adviser, under an investment advisory agreement with the Trust in effect through October 1, 2016, furnishes management and investment advisory services and, subject to the supervision of the trustees, directs the investments of each Fund according to each Fund’s investment objectives, policies and limitations. Frank E. Holmes, the controlling owner of the Adviser, was a trustee of the Funds through December 9, 2015.
For the services of the Adviser, each Fund pays a base management or advisory fee based upon its net assets. Fees are accrued daily and paid monthly. The contractual management fee for each fund is:
Fund | Annual Percentage of
Average Daily Net Assets |
U.S. Government Securities Ultra-Short Bond | .50% of the first $250,000,000
and .375% of the excess |
Near-Term Tax Free | .50% |
All American Equity | .80% of the first $500,000,000
and .75% of the excess |
Holmes Macro Trends | 1.00% |
Global Resources | .95% of the first $500,000,000;
.90% of $500,000,001 to $1,000,000,000 and .85% of the excess |
World Precious Minerals | 1.00% of the first $500,000,000;
.95% of $500,000,001 to $1,000,000,000 and .90% of the excess |
Gold and Precious Metals | .90% of the first $500,000,000
and .85% of the excess |
Emerging Europe | 1.25% |
China Region | 1.25% |
141
Notes to Financial Statements | December 31, 2015 |
The advisory agreement also provides that the base advisory fee of the Equity Funds will be adjusted upwards or downwards by 0.25 percent if there is a performance difference of 5 percent or more between a Fund’s performance and that of its designated benchmark index over the prior 12 months. The performance adjustment is calculated separately for each share class. The benchmarks are as follows:
Fund | Benchmark Index |
All American Equity | S&P 500 Index |
Holmes Macro Trends | S&P Composite 1500 Index |
Global Resources | S&P Global Natural Resources Index (Net Total Return)(1) |
World Precious Minerals | NYSE Arca Gold Miners Index |
Gold and Precious Metals | FTSE Gold Mines Index |
Emerging Europe | MSCI Emerging Markets Europe 10/40 Index (Net Total Return) |
China Region | Hang Seng Composite Index |
| | (1) | On July 4, 2014, Morgan Stanley discontinued its Morgan Stanley Commodity Related Index (“CRX”), which was the benchmark used by the Global Resources Fund to calculate its performance fee adjustment. The Fund replaced the CRX with the S&P Global Natural Resources Index (Net Total Return). Because the Global Resources Fund’s monthly performance fee adjustment is based on a rolling 12-month period, the Fund’s performance was compared for a period of time to a blend of the CRX and the S&P Global Natural Resources Index (Net Total Return), using the performance of the CRX through June 30, 2014, and the performance of the S&P Global Natural Resources Index (Net Total Return) after June 30, 2014. As each month passed, a month of the CRX performance rolled off and a month of the S&P Global Natural Resources Index (Net Total Return) was added until the Fund’s performance eventually was compared exclusively to the S&P Global Natural Resources Index (Net Total Return) for determining the Fund’s monthly performance fee adjustment. |
No performance adjustment is applied unless the difference between the class’s investment performance and the benchmark is 5 percent or greater (positive or negative) during the applicable performance measurement period. The performance fee adjustment is calculated monthly in arrears and is accrued ratably during the month. The management fee, net of any performance fee adjustment, is paid monthly in arrears.
142
Notes to Financial Statements | December 31, 2015 |
The Funds’ prospectus and statement of additional information contain additional information about the performance adjustment. The amounts shown as management fees on the Statements of Operations reflects the base fee plus/minus any performance adjustment. During the year ended December 31, 2015, the Funds recorded performance adjustments as follows:
Fund | | Investor Class Performance Fee Adjustment | | | Institutional Class Performance Fee Adjustment | |
All American Equity | | $ | (55,998 | ) | | | N/A | |
Holmes Macro Trends | | | (110,716 | ) | | | N/A | |
Global Resources | | | (519,692 | ) | | $ | (49,013 | ) |
World Precious Minerals | | | (139,644 | ) | | | (431 | ) |
Gold and Precious Metals | | | 52,026 | | | | N/A | |
Emerging Europe | | | 38,053 | | | | N/A | |
China Region | | | (23,341 | ) | | | N/A | |
On December 9, 2015, the Trust entered into an Amended Administrative Services Agreement with the Adviser and a Services Agreement with Atlantic Fund Administration, LLC (d/b/a Atlantic Fund Services) (“Atlantic”). Pursuant to these agreements, Atlantic and the Adviser act as co-administrators to the Trust. Atlantic’s services to the Trust include provision of certain officers as well as assistance with certain Trust and fund administration tasks. The Funds compensate Atlantic with a fee structure based on average net assets of each fund, subject to minimum fees.
The U.S. Government Securities Ultra-Short Bond, Near-Term Tax Free, All American Equity, Holmes Macro Trends, Gold and Precious Metals, Emerging Europe and China Region Funds compensate the Adviser at an annual rate of 0.05% (0.10% through December 9, 2015) of the average daily net assets of each Fund for administrative services provided, of which half is a fund-level fee and half is a class-level fee. The Global Resources and World Precious Minerals Funds compensate the Adviser at an annual rate of 0.05% (0.10% through December 9, 2015) of the average daily net assets for the Investor Class and 0.04% (0.08% through December 9, 2015) of the average daily net assets for the Institutional Class for administrative services provided, of which half is a fund-level fee and half is a class-level fee.
Through December 9, 2015, each fund also paid the Adviser an annual base administrative services fee of $7,000. This was a fund-level fee.
The Investor Class shares for Equity Funds in the Trust have adopted a distribution plan pursuant to Rule 12b-1 of the Investment Company Act of 1940 in which the Distributor is paid a fee at an annual rate of 0.25% of the average daily net assets of the Investor Class for sales and promotional services related to the distribution of Investor Class shares. The Institutional Class does not incur distribution plan fees.
The Adviser has voluntarily agreed to reimburse specific funds so that their total operating expenses will not exceed certain annual percentages of average net assets. The expenses for the year ended December 31, 2015, were limited as follows
143
Notes to Financial Statements | December 31, 2015 |
for the Investor Class: U.S. Government Securities Ultra-Short Bond Fund at 0.45%, All American Equity Fund and Holmes Macro Trends Fund at 2.20%, Global Resources, World Precious Minerals, and Gold and Precious Metals Funds at 1.90%, Emerging Europe Fund at 2.85% and China Region Fund at 2.55%. These expense limitations are exclusive of any performance fee adjustments and will continue on a voluntary basis at the Adviser’s discretion. The Adviser may temporarily agree to additional reimbursements or limitations.
The Adviser has contractually limited the total operating expenses of the Near-Term Tax Free Fund at 0.45% on an annualized basis through April 30, 2016.
Miscellaneous expenses include costs, totaling approximately $290,000, associated with a shareholder proxy (including: (i) the preparation, printing, and mailing of a proxy card and proxy statement, and all other costs incurred in connection with the solicitation of proxies for the Funds; (ii) trustee and legal fees in connection with the Board meetings at which the proposal was considered and approved; and (iii) ongoing insurance coverage over the next six years for the Trust and the Board of Trustees prior to December 9, 2015) during the period, which were split equally between the Adviser and the Trust, with the Trust’s portion exclusive of each Fund’s expense cap.
The Adviser has voluntarily agreed to waive all class specific expenses for the Institutional Class of the Global Resources Fund and the World Precious Minerals Fund. These expense waivers are exclusive of any performance fee adjustments, and the Adviser can modify or terminate this arrangement at any time.
Under an agreement entered into while the U.S. Government Securities Ultra-Short Bond Fund was a money market fund, the Adviser had voluntarily agreed to waive fees and/or reimburse the Fund to the extent necessary to maintain the yield at a certain level as determined by the Adviser (Minimum Yield). The Adviser may recapture any fees waived and/or expenses reimbursed within three years after the end of the fiscal year of such waiver and/or reimbursement to the extent that such recapture would not cause the Fund’s yield to fall below the Minimum Yield. The Adviser may seek reimbursement of previously waived and reimbursed fees of $498,342 until December 31, 2016.
U.S. Bancorp Fund Services, LLC is the transfer agent for the Funds. Each Fund’s share class pays an annual fee based on the number of shareholder accounts, certain base fees and transaction- and activity-based fees for transfer agency services. Certain account fees are paid directly by shareholders to the transfer agent, which, in turn, reduces its charge to the Funds.
The Adviser was reimbursed in 2015 for services of the Funds’ Chief Compliance Officer through December 9, 2015 in the amount of $134,187. Atlantic was paid for Chief Compliance Officer services thereafter in 2015 in the amount of $9,041.
Brown Brothers Harriman & Co. (BBH) serves as the custodian. SEI Investments Global Funds Services serves as fund accounting and administration service agent with a fee structure based on average net assets of the Trust, subject to minimum fees.
144
Notes to Financial Statements | December 31, 2015 |
Under a Distribution Agreement with the Trust dated December 9, 2015, Foreside Fund Services, LLC (the “Distributor”) acts as the agent of the Trust in connection with the continuous offering of shares of the Funds. The Distributor continually distributes shares of the Funds on a best efforts basis.
Prior to December 9, 2015, the predecessor independent Trustees received compensation for serving on the Board. Predecessor Trustees serving as Chairman of the Board or a special committee or as a member of a committee received additional compensation. Predecessor Trustees were also reimbursed for out-of-pocket expenses incurred while attending meetings. Frank E. Holmes received no compensation from the Funds for serving on the Board. On December 9, 2015, the shareholders of the Funds elected five new trustees to the Board of Trustees. Each predecessor Trustee resigned as of December 9, 2015. On December 9, 2015, the Board approved new trustee compensation under which Independent Trustees of the Trust each receive an annual fee of $15,000 for service to the Trust. The Chairman of the Board is paid an additional annual fee of $20,000. The trustees and Chairman may receive additional fees for special Board meetings. Each trustee is also reimbursed for all reasonable out-of-pocket expenses incurred in connection with his duties as a trustee, including travel and related expenses incurred in attending Board meetings. The Trust has no pension or retirement plan. No other entity affiliated with the Trust pays any compensation to the trustees.
Note 4: Investments
Cost of purchases and proceeds from sales of long-term securities for the year ended December 31, 2015, are summarized as follows:
Fund | | Purchases | | | Sales | |
U.S. Government Securities Ultra-Short Bond Fund | | $ | 27,316,790 | | | $ | 15,510,000 | |
Near-Term Tax Free Fund | | | 35,199,137 | | | | 11,413,443 | |
All American Equity Fund | | | 21,621,501 | | | | 23,382,323 | |
Holmes Macro Trends Fund | | | 134,386,221 | | | | 141,173,423 | |
Global Resources Fund | | | 562,717,195 | | | | 598,194,130 | |
World Precious Minerals Fund | | | 62,227,022 | | | | 74,312,229 | |
Gold and Precious Metals Fund | | | 59,878,128 | | | | 67,002,882 | |
Emerging Europe Fund | | | 73,226,354 | | | | 86,121,095 | |
China Region Fund | | | 42,510,770 | | | | 37,978,105 | |
145
Notes to Financial Statements | December 31, 2015 |
Note 5: Tax Information
The following table presents the income tax basis of securities owned at December 31, 2015, and the tax basis components of net unrealized appreciation (depreciation):
Fund | | Aggregate Tax Cost | | | Gross Unrealized Appreciation | | | Gross Unrealized Depreciation | | | Net Unrealized Appreciation (Depreciation) | |
U.S. Government Securities Ultra-Short Bond | | $ | 55,308,219 | | | $ | 101,921 | | | $ | (74,380 | ) | | $ | 27,541 | |
Near-Term Tax Free | | | 94,364,862 | | | | 1,346,740 | | | | (195,667 | ) | | | 1,151,073 | |
All American Equity | | | 18,172,984 | | | | 1,079,898 | | | | (526,855 | ) | | | 553,043 | |
Holmes Macro Trends | | | 37,897,350 | | | | 662,944 | | | | (1,407,279 | ) | | | (744,335 | ) |
Global Resources | | | 187,743,145 | | | | 3,321,954 | | | | (99,989,832 | ) | | | (96,667,878 | ) |
World Precious Minerals | | | 180,104,232 | | | | 6,621,931 | | | | (113,610,416 | ) | | | (106,988,485 | ) |
Gold and Precious Metals | | | 66,531,318 | | | | 7,053,537 | | | | (22,679,819 | ) | | | (15,626,282 | ) |
Emerging Europe | | | 47,083,520 | | | | 1,840,627 | | | | (8,960,193 | ) | | | (7,119,566 | ) |
China Region | | | 15,226,661 | | | | 985,198 | | | | (1,582,709 | ) | | | (597,511 | ) |
As of December 31, 2015, the components of distributable earnings on a tax basis were as follows:
Fund | | Undistributed Tax-Exempt Income | | | Undistributed Ordinary Income | | | Undistributed Long-Term Capital Gains | | | Capital Loss Carryforwards | |
U.S. Government Securities Ultra-Short Bond | | $ | — | | | $ | 1,340 | | | $ | — | | | $ | — | |
Near-Term Tax Free | | | 60,910 | | | | 2,107 | | | | — | | | | (386,601 | ) |
All American Equity | | | — | | | | 27,175 | | | | — | | | | (1,331,255 | ) |
Holmes Macro Trends | | | — | | | | — | | | | 3,169,942 | | | | (461,463 | ) |
Global Resources | | | — | | | | 3,036,353 | | | | — | | | | (450,231,671 | ) |
World Precious Minerals | | | — | | | | 675,876 | | | | — | | | | (304,344,963 | ) |
Gold and Precious Metals | | | — | | | | — | | | | — | | | | (98,001,704 | ) |
Emerging Europe | | | — | | | | — | | | | — | | | | (326,435,996 | ) |
China Region | | | — | | | | 27,741 | | | | — | | | | (18,290,597 | ) |
Fund | | Post October Losses | | | Current Year Late-Year Loss Deferral | | | Net Unrealized Appreciation (Depreciation) | | | Other Temporary Differences | | | Total | |
U.S. Government Securities Ultra-Short Bond | | $ | — | | | $ | — | | | $ | 27,541 | | | $ | — | | | $ | 28,881 | |
Near-Term Tax Free | | | — | | | | — | | | | 1,151,073 | | | | — | | | | 827,489 | |
All American Equity | | | — | | | | — | | | | 553,043 | | | | (1 | ) | | | (751,038 | ) |
Holmes Macro Trends | | | — | | | | — | | | | (744,335 | ) | | | (2 | ) | | | 1,964,142 | |
Global Resources | | | (613,075 | ) | | | — | | | | (96,654,175 | ) | | | (1 | ) | | | (544,462,569 | ) |
World Precious Minerals | | | (13,305,056 | ) | | | — | | | | (106,988,726 | ) | | | 89 | | | | (423,962,780 | ) |
Gold and Precious Metals | | | (5,850,927 | ) | | | (838,814 | ) | | | (15,626,576 | ) | | | (63,362 | ) | | | (120,381,383 | ) |
Emerging Europe | | | — | | | | (301,693 | ) | | | (7,164,635 | ) | | | 30,379 | | | | (333,871,945 | ) |
China Region | | | — | | | | — | | | | (598,829 | ) | | | — | | | | (18,861,685 | ) |
146
Notes to Financial Statements | December 31, 2015 |
The differences between book-basis and tax-basis unrealized appreciation (depreciation) for All American Equity, Holmes Macro Trends, Global Resources, World Precious Minerals, Gold and Precious Metals, Emerging Europe and China Region Funds are attributable primarily to the tax deferral of losses on wash sales, investment in passive foreign investment companies (PFIC), forwards marked to markets, adjustments for partnerships, tax straddle loss deferrals on written options, and adjustments for grantor trusts.
Reclassifications are made to the Funds’ capital accounts to reflect income and gains available for distribution (or available capital loss carryovers) under income tax regulations. For the year ended December 31, 2015, the Funds recorded the following reclassifications to increase (decrease) the accounts listed below:
Fund | | Accumulated Net Investment Income | | | Accumulated
Net Realized
Gain | | | Paid in
Capital | |
U.S. Government Securities Ultra-Short Bond | | $ | 8 | | | $ | (8 | ) | | $ | — | |
Near-Term Tax Free | | | — | | | | 13,185 | | | | (13,185 | ) |
All American Equity | | | 5,601 | | | | (5,601 | ) | | | — | |
Holmes Macro Trends | | | 216,973 | | | | 18,482 | | | | (235,455 | ) |
Global Resources | | | 1,510,553 | | | | (1,510,265 | ) | | | (288 | ) |
World Precious Minerals | | | 8,278,815 | | | | (8,278,815 | ) | | | — | |
Gold and Precious Metals | | | 1,089,221 | | | | (1,449,875 | ) | | | 360,654 | |
Emerging Europe | | | (554,936 | ) | | | 656,351 | | | | (101,415 | ) |
China Region | | | 42,803 | | | | (42,803 | ) | | | — | |
The tax character of distributions paid during the fiscal year ended December 31, 2015, were as follows:
Fund | | Tax-Exempt Income | | | Ordinary Income | | | Long-Term Capital Gains | | | Total | |
U.S. Government Securities Ultra-Short Bond | | $ | — | | | $ | 199,425 | | | $ | 4,235 | | | $ | 203,660 | |
Near-Term Tax Free | | | 1,316,177 | | | | 45,536 | | | | — | | | | 1,361,713 | |
All American Equity | | | — | | | | 653,208 | | | | 1,610,817 | | | | 2,264,025 | |
Holmes Macro Trends | | | — | | | | — | | | | 3,075,742 | | | | 3,075,742 | |
Global Resources | | | — | | | | 1,128,155 | | | | — | | | | 1,128,155 | |
World Precious Minerals | | | — | | | | 7,142,045 | | | | — | | | | 7,142,045 | |
Gold and Precious Metals | | | — | | | | 269,790 | | | | — | | | | 269,790 | |
Emerging Europe | | | — | | | | — | | | | — | | | | — | |
China Region | | | — | | | | 187,603 | | | | — | | | | 187,603 | |
147
Notes to Financial Statements | December 31, 2015 |
The tax character of distributions paid during the fiscal year ended December 31, 2014, were as follows:
Fund | | Tax-Exempt Income | | | Ordinary Income | | | Long-Term Capital Gains | | | Total | |
U.S. Government Securities Ultra-Short Bond | | $ | — | | | $ | 246,094 | | | $ | — | | | $ | 246,094 | |
Near-Term Tax Free | | | 1,382,047 | | | | 53,723 | | | | — | | | | 1,435,770 | |
All American Equity | | | — | | | | 817,613 | | | | 2,633,723 | | | | 3,451,336 | |
Holmes Macro Trends | | | — | | | | 750,789 | | | | 4,144,377 | | | | 4,895,166 | |
Global Resources | | | — | | | | — | | | | — | | | | — | |
World Precious Minerals | | | — | | | | — | | | | — | | | | — | |
Gold and Precious Metals | | | — | | | | — | | | | — | | | | — | |
Emerging Europe | | | — | | | | 2,243,528 | | | | — | | | | 2,243,528 | |
China Region | | | — | | | | — | | | | — | | | | — | |
Capital loss carryforwards may be used to offset current or future taxable capital gains until expiration. The Fund’s tax-basis capital gains and losses are determined only at the end of each fiscal year. Under the Regulated Investment Company Modernization Act of 2010, the Funds are permitted to carry forward capital losses incurred in taxable years beginning after December 22, 2010, for an unlimited period. Losses incurred during these years are required to be utilized prior to the losses incurred in pre-enactment tax years. As a result of this ordering rule, pre-enactment capital loss carryforwards may be more likely to expire unused. In addition, post-enactment capital losses that are carried forward retain their character as either short-term or long-term capital losses rather than being considered all short-term as under previous law. The loss carryforwards and related expiration dates for each fund, as of December 31, 2015, are as follows:
| | | No Expiration | |
Fund | | Short-Term | | | Long-Term | |
Near-Term Tax Free | | $ | 151,678 | | | $ | 231,557 | |
All American Equity | | | 1,331,255 | | | | — | |
Holmes Macro Trends | | | — | | | | — | |
Global Resources | | | 162,040,410 | | | | 28,978,749 | |
World Precious Minerals | | | 75,572,552 | | | | 164,992,899 | |
Gold and Precious Metals | | | 41,610,403 | | | | 56,391,301 | |
Emerging Europe | | | 13,372,996 | | | | 11,568,837 | |
China Region | | | 3,270,330 | | | | — | |
148
Notes to Financial Statements | December 31, 2015 |
| | | Expiration Date | | | | |
Fund | | 2016 | | | 2017 | | | 2018 | | | Total | |
Near-Term Tax Free | | $ | 112 | | | $ | 722 | | | $ | 2,532 | | | $ | 386,601 | |
All American Equity | | | — | | | | — | | | | — | | | | 1,331,255 | |
Holmes Macro Trends | | | 461,463 | | | | — | | | | — | | | | 461,463 | |
Global Resources | | | — | | | | 259,212,512 | | | | — | | | | 450,231,671 | |
World Precious Minerals | | | — | | | | 63,779,512 | | | | — | | | | 304,344,963 | |
Gold and Precious Metals | | | — | | | | — | | | | — | | | | 98,001,704 | |
Emerging Europe | | | 28,524,678 | | | | 257,523,539 | | | | 15,445,946 | | | | 326,435,996 | |
China Region | | | 15,020,267 | | | | — | | | | — | | | | 18,290,597 | |
| | (a) | Utilization of capital loss carryovers is subject to annual limitations. |
During the year ended December 31, 2015, the following funds utilized capital loss carryforwards to offset capital gains amounting to:
Fund | | | |
Holmes Macro Trends | | $ | 461,463 | |
China Region | | | 8,706 | |
In accordance with tax rules, the following net capital losses and ordinary losses (currency and late year losses) incurred after October 31, within each Fund’s tax year, are deemed to arise on the first day of the Fund’s next tax year if the Fund elects to defer such losses.
The Funds elected to defer losses incurred after October 31, 2015, as follows:
Fund | | Post October 31, 2015
Capital Loss Deferral | | | Post
October 31, 2015
Ordinary Loss Deferral | |
Global Resources | | $ | 613,075 | | | $ | — | |
World Precious Minerals | | | 13,305,056 | | | | — | |
Gold and Precious Metals | | | 5,850,927 | | | | 838,814 | |
Emerging Europe | | | — | | | | 301,693 | |
Note 6: Risks of Concentrations and Foreign Investments
The Near-Term Tax Free Fund may be exposed to risks related to concentration of investments in a particular state or geographic area. These investments present risks resulting from changes in economic conditions of the region or the issuer.
The Global Resources Fund, which concentrates its investments in a specific industry, may be subject to greater risks and fluctuations than a portfolio representing a broader range of industries.
The World Precious Minerals and Gold and Precious Metals Funds concentrate their investments in gold and other precious metals and minerals and, therefore, may be subject to greater risks and market fluctuations than a portfolio representing a broader range of industries. The funds invest in securities that typically respond
149
Notes to Financial Statements | December 31, 2015 |
to changes in the price of gold and other precious metals and minerals, which can be influenced by a variety of global economic, financial and political factors; increased environmental and labor costs in mining; and changes in laws relating to mining or gold production or sales. Fluctuations in the prices of gold and other precious metals and minerals will affect the market values of the securities held by these funds.
The Emerging Europe Fund invests more than 25% of its investments in companies principally engaged in the oil & gas or banking industries. The risk of concentrating investments in this group of industries will make the fund more susceptible to risk in these industries than funds which do not concentrate their investments in an industry.
The Emerging Europe Fund may be exposed to risks not typically associated with investment in the United States due to its concentration of investments in emerging markets. These risks include possible revaluation of currencies, less public information about companies, disruptive political or economic conditions and the possible imposition of adverse governmental laws or currency exchange restrictions. Moreover, securities of many foreign issuers, including sovereign nations, and their markets may be less liquid and their prices more volatile than those securities of comparable U.S. issuers.
The China Region Fund may be exposed to risks not typically associated with investments in the United States, due to its concentration of investments in foreign issuers in the region. These investments present risks resulting from disruptive political or economic conditions and the potential imposition of adverse governmental laws or currency exchange restrictions affecting the area.
Note 7: Credit Arrangements
Each of the Funds has a revolving credit facility with BBH. Borrowings of each Fund are collateralized by any or all of the securities held by BBH as the Fund’s custodian up to the amount of the borrowing. Interest on borrowings is charged at the current overnight Federal Funds Rate plus 2 percent. Each Fund has a maximum borrowing limit of 10 percent of qualified assets. The aggregate of borrowings by all Funds under the agreement cannot exceed $20,000,000 at any one time. There were no borrowings under the revolving credit facility during the period ended December 31, 2015. The U.S. Global Investors Funds paid BBH a total of $30,417 in commitment fees for the period ended December 31, 2015, under this arrangement.
150
U.S. Government Securities Ultra-Short Bond Fund
For a capital share outstanding during the
| | | Investor Class | |
| | | Year Ended December 31, | |
| | | 2015 | | | 2014 | | | | 2013 | * | | | 2012 | * | | | 2011 | * |
Net asset value, beginning of year | | $ | 2.00 | | | $ | 2.00 | | | $ | 2.00 | | | $ | 2.00 | | | $ | 2.00 | |
| | | | | | | | | | | | | | | | | | | | | |
Investment Activities | | | | | | | | | | | | | | | | | | | | |
Net investment income | | | .01 | | | | .01 | | | | — | (a) | | | — | (a) | | | — | (a) |
Net realized and unrealized gain | | | — | (a) | | | — | (a) | | | — | (a) | | | — | | | | — | |
Total from investment activities | | | .01 | | | | .01 | | | | — | | | | — | | | | — | |
Distributions | | | | | | | | | | | | | | | | | | | | |
From net investment income | | | (.01 | ) | | | (.01 | ) | | | — | (a) | | | — | (a) | | | — | (a) |
From net realized gains | | | — | (a) | | | — | | | | — | | | | — | | | | — | |
| | | | | | | | | | | | | | | | | | | | |
Net asset value, end of year | | $ | 2.00 | | | $ | 2.00 | | | $ | 2.00 | | | $ | 2.00 | | | $ | 2.00 | |
| | | | | | | | | | | | | | | | | | | | | |
Total Return (excluding account fees) (b) | | | .34 | % | | | .36 | % | | | .02 | % | | | .01 | % | | | .01 | % |
Ratios to Average Net Assets: | | | | | | | | | | | | | | | | | | | | |
Net investment income | | | .33 | % | | | .35 | % | | | .01 | % | | | .01 | % | | | .01 | % |
Total expenses | | | 1.13 | % | | | 1.07 | % | | | .97 | % | | | .87 | % | | | .81 | % |
Expenses waived or reimbursed (c) | | | (.68 | )% | | | (.74 | )% | | | (.91 | )% | | | (.74 | )% | | | (.74 | )% |
Net expenses (d) | | | .45 | % | | | .33 | % | | | .06 | % | | | .13 | % | | | .07 | % |
Portfolio turnover rate (e) | | | 60 | % | | | 33 | % | | | | | | | | | | | | |
| | | | | | | | | | | | | | | | | | | | | |
Net assets, end of year (in thousands) | | $ | 62,562 | | | $ | 64,020 | | | $ | 75,227 | | | $ | 140,425 | | | $ | 171,664 | |
* | The per share amounts for the periods have been adjusted to reflect a 1-for-2 reverse stock split, which was effective December 20, 2013. In addition, on December 20, 2013, the Fund changed from a constant $1.00 net asset value per share money market fund to a U.S. Government ultra-short bond fund (that is not a money market fund) with an objective of total return with current income. |
(a) | The per share amount does not round to a full penny. |
(b) | Assumes investment at the net asset value at the beginning of the period, reinvestment of all distributions and a complete redemption of the investment at the net asset value at the end of the period. |
(c) | Expenses waived or reimbursed reflect reductions to total expenses, as discussed in the notes to the financial statements. These amounts would increase the net investment loss ratio or decrease the net investment income ratio, as applicable, and decrease total returns had such reductions not occurred. During 2011, 2012 and 2013, the Adviser waived fees and/or reimbursed expenses under the Minimum Yield Agreement in the amount of $736,531, $509,874 and $498,342, respectively. The waivers/reimbursements from 2013 are subject to recapture in 2016. |
(d) | The net expense ratios shown above reflect expenses after waivers and reimbursements but exclude the effect of reductions to total expenses for any expenses offset. Expense offset arrangements reduce total expenses, as discussed in the notes to the financial statements. These amounts would decrease the net investment income ratio had such reductions not occurred. The effect of expenses offset are as follows: |
| | Investor Class |
| | Year Ended December 31, |
| | 2015 | 2014 | 2013* | 2012* | 2011* |
Ratios to Average Net Assets: | | | | | |
Expense offset (f) | — | — | — | — | — |
(e) | Portfolio turnover is not shown for periods that the Fund was a money market fund. |
(f) | Effect on the expense ratio was not greater than 0.005%. |
See accompanying notes to financial statements.
151
Near-Term Tax Free Fund
For a capital share outstanding during the
| | | Investor Class | |
| | | Year Ended December 31, | |
| | | 2015 | | | 2014 | | | 2013 | | | 2012 | | | 2011 | |
Net asset value, beginning of year | | $ | 2.25 | | | $ | 2.23 | | | $ | 2.27 | | | $ | 2.26 | | | $ | 2.22 | |
| | | | | | | | | | | | | | | | | | | | | |
Investment Activities | | | | | | | | | | | | | | | | | | | | |
Net investment income | | | .03 | | | | .05 | | | | .05 | | | | .05 | | | | .05 | |
Net realized and unrealized gain (loss) | | | — | (f) | | | .02 | | | | (.04 | ) | | | .01 | | | | .04 | |
Total from investment activities | | | .03 | | | | .07 | | | | .01 | | | | .06 | | | | .09 | |
Distributions from net investment income | | | (.03 | ) | | | (.05 | ) | | | (.05 | ) | | | (.05 | ) | | | (.05 | ) |
| | | | | | | | | | | | | | | | | | | | |
Net asset value, end of year | | $ | 2.25 | | | $ | 2.25 | | | $ | 2.23 | | | $ | 2.27 | | | $ | 2.26 | |
| | | | | | | | | | | | | | | | | | | | | |
Total Return (excluding account fees) (a) | | | 1.45 | % | | | 3.07 | % | | | 0.31 | % | | | 2.67 | % | | | 4.24 | % |
Ratios to Average Net Assets: | | | | | | | | | | | | | | | | | | | | |
Net investment income | | | 1.52 | % | | | 2.13 | % | | | 2.08 | % | | | 2.21 | % | | | 2.39 | % |
Total expenses | | | 1.09 | % | | | 1.08 | % | | | 1.21 | % | | | 1.25 | % | | | 1.26 | % |
Expenses waived or reimbursed (b) | | | (.64 | )% | | | (.63 | )% | | | (.76 | )% | | | (.80 | )% | | | (.81 | )% |
Net expenses (c) | | | .45 | % | | | .45 | % | | | .45 | % | | | .45 | % | | | .45 | % |
Portfolio turnover rate | | | 15 | % | | | 12 | % | | | 6 | % | | | 7 | % | | | —(d | ) |
| | | | | | | | | | | | | | | | | | | | | |
Net assets, end of year (in thousands) | | $ | 106,769 | | | $ | 89,595 | | | $ | 61,884 | | | $ | 44,509 | | | $ | 35,014 | |
(a) | Assumes investment at the net asset value at the beginning of the period, reinvestment of all distributions and a complete redemption of the investment at the net asset value at the end of the period. |
(b) | Expenses waived or reimbursed reflect reductions to total expenses, as discussed in the notes to the financial statements. These amounts would increase the net investment loss ratio or decrease the net investment income ratio, as applicable, and decrease total returns had such reductions not occurred. |
(c) | The net expense ratios shown above reflect expenses after waivers and reimbursements but exclude the effect of reductions to total expenses for any expenses offset. Expense offset arrangements reduce total expenses, as discussed in the notes to the financial statements. These amounts would decrease the net investment income ratio had such reductions not occurred. The effect of expenses offset are as follows: |
| | Investor Class |
| | Year Ended December 31, |
| | 2015 | 2014 | 2013 | 2012 | 2011 |
Ratios to Average Net Assets: | | | | | |
Expense offset (e) | — | — | — | — | — |
(d) | Portfolio turnover rate was not greater than 0.5%. |
(e) | Effect on the expense ratio was not greater than 0.005%. |
(f) | The per share amount does not round to a full penny. |
See accompanying notes to financial statements.
152
All American Equity Fund
For a capital share outstanding during the
| | | Investor Class | |
| | | Year Ended December 31, | |
| | | 2015 | | | 2014 | | | 2013 | | | 2012 | | | 2011 | |
Net asset value, beginning of year | | $ | 27.84 | | | $ | 32.18 | | | $ | 25.40 | | | $ | 22.72 | | | $ | 22.72 | |
| | | | | | | | | | | | | | | | | | | | | |
Investment Activities | | | | | | | | | | | | | | | | | | | | |
Net investment income (loss) | | | .09 | | | | (.16 | ) | | | (.12 | ) | | | .07 | | | | (.07 | ) |
Net realized and unrealized gain (loss) | | | (1.23 | ) | | | .84 | | | | 9.08 | | | | 2.61 | | | | .10 | |
Total from investment activities | | | (1.14 | ) | | | .68 | | | | 8.96 | | | | 2.68 | | | | .03 | |
Distributions | | | | | | | | | | | | | | | | | | | | |
From net investment income | | | (.06 | ) | | | — | | | | (.07 | ) | | | — | | | | (.03 | ) |
From net realized gains | | | (3.04 | ) | | | (5.02 | ) | | | (2.11 | ) | | | — | | | | — | |
Total distributions | | | (3.10 | ) | | | (5.02 | ) | | | (2.18 | ) | | | — | | | | (.03 | ) |
Short -Term Trading Fees* (a) | | | — | | | | — | | | | — | | | | — | | | | — | |
| | | | | | | | | | | | | | | | | | | | |
Net asset value, end of year | | $ | 23.60 | | | $ | 27.84 | | | $ | 32.18 | | | $ | 25.40 | | | $ | 22.72 | |
| | | | | | | | | | | | | | | | | | | | | |
Total Return (excluding account fees) (b) | | | (4.20 | )% | | | 1.94 | % | | | 35.55 | % | | | 11.80 | % | | | 0.14 | % |
Ratios to Average Net Assets: | | | | | | | | | | | | | | | | | | | | |
Net investment income (loss) | | | .31 | % | | | (.54 | )% | | | (.45 | )% | | | .28 | % | | | (.32 | )% |
Total expenses | | | 1.94 | % | | | 2.16 | % | | | 2.44 | % | | | 2.72 | % | | | 2.42 | % |
Expenses waived or reimbursed (c) | | | (.02 | )% | | | (.03 | )% | | | (.28 | )% | | | (.52 | )% | | | (.24 | )% |
Net expenses (d) | | | 1.92 | % | | | 2.13 | % | | | 2.16 | % | | | 2.20 | % | | | 2.18 | % |
Portfolio turnover rate | | | 109 | %(f) | | | 253 | % | | | 150 | % | | | 221 | % | | | 223 | % |
| | | | | | | | | | | | | | | | | | | | | |
Net assets, end of year (in thousands) | | $ | 19,117 | | | $ | 21,936 | | | $ | 23,388 | | | $ | 16,846 | | | $ | 16,399 | |
* | Based on average monthly shares outstanding. |
(a) | The per share amount does not round to a full penny. |
(b) | Assumes investment at the net asset value at the beginning of the period, reinvestment of all distributions and a complete redemption of the investment at the net asset value at the end of the period. |
(c) | Expenses waived or reimbursed reflect reductions to total expenses, as discussed in the notes to the financial statements. These amounts would increase the net investment loss ratio or decrease the net investment income ratio, as applicable, and decrease total returns had such reductions not occurred. |
(d) | The net expense ratios shown above reflect expenses after waivers and reimbursements but exclude the effect of reductions to total expenses for any expenses offset. Expense offset arrangements reduce total expenses, as discussed in the notes to the financial statements. These amounts would decrease the net investment income (loss) ratio had such reductions not occurred. The effect of expenses offset are as follows: |
| | Investor Class |
| | Year Ended December 31, |
| | 2015 | 2014 | 2013 | 2012 | 2011 |
Ratios to Average Net Assets: | | | | | |
Expense offset (e) | — | — | — | — | — |
(e) | Effect on the expense ratio was not greater than 0.005%. |
(f) | Excludes option transactions. |
See accompanying notes to financial statements.
153
Holmes Macro Trends Fund
For a capital share outstanding during the
| | | Investor Class | |
| | | Year Ended December 31, | |
| | | 2015 | | | 2014 | | | 2013 | | | 2012 | | | 2011 | |
Net asset value, beginning of year | | $ | 20.25 | | | $ | 24.24 | | | $ | 18.51 | | | $ | 17.62 | | | $ | 18.65 | |
| | | | | | | | | | | | | | | | | | | | | |
Investment Activities | | | | | | | | | | | | | | | | | | | | |
Net investment loss | | | (.11 | ) | | | (.26 | ) | | | (.18 | ) | | | (.10 | ) | | | (.26 | ) |
Net realized and unrealized gain (loss) | | | (.06 | ) | | | (1.36 | ) | | | 7.42 | | | | 1.29 | | | | (.77 | ) |
Total from investment activities | | | (.17 | ) | | | (1.62 | ) | | | 7.24 | | | | 1.19 | | | | (1.03 | ) |
Distributions from net realized gains | | | (1.49 | ) | | | (2.37 | ) | | | (1.51 | ) | | | (.30 | ) | | | — | |
Short -Term Trading Fees*(a) | | | — | | | | — | | | | — | | | | — | | | | — | |
| | | | | | | | | | | | | | | | | | | | |
Net asset value, end of year | | $ | 18.59 | | | $ | 20.25 | | | $ | 24.24 | | | $ | 18.51 | | | $ | 17.62 | |
| | | | | | | | | | | | | | | | | | | | | |
Total Return (excluding account fees) (b) | | | (.94 | )% | | | (6.74 | )% | | | 39.38 | % | | | 6.77 | % | | | (5.52 | )% |
Ratios to Average Net Assets: | | | | | | | | | | | | | | | | | | | | |
Net investment loss | | | (.55 | )% | | | (1.17 | )% | | | (1.11 | )% | | | (.51 | )% | | | (1.25 | )% |
Total expenses | | | 1.81 | % | | | 1.94 | % | | | 2.00 | % | | | 1.85 | % | | | 2.00 | % |
Expenses waived or reimbursed (c) | | | — | | | | — | | | | (.04 | )% | | | —(e | ) | | | — | |
Net expenses (d) | | | 1.81 | % | | | 1.94 | % | | | 1.96 | % | | | 1.85 | % | | | 2.00 | % |
Portfolio turnover rate | | | 320 | %(f) | | | 183 | %(f) | | | 109 | % | | | 214 | % | | | 210 | % |
| | | | | | | | | | | | | | | | | | | | | |
Net assets, end of year (in thousands) | | $ | 41,135 | | | $ | 46,250 | | | $ | 55,926 | | | $ | 34,639 | | | $ | 35,316 | |
* | Based on average monthly shares outstanding. |
(a) | The per share amount does not round to a full penny. |
(b) | Assumes investment at the net asset value at the beginning of the period, reinvestment of all distributions and a complete redemption of the investment at the net asset value at the end of the period. |
(c) | Expenses waived or reimbursed reflect reductions to total expenses, as discussed in the notes to the financial statements. These amounts would increase the net investment loss ratio or decrease the net investment income ratio, as applicable, and decrease total returns had such reductions not occurred. |
(d) | The net expense ratios shown above reflect expenses after waivers and reimbursements but exclude the effect of reductions to total expenses for any expenses offset. Expense offset arrangements reduce total expenses, as discussed in the notes to the financial statements. These amounts would decrease the net investment income ratio had such reductions not occurred. The effect of expenses offset are as follows: |
| | Investor Class |
| | Year Ended December 31, |
| | 2015 | 2014 | 2013 | 2012 | 2011 |
Ratios to Average Net Assets: | | | | | |
Expense offset (e) | — | — | — | — | — |
(e) | Effect on the expense ratio was not greater than 0.005%. |
(f) | Excludes option transactions. |
See accompanying notes to financial statements.
154
Global Resources Fund
For a capital share outstanding during the
| | | Investor Class | |
| | | Year Ended December 31, | |
| | | 2015 | | | 2014 | | | 2013 | | | 2012 | | | 2011 | |
Net asset value, beginning of year | | $ | 6.67 | | | $ | 9.36 | | | $ | 9.79 | | | $ | 9.36 | | | $ | 11.91 | |
| | | | | | | | | | | | | | | | | | | | | |
Investment Activities | | | | | | | | | | | | | | | | | | | | |
Net investment income (loss) | | | .10 | * | | | .04 | * | | | .02 | * | | | .04 | * | | | (.19 | ) |
Net realized and unrealized gain (loss) | | | (2.00 | )* | | | (2.73 | )* | | | (.10 | )* | | | .61 | * | | | (2.02 | ) |
Total from investment activities | | | (1.90 | ) | | | (2.69 | ) | | | (.08 | ) | | | .65 | | | | (2.21 | ) |
Distributions from net investment income | | | (.05 | ) | | | — | | | | (.35 | ) | | | (.22 | ) | | | (.34 | ) |
Short -Term Trading Fees*(a) | | | — | | | | — | | | | — | | | | — | | | | — | |
| | | | | | | | | | | | | | | | | | | | |
Net asset value, end of year | | $ | 4.72 | | | $ | 6.67 | | | $ | 9.36 | | | $ | 9.79 | | | $ | 9.36 | |
| | | | | | | | | | | | | | | | | | | | | |
Total Return (excluding account fees) (b) | | | (28.43 | )% | | | (28.74 | )% | | | (.72 | )% | | | 6.93 | % | | | (18.69 | )% |
Ratios to Average Net Assets: | | | | | | | | | | | | | | | | | | | | |
Net investment income (loss) | | | 1.72 | % | | | .44 | % | | | .16 | % | | | .44 | % | | | (.79 | )% |
Total expenses | | | 1.58 | % | | | 1.45 | % | | | 1.59 | % | | | 1.57 | % | | | 1.72 | % |
Expenses waived or reimbursed (c) | | | (.06 | )% | | | —(e | ) | | | — | | | | — | | | | — | |
Net expenses (d) | | | 1.52 | % | | | 1.45 | % | | | 1.59 | % | | | 1.57 | % | | | 1.72 | % |
Portfolio turnover rate (f) | | | 445 | %(g) | | | 444 | %(g) | | | 138 | % | | | 117 | % | | | 232 | % |
| | | | | | | | | | | | | | | | | | | | | |
Net assets, end of year (in thousands) | | $ | 98,126 | | | $ | 171,673 | | | $ | 326,320 | | | $ | 438,372 | | | $ | 551,793 | |
* | Based on average monthly shares outstanding. |
(a) | The per share amount does not round to a full penny. |
(b) | Assumes investment at the net asset value at the beginning of the period, reinvestment of all distributions and a complete redemption of the investment at the net asset value at the end of the period. |
(c) | Expenses waived or reimbursed reflect reductions to total expenses, as discussed in the notes to the financial statements. These amounts would increase the net investment loss ratio or decrease the net investment income ratio, as applicable, and decrease total returns had such reductions not occurred. |
(d) | The net expense ratios shown above reflect expenses after waivers and reimbursements but exclude the effect of reductions to total expenses for any expenses offset. Expense offset arrangements reduce total expenses, as discussed in the notes to the financial statements. These amounts would decrease the net investment income ratio had such reductions not occurred. The effect of expenses offset are as follows: |
| | Investor Class |
| | Year Ended December 31, |
| | 2015 | 2014 | 2013 | 2012 | 2011 |
Ratios to Average Net Assets: | | | | | |
Expense offset (e) | — | — | — | — | — |
(e) | Effect on the expense ratio was not greater than 0.005%. |
(f) | Portfolio turnover is calculated at the fund level. |
(g) | Excludes option transactions. |
See accompanying notes to financial statements.
155
Global Resources Fund
For a capital share outstanding during the
| | | Institutional Class | |
| | | Year Ended December 31, | |
| | | 2015 | | | 2014 | | | 2013 | | | 2012 | | | 2011 | |
Net asset value, beginning of year | | $ | 6.67 | | | $ | 9.30 | | | $ | 9.74 | | | $ | 9.39 | | | $ | 11.98 | |
| | | | | | | | | | | | | | | | | | | | | |
Investment Activities | | | | | | | | | | | | | | | | | | | | |
Net investment income (loss) | | | .17 | * | | | .08 | * | | | .07 | * | | | .10 | * | | | —* | (a) |
Net realized and unrealized gain (loss) | | | (2.02 | )* | | | (2.71 | )* | | | (.10 | )* | | | .60 | * | | | (2.17 | )* |
Total from investment activities | | | (1.85 | ) | | | (2.63 | ) | | | (.03 | ) | | | .70 | | | | (2.17 | ) |
Distributions from net investment income | | | (.08 | ) | | | — | | | | (.41 | ) | | | (.35 | ) | | | (.42 | ) |
Short -Term Trading Fees* | | | — | | | | — | | | | — | (a) | | | — | (a) | | | — | (a) |
| | | | | | | | | | | | | | | | | | | | |
Net asset value, end of year | | $ | 4.74 | | | $ | 6.67 | | | $ | 9.30 | | | $ | 9.74 | | | $ | 9.39 | |
| | | | | | | | | | | | | | | | | | | | | |
Total Return (excluding account fees) (b) | | | (27.73 | )% | | | (28.28 | )% | | | (0.15 | )% | | | 7.44 | % | | | (18.23 | )% |
Ratios to Average Net Assets: | | | | | | | | | | | | | | | | | | | | |
Net investment income (loss) | | | 2.92 | % | | | .85 | % | | | .68 | % | | | 1.02 | % | | | (.02 | )% |
Total expenses | | | 1.35 | % | | | 1.13 | % | | | 1.25 | % | | | 1.21 | % | | | 1.29 | % |
Expenses waived or reimbursed (c) | | | (.61 | )% | | | (.27 | )% | | | (.22 | )% | | | (.14 | )% | | | (.20 | )% |
Net expenses (d) | | | .74 | % | | | .86 | % | | | 1.03 | % | | | 1.07 | % | | | 1.09 | % |
Portfolio turnover rate (f) | | | 445 | %(g) | | | 444 | %(g) | | | 138 | % | | | 117 | % | | | 232 | % |
| | | | | | | | | | | | | | | | | | | | | |
Net assets, end of year (in thousands) | | $ | 1,882 | | | $ | 9,733 | | | $ | 51,122 | | | $ | 94,076 | | | $ | 55,985 | |
* | Based on average monthly shares outstanding. |
(a) | The per share amount does not round to a full penny. |
(b) | Assumes investment at the net asset value at the beginning of the period, reinvestment of all distributions and a complete redemption of the investment at the net asset value at the end of the period. |
(c) | Expenses waived or reimbursed reflect reductions to total expenses, as discussed in the notes to the financial statements. These amounts would increase the net investment loss ratio or decrease the net investment income ratio, as applicable, and decrease total returns had such reductions not occurred. |
(d) | The net expense ratios shown above reflect expenses after waivers and reimbursements but exclude the effect of reductions to total expenses for any expenses offset. Expense offset arrangements reduce total expenses, as discussed in the notes to the financial statements. These amounts would decrease the net investment income (loss) ratio had such reductions not occurred. The effect of expenses offset are as follows: |
| | Institutional Class |
| | Year Ended December 31, |
| | 2015 | 2014 | 2013 | 2012 | 2011 |
Ratios to Average Net Assets: | | | | | |
Expense offset (e) | — | — | — | — | — |
(e) | Effect on the expense ratio was not greater than 0.005%. |
(f) | Portfolio turnover rate is calculated at the fund level. |
(g) | Excludes option transactions. |
See accompanying notes to financial statements.
156
World Precious Minerals Fund
For a capital share outstanding during the
| | | Investor Class | |
| | | Year Ended December 31, | |
| | | 2015 | | | 2014 | | | 2013 | | | 2012 | | | 2011 | |
Net asset value, beginning of year | | $ | 4.75 | | | $ | 5.69 | | | $ | 11.70 | | | $ | 13.18 | | | $ | 22.28 | |
| | | | | | | | | | | | | | | | | | | | | |
Investment Activities | | | | | | | | | | | | | | | | | | | | |
Net investment loss | | | (.03 | )* | | | (.06 | )* | | | (.07 | )* | | | (.11 | )* | | | (.32 | ) |
Net realized and unrealized loss | | | (.72 | )* | | | (.88 | )* | | | (5.94 | )* | | | (1.37 | )* | | | (6.76 | ) |
Total from investment activities | | | (.75 | ) | | | (.94 | ) | | | (6.01 | ) | | | (1.48 | ) | | | (7.08 | ) |
Distributions from net investment income | | | (.36 | ) | | | — | | | | — | | | | — | | | | (2.02 | ) |
Short -Term Trading Fees*(a) | | | — | | | | — | | | | — | | | | — | | | | — | |
| | | | | | | | | | | | | | | | | | | | |
Net asset value, end of year | | $ | 3.64 | | | $ | 4.75 | | | $ | 5.69 | | | $ | 11.70 | | | $ | 13.18 | |
| | | | | | | | | | | | | | | | | | | | | |
Total Return (excluding account fees) (b) | | | (15.64 | )% | | | (16.52 | )% | | | (51.37 | )% | | | (11.23 | )% | | | (32.58 | )% |
Ratios to Average Net Assets: | | | | | | | | | | | | | | | | | | | | |
Net investment loss | | | (.71 | )% | | | (.91 | )% | | | (.90 | )% | | | (.85 | )% | | | (1.43 | )% |
Total expenses | | | 1.96 | % | | | 1.99 | % | | | 1.85 | % | | | 1.45 | % | | | 1.67 | % |
Expenses waived or reimbursed (c) | | | (.15 | )% | | | (.03 | )% | | | (.02 | )% | | | — | | | | — | |
Net expenses (d) | | | 1.81 | % | | | 1.96 | % | | | 1.83 | % | | | 1.45 | % | | | 1.67 | % |
Portfolio turnover rate (f) | | | 71 | %(g) | | | 61 | %(g) | | | 34 | % | | | 44 | % | | | 96 | % |
| | | | | | | | | | | | | | | | | | | | | |
Net assets, end of year (in thousands) | | $ | 78,150 | | | $ | 103,413 | | | $ | 134,065 | | | $ | 319,052 | | | $ | 436,504 | |
* | Based on average monthly shares outstanding. |
(a) | The per share amount does not round to a full penny. |
(b) | Assumes investment at the net asset value at the beginning of the period, reinvestment of all distributions and a complete redemption of the investment at the net asset value at the end of the period. |
(c) | Expenses waived or reimbursed reflect reductions to total expenses, as discussed in the notes to the financial statements. These amounts would increase the net investment loss ratio or decrease the net investment income ratio, as applicable, and decrease total returns had such reductions not occurred. |
(d) | The net expense ratios shown above reflect expenses after waivers and reimbursements but exclude the effect of reductions to total expenses for any expenses offset. Expense offset arrangements reduce total expenses, as discussed in the notes to the financial statements. These amounts would decrease the net investment income ratio had such reductions not occurred. The effect of expenses offset are as follows: |
| | Investor Class |
| | Year Ended December 31, |
| | 2015 | 2014 | 2013 | 2012 | 2011 |
Ratios to Average Net Assets: | | | | | |
Expense offset (e) | — | — | — | — | — |
(e) | Effect on the expense ratio was not greater than 0.005%. |
(f) | Portfolio turnover rate is calculated at the fund level. |
(g) | Excludes option transactions. |
See accompanying notes to financial statements.
157
World Precious Minerals Fund
For a capital share outstanding during the
| | | Institutional Class | |
| | | Year Ended December 31, | |
| | | 2015 | | | 2014 | | | 2013 | | | 2012 | | | 2011 | |
Net asset value, beginning of year | | $ | 4.78 | | | $ | 5.72 | | | $ | 11.69 | | | $ | 13.10 | | | $ | 22.29 | |
| | | | | | | | | | | | | | | | | | | | | |
Investment Activities | | | | | | | | | | | | | | | | | | | | |
Net investment loss | | | (.01 | )* | | | (.05 | )* | | | (.01 | )* | | | (.04 | )* | | | (.16 | )* |
Net realized and unrealized loss | | | (.72 | )* | | | (.89 | )* | | | (5.96 | )* | | | (1.37 | )* | | | (6.84 | )* |
Total from investment activities | | | (.73 | ) | | | (.94 | ) | | | (5.97 | ) | | | (1.41 | ) | | | (7.00 | ) |
Distributions from net investment income | | | (.40 | ) | | | — | | | | — | | | | — | | | | (2.19 | ) |
Short -Term Trading Fees* | | | — | | | | — | | | | — | | | | — | | | | — | |
| | | | | | | | | | | | | | | | | | | | |
Net asset value, end of year | | $ | 3.65 | | | $ | 4.78 | | | $ | 5.72 | | | $ | 11.69 | | | $ | 13.10 | |
| | | | | | | | | | | | | | | | | | | | | |
Total Return (excluding account fees) (a) | | | (15.07 | )% | | | (16.43 | )% | | | (51.07 | )% | | | (10.76 | )% | | | (32.28 | )% |
Ratios to Average Net Assets: | | | | | | | | | | | | | | | | | | | | |
Net investment loss | | | (.15 | )% | | | (.71 | )% | | | (.15 | )% | | | (.32 | )% | | | (.87 | )% |
Total expenses | | | 20.51 | % | | | 4.86 | % | | | 3.30 | % | | | 3.56 | % | | | 2.38 | % |
Expenses waived or reimbursed (b) | | | (19.31 | )% | | | (3.23 | )% | | | (1.97 | )% | | | (2.69 | )% | | | (1.27 | )% |
Net expenses (c) | | | 1.20 | % | | | 1.63 | % | | | 1.33 | % | | | .87 | % | | | 1.11 | % |
Portfolio turnover rate (e) | | | 71 | %(f) | | | 61 | %(f) | | | 34 | % | | | 44 | % | | | 96 | % |
| | | | | | | | | | | | | | | | | | | | | |
Net assets, end of year (in thousands) | | $ | 76 | | | $ | 154 | | | $ | 3,660 | | | $ | 769 | | | $ | 1,683 | |
* | Based on average monthly shares outstanding. |
(a) | Assumes investment at the net asset value at the beginning of the period, reinvestment of all distributions and a complete redemption of the investment at the net asset value at the end of the period. |
(b) | Expenses waived or reimbursed reflect reductions to total expenses, as discussed in the notes to the financial statements. These amounts would increase the net investment loss ratio or decrease the net investment income ratio, as applicable, and decrease total returns had such reductions not occurred. |
(c) | The net expense ratios shown above reflect expenses after waivers and reimbursements but exclude the effect of reductions to total expenses for any expenses offset. Expense offset arrangements reduce total expenses, as discussed in the notes to the financial statements. These amounts would decrease the net investment income ratio had such reductions not occurred. The effect of expenses offset are as follows: |
| | Institutional Class |
| | Year Ended December 31, |
| | 2015 | 2014 | 2013 | 2012 | 2011 |
Ratios to Average Net Assets: | | | | | |
Expense offset (d) | — | — | — | — | — |
(d) | Effect on the expense ratio was not greater than 0.005%. |
(e) | Portfolio turnover rate is calculated at the fund level. |
(f) | Excludes option transactions. |
See accompanying notes to financial statements.
158
Gold and Precious Metals Fund
For a capital share outstanding during the
| | | Investor Class | |
| | | Year Ended December 31, | |
| | | 2015 | | | 2014 | | | 2013 | | | 2012 | | | 2011 | |
Net asset value, beginning of year | | $ | 5.16 | | | $ | 6.00 | | | $ | 11.78 | | | $ | 12.61 | | | $ | 19.60 | |
| | | | | | | | | | | | | | | | | | | | | |
Investment Activities | | | | | | | | | | | | | | | | | | | | |
Net investment loss | | | (.04 | ) | | | (.05 | ) | | | (.06 | ) | | | (.09 | ) | | | (.17 | ) |
Net realized and unrealized loss | | | (.21 | ) | | | (.79 | ) | | | (5.72 | ) | | | (.72 | ) | | | (4.28 | ) |
Total from investment activities | | | (.25 | ) | | | (.84 | ) | | | (5.78 | ) | | | (.81 | ) | | | (4.45 | ) |
Distributions | | | | | | | | | | | | | | | | | | | | |
From net investment income | | | (.02 | ) | | | — | | | | — | | | | (.02 | ) | | | — | |
From net realized gains | | | — | | | | — | | | | — | | | | — | | | | (2.54 | ) |
Total distributions | | | (.02 | ) | | | — | | | | — | | | | (.02 | ) | | | (2.54 | ) |
Short -Term Trading Fees* (a) | | | — | | | | — | | | | — | | | | — | | | | — | |
| | | | | | | | | | | | | | | | | | | | |
Net asset value, end of year | | $ | 4.89 | | | $ | 5.16 | | | $ | 6.00 | | | $ | 11.78 | | | $ | 12.61 | |
| | | | | | | | | | | | | | | | | | | | | |
Total Return (excluding account fees) (b) | | | (4.78 | )% | | | (14.00 | )% | | | (49.07 | )% | | | (6.44 | )% | | | (23.97 | )% |
Ratios to Average Net Assets: | | | | | | | | | | | | | | | | | | | | |
Net investment loss | | | (.83 | )% | | | (.67 | )% | | | (.48 | )% | | | (.60 | )% | | | (1.06 | )% |
Total expenses | | | 2.13 | % | | | 1.93 | % | | | 2.12 | % | | | 1.61 | % | | | 1.56 | % |
Expenses waived or reimbursed (c) | | | (.08 | )% | | | (.05 | )% | | | (.06 | )% | | | — | | | | — | |
Net expenses (d) | | | 2.05 | % | | | 1.88 | % | | | 2.06 | % | | | 1.61 | % | | | 1.56 | % |
Portfolio turnover rate | | | 106 | %(f) | | | 99 | %(f) | | | 64 | % | | | 95 | % | | | 155 | % |
| | | | | | | | | | | | | | | | | | | | | |
Net assets, end of year (in thousands) | | $ | 58,298 | | | $ | 62,777 | | | $ | 74,627 | | | $ | 166,524 | | | $ | 195,087 | |
* | Based on average monthly shares outstanding. |
(a) | The per share amount does not round to a full penny. |
(b) | Assumes investment at the net asset value at the beginning of the period, reinvestment of all distributions and a complete redemption of the investment at the net asset value at the end of the period. |
(c) | Expenses waived or reimbursed reflect reductions to total expenses, as discussed in the notes to the financial statements. These amounts would increase the net investment loss ratio or decrease the net investment income ratio, as applicable, and decrease total returns had such reductions not occurred. |
(d) | The net expense ratios shown above reflect expenses after waivers and reimbursements but exclude the effect of reductions to total expenses for any expenses offset. Expense offset arrangements reduce total expenses, as discussed in the notes to the financial statements. These amounts would decrease the net investment loss ratio had such reductions not occurred. The effect of expenses offset are as follows: |
| | Investor Class |
| | Year Ended December 31, |
| | 2015 | 2014 | 2013 | 2012 | 2011 |
Ratios to Average Net Assets: | | | | | |
Expense offset (e) | — | — | — | — | — |
(e) | Effect on the expense ratio was not greater than 0.005%. |
(f) | Excludes option transactions. |
See accompanying notes to financial statements.
159
Emerging Europe Fund
For a capital share outstanding during the
| | | Investor Class | |
| | | Year Ended December 31, | |
| | | 2015 | | | 2014 | | | 2013 | | | 2012 | | | 2011 | |
Net asset value, beginning of year | | $ | 6.56 | | | $ | 8.82 | | | $ | 9.23 | | | $ | 7.79 | | | $ | 10.81 | |
| | | | | | | | | | | | | | | | | | | | | |
Investment Activities | | | | | | | | | | | | | | | | | | | | |
Net investment income | | | .04 | | | | .06 | | | | .19 | | | | .15 | | | | .03 | |
Net realized and unrealized gain (loss) | | | (1.40 | ) | | | (2.11 | ) | | | (.46 | ) | | | 1.35 | | | | (3.05 | ) |
Total from investment activities | | | (1.36 | ) | | | (2.05 | ) | | | (.27 | ) | | | 1.50 | | | | (3.02 | ) |
Distributions from net investment income | | | — | | | | (.21 | ) | | | (.14 | ) | | | (.06 | ) | | | — | |
Short -Term Trading Fees*(a) | | | — | | | | — | | | | — | | | | — | | | | — | |
| | | | | | | | | | | | | | | | | | | | |
Net asset value, end of year | | $ | 5.20 | | | $ | 6.56 | | | $ | 8.82 | | | $ | 9.23 | | | $ | 7.79 | |
| | | | | | | | | | | | | | | | | | | | | |
Total Return (excluding account fees) (b) | | | (20.73 | )% | | | (23.22 | )% | | | (2.93 | )% | | | 19.27 | % | | | (27.94 | )% |
Ratios to Average Net Assets: | | | | | | | | | | | | | | | | | | | | |
Net investment income | | | .63 | % | | | .23 | % | | | 1.59 | % | | | 1.39 | % | | | .25 | % |
Total expenses | | | 2.60 | % | | | 2.28 | % | | | 2.13 | % | | | 2.15 | % | | | 1.98 | % |
Expenses waived or reimbursed (c) | | | — | | | | — | | | | — | | | | — | | | | — | |
Net expenses (d) | | | 2.60 | % | | | 2.28 | % | | | 2.13 | % | | | 2.15 | % | | | 1.98 | % |
Portfolio turnover rate | | | 137 | %(f) | | | 93 | %(f) | | | 74 | % | | | 85 | % | | | 85 | % |
| | | | | | | | | | | | | | | | | | | | | |
Net assets, end of year (in thousands) | | $ | 44,666 | | | $ | 69,066 | | | $ | 122,570 | | | $ | 173,687 | | | $ | 193,599 | |
* | Based on average monthly shares outstanding. |
(a) | The per share amount does not round to a full penny. |
(b) | Assumes investment at the net asset value at the beginning of the period, reinvestment of all distributions and a complete redemption of the investment at the net asset value at the end of the period. |
(c) | Expenses waived or reimbursed reflect reductions to total expenses, as discussed in the notes to the financial statements. These amounts would increase the net investment loss ratio or decrease the net investment income ratio, as applicable, and decrease total returns had such reductions not occurred. |
(d) | The net expense ratios shown above reflect expenses after waivers and reimbursements but exclude the effect of reductions to total expenses for any expenses offset. Expense offset arrangements reduce total expenses, as discussed in the notes to the financial statements. These amounts would decrease the net investment income (loss) ratio had such reductions not occurred. The effect of expenses offset are as follows: |
| | Investor Class |
| | Year Ended December 31, |
| | 2015 | 2014 | 2013 | 2012 | 2011 |
Ratios to Average Net Assets: | | | | | |
Expense offset (e) | — | — | — | — | — |
(e) | Effect on the expense ratio was not greater than 0.005%. |
(f) | Excludes option transactions. |
See accompanying notes to financial statements.
160
China Region Fund
For a capital share outstanding during the
| | | Investor Class | |
| | | Year Ended December 31, | |
| | | 2015 | | | 2014 | | | 2013 | | | 2012 | | | 2011 | |
Net asset value, beginning of year | | $ | 8.20 | | | $ | 8.28 | | | $ | 7.61 | | | $ | 6.81 | | | $ | 9.47 | |
| | | | | | | | | | | | | | | | | | | | | |
Investment Activities | | | | | | | | | | | | | | | | | | | | |
Net investment income (loss) | | | .02 | | | | — | (a) | | | (.01 | ) | | | .04 | | | | (.08 | ) |
Net realized and unrealized gain (loss) | | | (.72 | ) | | | (.08 | ) | | | .70 | | | | .78 | | | | (2.59 | ) |
Total from investment activities | | | (.70 | ) | | | (.08 | ) | | | .69 | | | | .82 | | | | (2.67 | ) |
Distributions from net investment income | | | (.09 | ) | | | — | | | | (.02 | ) | | | (.02 | ) | | | — | |
Short -Term Trading Fees* | | | — | (a) | | | — | (a) | | | — | (a) | | | — | (a) | | | .01 | |
| | | | | | | | | | | | | | | | | | | | |
Net asset value, end of year | | $ | 7.41 | | | $ | 8.20 | | | $ | 8.28 | | | $ | 7.61 | | | $ | 6.81 | |
| | | | | | | | | | | | | | | | | | | | | |
Total Return (excluding account fees) (b) | | | (8.60 | )% | | | (.97 | )% | | | 9.07 | % | | | 12.00 | % | | | (28.09 | )% |
Ratios to Average Net Assets: | | | | | | | | | | | | | | | | | | | | |
Net investment income (loss) | | | .24 | % | | | .08 | % | | | (.12 | )% | | | .60 | % | | | (.64 | )% |
Total expenses | | | 3.03 | % | | | 2.94 | % | | | 2.75 | % | | | 2.64 | % | | | 2.49 | % |
Expenses waived or reimbursed (c) | | | (.51 | )% | | | (.43 | )% | | | (.37 | )% | | | (.39 | )% | | | (.08 | )% |
Net expenses (d) | | | 2.52 | % | | | 2.51 | % | | | 2.38 | % | | | 2.25 | % | | | 2.41 | % |
Portfolio turnover rate | | | 210 | %(f) | | | 235 | %(f) | | | 201 | % | | | 374 | % | | | 426 | % |
| | | | | | | | | | | | | | | | | | | | | |
Net assets, end of year (in thousands) | | $ | 16,183 | | | $ | 21,008 | | | $ | 26,386 | | | $ | 29,160 | | | $ | 30,635 | |
* | Based on average monthly shares outstanding. |
(a) | The per share amount does not round to a full penny. |
(b) | Assumes investment at the net asset value at the beginning of the period, reinvestment of all distributions and a complete redemption of the investment at the net asset value at the end of the period. |
(c) | Expenses waived or reimbursed reflect reductions to total expenses, as discussed in the notes to the financial statements. These amounts would increase the net investment loss ratio or decrease the net investment income ratio, as applicable, and decrease total returns had such reductions not occurred. |
(d) | The net expense ratios shown above reflect expenses after waivers and reimbursements but exclude the effect of reductions to total expenses for any expenses offset. Expense offset arrangements reduce total expenses, as discussed in the notes to the financial statements. These amounts would decrease the net investment income ratio had such reductions not occurred. The effect of expenses offset are as follows: |
| | Investor Class |
| | Year Ended December 31, |
| | 2015 | 2014 | 2013 | 2012 | 2011 |
Ratios to Average Net Assets: | | | | | |
Expense offset (e) | — | — | — | — | — |
(e) | Effect on the expense ratio was not greater than 0.005%. |
(f) | Excludes option transactions. |
See accompanying notes to financial statements.
161
Report of Independent Registered Public Accounting Firm |
The Board of Trustees and Shareholders of
U.S. Global Investors Funds:
We have audited the accompanying statements of assets and liabilities of U.S. Government Securities Ultra-Short Bond Fund, Near-Term Tax Free Fund, All American Equity Fund, Holmes Macro Trends Fund, Global Resources Fund, World Precious Minerals Fund, Gold and Precious Metals Fund, Emerging Europe Fund, and China Region Fund, each a fund within the U.S. Global Investors Funds (the Trust), including the portfolios of investments, as of December 31, 2015 and the related statements of operations for the year then ended, the statements of changes in net assets for each of the years in the two year period then ended, and the financial highlights for each of the years in the five year period then ended. These financial statements and financial highlights are the responsibility of the Trust’s management. Our responsibility is to express an opinion on these financial statements and financial highlights based on our audits.
We conducted our audits in accordance with the standards of the Public Company Accounting Oversight Board (United States). Those standards require that we plan and perform the audit to obtain reasonable assurance about whether the financial statements and financial highlights are free of material misstatement. An audit includes examining, on a test basis, evidence supporting the amounts and disclosures in the financial statements. Our procedures included confirmation of securities owned as of December 31, 2015, by correspondence with the custodian and brokers or by other appropriate auditing procedures. An audit also includes assessing the accounting principles used and significant estimates made by management, as well as evaluating the overall financial statement presentation. We believe that our audits provide a reasonable basis for our opinion.
In our opinion, the financial statements and financial highlights referred to above present fairly, in all material respects, the financial position of each of the funds within the U.S. Global Investors Funds listed above, as of December 31, 2015, the results of their operations for the year then ended, the changes in their net assets for each of the years in the two year period then ended, and the financial highlights for each of the years in the five year period then ended, in conformity with U.S. generally accepted accounting principles.
Boston, Massachusetts
February 26, 2016
162
Trustees and Officers (unaudited) | December 31, 2015 |
The following table presents information about the Trustees as of December 31, 2015, together with a brief description of their principal occupations during the last five years. Each trustee serves until his death, resignation or removal and replacement. The address for all trustees is c/o Atlantic Fund Services, Three Canal Plaza, Suite 600, Portland, Maine 04101. Stacey E. Hong and John Y. Keffer are considered interested trustees due to their affiliation with Atlantic. If you would like more information about the Trustees, you may call 1-800-US-FUNDS (1-800-873-8637) to request a free copy of the Statement of Additional Information.
Name and Year
of Birth | Position with
the Trust | Length of
Time
Served | Principal
Occupation(s) During
Past Five Years | Number of Series in Fund Complex
Overseen
By Trustee(1) | Other
Directorships
Held By
Trustee
During Past
Five Years |
Independent Trustees |
David Tucker Born: 1958 | Chairman of the Board; Trustee; Chairman, Nominating Committee and Qualified Legal Compliance Committee | Since 2015 | Director, Blue Sky Experience (a charitable endeavor), since 2008; Senior Vice President & General Counsel, American Century Companies 1998-2008. | 46 | Trustee, Forum Funds; Trustee, Forum ETF Trust; Trustee, Forum Funds II |
Mark D. Moyer Born: 1959 | Trustee; Chairman Audit Committee | Since 2015 | Chief Financial Officer, Institute of International Education 2008-2011; Chief Financial Officer and Chief Restructuring Officer, Ziff Davis Media Inc. 2005-2008; Adjunct Professor of Accounting, Fairfield University from 2009-2012. | 20 | Trustee, Forum ETF Trust; Trustee, Forum Funds II |
(1) | The Fund Complex includes the Trust, Forum Funds, Forum Funds II and Forum ETF Trust and is overseen by different Board of Trustees. |
163
Trustees and Officers (unaudited) | December 31, 2015 |
Name and Year
of Birth | Position with
the Trust | Length of
Time
Served | Principal
Occupation(s) During
Past Five Years | Number of
Series in Fund
Complex
Overseen
By Trustee(1) | Other
Directorships
Held By
Trustee
During Past
Five Years |
Jennifer Brown-Strabley Born: 1964 | Trustee | Since 2015 | Principal, Portland Global Advisors 1996-2010. | 20 | Trustee, Forum ETF Trust; Trustee, Forum Funds II |
Interested Trustees |
Stacey E. Hong Born: 1966 | Trustee | Since 2015 | President, Atlantic since 2008 | 20 | Trustee, Forum Funds II |
John Y. Keffer(2) Born: 1942 | Trustee | Since 2015 | Chairman, Atlantic since 2008; President, Forum Investment Advisors, LLC since 2011; President, Forum Foundation (a charitable organization) since 2005; President, Forum Trust, LLC (a non-depository trust company chartered in the State of Maine) since 1997. | 46 | Trustee, Forum Funds, Forum ETF Trust; Trustee, Forum Funds II, ALTMFX Trust; Director, Wintergreen Fund, Inc. |
(2) | Atlantic and Forum Investment Advisors, LLC are subsidiaries of Forum Holdings Corp. I, a Delaware corporation that is wholly owned by Mr. Keffer. |
164
Trustees and Officers (unaudited) | December 31, 2015 |
The following table presents information about each Officer of the Trust as of December 31, 2015, together with a brief description of their principal occupations during the last five years. Each officer serves until his or her death, resignation or removal and replacement. The business address of each officer is c/o Atlantic Fund Services, Three Canal Plaza, Suite 600, Portland, Maine 04101.
Principal Officers of the Trust
Name and Year
of Birth | Position with
the Trust | Length of
Time
Served | Principal
Occupation(s) During
Past Five Years |
Jessica Chase Born: 1970 | President; Chief Executive Officer | Since 2015 | Senior Vice President, Atlantic since 2008. |
Karen Shaw Born: 1972 | Treasurer; Chief Financial Officer | Since 2015 | Senior Vice President, Atlantic since 2008. |
Zachary Tackett Born: 1988 | Vice President; Secretary and Anti-Money Laundering Compliance Officer, and Identity Theft Prevention Officer | Since 2015 | Associate Counsel, Atlantic since 2014; Intern Associate, Coakley & Hyde, PLLC, 2010-2013. |
Carlyn Edgar Born: 1963 | Chief Compliance Officer, Code of Ethics Review Officer | Since 2015 | Senior Vice President, Atlantic since 2008. |
165
Additional Information (unaudited) |
Additional Federal Tax Information
The percentage of tax-exempt dividends paid by the Near-Term Tax Free Fund for the year ended December 31, 2015, was 96.66%.
The percentage of ordinary income dividends paid by the Funds during the year ended December 31, 2015, which qualify as Qualified Dividends Income (QDI) and the Dividends Received Deduction (DRD) available to corporate shareholders was:
| | Qualified Dividend Income | Dividend Received Deduction |
All American Equity | 43.24% | 43.86% |
Global Resources | 100.00% | 100.00% |
World Precious Minerals | 5.09% | 0.92% |
Gold and Precious Metals | 100.00% | 100.00% |
China Region | 100.00% | 100.00% |
The amounts which represent foreign source income and foreign taxes paid during the year ended December 31, 2015, are as follows:
| | | Foreign Source Income | | | Foreign Tax
Credit | |
All American Equity | | $ | 23,924 | | | $ | — | |
Global Resources | | | 2,514,692 | | | | — | |
World Precious Minerals | | | 1,034,688 | | | | 30,283 | |
Gold and Precious Metals | | | 779,706 | | | | — | |
Emerging Europe | | | 2,197,220 | | | | — | |
China Region | | | 569,675 | | | | 46,676 | |
In early 2016, the Funds reported on Form 1099-DIV the tax status of all distributions made during the 2015 calendar year. The Funds intend to distribute the maximum amount of qualified dividend income allowable. The amount of qualified dividend income distributed by each fund will be reported to shareholders on their Form 1099-DIV. Shareholders should use the information on Form 1099-DIV for their income tax returns.
Proxy Voting
A description of the policies and procedures that the Funds use to determine how to vote proxies relating to portfolio securities is available without charge, upon request, by calling 1-800-US-FUNDS (1-800-873-8637). It also appears in the Funds’ statement of additional information (Form 485B), which can be found on the SEC’s website at www.sec.gov.
Information regarding how the Funds voted proxies relating to portfolio securities during the most recent 12-month period ended June 30 is available without charge, upon request, by calling 1-800-US-FUNDS (1-800-873-8637) or accessing the Funds’ Form N-PX on the SEC’s website at www.sec.gov.
166
Additional Information (unaudited) |
Availability of Quarterly Portfolio Schedules
The Funds provide complete lists of holdings four times in each fiscal year, at the quarter-ends. For the second and fourth quarters, the lists appear in the Funds’ semi-annual and annual reports to shareholders. For the first and third quarters, the Funds file the lists with the SEC on Form N-Q. The Funds’ Forms N-Q are available on the SEC’s website at http://www.sec.gov. The Funds’ Forms N-Q may also be reviewed and copied at the SEC’s Public Room in Washington D.C. Information on the operation of the Public Reference Room may be obtained by calling 1-800-SEC-0330.
Shareholder Voting Results
On December 9, 2015, a Special Meeting of Shareholders of the Trust was convened to vote upon a proposal to elect five new trustees to the Board of Trustees of the Trust. Shares were voted as follows:
Proposal 1: To elect five Trustees to the Board of Trustees of the Trust
1A. Jennifer Brown-Strabley
Fund Name | | Total Shares
Voted | | | Shares Voted Affirmatively | | | % of Shares Voted Affirmatively | |
U.S. Government Securities Ultra-Short Bond Fund | | | 11,277,164 | | | | 11,152,895 | | | | 98.90 | % |
Near-Term Tax Free Fund | | | 33,313,481 | | | | 32,413,849 | | | | 97.30 | % |
All American Equity Fund | | | 265,958 | | | | 258,416 | | | | 97.16 | % |
Holmes Macro Trends Fund | | | 710,886 | | | | 676,791 | | | | 95.20 | % |
Global Resources Fund | | | 15,937,199 | | | | 14,526,781 | | | | 91.15 | % |
World Precious Minerals Fund | | | 12,592,124 | | | | 11,836,480 | | | | 94.00 | % |
Gold and Precious Metals Fund | | | 6,816,290 | | | | 6,421,378 | | | | 94.21 | % |
Emerging Europe Fund | | | 7,657,979 | | | | 7,013,045 | | | | 91.58 | % |
China Region Fund | | | 1,114,263 | | | | 962,958 | | | | 86.42 | % |
1B. Stacey E. Hong
Fund Name | | Total Shares
Voted | | | Shares Voted Affirmatively | | | % of Shares Voted Affirmatively | |
U.S. Government Securities Ultra-Short Bond Fund | | | 11,277,164 | | | | 11,143,991 | | | | 98.82 | % |
Near-Term Tax Free Fund | | | 33,313,481 | | | | 32,278,754 | | | | 96.89 | % |
All American Equity Fund | | | 265,958 | | | | 257,630 | | | | 96.87 | % |
Holmes Macro Trends Fund | | | 710,886 | | | | 675,291 | | | | 94.99 | % |
Global Resources Fund | | | 15,937,199 | | | | 14,428,175 | | | | 90.53 | % |
World Precious Minerals Fund | | | 12,592,124 | | | | 11,843,667 | | | | 94.06 | % |
Gold and Precious Metals Fund | | | 6,816,290 | | | | 6,435,182 | | | | 94.41 | % |
Emerging Europe Fund | | | 7,657,979 | | | | 6,997,923 | | | | 91.38 | % |
China Region Fund | | | 1,114,263 | | | | 964,459 | | | | 86.56 | % |
167
Additional Information (unaudited) |
1C. John Y. Keffer
Fund Name | | Total Shares
Voted | | | Shares Voted Affirmatively | | | % of Shares Voted Affirmatively | |
U.S. Government Securities Ultra-Short Bond Fund | | | 11,277,164 | | | | 11,145,147 | | | | 98.83 | % |
Near-Term Tax Free Fund | | | 33,313,481 | | | | 32,297,804 | | | | 96.95 | % |
All American Equity Fund | | | 265,958 | | | | 258,416 | | | | 97.16 | % |
Holmes Macro Trends Fund | | | 710,886 | | | | 677,773 | | | | 95.34 | % |
Global Resources Fund | | | 15,937,199 | | | | 14,533,811 | | | | 91.19 | % |
World Precious Minerals Fund | | | 12,592,124 | | | | 11,826,348 | | | | 93.92 | % |
Gold and Precious Metals Fund | | | 6,816,290 | | | | 6,412,651 | | | | 94.08 | % |
Emerging Europe Fund | | | 7,657,979 | | | | 7,009,594 | | | | 91.53 | % |
China Region Fund | | | 1,114,263 | | | | 962,993 | | | | 86.42 | % |
1D. Mark D. Moyer
Fund Name | | Total Shares
Voted | | | Shares Voted Affirmatively | | | % of Shares Voted Affirmatively | |
U.S. Government Securities Ultra-Short Bond Fund | | | 11,277,164 | | | | 11,152,486 | | | | 98.89 | % |
Near-Term Tax Free Fund | | | 33,313,481 | | | | 32,322,316 | | | | 97.02 | % |
All American Equity Fund | | | 265,958 | | | | 258,416 | | | | 97.16 | % |
Holmes Macro Trends Fund | | | 710,886 | | | �� | 678,381 | | | | 95.43 | % |
Global Resources Fund | | | 15,937,199 | | | | 14,594,654 | | | | 91.58 | % |
World Precious Minerals Fund | | | 12,592,124 | | | | 11,838,769 | | | | 94.02 | % |
Gold and Precious Metals Fund | | | 6,816,290 | | | | 6,430,117 | | | | 94.33 | % |
Emerging Europe Fund | | | 7,657,979 | | | | 7,022,299 | | | | 91.70 | % |
China Region Fund | | | 1,114,263 | | | | 967,427 | | | | 86.82 | % |
1E. David Tucker
Fund Name | | Total Shares
Voted | | | Shares Voted Affirmatively | | | % of Shares Voted Affirmatively | |
U.S. Government Securities Ultra-Short Bond Fund | | | 11,277,164 | | | | 11,155,775 | | | | 98.92 | % |
Near-Term Tax Free Fund | | | 33,313,481 | | | | 32,413,849 | | | | 97.30 | % |
All American Equity Fund | | | 265,958 | | | | 258,416 | | | | 97.16 | % |
Holmes Macro Trends Fund | | | 710,886 | | | | 678,381 | | | | 95.43 | % |
Global Resources Fund | | | 15,937,199 | | | | 14,582,910 | | | | 91.50 | % |
World Precious Minerals Fund | | | 12,592,124 | | | | 11,851,680 | | | | 94.12 | % |
Gold and Precious Metals Fund | | | 6,816,290 | | | | 6,440,242 | | | | 94.48 | % |
Emerging Europe Fund | | | 7,657,979 | | | | 7,010,944 | | | | 91.55 | % |
China Region Fund | | | 1,114,263 | | | | 968,157 | | | | 86.89 | % |
168
Additional Information (unaudited) |
Approval of the Advisory Agreement for Each Fund
On September 15, 2015, the Board of Trustees (the “Board”) of U.S. Global Investors Funds (the “Trust”), including all the trustees who are not “interested persons” of the Trust (the “Independent Trustees”), approved continuation of the advisory agreement with U.S. Global Investors, Inc. (the “Adviser”) for each fund for an additional one-year term ending October 1, 2016.
In considering approval of the agreement the Board reviewed a variety of materials relating to each fund and the Adviser, including (i) the nature, extent and quality of services provided; (ii) a comparison of services rendered and amounts paid to other registered investment companies, including other registered investment companies managed by the Adviser, and other accounts managed by the Adviser; (iii) the investment performance of the fund measured against appropriate benchmarks; (iv) the costs of services provided and estimated profits realized by the Adviser (and its affiliates); (v) the extent to which economies of scale are realized as the fund grows; (vi) whether fee levels reflect any possible economies of scale for the benefit of fund shareholders; and (vii) benefits realized by the Adviser (and its affiliates) from its relationship with the fund.
The Independent Trustees began their process at the Board’s March 3, 2015 meeting by developing a “15(c) request letter,” which requested the Adviser to provide specific information relative to their consideration of continuing the agreement. At the Board’s June 2, 2015 meeting, the Independent Trustees reviewed the initial information provided by the Adviser, which included, among other things, information on the performance of each fund, along with the performance information of a relevant securities index, a peer group and a peer universe, using information supplied by Lipper Inc. (“Lipper”). The Independent Trustees were represented by independent legal counsel throughout the process. After the June 2, 2015 Board meeting, at the direction of the Independent Trustees, independent legal counsel requested additional information from the Adviser. The Independent Trustees also had separate meetings among themselves and with independent legal counsel during this period. In addition, the Independent Trustees received materials from their independent legal counsel discussing the legal standards applicable to their consideration of the agreement. After their review of the information received, the Independent Trustees presented their findings and recommendations to the full Board.
The Board reviewed the functions performed by the Adviser, the portfolio management team and support staff of the Adviser, the Adviser’s investment strategy and process for each fund, and the Adviser’s financial condition, and considered the quality of services provided. The Board also reviewed performance information provided by Lipper.
For the All American Equity Fund, the information showed that for the one-, two-, three-, four- and five-year periods ended December 31, 2014, the fund’s performance was in the 5th, 5th, 5th, 5th and 4th quintile, respectively, of its applicable Lipper peer group and for the one-, two-, three-, four- and five-year periods ended December 31, 2014, the fund’s performance was in the 5th, 5th, 5th, 4th and 4th quintile, respectively, of its applicable Lipper peer universe (the 1st quintile being the best performers
169
Additional Information (unaudited) |
and the 5th quintile being the worst performers). The Board noted that the fund underperformed its benchmark index for the one-year period ended December 31, 2014. The Board further considered that the Adviser made changes to its investment model at the end of 2014 to address performance issues, and that the Adviser noted that, although the Fund underperformed its Lipper peer group for the six months ended June 30, 2015, additional portfolio management changes were made in the second quarter of 2015, which the Adviser believes should improve performance. The Board noted that the fund’s advisory fee includes a performance incentive adjustment based on the performance of the fund during the prior 12-month period.
For the Holmes Macro Trends Fund, the information showed that for the one-, two-, three-, four- and five-year periods ended December 31, 2014, the fund’s performance was in the 5th quintile of its applicable Lipper peer group and its applicable Lipper peer universe. The Board noted that the fund underperformed its benchmark index for the one-year period ended December 31, 2014. The Board further considered that the Adviser recently made changes to its investment model to address performance issues and that the Fund outperformed its Lipper peer group for the six months ended June 30, 2015. The Board noted that the fund’s advisory fee includes a performance incentive adjustment based on the performance of the fund during the prior 12-month period.
For the Global Resources Fund, the information showed that for the one-, two- and three year periods ended December 31, 2014, the fund’s investor class performance was in the 5th quintile of its applicable Lipper peer group and for the one-, two-, three-, four- and five-year periods ended December 31, 2014, the fund’s investor class performance was in the 5th, 5th, 5th, 5th and 4th quintile, respectively, of its applicable Lipper peer universe. In addition, the information showed that for the one-, two-, three- and four-year periods ended December 31, 2014, the fund’s institutional class performance was in the 5th quintile of its applicable Lipper peer group and its applicable Lipper peer universe. This information also showed that the fund underperformed its benchmark index for the one-year period ended December 31, 2014. The Board noted that the Adviser attributed underperformance to the fund’s emphasis in junior mining companies, which have significantly underperformed over the past four years, but have historically added value to the fund’s portfolio by outperforming senior gold mining companies. The Board further considered that the Adviser made personnel changes at the end of 2013 to address performance issues. The Board noted that the fund’s advisory fee includes a performance incentive adjustment based on the performance of the fund during the prior 12-month period.
For the World Precious Minerals Fund, the information showed that for the one-, two-, three-, four- and five-year periods ended December 31, 2014, the fund’s investor class performance was in the 5th, 5th, 5th, 5th and 4th quintile, respectively, of its applicable Lipper peer group and for the one-, two-, three-, four- and five-year periods ended December 31, 2014, the fund’s investor class performance was in the 5th quintile of its applicable Lipper peer universe. In addition, the information showed that for the one-, two-, three- and four-year periods ended December 31, 2014, the fund’s institutional class performance was in the 5th quintile of its applicable Lipper peer group and its applicable Lipper peer universe. This information also showed
170
Additional Information (unaudited) |
that the fund underperformed its benchmark index for the one-year period ended December 31, 2014. The Board noted that the Adviser attributed underperformance relative to the fund’s peers to the fund’s emphasis in junior mining companies, which have significantly underperformed over the past four years, but have historically added value to the fund’s portfolio by outperforming senior gold mining companies. The Board also took into consideration that the fund’s advisory fee includes a performance incentive adjustment based on the performance of the fund during the prior 12-month period.
For the Gold and Precious Metals Fund, the information showed that for the one-, two-, three-, four- and five-year periods ended December 31, 2014, the fund’s performance was in the 3rd, 4th, 4th, 4th and 3rd quintile, respectively, of its applicable Lipper peer group, and for the one-, two-, three-, four- and five-year periods ended December 31, 2014, the funds’ performance was in the 4th, 4th, 3rd, 4th and 4th quintile, respectively, of its applicable Lipper peer universe. The information also showed that the fund outperformed its benchmark index for the one-year period ended December 31, 2014. The Board noted that the Adviser attributed underperformance relative to the fund’s peers to the fund’s emphasis in junior mining companies, which have significantly underperformed over the past four years, but have historically added value to the fund’s portfolio by outperforming senior gold mining companies. The Board also took into consideration that the fund’s advisory fee includes a performance incentive adjustment based on the performance of the fund during the prior 12-month period.
For the Emerging Europe Fund, the information showed that for the one-, two-, three- and four-year periods ended December 31, 2014, the fund’s performance was in the 5th quintile of its applicable Lipper peer group and for the one-, two-, three-, four- and five-year periods ended December 31, 2014, the fund’s performance was in the 5th quintile of its applicable Lipper peer universe. In addition, the information showed that the fund outperformed its benchmark index for the one-year period ended December 31, 2014. The Board noted the Adviser’s belief that the funds within the fund’s peer group do not necessarily have the same regional focus as the fund, making performance comparisons difficult. In response to a request from the Independent Trustees, the Adviser provided performance of funds in a customized peer group which the Board had considered in prior years. However, the Board noted that there are only two other funds remaining in such group and the Adviser indicated that those two funds do not have the same regional focus as the fund. The Board also took into consideration that the fund’s advisory fee includes a performance incentive adjustment based on the performance of the fund during the prior 12 month period.
For the China Region Fund, the information showed that for the one-, two-, three-, four-and five-year periods ended December 31, 2014, the fund’s performance was in the 3rd, 4th, 5th, 5th and 5th quintile, respectively, of its applicable Lipper peer group and for the one-, two-, three-, four- and five-year periods ended December 31, 2014, the fund’s performance was in the 4th, 4th, 5th, 5th and 5th quintile, respectively, of its applicable Lipper peer universe. The Board noted that the fund underperformed its benchmark index for the one-year period ended December 31, 2014. The Board
171
Additional Information (unaudited) |
considered that the Adviser recently made changes to its investment model to address performance issues, but noted that the Fund underperformed its Lipper peer group and benchmark index for the six months ended June 30, 2015. The Board also noted that that the fund’s advisory fee includes a performance incentive adjustment based on the performance of the fund during the prior 12 month period.
For the Near-Term Tax Free Fund, the information showed that for the one , two-, three , four- and five-year periods ended December 31, 2014, the fund’s performance was in the 2nd, 2nd, 2nd, 3rd and 3rd quintile, respectively, of its applicable Lipper peer group and for the one-, two-, three-, four- and five-year periods ended December 31, 2014 was in the 2nd, 2nd, 2nd, 3rd and 2nd quintile, respectively, of its applicable Lipper peer universe. This information also showed that the fund outperformed its benchmark index for the one-year period ended December 31, 2014.
For the U.S. Government Securities Ultra-Short Bond Fund, the Board noted that prior to December 20, 2013, the fund was a money market fund and, consequently, determined that prior period performance was not relevant. For the first year after the Fund converted from a money market fund, the information showed that for the year ended December 31, 2014, the fund’s performance was in the 5th quintile of its applicable Lipper peer group and in the 3rd quintile of its applicable Lipper peer universe. The Board noted the Adviser’s statement that all but two of the funds in the Lipper peer group are inflation-protected bond funds unlike the fund. In addition, this information showed that the fund outperformed its benchmark index for the year ended December 31, 2014. In response, to a request from the Independent Trustees, the Adviser also provided performance information for Morningstar’s ultrashort bond fund peer group. The information showed that for the one-year period ended December 31, 2014, the fund’s performance was in the 3rd quintile of the Morningstar peer group and was also in the 3rd quintile of the 12 funds in the Morningstar peer group that the Adviser indicated that it believed were most comparable to the fund.
The Board also reviewed information on each fund’s advisory fee and expense ratio (on both a net basis giving effect to any expense cap) compared to the expenses of a peer group of funds based upon information prepared by Lipper. The Board also compared the advisory fees to the fees charged by the Adviser to two non U.S. registered funds managed by the Adviser. (The Board noted that, although these non U.S. registered funds may have investment objectives and policies that are similar to some of the funds, the contractual fees payable to the Adviser for managing those client assets are the same as or higher than the advisory fees of the similar funds.)
For the All American Equity Fund, the information showed that, with respect to the fund’s advisory fee, the fund is in the 4th quintile of its applicable Lipper peer group and in the 5th quintile of its applicable Lipper peer group with respect to its net expenses (the 1st quintile being the lowest fees or expenses and the 5th quintile being the highest fees or expenses).
172
Additional Information (unaudited) |
For the Holmes Macro Trends Fund, the information showed that, with respect to the fund’s advisory fee, the fund is in the 5th quintile of its applicable Lipper peer group and in the 5th quintile of its applicable Lipper peer group with respect to its net expenses.
For the Global Resources Fund’s investor class, the information showed that, with respect to the advisory fee and net expenses, it is in the 4th and 5th quintile, respectively, of its applicable Lipper peer group. In addition, for the fund’s institutional class, the information showed that, with respect to the advisory fee and net expenses, it is in the 4th quintile of its applicable Lipper peer group.
For the World Precious Minerals Fund’s investor class, the information showed that, with respect to the advisory fee and net expenses, the fund is in the 5th quintile of its applicable Lipper peer group. In addition, the information showed that, with respect to the fund’s institutional class, it is in the 5th quintile of its applicable Lipper peer group with respect to its advisory fee and net expenses.
For the Gold and Precious Metals Fund, the information showed that the fund is in the 5th quintile of its applicable Lipper peer group with respect to its advisory fee and net expenses.
For the Emerging Europe Fund, the information showed that, with respect to the fund’s advisory fee and net expenses, the fund is in the 5th quintile of its applicable Lipper peer group.
For the China Region Fund, the information showed that, with respect to the fund’s advisory fee, the fund is in the 3rd quintile of its applicable Lipper peer group and in the 5th quintile of its applicable Lipper peer group with respect to its net expenses.
For the Near-Term Tax Free Fund, the information showed that, with respect to the fund’s advisory fee and net expenses, the fund is in the 1st quintile of its applicable Lipper peer group.
For the U.S. Government Securities Ultra-Short Bond Fund, the information showed that, with respect to the fund’s advisory fee and net expenses, the fund is in the 1st quintile of its applicable Lipper peer group.
The Board considered the Adviser’s belief that higher expenses are inherent in small fund complexes, such as the U.S. Global Investors Funds, and that it could not operate effectively at a lower level of fees or with the burden of contractual expense caps for most funds. The Board also considered recent efforts proposed by the Adviser designed to gain economies of scale and reduce fund expenses, including outsourcing transfer agency and certain fund administration services and mergers of small funds. In addition, the Board noted that the Adviser is contractually limiting expenses on an annualized basis for the Near-Term Tax Free Fund at 0.45% of average net assets through April 30, 2016 and will voluntarily limit expenses at that level thereafter. The Board also noted that the Adviser will voluntarily reimburse all class specific expenses for the institutional class of the Global Resources Fund and
173
Additional Information (unaudited) |
the World Precious Minerals Fund and is currently voluntarily limiting expenses at the following levels for the funds (the voluntary expense limitation may be modified or removed by the Adviser at any time):
Fund | Voluntary Expense Limitation
(% of Average Net Assets) |
All American Equity Fund | 2.20% |
Holmes Macro Trends Fund | 2.20% |
Global Resources Fund (Investor Class) | 1.90% |
World Precious Minerals Fund (Investor Class) | 1.90% |
Gold and Precious Metals Fund | 1.90% |
Emerging Europe Fund | 2.85% |
China Region Fund | 2.55% |
U.S. Government Securities Ultra-Short Bond Fund | 0.45% |
The Board considered the fee structure of the agreement, including the costs of the services provided and the profits realized by the Adviser and its affiliates from their relationship with the funds. For all funds except the World Precious Minerals Fund, Global Resources Fund and Emerging Europe Fund, the net income generated from the advisory relationship was negative.
As part of its review of the agreement, the Board considered whether there will be economies of scale with respect to the management of each fund and whether each fund will benefit from any economies of scale. The Board considered that the advisory fees for the All American Equity Fund, Gold and Precious Metals Fund, World Precious Minerals Fund, Global Resources Fund and U.S. Government Securities Ultra-Short Bond Fund include a breakpoint. For the remaining funds, the Board reviewed each fund’s asset size and whether the Adviser was realizing economies of scale. The Board noted that, in all cases, the Adviser did not believe, with respect to the investment advisory services provided, that it was realizing significant economies of scale, and that the current fees represent an appropriate sharing of economies of scale.
The Board considered that the Adviser engages in soft-dollar arrangements in connection with brokerage transactions for the funds. The Board also considered benefits derived by the Adviser from its relationship with the funds, including the other services provided and fees received by the Adviser and its affiliates for providing such services.
At the Board’s September 15, 2015 meeting, the Board also considered that the Adviser proposed an “adoption” of the funds by a third-party service provider. At the same meeting, the Adviser indicated that it may propose to the Board at a future meeting(s) the merger of the Holmes Macro Trends Fund into the All American Equity Fund and/or the merger of the U.S. Government Securities Ultra-Short Bond Fund into the Near-Term Tax Free Fund. Action on any such proposals will be considered by the Board at a future meeting(s) pending the Board’s receipt of additional information.
Based on all the above-mentioned factors and related conclusions, with no single factor or conclusion being determinative and with each Trustee not necessarily attributing the same weight to each factor, the Board, including the Independent Trustees, concluded that approval of the advisory agreement would be in the interests of each fund.
174
Expense Example (unaudited) | December 31, 2015 |
As a shareholder of the funds, you incur two types of costs: (1) transaction costs, including short-term trading fees and exchange fees; and (2) ongoing costs, including management fees, distribution plan fees, shareholder reports (like this one), and other fund expenses. This example is intended to help you understand your ongoing costs (in dollars) of investing in other mutual funds.
The example is based on an investment of $1,000 invested at the beginning of the period and held for the entire period (July 1, 2015 to December 31, 2015) as indicated below.
● | Actual Expenses. The first line of the following table for each fund provides information about actual account values and actual expenses. You may use the information in this line, together with the amount you invested, to estimate the expenses you paid over the period. Simply divide your account value by $1,000 (for example, an $8,600 account value divided by $1,000 = 8.6), then multiply the result by the number in the first line under the heading ‘‘Expenses Paid During Period’’ to estimate the expenses you paid on your account during this period. |
● | Hypothetical Example for Comparison Purposes. The second line of the following table for each fund provides information about hypothetical account values and hypothetical expenses based on the fund’s actual expense ratio and an assumed rate of return of 5 percent per year before expenses, which is not the fund’s actual return. The hypothetical account values and expenses may not be used to estimate the actual ending account balance or expenses you paid for the period. You may use this information to compare the ongoing costs of investing in these funds and other funds. To do so, compare this 5 percent hypothetical example with the 5 percent hypothetical examples that appear in the shareholder reports of other funds. |
Please note that the expenses shown in the table are meant to highlight your ongoing costs only and do not reflect any direct or transactional costs, such as small account, exchange or short-term trading fees. Therefore, the second line of the table is useful in comparing ongoing costs only, and will not help you determine the relative total costs of owning different funds. In addition, if these direct or transactional costs were included, your costs would have been higher.
175
Expense Example (unaudited) | December 31, 2015 |
| Beginning Account Value
July 1,
2015 | Ending
Account Value
December 31,
2015 | Expenses
Paid During Period* |
U.S. Government Securities Ultra-Short Bond Fund | | |
Based on Actual Fund Return | $1,000.00 | $1,002.10 | $2.30 |
Based on Hypothetical 5% Yearly Return | $1,000.00 | $1,022.90 | $2.33 |
Near-Term Tax Free Fund | | | |
Based on Actual Fund Return | $1,000.00 | $1,010.90 | $2.28 |
Based on Hypothetical 5% Yearly Return | $1,000.00 | $1,022.94 | $2.29 |
All American Equity Fund | | | |
Based on Actual Fund Return | $1,000.00 | $962.20 | $10.04 |
Based on Hypothetical 5% Yearly Return | $1,000.00 | $1,014.98 | $10.31 |
Holmes Macro Trends Fund | | | |
Based on Actual Fund Return | $1,000.00 | $945.30 | $9.30 |
Based on Hypothetical 5% Yearly Return | $1,000.00 | $1,015.65 | $9.63 |
Global Resources Fund Investor Class | | | |
Based on Actual Fund Return | $1,000.00 | $866.40 | $7.47 |
Based on Hypothetical 5% Yearly Return | $1,000.00 | $1,017.20 | $8.08 |
Global Resources Fund Institutional Class | | | |
Based on Actual Fund Return | $1,000.00 | $871.70 | $2.43 |
Based on Hypothetical 5% Yearly Return | $1,000.00 | $1,022.61 | $2.63 |
World Precious Minerals Fund Investor Class | | | |
Based on Actual Fund Return | $1,000.00 | $880.70 | $9.58 |
Based on Hypothetical 5% Yearly Return | $1,000.00 | $1,015.02 | $10.26 |
World Precious Minerals Fund Institutional Class | | |
Based on Actual Fund Return | $1,000.00 | $888.30 | $4.60 |
Based on Hypothetical 5% Yearly Return | $1,000.00 | $1,020.33 | $4.93 |
Gold and Precious Metals Fund | | | |
Based on Actual Fund Return | $1,000.00 | $894.90 | $ 10.89 |
Based on Hypothetical 5% Yearly Return | $1,000.00 | $1,013.71 | $ 11.58 |
Emerging Europe Fund | | | |
Based on Actual Fund Return | $1,000.00 | $851.10 | $ 12.36 |
Based on Hypothetical 5% Yearly Return | $1,000.00 | $1,011.85 | $ 13.43 |
China Region Fund | | | |
Based on Actual Fund Return | $1,000.00 | $813.80 | $ 12.59 |
Based on Hypothetical 5% Yearly Return | $1,000.00 | $1,011.32 | $ 13.96 |
* | These calculations are based on expenses incurred in the most recent fiscal half-year. The funds’ Investor Class’ annualized expense ratios (after reimbursements and offsets) for the six months ended December 31, 2015, were 0.46%, 0.45%, 2.03%, 1.90%, 1.59%, 2.02%, 2.28%, 2.65% and 2.75%, respectively, for the U.S. Government Securities Ultra-Short Bond, Near-Term Tax Free, All American Equity, Holmes Macro Trends, Global Resources, World Precious Minerals, Gold and Precious Metals, Emerging Europe and China Region Funds. The funds’ Institutional Class’ annualized expense ratios (after reimbursements and offsets) for the six months ended December 31, 2015, were 0.52% and 0.97%, respectively, for the Global Resources and World Precious Minerals Funds. The dollar amounts shown as “Expenses Paid” are equal to the annualized expense ratio multiplied by the average account value over the period, multiplied by 184, the number of days in the period, then divided by 365 days in the current fiscal year. |
176
|
Fund Services, LLC
PO Box 701
Milwaukee, WI
53201-0701 |
Want to reduce paper waste? You can receive this report and other important documents electronically. Please visit www.usfunds.com and sign up at Access My Account. If you need further assistance, please call us at 800-873-8637. |