As filed with the Securities and Exchange Commission on March 6, 2018
UNITED STATES
SECURITIES AND EXCHANGE COMMISSION
WASHINGTON, D.C. 20549
FORM N-CSR
CERTIFIED SHAREHOLDER REPORT OF REGISTERED MANAGEMENT
INVESTMENT COMPANIES
Investment Company Act file number 811-01800
U.S. GLOBAL INVESTORS FUNDS
Three Canal Plaza, Suite 600
Portland, Maine 04101
Jessica Chase, Principal Executive Officer
Three Canal Plaza, Suite 600
Portland, Maine 04101
207-347-2000
Date of fiscal year end: December 31
Date of reporting period: January 1, 2017 – December 31, 2017
ITEM 1. REPORT TO STOCKHOLDERS.
U.S. Global Investors Funds
Annual Report
December 31, 2017
U.S. Global Investors Funds
Annual Report
December 31, 2017
Table of Contents
| Letter to Shareholders (unaudited) | 1 |
| Definitions for Management Teams’ Perspectives (unaudited) | 9 |
| Management Team’s Perspective (unaudited) | 11 |
| Portfolios of Investments | 45 |
| Notes to Portfolios of Investments | 93 |
| Statements of Assets and Liabilities | 110 |
| Statements of Operations | 114 |
| Statements of Changes in Net Assets | 118 |
| Notes to Financial Statements | 124 |
| Financial Highlights | 139 |
| Report of Independent Registered Public Accounting Firm | 150 |
| Trustees and Officers (unaudited) | 152 |
| Approval of Investment Advisory Agreement (unaudited) | 154 |
| Additional Information (unaudited) | 159 |
| Expense Example (unaudited) | 161 |
Nasdaq Symbols
U.S. Global Investors Funds
Investor Class | |
| U.S. Government Securities Ultra-Short Bond Fund | UGSDX |
| Near-Term Tax Free Fund | NEARX |
| All American Equity Fund | GBTFX |
| Holmes Macro Trends Fund | MEGAX |
| Global Resources Fund | PSPFX |
| World Precious Minerals Fund | UNWPX |
| Gold and Precious Metals Fund | USERX |
| Emerging Europe Fund | EUROX |
| China Region Fund | USCOX |
| | |
Institutional Class | |
| Global Resources Fund | PIPFX |
| World Precious Minerals Fund | UNWIX |
 | Atlantic Fund Services
3 Canal Plaza, Suite 600
Portland, ME
04101 |
| U.S. Global Investors Funds | (unaudited) |
Dear Fellow Shareholder,
The price of gold and gold mining stocks were very competitive in 2017. For the second straight year, the yellow metal ended positively, rising a little more than 13 percent to end the year above $1,300 an ounce. This made it gold’s best year since 2010. Gold stocks, meanwhile, gained more than 12 percent, as measured by the NYSE Arca Gold Miners Index. All of this occurred even as large-cap stocks regularly closed at all-time highs and cryptocurrencies invited massive speculation.
We can thank the Fear Trade for much of gold’s performance last year. The Fear Trade, of course, is driven by low to negative real interest rates—when inflation erodes away at government bond yields—deficit spending, a weaker U.S. dollar and geopolitical uncertainty.
I believe these forces could only intensify in 2018. With inflation finally showing green shoots and President Donald Trump’s $1.5 trillion tax reform law expected to increase deficit spending, this year could provide the right conditions to spur gold prices higher.
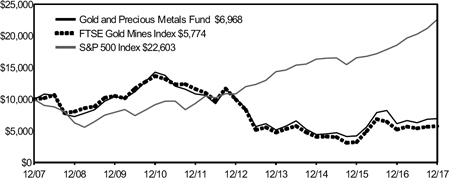
I was thrilled by the performance of our Gold and Precious Metals Fund (USERX), which returned more than 13 percent in 2017—in line with the price of gold and beating its benchmark, the FTSE Gold Mines Index.
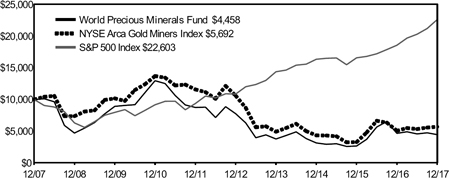
The World Precious Minerals Fund (UNWPX), however, ended the year down, mostly as a result of the massive rebalance trade we saw in June involving the VanEck Vectors Junior Gold Miners ETF (GDXJ). Because it had grown so large and was getting close to owning more than 20 percent of several underlying stocks—which would violate IRS diversification requirements and possibly trigger takeover laws in Canada—GDXJ had to dump as much as 50 percent of its shares in smaller gold firms, a value of $3 billion. This created heightened volatility and valuation compression in the gold market, triggering outflows from many gold- related mutual funds, ours included.
Commodities Demand Driven by Surging Manufacturing and Housing Sectors
Commodities barely eked out a win for the second straight year in 2017, edging up 0.7 percent, as measured by the Bloomberg Commodity Index. Spurred by a weaker U.S. dollar and strengthening materials demand from factories, the index headed higher thanks to a breathtaking rally late in the year that lasted a record 14 consecutive days.
The dollar appears to have peaked, making materials less expensive for overseas markets, and the Global Manufacturing Purchasing Manager’s Index (PMI) ended 2017 at 54.5, close to a seven-year high. December marked the 22nd year of expansion, with the eurozone signaling its fastest growth in the series’ two-decade history.
| U.S. Global Investors Funds | (unaudited) |
Strong manufacturing and construction expansion here in the U.S. is also supportive of commodity prices. December’s ISM Manufacturing PMI clocked in at a historically high 59.7. New orders grew 5.4 percent from the previous month to 59.4, its highest reading since January 2004. What’s more, U.S. construction spending in November rose to an all-time high of $1.257 trillion, according to the Census Bureau.
Mortgage securities firm Freddie Mac called 2017 the “best year in a decade” for the U.S. housing market by a variety of measures. These include low inflation, strong jobs growth and historically-low mortgage rates. Home builders right now are more confident of the future than they’ve been in over 18 years. December’s National Association of Home Builders (NAHB)/ Wells Fargo Housing Market Index (HMI) soared to 74, eight points up from the November reading and its highest report since July 1999.
Increased optimism and home demand is good news for resources and raw materials. According to home-construction services firm Happho, for every 1,000 square feet of new housing, nearly 8,820 pounds of steel are required, as well as 400 bags of cement, 1,800 cubic feet of sand and 1,350 cubic feet of gravel and other aggregate. This doesn’t begin to touch on finishers such as brick, paint and tiles, or fittings such as windows, doors, plumbing and electrical.
Of particular note is the increase in spending at building, hardware and garden stores. The most recent Visa Retail Spending Monitor found that consumption on home improvement and do-it-yourself (DIY) goods and services rose 12.8 percent in August compared to the same month in 2016.
I believe this was a windfall for our Holmes Macro Trends Fund (MEGAX), which ended the year up 19 percent. Not only is consumer discretionary the fund’s largest sector weighting, but it also invested in names associated with building and home improvement.
| U.S. Global Investors Funds | (unaudited) |
Jeffrey Gundlach: Time to Add Commodities
Appearing on CNBC, billionaire money manager Jeffrey Gundlach, founder of DoubleLine Capital, said he thought “investors should add commodities to their portfolios” for 2018, pointing out that they are just as cheap relative to stocks as they were at historical turning points. Below, you can see that the S&P GSCI Total Return Index-to-S&P 500 Index ratio is now at its lowest point since the dotcom bubble, meaning commodities and mining stocks are highly undervalued relative to large-cap stocks. We could see mean reversion begin to happen sometime this year, triggering a commodities super-cycle the likes of which we haven’t seen since the 2000s.
“We’re at that level where in the past you would have wanted commodities” in your portfolio, Gundlach said. “The repetition of this is almost eerie. And so if you look at that chart, the value in commodities is, historically, exactly where you want it to be a buy.”
For more, check out our Global Resources Fund (PSPFX), which returned close to 20 percent in 2017.
Emerging Markets Were the Big Winner
Domestic stocks were a great place to invest in 2017, but hopefully you didn’t overlook opportunities overseas. Emerging markets in Asia, Latin America, Europe and elsewhere had a gangbusters year, surging more than 37.5 percent with dividends reinvested, as measured by the MSCI Emerging Markets Index.
| U.S. Global Investors Funds | (unaudited) |
This was a boon for our China Region Fund (USCOX) and Emerging Europe Fund (EUROX), both of which crushed their benchmarks in 2017. USCOX was our best performing fund of the year, returning a phenomenal 57.67 percent, compared to the Hang Seng Composite Index, which rose nearly 43 percent. Our bets in Chinese automakers, as well as our overweight in technology firms, were particularly well-made.
EUROX, which invests in companies domiciled in Central and Eastern Europe (CEE) economies, beat its benchmark, the MSCI Emerging Markets Europe 10/40 Index, by 2.4 percentage points. Throughout 2017, the fund traded consistently above its 200-day moving averages and ended the year up 22.73 percent.
| U.S. Global Investors Funds | (unaudited) |
I’m optimistic this upswing can be sustained in 2018, supported by low unemployment, low inflation and record manufacturing growth. The European Central Bank (ECB) has also indicated it will continue its accommodative monetary policy by keeping rates low and expanding its balance sheet some 270 billion euros ($326 billion) through the first three quarters of 2018.
Effective September of this year, Poland will be upgraded from the “advanced emerging” category to “developed” by FTSE Russell. Poland, then, will be in the same company as, among others, the U.S., U.K., Japan, Germany and Singapore. The country is the first in the CEE region to receive “developed” status, and I believe the news will attract even more inflows from foreign investors.
Among the decisive factors behind the upgrade were the country’s advanced infrastructure, secure trading and a high gross national income (GNI) per capita. The World Bank forecasts its economy to grow 3.3 percent this year on the back of a strong labor market, improved consumption and the child benefit program Family 500+.
Economists aren’t the only ones noticing the improvement. Young Polish expats who had formerly sought work in the U.K. and elsewhere are now returning home in large numbers to participate in the booming economy. Banks and other companies, including JPMorgan Chase and Goldman Sachs, are similarly considering opening branches in Poland and hiring local talent.
| U.S. Global Investors Funds | (unaudited) |
Stay on the Short End of the Yield Curve
Finally, a few words on fixed income. The Federal Reserve hiked interest rates again in December, and many economists expect to see three additional hikes this year. We can’t be absolutely certain of anything, however, as the Fed will undergo a changing of the guard in 2018, with current chair Janet Yellen being replaced by Trump-nominee Jerome Powell. Although Powell has been described as someone who’ll mostly hold to the status quo established by his two immediate predecessors, he’s a question mark at this point, having served as a member of the Federal Reserve Board of Governors since only 2012.
In any case, with rates rising, it might be prudent to stay on the short end of the yield curve when it comes to fixed income such as Treasuries and municipal bonds. Shorter-term bonds are less sensitive to rate increases than longer-term bonds, whose maturities are further out. In 2017 we began to see the yield curve flatten, with the 10-year Treasury yield only half a percentage point more than the two-year Treasury yield as of December 29.
Remember, these are Treasuries—which, unlike municipal bonds, are backed by the full faith and credit of the U.S. government—but munis could be similarly affected.
If this is a concern, I urge you to consider our Near-Term Tax Free Fund (NEARX). NEARX invests primarily in munis with a maturity between one and five years, which could help reduce volatility longer-term instruments are likely to see in a rising interest rate environment.
To get the latest insights and commentary on gold, commodities, emerging markets, bitcoin and much, much more, subscribe to our award-winning Investor Alert and to my personal CEO blog, Frank Talk. Both can be reached by visiting usfunds.com.
Thank you for your continued trust and confidence in U.S. Global Investors. We wish you and your family good health and prosperity in 2018.
Sincerely,
Frank E. Holmes
CEO and Chief Investment Officer
U.S. Global Investors, Inc.
Please consider carefully a fund’s investment objectives, risks, charges and expenses. For this and other important information, obtain a fund prospectus by visiting www.usfunds.com or by calling 1-800-US-FUNDS (1-800-873-8637). Read it carefully before investing. Foreside Fund Services, LLC, Distributor. U.S. Global Investors is the investment adviser.
All opinions expressed and data provided are subject to change without notice. Some of these opinions may not be appropriate to every investor.
Stock markets can be volatile and share prices can fluctuate in response to sector-related and other risks as described in the fund prospectus. Gold, precious metals, and precious minerals funds may be susceptible to adverse economic, political or regulatory developments due to concentrating in a single theme. The prices of gold, precious metals, and precious minerals are subject to substantial price fluctuations over short periods of time and may be affected by unpredicted international monetary and political policies. We suggest investing no more than 5% to 10% of your portfolio in these sectors. Foreign and emerging market investing involves special risks such as currency fluctuation and less public disclosure, as well as economic and political risk. By investing in a specific geographic region, a regional fund’s returns and share price may be more volatile than those of a less concentrated portfolio. The Emerging Europe Fund invests more than 25% of its investments in companies principally engaged in the oil & gas or banking industries. The risk of concentrating investments in this group of industries will make the fund more susceptible to risk in these industries than funds which do not concentrate their investments in an industry and may make the fund’s performance more volatile. Because the Global Resources Fund concentrates its investments in specific industries, the fund may be subject to greater risks and fluctuations than a portfolio representing a broader range of industries. Bond funds are subject to interest-rate risk; their value declines as interest rates rise. Though the Near-Term Tax Free Fund seeks minimal fluctuations in share price, it is subject to the risk that the credit quality of a portfolio holding could decline, as well as risk related to changes in the economic conditions of a state, region or issuer. These risks could cause the fund’s share price to decline. Tax-exempt income is federal income tax free. A portion of this income may be subject to state and local taxes and at times the alternative minimum tax. The Near-Term Tax Free Fund may invest up to 20% of its assets in securities that pay taxable interest. Income or fund distributions attributable to capital gains are usually subject to both state and federal income taxes.
| U.S. Global Investors Funds | (unaudited) |
The NYSE Arca Gold Miners Index is a modified market capitalization weighted index comprised of publicly traded companies involved primarily in the mining for gold and silver. The index benchmark value was 500.0 at the close of trading on December 20, 2002.
The FTSE Gold Mines Index Series encompasses all gold mining companies that have a sustainable and attributable gold production of at least 300,000 ounces a year, and that derive 75% or more of their revenue from mined gold.
The S&P 500 Stock Index is a widely recognized capitalization-weighted index of 500 common stock prices in U.S. companies.
The Bloomberg Commodity Index is made up of 22 exchange-traded futures on physical commodities. The index represents 20 commodities, which are weighted to account for economic significance and market liquidity.
The Purchasing Manager’s Index is an indicator of the economic health of the manufacturing sector. The PMI index is based on five major indicators: new orders, inventory levels, production, supplier deliveries and the employment environment.
The Housing Market Index (HMI) is based on a monthly survey of NAHB members designed to take the pulse of the single-family housing market. The survey asks respondents to rate market conditions for the sale of new homes at the present time and in the next six months as well as the traffic of prospective buyers of new homes.
The S&P GSCI Total Return Index in USD is widely recognized as the leading measure of general commodity price movements and inflation in the world economy. Index is calculated primarily on a world production weighted basis, comprised of the principal physical commodities futures contracts.
| U.S. Global Investors Funds | (unaudited) |
The MSCI Emerging Markets Index is a free float-adjusted market capitalization index that is designed to measure equity market performance in the global emerging markets.
The MSCI Emerging Markets Europe 10/40 Index (Net Total Return) is a free float-adjusted market capitalization index that is designed to measure equity performance in the emerging market countries of Europe (Czech Republic, Greece, Hungary, Poland, Russia, and Turkey). The index is calculated on a net return basis (i.e., reflects the minimum possible dividend reinvestment after deduction of the maximum rate withholding tax). The index is periodically rebalanced relative to the constituents’ weights in the parent index.
Mean reversion is the theory suggesting that prices and returns eventually move back toward the mean or average. This mean or average can be the historical average of the price or return, or another relevant average such as the growth in the economy or the average return of an industry.
There is no guarantee that the issuers of any securities will declare dividends in the future or that, if declared, will remain at current levels or increase over time.
| Definitions for Management Teams’ Perspectives | (unaudited) |
Benchmark Index Definitions
Returns for indices reflect no deduction for fees, expenses or taxes, unless noted.
The Bloomberg Barclays U.S. Treasury Bills 6-9 Months Total Return Index tracks the performance of U.S. Treasury Bills with a maturity of six to nine months.
The Bloomberg Barclays 3-Year Municipal Bond Index is a total return benchmark designed for municipal assets. The index includes bonds with a minimum credit rating of BAA3, are issued as part of a deal of at least $50 million, have an amount outstanding of at least $5 million and have a maturity of two to four years.
The FTSE Gold Mines Index encompasses all gold mining companies that have a sustainable and attributable gold production of at least 300,000 ounces a year and that derive 75% or more of their revenue from mined gold.
The Hang Seng Composite Index is a market-capitalization weighted index that covers about 95% of the total market capitalization of companies listed on the Main Board of the Hong Kong Stock Exchange.
The MSCI Emerging Markets Europe 10/40 Index (Net Total Return) is a free float- adjusted market capitalization index that is designed to measure equity performance in the emerging market countries of Europe (Czech Republic, Greece, Hungary, Poland, Russia and Turkey). The index is calculated on a net return basis (i.e., reflects the minimum possible dividend reinvestment after deduction of the maximum rate withholding tax). The index is periodically rebalanced relative to the constituents’ weights in the parent index.
The NYSE Arca Gold Miners Index is a modified market capitalization-weighted index comprised of publicly-traded companies involved primarily in the mining for gold and silver.
The S&P Global Natural Resources Index (Net Total Return) includes 90 of the largest publicly-traded companies in natural resources and commodities businesses that meet specific investability requirements, offering investors diversified, liquid and investable equity exposure across 3 primary commodity-related sectors: Agribusiness, Energy, and Metals & Mining. The index is calculated on a net return basis (i.e., reflects the minimum possible dividend reinvestment after deduction of the maximum rate withholding tax).
The S&P 500 Index is a widely recognized capitalization-weighted index of 500 common stock prices in U.S. companies.
The S&P Composite 1500 Index is a broad-based capitalization-weighted index of 1500 U.S. companies and is comprised of the S&P 400, the S&P 500 and the S&P 600.
Other Index Definitions
The Bloomberg Commodity Index is made up of 22 exchange-traded futures on physical commodities. The index represents 20 commodities, which are weighted to account for economic significance and market liquidity.
| Definitions for Management Teams’ Perspectives | (unaudited) |
The Caixin China Manufacturing Purchasing Manager’s Index is a composite indicator designed to provide an overall view of activity in the manufacturing sector and acts as a leading indicator for the whole economy. When the PMI is below 50.0 this indicates that the manufacturing economy is declining and a value above 50.0 indicates an expansion of the manufacturing economy.
The FTSE 100 Index is an index composed of the 100 largest companies listed on the London Stock Exchange (LSE). It was launched on January 3, 1984, and had a start value of 1,000.
The Purchasing Manager’s Index (PMI) is an indicator of the economic health of the manufacturing sector. The PMI index is based on five major indicators: new orders, inventory levels, production, supplier deliveries and the employment environment.
The S&P 500 Telecommunication Services Index comprises those companies included in the S&P 500 that are classified as members of the telecommunication services sector.
| U.S. Government Securities Ultra-Short Bond Fund | (unaudited) |
Management Team’s Perspective
Introduction
The U.S. Government Securities Ultra-Short Bond Fund (UGSDX) is designed to be used as an investment that takes advantage of the security of U.S. Government bonds and obligations, while simultaneously pursuing a higher level of current income than money market funds offer. The fund’s dollar-weighted average effective maturity is two years or less.
Performance Graph
| U.S. Government Securities Ultra-Short Bond Fund |
|
| Average Annual Performance | For the Periods Ended December 31, 2017 |
| | One Year | Five Year | Ten Year |
| U.S. Government Securities Ultra-Short Bond Fund | 0.69% | 0.38% | 0.39% |
| Bloomberg Barclays U.S. Treasury Bills 6-9 Months | | | |
| Total Return Index | 0.72% | 0.32% | 0.40% |
| | Performance data quoted above is historical. Past performance is no guarantee of future results. Current performance may be higher or lower than the performance data quoted. The principal value and investment return of an investment will fluctuate so that an investor’s shares, when redeemed, may be worth more or less than their original cost. The graph and table do not reflect the deduction of taxes that a shareholder would pay on fund distributions or the redemption of fund shares. For all or a portion of the periods, the fund had expense limitations and reimbursements to maintain a minimum yield, without which returns would have been lower. The above returns for the U.S. Government Securities Ultra-Short Bond Fund include the fund’s results as a money market fund through the date of its conversion (December 20, 2013) to an ultra-short bond fund, and therefore are not representative of the fund’s results had it operated as an ultra-short bond fund for the full term of the periods shown. Returns greater than one year are annualized. Gross expense ratio as stated in the most recent prospectus is 1.00%. Pursuant to a voluntary arrangement, the Adviser has agreed to limit total fund operating expenses (exclusive of any acquired fund fees and expenses, performance fees, taxes, brokerage commissions and interest) to not exceed 0.45%. The Adviser can modify or terminate this arrangement at any time. In addition, returns may include the effects of additional voluntary waivers of fees and reimbursements of expenses by the Adviser, including waivers and reimbursements to maintain a minimum net yield for the fund. See Definitions for Management Teams��� Perspectives for index definitions. Please visit our website at www.usfunds.com for updated performance information for different time periods. | |
| U.S. Government Securities Ultra-Short Bond Fund | (unaudited) |
The Year in Review – Economic and Political Issues that Affected the Fund
The year was generally tumultuous, marked by natural disasters, geopolitical tensions and deep political divisions in many countries. On the economic front, however, 2017 was generally a positive year, with gross domestic product (GDP) accelerating over much of the world in the broadest cyclical upswing since the start of the decade. Nonetheless, wage growth has remained puzzlingly tepid in advanced economies despite falling unemployment rates. Continued slack in labor markets—in the form of still high unemployment in some countries or high levels of involuntary part time unemployment—along with weak productivity growth explain much of the lack of wage growth. Equity valuations continued their ascent and ended the year near record highs as central banks maintained accommodative monetary policies amid weak inflation. This was part of a broader trend across global financial markets where low interest rates, an improved economic outlook, and increased risk appetite boosted asset prices and suppressed volatility. While easier financial conditions bolstered growth momentum, they also pose risks if the reach for yield extends too far.
The Federal Reserve raised the target range for the fed funds rate three times in 2017 and began its balance sheet normalization process, curtailing the reinvestment of principal from maturing bonds. As a credit to the Federal Reserve’s communications policy, the change in policy was taken in stride by the stock market. The effectiveness was a result of the Fed’s repeated reminders that it expects the pace of interest rate hikes to be gradual. While its rate hikes hit the short end of the Treasury yield curve, with the two-year note yield rising 62 basis points in 2017 to 1.88 percent, the long end of the yield curve responded in the opposite direction. The yield on the 10-year note dropped seven basis points in 2017 to 2.41 percent, which led to the narrowest spread between the two-year 10-year note since October 2007. This was mainly as a result of the lack of inflation, which tends to be a driver of the long end of the curve. Furthermore, a flattening curve is often viewed as a harbinger of slower economic growth, yet the dovish policy accommodation still being provided by the European Central Bank (ECB) and the Bank of Japan (BoJ) fueled an interest rate differential trade that suppressed long-term rates in the U.S. and created some possible misdirection about the economic messaging coming across in the flattening yield curve.
Investment Highlights
The U.S. Government Securities Ultra-Short Bond Fund returned 0.69 percent for the year ended December 31, 2017, underperforming its benchmark, the Bloomberg Barclays U.S. Treasury Bills 6-9 Months Total Return Index, which returned 0.72 percent.
Current Outlook
The Federal Reserve, and other major central banks, will continue to play a key role in the market’s behavior in 2018. However, the Fed will soon be directed by Jerome Powell who will supplant Janet Yellen in February as Chairman of the Board of Governors. While it previously seemed that 2018 would feature broad-based policy tightening, the outlook has since become less hawkish on concerns about lagging inflation, economic risks and geopolitical tensions. Overall, the Fed is still expected to be more hawkish than other central banks in 2018. The ECB seems likely to follow in the Fed’s tightening path as it has already signaled a substantial reduction in asset purchases. In contrast, the Bank of England (BoE) has indicated that Brexit risks will preclude it from raising interest rates much further. Finally, the BoJ will likely remain the most dovish.
| U.S. Government Securities Ultra-Short Bond Fund | (unaudited) |
The section labeled Portfolio of Investments contains a complete list of the fund’s holdings.
Portfolio Allocation by Issuer
Based on Total Investments | December 31, 2017 |
| | |
|
| Portfolio Allocation by Maturity | | | | | December 31, 2017 | | |
| 1-3 Months | | $ | 3,750,857 | | | | 7.7 | % | |
| 3-12 Months | | | 16,244,975 | | | | 33.6 | % | |
| 1-3 Years | | | 28,461,462 | | | | 58.7 | % | |
| | | $ | 48,457,294 | | | | 100.0 | % | |
| | | | | | | | | | |
| Near-Term Tax Free Fund | (unaudited) |
Management Team’s Perspective
Introduction
The Near-Term Tax Free Fund (NEARX) seeks to provide a high level of current income exempt from federal income taxation and to preserve capital. However, a portion of any distribution may be subject to federal and/or state income taxes. The Near-Term Tax Free Fund will maintain a weighted average maturity of less than five years.
Performance Graph
| Near-Term Tax Free Fund | |
| | |
 |
| | |
| Average Annual Performance | For the Periods Ended December 31, 2017 |
| | One Year | Five Year | Ten Year |
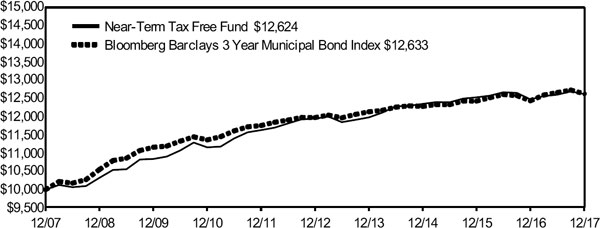
| Near-Term Tax Free Fund | 1.20% | 1.11% | 2.36% |
| Bloomberg Barclays 3 Year Municipal Bond Index | 1.56% | 1.07% | 2.36% |
| | Performance data quoted above is historical. Past performance is no guarantee of future results. Current performance may be higher or lower than the performance data quoted. The principal value and investment return of an investment will fluctuate so that an investor’s shares, when redeemed, may be worth more or less than their original cost. The graph and table do not reflect the deduction of taxes that a shareholder would pay on fund distributions or the redemption of fund shares. For all or a portion of the periods, the fund had expense limitations, without which returns would have been lower. Returns greater than one year are annualized. Gross expense ratio as stated in the most recent prospectus is 0.97%. The Adviser has contractually agreed to limit total fund operating expenses (exclusive of any acquired fund fees and expenses, extraordinary expenses, taxes, brokerage commissions and interest) to not exceed 0.45% on an annualized basis through April 30, 2018. See Definitions for Management Teams’ Perspectives for index definitions. Please visit our website at www.usfunds.com for updated performance information for different time periods. | |
The Year in Review – Economic and Political Issues that Affected the Fund
Three interest rate hikes in March, June and December signaled the Federal Reserve’s improving confidence in the U.S. economy and resulted in a federal funds rate that rose above 1 percent for the first time since September 2008. Meanwhile, long rates didn’t budge much due to a lack of inflation, despite stronger economic data. The municipal yield curve began to flatter, which generally has had a negative impact on short duration bonds while benefitting longer duration bonds. Further, bonds with lower credit ratings generally outperformed bonds of higher quality as a stronger economy fueled investors’ risk appetites. Early in 2017, the Fed communicated that it would begin paring back its balance sheet in October by reducing the reinvestment of principal payments on securities that it acquired through quantitative easing. Unlike the taper tantrum of 2013, the announcement and subsequent policy initiation was implemented with minimal volatility to the overall bond market.
| Near-Term Tax Free Fund | (unaudited) |
While overall state revenues continued to rise as the economy improved, some states remained in a perilous fiscal condition. After two full years without a budget, the State of Illinois began its 2017/18 fiscal year without a budget, but its legislature eventually overrode the governor’s veto to enact a budget that increased personal income taxes from 3.75 percent to 4.95 percent. New Jersey, Connecticut and Maine also started the fiscal year without a budget. The governor of Texas enacted legislation to improve the funding ratios of pension plans in Dallas and Houston. The reforms for Dallas raised the retirement age from 55 to 58, increased the employee contribution from 8.5 percent to 13.5 percent of pay and boosted the city’s contribution from 27.5 percent to 34.5 percent. The legislature for Houston lowered the plan’s assumed rate of return to 7 percent from between 8 and 8.5 percent. It also provided for reductions in benefits or increases in employee contributions if rates of return fall short of expectations.
Tax revenue for state and local governments continued to increase, although the rate of increase for state revenues was tepid. During the 12 months through June 2017, state revenue from individual income tax increased 2 percent, 2.8 percent from sales tax, but receipts from corporate income tax fell 4.3 percent. Local governments, which depend heavily on property taxes, fared better, as their property tax revenue grew 4.0 percent in the 12 months through June 2017 compared to the same period in 2016.
The tax bills passed by the U.S. House and Senate led to a rise in yields towards the end of the year. The proposed tax reform reduced or eliminated the tax advantages of certain types of municipal bonds, most notably advance refunding bonds, which caused many issuers to push their schedules forward and issue new bonds before the end of the year.
Investment Highlights
For the year ended December 31, 2017, the Near-Term Tax Free Fund returned 1.20 percent, underperforming its benchmark, the Bloomberg Barclays 3-Year Municipal Bond Index, which gained 1.56 percent.
Strengths
| ● | The fund’s overweight in highly rated bonds was a safeguard against market shocks. |
| ● | The fund benefited from its allocation to bonds from New Jersey and Illinois, which outperformed. |
| ● | The fund benefited from its allocation to school district bonds, which outperformed. |
Weaknesses
| ● | The fund’s underweight allocation to industrial development bonds was a drag on performance, as those bonds outperformed. |
| ● | The fund’s exposure to high quality general obligation bonds underperformed. |
| ● | The fund was hurt by its exposure to the short end of the yield curve, which underperformed the long end. |
Current Outlook
Opportunities
| ● | Tax reform could have the biggest impact on the muni bond market next year. The proposed legislation would make general obligation bonds more attractive for tax reduction purposes while limiting new issuances to borrowings from states and local governments. This could translate to less supply of higher-yield revenue bonds and more demand for specialty state general obligation bonds. |
| Near-Term Tax Free Fund | (unaudited) |
Threats
| ● | President Donald Trump appointed Jerome H. Powell as the next Chairman of the Federal Reserve to replace Janet Yellen. Powell is largely considered a non-interventionist and favors traditional monetary policy measures and a free market approach. He has always voted alongside Janet Yellen on policy decisions in the past and his speeches suggest that he favors a cautious approach. Some experts, however, believe he could be less dovish than Yellen, so the market will closely be watching where he falls on the spectrum. |
The section labeled Portfolio of Investments contains a complete list of the fund’s holdings.
| Top 10 Area Concentrations | | |
| (Based on Net Assets) | December 31, 2017 | |
| | Texas | 28.06% | |
| | New York | 9.54% | |
| | Washington | 7.67% | |
| | Florida | 5.44% | |
| | Illinois | 5.16% | |
| | Michigan | 4.86% | |
| | Pennsylvania | 3.98% | |
| | New Jersey | 3.75% | |
| | Missouri | 3.61% | |
| | North Carolina | 2.47% | |
| | Total Top 10 Areas | 74.54% | |
| Municipal Bond Ratings* | December 31, 2017 |
| Based on Total Municipal Bonds |
|
| * | Credit quality ratings are measured on a scale that generally ranges from AAA (highest) to D (lowest). “Not Rated” is used to classify securities for which a rating is not available. Credit-quality ratings for each issue are obtained from Moody’s and S&P Global Ratings, and the higher rating for each issue is used. |
| All American Equity Fund & Holmes Macro Trends Fund | (unaudited) |
Management Team’s Perspective
Introduction
The principal objective of the All American Equity Fund (GBTFX) is to seek capital appreciation by investing primarily in a broadly diversified portfolio of domestic common stocks. The fund invests in large-capitalization stocks while retaining the flexibility to seek out promising individual stock opportunities, including stocks with meaningful dividend yields.
The Holmes Macro Trends Fund (MEGAX) invests in companies with good growth prospects and strong positive earnings momentum. The fund’s primary objective is to seek long-term capital appreciation.
Performance Graphs
| All American Equity Fund |
|
| Average Annual Performance | For the Periods Ended December 31, 2017 |
| | One Year | Five Year | Ten Year |
| All American Equity Fund | 5.90% | 6.96% | 2.22% |
| S&P 500 Index | 21.83% | 15.79% | 8.50% |
| | Performance data quoted above is historical. Past performance is no guarantee of future results. Current performance may be higher or lower than the performance data quoted. The principal value and investment return of an investment will fluctuate so that an investor’s shares, when redeemed, may be worth more or less than their original cost. The graph and table do not reflect the deduction of taxes that a shareholder would pay on fund distributions or the redemption of fund shares. For all or a portion of the periods, the fund had expense limitations, without which returns would have been lower. Returns greater than one year are annualized. Gross expense ratio as stated in the most recent prospectus is 1.76%. Pursuant to a voluntary arrangement, the Adviser has agreed to limit total fund operating expenses (exclusive of any acquired fund fees and expenses, performance fees, taxes, brokerage commissions and interest) to not exceed 2.20%. The Adviser can modify or terminate this arrangement at any time. See Definitions for Management Teams’ Perspectives for index definitions. Please visit our website at www.usfunds.com for updated performance information for different time periods. | |
| All American Equity Fund & Holmes Macro Trends Fund | (unaudited) |
| Holmes Macro Trends Fund |
|
| Average Annual Performance | For the Periods Ended December 31, 2017 |
| | One Year | Five Year | Ten Year |
| Holmes Macro Trends Fund | 19.17% | 10.77% | 2.78% |
| S&P Composite 1500 TR | 21.13% | 15.74% | 8.69% |
| | Performance data quoted above is historical. Past performance is no guarantee of future results. Current performance may be higher or lower than the performance data quoted. The principal value and investment return of an investment will fluctuate so that an investor’s shares, when redeemed, may be worth more or less than their original cost. The graph and table do not reflect the deduction of taxes that a shareholder would pay on fund distributions or the redemption of fund shares. For all or a portion of the periods, the fund had expense limitations, without which returns would have been lower. Returns greater than one year are annualized. Gross expense ratio as stated in the most recent prospectus is 1.68%. Pursuant to a voluntary arrangement, the Adviser has agreed to limit total fund operating expenses (exclusive of any acquired fund fees and expenses, performance fees, taxes, brokerage commissions and interest) to not exceed 2.20%. The Adviser can modify or terminate this arrangement at any time. See Definitions for Management Teams’ Perspectives for index definitions. Please visit our website at www.usfunds.com for updated performance information for different time periods. | |
The Year in Review – Economic and Political Issues that Affected the Funds
There is always a first time for everything, and 2017 gave investors one for the record books. For the first time ever in its nearly 90-year history, the S&P 500 Index had a “perfect” year. The index of large-cap companies ended positively every month of the year, propelled by the promise of corporate tax cuts, a possible new infrastructure plan, historically low interest rates, a weak U.S. dollar and strong earnings growth.
The capitalization-weighted S&P 500 returned 21.8 percent, with dividends reinvested. The large market-capitalization equities were the driving theme behind the index’s advance. Investor preference for mega-capitalization was so pronounced that the top 10 most heavily weighted companies in the index accounted for more than a quarter of the index’s 21.8 percent return. The biggest drivers of performance were technology stocks, with Amazon up 55 percent; Apple, 48 percent, Facebook, 53 percent and Google, 35 percent. Investor demand was insatiable. With so many technology companies delivering dream-like returns, it should come as no surprise that the sector was the strongest of the year, returning 36.9 percent in total.
| All American Equity Fund & Holmes Macro Trends Fund | (unaudited) |
The S&P 500 Telecommunication Services Index, which has only three members, had the worst performance, declining 5.9 percent. With so few members, we need to evaluate the next worst performer, energy, which declined 3.8 percent. For the first eight months of the year, crude oil continued to slide until finally bottoming at $42.26 per barrel. The prolonged slide seemed to weigh on investor sentiment until traders and investors became “believers” in the turnaround. Crude finished the year at $59.82 per barrel.
Investment Highlights
The Holmes Macro Trends Fund (MEGAX) appreciated 19.17 percent in 2017, underperforming its benchmark, the S&P Composite 1500 Index, which returned 21.13 percent. The All American Equity Fund (GBTFX) rose 5.90 percent for the year, underperforming its benchmark, the S&P 500.
Overall growth-oriented stocks outperformed value and dividend-oriented companies, while utilities and more defensive areas of the market just didn’t capture investors’ fancy. The primary driver of underperformance in 2017 was the fact that the fund had more exposure to smaller and growth-oriented companies than the benchmark. Our investment style was effectively out of favor, and the market did not reward the same stocks we selected based on growth metrics. We believe this is transitory and our growth at a reasonable price (GARP) investment style will ultimately be rewarded.
Because the funds are actively managed, and because the holding period is generally not a consideration in investment decisions, the portfolios’ turnover rate might fluctuate from year to year as the funds adjust their portfolio composition. The funds’ annual portfolio turnovers were, and are expected to continue to be, more than 100 percent.
All American Equity Fund
Strengths
| ● | The fund’s allocation in financials and health care helped fund performance. |
| ● | Stock selection was better than the index in the energy and telecommunications sectors. |
| ● | Southwest Airlines, Ameriprise Financial and PulteGroup were the best contributors to fund performance. |
Weaknesses
| ● | The fund’s allocation in energy and information technology just didn’t seem to add to the bottom line. |
| ● | Investments in Bed Bath & Beyond, Foot Locker and Signet Jewelers were the worst contributors to performance |
Holmes Macro Trends Fund
Strengths
| ● | Stock selection was strong in select health care and consumer staples companies. |
| ● | The fund’s underweight position in health care was beneficial as the sector was leading its peers. |
| ● | S&P Global, LGI Homes and AbbVie were among the most positive contributors to fund performance. |
Weaknesses
| ● | Sector allocations in information technology and industrials did not perform as well as anticipated. |
| ● | Stock selection was fair across the board as our growth-oriented investment style was out of favor and the primary driver of lagging performance. |
| ● | Tenpur Sealy International, PentaNova Energy and Eagle Pharmaceuticals failed to live up to expectations and were among the worst contributors to the fund’s performance. |
| All American Equity Fund & Holmes Macro Trends Fund | (unaudited) |
Current Outlook
Opportunities
| ● | The economic outlook in the United States should improve due to the recently implemented tax bill. Companies are already starting to “pay if forward,” giving employees additional bonuses and 401(k) contributions. |
| ● | The majority of jobless rates across the world are in decline. Japan, Hong Kong, the U.S., Israel, the U.K. and Portugal, among other countries, registered 15-year lows. If this continues, investors can anticipate continued growth optimism. |
Threats
| ● | In November, Americans’ personal savings rate fell to 2.9 percent, its lowest reading since soon before the recession. This comes as Americans rely more and more on credit cards to make transactions. According to the just-released Federal Reserve Payments Study, credit card payments grew from 103.5 billion in 2015 to 111.1 billion in 2016, with the value surging from $5.65 trillion to almost $6 trillion. |
| ● | Will the North America Free Trade Agreement (NAFTA) get renegotiated or collapse altogether? The Trump administration is pushing to get talks wrapped up by the end of the first quarter of 2018, but there are still some major issues outstanding. |
| ● | If the Federal Reserve continues with its anticipated rate hikes and if the long end of the curve (30-year yields) fails to lift, we could see yield inversion, which would most likely become a drag on the economy. |
The section labeled Portfolio of Investments contains a complete list of the funds’ holdings.
All American Equity Fund
| Top 10 Equity Holdings (Based on Net Assets) | December 31, 2017 | |
| | The Boeing Co. | 4.26% | |
| | Aerospace/Defense | | |
| | Direxion Daily S&P 500 Bull 3X ETF | 3.90% | |
| | N.A. | | |
| | Visa, Inc., Class A | 3.72% | |
| | Finance - Credit Card | | |
| | Discover Financial Services | 3.72% | |
| | Finance - Credit Card | | |
| | DXC Technology Co. | 3.69% | |
| | Computer Services | | |
| | Total System Services, Inc. | 3.67% | |
| | Commercial Services - Finance | | |
| | Marathon Petroleum Corp. | 3.60% | |
| | Oil Refining & Marketing | | |
| | The Home Depot, Inc. | 3.45% | |
| | Retail - Building Products | | |
| | Constellation Brands, Inc., Class A | 3.44% | |
| | Beverages - Wine/Spirits | | |
| | The Estee Lauder Cos., Inc. | 3.43% | |
| | Cosmetics & Toiletries | | |
| | Total Top 10 Equity Holdings | 36.88% | |
| All American Equity Fund & Holmes Macro Trends Fund | (unaudited) |
All American Equity Fund
| Portfolio Allocation by Industry Sector* | December 31, 2017 |
| Based on Total Investments |
|
| * | Summary information above may differ from the portfolio schedule included in the financial statements due to the use of different classifications of securities for presentation purposes. |
Holmes Macro Trends Fund
| Top 10 Equity Holdings (Based on Net Assets) | December 31, 2017 | |
| | HFF, Inc. | 6.38% | |
| | Real Estate Management/Services | | |
| | Wynn Resorts, Ltd. | 5.92% | |
| | Casino Hotels | | |
| | S&P Global, Inc. | 4.93% | |
| | Commercial Services - Finance | | |
| | Medifast, Inc. | 4.78% | |
| | Commercial Services | | |
| | PetMed Express, Inc. | 4.66% | |
| | Retail - Pet Food & Supplies | | |
| | Pool Corp. | 4.46% | |
| | Distribution/Wholesale | | |
| | Lennox International, Inc. | 4.46% | |
| | Building Products - Air & Heating | | |
| | Trex Co., Inc. | 4.17% | |
| | Building & Construction Products - Miscellaneous | | |
| | LGI Homes, Inc. | 4.17% | |
| | Building - Residential/Commercial | | |
| | Valvoline, Inc. | 3.64% | |
| | Chemicals - Specialty | | |
| | Total Top 10 Equity Holdings | 47.57% | |
| All American Equity Fund & Holmes Macro Trends Fund | (unaudited) |
Holmes Macro Trends FundPortfolio Allocation by Industry Sector* Based on Total Investments | December 31, 2017 |
|
| * | Summary information above may differ from the portfolio schedule included in the financial statements due to the use of different classifications of securities for presentation purposes. |
| Global Resources Fund | (unaudited) |
Management Team’s Perspective
Introduction
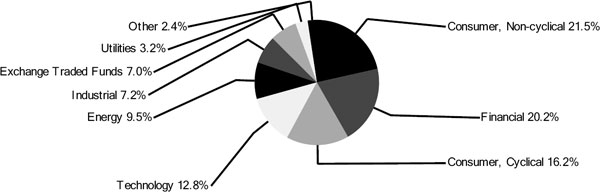
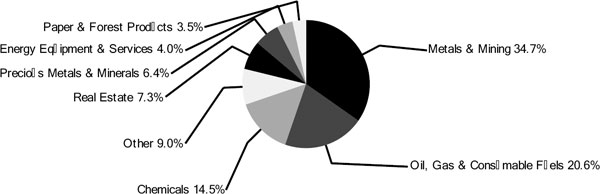
The Global Resources Fund (PSPFX and PIPFX) is a non-diversified natural resources fund with the principal objective of seeking long-term growth of capital while providing protection against inflation and monetary instability. The fund invests in companies involved in the exploration, production and processing of petroleum, natural gas, coal, alternative energies, chemicals, mining, iron and steel, and paper and forest products around the globe.
Performance Graph
| Global Resources Fund |
|
| Average Annual Performance | For the Periods Ended December 31, 2017 |
| | One Year | Five Year | Ten Year | Since Inception (Institutional Class) |
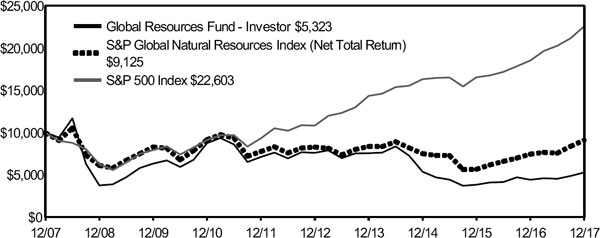
| Global Resources Fund - Investor Class | 19.57% | -6.99% | -6.11% | n/a |
| Global Resources Fund - Institutional Class (Inception 3/1/10) | 20.95% | -6.29% | n/a | -1.63% |
| S&P Global Natural Resources Index (Net Total Return) | 21.98% | 1.88% | -0.91% | 2.03% |
| S&P 500 Index | 21.83% | 15.79% | 8.50% | 14.17% |
| | Performance data quoted above is historical. Past performance is no guarantee of future results. Current performance may be higher or lower than the performance data quoted. The principal value and investment return of an investment will fluctuate so that an investor’s shares, when redeemed, may be worth more or less than their original cost. The graph and table do not reflect the deduction of taxes that a shareholder would pay on fund distributions or the redemption of fund shares. For all or a portion of the periods, the fund had expense limitations, without which returns would have been lower. Returns greater than one year are annualized. Gross expense ratio as stated in the most recent prospectus is 1.85% for the Investor Class and 5.41% for the Institutional Class. Pursuant to a voluntary arrangement, the Adviser has agreed to limit total fund operating expenses (exclusive of any acquired fund fees and expenses, performance fees, taxes, brokerage commissions and interest) to not exceed 1.90% for the Investor Class. Also pursuant to a voluntary agreement, the Adviser has agreed to waive all class specific expenses of the Institutional Class. The Adviser can modify or terminate these arrangements at any time. See Definitions for Management Teams’ Perspectives for index definitions. Please visit our website at www.usfunds.com for updated performance information for different time periods. | |
| Global Resources Fund | (unaudited) |
The Year in Review – Economic and Political Issues that Affected the Fund
The Bloomberg Commodity Index rose a meager 0.75 percent through the year 2017, posting its second consecutive annual advance since 2010. All major commodities rallied, with crude oil, copper and gold prices rallying 12, 31, and 13 percent respectively. Agricultural commodities lagged the spike in industrial commodities and dragged the Index lower. Corn production hit all-time highs in numerous high-production countries, resulting in increased global inventories, and depressed crop values.
The global manufacturing sector beat all expectations, and the year in review was marked by a steady upward trajectory in manufacturing activity across the globe. This was evidenced by JP Morgan’s Global Manufacturing PMI barometer, which steadily rose to an all-time high of 54.5 in December 2017. China’s manufacturing sector expanded at its fastest rate in four months in December. The Caixin-Markit manufacturing purchasing managers’ index rose to 51.5 in December. Eurozone manufacturers reported the strongest month on record—the manufacturing purchasing managers’ index for the eurozone as a whole came in at 60.6 in December, its strongest level since the survey began in mid-1997.
Crude oil’s advance was driven by the extension of self-imposed production caps by Organization of Petroleum Exporting Countries (OPEC) members. An increase in demand by developed countries, led by the U.S., resulted in substantially tighter inventory builds earlier in the year, and was replaced by a lengthy destocking period which ran into year end. For many market analysts, the global crude oil market is showing signs of being balanced for the first time since 2013.
The base metals complex, highly susceptible to manufacturing activity globally, rallied as Chinese imports of metals hit new records. Copper, nickel and zinc posted double-digit returns in 2017, a reflection of unexpected record demand for the metals. In addition, markets reacted to a number of supply cuts, mainly in the zinc market, and supply disruptions in the copper and nickel markets, which supported stronger pricing. The metals closed the year near 52-week highs on speculation that a “reflation” trade led by President-elect Trump could drive a demand boost from the metals-intensive infrastructure sector.
Gold rose for a second consecutive year in 2017, posting its best annual rise since 2010. Despite further interest rate increments arising from the Federal Reserve tightening cycle, the U.S. dollar posted its worst year since 2003, dropping nearly 10 percent. The weaker dollar and stronger industrial commodities have resulted in appreciating emerging market currencies which have boosted demand for physical gold.
Investment Highlights
Overview
For the year ended December 31, 2017, the Investor Class of the Global Resources Fund rose 19.57 percent and the Institutional Class rose 20.95 percent, trailing the fund’s benchmark, the S&P Global Natural Resources Index (Net Total Return), which rose 21.98 percent.
The fund employed a defensive investment position targeting value-driven opportunities with lower-than-average beta. However, to maintain varying degrees of investment exposure to the commodities market, the fund utilized a number of rolling call option positions to hedge the fund’s benchmark risks and provide optionality to upswings in commodities stocks. The options hedging model was highly successful in 2017, and provided upside protection for the fund.
Because the fund is actively managed and holding period is generally not a consideration in investment decisions, the portfolio turnover rate may fluctuate from year to year as the fund adjusts its portfolio composition. The fund’s annual portfolio turnover was, and is expected to continue to be, more than 100 percent.
Strengths
| ● | Commodities posted a third consecutive year of inflows in 2017 as global growth accelerated. Exchange-traded funds (ETFs) linked to raw materials attracted $9 billion dollars, capping a third straight annual inflow, the longest since 2010. Goldman Sachs analysts said the outlook is brighter over the next year, as they predict the sector will post a 7.5 percent return. |
| Global Resources Fund | (unaudited) |
| ● | The fund’s overweight in renewable energy, paper and forest, as well as its underweight in oil services and agricultural products stocks, had a positive contribution to the fund in excess of its benchmark. |
| ● | The fund had superior stock selection in the renewable energy, paper and forest, agricultural products and chemicals sectors. The best performing stocks were SolarEdge Technologies, Daqo New Energy and CVR Refining. |
Weaknesses
| ● | The Bloomberg Commodity Index, a measure of a basket of commodities, ended the year up a meager 0.75 percent, dragged lower by agricultural commodities, which lagged the spike in industrial and precious metals. Corn production hit all-time highs in numerous high-production countries, resulting in increased global inventories, and depressed crop values. |
| ● | The fund’s overweight in precious metals and consumer stocks, as well as its underweight in base and industrial metals stocks, had a negative contribution to the fund relative to its benchmark. |
| ● | The fund had inferior stock selection in the base and industrial metals sector and the oil and gas exploration and development sectors. The worst performing stocks were Pentanova Energy, Mandalay Resources and Siemens Gamesa Renewable Energy. |
Current Outlook
Opportunities
| ● | A major and extended 10-year bull market run in commodity prices may be in the cards, beginning in 2018, says Shawn Hackett, president of Hackett Financial Advisors. The Standard & Poor’s GSCI Total Return Index, which tracks 24 raw materials, is hovering near a record low valuation relative to the S&P 500 Index. According to Hackett, stocks were a screaming buy at the end of 2008 based on the same metric. Tis time the inverse is true, and the same metric is flashing a screaming buy for raw materials. |
| ● | Oil prices rose to their highest since 2015 after OPEC extended its production curbs into 2018; U.S. crude inventories continued to drop, even after the seasonal destocking period ended; and Saudi fiscal authorities revealed they expect prices to rise to $75 per barrel over the next five years. |
| ● | Precious metals prices rallied as the U.S. dollar extended its loss. Gold posted its best rally since October as macro analysts suggest the U.S. may see higher-than-expected inflation in 2018 as a result of the enactment of the tax overhaul, and see the potential for a major infrastructure plan funded using fiscal stimulus. |
Threats
| ● | Hopes of a spring bounce in Chinese commodity demand are becoming less clear, reports Bloomberg. China growth and commodities bulls aren’t hearing what they want from some members of the macro elite in Beijing, with two People’s Bank of China (PBOC) members and a party official talking down expectations for gross domestic product (GDP) growth. Fears of overleveraging, municipal bankruptcies and advocating for slower growth to ease debt and environmental burdens, are the reasons cited by the aforementioned macro elite members. |
| ● | China’s commitment to renewable energy, pollution control and environmental policy has weakened the dependence of the world’s largest consumer of commodities from raw materials producers. At the forefront of China’s environmental push are electric vehicles. The Asian nation will extend a tax rebate on purchases of these vehicles until the end of 2020, away from the traditional internal combustion engine. Similarly, policy-makers have shunned polluting steel mills and forced early closures, while imports of lower quality raw copper have also been suspended. |
| Global Resources Fund | (unaudited) |
| ● | The restoring of pipeline capacity, which caused supply disruptions into yearend, poses a challenge to the recent crude oil rally. The Forties pipeline in the U.K. is nearing full service following an unexpected shutdown. Similarly, the explosion at a Lybian pipeline, which affected nearly 1 million barrels a day of production, is expected to be restored to full capacity in the first weeks of 2018. |
The section labeled Portfolio of Investments contains a complete list of the fund’s holdings.
| Top 10 Equity Holdings (Based on Net Assets) | December 31, 2017 | |
| | Pacific Infrastructure, Inc. | 7.15% | |
| | Real Estate Operating/Development | | |
| | Daqo New Energy Corp., ADR | 2.36% | |
| | Chemicals - Specialty | | |
| | St Barbara, Ltd. | 1.93% | |
| | Gold Mining | | |
| | PentaNova Energy Corp. | 1.91% | |
| | Oil Companies - Exploration & Production | | |
| | CVR Refining LP | 1.87% | |
| | Oil Refining & Marketing | | |
| | Beach Energy, Ltd. | 1.79% | |
| | Oil Companies - Exploration & Production | | |
| | Rayonier Advanced Materials, Inc. | 1.77% | |
| | Chemicals - Fibers | | |
| | Northern Star Resources, Ltd. | 1.74% | |
| | Gold Mining | | |
| | Sandfire Resources NL | 1.58% | |
| | Metal - Diversified | | |
| | Teck Resources, Ltd. | 1.57% | |
| | Diversified Minerals | | |
| | Total Top 10 Equity Holdings | 23.67% | |
| Global Resources Fund | (unaudited) |
Portfolio Allocation by Industry Sector* Based on Total Investments | December 31, 2017 |
|
| * | Summary information above may differ from the portfolio schedule included in the financial statements due to the use of different classifications of securities for presentation purposes. |
| Precious Metals and Minerals Funds | (unaudited) |
Management Team's Perspective
Introduction
The World Precious Minerals Fund (UNWPX and UNWIX) and the Gold and Precious Metals Fund (USERX) pursue an objective of long-term capital growth through investments in gold, precious metals and mining companies. The World Precious Minerals Fund focuses on equity securities of companies principally engaged in the exploration, mining and processing of precious minerals such as gold, silver, platinum and diamonds. Although this fund has the latitude to invest in a broad range of precious minerals, it currently remains focused on the gold sector. The Gold and Precious Metals Fund focuses on the equity securities of established gold and precious metals companies and pursues current income as a secondary objective.
World Precious Minerals Fund | |
| | |
 | |
| | |
| Average Annual Performance | For the Periods Ended December 31, 2017 | |
| | One Year | Five Year | Ten Year | Since Inception (Institutional Class) | |
| World Precious Minerals Fund - Investor Class | -4.16% | -10.49% | -7.76% | n/a | |
| World Precious Minerals Fund - Institutional Class (Inception 3/1/10) | -3.71% | -10.06% | n/a | -7.97% | |
| NYSE Arca Gold Miners Index | 12.47% | -11.69% | -5.48% | -6.76% | |
| S&P 500 Index | 21.83% | 15.79% | 8.50% | 14.17% | |
Performance data quoted above is historical. Past performance is no guarantee of future results. Current performance may be higher or lower than the performance data quoted. The principal value and investment return of an investment will fluctuate so that an investor’s shares, when redeemed, may be worth more or less than their original cost. The graph and table do not reflect the deduction of taxes that a shareholder would pay on fund distributions or the redemption of fund shares. For all or a portion of the periods, the fund had expense limitations, without which returns would have been lower. Returns greater than one year are annualized. Gross expense ratio as stated in the most recent prospectus is 2.10% for the Investor Class and 2.71% for the Institutional Class. Pursuant to a voluntary arrangement, the Adviser has agreed to limit total fund operating expenses (exclusive of any acquired fund fees and expenses, performance fees, taxes, brokerage commissions and interest) to not exceed 1.90%. Also pursuant to a voluntary agreement, the Adviser has agreed to waive all class specific expenses of the Institutional Class. The Adviser can modify or terminate these arrangements at any time. See Definitions for Management Teams’ Perspectives for index definitions. Please visit our website at www.usfunds.com for updated performance information for different time periods. | |
| Precious Metals and Minerals Funds | (unaudited) |
| Gold and Precious Metals Fund | |
| | |
 | |
| | |
| Average Annual Performance | For the Periods Ended December 31, 2017 | |
| | One Year | Five Year | Ten Year | |
| Gold and Precious Metals Fund | 13.07% | -7.27% | -3.55% | |
| FTSE Gold Mines Index | 10.23% | -10.40% | -5.34% | |
| S&P 500 Index | 21.83% | 15.79% | 8.50% | |
Performance data quoted above is historical. Past performance is no guarantee of future results. Current performance may be higher or lower than the performance data quoted. The principal value and investment return of an investment will fluctuate so that an investor’s shares, when redeemed, may be worth more or less than their original cost. The graph and table do not reflect the deduction of taxes that a shareholder would pay on fund distributions or the redemption of fund shares. For all or a portion of the periods, the fund had expense limitations, without which returns would have been lower. Returns greater than one year are annualized. Gross expense ratio as stated in the most recent prospectus is 1.86%. Pursuant to a voluntary arrangement, the Adviser has agreed to limit total fund operating expenses (exclusive of any acquired fund fees and expenses, performance fees, taxes, brokerage commissions and interest) to not exceed 1.90%. The Adviser can modify or terminate this arrangement at any time. See Definitions for Management Teams’ Perspectives for index definitions. Please visit our website at www.usfunds.com for updated performance information for different time periods. | |
The Year in Review - Economic and Political Issues that Affected the Funds
Gold started 2017 strong despite the prospect of further interest rate hikes. Following the Federal Reserve’s 25 basis point rate hike in March, gold bounced over $20 the next day, reflecting that the decision was already baked into the price. Fed Chair Janet Yellen said the central bank intends to keep its monetary policy accommodative for “some time.” Gold rose 8.43 percent in the first quarter quarter, its best performance in a year.
China’s purchase of bullion bars in the first half of the year rose 51 percent. June imports of gold in India more than doubled compared to the same month last year, as consumers rushed to act before the country’s new tax law went into effect. Demand rose to 72 metric tons in June, up from 31.8 tons a year earlier. Sberbank, Russia’s largest bank, looked to finance the direct import of gold to India, according to Aleksei Kechko, managing director of the company’s Indian subsidiary. India is the world’s second largest importer of gold, and a direct trade between India and Russia would be beneficial to both countries. Russian officials have already signaled their desire to conduct transactions with BRICS nations (Brazil, Russia, India, China and South Africa) using gold, writes Russia Insider.
| Precious Metals and Minerals Funds | (unaudited) |
Amid unease over a congressional hearing on possible links between Russia and the Trump campaign, holdings in the world’s largest gold-backed ETF climbed to their highest-ever level in 2017 on the back of safe haven demand. In the two weeks through the end of May, hedge funds and other large speculators boosted their bullish bets on the precious metal 37 percent, the most since 2007, according to government data.
Perhaps the biggest gold miner story of the second quarter of 2017 was the reorganization of the index methodology for the VanEck Vectors Junior Gold Miners ETF (GDXJ). The ETF’s holdings in many of the junior names were approaching 20 percent of the outstanding shares, so their index group chose to downsize weightings in existing holdings by about 50 percent and reinvest the proceeds in more larger mid-tiered gold producers. This triggered a wave of price weakness throughout the junior gold stocks universe as much as $3 billion dollars of the $5.5 billion fund was projected to be sold in the June rebalancing and depressed values for the junior miners for much of the year.
North Korea fired a ballistic missile over Japan in August, sending gold to its highest level for the year. Gold bullion finished the third quarter up 3.11 percent after giving up about half of its quarterly gains as we entered September. This was led by 12 weeks of bullish outlook surveys of traders on bullion, but they turned somewhat pessimistic as President Trump began actively pushing his tax overhaul plan. This in turn led to somewhat of a pick-up in the value of the U.S. dollar as it hit 11-month lows. The gold price responded negatively to Fed officials’ announcement that the central bank would begin unwinding its $4.5 trillion balance sheet as soon as October and also signaled additional rate hikes in 2018 following a December hike.
2017 was the second year in a row that policy changes in India strained gold sales. Consumption was seen between 650 and 750 metric tons, compared to the annual average of around 850 tons in the previous half decade. The Indian government’s push to boost financial transparency cut consumption this year as they enacted a new consumer tax system. Gold prices in India were at their widest discount to international prices in 11 months.
The weakness of the dollar was a positive driver of the price, helping gold close the year up 13.09 percent. Nevertheless, traders were still reluctant to bet against gold even with impending tax cuts and rate hikes, thought to be negative for the yellow metal. Gold counter-intuitively rallied the last five times the Fed raised interest rates, leading some to believe gold had no reason not to rally again. Ray Dalio, manager of the world’s largest hedge fund at Bridgewater Associates, recommended that investors place 5 to 10 percent of their assets in gold. Dalio stated that given current geopolitical risks and the loss of faith in the effectiveness of our political processes, it would make sense to have a portion of a portfolio in gold as a hedge.
Investment Highlights
For the year ended December 31, 2017, the World Precious Minerals Fund Investor Class lost 4.16 percent and the Institutional Class fell 3.71 percent. The fund’s benchmark, the NYSE Arca Gold Miners Index, gained 12.47 percent on a total return basis.
The strategy of the World Precious Minerals Fund favors junior exploration and development stocks and mid-tiered producing stocks. These lower-capitalization stocks have historically outperformed senior gold mining companies over longer periods, as senior gold miners have typically acquired proven assets of junior gold companies rather than explored for new mining projects with capital-constrained budgets. The VanEck Vectors Junior Gold Miners ETF (GDXJ) down-weighting of the junior mining stocks at mid-year depressed the values of many of the stocks we held.
The Gold and Precious Metals Fund gained 13.07 percent for the year, outperforming its benchmark, the FTSE Gold Mines Index, which rose 10.23 percent on a total return basis. While focusing on established, gold-producing companies, the Gold and Precious Metals Fund holds a higher weighting of mid-tier stocks compared to its benchmark.
Both funds employed a defensive investment position from time to time in the past year with higher-than- average cash balances on hand to protect the liquidity of the funds. However, to maintain varying degrees of investment exposure to the gold market, the funds utilized some call options positions and directional ETFs, which are more liquid than options, to hedge the funds’ benchmark risks and provide optionality to upswings in gold stocks.
| Precious Metals and Minerals Funds | (unaudited) |
In addition to the rise in gold, silver finished the year up 6.42 percent, platinum only 2.99 percent. Palladium ended the year strongest with a gain of 50.25 percent, primarily driven by strong auto sales and greater need for pollution reduction, particularly in China.
Strengths
| ● | Kirkland Lake Gold became our largest position over the course of the year and was the best contributor to returns of our Gold and Precious Metals Fund (USERX), with a 195 percent return. Avoiding Barrick Gold in the World Precious Minerals Fund (UNWPX), relative to its large weighting in the fund’s benchmark, was the biggest positive contributor, as Barrick finished the year down 9 percent. |
| ● | St. Barbara was the second best dollar gainer for USERX, with a 107 percent gain. The second best contributor to UNWPX was Novo Resources, with a 579 percent gain for the year. The market took a serious interest in Novo’s large gold nugget conglomerate discovery in Northwestern Australia. |
| ● | The third best contributor to UNWPX was Cardinal Resources, which gained 141 percent in 2017. For USERX, our choice not to own Barrick Gold had the third highest attribution effect to fund performance relative to our benchmark. |
Weaknesses
| ● | For both gold oriented funds, Klondex Mines was our worst dollar contributor, with shares falling 44 percent over the year. Klondex had purchased the True North Mine in Canada, out of receivership and the Hollister Mine from private holders in the past year. Essentially, guidance for the ramp up of the two operations, particularly True North, was too optimistic over the course of the year with poor communication from its public relations firm. After the end of the year, Klondex announced it would put True North on care and maintenance, and the PR firm was terminated. We expect to see the share price make up lost ground in 2018. |
| ● | Jaguar Mining was the second biggest dollar detractor for USERX with the share price down 36 percent for the year. Barsele Minerals, down 30 percent, was the second largest dollar detractor for UNWPX. |
| ● | Comstock Mining was the third largest detractor for USERX, sliding 70 percent over the course of the year, while UNWPX missed not owning Franco-Nevada, which gained 36 percent in 2017. |
Current Outlook
Opportunities
| ● | China is preparing to launch a crude oil futures contract denominated in Chinese yuan and convertible into gold, the Nikkei Asian Review reports. This could potentially create the most important Asian oil benchmark and allow oil exporters to bypass the U.S.-dollar denominated benchmarks by trading in yuan. To make the yuan-denominated contract more attractive, China plans the yuan to be fully convertible in gold on the Shanghai and Hong Kong exchanges. |
| ● | Gold miners have cut costs but trade at a fraction of peak valuations, reports Bloomberg Intelligence. Since peak levels in 2008, gold-miner valuations have fallen over 50 percent based on enterprise value-to-reserves and resources. Miners have cut staff, focused on shrinking debt and are using new technology to garner cost efficiencies. Valuations don’t yet reflect these efforts. So do the miners see the value opportunity? Yes. In fact, the Canadian Imperial Bank of Commerce (CIBC) reports that gold miners invested around $290 million in exploration companies during the first six months of 2017, the highest level recorded in the past decade. In addition, nearly half of equity raised by junior gold stocks on the Toronto Stock Exchange (TSX) last year were through direct investments—no previous year had exceeded 20 percent, the CIBC continues. |
| Precious Metals and Minerals Funds | (unaudited) |
| ● | INK Research on gold stock sentiment was approaching a two-year high of 361 percent despite the growing popularity of bitcoin and digital currencies. The research showed insiders of gold mining companies were buying the gold stock dip as the year closed out, betting that gold could compete with cryptocurrencies as a form of insurance against unforeseen, negative market-moving events. Insiders buying stock in their own company generally is seen as a good sign to investors. In addition, the ratio of the S&P 500 Index relative to gold shows that gold is trading at a ratio of 0.50. The implication is that stocks, with record valuation levels, are expensive relative to gold. |
Threats
| ● | The world’s 20 leading gold producers’ share of metal output is expected to fall to its lowest level in a decade in 2019, according to Bloomberg industry analyst Eily Ong. The mining group’s share of world output fell from 47 percent in 2010 to 39 percent in 2016, and it could fall even further by 2019. As gold producers’ focus shifts from volume to profitable ounces, their existing gold mines’ life expectancies have also declined. With few deals completed in 2017 and negative investor relations, the total value of mining deals involving North American companies is $3.7 billion, down 40 percent from the same time in 2016. Possible explanations for the lack of deals may center on displeasure with results of transactions in prior years. |
| ● | Gold consumption in the world’s second biggest importer, India, was on track to hit a seven-year low in 2017 after tax and regulatory changes dampened demand, according to the World Gold Council (WGC). Factors hampering demand included increased purity standard, a revised anti-money laundering act and an uneven monsoon season that hurt income. |
| ● | New tax reform will sharply reduce interest deductibility on tax returns, which will raise the effective cost of debt relative to cash flow and ultimately stifle companies to raise debt for buybacks. A sharp fall in buybacks will lower net U.S. stock purchases and lower bank lending and credit issuance, which will tighten liquidity. This comes at a time when U.S. corporate investment is at its lowest in history, according to a Macro Strategy Partnership. Goldman Sachs warns of an eventual bear market as the current prolonged bull market has left a measure of average valuation at the highest since 1900, reports Christopher Anstey of Bloomberg. Goldman Sachs strategists wrote “all good things must come to an end,” adding that the average valuation across equity, bonds and credit in the U.S. is currently at an all-time high of 90 percent. |
| Precious Metals and Minerals Funds | (unaudited) |
The section labeled Portfolio of Investments contains a complete list of the funds’ holdings.
World Precious Minerals Fund
| Top 10 Equity Holdings (Based on Net Assets) | December 31, 2017 | |
| | Klondex Mines, Ltd. | 13.65% | |
| | Gold Mining | | |
| | Cardinal Resources, Ltd. | 4.30% | |
| | Metal - Diversified | | |
| | TriStar Gold, Inc. | 4.21% | |
| | Gold Mining | | |
| | Barsele Minerals Corp. | 3.67% | |
| | Precious Metals | | |
| | Dolly Varden Silver Corp. | 3.36% | |
| | Precious Metals | | |
| | Roxgold, Inc. | 2.84% | |
| | Precious Metals | | |
| | Nano One Materials Corp. | 2.27% | |
| | Advanced Materials/Production | | |
| | Mirasol Resources, Ltd. | 2.19% | |
| | Gold Mining | | |
| | Auryn Resources, Inc. | 2.06% | |
| | Diversified Minerals | | |
| | Pretium Resources, Inc. | 1.94% | |
| | Gold Mining | | |
| | Total Top 10 Equity Holdings | 40.49% | |
Portfolio Allocation by Industry* Based on Total Investments | December 31, 2017 |
| | |
 |
| | |
| * | Summary information above may differ from the portfolio schedule included in the financial statements due to the use of different classifications of securities for presentation purposes. |
| Precious Metals and Minerals Funds | (unaudited) |
Gold and Precious Metals Fund
| Top 10 Equity Holdings (Based on Net Assets) | December 31, 2017 | |
| | Klondex Mines, Ltd. | 13.07% | |
| | Gold Mining | | |
| | Kirkland Lake Gold, Ltd. | 10.65% | |
| | Gold Mining | | |
| | St Barbara, Ltd. | 8.87% | |
| | Gold Mining | | |
| | AuRico Metals, Inc. | 4.52% | |
| | Metal - Diversified | | |
| | Leagold Mining Corp. | 4.38% | |
| | Gold Mining | | |
| | Wesdome Gold Mines, Ltd. | 3.92% | |
| | Gold Mining | | |
| | Newmont Mining Corp. | 3.72% | |
| | Gold Mining | | |
| | Westgold Resources, Ltd. | 3.42% | |
| | Gold Mining | | |
| | Sandstorm Gold, Ltd. | 2.97% | |
| | Gold Mining | | |
| | Rye Patch Gold Corp. | 2.87% | |
| | Gold Mining | | |
| | Total Top 10 Equity Holdings | 58.39% | |
Portfolio Allocation by Industry* Based on Total Investments | December 31, 2017 |
| | |
 |
| | |
| * | Summary information above may differ from the portfolio schedule included in the financial statements due to the use of different classifications of securities for presentation purposes. |
| Emerging Europe Fund | (unaudited) |
Management Team's Perspective
Introduction
The investment objective of the Emerging Europe Fund (EUROX) is to achieve long-term capital growth by investing in a non-diversified portfolio of equity securities of companies located in the emerging markets of Europe.(1)
Performance Graph
Emerging Europe Fund |
| | |
 | |
| | |
| Average Annual Performance | For the Periods Ended December 31, 2017 | |
| | One Year | Five Year | Ten Year | |
| Emerging Europe Fund | 22.73% | -3.72% | -7.41% | |
| MSCI Emerging Markets Europe 10/40 Index (Net Total Return) | 20.34% | -2.75% | -4.63% | |
| S&P 500 Index | 21.83% | 15.79% | 8.50% | |
* Performance data quoted above is historical. Past performance is no guarantee of future results. Current performance may be higher or lower than the performance data quoted. The principal value and investment return of an investment will fluctuate so that an investor’s shares, when redeemed, may be worth more or less than their original cost. The graph and table do not reflect the deduction of taxes that a shareholder would pay on fund distributions or the redemption of fund shares. For all or a portion of the periods, the fund had expense limitations, without which returns would have been lower. Returns greater than one year are annualized. Gross expense ratio as stated in the most recent prospectus is 2.33%. Pursuant to a voluntary arrangement, the Adviser has agreed to limit total fund operating expenses (exclusive of any acquired fund fees and expenses, performance fees, taxes, brokerage commissions and interest) to not exceed 2.85%. The Adviser can modify or terminate this arrangement at any time. See Definitions for Management Teams’ Perspectives for index definitions. Please visit our website at www.usfunds.com for updated performance information for different time periods. | |
(1) | The following countries are considered to be in the emerging Europe region: Albania, Armenia, Azerbaijan, Belarus, Bulgaria, Croatia, the Czech Republic, Estonia, FYR Macedonia, Georgia, Greece, Hungary, Latvia, Lithuania, Moldova, Poland, Romania, Russia, Slovakia, Slovenia, Turkey and Ukraine. |
| Emerging Europe Fund | (unaudited) |
The Year in Review – Economic and Political Issues that Affected the Fund
Post-communist countries of Central and Eastern Europe (CEE) had a great year. Their rapidly developing economies were supported by strong global manufacturing activity and an acceleration in Western Europe growth. The emerging markets also benefited from the weaker U.S. dollar despite the Federal Reserve delivering three rates hikes. The Czech koruna and Polish zloty were the best performing currencies in the world, both appreciating more than 20 percent each against the dollar.
Poland was the best performing market this year. Its strengthening economy was supported by rising domestic demand and a pick-up in spending. Wages continued to grow and the labor market tightened further. Social programs implemented at the beginning of the year increased disposable income levels. Stronger real gross domestic product (GDP) and fiscal discipline contributed to smaller government budget deficits. However, the far-right-wing Law & Justice party (PiS), currently Poland’s largest, implemented media and judicial system reforms that were heavily criticized by the European Commission. The Commission launched Article 7 against Poland, which could end up losing its voting rights in the eurozone, the first such case in the European Union’s (EU) history. There is also a potential threat that Poland could be cut out of EU funds in the future. As of 2017, Poland was the largest recipient of EU funds, receiving 86 billion euros over the 2014-2020 cycle.
The Czech Republic was the second best performing market within the CEE countries. Economic growth was strong, supported by rising consumption and a record low unemployment rate. General elections were held in October, and as expected, the centrist populist ANO (Action for Dissatisfied Citizens) party, led by Andrej Babis, declared victory. The country’s newly elected government should be positive for growth for the next few years. The Czech National Bank dropped the currency floor in April. It also hiked its main rate by 20 basis points in August and a further 25 basis points in November, making it the first European country to start tightening policy.
The Greek market also outperformed in the past year. Greece is showing stronger signs of economic recovery. The unemployment rate was still at a very high level of 20 percent, but it is the lowest level since 2006. Industrial production picked up, and economic growth improved. Greece successfully held its first bond sale since 2014, which boosted investor sentiment. The country’s multiyear bailout program may end in August 2018, and the country will stop passing new austerity measures in exchange of money.
Turkey had a volatile year. After the failed coup attempt in July 2016, the country’s government implemented a slew of fiscal and monetary measures in order to stimulate the economy, supporting equities. Towards the end of this year, the economy started to show signs of overheating, with GDP reaching 7 percent in the third quarter. Headline inflation was higher by about 300 basis points from 8.5 percent at the end of 2016. The lira depreciated against the dollar by a further 7 percent in 2017. In April, Turkey approved a presidential system that gave additional power to President Recep Erdogan. Throughout the year, Erdogan pressed the government and central bank to boost economic activity, overlooking the country’s depreciating currency on a deteriorating political relationship between the U.S. and the eurozone.
Hungary experienced strong economic growth, supported by an expansionary fiscal policy, loose monetary policy and strong wage growth and tax relief. At the beginning of the year, Hungary cut its corporate tax rate to 9 percent, the lowest level in the EU, as well as one of the lowest anywhere in the world. In 2016 its current account surplus was at an historical high of 6.1 percent of GDP, and in 2017 the current account continued to perform well.
Russia was the worst performing market this year. After President Donald Trump won the U.S. presidential election at the end of 2016, investors were hoping for a removal of sanctions imposed on Russia for the annexation of Crimea as well as an improved relationship between the two countries. However, even tougher sanctions were imposed on Russia for meddling in the 2016 presidential election. The federation’s inflation is at a post-Soviet record low and its central bank has been cutting its main rate, but industrial production was still weak. Geopolitical noise kept the Moscow Exchange from moving higher, in-line with other emerging markets.
| Emerging Europe Fund | (unaudited) |
Investment Highlights
Overview
For the year ended December 31, 2017, the fund gained 22.7 percent, outperforming its benchmark, the MSCI Emerging Markets Europe 10/40 Index (Net Total Return), which appreciated 20.3 percent.
Poland, the Czech Republic, Greece, Turkey and Hungary outperformed the benchmark, while Russia underperformed. On a sector basis, industrials, consumer discretionary, finance and health care were the best-performing sectors, while materials, utilities, telecommunications, energy, information technology, real estate and consumer staples underperformed.
Strengths
| ● | The fund’s underweight of Russia as well as overweight of Austria had the most positive impact on the fund’s performance relative to its benchmark. |
| ● | The fund’s overweight in industrials and underweight in energy had the most positive effect on the fund’s performance relative to its benchmark. |
| ● | Sberbank of Russia made the largest single contribution to the performance of the fund. |
Weaknesses
| ● | The fund’s underweight of Poland had the most negative impact on the fund’s performance relative to its benchmark. |
| ● | The fund’s underweight in financials had the most negative effect on the fund’s performance relative to its benchmark. |
| ● | The Direxion Daily Russia Bull 3X ETF (RUSL) was the single worst contributor to the performance of the fund. |
Current Outlook
Opportunities
| ● | Economic growth in central emerging Europe could remain strong next year. Analysts at Wood & Company have a positive stance toward emerging market equites. However, given the strong performance of the stock market in 2017, the group prefers to be selective. Poland, Hungary and Romania are the preferred markets aimed at the strong expansion momentum and moderate valuations. Wood & Company also takes a more positive stance on Greece given the ongoing economic recovery, while also warning that volatility will persist. They are cautiously positive on Russia, expecting continued monetary easing via further rate cuts. |
| ● | Goldman Sachs expects the Russian oil sector’s dividends to rise 20 percent in 2018, while the other large global oil companies are expected to maintain flat dividends. Higher oil prices and lower capital spending should boost Russian oil’s free cash flow by 50 percent in 2018, allowing companies to increase their dividend payouts. |
| ● | Central emerging Europe may benefit from Brexit as companies are expected to relocate their businesses ahead of the U.K.’s departure from the EU. Some companies already announced plans to relocate their businesses to Poland and Hungary as central emerging Europe has a highly educated workforce with growing wages, though they still remain well below Western labor costs. |
| Emerging Europe Fund | (unaudited) |
Threats
| ● | Following 2017 elections in Germany, France and the U.K., Italy will hold general elections on March 4, 2018. The parliament’s current five-year term runs out in May. Recent polls and local election results suggest that Italy’s Northern League, an anti-EU and anti-immigration party, has a chance at governing in a coalition with the center-right Forza Italia party. Italy is the fourth-largest economy in Europe, and its next government will have to work on reducing debt, improving its banking system and breaking out of stagnation. |
| ● | Russia was the worst performing market this year, and next year could be volatile for Russian equities. Broader sanctions might be introduced on Russia in 2018 as part of the U.S. bill signed into law in August of 2017. The new sanctions could include restrictions on investment in Russia’s sovereign debt and an extension of the sanctioned individual’s list. In March, Russia will hold presidential elections. It is widely expected that Vladimir Putin, who has been actively serving the country since the end of 1999, will win again. However, investors need to wait and see what new social-economic program will be implemented for the next six-year presidential term. |
| ● | In 2017, the Czech Republic hiked its main rate twice. The first rate increase of 20 basis points took place in August and another 25 basis points hike followed in November. This year, more central emerging Europe countries may start hiking rates as inflation recovers and economic growth strengthens. |
The section labeled Portfolio of Investments contains a complete list of the fund’s holdings.
| | Top 10 Equity Holdings (Based on Net Assets) | December 31, 2017 | |
| | Sberbank of Russia PJSC, ADR | 10.66% | |
| | Commercial Banks Non-US | | |
| | LUKOIL PJSC, ADR | 6.82% | |
| | Oil Companies - Integrated | | |
| | Tatneft PJSC, ADR | 2.24% | |
| | Oil Companies - Integrated | | |
| | Evraz PLC | 1.79% | |
| | Steel - Producers | | |
| | Aegean Airlines SA | 1.59% | |
| | Airlines | | |
| | Tofas Turk Otomobil Fabrikasi AS | 1.56% | |
| | Automotive - Cars & Light Trucks | | |
| | Tekfen Holding AS | 1.51% | |
| | Diversified Operations | | |
| | MOL Hungarian Oil & Gas PLC | 1.51% | |
| | Oil Companies - Integrated | | |
| | Allianz SE | 1.46% | |
| | Multi-line Insurance | | |
| | Severstal PAO PJSC, GDR | 1.42% | |
| | Steel - Producers | | |
| | Total Top 10 Equity Holdings | 30.56% | |
| Emerging Europe Fund | (unaudited) |
Country Distribution* Based on Total Investments | December 31, 2017 |
| | |
 |
| | |
| * | Country distribution shown is based on domicile. The locale of company operations may be different. |
| China Region Fund | (unaudited) |
Management Team's Perspective
Introduction
The China Region Fund (USCOX) seeks long-term growth of capital. The fund invests in both established and emerging companies registered and operating in the China region.(1)
Performance Graph
| China Region Fund |
| | |
 | |
| | |
| Average Annual Performance | For the Periods Ended December 31, 2017 | |
| | One Year | Five Year | Ten Year | |
| China Region Fund | 57.67% | 9.03% | -0.81% | |
| Hang Seng Composite Index | 37.23% | 5.70% | 0.49% | |
Performance data quoted above is historical. Past performance is no guarantee of future results. Current performance may be higher or lower than the performance data quoted. The principal value and investment return of an investment will fluctuate so that an investor’s shares, when redeemed, may be worth more or less than their original cost. The graph and table do not reflect the deduction of taxes that a shareholder would pay on fund distributions or the redemption of fund shares. For all or a portion of the periods, the fund had expense limitations, without which returns would have been lower. Returns greater than one year are annualized. Gross expense ratio as stated in the most recent prospectus is 2.76%. Pursuant to a voluntary arrangement, the Adviser has agreed to limit total fund operating expenses (exclusive of any acquired fund fees and expenses, performance fees, taxes, brokerage commissions and interest) to not exceed 2.55%. The Adviser can modify or terminate this arrangement at any time. See Definitions for Management Teams’ Perspectives for index definitions. Please visit our website at www.usfunds.com for updated performance information for different time periods | |
(1) | The China region is defined as any country that either shares a border with China or is located in the South China Sea or the East China Sea and includes: the People’s Republic of China (PRC or China), Bangladesh, Cambodia, Hong Kong, India, Indonesia, Kazakhstan, Korea, Kyrgyzstan, Laos, Malaysia, Mongolia, Myanmar, Nepal, Pakistan, Philippines, Singapore, Taiwan, Tajikistan, Thailand and Vietnam. |
| China Region Fund | (unaudited) |
The Year in Review – Economic and Political Issues that Affected the Fund
2017 stands in stark contrast to 2016. While 2016 kicked off with a gloomy start amid a global selloff, 2017 steadily and powerfully scaled the proverbial wall of worry, defiantly bucking several geopolitical and economic concerns along the way.
In late 2016, Chinese President Xi Jinping expressed that he would be “comfortable” with a 2017 gross domestic product (GDP) growth rate below 6.5 percent as leadership sought to prioritize stability and risk control above growth for growth’s sake. But in spite of lowered expectations and a number of naysaying analyst reports around the start of the year, China’s 2017 growth handily outperformed expectations, with a steady pace of year-over-year GDP prints coming in at 6.9 percent (first quarter), 6.9 percent (second quarter) and 6.8 percent (third quarter). Now, with the release of the East Asian behemoth’s final quarterly GDP reading approaching, most analysts anticipate a healthy fourth-quarter reading of 6.7 percent, rounding out the year’s overall economic outperformance of expectations.
China’s Purchasing Manager’s Indices (PMIs) also reflected steady growth. The official PMI finished 2017 at 51.6, up mildly from the end of 2016’s reading of 51.4 but marking reasonably consistent, expansionary growth (i.e., readings above 50.0). Official government readings for non-manufacturing PMI finished at 55.0, just below its highest reading for the year and up from last year’s final reading of 54.5. The private Caixin China Manufacturing PMI constitutes the only major reading to finish down from last year, as the traditionally more export-oriented measurement clocked in at 51.5 for the December period, comfortably expansionary but down a touch from last year’s final reading of 51.9. Finally, the Caixin China Services PMI finished out quite strongly at the year’s high of 53.9, up from last year’s final December reading of 53.4.
Certainly such economic outperformance played out in price as the fund’s benchmark, the Hang Seng Composite Index (HSCI), jumped 37.23 percent for the year (among the planet’s best-performing indices for 2017), underpinned by solid gains in corporate earnings and significantly better sentiment than in 2016. Information technology dominated the gains for the HSCI, rising just over 92 percent for the year, though consumer goods and properties and construction also put in strong performances, climbing 51.30 and 48.84 percent respectively. Auto names performed tremendously well in 2017—and constituted a solid portion of the fund’s outperformance—while Macau names began to creep back into play as four trailing quarters of profitability and growth started turning heads once more. It seems that Chinese growth may well be back.
Indeed the growth extends far beyond China, and the latter portion of 2017 remains notable for the increasingly consensus view of—for the first time in several years—synchronized global growth. Most of the world’s major economies are chugging along steadily at this point, with the U.S. firmly amid a rate-hiking cycle even as Europe is actually talking tapering. Meanwhile, Britain bucks the brunt of Brexit and the FTSE 100 Index soars to new all-time highs, Abenomics continues to keep Japan humming for the moment and China beats expectations for growth even amid fierce deleveraging. The dollar is weaker; the yen is reasonably steady; the yuan, euro, and pound sterling notably stronger. Commodities have perked up. Things actually seem, from an economic standpoint—dare we say?—just fine at the moment, perhaps even rosy.
To be sure, the relative optimism and stability of global markets may well be the story of 2017. What of the paradigm-shifting rhetorical bluster and hullaballoo around the inauguration of U.S. President Donald Trump? It was taken in stride. The Twitter and media proxy wars between North Korea’s Kim Jong Un and President Trump have, thus far, also been taken in stride, as narcissistic bluster and ultimately not much more. Xi Jinping’s consolidation of clout, amid the recent Party Congress, as the Chinese Communist Party’s most powerful ruler since Deng Xiaoping and Mao Zedong—with no heir apparent? This too is taken in stride, maybe even celebrated in some quarters.
Perhaps global markets collectively recognized the economic and geopolitical possibilities, for U.S. markets are at highs and Trump’s desired tax reform bill has now passed into law, despite some earlier legislative setbacks. North Korea launched several missiles with increasingly concerning capabilities, and yet sanctions—agreed to by China and pushed through the United Nations (UN)—may be taking a bite as North and South Korea have actually returned to open and formal negotiations, even as the world seems increasingly comfortable discussing (if not wholly acquiescing to) the notion of a nuclear—and, one hopes, a responsible—North Korea. And while President Xi’s concentration of power and reassertion of Party centrality and authority come, perhaps, with certain potential longer term price tags, at the same time the steady deleveraging, ongoing anticorruption purges, and crackdown on capital outflows have offered consistency, stabilization of the yuan, and some domestic Chinese optimism. This in turn has delivered returns in the market and—importantly for Hong Kong—continued southbound flows to take advantage of broader opportunities and H-share discounts.
| China Region Fund | (unaudited) |
China’s monthly report on foreign exchange reserves demonstrated the sort of stability apparently sought by the market after 2016’s scares about outflows. Following a single, brief drop in January below the $3 trillion mark, foreign exchange reserves rose steadily throughout every other remaining month in 2017, finishing the year at $3.139 trillion. Along with this success in the yuan’s stabilization came impressive progress in its internationalization: the long-awaited inclusion of the A-shares in MSCI’s Emerging Markets Index, a sure step forward for broadening the base of international investors in Chinese equities as well as China’s renminbi.
Investment Highlights
Overview
For the year ended December 31, 2017, the China Region Fund soared 57.67 percent, handily outperforming the benchmark Hang Seng Composite Index (HSCI), which advanced 37.23 percent in total return.
Because the fund is actively managed and holding period is generally not a consideration in investment decisions, the portfolio turnover rate may fluctuate from year to year as the fund adjusts its portfolio composition. The fund’s annual portfolio turnover may prove to be more than 100 percent in the future, as it has in the past.
Strengths
| ● | Within the broader China region, Malaysia and Singapore proved most helpful with respect to positive contributions from country allocation to fund performance for the year. Notably, of course, with a strong bull market in the fund’s benchmark domicile of Hong Kong, a significant majority of the fund’s allocations were correspondingly focused upon Hong Kong, where the fund achieved significant outperformance primarily through stock selection. |
| ● | Stock selection within the financials, consumer goods and industrials sectors constituted the largest sector alpha generators for the fund. Sector allocations within information technology proved most successful. |
| ● | Geely Automobile Holdings, Sunny Optical Technology Group and BYD Electronic International finished the year as the top three positive single stock contributors to fund performance. The stocks climbed 268.62 percent, 195.86 percent and 180.26 percent, respectively, over the course of 2017. |
Weaknesses
| ● | Outside of Hong Kong, diversifying country allocations—although relatively minor—to Indonesia, the Philippines, South Korea and Thailand underperformed very mildly. South Korea’s spat with China over the Terminal High Altitude Area Defense (THAAD) missile system briefly impacted some of the fund’s South Korean holdings. |
| ● | The largest net detraction for the fund with respect to sector allocation actually came from cash. |
| ● | China Railway Group, Texhong Textile Group and China Communications Services detracted the most from fund performance for the year in terms of absolute performance. Notably, however, the largest stock detractor for the Fund over the course of 2017 was the fund’s relative underweighting of tech giant (and index heavyweight) Tencent Holdings. |
| China Region Fund | (unaudited) |
Current Outlook
Opportunities
| ● | China’s growing middle class—like other middle classes in the region—continues its ascent, perpetuating existing thematic trends in areas like tourism, automobiles and health care. This middle class story remains unchanged from the end of 2016, was aptly demonstrated throughout 2017 and is unlikely to change in 2018. |
| ● | The market seems to view the admittedly horrifying prospects of another war on the Korean peninsula—or within the broader region—as a relatively minor possibility. This is encouraging. That the North and South have returned to formal discussions is similarly encouraging (as is the fact that the U.S. is not seeking to prevent such dialogue). |
| ● | Chinese authorities recently telegraphed an intention to delay the implementation of a property tax, perhaps to 2020, affording property names a bit of respite and an improved 2018 outlook as the year kicks off. |
Threats
| ● | In 2017, Xi Jinping called for his comrades’ patriotism over profits, and for the building up of national champions. This provides for what may amount to rousing speech material, but it raises some questions as to how such a philosophy might play out in time. The government already discouraged companies from making overseas deals amid the crackdown on capital outflows early in 2017. Now there loom additional questions as to whether, or perhaps which, companies might receive the favor of the state in becoming national champions. |
| ● | Clearly, a nuclear North Korea must also be given serious consideration as a threat. Increased distances in intercontinental ballistic missile (ICBM) potential strike capabilities are concerning, as is the prospect of conventional or regional engagements. Once again, this prospect seems remote, but not irrelevant. |
| ● | It is conceivable that the pace of growth in China may slow, perhaps even beyond what analysts anticipate. |
| China Region Fund | (unaudited) |
The section labeled Portfolio of Investments contains a complete list of the fund’s holdings.
| Top 10 Equity Holdings (Based on Net Assets) | December 31, 2017 | |
| | Geely Automobile Holdings, Ltd. | 10.02% | |
| | Automotive - Cars & Light Trucks | | |
| | Tencent Holdings, Ltd. | 8.69% | |
| | Internet Application Software | | |
| | Sunny Optical Technology Group Co., Ltd. | 6.69% | |
| | Photo Equipment & Supplies | | |
| | Ping An Insurance Group Co. of China, Ltd., Class H | 5.16% | |
| | Multi-line Insurance | | |
| | Country Garden Holdings Co., Ltd. | 4.50% | |
| | Real Estate Operating/Development | | |
| | Guangzhou Automobile Group Co., Ltd., Class H | 4.36% | |
| | Automotive - Cars & Light Trucks | | |
| | AAC Technologies Holdings, Inc. | 3.86% | |
| | Electronic Components - Miscellaneous | | |
| | ASM Pacific Technology, Ltd. | 3.59% | |
| | Semiconductor Equipment | | |
| | Nexteer Automotive Group, Ltd. | 3.36% | |
| | Automotive/Truck Parts & Equipment - Original | | |
| | Man Wah Holdings, Ltd. | 3.28% | |
| | Retail - Home Furnishings | | |
| | Total Top 10 Equity Holdings | 53.51% | |
Country Distribution* Based on Total Investments | December 31, 2017 |
| | |
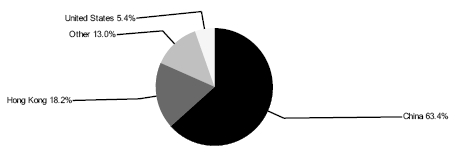 |
| | |
| * | Country distribution shown is based on domicile and not intended to conform to the China region definition in the prospectus. The locale of company operations may be different. |
| U.S. Government Securities Ultra-Short Bond | |
| Portfolio of Investments | December 31, 2017 |
United States Government and Agency Obligations 98.04% | | Coupon Rate % | | Maturity Date | | Principal Amount | | | Value | |
| Federal Farm Credit Bank 43.76% | | | | | | | | | | |
| Fixed Rates: | | | | | | | | | | |
| | | | 5.05 | | 06/22/18 | | $ | 500,000 | | | $ | 508,275 | |
| | | | 1.95 | | 08/28/18 | | | 100,000 | | | | 100,181 | |
| Floating Rates: | | | | | | | | | | | | | |
| (Federal Reserve Bank Prime Loan + (3.08)%) | | | 1.42 | | 03/11/19 | | | 7,000,000 | | | | 7,001,548 | |
| (U.S. Treasury 3 Month Bill Money Market Yield + 0.15%) | | | 1.60 | | 04/12/19 | | | 3,000,000 | | | | 3,004,776 | |
| (U.S. Treasury 3 Month Bill Money Market Yield + 0.09%) | | | 1.54 | | 06/19/19 | | | 8,000,000 | | | | 8,011,619 | |
| (USD 1 Month LIBOR + 0.03%) | | | 1.56 | | 03/22/18 | | | 3,000,000 | | | | 3,001,328 | |
| | | | | | | | | | | | | 21,627,727 | |
| Federal Home Loan Bank 49.88% | | | | | | | | | | | | | |
| Fixed Rates: | | | | | | | | | | | | | |
| | | | 1.13 | | 03/29/18 | | | 750,000 | | | | 749,529 | |
| | | | 1.13 | | 04/25/18 | | | 5,000,000 | | | | 4,994,820 | |
| | | | 1.00 | | 06/12/18 | | | 1,000,000 | | | | 997,436 | |
| | | | 5.38 | | 08/15/18 | | | 480,000 | | | | 490,919 | |
| | | | 1.00 | | 08/28/18 | | | 4,000,000 | | | | 3,981,552 | |
| | | | 1.75 | | 12/14/18 | | | 3,000,000 | | | | 2,997,363 | |
| | | | 1.50 | | 03/08/19 | | | 4,000,000 | | | | 3,979,924 | |
| | | | 1.50 | | 04/26/19 | | | 5,500,000 | | | | 5,473,375 | |
| | | | 1.20 | | 05/23/19 | | | 1,000,000 | | | | 990,220 | |
| | | | | | | | | | | | | 24,655,138 | |
| Tennessee Valley Authority 4.40% | | | | | | | | | | | | | |
| Fixed Rates: | | | | | | | | | | | | | |
| | | | 1.75 | | 10/15/18 | | | 2,174,000 | | | | 2,174,429 | |
| | | | | | | | | | | | | | |
| | | | | | | | | | | | | | |
| Investments, at value 98.04% | | | | | | | | | | | | 48,457,294 | |
| (cost $48,519,073) | | | | | | | | | | | | | |
| Other assets and liabilities, net 1.96% | | | | | | | | | | | | 969,447 | |
| | | | | | | | | | | | | | |
| Net Assets 100.00% | | | | | | | | | | | $ | 49,426,741 | |
See notes to portfolios of investments and notes to financial statements.
| Near-Term Tax Free Fund | |
| Portfolio of Investments | December 31, 2017 |
| Municipal Bonds 99.23% | | Coupon Rate % | | Maturity Date | | Principal Amount | | | Value | |
| Alabama 1.61% | | | | | | | | | | |
| | | | | | | | | | | |
| City of Bessemer Electric Revenue, Alabama, Refunding, RB AGM | | | 3.10 | | 12/01/21 | | $ | 100,000 | | | $ | 103,209 | |
| City of Pelham, Alabama, GO Unlimited | | | 2.00 | | 02/01/18 | | | 130,000 | | | | 130,060 | |
| Limestone County Water & Sewer Authority, Alabama, Refunding, RB | | | 2.25 | | 12/01/21 | | | 365,000 | | | | 366,847 | |
| University of South Alabama, Alabama, Refunding, RB | | | 5.00 | | 11/01/18 | | | 500,000 | | | | 514,040 | |
| | | | | | | | | | | | | 1,114,156 | |
| Alaska 0.87% | | | | | | | | | | | | | |
| Municipality of Anchorage, Alaska, GO Unlimited, Series A | | | 5.00 | | 09/01/26 | | | 500,000 | | | | 598,960 | |
| | | | | | | | | | | | | | |
| Arizona 0.62% | | | | | | | | | | | | | |
| City of Tempe, Arizona, GO Unlimited, Series A | | | 2.00 | | 07/01/19 | | | 220,000 | | | | 221,555 | |
| McAllister Academic Village, LLC, Arizona State University Hassayampa, Arizona, Refunding, RB | | | 5.75 | | 07/01/18 | | | 200,000 | | | | 204,252 | |
| | | | | | | | | | | | | 425,807 | |
| Arkansas 1.96% | | | | | | | | | | | | | |
| Atkins School District No. 18, Arkansas, Refunding, GO Limited | | | 1.00 | | 02/01/19 | | | 420,000 | | | | 415,510 | |
| Cave City School District No. 2-A, Arkansas, Refunding, GO Limited | | | 1.00 | | 02/01/19 | | | 260,000 | | | | 256,802 | |
| City of Hot Springs Wastewater Revenue, Arkansas, RB | | | 4.00 | | 12/01/19 | | | 510,000 | | | | 530,783 | |
| Paris School District No. 7, Arkansas, Refunding, GO Limited | | | 1.00 | | 06/01/18 | | | 150,000 | | | | 149,407 | |
| | | | | | | | | | | | | 1,352,502 | |
| California 0.99% | | | | | | | | | | | | | |
| California Statewide Communities Development Authority, Enloe Medical Center, California, RB, Series A | | | 5.25 | | 08/15/18 | | | 340,000 | | | | 348,109 | |
| Newman-Crows Landing Unified School District, California, Refunding, GO Unlimited AGM | | | 4.00 | | 08/01/19 | | | 115,000 | | | | 119,283 | |
| Riverside County Redevelopment Successor Agency, California, Refunding, Tax Allocation Bond | | | 5.00 | | 10/01/19 | | | 200,000 | | | | 211,576 | |
| State of California, California, GO Unlimited | | | 5.00 | | 12/01/19 | | | 5,000 | | | | 5,013 | |
| | | | | | | | | | | | | 683,981 | |
See notes to portfolios of investments and notes to financial statements.
| Near-Term Tax Free Fund | |
| Portfolio of Investments | December 31, 2017 |
| Municipal Bonds (cont’d) | | Coupon Rate % | | Maturity Date | | Principal Amount | | | Value | |
| Colorado 1.78% | | | | | | | | | | |
| City & County of Denver Airport System Revenue, Colorado, RB, Series B | | | 5.00 | | 11/15/27 | | $ | 300,000 | | | $ | 346,656 | |
| City of Glendale, Colorado, Refunding, COP AGM | | | 5.00 | | 12/01/25 | | | 750,000 | | | | 885,075 | |
| | | | | | | | | | | | | 1,231,731 | |
| District of Columbia 0.46% | | | | | | | | | | | | | |
| District of Columbia, District of Columbia, RB, Series A | | | 5.25 | | 12/01/27 | | | 300,000 | | | | 320,232 | |
| | | | | | | | | | | | | | |
| Florida 5.44% | | | | | | | | | | | | | |
| Citizens Property Insurance Corp., Senior Secured, Coastal Account, Florida, RB, Series A-1 | | | 4.00 | | 06/01/18 | | | 100,000 | | | | 101,023 | |
| City of Jacksonville, Florida, Refunding, RB, Series C | | | 5.00 | | 10/01/20 | | | 270,000 | | | | 294,241 | |
| City of Leesburg, Florida, Refunding, RB | | | 5.00 | | 10/01/21 | | | 405,000 | | | | 449,230 | |
| City of Margate Water & Sewer Revenue, Florida, Refunding, RB AGM | | | 4.00 | | 10/01/19 | | | 250,000 | | | | 259,662 | |
| City of Miramar, Florida, Refunding, RB | | | 5.00 | | 10/01/22 | | | 305,000 | | | | 348,289 | |
| County of St. Johns, Florida, Refunding, RB AGM | | | 5.00 | | 10/01/20 | | | 310,000 | | | | 335,832 | |
| Escambia County Health Facilities Authority, Baptist Hospital, Inc. Project, Florida, RB, Series A | | | 5.00 | | 08/15/19 | | | 290,000 | | | | 304,477 | |
| Florida Department of Management Services, Florida, Refunding, COP, Series A | | | 5.00 | | 08/01/19 | | | 500,000 | | | | 527,020 | |
| Florida Department of Management Services, Florida, COP, Series A | | | 5.00 | | 08/01/24 | | | 340,000 | | | | 350,288 | |
| Hillsborough County School Board, Florida, Refunding, COP, Series A | | | 4.25 | | 07/01/25 | | | 300,000 | | | | 315,969 | |
| Miami-Dade County Expressway Authority, Florida, RB, Series A | | | 5.00 | | 07/01/21 | | | 430,000 | | | | 476,707 | |
| | | | | | | | | | | | | 3,762,738 | |
| Georgia 2.20% | | | | | | | | | | | | | |
| Carroll City-County Hospital Authority, Tanner Medical Center, Inc. Project, Georgia, RB | | | 5.00 | | 07/01/18 | | | 600,000 | | | | 610,308 | |
| Gwinnett County Hospital Authority, Georgia, RB, Series B AGM | | | 5.00 | | 07/01/18 | | | 250,000 | | | | 254,208 | |
| Municipal Gas Authority of Georgia, Toccoa Project, Georgia, Refunding, RB AGM | | | 5.00 | | 06/01/22 | | | 600,000 | | | | 656,976 | |
| | | | | | | | | | | | | 1,521,492 | |
See notes to portfolios of investments and notes to financial statements.
| Near-Term Tax Free Fund | |
| Portfolio of Investments | December 31, 2017 |
| Municipal Bonds (cont’d) | | Coupon Rate % | | Maturity Date | | Principal Amount | | | Value | |
| Idaho 0.36% | | | | | | | | | | |
| Idaho Housing & Finance Association, Grant & Revenue Anticipation, Federal Highway Trust Fund, Idaho, RB, Series A | | | 5.00 | | 07/15/21 | | $ | 225,000 | | | $ | 249,377 | |
| | | | | | | | | | | | | | |
| Illinois 5.16% | | | | | | | | | | | | | |
| Chicago Board of Education, Illinois, GO Unlimited, Series A NATL | | | 5.25 | | 12/01/19 | | | 300,000 | | | | 314,493 | |
| Chicago O'Hare International Airport, Gen-Third Lien, Illinois, RB, Series C AGC | | | 5.25 | | 01/01/23 | | | 250,000 | | | | 266,265 | |
| Clinton Bond Fayette Etc Counties Community College District No. 501 Kaskaskia, Illinois, Refunding, GO Unlimited | | | 5.75 | | 12/01/19 | | | 500,000 | | | | 534,390 | |
| County of Du Page, Jail Project, Illinois, Refunding, GO Unlimited | | | 5.60 | | 01/01/21 | | | 270,000 | | | | 286,179 | |
| Du Page County School District No. 33 West Chicago, Illinois, Refunding, GO Unlimited, Series B | | | 4.00 | | 12/01/21 | | | 1,000,000 | | | | 1,075,260 | |
Metropolitan Pier & Exposition Authority, Illinois, Refunding, RB NATL ◊ | | | 1.70 | | 06/15/18 | | | 400,000 | | | | 397,300 | |
Metropolitan Pier & Exposition Authority, Illinois, Refunding, RB NATL ◊ | | | 1.70 | | 06/15/18 | | | 15,000 | | | | 14,816 | |
| Regional Transportation Authority, Illinois, RB, Series A, AMBAC | | | 7.20 | | 11/01/20 | | | 95,000 | | | | 104,191 | |
| Village of Fox Lake, Debt Certificates, Illinois, RB, Series B | | | 3.00 | | 11/01/19 | | | 265,000 | | | | 270,448 | |
| Will Grundy Etc Counties Community College District No. 525, Joliet Junior College, Illinois, GO Unlimited | | | 6.25 | | 06/01/22 | | | 300,000 | | | | 305,838 | |
| | | | | | | | | | | | | 3,569,180 | |
| Indiana 1.40% | | | | | | | | | | | | | |
| Clark-Pleasant School Building Corp., Indiana, Refunding, RB | | | 5.00 | | 01/15/19 | | | 275,000 | | | | 284,716 | |
| Indianapolis Local Public Improvement Bond Bank, Waterworks Project, Indiana, Prefunding, RB, Series 2007-L NATL | | | 5.25 | | 01/01/33 | | | 305,000 | | | | 305,000 | |
| Merrillville Redevelopment Authority, Indiana, Tax Allocation Bond | | | 5.00 | | 08/15/20 | | | 350,000 | | | | 377,653 | |
| | | | | | | | | | | | | 967,369 | |
See notes to portfolios of investments and notes to financial statements.
| Near-Term Tax Free Fund | |
| Portfolio of Investments | December 31, 2017 |
| Municipal Bonds (cont’d) | | Coupon Rate % | | Maturity Date | | Principal Amount | | | Value | |
| Iowa 0.93% | | | | | | | | | | |
| City of Clive, Iowa, Refunding, GO Unlimited, Series A | | | 2.00 | | 06/01/19 | | $ | 235,000 | | | $ | 236,469 | |
| Iowa State Board of Regents, University of Iowa Hospitals and Clinics, Iowa, Refunding, RB, Series A | | | 3.00 | | 09/01/19 | | | 400,000 | | | | 408,608 | |
| | | | | | | | | | | | | 645,077 | |
| Kentucky 0.81% | | | | | | | | | | | | | |
| Louisville & Jefferson County Metropolitan Sewer District, Kentucky, RB, Series A | | | 5.00 | | 05/15/23 | | | 500,000 | | | | 560,690 | |
| | | | | | | | | | | | | | |
| Louisiana 1.32% | | | | | | | | | | | | | |
| State of Louisiana, Louisiana, Prefunding, GO Unlimited, Series A | | | 5.00 | | 08/01/26 | | | 800,000 | | | | 911,624 | |
| | | | | | | | | | | | | | |
| Michigan 4.86% | | | | | | | | | | | | | |
| City of Wyoming, Water Supply System, Michigan, Refunding, RB | | | 4.00 | | 06/01/20 | | | 215,000 | | | | 225,537 | |
| Detroit Local Development Finance Authority, Michigan, Refunding, Tax Allocation Bond, Series A | | | 5.38 | | 05/01/18 | | | 35,000 | | | | 34,999 | |
| Gibraltar School District, Michigan, Refunding, GO Unlimited AGM | | | 5.00 | | 05/01/21 | | | 475,000 | | | | 509,376 | |
| Michigan Public Power Agency, AFEC Project, Michigan, RB, Series A | | | 4.50 | | 01/01/19 | | | 280,000 | | | | 287,109 | |
| Michigan State Hospital Finance Authority, Trinity Health, Michigan, RB, Series A | | | 6.00 | | 12/01/18 | | | 200,000 | | | | 207,924 | |
| Oxford Area Community School District, Michigan, Refunding, GO Unlimited, Series A Q-SBLF | | | 5.00 | | 05/01/22 | | | 365,000 | | | | 413,574 | |
| Portage Public Schools, School Building & Site, Michigan, Prefunding, GO Unlimited AGM | | | 5.00 | | 05/01/20 | | | 300,000 | | | | 303,561 | |
| Romeo Community School District, Michigan, Refunding, GO Unlimited Q-SBLF | | | 3.00 | | 05/01/18 | | | 500,000 | | | | 502,270 | |
| State of Michigan Trunk Line Revenue, Michigan, Refunding, RB | | | 4.50 | | 11/01/26 | | | 105,000 | | | | 110,073 | |
| Wayne County Airport Authority, Detroit Metropolitan Airport, Michigan, Refunding, RB, Series C | | | 4.00 | | 12/01/19 | | | 255,000 | | | | 266,029 | |
| Zeeland Public Schools, Michigan, Refunding, GO Unlimited | | | 5.00 | | 05/01/18 | | | 490,000 | | | | 495,738 | |
| | | | | | | | | | | | | 3,356,190 | |
See notes to portfolios of investments and notes to financial statements.
| Near-Term Tax Free Fund | |
| Portfolio of Investments | December 31, 2017 |
| Municipal Bonds (cont’d) | | Coupon Rate % | | Maturity Date | | Principal Amount | | | Value | |
| Minnesota 0.30% | | | | | | | | | | |
| Lake Washington Sanitary District, Minnesota, GO Unlimited, Series A AGM | | | 2.00 | | 02/01/18 | | $ | 205,000 | | | $ | 205,102 | |
| | | | | | | | | | | | | | |
| Mississippi 0.58% | | | | | | | | | | | | | |
| Rankin County School District, Mississippi, Refunding, GO Limited | | | 2.00 | | 08/01/19 | | | 400,000 | | | | 402,668 | |
| | | | | | | | | | | | | | |
| Missouri 3.61% | | | | | | | | | | | | | |
| City of Kansas City, Missouri, Refunding, RB, Series B | | | 5.00 | | 08/01/19 | | | 650,000 | | | | 683,039 | |
| City of Kansas City Water Revenue, Missouri, RB, Series F AGM | | | 4.00 | | 12/01/22 | | | 250,000 | | | | 275,490 | |
| County of Jackson, Truman Sports Complex Project, Special Obligation, Missouri, Refunding, RB | | | 5.00 | | 12/01/18 | | | 215,000 | | | | 221,504 | |
| Missouri State Board of Public Buildings, Missouri, RB, Series A | | | 3.00 | | 04/01/26 | | | 750,000 | | | | 786,878 | |
| Missouri State Regional Convention & Sports Complex Authority, Missouri, Refunding, RB, Series A | | | 5.00 | | 08/15/19 | | | 500,000 | | | | 527,100 | |
| | | | | | | | | | | | | 2,494,011 | |
| | | | | | | | | | | | | | |
| Nevada 0.48% | | | | | | | | | | | | | |
| Las Vegas Valley Water District, Nevada, Refunding, GO Limited, Series D | | | 5.00 | | 06/01/27 | | | 315,000 | | | | 329,881 | |
| | | | | | | | | | | | | | |
| New Hampshire 0.58% | | | | | | | | | | | | | |
| New Hampshire Health and Education Facilities Authority Act, Southern New Hampshire University, New Hampshire, RB | | | 5.00 | | 01/01/18 | | | 400,000 | | | | 400,000 | |
| | | | | | | | | | | | | | |
| New Jersey 3.75% | | | | | | | | | | | | | |
| Camden County Improvement Authority, New Jersey, Refunding, RB | | | 4.00 | | 01/15/18 | | | 600,000 | | | | 600,516 | |
| City of Atlantic City, Tax Appeal, New Jersey, Refunding, GO Unlimited | | | 4.00 | | 11/01/18 | | | 500,000 | | | | 496,870 | |
| Hudson County Improvement Authority, North Hudson Regional Fire, New Jersey, Refunding, RB, Series A AGM | | | 5.63 | | 09/01/18 | | | 400,000 | | | | 410,564 | |
See notes to portfolios of investments and notes to financial statements.
| Near-Term Tax Free Fund | |
| Portfolio of Investments | December 31, 2017 |
| Municipal Bonds (cont’d) | | Coupon Rate % | | Maturity Date | | Principal Amount | | | Value | |
| New Jersey (cont’d) | | | | | | | | | | |
| Middlesex County Improvement Authority, New Jersey, RB | | | 5.00 | | 07/01/25 | | $ | 425,000 | | | $ | 514,645 | |
| Passaic Valley Sewerage Commission, New Jersey, RB, Series G | | | 5.75 | | 12/01/21 | | | 500,000 | | | | 568,375 | |
| | | | | | | | | | | | | 2,590,970 | |
| New York 9.54% | | | | | | | | | | | | | |
| City of New York, New York, GO Unlimited, Series B | | | 5.00 | | 08/01/19 | | | 400,000 | | | | 420,972 | |
| City of New York, New York, GO Unlimited, Series E | | | 5.25 | | 08/01/22 | | | 875,000 | | | | 1,007,484 | |
| City of New York, New York, GO Unlimited, Series I | | | 5.00 | | 08/01/22 | | | 1,000,000 | | | | 1,140,470 | |
| Greece Central School District, New York, GO Unlimited | | | 2.00 | | 06/15/19 | | | 455,000 | | | | 458,381 | |
| Long Island Power Authority, New York, RB, Series B | | | 5.00 | | 09/01/21 | | | 465,000 | | | | 516,782 | |
| Nassau County Industrial Development Agency, New York Institute of Technology Project, New York, Refunding, RB, Series A | | | 5.00 | | 03/01/21 | | | 350,000 | | | | 374,629 | |
| New York State Dormitory Authority, New York, Refunding, RB, Series B | | | 5.00 | | 02/15/26 | | | 750,000 | | | | 916,530 | |
| New York State Urban Development Corp., New York, RB, Series A-2 NATL | | | 5.50 | | 03/15/19 | | | 615,000 | | | | 644,206 | |
| New York State Urban Development Corp., New York, Refunding, RB, Series D | | | 5.50 | | 01/01/19 | | | 250,000 | | | | 259,783 | |
| Sodus Central School District, New York, Refunding, GO Unlimited | | | 3.00 | | 06/15/18 | | | 640,000 | | | | 644,256 | |
| Town of North Castle, Public Improvement, New York, GO Unlimited | | | 3.88 | | 12/01/22 | | | 210,000 | | | | 210,477 | |
| | | | | | | | | | | | | 6,593,970 | |
| North Carolina 2.47% | | | | | | | | | | | | | |
| City of Charlotte, Equipment Acquisition & Public Facilities, North Carolina, COP, Series A | | | 5.00 | | 10/01/21 | | | 1,000,000 | | | | 1,090,350 | |
| County of Beaufort, North Carolina, RB | | | 5.00 | | 06/01/21 | | | 200,000 | | | | 220,102 | |
| North Carolina Municipal Power Agency No. 1, North Carolina, Refunding, RB | | | 5.25 | | 01/01/20 | | | 400,000 | | | | 400,000 | |
| | | | | | | | | | | | | 1,710,452 | |
| Ohio 2.13% | | | | | | | | | | | | | |
| City of Cleveland Parking Facility Revenue, Ohio, Refunding, RB AGM | | | 5.25 | | 09/15/22 | | | 130,000 | | | | 149,678 | |
| City of Columbus, Ohio, GO Limited, Series B | | | 4.00 | | 04/01/26 | | | 325,000 | | | | 372,574 | |
| County of Erie, Ohio, Refunding, GO Limited | | | 4.25 | | 10/01/25 | | | 305,000 | | | | 349,539 | |
See notes to portfolios of investments and notes to financial statements.
| Near-Term Tax Free Fund | |
| Portfolio of Investments | December 31, 2017 |
| Municipal Bonds (cont’d) | | Coupon Rate % | | Maturity Date | | Principal Amount | | | Value | |
| Ohio (cont’d) | | | | | | | | | | |
| County of Hamilton, Ohio, Refunding, GO Limited, Series A | | | 5.00 | | 12/01/24 | | $ | 500,000 | | | $ | 599,575 | |
| | | | | | | | | | | | | 1,471,366 | |
| Oklahoma 0.47% | | | | | | | | | | | | | |
| Oklahoma Agricultural & Mechanical Colleges, Oklahoma State University, Oklahoma, RB, Series A | | | 5.00 | | 08/01/21 | | | 300,000 | | | | 323,676 | |
| | | | | | | | | | | | | | |
| Oregon 0.31% | | | | | | | | | | | | | |
| Oregon State Facilities Authority, Legacy Health Project, Oregon, Refunding, RB, Series A | | | 4.50 | | 05/01/20 | | | 200,000 | | | | 212,960 | |
| | | | | | | | | | | | | | |
| Pennsylvania 3.98% | | | | | | | | | | | | | |
| Allegheny County Sanitary Authority, Pennsylvania, Refunding, RB AGM | | | 5.00 | | 06/01/19 | | | 700,000 | | | | 731,962 | |
| Delaware Valley Regional Finance Authority, Permanently Fixed Business Development Services, Pennsylvania, RB, AMBAC | | | 5.50 | | 08/01/18 | | | 295,000 | | | | 301,741 | |
| Pocono Mountain School District, Pennsylvania, Refunding, GO Limited AGM | | | 4.00 | | 09/01/25 | | | 300,000 | | | | 337,422 | |
| Reading School District, Pennsylvania, GO Unlimited, Series A | | | 5.00 | | 04/01/20 | | | 400,000 | | | | 425,016 | |
| The School District of Philadelphia, Pennsylvania, Refunding, GO Unlimited, Series E | | | 5.25 | | 09/01/24 | | | 625,000 | | | | 665,468 | |
| Wilkes-Barre Finance Authority, University of Scranton, Pennsylvania, Refunding, RB, Series A | | | 5.00 | | 11/01/19 | | | 275,000 | | | | 290,084 | |
| | | | | | | | | | | | | 2,751,693 | |
| South Carolina 1.35% | | | | | | | | | | | | | |
| Spartanburg Regional Health Services District, South Carolina, Refunding, RB, Series A | | | 5.00 | | 04/15/19 | | | 600,000 | | | | 624,312 | |
| Spartanburg Sanitation Sewer District, South Carolina, RB, Series A AGC | | | 3.50 | | 03/01/19 | | | 300,000 | | | | 306,561 | |
| | | | | | | | | | | | | 930,873 | |
See notes to portfolios of investments and notes to financial statements.
| Near-Term Tax Free Fund | |
| Portfolio of Investments | December 31, 2017 |
| Municipal Bonds (cont’d) | | Coupon Rate % | | Maturity Date | | Principal Amount | | | Value | |
| Tennessee 0.31% | | | | | | | | | | |
| City of Memphis Sanitary Sewerage System Revenue, Tennessee, Refunding, RB AGM | | | 5.00 | | 05/01/20 | | $ | 200,000 | | | $ | 215,138 | |
| | | | | | | | | | | | | | |
| Texas 28.06% | | | | | | | | | | | | | |
| Aldine Independent School District, Texas, Refunding, GO Unlimited PSF-GTD | | | 5.00 | | 02/15/26 | | | 750,000 | | | | 915,270 | |
| Bryan Independent School District, Texas, GO Unlimited, Series A PSF-GTD | | | 5.00 | | 02/15/22 | | | 410,000 | | | | 462,349 | |
| City of Arlington, Certificates of Obligation, Texas, GO Limited, Series B | | | 2.00 | | 08/15/19 | | | 500,000 | | | | 503,335 | |
| City of Baytown, Certificates of Obligation, Texas, GO Limited | | | 4.00 | | 02/01/26 | | | 750,000 | | | | 851,775 | |
| City of Cedar Hill, Texas, Refunding, GO Limited | | | 5.00 | | 02/15/22 | | | 800,000 | | | | 899,088 | |
City of Center, Certificates of Obligation, Texas, GO Limited AGM ◊ | | | 3.07 | | 02/15/20 | | | 150,000 | | | | 144,387 | |
| City of Denton, Texas, Refunding, GO Limited | | | 5.00 | | 02/15/19 | | | 500,000 | | | | 519,300 | |
| City of Fort Worth Water & Sewer System Revenue, Texas, Refunding, RB | | | 5.00 | | 02/15/19 | | | 800,000 | | | | 831,424 | |
| City of Garland, Texas, Refunding, GO Limited | | | 5.00 | | 02/15/25 | | | 650,000 | | | | 693,699 | |
| City of Longview Waterworks & Sewer System Revenue, Texas, Refunding, RB | | | 3.00 | | 03/01/22 | | | 610,000 | | | | 634,229 | |
| City of Pharr, Texas, Refunding, GO Limited, Series A | | | 5.00 | | 08/15/20 | | | 285,000 | | | | 307,518 | |
| City of Plano, Texas, Refunding, GO Limited | | | 5.00 | | 09/01/19 | | | 1,000,000 | | | | 1,056,510 | |
| City of Round Rock, Texas, Refunding, GO Limited | | | 2.00 | | 08/15/19 | | | 465,000 | | | | 468,399 | |
| City of Texarkana, Texas, Refunding, GO Limited | | | 5.00 | | 02/15/21 | | | 320,000 | | | | 351,302 | |
| City of Texarkana Waterworks & Sanitary Sewer System Revenue, Texas, RB | | | 3.00 | | 08/01/19 | | | 90,000 | | | | 91,983 | |
| City of Texarkana Waterworks & Sanitary Sewer System Revenue, Texas, RB | | | 3.00 | | 08/01/20 | | | 95,000 | | | | 97,616 | |
| Clear Lake City Water Authority, Waterworks & Sewer System, Texas, GO Unlimited | | | 3.00 | | 03/01/19 | | | 125,000 | | | | 127,149 | |
| Corpus Christi Business & Job Development Corp., Seawall Project, Texas, Refunding, RB | | | 5.00 | | 03/01/20 | | | 350,000 | | | | 373,012 | |
| County of Hays, Texas, Prefunding, GO Limited | | | 5.00 | | 02/15/23 | | | 500,000 | | | | 502,070 | |
| Culberson County-Allamoore Independent School District, Texas, GO Unlimited PSF-GTD | | | 3.00 | | 02/15/19 | | | 860,000 | | | | 874,319 | |
| Dimmitt Independent School District, Texas, GO Unlimited PSF-GTD | | | 3.00 | | 02/15/22 | | | 305,000 | | | | 317,728 | |
See notes to portfolios of investments and notes to financial statements.
| Near-Term Tax Free Fund | |
| Portfolio of Investments | December 31, 2017 |
| Municipal Bonds (cont’d) | | Coupon Rate % | | Maturity Date | | Principal Amount | | | Value | |
| Texas (cont’d) | | | | | | | | | | |
| Harris County Municipal Utility District No. 382, Texas, Refunding, GO Unlimited BAM | | | 3.00 | | 04/01/22 | | $ | 305,000 | | | $ | 312,113 | |
| Houston Community College System, Texas, GO Limited | | | 5.00 | | 02/15/19 | | | 755,000 | | | | 784,656 | |
| Lower Colorado River Authority, LCRA Transmission Services Corp., Texas, Refunding, RB, Series A | | | 5.00 | | 05/15/21 | | | 500,000 | | | | 552,200 | |
| Lubbock-Cooper Independent School District, Texas, GO Unlimited PSF-GTD | | | 3.00 | | 02/15/22 | | | 755,000 | | | | 791,399 | |
| Montgomery County Municipal Utility District No. 119, Texas, GO Unlimited, Series A AGM | | | 4.00 | | 04/01/18 | | | 315,000 | | | | 316,742 | |
| North Texas Tollway Authority, Texas, Refunding, RB, Series F | | | 5.75 | | 01/01/38 | | | 300,000 | | | | 300,000 | |
| Olmos Park Higher Education Facilities Corp., University of the Incarnate Word, Texas, Refunding, RB | | | 5.00 | | 12/01/21 | | | 500,000 | | | | 552,975 | |
| San Antonio Water System, Texas, Refunding, RB | | | 4.50 | | 05/15/21 | | | 400,000 | | | | 435,668 | |
| State of Texas, Texas, Refunding, GO Unlimited | | | 5.00 | | 10/01/20 | | | 1,150,000 | | | | 1,253,247 | |
| Texas State Public Finance Authority Charter School Finance Corp., Texas, Prefunding, RB, Series A | | | 6.20 | | 02/15/40 | | | 2,000,000 | | | | 2,180,160 | |
| Town of Addison, Certificates of Obligation, Texas, Prefunding, GO Limited | | | 4.00 | | 02/15/20 | | | 250,000 | | | | 250,775 | |
| Town of Addison, Certificates of Obligation, Texas, Prefunding, GO Limited | | | 4.50 | | 02/15/28 | | | 140,000 | | | | 140,515 | |
| Travis County Water Control & Improvement District No. 10, Texas, GO Unlimited | | | 2.00 | | 08/15/19 | | | 500,000 | | | | 503,575 | |
| | | | | | | | | | | | | 19,396,487 | |
| Utah 1.70% | | | | | | | | | | | | | |
| County of Davis, Utah, Refunding, GO Unlimited | | | 5.00 | | 02/01/19 | | | 200,000 | | | | 207,564 | |
| County of Weber, Utah, GO Unlimited | | | 4.00 | | 01/15/22 | | | 430,000 | | | | 467,866 | |
| Utah State Building Ownership Authority, State Facilities Master Lease Program, Utah, Refunding, RB, Series C AGM | | | 5.50 | | 05/15/19 | | | 180,000 | | | | 183,557 | |
| Washington County-St George Interlocal Agency, Utah, Refunding, RB, Series A | | | 4.00 | | 12/01/19 | | | 300,000 | | | | 312,801 | |
| | | | | | | | | | | | | 1,171,788 | |
See notes to portfolios of investments and notes to financial statements.
| Near-Term Tax Free Fund | |
| Portfolio of Investments | December 31, 2017 |
| Municipal Bonds (cont’d) | | Coupon Rate % | | Maturity Date | | Principal Amount | | | Value | |
| Virginia 0.81% | | | | | | | | | | |
| City of Lynchburg, Virginia, Refunding, GO Unlimited | | | 5.00 | | 02/01/19 | | $ | 540,000 | | | $ | 560,423 | |
| | | | | | | | | | | | | | |
| Washington 7.67% | | | | | | | | | | | | | |
| County of Cowlitz, Washington, Refunding, GO Limited, Series A | | | 3.00 | | 04/01/18 | | | 195,000 | | | | 195,760 | |
| County of Thurston, Washington, Refunding, GO Limited | | | 5.00 | | 12/01/20 | | | 1,625,000 | | | | 1,780,058 | |
| Spokane Public Facilities District, Washington, Refunding, RB, Series B | | | 5.00 | | 12/01/21 | | | 950,000 | | | | 1,060,865 | |
| State of Washington, Washington, Refunding, GO Unlimited, Series A | | | 5.00 | | 01/01/19 | | | 1,000,000 | | | | 1,035,230 | |
| State of Washington, Motor Vehicle Fuel Tax, Washington, GO Unlimited, Series C | | | 5.00 | | 02/01/19 | | | 830,000 | | | | 861,482 | |
| Tacoma Metropolitan Park District, Washington, Refunding, GO Unlimited, Series B | | | 4.00 | | 12/01/19 | | | 355,000 | | | | 371,106 | |
| | | | | | | | | | | | | 5,304,501 | |
| Wisconsin 0.36% | | | | | | | | | | | | | |
| Waunakee Community School District, Wisconsin, GO Unlimited, Series A | | | 5.00 | | 04/01/18 | | | 250,000 | | | | 252,157 | |
| | | | | | | | | | | | | | |
| Investments, at value 99.23% | | | | | | | | | | | | 68,589,222 | |
| (cost $68,769,816) | | | | | | | | | | | | | |
| Other assets and liabilities, net 0.77% | | | | | | | | | | | | 530,515 | |
| | | | | | | | | | | | | | |
| Net Assets 100.00% | | | | | | | | | | | $ | 69,119,737 | |
See notes to portfolios of investments and notes to financial statements.
| All American Equity Fund | |
| Portfolio of Investments | December 31, 2017 |
| Common Stocks 91.84% | | Shares | | | Value | |
| | | | | | | |
| Aerospace/Defense 4.26% | | | | | | |
| The Boeing Co. | | | 2,300 | | | $ | 678,293 | |
| | | | | | | | | |
| Airlines 3.41% | | | | | | | | |
| Southwest Airlines Co. | | | 8,300 | | | | 543,235 | |
| | | | | | | | | |
| Apparel Manufacturers 2.18% | | | | | | | | |
| Hanesbrands, Inc. | | | 16,600 | | | | 347,106 | |
| | | | | | | | | |
| Beverages - Wine/Spirits 3.44% | | | | | | | | |
| Constellation Brands, Inc., Class A | | | 2,400 | | | | 548,568 | |
| | | | | | | | | |
| Commercial Services - Finance 3.67% | | | | | | | | |
| Total System Services, Inc. | | | 7,400 | | | | 585,266 | |
| | | | | | | | | |
| Computer Services 3.69% | | | | | | | | |
| DXC Technology Co. | | | 6,200 | | | | 588,380 | |
| | | | | | | | | |
Cosmetics & Toiletries 3.43% | | | | | | | | |
| The Estee Lauder Cos., Inc. | | | 4,300 | | | | 547,132 | |
| | | | | | | | | |
Dental Supplies & Equipment 3.14% | | | | | | | | |
| DENTSPLY SIRONA, Inc. | | | 7,600 | | | | 500,308 | |
| | | | | | | | | |
| Diversified Banking Institution 6.36% | | | | | | | | |
| Citigroup, Inc. | | | 7,000 | | | | 520,870 | |
| Morgan Stanley | | | 9,400 | | | | 493,218 | |
| | | | | | | | 1,014,088 | |
| | | | | | | | | |
| Electronic Components - Semiconductors 5.83% | | | | | | | | |
| Broadcom, Ltd. | | | 1,500 | | | | 385,350 | |
| Texas Instruments, Inc. | | | 5,200 | | | | 543,088 | |
| | | | | | | | 928,438 | |
| | | | | | | | | |
| Electronic Secure Devices 2.85% | | | | | | | | |
| Allegion PLC | | | 5,700 | | | | 453,492 | |
| | | | | | | | | |
| Finance - Credit Card 7.44% | | | | | | | | |
| Discover Financial Services | | | 7,700 | | | | 592,284 | |
| Visa, Inc., Class A | | | 5,200 | | | | 592,904 | |
| | | | | | | | 1,185,188 | |
See notes to portfolios of investments and notes to financial statements.
| All American Equity Fund | |
| Portfolio of Investments | December 31, 2017 |
| Common Stocks (cont'd) | | Shares | | | Value | |
| | | | | | | |
| Gold Mining 2.31% | | | | | | |
| Newmont Mining Corp. | | | 9,800 | | | $ | 367,696 | |
| | | | | | | | | |
| Medical - Biomedical/Genetics 2.51% | | | | | | | | |
| Amgen, Inc. | | | 2,300 | | | | 399,970 | |
| | | | | | | | | |
| Medical - HMO 2.65% | | | | | | | | |
| Humana, Inc. | | | 1,700 | | | | 421,719 | |
| | | | | | | | | |
Medical Labs & Testing Services 2.41% | | | | | | | | |
| Quest Diagnostics, Inc. | | | 3,900 | | | | 384,111 | |
| | | | | | | | | |
Oil Companies - Exploration & Production 2.64% | | | | | | | | |
Cabot Oil & Gas Corp. | | | 14,700 | | | | 420,420 | |
| | | | | | | | | |
Oil Refining & Marketing 6.78% | | | | | | | | |
| Marathon Petroleum Corp. | | | 8,700 | | | | 574,026 | |
| Phillips 66 | | | 5,000 | | | | 505,750 | |
| | | | | | | | 1,079,776 | |
| | | | | | | | | |
| REITS - Diversified 2.86% | | | | | | | | |
| American Tower Corp. REIT | | | 3,200 | | | | 456,544 | |
| | | | | | | | | |
| Retail - Building Products 3.45% | | | | | | | | |
| The Home Depot, Inc. | | | 2,900 | | | | 549,637 | |
| | | | | | | | | |
| Retail - Drug Store 1.73% | | | | | | | | |
| CVS Health Corp. | | | 3,800 | | | | 275,500 | |
| | | | | | | | | |
| Retail - Jewelry 1.99% | | | | | | | | |
| Signet Jewelers, Ltd. | | | 5,600 | | | | 316,680 | |
| | | | | | | | | |
| Retail - Major Dept Store 3.26% | | | | | | | | |
| The TJX Cos., Inc. | | | 6,800 | | | | 519,928 | |
| | | | | | | | | |
| Semiconductor Equipment 3.12% | | | | | | | | |
| Lam Research Corp. | | | 2,700 | | | | 496,989 | |
| | | | | | | | | |
| Supranational Bank 3.27% | | | | | | | | |
| Comerica, Inc. | | | 6,000 | | | | 520,860 | |
See notes to portfolios of investments and notes to financial statements.
| All American Equity Fund | |
| Portfolio of Investments | December 31, 2017 |
| Common Stocks (cont'd) | | Shares | | | Value | |
| | | | | | | |
| Water 3.16% | | | | | | |
| American Water Works Co., Inc. | | | 5,500 | | | $ | 503,195 | |
| | | | | | | | | |
| Total Common Stocks | | | | | | | 14,632,519 | |
| (cost $14,033,750) | | | | | | | | |
| | | | | | | | | |
| Rights 0.00% | | | | | | | | |
| | | | | | | | | |
| Food - Retail 0.00% | | | | | | | | |
Casa Ley, S.A. de C.V., Contingent Value Right #*@ | | | 7,200 | | | | 0 | |
Property Development Centers, LLC, Contingent Value Right #*@ | | | 7,200 | | | | 0 | |
| | | | | | | | 0 | |
| | | | | | | | | |
| Total Rights | | | | | | | 0 | |
| (cost $0) | | | | �� | | | | |
| | | | | | | | | |
| Exchange Traded Funds 6.89% | | | | | | | | |
| Consumer Discretionary Select Sector SPDR Fund ETF | | | 1,100 | | | | 108,559 | |
| Direxion Daily S&P 500 Bull 3X ETF | | | 14,000 | | | | 620,620 | |
| Energy Select Sector SPDR Fund ETF | | | 600 | | | | 43,356 | |
| Financial Select Sector SPDR Fund ETF | | | 5,300 | | | | 147,923 | |
| Technology Select Sector SPDR Fund ETF | | | 1,700 | | | | 108,715 | |
| Utilities Select Sector SPDR Fund ETF | | | 1,300 | | | | 68,484 | |
| | | | | | | | | |
| Total Exchange Traded Funds | | | | | | | 1,097,657 | |
| (cost $1,056,538) | | | | | | | | |
| | | | | | | | | |
| Investments, at value 98.73% | | | | | | | 15,730,176 | |
| (cost $15,090,288) | | | | | | | | |
| Other assets and liabilities, net 1.27% | | | | | | | 201,737 | |
| | | | | | | | | |
| Net Assets 100.00% | | | | | | $ | 15,931,913 | |
See notes to portfolios of investments and notes to financial statements.
| Holmes Macro Trends Fund | |
| Portfolio of Investments | December 31, 2017 |
| Common Stocks 88.54% | | Shares | | | Value | |
| | | | | | | |
| Applications Software 2.48% | | | | | | |
| CDK Global, Inc. | | | 14,500 | | | $ | 1,033,560 | |
| | | | | | | | | |
| Bicycle Manufacturing 2.14% | | | | | | | | |
| Fox Factory Holding Corp. * | | | 22,900 | | | | 889,665 | |
| | | | | | | | | |
| Brewery 3.25% | | | | | | | | |
| The Boston Beer Co., Inc., Class A * | | | 7,067 | | | | 1,350,504 | |
| | | | | | | | | |
| Building - Residential/Commercial 4.17% | | | | | | | | |
| LGI Homes, Inc. * | | | 23,100 | | | | 1,733,193 | |
| | | | | | | | | |
Building & Construction Products - Miscellaneous 4.17% | | | | | | | | |
| Trex Co., Inc. * | | | 16,000 | | | | 1,734,240 | |
| | | | | | | | | |
Building Products - Air & Heating 4.46% | | | | | | | | |
| Lennox International, Inc. | | | 8,900 | | | | 1,853,514 | |
| | | | | | | | | |
| Casino Hotels 5.92% | | | | | | | | |
| Wynn Resorts, Ltd. | | | 14,600 | | | | 2,461,414 | |
| | | | | | | | | |
| Chemicals - Specialty 3.64% | | | | | | | | |
| Valvoline, Inc. | | | 60,500 | | | | 1,516,130 | |
| | | | | | | | | |
| Commercial Services 4.78% | | | | | | | | |
| Medifast, Inc. | | | 28,500 | | | | 1,989,585 | |
| | | | | | | | | |
| Commercial Services - Finance 4.93% | | | | | | | | |
| S&P Global, Inc. | | | 12,100 | | | | 2,049,740 | |
| | | | | | | | | |
| Consumer Products - Miscellaneous 3.78% | | | | | | | | |
| Kimberly-Clark Corp. | | | 5,900 | | | | 711,894 | |
| WD-40 Co. | | | 7,300 | | | | 861,400 | |
| | | | | | | | 1,573,294 | |
| | | | | | | | | |
| Distribution/Wholesale 4.46% | | | | | | | | |
| Pool Corp. | | | 14,300 | | | | 1,853,995 | |
| | | | | | | | | |
| Electronic Secure Devices 2.39% | | | | | | | | |
| Allegion PLC | | | 12,500 | | | | 994,500 | |
| | | | | | | | | |
| Energy - Alternate Sources 0.00% | | | | | | | | |
Pacific Green Energy Corp. #*@ | | | 100,000 | | | | 0 | |
See notes to portfolios of investments and notes to financial statements.
| Holmes Macro Trends Fund | |
| Portfolio of Investments | December 31, 2017 |
| Common Stocks (cont'd) | | Shares | | | Value | |
| | | | | | | |
| Food - Miscellaneous/Diversified 3.31% | | | | | | |
Lamb Weston Holdings, Inc. | | | 24,400 | | | $ | 1,377,380 | |
| | | | | | | | | |
| Golf 2.68% | | | | | | | | |
| Callaway Golf Co. | | | 79,900 | | | | 1,113,007 | |
| | | | | | | | | |
| Medical - Drugs 3.01% | | | | | | | | |
| Supernus Pharmaceuticals, Inc. * | | | 31,400 | | | | 1,251,290 | |
| | | | | | | | | |
| Medical - Hospitals 0.00% | | | | | | | | |
African Medical Investments PLC #*@ | | | 1,000,000 | | | | 0 | |
| | | | | | | | | |
| Oil Companies - Exploration & Production 1.10% | | | | | | | | |
| PentaNova Energy Corp. * | | | 1,000,000 | | | | 306,285 | |
PentaNova Energy Corp., 144A #*∆ | | | 500,000 | | | | 153,142 | |
| | | | | | | | 459,427 | |
| | | | | | | | | |
| Real Estate Management/Services 6.38% | | | | | | | | |
| HFF, Inc. | | | 54,600 | | | | 2,655,744 | |
| | | | | | | | | |
| Real Estate Operating/Development 0.95% | | | | | | | | |
Pacific Infrastructure, Inc. #*@+ | | | 426,533 | | | | 394,500 | |
| | | | | | | | | |
| REITS - Diversified 2.00% | | | | | | | | |
| Potlatch Corp. REIT | | | 16,700 | | | | 833,330 | |
| | | | | | | | | |
| Retail - Pet Food & Supplies 4.66% | | | | | | | | |
| PetMed Express, Inc. | | | 42,600 | | | | 1,938,300 | |
| | | | | | | | | |
| Retail - Restaurants 2.95% | | | | | | | | |
| DineEquity, Inc. | | | 24,152 | | | | 1,225,231 | |
| | | | | | | | | |
| Television 3.30% | | | | | | | | |
| AMC Networks, Inc., Class A * | | | 25,400 | | | | 1,373,632 | |
| | | | | | | | | |
| Tobacco 3.54% | | | | | | | | |
| Altria Group, Inc. | | | 20,600 | | | | 1,471,046 | |
| | | | | | | | | |
| Veterinary Diagnostics 1.92% | | | | | | | | |
| Phibro Animal Health Corp. | | | 23,900 | | | | 800,650 | |
See notes to portfolios of investments and notes to financial statements.
Holmes Macro Trends Fund | |
Portfolio of Investments | December 31, 2017 |
| Common Stocks (cont'd) | | Shares | | | Value | |
| | | | | | | |
| Web Hosting/Design 2.17% | | | | | | |
| NIC, Inc. | | | 54,411 | | | $ | 903,223 | |
| | | | | | | | | |
| | | | | | | | | |
| Total Common Stocks | | | | | | | 36,830,094 | |
| (cost $32,919,457) | | | | | | | | |
| Corporate Convertible Bond 0.79% | | Coupon Rate % | | Maturity Date | | Principal Amount | | | | |
| Gold Mining 0.79% | | | | | | | | | | |
| Gran Colombia Gold Corp. (cost $175,840) | | | 8.00 | | 01/02/24 | | $ | 332,971 | | | | 327,993 | |
Corporate Non-Convertible Bond 0.56%
| Electric - Generation 0.56% | | | | | | | | | | |
Interamerican Energy Corp. #@+ | | | 15.00 | | 11/08/21 | | | 233,829 | | | | 233,829 | |
| (cost $233,829) | | | | | | | | | | | | | |
| Exchange Traded Funds 3.91% | | Shares | | | | |
| Consumer Discretionary Select Sector SPDR Fund ETF | | | 5,100 | | | | 503,319 | |
| Direxion Daily S&P 500 Bull 3X ETF | | | 4,800 | | | | 212,784 | |
| Energy Select Sector SPDR Fund ETF | | | 1,300 | | | | 93,938 | |
| Financial Select Sector SPDR Fund ETF | | | 14,400 | | | | 401,904 | |
| Technology Select Sector SPDR Fund ETF | | | 4,600 | | | | 294,170 | |
| Utilities Select Sector SPDR Fund ETF | | | 2,300 | | | | 121,164 | |
| Total Exchange Traded Funds | | | | | | | 1,627,279 | |
| (cost $1,608,315) | | | | | | | | |
| Warrants 0.00% | | Exercise Price | | Exp. Date | | | | | | |
| Gold Mining 0.00% | | | | | | | | | | |
| Gran Colombia Gold Corp. * | | $ | 48.75 | | 03/18/19 | | | 250 | | | | 12 | |
See notes to portfolios of investments and notes to financial statements.
Holmes Macro Trends Fund | |
Portfolio of Investments | December 31, 2017 |
| Warrants (cont'd) | | Exercise Price | | Exp. Date | | Shares | | | Value | |
| | | | | | | | | | | |
| Oil Companies - Exploration & Production 0.00% | | | | | | | | | | |
PentaNova Energy Corp., 144A #*@∆ | | $ | 1.05 | | 07/31/22 | | | 500,000 | | | $ | 0 | |
| Total Warrants | | | | | | | | | | | | 12 | |
(cost $0) | | | | | | | | | | | | | |
| Investments, at value 93.80% | | | | | | | | | | | | 39,019,207 | |
(cost $34,937,441) | | | | | | | | | | | | | |
| Other assets and liabilities, net 6.20% | | | | | | | | | | | | 2,578,054 | |
| Net Assets 100.00% | | | | | | | | | | | $ | 41,597,261 | |
See notes to portfolios of investments and notes to financial statements.
Global Resources Fund | |
| Portfolio of Investments | December 31, 2017 |
| Common Stocks 82.31% | | Shares | | | Value | |
| Agricultural Chemicals 1.14% | | | | | | |
| Terra Nitrogen Co. LP | | | 13,800 | | | $ | 1,101,378 | |
| | | | | | | | | |
| Agricultural Operations 0.12% | | | | | | | | |
Agriterra, Ltd. * | | | 698,497 | | | | 116,161 | |
| | | | | | | | | |
| Automotive/Truck Parts & Equipment - Original 1.26% | | | | | | | | |
| Magna International, Inc. | | | 21,400 | | | | 1,212,738 | |
| | | | | | | | | |
| Chemicals - Diversified 5.36% | | | | | | | | |
| Braskem SA, ADR | | | 43,500 | | | | 1,142,310 | |
| LyondellBasell Industries NV, Class A | | | 12,800 | | | | 1,412,096 | |
| Sumitomo Seika Chemicals Co., Ltd. | | | 24,500 | | | | 1,358,827 | |
| Tosoh Corp. | | | 55,350 | | | | 1,248,707 | |
| | | | | | | | 5,161,940 | |
| Chemicals - Fibers 1.77% | | | | | | | | |
| Rayonier Advanced Materials, Inc. | | | 83,200 | | | | 1,701,440 | |
| | | | | | | | | |
| Chemicals - Specialty 3.41% | | | | | | | | |
Daqo New Energy Corp., ADR * | | | 38,200 | | | | 2,270,608 | |
| Kingboard Laminates Holdings, Ltd. | | | 653,600 | | | | 1,016,748 | |
| | | | | | | | 3,287,356 | |
| Coal 4.96% | | | | | | | | |
| Alliance Holdings GP LP | | | 38,900 | | | | 1,042,131 | |
| Alliance Resource Partners LP | | | 60,600 | | | | 1,193,820 | |
Caribbean Resources Corp. #*@~ | | | 17 | | | | 0 | |
| China Shenhua Energy Co., Ltd., Class H | | | 483,400 | | | | 1,248,837 | |
Jastrzebska Spolka Weglowa SA * | | | 46,800 | | | | 1,290,652 | |
Walter Energy, Inc., 144A #*@D | | | 4,293 | | | | 47 | |
| | | | | | | | 4,775,487 | |
| Coatings/Paint 1.23% | | | | | | | | |
| DAI Nippon Toryo Co., Ltd. | | | 74,200 | | | | 1,184,220 | |
| | | | | | | | | |
| Diamonds/Precious Stones 0.03% | | | | | | | | |
Diamond Fields Resources, Inc. * | | | 360,000 | | | | 32,935 | |
Rockwell Diamonds, Inc., 144A #*@D | | | 63,333 | | | | 756 | |
| | | | | | | | 33,691 | |
See notes to portfolios of investments and notes to financial statements.
Global Resources Fund | |
| Portfolio of Investments | December 31, 2017 |
| Common Stocks (cont'd) | | | Shares | | | | Value | |
| Diversified Minerals 5.24% | | | | | | | | |
| Anglo American PLC | | | 67,300 | | | $ | 1,399,772 | |
| Caledonia Mining Corp. PLC | | | 16,028 | | | | 118,447 | |
Dundee Sustainable Technologies, Inc. * | | | 3,587,500 | | | | 114,161 | |
Encanto Potash Corp., 144A #*D | | | 3,000,000 | | | | 107,398 | |
Lumina Gold Corp. * | | | 500,000 | | | | 298,329 | |
| Lundin Mining Corp. | | | 176,900 | | | | 1,176,519 | |
Niocan, Inc., 144A #*D | | | 362,069 | | | | 31,685 | |
| Teck Resources, Ltd. | | | 57,700 | | | | 1,508,993 | |
VR Resources, Ltd. * | | | 1,125,000 | | | | 286,396 | |
| | | | | | | | 5,041,700 | |
| Energy - Alternate Sources 3.93% | | | | | | | | |
Pacific Green Energy Corp. #*@~ | | | 2,400,000 | | | | 0 | |
SolarEdge Technologies, Inc. * | | | 39,900 | | | | 1,498,245 | |
TPI Composites, Inc. * | | | 58,300 | | | | 1,192,818 | |
| VERBIO Vereinigte BioEnergie AG | | | 111,700 | | | | 1,089,788 | |
| | | | | | | | 3,780,851 | |
| Forestry 3.44% | | | | | | | | |
Bravern Ventures, Ltd. *~ | | | 254,431 | | | | 32,386 | |
Canfor Corp. * | | | 56,300 | | | | 1,109,876 | |
| West Fraser Timber Co., Ltd. | | | 19,300 | | | | 1,191,011 | |
| Western Forest Products, Inc. | | | 500,000 | | | | 974,542 | |
| | | | | | | | 3,307,815 | |
| Gold Mining 13.54% | | | | | | | | |
Centerra Gold, Inc. * | | | 197,100 | | | | 1,009,804 | |
Chesapeake Gold Corp., 144A #*D | | | 52,400 | | | | 136,315 | |
Continental Gold, Inc. * | | | 180,000 | | | | 484,010 | |
CopperBank Resources Corp. * | | | 1,000,000 | | | | 83,532 | |
Corona Minerals, Ltd. #*@ | | | 5,000 | | | | 0 | |
| Evolution Mining, Ltd. | | | 79,666 | | | | 164,973 | |
| Highland Gold Mining, Ltd. | | | 643,700 | | | | 1,483,311 | |
Kinross Gold Corp. * | | | 1 | | | | 4 | |
Leagold Mining Corp. * | | | 442,000 | | | | 1,026,762 | |
NGEx Resources, Inc. * | | | 461,000 | | | | 393,801 | |
NGEx Resources, Inc. * | | | 259,500 | | | | 216,766 | |
| Northern Star Resources, Ltd. | | | 351,700 | | | | 1,674,468 | |
| See notes to portfolios of investments and notes to financial statements. | |
| Global Resources Fund | |
Portfolio of Investments | December 31, 2017 |
| Common Stocks (cont'd) | | Shares | | | Value | |
| | | | | | | |
| Gold Mining (cont'd) | | | | | | |
Premier Gold Mines, Ltd. * | | | 391,700 | | | $ | 1,121,814 | |
Radisson Mining Resources, Inc. * | | | 2,100,000 | | | | 342,482 | |
Ramelius Resources, Ltd. * | | | 3,174,800 | | | | 954,144 | |
Red Pine Exploration, Inc. * | | | 1,500,000 | | | | 119,332 | |
| Resolute Mining, Ltd. | | | 1,325,800 | | | | 1,179,415 | |
Revival Gold, Inc. * | | | 434,000 | | | | 241,687 | |
Royal Road Minerals, Ltd. * | | | 2,500,000 | | | | 238,663 | |
Rye Patch Gold Corp. * | | | 1,334,000 | | | | 302,458 | |
| St Barbara, Ltd. | | | 623,600 | | | | 1,857,106 | |
| | | | | | | | 13,030,847 | |
| | | | | | | | | |
| Medical - Drugs 0.05% | | | | | | | | |
Delta 9 Cannabis, Inc. * | | | 23,626 | | | | 52,252 | |
| | | | | | | | | |
| Medical - Hospitals 0.00% | | | | | | | | |
African Medical Investments PLC #*@ | | | 2,507,500 | | | | 0 | |
| | | | | | | | | |
| Metal - Copper 1.63% | | | | | | | | |
Highland Copper Co., Inc. * | | | 1,000,000 | | | | 115,354 | |
Taseko Mines, Ltd. * | | | 621,400 | | | | 1,453,394 | |
| | | | | | | | 1,568,748 | |
| | | | | | | | | |
| Metal - Diversified 4.08% | | | | | | | | |
Aguia Minerals Corp., 144A *@D | | | 1,450,000 | | | | 0 | |
Aguia Resources, Ltd. * | | | 3,400,000 | | | | 949,662 | |
Filo Mining Corp. * | | | 230,000 | | | | 463,611 | |
| Glencore PLC | | | 54,300 | | | | 284,204 | |
GoviEx Uranium, Inc. * | | | 2,100,000 | | | | 451,074 | |
GoviEx Uranium, Inc., 144A #D | | | 58,000 | | | | 12,458 | |
Ivanhoe Mines, Ltd. * | | | 28,700 | | | | 96,808 | |
Novo Resources Corp. * | | | 50,000 | | | | 146,778 | |
Orsu Metals Corp., 144A#*D | | | 14,761 | | | | 2,349 | |
| Sandfire Resources NL | | | 283,400 | | | | 1,519,269 | |
| | | | | | | | 3,926,213 | |
| | | | | | | | | |
| Metal - Iron 2.56% | | | | | | | | |
Consolidated Growth Holdings, Ltd. *@ | | | 19,859,173 | | | | 0 | |
| Ferrexpo PLC | | | 313,500 | | | | 1,237,933 | |
| Fortescue Metals Group, Ltd. | | | 323,200 | | | | 1,223,108 | |
See notes to portfolios of investments and notes to financial statements.
| Global Resources Fund | |
Portfolio of Investments | December 31, 2017 |
| Common Stocks (cont'd) | | Shares | | | Value | |
| | | | | | | |
| Metal - Iron (cont'd) | | | | | | |
WAI Capital Investment Corp., 144A#*@D | | | 292,500 | | | $ | 0 | |
| | | | | | | | 2,461,041 | |
| Mining Services 0.00% | | | | | | | | |
Bounty Mining, Ltd. *@ | | | 1,692,307 | | | | 0 | |
| | | | | | | | | |
| Natural Resource Technology 0.02% | | | | | | | | |
I-Pulse, Inc.,144A #*@+D | | | 15,971 | | | | 15,225 | |
| | | | | | | | | |
Non - Ferrous Metals 0.41% | | | | | | | | |
Group Eleven Resources Corp. * | | | 650,000 | | | | 157,717 | |
InZinc Mining, Ltd. * | | | 2,000,000 | | | | 214,797 | |
Sterling Group Ventures, Inc., 144A *D | | | 500,000 | | | | 19,600 | |
| | | | | | | | 392,114 | |
| | | | | | | | | |
| Oil - Field Services 1.25% | | | | | | | | |
Atlas African Industries, Ltd. *@~ | | | 255,854,621 | | | | 0 | |
| TGS NOPEC Geophysical Co. ASA | | | 51,000 | | | | 1,207,534 | |
| | | | | | | | 1,207,534 | |
| | | | | | | | | |
| Oil Companies - Exploration & Production 7.89% | | | | | | | | |
Africa Energy Corp., 144A #*D | | | 2,110,889 | | | | 285,482 | |
| Aker BP ASA | | | 60,600 | | | | 1,492,785 | |
| Beach Energy, Ltd. | | | 1,784,000 | | | | 1,722,938 | |
| CNOOC, Ltd., ADR | | | 8,800 | | | | 1,263,328 | |
Ivanhoe Energy, Inc. * | | | 18,719 | | | | 9 | |
PentaNova Energy Corp. * | | | 6,000,000 | | | | 1,837,709 | |
PentaNova Energy Corp., 144A #*D | | | 2,000,000 | | | | 612,570 | |
PentaNova Energy Corp. #*@+ | | | 1,000,000 | | | | 257,279 | |
Range Energy Resources, Inc., 144A #*D | | | 15,000,000 | | | | 119,332 | |
U.S. Oil Sands, Inc., 144A #*@D | | | 198,000 | | | | 0 | |
| | | | | | | | 7,591,432 | |
| | | | | | | | | |
| Oil Companies - US Royalty Trusts 0.08% | | | | | | | | |
| BP Prudhoe Bay Royalty Trust | | | 4,000 | | | | 80,400 | |
| | | | | | | | | |
| | | | | | | | | |
| Oil Refining & Marketing 3.12% | | | | | | | | |
| CVR Refining LP | | | 108,800 | | | | 1,800,640 | |
| Polski Koncern Naftowy ORLEN SA | | | 39,500 | | | | 1,200,594 | |
| | | | | | | | 3,001,234 | |
See notes to portfolios of investments and notes to financial statements.
| Global Resources Fund | |
Portfolio of Investments | December 31, 2017 |
| Common Stocks (cont'd) | | Shares | | | Value | |
| | | | | | | |
| Petrochemicals 2.27% | | | | | | |
| Lotte Chemical Corp. | | | 3,100 | | | $ | 1,064,450 | |
Sinopec Shanghai Petrochemical Co., Ltd. | | | 1,980,700 | | | | 1,125,984 | |
| | | | | | | | 2,190,434 | |
| | | | | | | | | |
| Poultry 1.21% | | | | | | | | |
Pilgrim's Pride Corp. * | | | 37,600 | | | | 1,167,856 | |
| | | | | | | | | |
| Precious Metals 1.00% | | | | | | | | |
SSR Mining, Inc. * | | | 109,200 | | | | 959,868 | |
| | | | | | | | | |
| Real Estate Operating/Development 7.15% | | | | | | | | |
Pacific Infrastructure, Inc.#*@+ | | | 7,443,544 | | | | 6,884,534 | |
| | | | | | | | | |
| Steel - Producers 3.00% | | | | | | | | |
| BlueScope Steel, Ltd. | | | 125,800 | | | | 1,498,348 | |
| Evraz PLC | | | 303,200 | | | | 1,385,781 | |
| | | | | | | | 2,884,129 | |
| | | | | | | | | |
| Transportation - Marine 1.16% | | | | | | | | |
| Golar LNG Partners LP | | | 49,000 | | | | 1,117,200 | |
| | | | | | | | | |
| Total Common Stocks | | | | | | | 79,235,838 | |
(cost $139,204,632) | | | | | | | | |
| Corporate Convertible Bond 8.14% | | Coupon Rate % | | Maturity Date | | Principal Amount | | | | |
| | | | | | | | | | | |
| Gold Mining 8.14% | | | | | | | | | | |
| | | | | | | | | | | |
| Gran Colombia Gold Corp. | | | 8.00 | | 01/02/24 | | $ | 7,951,710 | | | | 7,832,832 | |
(cost $4,222,421) | | | | | | | | | | | | | |
| | | | | | | | | | | | | | |
| Corporate Non-Convertible Bond 2.92% | | | | | | | | | | | | | |
| | | | | | | | | | | | | | |
| Electric - Generation 2.92% | | | | | | | | | | | | | |
| | | | | | | | | | | | | | |
Interamerican Energy Corp. #@+ | | | 15.00 | | 11/08/21 | | | 2,805,938 | | | | 2,805,938 | |
(cost $2,805,938) | | | | | | | | | | | | | |
See notes to portfolios of investments and notes to financial statements.
| Global Resources Fund | |
Portfolio of Investments | December 31, 2017 |
| Exchange Traded Funds 0.49% | | Shares | | | Value | |
| Guggenheim Shipping ETF | | | 16,300 | | | $ | 189,080 | |
| iShares S&P/TSX Capped Materials Index ETF | | | 16,800 | | | | 181,365 | |
| VanEck Vectors Coal ETF | | | 6,100 | | | | 97,783 | |
| | | | | | | | | |
| Total Exchange Traded Funds | | | | | | | 468,228 | |
| (cost $444,439) | | | | | | | | |
| | | | | | | | | |
| Subscription Receipts 0.50% | | | | | | | | |
| | | | | | | | | |
| Gold Mining 0.38% | | | | | | | | |
Troilus Gold, Inc. *@+ | | | 294,000 | | | | 364,401 | |
| | | | | | | | | |
| Metal - Copper 0.12% | | | | | | | | |
Chakana Copper Corp., 144A #*@+D | | | 320,000 | | | | 120,923 | |
| | | | | | | | | |
| Total Subscription Receipts | | | | | | | 485,324 | |
| (cost $503,347) | | | | | | | | |
| Warrants 0.00% | | Exercise Price | | Exp. Date | | | | | | |
| | | | | | | | | | | |
| Diversified Minerals 0.00% | | | | | | | | | | |
VR Resources, Ltd. #*@ | | $ | 0.60 | | 03/21/19 | | | 562,500 | | | | 0 | |
| | | | | | | | | | | | | | |
| Gold Mining 0.00% | | | | | | | | | | | | | |
Gran Colombia Gold Corp. * | | | 48.75 | | 03/18/19 | | | 59,500 | | | | 2,840 | |
| | | | | | | | | | | | | | |
| Non - Ferrous Metals 0.00% | | | | | | | | | | | | | |
Group Eleven Resources Corp. *@ | | | 0.60 | | 12/15/18 | | | 650,000 | | | | 0 | |
| | | | | | | | | | | | | | |
Oil Companies - Exploration & Production 0.00% | | | | | | | | | | |
PentaNova Energy Corp., 144A#*@D | | | 1.05 | | 07/31/22 | | | 2,000,000 | | | | 0 | |
| | | | | | | | | | | | | | |
| Total Warrants | | | | | | | | | | | | 2,840 | |
| (cost $0) | |
| Call Options Purchased 3.50% | | Strike Price | | | Exp. Date | | | Notional Contract Value | | | Contracts | | | Value | |
| | | | | | | | | | | | | | | | |
| Agricultural Chemicals 0.14% | | | | | | | | | | | | | | | |
Potash Corp. of Saskatchewan, Inc. | | $ | 19.00 | | | | 03/18 | | | $ | 1,140,000 | | | | 600 | | | | 135,000 | |
See notes to portfolios of investments and notes to financial statements.
| Global Resources Fund | |
Portfolio of Investments | December 31, 2017 |
Call Options
Purchased (cont'd) | | Strike Price | | | Exp. Date | | | Notional Contract Value | | | Contracts | | | Value | |
| | | | | | | | | | | | | | | | |
| Exchange Traded Fund 0.80% | | | | | | | | | | | | | | | |
| SPDR S&P Global Natural Resources ETF | | $ | 49.00 | | | | 06/18 | | | $ | 7,350,000 | | | | 1,500 | | | $ | 277,500 | |
| SPDR S&P Global Natural Resources ETF | | | 48.00 | | | | 06/18 | | | | 4,800,000 | | | | 1,000 | | | | 245,000 | |
| SPDR S&P Oil & Gas Exploration & Production ETF | | | 44.00 | | | | 01/18 | | | | 8,316,000 | | | | 1,890 | | | | 3,780 | |
| SPDR S&P Oil & Gas Exploration & Production ETF | | | 40.00 | | | | 01/18 | | | | 3,120,000 | | | | 780 | | | | 12,480 | |
| SPDR S&P Oil & Gas Exploration & Production ETF | | | 36.00 | | | | 01/18 | | | | 1,440,000 | | | | 400 | | | | 66,800 | |
| SPDR S&P Oil & Gas Exploration & Production ETF | | | 40.00 | | | | 06/18 | | | | 1,440,000 | | | | 360 | | | | 61,740 | |
| SPDR S&P Oil & Gas Exploration & Production ETF | | | 38.00 | | | | 06/18 | | | | 1,520,000 | | | | 400 | | | | 101,600 | |
| | | | | | | | | | | | | | | | | | | | 768,900 | |
| Gold Mining 0.61% | | | | | | | | | | | | | | | | | | | | |
| Franco-Nevada Corp. | | | 80.00 | | | | 01/18 | | | | 800,000 | | | | 100 | | | | 15,100 | |
| Franco-Nevada Corp. | | | 65.00 | | | | 01/18 | | | | 390,000 | | | | 60 | | | | 90,300 | |
| Sandstorm Gold, Ltd. | | | 4.00 | | | | 01/18 | | | | 1,880,000 | | | | 4,700 | | | | 479,400 | |
| | | | | | | | | | | | | | | | | | | | 584,800 | |
| Metal - Copper 0.64% | | | | | | | | | | | | | | | | | | | | |
| Freeport-McMoRan, Inc. | | | 13.00 | | | | 01/18 | | | | 910,000 | | | | 700 | | | | 420,000 | |
| Turquoise Hill Resources, Ltd. | | | 2.00 | | | | 01/18 | | | | 280,000 | | | | 1,400 | | | | 203,000 | |
| | | | | | | | | | | | | | | | | | | | 623,000 | |
| Metal - Diversified 0.30% | | | | | | | | | | | | | | | | | | | | |
| BHP Billiton, Ltd. | | | 45.00 | | | | 01/18 | | | | 1,845,000 | | | | 410 | | | | 67,650 | |
| BHP Billiton, Ltd. | | | 37.50 | | | | 01/18 | | | | 937,500 | | | | 250 | | | | 223,750 | |
| | | | | | | | | | | | | | | | | | | | 291,400 | |
| Oil Companies -Integrated 1.01% | | | | | | | | | | | | | | | | | | | | |
| Chevron Corp. | | | 110.00 | | | | 01/18 | | | | 1,650,000 | | | | 150 | | | | 230,250 | |
| Exxon Mobil Corp. | | | 90.00 | | | | 01/18 | | | | 18,090,000 | | | | 2,010 | | | | 4,020 | |
| Exxon Mobil Corp. | | | 90.00 | | | | 06/18 | | | | 3,600,000 | | | | 400 | | | | 29,600 | |
| Exxon Mobil Corp. | | | 85.00 | | | | 06/18 | | | | 4,250,000 | | | | 500 | | | | 116,500 | |
| Royal Dutch Shell PLC, ADR | | | 55.00 | | | | 01/18 | | | | 2,200,000 | | | | 400 | | | | 474,400 | |
See notes to portfolios of investments and notes to financial statements.
| Global Resources Fund | |
Portfolio of Investments | December 31, 2017 |
Call Options
Purchased (cont'd) | | Strike Price | | | Exp. Date | | | Notional Contract Value | | | Contracts | | | Value | |
| | | | | | | | | | | | | | | | |
| Oil Companies - Integrated (cont'd) | | | | | | | | | | |
| TOTAL SA, ADR | | $ | 52.50 | | | | 01/18 | | | $ | 2,100,000 | | | | 400 | | | $ | 116,000 | |
| | | | | | | | | | | | | | | | | | | | 970,770 | |
| | | | | | | | | | | | | | | | | | | | | |
| Total Purchased Call Options | | | | | | | | | | | | | | | | | | | 3,373,870 | |
| (premiums paid $2,502,749) | | | | | | | | | | | | | | | | | | | | |
| | | | | | | | | | | | | | | | | | | | | |
| Investments, at value 97.86% | | | | | | | | | | | | | | | | | | | 94,204,870 | |
(cost $149,683,526) | | | | | | | | | | | | | | | | | | | | |
| | | | | | | | | | | | | | | | | | | | | |
| Other assets and liabilities, net 2.14% | | | | | | | | | | | | | | | | | | | 2,059,845 | |
| | | | | | | | | | | | | | | | | | | | | |
| Net Assets 100.00% | | | | | | | | | | | | | | | | | | $ | 96,264,715 | |
See notes to portfolios of investments and notes to financial statements.
World Precious Minerals Fund
Portfolio of Investments | December 31, 2017 |
| Common Stocks 92.77% | | Shares | | | Value | |
| | | | | | | |
| Advanced Materials/Production 2.27% | | | | | | |
Nano One Materials Corp. * | | | 3,000,000 | | | $ | 2,673,031 | |
| | | | | | | | | |
| Capital Pools 0.09% | | | | | | | | |
Pinecrest Resources, Ltd. * | | | 400,000 | | | | 105,012 | |
| | | | | | | | | |
| Coal 0.00% | | | | | | | | |
Caribbean Resources Corp. #*@ | | | 4 | | | | 0 | |
| | | | | | | | | |
| Diamonds/Precious Stones 1.06% | | | | | | | | |
Barksdale Capital Corp. * | | | 1,510,000 | | | | 1,249,324 | |
Rockwell Diamonds, Inc., 144A #*@r | | | 171,667 | | | | 2,048 | |
| | | | | | | | 1,251,372 | |
| | | | | | | | | |
| Diversified Minerals 8.07% | | | | | | | | |
Adamera Minerals Corp., 144A #*r | | | 119,543 | | | | 9,035 | |
Argo Gold, Inc. *~ | | | 1,825,000 | | | | 257,707 | |
Auryn Resources, Inc. * | | | 1,475,000 | | | | 2,428,998 | |
Bacanora Minerals, Ltd. * | | | 250,000 | | | | 377,884 | |
Bacanora Minerals, Ltd. * | | | 179,923 | | | | 258,664 | |
Calibre Mining Corp. * | | | 4,500,000 | | | | 465,394 | |
Erdene Resource Development Corp. * | | | 300,000 | | | | 143,198 | |
Golden Peak Minerals, Inc. *~ | | | 2,299,998 | | | | 329,355 | |
Golden Predator Mining Corp. * | | | 1,250,000 | | | | 805,489 | |
Golden Reign Resources, Ltd. * | | | 1,500,000 | | | | 280,430 | |
Indochine Mining, Ltd. #*@ | | | 10,000 | | | | 0 | |
Lithium Power International, Ltd. * | | | 500,000 | | | | 221,877 | |
Lithium X Energy Corp. * | | | 1,194,300 | | | | 2,280,286 | |
Lumina Gold Corp. * | | | 1,100,000 | | | | 656,324 | |
Rubicon Minerals Corp. * | | | 475,000 | | | | 544,153 | |
VR Resources, Ltd. * | | | 1,750,000 | | | | 445,505 | |
| | | | | | | | 9,504,299 | |
| | | | | | | | | |
| Gold Mining 53.53% | | | | | | | | |
Alexandria Minerals Corp. * | | | 6,500,000 | | | | 413,683 | |
Algold Resources, Ltd. * | | | 5,400,000 | | | | 536,993 | |
Aurelius Minerals, Inc. * | | | 1,250,000 | | | | 64,638 | |
Barkerville Gold Mines, Ltd. * | | | 500,000 | | | | 298,329 | |
Black Dragon Gold Corp. * | | | 4,910,000 | | | | 214,837 | |
Bonterra Resources, Inc. * | | | 4,625,000 | | | | 2,134,049 | |
See notes to portfolios of investments and notes to financial statements.
World Precious Minerals Fund
Portfolio of Investments | December 31, 2017 |
| Common Stocks (cont’d) | | Shares | | | Value | |
| | | | | | | |
| Gold Mining (cont’d) | | | | | | |
Canyon Resources, Ltd. * | | | 15,000,000 | | | $ | 1,519,030 | |
Chesapeake Gold Corp., 144A #*r | | | 192,199 | | | | 499,993 | |
Comstock Mining, Inc. * | | | 533,000 | | | | 207,870 | |
CopperBank Resources Corp. *~ | | | 15,805,418 | | | | 1,320,262 | |
CopperBank Resources Corp., 144A #*@~r | | | 174,000 | | | | 14,535 | |
Corona Minerals, Ltd. #*@ | | | 81,250 | | | | 0 | |
Eastmain Resources, Inc. * | | | 1,500,000 | | | | 411,695 | |
Enforcer Gold Corp. * | | | 3,000,000 | | | | 202,864 | |
Fiore Gold, Ltd. #* | | | 2,400,000 | | | | 1,680,191 | |
Gascoyne Resources, Ltd. * | | | 1,600,000 | | | | 534,038 | |
Gold Standard Ventures Corp. * | | | 1,000,000 | | | | 1,750,000 | |
GoldQuest Mining Corp. * | | | 1,500,000 | | | | 435,561 | |
IDM Mining, Ltd. * | | | 5,000,000 | | | | 417,661 | |
IDM Mining, Ltd., 144A #r | | | 95,000 | | | | 7,936 | |
K92 Mining, Inc. * | | | 1,000,000 | | | | 429,594 | |
| Kirkland Lake Gold, Ltd. | | | 100,000 | | | | 1,533,015 | |
Klondex Mines, Ltd. * | | | 6,200,000 | | | | 16,079,554 | |
Klondike Gold Corp. * | | | 2,250,000 | | | | 626,492 | |
Leagold Mining Corp. * | | | 400,000 | | | | 929,196 | |
Leagold Mining Corp., 144A #r | | | 333,000 | | | | 773,556 | |
Lundin Gold, Inc. * | | | 500,000 | | | | 1,801,909 | |
Lundin Gold, Inc., 144A #*r | | | 70,000 | | | | 252,267 | |
Malbex Resources, Inc., 144A #*r | | | 133,333 | | | | 39,247 | |
Mammoth Resources Corp. *~ | | | 2,171,200 | | | | 215,911 | |
| McEwen Mining, Inc. | | | 134,764 | | | | 306,623 | |
Mirasol Resources, Ltd. * | | | 2,000,000 | | | | 2,577,566 | |
NGEx Resources, Inc. * | | | 1,500,000 | | | | 1,252,983 | |
Nighthawk Gold Corp. * | | | 1,855,000 | | | | 1,092,045 | |
NV Gold Corp. * | | | 1,700,000 | | | | 429,395 | |
OceanaGold Corp., 144A #r | | | 5,348 | | | | 1 3,742 | |
Oklo Resources, Ltd. * | | | 2,000,000 | | | | 637,734 | |
Orca Gold, Inc. * | | | 3,950,000 | | | | 2,105,410 | |
Osisko Mining, Inc. * | | | 375,000 | | | | 1,011,337 | |
Otis Gold Corp. * | | | 1,500,000 | | | | 262,530 | |
Petaquilla Minerals, Ltd., 144A #*@r | | | 2,660,000 | | | | 0 | |
Pretium Resources, Inc. * | | | 200,000 | | | | 2,281,811 | |
See notes to portfolios of investments and notes to financial statements.
World Precious Minerals Fund
Portfolio of Investments | December 31, 2017 |
| Common Stocks (cont’d) | | Shares | | | Value | |
| | | | | | | |
| Gold Mining (cont’d) | | | | | | |
Pure Gold Mining, Inc. * | | | 3,000,000 | | | $ | 1,336,516 | |
Radisson Mining Resources, Inc. * | | | 5,200,000 | | | | 848,051 | |
Radius Gold, Inc., 144A #*r | | | 125,000 | | | | 10,939 | |
Red Pine Exploration, Inc. * | | | 8,282,000 | | | | 658,870 | |
Redstar Gold Corp. * | | | 15,000,000 | | | | 775,656 | |
Revival Gold, Inc. * | | | 1,029,000 | | | | 573,031 | |
Rise Gold Corp. * | | | 2,500,000 | | | | 298,329 | |
| Rye Patch Gold Corp. * | | | 8,316,873 | | | | 1,885,687 | |
Rye Patch Gold Corp., 144A #r | | | 1,800,000 | | | | 408,115 | |
Seabridge Gold, Inc. * | | | 45,000 | | | | 510,859 | |
Seafield Resources, Ltd., 144A #*@r | | | 1,300,000 | | | | 0 | |
Strikepoint Gold, Inc. * | | | 1,100,000 | | | | 192,522 | |
Taurus Gold, Ltd., 144A #*@r | | | 2,448,381 | | | | 0 | |
TMAC Resources, Inc. * | | | 125,000 | | | | 960,621 | |
Tolima Gold, Inc., 144A #*r | | | 4,100,000 | | | | 114,161 | |
TriStar Gold, Inc. *~ | | | 27,110,500 | | | | 4,960,553 | |
| Victoria Gold Corp. * | | | 1,500,000 | | | | 519,093 | |
| Wesdome Gold Mines, Ltd. * | | | 1,000,000 | | | | 1,678,600 | |
| | | | | | | | 63,047,685 | |
| | | | | | | | | |
| Medical - Drugs 0.00% | | | | | | | | |
Delta 9 Cannabis, Inc. * | | | 1,616 | | | | 3,574 | |
| | | | | | | | | |
| Medical - Hospitals 0.00% | | | | | | | | |
African Medical Investments PLC #*@ | | | 4,637,500 | | | | 0 | |
| | | | | | | | | |
| Metal - Copper 0.58% | | | | | | | | |
Aston Bay Holdings, Ltd. #* | | | 825,000 | | | | 105,012 | |
Highland Copper Co., Inc. * | | | 5,000,000 | | | | 576,770 | |
| | | | | | | | 681,782 | |
| | | | | | | | | |
| Metal - Diversified 9.01% | | | | | | | | |
Cardinal Resources, Ltd. * | | | 12,000,000 | | | | 5,066,944 | |
Cartier Resources, Inc. * | | | 1,000,000 | | | | 167,064 | |
Columbus Gold Corp. * | | | 1,750,000 | | | | 1,085,919 | |
Dalradian Resources, Inc. * | | | 750,000 | | | | 790,573 | |
Filo Mining Corp. * | | | 400,000 | | | | 766,905 | |
Genesis Metals Corp., 144A #D | | | 2,917,000 | | | | 266,870 | |
See notes to portfolios of investments and notes to financial statements.
World Precious Minerals Fund
Portfolio of Investments | December 31, 2017 |
| Common Stocks (cont’d) | | Shares | | | Value | |
| | | | | | | |
| Metal - Diversified (cont’d) | | | | | | |
Genesis Metals Corp. * | | | 583,000 | | | $ | 53,337 | |
Ivanhoe Mines, Ltd. * | | | 200,000 | | | | 674,622 | |
New Age Metals, Inc., 144A #*r | | | 143,518 | | | | 13,130 | |
Novo Resources Corp. * | | | 50,000 | | | | 146,778 | |
Orex Minerals, Inc. * | | | 5,000,000 | | | | 536,993 | |
Orsu Metals Corp., 144A #*r | | | 186,922 | | | | 29,741 | |
Rockcliff Metals Corp., 144A #*r | | | 2,620,000 | | | | 135,481 | |
Sirios Resources, Inc. #* | | | 1,600,000 | | | | 400,955 | |
Torq Resources, Inc. * | | | 1,000,000 | | | | 477,327 | |
| | | | | | | | 10,612,639 | |
| | | | | | | | | |
| Mining Services 0.45% | | | | | | | | |
Argent Minerals, Ltd. * | | | 21,100,000 | | | | 525,788 | |
| | | | | | | | | |
| Non-Ferrous Metals 0.80% | | | | | | | | |
InZinc Mining, Ltd. * | | | 3,000,000 | | | | 322,196 | |
NextSource Materials, Inc. * | | | 12,000,000 | | | | 620,525 | |
| | | | | | | | 942,721 | |
| | | | | | | | | |
| Oil Companies - Exploration & Production 0.00% | | | | | | | | |
Big Sky Energy Corp. #*@ | | | 2,000,000 | | | | 0 | |
| | | | | | | | | |
| Optical Recognition Equipment 0.01% | | | | | | | | |
Nexoptic Technology Corp., 144A *r | | | 12,083 | | | | 10,862 | |
| | | | | | | | | |
| Precious Metals 16.82% | | | | | | | | |
Amani Gold, Ltd. * | | | 54,500,000 | | | | 934,159 | |
Barsele Minerals Corp. *~ | | | 7,871,299 | | | | 4,320,761 | |
Brixton Metals Corp. * | | | 2,500,000 | | | | 596,659 | |
Candente Gold Corp., 144A #*r | | | 4,875,000 | | | | 116,348 | |
Dolly Varden Silver Corp. *~ | | | 7,000,000 | | | | 3,953,858 | |
Dolly Varden Silver Corp. #*@~+ | | | 1,000,000 | | | | 544,153 | |
Equinox Gold Corp. #* | | | 203,500 | | | | 181,321 | |
GFG Resources, Inc. * | | | 2,000,000 | | | | 843,278 | |
Kootenay Silver, Inc. * | | | 1,000,000 | | | | 163,087 | |
Liberty Gold Corp. * | | | 500,000 | | | | 175,020 | |
Metalla Royalty & Streaming, Ltd. * | | | 1,000,000 | | | | 525,060 | |
New Pacific Metals Corp. * | | | 625,000 | | | | 730,907 | |
Probe Metals, Inc. * | | | 1,000,000 | | | | 1,193,317 | |
See notes to portfolios of investments and notes to financial statements.
World Precious Minerals Fund
Portfolio of Investments | December 31, 2017 |
| Common Stocks (cont’d) | | Shares | | | Value | |
| | | | | | | |
| Precious Metals (cont’d) | | | | | | |
Roxgold, Inc. * | | | 3,000,000 | | | $ | 3,341,289 | |
Silver Viper Minerals Corp. * | | | 1,300,000 | | | | 175,815 | |
SilverCrest Metals, Inc. * | | | 250,000 | | | | 356,006 | |
Terrax Minerals, Inc. * | | | 1,000,000 | | | | 421,639 | |
Toachi Mining, Inc. *~ | | | 4,000,000 | | | | 827,367 | |
Toachi Mining, Inc., 144A #~r | | | 2,000,000 | | | | 413,683 | |
| | | | | | | | 19,813,727 | |
| Silver Mining 0.08% | | | | | | |
Santacruz Silver Mining, Ltd. * | | | 1,000,000 | | | | 87,510 | |
| | | | | | | | | |
| Total Common Stocks | | | | | | | 109,260,002 | |
| (cost $134,498,655) | | | | | | | | |
| Corporate Convertible Bond 2.31% | | Coupon Rate % | | Maturity Date | | Principal Amount | | | | |
| | | | | | | | | | | |
| Gold Mining 2.31% | | | | | | | | | | |
| Gran Colombia Gold Corp. | | | | | | | | | | | | | |
| (cost $1,460,498) | | | 8.00 | | 01/02/24 | | $ | 2,765,613 | | | | 2,724,267 | |
| Corporate Non-Convertible Bond 0.64% | | | | | | | |
| | | | | | | | |
| Electric - Generation 0.64% | | | | | | | |
| Interamerican Energy Corp. #@+ | | | | | | | | | |
| (cost $748,250) | 15.00 | 11/08/21 | | | 748,250 | | | | 748,250 | |
| Right 0.38% | | Shares | | | | |
| | | | | | | |
| Metal - Diversified 0.38% | | | | | | |
| Cardinal Resources, Ltd. * | | | | | | | | |
| (cost $13,109) | | | 1,500,000 | | | | 450,594 | |
| Exchange Traded Funds 1.35% | | | | | | |
Direxion Daily Gold Miners Index Bull 3X Shares ETF * | | | 25,000 | | | | 792,500 | |
| Direxion Daily Junior Gold Miners Index Bull 3x Shares ETF | | | 45,000 | | | | 799,200 | |
| | | | | | | | | |
| Total Exchange Traded Funds | | | | | | | 1,591,700 | |
| (cost $1,309,735) | |
See notes to portfolios of investments and notes to financial statements.
World Precious Minerals Fund
Portfolio of Investments | December 31, 2017 |
| Subscription Receipt 0.39% | | Shares | | | Value | |
| | | | | | | |
| Metal - Copper 0.39% | | | | | | |
Chakana Copper Corp., 144A #*@+r | | | 1,200,000 | | | $ | 453,461 | |
| (cost $473,317) | | | | | | | | |
| Warrants 0.69% | | Exercise Price | | Exp. Date | | | | | | |
| | | | | | | | | | | |
| Diversified Minerals 0.00% | | | | | | | | | | |
VR Resources, Ltd. #*@ | | $ | 0.60 | | 03/21/19 | | | 862,500 | | | | 0 | |
| | | | | | | | | | | |
| Gold Mineral Exploration & Development 0.00% | | | | | | | | | | |
Western Exploration & Development, Ltd., 144A #*@r | | | 0.43 | | 10/01/20 | | | 600,000 | | | | 0 | |
| | | | | | | | | | | | | | |
| Gold Mining 0.49% | | | | | | | | | | | | | |
Alexandria Minerals Corp., 144A #*@r | | | 0.10 | | 06/20/19 | | | 1,256,195 | | | | 0 | |
Algold Resources, Ltd. #*@ | | | 0.15 | | 04/01/18 | | | 1,250,000 | | | | 0 | |
Bonterra Resources, Inc. #*@ | | | 0.30 | | 07/06/18 | | | 625,000 | | | | 134,248 | |
Fiore Gold, Ltd. #*@ | | | 0.45 | | 09/26/20 | | | 1,300,000 | | | | 0 | |
Gran Colombia Gold Corp. * | | | 48.75 | | 03/18/19 | | | 96,250 | | | | 4,594 | |
Osisko Gold Royalties, Ltd. * | | | 2.75 | | 02/18/22 | | | 200,000 | | | | 381,862 | |
Osisko Mining, Inc. * | | | 0.08 | | 08/25/18 | | | 1,000,000 | | | | 39,777 | |
Redstar Gold Corp. #*@ | | | 0.14 | | 05/03/19 | | | 2,500,000 | | | | 0 | |
Revival Gold, Inc., 144A #*@r | | | 0.90 | | 10/19/19 | | | 482,500 | | | | 0 | |
TriStar Gold, Inc., 144A #*@~r | | | 0.45 | | 04/28/19 | | | 1,000,000 | | | | 0 | |
Westgold Resources, Ltd. * | | | 0.00 | | 06/30/19 | | | 100,000 | | | | 17,556 | |
| | | | | | | | | | | | | 578,037 | |
| | | | | | | | | | | | | | |
| Metal - Diversified 0.04% | | | | | | | | | | | | | |
Genesis Metals Corp., 144A #*@r | | | 0.23 | | 06/05/19 | | | 1,458,500 | | | | 0 | |
Minera Alamos, Inc. #*@ | | | 0.15 | | 05/13/19 | | | 2,225,000 | | | | 53,103 | |
Murchison Minerals, Ltd., 144A #*@r | | | 0.30 | | 08/31/18 | | | 1,500,000 | | | | 0 | |
| | | | | | | | | | | | | 53,103 | |
See notes to portfolios of investments and notes to financial statements.
World Precious Minerals Fund
Portfolio of Investments | December 31, 2017 |
| Warrants (cont’d) | | Exercise Price | | Exp. Date | | Shares | | | Value | |
| | | | | | | | | | | |
| Precious Metals 0.16% | | | | | | | | | | |
Barsele Minerals Corp., 144A #*@~r | | $ | 0.30 | | 03/24/18 | | | 600,000 | | | $ | 186,157 | |
Probe Metals, Inc. #*@ | | | 1.75 | | 02/17/18 | | | 625,000 | | | | 0 | |
| | | | | | | | | | | | | 186,157 | |
| Total Warrants | | | 817,297 | |
| (cost $592,237) | |
| | |
| Investments, at value 98.53% | | | 116,045,571 | |
| (cost $139,095,801) | | | | |
| Other assets and liabilities, net 1.47% | | | 1,727,331 | |
| | | | | |
| Net Assets 100.00% | | $ | 117,772,902 | |
See notes to portfolios of investments and notes to financial statements.
Gold and Precious Metals Fund
Portfolio of Investments | December 31, 2017 |
| Common Stocks 93.87% | | Shares | | | Value | |
| | | | | | | |
| Capital Pools 0.47% | | | | | | |
Hut-8 Mining Corp., 144A #*@+r | | | 240,000 | | | $ | 477,327 | |
| | | | | | | | | |
| Diamonds/Precious Stones 0.89% | | | | | | | | |
| Lucara Diamond Corp. | | | 400,000 | | | | 894,193 | |
| | | | | | | | | |
| Gold Mining 75.04% | | | | | | | | |
Alio Gold, Inc. * | | | 200,000 | | | | 735,084 | |
Argonaut Gold, Inc. * | | | 500,000 | | | | 954,654 | |
Beadell Resources, Ltd. * | | | 3,000,000 | | | | 422,178 | |
Comstock Mining, Inc. * | | | 924,329 | | | | 360,488 | |
Detour Gold Corp. * | | | 50,000 | | | | 587,908 | |
Dundee Precious Metals, Inc. * | | | 550,000 | | | | 1,312,649 | |
| Evolution Mining, Ltd. | | | 32,000 | | | | 66,266 | |
Golden Star Resources, Ltd. * | | | 2,500,000 | | | | 2,225,000 | |
Guyana Goldfields, Inc. * | | | 300,000 | | | | 1,212,410 | |
| Harmony Gold Mining Co., Ltd., ADR | | | 375,000 | | | | 701,250 | |
| Highland Gold Mining, Ltd. | | | 28,000 | | | | 64,522 | |
Jaguar Mining, Inc. * | | | 7,196,500 | | | | 1,975,173 | |
K92 Mining, Inc. * | | | 1,750,000 | | | | 751,790 | |
| Kirkland Lake Gold, Ltd. | | | 700,000 | | | | 10,731,109 | |
Klondex Mines, Ltd. * | | | 5,075,000 | | | | 13,161,893 | |
Leagold Mining Corp. * | | | 1,900,000 | | | | 4,413,683 | |
Marlin Gold Mining, Ltd. * | | | 1,400,000 | | | | 1,136,038 | |
| Newmont Mining Corp. | | | 100,000 | | | | 3,752,000 | |
Northern Empire Resources Corp. * | | | 500,000 | | | | 373,906 | |
| Northern Star Resources, Ltd. | | | 600,000 | | | | 2,856,641 | |
Pantoro, Ltd. * | | | 2,000,000 | | | | 336,723 | |
Premier Gold Mines, Ltd. * | | | 500,000 | | | | 1,431,981 | |
Pretium Resources, Inc. * | | | 200,000 | | | | 2,282,000 | |
Rye Patch Gold Corp. * | | | 12,765,794 | | | | 2,894,392 | |
Sandstorm Gold, Ltd. * | | | 600,000 | | | | 2,994,000 | |
| Sibanye Gold, Ltd., ADR | | | 116,570 | | | | 588,679 | |
Silver Lake Resources, Ltd. * | | | 3,000,000 | | | | 891,269 | |
| St Barbara, Ltd. | | | 3,000,000 | | | | 8,934,122 | |
Wesdome Gold Mines, Ltd. * | | | 2,350,000 | | | | 3,944,710 | |
Westgold Resources, Ltd. * | | | 2,500,000 | | | | 3,450,064 | |
See notes to portfolios of investments and notes to financial statements.
Gold and Precious Metals Fund
Portfolio of Investments | December 31, 2017 |
| Common Stocks (cont’d) | | Shares | | | Value | |
| | | | | | | |
| Gold Mining (cont’d) | | | | | | |
| Zijin Mining Group Co., Ltd., Class H | | | 147,000 | | | $ | 55,493 | |
| | | | | | | | 75,598,075 | |
| | | | | | | | | |
| Medical - Hospitals 0.00% | | | | | | | | |
African Medical Investments PLC #*@ | | | 2,000,000 | | | | 0 | |
| | | | | | | | | |
| Metal - Diversified 4.52% | | | | | | | | |
AuRico Metals, Inc. * | | | 3,200,000 | | | | 4,556,881 | |
| | | | | | | | | |
| Precious Metals 7.99% | | | | | | | | |
Maverix Metals, Inc. * | | | 1,150,000 | | | | 1,692,522 | |
Roxgold, Inc. * | | | 1,750,000 | | | | 1,949,085 | |
Sailfish Royalty Corp. #*@ | | | 275,040 | | | | 0 | |
SSR Mining, Inc. * | | | 250,000 | | | | 2,197,500 | |
| Wheaton Precious Metals Corp. | | | 100,000 | | | | 2,213,000 | |
| | | | | | | | 8,052,107 | |
| Recycling 0.80% | | | | | | | | |
| Tomra Systems ASA | | | 50,000 | | | | 800,898 | |
| | | | | | | | | |
| Silver Mining 4.16% | | | | | | | | |
Americas Silver Corp. * | | | 250,000 | | | | 910,899 | |
Excellon Resources, Inc. * | | | 850,700 | | | | 1,245,257 | |
Great Panther Silver, Ltd. * | | | 200,000 | | | | 258,000 | |
| Pan American Silver Corp. | | | 100,000 | | | | 1,556,000 | |
Santacruz Silver Mining, Ltd. * | | | 2,500,000 | | | | 218,775 | |
| | | | | | | | 4,188,931 | |
| | | | | | | | | |
| Total Common Stocks | | | | | | | 94,568,412 | |
| (cost $74,410,670) | | | | | | | | |
| Corporate Convertible Bonds 1.74% | | Coupon Rate % | | Maturity Date | | Principal Amount | | | | |
| | | | | | | | | | | |
| Gold Mining 1.67% | | | | | | | | | | |
| Gran Colombia Gold Corp. | | | 8.00 | | 01/02/24 | | $ | 1,702,944 | | | | 1,677,485 | |
See notes to portfolios of investments and notes to financial statements.
Gold and Precious Metals Fund
| Portfolio of Investments | December 31, 2017 |
| Corporate Convertible Bonds (cont’d) | | Coupon Rate % | | Maturity Date | | Principal Amount | | | Value | |
| Precious Metals 0.07% | | | | | | | | | | |
Primero Mining Corp., 144A #r | | | 5.75 | | 02/28/20 | | $ | 1 10,000 | | | $ | 69,850 | |
| | | | | | | | | | | | | | |
| Total Corporate Convertible Bonds | | | | | | | | | | | | 1,747,335 | |
| (cost $963,812) | | | | | | | | | | | | | |
| Corporate Non-Convertible Bonds 0.28% | | | | | | | | | | |
| | | | | | | | | | | |
| Coal 0.00% | | | | | | | | | | |
Caribbean Resources Corp. @^ | | | 19.25 | | 06/15/15 | | | 485,766 | | | | 0 | |
| Electric - Generation 0.28% | | | | | | | | | | |
| | | | | | | | | | | |
Interamerican Energy Corp. #@+ | | | 15.00 | | 11/08/21 | | | 280,594 | | | | 280,594 | |
| | | | | | | | | | | | | | |
| Total Corporate Non-Convertible Bonds | | | | | | | | | | | | 280,594 | |
| (cost $766,360) | | | | | | | | | | | | | |
| Exchange Traded Funds 1.58% | | Shares | | | | |
Direxion Daily Gold Miners Index Bull 3X Shares ETF * | | | 25,000 | | | | 792,500 | |
| Direxion Daily Junior Gold Miners Index Bull 3x Shares ETF | | | 45,000 | | | | 799,200 | |
| | | | | | | | | |
| Total Exchange Traded Funds | | | | | | | 1,591,700 | |
| (cost $1,361,624) | | | | | | | | |
| Units 1.99% | | | | | | |
| | | | | | | |
| Retail - Apparel/Shoe 1.99% | | | | | | |
Mene, Inc., 144A *@~+r | | | 5,714,285 | | | | 2,000,000 | |
| (cost $2,000,000) | | | | | | | | |
| Warrants 0.43% | | Exercise Price | | Exp. Date | | | | | | |
| | | | | | | | | | | |
| Gold Mining 0.37% | | | | | | | | | | |
Gran Colombia Gold Corp. * | | $ | 48.75 | | 03/18/19 | | | 37,500 | | | | 1,790 | |
| Osisko Gold Royalties, Ltd. * | | | 2.75 | | 02/18/22 | | | 150,000 | | | | 286,396 | |
| Westgold Resources, Ltd. * | | | 0.43 | | 06/30/19 | | | 500,000 | | | | 87,778 | |
| | | | | | | | | | | | | 375,964 | |
See notes to portfolios of investments and notes to financial statements.
Gold and Precious Metals Fund
| Portfolio of Investments | December 31, 2017 |
| Warrants (cont’d) | | Exercise Price | | Exp. Date | | Shares | | | Value | |
| | | | | | | | | | | |
| Silver Mining 0.06% | | | | | | | | | | |
| Excellon Resources, Inc. * | | $ | 2.80 | | 12/31/18 | | | 325,000 | | | $ | 60,760 | |
| | | | | | | | | | | | | | |
| Total Warrants | | | | | | | | | | | | 436,724 | |
| (cost $219,158) | | | | | | | | |
| | | | | | | | | |
| Investments, at value 99.89% | | | | | | | | | | | | 100,624,765 | |
| (cost $79,721,624) | | | | | | | | | | | | | |
| Other assets and liabilities, net 0.11% | | | | | | | | | | | | 115,044 | |
| | | | | | | | | | | | | | |
| Net Assets 100.00% | | | | | | | | | | | $ | 100,739,809 | |
See notes to portfolios of investments and notes to financial statements.
Emerging Europe Fund
| Portfolio of Investments | December 31, 2017 |
| Common Stocks 97.24% | | Shares | | | Value | |
| | | | | | | |
| Agricultural Chemicals 1.04% | | | | | | |
Gubre Fabrikalari TAS * | | | 423,000 | | | $ | 471,557 | |
| | | | | | | | | |
| Airlines 6.90% | | | | | | | | |
| Aegean Airlines SA | | | 72,700 | | | | 717,126 | |
| Aeroflot PJSC | | | 224,000 | | | | 538,344 | |
| Deutsche Lufthansa AG | | | 14,950 | | | | 549,019 | |
Pegasus Hava Tasimaciligi AS * | | | 59,000 | | | | 526,044 | |
Turk Hava Yollari AO * | | | 113,000 | | | | 467,782 | |
Wizz Air Holdings PLC * | | | 6,600 | | | | 326,798 | |
| | | | | | | | 3,125,113 | |
| Airport Development/Maintenance 0.66% | | | | | | | | |
| TAV Havalimanlari Holding AS | | | 50,700 | | | | 300,083 | |
| Audio/Video Products 1.14% | | | | | | | | |
Vestel Elektronik Sanayi ve Ticaret AS * | | | 258,000 | | | | 514,942 | |
| Automotive - Cars & Light Trucks 2.86% | | | | | | | | |
| Ford Otomotiv Sanayi AS | | | 37,200 | | | | 591,046 | |
| Tofas Turk Otomobil Fabrikasi AS | | | 81,000 | | | | 704,923 | |
| | | | | | | | 1,295,969 | |
| Automotive/Truck Parts & Equipment - Original 0.41% | | | | | | | | |
| Brembo SpA | | | 12,150 | | | | 184,584 | |
| Beverages - Non-alcoholic 0.40% | | | | | | | | |
| Coca-Cola Icecek AS | | | 20,000 | | | | 180,371 | |
| Cellular Telecommunication 2.00% | | | | | | | | |
| MegaFon PJSC | | | 70,000 | | | | 622,039 | |
| Mobile TeleSystems PJSC, ADR | | | 27,700 | | | | 282,263 | |
| | | | | | | | 904,302 | |
| Chemicals - Diversified 1.69% | | | | | | | | |
| Ciech SA * | | | 28,600 | | | | 472,167 | |
| Petkim Petrokimya Holding AS | | | 144,000 | | | | 295,043 | |
| | | | | | | | 767,210 | |
See notes to portfolios of investments and notes to financial statements.
Emerging Europe Fund
| Portfolio of Investments | December 31, 2017 |
| Common Stocks (cont’d) | | Shares | | | Value | |
| | | | | | | |
| Chemicals - Fibers 0.99% | | | | | | |
| Aksa Akrilik Kimya Sanayii AS | | | 81,149 | | | $ | 274,964 | |
| Lenzing AG | | | 1,379 | | | | 174,986 | |
| | | | | | | | 449,950 | |
| Chemicals - Specialty 0.40% | | | | | | | | |
| Soda Sanayii AS | | | 137,000 | | | | 182,044 | |
| | | | | | | | | |
| Coal 2.35% | | | | | | | | |
Jastrzebska Spolka Weglowa SA * | | | 23,000 | | | | 634,295 | |
| Lubelski Wegiel Bogdanka SA | | | 22,300 | | | | 429,284 | |
| | | | | | | | 1,063,579 | |
| Commercial Banks Non-US 21.01% | | | | | | | | |
| Akbank Turk AS, ADR | | | 7,500 | | | | 38,700 | |
| Akbank Turk AS | | | 200,000 | | | | 519,040 | |
Alpha Bank AE * | | | 215,700 | | | | 462,464 | |
| Banca Transilvania SA | | | 357,218 | | | | 195,752 | |
Bank Millennium SA * | | | 61,000 | | | | 156,428 | |
| Bank Zachodni WBK SA | | | 2,500 | | | | 284,109 | |
| BRD-Groupe Societe Generale SA | | | 148,000 | | | | 490,795 | |
Eurobank Ergasias SA * | | | 215,000 | | | | 219,066 | |
National Bank of Greece SA * | | | 775,000 | | | | 296,289 | |
| OTP Bank PLC | | | 10,400 | | | | 429,531 | |
Piraeus Bank SA * | | | 44,000 | | | | 161,687 | |
Powszechna Kasa Oszczednosci Bank Polski SA * | | | 50,500 | | | | 641,110 | |
Raiffeisen Bank International AG * | | | 6,200 | | | | 224,353 | |
| Sberbank of Russia PJSC, ADR | | | 283,500 | | | | 4,828,005 | |
| Turkiye Garanti Bankasi AS | | | 202,000 | | | | 570,820 | |
| | | | | | | | 9,518,149 | |
| | | | | | | | | |
| Communications Software 0.40% | | | | | | | | |
| LiveChat Software SA | | | 16,000 | | | | 183,163 | |
| | | | | | | | | |
| Computer Services 1.64% | | | | | | | | |
| Asseco Poland SA | | | 39,000 | | | | 491,947 | |
| Luxoft Holding, Inc. * | | | 4,500 | | | | 250,650 | |
| | | | | | | | 742,597 | |
See notes to portfolios of investments and notes to financial statements.
Emerging Europe Fund
| Portfolio of Investments | December 31, 2017 |
| Common Stocks (cont’d) | | Shares | | | Value | |
| | | | | | | |
| Cosmetics & Toiletries 0.59% | | | | | | |
| Unilever PLC | | | 4,800 | | | $ | 266,238 | |
| | | | | | | | | |
| Diamonds/Precious Stones 0.38% | | | | | | | | |
| Alrosa PJSC | | | 133,000 | | | | 172,972 | |
| | | | | | | | | |
| Diversified Operations 2.53% | | | | | | | | |
| KOC Holding AS | | | 95,456 | | | | 465,081 | |
| Tekfen Holding AS | | | 152,500 | | | | 682,863 | |
| | | | | | | | 1,147,944 | |
| Electric - Distribution 1.22% | | | | | | | | |
| Enea SA | | | 37,000 | | | | 122,127 | |
| Energa SA | | | 118,000 | | | | 430,922 | |
| | | | | | | | 553,049 | |
| Electric - Generation 1.37% | | | | | | | | |
| CEZ AS | | | 9,800 | | | | 228,442 | |
| Inter RAO UES PJSC | | | 6,660,000 | | | | 392,049 | |
| | | | | | | | 620,491 | |
| Electric - Integrated 0.85% | | | | | | | | |
| OGK-2 PJSC, Class 2 | | | 50,100,000 | | | | 387,333 | |
| | | | | | | | | |
| Entertainment Software 0.71% | | | | | | | | |
| CD Projekt SA | | | 11,500 | | | | 320,310 | |
| | | | | | | | | |
| Finance - Other Services 0.33% | | | | | | | | |
Alior Bank SA * | | | 6,500 | | | | 148,101 | |
| | | | | | | | | |
| Food - Retail 2.21% | | | | | | | | |
| BIM Birlesik Magazalar AS | | | 11,000 | | | | 226,212 | |
Dino Polska SA * | | | 9,500 | | | | 214,604 | |
DIXY Group PJSC * | | | 9,000 | | | | 50,808 | |
| Magnit PJSC, GDR | | | 10,000 | | | | 272,164 | |
Migros Ticaret AS * | | | 32,500 | | | | 236,214 | |
| | | | | | | | 1,000,002 | |
| Food - Wholesale/Distribution 0.40% | | | | | | | | |
| Eurocash SA | | | 24,000 | | | | 182,341 | |
See notes to portfolios of investments and notes to financial statements.
Emerging Europe Fund
| Portfolio of Investments | December 31, 2017 |
| Common Stocks (cont’d) | | Shares | | | Value | |
| | | | | | | |
| Gold Mining 1.74% | | | | | | |
Dundee Precious Metals, Inc. * | | | 240,000 | | | $ | 572,792 | |
Petropavlovsk PLC * | | | 2,074,000 | | | | 215,793 | |
| | | | | | | | 788,585 | |
| Human Resources 0.60% | | | | | | | | |
Benefit Systems SA * | | | 812 | | | | 272,322 | |
| | | | | | | | | |
| Machinery - Farm 0.49% | | | | | | | | |
| Turk Traktor ve Ziraat Makineleri AS | | | 11,000 | | | | 220,621 | |
| | | | | | | | | |
| Metal - Diversified 1.70% | | | | | | | | |
| KGHM Polska Miedz SA | | | 8,100 | | | | 257,925 | |
| MMC Norilsk Nickel PJSC, ADR | | | 23,700 | | | | 448,167 | |
Orsu Metals Corp., 144A #*r | | | 402,500 | | | | 64,042 | |
| | | | | | | | 770,134 | |
| Metal - Iron 0.93% | | | | | | | | |
| Novolipetsk Steel PJSC, GDR | | | 16,700 | | | | 423,720 | |
| | | | | | | | | |
| Miscellaneous Manufacturing 0.68% | | | | | | | | |
| Trakya Cam Sanayii AS | | | 253,763 | | | | 309,308 | |
| | | | | | | | | |
| Multi-line Insurance 3.48% | | | | | | | | |
| Allianz SE | | | 2,900 | | | | 663,658 | |
| UNIQA Insurance Group AG | | | 42,700 | | | | 451,380 | |
| Vienna Insurance Group AG Wiener Versicherung Gruppe | | | 15,000 | | | | 462,730 | |
| | | | | | | | 1,577,768 | |
| Oil Companies - Exploration & Production 0.57% | | | | | | | | |
| Novatek PJSC, GDR | | | 2,200 | | | | 258,973 | |
| | | | | | | | | |
| Oil Companies - Integrated 13.27% | | | | | | | | |
| LUKOIL PJSC, ADR | | | 53,600 | | | | 3,090,040 | |
| MOL Hungarian Oil & Gas PLC | | | 58,860 | | | | 682,443 | |
| OMV Petrom SA, GDR | | | 28,000 | | | | 306,209 | |
| Polskie Gornictwo Naftowe i Gazownictwo SA | | | 247,500 | | | | 446,990 | |
| Surgutneftegas OJSC, ADR | | | 100,000 | | | | 471,010 | |
| Tatneft PJSC, ADR | | | 20,200 | | | | 1,015,656 | |
| | | | | | | | 6,012,348 | |
See notes to portfolios of investments and notes to financial statements.
Emerging Europe Fund
| Portfolio of Investments | December 31, 2017 |
| Common Stocks (cont’d) | | Shares | | | Value | |
| | | | | | | |
| Oil Refining & Marketing 3.44% | | | | | | |
| Grupa Lotos SA | | | 18,000 | | | $ | 297,813 | |
| Motor Oil Hellas Corinth Refineries SA | | | 18,900 | | | | 425,967 | |
| Polski Koncern Naftowy ORLEN SA | | | 18,350 | | | | 557,744 | |
| Tupras Turkiye Petrol Rafinerileri AS | | | 8,600 | | | | 275,599 | |
| | | | | | | | 1,557,123 | |
| Property/Casualty Insurance 1.01% | | | | | | | | |
| Powszechny Zaklad Ubezpieczen SA | | | 38,000 | | | | 459,636 | |
| | | | | | | | | |
| Real Estate Operating/Development 0.94% | | | | | | | | |
GEK Terna Holding Real Estate Construction SA * | | | 80,000 | | | | 424,962 | |
| | | | | | | | | |
| Regional Banks - Non US 0.98% | | | | | | | | |
| TCS Group Holding PLC, GDR | | | 23,500 | | | | 443,122 | |
| | | | | | | | | |
| Retail - Automobile 0.46% | | | | | | | | |
Dogus Otomotiv Servis ve Ticaret AS * | | | 95,000 | | | | 206,302 | |
| | | | | | | | | |
| Retail - Jewelry 0.44% | | | | | | | | |
| Pandora A/S | | | 1,815 | | | | 197,288 | |
| | | | | | | | | |
| Retail - Major Dept Store 0.29% | | | | | | | | |
| Detsky Mir PJSC | | | 80,000 | | | | 133,188 | |
| | | | | | | | | |
| Steel - Producers 5.52% | | | | | | | | |
| Eregli Demir ve Celik Fabrikalari TAS | | | 186,500 | | | | 492,077 | |
| Evraz PLC | | | 177,500 | | | | 811,267 | |
| Magnitogorsk Iron & Steel Works PJSC, GDR | | | 32,100 | | | | 310,893 | |
Mechel PJSC, ADR * | | | 46,000 | | | | 241,960 | |
| Severstal PAO PJSC, GDR | | | 41,700 | | | | 642,759 | |
| | | | | | | | 2,498,956 | |
| Telecom Services 1.21% | | | | | | | | |
| O2 Czech Republic AS | | | 16,100 | | | | 209,364 | |
| Sistema PJSC FC, GDR | | | 49,000 | | | | 204,685 | |
Turk Telekomunikasyon AS * | | | 78,200 | | | | 132,667 | |
| | | | | | | | 546,716 | |
See notes to portfolios of investments and notes to financial statements.
Emerging Europe Fund
| Portfolio of Investments | December 31, 2017 |
| Common Stocks (cont’d) | | Shares | | | Value | |
| | | | | | | |
| Telephone - Integrated 1.42% | | | | | | |
| Hellenic Telecommunications Organization SA | | | 17,100 | | | $ | 235,644 | |
| Magyar Telekom Telecommunications PLC | | | 230,500 | | | | 407,410 | |
| | | | | | | | 643,054 | |
| Textile - Apparel 0.51% | | | | | | |
| LPP SA | | | 91 | | | | 232,540 | |
| | | | | | | | | |
| Tobacco 0.45% | | | | | | | | |
| Philip Morris CR AS | | | 260 | | | | 202,418 | |
| | | | | | | | | |
| Transportation - Rail 1.10% | | | | | | | | |
| Globaltrans Investment PLC, GDR | | | 52,899 | | | | 496,643 | |
| | | | | | | | | |
| Transportation - Services 0.55% | | | | | | | | |
| Oesterreichische Post AG | | | 5,550 | | | | 249,298 | |
| | | | | | | | | |
| Travel Services 0.53% | | | | | | | | |
| TUI AG | | | 11,600 | | | | 240,321 | |
| | | | | | | | | |
| Web Portals/ISP 0.45% | | | | | | | | |
Yandex NV, Class A * | | | 6,250 | | | | 204,687 | |
| | | | | | | | | |
| Total Common Stocks | | | | | | | 44,052,427 | |
| (cost $37,761,565) | | | | | | | | |
| Exchange Traded Funds 0.97% | | | | | | |
| Direxion Daily Russia Bull 3x Shares ETF | | | 2,500 | | | | 126,200 | |
| iShares MSCI Poland Capped ETF | | | 11,450 | | | | 310,181 | |
| | | | | | | | | |
| Total Exchange Traded Funds | | | | | | | 436,381 | |
| (cost $444,131) | | | | | | | | |
| | | | | | | | | |
| Investments, at value 98.21% | | | | | | | 44,488,808 | |
| (cost $38,205,696) | | | | | | | | |
| Other assets and liabilities, net 1.79% | | | | | | | 813,061 | |
| | | | | | | | | |
| Net Assets 100.00% | | | | | | $ | 45,301,869 | |
See notes to portfolios of investments and notes to financial statements.
China Region Fund
| Portfolio of Investments | December 31, 2017 |
| Common Stocks 91.32% | | Shares | | | Value | |
| | | | | | | |
| Agricultural Operations 0.17% | | | | | | |
| First Resources, Ltd. | | | 18,000 | | | $ | 25,113 | |
| Perusahaan Perkebunan London Sumatra Indonesia Tbk | | | | | | | | |
| PT | | | 240,000 | | | | 25,121 | |
| | | | | | | | 50,234 | |
| Airlines 0.92% | | | | | | | | |
| AirAsia Bhd | | | 250,000 | | | | 206,951 | |
| Asia Aviation PCL, NVDR | | | 350,000 | | | | 65,976 | |
| | | | | | | | 272,927 | |
| Automotive - Cars & Light Trucks 15.03% | | | | | | | | |
| Geely Automobile Holdings, Ltd. | | | 866,000 | | | | 2,982,852 | |
| Great Wall Motor Co., Ltd., Class H | | | 170,500 | | | | 194,611 | |
| Guangzhou Automobile Group Co., Ltd., Class H | | | 550,000 | | | | 1,299,117 | |
| | | | | | | | 4,476,580 | |
| Automotive - Medium & Heavy Duty Trucks 0.94% | | | | | | | | |
| Sinotruk Hong Kong, Ltd. | | | 250,000 | | | | 281,359 | |
| | | | | | | | | |
| Automotive/Truck Parts & Equipment - Original 3.36% | | | | | | | | |
| Nexteer Automotive Group, Ltd. | | | 421,000 | | | | 1,000,475 | |
| | | | | | | | | |
| Batteries/Battery Systems 0.29% | | | | | | | | |
| Tianneng Power International, Ltd. | | | 82,000 | | | | 85,077 | |
| | | | | | | | | |
| Beverages - Non-alcoholic 0.19% | | | | | | | | |
| Vitasoy International Holdings, Ltd. | | | 22,000 | | | | 56,253 | |
| | | | | | | | | |
| Building & Construction Products - Miscellaneous 0.23% | | | | | | | | |
| China Lesso Group Holdings, Ltd. | | | 35,000 | | | | 22,626 | |
| Hyundai Development Co.-Engineering & Construction | | | 650 | | | | 23,386 | |
IS Dongseo Co., Ltd. * | | | 675 | | | | 21,925 | |
| | | | | | | | 67,937 | |
| Building Products - Doors & Windows 1.92% | | | | | | | | |
| Xinyi Glass Holdings, Ltd. | | | 440,000 | | | | 571,939 | |
See notes to portfolios of investments and notes to financial statements.
China Region Fund
| Portfolio of Investments | December 31, 2017 |
| Common Stocks (cont’d) | | Shares | | | Value | |
| | | | | | | |
| Casino Hotels 3.69% | | | | | | |
| Galaxy Entertainment Group, Ltd. | | | 40,000 | | | $ | 319,352 | |
| Sands China, Ltd. | | | 90,000 | | | | 463,252 | |
| Wynn Macau, Ltd. | | | 100,000 | | | | 316,147 | |
| | | | | | | | 1,098,751 | |
| Chemicals - Diversified 0.08% | | | | | | | | |
| Huchems Fine Chemical Corp. | | | 1,100 | | | | 25,196 | |
| | | | | | | | | |
| Chemicals - Other 1.00% | | | | | | | | |
| Kingboard Chemical Holdings, Ltd. | | | 55,000 | | | | 296,677 | |
| | | | | | | | | |
| Chemicals - Specialty 1.50% | | | | | | | | |
| Fufeng Group, Ltd. | | | 40,000 | | | | 26,088 | |
| Kingboard Laminates Holdings, Ltd. | | | 270,000 | | | | 420,015 | |
| | | | | | | | 446,103 | |
| Coal 2.04% | | | | | | | | |
| Adaro Energy Tbk PT | | | 184,000 | | | | 25,155 | |
| China Shenhua Energy Co., Ltd., Class H | | | 105,000 | | | | 271,262 | |
| Indo Tambangraya Megah Tbk PT | | | 80,000 | | | | 121,814 | |
| Semirara Mining & Power Corp., Class A | | | 256,000 | | | | 188,681 | |
| | | | | | | | 606,912 | |
| Commercial Banks Non-US 0.55% | | | | | | | | |
| Bank Negara Indonesia Persero Tbk PT | | | 225,000 | | | | 164,144 | |
| | | | | | | | | |
| Commercial Service - Finance 0.92% | | | | | | | | |
| Hi Sun Technology China, Ltd. * | | | 1,401,000 | | | | 273,460 | |
| Computers - Integrated System 0.26% | | | | | | | | |
| Posiflex Technology, Inc. | | | 16,724 | | | | 76,588 | |
| Computers - Memory Devices 0.57% | | | | | | | | |
| ASPEED Technology, Inc. | | | 7,000 | | | | 168,454 | |
| | | | | | | | | |
| Computers - Peripher Equipment 0.07% | | | | | | | | |
| Innolux Corp. | | | 50,000 | | | | 20,756 | |
| | | | | | | | | |
| Cosmetics & Toiletries 0.09% | | | | | | | | |
| Vinda International Holdings, Ltd. | | | 13,000 | | | | 26,080 | |
See notes to portfolios of investments and notes to financial statements.
China Region Fund
| Portfolio of Investments | December 31, 2017 |
| Common Stocks (cont’d) | | Shares | | | Value | |
| | | | | | | |
| Diversified Operations 1.18% | | | | | | |
| Melco International Development, Ltd. | | | 120,000 | | | $ | 351,899 | |
| | | | | | | | | |
| Electric - Distribution 0.10% | | | | | | | | |
| Manila Electric Co. | | | 4,500 | | | | 29,622 | |
| | | | | | | | | |
| Electronic Components - Miscellaneous 4.40% | | | | | | | | |
| AAC Technologies Holdings, Inc. | | | 65,000 | | | | 1,150,400 | |
| HannStar Display Corp. | | | 420,000 | | | | 140,156 | |
| Tongda Group Holdings, Ltd. | | | 80,000 | | | | 20,390 | |
| | | | | | | | 1,310,946 | |
| Electronic Components - Semiconductors 0.09% | | | | | | | | |
| SK Hynix, Inc. | | | 400 | | | | 28,411 | |
| | | | | | | | | |
| Entertainment Software 1.39% | | | | | | | | |
| IGG, Inc. | | | 225,000 | | | | 241,756 | |
| NetEase, Inc., ADR | | | 500 | | | | 172,535 | |
| | | | | | | | 414,291 | |
| Food - Miscellaneous/Diversified 0.06% | | | | | | | | |
| Green Seal Holding, Ltd. | | | 8,000 | | | | 17,339 | |
| | | | | | | | | |
| Internet Application Software 8.69% | | | | | | | | |
| Tencent Holdings, Ltd. | | | 50,000 | | | | 2,587,898 | |
| | | | | | | | | |
| Life/Health Insurance 0.33% | | | | | | | | |
| China Life Insurance Co., Ltd. | | | 98,972 | | | | 99,289 | |
| | | | | | | | | |
| Machinery - Construction & Mining 1.73% | | | | | | | | |
| Lonking Holdings, Ltd. | | | 1,175,000 | | | | 513,963 | |
| | | | | | | | | |
| Medical - Drugs 1.32% | | | | | | | | |
| China Pioneer Pharma Holdings, Ltd. | | | 380,000 | | | | 117,131 | |
| Consun Pharmaceutical Group, Ltd. | | | 305,000 | | | | 276,511 | |
| | | | | | | | 393,642 | |
| Medical Products 0.98% | | | | | | | | |
| China Medical System Holdings, Ltd. | | | 125,000 | | | | 290,974 | |
| | | | | | | | | |
| Metal - Copper 0.58% | | | | | | | | |
| Jiangxi Copper Co., Ltd. | | | 110,000 | | | | 174,052 | |
See notes to portfolios of investments and notes to financial statements.
China Region Fund
| Portfolio of Investments | December 31, 2017 |
| Common Stocks (cont’d) | | Shares | | | Value | |
| | | | | | | |
| Multi-line Insurance 5.16% | | | | | | |
| Ping An Insurance Group Co. of China, Ltd., Class H | | | 148,000 | | | $ | 1,535,066 | |
| | | | | | | | | |
| Non-Ferrous Metals 0.07% | | | | | | | | |
Sterling Group Ventures, Inc., 144A *r | | | 500,000 | | | | 19,600 | |
| | | | | | | | | |
| Non-hazardous Waste Disposal 0.39% | | | | | | | | |
| China Water Affairs Group, Ltd. | | | 130,000 | | | | 117,556 | |
| | | | | | | | | |
| Oil Companies - Integrated 0.77% | | | | | | | | |
| China Petroleum & Chemical Corp., ADR | | | 2,756 | | | | 202,208 | |
| PTT PCL, NVDR | | | 2,000 | | | | 26,952 | |
| | | | | | | | 229,160 | |
| Oil Refining & Marketing 1.59% | | | | | | | | |
| Formosa Petrochemical Corp. | | | 35,000 | | | | 135,378 | |
| SK Innovation Co., Ltd. | | | 800 | | | | 152,617 | |
| S-Oil Corp. | | | 250 | | | | 27,306 | |
| Thai Oil PCL, NVDR | | | 50,000 | | | | 158,663 | |
| | | | | | | | 473,964 | |
| Paper & Related Products 0.54% | | | | | | | | |
| Nine Dragons Paper Holdings, Ltd. | | | 100,000 | | | | 159,786 | |
| | | | | | | | | |
| Pastoral & Agricultural 0.63% | | | | | | | | |
COFCO Meat Holdings, Ltd. * | | | 925,000 | | | | 186,769 | |
| | | | | | | | | |
| Petrochemicals 1.83% | | | | | | | | |
| AK Holdings, Inc. | | | 2,000 | | | | 127,934 | |
| Lotte Chemical Corp. | | | 518 | | | | 177,866 | |
| Sinopec Shanghai Petrochemical Co., Ltd., ADR | | | 4,200 | | | | 239,400 | |
| | | | | | | | 545,200 | |
| Photo Equipment & Supplies 6.69% | | | | | | | | |
| Sunny Optical Technology Group Co., Ltd. | | | 157,000 | | | | 1,993,470 | |
| | | | | | | | | |
| Property/Casualty Insurance 2.38% | | | | | | | | |
| Hyundai Marine & Fire Insurance Co., Ltd. | | | 2,581 | | | | 113,196 | |
| Meritz Fire & Marine Insurance Co., Ltd. | | | 2,727 | | | | 59,767 | |
| PICC Property & Casualty Co., Ltd., H shares | | | 279,000 | | | | 534,501 | |
| | | | | | | | 707,464 | |
See notes to portfolios of investments and notes to financial statements.
China Region Fund
| Portfolio of Investments | December 31, 2017 |
| Common Stocks (cont’d) | | Shares | | | Value | |
| | | | | | | |
| Real Estate Operating/Development 8.51% | | | | | | |
| China Vanke Co., Ltd., Class H | | | 35,000 | | | $ | 139,282 | |
| Country Garden Holdings Co., Ltd. | | | 705,000 | | | | 1,339,356 | |
Jiayuan International Group, Ltd. * | | | 400,000 | | | | 371,568 | |
| Sino-Ocean Group Holding, Ltd. | | | 670,000 | | | | 461,369 | |
| Yuzhou Properties Co., Ltd. | | | 420,000 | | | | 223,876 | |
| | | | | | | | 2,535,451 | |
| Retail - Automobile 0.84% | | | | | | | | |
| Zhongsheng Group Holdings, Ltd. | | | 110,000 | | | | 249,973 | |
| | | | | | | | | |
| Retail - Home Furnishings 3.28% | | | | | | | | |
| Man Wah Holdings, Ltd. | | | 1,030,000 | | | | 976,631 | |
| | | | | | | | | |
| Semiconductor Equipment 3.59% | | | | | | | | |
| ASM Pacific Technology, Ltd. | | | 77,000 | | | | 1,068,224 | |
| | | | | | | | | |
| Telecom Services 0.38% | | | | | | | | |
| Telekomunikasi Indonesia Persero Tbk PT | | | 350,000 | | | | 114,553 | |
| | | | | | | | | |
| Total Common Stocks | | | | | | | 27,191,095 | |
| (cost $18,187,447) | | | | | | | | |
| Call Option Purchased 1.66% | | Strike Price | | | Exp. Date | | | Notional Contract Value | | | Contracts | | | | |
| | | | | | | | | | | | | | | | |
| Diversified Banking - Institutional 1.66% | | | | | | | | | | | | | | | |
| HSBC Holdings PLC (premiums paid $332,451) | | $ | 47.00 | | | | 03/18 | | | $ | 4,700,000 | | | | 1,000 | | | | 492,500 | |
| | | | | | | | | | | | | | | | | | | | | |
| Investments, at value 92.98% | | | | | | | | | | | | | | | | | | | 27,683,595 | |
| (cost $18,519,898) | | | | | | | | | | | | | | | | | | | | |
| Other assets and liabilities, net 7.02% | | | | | | | | | | | | | | | | | | | 2,091,638 | |
| | | | | | | | | | | | | | | | | | | | | |
| Net Assets 100.00% | | | | | | | | | | | | | | | | | | $ | 29,775,233 | |
See notes to portfolios of investments and notes to financial statements.
Notes to Portfolios of Investments | December 31, 2017 |
| Legend | |
| ◊ | Zero coupon bond. Interest rate presented is yield to maturity. |
| ~ | Affiliated company (see following) |
| @ | Security fair valued at December 31, 2017, by U.S. Global Investors, Inc. (Adviser) (other than international securities fair valued pursuant to systematic fair value models) in accordance with procedures approved by the Board of Trustees. These securities, as a percentage of net assets at December 31, 2017, were 0.00% of All American Equity Fund, 1.51% of Holmes Macro Trends Fund, 10.85% of Global Resources Fund, 1.81% of World Precious Minerals Fund and 2.74% of Gold and Precious Metals Fund, respectively. See the Fair Valuation of Securities section of these Notes to Portfolios of Investments for further discussion of fair valued securities. |
| r | Pursuant to Rule 144A of the Securities Act of 1933, these securities may be resold in transactions exempt from registration, normally to qualified institutional buyers. The market value of these securities and percentage of net assets as of December 31, 2017, amounted to $153,142, 0.37%, of Holmes Macro Trends Fund, $1,464,140, 1.52%, of Global Resources Fund, $3,771,307, 3.20%, of World Precious Minerals Fund, $2,547,177, 2.53% of Gold and Precious Metals Fund, $64,042, 0.14% of Emerging Europe Fund and $19,600, 0.07% of China Region Fund. |
| * | Non-income producing security. |
| # | Illiquid Security. |
| ^ | Security is currently in default and is on scheduled interest or principal payment. |
| + | See "Restricted Securities" in Notes to Portfolios of Investments. |
| ADR | American Depositary Receipt |
| AGC | Assured Guaranty Corporation |
| AGM | Assured Guaranty Municipal |
| AMBAC | American Municipal Bond Assurance Corporation |
| BAM | Build American Mutual Assurance Company |
| COP | Certificate of Participation |
| ETF | Exchange Traded Fund |
| GDR | Global Depositary Receipt |
| GO | General Obligation |
| LIBOR | London Interbank Offered Rate |
| LLC | Limited Liability Company |
| LP | Limited Partnership |
| NATL | National Public Finance Guarantee Corporation |
| NVDR | Non-Voting Depositary Receipt |
| OJSC | Open Joint Stock Company |
| PCL | Public Company Limited |
| PJSC | Public Joint Stock Company |
| PLC | Public Limited Company |
| PSF-GTD | Public School Fund Guarantee |
| Q-SBLF | Qualified School Bond Loan Fund |
| RB | Revenue Bond |
| REIT | Real Estate Investment Trust |
| S&P | Standard & Poor's |
| SPDR | Standard & Poor's Depositary Receipt |
General
The yields reflect the effective yield from the date of purchase.
Variable and Floating Rate Notes have periodic reset features, which effectively shorten the maturity dates and reset the interest rates as tied to various interest-bearing instruments. Rates shown are current rates at December 31, 2017.
Fair Valuation of Securities
For the Funds’ policies regarding the valuation of investments and other significant accounting policies, please refer to the Notes to Financial Statements.
Notes to Portfolios of Investments | December 31, 2017 |
The Funds are required to disclose information regarding the fair value measurements of a Fund’s assets and liabilities. Fair value is the price that would be received to sell an asset or paid to transfer a liability in an orderly transaction between market participants at the measurement date. The measurement requirements established a three-tier hierarchy to maximize the use of observable market data and minimize the use of unobservable inputs and to establish classification of fair value measurements for disclosure purposes. Inputs refer broadly to the assumptions that market participants would use in pricing the asset or liability, including assumptions about risk, for example, the risk inherent in a particular valuation technique used to measure fair value including such a pricing model and/or the risk inherent in the inputs to the valuation technique. Inputs may be observable or unobservable. Observable inputs are inputs that reflect the assumptions market participants would use in pricing the asset or liability developed based on market data obtained from sources independent of the reporting entity. Unobservable inputs are inputs that reflect the reporting entity's own assumptions about the assumptions market participants would use in pricing the asset or liability developed based on the best information available in the circumstances.
The inputs or methodology used for valuing securities are not necessarily an indication of the risk associated with investing in those securities. Because of the inherent uncertainties of valuation, the values reflected in the portfolios may materially differ from the values received upon actual sale of those investments.
The three levels defined by the fair value hierarchy are as follows:
Level 1 – Quoted prices in active markets for identical securities.
Level 2 – Prices determined using significant other observable inputs (including quoted prices for similar securities, interest rates, prepayment speeds, credit risk, etc.). Short-term securities with maturities of sixty days or less are valued at amortized cost, which approximates market value, and are categorized as Level 2 in the hierarchy. Municipal securities, long-term U.S. government obligations and corporate debt securities are valued in accordance with the evaluated price supplied by the pricing service and generally categorized as Level 2 in the hierarchy. Other securities that are categorized as Level 2 in the hierarchy include, but are not limited to, warrants that do not trade on an exchange, securities valued at the mean between the last reported bid and ask quotation and international equity securities valued by an independent third party in order to adjust for stale pricing.
Level 3 – Prices determined using significant unobservable inputs (including the Fund’s own assumptions). For restricted equity securities and private placements where observable inputs are limited, assumptions about market activity and risk are used in determining fair value.
Notes to Portfolios of Investments | December 31, 2017 |
The following table summarizes the valuation of each Fund’s securities as of December 31, 2017, using the fair value hierarchy:
| | | Quoted Prices in Active Markets for Identical Investments (Level 1) | | | Significant Other Observable Inputs (Level 2) | | | Significant Unobservable Inputs
(Level 3) | | | Total | |
| U.S. Government Securities Ultra-Short Bond Fund | | | | | | | | | | | | |
| Investments in Securities* | | | | | | | | | | | | |
| United States Government and Agency Obligations | | $ | – | | | $ | 48,457,294 | | | $ | – | | | $ | 48,457,294 | |
| Investments, at Value | | $ | – | | | $ | 48,457,294 | | | $ | – | | | $ | 48,457,294 | |
| | | Quoted Prices in Active Markets for Identical Investments (Level 1) | | | Significant Other Observable Inputs (Level 2) | | | Significant Unobservable Inputs
(Level 3) | | | Total | |
| Near-Term Tax Free Fund | | | | | | | | | | | | |
| Investments in Securities* | | | | | | | | | | | | |
| Municipal Bonds | | $ | – | | | $ | 68,589,222 | | | $ | – | | | $ | 68,589,222 | |
| Investments, at Value | | $ | – | | | $ | 68,589,222 | | | $ | – | | | $ | 68,589,222 | |
| | | Quoted Prices in Active Markets for Identical Investments (Level 1) | | | Significant Other Observable Inputs (Level 2) | | | Significant Unobservable Inputs (Level 3) | | | Total | |
| All American Equity Fund | | | | | | | | | | | | |
| Investments in Securities* | | | | | | | | | | | | |
| Common Stocks | | | | | | | | | | | | |
| Aerospace/Defense | | $ | 678,293 | | | $ | – | | | $ | – | | | $ | 678,293 | |
| Airlines | | | 543,235 | | | | – | | | | – | | | | 543,235 | |
| Apparel Manufacturers | | | 347,106 | | | | – | | | | – | | | | 347,106 | |
| Beverages - Wine/Spirits | | | 548,568 | | | | – | | | | – | | | | 548,568 | |
| Commercial Services - Finance | | | 585,266 | | | | – | | | | – | | | | 585,266 | |
| Computer Services | | | 588,380 | | | | – | | | | – | | | | 588,380 | |
| Cosmetics & Toiletries | | | 547,132 | | | | – | | | | – | | | | 547,132 | |
| Dental Supplies & Equipment | | | 500,308 | | | | – | | | | – | | | | 500,308 | |
| Diversified Banking Institution | | | 1,014,088 | | | | – | | | | – | | | | 1,014,088 | |
| Electronic Components - Semiconductors | | | 928,438 | | | | – | | | | – | | | | 928,438 | |
| Electronic Secure Devices | | | 453,492 | | | | – | | | | – | | | | 453,492 | |
| Finance - Credit Card | | | 1,185,188 | | | | – | | | | – | | | | 1,185,188 | |
Notes to Portfolios of Investments | December 31, 2017 |
| | | Quoted Prices in Active Markets for Identical Investments (Level 1) | | | Significant Other Observable Inputs (Level 2) | | | Significant Unobservable Inputs (Level 3) | | | Total | |
| All American Equity Fund (continued) | | | | | | | | | | | | |
| Investments in Securities* | | | | | | | | | | | | |
| (continued) | | | | | | | | | | | | |
| Gold Mining | | $ | 367,696 | | | $ | – | | | $ | – | | | $ | 367,696 | |
| Medical - Biomedical/Genetics | | | 399,970 | | | | – | | | | – | | | | 399,970 | |
| Medical - HMO | | | 421,719 | | | | – | | | | – | | | | 421,719 | |
| Medical Labs & Testing Services | | | 384,111 | | | | – | | | | – | | | | 384,111 | |
| Oil Companies - Exploration & Production | | | 420,420 | | | | – | | | | – | | | | 420,420 | |
| Oil Refining & Marketing | | | 1,079,776 | | | | – | | | | – | | | | 1,079,776 | |
| REITS - Diversified | | | 456,544 | | | | – | | | | – | | | | 456,544 | |
Retail - Building Products | | | 549,637 | | | | – | | | | – | | | | 549,637 | |
Retail - Drug Store | | | 275,500 | | | | – | | | | – | | | | 275,500 | |
Retail - Jewelry | | | 316,680 | | | | – | | | | – | | | | 316,680 | |
| Retail - Major Dept Store | | | 519,928 | | | | – | | | | – | | | | 519,928 | |
| Semiconductor Equipment | | | 496,989 | | | | – | | | | – | | | | 496,989 | |
| Supranational Bank | | | 520,860 | | | | – | | | | – | | | | 520,860 | |
| Water | | | 503,195 | | | | – | | | | – | | | | 503,195 | |
| Rights | | | | | | | | | | | | | | | | |
| Food - Retail | | | – | | | | – | | | | 0 | | | | 0 | |
| Exchange Traded Funds | | | 1,097,657 | | | | – | | | | – | | | | 1,097,657 | |
| Investments, at Value | | $ | 15,730,176 | | | $ | – | | | $ | 0 | | | $ | 15,730,176 | |
| | | Quoted Prices in Active Markets for Identical Investments (Level 1) | | | Significant Other Observable Inputs (Level 2) | | | Significant Unobservable Inputs (Level 3) | | | Total | |
| Holmes Macro Trends Fund | | | | | | | | | | | | |
| Investments in Securities* | | | | | | | | | | | | |
| Common Stocks | | | | | | | | | | | | |
| Applications Software | | $ | 1,033,560 | | | $ | – | | | $ | – | | | $ | 1,033,560 | |
| Bicycle Manufacturing | | | 889,665 | | | | – | | | | – | | | | 889,665 | |
| Brewery | | | 1,350,504 | | | | – | | | | – | | | | 1,350,504 | |
| Building - Residential/Commercial | | | 1,733,193 | | | | – | | | | – | | | | 1,733,193 | |
| Building & Construction Products - Miscellaneous | | | 1,734,240 | | | | – | | | | – | | | | 1,734,240 | |
| Building Products - Air & Heating | | | 1,853,514 | | | | – | | | | – | | | | 1,853,514 | |
| Casino Hotels | | | 2,461,414 | | | | – | | | | – | | | | 2,461,414 | |
| Chemicals - Specialty | | | 1,516,130 | | | | – | | | | – | | | | 1,516,130 | |
| Commercial Services | | | 1,989,585 | | | | – | | | | – | | | | 1,989,585 | |
Notes to Portfolios of Investments | December 31, 2017 |
| | | Quoted Prices in Active Markets for Identical Investments (Level 1) | | | Significant Other Observable Inputs (Level 2) | | | Significant Unobservable Inputs (Level 3) | | | Total | |
| Holmes Macro Trends Fund (continued) | | | | | | | | | | |
| Investments in Securities* | | | | | | | | | | | | |
| (continued) | | | | | | | | | | | | |
| Commercial Services - Finance | | $ | 2,049,740 | | | $ | – | | | $ | – | | | $ | 2,049,740 | |
| Consumer Products - Miscellaneous | | | 1,573,294 | | | | – | | | | – | | | | 1,573,294 | |
| Distribution/Wholesale | | | 1,853,995 | | | | – | | | | – | | | | 1,853,995 | |
| Electronic Secure Devices | | | 994,500 | | | | – | | | | – | | | | 994,500 | |
| Energy - Alternate Sources | | | – | | | | – | | | | 0 | | | | 0 | |
| Food - Miscellaneous/Diversified | | | 1,377,380 | | | | – | | | | – | | | | 1,377,380 | |
| Golf | | | 1,113,007 | | | | – | | | | – | | | | 1,113,007 | |
| Medical - Drugs | | | 1,251,290 | | | | – | | | | – | | | | 1,251,290 | |
| Medical - Hospitals | | | – | | | | – | | | | 0 | | | | 0 | |
| Oil Companies - Exploration & Production | | | 459,427 | | | | – | | | | – | | | | 459,427 | |
| Real Estate Management/Services | | | 2,655,744 | | | | – | | | | – | | | | 2,655,744 | |
| Real Estate Operating/Development | | | – | | | | – | | | | 394,500 | | | | 394,500 | |
| REITS - Diversified | | | 833,330 | | | | – | | | | – | | | | 833,330 | |
| Retail - Pet Food & Supplies | | | 1,938,300 | | | | – | | | | – | | | | 1,938,300 | |
| Retail - Restaurants | | | 1,225,231 | | | | – | | | | – | | | | 1,225,231 | |
| Television | | | 1,373,632 | | | | – | | | | – | | | | 1,373,632 | |
| Tobacco | | | 1,471,046 | | | | – | | | | – | | | | 1,471,046 | |
| Veterinary Diagnostics | | | 800,650 | | | | – | | | | – | | | | 800,650 | |
| Web Hosting/Design | | | 903,223 | | | | – | | | | – | | | | 903,223 | |
| Corporate Convertible Bond | | | – | | | | 327,993 | | | | – | | | | 327,993 | |
| Corporate Non-Convertible Bond | | | – | | | | – | | | | 233,829 | | | | 233,829 | |
| Exchange Traded Funds | | | 1,627,279 | | | | – | | | | – | | | | 1,627,279 | |
| Warrants | | | | | | | | | | | | | | | | |
| Gold Mining | | | 12 | | | | – | | | | – | | | | 12 | |
| Oil Companies - Exploration & Production | | | – | | | | 0 | | | | – | | | | 0 | |
| Investments, at Value | | $ | 38,062,885 | | | $ | 327,993 | | | $ | 628,329 | | | $ | 39,019,207 | |
| Notes to Portfolios of Investments | December 31, 2017 |
| | | Quoted Prices in Active Markets for Identical Investments (Level 1) | | | Significant Other Observable Inputs (Level 2) | | | Significant Unobservable Inputs (Level 3) | | | Total | |
| Global Resources Fund | | | | | | | | | | | | |
| Investments in Securities* | | | | | | | | | | | | |
| Common Stocks | | | | | | | | | | | | |
| Agricultural Chemicals | | $ | 1,101,378 | | | $ | – | | | $ | – | | | $ | 1,101,378 | |
| Agricultural Operations | | | – | | | | 116,161 | | | | – | | | | 116,161 | |
| Automotive/Truck Parts & Equipment - Original | | | 1,212,738 | | | | – | | | | – | | | | 1,212,738 | |
| Chemicals - Diversified | | | 2,554,406 | | | | 2,607,534 | | | | – | | | | 5,161,940 | |
| Chemicals - Fibers | | | 1,701,440 | | | | – | | | | – | | | | 1,701,440 | |
| Chemicals - Specialty | | | 2,270,608 | | | | 1,016,748 | | | | – | | | | 3,287,356 | |
| Coal | | | 2,235,998 | | | | 2,539,489 | | | | 0 | | | | 4,775,487 | |
| Coatings/Paint | | | – | | | | 1,184,220 | | | | – | | | | 1,184,220 | |
| Diamonds/Precious Stones | | | 32,935 | | | | – | | | | 756 | | | | 33,691 | |
| Diversified Minerals | | | 3,641,928 | | | | 1,399,772 | | | | – | | | | 5,041,700 | |
| Energy - Alternate Sources | | | 2,691,063 | | | | 1,089,788 | | | | 0 | | | | 3,780,851 | |
| Forestry | | | 3,275,429 | | | | 32,386 | | | | – | | | | 3,307,815 | |
| Gold Mining | | | 5,323,629 | | | | 7,707,218 | | | | 0 | | | | 13,030,847 | |
| Medical - Drugs | | | 52,252 | | | | – | | | | – | | | | 52,252 | |
| Medical - Hospitals | | | – | | | | – | | | | 0 | | | | 0 | |
| Metal - Copper | | | 1,568,748 | | | | – | | | | – | | | | 1,568,748 | |
| Metal - Diversified | | | 707,118 | | | | 3,219,095 | | | | – | | | | 3,926,213 | |
| Metal - Iron | | | – | | | | 2,461,041 | | | | 0 | | | | 2,461,041 | |
| Mining Services | | | – | | | | – | | | | 0 | | | | 0 | |
| Natural Resource Technology | | | – | | | | – | | | | 15,225 | | | | 15,225 | |
| Non-Ferrous Metals | | | 372,514 | | | | 19,600 | | | | – | | | | 392,114 | |
| Oil - Field Services | | | – | | | | 1,207,534 | | | | 0 | | | | 1,207,534 | |
| Oil Companies - Exploration & Production | | | 3,999,098 | | | | 3,592,334 | | | | 0 | | | | 7,591,432 | |
| Oil Companies - US Royalty Trusts | | | 80,400 | | | | – | | | | – | | | | 80,400 | |
| Oil Refining & Marketing | | | 1,800,640 | | | | 1,200,594 | | | | – | | | | 3,001,234 | |
| Petrochemicals | | | – | | | | 2,190,434 | | | | – | | | | 2,190,434 | |
| Poultry | | | 1,167,856 | | | | – | �� | | | – | | | | 1,167,856 | |
| Precious Metals | | | 959,868 | | | | – | | | | – | | | | 959,868 | |
| Real Estate Operating/ Development | | | – | | | | – | | | | 6,884,534 | | | | 6,884,534 | |
| Steel - Producers | | | – | | | | 2,884,129 | | | | – | | | | 2,884,129 | |
| Transportation - Marine | | | 1,117,200 | | | | – | | | | – | | | | 1,117,200 | |
| Corporate Convertible Bond | | | – | | | | 7,832,832 | | | | – | | | | 7,832,832 | |
| Corporate Non-Convertible Bond | | | – | | | | – | | | | 2,805,938 | | | | 2,805,938 | |
| Exchange Traded Funds | | | 468,228 | | | | – | | | | – | | | | 468,228 | |
| Subscription Receipts | | | – | | | | – | | | | 485,324 | | | | 485,324 | |
| Warrants | | | | | | | | | | | | | | | | |
| Diversified Minerals | | | – | | | | 0 | | | | – | | | | 0 | |
| Gold Mining | | | 2,840 | | | | – | | | | – | | | | 2,840 | |
| Notes to Portfolios of Investments | December 31, 2017 |
| | | Quoted Prices in Active Markets for Identical Investments (Level 1) | | | Significant Other Observable Inputs (Level 2) | | | Significant Unobservable Inputs (Level 3) | | | Total | |
| Global Resources Fund (continued) | | | | | | | | | | | | |
| Investments in Securities* (continued) | | | | | | | | | | | | |
| Non-Ferrous Metals | | $ | – | | | $ | 0 | | | $ | – | | | $ | 0 | |
| Oil Companies - Exploration & Production | | | – | | | | 0 | | | | – | | | | 0 | |
| Purchased Call Options | | | 1,631,200 | | | | 1,742,670 | | | | – | | | | 3,373,870 | |
| Investments, at Value | | $ | 39,969,514 | | | $ | 44,043,579 | | | $ | 10,191,777 | | | $ | 94,204,870 | |
| | | Quoted Prices in Active Markets for Identical Investments (Level 1) | | | Significant Other Observable Inputs (Level 2) | | | Significant Unobservable Inputs (Level 3) | | | Total | |
| World Precious Minerals Fund | | | | | | | | | | | | |
| Investments in Securities* | | | | | | | | | | | | |
| Common Stocks | | | | | | | | | | | | |
| Advanced Materials/ Production | | $ | 2,673,031 | | | $ | – | | | $ | – | | | $ | 2,673,031 | |
| Capital Pools | | | – | | | | 105,012 | | | | – | | | | 105,012 | |
| Coal | | | – | | | | – | | | | 0 | | | | 0 | |
| Diamonds/Precious Stones | | | 1,249,324 | | | | – | | | | 2,048 | | | | 1,251,372 | |
| Diversified Minerals | | | 8,436,696 | | | | 1,067,603 | | | | 0 | | | | 9,504,299 | |
| Gold Mining | | | 59,888,241 | | | | 3,159,444 | | | | 0 | | | | 63,047,685 | |
| Medical - Drugs | | | 3,574 | | | | – | | | | – | | | | 3,574 | |
| Medical - Hospitals | | | – | | | | – | | | | 0 | | | | 0 | |
| Metal - Copper | | | 681,782 | | | | – | | | | – | | | | 681,782 | |
| Metal - Diversified | | | 5,545,695 | | | | 5,066,944 | | | | – | | | | 10,612,639 | |
| Mining Services | | | – | | | | 525,788 | | | | – | | | | 525,788 | |
| Non-Ferrous Metals | | | 942,721 | | | | – | | | | – | | | | 942,721 | |
| Oil Companies - Exploration & Production | | | – | | | | – | | | | 0 | | | | 0 | |
| Optical Recognition | | | | | | | | | | | | | | | | |
| Equipment | | | 10,862 | | | | – | | | | – | | | | 10,862 | |
| Precious Metals | | | 18,335,415 | | | | 1,478,312 | | | | – | | | | 19,813,727 | |
| Silver Mining | | | 87,510 | | | | – | | | | – | | | | 87,510 | |
| Corporate Convertible Bond | | | – | | | | 2,724,267 | | | | – | | | | 2,724,267 | |
| Corporate Non-Convertible Bond | | | – | | | | – | | | | 748,250 | | | | 748,250 | |
| Right | | | 450,594 | | | | – | | | | – | | | | 450,594 | |
| Exchange Traded Funds | | | 1,591,700 | | | | – | | | | – | | | | 1,591,700 | |
| Subscription Receipt | | | – | | | | – | | | | 453,461 | | | | 453,461 | |
| Warrants | | | | | | | | | | | | | | | | |
| Diversified Minerals | | | – | | | | 0 | | | | – | | | | 0 | |
| Gold Mineral Exploration & Development | | | – | | | | – | | | | 0 | | | | 0 | |
| Notes to Portfolios of Investments | December 31, 2017 |
| | | Quoted Prices in Active Markets for Identical Investments (Level 1) | | | Significant Other Observable Inputs (Level 2) | | | Significant Unobservable Inputs (Level 3) | | | Total | |
| World Precious Minerals Fund (continued) | | | | | | | | | | | | |
| Investments in Securities* (continued) | | | | | | | | | | | | |
| Gold Mining | | $ | 443,789 | | | $ | 134,248 | | | $ | 0 | | | $ | 578,037 | |
| Metal - Diversified | | | – | | | | 53,103 | | | | – | | | | 53,103 | |
| Precious Metals | | | – | | | | 186,157 | | | | – | | | | 186,157 | |
| Investments, at Value | | $ | 100,340,934 | | | $ | 14,500,878 | | | $ | 1,203,759 | | | $ | 116,045,571 | |
| | | Quoted Prices in Active Markets for Identical Investments (Level 1) | | | Significant Other Observable Inputs (Level 2) | | | Significant Unobservable Inputs (Level 3) | | | Total | |
| Gold And Precious Metals Fund | | | | | | | | | | | | |
| Investments in Securities* | | | | | | | | | | | | |
| Common Stocks | | | | | | | | | | | | |
| Capital Pools | | $ | – | | | $ | – | | | $ | 477,327 | | | $ | 477,327 | |
| Diamonds/Precious Stones | | | 894,193 | | | | – | | | | – | | | | 894,193 | |
| Gold Mining | | | 58,520,797 | | | | 17,077,278 | | | | – | | | | 75,598,075 | |
| Medical - Hospitals | | | – | | | | – | | | | 0 | | | | 0 | |
| Metal - Diversified | | | 4,556,881 | | | | – | | | | – | | | | 4,556,881 | |
| Precious Metals | | | 8,052,107 | | | | – | | | | 0 | | | | 8,052,107 | |
| Recycling | | | – | | | | 800,898 | | | | – | | | | 800,898 | |
| Silver Mining | | | 4,188,931 | | | | – | | | | – | | | | 4,188,931 | |
| Corporate Convertible Bonds | | | – | | | | 1,747,335 | | | | – | | | | 1,747,335 | |
| Corporate Non-Convertible Bonds | | | – | | | | – | | | | 280,594 | | | | 280,594 | |
| Exchange Traded Funds | | | 1,591,700 | | | | – | | | | – | | | | 1,591,700 | |
| Units | | | – | | | | – | | | | 2,000,000 | | | | 2,000,000 | |
| Warrants | | | | | | | | | | | | | | | | |
| Gold Mining | | | 375,964 | | | | – | | | | – | | | | 375,964 | |
| Silver Mining | | | – | | | | 60,760 | | | | – | | | | 60,760 | |
| Investments, at Value | | $ | 78,180,573 | | | $ | 19,686,271 | | | $ | 2,757,921 | | | $ | 100,624,765 | |
| Notes to Portfolios of Investments | December 31, 2017 |
| | | Quoted Prices in Active Markets for Identical Investments (Level 1) | | | Significant Other Observable Inputs (Level 2) | | | Significant Unobservable Inputs (Level 3) | | | Total | |
| Emerging Europe Fund | | | | | | | | | | | | |
| Assets | | | | | | | | | | | | |
| Investments in Securities* | | | | | | | | | | | | |
| Common Stocks | | | | | | | | | | | | |
| Agricultural Chemicals | | $ | – | | | $ | 471,557 | | | $ | – | | | $ | 471,557 | |
| Airlines | | | – | | | | 3,125,113 | | | | – | | | | 3,125,113 | |
| Airport Development/ Maintenance | | | – | | | | 300,083 | | | | – | | | | 300,083 | |
| Audio/Video Products | | | – | | | | 514,942 | | | | – | | | | 514,942 | |
| Automotive - Cars & Light Trucks | | | – | | | | 1,295,969 | | | | – | | | | 1,295,969 | |
| Automotive/Truck Parts & Equipment - Original | | | – | | | | 184,584 | | | | – | | | | 184,584 | |
| Beverages - Non-alcoholic | | | – | | | | 180,371 | | | | – | | | | 180,371 | |
| Cellular Telecommunication | | | 282,263 | | | | 622,039 | | | | – | | | | 904,302 | |
| Chemicals - Diversified | | | – | | | | 767,210 | | | | – | | | | 767,210 | |
| Chemicals - Fibers | | | – | | | | 449,950 | | | | – | | | | 449,950 | |
| Chemicals - Specialty | | | – | | | | 182,044 | | | | – | | | | 182,044 | |
| Coal | | | – | | | | 1,063,579 | | | | – | | | | 1,063,579 | |
| Commercial Banks Non-US | | | 4,866,705 | | | | 4,651,444 | | | | – | | | | 9,518,149 | |
| Communications Software | | | – | | | | 183,163 | | | | – | | | | 183,163 | |
| Computer Services | | | 250,650 | | | | 491,947 | | | | – | | | | 742,597 | |
| Cosmetics & Toiletries | | | – | | | | 266,238 | | | | – | | | | 266,238 | |
| Diamonds/Precious Stones | | | – | | | | 172,972 | | | | – | | | | 172,972 | |
| Diversified Operations | | | – | | | | 1,147,944 | | | | – | | | | 1,147,944 | |
| Electric - Distribution | | | – | | | | 553,049 | | | | – | | | | 553,049 | |
| Electric - Generation | | | – | | | | 620,491 | | | | – | | | | 620,491 | |
| Electric - Integrated | | | – | | | | 387,333 | | | | – | | | | 387,333 | |
| Entertainment Software | | | – | | | | 320,310 | | | | – | | | | 320,310 | |
| Finance - Other Services | | | – | | | | 148,101 | | | | – | | | | 148,101 | |
| Food - Retail | | | – | | | | 1,000,002 | | | | – | | | | 1,000,002 | |
| Food - Wholesale/ Distribution | | | – | | | | 182,341 | | | | – | | | | 182,341 | |
| Gold Mining | | | 572,792 | | | | 215,793 | | | | – | | | | 788,585 | |
| Human Resources | | | – | | | | 272,322 | | | | – | | | | 272,322 | |
| Machinery - Farm | | | – | | | | 220,621 | | | | – | | | | 220,621 | |
| Metal - Diversified | | | 512,209 | | | | 257,925 | | | | – | | | | 770,134 | |
| Metal - Iron | | | – | | | | 423,720 | | | | – | | | | 423,720 | |
| Miscellaneous | | | | | | | | | | | | | | | | |
| Manufacturing | | | – | | | | 309,308 | | | | – | | | | 309,308 | |
| Multi-line Insurance | | | – | | | | 1,577,768 | | | | – | | | | 1,577,768 | |
| Oil Companies - Exploration & Production | | | 258,973 | | | | – | | | | – | | | | 258,973 | |
| Oil Companies - Integrated | | | 4,576,706 | | | | 1,435,642 | | | | – | | | | 6,012,348 | |
| Oil Refining & Marketing | | | – | | | | 1,557,123 | | | | – | | | | 1,557,123 | |
| Property/Casualty Insurance | | | – | | | | 459,636 | | | | – | | | | 459,636 | |
| Notes to Portfolios of Investments | December 31, 2017 |
| | | Quoted Prices in Active Markets for Identical Investments (Level 1) | | | Significant Other Observable Inputs (Level 2) | | | Significant Unobservable Inputs (Level 3) | | | Total | |
| Emerging Europe Fund (continued) | | | | | | | | | | | | |
| Assets (continued) | | | | | | | | | | | | |
| Investments in Securities* | | | | | | | | | | | | |
| (continued) | | | | | | | | | | | | |
| Real Estate Operating/ Development | | $ | – | | | $ | 424,962 | | | $ | – | | | $ | 424,962 | |
| Regional Banks - Non US | | | – | | | | 443,122 | | | | – | | | | 443,122 | |
| Retail - Automobile | | | – | | | | 206,302 | | | | – | | | | 206,302 | |
| Retail - Jewelry | | | – | | | | 197,288 | | | | – | | | | 197,288 | |
| Retail - Major Dept Store | | | – | | | | 133,188 | | | | – | | | | 133,188 | |
| Steel - Producers | | | 884,719 | | | | 1,614,237 | | | | – | | | | 2,498,956 | |
| Telecom Services | | | – | | | | 546,716 | | | | – | | | | 546,716 | |
| Telephone - Integrated | | | – | | | | 643,054 | | | | – | | | | 643,054 | |
| Textile - Apparel | | | – | | | | 232,540 | | | | – | | | | 232,540 | |
| Tobacco | | | – | | | | 202,418 | | | | – | | | | 202,418 | |
| Transportation - Rail | | | – | | | | 496,643 | | | | – | | | | 496,643 | |
| Transportation - Services | | | – | | | | 249,298 | | | | – | | | | 249,298 | |
| Travel Services | | | – | | | | 240,321 | | | | – | | | | 240,321 | |
| Web Portals/ISP | | | 204,687 | | | | – | | | | – | | | | 204,687 | |
| Exchange Traded Funds | | | 436,381 | | | | – | | | | – | | | | 436,381 | |
| Investments, at Value | | $ | 12,846,085 | | | $ | 31,642,723 | | | $ | – | | | $ | 44,488,808 | |
Other Financial Instruments† | | | | | | | | | | | | | | | | |
| Currency Contracts | | | – | | | | 26,243 | | | | – | | | | 26,243 | |
| Total Assets | | $ | 12,846,085 | | | $ | 31,668,966 | | | $ | – | | | $ | 44,515,051 | |
| | | | | | | | | | | | | | | | | |
| Liabilities | | | | | | | | | | | | | | | | |
Other Financial Instruments† | | | | | | | | | | | | | | | | |
| Currency Contracts | | | – | | | | (148,063 | ) | | | – | | | | (148,063 | ) |
| Total Liabilities | | $ | – | | | $ | (148,063 | ) | | $ | – | | | $ | (148,063 | ) |
| | | Quoted Prices in Active Markets for Identical Investments (Level 1) | | | Significant Other Observable Inputs (Level 2) | | | Significant Unobservable Inputs (Level 3) | | | Total | |
| China Region Fund | | | | | | | | | | | | |
| Investments in Securities* | | | | | | | | | | | | |
| Common Stocks | | | | | | | | | | | | |
| Agricultural Operations | | $ | – | | | $ | 50,234 | | | $ | – | | | $ | 50,234 | |
| Airlines | | | – | | | | 272,927 | | | | – | | | | 272,927 | |
| Automotive - Cars & Light | | | | | | | | | | | | | | | | |
| Trucks | | | – | | | | 4,476,580 | | | | – | | | | 4,476,580 | |
| Automotive - Medium & Heavy Duty Trucks | | | – | | | | 281,359 | | | | – | | | | 281,359 | |
| Notes to Portfolios of Investments | December 31, 2017 |
| | | Quoted Prices in Active Markets for Identical Investments (Level 1) | | | Significant Other Observable Inputs (Level 2) | | | Significant Unobservable Inputs (Level 3) | | | Total | |
| China Region Fund (continued) | | | | | | | | | | | | |
| Investments in Securities* (continued) | | | | | | | | | | | | |
| Automotive/Truck Parts & Equipment - Original | | $ | – | | | $ | 1,000,475 | | | $ | – | | | $ | 1,000,475 | |
| Batteries/Battery Systems | | | – | | | | 85,077 | | | | – | | | | 85,077 | |
| Beverages - Non-alcoholic | | | – | | | | 56,253 | | | | – | | | | 56,253 | |
| Building & Construction Products - Miscellaneous | | | – | | | | 67,937 | | | | – | | | | 67,937 | |
| Building Products - Doors & Windows | | | – | | | | 571,939 | | | | – | | | | 571,939 | |
| Casino Hotels | | | – | | | | 1,098,751 | | | | – | | | | 1,098,751 | |
| Chemicals - Diversified | | | – | | | | 25,196 | | | | – | | | | 25,196 | |
| Chemicals - Other | | | – | | | | 296,677 | | | | – | | | | 296,677 | |
| Chemicals - Specialty | | | – | | | | 446,103 | | | | – | | | | 446,103 | |
| Coal | | | – | | | | 606,912 | | | | – | | | | 606,912 | |
| Commercial Banks Non-US | | | – | | | | 164,144 | | | | – | | | | 164,144 | |
| Commercial Service - Finance | | | – | | | | 273,460 | | | | – | | | | 273,460 | |
| Computers - Integrated System | | | – | | | | 76,588 | | | | – | | | | 76,588 | |
| Computers - Memory Devices | | | – | | | | 168,454 | | | | – | | | | 168,454 | |
| Computers - Peripher Equipment | | | – | | | | 20,756 | | | | – | | | | 20,756 | |
| Cosmetics & Toiletries | | | – | | | | 26,080 | | | | – | | | | 26,080 | |
| Diversified Operations | | | – | | | | 351,899 | | | | – | | | | 351,899 | |
| Electric - Distribution | | | – | | | | 29,622 | | | | – | | | | 29,622 | |
| Electronic Components - Miscellaneous | | | – | | | | 1,310,946 | | | | – | | | | 1,310,946 | |
| Electronic Components - Semiconductors | | | – | | | | 28,411 | | | | – | | | | 28,411 | |
| Entertainment Software | | | 172,535 | | | | 241,756 | | | | – | | | | 414,291 | |
| Food - Miscellaneous/Diversified | | | – | | | | 17,339 | | | | – | | | | 17,339 | |
| Internet Application Software | | | – | | | | 2,587,898 | | | | – | | | | 2,587,898 | |
| Life/Health Insurance | | | – | | | | 99,289 | | | | – | | | | 99,289 | |
| Machinery - Construction & Mining | | | – | | | | 513,963 | | | | – | | | | 513,963 | |
| Medical - Drugs | | | – | | | | 393,642 | | | | – | | | | 393,642 | |
| Medical Products | | | – | | | | 290,974 | | | | – | | | | 290,974 | |
| Metal - Copper | | | – | | | | 174,052 | | | | – | | | | 174,052 | |
| Multi-line Insurance | | | – | | | | 1,535,066 | | | | – | | | | 1,535,066 | |
| Non-Ferrous Metals | | | – | | | | 19,600 | | | | – | | | | 19,600 | |
| Non-hazardous Waste Disposal | | | – | | | | 117,556 | | | | – | | | | 117,556 | |
| Oil Companies - Integrated | | | 202,208 | | | | 26,952 | | | | – | | | | 229,160 | |
| Notes to Portfolios of Investments | December 31, 2017 |
| | | Quoted Prices in Active Markets for Identical Investments (Level 1) | | | Significant Other Observable Inputs (Level 2) | | | Significant Unobservable Inputs (Level 3) | | | Total | |
| China Region Fund (continued) | | | | | | | | | | | | |
| Investments in Securities* (continued) | | | | | | | | | | | | |
| Oil Refining & Marketing | | $ | – | | | $ | 473,964 | | | $ | – | | | $ | 473,964 | |
| Paper & Related Products | | | – | | | | 159,786 | | | | – | | | | 159,786 | |
| Pastoral & Agricultural | | | – | | | | 186,769 | | | | – | | | | 186,769 | |
| Petrochemicals | | | 239,400 | | | | 305,800 | | | | – | | | | 545,200 | |
| Photo Equipment & Supplies | | | – | | | | 1,993,470 | | | | – | | | | 1,993,470 | |
| Property/Casualty Insurance | | | – | | | | 707,464 | | | | – | | | | 707,464 | |
| Real Estate Operating/Development | | | – | | | | 2,535,451 | | | | – | | | | 2,535,451 | |
| Retail - Automobile | | | – | | | | 249,973 | | | | – | | | | 249,973 | |
| Retail - Home Furnishings | | | – | | | | 976,631 | | | | – | | | | 976,631 | |
| Semiconductor Equipment | | | – | | | | 1,068,224 | | | | – | | | | 1,068,224 | |
| Telecom Services | | | – | | | | 114,553 | | | | – | | | | 114,553 | |
| Call Option | | | – | | | | 492,500 | | | | – | | | | 492,500 | |
| Investments, at Value | | $ | 614,143 | | | $ | 27,069,452 | | | $ | – | | | $ | 27,683,595 | |
| * | Refer to the Portfolio of Investments for a detailed list of the Fund’s investments. |
| † | Other Financial Instruments are derivatives not reflected in the Portfolio of Investments, such as Currency Contracts, which are valued at the unrealized appreciation (depreciation) at year end. |
The following table shows transfers between Level 1 and Level 2 of the fair value hierarchy during the period January 1, 2017 through December 31, 2017:
| Fund | | Transfers From Level 1 to Level 2* | | | Transfers from Level 2 to Level 1* | |
| Holmes Macro Trends Fund | | $ | — | | | $ | 12 | (1) |
| Global Resources Fund | | | 19,600 | (2) | | | 122,172 | (1) |
| World Precious Minerals Fund | | | — | | | | 4,380,091 | (1) |
| Gold and Precious Metals Fund | | | — | | | | 288,186 | (1) |
| China Region Fund | | | 19,600 | (2) | | | — | |
| * | The Funds’ policy is to recognize transfers in and transfers out as of the end of the reporting period. |
(1) | Securities were valued at a quoted price at the end of the current fiscal year, but at the mean between bid and ask quotations at the end of the prior fiscal year. |
(2) | Securities were valued at a IDC fair value price at the end of the current fiscal year, but at a quoted price at the end of the prior fiscal year. |
| Notes to Portfolios of Investments | December 31, 2017 |
The following is a reconciliation of assets for which unobservable inputs (Level 3) were used in determining fair value during the period January 1, 2017 through December 31, 2017:
| | | Rights | | | Total | |
| All American Equity Fund | | | | | | |
| Beginning Balance 12/31/16 | | $ | 0 | | | $ | 0 | |
| Ending Balance 12/31/17 | | $ | 0 | | | $ | 0 | |
Net change in unrealized appreciation (depreciation) from Investments held as of 12/31/17(1) | | $ | — | | | $ | — | |
| | | Common Stocks | | | Corporate Non-Convertible Bond | | | Total | |
| Holmes Macro Trends Fund | | | | | | | | | |
| Beginning Balance 12/31/16 | | $ | 293,796 | | | $ | 233,829 | | | $ | 527,625 | |
| Net change in unrealized appreciation (depreciation) | | | 100,704 | | | | — | | | | 100,704 | |
| Ending Balance 12/31/17 | | $ | 394,500 | | | $ | 233,829 | | | $ | 628,329 | |
Net change in unrealized appreciation (depreciation) from Investments held as of 12/31/17(1) | | $ | 100,704 | | | $ | — | | | $ | 100,704 | |
| | | Common Stocks | | | Corporate Non-Convertible Bond | | | Subscription Receipt | | | Total | |
| Global Resources Fund | | | | | | | | | | | | |
| Beginning Balance 12/31/16 | | $ | 5,264,464 | | | $ | 2,805,938 | | | $ | — | | | $ | 8,070,402 | |
| Purchases | | | — | | | | — | | | | 503,347 | | | | 503,347 | |
| Net change in unrealized appreciation (depreciation) | | | 1,635,295 | | | | — | | | | (18,023 | ) | | | 1,617,272 | |
| Transfers into Level 3* | | | 756 | | | | — | | | | — | | | | 756 | |
| Ending Balance 12/31/17 | | $ | 6,900,515 | | | $ | 2,805,938 | | | $ | 485,324 | | | $ | 10,191,777 | |
Net change in unrealized appreciation (depreciation) from Investments held as of 12/31/17(1) | | $ | 1,635,295 | | | $ | — | | | | (18,023 | ) | | | 1,617,272 | |
| | | Common Stock | | | Corporate Non-Convertible Bond | | | Subscription Receipt | | | Total | |
| World Precious Minerals Fund | | | | | | | | | | | | |
| Beginning Balance 12/31/2016 | | $ | — | | | $ | 748,250 | | | $ | — | | | $ | 748,250 | |
| Purchases | | | — | | | | — | | | | 473,317 | | | | 473,317 | |
| Net change in unrealized appreciation (depreciation) | | | — | | | | — | | | | (19,856 | ) | | | (19,856 | ) |
| Transfers into Level 3* | | | 2,048 | | | | — | | | | — | | | | 2,048 | |
| Ending Balance 12/31/2017 | | $ | 2,048 | | | $ | 748,250 | | | $ | 453,461 | | | $ | 1,203,759 | |
Net change in unrealized appreciation (depreciation) from Investments held as of 12/31/17(1) | | $ | — | | | $ | — | | | $ | (19,856 | ) | | $ | (19,856 | ) |
| Notes to Portfolios of Investments | December 31, 2017 |
| | | Common Stocks | | | Corporate Non-Convertible Bond | | | Units | | | Total | |
| Gold and Precious Metals Fund | | | | | | | | | | | | |
| Beginning Balance 12/31/16 | | $ | — | | | $ | 280,594 | | | $ | — | | | $ | 280,594 | |
| Purchases | | | 730,204 | | | | — | | | | 2,000,000 | | | | 2,730,204 | |
| Net change in unrealized appreciation (depreciation) | | | (252,877 | ) | | | — | | | | — | | | | (252,877 | ) |
| Ending Balance 12/31/17 | | $ | 477,327 | | | $ | 280,594 | | | $ | 2,000,000 | | | $ | 2,757,921 | |
Net change in unrealized appreciation (depreciation) from Investments held as of 12/31/17(1) | | $ | (252,877 | ) | | $ | — | | | $ | — | | | $ | (252,877 | ) |
| * | The Funds’ policy is to recognize transfers in and transfers out as of the end of the reporting period. |
(1) | The amounts shown represent the net change in unrealized appreciation (depreciation) attributable to only those investments still held and classified as Level 3 at December 31, 2017. |
Significant unobservable inputs developed by the Valuation Committee (“Valuation Committee”) for Level 3 investments held at year-end are as follows:
| | | Fair Value at 12/31/2017 | | Valuation Technique(s) | Unobservable Input | | Range (Weighted Average) | |
| All American Equity Fund | | | | | | | | |
| Investments in Securities Rights | | $ | — | | Market Transaction(1) | Discount | | | 100% | |
| | | | | | | | | | | |
| Holmes Macro Trends Fund | | | | | | | | | | |
| Investments in Securities | | | | | | | | 100% discount-12% | |
| Common Stocks | | | 394,500 | | Market Transaction(1) | Discount | | premium (36%discount) | |
| Corporate Non-Convertible Bonds | | | 233,829 | | Market Transaction(1) | Discount | | | 0% | |
| | | | | | | | | | | |
| Global Resources Fund | | | | | | | | | | |
| Investments in Securities | | | | | | | | 100% discount-12% | |
| Common Stocks | | | 6,900,515 | | Market Transaction(1) | Discount | | premium (86% discount) | |
| Corporate Non-Convertible Bonds | | | 2,805,938 | | Market Transaction(1) | Discount | | | 0% | |
| Subscription Receipts | | | 485,324 | | Market Transaction(1) | Discount | | 3% - 4% discount (4% discount) | |
| | | | | | | | | | | |
| World Precious Minerals Fund | | | | | | | |
| Investments in Securities | | | | | | | | 0%-100% discount | |
| Common Stocks | | | 2,048 | | Market Transaction(1) | Discount | | (100% discount) | |
| Corporate Non-Convertible Bonds | | | 748,250 | | Market Transaction(1) | Discount | | | 100% | |
| Subscription Receipts | | | 453,461 | | Market Transaction(1) | Discount | | | 4% | |
| Warrants | | | - | | Market Transaction(1) | Discount | | | 100% | |
| | | | | | | | | | | |
| Gold and Precious Metals Fund | | | | | | | |
| Investments in Securities | | | | | | | | 100%-2% premium | |
| Common Stocks | | | 477,327 | | Market Transaction(1) | Discount | | (41% discount) | |
| Notes to Portfolios of Investments | December 31, 2017 |
| | | Fair Value at 12/31/2017 | | Valuation Technique(s) | Unobservable Input | | Range (Weighted Average) | |
| Corporate Non-Convertible | | | | | | | 0% - 100% discount | |
| Bonds | | | 280,594 | | Market Transaction(1) | Discount | | (63% discount) | |
| Units | | | 2,000,000 | | Market Transaction(1) | Discount | | | 0% | |
(1) | Market Transaction refers to most recent known market transaction, including transactions in which the fund participated, as adjusted for any discount or premium as discussed below. |
The majority of securities classified as Level 3 are private companies. The initial valuation is usually cost, which is then adjusted as determined by the Valuation Committee for subsequent known market transactions and evaluated for progress against anticipated milestones and current operations. An evaluation that the holding no longer meets expectations could result in the application of discounts and a significantly lower fair valuation. For certain securities, the last known market transaction is increased or decreased by changes in a market index or industry peers as approved by the Valuation Committee.
Affiliated Companies
The Investment Company Act of 1940 defines affiliates as companies in which the Fund owns at least 5% of the outstanding voting securities. The following is a summary of transactions with each affiliated company during the year ended December 31, 2017.
| | | | | | Shares of Affiliated Companies | | | | |
| Global Resources Fund | | December 31, 2016 | | | Additions | | | Reductions | | | December 31, 2017 | |
| Agriterra, Ltd. | | | 69,849,776 | | | | — | | | | — | | | | 698,497 | (a) |
| Atlas African Industries, Ltd. | | | 255,854,621 | | | | — | | | | — | | | | 255,854,621 | |
| Bravern Ventures, Ltd. | | | 254,431 | | | | — | | | | — | | | | 254,431 | |
| Caribbean Resources Corp. | | | 17 | | | | — | | | | — | | | | 17 | |
| Pacific Green Energy Corp. | | | 2,400,000 | | | | — | | | | — | | | | 2,400,000 | |
At December 31, 2017, the value of investments in affiliated companies was $32,386, representing 0.03% of net assets, and the total cost was $34,833,526. There was no realized gain (loss) on transactions and no income earned for the period.
| | | | | | Shares of Affiliated Companies | | | | |
| World Precious Minerals Fund | | December 31, 2016 | | | Additions | | | Reductions | | | December 31, 2017 | |
| Argent Minerals, Ltd. | | | 17,100,000 | | | | 4,000,000 | | | | — | | | | 21,100,000 | (a) |
| Argo Gold, Inc. | | | — | | | | 1,825,000 | | | | — | | | | 1,825,000 | |
| Barsele Minerals Corp. | | | 10,169,000 | | | | 1,353,000 | | | | (3,650,701 | ) | | | 7,871,299 | |
| Barsele Minerals Corp., Warrants | | | 1,850,000 | | | | — | | | | (1,250,000 | ) | | | 600,000 | |
| Bonterra Resources, Inc. | | | 6,500,000 | | | | 625,000 | | | | (2,500,000 | ) | | | 4,625,000 | (a) |
| Bonterra Resources, Inc., Warrants | | | 1,250,000 | | | | — | | | | (625,000 | ) | | | 625,000 | (a) |
| Brixton Metals Corp. | | | 2,500,000 | | | | — | | | | — | | | | 2,500,000 | (a) |
| Canyon Resources, Ltd. | | | 10,006,593 | | | | 6,168,864 | | | | (1,175,457 | ) | | | 15,000,000 | (a) |
| Canyon Resources, Ltd., Warrants | | | 6,168,864 | | | | — | | | | — | | | | — | (a) |
| CopperBank Resources Corp. | | | 6,979,418 | | | | 9,000,000 | | | | — | | | | 15,979,418 | |
| Dolly Varden Silver Corp. | | | 5,628,500 | | | | 2,686,500 | | | | (315,000 | ) | | | 8,000,000 | |
| Enforcer Gold Corp. | | | — | | | | 3,000,000 | | | | — | | | | 3,000,000 | (a) |
| Fiore Exploration, Ltd. | | | 7,746,800 | | | | — | | | | — | | | | — | (a) |
| Notes to Portfolios of Investments | December 31, 2017 |
| World Precious Minerals Fund (cont'd) | | December 31, 2016 | | | Additions | | | Reductions | | | December 31, 2017 | |
| Golden Peak Minerals, Inc. | | | 1,999,998 | | | | 300,000 | | | | — | | | | 2,299,998 | |
| Mammoth Resources Corp. | | | 4,818,000 | | | | 1,025,000 | | | | (3,671,800 | ) | | | 2,171,200 | |
| Minera Alamos, Inc., Warrants | | | 2,225,000 | | | | — | | | | — | | | | 2,225,000 | (a) |
| Minera Alamos, Inc. | | | 4,450,000 | | | | — | | | | — | | | | — | (a) |
| Murchison Minerals, Ltd. | | | 3,000,000 | | | | — | | | | — | | | | — | (a) |
| Murchison Minerals, Ltd., Warrants | | | 1,500,000 | | | | — | | | | — | | | | 1,500,000 | (a) |
| Nano One Materials Corp. | | | 3,100,000 | | | | 500,000 | | | | (600,000 | ) | | | 3,000,000 | (a) |
| NV Gold Corp. | | | 1,800,000 | | | | — | | | | (100,000 | ) | | | 1,700,000 | (a) |
| Orex Minerals, Inc. | | | 8,173,000 | | | | — | | | | (3,173,000 | ) | | | 5,000,000 | (a) |
| Orex Minerals, Inc., Warrants | | | 1,250,000 | | | | — | | | | — | | | | — | (a) |
| Red Pine Exploration, Inc. | | | 10,000,000 | | | | — | | | | (1,718,000 | ) | | | 8,282,000 | (a) |
| Redstar Gold Corp. | | | 15,000,000 | | | | — | | | | — | | | | 15,000,000 | (a) |
| Redstar Gold Corp., Warrants | | | 2,500,000 | | | | — | | | | — | | | | 2,500,000 | (a) |
| Toachi Mining, Inc. | | | 6,350,000 | | | | 4,000,000 | | | | (4,350,000 | ) | | | 6,000,000 | |
| TriStar Gold, Inc. | | | 25,308,000 | | | | 2,000,000 | | | | (197,500 | ) | | | 27,110,500 | |
| TriStar Gold, Inc., Warrants | | | — | | | | 1,000,000 | | | | — | | | | 1,000,000 | |
At December 31, 2017, the value of investments in affiliated companies was $17,344,302, representing 14.73% of net assets, and the total cost was $14,481,874. Net realized gains on transactions were $3,344,211 and there was no income earned for the period.
| | | Shares of Affiliated Companies | |
| Gold And Precious Metals Fund | | December 31, 2016 | | | Additions | | | Reductions | | | December 31, 2017 | |
| Mene, Inc. | | | — | | | | 5,714,285 | | | | — | | | | 5,714,285 | |
At December 31, 2017, the value of investments in affiliated companies was $2,000,000, representing 1.99% of net assets, and the total cost was $2,000,000. There was no realized gain (loss) on transactions and no income earned for the period.
| (a) | At December 31, 2017, the company was no longer defined as an affiliate, although it was an affiliate company during the year. |
Restricted Securities
The following securities are subject to contractual and regulatory restrictions on resale or transfer. These investments may involve a high degree of business and financial risk. Because of the thinly traded markets for these investments, a Fund may be unable to liquidate its securities in a timely manner, especially if there is negative news regarding the specific securities or the markets overall. These securities could decline significantly in value before the Fund could liquidate these securities. The issuer bears the cost of registration, if any, involved in the disposition of these securities.
| Holmes Macro Trends Fund | Acquisition Date | Cost per Share/Unit | |
| Interamerican Energy Corp., Corporate Note (November 2021) | 05/25/12 | $ | 100.00 | |
| Pacific Infrastructure, Inc. | 08/06/10-11/22/10 | $ | 1.00 | |
As of December 31, 2017, the total cost of restricted securities was $660,454, and the total value was $628,329, representing 1.51% of net assets.
| Notes to Portfolios of Investments | December 31, 2017 |
| Global Resources Fund | Acquisition Date | Cost per Share/Unit | |
| Chakana Copper Corp., 144A, Subscription Receipts | 11/09/17 | $ | 0.39 | |
| Interamerican Energy Corp., Corporate Note (November 2021) | 05/25/12 | $ | 100.00 | |
| I-Pulse, Inc., 144A | 10/04/07 | $ | 1.88 | |
| Pacific Infrastructure, Inc. | 08/06/10-11/22/10 | $ | 1.00 | |
| PentaNova Energy Corp. | 08/30/17 | $ | 0.08 | |
| Troilus Gold, Inc., Subscription Receipts | 11/21/17 | $ | 1.28 | |
As of December 31, 2017, the total cost of restricted securities was $10,862,059, and the total value was $10,448,300, representing 10.85% of net assets.
| World Precious Minerals Fund | Acquisition Date | Cost per Share/Unit | |
| Chakana Copper Corp., 144A, Subscription Receipts | 11/09/17 | $ | 0.39 | |
| Dolly Varden Silver Corp. | 09/13/17 | $ | 0.50 | |
| Interamerican Energy Corp., Corporate Note (November 2021) | 05/25/12 | $ | 100.00 | |
As of December 31, 2017, the total cost of restricted securities was $1,722,224, and the total value was $1,745,864, representing 1.48% of net assets.
| Gold and Precious Metals Fund | Acquisition Date | Cost per Share/Unit | |
| Hut-8 Mining Corp. | 12/20/17 | $ | 1.95 | |
| Interamerican Energy Corp., Corporate Note (November 2021) | 05/25/12 | $ | 100.00 | |
| Mene, Inc., Units | 12/29/17 | $ | 0.35 | |
As of December 31, 2017, the total cost of restricted securities was $2,748,230, and the total value was $2,757,921, representing 2.74% of net assets.
Statements of Assets and Liabilities
| | | U.S. Government Securities Ultra-Short Bond Fund | |
| Investments, at identified cost | | $ | 48,519,073 | |
| | | | | |
| Assets | | | | |
| Investments, at value: | | | | |
| Securities of unaffiliated issuers | | $ | 48,457,294 | |
| Cash | | | 912,255 | |
| Receivables: | | | | |
| Dividends and interest | | | 103,781 | |
| Capital shares sold | | | 31,483 | |
| Prepaid expenses | | | 12,583 | |
| Total Assets | | | 49,517,396 | |
| | | | | |
| Liabilities | | | | |
| Payables: | | | | |
| Capital shares redeemed | | | 33,918 | |
| Distributions payable | | | 5,826 | |
| Accrued expenses and other payables: | | | | |
| Adviser | | | 10,923 | |
| Administration and Transfer Agent fees | | | 11,407 | |
| Trustees | | | 80 | |
| Other expenses | | | 28,501 | |
| Total Liabilities | | | 90,655 | |
| | | | | |
| Net Assets | | $ | 49,426,741 | |
| | | | | |
| Net Assets Consist of: | | | | |
| Paid-in capital | | $ | 49,490,291 | |
| Accumulated undistributed (distributions in excess of) net investment income | | | (1,113 | ) |
| Accumulated net realized loss from investment transactions and other assets and liabilities denominated in foreign currencies | | | (658 | ) |
| Net unrealized appreciation (depreciation) of investments and other assets and liabilities denominated in foreign currencies | | | (61,779 | ) |
| Net assets applicable to capital shares outstanding | | $ | 49,426,741 | |
| | | | | |
| By share class | | | | |
| | | | | |
| Net Assets | | | | |
| Investor Class | | $ | 49,426,741 | |
| | | | | |
| Capital shares outstanding, an unlimited number of no par shares authorized | | | | |
| Investor Class | | | 24,775,173 | |
| | | | | |
| Net Asset Value, Public Offering Price and Redemption Price per share* | | | | |
| Investor Class | | $ | 2.00 | |
| * | Redemption price per share may vary depending on length of time shares are held. See Note 1 I.. |
See accompanying notes to financial statements.
December 31, 2017
| | | Near-Term Tax Free Fund | | | All American Equity Fund | | | Holmes Macro Trends Fund | |
| | | $ | 68,769,816 | | | $ | 15,090,288 | | | $ | 34,937,441 | |
| | | | | | | | | | | | | |
| | | | | | | | | | | | | |
| | | $ | 68,589,222 | | | $ | 15,730,176 | | | $ | 39,019,207 | |
| | | | 472,060 | | | | 210,263 | | | | 2,584,043 | |
| | | | | | | | | | | | | |
| | | | 838,403 | | | | 9,975 | | | | 66,507 | |
| | | | 36,024 | | | | 19,485 | | | | 113,927 | |
| | | | 12,887 | | | | 11,003 | | | | 12,466 | |
| | | | 69,948,596 | | | | 15,980,902 | | | | 41,796,150 | |
| | | | | | | | | | | | | |
| | | | | | | | | | | | | |
| | | | 762,860 | | | | 9,302 | | | | 114,720 | |
| | | | 7,061 | | | | – | | | | – | |
| | | | | | | | | | | | | |
| | | | 13,422 | | | | 3,661 | | | | 35,079 | |
| | | | 12,477 | | | | 6,514 | | | | 10,373 | |
| | | | 115 | | | | 25 | | | | 65 | |
| | | | 32,924 | | | | 29,487 | | | | 38,652 | |
| | | | 828,859 | | | | 48,989 | | | | 198,889 | |
| | | | | | | | | | | | | |
| | | $ | 69,119,737 | | | $ | 15,931,913 | | | $ | 41,597,261 | |
| | | | | | | | | | | | | |
| | | $ | 70,183,807 | | | $ | 15,828,404 | | | $ | 37,822,655 | |
| | | | (3,429 | ) | | | 76,995 | | | | – | |
| | | | | | | | | | | | | |
| | | | (880,047 | ) | | | (613,374 | ) | | | (307,160 | ) |
| | | | | | | | | | | | | |
| | | | (180,594 | ) | | | 639,888 | | | | 4,081,766 | |
| | | $ | 69,119,737 | | | $ | 15,931,913 | | | $ | 41,597,261 | |
| | | | | | | | | | | | | |
| | | $ | 69,119,737 | | | $ | 15,931,913 | | | $ | 41,597,261 | |
| | | | | | | | | | | | | |
| | | | 31,328,194 | | | | 639,726 | | | | 2,130,944 | |
| | | | | | | | | | | | | |
| | | $ | 2.21 | | | $ | 24.90 | | | $ | 19.52 | |
Statements of Assets and Liabilities
| | | Global Resources Fund | |
| Investments, at identified cost | | $ | 149,683,526 | |
| Assets | | | | |
| Investments, at value: | | | | |
| Securities of unaffiliated issuers | | $ | 94,172,484 | |
| Securities of affiliated issuers | | | 32,386 | |
| Cash | | | 1,267,248 | |
| Unrealized gain on forward foreign currency contracts | | | – | |
| Foreign currencies (Cost $1,153,989, $180,248, $6,722, $229,100 and $112,525) | | | 1,149,947 | |
| Receivables: | | | | |
| Dividends and interest | | | 149,513 | |
| Capital shares sold | | | 122,680 | |
| Investments sold | | | – | |
| Prepaid expenses | | | 24,970 | |
| Total Assets | | | 96,919,228 | |
| | | | | |
| Liabilities | | | | |
| Unrealized loss on forward foreign currency contracts | | | – | |
| Payables: | | | | |
| Capital shares redeemed | | | 203,474 | |
| Investments purchased | | | 282,798 | |
| Foreign capital gains tax payable | | | – | |
| Accrued expenses and other payables: | | | | |
| Adviser | | | 81,194 | |
| Administration and Transfer Agent fees | | | 21,114 | |
| Trustees | | | 145 | |
| Other expenses | | | 65,788 | |
| Total Liabilities | | | 654,513 | |
| | | | | |
| Net Assets | | $ | 96,264,715 | |
| | | | | |
| Net Assets Consist of: | | | | |
| Paid-in capital | | $ | 356,523,580 | |
| Accumulated undistributed (distributions in excess of) net investment income | | | 1,183,598 | |
| Accumulated net realized loss from investment transactions and other assets and liabilities denominated in foreign currencies | | | (205,976,993 | ) |
| Net unrealized appreciation (depreciation) of investments and other assets and liabilities denominated in foreign currencies | | | (55,465,470 | ) |
| Net assets applicable to capital shares outstanding | | $ | 96,264,715 | |
| | | | | |
| By share class | | | | |
| | | | | |
| Net Assets | | | | |
| Investor Class | | $ | 95,746,907 | |
| Institutional Class | | $ | 517,808 | |
| | | | | |
| Capital shares outstanding, an unlimited number of no par shares authorized | | | | |
| Investor Class | | | 15,725,984 | |
| Institutional Class | | | 84,538 | |
| | | | | |
| Net Asset Value, Public Offering Price and Redemption Price per share* | | | | |
| Investor Class | | $ | 6.09 | |
| Institutional Class | | $ | 6.13 | |
| * | Redemption price per share may vary depending on length of time shares are held. See Note 1 I.. |
See accompanying notes to financial statements.
December 31, 2017
| | | World Precious Minerals Fund | | | Gold and Precious Metals Fund | | | Emerging Europe Fund | | | China Region Fund | |
| | | $ | 139,095,801 | | | $ | 79,721,624 | | | $ | 38,205,696 | | | $ | 18,519,898 | |
| | | | | | | | | | | | | | | | | |
| | | | | | | | | | | | | | | | | |
| | | $ | 98,701,269 | | | $ | 98,624,765 | | | $ | 44,488,808 | | | $ | 27,683,595 | |
| | | | 17,344,302 | | | | 2,000,000 | | | | – | | | | – | |
| | | | 1,346,416 | | | | 346,160 | | | | 672,185 | | | | 2,113,016 | |
| | | | – | | | | – | | | | 26,243 | | | | – | |
| | | | 180,255 | | | | 6,795 | | | | 231,870 | | | | 114,047 | |
| | | | | | | | | | | | | | | | | |
| | | | 31,023 | | | | 32,352 | | | | 210,918 | | | | 20,924 | |
| | | | 289,521 | | | | 1,037,094 | | | | 30,043 | | | | 79,968 | |
| | | | 225,191 | | | | – | | | | – | | | | – | |
| | | | 24,512 | | | | 13,137 | | | | 11,894 | | | | 13,135 | |
| | | | 118,142,489 | | | | 102,060,303 | | | | 45,671,961 | | | | 30,024,685 | |
| | | | | | | | | | | | | | | | | |
| | | | – | | | | – | | | | 148,063 | | | | – | |
| | | | | | | | | | | | | | | | | |
| | | | 216,230 | | | | 712,565 | | | | 1 03,840 | | | | 150,734 | |
| | | | 7,948 | | | | 473,638 | | | | – | | | | – | |
| | | | – | | | | – | | | | 4,880 | | | | 4,591 | |
| | | | | | | | | | | | | | | | | |
| | | | 42,777 | | | | 50,461 | | | | 47,394 | | | | 42,163 | |
| | | | 29,495 | | | | 21,192 | | | | 10,339 | | | | 8,550 | |
| | | | 175 | | | | 145 | | | | 70 | | | | 45 | |
| | | | 72,962 | | | | 62,493 | | | | 55,506 | | | | 43,369 | |
| | | | 369,587 | | | | 1,320,494 | | | | 370,092 | | | | 249,452 | |
| | | | | | | | | | | | | | | | | |
| | | $ | 117,772,902 | | | $ | 100,739,809 | | | $ | 45,301,869 | | | $ | 29,775,233 | |
| | | | | | | | | | | | | | | | | |
| | | $ | 454,955,596 | | | $ | 184,722,152 | | | $ | 77,441,811 | | | $ | 23,950,141 | |
| | | | (11,339,495 | ) | | | (4,212,058 | ) | | | (184,330 | ) | | | – | |
| | | | | | | | | | | | | | | | | |
| | | | (302,793,102 | ) | | | (100,673,586 | ) | | | (38,107,862 | ) | | | (3,335,567 | ) |
| | | | | | | | | | | | | | | | | |
| | | | (23,050,097 | ) | | | 20,903,301 | | | | 6,152,250 | | | | 9,160,659 | |
| | | $ | 117,772,902 | | | $ | 100,739,809 | | | $ | 45,301,869 | | | $ | 29,775,233 | |
| | | | | | | | | | | | | | | | | |
| | | $ | 114,765,794 | | | $ | 100,739,809 | | | $ | 45,301,869 | | | $ | 29,775,233 | |
| | | $ | 3,007,108 | | | $ | – | | | $ | – | | | $ | – | |
| | | | | | | | | | | | | | | | | |
| | | | 24,471,655 | | | | 12,656,624 | | | | 6,214,380 | | | | 2,582,962 | |
| | | | 638,486 | | | | – | | | | – | | | | – | |
| | | | | | | | | | | | | | | | | |
| | | $ | 4.69 | | | $ | 7.96 | | | $ | 7.29 | | | $ | 11.53 | |
| | | $ | 4.71 | | | $ | – | | | $ | – | | | $ | – | |
Statements of Operations
| | | U.S. Government Securities Ultra-Short Bond Fund | |
| Net Investment Income | | | |
| | | | |
| Income | | | |
| Dividends from unaffiliated issuers | | $ | – | |
| Net dividends | | | – | |
| Interest and other | | | 600,502 | |
| Total income | | | 600,502 | |
| | | | | |
| Expenses: | | | | |
| Management fee | | | 264,594 | |
| Administrative services fee | | | 47,937 | |
| Accounting service fees and expenses | | | 59,594 | |
| Distribution plan fee | | | – | |
| Transfer agent fees and expenses | | | 35,028 | |
| Professional fees | | | 32,323 | |
| Custodian fees | | | 5,738 | |
| Shareholder reporting expenses | | | 14,913 | |
| Registration fees | | | 15,167 | |
| Trustee fees and expenses | | | 6,473 | |
| Chief compliance officer fees | | | 11,816 | |
| Miscellaneous expenses | | | 53,084 | |
| Total expenses before reductions | | | 546,667 | |
| Expenses offset - Note 1 H | | | – | |
| Expenses reimbursed - Note 3 | | | (307,528 | ) |
| Net expenses | | | 239,139 | |
| | | | | |
| Net Investment Income (Loss) | | | 361,363 | |
| | | | | |
| Net Realized and Unrealized Gain (Loss) on Investments | | | | |
| Realized gain (loss) from: | | | | |
| Securities from unaffiliated issuers | | | (614 | ) |
| Foreign currency transactions | | | – | |
| Written options | | | – | |
| Net realized gain (loss) | | | (614 | ) |
| Net change in unrealized appreciation (depreciation) of: | | | | |
| Investments in unaffiliated issuers | | | (139,355 | ) |
| Net change in unrealized appreciation (depreciation) | | | (139,355 | ) |
| | | | | |
| Net Realized and Unrealized Gain (Loss) on Investments | | | (139,969 | ) |
| | | | | |
| Net Increase (Decrease) In Net Assets Resulting From Operations | | $ | 221,394 | |
See accompanying notes to financial statements.
For the Year Ended December 31, 2017
| | | Near-Term Tax Free Fund | | | All American Equity Fund | | | Holmes Macro Trends Fund | |
| | | $ | – | | | $ | 356,603 | | | $ | 500,371 | |
| | | | – | | | | 356,603 | | | | 500,371 | |
| | | | 1,350,218 | | | | – | | | | 65,022 | |
| | | | 1,350,218 | | | | 356,603 | | | | 565,393 | |
| | | | | | | | | | | | | |
| | | | 417,596 | | | | 86,325 | | | | 391,315 | |
| | | | 85,818 | | | | 30,539 | | | | 43,472 | |
| | | | 95,347 | | | | 18,845 | | | | 44,497 | |
| | | | – | | | | 41,728 | | | | 99,879 | |
| | | | 23,313 | | | | 21,585 | | | | 28,120 | |
| | | | 34,860 | | | | 28,092 | | | | 30,187 | |
| | | | 14,391 | | | | 8,235 | | | | 11,757 | |
| | | | 19,641 | | | | 9,323 | | | | 13,731 | |
| | | | 23,563 | | | | 15,484 | | | | 14,919 | |
| | | | 7,870 | | | | 4,876 | | | | 5,873 | |
| | | | 18,724 | | | | 3,742 | | | | 8,833 | |
| | | | 118,790 | | | | 29,721 | | | | 51,054 | |
| | | | 859,913 | | | | 298,495 | | | | 743,637 | |
| | | | (35,044 | ) | | | (6,149 | ) | | | (15,454 | ) |
| | | | (447,532 | ) | | | – | | | | – | |
| | | | 377,337 | | | | 292,346 | | | | 728,183 | |
| | | | | | | | | | | | | |
| | | | 972,881 | | | | 64,257 | | | | (162,790 | ) |
| | | | | | | | | | | | | |
| | | | (235,301 | ) | | | 385,174 | | | | 4,045,224 | |
| | | | – | | | | – | | | | 439 | |
| | | | – | | | | 9,470 | | | | 48,193 | |
| | | | (235,301 | ) | | | 394,644 | | | | 4,093,856 | |
| | | | | | | | | | | | | |
| | | | 414,855 | | | | 477,781 | | | | 3,047,423 | |
| | | | 414,855 | | | | 477,781 | | | | 3,047,423 | |
| | | | | | | | | | | | | |
| | | | 179,554 | | | | 872,425 | | | | 7,141,279 | |
| | | | | | | | | | | | | |
| | | $ | 1,152,435 | | | $ | 936,682 | | | $ | 6,978,489 | |
Statements of Operations
| | | Global Resources Fund | |
| Net Investment Income | | | |
| | | | |
| Income | | | |
| Dividends from unaffiliated issuers | | $ | 2,405,906 | |
| Foreign tax withheld on dividends | | | (134,679 | ) |
| Net dividends | | | 2,271,227 | |
| Interest and other | | | 1,093,994 | |
| Total income | | | 3,365,221 | |
| | | | | |
| Expenses: | | | | |
| Management fee | | | 653,242 | |
| Administrative services fee | | | 53,433 | |
| Administrative services fee - Investor Class | | | 47,269 | |
| Administrative services fee - Institutional Class | | | 325 | |
| Accounting service fees and expenses | | | 106,831 | |
| Distribution plan fee | | | 236,319 | |
| Transfer agent fees and expenses | | | – | |
| Transfer agent fees and expenses - Investor Class | | | 81,419 | |
| Transfer agent fees and expenses - Institutional Class | | | 8,655 | |
| Professional fees | | | 39,274 | |
| Custodian fees | | | 46,796 | |
| Shareholder reporting expenses | | | – | |
| Shareholder reporting expenses - Investor Class | | | 40,724 | |
| Shareholder reporting expenses - Institutional Class | | | 2,379 | |
| Registration fees | | | – | |
| Registration fees - Investor | | | 8,351 | |
| Registration fees - Institutional | | | 9,691 | |
| Trustee fees and expenses | | | 8,490 | |
| Chief compliance officer fees | | | 21,298 | |
| Miscellaneous expenses | | | 184,793 | |
| Total expenses before reductions | | | 1,549,289 | |
| Expenses offset - Note 1 H | | | (20,759 | ) |
| Expenses reimbursed - Note 3 | | | (17,331 | ) |
| Net expenses | | | 1,511,199 | |
| | | | | |
| Net Investment Income (Loss) | | | 1,854,022 | |
| | | | | |
| Net Realized and Unrealized Gain (Loss) on Investments | | | | |
| Realized gain (loss) from: | | | | |
| Securities from unaffiliated issuers | | | 3,876,583 | |
| Securities from affiliated issuers | | | – | |
| Foreign currency transactions | | | (88,661 | ) |
| Net realized gain | | | 3,787,922 | |
| Net change in unrealized appreciation (depreciation) of: | | | | |
| Investments in unaffiliated issuers | | | 45,982,506 | |
| Investments in affiliated issuers | | | (34,801,137 | ) |
| Other assets and liabilities denominated in foreign currencies | | | 3,006 | |
| Deferred foreign capital gains taxes | | | – | |
| Net change in unrealized appreciation (depreciation) | | | 11,184,375 | |
| | | | | |
| Net Realized and Unrealized Gain (Loss) on Investments | | | 14,972,297 | |
| | | | | |
| Net Increase (Decrease) In Net Assets Resulting From Operations | | $ | 16,826,319 | |
See accompanying notes to financial statements.
For the Year Ended December 31, 2017
| | | World Precious Minerals Fund | | | Gold and Precious Metals Fund | | | Emerging Europe Fund | | | China Region Fund | |
| | | $ | 44,408 | | | $ | 670,332 | | | $ | 1,838,688 | | | $ | 497,710 | |
| | | | (2,721 | ) | | | (26,610 | ) | | | (217,864 | ) | | | (36,030 | ) |
| | | | 41,687 | | | | 643,722 | | | | 1,620,824 | | | | 461,680 | |
| | | | 386,745 | | | | 178,909 | | | | – | | | | – | |
| | | | 428,432 | | | | 822,631 | | | | 1,620,824 | | | | 461,680 | |
| | | | | | | | | | | | | | | | | |
| | | | 1,359,934 | | | | 828,811 | | | | 542,244 | | | | 321,596 | |
| | | | 72,940 | | | | 105,869 | | | | 46,835 | | | | 35,850 | |
| | | | 67,196 | | | | – | | | | – | | | | – | |
| | | | 1,302 | | | | – | | | | – | | | | – | |
| | | | 158,405 | | | | 115,027 | | | | 51,043 | | | | 25,043 | |
| | | | 335,932 | | | | 254,361 | | | | 113,800 | | | | 60,213 | |
| | | | – | | | | 89,204 | | | | 37,567 | | | | 26,001 | |
| | | | 94,495 | | | | – | | | | – | | | | – | |
| | | | 14,682 | | | | – | | | | – | | | | – | |
| | | | 40,161 | | | | 37,992 | | | | 39,730 | | | | 34,896 | |
| | | | 58,249 | | | | 33,164 | | | | 63,815 | | | | 18,442 | |
| | | | – | | | | 26,198 | | | | 20,652 | | | | 19,908 | |
| | | | 37,131 | | | | – | | | | – | | | | – | |
| | | | 1,270 | | | | – | | | | – | | | | – | |
| | | | – | | | | 30,159 | | | | 13,450 | | | | 17,060 | |
| | | | 17,551 | | | | – | | | | – | | | | – | |
| | | | 4,818 | | | | – | | | | – | | | | – | |
| | | | 16,912 | | | | 8,883 | | | | 6,137 | | | | 5,176 | |
| | | | 31,221 | | | | 22,883 | | | | 10,062 | | | | 5,107 | |
| | | | 226,285 | | | | 155,072 | | | | 109,021 | | | | 57,164 | |
| | | | 2,538,484 | | | | 1,707,623 | | | | 1,054,356 | | | | 626,456 | |
| | | | (22,410 | ) | | | (28,966 | ) | | | (8,000 | ) | | | (11,965 | ) |
| | | | (29,301 | ) | | | – | | | | – | | | | (8,997 | ) |
| | | | 2,486,773 | | | | 1,678,657 | | | | 1,046,356 | | | | 605,494 | |
| | | | | | | | | | | | | | | | | |
| | | | (2,058,341 | ) | | | (856,026 | ) | | | 574,468 | | | | (143,814 | ) |
| | | | | | | | | | | | | | | | | |
| | | | 9,227,071 | | | | 5,712,281 | | | | 4,410,422 | | | | 1,580,658 | |
| | | | 3,344,211 | | | | – | | | | – | | | | – | |
| | | | (857,830 | ) | | | (585,524 | ) | | | (1,075,996 | ) | | | 5,153 | |
| | | | 11,713,452 | | | | 5,126,757 | | | | 3,334,426 | | | | 1,585,811 | |
| | | | | | | | | | | | | | | | | |
| | | | (9,769,272 | ) | | | 6,800,280 | | | | 5,626,436 | | | | 8,259,256 | |
| | | | (5,607,761 | ) | | | – | | | | – | | | | – | |
| | | | (459 | ) | | | 193 | | | | (113,591 | ) | | | 3,060 | |
| | | | – | | | | – | | | | (4,880 | ) | | | (4,591 | ) |
| | | | (15,377,492 | ) | | | 6,800,473 | | | | 5,507,965 | | | | 8,257,725 | |
| | | | (3,664,040 | ) | | | 11,927,230 | | | | 8,842,391 | | | | 9,843,536 | |
| | | $ | (5,722,381 | ) | | $ | 11,071,204 | | | $ | 9,416,859 | | | $ | 9,699,722 | |
Statements of Changes in Net Assets
| | | U.S. Government Securities Ultra-Short Bond Fund | |
| | | Year Ended December 31, 2017 | | | Year Ended December 31, 2016 | |
| Increase (Decrease) in Net Assets | | | | | | |
| | | | | | | |
| From operations: | | | | | | |
| Net investment income | | $ | 361,363 | | | $ | 259,443 | |
| Net realized gain (loss) | | | (614 | ) | | | 16,447 | |
| Net change in unrealized appreciation (depreciation) | | | (139,355 | ) | | | 50,035 | |
| Net increase (decrease) in net assets from operations | | | 221,394 | | | | 325,925 | |
| | | | | | | | | |
| Distributions to shareholders | | | | | | | | |
| From net investment income | | | | | | | | |
| Investor Class | | | (362,476 | ) | | | (259,648 | ) |
| From return of capital | | | | | | | | |
| Investor Class | | | – | | | | (2,047 | ) |
| From net realized gains | | | | | | | | |
| Investor Class | | | – | | | | (17,626 | ) |
| Total distributions to shareholders | | | (362,476 | ) | | | (279,321 | ) |
| | | | | | | | | |
| From capital share transactions: | | | | | | | | |
| Proceeds from shares sold | | | | | | | | |
| Investor Class | | | 12,743,407 | | | | 12,372,975 | |
| Distributions reinvested | | | | | | | | |
| Investor Class | | | 313,298 | | | | 238,566 | |
| Proceeds from short-term trading fees | | | | | | | | |
| Investor Class | | | – | | | | – | |
| | | | 13,056,705 | | | | 12,611,541 | |
| Cost of shares redeemed | | | | | | | | |
| Investor Class | | | (20,282,493 | ) | | | (18,426,069 | ) |
| | | | | | | | | |
| Net decrease in net assets from capital share transactions | | | (7,225,788 | ) | | | (5,814,528 | ) |
| | | | | | | | | |
| Net Decrease in Net Assets | | | (7,366,870 | ) | | | (5,767,924 | ) |
| | | | | | | | | |
| Net Assets | | | | | | | | |
| Beginning of year | | | 56,793,611 | | | | 62,561,535 | |
| End of year | | $ | 49,426,741 | | | $ | 56,793,611 | |
| | | | | | | | | |
| Accumulated undistributed net investment income (distributions in excess of net investment income), end of year | | $ | (1,113 | ) | | $ | 11 | |
| | | | | | | | | |
| Capital Share Activity | | | | | | | | |
| Investor Class | | | | | | | | |
| Shares sold | | | 6,371,703 | | | | 6,168,822 | |
| Shares reinvested | | | 156,649 | | | | 118,920 | |
| Shares redeemed | | | (10,141,246 | ) | | | (9,183,862 | ) |
| Net capital share activity | | | (3,612,894 | ) | | | (2,896,120 | ) |
See accompanying notes to financial statements.
| | | Near-Term Tax Free Fund | | | All American Equity Fund | |
| | | Year Ended December 31, 2017 | | | Year Ended December 31, 2016 | | | Year Ended December 31, 2017 | | | Year Ended December 31, 2016 | |
| | | $ | 972,881 | | | $ | 1,431,075 | | | $ | 64,257 | | | $ | 10,546 | |
| | | | (235,301 | ) | | | (258,979 | ) | | | 394,644 | | | | 364,020 | |
| | | | 414,855 | | | | (1,746,522 | ) | | | 477,781 | | | | (418,440 | ) |
| | | | 1,152,435 | | | | (574,426 | ) | | | 936,682 | | | | (43,874 | ) |
| | | | | | | | | | | | | | | | | |
| | | | | | | | | | | | | | | | | |
| | | | (977,375 | ) | | | (1,496,282 | ) | | | (11,077 | ) | | | (27,184 | ) |
| | | | | | | | | | | | | | | | | |
| | | | – | | | | (13,758 | ) | | | – | | | | – | |
| | | | | | | | | | | | | | | | | |
| | | | – | | | | – | | | | – | | | | – | |
| | | | (977,375 | ) | | | (1,510,040 | ) | | | (11,077 | ) | | | (27,184 | ) |
| | | | | | | | | | | | | | | | | |
| | | | | | | | | | | | | | | | | |
| | | | 21,459,051 | | | | 55,084,675 | | | | 2,362,418 | | | | 1,190,494 | |
| | | | | | | | | | | | | | | | | |
| | | | 895,633 | | | | 1,318,777 | | | | 10,314 | | | | 25,370 | |
| | | | | | | | | | | | | | | | | |
| | | | – | | | | – | | | | – | | | | 53 | |
| | | | 22,354,684 | | | | 56,403,452 | | | | 2,372,732 | | | | 1,215,917 | |
| | | | | | | | | | | | | | | | | |
| | | | (48,710,575 | ) | | | (65,787,063 | ) | | | (4,716,185 | ) | | | (2,912,402 | ) |
| | | | | | | | | | | | | | | | | |
| | | | (26,355,891 | ) | | | (9,383,611 | ) | | | (2,343,453 | ) | | | (1,696,485 | ) |
| | | | (26,180,831 | ) | | | (11,468,077 | ) | | | (1,417,848 | ) | | | (1,767,543 | ) |
| | | | | | | | | | | | | | | | | |
| | | | 95,300,568 | | | | 106,768,645 | | | | 17,349,761 | | | | 19,117,304 | |
| | | $ | 69,119,737 | | | $ | 95,300,568 | | | $ | 15,931,913 | | | $ | 17,349,761 | |
| | | | | | | | | | | | | | | | | |
| | | $ | (3,429 | ) | | $ | 1,073 | | | $ | 76,995 | | | $ | 11,078 | |
| | | | | | | | | | | | | | | | | |
| | | | | | | | | | | | | | | | | |
| | | | 9,658,012 | | | | 24,456,367 | | | | 97,117 | | | | 51,424 | |
| | | | 403,359 | | | | 587,206 | | | | 415 | | | | 1,071 | |
| | | | (21,934,446 | ) | | | (29,364,676 | ) | | | (195,073 | ) | | | (125,203 | ) |
| | | | (11,873,075 | ) | | | (4,321,103 | ) | | | (97,541 | ) | | | (72,708 | ) |
Statements of Changes in Net Assets
| | | Holmes Macro Trends Fund | |
| | | Year Ended December 31, 2017 | | | Year Ended December 31, 2016 | |
| | | | | | | |
| Increase (Decrease) in Net Assets | | | | | | |
| | | | | | | |
| From operations: | | | | | | |
| Net investment income (loss) | | $ | (162,790 | ) | | $ | (131,503 | ) |
| Net realized gain (loss) | | | 4,093,856 | | | | 1,479,047 | |
| Net change in unrealized appreciation (depreciation) | | | 3,047,423 | | | | 1,713,973 | |
| Net increase (decrease) in net assets from operations | | | 6,978,489 | | | | 3,061,517 | |
| | | | | | | | | |
| Distributions to shareholders | | | | | | | | |
| From net investment income | | | | | | | | |
| Investor Class | | | – | | | | – | |
| Institutional Class | | | – | | | | – | |
| From net realized gains | | | | | | | | |
| Investor Class | | | (5,106,810 | ) | | | (3,169,616 | ) |
| Total distributions to shareholders | | | (5,106,810 | ) | | | (3,169,616 | ) |
| | | | | | | | | |
| From capital share transactions: | | | | | | | | |
| Proceeds from shares sold | | | | | | | | |
| Investor Class | | | 4,012,800 | | | | 2,661,174 | |
| Institutional Class | | | – | | | | – | |
| Distributions reinvested | | | | | | | | |
| Investor Class | | | 4,818,939 | | | | 2,976,381 | |
| Institutional Class | | | – | | | | – | |
| Proceeds from short-term trading fees | | | | | | | | |
| Investor Class | | | 3 | | | | 28 | |
| Institutional Class | | | – | | | | – | |
| | | | 8,831,742 | | | | 5,637,583 | |
| Cost of shares redeemed | | | | | | | | |
| Investor Class | | | (9,812,182 | ) | | | (5,958,154 | ) |
| Institutional Class | | | – | | | | – | |
| Net increase (decrease) in net assets from capital share transactions | | | (980,440 | ) | | | (320,571 | ) |
| Net Increase (Decrease) in Net Assets | | | 891,239 | | | | (428,670 | ) |
| | | | | | | | | |
| Net Assets | | | | | | | | |
| Beginning of year | | | 40,706,022 | | | | 41,134,692 | |
| | | | | | | | | |
| End of year | | $ | 41,597,261 | | | $ | 40,706,022 | |
| | | | | | | | | |
| Accumulated undistributed net investment income (distributions in excess of net investment income), end of year | | $ | – | | | $ | – | |
| | | | | | | | | |
| Capital Share Activity | | | | | | | | |
| Investor Class | | | | | | | | |
| Shares sold | | | 201,917 | | | | 136,703 | |
| Shares reinvested | | | 246,745 | | | | 158,825 | |
| Shares redeemed | | | (499,768 | ) | | | (325,941 | ) |
| Net capital share activity | | | (51,106 | ) | | | (30,413 | ) |
| Institutional Class | | | | | | | | |
| Shares sold | | | – | | | | – | |
| Shares reinvested | | | – | | | | – | |
| Shares redeemed | | | – | | | | – | |
| Net capital share activity | | | – | | | | – | |
See accompanying notes to financial statements.
| | | Global Resources Fund | | | World Precious Minerals Fund | |
| | | Year Ended December 31, 2017 | | | Year Ended December 31, 2016 | | | Year Ended December 31, 2017 | | | Year Ended December 31, 2016 | |
| | | | | | | | | | | | | |
| | | $ | 1,854,022 | | | $ | 1,162,442 | | | $ | (2,058,341 | ) | | $ | (1,950,968 | ) |
| | | | 3,787,922 | | | | (9,927,687 | ) | | | 11,713,452 | | | | (31,496,878 | ) |
| | | | 11,184,375 | | | | 22,989,329 | | | | (15,377,492 | ) | | | 89,140,280 | |
| | | | 16,826,319 | | | | 14,224,084 | | | | (5,722,381 | ) | | | 55,692,434 | |
| | | | | | | | | | | | | | | | | |
| | | | | | | | | | | | | | | | | |
| | | | (2,820,970 | ) | | | (3,178,190 | ) | | | (25,786,058 | ) | | | (454,372 | ) |
| | | | (17,624 | ) | | | (43,050 | ) | | | (706,446 | ) | | | (22,591 | ) |
| | | | | | | | | | | | | | | | | |
| | | | – | | | | – | | | | – | | | | – | |
| | | | (2,838,594 | ) | | | (3,221,240 | ) | | | (26,492,504 | ) | | | (476,963 | ) |
| | | | | | | | | | | | | | | | | |
| | | | | | | | | | | | | | | | | |
| | | | 3,820,335 | | | | 6,726,486 | | | | 43,215,850 | | | | 82,725,215 | |
| | | | 1,393,643 | | | | 876,722 | | | | 1,164,153 | | | | 5,416,648 | |
| | | | | | | | | | | | | | | | | |
| | | | 2,710,005 | | | | 3,039,897 | | | | 24,321,600 | | | | 430,049 | |
| | | | 16,716 | | | | 42,805 | | | | 685,819 | | | | 22,459 | |
| | | | | | | | | | | | | | | | | |
| | | | 54 | | | | 28 | | | | 482 | | | | 688 | |
| | | | – | | | | – | | | | 3 | | | | – | |
| | | | 7,940,753 | | | | 10,685,938 | | | | 69,387,907 | | | | 88,595,059 | |
| | | | | | | | | | | | | | | | | |
| | | | (21,753,696 | ) | | | (21,821,448 | ) | | | (58,534,541 | ) | | | (79,820,997 | ) |
| | | | (1,935,931 | ) | | | (1,849,143 | ) | | | (2,024,363 | ) | | | (1,056,603 | ) |
| | | | | | | | | | | | | | | | | |
| | | | (15,748,874 | ) | | | (12,984,653 | ) | | | 8,829,003 | | | | 7,717,459 | |
| | | | (1,761,149 | ) | | | (1,981,809 | ) | | | (23,385,882 | ) | | | 62,932,930 | |
| | | | | | | | | | | | | | | | | |
| | | | 98,025,864 | | | | 100,007,673 | | | | 141,158,784 | | | | 78,225,854 | |
| | | $ | 96,264,715 | | | $ | 98,025,864 | | | $ | 117,772,902 | | | $ | 141,158,784 | |
| | | | | | | | | | | | | | | | | |
| | | $ | 1,183,598 | | | $ | 1,594,626 | | | $ | (11,339,495 | ) | | $ | 4,847,267 | |
| | | | | | | | | | | | | | | | | |
| | | | | | | | | | | | | | | | | |
| | | | 670,921 | | | | 1,271,267 | | | | 6,640,756 | | | | 11,000,585 | |
| | | | 454,695 | | | | 589,127 | | | | 5,404,357 | | | | 73,765 | |
| | | | (3,870,155 | ) | | | (4,174,210 | ) | | | (9,187,898 | ) | | | (10,933,443 | ) |
| | | | (2,744,539 | ) | | | (2,313,816 | ) | | | 2,857,215 | | | | 140,907 | |
| | | | | | | | | | | | | | | | | |
| | | | 249,133 | | | | 158,239 | | | | 174,505 | | | | 724,341 | |
| | | | 2,786 | | | | 8,312 | | | | 151,730 | | | | 3,833 | |
| | | | (361,840 | ) | | | (368,941 | ) | | | (286,385 | ) | | | (150,268 | ) |
| | | | (109,921 | ) | | | (202,390 | ) | | | 39,850 | | | | 577,906 | |
Statements of Changes in Net Assets
| | | Gold and Precious Metals Fund | |
| | | Year Ended December 31, 2017 | | | Year Ended December 31, 2016 | |
| | | | | | | |
| Increase (Decrease) in Net Assets | | | | | | |
| | | | | | | |
| From operations: | | | | | | |
| Net investment income (loss) | | $ | (856,026 | ) | | $ | (1,103,338 | ) |
| Net realized gain (loss) | | | 5,126,757 | | | | (1,192,256 | ) |
| Net change in unrealized appreciation | | | 6,800,473 | | | | 28,430,181 | |
| Net increase (decrease) in net assets from operations | | | 11,071,204 | | | | 26,134,587 | |
| | | | | | | | | |
| Distributions to shareholders | | | | | | | | |
| From net investment income | | | | | | | | |
| Investor Class | | | – | | | | (799,465 | ) |
| Total distributions to shareholders | | | – | | | | (799,465 | ) |
| | | | | | | | | |
| From capital share transactions: | | | | | | | | |
| Proceeds from shares sold | | | | | | | | |
| Investor Class | | | 49,647,272 | | | | 82,773,853 | |
| Distributions reinvested | | | | | | | | |
| Investor Class | | | – | | | | 743,031 | |
| Proceeds from short-term trading fees | | | | | | | | |
| Investor Class | | | 465 | | | | 2,692 | |
| | | | 49,647,737 | | | | 83,519,576 | |
| Cost of shares redeemed | | | | | | | | |
| Investor Class | | | (53,967,222 | ) | | | (73,164,260 | ) |
| Net increase (decrease) in net assets from capital share transactions | | | (4,319,485 | ) | | | 10,355,316 | |
| | | | | | | | | |
| Net Increase (Decrease) in Net Assets | | | 6,751,719 | | | | 35,690,438 | |
| | | | | | | | | |
| Net Assets | | | | | | | | |
| Beginning of year | | | 93,988,090 | | | | 58,297,652 | |
| | | | | | | | | |
| End of year | | $ | 100,739,809 | | | $ | 93,988,090 | |
| | | | | | | | | |
| Accumulated undistributed net investment income (distributions in excess of net investment income), end of year | | $ | (4,212,058 | ) | | $ | (2,777,434 | ) |
| | | | | | | | | |
| Capital Share Activity | | | | | | | | |
| Investor Class | | | | | | | | |
| Shares sold | | | 6,404,488 | | | | 10,461,783 | |
| Shares reinvested | | | – | | | | 115,737 | |
| Shares redeemed | | | (7,105,060 | ) | | | (9,147,567 | ) |
| Net capital share activity | | | (700,572 | ) | | | 1,429,953 | |
See accompanying notes to financial statements.
| | | Emerging Europe Fund | | | China Region Fund | |
| | Year Ended December 31, 2017 | | | Year Ended December 31, 2016 | | | Year Ended December 31, 2017 | | | Year Ended December 31, 2016 | |
| | | | | | | | | | | | | |
| | | $ | 574,468 | | | $ | 513,486 | | | $ | (143,814 | ) | | $ | 19,302 | |
| | | | 3,334,426 | | | | (2,602,615 | ) | | | 1,585,811 | | | | (1,505,243 | ) |
| | | | 5,507,965 | | | | 7,728,407 | | | | 8,257,725 | | | | 1,381,038 | |
| | | | 9,416,859 | | | | 5,639,278 | | | | 9,699,722 | | | | (104,903 | ) |
| | | | | | | | | | | | | | | | | |
| | | | | | | | | | | | | | | | | |
| | | | – | | | | – | | | | (29,602 | ) | | | (27,847 | ) |
| | | | – | | | | – | | | | (29,602 | ) | | | (27,847 | ) |
| | | | | | | | | | | | | | | | | |
| | | | | | | | | | | | | | | | | |
| | | | 7,150,395 | | | | 1,519,657 | | | | 18,143,688 | | | | 3,784,734 | |
| | | | | | | | | | | | | | | | | |
| | | | – | | | | – | | | | 27,491 | | | | 25,858 | |
| | | | | | | | | | | | | | | | | |
| | | | 19 | | | | 4 | | | | – | | | | 16 | |
| | | | 7,150,414 | | | | 1,519,661 | | | | 18,171,179 | | | | 3,810,608 | |
| | | | | | | | | | | | | | | | | |
| | | | (13,538,508 | ) | | | (9,551,413 | ) | | | (14,575,981 | ) | | | (3,351,272 | ) |
| | | | | | | | | | | | | | | | | |
| | | | (6,388,094 | ) | | | (8,031,752 | ) | | | 3,595,198 | | | | 459,336 | |
| | | | 3,028,765 | | | | (2,392,474 | ) | | | 13,265,318 | | | | 326,586 | |
| | | | | | | | | | | | | | | | | |
| | | | 42,273,104 | | | | 44,665,578 | | | | 16,509,915 | | | | 16,183,329 | |
| | | $ | 45,301,869 | | | $ | 42,273,104 | | | $ | 29,775,233 | | | $ | 16,509,915 | |
| | | | | | | | | | | | | | | | | |
| | | $ | (184,330 | ) | | $ | – | | | $ | – | | | $ | 16,259 | |
| | | | | | | | | | | | | | | | | |
| | | | | | | | | | | | | | | | | |
| | | | 1,125,093 | | | | 272,190 | | | | 1,683,280 | | | | 528,806 | |
| | | | – | | | | – | | | | 2,429 | | | | 3,572 | |
| | | | (2,033,015 | ) | | | (1,736,202 | ) | | | (1,358,352 | ) | | | (459,520 | ) |
| | | | (907,922 | ) | | | (1,464,012 | ) | | | 327,357 | | | | 72,858 | |
| Notes to Financial Statements | December 31, 2017 |
Note 1: Organization and Significant Accounting Policies
U.S. Global Investors Funds (“Trust”), consisting of the nine separate funds (“Funds”) included in this report, is organized as a Delaware statutory trust. Each Fund is an open-end management investment company registered under the Investment Company Act of 1940, as amended, and follows the specialized accounting and reporting guidance in FASB Accounting Standards Codification Topic 946. All Funds are diversified with the exception of Global Resources, World Precious Minerals, Gold and Precious Metals, Emerging Europe and China Region. A nondiversified fund may invest a greater percentage of its assets in a particular issuer in comparison to a diversified fund.
The following is a summary of significant accounting policies consistently followed by the Funds in the preparation of their financial statements. The policies are in conformity with U.S. generally accepted accounting principles.
A. Security Valuations
The Funds value investments traded on national or international securities exchanges or over-the-counter at the last sales price reported by the security’s primary exchange of its market at the time of daily valuation. Options and securities for which no sale was reported are valued at the mean between the last reported bid and asked quotation. Debt securities having 60 days or less to maturity that are expected to be valued at par at maturity may be priced by the amortized cost method if the Valuation Committee determines it would approximate market value. Municipal securities, long-term U.S. government obligations and corporate debt securities are valued by an independent pricing service using an evaluated quote based on such factors as institutional-size trading in similar groups of securities, yield, quality, maturity, coupon rate, type of issue, individual trading characteristics and other market data. For more information please see Notes to Portfolio of Investments.
B. Cash-Concentration in Uninsured Account
For cash management purposes the Funds may concentrate cash with the Funds’ custodian. This typically results in cash balances exceeding the Federal Deposit Insurance Corporation (“FDIC”) insurance limits. As of December 31, 2017, The U.S. Government Securities Ultra-Short Bond Fund, Near-Term Tax Free Fund, Holmes Macro Trends Fund, Global Resources Fund, World Precious Minerals Fund, Gold and Precious Metals Fund, Emerging Europe Fund and China Region Fund held $662,255, $222,060, $2,334,043, $1,017,248, $1,096,416, $96,160, $422,185 and $1,863,016, respectively, as cash reserves at Brown Brothers Harriman & Co. (BBH) that exceeded the FDIC insurance limit.
C. Fair Valued Securities
Securities for which market quotations are not readily available or which are subject to legal restrictions are valued at their fair value as determined in good faith by the Valuation Committee of U.S. Global Investors, Inc. (Adviser), under policies and procedures established by the Trust’s Board of Trustees. Fair value is the price that would be received to sell an asset or paid to transfer a liability in an orderly transaction between market participants at the measurement date. The Valuation Committee meets on a regular basis to review securities which may not have readily available market prices and considers a number of factors in determining fair value, including nature and duration of any trading restrictions, trading volume, market values of unrestricted shares of the same or similar class, investment management’s judgment regarding the market experience of the issuer, financial status and other operational and market factors affecting the issuer, issuer’s management, quality of the underlying property based on review of independent geological studies and other relevant matters. The fair values may differ from what would have been used had a broader market for these securities existed. The Valuation Committee regularly reviews inputs and assumptions and performs transactional back-testing and disposition analysis. The Valuation Committee reports quarterly to the Trust’s Board of Trustees.
| Notes to Financial Statements | December 31, 2017 |
For securities traded on international exchanges, if events which may materially affect the value of a Fund’s securities occur after the close of the primary exchange and before a Fund’s net asset value is next determined, then those securities will be valued at their fair value as determined in good faith in accordance with the policies approved by the Board of Trustees. The Funds use a systematic fair value model provided by an independent third party to value international securities primarily traded on an exchange or market outside the Western Hemisphere in order to adjust for stale pricing, which may occur between the close of certain foreign exchanges and the New York Stock Exchange.
D. Security Transactions and Investment Income
Security transactions are accounted for on trade date. Realized gains and losses from security transactions are determined on an identified cost basis. Dividend income is recorded on the ex-dividend date except that certain dividends from foreign securities where the ex-dividend date may have passed are recorded as soon as the Fund has confirmed the ex-dividend date. Interest income, which may include original issue discount, is recorded on an accrual basis. Discounts and premiums on securities purchased are accreted and amortized, respectively, on a yield-to-maturity basis as adjustments to interest income. Investment income is recorded net of foreign taxes withheld where recovery of such taxes is uncertain. Investment income and realized and unrealized gains (losses) are allocated to each Fund’s share class based on their respective net assets.
The Funds may purchase securities on a when-issued or delayed-delivery basis and segregate collateral on their books with a value at least equal to the amount of the commitment. Losses may arise due to the changes in the value of the underlying securities or if the counterparty does not perform under the contract.
E. Foreign Currency Transactions
Some Funds may invest in securities of foreign issuers. The accounting records of these Funds are maintained in U.S. dollars. At each net asset value determination date, the value of assets and liabilities denominated in foreign currencies are translated into U.S. dollars using the current prevailing exchange rate. Security transactions, income and expenses are converted at the prevailing rate of exchange on the respective dates of the transactions. The effect of changes in foreign exchange rates on foreign denominated securities is included with the net realized and unrealized gain or loss on securities. Other foreign currency gains or losses are reported separately.
F. Federal Income Taxes
The Funds intend to continue to comply with the requirements of Subchapter M of the Internal Revenue Code applicable to regulated investment companies and to distribute substantially all of their taxable income to shareholders. Accordingly, no provision for federal income taxes is required. Each Fund may be subject to foreign taxes on income and gains on investments, which are accrued based on the Fund’s understanding of the tax rules and regulations in the foreign markets.
| Notes to Financial Statements | December 31, 2017 |
The Funds recognize the tax benefits of uncertain tax positions only where the position is “more likely than not” to be sustained assuming examination by tax authorities. Management has analyzed the Funds’ tax positions, and has concluded that no liability for unrecognized tax benefits should be recorded related to uncertain tax positions taken on returns filed for open tax years or expected to be taken in 2017 tax returns. The Funds file U.S. federal and excise tax returns as required. The Funds’ 2014, 2015, 2016 and 2017 (when filed) tax returns are open to examination by the federal and applicable state tax authorities. The Funds have no examinations in progress.
G. Dividends and Distributions to Shareholders
The Funds record dividends and distributions to shareholders on the ex-dividend date. Distributions are determined in accordance with income tax regulations, which may differ from accounting principles generally accepted in the United States. Accordingly, periodic reclassifications related to permanent book and tax basis differences are made within the Funds’ capital accounts to reflect income and gains available for distribution under income tax regulations.
The Funds, except as noted below, generally pay income dividends and distribute capital gains, if any, annually. The U.S. Government Securities Ultra-Short Bond Fund and the Near-Term Tax Free Fund pay dividends monthly. A Fund may elect to designate a portion of the earnings and profits distributed to shareholders on the redemption of fund shares during the year as distributions for federal income tax purposes. Differences in per share dividend rates for multiclass funds generally result from the relative weightings of pro rata income and realized gain allocations and from differences in separate class expenses.
H. Expenses
Fund specific expenses are allocated to that Fund and pro rata across share classes. Expenses that are not fund specific are allocated among Funds and pro rata across share classes. Class specific expenses (including, but not limited to, distribution plan fees, if any, a portion of the administrative services fees, transfer agency fees and expenses, shareholder reporting expenses and certain legal and registration fees) are allocated to the class that incurs such expense. Except for the U.S. Government Securities Ultra-Short Bond Fund, expense offset arrangements have been made with the Funds’ custodian so the custodian fees may be paid indirectly by credits earned on the Funds’ cash balances. Such deposit arrangements are an alternative to overnight investments. Custodian fees are presented in the Statements of Operations gross of such credits, and the credits are presented as offsets to expenses. For the U.S. Government Securities Ultra-Short Bond Fund, credits earned on its cash balance are included in interest and other income.
I. Short-Term Trading (Redemption) Fees
Through April 30, 2017, short-term trading (redemption) fees were assessed on the All American, Holmes Macro Trends, Global Resources, World Precious Minerals, Gold and Precious Metals, Emerging Europe and China Region Funds (Equity Funds). These fees, which were retained by the Funds, were accounted for as an addition to paid-in capital. The fee for each of the Equity Funds was 0.05% of the amount redeemed on shares held seven days or less. Effective May 1, 2017, this fee is no longer assessed on any Fund.
J. Use of Estimates in Financial Statement Preparation
The Funds are investment companies accounted for in conformity with accounting principles generally accepted in the United States of America (“GAAP”). Therefore they follow the accounting and reporting guidelines for investment companies. The preparation of financial statements in conformity with GAAP requires management to make estimates and assumptions that affect the reported amounts of assets and liabilities and disclosure of contingent assets and liabilities at the date of the financial statements and the reported amounts of income and expenses during the reporting period. Actual results could differ from those estimates.
| Notes to Financial Statements | December 31, 2017 |
Note 2: Financial Derivative Instruments
A. Options Contracts
Equity Funds may purchase or write (sell) options on securities to manage their exposure to stock or commodity markets as well as fluctuations in interest and currency conversion rates. The use of options carries the risks of a change in value of the underlying instruments, an illiquid secondary market, or failure of the counterparty to perform its obligations.
A put option gives the purchaser of the option, upon payment of a premium, the right to sell, and the issuer of the option the obligation to buy, the underlying security, commodity, index, currency or other instrument at the exercise price. A call option, upon payment of a premium, gives the purchaser of the option the right to buy, and the issuer the obligation to sell, the underlying instrument at the exercise price.
Purchasing a put option tends to decrease a Fund’s exposure to the underlying instrument, whereas purchasing a call option tends to increase a Fund’s exposure to the underlying instrument. A Fund pays a premium which is included in the Statement of Assets and Liabilities as an investment and subsequently marked to market to reflect the current value of the option. Premiums paid to purchase options which expire are treated as realized losses. Premiums paid to purchase options which are exercised or closed are added to the cost of securities acquired or the proceeds from securities sold. The risk associated with purchasing put and call options is limited to the premium paid.
The Funds will realize a loss equal to all or a part of the premium paid for an option if the price of the underlying security or other instrument decreases or does not increase by more than the premium (in the case of a call option), or if the price of the underlying security or other instrument increases or does not decrease by more than the premium (in the case of a put option).
Writing a put option tends to increase a Fund’s exposure to the underlying instrument, whereas writing a call option tends to decrease a Fund’s exposure to the underlying instrument. The premium received is recorded as a liability in the Statement of Assets and Liabilities and subsequently marked to market to reflect the current value of the option written. Premiums received from writing options which expire are treated as realized gains. Premiums received from options which are exercised or closed are added to the proceeds or offset against amounts paid on the underlying transaction to determine the realized gain or loss. Written options include a risk of loss in excess of the option premium. A Fund as a writer of an option has no control over whether the underlying instrument may be sold (call) or purchased (put) and thus bears the market risk of an unfavorable change in the price of the instrument underlying the written option. There is also the risk a Fund may not be able to enter into a closing transaction because of an illiquid market.
A Fund’s ability to close out its position as a purchaser or seller of a put or call option is dependent, in part, upon the liquidity of the market for that particular option. There can be no guarantee that a fund will be able to close out an option position when desired. An inability to close out its options positions may reduce a Fund’s anticipated profits or increase its losses.
| Notes to Financial Statements | December 31, 2017 |
As of December 31, 2017, there were no securities held in escrow by the custodian as cover for call options written.
B. Forward Foreign Currency Contracts
The Funds enter into forward foreign currency contracts to lock in the U.S. dollar cost of purchase and sale transactions or to hedge the portfolio against currency fluctuations. A forward foreign currency contract is a commitment to purchase or sell a foreign currency at a future date at a negotiated rate. These contracts are valued daily, and the Fund’s net equity therein, representing unrealized gain or loss on the contracts as measured by the difference between the forward foreign exchange rates at the dates of entry into the contracts and the forward rates at the reporting date, is included in the Statement of Assets and Liabilities. Realized and unrealized gains and losses are included in the Statement of Operations. Risks may arise upon entering into these contracts from the potential inability of counterparties to meet the terms of the contracts and from unanticipated movements in the value of foreign currencies relative to the U.S. dollar.
Open forward foreign currency contracts as of December 31, 2017, were as follows:
| Fund | | Counterparty | | Currency to Deliver | | Currency to Receive | | Settlement Date | | | Settlement Value at December 31, 2017 | | | Net Unrealized Appreciation (Depreciation) | |
| Emerging Europe Fund | | Brown Brothers Harriman & Co. | | PLN 8,000,000 | | USD 2,256,108 | | 1/8/2018 | | $ | 2,298,243 | | $ | (42,135 | ) |
| | | Brown Brothers Harriman & Co. | | USD 2,286,237 | | PLN 8,000,000 | | 1/8/2018 | | | 2,298,243 | | | 12,006 | |
| | | Brown Brothers Harriman & Co. | | EUR 1,500,000 | | USD 1,763,625 | | 1/16/2018 | | | 1,801,598 | | | (37,973 | ) |
| | | Brown Brothers Harriman & Co. | | PLN 8,000,000 | | USD 2,230,307 | | 1/16/2018 | | | 2,298,262 | | | (67,955 | ) |
| | | Brown Brothers Harriman & Co. | | USD 1,793,700 | | EUR 1,500,000 | | 1/16/2018 | | | 1,801,598 | | | 7,898 | |
| | | Brown Brothers Harriman & Co. | | USD 1,142,792 | | PLN 4,000,000 | | 1/16/2018 | | | 1,149,131 | | | 6,339 | |
| Notes to Financial Statements | December 31, 2017 |
C. Summary of Derivative Instruments
The following is a summary of the valuations of derivative instruments categorized by location in the Statements of Assets and Liabilities as of December 31, 2017:
| | Location | | Global Resources Fund | | | Emerging Europe Fund | | | China Region Fund | |
| | Asset derivatives | | | | | | | | | |
| | Investments, at value | | | | | | | | | |
| | Purchased options | | $ | 3,373,870 | | | $ | – | | | $ | 492,500 | |
| | Unrealized gain on forward foreign currency contracts | | | – | | | | 26,243 | | | | – | |
| | | | | | | | | | | | | | |
| | Liability derivatives | | | | | | | | | | | | |
| | Unrealized loss on forward foreign currency contracts | | $ | – | | | $ | (148,063 | ) | | $ | – | |
| | Total | | $ | 3,373,870 | | | $ | (121,820 | ) | | $ | 492,500 | |
The following is a summary of the effect of derivative instruments on the Statements of Operations as of December 31, 2017:
| | Location | | All American Equity Fund | | | Holmes Macro Trends Fund | | | Global Resources Fund | |
| | Realized gain (loss) on derivatives recognized in income | | | | | | | | | |
| | Realized gain (loss) from securities Purchased options | | $ | – | | | $ | 20,965 | | | $ | (232,770 | ) |
| | Net realized gain (loss) from foreign currency transactions Foreign exchange contracts | | | – | | | | – | | | | (52,370 | ) |
| | Realized gain (loss) from written options | | | 9,470 | | | | 48,193 | | | | – | |
| | | | | 9,470 | | | | 69,158 | | | | (285,140 | ) |
| | | | | | | | | | | | | | |
| | Change in unrealized appreciation (depreciation) on derivatives recognized in income | | | | | | | | | | | | |
| | Net change in unrealized appreciation (depreciation) of investments Purchased options | | | – | | | | – | | | | 886,631 | |
| | Net change in unrealized gain (loss) from foreign currency transactions Foreign exchange contracts | | | – | | | | – | | | | – | |
| | | | | – | | | | – | | | | 886,631 | |
| | Total | | $ | 9,470 | | | $ | 69,158 | | | $ | 601,491 | |
| Notes to Financial Statements | December 31, 2017 |
| | Location | | World Precious Minerals Fund | | | Gold and Precious Metals Fund | | | Emerging Europe Fund | | | China Region Fund | |
| | Realized gain (loss) on derivatives recognized in income | | | | | | | | | | | | |
| | | | | | | | | | | | | | |
| | Realized gain (loss) from securities Purchased options | | $ | – | | | $ | – | | | $ | – | | | $ | 110,061 | |
| | Net realized gain (loss) from foreign currency transactions Foreign exchange contracts | | | (715,777 | ) | | | (458,661 | ) | | | (1,085,477 | ) | | | – | |
| | | | | (715,777 | ) | | | (458,661 | ) | | | (1,085,477 | ) | | | 110,061 | |
| | | | | | | | | | | | | | | | | | |
| | Change in unrealized appreciation (depreciation) on derivatives recognized in income | | | | | | | | | | | | | | | | |
| | Net change in unrealized appreciation (depreciation) of investments Purchased options | | | – | | | | – | | | | – | | | | 66,265 | |
| | Net change in unrealized gain (loss) from foreign currency transactions Foreign exchange contracts | | | – | | | | – | | | | (121,820 | ) | | | – | |
| | | | | – | | | | – | | | | (121,820 | ) | | | 66,265 | |
| | Total | | $ | (715,777 | ) | | $ | (458,661 | ) | | $ | (1,207,297 | ) | | $ | 176,326 | |
The total value of transactions in written options, purchased options and forward currency contracts outstanding during the year ended December 31, 2017, were approximately as follows:
| | Fund | | Purchased Options | | | Written Options | | | Forward Currency Contracts | |
| | All American Equity Fund | | $ | – | | | $ | (12,821 | ) | | $ | – | |
| | Holmes Macro Trends Fund | | | 29,329 | | | | (94,335 | ) | | | – | |
| | Global Resources Fund | | | 6,077,764 | | | | – | | | | 22,160,022 | |
| | World Precious Minerals Fund | | | – | | | | – | | | | 140,102,982 | |
| | Gold and Precious Metals Fund | | | – | | | | – | | | | 61,575,207 | |
| | Emerging Europe Fund | | | – | | | | – | | | | 74,862,186 | |
| | China Region Fund | | | 332,451 | | | | – | | | | – | |
| Notes to Financial Statements | December 31, 2017 |
Asset (Liability) amounts shown in the table below represent amounts for derivative related instruments at December 31, 2017. These amounts may be collateralized by cash or financial instruments.
| | | | Gross Asset (Liability) as Presented in the Statement of Assets and Liabilities | | | Financial Instruments (Received) Pledged* | | | Cash Collateral (Received)Pledged* | | | Net Amount | |
| | Global Resources | | | | | | | | | | | | |
| | | | | | | | | | | | | | |
| | Assets: | | | | | | | | | | | | |
| | Over-the-counter derivatives | | $ | 3,373,870 | | | $ | – | | | $ | – | | | $ | 3,373,870 | |
| | Emerging Europe | | | | | | | | | | | | | | | | |
| | | | | | | | | | | | | | | | | | |
| | Assets: | | | | | | | | | | | | | | | | |
| | Over-the-counter derivatives | | | 26,243 | | | | – | | | | – | | | | 26,243 | |
| | | | | | | | | | | | | | | | | | |
| | Liabilities: | | | | | | | | | | | | | | | | |
| | Over-the-counter derivatives | | | (148,063 | ) | | | – | | | | 148,063 | | | | – | |
| | China Region | | | | | | | | | | | | | | | | |
| | | | | | | | | | | | | | | | | | |
| | Assets: | | | | | | | | | | | | | | | | |
| | Over-the-counter derivatives | | | 492,500 | | | | – | | | | – | | | | 492,500 | |
| * | The actual financial instruments and cash collateral (received) pledged may be in excess of the amounts shown in the table. The table only reflects collateral amounts up to the amount of the financial instrument disclosed on the Statement of Assets and Liabilities. |
Note 3: Investment Advisory and Other Agreements
The Adviser, under an investment advisory agreement with the Trust in effect through October 1, 2018, furnishes management and investment advisory services and, subject to the supervision of the trustees, directs the investments of each Fund according to each Fund’s investment objectives, policies and limitations.
For the services of the Adviser, each Fund pays a base management or advisory fee based upon its net assets. Fees are accrued daily and paid monthly. The contractual management fee for each fund is:
| | Fund | Average Percentage of Average Daily Net Assets |
| | U.S. Government Securities Ultra-Short Bond | .50% of the first $250,000,000 and .375% of the excess |
| | Near-Term Tax Free | .50% |
| | All American Equity | .80% of the first $500,000,000 and .75% of the excess |
| | Holmes Macro Trends | 1.00% |
| | Global Resources | .95% of the first $500,000,000; .90% of $500,000,001 to $1,000,000,000 and .85% of the excess |
| | World Precious Minerals | 1.00% of the first $500,000,000; .95% of $500,000,001 to $1,000,000,000 and .90% of the excess |
| | Gold and Precious Metals | .90% of the first $500,000,000 and .85% of the excess |
| | Emerging Europe | 1.25% |
| Notes to Financial Statements | December 31, 2017 |
| | Fund | Average Percentage of Average Daily Net Assets |
| | China Region | 1.25% |
The advisory agreement also provides that the base advisory fee of the Equity Funds will be adjusted upwards or downwards by 0.25 percent if there is a performance difference of 5 percent or more between a Fund’s performance and that of its designated benchmark index over the prior 12 months. The performance adjustment is calculated separately for each share class. The benchmarks are as follows:
| | Fund | Benchmark Index |
| | All American Equity | S&P 500 Index |
| | Holmes Macro Trends | S&P Composite 1500 Index |
| | Global Resources | S&P Global Natural Resources Index (Net Total Return) |
| | World Precious Minerals | NYSE Arca Gold Miners Index |
| | Gold and Precious Metals | FTSE Gold Mines Index |
| | Emerging Europe | MSCI Emerging Markets Europe 10/40 Index (Net Total Return) |
| | China Region | Hang Seng Composite Index |
No performance adjustment is applied unless the difference between the class's investment performance and the benchmark is 5 percent or greater (positive or negative) during the applicable performance measurement period. The performance fee adjustment is calculated monthly in arrears and is accrued ratably during the month. The management fee, net of any performance fee adjustment, is paid monthly in arrears.
The amounts shown as Management fee on the Statements of Operations reflects the base fee plus/minus any performance adjustment. During the year ended December 31, 2017, the Funds recorded performance adjustments as follows:
| | Fund | | Investor Class Performance Fee Adjustment | | | Institutional Class Performance Fee Adjustment | |
| | All American Equity | | $ | (47,209 | ) | | | N/A | |
| | Holmes Macro Trends | | | (8,225 | ) | | | N/A | |
| | Global Resources | | | (250,592 | ) | | $ | (1,986 | ) |
| | World Precious Minerals | | | (15,680 | ) | | | (1,158 | ) |
| | Gold and Precious Metals | | | (87,024 | ) | | | N/A | |
| | Emerging Europe | | | (26,770 | ) | | | N/A | |
| | China Region | | | 20,521 | | | | N/A | |
Atlantic Fund Administration, LLC (d/b/a Atlantic Fund Services) (“Atlantic”) and the Adviser act as co-administrators to the Trust. Atlantic provides a Principal Executive Officer, a Principal Financial Officer, a Chief Compliance Officer and and Anti-Money Laundering Officer to each Fund, as well as certain additional compliance and administrative support functions. Effective November 1, 2017, Atlantic also provides fund accounting services to each Fund. The fees related to these services are included in Administration Fees within the Statement of Operations. Atlantic also provides certain shareholder report production and EDGAR conversion and filing services. Purusant to an Atlantic services agreement, each Fund pays Atlantic customary fees for its services.
The U.S. Government Securities Ultra-Short Bond, Near-Term Tax Free, All American Equity, Holmes Macro Trends, Gold and Precious Metals, Emerging Europe and China Region Funds compensate the Adviser at an annual rate of 0.05% of the average daily net assets of each Fund for administrative services provided, of which half is a fund-level fee and half is a class-level fee. The Global Resources and World Precious Minerals Funds compensate the Adviser at an annual rate of 0.05% of the average daily net assets for the Investor Class and 0.04% of the average daily net assets for the Institutional Class for administrative services provided, of which half is a fund-level fee and half is a class-level fee.
| Notes to Financial Statements | December 31, 2017 |
The Investor Class shares for Equity Funds in the Trust have adopted a distribution plan pursuant to Rule 12b-1 of the Investment Company Act of 1940 in which the Distributor is paid a fee at an annual rate of 0.25% of the average daily net assets of the Investor Class for sales and promotional services related to the distribution of Investor Class shares. The Institutional Class does not incur distribution plan fees.
The Adviser has voluntarily agreed to reimburse specific funds so that their total operating expenses will not exceed certain annual percentages of average net assets. The expenses for the period ended December 31, 2017, were limited as follows for the Investor Class: U.S. Government Securities Ultra-Short Bond Fund at 0.45%, All American Equity Fund and Holmes Macro Trends Fund at 2.20%, Global Resources, World Precious Minerals, and Gold and Precious Metals Funds at 1.90%, Emerging Europe Fund at 2.85% and China Region Fund at 2.55%. These expense limitations are exclusive of any performance fee adjustments and will continue on a voluntary basis at the Adviser's discretion. The Adviser may temporarily agree to additional reimbursements or limitations.
The Adviser has contractually limited the total operating expenses of the Near- Term Tax Free Fund at 0.45% on an annualized basis through April 30, 2018.
The Adviser has voluntarily agreed to waive all class specific expenses for the Institutional Class of the Global Resources Fund and the World Precious Minerals Fund. These expense waivers are exclusive of any performance fee adjustments, and the Adviser can modify or terminate this arrangement at any time.
Atlantic is the transfer agent for the Funds. Each Fund’s share class pays an annual fee based on the number of shareholder accounts, certain base fees and transaction- and activity-based fees for transfer agency services.
Certain account fees are paid directly by shareholders to the transfer agent, which, in turn, reduces its charge to the Funds.
Brown Brothers Harriman & Co. (BBH) serves as the custodian. Prior to November 1, 2017, SEI Investments Global Funds Services served as fund accounting and administration service agent with a fee structure based on average net assets of the Trust, subject to minimum fees.
Foreside Fund Services, LLC (the “Distributor”) acts as the agent of the Trust in connection with the continuous offering of shares of the Funds. The Distributor continually distributes shares of the Funds on a best efforts basis.
| Notes to Financial Statements | December 31, 2017 |
Note 4: Investments
Cost of purchases and proceeds from sales of long-term securities for the year ended December 31, 2017, are summarized as follows:
| | Fund | | Purchases | | | Sales | |
| | U.S. Government Securities Ultra-Short Bond | | $ | 21,638,587 | | | $ | 30,580,263 | |
| | Near-Term Tax Free | | | 10,535,248 | | | | 28,293,583 | |
| | All American Equity | | | 53,043,290 | | | | 53,372,969 | |
| | Holmes Macro Trends | | | 96,680,730 | | | | 101,006,137 | |
| | Global Resources | | | 116,464,077 | | | | 133,106,860 | |
| | World Precious Minerals | | | 47,572,357 | | | | 64,521,457 | |
| | Gold and Precious Metals | | | 65,067,234 | | | | 63,236,736 | |
| | Emerging Europe | | | 42,228,700 | | | | 48,681,753 | |
| | China Region | | | 24,697,389 | | | | 21,361,646 | |
Note 5: Tax Information
The following table presents the income tax basis of securities owned at December 31, 2017, and the tax basis components of net unrealized appreciation (depreciation):
| | Fund | | Aggregate Tax Cost | | | Gross Unrealized Appreciation | | | Gross Unrealized Depreciation | | | Net Unrealized Appreciation (Depreciation) | |
| | U.S. Government Securities Ultra-Short Bond | | $ | 48,519,073 | | | $ | 10,820 | | | $ | (72,599 | ) | | $ | (61,779 | ) |
| | Near-Term Tax Free | | | 68,769,816 | | | | 331,313 | | | | (511,907 | ) | | | (180,594 | ) |
| | All American Equity | | | 15,115,028 | | | | 781,645 | | | | (166,497 | ) | | | 615,148 | |
| | Holmes Macro Trends | | | 35,039,705 | | | | 4,984,399 | | | | (1,004,897 | ) | | | 3,979,502 | |
| | Global Resources | | | 151,385,823 | | | | 16,715,513 | | | | (73,896,466 | ) | | | (57,180,953 | ) |
| | World Precious Minerals | | | 162,086,435 | | | | 30,998,900 | | | | (77,039,764 | ) | | | (46,040,864 | ) |
| | Gold and Precious Metals | | | 85,456,203 | | | | 28,293,818 | | | | (13,125,256 | ) | | | 15,168,562 | |
| | Emerging Europe | | | 38,403,707 | | | | 8,271,422 | | | | (2,186,321 | ) | | | 6,085,101 | |
| | China Region | | | 18,524,847 | | | | 9,698,335 | | | | (539,587 | ) | | | 9,158,748 | |
As of December 31, 2017, the components of distributable earnings on a tax basis were as follows:
| | Fund | | Undistributed Tax-Exempt Income | | | Undistributed Ordinary Income | | | Undistributed Long-Term Capital Gains | | | Capital and Other Losses | |
| | U.S. Government Securities Ultra-Short Bond | | $ | – | | | $ | 4,713 | | | $ | – | | | $ | (658 | ) |
| | Near-Term Tax Free | | | 2,541 | | | | 1,091 | | | | – | | | | (880,047 | ) |
| | All American Equity | | | – | | | | 76,995 | | | | – | | | | (588,634 | ) |
| | Holmes Macro Trends | | | – | | | | – | | | | – | | | | (204,896 | ) |
| | Global Resources | | | – | | | | 2,616,198 | | | | – | | | | (205,707,296 | ) |
| | World Precious Minerals | | | – | | | | 10,699,245 | | | | – | | | | (301,841,208 | ) |
| | Gold and Precious Metals | | | – | | | | 1,486,189 | | | | – | | | | (100,637,254 | ) |
| | Emerging Europe | | | – | | | | – | | | | – | | | | (38,216,001 | ) |
| | China Region | | | – | | | | – | | | | – | | | | (3,330,618 | ) |
| Notes to Financial Statements | December 31, 2017 |
| | Fund (continued) | | Net Unrealized Appreciation (Depreciation) | | | Other Temporary Differences | | | Total | |
| | U.S. Government Securities Ultra-Short Bond | | $ | (61,779 | ) | | $ | (5,826 | ) | | $ | (63,550 | ) |
| | Near-Term Tax Free | | | (180,594 | ) | | | (7,061 | ) | | | (1,064,070 | ) |
| | All American Equity | | | 615,148 | | | | – | | | | 103,509 | |
| | Holmes Macro Trends | | | 3,979,502 | | | | – | | | | 3,774,606 | |
| | Global Resources | | | (57,167,767 | ) | | | – | | | | (260,258,865 | ) |
| | World Precious Minerals | | | (46,040,731 | ) | | | – | | | | (337,182,694 | ) |
| | Gold and Precious Metals | | | 15,168,722 | | | | – | | | | (83,982,343 | ) |
| | Emerging Europe | | | 6,076,059 | | | | – | | | | (32,139,942 | ) |
| | China Region | | | 9,155,710 | | | | – | | | | 5,825,092 | |
The differences between book-basis and tax-basis unrealized appreciation (depreciation) for All American Equity, Holmes Macro Trends, Global Resources, World Precious Minerals, Gold and Precious Metals, Emerging Europe and China Region Funds are attributable primarily to the tax deferral of losses on wash sales, investment in passive foreign investment companies (PFIC), section 988 forward currency contracts, and equity return of capital.
Reclassifications are made to the Funds’ capital accounts to reflect income and gains available for distribution (or available capital loss carryovers) under income tax regulations. For the year ended December 31, 2017, the Funds recorded the following reclassifications to increase (decrease) the accounts listed below:
| | Fund | | Accumulated Net Investment Income | | | Accumulated Net Realized Gain | | | Paid in Capital | |
| | U.S. Government Securities Ultra-Short Bond | | $ | (11 | ) | | $ | – | | | $ | 11 | |
| | Near-Term Tax Free | | | (8 | ) | | | 722 | | | | (714 | ) |
| | All American Equity | | | 12,737 | | | | (12,737 | ) | | | – | |
| | Holmes Macro Trends | | | 162,790 | | | | (115,548 | ) | | | (47,242 | ) |
| | Global Resources | | | 573,544 | | | | 258,639,062 | | | | (259,212,606 | ) |
| | World Precious Minerals | | | 12,364,083 | | | | 51,415,417 | | | | (63,779,500 | ) |
| | Gold and Precious Metals | | | (578,598 | ) | | | 571,312 | | | | 7,286 | |
| | Emerging Europe | | | (758,798 | ) | | | 258,599,537 | | | | (257,840,739 | ) |
| | China Region | | | 157,157 | | | | (28,017 | ) | | | (129,140 | ) |
| Notes to Financial Statements | December 31, 2017 |
The tax character of distributions paid during the fiscal year ended December 31, 2017, were as follows:
| | Fund | | Tax-Exempt Income | | | Ordinary Income | | | Long-Term Capital Gains | | | Return of Capital | | | Total | |
| | U.S. Government Securities Ultra-Short Bond | | $ | – | | | $ | 356,650 | | | $ | – | | | $ | – | | | $ | 356,650 | |
| | Near-Term Tax Free | | | 960,480 | | | | 9,834 | | | | – | | | | – | | | | 970,314 | |
| | All American Equity | | | – | | | | 11,077 | | | | – | | | | – | | | | 11,077 | |
| | Holmes Macro Trends | | | – | | | | 4,147,876 | | | | 958,934 | | | | – | | | | 5,106,810 | |
| | Global Resources | | | – | | | | 2,838,594 | | | | – | | | | – | | | | 2,838,594 | |
| | World Precious Minerals | | | – | | | | 26,492,504 | | | | – | | | | – | | | | 26,492,504 | |
| | Gold and Precious Metals | | | – | | | | – | | | | – | | | | – | | | | – | |
| | Emerging Europe | | | – | | | | – | | | | – | | | | – | | | | – | |
| | China Region | | | – | | | | 29,602 | | | | – | | | | – | | | | 29,602 | |
The tax character of distributions paid during the fiscal year ended December 31, 2016, were as follows:
| | Fund | | Tax-Exempt Income | | | Ordinary Income | | | Long-Term Capital Gains | | | Return of Capital | | | Total | |
| | U.S. Government Securities Ultra-Short Bond | | $ | – | | | $ | 261,314 | | | $ | 15,960 | | | $ | 2,047 | | | $ | 279,321 | |
| | Near-Term Tax Free | | | 1,476,349 | | | | 19,933 | | | | – | | | | 13,758 | | | | 1,510,040 | |
| | All American Equity | | | – | | | | 27,184 | | | | – | | | | – | | | | 27,184 | |
| | Holmes Macro Trends | | | – | | | | – | | | | 3,169,616 | | | | – | | | | 3,169,616 | |
| | Global Resources | | | – | | | | 3,221,240 | | | | – | | | | – | | | | 3,221,240 | |
| | World Precious Minerals | | | – | | | | 476,963 | | | | – | | | | – | | | | 476,963 | |
| | Gold and Precious Metals | | | – | | | | 799,465 | | | | – | | | | – | | | | 799,465 | |
| | Emerging Europe | | | – | | | | – | | | | – | | | | – | | | | – | |
| | China Region | | | – | | | | 27,847 | | | | – | | | | – | | | | 27,847 | |
Capital loss carryforwards may be used to off set current or future taxable capital gains until expiration. The Fund’s tax-basis capital gains and losses are determined only at the end of each fiscal year. Under the Regulated Investment Company Modernization Act of 2010, the Funds are permitted to carry forward capital losses incurred in taxable years beginning after December 22, 2010, for an unlimited period. Losses incurred during these years are required to be utilized prior to the losses incurred in pre-enactment tax years. As a result of this ordering rule, pre-enactment capital loss carryforwards may be more likely to expire unused. In addition, post-enactment capital losses that are carried forward retain their character as either short-term or long-term capital losses rather than being considered all short-term as under previous law. The loss carryforwards and related expiration dates for each fund, as of December 31, 2017, are as follows:
| | | | No Expiration | | | Expiration Date | | | | |
| | Fund | | Short-Term | | | Long-Term | | | 2018 | | | Total | |
| | U.S. Government Securities Ultra-Short Bond | | $ | 658 | | | $ | – | | | $ | – | | | $ | 658 | |
| | Near-Term Tax Free (a) | | | 531,173 | | | | 346,342 | | | | 2,532 | | | | 880,047 | |
| | All American Equity | | | 331,815 | | | | 256,819 | | | | – | | | | 588,634 | |
| | Holmes Macro Trends (a) | | | – | | | | – | | | | – | | | | – | |
| Notes to Financial Statements | December 31, 2017 |
| | | | No Expiration | | | Expiration Date | | | | |
| | Fund | | Short-Term | | | Long-Term | | | 2018 | | | Total | |
| | Global Resources | | $ | 155,607,152 | | | $ | 50,100,144 | | | $ | – | | | $ | 205,707,296 | |
| | World Precious Minerals | | | 82,982,057 | | | | 218,859,151 | | | | – | | | | 301,841,208 | |
| | Gold and Precious Metals | | | 38,864,443 | | | | 61,772,811 | | | | – | | | | 100,637,254 | |
| | Emerging Europe | | | 11,501,846 | | | | 10,962,059 | | | | 15,445,946 | | | | 37,909,851 | |
| | China Region | | | 3,330,618 | | | | – | | | | – | | | | 3,330,618 | |
| (a) | Utilization of capital loss carryforwards is subject to annual limitations. |
During the year ended December 31, 2017, the following Funds utilized capital loss carryforwards to offset capital gains amounting to:
| | Fund | | | |
| | All American Equity | | $ | 349,769 | |
| | Global Resources | | | 131,454 | |
| | Gold and Precious Metals | | | 2,682,333 | |
| | Emerging Europe | | | 4,258,272 | |
| | China Region | | | 1,491,681 | |
In accordance with tax rules, the following net capital losses and ordinary losses (currency and late year losses) incurred after October 31, within each Fund’s tax year, are deemed to arise on the first day of the Fund’s next tax year if the Fund elects to defer such losses.
The Funds elected to defer losses incurred after October 31, 2017, as follows:
| | Fund | | Post October 31, 2017 Capital Loss Deferral | | | Post October 31, 2017 Ordinary Loss Deferral | |
| | Holmes Macro Trends | | $ | 204,896 | | | $ | – | |
| | Emerging Europe | | | – | | | | 306,150 | |
Note 6: Risks of Concentrations and Foreign Investments
The Near-Term Tax Free Fund may be exposed to risks related to concentration of investments in a particular state or geographic area. These investments present risks resulting from changes in economic conditions of the region or the issuer.
The Global Resources Fund concentrates its investments in the natural resources industries and may be subject to greater risks and fluctuations than a portfolio representing a broader range of industries.
The World Precious Minerals and Gold and Precious Metals Funds concentrate their investments in gold and other precious metals and minerals and, therefore, may be subject to greater risks and market fluctuations than a portfolio representing a broader range of industries. The funds invest in securities that typically respond to changes in the price of gold and other precious metals and minerals, which can be influenced by a variety of global economic, financial and political factors; increased environmental and labor costs in mining; and changes in laws relating to mining or gold production or sales. Fluctuations in the prices of gold and other precious metals and minerals will affect the market values of the securities held by these funds.
| Notes to Financial Statements | December 31, 2017 |
The Emerging Europe Fund invests more than 25% of its investments in companies principally engaged in the oil, gas or banking industries. Oil and gas companies are a large part of the Russian economy, and banks typically are a significant component of emerging market economics, such as those in Russia and other Eastern European countries. The risk of concentrating investments in this group of industries will make the fund more susceptible to risk in these industries than funds which do not concentrate their investments in an industry.
The Emerging Europe Fund may be exposed to risks not typically associated with investment in the United States due to its concentration of investments in emerging markets. These risks include possible revaluation of currencies, less public information about companies, disruptive political or economic conditions and the possible imposition of adverse governmental laws or currency exchange restrictions. Moreover, securities of many foreign issuers, including sovereign nations, and their markets may be less liquid and their prices more volatile than those securities of comparable U.S. issuers.
The China Region Fund may be exposed to risks not typically associated with investments in the United States, due to its concentration of investments in foreign issuers in the region. These investments present risks resulting from disruptive political or economic conditions and the potential imposition of adverse governmental laws or currency exchange restrictions affecting the area.
Note 7: Credit Arrangements
Each of the Funds has a revolving credit facility with BBH. Borrowings of each Fund are collateralized by any or all of the securities held by BBH as the Fund’s custodian up to the amount of the borrowing. Interest on borrowings is charged at the current overnight Federal Funds Rate plus 2 percent. Each Fund has a maximum borrowing limit of 10 percent of qualified assets. The aggregate of borrowings by all Funds under the agreement cannot exceed $10,000,000 at any one time. There were no borrowings under the revolving credit facility during the year ended December 31, 2017. The Funds paid BBH a total of $18,875 in commitment fees for the year ended December 31, 2017, under this arrangement.
Note 8: Commitments and Contingencies
In the normal course of business, each Fund enters into contracts that provide general indemnifications by each Fund to the counterparty to the contract. Each Fund’s maximum exposure under these arrangements is dependent on future claims that may be made against each Fund and, therefore, cannot be estimated; however, based on experience, the risk of loss from such claims is considered remote. Each Fund has determined that none of these arrangements requires disclosure on each Fund’s balance sheet.
Note 9: Subsequent Events
The Funds have evaluated the need for additional disclosures and/or adjustments resulting from subsequent events. Based on this evaluation, no additional disclosures or adjustments were required to the financial statements as of the date the financial statements were issued.
Financial Highlights
U.S. Government Securities Ultra-Short Bond Fund
For a capital share outstanding during the
| | | Investor Class | |
| | | Year Ended December 31, | |
| | | 2017 | | | 2016 | | | 2015 | | | 2014 | | | | 2013+ | |
| Net asset value, beginning of year | | $ | 2.00 | | | $ | 2.00 | | | $ | 2.00 | | | $ | 2.00 | | | $ | 2.00 | |
| Investment Activities | | | | | | | | | | | | | | | | | | | | |
| Net investment income | | | 0.01 | * | | | 0.01 | | | | 0.01 | | | | 0.01 | | | | 0.00 | (a) |
| Net realized and unrealized gain (loss) (a) | | | (0.00 | ) | | | 0.00 | | | | 0.00 | | | | 0.00 | | | | 0.00 | |
| Total from investment activities | | | 0.01 | | | | 0.01 | | | | 0.01 | | | | 0.01 | | | | – | |
| | | | | | | | | | | | | | | | | | | | | |
| Distributions | | | | | | | | | | | | | | | | | | | | |
| From net investment income | | | (0.01 | ) | | | (0.01 | ) | | | (0.01 | ) | | | (0.01 | ) | | | 0.00 | (a) |
| From return of capital | | | – | | | | (0.00 | )(a) | | | – | | | | – | | | | – | |
| From net realized gains | | | – | | | | (0.00 | )(a) | | | (0.00 | )(a) | | | – | | | | – | |
| Net asset value, end of year | | $ | 2.00 | | | $ | 2.00 | | | $ | 2.00 | | | $ | 2.00 | | | $ | 2.00 | |
| | | | | | | | | | | | | | | | | | | | | |
| Total Return (b) | | | 0.69 | % | | | 0.47 | % | | | 0.34 | % | | | 0.36 | % | | | 0.02 | % |
| Ratios to Average Net Assets: | | | | | | | | | | | | | | | | | | | | |
| Net investment income | | | 0.68 | % | | | 0.43 | % | | | 0.33 | % | | | 0.35 | % | | | 0.01 | % |
| Total expenses | | | 1.03 | % | | | 1.00 | % | | | 1.13 | % | | | 1.07 | % | | | 0.97 | % |
| Expenses waived or reimbursed (c) | | | (0.58 | )% | | | (0.55 | )% | | | (0.68 | )% | | | (0.74 | )% | | | (0.91 | )% |
| Net expenses (d) | | | 0.45 | % | | | 0.45 | % | | | 0.45 | % | | | 0.33 | % | | | 0.06 | % |
| Portfolio turnover rate (e) | | | 52 | % | | | 18 | % | | | 60 | % | | | 33 | % | | | | |
| Net assets, end of year (in thousands) | | $ | 49,427 | | | $ | 56,794 | | | $ | 62,562 | | | $ | 64,020 | | | $ | 75,227 | |
| + | The per share amounts for the period have been adjusted to reflect a 1-for-2 reverse stock split, which was effective December 20, 2013. In addition, on December 20, 2013, the Fund changed from a constant $1.00 net asset value per share money market fund to a U.S. Government ultra-short bond fund (that is not a money market fund) with an objective of total return with current income. |
| * | Based on average shares outstanding. |
| (a) | The per share amount does not round to a full penny. |
| (b) | Assumes investment at the net asset value at the beginning of the period, reinvestment of all distributions and a complete redemption of the investment at the net asset value at the end of the period. |
| (c) | Expenses waived or reimbursed reflect reductions to total expenses, as discussed in the notes to the financial statements. These amounts would increase the net investment loss ratio or decrease the net investment income ratio, as applicable, and decrease the total returns had such reductions not occurred. |
| (d) | The net expense ratios shown above reflect expenses after waivers and reimbursements and include the effect of reductions to total expenses for any expenses offset. Expense offset arrangements reduce total expenses, as discussed in the notes to the financial statements. These amounts would decrease the net investment income (loss) ratio had such reductions not occurred. The effect of expenses offset are as follows: |
| | | Investor Class | |
| | | Year Ended December 31, | |
| | | 2017 | | | 2016 | | | 2015 | | | 2014 | | | 2013 | |
| Ratios to Average Net Assets: | | | | | | | | | | | | | | | |
| Expense offset (f) | | | – | | | | – | | | | – | | | | – | | | | – | |
| (e) | Portfolio turnover is not shown for periods that the Fund was a money market fund. |
| (f) | Effect on the expense ratio was not greater than 0.005%. |
See accompanying notes to financial statements.
Financial Highlights
Near-Term Tax Free Fund
For a capital share outstanding during the
| | | Investor Class | |
| | | Year Ended December 31, | |
| | | 2017 | | | 2016 | | | 2015 | | | 2014 | | | 2013 | |
| Net asset value, beginning of year | | $ | 2.21 | | | $ | 2.25 | | | $ | 2.25 | | | $ | 2.23 | | | $ | 2.27 | |
| Investment Activities | | | | | | | | | | | | | | | | | | | | |
| Net investment income | | | 0.03 | * | | | 0.03 | | | | 0.03 | | | | 0.05 | | | | 0.05 | |
| Net realized and unrealized gain (loss) | | | – | | | | (0.04 | ) | | | 0.00 | (a) | | | 0.02 | | | | (0.04 | ) |
| Total from investment activities | | | 0.03 | | | | (0.01 | ) | | | 0.03 | | | | 0.07 | | | | 0.01 | |
| | | | | | | | | | | | | | | | | | | | | |
| Distributions | | | | | | | | | | | | | | | | | | | | |
| From net investment income | | | (0.03 | ) | | | (0.03 | ) | | | (0.03 | ) | | | (0.05 | ) | | | (0.05 | ) |
| From return of capital | | | – | | | | (0.00 | )(a) | | | – | | | | – | | | | – | |
| Net asset value, end of year | | $ | 2.21 | | | $ | 2.21 | | | $ | 2.25 | | | $ | 2.25 | | | $ | 2.23 | |
| | | | | | | | | | | | | | | | | | | | | |
| Total Return (b) | | | 1.20 | % | | | (0.45 | )% | | | 1.45 | % | | | 3.07 | % | | | 0.31 | % |
| Ratios to Average Net Assets: | | | | | | | | | | | | | | | | | | | | |
| Net investment income | | | 1.16 | % | | | 1.25 | % | | | 1.52 | % | | | 2.13 | % | | | 2.08 | % |
| Total expenses | | | 1.03 | % | | | 0.97 | % | | | 1.09 | % | | | 1.08 | % | | | 1.21 | % |
| Expenses waived or reimbursed (c) | | | (0.58 | )% | | | (0.52 | )% | | | (0.64 | )% | | | (0.63 | )% | | | (0.76 | )% |
| Net expenses (d) | | | 0.45 | % | | | 0.45 | % | | | 0.45 | % | | | 0.45 | % | | | 0.45 | % |
| Portfolio turnover rate | | | 14 | % | | | 33 | % | | | 15 | % | | | 12 | % | | | 6 | % |
| Net assets, end of year (in thousands) | | $ | 69,120 | | | $ | 95,301 | | | $ | 106,769 | | | $ | 89,595 | | | $ | 61,884 | |
| (a) | The per share amount does not round to a full penny. |
| * | Based on average shares outstanding. |
| (b) | Assumes investment at the net asset value at the beginning of the period, reinvestment of all distributions and a complete redemption of the investment at the net asset value at the end of the period. |
| (c) | Expenses waived or reimbursed reflect reductions to total expenses, as discussed in the notes to the financial statements. These amounts would increase the net investment loss ratio or decrease the net investment income ratio, as applicable, and decrease the total returns had such reductions not occurred. |
| (d) | The net expense ratios shown above reflect expenses after waivers and reimbursements and include the effect of reductions to total expenses for any expenses offset. Expense offset arrangements reduce total expenses, as discussed in the notes to the financial statements. These amounts would decrease the net investment income (loss) ratio had such reductions not occurred. The effect of expenses offset are as follows: |
| | | Investor Class | |
| | | Year Ended December 31, | |
| | | 2017 | | | 2016 | | | 2015 | | | 2014 | | | 2013 | |
| Ratios to Average Net Assets: | | | | | | | | | | | | | | | |
| Expense offset | | | (0.04 | )% | | | (0.02 | )% | | | – | (e) | | | – | (e) | | | – | (e) |
| (e) | Effect on the expense ratio was not greater than 0.005%. |
See accompanying notes to financial statements.
Financial Highlights
All American Equity Fund
For a capital share outstanding during the
| | | Investor Class | |
| | | Year Ended December 31, | |
| | | 2017 | | | 2016 | | | 2015 | | | 2014 | | | 2013 | |
| Net asset value, beginning of year | | $ | 23.53 | | | $ | 23.60 | | | $ | 27.84 | | | $ | 32.18 | | | $ | 25.40 | |
| Investment Activities | | | | | | | | | | | | | | | | | | | | |
| Net investment income (loss) | | | 0.09 | * | | | 0.02 | | | | 0.09 | | | | (0.16 | ) | | | (0.12 | ) |
| Net realized and unrealized gain (loss) | | | 1.30 | | | | (0.05 | ) | | | (1.23 | ) | | | 0.84 | | | | 9.08 | |
| Total from investment activities | | | 1.39 | | | | (0.03 | ) | | | (1.14 | ) | | | 0.68 | | | | 8.96 | |
| | | | | | | | | | | | | | | | | | | | | |
| Distributions | | | | | | | | | | | | | | | | | | | | |
| From net investment income | | | (0.02 | ) | | | (0.04 | ) | | | (0.06 | ) | | | – | | | | (0.07 | ) |
| From net realized gains | | | – | | | | – | | | | (3.04 | ) | | | (5.02 | ) | | | (2.11 | ) |
| Short-Term Trading Fees* | | | – | | | | 0.00 | (a) | | | 0.00 | (a) | | | 0.00 | (a) | | | 0.00 | (a) |
| Net asset value, end of year | | $ | 24.90 | | | $ | 23.53 | | | $ | 23.60 | | | $ | 27.84 | | | $ | 32.18 | |
| | | | | | | | | | | | | | | | | | | | | |
| Total Return (b) | | | 5.90 | % | | | (0.14 | )% | | | (4.20 | )% | | | 1.94 | % | | | 35.55 | % |
| Ratios to Average Net Assets: | | | | | | | | | | | | | | | | | | | | |
| Net investment income (loss) | | | 0.38 | % | | | 0.06 | % | | | 0.31 | % | | | (0.54 | )% | | | (0.45 | )% |
| Total expenses | | | 1.79 | % | | | 1.75 | % | | | 1.94 | % | | | 2.16 | % | | | 2.44 | % |
| Expenses waived or reimbursed (c) | | | (0.04 | )% | | | (0.02 | )% | | | (0.02 | )% | | | (0.03 | )% | | | (0.28 | )% |
| Net expenses (d) | | | 1.75 | % | | | 1.73 | % | | | 1.92 | % | | | 2.13 | % | | | 2.16 | % |
| Portfolio turnover rate | | | 346 | % | | | 303 | % | | | 109 | %(e) | | | 253 | % | | | 150 | % |
| Net assets, end of year (in thousands) | | $ | 15,932 | | | $ | 17,350 | | | $ | 19,117 | | | $ | 21,936 | | | $ | 23,388 | |
| * | Based on average shares outstanding. |
| (a) | The per share amount does not round to a full penny. |
| (b) | Assumes investment at the net asset value at the beginning of the period, reinvestment of all distributions and a complete redemption of the investment at the net asset value at the end of the period. |
| (c) | Expenses waived or reimbursed reflect reductions to total expenses, as discussed in the notes to the financial statements. These amounts would increase the net investment loss ratio or decrease the net investment income ratio, as applicable, and decrease the total returns had such reductions not occurred. |
| (d) | The net expense ratios shown above reflect expenses after waivers and reimbursements and include the effect of reductions to total expenses for any expenses offset. Expense offset arrangements reduce total expenses, as discussed in the notes to the financial statements. These amounts would decrease the net investment income (loss) ratio had such reductions not occurred. The effect of expenses offset are as follows: |
| | | Investor Class | |
| | | Year Ended December 31, | |
| | | 2017 | | | 2016 | | | 2015 | | | 2014 | | | 2013 | |
| Ratios to Average Net Assets: | | | | | | | | | | | | | | | |
| Expense offset | | | (0.04 | )% | | | (0.02 | )% | | | – | (f) | | | – | (f) | | | – | (f) |
| (e) | Excludes option transactions. |
| (f) | Effect on the expense ratio was not greater than 0.005%. |
See accompanying notes to financial statements.
Financial Highlights
Holmes Macro Trends Fund
For a capital share outstanding during the
| | | Investor Class | |
| | | Year Ended December 31, | |
| | | 2017 | | | 2016 | | | 2015 | | | 2014 | | | 2013 | |
| Net asset value, beginning of year | | $ | 18.65 | | | $ | 18.59 | | | $ | 20.25 | | | $ | 24.24 | | | $ | 18.51 | |
| Investment Activities | | | | | | | | | | | | | | | | | | | | |
| Net investment loss | | | (0.08 | )* | | | (0.06 | ) | | | (0.11 | ) | | | (0.26 | ) | | | (0.18 | ) |
| Net realized and unrealized gain (loss) | | | 3.66 | | | | 1.68 | | | | (0.06 | ) | | | (1.36 | ) | | | 7.42 | |
| Total from investment activities | | | 3.58 | | | | 1.62 | | | | (0.17 | ) | | | (1.62 | ) | | | 7.24 | |
| Distributions From net realized gains | | | (2.71 | ) | | | (1.56 | ) | | | (1.49 | ) | | | (2.37 | ) | | | (1.51 | ) |
| Short-Term Trading Fees*(a) | | | 0.00 | | | | 0.00 | | | | 0.00 | | | | 0.00 | | | | 0.00 | |
| Net asset value, end of year | | $ | 19.52 | | | $ | 18.65 | | | $ | 18.59 | | | $ | 20.25 | | | $ | 24.24 | |
| | | | | | | | | | | | | | | | | | | | | |
| Total Return (b) | | | 19.17 | % | | | 8.66 | % | | | (0.94 | )% | | | (6.74 | )% | | | 39.38 | % |
| Ratios to Average Net Assets: | | | | | | | | | | | | | | | | | | | | |
| Net investment loss | | | (0.41 | )% | | | (0.34 | )% | | | (0.55 | )% | | | (1.17 | )% | | | (1.11 | )% |
| Total expenses | | | 1.86 | % | | | 1.67 | % | | | 1.81 | % | | | 1.94 | % | | | 2.00 | % |
| Expenses waived or reimbursed (c) | | | (0.04 | )% | | | – | | | | – | | | | – | | | | (0.04 | )% |
| Net expenses (d) | | | 1.82 | % | | | 1.67 | % | | | 1.81 | % | | | 1.94 | % | | | 1.96 | % |
| Portfolio turnover rate | | | 264 | %(e) | | | 275 | %(e) | | | 320 | %(e) | | | 183 | %(e) | | | 109 | % |
| Net assets, end of year (in thousands) | | $ | 41,597 | | | $ | 40,706 | | | $ | 41,135 | | | $ | 46,250 | | | $ | 55,926 | |
| * | Based on average shares outstanding. |
| (a) | The per share amount does not round to a full penny. |
| (b) | Assumes investment at the net asset value at the beginning of the period, reinvestment of all distributions and a complete redemption of the investment at the net asset value at the end of the period. |
| (c) | Expenses waived or reimbursed reflect reductions to total expenses, as discussed in the notes to the financial statements. These amounts would increase the net investment loss ratio or decrease the net investment income ratio, as applicable, and decrease the total returns had such reductions not occurred. |
| (d) | The net expense ratios shown above reflect expenses after waivers and reimbursements and include the effect of reductions to total expenses for any expenses offset. Expense offset arrangements reduce total expenses, as discussed in the notes to the financial statements. These amounts would decrease the net investment income (loss) ratio had such reductions not occurred. The effect of expenses offset are as follows: |
| | | Investor Class | |
| | | Year Ended December 31, | |
| | | 2017 | | | 2016 | | | 2015 | | | 2014 | | | 2013 | |
| Ratios to Average Net Assets: | | | | | | | | | | | | | | | | | | | | |
| Expense offset | | | (0.04 | )% | | | (0.02 | )% | | | –(f | ) | | | –(f | ) | | | –(f | ) |
| (e) | Excludes option transactions. |
| (f) | Effect on the expense ratio was not greater than 0.005%. |
See accompanying notes to financial statements.
Financial Highlights
Global Resources Fund
For a capital share outstanding during the
| | | Investor Class | |
| | | Year Ended December 31, | |
| | | 2017 | | | 2016 | | | 2015 | | | 2014 | | | 2013 | |
| Net asset value, beginning of year | | $ | 5.25 | | | $ | 4.72 | | | $ | 6.67 | | | $ | 9.36 | | | $ | 9.79 | |
| Investment Activities | | | | | | | | | | | | | | | | | | | | |
| Net investment income* | | | 0.11 | | | | 0.06 | | | | 0.10 | | | | 0.04 | | | | 0.02 | |
| Net realized and unrealized gain (loss) | | | 0.91 | | | | 0.64 | * | | | (2.00 | )* | | | (2.73 | )* | | | (0.10 | )* |
| Total from investment activities | | | 1.02 | | | | 0.70 | | | | (1.90 | ) | | | (2.69 | ) | | | (0.08 | ) |
| Distributions From net investment income | | | (0.18 | ) | | | (0.17 | ) | | | (0.05 | ) | | | – | | | | (0.35 | ) |
| Short-Term Trading Fees*(a) | | | 0.00 | | | | 0.00 | | | | 0.00 | | | | 0.00 | | | | 0.00 | |
| Net asset value, end of year | | $ | 6.09 | | | $ | 5.25 | | | $ | 4.72 | | | $ | 6.67 | | | $ | 9.36 | |
| Total Return (b) | | | 19.57 | % | | | 14.99 | % | | | (28.43 | )% | | | (28.74 | )% | | | (0.72 | )% |
| Ratios to Average Net Assets: | | | | | | | | | | | | | | | | | | | | |
| Net investment income | | | 1.94 | % | | | 1.13 | % | | | 1.72 | % | | | 0.44 | % | | | 0.16 | % |
| Total expenses | | | 1.61 | % | | | 1.85 | % | | | 1.58 | % | | | 1.45 | % | | | 1.59 | % |
| Expenses waived or reimbursed (c) | | | (0.02 | )% | | | (0.01 | )% | | | (0.06 | )% | | | –(d | ) | | | – | |
| Net expenses (e) | | | 1.59 | % | | | 1.84 | % | | | 1.52 | % | | | 1.45 | % | | | 1.59 | % |
| Portfolio turnover rate (f) | | | 131 | %(g) | | | 255 | %(g) | | | 445 | %(g) | | | 444 | %(g) | | | 138 | % |
| Net assets, end of year (in thousands) | | $ | 95,747 | | | $ | 97,005 | | | $ | 98,126 | | | $ | 171,673 | | | $ | 326,320 | |
| * | Based on average shares outstanding. |
| (a) | The per share amount does not round to a full penny. |
| (b) | Assumes investment at the net asset value at the beginning of the period, reinvestment of all distributions and a complete redemption of the investment at the net asset value at the end of the period. |
| (c) | Expenses waived or reimbursed reflect reductions to total expenses, as discussed in the notes to the financial statements. These amounts would increase the net investment loss ratio or decrease the net investment income ratio, as applicable, and decrease the total returns had such reductions not occurred. |
| (d) | Effect on the expense ratio was not greater than 0.005%. |
| (e) | The net expense ratios shown above reflect expenses after waivers and reimbursements and include the effect of reductions to total expenses for any expenses offset. Expense offset arrangements reduce total expenses, as discussed in the notes to the financial statements. These amounts would decrease the net investment income (loss) ratio had such reductions not occurred. The effect of expenses offset are as follows: |
| | | Investor Class | |
| | | Year Ended December 31, | |
| | | 2017 | | | 2016 | | | 2015 | | | 2014 | | | 2013 | |
| Ratios to Average Net Assets: | | | | | | | | | | | | | | | |
| Expense offset | | | (0.02 | )% | | | (0.01 | )% | | | – | (d) | | | – | (d) | | | – | (d) |
| (f) | Portfolio turnover is calculated at the fund level. |
| (g) | Excludes option transactions. |
See accompanying notes to financial statements.
Financial Highlights
Global Resources Fund
For a capital share outstanding during the
| | | Institutional Class | |
| | | Year Ended December 31, | |
| | | 2017 | | | 2016 | | | 2015 | | | 2014 | | | 2013 | |
| Net asset value, beginning of year | | $ | 5.25 | | | $ | 4.74 | | | $ | 6.67 | | | $ | 9.30 | | | $ | 9.74 | |
| Investment Activities | | | | | | | | | | | | | | | | | | | | |
| Net investment income* | | | 0.14 | | | | 0.08 | | | | 0.17 | | | | 0.08 | | | | 0.07 | |
| Net realized and unrealized gain (loss) | | | 0.96 | | | | 0.65 | * | | | (2.02 | )* | | | (2.71 | )* | | | (0.10 | )* |
| Total from investment activities | | | 1.10 | | | | 0.73 | | | | (1.85 | ) | | | (2.63 | ) | | | (0.03 | ) |
| Distributions | | | | | | | | | | | | | | | | | | | | |
| From net investment income | | | (0.22 | ) | | | (0.22 | ) | | | (0.08 | ) | | | – | | | | (0.41 | ) |
| Short-Term Trading Fees* | | | – | | | | – | | | | – | | | | – | | | | 0.00(a | ) |
| Net asset value, end of year | | $ | 6.13 | | | $ | 5.25 | | | $ | 4.74 | | | $ | 6.67 | | | $ | 9.30 | |
| Total Return (b) | | | 20.95 | % | | | 15.43 | % | | | (27.73 | )% | | | (28.28 | )% | | | (0.15 | )% |
| Ratios to Average Net Assets: | | | | | | | | | | | | | | | | | | | | |
| Net investment income | | | 2.43 | % | | | 1.61 | % | | | 2.92 | % | | | 0.85 | % | | | 0.68 | % |
| Total expenses | | | 3.56 | % | | | 5.41 | % | | | 1.35 | % | | | 1.13 | % | | | 1.25 | % |
| Expenses waived or reimbursed (c) | | | (2.46 | )% | | | (4.05 | )% | | | (0.61 | )% | | | (0.27 | )% | | | (0.22 | )% |
| Net expenses (d) | | | 1.10 | % | | | 1.36 | % | | | 0.74 | % | | | 0.86 | % | | | 1.03 | % |
| Portfolio turnover rate (e) | | | 131 | %(f) | | | 255 | %(f) | | | 445 | %(f) | | | 444 | %(f) | | | 138 | % |
| Net assets, end of year (in thousands) | | $ | 518 | | | $ | 1,021 | | | $ | 1,882 | | | $ | 9,733 | | | $ | 51,122 | |
| * | Based on average shares outstanding. |
| (a) | The per share amount does not round to a full penny. |
| (b) | Assumes investment at the net asset value at the beginning of the period, reinvestment of all distributions and a complete redemption of the investment at the net asset value at the end of the period. |
| (c) | Expenses waived or reimbursed reflect reductions to total expenses, as discussed in the notes to the financial statements. These amounts would increase the net investment loss ratio or decrease the net investment income ratio, as applicable, and decrease the total returns had such reductions not occurred. |
| (d) | The net expense ratios shown above reflect expenses after waivers and reimbursements and include the effect of reductions to total expenses for any expenses offset. Expense offset arrangements reduce total expenses, as discussed in the notes to the financial statements. These amounts would decrease the net investment income (loss) ratio had such reductions not occurred. The effect of expenses offset are as follows: |
| | | Institutional Class | |
| | | Year Ended December 31, | |
| | | 2017 | | | 2016 | | | 2015 | | | 2014 | | | 2013 | |
| Ratios to Average Net Assets: | | | | | | | | | | | | | | | |
| Expense offset | | | (0.02 | )% | | | (0.01 | )% | | | –(g | ) | | | –(g | ) | | | –(g | ) |
| (e) | Portfolio turnover is calculated at the fund level. |
| (f) | Excludes option transactions. |
| (g) | Effect on the expense ratio was not greater than 0.005%. |
See accompanying notes to financial statements.
Financial Highlights
World Precious Minerals Fund
For a capital share outstanding during the
| | | Investor Class | |
| | | Year Ended December 31, | |
| | | 2017 | | | 2016 | | | 2015 | | | 2014 | | | 2013 | |
| Net asset value, beginning of year | | $ | 6.35 | | | $ | 3.64 | | | $ | 4.75 | | | $ | 5.69 | | | $ | 11.70 | |
| Investment Activities | | | | | | | | | | | | | | | | | | | | |
| Net investment loss* | | | (0.10 | ) | | | (0.09 | ) | | | (0.03 | ) | | | (0.06 | ) | | | (0.07 | ) |
| Net realized and unrealized gain (loss) | | | (0.22 | ) | | | 2.82 | * | | | (0.72 | )* | | | (0.88 | )* | | | (5.94 | )* |
| Total from investment activities | | | (0.32 | ) | | | 2.73 | | | | (0.75 | ) | | | (0.94 | ) | | | (6.01 | ) |
| Distributions | | | | | | | | | | | | | | | | | | | | |
| From net investment income | | | (1.34 | ) | | | (0.02 | ) | | | (0.36 | ) | | | – | | | | – | |
| Short-Term Trading Fees*(a) | | | 0.00 | | | | 0.00 | | | | 0.00 | | | | 0.00 | | | | 0.00 | |
| Net asset value, end of year | | $ | 4.69 | | | $ | 6.35 | | | $ | 3.64 | | | $ | 4.75 | | | $ | 5.69 | |
| Total Return (b) | | | (4.16 | )% | | | 75.08 | % | | | (15.64 | )% | | | (16.52 | )% | | | (51.37 | )% |
| Ratios to Average Net Assets: | | | | | | | | | | | | | | | | | | | | |
| Net investment loss | | | (1.51 | )% | | | (1.28 | )% | | | (0.71 | )% | | | (0.91 | )% | | | (0.90 | )% |
| Total expenses | | | 1.84 | % | | | 1.99 | % | | | 1.96 | % | | | 1.99 | % | | | 1.85 | % |
| Expenses waived or reimbursed (c) | | | (0.02 | )% | | | (0.04 | )% | | | (0.15 | )% | | | (0.03 | )% | | | (0.02 | )% |
| Net expenses (d) | | | 1.82 | % | | | 1.95 | % | | | 1.81 | % | | | 1.96 | % | | | 1.83 | % |
| Portfolio turnover rate (e) | | | 36 | %(f) | | | 136 | %(f) | | | 71 | %(f) | | | 61 | %(f) | | | 34 | % |
| Net assets, end of year (in thousands) | | $ | 114,766 | | | $ | 137,338 | | | $ | 78,150 | | | $ | 103,413 | | | $ | 134,065 | |
| * | Based on average shares outstanding. |
| (a) | The per share amount does not round to a full penny. |
| (b) | Assumes investment at the net asset value at the beginning of the period, reinvestment of all distributions and a complete redemption of the investment at the net asset value at the end of the period. |
| (c) | Expenses waived or reimbursed reflect reductions to total expenses, as discussed in the notes to the financial statements. These amounts would increase the net investment loss ratio or decrease the net investment income ratio, as applicable, and decrease the total returns had such reductions not occurred. |
| (d) | The net expense ratios shown above reflect expenses after waivers and reimbursements and include the effect of reductions to total expenses for any expenses offset. Expense offset arrangements reduce total expenses, as discussed in the notes to the financial statements. These amounts would decrease the net investment income (loss) ratio had such reductions not occurred. The effect of expenses offset are as follows: |
| | | Investor Class | |
| | | Year Ended December 31, | |
| | | 2017 | | | 2016 | | | 2015 | | | 2014 | | | 2013 | |
| Ratios to Average Net Assets: | | | | | | | | | | | | | | | |
| Expense offset | | | (0.02 | )% | | | (0.01 | )% | | | –(g | ) | | | –(g | ) | | | –(g | ) |
| (e) | Portfolio turnover is calculated at the fund level. |
| (f) | Excludes option transactions. |
| (g) | Effect on the expense ratio was not greater than 0.005%. |
See accompanying notes to financial statements.
Financial Highlights
World Precious Minerals Fund
For a capital share outstanding during the
| | | Institutional Class | |
| | | Year Ended December 31, | |
| | | 2017 | | | 2016 | | | 2015 | | | 2014 | | | 2013 | |
| Net asset value, beginning of year | | $ | 6.38 | | | $ | 3.65 | | | $ | 4.78 | | | $ | 5.72 | | | $ | 11.69 | |
| Investment Activities | | | | | | | | | | | | | | | | | | | | |
| Net investment loss* | | | (0.06 | ) | | | (0.05 | ) | | | (0.01 | ) | | | (0.05 | ) | | | (0.01 | ) |
| Net realized and unrealized gain (loss) | | | (0.23 | ) | | | 2.82 | * | | | (0.72 | )* | | | (0.89 | )* | | | (5.96 | )* |
| Total from investment activities | | | (0.29 | ) | | | 2.77 | | | | (0.73 | ) | | | (0.94 | ) | | | (5.97 | ) |
| Distributions | | | | | | | | | | | | | | | | | | | | |
| From net investment income | | | (1.38 | ) | | | (0.04 | ) | | | (0.40 | ) | | | – | | | | – | |
| Short-Term Trading Fees* | | | 0.00(a | ) | | | – | | | | – | | | | – | | | | – | |
| Net asset value, end of year | | $ | 4.71 | | | $ | 6.38 | | | $ | 3.65 | | | $ | 4.78 | | | $ | 5.72 | |
| Total Return (b) | | | (3.71 | )% | | | 75.97 | % | | | (15.07 | )% | | | (16.43 | )% | | | (51.07 | )% |
| Ratios to Average Net Assets: | | | | | | | | | | | | | | | | | | | | |
| Net investment loss | | | (0.99 | )% | | | (0.69 | )% | | | (0.15 | )% | | | (0.71 | )% | | | (0.15 | )% |
| Total expenses | | | 2.21 | % | | | 2.60 | % | | | 20.51 | % | | | 4.86 | % | | | 3.30 | % |
| Expenses waived or reimbursed (c) | | | (0.91 | )% | | | (1.33 | )% | | | (19.31 | )% | | | (3.23 | )% | | | (1.97 | )% |
| Net expenses (d) | | | 1.30 | % | | | 1.27 | % | | | 1.20 | % | | | 1.63 | % | | | 1.33 | % |
| Portfolio turnover rate (e) | | | 36 | %(f) | | | 136 | %(f) | | | 71 | %(f) | | | 61 | %(f) | | | 34 | % |
| Net assets, end of year (in thousands) | | $ | 3,007 | | | $ | 3,821 | | | $ | 76 | | | $ | 154 | | | $ | 3,660 | |
| * | Based on average shares outstanding. |
| (a) | The per share amount does not round to a full penny. |
| (b) | Assumes investment at the net asset value at the beginning of the period, reinvestment of all distributions and a complete redemption of the investment at the net asset value at the end of the period. |
| (c) | Expenses waived or reimbursed reflect reductions to total expenses, as discussed in the notes to the financial statements. These amounts would increase the net investment loss ratio or decrease the net investment income ratio, as applicable, and decrease the total returns had such reductions not occurred. |
| (d) | The net expense ratios shown above reflect expenses after waivers and reimbursements and include the effect of reductions to total expenses for any expenses offset. Expense offset arrangements reduce total expenses, as discussed in the notes to the financial statements. These amounts would decrease the net investment income (loss) ratio had such reductions not occurred. The effect of expenses offset are as follows: |
| | | Institutional Class | |
| | | Year Ended December 31, | |
| | | 2017 | | | 2016 | | | 2015 | | | 2014 | | | 2013 | |
| Ratios to Average Net Assets: | | | | | | | | | | | | | | | |
| Expense offset | | | (0.02 | )% | | | (0.01 | )% | | | –(g | ) | | | –(g | ) | | | –(g | ) |
| (e) | Portfolio turnover is calculated at the fund level. |
| (f) | Excludes option transactions. |
| (g) | Effect on the expense ratio was not greater than 0.005%. |
See accompanying notes to financial statements.
Financial Highlights
Gold and Precious Metals Fund
For a capital share outstanding during the
| | | Investor Class | |
| | | Year Ended December 31, | |
| | | 2017 | | | 2016 | | | 2015 | | | 2014 | | | 2013 | |
| Net asset value, beginning of year | | $ | 7.04 | | | $ | 4.89 | | | $ | 5.16 | | | $ | 6.00 | | | $ | 11.78 | |
| Investment Activities | | | | | | | | | | | | | | | | | | | | |
| Net investment loss | | | (0.06 | )* | | | (0.07 | ) | | | (0.04 | ) | | | (0.05 | ) | | | (0.06 | ) |
| Net realized and unrealized gain (loss) | | | 0.98 | | | | 2.28 | | | | (0.21 | ) | | | (0.79 | ) | | | (5.72 | ) |
| Total from investment activities | | | 0.92 | | | | 2.21 | | | | (0.25 | ) | | | (0.84 | ) | | | (5.78 | ) |
| Distributions | | | | | | | | | | | | | | | | | | | | |
| From net investment income | | | – | | | | (0.06 | ) | | | (0.02 | ) | | | – | | | | – | |
| Short-Term Trading Fees*(a) | | | 0.00 | | | | (0.00 | ) | | | (0.00 | ) | | | (0.00 | ) | | | (0.00 | ) |
| Net asset value, end of year | | $ | 7.96 | | | $ | 7.04 | | | $ | 4.89 | | | $ | 5.16 | | | $ | 6.00 | |
| Total Return (b) | | | 13.07 | % | | | 45.36 | % | | | (4.78 | )% | | | (14.00 | )% | | | (49.07 | )% |
| Ratios to Average Net Assets: | | | | | | | | | | | | | | | | | | | | |
| Net investment loss | | | (0.84 | )% | | | (1.02 | )% | | | (0.83 | )% | | | (0.67 | )% | | | (0.48 | )% |
| Total expenses | | | 1.68 | % | | | 1.73 | % | | | 2.13 | % | | | 1.93 | % | | | 2.12 | % |
| Expenses waived or reimbursed (c) | | | (0.03 | )% | | | (0.02 | )% | | | (0.08 | )% | | | (0.05 | )% | | | (0.06 | )% |
| Net expenses (d) | | | 1.65 | % | | | 1.71 | % | | | 2.05 | % | | | 1.88 | % | | | 2.06 | % |
| Portfolio turnover rate | | | 67 | %(e) | | | 181 | %(e) | | | 106 | %(e) | | | 99 | %(e) | | | 64 | % |
| Net assets, end of year (in thousands) | | $ | 100,740 | | | $ | 93,988 | | | $ | 58,298 | | | $ | 62,777 | | | $ | 74,627 | |
| * | Based on average shares outstanding. |
| (a) | The per share amount does not round to a full penny. |
| (b) | Assumes investment at the net asset value at the beginning of the period, reinvestment of all distributions and a complete redemption of the investment at the net asset value at the end of the period. |
| (c) | Expenses waived or reimbursed reflect reductions to total expenses, as discussed in the notes to the financial statements. These amounts would increase the net investment loss ratio or decrease the net investment income ratio, as applicable, and decrease the total returns had such reductions not occurred. |
| (d) | The net expense ratios shown above reflect expenses after waivers and reimbursements and include the effect of reductions to total expenses for any expenses offset. Expense offset arrangements reduce total expenses, as discussed in the notes to the financial statements. These amounts would decrease the net investment income (loss) ratio had such reductions not occurred. The effect of expenses offset are as follows: |
| | | Investor Class | |
| | | Year Ended December 31, | |
| | | 2017 | | | 2016 | | | 2015 | | | 2014 | | | 2013 | |
| Ratios to Average Net Assets: | | | | | | | | | | | | | | | |
| Expense offset | | | (0.03 | )% | | | (0.01 | )% | | | –(f | ) | | | –(f | ) | | | –(f | ) |
| (e) | Excludes option transactions. |
| (f) | Effect on the expense ratio was not greater than 0.005%. |
See accompanying notes to financial statements.
Financial Highlights
Emerging Europe Fund
For a capital share outstanding during the
| | | Investor Class | |
| | | Year Ended December 31, | |
| | | 2017 | | | 2016 | | | 2015 | | | 2014 | | | 2013 | |
| Net asset value, beginning of year | | $ | 5.94 | | | $ | 5.20 | | | $ | 6.56 | | | $ | 8.82 | | | $ | 9.23 | |
| Investment Activities | | | | | | | | | | | | | | | | | | | | |
| Net investment income | | | 0.08 | * | | | 0.07 | | | | 0.04 | | | | 0.06 | | | | 0.19 | |
| Net realized and unrealized gain (loss) | | | 1.27 | | | | 0.67 | | | | (1.40 | ) | | | (2.11 | ) | | | (0.46 | ) |
| Total from investment activities | | | 1.35 | | | | 0.74 | | | | (1.36 | ) | | | (2.05 | ) | | | (0.27 | ) |
| Distributions | | | | | | | | | | | | | | | | | | | | |
| From net investment income | | | – | | | | – | | | | – | | | | (0.21 | ) | | | (0.14 | ) |
| Short-Term Trading Fees*(a) | | | 0.00 | | | | 0.00 | | | | 0.00 | | | | 0.00 | | | | 0.00 | |
| Net asset value, end of year | | $ | 7.29 | | | $ | 5.94 | | | $ | 5.20 | | | $ | 6.56 | | | $ | 8.82 | |
| Total Return (b) | | | 22.73 | % | | | 14.23 | % | | | (20.73 | )% | | | (23.22 | )% | | | (2.93 | )% |
| Ratios to Average Net Assets: | | | | | | | | | | | | | | | | | | | | |
| Net investment income | | | 1.26 | % | | | 1.19 | % | | | 0.63 | % | | | 0.23 | % | | | 1.59 | % |
| Total expenses | | | 2.32 | % | | | 2.31 | % | | | 2.60 | % | | | 2.28 | % | | | 2.13 | % |
| Expenses waived or reimbursed (c) | | | (0.02 | )% | | | –(d | ) | | | – | | | | – | | | | – | |
| Net expenses (e) | | | 2.30 | % | | | 2.31 | % | | | 2.60 | % | | | 2.28 | % | | | 2.13 | % |
| Portfolio turnover rate | | | 97 | %(f) | | | 164 | %(f) | | | 137 | %(f) | | | 93 | %(f) | | | 74 | % |
| Net assets, end of year (in thousands) | | $ | 45,302 | | | $ | 42,273 | | | $ | 44,666 | | | $ | 69,066 | | | $ | 122,570 | |
* | Based on average shares outstanding. |
| (a) | The per share amount does not round to a full penny. |
| (b) | Assumes investment at the net asset value at the beginning of the period, reinvestment of all distributions and a complete redemption of the investment at the net asset value at the end of the period. |
| (c) | Expenses waived or reimbursed reflect reductions to total expenses, as discussed in the notes to the financial statements. These amounts would increase the net investment loss ratio or decrease the net investment income ratio, as applicable, and decrease the total returns had such reductions not occurred. |
| (d) | Effect on the expense ratio was not greater than 0.005%. |
| (e) | The net expense ratios shown above reflect expenses after waivers and reimbursements and include the effect of reductions to total expenses for any expenses offset. Expense offset arrangements reduce total expenses, as discussed in the notes to the financial statements. These amounts would decrease the net investment income (loss) ratio had such reductions not occurred. The effect of expenses offset are as follows: |
| | | Investor Class | |
| | | Year Ended December 31, | |
| | | 2017 | | | 2016 | | | 2015 | | | 2014 | | | 2013 | |
| Ratios to Average Net Assets: | | | | | | | | | | | | | | | |
| Expense offset | | | (0.02 | )% | | | –(d | ) | | | –(d | ) | | | –(d | ) | | | –(d | ) |
| (f) | Excludes option transactions. |
See accompanying notes to financial statements.
Financial Highlights
China Region Fund
For a capital share outstanding during the
| | | Investor Class | |
| | | Year Ended December 31, | |
| | | 2017 | | | 2016 | | | 2015 | | | 2014 | | | 2013 | |
| Net asset value, beginning of year | | $ | 7.32 | | | $ | 7.41 | | | $ | 8.20 | | | $ | 8.28 | | | $ | 7.61 | |
| Investment Activities | | | | | | | | | | | | | | | | | | | | |
| Net investment income (loss) | | | (0.06 | )* | | | 0.01 | | | | 0.02 | | | | 0.00(a | ) | | | (0.01 | ) |
| Net realized and unrealized gain (loss) | | | 4.28 | | | | (0.09 | ) | | | (0.72 | ) | | | (0.08 | ) | | | 0.70 | |
| Total from investment activities | | | 4.22 | | | | (0.08 | ) | | | (0.70 | ) | | | (0.08 | ) | | | 0.69 | |
| Distributions | | | | | | | | | | | | | | | | | | | | |
| From net investment income | | | (0.01 | ) | | | (0.01 | ) | | | (0.09 | ) | | | – | | | | (0.02 | ) |
| Short-Term Trading Fees* | | | – | | | | 0.00(a | ) | | | 0.00(a | ) | | | 0.00(a | ) | | | 0.00(a | ) |
| Net asset value, end of year | | $ | 11.53 | | | $ | 7.32 | | | $ | 7.41 | | | $ | 8.20 | | | $ | 8.28 | |
| Total Return (b) | | | 57.67 | % | | | (1.05 | )% | | | (8.60 | )% | | | (0.97 | )% | | | 9.07 | % |
| Ratios to Average Net Assets: | | | | | | | | | | | | | | | | | | | | |
| Net investment income (loss) | | | (0.60 | )% | | | 0.12 | % | | | 0.24 | % | | | 0.08 | % | | | (0.12 | )% |
| Total expenses | | | 2.60 | % | | | 2.74 | % | | | 3.03 | % | | | 2.94 | % | | | 2.75 | % |
| Expenses waived or reimbursed (c) | | | (0.09 | )% | | | (0.38 | )% | | | (0.51 | )% | | | (0.43 | )% | | | (0.37 | )% |
| Net expenses (d) | | | 2.51 | % | | | 2.36 | % | | | 2.52 | % | | | 2.51 | % | | | 2.38 | % |
| Portfolio turnover rate | | | 102 | %(e) | | | 165 | %(e) | | | 210 | %(e) | | | 235 | %(e) | | | 201 | % |
| Net assets, end of year (in thousands) | | $ | 29,775 | | | $ | 16,510 | | | $ | 16,183 | | | $ | 21,008 | | | $ | 26,386 | |
| * | Based on average shares outstanding. |
| (a) | The per share amount does not round to a full penny. |
| (b) | Assumes investment at the net asset value at the beginning of the period, reinvestment of all distributions and a complete redemption of the investment at the net asset value at the end of the period. |
| (c) | Expenses waived or reimbursed reflect reductions to total expenses, as discussed in the notes to the financial statements. These amounts would increase the net investment loss ratio or decrease the net investment income ratio, as applicable, and decrease the total returns had such reductions not occurred. |
| (d) | The net expense ratios shown above reflect expenses after waivers and reimbursements and include the effect of reductions to total expenses for any expenses offset. Expense offset arrangements reduce total expenses, as discussed in the notes to the financial statements. These amounts would decrease the net investment income (loss) ratio had such reductions not occurred. The effect of expenses offset are as follows: |
| | | Investor Class | |
| | | Year Ended December 31, | |
| | | 2017 | | | 2016 | | | 2015 | | | 2014 | | | 2013 | |
| Ratios to Average Net Assets: | | | | | | | | | | | | | | | |
| Expense offset | | | (0.05 | )% | | | (0.01 | )% | | | –(f | ) | | | –(f | ) | | | –(f | ) |
| (e) | Excludes option transactions. |
| (f) | Effect on the expense ratio was not greater than 0.005%. |
See accompanying notes to financial statements.
Report of Independent Registered Public Accounting Firm
To the Board of Trustees and Shareholders of U.S. Global Investors Funds
Opinion on the Financial Statements
We have audited the accompanying statements of assets and liabilities of U.S. Government Securities Ultra-Short Bond Fund, Near-Term Tax Free Fund, All American Equity Fund, Holmes Macro Trends Fund, Global Resources Fund, World Precious Minerals Fund, Gold and Precious Metals Fund, Emerging Europe Fund and China Region Fund, each a series of shares of beneficial interest in U.S. Global Investors Funds (the “Funds”), including the portfolios of investments, as of December 31, 2017, and the related statements of operations for the year then ended and the statements of changes in net assets and the financial highlights for each of the years in the two-year period then ended, and the related notes and schedules (collectively referred to as the “financial statements”). In our opinion, the financial statements present fairly, in all material respects, the financial position of the Funds as of December 31, 2017, and the results of their operations for the year then ended and the changes in their net assets and their financial highlights for each of the years in the two-year period then ended, in conformity with accounting principles generally accepted in the United States of America (“GAAP”). The financial highlights for each of the years presented through December 31, 2015 were audited by other auditors, whose report dated February 26, 2016 expressed an unqualified opinion on those financial highlights.
Basis for Opinion
These financial statements are the responsibility of the Funds' management. Our responsibility is to express an opinion on the Funds' financial statements based on our audits. We are a public accounting firm registered with the Public Company Accounting Oversight Board (United States) (“PCAOB”) and are required to be independent with respect to the Funds in accordance with the U.S. federal securities law and the applicable rules and regulations of the Securities and Exchange Commission and the PCAOB.
We conducted our audits in accordance with the standards of the PCAOB. Those standards require that we plan and perform the audits to obtain reasonable assurance about whether the financial statements are free of material misstatement, whether due to error or fraud. The Funds are not required to have, nor were we engaged to perform, an audit of their internal control over financial reporting. As part of our audits we are required to obtain an understanding of internal control over financial reporting but not for the purpose of expressing an opinion on the effectiveness of the Funds' internal control over financial reporting. Accordingly, we express no such opinion.
Our audits included performing procedures to assess the risk of material misstatement of those financial statements, whether due to error or fraud, and performing procedures that respond to those risks. Such procedures included examining, on a test basis, evidence regarding the amounts and disclosures in the financial statements. Our procedures included confirmation of securities owned as of December 31, 2017 by correspondence with the custodian and brokers, or by other appropriate auditing procedures where replies from brokers were not received. Our audits also included evaluating the accounting principles used and significant estimates made by management, as well as evaluating the overall presentation of the financial statements. We believe that our audits provide a reasonable basis for our opinion.
Report of Independent Registered Public Accounting Firm
BBD, LLP
We have served as the auditor of one or more of the Funds in the U.S. Global Investors Funds since 2016.
Philadelphia, Pennsylvania
February 28, 2018
Trustees and Officers (unaudited) | December 31, 2017 |
The following table presents information about the Trustees as of December 31, 2017, together with a brief description of their principal occupations during the last five years. Each trustee serves until his death, resignation or removal and replacement. The address for all trustees is c/o Atlantic Fund Services, Three Canal Plaza, Suite 600, Portland, Maine 04101. Stacey E. Hong and John Y. Keffer are considered interested trustees due to their affiliation with Atlantic. If you would like more information about the Trustees, you may call 1-800-US-FUNDS (1-800-873-8637) to request a free copy of the Statement of Additional Information.
Name and Year of Birth | Position with the Trust | Length of Time Served | Principal Occupation(s) During Past Five Years | Number of Series in Fund Complex Overseen By Trustee | Other Directorships Held By Trustee During Past Five Years |
| Independent Trustees |
David Tucker
Born: 1958 | Chairman of the Board; Trustee; Chairman, Nominating Committee and Qualified Legal Compliance Committee | Since 2015 | Director, Blue Sky Experience (a charitable endeavor), since 2008; Senior Vice President & General Counsel, American Century Companies 1998-2008. | 9 | Trustee, Forum Funds; Trustee, Forum ETF Trust; Trustee, Forum Funds II |
Mark D. Moyer
Born: 1959 | Trustee; Chairman Audit Committee | Since 2015 | Chief Financial Officer, Institute of International Education 2008-2011; Chief Financial Officer and Chief Restructuring Officer, Ziff Davis Media Inc. 2005-2008; Adjunct Professor of Accounting, Fairfield University from 2009-2012. | 9 | Trustee, Forum ETF Trust; Trustee, Forum Funds II |
Jennifer
Brown-Strabley
Born: 1964 | Trustee | Since 2015 | Principal, Portland Global Advisors 1996-2010. | 9 | Trustee, Forum ETF Trust; Trustee, Forum Funds II |
| Interested Trustees |
Stacey E. Hong
Born: 1966 | Trustee | Since 2015 | President, Atlantic since 2008 | 9 | Trustee, Forum Funds II |
John Y. Keffer(1)
Born: 1942 | Trustee | Since 2015 | Chairman, Atlantic since 2008; President, Forum Investment Advisors, LLC since 2011; President, Forum Foundation (a charitable organization) since 2005; President, Forum Trust, LLC (a non-depository trust company chartered in the State of Maine) since 1997. | 9 | Trustee, Forum Funds; Trustee Forum ETF Trust; Trustee, Forum Funds II; Director, Wintergreen Fund, Inc. |
(1) | Atlantic and Forum Investment Advisors, LLC are subsidiaries of Forum Holdings Corp. I, a Delaware corporation that is wholly owned by Mr. Keffer. |
Trustees and Officers (unaudited) | December 31, 2017 |
The following table presents information about each Officer of the Trust as of December 31, 2017, together with a brief description of their principal occupations during the last five years. Each officer serves until his or her death, resignation or removal and replacement. The business address of each officer is c/o Atlantic Fund Services, Three Canal Plaza, Suite 600, Portland, Maine 04101.
Principal Officers of the Trust
Name and Year of Birth | Position with the Trust | Length of Time Served | Principal Occupation(s) During Past Five Years |
Jessica Chase Born: 1970 | President; Chief Executive Officer | Since 2015 | Senior Vice President, Atlantic since 2008. |
Karen Shaw Born: 1972 | Treasurer; Chief Financial Officer | Since 2015 | Senior Vice President, Atlantic since 2008. |
Zachary Tackett
Born: 1988 | Vice President; Secretary and Anti- Money Laundering Compliance Officer, and Identity Theft Prevention Officer | Since 2015 | Counsel, Atlantic since 2014; Intern Associate, Coakley & Hyde, PLLC, 2010-2013. |
Carlyn Edgar
Born: 1963 | Chief Compliance Officer, Code of Ethics Review Officer | Since 2015 | Senior Vice President, Atlantic since 2008. |
| Approval of Investment Advisory Agreement (unaudited) | December 31, 2017 |
On September 14, 2017, the Board of Trustees (the “Board”) of U.S. Global Investors Funds (the “Trust”), including all the trustees who are not “interested persons” of the Trust (the “Independent Trustees”), approved the continuation of the advisory agreement with U.S. Global Investors, Inc. (the “Adviser”) for each Fund for an additional one-year term ended October 1, 2018.
In considering approval of the agreement, the Board reviewed a variety of materials relating to each Fund and the Adviser, including (i) the nature, extent and quality of services provided; (ii) a comparison of services rendered and amounts paid to other registered investment companies; (iii) the investment performance of the Funds measured against appropriate benchmarks and peer groups; (iv) the costs of services provided and estimated profits realized by the Adviser (and its affiliates); (v) the extent to which economies of scale are realized as the Funds grow; (vi) whether fee levels reflect any economies of scale for the benefit of Fund shareholders; and (vii) fall-out benefits realized by the Adviser (and its affiliates) from its relationship with the Funds, if any.
In preparation for its September meeting of the Board of Trustees of the Trust (“September Meeting”), the Trustees were presented with a range of information to assist in their deliberations. Those materials included information from Broadridge Financial Solutions, Inc. (“Broadridge”), an independent source of data about the mutual fund industry, which compared each Fund’s total contractual and actual investment advisory fees, total expenses, and performance with a group of peer funds that were selected by Broadridge. The Trustees also received a memorandum from Independent Legal Counsel concerning their responsibilities with respect to the approval of the investment advisory agreement. The Independent Trustees met in executive session with Independent Legal Counsel while deliberating.
The Board reviewed the functions performed by the Adviser, the portfolio management team and support staff of the Adviser, the Adviser’s investment strategy and process for each Fund, and the Adviser’s financial condition, and considered the quality of services provided.
For the All American Equity Fund, the information showed that the Fund underperformed the median of its Broadridge peer group for the one-, three- and five-year periods ended June 30, 2017. The Board also observed that the Fund underperformed the S&P 500 Index, the Fund’s primary benchmark index, for the same periods under review. The Board noted the Adviser’s representation that the Fund’s underperformance could be attributed, at least in part, to the Fund’s lack of weighting to securities that were drivers of outperformance for the primary benchmark index and Broadridge peers, as determined by the Fund’s investment focus and Adviser’s investment model. The Board also noted the Adviser’s representation that the Adviser continues to evaluate opportunities to improve its investment model and reduce expenses that negatively affect the Fund’s investment results. The Board further noted the Adviser’s representation that a change in the Fund’s portfolio manager during the period negatively affected the consistency of the Fund’s performance but that the Adviser believed more recent modifications to the investment model would improve performance.
For the Holmes Macro Trends Fund, the information showed that the Fund performed in-line with its Broadridge peer group for the one-year period ended June 30, 2017 and underperformed the median of its Broadridge peer group for the three- and five-year periods ended June 30, 2017. The Board also observed that the Fund outperformed the S&P Composite 1500 Index, the Fund’s primary benchmark index, for the one-year period ended June 30, 2017, and underperformed the primary benchmark index for the three- and five-year periods ended June 30, 2017. The Board noted the improved relative performance for the Fund. The Board further noted the Adviser’s representation that the Fund’s underperformance relative to its benchmark and Broadridge peers over the three- and five-year periods could be attributed, in part, to the results of the investment model, which excluded exposure to certain securities in the index that contributed disproportionately to the performance of the index during those periods. The Board also noted the Adviser’s representation that the Adviser continued to evaluate opportunities to reduce expenses that negatively affect the Fund’s investment results..
| Approval of Investment Advisory Agreement (unaudited) | December 31, 2017 |
For the Global Resources Fund, the information showed that the Fund outperformed the median of its Broadridge peer group for the one-year period ended June 30, 2017, and underperformed the median of its Broadridge peers for the three- and five-year periods ended June 30, 2017. The Board also observed that the Fund underperformed the S&P Global Natural Resources Index (Net Total Return), its primary benchmark index, for the one-, three-, and five-year periods ended June 30, 2017. The Board noted the Adviser’s representations regarding the factors that contributed to or detracted from the Fund’s performance over these periods and that, since the end of 2015, the implementation of a quantitative-driven strategy had improved the Fund’s relative performance.
For the World Precious Minerals Fund, the information showed that the Fund underperformed the median of its Broadridge peers for the one-year period ended June 30, 2017, outperformed the median of its Broadridge peers for the three-year period ended June 30, 2017, and performed at the median for the five-year period ended June 30, 2017. The Board also observed that the Fund outperformed the NYSE Arca Gold Miners Index, its primary benchmark index, for the one-, three-, and five-year periods ended June 30, 2017. The Board also noted the Adviser’s representation that the Fund had low volatility compared to the Broadridge peer group.
For the Gold and Precious Metals Fund, the information showed that the Fund underperformed the median of its Broadridge peers for the one-year period ended June 30, 2017, and outperformed the median of its Broadridge peers for the three- and five-year periods ended June 30, 2017. The Board also observed that the Fund outperformed the FTSE Gold Mines Index, its primary benchmark index, for the one-, three-, and five-year periods ended June 30, 2017. The Board also noted the Adviser’s representation that the Fund had low volatility compared to the Broadridge peer group.
For the Emerging Europe Fund, the information showed that the Fund underperformed the median of the Broadridge peer group for the one-, three- and five-year periods ended June 30, 2017. The Board observed that the Fund outperformed the MSCI Emerging Markets Europe 10/40 Index (Net Total Return), the Fund’s primary benchmark index, for the one-year period ended June 30, 2017, and underperformed its primary benchmark index for the three- and five-year periods ended June 30, 2017. The Board noted that although certain positions in emerging market countries in Eastern Europe generally underperformed, the Adviser indicated that performance against the benchmark has improved over time due to improvements in the Fund’s model-based stock selection methodology.
For the China Region Fund, the information showed that the Fund outperformed the median Broadridge peer group for the one-year period ended June 30, 2017, and underperformed the median of its Broadridge peer group for the three- and five-year periods ended June 30, 2017. The Board observed that the Fund outperformed the Hang Seng Composite Index, its primary benchmark index, for the one-year period ended June 30, 2017, but underperformed its primary benchmark index for the three- and five-year periods ended June 30, 2017. The Board noted the Adviser’s representation that the Fund’s outperformance over the short term could be attributed, in part, to stock selection resulting from adjustments to the Fund’s investment model that were implemented in 2016. The Board noted the Adviser’s representation that the Fund continues to evaluate opportunities to reduce expenses that negatively affect the Fund’s performance.
| Approval of Investment Advisory Agreement (unaudited) | December 31, 2017 |
For the Near-Term Tax Free Fund, the information showed that the Fund underperformed the median of its Broadridge peer group for the one-, three- and five-year periods ended June 30, 2017. The Board also noted that the Fund underperformed the Bloomberg Barclays 3-Year Municipal Bond Index, the Fund’s primary benchmark index, for the one- and three-year periods ended June 30, 2017, but outperformed the primary benchmark index for the five-year period ended June 30, 2017. The Board noted the Adviser’s representation that the Fund’s underperformance relative to its peer group over the one-year period could be attributed to the Fund having a longer weighted duration than the peer group. The Board noted the Adviser’s representation that the Fund’s relative underperformance versus the peer group over the three-and five-year periods was a result of the Fund tending to hold a greater proportion of general obligation bonds (as opposed to revenue bonds) than the peer group and, during the period, revenue bonds outperformed general obligation bonds, which the Adviser believed to carry less risk.
For the U.S. Government Securities Ultra-Short Bond Fund, the information showed that the Fund underperformed the Bloomberg Barclays U.S. Treasury Bills 6-9 Month Total Return Index, the Fund’s primary benchmark index, for the one-year period ended June 30, 2017, but outperformed the primary benchmark index for the three- and five-year periods ended June 30, 2017. The Board also noted the Adviser’s representation that the Fund underperformed the average of the selected short U.S. Treasury Funds for the one-, three-, and five-year periods ended June 30, 2017. The Board noted the Adviser’s representation that challenges resulted from a surge in bond yields after the national election. The Board also noted the Adviser’s representation that the Federal Reserve had increased interest rates in December 2016 and March 2017, putting additional pressure on bonds. The Board further noted the Adviser’s representation that the Fund’s relative performance had rebounded over the last quarter, as the Fund’s positions in floating rate bonds outperformed as short yields rose.
The Board also reviewed information on each Fund’s advisory fee and expense ratios compared to the advisory fees and expense ratios of a peer group of funds based upon information prepared by Broadridge. The Board also compared the expense ratios of the Funds to industry data provided by the Adviser and compiled by the Investment Company Institute (“ICI”), which reflected the expense ratios for funds of small fund complexes, categorized into relevant fund types (e.g., sector funds, international funds, and growth funds).
For the All American Equity Fund, the information showed that, as of June 30, 2017, the Fund’s actual advisory fee and the actual total expenses were each greater than the median of its Broadridge peer group..
For the Holmes Macro Trends Fund, the information showed that, as of June 30, 2017, the Fund’s actual advisory fee and actual total expenses were each greater than the median of its Broadridge peer group.
| Approval of Investment Advisory Agreement (unaudited) | December 31, 2017 |
For the Global Resources Fund, the information showed that, as of June 30, 2017, the Fund’s actual advisory fee and actual total expenses were each greater than the median of its Broadridge peer group.
For the World Precious Minerals Fund, the information showed that, as of June 30, 2017, the Fund’s actual advisory fee and actual total expenses were each greater than the median of its Broadridge peer group.
For the Gold and Precious Metals Fund, the information showed that, as of June 30, 2017, the Fund’s actual advisory fee and actual total expenses were each greater than the median of its Broadridge peer group.
For the Emerging Europe Fund, the information showed that, as of June 30, 2017, each of the Fund’s actual advisory fee and actual total expenses were greater than the median of its Broadridge peer group.
For the China Region Fund, the information showed that, as of June 30, 2017, the Fund’s actual advisory fee was lower than the median of its Broadridge peer group but the Fund’s actual total expenses were greater than the median of its Broadridge peer group.
For the Near-Term Tax Free Fund, the information showed that, as of June 30, 2017, each of the Fund’s actual advisory fee and actual total expenses were less than the median of its Broadridge peer group.
For the U.S. Government Securities Ultra-Short Bond Fund, the information showed that, as of June 30, 2017, each of the Fund’s actual advisory fee and actual total expenses were less than the median of its Broadridge peer group.
The Board considered the Adviser’s representation that higher expenses are inherent in small fund complexes, such as the Trust, noting the difficulty that small complexes face in spreading increasing overhead over a small asset base. The Board also considered continued efforts by the Adviser designed to reduce Fund expenses, including different solutions for transfer agency and certain fund administration services. In addition, the Board noted that the Adviser is contractually limiting expenses (exclusive of acquired fund fees and expenses, extraordinary expenses, taxes, brokerage commissions and interest) on an annualized basis for the Near-Term Tax Free Fund at 0.45% of average net assets through at least April 30, 2018. The Board also noted that the Adviser is currently voluntarily waiving all class specific expenses for the Institutional Classes of the Global Resources Fund and the World Precious Minerals Fund and is currently voluntarily limiting expenses at the following levels for the Investor Classes of the Funds (all voluntary expense limitations may be modified or removed by the Adviser at any time and are exclusive of acquired fund fees and expenses, extraordinary expenses, taxes, brokerage commissions, interest, and advisory fee performance adjustments, if any):
| Approval of Investment Advisory Agreement (unaudited) | December 31, 2017 |
| Funds | Expense Cap |
| Inst'l Class | Investor Class |
| All American Equity Fund | N/A | 2.20% |
| China Region Fund | N/A | 2.55% |
| Emerging Europe Fund | N/A | 2.85% |
| Global Resources Fund | All class specific expenses | 1.90% |
| Gold and Precious Metals Fund | N/A | 1.90% |
| Holmes Macro Trends Fund | N/A | 2.20% |
| World Precious Minerals Fund | All class specific expenses | 1.90% |
| U.S. Government Securities Ultra-Short Bond Fund | N/A | 0.45% |
The Board considered the fee structure of the agreement, including the costs of the services provided and the profits realized by the Adviser and its affiliates from their relationship with the Funds.
As part of its review of the agreement, the Board considered whether there the Funds have experienced any economies of scale that should be shared with shareholders. The Board noted that, in all cases, the Adviser did not believe, with respect to the investment advisory services provided, that it was realizing significant economies of scale.
Based on all the above-mentioned factors, other information provided, and related conclusions, with no single factor or conclusion being determinative and with each Trustee not necessarily attributing the same weight to each factor, the Board, including the Independent Trustees, concluded that approval of the advisory agreement would be in the interests of each Fund.
Additional Information(unaudited)
Additional Federal Tax Information
The percentage of tax-exempt dividends paid by the Near-Term Tax Free Fund for the year ended December 31, 2017, was 98.99%.
The percentage of ordinary income dividends paid by the Funds during the year ended December 31, 2017, which qualify as Qualified Dividends Income (QDI) and the Dividends Received Deduction (DRD) available to corporate shareholders was:
| | | Qualified Dividend Income | | Dividend Received Deduction | | Qualified Investment Income | | Qualified Short Term Gain Dividends |
| U.S. Government Securities Ultra-Short Bond | | –% | | –% | | 100.00% | | –% |
| Near-Term Tax Free | | –% | | –% | | 0.11% | | –% |
| All American Equity | | 100.00% | | 100.00% | | –% | | –% |
| Holmes Macro Trends | | 19.25% | | 19.66% | | –% | | 100.00% |
| Global Resources | | 55.27% | | 22.90% | | –% | | –% |
| World Precious Minerals | | 1.67% | | 0.03% | | –% | | –% |
| China Region | | 100.00% | | 0.18% | | –% | | –% |
The amounts which represent foreign source income and foreign taxes paid during the year ended December 31, 2017, are as follows:
| | | Foreign Source Income | | | Foreign Tax Credit | |
| Global Resources | | $ | 2,564,985 | | | $ | 128,136 | |
| World Precious Minerals | | | 296,188 | | | | 2,721 | |
| China Region | | | 471,724 | | | | 36,030 | |
In early 2018, the Funds reported on Form 1099-DIV the tax status of all distributions made during the 2017 calendar year. The Funds intend to distribute the maximum amount of qualified dividend income allowable. The amount of qualified dividend income distributed by each Fund will be reported to shareholders on their Form 1099-DIV. Shareholders should use the information on Form 1099-DIV for their income tax returns.
Proxy Voting
A description of the policies and procedures that the Funds use to determine how to vote proxies relating to portfolio securities is available without charge, upon request, by calling 1-800-US-FUNDS (1-800-873-8637). It also appears in the Funds’ statement of additional information (Form 485B), which can be found on the SEC’s website at www.sec.gov.
Information regarding how the Funds voted proxies relating to portfolio securities during the most recent 12-month period ended June 30 is available without charge, upon request, by calling 1-800-US-FUNDS (1-800-873-8637) or accessing the Funds’ Form N-PX on the SEC’s website at www.sec.gov.
Availability of Quarterly Portfolio Schedules
The Funds provide complete lists of holdings four times in each fiscal year, at the quarter- ends. For the second and fourth quarters, the lists appear in the Fund’s semi-annual and annual reports to shareholders. For the first and third quarters, the Funds file the lists with the SEC on Form N-Q. The Funds’ Form N-Qs are available on the SEC’s website at http://www.sec.gov. The Funds’ Forms N-Q may also be reviewed and copied at the SEC’s Public Room in Washington D.C. Information on the operation of the Public Reference Room may be obtained by calling 1-800-SEC-0330.
| Expense Example (unaudited) | December 31, 2017 |
As a shareholder of the funds, you incur two types of costs: (1) transaction costs, including short-term trading fees and exchange fees; and (2) ongoing costs, including management fees, distribution plan fees, shareholder reports (like this one), and other fund expenses. This example is intended to help you understand your ongoing costs (in dollars) of investing in other mutual funds.
The example is based on an investment of $1,000 invested at the beginning of the period and held for the entire period (July 1, 2017 to December 31, 2017) as indicated below.
| ● | Actual Expenses. The first line of the following table for each fund provides information about actual account values and actual expenses. You may use the information in this line, together with the amount you invested, to estimate the expenses you paid over the period. Simply divide your account value by $1,000 (for example, an $8,600 account value divided by $1,000 = 8.6), then multiply the result by the number in the first line under the heading “Expenses Paid During Period” to estimate the expenses you paid on your account during this period. |
| ● | Hypothetical Example for Comparison Purposes. The second line of the following table for each fund provides information about hypothetical account values and hypothetical expenses based on the fund’s actual expense ratio and an assumed rate of return of 5 percent per year before expenses, which is not the fund’s actual return. The hypothetical account values and expenses may not be used to estimate the actual ending account balance or expenses you paid for the period. You may use this information to compare the ongoing costs of investing in these funds and other funds. To do so, compare this 5 percent hypothetical example with the 5 percent hypothetical examples that appear in the shareholder reports of other funds. |
Please note that the expenses shown in the table are meant to highlight your ongoing costs only and do not reflect any direct or transactional costs, such as small account, exchange or short-term trading fees. Therefore, the second line of the table is useful in comparing ongoing costs only, and will not help you determine the relative total costs of owning different funds. In addition, if these direct or transactional costs were included, your costs would have been higher.
| Expense Example (unaudited) | December 31, 2017 |
| | Beginning Account Value July 1, 2017 | Ending Account Value December 31, 2017 | Expenses Paid During Period* |
| U.S. Government Securities Ultra-Short Bond Fund | | | |
| Based on Actual Fund Return | $1,000.00 | $1,004.05 | $2.27 |
Based on Hypothetical 5% Yearly Return | $1,000.00 | $1,022.94 | $2.29 |
| Near-Term Tax Free Fund | | | |
| Based on Actual Fund Return | $1,000.00 | $1,001.42 | $2.27 |
| Based on Hypothetical 5% Yearly Return | $1,000.00 | $1,022.94 | $2.29 |
| All American Equity Fund | | | |
| Based on Actual Fund Return | $1,000.00 | $1,025.41 | $9.24 |
| Based on Hypothetical 5% Yearly Return | $1,000.00 | $1,016.08 | $9.20 |
| Holmes Macro Trends Fund | | | |
| Based on Actual Fund Return | $1,000.00 | $1,120.82 | $9.84 |
| Based on Hypothetical 5% Yearly Return | $1,000.00 | $1,015.93 | $9.35 |
| Global Resources Fund Investor Class | | | |
| Based on Actual Fund Return | $1,000.00 | $1,164.63 | $8.78 |
| Based on Hypothetical 5% Yearly Return | $1,000.00 | $1,017.09 | $8.19 |
| Global Resources Fund Institutional Class | | | |
| Based on Actual Fund Return | $1,000 00 | $1,169.42 | $4.98 |
| Based on Hypothetical 5% Yearly Return | $1,000 00 | $1,020.62 | $4.63 |
| World Precious Minerals Fund Investor Class | | | |
| Based on Actual Fund Return | $1,000.00 | $975.25 | $8.21 |
| Based on Hypothetical 5% Yearly Return | $1,000.00 | $1,016.89 | $8.39 |
| World Precious Minerals Fund Institutional Class | | | |
| Based on Actual Fund Return | $1,000.00 | $978.21 | $5.68 |
| Based on Hypothetical 5% Yearly Return | $1,000.00 | $1,019.46 | $5.80 |
| Gold and Precious Metals Fund | | | |
| Based on Actual Fund Return | $1,000.00 | $1,102.49 | $8.59 |
| Based on Hypothetical 5% Yearly Return | $1,000.00 | $1,017.04 | $8.24 |
| Emerging Europe Fund | | | |
| Based on Actual Fund Return | $1,000.00 | $1,149.84 | $12.73 |
| Based on Hypothetical 5% Yearly Return | $1,000.00 | $1,013.36 | $11.93 |
| China Region Fund | | | |
| Based on Actual Fund Return | $1,000.00 | $1,223.93 | $13.90 |
Based on Hypothetical 5% Yearly Return | $1,000.00 | $1,012.70 | $12.58 |
| * | These calculations are based on expenses incurred in the most recent fiscal half-year. The Fund’s Investor Class’ annualized expense ratios (after reimbursements and offsets) for the six month period ended December 31, 2017, were 0.45%, 0.45%, 1.81%, 1.84%, 1.61%, 1.65%, 1.62%, 2.35% and 2.48%, respectively, for the U.S. Government Securities Ultra-Short Bond, Near-Term Tax Free, All American Equity, Holmes Macro Trends, Global Resources, World Precious Minerals, Gold and Precious Metals, Emerging Europe and China Region Funds. The funds’ Institutional Class’ annualized expense ratios (after reimbursements and offsets) for the six month period ended December 31, 2017, were 0.91% and 1.14%, respectively, for the Global Resources and World Precious Minerals Funds. The dollar amounts shown as “Expenses Paid” are equal to the annualized expense ratio multiplied by the average account value over the period, multiplied by 184, the number of days in the period, then divided by 365 days in the current fiscal year. |
Atlantic Fund Services
3 Canal Plaza, Suite 600
Portland, ME
04101
| Want to reduce paper waste? You can receive this report and other important documents electronically. Please visit www.usfunds.com and sign up at Access My Account. If you need further assistance, please call us at 800-873-8637. |
ITEM 2. CODE OF ETHICS.
| (a) | As of the end of the period covered by this report, U.S. Global Investors Funds (the "Registrant") has adopted a code of ethics, which applies to its Principal Executive Officer and Principal Financial Officer (the "Code of Ethics"). |
| (c) | There have been no amendments to the Registrant's Code of Ethics during the period covered by this report. |
(d) There have been no waivers to the Registrant's Code of Ethics during the period covered by this report.
(e) Not applicable.
(f) (1) A copy of the Code of Ethics is being filed under Item 12(a) hereto.
ITEM 3. AUDIT COMMITTEE FINANCIAL EXPERT.
The Board of Trustees has determined that Mr. Mark Moyer is an "audit committee financial expert" as that term is defined under applicable regulatory guidelines. Mr. Moyer is a non- "interested" Trustee (as defined in Section 2(a)(19) under the Investment Company Act of 1940, as amended (the "Act")), and serves as Chairman of the Audit Committee.
ITEM 4. PRINCIPAL ACCOUNTANT FEES AND SERVICES.
(a) Audit Fees - The aggregate fees billed for each of the last two fiscal years (the "Reporting Periods") for professional services rendered by the Registrant's principal accountant for the audit of the Registrant's annual financial statements, or services that are normally provided by the principal accountant in connection with the statutory and regulatory filings or engagements for the Reporting Periods, were $151,900 in 2016 and $134,900 in 2017.
(b) Audit-Related Fees – The aggregate fees billed in the Reporting Periods for assurance and related services rendered by the principal accountant that were reasonably related to the performance of the audit of the Registrant's financial statements and are not reported under paragraph (a) of this Item 4 were $0 in 2016 and $0 in 2017.
(c) Tax Fees - The aggregate fees billed in the Reporting Periods for professional services rendered by the principal accountant to the Registrant for tax compliance, tax advice and tax planning were $27,000 in 2016 and $27,000 in 2017. These services consisted of review or preparation of U.S. federal, state, local and excise tax returns.
(d) All Other Fees - The aggregate fees billed in the Reporting Periods for products and services provided by the principal accountant to the Registrant, other than the services reported in paragraphs (a) through (c) of this Item, were $0 in 2016 and $0 in 2017.
(e) (1) The Audit Committee reviews and approves in advance all audit and "permissible non-audit services" (as that term is defined by the rules and regulations of the Securities and Exchange Commission) to be rendered to a series of the Registrant (each, a "Series"). In addition, the Audit Committee reviews and approves in advance all "permissible non-audit services" to be provided to an investment adviser (not including any sub-adviser) of a Series, or an affiliate of such investment adviser, that is controlling, controlled by or under common control with the investment adviser and provides on-going services to the Registrant ("Affiliate"), by the Series' principal accountant if the engagement relates directly to the operations and financial reporting of the Series. The Audit Committee considers whether fees paid by a Series' investment adviser or an Affiliate to the Series' principal accountant for audit and permissible non-audit services are consistent with the principal accountant's independence.
(e) (2) No services included in (b) - (d) above were approved pursuant to paragraph (c)(7)(i)(C) of Rule 2-01 of Regulation S-X.
(f) Less than 50 percent of the hours expended on the principal accountant's engagement to audit the Registrant's financial statements for the most recent fiscal year were attributed to work performed by persons other than the principal accountant's full-time, permanent employees.
(g) The aggregate fees billed by the Registrant's principal accountant for non-audit services rendered to the Registrant, its investment adviser, and any entity controlling, controlled by, or under common control with the investment adviser that provides ongoing services to the registrant were $27,000 in 2016 and $XXX in 2017. These fees related to tax services rendered to the Registrant.
(h) All non-audit services rendered in (g) above were considered by the registrant's audit committee in maintaining the principal accountant's independence.
ITEM 5. AUDIT COMMITTEE OF LISTED REGISTRANTS.
Not applicable
ITEM 6. INVESTMENTS.
| (a) | Included as part of report to shareholders under Item 1. |
ITEM 7. DISCLOSURE OF PROXY VOTING POLICIES AND PROCEDURES FOR CLOSED-END
MANAGEMENT INVESTMENT COMPANIES.
Not applicable.
ITEM 8. PORTFOLIO MANAGERS OF CLOSED-END MANAGEMENT INVESTMENT COMPANIES.
Not applicable.
ITEM 9. PURCHASES OF EQUITY SECURITIES BY CLOSED-END MANAGEMENT INVESTMENT COMPANY AND AFFILIATED PURCHASERS.
Not applicable.
ITEM 10. SUBMISSION OF MATTERS TO A VOTE OF SECURITY HOLDERS
The Registrant does not accept nominees to the board of trustees from shareholders.
ITEM 11. CONTROLS AND PROCEDURES
(a) The Registrant's Principal Executive Officer and Principal Financial Officer have concluded that the Registrant's disclosure controls and procedures (as defined in Rule 30a-3(c) under the Act are effective, based on their evaluation of the controls and procedures required by Rule 30a-3(b) under the Act and Rules 13a-15(b) or 15d-15(b) under the Securities Exchange Act of 1934, as of a date within 90 days of the filing date of this report.
(b) There were no changes in the Registrant's internal control over financial reporting (as defined in
Rule 30a-3(d) under the Act) that occurred during the second fiscal quarter of the period covered by this report that have materially affected, or are reasonably likely to materially affect, the Registrant's internal control over financial reporting.
ITEM 12. EXHIBITS.
(a)(1) Code of Ethics (Exhibit filed herewith).
(a)(2) Certifications pursuant to Rule 30a-2(a) of the Act, and Section 302 of the Sarbanes-Oxley Act of 2002. (Exhibits filed herewith)
(a)(3) Not applicable.
(b) Certifications pursuant to Rule 30a-2(b) of the Act, and Section 906 of the Sarbanes-Oxley Act of 2002. (Exhibit filed herewith)
SIGNATURES
Pursuant to the requirements of the Securities Exchange Act of 1934 and the Investment Company Act of 1940, the Registrant has duly caused this report to be signed on its behalf by the undersigned, thereunto duly authorized.
Registrant U.S. Global Investors Funds
By /s/ Jessica Chase
Jessica Chase, Principal Executive Officer
Date February 27, 2018
Pursuant to the requirements of the Securities Exchange Act of 1934 and the Investment Company Act of 1940, this report has been signed below by the following persons on behalf of the Registrant and in the capacities and on the dates indicated.
By /s/ Jessica Chase
Jessica Chase, Principal Executive Officer
Date February 27, 2018
By /s/ Karen Shaw
Karen Shaw, Principal Financial Officer
Date February 27, 2018