As filed with the Securities and Exchange Commission on March 4, 2020
UNITED STATES
SECURITIES AND EXCHANGE COMMISSION
WASHINGTON, D.C. 20549
FORM N-CSR
CERTIFIED SHAREHOLDER REPORT OF REGISTERED MANAGEMENT
INVESTMENT COMPANIES
Investment Company Act file number 811-01800
U.S. GLOBAL INVESTORS FUNDS
Three Canal Plaza, Suite 600
Portland, Maine 04101
Jessica Chase, Principal Executive Officer
Three Canal Plaza, Suite 600
Portland, Maine 04101
207-347-2000
Date of fiscal year end: December 31
Date of reporting period: January 1, 2019 – December 31, 2019
ITEM 1. REPORT TO SHAREHOLDERS
U.S. Global Investors Funds
December 31, 2019

Beginning on January 2021, as permitted by regulations adopted by the Securities and Exchange Commission, paper copies of the Funds’ shareholder reports will no longer be sent by mail, unless you specifically request paper copies of the reports from the Fund or from your financial intermediary, such as a broker-dealer or bank. Instead, the reports will be made available on a website, and you will be notified by mail each time a report is posted and provided with a website link to access the report.
If you already elected to receive shareholder reports electronically, you will not be affected by this change and you need not take any action. You may elect to receive shareholder reports and other communications from the Fund or your financial intermediary electronically by contacting the Fund at (800) 873-8637, or by contacting your financial intermediary directly.
You may elect to receive all future reports in paper free of charge. You can inform the Fund or your financial intermediary that you wish to continue receiving paper copies of your shareholder reports by contacting the Fund at (800) 873-8637, or by contacting your financial intermediary directly. Your election to receive reports in paper will apply to all Funds held with U.S. Global Investors Funds.
U.S. Global Investors Funds
Annual Report
December 31, 2019
Table of Contents
| Letter to Shareholders (unaudited) | 1 |
| Definitions for Management Teams’ Perspectives (unaudited) | 5 |
| Management Team’s Perspective (unaudited) | 8 |
| Portfolios of Investments | 41 |
| Notes to Portfolios of Investments | 78 |
| Statements of Assets and Liabilities | 96 |
| Statements of Operations | 100 |
| Statements of Changes in Net Assets | 104 |
| Notes to Financial Statements | 110 |
| Financial Highlights | 125 |
| Report of Independent Registered Public Accounting Firm | 134 |
| Trustees and Officers (unaudited) | 136 |
| Approval of Investment Advisory Agreement (unaudited) | 138 |
| Additional Information (unaudited) | 143 |
| Expense Example (unaudited) | 145 |
Nasdaq Symbols
U.S. Global Investors Funds
Investor Class
| U.S. Government Securities Ultra-Short Bond Fund | UGSDX |
| Near-Term Tax Free Fund | NEARX |
| All American Equity Fund | GBTFX |
| Holmes Macro Trends Fund | MEGAX |
| Global Resources Fund | PSPFX |
| World Precious Minerals Fund | UNWPX |
| Gold and Precious Metals Fund | USERX |
| Emerging Europe Fund | EUROX |
| China Region Fund | USCOX |
 | Apex Fund Services 3 Canal Plaza, Suite 600 Portland, ME 04101 |
| | |
| U.S. Global Investors Funds | (unaudited) |
Dear Fellow Shareholder,

Gold in 2019 had its best year since 2010, finishing up 18.31 percent for the year. The yellow metal’s historical role as a store of value shined brightly in the second half of the year when the pool of negative-yielding debt around the world began to skyrocket, eventually topping out at around $17 trillion in August. Gold briefly broke above $1,600 an ounce for the first time since April 2013 on the news that Iran launched a counterstrike against U.S.-occupied military bases in Iraq.
Safe haven-seeking investors around the world piled into gold-backed ETFs in 2019, making it the best year on record for gold holdings. Assets under management (AUM) in gold bullion ETFs expanded 37 percent from the previous year, adding $19.2 billion, or 400 tonnes, according to the World Gold Council (WGC). During the fourth quarter, total holdings hit a jaw-dropping 2,900 tonnes, the equivalent of 102 million ounces, which is the most on record.
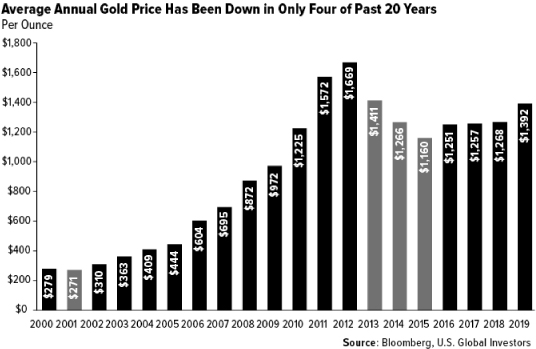
In the past two decades, gold has helped investors limit market volatility and portfolio losses. Between 2000 and 2019, the precious metal’s average annual price was down in only four years. Put another way, gold was up on average in four out of every five years—a remarkable track record.
Enhance Your Gold Position With Precious Metal Royalty Companies
There are other ways to get exposure to gold than coins and bars, of course. One of the best ways to enhance your gold position, I believe, is with precious metal royalty and streaming companies. Think Franco-Nevada, Wheaton Precious Metals, Royal Gold and others.
| U.S. Global Investors Funds | (unaudited) |
Loyal readers of Investor Alert and my CEO blog Frank Talk should know that I’ve discussed royalty companies a number of times before. Even so, I still come across new research and data that demonstrates their superiority in the metals and mining industry.
Take a look at the chart below. The world’s largest royalty and streaming company with a market cap of $26 billion, Franco-Nevada has outperformed gold bullion and gold equities in both bull markets and bear markets. Investors who like gold do so because they understand that the yellow metal may limit losses in their equity position and reduce volatility. Adding a royalty company such as Franco-Nevada to the mix could potentially have additional benefits.
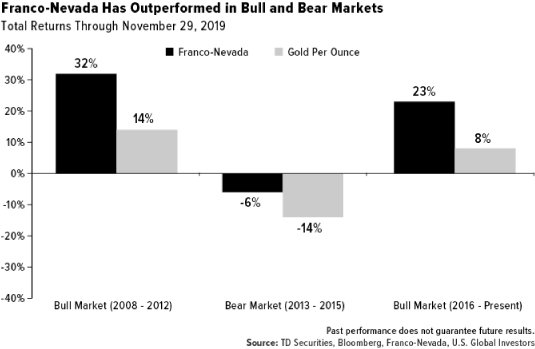
Although, they have enjoyed a lot of the upside potential when gold prices were rising, royalty companies have shared very little of the downside potential with producers and explorers when the metal was in decline. Royalty companies have been better insulated from bear markets because they have historically maintained a diversity of high-quality active mines in their portfolio.
What’s more, they’re not the ones spending money to develop a project. They simply put up the capital, and in exchange they enjoy either a royalty on whatever the miner produces or rights to a stream of metal supply at a fixed, lower-than-average cost.
“Buy-and-Hold” Has Historically Been a Winning Investment Strategy
Domestic stocks also exceeded expectations in 2019, with the S&P 500 Index increasing more than 31 percent, putting 2019 among the very best going all the way back to 1928. Since 1928, the market has ended in positive territory 73 percent of the time, with a gain “equal to or in excess of 30 percent (like 2019) occurring 19 out of 92 years, or 20 percent of the time,” according to Lauren Sanfilippo, vice president and market strategy analyst at Bank of America Merrill Lynch.
| U.S. Global Investors Funds | (unaudited) |
Negative years, by comparison, occurred 27 percent of the time. And even then, years in which stocks fell no more than 10 percent were most frequent, happening 12 out of 25 negative years, or 48 percent of the time.
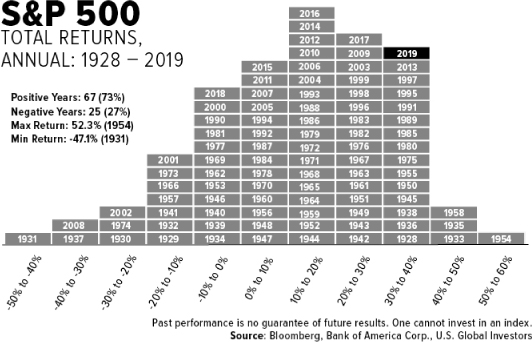
Looking at the chart above tells me a couple of things in particular. Number one, stocks have historically been more likely to end the year with a gain than a loss. The implication, then, is that a buy-and-hold strategy has worked out for a lot of investors in general—even those who still may have memories of the tech bubble 20 years ago and financial crisis more than 10 years ago.
And number two, the naysayers and “perma-bears”—those who’ve repeatedly predicted an end to the economic expansion, now in its 10th year—have not only been wrong time and again but may have also discouraged some investors from participating in this historic bull market.
Think back just 12 months ago. At the beginning of 2019, a number of economists and so-called experts were sounding the alarm bell over the inverted yield curve, not to mention U.S.-China trade tensions and slowing global economic growth. And yet look what happened. The market went on to hit as many as 35 record highs from start to finish, ending the year up nearly 300 percent from December 2009.
My point is not that you should put blinders on and ignore the risks completely. But neither should you take action every time Chicken Little warns you the sky’s about to come crashing down. Investors who continued to participate in 2019, despite the warnings, were rewarded.
To get the latest insights and commentary on gold, commodities, emerging markets, bitcoin and much, much more, subscribe to our award-winning Investor Alert and to my personal CEO blog, Frank Talk. Both can be reached by visiting usfunds.com.
| U.S. Global Investors Funds | (unaudited) |
Thank you for your continued trust and confidence in U.S. Global Investors. We wish you and your family good health and prosperity in 2020.
Sincerely,

Frank E. Holmes
CEO and Chief Investment Officer
U.S. Global Investors, Inc.
Please consider carefully a fund’s investment objectives, risks, charges and expenses. For this and other important information, obtain a fund prospectus by visiting www.usfunds.com or by calling 1-800-US-FUNDS (1-800-873-8637). Read it carefully before investing. Foreside Fund Services, LLC, Distributor. U.S. Global Investors is the investment adviser.
All opinions expressed and data provided are subject to change without notice. Some of these opinions may not be appropriate to every investor. The U.S. Dollar Index is an index of the value of the United States dollar relative to a basket of foreign currencies, often referred to as a basket of U.S. trade partners' currencies. The Index goes up when the U.S. dollar gains "strength" when compared to other currencies. The S&P 500 Stock Index is a widely recognized capitalization-weighted index of 500 common stock prices in U.S. companies. An inverted yield curve represents a situation in which long-term debt instruments have lower yields than short-term debt instruments of the same credit quality.
Holdings may change daily. Holdings are reported as of the most recent quarter-end. The following securities mentioned in the article were held by one or more accounts managed by U.S. Global Investors as of 12/31/19: Franco-Nevada Corp., Wheaton Precious Metals Corp., Royal Gold, Inc.
| Definitions for Management Teams’ Perspectives | (unaudited) |
Benchmark Index Definitions
Returns for indices reflect no deduction for fees, expenses or taxes, unless noted.
The Bloomberg Barclays U.S. Treasury Bills 6-9 Months Total Return Index tracks the performance of U.S. Treasury Bills with a maturity of six to nine months.
The Bloomberg Barclays 3 Year Municipal Bond Index is a total return benchmark designed for municipal assets. The index includes bonds with a minimum credit rating of BAA3, that are issued as part of a deal of at least $50 million, have an amount outstanding of at least $5 million and have a maturity of two to four years.
The FTSE Gold Mines Index encompasses all gold mining companies that have a sustainable and attributable gold production of at least 300,000 ounces a year and that derive 75% or more of their revenue from mined gold.
The Hang Seng Composite Index is a market-capitalization weighted index that covers about 95% of the total market capitalization of companies listed on the Main Board of the Hong Kong Stock Exchange.
The MSCI Emerging Markets Europe 10/40 Index (Net Total Return) is a free float-adjusted market capitalization index that is designed to measure equity performance in the emerging market countries of Europe (Czech Republic, Greece, Hungary, Poland, Russia and Turkey). The index is calculated on a net return basis (i.e., reflects the minimum possible dividend reinvestment after deduction of the maximum rate withholding tax). The index is periodically rebalanced relative to the constituents’ weights in the parent index.
The NYSE Arca Gold Miners Index is a modified market capitalization-weighted index comprised of publicly-traded companies involved primarily in the mining for gold and silver.
The S&P Global Natural Resources Index (Net Total Return) includes 90 of the largest publicly-traded companies in natural resources and commodities businesses that meet specific investability requirements, offering investors diversified, liquid and investable equity exposure across 3 primary commodity-related sectors: Agribusiness, Energy, and Metals & Mining. The index is calculated on a net return basis (i.e., reflects the minimum possible dividend reinvestment after deduction of the maximum rate withholding tax).
The S&P 500 Index is a widely recognized capitalization-weighted index of 500 common stock prices in U.S. companies.
The S&P Composite 1500 Index is a broad-based capitalization-weighted index of 1500 U.S. companies and is comprised of the S&P 400, the S&P 500 and the S&P 600.
Other Index Definitions
The Bloomberg Barclays High Yield Municipal Bond Index is a rules-based, market-value-weighted index that measures the non-investment grade and non-rated U.S. tax-exempt bond market.
| Definitions for Management Teams’ Perspectives | (unaudited) |
The Bloomberg Barclays U.S. Municipal Index covers the USD-denominated long-term tax exempt bond market. The index has four main sectors: state and local general obligation bonds, revenue bonds, insured bonds and pre-refunded bonds.
The China Manufacturing Purchasing Managers Index (PMI) provides an early indication each month of economic activities in the Chinese manufacturing sector.
The Hang Seng Index is a capitalization-weighted index of 33 companies that represent approximately 70 percent of the total market capitalization of The Stock Exchange of Hong Kong.
The Institute of Supply Management (ISM) Manufacturing Purchasing Managers Index (PMI) Report on Business is based on data compiled from monthly replies to questions asked of purchasing and supply executives in over 400 industrial companies. For each of the indicators measured (New Orders, Backlog of Orders, New Export Orders, Imports, Production, Supplier Deliveries, Inventories, Customers Inventories, Employment, and Prices), this report shows the percentage reporting each response, the net difference between the number of responses in the positive economic direction and the negative economic direction and the diffusion index. Responses are raw data and are never changed.
The MSCI Emerging Markets Europe Index is a free float-adjusted market capitalization index that is designed to measure equity market performance in the emerging markets countries of Europe (Czech Republic, Hungary, Poland, Russia, and Turkey).
The Purchasing Manager’s Index (PMI) is an indicator of the economic health of the manufacturing sector. The PMI index is based on five major indicators: new orders, inventory levels, production, supplier deliveries and the employment environment.
The S&P GSCI is the first major investable commodity index. It is one of the most widely recognized benchmarks that is broad-based and production weighted to represent the global commodity market beta. The index is designed to be investable by including the most liquid commodity futures, and provides diversification with low correlations to other asset classes.
The STOXX Europe 600 Index is derived from the STOXX Europe Total Market Index (TMI) and is a subset of the STOXX Global 1800 Index. With a fixed number of 600 components, the STOXX Europe 600 Index represents large, mid and small capitalization companies across 17 countries of the European region: Austria, Belgium, Denmark, Finland, France, Germany, Ireland, Italy, Luxembourg, the Netherlands, Norway, Poland, Portugal, Spain, Sweden, Switzerland and the United Kingdom.
The Taiwan Capitalization Weighted Stock Index is a stock market index for companies traded on the Taiwan Stock Exchange. TAIEX covers all of the listed stocks excluding preferred stocks, full-delivery stocks and newly listed stocks, which are listed for less than one calendar month.
| Definitions for Management Teams’ Perspectives | (unaudited) |
The Warsaw Stock Exchange Index (WIG) is the oldest stock exchange index, calculated at the first market session. The basic index values are calculated on the basis of the prices of shares of all stock exchange companies with at least 10% of freely-traded shares with a value equivalent to 1 million euro. WIG is a total-return index, and the revenues from both dividends and subscription rights are taken into account in its calculation.
| U.S. Government Securities Ultra-Short Bond Fund | (unaudited) |
Management Team’s Perspective
Introduction
The U.S. Government Securities Ultra-Short Bond Fund (UGSDX) is designed to be used as an investment that takes advantage of the security of U.S. Government bonds and obligations, while simultaneously pursuing a higher level of current income than money market funds offer. The fund’s dollar-weighted average effective maturity is two years or less. The fund seeks to provide current income and preserve capital.
Performance Graph
U.S. Government Securities Ultra-Short Bond Fund

| Average Annual Performance | | For the Periods Ended December 31, 2019 | |
| | One Year | Five Year | Ten Year | |
| U.S. Government Securities Ultra-Short Bond Fund | 1.50% | 0.83% | 0.46% | |
| Bloomberg Barclays U.S. Treasury Bills 6-9 Months | | | | |
| Total Return Index | 2.60% | 1.15% | 0.67% | |
Performance data quoted above is historical. Past performance is no guarantee of future results. Current performance may be higher or lower than the performance data quoted. The principal value and investment return of an investment will fluctuate so that an investor’s shares, when redeemed, may be worth more or less than their original cost. The graph and table do not reflect the deduction of taxes that a shareholder would pay on fund distributions or the redemption of fund shares. For all or a portion of the periods, the fund had expense limitations and reimbursements to maintain a minimum yield, without which returns would have been lower. The above returns for the U.S. Government Securities Ultra-Short Bond Fund include the fund’s results as a money market fund through the date of its conversion (December 20, 2013) to an ultra-short bond fund, and therefore are not representative of the fund’s results had it operated as an ultra-short bond fund for the full term of the periods shown. Returns greater than one year are annualized.
Gross expense ratio as stated in the most recent prospectus is 0.99%. Pursuant to a voluntary arrangement, the Adviser has agreed to limit total fund operating expenses (exclusive of any acquired fund fees and expenses, performance fees, taxes, brokerage commissions and interest) to not exceed 0.45%. The Adviser can modify or terminate this arrangement at any time. In addition, returns may include the effects of additional voluntary waivers of fees and reimbursements of expenses by the Adviser, including waivers and reimbursements to maintain a minimum net yield for the fund.
See Definitions for Management Teams’ Perspectives for index definitions.
Please visit our website at www.usfunds.com for updated performance information for different time periods.
| U.S. Government Securities Ultra-Short Bond Fund | (unaudited) |
The Year in Review – Economic and Political Issues that Affected the Fund
As 2019 began, the big economic stories were the Federal Reserve’s interest rate hiking cycle, the ongoing U.S. government shutdown, the December 2018 stock market drop, and the escalating U.S.-China trade war. As the year progressed, there was movement on all fronts. The Fed’s 2018 interest rate hikes were partially reversed as the FOMC cut rates three times in the second half of the year in reaction to a growing number of signals flashing an economic slowdown. The 35-day U.S. government shutdown, which ended on January 25, 2019, was the longest U.S. government shutdown in history. With many federal agencies closed and federal employees across the country furloughed or working without pay, the Congressional Budget Office estimated that the shutdown cost the economy $11 billion, $3 billion of which was permanently lost. The oscillations of U.S.-China trade negotiations sent global markets on a roller coaster ride throughout the year. As the year came to a close, the U.S. reached a so-called “Phase 1” trade agreement with China that reduced some of the tariffs imposed over the last 18 months and stopped the imposition of a new set of tariffs that had been set to go into effect on December 15. For its part, China agreed to purchase more U.S. agricultural products. While the agreement helped to diffuse global anxiety surrounding the growing trade tensions, it failed to address significant concerns around technology and intellectual property rights. Still, markets responded positively to the news, surging to new highs.
After repeated hawkish commentary throughout the fourth quarter of 2018 contributed to the largest S&P 500 correction since the 2008 financial crisis, Fed Chairman Powell did an about face in early January by essentially saying the balance sheet reduction program was no longer on auto pilot. In the following months, the increasing trade war rhetoric, falling inflation expectations, weakening economic data, and yield curve inversion drove the Fed into a “mid-cycle adjustment” of three, 25 basis point rate cuts in as many meetings commencing on July 31. Days before the September meeting, the Fed lost control of the short-term funding markets as overnight repos ballooned to ten percentage points and the fed funds rate rocketed 75 bps above the top end of the 2 percent - 2.25 percent target range. Temporary repo facilities and a $60 billion monthly Treasury bill purchase plan were quickly implemented, and the government’s balance sheet rose 11 percent from its low of $3.76 trillion on August 28 to $4.17 trillion in late December. Powell made it clear the bill purchases were not quantitative easing (QE), but with roughly $6 trillion - $7 trillion of paper that needs to be rolled every six months, some speculate this was the start of QE4 which in time could require the purchases of longer dated maturities. The Fed’s dovish pivot was cemented in the fourth quarter when Powell said the committee would need to see persistent inflation above the 2 percent level before even considering a change to short-term rates.
Treasury bonds had their best rally since 2014 as global flows sought safe havens due to continued weakness in the global economy, uncertainty from trade wars, and a new round of easing by global central banks. The U.S. Treasury 2-year yield declined 92 bps year-over-year and with it ended a streak of seven consecutive years in the green. The U.S. Treasury 10-year declined 77 bps year-over-year for its biggest drop since 2014. The Fed’s three rate cuts help to reverse a deeply inverted yield curve. Net supply of fixed income securities was notably higher in 2019. Net issuance of Treasuries went up as the federal budget deficit increased and corporate bond issuance was robust as well. Demand for U.S. fixed income remained broad-based as well. Foreign investors were major buyers, likely driven by wide interest rate differentials. On the domestic front, mutual fund demand remained steady while that from the banking sector picked up. This likely reflected pent-up demand for high quality liquid assets given the steady decline in reserve balances over time.
Investment Highlights
The U.S. Government Securities Ultra-Short Bond Fund returned 1.50 percent for the year ended December 31, 2019, underperforming its benchmark, the Bloomberg Barclays U.S. Treasury Bills 6-9 Months Total Return Index, which returned 2.60 percent.
The main source of underperformance came from floating rate bonds, as yields drifted lower overall due to geopolitical uncertainty.
| U.S. Government Securities Ultra-Short Bond Fund | (unaudited) |
Current Outlook
Waning recession fears should tilt the probabilities toward higher Treasury yields in 2020. One of the key drivers behind the steep drop in yields in 2019 was fear of a recession, as manufacturing activity fell and tariffs weighed on the growth outlook. However, rate cuts by the Federal Reserve have helped ease those concerns. In 2020, the lagged impact of the Fed’s interest rate cuts, signs of stabilization in the global economy, and an easing of trade tensions should provide a boost to bond yields. U.S economic growth is set to remain modest, but even at a GDP growth rate of between 2-3 percent, we believe there is still room for bond yields to move modestly higher.
The Federal Reserve has made it clear that after three rate cuts in 2019, bringing the federal funds rate to a range of 1.50 percent to 1.75 percent, monetary policy is on hold for the foreseeable future. The policy rate should be low enough to provide stimulus to the economy, keep credit flowing to businesses and consumers, and raise inflation expectations from very low levels. The Fed is also reportedly considering a policy of allowing inflation to hold above 2 percent without countering it in order to bolster positive inflation expectations.
The section labeled Portfolio of Investments contains a complete list of the fund’s holdings.
| | Portfolio Allocation by Issuer | | | | | | |
| | Based on Total Investments | | | | | December 31, 2019 | |
| | Federal Farm Credit Bank | | | 48.2% | |
| | U.S. Treasury Note | | | 16.9% | |
| | Federal Home Loan Mortgage Corporation | | | 11.3% | |
| | Vanguard Short-Term Treasury ETF | | | 10.6% | |
| | Federal Home Loan Bank | | | 7.0% | |
| | U.S. Treasury Bill | | | 6.0% | |
| | Total | | | | | 100.0% | |
| | | | | | | |
| | | | | | | |
| | Portfolio Allocation by Maturity | | | | December 31, 2019 | |
| | Less than 1 Month | $ | 4,379,760 | 10.6% | |
| | 1-3 Months | | 9,497,462 | 22.9% | |
| | 3-12 Months | | 17,272,357 | 41.6% | |
| | 1-3 Years | | 10,360,332 | | 24.9% | |
| | | $ | 41,509,911 | | 100.0% | |
| | | | | | | | |
| Near-Term Tax Free Fund | (unaudited) |
Management Team’s Perspective
Introduction
The Near-Term Tax Free Fund (NEARX) seeks to provide a high level of current income exempt from federal income taxation and to preserve capital. However, a portion of any distribution may be subject to federal and/or state income taxes. The Near-Term Tax Free Fund will maintain a weighted average maturity of less than five years.
Performance Graph
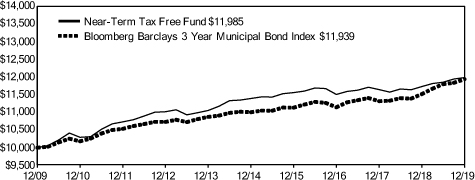
Near-Term Tax Free Fund
Average Annual Performance | | For the Periods Ended December 31, 2019 | |
| |
| |
| | One Year | Five Year | Ten Year | |
| |
| Near-Term Tax Free Fund | 2.18% | 1.02% | 1.83% | |
| Bloomberg Barclays 3 Year Municipal Bond Index | 3.67% | 1.64% | 1.79% | |
Performance data quoted above is historical. Past performance is no guarantee of future results. Current performance may be higher or lower than the performance data quoted. The principal value and investment return of an investment will fluctuate so that an investor’s shares, when redeemed, may be worth more or less than their original cost. The graph and table do not reflect the deduction of taxes that a shareholder would pay on fund distributions or the redemption of fund shares. For all or a portion of the periods, the fund had expense limitations, without which returns would have been lower. Returns greater than one year are annualized.
Gross expense ratio as stated in the most recent prospectus is 1.01%. The Adviser has contractually agreed to limit total fund operating expenses (exclusive of any acquired fund fees and expenses, extraordinary expenses, taxes, brokerage commissions and interest) to not exceed 0.45% on an annualized basis through April 30, 2020.
See Definitions for Management Teams’ Perspectives for index definitions.
Please visit our website at www.usfunds.com for updated performance information for different time periods.
The Year in Review – Economic and Political Issues that Affected the Fund
The municipal bond market had a banner year in 2019 thanks to a combination of tax reform, rising state revenues, declining default rates and improving credit quality. The U.S. municipal bond market posted additional positive performance, with the Bloomberg Barclays Municipal Index returning 7.5 percent, marking the sixth straight year of positive total returns. In addition to strong performance for investment-grade munis, the Bloomberg Barclays Municipal High Yield Index generated total returns of 10.7 percent.
| Near-Term Tax Free Fund | (unaudited) |
Supply was equally robust, with $418 billion of issuance, 21 percent higher than the amount issued the previous year. Net issuance for 2019 finished at +$51 billion, making 2019 the fourth out of the last five years to see muni market growth. After last year’s outflows, muni funds brought in a record $92 billion of inflows, with investment-grade muni funds experiencing $73 billion of inflows and high-yield muni funds seeing net inflows of about $19 billion on the year.
Unlike 2018 when fixed income and equity performance diverged, 2019 saw positive returns in both asset classes, with the latter especially outperforming. The macroeconomic environment was challenging throughout the year, with uncertainty brought about by U.S.-China trade negotiations, Brexit concerns and slower global growth. A dovish tone from the Federal Reserve in January surprised the market and set the tone for the year, as it pivoted from a hiking cycle to one of easing. The Fed lowered the fed funds rate three times in 2019, a reversal from the four rate hikes in 2018. As a result of the macro uncertainty and rate cuts by the Fed, rates dropped substantially. The first eight months of the year saw Treasury and muni yields drop by 100 basis points (with a majority of the decline occurring in August), with rates remaining range bound for the rest of the year. Consequently, the Bloomberg Barclays muni and treasury indices hit their peak in the third quarter, and remained steady for the rest of the year. Investment grade and high yield muni fund flows came in at a record pace as investors likely realized the effects of tax reform after filing their taxes. Strong mutual fund flows offset the lack of tax-exempt demand from banks and property and casualty insurers. The strong demand supported the tax-exempt market, particularly in the first half of the year, when supply came in much lower than investor expectations. While supply picked up in the second half of the year, a large part of that was taxable issuance. The muni curves flattened over the year, driven primarily by intermediate and long bonds as inflation fears subsided and investors reached for yield by extending.
The American Society of Civil Engineers estimates the cumulative funding gap for U.S. infrastructure is close to $5 trillion through 2040. With the lack of a federal infrastructure plan, state and local borrowers have picked up the slack on transportation and infrastructure borrowing in recent years. Transportation-bond issuance was $50 billion in 2019, a 25 percent increase from 2018. The $18 billion of issuance for airports led all transportation borrowing, followed by toll roads at $13 billion and public transportation at $5 billion. Acknowledging the poor state of infrastructure, voters have supported borrowing on the state and local level, with bond measures in cities in Maine, Arizona, Texas and Pennsylvania easily passing in November elections.
Investment Highlights
For the year ended December 31, 2019, the Near-Term Tax Free Fund returned 2.18 percent, underperforming its benchmark, the Bloomberg Barclays 3 Year Municipal Bond Index, which gained 3.67 percent.
Strengths
| ● | | The fund’s allocation to bonds from Colorado, Alabama and Louisiana outperformed. |
| ● | | The fund benefited from its allocation to school district, single-family housing and transportation bonds, which outperformed. |
| ● | | The fund’s allocation in the 7-10 year area of the yield curve outperformed. |
Weaknesses
| ● | | The fund’s allocation to bonds from Tennessee, Minnesota and Oregon underperformed. |
| ● | | The fund’s exposure to medical, utility and water bonds underperformed. |
| ● | | The fund’s allocation in the 1-3 year area of the yield curve underperformed. |
| Near-Term Tax Free Fund | (unaudited) |
Current Outlook
Opportunities
The Federal Reserve has signaled it will remain on hold through 2020. According to the minutes of the December meeting, monetary policy was “likely to remain appropriate for a time,” even with signs of some persistent downside risks. Given the concern of global economic market slowdowns and prospects of elevated global tensions following a U.S. military strike that killed Iran’s top general, perceived “safe-haven” investments, including municipal bonds, have been expected to benefit amid continued global uncertainty.
Looking ahead, the economic conditions that impact the three major sources of revenue for municipalities—income, sales taxes and property taxes—are all generally favorable. As a result, credit conditions are expected to remain mostly positive in the muni market. The long and slow economic recovery has generally benefited state and local governments, with many municipalities now in a better financial position than they were prior to the 2008 credit crisis.
Threats
Despite improvement in the broader equity markets in 2018-19, average state pension-plan funding only improved 1.5 percent. Median improvement aside, the number of states where the funding ratio declined more than doubled since fiscal 2017. In total, 14 saw their gap widen versus six in 2017. For the fourth straight year, New Jersey, Kentucky, Illinois and Connecticut claim top spots for lowest state-pension funding ratios, according to Bloomberg-compiled data.
Cyber security risks are an increasing concern for investors as well. Nearly 1,000 state and local governments, health care providers, universities, colleges and school districts were victims of cyber-attacks in 2019, according to security firm EMSISOFT. The outcomes of these attacks vary, but almost always require heavy investments in technology and security software. Rating agencies incorporate cyber risks into their analyses including such factors as vulnerability, preparedness, policies and procedures, technology investments and infrastructure, and insurance coverage.
The section labeled Portfolio of Investments contains a complete list of the fund’s holdings.
| | Top 10 Area Concentrations | | |
| | (Based on Net Assets) | December 31, 2019 | |
| | | Texas | 29.83% | |
| | | New York | 8.22% | |
| | | Florida | 6.61% | |
| | | Washington | 6.28% | |
| | | Illinois | 4.27% | |
| | | Louisiana | 3.14% | |
| | | North Carolina | 2.88% | |
| | | Colorado | 2.80% | |
| | | Michigan | 2.53% | |
| | | Total Top 10 Areas | 66.56% | |
| | | | | |
| Near-Term Tax Free Fund | (unaudited) |
| | Municipal Bond Ratings* | | |
| | Based on Total Municipal Bonds | December 31, 2019 | |
| | Bond | Percentage | |
| | AAA | 15.8% | |
| | AA | 62.1% | |
| | A | 15.4% | |
| | BBB | 5.5% | |
| | Not Rated | 1.2% | |
| | Total | 100.0% | |
| | | | |
| * | | Credit quality ratings are measured on a scale that generally ranges from AAA (highest) to D (lowest). “Not Rated” is used to classify securities for which a rating is not available. Credit quality ratings for each issue are obtained from Moody’s and S&P Global Ratings, and the higher rating for each issue is used. |
| All American Equity Fund & Holmes Macro Trends Fund | (unaudited) |
Management Team’s Perspective
Introduction
The principal objective of the All American Equity Fund (GBTFX) is to seek capital appreciation by investing primarily in a broadly diversified portfolio of domestic common stocks. The fund invests in large-capitalization stocks while retaining the flexibility to seek out promising individual stock opportunities, including stocks with meaningful dividend yields.
The Holmes Macro Trends Fund (MEGAX) invests in companies with good growth prospects and strong positive earnings momentum. The fund’s primary objective is to seek long-term capital appreciation.
Performance Graphs
All American Equity Fund
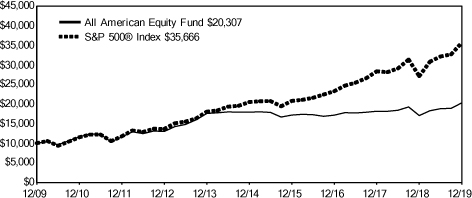
| Average Annual Performance | | For the Periods Ended December 31, 2019 | |
| | One Year | Five Year | Ten Year | |
| All American Equity Fund | 19.01% | 2.52% | 7.34% | |
| S&P 500® Index | 31.49% | 11.70% | 13.56% | |
Performance data quoted above is historical. Past performance is no guarantee of future results. Current performance may be higher or lower than the performance data quoted. The principal value and investment return of an investment will fluctuate so that an investor’s shares, when redeemed, may be worth more or less than their original cost. The graph and table do not reflect the deduction of taxes that a shareholder would pay on fund distributions or the redemption of fund shares. For all or a portion of the periods, the fund had expense limitations, without which returns would have been lower. Returns greater than one year are annualized.
Gross expense ratio as stated in the most recent prospectus is 1.86%. Pursuant to a voluntary arrangement, the Adviser has agreed to limit total fund operating expenses (exclusive of any acquired fund fees and expenses, performance fees, taxes, brokerage commissions and interest) to not exceed 2.20%. The Adviser can modify or terminate this arrangement at any time.
See Definitions for Management Teams’ Perspectives for index definitions.
Please visit our website at www.usfunds.com for updated performance information for different time periods.
| All American Equity Fund & Holmes Macro Trends Fund | (unaudited) |
Holmes Macro Trends Fund
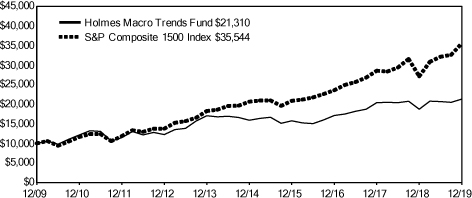
| Average Annual Performance | For the Periods Ended
December 31, 2019 | |
| One Year | Five Year | Ten Year | |
| Holmes Macro Trends Fund | 13.84% | 6.02% | 7.86% | |
| S&P Composite 1500 Index | 30.90% | 11.46% | 13.52% | |
Performance data quoted above is historical. Past performance is no guarantee of future results. Current performance may be higher or lower than the performance data quoted. The principal value and investment return of an investment will fluctuate so that an investor’s shares, when redeemed, may be worth more or less than their original cost. The graph and table do not reflect the deduction of taxes that a shareholder would pay on fund distributions or the redemption of fund shares. For all or a portion of the periods, the fund had expense limitations, without which returns would have been lower. Returns greater than one year are annualized.
Gross expense ratio as stated in the most recent prospectus is 1.77%. Pursuant to a voluntary arrangement, the Adviser has agreed to limit total fund operating expenses (exclusive of any acquired fund fees and expenses, performance fees, taxes, brokerage commissions and interest) to not exceed 2.20%. The Adviser can modify or terminate this arrangement at any time.
See Definitions for Management Teams’ Perspectives for index definitions.
Please visit our website at www.usfunds.com for updated performance information for different time periods.
The Year in Review – Economic and Political Issues that Affected the Funds
The economy entered 2019 on precarious footing with the Federal Reserve just completing its third rate hike in December of 2018. Jerome Powell, the current Fed Chairman, telegraphed to the nation that our economy was firing on all cylinders and the prudent approach for 2019 would consist of pivoting away from ratcheting interest rates higher and now watching, waiting and analyzing the upcoming future economic data for any signs of cracking.
It didn’t take long. In May, investors witnessed the start of the trade war. Talks stretched into the summer, with the lead U.S. negotiators and China going tit for tat, opening and closing the door to future negotiations driving worry into the minds of business people and investors alike. Their sentiments curdled and businesses shared thoughts of caution announcing intentions of scaling back operations in anticipation of a possible upcoming economic slowdown. Analysts lowered GDP estimates due to the threat of price increases upwards of 25 percent on goods arriving from China. Analysts were now pricing in 2 percent GDP.
| All American Equity Fund & Holmes Macro Trends Fund | (unaudited) |
As September arrived, anxious investors found some solace. The Fed pivoted to an accommodative stance. The constant pressure from the current administration pressuring the Fed to lower rates and analysts shaving off percentage points of GDP finally paid off.
The Fed reduced rates at the September meeting and then subsequently two additional times before the year concluded. And then, during mid-December, hints of a trade deal started to surface and the media conveyed to investors the president agreed to a “phase-one” trade deal with China.
There are a few motivations driving why we feel the market may continue to reward investors with future price appreciation in 2020.
First, the Fed has expressed its intention to keep interest rates low for the foreseeable future. In doing so, the U.S. consumer, especially the individuals with the inclination to spend will most likely seek to buy additional goods and services to enrich their lifestyle and provide additional boost to GDP.
Secondly, mortgage rates have recently declined to near decade lows and homeowner vacancies are near 38-year lows. Consumers and future home buyers alike are going to purchase big ticket items, and the current low interest rate environment is going to help them achieve those products sooner rather than later.
And finally, we feel combining the diminishing tax-like effects from tariffs along with personal incomes achieving a near 3 percent increase year-over-year will bolster our consumer driven economy.
Investment Highlights
The All American Equity Fund returned 19.01 percent for the year, underperforming its benchmark, the S&P 500, which returned 31.49 percent. The Holmes Macro Trends Fund returned 13.84 percent in 2019, underperforming its benchmark, the S&P Composite 1500 Index, which returned 30.90 percent.
Overall, mega-capitalization equities outperformed value and dividend-oriented companies, while the lagging sectors, energy and health care, just didn’t grab investor attention. The primary driver of underperformance in 2019 was the fact that both funds had more exposure to smaller and growth-oriented companies than their respective benchmarks. Our investment model was effectively out of favor with money flows, evidenced by the fact that the market did not reward securities we selected based on growth metrics. We believe this is transitory and that our growth at a reasonable price (GARP) investment style will ultimately be rewarded.
Our funds are actively managed, and because the holding period is generally not a consideration in investment decisions, the portfolios’ turnover rate might fluctuate from year to year as the funds adjust their portfolio composition. The funds’ annual portfolio turnovers were, and are expected to continue to be, more than 100 percent.
All American Equity Fund
Strengths
| ● | | The fund’s investments in consumer staples and consumer discretionary attributed the most to its return. |
| ● | | Stock selection was better than the index in the consumer materials and energy sectors. |
| ● | | Anadarko Petroleum, Zoetis and Union Pacific were the best contributors to fund performance. |
Weaknesses
| ● | | The fund’s investments in information technology and health care were a drag on performance. |
| ● | | Stock selection was worse than the index in utilities and financials. |
| ● | | Investments in Cabot Oil, A.O. Smith and Abbvie were the worst contributors to performance. |
| All American Equity Fund & Holmes Macro Trends Fund | (unaudited) |
Holmes Macro Trends Fund
Strengths
| ● | | Investments in consumer discretionary, financials and consumer staples attributed the most to the fund. |
| ● | | The fund’s stock selection in consumer discretionary and financials outpaced the index. |
| ● | | Versum Materials, MSCI and Tempur Sealy were among the best performers in the fund. |
Weaknesses
| ● | | The fund’s holdings in cash and health care attributed the least for the year. |
| ● | | Stock selection in the communication services and health care underperformed the benchmark’s securities in the same sector. |
| ● | | Pitney Bowes, AMC Networks and Stamps.com were among the worst contributors to the fund’s performance. |
Current Outlook
Opportunities
| ● | | The aerospace and defense industries look to be on good footing going into 2020. Spending is projected to grow in relation to increasing fuel efficiency and, within defense, exploring and countering new areas of threat including hypersonic weapons and cyber security. |
| ● | | Transportation infrastructure is shaping up to be another growth area in 2020. Capital expenditures are forecast to remain significant, mainly to address capacity constraints, tightening emissions regulations, and digitalization, including continued conversion by roads to all-electronic toll collection. |
| ● | | S&P Global’s outlook for U.S. homebuilding credit quality has shifted to a positive bias, with support from a continued favorable, but uneven, national housing market. The group believes positive rating actions could outnumber negative ones in 2020, given a 7 to 3 positive outlook bias. |
Threats
| ● | | Tensions between the U.S. and Iran have some market observers creating parallels between now and the Persian Gulf War three decades ago. Back then, equities had also just finished a banner year with the S&P 500 Index jumping 27 percent in 1989. Stocks peaked in July the following year, one month before the Gulf War began with a massive U.S.-led air offensive against Iraq. Over a stretch of three months, the benchmark tumbled as much as 20 percent. |
| ● | | During the past year, Americans were able to accumulate near record amounts of credit card debt, boosting the average balance per household to $8,701. Adding to the burden of reducing this debt, industry experts feel creditors will be reluctant to reduce the rates they charge even though the majority of interest rates in the U.S. continue to decline. Even more troubling, the cap established by the Consumer Financial Protection Bureau for consumers missing payments was recently increased from $1 to $39. |
| ● | | The median economic forecaster estimates a 33 percent probability of recession in the next 12 months. It seems many forecasters are referencing the classic “low unemployment rate” and flat yield curve. |
| All American Equity Fund & Holmes Macro Trends Fund | (unaudited) |
The section labeled Portfolio of Investments contains a complete list of the funds’ holdings.
All American Equity Fund
| | Top 10 Equity Holdings (Based on Net Assets) | December 31, 2019 | |
| | | Allegion PLC | 4.07% | |
| | | Electronic Secure Devices | | |
| | | Wynn Resorts, Ltd. | 3.65% | |
| | | Casino Hotels | | |
| | | HCA Healthcare, Inc. | 3.60% | |
| | | Medical - Hospitals | | |
| | | Altria Group, Inc. | 3.60% | |
| | | Tobacco | | |
| | | Regions Financial Corp. | 3.59% | |
| | | Commercial Banks - Southern US | | |
| | | The Sherwin-Williams Co. | 3.52% | |
| | | Coatings/Paint | | |
| | | MSCI, Inc. | 3.39% | |
| | | Decision Support Software | | |
| | | Starbucks Corp. | 3.37% | |
| | | Retail - Restaurants | | |
| | | The Charles Schwab Corp. | 3.35% | |
| | | Finance - Investment Banker/Broker | | |
| | | Broadcom, Inc. | 3.33% | |
| | | Electronic Components - Semiconductors | | |
| | | Total Top 10 Equity Holdings | 35.47% | |
| | | | |
| | Portfolio Allocation by Industry Sector* | | |
| | Based on Total Investments | December 31, 2019 | |
| | | Financials | 16.7% | |
| | | Information Technology | 15.9% | |
| | | Consumer Discretionary | 13.2% | |
| | | Health Care | 13.0% | |
| | | Industrials | 10.6% | |
| | | Consumer Staples | 9.8% | |
| | | Energy | 9.0% | |
| | | Materials | 5.8% | |
| | | Real Estate | 3.1% | |
| | | Other | 2.9% | |
| | | Total | 100.0% | |
| | | | | |
| * | | Summary information above may differ from the portfolio schedule included in the financial statements due to the use of different classifications of securities for presentation purposes. |
| All American Equity Fund & Holmes Macro Trends Fund | (unaudited) |
Holmes Macro Trends Fund
| | Top 10 Equity Holdings (Based on Net Assets) | December 31, 2019 | |
| | | MSCI, Inc. | 5.46% | |
| | | Decision Support Software | | |
| | | Moody's Corp. | 5.30% | |
| | | Commercial Service - Finance | | |
| | | Allegion PLC | 5.06% | |
| | | Electronic Secure Devices | | |
| | | Tempur Sealy International, Inc. | 4.86% | |
| | | Home Furnishings | | |
| | | The Home Depot, Inc. | 4.61% | |
| | | Retail - Building Products | | |
| | | Fair Isaac Corp. | 4.60% | |
| | | Data Processing/Management | | |
| | | The Scotts Miracle-Gro Co. | 4.45% | |
| | | Garden Products | | |
| | | IDEXX Laboratories, Inc. | 4.42% | |
| | | Diagnostic Kits | | |
| | | Pool Corp. | 3.94% | |
| | | Distribution/Wholesale | | |
| | | Ingevity Corp. | 3.83% | |
| | | Chemicals - Specialty | | |
| | | Total Top 10 Equity Holdings | 46.53% | |
| | | | |
| | Portfolio Allocation by Industry Sector* | | |
| | Based on Total Investments | December 31, 2019 | |
| | | Consumer Discretionary | 24.5% | |
| | | Information Technology | 14.5% | |
| | | Health Care | 14.2% | |
| | | Energy | 12.1% | |
| | | Materials | 10.1% | |
| | | Consumer Staples | 8.6% | |
| | | Communication Services | 6.3% | |
| | | Industrials | 5.2% | |
| | | Financials | 4.1% | |
| | | Other | 0.4% | |
| | | Total | 100.0% | |
| | | | | |
| * | | Summary information above may differ from the portfolio schedule included in the financial statements due to the use of different classifications of securities for presentation purposes. |
| Global Resources Fund | (unaudited) |
Management Team’s Perspective
Introduction
The Global Resources Fund (PSPFX) is a natural resources fund with the principal objective of seeking long-term growth of capital while providing protection against inflation and monetary instability. The fund invests in companies involved in the exploration, production and processing of petroleum, natural gas, coal, alternative energies, chemicals, mining, iron and steel, and paper and forest products around the globe.
Performance Graph
Global Resources Fund
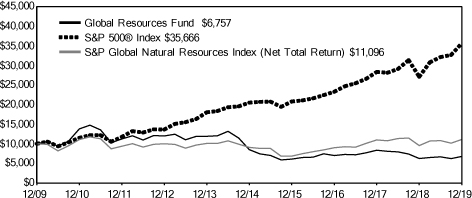
| Average Annual Performance | For the Periods Ended December 31, 2019 | |
| | One Year | Five Year | Ten Year | |
| Global Resources Fund | 8.55% | (4.46)% | (3.84)% | |
| S&P 500® Index | 31.49% | 11.70% | 13.56% | |
| S&P Global Natural Resources Index (Net Total Return) | 16.41% | 4.14% | 1.05% | |
Performance data quoted above is historical. Past performance is no guarantee of future results. Current performance may be higher or lower than the performance data quoted. The principal value and investment return of an investment will fluctuate so that an investor’s shares, when redeemed, may be worth more or less than their original cost. The graph and table do not reflect the deduction of taxes that a shareholder would pay on fund distributions or the redemption of fund shares. For all or a portion of the periods, the fund had expense limitations, without which returns would have been lower. Returns greater than one year are annualized.
Gross expense ratio as stated in the most recent prospectus is 1.57%. Pursuant to a voluntary arrangement, the Adviser has agreed to limit total fund operating expenses (exclusive of any acquired fund fees and expenses, performance fees, taxes, brokerage commissions and interest) to not exceed 1.90%. The Adviser can modify or terminate this arrangement at any time. See Definitions for Management Teams’ Perspectives for index definitions. Please visit our website at www.usfunds.com for updated performance information for different time periods.
The Year in Review – Economic and Political Issues that Affected the Fund
The Global Resources Fund outperformed its benchmark, the S&P Global Natural Resources Index in the second quarter of 2019, following an underperforming first quarter. The fund was predominately fully
| Global Resources Fund | (unaudited) |
invested, unlike the first quarter of 2019 where the fund had high cash levels at the start of the quarter. Oil had a significant run in the first quarter but those gains faded in the second quarter with weaker economic data starting to hit the tape, due to tariffs and economic sanctions on Venezuela and Iran.
In the third quarter, tariff fatigue and slower growth made the economic outlook less attractive; thus, the fund averaged just under 5 percent cash. Oil continued its second quarter decline of 3.56 percent, extending the downtrend another 7.13 percent drop in third quarter.
Oil was back on the rise in the fourth quarter and ended up 14.52 percent as the Organization of Petroleum Exporting Countries (OPEC) made cuts and the U.S.-China trade deal neared. Natural gas, on the other hand, took a big tumble, ending the quarter down 15.42 percent. Copper and precious metals were the better performers in the metals arena, but zinc, lead, iron and nickel did poorly.
Investment Highlights
Overview
For the year ended December 31, 2019, the Global Resources Fund returned 8.55, trailing the fund’s benchmark, the S&P Global Natural Resources Index (Net Total Return), which rose 16.41 percent. The fund outperformed for the month of December 2019, however, returning 9.05 percent versus 5.89 percent for the benchmark, as precious metals stocks climbed with gold. The fund had a higher weighting in gold mining stocks relative to the benchmark as central banks around the world added to their official reserves as debts rose.
Strengths
| ● | | The three strongest commodities for the year were palm oil, nickel and crude oil, up 36.80 percent, 31.55 percent and 25.59 percent, respectively. Direct exposure to palm oil via equity holdings is difficult to obtain. Nickel was strong on the imposition of an export ban of raw nickel ores from Indonesia in hopes of having a smelter built locally. Crude oil rallied hard in the first quarter but gave up most of those gains only to rally again in the fourth quarter with the prospect of an easing of sanctions with China. |
| ● | | The three best sector calls for the fund were an overweight position in precious metals, an underweight position in integrated oil and an underweight position in steel. Despite the fund’s overweighting in gold and precious metals, the return for that sector was consistent with the benchmark due to stock selection. But our stock selection within integrated oil and steel delivered better returns than the benchmark holdings. |
| ● | | The three best performing stock decisions were Royal Road Minerals and Ivanhoe Mines, followed by avoidance of any ownership in benchmark name Glencore. The list of regulatory agencies with open investigations regarding various ESG (environmental, social and governance) violations at Glencore continued to lengthen this year. Both Royal Road and Ivanhoe benefited from their precious metals components, but Ivanhoe also got a boost at year end with a potential rollback in tariffs. |
Weaknesses
| ● | | The three weakest commodities for the year were natural gas, tin and zinc, down 26.98 percent, 12.00 percent and 9.49 percent, respectively. Natural gas supplies remain abundant, and warmer weather trends have taken their toll. Direct exposure to tin via equity holdings is difficult to obtain. Zinc demand, being an industrial metal, was impacted by sanctions. |
| ● | | The fund’s sector underweight positions in pulp and paper as well as container/packaging stocks negatively impacted the fund. The fund’s more North America-centric stock selection did not do as well versus Europe in pulp and paper and containers/packaging stocks, which had stronger gains. |
| ● | | Infrastructure Ventures and Sun Metals were the biggest detractors from fund performance. Sun Metals’ drill plan had disappointing grades of copper, which may mean the deposit is small. |
| Global Resources Fund | (unaudited) |
Current Outlook
Opportunities
| ● | | Renewable energy such as wind and solar are cheaper than coal and in some cases more competitive than natural gas. Thus, we are seeing some disruption of the current energy mix. The leadership forward on the environmental side has not been at the bequest of government regulation as much as it has been shareholders’ interest that there are real consequences to ignoring the current trend in global warming. Demand for copper, nickel, lithium, cobalt and rare earth metals can have a future in supplying materials for energy storage. |
| ● | | The infrastructure spending plan that has been talked about in Congress will likely be resurrected with presidential elections coming in 2020. With tariffs still being a point of trade contention, capital allocation decisions are beginning to see pause as ISM Manufacturing PMI declined to 47.2 by December, a low for the year, after spiking higher in October. |
| ● | | Commodities as a whole had a mostly positive 2019, returning 16.53 percent as measured by the S&P GSCI. This far surpasses commodities' five-year average return of about negative 11.52 percent, between 2014 and 2018. Precious metals were responsible for much of the growth. Palladium, used widely in the production of catalytic converters, increased an incredible 54.21 percent to end 2019 at $1,912 an ounce. |
Threats
| ● | | While oil and natural gas are not going away, the prospects of a supply squeeze or potential recession next year seems buffered; thus, higher prices are likely in check for now. The Railroad Commission of Texas, which regulates oil and gas production, recently gave the market some pause when it raised some concern that routine flaring of natural gas may not stay “routinely approved.” |
| ● | | In the U.S. alone, assets under management (AUM) in ESG-oriented funds and ETFs have more than doubled from approximately $40 billion in 2013 to $90 billion in 2019, according to Morningstar data. Greater investments into renewable energy could take money away from traditional fossil fuels and hurt producers. |
| ● | | At the beginning of 2020, lawmakers in the U.S. passed a bill that will require the Environmental Protection Agency (EPA) to limit Americans’ exposure to chemicals connected to health problems. There is a growing concern about the quality of drinking water nationwide and the bill pushes for a limit to the maximum limit of chemicals allowed in sources of drinking water. This is a big threat to chemical producers, among others. |
The section labeled Portfolio of Investments contains a complete list of the fund’s holdings.
| Global Resources Fund | (unaudited) |
| | | | |
| | Top 10 Equity Holdings (Based on Net Assets) | December 31, 2019 | |
| | | Infrastructure Ventures, Inc. | 5.14% | |
| | | Real Estate Operating/Development | | |
| | | Ivanhoe Mines, Ltd. | 3.23% | |
| | | Metal - Diversified | | |
| | | LUKOIL PJSC | 2.88% | |
| | | Oil Companies - Integrated | | |
| | | Lundin Gold, Inc. | 2.59% | |
| | | Gold Mining | | |
| | | CNOOC, Ltd. | 2.39% | |
| | | Oil Companies - Exploration and Production | | |
| | | AngloGold Ashanti, Ltd. | 2.01% | |
| | | Gold Mining | | |
| | | Royal Road Minerals, Ltd. | 1.95% | |
| | | Gold Mining | | |
| | | Vestas Wind Systems A/S | 1.81% | |
| | | Energy - Alternate Sources | | |
| | | Champion Iron, Ltd. | 1.68% | |
| | | Metal - Iron | | |
| | | MMC Norilsk Nickel PJSC | 1.65% | |
| | | Metal - Diversified | | |
| | | Total Top 10 Equity Holdings | 25.33% | |
| | | | | |
| | Portfolio Allocation by Industry Sector* | | |
| | Based on Total Investments | December 31, 2019 | |
| | | Metals & Mining | 35.3% | |
| | | Oil, Gas & Consumable Fuels | 28.0% | |
| | | Precious Metals & Minerals | 11.3% | |
| | | Real Estate | 6.7% | |
| | | Exchange Traded Funds | 4.1% | |
| | | Other | 14.6% | |
| | | Total | 100.0% | |
| | | | | |
| * | | Summary information above may differ from the portfolio schedule included in the financial statements due to the use of different classifications of securities for presentation purposes. |
| Precious Metals and Minerals Funds | (unaudited) |
Management Team’s Perspective
Introduction
The World Precious Minerals Fund (UNWPX) and the Gold and Precious Metals Fund (USERX) pursue an objective of long-term capital growth through investments in gold, precious metals and mining companies. The World Precious Minerals Fund focuses on equity securities of companies principally engaged in the exploration, mining and processing of precious minerals such as gold, silver, platinum and diamonds. Although this fund has the latitude to invest in a broad range of precious minerals, it currently remains focused on the gold sector. The Gold and Precious Metals Fund focuses on the equity securities of established gold and precious metals companies and pursues current income as a secondary objective.
World Precious Minerals Fund

| Average Annual Performance | For the Periods Ended
December 31, 2019 | |
| | One Year | Five Year | Ten Year | |
| World Precious Minerals Fund | 22.59% | 3.47% | (8.33)% | |
| S&P 500® Index | 31.49% | 11.70% | 13.56% | |
| NYSE Arca Gold Miners Index | 41.26% | 11.11% | (3.20)% | |
Performance data quoted above is historical. Past performance is no guarantee of future results. Current performance may be higher or lower than the performance data quoted. The principal value and investment return of an investment will fluctuate so that an investor’s shares, when redeemed, may be worth more or less than their original cost. The graph and table do not reflect the deduction of taxes that a shareholder would pay on fund distributions or the redemption of fund shares. For all or a portion of the periods, the fund had expense limitations, without which returns would have been lower. Returns greater than one year are annualized.
Gross expense ratio as stated in the most recent prospectus is 1.54%. Pursuant to a voluntary arrangement, the Adviser has agreed to limit total fund operating expenses (exclusive of any acquired fund fees and expenses, performance fees, taxes, brokerage commissions and interest) to not exceed 1.90%. The Adviser can modify or terminate this arrangement at any time. See Definitions for Management Teams’ Perspectives for index definitions.
Please visit our website at www.usfunds.com for updated performance information for different time periods.
| Precious Metals and Minerals Funds | (unaudited) |
Gold and Precious Metals Fund
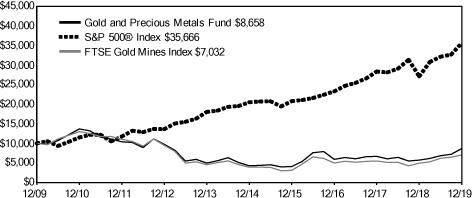
| Average Annual Performance | | For the Periods Ended
December 31, 2019 | |
| | One Year | Five Year | Ten Year | |
| Gold and Precious Metals Fund | 51.34% | 15.21% | (1.43)% | |
| S&P 500® Index | 31.49% | 11.70% | 13.56% | |
| FTSE Gold Mines Index | 42.68% | 12.58% | (3.46)% | |
Performance data quoted above is historical. Past performance is no guarantee of future results. Current performance may be higher or lower than the performance data quoted. The principal value and investment return of an investment will fluctuate so that an investor’s shares, when redeemed, may be worth more or less than their original cost. The graph and table do not reflect the deduction of taxes that a shareholder would pay on fund distributions or the redemption of fund shares. For all or a portion of the periods, the fund had expense limitations, without which returns would have been lower. Returns greater than one year are annualized.
Gross expense ratio as stated in the most recent prospectus is 1.78%. Pursuant to a voluntary arrangement, the Adviser has agreed to limit total fund operating expenses (exclusive of any acquired fund fees and expenses, performance fees, taxes, brokerage commissions and interest) to not exceed 1.90%. The Adviser can modify or terminate this arrangement at any time.
See Definitions for Management Teams’ Perspectives for index definitions.
Please visit our website at www.usfunds.com for updated performance information for different time periods.
The Year in Review - Economic and Political Issues that Affected the Funds
Venezuelan gold selling was a major headwind to a rising gold price early in 2019. Whenever it appears as if the South American country is approaching the market, prices have dropped due to the market recognizing a distressed seller is seeking liquidity.
Billionaire and founder of Equity Group Investments Sam Zell said in a Bloomberg interview that he has bought gold for the first time in his life “because it is a good hedge.” Zell continued to say that “supply is shrinking and that is going to have a positive impact on the price.”
The seasonal strength in gold prices during the first quarter of 2019 amounted to about a $50 lift in prices with half of that amount given up by the end of the quarter. Gold bullion jumped $104 in the month of June, nearly an 8 percent gain. Gold stocks responded in kind, with the largest and most liquid/leveraged companies seeing the most price appreciation.
| Precious Metals and Minerals Funds | (unaudited) |
Gold bullion continued to move higher in the third quarter, with spot prices gaining 4.47 percent. Tariffs and economic uncertainty continue to be key drivers. The Federal Reserve responded to market expectations with two 25 basis point interest rate cuts, at the July and then the September meetings. Gold prices rallied strongly in July and exceeded $1,550 per ounce by August. By the September interest rate cut, gold traders essentially were consolidating their positions at the $1,500 level, waiting for a new catalyst. Senior gold mining stocks rose on the price change in gold, but money flows into the precious metals space broadened with silver gaining 10.98 percent and platinum 5.79 percent for the quarter, better than gold’s price change.
Gold bullion fell early in the fourth quarter and then rallied as we entered December, with spot prices gaining 3.04 percent over the last three months of 2019. The yellow metal was driven by safe haven demand due to global geopolitical uncertainty, with total holdings in gold bullion ETFs reaching the most on record in the fourth quarter at 2,900 tonnes.
Investment Highlights
For the year ended December 31, 2019, the World Precious Minerals Fund returned 22.59 percent, underperforming its benchmark. The fund’s benchmark, the NYSE Arca Gold Miners Index, rose 41.26 percent on a total return basis.
The strategy of the World Precious Minerals Fund favors junior exploration and development stocks and mid-tiered producing stocks. These lower-capitalization stocks have historically outperformed senior gold mining companies over longer periods, as senior gold miners have typically acquired proven assets of junior gold companies rather than explored for new mining projects with capital-constrained budgets.
The Gold and Precious Metals Fund gained 51.34 percent for the year, outperforming its benchmark, the FTSE Gold Mines Index, which rose 42.68 percent on a total return basis. While focusing on established, gold-producing companies, the Gold and Precious Metals Fund holds a higher weighting of mid-tier stocks compared to its benchmark.
Both funds employed a defensive investment position from time to time in the past year with higher-than-average cash balances on hand to help protect the liquidity of the funds. However, to maintain varying degrees of investment exposure to the gold market, the funds utilized some call options positions and directional ETFs, which are more liquid than options, to hedge the funds’ benchmark risks and provide optionality to upswings in gold stocks.
Gold finished the year up 18.31 percent, while silver rose 15.21 percent. Palladium ended the year strongest with a gain of 54.20 percent, primarily driven by a shift in Europe to gasoline engines from diesel and a greater need for pollution reduction, particularly in China. This increases the demand for palladium, which is used in pollution-scrubbing catalytic converters. Platinum also put in a gain of 21.48 percent.
Strengths
| ● | | Wesdome Gold Mines Ltd. was one of both fund’s largest positions over the course of the year and was the best contributor to returns for both Gold and Precious Metals Fund (USERX) and World Precious Minerals Fund (UNWPX) with a 141.00 percent return. Wesdome is not a member of either of the funds’ benchmarks. |
| ● | | K92 Mining, Inc. was the second best dollar gainer for USERX, with a 259.92 percent gain. The second best contributor to UNWPX was Silvercrest Metals, Inc., which returned 208.57 percent. Neither K92 nor Silvercrest is a member of either of the benchmarks. |
| ● | | Diverting money away from index heavy-weight Newmont Goldcorp Corp. was our third best contributor to our relative performance as their price gain of 30.57 percent underperformed USERX and its benchmark. The third biggest contributor to UNPWX was New Pacific Metals Corp., a non-benchmark holding, where we gained 208.57 percent before closing out the position. |
| Precious Metals and Minerals Funds | (unaudited) |
Weaknesses
| ● | | Our average cash balance of 5.33 percent was the largest drag on the USERX’s return of 51.34 percent. For UNWPX, Cardinal Resources, a non-benchmark holding, was the largest detractor with a price slide of 29.76 percent over the year with asset sales and balance sheet repairs being the first order of business in 2019 versus taking on new projects. |
| ● | | St Barbara, a FTSE Gold Index member, was our second biggest detractor for USERX with its 39.01 percent slide over the year on the disappointing acquisition of Atlantic Gold Corp. Dolly Varden Silver Corp., a non-benchmark holding, was our second biggest drag on UNWPX with its price falling 31.22 percent. |
| ● | | An unfulfilled opportunity in USERX this year was Menē, Inc., which finished the year 3.45 percent lower despite sales and earnings continuing to grow for this online retailer of 24-karat gold jewelry. Nano One Materials Corp., a larger weighting in UNWPX, was also a drag on performance with its price drifting 1.47 percent lower over the year. Both Menē and Nano One are non-benchmark names. |
Current Outlook
Opportunities
| ● | | Central banks around the world, notably China, and including some that haven’t bought gold in decades, are adding bullion to their official reserves at a brisk rate compared to years past. Negative-yielding government debt appears to be a driver of higher prices for gold as pension investors search for alternative investments and central banks around the world are de-dollarizing where they can. Citigroup is very bullish on gold with a $2,000 per ounce forecast. |
| ● | | Palladium continued to perform with increased pollution standards on gasoline powered vehicles amid tight fiscal supplies. Palladium has been one of the strongest of the precious metals with increased pollution standards on gasoline powered vehicles. Platinum has been under pressure with a significant shift in consumer preference in Europe away from diesel powered vehicles, post the Volkswagen emissions scandal, towards gasoline fuel. |
| ● | | Gold broke through $1,500 per ounce in the third quarter, dipped a bit mid-quarter, and and then finished the year stong, which has raised its profile among investors. Senior gold mining stocks rose on the price change in gold, and we saw several major miners make smart transactions. |
Threats
| ● | | South Africa continued to experience rolling blackouts that pose big risks for the mining industry. In an effort to avoid a total grid collapse, state-run Eskom has implemented rotating blackouts and is working to assess the breakdowns across the grid which pose a safety and operating risk to the companies and their employees. |
| ● | | Tariffs have disrupted economic growth and this has kept silver prices subdued, relative to gold. Should the tariff issue be resolved, that could negatively impact gold. Despite the Fed cutting interest rates twice in 2019, the dollar has remained resilient and this has been a headwind for gold. Should higher interest rates make a comeback in 2020, we would expect the dollar to remain firm. |
| ● | | We are entering an election year, so the current administration is looking for economic wins that would enhance their reelection; hence positive economic action could derail the gold rally. Most of the past year was spent by the major gold miners on deleveraging their balance sheet with asset sales. One major problem in front of the senior gold companies is their reserve life relative to their current production. Global gold mining company reserves have fallen every year since 2012, almost a 50 percent drop. We now are seeing some of the senior and intermediate gold mining companies begin to take equity stakes in some of the junior miners, which could signal a bullish turn in the market. |
| Precious Metals and Minerals Funds | (unaudited) |
The section labeled Portfolio of Investments contains a complete list of the funds’ holdings.
World Precious Minerals Fund
| | Top 10 Equity Holdings (Based on Net Assets) | December 31, 2019 | |
| | | TriStar Gold, Inc. | 6.01% | |
| | | Gold Mining | | |
| | | Wesdome Gold Mines, Ltd. | 5.16% | |
| | | Gold Mining | | |
| | | SilverCrest Metals, Inc. | 4.45% | |
| | | Precious Metals | | |
| | | Cardinal Resources, Ltd.. | 4.29% | |
| | | Metal - Diversified | | |
| | | Lundin Gold, Inc. | 4.23% | |
| | | Gold Mining | | |
| | | Barsele Minerals Corp. | 3.81% | |
| | | Precious Metals | | |
| | | Nano One Materials Corp. | 3.77% | |
| | | Advanced Materials/Production | | |
| | | K92 Mining, Inc. | 3.66% | |
| | | Gold Mining | | |
| | | Direxion Daily Junior Gold Miners Index Bull 3x Shares ETF | 3.30% | |
| | | Exchange Traded Funds | | |
| | | Dolly Varden Silver Corp. | 2.97% | |
| | | Precious Metals | | |
| | | Total Top 10 Equity Holdings | 41.65% | |
| | | | |
| | Portfolio Allocation by Industry* | | |
| | Based on Total Investments | December 31, 2019 | |
| | | Gold Mining | 43.0% | |
| | | Precious Metals | 22.3% | |
| | | Metal - Diversified | 13.5% | |
| | | Exchange Traded Funds | 6.6% | |
| | | Diversified Minerals | 5.4% | |
| | | Advanced Materials/Production | 3.8% | |
| | | Other | 5.4% | |
| | | Total | 100.0% | |
| | | | | |
| * | | Summary information above may differ from the portfolio schedule included in the financial statements due to the use of different classifications of securities for presentation purposes. |
| Precious Metals and Minerals Funds | (unaudited) |
Gold and Precious Metals Fund
| | Top 10 Equity Holdings (Based on Net Assets) | December 31, 2019 | |
| | | Wesdome Gold Mines, Ltd. | 6.34% | |
| | | Gold Mining | | |
| | | K92 Mining, Inc. | 4.49% | |
| | | Gold Mining | | |
| | | Sandstorm Gold, Ltd. | 3.92% | |
| | | Gold Mining | | |
| | | Direxion Daily Gold Miners Index Bull 3X Shares ETF | 3.89% | |
| | | Exchange Traded Funds | | |
| | | Direxion Daily Junior Gold Miners Index Bull 3x Shares ETF | 3.72% | |
| | | Exchange Traded Funds | | |
| | | Wheaton Precious Metals Corp. | 3.61% | |
| | | Precious Metals | | |
| | | SSR Mining, Inc. | 3.12% | |
| | | Precious Metals | | |
| | | Maverix Metals, Inc. | 3.09% | |
| | | Precious Metals | | |
| | | Roxgold, Inc. | 2.59% | |
| | | Precious Metals | | |
| | | Torex Gold Resources, Inc. | 2.56% | |
| | | Gold Mining | | |
| | | Total Top 10 Equity Holdings | 37.33% | |
| | | | |
| | Portfolio Allocation by Industry* | | |
| | Based on Total Investments | December 31, 2019 | |
| | | Gold Mining | 59.2% | |
| | | Precious Metals | 18.1% | |
| | | Exchange Traded Funds | 8.1% | |
| | | Silver Mining | 5.4% | |
| | | Other | 9.2% | |
| | | Total | 100.0% | |
| | | | | |
| * | | Summary information above may differ from the portfolio schedule included in the financial statements due to the use of different classifications of securities for presentation purposes. |
| Emerging Europe Fund | (unaudited) |
Management Team’s Perspective
Introduction
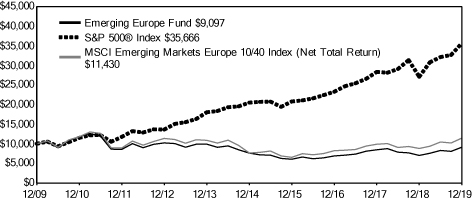
The investment objective of the Emerging Europe Fund (EUROX) is to achieve long-term capital growth by investing in a non-diversified portfolio of equity securities of companies located in the emerging markets of Europe.(1)
Performance Graph
Emerging Europe Fund
| Average Annual Performance | For the Periods Ended
December 31, 2019 | |
| | One Year | Five Year | Ten Year | |
| Emerging Europe Fund | 29.76% | 3.66% | (0.94)% | |
| S&P 500® Index | 31.49% | 11.70% | 13.56% | |
| MSCI Emerging Markets Europe 10/40 Index (Net Total Return) | 30.12% | 8.35% | 1.35% | |
| * | | Performance data quoted above is historical. Past performance is no guarantee of future results. Current performance may be higher or lower than the performance data quoted. The principal value and investment return of an investment will fluctuate so that an investor’s shares, when redeemed, may be worth more or less than their original cost. The graph and table do not reflect the deduction of taxes that a shareholder would pay on fund distributions or the redemption of fund shares. For all or a portion of the periods, the fund had expense limitations, without which returns would have been lower. Returns greater than one year are annualized. |
Gross expense ratio as stated in the most recent prospectus is 2.43%. Pursuant to a voluntary arrangement, the Adviser has agreed to limit total fund operating expenses (exclusive of any acquired fund fees and expenses, performance fees, taxes, brokerage commissions and interest) to not exceed 2.85%. The Adviser can modify or terminate this arrangement at any time.
See Definitions for Management Teams’ Perspectives for index definitions.
Please visit our website at www.usfunds.com for updated performance information for different time periods.
| (1) | | The following countries are considered to be in the emerging Europe region: Albania, Armenia, Azerbaijan, Belarus, Bulgaria, Croatia, the Czech Republic, Estonia, FYR Macedonia, Georgia, Greece, Hungary, Latvia, Lithuania, Moldova, Poland, Romania, Russia, Slovakia, Slovenia, Turkey and Ukraine. |
| Emerging Europe Fund | (unaudited) |
The Year in Review – Economic and Political Issues that Affected the Fund
2019 was a great year for emerging Europe equities. The broad MSCI Emerging Markets Europe Index appreciated 33.6 percent, outperforming the U.S. and the Western Europe, as measured by the S&P 500 Index and STOXX Europe 600 Index. Despite challenging Brexit discussions and trade negotiations, Europe performed strongly, supported by dovish central bank policies and strong consumer spending.
Greece was the best performing market. After years of austerity measures and bailout programs, Greece’s economy is improving. The new government is pro-business, cutting taxes and pushing forward with the planned reforms while maintaining a high primary surplus. Greek banks are reducing bad loans and investor confidence is slowly returning. Greece has the world’s strongest manufacturing sector. According to Prime Minister Kyriakos Mitsotakis, the country can regain investment grade status by the end of the first half of 2021.
Russia also outperformed in the region. Russian equites gained for the year, supported by higher oil prices and a lack of new significant sanctions. After years of tension between Ukraine and Russia, international relations have been improving since the new president came to power in Ukraine. Russian equities pay one of the world’s highest dividends, attracting investors looking for high paying assets. The Russian ruble was the best performing currency in the world in 2019, supported by high real rates and strong Brent crude oil price performance. The central bank of Russia cut rates five times in 2019, but the main rate remained at a high level of 6.25 percent in December. Inflation fell to 3 percent in December from 5 percent at the beginning of 2019. The price of crude oil rose 25.6 percent in the past twelve months.
Hungarian and Czech Republic stocks had positive gains, but underperformed the broad MSCI Emerging Markets Europe Index for the year. There are only a handful of stocks trading on the Prague and Budapest stock exchanges, but their performance was supported by strong domestic demand and a high utilization in EU funds. The central bank in Czech Republic has been hiking rates and has the highest potential among Central Emerging Europe to cut the policy rate. Hungary’s central bank maintained its rate close to zero in 2019 due to utilization of unconventional monetary policy rates.
Turkish equites recorded positive gains, but the lira has underperformed for years and 2019 was no different. The lira finished the year as the second weakest currency in the world, after only the Argentine peso. Domestic politics and international geopolitical developments pushed the lira lower. Turkey purchased a military defense system from Russia, and in response, the U.S. imposed sanctions on Turkey. The country’s incursion into northern Syria also sparked international criticism.
Stocks trading on the Warsaw exchange posted losses in 2019. Polish court reforms implemented by the ruling Law & Justice party sparked criticism from the eurozone. The European Court of Justice (ECJ) ruled that Poland broke EU law by implementing the judicial reforms, deepening the disagreement between Poland and Brussels. Moreover, banks’ large foreign loan exposure, mostly to Swiss francs, captured more attention this year. Polish lenders, which are heavily weighted in the Warsaw Stock Exchange Index, underperformed in the past 12 months.
Investment Highlights
Overview
For the year ended December 31, 2019, the Emerging Europe Fund returned 29.76 percent, while the benchmark MSCI Emerging Markets Europe 10/40 Index (Net Total Return) returned 30.12 percent.
Russia and Greece outperformed the benchmark, while Czech Republic, Turkey, Hungary and Poland underperformed the benchmark. Stocks trading on the Warsaw exchange lost value, while all other markets recorded profits. On a sector basis, communication services and energy were the best performing, while materials, finance, consumer discretionary, health care, consumer staples, utility and industrials underperformed.
| Emerging Europe Fund | (unaudited) |
Strengths
| ● | | The fund’s underweight position in Poland and good stock selection in Turkey had the most positive impact on the fund’s performance relative to its benchmark. |
| ● | | The fund’s underweighting in the financial sector had the most positive effect on the fund’s performance relative to its benchmark. |
| ● | | Gazprom, the Russian gas producer and distributor, made the largest single contribution to the performance of the fund. |
Weaknesses
| ● | | The fund’s underweight position in Russia and higher cash level had the most negative impact on the fund’s performance relative to its benchmark. |
| ● | | The fund’s overweighting in the industrial sector had the most negative effect on the fund’s performance relative to its benchmark. |
| ● | | Jastrzebska Spolka Weglowa, a Polish coking coal producer, was the single worst contributor to the performance of the fund. |
Current Outlook
Opportunities
| ● | | Eastern European equities gained 33.6 percent in 2019, beating Western Europe and the United States. Strong performance should continue in the region supported by easing trade tensions and a pickup in manufacturing activity. Europe’s manufacturing activity is heavily influenced by China’s industrial activity and car sales. With the expectation that China’s economy and auto sales continue to improve in 2020, Europe’s manufacturing activity and economic growth should improve as well. |
| ● | | In its Global Asset Allocation research “Top 10 Trades for 2020,” JPMorgan recommends overweighting Russia due to sustainable dividend yields and stable earnings per share forecasts. With negative bond yields around the world, Russia should remain a very attractive market for investors looking for higher yielding assets. Moreover, JPMorgan predicts a stable oil price, especially after the latest OPEC agreement, which should push the Moscow exchange higher. |
| ● | | According to Wood & Company research, the Polish stock market is likely to record inflows next year thanks to employer-sponsored pension programs – a new form of additional pension saving. Assuming 40 percent participation in the program, the inflows might reach 1.6 billion Polish zloty (“PLN”) next year and PLN 3.2 to 3.4 billion in 2021. The Warsaw stock exchange underperformed in 2019 and next year could be a turning point. |
Threats
| ● | | The British Prime Minister Boris Johnson won snap elections in December, and that resulted in the U.K. leaving the European Union on January 31, 2020. This date marks the beginning of important negotiations over how the separation will work in practice. Under the current agreement, the U.K. will have until December 31, 2020 to find common ground with the EU on many issues, including trade. It took three and a half years for the U.K. to exit the EU, and it could be too optimistic to assume that the negotiations will end by the end of 2020. A hard Brexit is not completely out of the picture. |
| ● | | Turkey is one of the cheapest emerging markets, but conditions may not be set there for a V-shaped recovery, according to Wood & Company research team. The Central Bank of Turkey will most likely |
| Emerging Europe Fund | (unaudited) |
continue to cut the policy rate aggressively, but domestic consumption most likely will not rebound strongly, which historically has been the main driver of economic growth. The lira could depreciate further against the U.S. dollar.
| ● | | In 2020 the eurozone will set its next multiyear budget for 2021-2027. Poland and Hungary are the biggest beneficiaries of EU funds, but the EU has threatened both countries and said the allocations will not be as large going forward. The European Commission accused both countries of undermining judicial independence and breaking democratic values. |
The section labeled Portfolio of Investments contains a complete list of the fund’s holdings.
| | Top 10 Equity Holdings (Based on Net Assets) | December 31, 2019 | |
| | | Gazprom PJSC | 9.86% | |
| | | Oil Companies - Integrated | | |
| | | LUKOIL PJSC | 9.08% | |
| | | Oil Companies - Integrated | | |
| | | Sberbank of Russia PJSC | 8.22% | |
| | | Commercial Banks Non-US | | |
| | | Novatek PJSC | 4.50% | |
| | | Oil Companies - Exploration & Production | | |
| | | Tatneft PJSC | 4.42% | |
| | | Oil Companies - Integrated | | |
| | | MMC Norilsk Nickel PJSC | 4.30% | |
| | | Metal - Diversified | | |
| | | Bank Polska Kasa Opieki SA | 2.29% | |
| | | Commercial Banks Non-US | | |
| | | Surgutneftegas PJSC | 1.46% | |
| | | Oil Companies - Integrated | | |
| | | Powszechny Zaklad Ubezpieczen SA | 1.46% | |
| | | Property/Casualty Insurance | | |
| | | PhosAgro PJSC | 1.36% | |
| | | Agricultural Chemicals | | |
| | | Total Top 10 Equity Holdings | 46.95% | |
| | | | |
| | Country Distribution* | | |
| | Based on Total Investments | December 31, 2019 | |
| | | Russian Federation | 56.0% | |
| | | Turkey | 12.5% | |
| | | Poland | 11.5% | |
| | | Greece | 5.6% | |
| | | Other | 14.4% | |
| | | Total | 100.0% | |
| | | | | |
| * | | Country distribution shown is based on domicile. The locale of company operations may be different. |
| China Region Fund | (unaudited) |
Management Team’s Perspective
Introduction
The China Region Fund (USCOX) seeks long-term growth of capital. The fund invests in both established and emerging companies registered and operating in the China region.(1)
Performance Graph
China Region Fund
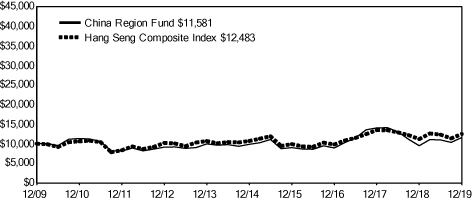
| Average Annual Performance | For the Periods Ended
December 31, 2019 | |
| | One Year | Five Year | Ten Year | |
| China Region Fund | 21.99% | 3.28% | 1.48% | |
| Hang Seng Composite Index | 11.57% | 3.12% | 2.24% | |
Performance data quoted above is historical. Past performance is no guarantee of future results. Current performance may be higher or lower than the performance data quoted. The principal value and investment return of an investment will fluctuate so that an investor’s shares, when redeemed, may be worth more or less than their original cost. The graph and table do not reflect the deduction of taxes that a shareholder would pay on fund distributions or the redemption of fund shares. For all or a portion of the periods, the fund had expense limitations, without which returns would have been lower. Returns greater than one year are annualized.
Gross expense ratio as stated in the most recent prospectus is 2.66%. Pursuant to a voluntary arrangement, the Adviser has agreed to limit total fund operating expenses (exclusive of any acquired fund fees and expenses, performance fees, taxes, brokerage commissions and interest) to not exceed 2.55%. The Adviser can modify or terminate this arrangement at any time.
See Definitions for Management Teams’ Perspectives for index definitions.
Please visit our website at www.usfunds.com for updated performance information for different time periods
| (1) | | The China region is defined as any country that either shares a border with China or is located in the South China Sea or the East China Sea and includes: the People’s Republic of China (PRC or China), Bangladesh, Cambodia, Hong Kong, India, Indonesia, Kazakhstan, Korea, Kyrgyzstan, Laos, Malaysia, Mongolia, Myanmar, Nepal, Pakistan, Philippines, Singapore, Taiwan, Tajikistan, Thailand and Vietnam. |
| China Region Fund | (unaudited) |
The Year in Review – Economic and Political Issues that Affected the Fund
The U.S.-China trade war defined 2019 in many ways, bringing ups and downs and, by year’s end, some modicum of conclusion—a pause, at least—to the present chapter of the trade spat, as the U.S. and Chinese negotiators reached a Phase One trade agreement. To be sure, other events of some significance occurred over the course of the year and remain notable—the ongoing protests in Hong Kong demand particular attention, for example—but at the end of the day, it has been the U.S.-China trade war that almost monolithically defined 2019 for many markets in general, and of course, for the China region in particular.
China started the year with a 6.4 percent GDP growth pace in the first quarter that slowed to 6.2 percent in the second before dropping to 6.0 percent for both the third and fourth quarters. Overall 2019 GDP was 6.15 percent, hardly a shabby reading overall and definitely within what the governmental guidance was for the calendar year’s range (6.0-6.5 percent).
China’s Manufacturing Purchasing Manager’s Index (PMI) started the year in contractionary territory with a 49.5 reading in January 2019, and aside from briefly poking its head up above 50 in March and April, the PMI mostly muddled along with a 49 handle until November and December, when the index turned back up to a 50.2 reading for the final two prints of the year. China’s official Non-manufacturing PMI spent the majority of the year with monthly readings above 54, although it closed the year out with a 53.5 print as of December. It is worth noting that amid tariff and trade war uncertainty, some company stocks with a more domestic Chinese focus performed better and more stably.
The latest round of Chinese data, though, now show what look like a bit of a collective pickup in the economy, perhaps due to clearly heading into a trade détente and perhaps additionally due to the continued and expected stimulus from mainland authorities, all coming amid a backdrop of improving global growth outlook and expectations. China’s middle class, for example, continues to grow; the country continues to garner inflows from overseas funds; the march forward of the internationalization of the renminbi continues. China has promised continued opening of the economy and especially of the financial sector. Foreign financial firms can now apply for full ownership and control of their China ventures, with JPMorgan the first to gain approval. Shanghai’s new science and technology STAR Market, or Star Board, launched with the aim of keeping more innovative and high-growth firms at home for capital-raising versus losing them to Hong Kong or overseas markets.
But on to Hong Kong, where massive crowds and fiery protests likely constitute what is arguably the front page image for the year in the minds of most global citizens. Like some perfect fractal of or metaphor for the larger U.S.-China conflict, this year Hong Kong was ground zero as representative of free market versus planned, liberal democracy versus PRC power, once thought of as a safe haven of stability— “Asia’s World City,” as it were—versus protests and firebombs against Beijing’s reach. People in Hong Kong usually mind the crosswalk signals—but not this year. Instead, as violence levels escalated, MTR rapid transit stations were blocked by fires, the Legislative Council blocked by human chains and crowds; lengthy, winding marches through Central and Admiralty downtown were the norm; school terms were placed on hold (and schools themselves at times shut, abandoned—even stormed). This was, to echo what’s been said already, not the way the script was expected to go.
The leaderless pro-democracy protest movement of Hong Kongers was sparked initially by rapid pushback against the Beijing-backed Carrie Lam government’s extradition bill, which would have granted Beijing frighteningly wide latitude in spiriting away to the mainland those it deemed criminal or problematic. The protesters did achieve their stated end: The extradition bill is dead. But in the initial process the arrests, the ill will, the alleged police violence without transparent accountability, and the breadth and vibrancy of the movement (not to mention its strong youth element) all developed quickly into a set of protestors’ demands not easily met by the Lam government. This increasingly raised the prospects of interference by Beijing more directly in some manner or another. Needless to say, Beijing, especially so under President Xi Jinping, seems most unlikely to grant full and universal suffrage to Hong Kong, making for a bit of deadlock on how to proceed exactly from here, given that this is, in fact, a demand of the protestors.
Hong Kong’s economy has suffered, slipping into recession. Especially hard hit have been, perhaps obviously, retail sales and tourist arrivals, both of which plummeted as protests forced the city to reckon
| China Region Fund | (unaudited) |
with ongoing disruptions. Financial Secretary Paul Chan gave full warning of expected contraction, while Lam said the city was staring “into the abyss.”
We do see a silver lining for Hong Kong, which continues to pull in major listings globally and which featured, most recently, a roughly $13 billion USD secondary IPO listing for Chinese e-commerce giant Alibaba. Netease and Trip.com, also U.S.-listed American depositary receipts (ADRs), are reportedly considering the same thing, and others will be sure to follow. Ironically, even as HK thumbs its nose at Beijing by means of protests and the elective power it does have, Hong Kong remains the best locale for Chinese companies to hedge off risk, as it were.
One final noteworthy point of review in looking back on 2019 with respect to Hong Kong is this, that the city’s de facto status as a special U.S. trading partner remains unchanged at present, but de jure certainly suffered a setback when Congress scaled back HK’s privileges to require an annual certification by the U.S. State Department that the city remains “sufficiently autonomous” from Beijing. While this is far from the special administrative region’s trading status being revoked or even close to it, the gesture was certainly a bit of a slap in the face to Beijing (and to some in Hong Kong) and could introduce further problems down the road during periods of tension.
A direct beneficiary of the U.S.-China trade war was the nation of Vietnam, which drew in some supply chain reorganization as tariffs bit into China. Notably, Vietnam signed a free-trade agreement with the European Union (EU) that should eliminate some 99 percent of tariffs over a 10-year period. Vietnam’s latest year-over-year GDP reading clocked in at just under 7 percent for the fourth quarter, and the rising nation of nearly 100 million people also hosted, in Hanoi in February, a heavily-publicized summit between President Donald Trump and North Korean Chairman Kim Jong-un.
Of particular note is that Indonesia’s Joko Widodo—re-elected to a second term in 2019—announced that the administrative capital of the country would be moved from the increasingly deadlocked and crowded Jakarta on Java to East Kalimantan province on Borneo. Many of the details remain forthcoming at this point, right down to the name of the new city-to-be, but the move—which will cost at least an estimated $30 billion USD—is aimed at easing the burden on Jakarta while simultaneously opening up and including more of the eastern parts of the island nation. And infrastructure is, of course, part and parcel of what “JokoWi” has been all about, although Indonesia’s GDP for the year remained stubbornly low compared to what the president surely had in mind—5.20 percent for the first quarter, 5.04 percent for the second quarter, 5.00 percent for the third quarter, and 4.97 percent for the fourth quarter.
Taiwan, which performed well over the course of 2019 (the Taiwan Capitalization Weighted Stock Index notched up a nearly 29 percent gain on the year), has now also just re-elected its president. In a relative landslide and in somewhat of a slap at China as well, President Tsai Ing-wen won her second term. Ms. Tsai’s polling numbers rose throughout the course of the Hong Kong protests, as both locales demonstrated resentment of Beijing’s influence and perceived overreach.
Investment Highlights
Overview
For the year ended December 31, 2019, the China Region Fund returned 21.99 percent, outperforming the Fund’s benchmark Hang Seng Composite Index (HSCI), which gained only 11.57 percent in total return over the same period.
Because the fund is actively managed and holding period is not always a consideration in investment decisions, the portfolio turnover rate may fluctuate from year to year as the fund adjusts its portfolio composition. The fund’s annual portfolio turnover for the year ending December 31, 2019, was 95 percent, and turnover could be above 100 percent in the future.
Strengths
| ● | | Within the broader “China region,” it remained the fund’s stock selection within its benchmark domicile of Hong Kong that proved to be the top relative and absolute allocation in the region over the course of the year. Indonesia and Taiwan also provided some secondary relative outperformance for the fund. |
| China Region Fund | (unaudited) |
| ● | | The top-performing sector for the fund in 2019 was properties and construction, followed by consumer goods and industrials. The fund’s three top-performing stocks all fall within these three sectors, within which overall stock selection played a useful role in the fund’s outperformance. |
| ● | | Yihai International, China Overseas Property and Weichai Power Co. finished as the year’s top three overall single stock contributors to absolute gains for the fund, rising 139.90 percent, 116.26 percent and 91.15 percent, respectively. |
Weaknesses
| ● | | The largest detractor among regional and country allocations came from South Korea and Thailand, which weighed more or less equally on relative fund performance. Both markets sported only single digit returns on the year for 2019, thus relatively underperforming the benchmark. |
| ● | | Both allocation and stock selection within the information technology sector weighed relatively on the fund’s 2019 performance; the same holds true for the fund’s second- and third-worst-performing sectors, energy and materials, respectively. Note that in a rising overall market, for the year as a whole, cash positions also served as a relative drag on fund performance (as the benchmark carries no cash). |
| ● | | IGG, Inc., Vitasoy International and Sino-Thai Engineering and Construction closed out the year as the largest single stock detractors from the fund’s performance, as the names fell 44.38 percent, 4.29 percent and 37.97 percent, respectively. |
Current Outlook
Opportunities
| ● | | While there are certainly no guarantees that recent U.S.-China trade negotiations will bear any other immediate fruit, the so-called Phase One trade agreement was signed and has already ushered in some degree of optimism and certainty that markets obviously prefer to pessimism or uncertainty. This is, to be sure, an unabashed positive. |
| ● | | China is stimulating its economy, remains supportive and has ample time now to adjust supply chains amid a Phase One pause. What’s more, MSCI portfolio flows continue. Internationalization of the renminbi continues. Shanghai launched its new STAR Market to focus on keeping science and technology companies at home in China rather than listing outside the mainland to raise money, and |
2020 will mark the STAR Board’s first full year. Foreign financial firms can now apply for majority ownership of their ventures in mainland China, yielding further opening in the financial sector and further internationalization. Ahead of the Phase One signing, the U.S. Department of the Treasury agreed to lift the “Currency Manipulator” label it had slapped on China over the yuan.
| ● | | The price-to-earnings ratio on developed market Hong Kong’s blue chip Hang Seng Index stands at an attractive 11.3 times earnings, while here in the U.S., the broad benchmark S&P 500 Index is trading at nearly 22 times earnings. Granted, Hong Kong has yet to sort out some of the issues around the protests of late, but indeed, while Hong Kong has already bounced up well off the lows of 2019, it has yet even to gain the highs of last year. |
Threats
| ● | | There remains at present a threat that Hong Kong’s troubles and divisions endure throughout much or all of the year 2020, and that these issues overshadow the political and/or economic future of the region. Such a threat cannot be ruled out given events of the last several months. Hong Kong proved already in 2019 controversial and topical enough to cause reactions and prompt responses originating from college campuses to NBA teams and beyond. As Beijing seems to be tightening its grip wherever it can, at least some in Hong Kong seem quite discontented with that trend. |
| China Region Fund | (unaudited) |
| ● | | “Enforceable.” That’s the word the U.S. is using to describe the foreign currency agreement with China now part and parcel of Phase One agreements. This means that should China deviate, the U.S., presumably, would retaliate. |
| ● | | Quietly—or perhaps not, if you’ve kept up with the steady drumbeat of global technology news and infrastructure and cybersecurity concerns—the pressure to choose sides between Huawei and the West continues, and may feature prominently in 2020. The U.S. is vocal about its security concerns, continues to pressure its allies not to incorporate Huawei 5G infrastructure or else risk intelligence-sharing pacts and arrangements with the U.S., and continues to seek extradition from Canada of Huawei’s chief financial officer (CFO) in the meantime. The UK and Germany, among others, have challenging choices to make that may reverberate for years to come in ways we don’t yet fully grasp. |
| ● | | Finally, as of the time of this commentary, a rising threat is developing – for at least the first quarter of 2020 and possibly the second as well – in the form of COVID-19, better known as the Wuhan coronavirus. This remains a developing story at this point, but is a clear threat to economic and industrial growth over the short run as quarantines spread and factories idle. |
The section labeled Portfolio of Investments contains a complete list of the fund’s holdings.
| | Top 10 Equity Holdings (Based on Net Assets) | December 31, 2019 | |
| | | Yihai International Holding, Ltd. | 8.65% | |
| | | Food - Miscellaneous/Diversified | | |
| | | Ping An Insurance Group Co. of China, Ltd. | 6.47% | |
| | | Multi-line Insurance | | |
| | | Weichai Power Co., Ltd. | 5.84% | |
| | | Automotive/Truck Parts & Equipment - Replacement | | |
| | | Country Garden Holdings Co., Ltd. | 5.16% | |
| | | Real Estate Operating/Development | | |
| | | Longfor Group Holdings, Ltd. | 4.70% | |
| | | Real Estate Operating/Development | | |
| | | Li Ning Co., Ltd. | 4.05% | |
| | | Retail - Apparel/Shoe | | |
| | | ANTA Sports Products, Ltd. | 3.78% | |
| | | Retail - Apparel/Shoe | | |
| | | China Mengniu Dairy Co., Ltd. | 3.69% | |
| | | Food - Dairy Products | | |
| | | Country Garden Services Holdings Co., Ltd. | 3.60% | |
| | | Real Estate Operating/Development | | |
| | | Central China Real Estate, Ltd. | 3.28% | |
| | | Real Estate Operating/Development | | |
| | | Total Top 10 Equity Holdings | 49.22% | |
| | | | | |
| China Region Fund | (unaudited) |
| | Country Distribution* | | |
| | Based on Total Investments | December 31, 2019 | |
| | China | 65.1% | |
| | Hong Kong | 11.6% | |
| | Taiwan, Province of China | 8.6% | |
| | Korea, Republic of | 6.0% | |
| | Indonesia | 4.1% | |
| | Other | 4.6% | |
| | Total | 100.0% | |
| | | | |
| * | | Country distribution shown is based on domicile and not intended to conform to the China region definition in the prospectus. The locale of company operations may be different. |
U.S. Government Securities Ultra-Short Bond Fund
| Portfolio of Investments | December 31, 2019 |
| United States Government and Agency Obligations 87.00% | | Coupon Rate % | | | Maturity Date | | Principal Amount | | | Value | |
| Federal Farm Credit Bank 46.87% | | | | | | | | | | | |
| Fixed Rates: | | | | | | | | | | | | | | |
| | | | 1.38 | | | 10/19/20 | | $ | 500,000 | | | $ | 498,993 | |
| | | | 1.54 | | | 12/14/20 | | | 1,006,000 | | | | 1,005,304 | |
| | | | 1.42 | | | 01/12/21 | | | 541,000 | | | | 539,749 | |
| | | | 1.90 | | | 09/01/21 | | | 956,000 | | | | 954,665 | |
| | | | 1.78 | | | 12/13/21 | | | 500,000 | | | | 499,810 | |
| | | | 1.70 | | | 12/20/21 | | | 3,000,000 | | | | 3,000,059 | |
| Floating Rates: | | | | | | | | | | | | | | |
| (Federal Reserve Bank Effective Rate + 0.12%) | | | 1.67 | | | 02/18/20 | | | 3,000,000 | | | | 3,000,313 | |
| (Federal Reserve Bank Prime Loan + (2.98)%) | | | 1.77 | | | 02/20/20 | | | 2,500,000 | | | | 2,500,042 | |
| (Federal Reserve Bank Prime Loan + (2.96)%) | | | 1.79 | | | 07/09/20 | | | 5,000,000 | | | | 5,003,395 | |
| (USD 1 Month LIBOR + 0.05%) | | | 1.84 | | | 02/21/20 | | | 3,000,000 | | | | 3,000,613 | |
| | | | | | | | | | | | | | 20,002,943 | |
| Federal Home Loan Bank 6.84% | | | | | | | | | | | | | | |
| Fixed Rates: | | | | | | | | | | | | | | |
| | | | 1.40 | | | 08/25/20 | | | 500,000 | | | | 499,185 | |
| | | | 1.40 | | | 01/19/21 | | | 500,000 | | | | 498,858 | |
| | | | 1.70 | | | 08/25/21 | | | 1,920,000 | | | | 1,920,117 | |
| | | | | | | | | | | | | | 2,918,160 | |
| Federal Home Loan Mortgage Corporation 11.03% | | | | | | | | | | | | | | |
| Fixed Rates: | | | | | | | | | | | | | | |
| | | | 1.75 | | | 08/28/20 | | | 1,260,000 | | | | 1,260,153 | |
| | | | 1.70 | | | 08/28/20 | | | 500,000 | | | | 500,068 | |
| | | | 2.00 | | | 01/08/21 | | | 1,200,000 | | | | 1,198,627 | |
| | | | 1.65 | | | 12/16/21 | | | 1,750,000 | | | | 1,748,447 | |
| | | | | | | | | | | | | | 4,707,295 | |
| U.S. Treasury Bill 5.82% ◊ | | | | | | | | | | | | | | |
| Yield to Maturity: | | | | | | | | | | | | | | |
| | | | 1.84 | | | 03/26/20 | | | 1,000,000 | | | | 996,494 | |
| | | | 1.84 | | | 06/18/20 | | | 1,500,000 | | | | 1,489,254 | |
| | | | | | | | | | | | | | 2,485,748 | |
| U.S. Treasury Note 16.44% | | | | | | | | | | | | | | |
| Fixed Rates: | | | | | | | | | | | | | | |
| | | | 1.88 | | | 06/30/20 | | | 3,000,000 | | | | 3,003,780 | |
| | | | 1.63 | | | 06/30/20 | | | 2,000,000 | | | | 2,000,098 | |
| | | | 2.63 | | | 08/15/20 | | | 2,000,000 | | | | 2,012,127 | |
| | | | | | | | | | | | | | 7,016,005 | |
| Total United States Government and Agency Obligations | | | | | | | | | | | | | 37,130,151 | |
| (cost $37,106,038) | | | | | | | | | | | | | | |
See notes to portfolios of investments and notes to financial statements.
U.S. Government Securities Ultra-Short Bond Fund
| Portfolio of Investments | December 31, 2019 |
| Exchange Traded Fund 10.26% | | Shares | | | Value | |
| Vanguard Short-Term Treasury ETF | | | 72,000 | | | $ | 4,379,760 | |
| (cost $4,391,687) | | | | | | | | |
| | | | | | | | | |
| Investments, at value 97.26% | | | | | | | 41,509,911 | |
| (cost $41,497,725) | | | | | | | | |
| Other assets and liabilities, net 2.74% | | | | | | | 1,170,592 | |
| Net Assets 100.00% | | | | | | $ | 42,680,503 | |
See notes to portfolios of investments and notes to financial statements.
Near-Term Tax Free Fund
| Portfolio of Investments | December 31, 2019 |
| Municipal Bonds 87.54% | | Coupon Rate % | | | Maturity Date | | Principal Amount | | | Value | |
| | | | | | | | | | | | |
| Alabama 2.01% | | | | | | | | | | | |
| City of Bessemer Electric Revenue, Alabama, Refunding, RB AGM | | | 3.10 | | | 12/01/21 | | $ | 100,000 | | | $ | 101,460 | |
| Tuscaloosa County Board of Education, Alabama, Special Tax Bond | | | 5.00 | | | 02/01/32 | | | 635,000 | | | | 763,880 | |
| | | | | | | | | | | | | | 865,340 | |
| California 0.59% | | | | | | | | | | | | | | |
| Lemon Grove School District, California, Refunding, GO Unlimited | | | 4.00 | | | 08/01/33 | | | 220,000 | | | | 252,478 | |
| | | | | | | | | | | | | | | |
| Colorado 2.80% | | | | | | | | | | | | | | |
| City & County of Denver Airport System Revenue, Colorado, RB, Series B | | | 5.00 | | | 11/15/27 | | | 300,000 | | | | 331,026 | |
| City of Glendale, Colorado, Refunding, COP AGM | | | 5.00 | | | 12/01/25 | | | 750,000 | | | | 876,255 | |
| | | | | | | | | | | | | | 1,207,281 | |
| Connecticut 2.50% | | | | | | | | | | | | | | |
| State of Connecticut, Connecticut, Refunding, GO Unlimited | | | 5.00 | | | 02/15/21 | | | 800,000 | | | | 834,064 | |
| State of Connecticut, Connecticut, Refunding, GO Unlimited | | | 5.00 | | | 05/15/27 | | | 200,000 | | | | 240,888 | |
| | | | | | | | | | | | | | 1,074,952 | |
| District of Columbia 2.06% | | | | | | | | | | | | | | |
| Washington Metropolitan Area Transit Authority, District of Columbia, Refunding, RB | | | 5.00 | | | 07/01/34 | | | 725,000 | | | | 888,183 | |
| | | | | | | | | | | | | | | |
| Florida 6.61% | | | | | | | | | | | | | | |
| City of Jacksonville, Florida, Refunding, RB, Series C | | | 5.00 | | | 10/01/20 | | | 270,000 | | | | 277,719 | |
| City of Leesburg, Florida, Refunding, RB | | | 5.00 | | | 10/01/21 | | | 405,000 | | | | 431,848 | |
| City of Miramar, Florida, Refunding, RB | | | 5.00 | | | 10/01/22 | | | 305,000 | | | | 336,177 | |
| County of St. Johns, Florida, Refunding, RB AGM | | | 5.00 | | | 10/01/20 | | | 310,000 | | | | 318,934 | |
| Orlando Utilities Commission, Florida, RB ‡ | | | 1.65 | | | 10/01/33 | | | 870,000 | | | | 870,000 | |
| State of Florida, Florida, Refunding, GO Unlimited | | | 5.00 | | | 06/01/28 | | | 500,000 | | | | 612,770 | |
| | | | | | | | | | | | | | 2,847,448 | |
| Idaho 0.55% | | | | | | | | | | | | | | |
| Idaho Housing & Finance Association, Grant & Revenue Anticipation, Federal Highway Trust Fund, Idaho, RB, Series A | | | 5.00 | | | 07/15/21 | | | 225,000 | | | | 238,057 | |
See notes to portfolios of investments and notes to financial statements.
Near-Term Tax Free Fund
| Portfolio of Investments | December 31, 2019 |
| Municipal Bonds (cont’d) | | Coupon Rate % | | | Maturity Date | | Principal Amount | | | Value | |
| | | | | | | | | | | | |
| Illinois 4.27% | | | | | | | | | | | |
| County of Du Page, Jail Project, Illinois, Refunding, GO Unlimited | | | 5.60 | | | 01/01/21 | | $ | 145,000 | | | $ | 148,268 | |
| Du Page County School District No. 33 West Chicago, Illinois, Refunding, GO Unlimited, Series B | | | 4.00 | | | 12/01/21 | | | 1,000,000 | | | | 1,052,350 | |
| Illinois State Toll Highway Authority, Illinois, RB | | | 5.00 | | | 01/01/32 | | | 505,000 | | | | 599,698 | |
| Regional Transportation Authority, Illinois, RB, Series A, AMBAC | | | 7.20 | | | 11/01/20 | | | 35,000 | | | | 36,718 | |
| | | | | | | | | | | | | | 1,837,034 | |
| Indiana 2.18% | | | | | | | | | | | | | | |
| City of Indianapolis Department of Public Utilities Gas Utility Revenue, Indiana, Refunding, RB AGC | | | 5.25 | | | 06/01/21 | | | 550,000 | | | | 581,867 | |
| Merrillville Redevelopment Authority, Indiana, Tax Allocation Bond | | | 5.00 | | | 08/15/20 | | | 350,000 | | | | 357,903 | |
| | | | | | | | | | | | | | 939,770 | |
| Kentucky 1.24% | | | | | | | | | | | | | | |
| Louisville & Jefferson County Metropolitan Sewer District, Kentucky, RB, Series A | | | 5.00 | | | 05/15/23 | | | 500,000 | | | | 535,815 | |
| | | | | | | | | | | | | | | |
| Louisiana 3.14% | | | | | | | | | | | | | | |
| Louisiana Housing Corp., Louisiana, RB FHLMC | | | 2.15 | | | 12/01/24 | | | 460,000 | | | | 472,296 | |
| State of Louisiana, Louisiana, Prefunding, GO Unlimited, Series A | | | 5.00 | | | 08/01/26 | | | 800,000 | | | | 879,288 | |
| | | | | | | | | | | | | | 1,351,584 | |
| Maryland 0.64% | | | | | | | | | | | | | | |
| City of Baltimore, Maryland, RB | | | 5.00 | | | 07/01/33 | | | 215,000 | | | | 274,015 | |
| | | | | | | | | | | | | | | |
| Massachusetts 0.77% | | | | | | | | | | | | | | |
| Massachusetts Housing Finance Agency, Massachusetts, Refunding, RB | | | 2.15 | | | 12/01/21 | | | 330,000 | | | | 333,330 | |
| | | | | | | | | | | | | | | |
| Michigan 2.53% | | | | | | | | | | | | | | |
| City of Wyoming, Water Supply System, Michigan, Refunding, RB | | | 4.00 | | | 06/01/20 | | | 215,000 | | | | 217,530 | |
| Oxford Area Community School District, Michigan, Refunding, GO Unlimited, Series A Q-SBLF | | | 5.00 | | | 05/01/22 | | | 365,000 | | | | 396,989 | |
| State of Michigan Trunk Line Revenue, Michigan, Refunding, RB | | | 4.50 | | | 11/01/26 | | | 105,000 | | | | 105,286 | |
See notes to portfolios of investments and notes to financial statements.
Near-Term Tax Free Fund
| Portfolio of Investments | December 31, 2019 |
| Municipal Bonds (cont’d) | | Coupon Rate % | | | Maturity Date | | Principal Amount | | | Value | |
| | | | | | | | | | | | |
| Michigan (cont’d) | | | | | | | | | | | |
| Walled Lake Consolidated School District, Michigan, Refunding, GO Unlimited Q-SBLF | | | 5.00 | | | 05/01/21 | | $ | 350,000 | | | $ | 367,605 | |
| | | | | | | | | | | | | | 1,087,410 | |
| Minnesota 0.63% | | | | | | | | | | | | | | |
| City of Minneapolis/St Paul Housing & Redevelopment Authority, Minnesota, RB AGM ‡ | | | 1.52 | | | 08/15/25 | | | 270,000 | | | | 270,000 | |
| | | | | | | | | | | | | | | |
| Missouri 0.63% | | | | | | | | | | | | | | |
| City of Kansas City Water Revenue, Missouri, RB, Series F AGM | | | 4.00 | | | 12/01/22 | | | 250,000 | | | | 270,412 | |
| | | | | | | | | | | | | | | |
| New Jersey 1.19% | | | | | | | | | | | | | | |
| Middlesex County Improvement Authority, New Jersey, RB | | | 5.00 | | | 07/01/25 | | | 425,000 | | | | 511,033 | |
| | | | | | | | | | | | | | | |
| New York 8.22% | | | | | | | | | | | | | | |
| City of New York, New York, GO Unlimited | | | 5.00 | | | 12/01/34 | | | 250,000 | | | | 312,945 | |
| City of New York, New York, GO Unlimited, Series E | | | 5.25 | | | 08/01/22 | | | 875,000 | | | | 967,461 | |
| City of New York, New York, GO Unlimited, Series I | | | 5.00 | | | 08/01/22 | | | 1,000,000 | | | | 1,099,340 | |
| Long Island Power Authority, New York, RB, Series B | | | 5.00 | | | 09/01/21 | | | 465,000 | | | | 495,160 | |
| Metropolitan Transportation Authority, New York, RB | | | 4.00 | | | 11/15/34 | | | 100,000 | | | | 113,618 | |
| Nassau County Industrial Development Agency, New York Institute of Technology Project, New York, Refunding, RB, Series A | | | 5.00 | | | 03/01/21 | | | 350,000 | | | | 352,226 | |
| New York City Water & Sewer System, New York, RB ‡ | | | 1.55 | | | 06/15/38 | | | 200,000 | | | | 200,000 | |
| | | | | | | | | | | | | | 3,540,750 | |
| North Carolina 2.88% | | | | | | | | | | | | | | |
| City of Charlotte, Equipment Acquisition & Public Facilities, North Carolina, COP, Series A | | | 5.00 | | | 10/01/21 | | | 1,000,000 | | | | 1,029,270 | |
| County of Beaufort, North Carolina, RB | | | 5.00 | | | 06/01/21 | | | 200,000 | | | | 210,774 | |
| | | | | | | | | | | | | | 1,240,044 | |
| Ohio 0.33% | | | | | | | | | | | | | | |
| City of Cleveland Parking Facility Revenue, Ohio, Refunding, RB AGM | | | 5.25 | | | 09/15/22 | | | 130,000 | | | | 144,165 | |
See notes to portfolios of investments and notes to financial statements.
Near-Term Tax Free Fund
| Portfolio of Investments | December 31, 2019 |
| Municipal Bonds (cont’d) | | Coupon Rate % | | | Maturity Date | | Principal Amount | | | Value | |
| | | | | | | | | | | | |
| Oregon 0.47% | | | | | | | | | | | |
| Oregon State Facilities Authority, Legacy Health Project, Oregon, Refunding, RB, Series A | | | 4.50 | | | 05/01/20 | | $ | 200,000 | | | $ | 202,128 | |
| | | | | | | | | | | | | | | |
| Pennsylvania 1.69% | | | | | | | | | | | | | | |
| Reading School District, Pennsylvania, GO Unlimited, Series A | | | 5.00 | | | 04/01/20 | | | 400,000 | | | | 403,272 | |
| Township of Penn, Pennsylvania, GO Unlimited BAM | | | 1.85 | | | 05/15/21 | | | 325,000 | | | | 325,084 | |
| | | | | | | | | | | | | | 728,356 | |
| South Carolina 1.31% | | | | | | | | | | | | | | |
| Aiken County Consolidated School District, South Carolina, GO Unlimited | | | 4.00 | | | 04/01/34 | | | 400,000 | | | | 463,908 | |
| City of Columbia Waterworks & Sewer System Revenue, South Carolina, RB ‡ | | | 1.60 | | | 02/01/38 | | | 100,000 | | | | 100,000 | |
| | | | | | | | | | | | | | 563,908 | |
| Tennessee 0.94% | | | | | | | | | | | | | | |
| City of Memphis Sanitary Sewerage System Revenue, Tennessee, Refunding, RB AGM | | | 5.00 | | | 05/01/20 | | | 200,000 | | | | 202,562 | |
| Town of Rogersville, Tennessee, Refunding, GO Unlimited | | | 2.00 | | | 06/01/20 | | | 200,000 | | | | 200,694 | |
| | | | | | | | | | | | | | 403,256 | |
| Texas 29.83% | | | | | | | | | | | | | | |
| Aldine Independent School District, Texas, Refunding, GO Unlimited PSF-GTD | | | 5.00 | | | 02/15/28 | | | 750,000 | | | | 904,845 | |
| Bryan Independent School District, Texas, GO Unlimited, Series A PSF-GTD | | | 5.00 | | | 02/15/22 | | | 410,000 | | | | 443,255 | |
| City of Austin, Texas, Refunding, RB ‡ | | | 1.61 | | | 11/15/29 | | | 800,000 | | | | 800,000 | |
| City of Buda, Texas, Refunding, GO Limited | | | 4.00 | | | 02/15/29 | | | 135,000 | | | | 158,879 | |
| City of Cedar Hill, Texas, Refunding, GO Limited | | | 5.00 | | | 02/15/22 | | | 800,000 | | | | 862,784 | |
| City of Center, Certificates of Obligation, Texas, GO Limited AGM ◊ | | | 3.07 | | | 02/15/20 | | | 150,000 | | | | 149,775 | |
| City of Longview Waterworks & Sewer System Revenue, Texas, Refunding, RB | | | 3.00 | | | 03/01/22 | | | 610,000 | | | | 631,869 | |
| City of Pharr, Texas, Refunding, GO Limited, Series A | | | 5.00 | | | 08/15/20 | | | 285,000 | | | | 291,720 | |
| City of Round Rock, Texas, GO Limited | | | 4.00 | | | 08/15/33 | | | 175,000 | | | | 203,476 | |
| City of Texarkana Waterworks & Sanitary Sewer System Revenue, Texas, RB | | | 3.00 | | | 08/01/20 | | | 95,000 | | | | 96,009 | |
See notes to portfolios of investments and notes to financial statements.
Near-Term Tax Free Fund
| Portfolio of Investments | December 31, 2019 |
| Municipal Bonds (cont’d) | | Coupon Rate % | | | Maturity Date | | Principal Amount | | | Value | |
| | | | | | | | | | | | |
| Texas (cont’d) | | | | | | | | | | | |
| Corpus Christi Business & Job Development Corp., Seawall Project, Texas, Refunding, RB | | | 5.00 | | | 03/01/20 | | $ | 350,000 | | | $ | 352,156 | |
| Dimmitt Independent School District, Texas, GO Unlimited PSF-GTD | | | 3.00 | | | 02/15/22 | | | 305,000 | | | | 315,648 | |
| Eagle Mountain & Saginaw Independent School District, Texas, Refunding, GO Unlimited PSF-GTD | | | 4.00 | | | 08/15/32 | | | 450,000 | | | | 506,421 | |
| Ector County Independent School District, Texas, GO Unlimited PSF-GTD | | | 5.00 | | | 08/15/29 | | | 400,000 | | | | 449,564 | |
| Harlandale Independent School District, Texas, Refunding, GO Unlimited PSF-GTD | | | 4.00 | | | 02/15/28 | | | 300,000 | | | | 341,994 | |
| Harris County Municipal Utility District No. 382, Texas, Refunding, GO Unlimited BAM | | | 3.00 | | | 04/01/22 | | | 305,000 | | | | 310,002 | |
| Lower Colorado River Authority, LCRA Transmission Services Corp., Texas, Refunding, RB, Series A | | | 5.00 | | | 05/15/21 | | | 500,000 | | | | 526,300 | |
| Lubbock-Cooper Independent School District, Texas, GO Unlimited PSF-GTD | | | 3.00 | | | 02/15/22 | | | 755,000 | | | | 783,607 | |
| Olmos Park Higher Education Facilities Corp., University of the Incarnate Word, Texas, Refunding, RB | | | 5.00 | | | 12/01/21 | | | 500,000 | | | | 535,490 | |
| Red River Education Finance Corp., Texas, RB ‡ | | | 1.60 | | | 03/15/35 | | | 700,000 | | | | 700,000 | |
| San Antonio Water System, Texas, Refunding, RB | | | 4.50 | | | 05/15/21 | | | 400,000 | | | | 418,280 | |
| State of Texas, Texas, Refunding, GO Unlimited | | | 5.00 | | | 10/01/20 | | | 550,000 | | | | 566,186 | |
| Texas City Independent School District, Texas, Refunding, GO Unlimited PSF-GTD | | | 5.00 | | | 08/15/28 | | | 410,000 | | | | 486,190 | |
| Texas State Public Finance Authority Charter School Finance Corp., Texas, Prefunding, RB, Series A | | | 6.20 | | | 02/15/40 | | | 2,000,000 | | | | 2,011,420 | |
| | | | | | | | | | | | | | 12,845,870 | |
| Utah 0.48% | | | | | | | | | | | | | | |
| Intermountain Power Agency, Utah, Refunding, RB | | | 5.00 | | | 07/01/20 | | | 205,000 | | | | 208,963 | |
| | | | | | | | | | | | | | | |
| Washington 6.28% | | | | | | | | | | | | | | |
| County of Thurston, Washington, Refunding, GO Limited | | | 5.00 | | | 12/01/20 | | | 1,625,000 | | | | 1,683,029 | |
| Spokane Public Facilities District, Washington, Refunding, RB, Series B | | | 5.00 | | | 12/01/21 | | | 950,000 | | | | 1,019,302 | |
| | | | | | | | | | | | | | 2,702,331 | |
See notes to portfolios of investments and notes to financial statements.
Near-Term Tax Free Fund
| Portfolio of Investments | December 31, 2019 |
| Municipal Bonds (cont’d) | | Coupon Rate % | | | Maturity Date | | Principal Amount | | | Value | |
| | | | | | | | | | | | |
| Wisconsin 0.77% | | | | | | | | | | | |
| Sun Prairie Area School District, Wisconsin, GO Unlimited | | | 4.00 | | | 03/01/31 | | $ | 300,000 | | | $ | 332,337 | |
| Total Municipal Bonds | | | | | | | | | | | | | 37,696,250 | |
| (cost $37,336,218) | | | | | | | | | | | | | | |
| Exchange Traded Funds 10.43% | | Shares | | | | |
| VanEck Vectors AMT-Free Intermediate Municipal Index ETF | | | 30,000 | | | | 1,506,900 | |
| VanEck Vectors AMT-Free Long Municipal Index ETF | | | 70,000 | | | | 1,470,700 | |
| VanEck Vectors AMT-Free Short Municipal Index ETF | | | 85,000 | | | | 1,512,575 | |
| Total Exchange Traded Funds | | | | | | | 4,490,175 | |
| (cost $4,525,930) | | | | | | | | |
| | | | | | | | | |
| Investments, at value 97.97% | | | | | | | 42,186,425 | |
| (cost $41,862,148) | | | | | | | | |
| Other assets and liabilities, net 2.03% | | | | | | | 874,270 | |
| Net Assets 100.00% | | | | | | $ | 43,060,695 | |
See notes to portfolios of investments and notes to financial statements.
All American Equity Fund
| Portfolio of Investments | December 31, 2019 |
| Common Stocks 96.18% | | Shares | | | Value | |
| | | | | | | |
| Applications Software 2.86% | | | | | | |
| Intuit, Inc. | | | 1,545 | | | $ | 404,682 | |
| | | | | | | | | |
| Building - Residential/Commercial 3.15% | | | | | | | | |
| PulteGroup, Inc. | | | 11,483 | | | | 445,540 | |
| | | | | | | | | |
| Casino Hotels 3.65% | | | | | | | | |
| Wynn Resorts, Ltd. | | | 3,728 | | | | 517,707 | |
| | | | | | | | | |
| Coatings/Paint 3.52% | | | | | | | | |
| The Sherwin-Williams Co. | | | 854 | | | | 498,343 | |
| | | | | | | | | |
| Commercial Banks - Southern US 3.59% | | | | | | | | |
| Regions Financial Corp. | | | 29,646 | | | | 508,725 | |
| | | | | | | | | |
| Computers 3.24% | | | | | | | | |
| HP, Inc. | | | 22,312 | | | | 458,512 | |
| | | | | | | | | |
| Decision Support Software 3.39% | | | | | | | | |
| MSCI, Inc. | | | 1,858 | | | | 479,699 | |
| | | | | | | | | |
| Electric - Integrated 2.83% | | | | | | | | |
| Evergy, Inc. | | | 6,160 | | | | 400,954 | |
| | | | | | | | | |
| Electronic Components - Semiconductors 3.33% | | | | | | | | |
| Broadcom, Inc. | | | 1,493 | | | | 471,818 | |
| | | | | | | | | |
| Electronic Secure Devices 4.07% | | | | | | | | |
| Allegion PLC | | | 4,626 | | | | 576,122 | |
| | | | | | | | | |
| Enterprise Software/Services 2.85% | | | | | | | | |
| Oracle Corp. | | | 7,615 | | | | 403,443 | |
| | | | | | | | | |
| Finance - Credit Card 6.32% | | | | | | | | |
| Mastercard, Inc., Class A | | | 1,517 | | | | 452,961 | |
| Visa, Inc., Class A | | | 2,356 | | | | 442,693 | |
| | | | | | | | 895,654 | |
| Finance - Investment Banker/Broker 3.35% | | | | | | | | |
| The Charles Schwab Corp. | | | 9,968 | | | | 474,078 | |
| | | | | | | | | |
| Food - Miscellaneous/Diversified 2.90% | | | | | | | | |
| Mondelez International, Inc., Class A | | | 7,464 | | | | 411,117 | |
| | | | | | | | | |
| Food - Wholesale/Distribution 3.18% | | | | | | | | |
| Sysco Corp. | | | 5,265 | | | | 450,368 | |
See notes to portfolios of investments and notes to financial statements.
All American Equity Fund
| Portfolio of Investments | December 31, 2019 |
| Common Stocks (cont’d) | | Shares | | | Value | |
| | | | | | | |
| Medical - Drugs 6.26% | | | | | | |
| Merck & Co., Inc. | | | 4,946 | | | $ | 449,839 | |
| Zoetis, Inc. | | | 3,296 | | | | 436,225 | |
| | | | | | | | 886,064 | |
| Medical - Hospitals 3.60% | | | | | | | | |
| HCA Healthcare, Inc. | | | 3,451 | | | | 510,092 | |
| | | | | | | | | |
| Medical - Wholesale Drug Distribution 2.95% | | | | | | | | |
| McKesson Corp. | | | 3,024 | | | | 418,280 | |
| | | | | | | | | |
| Oil Companies - Exploration & Production 8.86% | | | | | | | | |
| Cabot Oil & Gas Corp. | | | 23,709 | | | | 412,774 | |
| EOG Resources, Inc. | | | 5,568 | | | | 466,376 | |
| Occidental Petroleum Corp. | | | 9,130 | | | | 376,247 | |
| | | | | | | | 1,255,397 | |
| REITS - Diversified 3.03% | | | | | | | | |
| American Tower Corp. REIT | | | 1,868 | | | | 429,304 | |
| | | | | | | | | |
| Retail - Building Products 2.77% | | | | | | | | |
| The Home Depot, Inc. | | | 1,797 | | | | 392,429 | |
| | | | | | | | | |
| Retail - Restaurants 3.37% | | | | | | | | |
| Starbucks Corp. | | | 5,425 | | | | 476,966 | |
| | | | | | | | | |
| Supranational Bank 3.18% | | | | | | | | |
| Comerica, Inc. | | | 6,275 | | | | 450,231 | |
| | | | | | | | | |
| Tobacco 3.60% | | | | | | | | |
| Altria Group, Inc. | | | 10,209 | | | | 509,531 | |
| | | | | | | | | |
| Transportation - Rail 6.33% | | | | | | | | |
| Norfolk Southern Corp. | | | 2,259 | | | | 438,540 | |
| Union Pacific Corp. | | | 2,533 | | | | 457,941 | |
| | | | | | | | 896,481 | |
| Total Common Stocks | | | | | | | 13,621,537 | |
| (cost $12,324,256) | | | | | | | | |
| Corporate Non-Convertible Note 2.16% | | Coupon Rate % | | | Maturity Date | | Principal Amount | | | | |
| | | | | | | | | | | | |
| Gold Mining 2.16% | | | | | | | | | | | |
| | | | | | | | | | | | |
| Gran Colombia Gold Corp. | | | 8.25 | | | 04/30/24 | | $ | 290,255 | | | | 305,275 | |
| (cost $290,959) | | | | | | | | | | | | | | |
See notes to portfolios of investments and notes to financial statements.
All American Equity Fund
| Portfolio of Investments | December 31, 2019 |
| Put Option Purchased 0.00% | | Strike Price | | | Exp. Date | | Notional Contract Value | | | Contracts | | | Value | |
| | | | | | | | | | | | | | | |
| Exchange Traded Fund 0.00% | | | | | | | | | | | | | | |
| SPDR S&P 500 ETF Trust | | $ | 236.00 | | | 01/20 | | $ | 6,437,200 | | | | 200 | | | $ | 400 | |
| (premiums paid $333,609) | | | | | | | | | | | | | | | | | | |
| | | | | | | | | | | | | | | | | | | |
| Investments, at value 98.34% | | | | | | | | | | | | | | | | | 13,927,212 | |
| (cost $12,948,824) | | | | | | | | | | | | | | | | | | |
| Other assets and liabilities, net 1.66% | | | | | | | | | | | | | | | | | 234,688 | |
| Net Assets 100.00% | | | | | | | | | | | | | | | | $ | 14,161,900 | |
See notes to portfolios of investments and notes to financial statements.
Holmes Macro Trends Fund
| Portfolio of Investments | December 31, 2019 |
| Common Stocks 94.31% | | Shares | | | Value | |
| | | | | | | |
| Chemicals - Specialty 3.83% | | | | | | |
| Ingevity Corp. * | | | 15,375 | | | $ | 1,343,468 | |
| | | | | | | | | |
| Coal 2.65% | | | | | | | | |
| CONSOL Energy, Inc. * | | | 64,077 | | | | 929,757 | |
| | | | | | | | | |
| Commercial Service - Finance 5.30% | | | | | | | | |
| Moody's Corp. | | | 7,835 | | | | 1,860,107 | |
| | | | | | | | | |
| Commercial Services 2.99% | | | | | | | | |
| Medifast, Inc. | | | 9,566 | | | | 1,048,242 | |
| | | | | | | | | |
| Data Processing/Management 4.60% | | | | | | | | |
| Fair Isaac Corp. * | | | 4,301 | | | | 1,611,499 | |
| | | | | | | | | |
| Decision Support Software 5.46% | | | | | | | | |
| MSCI, Inc. | | | 7,412 | | | | 1,913,630 | |
| | | | | | | | | |
| Diagnostic Kits 4.42% | | | | | | | | |
| IDEXX Laboratories, Inc. * | | | 5,935 | | | | 1,549,807 | |
| | | | | | | | | |
| Distribution/Wholesale 3.94% | | | | | | | | |
| Pool Corp. | | | 6,510 | | | | 1,382,594 | |
| | | | | | | | | |
| Electronic Secure Devices 5.06% | | | | | | | | |
| Allegion PLC | | | 14,256 | | | | 1,775,442 | |
| | | | | | | | | |
| Energy - Alternate Sources 0.00% | | | | | | | | |
| Pacific Green Energy Corp. #*@ | | | 100,000 | | | | 0 | |
| | | | | | | | | |
| Enterprise Software/Services 1.49% | | | | | | | | |
| Donnelley Financial Solutions, Inc. * | | | 50,000 | | | | 523,500 | |
| | | | | | | | | |
| Finance - Investment Banker/Broker 3.49% | | | | | | | | |
| Evercore, Inc., Class A | | | 16,369 | | | | 1,223,747 | |
| | | | | | | | | |
| Garden Products 4.45% | | | | | | | | |
| The Scotts Miracle-Gro Co. | | | 14,688 | | | | 1,559,572 | |
| | | | | | | | | |
| Home Furnishings 4.86% | | | | | | | | |
| Tempur Sealy International, Inc. * | | | 19,595 | | | | 1,705,941 | |
| | | | | | | | | |
| Information Technology 0.37% | | | | | | | | |
| Abaxx Technologies, Inc., 144A #*@∆ | | | 200,000 | | | | 130,915 | |
| | | | | | | | | |
| Medical - Biomedical/Genetics 3.62% | | | | | | | | |
| Exelixis, Inc. * | | | 71,952 | | | | 1,267,794 | |
See notes to portfolios of investments and notes to financial statements.
Holmes Macro Trends Fund
| Portfolio of Investments | December 31, 2019 |
| Common Stocks (cont’d) | | Shares | | | Value | |
| | | | | | | |
| Medical - Drugs 5.62% | | | | | | |
| Eagle Pharmaceuticals, Inc. * | | | 18,800 | | | $ | 1,129,504 | |
| Supernus Pharmaceuticals, Inc. * | | | 35,500 | | | | 842,060 | |
| | | | | | | | 1,971,564 | |
| Medical - Hospitals 0.00% | | | | | | | | |
| African Medical Investments PLC #*@ | | | 1,000,000 | | | | 0 | |
| | | | | | | | | |
| Metal - Diversified 0.93% | | | | | | | | |
| Ivanhoe Mines, Ltd. * | | | 100,000 | | | | 327,288 | |
| | | | | | | | | |
| Office Automation & Equipment 2.49% | | | | | | | | |
| Pitney Bowes, Inc. | | | 216,637 | | | | 873,047 | |
| | | | | | | | | |
| Oil - Field Services 6.06% | | | | | | | | |
| DMC Global, Inc. | | | 19,677 | | | | 884,284 | |
| ProPetro Holding Corp. * | | | 110,408 | | | | 1,242,090 | |
| | | | | | | | 2,126,374 | |
| Oil Companies - Exploration & Production 2.97% | | | | | | | | |
| CruzSur Energy Corp., 144A #*∆ | | | 50,000 | | | | 10,011 | |
| Penn Virginia Corp. * | | | 33,974 | | | | 1,031,111 | |
| | | | | | | | 1,041,122 | |
| Paper & Related Products 2.78% | | | | | | | | |
| Mercer International, Inc. | | | 79,210 | | | | 974,283 | |
| | | | | | | | | |
| Real Estate Operating/Development 0.47% | | | | | | | | |
| Infrastructure Ventures, Inc. #*@+ | | | 426,533 | | | | 164,343 | |
| | | | | | | | | |
| Rental Auto/Equipment 2.76% | | | | | | | | |
| Avis Budget Group, Inc. * | | | 30,000 | | | | 967,200 | |
| | | | | | | | | |
| Retail - Building Products 4.61% | | | | | | | | |
| The Home Depot, Inc. | | | 7,411 | | | | 1,618,414 | |
| | | | | | | | | |
| Retail - Pet Food & Supplies 3.01% | | | | | | | | |
| PetMed Express, Inc. | | | 44,923 | | | | 1,056,589 | |
| | | | | | | | | |
| Television 3.00% | | | | | | | | |
| AMC Networks, Inc., Class A * | | | 26,653 | | | | 1,052,794 | |
| | | | | | | | | |
| Web Hosting/Design 3.08% | | | | | | | | |
| NIC, Inc. | | | 48,400 | | | | 1,081,740 | |
| Total Common Stocks | | | | | | | 33,080,773 | |
| (cost $32,178,579) | | | | | | | | |
See notes to portfolios of investments and notes to financial statements.
Holmes Macro Trends Fund
| Portfolio of Investments | December 31, 2019 |
| Corporate Non-Convertible Note 2.22% | | Coupon Rate % | | | Maturity Date | | Principal Amount | | | Value | |
| | | | | | | | | | | | |
| Gold Mining 2.22% | | | | | | | | | | | |
| | | | | | | | | | | | | | | |
| Gran Colombia Gold Corp. | | | 8.25 | | | 04/30/24 | | $ | 739,870 | | | $ | 778,159 | |
| (cost $741,664) | | | | | | | | | | | | | | |
| | | Exercise | | | Exp. | | | | | | |
| Warrants 0.00% | | Price | | | Date | | Shares | | | | |
| Information Technology 0.00% | | | | | | | | | | | |
| Abaxx Technologies, Inc., 144A #*@∆ | | $ | 2.00 | | | 12/31/20 | | | 100,000 | | | | 0 | |
| | | | | | | | | | | | | | | |
| Oil Companies - Exploration & Production 0.00% | | | | | | | | | | | | | | |
| CruzSur Energy Corp., 144A #*∆ | | | 10.50 | | | 07/31/22 | | | 50,000 | | | | 385 | |
| Total Warrants | | | | | | | | | | | | | 385 | |
| (cost $0) | | | | | | | | | | | | | | |
| Put Option Purchased 0.01% | | Strike Price | | | Exp. Date | | Notional Contract Value | | | Contracts | | | Value | |
| | | | | | | | | | | | | | | |
| Exchange Traded Fund 0.01% | | | | | | | | | | | | | | |
| SPDR S&P 500 ETF Trust | | $ | 236.00 | | | 01/20 | | $ | 16,093,000 | | | | 500 | | | | 1,000 | |
| (premiums paid $833,180) | | | | | | | | | | | | | | | | | | |
| | | | | | | | | | | | | | | | | | | |
| Investments, at value 96.54% | | | | | | | | | | | | | | | | | 33,860,317 | |
| (cost $33,753,423) | | | | | | | | | | | | | | | | | | |
| Other assets and liabilities, net 3.46% | | | | | | | | | | | | | | | | | 1,215,315 | |
| Net Assets 100.00% | | | | | | | | | | | | | | | | $ | 35,075,632 | |
See notes to portfolios of investments and notes to financial statements.
Global Resources Fund
| Portfolio of Investments | December 31, 2019 |
| Common Stocks 85.83% | | Shares | | | Value | |
| | | | | | | |
| Agricultural Chemicals 2.49% | | | | | | |
| CF Industries Holdings, Inc. | | | 10,000 | | | $ | 477,400 | |
| Nutrien, Ltd. | | | 10,000 | | | | 478,765 | |
| The Mosaic Co. | | | 20,000 | | | | 432,800 | |
| | | | | | | | 1,388,965 | |
| Building & Construction Products - Miscellaneous 0.53% | | | | | | | | |
| Louisiana-Pacific Corp. | | | 10,000 | | | | 296,700 | |
| | | | | | | | | |
| Building Products - Wood 0.48% | | | | | | | | |
| Norbord, Inc. | | | 10,000 | | | | 267,452 | |
| | | | | | | | | |
| Coal 0.00% | | | | | | | | |
| Caribbean Resources Corp. #*@~ | | | 17 | | | | 0 | |
| Walter Energy, Inc., 144A #*@∆ | | | 4,293 | | | | 0 | |
| | | | | | | | 0 | |
| Diamonds/Precious Stones 0.31% | | | | | | | | |
| Barksdale Capital Corp. * | | | 600,000 | | | | 170,960 | |
| Rockwell Diamonds, Inc., 144A #*@∆ | | | 63,333 | | | | 0 | |
| | | | | | | | 170,960 | |
| Diversified Minerals 6.23% | | | | | | | | |
| BHP Group, Ltd., ADR | | | 10,000 | | | | 547,100 | |
| Desert Mountain Energy Corp. * | | | 350,000 | | | | 61,992 | |
| Encanto Potash Corp. #* | | | 300,000 | | | | 13,284 | |
| Lumina Gold Corp. * | | | 500,000 | | | | 246,429 | |
| Lundin Mining Corp. | | | 125,000 | | | | 746,987 | |
| Mako Mining Corp. * | | | 1,200,000 | | | | 323,438 | |
| Niocan, Inc., 144A #*∆ | | | 362,069 | | | | 36,247 | |
| Salazar Resources, Ltd. * | | | 3,000,000 | | | | 438,951 | |
| Sun Metals Corp. * | | | 1,750,000 | | | | 303,223 | |
| Teck Resources, Ltd., Class B | | | 25,000 | | | | 433,560 | |
| VR Resources, Ltd. * | | | 1,125,000 | | | | 320,550 | |
| | | | | | | | 3,471,761 | |
| Electric - Integrated 1.03% | | | | | | | | |
| AGL Energy, Ltd. | | | 40,000 | | | | 575,743 | |
| | | | | | | | | |
| Energy - Alternate Sources 1.81% | | | | | | | | |
| Pacific Green Energy Corp. #*@~ | | | 2,400,000 | | | | 0 | |
| Vestas Wind Systems A/S | | | 10,000 | | | | 1,010,065 | |
| | | | | | | | 1,010,065 | |
| Finance - Investment Banker/Broker 0.52% | | | | | | | | |
| GoldMoney, Inc. | | | 200,000 | | | | 288,014 | |
| | | | | | | | | |
| Food - Miscellaneous/Diversified 1.17% | | | | | | | | |
| Ingredion, Inc. | | | 7,000 | | | | 650,650 | |
See notes to portfolios of investments and notes to financial statements.
Global Resources Fund
| Portfolio of Investments | December 31, 2019 |
| Common Stocks (cont’d) | | Shares | | | Value | |
| | | | | | | |
| Forestry 0.51% | | | | | | |
| Interfor Corp. * | | | 25,000 | | | $ | 282,430 | |
| | | | | | | | | |
| Gold Mining 12.61% | | | | | | | | |
| AngloGold Ashanti, Ltd., ADR | | | 50,000 | | | | 1,117,000 | |
| CopperBank Resources Corp. * | | | 13,200,000 | | | | 457,433 | |
| Corona Minerals, Ltd. #*@ | | | 5,000 | | | | 0 | |
| Dundee Precious Metals, Inc. * | | | 143,935 | | | | 618,503 | |
| Gran Colombia Gold Corp. * | | | 4,100 | | | | 17,587 | |
| Josemaria Resources, Inc. * | | | 461,000 | | | | 245,943 | |
| Josemaria Resources, Inc. * | | | 300,000 | | | | 175,580 | |
| Kirkland Lake Gold, Ltd. | | | 10,000 | | | | 440,700 | |
| Lundin Gold, Inc. * | | | 225,000 | | | | 1,443,341 | |
| Red Pine Exploration, Inc. * | | | 1,500,000 | | | | 57,757 | |
| Revival Gold, Inc. * | | | 1,025,000 | | | | 513,072 | |
| Royal Road Minerals, Ltd. * | | | 5,750,000 | | | | 1,084,864 | |
| Sandstorm Gold, Ltd. * | | | 90,000 | | | | 670,500 | |
| Western Atlas Resources, Inc. * | | | 3,000,000 | | | | 184,821 | |
| | | | | | | | 7,027,101 | |
| Information Technology 1.47% | | | | | | | | |
| Abaxx Technologies, Inc., 144A #*@∆ | | | 1,250,000 | | | | 818,220 | |
| | | | | | | | | |
| Medical - Hospitals 0.00% | | | | | | | | |
| African Medical Investments PLC #*@ | | | 2,507,500 | | | | 0 | |
| | | | | | | | | |
| Metal - Copper 0.59% | | | | | | | | |
| Freeport-McMoRan, Inc. | | | 25,000 | | | | 328,000 | |
| | | | | | | | | |
| Metal - Diversified 8.87% | | | | | | | | |
| Anglo American PLC | | | 25,000 | | | | 718,199 | |
| Ascendant Resources, Inc. * | | | 300,000 | | | | 72,773 | |
| Chakana Copper Corp. * | | | 1,250,000 | | | | 235,840 | |
| Filo Mining Corp. * | | | 234,650 | | | | 361,403 | |
| Filo Mining Corp. * | | | 115,250 | | | | 182,996 | |
| Galway Metals, Inc. * | | | 450,000 | | | | 116,091 | |
| GoviEx Uranium, Inc., 144A #*∆ | | | 58,000 | | | | 7,146 | |
| Ivanhoe Mines, Ltd. * | | | 550,000 | | | | 1,800,085 | |
| Largo Resources, Ltd. * | | | 100,000 | | | | 76,239 | |
| Luminex Res Corp. * | | | 120,615 | | | | 74,307 | |
| MMC Norilsk Nickel PJSC, ADR | | | 30,000 | | | | 917,438 | |
| Orsu Metals Corp., 144A #*∆ | | | 14,761 | | | | 3,012 | |
| South32, Ltd. | | | 125,000 | | | | 236,015 | |
| Troilus Gold Corp., 144A *∆ | | | 294,000 | | | | 144,900 | |
| | | | | | | | 4,946,444 | |
See notes to portfolios of investments and notes to financial statements.
Global Resources Fund
| Portfolio of Investments | December 31, 2019 |
| Common Stocks (cont’d) | | Shares | | | Value | |
| | | | | | | |
| Metal - Iron 3.66% | | | | | | |
| Champion Iron, Ltd. * | | | 500,000 | | | $ | 935,659 | |
| Consolidated Growth Holdings, Ltd. #*@ | | | 19,859,173 | | | | 0 | |
| Fortescue Metals Group, Ltd. | | | 110,000 | | | | 829,220 | |
| Novolipetsk Steel PJSC, GDR | | | 12,000 | | | | 276,623 | |
| WAI Capital Investment Corp., 144A #*@∆ | | | 292,500 | | | | 0 | |
| | | | | | | | 2,041,502 | |
| Mining Services 1.04% | | | | | | | | |
| Cordoba Minerals Corp. * | | | 1,000,000 | | | | 84,710 | |
| Defense Metals Corp. * | | | 1,500,000 | | | | 190,597 | |
| Talon Metals Corp. * | | | 2,629,827 | | | | 303,780 | |
| | | | | | | | 579,087 | |
| Natural Resource Technology 0.22% | | | | | | | | |
| I-Pulse, Inc., 144A #*@+∆ | | | 15,971 | | | | 120,741 | |
| | | | | | | | | |
| Non-Ferrous Metals 0.05% | | | | | | | | |
| InZinc Mining, Ltd. #* | | | 2,000,000 | | | | 30,804 | |
| Sterling Group Ventures, Inc., 144A #*@∆ | | | 500,000 | | | | 0 | |
| | | | | | | | 30,804 | |
| Oil - Field Services 0.88% | | | | | | | | |
| Halliburton Co. | | | 20,000 | | | | 489,400 | |
| | | | | | | | | |
| Oil Companies - Exploration & Production 8.58% | | | | | | | | |
| Africa Energy Corp. #* | | | 2,110,889 | | | | 438,905 | |
| Canadian Natural Resources, Ltd. | | | 20,000 | | | | 647,000 | |
| CNOOC, Ltd., ADR | | | 4,000 | | | | 666,680 | |
| CNOOC, Ltd. | | | 400,000 | | | | 665,132 | |
| ConocoPhillips | | | 10,000 | | | | 650,300 | |
| CruzSur Energy Corp., 144A #*∆ | | | 200,000 | | | | 40,045 | |
| EOG Resources, Inc. | | | 6,000 | | | | 502,560 | |
| Frontera Energy Corp. | | | 35,000 | | | | 264,141 | |
| Occidental Petroleum Corp. | | | 6,026 | | | | 248,331 | |
| Range Energy Resources, Inc., 144A #*∆ | | | 15,000,000 | | | | 57,757 | |
| U.S. Oil Sands, Inc., 144A #*@∆ | | | 198,000 | | | | 0 | |
| Woodside Petroleum, Ltd. | | | 25,000 | | | | 604,465 | |
| | | | | | | | 4,785,316 | |
| Oil Companies - Integrated 13.93% | | | | | | | | |
| China Petroleum & Chemical Corp., ADR | | | 7,500 | | | | 451,125 | |
| Ecopetrol SA, ADR | | | 30,000 | | | | 598,800 | |
| Eni SpA, ADR | | | 20,000 | | | | 619,200 | |
| Equinor ASA, ADR | | | 25,000 | | | | 497,750 | |
| Gazprom PJSC, ADR | | | 100,000 | | | | 825,353 | |
| LUKOIL PJSC, ADR | | | 16,100 | | | | 1,603,666 | |
| Petroleo Brasileiro SA, ADR * | | | 25,000 | | | | 398,500 | |
See notes to portfolios of investments and notes to financial statements.
Global Resources Fund
| Portfolio of Investments | December 31, 2019 |
| Common Stocks (cont’d) | | Shares | | | Value | |
| | | | | | | |
| Oil Companies - Integrated (cont’d) | | | | | | |
| Rosneft Oil Co. PJSC, GDR | | | 125,000 | | | $ | 907,489 | |
| Royal Dutch Shell PLC, ADR | | | 10,000 | | | | 589,800 | |
| Suncor Energy, Inc. | | | 20,000 | | | | 656,000 | |
| Surgutneftegas PJSC, ADR | | | 76,000 | | | | 617,553 | |
| | | | | | | | 7,765,236 | |
| Oil Companies - US Royalty Trusts 0.01% | | | | | | | | |
| San Juan Basin Royalty Trust | | | 2,000 | | | | 5,080 | |
| | | | | | | | | |
| Oil Refining & Marketing 2.56% | | | | | | | | |
| Phillips 66 | | | 6,500 | | | | 724,165 | |
| Valero Energy Corp. | | | 7,500 | | | | 702,375 | |
| | | | | | | | 1,426,540 | |
| Paper & Related Products 1.58% | | | | | | | | |
| Canfor Pulp Products, Inc. | | | 45,000 | | | | 289,708 | |
| International Paper Co. | | | 6,500 | | | | 299,325 | |
| Resolute Forest Products, Inc. * | | | 70,000 | | | | 294,000 | |
| | | | | | | | 883,033 | |
| Platinum 1.47% | | | | | | | | |
| Impala Platinum Holdings, Ltd., ADR * | | | 40,000 | | | | 409,600 | |
| Impala Platinum Holdings, Ltd. * | | | 40,000 | | | | 408,694 | |
| | | | | | | | 818,294 | |
| Precious Metals 3.92% | | | | | | | | |
| Brixton Metals Corp. * | | | 1,000,000 | | | | 173,270 | |
| Libero Copper & Gold Corp. * | | | 3,500,000 | | | | 309,961 | |
| Metalla Royalty & Streaming, Ltd. | | | 150,000 | | | | 808,595 | |
| Wheaton Precious Metals Corp. | | | 30,000 | | | | 892,500 | |
| | | | | | | | 2,184,326 | |
| Real Estate Operating/Development 5.14% | | | | | | | | |
| Infrastructure Ventures, Inc. #*@+ | | | 7,443,544 | | | | 2,867,998 | |
| | | | | | | | | |
| REITS - Diversified 1.07% | | | | | | | | |
| PotlatchDeltic Corp. REIT | | | 10,000 | | | | 432,700 | |
| Rayonier, Inc. REIT | | | 5,000 | | | | 163,800 | |
| | | | | | | | 596,500 | |
| Retail - Jewelry 0.27% | | | | | | | | |
| Mene, Inc. * | | | 350,000 | | | | 148,242 | |
See notes to portfolios of investments and notes to financial statements.
Global Resources Fund
| Portfolio of Investments | December 31, 2019 |
| Common Stocks (cont’d) | | Shares | | | Value | |
| | | | | | | |
| Steel - Producers 2.83% | | | | | | |
| Evraz PLC | | | 50,000 | | | $ | 267,741 | |
| Nucor Corp. | | | 12,500 | | | | 703,500 | |
| Severstal PJSC, GDR | | | 40,000 | | | | 605,344 | |
| | | | | | | | 1,576,585 | |
| Total Common Stocks | | | | | | | 47,841,189 | |
| (cost $95,735,004) | | | | | | | | |
| Corporate Non-Convertible Note 2.50% | | Coupon Rate % | | | Maturity Date | | Principal Amount | | | | |
| | | | | | | | | | | | |
| Gold Mining 2.50% | | | | | | | | | | | |
| Gran Colombia Gold Corp. | | | 8.25 | | | 04/30/24 | | $ | 1,324,288 | | | | 1,392,820 | |
| (cost $1,327,499) | | | | | | | | | | | | | | |
| Exchange Traded Funds 3.82% | | Shares | | | | |
| Aberdeen Standard Physical Platinum Shares ETF * | | | 1,000 | | | | 90,930 | |
| Direxion Daily Junior Gold Miners Index Bull 3x Shares ETF | | | 600 | | | | 50,082 | |
| First Trust Global Wind Energy ETF | | | 10,000 | | | | 146,456 | |
| Global X Lithium & Battery Tech ETF | | | 6,470 | | | | 176,890 | |
| Global X Silver Miners ETF | | | 3,700 | | | | 122,766 | |
| Invesco S&P Global Water Index ETF | | | 8,000 | | | | 329,040 | |
| Invesco Solar ETF | | | 4,500 | | | | 138,600 | |
| iShares U.S. Oil Equipment & Services ETF | | | 5,500 | | | | 111,815 | |
| ProShares Ultra Bloomberg Crude Oil ETF * | | | 2,200 | | | | 45,012 | |
| SPDR Gold Shares ETF * | | | 3,000 | | | | 428,700 | |
| Teucrium Soybean Fund ETF * | | | 4,000 | | | | 63,320 | |
| U.S. Gasoline Fund LP ETF * | | | 4,475 | | | | 144,818 | |
| VanEck Vectors Junior Gold Miners ETF | | | 1,500 | | | | 63,390 | |
| VanEck Vectors Rare Earth/Strategic Metals ETF | | | 16,250 | | | | 218,237 | |
| Total Exchange Traded Funds | | | | | | | 2,130,056 | |
| (cost $2,006,977) | | | | | | | | |
| Warrants 0.00% | | Exercise Price | | | Exp. Date | | | | | | |
| | | | | | | | | | | | |
| Electronics - Military 0.00% | | | | | | | | | | | |
| Global UAV Technologies, Ltd., 144A #*@∆ | | $ | 0.15 | | | 06/25/20 | | | 1,112,500 | | | | 0 | |
| | | | | | | | | | | | | | | |
| Gold Mining 0.00% | | | | | | | | | | | | | | |
| Troilus Gold Corp., 144A #*@∆ | | | 2.50 | | | 11/21/20 | | | 294,000 | | | | 0 | |
| | | | | | | | | | | | | | | |
| Metal - Diversified 0.00% | | | | | | | | | | | | | | |
| Aguia Resources, Ltd., 144A #*@∆ | | | 0.65 | | | 06/30/20 | | | 1,450,000 | | | | 0 | |
See notes to portfolios of investments and notes to financial statements.
Global Resources Fund
| Portfolio of Investments | December 31, 2019 |
| Warrants (cont’d) | | Exercise Price | | | Exp. Date | | Shares | | | Value | |
| | | | | | | | | | | | |
| Oil Companies - Exploration & Production 0.00% | | | | | | | | | | | |
| CruzSur Energy Corp., 144A #*∆ | | $ | 10.50 | | | 07/31/22 | | | 200,000 | | | $ | 1,540 | |
| Total Warrants | | | | | | | | | | | | | 1,540 | |
| (cost $0) | | | | | | | | | | | | | | |
| Call Option Purchased 0.57% | | Strike Price | | | Exp. Date | | Notional Contract Value | | | Contracts | | | Value | |
| | | | | | | | | | | | | | | |
| Gold Mining 0.57% | | | | | | | | | | | | | | |
| Barrick Gold Corp. | | $ | 17.00 | | | 01/22 | | $ | 1,275,000 | | | | 750 | | | | 316,500 | |
| (premiums paid $270,378) | | | | | | | | | | | | | | | | | | |
| | | | | | | | | | | | | | | | | | | |
| Investments, at value 92.72% | | | | | | | | | | | | | | | | | 51,682,105 | |
| (cost $99,339,858) | | | | | | | | | | | | | | | | | | |
| Other assets and liabilities, net 7.28% | | | | | | | | | | | | | | | | | 4,056,959 | |
| Net Assets 100.00% | | | | | | | | | | | | | | | | $ | 55,739,064 | |
See notes to portfolios of investments and notes to financial statements.
World Precious Minerals Fund
| Portfolio of Investments | December 31, 2019 |
| Common Stocks 92.81% | | Shares | | | Value | |
| | | | | | | |
| Advanced Materials/Production 3.77% | | | | | | |
| Nano One Materials Corp. * | | | 3,200,000 | | | $ | 2,858,573 | |
| | | | | | | | | |
| Capital Pools 0.47% | | | | | | | | |
| Magna Gold Corp. *@ | | | 1,600,000 | | | | 357,322 | |
| | | | | | | | | |
| Coal 0.00% | | | | | | | | |
| Caribbean Resources Corp. #*@ | | | 4 | | | | 0 | |
| | | | | | | | | |
| Diamonds/Precious Stones 1.03% | | | | | | | | |
| Barksdale Capital Corp. *~ | | | 2,750,000 | | | | 783,566 | |
| Rockwell Diamonds, Inc., 144A #*@∆ | | | 171,667 | | | | 0 | |
| | | | | | | | 783,566 | |
| Diversified Minerals 5.40% | | | | | | | | |
| Argo Gold, Inc. #*~ | | | 2,967,500 | | | | 262,803 | |
| Ascot Resources, Ltd., 144A #*∆ | | | 6,412 | | | | 4,395 | |
| Bluebird Battery Metals, Inc. * | | | 750,000 | | | | 40,430 | |
| Calibre Mining Corp. * | | | 777,000 | | | | 562,458 | |
| Erdene Resource Development Corp. * | | | 300,000 | | | | 40,430 | |
| Golden Predator Mining Corp. * | | | 1,000,000 | | | | 304,185 | |
| Indochine Mining, Ltd. #*@ | | | 10,000 | | | | 0 | |
| Lithoquest Diamonds, Inc. * | | | 750,000 | | | | 36,098 | |
| Lumina Gold Corp. * | | | 1,000,000 | | | | 492,857 | |
| Mako Mining Corp. * | | | 1,500,000 | | | | 404,297 | |
| NextSource Materials, Inc. * | | | 2,000,000 | | | | 69,308 | |
| NGEx Minerals, Ltd. * | | | 100,000 | | | | 29,649 | |
| Rubicon Minerals Corp. * | | | 500,000 | | | | 413,923 | |
| Sixth Wave Innovations, Inc. #*@ | | | 1,000,000 | | | | 577,567 | |
| VR Resources, Ltd. *~ | | | 3,000,000 | | | | 854,800 | |
| | | | | | | | 4,093,200 | |
| Finance - Investment Banker/Broker 0.03% | | | | | | | | |
| Coin Hodl, Inc., 144A #*∆ | | | 133,333 | | | | 20,536 | |
| | | | | | | | | |
| Gold Mining 42.39% | | | | | | | | |
| Adamera Minerals Corp., 144A #*∆ | | | 1,492,543 | | | | 34,482 | |
| Algold Resources, Ltd. * | | | 540,000 | | | | 31,189 | |
| Allegiant Gold, Ltd. * | | | 2,000,000 | | | | 300,335 | |
| Amilot Capital, Inc., 144A #*∆ | | | 410,000 | | | | 14,208 | |
| Auryn Resources, Inc. * | | | 500,000 | | | | 721,959 | |
| Bellevue Gold, Ltd. * | | | 2,600,000 | | | | 977,940 | |
| Black Dragon Gold Corp. * | | | 5,000,000 | | | | 279,135 | |
| Bonterra Resources, Inc. * | | | 400,000 | | | | 693,081 | |
| Comstock Mining, Inc. * | | | 106,600 | | | | 47,053 | |
| Contact Gold Corp. * | | | 3,000,000 | | | | 358,092 | |
| CopperBank Resources Corp. *~ | | | 22,805,418 | | | | 790,300 | |
| CopperBank Resources Corp., 144A #*~∆ | | | 174,000 | | | | 6,030 | |
See notes to portfolios of investments and notes to financial statements.
World Precious Minerals Fund
| Portfolio of Investments | December 31, 2019 |
| Common Stocks (cont’d) | | Shares | | | Value | |
| | | | | | | |
| Gold Mining (cont’d) | | | | | | |
| Coral Gold Resources, Ltd. * | | | 750,000 | | | $ | 254,130 | |
| Corona Minerals, Ltd. #*@ | | | 81,250 | | | | 0 | |
| Exore Resources, Ltd. * | | | 5,000,000 | | | | 241,788 | |
| Fiore Gold, Ltd. * | | | 1,000,000 | | | | 415,848 | |
| Fremont Gold, Ltd. *~ | | | 4,000,000 | | | | 231,027 | |
| Gascoyne Resources, Ltd. #*@ | | | 1,600,000 | | | | 21,895 | |
| Gold Standard Ventures Corp. * | | | 1,000,000 | | | | 856,000 | |
| GoldQuest Mining Corp. * | | | 1,500,000 | | | | 161,719 | |
| GT Gold Corp. * | | | 600,000 | | | | 489,777 | |
| Josemaria Resources, Inc. * | | | 200,000 | | | | 117,054 | |
| K92 Mining, Inc. * | | | 1,250,000 | | | | 2,772,323 | |
| Lion One Metals, Ltd. * | | | 300,000 | | | | 388,125 | |
| Lundin Gold, Inc. * | | | 500,000 | | | | 3,207,424 | |
| Mammoth Resources Corp. *~ | | | 2,171,200 | | | | 54,341 | |
| Maritime Resources Corp. * | | | 1,000,000 | | | | 61,607 | |
| Mawson Resources, Ltd. * | | | 625,000 | | | | 89,042 | |
| McEwen Mining, Inc. | | | 134,764 | | | | 172,275 | |
| Mirasol Resources, Ltd. * | | | 1,500,000 | | | | 612,221 | |
| Moneta Porcupine Mines, Inc. * | | | 1,825,000 | | | | 175,677 | |
| Nighthawk Gold Corp. * | | | 1,855,000 | | | | 742,829 | |
| NV Gold Corp. * | | | 1,000,000 | | | | 115,513 | |
| OceanaGold Corp., 144A ∆ | | | 5,348 | | | | 10,502 | |
| Oklo Resources, Ltd. * | | | 3,000,000 | | | | 295,653 | |
| Orca Gold, Inc. * | | | 4,100,000 | | | | 1,057,718 | |
| Otis Gold Corp. * | | | 1,500,000 | | | | 144,392 | |
| Pacton Gold, Inc. * | | | 1,000,000 | | | | 115,513 | |
| Petaquilla Minerals, Ltd., 144A #*@∆ | | | 2,660,000 | | | | 0 | |
| Pretium Resources, Inc. * | | | 71,250 | | | | 792,855 | |
| Probe Metals, Inc. * | | | 1,000,000 | | | | 885,603 | |
| Radisson Mining Resources, Inc. *~ | | | 8,500,000 | | | | 1,407,339 | |
| Radius Gold, Inc., 144A #*∆ | | | 125,000 | | | | 23,584 | |
| Red Pine Exploration, Inc. * | | | 8,000,000 | | | | 308,036 | |
| Redstar Gold Corp. * | | | 15,000,000 | | | | 288,784 | |
| Reunion Gold Corp. * | | | 4,750,000 | | | | 512,110 | |
| Revival Gold, Inc. * | | | 1,500,000 | | | | 750,837 | |
| Scottie Resources Corp. * | | | 2,000,000 | | | | 284,933 | |
| Seabridge Gold, Inc. * | | | 30,000 | | | | 414,600 | |
| Seafield Resources, Ltd., 144A #*@∆ | | | 1,300,000 | | | | 0 | |
| Southern Gold, Ltd. * | | | 3,500,000 | | | | 491,954 | |
| Strikepoint Gold, Inc. * | | | 3,250,000 | | | | 112,626 | |
| Taurus Gold, Ltd., 144A #*@∆ | | | 2,448,381 | | | | 0 | |
| TMAC Resources, Inc. * | | | 50,000 | | | | 145,547 | |
| TriStar Gold, Inc. *~ | | | 31,150,000 | | | | 4,557,776 | |
| Wesdome Gold Mines, Ltd. * | | | 500,000 | | | | 3,915,906 | |
| Wolfden Resources Corp. * | | | 2,000,000 | | | | 184,821 | |
| | | | | | | | 32,135,508 | |
See notes to portfolios of investments and notes to financial statements.
World Precious Minerals Fund
| Portfolio of Investments | December 31, 2019 |
| Common Stocks (cont’d) | | Shares | | | Value | |
| | | | | | | |
| Investment Companies 0.08% | | | | | | |
| Pinecrest Resources, Ltd. * | | | 400,000 | | | $ | 61,607 | |
| | | | | | | | | |
| Machinery - Construction & Mining 0.25% | | | | | | | | |
| Atico Mining Corp. * | | | 808,125 | | | | 192,922 | |
| | | | | | | | | |
| Medical - Hospitals 0.00% | | | | | | | | |
| African Medical Investments PLC #*@ | | | 4,637,500 | | | | 0 | |
| | | | | | | | | |
| Metal - Copper 0.23% | | | | | | | | |
| Wallbridge Mining Co., Ltd. * | | | 250,000 | | | | 175,195 | |
| | | | | | | | | |
| Metal - Diversified 13.49% | | | | | | | | |
| Adriatic Metals PLC * | | | 500,000 | | | | 552,174 | |
| Adventus Mining Corp. * | | | 1,050,000 | | | | 743,906 | |
| Argent Minerals, Ltd. * | | | 21,100,000 | | | | 267,280 | |
| Cardinal Resources, Ltd. * | | | 9,950,000 | | | | 2,090,164 | |
| Cardinal Resources, Ltd. * | | | 5,500,000 | | | | 1,164,761 | |
| Cartier Resources, Inc. * | | | 1,000,000 | | | | 119,364 | |
| Chakana Copper Corp. *~ | | | 4,750,000 | | | | 896,192 | |
| Genesis Metals Corp. * | | | 116,600 | | | | 26,489 | |
| Genesis Metals Corp., 144A #∆ | | | 583,400 | | | | 132,535 | |
| Integra Resources Corp. * | | | 350,000 | | | | 323,438 | |
| Ivanhoe Mines, Ltd. * | | | 550,000 | | | | 1,800,085 | |
| Kaizen Discovery, Inc. * | | | 8,000,000 | | | | 246,429 | |
| Luminex Res Corp. * | | | 150,000 | | | | 92,411 | |
| New Age Metals, Inc., 144A #*∆ | | | 143,518 | | | | 5,526 | |
| Orex Minerals, Inc. *~ | | | 6,150,000 | | | | 663,047 | |
| Orsu Metals Corp., 144A #*∆ | | | 186,922 | | | | 38,146 | |
| Regulus Resources, Inc. * | | | 100,000 | | | | 98,571 | |
| Rockcliff Metals Corp., 144A #*∆ | | | 873,333 | | | | 47,078 | |
| RTG Mining, Inc. * | | | 2,289,378 | | | | 153,249 | |
| Silver Bull Resources, Inc. * | | | 2,500,000 | | | | 182,500 | |
| Sirios Resources, Inc. * | | | 1,500,000 | | | | 179,046 | |
| Torq Resources, Inc. * | | | 1,000,000 | | | | 408,147 | |
| | | | | | | | 10,230,538 | |
| Metal - Iron 0.11% | | | | | | | | |
| Vector Resources, Ltd. #*@ | | | 10,000,000 | | | | 84,210 | |
| | | | | | | | | |
| Mining Services 0.92% | | | | | | | | |
| Cordoba Minerals Corp. * | | | 1,000,000 | | | | 84,710 | |
| Major Drilling Group International, Inc. * | | | 140,909 | | | | 615,266 | |
| | | | | | | | 699,976 | |
See notes to portfolios of investments and notes to financial statements.
World Precious Minerals Fund
| Portfolio of Investments | December 31, 2019 |
| Common Stocks (cont’d) | | Shares | | | Value | |
| | | | | | | |
| Non-Ferrous Metals 0.95% | | | | | | |
| InZinc Mining, Ltd. #* | | | 3,000,000 | | | $ | 46,205 | |
| Royal Nickel Corp. * | | | 1,546,000 | | | | 595,279 | |
| Tajiri Resources Corp. #* | | | 1,900,000 | | | | 80,475 | |
| | | | | | | | 721,959 | |
| Oil Companies - Exploration & Production 0.00% | | | | | | | | |
| Big Sky Energy Corp. #*@ | | | 2,000,000 | | | | 0 | |
| | | | | | | | | |
| Optical Recognition Equipment 0.01% | | | | | | | | |
| Nexoptic Technology Corp., 144A *∆ | | | 12,083 | | | | 3,675 | |
| | | | | | | | | |
| Platinum 0.28% | | | | | | | | |
| Platinum Group Metals, Ltd. * | | | 125,000 | | | | 211,775 | |
| | | | | | | | | |
| Precious Metals 22.34% | | | | | | | | |
| 1911 Gold Corp. * | | | 450,000 | | | | 86,635 | |
| Amani Gold, Ltd. * | | | 54,500,000 | | | | 76,223 | |
| Barsele Minerals Corp. *~ | | | 7,500,000 | | | | 2,887,836 | |
| Brixton Metals Corp. * | | | 3,000,000 | | | | 519,811 | |
| Candente Gold Corp., 144A #*∆ | | | 4,875,000 | | | | 103,240 | |
| Corvus Gold, Inc. * | | | 29,000 | | | | 48,015 | |
| Dolly Varden Silver Corp. *~ | | | 9,132,000 | | | | 2,250,387 | |
| GFG Resources, Inc. * | | | 4,250,000 | | | | 1,210,966 | |
| Group Ten Metals, Inc. * | | | 2,044,000 | | | | 346,294 | |
| Kootenay Silver, Inc. * | | | 1,000,000 | | | | 261,831 | |
| Liberty Gold Corp. * | | | 1,550,000 | | | | 1,301,067 | |
| Metalla Royalty & Streaming, Ltd. | | | 187,500 | | | | 1,010,743 | |
| Polarx, Ltd. #*@~ | | | 33,653,968 | | | | 1,205,418 | |
| Roxgold, Inc. * | | | 2,000,000 | | | | 1,601,787 | |
| Silver Viper Minerals Corp. *~ | | | 3,000,000 | | | | 646,875 | |
| SilverCrest Metals, Inc. * | | | 500,000 | | | | 3,376,843 | |
| | | | | | | | 16,933,971 | |
| Retail - Jewelry 0.89% | | | | | | | | |
| Mene, Inc. * | | | 1,600,000 | | | | 677,679 | |
| | | | | | | | | |
| Silver Mining 0.17% | | | | | | | | |
| Metallic Minerals Corp. * | | | 710,000 | | | | 128,489 | |
| Total Common Stocks | | | | | | | 70,370,701 | |
| (cost $108,544,264) | | | | | | | | |
See notes to portfolios of investments and notes to financial statements.
World Precious Minerals Fund
| Portfolio of Investments | December 31, 2019 |
| Exchange Traded Funds 6.63% | | Shares | | | Value | |
| Direxion Daily Gold Miners Index Bull 3X Shares ETF | | | 60,000 | | | $ | 2,090,400 | |
| Direxion Daily Junior Gold Miners Index Bull 3x Shares ETF | | | 30,000 | | | | 2,504,100 | |
| ETFMG Prime Junior Silver Miners ETF | | | 35,000 | | | | 435,400 | |
| Total Exchange Traded Funds | | | | | | | 5,029,900 | |
| (cost $3,810,760) | | | | | | | | |
| Warrants 0.02% | | Exercise Price | | | Exp. Date | | | | | | |
| | | | | | | | | | | | |
| Gold Mineral Exploration & Development 0.00% | | | | | | | | | | | |
| Western Exploration & Development, Ltd., 144A #*@∆ | | $ | 0.50 | | | 12/31/49 | | | 600,000 | | | | 0 | |
| | | | | | | | | | | | | | | |
| Gold Mining 0.00% | | | | | | | | | | | | | | |
| Fiore Gold, Ltd. #*@ | | | 0.45 | | | 09/26/20 | | | 1,300,000 | | | | 0 | |
| Strikepoint Gold, Inc., 144A #*@∆ | | | 0.30 | | | 07/22/20 | | | 450,000 | | | | 0 | |
| Strikepoint Gold, Inc., 144A #*@∆ | | | 0.20 | | | 07/21/22 | | | 625,000 | | | | 0 | |
| | | | | | | | | | | | | | 0 | |
| Retail - Jewelry 0.02% | | | | | | | | | | | | | | |
| Mene, Inc. #* | | | 1.00 | | | 11/29/20 | | | 465,000 | | | | 12,533 | |
| Total Warrants | | | | | | | | | | | | | 12,533 | |
| (cost $300,000) | | | | | | | | | | | | | | |
| Call Option Purchased 0.56% | | Strike Price | | | Exp. Date | | Notional Contract Value | | | Contracts | | | Value | |
| | | | | | | | | | | | | | | |
| Gold Mining 0.56% | | | | | | | | | | | | | | |
| Barrick Gold Corp. | | $ | 17.00 | | | 01/22 | | $ | 1,700,000 | | | | 1,000 | | | | 422,000 | |
| (premiums paid $360,504) | | | | | | | | | | | | | | | | | | |
| | | | | | | | | | | | | | | | | | | |
| Investments, at value 100.02% | | | | | | | | | | | | | | | | | 75,835,134 | |
| (cost $113,015,528) | | | | | | | | | | | | | | | | | | |
| Other assets and liabilities, net (0.02)% | | | | | | | | | | | | | | | | | (16,704 | ) |
| Net Assets 100.00% | | | | | | | | | | | | | | | | $ | 75,818,430 | |
See notes to portfolios of investments and notes to financial statements.
Gold and Precious Metals Fund
| Portfolio of Investments | December 31, 2019 |
| Common Stocks 83.60% | | Shares | | | Value | |
| | | | | | | |
| Diversified Minerals 1.75% | | | | | | |
| Calibre Mining Corp. * | | | 2,500,000 | | | $ | 1,809,711 | |
| Mako Mining Corp. * | | | 1,303,900 | | | | 351,442 | |
| | | | | | | | 2,161,153 | |
| Engineering/R&D Services 0.23% | | | | | | | | |
| Boart Longyear, Ltd. * | | | 250,000 | | | | 282,884 | |
| | | | | | | | | |
| Gold Mining 53.08% | | | | | | | | |
| Agnico Eagle Mines, Ltd. | | | 20,000 | | | | 1,232,200 | |
| Alacer Gold Corp. * | | | 350,000 | | | | 1,859,767 | |
| Alamos Gold, Inc. | | | 200,000 | | | | 1,204,000 | |
| Alio Gold, Inc. * | | | 700,000 | | | | 544,453 | |
| AngloGold Ashanti, Ltd., ADR | | | 100,000 | | | | 2,234,000 | |
| Argonaut Gold, Inc. * | | | 500,000 | | | | 750,838 | |
| Barrick Gold Corp. | | | 100,000 | | | | 1,859,000 | |
| Bonterra Resources, Inc. * | | | 150,000 | | | | 259,905 | |
| Centerra Gold, Inc. * | | | 350,000 | | | | 2,784,259 | |
| Dacian Gold, Ltd. * | | | 1,000,000 | | | | 1,107,892 | |
| Dundee Precious Metals, Inc. * | | | 309,865 | | | | 1,331,521 | |
| Evolution Mining, Ltd. | | | 375,000 | | | | 996,913 | |
| Gold Fields, Ltd., ADR | | | 250,000 | | | | 1,650,000 | |
| Golden Star Resources, Ltd. * | | | 200,000 | | | | 762,000 | |
| Harmony Gold Mining Co., Ltd., ADR * | | | 500,000 | | | | 1,815,000 | |
| Horizon Minerals, Ltd. * | | | 2,000,000 | | | | 119,032 | |
| IAMGOLD Corp. * | | | 500,000 | | | | 1,865,000 | |
| K92 Mining, Inc. * | | | 2,500,000 | | | | 5,544,646 | |
| Kirkland Lake Gold, Ltd. | | | 30,000 | | | | 1,322,100 | |
| Newmont Goldcorp Corp. | | | 50,000 | | | | 2,172,500 | |
| Northern Star Resources, Ltd. | | | 383,067 | | | | 3,018,899 | |
| OceanaGold Corp. | | | 500,000 | | | | 981,864 | |
| Pantoro, Ltd. * | | | 8,000,000 | | | | 870,187 | |
| Pretium Resources, Inc. * | | | 188,750 | | | | 2,100,372 | |
| Ramelius Resources, Ltd. | | | 750,000 | | | | 649,129 | |
| Resolute Mining, Ltd. * | | | 2,000,000 | | | | 1,759,922 | |
| Sandstorm Gold, Ltd. * | | | 650,000 | | | | 4,842,500 | |
| Silver Lake Resources, Ltd. * | | | 3,000,000 | | | | 2,811,759 | |
| St Barbara, Ltd. | | | 750,000 | | | | 1,424,957 | |
| Teranga Gold Corp. * | | | 250,000 | | | | 1,351,507 | |
| TMAC Resources, Inc. * | | | 100,000 | | | | 291,094 | |
| Torex Gold Resources, Inc. * | | | 200,000 | | | | 3,160,448 | |
| Wesdome Gold Mines, Ltd. * | | | 1,000,000 | | | | 7,831,812 | |
| Westgold Resources, Ltd. * | | | 1,000,000 | | | | 1,602,622 | |
| Yamana Gold, Inc. | | | 375,000 | | | | 1,481,250 | |
| | | | | | | | 65,593,348 | |
| Medical - Hospitals 0.00% | | | | | | | | |
| African Medical Investments PLC #*@ | | | 2,000,000 | | | | 0 | |
See notes to portfolios of investments and notes to financial statements.
Gold and Precious Metals Fund
| Portfolio of Investments | December 31, 2019 |
| Common Stocks (cont’d) | | Shares | | | Value | |
| | | | | | | |
| Metals & Mining 0.03% | | | | | | |
| Castile Resources Pty Ltd. *@ | | | 250,000 | | | $ | 35,087 | |
| | | | | | | | | |
| Mining Services 2.15% | | | | | | | | |
| Major Drilling Group International, Inc. * | | | 609,091 | | | | 2,659,540 | |
| | | | | | | | | |
| Non - Ferrous Metals 0.38% | | | | | | | | |
| Energy Fuels, Inc. * | | | 250,000 | | | | 477,500 | |
| | | | | | | | | |
| Platinum 2.07% | | | | | | | | |
| Impala Platinum Holdings, Ltd. * | | | 250,000 | | | | 2,554,337 | |
| | | | | | | | | |
| Precious Metals 16.96% | | | | | | | | |
| 1911 Gold Corp. * | | | 406,250 | | | | 78,212 | |
| Americas Gold & Silver Corp. * | | | 400,000 | | | | 1,253,706 | |
| EMX Royalty Corp. * | | | 1,100,000 | | | | 1,817,027 | |
| Great Panther Mining, Ltd. * | | | 1,000,000 | | | | 510,000 | |
| Maverix Metals, Inc. | | | 750,000 | | | | 3,817,720 | |
| Metalla Royalty & Streaming, Ltd. | | | 325,000 | | | | 1,751,954 | |
| Roxgold, Inc. * | | | 4,000,000 | | | | 3,203,573 | |
| Sailfish Royalty Corp. * | | | 300,000 | | | | 210,235 | |
| SSR Mining, Inc. * | | | 200,000 | | | | 3,852,000 | |
| Wheaton Precious Metals Corp. | | | 150,000 | | | | 4,462,500 | |
| | | | | | | | 20,956,927 | |
| Retail - Jewelry 1.99% | | | | | | | | |
| Mene, Inc. * | | | 100,000 | | | | 42,355 | |
| Mene, Inc., 144A *#∆ | | | 5,714,285 | | | | 2,420,282 | |
| | | | | | | | 2,462,637 | |
| Silver Mining 4.96% | | | | | | | | |
| Excellon Resources, Inc. * | | | 750,000 | | | | 594,894 | |
| Pan American Silver Corp. | | | 125,000 | | | | 2,961,250 | |
| Santacruz Silver Mining, Ltd. * | | | 2,500,000 | | | | 308,036 | |
| Silvercorp Metals, Inc. | | | 400,000 | | | | 2,268,000 | |
| | | | | | | | 6,132,180 | |
| Total Common Stocks | | | | | | | 103,315,593 | |
| (cost $71,959,350) | | | | | | | | |
| Corporate Non-Convertible Bond 0.00% | | Coupon Rate % | | | Maturity Date | | Principal Amount | | | | |
| | | | | | | | | | | | |
| Coal 0.00% | | | | | | | | | | | |
| | | | | | | | | | | | | | | |
| Caribbean Resources Corp. #@^ | | | 19.25 | | | 06/15/15 | | $ | 485,766 | | | | 0 | |
| (cost $485,766) | | | | | | | | | | | | | | |
See notes to portfolios of investments and notes to financial statements.
Gold and Precious Metals Fund
| Portfolio of Investments | December 31, 2019 |
| Corporate Non-Convertible Notes 1.72% | | Coupon Rate % | | | Maturity Date | | Principal Amount | | | Value | |
| | | | | | | | | | | | |
| Gold Mining 1.72% | | | | | | | | | | | |
| | | | | | | | | | | | | | | |
| Gran Colombia Gold Corp. | | | 8.25 | | | 04/30/24 | | $ | 2,024,363 | | | $ | 2,129,124 | |
| (cost $2,029,271) | | | | | | | | | | | | | | |
| Right 0.00% | | Shares | | | | |
| | | | | | | |
| Metals & Mining 0.00% | | | | | | |
| Castile Resources Pty Ltd. *@ | | | 250,000 | | | | 0 | |
| (cost $0) | | | | | | | | |
| | | | | | | | | |
| Exchange Traded Funds 7.61% | | | | | | | | |
| Direxion Daily Gold Miners Index Bull 3X Shares ETF | | | 138,000 | | | | 4,807,920 | |
| Direxion Daily Junior Gold Miners Index Bull 3x Shares ETF | | | 55,000 | | | | 4,590,850 | |
| Total Exchange Traded Funds | | | | | | | 9,398,770 | |
| (cost $5,588,244) | | | | | | | | |
| Warrants 0.05% | | Exercise Price | | | Exp. Date | | | | | | |
| | | | | | | | | | | | |
| Gold Mining 0.00% | | | | | | | | | | | |
| Alio Gold, Inc. #*@ | | $ | 3.44 | | | 01/31/20 | | | 240,000 | | | | 0 | |
| | | | | | | | | | | | | | | |
| Silver Mining 0.05% | | | | | | | | | | | | | | |
| Excellon Resources, Inc. * | | | 1.40 | | | 08/27/21 | | | 375,000 | | | | 62,088 | |
| Total Warrants | | | | | | | | | | | | | 62,088 | |
| (cost $0) | | | | | | | | | | | | | | |
| Call Option Purchased 0.51% | | Strike Price | | | Exp. Date | | Notional Contract Value | | | Contracts | | | Value | |
| | | | | | | | | | | | | | | |
| Gold Mining 0.51% | | | | | | | | | | | | | | |
| Barrick Gold Corp. | | $ | 17.00 | | | 01/22 | | $ | 2,550,000 | | | | 1,500 | | | | 633,000 | |
| (premiums paid $540,756) | | | | | | | | | | | | | | | | | | |
| | | | | | | | | | | | | | | | | | | |
| Investments, at value 93.49% | | | | | | | | | | | | | | | | | 115,538,575 | |
| (cost $80,603,387) | | | | | | | | | | | | | | | | | | |
| Other assets and liabilities, net 6.51% | | | | | | | | | | | | | | | | | 8,038,731 | |
| Net Assets 100.00% | | | | | | | | | | | | | | | | $ | 123,577,306 | |
See notes to portfolios of investments and notes to financial statements.
Emerging Europe Fund
| Portfolio of Investments | December 31, 2019 |
| Common Stocks 95.56% | | Shares | | | Value | |
| | | | | | | |
| Agricultural Chemicals 1.36% | | | | | | |
| PhosAgro PJSC, GDR | | | 38,250 | | | $ | 494,305 | |
| | | | | | | | | |
| Airlines 2.63% | | | | | | | | |
| Aegean Airlines SA | | | 47,500 | | | | 447,739 | |
| Pegasus Hava Tasimaciligi AS * | | | 12,800 | | | | 185,822 | |
| Turk Hava Yollari AO * | | | 79,500 | | | | 193,119 | |
| Wizz Air Holdings PLC * | | | 2,550 | | | | 131,811 | |
| | | | | | | | 958,491 | |
| Airport Development/Maintenance 0.49% | | | | | | | | |
| TAV Havalimanlari Holding AS | | | 36,300 | | | | 177,925 | |
| | | | | | | | | |
| Apparel Manufacturers 1.51% | | | | | | | | |
| Burberry Group PLC | | | 6,300 | | | | 183,932 | |
| Christian Dior SE | | | 225 | | | | 115,648 | |
| Hermes International | | | 50 | | | | 37,455 | |
| Kering SA | | | 165 | | | | 108,721 | |
| Moncler SpA | | | 2,350 | | | | 105,768 | |
| | | | | | | | 551,524 | |
| Appliances 0.53% | | | | | | | | |
| Vestel Beyaz Esya Sanayi ve Ticaret AS | | | 53,670 | | | | 194,760 | |
| | | | | | | | | |
| Athletic Footwear 0.32% | | | | | | | | |
| adidas AG | | | 360 | | | | 117,187 | |
| | | | | | | | | |
| Automotive - Cars & Light Trucks 0.79% | | | | | | | | |
| Ford Otomotiv Sanayi AS | | | 12,000 | | | | 142,875 | |
| Tofas Turk Otomobil Fabrikasi AS | | | 32,500 | | | | 146,634 | |
| | | | | | | | 289,509 | |
| Automotive/Truck Parts & Equipment - Original 0.11% | | | | | | | | |
| EGE Endustri VE Ticaret AS | | | 400 | | | | 39,013 | |
| | | | | | | | | |
| Beverages - Non-alcoholic 0.22% | | | | | | | | |
| Coca-Cola Icecek AS | | | 12,500 | | | | 81,231 | |
| | | | | | | | | |
| Brewery 0.43% | | | | | | | | |
| Anadolu Efes Biracilik Ve Malt Sanayii AS | | | 40,500 | | | | 157,147 | |
| | | | | | | | | |
| Building - Heavy Construction 0.76% | | | | | | | | |
| Mytilineos SA | | | 25,200 | | | | 276,773 | |
| | | | | | | | | |
| Building & Construction Products - Miscellaneous 1.07% | | | | | | | | |
| Enka Insaat ve Sanayi AS | | | 99,000 | | | | 106,875 | |
| Tekfen Holding AS | | | 87,600 | | | | 284,521 | |
| | | | | | | | 391,396 | |
See notes to portfolios of investments and notes to financial statements.
Emerging Europe Fund
| Portfolio of Investments | December 31, 2019 |
| Common Stocks (cont’d) | | Shares | | | Value | |
| | | | | | | |
| Cellular Telecommunication 1.21% | | | | | | |
| Mobile TeleSystems PJSC, ADR | | | 12,200 | | | $ | 123,830 | |
| PLAY Communications SA | | | 15,200 | | | | 140,158 | |
| Turkcell Iletisim Hizmetleri AS | | | 76,000 | | | | 176,267 | |
| | | | | | | | 440,255 | |
| Coal 0.30% | | | | | | | | |
| Jastrzebska Spolka Weglowa SA | | | 19,200 | | | | 108,337 | |
| | | | | | | | | |
| Commercial Banks Non-US 16.01% | | | | | | | | |
| Akbank T.A.S. * | | | 36,600 | | | | 49,853 | |
| Alpha Bank AE * | | | 136,200 | | | | 294,217 | |
| Banca Transilvania SA | | | 345,220 | | | | 209,913 | |
| Bank Polska Kasa Opieki SA | | | 31,600 | | | | 836,247 | |
| BRD-Groupe Societe Generale SA | | | 36,000 | | | | 133,636 | |
| Eurobank Ergasias SA * | | | 167,000 | | | | 172,696 | |
| National Bank of Greece SA * | | | 31,800 | | | | 107,953 | |
| OTP Bank Nyrt | | | 3,900 | | | | 204,204 | |
| Powszechna Kasa Oszczednosci Bank Polski SA | | | 32,450 | | | | 294,602 | |
| Santander Bank Polska SA | | | 1,600 | | | | 129,622 | |
| Sberbank of Russia PJSC, ADR | | | 182,750 | | | | 2,997,100 | |
| Turkiye Garanti Bankasi AS * | | | 216,000 | | | | 404,529 | |
| | | | | | | | 5,834,572 | |
| Commercial Services - Finance 0.42% | | | | | | | | |
| QIWI plc, ADR | | | 8,000 | | | | 154,880 | |
| | | | | | | | | |
| Diversified Operations 0.89% | | | | | | | | |
| KOC Holding AS | | | 95,000 | | | | 324,662 | |
| | | | | | | | | |
| Electric - Distribution 0.57% | | | | | | | | |
| Enerjisa Enerji AS | | | 133,000 | | | | 165,101 | |
| Societatea Nationala Nuclearelectrica SA | | | 13,000 | | | | 43,426 | |
| | | | | | | | 208,527 | |
| Electric - Generation 1.28% | | | | | | | | |
| CEZ AS | | | 2,800 | | | | 62,936 | |
| Inter RAO UES PJSC | | | 4,981,000 | | | | 405,125 | |
| | | | | | | | 468,061 | |
| Electric - Integrated 0.46% | | | | | | | | |
| Public Power Corp. SA * | | | 36,500 | | | | 169,301 | |
| | | | | | | | | |
| Energy - Alternate Sources 0.19% | | | | | | | | |
| Jade Power Trust * | | | 525,000 | | | | 70,752 | |
| | | | | | | | | |
| Entertainment Software 1.36% | | | | | | | | |
| CD Projekt SA | | | 6,700 | | | | 494,057 | |
See notes to portfolios of investments and notes to financial statements.
Emerging Europe Fund
| Portfolio of Investments | December 31, 2019 |
| Common Stocks (cont’d) | | Shares | | | Value | |
| | | | | | | |
| Finance - Other Services 0.52% | | | | | | |
| Moscow Exchange MICEX-RTS PJSC | | | 110,000 | | | $ | 190,978 | |
| | | | | | | | | |
| Food - Retail 2.74% | | | | | | | | |
| BIM Birlesik Magazalar AS | | | 15,600 | | | | 122,319 | |
| Dino Polska SA * | | | 5,000 | | | | 189,714 | |
| Migros Ticaret AS * | | | 27,700 | | | | 112,755 | |
| Sok Marketler Ticaret AS * | | | 58,000 | | | | 104,868 | |
| X5 Retail Group NV, GDR | | | 13,550 | | | | 467,475 | |
| | | | | | | | 997,131 | |
| Food - Wholesale/Distribution 0.62% | | | | | | | | |
| Eurocash SA | | | 39,400 | | | | 226,434 | |
| | | | | | | | | |
| Gold Mining 1.36% | | | | | | | | |
| Alacer Gold Corp. * | | | 25,000 | | | | 132,841 | |
| Highland Gold Mining, Ltd. | | | 40,000 | | | | 103,373 | |
| Polyus PJSC, GDR | | | 4,600 | | | | 260,590 | |
| | | | | | | | 496,804 | |
| Machinery - Farm 0.13% | | | | | | | | |
| Turk Traktor ve Ziraat Makineleri AS * | | | 5,000 | | | | 46,521 | |
| | | | | | | | | |
| Metal - Diversified 5.07% | | | | | | | | |
| KGHM Polska Miedz SA * | | | 7,800 | | | | 196,755 | |
| MMC Norilsk Nickel PJSC, ADR | | | 51,450 | | | | 1,568,710 | |
| Orsu Metals Corp., 144A #*∆ | | | 402,500 | | | | 82,140 | |
| | | | | | | | 1,847,605 | |
| Metal - Iron 1.14% | | | | | | | | |
| Novolipetsk Steel PJSC, GDR | | | 18,000 | | | | 414,935 | |
| | | | | | | | | |
| Miscellaneous Manufacturing 0.35% | | | | | | | | |
| Trakya Cam Sanayii AS | | | 214,000 | | | | 125,819 | |
| | | | | | | | | |
| Multi-line Insurance 0.89% | | | | | | | | |
| Allianz SE | | | 770 | | | | 188,672 | |
| Vienna Insurance Group AG Wiener Versicherung Gruppe | | | 4,750 | | | | 134,558 | |
| | | | | | | | 323,230 | |
| Oil Companies - Exploration & Production 4.80% | | | | | | | | |
| Novatek PJSC, GDR | | | 7,995 | | | | 1,638,975 | |
| Societatea Nationala de Gaze Naturale ROMGAZ SA | | | 12,600 | | | | 109,527 | |
| | | | | | | | 1,748,502 | |
| Oil Companies - Integrated 26.79% | | | | | | | | |
| Gazprom Neft PJSC, ADR | | | 1,550 | | | | 53,165 | |
| Gazprom PJSC, ADR | | | 435,300 | | | | 3,592,760 | |
| LUKOIL PJSC, ADR | | | 33,520 | | | | 3,308,759 | |
See notes to portfolios of investments and notes to financial statements.
Emerging Europe Fund
| Portfolio of Investments | December 31, 2019 |
| Common Stocks (cont’d) | | Shares | | | Value | |
| | | | | | | |
| Oil Companies - Integrated (cont’d) | | | | | | |
| MOL Hungarian Oil & Gas PLC | | | 27,610 | | | $ | 275,220 | |
| OMV Petrom SA | | | 1,933,000 | | | | 202,496 | |
| Rosneft Oil Co. PJSC, GDR | | | 26,000 | | | | 188,757 | |
| Surgutneftegas PJSC, ADR | | | 65,750 | | | | 534,265 | |
| Tatneft PJSC, ADR | | | 21,860 | | | | 1,609,989 | |
| | | | | | | | 9,765,411 | |
| Oil Refining & Marketing 3.92% | | | | | | | | |
| Aygaz AS | | | 59,000 | | | | 127,287 | |
| Grupa Lotos SA | | | 12,750 | | | | 281,248 | |
| Hellenic Petroleum SA | | | 32,500 | | | | 320,046 | |
| Polski Koncern Naftowy ORLEN SA | | | 16,950 | | | | 383,402 | |
| Tupras Turkiye Petrol Rafinerileri AS | | | 14,900 | | | | 317,477 | |
| | | | | | | | 1,429,460 | |
| Precious Metals 0.48% | | | | | | | | |
| Polymetal International PLC | | | 11,000 | | | | 173,966 | |
| | | | | | | | | |
| Property/Casualty Insurance 1.46% | | | | | | | | |
| Powszechny Zaklad Ubezpieczen SA | | | 50,400 | | | | 532,297 | |
| | | | | | | | | |
| Regional Banks - Non US 1.29% | | | | | | | | |
| Moneta Money Bank AS | | | 25,000 | | | | 93,804 | |
| TCS Group Holding PLC, GDR | | | 17,500 | | | | 376,767 | |
| | | | | | | | 470,571 | |
| Retail - Apparel/Shoe 1.01% | | | | | | | | |
| CCC SA | | | 2,800 | | | | 81,178 | |
| HUGO BOSS AG | | | 3,350 | | | | 162,154 | |
| Industria de Diseno Textil SA | | | 3,500 | | | | 123,692 | |
| | | | | | | | 367,024 | |
| Retail - Jewelry 0.94% | | | | | | | | |
| Pandora A/S | | | 7,865 | | | | 342,038 | |
| | | | | | | | | |
| Retail - Major Dept Store 0.79% | | | | | | | | |
| Detsky Mir PJSC | | | 180,000 | | | | 289,843 | |
| | | | | | | | | |
| Steel - Producers 3.80% | | | | | | | | |
| Eregli Demir ve Celik Fabrikalari TAS | | | 243,500 | | | | 369,806 | |
| Evraz PLC | | | 62,000 | | | | 331,999 | |
| Magnitogorsk Iron & Steel Works PJSC, GDR | | | 52,900 | | | | 458,846 | |
| Severstal PJSC, GDR | | | 15,000 | | | | 226,432 | |
| | | | | | | | 1,387,083 | |
See notes to portfolios of investments and notes to financial statements.
Emerging Europe Fund
| Portfolio of Investments | December 31, 2019 |
| Common Stocks (cont’d) | | Shares | | | Value | |
| | | | | | | |
| Telecom Services 0.68% | | | | | | |
| O2 Czech Republic AS | | | 12,600 | | | $ | 130,040 | |
| Turk Telekomunikasyon AS * | | | 94,700 | | | | 117,254 | |
| | | | | | | | 247,294 | |
| Telephone - Integrated 1.36% | | | | | | | | |
| Hellenic Telecommunications Organization SA | | | 10,650 | | | | 170,471 | |
| Magyar Telekom Telecommunications PLC | | | 215,000 | | | | 325,214 | |
| | | | | | | | 495,685 | |
| Textile - Apparel 0.39% | | | | | | | | |
| LPP SA | | | 61 | | | | 141,811 | |
| | | | | | | | | |
| Transportation - Rail 1.28% | | | | | | | | |
| Globaltrans Investment PLC, GDR | | | 52,499 | | | | 465,197 | |
| | | | | | | | | |
| Transportation - Services 0.84% | | | | | | | | |
| Celebi Hava Servisi AS | | | 7,050 | | | | 120,908 | |
| Oesterreichische Post AG | | | 4,920 | | | | 187,011 | |
| | | | | | | | 307,919 | |
| Total Common Stocks | | | | | | | 34,836,223 | |
| (cost $27,995,856) | | | | | | | | |
| | | | | | | | | |
| Exchange Traded Fund 0.96% | | | | | | | | |
| Direxion Daily Russia Bull 3x Shares ETF | | | 5,000 | | | | 348,400 | |
| (cost $272,104) | | | | | | | | |
| Warrant 0.00% | | Exercise Price | | | Exp. Date | | | | | | |
| | | | | | | | | | | | |
| Energy - Alternate Sources 0.00% | | | | | | | | | | | |
| Jade Power Trust #*@ | | $ | 0.80 | | | 01/08/20 | | | 262,500 | | | | 0 | |
| (cost $0) | | | | | | | | | | | | | | |
| | | | | | | | | | | | | | | |
| Investments, at value 96.52% | | | | | | | | | | | | | 35,184,623 | |
| (cost $28,267,960) | | | | | | | | | | | | | | |
| Other assets and liabilities, net 3.48% | | | | | | | | | | | | | 1,268,202 | |
| Net Assets 100.00% | | | | | | | | | | | | $ | 36,452,825 | |
See notes to portfolios of investments and notes to financial statements.
China Region Fund
| Portfolio of Investments | December 31, 2019 |
| Common Stocks 100.06% | | Shares | | | Value | |
| | | | | | | |
| Airlines 1.22% | | | | | | |
| AirAsia Group Bhd | | | 250,000 | | | $ | 103,946 | |
| Cebu Air, Inc. | | | 41,040 | | | | 72,451 | |
| | | | | | | | 176,397 | |
| Apparel Manufacturers 0.16% | | | | | | | | |
| Crystal International Group, Ltd. | | | 55,000 | | | | 22,668 | |
| | | | | | | | | |
| Athletic Footwear 0.09% | | | | | | | | |
| Feng TAY Enterprise Co., Ltd. | | | 2,000 | | | | 13,017 | |
| | | | | | | | | |
| Audio/Video Products 0.52% | | | | | | | | |
| TCL Electronics Holdings, Ltd. | | | 160,000 | | | | 75,160 | |
| | | | | | | | | |
| Automotive - Cars & Light Trucks 0.09% | | | | | | | | |
| BAIC Motor Corp., Ltd. | | | 23,000 | | | | 13,069 | |
| | | | | | | | | |
| Automotive/Truck Parts & Equipment - Replacement 5.84% | | | | | | | | |
| Weichai Power Co., Ltd. | | | 400,000 | | | | 844,290 | |
| | | | | | | | | |
| Batteries/Battery Systems 1.34% | | | | | | | | |
| Tianneng Power International, Ltd. | | | 254,000 | | | | 193,435 | |
| | | | | | | | | |
| Broadcast Service/Program 0.10% | | | | | | | | |
| Global Mediacom Tbk PT * | | | 580,900 | | | | 14,556 | |
| | | | | | | | | |
| Building - Heavy Construction 2.08% | | | | | | | | |
| China Tower Corp., Ltd. | | | 1,274,000 | | | | 281,465 | |
| DMCI Holdings, Inc. | | | 144,600 | | | | 18,859 | |
| | | | | | | | 300,324 | |
| Building & Construction Products - Miscellaneous 0.21% | | | | | | | | |
| China National Building Material Co., Ltd. | | | 18,000 | | | | 20,081 | |
| HDC Holdings Co., Ltd. * | | | 267 | | | | 2,541 | |
| HDC Hyundai Development Co.-Engineering & | | | | | | | | |
| Construction * | | | 374 | | | | 8,270 | |
| | | | | | | | 30,892 | |
| Building Products - Cement 2.82% | | | | | | | | |
| Anhui Conch Cement Co., Ltd. | | | 53,500 | | | | 389,808 | |
| West China Cement, Ltd. | | | 110,000 | | | | 18,078 | |
| | | | | | | | 407,886 | |
| Casino Hotels 1.89% | | | | | | | | |
| NagaCorp, Ltd. | | | 156,000 | | | | 272,453 | |
| | | | | | | | | |
| Chemicals - Diversified 0.10% | | | | | | | | |
| China Risun Group, Ltd. | | | 42,000 | | | | 13,966 | |
See notes to portfolios of investments and notes to financial statements.
China Region Fund
| Portfolio of Investments | December 31, 2019 |
| Common Stocks (cont’d) | | Shares | | | Value | |
| | | | | | | |
| Chemicals - Fibers 0.08% | | | | | | |
| Indorama Ventures PCL, NVDR | | | 9,700 | | | $ | 11,305 | |
| | | | | | | | | |
| Chemicals - Specialty 0.20% | | | | | | | | |
| Fufeng Group, Ltd. | | | 33,000 | | | | 14,545 | |
| Huabao International Holdings, Ltd. | | | 40,000 | | | | 14,689 | |
| | | | | | | | 29,234 | |
| Coal 1.27% | | | | | | | | |
| Adaro Energy Tbk PT | | | 1,373,600 | | | | 153,502 | |
| China Coal Energy Co., Ltd. | | | 38,000 | | | | 15,080 | |
| Yanzhou Coal Mining Co., Ltd. | | | 16,000 | | | | 14,375 | |
| | | | | | | | 182,957 | |
| Commercial Banks Non-US 1.77% | | | | | | | | |
| Bank Mandiri Persero Tbk PT | | | 69,300 | | | | 38,292 | |
| Bank of the Philippine Islands | | | 8,070 | | | | 13,996 | |
| Industrial & Commercial Bank of China, Ltd., H Shares | | | 196,000 | | | | 151,220 | |
| Kasikornbank PCL, NVDR | | | 3,100 | | | | 15,606 | |
| The Siam Commercial Bank PCL, NVDR | | | 9,100 | | | | 37,005 | |
| | | | | | | | 256,119 | |
| Computers - Integrated System 0.11% | | | | | | | | |
| PAX Global Technology, Ltd. | | | 33,000 | | | | 15,458 | |
| | | | | | | | | |
| Consumer Products - Miscellaneous 0.00% | | | | | | | | |
| Tongda Hong Tai Holdings, Ltd. * | | | 2,000 | | | | 203 | |
| | | | | | | | | |
| Diversified Financial Services 0.28% | | | | | | | | |
| China Galaxy Securities Co., Ltd., H Shares | | | 68,000 | | | | 40,059 | |
| | | | | | | | | |
| E-Commerce/Services 0.25% | | | | | | | | |
| King Slide Works Co., Ltd. | | | 3,000 | | | | 36,273 | |
| | | | | | | | | |
| Electronic Components - Miscellaneous 3.66% | | | | | | | | |
| Micro-Star International Co., Ltd. | | | 25,000 | | | | 72,284 | |
| Radiant Opto-Electronics Corp. | | | 63,000 | | | | 252,244 | |
| Simplo Technology Co., Ltd. | | | 13,000 | | | | 131,618 | |
| Venture Corp., Ltd. | | | 6,100 | | | | 73,589 | |
| | | | | | | | 529,735 | |
| Engineering/R&D Services 6.04% | | | | | | | | |
| KEPCO Plant Service & Engineering Co., Ltd. * | | | 13,105 | | | | 443,671 | |
| Samsung Engineering Co., Ltd. * | | | 26,009 | | | | 429,831 | |
| | | | | | | | 873,502 | |
| Enterprise Software/Services 0.21% | | | | | | | | |
| Sinosoft Technology Group, Ltd. | | | 151,000 | | | | 30,796 | |
See notes to portfolios of investments and notes to financial statements.
China Region Fund
| Portfolio of Investments | December 31, 2019 |
| Common Stocks (cont’d) | | Shares | | | Value | |
| | | | | | | |
| Entertainment Software 0.08% | | | | | | |
| iDreamSky Technology Holdings, Ltd. * | | | 20,000 | | | $ | 11,506 | |
| | | | | | | | | |
| Finance - Investment Banker/Broker 0.11% | | | | | | | | |
| China International Capital Corp., Ltd. | | | 8,000 | | | | 15,425 | |
| | | | | | | | | |
| Food - Dairy Products 3.69% | | | | | | | | |
| China Mengniu Dairy Co., Ltd. | | | 132,000 | | | | 533,952 | |
| | | | | | | | | |
| Food - Miscellaneous/Diversified 10.69% | | | | | | | | |
| Standard Foods Corp. | | | 127,000 | | | | 295,123 | |
| Yihai International Holding, Ltd. | | | 213,000 | | | | 1,250,351 | |
| | | | | | | | 1,545,474 | |
| Gambling (Non-Hotel) 0.26% | | | | | | | | |
| Bloomberry Resorts Corp. * | | | 167,500 | | | | 37,351 | |
| | | | | | | | | |
| Gas - Distribution 0.25% | | | | | | | | |
| ENN Energy Holdings, Ltd. | | | 3,300 | | | | 36,053 | |
| | | | | | | | | |
| Life/Health Insurance 1.40% | | | | | | | | |
| China Life Insurance Co., Ltd. | | | 54,000 | | | | 150,210 | |
| China Pacific Insurance Group Co., Ltd. | | | 3,800 | | | | 14,972 | |
| New China Life Insurance Co., Ltd. | | | 8,700 | | | | 37,402 | |
| | | | | | | | 202,584 | |
| Medical - Drugs 4.10% | | | | | | | | |
| Consun Pharmaceutical Group, Ltd. | | | 60,000 | | | | 35,734 | |
| Luye Pharma Group, Ltd. | | | 19,000 | | | | 14,245 | |
| Sino Biopharmaceutical, Ltd. | | | 299,000 | | | | 418,306 | |
| YiChang HEC ChangJiang Pharmaceutical Co., Ltd. | | | 22,000 | | | | 124,996 | |
| | | | | | | | 593,281 | |
| Multi-line Insurance 6.47% | | | | | | | | |
| Ping An Insurance Group Co. of China, Ltd., H Shares | | | 79,000 | | | | 934,844 | |
| | | | | | | | | |
| Multimedia 2.60% | | | | | | | | |
| Media Nusantara Citra Tbk PT | | | 3,210,500 | | | | 376,476 | |
| | | | | | | | | |
| Non-Ferrous Metals 0.00% | | | | | | | | |
| Sterling Group Ventures, Inc., 144A #*@∆ | | | 500,000 | | | | 0 | |
| | | | | | | | | |
| Oil Companies - Exploration & Production 0.52% | | | | | | | | |
| United Energy Group, Ltd. * | | | 370,000 | | | | 74,893 | |
| | | | | | | | | |
| Oil Field Machinery & Equipment 0.07% | | | | | | | | |
| CIMC Enric Holdings, Ltd. | | | 18,000 | | | | 10,723 | |
See notes to portfolios of investments and notes to financial statements.
China Region Fund
| Portfolio of Investments | December 31, 2019 |
| Common Stocks (cont’d) | | Shares | | | Value | |
| | | | | | | |
| Real Estate Operating/Development 26.80% | | | | | | |
| Central China Real Estate, Ltd. | | | 814,000 | | | $ | 474,434 | |
| China Vanke Co., Ltd., H Shares | | | 41,800 | | | | 178,323 | |
| Country Garden Holdings Co., Ltd. | | | 466,000 | | | | 745,844 | |
| Country Garden Services Holdings Co., Ltd. | | | 154,586 | | | | 520,464 | |
| Greenland Hong Kong Holdings, Ltd. | | | 724,000 | | | | 313,932 | |
| KWG Group Holdings, Ltd. | | | 110,000 | | | | 154,119 | |
| Longfor Group Holdings, Ltd. | | | 145,000 | | | | 679,032 | |
| Shimao Property Holdings, Ltd. | | | 117,000 | | | | 453,420 | |
| Shun Tak Holdings, Ltd. | | | 82,000 | | | | 39,154 | |
| Sunac China Holdings, Ltd. | | | 53,000 | | | | 316,412 | |
| | | | | | | | 3,875,134 | |
| Reinsurance 0.10% | | | | | | | | |
| China Reinsurance Group Corp. | | | 90,000 | | | | 14,792 | |
| | | | | | | | | |
| Retail - Apparel/Shoe 7.83% | | | | | | | | |
| ANTA Sports Products, Ltd. | | | 61,000 | | | | 546,144 | |
| Li Ning Co., Ltd. | | | 195,500 | | | | 586,360 | |
| | | | | | | | 1,132,504 | |
| Schools 1.51% | | | | | | | | |
| China Kepei Education Group, Ltd. | | | 148,000 | | | | 71,411 | |
| China Maple Leaf Educational Systems, Ltd. | | | 40,000 | | | | 16,330 | |
| China New Higher Education Group, Ltd. | | | 39,000 | | | | 15,173 | |
| China Yuhua Education Corp., Ltd. | | | 170,000 | | | | 114,888 | |
| | | | | | | | 217,802 | |
| Semiconductor Components - Integrated Circuit 3.04% | | | | | | | | |
| Realtek Semiconductor Corp. | | | 56,000 | | | | 440,061 | |
| | | | | | | | | |
| Tobacco 0.10% | | | | | | | | |
| Gudang Garam Tbk PT | | | 3,900 | | | | 14,877 | |
| | | | | | | | | |
| Transport Support Services 0.11% | | | | | | | | |
| Kerry Logistics Network, Ltd. | | | 9,000 | | | | 15,458 | |
| | | | | | | | | |
| Investments, at value 100.06% | | | | | | | 14,466,944 | |
| (cost $11,832,313) | | | | | | | | |
| Other assets and liabilities, net (0.06)% | | | | | | | (8,148 | ) |
| Net Assets 100.00% | | | | | | $ | 14,458,796 | |
See notes to portfolios of investments and notes to financial statements.
| Notes to Portfolios of Investments | December 31, 2019 |
Legend
| ◊ | Zero coupon bond. Interest rate presented is yield to maturity. |
| ‡ | Adjustable rate security, the interest rate of which adjusts periodically based on changes in the current interest rates. Rate presented is as of December 31, 2019. |
| * | Non-income producing security. |
| @ | Security was fair valued at December 31, 2019, by U.S. Global Investors, Inc. (Adviser) (other than international securities fair valued pursuant to systematic fair value models) in accordance with valuation procedures approved by the Board of Trustees. These securities, as a percentage of net assets at December 31, 2019, were 0.84% of Holmes Macro Trends Fund, 6.83% of Global Resources Fund, 2.96% of World Precious Minerals Fund, 0.03% of Gold And Precious Metals Fund, 0.00% of Emerging Europe Fund and 0.00% of China Region Fund, respectively. |
| | See the Fair Valuation of Securities section of these Notes to Portfolios of Investments for further discussion of fair valued securities. See further information and detail on restricted securities in the Restricted Securities section of these Notes to Portfolios of Investments. |
| # | Illiquid Security. |
| ∆ | Pursuant to Rule 144A of the Securities Act of 1933, these securities may be resold in transactions exempt from registration, normally to qualified institutional buyers. The market value of these securities and percentage of net assets as of December 31, 2019 amounted to $141,311, 0.40%, of Holmes Macro Trends Fund, $1,229,608, 2.21%, of Global Resources Fund, $443,937, 0.59%, of World Precious Minerals Fund, $2,420,282, 1.96%, of Gold And Precious Metals Fund, $82,140, 0.23%, of Emerging Europe Fund and $0, 0.00%, of China Region Fund. |
| + | See "Restricted Securities" in Notes to Portfolios of Investments. |
| ~ | Affiliated Company. (see following) |
| ^ | Security is currently in default and is on scheduled interest or principal payment. |
| ADR | American Depositary Receipt |
| AGC | Assured Guaranty Corporation |
| AGM | Assured Guaranty Municipal |
| AMBAC | American Municipal Bond Assurance Corporation |
| BAM | Build American Mutual Assurance Company |
| COP | Certificate of Participation |
| ETF | Exchange Traded Fund |
| FHLMC | Federal Home Loan Mortgage Corporation |
| FNMA | Federal National Mortgage Association |
| GDR | Global Depositary Receipt |
| GNMA | Government National Mortgage Association |
| GO | General Obligation |
| LIBOR | London Interbank Offered Rate |
| LP | Limited Partnership |
| MTN | Medium Term Note |
| NVDR | Non-Voting Depositary Receipt |
| PCL | Public Company Limited |
| PJSC | Public Joint Stock Company |
| PLC | Public Limited Company |
| PSF-GTD | Public School Fund Guarantee |
| Q-SBLF | Qualified School Bond Loan Fund |
| RB | Revenue Bond |
| REIT | Real Estate Investment Trust |
| S&P | Standard & Poor’s |
| SPDR | Standard & Poor’s Depositary Receipt |
General
The yields reflect the effective yield from the date of purchase.
| Notes to Portfolios of Investments | December 31, 2019 |
Variable and Floating Rate Notes have periodic reset features, which effectively shorten the maturity dates and reset the interest rates as tied to various interest-bearing instruments. Rates shown are current rates at December 31, 2019.
Fair Valuation of Securities
For the Funds’ policies regarding the valuation of investments and other significant accounting policies, please refer to the Notes to Financial Statements.
The Funds are required to disclose information regarding the fair value measurements of a Fund’s assets and liabilities. Fair value is the price that would be received to sell an asset or paid to transfer a liability in an orderly transaction between market participants at the measurement date. The measurement requirements established a three-tier hierarchy to maximize the use of observable market data and minimize the use of unobservable inputs and to establish classification of fair value measurements for disclosure purposes. Inputs refer broadly to the assumptions that market participants would use in pricing the asset or liability, including assumptions about risk, for example, the risk inherent in a particular valuation technique used to measure fair value including such a pricing model and/or the risk inherent in the inputs to the valuation technique. Inputs may be observable or unobservable. Observable inputs are inputs that reflect the assumptions market participants would use in pricing the asset or liability developed based on market data obtained from sources independent of the reporting entity. Unobservable inputs are inputs that reflect the reporting entity’s own assumptions about the assumptions market participants would use in pricing the asset or liability developed based on the best information available in the circumstances.
The inputs or methodology used for valuing securities are not necessarily an indication of the risk associated with investing in those securities. Because of the inherent uncertainties of valuation, the values reflected in the portfolios may materially differ from the values received upon actual sale of those investments.
The three levels defined by the fair value hierarchy are as follows:
Level 1 – Quoted prices in active markets for identical securities.
Level 2 – Prices determined using significant other observable inputs (including quoted prices for similar securities, interest rates, prepayment speeds, credit risk, etc.). Short-term securities with maturities of sixty days or less are valued at amortized cost, which approximates market value, and are categorized as Level 2 in the hierarchy. Municipal securities, long-term U.S. government obligations and corporate debt securities are valued in accordance with the evaluated price supplied by a pricing service and generally categorized as Level 2 in the hierarchy. Other securities that are categorized as Level 2 in the hierarchy include, but are not limited to, warrants that do not trade on an exchange, securities valued at the mean between the last reported bid and ask quotation and international equity securities valued by an independent third party in order to adjust for stale pricing.
Level 3 – Prices determined using significant unobservable inputs (including the Fund’s own assumptions). For restricted equity securities and private placements where observable inputs are limited, assumptions about market activity and risk are used in determining fair value.
| Notes to Portfolios of Investments | December 31, 2019 |
The following table summarizes the valuation of each Fund’s securities as of December 31, 2019, using the fair value hierarchy:
| | | Quoted Prices in Active Markets for Identical Investments (Level 1) | | | Significant Other Observable Inputs (Level 2) | | | Significant Unobservable Inputs (Level 3) | | | Total | |
| U.S. Government Securities Ultra-Short Bond Fund | | | | | | | | | | | | |
| Investments in Securities* | | | | | | | | | | | | |
| United States Government and Agency Obligations | | $ | – | | | $ | 37,130,151 | | | $ | – | | | $ | 37,130,151 | |
| Exchange Traded Fund | | | 4,379,760 | | | | – | | | | – | | | | 4,379,760 | |
| Investments, at Value | | $ | 4,379,760 | | | $ | 37,130,151 | | | $ | – | | | $ | 41,509,911 | |
| | | Quoted Prices in Active Markets for Identical Investments (Level 1) | | | Significant Other Observable Inputs (Level 2) | | | Significant Unobservable Inputs (Level 3) | | | Total | |
| Near-Term Tax Free Fund | | | | | | | | | | | | |
| Investments in Securities* | | | | | | | | | | | | |
| Municipal Bonds | | $ | – | | | $ | 37,696,250 | | | $ | – | | | $ | 37,696,250 | |
| Exchange Traded Funds | | | 4,490,175 | | | | – | | | | – | | | | 4,490,175 | |
| Investments, at Value | | $ | 4,490,175 | | | $ | 37,696,250 | | | $ | – | | | $ | 42,186,425 | |
| | | Quoted Prices in Active Markets for Identical Investments (Level 1) | | | Significant Other Observable Inputs (Level 2) | | | Significant Unobservable Inputs (Level 3) | | | Total | |
| All American Equity Fund | | | | | | | | | | | | | | | | |
| Investments in Securities* | | | | | | | | | | | | | | | | |
| Common Stocks | | | | | | | | | | | | | | | | |
| Applications Software | | $ | 404,682 | | | $ | – | | | $ | – | | | $ | 404,682 | |
| Building - Residential/ Commercial | | | 445,540 | | | | – | | | | – | | | | 445,540 | |
| Casino Hotels | | | 517,707 | | | | – | | | | – | | | | 517,707 | |
| Coatings/Paint | | | 498,343 | | | | – | | | | – | | | | 498,343 | |
| Commercial Banks - Southern US | | | 508,725 | | | | – | | | | – | | | | 508,725 | |
| Computers | | | 458,512 | | | | – | | | | – | | | | 458,512 | |
| Decision Support Software | | | 479,699 | | | | – | | | | – | | | | 479,699 | |
| Electric - Integrated | | | 400,954 | | | | – | | | | – | | | | 400,954 | |
| Electronic Components - Semiconductors | | | 471,818 | | | | – | | | | – | | | | 471,818 | |
| Electronic Secure Devices | | | 576,122 | | | | – | | | | – | | | | 576,122 | |
| Notes to Portfolios of Investments | December 31, 2019 |
| | | Quoted Prices in Active Markets for Identical Investments (Level 1) | | | Significant Other Observable Inputs (Level 2) | | | Significant Unobservable Inputs (Level 3) | | | Total | |
| All American Equity Fund (continued) | | | | | | | | | | | | |
| Investments in Securities* (continued) | | | | | | | | | | | | |
| Enterprise Software/ Services | | $ | 403,443 | | | $ | – | | | $ | – | | | $ | 403,443 | |
| Finance - Credit Card | | | 895,654 | | | | – | | | | – | | | | 895,654 | |
| Finance - Investment Banker/Broker | | | 474,078 | | | | – | | | | – | | | | 474,078 | |
| Food - Miscellaneous/ Diversified | | | 411,117 | | | | – | | | | – | | | | 411,117 | |
| Food - Wholesale/ Distribution | | | 450,368 | | | | – | | | | – | | | | 450,368 | |
| Medical - Drugs | | | 886,064 | | | | – | | | | – | | | | 886,064 | |
| Medical - Hospitals | | | 510,092 | | | | – | | | | – | | | | 510,092 | |
| Medical - Wholesale Drug Distribution | | | 418,280 | | | | – | | | | – | | | | 418,280 | |
| Oil Companies - Exploration & Production | | | 1,255,397 | | | | – | | | | – | | | | 1,255,397 | |
| REITS - Diversified | | | 429,304 | | | | – | | | | – | | | | 429,304 | |
| Retail - Building Products | | | 392,429 | | | | – | | | | – | | | | 392,429 | |
| Retail - Restaurants | | | 476,966 | | | | – | | | | – | | | | 476,966 | |
| Supranational Bank | | | 450,231 | | | | – | | | | – | | | | 450,231 | |
| Tobacco | | | 509,531 | | | | – | | | | – | | | | 509,531 | |
| Transportation - Rail | | | 896,481 | | | | – | | | | – | | | | 896,481 | |
| Corporate Non-Convertible Note | | | – | | | | 305,275 | | | | – | | | | 305,275 | |
| Put Option | | | 400 | | | | – | | | | – | | | | 400 | |
| Investments, at Value | | $ | 13,621,937 | | | $ | 305,275 | | | $ | – | | | $ | 13,927,212 | |
| | | Quoted Prices in Active Markets for Identical Investments (Level 1) | | | Significant Other Observable Inputs (Level 2) | | | Significant Unobservable Inputs (Level 3) | | | Total | |
| Holmes Macro Trends Fund | | | | | | | | | | | | |
| Investments in Securities* | | | | | | | | | | | | |
| Common Stocks | | | | | | | | | | | | | | | | |
| Chemicals - Specialty | | $ | 1,343,468 | | | $ | – | | | $ | – | | | $ | 1,343,468 | |
| Coal | | | 929,757 | | | | – | | | | – | | | | 929,757 | |
| Commercial Service - Finance | | | 1,860,107 | | | | – | | | | – | | | | 1,860,107 | |
| Commercial Services | | | 1,048,242 | | | | – | | | | – | | | | 1,048,242 | |
| Data Processing/ Management | | | 1,611,499 | | | | – | | | | – | | | | 1,611,499 | |
| Decision Support Software | | | 1,913,630 | | | | – | | | | – | | | | 1,913,630 | |
| Diagnostic Kits | | | 1,549,807 | | | | – | | | | – | | | | 1,549,807 | |
| Notes to Portfolios of Investments | December 31, 2019 |
| | | Quoted Prices in Active Markets for Identical Investments (Level 1) | | | Significant Other Observable Inputs (Level 2) | | | Significant Unobservable Inputs (Level 3) | | | Total | |
| Holmes Macro Trends Fund (continued) | | | | | | | | | | | | |
| Investments in Securities* (continued) | | | | | | | | | | | | |
| Distribution/Wholesale | | $ | 1,382,594 | | | $ | – | | | $ | – | | | $ | 1,382,594 | |
| Electronic Secure Devices | | | 1,775,442 | | | | – | | | | – | | | | 1,775,442 | |
| Energy - Alternate Sources | | | – | | | | – | | | | 0 | | | | 0 | |
| Enterprise Software/ Services | | | 523,500 | | | | – | | | | – | | | | 523,500 | |
| Finance - Investment Banker/Broker | | | 1,223,747 | | | | – | | | | – | | | | 1,223,747 | |
| Garden Products | | | 1,559,572 | | | | – | | | | – | | | | 1,559,572 | |
| Home Furnishings | | | 1,705,941 | | | | – | | | | – | | | | 1,705,941 | |
| Information Technology | | | – | | | | – | | | | 130,915 | | | | 130,915 | |
| Medical - Biomedical/ Genetics | | | 1,267,794 | | | | – | | | | – | | | | 1,267,794 | |
| Medical - Drugs | | | 1,971,564 | | | | – | | | | – | | | | 1,971,564 | |
| Medical - Hospitals | | | – | | | | – | | | | 0 | | | | 0 | |
| Metal - Diversified | | | 327,288 | | | | – | | | | – | | | | 327,288 | |
| Office Automation & Equipment | | | 873,047 | | | | – | | | | – | | | | 873,047 | |
| Oil - Field Services | | | 2,126,374 | | | | – | | | | – | | | | 2,126,374 | |
| Oil Companies - Exploration & Production | | | 1,041,122 | | | | – | | | | – | | | | 1,041,122 | |
| Paper & Related Products | | | 974,283 | | | | – | | | | – | | | | 974,283 | |
| Real Estate Operating/ Development | | | – | | | | – | | | | 164,343 | | | | 164,343 | |
| Rental Auto/Equipment | | | 967,200 | | | | – | | | | – | | | | 967,200 | |
| Retail - Building Products | | | 1,618,414 | | | | – | | | | – | | | | 1,618,414 | |
| Retail - Pet Food & Supplies | | | 1,056,589 | | | | – | | | | – | | | | 1,056,589 | |
| Television | | | 1,052,794 | | | | – | | | | – | | | | 1,052,794 | |
| Web Hosting/Design | | | 1,081,740 | | | | – | | | | – | | | | 1,081,740 | |
| Corporate Non-Convertible Note | | | – | | | | 778,159 | | | | – | | | | 778,159 | |
| Warrants | | | | | | | | | | | | | | | | |
| Information Technology | | | – | | | | – | | | | 0 | | | | 0 | |
| Oil Companies - Exploration & Production | | | 385 | | | | – | | | | – | | | | 385 | |
| Put Option | | | 1,000 | | | | – | | | | – | | | | 1,000 | |
| Investments, at Value | | | 32,786,900 | | | | 778,159 | | | | 295,258 | | | | 33,860,317 | |
| Notes to Portfolios of Investments | December 31, 2019 |
| | | Quoted Prices in Active Markets for Identical Investments (Level 1) | | | Significant Other Observable Inputs (Level 2) | | | Significant Unobservable Inputs (Level 3) | | | Total | |
| Global Resources Fund | | | | | | | | | | | | |
| Investments in Securities* | | | | | | | | | | | | |
| Common Stocks | | | | | | | | | | | | |
| Agricultural Chemicals | | $ | 1,388,965 | | | $ | – | | | $ | – | | | $ | 1,388,965 | |
| Building & Construction Products - Miscellaneous | | | 296,700 | | | | – | | | | – | | | | 296,700 | |
| Building Products - Wood | | | 267,452 | | | | – | | | | – | | | | 267,452 | |
| Coal | | | – | | | | – | | | | 0 | | | | 0 | |
| Diamonds/Precious Stones | | | 170,960 | | | | – | | | | 0 | | | | 170,960 | |
| Diversified Minerals | | | 3,471,761 | | | | – | | | | – | | | | 3,471,761 | |
| Electric - Integrated | | | – | | | | 575,743 | | | | – | | | | 575,743 | |
| Energy - Alternate Sources | | | – | | | | 1,010,065 | | | | 0 | | | | 1,010,065 | |
| Finance - Investment Banker/Broker | | | 288,014 | | | | – | | | | – | | | | 288,014 | |
| Food - Miscellaneous/ Diversified | | | 650,650 | | | | – | | | | – | | | | 650,650 | |
| Forestry | | | 282,430 | | | | – | | | | – | | | | 282,430 | |
| Gold Mining | | | 6,781,158 | | | | 245,943 | | | | 0 | | | | 7,027,101 | |
| Information Technology | | | – | | | | – | | | | 818,220 | | | | 818,220 | |
| Medical - Hospitals | | | – | | | | – | | | | 0 | | | | 0 | |
| Metal - Copper | | | 328,000 | | | | – | | | | – | | | | 328,000 | |
| Metal - Diversified | | | 2,891,796 | | | | 2,054,648 | | | | – | | | | 4,946,444 | |
| Metal - Iron | | | 935,659 | | | | 1,105,843 | | | | 0 | | | | 2,041,502 | |
| Mining Services | | | 388,490 | | | | 190,597 | | | | – | | | | 579,087 | |
| Natural Resource Technology | | | – | | | | – | | | | 120,741 | | | | 120,741 | |
| Non-Ferrous Metals | | | 30,804 | | | | – | | | | 0 | | | | 30,804 | |
| Oil - Field Services | | | 489,400 | | | | – | | | | – | | | | 489,400 | |
| Oil Companies - Exploration & Production | | | 3,457,962 | | | | 1,327,354 | | | | 0 | | | | 4,785,316 | |
| Oil Companies - Integrated | | | 4,428,728 | | | | 3,336,508 | | | | – | | | | 7,765,236 | |
| Oil Companies - US Royalty Trusts | | | 5,080 | | | | – | | | | – | | | | 5,080 | |
| Oil Refining & Marketing | | | 1,426,540 | | | | – | | | | – | | | | 1,426,540 | |
| Paper & Related Products | | | 883,033 | | | | – | | | | – | | | | 883,033 | |
| Platinum | | | 818,294 | | | | – | | | | – | | | | 818,294 | |
| Precious Metals | | | 2,184,326 | | | | – | | | | – | | | | 2,184,326 | |
| Real Estate Operating/ Development | | | – | | | | – | | | | 2,867,998 | | | | 2,867,998 | |
| REITS - Diversified | | | 596,500 | | | | – | | | | – | | | | 596,500 | |
| Retail - Jewelry | | | 148,242 | | | | – | | | | – | | | | 148,242 | |
| Steel - Producers | | | 703,500 | | | | 873,085 | | | | – | | | | 1,576,585 | |
| Corporate Non-Convertible Note | | | – | | | | 1,392,820 | | | | – | | | | 1,392,820 | |
| Exchange Traded Funds | | | 2,130,056 | | | | – | | | | – | | | | 2,130,056 | |
| Warrants | | | | | | | | | | | | | | | | |
| Electronics - Military | | | – | | | | 0 | | | | – | | | | 0 | |
| Gold Mining | | | – | | | | 0 | | | | – | | | | 0 | |
| Notes to Portfolios of Investments | December 31, 2019 |
| | | Quoted Prices in Active Markets for Identical Investments (Level 1) | | | Significant Other Observable Inputs (Level 2) | | | Significant Unobservable Inputs (Level 3) | | | Total | |
| Global Resources Fund (continued) | | | | | | | | | | | | |
| Investments in Securities* (continued) | | | | | | | | | | | | |
| Metal - Diversified | | $ | – | | | $ | 0 | | | $ | – | | | $ | 0 | |
| Oil Companies - Exploration & Production | | | – | | | | 1,540 | | | | – | | | | 1,540 | |
| Call Option | | | 316,500 | | | | – | | | | – | | | | 316,500 | |
| Investments, at Value | | | 35,761,000 | | | | 12,114,146 | | | | 3,806,959 | | | | 51,682,105 | |
| | | Quoted Prices in Active Markets for Identical Investments (Level 1) | | | Significant Other Observable Inputs (Level 2) | | | Significant Unobservable Inputs (Level 3) | | | Total | |
| World Precious Minerals Fund | | | | | | | | | | | | |
| Investments in Securities* | | | | | | | | | | | | |
| Common Stocks | | | | | | | | | | | | |
| Advanced Materials/ Production | | $ | 2,858,573 | | | $ | – | | | $ | – | | | $ | 2,858,573 | |
| Capital Pools | | | – | | | | 357,322 | | | | – | | | | 357,322 | |
| Coal | | | – | | | | – | | | | 0 | | | | 0 | |
| Diamonds/Precious Stones | | | 783,566 | | | | – | | | | 0 | | | | 783,566 | |
| Diversified Minerals | | | 3,515,633 | | | | – | | | | 577,567 | | | | 4,093,200 | |
| Finance - Investment Banker/Broker | | | 20,536 | | | | – | | | | – | | | | 20,536 | |
| Gold Mining | | | 29,821,113 | | | | 2,292,500 | | | | 21,895 | | | | 32,135,508 | |
| Investment Companies | | | 61,607 | | | | – | | | | – | | | | 61,607 | |
| Machinery - Construction & Mining | | | 192,922 | | | | – | | | | – | | | | 192,922 | |
| Medical - Hospitals | | | – | | | | – | | | | 0 | | | | 0 | |
| Metal - Copper | | | 175,195 | | | | – | | | | – | | | | 175,195 | |
| Metal - Diversified | | | 6,002,910 | | | | 4,227,628 | | | | – | | | | 10,230,538 | |
| Metal - Iron | �� | | – | | | | 84,210 | | | | – | | | | 84,210 | |
| Mining Services | | | 699,976 | | | | – | | | | – | | | | 699,976 | |
| Non-Ferrous Metals | | | 721,959 | | | | – | | | | – | | | | 721,959 | |
| Oil Companies - Exploration & Production | | | – | | | | – | | | | 0 | | | | 0 | |
| Optical Recognition Equipment | | | 3,675 | | | | – | | | | – | | | | 3,675 | |
| Platinum | | | 211,775 | | | | – | | | | – | | | | 211,775 | |
| Precious Metals | | | 15,652,330 | | | | 1,281,641 | | | | – | | | | 16,933,971 | |
| Retail - Jewelry | | | 677,679 | | | | – | | | | – | | | | 677,679 | |
| Silver Mining | | | 128,489 | | | | – | | | | – | | | | 128,489 | |
| Exchange Traded Funds | | | 5,029,900 | | | | – | | | | – | | | | 5,029,900 | |
| Notes to Portfolios of Investments | December 31, 2019 |
| | | Quoted Prices in Active Markets for Identical Investments (Level 1) | | | Significant Other Observable Inputs (Level 2) | | | Significant Unobservable Inputs (Level 3) | | | Total | |
| World Precious Minerals Fund (continued) | | | | | | | | | | | | |
| Investments in Securities* (continued) | | | | | | | | | | | | |
| Warrants | | | | | | | | | | | | |
| Gold Mineral Exploration & Development | | $ | – | | | $ | – | | | $ | 0 | | | $ | 0 | |
| Gold Mining | | | – | | | | 0 | | | | – | | | | 0 | |
| Retail - Jewelry | | | 12,533 | | | | – | | | | – | | | | 12,533 | |
| Call Option | | | 422,000 | | | | – | | | | – | | | | 422,000 | |
| Investments, at Value | | | 66,992,371 | | | | 8,243,301 | | | | 599,462 | | | | 75,835,134 | |
| | | Quoted Prices in Active Markets for Identical Investments (Level 1) | | | Significant Other Observable Inputs (Level 2) | | | Significant Unobservable Inputs (Level 3) | | | Total | |
| Gold And Precious Metals Fund | | | | | | | | | | | | |
| Investments in Securities* | | | | | | | | | | | | |
| Common Stocks | | | | | | | | | | | | |
| Diversified Minerals | | $ | 2,161,153 | | | $ | – | | | $ | – | | | $ | 2,161,153 | |
| Engineering/R&D Services | | | – | | | | 282,884 | | | | – | | | | 282,884 | |
| Gold Mining | | | 51,232,036 | | | | 14,361,312 | | | | – | | | | 65,593,348 | |
| Medical - Hospitals | | | – | | | | – | | | | 0 | | | | 0 | |
| Metals & Mining | | | – | | | | – | | | | 35,087 | | | | 35,087 | |
| Mining Services | | | 2,659,540 | | | | – | | | | – | | | | 2,659,540 | |
| Non - Ferrous Metals | | | 477,500 | | | | – | | | | – | | | | 477,500 | |
| Platinum | | | 2,554,337 | | | | – | | | | – | | | | 2,554,337 | |
| Precious Metals | | | 20,956,927 | | | | – | | | | – | | | | 20,956,927 | |
| Retail - Jewelry | | | 2,462,637 | | | | – | | | | – | | | | 2,462,637 | |
| Silver Mining | | | 6,132,180 | | | | – | | | | – | | | | 6,132,180 | |
| Corporate Non-Convertible Bond | | | – | | | | – | | | | 0 | | | | 0 | |
| Corporate Non-Convertible Notes | | | – | | | | 2,129,124 | | | | – | | | | 2,129,124 | |
| Right | | | – | | | | – | | | | 0 | | | | 0 | |
| Exchange Traded Funds | | | 9,398,770 | | | | – | | | | – | | | | 9,398,770 | |
| Warrants | | | | | | | | | | | | | | | | |
| Gold Mining | | | – | | | | 0 | | | | – | | | | 0 | |
| Silver Mining | | | 62,088 | | | | – | | | | – | | | | 62,088 | |
| Call Option | | | 633,000 | | | | – | | | | – | | | | 633,000 | |
| Investments, at Value | | $ | 98,730,168 | | | $ | 16,773,320 | | | $ | 35,087 | | | $ | 115,538,575 | |
| Notes to Portfolios of Investments | December 31, 2019 |
| | | Quoted Prices in Active Markets for Identical Investments (Level 1) | | | Significant Other Observable Inputs (Level 2) | | | Significant Unobservable Inputs (Level 3) | | | Total | |
| Emerging Europe Fund | | | | | | | | | | | | |
| Assets | | | | | | | | | | | | |
| Investments in Securities* | | | | | | | | | | | | |
| Common Stocks | | | | | | | | | | | | | | | | |
| Agricultural Chemicals | | $ | 494,305 | | | $ | – | | | $ | – | | | $ | 494,305 | |
| Airlines | | | – | | | | 958,491 | | | | – | | | | 958,491 | |
| Airport Development/ Maintenance | | | – | | | | 177,925 | | | | – | | | | 177,925 | |
| Apparel Manufacturers | | | – | | | | 551,524 | | | | – | | | | 551,524 | |
| Appliances | | | – | | | | 194,760 | | | | – | | | | 194,760 | |
| Athletic Footwear | | | – | | | | 117,187 | | | | – | | | | 117,187 | |
| Automotive - Cars & Light Trucks | | | – | | | | 289,509 | | | | – | | | | 289,509 | |
| Automotive/Truck Parts & Equipment - Original | | | – | | | | 39,013 | | | | – | | | | 39,013 | |
| Beverages - Non-alcoholic | | | – | | | | 81,231 | | | | – | | | | 81,231 | |
| Brewery | | | – | | | | 157,147 | | | | – | | | | 157,147 | |
| Building - Heavy Construction | | | – | | | | 276,773 | | | | – | | | | 276,773 | |
| Building & Construction Products - Miscellaneous | | | – | | | | 391,396 | | | | – | | | | 391,396 | |
| Cellular Telecommunication | | | 123,830 | | | | 316,425 | | | | – | | | | 440,255 | |
| Coal | | | – | | | | 108,337 | | | | – | | | | 108,337 | |
| Commercial Banks Non-US | | | 2,997,100 | | | | 2,837,472 | | | | – | | | | 5,834,572 | |
| Commercial Services - Finance | | | 154,880 | | | | – | | | | – | | | | 154,880 | |
| Diversified Operations | | | – | | | | 324,662 | | | | – | | | | 324,662 | |
| Electric - Distribution | | | – | | | | 208,527 | | | | – | | | | 208,527 | |
| Electric - Generation | | | – | | | | 468,061 | | | | – | | | | 468,061 | |
| Electric - Integrated | | | – | | | | 169,301 | | | | – | | | | 169,301 | |
| Energy - Alternate Sources | | | 70,752 | | | | – | | | | – | | | | 70,752 | |
| Entertainment Software | | | – | | | | 494,057 | | | | – | | | | 494,057 | |
| Finance - Other Services | | | – | | | | 190,978 | | | | – | | | | 190,978 | |
| Food - Retail | | | 467,475 | | | | 529,656 | | | | – | | | | 997,131 | |
| Food - Wholesale/ Distribution | | | – | | | | 226,434 | | | | – | | | | 226,434 | |
| Gold Mining | | | 132,841 | | | | 363,963 | | | | – | | | | 496,804 | |
| Machinery - Farm | | | – | | | | 46,521 | | | | – | | | | 46,521 | |
| Metal - Diversified | | | 1,650,850 | | | | 196,755 | | | | – | | | | 1,847,605 | |
| Metal - Iron | | | – | | | | 414,935 | | | | – | | | | 414,935 | |
| Miscellaneous Manufacturing | | | – | | | | 125,819 | | | | – | | | | 125,819 | |
| Multi-line Insurance | | | – | | | | 323,230 | | | | – | | | | 323,230 | |
| Oil Companies - Exploration & Production | | | 1,638,975 | | | | 109,527 | | | | – | | | | 1,748,502 | |
| Oil Companies - Integrated | | | 5,453,013 | | | | 4,312,398 | | | | – | | | | 9,765,411 | |
| Oil Refining & Marketing | | | – | | | | 1,429,460 | | | | – | | | | 1,429,460 | |
| Notes to Portfolios of Investments | December 31, 2019 |
| | | Quoted Prices in Active Markets for Identical Investments (Level 1) | | | Significant Other Observable Inputs (Level 2) | | | Significant Unobservable Inputs (Level 3) | | | Total | |
| Emerging Europe Fund (continued) | | | | | | | | | | | | |
| Assets (continued) | | | | | | | | | | | | |
| Investments in Securities* (continued) | | | | | | | | | | | | | | | | |
| Precious Metals | | $ | – | | | $ | 173,966 | | | $ | – | | | $ | 173,966 | |
| Property/Casualty Insurance | | | – | | | | 532,297 | | | | – | | | | 532,297 | |
| Regional Banks - Non US | | | – | | | | 470,571 | | | | – | | | | 470,571 | |
| Retail - Apparel/Shoe | | | – | | | | 367,024 | | | | – | | | | 367,024 | |
| Retail - Jewelry | | | – | | | | 342,038 | | | | – | | | | 342,038 | |
| Retail - Major Dept Store | | | – | | | | 289,843 | | | | – | | | | 289,843 | |
| Steel - Producers | | | 226,432 | | | | 1,160,651 | | | | – | | | | 1,387,083 | |
| Telecom Services | | | – | | | | 247,294 | | | | – | | | | 247,294 | |
| Telephone - Integrated | | | – | | | | 495,685 | | | | – | | | | 495,685 | |
| Textile - Apparel | | | – | | | | 141,811 | | | | – | | | | 141,811 | |
| Transportation - Rail | | | – | | | | 465,197 | | | | – | | | | 465,197 | |
| Transportation - Services | | | – | | | | 307,919 | | | | – | | | | 307,919 | |
| Exchange Traded Fund | | | 348,400 | | | | – | | | | – | | | | 348,400 | |
| Warrant | | | | | | | | | | | | | | | | |
| Energy - Alternate Sources | | | – | | | | 0 | | | | – | | | | 0 | |
| Investments, at Value | | $ | 13,758,853 | | | $ | 21,425,770 | | | $ | – | | | $ | 35,184,623 | |
| Total Assets | | $ | 13,758,853 | | | $ | 21,425,770 | | | $ | – | | | $ | 35,184,623 | |
| | | | | | | | | | | | | | | | | |
| Liabilities | | | | | | | | | | | | | | | | |
| Other Financial Instruments† | | | | | | | | | | | | | | | | |
| Currency Contracts | | | – | | | | (11,541 | ) | | | – | | | | (11,541 | ) |
| Total Liabilities | | $ | – | | | $ | (11,541 | ) | | $ | – | | | $ | (11,541 | ) |
| | | Quoted Prices in Active Markets for Identical Investments (Level 1) | | | Significant Other Observable Inputs (Level 2) | | | Significant Unobservable Inputs (Level 3) | | | Total | |
| China Region Fund | | | | | | | | | | | | | | | | |
| Investments in Securities* | | | | | | | | | | | | | | | | |
| Common Stocks | | | | | | | | | | | | | | | | |
| Airlines | | $ | – | | | $ | 176,397 | | | $ | – | | | $ | 176,397 | |
| Apparel Manufacturers | | | – | | | | 22,668 | | | | – | | | | 22,668 | |
| Athletic Footwear | | | – | | | | 13,017 | | | | – | | | | 13,017 | |
| Audio/Video Products | | | – | | | | 75,160 | | | | – | | | | 75,160 | |
| Automotive - Cars & Light Trucks | | | – | | | | 13,069 | | | | – | | | | 13,069 | |
| Automotive/Truck Parts & Equipment - Replacement | | | – | | | | 844,290 | | | | – | | | | 844,290 | |
| Batteries/Battery Systems | | | – | | | | 193,435 | | | | – | | | | 193,435 | |
| Notes to Portfolios of Investments | December 31, 2019 |
| | | Quoted Prices in Active Markets for Identical Investments (Level 1) | | | Significant Other Observable Inputs (Level 2) | | | Significant Unobservable Inputs (Level 3) | | | Total | |
| China Region Fund (continued) | | | | | | | | | | | | |
| Investments in Securities* (continued) | | | | | | | | | | | | | | | | |
| Broadcast Service/Program | | $ | – | | | $ | 14,556 | | | $ | – | | | $ | 14,556 | |
| Building - Heavy Construction | | | – | | | | 300,324 | | | | – | | | | 300,324 | |
| Building & Construction Products - Miscellaneous | | | – | | | | 30,892 | | | | – | | | | 30,892 | |
| Building Products - Cement | | | – | | | | 407,886 | | | | – | | | | 407,886 | |
| Casino Hotels | | | – | | | | 272,453 | | | | – | | | | 272,453 | |
| Chemicals - Diversified | | | – | | | | 13,966 | | | | – | | | | 13,966 | |
| Chemicals - Fibers | | | – | | | | 11,305 | | | | – | | | | 11,305 | |
| Chemicals - Specialty | | | – | | | | 29,234 | | | | – | | | | 29,234 | |
| Coal | | | – | | | | 182,957 | | | | – | | | | 182,957 | |
| Commercial Banks Non-US | | | – | | | | 256,119 | | | | – | | | | 256,119 | |
| Computers - Integrated System | | | – | | | | 15,458 | | | | – | | | | 15,458 | |
| Consumer Products - Miscellaneous | | | – | | | | 203 | | | | – | | | | 203 | |
| Diversified Financial Services | | | – | | | | 40,059 | | | | – | | | | 40,059 | |
| E-Commerce/Services | | | – | | | | 36,273 | | | | – | | | | 36,273 | |
| Electronic Components - Miscellaneous | | | – | | | | 529,735 | | | | – | | | | 529,735 | |
| Engineering/R&D Services | | | – | | | | 873,502 | | | | – | | | | 873,502 | |
| Enterprise Software/ Services | | | – | | | | 30,796 | | | | – | | | | 30,796 | |
| Entertainment Software | | | – | | | | 11,506 | | | | – | | | | 11,506 | |
| Finance - Investment Banker/Broker | | | – | | | | 15,425 | | | | – | | | | 15,425 | |
| Food - Dairy Products | | | – | | | | 533,952 | | | | – | | | | 533,952 | |
| Food - Miscellaneous/ Diversified | | | – | | | | 1,545,474 | | | | – | | | | 1,545,474 | |
| Gambling (Non-Hotel) | | | – | | | | 37,351 | | | | – | | | | 37,351 | |
| Gas - Distribution | | | – | | | | 36,053 | | | | – | | | | 36,053 | |
| Life/Health Insurance | | | – | | | | 202,584 | | | | – | | | | 202,584 | |
| Medical - Drugs | | | – | | | | 593,281 | | | | – | | | | 593,281 | |
| Multi-line Insurance | | | – | | | | 934,844 | | | | – | | | | 934,844 | |
| Multimedia | | | – | | | | 376,476 | | | | – | | | | 376,476 | |
| Non-Ferrous Metals | | | – | | | | – | | | | 0 | | | | 0 | |
| Oil Companies - Exploration & Production | | | – | | | | 74,893 | | | | – | | | | 74,893 | |
| Oil Field Machinery & Equipment | | | – | | | | 10,723 | | | | – | | | | 10,723 | |
| Real Estate Operating/ Development | | | – | | | | 3,875,134 | | | | – | | | | 3,875,134 | |
| Reinsurance | | | – | | | | 14,792 | | | | – | | | | 14,792 | |
| Retail - Apparel/Shoe | | | – | | | | 1,132,504 | | | | – | | | | 1,132,504 | |
| Notes to Portfolios of Investments | December 31, 2019 |
| | | Quoted Prices in Active Markets for Identical Investments (Level 1) | | | Significant Other Observable Inputs (Level 2) | | | Significant Unobservable Inputs (Level 3) | | | Total | |
| China Region Fund (continued) | | | | | | | | | | | | |
| Investments in Securities* (continued) | | | | | | | | | | | | | | | | |
| Schools | | $ | – | | | $ | 217,802 | | | $ | – | | | $ | 217,802 | |
| Semiconductor Components - Integrated Circuit | | | – | | | | 440,061 | | | | – | | | | 440,061 | |
| Tobacco | | | – | | | | 14,877 | | | | – | | | | 14,877 | |
| Transport Support Services | | | – | | | | 15,458 | | | | – | | | | 15,458 | |
| Investments, at Value | | $ | – | | | $ | 14,466,944 | | | $ | 0 | | | $ | 14,466,944 | |
| * | Refer to the Portfolios of Investments for a detailed list of the Funds’ investments. |
| † | Other Financial Instruments are derivatives not reflected in the Portfolios of Investments, such as Currency Contracts, which are valued at the unrealized appreciation (depreciation) at period end. |
The following is a reconciliation of assets for which unobservable inputs (Level 3) were used in determining fair value during the period January 1, 2019 through December 31, 2019:
| | | Common Stocks | | | Corporate Non- Convertible Bond | | | Warrants | | | Total | |
| Holmes Macro Trends Fund | | | | | | | | | | | | | | | | |
| Beginning Balance 12/31/18 | | $ | 236,043 | | | $ | 233,829 | | | $ | 0 | | | $ | 469,872 | |
| Paydowns/Maturities | | | — | | | | (233,829 | ) | | | — | | | | (233,829 | ) |
| Purchases | | | 150,032 | | | | — | | | | — | | | | 150,032 | |
| Net change in unrealized appreciation (depreciation) | | | (90,817 | ) | | | — | | | | — | | | | (90,817 | ) |
| Ending Balance 12/31/19 | | $ | 295,258 | | | $ | — | | | | 0 | | | $ | 295,258 | |
| Net change in unrealized appreciation (depreciation) from Investments held as of 12/31/19(1) | | $ | (90,817 | ) | | $ | — | | | $ | — | | | $ | (90,817 | ) |
| | | Common Stocks | | | Corporate Non- Convertible Bond | | | Total | |
| Global Resources Fund | | | | | | | | | | | | |
| Beginning Balance 12/31/18 | | $ | 4,606,245 | | | $ | 2,805,938 | | | $ | 7,412,183 | |
| Paydowns/Maturities | | | — | | | | (2,805,938 | ) | | | (2,805,938 | ) |
| Transfers into Level 3 | | | 0 | | | | — | | | | 0 | |
| Net change in unrealized appreciation (depreciation) | | | (799,286 | ) | | | — | | | | (799,286 | ) |
| Ending Balance 12/31/19 | | $ | 3,806,959 | | | $ | — | | | $ | 3,806,959 | |
| Net change in unrealized appreciation (depreciation) from Investments held as of 12/31/19(1) | | $ | (799,286 | ) | | $ | — | | | $ | (799,286 | ) |
| Notes to Portfolios of Investments | December 31, 2019 |
| | | Common Stock | | | Corporate Non- Convertible Bond | | | Warrants | | | Total | |
| World Precious Minerals Fund | | | | | | | | | | | | | | | | |
| Beginning Balance 12/31/18 | | $ | 0 | | | $ | 748,250 | | | $ | 0 | | | $ | 748,250 | |
| Paydown/Maturities | | | — | | | | (748,250 | ) | | | — | | | | (748,250 | ) |
| Transfers into Level 3 | | | 21,895 | | | | — | | | | — | | | | 21,895 | |
| Purchases | | | 570,364 | | | | — | | | | — | | | | 570,364 | |
| Net change in unrealized appreciation (depreciation) | | | 7,203 | | | | — | | | | 0 | | | | 7,203 | |
| Ending Balance 12/31/19 | | $ | 599,462 | | | $ | — | | | $ | 0 | | | $ | 599,462 | |
| Net change in unrealized appreciation (depreciation) from Investments held as of 12/31/19(1) | | $ | 7,203 | | | $ | — | | | $ | 0 | | | $ | 7,203 | |
| | | Common Stocks | | | Corporate Non- Convertible Bond | | | Total | |
| Gold and Precious Metals Fund | | | | | | | | | | | | |
| Beginning Balance 12/31/18 | | $ | 0 | | | $ | 280,594 | | | $ | 280,594 | |
| Paydowns/Maturities | | | — | | | | (280,594 | ) | | | (280,594 | ) |
| Purchases | | | 0 | | | | — | | | | 0 | |
| Net change in unrealized appreciation (depreciation) | | | 35,087 | | | | — | | | | 35,087 | |
| Ending Balance 12/31/19 | | $ | 35,087 | | | $ | — | | | $ | 35,087 | |
| Net change in unrealized appreciation (depreciation) from Investments held as of 12/31/19(1) | | $ | 35,087 | | | $ | — | | | $ | 35,087 | |
| | | Common Stocks | |
| China Region Fund | | | | |
| Beginning Balance 12/31/18 | | $ | 0 | |
| Transfers to Level 3 | | | 0 | |
| Ending Balance 12/31/19 | | $ | 0 | |
| Net change in unrealized appreciation (depreciation) from Investments held as of 12/31/19(1) | | $ | — | |
| (1) | The amounts shown represent the net change in unrealized appreciation (depreciation) attributable to only those investments still held and classified as Level 3 at December 31, 2019. |
Significant unobservable inputs developed by the Valuation Committee (“Valuation Committee”) for Level 3 investments held at period end are as follows:
| | | Fair Value at 12/31/19 | | | Valuation Technique(s) | | Unobservable Input | | Range (Weighted Average) |
| Holmes Macro Trends Fund | | | | | | | | | | |
| Investments in Securities | | | | | | | | | | |
| Common Stocks | | | 130,915 | | | Market Transaction(1) | | Discount | | 15% - 100% discount (69% discount) |
| Common Stocks | | | 164,343 | | | Method of Comparables Pricing (2) | | Multiples | | 8.0 – 31.6 (15.0) |
| Warrants | | | 0 | | | Market Transaction(1) | | Discount | | 0% |
| Notes to Portfolios of Investments | December 31, 2019 |
| | | Fair Value at 12/31/19 | | | Valuation Technique(s) | | Unobservable Input | | Range (Weighted Average) |
| Global Resources Fund | | | | | | | | | | |
| Investments in Securities | | | | | | | | | | |
| Common Stocks | | | 938,961 | | | Market Transaction(1) | | Discount | | 15% - 100% discount (97% discount) |
| Common Stocks | | | 2,867,998 | | | Method of Comparables Pricing (2) | | Multiples | | 8.0 – 31.6 (15.0) |
| | | | | | | | | | | |
| World Precious Minerals Fund | | | | | | | | | | |
| Investments in Securities | | | | | | | | | | |
| Common Stocks | | | 599,462 | | | Market Transaction(1) | | Discount | | 0% - 100% discount (94% discount) |
| Warrants | | | 0 | | | Market Transaction(1) | | Discount | | 100% |
| | | | | | | | | | | |
| Gold and Precious Metals Fund | | | | | | | | | | |
| Investments in Securities | | | | | | | | | | |
| Common Stocks | | | 35,087 | | | Market Transaction(1) | | Discount | | 0% - 100% discount (91% discount) |
| Corporate Non-Convertible Bond | | | 0 | | | Market Transaction(1) | | Discount | | 100% |
| Right | | | 0 | | | Market Transaction(1) | | Discount | | 0% |
| | | | | | | | | | | |
| China Region Fund | | | | | | | | | | |
| Investments in Securities | | | | | | | | | | |
| Common Stocks | | | 0 | | | Market Transaction(1) | | Discount | | 100% |
| (1) | Market Transaction refers to most recent known market transaction, including transactions in which the fund participated, as adjusted for any discount or premium as discussed below. |
| (2) | The Method of Comparables Pricing valuation technique involves determining a comparable group of companies that exhibit similar characteristics to that of the Level 3 security (the Comparables), gathering information about the Comparables to determine their range of valuation multiples and selecting the appropriate multiple within the determined range of the Comparables to apply in valuing the Level 3 security. |
The majority of securities classified as Level 3 are private companies. The initial valuation is usually cost, which is then adjusted as determined by the Valuation Committee for subsequent known market transactions and evaluated for progress against anticipated milestones and current operations. An evaluation that the holding no longer meets expectations could result in the application of discounts and a significantly lower fair valuation. For certain securities, the last known market transaction is increased or decreased by changes in a market index or industry peers as approved by the Valuation Committee.
Affiliated Companies
The Investment Company Act of 1940 defines affiliates as companies in which the Fund owns at least 5% of the outstanding voting securities. The following is a summary of transactions with each affiliated company during the period ended December 31, 2019.
| Notes to Portfolios of Investments | December 31, 2019 |
| | | Shares of Affiliated Companies | |
| Global Resources Fund | | December 31, 2018 | | | Additions | | | Reductions | | | December 31, 2019 | |
| Caribbean Resources Corp. | | | 17 | | | | — | | | | — | | | | 17 | |
| Libero Copper Corp. | | | 3,875,000 | | | | — | | | | (375,000 | ) | | | 3,500,000 | (a) |
| Pacific Green Energy Corp. | | | 2,400,000 | | | | — | | | | — | | | | 2,400,000 | |
| | | Values of Affiliated Companies | |
| Global Resources Fund | | December 31, 2018 | | | Purchases Cost | | | Sales Proceeds | | | December 31, 2019 | | | Income | | | Realized Gain (Loss) on Investments | | | Change in Unrealized Appreciation (Depreciation) | |
| Caribbean Resources Corp. | | $ | 0 | | | $ | — | | | $ | — | | | $ | 0 | | | $ | — | | | $ | – | | | $ | 0 | |
| Libero Copper & Gold Corp. | | | 219,977 | | | | — | | | | (47,716 | ) | | | 309,961 | (a) | | | — | | | | 24,198 | | | | 113,502 | |
| Pacific Green Energy Corp. | | | 0 | | | | — | | | | — | | | | 0 | | | | — | | | | – | | | | – | |
At December 31, 2019, the value of investments in affiliated companies was $0, representing 0.00% of net assets, and the total cost was $27,968,676.
| | | Shares of Affiliated Companies | |
| World Precious Minerals Fund | | December 31, 2018 | | | Additions | | | Reductions | | | December 31, 2019 | |
| Argo Gold, Inc. | | | 2,967,500 | | | | — | | | | — | | | | 2,967,500 | |
Atico Mining Corp.,
(formerly Toachi Mining, Inc.) | | | 6,000,000 | | | | — | | | | (5,191,875 | ) | | | 808,125 | a) |
| Barksdale Capital Corp. | | | 2,700,000 | | | | 50,000 | | | | — | | | | 2,750,000 | |
| Barsele Minerals Corp. | | | 7,050,000 | | | | 450,000 | | | | — | | | | 7,500,000 | |
| Chakana Copper Corp. | | | 4,600,000 | | | | 150,000 | | | | — | | | | 4,750,000 | |
| CopperBank Resources Corp. | | | 22,979,418 | | | | — | | | | — | | | | 22,979,418 | |
| Dolly Varden Silver Corp. | | | 8,428,000 | | | | 704,000 | | | | — | | | | 9,132,000 | |
| Fremont Gold, Ltd. | | | 4,000,000 | | | | — | | | | — | | | | 4,000,000 | |
| Mammoth Resources Corp. | | | 2,171,200 | | | | — | | | | — | | | | 2,171,200 | |
| Orex Minerals, Inc. | | | 5,000,000 | | | | 1,150,000 | | | | — | | | | 6,150,000 | |
| Polarx, Ltd. | | | 15,653,968 | | | | 18,000,000 | | | | — | | | | 33,653,968 | |
| Radisson Mining Resources, Inc. | | | 8,244,000 | | | | 1,060,000 | | | | (804,000 | ) | | | 8,500,000 | |
| Silver Viper Minerals Corp | | | 1,300,000 | | | | 1,850,000 | | | | (150,000 | ) | | | 3,000,000 | |
| TriStar Gold, Inc. | | | 31,130,000 | | | | 20,000 | | | | — | | | | 31,150,000 | |
| TriStar Gold, Inc., Warrants | | | 1,000,000 | | | | — | | | | (1,000,000 | ) | | | — | (a) |
| VR Resources, Ltd. | | | 3,000,000 | | | | — | | | | — | | | | 3,000,000 | |
| VR Resources, Ltd., Warrants | | | 862,500 | | | | — | | | | (862,500 | ) | | | — | (a) |
| Notes to Portfolios of Investments | December 31, 2019 |
| | | Values of Affiliated Companies | |
| World Precious Minerals Fund | | December 31, 2018 | | | Purchases Cost | | | Sales Proceeds | | | December 31, 2019 | | | Income | | | Realized Gain (Loss) on Investments | | | Change in Unrealized Appreciation (Depreciation) | |
| Argo Gold, Inc. | | $ | 344,126 | | | $ | — | | | $ | — | | | $ | 262,803 | | | $ | — | | | $ | – | | | $ | (81,323 | ) |
| Atico Mining Corp., (formerly Toachi Mining, Inc.) | | | 417,522 | | | | — | | | | (123,908 | ) | | | 192,922 | (a) | | | — | | | | (740,294 | ) | | | 639,602 | |
| Barksdale Capital Corp. | | | 1,147,085 | | | | 24,409 | | | | — | | | | 783,566 | | | | — | | | | – | | | | (387,928 | ) |
| Barsele Minerals Corp. | | | 2,065,631 | | | | 188,493 | | | | — | | | | 2,887,836 | | | | — | | | | – | | | | 633,712 | |
| Chakana Copper Corp. | | | 1,415,177 | | | | 45,549 | | | | — | | | | 896,192 | | | | — | | | | – | | | | (564,534 | ) |
| CopperBank Resources Corp. | | | 841,614 | | | | — | | | | — | | | | 796,330 | | | | — | | | | – | | | | (45,284 | ) |
| Dolly Varden Silver Corp. | | | 3,024,993 | | | | 117,845 | | | | — | | | | 2,250,387 | | | | — | | | | – | | | | (892,451 | ) |
| Fremont Gold, Ltd. | | | 439,496 | | | | — | | | | — | | | | 231,027 | | | | — | | | | – | | | | (208,469 | ) |
| Mammoth Resources Corp. | | | 95,423 | | | | — | | | | — | | | | 54,341 | | | | — | | | | – | | | | (41,082 | ) |
| Orex Minerals, Inc. | | | 292,997 | | | | 87,569 | | | | — | | | | 663,047 | | | | — | | | | – | | | | 282,481 | |
| Polarx, Ltd. | | | 604,063 | | | | 785,344 | | | | — | | | | 1,205,418 | | | | — | | | | – | | | | (183,989 | ) |
| Radisson Mining Resources, Inc. | | | 603,868 | | | | 150,418 | | | | (59,308 | ) | | | 1,407,339 | | | | — | | | | (21,412 | ) | | | 733,773 | |
| Silver Viper Minerals Corp. | | | 80,941 | | | | 277,056 | | | | (33,290 | ) | | | 646,875 | | | | — | | | | 531 | | | | 321,637 | |
| TriStar Gold, Inc. | | | 3,534,391 | | | | 3,082 | | | | — | | | | 4,557,776 | | | | — | | | | – | | | | 1,020,303 | |
| TriStar Gold, Inc., Warrants | | | 0 | | | | — | | | | — | | | | — | (a) | | | — | | | | – | | | | — | |
| VR Resources, Ltd. | | | 395,546 | | | | — | | | | — | | | | 854,800 | | | | — | | | | – | | | | 459,254 | |
| VR Resources, Ltd., Warrants | | | 0 | | | | — | | | | — | | | | — | (a) | | | — | | | | – | | | | — | |
At December 31, 2019, the value of investments in affiliated companies was $17,497,737, representing 23.08% of net assets, and the total cost was $22,302,543.
| (a) | At December 31, 2019, the company was no longer defined as an affiliate, although it was an affiliate company during the year. |
Restricted Securities
The following securities are subject to contractual and regulatory restrictions on resale or transfer. These investments may involve a high degree of business and financial risk. Because of the thinly traded markets for these investments, a Fund may be unable to liquidate its securities in a timely manner, especially if there is negative news regarding the specific securities or the markets overall. These securities could decline significantly in value before the Fund could liquidate these securities. The issuer bears the cost of registration, if any, involved in the disposition of these securities.
| Holmes Macro Trends Fund | | Acquisition Date | | Cost per Share/Unit | |
| Infrastructure Ventures, Inc. | | 08/06/10-11/22/10 | | $ | 1.00 | |
| Notes to Portfolios of Investments | December 31, 2019 |
As of December 31, 2019, the total cost of restricted securities was $426,625, and the total value was $164,343, representing 0.47% of net assets.
| Global Resources Fund | | Acquisition Date | | Cost per Share/Unit | |
| I-Pulse, Inc., 144A | | 10/04/07 | | $ | 1.88 | |
| Infrastructure Ventures, Inc. | | 08/06/10-11/22/10 | | $ | 1.00 | |
As of December 31, 2019, the total cost of restricted securities was $7,473,544, and the total value was $2,988,739, representing 5.36% of net assets.
Statements of Assets and Liabilities
| | | U.S. Government Securities Ultra-Short Bond Fund | |
| Investments, at identified cost | | $ | 41,497,725 | |
| | | | | |
| Assets | | | | |
| Investments, at value: | | | | |
| Securities of unaffiliated issuers | | $ | 41,509,911 | |
| Cash | | | 1,085,207 | |
| Receivables: | | | | |
| Dividends and interest | | | 108,661 | |
| Capital shares sold | | | 19,104 | |
| From adviser | | | 184 | |
| Prepaid expenses | | | 10,384 | |
| Total Assets | | | 42,733,451 | |
| | | | | |
| Liabilities | | | | |
| Payables: | | | | |
| Capital shares redeemed | | | 3,360 | |
| Distributions payable | | | 7,603 | |
| Accrued expenses and other payables: | | | | |
| Adviser | | | – | |
| Administration and Transfer Agent fees | | | 10,224 | |
| Other expenses | | | 31,761 | |
| Total Liabilities | | | 52,948 | |
| | | | | |
| Net Assets | | $ | 42,680,503 | |
| | | | | |
| Net Assets Consist of: | | | | |
| Paid-in capital | | $ | 42,649,233 | |
| Distributable earnings | | | 31,270 | |
| Net assets applicable to capital shares outstanding | | $ | 42,680,503 | |
| By share class | | | | |
| Net Assets | | | | |
| Investor Class | | $ | 42,680,503 | |
| Capital shares outstanding, an unlimited number of no par shares authorized | | | | |
| Investor Class | | | 21,352,341 | |
| Net Asset Value, Public Offering Price and Redemption Price per share | | | | |
| Investor Class | | $ | 2.00 | |
See accompanying notes to financial statements.
| Near-Term Tax Free Fund | | All American Equity Fund | | Holmes Macro Trends Fund | |
| $ | 41,862,148 | | $ | 12,948,824 | | $ | 33,753,423 | |
| | | | | | | | | |
| | | | | | | | | |
| $ | 42,186,425 | | $ | 13,927,212 | | $ | 33,860,317 | |
| | 459,733 | | | 244,829 | | | 1,302,673 | |
| | 437,935 | | | 38,335 | | | 14,405 | |
| | 23,495 | | | 2,939 | | | 1,899 | |
| | – | | | – | | | – | |
| | 14,421 | | | 9,535 | | | 14,643 | |
| | 43,122,009 | | | 14,222,850 | | | 35,193,937 | |
| | | | | | | | | |
| | 6,379 | | | 22,244 | | | 57,922 | |
| | 3,435 | | | – | | | – | |
| | | | | | | | | |
| | 8,760 | | | 3,629 | | | 14,442 | |
| | 9,219 | | | 6,416 | | | 9,432 | |
| | 33,521 | | | 28,661 | | | 36,509 | |
| | 61,314 | | | 60,950 | | | 118,305 | |
| $ | 43,060,695 | | $ | 14,161,900 | | $ | 35,075,632 | |
| | | | | | | | | |
| | | | | | | | | |
| $ | 43,938,220 | | $ | 13,417,358 | | $ | 35,079,098 | |
| | (877,525 | ) | | 744,542 | | | (3,466 | ) |
| $ | 43,060,695 | | $ | 14,161,900 | | $ | 35,075,632 | |
| | | | | | | | | |
| $ | 43,060,695 | | $ | 14,161,900 | | $ | 35,075,632 | |
| | | | | | | | | |
| | 19,395,311 | | | 544,163 | | | 2,053,002 | |
| | | | | | | | | |
| $ | 2.22 | | $ | 26.03 | | $ | 17.09 | |
Statements of Assets and Liabilities
| | | Global Resources Fund | |
| Investments, at identified cost | | $ | 99,339,858 | |
| | | | | |
| Assets | | | | |
| Investments, at value: | | | | |
| Securities of unaffiliated issuers | | $ | 51,682,105 | |
| Securities of affiliated issuers | | | – | |
| Cash | | | 2,252,756 | |
| Foreign currencies (Cost $1,285,734, $177,162, $7,085, $518,446 and $0) | | | 1,311,000 | |
| Receivables: | | | | |
| Dividends and interest | | | 170,969 | |
| Capital shares sold | | | 4,724 | |
| Investments sold | | | 886,179 | |
| Prepaid expenses | | | 10,078 | |
| Total Assets | | | 56,317,811 | |
| | | | | |
| Liabilities | | | | |
| Unrealized loss on forward foreign currency contracts | | | – | |
| Payables: | | | | |
| Capital shares redeemed | | | 85,663 | |
| Investments purchased | | | 410,576 | |
| Foreign capital gains tax payable | | | – | |
| Accrued expenses and other payables: | | | | |
| Adviser | | | 20,763 | |
| Administration and Transfer Agent fees | | | 15,012 | |
| Other expenses | | | 46,733 | |
| Total Liabilities | | | 578,747 | |
| | | | | |
| Net Assets | | $ | 55,739,064 | |
| | | | | |
| Net Assets Consist of: | | | | |
| Paid-in capital | | $ | 337,281,837 | |
| Distributable earnings | | | (281,542,773 | ) |
| Net assets applicable to capital shares outstanding | | $ | 55,739,064 | |
| By share class | | | | |
| Net Assets | | | | |
| Investor Class | | $ | 55,739,064 | |
| Capital shares outstanding, an unlimited number of no par shares authorized | | | | |
| Investor Class | | | 12,085,575 | |
| Net Asset Value, Public Offering Price and Redemption Price per share | | | | |
| Investor Class | | $ | 4.61 | |
See accompanying notes to financial statements.
| World Precious Minerals Fund | | | Gold and Precious Metals Fund | | | Emerging Europe Fund | | | China Region Fund | |
| $ | 113,015,528 | | | $ | 80,603,387 | | | $ | 28,267,960 | | | $ | 11,832,313 | |
| | | | | | | | | | | | | | | |
| | | | | | | | | | | | | | | |
| $ | 58,337,397 | | | $ | 115,538,575 | | | $ | 35,184,623 | | | $ | 14,466,944 | |
| | 17,497,737 | | | | – | | | | – | | | | – | |
| | 1,417,367 | | | | 9,365,139 | | | | 715,344 | | | | 22,544 | |
| | 177,162 | | | | 7,077 | | | | 520,975 | | | | – | |
| | 10,153 | | | | 25,636 | | | | 231,582 | | | | 31,043 | |
| | 130,970 | | | | 233,452 | | | | 10,620 | | | | 2,838 | |
| | 56,088 | | | | 132,732 | | | | – | | | | – | |
| | 10,262 | | | | 17,748 | | | | 6,634 | | | | 6,618 | |
| | 77,637,136 | | | | 125,320,359 | | | | 36,669,778 | | | | 14,529,987 | |
| | | | | | | | | | | | | | | |
| | – | | | | – | | | | 11,541 | | | | – | |
| | 1,190,126 | | | | 219,837 | | | | 51,081 | | | | – | |
| | 528,045 | | | | 1,331,517 | | | | – | | | | – | |
| | – | | | | – | | | | 42,851 | | | | 115 | |
| | 31,824 | | | | 108,015 | | | | 37,725 | | | | 24,892 | |
| | 18,648 | | | | 23,857 | | | | 10,121 | | | | 8,216 | |
| | 50,063 | | | | 59,827 | | | | 63,634 | | | | 37,968 | |
| | 1,818,706 | | | | 1,743,053 | | | | 216,953 | | | | 71,191 | |
| $ | 75,818,430 | | | $ | 123,577,306 | | | $ | 36,452,825 | | | $ | 14,458,796 | |
| | | | | | | | | | | | | | | |
| $ | 440,221,203 | | | $ | 179,430,641 | | | $ | 52,137,844 | | | $ | 13,432,132 | |
| | (364,402,773 | ) | | | (55,853,335 | ) | | | (15,685,019 | ) | | | 1,026,664 | |
| $ | 75,818,430 | | | $ | 123,577,306 | | | $ | 36,452,825 | | | $ | 14,458,796 | |
| | | | | | | | | | | | | | | |
| $ | 75,818,430 | | | $ | 123,577,306 | | | $ | 36,452,825 | | | $ | 14,458,796 | |
| | | | | | | | | | | | | | | |
| | 22,911,107 | | | | 12,188,121 | | | | 4,736,532 | | | | 1,585,712 | |
| | | | | | | | | | | | | | | |
| $ | 3.31 | | | $ | 10.14 | | | $ | 7.70 | | | $ | 9.12 | |
Statements of Operations
| | | U.S. Government Securities Ultra-Short Bond Fund | |
| Net Investment Income | | | | |
| | | | | |
| Income | | | | |
| Dividends from unaffiliated issuers | | $ | 31,061 | |
| Net dividends | | | 31,061 | |
| Interest and other | | | 849,448 | |
| Total income | | | 880,509 | |
| | | | | |
| Expenses: | | | | |
| Management fee | | | 229,075 | |
| Administrative services fee | | | 85,224 | |
| Distribution plan fee | | | – | |
| Transfer agent fees and expenses | | | 34,118 | |
| Professional fees | | | 31,810 | |
| Custodian fees | | | 5,445 | |
| Shareholder reporting expenses | | | 11,496 | |
| Registration fees | | | 19,324 | |
| Trustee fees and expenses | | | 5,933 | |
| Chief compliance officer fees | | | 5,960 | |
| Miscellaneous expenses | | | 31,786 | |
| Total expenses before reductions | | | 460,171 | |
| Expenses offset - Note 1 H | | | – | |
| Expenses reimbursed - Note 3 | | | (254,003 | ) |
| Net expenses | | | 206,168 | |
| | | | | |
| Net Investment Income (Loss) | | | 674,341 | |
| | | | | |
| Net Realized and Unrealized Gain (Loss) on Investments | | | | |
| Realized gain (loss) from: | | | | |
| Securities from unaffiliated issuers | | | 19,110 | |
| Foreign currency transactions | | | – | |
| Written options | | | – | |
| Net realized gain (loss) | | | 19,110 | |
| Net change in unrealized appreciation of: | | | | |
| Investments in unaffiliated issuers | | | 32,331 | |
| Net change in unrealized appreciation | | | 32,331 | |
| Net Realized and Unrealized Gain (Loss) on Investments | | | 51,441 | |
| | | | | |
| Net Increase (Decrease) In Net Assets Resulting From Operations | | $ | 725,782 | |
See accompanying notes to financial statements.
For the Year Ended December 31, 2019
| Near-Term Tax Free Fund | | | All American Equity Fund | | | Holmes Macro Trends Fund | |
| | | | | | | | |
| | | | | | | | |
| $ | 32,102 | | | $ | 291,298 | | | $ | 406,078 | |
| | 32,102 | | | | 291,298 | | | | 406,078 | |
| | 747,701 | | | | 30,376 | | | | 93,616 | |
| | 779,803 | | | | 321,674 | | | | 499,694 | |
| | 230,997 | | | | 77,993 | | | | 303,424 | |
| | 85,723 | | | | 52,635 | | | | 84,094 | |
| | – | | | | 34,840 | | | | 89,285 | |
| | 20,488 | | | | 21,812 | | | | 24,702 | |
| | 31,933 | | | | 25,613 | | | | 30,335 | |
| | 6,131 | | | | 5,966 | | | | 581 | |
| | 11,168 | | | | 9,823 | | | | 11,121 | |
| | 19,566 | | | | 17,840 | | | | 15,915 | |
| | 5,948 | | | | 3,736 | | | | 5,231 | |
| | 6,010 | | | | 1,815 | | | | 4,652 | |
| | 66,591 | | | | 16,565 | | | | 35,629 | |
| | 484,555 | | | | 268,638 | | | | 604,969 | |
| | (37,403 | ) | | | (15,619 | ) | | | (56,218 | ) |
| | (239,253 | ) | | | – | | | | – | |
| | 207,899 | | | | 253,019 | | | | 548,751 | |
| | 571,904 | | | | 68,655 | | | | (49,057 | ) |
| | | | | | | | | | | |
| | | | | | | | | | | |
| | 2,599 | | | | (288,290 | ) | | | 1,076,062 | |
| | – | | | | 130 | | | | 1,480 | |
| | – | | | | 7,426 | | | | 16,233 | |
| | 2,599 | | | | (280,734 | ) | | | 1,093,775 | |
| | | | | | | | | | | |
| | 516,405 | | | | 2,630,846 | | | | 3,508,230 | |
| | 516,405 | | | | 2,630,846 | | | | 3,508,230 | |
| | 519,004 | | | | 2,350,112 | | | | 4,602,005 | |
| $ | 1,090,908 | | | $ | 2,418,767 | | | $ | 4,552,948 | |
Statements of Operations
| Global Resources Fund | |
| Net Investment Income | | | |
| | | | |
| Income | | | |
| Dividends from unaffiliated issuers | | $ | 2,000,016 | |
| Foreign tax withheld on dividends | | | (188,825 | ) |
| Net dividends | | | 1,811,191 | |
| Interest and other | | | 332,819 | |
| Total income | | | 2,144,010 | |
| | | | | |
| Expenses: | | | | |
| Management fee | | | 411,109 | |
| Administrative services fee | | | 96,784 | |
| Administrative services fee - Investor Class | | | 29,101 | |
| Administrative services fee - Institutional Class | | | 39 | |
| Distribution plan fee | | | 145,503 | |
| Transfer agent fees and expenses | | | – | |
| Transfer agent fees and expenses - Investor Class | | | 54,564 | |
| Transfer agent fees and expenses - Institutional Class | | | 7,337 | |
| Professional fees | | | 34,093 | |
| Custodian fees | | | 27,152 | |
| Shareholder reporting expenses | | | – | |
| Shareholder reporting expenses - Investor Class | | | 11,198 | |
| Shareholder reporting expenses - Institutional Class | | | 1,124 | |
| Registration fees | | | – | |
| Registration fees - Investor | | | 14,357 | |
| Registration fees - Institutional | | | 18,125 | |
| Trustee fees and expenses | | | 6,760 | |
| Chief compliance officer fees | | | 7,607 | |
| Miscellaneous expenses | | | 102,560 | |
| Total expenses before reductions | | | 967,413 | |
| Expenses offset - Note 1 H | | | (44,569 | ) |
| Expenses reimbursed - Note 3 | | | (30,618 | ) |
| Net expenses | | | 892,226 | |
| | | | | |
| Net Investment Income (Loss) | | 1,251,784 | |
| Net Realized and Unrealized Gain (Loss) on Investments | | | | |
| Realized gain (loss) from: | | | | |
| Securities from unaffiliated issuers | | | (17,286,937 | ) |
| Securities from affiliated issuers | | | 24,198 | |
| Foreign currency transactions | | | (28,466 | ) |
| Foreign capital gains taxes | | | – | |
| Net realized gain (loss) | | | (17,291,205 | ) |
| Net change in unrealized appreciation (depreciation) of: | | | | |
| Investments in unaffiliated issuers | | | 20,586,672 | |
| Investments in affiliated issuers | | | 113,502 | |
| Other assets and liabilities denominated in foreign currencies | | | 36,218 | |
| Deferred foreign capital gains taxes | | | – | |
| Net change in unrealized appreciation | | | 20,736,392 | |
| | | | | |
| Net Realized and Unrealized Gain (Loss) on Investments | | | 3,445,187 | |
| Net Increase (Decrease) In Net Assets Resulting From Operations | | $ | 4,696,971 | |
See accompanying notes to financial statements.
For the Year Ended December 31, 2019
| World Precious Minerals Fund | | | Gold and Precious Metals Fund | | | Emerging Europe Fund | | | China Region Fund | |
| | | | | | | | | | | |
| $ | 93,622 | | $ | | 463,188 | | | $ | 2,003,881 | | | $ | 491,185 | |
| | (1,762 | ) | | | (77,007 | ) | | | (224,964 | ) | | | (22,984 | ) |
| | 91,860 | | | | 386,181 | | | | 1,778,917 | | | | 468,201 | |
| | 51,806 | | | | 230,693 | | | | – | | | | – | |
| | 143,666 | | | | 616,874 | | | | 1,778,917 | | | | 468,201 | |
| | | | | | | | | | | | | | | |
| | 531,828 | | | | 854,141 | | | | 355,146 | | | | 166,155 | |
| | 108,235 | | | | 179,183 | | | | 90,407 | | | | 74,700 | |
| | 35,889 | | | | – | | | | – | | | | – | |
| | 323 | | | | – | | | | – | | | | – | |
| | 179,437 | | | | 253,353 | | | | 82,688 | | | | 36,414 | |
| | – | | | | 73,813 | | | | 22,241 | | | | 21,905 | |
| | 73,580 | | | | – | | | | – | | | | – | |
| | 7,292 | | | | – | | | | – | | | | – | |
| | 35,654 | | | | 39,373 | | | | 33,154 | | | | 30,489 | |
| | 22,588 | | | | 25,939 | | | | 50,742 | | | | 5,539 | |
| | – | | | | 15,700 | | | | 11,088 | | | | 9,781 | |
| | 11,984 | | | | – | | | | – | | | | – | |
| | 1,197 | | | | – | | | | – | | | | – | |
| | – | | | | 28,280 | | | | 19,299 | | | | 18,022 | |
| | 20,256 | | | | – | | | | – | | | | – | |
| | 18,644 | | | | – | | | | – | | | | – | |
| | 7,774 | | | | 9,707 | | | | 5,024 | | | | 3,767 | |
| | 9,492 | | | | 13,258 | | | | 4,313 | | | | 1,893 | |
| | 94,160 | | | | 113,997 | | | | 107,707 | | | | 60,330 | |
| | 1,158,333 | | | | 1,606,744 | | | | 781,809 | | | | 428,995 | |
| | (28,960 | ) | | | (79,797 | ) | | | (21,511 | ) | | | (13,943 | ) |
| | (33,933 | ) | | | – | | | | – | | | | (59,543 | ) |
| | 1,095,440 | | | | 1,526,947 | | | | 760,298 | | | | 355,509 | |
| | | | | | | | | | | | | | | |
| | (951,774 | ) | | | (910,073 | ) | | | 1,018,619 | | | | 112,692 | |
| | | | | | | | | | | | | | | |
| | (7,857,776 | ) | | | 3,904,272 | | | | (957,975 | ) | | | (1,208,754 | ) |
| | (761,175 | ) | | | – | | | | – | | | | – | |
| | 15,368 | | | | (34,368 | ) | | | (441,596 | ) | | | (6,843 | ) |
| | – | | | | – | | | | (8,332 | ) | | | – | |
| | (8,603,583 | ) | | | 3,869,904 | | | | (1,407,903 | ) | | | (1,215,597 | ) |
| | | | | | | | | | | | | | | |
| | 22,698,444 | | | | 39,771,514 | | | | 9,033,684 | | | | 3,903,350 | |
| | 1,685,702 | | | | – | | | | – | | | | – | |
| | (945 | ) | | | (7,859 | ) | | | 23,615 | | | | (93 | ) |
| | – | | | | – | | | | (19,882 | ) | | | (115 | ) |
| | 24,383,201 | | | | 39,763,655 | | | | 9,037,417 | | | | 3,903,142 | |
| | 15,779,618 | | | | 43,633,559 | | | | 7,629,514 | | | | 2,687,545 | |
| $ | 14,827,844 | | $ | | 42,723,486 | | | $ | 8,648,133 | | | $ | 2,800,237 | |
Statements of Changes in Net Assets
| | | U.S. Government Securities Ultra-Short Bond Fund | |
| | | Year Ended December 31, 2019 | | | Year Ended December 31, 2018 | |
| Increase (Decrease) in Net Assets | | | | | | |
| From operations: | | | | | | |
| Net investment income | | $ | 674,341 | | | $ | 551,515 | |
| Net realized gain (loss) | | | 19,110 | | | | 5,522 | |
| Net change in unrealized appreciation (depreciation) | | | 32,331 | | | | 41,634 | |
| Net increase (decrease) in net assets from operations | | | 725,782 | | | | 598,671 | |
| | | | | | | | | |
| Distributions to shareholders | | | | | | | | |
| Investor Class | | | (679,210 | ) | | | (550,423 | ) |
| Total distributions paid | | | (679,210 | ) | | | (550,423 | ) |
| | | | | | | | | |
| From capital share transactions: | | | | | | | | |
| Proceeds from shares sold | | | | | | | | |
| Investor Class | | | 8,427,240 | | | | 7,872,300 | |
| Distributions reinvested | | | | | | | | |
| Investor Class | | | 565,812 | | | | 465,299 | |
| | | | 8,993,052 | | | | 8,337,599 | |
| Cost of shares redeemed | | | | | | | | |
| Investor Class | | | (13,649,538 | ) | | | (10,522,171 | ) |
| Net decrease in net assets from capital share transactions | | | (4,656,486 | ) | | | (2,184,572 | ) |
| Net Increase (Decrease) in Net Assets | | | (4,609,914 | ) | | | (2,136,324 | ) |
| Net Assets | | | | | | | | |
| Beginning of year | | | 47,290,417 | | | | 49,426,741 | |
| End of year | | $ | 42,680,503 | | | $ | 47,290,417 | |
| Capital Share Activity | | | | | | | | |
| Investor Class | | | | | | | | |
| Shares sold | | | 4,213,619 | | | | 3,941,763 | |
| Shares reinvested | | | 282,906 | | | | 233,093 | |
| Shares redeemed | | | (6,824,769 | ) | | | (5,269,444 | ) |
| Net capital share activity | | | (2,328,244 | ) | | | (1,094,588 | ) |
See accompanying notes to financial statements.
| | Near-Term Tax Free Fund | | | All American Equity Fund | |
| | Year Ended December 31, 2019 | | | | Year Ended December 31, 2018 | | | | Year Ended December 31, 2019 | | | | Year Ended December 31, 2018 | |
| | | | | | | | | | | | | | | |
| $ | 571,904 | | | $ | 688,086 | | | $ | 68,655 | | | $ | 11,267 | |
| | 2,599 | | | | (326,886 | ) | | | (280,734 | ) | | | 1,402,742 | |
| | 516,405 | | | | (11,534 | ) | | | 2,630,846 | | | | (2,292,346 | ) |
| | 1,090,908 | | | | 349,666 | | | | 2,418,767 | | | | (878,337 | ) |
| | | | | | | | | | | | | | | |
| | (571,900 | ) | | | (684,664 | ) | | | (266,283 | ) | | | (633,115 | ) |
| | (571,900 | ) | | | (684,664 | ) | | | (266,283 | ) | | | (633,115 | ) |
| | | | | | | | | | | | | | | |
| | | | | | | | | | | | | | | |
| | 13,722,309 | | | | 10,510,615 | | | | 2,304,588 | | | | 3,247,177 | |
| | | | | | | | | | | | | | | |
| | 537,128 | | | | 637,794 | | | | 252,891 | | | | 603,522 | |
| | 14,259,437 | | | | 11,148,409 | | | | 2,557,479 | | | | 3,850,699 | |
| | | | | | | | | | | | | | | |
| | (21,631,365 | ) | | | (30,019,533 | ) | | | (4,183,899 | ) | | | (4,635,324 | ) |
| | | | | | | | | | | | | | | |
| | (7,371,928 | ) | | | (18,871,124 | ) | | | (1,626,420 | ) | | | (784,625 | ) |
| | (6,852,920 | ) | | | (19,206,122 | ) | | | 526,064 | | | | (2,296,077 | ) |
| | | | | | | | | | | | | | | |
| | 49,913,615 | | | | 69,119,737 | | | | 13,635,836 | | | | 15,931,913 | |
| $ | 43,060,695 | | | $ | 49,913,615 | | | $ | 14,161,900 | | | $ | 13,635,836 | |
| | | | | | | | | | | | | | | |
| | | | | | | | | | | | | | | |
| | 6,199,907 | | | | 4,782,451 | | | | 91,833 | | | | 128,047 | |
| | 242,661 | | | | 290,776 | | | | 9,791 | | | | 27,634 | |
| | (9,781,002 | ) | | | (13,667,676 | ) | | | (169,071 | ) | | | (183,797 | ) |
| | (3,338,434 | ) | | | (8,594,449 | ) | | | (67,447 | ) | | | (28,116 | ) |
Statements of Changes in Net Assets
| | | | Holmes Macro Trends Fund | |
| | | | Year Ended December 31, 2019 | | | | Year Ended December 31, 2018 | |
| Increase (Decrease) in Net Assets | | | | | | | | |
| From operations: | | | | | | | | |
| Net investment income (loss) | | $ | (49,057 | ) | | $ | (125,451 | ) |
| Net realized gain (loss) | | | 1,093,775 | | | | 4,467,826 | |
| Net change in unrealized appreciation (depreciation) | | | 3,508,230 | | | | (7,483,102 | ) |
| Net increase (decrease) in net assets from operations | | | 4,552,948 | | | | (3,140,727 | ) |
| | | | | | | | | |
| Distributions to shareholders | | | | | | | | |
| Investor Class | | | (796,931 | ) | | | (4,775,226 | ) |
| Institutional Class | | | – | | | | – | |
| Total distributions paid | | | (796,931 | ) | | | (4,775,226 | ) |
| | | | | | | | | |
| From capital share transactions: | | | | | | | | |
| Proceeds from shares sold | | | | | | | | |
| Investor Class | | | 1,376,434 | | | | 1,951,359 | |
| Institutional Class | | | – | | | | – | |
| Distributions reinvested | | | | | | | | |
| Investor Class | | | 762,742 | | | | 4,545,440 | |
| Institutional Class | | | – | | | | – | |
| | | | 2,139,176 | | | | 6,496,799 | |
| Cost of shares redeemed | | | | | | | | |
| Investor Class | | | (4,667,084 | ) | | | (6,330,584 | ) |
| Institutional Class | | | – | | | | – | |
| Net increase (decrease) in net assets from capital share transactions | | | (2,527,908 | ) | | | 166,215 | |
| Net Increase (Decrease) in Net Assets | | | 1,228,109 | | | | (7,749,738 | ) |
| Net Assets | | | | | | | | |
| Beginning of year | | | 33,847,523 | | | | 41,597,261 | |
| End of year | | $ | 35,075,632 | | | $ | 33,847,523 | |
| Capital Share Activity | | | | | | | | |
| Investor Class | | | | | | | | |
| Shares sold | | | 81,807 | | | | 104,653 | |
| Shares reinvested | | | 44,798 | | | | 302,626 | |
| Shares redeemed | | | (277,604 | ) | | | (334,222 | ) |
| Net capital share activity | | | (150,999 | ) | | | 73,057 | |
| Institutional Class | | | | | | | | |
| Shares sold | | | – | | | | – | |
| Shares reinvested | | | – | | | | – | |
| Shares redeemed | | | – | | | | – | |
| Net capital share activity | | | – | | | | – | |
See accompanying notes to financial statements.
| Global Resources Fund | | | World Precious Minerals Fund | |
| Year Ended December 31, 2019 | | | Year Ended December 31, 2018 | | | Year Ended December 31, 2019 | | | Year Ended December 31, 2018 | |
| | | | | | | | | | | |
| $ | 1,251,784 | | | $ | 1,705,113 | | | $ | (951,774 | ) | | $ | (712,552 | ) |
| | (17,291,205 | ) | | | (10,958,982 | ) | | | (8,603,583 | ) | | | 1,972,867 | |
| | 20,736,392 | | | | (12,888,701 | ) | | | 24,383,201 | | | | (38,514,554 | ) |
| | 4,696,971 | | | | (22,142,570 | ) | | | 14,827,844 | | | | (37,254,239 | ) |
| | | | | | | | | | | | | | | |
| | (1,052,138 | ) | | | (2,777,109 | ) | | | – | | | | (10,428,896 | ) |
| | – | | | | (11,485 | ) | | | – | | | | (270,361 | ) |
| | (1,052,138 | ) | | | (2,788,594 | ) | | | – | | | | (10,699,257 | ) |
| | | | | | | | | | | | | | | |
| | | | | | | | | | | | | | | |
| | 1,507,996 | | | | 6,295,513 | | | | 22,616,733 | | | | 33,624,272 | |
| | 1,428 | | | | 27,542 | | | | 91,417 | | | | 142,294 | |
| | | | | | | | | | | | | | | |
| | 1,010,475 | | | | 2,670,832 | | | | – | | | | 9,830,922 | |
| | – | | | | 9,902 | | | | – | | | | 269,739 | |
| | 2,519,899 | | | | 9,003,789 | | | | 22,708,150 | | | | 43,867,227 | |
| | | | | | | | | | | | | | | |
| | (11,117,069 | ) | | | (19,180,191 | ) | | | (30,772,119 | ) | | | (42,288,710 | ) |
| | (229,984 | ) | | | (235,764 | ) | | | (1,806,332 | ) | | | (537,036 | ) |
| | | | | | | | | | | | | | | |
| | (8,827,154 | ) | | | (10,412,166 | ) | | | (9,870,301 | ) | | | 1,041,481 | |
| | (5,182,321 | ) | | | (35,343,330 | ) | | | 4,957,543 | | | | (46,912,015 | ) |
| | | | | | | | | | | | | | | |
| | 60,921,385 | | | | 96,264,715 | | | | 70,860,887 | | | | 117,772,902 | |
| $ | 55,739,064 | | | $ | 60,921,385 | | | $ | 75,818,430 | | | $ | 70,860,887 | |
| | | | | | | | | | | | | | | |
| | | | | | | | | | | | | | | |
| | 337,955 | | | | 1,049,184 | | | | 7,723,187 | | | | 8,676,459 | |
| | 225,552 | | | | 626,956 | | | | – | | | | 3,900,899 | |
| | (2,491,594 | ) | | | (3,388,462 | ) | | | (10,416,926 | ) | | | (11,444,167 | ) |
| | (1,928,087 | ) | | | (1,712,322 | ) | | | (2,693,739 | ) | | | 1,133,191 | |
| | | | | | | | | | | | | | | |
| | 311 | | | | 4,816 | | | | 32,173 | | | | 33,951 | |
| | – | | | | 2,297 | | | | – | | | | 107,039 | |
| | (51,066 | ) | | | (40,896 | ) | | | (676,052 | ) | | | (135,597 | ) |
| | (50,755 | ) | | | (33,783 | ) | | | (643,879 | ) | | | 5,393 | |
Statements of Changes in Net Assets
| | | | Gold and Precious Metals Fund | |
| | | | Year Ended December 31, 2019 | | | | Year Ended December 31, 2018 | |
| Increase (Decrease) in Net Assets | | | | | | | | |
| From operations: | | | | | | | | |
| Net investment income (loss) | | $ | (910,073 | ) | | $ | (757,104 | ) |
| Net realized gain (loss) | | | 3,869,904 | | | | 12,685,301 | |
| Net change in unrealized appreciation (depreciation) | | | 39,763,655 | | | | (25,732,709 | ) |
| Net increase (decrease) in net assets from operations | | | 42,723,486 | | | | (13,804,512 | ) |
| | | | | | | | | |
| Distributions to shareholders | | | | | | | | |
| Investor Class | | | – | | | | (1,486,190 | ) |
| Total distributions paid | | | – | | | | (1,486,190 | ) |
| | | | | | | | | |
| From capital share transactions: | | | | | | | | |
| Proceeds from shares sold | | | | | | | | |
| Investor Class | | | 66,317,303 | | | | 32,704,882 | |
| Distributions reinvested | | | | | | | | |
| Investor Class | | | – | | | | 1,376,717 | |
| | | | 66,317,303 | | | | 34,081,599 | |
| Cost of shares redeemed | | | | | | | | |
| Investor Class | | | (71,569,873 | ) | | | (33,424,316 | ) |
| Net increase (decrease) in net assets from capital share transactions | | | (5,252,570 | ) | | | 657,283 | |
| Net Increase (Decrease) in Net Assets | | | 37,470,916 | | | | (14,633,419 | ) |
| Net Assets | | | | | | | | |
| Beginning of year | | | 86,106,390 | | | | 100,739,809 | |
| End of year | | $ | 123,577,306 | | | $ | 86,106,390 | |
| Capital Share Activity | | | | | | | | |
| Investor Class | | | | | | | | |
| Shares sold | | | 8,143,005 | | | | 4,598,868 | |
| Shares reinvested | | | – | | | | 213,114 | |
| Shares redeemed | | | (8,802,179 | ) | | | (4,621,311 | ) |
| Net capital share activity | | | (659,174 | ) | | | 190,671 | |
See accompanying notes to financial statements.
| Emerging Europe Fund | | | China Region Fund | |
| Year Ended December 31, 2019 | | | Year Ended December 31, 2018 | | | Year Ended December 31, 2019 | | | Year Ended December 31, 2018 | |
| | | | | | | | | | | |
| $ | 1,018,619 | | | $ | 812,529 | | | $ | 112,692 | | | $ | 207,982 | |
| | (1,407,903 | ) | | | 558,281 | | | | (1,215,597 | ) | | | 3,179,729 | |
| | 9,037,417 | | | | (8,317,244 | ) | | | 3,903,142 | | | | (10,429,228 | ) |
| | 8,648,133 | | | | (6,946,434 | ) | | | 2,800,237 | | | | (7,041,517 | ) |
| | | | | | | | | | | | | | | |
| | (692,722 | ) | | | – | | | | (165,230 | ) | | | (391,917 | ) |
| | (692,722 | ) | | | – | | | | (165,230 | ) | | | (391,917 | ) |
| | | | | | | | | | | | | | | |
| | | | | | | | | | | | | | | |
| | 2,969,604 | | | | 2,640,089 | | | | 1,847,482 | | | | 3,083,370 | |
| | | | | | | | | | | | | | | |
| | 668,067 | | | | – | | | | 152,820 | | | | 361,957 | |
| | 3,637,671 | | | | 2,640,089 | | | | 2,000,302 | | | | 3,445,327 | |
| | | | | | | | | | | | | | | |
| | (6,290,279 | ) | | | (9,845,502 | ) | | | (3,429,396 | ) | | | (12,534,243 | ) |
| | | | | | | | | | | | | | | |
| | (2,652,608 | ) | | | (7,205,413 | ) | | | (1,429,094 | ) | | | (9,088,916 | ) |
| | 5,302,803 | | | | (14,151,847 | ) | | | 1,205,913 | | | | (16,522,350 | ) |
| | | | | | | | | | | | | | | |
| | 31,150,022 | | | | 45,301,869 | | | | 13,252,883 | | | | 29,775,233 | |
| $ | 36,452,825 | | | $ | 31,150,022 | | | $ | 14,458,796 | | | $ | 13,252,883 | |
| | | | | | | | | | | | | | | |
| | | | | | | | | | | | | | | |
| | | | | | | | | | | | | | | |
| | 415,082 | | | | 360,886 | | | | 213,730 | | | | 275,292 | |
| | 88,486 | | | | – | | | | 16,949 | | | | 48,390 | |
| | (912,769 | ) | | | (1,429,533 | ) | | | (398,326 | ) | | | (1,153,285 | ) |
| | (409,201 | ) | | | (1,068,647 | ) | | | (167,647 | ) | | | (829,603 | ) |
| Notes to Financial Statements | December 31, 2019 |
Note 1: Organization and Significant Accounting Policies
U.S. Global Investors Funds (“Trust”), consisting of the nine separate funds (“Funds”) included in this report, is organized as a Delaware statutory trust. Each Fund is an open-end management investment company registered under the Investment Company Act of 1940, as amended, and follows the specialized accounting and reporting guidance in FASB Accounting Standards Codification Topic 946. All Funds are diversified with the exception of World Precious Minerals, Gold and Precious Metals, Emerging Europe and China Region. A nondiversified fund may invest a greater percentage of its assets in a particular issuer in comparison to a diversified fund.
On June 14, 2019, the Institutional Shares of the Global Resources Fund and the World Precious Minerals Fund were liquidated and terminated pursuant to a Board approved Plan of Share Class Termination. On the Liquidation Date, each Fund made a liquidating distribution to shareholders of the Institutional Shares equal to each Shareholder’s proportionate interest in the Institutional Shares.
The following is a summary of significant accounting policies consistently followed by the Funds in the preparation of their financial statements. The policies are in conformity with U.S. generally accepted accounting principles.
A. Security Valuations
The Funds value investments traded on national or international securities exchanges or over-the-counter at the last sales price reported by the security’s primary exchange of its market at the time of daily valuation. Options and securities for which no sale was reported are valued at the mean between the last reported bid and asked quotation. Debt securities having 60 days or less to maturity that are expected to be valued at par at maturity may be priced by the amortized cost method if the Valuation Committee determines it would approximate market value. Municipal securities, long-term U.S. government obligations and corporate debt securities are valued by an independent pricing service using an evaluated quote based on such factors as institutional-size trading in similar groups of securities, yield, quality, maturity, coupon rate, type of issue, individual trading characteristics and other market data. For more information please see Notes to Portfolio of Investments.
B. Cash-Concentration in Uninsured Account
For cash management purposes the Funds may concentrate cash with the Funds’ custodian. As of December 31, 2019, The U.S. Government Securities Ultra-Short Bond Fund, Near-Term Tax Free Fund, All American Equity Fund, Holmes Macro Trends Fund, Global Resources Fund, World Precious Minerals Fund, Gold and Precious Metals Fund, Emerging Europe Fund and China Region Fund held $1,085,207, $459,733, $244,829, $1,302,673, $2,252,756, $1,417,367, $9,365,139, $715,344 and $22,544, respectively, as cash reserves at Brown Brothers Harriman & Co. (BBH).
C. Fair Valued Securities
Securities for which market quotations are not readily available or which are subject to legal restrictions are valued at their fair value as determined in good faith by the Valuation Committee of U.S. Global Investors, Inc. (Adviser), under policies and procedures established by the Trust’s Board of Trustees. Fair value is the price that would be received to sell an asset or paid to transfer a liability in an orderly transaction between market participants at the measurement date. The Valuation Committee meets on a regular basis to review securities which may not have readily available market prices and considers a
| Notes to Financial Statements | December 31, 2019 |
number of factors in determining fair value, including nature and duration of any trading restrictions, trading volume, market values of unrestricted shares of the same or similar class, investment management’s judgment regarding the market experience of the issuer, financial status and other operational and market factors affecting the issuer, issuer’s management, quality of the underlying property based on review of independent geological studies and other relevant matters. The fair values may differ from what would have been used had a broader market for these securities existed. The Valuation Committee regularly reviews inputs and assumptions and performs transactional back-testing and disposition analysis. The Valuation Committee reports quarterly to the Trust’s Board of Trustees.
For securities traded on international exchanges, if events which may materially affect the value of a Fund’s securities occur after the close of the primary exchange and before a Fund’s net asset value is next determined, then those securities will be valued at their fair value as determined in good faith in accordance with the policies approved by the Board of Trustees. The Funds use a systematic fair value model provided by an independent third party to value international securities primarily traded on an exchange or market outside the Western Hemisphere in order to adjust for stale pricing, which may occur between the close of certain foreign exchanges and the New York Stock Exchange.
D. Security Transactions and Investment Income
Security transactions are accounted for on trade date. Realized gains and losses from security transactions are determined on an identified cost basis. Dividend income is recorded on the ex-dividend date except that certain dividends from foreign securities where the ex-dividend date may have passed are recorded as soon as the Fund has confirmed the ex-dividend date. Interest income, which may include original issue discount, is recorded on an accrual basis. Discounts and premiums on securities purchased are accreted and amortized, respectively, on a yield-to-worst basis as adjustments to interest income. Investment income is recorded net of foreign taxes withheld where recovery of such taxes is uncertain. Investment income and realized and unrealized gains (losses) are allocated to each Fund’s share class based on their respective net assets.
The Funds may purchase securities on a when-issued or delayed-delivery basis and segregate collateral on their books with a value at least equal to the amount of the commitment. Losses may arise due to the changes in the value of the underlying securities or if the counterparty does not perform under the contract.
E. Foreign Currency Transactions
Some Funds may invest in securities of foreign issuers. The accounting records of these Funds are maintained in U.S. dollars. At each net asset value determination date, the value of assets and liabilities denominated in foreign currencies are translated into U.S. dollars using the current prevailing exchange rate. Security transactions, income and expenses are converted at the prevailing rate of exchange on the respective dates of the transactions. The effect of changes in foreign exchange rates on foreign denominated securities is included with the net realized and unrealized gain or loss on securities. Other foreign currency gains or losses are reported separately.
F. Federal Income Taxes
The Funds intend to continue to comply with the requirements of Subchapter M of the Internal Revenue Code applicable to regulated investment companies and to distribute substantially all of their taxable income to shareholders. Accordingly, no provision for
| Notes to Financial Statements | December 31, 2019 |
federal income taxes is required. Each Fund may be subject to foreign taxes on income and gains on investments, which are accrued based on the Fund’s understanding of the tax rules and regulations in the foreign markets.
The Funds recognize the tax benefits of uncertain tax positions only where the position is “more likely than not” to be sustained assuming examination by tax authorities. Management has analyzed the Funds’ tax positions, and has concluded that no liability for unrecognized tax benefits should be recorded related to uncertain tax positions taken on returns filed for open tax years or expected to be taken in 2019 tax returns. The Funds file U.S. federal and excise tax returns as required. The Funds’ 2016, 2017, 2018 and 2019 (when filed) tax returns are open to examination by the federal and applicable state tax authorities. The Funds have no examinations in progress.
G. Dividends and Distributions to Shareholders
The Funds record dividends and distributions to shareholders on the ex-dividend date. Distributions are determined in accordance with income tax regulations, which may differ from accounting principles generally accepted in the United States. Accordingly, periodic reclassifications related to permanent book and tax basis differences are made within the Funds’ capital accounts to reflect income and gains available for distribution under income tax regulations.
The Funds, except as noted below, generally pay income dividends and distribute capital gains, if any, annually. The U.S. Government Securities Ultra-Short Bond Fund and the Near-Term Tax Free Fund pay dividends monthly. A Fund may elect to designate a portion of the earnings and profits distributed to shareholders on the redemption of fund shares during the year as distributions for federal income tax purposes. Differences in per share dividend rates for multiclass funds generally result from the relative weightings of pro rata income allocations and from differences in separate class expenses.
H. Expenses
Fund specific expenses are allocated to that Fund and pro rata across share classes. Expenses that are not fund specific are allocated among Funds and pro rata across share classes. Class specific expenses (including, but not limited to, distribution plan fees, if any, a portion of the administrative services fees, transfer agency fees and expenses, shareholder reporting expenses and certain legal and registration fees) are allocated to the class that incurs such expense. Except for the U.S. Government Securities Ultra-Short Bond Fund, expense offset arrangements have been made with the Funds’ custodian so the custodian fees may be paid indirectly by credits earned on the Funds’ cash balances. Such deposit arrangements are an alternative to overnight investments. Custodian fees are presented in the Statements of Operations gross of such credits, and the credits are presented as offsets to expenses. For the U.S. Government Securities Ultra-Short Bond Fund, credits earned on its cash balance are included in interest and other income.
I. Use of Estimates in Financial Statement Preparation
The Funds are investment companies accounted for in conformity with accounting principles generally accepted in the United States of America (“GAAP”). Therefore they follow the accounting and reporting guidelines for investment companies. The preparation of financial statements in conformity with GAAP requires management to make estimates and assumptions that affect the reported amounts of assets and liabilities and disclosure of contingent assets and liabilities at the date of the financial statements and the reported
| Notes to Financial Statements | December 31, 2019 |
amounts of income and expenses during the reporting period. Actual results could differ from those estimates.
Note 2: Financial Derivative Instruments
A. Options Contracts
Equity Funds may purchase or write (sell) options on securities to manage their exposure to stock or commodity markets as well as fluctuations in interest and currency conversion rates. The use of options carries the risks of a change in value of the underlying instruments, an illiquid secondary market, or failure of the counterparty to perform its obligations.
A put option gives the purchaser of the option, upon payment of a premium, the right to sell, and the issuer of the option the obligation to buy, the underlying security, commodity, index, currency or other instrument at the exercise price. A call option, upon payment of a premium, gives the purchaser of the option the right to buy, and the issuer the obligation to sell, the underlying instrument at the exercise price.
Purchasing a put option tends to decrease a Fund’s exposure to the underlying instrument, whereas purchasing a call option tends to increase a Fund’s exposure to the underlying instrument. A Fund pays a premium which is included in the Statement of Assets and Liabilities as an investment and subsequently marked to market to reflect the current value of the option. Premiums paid to purchase options which expire are treated as realized losses. Premiums paid to purchase options which are exercised or closed are added to the cost of securities acquired or the proceeds from securities sold. The risk associated with purchasing put and call options is limited to the premium paid.
The Funds will realize a loss equal to all or a part of the premium paid for an option if the price of the underlying security or other instrument decreases or does not increase by more than the premium (in the case of a call option), or if the price of the underlying security or other instrument increases or does not decrease by more than the premium (in the case of a put option).
Writing (selling) a put option tends to increase a Fund’s exposure to the underlying instrument, whereas writing a call option tends to decrease a Fund’s exposure to the underlying instrument. The premium received is recorded as a liability in the Statement of Assets and Liabilities and subsequently marked to market to reflect the current value of the option written. Premiums received from writing options which expire are treated as realized gains. Premiums received from options which are exercised or closed are added to the proceeds or offset against amounts paid on the underlying transaction to determine the realized gain or loss. Written options include a risk of loss in excess of the option premium. A Fund as a writer of an option has no control over whether the underlying instrument may be sold (call) or purchased (put) and thus bears the market risk of an unfavorable change in the price of the instrument underlying the written option. There is also the risk a Fund may not be able to enter into a closing transaction because of an illiquid market.
A Fund’s ability to close out its position as a purchaser or seller of a put or call option is dependent, in part, upon the liquidity of the market for that particular option. There can be no guarantee that a Fund will be able to close out an option position when desired. An inability to close out its options positions may reduce a Fund’s anticipated profits or increase its losses.
As of December 31, 2019, there were no securities held in escrow by the custodian as cover for call options written.
| Notes to Financial Statements | December 31, 2019 |
B. Forward Foreign Currency Contracts
The Funds enter into forward foreign currency contracts to lock in the U.S. dollar cost of purchase and sale transactions or to hedge the portfolio against currency fluctuations. A forward foreign currency contract is a commitment to purchase or sell a foreign currency at a future date at a negotiated rate. These contracts are valued daily, and the Fund’s net equity therein, representing unrealized gain or loss on the contracts as measured by the difference between the forward foreign exchange rates at the dates of entry into the contracts and the forward rates at the reporting date, is included in the Statement of Assets and Liabilities. Realized and unrealized gains and losses are included in the Statement of Operations. Risks may arise upon entering into these contracts from the potential inability of counterparties to meet the terms of the contracts and from unanticipated movements in the value of foreign currencies relative to the U.S. dollar.
Open forward foreign currency contracts as of December 31, 2019, were as follows:
| Fund | | | Counterparty | | Currency to Deliver | | | Currency to Receive | | | Settlement Date | | Settlement Value at December 31, 2019 | | | Net Unrealized Depreciation | |
| Emerging Europe Fund | | | | Brown Brothers Harriman & Co. | | GBP | 500,000 | | | USD | | | 654,150 | | | 1/21/2020 | | $ | 662,713 | | | $ | (8,563 | ) |
| | | | | Brown Brothers Harriman & Co. | | TRY | 12,000,000 | | | USD | | | 2,001,334 | | | 1/24/2020 | | | 2,004,312 | | | | (2,978 | ) |
C. Summary of Derivative Instruments
The following is a summary of the valuations of derivative instruments categorized by location in the Statements of Assets and Liabilities as of December 31, 2019:
| Location | | All American Equity Fund | | | Holmes Macro Trends Fund | | | Global Resources Fund | |
| Asset derivatives | | | | | | | | | | | | |
| Investments, at value | | | | | | | | | | | | |
| Purchased options – Equity risk | | $ | 400 | | | $ | 1,000 | | | $ | 316,500 | |
| Total | | $ | 400 | | | $ | 1,000 | | | $ | 316,500 | |
| Location | | World Precious Minerals Fund | | | Gold and Precious Metals Fund | | | Emerging Europe Fund | |
| Asset derivatives | | | | | | | | | | | | |
| Investments, at value | | | | | | | | | | | | |
| Purchased options – Equity risk | | $ | 422,000 | | | $ | 633,000 | | | $ | – | |
| Liability derivatives | | | | | | | | | | | | |
| Unrealized loss on forward foreign currency contracts – Currency contract risk | | $ | – | | | $ | – | | | $ | (11,541 | ) |
| Total | | $ | 422,000 | | | $ | 633,000 | | | $ | (11,541 | ) |
| Notes to Financial Statements | December 31, 2019 |
The following is a summary of the effect of derivative instruments on the Statements of
Operations as of December 31, 2019:
| Location | | All American Equity Fund | | | Holmes Macro Trends Fund | | | Global Resources Fund | |
| Realized gain (loss) on derivatives recognized in income | | | | | | | | | | | | |
| Realized gain (loss) from securities | | | | | | | | | | | | |
| Purchased options – Equity risk | | $ | – | | | $ | – | | | $ | (1,129,564 | ) |
| Net realized gain (loss) from foreign currency transactions | | | | | | | | | | | | |
| Foreign exchange contracts – Currency contract risk | | | – | | | | – | | | | – | |
| Realized gain (loss) from written options – Equity risk | | | 7,426 | | | | 16,233 | | | | – | |
| | | | 7,426 | | | | 16,233 | | | | (1,129,564 | ) |
| Change in unrealized appreciation (depreciation) on derivatives recognized in income | | | | | | | | | | | | |
| Net change in unrealized appreciation (depreciation) of investments | | | | | | | | | | | | |
| Purchased options – Equity risk | | | (243,849 | ) | | | (609,093 | ) | | | 966,858 | |
| Net change in unrealized gain (loss) from foreign currency transactions – Currency contract risk | | | – | | | | – | | | | – | |
| | | | (243,849 | ) | | | (609,093 | ) | | | 966,858 | |
| Total | | $ | (236,423 | ) | | $ | (592,860 | ) | | $ | (162,706 | ) |
| Notes to Financial Statements | December 31, 2019 |
| Location | | World Precious Minerals Fund | | | Gold and Precious Metals Fund | | | Emerging Europe Fund | | | China Region Fund | |
| Realized gain (loss) on derivatives recognized in income | | | | | | | | | | | | | | | | |
| Realized gain (loss) from securities | | | | | | | | | | | | | | | | |
| Purchased options – Equity risk | | $ | (60,340 | ) | | $ | 33,249 | | | $ | – | | | $ | (240,574 | ) |
| Net realized gain (loss) from foreign currency transactions | | | | | | | | | | | | | | | | |
| Foreign exchange contracts – Currency contract risk | | | – | | | | – | | | | (412,665 | ) | | | – | |
| Realized gain (loss) from written options – Equity risk | | | – | | | | – | | | | – | | | | – | |
| | | | (60,340 | ) | | | 33,249 | | | | (412,665 | ) | | | (240,574 | ) |
| Change in unrealized appreciation (depreciation) on derivatives recognized in income | | | | | | | | | | | | | | | | |
| Net change in unrealized appreciation (depreciation) of investments Purchased options – Equity risk | | | 48,066 | | | | 74,882 | | | | – | | | | – | |
| Net change in unrealized gain (loss) from other assets and liabilities denominated in foreign currencies | | | | | | | | | | | | | | | | |
| Foreign exchange contracts – Currency contract risk | | | – | | | | – | | | | (11,541 | ) | | | – | |
| | | | 48,066 | | | | 74,882 | | | | (11,541 | ) | | | – | |
| Total | | $ | (12,274 | ) | | $ | 108,131 | | | $ | (424,206 | ) | | $ | (240,574 | ) |
The total value of transactions in written options, purchased options and forward currency contracts outstanding during the year ended December 31, 2019, were approximately as follows:
| Fund | | Purchased Options | | | Written Options | | | Forward Currency Contracts | |
| All American Equity Fund | | $ | 50,198 | | | $ | (13,354 | ) | | $ | – | |
| Holmes Macro Trends Fund | | | 125,644 | | | | (50,565 | ) | | | – | |
| Global Resources Fund | | | 828,680 | | | | – | | | | – | |
| World Precious Minerals Fund | | | 1,013,491 | | | | – | | | | – | |
| Gold and Precious Metals Fund | | | 1,272,952 | | | | – | | | | – | |
| Emerging Europe Fund | | | – | | | | – | | | | 36,299,294 | |
| China Region Fund | | | 240,574 | | | | – | | | | – | |
| Notes to Financial Statements | December 31, 2019 |
Asset (Liability) amounts shown in the table below represent amounts for derivative related instruments at December 31, 2019. These amounts may be collateralized by cash or financial instruments.
| | | Gross Asset (Liability) as Presented in the Statement of Assets and Liabilities | | | Financial Instruments (Received) Pledged* | | | Cash Collateral (Received) Pledged* | | Net Amount | |
| All American Equity | | | | | | | | | | | | | | | | | | |
| Assets: | | | | | | | | | | | | | | | | | | |
| Over-the-counter derivatives | | $ | 400 | | | $ | – | | | $ | | | – | | | $ | 400 | |
| Holmes Macro Trends | | | | | | | | | | | | | | | | | | |
| Assets: | | | | | | | | | | | | | | | | | | |
| Over-the-counter derivatives | | | 1,000 | | | | – | | | | | | – | | | | 1,000 | |
| Global Resources | | | | | | | | | | | | | | | | | | |
| Assets: | | | | | | | | | | | | | | | | | | |
| Over-the-counter derivatives | | | 316,500 | | | | – | | | | | | – | | | | 316,500 | |
| World Precious Minerals | | | | | | | | | | | | | | | | | | |
| Assets: | | | | | | | | | | | | | | | | | | |
| Over-the-counter derivatives | | | 422,000 | | | | – | | | | | | – | | | | 422,000 | |
| Gold and Precious Metals | | | | | | | | | | | | | | | | | | |
| Assets: | | | | | | | | | | | | | | | | | | |
| Over-the-counter derivatives | | | 633,000 | | | | – | | | | | | – | | | | 633,000 | |
| Emerging Europe | | | | | | | | | | | | | | | | | | |
| Liabilities: | | | | | | | | | | | | | | | | | | |
| Over-the-counter derivatives | | | (11,541 | ) | | | – | | | | | | – | | | | (11,541 | ) |
| * | | The actual financial instruments and cash collateral (received) pledged may be in excess of the amounts shown in the table. The table only reflects collateral amounts up to the amount of the financial instrument disclosed on the Statement of Assets and Liabilities. |
Note 3: Investment Advisory and Other Agreements
The Adviser, under an investment advisory agreement with the Trust in effect through October 1, 2020, furnishes management and investment advisory services and, subject to the supervision of the trustees, directs the investments of each Fund according to each Fund’s investment objectives, policies and limitations.
For the services of the Adviser, each Fund pays a base management or advisory fee based upon its net assets. Fees are accrued daily and paid monthly. The contractual management fee for each fund is:
| Notes to Financial Statements | December 31, 2019 |
| | Average Percentage of |
| Fund | Average Daily Net Assets |
| U.S. Government Securities Ultra-Short Bond | .50% of the first $250,000,000 and .375% of the excess |
| Near-Term Tax Free | .50% |
| All American Equity | .80% of the first $500,000,000 and .75% of the excess |
| Holmes Macro Trends | 1.00% |
| Global Resources | .95% of the first $500,000,000; .90% of $500,000,001 to $1,000,000,000 and .85% of the excess |
| World Precious Minerals | 1.00% of the first $500,000,000; .95% of $500,000,001 to $1,000,000,000 and .90% of the excess |
| Gold and Precious Metals | .90% of the first $500,000,000 and .85% of the excess |
| Emerging Europe | 1.25% |
| China Region | 1.25% |
The advisory agreement also provides that the base advisory fee of the Equity Funds will be adjusted upwards or downwards by 0.25 percent if there is a performance difference of 5 percent or more between a Fund’s performance and that of its designated benchmark index over the prior 12 months. The performance adjustment is calculated separately for each share class. The benchmarks are as follows:
| Fund | Benchmark Index |
| All American Equity | S&P 500 Index |
| Holmes Macro Trends | S&P Composite 1500 Index |
| Global Resources | S&P Global Natural Resources Index (Net Total Return) |
| World Precious Minerals | NYSE Arca Gold Miners Index |
| Gold and Precious Metals | FTSE Gold Mines Index |
| Emerging Europe | MSCI Emerging Markets Europe 10/40 Index (Net Total Return) |
| China Region | Hang Seng Composite Index |
No performance adjustment is applied unless the difference between the class’s investment performance and the benchmark is 5 percent or greater (positive or negative) during the applicable performance measurement period. The performance fee adjustment is calculated monthly in arrears and is accrued ratably during the month. The management fee, net of any performance fee adjustment, is paid monthly in arrears.
The amounts shown as Management fee on the Statements of Operations reflects the base fee plus/minus any performance adjustment. During the year ended December 31, 2019, the Funds recorded performance adjustments as follows:
| Fund | | Investor Class Performance Fee Adjustment | | | Institutional Class Performance Fee Adjustment |
| All American Equity | | $ | (33,495 | ) | | $ | | | N/A | |
| Holmes Macro Trends | | | (53,719 | ) | | | | | N/A | |
| Global Resources | | | (142,409 | ) | | | | | (331 | ) |
| World Precious Minerals | | | (192,028 | ) | | | | | (2,104 | ) |
| Gold and Precious Metals | | | (57,932 | ) | | | | | N/A | |
| Emerging Europe | | | (58,297 | ) | | | | | N/A | |
| China Region | | | (15,915 | ) | | | | | N/A | |
Atlantic Fund Administration, LLC, a wholly owned subsidiary of Apex US Holdings, LLC (d/b/a Apex Fund Services) (“Apex”) and the Adviser act as co-administrators to the Trust. Apex provides a Principal Executive Officer, a Principal Financial Officer, a Chief Compliance Officer and and Anti-Money Laundering Officer to each Fund, as well as certain additional compliance and administrative support functions. Apex also provides
| Notes to Financial Statements | December 31, 2019 |
fund accounting services to each Fund. The fees related to these services are included in Administration Fees within the Statement of Operations. Apex also provides certain shareholder report production and EDGAR conversion and filing services. Pursuant to an Apex services agreement, each Fund pays Apex customary fees for its services.
The U.S. Government Securities Ultra-Short Bond, Near-Term Tax Free, All American Equity, Holmes Macro Trends, Global Resources, World Precious Minerals, Gold and Precious Metals, Emerging Europe and China Region Funds compensate the Adviser at an annual rate of 0.05% of the average daily net assets of each Fund for administrative services provided, of which half is a fund-level fee and half is a class-level fee.
The Equity Funds in the Trust have adopted a distribution plan pursuant to Rule 12b-1 of the Investment Company Act of 1940 in which the Distributor is paid a fee at an annual rate of 0.25% of the average daily net assets of the Fund for sales and promotional services related to the distribution of shares.
The Adviser has voluntarily agreed to reimburse specific funds so that their total operating expenses will not exceed certain annual percentages of average net assets. The expenses for the year ended December 31, 2019, were limited as follows: U.S. Government Securities Ultra-Short Bond Fund at 0.45%, All American Equity Fund and Holmes Macro Trends Fund at 2.20%, Global Resources, World Precious Minerals, and Gold and Precious Metals Funds at 1.90%, Emerging Europe Fund at 2.85% and China Region Fund at 2.55%. These expense limitations are exclusive of any performance fee adjustments and will continue on a voluntary basis at the Adviser’s discretion. The Adviser may temporarily agree to additional reimbursements or limitations.
The Adviser has contractually limited the total operating expenses of the Near- Term Tax Free Fund at 0.45% on an annualized basis through April 30, 2020.
Apex is the transfer agent for the Funds. Each Fund’s share class pays an annual fee based on the number of shareholder accounts, certain base fees and transaction- and activity-based fees for transfer agency services. Certain account fees are paid directly by shareholders to the transfer agent, which, in turn, reduces its charge to the Funds.
Brown Brothers Harriman & Co. (BBH) serves as the custodian.
Foreside Fund Services, LLC (the “Distributor”) acts as the agent of the Trust in connection with the continuous offering of shares of the Funds. The Distributor continually distributes shares of the Funds on a best efforts basis.
| Notes to Financial Statements | December 31, 2019 |
Note 4: Investments
Cost of purchases and proceeds from sales of long-term securities for the period ended December 31, 2019, are summarized as follows:
| Fund | | Purchases | | | Sales | |
| U.S. Government Securities Ultra-Short Bond | | $ | 29,079,531 | | | $ | 41,850,000 | |
| Near-Term Tax Free | | | 15,465,939 | | | | 19,453,400 | |
| All American Equity | | | 30,215,906 | | | | 30,955,471 | |
| Holmes Macro Trends | | | 96,191,322 | | | | 94,161,260 | |
| Global Resources | | | 70,380,694 | | | | 78,459,054 | |
| World Precious Minerals | | | 14,520,390 | | | | 25,158,372 | |
| Gold and Precious Metals | | | 35,170,496 | | | | 46,238,391 | |
| Emerging Europe | | | 27,550,498 | | | | 29,189,954 | |
| China Region | | | 13,031,205 | | | | 12,922,605 | |
Note 5: Tax Information
The following table presents the income tax basis of securities owned at December 31, 2019, and the tax basis components of net unrealized appreciation (depreciation):
| Fund | | Aggregate Tax Cost | | | Gross Unrealized Appreciation | | | Gross Unrealized Depreciation | | | Net Unrealized Appreciation (Depreciation) | |
| U.S. Government Securities Ultra-Short Bond | | $ | 41,497,725 | | | $ | 27,290 | | | $ | (15,104 | ) | | $ | 12,186 | |
| Near-Term Tax Free | | | 41,862,148 | | | | 373,542 | | | | (49,265 | ) | | | 324,277 | |
| All American Equity | | | 12,962,294 | | | | 1,544,277 | | | | (579,359 | ) | | | 964,918 | |
| Holmes Macro Trends | | | 33,863,783 | | | | 3,419,129 | | | | (3,422,595 | ) | | | (3,466 | ) |
| Global Resources | | | 101,949,393 | | | | 7,971,197 | | | | (58,238,485 | ) | | | (50,267,288 | ) |
| World Precious Minerals | | | 127,467,213 | | | | 20,129,222 | | | | (71,761,301 | ) | | | (51,632,079 | ) |
| Gold and Precious Metals | | | 81,732,824 | | | | 39,550,954 | | | | (5,745,203 | ) | | | 33,805,751 | |
| Emerging Europe | | | 28,843,782 | | | | 8,121,757 | | | | (1,780,916 | ) | | | 6,340,841 | |
| China Region | | | 11,881,935 | | | | 3,050,634 | | | | (465,625 | ) | | | 2,585,009 | |
As of December 31, 2019, the components of distributable earnings on a tax basis were as follows:
| Fund | | Undistributed Tax-Exempt Income | | | Undistributed Ordinary Income | | | Undistributed Long-Term Capital Gains | | | Capital and Other Losses | |
| U.S. Government Securities Ultra-Short Bond | | $ | – | | | $ | 20,569 | | | $ | 6,118 | | | $ | – | |
| Near-Term Tax Free | | | – | | | | – | | | | – | | | | (1,201,802 | ) |
| All American Equity | | | – | | | | 68,652 | | | | – | | | | (289,028 | ) |
| Holmes Macro Trends | | | – | | | | – | | | | – | | | | – | |
| Global Resources | | | – | | | | 3,361,514 | | | | – | | | | (234,676,973 | ) |
| World Precious Minerals | | | – | | | | 7,420,596 | | | | – | | | | (320,190,234 | ) |
| Gold and Precious Metals | | | – | | | | – | | | | – | | | | (89,658,145 | ) |
| Emerging Europe | | | – | | | | 869,613 | | | | – | | | | (22,862,774 | ) |
| China Region | | | – | | | | 66,170 | | | | – | | | | (1,624,457 | ) |
| Notes to Financial Statements | December 31, 2019 |
| Fund (continued) | | Net Unrealized Appreciation (Depreciation) | | | Other Temporary Differences | | | Total | |
| U.S. Government Securities Ultra-Short Bond | | $ | 12,186 | | | $ | (7,603 | ) | | $ | 31,270 | |
| Near-Term Tax Free | | | 324,277 | | | | – | | | | (877,525 | ) |
| All American Equity | | | 964,918 | | | | – | | | | 744,542 | |
| Holmes Macro Trends | | | (3,466 | ) | | | – | | | | (3,466 | ) |
| Global Resources | | | (50,227,314 | ) | | | – | | | | (281,542,773 | ) |
| World Precious Minerals | | | (51,633,135 | ) | | | – | | | | (364,402,773 | ) |
| Gold and Precious Metals | | | 33,804,810 | | | | – | | | | (55,853,335 | ) |
| Emerging Europe | | | 6,308,142 | | | | – | | | | (15,685,019 | ) |
| China Region | | | 2,584,951 | | | | – | | | | 1,026,664 | |
The differences between book-basis and tax-basis unrealized appreciation (depreciation) for All American Equity, Holmes Macro Trends, Global Resources, World Precious Minerals, Gold and Precious Metals, Emerging Europe and China Region Funds are attributable primarily to the tax deferral of losses on wash sales, investment in passive foreign investment companies (PFIC), section 988 forward currency contracts, investments in real estate investment trusts, equity return of capital and investments in grantor trusts.
Reclassifications are made to the Funds’ capital accounts to reflect income and gains available for distribution (or available capital loss carryovers) under income tax regulations. For the year ended December 31, 2019, the Funds recorded the following reclassifications to increase (decrease) the accounts listed below:
| Fund | | Distributable Earnings | | | Paid in Capital | |
| U.S. Government Securities Ultra-Short Bond | | $ | – | | | $ | – | |
| Near-Term Tax Free | | | 3 | | | | (3 | ) |
| All American Equity | | | – | | | | – | |
| Holmes Macro Trends | | | 121,753 | | | | (121,753 | ) |
| Global Resources | | | 1,010 | | | | (1,010 | ) |
| World Precious Minerals | | | – | | | | – | |
| Gold and Precious Metals | | | 545,717 | | | | (545,717 | ) |
| Emerging Europe | | | – | | | | – | |
| China Region | | | – | | | | – | |
The tax character of distributions paid during the fiscal year ended December 31, 2019, were as follows:
| Fund | | Tax-Exempt Income | | | Ordinary Income | | | Long-Term Capital Gains | | | Return of Capital | | | Total | |
| U.S. Government Securities Ultra-Short Bond | | $ | – | | | $ | 675,524 | | | $ | 4,883 | | | $ | – | | | $ | 680,407 | |
| Near-Term Tax Free | | | 575,290 | | | | – | | | | – | | | | – | | | | 575,290 | |
| All American Equity | | | – | | | | 266,283 | | | | – | | | | – | | | | 266,283 | |
| Holmes Macro Trends | | | – | | | | 606,426 | | | | 190,505 | | | | – | | | | 796,931 | |
| Global Resources | | | – | | | | 1,052,138 | | | | – | | | | – | | | | 1,052,138 | |
| World Precious Minerals | | | – | | | | – | | | | – | | | | – | | | | – | |
| Gold and Precious Metals | | | – | | | | – | | | | – | | | | – | | | | – | |
| Emerging Europe | | | – | | | | 692,722 | | | | – | | | | – | | | | 692,722 | |
| China Region | | | – | | | | 165,230 | | | | – | | | | – | | | | 165,230 | |
| Notes to Financial Statements | December 31, 2019 |
The tax character of distributions paid during the fiscal year ended December 31, 2018, were as follows:
| Fund | | Tax-Exempt Income | | | Ordinary Income | | | Long-Term Capital Gains | | | Return of Capital | | | Total | |
| U.S. Government Securities Ultra-Short Bond | | $ | – | | | $ | 547,449 | | | $ | – | | | $ | – | | | $ | 547,449 | |
| Near-Term Tax Free | | | 687,244 | | | | 1,091 | | | | – | | | | – | | | | 688,335 | |
| All American Equity | | | – | | | | 633,115 | | | | – | | | | – | | | | 633,115 | |
| Holmes Macro Trends | | | – | | | | 4,744,187 | | | | 31,039 | | | | – | | | | 4,775,226 | |
| Global Resources | | | – | | | | 2,788,594 | | | | – | | | | – | | | | 2,788,594 | |
| World Precious Minerals | | | – | | | | 10,699,257 | | | | – | | | | – | | | | 10,699,257 | |
| Gold and Precious Metals | | | – | | | | 1,486,190 | | | | – | | | | – | | | | 1,486,190 | |
| Emerging Europe | | | – | | | | – | | | | – | | | | – | | | | – | |
| China Region | | | – | | | | 134,447 | | | | 257,470 | | | | – | | | | 391,917 | |
Capital loss carryforwards may be used to off set current or future taxable capital gains. The loss carryforwards for each Fund, as of December 31, 2019, are as follows:
| | | No Expiration | | | | |
| Fund | | Short-Term | | | Long-Term | | | Total | |
| U.S. Government Securities Ultra-Short Bond | | $ | – | | | $ | – | | | $ | – | |
| Near-Term Tax Free | | | 675,870 | | | | 525,932 | | | | 1,201,802 | |
| All American Equity | | | 245,055 | | | | 43,973 | | | | 289,028 | |
| Holmes Macro Trends | | | – | | | | – | | | | – | |
| Global Resources | | | 163,535,107 | | | | 71,141,866 | | | | 234,676,973 | |
| World Precious Minerals | | | 86,588,158 | | | | 233,602,076 | | | | 320,190,234 | |
| Gold and Precious Metals | | | 42,614,565 | | | | 47,043,580 | | | | 89,658,145 | |
| Emerging Europe | | | 12,279,250 | | | | 10,583,524 | | | | 22,862,774 | |
| China Region | | | 1,559,050 | | | | 65,407 | | | | 1,624,457 | |
During the year ended December 31, 2019, the following Funds utilized capital loss carryforwards to offset capital gains amounting to:
| Fund | | | |
| Near-Term Tax Free | | $ | 2,599 | |
| Gold and Precious Metals | | | 3,316,333 | |
Note 6: Risks of Concentrations and Foreign Investments
The Near-Term Tax Free Fund may be exposed to risks related to concentration of investments in a particular state or geographic area. These investments present risks resulting from changes in economic conditions of the region or the issuer.
The Global Resources Fund concentrates its investments in the natural resources industries and may be subject to greater risks and fluctuations than a portfolio representing a broader range of industries.
The World Precious Minerals and Gold and Precious Metals Funds concentrate their investments in gold and other precious metals and minerals and, therefore, may be subject to greater risks and market fluctuations than a portfolio representing a broader range of
| Notes to Financial Statements | December 31, 2019 |
industries. The funds invest in securities that typically respond to changes in the price of gold and other precious metals and minerals, which can be influenced by a variety of global economic, financial and political factors; increased environmental and labor costs in mining; and changes in laws relating to mining or gold production or sales. Fluctuations in the prices of gold and other precious metals and minerals will affect the market values of the securities held by these funds.
The Emerging Europe Fund invests more than 25% of its investments in companies principally engaged in the oil, gas or banking industries. Oil and gas companies are a large part of the Russian economy, and banks typically are a significant component of emerging market economics, such as those in Russia and other Eastern European countries.
The risk of concentrating investments in this group of industries will make the fund more susceptible to risk in these industries than funds which do not concentrate their investments in an industry.
The Emerging Europe Fund may be exposed to risks not typically associated with investment in the United States due to its concentration of investments in emerging markets. These risks include possible revaluation of currencies, less public information about companies, disruptive political or economic conditions and the possible imposition of adverse governmental laws or currency exchange restrictions. Moreover, securities of many foreign issuers, including sovereign nations, and their markets may be less liquid and their prices more volatile than those securities of comparable U.S. issuers.
The China Region Fund may be exposed to risks not typically associated with investments in the United States, due to its concentration of investments in foreign issuers in the region. These investments present risks resulting from disruptive political or economic conditions and the potential imposition of adverse governmental laws or currency exchange restrictions affecting the area.
Note 7: Credit Arrangements
Each of the Funds has an uncommitted credit facility with BBH. On April 24, 2019, the Adviser opted to convert the committed line of credit into an uncommitted line of credit. As a result, the Adviser is no longer obligated to pay commitment fees to BBH. Borrowings of each Fund are collateralized by any or all of the securities held by BBH as the Funds’ custodian up to the amount of the borrowing. Interest on borrowings is charged at the current overnight Federal Funds Rate plus 2 percent. Each Fund has a maximum borrowing limit of 10 percent of qualified assets. The aggregate of borrowings by all Funds under the agreement cannot exceed $10,000,000 at any one time. There were no borrowings under the credit facility during the year ended December 31, 2019.
Note 8: Commitments and Contingencies
In the normal course of business, each Fund enters into contracts that provide general indemnifications by each Fund to the counterparty to the contract. Each Fund’s maximum exposure under these arrangements is dependent on future claims that may be made against each Fund and, therefore, cannot be estimated; however, based on experience, the risk of loss from such claims is considered remote. Each Fund has determined that none of these arrangements requires disclosure on each Fund’s balance sheet.
| Notes to Financial Statements | December 31, 2019 |
Note 9: Subsequent Events
The Funds have evaluated the need for additional disclosures and/or adjustments resulting from subsequent events. Based on this evaluation, no additional disclosures or adjustments were required to the financial statements as of the date the financial statements were issued.
Financial Highlights
U.S. Government Securities Ultra-Short Bond Fund
For a capital share outstanding during the
| | | Investor Class | |
| | | Year Ended December 31, | |
| | | 2019 | | | 2018 | | | 2017 | | | 2016 | | | 2015 | |
| Net asset value, beginning of year | | $ | 2.00 | | | $ | 2.00 | | | $ | 2.00 | | | $ | 2.00 | | | $ | 2.00 | |
| Investment Activities | | | | | | | | | | | | | | | | | | | | |
| Net investment income | | | 0.03 | * | | | 0.02 | * | | | 0.01 | * | | | 0.01 | | | | 0.01 | |
| Net realized and unrealized gain (loss) (a) | | | 0.00 | | | | 0.00 | | | | (0.00 | ) | | | 0.00 | | | | 0.00 | |
| Total from investment activities | | | 0.03 | | | | 0.02 | | | | 0.01 | | | | 0.01 | | | | 0.01 | |
| Distributions | | | | | | | | | | | | | | | | | | | | |
| From net investment income | | | (0.03 | ) | | | (0.02 | ) | | | (0.01 | ) | | | (0.01 | ) | | | (0.01 | ) |
| From return of capital | | | – | | | | – | | | | – | | | | (0.00 | )(a) | | | – | |
| From net realized gains | | | (0.00 | )(a) | | | – | | | | – | | | | (0.00 | )(a) | | | (0.00 | )(a) |
| Net asset value, end of year | | $ | 2.00 | | | $ | 2.00 | | | $ | 2.00 | | | $ | 2.00 | | | $ | 2.00 | |
| Total Return (b) | | | 1.50 | % | | | 1.15 | % | | | 0.69 | % | | | 0.47 | % | | | 0.34 | % |
| Ratios to Average Net Assets: | | | | | | | | | | | | | | | | | | | | |
| Net investment income | | | 1.47 | % | | | 1.14 | % | | | 0.68 | % | | | 0.43 | % | | | 0.33 | % |
| Total expenses | | | 1.00 | % | | | 0.99 | % | | | 1.03 | % | | | 1.00 | % | | | 1.13 | % |
| Expenses waived or reimbursed (c) | | | (0.55 | )% | | | (0.54 | )% | | | (0.58 | )% | | | (0.55 | )% | | | (0.68 | )% |
| Net expenses (d) | | | 0.45 | % | | | 0.45 | % | | | 0.45 | % | | | 0.45 | % | | | 0.45 | % |
| Portfolio turnover rate | | | 97 | % | | | 32 | % | | | 52 | % | | | 18 | % | | | 60 | % |
| Net assets, end of year (in thousands) | | $ | 42,681 | | | $ | 47,290 | | | $ | 49,427 | | | $ | 56,794 | | | $ | 62,562 | |
| * | Based on average shares outstanding. |
| (a) | The per share amount does not round to a full penny. |
| (b) | Assumes investment at the net asset value at the beginning of the period, reinvestment of all distributions and a complete redemption of the investment at the net asset value at the end of the period. |
| (c) | Expenses waived or reimbursed reflect reductions to total expenses, as discussed in the notes to the financial statements. These amounts would increase the net investment loss ratio or decrease the net investment income ratio, as applicable, and decrease the total returns had such reductions not occurred. |
| (d) | The net expense ratios shown above reflect expenses after waivers and reimbursements and include the effect of reductions to total expenses for any expenses offset. Expense offset arrangements reduce total expenses, as discussed in the notes to the financial statements. These amounts would decrease the net investment income ratio had such reductions not occurred. The effect of expenses offset are as follows: |
| | | Investor Class | |
| | | Year Ended December 31, | |
| | | 2019 | | | 2018 | | | 2017 | | | 2016 | | | 2015 | |
| Ratios to Average Net Assets: | | | | | | | | | | | | | | | | | | | | |
| Expense offset | | | – | | | | – | | | | – | | | | – | | | | – | |
See accompanying notes to financial statements.
Financial Highlights
Near-Term Tax Free Fund
For a capital share outstanding during the
| | | Investor Class | |
| | | Year Ended December 31, | |
| | | 2019 | | | 2018 | | | 2017 | | | 2016 | | | 2015 | |
| Net asset value, beginning of year | | $ | 2.20 | | | $ | 2.21 | | | $ | 2.21 | | | $ | 2.25 | | | $ | 2.25 | |
| Investment Activities | | | | | | | | | | | | | | | | | | | | |
| Net investment income | | | 0.03 | * | | | 0.03 | * | | | 0.03 | * | | | 0.03 | | | | 0.03 | |
| Net realized and unrealized gain (loss) | | | 0.02 | | | | (0.01 | ) | | | – | | | | (0.04 | ) | | | 0.00 | (a) |
| Total from investment activities | | | 0.05 | | | | 0.02 | | | | 0.03 | | | | (0.01 | ) | | | 0.03 | |
| Distributions | | | | | | | | | | | | | | | | | | | | |
| From net investment income | | | (0.03 | ) | | | (0.03 | ) | | | (0.03 | ) | | | (0.03 | ) | | | (0.03 | ) |
| From return of capital | | | – | | | | – | | | | – | | | | (0.00 | )(a) | | | – | |
| Net asset value, end of year | | $ | 2.22 | | | $ | 2.20 | | | $ | 2.21 | | | $ | 2.21 | | | $ | 2.25 | |
| Total Return (b) | | | 2.18 | % | | | 0.73 | % | | | 1.20 | % | | | (0.45 | )% | | | 1.45 | % |
| Ratios to Average Net Assets: | | | | | | | | | | | | | | | | | | | | |
| Net investment income | | | 1.25 | % | | | 1.17 | % | | | 1.16 | % | | | 1.25 | % | | | 1.52 | % |
| Total expenses | | | 1.05 | % | | | 1.01 | % | | | 1.03 | % | | | 0.97 | % | | | 1.09 | % |
| Expenses waived or reimbursed (c) | | | (0.60 | )% | | | (0.56 | )% | | | (0.58 | )% | | | (0.52 | )% | | | (0.64 | )% |
| Net expenses (d) | | | 0.45 | % | | | 0.45 | % | | | 0.45 | % | | | 0.45 | % | | | 0.45 | % |
| Portfolio turnover rate | | | 35 | % | | | 16 | % | | | 14 | % | | | 33 | % | | | 15 | % |
| Net assets, end of year (in thousands) | | $ | 43,061 | | | $ | 49,914 | | | $ | 69,120 | | | $ | 95,301 | | | $ | 106,769 | |
| * | Based on average shares outstanding. |
| (a) | The per share amount does not round to a full penny. |
| (b) | Assumes investment at the net asset value at the beginning of the period, reinvestment of all distributions and a complete redemption of the investment at the net asset value at the end of the period. |
| (c) | Expenses waived or reimbursed reflect reductions to total expenses, as discussed in the notes to the financial statements. These amounts would increase the net investment loss ratio or decrease the net investment income ratio, as applicable, and decrease the total returns had such reductions not occurred. |
| (d) | The net expense ratios shown above reflect expenses after waivers and reimbursements and include the effect of reductions to total expenses for any expenses offset. Expense offset arrangements reduce total expenses, as discussed in the notes to the financial statements. These amounts would decrease the net investment income ratio had such reductions not occurred. The effect of expenses offset are as follows: |
| | | Investor Class | |
| | | Year Ended December 31, | |
| | | 2019 | | | 2018 | | | 2017 | | | 2016 | | | 2015 | |
| Ratios to Average Net Assets: | | | | | | | | | | | | | | | | | | | | |
| Expense offset | | | (0.08 | )% | | | (0.07 | )% | | | (0.04 | )% | | | (0.02 | )% | | | – | (e) |
| (e) | Effect on the expense ratio was not greater than 0.005%. |
See accompanying notes to financial statements.
Financial Highlights
All American Equity Fund
For a capital share outstanding during the
| | | Investor Class | |
| | | Year Ended December 31, | |
| | | 2019 | | | 2018 | | | 2017 | | | 2016 | | | 2015 | |
| Net asset value, beginning of year | | $ | 22.29 | | | $ | 24.90 | | | $ | 23.53 | | | $ | 23.60 | | | $ | 27.84 | |
| Investment Activities | | | | | | | | | | | | | | | | | | | | |
| Net investment income | | | 0.12 | * | | | 0.02 | * | | | 0.09 | * | | | 0.02 | | | | 0.09 | |
| Net realized and unrealized gain (loss) | | | 4.11 | | | | (1.55 | ) | | | 1.30 | | | | (0.05 | ) | | | (1.23 | ) |
| Total from investment activities | | | 4.23 | | | | (1.53 | ) | | | 1.39 | | | | (0.03 | ) | | | (1.14 | ) |
| Distributions | | | | | | | | | | | | | | | | | | | | |
| From net investment income | | | – | | | | (0.15 | ) | | | (0.02 | ) | | | (0.04 | ) | | | (0.06 | ) |
| From net realized gains | | | (0.49 | ) | | | (0.93 | ) | | | – | | | | – | | | | (3.04 | ) |
| Short-Term Trading Fees* | | | – | | | | – | | | | – | | | | 0.00 | (a) | | | 0.00 | (a) |
| Net asset value, end of year | | $ | 26.03 | | | $ | 22.29 | | | $ | 24.90 | | | $ | 23.53 | | | $ | 23.60 | |
| Total Return (b) | | | 19.01 | % | | | (6.07 | )% | | | 5.90 | % | | | (0.14 | )% | | | (4.20 | )% |
| Ratios to Average Net Assets: | | | | | | | | | | | | | | | | | | | | |
| Net investment income | | | 0.49 | % | | | 0.07 | % | | | 0.38 | % | | | 0.06 | % | | | 0.31 | % |
| Total expenses | | | 1.93 | % | | | 1.86 | % | | | 1.79 | % | | | 1.75 | % | | | 1.94 | % |
| Expenses waived or reimbursed (c) | | | (0.11 | )% | | | (0.07 | )% | | | (0.04 | )% | | | (0.02 | )% | | | (0.02 | )% |
| Net expenses (d) | | | 1.82 | % | | | 1.79 | % | | | 1.75 | % | | | 1.73 | % | | | 1.92 | % |
| Portfolio turnover rate | | | 232 | %(e) | | | 244 | % | | | 346 | % | | | 303 | % | | | 109 | %(e) |
| Net assets, end of year (in thousands) | | $ | 14,162 | | | $ | 13,636 | | | $ | 15,932 | | | $ | 17,350 | | | $ | 19,117 | |
| * | Based on average shares outstanding. |
| (a) | The per share amount does not round to a full penny. |
| (b) | Assumes investment at the net asset value at the beginning of the period, reinvestment of all distributions and a complete redemption of the investment at the net asset value at the end of the period. |
| (c) | Expenses waived or reimbursed reflect reductions to total expenses, as discussed in the notes to the financial statements. These amounts would increase the net investment loss ratio or decrease the net investment income ratio, as applicable, and decrease the total returns had such reductions not occurred. |
| (d) | The net expense ratios shown above reflect expenses after waivers and reimbursements and include the effect of reductions to total expenses for any expenses offset. Expense offset arrangements reduce total expenses, as discussed in the notes to the financial statements. These amounts would decrease the net investment income ratio had such reductions not occurred. The effect of expenses offset are as follows: |
| | | Investor Class | |
| | | Year Ended December 31, | |
| | | 2019 | | | 2018 | | | 2017 | | | 2016 | | | 2015 | |
| Ratios to Average Net Assets: | | | | | | | | | | | | | | | | | | | | |
| Expense offset | | | (0.11 | )% | | | (0.07 | )% | | | (0.04 | )% | | | (0.02 | )% | | | – | (f) |
| (e) | Excludes option transactions. |
| (f) | Effect on the expense ratio was not greater than 0.005%. |
See accompanying notes to financial statements.
Financial Highlights
Holmes Macro Trends Fund
For a capital share outstanding during the
| | | Investor Class | |
| | | Year Ended December 31, | |
| | | 2019 | | | 2018 | | | 2017 | | | 2016 | | | 2015 | |
| Net asset value, beginning of year | | $ | 15.36 | | | $ | 19.52 | | | $ | 18.65 | | | $ | 18.59 | | | $ | 20.25 | |
| Investment Activities | | | | | | | | | | | | | | | | | | | | |
| Net investment loss | | | (0.02 | )* | | | (0.06 | )* | | | (0.08 | )* | | | (0.06 | ) | | | (0.11 | ) |
| Net realized and unrealized gain (loss) | | | 2.14 | | | | (1.61 | ) | | | 3.66 | | | | 1.68 | | | | (0.06 | ) |
| Total from investment activities | | | 2.12 | | | | (1.67 | ) | | | 3.58 | | | | 1.62 | | | | (0.17 | ) |
| Distributions | | | | | | | | | | | | | | | | | | | | |
| From net realized gains | | | (0.39 | ) | | | (2.49 | ) | | | (2.71 | ) | | | (1.56 | ) | | | (1.49 | ) |
| Short-Term Trading Fees* | | | – | | | | – | | | | 0.00 | (a) | | | 0.00 | (a) | | | 0.00 | (a) |
| Net asset value, end of year | | $ | 17.09 | | | $ | 15.36 | | | $ | 19.52 | | | $ | 18.65 | | | $ | 18.59 | |
| Total Return (b) | | | 13.84 | % | | | (8.28 | )% | | | 19.17 | % | | | 8.66 | % | | | (0.94 | )% |
| Ratios to Average Net Assets: | | | | | | | | | | | | | | | | | | | | |
| Net investment loss | | | (0.14 | )% | | | (0.32 | )% | | | (0.41 | )% | | | (0.34 | )% | | | (0.55 | )% |
| Total expenses | | | 1.69 | % | | | 1.77 | % | | | 1.86 | % | | | 1.67 | % | | | 1.81 | % |
| Expenses waived or reimbursed (c) | | | (0.15 | )% | | | (0.06 | )% | | | (0.04 | )% | | | – | | | | – | |
| Net expenses (d) | | | 1.54 | % | | | 1.71 | % | | | 1.82 | % | | | 1.67 | % | | | 1.81 | % |
| Portfolio turnover rate | | | 292 | %(e) | | | 245 | % | | | 264 | %(e) | | | 275 | %(e) | | | 320 | %(e) |
| Net assets, end of year (in thousands) | | $ | 35,076 | | | $ | 33,848 | | | $ | 41,597 | | | $ | 40,706 | | | $ | 41,135 | |
| * | Based on average shares outstanding. |
| (a) | The per share amount does not round to a full penny. |
| (b) | Assumes investment at the net asset value at the beginning of the period, reinvestment of all distributions and a complete redemption of the investment at the net asset value at the end of the period. |
| (c) | Expenses waived or reimbursed reflect reductions to total expenses, as discussed in the notes to the financial statements. These amounts would increase the net investment loss ratio or decrease the net investment income ratio, as applicable, and decrease the total returns had such reductions not occurred. |
| (d) | The net expense ratios shown above reflect expenses after waivers and reimbursements and include the effect of reductions to total expenses for any expenses offset. Expense offset arrangements reduce total expenses, as discussed in the notes to the financial statements. These amounts would decrease the net investment income (loss) ratio had such reductions not occurred. The effect of expenses offset are as follows: |
| | | Investor Class | |
| | | Year Ended December 31, | |
| | | 2019 | | | 2018 | | | 2017 | | | 2016 | | | 2015 | |
| Ratios to Average Net Assets: | | | | | | | | | | | | | | | | | | | | |
| Expense offset | | | (0.15 | )% | | | (0.06 | )% | | | (0.04 | )% | | | (0.02 | )% | | | – | (f) |
| (e) | Excludes option transactions. |
| (f) | Effect on the expense ratio was not greater than 0.005%. |
See accompanying notes to financial statements.
Financial Highlights
Global Resources Fund
For a capital share outstanding during the
| | | Investor Class | |
| | | Year Ended December 31, | |
| | | 2019 | | | 2018 | | | 2017 | | | 2016 | | | 2015 | |
| Net asset value, beginning of year | | $ | 4.33 | | | $ | 6.09 | | | $ | 5.25 | | | $ | 4.72 | | | $ | 6.67 | |
| Investment Activities | | | | | | | | | | | | | | | | | | | | |
| Net investment income* | | | 0.10 | | | | 0.12 | | | | 0.11 | | | | 0.06 | | | | 0.10 | |
| Net realized and unrealized gain (loss) | | | 0.27 | | | | (1.67 | ) | | | 0.91 | | | | 0.64 | * | | | (2.00 | )* |
| Total from investment activities | | | 0.37 | | | | (1.55 | ) | | | 1.02 | | | | 0.70 | | | | (1.90 | ) |
| Distributions | | | | | | | | | | | | | | | | | | | | |
| From net investment income | | | (0.09 | ) | | | (0.21 | ) | | | (0.18 | ) | | | (0.17 | ) | | | (0.05 | ) |
| Short-Term Trading Fees* | | | – | | | | – | | | | 0.00 | (a) | | | 0.00 | (a) | | | 0.00 | (a) |
| Net asset value, end of year | | $ | 4.61 | | | $ | 4.33 | | | $ | 6.09 | | | $ | 5.25 | | | $ | 4.72 | |
| Total Return (b) | | | 8.55 | % | | | (25.48 | )% | | | 19.57 | % | | | 14.99 | % | | | (28.43 | )% |
| Ratios to Average Net Assets: | | | | | | | | | | | | | | | | | | | | |
| Net investment income | | | 2.15 | % | | | 2.05 | % | | | 1.94 | % | | | 1.13 | % | | | 1.72 | % |
| Total expenses | | | 1.61 | % | | | 1.57 | % | | | 1.61 | % | | | 1.85 | % | | | 1.58 | % |
| Expenses waived or reimbursed (c) | | | (0.08 | )% | | | (0.06 | )% | | | (0.02 | )% | | | (0.01 | )% | | | (0.06 | )% |
| Net expenses (d) | | | 1.53 | % | | | 1.51 | % | | | 1.59 | % | | | 1.84 | % | | | 1.52 | % |
| Portfolio turnover rate (e) | | | 129 | %(f) | | | 119 | % | | | 131 | %(f) | | | 255 | %(f) | | | 445 | %(f) |
| Net assets, end of year (in thousands) | | $ | 55,739 | | | $ | 60,699 | | | $ | 95,747 | | | $ | 97,005 | | | $ | 98,126 | |
| * | Based on average shares outstanding. |
| (a) | The per share amount does not round to a full penny. |
| (b) | Assumes investment at the net asset value at the beginning of the period, reinvestment of all distributions and a complete redemption of the investment at the net asset value at the end of the period. |
| (c) | Expenses waived or reimbursed reflect reductions to total expenses, as discussed in the notes to the financial statements. These amounts would increase the net investment loss ratio or decrease the net investment income ratio, as applicable, and decrease the total returns had such reductions not occurred. |
| (d) | The net expense ratios shown above reflect expenses after waivers and reimbursements and include the effect of reductions to total expenses for any expenses offset. Expense offset arrangements reduce total expenses, as discussed in the notes to the financial statements. These amounts would decrease the net investment income (loss) ratio had such reductions not occurred. The effect of expenses offset are as follows: |
| | | Investor Class | |
| | | Year Ended December 31, | |
| | | 2019 | | | 2018 | | | 2017 | | | 2016 | | | 2015 | |
| Ratios to Average Net Assets: | | | | | | | | | | | | | | | |
| Expense offset | | | (0.08 | )% | | | (0.05 | )% | | | (0.02 | )% | | | (0.01 | )% | | | – | (g) |
| (e) | Portfolio turnover is calculated at the fund level. |
| (f) | Excludes option transactions. |
| (g) | Effect on the expense ratio was not greater than 0.005%. |
See accompanying notes to financial statements.
Financial Highlights
World Precious Minerals Fund
For a capital share outstanding during the
| | | Investor Class | |
| | | Year Ended December 31, | |
| | | 2019 | | | 2018 | | | 2017 | | | 2016 | | | 2015 | |
| Net asset value, beginning of year | | $ | 2.70 | | | $ | 4.69 | | | $ | 6.35 | | | $ | 3.64 | | | $ | 4.75 | |
| Investment Activities | | | | | | | | | | | | | | | | | | | | |
| Net investment loss* | | | (0.04 | ) | | | (0.03 | ) | | | (0.10 | ) | | | (0.09 | ) | | | (0.03 | ) |
| Net realized and unrealized gain (loss) | | | 0.65 | | | | (1.49 | ) | | | (0.22 | ) | | | 2.82 | * | | | (0.72 | )* |
| Total from investment activities | | | 0.61 | | | | (1.52 | ) | | | (0.32 | ) | | | 2.73 | | | | (0.75 | ) |
| Distributions | | | | | | | | | | | | | | | | | | | | |
| From net investment income | | | – | | | | (0.47 | ) | | | (1.34 | ) | | | (0.02 | ) | | | (0.36 | ) |
| Short-Term Trading Fees* | | | – | | | | – | | | | 0.00 | (a) | | | 0.00 | (a) | | | 0.00 | (a) |
| Net asset value, end of year | | $ | 3.31 | | | $ | 2.70 | | | $ | 4.69 | | | $ | 6.35 | | | $ | 3.64 | |
| Total Return (b) | | | 22.59 | % | | | (31.67 | )% | | | (4.16 | )% | | | 75.08 | % | | | (15.64 | )% |
| Ratios to Average Net Assets: | | | | | | | | | | | | | | | | | | | | |
| Net investment loss | | | (1.31 | )% | | | (0.77 | )% | | | (1.51 | )% | | | (1.28 | )% | | | (0.71 | )% |
| Total expenses | | | 1.55 | % | | | 1.52 | % | | | 1.84 | % | | | 1.99 | % | | | 1.96 | % |
| Expenses waived or reimbursed (c) | | | (0.04 | )% | | | (0.04 | )% | | | (0.02 | )% | | | (0.04 | )% | | | (0.15 | )% |
| Net expenses (d) | | | 1.51 | % | | | 1.48 | % | | | 1.82 | % | | | 1.95 | % | | | 1.81 | % |
| Portfolio turnover rate (e) | | | 20 | %(f) | | | 55 | % | | | 36 | %(f) | | | 136 | %(f) | | | 71 | %(f) |
| Net assets, end of year (in thousands) | | $ | 75,818 | | | $ | 69,117 | | | $ | 114,766 | | | $ | 137,338 | | | $ | 78,150 | |
| * | Based on average shares outstanding. |
| (a) | The per share amount does not round to a full penny. |
| (b) | Assumes investment at the net asset value at the beginning of the period, reinvestment of all distributions and a complete redemption of the investment at the net asset value at the end of the period. |
| (c) | Expenses waived or reimbursed reflect reductions to total expenses, as discussed in the notes to the financial statements. These amounts would increase the net investment loss ratio or decrease the net investment income ratio, as applicable, and decrease the total returns had such reductions not occurred. |
| (d) | The net expense ratios shown above reflect expenses after waivers and reimbursements and include the effect of reductions to total expenses for any expenses offset. Expense offset arrangements reduce total expenses, as discussed in the notes to the financial statements. These amounts would decrease the net investment income (loss) ratio had such reductions not occurred. The effect of expenses offset are as follows: |
| | | Investor Class | |
| | | Year Ended December 31, | |
| | | 2019 | | | 2018 | | | 2017 | | | 2016 | | | 2015 | |
| Ratios to Average Net Assets: | | | | | | | | | | | | | | | |
| Expense offset | | | (0.04 | )% | | | (0.04 | )% | | | (0.02 | )% | | | (0.01 | )% | | | – | (g) |
| (e) | Portfolio turnover is calculated at the fund level. |
| (f) | Excludes option transactions. |
| (g) | Effect on the expense ratio was not greater than 0.005%. |
See accompanying notes to financial statements.
Financial Highlights
Gold and Precious Metals Fund
For a capital share outstanding during the
| | | Investor Class | |
| | | Year Ended December 31, | |
| | | 2019 | | | 2018 | | | 2017 | | | 2016 | | | 2015 | |
| Net asset value, beginning of year | | $ | 6.70 | | | $ | 7.96 | | | $ | 7.04 | | | $ | 4.89 | | | $ | 5.16 | |
| Investment Activities | | | | | | | | | | | | | | | | | | | | |
| Net investment loss | | | (0.07 | )* | | | (0.06 | )* | | | (0.06 | )* | | | (0.07 | ) | | | (0.04 | ) |
| Net realized and unrealized gain (loss) | | | 3.51 | | | | (1.08 | ) | | | 0.98 | | | | 2.28 | | | | (0.21 | ) |
| Total from investment activities | | | 3.44 | | | | (1.14 | ) | | | 0.92 | | | | 2.21 | | | | (0.25 | ) |
| Distributions | | | | | | | | | | | | | | | | | | | | |
| From net investment income | | | – | | | | (0.12 | ) | | | – | | | | (0.06 | ) | | | (0.02 | ) |
| Short-Term Trading Fees* | | | – | | | | – | | | | 0.00 | (a) | | | (0.00 | )(a) | | | (0.00 | )(a) |
| Net asset value, end of year | | $ | 10.14 | | | $ | 6.70 | | | $ | 7.96 | | | $ | 7.04 | | | $ | 4.89 | |
| Total Return (b) | | | 51.34 | % | | | (14.29 | )% | | | 13.07 | % | | | 45.36 | % | | | (4.78 | )% |
| Ratios to Average Net Assets: | | | | | | | | | | | | | | | | | | | | |
| Net investment loss | | | (0.90 | )% | | | (0.87 | )% | | | (0.84 | )% | | | (1.02 | )% | | | (0.83 | )% |
| Total expenses | | | 1.59 | % | | | 1.76 | % | | | 1.68 | % | | | 1.73 | % | | | 2.13 | % |
| Expenses waived or reimbursed(c) | | | (0.08 | )% | | | (0.06 | )% | | | (0.03 | )% | | | (0.02 | )% | | | (0.08 | )% |
| Net expenses (d) | | | 1.51 | % | | | 1.70 | % | | | 1.65 | % | | | 1.71 | % | | | 2.05 | % |
| Portfolio turnover rate | | | 36 | %(e) | | | 74 | % | | | 67 | %(e) | | | 181 | %(e) | | | 106 | %(e) |
| Net assets, end of year (in thousands) | | $ | 123,577 | | | $ | 86,106 | | | $ | 100,740 | | | $ | 93,988 | | | $ | 58,298 | |
| * | Based on average shares outstanding. |
| (a) | The per share amount does not round to a full penny. |
| (b) | Assumes investment at the net asset value at the beginning of the period, reinvestment of all distributions and a complete redemption of the investment at the net asset value at the end of the period. |
| (c) | Expenses waived or reimbursed reflect reductions to total expenses, as discussed in the notes to the financial statements. These amounts would increase the net investment loss ratio or decrease the net investment income ratio, as applicable, and decrease the total returns had such reductions not occurred. |
| (d) | The net expense ratios shown above reflect expenses after waivers and reimbursements and include the effect of reductions to total expenses for any expenses offset. Expense offset arrangements reduce total expenses, as discussed in the notes to the financial statements. These amounts would decrease the net investment income (loss) ratio had such reductions not occurred. The effect of expenses offset are as follows: |
| | | Investor Class | |
| | | Year Ended December 31, | |
| | | 2019 | | | 2018 | | | 2017 | | | 2016 | | | 2015 | |
| Ratios to Average Net Assets: | | | | | | | | | | | | | | | |
| Expense offset | | | (0.08 | )% | | | (0.06 | )% | | | (0.03 | )% | | | (0.01 | )% | | | – | (f) |
| (e) | Excludes option transactions. |
| (f) | Effect on the expense ratio was not greater than 0.005%. |
See accompanying notes to financial statements.
Financial Highlights
Emerging Europe Fund
For a capital share outstanding during the
| | | Investor Class | |
| | | Year Ended December 31, | |
| | | 2019 | | | 2018 | | | 2017 | | | 2016 | | | 2015 | |
| Net asset value, beginning of year | | $ | 6.05 | | | $ | 7.29 | | | $ | 5.94 | | | $ | 5.20 | | | $ | 6.56 | |
| Investment Activities | | | | | | | | | | | | | | | | | | | | |
| Net investment income | | | 0.21 | * | | | 0.14 | * | | | 0.08 | * | | | 0.07 | | | | 0.04 | |
| Net realized and unrealized gain (loss) | | | 1.59 | | | | (1.38 | ) | | | 1.27 | | | | 0.67 | | | | (1.40 | ) |
| Total from investment activities | | | 1.80 | | | | (1.24 | ) | | | 1.35 | | | | 0.74 | | | | (1.36 | ) |
| Distributions | | | | | | | | | | | | | | | | | | | | |
| From net investment income | | | (0.15 | ) | | | – | | | | – | | | | – | | | | – | |
| Short-Term Trading Fees* | | | – | | | | – | | | | 0.00 | (a) | | | 0.00 | (a) | | | 0.00 | (a) |
| Net asset value, end of year | | $ | 7.70 | | | $ | 6.05 | | | $ | 7.29 | | | $ | 5.94 | | | $ | 5.20 | |
| Total Return (b) | | | 29.76 | % | | | (17.01 | )% | | | 22.73 | % | | | 14.23 | % | | | (20.73 | )% |
| Ratios to Average Net Assets: | | | | | | | | | | | | | | | | | | | | |
| Net investment income | | | 3.08 | % | | | 2.05 | % | | | 1.26 | % | | | 1.19 | % | | | 0.63 | % |
| Total expenses | | | 2.36 | % | | | 2.43 | % | | | 2.32 | % | | | 2.31 | % | | | 2.60 | % |
| Expenses waived or reimbursed(c) | | | (0.06 | )% | | | (0.04 | )% | | | (0.02 | )% | | | – | (f) | | | – | |
| Net expenses (d) | | | 2.30 | % | | | 2.39 | % | | | 2.30 | % | | | 2.31 | % | | | 2.60 | % |
| Portfolio turnover rate | | | 87 | % | | | 81 | % | | | 97 | %(e) | | | 164 | %(e) | | | 137 | %(e) |
| Net assets, end of year (in thousands) | | $ | 36,453 | | | $ | 31,150 | | | $ | 45,302 | | | $ | 42,273 | | | $ | 44,666 | |
| * | Based on average shares outstanding. |
| (a) | The per share amount does not round to a full penny. |
| (b) | Assumes investment at the net asset value at the beginning of the period, reinvestment of all distributions and a complete redemption of the investment at the net asset value at the end of the period. |
| (c) | Expenses waived or reimbursed reflect reductions to total expenses, as discussed in the notes to the financial statements. These amounts would increase the net investment loss ratio or decrease the net investment income ratio, as applicable, and decrease the total returns had such reductions not occurred. |
| (d) | The net expense ratios shown above reflect expenses after waivers and reimbursements and include the effect of reductions to total expenses for any expenses offset. Expense offset arrangements reduce total expenses, as discussed in the notes to the financial statements. These amounts would decrease the net investment income (loss) ratio had such reductions not occurred. The effect of expenses offset are as follows: |
| | | Investor Class | |
| | | Year Ended December 31, | |
| | | 2019 | | | 2018 | | | 2017 | | | 2016 | | | 2015 | |
| Ratios to Average Net Assets: | | | | | | | | | | | | | | | |
| Expense offset | | | (0.06 | )% | | | (0.04 | )% | | | (0.02 | )% | | | – | (f) | | | – | (f) |
| (e) | Excludes option transactions. |
| (f) | Effect on the expense ratio was not greater than 0.005%. |
See accompanying notes to financial statements.
Financial Highlights
China Region Fund
For a capital share outstanding during the
| | | Investor Class | |
| | | Year Ended December 31, | |
| | | 2019 | | | 2018 | | | 2017 | | | 2016 | | | 2015 | |
| Net asset value, beginning of year | | $ | 7.56 | | | $ | 11.53 | | | $ | 7.32 | | | $ | 7.41 | | | $ | 8.20 | |
| Investment Activities | | | | | | | | | | | | | | | | | | | | |
| Net investment income (loss) | | | 0.07 | * | | | 0.10 | * | | | (0.06 | )* | | | 0.01 | | | | 0.02 | |
| Net realized and unrealized gain (loss) | | | 1.59 | | | | (3.84 | ) | | | 4.28 | | | | (0.09 | ) | | | (0.72 | ) |
| Total from investment activities | | | 1.66 | | | | (3.74 | ) | | | 4.22 | | | | (0.08 | ) | | | (0.70 | ) |
| Distributions | | | | | | | | | | | | | | | | | | | | |
| From net investment income | | | (0.10 | ) | | | (0.08 | ) | | | (0.01 | ) | | | (0.01 | ) | | | (0.09 | ) |
| From net realized gains | | | – | | | | (0.15 | ) | | | – | | | | – | | | | – | |
| Short-Term Trading Fees* | | | – | | | | – | | | | – | | | | 0.00 | (a) | | | 0.00 | (a) |
| Net asset value, end of year | | $ | 9.12 | | | $ | 7.56 | | | $ | 11.53 | | | $ | 7.32 | | | $ | 7.41 | |
| Total Return (b) | | | 21.99 | % | | | (32.46 | )% | | | 57.67 | % | | | (1.05 | )% | | | (8.60 | )% |
| Ratios to Average Net Assets: | | | | | | | | | | | | | | | | | | | | |
| Net investment income (loss) | | | 0.77 | % | | | 0.96 | % | | | (0.60 | )% | | | 0.12 | % | | | 0.24 | % |
| Total expenses | | | 2.95 | % | | | 2.66 | % | | | 2.60 | % | | | 2.74 | % | | | 3.03 | % |
| Expenses waived or reimbursed(c) | | | (0.51 | )% | | | (0.22 | )% | | | (0.09 | )% | | | (0.38 | )% | | | (0.51 | )% |
| Net expenses (d) | | | 2.44 | % | | | 2.44 | % | | | 2.51 | % | | | 2.36 | % | | | 2.52 | % |
| Portfolio turnover rate | | | 95 | % | | | 109 | % | | | 102 | %(e) | | | 165 | %(e) | | | 210 | %(e) |
| Net assets, end of year (in thousands) | | $ | 14,459 | | | $ | 13,253 | | | $ | 29,775 | | | $ | 16,510 | | | $ | 16,183 | |
| * | Based on average shares outstanding. |
| (a) | The per share amount does not round to a full penny. |
| (b) | Assumes investment at the net asset value at the beginning of the period, reinvestment of all distributions and a complete redemption of the investment at the net asset value at the end of the period. |
| (c) | Expenses waived or reimbursed reflect reductions to total expenses, as discussed in the notes to the financial statements. These amounts would increase the net investment loss ratio or decrease the net investment income ratio, as applicable, and decrease the total returns had such reductions not occurred. |
| (d) | The net expense ratios shown above reflect expenses after waivers and reimbursements and include the effect of reductions to total expenses for any expenses offset. Expense offset arrangements reduce total expenses, as discussed in the notes to the financial statements. These amounts would decrease the net investment income (loss) ratio had such reductions not occurred. The effect of expenses offset are as follows: |
| | | Investor Class | |
| | | Year Ended December 31, | |
| | | 2019 | | | 2018 | | | 2017 | | | 2016 | | | 2015 | |
| Ratios to Average Net Assets: | | | | | | | | | | | | | | | |
| Expense offset | | | (0.10 | )% | | | (0.04 | )% | | | (0.05 | )% | | | (0.01 | )% | | | – | (f) |
| (e) | Excludes option transactions. |
| (f) | Effect on the expense ratio was not greater than 0.005%. |
See accompanying notes to financial statements.
Report of Independent Registered Public Accounting Firm
To the Board of Trustees and Shareholders of U.S. Global Investors Funds
Opinion on the Financial Statements
We have audited the accompanying statements of assets and liabilities of U.S. Government
Securities Ultra-Short Bond Fund, Near-Term Tax Free Fund, All American Equity Fund, Holmes Macro Trends Fund, Global Resources Fund, World Precious Minerals Fund, Gold and Precious Metals Fund, Emerging Europe Fund and China Region Fund, each a series of shares of beneficial interest in U.S. Global Investors Funds (the “Funds”), including the portfolios of investments, as of December 31, 2019, and the related statements of operations for the year then ended, the statements of changes in net assets for each of the years in the two-year period then ended and the financial highlights for each of the years in the four-year period then ended, and the related notes (collectively referred to as the “financial statements”). In our opinion, the financial statements present fairly, in all material respects, the financial position of the Funds as of December 31, 2019, and the results of their operations for the year then ended, the changes in their net assets for each of the years in the two-year period then ended and their financial highlights for each of the years in the four-year period then ended, in conformity with accounting principles generally accepted in the United States of America. The financial highlights for the year ended December 31, 2015 were audited by other auditors, whose report dated February 26, 2016 expressed an unqualified opinion on those financial highlights.
Basis for Opinion
These financial statements are the responsibility of the Funds' management. Our responsibility is to express an opinion on the Funds’ financial statements based on our audits. We are a public accounting firm registered with the Public Company Accounting Oversight Board (United States) (“PCAOB”) and are required to be independent with respect to the Funds in accordance with the U.S. federal securities law and the applicable rules and regulations of the Securities and Exchange Commission and the PCAOB.
We conducted our audits in accordance with the standards of the PCAOB. Those standards require that we plan and perform the audits to obtain reasonable assurance about whether the financial statements are free of material misstatement, whether due to error or fraud. The Funds are not required to have, nor were we engaged to perform, an audit of their internal control over financial reporting. As part of our audits we are required to obtain an understanding of internal control over financial reporting but not for the purpose of expressing an opinion on the effectiveness of the Funds’ internal control over financial reporting. Accordingly, we express no such opinion.
Report of Independent Registered Public Accounting Firm
Our audits included performing procedures to assess the risk of material misstatement of the financial statements, whether due to error or fraud, and performing procedures that respond to those risks. Such procedures included examining, on a test basis, evidence regarding the amounts and disclosures in the financial statements. Our procedures included confirmation of securities owned as of December 31, 2019 by correspondence with the custodian and brokers, or by other appropriate auditing procedures where replies from brokers were not received. Our audits also included evaluating the accounting principles used and significant estimates made by management, as well as evaluating the overall presentation of the financial statements. We believe that our audits provide a reasonable basis for our opinion.

BBD, LLP
We have served as the auditor of one or more of the Funds in the U.S. Global Investors Funds since 2016.
Philadelphia, Pennsylvania
February 28, 2020
| Trustees and Officers (unaudited) | December 31, 2019 |
The following table presents information about the Trustees as of December 31, 2019, together with a brief description of their principal occupations during the last five years. Each trustee serves until his death, resignation or removal and replacement. The address for all trustees is c/o Atlantic Fund Services, Three Canal Plaza, Suite 600, Portland, Maine 04101. If you would like more information about the Trustees, you may call 1-800-US-FUNDS (1-800-873-8637) to request a free copy of the Statement of Additional Information.
| Name and Year of Birth | Position with the Trust | Length of Time Served | Principal Occupation(s) During Past Five Years | Number of Series in Fund Complex Overseen By Trustee | Other Directorships Held By Trustee During Past Five Years |
| Independent Trustees |
David Tucker
Born: 1958 | Chairman of the Board; Trustee; Chairman, Nominating Committee and Qualified Legal Compliance Committee | Since 2015 | Director, Blue Sky Experience (a charitable endeavor), since 2008; Senior Vice President & General Counsel, American Century Companies (an investment management firm), 1998-2008. | 9 | Trustee, Forum Funds; Trustee, Forum Funds II |
Mark D. Moyer
Born: 1959 | Trustee; Chairman Audit Committee | Since 2015 | Chief Financial Officer, Freedom House (a NGO advocating political freedom and democracy), since 2017; independent consultant providing interim CFO services, principally to non-profit organizations, 2011- 2017; Chief Financial Officer, Institute of International Education (a NGO administering international educational exchange programs), 2008-2011; Chief Financial Officer and Chief Restructuring Officer, Ziff Davis Media Inc. (an integrated media company), 2005-2008; Adjunct Professor of Accounting, Fairfield University from 2009- 2012. | 9 | Trustee, Forum Funds; Trustee, Forum Funds II |
Jennifer Brown-Strabley
Born: 1964 | Trustee | Since 2015 | Principal, Portland Global Advisors (a registered investment adviser), 1996-2010. | 9 | Trustee, Forum Funds; Trustee, Forum Funds II |
| Trustees and Officers (unaudited) | December 31, 2019 |
| Name and Year of Birth | Position with the Trust | Length of Time Served | Principal Occupation(s) During Past Five Years | Number of Series in Fund Complex Overseen By Trustee | Other Directorships Held By Trustee During Past Five Years |
| Interested Trustees (1) |
Jessica Chase
Born: 1970 | Trustee | Since 2019 | Director, Apex Fund Services since 2019; Senior Vice President, Atlantic Fund Services 2008-2019. | 9 | Trustee, Forum Funds; Trustee, Forum Funds II |
| (1) | Jessica chase is currently treated as an interested person of the Trust, as defined in the 1940 Act, due to her affiliation with Apex Fund Services and her role as President of the Trust. Apex Fund Services is a wholly owned subsidiary of Apex US Holdings LLC. |
The following table presents information about each Officer of the Trust as of December 31, 2019, together with a brief description of their principal occupations during the last five years. Each officer serves until his or her death, resignation or removal and replacement. The business address of each officer is c/o Apex Fund Services, Three Canal Plaza, Suite 600, Portland, Maine 04101.
Principal Officers of the Trust
| Name and Year of Birth | Position with the Trust | Length of Time Served | Principal Occupation(s) During Past Five Years |
Jessica Chase
Born: 1970 | President; Principal Executive Officer | Since 2015 | Director, Apex Fund Services since 2019; Senior Vice President, Atlantic Fund Services 2008-2019. |
| Karen Shaw Born: 1972 | Treasurer; Principal Financial Officer | Since 2015 | Senior Vice President, Apex Fund Services since 2019; Senior Vice President, Atlantic Fund Services 2008-2019. |
Zachary Tackett
Born: 1988 | Vice President; Secretary and Anti- Money Laundering Compliance Officer | Since 2015 | Counsel, Apex Fund Services since 2019; Counsel, Atlantic Fund Services 2014-2019. |
Carlyn Edgar
Born: 1963 | Chief Compliance Officer, Code of Ethics Review Officer | Since 2015 | Senior Vice President, Apex Fund Services since 2019; Senior Vice President, Atlantic Fund Services since 2008-2014. |
Kathleen Somerville
Born: 1962 | Vice President | Since 2018 | Director of Financial Reporting, U.S. Global Investors, Inc. since 2016; Corporate Internal Auditor, U.S. Global Investors, Inc., 1999-2016. |
| Approval of Investment Advisory Agreement (unaudited) | December 31, 2019 |
On September 12, 2019, the Board of Trustees (the “Board”) of U.S. Global Investors Funds (the “Trust”), including all the trustees who are not “interested persons” of the Trust (the “Independent Trustees”), met in person and approved the continuation of the advisory agreement between U.S. Global Investors, Inc. (the “Adviser”) and the Trust (the “Advisory Agreement”), on behalf of each series of the Trust (each, a “Fund” and together, the “Funds”) for an additional one-year term ended September 30, 2020.
In considering approval of the agreement, the Board reviewed a variety of materials relating to each Fund and the Adviser, including (i) the nature, extent and quality of services provided; (ii) a comparison of services rendered and amounts paid to other registered investment companies; (iii) the investment performance of the Funds measured against appropriate benchmarks and peer groups; (iv) the costs of services provided and estimated profits realized by the Adviser (and its affiliates); (v) the extent to which economies of scale are realized as the Funds grow; (vi) whether fee levels reflect any economies of scale for the benefit of Fund shareholders; and (vii) fall-out benefits realized by the Adviser (and its affiliates) from its relationship with the Funds, if any.
In preparation for its September meeting of the Board of Trustees of the Trust (“September Meeting”), the Trustees were presented with a range of information to assist in their deliberations. Those materials included information from Broadridge Financial Solutions, Inc. (“Broadridge”), an independent source of data about the mutual fund industry, which compared each Fund’s total contractual and actual investment advisory fees, total expenses, and performance with a group of peer funds that were selected by Broadridge. The Trustees also received a memorandum from Independent Legal Counsel concerning their responsibilities with respect to the approval of the investment advisory agreement. The Independent Trustees met in executive session with Independent Legal Counsel while deliberating.
The Board reviewed the functions performed by the Adviser, the portfolio management team and support staff of the Adviser, the Adviser’s investment strategy and process for each Fund, and the Adviser’s financial condition, and considered the quality of services provided.
With respect to performance, the Board noted the Adviser’s overall representation that the Funds’ relatively small asset size meant that fund expenses also served as a disproportionate drag on performance relative to the larger peers in each Fund’s respective Broadridge peer group.
For the All American Equity Fund, the information showed that the Fund outperformed the median of its Broadridge peer group for the one-year period ended June 30, 2019, and underperformed the median of its Broadridge peers for the three- and five-year periods ended June 30, 2019. The Board also observed that the Fund underperformed the S&P 500 Index, the Fund’s primary benchmark index, for the one-, three-, and five-year periods ended June 30, 2019. The Board noted the Adviser’s representation that the Fund’s underperformance could be attributed, at least in part, to the Fund’s narrow investment focus and on the Fund’s emphasis on stocks exhibiting strong shareholder yield characteristics. The Board also noted the Adviser’s representation that the Adviser continues to evaluate opportunities to improve its investment model.
For the Holmes Macro Trends Fund, the information showed that the Fund underperformed the median of its Broadridge peer group for the one-, three-, and five-year periods ended June 30, 2019. The Board also observed that the Fund underperformed the S&P Composite
| Approval of Investment Advisory Agreement (unaudited) | December 31, 2019 |
1500 Index, the Fund’s primary benchmark index, for the one-, three-, and five-year periods ended June 30, 2019. The Board noted the Adviser’s representation that underperformance was related to the Fund’s underweight exposure to certain market sectors that were significant drivers of its peer group and benchmark’s performances.
For the Global Resources Fund, the information showed that the Fund underperformed the median of its Broadridge peer group for the one-, three-, and five-year periods ended June 30, 2019. The Board also observed that the Fund underperformed the S&P Global Natural Resources Index (Net Total Return), its primary benchmark index, for the one-, three-, and five-year periods ended June 30, 2019. The Board noted the Adviser’s representation that underperformance of the Fund can be attributed to sector allocation and higher relative exposure to certain market sectors.
For the World Precious Minerals Fund, the information showed that the Fund underperformed the median of its Broadridge peers for the one-, three- and five-year period ended June 30, 2019. The Board also observed that the Fund underperformed the NYSE Arca Gold Miners Index, its primary benchmark index, for the one-, three-, and five-year periods ended June 30, 2019. The Board noted that the Fund’s underperformance relative to the index and peers can be attributed to the performance of the exploration and development companies in which the Fund invested.
For the Gold and Precious Metals Fund, the information showed that the Fund underperformed the median of its Broadridge peers for the one-year period ended June 30, 2019, and outperformed the median of the Broadridge peers for the three- and five-year periods ended June 30, 2019. The Board also observed that the Fund also underperformed the FTSE Gold Mines Index, its primary benchmark index, for the one-, three-, and five-year periods ended June 30, 2019. The Board noted the Adviser’s representation that the Fund’s relative underperformance over relevant periods could be attributable, in part, to market preference for larger and more liquid gold companies, whereas the Fund tended to invest in companies with significantly lower median market capitalizations.
For the Emerging Europe Fund, the information showed that the Fund outperformed the median of the Broadridge peer group for the one-year period ended June 30, 2019, performed at the median of the Broadridge peers for the three-year period ended June 30, 2019, and underperformed the median of the Broadridge peer group for the five-year period ended June 30, 2019. The Board observed that the Fund underperformed the MSCI Emerging Markets Europe 10/40 Index (Net Total Return), the Fund’s primary benchmark index, for the one-, three-, and five-year periods ended June 30, 2019. The Board noted the Adviser’s representation that the funds in the Broadridge peer group consist of broad emerging market strategies, whereas the Fund employs a unique, dedicated emerging Europe strategy.
For the China Region Fund, the information showed that the Fund underperformed the median of the Broadridge peer group for the one-, three-, and five-year periods ended June 30, 2019. The Board observed that the Fund underperformed the Hang Seng Composite Index, its primary benchmark index, for the one-, three-, and five-year periods ended June 30, 2019. The Board noted the Adviser’s representation that the Fund’s underperformance could be attributed, in part, to trade war concerns during 2018 and 2019, as well as the Fund’s model-driven preference for certain subsectors that underperformed the market on the whole.
| Approval of Investment Advisory Agreement (unaudited) | December 31, 2019 |
For the Near-Term Tax-Free Fund, the information showed that the Fund underperformed the median of its Broadridge peer group for the one-, three-, and five-year periods ended June 30, 2019. The Board also noted that the Fund underperformed the Bloomberg Barclays 3-Year Municipal Bond Index, the Fund’s primary benchmark index, for the one-, three-, and five-year periods ended June 30, 2019.
The Board noted the Adviser’s representation that underperformance against the benchmark was a result of the Fund’s duration being shorter than the benchmark and peers over a period during which falling yields benefitted longer maturity investment strategies.
For the U.S. Government Securities Ultra-Short Bond Fund, the information showed that the Fund underperformed the Bloomberg Barclays U.S. Treasury Bills 6-9 Month Total Return Index, the Fund’s primary benchmark index, for the one-, three-, and five-year period ended June 30, 2019. The Board also noted the Adviser’s representation that the Fund underperformed the median of its Broadridge peers for the one-year period ending June 30, 2019 and outperformed the median of its Broadridge peers for the three- and five-year periods ended June 30, 2019. The Board noted the Adviser’s representation that underperformance against the benchmark was a result of the Fund’s duration being shorter than the benchmark and peers over a period during which falling yields benefitted longer maturity investment strategies.
The Board also reviewed information on each Fund’s advisory fee and expense ratios compared to the advisory fees and expense ratios of a peer group of funds based upon information prepared by Broadridge.
For the All American Equity Fund, the information showed that, as of June 30, 2019, the Fund’s actual advisory fee rate and actual total expense ratio were each higher than the median of its Broadridge peer group.
For the Holmes Macro Trends Fund, the information showed that, as of June 30, 2019, the Fund’s actual advisory fee rate and actual total expense ratio were each higher than the median of its Broadridge peer group.
For the Global Resources Fund, the information showed that, as of June 30, 2019, the Fund’s actual advisory fee rate and its actual total expense ratio were each higher than the median of its Broadridge peer group, though the Board noted that the total expense ratios of all of the peers were within a narrow range.
For the World Precious Minerals Fund, the information showed that, as of June 30, 2019, the Fund’s actual advisory fee rate was lower that the median of its Broadridge peer group and that the actual total expense ratio was higher than the median of its Broadridge peer group.
For the Gold and Precious Metals Fund, the information showed that, as of June 30, 2019, the Fund’s actual advisory fee rate and actual total expense ratio were each higher than the median of its Broadridge peer group.
For the Emerging Europe Fund, the information showed that, as of June 30, 2019, each of the Fund’s actual advisory fee rate and actual total expense ratio were higher than the median of its Broadridge peer group.
| Approval of Investment Advisory Agreement (unaudited) | December 31, 2019 |
For the China Region Fund, the information showed that, as of June 30, 2019, the Fund’s actual advisory fee rate and its actual total expense ratio were each higher than the median of its Broadridge peer group.
For the Near-Term Tax-Free Fund, the information showed that, as of June 30, 2019, the Fund’s actual advisory fee rate and actual total expense ratio were each less than the median of its Broadridge peer group.
For the U.S. Government Securities Ultra-Short Bond Fund, the information showed that, as of June 30, 2019, the Fund’s actual advisory fee rate and actual total expense ratio were each less than the median of its Broadridge peer group.
The Board considered the Adviser’s representation that higher expenses are inherent in small fund complexes, such as the Trust, noting the difficulty that small complexes face in spreading increasing overhead over a small asset base. The Board noted the Adviser’s representation that the Adviser continues to evaluate opportunities to reduce expenses that negatively affect the Funds’ investment results. In addition, the Board noted that the Adviser is contractually limiting expenses (exclusive of acquired fund fees and expenses, extraordinary expenses, taxes, brokerage commissions and interest) on an annualized basis for the Near-Term Tax-Free Fund at 0.45% of average net assets through at least April 30, 2020.
The Board further noted that the Adviser is currently voluntarily limiting expenses at the following levels for the Funds (all voluntary expense limitations may be modified or removed by the Adviser at any time and are exclusive of acquired fund fees and expenses, extraordinary expenses, taxes, brokerage commissions, interest, and advisory fee performance adjustments, if any):
| Funds | Expense Cap |
| All American Equity Fund | 2.20% |
| China Region Fund | 2.55% |
| Emerging Europe Fund | 2.85% |
| Global Resources Fund | 1.90% |
| Gold and Precious Metals Fund | 1.90% |
| Holmes Macro Trends Fund | 2.20% |
| World Precious Minerals Fund | 1.90% |
| U.S. Government Securities Ultra-Short Bond Fund | 0.45% |
The Board considered the fee structure of the Advisory Agreement, including the costs of the services provided and the profits realized by the Adviser and its affiliates from their relationship with the Funds.
As part of its review of the Advisory Agreement, the Board considered whether the Funds would benefit from any economies of scale. In this respect, the Board considered the Funds’ fee structures, asset sizes, and net expense ratios. The Board noted the Adviser’s representation that economies of scale could be experienced by shareholders of the Funds upon reaching significantly higher asset levels but that, in light of the Funds’ current asset levels, breakpoints in the advisory fee were not believed by the Adviser to be appropriate at this time. Based on the foregoing information and other applicable considerations, the Board concluded that the asset levels of the Funds were not indicative of economies of scale such that economies of scale were not a material factor in approving the Advisory Agreement.
| Approval of Investment Advisory Agreement (unaudited) | December 31, 2019 |
Based on all the above-mentioned factors, other information provided, and related conclusions, with no single factor or conclusion being determinative and with each Trustee not necessarily attributing the same weight to each factor, the Board, including the Independent Trustees, concluded that the nature, extent and quality of services provided by the Adviser supported the renewal of the advisory agreement with the Adviser.
Additional Information (unaudited)
Additional Federal Tax Information
The percentage of tax-exempt dividends paid by the Near-Term Tax Free Fund for the year ended December 31, 2019, was 100.00%.
In early 2020, the Funds reported on Form 1099-DIV the tax status of all distributions made during the 2019 calendar year. The Funds intend to distribute the maximum amount of qualified dividend income allowable. The amount of qualified dividend income distributed by each Fund will be reported to shareholders on their Form 1099-DIV. Shareholders should use the information on Form 1099-DIV for their income tax returns.
The percentage of ordinary income dividends paid by the Funds during the year ended
December 31, 2019, which qualify as Qualified Dividends Income (QDI) and the Dividends Received Deduction (DRD) available to corporate shareholders was:
| | | Qualified Dividend Income | | | Dividend Received Deduction | | | Qualified Investment Income | | | Qualified Short Term Gain Dividends | |
| U.S. Government Securities Ultra-Short Bond | | | – | % | | | – | % | | | 91.57 | % | | | – | % |
| All American Equity | | | 31.62 | % | | | 30.09 | % | | | – | % | | | 100.00 | % |
| Holmes Macro Trends | | | 60.49 | % | | | 58.71 | % | | | 1.31 | % | | | 97.59 | % |
| Global Resources | | | 92.21 | % | | | 12.96 | % | | | 16.84 | % | | | – | % |
| Emerging Europe | | | 100.00 | % | | | – | % | | | – | % | | | – | % |
| China Region | | | 93.72 | % | | | – | % | | | – | % | | | – | % |
The amounts which represent foreign source income and foreign taxes paid during the year ended December 31, 2019, are as follows:
| | | Foreign Source Income | | | Foreign Tax Credit | |
| Global Resources | | $ | 1,750,381 | | | $ | 180,365 | |
| Emerging Europe | | | 1,996,899 | | | | 224,964 | |
| China Region | | | 488,557 | | | | 22,984 | |
Proxy Voting
A description of the policies and procedures that the Funds use to determine how to vote proxies relating to portfolio securities is available without charge, upon request, by calling 1-800-US-FUNDS (1-800-873-8637). It also appears in the Funds’ statement of additional information (Form 485B), which can be found on the SEC’s website at www.sec.gov.
Information regarding how the Funds voted proxies relating to portfolio securities during the most recent 12-month period ended June 30 is available without charge, upon request, by calling 1-800-US-FUNDS (1-800-873-8637) or accessing the Funds’ Form N-PX on the SEC’s website at www.sec.gov.
Availability of Quarterly Portfolio Schedules
The Funds provide complete lists of holdings four times in each fiscal year, at the quarter-ends. For the second and fourth quarters, the lists appear in the Fund’s semi-annual and annual reports to shareholders. For the first and third quarters, the Funds file the lists with the SEC
Additional Information (unaudited)
on Form N-Q. The Funds’ Form N-Qs are available on the SEC’s website at http://www.sec. gov. The Funds’ Forms N-Q may also be reviewed and copied at the SEC’s Public Room in Washington D.C. Information on the operation of the Public Reference Room may be obtained by calling 1-800-SEC-0330.
| Expense Example (unaudited) | December 31, 2019 |
As a shareholder of the funds, you incur two types of costs: (1) transaction costs, including short-term trading fees and exchange fees; and (2) ongoing costs, including management fees, distribution plan fees, shareholder reports (like this one), and other fund expenses. This example is intended to help you understand your ongoing costs (in dollars) of investing in other mutual funds.
The example is based on an investment of $1,000 invested at the beginning of the period and held for the entire period (July 1, 2019 to December 31, 2019) as indicated below.
| • | Actual Expenses. The first line of the following table for each fund provides information about actual account values and actual expenses. You may use the information in this line, together with the amount you invested, to estimate the expenses you paid over the period. Simply divide your account value by $1,000 (for example, an $8,600 account value divided by $1,000 = 8.6), then multiply the result by the number in the first line under the heading ‘‘Expenses Paid During Period’’ to estimate the expenses you paid on your account during this period. |
| • | Hypothetical Example for Comparison Purposes. The second line of the following table for each fund provides information about hypothetical account values and hypothetical expenses based on the fund’s actual expense ratio and an assumed rate of return of 5 percent per year before expenses, which is not the fund’s actual return. The hypothetical account values and expenses may not be used to estimate the actual ending account balance or expenses you paid for the period. You may use this information to compare the ongoing costs of investing in these funds and other funds. To do so, compare this 5 percent hypothetical example with the 5 percent hypothetical examples that appear in the shareholder reports of other funds. |
Please note that the expenses shown in the table are meant to highlight your ongoing costs only and do not reflect any direct or transactional costs, such as small account, exchange or short-term trading fees. Therefore, the second line of the table is useful in comparing ongoing costs only, and will not help you determine the relative total costs of owning different funds. In addition, if these direct or transactional costs were included, your costs would have been higher.
| Expense Example (unaudited) | December 31, 2019 |
| | | Beginning Account Value July 1, 2019 | | | Ending Account Value December 31, 2019 | | | Expenses Paid During Period* | |
| U.S. Government Securities Ultra-Short Bond Fund | | | | | | | | | |
| Based on Actual Fund Return | | $ | 1,000.00 | | | $ | 1,007.03 | | | $ | 2.28 | |
| Based on Hypothetical 5% Yearly Return | | $ | 1,000.00 | | | $ | 1,022.94 | | | $ | 2.29 | |
| Near-Term Tax Free Fund | | | | | | | | | | | | |
| Based on Actual Fund Return | | $ | 1,000.00 | | | $ | 1,011.15 | | | $ | 2.28 | |
| Based on Hypothetical 5% Yearly Return | | $ | 1,000.00 | | | $ | 1,022.94 | | | $ | 2.29 | |
| All American Equity Fund | | | | | | | | | | | | |
| Based on Actual Fund Return | | $ | 1,000.00 | | | $ | 1,078.84 | | | $ | 9.06 | |
| Based on Hypothetical 5% Yearly Return | | $ | 1,000.00 | | | $ | 1,016.48 | | | $ | 8.79 | |
| Holmes Macro Trends Fund | | | | | | | | | | | | |
| Based on Actual Fund Return | | $ | 1,000.00 | | | $ | 1,030.39 | | | $ | 7.22 | |
| Based on Hypothetical 5% Yearly Return | | $ | 1,000.00 | | | $ | 1,018.10 | | | $ | 7.17 | |
| Global Resources Fund | | | | | | | | | | | | |
| Based on Actual Fund Return | | $ | 1,000.00 | | | $ | 1,015.17 | | | $ | 7.77 | |
| Based on Hypothetical 5% Yearly Return | | $ | 1,000.00 | | | $ | 1,017.49 | | | $ | 7.78 | |
| World Precious Minerals Fund | | | | | | | | | | | | |
| Based on Actual Fund Return | | $ | 1,000.00 | | | $ | 1,153.31 | | | $ | 7.98 | |
| Based on Hypothetical 5% Yearly Return | | $ | 1,000.00 | | | $ | 1,017.80 | | | $ | 7.48 | |
| Gold and Precious Metals Fund | | | | | | | | | | | | |
| Based on Actual Fund Return | | $ | 1,000.00 | | | $ | 1,267.50 | | | $ | 7.72 | |
| Based on Hypothetical 5% Yearly Return | | $ | 1,000.00 | | | $ | 1,018.40 | | | $ | 6.87 | |
| Emerging Europe Fund | | | | | | | | | | | | |
| Based on Actual Fund Return | | $ | 1,000.00 | | | $ | 1,097.97 | | | $ | 12.32 | |
| Based on Hypothetical 5% Yearly Return | | $ | 1,000.00 | | | $ | 1,013.46 | | | $ | 11.82 | |
| China Region Fund | | | | | | | | | | | | |
| Based on Actual Fund Return | | $ | 1,000.00 | | | $ | 1,056.45 | | | $ | 13.17 | |
| Based on Hypothetical 5% Yearly Return | | $ | 1,000.00 | | | $ | 1,012.40 | | | $ | 12.88 | |
| * | These calculations are based on expenses incurred in the most recent fiscal half-year. The Funds' Investor Class' annualized expense ratios (after reimbursements and offsets) for the six month period ended December 31, 2019, were 0.45%, 0.45%, 1.73%, 1.41%, 1.53%, 1.47%, 1.35%, 2.33% and 2.54%, respectively, for the U.S. Government Securities Ultra-Short Bond, Near-Term Tax Free, All American Equity, Holmes Macro Trends, Global Resources, World Precious Minerals, Gold and Precious Metals, Emerging Europe and China Region Funds. The dollar amounts shown as "Expenses Paid" are equal to the annualized expense ratio multiplied by the average account value over the period, multiplied by 184, the number of days in the period, then divided by 365 days in the current fiscal year. |
Apex Fund Services
3 Canal Plaza, Suite 600
Portland, ME 04101
| Want to reduce paper waste? You can receive this report and other important documents electronically. Please visit www.usfunds.com and sign up at Access My Account. If you need further assistance, please call us at 800-873-8637. | |
ITEM 2. CODE OF ETHICS.
| (a) | As of the end of the period covered by this report, U.S. Global Investors Funds (the “Registrant”) has adopted a code of ethics, which applies to its Principal Executive Officer and Principal Financial Officer (the “Code of Ethics”). |
| (c) | There have been no amendments to the Registrant’s Code of Ethics during the period covered by this report. |
(d) There have been no waivers to the Registrant’s Code of Ethics during the period covered by this report.
(e) Not applicable.
(f) (1) A copy of the Code of Ethics is being filed under Item 12(a) hereto.
ITEM 3. AUDIT COMMITTEE FINANCIAL EXPERT.
The Board of Trustees has determined that Mr. Mark Moyer is an "audit committee financial expert" as that term is defined under applicable regulatory guidelines. Mr. Moyer is a non- “interested” Trustee (as defined in Section 2(a)(19) under the Investment Company Act of 1940, as amended (the “Act”)), and serves as Chairman of the Audit Committee.
ITEM 4. PRINCIPAL ACCOUNTANT FEES AND SERVICES.
(a) Audit Fees - The aggregate fees billed for each of the last two fiscal years (the “Reporting Periods”) for professional services rendered by the Registrant’s principal accountant for the audit of the Registrant’s annual financial statements, or services that are normally provided by the principal accountant in connection with the statutory and regulatory filings or engagements for the Reporting Periods, were $139,600 in 2018 and $139,600 in 2019.
(b) Audit-Related Fees – The aggregate fees billed in the Reporting Periods for assurance and related services rendered by the principal accountant that were reasonably related to the performance of the audit of the Registrant’s financial statements and are not reported under paragraph (a) of this Item 4 were $0 in 2018 and $0 in 2019.
(c) Tax Fees - The aggregate fees billed in the Reporting Periods for professional services rendered by the principal accountant to the Registrant for tax compliance, tax advice and tax planning were $27,000 in 2018 and $27,000 in 2019. These services consisted of review or preparation of U.S. federal, state, local and excise tax returns.
(d) All Other Fees - The aggregate fees billed in the Reporting Periods for products and services provided by the principal accountant to the Registrant, other than the services reported in paragraphs (a) through (c) of this Item, were $0 in 2018 and $0 in 2019.
(e) (1) The Audit Committee reviews and approves in advance all audit and “permissible non-audit services” (as that term is defined by the rules and regulations of the Securities and Exchange Commission) to be rendered to a series of the Registrant (each, a “Series”). In addition, the Audit Committee reviews and approves in advance all “permissible non-audit services” to be provided to an investment adviser (not including any sub-adviser) of a Series, or an affiliate of such investment adviser, that is controlling, controlled by or under common control with the investment adviser and provides on-going services to the Registrant (“Affiliate”), by the Series’ principal accountant if the engagement relates directly to the operations and financial reporting of the Series. The Audit Committee considers whether fees paid by a Series’ investment adviser or an Affiliate to the Series’ principal accountant for audit and permissible non-audit services are consistent with the principal accountant’s independence.
(e) (2) No services included in (b) - (d) above were approved pursuant to paragraph (c)(7)(i)(C) of Rule 2-01 of Regulation S-X.
(f) Less than 50 percent of the hours expended on the principal accountant’s engagement to audit the Registrant’s financial statements for the most recent fiscal year were attributed to work performed by persons other than the principal accountant’s full-time, permanent employees.
(g) The aggregate fees billed by the Registrant’s principal accountant for non-audit services rendered to the Registrant, its investment adviser, and any entity controlling, controlled by, or under common control with the investment adviser that provides ongoing services to the registrant were $27,000 in 2018 and $27,000 in 2019. These fees related to tax services rendered to the Registrant.
(h) All non-audit services rendered in (g) above were considered by the registrant’s audit committee in maintaining the principal accountant’s independence.
ITEM 5. AUDIT COMMITTEE OF LISTED REGISTRANTS.
Not applicable.
ITEM 6. INVESTMENTS.
| (a) | Included as part of report to shareholders under Item 1. |
ITEM 7. DISCLOSURE OF PROXY VOTING POLICIES AND PROCEDURES FOR CLOSED-END
MANAGEMENT INVESTMENT COMPANIES.
Not applicable.
ITEM 8. PORTFOLIO MANAGERS OF CLOSED-END MANAGEMENT INVESTMENT COMPANIES.
Not applicable.
ITEM 9. PURCHASES OF EQUITY SECURITIES BY CLOSED-END MANAGEMENT INVESTMENT COMPANY AND AFFILIATED PURCHASERS.
Not applicable.
ITEM 10. SUBMISSION OF MATTERS TO A VOTE OF SECURITY HOLDERS
The Registrant does not accept nominees to the board of trustees from shareholders.
ITEM 11. CONTROLS AND PROCEDURES
(a) The Registrant’s Principal Executive Officer and Principal Financial Officer have concluded that the Registrant’s disclosure controls and procedures (as defined in Rule 30a-3(c) under the Act are effective, based on their evaluation of the controls and procedures required by Rule 30a-3(b) under the Act and Rules 13a-15(b) or 15d-15(b) under the Securities Exchange Act of 1934, as of a date within 90 days of the filing date of this report.
(b) There were no changes in the Registrant’s internal control over financial reporting (as defined in
Rule 30a-3(d) under the Act) that occurred during the second fiscal quarter of the period covered by this report that have materially affected, or are reasonably likely to materially affect, the Registrant’s internal control over financial reporting.
ITEM 12. DISCLOSURE OF SECURITIES LENDING ACTIVITIES FOR CLOSED-END MANAGEMENT INVESTMENT COMPANIES
Not applicable.
ITEM 13. EXHIBITS.
(a)(1) Code of Ethics (Exhibit filed herewith).
(a)(2) Certifications pursuant to Rule 30a-2(a) of the Act, and Section 302 of the Sarbanes-Oxley Act of 2002. (Exhibits filed herewith)
(a)(3) Not applicable.
(b) Certifications pursuant to Rule 30a-2(b) of the Act, and Section 906 of the Sarbanes-Oxley Act of 2002. (Exhibit filed herewith)
SIGNATURES
Pursuant to the requirements of the Securities Exchange Act of 1934 and the Investment Company Act of 1940, the Registrant has duly caused this report to be signed on its behalf by the undersigned, thereunto duly authorized.
Registrant U.S. Global Investors Funds
| By: | /s/ Jessica Chase
| |
| | Jessica Chase, Principal Executive Officer | |
| | | |
| Date: | February 28, 2020
| |
Pursuant to the requirements of the Securities Exchange Act of 1934 and the Investment Company Act of 1940, this report has been signed below by the following persons on behalf of the Registrant and in the capacities and on the dates indicated.
| By: | /s/ Jessica Chase
| |
| | Jessica Chase, Principal Executive Officer | |
| | | |
| Date: | February 28, 2020
| |
| By: | /s/ Karen Shaw
| |
| | Karen Shaw, Principal Financial Officer | |
| | | |
| Date: | February 28, 2020
| |