As filed with the Securities and Exchange Commission on March 7, 2017
UNITED STATES
SECURITIES AND EXCHANGE COMMISSION
WASHINGTON, D.C. 20549
FORM N-CSR
CERTIFIED SHAREHOLDER REPORT OF REGISTERED MANAGEMENT
INVESTMENT COMPANIES
Investment Company Act file number 811-01800
U.S. GLOBAL INVESTORS FUNDS
Three Canal Plaza, Suite 600
Portland, Maine 04101
Jessica Chase, Principal Executive Officer
Three Canal Plaza, Suite 600
Portland, Maine 04101
207-347-2000
Date of fiscal year end: December 31
Date of reporting period: January 1, 2016 – December 31, 2016
ITEM 1. REPORT TO STOCKHOLDERS.
U.S. Global Investors Funds Annual Report
December 31, 2016

U.S. Global Investors Funds
Annual Report
December 31, 2016
Table of Contents
Letter to Shareholders | 1 |
Definitions for Management Teams' Perspectives | 10 |
Management Team's Perspective | 12 |
Portfolios of Investments | 54 |
Notes to Portfolios of Investments | 98 |
Statements of Assets and Liabilities | 110 |
Statements of Operations | 114 |
Statements of Changes in Net Assets | 118 |
Notes to Financial Statements | 124 |
Financial Highlights | 140 |
Report of Independent Registered Public Accounting Firm | 151 |
Trustees and Officers | 152 |
Approval of Investment Advisory Agreement | 155 |
Additional Information | 162 |
Expense Example | 164 |
Nasdaq Symbols
U.S. Global Investors Funds
Investor Class | |
U.S. Government Securities Ultra-Short Bond Fund | UGSDX |
Near-Term Tax Free Fund | NEARX |
All American Equity Fund | GBTFX |
Holmes Macro Trends Fund | MEGAX |
Global Resources Fund | PSPFX |
World Precious Minerals Fund | UNWPX |
Gold and Precious Metals Fund | USERX |
Emerging Europe Fund | EUROX |
China Region Fund | USCOX |
| | |
Institutional Class | |
Global Resources Fund | PIPFX |
World Precious Minerals Fund | UNWIX |
Gold and Precious Metals Fund* | USEIX |
Emerging Europe Fund* | EURIX |
* | The Institutional Class shares of the Gold and Precious Metals and Emerging Europe Funds have not commenced operations and currently are closed to investors. A notice will be issued when each class commences operations and opens to investors. |

| Atlantic Fund Services
3 Canal Plaza, Suite 600
Portland, ME
04101 |
U.S. Global Investors Funds | (unaudited) |

Dear Fellow Shareholder,
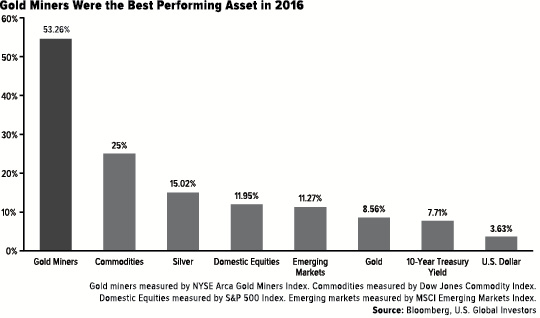
2016 was a banner year for gold. After finishing in the red for three straight years, the yellow metal made a remarkable turnaround, ending 2016 up 8.56 percent.
In the first half of the year—gold’s best since 1974—demand was driven largely by the Fear Trade. Government bond yields in countries such as Japan, Switzerland and Germany plunged below zero, prompting overseas investors to pile into gold, not to mention American municipal debt. A shaky stock market early in the year, not to mention geopolitical uncertainty—specifically the risk of Brexit in the United Kingdom and the rise of Donald J. Trump here in the United States—also boosted demand.
In the second half, gold began to stall as investors awaited the results of the U.S. presidential election and anticipated a December rate hike. Immediately following Trump’s win, equities took off and the U.S. dollar surged, causing gold to fall out of favor. Between November 8 and December 31, 2016, the precious metal retreated nearly 10 percent.
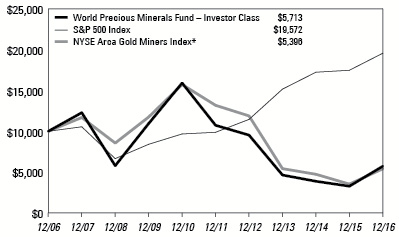
Despite the downturn, gold miners managed to strike gold in 2016. The group, as measured by the NYSE Arca Gold Miners Index, finished the year up an amazing 53.26 percent, based on simple price appreciation, handily beating all other asset classes shown below.
I was immensely happy with the performance of our two gold funds, the Gold and Precious Metals Fund (USERX) and the World Precious Minerals Fund (UNWPX), both of which led many of their peers.
1
U.S. Global Investors Funds | (unaudited) |
The two funds also received special recognition from Morningstar in 2016. USERX earned a 5-Star Overall Rating (as of December 31, among 71 Equity Precious Metals funds, based on risk-adjusted returns), while UNWPX was honored with a 5-Star Rating over the three-year period (again, as of December 31, among 71 Equity Precious Metals funds, based on risk-adjusted returns).
Gold should continue to be supported in 2017 by even deeper negative real rates, which could fall to their lowest level in two years as inflation outpaces nominal interest rate increases, according to UBS. In October, Federal Reserve Chair Janet Yellen suggested there might be some benefit in allowing inflation to exceed the central bank’s target rate of 2 percent before another hike is considered, which is good news for gold. Numerous times in the past I’ve shown that the yellow metal has tended to rise when real rates—what you get when you subtract inflation from the federal funds rate—fell into negative territory.
Global Manufacturing Improved, Supporting Commodity Prices
Commodities were the second-best asset class last year, responding to improved manufacturing activity and trade volumes around the world. Global manufacturing expanded for the fourth straight month in December, reaching 52.7, its highest reading since February 2014.

Purchasing manager’s index (PMI) readings for the U.S., Germany, Japan and the eurozone all recorded their highest posts in at least a year after building on a strengthening uptrend that had been in place since September. International trade volume expansion hit a 27-month high in December. And despite the “negative” consequence of Brexit, the U.K. Manufacturing PMI posted an amazing 56.1, up from 53.4 in November.
2
U.S. Global Investors Funds | (unaudited) |
Despite a strengthening dollar, commodity prices remained relatively resilient, presumably on hopes that Trump’s proposed $1 trillion infrastructure spending package would be realized.
Year after year, the Periodic Table of Commodity Returns continues to be one of our most popular pieces. You can find the full-color, high-resolution version on our website, www.usfunds.com.
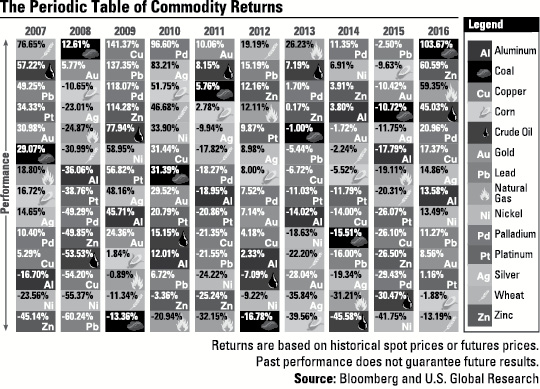
China’s commodities trading volume was also impressive in 2016. For the seventh consecutive year, the Asian giant maintained its rank as the biggest importer of raw materials. This helped solidify China’s role as the world’s top engine of economic growth, contributing an estimated 33.2 percent to global economic expansion in 2016, according to China’s National Bureau of Statistics.
Small Business Optimism Soared to 12-Year High
Here in the U.S., President Trump’s pledge to lower taxes and slash regulations is working wonders for business optimism. In December, the Index of Small Business Optimism soared a phenomenal 7.4 points to 105.8, its highest reading since 2004. The National Federation of Independent Business (NFIB), which conducts the survey, reported that attitudes toward capital spending and job creation in particular surprised to the upside.
3
U.S. Global Investors Funds | (unaudited) |

Small-cap stocks, as measured by the Russell 2000 Index, surged on bets that Trump’s “America First” policies will benefit domestics with limited exposure to foreign markets, more so than multinational blue-chip stocks.

4
U.S. Global Investors Funds | (unaudited) |
The president’s proposals are aggressively inward-facing, which bodes well for companies with little foreign exposure. As a group, small caps have far less exposure to foreign markets than larger, multinational companies do. Because they rely a lot less on exports, they’re not as negatively affected by a strong U.S. dollar, which has the effect of making American-made products more expensive for foreign buyers.
New Models for Our Domestic Equities Funds
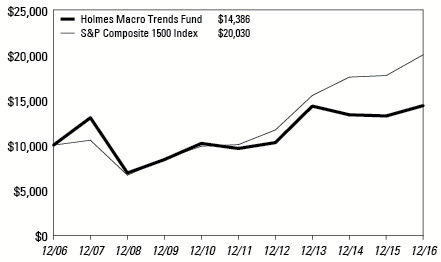
We’re committed to taking advantage of this upside, which is why we adjusted and dramatically improved the methodology for our two domestic equities funds, the All American Equity Fund (GBTFX) and the Holmes Macro Trends Fund (MEGAX).
Among other changes, we seek to capture the performance of the “growthiest” companies in All American’s benchmark, the S&P 500 Index, by focusing on those whose most recent quarter’s sales per share is greater than the average of the previous four quarters. So if a company’s average sales per share for the past four quarters is $30, let’s say, it needs to show something higher than that in the current quarter to be considered. We want the most active, productive companies on a per-share basis, and we’ve found that sales per share (also known as revenue per share) is one of the best ways to measure this.
The benchmark for MEGAX is the S&P Composite 1500 Index, which introduces small- and mid-cap stocks to our universe of investable companies. Again, many of these stocks have been among the best performers since the November election.
Mid-cap companies are especially attractive because they’ve reached a point in their enterprise life cycle where the challenges inherent to smaller companies—raising capital early on and managing capacity growth, for example—are mostly behind them. At the same time, they remain dynamic enough for rapid growth to be possible.
That’s why mid-cap stocks now account for 40 percent of our new MEGAX model. Meanwhile, 36 percent is in small caps, the remaining 24 percent in large caps.
We’re very excited about the changes and have a lot of confidence in them going forward.
Warren Buffett’s Big Bet on Airlines
After years of deriding the airline industry, billionaire investor Warren Buffett confirmed in November that his holding company invested nearly $1.3 billion in the four big-name domestic carriers.
This was a dramatic reversal for the 86-year-old investing wizard, who previously called the airline industry a capital “death trap” and once joked that investors would have been served well had Orville Wright’s plane been shot down at Kitty Hawk.
5
U.S. Global Investors Funds | (unaudited) |
The thing is, Buffett held these opinions long before airlines began making the fundamental changes that would flip their fortunes from bankruptcy to record profitability. When Buffett first tried his hand at making money in the aviation industry in 1989, airlines were still struggling in a fiercely competitive marketplace.
But following the massive wave of industry consolidation between 2005 and 2010, a new business environment emerged, one characterized by disciplined capacity growth, new sources of revenue, greater efficiency and a commitment to repairing balance sheets.
Buffett professes to like airlines now for the same reason he’s long been a fan of railroads—namely, the barriers to entry are extremely high if not entirely impenetrable to new competitors. This is the “moat” Buffett refers to when talking about rail. What’s more, as a value investor, he prefers inexpensive stocks, and among industrials, airlines were cheapest of all, based on price-to-earnings and cash flow.

Muni Bonds a Key to Making America Great Again
Again, President Trump has proposed a spending package as high as $1 trillion over the next 10 years. Although the private sector will be expected to finance a large portion of the work, massive amounts of public debt will be necessary.
6
U.S. Global Investors Funds | (unaudited) |
As such, this could be a “very big item for the muni market in the coming years,” according to John Vahey, managing director of federal policy for Bond Dealers of America, a trade association for fixed-income dealers. Demand is high at the moment. On Election Day alone, U.S. voters approved $55.7 billion in new debt, the highest single-day issuance since 2008.
Even though rates were lifted only 0.25 percent in December, it’s important to be aware that when rates rise, bond prices fall. At first glance, this inverse relationship might seem illogical, but it makes sense. If newly-issued bonds carry a higher yield, the value of existing bonds with lower rates declines.
That’s why investors should consider taking advantage of shorter-duration, investment-grade munis, which are less sensitive to rate increases than longer-term bonds whose maturities are further out.
Our Near-Term Tax Free Fund (NEARX) invests primarily in high-quality, investment-grade muni bonds in attractive jurisdictions. We believe after all, a well-structured, diversified portfolio—one that also includes munis—is still the most prudent strategy going forward.
To get the latest insights and commentary on gold and other commodities, emerging markets, municipal bonds and much, much more, subscribe to our Investor Alert and to my personal CEO blog, Frank Talk. Both can be reached by visiting usfunds.com.
Thank you for your continued trust and confidence in U.S. Global Investors.
Happy investing!

Frank E. Holmes
CEO and Chief Investment Officer
U.S. Global Investors, Inc.
Please consider carefully a fund’s investment objectives, risks, charges and expenses. For this and other important information, obtain a fund prospectus by visiting www.usfunds.com or by calling 1-800-US-FUNDS (1-800-873-8637). Read it carefully before investing. The Funds are distributed by Foreside Fund Services, LLC. U.S. Global Investors is the investment adviser.
7
U.S. Global Investors Funds | (unaudited) |
Morningstar ratings based on risk-adjusted return and number of funds
Category: Equity Precious Metals
Through: 12/31/2016
The Morningstar Rating™ for funds, or “star rating”, is calculated for managed products (including mutual funds, variable annuity and variable life subaccounts, exchange-traded funds, closed-end funds, and separate accounts) with at least a three-year history. Exchange-traded funds and open-ended mutual funds are considered a single population for comparative purposes. It is calculated based on a Morningstar Risk-Adjusted Return measure that accounts for variation in a managed product’s monthly excess performance, placing more emphasis on downward variations and rewarding consistent performance. The top 10% of products in each product category receive 5 stars, the next 22.5% receive 4 stars, the next 35% receive 3 stars, the next 22.5% receive 2 stars, and the bottom 10% receive 1 star. The Overall Morningstar Rating for a managed product is derived from a weighted average of the performance figures associated with its three-, five-, and 10-year (if applicable) Morningstar Rating metrics. The weights are: 100% three-year rating for 36-59 months of total returns, 60% five-year rating/40% three-year rating for 60-119 months of total returns, and 50% 10-year rating/30% five-year rating/20% three-year rating for 120 or more months of total returns. While the 10-year overall star rating formula seems to give the most weight to the 10-year period, the most recent three-year period actually has the greatest impact because it is included in all three rating periods.
Bond funds are subject to interest-rate risk; their value declines as interest rates rise. Though the Near-Term Tax Free Fund seeks minimal fluctuations in share price, it is subject to the risk that the credit quality of a portfolio holding could decline, as well as risk related to changes in the economic conditions of a state, region or issuer. These risks could cause the fund’s share price to decline. Tax-exempt income is federal income tax free. A portion of this income may be subject to state and local taxes and at times the alternative minimum tax. The Near-Term Tax Free Fund may invest up to 20% of its assets in securities that pay taxable interest. Income or fund distributions attributable to capital gains are usually subject to both state and federal income taxes.
Stock markets can be volatile and share prices can fluctuate in response to sector-related and other risks as described in the fund prospectus.
Gold, precious metals, and precious minerals funds may be susceptible to adverse economic, political or regulatory developments due to concentrating in a single theme. The prices of gold, precious metals, and precious minerals are subject to substantial price fluctuations over short periods of time and may be affected by unpredicted international monetary and political policies. We suggest investing no more than 5% to 10% of your portfolio in these sectors.
The S&P 500 Index is a widely recognized capitalization-weighted index of 500 common stock prices in U.S. companies. The NYSE Arca Gold Miners Index is a modified market capitalization-weighted index comprised of publicly-traded companies involved primarily in the mining for gold and silver. The index benchmark value was 500.0 at the close of trading on December 20, 2002. The MSCI Emerging Markets Index is a free float-adjusted market capitalization index that is designed to measure equity market performance
8
U.S. Global Investors Funds | (unaudited) |
in the global emerging markets. The Russell 2000 Index is a U.S. equity index measuring the performance of the 2,000 smallest companies in the Russell 3000. The Russell 3000 Index consists of the 3,000 largest U.S. companies as determined by total market capitalization. The S&P Composite 1500 is a broad-based capitalization-weighted index of 1500 U.S. companies and is comprised of the S&P 400, the S&P 500 and the S&P 600. The index was developed with a base value of 100 as of December 30, 1994.
The JPMorgan Global Manufacturing Purchasing Manager’s Index is an indicator of the economic health of the global manufacturing sector. The PMI index is based on five major indicators: new orders, inventory levels, production, supplier deliveries and the employment environment.
The Small Business Optimism Index is compiled from a survey that is conducted each month by the National Federation of Independent Business (NFIB) of its members.
U.S. Global Investors is not affiliated with Warren Buffett or Berkshire Hathaway.
The sections labeled Portfolio of Investments contain complete lists of the funds’ holdings.
There is no guarantee that the issuers of any securities will declare dividends in the future or that, if declared, will remain at current levels or increase over time.
All opinions expressed and data provided are subject to change without notice. Some of these opinions may not be appropriate to every investor.
9
Definitions for Management Teams’ Perspectives | (unaudited) |
Benchmark Index Definitions
Returns for indices reflect no deduction for fees, expenses or taxes, unless noted.
The Bloomberg Barclays U.S. Treasury Bills 6-9 Months Total Return Index tracks the performance of U.S. Treasury Bills with a maturity of six to nine months.
The Bloomberg Barclays 3-Year Municipal Bond Index is a total return benchmark designed for municipal assets. The index includes bonds with a minimum credit rating of BAA3, are issued as part of a deal of at least $50 million, have an amount outstanding of at least $5 million and have a maturity of two to four years.
The FTSE Gold Mines Index encompasses all gold mining companies that have a sustainable and attributable gold production of at least 300,000 ounces a year and that derive 75% or more of their revenue from mined gold.
The Hang Seng Composite Index is a market-capitalization weighted index that covers about 95% of the total market capitalization of companies listed on the Main Board of the Hong Kong Stock Exchange.
The MSCI Emerging Markets Europe 10/40 Index (Net Total Return) is a free float-adjusted market capitalization index that is designed to measure equity performance in the emerging market countries of Europe (Czech Republic, Greece, Hungary, Poland, Russia and Turkey). The index is calculated on a net return basis (i.e., reflects the minimum possible dividend reinvestment after deduction of the maximum rate withholding tax). The index is periodically rebalanced relative to the constituents’ weights in the parent index.
The NYSE Arca Gold Miners Index is a modified market capitalization-weighted index comprised of publicly-traded companies involved primarily in the mining for gold and silver.
The S&P Global Natural Resources Index (Net Total Return) includes 90 of the largest publicly-traded companies in natural resources and commodities businesses that meet specific investability requirements, offering investors diversified, liquid and investable equity exposure across 3 primary commodity-related sectors: Agribusiness, Energy, and Metals & Mining. The index is calculated on a net return basis (i.e., reflects the minimum possible dividend reinvestment after deduction of the maximum rate withholding tax).
The S&P 500 Index is a widely recognized capitalization-weighted index of 500 common stock prices in U.S. companies.
The S&P Composite 1500 Index is a broad-based capitalization-weighted index of 1500 U.S. companies and is comprised of the S&P 400, the S&P 500 and the S&P 600.
10
Definitions for Management Teams’ Perspectives | (unaudited) |
Other Index Definitions
The Bloomberg Commodity Index is made up of 22 exchange-traded futures on physical commodities. The index represents 20 commodities, which are weighted to account for economic significance and market liquidity.
The Caixin China Manufacturing Purchasing Manager’s Index is a composite indicator designed to provide an overall view of activity in the manufacturing sector and acts as a leading indicator for the whole economy. When the PMI is below 50.0 this indicates that the manufacturing economy is declining and a value above 50.0 indicates an expansion of the manufacturing economy.
The MSCI All Country Far East Free ex Japan Index is a free float-adjusted market capitalization-weighted index that is designed to measure the equity market performance of the Far East, excluding Japan. The index consists of the following developed and emerging market country indices: China, Hong Kong, Indonesia, Korea, Malaysia, the Philippines, Singapore, Taiwan and Thailand.
The Purchasing Manager’s Index (PMI) is an indicator of the economic health of the manufacturing sector. The PMI index is based on five major indicators: new orders, inventory levels, production, supplier deliveries and the employment environment.
The Shanghai Composite Index is an index of all stocks that trade on the Shanghai Stock Exchange.
The U.S. Trade Weighted Dollar Index provides a general indication of the international value of the U.S. dollar.
11
U.S. Government Securities Ultra-Short Bond Fund | (unaudited) |
Management Team’s Perspective
Introduction
The U.S. Government Securities Ultra-Short Bond Fund (UGSDX) is designed to be used as an investment that takes advantage of the security of U.S. Government bonds and obligations, while simultaneously pursuing a higher level of current income than money market funds offer. The fund’s dollar-weighted average effective maturity is two years or less.
Performance Graph
U.S. Government Securities Ultra-Short Bond Fund |

|
Average Annual Performance | For the Years Ended
December 31, 2016 |
| | One Year | Five Year | Ten Year |
U.S. Government Securities Ultra-Short Bond Fund | 0.47% | 0.24% | 0.78% |
Bloomberg Barclays U.S. Treasury Bills 6-9 Months Total Return Index | 0.49% | 0.20% | 0.40% |
Performance data quoted above is historical. Past performance is no guarantee of future results. Current performance may be higher or lower than the performance data quoted. The principal value and investment return of an investment will fluctuate so that an investor’s shares, when redeemed, may be worth more or less than their original cost. The graph and table do not reflect the deduction of taxes that a shareholder would pay on fund distributions or the redemption of fund shares. For all or a portion of the periods, the fund had expense limitations and reimbursements to maintain a minimum yield, without which returns would have been lower. The above returns for the U.S. Government Securities Ultra-Short Bond Fund include the fund’s results as a money market fund through the date of its conversion (December 20, 2013) to an ultra-short bond fund, and therefore are not representative of the fund’s results had it operated as an ultra-short bond fund for the full term of the periods shown. Gross expense ratio as stated in the most recent prospectus is 1.13%. Pursuant to a voluntary arrangement, the Adviser has agreed to limit total fund operating expenses (exclusive of any acquired fund fees and expenses, performance fees, taxes, brokerage commissions and interest) to not exceed 0.45%. The Adviser can modify or terminate this arrangement at any time. In addition, returns may include the effects of additional voluntary waivers of fees and reimbursements of expenses by the Adviser, including waivers and reimbursements to maintain a minimum net yield for the fund. See Definitions for Management Teams’ Perspectives for index definitions. Please visit our website at www.usfunds.com for updated performance information for different time periods. |
12
U.S. Government Securities Ultra-Short Bond Fund | (unaudited) |
The Year in Review – Economic and Political Issues that Affected the Fund
Despite no tangible change in economic fundamentals, the risk-off sentiment that dominated the beginning of the year completely reversed by the first quarter’s end. To start the year, depressed oil prices and global growth concerns, particularly in China, led to significant spread widening across the credit markets, a sharp drop in equity markets and a rally in Treasuries. However, the market rebounded in mid-February on little data, causing oil prices to rise by nearly 10 percent, the S&P 500 Index to post a positive 1.2 percent return, and high-yield debt to recover amidst significant inflows. Poor liquidity conditions exacerbated market volatility in the first quarter. The depth to which the markets fell and the speed at which prices rebounded without any significant fundamental catalyst are evidence of the challenges investors face in the illiquid environment. Trading volumes have failed to keep pace with an increase in issuance across corporate and sovereign bonds, increasing the likelihood that smaller trading volumes will have an outsize impact on market pricing. Given the volatility that dominated the beginning of the year and increasing evidence of a slowing U.S. economy, the market largely expected the Federal Reserve (the Fed) to keep rates on hold at its March meeting. The Fed delivered, keeping the benchmark lending rate steady at between 0.25 and 0.50 percent. The Fed emphasized the uncertainty surrounding the outlook and the rising risks from abroad as some of the key factors weighing on its decision. Furthermore, Fed officials scaled back its forecast for rate hikes during the remainder of the year, expecting to raise rates twice in 2016, compared to their December 2015 projection of four times. By focusing on financial market turmoil as a key element that factored into its decision, the Fed appeared to be reversing course on the importance of market volatility. Previously, the Fed dismissed volatility in oil prices or markets as a normal phenomenon that did not drive policy. Now, the Fed stated it is uncomfortable raising rates in the context of market volatility like that seen during the first quarter.
The second quarter saw the unprecedented phenomenon of more than $10 trillion in negative-yielding government debt stretching around the world, defying the boundaries of what should be possible according to traditional economics. Central banks’ pumping continued monetary stimulus, coupled with weak fundamentals, drove markets to extreme levels. Concerns over a number of potential tail risks during previous months resulted in intense market volatility with sharp selloffs, followed by exuberant rallies. The Brexit surprise was the latest such event that appeared on most investors’ list of concerns, and if realized, was expected to result in a market selloff. While a selloff did occur, it was only a moderate one over a period of just two days. A rally then persisted not only for risky assets but U.S. Treasuries as well. This trend was representative of broader forces at work, all of which resulted in increased market volatility. As investors awaited the remaining half of the year, there were many potential market disruptors that included the U.S. elections, other referendums (Scotland, Catalonia), potential policy error by the Fed, China’s economic rebalancing, sluggish global growth, troubled Italian banks, negative
13
U.S. Government Securities Ultra-Short Bond Fund | (unaudited) |
interest rate policies (NIRP) and other geopolitical events. As disruptive as it was, NIRP ironically had a silver lining. The lack of yield across the globe implied that U.S. fixed income markets were one of the world’s most attractive, particularly on a risk adjusted basis. This was reflected in the strong performance of U.S. fixed income during the second quarter. The U.S. Treasury curve flattened, with 10+ year maturity bonds exhibiting declines of 30 basis points (bps) or more. The 10-year ended the quarter at 1.47 percent. Corporate bond performance, maintaining the momentum from the first quarter, was mostly positive with energy and metals & mining leading the charge. Spreads shrugged off the Brexit vote late in June.
The month of September was dominated by central bank meetings as the Federal Reserve, Bank of Japan, European Central Bank (ECB) and the Bank of England all held policy meetings. Importantly, the sentiment around September’s meetings was a bit different than in past years as the market started to question the efficacy of further central bank easing. Judging by Treasury market price action, the aggregate of global central bank action for September left the market wanting as Treasury yields finished lower on the month. The release of the September statement showed a Fed that hoped a tightening could be warranted in December. It was apparent from the release of the staff economic projections that hiking aspirations for 2017 and beyond were significantly more tepid than they were previously. The staff’s forecasts for the fed funds rate called for one rate hike in 2016 (down from two before), two hikes in 2017 (down from three before) and three hikes in 2018 (same as before). These downward revisions suggested the notion that monetary policy is less accommodative at current levels than previously thought was beginning to take hold inside the Federal Reserve Open Market Committee (FOMC).
While the ECB elected to ease policy in roundabout fashion at their December policy meeting, the FOMC decided to tighten policy at its own December meeting, raising the policy rate from 25-50 bps to 50-70 bps. This move did not come as much of a surprise to market participants, as it was fully priced into fed funds future contracts prior to the meeting. Similarly, the release of the FOMC statement was very much as expected, delivering an even-handed, non-committal assessment of the U.S. macroeconomic backdrop. However, the Fed did deliver one final surprise to the market in the form of an upgrade to the policy-tightening forecast for 2017. The median participant now looks for three hikes in 2017, up from two in September, and the mean outlook for the funds rate at the end of next year was revised up 7 bps from 1.31 percent to 1.38 percent. The level of the funds rate projection for 2018 and 2019 was shifted up slightly, though the pace of hikes in those years was generally little changed from the September projections. Interestingly, this upgraded 2017 tightening guidance did not come with any upgrades to the FOMC’s economic forecast projections. The Fed expects slightly better growth next year of 2.1 percent versus its prior forecast of 2 percent. The 2018 growth forecast was left unchanged at 2 percent. Despite offering minimal forward guidance, the 25 bps policy tightening seemed to temporarily reawaken the animal spirits in the U.S. Treasury market as yields surged higher, led by the middle segment of the curve.
14
U.S. Government Securities Ultra-Short Bond Fund | (unaudited) |
Investment Highlights
The U.S. Government Securities Ultra-Short Bond Fund returned 0.47 percent for the year ended December 31, 2016, underperforming its benchmark, the Bloomberg Barclays U.S. Treasury Bills 6-9 Months Total Return Index, which returned 0.49 percent.
The fund shortened its maturity profile toward the latter half of 2016 as interest rates on short-term agency securities moved higher in anticipation of the Fed’s rate hike and after the U.S. election. This allowed the fund to mitigate losses.
Current Outlook
Interest rates rose much further and faster than expected in 2016. From a post-Brexit low of 1.37 percent in July, the benchmark 10-year Treasury yield hit a high of 2.64 percent in December, after the Fed hiked the fed funds rate for the first time all year, and indicated that it may raise it three more times in 2017. Elections and geopolitical events around the world seem to be pointing to a paradigm shift. Populist forces eager for faster growth have led to a shift from monetary policy to fiscal stimulus. In the U.S., expectations are running high that the pro-growth policies of Donald Trump will lead to a more hawkish Fed and higher rates.
The section labeled Portfolio of Investments contains a complete list of the fund’s holdings.
Portfolio Allocation by Issuer
Based on Total Investments | December 31, 2016 |

|
Portfolio Allocation by Maturity | | December 31, 2016 | |
6 – 12 Months | | $ | 40,778,171 | | | | 74.5 | % |
1 – 2 Years | | | 13,940,322 | | | | 25.5 | % |
| | | $ | 54,718,493 | | | | 100.0 | % |
| | | | | | | | | |
15
Near-Term Tax Free Fund | (unaudited) |
Management Team’s Perspective
Introduction
The Near-Term Tax Free Fund (NEARX) seeks to provide a high level of current income exempt from federal income taxation and to preserve capital. However, a portion of any distribution may be subject to federal and/or state income taxes. The Near-Term Tax Free Fund will maintain a weighted average maturity of less than five years.
Performance Graph
Near-Term Tax Free Fund |

|
Average Annual Performance | For the Years Ended
December 31, 2016 |
| | One Year | Five Year | Ten Year |
Near-Term Tax Free Fund | -0.45% | 1.40% | 2.69% |
Bloomberg Barclays 3-Year Municipal Bond Index | 0.08% | 1.13% | 2.71% |
Performance data quoted above is historical. Past performance is no guarantee of future results. Current performance may be higher or lower than the performance data quoted. The principal value and investment return of an investment will fluctuate so that an investor’s shares, when redeemed, may be worth more or less than their original cost. The graph and table do not reflect the deduction of taxes that a shareholder would pay on fund distributions or the redemption of fund shares. For all or a portion of the periods, the fund had expense limitations, without which returns would have been lower. Gross expense ratio as stated in the most recent prospectus is 1.09%. The Adviser has contractually agreed to limit total fund operating expenses (exclusive of any acquired fund fees and expenses, performance fees, taxes, brokerage commissions and interest) to not exceed 0.45% on an annualized basis through April 30, 2017. See Definitions for Management Teams’ Perspectives for index definitions. Please visit our website at www.usfunds.com for updated performance information for different time periods. |
16
Near-Term Tax Free Fund | (unaudited) |
The Year in Review – Economic and Political Issues that Affected the Fund
Municipal bond yields declined during the first quarter of the year, which drove prices higher. A higher exposure to cash, given unattractive yields, was a drag on fund performance. As short-term rates rose and longer-term yields declined, the municipal yield curve flattened. As a result, longer-term bonds outperformed. The front end of the yield curve, in the area with less-than-two-year maturities, had the weakest returns. The fund benefited modestly from its barbell positioning. Within the main sectors, revenue bonds and general obligations outperformed and pre-refunded bonds lagged. Of the largest states, New Jersey had the best returns for the quarter. Illinois outperformed to a lesser extent, and California lagged slightly. Investors’ fears about falling commodity prices, a slowing Chinese economy and market volatility abated during the first quarter, which led to a greater appetite for risk and allowed lower-rated and longer-maturity bonds to outperform. The fund’s large exposure to higher quality bonds was a source of underperformance. While overall credit fundamentals remain sound, specific issuers were newsworthy. Illinois remained without a state budget, and the impasse continued to pressure state universities and the Chicago Board of Education, among others. Energy-producing states North Dakota, Alaska and Louisiana were downgraded in response to ongoing weakness in oil prices. Draft legislation from the U.S. House of Representatives was set to allow Puerto Rico to restructure some of its $70 billion debt under a federal oversight board, and this legislation was slated to be formally introduced to the U.S. Congress in April.
The second quarter saw unprecedented geopolitical outcomes. Most notably, in a historic decision, the U.K. voted to exit the European Union. Despite polls showing a close race, markets were taken aback by the “leave” decision and sold off sharply. The pound dropped 12 percent to a 30-year low. Global stock markets also suffered large corrections. Meanwhile, global rates saw immediate flight-to-safety moves with the 10-year U.S. Treasury yield touching 1.40 percent and German 10-year yields reaching negative 0.16 percent. In U.S. markets, the dollar, U.S. Treasuries and equities saw the greatest price impacts following the Brexit vote, but they rebounded quickly as fears faded that Brexit was a new “Lehman moment.” Central banks stepped in to backstop risk by providing ample liquidity to the market, but the 10-year U.S. Treasury yield remained hovering around 1.5 percent, roughly 30 bps below where it was pre-Brexit, reflecting the significant uncertainty that still hung over the market. With nearly 50 percent of global fixed income securities yielding 1 percent or lower, the search for yield drove investors into riskier assets and overshadowed worsening fundamentals. During the quarter, the spread between the 2-year Treasury note and the 10-year was less than 90 bps, the lowest level since 2007. In contrast to previous episodes of curve flattening, which were driven by Federal Reserve rate hikes on the front end, this instance of curve flattening was driven by a rally in 10-year rates. Amid worries about jobs growth and low inflation, the Fed opted to hold off on a rate hike at the June meeting. Bringing its views more in line with market expectations, the Fed revised its forecast for growth in
17
Near-Term Tax Free Fund | (unaudited) |
2016, from 2.2 percent to 2 percent, and lowered projections of future rate increases. As of the June meeting, most members still anticipated two hikes, though a greater number of officials forecasted just one increase. In municipal market developments, the U.S. Senate passed the bill protecting Puerto Rico from creditors. The legislation created a financial control board to help restructure the island’s $70 billion in debt and oversee its finances, marking the largest federal intervention ever into the U.S. municipal bond market. Illinois had its bond ratings dropped to levels not seen for a U.S. state in over a decade because of a protracted political deadlock that had left it veering toward its second straight year without a budget. Moody’s cut its grade on about $28.8 billion of general-obligation and sales-tax debt by one level to Baa2, its lowest for a state since Massachusetts in 1992. S&P Global Ratings followed by dropping it one step to BBB+. Atlantic City got a lifeline as New Jersey Governor Chris Christie signed two bills that pulled the city from the brink of bankruptcy and gave it about five months to right its finances, a task that if unmet would result in an unprecedented state takeover. The measures infused Atlantic City with enough cash to pay bills and workers through October. Officials had until then to craft a five-year plan to restore fiscal stability. Tennessee was awarded a AAA general-obligation bond rating from S&P Global Ratings, which cited the strengthening state economy, growing reserves and consistent payment of its required contribution to the state’s pension system. It became the eighth state to receive the top bond rating ranking from both S&P Global Ratings and Moody’s. The others are Delaware, Maryland, Missouri, North Carolina, Texas, Utah and Virginia.
As was widely expected, in their September meeting, the Federal Reserve’s Open Market Committee (FOMC) opted to keep the federal funds rate unchanged. Fed Chair Janet Yellen and her allies maintained that employment and inflation data did not warrant an increase and they continued to resist pressures to tighten monetary policy. While the Fed was reluctant to act, the end of the lower-for-longer era of U.S. central bank policy appeared to be drawing closer and a December rate hike looked likely. The FOMC upgraded its assessment of near-term risks, describing them as “roughly balanced.” The Fed also clearly signaled its intent in its Summary of Economic Projections by showing a preponderance of participants still expected an increase in 2016. Investors’ focus for the remainder of the quarter shifted toward the November elections and December’s FOMC meeting. In state and municipal government news, a report from Moody’s evaluated the impact of low oil and gas prices on energy-dependent state and local governments. It noted that the hardest hit states were Alaska, Louisiana, North Dakota, Oklahoma and New Mexico. In other news, Chicago approved a plan to raise the city’s water and sewer taxes to shore up its pension funds. The plan calls for a hike in the taxes of about 33 percent over five years. California had its credit rating raised by Fitch Ratings to AA- because of the strength of its economy and strong budget management. Lastly, in a report analyzing the fiscal resilience among U.S. states, S&P Global Ratings deemed Illinois, Pennsylvania, New Jersey and Connecticut to have “only a limited capacity” to withstand the effect of a moderate recession. The report also found Washington, Florida and New York as the best positioned.
18
Near-Term Tax Free Fund | (unaudited) |
November’s surprise election outcome proved to be a boon for risk assets and a bust for so-called “safe havens,” including Treasuries and municipal bonds. Muni prices sank as a result of a rally in yields and, to a lesser degree, concerns over future infrastructure spending and tax policies. It was the market’s worst performance month since the 2008 financial crisis. Fund flows, a measure of demand, turned sharply negative, ending 56 weeks of inflows. More than $10 billion left muni funds in November. The California Public Employees’ Retirement System (CalPERS), the nation’s largest public pension fund, voted to reduce its discount rate or rate of return on its investments from 7.5 percent to 7 percent over the next three years. CalPERS determined that achieving a 7.5 percent investment return over the next 10 years would be a significant challenge. Reducing the discount rate will undoubtedly result in higher contribution rates for California local governments that participate in the CalPERS plan. Furthermore, CalPERS’ decision to lower its discount rate has far reaching implications beyond California to the broader state and local government sector. Given the size of the fund (more than $300 billion), CalPERS has been a bellwether for investment trends at other public plans. Any change it makes will likely influence others to follow suit and lower their own discount rates, which, in turn, will result in incremental credit pressure for the sector. Overall, rating agencies do a good job of incorporating the implications of changes in discount rate assumption into their analysis by using their own hypothetical standardized discount rates to calculate the unfunded pension liabilities. However, the ratings don’t necessarily fully incorporate the potential budgetary impact of a reduction in discount rates. As a result, as broader public pension funds continue to reduce discount rates, state and local governments will likely feel incremental negative ratings pressure.
Investment Highlights
For the year ended December 31, 2016, the Near-Term Tax Free Fund returned -0.45 percent, underperforming its benchmark, the Bloomberg Barclays 3-Year Municipal Bond Index, which gained 0.08 percent.
Strengths
● | Buying opportunistically during multi-standard deviation moves in the municipal bond market and letting the yield advantage work in the fund’s favor over time has proven to be advantageous, as has the fund’s low turnover approach. |
● | The fund benefited from its allocation to bonds from New York, New Hampshire and New Jersey. |
● | The fund benefited from its allocation to medical and higher education bonds. |
Weaknesses
● | The fund was negatively impacted from an overweight position in Texas bonds, which underperformed. |
● | The fund’s exposure to general obligation bonds underperformed. |
19
Near-Term Tax Free Fund | (unaudited) |
● | The fund was hurt by its exposure to the longer end of the yield curve, which underperformed the shorter end. |
Current Outlook
Opportunities
● | Concerns about overburdened pensions place increasingly more pressure on troubled state’s general obligation bonds. As a result, focusing on high quality essential revenue bonds instead of general obligation bonds is likely to be an area of opportunity. |
Threats
● | Tax reform, which has been a Republican priority, is likely to garner increasing interest. While the value of tax exemption would be lessened if the top marginal tax rate were reduced from 39.6 percent to 33 percent, the correction necessary to overcome this lower-tax environment is likely to be manageable. While the elimination of the tax exemption is unlikely, it poses a major threat to the municipal market. |
The section labeled Portfolio of Investments contains a complete list of the fund’s holdings.
Top 10 Area Concentrations
(Based on Net Assets) | December 31, 2016 |
Texas | 23.95% |
New York | 9.54% |
Washington | 8.90% |
Florida | 5.21% |
Illinois | 4.48% |
Michigan | 3.86% |
Pennsylvania | 3.17% |
New Jersey | 3.16% |
California | 2.68% |
Missouri | 2.38% |
Total Top 10 Areas | 67.33% |
20
Near-Term Tax Free Fund | (unaudited) |
Municipal Bond Ratings*
Based on Total Municipal Bonds | December 31, 2016 |

|
* | Credit quality ratings are measured on a scale that generally ranges from AAA (highest) to D (lowest). “Not Rated” is used to classify securities for which a rating is not available. Credit-quality ratings for each issue are obtained from Moody’s and S&P Global Ratings, and the higher rating for each issue is used. |
21
All American Equity Fund & Holmes Macro Trends Fund | (unaudited) |
Management Team’s Perspective
Introduction
The principal objective of the All American Equity Fund (GBTFX) is to seek capital appreciation by investing primarily in a broadly diversified portfolio of domestic common stocks. The fund invests in large-capitalization stocks while retaining the flexibility to seek out promising individual stock opportunities, including stocks with meaningful dividend yields.
The Holmes Macro Trends Fund (MEGAX) invests in companies with good growth prospects and strong positive earnings momentum. The fund’s primary objective is to seek long-term capital appreciation.
Performance Graphs
All American Equity Fund |

|
Average Annual Performance | For the Years Ended
December 31, 2016 |
| | One Year | Five Year | Ten Year |
All American Equity Fund | -0.14% | 8.12% | 4.10% |
S&P 500 Index | 11.96% | 14.66% | 6.95% |
Performance data quoted above is historical. Past performance is no guarantee of future results. Current performance may be higher or lower than the performance data quoted. The principal value and investment return of an investment will fluctuate so that an investor’s shares, when redeemed, may be worth more or less than their original cost. The graph and table do not reflect the deduction of taxes that a shareholder would pay on fund distributions or the redemption of fund shares. For all or a portion of the periods, the fund had expense limitations, without which returns would have been lower. Gross expense ratio as stated in the most recent prospectus is 1.94%. Pursuant to a voluntary arrangement, the Adviser has agreed to limit total fund operating expenses (exclusive of any acquired fund fees and expenses, performance fees, taxes, brokerage commissions and interest) to not exceed 2.20%. The Adviser can modify or terminate this arrangement at any time. See Definitions for Management Teams’ Perspectives for index definitions. Please visit our website at www.usfunds.com for updated performance information for different time periods. |
22
All American Equity Fund & Holmes Macro Trends Fund | (unaudited) |
Holmes Macro Trends Fund |
|
Average Annual Performance | For the Years Ended
December 31, 2016 |
| | One Year | Five Year | Ten Year |
Holmes Macro Trends Fund | 8.66% | 8.36% | 3.70% |
S&P Composite 1500 Index | 13.03% | 14.78% | 7.19% |
Performance data quoted above is historical. Past performance is no guarantee of future results. Current performance may be higher or lower than the performance data quoted. The principal value and investment return of an investment will fluctuate so that an investor’s shares, when redeemed, may be worth more or less than their original cost. The graph and table do not reflect the deduction of taxes that a shareholder would pay on fund distributions or the redemption of fund shares. For all or a portion of the periods, the fund had expense limitations, without which returns would have been lower. Gross expense ratio as stated in the most recent prospectus is 1.81%. Pursuant to a voluntary arrangement, the Adviser has agreed to limit total fund operating expenses (exclusive of any acquired fund fees and expenses, performance fees, taxes, brokerage commissions and interest) to not exceed 2.20%. The Adviser can modify or terminate this arrangement at any time. See Definitions for Management Teams’ Perspectives for index definitions. Please visit our website at www.usfunds.com for updated performance information for different time periods. |
The Year in Review – Economic and Political Issues that Affected the Funds
The fundamental manager struggled in 2016 against a sea of macro related surprises. For example, volatility spiked the first few months of the year, Brexit surprised investors in June, the world experienced a surprise outcome with a Donald Trump win in the U.S. presidential election and the Federal Reserve raised rates in December.
Despite the macro surprises, U.S. equities performed well, finishing the year with a 11.96 percent gain.
23
All American Equity Fund & Holmes Macro Trends Fund | (unaudited) |
The top performing factors in 2015 failed to continue their winning ways in 2016. Returns, balance sheet, size and volatility started off strong early in the year, but reversed and continued to be weak the remainder of the year due to reflationary expectations on investors’ minds. Value was the best performing factor in 2016.
In December, the Fed raised its benchmark rate 25 bps. This will be a slight headwind going into 2017, but the Fed believes the economy should remain on its current pace of growth. The Fed is so confident about economic growth, in fact, that it warned about a possible two additional hikes before the end of 2017.
Investment Highlights
The All American Equity Fund returned -0.14 percent for the year ending 2016, underperforming the 11.96 percent return for the benchmark S&P 500 Index. The Holmes Macro Trends Fund returned 8.66 percent for the year ending 2016, underperforming the 13.03 percent return for the benchmark S&P Composite 1500 Index.
Because the funds are actively managed and the holding period is generally not a consideration in investment decisions, the portfolio turnover rate may fluctuate from year to year as the funds adjust their portfolio composition. The funds’ annual portfolio turnovers were, and are expected to continue to be, more than 100 percent.
All American Equity Fund
Strengths
● | Health care, telecommunication services and utilities were the top three best-performing sectors. |
● | Darden Restaurants was the biggest contributor to the fund. |
● | The underweighting in telecommunications helped the fund outperform the benchmark’s allocation. |
Weakness
● | Consumer discretionary, cash and financials were the three allocations that detracted from the fund the most. |
● | Tractor Supply Co. was the single largest detractor from the fund. |
● | The fund’s underweighting in financials reduced its potential performance. |
Holmes Macro Trends Fund
Strengths
● | The industrials and health care sectors as well as the fund’s ETF allocations were the top contributors to fund performance. |
24
All American Equity Fund & Holmes Macro Trends Fund | (unaudited) |
● | LogMeIn was the biggest contributor to the fund. |
● | The overweighting in the industrial sector helped the fund outperform the benchmark’s allocation. |
Weaknesses
● | Materials and energy as well as the fund’s cash allocations were the largest drags on fund performance. |
● | Regeneron Pharmaceuticals was the single largest detractor from the fund. |
● | The fund’s overweighting in cash reduced potential returns. |
Current Outlook
Opportunities
● | The Donald J. Trump administration has been telegraphing increased infrastructure stimulus. This should bode well for the country’s growth prospects. |
● | Global leading indicators continue to improve. This should provide the needed support necessary for investors to feel comfortable with elevated price-to-earnings (P/E) ratios. |
● | The continuing combination of improved consumer and business confidence and surging U.S. stock markets should boost investors’ future expectations of the equities growth. |
Threats
● | U.S. equities are considered to be in an eight-year bull market. It is not unreasonable to anticipate a possible correction. |
● | The Federal Reserve is now tasked with returning the benchmark interest rates to “normal” levels. The latest minutes imply possibly two rate hikes in 2017. |
● | A large risk to the future outlook of the markets and economy is a negative shock to sentiment. |
The section labeled Portfolio of Investments contains a complete list of the funds’ holdings.
25
All American Equity Fund & Holmes Macro Trends Fund | (unaudited) |
All American Equity Fund
Top 10 Equity Holdings (Based on Net Assets) | December 31, 2016 |
Whirlpool Corp. | 3.25% |
Appliances | |
Public Storage | 3.22% |
REITS - Storage | |
Delta Air Lines, Inc. | 3.18% |
Airlines | |
Phillips 66 | 3.14% |
Oil Companies - Integrated | |
Travelers Companies, Inc. | 3.10% |
Property/Casualty Insurance | |
CVS Health Corp. | 3.10% |
Retail - Drug Store | |
PulteGroup, Inc. | 3.09% |
Building - Residential/Commercial | |
Patterson Companies, Inc. | 3.08% |
Dental Supplies & Equipment | |
Pfizer, Inc. | 3.05% |
Medical - Drugs | |
Entergy Corp. | 3.05% |
Electric - Integrated | |
Total Top 10 Equity Holdings | 31.26% |
Portfolio Allocation by Industry Sector* Based on Total Investments | December 31, 2016 |
|
* | Summary information above may differ from the portfolio schedule included in the financial statements due to the use of different classifications of securities for presentation purposes. |
26
All American Equity Fund & Holmes Macro Trends Fund | (unaudited) |
Holmes Macro Trends Fund
Top 10 Equity Holdings (Based on Net Assets) | December 31, 2016 |
Kimberly-Clark Corp. | 5.89% |
Consumer Product - Miscellaneous | |
Altria Group, Inc. | 5.65% |
Tobacco | |
IDEXX Laboratories, Inc. | 5.25% |
Diagnostic Kits | |
Pool Corp. | 4.87% |
Distribution/Wholesale | |
Pitney Bowes, Inc. | 4.78% |
Office Automation & Equipment | |
Tempur Sealy International, Inc. | 4.19% |
Home Furnishings | |
Lennox International, Inc. | 3.95% |
Building Products - Air & Heating | |
B/E Aerospace, Inc. | 3.70% |
Aerospace/Defense - Equipment | |
NewMarket Corp. | 3.64% |
Chemicals - Specialty | |
Hawaiian Holdings, Inc. | 3.47% |
Airlines | |
Total Top 10 Equity Holdings | 45.39% |
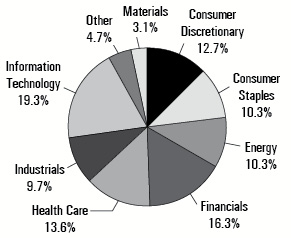
Portfolio Allocation by Industry Sector* Based on Total Investments | December 31, 2016 |

|
* | Summary information above may differ from the portfolio schedule included in the financial statements due to the use of different classifications of securities for presentation purposes. |
27
Global Resources Fund | (unaudited) |
Management Team’s Perspective
Introduction
The Global Resources Fund (PSPFX and PIPFX) is a non-diversified natural resources fund with the principal objective of seeking long-term growth of capital while providing protection against inflation and monetary instability. The fund invests in companies involved in the exploration, production and processing of petroleum, natural gas, coal, alternative energies, chemicals, mining, iron and steel, and paper and forest products around the globe.
Performance Graph
Global Resources Fund |

|
Average Annual Performance | For the Periods Ended
December 31, 2016 |
| | One Year | Five Year | Ten Year | Since Inception (Institutional Class) |
Global Resources Fund - Investor Class | 14.99% | -9.04% | -4.62% | n/a |
Global Resources Fund - Institutional Class (Inception 3/1/10) | 15.43% | -8.49% | n/a | -4.56% |
S&P 500 Index | 11.96% | 14.66% | 6.95% | 13.08% |
S&P Global Natural Resources Index (Net Total Return) | 31.45% | -0.82% | 0.55% | -0.60% |
Performance data quoted above is historical. Past performance is no guarantee of future results. Current performance may be higher or lower than the performance data quoted. The principal value and investment return of an investment will fluctuate so that an investor’s shares, when redeemed, may be worth more or less than their original cost. The graph and table do not reflect the deduction of taxes that a shareholder would pay on fund distributions or the redemption of fund shares. For all or a portion of the periods, the fund had expense limitations, without which returns would have been lower. Gross expense ratio as stated in the most recent prospectus is 1.58% for the Investor Class and 1.35% for the Institutional Class. Pursuant to a voluntary arrangement, the Adviser has agreed to limit total fund operating expenses (exclusive of any acquired fund fees and expenses, performance fees, taxes, brokerage commissions and interest) to not exceed 1.90% for the Investor Class. Also pursuant to a voluntary agreement, the Adviser has agreed to waive all class specific expenses of the Institutional Class. The Adviser can modify or terminate these arrangements at any time. See Definitions for Management Teams’ Perspectives for index definitions. Please visit our website at www.usfunds.com for updated performance information for different time periods. |
28
Global Resources Fund | (unaudited) |
The Year in Review – Economic and Political Issues that Affected the Fund
The Bloomberg Commodity Index rose 11.4 percent through the year 2016, posting its first positive year since 2010. All major commodities rallied, with crude oil, copper and gold prices rallying 45, 17.4, and 8.6 percent, respectively. Initial concerns that the global economy was slowing, particularly due to weaker economic data from China, did not materialize. In a sharp contrast to expectations, the global manufacturing sector beat all expectations, and the year in review was marked by a steady upward trajectory in manufacturing activity across the globe. This was evidenced by JP Morgan’s Global Manufacturing PMI barometer, which troughed in February and steadily rose to an 18-month high in December 2016. Both U.S. and Chinese manufacturing activity rallied throughout the year and also ended 2016 on their highest respective points, both denoting solid expansionary momentum.
Crude oil’s significant relative outperformance to the broader market was driven by lower U.S. oil production and self-imposed caps by Organization of Petroleum Exporting Nations (OPEC) members. U.S. shale producers slashed production earlier in the year in response to prices below $35 per barrel, removing as many as 600,000 barrels per day from the market, and leading the market closer to a supply-demand balance. Once prices stabilized in the second quarter, stronger manufacturing activity, as well as increasing gasoline demand, supported a price rally back into the $40 to $50 range. In the second half of the year, OPEC took decisive leadership and engineered a self-imposed cap on production, which helped improve sentiment toward the sector by signaling that OPEC members can still work together.
The base metals complex, highly susceptible to manufacturing activity globally, rallied as Chinese imports of metals hit new records. Copper, nickel and zinc posted double-digit returns in 2016, a reflection of unexpected record demand for the metals. In addition, markets reacted to a number of supply cuts, mainly in the zinc market, and supply disruptions in the copper and nickel markets, which supported stronger pricing. The metals closed the year near 52-week highs on speculation that a “reflation” trade led by President Donald Trump could drive a demand boost from the metals-intensive infrastructure sector.
Gold rose for the first time in four years. The first Federal Reserve rate-hike in the tightening cycle, which happened back in December 2015, gave way to a gold rally, as investors were quick to realize the Fed could not achieve its initial pace for rate hikes, which weighed on the U.S. dollar. Most important, however, was gold’s safe haven status, which helped the metal garner assets after U.K. voters surprisingly voted in favor of an exit from the EU.
29
Global Resources Fund | (unaudited) |
Investment Highlights
Overview
For the year ended December 31, 2016, the Investor Class of the Global Resources Fund returned 14.99 percent and the Institutional Class returned 15.43 percent, trailing the fund’s benchmark, the S&P Global Natural Resources Index (Net Total Return) (SPGNRUT), which rose 31.45 percent.
The fund employed a defensive investment position from time to time in the past year with higher-than-average cash balances on hand to protect the liquidity of the fund. However, to maintain varying degrees of investment exposure to the commodities market, the fund utilized a number of rolling call option positions to hedge the fund’s benchmark risks and provide optionality to upswings in commodities stocks.
Because the fund is actively managed and holding period is generally not a consideration in investment decisions, the portfolio turnover rate may fluctuate from year to year as the fund adjusts its portfolio composition. The fund’s annual portfolio turnover was, and is expected to continue to be, more than 100 percent.
Strengths
● | The fund’s overweighting in precious metals, construction materials and junior natural resource stocks, as well as its underweight in fertilizers and chemicals, paper and forest and oil exploring and developer stocks had a positive contribution to the fund relative to its benchmark. |
● | The fund had superior stock selection in oil explorers and developers, precious metals, construction materials, industrials and fertilizer and chemicals’ sectors. This superior stock selection resulted in positive contribution to the fund relative to its benchmark. |
● | The securities that provided the highest contribution to the fund were Klondex Mines, Gran Colombia Gold, Richmont Mines and Claude Resources. |
Weaknesses
● | The fund’s overweighting in industrials, agribusiness, oil and gas refining and renewable stocks, as well as its underweighting in base and industrial metals stocks, had a negative contribution to the fund relative to its benchmark. |
● | The fund had inferior stock selection in the base and industrial metals sector, the oil and gas refining sector, the oil services sector, paper and forest companies and the integrated oil sector. |
● | The securities that resulted in the largest negative contribution to the fund were Atlas African Industries, Pacific Green Energy, Doray Minerals, DHT Holdings and Pacific Infrastructure. |
30
Global Resources Fund | (unaudited) |
Current Outlook
Opportunities
● | Commodity prices may continue to rally as supply and demand dynamics are tightening, according to Citigroup. With 2016 almost in the books, commodities are posting their best annual performance in over five years. The trend should continue in 2017, says Citigroup, a bank which has been notoriously bearish on commodities, by stating that “there is absolutely no doubt that commodity markets are at a turning point.” |
● | The Brent forward curve is signaling that oil storage tanks will start emptying the second half of 2017, according to oil traders surveyed by Reuters. As crude oil trades range bound and overhang continues to exist in inventories, higher demand in the future is slowly starting to emerge where oil fundamentals may turn bullish in late 2017. |
● | 2016 led rallies in zinc and coal, but 2017 could be the year of nickel and oil. Nickel will be finishing 2016 with a rally of 22 percent; however, developments such as the Philippines President Rodrigo Duterte’s rally against mining companies and Indonesia’s export ban may dramatically hamper the metals fundamentals and create a severe supply shortage. |
Threats
● | China may fall short of its 6.5 percent in economic growth objective according to president Xi Jinping. Xi stated that the country doesn’t need to meet its objective if doing so will create too much systematic risk and jeopardize its long term growth prospects. In 2015 policymakers pledged an annual growth rate of at least 6.5 percent through 2020. Falling short of its growth objectives will have negative ramifications for industrial metals demand, a negative read-through for base metals. |
● | Commodity prices may be susceptible to major swings in 2017 as commodity exporting nations prepare for the potential of protectionist measures in the U.S. Following the victory of President Donald Trump, markets have reacted to a stronger U.S. dollar and are making preparations for potential protectionist policies against their imports. Some economic commentators have warned that a wave of protectionist measures may sink the world into a global recession, with negative implications for commodity prices. |
● | General Motors is temporarily idling five U.S. assembly plants in an attempt to reduce bloated inventories. The sector has experienced rapid growth over the past five years as a result of cheap consumer financing; however, interest rates on car loans are slowly rising while terms are much longer than before. According to the research organization IHS Automotive, sales could slide by more than 200,000 vehicles if the company permanently suspends production from these plants—a negative read-through for platinum group metals and steel demand. |
The section labeled Portfolio of Investments contains a complete list of the fund’s holdings.
31
Global Resources Fund | (unaudited) |
Top 10 Equity Holdings (Based on Net Assets) | December 31, 2016 |
Klondex Mines Ltd. | 7.09% |
Gold Mining | |
Pacific Infrastructure Ventures, Inc. | 5.23% |
Real Estate Operating/Development | |
Regis Resources Ltd. | 1.63% |
Gold Mining | |
Northern Star Resources Ltd. | 1.43% |
Gold Mining | |
Resolute Mining | 1.43% |
Gold Mining | |
Nippon Light Metal Holdings Co., Ltd. | 1.42% |
Metal - Aluminum | |
Interfor Corp. | 1.39% |
Forestry | |
Evolution Mining Ltd. | 1.34% |
Gold Mining | |
Nevsun Resources Ltd. | 1.34% |
Metal - Copper | |
Vestas Wind Systems A.S. | 1.33% |
Energy - Alternate Sources | |
Total Top 10 Equity Holdings | 23.63% |
Portfolio Allocation by Industry Sector* Based on Total Investments | December 31, 2016 |

|
* | Summary information above may differ from the portfolio schedule included in the financial statements due to the use of different classifications of securities for presentation purposes. |
32
Precious Metals and Minerals Funds | (unaudited) |
Management Team’s Perspective
Introduction
The World Precious Minerals Fund (UNWPX and UNWIX) and the Gold and Precious Metals Fund (USERX) pursue an objective of long-term capital growth through investments in gold, precious metals and mining companies. The World Precious Minerals Fund focuses on equity securities of companies principally engaged in the exploration, mining and processing of precious minerals such as gold, silver, platinum and diamonds. Although this fund has the latitude to invest in a broad range of precious minerals, it currently remains focused on the gold sector. The Gold and Precious Metals Fund focuses on the equity securities of established gold and precious metals companies and pursues current income as a secondary objective.
World Precious Minerals Fund |
|
Average Annual Performance | For the Periods Ended December 31, 2016 |
| | One Year | Five Year | Ten Year | Since Inception (Institutional Class) |
World Precious Minerals Fund - Investor Class | 75.08% | -11.85% | -5.45% | n/a |
World Precious Minerals Fund - Institutional Class (Inception 3/1/10) | 75.97% | -11.42% | n/a | -8.58% |
S&P 500 Index | 11.96% | 14.66% | 6.95% | 13.08% |
NYSE Arca Gold Miners Index* | 53.26% | -16.36% | -5.98% | -10.33% |
* These are not the total returns. These returns reflect simple appreciation only and do not reflect dividend reinvestment. Performance data quoted above is historical. Past performance is no guarantee of future results. Current performance may be higher or lower than the performance data quoted. The principal value and investment return of an investment will fluctuate so that an investor’s shares, when redeemed, may be worth more or less than their original cost. The graph and table do not reflect the deduction of taxes that a shareholder would pay on fund distributions or the redemption of fund shares. For all or a portion of the periods, the fund had expense limitations, without which returns would have been lower. Gross expense ratio as stated in the most recent prospectus is 2.01% for the Investor Class and 20.56% for the Institutional Class. Pursuant to a voluntary arrangement, the Adviser has agreed to limit total fund operating expenses (exclusive of any acquired fund fees and expenses, performance fees, taxes, brokerage commissions and interest) to not exceed 1.90%. Also pursuant to a voluntary agreement, the Adviser has agreed to waive all class specific expenses of the Institutional Class. The Adviser can modify or terminate these arrangements at any time. See Definitions for Management Teams’ Perspectives for index definitions. Please visit our website at www.usfunds.com for updated performance information for different time periods. |
33
Precious Metals and Minerals Funds | (unaudited) |
Gold and Precious Metals Fund |
|
Average Annual Performance | For the Year Ended
December 31, 2016 |
| | One Year | Five Year | Ten Year |
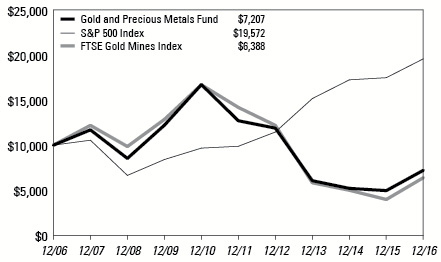
Gold and Precious Metals Fund | 45.36% | -10.72% | -3.22% |
S&P 500 Index | 11.96% | 14.66% | 6.95% |
FTSE Gold Mines Index | 60.72% | -14.75% | -4.38% |
Performance data quoted above is historical. Past performance is no guarantee of future results. Current performance may be higher or lower than the performance data quoted. The principal value and investment return of an investment will fluctuate so that an investor’s shares, when redeemed, may be worth more or less than their original cost. The graph and table do not reflect the deduction of taxes that a shareholder would pay on fund distributions or the redemption of fund shares. For all or a portion of the periods, the fund had expense limitations, without which returns would have been lower. Gross expense ratio as stated in the most recent prospectus is 2.20%. Pursuant to a voluntary arrangement, the Adviser has agreed to limit total fund operating expenses (exclusive of any acquired fund fees and expenses, performance fees, taxes, brokerage commissions and interest) to not exceed 1.90%. The Adviser can modify or terminate this arrangement at any time. See Definitions for Management Teams’ Perspectives for index definitions. Please visit our website at www.usfunds.com for updated performance information for different time periods. |
34
Precious Metals and Minerals Funds | (unaudited) |
The Year in Review - Economic and Political Issues that Affected the Funds
Gold started the year strong following the first rate hike in December 2015, marking the first rate hike in eight years. Precious metals got an early boost following Janet Yellen’s remarks stating that the Federal Reserve will proceed “cautiously” with rate hikes this year. Gold investors started pouring money into gold ETFs at the fastest pace since 2009, with negative rates in Europe boosting its appeal. Hence, gold bullion prices clocked their best quarterly rally in 30 years.
Momentum continued into the second quarter, helped by the market turmoil following the United Kingdom’s decision to leave the European Union late in June. Gold rallied more in the first half of the year than in any other year since 1974, with prices pushed up 24 percent. The funds were the beneficiaries of two significant transactions in the first half of the year. In the first major deal, Tahoe Resources announced its definitive agreement to acquire Lake Shore Gold for $678 million in an all-stock transaction. The premium paid was about 15 percent to the prior closing price of Lake Shore. In the second transaction, Silver Standard Resources announced its agreement to buy all the outstanding common shares of Claude Resources, with the offer valuing Claude at C$337 million. According to Bloomberg, the price is about a 25 percent premium to the 20-day weighted average price of Claude and a 30 percent premium to Claude’s closing price on March 4. Our gold funds held slightly more than 9 million shares of Claude, almost 5 percent of the company.
China introduced a new yuan-priced gold fix, and within a week of the new fix being introduced, Russia and China announced a new gold trading platform. The trading platform the Chinese and Russians have adopted may eventually be a mechanism to set prices for goods or services in terms of gold and to break the dollar’s place as the currency of international trade. Platts reported that both Chinese and Russian banks increased their gold purchases during the month of June after they had both slowed their gold purchases in May. Russia added around 18 metric tons, and China added around 15 metric tons. China is now the sixth-largest holder of gold reserves, and Russia is the seventh-largest. The two countries have accounted for over 95 percent of total central bank purchases of gold in the last two years in their efforts to diversify away from foreign currency.
The surge in gold prices did have some drawbacks as price-sensitive India cut demand for the precious metal to the lowest in seven years. Weak demand forced dealers to sell gold at a discount to clear inventories. In addition, India’s gold imports in June were just 32 tonnes and were 43 percent less than June last year. This is a significant drop for India, one of the top countries for gold consumption, along with China. China consumption had its own headwinds with anti-corruption measures taking a toll on gold jewelry purchases, with demand falling 17.4 percent compared to 2015. Meanwhile, the investment-related demand for gold picked up, with gold bar and coin purchases up 25.3 percent and 17.3 percent, respectively.
35
Precious Metals and Minerals Funds | (unaudited) |
China’s gold withdrawals surged in November as prices fell with the anticipated U.S. rate hike in December. According to the monthly report from the Shanghai Gold Exchange, purchases increased to 214.72 tonnes and was a 40 percent rise over the October figure. According to Bloomberg Intelligence, the five-year average gold premium is typically around $5.50 an ounce in China, but has soared to almost $40 an ounce, as falling prices invite “bargain buying” among the Chinese. This level of demand puts China on track to potentially maintain its position as the world’s largest gold consumer. Rumors and reports indicate that international banks are having difficulties with their imports, as the People’s Bank of China is taking longer to approve each importing transaction. The central bank may be trying to unofficially restrict gold imports to curb high capital outflows from China’s investors.
MarketWatch writer Nigam Arora believes the real reason behind the crash in gold price is India, not Trump. Citigroup analysts predicted that a Trump victory would push gold to $1,400, while a Hillary Clinton victory would send prices down to $1,250. Coincidently, India’s Prime Minister Narendra Modi directed that 500 and 1,000 rupee notes be banned as elections were taking place in the U.S. These represent 20 percent of the cash value in circulation and 80 percent of cash outstanding. The impact of demonetization in India is still being felt in gold demand. Gold imports in India for 2016 were much lower than the annual average of 1,000 metric tons, with just over 600 tons in 2016. Analysts anticipate that demand will be similarly low in 2017. Market observers in India say demand for gold is at rock bottom, despite the typically lucrative Indian wedding season in the fourth quarter. Precious metals prices did not rally until the last week of the year, with gold rising above $1,150 per ounce, snapping a three-year losing streak with an 8.56 percent gain.
Investment Highlights
For the year ended December 31, 2016, the World Precious Minerals Fund Investor Class returned 75.08 percent and the Institutional Class returned 75.97 percent, making the fund the best-performing actively managed mutual fund for all funds in the U.S. The fund’s benchmark, the NYSE Arca Gold Miners Index, gained 53.26 percent (simple price appreciation basis). The strategy of the World Precious Minerals Fund favors junior exploration and development stocks and mid-tiered producing stocks. These lower-capitalization stocks have historically outperformed senior gold mining companies over longer periods, as senior gold miners have typically acquired proven assets of junior gold companies rather than explored for new mining projects with capital-constrained budgets.
The Gold and Precious Metals Fund returned 45.36 percent for the year, underperforming its benchmark, the FTSE Gold Mines Index, which rose 60.72 percent on a total return basis. While focusing on established, gold-producing companies, the Gold and Precious Metals Fund holds a higher weighting of mid-tier stocks compared to its benchmark.
36
Precious Metals and Minerals Funds | (unaudited) |
Both funds employed a defensive investment position from time to time in the past year with higher-than-average cash balances on hand to protect the liquidity of the funds. However, to maintain varying degrees of investment exposure to the gold market, the funds utilized some call options positions and directional ETFs, which are more liquid than options, to hedge the funds’ benchmark risks and provide optionality to upswings in gold stocks.
In addition to the rise in gold, silver finished the year up 14.86 percent, platinum only gained 1.16 percent, but palladium ended the year strongest with a gain of 20.96 percent, driven primarily by strong auto sales and anticipation of pro-growth Trump spending plans.
Because the funds are actively managed and the holding period is generally not a consideration in investment decisions, the portfolio turnover rate may fluctuate from year to year as the funds adjust their portfolio composition. The funds’ annual portfolio turnovers were, and are expected to continued to be, more than 100 percent.
Strengths
● | Barsele Minerals was spun out of Orex Minerals late in 2015 to gain better recognition of the three individual assets held by the company, two of which are in Mexico while Barsele’s asset is in Sweden and is joint-ventured with Agnico-Eagle Mines. Overall, Barsele was the biggest dollar contributor to the World Precious Minerals Fund with an 846 percent gain. |
● | Klondex Mines was the best dollar gainer for Gold and Precious Metals with a 129 percent gain and was also the second-best contributor to World Precious Minerals. The second-best contributor to Gold and Precious Metals was the choice to eliminate Goldcorp from the portfolios earlier in the year, which significantly underperformed the market. |
● | The third-best contributor to World Precious Minerals was Orex Minerals with a 127 percent gain. For Gold and Precious Metals, the choice not to own Newcrest Mining also had the third-highest attribution effect to fund performance relative to its benchmark. |
Weaknesses
● | For both gold-oriented funds, Barrick Gold and Newmont Mining, relative to their benchmarks, showed up as being significant detractors to the funds’ performance as they were underweight both names, which delivered price changes of 118 percent and 90 percent, respectively. However, the large weighting in both funds in Klondex Mines, which gained 129 percent, outperformed Barrick Gold and Newmont Mining and did so while posting double-digit returns on invested capital. Barrick and Newmont had poor returns on invested capital. |
37
Precious Metals and Minerals Funds | (unaudited) |
● | Barrick Gold parsed out as being the biggest detractor to the funds’ returns. Newmont Mining was the second-worst contributor to World Precious Minerals and the third-worst contributor to Gold and Precious Metals. |
● | The second-biggest drag on Gold and Precious Metals was from the Osisko Gold Royalty warrants held throughout the year. The warrants averaged less than 1 percent of the fund and only appreciated 6 percent over the year. The third-biggest drag on the performance of World Precious Minerals was its avoidance of any ownership in Kinross Gold. Although it appreciated 73 percent over the course of the year, its returns on invested capital hovered around negative 30 percent for most of the year. |
Current Outlook
Opportunities
● | Mark Mobius, executive chairman of Templeton Emerging Markets Group, says he thinks gold will gain as much as 15 percent through 2017, as the Federal Reserve increases rates slowly and the dollar remains subdued. “The U.S. dollar is not that strong and may even decline,” said Mobius. Goldman has reiterated its view that any sell-off substantially below $1,250 an ounce should be seen as a buying opportunity. Gold demand may be spurred by weakness in China’s currency and concerns over the nation’s property market. In addition, global inflation expectations have risen to the highest level since May 2015. Investors anticipate annual consumer inflation of 1.4 percent. Gold is traditionally used as a hedge against inflation. |
● | Bank Credit Analyst (BCA) points out that, realistically, it will take time for the incoming Trump administration to draft legislation that deploys fiscal stimulus—at least six months. It will then take time to see if it works. Given this reality, BCA’s team notes that the U.S. dollar and real rates “have moved too far too fast and likely will correct.” Where BCA differs from consensus is that the rising inflation expectations it measures in the forward markets are probably warranted for 2017. If growth materializes with stimulus, overlaid on a labor market that is close to full employment, the low inflation consensus could shift higher. This could depress real rates and provide a more attractive outlook for gold in 2017. Portfolio manager Terence Kooyker at Blenheim says he is bullish on gold, too. Kooyker says faster U.S. inflation and low interest rates will support gold, adding that “gold always performs best when nobody thinks you should own it.” |
● | U.S. debt dynamics are set to turn positive for gold in 2017, according to ICBC Standard Bank, highlighting that the costs of higher yields are being overlooked. The Congressional Budget Office (CBO) calculates that net interest payments on the approximately $14 trillion of U.S. debt will amount to around $250 billion in 2017 (around 1.4 percent of U.S. GDP). “If we apply an 80-basis point increase to the CBO’s net interest forecasts and keep the other variables unchanged, then by 2026 the Treasury would be paying an additional $185 billion in interest annually, |
38
Precious Metals and Minerals Funds | (unaudited) |
and interest will have increased to 3.3 percent of GDP,” the report continues. In the note, Tom Kendall stresses the key point that the financing costs for the U.S. have already jumped, whereas the Trump administration’s policies may or may not have a positive impact on U.S. growth and the effects will be lagged. Thus, any disappointments on the growth front, combined with higher interest costs and contentious negotiations on raising the debt ceiling in the first quarter, could well result in a more bullish scenario for gold.
Threats
● | Two top gold forecasters see further losses for the yellow metal in 2017. Both Oversea-Chinese Banking and ABN Amro see gold slipping to $1,100 an ounce by the end of 2017. “From an investor point of view, there is little reason to own gold,” Georgette Boele, a currency and commodity analyst with ABN Amro, said. In a parallel vein to India’s demonetization, Goldcore reported that Citibank will make all Australian branches cashless, and UBS proposes that Australia eliminate $100 and $50 bills. |
● | Earlier this year, it was reported that CalPERS, the largest public pension fund in the U.S., earned only 0.6 percent on its investments last fiscal year. In order to meet its long-term goal, however, the pension needs to be returning over 12 times that amount. CalPERS’ Chief Investment Officer Ted Eliopoulus writes that it is a significant policy issue and the system must average at least 7.5 percent a year to match its assumed rate of return or turn to taxpayers to make up the difference. CalPERS has subsequently announced it is looking to pair back its global equity and private equity exposure by 5 percentage points in favor of a larger allocation to real assets and inflation and liquidity asset classes. |
● | Hedge fund manager Stanley Druckenmiller told CNBC that he sold all of his gold on the night of President Trump’s victory, saying that “All the reasons I owned it for the last couple of years seen to be ending.” Druckenmiller stated that he now has a “large bet on economic growth.” Some caution on exuberance may be warranted though, as David Rosenberg highlights in a piece for The Globe and Mail. Back in September, Donald Trump declared that markets are in a “big, fat ugly bubble.” Rosenberg believes Trump may be right on this one—this is the most expensive market in 15 years. In fact, if the price-to-earnings (P/E) ratio does its own version of mean-regression, then the equity market is discounting 33 percent earnings growth in 2017. “Look, if the market was even discounting 10 to 15 percent earnings per share growth, there is some moderate upside,” he continues. “But Mr. Market is priced for a one-in-20 event that only occurs at the early stages of the cycle, not heading into year number eight.” |
The section labeled Portfolio of Investments contains a complete list of the funds’ holdings.
39
Precious Metals and Minerals Funds | (unaudited) |
World Precious Minerals Fund
Top 10 Equity Holdings (Based on Net Assets) | December 31, 2016 |
Klondex Mines Ltd. | 19.79% |
Gold Mining | |
Barsele Minerals Corp. | 6.37% |
Precious Metals | |
TriStar Gold, Inc. | 3.61% |
Gold Mining | |
Pretium Resources, Inc. | 3.22% |
Gold Mining | |
Auryn Resources, Inc. | 2.42% |
Diversified Minerals | |
Lithium X Energy Corp. | 2.11% |
Diversified Minerals | |
Fiore Exploration Ltd. | 1.92% |
Precious Metals | |
Roxgold, Inc. | 1.92% |
Precious Metals | |
Gold Standard Ventures Corp. | 1.80% |
Gold Mining | |
Lundin Gold, Inc. | 1.79% |
Gold Mining | |
Total Top 10 Equity Holdings | 44.95% |
Portfolio Allocation by Industry* Based on Total Investments | December 31, 2016 |
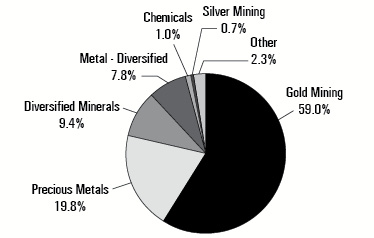
|
* | Summary information above may differ from the portfolio schedule included in the financial statements due to the use of different classifications of securities for presentation purposes. |
40
Precious Metals and Minerals Funds | (unaudited) |
Gold and Precious Metals Fund
Top 10 Equity Holdings (Based on Net Assets) | December 31, 2016 |
Klondex Mines Ltd. | 22.29% |
Gold Mining | |
Kirkland Lake Gold, Inc. | 8.02% |
Gold Mining | |
Wesdome Gold Mines Ltd. | 5.30% |
Gold Mining | |
St Barbara Ltd. | 4.61% |
Gold Mining | |
Barrick Gold Corp. | 3.83% |
Gold Mining | |
Jaguar Mining, Inc. | 3.47% |
Gold Mining | |
Royal Gold, Inc. | 3.37% |
Gold Mining | |
Torex Gold Resources, Inc. | 3.29% |
Gold Mining | |
Newmont Mining Corp. | 3.26% |
Gold Mining | |
Silver Wheaton Corp. | 3.08% |
Silver Mining | |
Total Top 10 Equity Holdings | 60.52% |
Portfolio Allocation by Industry* Based on Total Investments | December 31, 2016 |

|
* | Summary information above may differ from the portfolio schedule included in the financial statements due to the use of different classifications of securities for presentation purposes. |
41
Emerging Europe Fund | (unaudited) |
Management Team’s Perspective
Introduction
The investment objective of the Emerging Europe Fund (EUROX) is to achieve long-term capital growth by investing in a non-diversified portfolio of equity securities of companies located in the emerging markets of Europe.(1)
Performance Graph
Emerging Europe Fund |

|
Average Annual Performance | For the Years Ended
December 31, 2016 |
| | One Year | Five Year | Ten Year |
Emerging Europe Fund | 14.23% | -4.25% | -6.67% |
S&P 500 Index | 11.96% | 14.66% | 6.95% |
MSCI Emerging Markets Europe 10/40 Index (Net Total Return) | 25.70% | -1.64% | -3.59% |
* Performance data quoted above is historical. Past performance is no guarantee of future results. Current performance may be higher or lower than the performance data quoted. The principal value and investment return of an investment will fluctuate so that an investor’s shares, when redeemed, may be worth more or less than their original cost. The graph and table do not reflect the deduction of taxes that a shareholder would pay on fund distributions or the redemption of fund shares. For all or a portion of the periods, the fund had expense limitations, without which returns would have been lower. Gross expense ratio as stated in the most recent prospectus is 2.61%. Pursuant to a voluntary arrangement, the Adviser has agreed to limit total fund operating expenses (exclusive of any acquired fund fees and expenses, performance fees, taxes, brokerage commissions and interest) to not exceed 2.85%. The Adviser can modify or terminate this arrangement at any time. See Definitions for Management Teams’ Perspectives for index definitions. Please visit our website at www.usfunds.com for updated performance information for different time periods. |
(1) | The following countries are considered to be in the emerging Europe region: Albania, Armenia, Azerbaijan, Belarus, Bulgaria, Croatia, the Czech Republic, Estonia, FYR Macedonia, Georgia, Greece, Hungary, Latvia, Lithuania, Moldova, Poland, Romania, Russia, Slovakia, Slovenia, Turkey and Ukraine. |
42
Emerging Europe Fund | (unaudited) |
The Year in Review – Economic and Political Issues that Affected the Fund
Russia was the best performing market this year. The MSCI Russia Index rebounded at the beginning of the year and continued its sharp upward move after the Organization of Petroleum Exporting Countries (OPEC) announced production cuts at the end of November. Russia benefits from higher oil prices, as a majority of the country’s revenue comes from the sale of oil and gas, comprising about 30 percent of the country’s gross domestic product (GDP). A couple of events took place this year that strengthened Russia’s positon in Europe. First, the United Kingdom voted to exit the eurozone, leaving the continent more divided. The U.K. had consistently spoken in favor of preserving the sanctions against Russia, which were introduced in 2014 after Russia annexed Crimea. Also, the U.S. presidential election boosted optimism among Russian investors as Donald Trump wants to cooperate with Vladimir Putin in fighting terrorism and may review sanctions that Barack Obama imposed on Russia after its conflict with Ukraine.
Hungary was the second-best performing market within the emerging European countries. The aggressive monetary easing program continued. The central bank of Hungary is dovish and trying to be growth supportive, bringing benchmark rates down to 90 basis points from 1.35 percent at the beginning of 2016. Hungary’s government will cut its corporate tax rate to the lowest level in the eurozone; a new 9 percent corporate tax rate will be introduced in 2017, significantly lower than Ireland’s 12.5 percent. Hungary regained its investment grade at S&P Global Ratings after almost five years as economic growth rebounded and the government’s budget discipline bolstered public finances.
In Poland, the newly elected right wing Law & Justice party started to implement social spending programs and create more state controlled economy. At the beginning of the year, S&P Global Ratings cut Poland’s long-term foreign currency sovereign credit rating from A- to BBB+ with negative outlook, citing moves by the new Law & Justice administration to seize control of the country’s public media and challenge the independence of its constitutional court. In December, S&P Global Ratings raised the outlook to stable from negative on reduced concerns over the central banks’ independence from government.
The Czech Republic underperformed the index. The country’s central bank has kept the benchmark rate at a record low of 0.05 percent through the year and has indicated that it will remove a cap on the koruna once inflation reaches its target of 2 percent. The approaching end of the intervention regime and expectations of exchange-rate gains are luring investors into Czech sovereign bonds.
43
Emerging Europe Fund | (unaudited) |
The Greek market also underperformed in the past year. Eurozone finance ministers agreed to unlock a further 10.3 billion euros in loans—a tranche of cash that Athens needed to meet debt repayments due in July. Debt relief for Greece was also approved, extending the repayment period and capping interest rates. Greece needs more disbursements and currently is working on implementation of further reforms.
Turkey was the worst performing market for the second year in a row. The country’s tourism industry experienced its worst summer in 25 years amid terrorism and an attempted coup. A state of emergency was declared on July 21, a move that President Recep Tayyip Erdogan said would enable the state to act faster against those who plotted a failed coup. Thousands of people were arrested, from high-ranking military officials to university professors, on alleged links to the Gulen Movement. Toward the end of the year, President Erdogan pushed forward with the process of concentrating power in his office as the governing party officially proposed an executive presidency to parliament. It was a year of valiance and political instability in Turkey. The lira declined 17 percent against the dollar.
Investment Highlights
Overview
For the year ended December 31, 2016, the fund returned 14.23 percent, while the benchmark MSCI Emerging Markets Europe 10/40 Index (Net Total Return) returned 25.70 percent.
Russia and Hungary outperformed the benchmark, while Greece, Poland, the Czech Republic and Turkey underperformed. On a sector basis, energy and material were the best-performing sectors, while finance, consumer discretionary, health care, telecommunications, consumer staples, utilities, real estate and industrials underperformed.
At the beginning of 2016, the fund was positioned in a defensive mode, underweighting Russia. Throughout the year, the fund increased its Russian holdings and used call options on a Russian ETF (RSX) as well as directional ETFs to hedge the fund’s benchmark risk.
Because the fund is actively managed, and the holding period is generally not a consideration in investment decisions, the portfolio turnover rate may fluctuate from year to year as the fund adjusts its portfolio composition. The fund’s annual portfolio turnovers were, and are expected to continued to be, more than 100 percent.
Strengths
● | The fund’s underweighting of Poland as well as good stock selection in Greece had a positive contribution to the fund’s performance relative to its benchmark. |
● | The fund’s stock selection in financials and utilities had a positive contribution to the performance of the fund relative to its benchmark. |
44
Emerging Europe Fund | (unaudited) |
● | Sberbank, a Russian bank, made the largest single contribution to the performance of the fund. |
Weaknesses
● | The fund’s underweighting of Russia as well as higher cash levels had a negative impact on the fund’s performance relative to its benchmark. |
● | The fund’s overweighting in industrials and underweighting in energy had a negative effect on the fund’s performance relative to its benchmark. |
● | The Direxion Daily Russia 3X Bear ETF was the single worst contributor to the performance of the fund. |
Current Outlook
Opportunities
● | The central bank of the Czech Republic expects inflation to accelerate to 2 percent in the third quarter of next year, and may remove a cap on the koruna. The market has already started to bet on the foreign-exchange regime changing and selling the euro against the koruna as one of the top trades for 2017. |
● | The U.S. will likely start easing its penalties—imposed on Russia over annexation of Crimea in 2014—during the next 12 months, according to 55 percent of respondents in a Bloomberg survey. Without the restrictions, Russia’s economic growth would get a boost equivalent to 0.2 percentage points of gross domestic product next year and 0.5 percentage points in 2018. Donald Trump’s surprise election in November is feeding expectations of policy change toward Russia. |
● | The FTSE index provider classifies Romania as a frontier market and, in September 2016, added it to the watch list for possible promotion to Secondary Emerging Market status. Romania meets eight of the nine “Quality of Markets” criteria required for attaining Secondary Emerging Market status, with recent developments in the infrastructure of the market being received positively by international portfolio investors. The one outstanding criterion is sufficient broad-market liquidity to support a sizeable global investment. Romania may be coming closer to emerging market status. |
Threats
● | The European political calendar is full for the next 12 months and could create some political tension. British Prime Minister Theresa May gave March 31 as the deadline for triggering Article 50, which will start the process of Brexit. In April, France will hold presidential elections. A Marine Le Pen victory could create crisis in the European Union area given her antipathy to this area. It could also promote a more populist, industrial-policy driven agenda. In August, Germany will hold national elections. Angela Merkel announced her decision to run for |
45
Emerging Europe Fund | (unaudited) |
| a fourth term. Her leadership is critical to retain investment confidence in the region. However, her supporters have declined in number due to her immigration policies. |
● | The Bank Credit Analyst research team predicts the dollar bull market to stay intact during 2017, with the Trade Weighted Index rising by around 5 percent, which should be negative for riskier emerging Europe assets. The group remains bearish on emerging Europe currencies. |
● | The outflow of assets from Turkey could continue next year and the lira may remain vulnerable to external conditions and political risks feeding into higher inflation. The Turkish economy faces recession risks as the third quarter GDP contracted 1.8 percent on a year-over-year basis, the first contraction since the third quarter on 2009. The coup attempt in July appears to have hurt the economy more than expected. |
The section labeled Portfolio of Investments contains a complete list of the fund’s holdings.
Top 10 Equity Holdings (Based on Net Assets) | December 31, 2016 |
Sberbank of Russia | 10.49% |
Commercial Banks - Non US | |
Lukoil PJSC | 8.18% |
Oil Companies - Integrated | |
Gazprom OAO | 7.93% |
Oil Companies - Integrated | |
Polski Koncern Naftowy Orlen S.A. | 1.97% |
Oil Refining & Marketing | |
Moneta Money Bank A.S. | 1.82% |
Regional Banks - Non US | |
OTP Bank plc | 1.75% |
Commercial Banks - Non US | |
Eurocash S.A. | 1.64% |
Food - Wholesale/Distribution | |
Arcelik A.S. | 1.58% |
Appliances | |
Magnit PJSC | 1.46% |
Food - Retail | |
MOL Hungarian Oil & Gas plc | 1.45% |
Oil Companies - Integrated | |
Total Top 10 Equity Holdings | 38.27% |
46
Emerging Europe Fund | (unaudited) |
Country Distribution* Based on Total Investments | December 31, 2016 |

|
* | Country distribution shown is based on domicile. The locale of company operations may be different. |
47
China Region Fund | (unaudited) |
Management Team’s Perspective
Introduction
The China Region Fund (USCOX) seeks long-term growth of capital. The fund invests in both established and emerging companies registered and operating in the China region.(1)
Performance Graph
China Region Fund |

|
Average Annual Performance | For the Years Ended
December 31, 2016 |
| | One Year | Five Year | Ten Year |
China Region Fund | -1.05% | 1.82% | -1.09% |
Hang Seng Composite Index | 2.73% | 6.94% | 4.00% |
MSCI All Country Far East Free ex Japan Index* | 6.57% | 4.98% | 4.16% |
* These are not total returns. These returns reflect simple appreciation only and do not reflect dividend reinvestment. Performance data quoted above is historical. Past performance is no guarantee of future results. Current performance may be higher or lower than the performance data quoted. The principal value and investment return of an investment will fluctuate so that an investor’s shares, when redeemed, may be worth more or less than their original cost. The graph and table do not reflect the deduction of taxes that a shareholder would pay on fund distributions or the redemption of fund shares. For all or a portion of the periods, the fund had expense limitations, without which returns would have been lower. Gross expense ratio as stated in the most recent prospectus is 3.08%. Pursuant to a voluntary arrangement, the Adviser has agreed to limit total fund operating expenses (exclusive of any acquired fund fees and expenses, performance fees, taxes, brokerage commissions and interest) to not exceed 2.55%. The Adviser can modify or terminate this arrangement at any time. See Definitions for Management Teams’ Perspectives for index definitions. Please visit our website at www.usfunds.com for updated performance information for different time periods.. |
(1) | The China region is defined as any country that either shares a border with China or is located in the South China Sea or the East China Sea and includes: the People’s Republic of China (PRC or China), Bangladesh, Cambodia, Hong Kong, India, Indonesia, Kazakhstan, Korea, Kyrgyzstan, Laos, Malaysia, Mongolia, Myanmar, Nepal, Pakistan, Philippines, Singapore, Taiwan, Tajikistan, Thailand and Vietnam. |
48
China Region Fund | (unaudited) |
The Year in Review – Economic and Political Issues that Affected the Fund
2016 kicked off with an explosive bang as the Shanghai Composite Index tumbled in the opening days of the year, losing as much as a quarter of its value in the month of January. The Hang Seng Composite Index (HSCI)—along with most global indices—also dropped sharply that month, falling as much as 16 percent. While Hong Kong stumbled back to a positive total return, Shanghai did not fully recover and finished down more than 10 percent for the year.
Despite equity market hiccups, 2016 offered positive signs from measurements of manufacturing in China. The official China Manufacturing Purchasing Manager’s Index (PMI) rose from 49.7 at the close of 2015 to 51.4 at the close of 2016. This official data was consistent with the private Caixin China Manufacturing Purchasing Manager’s Index (PMI), which also rose steadily throughout the year, climbing from the contractionary 48 range to an expansionary 51.9 in December, thus closing 2016 at the high for the year.
Toward the end of 2015, the Chinese authorities lowered expectations for 2016’s gross domestic product (GDP) growth rate to a range of 6.5-7.0 percent, promising a focus upon growth-oriented policies; this range was indeed met as GDP in China finished out the year at 6.8 percent. Particularly noteworthy in 2016 is the historic inclusion of the Chinese renminbi in the International Monetary Fund’s (IMF’s) Special Drawing Rights (SDR) basket of currencies, granting the yuan a powerful place alongside the U.S. dollar, British pound sterling, Japanese yen and the euro as a global reserve currency.
Near the end of 2016, press reports confirmed that China’s Xi Jinping remains “comfortable” with a 2017 GDP growth rate below 6.5 percent as leadership seeks to prioritize stability and risk control above growth for growth’s sake. Indeed, while 2016 was marked in some ways by relatively quiet(ed) but nonetheless creeping concerns about rising Chinese debt levels and non-performing loans (in addition to slowing growth), the proxies for investors were primarily the yuan—which weakened throughout much of the year, stabilized ahead of SDR inclusion and a G-20 summit in China, and then continued weakening until hitting more than 6.96—and a close eye on China’s FX reserve levels, which fell to roughly $3 trillion at the close of the year. Throughout 2016, Chinese authorities attempted to crack down heavily on capital outflows from the mainland by methods ranging from capping certain foreign currency transactions to prohibiting various purchases of wealth management products (which weighed on insurers to some degree). Separately, Chinese authorities also clamped down quickly upon a surge in commodities speculation, while various cities and local governments took a number of steps to curb rapid property appreciation, especially in Tier 1 cities.
49
China Region Fund | (unaudited) |
All the while, China’s growing middle class—like other middle classes in the region—continued its ascent, perpetuating thematic trends in industries like tourism, automobiles and health care, for example. Macau also saw a resurgence in latter 2016, as the gaming and hospitality center began a recovery from Xi Jinping’s crackdown on corruption, perhaps signaling that China’s middle class stepped up, at least partly, to fill in some of the gaps from Macau’s formerly ostentatious VIP orientation.
Elsewhere in the region, President Joko Widodo of the Republic of Indonesia continued his promised course of reform, achieving his stated objective of a Tax Amnesty Scheme (TAS) for repatriating offshore and undeclared assets to bring in tax revenue and keep Indonesia ahead of the 2018 implementation of the Automatic Exchange of Information banking secrecy laws. This encouraging move should help to offset “JokoWi’s” promised infrastructure spending and development, bolster property investment and bring increased transparency and revenue to the island-nation.
Other particularly notable political developments in the region include the rise of President Tsai Ing-wen of the Democratic Progressive Party to office in Taiwan (her carefully crafted rhetoric and relations with the People’s Republic of China may well be frostier than under her recent predecessors), while the tough-talking, populist former Davao City mayor Rodrigo Roa Duterte won election to the presidency of the Philippines. Thailand’s revered and long-reigning King Bhumibol (Rama IX) passed away in October and was succeeded by his son, Vajiralongkorn.
Of relevance for the region are three final, interrelated geopolitical issues affecting 2016 and the future, all of which involve the United States of America. The first is the continued rise in U.S. interest rates in the wake of a reasonably strong U.S. economy, which reverberates around the world due to the reach of the strengthened U.S. dollar. The second is the election of U.S. President Donald Trump, whose openly protectionist policies and saber-rattling rhetoric raise several questions concerning the region, especially with respect to China: the potential effects and fallout of branding China a “currency manipulator,” the status of U.S. policies on China and Taiwan and issues of sovereignty in the South China Sea, among others. Third, and finally, the Obama administration’s troubled Trans-Pacific Partnership (TPP) now appears to be dead in the water.
Investment Highlights
Overview
For the year ended December 31, 2016, the China Region Fund had a negative return of 1.05 percent, underperforming the benchmark Hang Seng Composite Index (HSCI), which advanced 2.73 percent in total return.
50
China Region Fund | (unaudited) |
Because the fund is actively managed and holding period is generally not a consideration in investment decisions, the portfolio turnover rate may fluctuate from year to year as the fund adjusts its portfolio composition. The fund’s annual portfolio turnover was, and is expected to continue to be, more than 100 percent.
Strengths
● | Within the broader “China Region,” Indonesia and Taiwan proved most helpful with respect to positive contributions from country allocation to fund performance for the year. |
● | Stock selection within the consumer goods sector constituted the largest sector alpha generator for the fund, while sector allocation within conglomerates proved most successful. |
● | Geely Automobile Holdings, Sunny Optical Technology Group and Guangzhou Automobile Group finished the year as the top three contributors to fund performance. |
Weaknesses
● | Outside of Hong Kong—where stock selection left room for improvement—country allocation to South Korea and Malaysia was less than satisfactory. |
● | Sector allocation to consumer services was a net detractor for the fund. |
● | Boer Power Holdings, AIA Group and China Construction Bank detracted the most from fund performance for the year. |
Current Outlook
Opportunities
● | Chinese tourism continues to grow steadily, with domestic tourists taking 4.44 billion trips in 2016, up 11 percent from the previous year. Tourism contributed a whopping 11 percent to the country’s GDP. |
● | As expected (though somewhat unprecedented), the 2017 resolution to impeach South Korean President Park Geun-hye may provide more transparency and something of a reset for South Korean domestic politics in new elections. |
● | Even though the Trans-Pacific Partnership (TPP)—to which China was noticeably not party—is now apparently defunct, China is already moving, along with regional partners, to create a replacement trade agreement—to which the U.S. has not been party—with talks that began in 2016 and are expected to continue in 2017. Regardless of U.S. involvement or lack thereof, a new trade agreement could provide a number of the same expected benefits that TPP potentially could have. |
51
China Region Fund | (unaudited) |
Threats
● | The declining levels of China’s FX reserves continue to hold investors’ attention, particularly as the yuan has approached 7.0 and reserves have fallen to just above $3 trillion. |
● | Perhaps central to issues of declining reserves and a weaker yuan is the question of where U.S.-China trade policies go from here. While investors have obvious reasons to expect U.S. President Trump to seek policies that minimize the potential for a trade war and that discourage unnecessary tension, thus far President Trump’s rhetoric remains elevated and his policies unclarified. |
● | In addition to potentially sweeping U.S. political and policy changes that could reverberate throughout the world, recent regional developments also remain highly relevant. Questions and potential threats exist, for example, around the issues of the Philippine “pivot” toward China, the effectiveness of recent Indian demonetization, the status of Taiwan, an as-yet constitutionally unapproved impeachment in South Korea and ongoing concerns about sovereignty in disputed areas of the South China Sea. |
The section labeled Portfolio of Investments contains a complete list of the fund’s holdings.
Top 10 Equity Holdings (Based on Net Assets) | December 31, 2016 |
Tencent Holdings Ltd. | 5.29% |
Internet Application Software | |
Geely Automobile Holdings Ltd. | 4.99% |
Automotive - Cars & Light Trucks | |
Sunny Optical Technology Group Co., Ltd. | 4.15% |
Photo Equipment & Supplies | |
Guangzhou Automobile Group Co., Ltd. | 4.01% |
Automotive - Cars & Light Trucks | |
GF Securities Co., Ltd. | 3.14% |
Investment Management/Advisory Services | |
PICC Property & Casualty Co., Ltd. | 2.99% |
Property/Casualty Insurance | |
PCCW Ltd. | 2.78% |
Telecom Services | |
CSPC Pharmaceutical Group Ltd. | 2.77% |
Medical - Drugs | |
Man Wah Holdings Ltd. | 2.54% |
Retail - Home Furnishings | |
ANTA Sports Products Ltd. | 2.25% |
Retail - Apparel/Shoe | |
Total Top 10 Equity Holdings | 34.91% |
52
China Region Fund | (unaudited) |
Country Distribution* Based on Total Investments | December 31, 2016 |
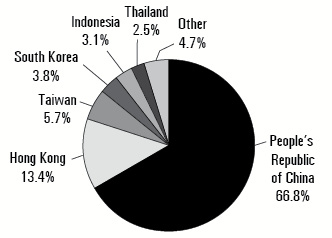
|
* | Country distribution shown is based on domicile and not intended to conform to the China region definition in the prospectus. The locale of company operations may be different. |
53
U.S. Government Securities Ultra-Short Bond Fund
Portfolio of Investments | December 31, 2016 |
United States
Government and Agency
Obligations 96.35% | | Coupon Rate % | | Maturity Date | | Principal Amount | | | Value | |
| | | | | | | | | | | |
Federal Farm Credit Bank 47.01% | |
Fixed Rates: | | | | | | | | | | |
| | | 1.13 | | 09/22/17 | | $ | 2,000,000 | | | $ | 2,004,594 | |
| | | 1.16 | | 10/23/17 | | | 1,000,000 | | | | 1,002,589 | |
Variable Rates: | | | | | | | | | | | | |
| | | 0.70 | | 01/30/17 | | | 1,650,000 | | | | 1,650,084 | |
| | | 0.72 | | 04/27/17 | | | 9,000,000 | | | | 9,001,738 | |
| | | 0.73 | | 05/12/17 | | | 5,933,000 | | | | 5,934,388 | |
| | | 0.69 | | 10/13/17 | | | 4,100,000 | | | | 4,103,120 | |
| | | 0.78 | | 03/22/18 | | | 3,000,000 | | | | 3,004,068 | |
| | | | | | | | | | | | 26,700,581 | |
| | | | | | | | | | | | | |
Federal Home Loan Bank 40.06% | |
Fixed Rates: | | | | | | | | | | | | |
| | | 0.63 | | 04/26/17 | | | 3,000,000 | | | | 2,999,751 | |
| | | 0.88 | | 09/27/17 | | | 3,000,000 | | | | 3,001,521 | |
| | | 1.00 | | 12/19/17 | | | 8,000,000 | | | | 8,005,128 | |
| | | 1.13 | | 03/29/18 | | | 750,000 | | | | 749,753 | |
| | | 1.00 | | 08/28/18 | | | 4,000,000 | | | | 3,979,920 | |
| | | 1.50 | | 03/08/19 | | | 4,000,000 | | | | 4,013,348 | |
| | | | | | | | | | | | 22,749,421 | |
| | | | | | | | | | | | | |
Tennessee Valley Authority 9.28% | |
Fixed Rates: | | | | | | | | | | | | |
| | | 6.25 | | 12/15/17 | | | 2,930,000 | | | | 3,075,258 | |
| | | 1.75 | | 10/15/18 | | | 2,174,000 | | | | 2,193,233 | |
| | | | | | | | | | | | 5,268,491 | |
| |
Total Investments 96.35% | | | | 54,718,493 | |
(cost $54,640,917) | | | | | | | | | | | | |
Other assets and liabilities, net 3.65% | | | | | | | | | | | 2,075,118 | |
| | | | | | | | | | | | | |
Net Assets 100.0% | | | | | | | | | | $ | 56,793,611 | |
See notes to portfolios of investments and notes to financial statements.
54
Near-Term Tax Free Fund
Portfolio of Investments | December 31, 2016 |
Municipal Bonds 92.86% | | Coupon
Rate % | | Maturity
Date | | Principal
Amount | | | Value | |
| | | | | | | | | | | |
Alabama 1.22% | |
Bessemer, Alabama Electric Revenue, Refunding, AGM | | 3.10 | | 12/01/21 | | $ | 100,000 | | | $ | 102,706 | |
Limestone County, Water & Sewer Authority | | 2.25 | | 12/01/21 | | | 365,000 | | | | 355,634 | |
Mobile Alabama, Refunding, GO Unlimited, Series B | | 5.00 | | 02/15/17 | | | 45,000 | | | | 45,210 | |
Pelham, Alabama, GO Unlimited | | 2.00 | | 02/01/18 | | | 130,000 | | | | 131,257 | |
University of South Alabama, University Revenue, Refunding | | 5.00 | | 11/01/18 | | | 500,000 | | | | 531,705 | |
| | | | | | | | | | | | 1,166,512 | |
| | | | | | | | | | | | | |
Alaska 0.04% | |
Valdez Alaska, School District, GO Unlimited | | 4.00 | | 06/30/17 | | | 40,000 | | | | 40,561 | |
| | | | | | | | | | | | | |
Arizona 0.65% | |
Arizona State Transportation Board Excise Tax Revenue | | 5.00 | | 07/01/17 | | | 175,000 | | | | 178,518 | |
McAllister Academic Village LLC, Arizona State University Hassayampa Revenue, Refunding | | 5.75 | | 07/01/18 | | | 200,000 | | | | 212,898 | |
Tempe, Arizona, GO Unlimited, Series A | | 2.00 | | 07/01/19 | | | 220,000 | | | | 223,219 | |
| | | | | | | | | | | | 614,635 | |
| | | | | | | | | | | | | |
Arkansas 1.43% | |
Atkins School District No. 18, Refunding, GO Limited | | 1.00 | | 02/01/19 | | | 420,000 | | | | 413,797 | |
Cave City School District No. 2-A, Refunding, GO Limited | | 1.00 | | 02/01/19 | | | 260,000 | | | | 255,369 | |
Hot Springs, Arizona Wastewater Revenue | | 4.00 | | 12/01/19 | | | 510,000 | | | | 540,279 | |
Paris School District No. 7, Refunding, GO Limited | | 1.00 | | 06/01/18 | | | 150,000 | | | | 149,207 | |
| | | | | | | | | | | | 1,358,652 | |
| | | | | | | | | | | | | |
California 2.68% | |
California State, Recreational Facility, Refunding, GO Unlimited | | 5.00 | | 12/01/19 | | | 5,000 | | | | 5,014 | |
California State, Statewide Communities Development Authority, Enloe Medical Center Revenue, Series A | | 5.25 | | 08/15/18 | | | 340,000 | | | | 361,508 | |
Chaffey Community College District, GO Unlimited, Series C, NATL | | 5.00 | | 06/01/32 | | | 300,000 | | | | 305,028 | |
Delano, California Union High School District, Refunding, GO Unlimited, Series A, NATL | | 4.75 | | 02/01/17 | | | 200,000 | | | | 200,540 | |
See notes to portfolios of investments and notes to financial statements.
55
Near-Term Tax Free Fund
Portfolio of Investments | December 31, 2016 |
| Municipal Bonds (cont'd) | | Coupon
Rate % | | Maturity
Date | | Principal
Amount | | | Value | |
| | | | | | | | | | | |
| California (cont'd) | |
| Los Angeles Unified School District, Election 2004, GO Unlimited, Series H, AGM | | 5.00 | | 07/01/32 | | $ | 200,000 | | | $ | 203,970 | |
| Newman-Crows Landing Unified School District, GO Unlimited, AGM | | 4.00 | | 08/01/19 | | | 115,000 | | | | 122,017 | |
| Orange County Sanitation District, Certificates of Participation, Series B, AGM | | 5.00 | | 02/01/21 | | | 100,000 | | | | 100,306 | |
| Riverside County, California Redevelopment Successor Agency, Refunding, Tax Allocation | | 5.00 | | 10/01/19 | | | 200,000 | | | | 216,632 | |
| Santa Clara County, California Financing Authority Revenue, Obstetrics and Gynecology, El Camino Hospital, AMBAC | | 5.00 | | 02/01/18 | | | 350,000 | | | | 358,110 | |
| Santa Clara Valley Transportation Authority, Series A, AMBAC | | 5.00 | | 04/01/27 | | | 370,000 | | | | 373,659 | |
| Santa Paula Schools Financing Authority, Santa Paula Elementary School District Revenue, AGM | | 4.25 | | 11/01/22 | | | 300,000 | | | | 307,161 | |
| | | | | | | | | | | | 2,553,945 | |
| | | | | | | | | | | | | |
| District of Columbia 0.35% | |
| District of Columbia Income Tax Revenue, Series A | | 5.25 | | 12/01/27 | | | 300,000 | | | | 330,063 | |
| | | | | | | | | | | | | |
| Florida 5.21% | |
| Citizens Property Insurance Co., Senior Secured, Coastal Account, Revenue, Series A-1 | | 4.00 | | 06/01/18 | | | 100,000 | | | | 103,463 | |
| Escambia County, Florida, Health Facilities Authority Revenue, Baptist Hospital, Inc. Project, Series A | | 5.00 | | 08/15/19 | | | 290,000 | | | | 309,650 | |
| Florida State Board of Education Lottery Revenue, Series B, BHAC | | 5.00 | | 07/01/26 | | | 100,000 | | | | 102,986 | |
| Florida State Board of Governors Parking Facility Revenue, Series A | | 3.00 | | 07/01/17 | | | 300,000 | | | | 303,066 | |
| Florida State Department of Management Services Certificates of Participation, Refunding, Series A | | 5.00 | | 08/01/19 | | | 500,000 | | | | 543,725 | |
| Florida State Department of Management Services Certificates of Participation, Series A | | 5.00 | | 08/01/24 | | | 340,000 | | | | 362,182 | |
See notes to portfolios of investments and notes to financial statements.
56
Near-Term Tax Free Fund
Portfolio of Investments | December 31, 2016 |
Municipal Bonds (cont'd) | | Coupon
Rate % | | Maturity
Date | | Principal
Amount | | | Value | |
| | | | | | | | | | | |
Florida (cont'd) | |
Florida State Municipal Power Agency, Stanton Project Revenue, Refunding | | 5.13 | | 10/01/17 | | $ | 300,000 | | | $ | 308,790 | |
Hillsborough County, Florida School Board, Refunding, Certificates of Participation, Series A | | 4.25 | | 07/01/25 | | | 300,000 | | | | 319,401 | |
Hillsborough County, Florida School Board, Certificates of Participation, Refunding, NATL | | 4.00 | | 07/01/19 | | | 100,000 | | | | 101,267 | |
Jacksonville Florida Special Revenue, Series C | | 5.00 | | 10/01/20 | | | 270,000 | | | | 299,754 | |
Leesburg, Florida Capital Improvement Revenue Bonds, Refunding | | 5.00 | | 10/01/21 | | | 405,000 | | | | 447,489 | |
Margate, Florida Water & Sewer Revenue, Refunding, AGM | | 4.00 | | 10/01/19 | | | 250,000 | | | | 264,353 | |
Miami - Dade County, Florida Expressway Authority Toll System Revenue, Series A | | 5.00 | | 07/01/21 | | | 430,000 | | | | 483,939 | |
Orange County School Board, Certificates of Participation, Series A, NATL | | 5.00 | | 08/01/32 | | | 275,000 | | | | 281,306 | |
Orlando, Florida Community Redevelopment Agency Tax Increment Revenue, Downtown District, Tax Allocation, Series A | | 4.00 | | 09/01/17 | | | 170,000 | | | | 172,212 | |
Polk County, Florida School District Revenue, AGM | | 5.00 | | 10/01/17 | | | 215,000 | | | | 221,102 | |
Saint Johns County, Florida Transportation Revenue, Refunding, AGM | | 5.00 | | 10/01/20 | | | 310,000 | | | | 344,754 | |
| | | | | | | | | | | | 4,969,439 | |
| | | | | | | | | | | | | |
Georgia 1.85% | |
Carroll City-County, Georgia Hospital Authority, Tanner Medical Center, Inc. Project | | 5.00 | | 07/01/18 | | | 600,000 | | | | 632,904 | |
Georgia State Municipal Electric Authority Revenue, Unrefunded, NATL | | 5.50 | | 01/01/20 | | | 40,000 | | | | 41,093 | |
Georgia State Municipal Gas Authority, Toccoa Project, Refunding, AGM | | 5.00 | | 06/01/22 | | | 600,000 | | | | 670,428 | |
Glynn-Brunswick Memorial Hospital Authority, Southeast Georgia Health System and Affiliates Revenue, Certificates of Participation, Series A | | 4.50 | | 08/01/17 | | | 150,000 | | | | 152,918 | |
Gwinnett County, Georgia, Hospital Authority, Gwinnett Hospital Systems Revenue, Series B, AGM | | 5.00 | | 07/01/18 | | | 250,000 | | | | 263,483 | |
| | | | | | | | | | | | 1,760,826 | |
See notes to portfolios of investments and notes to financial statements.
57
Near-Term Tax Free Fund
Portfolio of Investments | December 31, 2016 |
Municipal Bonds (cont'd) | | Coupon
Rate % | | Maturity
Date | | Principal
Amount | | | Value | |
| | | | | | | | | | |
Idaho 0.27% | |
Idaho Housing & Finance Association, Grant & Revenue Anticipation, Federal Highway Trust Fund, Series A | | 5.00 | | 07/15/21 | | $ | 225,000 | | | $ | 252,938 | |
| | | | | | | | | | | | | |
Illinois 4.48% | |
Chicago Board of Education, GO Unlimited, NATL | | 5.25 | | 12/01/19 | | | 300,000 | | | | 318,381 | |
Chicago, Illinois, O’Hare International Airport Revenue, Gen - Third Lien, Series C, AGC | | 5.25 | | 01/01/23 | | | 250,000 | | | | 272,965 | |
Clinton Bond Fayette Etc Counties Community College District No. 501 Kaskaskia, GO Unlimited | | 5.75 | | 12/01/19 | | | 500,000 | | | | 547,905 | |
Du Page County, Refunding, GO Unlimited | | 5.60 | | 01/01/21 | | | 330,000 | | | | 356,720 | |
Du Page County School District No. 33 West Chicago, Redunding, GO Unlimited, Series B | | 4.00 | | 12/01/21 | | | 1,000,000 | | | | 1,078,419 | |
Illinois Metropolitan Pier & Exposition Authority, Unrefunded, NATL (ZCB) | | 1.75 | (1) | 06/15/18 | | | 415,000 | | | | 399,857 | |
Illinois Regional Transportation Authority, Series A, AMBAC | | 7.20 | | 11/01/20 | | | 120,000 | | | | 133,174 | |
Lake & McHenry County, Fox Lake, Illinois, Debt Certificates, Series B | | 3.00 | | 11/01/19 | | | 265,000 | | | | 270,109 | |
Springfield, Illinois Metropolitan Sanitation District, Sewer Revenue, Senior Lien, Series A | | 4.00 | | 01/01/17 | | | 570,000 | | | | 570,000 | |
Will Grundy Etc Counties Community College District No. 525, Joliet Junior College Project, GO Unlimited | | 6.25 | | 06/01/22 | | | 300,000 | | | | 319,566 | |
| | | | | | | | | | | | 4,267,096 | |
| | | | | | | | | | | | | |
Indiana 1.89% | |
Clark-Pleasant, Indiana School Building | | 5.00 | | 01/15/19 | | | 275,000 | | | | 294,151 | |
Indianapolis Local Public Improvement Bond Bank, Waterworks Project, Series 2007 L, NATL | | 5.25 | | 01/01/33 | | | 305,000 | | | | 317,661 | |
Merrillville Redevelopment Authority, Tax Allocation | | 5.00 | | 08/15/20 | | | 350,000 | | | | 385,882 | |
Tri-Creek 2002 High School Building, AGM | | 5.00 | | 07/15/19 | | | 800,000 | | | | 800,928 | |
| | | | | | | | | | | | 1,798,622 | |
| | | | | | | | | | | | | |
Iowa 0.68% | |
Clive, Iowa, GO Unlimited, Series A | | 2.00 | | 06/01/19 | | | 235,000 | | | | 238,100 | |
See notes to portfolios of investments and notes to financial statements.
58
Near-Term Tax Free Fund
Portfolio of Investments | December 31, 2016 |
Municipal Bonds (cont'd) | | Coupon
Rate % | | Maturity
Date | | Principal
Amount | | | Value | |
| | | | | | | | | | | |
Iowa (cont’d) | |
University of Iowa Hospitals and Clinics, Iowa State Board of Regents, Hospital Revenue, Series A | | 3.00 | | 09/01/19 | | $ | 400,000 | | | $ | 413,228 | |
| | | | | | | | | | | | 651,328 | |
| | | | | | | | | | | | | |
Kansas 1.28% | |
Sedgwick County, Kansas, Unified School District No. 261 Haysville, GO Unlimited | | 5.00 | | 11/01/17 | | | 885,000 | | | | 913,161 | |
Sedgwick County, Kansas, Unified School District No. 266 Maize, GO Unlimited, NATL | | 5.00 | | 09/01/17 | | | 50,000 | | | | 51,283 | |
Wichita, Kansas, Refunding, GO Unlimited, Series A | | 5.00 | | 12/01/17 | | | 250,000 | | | | 259,130 | |
| | | | | | | | | | | | 1,223,574 | |
| | | | | | | | | | | | | |
Kentucky 1.98% | |
Boyle County, Kentucky Library District, Refunding, GO Unlimited, BAM | | 2.00 | | 01/01/17 | | | 220,000 | | | | 220,000 | |
Fort Thomas Independent School District Finance Corp., Series C | | 2.00 | | 11/01/17 | | | 465,000 | | | | 468,413 | |
Hardin County Water District No. 2, Refunding, Series C | | 2.00 | | 01/01/17 | | | 180,000 | | | | 180,000 | |
Kentucky Municipal Power Agency, Power System Revenue, Prairie State Project, Series A, NATL | | 5.25 | | 09/01/22 | | | 440,000 | | | | 452,065 | |
Louisville & Jefferson County Metropolitan Sewer District, Series A | | 5.00 | | 05/15/23 | | | 500,000 | | | | 566,910 | |
| | | | | | | | | | | | 1,887,388 | |
| | | | | | | | | | | | | |
Louisiana 1.73% | |
Louisiana Office Facilities Corp, Refunding | | 5.00 | | 11/01/17 | | | 700,000 | | | | 721,392 | |
Louisiana State, GO Unlimited, Series A | | 5.00 | | 08/01/26 | | | 800,000 | | | | 924,120 | |
| | | | | | | | | | | | 1,645,512 | |
| | | | | | | | | | | | | |
Massachusetts 1.20% | |
Massachusetts State, Refunding, GO Limited, Series C | | 5.00 | | 04/01/22 | | | 800,000 | | | | 919,640 | |
Stoughton, Massachusetts Public Improvement, GO Limited, NATL | | 4.00 | | 05/01/17 | | | 225,000 | | | | 225,509 | |
| | | | | | | | | | | | 1,145,149 | |
See notes to portfolios of investments and notes to financial statements.
59
Near-Term Tax Free Fund
Portfolio of Investments | December 31, 2016 |
Municipal Bonds (cont'd) | | Coupon
Rate % | | Maturity
Date | | Principal
Amount | | | Value | |
| | | | | | | | | | | |
Michigan 3.86% | |
Detroit, Michigan Local Development Financing Authority, Refunding, Tax Allocation, Series A | | 5.38 | | 05/01/18 | | $ | 70,000 | | | $ | 70,057 | |
Gibraltar, Michigan School District, Refunding, GO Unlimited, AGM | | 5.00 | | 05/01/21 | | | 475,000 | | | | 522,500 | |
Michigan Public Power Agency AFEC Project Revenue, Series A | | 4.50 | | 01/01/19 | | | 280,000 | | | | 295,098 | |
Michigan State, Trunk Line Revenue, Refunding | | 4.50 | | 11/01/26 | | | 105,000 | | | | 112,495 | |
Michigan State Hospital Finance Authority, Trinity Health, Series A | | 6.00 | | 12/01/18 | | | 200,000 | | | | 217,594 | |
Michigan Strategic Fund, Series A, AGC | | 5.00 | | 10/15/17 | | | 200,000 | | | | 205,926 | |
Oxford Area Community School District, GO Unlimited, Series A, Q-SBLF | | 5.00 | | 05/01/22 | | | 365,000 | | | | 415,268 | |
Portage Public Schools, School Building & Site, GO Unlimited, AGM | | 5.00 | | 05/01/20 | | | 300,000 | | | | 315,066 | |
Romeo Community School District, Refunding, GO Unlimited, Q-SBLF | | 3.00 | | 05/01/18 | | | 500,000 | | | | 509,840 | |
Wayne County, Michigan Airport Authority Revenue, Detroit Metropolitan Airport, Refunding, Series C | | 4.00 | | 12/01/19 | | | 255,000 | | | | 268,288 | |
Wyoming, Michigan, Water Supply System, Refunding | | 4.00 | | 06/01/20 | | | 215,000 | | | | 229,964 | |
Zeeland Public Schools, Refunding, GO Unlimited | | 5.00 | | 05/01/18 | | | 490,000 | | | | 512,756 | |
| | | | | | | | | | | | 3,674,852 | |
| | | | | | | | | | | | | |
Minnesota 1.17% | |
Chaska, Minnesota Electric Revenue, Refunding, Series A | | 3.00 | | 10/01/17 | | | 535,000 | | | | 542,372 | |
Lake Washington Sanitary District, GO Unlimited, Series A, AGM | | 2.00 | | 02/01/18 | | | 205,000 | | | | 207,005 | |
Minneapolis & St Paul, Minnesota Metropolitan Airports Commission, Airport Revenue, Airport Revenue, Refunding, Series B, NATL | | 5.00 | | 01/01/19 | | | 255,000 | | | | 255,000 | |
Royalton Independent School District No. 485, GO Unlimited, Series A | | 5.00 | | 02/01/17 | | | 110,000 | | | | 110,333 | |
| | | | | | | | | | | | 1,114,710 | |
| | | | | | | | | | | | | |
Mississippi 0.42% | |
Rankin County School District, GO Limited | | 2.00 | | 08/01/19 | | | 400,000 | | | | 402,200 | |
See notes to portfolios of investments and notes to financial statements.
60
Near-Term Tax Free Fund
Portfolio of Investments | December 31, 2016 |
Municipal Bonds (cont'd) | | Coupon
Rate % | | Maturity
Date | | Principal
Amount | | | Value | |
| | | | | | | | | | | |
Missouri 2.38% | |
Jackson County, Missouri, Special Obligation Refunding, Truman Sports Complex Project | | 5.00 | | 12/01/18 | | $ | 215,000 | | | $ | 228,747 | |
Kansas City, Missouri, Refunding, Series B | | 5.00 | | 08/01/19 | | | 650,000 | | | | 703,580 | |
Kansas City, Missouri Water Revenue, Series F, AGM | | 4.00 | | 12/01/22 | | | 250,000 | | | | 277,423 | |
Missouri Development Finance Board, Eastland Center Project, Tax Allocation, Series A | | 5.00 | | 04/01/17 | | | 250,000 | | | | 252,320 | |
Missouri State Health & Educational Facilities Authority, Southwestern Baptist University Revenue | | 3.00 | | 10/01/17 | | | 265,000 | | | | 267,965 | |
Missouri State Regional Convention & Sports Complex Authority | | 5.00 | | 08/15/19 | | | 500,000 | | | | 541,425 | |
| | | | | | | | | | | | 2,271,460 | |
| | | | | | | | | | | | | |
New Hampshire 0.65% | |
New Hampshire, Federal Highway Grant Anticipation Bonds | | 5.00 | | 09/01/17 | | | 200,000 | | | | 205,024 | |
New Hampshire Health & Education Facilities Authority Revenue, Southern New Hampshire University Project | | 5.00 | | 01/01/18 | | | 400,000 | | | | 414,656 | |
| | | | | | | | | | | | 619,680 | |
| | | | | | | | | | | | | |
New Jersey 3.16% | |
Atlantic City, New Jersey, Refunding Tax Appeal, GO Unlimited | | 4.00 | | 11/01/18 | | | 500,000 | | | | 417,695 | |
Atlantic City, New Jersey Municipal Utilities Authority Revenue, Refunding, AMBAC | | 5.00 | | 06/01/17 | | | 150,000 | | | | 150,155 | |
Camden County, New Jersey Improvement Authority, Refunding | | 4.00 | | 01/15/18 | | | 600,000 | | | | 617,418 | |
Cumberland County, New Jersey Improvement Authority, Technical High School Project, AGM | | 3.00 | | 09/01/17 | | | 550,000 | | | | 556,765 | |
Elizabeth, New Jersey Parking Authority Project Revenue, Elizabethtown Plaza Redevelopment, Series B | | 4.00 | | 11/01/17 | | | 255,000 | | | | 261,033 | |
Hudson County, New Jersey Improvement Authority Lease Revenue, North Hudson Regional Fire, Refunding, Series A, AGM | | 5.63 | | 09/01/18 | | | 400,000 | | | | 427,144 | |
Passaic Valley, New Jersey, Sewage Commissioners Revenue, Series G | | 5.75 | | 12/01/21 | | | 500,000 | | | | 578,070 | |
| | | | | | | | | | | | 3,008,280 | |
See notes to portfolios of investments and notes to financial statements.
61
Near-Term Tax Free Fund
Portfolio of Investments | December 31, 2016 |
Municipal Bonds (cont'd) | | Coupon
Rate % | | Maturity
Date | | Principal
Amount | | | Value | |
| | | | | | | | | | | |
New York 9.54% | |
Arlington Central School District, GO Unlimited | | 5.00 | | 12/15/25 | | $ | 1,000,000 | | | $ | 1,157,619 | |
Greece, New York Central School District, GO Unlimited | | 2.00 | | 06/15/19 | | | 455,000 | | | | 459,018 | |
Long Island Power Authority Revenue, Series B | | 5.00 | | 09/01/21 | | | 465,000 | | | | 523,836 | |
Nassau County Industrial Development Agency, New York Institute of Technology Project Revenue, Refunding, Remarketing, Series A | | 5.00 | | 03/01/21 | | | 350,000 | | | | 386,243 | |
New York City, GO Unlimited, Series B | | 5.00 | | 08/01/19 | | | 400,000 | | | | 434,556 | |
New York City, GO Unlimited, Series E | | 5.25 | | 08/01/22 | | | 875,000 | | | | 1,018,210 | |
New York City, GO Unlimited, Series I | | 5.00 | | 08/01/22 | | | 1,000,000 | | | | 1,150,599 | |
New York State Dormitory Authority, Nonconstruction Supported Debt, Municipal Facilities Health Lease, Series 1 | | 5.00 | | 01/15/17 | | | 300,000 | | | | 300,351 | |
New York State Thruway Authority, Series B | | 5.00 | | 04/01/27 | | | 1,335,000 | | | | 1,374,395 | |
New York State Urban Development, Series D | | 5.50 | | 01/01/19 | | | 250,000 | | | | 270,190 | |
New York State Urban Development, NATL | | 5.50 | | 03/15/19 | | | 615,000 | | | | 670,129 | |
North Castle, New York, Public Improvement, GO Unlimited | | 3.88 | | 12/01/22 | | | 210,000 | | | | 214,851 | |
Patchogue-Medford Union Free School District, GO Unlimited | | 5.00 | | 10/01/17 | | | 465,000 | | | | 478,197 | |
Sodus, New York Central School District, Refunding, GO Unlimited | | 3.00 | | 06/15/18 | | | 640,000 | | | | 655,424 | |
| | | | | | | | | | | | 9,093,618 | |
| | | | | | | | | | | | | |
North Carolina 2.29% | |
Beaufort County, North Carolina, GO Limited | | 5.00 | | 06/01/21 | | | 200,000 | | | | 223,744 | |
Charlotte, North Carolina Certificates of Participation, Series A | | 5.00 | | 10/01/21 | | | 1,000,000 | | | | 1,114,409 | |
North Carolina Medical Care Commission, Firsthealth Carolina Project, Refunding, Series C | | 4.00 | | 10/01/17 | | | 420,000 | | | | 429,152 | |
North Carolina State Municipal Power Agency #1, Catawba Electric Revenue, Refunding, Series A | | 5.25 | | 01/01/20 | | | 400,000 | | | | 416,404 | |
| | | | | | | | | | | | 2,183,709 | |
| | | | | | | | | | | | | |
Ohio 1.01% | |
Cleveland, Ohio, Parking Facility Revenue, Prefunding, Refunding, AGM | | 5.25 | | 09/15/22 | | | 130,000 | | | | 152,247 | |
Lorain County, Ohio, Community College District, Revenue | | 3.25 | | 12/01/17 | | | 650,000 | | | | 662,968 | |
See notes to portfolios of investments and notes to financial statements.
62
Near-Term Tax Free Fund
Portfolio of Investments | December 31, 2016 |
Municipal Bonds (cont'd) | | Coupon
Rate % | | Maturity
Date | | Principal
Amount | | | Value | |
| | | | | | | | | | | |
Ohio (cont’d) | |
Marion County, Ohio, Variable Refunding, GO Limited, AGC | | 4.00 | | 12/01/20 | | $ | 150,000 | | | $ | 150,173 | |
| | | | | | | | | | | | 965,388 | |
| | | | | | | | | | | | | |
Oklahoma 0.35% | |
Oklahoma State Agricultural & Mechanical Colleges, Oklahoma State University, Series A | | 5.00 | | 08/01/21 | | | 300,000 | | | | 332,187 | |
| | | | | | | | | | | | | |
Oregon 0.23% | |
Oregon State Facilities Authority, Legacy Health Project Revenue, Refunding, Series A | | 4.50 | | 05/01/20 | | | 200,000 | | | | 216,592 | |
| | | | | | | | | | | | | |
Pennsylvania 3.17% | |
Allegheny County, Pennsylvania Sanitary Authority, AGM | | 5.00 | | 06/01/19 | | | 700,000 | | | | 755,069 | |
Delaware Valley, Pennsylvania, Regional Financial Authority Revenue, Permanently Fixed Business Development Services, AMBAC | | 5.50 | | 08/01/18 | | | 295,000 | | | | 313,550 | |
Muhlenberg Township, Pennsylvania, GO Unlimited, AGM | | 3.00 | | 11/01/17 | | | 280,000 | | | | 281,795 | |
Pennsylvania Higher Educational Facilities Authority, State System, Higher Education Project, Refunding, Series AQ | | 5.00 | | 06/15/17 | | | 275,000 | | | | 279,925 | |
Philadelphia School District, Pennsylvania, Refunding, GO Unlimited, Series E | | 5.25 | | 09/01/24 | | | 625,000 | | | | 664,625 | |
Reading, Pennsylvania School District, GO Unlimited, Series A | | 5.00 | | 04/01/20 | | | 400,000 | | | | 433,900 | |
Wilkes-Barre Finance Authority, University of Scranton, Refunding, Series A | | 5.00 | | 11/01/19 | | | 275,000 | | | | 295,559 | |
| | | | | | | | | | | | 3,024,423 | |
| | | | | | | | | | | | | |
South Carolina 1.00% | |
Spartanburg County, South Carolina Regional Health Services District, Hospital Revenue, Refunding, Series A | | 5.00 | | 04/15/19 | | | 600,000 | | | | 642,924 | |
Spartanburg County, South Carolina Sanitation Sewer District, Series A, AGC | | 3.50 | | 03/01/19 | | | 300,000 | | | | 312,609 | |
| | | | | | | | | | | | 955,533 | |
Tennessee 0.23% | |
Memphis, Tennessee Sanitary Sewage System Revenue, Refunding, AGM | | 5.00 | | 05/01/20 | | | 200,000 | | | | 221,364 | |
See notes to portfolios of investments and notes to financial statements.
63
Near-Term Tax Free Fund
Portfolio of Investments | December 31, 2016 |
Municipal Bonds (cont'd) | | Coupon
Rate % | | Maturity
Date | | Principal
Amount | | | Value | |
| | | | | | | | | | | |
Texas 23.95% | |
Addison, Texas Certificates of Obligation, GO Limited | | 4.50 | | 02/15/28 | | $ | 140,000 | | | $ | 145,335 | |
Addison, Texas Certificates of Obligation, GO Limited | | 4.00 | | 02/15/20 | | | 250,000 | | | | 258,153 | |
Arlington, Texas, GO Limited, Series B | | 2.00 | | 08/15/19 | | | 500,000 | | | | 505,860 | |
Beaumont Independent School District, GO Unlimited, PSF-GTD | | 5.00 | | 02/15/23 | | | 1,000,000 | | | | 1,004,670 | |
Bryan Independent School District, GO Unlimited, Series A, PSF-GTD | | 5.00 | | 02/15/22 | | | 410,000 | | | | 469,040 | |
Cedar Hill Texas, Refunding, GO Limited | | 5.00 | | 02/15/22 | | | 800,000 | | | | 918,136 | |
Center, Texas Certificates of Obligation, GO Limited, AGM (ZCB) | | 3.55(1) | | 02/15/20 | | | 150,000 | | | | 139,313 | |
Clear Lake, Texas, Waterworks & Sewer System, GO Unlimited | | 3.00 | | 03/01/19 | | | 125,000 | | | | 129,311 | |
Conroe Independent School District, GO Unlimited, PSF-GTD | | 4.00 | | 02/15/17 | | | 55,000 | | | | 55,196 | |
Corpus Christi, Texas Business & Job Development Corporation, Seawall Project, Sales Tax Revenue, Refunding | | 5.00 | | 03/01/20 | | | 350,000 | | | | 382,620 | |
Culberson County-Allamoore Independent School District, GO Unlimited, PSF-GTD | | 3.00 | | 02/15/19 | | | 860,000 | | | | 887,606 | |
Dallas, Texas Waterworks & Sewer System Revenue, Unrefunded, AMBAC | | 4.50 | | 10/01/19 | | | 165,000 | | | | 169,288 | |
Dallas, Texas Waterworks & Sewer System Revenue, Prerefunded, AMBAC | | 4.50 | | 10/01/19 | | | 60,000 | | | | 61,537 | |
Denton County, Texas, GO Limited | | 2.00 | | 07/15/22 | | | 680,000 | | | | 680,000 | |
Denton, Texas, Refunding, GO Limited | | 5.00 | | 02/15/19 | | | 500,000 | | | | 537,310 | |
Dimmitt Independent School District, GO Unlimited, PSF-GTD | | 3.00 | | 02/15/22 | | | 305,000 | | | | 319,442 | |
Forney, Texas, GO Limited, AGM | | 5.00 | | 02/15/27 | | | 500,000 | | | | 502,305 | |
Fort Worth, Texas Water & Sewer System Revenue | | 5.00 | | 02/15/19 | | | 800,000 | | | | 858,824 | |
Frisco, Texas Independent School District, School Building, GO Unlimited, Series A, PSF-GTD | | 4.50 | | 08/15/25 | | | 180,000 | | | | 183,917 | |
Garland, Texas, GO Limited | | 5.00 | | 02/15/17 | | | 500,000 | | | | 502,255 | |
Garland, Texas, GO Limited | | 5.00 | | 02/15/25 | | | 650,000 | | | | 715,208 | |
Goose Creek, Texas Independent School District, GO Unlimited, Series A, PSF-GTD | | 5.25 | | 02/15/18 | | | 370,000 | | | | 371,828 | |
Harris County, Texas Municipal Utility District No 290, GO Unlimited, Series A, BAM | | 1.50 | | 09/01/17 | | | 200,000 | | | | 200,442 | |
See notes to portfolios of investments and notes to financial statements.
64
Near-Term Tax Free Fund
Portfolio of Investments | December 31, 2016 |
Municipal Bonds (cont'd) | | Coupon
Rate % | | Maturity
Date | | Principal
Amount | | | Value | |
| | | | | | | | | | | |
Texas (cont'd) | |
Harris County, Texas Municipal Utility District No. 382, GO Unlimited, BAM | | 3.00 | | 04/01/22 | | $ | 305,000 | | | $ | 309,615 | |
Hays County, Texas, GO Limited | | 5.00 | | 02/15/23 | | | 500,000 | | | | 521,245 | |
Houston Community College System, GO Limited | | 5.00 | | 02/15/19 | | | 755,000 | | | | 811,987 | |
Houston, Texas, Hotel Occupancy Tax, Unrefunded, Series B | | 5.00 | | 09/01/19 | | | 45,000 | | | | 45,132 | |
Houston, Texas Combined Utility System Revenue, Prerefunded, AGM | | 5.00 | | 11/15/27 | | | 150,000 | | | | 155,103 | |
Houston, Texas Public Improvement, Prerefunded, GO Limited, NATL | | 5.00 | | 03/01/32 | | | 155,000 | | | | 155,994 | |
Hutto Independent School District, GO Unlimited, AGC | | 4.75 | | 08/01/31 | | | 600,000 | | | | 612,906 | |
Laredo, Texas, Waterworks & Sewer System Revenue, AGM | | 4.25 | | 03/01/18 | | | 100,000 | | | | 100,525 | |
Longview, Texas Waterworks & Sewer System Revenue, Refunding | | 3.00 | | 03/01/22 | | | 610,000 | | | | 636,986 | |
Lower Colorado River Authority, Transmission Contract Revenue, Refunding, Series A | | 5.00 | | 05/15/21 | | | 500,000 | | | | 561,445 | |
Lubbock-Cooper Independent School District, GO Unlimited, PSF-GTD | | 3.00 | | 02/15/22 | | | 755,000 | | | | 792,252 | |
Midland, Texas, GO Limited | | 5.00 | | 03/01/22 | | | 725,000 | | | | 830,640 | |
Montgomery County, Texas Municipal Utility District No 113, GO Unlimited, BAM | | 2.00 | | 09/01/17 | | | 260,000 | | | | 261,438 | |
Montgomery County, Texas Municipal Utility District No 119, GO Unlimited, Series A, AGM | | 4.00 | | 04/01/18 | | | 315,000 | | | | 324,860 | |
North Texas Tollway Authority Revenue, Series F | | 5.75 | | 01/01/38 | | | 300,000 | | | | 313,620 | |
Olmos Park Higher Education Facilities Corp, University of the Incarnate Word, Refunding | | 5.00 | | 12/01/21 | | | 500,000 | | | | 559,320 | |
Pharr, Texas, Refunding, GO Limited, Series A | | 5.00 | | 08/15/20 | | | 285,000 | | | | 314,637 | |
Plano, Texas, Refunding, GO Limited | | 5.00 | | 09/01/19 | | | 1,000,000 | | | | 1,089,669 | |
Round Rock, Texas, GO Limited | | 2.00 | | 08/15/19 | | | 465,000 | | | | 470,092 | |
San Antonio, Texas, Water Revenue, Refunding | | 4.50 | | 05/15/21 | | | 400,000 | | | | 443,500 | |
San Marcos, Texas Tax & Toll Revenue, GO Limited, AGM | | 5.10 | | 08/15/27 | | | 400,000 | | | | 410,036 | |
Texarkana, Texas Waterworks & Sanitary Sewer System Revenue | | 3.00 | | 08/01/19 | | | 90,000 | | | | 92,496 | |
See notes to portfolios of investments and notes to financial statements.
65
Near-Term Tax Free Fund
Portfolio of Investments | December 31, 2016 |
Municipal Bonds (cont'd) | | Coupon
Rate % | | Maturity
Date | | Principal
Amount | | | Value | |
| | | | | | | | | | | |
Texas (cont'd) | |
Texarkana, Texas Waterworks & Sanitary Sewer System Revenue | | 3.00 | | 08/01/20 | | $ | 95,000 | | | $ | 97,860 | |
Texarkana, Texas, Refunding, GO Limited | | 5.00 | | 02/15/21 | | | 320,000 | | | | 359,315 | |
Texas Municipal Power Agency Revenue, Refunding, Series Sub, AGC | | 5.00 | | 09/01/17 | | | 250,000 | | | | 256,348 | |
Texas State, Public Finance Authority, Refunding, GO Unlimited | | 5.00 | | 10/01/20 | | | 1,150,000 | | | | 1,286,884 | |
Travis County, Texas Water Control & Improvement District No. 10, GO Unlimited | | 2.00 | | 08/15/19 | | | 500,000 | | | | 505,350 | |
Waxahachie, Texas, Refunding, GO Limited, AMBAC | | 4.20 | | 08/01/22 | | | 500,000 | | | | 509,385 | |
| | | | | | | | | | | | 22,826,236 | |
| | | | | | | | | | | | | |
Utah 1.67% | |
Davis County, Utah, GO Unlimited | | 5.00 | | 02/01/19 | | | 200,000 | | | | 214,356 | |
Salt Lake County, Utah, Westminster College Project Revenue | | 5.00 | | 10/01/24 | | | 235,000 | | | | 237,272 | |
Utah State Building Ownership Authority, Lease Revenue, Refunding, Series C, AGM | | 5.50 | | 05/15/19 | | | 340,000 | | | | 353,729 | |
Washington County-St George Interlocal Agency, Lease Revenue, Refunding, Series A | | 4.00 | | 12/01/19 | | | 300,000 | | | | 315,807 | |
Weber County, Utah, GO Unlimited | | 4.00 | | 01/15/22 | | | 430,000 | | | | 474,406 | |
| | | | | | | | | | | | 1,595,570 | |
| | | | | | | | | | | | | |
Virginia 0.61% | |
Lynchburg, Virginia, Refunding, GO Unlimited | | 5.00 | | 02/01/19 | | | 540,000 | | | | 580,370 | |
| | | | | | | | | | | | | |
Washington 8.90% | |
Cowlitz County, Washington, Refunding, GO Limited, Series B | | 3.00 | | 04/01/17 | | | 175,000 | | | | 175,835 | |
Cowlitz County, Washington, Refunding, GO Limited, Series A | | 3.00 | | 04/01/18 | | | 195,000 | | | | 199,155 | |
Grant County, Washington Public Utility District No. 2, Series A, NATL | | 5.00 | | 01/01/43 | | | 1,000,000 | | | | 1,000,000 | |
King County School District No. 403 Renton, GO Unlimited | | 5.00 | | 12/01/22 | | | 1,000,000 | | | | 1,154,069 | |
Snohomish County, Washington Public Utility District No 1, Refunding | | 5.00 | | 12/01/17 | | | 550,000 | | | | 569,470 | |
Spokane County, Washington Public Facilities District, Refunding, Series B | | 5.00 | | 12/01/21 | | | 950,000 | | | | 1,066,916 | |
See notes to portfolios of investments and notes to financial statements.
66
Near-Term Tax Free Fund
Portfolio of Investments | December 31, 2016 |
Municipal Bonds (cont'd) | | Coupon
Rate % | | Maturity
Date | | Principal
Amount | | | Value | |
| | | | | | | | | | | |
Washington (cont’d) | |
Tacoma, Washington Metropolitan Park District, GO Unlimited, Series B | | 4.00 | | 12/01/19 | | $ | 355,000 | | | $ | 379,509 | |
Thurston County, Washington, Refunding, GO Limited | | 5.00 | | 12/01/20 | | | 1,625,000 | | | | 1,819,593 | |
Washington State Health Care Facilities Authority, Seattle Children's Hospital Project | | 5.00 | | 10/01/17 | | | 150,000 | | | | 154,449 | |
Washington State, Motor Vehicle Fuel Tax, GO Unlimited, Series C | | 5.00 | | 02/01/19 | | | 830,000 | | | | 891,520 | |
Washington State, Refunding, GO Unlimited, Series A | | 5.00 | | 01/01/19 | | | 1,000,000 | | | | 1,071,589 | |
| | | | | | | | | | | | 8,482,105 | |
| | | | | | | | | | | | | |
Wisconsin 1.33% | |
Johnson Creek School District, Bond Anticipation Note | | 3.00 | | 03/01/20 | | | 1,000,000 | | | | 1,002,430 | |
Waunakee Community School District, GO Unlimited, Series A | | 5.00 | | 04/01/18 | | | 250,000 | | | | 261,548 | |
| | | | | | | | | | | | 1,263,978 | |
| |
Total Investments 92.86% | | | | 88,498,495 | |
(cost $89,093,944) | | | | | | | | | | | | |
Other assets and liabilities, net 7.14% | | | | | | | | | | | 6,802,073 | |
| | | | | | | | | | | | | |
Net Assets 100.0% | | | | | | | | | | $ | 95,300,568 | |
(1) | Represents Yield on zero coupon bond. |
See notes to portfolios of investments and notes to financial statements.
67
All American Equity Fund
Portfolio of Investments | December 31, 2016 |
Common Stocks 89.29% | | Shares | | | Value | |
| | | | | | | |
Aerospace/Defense - Equipment 3.03% | |
United Technologies Corp. | | | 4,800 | | | $ | 526,176 | |
| | | | | | | | | |
Agricultural Operations 3.03% | |
Archer-Daniels-Midland Co. | | | 11,500 | | | | 524,975 | |
| | | | | | | | | |
Airlines 3.17% | |
Delta Air Lines, Inc. | | | 11,200 | | | | 550,928 | |
| | | | | | | | | |
Appliances 3.25% | |
Whirlpool Corp. | | | 3,100 | | | | 563,487 | |
| | | | | | | | | |
Building - Residential/Commercial 3.09% | |
PulteGroup, Inc. | | | 29,200 | | | | 536,696 | |
| | | | | | | | | |
Chemicals - Diversified 2.72% | |
LyondellBasell Industries N.V., Class A | | | 5,500 | | | | 471,790 | |
| | | | | | | | | |
Computers - Memory Devices 2.85% | |
NetApp, Inc. | | | 14,000 | | | | 493,780 | |
| | | | | | | | | |
Cruise Lines 2.97% | |
Carnival Corp. | | | 9,900 | | | | 515,394 | |
| | | | | | | | | |
Dental Supplies & Equipment 3.08% | |
Patterson Companies, Inc. | | | 13,027 | | | | 534,498 | |
| | | | | | | | | |
Distribution/Wholesale 2.88% | |
WW Grainger, Inc. | | | 2,150 | | | | 499,337 | |
| | | | | | | | | |
Electric - Integrated 3.05% | |
Entergy Corp. | | | 7,200 | | | | 528,984 | |
| | | | | | | | | |
Electronic Components - Miscellaneous 5.96% | |
Corning, Inc. | | | 21,200 | | | | 514,524 | |
TE Connectivity Ltd. | | | 7,500 | | | | 519,600 | |
| | | | | | | | 1,034,124 | |
| | | | | | | | | |
Enterprise Software/Services 2.82% | |
CA, Inc. | | | 15,400 | | | | 489,258 | |
| | | | | | | | | |
Finance - Credit Card 2.61% | |
Visa, Inc., Class A | | | 5,800 | | | | 452,516 | |
| | | | | | | | | |
Food - Meat Products 2.63% | |
Tyson Foods, Inc., Class A | | | 7,400 | | | | 456,432 | |
See notes to portfolios of investments and notes to financial statements.
68
All American Equity Fund
Portfolio of Investments | December 31, 2016 |
Common Stocks (cont’d) | | Shares | | | Value | |
| | | | | | | |
Investment Management/Advisory Services 5.16% | |
Ameriprise Financial, Inc. | | | 4,400 | | | $ | 488,136 | |
Legg Mason, Inc. | | | 13,600 | | | | 406,776 | |
| | | | | | | | 894,912 | |
| | | | | | | | | |
Medical - Drugs 3.05% | |
Pfizer, Inc. | | | 16,300 | | | | 529,424 | |
| | | | | | | | | |
Medical - Wholesale Drug Distribution 3.04% | |
Cardinal Health, Inc. | | | 7,330 | | | | 527,540 | |
| | | | | | | | | |
| | | | | | | | | |
Medical Labs & Testing Services 2.97% | |
Quest Diagnostics, Inc. | | | 5,600 | | | | 514,640 | |
| | | | | | | | | |
Multi-line Insurance 2.90% | |
American International Group, Inc. | | | 7,700 | | | | 502,887 | |
| | | | | | | | | |
Oil Companies - Integrated 6.16% | |
Exxon Mobil Corp. | | | 5,800 | | | | 523,508 | |
Phillips 66 | | | 6,300 | | | | 544,383 | |
| | | | | | | | 1,067,891 | |
| | | | | | | | | |
Oil Refining & Marketing 2.95% | |
Valero Energy Corp. | | | 7,500 | | | | 512,400 | |
| | | | | | | | | |
Property/Casualty Insurance 3.10% | |
Travelers Companies, Inc. | | | 4,400 | | | | 538,648 | |
| | | | | | | | | |
REITS - Storage 3.22% | |
Public Storage | | | 2,500 | | | | 558,750 | |
| | | | | | | | | |
Retail - Discount 2.69% | |
Dollar General Corp. | | | 6,300 | | | | 466,641 | |
| | | | | | | | | |
Retail - Drug Store 3.10% | |
CVS Health Corp. | | | 6,825 | | | | 538,561 | |
| | | | | | | | | |
Semiconductor Components 2.63% | |
QUALCOMM, Inc. | | | 7,000 | | | | 456,400 | |
| | | | | | | | | |
Telephone - Integrated 1.18% | |
AT&T, Inc. | | | 4,800 | | | | 204,144 | |
| |
Total Common Stocks | | | | 15,491,213 | |
(cost $15,329,106) | | | | | | | | |
See notes to portfolios of investments and notes to financial statements.
69
All American Equity Fund
Portfolio of Investments | December 31, 2016 |
| Rights 0.00% | | Shares | | | Value | |
| | | | | | | |
| Food - Retail 0.00% | |
| Casa Ley, S.A. de C.V., Contingent Value Right | | | 7,200 | | | $ | 0 | *#@ |
| Property Development Centers, LLC, Contingent Value Right | | | 7,200 | | | | 0 | *#@ |
| | |
| Total Rights | | | | 0 | |
| (cost $0) | | | | | | | | |
| | |
| Total Investments 89.29% | | | | 15,491,213 | |
| (cost $15,329,106) | | | | | | | | |
| Other assets and liabilities, net 10.71% | | | | | | | 1,858,548 | |
| | | | | | | | | |
| Net Assets 100.0% | | | | | | $ | 17,349,761 | |
See notes to portfolios of investments and notes to financial statements.
70
Holmes Macro Trends Fund
Portfolio of Investments | December 31, 2016 |
Common Stocks 87.80% | | Shares | | | Value | |
| | | | | | | |
Aerospace/Defense - Equipment 3.70% | |
B/E Aerospace, Inc. | | | 25,000 | | | $ | 1,504,750 | |
| | | | | | | | | |
Airlines 6.23% | |
Allegiant Travel Co., Class A | | | 6,744 | | | | 1,122,202 | |
Hawaiian Holdings, Inc. | | | 24,810 | | | | 1,414,170 | * |
| | | | | | | | 2,536,372 | |
| | | | | | | | | |
Automotive Truck Parts & Equipment - Original 0.85% | |
American Axle & Manufacturing Holdings, Inc. | | | 18,000 | | | | 347,400 | * |
| | | | | | | | | |
Bicycle Manufacturing 3.07% | |
Fox Factory Holding Corp. | | | 45,000 | | | | 1,248,750 | * |
| | | | | | | | | |
Building - Residential/Commercial 1.48% | |
LGI Homes, Inc. | | | 21,000 | | | | 603,330 | * |
| | | | | | | | | |
Building Products - Air & Heating 3.95% | |
Lennox International, Inc. | | | 10,500 | | | | 1,608,285 | |
| | | | | | | | | |
Chemicals - Specialty 6.16% | |
Kraton Corp. | | | 36,000 | | | | 1,025,280 | * |
NewMarket Corp. | | | 3,500 | | | | 1,483,440 | |
| | | | | | | | 2,508,720 | |
| | | | | | | | | |
Commercial Services - Finance 2.64% | |
S&P Global, Inc. | | | 10,000 | | | | 1,075,400 | |
| | | | | | | | | |
Consumer Products - Miscellaneous 9.05% | |
Kimberly-Clark Corp. | | | 21,000 | | | | 2,396,520 | |
WD-40 Co. | | | 11,000 | | | | 1,285,900 | |
| | | | | | | | 3,682,420 | |
| | | | | | | | | |
Containers - Metal/Glass 1.84% | |
Owens-Illinois Group, Inc. | | | 43,000 | | | | 748,630 | * |
| | | | | | | | | |
Data Processing/Management 1.78% | |
CSG Systems International, Inc. | | | 15,000 | | | | 726,000 | |
| | | | | | | | | |
Diagnostic Kits 5.25% | |
IDEXX Laboratories, Inc. | | | 18,234 | | | | 2,138,301 | * |
| | | | | | | | | |
Distribution/Wholesale 4.87% | |
Pool Corp. | | | 19,000 | | | | 1,982,460 | |
See notes to portfolios of investments and notes to financial statements.
71
Holmes Macro Trends Fund
Portfolio of Investments | December 31, 2016 |
Common Stocks (cont’d) | | Shares | | | Value | |
| | | | | | | |
Electronic Security Devices 1.89% | |
Allegion plc | | | 12,000 | | | $ | 768,000 | |
| | | | | | | | | |
Energy - Alternate Sources 0.00% | |
Pacific Green Energy Corp. | | | 100,000 | | | 0 | *#@ |
| | | | | | | | | |
Finance - Commercial 0.55% | |
IOU Financial, Inc. | | | 1,093,000 | | | | 223,867 | * |
| | | | | | | | | |
Finance - Investment Banker/Broker 0.81% | |
GMP Capital, Inc. | | | 100,000 | | | | 328,455 | |
| | | | | | | | | |
Firearms & Ammunition 3.11% | |
Sturm, Ruger & Co., Inc. | | | 24,000 | | | | 1,264,800 | |
| | | | | | | | | |
Gold Mining 0.00% | |
Gran Colombia Gold Corp. | | | 500 | | | | 35 | * |
| | | | | | | | | |
Home Furnishings 4.19% | |
Tempur Sealy International, Inc. | | | 25,000 | | | | 1,707,000 | * |
| | | | | | | | | |
Human Resources 1.43% | |
Robert Half International, Inc. | | | 11,900 | | | | 580,482 | |
| | | | | | | | | |
Medical - Hospitals 0.00% | |
African Medical Investments plc | | | 1,000,000 | | | 0 | *#@ |
| | | | | | | | | |
Office Automation & Equipment 4.78% | |
Pitney Bowes, Inc | | | 128,000 | | | | 1,944,320 | |
| | | | | | | | | |
Property/Casualty Insurance 3.40% | |
Universal Insurance Holdings, Inc. | | | 48,760 | | | | 1,384,784 | |
| | | | | | | | | |
Protection - Safety 2.60% | |
Landauer, Inc. | | | 22,000 | | | | 1,058,200 | |
| | | | | | | | | |
Real Estate Operating/Development 0.72% | |
Pacific Infrastructure Ventures, Inc. (RS) | | | 426,533 | | | 293,796 | *#@ |
| | | | | | | | | |
Retail - Pet Food & Supplies 3.27% | |
PetMed Express, Inc. | | | 57,677 | | | | 1,330,608 | |
| | | | | | | | | |
Telecom Services 1.22% | |
Spok Holdings, Inc. | | | 24,000 | | | | 498,000 | |
See notes to portfolios of investments and notes to financial statements.
72
Holmes Macro Trends Fund
Portfolio of Investments | December 31, 2016 |
Common Stocks (cont’d) | | Shares | | | Value | |
| | | | | | | |
Tobacco 5.65% | |
Altria Group, Inc. | | | 34,000 | | | $ | 2,299,080 | |
| | | | | | | | | |
Veterinary Diagnostics 3.31% | |
Phibro Animal Health Corp., Class A | | | 46,000 | | | | 1,347,800 | |
| |
Total Common Stocks | | | | 35,740,045 | |
(cost $34,830,774) | | | | | | | | |
| | | | | | | | | |
Warrants 0.00% | | | | | | | | |
| | | | | | | | | |
Gold Mining 0.00% | |
Gran Colombia Gold Corp., 144A, Warrants (October 2017) | | | 3,700 | | | 0 | *#@ |
Gran Colombia Gold Corp., Warrants (March 2019) | | | 250 | | | | 10 | * |
| | | | | | | | 10 | |
| |
Total Warrants | | | | 10 | |
(cost $0) | | | | | | | | |
| | | | | | | | | |
Convertible Debenture 0.83% | | Principal
Amount | | | | | |
| | | | | | | | |
Gold Mining 0.83% | |
Gran Colombia Gold Corp., 6.00%, maturity 01/02/20 | | $ | 400,971 | | | | 336,816 | |
(cost $211,750) | | | | | | | | |
| | | | | | | | | |
Corporate Note 0.57% | | | | | | | | |
| | | | | | | | | |
Electric Generation 0.57% | |
Interamerican Energy Corp., 15.00%, maturity 11/08/21 (RS) | | | 233,829 | | | 233,829 | #@ |
(cost $233,829) | | | | | | | | |
| |
Total Investments 89.20% | | | | 36,310,700 | |
(cost $35,276,353) | | | | | | | | |
Other assets and liabilities, net 10.80% | | | | | | | 4,395,322 | |
| | | | | | | | | |
Net Assets 100.0% | | | | | | $ | 40,706,022 | |
See notes to portfolios of investments and notes to financial statements.
73
Global Resources Fund
Portfolio of Investments | December 31, 2016 |
Common Stocks 81.28% | | Shares | | | Value | |
| | | | | | | |
Agricultural Chemicals 3.45% | |
Monsanto Co. | | | 7,200 | | | $ | 757,512 | |
PhosAgro PJSC, GDR | | | 69,300 | | | | 983,506 | |
Syngenta, AG, ADR | | | 6,500 | | | | 513,825 | |
Yara International ASA | | | 28,700 | | | | 1,129,031 | |
| | | | | | | | 3,383,874 | |
| | | | | | | | | |
Agricultural Operations 1.20% | |
Agriterra Ltd. | | | 69,849,776 | | | | 99,168 | *+ |
Kernel Holding S.A. | | | 70,500 | | | | 1,075,981 | |
| | | | | | | | 1,175,149 | |
| | | | | | | | | |
Automotive Truck Parts & Equipment - Original 3.20% | |
Lear Corp. | | | 7,900 | | | | 1,045,723 | |
Linamar Corp. | | | 25,500 | | | | 1,095,665 | |
Magna International, Inc. | | | 23,000 | | | | 998,200 | |
| | | | | | | | 3,139,588 | |
| | | | | | | | | |
Building & Construction Products - Miscellaneous 1.06% | |
Owens Corning | | | 20,100 | | | | 1,036,356 | |
| | | | | | | | | |
Chemicals - Fibers 1.02% | |
Rayonier Advanced Materials, Inc. | | | 64,900 | | | | 1,003,354 | |
| | | | | | | | | |
Chemicals - Plastics 1.16% | |
Sekisui Jushi Corp. | | | 72,000 | | | | 1,134,973 | |
| | | | | | | | | |
Coal 2.36% | |
Alliance Holdings GP | | | 40,300 | | | | 1,132,430 | |
Caribbean Resources Corp. | | | 17 | | | 0 | *+#@ |
China Shenhua Energy, Class H | | | 632,000 | | | | 1,181,344 | |
Consolidated Growth Holdings Ltd. | | | 19,859,173 | | | 0 | *#@ |
Walter Energy, Inc., 144A | | | 4,293 | | | | 687 | * |
| | | | | | | | 2,314,461 | |
| | | | | | | | | |
Diamonds/Precious Stones 1.25% | |
Diamond Fields International Ltd. | | | 360,000 | | | | 44,241 | * |
Lucara Diamond Corp. | | | 519,500 | | | | 1,176,241 | |
Rockwell Diamonds, Inc., 144A | | | 63,333 | | | | 2,358 | * |
| | | | | | | | 1,222,840 | |
| | | | | | | | | |
Diversified Minerals 3.68% | |
Canada Zinc Metals Corp. | | | 1,000,000 | | | | 275,575 | * |
Ciner Resources LP | | | 35,800 | | | | 1,041,064 | |
Dowa Holdings Co., Ltd. | | | 130,400 | | | | 991,621 | |
Dundee Sustainable Technologies, Inc. | | | 3,587,500 | | | | 120,238 | * |
See notes to portfolios of investments and notes to financial statements.
74
Global Resources Fund
Portfolio of Investments | December 31, 2016 |
Common Stocks (cont’d) | | Shares | | | Value | |
| | | | | | | |
Diversified Minerals (cont’d) | |
Encanto Potash Corp., 144A | | | 3,000,000 | | | $ | 156,407 | * |
Neo Lithium Corp., 144A | | | 1,265,000 | | | | 1,008,118 | * |
Niocan, Inc., 144A | | | 362,069 | | | | 15,506 | * |
| | | | | | | | 3,608,529 | |
| | | | | | | | | |
Energy - Alternate Sources 2.33% | |
Pacific Green Energy Corp. | | | 2,400,000 | | | 0 | *+#@ |
SolarEdge Technologies, Inc. | | | 78,700 | | | | 975,880 | * |
Vestas Wind Systems A.S. | | | 20,200 | | | | 1,308,245 | |
| | | | | | | | 2,284,125 | |
| | | | | | | | | |
Food-Dairy Products 1.02% | |
Dean Foods Co. | | | 46,000 | | | | 1,001,880 | |
| | | | | | | | | |
Forestry 3.66% | |
Bravern Ventures Ltd. | | | 254,431 | | | | 29,372 | * |
Canfor Corp. | | | 97,300 | | | | 1,106,596 | * |
Interfor Corp., Class A | | | 122,100 | | | | 1,366,821 | * |
Western Forest Products, Inc. | | | 772,400 | | | | 1,087,280 | |
| | | | | | | | 3,590,069 | |
| | | | | | | | | |
Gold Mining 22.41% | |
Centamin plc | | | 656,300 | | | | 1,110,903 | |
Centerra Gold, Inc. | | | 255,500 | | | | 1,196,957 | |
Chesapeake Gold Corp., 144A | | | 52,400 | | | | 142,450 | * |
Corona Minerals Ltd. | | | 100,000 | | | 0 | *#@ |
Doray Minerals Ltd. | | | 3,242,900 | | | | 999,371 | * |
Evolution Mining Ltd. | | | 879,666 | | | | 1,315,417 | |
Franco-Nevada Corp. | | | 4,900 | | | | 292,824 | |
Gran Colombia Gold Corp. | | | 119,000 | | | | 8,420 | * |
Harmony Gold Mining Co. Ltd., Sponsored ADR | | | 516,800 | | | | 1,142,128 | |
Kinross Gold Corp. | | | 1 | | | | 3 | * |
Klondex Mines Ltd. | | | 1,492,300 | | | | 6,946,617 | * |
Newcastle Gold Ltd., 144A | | | 166,666 | | | | 90,616 | * |
NGEx Resources, Inc. | | | 971,000 | | | | 862,311 | * |
Northern Star Resources Ltd. | | | 547,800 | | | | 1,400,104 | |
Radisson Mining Resources, Inc. (RS) | | | 2,100,000 | | | 245,168 | *#@ |
Ramelius Resources Ltd. | | | 3,039,800 | | | | 1,084,214 | * |
Regis Resources Ltd. | | | 759,700 | | | | 1,597,526 | |
Resolute Mining Ltd. | | | 1,535,800 | | | | 1,397,040 | |
Rye Patch Gold Corp. | | | 1,141,500 | | | | 263,557 | * |
Sandstorm Gold Ltd. | | | 158,800 | | | | 619,320 | * |
Sibanye Gold Ltd., Sponsored ADR | | | 177,100 | | | | 1,250,326 | |
| | | | | | | | 21,965,272 | |
See notes to portfolios of investments and notes to financial statements.
75
Global Resources Fund
Portfolio of Investments | December 31, 2016 |
Common Stocks (cont’d) | | Shares | | | Value | |
| | | | | | | |
Medical - Hospitals 0.00% | |
African Medical Investments plc | | | 2,507,500 | | $ | 0 | *#@ |
| | | | | | | | |
Metal - Aluminum 1.42% | |
Nippon Light Metal Holdings Co., Ltd. | | | 661,000 | | | | 1,391,656 | |
| | | | | | | | | |
Metal - Copper 2.41% | |
Highland Copper Company Inc. | | | 1,000,000 | | | | 70,756 | * |
Nevsun Resources Ltd. | | | 425,200 | | | | 1,313,868 | |
OZ Minerals Ltd. | | | 172,500 | | | | 974,581 | |
| | | | | | | | 2,359,205 | |
| | | | | | | | | |
Metal - Diversified 2.13% | |
Filo Mining Corp. | | | 115,250 | | | | 137,894 | * |
Filo Mining Corp., 144A | | | 114,750 | | | | 149,564 | * |
GoviEx Uranium, Inc., Class A | | | 755,000 | | | | 84,348 | * |
GoviEx Uranium, Inc., 144A, Class A | | | 58,000 | | | | 6,480 | * |
Ivanhoe Mines Ltd., Class A | | | 118,600 | | | | 224,365 | * |
Mandalay Resources Corp. | | | 2,106,300 | | | | 1,255,011 | |
Orsu Metals Corp., 144A | | | 147,605 | | | | 2,749 | * |
Renaissance Oil Corp. | | | 1,380,000 | | | | 231,259 | * |
| | | | | | | | 2,091,670 | |
| | | | | | | | | |
Metal - Iron 2.54% | |
Fortescue Metals Group Ltd. | | | 284,000 | | | | 1,186,840 | |
Novolipetsk Steel PJSC, GDR | | | 70,500 | | | | 1,302,098 | |
WAI Capital Investment Corp., 144A | | | 292,500 | | | 0 | *#@ |
| | | | | | | | 2,488,938 | |
| | | | | | | | | |
Mining Services 0.00% | |
Bounty Mining Ltd. | | | 22,000,000 | | | 0 | *#@ |
| | | | | | | | | |
Natural Resource Technology 0.14% | |
I-Pulse, Inc., 144A (RS) | | | 15,971 | | | 137,351 | *#@ |
| | | | | | | | | |
Non - Ferrous Metals 0.09% | |
Sterling Group Ventures, Inc. | | | 500,000 | | | | 85,000 | * |
| | | | | | | | | |
Oil - Field Services 0.00% | |
Atlas African Industries Ltd. | | | 255,854,621 | | | 0 | *+#@ |
| | | | | | | | | |
Oil - US Royalty Trusts 0.47% | |
San Juan Basin Royalty Trust | | | 69,600 | | | | 460,752 | |
| | | | | | | | | |
Oil & Gas Drilling 1.33% | |
Rowan Companies plc, Class A | | | 69,100 | | | | 1,305,299 | |
See notes to portfolios of investments and notes to financial statements.
76
Global Resources Fund
Portfolio of Investments | December 31, 2016 |
Common Stocks (cont’d) | | Shares | | | Value | |
| | | | | | | |
Oil Companies - Exploration & Production 4.21% | |
Africa Energy Corp., 144A | | | 2,110,889 | | | $ | 416,628 | * |
CNOOC Ltd., Sponsored ADR | | | 9,300 | | | | 1,152,828 | |
Gran Tierra Energy, Inc. | | | 197,700 | | | | 597,819 | * |
Granite Oil Corp. | | | 58,600 | | | | 257,069 | |
Ivanhoe Energy, Inc. | | | 18,719 | | | | 206 | * |
Kunlun Energy Co. Ltd. | | | 1,517,000 | | | | 1,130,229 | |
Range Energy Resources, Inc., 144A | | | 15,000,000 | | | | 195,509 | * |
SVT Capital Corp. | | | 23,626 | | | | 3,783 | * |
U.S. Oil Sands, Inc. | | | 7,000,000 | | | | 156,407 | * |
U.S. Oil Sands, Inc., 144A | | | 9,900,000 | | | | 221,205 | * |
| | | | | | | | 4,131,683 | |
| | | | | | | | | |
Oil Companies - Integrated 2.37% | |
Gazprom OAO, Sponsored ADR | | | 229,800 | | | | 1,169,682 | |
Lukoil PJSC, Sponsored ADR | | | 20,500 | | | | 1,150,460 | |
| | | | | | | | 2,320,142 | |
| | | | | | | | | |
Oil Field Machinery & Equipment 1.06% | |
Dril-Quip, Inc. | | | 17,300 | | | | 1,038,865 | * |
| | | | | | | | | |
Oil Refining & Marketing 1.12% | |
Valero Energy Corp. | | | 16,000 | | | | 1,093,120 | |
| | | | | | | | | |
Paper & Related Products 1.05% | |
Domtar Corp. | | | 26,400 | | | | 1,030,392 | |
| | | | | | | | | |
Pipelines 1.25% | |
Western Gas Partners LP | | | 20,900 | | | | 1,228,084 | |
| | | | | | | | | |
Real Estate Operating/Development 5.23% | |
Pacific Infrastructure Ventures, Inc. (RS) | | | 7,443,544 | | | 5,127,113*#@ | |
| | | | | | | | | |
Rubber - Tires 1.00% | |
Cooper Tire & Rubber Co. | | | 25,300 | | | | 982,905 | |
| | | | | | | | | |
Steel - Producers 3.50% | |
Severstal PAO PJSC, GDR | | | 75,600 | | | | 1,166,871 | |
Tokyo Steel Manufacturing Co., Ltd. | | | 150,000 | | | | 1,144,804 | |
Yodogawa Steel Works Ltd. | | | 43,100 | | | | 1,123,241 | |
| | | | | | | | 3,434,916 | |
| | | | | | | | | |
Steel - Specialty 1.14% | |
Sanyo Special Steel Co., Ltd. | | | 236,900 | | | | 1,117,339 | |
See notes to portfolios of investments and notes to financial statements.
77
Global Resources Fund
Portfolio of Investments | December 31, 2016 |
Common Stocks (cont’d) | | Shares | | | Value | |
| | | | | | | |
Textile - Products 1.02% | |
Nitto Boseki Co., Ltd. | | | 255,000 | | | $ | 994,755 | |
| |
Total Common Stocks | | | | 79,679,655 | |
(cost $149,683,677) | | | | | | | | |
| | | | | | | | | |
Exchange-Traded Fund 0.63% | |
Direxion Daily Gold Miners Index Bull 3X Shares | | | 80,900 | | | | 618,076 | |
(cost $745,646) | | | | | | | | |
| | | | | | | | | |
Warrants 0.04% | | | | | | | | |
| | | | | | | | | |
Gold Mining 0.04% | |
Gran Colombia Gold Corp., 144A, Warrants (October 2017) | | | 86,150 | | | 0 | *#@ |
Gran Colombia Gold Corp., Warrants (March 2019) | | | 59,500 | | | | 2,437 | * |
Newcastle Gold Ltd., Warrants (February 2017) | | | 83,333 | | | 0 | *#@ |
New Gold, Inc., 144A, Warrants (June 2017) | | | 822,570 | | | | 33,696 | * |
| |
Total Warrants | | | | 36,133 | |
(cost $0) | | | | | | | | |
| | | | | | | | | |
Purchased Call Options 1.16% | | Contracts | | | | | |
| | | | | | | | |
Exchange-Traded Fund 0.19% | |
SPDR S&P 500 ETF Trust, Strike Price $217.00, Expiration Jan. 2017 | | | 2,180 | | | | 187,480 | * |
| | | | | | | | | |
Gold Mining 0.24% | |
Franco-Nevada Corp., Strike Price $65.00, Expiration Apr. 2017 | | | 780 | | | | 239,850 | * |
| | | | | | | | | |
Metal - Copper 0.08% | |
Freeport-McMoRan, Inc., Strike Price $10.00, Expiration Jan. 2018 | | | 160 | | | | 73,600 | * |
| | | | | | | | | |
Metal - Diversified 0.05% | |
BHP Billiton Ltd., Strike Price $34.00, Expiration Jan. 2017 | | | 200 | | | | 45,700 | * |
| | | | | | | | | |
Oil - US Royalty Trusts 0.03% | |
San Juan Basin Royalty Trust, Strike Price $7.50, Expiration Jan. 2017 | | | 2,662 | | | | 26,620 | * |
| | | | | | | | | |
Oil Companies - Integrated 0.43% | |
BP plc, Strike Price $35.00, Expiration Apr. 2017 | | | 390 | | | | 117,975 | * |
Chevron Corp., Strike Price $115.00, Expiration Jan. 2017 | | | 1,250 | | | | 108,750 | * |
Exxon Mobil Corp, Strike Price $85.00, Expiration Jun. 2017 | | | 100 | | | | 73,000 | * |
Royal Dutch Shell plc, Strike Price $50.00, Expiration Apr. 2017 | | | 230 | | | | 125,350 | * |
| | | | | | | | 425,075 | |
See notes to portfolios of investments and notes to financial statements.
78
Global Resources Fund
Portfolio of Investments | December 31, 2016 |
Purchased Call Options (cont’d) | | Contracts | | | Value | |
| | | | | | | |
Oil Refining & Marketing 0.14% | |
Phillips 66, Strike Price $82.50, Expiration Jan. 2017 | | | 300 | | | $ | 138,000 | * |
| |
Total Purchased Call Options | | | | 1,136,325 | |
(cost $1,151,835) | | | | | | | | |
| | | | | | | | | |
Convertible Debentures 9.86%
| | Principal
Amount | | | | | |
| | | | | | | | |
Gold Mining 9.86% | |
Gran Colombia Gold Corp., 1.00%, maturity 08/11/18 | | $ | 2,578,772 | | | | 1,573,051 | |
Gran Colombia Gold Corp., 6.00%, maturity 01/02/20 | | | 9,632,710 | | | | 8,091,476 | |
| |
Total Convertible Debentures | | | | 9,664,527 | |
(cost $6,213,583) | | | | | | | | |
| | | | | | | | | |
Corporate Note 2.86% | | | | | | | | |
| | | | | | | | | |
Electric Generation 2.86% | |
Interamerican Energy Corp., 15.00%, maturity 11/08/21 (RS) | | | 2,805,938 | | | 2,805,938 | #@ |
(cost $2,805,938) | | | | | | | | |
| |
Total Investments 95.83% | | | | 93,940,654 | |
(cost $160,600,679) | | | | | | | | |
Other assets and liabilities, net 4.17% | | | | | | | 4,085,210 | |
| | | | | | | | | |
Net Assets 100.0% | | | | | | $ | 98,025,864 | |
See notes to portfolios of investments and notes to financial statements.
79
World Precious Minerals Fund
Portfolio of Investments | December 31, 2016 |
Common Stocks 89.87% | | Shares | | | Value | |
| | | | | | | |
Advanced Materials/Products 0.87% | |
Nano One Materials Corp. | | | 3,100,000 | | | $ | 1,223,699 | *+ |
| | | | | | | | | |
Agricultural Operations 0.02% | |
Agriterra Ltd. | | | 15,001,664 | | | | 21,298 | * |
| | | | | | | | | |
Coal 0.00% | |
Caribbean Resources Corp. | | | 4 | | | 0 | *#@ |
| | | | | | | | | |
Diamonds/Precious Stones 0.04% | |
Olivut Resources Ltd. | | | 388,500 | | | | 43,403 | * |
Rockwell Diamonds, Inc., 144A | | | 171,667 | | | | 6,393 | * |
| | | | | | | | 49,796 | |
| | | | | | | | | |
Diversified Minerals 8.99% | |
Adamera Minerals Corp., 144A | | | 119,543 | | | | 6,678 | * |
Amani Gold Ltd. | | | 54,500,000 | | | | 1,927,171 | * |
Amarc Resources Ltd. | | | 695,545 | | | | 38,853 | * |
Auryn Resources, Inc. | | | 1,548,942 | | | | 3,414,790 | * |
Calibre Mining Corp. | | | 4,650,000 | | | | 484,862 | * |
Golden Reign Resources Ltd. | | | 1,500,000 | | | | 329,572 | * |
Indochine Mining Ltd. | | | 10,000 | | | 0 | *#@ |
Lithium Americas Corp. | | | 1,750,000 | | | | 1,042,714 | * |
Lithium X Energy Corp. | | | 1,775,000 | | | | 2,974,528 | * |
Neo Lithium Corp. | | | 230,000 | | | | 183,294 | * |
Neo Lithium Corp., 144A | | | 1,735,000 | | | | 1,382,676 | * |
Rise Resources, Inc. | | | 1,500,000 | | | | 290,470 | * |
Terrax Minerals, Inc. | | | 1,215,000 | | | | 615,350 | * |
| | | | | | | | 12,690,958 | |
| | | | | | | | | |
Gold Mining 53.42% | |
Alexandria Minerals Corp. | | | 7,751,675 | | | | 346,405 | * |
Algold Resources Ltd. | | | 5,400,000 | | | | 965,255 | * |
Anfield Gold Corp. | | | 1,314,000 | | | | 1,135,247 | * |
Anfield Gold Corp., 144A | | | 500,000 | | | | 431,982 | * |
Bonterra Resources, Inc. | | | 6,500,000 | | | | 1,403,940 | *+ |
Canyon Resources Ltd. | | | 10,006,593 | | | | 759,779 | * |
Chesapeake Gold Corp., 144A | | | 192,199 | | | | 522,494 | * |
Comstock Mining, Inc. | | | 2,665,000 | | | | 700,895 | * |
CopperBank Resources Corp. | | | 6,805,418 | | | | 354,805 | * |
CopperBank Resources Corp., 144A | | | 174,000 | | | | 9,072 | * |
Corona Minerals Ltd. | | | 1,625,000 | | | 0 | *#@ |
Doray Minerals Ltd. | | | 1,500,000 | | | | 462,258 | * |
Eastmain Resources, Inc. | | | 2,000,000 | | | | 759,692 | * |
Gold Standard Ventures Corp. | | | 1,200,000 | | | | 2,544,000 | * |
Gran Colombia Gold Corp. | | | 192,500 | | | | 13,620 | * |
See notes to portfolios of investments and notes to financial statements.
80
World Precious Minerals Fund
Portfolio of Investments | December 31, 2016 |
Common Stocks (cont’d) | | Shares | | | Value | |
| | | | | | | |
Gold Mining (cont’d) | |
Harte Gold Corp. | | | 3,000,000 | | | $ | 670,316 | * |
IDM Mining Ltd. | | | 5,000,000 | | | | 521,357 | * |
IDM Mining Ltd., 144A | | | 95,000 | | | | 9,906 | * |
Integra Gold Corp. | | | 3,000,000 | | | | 1,251,257 | * |
K92 Mining Ltd. | | | 1,500,000 | | | | 1,083,678 | * |
Kirkland Lake Gold, Inc. | | | 384,992 | | | | 2,012,916 | * |
Kirkland Lake Gold, Inc., 144A (RS) | | | 90,000 | | | 447,034 | *#@ |
Klondex Mines Ltd. | | | 6,000,000 | | | | 27,929,840 | * |
Leagold Mining Corp., 144A | | | 1,665,000 | | | | 762,652 | * |
Lexam VG Gold, Inc., 144A | | | 2,406,501 | | | | 376,394 | * |
Malbex Resources, Inc., 144A | | | 133,333 | | | | 34,757 | * |
Mammoth Resources Corp. | | | 4,818,000 | | | | 62,797 | *+ |
Mirasol Resources Ltd. | | | 2,000,000 | | | | 2,249,283 | * |
Newcastle Gold Ltd., 144A | | | 66,667 | | | | 36,247 | * |
NGEx Resources, Inc. | | | 2,000,000 | | | | 1,787,510 | * |
Nighthawk Gold Corp. | | | 1,750,000 | | | | 566,976 | * |
NV Gold Corp. | | | 1,800,000 | | | | 311,697 | *+ |
OceanaGold Corp., 144A | | | 5,348 | | | | 15,574 | |
Osisko Mining, Inc. | | | 200,000 | | | | 363,460 | * |
Petaquilla Minerals Ltd., 144A | | | 2,660,000 | | | 0 | *#@ |
Pilot Gold, Inc. | | | 1,000,000 | | | | 331,434 | * |
Pretium Resources, Inc. | | | 550,000 | | | | 4,542,532 | * |
Pure Gold Mining, Inc. | | | 3,500,000 | | | | 1,355,528 | * |
Radisson Mining Resources, Inc. (RS) | | | 5,200,000 | | | 607,083 | *#@ |
Radius Gold, Inc., 144A | | | 125,000 | | | | 9,775 | * |
Red Pine Exploration | | | 10,000,000 | | | | 1,005,474 | *+ |
Redstar Gold Corp. | | | 15,000,000 | | | | 1,619,931 | *+ |
Rye Patch Gold Corp. | | | 8,316,873 | | | | 1,920,256 | * |
Rye Patch Gold Corp., 144A | | | 1,800,000 | | | | 415,596 | * |
Sandstorm Gold Ltd. | | | 150,000 | | | | 585,000 | * |
Seafield Resources Ltd., 144A | | | 1,300,000 | | | 0 | *#@ |
Skeena Resources Ltd. | | | 6,000,000 | | | | 335,158 | * |
St Barbara Ltd. | | | 1,000,000 | | | | 1,444,869 | * |
Taurus Gold Ltd., 144A | | | 2,448,381 | | | 0 | *#@ |
TMAC Resources, Inc. | | | 150,000 | | | | 1,712,658 | * |
Tolima Gold, Inc. | | | 3,250,000 | | | | 18,154 | * |
Tolima Gold, Inc., 144A | | | 850,000 | | | | 4,748 | * |
TriStar Gold, Inc. | | | 25,308,000 | | | | 5,089,308 | *+ |
Victoria Gold Corp. | | | 2,450,000 | | | | 1,021,860 | * |
Wesdome Gold Mines Ltd. | | | 1,600,000 | | | | 2,490,597 | * |
| | | | | | | | 75,413,056 | |
| | | | | | | | | |
Medical - Hospitals 0.00% | |
African Medical Investments plc | | | 4,637,500 | | | 0 | *#@ |
See notes to portfolios of investments and notes to financial statements.
81
World Precious Minerals Fund
Portfolio of Investments | December 31, 2016 |
Common Stocks (cont’d) | | Shares | | | Value | |
| | | | | | | |
Metal - Copper 0.38% | |
Highland Copper Company, Inc. | | | 5,000,000 | | | $ | 353,778 | * |
Rockcliff Copper Corp., 144A | | | 2,620,000 | | | | 185,380 | * |
| | | | | | | | 539,158 | |
| | | | | | | | | |
Metal - Diversified 7.22% | |
AuRico Metals, Inc. | | | 350,000 | | | | 263,285 | * |
Balmoral Resources Ltd. | | | 500,000 | | | | 268,127 | * |
Cardinal Resources Ltd. | | | 14,000,000 | | | | 2,393,713 | * |
Columbus Gold Corp. | | | 2,000,000 | | | | 893,755 | * |
Filo Mining Corp. | | | 475,000 | | | | 619,111 | * |
First Point Minerals Corp. | | | 2,000,000 | | | | 126,615 | * |
Ivanhoe Mines Ltd., Class A | | | 100,000 | | | | 189,178 | * |
Mandalay Resources Corp. | | | 2,500,000 | | | | 1,489,592 | |
Minera Alamos, Inc. | | | 4,450,000 | | | | 447,436 | *+ |
Mineral Mountain Resources Ltd. | | | 1,843,000 | | | | 384,344 | * |
Murchison Minerals Ltd., 144A (RS) | | | 3,000,000 | | | 382,080 | *+#@ |
Nemaska Lithium, Inc. | | | 500,000 | | | | 461,773 | * |
Novo Resources Corp. | | | 1,000,000 | | | | 595,837 | * |
Orex Minerals, Inc. | | | 8,173,000 | | | | 1,643,548 | *+ |
Orsu Metals Corp., 144A | | | 1,869,220 | | | | 34,805 | * |
| | | | | | | | 10,193,199 | |
| | | | | | | | | |
Mining Services 0.21% | |
Argent Minerals Ltd. | | | 17,100,000 | | | | 293,278 | * |
| | | | | | | | | |
Non-Ferrous Metals 0.45% | |
Energizer Resources, Inc. | | | 13,000,000 | | | | 629,352 | * |
| | | | | | | | | |
Oil Companies - Exploration & Production 0.00% | |
Big Sky Energy Corp. | | | 2,000,000 | | | 0 | *#@ |
SVT Capital Corp. | | | 1,616 | | | | 259 | * |
| | | | | | | | 259 | |
| | | | | | | | | |
Optical Recognition Equipment 0.00% | |
Nexoptic Technology Corp., 144A | | | 12,083 | | | | 6,210 | * |
| | | | | | | | | |
Other Mined Materials 0.58% | |
Golden Peak Minerals, Inc. (RS) | | | 1,999,998 | | | 813,689 | *+#@ |
| | | | | | | | | |
Platinum 0.01% | |
Pacific North West Capital Corp., 144A | | | 430,555 | | | | 9,620 | * |
| | | | | | | | | |
Precious Metals 17.04% | |
Barsele Minerals Corp. | | | 10,169,000 | | | | 7,952,519 | *+ |
Brixton Metals Corp. | | | 2,500,000 | | | | 642,386 | *+ |
See notes to portfolios of investments and notes to financial statements.
82
World Precious Minerals Fund
Portfolio of Investments | December 31, 2016 |
Common Stocks (cont’d) | | Shares | | | Value | |
| | | | | | | |
Precious Metals (cont’d) | |
Candente Gold Corp., 144A | | | 4,875,000 | | | $ | 145,235 | * |
Dolly Varden Silver Corp. | | | 4,128,500 | | | | 1,829,559 | *+ |
Dolly Varden Silver Corp. (RS) | | | 1,500,000 | | | 631,494 | *+#@ |
Fiore Exploration Ltd. | | | 7,746,800 | | | | 2,711,798 | *+ |
GFG Resources | | | 1,500,000 | | | | 1,273,601 | * |
Kootenay Silver, Inc. | | | 1,000,000 | | | | 234,611 | * |
Lundin Gold, Inc. | | | 575,000 | | | | 2,252,635 | * |
Lundin Gold, Inc., 144A | | | 70,000 | | | | 274,234 | * |
Probe Metals, Inc. | | | 1,250,000 | | | | 1,256,843 | * |
Roxgold, Inc. | | | 3,000,000 | | | | 2,703,608 | * |
Santana Minerals Ltd. | | | 750,000 | | | | 24,369 | * |
SilverCrest Metals, Inc. | | | 250,000 | | | | 439,429 | * |
Toachi Mining, Inc. | | | 4,350,000 | | | | 1,150,151 | *+ |
Toachi Mining, Inc., 144A | | | 2,000,000 | | | | 528,805 | *+ |
| | | | | | | | 24,051,277 | |
| | | | | | | | | |
Silver Mining 0.65% | |
MAG Silver Corp. | | | 50,000 | | | | 551,500 | * |
Santacruz Silver Mining Ltd. | | | 1,600,000 | | | | 369,419 | * |
| | | | | | | | 920,919 | |
| |
Total Common Stocks | | | | 126,855,768 | |
(cost $137,535,279) | | | | | | | | |
| | | | | | | | | |
Warrants 1.66% | | | | | | | | |
| | | | | | | | | |
Diversified Minerals 0.02% | |
Amani Gold Ltd., Warrants (July 2017) | | | 3,500,000 | | | | 25,258 | * |
| | | | | | | | | |
Gold Mining 0.77% | |
Alamos Gold, Inc., Warrants (August 2018) | | | 110,000 | | | | 28,265 | * |
Alexandria Minerals Corp., 144A, Warrants (June 2019) | | | 1,256,195 | | | 0 | *#@ |
Algold Resources Ltd., Warrants (April 2018) | | | 1,250,000 | | | 83,789 | *#@ |
Bonterra Resources, Inc., Warrants (December 2017) | | | 625,000 | | | 0 | *+#@ |
Bonterra Resources, Inc., Warrants (July 2018) | | | 625,000 | | | 0 | *+#@ |
Canyon Resources Ltd., Warrants (January 2017) | | | 6,168,864 | | | | 133,553 | * |
Gran Colombia Gold Corp., 144A, Warrants (October 2017) | | | 58,450 | | | 0 | *#@ |
Gran Colombia Gold Corp., Warrants (March 2019) | | | 96,250 | | | | 3,943 | * |
Newcastle Gold Ltd., Warrants (February 2017) | | | 33,333 | | | 0 | *#@ |
New Gold, Inc., 144A, Warrants (June 2017) | | | 352,530 | | | | 14,441 | * |
Osisko Gold Royalties Ltd., Warrants (February 2022) | | | 377,500 | | | | 773,191 | * |
Osisko Mining, Inc., Warrants (August 2018) | | | 1,000,000 | | | | 37,240 | * |
Redstar Gold Corp., Warrants (May 2019) | | | 2,500,000 | | | 9,310 | *+#@ |
| | | | | | | | 1,083,732 | |
See notes to portfolios of investments and notes to financial statements.
83
World Precious Minerals Fund
Portfolio of Investments | December 31, 2016 |
Warrants (cont’d) | | Shares | | | Value | |
| | | | | | | |
Metal - Diversified 0.14% | |
Dalradian Resources, Inc., Warrants (July 2017) | | | 1,500,000 | | | $ | 198,302 | * |
HudBay Minerals, Inc., Warrants (July 2018) | | | 17,000 | | | | 5,761 | * |
Minera Alamos, Inc., Warrants (May 2019) | | | 2,225,000 | | | 0 | *+#@ |
Murchison Minerals Ltd., 144A, Warrants (August 2018) (RS) | | | 1,500,000 | | | 0 | *+#@ |
Orex Minerals, Inc., 144A, Warrants (November 2017) | | | 1,250,000 | | | 0 | *+#@ |
| | | | | | | | 204,063 | |
| | | | | | | | | |
Precious Metals 0.73% | |
Barsele Minerals Corp., 144A, Warrants (November 2017) | | | 1,250,000 | | | 698,246 | *+#@ |
Barsele Minerals Corp., 144A, Warrants (March 2018) | | | 600,000 | | | 335,158 | *+#@ |
Probe Metals, Inc., Warrants (February 2018) | | | 625,000 | | | 0 | *#@ |
| | | | | | | | 1,033,404 | |
| | | | | | | | | |
Silver Mining 0.00% | |
Source Exploration Corp., 144A, Warrants (February 2017) | | | 250,000 | | | 0 | *#@ |
| |
Total Warrants | | | | 2,346,457 | |
(cost $984,879) | | | | | | | | |
| | | | | | | | | |
Special Warrant 0.00% | | | | | | | | |
| | | | | | | | | |
Gold/Mineral Exploration & Development 0.00% | |
Western Exploration & Development Ltd., 144A, Special Warrants | | | 600,000 | | | 0 | *#@ |
(cost $300,000) | | | | | | | | |
| | | | | | | | | |
Right 0.10% | | | | | | | | |
| | | | | | | | | |
Metal - Diversified 0.10% | |
Cardinal Resources Ltd. | | | 1,500,000 | | | | 135,310 | * |
(cost $13,109) | | | | | | | | |
| | | | | | | | | |
Convertible Debentures 3.74% | | Principal
Amount | | | | | |
| | | | | | | | |
Gold Mining 3.74% | |
Gran Colombia Gold Corp., 1.00%, maturity 08/11/18 | | $ | 3,056,566 | | | | 1,864,505 | |
Gran Colombia Gold Corp., 6.00%, maturity 01/02/20 | | | 4,058,613 | | | | 3,409,235 | |
| |
Total Convertible Debentures | | | | 5,273,740 | |
(cost $3,451,205) | | | | | | | | |
See notes to portfolios of investments and notes to financial statements.
84
World Precious Minerals Fund
Portfolio of Investments | December 31, 2016 |
Corporate Note 0.53%
| | Principal
Amount | | | Value | |
| | | | | | | |
Electric Generation 0.53% | |
Interamerican Energy Corp., 15.00%, maturity 11/08/21 (RS) | | $ | 748,250 | | | $ | 748,250 | #@ |
(cost $748,250) | | | | | | | | |
| |
Total Investments 95.89% | | | | 135,359,525 | |
(cost $143,032,722) | | | | | | | | |
Other assets and liabilities, net 4.11% | | | | | | | 5,799,259 | |
| | | | | | | | | |
Net Assets 100.0% | | | | | | $ | 141,158,784 | |
See notes to portfolios of investments and notes to financial statements.
85
Gold and Precious Metals Fund
Portfolio of Investments | December 31, 2016 |
Common Stocks 87.94% | | Shares | | | Value | |
| | | | | | | |
Diamonds/Precious Stones 0.96% | |
Lucara Diamond Corp. | | | 400,000 | | | $ | 905,671 | |
| | | | | | | | | |
Gold Mining 77.79% | |
Argonaut Gold, Inc. | | | 750,000 | | | | 1,184,225 | * |
Barrick Gold Corp. | | | 225,000 | | | | 3,595,500 | |
Beadell Resources Ltd. | | | 4,000,000 | | | | 758,866 | * |
Comstock Mining, Inc. | | | 4,621,648 | | | | 1,215,493 | * |
Doray Minerals Ltd. | | | 1,000,000 | | | | 308,172 | * |
Dundee Precious Metals, Inc. | | | 550,000 | | | | 921,685 | * |
Golden Star Resources Ltd. | | | 2,000,000 | | | | 1,491,000 | * |
Gran Colombia Gold Corp. | | | 75,000 | | | | 5,307 | * |
Harmony Gold Mining Co. Ltd., Sponsored ADR | | | 375,000 | | | | 828,750 | |
Jaguar Mining, Inc. | | | 7,550,000 | | | | 3,261,461 | * |
K92 Mining Ltd. | | | 2,250,000 | | | | 1,625,517 | * |
Kirkland Lake Gold, Inc. | | | 1,274,983 | | | | 6,666,206 | * |
Kirkland Lake Gold, Inc., 144A (RS) | | | 175,000 | | | 869,232 | *#@ |
Klondex Mines Ltd. | | | 4,500,000 | | | | 20,947,380 | * |
Marlin Gold Mining Ltd. | | | 1,375,200 | | | | 594,061 | * |
Newmont Mining Corp. | | | 90,000 | | | | 3,066,300 | |
Northern Star Resources Ltd. | | | 1,000,000 | | | | 2,555,867 | |
Richmont Mines, Inc. | | | 200,000 | | | | 1,300,000 | * |
Royal Gold, Inc. | | | 50,000 | | | | 3,167,500 | |
Rye Patch Gold Corp. | | | 10,070,794 | | | | 2,325,212 | * |
Sandstorm Gold Ltd. | | | 600,000 | | | | 2,340,000 | * |
Saracen Mineral Holdings Ltd. | | | 450,000 | | | | 315,668 | * |
Silver Lake Resources Ltd. | | | 3,000,000 | | | | 1,360,462 | * |
St Barbara Ltd. | | | 3,000,000 | | | | 4,334,606 | * |
Torex Gold Resources, Inc. | | | 200,000 | | | | 3,096,861 | * |
Wesdome Gold Mines Ltd. | | | 3,200,000 | | | | 4,981,194 | * |
| | | | | | | | 73,116,525 | |
| | | | | | | | | |
Medical - Hospitals 0.00% | |
African Medical Investments plc | | | 2,000,000 | | | 0 | *#@ |
| | | | | | | | | |
Metal - Diversified 3.67% | |
AuRico Metals, Inc. | | | 3,000,000 | | | | 2,256,731 | * |
Mandalay Resources Corp. | | | 2,000,000 | | | | 1,191,673 | |
| | | | | | | | 3,448,404 | |
| | | | | | | | | |
Precious Metals 1.82% | |
Maverix Metals, Inc. | | | 1,050,000 | | | | 1,259,077 | * |
Roxgold, Inc. | | | 500,000 | | | | 450,602 | * |
| | | | | | | | 1,709,679 | |
See notes to portfolios of investments and notes to financial statements.
86
Gold and Precious Metals Fund
Portfolio of Investments | December 31, 2016 |
Common Stocks (cont’d) | | Shares | | | Value | |
| | | | | | | |
Silver Mining 3.70% | |
Santacruz Silver Mining Ltd. | | | 2,500,000 | | | $ | 577,217 | * |
Silver Wheaton Corp. | | | 150,000 | | | | 2,898,000 | |
| | | | | | | | 3,475,217 | |
| |
Total Common Stocks | | | | 82,655,496 | |
(cost $69,106,358) | | | | | | | | |
| | | | | | | | | |
Warrants 0.40% | | | | | | | | |
| | | | | | | | | |
Gold Mining 0.40% | |
Gran Colombia Gold Corp., 144A, Warrants (October 2017) | | | 29,400 | | | 0 | *#@ |
Gran Colombia Gold Corp., Warrants (March 2019) | | | 37,500 | | | | 1,536 | * |
Osisko Gold Royalties Ltd., Warrants (February 2022) | | | 183,900 | | | | 376,662 | * |
| |
Total Warrants | | | | 378,198 | |
(cost $271,712) | | | | | | | | |
| | | | | | | | | |
Convertible Debentures 2.88% | | Principal
Amount | | | | | |
| | | | | | | | |
Gold Mining 2.88% | |
Gran Colombia Gold Corp., 1.00%, maturity 08/11/18 | | $ | 1,607,149 | | | | 980,361 | |
Gran Colombia Gold Corp., 6.00%, maturity 01/02/20 | | | 2,052,944 | | | | 1,724,473 | |
| |
Total Convertible Debentures | | | | 2,704,834 | |
(cost $1,771,831) | | | | | | | | |
| | | | | | | | | |
Corporate Notes 0.30% | | | | | | | | |
| | | | | | | | | |
Coal 0.00% | |
Caribbean Resources Corp., 19.25%, maturity 06/15/15 | | | 485,766 | | | 0 | *#^@ |
| | | | | | | | | |
Electric Generation 0.30% | |
Interamerican Energy Corp., 15.00%, maturity 11/08/21 (RS) | | | 280,594 | | | 280,594 | #@ |
| |
Total Corporate Notes | | | | 280,594 | |
(cost $766,360) | | | | | | | | |
| |
Total Investments 91.52% | | | | 86,019,122 | |
(cost $71,916,261) | | | | | | | | |
Other assets and liabilities, net 8.48% | | | | | | | 7,968,968 | |
| | | | | | | | | |
Net Assets 100.0% | | | | | | $ | 93,988,090 | |
See notes to portfolios of investments and notes to financial statements.
87
Emerging Europe Fund
Portfolio of Investments | December 31, 2016 |
Common Stocks 96.17% | | Shares | | | Value | |
| | | | | | | |
Agricultural Chemicals 1.98% | |
Gubre Fabrikalari TAS | | | 478,000 | | | $ | 592,796 | |
PhosAgro PJSC, GDR | | | 15,900 | | | | 242,150 | |
| | | | | | | | 834,946 | |
| | | | | | | | | |
Airlines 3.95% | |
Aegean Airlines S.A. | | | 70,000 | | | | 466,100 | |
Aeroflot PJSC | | | 184,500 | | | | 459,759 | * |
Deutsche Lufthansa AG | | | 30,700 | | | | 395,747 | |
Turk Hava Yollari AO | | | 127,000 | | | | 180,161 | * |
Wizz Air Holdings plc | | | 7,700 | | | | 169,878 | * |
| | | | | | | | 1,671,645 | |
| | | | | | | | | |
Airport Development/Maintenance 0.36% | |
TAV Havalimanlari Holding A.S. | | | 38,700 | | | | 153,726 | |
| | | | | | | | | |
Appliances 2.70% | |
Arcelik A.S. | | | 111,200 | | | | 667,875 | |
Vestel Beyaz Esya Sanayi ve Ticaret A.S. | | | 139,000 | | | | 472,851 | |
| | | | | | | | 1,140,726 | |
| | | | | | | | | |
Automotive - Cars & Light Trucks 1.40% | |
Ford Otomotiv Sanayi A.S. | | | 68,500 | | | | 593,479 | |
| | | | | | | | | |
Automotive Truck Parts & Equipment 0.53% | |
Brembo S.p.A | | | 3,680 | | | | 222,623 | |
| | | | | | | | | |
Building & Construction - Miscellaneous 2.08% | |
Budimex S.A. | | | 7,600 | | | | 359,266 | |
Enka Insaat ve Sanayi A.S. | | | 342,000 | | | | 520,942 | |
| | | | | | | | 880,208 | |
| | | | | | | | | |
Building & Construction Products - Miscellaneous 0.72% | |
Wienerberger AG | | | 17,500 | | | | 303,573 | |
| | | | | | | | | |
Building Products - Cement/Aggregates 0.54% | |
Cimsa Cimento Sanayi VE Ticaret | | | 51,000 | | | | 228,201 | |
| | | | | | | | | |
Cellular Telecommunication 2.13% | |
MegaFon PJSC, GDR | | | 20,600 | | | | 194,467 | |
Mobile TeleSystems OJSC, Sponsored ADR | | | 54,700 | | | | 498,317 | |
Turkcell Iletisim Hizmetleri A.S. | | | 75,000 | | | | 207,090 | |
| | | | | | | | 899,874 | |
| | | | | | | | | |
Chemicals - Diversified 0.61% | |
Ciech S.A. | | | 18,500 | | | | 257,675 | |
See notes to portfolios of investments and notes to financial statements.
88
Emerging Europe Fund
Portfolio of Investments | December 31, 2016 |
Common Stocks (cont’d) | | Shares | | | Value | |
| | | | | | | |
Chemicals - Fibers 1.30% | |
Aksa Akrilik Kimya Sanayii A.S. | | | 139,000 | | | $ | 361,442 | |
Lenzing AG | | | 1,550 | | | | 187,584 | |
| | | | | | | | 549,026 | |
| | | | | | | | | |
Coal 1.41% | |
Lubelski Wegiel Bogdanka S.A. | | | 36,000 | | | | 597,043 | |
| | | | | | | | | |
Commercial Banks - Non US 17.32% | |
Akbank T.A.S. | | | 143,000 | | | | 316,553 | |
Akbank T.A.S., Sponsored ADR | | | 27,000 | | | | 117,720 | |
Alpha Bank AE | | | 133,700 | | | | 266,872 | * |
Banca Transilvania S.A. | | | 1 | | | | 1 | |
BGEO Group plc | | | 2,600 | | | | 95,732 | |
BRD-Groupe Societe Generale S.A. | | | 216,000 | | | | 594,619 | |
Eurobank Ergasias S.A. | | | 202,000 | | | | 136,929 | * |
National Bank of Greece S.A. | | | 400,000 | | | | 104,390 | * |
OTP Bank plc | | | 25,950 | | | | 740,986 | |
Powszechna Kasa Oszczednosci Bank Polski S.A. | | | 24,700 | | | | 165,921 | |
Sberbank of Russia, Sponsored ADR | | | 383,000 | | | | 4,435,140 | |
Turkiye Garanti Bankasi A.S. | | | 161,000 | | | | 347,216 | |
| | | | | | | | 7,322,079 | |
| | | | | | | | | |
Communications Software 0.56% | |
LiveChat Software S.A. | | | 20,000 | | | | 237,426 | |
| | | | | | | | | |
Computer Services 1.71% | |
Asseco Poland S.A. | | | 36,300 | | | | 467,888 | |
Luxoft Holding, Inc., Class A | | | 4,500 | | | | 252,900 | * |
| | | | | | | | 720,788 | |
| | | | | | | | | |
Diamonds/Precious Stones 1.10% | |
Alrosa PJSC | | | 291,000 | | | | 462,872 | |
| | | | | | | | | |
Diversified Operations 1.75% | |
KOC Holding A.S. | | | 117,456 | | | | 459,038 | |
Tekfen Holding A.S. | | | 153,500 | | | | 281,006 | |
| | | | | | | | 740,044 | |
| | | | | | | | | |
Electric - Distribution 0.21% | |
Electrica S.A. | | | 28,700 | | | | 87,547 | |
| | | | | | | | | |
Electric - Generation 1.32% | |
Inter RAO UES PJSC | | | 8,910,000 | | | | 558,213 | |
See notes to portfolios of investments and notes to financial statements.
89
Emerging Europe Fund
Portfolio of Investments | December 31, 2016 |
Common Stocks (cont’d) | | Shares | | | Value | |
| | | | | | | |
Electric - Integrated 0.23% | |
RusHydro PJSC, Sponsored ADR | | | 66,942 | | | $ | 97,249 | |
| | | | | | | | | |
Electronics - Military 1.26% | |
Aselsan Elektronik Sanayi Ve Ticaret | | | 30,500 | | | | 109,842 | |
Safran S.A. | | | 5,880 | | | | 422,914 | |
| | | | | | | | 532,756 | |
| | | | | | | | | |
Enterprise Software/Services 0.46% | |
Logo Yazilim Sanayi Ve Ticaret | | | 12,700 | | | | 195,665 | * |
| | | | | | | | | |
Entertainment Software 0.57% | |
CD Projekt S.A. | | | 19,300 | | | | 240,604 | * |
| | | | | | | | | |
Food - Retail 2.01% | |
BIM Birlesik Magazalar A.S. | | | 16,700 | | | | 231,748 | |
Magnit PJSC, Sponsored GDR | | | 14,000 | | | | 616,264 | |
| | | | | | | | 848,012 | |
| | | | | | | | | |
Food - Wholesale/Distribution 1.64% | |
Eurocash S.A. | | | 74,000 | | | | 695,335 | |
| | | | | | | | | |
Gambling (Non-Hotel) 0.70% | |
OPAP S.A. | | | 33,400 | | | | 295,200 | |
| | | | | | | | | |
Gold Mining 0.09% | |
Koza Altin Isletmeleri A.S. | | | 8,500 | | | | 39,253 | * |
| | | | | | | | | |
Human Resources 0.49% | |
Benefit Systems S.A. | | | 1,260 | | | | 207,705 | * |
| | | | | | | | | |
Machinery - General Industrial 0.41% | |
Andritz AG | | | 3,450 | | | | 172,893 | |
| | | | | | | | | |
Medical - Drugs 0.59% | |
Richter Gedeon Nyrt | | | 11,900 | | | | 251,356 | |
| | | | | | | | | |
Metal - Diversified 0.67% | |
MMC Norilsk Nickel PJSC, Sponsored ADR | | | 12,200 | | | | 206,424 | |
Orsu Metals Corp., 144A | | | 4,025,000 | | | | 74,945 | * |
| | | | | | | | 281,369 | |
| | | | | | | | | |
Metal - Iron 1.94% | |
Magnitogorsk Iron & Steel Works OJSC, GDR | | | 62,600 | | | | 433,335 | |
Novolipetsk Steel PJSC, GDR | | | 21,000 | | | | 387,859 | |
| | | | | | | | 821,194 | |
See notes to portfolios of investments and notes to financial statements.
90
Emerging Europe Fund
Portfolio of Investments | December 31, 2016 |
Common Stocks (cont’d) | | Shares | | | Value | |
| | | | | | | |
Miscellaneous Manufacturing 0.66% | |
RHI AG | | | 10,900 | | | $ | 277,534 | |
| | | | | | | | | |
Multi-line Insurance 1.35% | |
UNIQA Insurance Group AG | | | 33,500 | | | | 253,323 | |
Vienna Insurance Group Wiener Versicherung Gruppe AG | | | 14,200 | | | | 317,710 | |
| | | | | | | | 571,033 | |
| | | | | | | | | |
Oil Companies - Integrated 19.44% | |
Gazprom OAO, Sponsored ADR | | | 663,000 | | | | 3,353,681 | |
Lukoil PJSC, Sponsored ADR | | | 61,600 | | | | 3,456,992 | |
MOL Hungarian Oil & Gas plc | | | 8,720 | | | | 611,452 | |
OMV Petrom, GDR | | | 32,500 | | | | 297,050 | |
Polskie Gornictwo Naftowe i Gazownictwo S.A. | | | 372,000 | | | | 499,870 | |
| | | | | | | | 8,219,045 | |
| | | | | | | | | |
Oil Refining & Marketing 6.01% | |
Aygaz A.S. | | | 56,000 | | | | 190,841 | |
Grupa Lotos S.A. | | | 20,000 | | | | 182,575 | * |
Hellenic Petroleum S.A. | | | 100,000 | | | | 464,895 | |
Motor Oil Hellas Corinth Refineries S.A. | | | 28,700 | | | | 395,548 | |
Polski Koncern Naftowy Orlen S.A. | | | 40,900 | | | | 832,965 | |
Tupras Turkiye Petrol Rafinerileri A.S. | | | 23,700 | | | | 474,910 | |
| | | | | | | | 2,541,734 | |
| | | | | | | | | |
Property/Casualty Insurance 1.09% | |
Powszechny Zaklad Ubezpieczen S.A. | | | 58,100 | | | | 460,679 | |
| | | | | | | | | |
Regional Banks - Non US 1.82% | |
Moneta Money Bank A.S. | | | 239,000 | | | | 770,619 | * |
| | | | | | | | | |
Retail - Appliances 1.12% | |
M.Video PJSC | | | 75,000 | | | | 474,325 | |
| | | | | | | | | |
Retail - Jewelry 0.47% | |
Pandora A/S | | | 1,515 | | | | 197,768 | |
| | | | | | | | | |
Retail - Restaurants 0.59% | |
AmRest Holdings S.E. | | | 3,500 | | | | 247,443 | * |
| | | | | | | | | |
Steel - Producers 2.79% | |
Eregli Demir ve Celik Fabrikalari T.A.S. | | | 326,000 | | | | 474,309 | |
Evraz plc | | | 171,500 | | | | 467,296 | |
Severstal PAO PJSC, GDR | | | 15,300 | | | | 236,153 | |
| | | | | | | | 1,177,758 | |
See notes to portfolios of investments and notes to financial statements.
91
Emerging Europe Fund
Portfolio of Investments | December 31, 2016 |
Common Stocks (cont’d) | | Shares | | | Value | |
| | | | | | | |
Telecom Services 1.71% | |
O2 Czech Republic a.s. | | | 16,100 | | | $ | 163,032 | |
Sistema PJSC FC, GDR | | | 49,000 | | | | 441,019 | |
Turk Telekomunikasyon A.S. | | | 78,200 | | | | 116,887 | |
| | | | | | | | 720,938 | |
| | | | | | | | | |
Telephone - Integrated 2.29% | |
Hellenic Telecommunications Organization S.A. | | | 56,100 | | | | 526,855 | |
Magyar Telekom Telecommunications | | | 260,500 | | | | 441,328 | |
| | | | | | | | 968,183 | |
| | | | | | | | | |
Tobacco 0.53% | |
Philip Morris CR A.S. | | | 440 | | | | 224,496 | |
| | | | | | | | | |
Transportation - Services 1.11% | |
Oesterreichische Post AG | | | 14,050 | | | | 470,963 | |
| | | | | | | | | |
Web Portals/ISP 0.45% | |
Yandex NV, Class A | | | 9,450 | | | | 190,229 | * |
| |
Total Common Stocks | | | | 40,653,052 | |
(cost $39,996,251) | | | | | | | | |
| | | | | | | | | |
Exchange-Traded Fund 0.59% | | | | | | | | |
| | | | | | | | | |
Direxion Daily Russia Bull 3x Shares | | | 2,500 | | | | 251,952 | |
(cost $252,077) | | | | | | | | |
| |
Total Investments 96.76% | | | | 40,905,004 | |
(cost $40,248,328) | | | | | | | | |
Other assets and liabilities, net 3.24% | | | | | | | 1,368,100 | |
| | | | | | | | | |
Net Assets 100.0% | | | | | | $ | 42,273,104 | |
See notes to portfolios of investments and notes to financial statements.
92
China Region Fund
Portfolio of Investments | December 31, 2016 |
Common Stocks 85.49% | | Shares | | | Value | |
| | | | | | | |
Airlines 2.47% | |
Air China Ltd., H shares | | | 220,000 | | | $ | 139,751 | |
AirAsia Berhad | | | 250,000 | | | | 127,448 | |
Cebu Air, Inc. | | | 75,000 | | | | 140,233 | |
| | | | | | | | 407,432 | |
| | | | | | | | | |
Apparel Manufacturers 0.51% | |
Regina Miracle International Holdings Ltd. | | | 101,000 | | | | 83,528 | |
| | | | | | | | | |
Athletic Footwear 0.23% | |
Feng TAY Enterprise | | | 10,080 | | | | 37,334 | |
| | | | | | | | | |
Automotive - Cars & Light Trucks 9.51% | |
Geely Automobile Holdings Ltd. | | | 866,000 | | | | 823,094 | |
Great Wall Motor Co., Ltd., H shares | | | 90,500 | | | | 83,951 | |
Guangzhou Automobile Group Co., Ltd., H shares | | | 550,000 | | | | 662,847 | |
| | | | | | | | 1,569,892 | |
| | | | | | | | | |
Automotive/Truck Parts & Equipment - Original 0.11% | |
Nexteer Automotive Group Ltd. | | | 16,000 | | | | 18,946 | |
| | | | | | | | | |
Batteries/Battery Systems 0.45% | |
Tianneng Power International Ltd. | | | 82,000 | | | | 75,038 | |
| | | | | | | | | |
Building - Heavy Construction 1.89% | |
China Communications Services, H shares | | | 490,000 | | | | 311,333 | |
| | | | | | | | | |
Cellular Telecommunication 0.85% | |
SmarTone Telecommunications Holdings Ltd. | | | 105,000 | | | | 140,954 | |
| | | | | | | | | |
Circuit Boards 0.68% | |
KCE Electronics NVDR | | | 33,000 | | | | 112,210 | |
| | | | | | | | | |
Commercial Banks - Non US 3.93% | |
Bank Mandiri Persero Tbk PT | | | 94,000 | | | | 80,453 | |
Bank Rakyat Indonesia Persero Tbk PT | | | 165,000 | | | | 142,513 | |
Bank Tabungan Negara Persero Tbk PT | | | 600,000 | | | | 77,228 | |
Huishang Bank Corp., Ltd., H shares | | | 685,000 | | | | 348,465 | |
| | | | | | | | 648,659 | |
| | | | | | | | | |
Commercial Services 0.28% | |
Goldpac Group Ltd. | | | 173,000 | | | | 45,777 | |
| | | | | | | | | |
Computer Services 0.26% | |
SK Holdings Co., Ltd. | | | 225 | | | | 42,712 | * |
See notes to portfolios of investments and notes to financial statements.
93
China Region Fund
Portfolio of Investments | December 31, 2016 |
Common Stocks (cont’d) | | Shares | | | Value | |
| | | | | | | |
Computers 0.51% | |
Foxconn Technology Co., Ltd. | | | 32,320 | | | $ | 85,035 | |
| | | | | | | | | |
Computers - Integrated System 0.54% | |
Posiflex Technology, Inc. | | | 16,399 | | | | 89,843 | |
| | | | | | | | | |
Containers - Paper/Plastic 0.53% | |
Greatview Aseptic Packaging Co., Ltd. | | | 170,000 | | | | 86,900 | |
| | | | | | | | | |
Cosmetics & Toiletries 0.39% | |
AMOREPACIFIC Group | | | 585 | | | | 64,295 | * |
| | | | | | | | | |
Distribution/Wholesale 1.76% | |
Yestar International Holdings Co., Ltd. | | | 600,000 | | | | 290,861 | |
| | | | | | | | | |
Diversified Financial Services 1.96% | |
China Galaxy Securities Co., Ltd., H shares | | | 210,000 | | | | 188,250 | |
CTBC Financial Holding Co., Ltd. | | | 248,400 | | | | 135,504 | |
| | | | | | | | 323,754 | |
| | | | | | | | | |
Electronic Components - Miscellaneous 0.65% | |
Micro-Star International Co. | | | 47,000 | | | | 106,652 | |
| | | | | | | | | |
Energy - Alternate Sources 1.66% | |
Beijing Jingneng Clean Energy Co., Ltd., H shares | | | 400,000 | | | | 123,833 | |
Gigasolar Materials Corp. | | | 4,000 | | | | 47,278 | |
Xinyi Solar Holdings Ltd. | | | 320,000 | | | | 103,569 | |
| | | | | | | | 274,680 | |
| | | | | | | | | |
Enterprise Software/Services 0.23% | |
Sinosoft Technology Group Ltd. | | | 120,000 | | | | 37,711 | |
| | | | | | | | | |
Entertainment Software 0.65% | |
NetEase, Inc., Sponsored ADR | | | 500 | | | | 107,670 | |
| | | | | | | | | |
Finance - Investment Banker/Broker 2.32% | |
China International Capital, H shares | | | 150,000 | | | | 211,577 | * |
CITIC Securities Co., Ltd., H shares | | | 85,000 | | | | 171,761 | |
| | | | | | | | 383,338 | |
| | | | | | | | | |
Food - Confectionery 0.78% | |
Dali Foods Group Co., Ltd. | | | 244,000 | | | | 128,754 | |
| | | | | | | | | |
Food - Dairy Products 1.19% | |
China Shengmu Organic Milk Ltd. | | | 710,000 | | | | 196,454 | * |
See notes to portfolios of investments and notes to financial statements.
94
China Region Fund
Portfolio of Investments | December 31, 2016 |
Common Stocks (cont’d) | | Shares | | | Value | |
| | | | | | | |
Food - Miscellaneous/Diversified 0.43% | |
Uni-President China Holdings Ltd. | | | 100,000 | | | $ | 70,369 | |
| | | | | | | | | |
Funeral Services & Related Items 0.39% | |
Fu Shou Yuan International Group Ltd. | | | 110,000 | | | | 64,942 | |
| | | | | | | | | |
Internet Application Software 5.29% | |
Tencent Holdings Ltd. | | | 36,000 | | | | 872,896 | |
| | | | | | | | | |
Internet Content - Entertainment 0.24% | |
Com2uS Corp. | | | 542 | | | | 39,055 | |
| | | | | | | | | |
Internet Financial Services 0.19% | |
China Finance Online Co., Ltd., Sponsored ADR | | | 8,500 | | | | 30,770 | * |
| | | | | | | | | |
Investment Management/Advisory Services 3.14% | |
GF Securities Co., Ltd., H shares | | | 250,000 | | | | 518,765 | |
| | | | | | | | | |
Life/Health Insurance 1.61% | |
China Life Insurance Co., Ltd. | | | 20,800 | | | | 20,566 | |
China Pacific Insurance Group Co., Ltd., H shares | | | 71,000 | | | | 245,787 | |
| | | | | | | | 266,353 | |
| | | | | | | | | |
Medical - Drugs 4.77% | |
CSPC Pharmaceutical Group Ltd. | | | 430,000 | | | | 457,855 | |
Livzon Pharmaceutical Group, Inc., H shares | | | 33,000 | | | | 192,510 | |
Sino Biopharmaceutical Ltd. | | | 196,000 | | | | 137,441 | |
| | | | | | | | 787,806 | |
| | | | | | | | | |
Medical - Wholesale Drug Distribution 1.12% | |
Sinopharm Group Co., Ltd., H shares | | | 45,000 | | | | 184,425 | |
| | | | | | | | | |
Medical Products 1.45% | |
Lifetech Scientific Corp. | | | 1,000,000 | | | | 239,010 | * |
| | | | | | | | | |
Metal Processors & Fabricators 0.48% | |
STP & I PCL, NVDR | | | 256,000 | | | | 78,978 | |
| | | | | | | | | |
Miscellaneous Manufacturing 1.74% | |
China Railway Signal & Communication, H shares | | | 400,000 | | | | 287,180 | |
| | | | | | | | | |
Multi-line Insurance 1.65% | |
Ping An Insurance Group Co of China Ltd., H shares | | | 55,000 | | | | 273,245 | |
| | | | | | | | | |
Non - Ferrous Metals 0.51% | |
Sterling Group Ventures, Inc. | | | 500,000 | | | | 85,000 | * |
See notes to portfolios of investments and notes to financial statements.
95
China Region Fund
Portfolio of Investments | December 31, 2016 |
Common Stocks (cont’d) | | Shares | | | Value | |
| | | | | | | |
Optical Supplies 0.35% | |
St. Shine Optical Co., Ltd. | | | 3,000 | | | $ | 57,268 | |
| | | | | | | | | |
Photo Equipment & Supplies 4.14% | |
Sunny Optical Technology Group Co., Ltd. | | | 157,000 | | | | 684,361 | |
| | | | | | | | | |
Power Converters/Supply Equipment 0.61% | |
Boer Power Holdings Ltd. | | | 253,000 | | | | 100,370 | |
| | | | | | | | | |
Property/Casualty Insurance 4.57% | |
Dongbu Insurance Co., Ltd. | | | 1,700 | | | | 88,012 | * |
Hyundai Marine & Fire Insurance Co., Ltd. | | | 2,581 | | | | 67,183 | * |
Meritz Fire & Marine Insurance Co., Ltd. | | | 5,357 | | | | 67,801 | * |
PICC Property & Casualty Co., Ltd., H shares | | | 319,000 | | | | 493,388 | |
Samsung Fire & Marine Insurance Co., Ltd. | | | 170 | | | | 37,774 | * |
| | | | | | | | 754,158 | |
| | | | | | | | | |
Real Estate Operating/Development 3.30% | |
China Vanke Co., Ltd., H shares | | | 35,000 | | | | 79,564 | |
Highwealth Construction Corp. | | | 75,000 | | | | 105,799 | |
LPN Development PCL, NVDR | | | 220,000 | | | | 74,376 | |
New World Development Co., Ltd. | | | 270,000 | | | | 284,474 | |
| | | | | | | | 544,213 | |
| | | | | | | | | |
Reinsurance 0.35% | |
Korean Reinsurance Co. | | | 6,145 | | | | 57,961 | * |
| | | | | | | | | |
Retail - Apparel/Shoe 2.83% | |
ANTA Sports Products Ltd. | | | 125,000 | | | | 371,477 | |
China Lilang Ltd. | | | 170,000 | | | | 95,563 | |
| | | | | | | | 467,040 | |
| | | | | | | | | |
Retail - Building Products 0.54% | |
Home Product Center PCL, NVDR | | | 313,000 | | | | 88,955 | |
| | | | | | | | | |
Retail - Home Furnishings 2.53% | |
Man Wah Holdings Ltd. | | | 620,000 | | | | 418,637 | |
| | | | | | | | | |
Semiconductor Components - Integrated Circuits 0.52% | |
Powertech Technology, Inc. | | | 32,000 | | | | 85,872 | |
| | | | | | | | | |
Telecom Services 3.71% | |
PCCW Ltd. | | | 850,000 | | | | 459,496 | |
Telekomunikasi Indonesia Persero Tbk PT | | | 520,000 | | | | 152,980 | |
| | | | | | | | 612,476 | |
See notes to portfolios of investments and notes to financial statements.
96
China Region Fund
Portfolio of Investments | December 31, 2016 |
Common Stocks (cont’d) | | Shares | | | Value | |
| | | | | | | |
Telecommunication Equipment 1.38% | |
BYD Electronic International Co., Ltd. | | | 290,000 | | | $ | 227,489 | |
| | | | | | | | | |
Textile - Apparel 2.10% | |
Eclat Textile Ltd. | | | 5,000 | | | | 52,061 | |
Texhong Textile Group Ltd. | | | 218,000 | | | | 294,474 | |
| | | | | | | | 346,535 | |
| | | | | | | | | |
Therapeutics 0.69% | |
Dawnrays Pharmaceutical (Holdings) Ltd. | | | 190,000 | | | | 113,881 | |
| | | | | | | | | |
Web Portals/ISP 0.52% | |
NAVER Corp. | | | 134 | | | | 85,811 | * |
| |
Total Common Stocks | | | | 14,113,583 | |
(cost $13,302,626) | | | | | | | | |
| | | | | | | | | |
Exchange-Traded Fund 0.47% | | | | | | | | |
| | | | | | | | | |
VanEck Vectors Vietnam ETF | | | 6,000 | | | | 78,182 | |
(cost $78,482) | | | | | | | | |
| | | | | | | | | |
Purchased Call Option 1.33% | | Contracts | | | | | |
| | | | | | | | | |
Diversified Banking - Institutional 1.33% | |
HSBC Holdings, Strike Price $35.00, Expiration Mar. 2017 | | | 400 | | | | 219,000 | * |
(cost $125,216) | | | | | | | | |
| |
Total Investments 87.29% | | | | 14,410,765 | |
(cost $13,506,324) | | | | | | | | |
Other assets and liabilities, net 12.71% | | | | | | | 2,099,150 | |
| | | | | | | | | |
Net Assets 100.0% | | | | | | $ | 16,509,915 | |
See notes to portfolios of investments and notes to financial statements.
97
Notes to Portfolios of Investments | December 31, 2016 |
Legend
| + | Affiliated company (see following) |
| # | Illiquid Security |
| ^ | In default on interest and/or principal payments. Rate shown represents the last coupon rate prior to default. |
| ADR | American Depositary Receipt |
| AGC | Assured Guaranty Corporation |
| AGM | Assured Guaranty Municipal |
| AMBAC | American Municipal Bond Assurance Corporation |
| BAM | Build America Mutual Assurance Company |
| BHAC | Berkshire Hathaway Insurance Corporation CI |
| GDR | Global Depositary Receipt |
| ETF | Exchange-Traded Fund |
| GO | General Obligation Bond |
| LLC | Limited Liability Company |
| LP | Limited Partnership |
| NATL | National Public Finance Guarantee Corporation |
| NVDR | Non-voting Depositary Receipt |
| OJSC | Open Joint Stock Company |
| PJSC | Public Joint Stock Company |
| PCL | Public Company Limited |
| PSF-GTD | Texas Public School Fund Guarantee |
| Q-SBLF | Qualified School Bond Loan Fund |
| RS | Restricted Security (see following) |
| ZCB | Zero Coupon Bond |
| @ | Security was fair valued at December 31, 2016, by U.S. Global Investors, Inc. (Adviser) (other than international securities fair valued pursuant to systematic fair value models) in accordance with valuation procedures approved by the Board of Trustees. These securities, as a percentage of net assets at December 31, 2016, were 0.00% of All American Equity Fund, 1.30% of Holmes Macro Trends Fund, 8.48% of Global Resources Fund, 3.37% of World Precious Minerals Fund and 1.22% of Gold and Precious Metals Fund, respectively. See the Fair Valuation of Securities section of these Notes to Portfolios of Investments for further discussion of fair valued securities. See further information and detail on restricted securities in the Restricted Securities section of these Notes to Portfolios of Investments. |
| 144A | Pursuant to Rule 144A of the Securities Act of 1933, these securities may be resold in transactions exempt from registration, normally to qualified institutional buyers. The market value of these securities and percentage of net assets as of December 31, 2016 amounted to $0, 0.00%, of Holmes Macro Trends Fund, $2,579,324, 2.63%, of Global Resources Fund, $7,086,192, 5.02%, of World Precious Minerals Fund, $869,232, 0.92%, of Gold and Precious Metals Fund and $74,945, 0.18%, of Emerging Europe Fund. |
General
The yields reflect the effective yield from the date of purchase.
Variable Rate Notes have periodic reset features, which effectively shorten the maturity dates and reset the interest rates as tied to various interest-bearing instruments. Rates shown are current rates at December 31, 2016.
Principal amounts are in U.S. dollars unless otherwise noted.
Fair Valuation of Securities
For the Funds’ policies regarding the valuation of investments and other significant accounting policies, please refer to the Notes to Financial Statements.
The Funds are required to disclose information regarding the fair value measurements of a Fund’s assets and liabilities. Fair value is the price that would be received to sell an asset or paid to transfer a liability in an orderly transaction between
98
Notes to Portfolios of Investments | December 31, 2016 |
market participants at the measurement date. The measurement requirements established a three-tier hierarchy to maximize the use of observable market data and minimize the use of unobservable inputs and to establish classification of fair value measurements for disclosure purposes. Inputs refer broadly to the assumptions that market participants would use in pricing the asset or liability, including assumptions about risk, for example, the risk inherent in a particular valuation technique used to measure fair value including such a pricing model and/or the risk inherent in the inputs to the valuation technique. Inputs may be observable or unobservable. Observable inputs are inputs that reflect the assumptions market participants would use in pricing the asset or liability developed based on market data obtained from sources independent of the reporting entity. Unobservable inputs are inputs that reflect the reporting entity’s own assumptions about the assumptions market participants would use in pricing the asset or liability developed based on the best information available in the circumstances.
The inputs or methodology used for valuing securities are not necessarily an indication of the risk associated with investing in those securities. For example, short term U.S. government obligations maturing in sixty days or less are valued using amortized cost. Generally, amortized cost reflects the current fair value of a security, but since the value is not obtained from a quoted price in an active market, such securities are reflected as Level 2. Because of the inherent uncertainties of valuation, the values reflected in the portfolios may materially differ from the values received upon actual sale of those investments.
The three levels defined by the fair value hierarchy are as follows:
Level 1 – Quoted prices in active markets for identical securities.
Level 2 – Prices determined using significant other observable inputs (including quoted prices for similar securities, interest rates, prepayment speeds, credit risk, etc.). Short-term securities with maturities of sixty days or less are valued at amortized cost, which approximates market value, and are categorized as Level 2 in the hierarchy. Municipal securities, long-term U.S. government obligations and corporate debt securities are valued in accordance with the evaluated price supplied by the pricing service and generally categorized as Level 2 in the hierarchy. Other securities that are categorized as Level 2 in the hierarchy include, but are not limited to, warrants that do not trade on an exchange, securities valued at the mean between the last reported bid and ask quotation and international equity securities valued by an independent third party in order to adjust for stale pricing.
Level 3 – Prices determined using significant unobservable inputs (including the Fund’s own assumptions). For restricted equity securities and private placements where observable inputs are limited, assumptions about market activity and risk are used in determining fair value.
99
Notes to Portfolios of Investments | December 31, 2016 |
The following table summarizes the valuation of each Fund’s securities as of December 31, 2016, using the fair value hierarchy:
| | Quoted Prices in Active Markets
for Identical Investments
(Level 1) | | | Significant
Other
Observable
Inputs
(Level 2) | | | Significant Unobservable
Inputs
(Level 3) | | | Total | |
U.S. Government Securities Ultra-Short Bond Fund | | | | | | | |
Investments in Securities* | | | | | | | | | | | | |
United States Government and Agency Obligations | | $ | — | | | $ | 54,718,493 | | | $ | — | | | $ | 54,718,493 | |
Total | | $ | — | | | $ | 54,718,493 | | | $ | — | | | $ | 54,718,493 | |
Near-Term Tax Free Fund | | | | | | | | | | | | | | | | |
Investments in Securities* | | | | | | | | | | | | | | | | |
Municipal Bonds | | $ | — | | | $ | 88,498,495 | | | $ | — | | | $ | 88,498,495 | |
Total | | $ | — | | | $ | 88,498,495 | | | $ | — | | | $ | 88,498,495 | |
All American Equity Fund | | | | | | | | | | | | | | | | |
Investments in Securities* | | | | | | | | | | | | | | | | |
Common Stocks: | | $ | 15,491,213 | | | $ | — | | | $ | — | | | $ | 15,491,213 | |
Rights | | | — | | | | — | | | | — | | | | — | |
Total | | $ | 15,491,213 | | | $ | — | | | $ | — | | | $ | 15,491,213 | |
Holmes Macro Trends Fund | | | | | | | | | | | | | | | | |
Investments in Securities* | | | | | | | | | | | | | | | | |
Common Stocks: | | | | | | | | | | | | | | | | |
Energy - Alternate Sources | | $ | — | | | $ | — | | | $ | — | | | $ | — | |
Real Estate Operating/Development | | | — | | | | — | | | | 293,796 | | | | 293,796 | |
All Other Common Stocks | | | 35,446,249 | | | | — | | | | — | | | | 35,446,249 | |
Warrants: | | | | | | | | | | | | | | | | |
Gold Mining | | | — | | | | 10 | | | | — | | | | 10 | |
Convertible Debenture | | | 336,816 | | | | — | | | | — | | | | 336,816 | |
Corporate Note | | | — | | | | — | | | | 233,829 | | | | 233,829 | |
Total | | $ | 35,783,065 | | | $ | 10 | | | $ | 527,625 | | | $ | 36,310,700 | |
Global Resources Fund | | | | | | | | | | | | | | | | |
Investments in Securities* | | | | | | | | | | | | | | | | |
Common Stocks: | | | | | | | | | | | | | | | | |
Agricultural Chemicals | | $ | 1,271,337 | | | $ | 2,112,537 | | | $ | — | | | $ | 3,383,874 | |
Agricultural Operations | | | — | | | | 1,175,149 | | | | — | | | | 1,175,149 | |
Chemicals - Plastics | | | — | | | | 1,134,973 | | | | — | | | | 1,134,973 | |
Coal | | | 1,133,117 | | | | 1,181,344 | | | | — | | | | 2,314,461 | |
Diversified Minerals | | | 2,601,402 | | | | 1,007,127 | | | | — | | | | 3,608,529 | |
Energy - Alternate Sources | | | 975,880 | | | | 1,308,245 | | | | — | | | | 2,284,125 | |
Forestry | | | 3,560,697 | | | | 29,372 | | | | — | | | | 3,590,069 | |
Gold Mining | | | 12,409,033 | | | | 9,556,239 | | | | — | | | | 21,965,272 | |
Metal - Aluminum | | | — | | | | 1,391,656 | | | | — | | | | 1,391,656 | |
Metal - Copper | | | 1,384,624 | | | | 974,581 | | | | — | | | | 2,359,205 | |
Metal - Diversified | | | 1,953,776 | | | | 137,894 | | | | — | | | | 2,091,670 | |
Metal - Iron | | | — | | | | 2,488,938 | | | | — | | | | 2,488,938 | |
Natural Resource Technology | | | — | | | | — | | | | 137,351 | | | | 137,351 | |
Oil Companies - Exploration & Production | | | 2,802,162 | | | | 1,329,521 | | | | — | | | | 4,131,683 | |
Real Estate Operating/Development | | | — | | | | — | | | | 5,127,113 | | | | 5,127,113 | |
Steel - Producers | | | — | | | | 3,434,916 | | | | — | | | | 3,434,916 | |
100
Notes to Portfolios of Investments | December 31, 2016 |
| | Quoted Prices in Active Markets
for Identical Investments
(Level 1) | | | Significant
Other
Observable
Inputs
(Level 2) | | | Significant Unobservable
Inputs
(Level 3) | | | Total | |
Global Resources Fund (cont’d) | | | | | | | | | | | | |
Investments in Securities* (cont’d) | | | | | | | | | | | | |
Common Stocks: (cont’d) | | | | | | | | | | | | |
Steel - Specialty | | $ | — | | | $ | 1,117,339 | | | $ | — | | | $ | 1,117,339 | |
Textile - Products | | | — | | | | 994,755 | | | | — | | | | 994,755 | |
All Other Common Stocks | | | 16,948,577 | | | | — | | | | — | | | | 16,948,577 | |
Exchange-Traded Fund | | | 618,076 | | | | — | | | | — | | | | 618,076 | |
Warrants: | | | | | | | | | | | | | | | | |
Gold Mining | | | — | | | | 36,133 | | | | — | | | | 36,133 | |
Purchased Call Options | | | — | | | | 1,136,325 | | | | — | | | | 1,136,325 | |
Convertible Debentures | | | 9,664,527 | | | | — | | | | — | | | | 9,664,527 | |
Corporate Note | | | — | | | | — | | | | 2,805,938 | | | | 2,805,938 | |
Total | | $ | 55,323,208 | | | $ | 30,547,044 | | | $ | 8,070,402 | | | $ | 93,940,654 | |
World Precious Minerals Fund | | | | | | | | | | | | | | | | |
Investments in Securities* | | | | | | | | | | | | | | | | |
Common Stocks: | | | | | | | | | | | | | | | | |
Agricultural Operations | | $ | — | | | $ | 21,298 | | | $ | — | | | $ | 21,298 | |
Diversified Minerals | | | 10,763,787 | | | | 1,927,171 | | | | — | | | | 12,690,958 | |
Gold Mining | | | 70,531,984 | | | | 4,881,072 | | | | — | | | | 75,413,056 | |
Metal - Diversified | | | 6,969,970 | | | | 3,223,229 | | | | — | | | | 10,193,199 | |
Mining Services | | | — | | | | 293,278 | | | | — | | | | 293,278 | |
Oil Companies - Exploration & Production | | | 259 | | | | — | | | | — | | | | 259 | |
Other Mined Materials | | | — | | | | 813,689 | | | | — | | | | 813,689 | |
Precious Metals | | | 21,565,856 | | | | 2,485,421 | | | | — | | | | 24,051,277 | |
All Other Common Stocks | | | 3,378,754 | | | | — | | | | — | | | | 3,378,754 | |
Warrants: | | | | | | | | | | | | | | | | |
Diversified Minerals | | | — | | | | 25,258 | | | | — | | | | 25,258 | |
Gold Mining | | | — | | | | 1,083,732 | | | | — | | | | 1,083,732 | |
Metal - Diversified | | | — | | | | 204,063 | | | | — | | | | 204,063 | |
Precious Metals | | | — | | | | 1,033,404 | | | | — | | | | 1,033,404 | |
Silver Mining | | | — | | | | — | | | | — | | | | — | |
Special Warrant | | | — | | | | — | | | | — | | | | — | |
Right | | | 135,310 | | | | — | | | | — | | | | 135,310 | |
Convertible Debentures | | | 5,273,740 | | | | — | | | | — | | | | 5,273,740 | |
Corporate Note | | | — | | | | — | | | | 748,250 | | | | 748,250 | |
Total | | $ | 118,619,660 | | | $ | 15,991,615 | | | $ | 748,250 | | | $ | 135,359,525 | |
Gold and Precious Metals Fund | | | | | | | | | | | | | | | | |
Investments in Securities* | | | | | | | | | | | | | | | | |
Common Stocks: | | | | | | | | | | | | | | | | |
Gold Mining | | $ | 62,613,652 | | | $ | 10,502,873 | | | $ | — | | | $ | 73,116,525 | |
Medical - Hospitals | | | — | | | | — | | | | — | | | | — | |
All Other Common Stocks | | | 9,538,971 | | | | — | | | | — | | | | 9,538,971 | |
Warrants: | | | | | | | | | | | | | | | | |
Gold Mining | | | — | | | | 378,198 | | | | — | | | | 378,198 | |
Convertible Debentures | | | 2,704,834 | | | | — | | | | — | | | | 2,704,834 | |
Corporate Notes | | | — | | | | — | | | | 280,594 | | | | 280,594 | |
Total | | $ | 74,857,457 | | | $ | 10,881,071 | | | $ | 280,594 | | | $ | 86,019,122 | |
101
Notes to Portfolios of Investments | December 31, 2016 |
| | Quoted Prices in Active Markets
for Identical Investments
(Level 1) | | | Significant
Other
Observable
Inputs
(Level 2) | | | Significant Unobservable
Inputs
(Level 3) | | | Total | |
Emerging Europe Fund | | | | | | | | | | | | |
Investments in Securities* | | | | | | | | | | | | |
Common Stocks: | | | | | | | | | | | | |
Cellular Telecommunications | | $ | 498,317 | | | $ | 401,557 | | | $ | — | | | $ | 899,874 | |
Commercial Banks – Non US | | | 4,552,860 | | | | 2,769,219 | | | | — | | | | 7,322,079 | |
Computer Services | | | 252,900 | | | | 467,888 | | | | — | | | | 720,788 | |
Oil Companies - Integrated | | | 4,449,542 | | | | 3,769,503 | | | | — | | | | 8,219,045 | |
All Other Common Stocks | | | 471,598 | | | | 23,019,668 | | | | — | | | | 23,491,266 | |
Exchange-Traded Fund | | | 251,952 | | | | — | | | | — | | | | 251,952 | |
Total | | $ | 10,477,169 | | | $ | 30,427,835 | | | $ | — | | | $ | 40,905,004 | |
China Region Fund | | | | | | | | | | | | | | | | |
Investments in Securities* | | | | | | | | | | | | | | | | |
Common Stocks: | | $ | 223,440 | | | $ | 13,890,143 | | | $ | — | | | $ | 14,113,583 | |
Exchange-Traded Fund | | | 78,182 | | | | — | | | | — | | | | 78,182 | |
Purchased Call Option | | | — | | | | 219,000 | | | | — | | | | 219,000 | |
Total | | $ | 301,622 | | | $ | 14,109,143 | | | $ | — | | | $ | 14,410,765 | |
* | Refer to the Portfolio of Investments for a detailed list of the Fund’s investments. |
The following table shows transfers between Level 1 and Level 2 of the fair value hierarchy during the period January 1, 2016, through December 31, 2016:
Fund | | Transfers From
Level 1 to
Level 2* | | | Transfers From
Level 2 to
Level 1* | |
Global Resources Fund | | $ | — | | | $ | 594,814 | (1) |
World Precious Minerals Fund | | | — | | | | 1,901,901 | (1) |
China Region Fund | | | — | | | | 85,000 | (1) |
* | The Funds’ policy is to recognize transfers in and transfers out as of the end of the reporting period. |
(1) | Securities were valued at a quoted price at the end of the current period, but at the mean between bid and ask quotations at the end of the prior fiscal year. |
The following is a reconciliation of assets for which unobservable inputs (Level 3) were used in determining fair value during the period January 1, 2016, through December 31, 2016:
| | Rights | | | Total | |
All American Equity Fund | | | | | | |
Beginning Balance 12/31/15 | | $ | 7,659 | | | $ | 7,659 | |
Net change in unrealized appreciation (depreciation) | | | (7,659 | ) | | | (7,659 | ) |
Ending Balance 12/31/16 | | $ | — | | | $ | — | |
| | | | | | | | | |
Net change in unrealized appreciation (depreciation) from Investments held as of 12/31/16(1) | | $ | (7,659 | ) | | $ | (7,659 | ) |
102
Notes to Portfolios of Investments | December 31, 2016 |
| | Common
Stocks | | | Convertible
Debentures | | | Corporate
Note | | | Total | |
Holmes Macro Trends Fund | | | | | | | | | | | | |
Beginning Balance 12/31/15 | | $ | 349,510 | | | $ | 190,575 | | | $ | 212,500 | | | $ | 752,585 | |
Purchases | | | — | | | | 211,750 | | | | 21,329 | | | | 233,079 | |
Sales | | | — | | | | (211,750 | ) | | | — | | | | (211,750 | ) |
Total realized gain (loss) | | | — | | | | (167,750 | ) | | | — | | | | (167,750 | ) |
Net change in unrealized appreciation (depreciation) | | | (55,714 | ) | | | 313,991 | | | | — | | | | 258,277 | |
Transfers out of Level 3* | | | — | | | | (336,816 | ) | | | — | | | | (336,816 | ) |
Ending Balance 12/31/16 | | $ | 293,796 | | | $ | — | | | $ | 233,829 | | | $ | 527,625 | |
| | | | | | | | | | | | | | | | | |
Net change in unrealized appreciation (depreciation) from Investments held as of 12/31/16(1) | | $ | (55,714 | ) | | $ | — | | | $ | — | | | $ | (55,714 | ) |
| | Common
Stocks | | | Convertible
Debentures | | | Corporate
Note | | | Total | |
Global Resources Fund | | | | | | | | | | | | |
Beginning Balance 12/31/15 | | $ | 6,751,495 | | | $ | 4,428,765 | | | $ | 2,550,000 | | | $ | 13,730,260 | |
Purchases | | | — | | | | 5,110,143 | | | | 255,938 | | | | 5,366,081 | |
Sales | | | — | | | | (4,920,850 | ) | | | — | | | | (4,920,850 | ) |
Total realized gain (loss) | | | — | | | | (3,901,360 | ) | | | — | | | | (3,901,360 | ) |
Net change in unrealized appreciation (depreciation) | | | (1,487,031 | ) | | | 7,374,778 | | | | — | | | | 5,887,747 | |
Transfers out of Level 3* | | | — | | | | (8,091,476 | ) | | | — | | | | (8,091,476 | ) |
Ending Balance 12/31/16 | | $ | 5,264,464 | | | $ | — | | | $ | 2,805,938 | | | $ | 8,070,402 | |
| | | | | | | | | | | | | | | | | |
Net change in unrealized appreciation (depreciation) from Investments held as of 12/31/16(1) | | $ | (1,487,031 | ) | | $ | — | | | $ | — | | | $ | (1,487,031 | ) |
| | Common
Stocks | | | Warrants | | | Special
Warrants | | | Convertible Debentures | | | Corporate
Note | | | Total | |
World Precious Minerals Fund | |
Beginning Balance 12/31/15 | | $ | 72,013 | | | $ | — | | | $ | — | | | $ | 2,999,700 | | | $ | 680,000 | | | $ | 3,751,713 | |
Purchases | | | — | | | | — | | | | — | | | | 3,333,000 | | | | 68,250 | | | | 3,401,250 | |
Sales | | | — | | | | — | | | | — | | | | (5,245,346 | ) | | | — | | | | (5,245,346 | ) |
Total realized gain (loss) | | | — | | | | — | | | | — | | | | (1,921,734 | ) | | | — | | | | (1,921,734 | ) |
Net change in unrealized appreciation (depreciation) | | | (72,013 | ) | | | — | | | | — | | | | 4,243,615 | | | | — | | | | 4,171,602 | |
Transfers out of Level 3* | | | — | | | | — | | | | — | | | | (3,409,235 | ) | | | — | | | | (3,409,235 | ) |
Ending Balance 12/31/16 | | $ | — | | | $ | — | | | $ | — | | | $ | — | | | $ | 748,250 | | | $ | 748,250 | |
| | | | | | | | | | | | | | | | | | | | | | | | | |
Net change in unrealized appreciation (depreciation) from Investments held as of 12/31/16(1) | | $ | (72,013 | ) | | $ | — | | | $ | — | | | $ | — | | | $ | — | | | $ | (72,013 | ) |
103
Notes to Portfolios of Investments | December 31, 2016 |
| | Common
Stocks | | | Warrants | | | Convertible Debentures | | | Corporate
Notes | | | Total | |
Gold and Precious Metals Fund | | | | | | | | | | | | | | | |
Beginning Balance 12/31/15 | | $ | — | | | $ | — | | | | 1,517,175 | | | $ | 740,766 | | | | 2,257,941 | |
Purchases | | | — | | | | — | | | | 1,685,750 | | | | 25,594 | | | | 1,711,344 | |
Sales | | | — | | | | — | | | | (2,652,742 | ) | | | — | | | | (2,652,742 | ) |
Total realized gain (loss) | | | — | | | | — | | | | (967,925 | ) | | | — | | | | (967,925 | ) |
Net change in unrealized appreciation (depreciation) | | | — | | | | — | | | | 2,142,215 | | | | (485,766 | ) | | | 1,656,449 | |
Transfers out of Level 3* | | | — | | | | — | | | | (1,724,473 | ) | | | — | | | | (1,724,473 | ) |
Ending Balance 12/31/16 | | $ | — | | | $ | — | | | $ | — | | | $ | 280,594 | | | $ | 280,594 | |
| | | | | | | | | | | | | | | | | | | | | |
Net change in unrealized appreciation (depreciation) from Investments held as of 12/31/16(1) | | $ | — | | | $ | — | | | $ | — | | | $ | (485,766 | ) | | $ | (485,766 | ) |
| | Corporate
Note | | | Total | |
Emerging Europe Fund | | | | | | |
Beginning Balance 12/31/15 | | $ | 60,525 | | | $ | 60,525 | |
Sales | | | (53,698 | ) | | | (53,698 | ) |
Total realized gain (loss) | | | (1,296,647 | ) | | | (1,296,647 | ) |
Net change in unrealized appreciation (depreciation) | | | 1,289,820 | | | | 1,289,820 | |
Ending Balance 12/31/16 | | $ | — | | | $ | — | |
| | | | | | | | | |
Net change in unrealized appreciation (depreciation) from Investments held as of 12/31/16(1) | | $ | — | | | $ | — | |
| | Common
Stocks | | | Total | |
China Region Fund | | | | | | |
Beginning Balance 12/31/15 | | $ | 233,670 | | | $ | 233,670 | |
Sales | | | (91,764 | ) | | | (91,764 | ) |
Total realized gain (loss) | | | (4,549 | ) | | | (4,549 | ) |
Net change in unrealized appreciation (depreciation) | | | (51,469 | ) | | | (51,469 | ) |
Transfers out of Level 3* | | | (85,888 | ) | | | (85,888 | ) |
Ending Balance 12/31/16 | | $ | — | | | $ | — | |
| | | | | | | | | |
Net change in unrealized appreciation (depreciation) from Investments held as of 12/31/16(1) | | $ | — | | | $ | — | |
* | The Funds’ policy is to recognize transfers in and transfers out as of the end of the reporting period. |
(1) | The amounts shown represent the net change in unrealized appreciation (depreciation) attributable to only those investments still held and classified as Level 3 at December 31, 2016. |
104
Notes to Portfolios of Investments | December 31, 2016 |
Significant unobservable inputs developed by the Valuation Committee (“Valuation Committee”) for Level 3 investments held at year-end are as follows:
| | Fair Value
at 12/31/16 | | Valuation Technique(s) | Unobservable
Input | | Range
(Weighted Average) |
All American Equity Fund | | | | | | |
Investments in Securities | | | | | | |
Rights | | $ | — | | Market Transaction(1) | Discount | | | 100% |
| | | | | | | | | | | |
Holmes Macro Trends Fund | | | | | | | |
Investments in Securities | | | | | | | |
Common Stocks | | | — | | Market Transaction(1) | Discount | | | 100% |
Common Stocks | | | 293,796 | | Method of Comparables Pricing(2) | Multiples | | | 5.0 - 19.7(10.1) |
Corporate Note | | | 233,829 | | Market Transaction(1) | Discount | | | 0% |
| | | | | | | | | | | |
Global Resources Fund | | | | | | | |
Investments in Securities | | | | | | | |
Common Stocks | | | 137,351 | | Market Transaction(1) | Discount | | 0% - 100% discount (100% discount) |
Common Stocks | | | 5,127,113 | | Method of Comparables Pricing(2) | Multiples | | | 5.0 - 19.7(10.1) |
Corporate Note | | | 2,805,938 | | Market Transaction(1) | Discount | | | 0% |
| | | | | | | | | | | |
World Precious Minerals Fund | | | | | | | |
Investments in Securities | | | | | | | |
Common Stocks | | | — | | Market Transaction(1) | Discount | | | 100% |
Special Warrants | | | — | | Market Transaction(1) | Discount | | | 100% |
Corporate Note | | | 748,250 | | Market Transaction(1) | Discount | | | 0% |
| | | | | | | | | | | |
Gold and Precious Metals Fund | | | | | | | |
Investments in Securities | | | | | | | |
Common Stocks | | | — | | Market Transaction(1) | Discount | | | 100% |
Corporate Notes | | | 280,594 | | Market Transaction(1) | Discount | | 0% - 100% discount (63% discount) |
(1) | Market Transaction refers to most recent known market transaction, including transactions in which the fund participated, as adjusted for any discount or premium as discussed below. |
(2) | The Method of Comparables Pricing valuation technique involves determining a comparable group of companies that exhibit similar characteristics to that of the Level 3 security (the Comparables), gathering information about the Comparables to determine their range of valuation multiples and selecting the appropriate multiple within the determined range of the Comparables to apply in valuing the Level 3 security. |
The majority of securities classified as Level 3 are private companies. The initial valuation is usually cost, which is then adjusted as determined by the Valuation Committee for subsequent known market transactions and evaluated for progress against anticipated milestones and current operations. An evaluation that the holding no longer meets expectations could result in the application of discounts and a significantly lower fair valuation. For certain securities, the last known market transaction is increased or decreased by changes in a market index or industry peers as approved by the Valuation Committee.
105
Notes to Portfolios of Investments | December 31, 2016 |
Affiliated Companies - Indicated in Portfolio of Investments as “+”
The Investment Company Act of 1940 defines affiliates as companies in which the Fund owns at least 5% of the outstanding voting securities. The following is a summary of transactions with each affiliated company during the year ended December 31, 2016.
| | | Shares of Affiliated Companies | |
Global Resources Fund | | December 31,
2015 | | | Additions | | | Reductions | | | December 31,
2016 | |
Agriterra Ltd. | | | 69,849,776 | | | | — | | | | — | | | | 69,849,776 | |
Atlas African Industries Ltd. (a) | | | 42,993,083 | | | | 212,861,538 | | | | — | | | | 255,854,621 | |
Caribbean Resources Corp. (b) | | | 4,362,314 | | | | — | | | | (4,362,297 | ) | | | 17 | |
Pacific Green Energy Corp. | | | 2,400,000 | | | | — | | | | — | | | | 2,400,000 | |
Sunridge Gold Corp. | | | 10,933,788 | | | | — | | | | (10,933,788 | ) | | | — | (c) |
Sunridge Gold Corp., Warrants | | | 6,333,788 | | | | — | | | | (6,333,788 | ) | | | — | (c) |
At December 31, 2016, the value of investments in affiliated companies was $99,168, representing 0.10% of net assets, and the total cost was $39,515,467. Net realized losses on transactions were $24,070, and there was no income earned for the period.
| | | Shares of Affiliated Companies | |
World Precious Minerals Fund | | December 31,
2015 | | | Additions | | | Reductions | | | December 31,
2016 | |
Argent Minerals Ltd. | | | 17,100,000 | | | | — | | | | — | | | | 17,100,000 | (c) |
Barsele Minerals Corp. | | | 9,411,500 | | | | 1,352,000 | | | | (594,500 | ) | | | 10,169,000 | |
Barsele Minerals Corp., Warrants | | | 1,850,000 | | | | — | | | | — | | | | 1,850,000 | |
Bonterra Resources, Inc. | | | 2,500,000 | | | | 5,250,000 | | | | (1,250,000 | ) | | | 6,500,000 | |
Bonterra Resources, Inc., Warrants | | | 625,000 | | | | 625,000 | | | | — | | | | 1,250,000 | |
Brixton Metals Corp. | | | — | | | | 2,500,000 | | | | — | | | | 2,500,000 | |
Candente Gold Corp. | | | 4,875,000 | | | | — | | | | — | | | | 4,875,000 | (c) |
Canyon Resources Ltd. | | | 10,006,593 | | | | — | | | | — | | | | 10,006,593 | (c) |
Canyon Resources Ltd., Warrants | | | 6,168,864 | | | | — | | | | — | | | | 6,168,864 | (c) |
Cardinal Resources Ltd. | | | 9,000,000 | | | | 5,888,743 | | | | (888,743 | ) | | | 14,000,000 | (c) |
Cardinal Resources Ltd., Rights | | | 1,500,000 | | | | — | | | | — | | | | 1,500,000 | (c) |
Dolly Varden Silver Corp. | | | — | | | | 5,828,500 | | | | (200,000 | ) | | | 5,628,500 | |
Fiore Exploration Ltd. | | | — | | | | 7,746,800 | | | | — | | | | 7,746,800 | |
Golden Peak Minerals, Inc. | | | — | | | | 1,999,998 | | | | — | | | | 1,999,998 | |
Mammoth Resources Corp. | | | 2,818,000 | | | | 2,000,000 | | | | — | | | | 4,818,000 | |
106
Notes to Portfolios of Investments | December 31, 2016 |
| | | Shares of Affiliated Companies | |
World Precious Minerals Fund (cont’d) | | December 31,
2015 | | | Additions | | | Reductions | | | December 31,
2016 | |
Minera Alamos, Inc. | | | — | | | | 4,450,000 | | | | — | | | | 4,450,000 | |
Minera Alamos, Inc., Warrants | | | — | | | | 2,225,000 | | | | — | | | | 2,225,000 | |
Mineral Mountain Resources Ltd. | | | 10,000,000 | | | | — | | | | (8,157,000 | ) | | | 1,843,000 | (c) |
Mineral Mountain Resources Ltd., Warrants | | | 3,500,000 | | | | — | | | | (3,500,000 | ) | | | — | (c) |
Murchison Minerals Ltd. | | | — | | | | 3,000,000 | | | | — | | | | 3,000,000 | |
Murchison Minerals Ltd., Warrants | | | — | | | | 1,500,000 | | | | — | | | | 1,500,000 | |
Nano One Materials Corp. | | | — | | | | 3,100,000 | | | | — | | | | 3,100,000 | |
NV Gold Corp. | | | — | | | | 1,800,000 | | | | — | | | | 1,800,000 | |
Orex Minerals, Inc. | | | 9,510,000 | | | | 1,752,200 | | | | (3,089,200 | ) | | | 8,173,000 | |
Orex Minerals, Inc., Warrants | | | 1,850,000 | | | | — | | | | (600,000 | ) | | | 1,250,000 | |
Red Pine Exploration, Inc. | | | — | | | | 12,000,000 | | | | (2,000,000 | ) | | | 10,000,000 | |
Redstar Gold Corp. | | | 8,797,714 | | | | 6,202,286 | | | | — | | | | 15,000,000 | |
Redstar Gold Corp., Warrants | | | — | | | | 2,500,000 | | | | — | | | | 2,500,000 | |
Source Exploration Corp. | | | 4,975,000 | | | | — | | | | (4,975,000 | ) | | | — | (c) |
Source Exploration Corp., Warrants | | | 2,500,000 | | | | — | | | | (2,250,000 | ) | | | 250,000 | (c) |
Toachi Mining, Inc. | | | — | | | | 6,350,000 | | | | — | | | | 6,350,000 | |
TriStar Gold, Inc. | | | 17,994,000 | | | | 7,548,500 | | | | (234,500 | ) | | | 25,308,000 | |
At December 31, 2016, the value of investments in affiliated companies was $30,493,025, representing 21.60% of net assets, and the total cost was $22,022,837. Net realized gains on transactions were $1,317,076, and there was no income earned for the period.
| | | Shares of Affiliated Companies | |
Gold and Precious Metals Fund | | December 31,
2015 | | | Additions | | | Reductions | | | December 31,
2016 | |
Jaguar Mining, Inc. | | | — | | | | 7,550,000 | | | | — | | | | 7,550,000 | (c) |
At December 31, 2016, the value of investments in affiliated companies was $0, representing 0.00% of assets, and the total cost was $0. There was no realized gain (loss) on transactions and no income earned for the period.
(a) | Effective March 17, 2016, Atlas Development & Support Services Ltd.’s name was changed to Atlas African Industries Ltd. |
(b) | Effective February 10, 2016, Pacific Coal Resources Ltd.’s name was changed to Caribbean Resources Corp. |
(c) | At December 31, 2016, the company is no longer defined as an affiliate, although it was an affiliated company during the year. |
107
Notes to Portfolios of Investments | December 31, 2016 |
Restricted Securities - Indicated in Portfolio of Investments as “RS”
The following securities are subject to contractual and regulatory restrictions on resale or transfer. These investments may involve a high degree of business and financial risk. Because of the thinly traded markets for these investments, a Fund may be unable to liquidate its securities in a timely manner, especially if there is negative news regarding the specific securities or the markets overall. These securities could decline significantly in value before the Fund could liquidate these securities. The issuer bears the cost of registration, if any, involved in the disposition of these securities.
Holmes Macro Trends Fund | Acquisition
Date | | Cost per
Share/Unit | |
Interamerican Energy Corp., Corporate Note (November 2021) | 05/25/12 | | $ | 100.00 | |
Pacific Infrastructure Ventures, Inc. | 08/06/10-11/22/10 | | $ | 1.00 | |
As of December 31, 2016, the total cost of restricted securities was $660,454, and the total value was $527,625, representing 1.30% of net assets.
Global Resources Fund | Acquisition
Date | | Cost per
Share/Unit | |
Interamerican Energy Corp., Corporate Note (November 2021) | 05/25/12 | | $ | 100.00 | |
I-Pulse, Inc., 144A | 10/04/07 | | $ | 1.88 | |
Pacific Infrastructure Ventures, Inc. | 08/06/10-11/22/10 | | $ | 1.00 | |
Radisson Mining Resources, Inc. | 09/22/16 | | $ | 0.10 | |
As of December 31, 2016, the total cost of restricted securities was $10,480,462, and the total value was $8,315,570, representing 8.48% of net assets.
World Precious Minerals Fund | Acquisition
Date | | Cost per
Share/Unit | |
Dolly Varden Silver Corp. | 08/02/16 | | $ | 0.38 | |
Golden Peak Minerals, Inc. | 12/21/16 | | $ | 0.37 | |
Interamerican Energy Corp., Corporate Note (November 2021) | 05/25/12 | | $ | 100.00 | |
Kirkland Lake Gold, Inc., 144A | 12/15/16 | | $ | 5.62 | |
Murchison Minerals Ltd., 144A | 08/31/16 | | $ | 0.18 | |
Murchison Minerals Ltd., 144A, Warrants (August 2018) | 08/31/16 | | $ | 0.00 | |
Radisson Mining Resources, Inc. | 09/22/16 | | $ | 0.10 | |
As of December 31, 2016, the total cost of restricted securities was $3,584,655, and the total value was $3,629,630, representing 2.57% of net assets.
Gold and Precious Metals Fund | Acquisition
Date | | Cost per
Share/Unit | |
Interamerican Energy Corp., Corporate Note (November 2021) | 05/25/12 | | $ | 100.00 | |
Kirkland Lake Gold, Inc., 144A | 12/15/16 | | $ | 5.62 | |
As of December 31, 2016, the total cost of restricted securities was $1,263,961, and the total value was $1,149,826, representing 1.22% of net assets.
108
[THIS PAGE INTENTIONALLY LEFT BLANK]
Statements of Assets and Liabilities | |
| | | U.S. Government
Securities
Ultra-Short
Bond Fund | |
| Investments, at identified cost | | $ | 54,640,917 | |
| | | | | |
| Assets | | | | |
| Investments, at value: | | | | |
| Securities of unaffiliated issuers | | $ | 54,718,493 | |
| Cash | | | 2,012,413 | |
| Receivables: | | | | |
| Dividends and interest | | | 91,414 | |
| Capital shares sold | | | 7,328 | |
| Investments sold | | | — | |
| From adviser | | | 2,699 | |
| Other assets | | | 10,143 | |
| Total Assets | | | 56,842,490 | |
| | | | | |
| Liabilities | | | | |
| Payables: | | | | |
| Capital shares redeemed | | | 8,744 | |
| Distributions payable | | | 5,060 | |
| Investments purchased | | | — | |
| Accrued expenses and other payables: | | | | |
| Adviser | | | — | |
| Administration and Transfer Agent fees | | | 7,433 | |
| Trustees | | | 463 | |
| Other expenses | | | 27,179 | |
| Total Liabilities | | | 48,879 | |
| | | | | |
| Net Assets | | $ | 56,793,611 | |
| | | | | |
| Net Assets Consist of: | | | | |
| Paid-in-capital | | $ | 56,716,068 | |
| Accumulated undistributed (distributions in excess of) net investment income | | | 11 | |
| Accumulated net realized gains (losses) from investment transactions and other assets and liabilities denominated in foreign currencies | | | (44 | ) |
| Net unrealized appreciation (depreciation) of investments and other assets and liabilities denominated in foreign currencies | | | 77,576 | |
| Net assets applicable to capital shares outstanding | | $ | 56,793,611 | |
| | | | | |
| By share class | | | | |
| | | | | |
| Net Assets | | | | |
| Investor Class | | $ | 56,793,611 | |
| | | | | |
| Capital shares outstanding, an unlimited number of no par shares authorized | | | | |
| Investor Class | | | 28,388,067 | |
| | | | | |
| Net Asset Value, Public Offering Price, and Redemption Price per share* | | | | |
| Investor Class | | $ | 2.00 | |
| * | Redemption price per share may vary depending on length of time shares are held. See Note 1 H. |
See accompanying notes to financial statements.
110
| | Near-Term
Tax Free Fund | | | All American
Equity Fund | | | Holmes Macro
Trends Fund | |
| | | $ | 89,093,944 | | | $ | 15,329,106 | | | $ | 35,276,353 | |
| | | | | | | | | | | | | |
| | | | | | | | | | | | | |
| | | | | | | | | | | | | |
| | | $ | 88,498,495 | | | $ | 15,491,213 | | | $ | 36,310,700 | |
| | | | 5,952,219 | | | | 1,491,302 | | | | 3,915,144 | |
| | | | | | | | | | | | | |
| | | | 1,093,449 | | | | 17,272 | | | | 38,593 | |
| | | | 308,957 | | | | 1,724 | | | | 1,957 | |
| | | | — | | | | 862,495 | | | | 1,316,025 | |
| | | | 14,852 | | | | — | | | | — | |
| | | | 14,836 | | | | 10,243 | | | | 10,233 | |
| | | | 95,882,808 | | | | 17,874,249 | | | | 41,592,652 | |
| | | | | | | | | | | | | |
| | | | | | | | | | | | | |
| | | | | | | | | | | | | |
| | | | 512,476 | | | | 23,785 | | | | 10,379 | |
| | | | 10,936 | | | | — | | | | — | |
| | | | — | | | | 466,938 | | | | 801,573 | |
| | | | | | | | | | | | | |
| | | | — | | | | 8,014 | | | | 34,298 | |
| | | | 23,564 | | | | 3,974 | | | | 6,649 | |
| | | | 807 | | | | 145 | | | | 331 | |
| | | | 34,457 | | | | 21,632 | | | | 33,400 | |
| | | | 582,240 | | | | 524,488 | | | | 886,630 | |
| | | | | | | | | | | | | |
| | | $ | 95,300,568 | | | $ | 17,349,761 | | | $ | 40,706,022 | |
| | | | | | | | | | | | | |
| | | | | | | | | | | | | |
| | | $ | 96,540,412 | | | $ | 18,171,857 | | | $ | 38,850,337 | |
| | | | 1,073 | | | | 11,078 | | | | — | |
| | | | (645,468 | ) | | | (995,281 | ) | | | 821,342 | |
| | | | (595,449 | ) | | | 162,107 | | | | 1,034,343 | |
| | | $ | 95,300,568 | | | $ | 17,349,761 | | | $ | 40,706,022 | |
| | | | | | | | | | | | | |
| | | | | | | | | | | | | |
| | | | | | | | | | | | | |
| | | | | | | | | | | | | |
| | | $ | 95,300,568 | | | $ | 17,349,761 | | | $ | 40,706,022 | |
| | | | | | | | | | | | | |
| | | | | | | | | | | | | |
| | | | 43,201,269 | | | | 737,267 | | | | 2,182,050 | |
| | | | | | | | | | | | | |
| | | | | | | | | | | | | |
| | | $ | 2.21 | | | $ | 23.53 | | | $ | 18.65 | |
111
Statements of Assets and Liabilities | |
| | Global
Resources Fund | |
Investments, at identified cost | $ | 160,600,679 | |
| | | | |
Assets | | | |
Investments, at value: | | | |
Securities of unaffiliated issuers | $ | 93,841,486 | |
Securities of affiliated issuers | | 99,168 | |
Cash | | 4,663,169 | |
Foreign currencies (Cost $126,865, $89,463, $94,291, $307,417 and $117,575) | | 124,319 | |
Receivables: | | | |
Dividends and interest | | 182,998 | |
Capital shares sold | | 66,064 | |
Investments sold | | 22,877 | |
Other assets | | 18,725 | |
Total Assets | | 99,018,806 | |
| | | | |
Liabilities | | | |
Payables: | | | |
Capital shares redeemed | | 138,541 | |
Investments purchased | | 696,388 | |
Accrued expenses and other payables: | | | |
Adviser | | 56,017 | |
Administration and Transfer Agent fees | | 30,308 | |
Trustees | | 849 | |
Other expenses | | 70,839 | |
Total Liabilities | | 992,942 | |
| | | | |
Net Assets | $ | 98,025,864 | |
| | | | |
Net Assets Consist of: | | | |
Paid-in-capital | $ | 631,485,060 | |
Accumulated undistributed (distributions in excess of) net investment income | | 1,594,626 | |
Accumulated net realized losses from investment transactions and other assets and liabilities denominated in foreign currencies | | (468,403,977 | ) |
Net unrealized appreciation (depreciation) of investments and other assets and liabilities denominated in foreign currencies | | (66,649,845 | ) |
Net assets applicable to capital shares outstanding | $ | 98,025,864 | |
| | | | |
By share class | | | |
| | | | |
Net Assets | | | |
Investor Class | $ | 97,004,746 | |
Institutional Class | $ | 1,021,118 | |
| | | | |
Capital shares outstanding, an unlimited number of no par shares authorized | | | |
Investor Class | | 18,470,523 | |
Institutional Class | | 194,459 | |
| | | | |
Net Asset Value, Public Offering Price, and Redemption Price per share* | | | |
Investor Class | $ | 5.25 | |
Institutional Class | | 5.25 | |
* | Redemption price per share may vary depending on length of time shares are held. See Note 1 H. |
See accompanying notes to financial statements.
112
| | | World Precious
Minerals Fund | | | Gold and
Precious
Metals Fund | | | Emerging
Europe
Fund | | | China
Region
Fund | |
| | | $ | 143,032,722 | | | $ | 71,916,261 | | | $ | 40,248,328 | | | $ | 13,506,324 | |
| | | | | | | | | | | | | | | | | |
| | | | | | | | | | | | | | | | | |
| | | | | | | | | | | | | | | | | |
| | | $ | 104,866,500 | | | $ | 86,019,122 | | | $ | 40,905,004 | | | $ | 14,410,765 | |
| | | | 30,493,025 | | | | — | | | | — | | | | — | |
| | | | 5,346,449 | | | | 5,739,315 | | | | 1,544,994 | | | | 2,106,597 | |
| | | | 89,991 | | | | 94,362 | | | | 308,804 | | | | 116,055 | |
| | | | | | | | | | | | | | | | | |
| | | | 24,135 | | | | 15,229 | | | | 130,521 | | | | 13,855 | |
| | | | 593,230 | | | | 2,440,148 | | | | 25,296 | | | | 1,351 | |
| | | | 403,107 | | | | 19,502 | | | | — | | | | — | |
| | | | 23,932 | | | | 18,220 | | | | 10,609 | | | | 11,645 | |
| | | | 141,840,369 | | | | 94,345,898 | | | | 42,925,228 | | | | 16,660,268 | |
| | | | | | | | | | | | | | | | | |
| | | | | | | | | | | | | | | | | |
| | | | | | | | | | | | | | | | | |
| | | | 259,313 | | | | 102,295 | | | | 117,601 | | | | 12,650 | |
| | | | 171,187 | | | | 107,696 | | | | 432,514 | | | | 78,484 | |
| | | | | | | | | | | | | | | | | |
| | | | 124,317 | | | | 60,500 | | | | 35,234 | | | | 16,902 | |
| | | | 38,858 | | | | 25,561 | | | | 12,176 | | | | 5,252 | |
| | | | 1,219 | | | | 787 | | | | 356 | | | | 143 | |
| | | | 86,691 | | | | 60,969 | | | | 54,243 | | | | 36,922 | |
| | | | 681,585 | | | | 357,808 | | | | 652,124 | | | | 150,353 | |
| | | | | | | | | | | | | | | | | |
| | | $ | 141,158,784 | | | $ | 93,988,090 | | | $ | 42,273,104 | | | $ | 16,509,915 | |
| | | | | | | | | | | | | | | | | |
| | | | | | | | | | | | | | | | | |
| | | $ | 509,906,093 | | | $ | 189,034,351 | | | $ | 341,670,644 | | | $ | 20,484,083 | |
| | | | 4,847,267 | | | | (2,777,434 | ) | | | — | | | | 16,259 | |
| | | | (365,921,971 | ) | | | (106,371,655 | ) | | | (300,041,825 | ) | | | (4,893,361 | ) |
| | | | (7,672,605 | ) | | | 14,102,828 | | | | 644,285 | | | | 902,934 | |
| | | $ | 141,158,784 | | | $ | 93,988,090 | | | $ | 42,273,104 | | | $ | 16,509,915 | |
| | | | | | | | | | | | | | | | | |
| | | | | | | | | | | | | | | | | |
| | | | | | | | | | | | | | | | | |
| | | | | | | | | | | | | | | | | |
| | | $ | 137,338,130 | | | $ | 93,988,090 | | | $ | 42,273,104 | | | $ | 16,509,915 | |
| | | $ | 3,820,654 | | | $ | — | | | $ | — | | | $ | — | |
| | | | | | | | | | | | | | | | | |
| | | | | | | | | | | | | | | | | |
| | | | 21,614,440 | | | | 13,357,196 | | | | 7,122,302 | | | | 2,255,605 | |
| | | | 598,636 | | | | — | | | | — | | | | — | |
| | | | | | | | | | | | | | | | | |
| | | | | | | | | | | | | | | | | |
| | | $ | 6.35 | | | $ | 7.04 | | | $ | 5.94 | | | $ | 7.32 | |
| | | | 6.38 | | | | — | | | | — | | | | — | |
113
| | | U.S. Government
Securities
Ultra-Short
Bond Fund | |
Net Investment Income | | | |
| | | | |
Income | | | |
Dividends from unaffiliated issuers | | $ | — | |
Net dividends | | | — | |
Interest and other | | | 526,313 | |
Total income | | | 526,313 | |
| | | | | |
Expenses: | | | | |
Management fee | | | 299,089 | |
Administrative services fee | | | 52,676 | |
Accounting service fees and expenses | | | 78,406 | |
Distribution plan fee | | | — | |
Transfer agent fees and expenses | | | 67,921 | |
Professional fees | | | 32,515 | |
Custodian fees | | | 6,679 | |
Shareholder reporting expenses | | | 13,661 | |
Registration fees | | | 19,694 | |
Trustee fees and expenses | | | 6,087 | |
Chief compliance officer fees | | | 13,934 | |
Miscellaneous expenses | | | 10,305 | |
Total expenses before reductions | | | 600,967 | |
Expenses offset - Note 1 H | | | — | |
Expenses reimbursed - Note 3 | | | (334,097 | ) |
Net expenses | | | 266,870 | |
| | | | |
Net Investment Income (Loss) | | | 259,443 | |
| | | | | |
Net Realized and Unrealized Gain (Loss) on Investments | | | | |
Realized gain (loss) from: | | | | |
Securities from unaffiliated issuers | | | 16,447 | |
Foreign currency transactions | | | — | |
Net realized gain (loss) | | | 16,447 | |
Net change in unrealized appreciation (depreciation) of: | | | | |
Investments | | | 50,035 | |
Other assets and liabilities denominated in foreign currencies | | | — | |
Net change in unrealized appreciation (depreciation) | | | 50,035 | |
| | | | |
Net Realized and Unrealized Gain (Loss) on Investments | | | 66,482 | |
| | | | | |
Net Increase (Decrease) In Net Assets Resulting From Operations | | $ | 325,925 | |
See accompanying notes to financial statements.
114
For the Year Ended December 31, 2016 |
| | | Near-Term
Tax Free Fund | | | All American
Equity Fund | | | Holmes Macro
Trends Fund | |
| | | | | | | | | | |
| | | | | | | | | | |
| | | | | | | | | | |
| | | $ | — | | | $ | 320,318 | | | $ | 435,808 | |
| | | | — | | | | 320,318 | | | | 435,808 | |
| | | | 1,945,335 | | | | 1 | | | | 72,221 | |
| | | | 1,945,335 | | | | 320,319 | | | | 508,029 | |
| | | | | | | | | | | | | |
| | | | | | | | | | | | | |
| | | | 570,559 | | | | 103,449 | | | | 305,744 | |
| | | | 107,366 | | | | 29,927 | | | | 40,062 | |
| | | | 173,912 | | | | 23,504 | | | | 49,639 | |
| | | | — | | | | 44,847 | | | | 95,522 | |
| | | | 122,651 | | | | 40,246 | | | | 56,280 | |
| | | | 39,272 | | | | 26,050 | | | | 30,357 | |
| | | | 12,213 | | | | 6,281 | | | | 14,637 | |
| | | | 16,426 | | | | 11,321 | | | | 12,432 | |
| | | | 30,026 | | | | 18,091 | | | | 19,583 | |
| | | | 9,561 | | | | 3,289 | | | | 4,726 | |
| | | | 26,375 | | | | 4,179 | | | | 8,876 | |
| | | | 15,704 | | | | 5,607 | | | | 8,307 | |
| | | | 1,124,065 | | | | 316,791 | | | | 646,165 | |
| | | | (20,108 | ) | | | (3,490 | ) | | | (6,633 | ) |
| | | | (589,697 | ) | | | (3,528 | ) | | | — | |
| | | | 514,260 | | | | 309,773 | | | | 639,532 | |
| | | | | | | | | | | | | |
| | | | 1,431,075 | | | | 10,546 | | | | (131,503 | ) |
| | | | | | | | | | | | | |
| | | | | | | | | | | | | |
| | | | | | | | | | | | | |
| | | | (258,979 | ) | | | 364,020 | | | | 1,478,996 | |
| | | | — | | | | — | | | | 51 | |
| | | | (258,979 | ) | | | 364,020 | | | | 1,479,047 | |
| | | | | | | | | | | | | |
| | | | (1,746,522 | ) | | | (418,440 | ) | | | 1,713,977 | |
| | | | — | | | | — | | | | (4 | ) |
| | | | (1,746,522 | ) | | | (418,440 | ) | | | 1,713,973 | |
| | | | | | | | | | | | | |
| | | | (2,005,501 | ) | | | (54,420 | ) | | | 3,193,020 | |
| | | | | | | | | | | | | |
| | | $ | (574,426 | ) | | $ | (43,874 | ) | | $ | 3,061,517 | |
115
| | | Global
Resources Fund | |
Net Investment Income | | | |
| | | | |
Income | | | |
Dividends from unaffiliated issuers | | $ | 1,939,985 | |
Foreign tax withheld on dividends | | | (107,557 | ) |
Net dividends | | | 1,832,428 | |
Interest and other | | | 1,216,626 | |
Total income | | | 3,049,054 | |
| | | | | |
Expenses: | | | | |
Management fee | | | 997,180 | |
Administrative services fee | | | 72,026 | |
Administrative services fee - Investor Class | | | 25,462 | |
Administrative services fee - Institutional Class | | | 159 | |
Accounting service fees and expenses | | | 134,502 | |
Distribution plan fee | | | 254,624 | |
Transfer agent fees and expenses | | | — | |
Transfer agent fees and expenses - Investor Class | | | 214,797 | |
Transfer agent fees and expenses - Institutional Class | | | 14,968 | |
Professional fees | | | 41,119 | |
Custodian fees | | | 52,523 | |
Shareholder reporting expenses | | | — | |
Shareholder reporting expenses - Investor Class | | | 35,927 | |
Shareholder reporting expenses - Institutional Class | | | 3,284 | |
Registration fees | | | 5,000 | |
Registration fees - Investor Class | | | 16,707 | |
Registration fees - Institutional Class | | | 13,131 | |
Trustee fees and expenses | | | 9,165 | |
Chief compliance officer fees | | | 23,786 | |
Miscellaneous expenses | | | 21,021 | |
Total expenses before reductions | | | 1,935,381 | |
Expenses offset - Note 1 H | | | (10,231 | ) |
Expenses reimbursed - Note 3 | | | (38,538 | ) |
Net expenses | | | 1,886,612 | |
| | | | |
Net Investment Income (Loss) | | | 1,162,442 | |
| | | | | |
Net Realized and Unrealized Gain (Loss) on Investments | | | | |
Realized gain (loss) from: | | | | |
Securities from unaffiliated issuers | | | (9,109,540 | ) |
Securities from affiliated issuers | | | (24,070 | ) |
Foreign currency transactions | | | (794,077 | ) |
Net realized gain (loss) | | | (9,927,687 | ) |
Net change in unrealized appreciation (depreciation) of: | | | | |
Investments | | | 22,992,852 | |
Other assets and liabilities denominated in foreign currencies | | | (3,523 | ) |
Net change in unrealized appreciation (depreciation) | | | 22,989,329 | |
| | | | |
Net Realized and Unrealized Gain (Loss) on Investments | | | 13,061,642 | |
| | | | | |
Net Increase (Decrease) In Net Assets Resulting From Operations | | $ | 14,224,084 | |
See accompanying notes to financial statements.
116
For the Year Ended December 31, 2016 |
| | | World Precious Minerals Fund | | | Gold and
Precious
Metals Fund | | | Emerging
Europe
Fund | | | China Region
Fund | |
| | | | | | | | | | | | | |
| | | | | | | | | | | | | |
| | | | | | | | | | | | | |
| | | $ | 447,778 | | | $ | 496,865 | | | $ | 1,707,042 | | | $ | 431,969 | |
| | | | (64,086 | ) | | | (52,707 | ) | | | (192,911 | ) | | | (31,817 | ) |
| | | | 383,692 | | | | 444,158 | | | | 1,514,131 | | | | 400,152 | |
| | | | 645,378 | | | | 311,787 | | | | — | | | | — | |
| | | | 1,029,070 | | | | 755,945 | | | | 1,514,131 | | | | 400,152 | |
| | | | | | | | | | | | | | | | | |
| | | | | | | | | | | | | | | | | |
| | | | 1,808,776 | | | | 987,182 | | | | 489,208 | | | | 201,459 | |
| | | | 110,498 | | | | 106,948 | | | | 42,576 | | | | 29,016 | |
| | | | 37,796 | | | | — | | | | — | | | | — | |
| | | | 514 | | | | — | | | | — | | | | — | |
| | | | 194,480 | | | | 137,191 | | | | 66,357 | | | | 29,770 | |
| | | | 377,961 | | | | 271,094 | | | | 108,093 | | | | 40,291 | |
| | | | — | | | | 199,440 | | | | 100,377 | | | | 43,181 | |
| | | | 262,031 | | | | — | | | | — | | | | — | |
| | | | 16,764 | | | | — | | | | — | | | | — | |
| | | | 48,943 | | | | 39,577 | | | | 42,348 | | | | 39,706 | |
| | | | 86,188 | | | | 44,973 | | | | 85,493 | | | | 20,335 | |
| | | | — | | | | 32,476 | | | | 24,977 | | | | 9,876 | |
| | | | 37,279 | | | | — | | | | — | | | | — | |
| | | | 3,447 | | | | — | | | | — | | | | — | |
| | | | 4,878 | | | | 28,776 | | | | 19,045 | | | | 18,116 | |
| | | | 19,189 | | | | — | | | | — | | | | — | |
| | | | 10,759 | | | | — | | | | — | | | | — | |
| | | | 11,250 | | | | 8,507 | | | | 5,116 | | | | 3,156 | |
| | | | 34,539 | | | | 24,518 | | | | 10,080 | | | | 3,714 | |
| | | | 19,230 | | | | 13,653 | | | | 10,789 | | | | 5,765 | |
| | | | 3,084,522 | | | | 1,894,335 | | | | 1,004,459 | | | | 444,385 | |
| | | | (10,907 | ) | | | (13,323 | ) | | | (3,445 | ) | | | (1,869 | ) |
| | | | (93,577 | ) | | | (21,729 | ) | | | (369 | ) | | | (61,666 | ) |
| | | | 2,980,038 | | | | 1,859,283 | | | | 1,000,645 | | | | 380,850 | |
| | | | | | | | | | | | | | | | | |
| | | | (1,950,968 | ) | | | (1,103,338 | ) | | | 513,486 | | | | 19,302 | |
| | | | | | | | | | | | | | | | | |
| | | | | | | | | | | | | | | | | |
| | | | | | | | | | | | | | | | | |
| | | | (28,421,382 | ) | | | 1,130,083 | | | | (2,048,542 | ) | | | (1,501,897 | ) |
| | | | 1,317,076 | | | | — | | | | — | | | | — | |
| | | | (4,392,572 | ) | | | (2,322,339 | ) | | | (554,073 | ) | | | (3,346 | ) |
| | | | (31,496,878 | ) | | | (1,192,256 | ) | | | (2,602,615 | ) | | | (1,505,243 | ) |
| | | | | | | | | | | | | | | | | |
| | | | 89,139,437 | | | | 28,429,920 | | | | 7,695,729 | | | | 1,381,227 | |
| | | | 843 | | | | 261 | | | | 32,678 | | | | (189 | ) |
| | | | 89,140,280 | | | | 28,430,181 | | | | 7,728,407 | | | | 1,381,038 | |
| | | | | | | | | | | | | | | | | |
| | | | 57,643,402 | | | | 27,237,925 | | | | 5,125,792 | | | | (124,205 | ) |
| | | | | | | | | | | | | | | | | |
| | | $ | 55,692,434 | | | $ | 26,134,587 | | | $ | 5,639,278 | | | $ | (104,903 | ) |
117
Statements of Changes in Net Assets | |
| | | U.S. Government Securities
Ultra-Short Bond Fund | |
| | | Year Ended
December 31,
2016 | | | Year Ended
December 31,
2015 | |
Increase (Decrease) in Net Assets | | | | | | |
| | | | | | | |
From operations: | | | | | | |
Net investment income | | $ | 259,443 | | | $ | 199,412 | |
Net realized gains (losses) | | | 16,447 | | | | 5,413 | |
Net change in unrealized appreciation (depreciation) | | | 50,035 | | | | (49,997 | ) |
Net increase (decrease) in net assets from operations | | | 325,925 | | | | 154,828 | |
| | | | | | | | | |
Distributions to shareholders | | | | | | | | |
From net investment income | | | | | | | | |
Investor Class | | | (259,648 | ) | | | (199,409 | ) |
From return of capital | | | | | | | | |
Investor Class | | | (2,047 | ) | | | — | |
From net realized gains | | | | | | | | |
Investor Class | | | (17,626 | ) | | | (4,251 | ) |
Total distributions to shareholders | | | (279,321 | ) | | | (203,660 | ) |
| | | | | | | | | |
From capital share transactions: | | | | | | | | |
Proceeds from shares sold | | | | | | | | |
Investor Class | | | 12,372,975 | | | | 14,907,060 | |
Distributions reinvested | | | | | | | | |
Investor Class | | | 238,566 | | | | 159,674 | |
Proceeds from short-term trading fees | | | | | | | | |
Investor Class | | | — | | | | — | |
| | | | 12,611,541 | | | | 15,066,734 | |
Cost of shares redeemed | | | | | | | | |
Investor Class | | | (18,426,069 | ) | | | (16,476,556 | ) |
Net increase (decrease) in net assets from capital share transactions | | | (5,814,528 | ) | | | (1,409,822 | ) |
| | | | | | | | |
Net Increase (Decrease) in Net Assets | | | (5,767,924 | ) | | | (1,458,654 | ) |
| | | | | | | | | |
Net Assets | | | | | | | | |
Beginning of year | | | 62,561,535 | | | | 64,020,189 | |
| | | | | | | | |
End of year | | $ | 56,793,611 | | | $ | 62,561,535 | |
| | | | | | | | | |
Accumulated undistributed net investment income (distributions in excess of net investment income), end of year | | $ | 11 | | | $ | 11 | |
| | | | | | | | | |
Capital Share Activity | | | | | | | | |
Investor Class | | | | | | | | |
Shares sold | | | 6,168,822 | | | | 7,448,636 | |
Shares reinvested | | | 118,920 | | | | 79,605 | |
Shares redeemed | | | (9,183,862 | ) | | | (8,222,981 | ) |
Net share activity | | | (2,896,120 | ) | | | (694,740 | ) |
See accompanying notes to financial statements.
118
Near-Term Tax Free Fund | | | | All American Equity Fund | |
Year Ended
December 31,
2016 | | | Year Ended
December 31,
2015 | | | | Year Ended
December 31,
2016 | | | Year Ended
December 31,
2015 | |
| | | | | | | | | | | | |
| | | | | | | | | | | | |
| | | | | | | | | | | | |
$ | 1,431,075 | | | $ | 1,424,739 | | | | $ | 10,546 | | | $ | 64,612 | |
| | (258,979 | ) | | | (27,203 | ) | | | | 364,020 | | | | (1,276,414 | ) |
| | (1,746,522 | ) | | | (297,263 | ) | | | | (418,440 | ) | | | 377,292 | |
| | (574,426 | ) | | | 1,100,273 | | | | | (43,874 | ) | | | (834,510 | ) |
| | | | | | | | | | | | | | | | |
| | | | | | | | | | | | | | | | |
| | | | | | | | | | | | | | | | |
| | (1,496,282 | ) | | | (1,361,713 | ) | | | | (27,184 | ) | | | (43,038 | ) |
| | | | | | | | | | | | | | | | |
| | (13,758 | ) | | | — | | | | | — | | | | — | |
| | | | | | | | | | | | | | | | |
| | — | | | | — | | | | | — | | | | (2,220,987 | ) |
| | (1,510,040 | ) | | | (1,361,713 | ) | | | | (27,184 | ) | | | (2,264,025 | ) |
| | | | | | | | | | | | | | | | |
| | | | | | | | | | | | | | | | |
| | | | | | | | | | | | | | | | |
| | 55,084,675 | | | | 71,543,252 | | | | | 1,190,494 | | | | 2,501,699 | |
| | | | | | | | | | | | | | | | |
| | 1,318,777 | | | | 1,116,722 | | | | | 25,370 | | | | 2,101,779 | |
| | | | | | | | | | | | | | | | |
| | — | | | | — | | | | | 53 | | | | 100 | |
| | 56,403,452 | | | | 72,659,974 | | | | | 1,215,917 | | | | 4,603,578 | |
| | | | | | | | | | | | | | | | |
| | (65,787,063 | ) | | | (55,225,263 | ) | | | | (2,912,402 | ) | | | (4,323,344 | ) |
| | (9,383,611 | ) | | | 17,434,711 | | | | | (1,696,485 | ) | | | 280,234 | |
| | | | | | | | | | | | | | | | |
| | (11,468,077 | ) | | | 17,173,271 | | | | | (1,767,543 | ) | | | (2,818,301 | ) |
| | | | | | | | | | | | | | | | |
| | | | | | | | | | | | | | | | |
| | 106,768,645 | | | | 89,595,374 | | | | | 19,117,304 | | | | 21,935,605 | |
| | | | | | | | | | | | | | | | |
$ | 95,300,568 | | | $ | 106,768,645 | | | | $ | 17,349,761 | | | $ | 19,117,304 | |
| | | | | | | | | | | | | | | | |
$ | 1,073 | | | $ | 63,026 | | | | $ | 11,078 | | | $ | 27,175 | |
| | | | | | | | | | | | | | | | |
| | | | | | | | | | | | | | | | |
| | | | | | | | | | | | | | | | |
| | 24,456,367 | | | | 31,811,923 | | | | | 51,424 | | | | 91,535 | |
| | 587,206 | | | | 496,931 | | | | | 1,071 | | | | 88,125 | |
| | (29,364,676 | ) | | | (24,584,374 | ) | | | | (125,203 | ) | | | (157,508 | ) |
| | (4,321,103 | ) | | | 7,724,480 | | | | | (72,708 | ) | | | 22,152 | |
119
Statements of Changes in Net Assets | |
| | | Holmes Macro Trends Fund | |
| | | Year Ended
December 31,
2016 | | | Year Ended
December 31,
2015 | |
Increase (Decrease) in Net Assets | | | | | | |
| | | | | | | |
From operations: | | | | | | |
Net investment income (loss) | | $ | (131,503 | ) | | $ | (245,909 | ) |
Net realized gains (losses) | | | 1,479,047 | | | | 4,636,788 | |
Net change in unrealized appreciation (depreciation) | | | 1,713,973 | | | | (4,709,061 | ) |
Net increase (decrease) in net assets from operations | | | 3,061,517 | | | | (318,182 | ) |
| | | | | | | | | |
Distributions to shareholders | | | | | | | | |
From net investment income | | | | | | | | |
Investor Class | | | — | | | | — | |
Institutional Class | | | — | | | | — | |
From net realized gains | | | | | | | | |
Investor Class | | | (3,169,616 | ) | | | (3,075,742 | ) |
Total distributions to shareholders | | | (3,169,616 | ) | | | (3,075,742 | ) |
| | | | | | | | | |
From capital share transactions: | | | | | | | | |
Proceeds from shares sold | | | | | | | | |
Investor Class | | | 2,661,174 | | | | 2,614,600 | |
Institutional Class | | | — | | | | — | |
Distributions reinvested | | | | | | | | |
Investor Class | | | 2,976,381 | | | | 2,906,576 | |
Institutional Class | | | — | | | | — | |
Proceeds from short-term trading fees | | | | | | | | |
Investor Class | | | 28 | | | | 305 | |
| | | | 5,637,583 | | | | 5,521,481 | |
Cost of shares redeemed | | | | | | | | |
Investor Class | | | (5,958,154 | ) | | | (7,242,945 | ) |
Institutional Class | | | — | | | | — | |
Net increase (decrease) in net assets from capital share transactions | | | (320,571 | ) | | | (1,721,464 | ) |
| | | | | | | | |
Net Increase (Decrease) in Net Assets | | | (428,670 | ) | | | (5,115,388 | ) |
| | | | | | | | | |
Net Assets | | | | | | | | |
Beginning of year | | | 41,134,692 | | | | 46,250,080 | |
| | | | | | | | |
End of year | | $ | 40,706,022 | | | $ | 41,134,692 | |
| | | | | | | | | |
Accumulated undistributed net investment income (distributions in excess of net investment income), end of year | | $ | — | | | $ | 44 | |
| | | | | | | | | |
Capital Share Activity | | | | | | | | |
Investor Class | | | | | | | | |
Shares sold | | | 136,703 | | | | 126,790 | |
Shares reinvested | | | 158,825 | | | | 154,277 | |
Shares redeemed | | | (325,941 | ) | | | (352,634 | ) |
Net share activity | | | (30,413 | ) | | | (71,567 | ) |
Institutional Class | | | | | | | | |
Shares sold | | | — | | | | — | |
Shares reinvested | | | — | | | | — | |
Shares redeemed | | | — | | | | — | |
Net share activity | | | — | | | | — | |
See accompanying notes to financial statements.
120
Global Resources Fund | | | | World Precious Minerals Fund | |
Year Ended
December 31,
2016 | | | Year Ended
December 31,
2015 | | | | Year Ended
December 31,
2016 | | | Year Ended
December 31,
2015 | |
| | | | | | | | | | | | |
| | | | | | | | | | | | |
| | | | | | | | | | | | |
$ | 1,162,442 | | | $ | 2,421,024 | | | | $ | (1,950,968 | ) | | $ | (660,652 | ) |
| | (9,927,687 | ) | | | (76,696,259 | ) | | | | (31,496,878 | ) | | | (53,557,002 | ) |
| | 22,989,329 | | | | 26,850,852 | | | | | 89,140,280 | | | | 38,597,787 | |
| | 14,224,084 | | | | (47,424,383 | ) | | | | 55,692,434 | | | | (15,619,867 | ) |
| | | | | | | | | | | | | | | | |
| | | | | | | | | | | | | | | | |
| | | | | | | | | | | | | | | | |
| | (3,178,190 | ) | | | (1,094,201 | ) | | | | (454,372 | ) | | | (7,134,044 | ) |
| | (43,050 | ) | | | (33,954 | ) | | | | (22,591 | ) | | | (8,001 | ) |
| | | | | | | | | | | | | | | | |
| | — | | | | — | | | | | — | | | | — | |
| | (3,221,240 | ) | | | (1,128,155 | ) | | | | (476,963 | ) | | | (7,142,045 | ) |
| | | | | | | | | | | | | | | | |
| | | | | | | | | | | | | | | | |
| | | | | | | | | | | | | | | | |
| | 6,726,486 | | | | 8,877,256 | | | | | 82,725,215 | | | | 19,227,284 | |
| | 876,722 | | | | 5,787,569 | | | | | 5,416,648 | | | | 2,885 | |
| | | | | | | | | | | | | | | | |
| | 3,039,897 | | | | 1,044,971 | | | | | 430,049 | | | | 6,735,209 | |
| | 42,805 | | | | 33,792 | | | | | 22,459 | | | | 7,771 | |
| | | | | | | | | | | | | | | | |
| | 28 | | | | 30 | | | | | 688 | | | | 122 | |
| | 10,685,938 | | | | 15,743,618 | | | | | 88,595,059 | | | | 25,973,271 | |
| | | | | | | | | | | | | | | | |
| | (21,821,448 | ) | | | (37,739,926 | ) | | | | (79,820,997 | ) | | | (28,492,715 | ) |
| | (1,849,143 | ) | | | (10,849,018 | ) | | | | (1,056,603 | ) | | | (59,118 | ) |
| | (12,984,653 | ) | | | (32,845,326 | ) | | | | 7,717,459 | | | | (2,578,562 | ) |
| | | | | | | | | | | | | | | | |
| | (1,981,809 | ) | | | (81,397,864 | ) | | | | 62,932,930 | | | | (25,340,474 | ) |
| | | | | | | | | | | | | | | | |
| | | | | | | | | | | | | | | | |
| | 100,007,673 | | | | 181,405,537 | | | | | 78,225,854 | | | | 103,566,328 | |
| | | | | | | | | | | | | | | | |
$ | 98,025,864 | | | $ | 100,007,673 | | | | $ | 141,158,784 | | | $ | 78,225,854 | |
| | | | | | | | | | | | | | | | |
$ | 1,594,626 | | | $ | 2,236,563 | | | | $ | 4,847,267 | | | $ | (2,181,239 | ) |
| | | | | | | | | | | | | | | | |
| | | | | | | | | | | | | | | | |
| | | | | | | | | | | | | | | | |
| | 1,271,267 | | | | 1,567,275 | | | | | 11,000,585 | | | | 4,406,357 | |
| | 589,127 | | | | 224,725 | | | | | 73,765 | | | | 1,897,242 | |
| | (4,174,210 | ) | | | (6,748,854 | ) | | | | (10,933,443 | ) | | | (6,586,395 | ) |
| | (2,313,816 | ) | | | (4,956,854 | ) | | | | 140,907 | | | | (282,796 | ) |
| | | | | | | | | | | | | | | | |
| | 158,239 | | | | 912,723 | | | | | 724,341 | | | | 686 | |
| | 8,312 | | | | 7,236 | | | | | 3,833 | | | | 2,183 | |
| | (368,941 | ) | | | (1,981,786 | ) | | | | (150,268 | ) | | | (14,336 | ) |
| | (202,390 | ) | | | (1,061,827 | ) | | | | 577,906 | | | | (11,467 | ) |
121
Statements of Changes in Net Assets | |
| | | Gold and Precious Metals Fund | |
| | | Year Ended
December 31,
2016 | | | Year Ended
December 31,
2015 | |
Increase (Decrease) in Net Assets | | | | | | |
| | | | | | | |
From operations: | | | | | | |
Net investment income (loss) | | $ | (1,103,338 | ) | | $ | (522,899 | ) |
Net realized gains (losses) | | | (1,192,256 | ) | | | (29,177,581 | ) |
Net change in unrealized appreciation (depreciation) | | | 28,430,181 | | | | 26,975,320 | |
Net increase (decrease) in net assets from operations | | | 26,134,587 | | | | (2,725,160 | ) |
| | | | | | | | | |
Distributions to shareholders | | | | | | | | |
From net investment income | | | | | | | | |
Investor Class | | | (799,465 | ) | | | (269,790 | ) |
Total distributions to shareholders | | | (799,465 | ) | | | (269,790 | ) |
| | | | | | | | | |
From capital share transactions: | | | | | | | | |
Proceeds from shares sold | | | | | | | | |
Investor Class | | | 82,773,853 | | | | 20,024,811 | |
Distributions reinvested | | | | | | | | |
Investor Class | | | 743,031 | | | | 248,899 | |
Proceeds from short-term trading fees | | | | | | | | |
Investor Class | | | 2,692 | | | | 460 | |
| | | | 83,519,576 | | | | 20,274,170 | |
Cost of shares redeemed | | | | | | | | |
Investor Class | | | (73,164,260 | ) | | | (21,758,486 | ) |
Net increase (decrease) in net assets from capital share transactions | | | 10,355,316 | | | | (1,484,316 | ) |
| | | | | | | | |
Net Increase (Decrease) in Net Assets | | | 35,690,438 | | | | (4,479,266 | ) |
| | | | | | | | | |
Net Assets | | | | | | | | |
Beginning of year | | | 58,297,652 | | | | 62,776,918 | |
| | | | | | | | |
End of year | | $ | 93,988,090 | | | $ | 58,297,652 | |
| | | | | | | | | |
Accumulated undistributed net investment income (distributions in excess of net investment income), end of year | | $ | (2,777,434 | ) | | $ | (959,953 | ) |
| | | | | | | | | |
Capital Share Activity | | | | | | | | |
Investor Class | | | | | | | | |
Shares sold | | | 10,461,783 | | | | 3,863,087 | |
Shares reinvested | | | 115,737 | | | | 51,319 | |
Shares redeemed | | | (9,147,567 | ) | | | (4,144,783 | ) |
Net share activity | | | 1,429,953 | | | | (230,377 | ) |
See accompanying notes to financial statements.
122
Emerging Europe Fund | | | | China Region Fund | |
Year Ended
December 31,
2016 | | | Year Ended
December 31,
2015 | | | | Year Ended
December 31,
2016 | | | Year Ended
December 31,
2015 | |
| | | | | | | | | | | | |
| | | | | | | | | | | | |
| | | | | | | | | | | | |
$ | 513,486 | | | $ | 366,541 | | | | $ | 19,302 | | | $ | 46,579 | |
| | (2,602,615 | ) | | | (15,611,113 | ) | | | | (1,505,243 | ) | | | 6,347 | |
| | 7,728,407 | | | | 2,578,365 | | | | | 1,381,038 | | | | (1,584,324 | ) |
| | 5,639,278 | | | | (12,666,207 | ) | | | | (104,903 | ) | | | (1,531,398 | ) |
| | | | | | | | | | | | | | | | |
| | | | | | | | | | | | | | | | |
| | | | | | | | | | | | | | | | |
| | — | | | | — | | | | | (27,847 | ) | | | (187,603 | ) |
| | — | | | | — | | | | | (27,847 | ) | | | (187,603 | ) |
| | | | | | | | | | | | | | | | |
| | | | | | | | | | | | | | | | |
| | | | | | | | | | | | | | | | |
| | 1,519,657 | | | | 3,580,763 | | | | | 3,784,734 | | | | 2,429,974 | |
| | | | | | | | | | | | | | | | |
| | — | | | | — | | | | | 25,858 | | | | 173,643 | |
| | | | | | | | | | | | | | | | |
| | 4 | | | | 28 | | | | | 16 | | | | 20 | |
| | 1,519,661 | | | | 3,580,791 | | | | | 3,810,608 | | | | 2,603,637 | |
| | | | | | | | | | | | | | | | |
| | (9,551,413 | ) | | | (15,314,877 | ) | | | | (3,351,272 | ) | | | (5,709,295 | ) |
| | (8,031,752 | ) | | | (11,734,086 | ) | | | | 459,336 | | | | (3,105,658 | ) |
| | | | | | | | | | | | | | | | |
| | (2,392,474 | ) | | | (24,400,293 | ) | | | | 326,586 | | | | (4,824,659 | ) |
| | | | | | | | | | | | | | | | |
| | | | | | | | | | | | | | | | |
| | 44,665,578 | | | | 69,065,871 | | | | | 16,183,329 | | | | 21,007,988 | |
| | | | | | | | | | | | | | | | |
$ | 42,273,104 | | | $ | 44,665,578 | | | | $ | 16,509,915 | | | $ | 16,183,329 | |
| | | | | | | | | | | | | | | | |
$ | — | | | $ | (271,313 | ) | | | $ | 16,259 | | | $ | 27,741 | |
| | | | | | | | | | | | | | | | |
| | | | | | | | | | | | | | | | |
| | | | | | | | | | | | | | | | |
| | 272,190 | | | | 569,033 | | | | | 528,806 | | | | 268,194 | |
| | — | | | | — | | | | | 3,572 | | | | 22,969 | |
| | (1,736,202 | ) | | | (2,513,600 | ) | | | | (459,520 | ) | | | (671,842 | ) |
| | (1,464,012 | ) | | | (1,944,567 | ) | | | | 72,858 | | | | (380,679 | ) |
123
Notes to Financial Statements | December 31, 2016 |
Note 1: Organization and Significant Accounting Policies
U.S. Global Investors Funds (Trust), consisting of the nine separate funds (Funds) included in this report, is organized as a Delaware statutory trust. Each Fund is an open-end management investment company registered under the Investment Company Act of 1940, as amended, and follows the specialized accounting and reporting guidance in FASB Accounting Standards Codification 946. All funds are diversified with the exception of Global Resources, World Precious Minerals, Gold and Precious Metals, Emerging Europe and China Region. A nondiversified fund may invest a greater percentage of its assets in a particular issuer in comparison to a diversified fund.
The following is a summary of significant accounting policies consistently followed by the Funds in the preparation of their financial statements. The policies are in conformity with U.S. generally accepted accounting principles.
The Funds value investments traded on national or international securities exchanges or over-the-counter at the last sales price reported by the security’s primary exchange of its market at the time of daily valuation. Options and securities for which no sale was reported are valued at the mean between the last reported bid and asked quotation. Debt securities having 60 days or less to maturity that are expected to be valued at par at maturity may be priced by the amortized cost method if the Valuation Committee determines it would approximate market value. Municipal securities, long-term U.S. government obligations and corporate debt securities are valued by an independent pricing service using an evaluated quote based on such factors as institutional-size trading in similar groups of securities, yield, quality, maturity, coupon rate, type of issue, individual trading characteristics and other market data. For more information please see Notes to Portfolio of Investments.
| | B. | Cash-Concentration in Uninsured Account |
For cash management purposes the Funds may concentrate cash with the Funds’ custodian. This typically results in cash balances exceeding the Federal Deposit Insurance Corporation (“FDIC”) insurance limits. As of December 31, 2016, The U.S. Government Securities Ultra-Short Bond Fund, Near-Term Tax Free Fund, All American Equity Fund, Holmes Macro Trends Fund, Global Resources Fund, World Precious Minerals Fund, Gold and Precious Metals Fund, Emerging Europe Fund and China Region Fund held $1,762,413, $5,702,219, $1,241,302, $3,665,144, $4,413,169, $5,096,449, $5,489,315, $1,294,994 and $1,856,597, respectively, as cash reserves at Brown Brothers Harriman & Co. (BBH) that exceeded the FDIC insurance limit.
| | C. | Fair Valued Securities |
Securities for which market quotations are not readily available or which are subject to legal restrictions are valued at their fair value as determined in good faith by the Valuation Committee of U.S. Global Investors, Inc. (Adviser), under policies and procedures established by the Funds’ Board of Trustees. Fair value is the price
124
Notes to Financial Statements | December 31, 2016 |
that would be received to sell an asset or paid to transfer a liability in an orderly transaction between market participants at the measurement date. The Valuation Committee meets on a regular basis to review securities which may not have readily available market prices and considers a number of factors in determining fair value, including nature and duration of any trading restrictions, trading volume, market values of unrestricted shares of the same or similar class, investment management’s judgment regarding the market experience of the issuer, financial status and other operational and market factors affecting the issuer, issuer’s management, quality of the underlying property based on review of independent geological studies and other relevant matters. The fair values may differ from what would have been used had a broader market for these securities existed. The Valuation Committee regularly reviews inputs and assumptions and performs transactional back-testing and disposition analysis. The Valuation Committee reports quarterly to the Funds’ Board of Trustees.
For securities traded on international exchanges, if events which may materially affect the value of a Fund’s securities occur after the close of the primary exchange and before a Fund’s net asset value is next determined, then those securities will be valued at their fair value as determined in good faith in accordance with the policies approved by the Board of Trustees. The Funds use a systematic fair value model provided by an independent third party to value international securities primarily traded on an exchange or market outside the Western Hemisphere in order to adjust for stale pricing, which may occur between the close of certain foreign exchanges and the New York Stock Exchange.
| | D. | Security Transactions and Investment Income |
Security transactions are accounted for on trade date. Realized gains and losses from security transactions are determined on an identified cost basis. Dividend income is recorded on the ex-dividend date except that certain dividends from foreign securities where the ex-dividend date may have passed are recorded as soon as the Fund has confirmed the ex-dividend date. Interest income, which may include original issue discount, is recorded on an accrual basis. Discounts and premiums on securities purchased are accreted and amortized, respectively, on a yield-to-maturity basis as adjustments to interest income. Investment income is recorded net of foreign taxes withheld where recovery of such taxes is uncertain. Investment income and realized and unrealized gains (losses) are allocated to each Fund’s share class based on their respective net assets.
The Funds may purchase securities on a when-issued or delayed-delivery basis and segregate collateral on their books with a value at least equal to the amount of the commitment. Losses may arise due to the changes in the value of the underlying securities or if the counterparty does not perform under the contract.
| | E. | Foreign Currency Transactions |
Some Funds may invest in securities of foreign issuers. The accounting records of these Funds are maintained in U.S. dollars. At each net asset value determination date, the value of assets and liabilities denominated in foreign currencies are
125
Notes to Financial Statements | December 31, 2016 |
translated into U.S. dollars using the current prevailing exchange rate. Security transactions, income and expenses are converted at the prevailing rate of exchange on the respective dates of the transactions. The effect of changes in foreign exchange rates on foreign denominated securities is included with the net realized and unrealized gain or loss on securities. Other foreign currency gains or losses are reported separately.
The Funds intend to continue to comply with the requirements of Subchapter M of the Internal Revenue Code applicable to regulated investment companies and to distribute substantially all of their taxable income to shareholders. Accordingly, no provision for federal income taxes is required. Each Fund may be subject to foreign taxes on income and gains on investments, which are accrued based on the Fund’s understanding of the tax rules and regulations in the foreign markets.
The Funds recognize the tax benefits of uncertain tax positions only where the position is “more likely than not” to be sustained assuming examination by tax authorities. Management has analyzed the Funds’ tax positions, and has concluded that no liability for unrecognized tax benefits should be recorded related to uncertain tax positions taken on returns filed for open tax years or expected to be taken in 2016 tax returns. The Funds file U.S. federal and excise tax returns as required. The Funds’ 2013, 2014, 2015 and 2016 (when filed) tax returns are open to examination by the federal and applicable state tax authorities. The Funds have no examinations in progress.
| | G. | Dividends and Distributions to Shareholders |
The Funds record dividends and distributions to shareholders on the ex-dividend date. Distributions are determined in accordance with income tax regulations, which may differ from accounting principles generally accepted in the United States. Accordingly, periodic reclassifications related to permanent book and tax basis differences are made within the Funds’ capital accounts to reflect income and gains available for distribution under income tax regulations.
The Funds, except as noted below, generally pay income dividends and distribute capital gains, if any, annually. The U.S. Government Securities Ultra-Short Bond Fund and the Near-Term Tax Free Fund accrue daily and pay dividends monthly. A Fund may elect to designate a portion of the earnings and profits distributed to shareholders on the redemption of fund shares during the year as distributions for federal income tax purposes. Differences in per share dividend rates for multiclass funds generally result from the relative weightings of pro rata income and realized gain allocations and from differences in separate class expenses.
Fund specific expenses are allocated to that Fund and pro rata across share classes. Expenses that are not fund specific are allocated among Funds and pro rata across share classes. Class specific expenses (including, but not limited to, distribution plan fees, if any, a portion of the administrative services fees, transfer agency fees and expenses, shareholder reporting expenses and certain legal and registration
126
Notes to Financial Statements | December 31, 2016 |
fees) are allocated to the class that incurs such expense. Except for the U.S. Government Securities Ultra-Short Bond Fund, expense offset arrangements have been made with the Funds’ custodian so the custodian fees may be paid indirectly by credits earned on the Funds’ cash balances. Such deposit arrangements are an alternative to overnight investments. Custodian fees are presented in the Statements of Operations gross of such credits, and the credits are presented as offsets to expenses. For the U.S. Government Securities Ultra-Short Bond Fund, credits earned on its cash balance are included in interest and other income.
| | I. | Short-Term Trading (Redemption) Fees |
Short-term trading (redemption) fees are assessed on the All American, Holmes Macro Trends, Global Resources, World Precious Minerals, Gold and Precious Metals, Emerging Europe and China Region Funds (Equity Funds). These fees, which are retained by the Funds, are accounted for as an addition to paid-in capital. The fee for each of the Equity Funds is 0.05% of the amount redeemed on shares held seven days or less.
| | J. | Use of Estimates in Financial Statement Preparation |
The Funds are investment companies accounted for in conformity with accounting principles generally accepted in the United States of America (“GAAP”). Therefore they follow the accounting and reporting guidelines for investment companies. The preparation of financial statements in conformity with GAAP requires management to make estimates and assumptions that affect the reported amounts of assets and liabilities and disclosure of contingent assets and liabilities at the date of the financial statements and the reported amounts of income and expenses during the reporting period. Actual results could differ from those estimates.
Note 2: Financial Derivative Instruments
Equity Funds may purchase or write (sell) options on securities to manage their exposure to stock or commodity markets as well as fluctuations in interest and currency conversion rates. The use of options carries the risks of a change in value of the underlying instruments, an illiquid secondary market, or failure of the counterparty to perform its obligations.
A put option gives the purchaser of the option, upon payment of a premium, the right to sell, and the issuer of the option the obligation to buy, the underlying security, commodity, index, currency or other instrument at the exercise price. A call option, upon payment of a premium, gives the purchaser of the option the right to buy, and the issuer the obligation to sell, the underlying instrument at the exercise price.
Purchasing a put option tends to decrease a Fund’s exposure to the underlying instrument, whereas purchasing a call option tends to increase a Fund’s exposure to the underlying instrument. A Fund pays a premium which is included in the Statement of Assets and Liabilities as an investment and subsequently marked to market to reflect the current value of the option. Premiums paid to purchase
127
Notes to Financial Statements | December 31, 2016 |
options which expire are treated as realized losses. Premiums paid to purchase options which are exercised or closed are added to the cost of securities acquired or the proceeds from securities sold. The risk associated with purchasing put and call options is limited to the premium paid.
The Funds will realize a loss equal to all or a part of the premium paid for an option if the price of the underlying security or other instrument decreases or does not increase by more than the premium (in the case of a call option), or if the price of the underlying security or other instrument increases or does not decrease by more than the premium (in the case of a put option).
Writing a put option tends to increase a Fund’s exposure to the underlying instrument, whereas writing a call option tends to decrease a Fund’s exposure to the underlying instrument. The premium received is recorded as a liability in the Statement of Assets and Liabilities and subsequently marked to market to reflect the current value of the option written. Premiums received from writing options which expire are treated as realized gains. Premiums received from options which are exercised or closed are added to the proceeds or offset against amounts paid on the underlying transaction to determine the realized gain or loss. Written options include a risk of loss in excess of the option premium. A Fund as a writer of an option has no control over whether the underlying instrument may be sold (call) or purchased (put) and thus bears the market risk of an unfavorable change in the price of the instrument underlying the written option. There is also the risk a Fund may not be able to enter into a closing transaction because of an illiquid market.
A Fund’s ability to close out its position as a purchaser or seller of a put or call option is dependent, in part, upon the liquidity of the market for that particular option. There can be no guarantee that a fund will be able to close out an option position when desired. An inability to close out its options positions may reduce a Fund’s anticipated profits or increase its losses.
As of December 31, 2016, there were no securities held in escrow by the custodian as cover for call options written.
There were no transactions in written call options during the year ended December 31, 2016.
| | B. | Forward Foreign Currency Contracts |
The Funds enter into forward foreign currency contracts to lock in the U.S. dollar cost of purchase and sale transactions or to hedge the portfolio against currency fluctuations. A forward foreign currency contract is a commitment to purchase or sell a foreign currency at a future date at a negotiated rate. These contracts are valued daily, and the Fund’s net equity therein, representing unrealized gain or loss on the contracts as measured by the difference between the forward foreign exchange rates at the dates of entry into the contracts and the forward rates at the reporting date, is included in the statement of assets and liabilities. Realized and unrealized gains and losses are included in the statement of operations. Risks may arise upon entering into these contracts from the potential inability
128
Notes to Financial Statements | December 31, 2016 |
of counterparties to meet the terms of the contracts and from unanticipated movements in the value of foreign currencies relative to the U.S. dollar.
There were no open forward foreign currency contracts as of December 31, 2016.
| | C. | Summary of Derivative Instruments |
The following is a summary of the valuations of derivative instruments categorized by location in the Statements of Assets and Liabilities as of December 31, 2016:
Location | | Global
Resources Fund | | | China
Region Fund | |
Asset derivatives | | | | | | |
Investments, at value | | | | | | |
Purchased options | | $ | 1,136,325 | | | $ | 219,000 | |
Total | | $ | 1,136,325 | | | $ | 219,000 | |
The following is a summary of the effect of derivative instruments on the Statements of Operations for the year ended December 31, 2016:
Location | | Holmes
Macro
Trends Fund | | | Global
Resources
Fund | | | World Precious
Minerals
Fund | |
Realized gain (loss) on derivatives recognized in income | | | | | | | | | |
Realized gain (loss) from securities | | | | | | | | | |
Purchased options | | $ | (50,435 | ) | | $ | (425,142 | ) | | $ | (1,336,631 | ) |
Net realized gain (loss) from foreign currency transactions | | | | | | | | | | | | |
Foreign exchange contracts | | | — | | | | (740,092 | ) | | | (11,888,041 | ) |
| | | | (50,435 | ) | | | (1,165,234 | ) | | | (13,224,672 | ) |
| | | | | | | | | | | | | |
Change in unrealized appreciation (depreciation) on derivatives recognized in income | | | | | | | | | | | | |
Net change in unrealized appreciation (depreciation) of investments | | | | | | | | | | | | |
Purchased options | | | 49,635 | | | | (23,157 | ) | | | 1,496,734 | |
Net change in unrealized gain (loss) from foreign currency transactions | | | | | | | | | | | | |
Foreign exchange contracts | | | — | | | | — | | | | 93 | |
| | | | 49,635 | | | | (23,157 | ) | | | 1,496,827 | |
Total | | $ | 800 | | | $ | (1,188,391 | ) | | $ | (11,727,845 | ) |
129
Notes to Financial Statements | December 31, 2016 |
Location | | Gold and
Precious
Metals
Fund | | | Emerging
Europe
Fund | | | China
Region
Fund | |
Realized gain (loss) on derivatives recognized in income | | | | | | | | | |
Realized gain (loss) from securities | | | | | | | | | |
Purchased options | | $ | (757,510 | ) | | $ | (89,753 | ) | | $ | (90,420 | ) |
Net realized gain (loss) from foreign currency transactions | | | | | | | | | | | | |
Foreign exchange contracts | | | (2,553,432 | ) | | | (490,792 | ) | | | — | |
| | | | (3,310,942 | ) | | | (580,545 | ) | | | (90,420 | ) |
| | | | | | | | | | | | | |
Change in unrealized appreciation (depreciation) on derivatives recognized in income | | | | | | | | | | | | |
Net change in unrealized appreciation (depreciation) of investments | | | | | | | | | | | | |
Purchased options | | | 985,423 | | | | 128,688 | | | | 175,379 | |
Net change in unrealized gain (loss) from foreign currency transactions | | | | | | | | | | | | |
Foreign exchange contracts | | | 70 | | | | 30,380 | | | | — | |
| | | | 985,493 | | | | 159,068 | | | | 175,379 | |
Total | | $ | (2,325,449 | ) | | $ | (421,477 | ) | | $ | 84,959 | |
The average notional amounts of written options, purchased options and forward currency contracts outstanding during the year ended December 31, 2016, were approximately as follows:
Fund | | Purchased
Options | | | Forward
Currency
Contracts | |
Holmes Macro Trends | | $ | 114 | | | $ | — | |
Global Resources | | | 590,178 | | | | 1,542,032 | |
World Precious Minerals | | | 139,108 | | | | 6,803,255 | |
Gold and Precious Metals | | | 107,104 | | | | 4,277,272 | |
Emerging Europe | | | 295,607 | | | | 1,103,317 | |
China Region | | | 86,986 | | | | — | |
Note 3: Investment Advisory and Other Agreements
The Adviser, under an investment advisory agreement with the Trust in effect through October 1, 2017, furnishes management and investment advisory services and, subject to the supervision of the trustees, directs the investments of each Fund according to each Fund’s investment objectives, policies and limitations.
130
Notes to Financial Statements | December 31, 2016 |
For the services of the Adviser, each Fund pays a base management or advisory fee based upon its net assets. Fees are accrued daily and paid monthly. The contractual management fee for each fund is:
Fund | Annual Percentage of
Average Daily Net Assets |
U.S. Government Securities Ultra-Short Bond | .50% of the first $250,000,000
and .375% of the excess |
Near-Term Tax Free | .50% |
All American Equity | .80% of the first $500,000,000
and .75% of the excess |
Holmes Macro Trends | 1.00% |
Global Resources | .95% of the first $500,000,000;
.90% of $500,000,001 to $1,000,000,000 and .85% of the excess |
World Precious Minerals | 1.00% of the first $500,000,000;
.95% of $500,000,001 to $1,000,000,000 and .90% of the excess |
Gold and Precious Metals | .90% of the first $500,000,000
and .85% of the excess |
Emerging Europe | 1.25% |
China Region | 1.25% |
The advisory agreement also provides that the base advisory fee of the Equity Funds will be adjusted upwards or downwards by 0.25 percent if there is a performance difference of 5 percent or more between a Fund’s performance and that of its designated benchmark index over the prior 12 months. The performance adjustment is calculated separately for each share class. The benchmarks are as follows:
Fund | Benchmark Index |
All American Equity | S&P 500 Index |
Holmes Macro Trends | S&P Composite 1500 Index |
Global Resources | S&P Global Natural Resources Index (Net Total Return) |
World Precious Minerals | NYSE Arca Gold Miners Index |
Gold and Precious Metals | FTSE Gold Mines Index |
Emerging Europe | MSCI Emerging Markets Europe 10/40 Index (Net Total Return) |
China Region | Hang Seng Composite Index |
No performance adjustment is applied unless the difference between the class’s investment performance and the benchmark is 5 percent or greater (positive or negative) during the applicable performance measurement period. The performance fee adjustment is calculated monthly in arrears and is accrued ratably during the month. The management fee, net of any performance fee adjustment, is paid monthly in arrears.
131
Notes to Financial Statements | December 31, 2016 |
The amounts shown as Management fee on the Statements of Operations reflects the base fee plus/minus any performance adjustment. During the year ended December 31, 2016, the Funds recorded performance adjustments as follows:
Fund | | Investor Class
Performance Fee
Adjustment | | | Institutional Class
Performance Fee
Adjustment | |
All American Equity | | $ | (40,065 | ) | | | N/A | |
Holmes Macro Trends | | | (76,353 | ) | | | N/A | |
Global Resources | | | 20,761 | | | | 1,128 | |
World Precious Minerals | | | 269,126 | | | | 1,721 | |
Gold and Precious Metals | | | 11,022 | | | | N/A | |
Emerging Europe | | | (51,270 | ) | | | N/A | |
Atlantic Fund Administration, LLC (d/b/a Atlantic Fund Services) (“Atlantic”) and the Adviser act as co-administrators to the Trust. Atlantic’s services to the Trust include provision of certain officers as well as assistance with certain Trust and fund administration tasks. The Funds compensate Atlantic with a fee structure based on average net assets of each fund, subject to minimum fees. The expenses payable to Atlantic are disclosed on the Statements of Assets and Liabilities.
The U.S. Government Securities Ultra-Short Bond, Near-Term Tax Free, All American Equity, Holmes Macro Trends, Gold and Precious Metals, Emerging Europe and China Region Funds compensate the Adviser at an annual rate of 0.05% of the average daily net assets of each Fund for administrative services provided, of which half is a fund-level fee and half is a class-level fee. The Global Resources and World Precious Minerals Funds compensate the Adviser at an annual rate of 0.05% of the average daily net assets for the Investor Class and 0.04% of the average daily net assets for the Institutional Class for administrative services provided, of which half is a fund-level fee and half is a class-level fee.
The Investor Class shares for Equity Funds in the Trust have adopted a distribution plan pursuant to Rule 12b-1 of the Investment Company Act of 1940 in which the Distributor is paid a fee at an annual rate of 0.25% of the average daily net assets of the Investor Class for sales and promotional services related to the distribution of Investor Class shares. The Institutional Class does not incur distribution plan fees.
The Adviser has voluntarily agreed to reimburse specific funds so that their total operating expenses will not exceed certain annual percentages of average net assets. The expenses for the period ended December 31, 2016, were limited as follows for the Investor Class: U.S. Government Securities Ultra-Short Bond Fund at 0.45%, All American Equity Fund and Holmes Macro Trends Fund at 2.20%, Global Resources, World Precious Minerals, and Gold and Precious Metals Funds at 1.90%, Emerging Europe Fund at 2.85% and China Region Fund at 2.55%. These expense limitations are exclusive of any performance fee adjustments and will continue on a voluntary basis at the Adviser’s discretion. The Adviser may temporarily agree to additional reimbursements or limitations.
132
Notes to Financial Statements | December 31, 2016 |
The Adviser has contractually limited the total operating expenses of the Near-Term Tax Free Fund at 0.45% on an annualized basis through April 30, 2017.
The Adviser has voluntarily agreed to waive all class specific expenses for the Institutional Class of the Global Resources Fund and the World Precious Minerals Fund. These expense waivers are exclusive of any performance fee adjustments, and the Adviser can modify or terminate this arrangement at any time.
Atlantic Fund Services is the transfer agent for the Funds as of August 29, 2016. Prior to August 29, 2016, U.S. Bancorp Fund Services, LLC served as the transfer agent. Each Fund’s share class pays an annual fee based on the number of shareholder accounts, certain base fees and transaction- and activity-based fees for transfer agency services.
Certain account fees are paid directly by shareholders to the transfer agent, which, in turn, reduces its charge to the Funds.
Brown Brothers Harriman & Co. (BBH) serves as the custodian. SEI Investments Global Funds Services serves as fund accounting and administration service agent with a fee structure based on average net assets of the Trust, subject to minimum fees.
Foreside Fund Services, LLC (the “Distributor”) acts as the agent of the Trust in connection with the continuous offering of shares of the Funds. The Distributor continually distributes shares of the Funds on a best efforts basis.
The Independent Trustees of the Trust each receive an annual fee of $15,000 for service to the Trust. The Chairman of the Board is paid an additional annual fee of $20,000. The trustees and Chairman may receive additional fees for special Board meetings. Each trustee is also reimbursed for all reasonable out-of-pocket expenses incurred in connection with his duties as a trustee, including travel and related expenses incurred in attending Board meetings. The Trust has no pension or retirement plan. No other entity affiliated with the Trust pays any compensation to the trustees.
Note 4: Investments
Cost of purchases and proceeds from sales of long-term securities for the year ended December 31, 2016, are summarized as follows:
Fund | | Purchases | | | Sales | |
U.S. Government Securities Ultra-Short Bond Fund | | $ | 9,996,130 | | | $ | 20,534,494 | |
Near-Term Tax Free Fund | | | 35,837,839 | | | | 30,962,837 | |
All American Equity Fund | | | 48,311,108 | | | | 51,479,831 | |
Holmes Macro Trends Fund | | | 94,423,254 | | | | 98,473,925 | |
Global Resources Fund | | | 241,865,392 | | | | 252,303,175 | |
World Precious Minerals Fund | | | 192,829,362 | | | | 191,985,040 | |
Gold and Precious Metals Fund | | | 176,754,464 | | | | 171,034,629 | |
Emerging Europe Fund | | | 67,154,299 | | | | 71,685,173 | |
China Region Fund | | | 24,246,839 | | | | 24,469,360 | |
133
Notes to Financial Statements | December 31, 2016 |
Note 5: Tax Information
The following table presents the income tax basis of securities owned at December 31, 2016, and the tax basis components of net unrealized appreciation (depreciation):
Fund | | Aggregate
Tax Cost | | | Gross
Unrealized Appreciation | | | Gross
Unrealized Depreciation | | | Net Unrealized Appreciation (Depreciation) | |
U.S. Government Securities Ultra-Short Bond | | $ | 54,640,917 | | | $ | 100,815 | | | $ | (23,239 | ) | | $ | 77,576 | |
Near-Term Tax Free | | | 89,093,944 | | | | 496,950 | | | | (1,092,399 | ) | | | (595,449 | ) |
All American Equity | | | 15,385,982 | | | | 487,975 | | | | (382,744 | ) | | | 105,231 | |
Holmes Macro Trends | | | 35,436,618 | | | | 2,196,167 | | | | (1,322,085 | ) | | | 874,082 | |
Global Resources | | | 165,221,815 | | | | 11,323,775 | | | | (82,604,936 | ) | | | (71,281,161 | ) |
World Precious Minerals | | | 176,206,293 | | | | 44,107,019 | | | | (84,953,787 | ) | | | (40,846,768 | ) |
Gold and Precious Metals | | | 77,551,765 | | | | 25,819,414 | | | | (17,352,057 | ) | | | 8,467,357 | |
Emerging Europe | | | 40,598,489 | | | | 4,006,252 | | | | (3,699,737 | ) | | | 306,515 | |
China Region | | | 13,577,386 | | | | 1,969,521 | | | | (1,136,142 | ) | | | 833,379 | |
As of December 31, 2016, the components of distributable earnings on a tax basis were as follows:
Fund | | Undistributed
Tax-Exempt
Income | | | Undistributed
Ordinary
Income | | | Undistributed
Long-Term
Capital Gains | | | Capital Loss Carryforwards | |
U.S. Government Securities Ultra-Short Bond | | $ | — | | | $ | 11 | | | $ | — | | | $ | — | |
Near-Term Tax Free | | | — | | | | 1,065 | | | | — | | | | (354,180 | ) |
All American Equity | | | — | | | | 11,076 | | | | — | | | | (938,403 | ) |
Holmes Macro Trends | | | — | | | | 832,950 | | | | 157,660 | | | | — | |
Global Resources | | | — | | | | 2,703,819 | | | | — | | | | (464,892,032 | ) |
World Precious Minerals | | | — | | | | 25,987,816 | | | | — | | | | (347,584,197 | ) |
Gold and Precious Metals | | | — | | | | — | | | | — | | | | (103,319,587 | ) |
Emerging Europe | | | — | | | | — | | | | — | | | | (299,691,662 | ) |
China Region | | | — | | | | 16,260 | | | | — | | | | (4,822,299 | ) |
Fund (continued) | | Post October
Losses | | | Current Year
Late-Year
Loss Deferral | | | Net
Unrealized Appreciation (Depreciation) | | | Other
Temporary Differences | | | Total | |
U.S. Government Securities Ultra-Short Bond | | $ | (44 | ) | | $ | — | | | $ | 77,576 | | | $ | — | | | $ | 77,543 | |
Near-Term Tax Free | | | (291,288 | ) | | | — | | | | (595,449 | ) | | | 8 | | | | (1,239,844 | ) |
All American Equity | | | — | | | | — | | | | 105,231 | | | | — | | | | (822,096 | ) |
Holmes Macro Trends | | | — | | | | — | | | | 874,078 | | | | (3 | ) | | | 1,855,685 | |
Global Resources | | | — | | | | — | | | | (71,270,979 | ) | | | (4 | ) | | | (533,459,196 | ) |
World Precious Minerals | | | (6,304,769 | ) | | | — | | | | (40,846,153 | ) | | | (6 | ) | | | (368,747,309 | ) |
Gold and Precious Metals | | | — | | | | (193,994 | ) | | | 8,467,324 | | | | (4 | ) | | | (95,046,261 | ) |
Emerging Europe | | | — | | | | — | | | | 294,123 | | | | (1 | ) | | | (299,397,540 | ) |
China Region | | | — | | | | — | | | | 831,872 | | | | (1 | ) | | | (3,974,168 | ) |
134
Notes to Financial Statements | December 31, 2016 |
The differences between book-basis and tax-basis unrealized appreciation (depreciation) for All American Equity, Holmes Macro Trends, Global Resources, World Precious Minerals, Gold and Precious Metals, Emerging Europe and China Region Funds are attributable primarily to the tax deferral of losses on wash sales, investment in passive foreign investment companies (PFIC), adjustments for partnerships, and adjustments for grantor trusts.
Reclassifications are made to the Funds’ capital accounts to reflect income and gains available for distribution (or available capital loss carryovers) under income tax regulations. For the year ended December 31, 2016, the Funds recorded the following reclassifications to increase (decrease) the accounts listed below:
Fund | | Accumulated
Net Investment Income | | | Accumulated
Net Realized
Gain | | | Paid in
Capital | |
U.S. Government Securities Ultra-Short Bond | | $ | 205 | | | $ | (205 | ) | | $ | — | |
Near-Term Tax Free | | | 3,254 | | | | 112 | | | | (3,366 | ) |
All American Equity | | | 541 | | | | (541 | ) | | | — | |
Holmes Macro Trends | | | 131,459 | | | | (131,861 | ) | | | 402 | |
Global Resources | | | 1,416,861 | | | | (1,416,332 | ) | | | (529 | ) |
World Precious Minerals | | | 9,456,437 | | | | (9,456,437 | ) | | | — | |
Gold and Precious Metals | | | 85,322 | | | | (85,322 | ) | | | — | |
Emerging Europe | | | (242,173 | ) | | | 29,077,300 | | | | (28,835,127 | ) |
China Region | | | (2,937 | ) | | | 15,023,204 | | | | (15,020,267 | ) |
The tax character of distributions paid during the fiscal year ended December 31, 2016, were as follows:
Fund | | Tax-Exempt
Income | | | Ordinary
Income | | | Long-Term
Capital Gains | | | Return of
Capital | | | Total | |
U.S. Government Securities Ultra-Short Bond | | $ | — | | | $ | 261,314 | | | $ | 15,960 | | | $ | 2,047 | | | $ | 279,321 | |
Near-Term Tax Free | | | 1,476,349 | | | | 19,933 | | | | — | | | | 13,758 | | | | 1,510,040 | |
All American Equity | | | — | | | | 27,184 | | | | — | | | | — | | | | 27,184 | |
Holmes Macro Trends | | | — | | | | — | | | | 3,169,616 | | | | — | | | | 3,169,616 | |
Global Resources | | | — | | | | 3,221,240 | | | | — | | | | — | | | | 3,221,240 | |
World Precious Minerals | | | — | | | | 476,963 | | | | — | | | | — | | | | 476,963 | |
Gold and Precious Metals | | | — | | | | 799,465 | | | | — | | | | — | | | | 799,465 | |
Emerging Europe | | | — | | | | — | | | | — | | | | — | | | | — | |
China Region | | | — | | | | 27,847 | | | | — | | | | — | | | | 27,847 | |
135
Notes to Financial Statements | December 31, 2016 |
The tax character of distributions paid during the fiscal year ended December 31, 2015, were as follows:
Fund | | Tax-Exempt
Income | | | Ordinary
Income | | | Long-Term
Capital Gains | | | Total | |
U.S. Government Securities Ultra-Short Bond | | $ | — | | | $ | 199,425 | | | $ | 4,235 | | | $ | 203,660 | |
Near-Term Tax Free | | | 1,316,177 | | | | 45,536 | | | | — | | | | 1,361,713 | |
All American Equity | | | — | | | | 653,208 | | | | 1,610,817 | | | | 2,264,025 | |
Holmes Macro Trends | | | — | | | | — | | | | 3,075,742 | | | | 3,075,742 | |
Global Resources | | | — | | | | 1,128,155 | | | | — | | | | 1,128,155 | |
World Precious Minerals | | | — | | | | 7,142,045 | | | | — | | | | 7,142,045 | |
Gold and Precious Metals | | | — | | | | 269,790 | | | | — | | | | 269,790 | |
Emerging Europe | | | — | | | | — | | | | — | | | | — | |
China Region | | | — | | | | 187,603 | | | | — | | | | 187,603 | |
Capital loss carryforwards may be used to offset current or future taxable capital gains until expiration. The Fund’s tax-basis capital gains and losses are determined only at the end of each fiscal year. Under the Regulated Investment Company Modernization Act of 2010, the Funds are permitted to carry forward capital losses incurred in taxable years beginning after December 22, 2010, for an unlimited period. Losses incurred during these years are required to be utilized prior to the losses incurred in pre-enactment tax years. As a result of this ordering rule, pre-enactment capital loss carryforwards may be more likely to expire unused. In addition, post-enactment capital losses that are carried forward retain their character as either short-term or long-term capital losses rather than being considered all short-term as under previous law. The loss carryforwards and related expiration dates for each fund, as of December 31, 2016, are as follows:
| | | No Expiration | | | Expiration Date | | | | |
Fund | | Short-Term | | | Long-Term | | | 2017 | | | 2018 | | | Total | |
Near-Term Tax Free (a) | | $ | 154,542 | | | $ | 196,384 | | | $ | 722 | | | $ | 2,532 | | | $ | 354,180 | |
All American Equity | | | 938,403 | | | | — | | | | — | | | | — | | | | 938,403 | |
Holmes Macro Trends (a) | | | — | | | | — | | | | — | | | | — | | | | — | |
Global Resources | | | 157,911,652 | | | | 47,767,868 | | | | 259,212,512 | | | | — | | | | 464,892,032 | |
World Precious Minerals | | | 67,035,669 | | | | 216,769,016 | | | | 63,779,512 | | | | — | | | | 347,584,197 | |
Gold and Precious Metals | | | 36,635,685 | | | | 66,683,902 | | | | — | | | | — | | | | 103,319,587 | |
Emerging Europe | | | 14,051,309 | | | | 12,670,868 | | | | 257,523,539 | | | | 15,445,946 | | | | 299,691,662 | |
China Region | | | 4,822,299 | | | | — | | | | — | | | | — | | | | 4,822,299 | |
| | (a) | Utilization of capital loss carryovers is subject to annual limitations. |
136
Notes to Financial Statements | December 31, 2016 |
During the year ended December 31, 2016, the following funds utilized capital loss carryforwards to offset capital gains amounting to:
Fund | | | |
Near-Term Tax Free | | $ | 35,173 | |
All American Equity | | | 392,852 | |
Holmes Macro Trends | | | 461,463 | |
World Precious Minerals | | | 8,536,883 | |
In accordance with tax rules, the following net capital losses and ordinary losses (currency and late year losses) incurred after October 31, within each Fund’s tax year, are deemed to arise on the first day of the Fund’s next tax year if the Fund elects to defer such losses.
The Funds elected to defer losses incurred after October 31, 2016, as follows:
Fund | | Post
October 31, 2016
Capital Loss
Deferral | | | Post
October 31, 2016
Ordinary Loss
Deferral | |
U.S. Government Securities Ultra-Short Bond | | $ | 44 | | | $ | — | |
Near-Term Tax Free | | | 291,288 | | | | — | |
World Precious Minerals | | | 6,304,769 | | | | — | |
Gold and Precious Metals | | | — | | | | 193,994 | |
Note 6: Risks of Concentrations and Foreign Investments
The Near-Term Tax Free Fund may be exposed to risks related to concentration of investments in a particular state or geographic area. These investments present risks resulting from changes in economic conditions of the region or the issuer.
The Global Resources Fund concentrates its investments in the natural resources industries and may be subject to greater risks and fluctuations than a portfolio representing a broader range of industries.
The World Precious Minerals and Gold and Precious Metals Funds concentrate their investments in gold and other precious metals and minerals and, therefore, may be subject to greater risks and market fluctuations than a portfolio representing a broader range of industries. The funds invest in securities that typically respond to changes in the price of gold and other precious metals and minerals, which can be influenced by a variety of global economic, financial and political factors; increased environmental and labor costs in mining; and changes in laws relating to mining or gold production or sales. Fluctuations in the prices of gold and other precious metals and minerals will affect the market values of the securities held by these funds.
The Emerging Europe Fund invests more than 25% of its investments in companies principally engaged in the oil, gas or banking industries. Oil and gas companies are a large part of the Russian economy, and banks typically are a significant component of emerging market economics, such as those in Russia and other Eastern European
137
Notes to Financial Statements | December 31, 2016 |
countries. The risk of concentrating investments in this group of industries will make the fund more susceptible to risk in these industries than funds which do not concentrate their investments in an industry.
The Emerging Europe Fund may be exposed to risks not typically associated with investment in the United States due to its concentration of investments in emerging markets. These risks include possible revaluation of currencies, less public information about companies, disruptive political or economic conditions and the possible imposition of adverse governmental laws or currency exchange restrictions. Moreover, securities of many foreign issuers, including sovereign nations, and their markets may be less liquid and their prices more volatile than those securities of comparable U.S. issuers.
The China Region Fund may be exposed to risks not typically associated with investments in the United States, due to its concentration of investments in foreign issuers in the region. These investments present risks resulting from disruptive political or economic conditions and the potential imposition of adverse governmental laws or currency exchange restrictions affecting the area.
Note 7: Credit Arrangements
Each of the Funds has a revolving credit facility with BBH. Borrowings of each Fund are collateralized by any or all of the securities held by BBH as the Fund’s custodian up to the amount of the borrowing. Interest on borrowings is charged at the current overnight Federal Funds Rate plus 2 percent. Each Fund has a maximum borrowing limit of 10 percent of qualified assets. The aggregate of borrowings by all Funds under the agreement cannot exceed $10,000,000 at any one time. There were no borrowings under the revolving credit facility during the year ended December 31, 2016. The Funds paid BBH a total of $18,917 in commitment fees for the period ended December 31, 2016, under this arrangement.
Note 8: Change of Independent Registered Public Accounting Firm
The Funds have selected BBD, LLP (“BBD”) to serve as the Funds’ independent registered public accounting firm for the Funds’ fiscal year ended December 31, 2016. The decision to select BBD was recommended by the Funds’ Audit Committee on March 24, 2016 and was approved by the Funds’ Board of Trustees on March 24, 2016. During the Funds’ fiscal year ended December 31, 2015, neither the Funds’, nor anyone on their behalf, consulted with BBD on items which: (i) concerned the application of accounting principles to a specified transaction, either completed or proposed, or the type of audit opinion that might be rendered on the Funds’ financial statements; or (ii) concerned the subject of a disagreement (as defined in paragraph (a)(1)(iv) of said Item 304). The selection of BBD does not reflect any disagreements with or dissatisfaction by the Funds or the Funds’ Board of Trustees with the performance of the Funds’ prior independent registered public accounting firm, KPMG, LLP (“KPMG”). The decision not to renew the engagement of KPMG, effective upon its completion of its audit for the fiscal year ended December 31, 2015, and to select BBD was recommended by the Funds’ Audit Committee and
138
Notes to Financial Statements | December 31, 2016 |
approved by the Funds’ Board of Trustees. KPMG’s report on the Funds’ financial statement for the fiscal year ended December 31, 2015 contained no adverse opinion or disclaimer of opinion, nor was it qualified or modified as to uncertainty, audit scope, or accounting principles. During the Funds’ fiscal year ended 2015 (i) there were no disagreements with KPMG on any matter of accounting principles or practices, financial statement disclosure, or auditing scope or procedure, which disagreements, if not resolved to the satisfaction of KPMG, would have caused them to make reference to the subject matter of the disagreements in connection with their reports on the Funds’ financial statements for such years; and (ii) there were no “reportable events” of the kind described in Item 304(a)(1)(v) of Regulation S-K.
Note 9: New Accounting Pronouncement
In October 2016, the U.S. Securities and Exchange Commission (“SEC”) issued a new rule, Investment Company Reporting Modernization, which, among other provisions, amends Regulation S-X to require standardized, enhanced disclosures particularly related to derivatives, in investment company financial statements. Compliance with the amendments to Regulation S-X is required for financial statements filed with the SEC on or after August 1, 2017. Management is currently evaluating the impact that the amendments will have on the Funds’ financial statements and related disclosures.
Note 10: Subsequent Events
The Funds have evaluated the need for additional disclosures and/or adjustments resulting from subsequent events. Based on this evaluation, no additional disclosures or adjustments were required to the financial statements as of the date the financial statements were issued.
139
U.S. Government Securities Ultra-Short Bond Fund
For a capital share outstanding during the
| | | Investor Class | |
| | | Year Ended December 31, | |
| | | 2016 | | | 2015 | | | 2014 | | | | 2013 | * | | | 2012 | * |
Net asset value, beginning of year | | $ | 2.00 | | | $ | 2.00 | | | $ | 2.00 | | | $ | 2.00 | | | $ | 2.00 | |
| | | | | | | | | | | | | | | | | | | | | |
Investment Activities | | | | | | | | | | | | | | | | | | | | |
Net investment income | | | .01 | | | | .01 | | | | .01 | | | | — | (a) | | | — | (a) |
Net realized and unrealized gain | | | — | (a) | | | — | (a) | | | — | (a) | | | — | (a) | | | — | |
Total from investment activities | | | .01 | | | | .01 | | | | .01 | | | | — | | | | — | |
Distributions | | | | | | | | | | | | | | | | | | | | |
From net investment income | | | (.01 | ) | | | (.01 | ) | | | (.01 | ) | | | — | (a) | | | — | (a) |
From return of capital | | | — | (a) | | | — | | | | — | | | | — | | | | — | |
From net realized gains | | | — | (a) | | | — | (a) | | | — | | | | — | | | | — | |
| | | | | | | | | | | | | | | | | | | | |
Net asset value, end of year | | $ | 2.00 | | | $ | 2.00 | | | $ | 2.00 | | | $ | 2.00 | | | $ | 2.00 | |
| | | | | | | | | | | | | | | | | | | | | |
Total Return (b) | | | .47 | % | | | .34 | % | | | .36 | % | | | .02 | % | | | .01 | % |
Ratios to Average Net Assets: | | | | | | | | | | | | | | | | | | | | |
Net investment income | | | .43 | % | | | .33 | % | | | .35 | % | | | .01 | % | | | .01 | % |
Total expenses | | | 1.00 | % | | | 1.13 | % | | | 1.07 | % | | | .97 | % | | | .87 | % |
Expenses waived or reimbursed (c) | | | (.55 | )% | | | (.68 | )% | | | (.74 | )% | | | (.91 | )% | | | (.74 | )% |
Net expenses (d) | | | .45 | % | | | .45 | % | | | .33 | % | | | .06 | % | | | .13 | % |
Portfolio turnover rate (e) | | | 18 | % | | | 60 | % | | | 33 | % | | | | | | | | |
| | | | | | | | | | | | | | | | | | | | | |
Net assets, end of year (in thousands) | | $ | 56,794 | | | $ | 62,562 | | | $ | 64,020 | | | $ | 75,227 | | | $ | 140,425 | |
* | The per share amounts for the periods have been adjusted to reflect a 1-for-2 reverse stock split, which was effective December 20, 2013. In addition, on December 20, 2013, the Fund changed from a constant $1.00 net asset value per share money market fund to a U.S. Government ultra-short bond fund (that is not a money market fund) with an objective of total return with current income. |
(a) | The per share amount does not round to a full penny. |
(b) | Assumes investment at the net asset value at the beginning of the period, reinvestment of all distributions and a complete redemption of the investment at the net asset value at the end of the period. |
(c) | Expenses waived or reimbursed reflect reductions to total expenses, as discussed in the notes to the financial statements. These amounts would increase the net investment loss ratio or decrease the net investment income ratio, as applicable, and decrease total returns had such reductions not occurred. |
(d) | The net expense ratios shown above reflect expenses after waivers and reimbursements but exclude the effect of reductions to total expenses for any expenses offset. Expense offset arrangements reduce total expenses, as discussed in the notes to the financial statements. These amounts would decrease the net investment income ratio had such reductions not occurred. The effect of expenses offset are as follows: |
| | | Investor Class | |
| | | Year Ended December 31, | |
| | | 2016 | | | 2015 | | | 2014 | | | | 2013 | * | | | 2012 | * |
Ratios to Average Net Assets: | | | | | | | | | | | | | | | | | |
Expense offset (f) | | | — | | | | — | | | | — | | | | — | | | | — | |
(e) | Portfolio turnover is not shown for periods that the Fund was a money market fund. |
(f) | Effect on the expense ratio was not greater than 0.005%. |
See accompanying notes to financial statements.
140
Near-Term Tax Free Fund
For a capital share outstanding during the
| | | Investor Class | |
| | | Year Ended December 31, | |
| | | 2016 | | | 2015 | | | 2014 | | | 2013 | | | 2012 | |
Net asset value, beginning of year | | $ | 2.25 | | | $ | 2.25 | | | $ | 2.23 | | | $ | 2.27 | | | $ | 2.26 | |
| | | | | | | | | | | | | | | | | | | | | |
Investment Activities | | | | | | | | | | | | | | | | | | | | |
Net investment income | | | .03 | | | | .03 | | | | .05 | | | | .05 | | | | .05 | |
Net realized and unrealized gain (loss) | | | (.04 | ) | | | — | (a) | | | .02 | | | | (.04 | ) | | | .01 | |
Total from investment activities | | | (.01 | ) | | | .03 | | | | .07 | | | | .01 | | | | .06 | |
Distributions | | | | | | | | | | | | | | | | | | | | |
From net investment income | | | (.03 | ) | | | (.03 | ) | | | (.05 | ) | | | (.05 | ) | | | (.05 | ) |
From return of capital | | | — | (a) | | | — | | | | — | | | | — | | | | — | |
| | | | | | | | | | | | | | | | | | | | |
Net asset value, end of year | | $ | 2.21 | | | $ | 2.25 | | | $ | 2.25 | | | $ | 2.23 | | | $ | 2.27 | |
| | | | | | | | | | | | | | | | | | | | | |
Total Return (b) | | | (.45 | )% | | | 1.45 | % | | | 3.07 | % | | | .31 | % | | | 2.67 | % |
Ratios to Average Net Assets: | | | | | | | | | | | | | | | | | | | | |
Net investment income | | | 1.25 | % | | | 1.52 | % | | | 2.13 | % | | | 2.08 | % | | | 2.21 | % |
Total expenses | | | 0.97 | % | | | 1.09 | % | | | 1.08 | % | | | 1.21 | % | | | 1.25 | % |
Expenses waived or reimbursed (c) | | | (.52 | )% | | | (.64 | )% | | | (.63 | )% | | | (.76 | )% | | | (.80 | )% |
Net expenses (d) | | | .45 | % | | | .45 | % | | | .45 | % | | | .45 | % | | | .45 | % |
Portfolio turnover rate | | | 33 | % | | | 15 | % | | | 12 | % | | | 6 | % | | | 7 | % |
| | | | | | | | | | | | | | | | | | | | | |
Net assets, end of year (in thousands) | | $ | 95,301 | | | $ | 106,769 | | | $ | 89,595 | | | $ | 61,884 | | | $ | 44,509 | |
(a) | The per share amount does not round to a full penny. |
(b) | Assumes investment at the net asset value at the beginning of the period, reinvestment of all distributions and a complete redemption of the investment at the net asset value at the end of the period. |
(c) | Expenses waived or reimbursed reflect reductions to total expenses, as discussed in the notes to the financial statements. These amounts would increase the net investment loss ratio or decrease the net investment income ratio, as applicable, and decrease total returns had such reductions not occurred. |
(d) | The net expense ratios shown above reflect expenses after waivers and reimbursements but exclude the effect of reductions to total expenses for any expenses offset. Expense offset arrangements reduce total expenses, as discussed in the notes to the financial statements. These amounts would decrease the net investment income ratio had such reductions not occurred. The effect of expenses offset are as follows: |
| | | Investor Class | |
| | | Year Ended December 31, | |
| | | 2016 | | | 2015 | | | 2014 | | | 2013 | | | 2012 | |
Ratios to Average Net Assets: | | | | | | | | | | | | | | | |
Expense offset | | | (.02 | )% | | | — | (e) | | | — | (e) | | | — | (e) | | | — | (e) |
(e) | Effect on the expense ratio was not greater than 0.005%. |
See accompanying notes to financial statements.
141
All American Equity Fund
For a capital share outstanding during the
| | | Investor Class | |
| | | Year Ended December 31, | |
| | | 2016 | | | 2015 | | | 2014 | | | 2013 | | | 2012 | |
Net asset value, beginning of year | | $ | 23.60 | | | $ | 27.84 | | | $ | 32.18 | | | $ | 25.40 | | | $ | 22.72 | |
| | | | | | | | | | | | | | | | | | | | | |
Investment Activities | | | | | | | | | | | | | | | | | | | | |
Net investment income (loss) | | | .02 | | | | .09 | | | | (.16 | ) | | | (.12 | ) | | | .07 | |
Net realized and unrealized gain (loss) | | | (.05 | ) | | | (1.23 | ) | | | .84 | | | | 9.08 | | | | 2.61 | |
Total from investment activities | | | (.03 | ) | | | (1.14 | ) | | | .68 | | | | 8.96 | | | | 2.68 | |
Distributions | | | | | | | | | | | | | | | | | | | | |
From net investment income | | | (.04 | ) | | | (.06 | ) | | | — | | | | (.07 | ) | | | — | |
From net realized gains | | | — | | | | (3.04 | ) | | | (5.02 | ) | | | (2.11 | ) | | | — | |
Total distributions | | | (.04 | ) | | | (3.10 | ) | | | (5.02 | ) | | | (2.18 | ) | | | — | |
Short -Term Trading Fees* (a) | | | — | | | | — | | | | — | | | | — | | | | — | |
| | | | | | | | | | | | | | | | | | | | |
Net asset value, end of year | | $ | 23.53 | | | $ | 23.60 | | | $ | 27.84 | | | $ | 32.18 | | | $ | 25.40 | |
| | | | | | | | | | | | | | | | | | | | | |
Total Return (b) | | | (.14 | )% | | | (4.20 | )% | | | 1.94 | % | | | 35.55 | % | | | 11.80 | % |
Ratios to Average Net Assets: | | | | | | | | | | | | | | | | | | | | |
Net investment income (loss) | | | .06 | % | | | .31 | % | | | (.54 | )% | | | (.45 | )% | | | .28 | % |
Total expenses | | | 1.75 | % | | | 1.94 | % | | | 2.16 | % | | | 2.44 | % | | | 2.72 | % |
Expenses waived or reimbursed (c) | | | (.02 | )% | | | (.02 | )% | | | (.03 | )% | | | (.28 | )% | | | (.52 | )% |
Net expenses (d) | | | 1.73 | % | | | 1.92 | % | | | 2.13 | % | | | 2.16 | % | | | 2.20 | % |
Portfolio turnover rate | | | 303 | % | | | 109 | %(f) | | | 253 | % | | | 150 | % | | | 221 | % |
| | | | | | | | | | | | | | | | | | | | | |
Net assets, end of year (in thousands) | | $ | 17,350 | | | $ | 19,117 | | | $ | 21,936 | | | $ | 23,388 | | | $ | 16,846 | |
* | Based on average monthly shares outstanding. |
(a) | The per share amount does not round to a full penny. |
(b) | Assumes investment at the net asset value at the beginning of the period, reinvestment of all distributions and a complete redemption of the investment at the net asset value at the end of the period. |
(c) | Expenses waived or reimbursed reflect reductions to total expenses, as discussed in the notes to the financial statements. These amounts would increase the net investment loss ratio or decrease the net investment income ratio, as applicable, and decrease total returns had such reductions not occurred. |
(d) | The net expense ratios shown above reflect expenses after waivers and reimbursements but exclude the effect of reductions to total expenses for any expenses offset. Expense offset arrangements reduce total expenses, as discussed in the notes to the financial statements. These amounts would decrease the net investment income (loss) ratio had such reductions not occurred. The effect of expenses offset are as follows: |
| | | Investor Class | |
| | | Year Ended December 31, | |
| | | 2016 | | | 2015 | | | 2014 | | | 2013 | | | 2012 | |
Ratios to Average Net Assets: | | | | | | | | | | | | | | | |
Expense offset | | | (.02 | )% | | | — | (e) | | | — | (e) | | | — | (e) | | | — | (e) |
(e) | Effect on the expense ratio was not greater than 0.005%. |
(f) | Excludes option transactions. |
See accompanying notes to financial statements.
142
Holmes Macro Trends Fund
For a capital share outstanding during the
| | | Investor Class | |
| | | Year Ended December 31, | |
| | | 2016 | | | 2015 | | | 2014 | | | 2013 | | | 2012 | |
Net asset value, beginning of year | | $ | 18.59 | | | $ | 20.25 | | | $ | 24.24 | | | $ | 18.51 | | | $ | 17.62 | |
| | | | | | | | | | | | | | | | | | | | | |
Investment Activities | | | | | | | | | | | | | | | | | | | | |
Net investment loss | | | (.06 | ) | | | (.11 | ) | | | (.26 | ) | | | (.18 | ) | | | (.10 | ) |
Net realized and unrealized gain (loss) | | | 1.68 | | | | (.06 | ) | | | (1.36 | ) | | | 7.42 | | | | 1.29 | |
Total from investment activities | | | 1.62 | | | | (.17 | ) | | | (1.62 | ) | | | 7.24 | | | | 1.19 | |
Distributions from net realized gains | | | (1.56 | ) | | | (1.49 | ) | | | (2.37 | ) | | | (1.51 | ) | | | (.30 | ) |
Short -Term Trading Fees*(a) | | | — | | | | — | | | | — | | | | — | | | | — | |
| | | | | | | | | | | | | | | | | | | | |
Net asset value, end of year | | $ | 18.65 | | | $ | 18.59 | | | $ | 20.25 | | | $ | 24.24 | | | $ | 18.51 | |
| | | | | | | | | | | | | | | | | | | | | |
Total Return (b) | | | 8.66 | % | | | (.94 | )% | | | (6.74 | )% | | | 39.38 | % | | | 6.77 | % |
Ratios to Average Net Assets: | | | | | | | | | | | | | | | | | | | | |
Net investment loss | | | (.34 | )% | | | (.55 | )% | | | (1.17 | )% | | | (1.11 | )% | | | (.51 | )% |
Total expenses | | | 1.67 | % | | | 1.81 | % | | | 1.94 | % | | | 2.00 | % | | | 1.85 | % |
Expenses waived or reimbursed (c) | | | — | | | | — | | | | — | | | | (.04 | )% | | | —(e | ) |
Net expenses (d) | | | 1.67 | % | | | 1.81 | % | | | 1.94 | % | | | 1.96 | % | | | 1.85 | % |
Portfolio turnover rate | | | 275 | %(f) | | | 320 | %(f) | | | 183 | %(f) | | | 109 | % | | | 214 | % |
| | | | | | | | | | | | | | | | | | | | | |
Net assets, end of year (in thousands) | | $ | 40,706 | | | $ | 41,135 | | | $ | 46,250 | | | $ | 55,926 | | | $ | 34,639 | |
* | Based on average monthly shares outstanding. |
(a) | The per share amount does not round to a full penny. |
(b) | Assumes investment at the net asset value at the beginning of the period, reinvestment of all distributions and a complete redemption of the investment at the net asset value at the end of the period. |
(c) | Expenses waived or reimbursed reflect reductions to total expenses, as discussed in the notes to the financial statements. These amounts would increase the net investment loss ratio or decrease the net investment income ratio, as applicable, and decrease total returns had such reductions not occurred. |
(d) | The net expense ratios shown above reflect expenses after waivers and reimbursements but exclude the effect of reductions to total expenses for any expenses offset. Expense offset arrangements reduce total expenses, as discussed in the notes to the financial statements. These amounts would decrease the net investment income ratio had such reductions not occurred. The effect of expenses offset are as follows: |
| | | Investor Class | |
| | | Year Ended December 31, | |
| | | 2016 | | | 2015 | | | 2014 | | | 2013 | | | 2012 | |
Ratios to Average Net Assets: | | | | | | | | | | | | | | | |
Expense offset | | | (.02 | )% | | | — | (e) | | | — | (e) | | | — | (e) | | | — | (e) |
(e) | Effect on the expense ratio was not greater than 0.005%. |
(f) | Excludes option transactions. |
See accompanying notes to financial statements.
143
Global Resources Fund
For a capital share outstanding during the
| | | Investor Class | |
| | | Year Ended December 31, | |
| | | 2016 | | | 2015 | | | 2014 | | | 2013 | | | 2012 | |
Net asset value, beginning of year | | $ | 4.72 | | | $ | 6.67 | | | $ | 9.36 | | | $ | 9.79 | | | $ | 9.36 | |
| | | | | | | | | | | | | | | | | | | | | |
Investment Activities | | | | | | | | | | | | | | | | | | | | |
Net investment income (loss) | | | .06 | * | | | .10 | * | | | .04 | * | | | .02 | * | | | .04 | * |
Net realized and unrealized gain (loss) | | | .64 | * | | | (2.00 | )* | | | (2.73 | )* | | | (.10 | )* | | | .61 | * |
Total from investment activities | | | .70 | | | | (1.90 | ) | | | (2.69 | ) | | | (.08 | ) | | | .65 | |
Distributions from net investment income | | | (.17 | ) | | | (.05 | ) | | | — | | | | (.35 | ) | | | (.22 | ) |
Short -Term Trading Fees*(a) | | | — | | | | — | | | | — | | | | — | | | | — | |
| | | | | | | | | | | | | | | | | | | | |
Net asset value, end of year | | $ | 5.25 | | | $ | 4.72 | | | $ | 6.67 | | | $ | 9.36 | | | $ | 9.79 | |
| | | | | | | | | | | | | | | | | | | | | |
Total Return (b) | | | 14.99 | % | | | (28.43 | )% | | | (28.74 | )% | | | (.72 | )% | | | 6.93 | % |
Ratios to Average Net Assets: | | | | | | | | | | | | | | | | | | | | |
Net investment income (loss) | | | 1.13 | % | | | 1.72 | % | | | .44 | % | | | .16 | % | | | .44 | % |
Total expenses | | | 1.85 | % | | | 1.58 | % | | | 1.45 | % | | | 1.59 | % | | | 1.57 | % |
Expenses waived or reimbursed (c) | | | (.01 | )% | | | (.06 | )% | | | —(e | ) | | | — | | | | — | |
Net expenses (d) | | | 1.84 | % | | | 1.52 | % | | | 1.45 | % | | | 1.59 | % | | | 1.57 | % |
Portfolio turnover rate (f) | | | 255 | %(g) | | | 445 | %(g) | | | 444 | %(g) | | | 138 | % | | | 117 | % |
| | | | | | | | | | | | | | | | | | | | | |
Net assets, end of year (in thousands) | | $ | 97,005 | | | $ | 98,126 | | | $ | 171,673 | | | $ | 326,320 | | | $ | 438,372 | |
* | Based on average monthly shares outstanding. |
(a) | The per share amount does not round to a full penny. |
(b) | Assumes investment at the net asset value at the beginning of the period, reinvestment of all distributions and a complete redemption of the investment at the net asset value at the end of the period. |
(c) | Expenses waived or reimbursed reflect reductions to total expenses, as discussed in the notes to the financial statements. These amounts would increase the net investment loss ratio or decrease the net investment income ratio, as applicable, and decrease total returns had such reductions not occurred. |
(d) | The net expense ratios shown above reflect expenses after waivers and reimbursements but exclude the effect of reductions to total expenses for any expenses offset. Expense offset arrangements reduce total expenses, as discussed in the notes to the financial statements. These amounts would decrease the net investment income ratio had such reductions not occurred. The effect of expenses offset are as follows: |
| | | Investor Class | |
| | | Year Ended December 31, | |
| | | 2016 | | | 2015 | | | 2014 | | | 2013 | | | 2012 | |
Ratios to Average Net Assets: | | | | | | | | | | | | | | | |
Expense offset | | | (.01 | )% | | | — | (e) | | | — | (e) | | | — | (e) | | | — | (e) |
(e) | Effect on the expense ratio was not greater than 0.005%. |
(f) | Portfolio turnover is calculated at the fund level. |
(g) | Excludes option transactions. |
See accompanying notes to financial statements.
144
Global Resources Fund
For a capital share outstanding during the
| | | Institutional Class | |
| | | Year Ended December 31, | |
| | | 2016 | | | 2015 | | | 2014 | | | 2013 | | | 2012 | |
Net asset value, beginning of year | | $ | 4.74 | | | $ | 6.67 | | | $ | 9.30 | | | $ | 9.74 | | | $ | 9.39 | |
| | | | | | | | | | | | | | | | | | | | | |
Investment Activities | | | | | | | | | | | | | | | | | | | | |
Net investment income (loss) | | | .08 | * | | | .17 | * | | | .08 | * | | | .07 | * | | | .10 | * |
Net realized and unrealized gain (loss) | | | .65 | * | | | (2.02 | )* | | | (2.71 | )* | | | (.10 | )* | | | .60 | * |
Total from investment activities | | | .73 | | | | (1.85 | ) | | | (2.63 | ) | | | (.03 | ) | | | .70 | |
Distributions from net investment income | | | (.22 | ) | | | (.08 | ) | | | — | | | | (.41 | ) | | | (.35 | ) |
Short -Term Trading Fees* | | | — | | | | — | | | | — | | | | — | (a) | | | — | (a) |
| | | | | | | | | | | | | | | | | | | | |
Net asset value, end of year | | $ | 5.25 | | | $ | 4.74 | | | $ | 6.67 | | | $ | 9.30 | | | $ | 9.74 | |
| | | | | | | | | | | | | | | | | | | | | |
Total Return (b) | | | 15.43 | % | | | (27.73 | )% | | | (28.28 | )% | | | (.15 | )% | | | 7.44 | % |
Ratios to Average Net Assets: | | | | | | | | | | | | | | | | | | | | |
Net investment income (loss) | | | 1.61 | % | | | 2.92 | % | | | .85 | % | | | .68 | % | | | 1.02 | % |
Total expenses | | | 5.41 | % | | | 1.35 | % | | | 1.13 | % | | | 1.25 | % | | | 1.21 | % |
Expenses waived or reimbursed (c) | | | (4.05 | )% | | | (.61 | )% | | | (.27 | )% | | | (.22 | )% | | | (.14 | )% |
Net expenses (d) | | | 1.36 | % | | | .74 | % | | | .86 | % | | | 1.03 | % | | | 1.07 | % |
Portfolio turnover rate (f) | | | 255 | %(g) | | | 445 | %(g) | | | 444 | %(g) | | | 138 | % | | | 117 | % |
| | | | | | | | | | | | | | | | | | | | | |
Net assets, end of year (in thousands) | | $ | 1,021 | | | $ | 1,882 | | | $ | 9,733 | | | $ | 51,122 | | | $ | 94,076 | |
* | Based on average monthly shares outstanding. |
(a) | The per share amount does not round to a full penny. |
(b) | Assumes investment at the net asset value at the beginning of the period, reinvestment of all distributions and a complete redemption of the investment at the net asset value at the end of the period. |
(c) | Expenses waived or reimbursed reflect reductions to total expenses, as discussed in the notes to the financial statements. These amounts would increase the net investment loss ratio or decrease the net investment income ratio, as applicable, and decrease total returns had such reductions not occurred. |
(d) | The net expense ratios shown above reflect expenses after waivers and reimbursements but exclude the effect of reductions to total expenses for any expenses offset. Expense offset arrangements reduce total expenses, as discussed in the notes to the financial statements. These amounts would decrease the net investment income (loss) ratio had such reductions not occurred. The effect of expenses offset are as follows: |
| | | Institutional Class | |
| | | Year Ended December 31, | |
| | | 2016 | | | 2015 | | | 2014 | | | 2013 | | | 2012 | |
Ratios to Average Net Assets: | | | | | | | | | | | | | | | |
Expense offset | | | (.01 | )% | | | — | (e) | | | — | (e) | | | — | (e) | | | — | (e) |
(e) | Effect on the expense ratio was not greater than 0.005%. |
(f) | Portfolio turnover rate is calculated at the fund level. |
(g) | Excludes option transactions. |
See accompanying notes to financial statements.
145
World Precious Minerals Fund
For a capital share outstanding during the
| | | Investor Class | |
| | | Year Ended December 31, | |
| | | 2016 | | | 2015 | | | 2014 | | | 2013 | | | 2012 | |
Net asset value, beginning of year | | $ | 3.64 | | | $ | 4.75 | | | $ | 5.69 | | | $ | 11.70 | | | $ | 13.18 | |
| | | | | | | | | | | | | | | | | | | | | |
Investment Activities | | | | | | | | | | | | | | | | | | | | |
Net investment loss | | | (.09 | )* | | | (.03 | )* | | | (.06 | )* | | | (.07 | )* | | | (.11 | )* |
Net realized and unrealized loss | | | 2.82 | * | | | (.72 | )* | | | (.88 | )* | | | (5.94 | )* | | | (1.37 | )* |
Total from investment activities | | | 2.73 | | | | (.75 | ) | | | (.94 | ) | | | (6.01 | ) | | | (1.48 | ) |
Distributions from net investment income | | | (.02 | ) | | | (.36 | ) | | | — | | | | — | | | | — | |
Short -Term Trading Fees*(a) | | | — | | | | — | | | | — | | | | — | | | | — | |
| | | | | | | | | | | | | | | | | | | | |
Net asset value, end of year | | $ | 6.35 | | | $ | 3.64 | | | $ | 4.75 | | | $ | 5.69 | | | $ | 11.70 | |
| | | | | | | | | | | | | | | | | | | | | |
Total Return (b) | | | 75.08 | % | | | (15.64 | )% | | | (16.52 | )% | | | (51.37 | )% | | | (11.23 | )% |
Ratios to Average Net Assets: | | | | | | | | | | | | | | | | | | | | |
Net investment loss | | | (1.28 | )% | | | (.71 | )% | | | (.91 | )% | | | (.90 | )% | | | (.85 | )% |
Total expenses | | | 1.99 | % | | | 1.96 | % | | | 1.99 | % | | | 1.85 | % | | | 1.45 | % |
Expenses waived or reimbursed (c) | | | (.04 | )% | | | (.15 | )% | | | (.03 | )% | | | (.02 | )% | | | — | |
Net expenses (d) | | | 1.95 | % | | | 1.81 | % | | | 1.96 | % | | | 1.83 | % | | | 1.45 | % |
Portfolio turnover rate (f) | | | 136 | %(g) | | | 71 | %(g) | | | 61 | %(g) | | | 34 | % | | | 44 | % |
| | | | | | | | | | | | | | | | | | | | | |
Net assets, end of year (in thousands) | | $ | 137,338 | | | $ | 78,150 | | | $ | 103,413 | | | $ | 134,065 | | | $ | 319,052 | |
* | Based on average monthly shares outstanding. |
(a) | The per share amount does not round to a full penny. |
(b) | Assumes investment at the net asset value at the beginning of the period, reinvestment of all distributions and a complete redemption of the investment at the net asset value at the end of the period. |
(c) | Expenses waived or reimbursed reflect reductions to total expenses, as discussed in the notes to the financial statements. These amounts would increase the net investment loss ratio or decrease the net investment income ratio, as applicable, and decrease total returns had such reductions not occurred. |
(d) | The net expense ratios shown above reflect expenses after waivers and reimbursements but exclude the effect of reductions to total expenses for any expenses offset. Expense offset arrangements reduce total expenses, as discussed in the notes to the financial statements. These amounts would decrease the net investment income ratio had such reductions not occurred. The effect of expenses offset are as follows: |
| | | Investor Class | |
| | | Year Ended December 31, | |
| | | 2016 | | | 2015 | | | 2014 | | | 2013 | | | 2012 | |
Ratios to Average Net Assets: | | | | | | | | | | | | | | | |
Expense offset | | | (.01 | )% | | | — | (e) | | | — | (e) | | | — | (e) | | | — | (e) |
(e) | Effect on the expense ratio was not greater than 0.005%. |
(f) | Portfolio turnover rate is calculated at the fund level. |
(g) | Excludes option transactions. |
See accompanying notes to financial statements.
146
World Precious Minerals Fund
For a capital share outstanding during the
| | | Institutional Class | |
| | | Year Ended December 31, | |
| | | 2016 | | | 2015 | | | 2014 | | | 2013 | | | 2012 | |
Net asset value, beginning of year | | $ | 3.65 | | | $ | 4.78 | | | $ | 5.72 | | | $ | 11.69 | | | $ | 13.10 | |
| | | | | | | | | | | | | | | | | | | | | |
Investment Activities | | | | | | | | | | | | | | | | | | | | |
Net investment loss | | | (.05 | )* | | | (.01 | )* | | | (.05 | )* | | | (.01 | )* | | | (.04 | )* |
Net realized and unrealized loss | | | 2.82 | * | | | (.72 | )* | | | (.89 | )* | | | (5.96 | )* | | | (1.37 | )* |
Total from investment activities | | | 2.77 | | | | (.73 | ) | | | (.94 | ) | | | (5.97 | ) | | | (1.41 | ) |
Distributions from net investment income | | | (.04 | ) | | | (.40 | ) | | | — | | | | — | | | | — | |
Short -Term Trading Fees* | | | — | | | | — | | | | — | | | | — | | | | — | |
| | | | | | | | | | | | | | | | | | | | |
Net asset value, end of year | | $ | 6.38 | | | $ | 3.65 | | | $ | 4.78 | | | $ | 5.72 | | | $ | 11.69 | |
| | | | | | | | | | | | | | | | | | | | | |
Total Return (a) | | | 75.97 | % | | | (15.07 | )% | | | (16.43 | )% | | | (51.07 | )% | | | (10.76 | )% |
Ratios to Average Net Assets: | | | | | | | | | | | | | | | | | | | | |
Net investment loss | | | (.69 | )% | | | (.15 | )% | | | (.71 | )% | | | (.15 | )% | | | (.32 | )% |
Total expenses | | | 2.60 | % | | | 20.51 | % | | | 4.86 | % | | | 3.30 | % | | | 3.56 | % |
Expenses waived or reimbursed (b) | | | (1.33 | )% | | | (19.31 | )% | | | (3.23 | )% | | | (1.97 | )% | | | (2.69 | )% |
Net expenses (c) | | | 1.27 | % | | | 1.20 | % | | | 1.63 | % | | | 1.33 | % | | | .87 | % |
Portfolio turnover rate (e) | | | 136 | %(f) | | | 71 | %(f) | | | 61 | %(f) | | | 34 | % | | | 44 | % |
| | | | | | | | | | | | | | | | | | | | | |
Net assets, end of year (in thousands) | | $ | 3,821 | | | $ | 76 | | | $ | 154 | | | $ | 3,660 | | | $ | 769 | |
* | Based on average monthly shares outstanding. |
(a) | Assumes investment at the net asset value at the beginning of the period, reinvestment of all distributions and a complete redemption of the investment at the net asset value at the end of the period. |
(b) | Expenses waived or reimbursed reflect reductions to total expenses, as discussed in the notes to the financial statements. These amounts would increase the net investment loss ratio or decrease the net investment income ratio, as applicable, and decrease total returns had such reductions not occurred. |
(c) | The net expense ratios shown above reflect expenses after waivers and reimbursements but exclude the effect of reductions to total expenses for any expenses offset. Expense offset arrangements reduce total expenses, as discussed in the notes to the financial statements. These amounts would decrease the net investment income ratio had such reductions not occurred. The effect of expenses offset are as follows: |
| | | Institutional Class | |
| | | Year Ended December 31, | |
| | | 2016 | | | 2015 | | | 2014 | | | 2013 | | | 2012 | |
Ratios to Average Net Assets: | | | | | | | | | | | | | | | |
Expense offset | | | (.01 | )% | | | — | (d) | | | — | (d) | | | — | (d) | | | — | (d) |
(d) | Effect on the expense ratio was not greater than 0.005%. |
(e) | Portfolio turnover rate is calculated at the fund level. |
(f) | Excludes option transactions. |
See accompanying notes to financial statements.
147
Gold and Precious Metals Fund
For a capital share outstanding during the
| | | Investor Class | |
| | | Year Ended December 31, | |
| | | 2016 | | | 2015 | | | 2014 | | | 2013 | | | 2012 | |
Net asset value, beginning of year | | $ | 4.89 | | | $ | 5.16 | | | $ | 6.00 | | | $ | 11.78 | | | $ | 12.61 | |
| | | | | | | | | | | | | | | | | | | | | |
Investment Activities | | | | | | | | | | | | | | | | | | | | |
Net investment loss | | | (.07 | ) | | | (.04 | ) | | | (.05 | ) | | | (.06 | ) | | | (.09 | ) |
Net realized and unrealized gain (loss) | | | 2.28 | | | | (.21 | ) | | | (.79 | ) | | | (5.72 | ) | | | (.72 | ) |
Total from investment activities | | | 2.21 | | | | (.25 | ) | | | (.84 | ) | | | (5.78 | ) | | | (.81 | ) |
Distributions | | | | | | | | | | | | | | | | | | | | |
From net investment income | | | (.06 | ) | | | (.02 | ) | | | — | | | | — | | | | (.02 | ) |
Short -Term Trading Fees* (a) | | | — | | | | — | | | | — | | | | — | | | | — | |
| | | | | | | | | | | | | | | | | | | | |
Net asset value, end of year | | $ | 7.04 | | | $ | 4.89 | | | $ | 5.16 | | | $ | 6.00 | | | $ | 11.78 | |
| | | | | | | | | | | | | | | | | | | | | |
Total Return (b) | | | 45.36 | % | | | (4.78 | )% | | | (14.00 | )% | | | (49.07 | )% | | | (6.44 | )% |
Ratios to Average Net Assets: | | | | | | | | | | | | | | | | | | | | |
Net investment loss | | | (1.02 | )% | | | (.83 | )% | | | (.67 | )% | | | (.48 | )% | | | (.60 | )% |
Total expenses | | | 1.73 | % | | | 2.13 | % | | | 1.93 | % | | | 2.12 | % | | | 1.61 | % |
Expenses waived or reimbursed (c) | | | (.02 | )% | | | (.08 | )% | | | (.05 | )% | | | (.06 | )% | | | — | |
Net expenses (d) | | | 1.71 | % | | | 2.05 | % | | | 1.88 | % | | | 2.06 | % | | | 1.61 | % |
Portfolio turnover rate | | | 181 | %(f) | | | 106 | %(f) | | | 99 | %(f) | | | 64 | % | | | 95 | % |
| | | | | | | | | | | | | | | | | | | | | |
Net assets, end of year (in thousands) | | $ | 93,988 | | | $ | 58,298 | | | $ | 62,777 | | | $ | 74,627 | | | $ | 166,524 | |
* | Based on average monthly shares outstanding. |
(a) | The per share amount does not round to a full penny. |
(b) | Assumes investment at the net asset value at the beginning of the period, reinvestment of all distributions and a complete redemption of the investment at the net asset value at the end of the period. |
(c) | Expenses waived or reimbursed reflect reductions to total expenses, as discussed in the notes to the financial statements. These amounts would increase the net investment loss ratio or decrease the net investment income ratio, as applicable, and decrease total returns had such reductions not occurred. |
(d) | The net expense ratios shown above reflect expenses after waivers and reimbursements but exclude the effect of reductions to total expenses for any expenses offset. Expense offset arrangements reduce total expenses, as discussed in the notes to the financial statements. These amounts would decrease the net investment loss ratio had such reductions not occurred. The effect of expenses offset are as follows: |
| | | Investor Class | |
| | | Year Ended December 31, | |
| | | 2016 | | | 2015 | | | 2014 | | | 2013 | | | 2012 | |
Ratios to Average Net Assets: | | | | | | | | | | | | | | | |
Expense offset | | | (.01 | )% | | | — | (e) | | | — | (e) | | | — | (e) | | | — | (e) |
(e) | Effect on the expense ratio was not greater than 0.005%. |
(f) | Excludes option transactions. |
See accompanying notes to financial statements.
148
Emerging Europe Fund
For a capital share outstanding during the
| | | Investor Class | |
| | | Year Ended December 31, | |
| | | 2016 | | | 2015 | | | 2014 | | | 2013 | | | 2012 | |
Net asset value, beginning of year | | $ | 5.20 | | | $ | 6.56 | | | $ | 8.82 | | | $ | 9.23 | | | $ | 7.79 | |
| | | | | | | | | | | | | | | | | | | | | |
Investment Activities | | | | | | | | | | | | | | | | | | | | |
Net investment income | | | .07 | | | | .04 | | | | .06 | | | | .19 | | | | .15 | |
Net realized and unrealized gain (loss) | | | .67 | | | | (1.40 | ) | | | (2.11 | ) | | | (.46 | ) | | | 1.35 | |
Total from investment activities | | | .74 | | | | (1.36 | ) | | | (2.05 | ) | | | (.27 | ) | | | 1.50 | |
Distributions from net investment income | | | — | | | | — | | | | (.21 | ) | | | (.14 | ) | | | (.06 | ) |
Short -Term Trading Fees*(a) | | | — | | | | — | | | | — | | | | — | | | | — | |
| | | | | | | | | | | | | | | | | | | | |
Net asset value, end of year | | $ | 5.94 | | | $ | 5.20 | | | $ | 6.56 | | | $ | 8.82 | | | $ | 9.23 | |
| | | | | | | | | | | | | | | | | | | | | |
Total Return (b) | | | 14.23 | % | | | (20.73 | )% | | | (23.22 | )% | | | (2.93 | )% | | | 19.27 | % |
Ratios to Average Net Assets: | | | | | | | | | | | | | | | | | | | | |
Net investment income | | | 1.19 | % | | | .63 | % | | | .23 | % | | | 1.59 | % | | | 1.39 | % |
Total expenses | | | 2.31 | % | | | 2.60 | % | | | 2.28 | % | | | 2.13 | % | | | 2.15 | % |
Expenses waived or reimbursed (c) | | | — | (e) | | | — | | | | — | | | | — | | | | — | |
Net expenses (d) | | | 2.31 | % | | | 2.60 | % | | | 2.28 | % | | | 2.13 | % | | | 2.15 | % |
Portfolio turnover rate | | | 164 | %(f) | | | 137 | %(f) | | | 93 | %(f) | | | 74 | % | | | 85 | % |
| | | | | | | | | | | | | | | | | | | | | |
Net assets, end of year (in thousands) | | $ | 42,273 | | | $ | 44,666 | | | $ | 69,066 | | | $ | 122,570 | | | $ | 173,687 | |
* | Based on average monthly shares outstanding. |
(a) | The per share amount does not round to a full penny. |
(b) | Assumes investment at the net asset value at the beginning of the period, reinvestment of all distributions and a complete redemption of the investment at the net asset value at the end of the period. |
(c) | Expenses waived or reimbursed reflect reductions to total expenses, as discussed in the notes to the financial statements. These amounts would increase the net investment loss ratio or decrease the net investment income ratio, as applicable, and decrease total returns had such reductions not occurred. |
(d) | The net expense ratios shown above reflect expenses after waivers and reimbursements but exclude the effect of reductions to total expenses for any expenses offset. Expense offset arrangements reduce total expenses, as discussed in the notes to the financial statements. These amounts would decrease the net investment income (loss) ratio had such reductions not occurred. The effect of expenses offset are as follows: |
| | | Investor Class | |
| | | Year Ended December 31, | |
| | | 2016 | | | 2015 | | | 2014 | | | 2013 | | | 2012 | |
Ratios to Average Net Assets: | | | | | | | | | | | | | | | |
Expense offset (e) | | | — | | | | — | | | | — | | | | — | | | | — | |
(e) | Effect on the expense ratio was not greater than 0.005%. |
(f) | Excludes option transactions. |
See accompanying notes to financial statements.
149
China Region Fund
For a capital share outstanding during the
| | | Investor Class | |
| | | Year Ended December 31, | |
| | | 2016 | | | 2015 | | | 2014 | | | 2013 | | | 2012 | |
Net asset value, beginning of year | | $ | 7.41 | | | $ | 8.20 | | | $ | 8.28 | | | $ | 7.61 | | | $ | 6.81 | |
| | | | | | | | | | | | | | | | | | | | | |
Investment Activities | | | | | | | | | | | | | | | | | | | | |
Net investment income (loss) | | | .01 | | | | .02 | | | | —(a | ) | | | (.01 | ) | | | .04 | |
Net realized and unrealized gain (loss) | | | (.09 | ) | | | (.72 | ) | | | (.08 | ) | | | .70 | | | | .78 | |
Total from investment activities | | | (.08 | ) | | | (.70 | ) | | | (.08 | ) | | | .69 | | | | .82 | |
Distributions from net investment income | | | (.01 | ) | | | (.09 | ) | | | — | | | | (.02 | ) | | | (.02 | ) |
Short -Term Trading Fees* (a) | | | — | | | | — | | | | — | | | | — | | | | — | |
| | | | | | | | | | | | | | | | | | | | |
Net asset value, end of year | | $ | 7.32 | | | $ | 7.41 | | | $ | 8.20 | | | $ | 8.28 | | | $ | 7.61 | |
| | | | | | | | | | | | | | | | | | | | | |
Total Return (b) | | | (1.05 | )% | | | (8.60 | )% | | | (.97 | )% | | | 9.07 | % | | | 12.00 | % |
Ratios to Average Net Assets: | | | | | | | | | | | | | | | | | | | | |
Net investment income (loss) | | | .12 | % | | | .24 | % | | | .08 | % | | | (.12 | )% | | | .60 | % |
Total expenses | | | 2.74 | % | | | 3.03 | % | | | 2.94 | % | | | 2.75 | % | | | 2.64 | % |
Expenses waived or reimbursed (c) | | | (.38 | )% | | | (.51 | )% | | | (.43 | )% | | | (.37 | )% | | | (.39 | )% |
Net expenses (d) | | | 2.36 | % | | | 2.52 | % | | | 2.51 | % | | | 2.38 | % | | | 2.25 | % |
Portfolio turnover rate | | | 165 | %(f) | | | 210 | %(f) | | | 235 | %(f) | | | 201 | % | | | 374 | % |
| | | | | | | | | | | | | | | | | | | | | |
Net assets, end of year (in thousands) | | $ | 16,510 | | | $ | 16,183 | | | $ | 21,008 | | | $ | 26,386 | | | $ | 29,160 | |
* | Based on average monthly shares outstanding. |
(a) | The per share amount does not round to a full penny. |
(b) | Assumes investment at the net asset value at the beginning of the period, reinvestment of all distributions and a complete redemption of the investment at the net asset value at the end of the period. |
(c) | Expenses waived or reimbursed reflect reductions to total expenses, as discussed in the notes to the financial statements. These amounts would increase the net investment loss ratio or decrease the net investment income ratio, as applicable, and decrease total returns had such reductions not occurred. |
(d) | The net expense ratios shown above reflect expenses after waivers and reimbursements but exclude the effect of reductions to total expenses for any expenses offset. Expense offset arrangements reduce total expenses, as discussed in the notes to the financial statements. These amounts would decrease the net investment income ratio had such reductions not occurred. The effect of expenses offset are as follows: |
| | | Investor Class | |
| | | Year Ended December 31, | |
| | | 2016 | | | 2015 | | | 2014 | | | 2013 | | | 2012 | |
Ratios to Average Net Assets: | | | | | | | | | | | | | | | |
Expense offset | | | (.01 | )% | | | — | (e) | | | — | (e) | | | — | (e) | | | — | (e) |
(e) | Effect on the expense ratio was not greater than 0.005%. |
(f) | Excludes option transactions. |
See accompanying notes to financial statements.
150
Report of Independent Registered Public Accounting Firm |
To the Board of Trustees and Shareholders of
U.S. Global Investors Funds
We have audited the accompanying statements of assets and liabilities of U.S. Government Securities Ultra-Short Bond Fund, Near-Term Tax Free Fund, All American Equity Fund, Holmes Macro Trends Fund, Global Resources Fund, World Precious Minerals Fund, Gold and Precious Metals Fund, Emerging Europe Fund, and China Region Fund (the “Funds”), each a series of shares of beneficial interest in U.S. Global Investors Funds, including the portfolios of investments, as of December 31, 2016, and the related statements of operations and changes in net assets and the financial highlights for the year then ended. These financial statements and financial highlights are the responsibility of the Funds’ management. Our responsibility is to express an opinion on these financial statements and financial highlights based on our audits. The statements of changes in net assets and the financial highlights for each of the years presented through December 31, 2015 were audited by other auditors, whose report dated February 26, 2016 expressed an unqualified opinion on those financial statements and financial highlights.
We conducted our audits in accordance with the standards of the Public Company Accounting Oversight Board (United States). Those standards require that we plan and perform the audits to obtain reasonable assurance about whether the financial statements and financial highlights are free of material misstatement. An audit includes examining, on a test basis, evidence supporting the amounts and disclosures in the financial statements. Our procedures included confirmation of securities owned as of December 31, 2016 by correspondence with the custodian and brokers or by other appropriate procedures where replies from brokers were not received. An audit also includes assessing the accounting principles used and significant estimates made by management, as well as evaluating the overall financial statement presentation. We believe that our audits provide a reasonable basis for our opinion.
In our opinion, the financial statements and financial highlights referred to above present fairly, in all material respects, the financial position of U.S. Government Securities Ultra-Short Bond Fund, Near-Term Tax Free Fund, All American Equity Fund, Holmes Macro Trends Fund, Global Resources Fund, World Precious Minerals Fund, Gold and Precious Metals Fund, Emerging Europe Fund, and China Region Fund as of December 31, 2016, and the results of their operations, the changes in their net assets and their financial highlights for the year then ended, in conformity with accounting principles generally accepted in the United States of America.

|
BBD, LLP |
Philadelphia, Pennsylvania
March 1, 2017
151
Trustees and Officers (unaudited) | December 31, 2016 |
The following table presents information about the Trustees as of December 31, 2016, together with a brief description of their principal occupations during the last five years. Each trustee serves until his death, resignation or removal and replacement. The address for all trustees is c/o Atlantic Fund Services, Three Canal Plaza, Suite 600, Portland, Maine 04101. Stacey E. Hong and John Y. Keffer are considered interested trustees due to their affiliation with Atlantic. If you would like more information about the Trustees, you may call 1-800-US-FUNDS (1-800-873-8637) to request a free copy of the Statement of Additional Information.
Name and Year
of Birth | Position with
the Trust | Length of
Time
Served | Principal
Occupation(s) During
Past Five Years | Number of
Series in Fund
Complex
Overseen
By Trustee(1) | Other
Directorships
Held By
Trustee
During Past
Five Years |
Independent Trustees |
David Tucker Born: 1958 | Chairman of the Board; Trustee; Chairman, Nominating Committee and Qualified Legal Compliance Committee | Since 2015 | Director, Blue Sky Experience (a charitable endeavor), since 2008; Senior Vice President & General Counsel, American Century Companies 1998-2008. | 47 | Trustee, Forum Funds; Trustee, Forum ETF Trust; Trustee, Forum Funds II |
Mark D. Moyer Born: 1959 | Trustee; Chairman Audit Committee | Since 2015 | Chief Financial Officer, Institute of International Education 2008-2011; Chief Financial Officer and Chief Restructuring Officer, Ziff Davis Media Inc. 2005-2008; Adjunct Professor of Accounting, Fairfield University from 2009-2012. | 23 | Trustee, Forum ETF Trust; Trustee, Forum Funds II |
(1) | The Fund Complex includes the Trust, Forum Funds, Forum Funds II and Forum ETF Trust and is overseen by different Board of Trustees. |
152
Trustees and Officers (unaudited) | December 31, 2016 |
Name and Year
of Birth | Position with
the Trust | Length of
Time
Served | Principal
Occupation(s) During
Past Five Years | Number of
Series in Fund
Complex
Overseen
By Trustee(1) | Other
Directorships
Held By
Trustee
During Past
Five Years |
Jennifer Brown-Strabley Born: 1964 | Trustee | Since 2015 | Principal, Portland Global Advisors 1996-2010. | 23 | Trustee, Forum ETF Trust; Trustee, Forum Funds II |
Interested Trustees |
Stacey E. Hong Born: 1966 | Trustee | Since 2015 | President, Atlantic since 2008 | 23 | Trustee, Forum Funds II |
John Y. Keffer(2) Born: 1942 | Trustee | Since 2015 | Chairman, Atlantic since 2008; President, Forum Investment Advisors, LLC since 2011; President, Forum Foundation (a charitable organization) since 2005; President, Forum Trust, LLC (a non-depository trust company chartered in the State of Maine) since 1997. | 47 | Trustee, Forum Funds; Trustee Forum ETF Trust; Trustee, Forum Funds II; Director, Wintergreen Fund, Inc. |
(2) | Atlantic and Forum Investment Advisors, LLC are subsidiaries of Forum Holdings Corp. I, a Delaware corporation that is wholly owned by Mr. Keffer. |
153
Trustees and Officers (unaudited) | December 31, 2016 |
The following table presents information about each Officer of the Trust as of December 31, 2016, together with a brief description of their principal occupations during the last five years. Each officer serves until his or her death, resignation or removal and replacement. The business address of each officer is c/o Atlantic Fund Services, Three Canal Plaza, Suite 600, Portland, Maine 04101.
Principal Officers of the Trust
Name and Year
of Birth | Position with
the Trust | Length of
Time
Served | Principal
Occupation(s) During
Past Five Years |
Jessica Chase Born: 1970 | President; Chief Executive Officer | Since 2015 | Senior Vice President, Atlantic since 2008. |
Karen Shaw Born: 1972 | Treasurer; Chief Financial Officer | Since 2015 | Senior Vice President, Atlantic since 2008. |
Zachary Tackett Born: 1988 | Vice President; Secretary and Anti-Money Laundering Compliance Officer, and Identity Theft Prevention Officer | Since 2015 | Counsel, Atlantic since 2014; Intern Associate, Coakley & Hyde, PLLC, 2010-2013. |
Carlyn Edgar Born: 1963 | Chief Compliance Officer, Code of Ethics Review Officer | Since 2015 | Senior Vice President, Atlantic since 2008. |
154
Approval of Investment Advisory Agreement (unaudited) | December 31, 2016 |
On September 9, 2016, the Board of Trustees (the “Board”) of U.S. Global Investors Funds (the “Trust”), including all the trustees who are not “interested persons” of the Trust (the “Independent Trustees”), approved the continuation of the advisory agreement with U.S. Global Investors, Inc. (the “Adviser”) for each Fund for an additional one-year term ended October 1, 2017.
In considering approval of the agreement, the Board reviewed a variety of materials relating to each Fund and the Adviser, including (i) the nature, extent and quality of services provided; (ii) a comparison of services rendered and amounts paid to other registered investment companies, including other accounts managed by the Adviser; (iii) the investment performance of the Funds measured against appropriate benchmarks; (iv) the costs of services provided and estimated profits realized by the Adviser (and its affiliates); (v) the extent to which economies of scale are realized as the Funds grow; (vi) whether fee levels reflect any possible economies of scale for the benefit of Fund shareholders; and (vii) benefits realized by the Adviser (and its affiliates) from its relationship with the Funds.
In preparation for its September meeting of the Board of Trustees of the Trust (“September Meeting”), the Trustees were presented with a range of information to assist in their deliberations. Those materials included information from Broadridge Financial Solutions, Inc. (“Broadridge”), a leading independent source of data about the mutual fund industry, which compared each Fund’s total contractual investment advisory fees, total expenses, and performance with an appropriate group of peer funds that were selected by Broadridge. The Trustees also received a memorandum from Independent Legal Counsel concerning their responsibilities with respect to the approval of the investment advisory agreement. The Independent Trustees met in executive session with Independent Legal Counsel while deliberating.
The Board reviewed the functions performed by the Adviser, the portfolio management team and support staff of the Adviser, the Adviser’s investment strategy and process for each Fund, and the Adviser’s financial condition, and considered the quality of services provided. The Board also reviewed performance information provided by Broadridge.
For the All American Equity Fund, the information showed that the Fund outperformed the median of its Broadridge peer group for the one-year period ended June 30, 2016, but underperformed the median of its Broadridge peer group for the three- and five-year periods ended June 30, 2016. The Board observed that the Fund also underperformed the S&P 500 Index, the Fund’s primary benchmark index, for the one-year period ended June 30, 2016. The Board noted the Adviser’s representation that the Fund’s underperformance could be attributed to the Fund’s overweight position in discretionary stocks relative to the index and peer group, a sector that did not significantly outperform the market during the period, as well as the Fund’s underweight positions in telecom and utility sectors relative to the index and peer group, which were sectors that outperformed the market during the period. The Board also noted the Adviser’s representation that securities held in the Fund’s portfolio that focus on value factors such as dividends and earnings growth were
155
Approval of Investment Advisory Agreement (unaudited) | December 31, 2016 |
expected to rebound in the latter half of 2016. The Board noted that the advisory fee paid to the Adviser by the Fund included a performance incentive adjustment based on the performance of the Fund during the prior 12-month period.
For the Holmes Macro Trends Fund, the information showed that the Fund underperformed the median of its Broadridge peer group for the one-, three-, and five-year periods ended June 30, 2016. The Board observed that the Fund also underperformed the S&P Composite 1500 Index, the Fund’s primary benchmark index, for the one-year period ended June 30, 2016. The Board noted the Adviser’s representation that the Fund’s underperformance relative to its primary benchmark index and Broadridge peer group could be attributed to the Fund’s underweight positions in the utilities and telecom sectors, which outperformed the market generally during the period. The Board also noted the Adviser’s representation that the Fund’s investment model indicated that the highest rated stocks were in the discretionary sector, which suffered from poor performance early in 2016 but had rebounded since the “Brexit” at the end of June 2016, and that the Adviser was reevaluating the Fund’s investment model to incorporate exposure to additional sectors going forward. The Board noted that the advisory fee paid to the Adviser by the Fund included a performance incentive adjustment based on the performance of the Fund during the prior 12-month period.
For the Global Resources Fund, the information showed that the Fund outperformed the median of its Broadridge peer group for the one-year period ended June 30, 2016, but had underperformed the median of its Broadridge peer group for the three- and five-year periods ended June 30, 2016. The Board observed that the Fund had outperformed the S&P Global Natural Resources Index, the Fund’s primary benchmark index, for the one-year period ended June 30, 2016. The Board noted the Adviser’s representation that it was pleased with the improved performance achieved for the Fund as a result of increasing exposure to energy and making the Fund’s investment model more dynamic. The Board noted that the advisory fee paid to the Adviser by the Fund included a performance incentive adjustment based on the performance of the Fund during the prior 12-month period.
For the World Precious Minerals Fund, the information showed that the Fund outperformed the median of its Broadridge peer group for the one- and three-year periods ended June 30, 2016, but had underperformed the median of its Broadridge peer group for the five-year period ended June 30, 2016. The Board observed that the Fund had outperformed the NYSE Arca Gold Miners Index, the Fund’s primary benchmark index, for the one-year period ended June 30, 2016. The Board noted the Adviser’s representation that the Fund’s outperformance during the one-year period was largely attributable to a lower cash position, as well as revisions to the Fund’s investment model, which reallocated its weightings in certain countries, sectors, and individual securities. The Board noted that the advisory fee paid to the Adviser by the Fund included a performance incentive adjustment based on the performance of the Fund during the prior 12-month period.
156
Approval of Investment Advisory Agreement (unaudited) | December 31, 2016 |
For the Gold and Precious Metals Fund, the information showed that the Fund outperformed the median of its Broadridge peer group for the one-, three-, and five-year periods ended June 30, 2016. The Board observed that the Fund had outperformed the FTSE Gold Mines Index, the Fund’s primary benchmark index, over the one-year period ended June 30, 2016. The Board noted the Adviser’s representation that negative real interest rates across the globe had resulted in a rally in gold stock, and noted the Fund’s dynamic approach with respect to its gold positions. The Board further noted the Adviser’s representation that the price of gold had increased in the United States during 2015 and 2016, though the rise in the price of gold was more dramatic in other countries due to currency devaluations. The Board noted that the advisory fee paid to the Adviser by the Fund included a performance incentive adjustment based on the performance of the Fund during the prior 12-month period.
For the Emerging Europe Fund, the information showed that the Fund underperformed the median of its Broadridge peer group for the one-, three-, and five-year periods ended June 30, 2016. The Board observed that the Fund had underperformed the MSCI Emerging Markets Europe 10/40 Index, the Fund’s primary benchmark index for the one-year period ended June 30, 2016. The Board noted the Adviser’s representation that the Fund’s underperformance relative to the primary benchmark index and peer group could be attributed to the Fund’s Turkish holdings after the country’s currency declined by seven percent versus the dollar over the past year. The Board noted the Adviser’s representation that the Fund’s underweight positions in Russian holdings also hurt the Fund’s relative performance, as Russia rebounded in the first half of 2016 to correspond with the increase in the price of oil, and that the Fund’s primary benchmark index was a challenging index to outperform due to the index being heavily comprised of Russian companies. The Board noted the Adviser’s representation that the Fund’s investment model did not allocate a favorable valuation to energy companies during the period such that the Fund was not able to benefit from the rebound in the price of oil companies. The Board noted also that, although the Fund narrowly underperformed the median of its Broadridge peer group for the one-year period ended June 30, 2016, the peer funds did not necessarily represent a precise comparison because the Fund was included within a broad emerging market peer group; one that did not emphasize a dedication to emerging Europe. The Board noted the Adviser’s representation that disparities in returns between broadly diversified global emerging regions funds can be significantly different than returns in the emerging Europe region, but that the Fund’s performance had improved since the prior year as a result of refinements in the Fund’s investment model. The Board noted that the advisory fee paid to the Adviser by the Fund included a performance incentive adjustment based on the performance of the Fund during the prior 12-month period.
For the China Region Fund, the information showed that the Fund underperformed the median of its Broadridge peer group for the one-, three-, and five-year periods ended June 30, 2016. The Board observed that the Fund had underperformed the Hang Seng Composite Index, the China Fund’s primary benchmark index, for the one-year period ended June 30, 2016. The Board noted the Adviser’s representation
157
Approval of Investment Advisory Agreement (unaudited) | December 31, 2016 |
that the Fund’s underperformance relative to the peer group and index was largely derived from the continued unwinding of China’s raging bull market in the later half of 2015 and that corrective revisions to the Fund’s investment model and procedures had been implemented in early 2016, resulting in the Fund outperforming its primary benchmark index for much of the first half of 2016. The Board also noted the Adviser’s representation that the Fund was outperforming the primary benchmark index as of the date of the meeting. The Board noted that the advisory fee paid to the Adviser by the Fund included a performance incentive adjustment based on the performance of the Fund during the prior 12-month period.
For the Near-Term Tax Free Fund, the information showed that the Fund outperformed the median of its Broadridge peer group for the one-, three-, and five-year periods ended June 30, 2016. The Board observed that the Fund had underperformed the Barclays 3-Year Municipal Bond Index, the Fund’s primary benchmark index, for the one-year period ended June 30, 2016, but had outperformed the primary benchmark index gross of fees. The Board noted the Adviser’s representation that the Fund had achieved its 22nd consecutive year of gross-fee positive performance.
For the U.S. Government Securities Ultra-Short Bond Fund, the information showed that the Fund had underperformed the median of its Broadridge peer group for the one- and three-year periods ended June 30, 2016, but had outperformed the median of its Broadridge peer group for the five-year period ended June 30, 2016. The Board observed that the Fund had outperformed the Barclays US Treasury Bills 6-9 Months Index, the Fund’s primary benchmark index, for the one-year period ended June 30, 2016. The Board noted the Adviser’s representation that the primary source of the Fund’s underperformance relative to the peer group was from having the shortest effective duration versus its peers. The Board noted the Adviser’s explanation that the average effective duration of the peer group was two-and-a-half years, while the Fund’s effective duration over the same period was less than a year. The Board noted the Adviser’s representation that a shorter duration would curtail performance relative to a longer duration fund, particularly in a year where interest rates dropped, though the Adviser was pleased with the overall performance achieved for the Fund during the period.
The Board also reviewed information on each Fund’s advisory fee and expense ratios compared to the advisory fees and expense ratios of a peer group of funds based upon information prepared by Broadridge. The Board also compared the expense ratios of the Funds to industry data compiled by the Investment Company Institute (“ICI”), which reflected the expense ratios for funds of small fund complexes, categorized into relevant fund types (e.g., sector funds, international funds, and growth funds).
For the All American Equity Fund, the information showed that, as of June 30, 2016, the Fund’s actual advisory fee was less than the median of its Broadridge peer group and that the actual total expenses for the Fund were greater than the median of its Broadridge peer group. The information also showed that the Fund was in the second quintile of its applicable Broadridge peer group with regard to the actual
158
Approval of Investment Advisory Agreement (unaudited) | December 31, 2016 |
advisory fee and in the fifth quintile of its applicable Broadridge peer group with respect to the total expenses (the first quintile being the lowest fees or expenses and the fifth quintile being the highest fees or expenses).
For the Holmes Macro Trends Fund, the information showed that, as of June 30, 2016, the Fund’s actual advisory fee and actual total expenses were each greater than the median of its Broadridge peer group. The information also showed that the Fund was in the fourth quintile of its applicable Broadridge peer group with regard to the actual advisory fee and in the fifth quintile of its applicable Broadridge peer group with respect to the total expenses.
For the Global Resources Fund, the information showed that, as of June 30, 2016, the Fund’s actual advisory fee was less than the median of its Broadridge peer group and that the actual total expenses for the Fund were higher than the median of its Broadridge peer group. The information also showed that the Fund was in the first quintile of its applicable Broadridge peer group with regard to the actual advisory fee and in the fifth quintile of its applicable Broadridge peer group with respect to the total expenses.
For the World Precious Minerals Fund, the information showed that, as of June 30, 2016, the Fund’s actual advisory fee was less than the median of its Broadridge peer group and that the actual total expenses for the Fund were higher than the median of its Broadridge peer group. The information also showed that the Fund was in the third quintile of its applicable Broadridge peer group with regard to the actual advisory fee and in the fourth quintile of its applicable Broadridge peer group with respect to the total expenses.
For the Gold and Precious Metals Fund, the information showed that, as of June 30, 2016, the Fund’s actual advisory fee and actual total expenses were each greater than the median of its Broadridge peer group. The information also showed that the Fund was in the fifth quintile of its applicable Broadridge peer group with regard to each of the actual advisory fee and total expenses.
For the Emerging Europe Fund, the information showed that, as of June 30, 2016, each of the Fund’s actual advisory fee and actual total expenses were greater than the median of its Broadridge peer group. The information also showed that the Fund was in the fifth quintile of its applicable Broadridge peer group with regard to each of the actual advisory fee and total expenses.
For the China Region Fund, the information showed that, as of June 30, 2016, the Fund’s actual advisory fee was less than the median of its Broadridge peer group and that the actual total expenses for the Fund were greater than the median of its Broadridge peer group. The information also showed that the Fund was in the second quintile of its applicable Broadridge peer group with regard to the actual advisory fee and in the fifth quintile of its applicable Broadridge peer group with respect to the total expenses.
159
Approval of Investment Advisory Agreement (unaudited) | December 31, 2016 |
For the Near-Term Tax Free Fund, the information showed that, as of June 30, 2016, each of the Fund’s actual advisory fee and actual total expenses were less than the median of its Broadridge peer group. The information also showed that the Fund was in the first quintile of its applicable Broadridge peer group with regard to each of the actual advisory fee and total expenses.
For the U.S. Government Securities Ultra-Short Bond Fund, the information showed that, as of June 30, 2016, each of the Fund’s actual advisory fee and actual total expenses were less than the median of its Broadridge peer group. The information also showed that the Fund was in the first quintile of its applicable Broadridge peer group with regard to each of the actual advisory fee and total expenses.
The Board considered the Adviser’s representation that higher expenses are inherent in small fund complexes, such as the Trust, and that it could not operate effectively at a lower level of fees or with the burden of contractual expense caps for most funds. The Board also considered recent efforts by the Adviser designed to gain economies of scale and reduce Fund expenses, including outsourcing transfer agency and certain fund administration services. In addition, the Board noted that the Adviser is contractually limiting expenses on an annualized basis for the Near-Term Tax Free Fund at 0.45% of average net assets through April 30, 2017. The Board also noted that the Adviser will voluntarily reimburse all class specific expenses for the institutional class of the Global Resources Fund and the World Precious Minerals Fund and is currently voluntarily limiting expenses at the following levels for the Funds (the voluntary expense limitation may be modified or removed by the Adviser at any time):
| | Expense Cap |
Funds | Inst’l Class | Investor Class |
All American Equity Fund | N/A | 2.20% |
China Region Fund | N/A | 2.55% |
Emerging Europe Fund | N/A | 2.85% |
Global Resources Fund | All class specific expenses | 1.90% |
Gold and Precious Metals Fund | N/A | 1.90% |
Holmes Macro Trends Fund | N/A | 2.20% |
Near-Term Tax Free Fund | N/A | 0.45% |
World Precious Minerals Fund | All class specific expenses | 1.90% |
U.S. Government Securities Ultra-Short Bond Fund | N/A | 0.45% |
The Board considered the fee structure of the agreement, including the costs of the services provided and the profits realized by the Adviser and its affiliates from their relationship with the Funds.
As part of its review of the agreement, the Board considered whether there will be economies of scale with respect to the management of each Fund and whether each Fund will benefit from any economies of scale. The Board noted that, in all cases, the Adviser did not believe, with respect to the investment advisory services provided, that it was realizing significant economies of scale, and that the current fees represented an appropriate sharing of economies of scale.
160
Approval of Investment Advisory Agreement (unaudited) | December 31, 2016 |
The Board noted that the Adviser engages in soft-dollar arrangements in connection with brokerage transactions for the Funds. The Board also considered benefits derived by the Adviser from its relationship with the Funds, including the other services provided and fees received by the Adviser and its affiliates for providing such services.
Based on all the above-mentioned factors and related conclusions, with no single factor or conclusion being determinative and with each Trustee not necessarily attributing the same weight to each factor, the Board, including the Independent Trustees, concluded that approval of the advisory agreement would be in the interests of each Fund.
161
Additional Information (unaudited) |
Additional Federal Tax Information
The percentage of tax-exempt dividends paid by the Near-Term Tax Free Fund for the year ended December 31, 2016, was 97.55%.
The percentage of ordinary income dividends paid by the Funds during the year ended December 31, 2016, which qualify as Qualified Dividends Income (QDI) and the Dividends Received Deduction (DRD) available to corporate shareholders was:
| | | Qualified Dividend
Income | | | Dividend Received
Deduction | |
All American Equity | | | 100.00 | % | | | 100.00 | % |
Global Resources | | | 98.75 | % | | | 97.79 | % |
World Precious Minerals | | | 88.11 | % | | | 40.78 | % |
Gold and Precious Metals | | | 56.68 | % | | | 5.19 | % |
China Region | | | 100.00 | % | | | 46.78 | % |
The amounts which represent foreign source income and foreign taxes paid during the year ended December 31, 2016, are as follows:
| | | Foreign Source
Income | | | Foreign Tax
Credit | |
Global Resources | | $ | 2,062,103 | | | $ | 95,836 | |
World Precious Minerals | | | 1,090,856 | | | | 64,086 | |
Gold and Precious Metals | | | 770,218 | | | | 52,707 | |
China Region | | | 426,590 | | | | 31,817 | |
In early 2017, the Funds reported on Form 1099-DIV the tax status of all distributions made during the 2016 calendar year. The Funds intend to distribute the maximum amount of qualified dividend income allowable. The amount of qualified dividend income distributed by each fund will be reported to shareholders on their Form 1099-DIV. Shareholders should use the information on Form 1099-DIV for their income tax returns.
Proxy Voting
A description of the policies and procedures that the Funds use to determine how to vote proxies relating to portfolio securities is available without charge, upon request, by calling 1-800-US-FUNDS (1-800-873-8637). It also appears in the Funds’ statement of additional information (Form 485B), which can be found on the SEC’s website at www.sec.gov.
Information regarding how the Funds voted proxies relating to portfolio securities during the most recent 12-month period ended June 30 is available without charge, upon request, by calling 1-800-US-FUNDS (1-800-873-8637) or accessing the Funds’ Form N-PX on the SEC’s website at www.sec.gov.
162
Additional Information (unaudited) |
Availability of Quarterly Portfolio Schedules
The Funds provide complete lists of holdings four times in each fiscal year, at the quarter-ends. For the second and fourth quarters, the lists appear in the Funds’ semi-annual and annual reports to shareholders. For the first and third quarters, the Funds file the lists with the SEC on Form N-Q. The Funds’ Forms N-Q are available on the SEC’s website at http://www.sec.gov. The Funds’ Forms N-Q may also be reviewed and copied at the SEC’s Public Room in Washington D.C. Information on the operation of the Public Reference Room may be obtained by calling 1-800-SEC-0330.
163
Expense Example (unaudited) | December 31, 2016 |
As a shareholder of the funds, you incur two types of costs: (1) transaction costs, including short-term trading fees and exchange fees; and (2) ongoing costs, including management fees, distribution plan fees, shareholder reports (like this one), and other fund expenses. This example is intended to help you understand your ongoing costs (in dollars) of investing in other mutual funds.
The example is based on an investment of $1,000 invested at the beginning of the period and held for the entire period (July 1, 2016 to December 31, 2016) as indicated below.
● | Actual Expenses. The first line of the following table for each fund provides information about actual account values and actual expenses. You may use the information in this line, together with the amount you invested, to estimate the expenses you paid over the period. Simply divide your account value by $1,000 (for example, an $8,600 account value divided by $1,000 = 8.6), then multiply the result by the number in the first line under the heading ‘‘Expenses Paid During Period’’ to estimate the expenses you paid on your account during this period. |
● | Hypothetical Example for Comparison Purposes. The second line of the following table for each fund provides information about hypothetical account values and hypothetical expenses based on the fund’s actual expense ratio and an assumed rate of return of 5 percent per year before expenses, which is not the fund’s actual return. The hypothetical account values and expenses may not be used to estimate the actual ending account balance or expenses you paid for the period. You may use this information to compare the ongoing costs of investing in these funds and other funds. To do so, compare this 5 percent hypothetical example with the 5 percent hypothetical examples that appear in the shareholder reports of other funds. |
Please note that the expenses shown in the table are meant to highlight your ongoing costs only and do not reflect any direct or transactional costs, such as small account, exchange or short-term trading fees. Therefore, the second line of the table is useful in comparing ongoing costs only, and will not help you determine the relative total costs of owning different funds. In addition, if these direct or transactional costs were included, your costs would have been higher.
164
Expense Example (unaudited) | December 31, 2016 |
| Beginning
Account Value
July 1,
2016 | Ending
Account Value
December 31,
2016 | Expenses
Paid During
Period* |
U.S. Government Securities Ultra-Short Bond Fund | | |
Based on Actual Fund Return | $ 1,000.00 | $ 997.50 | $ 2.22 |
Based on Hypothetical 5% Yearly Return | $ 1,000.00 | $ 1,022.91 | $ 2.25 |
Near-Term Tax Free Fund | | | |
Based on Actual Fund Return | $ 1,000.00 | $ 984.40 | $ 2.25 |
Based on Hypothetical 5% Yearly Return | $ 1,000.00 | $ 1,022.87 | $ 2.29 |
All American Equity Fund | | | |
Based on Actual Fund Return | $ 1,000.00 | $ 993.10 | $ 7.26 |
Based on Hypothetical 5% Yearly Return | $ 1,000.00 | $ 1,017.86 | $ 7.35 |
Holmes Macro Trends Fund | | | |
Based on Actual Fund Return | $ 1,000.00 | $ 1,138.60 | $ 8.06 |
Based on Hypothetical 5% Yearly Return | $ 1,000.00 | $ 1,017.60 | $ 7.61 |
Global Resources Fund Investor Class | | | |
Based on Actual Fund Return | $ 1,000.00 | $ 1,064.30 | $ 9.33 |
Based on Hypothetical 5% Yearly Return | $ 1,000.00 | $ 1,016.10 | $ 9.11 |
Global Resources Fund Institutional Class | | | |
Based on Actual Fund Return | $ 1,000.00 | $ 1,066.50 | $ 7.53 |
Based on Hypothetical 5% Yearly Return | $ 1,000.00 | $ 1,017.86 | $ 7.35 |
World Precious Minerals Fund Investor Class | | |
Based on Actual Fund Return | $ 1,000.00 | $ 823.40 | $ 8.79 |
Based on Hypothetical 5% Yearly Return | $ 1,000.00 | $ 1,015.50 | $ 9.71 |
World Precious Minerals Fund Institutional Class | | |
Based on Actual Fund Return | $ 1,000.00 | $ 826.60 | $ 5.98 |
Based on Hypothetical 5% Yearly Return | $ 1,000.00 | $ 1,018.59 | $ 6.61 |
Gold and Precious Metals Fund | | | |
Based on Actual Fund Return | $ 1,000.00 | $ 776.90 | $ 7.21 |
Based on Hypothetical 5% Yearly Return | $ 1,000.00 | $ 1,017.03 | $ 8.18 |
Emerging Europe Fund | | | |
Based on Actual Fund Return | $ 1,000.00 | $ 1,116.50 | $ 11.58 |
Based on Hypothetical 5% Yearly Return | $ 1,000.00 | $ 1,014.19 | $ 11.02 |
China Region Fund | | | |
Based on Actual Fund Return | $ 1,000.00 | $ 1,038.60 | $ 11.34 |
Based on Hypothetical 5% Yearly Return | $ 1,000.00 | $ 1,014.01 | $ 11.21 |
* | These calculations are based on expenses incurred in the most recent fiscal half-year. The Funds’ Investor Class’ annualized expense ratios (after reimbursements and offsets) for the six month period ended December 31, 2016, were 0.44%, 0.45%, 1.45%, 1.50%, 1.80%, 1.92%, 1.61%, 2.18% and 2.21%, respectively, for the U.S. Government Securities Ultra-Short Bond, Near-Term Tax Free, All American Equity, Holmes Macro Trends, Global Resources, World Precious Minerals, Gold and Precious Metals, Emerging Europe and China Region Funds. The funds’ Institutional Class’ annualized expense ratios (after reimbursements and offsets) for the six month period ended December 31, 2016, were 1.45% and 1.30%, respectively, for the Global Resources and World Precious Minerals Funds. The dollar amounts shown as “Expenses Paid” are equal to the annualized expense ratio multiplied by the average account value over the period, multiplied by 184, the number of days in the period, then divided by 366 days in the current fiscal year. |
165
[THIS PAGE INTENTIONALLY LEFT BLANK]
[THIS PAGE INTENTIONALLY LEFT BLANK]
[THIS PAGE INTENTIONALLY LEFT BLANK]
[THIS PAGE INTENTIONALLY LEFT BLANK]
[THIS PAGE INTENTIONALLY LEFT BLANK]
[THIS PAGE INTENTIONALLY LEFT BLANK]
|
Atlantic Fund Services
3 Canal Plaza, Suite 600
Portland, ME
04101 |
Want to reduce paper waste? You can receive this report and other important documents electronically. Please visit www.usfunds.com and sign up at Access My Account. If you need further assistance, please call us at 800-873-8637. |
ITEM 2. CODE OF ETHICS.
| (a) | As of the end of the period covered by this report, U.S. Global Investors Funds (the "Registrant") has adopted a code of ethics, which applies to its Principal Executive Officer and Principal Financial Officer (the "Code of Ethics"). |
| (c) | There have been no amendments to the Registrant's Code of Ethics during the period covered by this report. |
| (d) | There have been no waivers to the Registrant's Code of Ethics during the period covered by this report. |
(f) (1) A copy of the Code of Ethics is being filed under Item 12(a) hereto.
ITEM 3. AUDIT COMMITTEE FINANCIAL EXPERT.
The Board of Trustees has determined that Mr. Mark Moyer is an "audit committee financial expert" as that term is defined under applicable regulatory guidelines. Mr. Moyer is a non- "interested" Trustee (as defined in Section 2(a)(19) under the Investment Company Act of 1940, as amended (the "Act")), and serves as Chairman of the Audit Committee.
ITEM 4. PRINCIPAL ACCOUNTANT FEES AND SERVICES.
(a) Audit Fees - The aggregate fees billed for each of the last two fiscal years (the "Reporting Periods") for professional services rendered by the Registrant's principal accountant for the audit of the Registrant's annual financial statements, or services that are normally provided by the principal accountant in connection with the statutory and regulatory filings or engagements for the Reporting Periods, were $234,400 in 2015 and $151,900 in 2016.
(b) Audit-Related Fees – The aggregate fees billed in the Reporting Periods for assurance and related services rendered by the principal accountant that were reasonably related to the performance of the audit of the Registrant's financial statements and are not reported under paragraph (a) of this Item 4 were $0 in 2015 and $0 in 2016.
(c) Tax Fees - The aggregate fees billed in the Reporting Periods for professional services rendered by the principal accountant to the Registrant for tax compliance, tax advice and tax planning were $51,250 in 2015 and $27,000 in 2016. These services consisted of review or preparation of U.S. federal, state, local and excise tax returns.
(d) All Other Fees - The aggregate fees billed in the Reporting Periods for products and services provided by the principal accountant to the Registrant, other than the services reported in paragraphs (a) through (c) of this Item, were $0 in 2015 and $0 in 2016.
(e) (1) The Audit Committee reviews and approves in advance all audit and "permissible non-audit services" (as that term is defined by the rules and regulations of the Securities and Exchange Commission) to be rendered to a series of the Registrant (each, a "Series"). In addition, the Audit Committee reviews and approves in advance all "permissible non-audit services" to be provided to an investment adviser (not including any sub-adviser) of a Series, or an affiliate of such investment adviser, that is controlling, controlled by or under common control with the investment adviser and provides on-going services to the Registrant ("Affiliate"), by the Series' principal accountant if the engagement relates directly to the operations and financial reporting of the Series. The Audit Committee considers whether fees paid by a Series' investment adviser or an Affiliate to the Series' principal accountant for audit and permissible non-audit services are consistent with the principal accountant's independence.
(e) (2) No services included in (b) - (d) above were approved pursuant to paragraph (c)(7)(i)(C) of Rule 2-01 of Regulation S-X.
(f) Less than 50 percent of the hours expended on the principal accountant's engagement to audit the Registrant's financial statements for the most recent fiscal year were attributed to work performed by persons other than the principal accountant's full-time, permanent employees.
(g) The aggregate fees billed by the Registrant's principal accountant for non-audit services rendered to the Registrant, its investment adviser, and any entity controlling, controlled by, or under common control with the investment adviser that provides ongoing services to the registrant were $51,250 in 2015 and $27,000 in 2016. These fees related to tax services rendered to the Registrant.
(h) All non-audit services rendered in (g) above were considered by the registrant's audit committee in maintaining the principal accountant's independence.
ITEM 5. AUDIT COMMITTEE OF LISTED REGISTRANTS.
Not applicable
ITEM 6. INVESTMENTS.
| (a) | Included as part of report to shareholders under Item 1. |
ITEM 7. DISCLOSURE OF PROXY VOTING POLICIES AND PROCEDURES FOR CLOSED-END MANAGEMENT INVESTMENT COMPANIES.
Not applicable.
ITEM 8. PORTFOLIO MANAGERS OF CLOSED-END MANAGEMENT INVESTMENT COMPANIES.
Not applicable.
ITEM 9. PURCHASES OF EQUITY SECURITIES BY CLOSED-END MANAGEMENT INVESTMENT COMPANY AND AFFILIATED PURCHASERS.
Not applicable.
ITEM 10. SUBMISSION OF MATTERS TO A VOTE OF SECURITY HOLDERS
The Registrant does not accept nominees to the board of trustees from shareholders.
ITEM 11. CONTROLS AND PROCEDURES
(a) The Registrant's Principal Executive Officer and Principal Financial Officer have concluded that the Registrant's disclosure controls and procedures (as defined in Rule 30a-3(c) under the Act are effective, based on their evaluation of the controls and procedures required by Rule 30a-3(b) under the Act and Rules 13a-15(b) or 15d-15(b) under the Securities Exchange Act of 1934, as of a date within 90 days of the filing date of this report.
(b) There were no changes in the Registrant's internal control over financial reporting (as defined in
Rule 30a-3(d) under the Act) that occurred during the second fiscal quarter of the period covered by this report that have materially affected, or are reasonably likely to materially affect, the Registrant's internal control over financial reporting.
ITEM 12. EXHIBITS.
(a)(1) Code of Ethics (Exhibit filed herewith).
(a)(2) Certifications pursuant to Rule 30a-2(a) of the Act, and Section 302 of the Sarbanes-Oxley Act of 2002. (Exhibits filed herewith)
(a)(3) Not applicable.
(b) Certifications pursuant to Rule 30a-2(b) of the Act, and Section 906 of the Sarbanes-Oxley Act of 2002. (Exhibit filed herewith)
SIGNATURES
Pursuant to the requirements of the Securities Exchange Act of 1934 and the Investment Company Act of 1940, the Registrant has duly caused this report to be signed on its behalf by the undersigned, thereunto duly authorized.
| Registrant | U.S. Global Investors Funds | |
| | | |
| By | /s/ Jessica Chase | |
| | Jessica Chase, Principal Executive Officer | |
| | | |
| Date | March 7, 2017 | |
| | | |
| Pursuant to the requirements of the Securities Exchange Act of 1934 and the Investment Company Act of 1940, this report has been signed below by the following persons on behalf of the Registrant and in the capacities and on the dates indicated. |
| | | |
| By | /s/ Jessica Chase | |
| | Jessica Chase, Principal Executive Officer | |
| | | |
| Date | March 7, 2017 | |
| | | |
| By | /s/ Karen Shaw | |
| | Karen Shaw, Principal Financial Officer | |
| | | |
| Date | March 7, 2017 | |
