As filed with the Securities and Exchange Commission on March 5, 2019
UNITED STATES
SECURITIES AND EXCHANGE COMMISSION
WASHINGTON, D.C. 20549
FORM N-CSR
CERTIFIED SHAREHOLDER REPORT OF REGISTERED MANAGEMENT
INVESTMENT COMPANIES
Investment Company Act file number 811-01800
U.S. GLOBAL INVESTORS FUNDS
Three Canal Plaza, Suite 600
Portland, Maine 04101
Jessica Chase, Principal Executive Officer
Three Canal Plaza, Suite 600
Portland, Maine 04101
207-347-2000
Date of fiscal year end: December 31
Date of reporting period: January 1, 2018 – December 31, 2018
ITEM 1. REPORT TO STOCKHOLDERS.
U.S. Global Investors Funds
Annual Report
December 31, 2018

Beginning on January 2021, as permitted by regulations adopted by the Securities and Exchange Commission, paper copies of the Funds’ shareholder reports will no longer be sent by mail, unless you specifically request paper copies of the reports from the Fund or from your financial intermediary, such as a broker-dealer or bank. Instead, the reports will be made available on a website, and you will be notified by mail each time a report is posted and provided with a website link to access the report.
If you already elected to receive shareholder reports electronically, you will not be affected by this change and you need not take any action. You may elect to receive shareholder reports and other communications from the Fund or your financial intermediary electronically by contacting the Fund at (800) 873-8637, or by contacting your financial intermediary directly.
You may elect to receive all future reports in paper free of charge. You can inform the Fund or your financial intermediary that you wish to continue receiving paper copies of your shareholder reports by contacting the Fund at (800) 873-8637, or by contacting your financial intermediary directly. Your election to receive reports in paper will apply to all Funds held with U.S. Global Investors Funds.
U.S. Global Investors Funds
Annual Report
December 31, 2018
Table of Contents
| Letter to Shareholders (unaudited) | 1 |
| Definitions for Management Teams’ Perspectives (unaudited) | 7 |
| Management Team’s Perspective (unaudited) | 9 |
| Portfolios of Investments | 43 |
| Notes to Portfolios of Investments | 82 |
| Statements of Assets and Liabilities | 98 |
| Statements of Operations | 102 |
| Statements of Changes in Net Assets | 106 |
| Notes to Financial Statements | 112 |
| Financial Highlights | 127 |
| Report of Independent Registered Public Accounting Firm | 138 |
| Trustees and Officers (unaudited) | 140 |
| Approval of Investment Advisory Agreement (unaudited) | 142 |
| Additional Information (unaudited) | 147 |
| Expense Example (unaudited) | 149 |
Nasdaq Symbols
U.S. Global Investors Funds
| Investor Class | |
| U.S. Government Securities Ultra-Short Bond Fund | UGSDX |
| Near-Term Tax Free Fund | NEARX |
| All American Equity Fund | GBTFX |
| Holmes Macro Trends Fund | MEGAX |
| Global Resources Fund | PSPFX |
| World Precious Minerals Fund | UNWPX |
| Gold and Precious Metals Fund | USERX |
| Emerging Europe Fund | EUROX |
| China Region Fund | USCOX |
| Institutional Class | |
| Global Resources Fund | PIPFX |
| World Precious Minerals Fund | UNWIX |
 | Atlantic Fund Services 3 Canal Plaza, Suite 600 Portland, ME 04101 |
| U.S. Global Investors Funds | (unaudited) |
Dear Fellow Shareholder,

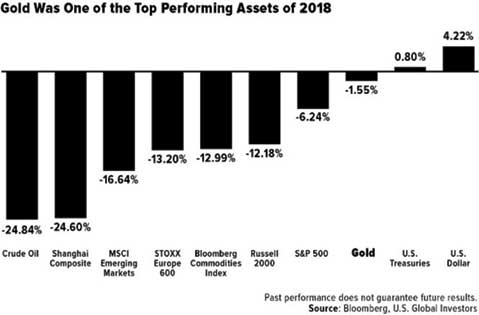
King Dollar was on top in 2018, one of the few major assets to end the year in the black on steady interest rate hikes and robust economic growth in the U.S. But greenback strength is a double-edged sword, as you know. Although good for U.S. consumers, it can hamper exporters, commodities, oil, gold and more.
So will rates continue to rise in 2019? If so, the dollar will follow suit, putting additional pressure on other assets. I think there are a number of signs that the rate hike we saw in December could be the last one this cycle. Significantly, Federal Reserve Chairman Jerome Powell said that “we will be patient” with further tightening.
Under the circumstances, I’m very pleased with how well gold performed last year. It did what most investors expect it to do. Stocks began to sell off late in the year, boosting investor demand for safe haven assets. The yellow metal remarkably beat the S&P 500 Index for the month of December, the fourth quarter and the year. It’s also outperforming the market so far in the 21st century, even with dividends reinvested.
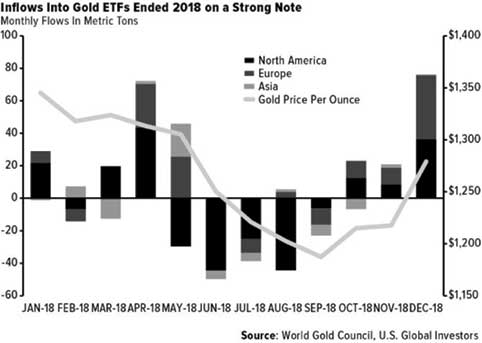
It wasn’t just physical gold that investors were drawn to. Inflows into global gold ETFs surged late in 2018, attracting as much as $3.1 billion, or 76 metric tons, in December alone, the best month of the year.
| U.S. Global Investors Funds | (unaudited) |
Is Gold Ready to Break Out?
Throughout the year, I saw multiple signs that lead me to believe that the gold market has found a bottom. One of those signs was Vanguard’s decision to change the name and investment strategy of its Precious Metals and Mining Fund. In September, the company lowered the fund’s exposure to metals and mining, from 80 percent to 25 percent, effectively orphaning gold investors and giving them no way to participate in a potential rally.
This isn’t the first time Vanguard has done this to investors. Back in 2001, it removed the word “gold” from what was then the Gold and Precious Metals Fund. The change coincided with a decade-long precious metals bull run that saw gold rally from an average price of $271 an ounce in 2001 to an all-time high of more than $1,900 in September 2011. That’s more than a sevenfold increase.
Another sign that this could be a bottom is the prevalence of merger and acquisition (M&A) activity among big-name gold producers. In September 2018, Barrick Gold and Randgold Resources announced a merger worth $6.5 billion, creating the world’s largest gold miner. That title didn’t stand for long, however, after Newmont Mining said it would be buying Goldcorp for a cool $10 billion. Whereas Barrick-Randgold produced a combined 6.6 million ounces of gold in 2017, Newmont-Goldcorp was responsible for as much as nearly 8 million ounces.
I see this news as positive overall for the metals and mining industry, which has long signaled the need for consolidation. As I explained in a Frank Talk Live segment back in October, it’s when an industry has found a bottom that you start to see big M&A deals. A couple of years
| U.S. Global Investors Funds | (unaudited) |
ago, the very talented people at Visual Capitalist showed in an infographic that mining M&As peaked in the aftermath of the financial crisis.
Gold Royalty Companies Are the “Best Bet,” Says Paradigm Capital
It’s no secret that I’m a fan of royalty and streaming companies such as Franco-Nevada and Wheaton Precious Metals. I’ve long admired these companies for generating profits and creating value, even when the metals market is flat or weak. We own significant positions in royalty and streaming companies in our Gold and Precious Metals Fund (USERX) and World Precious Minerals Fund (UNWPX).
Paradigm Capital reaffirmed my conviction in the royalty model. The Canadian investment dealer recently shared its research into the long-term performance of the various “tiers” in gold mining, from juniors to seniors, from explorers to developers. The royalty companies—which include not just Franco and Wheaton but also Royal Gold, Sandstorm and Osisko Royalties— are the “best bet” when seeking to “make money in gold equities,” according to Paradigm’s senior analyst, Don MacLean. He adds: “Royalty companies have the best business model in the sector, by far.”
Below, you can see that royalty companies have outperformed all other tiers, including gold itself. Royalty companies collectively delivered 16 percent in compound annual growth from 2004 to 2018. Put another way, they returned a massive 884 percent in cumulative change, compared to gold at 300 percent.
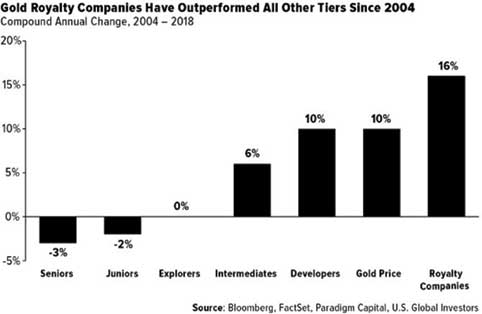
Many junior and senior producers have struggled over the same time period, but Paradigm writes that gold equities are like “coiled springs” and should outperform the precious metal if a “meaningful” gold rally of 10 percent or more occurs. At the end of 2018, large-cap seniors led the rally, followed by intermediates and royalty companies. This is in line with past gold
| U.S. Global Investors Funds | (unaudited) |
equity rallies, Paradigm says, as the largest producers have historically performed best at the start.

Diana Widmaier-Picasso, co-founder of Menē Photo courtesy of Menē
Active Management Can Help You Invest in Attractive Companies Before the Street Does
One of our favorite companies this past year was newcomer Mene, a gold and platinum jewelry designer and manufacturer. You might not have heard the name yet, but you could soon enough.
Founded in 2017 by Roy Sebag, co-founder of gold financial services firm Goldmoney, and Diana Widmaier-Picasso, granddaughter of—you guessed it—Pablo Picasso, Mene's mission is to disrupt the gold jewelry market by selling directly to the consumer and pricing its merchandise fairly and transparently. Unlike traditional sellers like Tiffany & Co. and Cartier, which sometimes have high premiums, Mene prices its jewelry based on the changing value of gold. It then charges a 15 percent to 20 percent design and production fee on top of that.
What also sets the company apart is that its jewelry—from earrings to necklaces, bracelets to charms—is made of 24-karat gold or platinum. No alloys, no insets of diamonds or other stones. That’s done to help the pieces retain their value over time.
Here at U.S. Global Investors, we believe gold is money and a timeless investment. Mene, which takes its name from the Aramaic word for “money,” has clearly run with that idea, going so far as to trademark the phrase “investment jewelry.”
It’s a business model that seems to have resonated with consumers and investors alike. In its first 10 months of operation, Mene did as much as $7 million in sales in more than 53 countries, as of October 2018.
The reason I tell you this is to highlight our potential ability to find and invest in little-known yet promising companies before they become overvalued. In the case of Mene, we managed to get in even earlier, before shares in the company were made available to the public. The jeweler went public on the Toronto Stock Exchange (TSX) in November, but thanks to active management and our industry relationships, we were able to buy shares privately seven months prior to that. So even before its stock was available to retail investors, Mene accounted for 2.46 percent of the Gold and Precious Metals Fund (USERX) as of September 30.
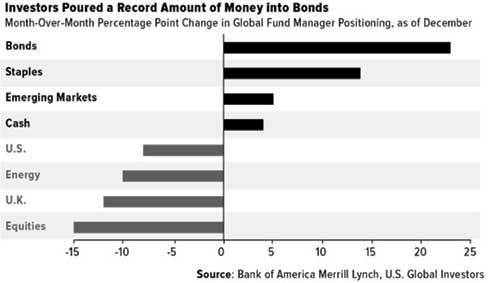
Fund Managers De-Risked in Favor of Bonds and Cash
Late last year, as volatility heightened, fund managers turned incredibly bearish on risk assets and bullish on defensive positions such as bonds, staples and cash. According to Zero Hedge’s analysis of a Bank of America Merrill Lynch report, December represented “the biggest ever one-month rotation into bonds class as investors dumped equities around the globe while bond allocations rose 23 percentage points to net 35 percent underweight.” What’s more, fund
| U.S. Global Investors Funds | (unaudited) |
managers’ average cash levels stood at 4.7 percent in November, above the 10-year average, according to Morningstar data.
Equity outflows were particularly pronounced. According to Lipper data, as much as $46 billion fled U.S. stock mutual funds and ETFs in the week ended December 13. That’s the most ever for a one-week period. It’s very possible that the selling was related to end-of-year tax-loss harvesting, but again, we’ve never seen outflows of that magnitude.
Within the bond category, ultrashort vehicles were most favored. In November, ultrashort bond funds, such as our U.S. Government Securities Ultra-Short Bond Fund (UGSDX), saw the greatest inflows compared to other categories, attracting a remarkable $5.7 billion. That’s the most in at least a decade, according to Morningstar.
Investors might also want to consider short-term municipal bonds, the kind our Near-Term Tax Free Fund (NEARX) invests in, as they’ve historically done well during times of geopolitical and economic uncertainty.
To get the latest insights and commentary on gold, commodities, emerging markets, bitcoin and much, much more, subscribe to our award-winning Investor Alert and to my personal CEO blog, Frank Talk. Both can be reached by visiting usfunds.com.
Thank you for your continued trust and confidence in U.S. Global Investors. We wish you and your family good health and prosperity in 2019.
Sincerely,

Frank E. Holmes
CEO and Chief Investment Officer
U.S. Global Investors, Inc.
| U.S. Global Investors Funds | (unaudited) |
Please consider carefully a fund’s investment objectives, risks, charges and expenses. For this and other important information, obtain a fund prospectus by visiting www.usfunds.com or by calling 1-800-US-FUNDS (1-800-873-8637). Read it carefully before investing. Foreside Fund Services, LLC, Distributor. U.S. Global Investors is the investment adviser.
Bond funds are subject to interest-rate risk; their value declines as interest rates rise. Gold, precious metals, and precious minerals funds may be susceptible to adverse economic, political or regulatory developments due to concentrating in a single theme. The prices of gold, precious metals, and precious minerals are subject to substantial price fluctuations over short periods of time and may be affected by unpredicted international monetary and political policies. We suggest investing no more than 5% to 10% of your portfolio in these sectors. Though the Near-Term Tax Free Fund seeks minimal fluctuations in share price, it is subject to the risk that the credit quality of a portfolio holding could decline, as well as risk related to changes in the economic conditions of a state, region or issuer. These risks could cause the fund’s share price to decline. Tax-exempt income is federal income tax free. A portion of this income may be subject to state and local taxes and at times the alternative minimum tax. The Near-Term Tax Free Fund may invest up to 20% of its assets in securities that pay taxable interest. Income or fund distributions attributable to capital gains are usually subject to both state and federal income taxes.
The Shanghai Composite Index (SSE) is an index of all stocks that trade on the Shanghai Stock Exchange. The MSCI Emerging Markets Index is a free float-adjusted market capitalization index that is designed to measure equity market performance in the global emerging markets. The STOXX Europe 600 Index is derived from the STOXX Europe Total Market Index (TMI) and is a subset of the STOXX Global 1800 Index. With a fixed number of 600 components, the STOXX Europe 600 Index represents large, mid and small capitalization companies across 18 countries of the European region: Austria, Belgium, Czech Republic, Denmark, Finland, France, Germany, Greece, Ireland, Italy, Luxembourg, the Netherlands, Norway, Portugal, Spain, Sweden, Switzerland and the United Kingdom. The Bloomberg Commodity Index is made up of 22 exchange-traded futures on physical commodities. The index represents 20 commodities, which are weighted to account for economic significance and market liquidity. The Russell 2000 Index is a U.S. equity index measuring the performance of the 2,000 smallest companies in the Russell 3000. The Russell 3000 Index consists of the 3,000 largest U.S. companies as determined by total market capitalization. The S&P 500 Stock Index is a widely recognized capitalization-weighted index of 500 common stock prices in U.S. companies.
Fund portfolios are actively managed, and holdings may change daily. Holdings are reported as of the most recent quarter-end. Holdings in the Gold and Precious Metals Fund, World Precious Minerals Fund, Near-Term Tax Free Fund and U.S. Government Securities Ultra- Short Bond Fund as a percentage of net assets as of 12/31/2018: Barrick Gold Corp. 0.00%; Randgold Resources Ltd 0.00%; Newmont Mining Corp. 1.01% in Gold and Precious Metals Fund; Goldcorp Inc. 0.00%; Franco-Nevada Corp. 0.00%; Wheaton Precious Metals Corp. 2.50% in Gold and Precious Metals Fund, 0.20% in World Precious Minerals Fund; Royal Gold Inc. 0.00%; Sandstorm Gold Ltd. 3.22% in Gold and Precious Metals Fund; Osisko Gold Royalties Ltd. 1.07% in Gold and Precious Metals Fund, 1.31% in World Precious Minerals Fund; Mene Inc. 2.95% in Gold and Precious Metals Fund, 0.92% in World Precious Minerals Fund.
All opinions expressed and data provided are subject to change without notice. Some of these opinions may not be appropriate to every investor.
| Definitions for Management Teams’ Perspectives | (unaudited) |
Benchmark Index Definitions
Returns for indices reflect no deduction for fees, expenses or taxes, unless noted.
The Bloomberg Barclays U.S. Treasury Bills 6-9 Months Total Return Index tracks the performance of U.S. Treasury Bills with a maturity of six to nine months.
The Bloomberg Barclays 3-Year Municipal Bond Index is a total return benchmark designed for municipal assets. The index includes bonds with a minimum credit rating of BAA3, that are issued as part of a deal of at least $50 million, have an amount outstanding of at least $5 million and have a maturity of two to four years.
The FTSE Gold Mines Index encompasses all gold mining companies that have a sustainable and attributable gold production of at least 300,000 ounces a year and that derive 75% or more of their revenue from mined gold.
The Hang Seng Composite Index is a market-capitalization weighted index that covers about 95% of the total market capitalization of companies listed on the Main Board of the Hong Kong Stock Exchange.
The MSCI Emerging Markets Europe 10/40 Index (Net Total Return) is a free float-adjusted market capitalization index that is designed to measure equity performance in the emerging market countries of Europe (Czech Republic, Greece, Hungary, Poland, Russia and Turkey). The index is calculated on a net return basis (i.e., reflects the minimum possible dividend reinvestment after deduction of the maximum rate withholding tax). The index is periodically rebalanced relative to the constituents’ weights in the parent index.
The NYSE Arca Gold Miners Index is a modified market capitalization-weighted index comprised of publicly-traded companies involved primarily in the mining for gold and silver.
The S&P Global Natural Resources Index (Net Total Return) includes 90 of the largest publicly-traded companies in natural resources and commodities businesses that meet specific investability requirements, offering investors diversified, liquid and investable equity exposure across 3 primary commodity-related sectors: Agribusiness, Energy, and Metals & Mining. The index is calculated on a net return basis (i.e., reflects the minimum possible dividend reinvestment after deduction of the maximum rate withholding tax).
The S&P 500 Index is a widely recognized capitalization-weighted index of 500 common stock prices in U.S. companies.
The S&P Composite 1500 Index is a broad-based capitalization-weighted index of 1500 U.S. companies and is comprised of the S&P 400, the S&P 500 and the S&P 600.
Other Index Definitions
The Bloomberg Commodity Index is made up of 22 exchange-traded futures on physical commodities. The index represents 20 commodities, which are weighted to account for economic significance and market liquidity.
| Definitions for Management Teams’ Perspectives | (unaudited) |
The Caixin China Manufacturing Purchasing Manager’s Index is a composite indicator designed to provide an overall view of activity in the manufacturing sector and acts as a leading indicator for the whole economy. When the PMI is below 50.0 this indicates that the manufacturing economy is declining and a value above 50.0 indicates an expansion of the manufacturing economy.
The Citigroup Economic Surprise Indices are objective and quantitative measures of economic news. They are defined as weighted historical standard deviations of data surprises (actual releases vs Bloomberg survey median).
The Consumer Price Index (CPI) is one of the most widely recognized price measures for tracking the price of a market basket of goods and services purchased by individuals. The weights of components are based on consumer spending patterns.
The Hang Seng Index is a capitalization-weighted index of 33 companies that represent approximately 70 percent of the total market capitalization of The Stock Exchange of Hong Kong.
The MSCI Emerging Markets Europe Index is a free float-adjusted market capitalization index that is designed to measure equity market performance in the emerging markets countries of Europe (Czech Republic, Hungary, Poland, Russia, and Turkey).
The NAHB Housing Market Index is derived from a monthly survey, and gauges builder perceptions of current single-family home sales and sales expectations for the next six months, as well as rating traffic of prospective buyers. Scores from each component are then used to calculate a seasonally adjusted index where any number over 50 indicates that more builders view conditions as good than poor.
The Philadelphia Gold and Silver Index (XAU) is a capitalization-weighted index that includes the leading companies involved in the mining of gold and silver.
The Purchasing Manager’s Index (PMI) is an indicator of the economic health of the manufacturing sector. The PMI index is based on five major indicators: new orders, inventory levels, production, supplier deliveries and the employment environment.
The S&P 500 Energy Index is a capitalization-weighted index that tracks the companies in the energy sector as a subset of the S&P 500.
| U.S. Government Securities Ultra-Short Bond Fund | (unaudited) |
Management Team’s Perspective
Introduction
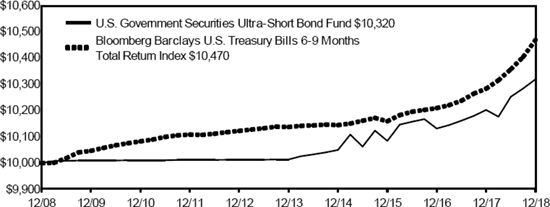
The U.S. Government Securities Ultra-Short Bond Fund (UGSDX) is designed to be used as an investment that takes advantage of the security of U.S. Government bonds and obligations, while simultaneously pursuing a higher level of current income than money market funds offer. The fund’s dollar-weighted average effective maturity is two years or less.
Performance Graph
U.S. Government Securities Ultra-Short Bond Fund
| Average Annual Performance | For the Periods Ended December 31, 2018 |
| | One Year | Five Year | Ten Year |
| U.S. Government Securities Ultra-Short Bond Fund | 1.15% | 0.60% | 0.32% |
| Bloomberg Barclays U.S. Treasury Bills 6-9 Months Total Return Index | 1.81% | 0.65% | 0.46% |
Performance data quoted above is historical. Past performance is no guarantee of future results. Current performance may be higher or lower than the performance data quoted. The principal value and investment return of an investment will fluctuate so that an investor’s shares, when redeemed, may be worth more or less than their original cost. The graph and table do not reflect the deduction of taxes that a shareholder would pay on fund distributions or the redemption of fund shares. For all or a portion of the periods, the fund had expense limitations and reimbursements to maintain a minimum yield, without which returns would have been lower. The above returns for the U.S. Government Securities Ultra-Short Bond Fund include the fund’s results as a money market fund through the date of its conversion (December 20, 2013) to an ultra-short bond fund, and therefore are not representative of the fund’s results had it operated as an ultra-short bond fund for the full term of the periods shown. Returns greater than one year are annualized.
Gross expense ratio as stated in the most recent prospectus is 1.03%. Pursuant to a voluntary arrangement, the Adviser has agreed to limit total fund operating expenses (exclusive of any acquired fund fees and expenses, performance fees, taxes, brokerage commissions and interest) to not exceed 0.45%. The Adviser can modify or terminate this arrangement at any time. In addition, returns may include the effects of additional voluntary waivers of fees and reimbursements of expenses by the Adviser, including waivers and reimbursements to maintain a minimum net yield for the fund.
See Definitions for Management Teams’ Perspectives for index definitions.
Please visit our website at www.usfunds.com for updated performance information for different time periods.
| U.S. Government Securities Ultra-Short Bond Fund | (unaudited) |
The Year in Review – Economic and Political Issues that Affected the Fund
2018 started off with synchronized global growth across key economies. However, within a few months, it became clear that growth trajectories between the U.S. and the rest of the world were diverging. U.S. bonds were affected in 2018 as a result of the surge in GDP growth following the December 2017 tax cut and the steady pace of Federal Reserve rate hikes. Personal income tax cuts, together with low unemployment, boosted household disposable income and powered strong consumer spending growth. A lower corporate tax rate, combined with a continued U.S. boom in oil and gas fracking, supported business investment. A congressional budget deal in February led to strong U.S. military spending, while spending by state and local governments also picked up. Faster GDP growth led to tight labor markets and rising inflation. In response, the Fed continued down the path of rate normalization and the unwinding of quantitative easing, increasing interest rates four times during the year and boosting rates by a cumulative 100 basis points. While higher interest rates began impacting the economy, U.S. trade tariffs instituted throughout the year also hurt growth, both domestically and abroad. One sector hit by the Fed’s moves was the interest-sensitive housing market, where sales and construction slowed in 2018.
Interest rates were very volatile throughout the year, and a general flattening trend saw a part of the yield curve (three-year/five-year yields) invert for the first time since 2007. Long yields made fresh multi-year highs in 2018, with the 10-year Treasury yield’s move above the prior highs of 2013 and 2014 at the 3 percent to 3.05 percent range, to its 2018 high of 3.25 percent in October. Following a retest of the 3.05 percent breakout in late October, the long yield attempted a move to new highs but failed to move past 3.25 percent. The ensuing move lower was swift, with the 10-year yield ending 2018 at 2.68 percent. The short end of the curve spent most of 2018 rising faster than the long end, and thus the two-year/10-year spread flattened to its narrowest spread in a decade.
Investment Highlights
The U.S. Government Securities Ultra-Short Bond Fund returned 1.15 percent for the year ended December 31, 2018, underperforming its benchmark, the Bloomberg Barclays U.S. Treasury Bills 6-9 Months Total Return Index, which returned 1.81 percent.
Current Outlook
2019 is shaping up as a year where volatility will persist as investors await clarity around policy decisions from central banks and monitor trade negotiations between the U.S. and China. The Fed’s renewed focus on contained inflation, risk management and a lack of certainty about equilibrium or neutral rates suggests a more dovish direction moving forward. Furthermore, monetary policy has been tightening for two years and fiscal stimulus is waning. As a result, the economy is facing a more serious moderation in growth and inflation, and as such the Fed is likely to act cautiously regarding its policy path.
| U.S. Government Securities Ultra-Short Bond Fund | (unaudited) |
The section labeled Portfolio of Investments contains a complete list of the fund’s holdings.
Portfolio Allocation by Issuer Based on Total Investments | | December 31, 2018 | |
| Federal Farm Credit Bank | | | 75.6 | % |
| Federal Home Loan Bank | | | 24.4 | % |
| Total | | | 100.0 | % |
| Portfolio Allocation by Maturity | | | | | December 31, 2018 | |
| 1-3 Months | | $ | 11,990,725 | | | | 27.9 | % |
| 3-12 Months | | | 17,482,071 | | | | 40.7 | % |
| 1-3 Years | | | 13,498,054 | | | | 31.4 | % |
| | | $ | 42,970,850 | | | | 100.0 | % |
| Near-Term Tax Free Fund | (unaudited) |
Management Team’s Perspective
Introduction
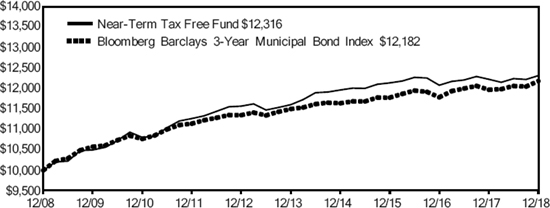
The Near-Term Tax Free Fund (NEARX) seeks to provide a high level of current income exempt from federal income taxation and to preserve capital. However, a portion of any distribution may be subject to federal and/or state income taxes. The Near-Term Tax Free Fund will maintain a weighted average maturity of less than five years.
Performance Graph
Near-Term Tax Free Fund
| Average Annual Performance | For the Periods Ended December 31, 2018 |
| | One Year | Five Year | Ten Year |
| Near-Term Tax Free Fund | 0.73% | 1.19% | 2.10% |
| Bloomberg Barclays 3-Year Municipal Bond Index | 1.76% | 1.16% | 1.99% |
Performance data quoted above is historical. Past performance is no guarantee of future results. Current performance may be higher or lower than the performance data quoted. The principal value and investment return of an investment will fluctuate so that an investor’s shares, when redeemed, may be worth more or less than their original cost. The graph and table do not reflect the deduction of taxes that a shareholder would pay on fund distributions or the redemption of fund shares. For all or a portion of the periods, the fund had expense limitations, without which returns would have been lower. Returns greater than one year are annualized.
Gross expense ratio as stated in the most recent prospectus is 0.99%. The Adviser has contractually agreed to limit total fund operating expenses (exclusive of any acquired fund fees and expenses, extraordinary expenses, taxes, brokerage commissions and interest) to not exceed 0.45% on an annualized basis through April 30, 2019.
See Definitions for Management Teams’ Perspectives for index definitions.
Please visit our website at www.usfunds.com for updated performance information for different time periods.
The Year in Review – Economic and Political Issues that Affected the Fund
Looking back on 2018, the municipal market was pressured in the first quarter as a result of the interest-rate environment, stronger inflation data and rising bond yields. The Federal Reserve raised interest rates again at its mid-March policy meeting, bringing the federal funds rate to a 1.50 percent to 1.75 percent range. The Fed also alerted investors they should expect another two rate hikes later in the year, followed by three more in 2019. After running below the Fed’s 2 percent target rate for most of the previous six
| Near-Term Tax Free Fund | (unaudited) |
years, inflation data started to firm up throughout the quarter. As a result, a majority of Fed members believed inflation would rise above the 2 percent threshold throughout 2018. During the first quarter, the front end of the curve outperformed the long end, while lower quality credit outperformed higher quality. Technical conditions were impacted by the record $62.5 billion in supply that was pulled forward and priced ahead of the passage of the Tax Cuts and Jobs Act in December 2017. The pull forward led to a new-issue total of $63 billion in the first quarter, down roughly 32 percent from the previous year. As expected, the elimination of advanced refundings had a significant negative impact on supply as well.
Municipal bonds had positive returns in the second quarter as demand improved following the U.S. Treasury-led selloff in the first quarter. New municipal bond issuance totaled $96 billion in the second quarter, down 12 percent from the previous year. Both municipal and U.S. Treasury yields were volatile during the quarter. The 10-year Treasury bond yield surpassed 3.1 percent in May, reaching its highest level since 2011. By the end of the month, bond yields had declined. Municipals outperformed Treasuries on a total return basis on both the short and long end of the curve. For the first time since the financial crisis, banks reduced their municipal bond holdings as a result of the corporate tax cuts enacted in December 2017, which made municipal bonds less appealing. Demand picked up from households in many high-tax states such as California and New York. The Tax Cuts and Jobs Act of 2017 capped the state and local tax deduction (SALT) at $10,000. The change in the SALT deduction made the attractiveness of municipal bonds increase in certain high-tax locations. The Fed raised rates in June to a 1.75 percent to 2.00 percent target range and anticipated to carry out two more rate hikes in the remainder of the year. Inflation moved higher during the quarter, while U.S. economic data on job creation, consumer spending, housing and manufacturing and services generally remained robust, keeping the economy on its upward trajectory.
During the third quarter, municipal bonds fell short of Treasuries’ performance due to more than expected supply coming to the secondary market. The Federal Reserve raised the federal funds rate to a target range of between 2.00 percent and 2.25 percent in September and announced it expected one more rate increase in 2018 and three more in 2019. Noting the strength of the U.S. economy and inflation near the 2 percent target, the Fed removed language that interest rate policy would remain “accommodative.” Standard & Poor’s (S&P) released a September 2018 report in which it subjected state financial operations to the stresses of moderate and severe recessions and then compared 2018 reserves to expected drawdowns. Only 20 states had reserves sufficient to cover loss of revenue and increased social service spending during a moderate recession, and overall the states showed an average revenue shortfall of 9.9 percent. S&P went further and made adjustments for dependence on more cyclical revenue streams, level of social-service spending and fixed costs, including pensions. After the adjustments, 14 states were considered low risk, 21 moderate and 14 elevated. S&P contended, however, that states have the capacity to make fiscal adjustments in response to a downturn. S&P also noted, however, that there were 19 state downgrades from the beginning of 2016 through August 2018, compared with just four upgrades, and observed that this ratio was abnormal this far into a recovery.
In the last quarter of the year, the Fed raised the federal funds rate in December to a target range of 2.25 percent to 2.50 percent, for a grand total of four quarter-point hikes in 2018. The Fed lowered its inflation and growth expectations for 2019 and subsequently reduced its rate hike projections for the following year from three hikes to two. Although Fed Chair Powell was arguably “dovish” at the December press conference, markets were hoping for more flexibility as they navigate the balance sheet tapering. Municipal bonds ended the quarter on positive performance that was on par with their taxable peers, assisted by a sell-off in equity markets that led to fixed-income and other safe haven demand.
Investment Highlights
For the year ended December 31, 2018, the Near-Term Tax Free Fund returned 0.73 percent, underperforming its benchmark, the Bloomberg Barclays 3-Year Municipal Bond Index, which gained 1.76 percent.
Strengths
| ● | The fund’s allocation to bonds from New Jersey, Utah and South Carolina outperformed. |
| | |
| ● | The fund benefited from its allocation to airports, higher education and school district bonds, which all outperformed. |
| Near-Term Tax Free Fund | (unaudited) |
| ● | The fund’s allocation toward the short-end of the yield curve outperformed. |
Weaknesses
| ● | The fund’s allocation to bonds from New York and Missouri underperformed. |
| ● | The fund’s exposure to housing and utilities bonds underperformed. |
| ● | The fund’s allocation towards the long end of the yield curve underperformed. |
Current Outlook
Opportunities
After hiking interest rates four times in 2018, the Federal Reserve seems open to keep increases on hold at least through early 2019. Although hard economic data has generally remained solid in the U.S., signs of a slowdown in the rest of the world and a muted inflation environment provide leeway for the Fed to wait and see how the economy evolves. Chairman Powell affirmed that there is no preset path for rates and that the Fed will be agile in shifting its policy if necessary to keep the economy strong. This stance is positive for financial markets broadly, and creates the backdrop for a calmer interest rate environment that is especially supportive for fixed income assets.
Threats
State and local government sectors could come under pressure if the U.S. economy slows enough to constrain revenues from sales and income tax receipts. State governments may be forced to rein in their spending, while pension underfunding remains a significant concern.
The section labeled Portfolio of Investments contains a complete list of the fund’s holdings.
| Top 10 Area Concentrations | |
| (Based on Net Assets) | December 31, 2018 |
| Texas | 26.11% |
| New York | 11.87% |
| Florida | 9.33% |
| Washington | 6.24% |
| Illinois | 4.87% |
| South Carolina | 2.98% |
| Missouri | 2.89% |
| Pennsylvania | 2.81% |
| Michigan | 2.54% |
| North Carolina | 2.54% |
| Total Top 10 Areas | 72.18% |
| Near-Term Tax Free Fund | (unaudited) |
| Municipal Bond Ratings* | |
| Based on Total Municipal Bonds | December 31, 2018 |
| Bond | Percentage |
| AAA | 12.5% |
| AA | 62.6% |
| A | 18.2% |
| BBB | 6.0% |
| Not Rated | 0.7% |
| Total | 100.0% |
| * | Credit quality ratings are measured on a scale that generally ranges from AAA (highest) to D (lowest). “Not Rated” is used to classify securities for which a rating is not available. Credit quality ratings for each issue are obtained from Moody’s and S&P Global Ratings, and the higher rating for each issue is used. |
| All American Equity Fund & Holmes Macro Trends Fund | (unaudited) |
Management Team’s Perspective
Introduction
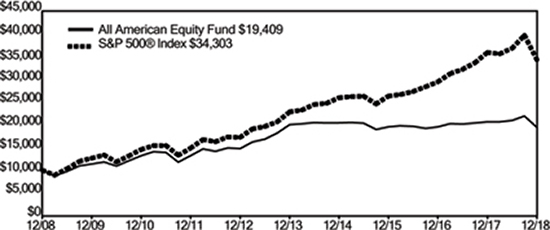
The principal objective of the All American Equity Fund (GBTFX) is to seek capital appreciation by investing primarily in a broadly diversified portfolio of domestic common stocks. The fund invests in large-capitalization stocks while retaining the flexibility to seek out promising individual stock opportunities, including stocks with meaningful dividend yields.
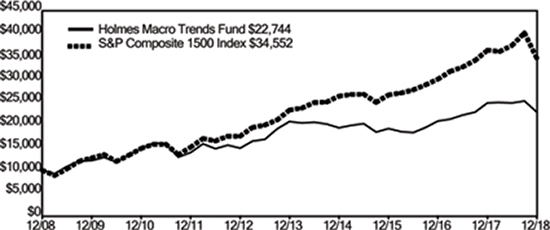
The Holmes Macro Trends Fund (MEGAX) invests in companies with good growth prospects and strong positive earnings momentum. The fund’s primary objective is to seek long-term capital appreciation.
Performance Graphs
All American Equity Fund
| Average Annual Performance | | For the Periods Ended December 31, 2018 |
| | One Year | Five Year | Ten Year |
| All American Equity Fund | (6.07)% | (0.61)% | 6.86% |
| S&P 500® Index | (4.38)% | 8.49% | 13.12% |
Performance data quoted above is historical. Past performance is no guarantee of future results. Current performance may be higher or lower than the performance data quoted. The principal value and investment return of an investment will fluctuate so that an investor’s shares, when redeemed, may be worth more or less than their original cost. The graph and table do not reflect the deduction of taxes that a shareholder would pay on fund distributions or the redemption of fund shares. For all or a portion of the periods, the fund had expense limitations, without which returns would have been lower. Returns greater than one year are annualized.
Gross expense ratio as stated in the most recent prospectus is 1.79%. Pursuant to a voluntary arrangement, the Adviser has agreed to limit total fund operating expenses (exclusive of any acquired fund fees and expenses, performance fees, taxes, brokerage commissions and interest) to not exceed 2.20%. The Adviser can modify or terminate this arrangement at any time.
See Definitions for Management Teams’ Perspectives for index definitions.
Please visit our website at www.usfunds.com for updated performance information for different time periods.
| All American Equity Fund & Holmes Macro Trends Fund | (unaudited) |
Holmes Macro Trends Fund
| Average Annual Performance | | For the Periods Ended December 31, 2018 |
| | One Year | Five Year | Ten Year |
| Holmes Macro Trends Fund | (8.28)% | 1.87% | 8.56% |
| S&P Composite 1500 Index | (4.96)% | 8.25% | 13.20% |
Performance data quoted above is historical. Past performance is no guarantee of future results. Current performance may be higher or lower than the performance data quoted. The principal value and investment return of an investment will fluctuate so that an investor’s shares, when redeemed, may be worth more or less than their original cost. The graph and table do not reflect the deduction of taxes that a shareholder would pay on fund distributions or the redemption of fund shares. For all or a portion of the periods, the fund had expense limitations, without which returns would have been lower. Returns greater than one year are annualized.
Gross expense ratio as stated in the most recent prospectus is 1.83%. Pursuant to a voluntary arrangement, the Adviser has agreed to limit total fund operating expenses (exclusive of any acquired fund fees and expenses, performance fees, taxes, brokerage commissions and interest) to not exceed 2.20%. The Adviser can modify or terminate this arrangement at any time.
See Definitions for Management Teams’ Perspectives for index definitions.
Please visit our website at www.usfunds.com for updated performance information for different time periods.
The Year in Review – Economic and Political Issues that Affected the Funds
In 2017, the S&P 500 Index set a record of 12 consecutive months of price appreciation. This was an accomplishment that has not occurred for over 90 years. But as investors, we understand prices don’t continue to drift higher without checking investor sentiment, and it was definitely checked in 2018.
Early in the year, the tax cuts continued to help the markets find traction and propelled the market higher until around October. The dollar remained strong all year, creating a small headwind for U.S. exports. And as almost every global market slowed or stopped quantitative easing—the exception being Japan—the Federal Reserve raised rates four times. The market didn’t appear to care, however, until late in the year.
In October the markets started to fall apart as tariff talks caused investors to question economic growth patterns. Investors’ emotions created so much disquiet that we were left with the worst December performance since 1931. The capitalization-weighted S&P 500 fell 4.39 percent, with dividends reinvested.
| All American Equity Fund & Holmes Macro Trends Fund | (unaudited) |
With regard to investing style, growth stocks were the strongest for the year. Although they fell 0.01 percent (including dividends), they still outperformed value, which lost 8.97 (including dividends). Health care was the strongest sector of the year, up 4.6 percent. The S&P 500 Energy Index declined 20.5 percent. West Texas Intermediate (WTI) crude fell 24.8 percent, with the majority of the losses happening between October and the end of the year. The commodity closed the year at $45 per barrel.
Investment Highlights
The Holmes Macro Trends Fund (MEGAX) fell 8.28 percent in 2018, underperforming its benchmark, the S&P Composite 1500 Index, which gave back 4.96 percent. The All American Equity Fund (GBTFX) declined 6.07 percent for the year, underperforming its benchmark, the S&P 500 Index.
Overall growth-oriented stocks outperformed value and dividend-oriented companies, while the lagging sectors, energy and materials, just didn’t grab investor attention. The primary driver of underperformance in 2018 was the fact that the funds had more exposure to smaller and growth-oriented companies than their benchmarks. Our investment model was effectively out of favor with money flows, evidenced by the fact that the market did not reward securities we selected based on growth metrics. We believe this is transitory and that our growth at a reasonable price (GARP) investment style will ultimately be rewarded.
Our funds are actively managed, and because the holding period is generally not a consideration in investment decisions, the portfolios’ turnover rate might fluctuate from year to year as the funds adjust their portfolio composition. The funds’ annual portfolio turnovers were, and are expected to continue to be, more than 100 percent.
All American Equity Fund
Strengths
| ● | The fund’s allocation in consumer staples and utilities helped fund performance. |
| ● | Stock selection was better than the index in the industrials and consumer staples sectors. |
| ● | Ball Corporation, Valero Energy and Keurig Dr Pepper were the best contributors to fund performance. |
Weaknesses
| ● | The fund’s allocation in financials and energy didn’t seem to add to the bottom line. |
| ● | Investments in Constellation Brands, Affiliated Managers Group and Southwest Airlines were the worst contributors to performance. |
Holmes Macro Trends Fund
Strengths
| ● | Stock selection was strong in information technology and consumer staples companies. |
| ● | The fund’s underweight position in technology was beneficial, as was the fund’s overweighing of the consumer discretionary sector. |
| ● | Medifast and Electro Scientific Industries were among the best performers in the fund. |
Weaknesses
| ● | Sector allocations in the energy and materials sectors did not perform as well as anticipated. |
| ● | Stock selection in the consumer discretionary and health care sectors seemed to be a drag on the fund. |
| ● | Cutera and Chemours failed to live up to expectations and were among the worst contributors to the fund’s performance. |
| All American Equity Fund & Holmes Macro Trends Fund | (unaudited) |
Current Outlook
Opportunities
| ● | Strong hiring in 2018 pushed the unemployment rate to its lowest level in almost 50 years, with jobless rates near 3.7 percent for the end of the year. As such, workers saw the fastest wage growth in nine years. |
| ● | The University of Michigan said its consumer sentiment index reading at the end of the year was unchanged at 97.5, keeping most of the gains consumers have registered over the last two years. The last time the sentiment index was consistently above 90 was between 1997 and 2000, when it recorded a four-year average of 105.3. |
| ● | U.S. consumer spending gathered momentum the last quarter of the year, with retail sales rising 0.9 percent in December, helping to calm investor fears of an imminent economic slowdown. |
Threats
| ● | Goldman Sachs predicts that 2019 will be another poor year for risk-adjusted investment returns due to slowing economic growth, shrinking central bank balance sheets and continued bouts of volatility. UBS Group wealth managers wrote that gold may rise to $1,300 an ounce in 2019 as volatility grows. |
| ● | The Commerce Department showed a steep drop in new orders for U.S. manufactured goods. Factory orders tumbled 2.1 percent in the third quarter. Durable goods orders led the way lower, dropping 4.3 percent amid a 12 percent plunge in orders for transportation equipment. |
| ● | OPEC producers and allies surprised the market with a larger-than-expected deal to reduce output. The group will collectively curb production by 1.2 million barrels a day, higher than the 1 million barrel-a-day scenario that was earlier floated. |
The section labeled Portfolio of Investments contains a complete list of the funds’ holdings.
| All American Equity Fund & Holmes Macro Trends Fund | (unaudited) |
All American Equity Fund
| Top 10 Equity Holdings (Based on Net Assets) | December 31, 2018 |
| CMS Energy Corp. | 5.19% |
| Electric - Integrated | |
| Yum! Brands, Inc. | 4.40% |
| Retail - Restaurants | |
| Mondelez International, Inc. | 4.00% |
| Food - Miscellaneous/Diversified | |
| Amgen, Inc. | 3.72% |
| Medical - Biomedical/Genetics | |
| Zoetis, Inc. | 3.71% |
| Medical - Drugs | |
| Visa, Inc. | 3.70% |
| Finance - Credit Card | |
| Baxter International, Inc. | 3.59% |
| Medical Products | |
| Cognizant Technology Solutions Corp. | 3.47% |
| Computer Services | |
| Tyson Foods, Inc. | 3.38% |
| Food - Meat Products | |
| American Tower Corp. REIT | 3.23% |
| REITS - Diversified | |
| Total Top 10 Equity Holdings | 38.39% |
| Portfolio Allocation by Industry Sector* | |
| Based on Total Investments | December 31, 2018 |
| Consumer, Non-cyclical | 27.9% |
| Financial | 18.3% |
| Consumer, Cyclical | 18.2% |
| Technology | 12.9% |
| Energy | 7.4% |
| Utilities | 5.6% |
| Exchange Traded Funds | 5.0% |
| Industrial | 3.2% |
| Other | 1.5% |
| Total | 100.0% |
| * | Summary information above may differ from the portfolio schedule included in the financial statements due to the use of different classifications of securities for presentation purposes. |
| All American Equity Fund & Holmes Macro Trends Fund | (unaudited) |
Holmes Macro Trends Fund
| Top 10 Equity Holdings (Based on Net Assets) | December 31, 2018 |
| Kimberly-Clark Corp. | 4.61% |
| Consumer Products - Miscellaneous | |
| AbbVie, Inc. | 4.43% |
| Medical - Drugs | |
| Ciena Corp. | 4.21% |
| Telecom Equipment Fiber Optics | |
| TEGNA, Inc. | 4.00% |
| Television | |
| The Home Depot, Inc. | 3.76% |
| Retail - Building Products | |
| Pool Corp. | 3.71% |
| Distribution/Wholesale | |
| S&P Global, Inc. | 3.67% |
| Commercial Services - Finance | |
| Trex Co., Inc. | 3.42% |
| Building & Construction Products - Miscellaneous | |
| Ingevity Corp. | 3.18% |
| Chemicals - Specialty | |
| Electro Scientific Industries, Inc. | 2.94% |
| Lasers - System/Components | |
| Total Top 10 Equity Holdings | 37.93% |
| Portfolio Allocation by Industry Sector* | |
| Based on Total Investments | December 31, 2018 |
| Consumer, Non-cyclical | 31.9% |
| Communications | 16.1% |
| Industrial | 14.7% |
| Consumer, Cyclical | 13.4% |
| Basic Materials | 9.6% |
| Exchange Traded Funds | 5.4% |
| Financial | 3.6% |
| Technology | 3.5% |
| Other | 1.8% |
| Total | 100.0% |
| * | Summary information above may differ from the portfolio schedule included in the financial statements due to the use of different classifications of securities for presentation purposes. |
| Global Resources Fund | (unaudited) |
Management Team’s Perspective
Introduction
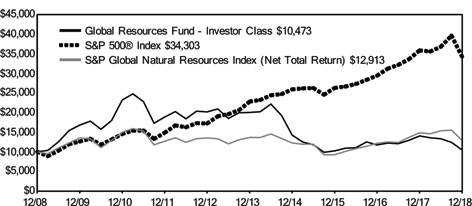
The Global Resources Fund (PSPFX and PIPFX) is a non-diversified natural resources fund with the principal objective of seeking long-term growth of capital while providing protection against inflation and monetary instability. The fund invests in companies involved in the exploration, production and processing of petroleum, natural gas, coal, alternative energies, chemicals, mining, iron and steel, and paper and forest products around the globe.
Performance Graph
Global Resources Fund
| Average Annual Performance | | | For the Periods Ended December 31, 2018 |
| | One Year | Five Year | Ten Year | Since Inception (Institutional Class) |
| Global Resources Fund - Investor Class | (25.48)% | (12.17)% | 0.46% | n/a |
| Global Resources Fund - Institutional Class (Inception 3/1/10) | (24.66)% | (11.42)% | n/a | (4.56)% |
| S&P 500® Index | (4.38)% | 8.49% | 13.12% | 11.91% |
| S&P Global Natural Resources Index (Net Total Return) | (13.08)% | (1.12)% | 2.59% | 0.20% |
Performance data quoted above is historical. Past performance is no guarantee of future results. Current performance may be higher or lower than the performance data quoted. The principal value and investment return of an investment will fluctuate so that an investor’s shares, when redeemed, may be worth more or less than their original cost. The graph and table do not reflect the deduction of taxes that a shareholder would pay on fund distributions or the redemption of fund shares. For all or a portion of the periods, the fund had expense limitations, without which returns would have been lower. Returns greater than one year are annualized.
Gross expense ratio as stated in the most recent prospectus is 1.59% for the Investor Class and 3.55% for the Institutional Class. Pursuant to a voluntary arrangement, the Adviser has agreed to limit total fund operating expenses (exclusive of any acquired fund fees and expenses, performance fees, taxes, brokerage commissions and interest) to not exceed 1.90% for the Investor Class. Also pursuant to a voluntary agreement, the Adviser has agreed to waive all class specific expenses of the Institutional Class. The Adviser can modify or terminate these arrangements at any time. See Definitions for Management Teams’ Perspectives for index definitions. Please visit our website at www.usfunds.com for updated performance information for different time periods.
| Global Resources Fund | (unaudited) |
The Year in Review – Economic and Political Issues that Affected the Fund
The Bloomberg Commodity Index dropped 13 percent in 2018, posting its first decline in three years. All major commodities dropped, with crude oil, copper and gold prices falling 25, 20 and 1.6 percent respectively. Prospects for a trade war between China and the U.S., following President Donald Trump’s imposing tariffs on certain imports of Chinese goods, set off negative investor sentiment toward growth, specifically in China, the world’s largest consumer of raw materials.
These trade war fears were exacerbated by the global manufacturing sector slowdown, following a two-year global synchronized upward trajectory in manufacturing activity. This was evidenced by JP Morgan’s Global Manufacturing Purchasing Manager’s Index (PMI) barometer, which peaked in December 2017 at 54.5, and fell steadily to fresh lows of 51.5 in December 2018. China’s manufacturing sector actually contracted in December, after weakening throughout the year. U.S. and eurozone manufacturers also ended the year with a lower reading.
Crude oil’s drop was driven by the rapid and unexpected volume growth out of U.S. producers, which led the nation to become the world’s largest producer of crude, ahead of Russia and Saudi Arabia. This supply shock was made worse by waivers to U.S. sanctions on Iran, which allowed certain nations to continue importing Iranian crude. The price drop was only marginally offset by a fresh agreement among members of the Organization of Petroleum Exporting Countries (OPEC) to limit production.
The base metals complex, highly susceptible to manufacturing activity globally, dropped as fears of a trade war between the U.S. and China raised concerns over China’s ability to maintain its gross domestic product (GDP) growth forecasts. Copper, nickel and zinc posted double-digit drops in 2018, a reflection of lower GDP and PMI readings, suggesting weaker demand for the metals.
Gold was the best performing major commodity in 2018, declining marginally by 1.6 percent, after posting two consecutive annual advances. The weaker global PMIs, coupled with an earnings’ slowdown in the U.S., have resulted in Federal Reserve officials communicating a slower pace to the ongoing tightening cycle.
Investment Highlights
Overview
For the year ended December 31, 2018, the Investor Class of the Global Resources Fund dropped 25.48 percent and the Institutional Class dropped 24.66 percent, trailing the fund’s benchmark, the S&P Global Natural Resources Index (Net Total Return), which dropped 13.08 percent.
The fund employed a defensive investment position targeting value-driven opportunities with lower-than-average beta. However, to maintain varying degrees of investment exposure to the commodities market, the fund utilized a number of rolling call option positions to hedge the fund’s benchmark risks and provide optionality to upswings in commodities stocks. The options hedging model was highly successful in early 2018, but later offset by paying premiums that expired out of the money. The fund has greater exposure to income-yielding securities, and as such pays a yield in excess of 4 percent, the highest dividend yield of any of its peers.
Because the fund is actively managed and holding period is generally not a consideration in investment decisions, the portfolio turnover rate may fluctuate from year to year as the fund adjusts its portfolio composition. The fund’s annual portfolio turnover was, and is expected to continue to be, more than 100 percent.
Strengths
| ● | The U.S. dollar slipped from its 2018 high as Federal Reserve Chairman Jerome Powell hinted he's ready to pause rate hikes while he assesses risks to the U.S. economy. Major economists now |
| Global Resources Fund | (unaudited) |
coincide that a weaker U.S. dollar may be in the cards, which conversely should benefit commodity prices and overall import demand from emerging markets.
| ● | The fund’s overweight in precious metals, renewable energy, oil services, oil refiners and oil explorers and producers (E&Ps) as well as its underweight in industrials stocks had a positive contribution to the fund in excess of its benchmark. The fund’s cash holdings also provided a positive contribution. |
| ● | The fund had superior stock selection in the precious metals, industrials, oil services and integrated oil sectors. The best performing stocks were OceanaGold, EVRAZ and Grupa Lotos. |
Weaknesses
| ● | The Bloomberg Commodity Index, a measure of a basket of commodities, ended the year down for the first time in three years. All major commodities dropped, with crude oil, copper and gold prices falling. Prospects for a trade war between China and the U.S. set off negative investor sentiment toward growth, specifically in China, the world’s largest consumer of raw materials. |
| ● | The fund’s overweight in junior resource stocks and industrial chemicals, as well as its underweight in integrated oil, base and industrial metals stocks, had a negative contribution to the fund relative to its benchmark. |
| ● | The fund had inferior stock selection in the oil refiners, oil E&Ps, agricultural and industrial chemical sectors. The worst performing stocks were CruzSur Energy (formerly Pentanova Energy), Pacific Infrastructure and Daqo New Energy. |
Current Outlook
Opportunities
| ● | Goldman Sachs, Morgan Stanley and Citi all agree that commodities as a complex are compelling. Interestingly, there have been seven Fed rate hike cycles over the past 50 years, and all but one of those cycles have coincided with commodities outperforming the market. |
| ● | Japanese bank Nomura is bearish on the U.S. dollar. The bank notes that U.S. growth is already losing momentum, and even with a few more hikes, Fed policy rates would settle at their lowest level in history for the end of a hiking cycle. The punchline is that “U.S. yields are simply not high enough to make up for the U.S. growing twin deficits, and lack of foreign capital inflows,” concludes the report. |
| ● | China is taking steps to address U.S. complaints that Beijing engages in unfair trade practices. The Wall Street Journal reported: “Chinese officials are also considering making changes to the Made in China 2025 Plan, a state-led industrial policy aimed at enabling Chinese companies to dominate a number of industries such as artificial intelligence and robotics.” This policy is a focal point of the U.S. complaints against China. |
Threats
| ● | The main issue for base metals in 2019 is whether Chinese infrastructure stimulus can offset slowing property demand, according to BMO analysts. “It is fair to say the jury is still out on whether efforts thus far are sufficient,” referring to the amount of stimulus promised by Chinese Premier Li Keqiang, and the central bank. |
| ● | The strength of U.S. economic indicators appears to be fading. The Citigroup U.S. Economic Surprise Index, which measures whether economic data have exceeded or fallen short of analysts’ estimates, fell to the lowest in more than a year. The Fed’s Beige Book report showed fading optimism over growth prospects at U.S. firms even as most districts continued to report a modest expansion. |
| Global Resources Fund | (unaudited) |
| ● | The U.S. NAHB Housing Market Index declined to 56 points in December versus 60 points the previous month, and dropped to the lowest level since May 2015. In addition, the drop now constitutes the largest two-month drop since October 2001, highlighting the negative momentum in a key end market for natural resources. |
The section labeled Portfolio of Investments contains a complete list of the fund’s holdings.
| Top 10 Equity Holdings (Based on Net Assets) | December 31, 2018 |
| Pacific Infrastructure Ventures, Inc. | 6.76% |
| Real Estate Operating/Development | |
| OceanaGold Corp. | 2.37% |
| Gold Mining | |
| Grupa Lotos SA | 2.23% |
| Oil Refining & Marketing | |
| Vestas Wind Systems A/S | 2.21% |
| Energy - Alternate Sources | |
| Centamin PLC | 2.20% |
| Gold Mining | |
| Polskie Gornictwo Naftowe i Gazownictwo SA | 2.19% |
| Oil Companies - Integrated | |
| Anglo American PLC | 2.11% |
| Diversified Minerals | |
| Hudbay Minerals, Inc. | 2.10% |
| Metal - Copper | |
| AGL Energy, Ltd. | 2.00% |
| Electric - Integrated | |
| China Shenhua Energy Co., Ltd. | 2.00% |
| Coal | |
| Total Top 10 Equity Holdings | 26.17% |
| Global Resources Fund | (unaudited) |
| Portfolio Allocation by Industry Sector* | |
| Based on Total Investments | December 31, 2018 |
| Metals & Mining | 29.8% |
| Oil, Gas & Consumable Fuels | 16.2% |
| Chemicals | 15.5% |
| Precious Metals & Minerals | 7.6% |
| Real Estate | 7.3% |
| Electric - Generation | 5.0% |
| Building Products | 4.9% |
| Energy Equipment & Services | 3.7% |
| Paper & Forest Products | 3.1% |
| Other | 6.9% |
| Total | 100.0% |
| * | Summary information above may differ from the portfolio schedule included in the financial statements due to the use of different classifications of securities for presentation purposes. |
| Precious Metals and Minerals Funds | (unaudited) |
Management Team’s Perspective
Introduction
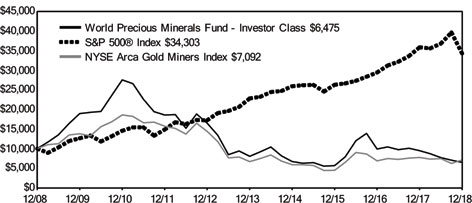
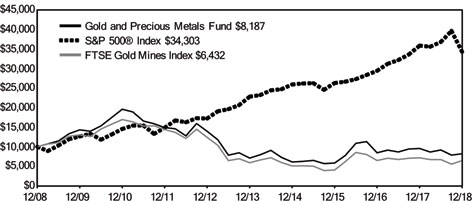
The World Precious Minerals Fund (UNWPX and UNWIX) and the Gold and Precious Metals Fund (USERX) pursue an objective of long-term capital growth through investments in gold, precious metals and mining companies. The World Precious Minerals Fund focuses on equity securities of companies principally engaged in the exploration, mining and processing of precious minerals such as gold, silver, platinum and diamonds. Although this fund has the latitude to invest in a broad range of precious minerals, it currently remains focused on the gold sector. The Gold and Precious Metals Fund focuses on the equity securities of established gold and precious metals companies and pursues current income as a secondary objective.
World Precious Minerals Fund
| Average Annual Performance | | | For the Periods Ended December 31, 2018 |
| | One Year | Five Year | Ten Year | Since Inception (Institutional Class) |
| World Precious Minerals Fund - Investor Class | (31.67)% | (4.19)% | (4.25)% | n/a |
| World Precious Minerals Fund - Institutional Class (Inception 3/1/10) | (31.20)% | (3.72)% | n/a | (10.95)% |
| S&P 500® Index | (4.38)% | 8.49% | 13.12% | 11.91% |
| NYSE Arca Gold Miners Index | (8.21)% | 1.22% | (3.38)% | (6.92)% |
Performance data quoted above is historical. Past performance is no guarantee of future results. Current performance may be higher or lower than the performance data quoted. The principal value and investment return of an investment will fluctuate so that an investor’s shares, when redeemed, may be worth more or less than their original cost. The graph and table do not reflect the deduction of taxes that a shareholder would pay on fund distributions or the redemption of fund shares. For all or a portion of the periods, the fund had expense limitations, without which returns would have been lower. Returns greater than one year are annualized.
Gross expense ratio as stated in the most recent prospectus is 1.85% for the Investor Class and 2.23% for the Institutional Class. Pursuant to a voluntary arrangement, the Adviser has agreed to limit total fund operating expenses (exclusive of any acquired fund fees and expenses, performance fees, taxes, brokerage commissions and interest) to not exceed 1.90%. Also pursuant to a voluntary agreement, the Adviser has agreed to waive all class specific expenses of the Institutional Class. The Adviser can modify or terminate these arrangements at any time. See Definitions for Management Teams’ Perspectives for index definitions.
Please visit our website at www.usfunds.com for updated performance information for different time periods.
| Precious Metals and Minerals Funds | (unaudited) |
Gold and Precious Metals Fund
| Average Annual Performance | | For the Periods Ended December 31, 2018 |
| | One Year | Five Year | Ten Year |
| Gold and Precious Metals Fund | (14.29)% | 2.90% | (1.98)% |
| S&P 500® Index | (4.38)% | 8.49% | 13.12% |
| FTSE Gold Mines Index | (10.04)% | 1.69% | (4.32)% |
Performance data quoted above is historical. Past performance is no guarantee of future results. Current performance may be higher or lower than the performance data quoted. The principal value and investment return of an investment will fluctuate so that an investor’s shares, when redeemed, may be worth more or less than their original cost. The graph and table do not reflect the deduction of taxes that a shareholder would pay on fund distributions or the redemption of fund shares. For all or a portion of the periods, the fund had expense limitations, without which returns would have been lower. Returns greater than one year are annualized.
Gross expense ratio as stated in the most recent prospectus is 1.66%. Pursuant to a voluntary arrangement, the Adviser has agreed to limit total fund operating expenses (exclusive of any acquired fund fees and expenses, performance fees, taxes, brokerage commissions and interest) to not exceed 1.90%. The Adviser can modify or terminate this arrangement at any time.
See Definitions for Management Teams’ Perspectives for index definitions.
Please visit our website at www.usfunds.com for updated performance information for different time periods.
The Year in Review - Economic and Political Issues that Affected the Funds
Gold started the year above $1,300 an ounce, but by the end of the first quarter, momentum was waning and the dollar started to pick up strength, particularly against the Turkish lira, as economic conditions worsened. It was reported in April that the Turkish central bank transferred approximately 220 tons of its gold reserves stored in the U.S. Federal Reserve system back to Turkey and that two other banks were in the process of transferring 95 tons of gold reserves from the U.S. back to Turkey. The race was then on to see who could front-run their sell before Turkey hit the market. Hedge funds and other large speculators pared bullish bets on bullion to the lowest in more than two years. Gold racked up six consecutive months of declines, its longest losing streak in five years, and pushed the gold futures market for speculators to the first net short position since late 2001.
Turkey’s gold selling found many central banks were willing buyers. The World Gold Council (WGC) reported that central banks added a net total of 193.3 tonnes of gold to their reserves in the first six months of 2018, representing an 8 percent increase from the same period in 2017, and the strongest first half of
| Precious Metals and Minerals Funds | (unaudited) |
the year since 2015. Russia has been a steady buyer of gold, and India, Poland and Hungary also added to their gold reserves in 2018.
The U.S. Treasury reported that Russia sold $81 billion worth of U.S. government debt and bought more gold in July than in any other month in 2018. The yuan’s share in the Russian central bank’s foreign-exchange and gold assets almost tripled in a matter of three months, jumping from only 1 percent in the third quarter to 2.8 percent. “The rise in the share of yuan assets reflects Russia’s intentions to diversify away from major currencies. The International Monetary Fund (IMF) approved adding the yuan, China’s currency, into the IMF’s foreign exchange basket. This is the first time the IMF has ever added a new currency to its foreign exchange basket. The IMF’s acceptance opens the door for potentially putting the yuan on par with the U.S. dollar,” according to Reuters.
By September, the urgency of the currency crisis in Turkey had abated and by the middle of the month we began seeing weekly updates of its central bank adding to its gold holdings after selling off about 15 percent of its reserves. With these weekly updates of growing gold reserves in Turkey, gold prices closed out the year with three consecutive monthly gains. Although gold finished the year with a negative return, it did outperform the S&P 500 Index for the year.
For the exploration & development gold companies, access to capital in 2018 was a major impediment. Many investment banks have left aside the business of funding smaller mining projects, leaving an opening for less traditional sources of capital for raising money. RBC Capital Markets reported that of the approximately $925 million raised by junior precious metals companies for the first part of 2018, only 14 percent has come from traditional equity sources, with the rest from alternative lenders such as royalty and streaming companies. The shift in funding has largely been driven by investors blindly buying gold mining stock ETFs for the exposure to gold’s beta, and not conducting any due diligence on the investment merits of the underlying securities held by the ETF.
At the end of July, Vanguard announced that it was restructuring and changing the name of its $2.3 billion Precious Metals and Mining Fund. The fund, renamed the Global Capital Cycles Fund, reduced its exposure to mining stocks to just 25 percent from 80 percent. This move showed that negative sentiment and bearishness on gold and precious metals had hit a bottom, as Vanguard is one of the largest fund companies. Its rotation out of gold mining stocks could lead to some near-term weakness in share prices but could certainly be a buying opportunity as well. In terms of timing, Avi Gilbert, creator of Elliotwavetrader.net, noted: “You don’t see these types of moves at market tops.”
The net result is that there are many cheap non-index gold companies that may see the first benefits of industry consolidation as the seniors scramble to replace their depleting resource base and falling production profile. Gold company CEOs, however, are paralyzed with fear that they will lose their jobs (finally) if they do one more bad deal. The world’s major gold producers had cut back on mergers and acquisitions (M&As) with industry transactions totaling just $8.95 billion in 2017, tumbling by a third from the previous year, according to Bloomberg. In a rush to boost output in 2011, when gold was at an all-time high of $1,921.17 an ounce, companies spent a record $38.7 billion on acquisitions.
Barrick Gold, the world’s largest producer of gold, reported a decline in first-quarter production as planned maintenance weighed on output, as expected. The gold miner produced only 1.05 million ounces in the first quarter of the year, which is the lowest quarterly production amount for Barrick in 16 years. This emphasized the notion that the world may have hit “peak gold” supply, where most of the world’s gold has already been discovered, and it’s become much more difficult to find new deposits. 2018 may well have been the year when shareholder activism in the gold space wrecked management’s perverse malaise. Paulson & Co launched a successful bid to oust the management and board of Detour Gold by year end. Gold giant Barrick, likely seeing the writing on the wall, announced a friendly merger with Randgold Resources to bring its highly successful management team into Barrick to create the world’s largest gold mining company. Mark Bristow, CEO of Randgold, will be become the CEO of the newly combined company. The installment of Bristow may mark a shift from gold mines being run by financial “artists” back to true scientists.
Investment Highlights
For the year ended December 31, 2018, the World Precious Minerals Fund Investor Class lost 31.67 percent, and the Institutional Class fell 31.20 percent. The fund’s benchmark, the NYSE Arca Gold Miners Index, declined 8.21 percent on a total return basis.
| Precious Metals and Minerals Funds | (unaudited) |
The strategy of the World Precious Minerals Fund favors junior exploration and development stocks and mid-tiered producing stocks. These lower-capitalization stocks have historically outperformed senior gold mining companies over longer periods, as senior gold miners have typically acquired proven assets of junior gold companies rather than explored for new mining projects with capital-constrained budgets.
The Gold and Precious Metals Fund declined 14.29 percent for the year, slightly underperforming its benchmark, the FTSE Gold Mines Index, which fell 10.04 percent on a total return basis. While focusing on established, gold-producing companies, the Gold and Precious Metals Fund holds a higher weighting of mid-tier stocks compared to its benchmark.
Both funds employed a defensive investment position from time to time in the past year with higher-than-average cash balances on hand to protect the liquidity of the funds. However, to maintain varying degrees of investment exposure to the gold market, the funds utilized some call options positions and directional ETFs, which are more liquid than options, to hedge the funds’ benchmark risks and provide optionality to upswings in gold stocks.
Gold finished the year down just 1.58 percent, while silver fell 8.53 percent. Palladium ended the year strongest with a gain of 18.59 percent, primarily driven by a shift in Europe to gasoline engines from diesel and a greater need for pollution reduction, particularly in China. This increases the demand for palladium, which is used in pollution-scrubbing catalytic converters. Platinum sank 14.49 percent on weakening demand relative to palladium.
Strengths
| ● | Wesdome Gold Mines became our largest position over the course of the year and was the best contributor to returns for both Gold and Precious Metals Fund (USERX) and World Precious Minerals Fund (UNWPX) with a 103.53 percent return. |
| ● | St Barbara was the second best dollar gainer for USERX, with a 17.89 percent gain. The second best contributor to UNWPX was avoiding the third largest gold mining company, Goldcorp, which fell 22.95 percent in the past year. |
| ● | Kirkland Lake Gold was the third best performer for USERX, with a 22.02 percent gain, before the fund took final profits following returns that approached 200 percent in the prior year. The third best contributor to UNWPX was Canyon Resources, which surged almost threefold on the awarding of the Martap Bauxite license in Cameroon. |
Weaknesses
| ● | Rye Patch Gold was the biggest detractor for USERX, losing 44.33 percent before being taken over by Alio Gold on poor restart results for the Florida Canyon Mine in Nevada. For UNWPX, tax-loss selling played a role in pushing down returns across the junior mining and exploration space as we closed out the year. Barsele Minerals, despite finishing the first nine months of the year with positive returns, was our most significant dollar decliner with a price drop of 46.82 percent by year end on no negative headline news. |
| ● | Leagold Mining was the second biggest dollar detractor for USERX with the share price down 39.39 percent for the year. TriStar Gold, down 38.18 percent, was the second largest dollar detractor for UNWPX, with the bulk of the losses coming in the fourth quarter. |
| ● | In the third quarter, Anglogold Ashanti hired Kevin Dushnisky, co-president of Barrick Gold, as its new CEO. USERX did not own any Anglogold, but the market seemed to reward the change in leadership with the shares finishing the year up 22.41 percent. There was little material news to support the rerating. Roxgold finished the year down 46.92 percent and was the third worst performer for UNWPX. One of the largest holders of Roxgold was the Vanguard Precious Metals and Minerals Fund, which announced it was changing the investment objective and significantly down-weighting its gold exposure. The holding remained an overhang on the market until the position was sold from Vanguard’s portfolio at year end. |
| Precious Metals and Minerals Funds | (unaudited) |
Current Outlook
Opportunities
| ● | Goldman Sachs economists released three reasons to buy gold after this year’s selloff. Firstly, it forecasts emerging market growth stabilization and maintains a constructive outlook on emerging market currencies. Secondly, it views the recent gold ETF and Commodity Futures Trading Commission (CFTC) net specs liquidation as a one-off cleaning up on speculative positions. And thirdly, it views the rising interest rate environment as not necessarily bearish for gold, as many believe. |
| ● | Ulf Lindahl, CEO of A.G. Bisset Associates, predicts that the U.S. dollar will fall by around 40 percent against the euro by 2024, citing a 15-year cycle of losses and gains, reports Bloomberg. Lindahl hedges foreign exchange risk for pension funds and family offices in the U.S. and Europe and has helped clients pick up around 100 basis points per year on their portfolios over the last 25 years. “We could see a very substantial decline in the dollar,” and “it has massive implications for all the financial markets,” Lindahl said in an interview in August. |
| ● | According to Barron’s Andrew Barry, “out-of-favor gold” now deserves a place in investment portfolios. Compared with stocks and other financial assets, gold appears to be inexpensive, and gold stocks are at their most discounted level in over 20 years relatively speaking. Gold miners, as measured by the Philadelphia Gold and Silver Index, set its lowest 14-day relative strength index (RSI) reading in 31 years, writes Bloomberg. This demonstrates that gold mining stocks are as oversold as they’ve been since the crash of October 1987. Keith Trauner, co-portfolio manager of the GoodHaven Fund, says that “virtually every government in the world is trying to promote inflation partly because there is so much sovereign debt,” and with so much debt, governments have only three choices: default, restructure or inflate the currency. Trauner notes that most governments will choose inflation, which has historically been positive for the price of gold. |
Threats
| ● | A former JPMorgan precious metals trader admitted in 2018 that he had engaged in a spoofing scheme for six years that defrauded investors in gold, silver, platinum and palladium futures contracts, writes Zero Hedge. This is possibly the first major gold-bank trader to come clean about market manipulation after being suspected of committing fraud. There was once a time when the mere mention of gold manipulation would have branded someone as a conspiracy theorist, but more and more accounts of actual manipulation have come to light so far this year. |
| ● | Mexico has proposed changes to its mining laws that could be slightly negative for mining companies operating in the country. The new laws enable a government entity to perform social impact studies as a part of the concession process. It will enable the Commerce Secretary to declare protected areas and require companies to set aside monies for sustainable development, as well as issue a yearly social impact study of company activities. Another concern for the Mexican mining industry is the return of former mining and metal works union leader Napoleon Gomez, who was accused of taking $55 million from a workers fund in 2004-2005. Gomez fled to Vancouver until he was pardoned in 2014, and is now back working on the proposed changes to the mining legislation in the Mexican Senate. |
| ● | According to a model tracked by JPMorgan Chase, the probability of a U.S. recession within one year is almost 28 percent, while there is a 60 percent chance of a recession in the next two years. Bloomberg reports that fund managers surveyed by Bank of America Merrill Lynch this month are the most bearish on global activity in 10 years, with 85 percent saying that the global economy is in late cycle. Attila Dzsubak, investment director at MKB-Pannonia, which oversees $2.4 billion in assets, said that “investors have to start looking for a way out from equities now,” and that “past experience shows that exits can quickly become too narrow.” According to Bloomberg, Dzsubak |
| Precious Metals and Minerals Funds | (unaudited) |
has started to make his portfolio more defensive by purchasing gold equities and ETFs investing in precious metals.
The section labeled Portfolio of Investments contains a complete list of the funds’ holdings.
World Precious Minerals Fund
| Top 10 Equity Holdings (Based on Net Assets) | December 31, 2018 |
| Wesdome Gold Mines, Ltd. | 6.87% |
| Gold Mining | |
| Cardinal Resources, Ltd. | 5.78% |
| Metal - Diversified | |
| TriStar Gold, Inc. | 4.99% |
| Gold Mining | |
| Dolly Varden Silver Corp. | 4.27% |
| Precious Metals | |
| SilverCrest Metals, Inc. | 4.12% |
| Precious Metals | |
| Nano One Materials Corp. | 3.85% |
| Advanced Materials/Production | |
| Barsele Minerals Corp. | 2.92% |
| Precious Metals | |
| Lundin Gold, Inc. | 2.58% |
| Gold Mining | |
| Hecla Mining Co. | 2.45% |
| Precious Metals | |
| Orca Gold, Inc. | 2.22% |
| Gold Mining | |
| Total Top 10 Equity Holdings | 40.05% |
Portfolio Allocation by Industry* Based on Total Investments | December 31, 2018 |
| Gold Mining | 46.7% |
| Precious Metals | 22.8% |
| Metal - Diversified | 11.9% |
| Diversified Minerals | 4.7% |
| Advanced Materials/Production | 3.9% |
| Exchange Traded Funds | 3.4% |
| Other | 6.6% |
| Total | 100.0% |
| * | Summary information above may differ from the portfolio schedule included in the financial statements due to the use of different classifications of securities for presentation purposes. |
| Precious Metals and Minerals Funds | (unaudited) |
Gold and Precious Metals Fund
| Top 10 Equity Holdings (Based on Net Assets) | December 31, 2018 |
| Wesdome Gold Mines, Ltd. | 9.23% |
| Gold Mining | |
| St Barbara, Ltd. | 8.66% |
| Gold Mining | |
| Northern Star Resources, Ltd. | 4.55% |
| Gold Mining | |
| Sandstorm Gold, Ltd. | 3.21% |
| Gold Mining | |
| Maverix Metals, Inc. | 3.09% |
| Precious Metals | |
| Direxion Daily Gold Miners Index Bull 3X Shares ETF | 3.05% |
| Exchange Traded Funds | |
| Mene, Inc. | 2.94% |
| Retail - Jewelry | |
| SSR Mining, Inc. | 2.81% |
| Precious Metals | |
| Direxion Daily Junior Gold Miners Index Bull 3x Shares ETF | 2.67% |
| Exchange Traded Funds | |
| Pan American Silver Corp. | 2.54% |
| Silver Mining | |
| Total Top 10 Equity Holdings | 42.75% |
Portfolio Allocation by Industry* Based on Total Investments | December 31, 2018 |
| Gold Mining | 66.5% |
| Precious Metals | 15.9% |
| Exchange Traded Funds | 5.9% |
| Silver Mining | 5.9% |
| Retail - Jewelry | 3.1% |
| Other | 2.7% |
| Total | 100.0% |
| * | Summary information above may differ from the portfolio schedule included in the financial statements due to the use of different classifications of securities for presentation purposes. |
| Emerging Europe Fund | (unaudited) |
Management Team’s Perspective
Introduction
The investment objective of the Emerging Europe Fund (EUROX) is to achieve long-term capital growth by investing in a non-diversified portfolio of equity securities of companies located in the emerging markets of Europe.(1)
Performance Graph
Emerging Europe Fund
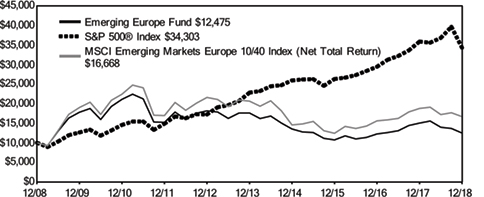
| Average Annual Performance | | For the Periods Ended December 31, 2018 |
| | One Year | Five Year | Ten Year |
| Emerging Europe Fund | (17.01)% | (6.67)% | 2.24% |
| S&P 500® Index | (4.38)% | 8.49% | 13.12% |
| MSCI Emerging Markets Europe 10/40 Index (Net Total Return) | (11.20)% | (4.19)% | 5.24% |
| * | Performance data quoted above is historical. Past performance is no guarantee of future results. Current performance may be higher or lower than the performance data quoted. The principal value and investment return of an investment will fluctuate so that an investor’s shares, when redeemed, may be worth more or less than their original cost. The graph and table do not reflect the deduction of taxes that a shareholder would pay on fund distributions or the redemption of fund shares. For all or a portion of the periods, the fund had expense limitations, without which returns would have been lower. Returns greater than one year are annualized. |
Gross expense ratio as stated in the most recent prospectus is 2.32%. Pursuant to a voluntary arrangement, the Adviser has agreed to limit total fund operating expenses (exclusive of any acquired fund fees and expenses, performance fees, taxes, brokerage commissions and interest) to not exceed 2.85%. The Adviser can modify or terminate this arrangement at any time.
See Definitions for Management Teams’ Perspectives for index definitions.
Please visit our website at www.usfunds.com for updated performance information for different time periods.
| (1) | The following countries are considered to be in the emerging Europe region: Albania, Armenia, Azerbaijan, Belarus, Bulgaria, Croatia, the Czech Republic, Estonia, FYR Macedonia, Georgia, Greece, Hungary, Latvia, Lithuania, Moldova, Poland, Romania, Russia, Slovakia, Slovenia, Turkey and Ukraine. |
| Emerging Europe Fund | (unaudited) |
The Year in Review – Economic and Political Issues that Affected the Fund
2018 was a challenging year for emerging markets compared to the United States. The Federal Reserve continued its tightening policy, supporting the dollar, which translated into pressure on emerging market currencies. The trade war with China also significantly contributed to outperformance of U.S. equites compared to European stocks. On a positive note, post-communist emerging Eastern European countries recorded smaller losses in 2018 than the broad global emerging markets and developed Western Europe countries.
Russia was the best performing market this year, and proved to be the most resilient to higher U.S. rates and trade war talks. The country has strong valuation support, and its high dividend rates are attractive to investors. The Russian ruble depreciated against the dollar, supporting economic growth and improving profit margins of commodity producers. Despite stricter sanctions imposed in April, most stocks trading on the Moscow Exchange were able to recover from the sharp sell-off. However, the threat of more sanctions imposed by the U.S. and Western Europe for the annexation of Crimea and interference in the 2016 U.S. presidential election still remains.
Hungary was the second best performing market within the emerging Europe countries. Hungarian parliamentary elections took place in April, which secured a victory for the Fidesz party. Viktor Orban remains the prime minister. Hungary’s government and the country’s central bank have been supporting economic growth by cutting taxes and keeping the main rate at a record low level despite rising inflation.
Stocks trading on the Prague Stock Exchange outperformed in 2018. At the beginning of the year, pro- Russian populist Milos Zeman was re-elected as president. Later in the year, the Czech prime minister’s ANO party won the nationwide municipal elections. The central bank of Czech Republic was one of very few in the world to start monetary tightening. The Czech Republic introduced a constitutional debt limit, set at 55 percent of its gross domestic product (GDP), and a long-term national investment plan worth 133 billion euros for years 2019 through 2030.
Poland underperformed last year. The Polish government pushed for judicial reforms, which strained relations with Brussels. Despite political noise, Poland recorded another year with strong economic growth and consumer spending. Unemployment was at a record low, and growing wages were expected to increase inflation. General elections are scheduled to take place in 2019, and currently the Law & Justice party is maintaining its lead.
Equites trading on the Athens Exchange underperformed the MSCI Emerging Europe Index. Investors lack confidence that Greece’s economic situation will improve quickly with the high level of banks’ exposure to non-performing loans. However, the country is beginning to see the positive effect of past reforms, including improvement in the net trade balance and stable household consumption.
Turkey had a volatile 2018 and was the worst performing market. Its currency, the lira, sold off sharply, depreciating against the dollar by almost 30 percent in 2018. Higher rates in the U.S. and geopolitical tension put pressure on Turkish equites and the lira. In August, the U.S. imposed sanctions on Turkey over a detained American pastor, which resulted in the lira selling off 20 percent in just two days. Later in the year, relations between the two countries improved, followed by price recovery in equities and the lira.
Investment Highlights
Overview
For the year ended December 31, 2018, the Emerging Europe Fund lost 17.01 percent, while the benchmark MSCI Emerging Markets Europe 10/40 Index (Net Total Return) declined by 11.20 percent.
Russia, Hungary and the Czech Republic outperformed the benchmark, while Poland, Greece and Turkey underperformed. On a sector basis, information technology and energy were the best performing sectors, while materials, utility, health care, finance, consumer service, consumer discretionary, industrials, consumer staples and real estate underperformed.
| Emerging Europe Fund | (unaudited) |
Strengths
| ● | The fund’s higher cash level and underweight stock selection in Greece had the most positive impact on the fund’s performance relative to its benchmark. |
| ● | The fund’s underweight in financials and stock selection in telecommunication services had the most positive effect on the fund’s performance relative to its benchmark. |
| ● | Lukoil, the Russian oil producer, made the largest single contribution to the performance of the fund. |
Weaknesses
| ● | The fund’s underweight of Russia had the most negative impact on the fund’s performance relative to its benchmark. |
| ● | The fund’s underweight in energy and overweight in industrials had the most negative effects on the fund’s performance relative to its benchmark. |
| ● | Sberbank, a Russian bank, was the single worst contributor to the performance of the fund. |
Current Outlook
Opportunities
| ● | Central and Eastern European (CEE) economies are expected to grow 3.4 percent in 2019. That’s slower than in 2018 but stronger than Western Europe and the U.S. Professional forecasters see economic growth in the U.S. easing to 2.4 percent in 2019 and 2.1 percent in the European Union. In CEE, low unemployment, rising wages and still-cheap borrowing costs are expected to support growth. Slovakia and Poland are projected to be the region’s top performers in 2019, according to the Focus Economics Consensus Forecast. |
| ● | The Cornerstone Macro research team predicts that economic activity in China will rebound in 2019. This should help support economic activity in the eurozone, as EU exports to China are picking up. Manufacturing PMI readings in China and the eurozone could move higher, above the 50 level that separates growth from contraction. Analysts also forecast the emerging market currency turmoil to be over. |
| ● | Poland’s budget deficit is expected to be the lowest since 2009, the country’s finance minister said. The government expects the economy to grow 3.8 percent in 2019, with inflation targeted at 2.3 percent. The country’s budget deficit is expected to be no more than 28.5 billion (or $7.6 billion), which is 1.8 percent of GDP. |
Threats
| ● | The migration crisis in Europe has led to the rise of anti-European, anti-migration populist movements. The next crucial test for the EU will be the 2019 elections for the European Parliament on May 23-26. The national parliaments in EU member states have gained power in the past few years, and that shift can be reflected in the European Parliament. |
| ● | Poland is in the midst of a record rate pause, while Hungary keeps its borrowing costs near zero. The Czech Republic’s central bank raised rates five times in 2018 and Romania lifted rates, too. With the European Central Bank (ECB) having ended its bond-buying program at the end of 2018, this may persuade Eastern European central banks to soften their dovish tones. |
| ● | United Kingdom Prime Minister Theresa May triggered Article 50 of the Lisbon Treaty back in March 2017, which gives the U.K. and EU a window of two years to negotiate the terms on which |
| Emerging Europe Fund | (unaudited) |
the U.K. would exit the EU. The departure is scheduled for 11:00 p.m. on Friday, March 29, 2019. If no deal is reached, many analysts predict economic and social chaos.
The section labeled Portfolio of Investments contains a complete list of the fund’s holdings.
| Top 10 Equity Holdings (Based on Net Assets) | December 31, 2018 |
| LUKOIL PJSC | 10.42% |
| Oil Companies - Integrated | |
| Sberbank of Russia PJSC | 7.77% |
| Commercial Banks Non-US | |
| Gazprom PJSC | 5.39% |
| Oil Companies - Integrated | |
| Tatneft PJSC | 2.46% |
| Oil Companies - Integrated | |
| MOL Hungarian Oil & Gas PLC | 1.80% |
| Oil Companies - Integrated | |
| Globaltrans Investment PLC | 1.70% |
| Transportation - Rail | |
| Evraz PLC | 1.61% |
| Steel - Producers | |
| Novolipetsk Steel PJSC | 1.60% |
| Metal - Iron | |
| Magnitogorsk Iron & Steel Works PJSC | 1.56% |
| Steel - Producers | |
| Aeroflot PJSC | 1.52% |
| Airlines | |
| Total Top 10 Equity Holdings | 35.83% |
| Country Distribution* | |
| Based on Total Investments | December 31, 2018 |
| Russian Federation | 45.6% |
| Poland | 15.9% |
| Turkey | 13.1% |
| Hungary | 4.5% |
| Greece | 3.7% |
| Other | 17.2% |
| Total | 100.0% |
| * | Country distribution shown is based on domicile. The locale of company operations may be different. |
| China Region Fund | (unaudited) |
Management Team’s Perspective
Introduction
The China Region Fund (USCOX) seeks long-term growth of capital. The fund invests in both established and emerging companies registered and operating in the China region.(1)
Performance Graph
China Region Fund
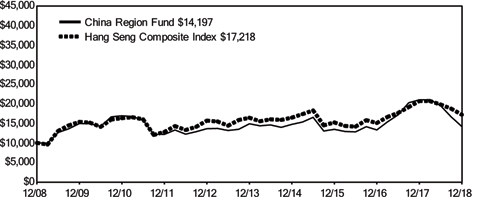
| Average Annual Performance | | For the Periods Ended December 31, 2018 |
| | One Year | Five Year | Ten Year |
| China Region Fund | (32.46)% | (0.94)% | 3.57% |
| Hang Seng Composite Index | (16.89)% | 0.93% | 5.58% |
Performance data quoted above is historical. Past performance is no guarantee of future results. Current performance may be higher or lower than the performance data quoted. The principal value and investment return of an investment will fluctuate so that an investor’s shares, when redeemed, may be worth more or less than their original cost. The graph and table do not reflect the deduction of taxes that a shareholder would pay on fund distributions or the redemption of fund shares. For all or a portion of the periods, the fund had expense limitations, without which returns would have been lower. Returns greater than one year are annualized.
Gross expense ratio as stated in the most recent prospectus is 2.52%. Pursuant to a voluntary arrangement, the Adviser has agreed to limit total fund operating expenses (exclusive of any acquired fund fees and expenses, performance fees, taxes, brokerage commissions and interest) to not exceed 2.55%. The Adviser can modify or terminate this arrangement at any time.
See Definitions for Management Teams’ Perspectives for index definitions.
Please visit our website at www.usfunds.com for updated performance information for different time periods
| (1) | The China region is defined as any country that either shares a border with China or is located in the South China Sea or the East China Sea and includes: the People’s Republic of China (PRC or China), Bangladesh, Cambodia, Hong Kong, India, Indonesia, Kazakhstan, Korea, Kyrgyzstan, Laos, Malaysia, Mongolia, Myanmar, Nepal, Pakistan, Philippines, Singapore, Taiwan, Tajikistan, Thailand and Vietnam. |
| China Region Fund | (unaudited) |
The Year in Review – Economic and Political Issues that Affected the Fund
The year 2018 saw Hong Kong’s Hang Seng Composite Index (HSCI) soar to new 52-week highs before subsequently plunging to 52-week lows as the U.S. and China engaged in a trade war. Both the HSCI and the fund fell into a technical bear market after losing more than 20 percent from their respective highs. Without doubt, this ongoing trade war remains in many ways the primary—though certainly not the only—economic and political issue affecting the fund for the year.
The lower end of China’s own gross domestic product (GDP) forecasts for calendar year 2018 were always set conservatively at 6.5 percent, though official statements even by late 2016 had indicated a realistic, if begrudging, acceptance of eventually slowing growth in the future if it advanced stability and the de-risking and deleveraging of the Chinese financial system. If slowing growth, in other words, can be stable growth, then it may be a good trade overall, policy statements seemed to indicate.
Of course, that was before the trade war. The escalation, first of heated rhetoric and then of actual tit-for-tat tariffs in 2018, introduced significant uncertainty into markets; a cycle of on-again, off-again “talks” perpetuates it. While there are some signs, more recently, of improvement—a “truce,” if you will—in the form of a mutual three-month delay in the deadlines before further escalation between the two economic juggernauts, uncertainty remains at this point. And the trade war’s impact both to date and in the future may well be further complicated by and perhaps inextricably interwoven into the aforementioned slowing Chinese growth scenario.
Indeed, after two consecutive 6.8 percent GDP growth prints in the latter half of 2017, China first matched that pace with an early 6.8 percent print in the first quarter of 2018 before subsequently slowing in the second quarter to a 6.7 percent pace, then dropping to 6.5 percent and 6.4 percent for the third and fourth quarters of 2018, respectively. China recently lowered its official 2019 GDP forecast to a range of 6.0 percent to 6.5 percent.
Both the official China PMI readings and Caixin PMI readings tell a similar tale of deterioration over the course of the year. Non-manufacturing PMI declined in the official readings from 55.3 in January of 2018 to 53.8 by the year’s end. These narratives are matched almost exactly in the Caixin readings. Again, in the manufacturing PMI, we started the year off at 51.5 and declined to contractionary levels of 49.7. On the Caixin Services PMI side of things (the steadiest of the four readings, and equivalent roughly to the official “non-manufacturing” readings but more export- and smaller business-oriented), we saw a rock-solid January 2018 print of 54.7, but that number dipped as low as 50.8 over the course of the year with upticks late in 2018 to finish at 53.9.
The shifting economic sands and ensuing turmoil in markets brought changing market leadership and a different investment climate, one that weighed particularly acutely on some areas of the market—from Macau casinos, for example, to some of the industrials, automakers and technology names. From an even broader standpoint, emerging markets in general suffered over the course of the year, with foreign exchange playing a major role. The various currencies and equity indices of the “China region” remain in many ways still subject to heavily-outsized influence of the U.S. dollar, and thus, by extension, the Federal Reserve’s interest rate policy. In particular, those nations, such as the Philippines and Indonesia that retain relatively high levels of dollar-denominated debt, essentially imported inflation over the course of the year, which weakened the respective currencies and required reactionary hikes and policy adjustments while weighing on sentiment. Consumer price index (CPI) readings in the Philippines, for example, climbed progressively throughout the year before finally topping out at a couple of 6.7 percent prints, and subsequently slowing to 5.1 percent at the close of the year.
Wild swings in energy markets over the course of the year added to the choppiness of markets. For example, after rising more than 40 percent from lows in February 2018, Brent crude subsequently soared to more than $86 a barrel, only to decline by more than 40 percent in the fourth quarter alone. Oil dropped to a new 52-week low of just under $50 and finally closed the year in the low $50s.
In a different sort of wild swing, Southeast Asia’s only major oil-exporting country, Malaysia, ended the ruling party’s 61-year tenure in a dramatic, unexpected electoral victory of 92-year-old Mahathir Mohamad, who led a four-party opposition coalition to victory, unseating then-Prime Minister Najib Razak—Mohamad’s own former protégé—in the process. The new regime is facing questions about fiscal sustainability and stability, given an ambitious spending agenda and swings in energy prices and the
| China Region Fund | (unaudited) |
tax base. This is all happening while Malaysia’s leaders continue to deal with and attempt to quantify the fallout from the now-well-publicized 1Malaysia Development Berhad scandal involving American investment bank Goldman Sachs.
Of notable mention are the developments in negotiations and talks with North Korea. The historic “Singapore Summit” on Sentosa Island, between U.S. President Donald Trump and North Korea’s leader Kim Jong Un, indeed received much and worthy attention, and led to a marked uptick in sentiment and expectations toward U.S.-North Korean relations, and thus, in some ways, toward Inter-Korean relations. There is increasingly a real possibility of some sort of peace agreement or progress toward one. Thus far, concrete progress seems to be lacking, but given the admittedly egotistical primary parties involved in the summit and the often-slow-moving nature of such negotiations and ongoing diplomatic talks, perhaps for a long while the entire affair may come to consist of not much more than a series of regular and much-ballyhooed photo-ops. Time will tell, but one certainly hopes for real, enduring, peaceful and productive resolution to this thorny geopolitical issue. China, of course, stays quite abreast and informed of the situation regarding North Korea, and indeed, Mr. Kim has made regular state visits to Beijing as part of his increasingly busy social schedule.
Finally, one should note that the listing changes and revisions this year adopted by Hong Kong’s stock exchange allowed it to score major technology initial public offerings (IPOs) for its attractive, liquid and internationalized venue. To be sure, this was not Chinese technology’s best year, for reasons that are quite obvious at this point, but the moves made by the exchange remain notable nonetheless, not only for the sheer, globally-dominant size of the IPOs on the year but also for the future and opportunity the various listings represent.
Investment Highlights
Overview
For the year ended December 31, 2018, the China Region Fund (USCOX) declined 32.46 percent, underperforming its benchmark, the Hang Seng Composite Index (HSCI), which declined 16.89 percent in total return.
Because the fund is actively managed and holding period is not always a consideration in investment decisions, the portfolio turnover rate may fluctuate from year to year as the fund adjusts its portfolio composition. The fund’s annual portfolio turnover for the year ending December 31, 2018 was more than 100 percent, and turnover may remain above 100 percent in the future.
Strengths
| ● | Within the broader “China region,” diversifying but regrettably smaller allocations and investments in Malaysia and Singapore proved to be the top selections over the course of the year. |
| ● | Selection within the energy sector was a relative boost to the fund in 2018, while allocations to properties and construction, as well as higher cash levels, also helped fund performance. |
| ● | Jiayuan International Group, United Energy Group and China Petroleum and Chemical Corp. finished as the year’s top three overall single stock contributors for the fund in 2018, rising 103.53 percent, 127.62 percent and 5.18 percent respectively. |
Weaknesses
| ● | The largest detractor among regional allocations came in the form of the fund’s benchmark-domicile of Hong Kong, where stock selection for the year was relatively poor versus the Hang Seng Composite Index, complicated by the vagaries and uncertainty introduced by the trade war even as Chinese growth slowed and the region declined into various bear markets. |
| ● | Selection within consumer goods weighed on the fund’s 2018 performance; allocations to technology did the same. |
| China Region Fund | (unaudited) |
| ● | Geely Automobile Holdings, Tencent Holdings and Country Garden Holdings closed out the year as the largest single stock detractors from the fund’s performance, as the names fell, respectively, 48.45 percent, 22.49 percent and 30.10 percent. |
Current Outlook
Opportunities
| ● | Any real or perceived cessation in U.S.-China trade war “hostilities” could boost expectations for the region. The current truce, while perhaps a short-term positive simply in that it is not negative and thereby leaves open the possibility of a resolution or potential “deal,” nonetheless retains several degrees of uncertainty. But if resolved in a relatively clean fashion, the U.S.-China spat could unleash optimism and change sentiment dramatically. |
| ● | To reiterate a point made above in the commentary, China’s gradual opening and internationalization of financial markets remains a big deal—one to be considered and measured in years rather than days, weeks or even months, a view clearly supported by the fact that the government sees fit to proceed apace in a fashion entirely separate from the outcome of the U.S.-China trade spat. |
| ● | The relatively pervasive negative sentiment toward China and around the region amid dollar strength may well have brought emerging markets—and even some developed markets—to enticing and attractive valuation levels that may pique the interest of value-oriented investors and those with longer-term time horizons who remain content to ride out some of the tweet-heavy headlines of the present for a bet on the future. There is no doubt that on a relative valuation level, emerging markets are cheap compared to developed markets. Indeed, even the venerable blue-chip Hang Seng Index of Hong Kong, for example, stands at a price-to-earnings (P/E) ratio of 10.30. Compare this, for example, to the S&P 500 Index, which is running a P/E of around 18. |
Threats
| ● | Perhaps obvious, but any escalation—real or perceived—in the trade war between the U.S. and China could have significant and negative effects upon the region’s outlook. While it is indeed positive we are currently in some sort of “truce,” what has already been explained above is here reiterated: There are obvious possible downsides to a trade war, one of which is continued uncertainty. |
| ● | As the Fed struck a moderately less hawkish tone and seemed to indicate a willingness to pause, emerging markets rejoiced, but this should in some ways underscore global dependency and the outsized role of U.S. policy rather than diminish one’s thoughts about it. After a busy year of central bank headlines from the Fed to Jakarta to Manila, remember that central bank policies and the specter of potential missteps (real or perceived) will continue to loom large in 2019. |
| ● | China recently lowered its 2019 GDP forecast to a range of 6.0 percent and 6.5 percent at the start of 2019. One downside to slowing growth is that the state may favor or stimulate some sectors or industries at the expense of others as it continues to shift toward an increasingly services-oriented economy and away from heavy manufacturing and industry. And depending on the outcome of the U.S.-China trade negotiations, the thorny issue of Chinese President Xi Jinping’s “Made in China 2025” initiative could be tweaked, opposed, ramped down, slowed down or, possibly, tank the negotiations altogether as the U.S. continues to stress strong intellectual property rights and oppose forced technology transfers. While monitoring the headlines and details of the ongoing trade war, pay particular attention to the issue of “Made in China 2025.” It already appears China may be willing to walk back in some degree on the issue. |
| China Region Fund | (unaudited) |
The section labeled Portfolio of Investments contains a complete list of the fund’s holdings.
| Top 10 Equity Holdings (Based on Net Assets) | December 31, 2018 |
| Ping An Insurance Group Co. of China, Ltd. | 5.26% |
| Multi-line Insurance | |
| Sinotruk Hong Kong, Ltd. | 4.72% |
| Automotive - Medium & Heavy Duty Trucks | |
| CNOOC, Ltd. | 4.48% |
| Oil Companies - Exploration & Production | |
| PetroChina Co., Ltd. | 4.41% |
| Oil Companies - Integrated | |
| Maanshan Iron & Steel Co., Ltd. | 4.16% |
| Steel - Producers | |
| Country Garden Holdings Co., Ltd. | 4.04% |
| Real Estate Operating/Development | |
| CITIC Telecom International Holdings, Ltd. | 3.89% |
| Telecom Services | |
| Kunlun Energy Co., Ltd. | 3.69% |
| Oil Companies - Exploration & Production | |
| Zijin Mining Group Co., Ltd. | 3.48% |
| Gold Mining | |
| Yihai International Holding, Ltd. | 3.32% |
| Food - Miscellaneous/Diversified | |
| Total Top 10 Equity Holdings | 41.45% |
| Country Distribution* | |
| Based on Total Investments | December 31, 2018 |
| China | 64.9% |
| Hong Kong | 16.3% |
| Republic of Korea | 5.6% |
| United States | 3.1% |
| Other | 10.1% |
| Total | 100.0% |
| * | Country distribution shown is based on domicile and not intended to conform to the China region definition in the prospectus. The locale of company operations may be different. |
U.S. Government Securities Ultra-Short Bond Fund
| Portfolio of Investments | December 31, 2018 |
| United States Government and Agency | | Coupon | | | Maturity | | | Principal | | | | |
| Obligations 90.87% | | Rate % | | | Date | | | Amount | | | Value | |
| Federal Farm Credit Bank 68.74% | | | | | | | | | | | | |
| Fixed Rates: | | | | | | | | | | | | | | | |
| | | | 1.11 | | | 02/19/19 | | | $ | 1,000,000 | | | $ | 998,581 | |
| Floating Rates: | | | | | | | | | | | | | | | |
| (Federal Reserve Bank Effective Rate + 0.12%) | | | 2.52 | | | 02/18/20 | | | | 3,000,000 | | | | 3,000,319 | |
| (Federal Reserve Bank Prime Loan + (3.08)%) | | | 2.42 | | | 03/11/19 | | | | 7,000,000 | | | | 6,999,452 | |
| (Federal Reserve Bank Prime Loan + (2.98)%) | | | 2.52 | | | 02/20/20 | | | | 2,500,000 | | | | 2,499,419 | |
| (Federal Reserve Bank Prime Loan + (2.96)%) | | | 2.54 | | | 07/09/20 | | | | 5,000,000 | | | | 4,996,973 | |
| (U.S. Treasury 3 Month Bill Money Market Yield + 0.15%) | | | 2.63 | | | 04/12/19 | | | | 3,000,000 | | | | 3,001,406 | |
| (U.S. Treasury 3 Month Bill Money Market Yield + 0.09%) | | | 2.57 | | | 06/19/19 | | | | 8,000,000 | | | | 8,004,773 | |
| (USD 1 Month LIBOR + 0.05%) | | | 2.53 | | | 02/21/20 | | | | 3,000,000 | | | | 3,001,343 | |
| | | | | | | | | | | | | | | 32,502,266 | |
| Federal Home Loan Bank 22.13% | | | | | | | | | | | | | | | |
| Fixed Rates: | | | | | | | | | | | | | | | |
| | | | 1.50 | | | 03/08/19 | | | | 4,000,000 | | | | 3,992,692 | |
| | | | 1.50 | | | 04/26/19 | | | | 5,500,000 | | | | 5,481,432 | |
| | | | 1.20 | | | 05/23/19 | | | | 1,000,000 | | | | 994,460 | |
| | | | | | | | | | | | | | | 10,468,584 | |
| Investments, at value 90.87% | | | | | | | | | | | | | | 42,970,850 | |
| (cost $42,990,995) | | | | | | | | | | | | | | | |
| Other assets and liabilities, net 9.13% | | | | | | | | | | | | | | 4,319,567 | |
| Net Assets 100.00% | | | | | | | | | | | | | $ | 47,290,417 | |
See notes to portfolios of investments and notes to financial statements.
Near-Term Tax Free Fund
| Portfolio of Investments | December 31, 2018 |
| Municipal Bonds 92.90% | | Coupon Rate % | | | Maturity Date | | Principal Amount | | | Value | |
| | | | | | | | | | | | |
| Alabama 0.20% | | | | | | | | | | | |
| City of Bessemer Electric Revenue, Alabama, Refunding, RB AGM | | | 3.10 | | | 12/01/21 | | $ | 100,000 | | | $ | 101,561 | |
| | | | | | | | | | | | | | | |
| Arizona 0.44% | | | | | | | | | | | | | | |
| City of Tempe, Arizona, GO Unlimited, Series A | | | 2.00 | | | 07/01/19 | | | 220,000 | | | | 220,279 | |
| | | | | | | | | | | | | | | |
| Arkansas 2.40% | | | | | | | | | | | | | | |
| Atkins School District No. 18, Arkansas, Refunding, GO Limited | | | 1.00 | | | 02/01/19 | | | 420,000 | | | | 419,610 | |
| Cave City School District No. 2-A, Arkansas, Refunding, GO Limited | | | 1.00 | | | 02/01/19 | | | 260,000 | | | | 259,693 | |
| City of Hot Springs Wastewater Revenue, Arkansas, RB | | | 4.00 | | | 12/01/19 | | | 510,000 | | | | 519,435 | |
| | | | | | | | | | | | | | 1,198,738 | |
| | | | | | | | | | | | | | | |
| California 0.65% | | | | | | | | | | | | | | |
| Newman-Crows Landing Unified School District, California, Refunding, GO Unlimited AGM | | | 4.00 | | | 08/01/19 | | | 115,000 | | | | 116,547 | |
| Riverside County Redevelopment Successor Agency, California, Refunding, Tax Allocation Bond | | | 5.00 | | | 10/01/19 | | | 200,000 | | | | 204,796 | |
| State of California, California, GO Unlimited | | | 5.00 | | | 12/01/19 | | | 5,000 | | | | 5,014 | |
| | | | | | | | | | | | | | 326,357 | |
| Colorado 2.38% | | | | | | | | | | | | | | |
| City & County of Denver Airport System Revenue, Colorado, RB, Series B | | | 5.00 | | | 11/15/27 | | | 300,000 | | | | 330,498 | |
| City of Glendale, Colorado, Refunding, COP AGM | | | 5.00 | | | 12/01/25 | | | 750,000 | | | | 858,315 | |
| | | | | | | | | | | | | | 1,188,813 | |
| | | | | | | | | | | | | | | |
| Florida 9.33% | | | | | | | | | | | | | | |
| City of Jacksonville, Florida, Refunding, RB, Series C | | | 5.00 | | | 10/01/20 | | | 270,000 | | | | 283,430 | |
| City of Leesburg, Florida, Refunding, RB | | | 5.00 | | | 10/01/21 | | | 405,000 | | | | 435,812 | |
| City of Margate Water & Sewer Revenue, Florida, Refunding, RB AGM | | | 4.00 | | | 10/01/19 | | | 250,000 | | | | 253,783 | |
| City of Miramar, Florida, Refunding, RB | | | 5.00 | | | 10/01/22 | | | 305,000 | | | | 337,263 | |
| County of St. Johns, Florida, Refunding, RB AGM | | | 5.00 | | | 10/01/20 | | | 310,000 | | | | 326,787 | |
| Escambia County Health Facilities Authority, Baptist Hospital, Inc. Project, Florida, RB, Series A | | | 5.00 | | | 08/15/19 | | | 290,000 | | | | 295,353 | |
| Florida Department of Management Services, Florida, Refunding, COP, Series A | | | 5.00 | | | 08/01/19 | | | 500,000 | | | | 509,090 | |
See notes to portfolios of investments and notes to financial statements.
Near-Term Tax Free Fund
| Portfolio of Investments | December 31, 2018 |
| Municipal Bonds (cont’d) | | Coupon Rate % | | | Maturity Date | | Principal Amount | | | Value | |
| | | | | | | | | | | | |
| Florida (cont’d) | | | | | | | | | | | | | | |
| Florida Department of Management Services, Florida, COP, Series A | | | 5.00 | | | 08/01/24 | | $ | 340,000 | | | $ | 343,777 | |
| Orlando Utilities Commission, Florida, RB ‡ | | | 1.72 | | | 10/01/33 | | | 870,000 | | | | 870,000 | |
| Pinellas County Health Facilities Authority, Florida, RB ‡ | | | 1.71 | | | 11/01/38 | | | 1,000,000 | | | | 1,000,000 | |
| | | | | | | | | | | | | | 4,655,295 | |
| Georgia 0.60% | | | | | | | | | | | | | | |
| Cobb County Hospital Authority, Georgia, RB ‡ | | | 1.71 | | | 04/01/36 | | | 300,000 | | | | 300,000 | |
| | | | | | | | | | | | | | | |
| Idaho 0.48% | | | | | | | | | | | | | | |
| Idaho Housing & Finance Association, Grant & Revenue Anticipation, Federal Highway Trust Fund, Idaho, RB, Series A | | | 5.00 | | | 07/15/21 | | | 225,000 | | | | 241,533 | |
| | | | | | | | | | | | | | | |
| Illinois 4.87% | | | | | | | | | | | | | | |
| Chicago Board of Education, Illinois, GO Unlimited, Series A NATL | | | 5.25 | | | 12/01/19 | | | 300,000 | | | | 306,285 | |
| Clinton Bond Fayette Etc Counties Community College District No. 501 Kaskaskia, Illinois, Refunding, GO Unlimited | | | 5.75 | | | 12/01/19 | | | 500,000 | | | | 516,190 | |
| County of Du Page, Jail Project, Illinois, Refunding, GO Unlimited | | | 5.60 | | | 01/01/21 | | | 210,000 | | | | 217,978 | |
| Du Page County School District No. 33 West Chicago, Illinois, Refunding, GO Unlimited, Series B | | | 4.00 | | | 12/01/21 | | | 1,000,000 | | | | 1,051,630 | |
| Regional Transportation Authority, Illinois, RB, Series A, AMBAC | | | 7.20 | | | 11/01/20 | | | 65,000 | | | | 69,423 | |
| Village of Fox Lake, Debt Certificates, Illinois, RB, Series B | | | 3.00 | | | 11/01/19 | | | 265,000 | | | | 267,292 | |
| | | | | | | | | | | | | | 2,428,798 | |
| | | | | | | | | | | | | | | |
| Indiana 1.29% | | | | | | | | | | | | | | |
| Clark-Pleasant School Building Corp., Indiana, Refunding, RB | | | 5.00 | | | 01/15/19 | | | 275,000 | | | | 275,291 | |
| Merrillville Redevelopment Authority, Indiana, Tax Allocation Bond | | | 5.00 | | | 08/15/20 | | | 350,000 | | | | 366,387 | |
| | | | | | | | | | | | | | 641,678 | |
| Iowa 1.28% | | | | | | | | | | | | | | |
| City of Clive, Iowa, Refunding, GO Unlimited, Series A | | | 2.00 | | | 06/01/19 | | | 235,000 | | | | 235,266 | |
| Iowa State Board of Regents, University of Iowa Hospitals and Clinics, Iowa, Refunding, RB, Series A | | | 3.00 | | | 09/01/19 | | | 400,000 | | | | 402,896 | |
| | | | | | | | | | | | | | 638,162 | |
See notes to portfolios of investments and notes to financial statements.
Near-Term Tax Free Fund
| Portfolio of Investments | December 31, 2018 |
| Municipal Bonds (cont’d) | | Coupon Rate % | | | Maturity Date | | Principal Amount | | | Value | |
| | | | | | | | | | | | |
| Kentucky 1.09% | | | | | | | | | | | |
| Louisville & Jefferson County Metropolitan Sewer District, Kentucky, RB, Series A | | | 5.00 | | | 05/15/23 | | $ | 500,000 | | | $ | 542,890 | |
| | | | | | | | | | | | | | | |
| Louisiana 1.77% | | | | | | | | | | | | | | |
| State of Louisiana, Louisiana, Prefunding, GO Unlimited, Series A | | | 5.00 | | | 08/01/26 | | | 800,000 | | | | 885,960 | |
| | | | | | | | | | | | | | | |
| Massachusetts 0.60% | | | | | | | | | | | | | | |
| Massachusetts Transportation Trust Fund Metropolitan Highway System Revenue, Massachusetts, RB ‡ | | | 1.69 | | | 01/01/37 | | | 300,000 | | | | 300,000 | |
| | | | | | | | | | | | | | | |
| Michigan 2.54% | | | | | | | | | | | | | | |
| City of Wyoming, Water Supply System, Michigan, Refunding, RB | | | 4.00 | | | 06/01/20 | | | 215,000 | | | | 221,528 | |
| Michigan Public Power Agency, AFEC Project, Michigan, RB, Series A | | | 4.50 | | | 01/01/19 | | | 280,000 | | | | 280,000 | |
| Oxford Area Community School District, Michigan, Refunding, GO Unlimited, Series A Q-SBLF | | | 5.00 | | | 05/01/22 | | | 365,000 | | | | 400,693 | |
| State of Michigan Trunk Line Revenue, Michigan, Refunding, RB | | | 4.50 | | | 11/01/26 | | | 105,000 | | | | 107,316 | |
| Wayne County Airport Authority, Detroit Metropolitan Airport, Michigan, Refunding, RB, Series C | | | 4.00 | | | 12/01/19 | | | 255,000 | | | | 260,067 | |
| | | | | | | | | | | | | | 1,269,604 | |
| | | | | | | | | | | | | | | |
| Minnesota 0.59% | | | | | | | | | | | | | | |
| City of Minneapolis MN/St Paul Housing & Redevelopment Authority, Minnesota, RB AGM ‡ | | | 1.62 | | | 08/15/25 | | | 295,000 | | | | 295,000 | |
| | | | | | | | | | | | | | | |
| Missouri 2.89% | | | | | | | | | | | | | | |
| City of Kansas City, Missouri, Refunding, RB, Series B | | | 5.00 | | | 08/01/19 | | | 650,000 | | | | 661,628 | |
| City of Kansas City Water Revenue, Missouri, RB, Series F AGM | | | 4.00 | | | 12/01/22 | | | 250,000 | | | | 268,815 | |
| Missouri State Regional Convention & Sports Complex Authority, Missouri, Refunding, RB, Series A | | | 5.00 | | | 08/15/19 | | | 500,000 | | | | 509,945 | |
| | | | | | | | | | | | | | 1,440,388 | |
| | | | | | | | | | | | | | | |
| Nevada 0.64% | | | | | | | | | | | | | | |
| Las Vegas Valley Water District, Nevada, Refunding, GO Limited, Series D | | | 5.00 | | | 06/01/27 | | | 315,000 | | | | 319,155 | |
See notes to portfolios of investments and notes to financial statements.
Near-Term Tax Free Fund
| Portfolio of Investments | December 31, 2018 |
| Municipal Bonds (cont’d) | | Coupon Rate % | | | Maturity Date | | Principal Amount | | | Value | |
| | | | | | | | | | | | |
| New Jersey 1.00% | | | | | | | | | | | | | | |
| Middlesex County Improvement Authority, New Jersey, RB | | | 5.00 | | | 07/01/25 | | $ | 425,000 | | | $ | 499,180 | |
| | | | | | | | | | | | | | | |
| New York 11.87% | | | | | | | | | | | | | | |
| City of New York, New York, GO Unlimited ‡ | | | 1.73 | | | 08/01/44 | | | 1,000,000 | | | | 1,000,000 | |
| City of New York, New York, GO Unlimited, Series B | | | 5.00 | | | 08/01/19 | | | 400,000 | | | | 407,504 | |
| City of New York, New York, GO Unlimited, Series E | | | 5.25 | | | 08/01/22 | | | 875,000 | | | | 974,951 | |
| City of New York, New York, GO Unlimited, Series I | | | 5.00 | | | 08/01/22 | | | 1,000,000 | | | | 1,105,620 | |
| Long Island Power Authority, New York, RB, Series B | | | 5.00 | | | 09/01/21 | | | 465,000 | | | | 502,349 | |
| Nassau County Industrial Development Agency, New York Institute of Technology Project, New York, Refunding, RB, Series A | | | 5.00 | | | 03/01/21 | | | 350,000 | | | | 362,516 | |
| New York City Water & Sewer System, New York, RB ‡ | | | 1.71 | | | 06/15/38 | | | 200,000 | | | | 200,000 | |
| New York State Housing Finance Agency, New York, RB ‡ | | | 1.70 | | | 05/15/37 | | | 500,000 | | | | 500,000 | |
| New York State Urban Development Corp., New York, RB, Series A-2 NATL | | | 5.50 | | | 03/15/19 | | | 615,000 | | | | 619,772 | |
| New York State Urban Development Corp., New York, Refunding, RB, Series D | | | 5.50 | | | 01/01/19 | | | 250,000 | | | | 250,000 | |
| | | | | | | | | | | | | | 5,922,712 | |
| | | | | | | | | | | | | | | |
| North Carolina 2.54% | | | | | | | | | | | | | | |
| City of Charlotte, Equipment Acquisition & Public Facilities, North Carolina, COP, Series A | | | 5.00 | | | 10/01/21 | | | 1,000,000 | | | | 1,054,330 | |
| County of Beaufort, North Carolina, RB | | | 5.00 | | | 06/01/21 | | | 200,000 | | | | 213,954 | |
| | | | | | | | | | | | | | 1,268,284 | |
| Ohio 0.29% | | | | | | | | | | | | | | |
| City of Cleveland Parking Facility Revenue, Ohio, Refunding, RB AGM | | | 5.25 | | | 09/15/22 | | | 130,000 | | | | 145,090 | |
| | | | | | | | | | | | | | | |
| Oregon 0.41% | | | | | | | | | | | | | | |
| Oregon State Facilities Authority, Legacy Health Project, Oregon, Refunding, RB, Series A | | | 4.50 | | | 05/01/20 | | | 200,000 | | | | 206,702 | |
See notes to portfolios of investments and notes to financial statements.
Near-Term Tax Free Fund
| Portfolio of Investments | December 31, 2018 |
| Municipal Bonds (cont’d) | | Coupon Rate % | | | Maturity Date | | Principal Amount | | | Value | |
| | | | | | | | | | | | |
| Pennsylvania 2.81% | | | | | | | | | | | |
| Allegheny County Sanitary Authority, Pennsylvania, Refunding, RB AGM | | | 5.00 | | | 06/01/19 | | $ | 700,000 | | | $ | 708,974 | |
| Reading School District, Pennsylvania, GO Unlimited, Series A | | | 5.00 | | | 04/01/20 | | | 400,000 | | | | 413,112 | |
| Wilkes-Barre Finance Authority, University of Scranton, Pennsylvania, Refunding, RB, Series A | | | 5.00 | | | 11/01/19 | | | 275,000 | | | | 282,054 | |
| | | | | | | | | | | | | | 1,404,140 | |
| Rhode Island 2.40% | | | | | | | | | | | | | | |
| Rhode Island Housing & Mortgage Finance Corp., Rhode Island, RB ‡ | | | 1.78 | | | 04/01/39 | | | 1,200,000 | | | | 1,200,000 | |
| | | | | | | | | | | | | | | |
| South Carolina 2.98% | | | | | | | | | | | | | | |
| City of Columbia SC Waterworks & Sewer System Revenue, South Carolina, RB ‡ | | | 1.71 | | | 02/01/38 | | | 100,000 | | | | 100,000 | |
| City of North Charleston, South Carolina, Tax Allocation Bond ‡ | | | 1.70 | | | 09/01/37 | | | 480,000 | | | | 480,000 | |
| Spartanburg Regional Health Services District, South Carolina, Refunding, RB, Series A | | | 5.00 | | | 04/15/19 | | | 600,000 | | | | 605,154 | |
| Spartanburg Sanitation Sewer District, South Carolina, RB, Series A AGC | | | 3.50 | | | 03/01/19 | | | 300,000 | | | | 300,798 | |
| | | | | | | | | | | | | | 1,485,952 | |
| | | | | | | | | | | | | | | |
| Tennessee 1.12% | | | | | | | | | | | | | | |
| City of Memphis Sanitary Sewerage System Revenue, Tennessee, Refunding, RB AGM | | | 5.00 | | | 05/01/20 | | | 200,000 | | | | 208,436 | |
| The Public Building Authority of Sevier County TN, Tennessee, RB ‡ | | | 1.73 | | | 06/01/32 | | | 350,000 | | | | 350,000 | |
| | | | | | | | | | | | | | 558,436 | |
| | | | | | | | | | | | | | | |
| Texas 26.11% | | | | | | | | | | | | | | |
| Bryan Independent School District, Texas, GO Unlimited, Series A PSF-GTD | | | 5.00 | | | 02/15/22 | | | 410,000 | | | | 447,888 | |
| City of Arlington, Certificates of Obligation, Texas, GO Limited, Series B | | | 2.00 | | | 08/15/19 | | | 500,000 | | | | 500,790 | |
| City of Austin, Texas, Refunding, RB ‡ | | | 1.71 | | | 11/15/29 | | | 900,000 | | | | 900,000 | |
| City of Cedar Hill, Texas, Refunding, GO Limited | | | 5.00 | | | 02/15/22 | | | 800,000 | | | | 871,640 | |
| City of Center, Certificates of Obligation, Texas, GO Limited AGM ◊ | | | 3.07 | | | 02/15/20 | | | 150,000 | | | | 146,605 | |
| City of Fort Worth Water & Sewer System Revenue, Texas, Refunding, RB | | | 5.00 | | | 02/15/19 | | | 800,000 | | | | 803,120 | |
| City of Longview Waterworks & Sewer System Revenue, Texas, Refunding, RB | | | 3.00 | | | 03/01/22 | | | 610,000 | | | | 626,318 | |
See notes to portfolios of investments and notes to financial statements.
Near-Term Tax Free Fund
| Portfolio of Investments | December 31, 2018 |
| Municipal Bonds (cont’d) | | Coupon Rate % | | | Maturity Date | | Principal Amount | | | Value | |
| | | | | | | | | | | | |
| Texas (cont’d) | | | | | | | | | | | | | | |
| City of Pharr, Texas, Refunding, GO Limited, Series A | | | 5.00 | | | 08/15/20 | | $ | 285,000 | | | $ | 298,902 | |
| City of Plano, Texas, Refunding, GO Limited | | | 5.00 | | | 09/01/19 | | | 1,000,000 | | | | 1,021,710 | |
| City of Round Rock, Texas, Refunding, GO Limited | | | 2.00 | | | 08/15/19 | | | 465,000 | | | | 465,479 | |
| City of Texarkana Waterworks & Sanitary Sewer System Revenue, Texas, RB | | | 3.00 | | | 08/01/19 | | | 90,000 | | | | 90,581 | |
| City of Texarkana Waterworks & Sanitary Sewer System Revenue, Texas, RB | | | 3.00 | | | 08/01/20 | | | 95,000 | | | | 96,587 | |
| Clear Lake City Water Authority, Waterworks & Sewer System, Texas, GO Unlimited | | | 3.00 | | | 03/01/19 | | | 125,000 | | | | 125,264 | |
| Corpus Christi Business & Job Development Corp., Seawall Project, Texas, Refunding, RB | | | 5.00 | | | 03/01/20 | | | 350,000 | | | | 362,435 | |
| Dimmitt Independent School District, Texas, GO Unlimited PSF-GTD | | | 3.00 | | | 02/15/22 | | | 305,000 | | | | 313,143 | |
| Harris County Municipal Utility District No. 382, Texas, Refunding, GO Unlimited BAM | | | 3.00 | | | 04/01/22 | | | 305,000 | | | | 308,572 | |
| Lower Colorado River Authority, LCRA Transmission Services Corp., Texas, Refunding, RB, Series A | | | 5.00 | | | 05/15/21 | | | 500,000 | | | | 534,975 | |
| Lubbock-Cooper Independent School District, Texas, GO Unlimited PSF-GTD | | | 3.00 | | | 02/15/22 | | | 755,000 | | | | 779,545 | |
| Olmos Park Higher Education Facilities Corp., University of the Incarnate Word, Texas, Refunding, RB | | | 5.00 | | | 12/01/21 | | | 500,000 | | | | 538,525 | |
| Red River Education Finance Corp., Texas, RB ‡ | | | 1.70 | | | 03/15/35 | | | 700,000 | | | | 700,000 | |
| San Antonio Water System, Texas, Refunding, RB | | | 4.50 | | | 05/15/21 | | | 400,000 | | | | 423,948 | |
| State of Texas, Texas, Refunding, GO Unlimited | | | 5.00 | | | 10/01/20 | | | 550,000 | | | | 579,980 | |
| Texas State Public Finance Authority Charter School Finance Corp., Texas, Prefunding, RB, Series A | | | 6.20 | | | 02/15/40 | | | 2,000,000 | | | | 2,094,760 | |
| | | | | | | | | | | | | | 13,030,767 | |
| Utah 1.09% | | | | | | | | | | | | | | |
| County of Davis, Utah, Refunding, GO Unlimited | | | 5.00 | | | 02/01/19 | | | 200,000 | | | | 200,510 | |
| Utah State Building Ownership Authority, State Facilities Master Lease Program, Utah, Refunding, RB, Series C AGM | | | 5.50 | | | 05/15/19 | | | 35,000 | | | | 35,483 | |
| Washington County-St George Interlocal Agency, Utah, Refunding, RB, Series A | | | 4.00 | | | 12/01/19 | | | 300,000 | | | | 305,688 | |
| | | | | | | | | | | | | | 541,681 | |
See notes to portfolios of investments and notes to financial statements.
Near-Term Tax Free Fund
| Portfolio of Investments | December 31, 2018 |
| Municipal Bonds (cont’d) | | Coupon Rate % | | | Maturity Date | | Principal Amount | | | Value | |
| | | | | | | | | | | | |
| Washington 6.24% | | | | | | | | | | | |
| County of Thurston, Washington, Refunding, GO Limited | | | 5.00 | | | 12/01/20 | | $ | 1,625,000 | | | $ | 1,722,549 | |
| Spokane Public Facilities District, Washington, Refunding, RB, Series B | | | 5.00 | | | 12/01/21 | | | 950,000 | | | | 1,029,629 | |
| Tacoma Metropolitan Park District, Washington, Refunding, GO Unlimited, Series B | | | 4.00 | | | 12/01/19 | | | 355,000 | | | | 362,217 | |
| | | | | | | | | | | | | | 3,114,395 | |
| Investments, at value 92.90% | | | | | | | | | | | | | 46,371,550 | |
| (cost $46,563,678) | | | | | | | | | | | | | | |
| Other assets and liabilities, net 7.10% | | | | | | | | | | | | | 3,542,065 | |
| Net Assets 100.00% | | | | | | | | | | | | $ | 49,913,615 | |
See notes to portfolios of investments and notes to financial statements.
| All American Equity Fund | |
| Portfolio of Investments | December 31, 2018 |
| Common Stocks 86.83% | | Shares | | Value |
| | | | | |
| Airlines 5.18% | | | | | | | | |
| Delta Air Lines, Inc. | | | 7,608 | | | $ | 379,639 | |
| Southwest Airlines Co. | | | 7,021 | | | | 326,336 | |
| | | | | | | | 705,975 | |
| | | | | | | | | |
| Beverages - Wine/Spirits 3.18% | | | | | | | | |
| Constellation Brands, Inc., Class A | | | 2,695 | | | | 433,410 | |
| | | | | | | | | |
| Commercial Banks 2.80% | | | | | | | | |
| Zions Bancorp. | | | 9,381 | | | | 382,182 | |
| | | | | | | | | |
| Computer Services 3.47% | | | | | | | | |
| Cognizant Technology Solutions Corp., Class A | | | 7,463 | | | | 473,751 | |
| | | | | | | | | |
| Computers 2.17% | | | | | | | | |
| Hewlett Packard Enterprise Co. | | | 22,375 | | | | 295,574 | |
| | | | | | | | | |
| Computers - Memory Devices 1.95% | | | | | | | | |
| NetApp, Inc. | | | 4,451 | | | | 265,591 | |
| | | | | | | | | |
| Diversified Banking Institution 4.71% | | | | | | | | |
| Bank of America Corp. | | | 16,814 | | | | 414,297 | |
| Citigroup, Inc. | | | 4,375 | | | | 227,763 | |
| | | | | | | | 642,060 | |
| Electric - Integrated 5.19% | | | | |
| CMS Energy Corp. | | | 14,248 | | | | 707,413 | |
| | | | | | | | | |
| Electronic Components - Semiconductors 2.50% | | | | | | | | |
| Broadcom, Inc. | | | 1,341 | | | | 340,990 | |
| | | | | | | | | |
| Finance - Credit Card 3.70% | | | | | | | | |
| Visa, Inc., Class A | | | 3,828 | | | | 505,066 | |
| | | | | | | | | |
| Food - Meat Products 3.38% | | | | | | | | |
| Tyson Foods, Inc., Class A | | | 8,627 | | | | 460,682 | |
| | | | | | | | | |
| Food - Miscellaneous/Diversified 4.00% | | | | | | | | |
| Mondelez International, Inc., Class A | | | 13,618 | | | | 545,129 | |
| | | | | | | | | |
| Investment Management/Advisory Services 2.52% | | | | | | | | |
| Affiliated Managers Group, Inc. | | | 3,528 | | | | 343,768 | |
| | | | | | | | | |
| Medical - Biomedical/Genetics 3.72% | | | | | | | | |
| Amgen, Inc. | | | 2,604 | | | | 506,921 | |
| See notes to portfolios of investments and notes to financial statements. | |
| All American Equity Fund | |
| Portfolio of Investments | December 31, 2018 |
| Common Stocks (cont’d) | | Shares | | Value |
| | | | | |
| Medical - Drugs 5.04% | | | | | | | | |
| AbbVie, Inc. | | | 1,963 | | | $ | 180,969 | |
| Zoetis, Inc. | | | 5,919 | | | | 506,311 | |
| | | | | | | | 687,280 | |
| | | | | | | | | |
| Medical Products 3.59% | | | | | | | | |
| Baxter International, Inc. | | | 7,444 | | | | 489,964 | |
| | | | | | | | | |
| Office Supplies & Forms 2.98% | | | | | | | | |
| Avery Dennison Corp. | | | 4,519 | | | | 405,942 | |
| | | | | | | | | |
| Oil Companies - Exploration & Production 1.66% | | | | | | | | |
| Cimarex Energy Co. | | | 3,663 | | | | 225,824 | |
| | | | | | | | | |
| Oil Refining & Marketing 5.27% | | | | | | | | |
| Marathon Petroleum Corp. | | | 5,032 | | | | 296,938 | |
| Phillips 66 | | | 4,893 | | | | 421,532 | |
| | | | | | | | 718,470 | |
| REITS - Diversified 3.23% | | | | |
| American Tower Corp. REIT | | | 2,789 | | | | 441,192 | |
| | | | | | | | | |
| Retail - Apparel/Shoe 2.79% | | | | | | | | |
| Ross Stores, Inc. | | | 4,569 | | | | 380,141 | |
| | | | | | | | | |
| Retail - Consumer Electronics 1.93% | | | | | | | | |
| Best Buy Co., Inc. | | | 4,974 | | | | 263,423 | |
| | | | | | | | | |
| Retail - Restaurants 4.40% | | | | | | | | |
| Yum! Brands, Inc. | | | 6,522 | | | | 599,502 | |
| | | | | | | | | |
| Rubber - Tires 2.63% | | | | | | | | |
| The Goodyear Tire & Rubber Co. | | | 17,576 | | | | 358,726 | |
| | | | | | | | | |
| Semiconductor Equipment 1.86% | | | | | | | | |
| Lam Research Corp. | | | 1,867 | | | | 254,229 | |
| | | | | | | | | |
| Transportation - Rail 2.98% | | | | | | | | |
| Union Pacific Corp. | | | 2,945 | | | | 407,087 | |
| | | | | | | | | |
| Total Common Stocks | | | | | | | 11,840,292 | |
| (cost $13,374,818) | | | | | | | | |
| See notes to portfolios of investments and notes to financial statements. |
| All American Equity Fund | |
| Portfolio of Investments | December 31, 2018 |
| Exchange Traded Funds 4.59% | | Shares | | Value |
| Consumer Staples Select Sector SPDR Fund ETF | | | 2,200 | | | $ | 111,716 | |
| Health Care Select Sector SPDR Fund ETF | | | 2,600 | | | | 224,926 | |
| Real Estate Select Sector SPDR Fund ETF | | | 4,400 | | | | 136,400 | |
| Utilities Select Sector SPDR Fund ETF | | | 2,882 | | | | 152,516 | |
| Total Exchange Traded Funds | | | | | | | 625,558 | |
| (cost $654,130) | | | | | | | | |
| Put Option Purchased 1.42% | | Strike Price | | Exp. Date | | Notional Contract Value | | Contracts | | |
| | | | | | | | | | | |
| Exchange Traded Fund 1.42% | | | | | | | | | | | | | | | | | | | | |
| SPDR S&P 500 ETF Trust | | $ | 236.00 | | | | 01 | /20 | | $ | 3,573,856 | | | | 143 | | | | 194,051 | |
| (premiums paid $283,411) | | | | | | | | | | | | | | | | | | | | |
| | | | | | | | | | | | | | | | | | | | | |
| Investments, at value 92.84% | | | | | | | | | | | | | | | | | | | 12,659,901 | |
| (cost $14,312,359) | | | | | | | | | | | | | | | | | | | | |
| Other assets and liabilities, net 7.16% | | | | | | | | | | | | | | | | | | | 975,935 | |
| Net Assets 100.00% | | | | | | | | | | | | | | | | | | $ | 13,635,836 | |
| See notes to portfolios of investments and notes to financial statements. | |
| Holmes Macro Trends Fund | |
| Portfolio of Investments | December 31, 2018 |
| Common Stocks 73.94% | | Shares | | Value |
| Building - Residential/Commercial 1.35% | | | | | | | | |
| LGI Homes, Inc. * | | | 10,086 | | | $ | 456,089 | |
| | | | | | | | | |
| Building & Construction Products - Miscellaneous 3.42% | | | | | | | | |
| Trex Co., Inc. * | | | 19,512 | | | | 1,158,232 | |
| | | | | | | | | |
| Chemicals - Specialty 7.75% | | | | | | | | |
| Ingevity Corp. * | | | 12,867 | | | | 1,076,839 | |
| The Chemours Co. | | | 27,142 | | | | 765,947 | |
| Versum Materials, Inc. | | | 28,097 | | | | 778,849 | |
| | | | | | | | 2,621,635 | |
| | | | | | | | | |
| Commercial Services 2.63% | | | | | | | | |
| Nutrisystem, Inc. | | | 20,285 | | | | 890,106 | |
| | | | | | | | | |
| Commercial Services - Finance 6.24% | | | | | | | | |
| S&P Global, Inc. | | | 7,321 | | | | 1,244,131 | |
| Sabre Corp. | | | 40,162 | | | | 869,106 | |
| | | | | | | | 2,113,237 | |
| | | | | | | | | |
| Consumer Products - Miscellaneous 4.61% | | | | | | | | |
| Kimberly-Clark Corp. | | | 13,708 | | | | 1,561,890 | |
| | | | | | | | | |
| Distribution/Wholesale 3.71% | | | | | | | | |
| Pool Corp. | | | 8,447 | | | | 1,255,647 | |
| | | | | | | | | |
| Diversified Manufacturing Operations 2.34% | | | | | | | | |
| EnPro Industries, Inc. | | | 13,152 | | | | 790,435 | |
| | | | | | | | | |
| Energy - Alternate Sources 0.00% | | | | | | | | |
| Pacific Green Energy Corp. #*@ | | | 100,000 | | | | 0 | |
| | | | | | | | | |
| Lasers - System/Components 2.94% | | | | | | | | |
| Electro Scientific Industries, Inc. * | | | 33,187 | | | | 994,283 | |
| | | | | | | | | |
| Medical - Drugs 6.60% | | | | | | | | |
| AbbVie, Inc. | | | 16,256 | | | | 1,498,641 | |
| Corcept Therapeutics, Inc. * | | | 55,110 | | | | 736,269 | |
| | | | | | | | 2,234,910 | |
| Medical - Hospitals 0.00% | | | | | | | | |
| African Medical Investments PLC #*@ | | | 1,000,000 | | | | 0 | |
| | | | | | | | | |
| Medical Laser Systems 1.41% | | | | | | | | |
| Cutera, Inc. * | | | 28,080 | | | | 477,922 | |
| | | | | | | | | |
| Oil Companies - Exploration & Production 0.02% | | | | | | | | |
| CruzSur Energy Corp., 144A #*∆ | | | 50,000 | | | | 5,860 | |
See notes to portfolios of investments and notes to financial statements.
| Holmes Macro Trends Fund | |
| Portfolio of Investments | December 31, 2018 |
| Common Stocks (cont’d) | | Shares | | Value |
| Pastoral & Agricultural 2.09% | | | | |
| Phibro Animal Health Corp. | | | 22,044 | | | $ | 708,935 | |
| | | | | | | | | |
| Power Conversion/Supply Equipment 2.38% | | | | | | | | |
| SPX Corp. * | | | 28,740 | | | | 805,007 | |
| | | | | | | | | |
| Real Estate Management/Services 2.20% | | | | | | | | |
| HFF, Inc., Class A * | | | 22,446 | | | | 744,309 | |
| | | | | | | | | |
| Real Estate Operating/Development 0.70% | | | | | | | | |
| Pacific Infrastructure Ventures, Inc. #*@+ | | | 426,533 | | | | 236,043 | |
| | | | | | | | | |
| Rental Auto/Equipment 2.10% | | | | | | | | |
| Avis Budget Group, Inc. * | | | 31,585 | | | | 710,031 | |
| | | | | | | | | |
| Retail - Building Products 3.76% | | | | | | | | |
| The Home Depot, Inc. | | | 7,408 | | | | 1,272,843 | |
| | | | | | | | | |
| Retail - Pet Food & Supplies 1.96% | | | | | | | | |
| PetMed Express, Inc. | | | 28,551 | | | | 664,096 | |
| | | | | | | | | |
| Semiconductor Equipment 2.80% | | | | | | | | |
| Axcelis Technologies, Inc. * | | | 53,305 | | | | 948,829 | |
| | | | | | | | | |
| Telecom Equipment Fiber Optics 4.21% | | | | | | | | |
| Ciena Corp. * | | | 41,996 | | | | 1,424,084 | |
| | | | | | | | | |
| Television 6.45% | | | | | | | | |
| AMC Networks, Inc., Class A * | | | 15,115 | | | | 829,511 | |
| TEGNA, Inc. | | | 124,565 | | | | 1,354,022 | |
| | | | | | | | 2,183,533 | |
| | | | | | | | | |
| Web Hosting/Design 2.27% | | | | | | | | |
| NIC, Inc. | | | 61,436 | | | | 766,721 | |
| Total Common Stocks | | | | | | | 25,024,677 | |
| (cost $28,141,087) | | | | | | | | |
| | | Coupon | | Maturity | | Principal | | |
| Corporate Non-Convertible Bond 0.69% | | Rate% | | Date | | Amount | | |
| Electric - Generation 0.69% | | | | | | | | | | | | | | | | |
| | | | | | | | | | | | | | | | | |
| Interamerican Energy Corp. #@+ | | | 15.00 | | | | 11/08/21 | | | $ | 233,829 | | | | 233,829 | |
| (cost $233,829) | | | | | | | | | | | | | | | | |
| Exchange Traded Funds 4.33% | | Shares | | |
| Consumer Staples Select Sector SPDR Fund ETF | | | 4,800 | | | | 243,744 | |
| Health Care Select Sector SPDR Fund ETF | | | 6,116 | | | | 529,095 | |
| Real Estate Select Sector SPDR Fund ETF | | | 10,500 | | | | 325,500 | |
See notes to portfolios of investments and notes to financial statements.
| Holmes Macro Trends Fund | |
| Portfolio of Investments | December 31, 2018 |
| Exchange Traded Funds (cont’d) | | Shares | | Value |
| Utilities Select Sector SPDR Fund ETF | | | 6,956 | | | $ | 368,112 | |
| Total Exchange Traded Funds | | | | | | | 1,466,451 | |
| (cost $1,532,599) | | | | | | | | |
| Warrants 0.01% | | | Exercise Price | | | Exp. Date | | | | | | | | |
| Gold Mining 0.00% | | | | | | | | | | | | | | |
| Gran Colombia Gold Corp. * | | $ | 48.75 | | | 03/18/19 | | | 250 | | | | 6 | |
| Oil Companies - Exploration & Production 0.01% | | | | | | | | | | | | | | |
| CruzSur Energy Corp., 144A #*∆ | | | 10.50 | | | 07/31/22 | | | 50,000 | | | | 4,303 | |
| Total Warrants | | | | | | | | | | | | | 4,309 | |
| (cost $0) | | | | | | | | | | | | | | |
| | | | | | | Notional | | | | |
| | | Strike | | Exp. | | Contract | | | | |
| Put Option Purchased 1.43% | | Price | | Date | | Value | | Contracts | | Value |
| Exchange Traded Fund 1.43% | | | | | | | | | | |
| SPDR S&P 500 ETF Trust | | $ | 236.00 | | | 01/20 | | $ | 8,922,144 | | | | 357 | | | | 484,449 | |
| (premiums paid $707,536) | | | | | | | | | | | | | | | | | | |
| | | | | | | | | | | | | | | | | | | |
| Investments, at value 80.40% | | | | | | | | | | | | | | | | | 27,213,715 | |
| (cost $30,615,051) | | | | | | | | | | | | | | | | | | |
| Other assets and liabilities, net 19.60% | | | | | | | | | | | | | | | | | 6,633,808 | |
| Net Assets 100.00% | | | | | | | | | | | | | | | | $ | 33,847,523 | |
See notes to portfolios of investments and notes to financial statements.
Global Resources Fund
| Portfolio of Investments | December 31, 2018 |
| Common Stocks 87.37% | | Shares | | | Value | |
| Agricultural Chemicals 1.01% | | | | | | | | |
| Ishihara Sangyo Kaisha, Ltd. * | | | 62,600 | | | $ | 611,867 | |
| | | | | | | | | |
| Building & Construction Products - Miscellaneous 1.52% | | | | | | | | |
| Louisiana-Pacific Corp. | | | 41,600 | | | | 924,352 | |
| | | | | | | | | |
| Building Products - Cement 1.64% | | | | | | | | |
| Anhui Conch Cement Co., Ltd. | | | 206,400 | | | | 998,104 | |
| | | | | | | | | |
| Building Products - Wood 1.37% | | | | | | | | |
| Norbord, Inc. | | | 31,300 | | | | 832,252 | |
| | | | | | | | | |
| Chemicals - Diversified 8.69% | | | | | | | | |
| Covestro AG | | | 14,200 | | | | 703,248 | |
| Dongyue Group, Ltd. | | | 1,801,800 | | | | 929,264 | |
| Kumho Petrochemical Co., Ltd. * | | | 13,900 | | | | 1,088,330 | |
| Nitto Denko Corp. | | | 12,200 | | | | 611,884 | |
| Tokuyama Corp. | | | 44,600 | | | | 978,825 | |
| Tosoh Corp. | | | 75,750 | | | | 982,561 | |
| | | | | | | | 5,294,112 | |
| | | | | | | | | |
| Chemicals - Specialty 1.63% | | | | | | | | |
| China Sanjiang Fine Chemicals Co., Ltd. | | | 4,139,900 | | | | 995,385 | |
| | | | | | | | | |
| Coal 3.15% | | | | | | | | |
| Caribbean Resources Corp. #*@~ | | | 17 | | | | 0 | |
| China Shenhua Energy Co., Ltd., H Shares | | | 558,000 | | | | 1,216,967 | |
| Peabody Energy Corp. | | | 23,000 | | | | 701,040 | |
| Walter Energy, Inc., 144A #*∆ | | | 4,293 | | | | 1 | |
| | | | | | | | 1,918,008 | |
| | | | | | | | | |
| Commercial Service - Finance 0.31% | | | | | | | | |
| BIG Blockchain Intelligence Group, Inc. * | | | 2,600,000 | | | | 190,448 | |
| | | | | | | | | |
| Diamonds/Precious Stones 0.28% | | | | | | | | |
| Barksdale Capital Corp. * | | | 400,000 | | | | 169,938 | |
| Rockwell Diamonds, Inc., 144A #*@∆ | | | 63,333 | | | | 0 | |
| | | | | | | | 169,938 | |
| | | | | | | | | |
| Diversified Minerals 6.57% | | | | | | | | |
| Anglo American PLC | | | 57,500 | | | | 1,285,739 | |
| Anglo Pacific Group PLC | | | 117,400 | | | | 223,593 | |
| Caledonia Mining Corp. PLC | | | 72,811 | | | | 382,527 | |
| Encanto Potash Corp., 144A #*∆ | | | 300,000 | | | | 32,962 | |
| Libero Copper Corp. *~ | | | 3,875,000 | | | | 219,977 | |
| Lumina Gold Corp. * | | | 804,100 | | | | 341,619 | |
| Mako Mining Corp. * | | | 1,200,000 | | | | 149,429 | |
| Niocan, Inc., 144A #*∆ | | | 362,069 | | | | 41,108 | |
| Salazar Resources, Ltd. * | | | 3,000,000 | | | | 252,710 | |
See notes to portfolios of investments and notes to financial statements.
Global Resources Fund
| Portfolio of Investments | December 31, 2018 |
| Common Stocks (cont’d) | | Shares | | | Value | |
| Diversified Minerals (cont’d) | | | | | | | | |
| Teck Resources, Ltd., Class B | | | 25,000 | | | $ | 538,200 | |
| Teck Resources, Ltd., Class B | | | 18,000 | | | | 387,720 | |
| VR Resources, Ltd. * | | | 1,125,000 | | | | 148,330 | |
| | | | | | | | 4,003,914 | |
| | | | | | | | | |
| Electric - Integrated 2.00% | | | | | | | | |
| AGL Energy, Ltd. | | | 83,900 | | | | 1,218,414 | |
| | | | | | | | | |
| Electronics - Military 0.09% | | | | | | | | |
| Global UAV Technologies, Ltd. * | | | 2,225,000 | | | | 57,043 | |
| | | | | | | | | |
| Energy - Alternate Sources 3.45% | | | | | | | | |
| Pacific Green Energy Corp. #*@~ | | | 2,400,000 | | | | 0 | |
| Polaris Infrastructure, Inc. | | | 100,000 | | | | 754,468 | |
| Vestas Wind Systems A/S | | | 17,800 | | | | 1,347,436 | |
| | | | | | | | 2,101,904 | |
| Finance - Investment Banker/Broker 0.41% | | | | | | | | |
| GoldMoney, Inc. * | | | 200,000 | | | | 251,978 | |
| | | | | | | | | |
| Forestry 1.04% | | | | | | | | |
| Interfor Corp. * | | | 60,000 | | | | 633,753 | |
| | | | | | | | | |
| Gold Mining 10.81% | | | | | | | | |
| Centamin PLC | | | 962,200 | | | | 1,338,823 | |
| Chesapeake Gold Corp., 144A *∆ | | | 52,400 | | | | 69,856 | |
| Continental Gold, Inc. * | | | 82,800 | | | | 136,464 | |
| CopperBank Resources Corp. * | | | 1,300,000 | | | | 47,612 | |
| Corona Minerals, Ltd. #*@ | | | 5,000 | | | | 0 | |
| Dundee Precious Metals, Inc. * | | | 260,000 | | | | 685,614 | |
| Evolution Mining, Ltd. | | | 193,866 | | | | 504,326 | |
| Gran Colombia Gold Corp. * | | | 4,100 | | | | 8,469 | |
| NGEx Resources, Inc. * | | | 461,000 | | | | 347,908 | |
| NGEx Resources, Inc. * | | | 255,900 | | | | 192,131 | |
| Northern Star Resources, Ltd. | | | 84,400 | | | | 550,926 | |
| OceanaGold Corp. | | | 395,500 | | | | 1,442,712 | |
| Radisson Mining Resources, Inc. * | | | 1,160,900 | | | | 85,035 | |
| Ramelius Resources, Ltd. * | | | 483,100 | | | | 159,789 | |
| Red Pine Exploration, Inc. * | | | 1,500,000 | | | | 49,443 | |
| Revival Gold, Inc. * | | | 500,000 | | | | 292,997 | |
| Royal Road Minerals, Ltd. * | | | 5,750,000 | | | | 294,829 | |
| Sandstorm Gold, Ltd. * | | | 82,000 | | | | 378,020 | |
| | | | | | | | 6,584,954 | |
| Information Technology 0.60% | | | | | | | | |
| Abaxx Technologies, Inc., 144A #*@∆ | | | 1,250,000 | | | | 366,247 | |
See notes to portfolios of investments and notes to financial statements.
Global Resources Fund
| Portfolio of Investments | December 31, 2018 |
| Common Stocks (cont’d) | | Shares | | | Value | |
| Medical - Hospitals 0.00% | | | | | | | | |
| African Medical Investments PLC #*@ | | | 2,507,500 | | | $ | 0 | |
| | | | | | | | | |
| Metal - Copper 2.10% | | | | | | | | |
| Hudbay Minerals, Inc. | | | 270,800 | | | | 1,281,401 | |
| | | | | | | | | |
| Metal - Diversified 5.81% | | | | | | | | |
| Aguia Resources, Ltd. * | | | 2,949,500 | | | | 291,894 | |
| Aguia Resources, Ltd. * | | | 714,286 | | | | 68,017 | |
| Ascendant Resources, Inc. * | | | 300,000 | | | | 88,998 | |
| Chakana Copper Corp. * | | | 320,000 | | | | 98,447 | |
| Filo Mining Corp. * | | | 134,650 | | | | 216,987 | |
| Filo Mining Corp. * | | | 115,250 | | | | 177,975 | |
| Galway Metals, Inc. * | | | 500,000 | | | | 65,924 | |
| Glencore PLC | | | 5,600 | | | | 20,821 | |
| GoviEx Uranium, Inc. * | | | 2,100,000 | | | | 230,735 | |
| GoviEx Uranium, Inc., 144A #*∆ | | | 58,000 | | | | 6,373 | |
| Ivanhoe Mines, Ltd. * | | | 305,900 | | | | 531,045 | |
| Luminex Resources Corp. * | | | 120,615 | | | | 56,544 | |
| NorthIsle Copper & Gold, Inc. * | | | 1,000,000 | | | | 62,262 | |
| Novo Resources Corp. * | | | 158,600 | | | | 288,110 | |
| Orsu Metals Corp., 144A #*∆ | | | 14,761 | | | | 3,136 | |
| Sandfire Resources NL | | | 248,700 | | | | 1,171,062 | |
| Troilus Gold Corp. * | | | 294,000 | | | | 161,515 | |
| | | | | | | | 3,539,845 | |
| | | | | | | | | |
| Metal - Iron 0.00% | | | | | | | | |
| Consolidated Growth Holdings, Ltd. #*@ | | | 19,859,173 | | | | 0 | |
| WAI Capital Investment Corp., 144A #*@∆ | | | 292,500 | | | | 0 | |
| | | | | | | | 0 | |
| | | | | | | | | |
| Mining Services 0.32% | | | | | | | | |
| Bounty Mining, Ltd. * | | | 1,692,307 | | | | 107,121 | |
| Cordoba Minerals Corp. * | | | 1,000,000 | | | | 84,237 | |
| | | | | | | | 191,358 | |
| | | | | | | | | |
| Natural Resource Technology 0.20% | | | | | | | | |
| I-Pulse, Inc., 144A #*@+∆ | | | 15,971 | | | | 120,741 | |
| | | | | | | | | |
| Non-Ferrous Metals 0.26% | | | | | | | | |
| Group Eleven Resources Corp. * | | | 650,000 | | | | 57,134 | |
| InZinc Mining, Ltd. * | | | 2,000,000 | | | | 73,249 | |
| NxGold, Ltd. * | | | 200,000 | | | | 11,354 | |
| Sterling Group Ventures, Inc., 144A #*∆ | | | 500,000 | | | | 17,500 | |
| | | | | | | | 159,237 | |
| | | | | | | | | |
| Oil - Field Services 0.03% | | | | | | | | |
| Cabot Energy PLC * | | | 2,500,000 | | | | 19,903 | |
See notes to portfolios of investments and notes to financial statements.
Global Resources Fund
| Portfolio of Investments | December 31, 2018 |
| Common Stocks (cont’d) | | Shares | | | Value | |
| Oil Companies - Exploration & Production 2.92% | | | | | | | | |
| Africa Energy Corp., 144A #*∆ | | | 2,110,889 | | | $ | 262,856 | |
| CNOOC, Ltd., ADR | | | 4,000 | | | | 609,800 | |
| CruzSur Energy Corp. * | | | 300,000 | | | | 35,160 | |
| CruzSur Energy Corp. #*@+ | | | 50,000 | | | | 5,332 | |
| CruzSur Energy Corp., 144A #*∆ | | | 200,000 | | | | 23,440 | |
| Frontera Energy Corp. * | | | 80,000 | | | | 784,061 | |
| Ivanhoe Energy, Inc. * | | | 18,719 | | | | 112 | |
| Range Energy Resources, Inc., 144A #*∆ | | | 15,000,000 | | | | 54,937 | |
| U.S. Oil Sands, Inc., 144A #*@∆ | | | 198,000 | | | | 0 | |
| | | | | | | | 1,775,698 | |
| | | | | | | | | |
| Oil Companies - Integrated 3.61% | | | | | | | | |
| LUKOIL PJSC, ADR | | | 12,100 | | | | 864,908 | |
| Polskie Gornictwo Naftowe i Gazownictwo SA | | | 721,400 | | | | 1,333,849 | |
| | | | | | | | 2,198,757 | |
| | | | | | | | | |
| Oil Companies - US Royalty Trusts 0.02% | | | | | | | | |
| San Juan Basin Royalty Trust | | | 2,000 | | | | 9,600 | |
| | | | | | | | | |
| Oil Refining & Marketing 5.19% | | | | | | | | |
| Grupa Lotos SA | | | 57,300 | | | | 1,357,610 | |
| PBF Energy, Inc., Class A | | | 23,400 | | | | 764,478 | |
| Saras SpA | | | 536,900 | | | | 1,041,705 | |
| | | | | | | | 3,163,793 | |
| | | | | | | | | |
| Paper & Related Products 1.79% | | | | | | | | |
| Canfor Pulp Products, Inc. | | | 45,000 | | | | 534,317 | |
| Resolute Forest Products, Inc. | | | 70,000 | | | | 555,100 | |
| | | | | | | | 1,089,417 | |
| | | | | | | | | |
| Petrochemicals 2.98% | | | | | | | | |
| Lotte Chemical Corp. | | | 4,700 | | | | 1,168,570 | |
| Sinopec Shanghai Petrochemical Co., Ltd., ADR | | | 15,000 | | | | 647,400 | |
| | | | | | | | 1,815,970 | |
| | | | | | | | | |
| Precious Metals 0.18% | | | | | | | | |
| Brixton Metals Corp. #*@+ | | | 1,000,000 | | | | 111,339 | |
| | | | | | | | | |
| Real Estate Operating/Development 6.76% | | | | | | | | |
| Pacific Infrastructure Ventures, Inc. #*@+ | | | 7,443,544 | | | | 4,119,257 | |
| | | | | | | | | |
| Retail - Jewelry 0.01% | | | | | | | | |
| Mene, Inc. * | | | 10,353 | | | | 4,550 | |
| | | | | | | | | |
| Rubber & Vinyl 1.75% | | | | | | | | |
| Zeon Corp. | | | 116,200 | | | | 1,063,831 | |
See notes to portfolios of investments and notes to financial statements.
Global Resources Fund
| Portfolio of Investments | December 31, 2018 |
| Common Stocks (cont’d) | | Shares | | | Value | |
| Rubber/Plastic Products 0.75% | | | | | | | | |
| Trinseo SA | | | 10,000 | | | $ | 457,800 | |
| | | | | | | | | |
| Silver Mining 0.03% | | | | | | | | |
| Bunker Hill Mining Corp. * | | | 500,000 | | | | 20,144 | |
| | | | | | | | | |
| Steel - Producers 8.09% | | | | | | | | |
| China Oriental Group Co., Ltd. | | | 1,520,100 | | | | 906,057 | |
| Evraz PLC | | | 190,500 | | | | 1,166,523 | |
| Maanshan Iron & Steel Co., Ltd. | | | 2,429,000 | | | | 1,071,633 | |
| Salzgitter AG | | | 26,200 | | | | 764,602 | |
| Severstal PJSC, GDR | | | 74,800 | | | | 1,021,020 | |
| | | | | | | | 4,929,835 | |
| Total Common Stocks | | | | | | | 53,225,149 | |
| (cost $120,680,970) | | | | | | | | |
| Corporate Non-Convertible Bond 4.60% | | | Coupon Rate % | | | Maturity Date | | | Principal Amount | | | | | |
| Electric - Generation 4.60% | | | | | | | | | | | | | | |
| | | | | | | | | | | | | | | |
| Interamerican Energy Corp. #@+ | | | 15.00 | | | 11/08/21 | | $ | 2,805,938 | | | | 2,805,938 | |
| (cost $2,805,938) | | | | | | | | | | | | | | |
| Warrants 0.03% | | Exercise Price | | | Exp. Date | | Shares | | | | |
| Diversified Minerals 0.00% | | | | | | | | | | | | | | |
| VR Resources, Ltd. #*@ | | $ | 0.60 | | | 03/21/19 | | | 562,500 | | | | 0 | |
| | | | | | | | | | | | | | | |
| Electronics - Military 0.00% | | | | | | | | | | | | | | |
| Global UAV Technologies, Ltd., 144A #*@∆ | | | 0.15 | | | 06/25/20 | | | 1,112,500 | | | | 0 | |
| | | | | | | | | | | | | | | |
| Gold Mining 0.00% | | | | | | | | | | | | | | |
| Gran Colombia Gold Corp. * | | | 48.75 | | | 03/18/19 | | | 59,500 | | | | 1,416 | |
| Troilus Gold Corp. #*@ | | | 2.50 | | | 11/21/20 | | | 294,000 | | | | 0 | |
| | | | | | | | | | | | | | 1,416 | |
| Metal - Diversified 0.00% | | | | | | | | | | | | | | |
| Aguia Resources, Ltd., 144A #*@∆ | | | 0.65 | | | 06/30/20 | | | 1,450,000 | | | | 0 | |
| | | | | | | | | | | | | | | |
| Non-Ferrous Metals 0.00% | | | | | | | | | | | | | | |
| Giyani Metals Corp., 144A #*@∆ | | | 0.40 | | | 08/07/19 | | | 174,318 | | | | 0 | |
See notes to portfolios of investments and notes to financial statements.
Global Resources Fund
| Portfolio of Investments | December 31, 2018 |
| Warrants (cont’d) | | Exercise Price | | | Exp. Date | | Shares | | | Value | |
| Oil Companies - Exploration & Production 0.03% | | | | | | | | | | | | | | |
| CruzSur Energy Corp., 144A #* | | $ | 10.50 | | | 07/31/22 | | | 200,000 | | | $ | 17,214 | |
| Total Warrants | | | | | | | | | | | | | 18,630 | |
| (cost $0) | | | | | | | | | | | | | | |
| Call Options Purchased 0.14% | | Strike Price | | | Exp. Date | | | Notional Contract Value | | | Contracts | | | Value | |
| Agricultural Chemicals 0.00% | | | | | | | | | | | | | | | | | | | | |
| Nutrien, Ltd. | | $ | 55.00 | | | | 01/19 | | | $ | 1,650,000 | | | | 300 | | | | 300 | |
| | | | | | | | | | | | | | | | | | | | | |
| Commodity 0.12% | | | | | | | | | | | | | | | | | | | | |
| SPDR Gold Shares ETF | | | 118.00 | | | | 01/19 | | | | 2,360,000 | | | | 200 | | | | 71,600 | |
| | | | | | | | | | | | | | | | | | | | | |
| Diversified Minerals 0.01% | | | | | | | | | | | | | | | | | | | | |
| BHP Group, Ltd. | | | 55.00 | | | | 01/19 | | | | 3,300,000 | | | | 600 | | | | 4,500 | |
| | | | | | | | | | | | | | | | | | | | | |
| Gold Mining 0.00% | | | | | | | | | | | | | | | | | | | | |
| Franco-Nevada Corp. | | | 85.00 | | | | 01/19 | | | | 1,275,000 | | | | 150 | | | | 150 | |
| | | | | | | | | | | | | | | | | | | | | |
| Metal - Copper 0.00% | | | | | | | | | | | | | | | | | | | | |
| Freeport-McMoRan, Inc. | | | 22.00 | | | | 01/19 | | | | 880,000 | | | | 400 | | | | 400 | |
| Freeport-McMoRan, Inc. | | | 20.00 | | | | 01/19 | | | | 1,400,000 | | | | 700 | | | | 700 | |
| Freeport-McMoRan, Inc. | | | 17.00 | | | | 01/19 | | | | 1,360,000 | | | | 800 | | | | 800 | |
| | | | | | | | | | | | | | | | | | | | 1,900 | |
| | | | | | | | | | | | | | | | | | | | | |
| Oil Companies - Integrated 0.00% | | | | | | | | | | | | | | | | | | | | |
| BP PLC | | | 45.00 | | | | 01/19 | | | | 2,295,000 | | | | 510 | | | | 510 | |
| Chevron Corp. | | | 135.00 | | | | 01/19 | | | | 2,160,000 | | | | 160 | | | | 160 | |
| Royal Dutch Shell PLC | | | 70.00 | | | | 01/19 | | | | 1,960,000 | | | | 280 | | | | 280 | |
| TOTAL SA | | | 62.50 | | | | 01/19 | | | | 3,750,000 | | | | 600 | | | | 600 | |
| | | | | | | | | | | | | | | | | | | | 1,550 | |
| | | | | | | | | | | | | | | | | | | | | |
| Precious Metals 0.01% | | | | | | | | | | | | | | | | | | | | |
| VanEck Vectors Junior Gold | | | | | | | | | | | | | | | | | | | | |
| Miners ETF | | | 34.00 | | | | 01/19 | | | | 1,360,000 | | | | 400 | | | | 4,600 | |
| | | | | | | | | | | | | | | | | | | | | |
| Total Purchased Call Options | | | | | | | | | | | | | | | | | | | 84,600 | |
| (premiums paid $1,005,336) | | | | | | | | | | | | | | | | | | | | |
| | | | | | | | | | | | | | | | | | | | | |
| Investments, at value 92.14% | | | | | | | | | | | | | | | | | | | 56,134,317 | |
| (cost $124,492,244) | | | | | | | | | | | | | | | | | | | | |
| Other assets and liabilities, net 7.86% | | | | | | | | | | | | | | | | | | | 4,787,068 | |
| | | | | | | | | | | | | | | | | | | | | |
| Net Assets 100.00% | | | | | | | | | | | | | | | | | | $ | 60,921,385 | |
See notes to portfolios of investments and notes to financial statements.
World Precious Minerals Fund
| Portfolio of Investments | December 31, 2018 |
| Common Stocks 93.95% | | Shares | | | Value | |
| Advanced Materials/Production 3.85% | | | | | | |
| Nano One Materials Corp. * | | | 3,000,000 | | | $ | 2,724,875 | |
| | | | | | | | | |
| Capital Pools 0.71% | | | | | | | | |
| Magna Gold Corp. #*@ | | | 1,000,000 | | | | 256,373 | |
| Westhaven Ventures, Inc. * | | | 250,000 | | | | 247,216 | |
| | | | | | | | 503,589 | |
| | | | | | | | | |
| Coal 0.00% | | | | | | | | |
| Caribbean Resources Corp. #*@ | | | 4 | | | | 0 | |
| | | | | | | | | |
| Diamonds/Precious Stones 1.62% | | | | | | | | |
| Barksdale Capital Corp. *~ | | | 2,700,000 | | | | 1,147,085 | |
| Rockwell Diamonds, Inc., 144A #*@∆ | | | 171,667 | | | | 0 | |
| | | | | | | | 1,147,085 | |
| | | | | | | | | |
| Diversified Minerals 4.66% | | | | | | | | |
| Adamera Minerals Corp., 144A #*∆ | | | 1,492,543 | | | | 87,462 | |
| Argo Gold, Inc. *~ | | | 2,342,500 | | | | 274,539 | |
| Argo Gold, Inc. #*@~+ | | | 625,000 | | | | 69,587 | |
| Bluebird Battery Metals, Inc. * | | | 1,000,000 | | | | 172,136 | |
| Calibre Mining Corp. * | | | 450,000 | | | | 120,312 | |
| Erdene Resource Development Corp. * | | | 300,000 | | | | 57,135 | |
| Gatling Exploration, Inc. * | | | 992,857 | | | | 283,632 | |
| Golden Predator Mining Corp. * | | | 1,200,000 | | | | 224,143 | |
| Indochine Mining, Ltd. #*@ | | | 10,000 | | | | 0 | |
| Lithium Power International, Ltd. * | | | 500,000 | | | | 91,612 | |
| Lithoquest Diamonds, Inc. * | | | 750,000 | | | | 101,633 | |
| Lumina Gold Corp. * | | | 1,000,000 | | | | 424,846 | |
| Mako Mining Corp. * | | | 1,500,000 | | | | 186,786 | |
| NextSource Materials, Inc. * | | | 3,000,000 | | | | 197,773 | |
| Rubicon Minerals Corp. * | | | 500,000 | | | | 487,108 | |
| Salazar Resources, Ltd. * | | | 1,500,000 | | | | 126,355 | |
| VR Resources, Ltd. *~ | | | 3,000,000 | | | | 395,546 | |
| | | | | | | | 3,300,605 | |
| | | | | | | | | |
| Finance - Investment Banker/Broker 0.02% | | | | | | | | |
| Coin Hodl, Inc., 144A #*∆ | | | 133,333 | | | | 14,894 | |
| | | | | | | | | |
| Gold Mining 46.17% | | | | | | | | |
| Alexandria Minerals Corp. * | | | 9,048,000 | | | | 198,828 | |
| Algold Resources, Ltd. * | | | 540,000 | | | | 146,352 | |
| Alio Gold, Inc. * | | | 359,999 | | | | 303,251 | |
| Alio Gold, Inc., 144A ∆ | | | 132,924 | | | | 111,971 | |
| Allegiant Gold, Ltd. * | | | 2,150,000 | | | | 488,207 | |
| Aurelius Minerals, Inc. * | | | 1,250,000 | | | | 32,047 | |
| Auryn Resources, Inc. * | | | 1,250,000 | | | | 1,144,521 | |
| Barkerville Gold Mines, Ltd. * | | | 500,000 | | | | 146,499 | |
See notes to portfolios of investments and notes to financial statements.
World Precious Minerals Fund
| Portfolio of Investments | December 31, 2018 |
| Common Stocks (cont’d) | | Shares | | | Value | |
| Gold Mining (cont’d) | | | | | | |
| Bellevue Gold, Ltd. * | | | 3,000,000 | | | $ | 869,186 | |
| Black Dragon Gold Corp. * | | | 4,000,000 | | | | 278,347 | |
| Black Dragon Gold Corp. * | | | 1,000,000 | | | | 61,788 | |
| Bonterra Resources, Inc. * | | | 418,636 | | | | 794,219 | |
| Chesapeake Gold Corp., 144A *∆ | | | 192,199 | | | | 256,228 | |
| Comstock Mining, Inc. * | | | 533,000 | | | | 70,889 | |
| Contact Gold Corp. * | | | 1,300,000 | | | | 323,762 | |
| CopperBank Resources Corp. *~ | | | 22,805,418 | | | | 835,241 | |
| CopperBank Resources Corp., 144A #*~∆ | | | 174,000 | | | | 6,373 | |
| Coral Gold Resources, Ltd. * | | | 750,000 | | | | 208,761 | |
| Corona Minerals, Ltd. #*@ | | | 81,250 | | | | 0 | |
| Eastmain Resources, Inc. * | | | 1,000,000 | | | | 120,861 | |
| Fiore Gold, Ltd. * | | | 2,000,000 | | | | 498,095 | |
| Fremont Gold, Ltd. *~ | | | 4,000,000 | | | | 439,496 | |
| Gascoyne Resources, Ltd. * | | | 1,600,000 | | | | 152,738 | |
| Gold Standard Ventures Corp. * | | | 1,150,000 | | | | 1,437,500 | |
| Golden Star Resources, Ltd. * | | | 50,000 | | | | 157,500 | |
| GoldQuest Mining Corp. * | | | 1,500,000 | | | | 115,368 | |
| GT Gold Corp. * | | | 375,000 | | | | 167,558 | |
| IDM Mining, Ltd. * | | | 5,000,000 | | | | 219,748 | |
| IDM Mining, Ltd., 144A #*∆ | | | 95,000 | | | | 4,175 | |
| Jaguar Mining, Inc. * | | | 1,801,000 | | | | 277,036 | |
| K92 Mining, Inc. * | | | 1,250,000 | | | | 769,118 | |
| Klondike Gold Corp. * | | | 503,000 | | | | 66,320 | |
| Lundin Gold, Inc. * | | | 500,000 | | | | 1,827,571 | |
| Mammoth Resources Corp. *~ | | | 2,171,200 | | | | 95,423 | |
| McEwen Mining, Inc. | | | 134,764 | | | | 246,784 | |
| Mirasol Resources, Ltd. * | | | 2,000,000 | | | | 1,538,236 | |
| Nighthawk Gold Corp. * | | | 1,855,000 | | | | 597,861 | |
| NV Gold Corp. * | | | 1,000,000 | | | | 84,237 | |
| OceanaGold Corp., 144A ∆ | | | 5,348 | | | | 19,509 | |
| Oklo Resources, Ltd. * | | | 4,000,000 | | | | 704,296 | |
| Orca Gold, Inc. * | | | 4,045,000 | | | | 1,570,356 | |
| Osisko Gold Royalties, Ltd. | | | 100,000 | | | | 876,795 | |
| Otis Gold Corp. * | | | 1,500,000 | | | | 109,874 | |
| Petaquilla Minerals, Ltd., 144A#*@∆ | | | 2,660,000 | | | | 0 | |
| Probe Metals, Inc. * | | | 1,000,000 | | | | 966,891 | |
| Pure Gold Mining, Inc. * | | | 3,000,000 | | | | 1,428,362 | |
| Radisson Mining Resources, Inc. *~ | | | 8,244,000 | | | | 603,868 | |
| Radius Gold, Inc., 144A #*∆ | | | 125,000 | | | | 10,530 | |
| Red Pine Exploration, Inc. * | | | 8,000,000 | | | | 263,698 | |
| Redstar Gold Corp. * | | | 15,000,000 | | | | 329,622 | |
| Reunion Gold Corp. * | | | 3,000,000 | | | | 395,546 | |
| Revival Gold, Inc. * | | | 1,500,000 | | | | 878,992 | |
| Rise Gold Corp. * | | | 2,000,000 | | | | 124,524 | |
| Seafield Resources, Ltd., 144A #*@∆ | | | 1,300,000 | | | | 0 | |
| Silver Lake Resources, Ltd. * | | | 500,000 | | | | 195,998 | |
See notes to portfolios of investments and notes to financial statements.
World Precious Minerals Fund
| Portfolio of Investments | December 31, 2018 |
| Common Stocks (cont’d) | | Shares | | | Value | |
| Gold Mining (cont’d) | | | | | | | | |
| Strikepoint Gold, Inc. * | | | 2,000,000 | | | $ | 219,748 | |
| Taurus Gold, Ltd., 144A #*@∆ | | | 2,448,381 | | | | 0 | |
| TMAC Resources, Inc. * | | | 100,000 | | | | 502,490 | |
| Tolima Gold, Inc., 144A #*∆ | | | 4,100,000 | | | | 22,524 | |
| TriStar Gold, Inc. *~ | | | 31,130,000 | | | | 3,534,391 | |
| Wesdome Gold Mines, Ltd. * | | | 1,500,000 | | | | 4,867,419 | |
| | | | | | | | 32,717,528 | |
| | | | | | | | | |
| Investment Companies 0.10% | | | | | | | | |
| Pinecrest Resources, Ltd. * | | | 400,000 | | | | 71,784 | |
| | | | | | | | | |
| Medical - Hospitals 0.00% | | | | | | | | |
| African Medical Investments PLC #*@ | | | 4,637,500 | | | | 0 | |
| | | | | | | | | |
| Metal - Copper 0.05% | | | | | | | | |
| Aston Bay Holdings, Ltd. * | | | 825,000 | | | | 33,237 | |
| | | | | | | | | |
| Metal - Diversified 11.38% | | | | | | | | |
| Argent Minerals, Ltd. * | | | 21,100,000 | | | | 221,441 | |
| Cardinal Resources, Ltd. * | | | 7,450,000 | | | | 2,251,799 | |
| Cardinal Resources, Ltd. * | | | 5,142,500 | | | | 1,582,076 | |
| Cartier Resources, Inc. * | | | 1,000,000 | | | | 97,055 | |
| Chakana Copper Corp. *~ | | | 4,600,000 | | | | 1,415,177 | |
| Columbus Gold Corp. * | | | 750,000 | | | | 109,874 | |
| Genesis Metals Corp. * | | | 583,000 | | | | 38,434 | |
| Genesis Metals Corp., 144A #*∆ | | | 2,917,000 | | | | 192,301 | |
| Integra Resources Corp. * | | | 400,000 | | | | 246,118 | |
| Kaizen Discovery, Inc. * | | | 8,000,000 | | | | 351,597 | |
| Luminex Resources Corp. * | | | 150,000 | | | | 70,319 | |
| New Age Metals, Inc., 144A #*∆ | | | 143,518 | | | | 6,308 | |
| Novo Resources Corp. * | | | 100,000 | | | | 181,658 | |
| Orex Minerals, Inc. * | | | 5,000,000 | | | | 292,997 | |
| Orsu Metals Corp., 144A #*∆ | | | 186,922 | | | | 39,707 | |
| Rockcliff Metals Corp., 144A #*∆ | | | 873,333 | | | | 54,375 | |
| RTG Mining, Inc. * | | | 2,289,378 | | | | 177,836 | |
| Silver Bull Resources, Inc. * | | | 2,500,000 | | | | 264,500 | |
| Sirios Resources, Inc. * | | | 1,600,000 | | | | 164,079 | |
| Torq Resources, Inc. * | | | 1,000,000 | | | | 309,478 | |
| | | | | | | | 8,067,129 | |
| | | | | | | | | |
| Metal - Iron 0.20% | | | | | | | | |
| Vector Resources, Ltd. * | | | 10,000,000 | | | | 140,257 | |
| | | | | | | | | |
| Mining Services 0.19% | | | | | | | | |
| Cordoba Minerals Corp. * | | | 500,000 | | | | 42,118 | |
| Havilah Mining Corp. * | | | 450,000 | | | | 95,591 | |
| | | | | | | | 137,709 | |
See notes to portfolios of investments and notes to financial statements.
World Precious Minerals Fund
| Portfolio of Investments | December 31, 2018 |
| Common Stocks (cont’d) | | Shares | | | Value | |
| Non-Ferrous Metals 1.17% | | | | | | | | |
| Adventus Zinc Corp. * | | | 1,000,000 | | | $ | 549,370 | |
| InZinc Mining, Ltd. * | | | 3,000,000 | | | | 109,874 | |
| Tajiri Resources Corp. #*@ | | | 1,900,000 | | | | 167,009 | |
| | | | | | | | 826,253 | |
| | | | | | | | | |
| Oil Companies - Exploration & Production 0.00% | | | | | | | | |
| Big Sky Energy Corp. #*@ | | | 2,000,000 | | | | 0 | |
| | | | | | | | | |
| Optical Recognition Equipment 0.01% | | | | | | | | |
| Nexoptic Technology Corp., 144A *∆ | | | 12,083 | | | | 5,753 | |
| | | | | | | | | |
| Precious Metals 22.46% | | | | | | | | |
| Amani Gold, Ltd. * | | | 54,500,000 | | | | 153,471 | |
| Barsele Minerals Corp. *~ | | | 7,050,000 | | | | 2,065,631 | |
| Brixton Metals Corp. * | | | 2,500,000 | | | | 292,997 | |
| Brixton Metals Corp. #*@+ | | | 1,000,000 | | | | 111,339 | |
| Candente Gold Corp., 144A #*∆ | | | 4,875,000 | | | | 71,418 | |
| Corvus Gold, Inc. * | | | 29,000 | | | | 55,867 | |
| Dolly Varden Silver Corp. *~ | | | 8,428,000 | | | | 3,024,993 | |
| GFG Resources, Inc. * | | | 3,250,000 | | | | 488,024 | |
| Group Ten Metals, Inc. * | | | 1,044,000 | | | | 133,827 | |
| Hecla Mining Co. | | | 735,000 | | | | 1,734,600 | |
| Kootenay Silver, Inc. * | | | 1,000,000 | | | | 98,887 | |
| Liberty Gold Corp. * | | | 500,000 | | | | 111,705 | |
| Metalla Royalty & Streaming, Ltd. | | | 1,000,000 | | | | 615,294 | |
| New Pacific Metals Corp. * | | | 1,075,000 | | | | 1,141,774 | |
| Polarx, Ltd. * | | | 15,653,968 | | | | 604,063 | |
| Roxgold, Inc. * | | | 2,500,000 | | | | 1,483,299 | |
| Silver Viper Minerals Corp. * | | | 1,300,000 | | | | 80,941 | |
| SilverCrest Metals, Inc. * | | | 1,000,000 | | | | 2,922,649 | |
| Terrax Minerals, Inc. * | | | 1,000,000 | | | | 307,647 | |
| Toachi Mining, Inc. *~ | | | 4,000,000 | | | | 278,348 | |
| Toachi Mining, Inc., 144A #~∆ | | | 2,000,000 | | | | 139,174 | |
| | | | | | | | 15,915,948 | |
| | | | | | | | | |
| Retail - Jewelry 0.91% | | | | | | | | |
| Mene, Inc. * | | | 1,475,000 | | | | 648,257 | |
| | | | | | | | | |
| Silver Mining 0.45% | | | | | | | | |
| Americas Silver Corp. * | | | 100,000 | | | | 163,346 | |
| Metallic Minerals Corp. * | | | 710,000 | | | | 109,215 | |
| Santacruz Silver Mining, Ltd. * | | | 1,000,000 | | | | 43,949 | |
| | | | | | | | 316,510 | |
| | | | | | | | | |
| Total Common Stocks | | | | | | | 66,571,413 | |
| (cost $126,903,146) | | | | | | | | |
See notes to portfolios of investments and notes to financial statements.
World Precious Minerals Fund
| Portfolio of Investments | December 31, 2018 |
| Corporate Non-Convertible Bond 1.06% | | Coupon Rate % | | | Maturity Date | | Principal Amount | | | Value | |
| Electric - Generation 1.06% | | | | | | | | | | | | | | |
| | | | | | | | | | | | | | | |
| Interamerican Energy Corp. #@+ | | | 15.00 | | | 11/08/21 | | $ | 748,250 | | | $ | 748,250 | |
| (cost $748,250) | | | | | | | | | | | | | | |
| Right 0.36% | | Shares | | | | |
| Metal - Diversified 0.36% | | | | | | | | |
| Cardinal Resources, Ltd. * | | | 1,500,000 | | | | 258,849 | |
| (cost $13,109) | | | | | | | | |
| | | | | | | | | |
| Exchange Traded Funds 3.43% | | | | | | | | |
| Direxion Daily Gold Miners Index Bull 3X Shares ETF | | | 60,000 | | | | 1,050,000 | |
| Direxion Daily Junior Gold Miners Index Bull 3x Shares ETF | | | 150,000 | | | | 1,381,500 | |
| Total Exchange Traded Funds | | | | | | | 2,431,500 | |
| (cost $3,438,611) | | | | | | | | |
| Warrants 0.08% | | Exercise Price | | | Exp. Date | | | | | | |
| Diversified Minerals 0.00% | | | | | | | | | | | | | | |
| VR Resources, Ltd. #*@~ | | $ | 0.60 | | | 03/21/19 | | | 862,500 | | | | 0 | |
| | | | | | | | | | | | | | | |
| Gold Mineral Exploration & Development 0.00% | | | | | | | | | | | | | | |
| Western Exploration & Development, Ltd., 144A #*@∆ | | | 0.50 | | | 12/31/49 | | | 600,000 | | | | 0 | |
| | | | | | | | | | | | | | | |
| Gold Mining 0.08% | | | | | | | | | | | | | | |
| Alexandria Minerals Corp., 144A #*@∆ | | | 0.10 | | | 06/20/19 | | | 1,256,195 | | | | 0 | |
| Fiore Gold, Ltd. #*@ | | | 0.45 | | | 09/26/20 | | | 1,300,000 | | | | 0 | |
| Gran Colombia Gold Corp. * | | | 48.75 | | | 03/18/19 | | | 96,250 | | | | 2,291 | |
| Osisko Gold Royalties, Ltd. * | | | 36.50 | | | 02/18/22 | | | 164,658 | | | | 52,466 | |
| Redstar Gold Corp. #*@ | | | 0.14 | | | 05/03/19 | | | 2,500,000 | | | | 0 | |
| Revival Gold, Inc., 144A #*@∆ | | | 0.90 | | | 10/19/19 | | | 482,500 | | | | 0 | |
| Strikepoint Gold, Inc., 144A #*@∆ | | | 0.30 | | | 07/22/20 | | | 450,000 | | | | 0 | |
| TriStar Gold, Inc., 144A #*@~∆ | | | 0.45 | | | 04/28/19 | | | 1,000,000 | | | | 0 | |
| Westgold Resources, Ltd. * | | | 2.00 | | | 06/30/19 | | | 100,000 | | | | 951 | |
| | | | | | | | | | | | | | 55,708 | |
| | | | | | | | | | | | | | | |
| Metal - Diversified 0.00% | | | | | | | | | | | | | | |
| Genesis Metals Corp., 144A #*@∆ | | | 0.23 | | | 06/05/19 | | | 1,604,500 | | | | 0 | |
| Minera Alamos, Inc. #*@ | | | 0.15 | | | 05/13/19 | | | 2,225,000 | | | | 0 | |
| | | | | | | | | | | | | | 0 | |
See notes to portfolios of investments and notes to financial statements.
World Precious Minerals Fund
| Portfolio of Investments | December 31, 2018 |
| Warrants (cont’d) | | Exercise Price | | | Exp. Date | | Shares | | | Value | |
| Retail - Jewelry 0.00% | | | | | | | | | | | | | | |
| Mene, Inc. #*@ | | $ | 1.00 | | | 11/29/20 | | | 465,000 | | | $ | 0 | |
| Total Warrants | | | | | | | | | | | | | 55,708 | |
| (cost $540,574) | | | | | | | | | | | | | | |
| Call Options Purchased 0.33% | | Strike Price | | | Exp. Date | | | Notional Contract Value | | | Contracts | | | Value | |
| Gold Mining 0.14% | | | | | | | | | | | | | | | | | | | | |
| Pretium Resources, Inc. | | $ | 8.00 | | | | 03/19 | | | $ | 680,000 | | | | 850 | | | | 97,750 | |
| | | | | | | | | | | | | | | | | | | | | |
| Precious Metals 0.19% | | | | | | | | | | | | | | | | | | | | |
| Wheaton Precious Metals Corp. | | | 20.00 | | | | 03/19 | | | | 2,500,000 | | | | 1,250 | | | | 140,000 | |
| Total Purchased Call Options | | | | | | | | | | | | | | | | | | | 237,750 | |
| (premiums paid $224,320) | | | | | | | | | | | | | | | | | | | | |
| | | | | | | | | | | | | | | | | | | | | |
| Investments, at value 99.21% | | | | | | | | | | | | | | | | | | | 70,303,470 | |
| (cost $131,868,010) | | | | | | | | | | | | | | | | | | | | |
| Other assets and liabilities, net 0.79% | | | | | | | | | | | | | | | | | | | 557,417 | |
| | | | | | | | | | | | | | | | | | | | | |
| Net Assets 100.00% | | | | | | | | | | | | | | | | | | $ | 70,860,887 | |
See notes to portfolios of investments and notes to financial statements.
| Gold and Precious Metals Fund | |
| Portfolio of Investments | December 31, 2018 |
| Common Stocks 90.09% | | Shares | | | Value | |
| Diversified Minerals 0.13% | | | | | | | | |
| Mako Mining Corp. * | | | 862,400 | | | $ | 107,389 | |
| | | | | | | | | |
| Gold Mining 63.86% | | | | | | | | |
| Acacia Mining PLC * | | | 700,000 | | | | 1,635,599 | |
| Agnico Eagle Mines, Ltd. | | | 35,000 | | | | 1,414,000 | |
| Alacer Gold Corp. * | | | 500,000 | | | | 922,942 | |
| Alamos Gold, Inc. | | | 350,000 | | | | 1,260,000 | |
| Alio Gold, Inc. * | | | 740,000 | | | | 623,352 | |
| Argonaut Gold, Inc. * | | | 500,000 | | | | 571,345 | |
| B2Gold Corp. * | | | 150,000 | | | | 438,000 | |
| Beadell Resources, Ltd. * | | | 4,000,000 | | | | 144,023 | |
| Bonterra Resources, Inc. * | | | 150,000 | | | | 284,574 | |
| Centamin PLC | | | 650,000 | | | | 904,422 | |
| Centerra Gold, Inc. * | | | 300,000 | | | | 1,287,723 | |
| Cia de Minas Buenaventura SAA, ADR | | | 50,000 | | | | 811,000 | |
| Comstock Mining, Inc. * | | | 924,329 | | | | 122,936 | |
| Dundee Precious Metals, Inc. * | | | 550,000 | | | | 1,450,337 | |
| Eldorado Gold Corp. * | | | 250,000 | | | | 720,000 | |
| Gold Fields, Ltd., ADR | | | 250,000 | | | | 880,000 | |
| Golden Star Resources, Ltd. * | | | 600,000 | | | | 1,890,000 | |
| Harmony Gold Mining Co., Ltd., ADR * | | | 500,000 | | | | 895,000 | |
| Harte Gold Corp. * | | | 1,500,000 | | | | 423,015 | |
| IAMGOLD Corp. * | | | 250,000 | | | | 920,000 | |
| Intermin Resources, Ltd. * | | | 2,000,000 | | | | 182,817 | |
| Jaguar Mining, Inc. * | | | 7,205,000 | | | | 1,108,299 | |
| K92 Mining, Inc. * | | | 1,650,000 | | | | 1,015,236 | |
| Leagold Mining Corp. * | | | 1,680,000 | | | | 2,128,919 | |
| Newmont Mining Corp. | | | 25,000 | | | | 866,250 | |
| Northern Star Resources, Ltd. | | | 600,000 | | | | 3,916,539 | |
| Osisko Gold Royalties, Ltd. | | | 100,000 | | | | 876,794 | |
| Pantoro, Ltd. * | | | 3,000,000 | | | | 422,265 | |
| Premier Gold Mines, Ltd. * | | | 1,000,000 | | | | 1,179,314 | |
| Resolute Mining, Ltd. | | | 2,000,000 | | | | 1,628,858 | |
| Sandstorm Gold, Ltd. * | | | 600,000 | | | | 2,766,000 | |
| Silver Lake Resources, Ltd. * | | | 3,000,000 | | | | 1,175,986 | |
| St Barbara, Ltd. | | | 2,250,000 | | | | 7,452,777 | |
| Superior Gold, Inc. * | | | 1,750,000 | | | | 1,076,765 | |
| Teranga Gold Corp. * | | | 375,000 | | | | 1,106,981 | |
| TMAC Resources, Inc. * | | | 100,000 | | | | 502,490 | |
| Wesdome Gold Mines, Ltd. * | | | 2,450,000 | | | | 7,950,117 | |
| Westgold Resources, Ltd. * | | | 1,000,000 | | | | 619,793 | |
| Yamana Gold, Inc. | | | 600,000 | | | | 1,416,000 | |
| | | | | | | | 54,990,468 | |
| | | | | | | | | |
| Medical - Hospitals 0.00% | | | | | | |
| African Medical Investments PLC #*@ | | | 2,000,000 | | | | 0 | |
See notes to portfolios of investments and notes to financial statements.
| Gold and Precious Metals Fund | |
| Portfolio of Investments | December 31, 2018 |
| Common Stocks (cont’d) | Shares | Value |
| Metals & Mining 0.66% | | | | | | |
| North American Palladium, Ltd. #*@+ | | | 75,000 | | | $ | 563,132 | |
| | | | | | | | | |
| Mining Services 0.10% | | | | | | | | |
| Havilah Mining Corp. * | | | 406,250 | | | | 86,297 | |
| | | | | | | | | |
| Non - Ferrous Metals 0.83% | | | | | | | | |
| Energy Fuels, Inc. * | | | 250,000 | | | | 712,500 | |
| | | | | | | | | |
| Precious Metals 15.19% | | | | | | | | |
| Coeur Mining, Inc. * | | | 145,225 | | | | 649,156 | |
| EMX Royalty Corp. * | | | 1,008,500 | | | | 1,115,467 | |
| Hecla Mining Co. | | | 900,000 | | | | 2,124,000 | |
| Maverix Metals, Inc. * | | | 1,500,000 | | | | 2,658,951 | |
| Metalla Royalty & Streaming, Ltd. | | | 750,000 | | | | 461,471 | |
| Roxgold, Inc. * | | | 2,500,000 | | | | 1,483,299 | |
| Sailfish Royalty Corp. * | | | 300,000 | | | | 217,550 | |
| SSR Mining, Inc. * | | | 200,000 | | | | 2,418,000 | |
| Wheaton Precious Metals Corp. | | | 100,000 | | | | 1,953,000 | |
| | | | | | | | 13,080,894 | |
| Recycling 0.65% | | | | | | | | |
| Tomra Systems ASA | | | 25,000 | | | | 563,036 | |
| | | | | | | | | |
| Retail - Jewelry 2.94% | | | | | | | | |
| Mene, Inc. * | | | 50,000 | | | | 21,975 | |
| Mene, Inc., 144A #∆ | | | 5,714,285 | | | | 2,511,406 | |
| | | | | | | | 2,533,381 | |
| | | | | | | | | |
| Silver Mining 5.73% | | | | | | | | |
| Americas Silver Corp. * | | | 250,000 | | | | 408,365 | |
| Excellon Resources, Inc. * | | | 850,700 | | | | 429,961 | |
| Great Panther Silver, Ltd. * | | | 750,000 | | | | 532,500 | |
| Pan American Silver Corp. | | | 150,000 | | | | 2,190,000 | |
| Santacruz Silver Mining, Ltd. * | | | 2,500,000 | | | | 109,874 | |
| Silvercorp Metals, Inc. | | | 600,000 | | | | 1,260,000 | |
| | | | | | | | 4,930,700 | |
| Total Common Stocks | | | | | | | 77,567,797 | |
| (cost $81,088,517) | | | | | | | | |
| Corporate Non-Convertible Bonds 0.33% | | | Coupon
Rate % | | | Maturity
Date | | | Principal
Amount | | | | | |
| Coal 0.00% | | | | | | | | | | | | | | |
| Caribbean Resources Corp. #@^ | | | 19.25 | | | 06/15/15 | | $ | 485,766 | | | | 0 | |
See notes to portfolios of investments and notes to financial statements.
| Gold and Precious Metals Fund | |
| Portfolio of Investments | December 31, 2018 |
| Corporate Non-Convertible Bonds (cont’d) | | Coupon
Rate % | | | Maturity
Date | | Principal
Amount | | | Value | |
| Electric - Generation 0.33% | | | | | | | | | | | | | | |
| | | | | | | | | | | | | | | |
| Interamerican Energy Corp. #@+ | | | 15.00 | | | 11/08/21 | | $ | 280,594 | | | $ | 280,594 | |
| Total Corporate Non-Convertible Bonds | | | | | | | | | | | | | 280,594 | |
| (cost $766,360) | | | | | | | | | | | | | | |
| | | | | | | | | | | | | | | |
| Exchange Traded Funds 5.72% | | | | | | | | | Shares | | | | | |
| Direxion Daily Gold Miners Index Bull 3X Shares ETF | | | | | | | | | 150,000 | | | | 2,625,000 | |
| Direxion Daily Junior Gold Miners Index Bull 3x Shares ETF | | | | | | | | | 250,000 | | | | 2,302,500 | |
| Total Exchange Traded Funds | | | | | | | | | | | | | 4,927,500 | |
| (cost $5,639,556) | | | | | | | | | | | | | | |
| Warrants 0.05% | | Exercise
Price | | | Exp.
Date | | | | | | |
| Gold Mining 0.05% | | | | | | | | | | | | | | |
| Alio Gold, Inc., 144A #*@∆ | | $ | 3.44 | | | 01/31/20 | | | 240,000 | | | | 0 | |
| Gran Colombia Gold Corp. * | | | 48.75 | | | 03/18/19 | | | 37,500 | | | | 893 | |
| Osisko Gold Royalties, Ltd. * | | | 36.50 | | | 02/18/22 | | | 123,242 | | | | 39,269 | |
| Westgold Resources, Ltd. * | | | 2.00 | | | 06/30/19 | | | 500,000 | | | | 4,755 | |
| | | | | | | | | | | | | | 44,917 | |
| | | | | | | | | | | | | | | |
| Retail - Jewelry 0.00% | | | | | | | | | | | | | | |
| Mene, Inc., 144A #*@∆ | | | 0.70 | | | 12/29/19 | | | 5,714,285 | | | | 0 | |
| Total Warrants | | | | | | | | | | | | | 44,917 | |
| (cost $180,063) | | | | | | | | | | | | | | |
| Call Options Purchased 0.36% | | Strike
Price | | | Exp.
Date | | | Notional
Contract
Value | | | Contracts | | | Value | |
| Gold Mining 0.13% | | | | | | | | | | | | | | | | | | | | |
| Pretium Resources, Inc. | | $ | 8.00 | | | | 03/19 | | | $ | 800,000 | | | | 1,000 | | | | 115,000 | |
| | | | | | | | | | | | | | | | | | | | | |
| Precious Metals 0.23% | | | | | | | | | | | | | | | | | | | | |
| Wheaton Precious Metals Corp. | | | 20.00 | | | | 03/19 | | | | 3,500,000 | | | | 1,750 | | | | 196,000 | |
| Total Purchased Call Options | | | | | | | | | | | | | | | | | | | 311,000 | |
| (premiums paid $293,638) | | | | | | | | | | | | | | | | | | | | |
| | | | | | | | | | | | | | | | | | | | | |
| Investments, at value 96.55% | | | | | | | | | | | | | | | | | | | 83,131,808 | |
| (cost $87,968,134) | | | | | | | | | | | | | | | | | | | | |
| Other assets and liabilities, net 3.45% | | | | | | | | | | | | | | | | | | | 2,974,582 | |
| | | | | | | | | | | | | | | | | | | | | |
| Net Assets 100.00% | | | | | | | | | | | | | | | | | | $ | 86,106,390 | |
See notes to portfolios of investments and notes to financial statements.
Emerging Europe Fund
| Portfolio of Investments | December 31, 2018 |
| Common Stocks 90.69% | | Shares | | | Value | |
| | | | | | | |
| Agricultural Operations 0.90% | | | | | | | | |
| Kernel Holding SA | | | 21,300 | | | $ | 278,938 | |
| | | | | | | | | |
| Airlines 7.39% | | | | | | | | |
| Aegean Airlines SA | | | 47,000 | | | | 397,514 | |
| Aeroflot PJSC | | | 328,000 | | | | 475,196 | |
| Deutsche Lufthansa AG | | | 18,350 | | | | 414,408 | |
| easyJet PLC | | | 24,000 | | | | 338,180 | |
| Pegasus Hava Tasimaciligi AS * | | | 45,000 | | | | 194,246 | |
| Ryanair Holdings PLC, ADR * | | | 2,070 | | | | 147,674 | |
| Turk Hava Yollari AO * | | | 53,000 | | | | 160,851 | |
| Wizz Air Holdings PLC * | | | 4,910 | | | | 175,415 | |
| | | | | | | | 2,303,484 | |
| | | | | | | | | |
| Appliances 0.43% | | | | | | | | |
| Vestel Beyaz Esya Sanayi ve Ticaret AS | | | 58,670 | | | | 133,291 | |
| | | | | | | | | |
| Automotive - Cars & Light Trucks 1.97% | | | | | | | | |
| Ford Otomotiv Sanayi AS | | | 41,200 | | | | 388,669 | |
| Tofas Turk Otomobil Fabrikasi AS | | | 70,750 | | | | 225,835 | |
| | | | | | | | 614,504 | |
| | | | | | | | | |
| Automotive - Medium & Heavy Duty Trucks 0.29% | | | | | | | | |
| Otokar Otomotiv Ve Savunma Sanayi A.S. | | | 5,370 | | | | 89,534 | |
| | | | | | | | | |
| Automotive/Truck Parts & Equipment - Original 0.51% | | | | | | | | |
| Brembo SpA | | | 15,650 | | | | 159,721 | |
| | | | | | | | | |
| Beverages - Non-alcoholic 0.40% | | | | | | | | |
| Coca-Cola Icecek AS | | | 21,500 | | | | 125,234 | |
| | | | | | | | | |
| Building & Construction Products - Miscellaneous 0.39% | | | | | | | | |
| Enka Insaat ve Sanayi AS | | | 139,000 | | | | 120,334 | |
| | | | | | | | | |
| Cellular Telecommunication 1.30% | | | | | | | | |
| Mobile TeleSystems PJSC, ADR | | | 19,200 | | | | 134,400 | |
| PLAY Communications SA | | | 24,000 | | | | 134,106 | |
| Turkcell Iletisim Hizmetleri AS | | | 59,500 | | | | 136,441 | |
| | | | | | | | 404,947 | |
| | | | | | | | | |
| Chemicals - Diversified 0.88% | | | | | | | | |
| Ciech SA | | | 23,100 | | | | 273,713 | |
| | | | | | | | | |
| Coal 1.11% | | | | | | | | |
| Jastrzebska Spolka Weglowa SA * | | | 19,200 | | | | 347,133 | |
See notes to portfolios of investments and note to financial statments.
Emerging Europe Fund
| Portfolio of Investments | December 31, 2018 |
| Common Stocks (cont’d) | | Shares | | | Value | |
| | | | | | | |
| Commercial Banks Non-US 16.04% | | | | | | | | |
| Akbank T.A.S. | | | 212,000 | | | $ | 273,493 | |
| Alior Bank SA * | | | 6,500 | | | | 92,545 | |
| Alpha Bank AE * | | | 185,700 | | | | 233,583 | |
| Banca Transilvania SA | | | 694,465 | | | | 342,517 | |
| Bank Polska Kasa Opieki SA | | | 10,250 | | | | 298,831 | |
| National Bank of Greece SA * | | | 72,800 | | | | 91,620 | |
| OTP Bank PLC | | | 10,900 | | | | 440,503 | |
| Piraeus Bank SA * | | | 36,000 | | | | 34,618 | |
| Powszechna Kasa Oszczednosci Bank Polski SA | | | 29,250 | | | | 308,984 | |
| Santander Bank Polska SA | | | 2,000 | | | | 192,233 | |
| Sberbank of Russia PJSC, ADR | | | 220,700 | | | | 2,418,872 | |
| Turkiye Garanti Bankasi AS | | | 101,000 | | | | 151,387 | |
| Yapi ve Kredi Bankasi AS * | | | 385,000 | | | | 116,249 | |
| | | | | | | | 4,995,435 | |
| | | | | | | | | |
| Computer Services 0.95% | | | | | | | | |
| Asseco Poland SA | | | 24,000 | | | | 296,094 | |
| | | | | | | | | |
| Cosmetics & Toiletries 0.54% | | | | | | | | |
| Unilever PLC | | | 3,200 | | | | 168,009 | |
| | | | | | | | | |
| Diamonds/Precious Stones 0.60% | | | | | | | | |
| Alrosa PJSC | | | 132,000 | | | | 185,938 | |
| | | | | | | | | |
| Diversified Operations 1.27% | | | | | | | | |
| Tekfen Holding AS | | | 101,000 | | | | 394,499 | |
| | | | | | | | | |
| Electric - Distribution 1.05% | | | | | | | | |
| Enea SA * | | | 123,000 | | | | 325,965 | |
| | | | | | | | | |
| Electric - Generation 0.94% | | | | | | | | |
| Inter RAO UES PJSC | | | 5,301,000 | | | | 294,244 | |
| | | | | | | | | |
| Electric - Integrated 0.90% | | | | | | | | |
| PGE Polska Grupa Energetyczna SA * | | | 105,000 | | | | 281,545 | |
| | | | | | | | | |
| Energy - Alternate Sources 0.13% | | | | | | | | |
| Blockchain Power Trust * | | | 525,000 | | | | 40,379 | |
| | | | | | | | | |
| Food - Retail 2.24% | | | | | | | | |
| BIM Birlesik Magazalar AS | | | 5,750 | | | | 94,516 | |
| Dino Polska SA * | | | 6,650 | | | | 170,772 | |
| Magnit PJSC, GDR | | | 7,500 | | | | 95,451 | |
| Migros Ticaret AS * | | | 60,500 | | | | 170,203 | |
| X5 Retail Group NV, GDR | | | 6,700 | | | | 166,228 | |
| | | | | | | | 697,170 | |
See notes to portfolios of investments and note to financial statments.
Emerging Europe Fund
| Portfolio of Investments | December 31, 2018 |
| Common Stocks (cont’d) | | Shares | | | Value | |
| | | | | | | |
| Food - Wholesale/Distribution 1.42% | | | | | | | | |
| Eurocash SA | | | 93,500 | | | $ | 440,961 | |
| | | | | | | | | |
| Gold Mining 0.42% | | | | | | | | |
| Alacer Gold Corp. * | | | 40,000 | | | | 73,835 | |
| Eldorado Gold Corp. * | | | 20,000 | | | | 57,600 | |
| | | | | | | | 131,435 | |
| | | | | | | | | |
| Machinery - Farm 0.47% | | | | | | | | |
| Turk Traktor ve Ziraat Makineleri AS | | | 22,000 | | | | 144,949 | |
| | | | | | | | | |
| Metal - Diversified 0.74% | | | | | | | | |
| MMC Norilsk Nickel PJSC, ADR | | | 7,750 | | | | 146,010 | |
| Orsu Metals Corp., 144A #*∆ | | | 402,500 | | | | 85,500 | |
| | | | | | | | 231,510 | |
| | | | | | | | | |
| Metal - Iron 1.60% | | | | | | | | |
| Novolipetsk Steel PJSC, GDR | | | 21,800 | | | | 499,699 | |
| | | | | | | | | |
| Miscellaneous Manufacturing 0.66% | | | | | | | | |
| Trakya Cam Sanayii AS | | | 359,251 | | | | 205,524 | |
| | | | | | | | | |
| Multi-line Insurance 1.03% | | | | | | | | |
| Allianz SE | | | 1,590 | | | | 319,519 | |
| | | | | | | | | |
| Oil Companies - Exploration & Production 1.09% | | | | | | | | |
| Novatek PJSC, GDR | | | 985 | | | | 166,465 | |
| Societatea Nationala de Gaze Naturale ROMGAZ SA | | | 25,350 | | | | 173,766 | |
| | | | | | | | 340,231 | |
| | | | | | | | | |
| Oil Companies - Integrated 22.63% | | | | | | | | |
| Gazprom Neft PJSC, ADR | | | 1,550 | | | | 39,339 | |
| Gazprom PJSC, ADR | | | 379,000 | | | | 1,677,953 | |
| LUKOIL PJSC, ADR | | | 45,500 | | | | 3,245,970 | |
| MOL Hungarian Oil & Gas PLC | | | 51,010 | | | | 559,803 | |
| OMV Petrom SA | | | 3,780,000 | | | | 278,327 | |
| Polskie Gornictwo Naftowe i Gazownictwo SA | | | 159,500 | | | | 294,911 | |
| Surgutneftegas OJSC, ADR | | | 50,000 | | | | 188,000 | |
| Tatneft PJSC, ADR | | | 12,050 | | | | 765,175 | |
| | | | | | | | 7,049,478 | |
| | | | | | | | | |
| Oil Refining & Marketing 2.55% | | | | | | | | |
| Aygaz AS | | | 53,000 | | | | 113,368 | |
| Grupa Lotos SA | | | 11,150 | | | | 264,177 | |
| Motor Oil Hellas Corinth Refineries SA | | | 13,100 | | | | 315,468 | |
| Polski Koncern Naftowy ORLEN SA | | | 3,550 | | | | 102,857 | |
| | | | | | | | 795,870 | |
See notes to portfolios of investments and note to financial statments.
Emerging Europe Fund
| Portfolio of Investments | December 31, 2018 |
| Common Stocks (cont’d) | | Shares | | | Value | |
| | | | | | | |
| Property/Casualty Insurance 1.16% | | | | | | | | |
| Powszechny Zaklad Ubezpieczen SA | | | 30,750 | | | $ | 362,284 | |
| | | | | | | | | |
| Recreational Centers 0.59% | | | | | | | | |
| Benefit Systems SA * | | | 812 | | | | 183,781 | |
| | | | | | | | | |
| Regional Banks - Non US 1.50% | | | | | | | | |
| TCS Group Holding PLC, GDR | | | 30,000 | | | | 465,929 | |
| | | | | | | | | |
| Retail - Jewelry 0.24% | | | | | | | | |
| Pandora A/S | | | 1,815 | | | | 74,097 | |
| | | | | | | | | |
| Retail - Major Dept Store 1.52% | | | | | | | | |
| Detsky Mir PJSC | | | 365,000 | | | | 474,269 | |
| | | | | | | | | |
| Steel - Producers 6.33% | | | | | | | | |
| Eregli Demir ve Celik Fabrikalari TAS | | | 207,500 | | | | 282,111 | |
| Evraz PLC | | | 81,800 | | | | 500,901 | |
| Kardemir Karabuk Demir Celik Sanayi ve Ticaret AS * | | | 215,000 | | | | 88,451 | |
| Magnitogorsk Iron & Steel Works PJSC, GDR | | | 58,600 | | | | 487,205 | |
| Mechel PJSC, ADR * | | | 78,000 | | | | 154,440 | |
| Severstal PJSC, GDR | | | 33,800 | | | | 459,403 | |
| | | | | | | | 1,972,511 | |
| | | | | | | | | |
| Telecom Services 0.90% | | | | | | | | |
| O2 Czech Republic AS | | | 12,600 | | | | 135,468 | |
| Turk Telekomunikasyon AS * | | | 198,200 | | | | 145,872 | |
| | | | | | | | 281,340 | |
| | | | | | | | | |
| Telephone - Integrated 0.91% | | | | | | | | |
| Magyar Telekom Telecommunications PLC | | | 181,000 | | | | 284,677 | |
| | | | | | | | | |
| Textile - Apparel 0.61% | | | | | | | | |
| LPP SA | | | 91 | | | | 191,326 | |
| | | | | | | | | |
| Tobacco 0.53% | | | | | | | | |
| Philip Morris CR AS | | | 265 | | | | 165,813 | |
| | | | | | | | | |
| Transportation - Rail 1.70% | | | | | | | | |
| Globaltrans Investment PLC, GDR | | | 58,399 | | | | 528,298 | |
| | | | | | | | | |
| Transportation - Services 1.14% | | | | | | | | |
| Oesterreichische Post AG | | | 10,300 | | | | 353,943 | |
| | | | | | | | | |
| Travel Services 0.34% | | | | | | | | |
| TUI AG | | | 7,400 | | | | 106,358 | |
See notes to portfolios of investments and note to financial statments.
Emerging Europe Fund
| Portfolio of Investments | December 31, 2018 |
| Common Stocks (cont’d) | | Shares | | | Value | |
| | | | | | | |
| Warehousing & Harbor Transportation Services 0.38% | | | | | | | | |
| Tallinna Sadam AS * | | | 50,000 | | | $ | 116,903 | |
| | | | | | | | | |
| Total Common Stocks | | | | | | | 28,250,816 | |
| (cost $30,351,977) | | | | | | | | |
| | | | | | | | | |
| Exchange Traded Funds 1.60% | | | | | | | | |
| Direxion Daily Russia Bull 3x Shares ETF | | | 10,500 | | | | 313,005 | |
| iShares MSCI Poland Capped ETF | | | 8,000 | | | | 184,240 | |
| | | | | | | | | |
| Total Exchange Traded Funds | | | | | | | 497,245 | |
| (cost $513,105) | | | | | | | | |
| Warrant 0.00% | | Exercise Price | | | Exp. Date | | | | | | |
| | | | | | | | | | | | |
| Energy - Alternate Sources 0.00% | | | | | | | | | | | | | | |
| Blockchain Power Trust #*@ | | $ | 0.80 | | | 01/09/20 | | | 262,500 | | | | 0 | |
| (cost $0) | | | | | | | | | | | | | | |
| | | | | | | | | | | | | | | |
| Investments, at value 92.29% | | | | | | | | | | | | | 28,748,061 | |
| (cost $30,865,082) | | | | | | | | | | | | | | |
| Other assets and liabilities, net 7.71% | | | | | | | | | | | | | 2,401,961 | |
| | | | | | | | | | | | | | | |
| Net Assets 100.00% | | | | | | | | | | | | $ | 31,150,022 | |
See notes to portfolios of investments and note to financial statements.
| China Region Fund | |
| Portfolio of Investments | December 31, 2018 |
| Common Stocks 83.50% | | Shares | | Value |
| | | | | |
| Agricultural Operations 0.43% | | | | | | | | |
| First Resources, Ltd. | | | 50,000 | | | $ | 56,653 | |
| | | | | | | | | |
| Airlines 1.35% | | | | | | | | |
| AirAsia Bhd | | | 250,000 | | | | 179,212 | |
| | | | | | | | | |
| Appliances 0.59% | | | | | | | | |
| Haier Electronics Group Co., Ltd. | | | 32,000 | | | | 78,706 | |
| | | | | | | | | |
| Automotive - Cars & Light Trucks 1.24% | | | | | | | | |
| BAIC Motor Corp., Ltd. | | | 23,000 | | | | 12,167 | |
| Geely Automobile Holdings, Ltd. | | | 86,000 | | | | 151,668 | |
| | | | | | | | 163,835 | |
| | | | | | | | | |
| Automotive - Medium & Heavy Duty Trucks 4.72% | | | | | | | | |
| Sinotruk Hong Kong, Ltd. | | | 415,000 | | | | 625,659 | |
| | | | | | | | | |
| Automotive/Truck Parts & Equipment - Original 0.44% | | | | | | | | |
| Fuyao Glass Industry Group Co., Ltd. | | | 18,400 | | | | 58,911 | |
| | | | | | | | | |
| Automotive/Truck Parts & Equipment - Replacement 3.25% | | | | | | | | |
| Weichai Power Co., Ltd. | | | 376,000 | | | | 430,467 | |
| | | | | | | | | |
| Batteries/Battery Systems 1.40% | | | | | | | | |
| Tianneng Power International, Ltd. | | | 222,000 | | | | 185,113 | |
| | | | | | | | | |
| Building - Heavy Construction 0.24% | | | | | | | | |
| DMCI Holdings, Inc. | | | 133,200 | | | | 32,364 | |
| | | | | | | | | |
| Building & Construction Products - Miscellaneous 1.23% | | | | | | | | |
| China National Building Material Co., Ltd. | | | 18,000 | | | | 12,317 | |
| HDC Holdings Co., Ltd. | | | 267 | | | | 4,126 | |
| HDC Hyundai Development Co.-Engineering & Construction * | | | 374 | | | | 16,198 | |
| IS Dongseo Co., Ltd. | | | 4,743 | | | | 130,290 | |
| | | | | | | | 162,931 | |
| | | | | | | | | |
| Building Products - Cement 2.70% | | | | | | | | |
| Anhui Conch Cement Co., Ltd. | | | 71,000 | | | | 343,340 | |
| West China Cement, Ltd. | | | 110,000 | | | | 14,919 | |
| | | | | | | | 358,259 | |
| | | | | | | | | |
| Casino Hotels 1.10% | | | | | | | | |
| Wynn Macau, Ltd. | | | 66,800 | | | | 145,415 | |
| | | | | | | | | |
| Chemicals - Diversified 0.52% | | | | | | | | |
| Dongyue Group, Ltd. | | | 24,000 | | | | 12,378 | |
| Huchems Fine Chemical Corp. | | | 707 | | | | 15,226 | |
| Kumho Petrochemical Co., Ltd. * | | | 190 | | | | 14,876 | |
See notes to portfolios of investments and notes to financial statements.
| China Region Fund | |
| Portfolio of Investments | December 31, 2018 |
| Common Stocks (cont’d) | | Shares | | Value |
| | | | | |
| Chemicals - Diversified (cont’d) | | | | | | | | |
| PTT Global Chemical PCL, NVDR | | | 12,200 | | | $ | 26,731 | |
| | | | | | | | 69,211 | |
| | | | | | | | | |
| Chemicals - Specialty 0.10% | | | | | | | | |
| Huabao International Holdings, Ltd. | | | 32,000 | | | | 13,565 | |
| | | | | | | | | |
| Coal 1.13% | | | | | | | | |
| Indo Tambangraya Megah Tbk PT | | | 106,000 | | | | 149,492 | |
| | | | | | | | | |
| Consumer Products - Miscellaneous 0.00% | | | | | | | | |
| Tongda Hong Tai Holdings, Ltd. * | | | 2,000 | | | | 317 | |
| | | | | | | | | |
| Containers - Paper/Plastic 0.13% | | | | | | | | |
| Lee & Man Paper Manufacturing, Ltd. | | | 20,000 | | | | 16,926 | |
| | | | | | | | | |
| Distribution/Wholesale 0.21% | | | | | | | | |
| Crystal International Group, Ltd. | | | 55,000 | | | | 27,906 | |
| | | | | | | | | |
| Electronic Components - Miscellaneous 0.08% | | | | | | | | |
| Yageo Corp. | | | 1,000 | | | | 10,358 | |
| | | | | | | | | |
| Electronic Components - Semiconductors 0.53% | | | | | | | | |
| Sino-American Silicon Products, Inc. | | | 14,000 | | | | 27,848 | |
| SK Hynix, Inc. | | | 767 | | | | 41,814 | |
| | | | | | | | 69,662 | |
| | | | | | | | | |
| Electronic Measuring Instruments 0.09% | | | | | | | | |
| Chroma ATE, Inc. | | | 3,000 | | | | 11,530 | |
| | | | | | | | | |
| Enterprise Software/Services 0.87% | | | | | | | | |
| Sinosoft Technology Group, Ltd. | | | 442,000 | | | | 114,937 | |
| | | | | | | | | |
| Entertainment Software 1.50% | | | | | | | | |
| IGG, Inc. | | | 145,000 | | | | 198,847 | |
| | | | | | | | | |
| Food - Flour & Grain 0.38% | | | | | | | | |
| Tingyi Cayman Islands Holding Corp. | | | 38,000 | | | | 50,894 | |
| | | | | | | | | |
| Food - Miscellaneous/Diversified 3.32% | | | | | | | | |
| Yihai International Holding, Ltd. | | | 181,000 | | | | 440,576 | |
| | | | | | | | | |
| Gas - Distribution 0.18% | | | | | | | | |
| China Resources Gas Group, Ltd. | | | 6,000 | | | | 23,775 | |
| | | | | | | | | |
| Gold Mining 3.48% | | | | | | | | |
| Zijin Mining Group Co., Ltd., H Shares | | | 1,218,000 | | | | 461,583 | |
See notes to portfolios of investments and notes to financial statements.
| China Region Fund | |
| Portfolio of Investments | December 31, 2018 |
| Common Stocks (cont’d) | | Shares | | Value |
| | | | | |
| Internet Content - Entertainment 2.12% | | | | | | | | |
| NCSoft Corp. | | | 670 | | | $ | 280,844 | |
| | | | | | | | | |
| Investment Management/Advisory Services 0.13% | | | | | | | | |
| Value Partners Group, Ltd. | | | 25,000 | | | | 17,359 | |
| | | | | | | | | |
| Life/Health Insurance 2.82% | | | | | | | | |
| New China Life Insurance Co., Ltd. | | | 94,200 | | | | 373,780 | |
| | | | | | | | | |
| Machinery - Construction & Mining 0.35% | | | | | | | | |
| United Tractors Tbk PT | | | 24,000 | | | | 45,690 | |
| | | | | | | | | |
| Medical - Drugs 0.39% | | | | | | | | |
| Luye Pharma Group, Ltd. | | | 19,000 | | | | 13,224 | |
| SSY Group, Ltd. | | | 34,000 | | | | 25,228 | |
| YiChang HEC ChangJiang Pharmaceutical Co., Ltd. | | | 3,800 | | | | 12,700 | |
| | | | | | | | 51,152 | |
| | | | | | | | | |
| Multi-line Insurance 7.17% | | | | | | | | |
| China Taiping Insurance Holdings Co., Ltd. | | | 92,200 | | | | 253,493 | |
| Ping An Insurance Group Co. of China, Ltd., H shares | | | 79,000 | | | | 696,939 | |
| | | | | | | | 950,432 | |
| | | | | | | | | |
| Non-Ferrous Metals 0.13% | | | | | | | | |
| Sterling Group Ventures, Inc., 144A #*∆ | | | 500,000 | | | | 17,500 | |
| | | | | | | | | |
| Oil Companies - Exploration & Production 8.17% | | | | | | | | |
| CNOOC, Ltd., ADR | | | 3,900 | | | | 594,555 | |
| Kunlun Energy Co., Ltd. | | | 460,000 | | | | 488,743 | |
| | | | | | | | 1,083,298 | |
| | | | | | | | | |
| Oil Companies - Integrated 4.60% | | | | | | | | |
| China Petroleum & Chemical Corp., ADR | | | 350 | | | | 24,710 | |
| PetroChina Co., Ltd., ADR | | | 9,500 | | | | 584,725 | |
| | | | | | | | 609,435 | |
| | | | | | | | | |
| Oil Refining & Marketing 2.27% | | | | | | | | |
| Formosa Petrochemical Corp. | | | 44,000 | | | | 156,135 | |
| SK Innovation Co., Ltd. | | | 763 | | | | 122,472 | |
| Thai Oil PCL, NVDR | | | 11,200 | | | | 22,763 | |
| | | | | | | | 301,370 | |
| | | | | | | | | |
| Paper & Related Products 0.13% | | | | | | | | |
| Nine Dragons Paper Holdings, Ltd. | | | 18,000 | | | | 16,628 | |
See notes to portfolios of investments and notes to financial statements.
| China Region Fund | |
| Portfolio of Investments | December 31, 2018 |
| Common Stocks (cont’d) | | Shares | | Value |
| | | | | |
| Petrochemicals 1.10% | | | | | | | | |
| IRPC PCL, NVDR | | | 250,000 | | | $ | 44,161 | |
| Lotte Chemical Corp. | | | 61 | | | | 15,166 | |
| Sinopec Shanghai Petrochemical Co., Ltd., ADR | | | 2,000 | | | | 86,320 | |
| | | | | | | | 145,647 | |
| | | | | | | | | |
| Property/Casualty Insurance 0.84% | | | | | | | | |
| PICC Property & Casualty Co., Ltd., H shares | | | 109,500 | | | | 111,730 | |
| | | | | | | | | |
| Real Estate Management/Services 2.64% | | | | | | | | |
| China Overseas Property Holdings, Ltd. | | | 1,140,000 | | | | 332,983 | |
| Colour Life Services Group Co., Ltd. * | | | 31,000 | | | | 16,568 | |
| | | | | | | | 349,551 | |
| | | | | | | | | |
| Real Estate Operating/Development 9.01% | | | | | | | | |
| China Vanke Co., Ltd., H Shares | | | 31,000 | | | | 104,986 | |
| Country Garden Holdings Co., Ltd. | | | 441,000 | | | | 535,509 | |
| Country Garden Services Holdings Co., Ltd. * | | | 97,586 | | | | 154,502 | |
| Guangzhou R&F Properties Co., Ltd., H shares | | | 10,000 | | | | 15,132 | |
| Longfor Properties Co., Ltd. | | | 90,000 | | | | 267,670 | |
| Road King Infrastructure, Ltd. | | | 19,000 | | | | 33,776 | |
| Sunac China Holdings, Ltd. | | | 5,000 | | | | 16,227 | |
| Yuzhou Properties Co., Ltd. | | | 160,000 | | | | 66,033 | |
| | | | | | | | 1,193,835 | |
| | | | | | | | | |
| Retail - Apparel/Shoe 0.22% | | | | | | | | |
| ANTA Sports Products, Ltd. | | | 3,000 | | | | 14,362 | |
| China Lilang, Ltd. | | | 17,000 | | | | 14,285 | |
| | | | | | | | 28,647 | |
| | | | | | | | | |
| Retail - Regional Dept Store 0.22% | | | | | | | | |
| Golden Eagle Retail Group, Ltd. | | | 27,000 | | | | 28,841 | |
| | | | | | | | | |
| Semiconductor Components - Integrated Circuit 0.24% | | | | | | | | |
| Nanya Technology Corp. | | | 18,000 | | | | 32,235 | |
| | | | | | | | | |
| Shipbuilding 1.59% | | | | | | | | |
| Yangzijiang Shipbuilding Holdings, Ltd. | | | 230,000 | | | | 211,334 | |
| | | | | | | | | |
| Steel - Producers 4.16% | | | | | | | | |
| Maanshan Iron & Steel Co., Ltd. | | | 1,250,000 | | | | 551,479 | |
| | | | | | | | | |
| Telecom Services 3.89% | | | | | | | | |
| CITIC Telecom International Holdings, Ltd. | | | 1,470,000 | | | | 515,867 | |
| | | | | | | | | |
| Therapeutics 0.10% | | | | | | | | |
| Dawnrays Pharmaceutical Holdings, Ltd. | | | 68,000 | | | | 12,731 | |
| Total Common Stocks (cost $12,314,452) | | | | | | | 11,066,489 | |
See notes to portfolios of investments and notes to financial statements.
| China Region Fund | |
| Portfolio of Investments | December 31, 2018 |
| Exchange Traded Fund 2.69% | | Shares | | Value |
| Direxion Daily FTSE China Bear 3X Shares ETF | | | 5,350 | | | $ | 356,685 | |
| (cost $377,441) | | | | | | | | |
| | | | | | | | | |
| Investments, at value 86.19% | | | | | | | 11,423,174 | |
| (cost $12,691,893) | | | | | | | | |
| Other assets and liabilities, net 13.81% | | | | | | | 1,829,709 | |
| Net Assets 100.00% | | | | | | $ | 13,252,883 | |
See notes to portfolios of investments and notes to financial statements.
| Notes to Portfolios of Investments | December 31, 2018 |
Legend
| ‡ | Adjustable rate security, the interest rate of which adjusts periodically based on changes in the current interest rates. Rate presented is as of December 31, 2018. |
| ◊ | Zero coupon bond. Interest rate presented is yield to maturity. |
| * | Non-income producing security. |
| @ | Security was fair valued at December 31, 2018, by U.S. Global Investors, Inc. (Adviser) (other than international securities fair valued pursuant to systematic fair value models) in accordance with valuation procedures approved by the Board of Trustees. These securities, as a percentage of net assets at December 31, 2018, were 1.39% of Holmes Macro Trends Fund, 12.36% of Global Resources Fund, 1.91% of World Precious Minerals Fund, 0.98% of Gold And Precious Metals Fund and 0.00% of Emerging Europe Fund, respectively. See the Fair Valuation of Securities section of these Notes to Portfolios of Investments for further discussion of fair valued securities. See further information and detail on restricted securities in the Restricted Securities section of these Notes to Portfolios of Investments. |
| # | Illiquid Security. |
| ∆ | Pursuant to Rule 144A of the Securities Act of 1933, these securities may be resold in transactions exempt from registration, normally to qualified institutional buyers. The market value of these securities and percentage of net assets as of December 31, 2018 amounted to $10,163, 0.03%, of Holmes Macro Trends Fund, $1,016,371, 1.67%, of Global Resources Fund, $1,042,702, 1.47%, of World Precious Minerals Fund, $2,511,406, 2.92%, of Gold And Precious Metals Fund, $85,500, 0.27%, of Emerging Europe Fund and $17,500, 0.13%, of China Region Fund. |
| + | See "Restricted Securities" in Notes to Portfolios of Investments. |
| ~ | Affiliated Company. (see following) |
| ^ | Security is currently in default and is on scheduled interest or principal payment. |
| ADR | American Depositary Receipt |
| AGC | Assured Guaranty Corporation |
| AGM | Assured Guaranty Municipal |
| AMBAC | American Municipal Bond Assurance Corporation |
| BAM | Build American Mutual Assurance Company |
| COP | Certificate of Participation |
| ETF | Exchange Traded Fund |
| GDR | Global Depositary Receipt |
| GO | General Obligation |
| LIBOR | London Interbank Offered Rate |
| NATL | National Public Finance Guarantee Corporation |
| NVDR | Non-Voting Depositary Receipt |
| OJSC | Open Joint Stock Company |
| PCL | Public Company Limited |
| PJSC | Public Joint Stock Company |
| PLC | Public Limited Company |
| PSF-GTD | Public School Fund Guarantee |
| Q-SBLF | Qualified School Bond Loan Fund |
| RB | Revenue Bond |
| REIT | Real Estate Investment Trust |
| S&P | Standard & Poor’s |
| SPDR | Standard & Poor’s Depositary Receipt |
General
The yields reflect the effective yield from the date of purchase.
Variable and Floating Rate Notes have periodic reset features, which effectively shorten the maturity dates and reset the interest rates as tied to various interest-bearing instruments. Rates shown are current rates at December 31, 2018.
| Notes to Portfolios of Investments | December 31, 2018 |
Fair Valuation of Securities
For the Funds’ policies regarding the valuation of investments and other significant accounting policies, please refer to the Notes to Financial Statements.
The Funds are required to disclose information regarding the fair value measurements of a Fund’s assets and liabilities. Fair value is the price that would be received to sell an asset or paid to transfer a liability in an orderly transaction between market participants at the measurement date. The measurement requirements established a three-tier hierarchy to maximize the use of observable market data and minimize the use of unobservable inputs and to establish classification of fair value measurements for disclosure purposes. Inputs refer broadly to the assumptions that market participants would use in pricing the asset or liability, including assumptions about risk, for example, the risk inherent in a particular valuation technique used to measure fair value including such a pricing model and/or the risk inherent in the inputs to the valuation technique. Inputs may be observable or unobservable. Observable inputs are inputs that reflect the assumptions market participants would use in pricing the asset or liability developed based on market data obtained from sources independent of the reporting entity. Unobservable inputs are inputs that reflect the reporting entity’s own assumptions about the assumptions market participants would use in pricing the asset or liability developed based on the best information available in the circumstances.
The inputs or methodology used for valuing securities are not necessarily an indication of the risk associated with investing in those securities. Because of the inherent uncertainties of valuation, the values reflected in the portfolios may materially differ from the values received upon actual sale of those investments.
The three levels defined by the fair value hierarchy are as follows:
Level 1 – Quoted prices in active markets for identical securities.
Level 2 – Prices determined using significant other observable inputs (including quoted prices for similar securities, interest rates, prepayment speeds, credit risk, etc.). Short-term securities with maturities of sixty days or less are valued at amortized cost, which approximates market value, and are categorized as Level 2 in the hierarchy. Municipal securities, long-term U.S. government obligations and corporate debt securities are valued in accordance with the evaluated price supplied by the pricing service and generally categorized as Level 2 in the hierarchy. Other securities that are categorized as Level 2 in the hierarchy include, but are not limited to, warrants that do not trade on an exchange, securities valued at the mean between the last reported bid and ask quotation and international equity securities valued by an independent third party in order to adjust for stale pricing.
Level 3 – Prices determined using significant unobservable inputs (including the Fund’s own assumptions). For restricted equity securities and private placements where observable inputs are limited, assumptions about market activity and risk are used in determining fair value.
| Notes to Portfolios of Investments | December 31, 2018 |
The following table summarizes the valuation of each Fund’s securities as of December 31, 2018, using the fair value hierarchy:
| | | Quoted Prices in Active Markets for Identical Investments (Level 1) | | | Significant Other Observable Inputs (Level 2) | | | Significant Unobservable Inputs (Level 3) | | | Total | |
| U.S. Government Securities Ultra-Short Bond Fund | | | | | | | | | | | | | | | | |
| Investments in Securities* | | | | | | | | | | | | | | | | |
| United States Government and Agency Obligations | | $ | – | | | $ | 42,970,850 | | | $ | – | | | $ | 42,970,850 | |
| Investments, at Value | | $ | – | | | $ | 42,970,850 | | | $ | – | | | $ | 42,970,850 | |
| | | Quoted Prices in Active Markets for Identical Investments (Level 1) | | | Significant Other Observable Inputs (Level 2) | | | Significant Unobservable Inputs (Level 3) | | | Total | |
| Near-Term Tax Free Fund | | | | | | | | | | | | | | | | |
| Investments in Securities* | | | | | | | | | | | | | | | | |
| Municipal Bonds | | $ | – | | | $ | 46,371,550 | | | $ | – | | | $ | 46,371,550 | |
| Investments, at Value | | $ | – | | | $ | 46,371,550 | | | $ | – | | | $ | 46,371,550 | |
| | | Quoted Prices in
Active Markets
for Identical
Investments
(Level 1) | | | Significant
Other
Observable
Inputs (Level 2) | | | Significant
Unobservable
Inputs
(Level 3) | | | Total | |
| All American Equity Fund | | | | | | | | | | | | | | | | |
| Investments in Securities* | | | | | | | | | | | | | | | | |
| Common Stocks | | | | | | | | | | | | | | | | |
| Airlines | | $ | 705,975 | | | $ | – | | | $ | – | | | $ | 705,975 | |
| Beverages - Wine/Spirits | | | 433,410 | | | | – | | | | – | | | | 433,410 | |
| Commercial Banks | | | 382,182 | | | | – | | | | – | | | | 382,182 | |
| Computer Services | | | 473,751 | | | | – | | | | – | | | | 473,751 | |
| Computers | | | 295,574 | | | | – | | | | – | | | | 295,574 | |
| Computers - Memory | | | | | | | | | | | | | | | | |
| Devices | | | 265,591 | | | | – | | | | – | | | | 265,591 | |
| Diversified Banking | | | | | | | | | | | | | | | | |
| Institution | | | 642,060 | | | | – | | | | – | | | | 642,060 | |
| Electric - Integrated | | | 707,413 | | | | – | | | | – | | | | 707,413 | |
| Electronic Components - Semiconductors | | | 340,990 | | | | – | | | | – | | | | 340,990 | |
| Finance - Credit Card | | | 505,066 | | | | – | | | | – | | | | 505,066 | |
| Food - Meat Products | | | 460,682 | | | | – | | | | – | | | | 460,682 | |
| Food - Miscellaneous/ Diversified | | | 545,129 | | | | – | | | | – | | | | 545,129 | |
| Notes to Portfolios of Investments | December 31, 2018 |
| | | Quoted Prices in Active Markets for Identical Investments (Level 1) | | | Significant Other Observable Inputs (Level 2) | | | Significant Unobservable Inputs (Level 3) | | | Total | |
| All American Equity Fund (continued) | | | | | | | | | | | | | | | | |
| Investments in Securities* | | | | | | | | | | | | | | | | |
| (continued) | | | | | | | | | | | | | | | | |
| Investment Management/ Advisory Services | | $ | 343,768 | | | $ | – | | | $ | – | | | $ | 343,768 | |
| Medical - Biomedical/ Genetics | | | 506,921 | | | | – | | | | – | | | | 506,921 | |
| Medical - Drugs | | | 687,280 | | | | – | | | | – | | | | 687,280 | |
| Medical Products | | | 489,964 | | | | – | | | | – | | | | 489,964 | |
| Office Supplies & Forms | | | 405,942 | | | | – | | | | – | | | | 405,942 | |
| Oil Companies - Exploration & Production | | | 225,824 | | | | – | | | | – | | | | 225,824 | |
| Oil Refining & Marketing | | | 718,470 | | | | – | | | | – | | | | 718,470 | |
| REITS - Diversified | | | 441,192 | | | | – | | | | – | | | | 441,192 | |
| Retail - Apparel/Shoe | | | 380,141 | | | | – | | | | – | | | | 380,141 | |
| Retail - Consumer Electronics | | | 263,423 | | | | – | | | | – | | | | 263,423 | |
| Retail - Restaurants | | | 599,502 | | | | – | | | | – | | | | 599,502 | |
| Rubber - Tires | | | 358,726 | | | | – | | | | – | | | | 358,726 | |
| Semiconductor Equipment | | | 254,229 | | | | – | | | | – | | | | 254,229 | |
| Transportation - Rail | | | 407,087 | | | | – | | | | – | | | | 407,087 | |
| Exchange Traded Funds | | | 625,558 | | | | – | | | | – | | | | 625,558 | |
| Put Option | | | – | | | | 194,051 | | | | – | | | | 194,051 | |
| Investments, at Value | | $ | 12,465,850 | | | $ | 194,051 | | | $ | – | | | $ | 12,659,901 | |
| | | | | | | | | | | | | | | | | |
| | | Quoted Prices in Active Markets for Identical Investments (Level 1) | | | Significant Other Observable Inputs (Level 2) | | | Significant Unobservable Inputs (Level 3) | | | Total | |
| Holmes Macro Trends Fund | | | | | | | | | | | | | | | | |
| Investments in Securities* | | | | | | | | | | | | | | | | |
| Common Stocks | | | | | | | | | | | | | | | | |
| Building - Residential/ Commercial | | $ | 456,089 | | | $ | – | | | $ | – | | | $ | 456,089 | |
| Building & Construction | | | | | | | | | | | | | | | | |
| Products - Miscellaneous | | | 1,158,232 | | | | – | | | | – | | | | 1,158,232 | |
| Chemicals - Specialty | | | 2,621,635 | | | | – | | | | – | | | | 2,621,635 | |
| Commercial Services | | | 890,106 | | | | – | | | | – | | | | 890,106 | |
| Commercial Services - Finance | | | 2,113,237 | | | | – | | | | – | | | | 2,113,237 | |
| Consumer Products - Miscellaneous | | | 1,561,890 | | | | – | | | | – | | | | 1,561,890 | |
| Distribution/Wholesale | | | 1,255,647 | | | | – | | | | – | | | | 1,255,647 | |
| Notes to Portfolios of Investments | December 31, 2018 |
| | | Quoted Prices in Active Markets for Identical Investments (Level 1) | | | Significant Other Observable Inputs (Level 2) | | | Significant Unobservable Inputs (Level 3) | | | Total | |
| Holmes Macro Trends Fund (continued) | | | | | | | | | | | | | | | | |
| Investments in Securities* | | | | | | | | | | | | | | | | |
| (continued) | | | | | | | | | | | | | | | | |
| Diversified Manufacturing Operations | | $ | 790,435 | | | $ | – | | | $ | – | | | $ | 790,435 | |
| Energy - Alternate Sources | | | – | | | | – | | | | 0 | | | | 0 | |
| Lasers - System/Components | | | 994,283 | | | | ��� | | | | – | | | | 994,283 | |
| Medical - Drugs | | | 2,234,910 | | | | – | | | | – | | | | 2,234,910 | |
| Medical - Hospitals | | | – | | | | – | | | | 0 | | | | 0 | |
| Medical Laser Systems | | | 477,922 | | | | – | | | | – | | | | 477,922 | |
| Oil Companies - Exploration & Production | | | 5,860 | | | | – | | | | – | | | | 5,860 | |
| Pastoral & Agricultural | | | 708,935 | | | | – | | | | – | | | | 708,935 | |
| Power Conversion/Supply Equipment | | | 805,007 | | | | – | | | | – | | | | 805,007 | |
| Real Estate Management/Services | | | 744,309 | | | | – | | | | – | | | | 744,309 | |
| Real Estate Operating/Development | | | – | | | | – | | | | 236,043 | | | | 236,043 | |
| Rental Auto/Equipment | | | 710,031 | | | | – | | | | – | | | | 710,031 | |
| Retail - Building Products | | | 1,272,843 | | | | – | | | | – | | | | 1,272,843 | |
| Retail - Pet Food & Supplies | | | 664,096 | | | | – | | | | – | | | | 664,096 | |
| Semiconductor Equipment | | | 948,829 | | | | – | | | | – | | | | 948,829 | |
| Telecom Equipment Fiber Optics | | | 1,424,084 | | | | – | | | | – | | | | 1,424,084 | |
| Television | | | 2,183,533 | | | | – | | | | – | | | | 2,183,533 | |
| Web Hosting/Design | | | 766,721 | | | | – | | | | – | | | | 766,721 | |
| Corporate Non-Convertible Bond | | | – | | | | – | | | | 233,829 | | | | 233,829 | |
| Exchange Traded Funds | | | 1,466,451 | | | | – | | | | – | | | | 1,466,451 | |
| Warrants | | | | | | | | | | | | | | | | |
| Gold Mining | | | 6 | | | | – | | | | – | | | | 6 | |
| Oil Companies - Exploration & Production | | | 4,303 | | | | – | | | | – | | | | 4,303 | |
| Put Option | | | – | | | | 484,449 | | | | – | | | | 484,449 | |
| Investments, at Value | | | 26,259,394 | | | | 484,449 | | | | 469,872 | | | | 27,213,715 | |
| Notes to Portfolios of Investments | December 31, 2018 |
| | | Quoted Prices in Active Markets for Identical Investments (Level 1) | | | Significant Other Observable Inputs (Level 2) | | | Significant Unobservable Inputs (Level 3) | | | Total | |
| Global Resources Fund | | | | | | | | | | | | |
| Investments in Securities* | | | | | | | | | | | | | | | | |
| Common Stocks | | | | | | | | | | | | | | | | |
| Agricultural Chemicals | | $ | – | | | $ | 611,867 | | | $ | – | | | $ | 611,867 | |
| Building & Construction Products - Miscellaneous | | | 924,352 | | | | – | | | | – | | | | 924,352 | |
| Building Products - Cement | | | – | | | | 998,104 | | | | – | | | | 998,104 | |
| Building Products - Wood | | | 832,252 | | | | – | | | | – | | | | 832,252 | |
| Chemicals - Diversified | | | – | | | | 5,294,112 | | | | – | | | | 5,294,112 | |
| Chemicals - Specialty | | | – | | | | 995,385 | | | | – | | | | 995,385 | |
| Coal | | | 701,040 | | | | 1,216,968 | | | | 0 | | | | 1,918,008 | |
| Commercial Service - Finance | | | 190,448 | | | | – | | | | – | | | | 190,448 | |
| Diamonds/Precious Stones | | | 169,938 | | | | – | | | | 0 | | | | 169,938 | |
| Diversified Minerals | | | 2,021,895 | | | | 1,982,019 | | | | – | | | | 4,003,914 | |
| Electric - Integrated | | | – | | | | 1,218,414 | | | | – | | | | 1,218,414 | |
| Electronics - Military | | | – | | | | 57,043 | | | | – | | | | 57,043 | |
| Energy - Alternate Sources | | | 754,468 | | | | 1,347,436 | | | | 0 | | | | 2,101,904 | |
| Finance - Investment Banker/Broker | | | 251,978 | | | | – | | | | – | | | | 251,978 | |
| Forestry | | | 633,753 | | | | – | | | | – | | | | 633,753 | |
| Gold Mining | | | 3,482,582 | | | | 3,102,372 | | | | 0 | | | | 6,584,954 | |
| Information Technology | | | – | | | | – | | | | 366,247 | | | | 366,247 | |
| Medical - Hospitals | | | – | | | | – | | | | 0 | | | | 0 | |
| Metal - Copper | | | 1,281,401 | | | | – | | | | – | | | | 1,281,401 | |
| Metal - Diversified | | | 1,747,814 | | | | 1,792,031 | | | | – | | | | 3,539,845 | |
| Metal - Iron | | | – | | | | – | | | | 0 | | | | 0 | |
| Mining Services | | | 84,237 | | | | 107,121 | | | | – | | | | 191,358 | |
| Natural Resource Technology | | | – | | | | – | | | | 120,741 | | | | 120,741 | |
| Non-Ferrous Metals | | | 130,383 | | | | 28,854 | | | | – | | | | 159,237 | |
| Oil - Field Services | | | – | | | | 19,903 | | | | – | | | | 19,903 | |
| Oil Companies - Exploration & Production | | | 1,715,429 | | | | 60,269 | | | | 0 | | | | 1,775,698 | |
| Oil Companies - Integrated | | | 864,908 | | | | 1,333,849 | | | | – | | | | 2,198,757 | |
| Oil Companies - US Royalty | | | | | | | | | | | | | | | | |
| Trusts | | | 9,600 | | | | – | | | | – | | | | 9,600 | |
| Oil Refining & Marketing | | | 764,478 | | | | 2,399,315 | | | | – | | | | 3,163,793 | |
| Paper & Related Products | | | 1,089,417 | | | | – | | | | – | | | | 1,089,417 | |
| Petrochemicals | | | 647,400 | | | | 1,168,570 | | | | – | | | | 1,815,970 | |
| Precious Metals | | | – | | | | 111,339 | | | | – | | | | 111,339 | |
| Real Estate Operating/Development | | | – | | | | – | | | | 4,119,257 | | | | 4,119,257 | |
| Retail - Jewelry | | | 4,550 | | | | – | | | | – | | | | 4,550 | |
| Rubber & Vinyl | | | – | | | | 1,063,831 | | | | – | | | | 1,063,831 | |
| Rubber/Plastic Products | | | 457,800 | | | | – | | | | – | | | | 457,800 | |
| Silver Mining | | | – | | | | 20,144 | | | | – | | | | 20,144 | |
| Notes to Portfolios of Investments | December 31, 2018 |
| | | Quoted Prices in Active Markets for Identical Investments (Level 1) | | | Significant Other Observable Inputs (Level 2) | | | Significant Unobservable Inputs (Level 3) | | | Total | |
| Global Resources Fund (continued) | | | | | | | | | | | | | | | | |
| Investments in Securities* | | | | | | | | | | | | | | | | |
| (continued) | | | | | | | | | | | | | | | | |
| Steel - Producers | | $ | 1,021,020 | | | $ | 3,908,815 | | | $ | – | | | $ | 4,929,835 | |
| Corporate Non-Convertible Bond | | | – | | | | – | | | | 2,805,938 | | | | 2,805,938 | |
| Warrants | | | | | | | | | | | | | | | | |
| Diversified Minerals | | | – | | | | 0 | | | | – | | | | 0 | |
| Electronics - Military | | | – | | | | 0 | | | | – | | | | 0 | |
| Gold Mining | | | – | | | | 1,416 | | | | – | | | | 1,416 | |
| Metal - Diversified | | | – | | | | 0 | | | | – | | | | 0 | |
| Non-Ferrous Metals | | | – | | | | 0 | | | | – | | | | 0 | |
| Oil Companies - Exploration & Production | | | – | | | | 17,214 | | | | – | | | | 17,214 | |
| Purchased Call Options | | | 71,600 | | | | 13,000 | | | | – | | | | 84,600 | |
| Investments, at Value | | | 19,852,743 | | | | 28,869,391 | | | | 7,412,183 | | | | 56,134,317 | |
| | | Quoted Prices in Active Markets for Identical Investments (Level 1) | | | Significant Other Observable Inputs (Level 2) | | | Significant Unobservable Inputs (Level 3) | | | Total | |
| World Precious Minerals Fund | | | | | | | | | | | | | | | | |
| Investments in Securities* | | | | | | | | | | | | | | | | |
| Common Stocks | | | | | | | | | | | | | | | | |
| Advanced Materials/Production | | $ | 2,724,875 | | | $ | – | | | $ | – | | | $ | 2,724,875 | |
| Capital Pools | | | 247,216 | | | | 256,373 | | | | – | | | | 503,589 | |
| Coal | | | – | | | | – | | | | 0 | | | | 0 | |
| Diamonds/Precious Stones | | | 1,147,085 | | | | – | | | | 0 | | | | 1,147,085 | |
| Diversified Minerals | | | 2,738,512 | | | | 562,093 | | | | 0 | | | | 3,300,605 | |
| Finance - Investment Banker/Broker | | | – | | | | 14,894 | | | | – | | | | 14,894 | |
| Gold Mining | | | 30,223,890 | | | | 2,493,638 | | | | 0 | | | | 32,717,528 | |
| Investment Companies | | | – | | | | 71,784 | | | | – | | | | 71,784 | |
| Medical - Hospitals | | | – | | | | – | | | | 0 | | | | 0 | |
| Metal - Copper | | | 33,237 | | | | – | | | | – | | | | 33,237 | |
| Metal - Diversified | | | 5,009,520 | | | | 3,057,609 | | | | – | | | | 8,067,129 | |
| Metal - Iron | | | – | | | | 140,257 | | | | – | | | | 140,257 | |
| Mining Services | | | 137,709 | | | | – | | | | – | | | | 137,709 | |
| Non-Ferrous Metals | | | 659,244 | | | | 167,009 | | | | – | | | | 826,253 | |
| Oil Companies - Exploration & Production | | | – | | | | – | | | | 0 | | | | 0 | |
| Optical Recognition Equipment | | | 5,753 | | | | – | | | | – | | | | 5,753 | |
| Notes to Portfolios of Investments | December 31, 2018 |
| | | Quoted Prices in Active Markets for Identical Investments (Level 1) | | | Significant Other Observable Inputs (Level 2) | | | Significant Unobservable Inputs (Level 3) | | | Total | |
| World Precious Minerals Fund (continued) | | | | | | | | | | | | | | | | |
| Investments in Securities* | | | | | | | | | | | | | | | | |
| (continued) | | | | | | | | | | | | | | | | |
| Precious Metals | | $ | 14,966,134 | | | $ | 949,814 | | | $ | – | | | $ | 15,915,948 | |
| Retail - Jewelry | | | 648,257 | | | | – | | | | – | | | | 648,257 | |
| Silver Mining | | | 316,510 | | | | – | | | | – | | | | 316,510 | |
| Corporate Non-Convertible Bond | | | – | | | | – | | | | 748,250 | | | | 748,250 | |
| Right | | | 258,849 | | | | – | | | | – | | | | 258,849 | |
| Exchange Traded Funds | | | 2,431,500 | | | | – | | | | – | | | | 2,431,500 | |
| Warrants | | | | | | | | | | | | | | | | |
| Diversified Minerals | | | – | | | | 0 | | | | – | | | | 0 | |
| Gold Mineral Exploration & Development | | | – | | | | – | | | | 0 | | | | 0 | |
| Gold Mining | | | – | | | | 55,708 | | | | – | | | | 55,708 | |
| Metal - Diversified | | | – | | | | 0 | | | | – | | | | 0 | |
| Retail - Jewelry | | | – | | | | 0 | | | | – | | | | 0 | |
| Purchased Call Options | | | 237,750 | | | | – | | | | – | | | | 237,750 | |
| Investments, at Value | | | 61,786,041 | | | | 7,769,179 | | | | 748,250 | | | | 70,303,470 | |
| | | Quoted Prices in Active Markets for Identical Investments (Level 1) | | | Significant Other Observable Inputs (Level 2) | | | Significant Unobservable Inputs (Level 3) | | | Total | |
| Gold And Precious Metals Fund | | | | | | | | | | | | | | | | |
| Investments in Securities* | | | | | | | | | | | | | | | | |
| Common Stocks | | | | | | | | | | | | | | | | |
| Diversified Minerals | | $ | 107,389 | | | $ | – | | | $ | – | | | $ | 107,389 | |
| Gold Mining | | | 36,907,389 | | | | 18,083,079 | | | | – | | | | 54,990,468 | |
| Medical - Hospitals | | | – | | | | – | | | | 0 | | | | 0 | |
| Metals & Mining | | | – | | | | 563,132 | | | | – | | | | 563,132 | |
| Mining Services | | | 86,297 | | | | – | | | | – | | | | 86,297 | |
| Non - Ferrous Metals | | | 712,500 | | | | – | | | | – | | | | 712,500 | |
| Precious Metals | | | 13,080,894 | | | | – | | | | – | | | | 13,080,894 | |
| Recycling | | | – | | | | 563,036 | | | | – | | | | 563,036 | |
| Retail - Jewelry | | | 2,533,381 | | | | – | | | | – | | | | 2,533,381 | |
| Silver Mining | | | 4,930,700 | | | | – | | | | – | | | | 4,930,700 | |
| Corporate Non-Convertible Bonds | | | – | | | | – | | | | 280,594 | | | | 280,594 | |
| Exchange Traded Funds | | | 4,927,500 | | | | – | | | | – | | | | 4,927,500 | |
| Warrants | | | | | | | | | | | | | | | | |
| Gold Mining | | | – | | | | 44,917 | | | | – | | | | 44,917 | |
| Retail - Jewelry | | | – | | | | 0 | | | | – | | | | 0 | |
| Notes to Portfolios of Investments | December 31, 2018 |
| | | Quoted Prices in Active Markets for Identical Investments (Level 1) | | | Significant Other Observable Inputs (Level 2) | | | Significant Unobservable Inputs (Level 3) | | | Total | |
| Gold And Precious Metals Fund (continued) | | | | | | | | | | | | | | | | |
| Investments in Securities* | | | | | | | | | | | | | | | | |
| (continued) | | | | | | | | | | | | | | | | |
| Purchased Call Options | | $ | 311,000 | | | $ | – | | | $ | – | | | $ | 311,000 | |
| Investments, at Value | | $ | 63,597,050 | | | $ | 19,254,164 | | | $ | 280,594 | | | $ | 83,131,808 | |
| | | Quoted Prices in Active Markets for Identical Investments (Level 1) | | | Significant Other Observable Inputs (Level 2) | | | Significant Unobservable Inputs (Level 3) | | | Total | |
| Emerging Europe Fund | | | | | | | | | | | | |
| Assets | | | | | | | | | | | | |
| Investments in Securities* | | | | | | | | | | | | | | | | |
| Common Stocks | | | | | | | | | | | | | | | | |
| Agricultural Operations | | $ | – | | | $ | 278,938 | | | $ | – | | | $ | 278,938 | |
| Airlines | | | 147,674 | | | | 2,155,810 | | | | – | | | | 2,303,484 | |
| Appliances | | | – | | | | 133,291 | | | | – | | | | 133,291 | |
| Automotive - Cars & Light Trucks | | | – | | | | 614,504 | | | | – | | | | 614,504 | |
| Automotive - Medium & Heavy Duty Trucks | | | – | | | | 89,534 | | | | – | | | | 89,534 | |
| Automotive/Truck Parts & Equipment - Original | | | – | | | | 159,721 | | | | – | | | | 159,721 | |
| Beverages - Non-alcoholic | | | – | | | | 125,234 | | | | – | | | | 125,234 | |
| Building & Construction Products - Miscellaneous | | | – | | | | 120,334 | | | | – | | | | 120,334 | |
| Cellular Telecommunication | | | 134,400 | | | | 270,547 | | | | – | | | | 404,947 | |
| Chemicals - Diversified | | | – | | | | 273,713 | | | | – | | | | 273,713 | |
| Coal | | | – | | | | 347,133 | | | | – | | | | 347,133 | |
| Commercial Banks Non-US | | | 2,418,872 | | | | 2,576,563 | | | | – | | | | 4,995,435 | |
| Computer Services | | | – | | | | 296,094 | | | | – | | | | 296,094 | |
| Cosmetics & Toiletries | | | – | | | | 168,009 | | | | – | | | | 168,009 | |
| Diamonds/Precious Stones | | | – | | | | 185,938 | | | | – | | | | 185,938 | |
| Diversified Operations | | | – | | | | 394,499 | | | | – | | | | 394,499 | |
| Electric - Distribution | | | – | | | | 325,965 | | | | – | | | | 325,965 | |
| Electric - Generation | | | – | | | | 294,244 | | | | – | | | | 294,244 | |
| Electric - Integrated | | | – | | | | 281,545 | | | | – | | | | 281,545 | |
| Energy - Alternate Sources | | | 40,379 | | | | – | | | | – | | | | 40,379 | |
| Food - Retail | | | 261,679 | | | | 435,491 | | | | – | | | | 697,170 | |
| Food - Wholesale/Distribution | | | – | | | | 440,961 | | | | – | | | | 440,961 | |
| Gold Mining | | | 131,435 | | | | – | | | | – | | | | 131,435 | |
| Machinery - Farm | | | – | | | | 144,949 | | | | – | | | | 144,949 | |
| Metal - Diversified | | | 231,510 | | | | – | | | | – | | | | 231,510 | |
| Notes to Portfolios of Investments | December 31, 2018 |
| | | Quoted Prices in Active Markets for Identical Investments (Level 1) | | | Significant Other Observable Inputs (Level 2) | | | Significant Unobservable Inputs (Level 3) | | | Total | |
| Emerging Europe Fund (continued) | | | | | | | | | | | | | | | | |
| Assets (continued) | | | | | | | | | | | | | | | | |
| Investments in Securities* | | | | | | | | | | | | | | | | |
| (continued) | | | | | | | | | | | | | | | | |
| Metal - Iron | | $ | 499,699 | | | $ | – | | | $ | – | | | $ | 499,699 | |
| Miscellaneous Manufacturing | | | – | | | | 205,524 | | | | – | | | | 205,524 | |
| Multi-line Insurance | | | – | | | | 319,519 | | | | – | | | | 319,519 | |
| Oil Companies - Exploration & Production | | | 166,465 | | | | 173,766 | | | | – | | | | 340,231 | |
| Oil Companies - Integrated | | | 5,916,437 | | | | 1,133,041 | | | | – | | | | 7,049,478 | |
| Oil Refining & Marketing | | | – | | | | 795,870 | | | | – | | | | 795,870 | |
| Property/Casualty Insurance | | | – | | | | 362,284 | | | | – | | | | 362,284 | |
| Recreational Centers | | | – | | | | 183,781 | | | | – | | | | 183,781 | |
| Regional Banks - Non US | | | 465,929 | | | | – | | | | – | | | | 465,929 | |
| Retail - Jewelry | | | – | | | | 74,097 | | | | – | | | | 74,097 | |
| Retail - Major Dept Store | | | – | | | | 474,269 | | | | – | | | | 474,269 | |
| Steel - Producers | | | 1,101,048 | | | | 871,463 | | | | – | | | | 1,972,511 | |
| Telecom Services | | | – | | | | 281,340 | | | | – | | | | 281,340 | |
| Telephone - Integrated | | | – | | | | 284,677 | | | | – | | | | 284,677 | |
| Textile - Apparel | | | – | | | | 191,326 | | | | – | | | | 191,326 | |
| Tobacco | | | – | | | | 165,813 | | | | – | | | | 165,813 | |
| Transportation - Rail | | | 528,298 | | | | – | | | | – | | | | 528,298 | |
| Transportation - Services | | | – | | | | 353,943 | | | | – | | | | 353,943 | |
| Travel Services | | | – | | | | 106,358 | | | | – | | | | 106,358 | |
| Warehousing & Harbor Transportation Services | | | – | | | | 116,903 | | | | – | | | | 116,903 | |
| Exchange Traded Funds | | | 497,245 | | | | – | | | | – | | | | 497,245 | |
| Warrant | | | – | | | | 0 | | | | – | | | | 0 | |
| Investments, at Value | | $ | 12,541,070 | | | $ | 16,206,991 | | | $ | – | | | $ | 28,748,061 | |
| Total Assets | | $ | 12,541,070 | | | $ | 16,206,991 | | | $ | – | | | $ | 28,748,061 | |
| | | | | | | | | | | | | | | | | |
| Liabilities | | | | | | | | | | | | | | | | |
| Other Financial Instruments† | | | | | | | | | | | | | | | | |
| Currency Contract | | | – | | | | (35,064 | ) | | | – | | | | (35,064 | ) |
| Total Liabilities | | $ | – | | | $ | (35,064 | ) | | $ | – | | | $ | (35,064 | ) |
| Notes to Portfolios of Investments | December 31, 2018 |
| | | Quoted Prices in Active Markets for Identical Investments (Level 1) | | | Significant Other Observable Inputs (Level 2) | | | Significant Unobservable Inputs (Level 3) | | | Total | |
| China Region Fund | | | | | | | | | | | | |
| Investments in Securities* | | | | | | | | | | | | | | | | |
| Common Stocks | | | | | | | | | | | | | | | | |
| Agricultural Operations | | $ | – | | | $ | 56,653 | | | $ | – | | | $ | 56,653 | |
| Airlines | | | – | | | | 179,212 | | | | – | | | | 179,212 | |
| Appliances | | | – | | | | 78,706 | | | | – | | | | 78,706 | |
| Automotive - Cars & Light Trucks | | | – | | | | 163,835 | | | | – | | | | 163,835 | |
| Automotive - Medium & Heavy Duty Trucks | | | – | | | | 625,659 | | | | – | | | | 625,659 | |
| Automotive/Truck Parts & Equipment - Original | | | – | | | | 58,911 | | | | – | | | | 58,911 | |
| Automotive/Truck Parts & | | | | | | | | | | | | | | | | |
| Equipment - Replacement | | | – | | | | 430,467 | | | | – | | | | 430,467 | |
| Batteries/Battery Systems | | | – | | | | 185,113 | | | | – | | | | 185,113 | |
| Building - Heavy Construction | | | – | | | | 32,364 | | | | – | | | | 32,364 | |
| Building & Construction Products - Miscellaneous | | | – | | | | 162,931 | | | | – | | | | 162,931 | |
| Building Products - Cement | | | – | | | | 358,259 | | | | – | | | | 358,259 | |
| Casino Hotels | | | – | | | | 145,415 | | | | – | | | | 145,415 | |
| Chemicals - Diversified | | | – | | | | 69,211 | | | | – | | | | 69,211 | |
| Chemicals - Specialty | | | – | | | | 13,565 | | | | – | | | | 13,565 | |
| Coal | | | – | | | | 149,492 | | | | – | | | | 149,492 | |
| Consumer Products - Miscellaneous | | | – | | | | 317 | | | | – | | | | 317 | |
| Containers - Paper/Plastic | | | – | | | | 16,926 | | | | – | | | | 16,926 | |
| Distribution/Wholesale | | | – | | | | 27,906 | | | | – | | | | 27,906 | |
| Electronic Components - Miscellaneous | | | – | | | | 10,358 | | | | – | | | | 10,358 | |
| Electronic Components - Semiconductors | | | – | | | | 69,662 | | | | – | | | | 69,662 | |
| Electronic Measuring Instruments | | | – | | | | 11,530 | | | | – | | | | 11,530 | |
| Enterprise Software/Services | | | – | | | | 114,937 | | | | – | | | | 114,937 | |
| Entertainment Software | | | – | | | | 198,847 | | | | – | | | | 198,847 | |
| Food - Flour & Grain | | | – | | | | 50,894 | | | | – | | | | 50,894 | |
| Food - Miscellaneous/Diversified | | | – | | | | 440,576 | | | | – | | | | 440,576 | |
| Gas - Distribution | | | – | | | | 23,775 | | | | – | | | | 23,775 | |
| Gold Mining | | | – | | | | 461,583 | | | | – | | | | 461,583 | |
| Internet Content - Entertainment | | | – | | | | 280,844 | | | | – | | | | 280,844 | |
| Investment Management/Advisory Services | | | – | | | | 17,359 | | | | – | | | | 17,359 | |
| Life/Health Insurance | | | – | | | | 373,780 | | | | – | | | | 373,780 | |
| Notes to Portfolios of Investments | December 31, 2018 |
| | | Quoted Prices in Active Markets for Identical Investments (Level 1) | | | Significant Other Observable Inputs (Level 2) | | | Significant Unobservable Inputs (Level 3) | | | Total | |
| China Region Fund (continued) | | | | | | | | | | | | | | | | |
| Investments in Securities* | | | | | | | | | | | | | | | | |
| (continued) | | | | | | | | | | | | | | | | |
| Machinery - Construction & Mining | | $ | – | | | $ | 45,690 | | | $ | – | | | $ | 45,690 | |
| Medical - Drugs | | | – | | | | 51,152 | | | | – | | | | 51,152 | |
| Multi-line Insurance | | | – | | | | 950,432 | | | | – | | | | 950,432 | |
| Non-Ferrous Metals | | | – | | | | 17,500 | | | | – | | | | 17,500 | |
| Oil Companies - Exploration & Production | | | 594,555 | | | | 488,743 | | | | – | | | | 1,083,298 | |
| Oil Companies - Integrated | | | 609,435 | | | | – | | | | – | | | | 609,435 | |
| Oil Refining & Marketing | | | – | | | | 301,370 | | | | – | | | | 301,370 | |
| Paper & Related Products | | | – | | | | 16,628 | | | | – | | | | 16,628 | |
| Petrochemicals | | | 86,320 | | | | 59,327 | | | | – | | | | 145,647 | |
| Property/Casualty Insurance | | | – | | | | 111,730 | | | | – | | | | 111,730 | |
| Real Estate Management/Services | | | – | | | | 349,551 | | | | – | | | | 349,551 | |
| Real Estate Operating/Development | | | – | | | | 1,193,835 | | | | – | | | | 1,193,835 | |
| Retail - Apparel/Shoe | | | – | | | | 28,647 | | | | – | | | | 28,647 | |
| Retail - Regional Dept Store | | | – | | | | 28,841 | | | | – | | | | 28,841 | |
| Semiconductor Components - Integrated Circuit | | | – | | | | 32,235 | | | | – | | | | 32,235 | |
| Shipbuilding | | | – | | | | 211,334 | | | | – | | | | 211,334 | |
| Steel - Producers | | | – | | | | 551,479 | | | | – | | | | 551,479 | |
| Telecom Services | | | – | | | | 515,867 | | | | – | | | | 515,867 | |
| Therapeutics | | | – | | | | 12,731 | | | | – | | | | 12,731 | |
| Exchange Traded Fund | | | 356,685 | | | | – | | | | – | | | | 356,685 | |
| Investments, at Value | | $ | 1,646,995 | | | $ | 9,776,179 | | | $ | – | | | $ | 11,423,174 | |
| * | Refer to the Portfolios of Investments for a detailed list of the Fund’s investments. |
| † | Other Financial Instruments are derivatives not reflected in the Portfolios of Investments, such as Currency Contracts, which are valued at the unrealized appreciation (depreciation) at year end. |
The following is a reconciliation of assets for which unobservable inputs (Level 3) were used in determining fair value during the period January 1, 2018 through December 31, 2018:
| | | Common Stocks | | | Corporate Non- Convertible Bond | | | Total | |
| Holmes Macro Trends Fund | | | | | | | | | | | | |
| Beginning Balance 12/31/17 | | $ | 394,500 | | | $ | 233,829 | | | $ | 628,329 | |
| Net change in unrealized appreciation (depreciation) | | | (158,457 | ) | | | – | | | | (158,457 | ) |
| Ending Balance 12/31/18 | | $ | 236,043 | | | $ | 233,829 | | | $ | 469,872 | |
| Net change in unrealized appreciation (depreciation) from Investments held as of 12/31/18(1) | | $ | (158,457 | ) | | $ | – | | | $ | (158,457 | ) |
| Notes to Portfolios of Investments | December 31, 2018 |
| | | Common Stocks | | | Corporate Non- Convertible Bond | | | Subscription Receipt | | | Total | |
| Global Resources Fund | | | | | | | | | | | | |
| Beginning Balance 12/31/17 | | $ | 6,900,515 | | | $ | 2,805,938 | | | $ | 485,324 | | | $ | 10,191,777 | |
| Purchases | | | 388,470 | | | | – | | | | – | | | | 388,470 | |
| Transfers out of Level 3 | | | (107,121 | ) | | | – | | | | (259,962 | ) | | | (367,083 | ) |
| Net change in unrealized appreciation (depreciation) | | | (2,575,619 | | | | – | | | | (225,362 | ) | | | (2,800,981 | ) |
| Ending Balance 12/31/18 | | $ | 4,606,245 | | | $ | 2,805,938 | | | $ | – | | | $ | 7,412,183 | |
| Net change in unrealized appreciation (depreciation) from Investments held as of 12/31/18(1) | | $ | (2,682,740 | ) | | $ | – | | | $ | – | | | $ | (2,682,740 | ) |
| | | Common Stock | | | Corporate Non- Convertible Bond | | | Subscription Receipt | | | Warrants | | | Total | |
| World Precious Minerals Fund | | | | | | | | | | | | | | | | | | | | |
| Beginning Balance 12/31/2017 | | $ | 2,048 | | | $ | 748,250 | | | $ | 453,461 | | | $ | 0 | | | $ | 1,203,759 | |
| Purchases | | | – | | | | – | | | | 2,221,627 | | | | 0 | | | | 2,221,627 | |
| Transfers out of Level 3 | | | – | | | | – | | | | (1,415,177 | ) | | | 0 | | | | (1,415,177 | ) |
| Net change in unrealized appreciation (depreciation) | | | (2,048 | ) | | | – | | | | (1,259,911 | ) | | | 0 | | | | (1,261,959 | ) |
| Ending Balance 12/31/18 | | $ | – | | | $ | 748,250 | | | $ | – | | | $ | 0 | | | $ | 748,250 | |
| Net change in unrealized appreciation (depreciation) from Investments held as of 12/31/18(1) | | $ | (2,048 | ) | | $ | – | | | $ | – | | | $ | – | | | $ | (2,048 | ) |
| | | Common Stocks | | | Corporate Non- Convertible Bond | | | Units | | | Total | |
| Gold and Precious Metals Fund | | | | | | | | | | | | | | | | |
| Beginning Balance 12/31/17 | | $ | 477,327 | | | $ | 280,594 | | | $ | 2,000,000 | | | $ | 2,757,921 | |
| Purchases | | | 660,575 | | | | – | | | | – | | | | 660,575 | |
| Sales | | | (1,014,044 | ) | | | – | | | | – | | | | (1,014,044 | ) |
| Realized Gain (Loss) | | | 174,214 | | | | – | | | | – | | | | 174,214 | |
| Transfers out of Level 3 | | | (217,550 | ) | | | – | | | | – | | | | (217,550 | ) |
| Conversion to Common Stock | | | – | | | | – | | | | (2,000,000 | ) | | | (2,000,000 | ) |
| Net change in unrealized appreciation (depreciation) | | | (80,522 | ) | | | – | | | | – | | | | (80,522 | ) |
| Ending Balance 12/31/18 | | $ | – | | | $ | 280,594 | | | $ | – | | | $ | 280,594 | |
| Net change in unrealized appreciation (depreciation) from Investments held as of 12/31/18(1) | | $ | – | | | $ | – | | | $ | – | | | $ | – | |
| * | The Funds’ policy is to recognize transfers in and transfers out as of the end of the reporting period. |
| (1) | The amounts shown represent the net change in unrealized appreciation (depreciation) attributable to only those investments still held and classified as Level 3 at December 31, 2018. |
| Notes to Portfolios of Investments | December 31, 2018 |
Significant unobservable inputs developed by the Valuation Committee (“Valuation Committee”) for Level 3 investments held at period end are as follows:
| | | Fair Value at 12/31/18 | | | Valuation Technique(s) | | Unobservable Input | | Range (Weighted Average) |
| Holmes Macro Trends Fund | | | | | | | | | | |
| Investments in Securities | | | | | | | | | | |
| Common Stocks | | | 0 | | | Market Transaction(1) | | Discount | | 100% |
| Common Stocks | | | 236,043 | | | Method of Comparables Pricing (2) | | Multiples | | 7.7 - 22.7 (11.4) |
| Corporate Note | | | 233,829 | | | Market Transaction(1) | | Discount | | 0% |
| | | | | | | | | | | |
| Global Resources Fund | | | | | | | | | | |
| Investments in Securities | | | | | | | | | | 0% - 100% discount |
| Common Stocks | | | 486,988 | | | Market Transaction(1) | | Discount | | (99% discount) |
| Common Stocks | | | 4,119,257 | | | Method of Comparables Pricing (2) | | Multiples | | 7.7 - 22.7 (11.4) |
| Corporate Note | | | 2,805,938 | | | Market Transaction(1) | | Discount | | 0% |
| | | | | | | | | | | |
| World Precious Minerals Fund | | | | | | | | | | |
| Investments in Securities | | | | | | | | | | |
| Common Stocks | | | - | | | Market Transaction(1) | | Discount | | 100% |
| Special Warrants | | | - | | | Market Transaction(1) | | Discount | | 100% |
| Corporate Note | | | 748,250 | | | Market Transaction(1) | | Discount | | 0% |
| | | | | | | | | | | |
| Gold and Precious Metals Fund | | | | | | | | | | |
| Investments in Securities | | | | | | | | | | |
| Common Stocks | | | 0 | | | Market Transaction(1) | | Discount | | 100% |
| Corporate Notes | | | 280,594 | | | Market Transaction(1) | | Discount | | 0% - 100% discount (63% discount) |
| (1) | Market Transaction refers to most recent known market transaction, including transactions in which |
| (2) | the fund participated, as adjusted for any discount or premium as discussed below. The Method of Comparables Pricing valuation technique involves determining a comparable group of companies that exhibit similar characteristics to that of the Level 3 security (the Comparables), gathering information about the Comparables to determine their range of valuation multiples and selecting the appropriate multiple within the determined range of the Comparables to apply in valuing the Level 3 security. |
The majority of securities classified as Level 3 are private companies. The initial valuation is usually cost, which is then adjusted as determined by the Valuation Committee for subsequent known market transactions and evaluated for progress against anticipated milestones and current operations. An evaluation that the holding no longer meets expectations could result in the application of discounts and a significantly lower fair valuation. For certain securities, the last known market transaction is increased or decreased by changes in a market index or industry peers as approved by the Valuation Committee.
| Notes to Portfolios of Investments | December 31, 2018 |
Affiliated Companies
The Investment Company Act of 1940 defines affiliates as companies in which the Fund owns at least 5% of the outstanding voting securities. The following is a summary of transactions with each affiliated company during the period ended December 31, 2018.
| | | | | | Shares of Affiliated Companies | | | | |
| Global Resources Fund | | December 31,
2017 | | | Additions | | | Reductions | | | December 31,
2018 | |
| Atlas African Industries, Ltd. | | | 255,854,621 | | | | – | | | | (255,854,621 | ) | | | – | (a) |
| Bravern Ventures, Ltd. | | | 254,431 | | | | – | | | | (254,431 | ) | | | – | (a) |
| Caribbean Resources Corp. | | | 17 | | | | – | | | | – | | | | 17 | |
| Libero Copper Corp. | | | – | | | | 3,875,000 | | | | – | | | | 3,875,000 | |
| Pacific Green Energy Corp. | | | 2,400,000 | | | | – | | | | – | | | | 2,400,000 | |
At December 31, 2018, the value of investments in affiliated companies was $219,977, representing 0.36% of net assets, and the total cost was $28,210,559. Net realized loss on transactions was $(6,842,269) and there was no income earned for the year.
| | | | | | Shares of Affiliated Companies | | | | |
| World Precious Minerals Fund | | December 31,
2017 | | | Additions | | | Reductions | | | December 31,
2018 | |
| Argo Gold, Inc. | | | 1,825,000 | | | | 1,142,500 | | | | – | | | | 2,967,500 | |
| Barksdale Capital Corp. | | | – | | | | 2,700,000 | | | | – | | | | 2,700,000 | |
| Barsele Minerals Corp. | | | 7,871,299 | | | | 653,701 | | | | (1,475,000 | ) | | | 7,050,000 | |
| Barsele Minerals Corp., Warrants | | | 600,000 | | | | – | | | | (600,000 | ) | | | – | (a) |
| Bluebird Battery Metals, Inc. (formerly Golden Peak Minerals, Inc.) | | | 2,299,998 | | | | – | | | | (1,299,998 | ) | | | 1,000,000 | (a) |
| Chakana Copper Corp. | | | – | | | | 4,600,000 | | | | – | | | | 4,600,000 | |
| CopperBank Resources Corp. | | | 15,979,418 | | | | 7,000,000 | | | | – | | | | 22,979,418 | |
| Dolly Varden Silver Corp. | | | 8,000,000 | | | | 428,000 | | | | – | | | | 8,428,000 | |
| Fremont Gold, Ltd. | | | – | | | | 4,000,000 | | | | – | | | | 4,000,000 | |
| Mammoth Resources Corp. | | | 2,171,200 | | | | – | | | | – | | | | 2,171,200 | |
| Radisson Mining Resources, Inc. | | | 5,200,000 | | | | 4,000,000 | | | | (956,000 | ) | | | 8,244,000 | |
| Toachi Mining, Inc. | | | 6,000,000 | | | | – | | | | – | | | | 6,000,000 | |
| TriStar Gold, Inc. | | | 27,110,500 | | | | 4,019,500 | | | | – | | | | 31,130,000 | |
| TriStar Gold, Inc., Warrants | | | 1,000,000 | | | | – | | | | – | | | | 1,000,000 | |
| VR Resources, Ltd. | | | 1,750,000 | | | | 1,250,000 | | | | – | | | | 3,000,000 | |
| VR Resources, Ltd., Warrants | | | 862,500 | | | | – | | | | – | | | | 862,500 | |
At December 31, 2018, the value of investments in affiliated companies was $14,324,872, representing 20.22% of net assets, and the total cost was $20,276,910. Net realized gain on transactions was $13,979 and there was no income earned for the year.
| | | | | Shares of Affiliated Companies | | | | |
| Gold And Precious Metals Fund | | December 31,
2017 | | | Additions | | | Reductions | | | December 31,
2018 | |
| Mene, Inc. | | | 5,714,285 | | | | – | | | | – | | | | 5,714,285 | (a) |
At December 31, 2018, the value of investments in affiliated companies was $0, representing 0.00% of net assets, and the total cost was $0. There was no realized gain (loss) on transactions and no income earned for the year.
| Notes to Portfolios of Investments | December 31, 2018 |
| (a) | At December 31, 2018, the company was no longer defined as an affiliate, although it was an affiliate company during the year. |
Restricted Securities
The following securities are subject to contractual and regulatory restrictions on resale or transfer. These investments may involve a high degree of business and financial risk. Because of the thinly traded markets for these investments, a Fund may be unable to liquidate its securities in a timely manner, especially if there is negative news regarding the specific securities or the markets overall. These securities could decline significantly in value before the Fund could liquidate these securities. The issuer bears the cost of registration, if any, involved in the disposition of these securities.
| Holmes Macro Trends Fund | | Acquisition Date | | Cost per Share/Unit | |
| Interamerican Energy Corp., Corporate Note (November 2021) | | 05/25/12 | | $ | 100.00 | |
| Pacific Infrastructure Ventures, Inc. | | 08/06/10-11/22/10 | | $ | 1.00 | |
As of December 31, 2018, the total cost of restricted securities was $660,454, and the total value was $469,872, representing 1.39% of net assets.
| Global Resources Fund | | Acquisition Date | | Cost per Share/Unit | |
| Brixton Metals Corp. | | 12/18/18 | | $ | 0.09 | |
| CruzSur Energy Corp. | | 08/30/17 | | $ | 0.79 | |
| Interamerican Energy Corp., Corporate Note (November 2021) | | 05/25/12 | | $ | 100.00 | |
| I-Pulse, Inc., 144A | | 10/04/07 | | $ | 1.88 | |
| Pacific Infrastructure Ventures, Inc. | | 08/06/10-11/22/10 | | $ | 1.00 | |
As of December 31, 2018, the total cost of restricted securities was $10,408,144, and the total value was $7,162,607, representing 11.76% of net assets.
| World Precious Minerals Fund | | Acquisition Date | | Cost per Share/Unit | |
| Argo Gold, Inc. | | 12/24/18 | | $ | 0.12 | |
| Brixton Metals Corp. | | 12/13/18 | | $ | 0.09 | |
| Interamerican Energy Corp., Corporate Note (November 2021) | | 05/25/12 | | $ | 100.00 | |
As of December 31, 2018, the total cost of restricted securities was $911,652, and the total value was $929,176, representing 1.31% of net assets.
| Gold and Precious Metals Fund | | Acquisition Date | | Cost per Share/Unit | |
| Interamerican Energy Corp., Corporate Note (November 2021) | | 05/25/12 | | $ | 100.00 | |
| North American Palladium, Ltd. | | 12/20/18 | | $ | 7.41 | |
As of December 31, 2018, the total cost of restricted securities was $836,603, and the total value was $843,726, representing 0.98% of net assets.
Statements of Assets and Liabilities
| | | U.S. Government Securities
Ultra-Short Bond Fund | |
| Investments, at identified cost | | $ | 42,990,995 | |
| | | | | |
| Assets | | | | |
| Investments, at value: | | | | |
| Securities of unaffiliated issuers | | $ | 42,970,850 | |
| Cash | | | 4,242,367 | |
| Receivables: | | | | |
| Dividends and interest | | | 117,483 | |
| Capital shares sold | | | 51,416 | |
| From adviser | | | 5,144 | |
| Prepaid expenses | | | 8,139 | |
| Total Assets | | | 47,395,399 | |
| | | | | |
| Liabilities | | | | |
| Due to custodian | | | – | |
| Payables: | | | | |
| Capital shares redeemed | | | 57,248 | |
| Distributions payable | | | 8,800 | |
| Accrued expenses and other payables: | | | | |
| Adviser | | | – | |
| Administration and Transfer Agent fees | | | 11,084 | |
| Other expenses | | | 27,850 | |
| Total Liabilities | | | 104,982 | |
| | | | | |
| Net Assets | | $ | 47,290,417 | |
| | | | | |
| Net Assets Consist of: | | | | |
| Paid-in capital | | $ | 47,305,719 | |
| Distributable earnings | | | (15,302 | ) |
| Net assets applicable to capital shares outstanding | | $ | 47,290,417 | |
| By share class | | | | |
| Net Assets | | | | |
| Investor Class | | $ | 47,290,417 | |
| Capital shares outstanding, an unlimited number of no par shares authorized | | | | |
| Investor Class | | | 23,680,585 | |
| Net Asset Value, Public Offering Price and Redemption Price per share | | | | |
| Investor Class | | $ | 2.00 | |
See accompanying notes to financial statements.
December 31, 2018
| Near-Term Tax Free Fund | | | All American Equity Fund | | | Holmes Macro Trends Fund | |
| $ | 46,563,678 | | | $ | 14,312,359 | | | $ | 30,615,051 | |
| | | | | | | | | | | |
| | | | | | | | | | | |
| $ | 46,371,550 | | | $ | 12,659,901 | | | $ | 27,213,715 | |
| | 3,145,769 | | | | 988,266 | | | | 6,602,503 | |
| | | | | | | | | | | |
| | 467,850 | | | | 11,038 | | | | 25,634 | |
| | 59,688 | | | | 15,485 | | | | 101,184 | |
| | 12,706 | | | | – | | | | – | |
| | 15,272 | | | | 7,188 | | | | 10,258 | |
| | 50,072,835 | | | | 13,681,878 | | | | 33,953,294 | |
| | | | | | | | | | | |
| | – | | | | – | | | | – | |
| | | | | | | | | | | |
| | 112,326 | | | | 4,370 | | | | 41,514 | |
| | 3,390 | | | | – | | | | – | |
| | | | | | | | | | | |
| | – | | | | 9,491 | | | | 20,509 | |
| | 10,185 | | | | 6,428 | | | | 9,554 | |
| | 33,319 | | | | 25,753 | | | | 34,194 | |
| | 159,220 | | | | 46,042 | | | | 105,771 | |
| | | | | | | | | | | |
| $ | 49,913,615 | | | $ | 13,635,836 | | | $ | 33,847,523 | |
| | | | | | | | | | | |
| $ | 51,310,151 | | | $ | 15,043,778 | | | $ | 37,728,759 | |
| | (1,396,536 | ) | | | (1,407,942 | ) | | | (3,881,236 | ) |
| $ | 49,913,615 | | | $ | 13,635,836 | | | $ | 33,847,523 | |
| | | | | | | | | | | |
| $ | 49,913,615 | | | $ | 13,635,836 | | | $ | 33,847,523 | |
| | | | | | | | | | | |
| | 22,733,745 | | | | 611,610 | | | | 2,204,001 | |
| | | | | | | | | | | |
| $ | 2.20 | | | $ | 22.29 | | | $ | 15.36 | |
Statements of Assets and Liabilities
| | | Global Resources Fund | |
| Investments, at identified cost | | $ | 124,492,244 | |
| | | | | |
| Assets | | | | |
| Investments, at value: | | | | |
| Securities of unaffiliated issuers | | $ | 55,914,340 | |
| Securities of affiliated issuers | | | 219,977 | |
| Cash | | | – | |
| Foreign currencies (Cost $884,818, $201,361, $0, $118,827 and $24,082) | | | 865,755 | |
| Receivables: | | | | |
| Dividends and interest | | | 165,822 | |
| Capital shares sold | | | 6,606 | |
| Investments sold | | | 4,444,128 | |
| From adviser | | | 6,187 | |
| Prepaid expenses | | | 10,631 | |
| Total Assets | | | 61,633,446 | |
| | | | | |
| Liabilities | | | | |
| Unrealized loss on forward foreign currency contracts | | | – | |
| Due to custodian | | | 596,746 | |
| Payables: | | | | |
| Capital shares redeemed | | | 45,934 | |
| Investments purchased | | | – | |
| Foreign capital gains tax payable | | | – | |
| Accrued expenses and other payables: | | | | |
| Adviser | | | – | |
| Administration and Transfer Agent fees | | | 17,637 | |
| Other expenses | | | 51,744 | |
| Total Liabilities | | | 712,061 | |
| | | | | |
| Net Assets | | $ | 60,921,385 | |
| | | | | |
| Net Assets Consist of: | | | | |
| Paid-in capital | | $ | 346,110,001 | |
| Distributable earnings | | | (285,188,616 | ) |
| Net assets applicable to capital shares outstanding | | $ | 60,921,385 | |
| By share class | | | | |
| Net Assets | | | | |
| Investor Class | | $ | 60,698,984 | |
| Institutional Class | | $ | 222,401 | |
| Capital shares outstanding, an unlimited number of no par shares authorized | | | | |
| Investor Class | | | 14,013,662 | |
| Institutional Class | | | 50,755 | |
| Net Asset Value, Public Offering Price and Redemption Price per share | | | | |
| Investor Class | | $ | 4.33 | |
| Institutional Class | | $ | 4.38 | |
See accompanying notes to financial statements.
December 31, 2018
World Precious Minerals Fund | | | Gold and Precious Metals Fund | | | Emerging Europe Fund | | | China Region Fund | |
| $ | 131,868,010 | | | $ | 87,968,134 | | | $ | 30,865,082 | | | $ | 12,691,893 | |
| | | | | | | | | | | | | | | |
| | | | | | | | | | | | | | | |
| $ | 55,978,598 | | | $ | 83,131,808 | | | $ | 28,748,061 | | | $ | 11,423,174 | |
| | 14,324,872 | | | | – | | | | – | | | | – | |
| | 80,004 | | | | 2,028,971 | | | | 1,944,228 | | | | 1,826,702 | |
| | 201,396 | | | | – | | | | 121,702 | | | | 24,198 | |
| | | | | | | | | | | | | | | |
| | 18,193 | | | | 28,976 | | | | 174,692 | | | | 21,258 | |
| | 145,563 | | | | 449,620 | | | | 23,221 | | | | 1,914 | |
| | 328,566 | | | | 1,129,435 | | | | 363,905 | | | | – | |
| | – | | | | – | | | | – | | | | 1,377 | |
| | 11,557 | | | | 16,847 | | | | 5,768 | | | | 5,177 | |
| | 71,088,749 | | | | 86,785,657 | | | | 31,381,577 | | | | 13,303,800 | |
| | | | | | | | | | | | | | | |
| | – | | | | – | | | | 35,064 | | | | – | |
| | – | | | | 303,851 | | | | – | | | | – | |
| | | | | | | | | | | | | | | |
| | 86,373 | | | | 85,067 | | | | 114,353 | | | | 7,607 | |
| | 53,544 | | | | 153,179 | | | | – | | | | – | |
| | – | | | | – | | | | 6,326 | | | | – | |
| | | | | | | | | | | | | | | |
| | 14,426 | | | | 62,288 | | | | 17,256 | | | | – | |
| | 20,023 | | | | 19,561 | | | | 9,047 | | | | 7,441 | |
| | 53,496 | | | | 55,321 | | | | 49,509 | | | | 35,869 | |
| | 227,862 | | | | 679,267 | | | | 231,555 | | | | 50,917 | |
| | | | | | | | | | | | | | | |
| $ | 70,860,887 | | | $ | 86,106,390 | | | $ | 31,150,022 | | | $ | 13,252,883 | |
| | | | | | | | | | | | | | | |
| $ | 450,091,504 | | | $ | 185,228,928 | | | $ | 54,790,452 | | | $ | 14,861,226 | |
| | (379,230,617 | ) | | | (99,122,538 | ) | | | (23,640,430 | ) | | | (1,608,343 | ) |
| $ | 70,860,887 | | | $ | 86,106,390 | | | $ | 31,150,022 | | | $ | 13,252,883 | |
| | | | | | | | | | | | | | | |
| $ | 69,116,788 | | | $ | 86,106,390 | | | $ | 31,150,022 | | | $ | 13,252,883 | |
| $ | 1,744,099 | | | $ | – | | | $ | – | | | $ | – | |
| | | | | | | | | | | | | | | |
| | 25,604,846 | | | | 12,847,295 | | | | 5,145,733 | | | | 1,753,359 | |
| | 643,879 | | | | – | | | | – | | | | – | |
| | | | | | | | | | | | | | | |
| $ | 2.70 | | | $ | 6.70 | | | $ | 6.05 | | | $ | 7.56 | |
| $ | 2.71 | | | $ | – | | | $ | – | | | $ | – | |
Statements of Operations
| | | U.S. Government Securities Ultra-Short Bond Fund | |
| Net Investment Income | | | |
| | | | |
| Income | | | |
| Dividends from unaffiliated issuers | | $ | – | |
| Net dividends | | | – | |
| Interest and other | | | 768,515 | |
| Total income | | | 768,515 | |
| | | | | |
| Expenses: | | | | |
| Management fee | | | 241,110 | |
| Administrative services fee | | | 88,351 | |
| Distribution plan fee | | | – | |
| Transfer agent fees and expenses | | | 39,107 | |
| Professional fees | | | 21,429 | |
| Custodian fees | | | 6,945 | |
| Shareholder reporting expenses | | | 11,973 | |
| Registration fees | | | 24,088 | |
| Trustee fees and expenses | | | 5,964 | |
| Chief compliance officer fees | | | 5,489 | |
| Miscellaneous expenses | | | 33,937 | |
| Total expenses before reductions | | | 478,393 | |
| Expenses offset - Note 1 H | | | – | |
| Expenses reimbursed - Note 3 | | | (261,393 | ) |
| Net expenses | | | 217,000 | |
| | | | | |
| Net Investment Income (Loss) | | | 551,515 | |
| | | | | |
| Net Realized and Unrealized Gain (Loss) on Investments | | | | |
| Realized gain (loss) from: | | | | |
| Securities from unaffiliated issuers | | | 5,522 | |
| Foreign currency transactions | | | – | |
| Written options | | | – | |
| Net realized gain (loss) | | | 5,522 | |
| Net change in unrealized appreciation (depreciation) of: | | | | |
| Investments in unaffiliated issuers | | | 41,634 | |
| Net change in unrealized appreciation (depreciation) | | | 41,634 | |
| | | | | |
| Net Realized and Unrealized Gain (Loss) on Investments | | | 47,156 | |
| | | | | |
| Net Increase (Decrease) In Net Assets Resulting From Operations | | $ | 598,671 | |
See accompanying notes to financial statements.
December 31, 2018
| | Near-Term Tax Free Fund | | | | All American Equity Fund | | | | Holmes Macro Trends Fund | |
| | | | | | | | | | | |
| $ | – | | | $ | 289,618 | | | $ | 500,210 | |
| | – | | | | 289,618 | | | | 500,210 | |
| | 951,896 | | | | – | | | | 43,528 | |
| | 951,896 | | | | 289,618 | | | | 543,738 | |
| | | | | | | | | | | |
| | 293,122 | | | | 90,826 | | | | 366,599 | |
| | 101,861 | | | | 53,379 | | | | 88,617 | |
| | – | | | | 38,808 | | | | 97,970 | |
| | 23,531 | | | | 22,301 | | | | 28,272 | |
| | 22,266 | | | | 17,673 | | | | 20,894 | |
| | 11,417 | | | | 8,298 | | | | 3,575 | |
| | 12,677 | | | | 6,632 | | | | 9,905 | |
| | 25,479 | | | | 22,988 | | | | 25,133 | |
| | 6,639 | | | | 3,801 | | | | 5,360 | |
| | 6,615 | | | | 1,763 | | | | 4,440 | |
| | 89,389 | | | | 22,250 | | | | 41,462 | |
| | 592,996 | | | | 288,719 | | | | 692,227 | |
| | (42,575 | ) | | | (10,368 | ) | | | (23,038 | ) |
| | (286,611 | ) | | | – | | | | – | |
| | 263,810 | | | | 278,351 | | | | 669,189 | |
| | | | | | | | | | | |
| | 688,086 | | | | 11,267 | | | | (125,451 | ) |
| | | | | | | | | | | |
| | (326,886 | ) | | | 1,390,453 | | | | 4,419,415 | |
| | – | | | | – | | | | 85 | |
| | – | | | | 12,289 | | | | 48,326 | |
| | (326,886 | ) | | | 1,402,742 | | | | 4,467,826 | |
| | | | | | | | | | | |
| | (11,534 | ) | | | (2,292,346 | ) | | | (7,483,102 | ) |
| | (11,534 | ) | | | (2,292,346 | ) | | | (7,483,102 | ) |
| | | | | | | | | | | |
| | (338,420 | ) | | | (889,604 | ) | | | (3,015,276 | ) |
| | | | | | | | | | | |
| $ | 349,666 | | | $ | (878,337 | ) | | $ | (3,140,727 | ) |
Statements of Operations
| | | Global Resources Fund | |
| Net Investment Income | | | | |
| Income | | | | |
| Dividends from unaffiliated issuers | | $ | 2,607,500 | |
| Foreign tax withheld on dividends | | | (268,521 | ) |
| Net dividends | | | 2,338,979 | |
| Interest and other | | | 622,915 | |
| Total income | | | 2,961,894 | |
| | | | | |
| Expenses: | | | | |
| Management fee | | | 581,000 | |
| Administrative services fee | | | 119,251 | |
| Administrative services fee - Investor Class | | | 41,416 | |
| Administrative services fee - Institutional Class | | | 157 | |
| Distribution plan fee | | | 206,991 | |
| Transfer agent fees and expenses | | | – | |
| Transfer agent fees and expenses - Investor Class | | | 64,885 | |
| Transfer agent fees and expenses - Institutional Class | | | 16,121 | |
| Professional fees | | | 24,004 | |
| Custodian fees | | | 36,749 | |
| Shareholder reporting expenses | | | – | |
| Shareholder reporting expenses - Investor Class | | | 19,640 | |
| Shareholder reporting expenses - Institutional Class | | | 1,235 | |
| Registration fees | | | – | |
| Registration fees - Investor | | | 27,546 | |
| Registration fees - Institutional | | | 19,987 | |
| Trustee fees and expenses | | | 8,276 | |
| Chief compliance officer fees | | | 9,350 | |
| Miscellaneous expenses | | | 167,882 | |
| Total expenses before reductions | | | 1,344,490 | |
| Expenses offset - Note 1 H | | | (41,792 | ) |
| Expenses reimbursed - Note 3 | | | (45,917 | ) |
| Net expenses | | | 1,256,781 | |
| | | | | |
| Net Investment Income (Loss) | | | 1,705,113 | |
| | | | | |
| Net Realized and Unrealized Gain (Loss) on Investments | | | | |
| Realized gain (loss) from: | | | | |
| Securities from unaffiliated issuers | | | (3,793,304 | ) |
| Securities from affiliated issuers | | | (6,842,269 | ) |
| Foreign currency transactions | | | (323,409 | ) |
| Foreign capital gains taxes | | | – | |
| Net realized gain (loss) | | | (10,958,982 | ) |
| Net change in unrealized appreciation (depreciation) of: | | | | |
| Investments in unaffiliated issuers | | | (19,689,826 | ) |
| Investments in affiliated issuers | | | 6,810,555 | |
| Other assets and liabilities denominated in foreign currencies | | | (9,430 | ) |
| Deferred foreign capital gains taxes | | | – | |
| Net change in unrealized depreciation | | | (12,888,701 | ) |
| | | | | |
| Net Realized and Unrealized Loss on Investments | | | (23,847,683 | ) |
| | | | | |
| Net Decrease In Net Assets Resulting From Operations | | $ | (22,142,570 | ) |
See accompanying notes to financial statements.
December 31, 2018
World Precious Minerals Fund | | | Gold and Precious Metals Fund | | | Emerging Europe Fund | | | China Region Fund | |
| | | | | | | | | | | |
| $ | 538,448 | | | $ | 791,902 | | | $ | 2,012,232 | | | $ | 776,777 | |
| | (3,582 | ) | | | (146,293 | ) | | | (250,171 | ) | | | (40,494 | ) |
| | 534,866 | | | | 645,609 | | | | 1,762,061 | | | | 736,283 | |
| | 139,150 | | | | 80,745 | | | | – | | | | – | |
| | 674,016 | | | | 726,354 | | | | 1,762,061 | | | | 736,283 | |
| | | | | | | | | | | | | | | |
| | 657,715 | | | | 844,523 | | | | 478,554 | | | | 266,308 | |
| | 128,206 | | | | 160,203 | | | | 98,225 | | | | 78,346 | |
| | 46,050 | | | | – | | | | – | | | | – | |
| | 915 | | | | – | | | | – | | | | – | |
| | 230,248 | | | | 218,284 | | | | 99,123 | | | | 54,090 | |
| | – | | | | 80,553 | | | | 23,907 | | | | 22,703 | |
| | 84,648 | | | | – | | | | – | | | | – | |
| | 16,181 | | | | – | | | | – | | | | – | |
| | 24,743 | | | | 24,113 | | | | 23,983 | | | | 22,853 | |
| | 39,836 | | | | 26,055 | | | | 61,968 | | | | 17,578 | |
| | – | | | | 20,132 | | | | 11,669 | | | | 8,653 | |
| | 22,853 | | | | – | | | | – | | | | – | |
| | 1,576 | | | | – | | | | – | | | | – | |
| | – | | | | 25,319 | | | | 25,129 | | | | 24,189 | |
| | 27,510 | | | | – | | | | – | | | | – | |
| | 21,323 | | | | – | | | | – | | | | – | |
| | 9,004 | | | | 8,460 | | | | 5,381 | | | | 4,200 | |
| | 10,583 | | | | 9,896 | | | | 4,462 | | | | 2,403 | |
| | 149,553 | | | | 119,181 | | | | 130,676 | | | | 74,186 | |
| | 1,470,944 | | | | 1,536,719 | | | | 963,077 | | | | 575,509 | |
| | (32,176 | ) | | | (53,261 | ) | | | (13,545 | ) | | | (9,680 | ) |
| | (52,200 | ) | | | – | | | | – | | | | (37,528 | ) |
| | 1,386,568 | | | | 1,483,458 | | | | 949,532 | | | | 528,301 | |
| | | | | | | | | | | | | | | |
| | (712,552 | ) | | | (757,104 | ) | | | 812,529 | | | | 207,982 | |
| | | | | | | | | | | | | | | |
| | 746,427 | | | | 12,303,232 | | | | 466,896 | | | | 3,185,778 | |
| | 13,979 | | | | – | | | | – | | | | – | |
| | 1,212,461 | | | | 382,069 | | | | 100,672 | | | | (6,049 | ) |
| | – | | | | – | | | | (9,287 | ) | | | – | |
| | 1,972,867 | | | | 12,685,301 | | | | 558,281 | | | | 3,179,729 | |
| | | | | | | | | | | | | | | |
| | (29,699,846 | ) | | | (25,739,467 | ) | | | (8,400,133 | ) | | | (10,432,416 | ) |
| | (8,814,465 | ) | | | – | | | | – | | | | – | |
| | (243 | ) | | | 6,758 | | | | 84,336 | | | | (1,403 | ) |
| | – | | | | – | | | | (1,447 | ) | | | 4,591 | |
| | (38,514,554 | ) | | | (25,732,709 | ) | | | (8,317,244 | ) | | | (10,429,228 | ) |
| | | | | | | | | | | | | | | |
| | (36,541,687 | ) | | | (13,047,408 | ) | | | (7,758,963 | ) | | | (7,249,499 | ) |
| | | | | | | | | | | | | | | |
| $ | (37,254,239 | ) | | $ | (13,804,512 | ) | | $ | (6,946,434 | ) | | $ | (7,041,517 | ) |
| Statements of Changes in Net Assets |
| | | U.S. Government Securities Ultra-Short Bond Fund |
| | | Year Ended December 31, 2018 | | Year Ended December 31, 2017 |
| Increase (Decrease) in Net Assets | | | | | | | | |
| From operations: | | | | | | | | |
| Net investment income | | $ | 551,515 | | | $ | 361,363 | |
| Net realized gain (loss) | | | 5,522 | | | | (614 | ) |
| Net change in unrealized appreciation (depreciation) | | | 41,634 | | | | (139,355 | ) |
| Net increase (decrease) in net assets from operations | | | 598,671 | | | | 221,394 | |
| | | | | | | | | |
| Distributions to shareholders | | | | | | | | |
| Investor Class | | | (550,423 | ) | | | (362,476 | ) |
| Total distributions paid | | | (550,423 | ) | | | (362,476 | )* |
| | | | | | | | | |
| From capital share transactions: | | | | | | | | |
| Proceeds from shares sold | | | | | | | | |
| Investor Class | | | 7,872,300 | | | | 12,743,407 | |
| Distributions reinvested | | | | | | | | |
| Investor Class | | | 465,299 | | | | 313,298 | |
| | | | 8,337,599 | | | | 13,056,705 | |
| Cost of shares redeemed | | | | | | | | |
| Investor Class | | | (10,522,171 | ) | | | (20,282,493 | ) |
| Net decrease in net assets from capital share transactions | | | (2,184,572 | ) | | | (7,225,788 | ) |
| Net Decrease in Net Assets | | | (2,136,324 | ) | | | (7,366,870 | ) |
| Net Assets | | | | | | | | |
| Beginning of year | | | 49,426,741 | | | | 56,793,611 | |
| End of year | | $ | 47,290,417 | | | $ | 49,426,741 | ** |
| Capital Share Activity | | | | | | | | |
| Investor Class | | | | | | | | |
| Shares sold | | | 3,941,763 | | | | 6,371,703 | |
| Shares reinvested | | | 233,093 | | | | 156,649 | |
| Shares redeemed | | | (5,269,444 | ) | | | (10,141,246 | ) |
| Net capital share activity | | | (1,094,588 | ) | | | (3,612,894 | ) |
| * | Distributions for December 31, 2017, were the result of net investment income. |
| ** | Includes accumulated undistributed net investment income (distributions in excess of net investment income of $(1,113), $(3,429) and $76,995 for U.S. Government Securities Ultra-Short Bond Fund, Near-Term Tax Free Fund and All American Equity Fund, respectively, at December 31, 2017. The requirement to disclose the corresponding amount as of December 31, 2018 was eliminated. |
| See accompanying notes to financial statements. |
| | Near-Term Tax Free Fund | | | | All American Equity Fund | |
| | Year Ended December 31, 2018 | | | | Year Ended December 31, 2017 | | | | Year Ended December 31, 2018 | | | | Year Ended December 31, 2017 | |
| $ | 688,086 | | | $ | 972,881 | | | $ | 11,267 | | | $ | 64,257 | |
| | (326,886 | ) | | | (235,301 | ) | | | 1,402,742 | | | | 394,644 | |
| | (11,534 | ) | | | 414,855 | | | | (2,292,346 | ) | | | 477,781 | |
| | 349,666 | | | | 1,152,435 | | | | (878,337 | ) | | | 936,682 | |
| | | | | | | | | | | | | | | |
| | (684,664 | ) | | | (977,375 | ) | | | (633,115 | ) | | | (11,077 | ) |
| | (684,664 | ) | | | (977,375 | )* | | | (633,115 | ) | | | (11,077 | )* |
| | | | | | | | | | | | | | | |
| | | | | | | | | | | | | | | |
| | 10,510,615 | | | | 21,459,051 | | | | 3,247,177 | | | | 2,362,418 | |
| | | | | | | | | | | | | | | |
| | 637,794 | | | | 895,633 | | | | 603,522 | | | | 10,314 | |
| | 11,148,409 | | | | 22,354,684 | | | | 3,850,699 | | | | 2,372,732 | |
| | | | | | | | | | | | | | | |
| | (30,019,533 | ) | | | (48,710,575 | ) | | | (4,635,324 | ) | | | (4,716,185 | ) |
| | | | | | | | | | | | | | | |
| | (18,871,124 | ) | | | (26,355,891 | ) | | | (784,625 | ) | | | (2,343,453 | ) |
| | (19,206,122 | ) | | | (26,180,831 | ) | | | (2,296,077 | ) | | | (1,417,848 | ) |
| | | | | | | | | | | | | | | |
| | 69,119,737 | | | | 95,300,568 | | | | 15,931,913 | | | | 17,349,761 | |
| $ | 49,913,615 | | | $ | 69,119,737 | ** | | $ | 13,635,836 | | | $ | 15,931,913 | ** |
| | | | | | | | | | | | | | | |
| | | | | | | | | | | | | | | |
| | 4,782,451 | | | | 9,658,012 | | | | 128,047 | | | | 97,117 | |
| | 290,776 | | | | 403,359 | | | | 27,634 | | | | 415 | |
| | (13,667,676 | ) | | | (21,934,446 | ) | | | (183,797 | ) | | | (195,073 | ) |
| | (8,594,449 | ) | | | (11,873,075 | ) | | | (28,116 | ) | | | (97,541 | ) |
| Statements of Changes in Net Assets |
| | | | Holmes Macro Trends Fund | |
| | | | Year Ended December 31, 2018 | | | | Year Ended December 31, 2017 | |
| Increase (Decrease) in Net Assets | | | | | | | | |
| From operations: | | | | | | | | |
| Net investment income (loss) | | $ | (125,451 | ) | | $ | (162,790 | ) |
| Net realized gain (loss) | | | 4,467,826 | | | | 4,093,856 | |
| Net change in unrealized appreciation (depreciation) | | | (7,483,102 | ) | | | 3,047,423 | |
| Net increase (decrease) in net assets from operations | | | (3,140,727 | ) | | | 6,978,489 | |
| | | | | | | | | |
| Distributions to shareholders | | | | | | | | |
| Investor Class | | | (4,775,226 | ) | | | (5,106,810 | ) |
| Institutional Class | | | – | | | | – | |
| Total distributions paid | | | (4,775,226 | ) | | | (5,106,810 | )* |
| | | | | | | | | |
| From capital share transactions: | | | | | | | | |
| Proceeds from shares sold | | | | | | | | |
| Investor Class | | | 1,951,359 | | | | 4,012,800 | |
| Institutional Class | | | – | | | | – | |
| Distributions reinvested | | | | | | | | |
| Investor Class | | | 4,545,440 | | | | 4,818,939 | |
| Institutional Class | | | – | | | | – | |
| Proceeds from short-term trading fees | | | | | | | | |
| Investor Class | | | – | | | | 3 | |
| Institutional Class | | | – | | | | – | |
| | | | 6,496,799 | | | | 8,831,742 | |
| Cost of shares redeemed | | | | | | | | |
| Investor Class | | | (6,330,584 | ) | | | (9,812,182 | ) |
| Institutional Class | | | – | | | | – | |
| Net increase (decrease) in net assets from capital share transactions | | | 166,215 | | | | (980,440 | ) |
| Net Increase (Decrease) in Net Assets | | | (7,749,738 | ) | | | 891,239 | |
| Net Assets | | | | | | | | |
| Beginning of year | | | 41,597,261 | | | | 40,706,022 | |
| End of year | | $ | 33,847,523 | | | $ | 41,597,261 | ** |
| Capital Share Activity | | | | | | | | |
| Investor Class | | | | | | | | |
| Shares sold | | | 104,653 | | | | 201,917 | |
| Shares reinvested | | | 302,626 | | | | 246,745 | |
| Shares redeemed | | | (334,222 | ) | | | (499,768 | ) |
| Net capital share activity | | | 73,057 | | | | (51,106 | ) |
| Institutional Class | | | | | | | | |
| Shares sold | | | – | | | | – | |
| Shares reinvested | | | – | | | | – | |
| Shares redeemed | | | – | | | | – | |
| Net capital share activity | | | – | | | | – | |
| * | Distributions for December 31, 2017, were the result of net realized gains for Holmes Macro Trends Fund and net investment income for Global Resources Fund and World Precious Minerals Fund. |
| See accompanying notes to financial statements. |
| Global Resources Fund | | World Precious Minerals Fund |
| | Year Ended December 31, 2018 | | | | Year Ended December 31, 2017 | | | | Year Ended December 31, 2018 | | | | Year Ended December 31, 2017 | |
| $ | 1,705,113 | | | $ | 1,854,022 | | | $ | (712,552 | ) | | $ | (2,058,341 | ) |
| | (10,958,982 | ) | | | 3,787,922 | | | | 1,972,867 | | | | 11,713,452 | |
| | (12,888,701 | ) | | | 11,184,375 | | | | (38,514,554 | ) | | | (15,377,492 | ) |
| | (22,142,570 | ) | | | 16,826,319 | | | | (37,254,239 | ) | | | (5,722,381 | ) |
| | | | | | | | | | | | | | | |
| | (2,777,109 | ) | | | (2,820,970 | ) | | | (10,428,896 | ) | | | (25,786,058 | ) |
| | (11,485 | ) | | | (17,624 | ) | | | (270,361 | ) | | | (706,446 | ) |
| | (2,788,594 | ) | | | (2,838,594 | )* | | | (10,699,257 | ) | | | (26,492,504 | )* |
| | | | | | | | | | | | | | | |
| | | | | | | | | | | | | | | |
| | 6,295,513 | | | | 3,820,335 | | | | 33,624,272 | | | | 43,215,850 | |
| | 27,542 | | | | 1,393,643 | | | | 142,294 | | | | 1,164,153 | |
| | | | | | | | | | | | | | | |
| | 2,670,832 | | | | 2,710,005 | | | | 9,830,922 | | | | 24,321,600 | |
| | 9,902 | | | | 16,716 | | | | 269,739 | | | | 685,819 | |
| | | | | | | | | | | | | | | |
| | – | | | | 54 | | | | – | | | | 482 | |
| | – | | | | – | | | | – | | | | 3 | |
| | 9,003,789 | | | | 7,940,753 | | | | 43,867,227 | | | | 69,387,907 | |
| | | | | | | | | | | | | | | |
| | (19,180,191 | ) | | | (21,753,696 | ) | | | (42,288,710 | ) | | | (58,534,541 | ) |
| | (235,764 | ) | | | (1,935,931 | ) | | | (537,036 | ) | | | (2,024,363 | ) |
| | | | | | | | | | | | | | | |
| | (10,412,166 | ) | | | (15,748,874 | ) | | | 1,041,481 | | | | 8,829,003 | |
| | (35,343,330 | ) | | | (1,761,149 | ) | | | (46,912,015 | ) | | | (23,385,882 | ) |
| | | | | | | | | | | | | | | |
| | 96,264,715 | | | | 98,025,864 | | | | 117,772,902 | | | | 141,158,784 | |
| $ | 60,921,385 | | | $ | 96,264,715 | ** | | $ | 70,860,887 | | | $ | 117,772,902 | ** |
| | | | | | | | | | | | | | | |
| | | | | | | | | | | | | | | |
| | 1,049,184 | | | | 670,921 | | | | 8,676,459 | | | | 6,640,756 | |
| | 626,956 | | | | 454,695 | | | | 3,900,899 | | | | 5,404,357 | |
| | (3,388,462 | ) | | | (3,870,155 | ) | | | (11,444,167 | ) | | | (9,187,898 | ) |
| | (1,712,322 | ) | | | (2,744,539 | ) | | | 1,133,191 | | | | 2,857,215 | |
| | | | | | | | | | | | | | | |
| | 4,816 | | | | 249,133 | | | | 33,951 | | | | 174,505 | |
| | 2,297 | | | | 2,786 | | | | 107,039 | | | | 151,730 | |
| | (40,896 | ) | | | (361,840 | ) | | | (135,597 | ) | | | (286,385 | ) |
| | (33,783 | ) | | | (109,921 | ) | | | 5,393 | | | | 39,850 | |
| ** | Includes accumulated undistributed net investment income (distributions in excess of net investment income of $-, $1,183,598 and $(11,339,495) for Holmes Macro Trends Fund, Global Resources Fund and World Precious Minerals Fund, respectively, at December 31, 2017. The requirement to disclose the corresponding amount as of December 31, 2018 was eliminated. |
Statements of Changes in Net Assets
| | | | Gold and Precious Metals Fund | |
| | | | Year Ended December 31, 2018 | | | | Year Ended December 31, 2017 | |
| Increase (Decrease) in Net Assets | | | | | | | | |
| From operations: | | | | | | | | |
| Net investment income (loss) | | $ | (757,104 | ) | | $ | (856,026 | ) |
| Net realized gain | | | 12,685,301 | | | | 5,126,757 | |
| Net change in unrealized appreciation (depreciation) | | | (25,732,709 | ) | | | 6,800,473 | |
| Net increase (decrease) in net assets from operations | | | (13,804,512 | ) | | | 11,071,204 | |
| | | | | | | | | |
| Distributions to shareholders | | | | | | | | |
| Investor Class | | | (1,486,190 | ) | | | – | |
| Total distributions paid | | | (1,486,190 | ) | | | – | |
| | | | | | | | | |
| From capital share transactions: | | | | | | | | |
| Proceeds from shares sold | | | | | | | | |
| Investor Class | | | 32,704,882 | | | | 49,647,272 | |
| Distributions reinvested | | | | | | | | |
| Investor Class | | | 1,376,717 | | | | – | |
| Proceeds from short-term trading fees | | | | | | | | |
| Investor Class | | | – | | | | 465 | |
| | | | 34,081,599 | | | | 49,647,737 | |
| Cost of shares redeemed | | | | | | | | |
| Investor Class | | | (33,424,316 | ) | | | (53,967,222 | ) |
| Net increase (decrease) in net assets from capital share transactions | | | 657,283 | | | | (4,319,485 | ) |
| Net Increase (Decrease) in Net Assets | | | (14,633,419 | ) | | | 6,751,719 | |
| Net Assets | | | | | | | | |
| Beginning of year | | | 100,739,809 | | | | 93,988,090 | |
| End of year | | $ | 86,106,390 | | | $ | 100,739,809 | ** |
| Capital Share Activity | | | | | | | | |
| Investor Class | | | | | | | | |
| Shares sold | | | 4,598,868 | | | | 6,404,488 | |
| Shares reinvested | | | 213,114 | | | | – | |
| Shares redeemed | | | (4,621,311 | ) | | | (7,105,060 | ) |
| Net capital share activity | | | 190,671 | | | | (700,572 | ) |
| * | Distributions for December 31, 2017, were the result of net investment income. |
| ** | Includes distributions in excess of net investment income of $(4,212,058), $(184,330) and $- for Gold and Precious Metals Fund, Emerging Europe Fund and China Region Fund, respectively, at December 31, 2017. The requirement to disclose the corresponding amount as of December 31, 2018 was eliminated. |
See accompanying notes to financial statements.
December 31, 2018
| Emerging Europe Fund | | | China Region Fund |
Year Ended December 31, 2018 | | | Year Ended December 31, 2017 | | | Year Ended December 31, 2018 | | | Year Ended December 31, 2017 | |
| $ | 812,529 | | | $ | 574,468 | | | $ | 207,982 | | | $ | (143,814 | ) |
| | 558,281 | | | | 3,334,426 | | | | 3,179,729 | | | | 1,585,811 | |
| | (8,317,244 | ) | | | 5,507,965 | | | | (10,429,228 | ) | | | 8,257,725 | |
| | (6,946,434 | ) | | | 9,416,859 | | | | (7,041,517 | ) | | | 9,699,722 | |
| | | | | | | | | | | | | | | |
| | – | | | | – | | | | (391,917 | ) | | | (29,602 | ) |
| | – | | | | – | | | | (391,917 | ) | | | (29,602 | )* |
| | | | | | | | | | | | | | | |
| | | | | | | | | | | | | | | |
| | 2,640,089 | | | | 7,150,395 | | | | 3,083,370 | | | | 18,143,688 | |
| | | | | | | | | | | | | | | |
| | – | | | | – | | | | 361,957 | | | | 27,491 | |
| | | | | | | | | | | | | | | |
| | – | | | | 19 | | | | – | | | | – | |
| | 2,640,089 | | | | 7,150,414 | | | | 3,445,327 | | | | 18,171,179 | |
| | | | | | | | | | | | | | | |
| | (9,845,502 | ) | | | (13,538,508 | ) | | | (12,534,243 | ) | | | (14,575,981 | ) |
| | | | | | | | | | | | | | | |
| | (7,205,413 | ) | | | (6,388,094 | ) | | | (9,088,916 | ) | | | 3,595,198 | |
| | (14,151,847 | ) | | | 3,028,765 | | | | (16,522,350 | ) | | | 13,265,318 | |
| | | | | | | | | | | | | | | |
| | 45,301,869 | | | | 42,273,104 | | | | 29,775,233 | | | | 16,509,915 | |
| $ | 31,150,022 | | | $ | 45,301,869 | ** | | $ | 13,252,883 | | | $ | 29,775,233 | ** |
| | | | | | | | | | | | | | | |
| | 360,886 | | | | 1,125,093 | | | | 275,292 | | | | 1,683,280 | |
| | – | | | | – | | | | 48,390 | | | | 2,429 | |
| | (1,429,533 | ) | | | (2,033,015 | ) | | | (1,153,285 | ) | | | (1,358,352 | ) |
| | (1,068,647 | ) | | | (907,922 | ) | | | (829,603 | ) | | | 327,357 | |
| Notes to Financial Statements | December 31, 2018 |
Note 1: Organization and Significant Accounting Policies
U.S. Global Investors Funds (“Trust”), consisting of the nine separate funds (“Funds”) included in this report, is organized as a Delaware statutory trust. Each Fund is an open-end management investment company registered under the Investment Company Act of 1940, as amended, and follows the specialized accounting and reporting guidance in FASB Accounting Standards Codification Topic 946. All Funds are diversified with the exception of Global Resources, World Precious Minerals, Gold and Precious Metals, Emerging Europe and China Region. A nondiversified fund may invest a greater percentage of its assets in a particular issuer in comparison to a diversified fund.
The following is a summary of significant accounting policies consistently followed by the Funds in the preparation of their financial statements. The policies are in conformity with U.S. generally accepted accounting principles.
A. Security Valuations
The Funds value investments traded on national or international securities exchanges or over-the-counter at the last sales price reported by the security’s primary exchange of its market at the time of daily valuation. Options and securities for which no sale was reported are valued at the mean between the last reported bid and asked quotation. Debt securities having 60 days or less to maturity that are expected to be valued at par at maturity may be priced by the amortized cost method if the Valuation Committee determines it would approximate market value. Municipal securities, long-term U.S. government obligations and corporate debt securities are valued by an independent pricing service using an evaluated quote based on such factors as institutional-size trading in similar groups of securities, yield, quality, maturity, coupon rate, type of issue, individual trading characteristics and other market data. For more information please see Notes to Portfolio of Investments.
B. Cash-Concentration in Uninsured Account
For cash management purposes the Funds may concentrate cash with the Funds’ custodian. As of December 31, 2018, The U.S. Government Securities Ultra-Short Bond Fund, Near-Term Tax Free Fund, All American Equity Fund, Holmes Macro Trends Fund, World Precious Minerals Fund, Gold and Precious Metals Fund, Emerging Europe Fund and China Region Fund held $4,242,367, $3,145,769, $988,266, $6,602,503, $80,004, $2,028,971, $1,944,228, and$1,826,702, respectively, as cash reserves at Brown Brothers Harriman & Co. (BBH).
C. Fair Valued Securities
Securities for which market quotations are not readily available or which are subject to legal restrictions are valued at their fair value as determined in good faith by the Valuation Committee of U.S. Global Investors, Inc. (Adviser), under policies and procedures established by the Trust’s Board of Trustees. Fair value is the price that would be received to sell an asset or paid to transfer a liability in an orderly transaction between market participants at the measurement date. The Valuation Committee meets on a regular basis to review securities which may not have readily available market prices and considers a number of factors in determining fair value, including nature and duration of any trading restrictions, trading volume, market values of unrestricted shares of the same or similar class, investment management’s judgment regarding the market experience of the issuer, financial status and other operational and market factors affecting the issuer, issuer’s management, quality of the underlying property based on review of independent geological
| Notes to Financial Statements | December 31, 2018 |
studies and other relevant matters. The fair values may differ from what would have been used had a broader market for these securities existed. The Valuation Committee regularly reviews inputs and assumptions and performs transactional back-testing and disposition analysis. The Valuation Committee reports quarterly to the Trust’s Board of Trustees.
For securities traded on international exchanges, if events which may materially affect the value of a Fund’s securities occur after the close of the primary exchange and before a Fund’s net asset value is next determined, then those securities will be valued at their fair value as determined in good faith in accordance with the policies approved by the Board of Trustees. The Funds use a systematic fair value model provided by an independent third party to value international securities primarily traded on an exchange or market outside the Western Hemisphere in order to adjust for stale pricing, which may occur between the close of certain foreign exchanges and the New York Stock Exchange.
D. Security Transactions and Investment Income
Security transactions are accounted for on trade date. Realized gains and losses from security transactions are determined on an identified cost basis. Dividend income is recorded on the ex-dividend date except that certain dividends from foreign securities where the ex-dividend date may have passed are recorded as soon as the Fund has confirmed the ex-dividend date. Interest income, which may include original issue discount, is recorded on an accrual basis. Discounts and premiums on securities purchased are accreted and amortized, respectively, on a yield-to-maturity basis as adjustments to interest income. Investment income is recorded net of foreign taxes withheld where recovery of such taxes is uncertain. Investment income and realized and unrealized gains (losses) are allocated to each Fund’s share class based on their respective net assets.
The Funds may purchase securities on a when-issued or delayed-delivery basis and segregate collateral on their books with a value at least equal to the amount of the commitment. Losses may arise due to the changes in the value of the underlying securities or if the counterparty does not perform under the contract.
E. Foreign Currency Transactions
Some Funds may invest in securities of foreign issuers. The accounting records of these Funds are maintained in U.S. dollars. At each net asset value determination date, the value of assets and liabilities denominated in foreign currencies are translated into U.S. dollars using the current prevailing exchange rate. Security transactions, income and expenses are converted at the prevailing rate of exchange on the respective dates of the transactions. The effect of changes in foreign exchange rates on foreign denominated securities is included with the net realized and unrealized gain or loss on securities. Other foreign currency gains or losses are reported separately.
F. Federal Income Taxes
The Funds intend to continue to comply with the requirements of Subchapter M of the Internal Revenue Code applicable to regulated investment companies and to distribute substantially all of their taxable income to shareholders. Accordingly, no provision for federal income taxes is required. Each Fund may be subject to foreign taxes on income and gains on investments, which are accrued based on the Fund’s understanding of the tax rules and regulations in the foreign markets.
The Funds recognize the tax benefits of uncertain tax positions only where the position is “more likely than not” to be sustained assuming examination by tax authorities.
| Notes to Financial Statements | December 31, 2018 |
Management has analyzed the Funds’ tax positions, and has concluded that no liability for unrecognized tax benefits should be recorded related to uncertain tax positions taken on returns filed for open tax years or expected to be taken in 2018 tax returns. The Funds file U.S. federal and excise tax returns as required. The Funds’ 2015, 2016, 2017 and 2018 (when filed) tax returns are open to examination by the federal and applicable state tax authorities. The Funds have no examinations in progress.
G. Dividends and Distributions to Shareholders
The Funds record dividends and distributions to shareholders on the ex-dividend date. Distributions are determined in accordance with income tax regulations, which may differ from accounting principles generally accepted in the United States. Accordingly, periodic reclassifications related to permanent book and tax basis differences are made within the Funds’ capital accounts to reflect income and gains available for distribution under income tax regulations.
The Funds, except as noted below, generally pay income dividends and distribute capital gains, if any, annually. The U.S. Government Securities Ultra-Short Bond Fund and the Near-Term Tax Free Fund pay dividends monthly. A Fund may elect to designate a portion of the earnings and profits distributed to shareholders on the redemption of fund shares during the year as distributions for federal income tax purposes. Differences in per share dividend rates for multiclass funds generally result from the relative weightings of pro rata income allocations and from differences in separate class expenses.
H. Expenses
Fund specific expenses are allocated to that Fund and pro rata across share classes. Expenses that are not fund specific are allocated among Funds and pro rata across share classes. Class specific expenses (including, but not limited to, distribution plan fees, if any, a portion of the administrative services fees, transfer agency fees and expenses, shareholder reporting expenses and certain legal and registration fees) are allocated to the class that incurs such expense. Except for the U.S. Government Securities Ultra-Short Bond Fund, expense offset arrangements have been made with the Funds’ custodian so the custodian fees may be paid indirectly by credits earned on the Funds’ cash balances. Such deposit arrangements are an alternative to overnight investments. Custodian fees are presented in the Statements of Operations gross of such credits, and the credits are presented as offsets to expenses. For the U.S. Government Securities Ultra-Short Bond Fund, credits earned on its cash balance are included in interest and other income.
I. Use of Estimates in Financial Statement Preparation
The Funds are investment companies accounted for in conformity with accounting principles generally accepted in the United States of America (“GAAP”). Therefore they follow the accounting and reporting guidelines for investment companies. The preparation of financial statements in conformity with GAAP requires management to make estimates and assumptions that affect the reported amounts of assets and liabilities and disclosure of contingent assets and liabilities at the date of the financial statements and the reported amounts of income and expenses during the reporting period. Actual results could differ from those estimates.
| Notes to Financial Statements | December 31, 2018 |
Note 2: Financial Derivative Instruments
A. Options Contracts
Equity Funds may purchase or write (sell) options on securities to manage their exposure to stock or commodity markets as well as fluctuations in interest and currency conversion rates. The use of options carries the risks of a change in value of the underlying instruments, an illiquid secondary market, or failure of the counterparty to perform its obligations.
A put option gives the purchaser of the option, upon payment of a premium, the right to sell, and the issuer of the option the obligation to buy, the underlying security, commodity, index, currency or other instrument at the exercise price. A call option, upon payment of a premium, gives the purchaser of the option the right to buy, and the issuer the obligation to sell, the underlying instrument at the exercise price.
Purchasing a put option tends to decrease a Fund’s exposure to the underlying instrument, whereas purchasing a call option tends to increase a Fund’s exposure to the underlying instrument. A Fund pays a premium which is included in the Statement of Assets and Liabilities as an investment and subsequently marked to market to reflect the current value of the option. Premiums paid to purchase options which expire are treated as realized losses. Premiums paid to purchase options which are exercised or closed are added to the cost of securities acquired or the proceeds from securities sold. The risk associated with purchasing put and call options is limited to the premium paid.
The Funds will realize a loss equal to all or a part of the premium paid for an option if the price of the underlying security or other instrument decreases or does not increase by more than the premium (in the case of a call option), or if the price of the underlying security or other instrument increases or does not decrease by more than the premium (in the case of a put option).
Writing a put option tends to increase a Fund’s exposure to the underlying instrument, whereas writing a call option tends to decrease a Fund’s exposure to the underlying instrument. The premium received is recorded as a liability in the Statement of Assets and Liabilities and subsequently marked to market to reflect the current value of the option written. Premiums received from writing options which expire are treated as realized gains. Premiums received from options which are exercised or closed are added to the proceeds or offset against amounts paid on the underlying transaction to determine the realized gain or loss. Written options include a risk of loss in excess of the option premium. A Fund as a writer of an option has no control over whether the underlying instrument may be sold (call) or purchased (put) and thus bears the market risk of an unfavorable change in the price of the instrument underlying the written option. There is also the risk a Fund may not be able to enter into a closing transaction because of an illiquid market.
A Fund’s ability to close out its position as a purchaser or seller of a put or call option is dependent, in part, upon the liquidity of the market for that particular option. There can be no guarantee that a Fund will be able to close out an option position when desired. An inability to close out its options positions may reduce a Fund’s anticipated profits or increase its losses.
As of December 31, 2018, there were no securities held in escrow by the custodian as cover for call options written.
| Notes to Financial Statements | December 31, 2018 |
B. Forward Foreign Currency Contracts
The Funds enter into forward foreign currency contracts to lock in the U.S. dollar cost of purchase and sale transactions or to hedge the portfolio against currency fluctuations. A forward foreign currency contract is a commitment to purchase or sell a foreign currency at a future date at a negotiated rate. These contracts are valued daily, and the Fund’s net equity therein, representing unrealized gain or loss on the contracts as measured by the difference between the forward foreign exchange rates at the dates of entry into the contracts and the forward rates at the reporting date, is included in the Statement of Assets and Liabilities. Realized and unrealized gains and losses are included in the Statement of Operations. Risks may arise upon entering into these contracts from the potential inability of counterparties to meet the terms of the contracts and from unanticipated movements in the value of foreign currencies relative to the U.S. dollar.
Open forward foreign currency contracts as of December 31, 2018, were as follows:
| | | | | | | | | | | | Settlement Value at | | | | |
| Fund | | Counterparty | | Currency to Deliver | | Currency to Receive�� | | | Settlement Date | | December 31, 2018 | | | Net Unrealized Depreciation | |
| Emerging Europe Fund | | Brown Brothers Harriman & Co. | | TRY 7,000,000 | | | USD 1,274,094 | | | 1/17/2019 | | $ | 1,309,158 | | | $ | (35,064 | ) |
C. Summary of Derivative Instruments
The following is a summary of the valuations of derivative instruments categorized by location in the Statements of Assets and Liabilities as of December 31, 2018:
| Location | | All American Equity Fund | | | Holmes Macro Trends Fund | | | Global Resources Fund | |
| Asset derivatives | | | | | | | | | | | | |
| Investments, at value | | | | | | | | | | | | |
| Purchased options – Equity risk | | $ | 194,051 | | | $ | 484,449 | | | $ | 84,600 | |
| Total | | $ | 194,051 | | | $ | 484,449 | | | $ | 84,600 | |
| Location | | World Precious Minerals Fund | | | Gold and Precious Metals Fund | | | Emerging Europe Fund | |
| Asset derivatives | | | | | | | | | | | | |
| Investments, at value | | | | | | | | | | | | |
| Purchased options - Equity risk | | $ | 237,750 | | | $ | 311,000 | | | $ | – | |
| | | | | | | | | | | | | |
| Liability derivatives | | | | | | | | | | | | |
| Unrealized loss on forward foreign currency contracts – Currency contract risk | | $ | – | | | $ | – | | | $ | (35,064 | ) |
| Total | | $ | 237,750 | | | $ | 311,000 | | | $ | (35,064 | ) |
| Notes to Financial Statements | December 31, 2018 |
The following is a summary of the effect of derivative instruments on the Statements of Operations as of December 31, 2018:
| Location | | All American Equity Fund | | | Holmes Macro Trends Fund | | | Global Resources Fund | |
| Realized gain (loss) on derivatives recognized in income | | | | | | | | | | | | |
| Realized gain (loss) from securities | | | | | | | | | | | | |
| Purchased options – Equity risk | | $ | 310,563 | | | $ | 767,990 | | | $ | 1,059,085 | |
| Net realized gain (loss) from foreign currency transactions | | | | | | | | | | | | |
| Foreign exchange contracts – Currency contract risk | | | – | | | | – | | | | (221,595 | ) |
| Realized gain (loss) from written options– Equity risk | | | 12,289 | | | | 48,326 | | | | – | |
| | | | 322,852 | | | | 816,316 | | | | 837,490 | |
| Change in unrealized appreciation (depreciation) on derivatives recognized in income | | | | | | | | | | | | |
| Net change in unrealized appreciation (depreciation) of investments | | | | | | | | | | | | |
| Purchased options– Equity risk | | | (89,360 | ) | | | (223,087 | ) | | | (1,791,857 | ) |
| | | | (89,360 | ) | | | (223,087 | ) | | | (1,791,857 | ) |
| Total | | $ | 233,492 | | | $ | 593,229 | | | $ | (954,367 | ) |
| Location | | World Precious Minerals Fund | | | Gold and Precious Metals Fund | | | Emerging Europe Fund | | | China Region Fund | |
| Realized gain (loss) on derivatives recognized in income | | | | | | | | | | | | | | | | |
| Realized gain (loss) from securities | | | | | | | | | | | | | | | | |
| Purchased options– Equity risk | | $ | (5 | ) | | $ | – | | | $ | – | | | $ | (112,735 | ) |
| Net realized gain (loss) from foreign currency transactions | | | | | | | | | | | | | | | | |
| Foreign exchange contracts– Currency contract risk | | | (603,339 | ) | | | (412,943 | ) | | | 180,744 | | | | – | |
| | | | (603,344 | ) | | | (412,943 | ) | | | 180,744 | | | | (112,735 | ) |
| Change in unrealized appreciation (depreciation) on derivatives recognized in income | | | | | | | | | | | | | | | | |
| Net change in unrealized appreciation (depreciation) of investments | | | | | | | | | | | | | | | | |
| Purchased options– Equity risk | | | 13,430 | | | | 17,362 | | | | – | | | | (160,049 | ) |
| Net change in unrealized gain (loss) from foreign currency transactions | | | | | | | | | | | | | | | | |
| Foreign exchange contracts– Currency contract risk | | | – | | | | – | | | | (35,064 | ) | | | – | |
| | | | 13,430 | | | | 17,362 | | | | (35,064 | ) | | | (160,049 | ) |
| Total | | $ | (589,914 | ) | | $ | (395,581 | ) | | $ | 145,680 | | | $ | (272,784 | ) |
| Notes to Financial Statements | December 31, 2018 |
The total value of transactions in written options, purchased options and forward currency contracts outstanding during the year ended December 31, 2018, were approximately as follows:
| Fund | | Purchased Options | | | Written Options | | | Forward Currency Contracts | |
| All American Equity Fund | | $ | 538,469 | | | $ | (61,921 | ) | | $ | – | |
| Holmes Macro Trends Fund | | | 1,436,131 | | | | (99,832 | ) | | | – | |
| Global Resources Fund | | | 2,371,718 | | | | – | | | | 18,868,411 | |
| World Precious Minerals Fund | | | 224,320 | | | | – | | | | 66,545,147 | |
| Gold and Precious Metals Fund | | | 293,638 | | | | – | | | | 44,793,089 | |
| Emerging Europe Fund | | | – | | | | – | | | | 46,848,126 | |
Asset (Liability) amounts shown in the table below represent amounts for derivative related instruments at December 31, 2018. These amounts may be collateralized by cash or financial instruments.
| | | Gross Asset (Liability) as Presented in the Statement of Assets and Liabilities | | | Financial Instruments (Received) Pledged* | | | Cash Collateral (Received) Pledged* | | | Net Amount | |
| All American Equity | | | | | | | | | | | | |
| Assets: | | | | | | | | | | | | |
| Over-the-counter derivatives | | $ | 194,051 | | | $ | – | | | $ | – | | | $ | 194,051 | |
| Holmes Macro Trends | | | | | | | | | | | | | | | | |
| Assets: | | | | | | | | | | | | | | | | |
| Over-the-counter derivatives | | | 484,449 | | | | – | | | | – | | | | 484,449 | |
| Global Resources | | | | | | | | | | | | | | | | |
| Assets: | | | | | | | | | | | | | | | | |
| Over-the-counter derivatives | | | 84,600 | | | | – | | | | – | | | | 84,600 | |
| World Precious Minerals | | | | | | | | | | | | | | | | |
| Assets: | | | | | | | | | | | | | | | | |
| Over-the-counter derivatives | | | 237,750 | | | | – | | | | – | | | | 237,750 | |
| Gold and Precious Metals | | | | | | | | | | | | | | | | |
| Assets: | | | | | | | | | | | | | | | | |
| Over-the-counter derivatives | | | 311,000 | | | | – | | | | – | | | | 311,000 | |
| Emerging Europe | | | | | | | | | | | | | | | | |
| Liabilities: | | | | | | | | | | | | | | | | |
| Over-the-counter derivatives | | | (35,064 | ) | | | – | | | | 35,064 | | | | – | |
| * | The actual financial instruments and cash collateral (received) pledged may be in excess of the amounts shown in the table. The table only reflects collateral amounts up to the amount of the financial instrument disclosed on the Statement of Assets and Liabilities. |
| Notes to Financial Statements | December 31, 2018 |
Note 3: Investment Advisory and Other Agreements
The Adviser, under an investment advisory agreement with the Trust in effect through October 1, 2019, furnishes management and investment advisory services and, subject to the supervision of the trustees, directs the investments of each Fund according to each Fund’s investment objectives, policies and limitations.
For the services of the Adviser, each Fund pays a base management or advisory fee based upon its net assets. Fees are accrued daily and paid monthly. The contractual management fee for each fund is:
| Fund | Average Percentage of Average Daily Net Assets |
| U.S. Government Securities Ultra-Short Bond | .50% of the first $250,000,000 and .375% of the excess |
| Near-Term Tax Free | .50% |
| All American Equity | .80% of the first $500,000,000 and .75% of the excess |
| Holmes Macro Trends | 1.00% |
| Global Resources | .95% of the first $500,000,000; .90% of $500,000,001 to $1,000,000,000 and .85% of the excess |
| World Precious Minerals | 1.00% of the first $500,000,000; .95% of $500,000,001 to $1,000,000,000 and .90% of the excess |
| Gold and Precious Metals | .90% of the first $500,000,000 and .85% of the excess |
| Emerging Europe | 1.25% |
| China Region | 1.25% |
The advisory agreement also provides that the base advisory fee of the Equity Funds will be adjusted upwards or downwards by 0.25 percent if there is a performance difference of 5 percent or more between a Fund’s performance and that of its designated benchmark index over the prior 12 months. The performance adjustment is calculated separately for each share class. The benchmarks are as follows:
| Fund | Benchmark Index |
| All American Equity | S&P 500 Index |
| Holmes Macro Trends | S&P Composite 1500 Index |
| Global Resources | S&P Global Natural Resources Index (Net Total Return) |
| World Precious Minerals | NYSE Arca Gold Miners Index |
| Gold and Precious Metals | FTSE Gold Mines Index |
| Emerging Europe | MSCI Emerging Markets Europe 10/40 Index (Net Total Return) |
| China Region | Hang Seng Composite Index |
No performance adjustment is applied unless the difference between the class’s investment performance and the benchmark is 5 percent or greater (positive or negative) during the applicable performance measurement period. The performance fee adjustment is calculated monthly in arrears and is accrued ratably during the month. The management fee, net of any performance fee adjustment, is paid monthly in arrears.
The amounts shown as Management fee on the Statements of Operations reflects the base fee plus/minus any performance adjustment. During the year ended December 31, 2018, the Funds recorded performance adjustments as follows:
| Notes to Financial Statements | December 31, 2018 |
| Fund | | Investor Class Performance Fee Adjustment | | | Institutional Class Performance Fee Adjustment | |
| All American Equity | | $ | (33,360 | ) | | | N/A | |
| Holmes Macro Trends | | | (25,281 | ) | | | N/A | |
| Global Resources | | | (208,505 | ) | | $ | (790 | ) |
| World Precious Minerals | | | (279,263 | ) | | | (6,883 | ) |
| Gold and Precious Metals | | | 58,699 | | | | N/A | |
| Emerging Europe | | | (17,060 | ) | | | N/A | |
| China Region | | | (4,143 | ) | | | N/A | |
Atlantic Fund Administration, LLC (d/b/a Atlantic Fund Services) (“Atlantic”) and the Adviser act as co-administrators to the Trust. Atlantic provides a Principal Executive Officer, a Principal Financial Officer, a Chief Compliance Officer and and Anti-Money Laundering Officer to each Fund, as well as certain additional compliance and administrative support functions. Atlantic also provides fund accounting services to each Fund. The fees related to these services are included in Administration Fees within the Statement of Operations. Atlantic also provides certain shareholder report production and EDGAR conversion and filing services. Pursuant to an Atlantic services agreement, each Fund pays Atlantic customary fees for its services.
The U.S. Government Securities Ultra-Short Bond, Near-Term Tax Free, All American Equity, Holmes Macro Trends, Gold and Precious Metals, Emerging Europe and China Region Funds compensate the Adviser at an annual rate of 0.05% of the average daily net assets of each Fund for administrative services provided, of which half is a fund-level fee and half is a class-level fee. The Global Resources and World Precious Minerals Funds compensate the Adviser at an annual rate of 0.05% of the average daily net assets for the Investor Class and 0.04% of the average daily net assets for the Institutional Class for administrative services provided, of which half is a fund-level fee and half is a class-level fee.
The Investor Class shares for Equity Funds in the Trust have adopted a distribution plan pursuant to Rule 12b-1 of the Investment Company Act of 1940 in which the Distributor is paid a fee at an annual rate of 0.25% of the average daily net assets of the Investor Class for sales and promotional services related to the distribution of Investor Class shares. The Institutional Class does not incur distribution plan fees.
The Adviser has voluntarily agreed to reimburse specific funds so that their total operating expenses will not exceed certain annual percentages of average net assets. The expenses for the year ended December 31, 2018, were limited as follows for the Investor Class: U.S. Government Securities Ultra-Short Bond Fund at 0.45%, All American Equity Fund and Holmes Macro Trends Fund at 2.20%, Global Resources, World Precious Minerals, and Gold and Precious Metals Funds at 1.90%, Emerging Europe Fund at 2.85% and China Region Fund at 2.55%. These expense limitations are exclusive of any performance fee adjustments and will continue on a voluntary basis at the Adviser’s discretion. The Adviser may temporarily agree to additional reimbursements or limitations.
The Adviser has contractually limited the total operating expenses of the Near- Term Tax Free Fund at 0.45% on an annualized basis through April 30, 2019.
The Adviser has voluntarily agreed to waive all class specific expenses for the Institutional Class of the Global Resources Fund and the World Precious Minerals Fund. These expense
| Notes to Financial Statements | December 31, 2018 |
waivers are exclusive of any performance fee adjustments, and the Adviser can modify or terminate this arrangement at any time.
Atlantic is the transfer agent for the Funds. Each Fund’s share class pays an annual fee based on the number of shareholder accounts, certain base fees and transaction- and activity-based fees for transfer agency services. Certain account fees are paid directly by shareholders to the transfer agent, which, in turn, reduces its charge to the Funds.
Brown Brothers Harriman & Co. (BBH) serves as the custodian.
Foreside Fund Services, LLC (the “Distributor”) acts as the agent of the Trust in connection with the continuous offering of shares of the Funds. The Distributor continually distributes shares of the Funds on a best efforts basis.
Note 4: Investments
Cost of purchases and proceeds from sales of long-term securities for the year ended December 31, 2018, are summarized as follows:
| Fund | | Purchases | | | Sales | |
| U.S. Government Securities Ultra-Short Bond | | $ | 13,502,434 | | | $ | 15,004,000 | |
| Near-Term Tax Free | | | 8,885,594 | | | | 29,124,841 | |
| All American Equity | | | 35,185,953 | | | | 37,064,395 | |
| Holmes Macro Trends | | | 89,091,444 | | | | 97,134,343 | |
| Global Resources | | | 92,026,821 | | | | 103,529,750 | |
| World Precious Minerals | | | 50,308,563 | | | | 59,462,445 | |
| Gold and Precious Metals | | | 61,882,532 | | | | 66,438,538 | |
| Emerging Europe | | | 31,042,178 | | | | 38,849,788 | |
| China Region | | | 22,257,299 | | | | 31,176,272 | |
Note 5: Tax Information
The following table presents the income tax basis of securities owned at December 31, 2018, and the tax basis components of net unrealized appreciation (depreciation):
| Fund | | Aggregate Tax Cost | | | Gross Unrealized Appreciation | | | Gross Unrealized Depreciation | | | Net Unrealized Appreciation (Depreciation) | |
| U.S. Government Securities Ultra-Short Bond | | $ | 42,990,995 | | | $ | 4,471 | | | $ | (24,616 | ) | | $ | (20,145 | ) |
| Near-Term Tax Free | | | 46,563,678 | | | | 108,856 | | | | (300,984 | ) | | | (192,128 | ) |
| All American Equity | | | 14,334,125 | | | | 272,951 | | | | (1,947,175 | ) | | | (1,674,224 | ) |
| Holmes Macro Trends | | | 31,094,951 | | | | 1,550,449 | | | | (5,431,685 | ) | | | (3,881,236 | ) |
| Global Resources | | | 125,388,028 | | | | 2,657,602 | | | | (71,911,313 | ) | | | (69,253,711 | ) |
| World Precious Minerals | | | 141,138,984 | | | | 10,350,341 | | | | (81,185,855 | ) | | | (70,835,514 | ) |
| Gold and Precious Metals | | | 89,249,058 | | | | 19,320,243 | | | | (25,437,493 | ) | | | (6,117,250 | ) |
| Emerging Europe | | | 31,425,956 | | | | 3,417,570 | | | | (6,095,465 | ) | | | (2,677,895 | ) |
| China Region | | | 12,696,632 | | | | 415,202 | | | | (1,688,660 | ) | | | (1,273,458 | ) |
As of December 31, 2018, the components of distributable earnings on a tax basis were as follows:
| Notes to Financial Statements | December 31, 2018 |
| Fund | | Undistributed Tax-Exempt Income | | | Undistributed Ordinary Income | | | Undistributed Long-Term Capital Gains | | | Capital and Other Losses | |
| U.S. Government Securities Ultra-Short Bond | | $ | – | | | $ | 8,779 | | | $ | 4,864 | | | $ | – | |
| Near-Term Tax Free | | | 3,383 | | | | – | | | | – | | | | (1,204,401 | ) |
| All American Equity | | | – | | | | 266,282 | | | | – | | | | – | |
| Holmes Macro Trends | | | – | | | | – | | | | – | | | | – | |
| Global Resources | | | – | | | | 598,802 | | | | – | | | | (216,537,463 | ) |
| World Precious Minerals | | | – | | | | – | | | | – | | | | (308,394,992 | ) |
| Gold and Precious Metals | | | – | | | | – | | | | – | | | | (93,012,206 | ) |
| Emerging Europe | | | – | | | | 692,720 | | | | – | | | | (21,642,346 | ) |
| China Region | | | – | | | | 78,064 | | | | – | | | | (413,099 | ) |
| Fund (continued) | | Net Unrealized Appreciation (Depreciation) | | | Other Temporary Differences | | | Total | |
| U.S. Government Securities Ultra-Short Bond | | $ | (20,145 | ) | | $ | (8,800 | ) | | $ | (15,302 | ) |
| Near-Term Tax Free | | | (192,128 | ) | | | (3,390 | ) | | | (1,396,536 | ) |
| All American Equity | | | (1,674,224 | ) | | | – | | | | (1,407,942 | ) |
| Holmes Macro Trends | | | (3,881,236 | ) | | | – | | | | (3,881,236 | ) |
| Global Resources | | | (69,249,955 | ) | | | – | | | | (285,188,616 | ) |
| World Precious Minerals | | | (70,835,625 | ) | | | – | | | | (379,230,617 | ) |
| Gold and Precious Metals | | | (6,110,332 | ) | | | – | | | | (99,122,538 | ) |
| Emerging Europe | | | (2,690,804 | ) | | | – | | | | (23,640,430 | ) |
| China Region | | | (1,273,308 | ) | | | – | | | | (1,608,343 | ) |
The differences between book-basis and tax-basis unrealized appreciation (depreciation) for All American Equity, Holmes Macro Trends, Global Resources, World Precious Minerals, Gold and Precious Metals, Emerging Europe and China Region Funds are attributable primarily to the tax deferral of losses on wash sales, investment in passive foreign investment companies (PFIC), section 988 forward currency contracts, and investments in grantor trusts.
Reclassifications are made to the Funds’ capital accounts to reflect income and gains available for distribution (or available capital loss carryovers) under income tax regulations. For the year ended December 31, 2018, the Funds recorded the following reclassifications to increase (decrease) the accounts listed below:
| Fund | | Distributable Earnings | | | Paid in Capital | |
| U.S. Government Securities Ultra-Short Bond | | $ | – | | | $ | – | |
| Near-Term Tax Free | | | 2,532 | | | | (2,532 | ) |
| All American Equity | | | 1 | | | | (1 | ) |
| Holmes Macro Trends | | | 260,111 | | | | (260,111 | ) |
| Global Resources | | | 1,413 | | | | (1,413 | ) |
| World Precious Minerals | | | 5,905,573 | | | | (5,905,573 | ) |
| Gold and Precious Metals | | | 150,507 | | | | (150,507 | ) |
| Emerging Europe | | | 15,445,946 | | | | (15,445,946 | ) |
| China Region | | | (1 | ) | | | 1 | |
| Notes to Financial Statements | December 31, 2018 |
The tax character of distributions paid during the fiscal year ended December 31, 2018, were as follows:
| Fund | | Tax-Exempt Income | | | Ordinary Income | | | Long-Term Capital Gains | | | Return of Capital | | | Total | |
| U.S. Government Securities Ultra-Short Bond | | $ | – | | | $ | 547,449 | | | $ | – | | | $ | – | | | $ | 547,449 | |
| Near-Term Tax Free | | | 687,244 | | | | 1,091 | | | | – | | | | – | | | | 688,335 | |
| All American Equity | | | – | | | | 633,115 | | | | – | | | | – | | | | 633,115 | |
| Holmes Macro Trends | | | – | | | | 4,744,187 | | | | 31,039 | | | | – | | | | 4,775,226 | |
| Global Resources | | | – | | | | 2,788,594 | | | | – | | | | – | | | | 2,788,594 | |
| World Precious Minerals | | | – | | | | 10,699,257 | | | | – | | | | – | | | | 10,699,257 | |
| Gold and Precious Metals | | | – | | | | 1,486,190 | | | | – | | | | – | | | | 1,486,190 | |
| Emerging Europe | | | – | | | | – | | | | – | | | | – | | | | – | |
| China Region | | | – | | | | 134,447 | | | | 257,470 | | | | – | | | | 391,917 | |
The tax character of distributions paid during the fiscal year ended December 31, 2017, were as follows:
| Fund | | Tax-Exempt Income | | | Ordinary Income | | | Long-Term Capital Gains | | | Return of Capital | | | Total | |
| U.S. Government Securities Ultra-Short Bond | | $ | – | | | $ | 356,650 | | | $ | – | | | $ | – | | | $ | 356,650 | |
| Near-Term Tax Free | | | 960,480 | | | | 9,834 | | | | – | | | | – | | | | 970,314 | |
| All American Equity | | | – | | | | 11,077 | | | | – | | | | – | | | | 11,077 | |
| Holmes Macro Trends | | | – | | | | 4,147,876 | | | | 958,934 | | | | – | | | | 5,106,810 | |
| Global Resources | | | – | | | | 2,838,594 | | | | – | | | | – | | | | 2,838,594 | |
| World Precious Minerals | | | – | | | | 26,492,504 | | | | – | | | | – | | | | 26,492,504 | |
| Gold and Precious Metals | | | – | | | | – | | | | – | | | | – | | | | – | |
| Emerging Europe | | | – | | | | – | | | | – | | | | – | | | | – | |
| China Region | | | – | | | | 29,602 | | | | – | | | | – | | | | 29,602 | |
Capital loss carryforwards may be used to off set current or future taxable capital gains until expiration. The loss carryforwards and related expiration dates for each Fund, as of December 31, 2018, are as follows:
| | | No Expiration | | | | | |
| Fund | | Short-Term | | | Long-Term | | | Total | |
| U.S. Government Securities Ultra-Short Bond | | $ | – | | | $ | – | | | $ | – | |
| Near-Term Tax Free | | | 675,870 | | | | 528,531 | | | | 1,204,401 | |
| All American Equity | | | – | | | | – | | | | – | |
| Holmes Macro Trends | | | – | | | | – | | | | – | |
| Global Resources | | | 155,390,162 | | | | 61,147,301 | | | | 216,537,463 | |
| World Precious Minerals | | | 85,683,475 | | | | 221,663,962 | | | | 307,347,437 | |
| Gold and Precious Metals | | | 42,304,736 | | | | 50,669,742 | | | | 92,974,478 | |
| Emerging Europe | | | 11,925,933 | | | | 9,716,413 | | | | 21,642,346 | |
| China Region | | | – | | | | – | | | | – | |
During the year ended December 31, 2018, the following Funds utilized capital loss carryforwards to offset capital gains amounting to:
| Notes to Financial Statements | December 31, 2018 |
| Fund | | | |
| U.S. Government Securities Ultra-Short Bond | | $ | 658 | |
| All American Equity | | | 588,634 | |
| Gold and Precious Metals | | | 7,662,776 | |
| Emerging Europe | | | 821,559 | |
| China Region | | | 3,330,618 | |
In accordance with tax rules, the following net capital losses and ordinary losses (currency and late year losses) incurred after October 31, within each Fund’s tax year, are deemed to arise on the first day of the Fund’s next tax year if the Fund elects to defer such losses.
The Funds elected to defer losses incurred after October 31, 2018, as follows:
| Fund | | Post October 31, 2018 Capital Loss Deferral | | | Post October 31, 2018 Ordinary Loss Deferral | |
| World Precious Minerals | | $ | – | | | $ | 1,047,555 | |
| Gold and Precious Metals | | | – | | | | 37,728 | |
| China Region | | | 413,099 | | | | – | |
Note 6: Risks of Concentrations and Foreign Investments
The Near-Term Tax Free Fund may be exposed to risks related to concentration of investments in a particular state or geographic area. These investments present risks resulting from changes in economic conditions of the region or the issuer.
The Global Resources Fund concentrates its investments in the natural resources industries and may be subject to greater risks and fluctuations than a portfolio representing a broader range of industries.
The World Precious Minerals and Gold and Precious Metals Funds concentrate their investments in gold and other precious metals and minerals and, therefore, may be subject to greater risks and market fluctuations than a portfolio representing a broader range of industries. The funds invest in securities that typically respond to changes in the price of gold and other precious metals and minerals, which can be influenced by a variety of global economic, financial and political factors; increased environmental and labor costs in mining; and changes in laws relating to mining or gold production or sales. Fluctuations in the prices of gold and other precious metals and minerals will affect the market values of the securities held by these funds.
The Emerging Europe Fund invests more than 25% of its investments in companies principally engaged in the oil, gas or banking industries. Oil and gas companies are a large part of the Russian economy, and banks typically are a significant component of emerging market economics, such as those in Russia and other Eastern European countries. The risk of concentrating investments in this group of industries will make the fund more susceptible to risk in these industries than funds which do not concentrate their investments in an industry.
The Emerging Europe Fund may be exposed to risks not typically associated with investment in the United States due to its concentration of investments in emerging markets. These risks include possible revaluation of currencies, less public information about companies, disruptive political or economic conditions and the possible imposition of adverse governmental laws or currency exchange restrictions. Moreover, securities of
| Notes to Financial Statements | December 31, 2018 |
many foreign issuers, including sovereign nations, and their markets may be less liquid and their prices more volatile than those securities of comparable U.S. issuers.
The China Region Fund may be exposed to risks not typically associated with investments in the United States, due to its concentration of investments in foreign issuers in the region. These investments present risks resulting from disruptive political or economic conditions and the potential imposition of adverse governmental laws or currency exchange restrictions affecting the area.
Note 7: Credit Arrangements
Each of the Funds has a revolving credit facility with BBH. Borrowings of each Fund are collateralized by any or all of the securities held by BBH as the Fund’s custodian up to the amount of the borrowing. Interest on borrowings is charged at the current overnight Federal Funds Rate plus 2 percent. Each Fund has a maximum borrowing limit of 10 percent of qualified assets. The aggregate of borrowings by all Funds under the agreement cannot exceed $10,000,000 at any one time. There were no borrowings under the revolving credit facility during the year ended December 31, 2018. The Funds paid BBH a total of $15,000 in commitment fees for the year ended December 31, 2018, under this arrangement.
Note 8: Commitments and Contingencies
In the normal course of business, each Fund enters into contracts that provide general indemnifications by each Fund to the counterparty to the contract. Each Fund’s maximum exposure under these arrangements is dependent on future claims that may be made against each Fund and, therefore, cannot be estimated; however, based on experience, the risk of loss from such claims is considered remote. Each Fund has determined that none of these arrangements requires disclosure on each Fund’s balance sheet.
Note 9: Recent Accounting Pronouncements
In August 2018, the Financial Accounting Standards Board (“FASB”) issued Accounting Standards Update No. 2018-13 “Fair Value Measurement (Topic 820): Disclosure Framework - Changes to the Disclosure Requirements for Fair Value Measurement” (“ASU 2018-13”) which includes amendments intended to improve the effectiveness of disclosures in the notes to financial statements. For example, ASU 2018-13 includes additional disclosures regarding the range and weighted average of significant unobservable inputs used to develop Level 3 fair value measurements, and clarifications to the narrative description of measurement uncertainty disclosures. ASU 2018-13 is effective for interim and annual periods beginning after December 15, 2019. Early adoption is permitted and the Funds have adopted ASU 2018-13 within these financial statements.
In September 2018, the Securities and Exchange Commission released Final Rule 33- 10532 captioned “Disclosure Update and Simplification,” include: (i) an amendment to require presentation of the total, rather than the components, of distributable earnings on the Statement of Assets and Liabilities; and (ii) an amendment to require presentation of the total, rather than the components, of distributions to shareholders, except for tax return of capital distributions, on the Statement of Changes in Net Assets. The amendments also removed the requirement for parenthetical disclosure of undistributed net investment income on the Statement of Changes in Net Assets. These changes were effective November 5, 2018. These amendments are reflected in the Funds’ financial statements for the year ended December 31, 2018.
| Notes to Financial Statements | December 31, 2018 |
Note 10: Subsequent Events
The Funds have evaluated the need for additional disclosures and/or adjustments resulting from subsequent events. Based on this evaluation, no additional disclosures or adjustments were required to the financial statements as of the date the financial statements were issued.
Financial Highlights
U.S. Government Securities Ultra-Short Bond Fund
For a capital share outstanding during the
| | | Investor Class | |
| | | Year Ended December 31, | |
| | | 2018 | | | 2017 | | | 2016 | | | 2015 | | | 2014 | |
| Net asset value, beginning of year | | $ | 2.00 | | | $ | 2.00 | | | $ | 2.00 | | | $ | 2.00 | | | $ | 2.00 | |
| Investment Activities | | | | | | | | | | | | | | | | | | | | |
| Net investment income | | | 0.02 | * | | | 0.01 | * | | | 0.01 | | | | 0.01 | | | | 0.01 | |
| Net realized and unrealized gain (loss) (a) | | | 0.00 | | | | (0.00 | ) | | | 0.00 | | | | 0.00 | | | | 0.00 | |
| Total from investment activities | | | 0.02 | | | | 0.01 | | | | 0.01 | | | | 0.01 | | | | 0.01 | |
| Distributions | | | | | | | | | | | | | | | | | | | | |
| From net investment income | | | (0.02 | ) | | | (0.01 | ) | | | (0.01 | ) | | | (0.01 | ) | | | (0.01 | ) |
| From return of capital | | | – | | | | – | | | | (0.00 | )(a) | | | – | | | | – | |
| From net realized gains | | | – | | | | – | | | | (0.00 | )(a) | | | (0.00 | )(a) | | | – | |
| Net asset value, end of year | | $ | 2.00 | | | $ | 2.00 | | | $ | 2.00 | | | $ | 2.00 | | | $ | 2.00 | |
| Total Return (b) | | | 1.15 | % | | | 0.69 | % | | | 0.47 | % | | | 0.34 | % | | | 0.36 | % |
| Ratios to Average Net Assets: | | | | | | | | | | | | | | | | | | | | |
| Net investment income | | | 1.14 | % | | | 0.68 | % | | | 0.43 | % | | | 0.33 | % | | | 0.35 | % |
| Total expenses | | | 0.99 | % | | | 1.03 | % | | | 1.00 | % | | | 1.13 | % | | | 1.07 | % |
| Expenses waived or reimbursed (c) | | | (0.54 | )% | | | (0.58 | )% | | | (0.55 | )% | | | (0.68 | )% | | | (0.74 | )% |
| Net expenses (d) | | | 0.45 | % | | | 0.45 | % | | | 0.45 | % | | | 0.45 | % | | | 0.33 | % |
| Portfolio turnover rate | | | 32 | % | | | 52 | % | | | 18 | % | | | 60 | % | | | 33 | % |
| Net assets, end of year (in thousands) | | $ | 47,290 | | | $ | 49,427 | | | $ | 56,794 | | | $ | 62,562 | | | $ | 64,020 | |
| * | Based on average shares outstanding. |
| (a) | The per share amount does not round to a full penny. |
| (b) | Assumes investment at the net asset value at the beginning of the period, reinvestment of all distributions and a complete redemption of the investment at the net asset value at the end of the period. |
| (c) | Expenses waived or reimbursed reflect reductions to total expenses, as discussed in the notes to the financial statements. These amounts would increase the net investment loss ratio or decrease the net investment income ratio, as applicable, and decrease the total returns had such reductions not occurred. |
| (d) | The net expense ratios shown above reflect expenses after waivers and reimbursements and include the effect of reductions to total expenses for any expenses offset. Expense offset arrangements reduce total expenses, as discussed in the notes to the financial statements. These amounts would decrease the net investment income (loss) ratio had such reductions not occurred. The effect of expenses offset are as follows: |
| | | Investor Class | |
| | | Year Ended December 31, | |
| | | 2018 | | | 2017 | | | 2016 | | | 2015 | | | 2014 | |
| Ratios to Average Net Assets: | | | | | | | | | | | | | | | | | | | | |
| Expense offset | | | – | | | | – | | | | – | | | | – | | | | – | |
See accompanying notes to financial statements.
Financial Highlights
Near-Term Tax Free Fund
For a capital share outstanding during the
| | | Investor Class | |
| | | Year Ended December 31, | |
| | | 2018 | | | 2017 | | | 2016 | | | 2015 | | | 2014 | |
| Net asset value, beginning of year | | $ | 2.21 | | | $ | 2.21 | | | $ | 2.25 | | | $ | 2.25 | | | $ | 2.23 | |
| Investment Activities | | | | | | | | | | | | | | | | | | | | |
| Net investment income | | | 0.03 | * | | | 0.03 | * | | | 0.03 | | | | 0.03 | | | | 0.05 | |
| Net realized and unrealized gain (loss) | | | (0.01 | ) | | | – | | | | (0.04 | ) | | | 0.00 | (a) | | | 0.02 | |
| Total from investment activities | | | 0.02 | | | | 0.03 | | | | (0.01 | ) | | | 0.03 | | | | 0.07 | |
| Distributions | | | | | | | | | | | | | | | | | | | | |
| From net investment income | | | (0.03 | ) | | | (0.03 | ) | | | (0.03 | ) | | | (0.03 | ) | | | (0.05 | ) |
| From return of capital | | | – | | | | – | | | | (0.00 | )(a) | | | – | | | | – | |
| Net asset value, end of year | | $ | 2.20 | | | $ | 2.21 | | | $ | 2.21 | | | $ | 2.25 | | | $ | 2.25 | |
| Total Return (b) | | | 0.73 | % | | | 1.20 | % | | | (0.45 | )% | | | 1.45 | % | | | 3.07 | % |
| Ratios to Average Net Assets: | | | | | | | | | | | | | | | | | | | | |
| Net investment income | | | 1.17 | % | | | 1.16 | % | | | 1.25 | % | | | 1.52 | % | | | 2.13 | % |
| Total expenses | | | 1.01 | % | | | 1.03 | % | | | 0.97 | % | | | 1.09 | % | | | 1.08 | % |
| Expenses waived or reimbursed (c) | | | (0.56 | )% | | | (0.58 | )% | | | (0.52 | )% | | | (0.64 | )% | | | (0.63 | )% |
| Net expenses (d) | | | 0.45 | % | | | 0.45 | % | | | 0.45 | % | | | 0.45 | % | | | 0.45 | % |
| Portfolio turnover rate | | | 16 | % | | | 14 | % | | | 33 | % | | | 15 | % | | | 12 | % |
| Net assets, end of year (in thousands) | | $ | 49,914 | | | $ | 69,120 | | | $ | 95,301 | | | $ | 106,769 | | | $ | 89,595 | |
| * | Based on average shares outstanding. |
| (a) | The per share amount does not round to a full penny. |
| (b) | Assumes investment at the net asset value at the beginning of the period, reinvestment of all distributions and a complete redemption of the investment at the net asset value at the end of the period. |
| (c) | Expenses waived or reimbursed reflect reductions to total expenses, as discussed in the notes to the financial statements. These amounts would increase the net investment loss ratio or decrease the net investment income ratio, as applicable, and decrease the total returns had such reductions not occurred. |
| (d) | The net expense ratios shown above reflect expenses after waivers and reimbursements and include the effect of reductions to total expenses for any expenses offset. Expense offset arrangements reduce total expenses, as discussed in the notes to the financial statements. These amounts would decrease the net investment income (loss) ratio had such reductions not occurred. The effect of expenses offset are as follows: |
| | | Investor Class | |
| | | Year Ended December 31, | |
| | | 2018 | | | 2017 | | | 2016 | | | 2015 | | | 2014 | |
| Ratios to Average Net Assets: | | | | | | | | | | | | | | | | | | | | |
| Expense offset | | | (0.07 | )% | | | (0.04 | )% | | | (0.02 | )% | | | – | (e) | | | – | (e) |
| (e) | Effect on the expense ratio was not greater than 0.005%. |
See accompanying notes to financial statements.
Financial Highlights
All American Equity Fund
For a capital share outstanding during the
| | | Investor Class | |
| | | Year Ended December 31, | |
| | | 2018 | | | 2017 | | | 2016 | | | 2015 | | | 2014 | |
| Net asset value, beginning of year | | $ | 24.90 | | | $ | 23.53 | | | $ | 23.60 | | | $ | 27.84 | | | $ | 32.18 | |
| Investment Activities | | | | | | | | | | | | | | | | | | | | |
| Net investment income (loss) | | | 0.02 | * | | | 0.09 | * | | | 0.02 | | | | 0.09 | | | | (0.16 | ) |
| Net realized and unrealized gain (loss) | | | (1.55 | ) | | | 1.30 | | | | (0.05 | ) | | | (1.23 | ) | | | 0.84 | |
| Total from investment activities | | | (1.53 | ) | | | 1.39 | | | | (0.03 | ) | | | (1.14 | ) | | | 0.68 | |
| Distributions | | | | | | | | | | | | | | | | | | | | |
| From net investment income | | | (0.15 | ) | | | (0.02 | ) | | | (0.04 | ) | | | (0.06 | ) | | | – | |
| From net realized gains | | | (0.93 | ) | | | – | | | | – | | | | (3.04 | ) | | | (5.02 | ) |
| Short-Term Trading Fees* | | | – | | | | – | | | | 0.00 | (a) | | | 0.00 | (a) | | | 0.00 | (a) |
| Net asset value, end of year | | $ | 22.29 | | | $ | 24.90 | | | $ | 23.53 | | | $ | 23.60 | | | $ | 27.84 | |
| Total Return (b) | | | (6.07 | )% | | | 5.90 | % | | | (0.14 | )% | | | (4.20 | )% | | | 1.94 | % |
| Ratios to Average Net Assets: | | | | | | | | | | | | | | | | | | | | |
| Net investment income (loss) | | | 0.07 | % | | | 0.38 | % | | | 0.06 | % | | | 0.31 | % | | | (0.54 | )% |
| Total expenses | | | 1.86 | % | | | 1.79 | % | | | 1.75 | % | | | 1.94 | % | | | 2.16 | % |
| Expenses waived or reimbursed (c) | | | (0.07 | )% | | | (0.04 | )% | | | (0.02 | )% | | | (0.02 | )% | | | (0.03 | )% |
| Net expenses (d) | | | 1.79 | % | | | 1.75 | % | | | 1.73 | % | | | 1.92 | % | | | 2.13 | % |
| Portfolio turnover rate | | | 244 | % | | | 346 | % | | | 303 | % | | | 109 | %(e) | | | 253 | % |
| Net assets, end of year (in thousands) | | $ | 13,636 | | | $ | 15,932 | | | $ | 17,350 | | | $ | 19,117 | | | $ | 21,936 | |
| * | Based on average shares outstanding. |
| (a) | The per share amount does not round to a full penny. |
| (b) | Assumes investment at the net asset value at the beginning of the period, reinvestment of all distributions and a complete redemption of the investment at the net asset value at the end of the period. |
| (c) | Expenses waived or reimbursed reflect reductions to total expenses, as discussed in the notes to the financial statements. These amounts would increase the net investment loss ratio or decrease the net investment income ratio, as applicable, and decrease the total returns had such reductions not occurred. |
| (d) | The net expense ratios shown above reflect expenses after waivers and reimbursements and include the effect of reductions to total expenses for any expenses offset. Expense offset arrangements reduce total expenses, as discussed in the notes to the financial statements. These amounts would decrease the net investment income (loss) ratio had such reductions not occurred. The effect of expenses offset are as follows: |
| | | Investor Class | |
| | | Year Ended December 31, | |
| | | 2018 | | | 2017 | | | 2016 | | | 2015 | | | 2014 | |
| Ratios to Average Net Assets: | | | | | | | | | | | | | | | | | | | | |
| Expense offset | | | (0.07 | )% | | | (0.04 | )% | | | (0.02 | )% | | | – | (f) | | | – | (f) |
| (e) | Excludes option transactions. |
| (f) | Effect on the expense ratio was not greater than 0.005%. |
See accompanying notes to financial statements.
Financial Highlights
Holmes Macro Trends Fund
For a capital share outstanding during the
| | | Investor Class | |
| | | Year Ended December 31, | |
| | | 2018 | | | 2017 | | | 2016 | | | 2015 | | | 2014 | |
| Net asset value, beginning of year | | $ | 19.52 | | | $ | 18.65 | | | $ | 18.59 | | | $ | 20.25 | | | $ | 24.24 | |
| Investment Activities | | | | | | | | | | | | | | | | | | | | |
| Net investment loss | | | (0.06 | )* | | | (0.08 | )* | | | (0.06 | ) | | | (0.11 | ) | | | (0.26 | ) |
| Net realized and unrealized gain (loss) | | | (1.61 | ) | | | 3.66 | | | | 1.68 | | | | (0.06 | ) | | | (1.36 | ) |
| Total from investment activities | | | (1.67 | ) | | | 3.58 | | | | 1.62 | | | | (0.17 | ) | | | (1.62 | ) |
| Distributions | | | | | | | | | | | | | | | | | | | | |
| From net realized gains | | | (2.49 | ) | | | (2.71 | ) | | | (1.56 | ) | | | (1.49 | ) | | | (2.37 | ) |
| Short-Term Trading Fees* | | | – | | | | 0.00 | (a) | | | 0.00 | (a) | | | 0.00 | (a) | | | 0.00 | (a) |
| Net asset value, end of year | | $ | 15.36 | | | $ | 19.52 | | | $ | 18.65 | | | $ | 18.59 | | | $ | 20.25 | |
| Total Return (b) | | | (8.28 | )% | | | 19.17 | % | | | 8.66 | % | | | (0.94 | )% | | | (6.74 | )% |
| Ratios to Average Net Assets: | | | | | | | | | | | | | | | | | | | | |
| Net investment loss | | | (0.32 | )% | | | (0.41 | )% | | | (0.34 | )% | | | (0.55 | )% | | | (1.17 | )% |
| Total expenses | | | 1.77 | % | | | 1.86 | % | | | 1.67 | % | | | 1.81 | % | | | 1.94 | % |
| Expenses waived or reimbursed (c) | | | (0.06 | )% | | | (0.04 | )% | | | – | | | | – | | | | – | |
| Net expenses (d) | | | 1.71 | % | | | 1.82 | % | | | 1.67 | % | | | 1.81 | % | | | 1.94 | % |
| Portfolio turnover rate | | | 245 | % | | | 264 | %(e) | | | 275 | %(e) | | | 320 | %(e) | | | 183 | %(e) |
| Net assets, end of year (in thousands) | | $ | 33,848 | | | $ | 41,597 | | | $ | 40,706 | | | $ | 41,135 | | | $ | 46,250 | |
| * | Based on average shares outstanding. |
| (a) | The per share amount does not round to a full penny. |
| (b) | Assumes investment at the net asset value at the beginning of the period, reinvestment of all distributions and a complete redemption of the investment at the net asset value at the end of the period. |
| (c) | Expenses waived or reimbursed reflect reductions to total expenses, as discussed in the notes to the financial statements. These amounts would increase the net investment loss ratio or decrease the net investment income ratio, as applicable, and decrease the total returns had such reductions not occurred. |
| (d) | The net expense ratios shown above reflect expenses after waivers and reimbursements and include the effect of reductions to total expenses for any expenses offset. Expense offset arrangements reduce total expenses, as discussed in the notes to the financial statements. These amounts would decrease the net investment income (loss) ratio had such reductions not occurred. The effect of expenses offset are as follows: |
| | | Investor Class | |
| | | Year Ended December 31, | |
| | | 2018 | | | 2017 | | | 2016 | | | 2015 | | | 2014 | |
| Ratios to Average Net Assets: | | | | | | | | | | | | | | | | | | | | |
| Expense offset | | | (0.06 | )% | | | (0.04 | )% | | | (0.02 | )% | | | – | (f) | | | – | (f) |
| (e) | Excludes option transactions. |
| (f) | Effect on the expense ratio was not greater than 0.005%. |
See accompanying notes to financial statements.
Financial Highlights
Global Resources Fund
For a capital share outstanding during the
| | | Investor Class | |
| | | Year Ended December 31, | |
| | | 2018 | | | 2017 | | | 2016 | | | 2015 | | | 2014 | |
| Net asset value, beginning of year | | $ | 6.09 | | | $ | 5.25 | | | $ | 4.72 | | | $ | 6.67 | | | $ | 9.36 | |
| Investment Activities | | | | | | | | | | | | | | | | | | | | |
| Net investment income* | | | 0.12 | | | | 0.11 | | | | 0.06 | | | | 0.10 | | | | 0.04 | |
| Net realized and unrealized gain (loss) | | | (1.67 | ) | | | 0.91 | | | | 0.64 | * | | | (2.00 | )* | | | (2.73 | )* |
| Total from investment activities | | | (1.55 | ) | | | 1.02 | | | | 0.70 | | | | (1.90 | ) | | | (2.69 | ) |
| Distributions | | | | | | | | | | | | | | | | | | | | |
| From net investment income | | | (0.21 | ) | | | (0.18 | ) | | | (0.17 | ) | | | (0.05 | ) | | | – | |
| Short-Term Trading Fees* | | | – | | | | 0.00 | (a) | | | 0.00 | (a) | | | 0.00 | (a) | | | 0.00 | (a) |
| Net asset value, end of year | | $ | 4.33 | | | $ | 6.09 | | | $ | 5.25 | | | $ | 4.72 | | | $ | 6.67 | |
| Total Return (b) | | | (25.48 | )% | | | 19.57 | % | | | 14.99 | % | | | (28.43 | )% | | | (28.74 | )% |
| Ratios to Average Net Assets: | | | | | | | | | | | | | | | | | | | | |
| Net investment income | | | 2.05 | % | | | 1.94 | % | | | 1.13 | % | | | 1.72 | % | | | 0.44 | % |
| Total expenses | | | 1.57 | % | | | 1.61 | % | | | 1.85 | % | | | 1.58 | % | | | 1.45 | % |
| Expenses waived or reimbursed (c) | | | (0.06 | )% | | | (0.02 | )% | | | (0.01 | )% | | | (0.06 | )% | | | – | (d) |
| Net expenses (e) | | | 1.51 | % | | | 1.59 | % | | | 1.84 | % | | | 1.52 | % | | | 1.45 | % |
| Portfolio turnover rate (f) | | | 119 | % | | | 131 | %(g) | | | 255 | %(g) | | | 445 | %(g) | | | 444 | %(g) |
| Net assets, end of year (in thousands) | | $ | 60,699 | | | $ | 95,747 | | | $ | 97,005 | | | $ | 98,126 | | | $ | 171,673 | |
| * | Based on average shares outstanding. |
| (a) | The per share amount does not round to a full penny. |
| (b) | Assumes investment at the net asset value at the beginning of the period, reinvestment of all distributions and a complete redemption of the investment at the net asset value at the end of the period. |
| (c) | Expenses waived or reimbursed reflect reductions to total expenses, as discussed in the notes to the financial statements. These amounts would increase the net investment loss ratio or decrease the net investment income ratio, as applicable, and decrease the total returns had such reductions not occurred. |
| (d) | Effect on the expense ratio was not greater than 0.005%. |
| (e) | The net expense ratios shown above reflect expenses after waivers and reimbursements and include the effect of reductions to total expenses for any expenses offset. Expense offset arrangements reduce total expenses, as discussed in the notes to the financial statements. These amounts would decrease the net investment income (loss) ratio had such reductions not occurred. The effect of expenses offset are as follows: |
| | | Investor Class | |
| | | Year Ended December 31, | |
| | | 2018 | | | 2017 | | | 2016 | | | 2015 | | | 2014 | |
| Ratios to Average Net Assets: | | | | | | | | | | | | | | | | | | | | |
| Expense offset | | | (0.05 | )% | | | (0.02 | )% | | | (0.01 | )% | | | – | (d) | | | – | (d) |
| (f) | Portfolio turnover is calculated at the fund level. |
| (g) | Excludes option transactions. |
See accompanying notes to financial statements.
Financial Highlights
Global Resources Fund
For a capital share outstanding during the
| | | Institutional Class | |
| | | Year Ended December 31, | |
| | | 2018 | | | 2017 | | | 2016 | | | 2015 | | | 2014 | |
| Net asset value, beginning of year | | $ | 6.13 | | | $ | 5.25 | | | $ | 4.74 | | | $ | 6.67 | | | $ | 9.30 | |
| Investment Activities | | | | | | | | | | | | | | | | | | | | |
| Net investment income* | | | 0.14 | | | | 0.14 | | | | 0.08 | | | | 0.17 | | | | 0.08 | |
| Net realized and unrealized gain (loss) | | | (1.66 | ) | | | 0.96 | | | | 0.65 | * | | | (2.02 | )* | | | (2.71 | )* |
| Total from investment activities | | | (1.52 | ) | | | 1.10 | | | | 0.73 | | | | (1.85 | ) | | | (2.63 | ) |
| Distributions | | | | | | | | | | | | | | | | | | | | |
| From net investment income | | | (0.23 | ) | | | (0.22 | ) | | | (0.22 | ) | | | (0.08 | ) | | | – | |
| Net asset value, end of year | | $ | 4.38 | | | $ | 6.13 | | | $ | 5.25 | | | $ | 4.74 | | | $ | 6.67 | |
| Total Return (a) | | | (24.66 | )% | | | 20.95 | % | | | 15.43 | % | | | (27.73 | )% | | | (28.28 | )% |
| Ratios to Average Net Assets: | | | | | | | | | | | | | | | | | | | | |
| Net investment income | | | 2.48 | % | | | 2.43 | % | | | 1.61 | % | | | 2.92 | % | | | 0.85 | % |
| Total expenses | | | 11.95 | % | | | 3.56 | % | | | 5.41 | % | | | 1.35 | % | | | 1.13 | % |
| Expenses waived or reimbursed (b) | | | (10.87 | )% | | | (2.46 | )% | | | (4.05 | )% | | | (0.61 | )% | | | (0.27 | )% |
| Net expenses (c) | | | 1.08 | % | | | 1.10 | % | | | 1.36 | % | | | 0.74 | % | | | 0.86 | % |
| Portfolio turnover rate (d) | | | 119 | % | | | 131 | %(e) | | | 255 | %(e) | | | 445 | %(e) | | | 444 | %(e) |
| Net assets, end of year (in thousands) | | $ | 222 | | | $ | 518 | | | $ | 1,021 | | | $ | 1,882 | | | $ | 9,733 | |
| * | Based on average shares outstanding. |
| (a) | Assumes investment at the net asset value at the beginning of the period, reinvestment of all distributions and a complete redemption of the investment at the net asset value at the end of the period. |
| (b) | Expenses waived or reimbursed reflect reductions to total expenses, as discussed in the notes to the financial statements. These amounts would increase the net investment loss ratio or decrease the net investment income ratio, as applicable, and decrease the total returns had such reductions not occurred. |
| (c) | The net expense ratios shown above reflect expenses after waivers and reimbursements and include the effect of reductions to total expenses for any expenses offset. Expense offset arrangements reduce total expenses, as discussed in the notes to the financial statements. These amounts would decrease the net investment income (loss) ratio had such reductions not occurred. The effect of expenses offset are as follows: |
| | | Institutional Class | |
| | | Year Ended December 31, | |
| | | 2018 | | | 2017 | | | 2016 | | | 2015 | | | 2014 | |
| Ratios to Average Net Assets: | | | | | | | | | | | | | | | | | | | | |
| Expense offset | | | (0.05 | )% | | | (0.02 | )% | | | (0.01 | )% | | | – | (f) | | | – | (f) |
| (d) | Portfolio turnover is calculated at the fund level. |
| (e) | Excludes option transactions. |
| (f) | Effect on the expense ratio was not greater than 0.005%. |
See accompanying notes to financial statements.
Financial Highlights
World Precious Minerals Fund
For a capital share outstanding during the
| | | Investor Class | |
| | | Year Ended December 31, | |
| | | 2018 | | | 2017 | | | 2016 | | | 2015 | | | 2014 | |
| Net asset value, beginning of year | | $ | 4.69 | | | $ | 6.35 | | | $ | 3.64 | | | $ | 4.75 | | | $ | 5.69 | |
| Investment Activities | | | | | | | | | | | | | | | | | | | | |
| Net investment loss* | | | (0.03 | ) | | | (0.10 | ) | | | (0.09 | ) | | | (0.03 | ) | | | (0.06 | ) |
| Net realized and unrealized gain (loss) | | | (1.49 | ) | | | (0.22 | ) | | | 2.82 | * | | | (0.72 | )* | | | (0.88 | )* |
| Total from investment activities | | | (1.52 | ) | | | (0.32 | ) | | | 2.73 | | | | (0.75 | ) | | | (0.94 | ) |
| Distributions | | | | | | | | | | | | | | | | | | | | |
| From net investment income | | | (0.47 | ) | | | (1.34 | ) | | | (0.02 | ) | | | (0.36 | ) | | | – | |
| Short-Term Trading Fees* | | | – | | | | 0.00 | (a) | | | 0.00 | (a) | | | 0.00 | (a) | | | 0.00 | (a) |
| Net asset value, end of year | | $ | 2.70 | | | $ | 4.69 | | | $ | 6.35 | | | $ | 3.64 | | | $ | 4.75 | |
| Total Return (b) | | | (31.67 | )% | | | (4.16 | )% | | | 75.08 | % | | | (15.64 | )% | | | (16.52 | )% |
| Ratios to Average Net Assets: | | | | | | | | | | | | | | | | | | | | |
| Net investment loss | | | (0.77 | )% | | | (1.51 | )% | | | (1.28 | )% | | | (0.71 | )% | | | (0.91 | )% |
| Total expenses | | | 1.52 | % | | | 1.84 | % | | | 1.99 | % | | | 1.96 | % | | | 1.99 | % |
| Expenses waived or reimbursed (c) | | | (0.04 | )% | | | (0.02 | )% | | | (0.04 | )% | | | (0.15 | )% | | | (0.03 | )% |
| Net expenses (d) | | | 1.48 | % | | | 1.82 | % | | | 1.95 | % | | | 1.81 | % | | | 1.96 | % |
| Portfolio turnover rate (e) | | | 55 | % | | | 36 | %(f) | | | 136 | %(f) | | | 71 | %(f) | | | 61 | %(f) |
| Net assets, end of year (in thousands) | | $ | 69,117 | | | $ | 114,766 | | | $ | 137,338 | | | $ | 78,150 | | | $ | 103,413 | |
| * | Based on average shares outstanding. |
| (a) | The per share amount does not round to a full penny. |
| (b) | Assumes investment at the net asset value at the beginning of the period, reinvestment of all distributions and a complete redemption of the investment at the net asset value at the end of the period. |
| (c) | Expenses waived or reimbursed reflect reductions to total expenses, as discussed in the notes to the financial statements. These amounts would increase the net investment loss ratio or decrease the net investment income ratio, as applicable, and decrease the total returns had such reductions not occurred. |
| (d) | The net expense ratios shown above reflect expenses after waivers and reimbursements and include the effect of reductions to total expenses for any expenses offset. Expense offset arrangements reduce total expenses, as discussed in the notes to the financial statements. These amounts would decrease the net investment income (loss) ratio had such reductions not occurred. The effect of expenses offset are as follows: |
| | | Investor Class | |
| | | Year Ended December 31, | |
| | | 2018 | | | 2017 | | | 2016 | | | 2015 | | | 2014 | |
| Ratios to Average Net Assets: | | | | | | | | | | | | | | | | | | | | |
| Expense offset | | | (0.04 | )% | | | (0.02 | )% | | | (0.01 | )% | | | – | (g) | | | – | (g) |
| (e) | Portfolio turnover is calculated at the fund level. |
| (f) | Excludes option transactions. |
| (g) | Effect on the expense ratio was not greater than 0.005%. |
See accompanying notes to financial statements.
Financial Highlights
World Precious Minerals Fund
For a capital share outstanding during the
| | | Institutional Class | |
| | | Year Ended December 31, | |
| | | 2018 | | | 2017 | | | 2016 | | | 2015 | | | 2014 | |
| Net asset value, beginning of year | | $ | 4.71 | | | $ | 6.38 | | | $ | 3.65 | | | $ | 4.78 | | | $ | 5.72 | |
| Investment Activities | | | | | | | | | | | | | | | | | | | | |
| Net investment loss* | | | (0.00 | )(a) | | | (0.06 | ) | | | (0.05 | ) | | | (0.01 | ) | | | (0.05 | ) |
| Net realized and unrealized gain (loss) | | | (1.51 | ) | | | (0.23 | ) | | | 2.82 | * | | | (0.72 | )* | | | (0.89 | )* |
| Total from investment activities | | | (1.51 | ) | | | (0.29 | ) | | | 2.77 | | | | (0.73 | ) | | | (0.94 | ) |
| Distributions | | | | | | | | | | | | | | | | | | | | |
| From net investment income | | | (0.49 | ) | | | (1.38 | ) | | | (0.04 | ) | | | (0.40 | ) | | | – | |
| Short-Term Trading Fees* | | | – | | | | 0.00 | (a) | | | – | | | | – | | | | – | |
| Net asset value, end of year | | $ | 2.71 | | | $ | 4.71 | | | $ | 6.38 | | | $ | 3.65 | | | $ | 4.78 | |
| Total Return (b) | | | (31.20 | )% | | | (3.71 | )% | | | 75.97 | % | | | (15.07 | )% | | | (16.43 | )% |
| Ratios to Average Net Assets: | | | | | | | | | | | | | | | | | | | | |
| Net investment loss | | | (0.12 | )% | | | (0.99 | )% | | | (0.69 | )% | | | (0.15 | )% | | | (0.71 | )% |
| Total expenses | | | 3.15 | % | | | 2.21 | % | | | 2.60 | % | | | 20.51 | % | | | 4.86 | % |
| Expenses waived or reimbursed (c) | | | (2.32 | )% | | | (0.91 | )% | | | (1.33 | )% | | | (19.31 | )% | | | (3.23 | )% |
| Net expenses (d) | | | 0.83 | % | | | 1.30 | % | | | 1.27 | % | | | 1.20 | % | | | 1.63 | % |
| Portfolio turnover rate (e) | | | 55 | % | | | 36 | %(f) | | | 136 | %(f) | | | 71 | %(f) | | | 61 | %(f) |
| Net assets, end of year (in thousands) | | $ | 1,744 | | | $ | 3,007 | | | $ | 3,821 | | | $ | 76 | | | $ | 154 | |
| * | Based on average shares outstanding. |
| (a) | The per share amount does not round to a full penny. |
| (b) | Assumes investment at the net asset value at the beginning of the period, reinvestment of all distributions and a complete redemption of the investment at the net asset value at the end of the period. |
| (c) | Expenses waived or reimbursed reflect reductions to total expenses, as discussed in the notes to the financial statements. These amounts would increase the net investment loss ratio or decrease the net investment income ratio, as applicable, and decrease the total returns had such reductions not occurred. |
| (d) | The net expense ratios shown above reflect expenses after waivers and reimbursements and include the effect of reductions to total expenses for any expenses offset. Expense offset arrangements reduce total expenses, as discussed in the notes to the financial statements. These amounts would decrease the net investment income (loss) ratio had such reductions not occurred. The effect of expenses offset are as follows: |
| | | Institutional Class | |
| | | Year Ended December 31, | |
| | | 2018 | | | 2017 | | | 2016 | | | 2015 | | | 2014 | |
| Ratios to Average Net Assets: | | | | | | | | | | | | | | | | | | | | |
| Expense offset | | | (0.04 | )% | | | (0.02 | )% | | | (0.01 | )% | | | – | (g) | | | – | (g) |
| (e) | Portfolio turnover is calculated at the fund level. |
| (f) | Excludes option transactions. |
| (g) | Effect on the expense ratio was not greater than 0.005%. |
See accompanying notes to financial statements.
Financial Highlights
Gold and Precious Metals Fund
For a capital share outstanding during the
| | | Investor Class | |
| | | Year Ended December 31, | |
| | | 2018 | | | 2017 | | | 2016 | | | 2015 | | | 2014 | |
| Net asset value, beginning of year | | $ | 7.96 | | | $ | 7.04 | | | $ | 4.89 | | | $ | 5.16 | | | $ | 6.00 | |
| Investment Activities | | | | | | | | | | | | | | | | | | | | |
| Net investment loss | | | (0.06 | )* | | | (0.06 | )* | | | (0.07 | ) | | | (0.04 | ) | | | (0.05 | ) |
| Net realized and unrealized gain (loss) | | | (1.08 | ) | | | 0.98 | | | | 2.28 | | | | (0.21 | ) | | | (0.79 | ) |
| Total from investment activities | | | (1.14 | ) | | | 0.92 | | | | 2.21 | | | | (0.25 | ) | | | (0.84 | ) |
| Distributions | | | | | | | | | | | | | | | | | | | | |
| From net investment income | | | (0.12 | ) | | | – | | | | (0.06 | ) | | | (0.02 | ) | | | – | |
| Short-Term Trading Fees* | | | – | | | | 0.00 | (a) | | | (0.00 | )(a) | | | (0.00 | )(a) | | | (0.00 | )(a) |
| Net asset value, end of year | | $ | 6.70 | | | $ | 7.96 | | | $ | 7.04 | | | $ | 4.89 | | | $ | 5.16 | |
| Total Return (b) | | | (14.29 | )% | | | 13.07 | % | | | 45.36 | % | | | (4.78 | )% | | | (14.00 | )% |
| Ratios to Average Net Assets: | | | | | | | | | | | | | | | | | | | | |
| Net investment loss | | | (0.87 | )% | | | (0.84 | )% | | | (1.02 | )% | | | (0.83 | )% | | | (0.67 | )% |
| Total expenses | | | 1.76 | % | | | 1.68 | % | | | 1.73 | % | | | 2.13 | % | | | 1.93 | % |
| Expenses waived or reimbursed (c) | | | (0.06 | )% | | | (0.03 | )% | | | (0.02 | )% | | | (0.08 | )% | | | (0.05 | )% |
| Net expenses (d) | | | 1.70 | % | | | 1.65 | % | | | 1.71 | % | | | 2.05 | % | | | 1.88 | % |
| Portfolio turnover rate | | | 74 | % | | | 67 | %(e) | | | 181 | %(e) | | | 106 | %(e) | | | 99 | %(e) |
| Net assets, end of year (in thousands) | | $ | 86,106 | | | $ | 100,740 | | | $ | 93,988 | | | $ | 58,298 | | | $ | 62,777 | |
| * | Based on average shares outstanding. |
| (a) | The per share amount does not round to a full penny. |
| (b) | Assumes investment at the net asset value at the beginning of the period, reinvestment of all distributions and a complete redemption of the investment at the net asset value at the end of the period. |
| (c) | Expenses waived or reimbursed reflect reductions to total expenses, as discussed in the notes to the financial statements. These amounts would increase the net investment loss ratio or decrease the net investment income ratio, as applicable, and decrease the total returns had such reductions not occurred. |
| (d) | The net expense ratios shown above reflect expenses after waivers and reimbursements and include the effect of reductions to total expenses for any expenses offset. Expense offset arrangements reduce total expenses, as discussed in the notes to the financial statements. These amounts would decrease the net investment income (loss) ratio had such reductions not occurred. The effect of expenses offset are as follows: |
| | | Investor Class | |
| | | Year Ended December 31, | |
| | | 2018 | | | 2017 | | | 2016 | | | 2015 | | | 2014 | |
| Ratios to Average Net Assets: | | | | | | | | | | | | | | | | | | | | |
| Expense offset | | | (0.06 | )% | | | (0.03 | )% | | | (0.01 | )% | | | – | (f) | | | – | (f) |
| (e) | Excludes option transactions. |
| (f) | Effect on the expense ratio was not greater than 0.005%. |
See accompanying notes to financial statements.
Financial Highlights
Emerging Europe Fund
For a capital share outstanding during the
| | | Investor Class | |
| | | Year Ended December 31, | |
| | | 2018 | | | 2017 | | | 2016 | | | 2015 | | | 2014 | |
| Net asset value, beginning of year | | $ | 7.29 | | | $ | 5.94 | | | $ | 5.20 | | | $ | 6.56 | | | $ | 8.82 | |
| Investment Activities | | | | | | | | | | | | | | | | | | | | |
| Net investment income | | | 0.14 | * | | | 0.08 | * | | | 0.07 | | | | 0.04 | | | | 0.06 | |
| Net realized and unrealized gain (loss) | | | (1.38 | ) | | | 1.27 | | | | 0.67 | | | | (1.40 | ) | | | (2.11 | ) |
| Total from investment activities | | | (1.24 | ) | | | 1.35 | | | | 0.74 | | | | (1.36 | ) | | | (2.05 | ) |
| Distributions | | | | | | | | | | | | | | | | | | | | |
| From net investment income | | | – | | | | – | | | | – | | | | – | | | | (0.21 | ) |
| Short-Term Trading Fees* | | | – | | | | 0.00 | (a) | | | 0.00 | (a) | | | 0.00 | (a) | | | 0.00 | (a) |
| Net asset value, end of year | | $ | 6.05 | | | $ | 7.29 | | | $ | 5.94 | | | $ | 5.20 | | | $ | 6.56 | |
| Total Return (b) | | | (17.01 | )% | | | 22.73 | % | | | 14.23 | % | | | (20.73 | )% | | | (23.22 | )% |
| Ratios to Average Net Assets: | | | | | | | | | | | | | | | | | | | | |
| Net investment income | | | 2.05 | % | | | 1.26 | % | | | 1.19 | % | | | 0.63 | % | | | 0.23 | % |
| Total expenses | | | 2.43 | % | | | 2.32 | % | | | 2.31 | % | | | 2.60 | % | | | 2.28 | % |
| Expenses waived or reimbursed (c) | | | (0.04 | )% | | | (0.02 | )% | | | – | (f) | | | – | | | | – | |
| Net expenses (d) | | | 2.39 | % | | | 2.30 | % | | | 2.31 | % | | | 2.60 | % | | | 2.28 | % |
| Portfolio turnover rate | | | 81 | % | | | 97 | %(e) | | | 164 | %(e) | | | 137 | %(e) | | | 93 | %(e) |
| Net assets, end of year (in thousands) | | $ | 31,150 | | | $ | 45,302 | | | $ | 42,273 | | | $ | 44,666 | | | $ | 69,066 | |
| * | Based on average shares outstanding. |
| (a) | The per share amount does not round to a full penny. |
| (b) | Assumes investment at the net asset value at the beginning of the period, reinvestment of all distributions and a complete redemption of the investment at the net asset value at the end of the period. |
| (c) | Expenses waived or reimbursed reflect reductions to total expenses, as discussed in the notes to the financial statements. These amounts would increase the net investment loss ratio or decrease the net investment income ratio, as applicable, and decrease the total returns had such reductions not occurred. |
| (d) | The net expense ratios shown above reflect expenses after waivers and reimbursements and include the effect of reductions to total expenses for any expenses offset. Expense offset arrangements reduce total expenses, as discussed in the notes to the financial statements. These amounts would decrease the net investment income (loss) ratio had such reductions not occurred. The effect of expenses offset are as follows: |
| | | Investor Class | |
| | | Year Ended December 31, | |
| | | 2018 | | | 2017 | | | 2016 | | | 2015 | | | 2014 | |
| Ratios to Average Net Assets: | | | | | | | | | | | | | | | | | | | | |
| Expense offset | | | (0.04 | )% | | | (0.02 | )% | | | – | (f) | | | – | (f) | | | – | (f) |
| (e) | Excludes option transactions. |
| (f) | Effect on the expense ratio was not greater than 0.005%. |
See accompanying notes to financial statements.
Financial Highlights
China Region Fund
For a capital share outstanding during the
| | | Investor Class | |
| | | Year Ended December 31, | |
| | | 2018 | | | 2017 | | | 2016 | | | 2015 | | | 2014 | |
| Net asset value, beginning of year | | $ | 11.53 | | | $ | 7.32 | | | $ | 7.41 | | | $ | 8.20 | | | $ | 8.28 | |
| Investment Activities | | | | | | | | | | | | | | | | | | | | |
| Net investment income (loss) | | | 0.10 | * | | | (0.06 | )* | | | 0.01 | | | | 0.02 | | | | 0.00 | (a) |
| Net realized and unrealized gain (loss) | | | (3.84 | ) | | | 4.28 | | | | (0.09 | ) | | | (0.72 | ) | | | (0.08 | ) |
| Total from investment activities | | | (3.74 | ) | | | 4.22 | | | | (0.08 | ) | | | (0.70 | ) | | | (0.08 | ) |
| Distributions | | | | | | | | | | | | | | | | | | | | |
| From net investment income | | | (0.08 | ) | | | (0.01 | ) | | | (0.01 | ) | | | (0.09 | ) | | | – | |
| From net realized gains | | | (0.15 | ) | | | – | | | | – | | | | – | | | | – | |
| Short-Term Trading Fees* | | | – | | | | – | | | | 0.00 | (a) | | | 0.00 | (a) | | | 0.00 | (a) |
| Net asset value, end of year | | $ | 7.56 | | | $ | 11.53 | | | $ | 7.32 | | | $ | 7.41 | | | $ | 8.20 | |
| Total Return (b) | | | (32.46 | )% | | | 57.67 | % | | | (1.05 | )% | | | (8.60 | )% | | | (0.97 | )% |
| Ratios to Average Net Assets: | | | | | | | | | | | | | | | | | | | | |
| Net investment income (loss) | | | 0.96 | % | | | (0.60 | )% | | | 0.12 | % | | | 0.24 | % | | | 0.08 | % |
| Total expenses | | | 2.66 | % | | | 2.60 | % | | | 2.74 | % | | | 3.03 | % | | | 2.94 | % |
| Expenses waived or reimbursed (c) | | | (0.22 | )% | | | (0.09 | )% | | | (0.38 | )% | | | (0.51 | )% | | | (0.43 | )% |
| Net expenses (d) | | | 2.44 | % | | | 2.51 | % | | | 2.36 | % | | | 2.52 | % | | | 2.51 | % |
| Portfolio turnover rate | | | 109 | % | | | 102 | %(e) | | | 165 | %(e) | | | 210 | %(e) | | | 235 | %(e) |
| Net assets, end of year (in thousands) | | $ | 13,253 | | | $ | 29,775 | | | $ | 16,510 | | | $ | 16,183 | | | $ | 21,008 | |
| * | Based on average shares outstanding. |
| (a) | The per share amount does not round to a full penny. |
| (b) | Assumes investment at the net asset value at the beginning of the period, reinvestment of all distributions and a complete redemption of the investment at the net asset value at the end of the period. |
| (c) | Expenses waived or reimbursed reflect reductions to total expenses, as discussed in the notes to the financial statements. These amounts would increase the net investment loss ratio or decrease the net investment income ratio, as applicable, and decrease the total returns had such reductions not occurred. |
| (d) | The net expense ratios shown above reflect expenses after waivers and reimbursements and include the effect of reductions to total expenses for any expenses offset. Expense offset arrangements reduce total expenses, as discussed in the notes to the financial statements. These amounts would decrease the net investment income (loss) ratio had such reductions not occurred. The effect of expenses offset are as follows: |
| | | Investor Class | |
| | | Year Ended December 31, | |
| | | 2018 | | | 2017 | | | 2016 | | | 2015 | | | 2014 | |
| Ratios to Average Net Assets: | | | | | | | | | | | | | | | | | | | | |
| Expense offset | | | (0.04 | )% | | | (0.05 | )% | | | (0.01 | )% | | | – | (f) | | | – | (f) |
| (e) | Excludes option transactions. |
| (f) | Effect on the expense ratio was not greater than 0.005%. |
See accompanying notes to financial statements.
Report of Independent Registered Public Accounting Firm
To the Board of Trustees and Shareholders of U.S. Global Investors Funds
Opinion on the Financial Statements
We have audited the accompanying statements of assets and liabilities of U.S. Government Securities Ultra-Short Bond Fund, Near-Term Tax Free Fund, All American Equity Fund, Holmes Macro Trends Fund, Global Resources Fund, World Precious Minerals Fund, Gold and Precious Metals Fund, Emerging Europe Fund and China Region Fund, each a series of shares of beneficial interest in U.S. Global Investors Funds (the “Funds”), including the portfolios of investments, as of December 31, 2018, and the related statements of operations for the year then ended, the statements of changes in net assets for each of the years in the two-year period then ended and the financial highlights for each of the years in the three-year period then ended, and the related notes (collectively referred to as the “financial statements”). In our opinion, the financial statements present fairly, in all material respects, the financial position of the Funds as of December 31, 2018, and the results of their operations for the year then ended, the changes in their net assets for each of the years in the two-year period then ended and their financial highlights for each of the years in the three-year period then ended, in conformity with accounting principles generally accepted in the United States of America. The financial highlights for each of the years in the two-year period ended December 31, 2015 were audited by other auditors, whose report dated February 26, 2016 expressed an unqualified opinion on those financial highlights.
Basis for Opinion
These financial statements are the responsibility of the Funds' management. Our responsibility is to express an opinion on the Funds’ financial statements based on our audits. We are a public accounting firm registered with the Public Company Accounting Oversight Board (United States) (“PCAOB”) and are required to be independent with respect to the Funds in accordance with the U.S. federal securities law and the applicable rules and regulations of the Securities and Exchange Commission and the PCAOB.
We conducted our audits in accordance with the standards of the PCAOB. Those standards require that we plan and perform the audits to obtain reasonable assurance about whether the financial statements are free of material misstatement, whether due to error or fraud. The Funds are not required to have, nor were we engaged to perform, an audit of their internal control over financial reporting. As part of our audits we are required to obtain an understanding of internal control over financial reporting but not for the purpose of expressing an opinion on the effectiveness of the Funds’ internal control over financial reporting. Accordingly, we express no such opinion.
Report of Independent Registered Public Accounting Firm
Our audits included performing procedures to assess the risk of material misstatement of the financial statements, whether due to error or fraud, and performing procedures that respond to those risks. Such procedures included examining, on a test basis, evidence regarding the amounts and disclosures in the financial statements. Our procedures included confirmation of securities owned as of December 31, 2018 by correspondence with the custodian and brokers. Our audits also included evaluating the accounting principles used and significant estimates made by management, as well as evaluating the overall presentation of the financial statements. We believe that our audits provide a reasonable basis for our opinion.

BBD, LLP
We have served as the auditor of one or more of the Funds in the U.S. Global Investors Funds since 2016.
Philadelphia, Pennsylvania
February 27, 2019
| Trustees and Officers (unaudited) | December 31, 2018 |
The following table presents information about the Trustees as of December 31, 2018, together with a brief description of their principal occupations during the last five years. Each trustee serves until his death, resignation or removal and replacement. The address for all trustees is c/o Atlantic Fund Services, Three Canal Plaza, Suite 600, Portland, Maine 04101. Stacey E. Hong and John Y. Keffer are considered interested trustees due to their affiliation with Atlantic. If you would like more information about the Trustees, you may call 1-800-US-FUNDS (1-800-873-8637) to request a free copy of the Statement of Additional Information.
Name and Year of Birth | Position with the Trust | Length of Time Served | Principal Occupation(s) During Past Five Years | Number of Series in Fund Complex Overseen By Trustee | Other Directorships Held By Trustee During Past Five Years |
| Independent Trustees | | | | |
David Tucker Born: 1958 | Chairman of the Board; Trustee; Chairman, Nominating Committee and Qualified Legal Compliance Committee | Since 2015 | Director, Blue Sky Experience (a charitable endeavor), since 2008; Senior Vice President & General Counsel, American Century Companies (an investment management firm), 1998-2008. | 9 | Trustee, Forum Funds; Trustee, Forum ETF Trust; Trustee, Forum Funds II |
Mark D. Moyer Born: 1959 | Trustee; Chairman Audit Committee | Since 2015 | Chief Financial Officer, Freedom House (a NGO advocating political freedom and democracy), since 2017; independent consultant providing interim CFO services, principally to non-profit organizations, 2011- 2017; Chief Financial Officer, Institute of International Education, 2008-2011; Chief Financial Officer and Chief Restructuring Officer, Ziff Davis Media Inc. (an integrated media company), 2005-2008; Adjunct Professor of Accounting, Fairfield University from 2009- 2012. | 9 | Trustee, Forum Funds; Trustee, Forum ETF Trust; Trustee, Forum Funds II |
Jennifer Brown-Strabley Born: 1964 | Trustee | Since 2015 | Principal, Portland Global Advisors (a registered investment adviser), 1996-2010. | 9 | Trustee, Forum Funds; Trustee, Forum ETF Trust; Trustee, Forum Funds II |
| Trustees and Officers (unaudited) | December 31, 2018 |
Name and Year of Birth | Position with the Trust | Length of Time Served | Principal Occupation(s) During Past Five Years | Number of Series in Fund Complex Overseen By Trustee | Other Directorships Held By Trustee During Past Five Years |
| Interested Trustees (1) | | | | |
Stacey E. Hong Born: 1966 | Trustee | Since 2015 | President, Atlantic since 2008 | 9 | Trustee, Forum Funds II |
John Y. Keffer Born: 1942 | Trustee | Since 2015 | Chairman, Atlantic since 2008; President, Forum Investment Advisors, LLC since 2011; President, Forum Foundation (a charitable organization) since 2005; President, Forum Trust, LLC (a non-depository trust company chartered in the State of Maine) since 1997. | 9 | Trustee Forum ETF Trust; Trustee, Forum Funds II; Director, Wintergreen Fund, Inc. |
| (1) | Stacey E. Hong and John Y. Keffer are currently treated as interested persons of the Trust, as defined in the 1940 Act, due to their affiliations with Atlantic. Atlantic and Forum Investment Advisors, LLC are subsidiaries of Forum Holdings Corp. I, a Delaware corporation that is wholly owned by Mr. Keffer. |
The following table presents information about each Officer of the Trust as of December 31, 2018, together with a brief description of their principal occupations during the last five years. Each officer serves until his or her death, resignation or removal and replacement. The business address of each officer is c/o Atlantic Fund Services, Three Canal Plaza, Suite 600, Portland, Maine 04101.
Principal Officers of the Trust
Name and Year of Birth | Position with the Trust | Length of Time Served | Principal Occupation(s) During Past Five Years |
Jessica Chase Born: 1970 | President; Principal Executive Officer | Since 2015 | Senior Vice President, Atlantic since 2008. |
Karen Shaw Born: 1972 | Treasurer; Principal Financial Officer | Since 2015 | Senior Vice President, Atlantic since 2008. |
Zachary Tackett Born: 1988 | Vice President; Secretary and Anti- Money Laundering Compliance Officer | Since 2015 | Counsel, Atlantic since 2014. |
Carlyn Edgar Born: 1963 | Chief Compliance Officer, Code of Ethics Review Officer | Since 2015 | Senior Vice President, Atlantic since 2008. |
Kathleen Somerville Born: 1962 | Vice President | Since 2018 | Director of Financial Reporting, U.S. Global Investors, Inc. since 2016; Corporate Internal Auditor, U.S. Global Investors, Inc., 1999-2016. |
| Approval of Investment Advisory Agreement (unaudited) | December 31, 2018 |
On September 13, 2018, the Board of Trustees (the “Board”) of U.S. Global Investors Funds (the “Trust”), including all the trustees who are not “interested persons” of the Trust (the “Independent Trustees”), approved the continuation of the advisory agreement with U.S. Global Investors, Inc. (the “Adviser”) for each Fund for an additional one-year term ended September 30, 2019.
In considering approval of the agreement, the Board reviewed a variety of materials relating to each Fund and the Adviser, including (i) the nature, extent and quality of services provided; (ii) a comparison of services rendered and amounts paid to other registered investment companies; (iii) the investment performance of the Funds measured against appropriate benchmarks and peer groups; (iv) the costs of services provided and estimated profits realized by the Adviser (and its affiliates); (v) the extent to which economies of scale are realized as the Funds grow; (vi) whether fee levels reflect any economies of scale for the benefit of Fund shareholders; and (vii) fall-out benefits realized by the Adviser (and its affiliates) from its relationship with the Funds, if any.
In preparation for its September meeting of the Board of Trustees of the Trust (“September Meeting”), the Trustees were presented with a range of information to assist in their deliberations. Those materials included information from Broadridge Financial Solutions, Inc. (“Broadridge”), an independent source of data about the mutual fund industry, which compared each Fund’s total contractual and actual investment advisory fees, total expenses, and performance with a group of peer funds that were selected by Broadridge. The Trustees also received a memorandum from Independent Legal Counsel concerning their responsibilities with respect to the approval of the investment advisory agreement. The Independent Trustees met in executive session with Independent Legal Counsel while deliberating.
The Board reviewed the functions performed by the Adviser, the portfolio management team and support staff of the Adviser, the Adviser’s investment strategy and process for each Fund, and the Adviser’s financial condition, and considered the quality of services provided.
For the All American Equity Fund, the information showed that the Fund underperformed the median of its Broadridge peer group for the one-, three- and five-year periods ended June 30, 2018. The Board also observed that the Fund underperformed the S&P 500 Index, the Fund’s primary benchmark index, for the same periods under review. The Board noted the Adviser’s representation that the Fund’s underperformance could be attributed, at least in part, to the Fund’s lack of weighting to securities that were drivers of outperformance for the primary benchmark index and Broadridge peers, as determined by the Fund’s investment focus and Adviser’s investment model. The Board also noted the Adviser’s representation that the Adviser continues to evaluate opportunities to improve its investment model.
For the Holmes Macro Trends Fund, the information showed that the Fund underperformed the median of its Broadridge peer group for the one-, three-, and five-year periods ended June 30, 2018. The Board also observed that the Fund underperformed the S&P Composite 1500 Index, the Fund’s primary benchmark index, for the one-, three-, and five-year periods ended June 30, 2018. The Board noted the Adviser’s representation that underperformance was related to the Fund’s underweight in securities that were drivers towards its peer group and benchmark’s performances as well as the expense ratio of the Fund.
For the Global Resources Fund, the information showed that the Fund outperformed the median of its Broadridge peer group for the three-year period ended June 30, 2018, and
| Approval of Investment Advisory Agreement (unaudited) | December 31, 2018 |
underperformed the median of its Broadridge peers for the one- and five-year periods ended June 30, 2018. The Board also observed that the Fund underperformed the S&P Global Natural Resources Index (Net Total Return), its primary benchmark index, for the one-, three-, and five-year periods ended June 30, 2018. The Board also considered a group of peers the Adviser believes provide a more optimal comparison (“Comparable Peers”) and noted that the Fund underperformed the Comparable Peers for the one-year period ended June 30, 2018 and outperformed the Comparable Peers for the three-year period ended June 30, 2018. The Board noted the Advisers representation that underperformance over the short term can be attributed to sector allocation and overexposure to junior and small capitalization resource companies. The Board noted the Adviser’s representation that the Adviser anticipates stronger performance over longer periods of time and that the current strategy employed by the Fund does not require remediation.
For the World Precious Minerals Fund, the information showed that the Fund underperformed the median of its Broadridge peers for the one-, three- and five-year period ended June 30, 2018. The Board also observed that the Fund underperformed the NYSE Arca Gold Miners Index, its primary benchmark index, for the one-, three-, and five-year periods ended June 30, 2018. The Board noted that the underperformance relative to the short term can be attributed to a drag on exploration and development companies’ performance and underperformance relative to the three- and five-year periods was due to weak one-year performance.
For the Gold and Precious Metals Fund, the information showed that the Fund outperformed the median of its Broadridge peers for the one-, three-, and five-year periods ended June 30, 2018. The Board also observed that the Fund also outperformed the FTSE Gold Mines Index, its primary benchmark index, for the one-year period ended June 30, 2018 and underperformed its primary benchmark index for the three- and five-year periods ended June 30, 2018.
For the Emerging Europe Fund, the information showed that the Fund performed at the median of the Broadridge peer group for the one-year period ended June 30, 2018, and underperformed the median of the Broadridge peer group for the three- and five-year period ended June 30, 2018. The Board observed that the Fund outperformed the MSCI Emerging Markets Europe 10/40 Index (Net Total Return), the Fund’s primary benchmark index, for the one-year period ended June 30, 2018, and underperformed its primary benchmark index for the three- and five-year periods ended June 30, 2018. The Board noted the Adviser’s representation that the Broadridge peer group, which consists of broad emerging market strategies, does not provide an optimal comparison to the Fund’s dedicated emerging Europe strategy.
For the China Region Fund, the information showed that the Fund underperformed the median Broadridge peer group for the one-, three-, and five-year periods ended June 30, 2018. The Board observed that the Fund outperformed the Hang Seng Composite Index (“HSCI”), its primary benchmark index, for the one-, three-, and five-year periods ended June 30, 2018. The Board noted the Adviser’s representation that the Fund is designed to outperform the HSCI with a focus on investments in Hong Kong, consistent with the constituents of the benchmark, and not the broader region, unlike some of the peer funds.
For the Near-Term Tax Free Fund, the information showed that the Fund performed at the median of its Broadridge peer group for the one- and five-year periods ended June 30, 2018 and underperformed the median of its Broadridge peers for the three-year period ended June 30, 2018. The Board also noted that the Fund underperformed the Bloomberg Barclays 3-Year Municipal Bond Index, the Fund’s primary benchmark index, for the one- and three-
| Approval of Investment Advisory Agreement (unaudited) | December 31, 2018 |
year periods ended June 30, 2018, but outperformed the primary benchmark index for the five-year period ended June 30, 2018. The Board noted the Adviser’s representation that the Fund’s median performance relative to its peer group’s average performance over the one-year period could be attributed to the Fund having a longer weighted duration than one of the funds in the peer group at a time when short-term yields outperformed long-term yields. The Board noted the Adviser’s representation that underperformance relative to the Fund’s primary benchmark can be attributed to maintaining an underweight duration position versus the benchmark, which the Adviser believes will benefits shareholders due to continued rate hikes by the Federal Reserve and potential accelerated inflation.
For the U.S. Government Securities Ultra-Short Bond Fund, the information showed that the Fund underperformed the Bloomberg Barclays U.S. Treasury Bills 6-9 Month Total Return Index, the Fund’s primary benchmark index, for the one- and three-year period ended June 30, 2018, but outperformed the primary benchmark index for the five-year period ended June 30, 2018. The Board also noted the Adviser’s representation that the Fund outperformed the average of the selected short U.S. Treasury Funds for the one-year period ended June 30, 2018, and underperformed the average of selected short U.S. Treasury Funds for the three-and five-year periods ended June 30, 2018. The Board noted the Adviser’s representation that underperformance against the benchmark was a result of the Fund’s duration being longer than the benchmark during a period when shorter yield outperformed longer yields.
The Board also reviewed information on each Fund’s advisory fee and expense ratios compared to the advisory fees and expense ratios of a peer group of funds based upon information prepared by Broadridge. The Board also compared the expense ratios of the Funds to industry data provided by the Adviser and compiled by the Investment Company Institute (“ICI”), which reflected the expense ratios for funds of small fund complexes, categorized into relevant fund types (e.g., sector funds, international funds, and growth funds). The Board also noted the Adviser’s representation that the Adviser continues to evaluate opportunities to reduce expenses that negatively affect the Funds’ investment results.
For the All American Equity Fund, the information showed that, as of June 30, 2018, the Fund’s actual advisory fee and the actual total expenses were each greater than the median of its Broadridge peer group.
For the Holmes Macro Trends Fund, the information showed that, as of June 30, 2018, the Fund’s actual advisory fee and actual total expenses were each greater than the median of its Broadridge peer group.
For the Global Resources Fund, the information showed that, as of June 30, 2018, the Fund’s actual advisory fee was equal to the median of its Broadridge peer group, and its actual total expenses was greater than the median of its Broadridge peer group.
For the World Precious Minerals Fund, the information showed that, as of June 30, 2018, the Fund’s actual advisory fee and actual total expenses were each greater than the median of its Broadridge peer group.
For the Gold and Precious Metals Fund, the information showed that, as of June 30, 2018, the Fund’s actual advisory fee and actual total expenses were each greater than the median of its Broadridge peer group.
| Approval of Investment Advisory Agreement (unaudited) | December 31, 2018 |
For the Emerging Europe Fund, the information showed that, as of June 30, 2018, each of the Fund’s actual advisory fee and actual total expenses were greater than the median of its Broadridge peer group.
For the China Region Fund, the information showed that, as of June 30, 2018, the Fund’s actual advisory fee and actual total expenses were each greater than the median of its Broadridge peer group.
For the Near-Term Tax Free Fund, the information showed that, as of June 30, 2018, each of the Fund’s actual advisory fee and actual total expenses were less than the median of its Broadridge peer group.
For the U.S. Government Securities Ultra-Short Bond Fund, the information showed that, as of June 30, 2018, each of the Fund’s actual advisory fee and actual total expenses were less than the median of its Broadridge peer group.
The Board considered the Adviser’s representation that higher expenses are inherent in small fund complexes, such as the Trust, noting the difficulty that small complexes face in spreading increasing overhead over a small asset base. In addition, the Board noted that the Adviser is contractually limiting expenses (exclusive of acquired fund fees and expenses, extraordinary expenses, taxes, brokerage commissions and interest) on an annualized basis for the Near- Term Tax Free Fund at 0.45% of average net assets through at least April 30, 2019. The Board also noted that the Adviser is currently voluntarily waiving all class specific expenses for the Institutional Classes of the Global Resources Fund and the World Precious Minerals Fund and is currently voluntarily limiting expenses at the following levels for the Investor Classes of the Funds (all voluntary expense limitations may be modified or removed by the Adviser at any time and are exclusive of acquired fund fees and expenses, extraordinary expenses, taxes, brokerage commissions, interest, and advisory fee performance adjustments, if any):
| | Expense Cap |
| Funds | Inst’l Class | Investor Class |
| All American Equity Fund | N/A | 2.20% |
| China Region Fund | N/A | 2.55% |
| Emerging Europe Fund | N/A | 2.85% |
| Global Resources Fund | All class specific expenses | 1.90% |
| Gold and Precious Metals Fund | N/A | 1.90% |
| Holmes Macro Trends Fund | N/A | 2.20% |
| World Precious Minerals Fund | All class specific expenses | 1.90% |
| U.S. Government Securities Ultra-Short Bond Fund | N/A | 0.45% |
The Board considered the fee structure of the agreement, including the costs of the services provided and the profits realized by the Adviser and its affiliates from their relationship with the Funds.
As part of its review of the agreement, the Board considered whether the Funds have experienced any economies of scale that should be shared with shareholders. The Board noted that, in all cases, the Adviser did not believe, with respect to the investment advisory services provided, that it was realizing significant economies of scale.
Based on all the above-mentioned factors, other information provided, and related conclusions, with no single factor or conclusion being determinative and with each Trustee not necessarily attributing the same weight to each factor, the Board, including the Independent Trustees,
| Approval of Investment Advisory Agreement (unaudited) | December 31, 2018 |
concluded that the nature, extent and quality of services provided by the Adviser supported the renewal of the advisory agreement with the Adviser.
Additional Information (unaudited)
Additional Federal Tax Information
The percentage of tax-exempt dividends paid by the Near-Term Tax Free Fund for the year ended December 31, 2018, was 99.84%.
In early 2019, the Funds reported on Form 1099-DIV the tax status of all distributions made during the 2018 calendar year. The Funds intend to distribute the maximum amount of qualified dividend income allowable. The amount of qualified dividend income distributed by each Fund will be reported to shareholders on their Form 1099-DIV. Shareholders should use the information on Form 1099-DIV for their income tax returns.
The percentage of ordinary income dividends paid by the Funds during the year ended December 31, 2018, which qualify as Qualified Dividends Income (QDI) and the Dividends Received Deduction (DRD) available to corporate shareholders was:
| | Qualified Dividend Income | Dividend Received Deduction | Qualified Investment Income | Qualified Short Term Gain Dividends |
| U.S. Government Securities Ultra-Short Bond | –% | –% | 100.00% | –% |
| All American Equity | 39.93% | 38.59% | –% | 86.06% |
| Holmes Macro Trends | 8.60% | 8.49% | –% | 100.00% |
| Global Resources | 62.44% | 4.55% | 13.22% | –% |
| World Precious Minerals | 0.41% | 0.01% | 0.05% | –% |
| Gold and Precious Metals | 24.62% | 2.04% | 2.28% | –% |
| China Region | 97.53% | –% | –% | –% |
The amounts which represent foreign source income and foreign taxes paid during the year ended December 31, 2018, are as follows:
| | Foreign Source Income | Foreign Tax Credit |
| Global Resources | $2,208,156 | $252,621 |
| World Precious Minerals | 731,997 | 3,582 |
| Gold and Precious Metals | 1,003,835 | 146,293 |
| China Region | 775,656 | 40,494 |
Proxy Voting
A description of the policies and procedures that the Funds use to determine how to vote proxies relating to portfolio securities is available without charge, upon request, by calling 1-800-US-FUNDS (1-800-873-8637). It also appears in the Funds’ statement of additional information (Form 485B), which can be found on the SEC’s website at www.sec.gov.
Information regarding how the Funds voted proxies relating to portfolio securities during the most recent 12-month period ended June 30 is available without charge, upon request, by calling 1-800-US-FUNDS (1-800-873-8637) or accessing the Funds’ Form N-PX on the SEC’s website at www.sec.gov.
Additional Information (unaudited)
Availability of Quarterly Portfolio Schedules
The Funds provide complete lists of holdings four times in each fiscal year, at the quarter-ends. For the second and fourth quarters, the lists appear in the Fund’s semi-annual and annual reports to shareholders. For the first and third quarters, the Funds file the lists with the SEC on Form N-Q. The Funds’ Form N-Qs are available on the SEC’s website at http://www.sec. gov. The Funds’ Forms N-Q may also be reviewed and copied at the SEC’s Public Room in Washington D.C. Information on the operation of the Public Reference Room may be obtained by calling 1-800-SEC-0330.
| Expense Example (unaudited) | December 31, 2018 |
As a shareholder of the funds, you incur two types of costs: (1) transaction costs, including short-term trading fees and exchange fees; and (2) ongoing costs, including management fees, distribution plan fees, shareholder reports (like this one), and other fund expenses. This example is intended to help you understand your ongoing costs (in dollars) of investing in other mutual funds.
The example is based on an investment of $1,000 invested at the beginning of the period and held for the entire period (July 1, 2018 to December 31, 2018) as indicated below.
| ● | Actual Expenses. The first line of the following table for each fund provides information about actual account values and actual expenses. You may use the information in this line, together with the amount you invested, to estimate the expenses you paid over the period. Simply divide your account value by $1,000 (for example, an $8,600 account value divided by $1,000 = 8.6), then multiply the result by the number in the first line under the heading ‘‘Expenses Paid During Period’’ to estimate the expenses you paid on your account during this period. |
| ● | Hypothetical Example for Comparison Purposes. The second line of the following table for each fund provides information about hypothetical account values and hypothetical expenses based on the fund’s actual expense ratio and an assumed rate of return of 5 percent per year before expenses, which is not the fund’s actual return. The hypothetical account values and expenses may not be used to estimate the actual ending account balance or expenses you paid for the period. You may use this information to compare the ongoing costs of investing in these funds and other funds. To do so, compare this 5 percent hypothetical example with the 5 percent hypothetical examples that appear in the shareholder reports of other funds. |
Please note that the expenses shown in the table are meant to highlight your ongoing costs only and do not reflect any direct or transactional costs, such as small account, exchange or short-term trading fees. Therefore, the second line of the table is useful in comparing ongoing costs only, and will not help you determine the relative total costs of owning different funds. In addition, if these direct or transactional costs were included, your costs would have been higher.
| Expense Example (unaudited) | December 31, 2018 |
| | Beginning Account Value July 1, 2018 | Ending Account Value December 31, 2018 | Expenses Paid During Period* |
| U.S. Government Securities Ultra-Short Bond Fund | | | |
| Based on Actual Fund Return | $1,000.00 | $1,006.52 | $2.28 |
| Based on Hypothetical 5% Yearly Return | $1,000.00 | $1,022.94 | $2.29 |
| Near-Term Tax Free Fund | | | |
| Based on Actual Fund Return | $1,000.00 | $1,005.98 | $2.28 |
| Based on Hypothetical 5% Yearly Return | $1,000.00 | $1,022.94 | $2.29 |
| All American Equity Fund | | | |
| Based on Actual Fund Return | $1,000.00 | $926.24 | $8.79 |
| Based on Hypothetical 5% Yearly Return | $1,000.00 | $1,016.08 | $9.20 |
| Holmes Macro Trends Fund | | | |
| Based on Actual Fund Return | $1,000.00 | $917.21 | $7.93 |
| Based on Hypothetical 5% Yearly Return | $1,000.00 | $1,016.94 | $8.34 |
| Global Resources Fund Investor Class | | | |
| Based on Actual Fund Return | $1,000.00 | $786.57 | $6.62 |
| Based on Hypothetical 5% Yearly Return | $1,000.00 | $1,017.80 | $7.48 |
| Global Resources Fund Institutional Class | | | |
| Based on Actual Fund Return | $1,000.00 | $789.49 | $3.97 |
| Based on Hypothetical 5% Yearly Return | $1,000.00 | $1,020.77 | $4.48 |
| World Precious Minerals Fund Investor Class | | | |
| Based on Actual Fund Return | $1,000.00 | $843.37 | $6.83 |
| Based on Hypothetical 5% Yearly Return | $1,000.00 | $1,017.80 | $7.48 |
| World Precious Minerals Fund Institutional Class | | | |
| Based on Actual Fund Return | $1,000.00 | $846.13 | $4.37 |
| Based on Hypothetical 5% Yearly Return | $1,000.00 | $1,020.47 | $4.79 |
| Gold and Precious Metals Fund | | | |
| Based on Actual Fund Return | $1,000.00 | $893.00 | $8.30 |
| Based on Hypothetical 5% Yearly Return | $1,000.00 | $1,016.43 | $8.84 |
| Emerging Europe Fund | | | |
| Based on Actual Fund Return | $1,000.00 | $893.65 | $11.98 |
| Based on Hypothetical 5% Yearly Return | $1,000.00 | $1,012.55 | $12.73 |
| China Region Fund | | | |
| Based on Actual Fund Return | $1,000.00 | $727.17 | $10.01 |
| Based on Hypothetical 5% Yearly Return | $1,000.00 | $1,013.61 | $11.67 |
| * | These calculations are based on expenses incurred in the most recent fiscal half-year. The Funds’ Investor Class’ annualized expense ratios (after reimbursements and offsets) for the six month period ended December 31, 2018, were 0.45%, 0.45%, 1.81%, 1.64%, 1.47%, 1.47%, 1.74%, 2.51% and 2.30%, respectively, for the U.S. Government Securities Ultra-Short Bond, Near-Term Tax Free, All American Equity, Holmes Macro Trends, Global Resources, World Precious Minerals, Gold and Precious Metals, Emerging Europe and China Region Funds. The funds’ Institutional Class’ annualized expense ratios (after reimbursements and offsets) for the six month period ended December 31, 2018, were 0.88% and 0.94%, respectively, for the Global Resources and World Precious Minerals Funds. The dollar amounts shown as “Expenses Paid” are equal to the annualized expense ratio multiplied by the average account value over the period, multiplied by 184, the number of days in the period, then divided by 365 days in the current fiscal year. |
Atlantic Fund Services
3 Canal Plaza, Suite 600
Portland, ME
04101
| Want to reduce paper waste? You can receive this report and other important documents electronically. Please visit www.usfunds.com and sign up at Access My Account. If you need further assistance, please call us at 800-873-8637. |
ITEM 2. CODE OF ETHICS.
| (a) | As of the end of the period covered by this report, U.S. Global Investors Funds (the “Registrant”) has adopted a code of ethics, which applies to its Principal Executive Officer and Principal Financial Officer (the “Code of Ethics”). |
| (c) | There have been no amendments to the Registrant’s Code of Ethics during the period covered by this report. |
(d) There have been no waivers to the Registrant’s Code of Ethics during the period covered by this report.
(e) Not applicable.
(f) (1) A copy of the Code of Ethics is being filed under Item 12(a) hereto.
ITEM 3. AUDIT COMMITTEE FINANCIAL EXPERT.
The Board of Trustees has determined that Mr. Mark Moyer is an "audit committee financial expert" as that term is defined under applicable regulatory guidelines. Mr. Moyer is a non- “interested” Trustee (as defined in Section 2(a)(19) under the Investment Company Act of 1940, as amended (the “Act”)), and serves as Chairman of the Audit Committee.
ITEM 4. PRINCIPAL ACCOUNTANT FEES AND SERVICES.
(a) Audit Fees - The aggregate fees billed for each of the last two fiscal years (the “Reporting Periods”) for professional services rendered by the Registrant’s principal accountant for the audit of the Registrant’s annual financial statements, or services that are normally provided by the principal accountant in connection with the statutory and regulatory filings or engagements for the Reporting Periods, were $134,900 in 2017 and $139,600 in 2018.
(b) Audit-Related Fees – The aggregate fees billed in the Reporting Periods for assurance and related services rendered by the principal accountant that were reasonably related to the performance of the audit of the Registrant’s financial statements and are not reported under paragraph (a) of this Item 4 were $0 in 2017 and $0 in 2018.
(c) Tax Fees - The aggregate fees billed in the Reporting Periods for professional services rendered by the principal accountant to the Registrant for tax compliance, tax advice and tax planning were $27,000 in 2017 and $27,000 in 2018. These services consisted of review or preparation of U.S. federal, state, local and excise tax returns.
(d) All Other Fees - The aggregate fees billed in the Reporting Periods for products and services provided by the principal accountant to the Registrant, other than the services reported in paragraphs (a) through (c) of this Item, were $0 in 2017 and $0 in 2018.
(e) (1) The Audit Committee reviews and approves in advance all audit and “permissible non-audit services” (as that term is defined by the rules and regulations of the Securities and Exchange Commission) to be rendered to a series of the Registrant (each, a “Series”). In addition, the Audit Committee reviews and approves in advance all “permissible non-audit services” to be provided to an investment adviser (not including any sub-adviser) of a Series, or an affiliate of such investment adviser, that is controlling, controlled by or under common control with the investment adviser and provides on-going services to the Registrant (“Affiliate”), by the Series’ principal accountant if the engagement relates directly to the operations and financial reporting of the Series. The Audit Committee considers whether fees paid by a Series’ investment adviser or an Affiliate to the Series’ principal accountant for audit and permissible non-audit services are consistent with the principal accountant’s independence.
(e) (2) No services included in (b) - (d) above were approved pursuant to paragraph (c)(7)(i)(C) of Rule 2-01 of Regulation S-X.
(f) Less than 50 percent of the hours expended on the principal accountant’s engagement to audit the Registrant’s financial statements for the most recent fiscal year were attributed to work performed by persons other than the principal accountant’s full-time, permanent employees.
(g) The aggregate fees billed by the Registrant’s principal accountant for non-audit services rendered to the Registrant, its investment adviser, and any entity controlling, controlled by, or under common control with the investment adviser that provides ongoing services to the registrant were $27,000 in 2017 and $27,000 in 2018. These fees related to tax services rendered to the Registrant.
(h) All non-audit services rendered in (g) above were considered by the registrant’s audit committee in maintaining the principal accountant’s independence.
ITEM 5. AUDIT COMMITTEE OF LISTED REGISTRANTS.
Not applicable.
ITEM 6. INVESTMENTS.
| (a) | Included as part of report to shareholders under Item 1. |
ITEM 7. DISCLOSURE OF PROXY VOTING POLICIES AND PROCEDURES FOR CLOSED-END
MANAGEMENT INVESTMENT COMPANIES.
Not applicable.
ITEM 8. PORTFOLIO MANAGERS OF CLOSED-END MANAGEMENT INVESTMENT COMPANIES.
Not applicable.
ITEM 9. PURCHASES OF EQUITY SECURITIES BY CLOSED-END MANAGEMENT INVESTMENT COMPANY AND AFFILIATED PURCHASERS.
Not applicable.
ITEM 10. SUBMISSION OF MATTERS TO A VOTE OF SECURITY HOLDERS
The Registrant does not accept nominees to the board of trustees from shareholders.
ITEM 11. CONTROLS AND PROCEDURES
(a) The Registrant’s Principal Executive Officer and Principal Financial Officer have concluded that the Registrant’s disclosure controls and procedures (as defined in Rule 30a-3(c) under the Act are effective, based on their evaluation of the controls and procedures required by Rule 30a-3(b) under the Act and Rules 13a-15(b) or 15d-15(b) under the Securities Exchange Act of 1934, as of a date within 90 days of the filing date of this report.
(b) There were no changes in the Registrant’s internal control over financial reporting (as defined in
Rule 30a-3(d) under the Act) that occurred during the second fiscal quarter of the period covered by this report that have materially affected, or are reasonably likely to materially affect, the Registrant’s internal control over financial reporting.
ITEM 12. DISCLOSURE OF SECURITIES LENDING ACTIVITIES FOR CLOSED-END MANAGEMENT INVESTMENT COMPANIES
Not applicable.
ITEM 13. EXHIBITS.
(a)(1) Code of Ethics (Exhibit filed herewith).
(a)(2) Certifications pursuant to Rule 30a-2(a) of the Act, and Section 302 of the Sarbanes-Oxley Act of 2002. (Exhibits filed herewith)
(a)(3) Not applicable.
(b) Certifications pursuant to Rule 30a-2(b) of the Act, and Section 906 of the Sarbanes-Oxley Act of 2002. (Exhibit filed herewith)
SIGNATURES
Pursuant to the requirements of the Securities Exchange Act of 1934 and the Investment Company Act of 1940, the Registrant has duly caused this report to be signed on its behalf by the undersigned, thereunto duly authorized.
Registrant U.S. Global Investors Funds
| By | /s/ Jessica Chase
| |
| | Jessica Chase, Principal Executive Officer | |
| | | |
| Date | February 26, 2019
| |
Pursuant to the requirements of the Securities Exchange Act of 1934 and the Investment Company Act of 1940, this report has been signed below by the following persons on behalf of the Registrant and in the capacities and on the dates indicated.
| By | /s/ Jessica Chase
| |
| | Jessica Chase, Principal Executive Officer | |
| | | |
| Date | February 26, 2019
| |
| By | /s/ Karen Shaw
| |
| | Karen Shaw, Principal Financial Officer | |
| | | |
| Date | February 26, 2019
| |