UNITED STATES
SECURITIES AND EXCHANGE COMMISSION
Washington, D.C. 20549
FORM N-CSR
CERTIFIED SHAREHOLDER REPORT OF REGISTERED
MANAGEMENT INVESTMENT COMPANIES
Investment Company Act file number | 811-1800 |
|
U.S. GLOBAL INVESTORS FUNDS |
(Exact name of registrant as specified in charter) |
|
7900 CALLAGHAN ROAD SAN ANTONIO, TX | | 78229 |
(Address of principal executive offices) | | (Zip code) |
|
SUSAN B. MCGEE, ESQ. 7900 CALLAGHAN ROAD SAN ANTONIO, TX 78229 |
(Name and address of agent for service) |
|
Registrant’s telephone number, including area code: | 210-308-1234 | |
|
Date of fiscal year end: | DECEMBER 31, 2014 | |
|
Date of reporting period: | DECEMBER 31, 2014 | |
| | | | | | | | |
ITEM 1. REPORTS TO STOCKHOLDERS.
U.S. Global Investors Funds
Annual Report
December 31, 2014

U.S. Global Investors Funds
Annual Report
December 31, 2014
Letter to Shareholders | | | 1 | | |
Definitions for Management Teams' Perspectives | | | 16 | | |
Management Team's Perspective | | | 18 | | |
Expense Example | | | 63 | | |
Portfolios of Investments | | | 65 | | |
Notes to Portfolios of Investments | | | 118 | | |
Statements of Assets and Liabilities | | | 128 | | |
Statements of Operations | | | 132 | | |
Statements of Changes in Net Assets | | | 136 | | |
Notes to Financial Statements | | | 142 | | |
Financial Highlights | | | 161 | | |
Report of Independent Registered Public Accounting Firm | | | 172 | | |
Trustees and Officers | | | 173 | | |
Additional Information | | | 175 | | |
U.S. Global Investors Funds
Investor Class
U.S. Government Securities Ultra-Short Bond Fund | | UGSDX | |
Near-Term Tax Free Fund | | NEARX | |
All American Equity Fund | | GBTFX | |
Holmes Macro Trends Fund | | MEGAX* | |
Global Resources Fund | | PSPFX | |
World Precious Minerals Fund | | UNWPX | |
Gold and Precious Metals Fund | | USERX | |
Emerging Europe Fund | | EUROX | |
China Region Fund | | USCOX | |
Institutional Class | |
Global Resources Fund | | PIPFX | |
World Precious Minerals Fund | | UNWIX | |
Gold and Precious Metals Fund** | | USEIX | |
Emerging Europe Fund** | | EURIX | |
* The Nasdaq symbol for the Holmes Macro Trends Fund changed from ABCGX to MEGAX in March 2014.
** The Institutional Class shares of the Gold and Precious Metals and Emerging Europe Funds have not commenced operations and currently are closed to investors. A notice will be issued when each class commences operations and opens to investors.
Fund Services, LLC
PO Box 701
Milwaukee, WI
53201-0701
Tel 1.800.US.FUNDS
www.usfunds.com
U.S. Global Investors Funds (unaudited)

Six years. That's the longest duration of time that U.S. equities have consecutively risen, according to research by Nobel Prize-winning economist Robert Shiller.
Since 1871, it's happened only twice – once between 1898 and 1903, and again between 2009 and 2014. Note that the chart below shows only historical price changes and not total returns, including dividends.
What this means is that we're currently in one of the longest-running bull markets in U.S. equities history.
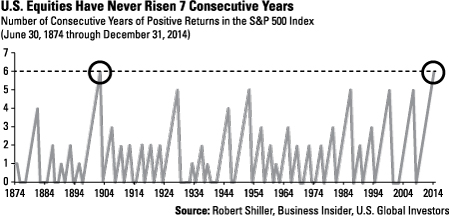
While this might sound exciting, a quick glance at the chart reveals what some could perceive as troubling news. A majority of the winning streaks lasted only two or three years before dipping into the red. What the bull giveth, the bear taketh away.
Yet this is how the market (normally) works. One year it's up, the next it's down, and there's money to be made in both directions. As Warren Buffett famously quipped, "I'd be a bum on the street with a tin cup if the market was always efficient."
Indeed, you can make the argument that the market tends to do exactly that which displeases the most people. Take, for instance, the S&P Composite 1500 Index, the benchmark for our Holmes Macro Trends Fund (MEGAX). Even though the S&P 1500 returned 13.08 percent in 2014, smaller-cap and growth-oriented companies – the kind of names MEGAX has an overweight position in – were generally out-of-favor and therefore underperformed,
1
U.S. Global Investors Funds (unaudited)
after a successful 2013. The same can be said of our All American Equity Fund (GBTFX). It ended the year in positive territory but still came in under its benchmark, the S&P 500 Index.
But just as a smooth sea never makes a skilled sailor, an ever-efficient market never leads to skilled investment management.
If you want to know what "skilled" looks like, check out the following chart:

What resembles the Manhattan skyline is actually the 20 straight years of positive returns in our Near-Term Tax Free Fund (NEARX). Amazingly, that's more than three times the number of such years the general equities market has delivered in its longest stretch of year-over-year growth. Since its inception in 1990, NEARX has been down only one year.
According to Lipper, among 25,000 equity and bond funds in the U.S., only 30 have achieved the feat of giving investors positive returns for the past 20 years.
That equates to a rare 0.1 percent.
2
U.S. Global Investors Funds (unaudited)
Here's another way of looking at it:

As you can see, a hypothetical $100,000 invested in an S&P 500 index fund in December 1999 would have taken almost 14 years to catch up to and surpass a similar investment in NEARX.
Although we can't guarantee how the fund will perform in the future, NEARX has historically shown an ability to dodge the dramatic swings and volatility in the equities market, similar to the ones we experienced during the first decade of the century – the dotcom bubble, for instance, and the Great Recession. And there will be times, of course, when products such as an S&P 500 index fund will strongly outperform NEARX.
But unlike the equities market, NEARX has a time-tested history of no drama. As one has swung wildly this way and that, the other has calmly, confidently ticked up each year.
3
U.S. Global Investors Funds (unaudited)
What's more, NEARX continued to maintain its coveted 5-star overall rating from Morningstar, among 173 Municipal National Short-Term funds as of December 31, 2014, based on risk-adjusted return.
Municipal bonds, by the way, just had their best year in approximately two decades, posting their "longest string of monthly gains" and "outpacing gains in corporate bonds and U.S. government debt," according to the Wall Street Journal.
Call us at 1-800-386-3847 to request a copy of "Can You Handle the Stress of Losing 40 Percent in the Market?" and "A Little Pillow Talk Turned Her Husband on to Bonds" to better understand the benefits of planning your retirement dollars by investing in NEARX.
Actively Managing Emerging Markets
Since we've experienced an equity bull run for six years now, it's easy to presume that an index fund will be able to catch all the upside. But what about the downside? A correction is likely to occur at some point. As opposed to an index fund, active management can help to curtail volatility, such as what we've seen lately in certain sectors such as commodities and emerging markets, and mitigate risk.
A perfect example of this was our exit from Russia in 2014. The benchmark of our Emerging Europe Fund (EUROX), the MSCI Emerging Markets Europe 10/40 Index, maintains a 51-percent weighting in Russia. But because of prudent active management, we were able to limit our exposure to Russia and avoid many of the downturns incurred by international sanctions, falling oil prices and a weakening ruble.
Lately, however, we've seen Russian stocks outperform and have begun again to build indirect exposure to the country through American depository receipts (ADRs), global depository receipts (GDRs) and exchange-traded funds (ETFs).
The European slowdown has received much attention, in my own blog and elsewhere, but there are still plenty of investment opportunities. A recent InvestmentNews piece finds that "European 'quality growth' companies, which include euro-area and non-euro-area firms, are trading at a significant discount to their small-cap peers in other regions." Additionally, the writers' analysis "suggests that European companies have the most potential to improve returns... as a more sustainable European recovery takes hold."
4
U.S. Global Investors Funds (unaudited)
Indeed, several European businesses are making admirable strides. Names that EUROX owns that paid a dividend in 2014 include Italy's UniCredit and Brembo and Switzerland's Straumann Holding. Poland has also been good to the fund. For 2014, Energa S.A. had a 12-month dividend yield of 4.6 percent; PKO Bank Polski, 2.3 percent; and insurer PZU Group, 7.1 percent.
Take a look at the following chart. What it shows is that Polish equities, indicated by the WIG20 Index, are not only cheaper than U.S. equities, but they also pay out twice the dividend yield. Simply put, you're getting more for less.
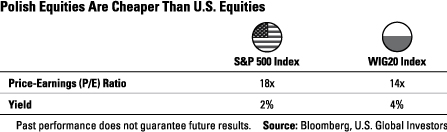
Chinese stocks in the MSCI China Index are also currently valued below their own historical averages, making them both attractive and competitive. They are trading at 10 times earnings, whereas U.S. stocks in the S&P 500 Index are trading at 18 times.

5
U.S. Global Investors Funds (unaudited)
Chinese A-Shares – stocks that are typically available only to mainland Chinese citizens – surprised the market by breaking out last summer and delivering 54 percent for the 12-month period ending December 31, 2014.
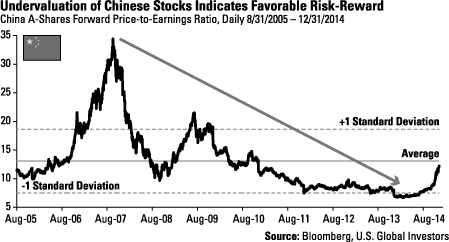
What's more, the upside is unlikely to have been exhausted. Although they aren't as stellar of a bargain as they once were, A-Shares are not yet overvalued, and retail and institutional investors might accumulate on pullbacks.
"The better the Chinese markets perform, the more global liquidity they might attract," Xian Liang, portfolio manager of our China Region Fund (USCOX), says.
H-Shares, or Chinese stock that's listed on foreign stock exchanges, comprise the vast majority of USCOX's exposure to Chinese equities, with additional minimal exposure gained through A-Share exchange-traded funds (ETFs). In today's environment, we believe investable H-Shares, driven by the A-Share market, to be less risky; last year they returned 15.5 percent.
6
U.S. Global Investors Funds (unaudited)
Epic Commodities Price Reversal
If you want to know what happened in 2014 with regard to gold and oil, it's important to appreciate the inverse relationship between the U.S. dollar and commodities that we typically see. The following charts are a good place to start:
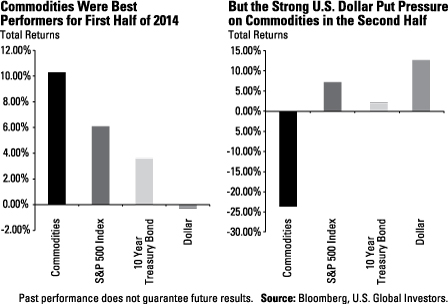
Whereas total returns for the S&P 500 Index and 10-Year Treasury bond stayed relatively stable throughout the year, commodities and the U.S. dollar both made an incredible about-face starting around late June, early July. As I've discussed on multiple occasions, the strong dollar has weighed heavily on the commodities we track very closely and report on here at U.S. Global Investors, especially gold and crude oil. We're happy to see, however, that the yellow metal has risen approximately 2.5 percent since the beginning of the new year, while West Texas Intermediate (WTI) crude has appeared to have found support at $45 per barrel.
But this is why it's so important to manage expectations. As I wrote in my most recent whitepaper:
A keen awareness of the ebbs and flows of historical and socioeconomic conditions, on both the macro and micro scales, allows our investment management strategy to be more proactive than reactive.
7
U.S. Global Investors Funds (unaudited)
Everything operates in cycles, including the weather, gold seasonal trends, four-year election terms and more. The domestic and global markets are no different. Commodities might be down this year, but as recently as 2009 and 2010, they were the best-performing asset class.
It might be hard to believe now, but oil was the second-best-performing commodity in 2013, returning 7.19 percent, while gold had its worst year since 1981.
How things have reversed. Even though it fell 1.72 percent, gold was actually the second-best-performing currency of 2014, behind the U.S. dollar:
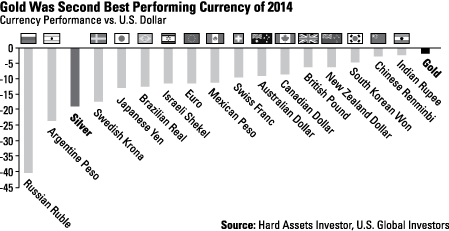
Gold might have fallen close to 2 percent in 2014, but gold stocks fell even further. Despite this, our Gold and Precious Metals Fund (USERX) slightly outperformed its benchmark, the FTSE Gold Miners Index. Whereas the FTSE Gold Miners Index lost 14.18 percent for the year, USERX lost 14.00 percent.
Such is the nature of investing. Every asset class, as I often say, has its own DNA of volatility.
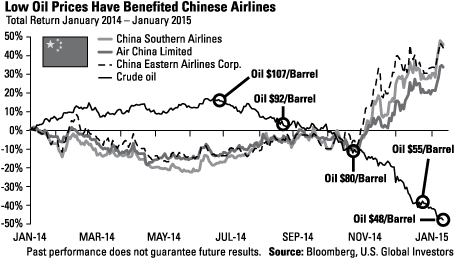
It should come as no surprise that oil dominated the news in the second half of 2014. Since its peak in June, when WTI crude was priced at around $105 per barrel, oil has tumbled more than half to settle below $50 per barrel as of January 2015. We haven't seen a decline such as this since the financial collapse of 2008-2009.
So how did prices get here? How did they fall so steeply, so unexpectedly?
8
U.S. Global Investors Funds (unaudited)
It's been a perfect storm, to be sure. For one, the U.S. shale boom has brought about what some call an oil glut in the market. The Saudis have also resisted oil production curbs with the intention of undercutting the world's competition, namely the U.S., Russia and fellow members of the Organization of the Petroleum Exporting Countries (OPEC).
The chart below shows the inverse relationship between crude and the dollar, going back to 1984. The current standard deviation spread between the two is clearly widening to 1985 and 2008-2009 levels. But in both episodes, as strong as the dollar or as depressed as oil got, both eventually reverted back to their means.

The drop in oil prices, strong U.S. dollar and weak global growth all contributed to the underperformance of our Global Resources Fund (PSPFX), which fell 28.74 percent in 2014. For PSPFX, we continue to use a 5-factor model that focuses on fundamentals.
Granted, battered oil prices have led to cheap gasoline, giving consumers all over the globe a welcome multibillion-dollar "tax break." In the U.S. alone, according to BCA Research:
The decline in gasoline prices should boost household disposable incomes by around $150 billion [in 2015]... The money spent, in turn,
9
U.S. Global Investors Funds (unaudited)
will generate additional demand for goods and services. This will lead to faster employment growth, translating into more income and spending.
Despite some turbulence, such as an October selloff and the Ebola scares, airline stocks have continued to ascend because of low fuel prices:

This isn't just an American phenomenon; Chinese airlines have also benefited:
10
U.S. Global Investors Funds (unaudited)
But not all sectors and industries have fared as well as the airlines have. Many oil companies involved in hydraulic fracturing, which is a pricier process than more conventional production methods, are feeling the pinch. Several have already been forced to abandon exploration and temporarily close rigs in pricier shale regions such as the Bakken formation in North Dakota. Schlumberger, the world's largest oilfield services company, announced in mid-January 2015 that it would cut 9,000 of its workers.
As calamitous as this might sound, there are still investment opportunities aplenty. Speaking to Fox Business in January 2015, the portfolio manager of our Global Resources Fund (PSPFX), Brian Hicks, explained where we continue to see opportunity and value in this low-price environment:
Certainly the [oil] selloff is getting long in the tooth and we're actually becoming more and more constructive as [it] continues... These prices are not sustainable [and] not high enough to replace production going down a few years from now. We think the stocks look very attractive here, and if you look at their performance to crude oil, they've actually been outperforming since mid-December.

Diversifying Your Portfolio
At U.S. Global Investors, we've always advocated a balance between equities and bonds, and rebalancing annually. This helps soften the kind of volatility
11
U.S. Global Investors Funds (unaudited)
we've seen recently and capture gains while buying assets on sale. The basic rule of thumb is that your level of investment in short-term municipal bonds should be proportionate to your age. So at 50 years of age, as a rule of thumb it's prudent to be 50 percent invested in bonds, 50 percent in equities; at 60 years, the weighting is 60 percent in short-term munis, 40 percent in stocks; and so on.
The following chart, last seen in a December Frank Talk, shows the benefits of diversifying a portfolio, especially now that we're experiencing a major price correction in commodities:
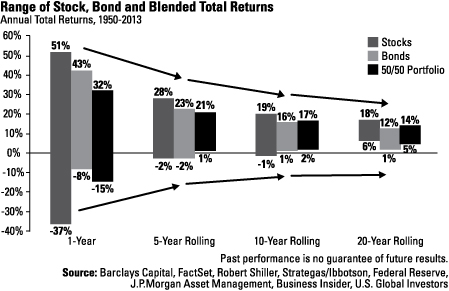
Using data collected between 1950 and 2013, we can see that the returns of a portfolio composed strictly of stocks have greatly outperformed those of bonds and a blended portfolio in the short term, or one-year period. The risks, on the other hand, have also far exceeded the other two scenarios, by a spread of at least 22 percentage points: stocks' -37 percent versus a blended portfolio's -15 percent.
But when blended portfolios were held for five, 10 and 20 years, they began to do two curious things: 1) they gradually outperformed bonds, and 2) they demonstrated less risk than stocks. In other words, they helped smooth out the ride and decreased the likelihood of hitting turbulence along the way.
12
U.S. Global Investors Funds (unaudited)
That's why savvy investors know to be patient with their holdings and not easily give in to the prevailing culture of instant gratification. I've run multiple marathons over the years and am very familiar with the personal rewards of going the distance. A similar investing strategy can come with similar rewards.
To get the latest insight and commentary on gold and other commodities, emerging markets, municipal bonds and much more, subscribe to our Investor Alert and to my personal blog, Frank Talk. Both can be reached by visiting usfunds.com.
Happy investing!

Frank Holmes
CEO and Chief Investment Officer
U.S. Global Investors, Inc.
Please consider carefully a fund's investment objectives, risks, charges and expenses. For this and other important information, obtain a fund prospectus by visiting www.usfunds.com or by calling 1-800-US-FUNDS (1-800-873-8637). Read it carefully before investing. Distributed by U.S. Global Brokerage, Inc.
MorningstarTM | | | |
***** (5 Stars) | | Overall/173 | |
***** (5 Stars) | | 3-Year/173 | |
***** (5 Stars) | | 5-Year/142 | |
**** (4 Stars) | | 10-Year/103 | |
Morningstar ratings based on risk-adjusted return and number of funds
Category: Municipal National Short-term funds
Through: 12/31/2014
13
U.S. Global Investors Funds (unaudited)
Morningstar Ratings are based on risk-adjusted return.The Morningstar Rating for a fund is derived from a weighted-average of the performance figures associated with its three-, five- and ten-year (if applicable) Morningstar Rating metrics. Past performance does not guarantee future results. For each fund with at least a three-year history, Morningstar calculates a Morningstar RatingTM based on a Morningstar Risk-Adjusted Return measure that accounts for variation in a fund's monthly performance (including the effects of sales charges, loads, and redemption fees), placing more emphasis on downward variations and rewarding consistent performance. The top 10% of funds in each category receive 5 stars, the next 22.5% receive 4 stars, the next 35% receive 3 stars, the next 22.5% receive 2 stars and the bottom 10% receive 1 star. (Each share class is counted as a fraction of one fund within this scale and rated separately, which may cause slight variations in the distribution percentages.)
Stock markets can be volatile and share prices can fluctuate in response to sector-related and other risks as described in the fund prospectus.
Bond funds are subject to interest-rate risk; their value declines as interest rates rise. Though the Near-Term Tax Free Fund seeks minimal fluctuations in share price, it is subject to the risk that the credit quality of a portfolio holding could decline, as well as risk related to changes in the economic conditions of a state, region or issuer. These risks could cause the fund's share price to decline. Tax-exempt income is federal income tax free. A portion of this income may be subject to state and local taxes and at times the alternative minimum tax. The Near-Term Tax Free Fund may invest up to 20% of its assets in securities that pay taxable interest. Income or fund distributions attributable to capital gains are usually subject to both state and federal income taxes.
Foreign and emerging market investing involves special risks such as currency fluctuation and less public disclosure, as well as economic and political risk. Because the Global Resources Fund concentrates its investments in specific industries, the fund may be subject to greater risks and fluctuations than a portfolio representing a broader range of industries.
Gold, precious metals, and precious minerals funds may be susceptible to adverse economic, political or regulatory developments due to concentrating in a single theme. The prices of gold, precious metals, and precious minerals are subject to substantial price fluctuations over short periods of time and may be affected by unpredicted international monetary and political policies. We suggest investing no more than 5% to 10% of your portfolio in these sectors.
Because the Global Resources Fund concentrates its investments in specific industries, the fund may be subject to greater risks and fluctuations than a portfolio representing a broader range of industries.
The S&P 500 Stock Index is a widely recognized capitalization-weighted index of 500 common stock prices in U.S. companies.
The S&P 1500 Composite is a broad-based capitalization-weighted index of 1500 U.S. companies and is comprised of the S&P 400, S&P 500, and the S&P 600. The index was developed with a base value of 100 as of December 30, 1994.
The MSCI China Free Index is a capitalization weighted index that monitors the performance of stocks from the country of China.
The WIG20 Index is a modified capitalization-weighted index of 20 Polish stocks which as listed on the main market. The index is the underlying instrument for futures transactions listed on the Warsaw Stock Exchange.
14
U.S. Global Investors Funds (unaudited)
The MSCI Emerging Markets Europe 10/40 Index (Net Total Return) is a free float-adjusted market capitalization index that is designed to measure equity performance in the emerging market countries of Europe (Czech Republic, Greece, Hungary, Poland, Russia, and Turkey). The index is calculated on a net return basis (i.e., reflects the minimum possible dividend reinvestment after deduction of the maximum rate withholding tax). The index is periodically rebalanced relative to the constituents' weights in the parent index.
The NYSE Arca Airline Index is an equal dollar weighted index designed to measure the performance of highly capitalized companies in the airline industry. The XAL Index tracks the price performance of major U.S. and overseas airlines.
The FTSE Gold Mines Index Series encompasses all gold mining companies that have a sustainable and attributable gold production of at least 300,000 ounces a year, and that derive 75% or more of their revenue from mined gold.
Although Lipper makes reasonable efforts to ensure the accuracy and reliability of the data contained herein, the accuracy is not guaranteed by Lipper. Users acknowledge that they have not relied upon any warranty, condition, guarantee, or representation made by Lipper. Any use of the data for analyzing, managing, or trading financial instruments is at the user's own risk. This is not an offer to buy or sell securities.
Standard deviation is a measure of the dispersion of a set of data from its mean. The more spread apart the data, the higher the deviation. Standard deviation is also known as historical volatility.
There is no guarantee that the issuers of any securities will declare dividends in the future or that, if declared, will remain at current levels or increase over time.
Diversification does not protect an investor from market risks and does not assure a profit.
All opinions expressed and data provided are subject to change without notice. Some of these opinions may not be appropriate to every investor.
15
Definitions for Management Teams' Perspectives (unaudited)
Benchmark Index Definitions
Returns for indices reflect no deduction for fees, expenses or taxes, unless noted.
The Barclays U.S. Treasury Bills 6-9 Months Total Return Index tracks the performance of U.S. Treasury Bills with a maturity of six to nine months.
The Barclays 3-Year Municipal Bond Index is a total return benchmark designed for municipal assets. The index includes bonds with a minimum credit rating of BAA3, are issued as part of a deal of at least $50 million, have an amount outstanding of at least $5 million and have a maturity of two to four years.
The FTSE Gold Mines Index encompasses all gold mining companies that have a sustainable and attributable gold production of at least 300,000 ounces a year and that derive 75% or more of their revenue from mined gold.
The Hang Seng Composite Index is a market-capitalization weighted index that covers about 95% of the total market capitalization of companies listed on the Main Board of the Hong Kong Stock Exchange.
The MSCI Emerging Markets Europe 10/40 Index (Net Total Return) is a free float-adjusted market capitalization index that is designed to measure equity performance in the emerging market countries of Europe (Czech Republic, Greece, Hungary, Poland, Russia and Turkey). The index is calculated on a net return basis (i.e., reflects the minimum possible dividend reinvestment after deduction of the maximum rate withholding tax). The index is periodically rebalanced relative to the constituents' weights in the parent index.
The S&P Global Natural Resources Index (Net Total Return) includes 90 of the largest publicly-traded companies in natural resources and commodities businesses that meet specific investability requirements, offering investors diversified, liquid and investable equity exposure across 3 primary commodity-related sectors: Agribusiness, Energy, and Metals & Mining. The index is calculated on a net return basis (i.e., reflects the minimum possible dividend reinvestment after deduction of the maximum rate withholding tax).
The S&P Global Natural Resources/Morgan Stanley Commodity Related Equity Blended Index – The Morgan Stanley Commodity Related Equity Index (CRX) is an equal-dollar weighted index of 20 stocks involved in commodity-related industries such as energy, non-ferrous metals, agriculture and forest products. This index was discontinued on July 4, 2014. The Global Resources Fund's benchmark then changed to the S&P Global Natural Resources Index (Net Total Return) (see definition above). For purposes of the fund's performance fee adjustment, until the new benchmark has been in place one full year, the fund's performance is compared to a blend of the CRX and the S&P Global Natural Resources Index (Net Total Return), using the performance of the CRX through June 30, 2014, and the performance of the S&P Global Natural Resources Index (Net Total Return) after June 30, 2014.
The NYSE Arca Gold Miners Index is a modified market capitalization-weighted index comprised of publicly-traded companies involved primarily in the mining for gold and silver.
16
Definitions for Management Teams' Perspectives (unaudited)
The S&P 500 Index is a widely recognized capitalization-weighted index of 500 common stock prices in U.S. companies.
The S&P Composite 1500 Index is a broad-based capitalization-weighted index of 1500 U.S. companies and is comprised of the S&P 400, the S&P 500 and the S&P 600.
Other Index Definitions
The Barclays Municipal Bond Index is an unmanaged index representative of the tax-exempt bond market.
The Bloomberg Commodity Index is calculated on an excess return basis and reflects commodity futures price movements. The index rebalances annually weighted 2/3 by trading volume and 1/3 by world production and weight-caps are applied at the commodity, sector and group level for diversification.
The Consumer Price Index (CPI) is one of the most widely recognized price measures for tracking the price of a market basket of goods and services purchased by individuals. The weights of components are based on consumer spending patterns.
The ISM Manufacturing Composite Index is a diffusion index calculated from five of the eight sub-components of a monthly survey of purchasing managers at roughly 300 manufacturing firms from 21 industries in all 50 states.
The MSCI All Country Far East Free ex Japan Index is a free float-adjusted market capitalization-weighted index that is designed to measure the equity market performance of the Far East, excluding Japan. The index consists of the following developed and emerging market country indices: China, Hong Kong, Indonesia, Korea, Malaysia, Philippines, Singapore, Taiwan and Thailand.
The Purchasing Manager's Index (PMI) is an indicator of the economic health of the manufacturing sector. The PMI index is based on five major indicators: new orders, inventory levels, production, supplier deliveries and the employment environment.
The S&P High Yield Dividend Aristocrats Index is designed to measure the performance of the 50 highest dividend yielding S&P Composite 1500 constituents which have followed a managed dividends policy of consistently increasing dividends every year for at least 25 years.
The S&P/TSX Venture Composite Index is a broad market indicator for the Canadian venture capital market. The index is market capitalization weighted and, at its inception, included 531 companies. A quarterly revision process is used to remove companies that comprise less than 0.05% of the weight of the index, and add companies whose weight, when included, will be greater than 0.05% of the index.
The Stoxx Europe 600 Index represents large, mid and small capitalization companies across 18 countries of the European region.
The U.S. Trade Weighted Dollar Index provides a general indication of the international value of the U.S. dollar.
17
U.S. Government Securities Ultra-Short Bond Fund (unaudited)
Management Team's Perspective
Introduction
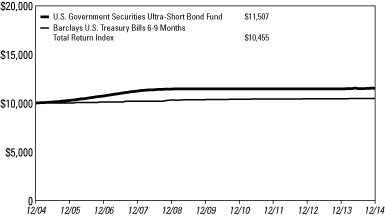
The U.S. Government Securities Ultra-Short Bond Fund (UGSDX) is designed to be used as an investment that takes advantage of the security of U.S. Government bonds and obligations, while simultaneously pursuing a higher level of current income than money market funds offer. The fund's dollar-weighted average effective maturity is two years or less.
Performance Graph
U.S. Government Securities Ultra-Short Bond Fund
Average Annual Performance For the Years Ended
December 31, 2014
| | | One Year | | Five Year | | Ten Year | |
U.S. Government Securities Ultra-Short Bond Fund | | | 0.36 | % | | | 0.08 | % | | | 1.41 | % | |
Barclays U.S. Treasury Bills 6-9 Months
Total Return Index | | | 0.07 | % | | | 0.20 | % | | | 0.45 | % | |
Performance data quoted above is historical. Past performance is no guarantee of future results. Current performance may be higher or lower than the performance data quoted. The principal value and investment return of an investment will fluctuate so that an investor's shares, when redeemed, may be worth more or less than their original cost. The graph and table do not reflect the deduction of taxes that a shareholder would pay on fund distributions or the redemption of fund shares. For all or a portion of the periods, the fund had expense limitations and reimbursements, without which returns would have been lower.
The above returns for the U.S. Government Securities Ultra-Short Bond Fund include the fund's results as a money market fund through the date of its conversion (December 20, 2013) to an ultra-short bond fund, and therefore are not representative of the fund's results had it operated as an ultra-short bond fund for the full term of the periods shown.
Pursuant to a voluntary arrangement, the Adviser has agreed to limit total fund operating expenses (exclusive of any acquired fund fees and expenses, performance fees, taxes, brokerage commissions and interest) to not exceed 0.45%. The Adviser can modify or terminate this arrangement at any time. In addition, returns may include the effects of additional voluntary waivers of fees and reimbursements of expenses by the Adviser, including waivers and reimbursements to maintain a minimum net yield for the fund.
See Definitions for Management Teams' Perspectives for index definitions.
Please visit our website at www.usfunds.com for updated performance information for different time periods.
18
U.S. Government Securities Ultra-Short Bond Fund (unaudited)
The Year In Review - Economic And Political Issues That Affected The Fund
The U.S. economy experienced a relatively robust 2014 with the exception of a weak first quarter, which was disrupted by frigid weather and a late Easter. First quarter GDP contracted 2.1 percent, while the second and third quarters expanded 4.6 and 5.0 percent, respectively. Fourth quarter GDP was a moderate 2.6 percent but continues the positive economic momentum.
The ISM Manufacturing Composite Index reached its highest level since 2011 in the second half of the year before pulling back at year-end. The manufacturing sector has been a source of strength for the economy, with auto- and energy-related areas of the economy making solid contributions. Global manufacturing indicators peaked in the first quarter and have been broadly trending lower since then. The U.S. decoupled from the world in this regard and has been a bright spot for global economic growth.
Employment steadily improved all year with very consistent nonfarm payroll growth of between 200,000 and 300,000 jobs per month. Housing activity hasn't been as much of a tailwind for the economy as it has been in the past. Generally higher housing prices, along with a strong stock market, have created a "wealth effect." This, combined with sharply lower gasoline prices in the fourth quarter, led to improved consumer attitudes toward their financial safety. Increasing consumer confidence drove very strong auto sales in 2014, which has positively affected the manufacturing sector.
In May 2013, then Federal Reserve Chairman Ben Bernanke indicated an inclination to begin reducing the quantitative easing (QE) stimulus program that has been widely described as "tapering." The Fed tapered by $10 billion in December 2013, and that process has continued at every Federal Open Market Committee (FOMC) meeting until the program completely wound down at the meeting on October 29, 2014. The Fed has also shifted its stance in recent months and appears to be preparing the market for an interest rate increase sometime in mid-2015.
Inflation in the U.S. has oscillated between 1 and 2 percent for more than two years. We are currently at the low end of that range. However, the Fed is posturing for an interest rate increase. Global inflation has generally remained low and is trending lower, which has allowed other global central bankers to comfortably maintain pro-growth policies. Key global economies participating in this trend include Japan, China and Europe. Europe in particular has taken new stimulative steps in recent months, taking the equivalent Fed funds rate into negative territory. It's expected to do more in 2015.
Japan remains committed to an aggressive reflation policy, and China appears comfortable maintaining a stable growth policy. The current Chinese administration has
19
U.S. Government Securities Ultra-Short Bond Fund (unaudited)
focused on addressing domestic imbalances and, thus, has not been the global growth catalyst it was after the financial crisis. Europe, after improving in 2013 and early 2014, has fallen back to virtually no growth.
Yields on the three-month Treasury bill were just 4 basis points at the end of 2014, while yields on the two-year Treasury ended the year at 0.67 percent, well above levels of 0.38 percent just a year ago.
Investment Highlights
The U.S. Government Securities Ultra-Short Bond Fund returned 0.36 percent for the year ended December 31, 2014, outperforming its benchmark, the Barclays U.S. Treasury Bills 6-9 Months Total Return Index, which returned 0.07 percent.
The fund extended its maturity profile at the end of 2013 and very early in 2014 as interest rates on short-term agency securities were relatively attractive, which proved to be very good timing as the market rallied, sending yields lower for most of the year. We recently saw short-term agency yields move back near the high-yield levels experienced a year ago and used this volatility as an opportunity to extend duration.
Current Outlook
The Fed continues to remain accommodative but has clearly shifted its thinking toward interest rate normalization. We believe the U.S. will maintain a more amenable monetary policy than is generally expected in the market as global weakness and deflation fears will force it to stay on the sidelines.
20
U.S. Government Securities Ultra-Short Bond Fund (unaudited)
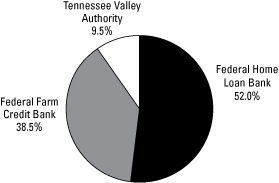
Portfolio Allocation by Issuer
Based on Total Investments December 31, 2014
Portfolio Allocation by Maturity December 31, 2014
| 1 - 3 Months | | $ | 24,283,702 | | | | 41.6 | % | |
| 3 - 12 Months | | | 2,998,279 | | | | 5.1 | % | |
| 1 - 3 Years | | | 5,751,853 | | | | 9.9 | % | |
| 3 - 5 Years | | | 25,351,032 | | | | 43.4 | % | |
| | | $ | 58,384,866 | | | | 100.0 | % | |
21
Near-Term Tax Free Fund (unaudited)
Management Team's Perspective
Introduction
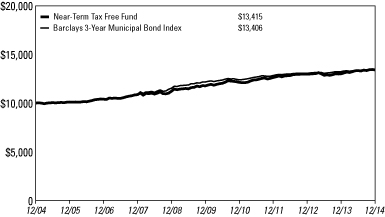
The Near-Term Tax Free Fund (NEARX) seeks to provide a high level of current income exempt from federal income taxation and to preserve capital. However, a portion of any distribution may be subject to federal and/or state income taxes. The Near-Term Tax Free Fund will maintain a weighted average maturity of less than five years.
Performance Graph
Near-Term Tax Free Fund
Average Annual Performance For the Years Ended
December 31, 2014
| | | One Year | | Five Year | | Ten Year | |
Near-Term Tax Free Fund | | | 3.07 | % | | | 2.64 | % | | | 2.98 | % | |
Barclays 3-Year Municipal Bond Index | | | 1.22 | % | | | 1.93 | % | | | 2.97 | % | |
Performance data quoted above is historical. Past performance is no guarantee of future results. Current performance may be higher or lower than the performance data quoted. The principal value and investment return of an investment will fluctuate so that an investor's shares, when redeemed, may be worth more or less than their original cost. The graph and table do not reflect the deduction of taxes that a shareholder would pay on fund distributions or the redemption of fund shares. For all or a portion of the periods, the fund had expense limitations, without which returns would have been lower.
The Adviser has contractually agreed to limit total fund operating expenses (exclusive of any acquired fund fees and expenses, performance fees, taxes, brokerage commissions and interest) to not exceed 0.45% on an annualized basis through December 31, 2015.
See Definitions for Management Teams' Perspectives for index definitions.
Please visit our website at www.usfunds.com for updated performance information for different time periods.
22
Near-Term Tax Free Fund (unaudited)
The Year In Review - Economic And Political Issues That Affected The Fund
Defying the skeptics who anticipated higher yields and interest rates in 2014 with corresponding lower bond values, the Barclays Municipal Bond Index, a measure of the general municipal bond market, rallied 9.05 percent. This comes on the back of a difficult 2013 in which the municipal market experienced its worst performance since 2008. The yield curve experienced significant flattening with yields on the short end rising 20 to 40 basis points, while the long end of the curve saw yields fall more than 100 basis points.
With the yield curve dynamics mentioned above, there was a very linear relationship between maturity and total return in 2014; the further out the yield curve you moved, the higher the returns. The very long end of the yield curve – bonds with maturities of 22 years or more – rose more than 15 percent. However, the Near-Term Tax Free Fund tends to invest in the short and intermediate part of the municipal market. This segment of the market rose 1.22 percent during 2014, as measured by the Barclays 3-Year Municipal Bond Index.
Back in May 2013, then Federal Reserve Chairman Ben Bernanke introduced the idea of tapering the Fed's quantitative easing stimulus program. At that time, the Fed was spending $85 billion per month buying Treasuries and mortgage-backed securities in an attempt to stimulate the economy. This announcement roiled the market, sending yields higher through late December 2013. The key inflection point for the market came right around the end of 2013 when fears regarding tapering subsided as the Fed introduced tapering at the December 2013 Federal Open Market Committee (FOMC) meeting. In a classic sense, the market had absorbed all the fears of tapering and what that could potentially mean. By the time tapering actually occurred, the market had already priced it in and was able to rally almost uninterrupted in 2014.
The economy was a steady performer this year, with consistent employment gains and a strong manufacturing sector. Consumer confidence strengthened for most of the year. The icing on the cake came with the dramatic fall in gasoline prices during the fourth quarter, boosting consumers' spending power in the heart of the holiday retail season. After icy weather disrupted the first quarter, GDP came on strong in the second and third quarters, and had moderate growth in the fourth quarter.
Revenue-backed municipals outperformed general obligation credits, with specific strength in hospital and industrial development issues. Credit factors also played a significant role as performance differences between low-quality and high-quality bonds were large. AAA-rated municipals rose 6.34 percent, while BBB-rated municipals surged 14.47 percent. There were specific credit events that exacerbated the volatility of BBB returns, such as Puerto Rico-backed debt, but the overall trend still held. High-yield, or "junk bonds," also outperformed, rising 13.84 percent in 2014.
23
Near-Term Tax Free Fund (unaudited)
In specialty state trading, Puerto Rico was a standout performer, as were California and Illinois, while New York and New Jersey credits underperformed in 2014.
Investment Highlights
For the year ended December 31, 2014, the Near-Term Tax Free Fund returned 3.07 percent, outperforming its benchmark, the Barclays 3-Year Municipal Bond Index, which gained 1.22 percent.
The Near-Term Tax Free Fund also outperformed the Lipper Short-Intermediate Municipal Bond Funds peer group in 2014. The Near-Term Tax Free Fund remained true to form, with a low turnover approach and investing in traditional high-quality municipals. The fund has been able to outperform due to a slightly longer maturity structure and advantageous yield curve positioning.
Strengths
• Buying opportunistically and letting that yield advantage work in the fund's favor over time, as well as the fund's low turnover approach, have proven to be advantageous.
• The fund's longer maturity structure was favorable, as the market rewarded investors for stepping out on the yield curve.
• The fund benefited from significant exposure to Illinois, which outperformed.
Weaknesses
• The fund had less exposure to the lower-quality investment grade credits that outperformed by wide margins.
• The fund also had very little exposure to the industrial development and non-investment grade credits that outperformed.
• Bonds that are subject to the alternative minimum tax (AMT) also outperformed; however, the fund has no exposure to these bonds.
Current Outlook
Opportunities
• 2015 could end up looking a lot like 2014. The Federal Reserve continues to transition to a more normalized monetary policy approach, even as the rest of the developed world is battling a deflation threat. The short-end of the yield curve could continue rising while the long-end rallies on the expectation that Fed tightening will slow economic growth. The fund's recent barbell positioning further out on the yield curve, coupled with very short-term investments, might turn out to be a winning approach.
24
Near-Term Tax Free Fund (unaudited)
Threats
• Continued outperformance of low-quality bonds is the most significant threat on a relative basis.
• When the Fed reverses its monetary policy stance and begins to raise interest rates, the macro interest rate environment could become more difficult from a total return standpoint.
25
Near-Term Tax Free Fund (unaudited)
Top 10 Area Concentrations
(Based on Net Assets) December 31, 2014
Texas | | | 18.26 | % | |
Illinois | | | 8.04 | % | |
Florida | | | 7.67 | % | |
New Jersey | | | 4.81 | % | |
New York | | | 4.08 | % | |
California | | | 3.44 | % | |
Michigan | | | 3.13 | % | |
Indiana | | | 2.80 | % | |
Pennsylvania | | | 2.72 | % | |
Oklahoma | | | 2.47 | % | |
Total Top 10 Areas | | | 57.42 | % | |
Municipal Bond Ratings*
Based on Total Municipal Bonds December 31, 2014

* Credit quality ratings are measured on a scale that generally ranges from AAA (highest) to D (lowest). "Not Rated" is used to classify securities for which a rating is not available. Credit-quality ratings for each issue are obtained from Moody's and S&P, and the higher rating for each issue is used.
26
All American Equity Fund (unaudited)
Management Team's Perspective
Introduction
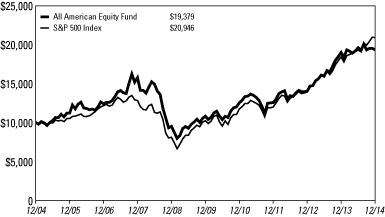
The principal objective of the All American Equity Fund (GBTFX) is to seek capital appreciation by investing primarily in a broadly diversified portfolio of domestic common stocks. The fund invests in large-capitalization stocks while retaining the flexibility to seek out promising individual stock opportunities, including stocks with meaningful dividend yields.
Performance Graph
All American Equity Fund
Average Annual Performance For the Years Ended
December 31, 2014
| | | One Year | | Five Year | | Ten Year | |
All American Equity Fund | | | 1.94 | % | | | 12.39 | % | | | 6.84 | % | |
S&P 500 Index | | | 13.69 | % | | | 15.45 | % | | | 7.67 | % | |
Performance data quoted above is historical. Past performance is no guarantee of future results. Current performance may be higher or lower than the performance data quoted. The principal value and investment return of an investment will fluctuate so that an investor's shares, when redeemed, may be worth more or less than their original cost. The graph and table do not reflect the deduction of taxes that a shareholder would pay on fund distributions or the redemption of fund shares. For all or a portion of the periods, the fund had expense limitations, without which returns would have been lower.
Pursuant to a voluntary arrangement, the Adviser has agreed to limit total fund operating expenses (exclusive of any acquired fund fees and expenses, performance fees, taxes, brokerage commissions and interest) to not exceed 2.20%. The Adviser can modify or terminate this arrangement at any time.
See Definitions for Management Teams' Perspectives for index definitions.
Please visit our website at www.usfunds.com for updated performance information for different time periods.
27
All American Equity Fund (unaudited)
The Year In Review - Economic And Political Issues That Affected The Fund
Economic growth during 2014 in the U.S. has been generally better than expected. After a slow start because of icy weather, GDP growth bounced back and accelerated in the second and third quarters of the year, rising 4.6 and 5.0 percent, respectively. Fourth quarter GDP came in moderately below estimates at 2.6 percent but continues the positive economic momentum.
U.S. stocks were solid performers in 2014, with the S&P 500 Index rising 13.69 percent. Dividend-paying stocks generally outperformed the broad market, as measured by the S&P 500 Index, with the S&P High Yield Dividend Aristocrats Index gaining 14.26 percent.
Indicators for global manufacturing, which tends to have a huge influence on the domestic market, ended the year on a weakening trend. This is symptomatic of sluggish growth from the key global economic players outside the U.S. Europe is on the verge of returning to recession and the European Central Bank (ECB) is expected to implement its own quantitative easing (QE) program in the first quarter of 2015 to address this weakness. China is also shifting to a policy of reform and deemphasizing growth at all cost.
In the U.S., the automotive sector in particular has performed very well, with annualized sales in December of 16.8 million vehicles; this is its best performance since 2006. The U.S. housing market has been steady but not quite the positive catalyst many were looking for coming into the year. Combined with a rising equity market, home price appreciation has been solid, boosting the wealth effect for consumers.
The Fed completed its QE program at the October 29 Federal Open Market Committee (FOMC) meeting in an attempt to begin normalizing monetary policy. The Fed is also preparing the market for an interest rate increase by mid-2015. With deflation concerns in Europe and falling inflation expectations in the U.S., combined with a weak global growth outlook, the Fed might not be able to follow through with these projections.
Investment Highlights
Overview
The All American Equity Fund returned 1.94 percent for the year ending December 31, 2014, underperforming the 13.69 percent return for the S&P 500 Index benchmark.
28
All American Equity Fund (unaudited)
Because the fund is actively managed and the holding period is generally not a consideration in investment decisions, the portfolio turnover rate may fluctuate from year to year as the fund adjusts its portfolio composition. The fund's annual portfolio turnover was, and is expected to continue to be, more than 100 percent.
Strengths
• The fund's stock selections in the consumer staples, industrials and materials sectors were better than the benchmark. The fund was modestly overweight in the utilities sector, which was by far the best performing sector in the S&P 500 Index, rising 29 percent.
• The fund's exposure to dividend-paying stocks over the past year was beneficial to relative performance as this portion of the fund outperformed the more growth-oriented portion of the portfolio.
• Facebook, Inc.,(1) Continental Resources, Inc.(1) and Apple, Inc.(2) were among the best contributors to fund performance.
Weaknesses
• The fund's overall stock selection was a drag on relative performance; this was particularly true in the technology and energy sectors.
• Cash and defensive option strategies did not aid fund performance as the market rallied strongly.
• Chicago Bridge & Iron Co. N.V.,(1) MasterCard, Inc.(1) and Halliburton Co.(1) were among the worst individual contributors to performance.
Current Outlook
Opportunities
• The global economic outlook should improve as the year progresses. Additional government policy support from many areas around the globe should be supportive of an improving global macro outlook. The U.S. has virtually been the single engine of growth in the developed world, and if Europe or China can improve, it would provide a lift to the U.S. equity market.
• Falling gasoline prices have created an opportunity for many consumer-oriented areas, ranging from restaurants and retailers to airline companies as consumers have more disposable income.
• Corporate cash levels continue to remain high, providing corporations the ability to pursue mergers and acquisitions (M&A). An increase in M&A activity holds promise for both portfolio gains and an increase in overall market valuations.
29
All American Equity Fund (unaudited)
Threats
• With the S&P 500 trading at nearly 18x earnings, which is at the high end of the historical range, earnings growth will be especially critical to keep the bull market moving forward. Expectations for 2015 are in the low single digits, with big cuts coming from the energy sector in recent months.
• The market has been on an unusually long, almost uninterrupted winning streak for the past two years. A short-term correction of 10 percent or more would not be a surprise at this point.
• Global government policy delays or outright missteps are a threat to global equity markets, including the U.S.
(1)The fund did not hold this security as of 12/31/14.
(2)This security comprised 3.52% of the fund's total net assets as of 12/31/14.
30
All American Equity Fund (unaudited)
Top 10 Equity Holdings Based on Net Assets December 31, 2014
Apple, Inc.
Computers | | | 3.52 | % | |
Northrop Grumman Corp.
Aerospace/Defense | | | 1.34 | % | |
Union Pacific Corp.
Transportation - Rail | | | 1.25 | % | |
Allstate Corp.
Multi-line Insurance | | | 1.25 | % | |
Waste Management, Inc.
Non-hazardous Waste Disposal | | | 1.24 | % | |
Emerson Electric Co.
Electric Products - Miscellaneous | | | 1.24 | % | |
Huntington Bancshares, Inc.
Super-Regional Banks - US | | | 1.24 | % | |
Prudential Financial, Inc.
Life/Health Insurance | | | 1.24 | % | |
Marathon Petroleum Corp.
Oil Refining & Marketing | | | 1.23 | % | |
MetLife, Inc.
Multi-line Insurance | | | 1.23 | % | |
Total Top 10 Equity Holdings | | | 14.78 | % | |
Portfolio Allocation by Industry Sector*
Based on Total Investments December 31, 2014

* Summary information above may differ from the portfolio schedule included in the financial statements due to the use of different classifications of securities for presentation purposes.
31
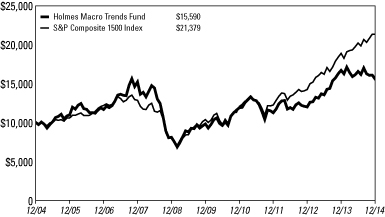
Holmes Macro Trends Fund (unaudited)
Management Team's Perspective
Introduction
The Holmes Macro Trends Fund (MEGAX) invests in companies with good growth prospects and strong positive earnings momentum. The fund's primary objective is to seek long-term capital appreciation.
Performance Graph
Holmes Macro Trends Fund
Average Annual Performance For the Years Ended
December 31, 2014
| | | One Year | | Five Year | | Ten Year | |
Holmes Macro Trends Fund | | | (6.74 | )% | | | 9.73 | % | | | 4.54 | % | |
S&P Composite 1500 Index | | | 13.08 | % | | | 15.62 | % | | | 7.89 | % | |
Performance data quoted above is historical. Past performance is no guarantee of future results. Current performance may be higher or lower than the performance data quoted. The principal value and investment return of an investment will fluctuate so that an investor's shares, when redeemed, may be worth more or less than their original cost. The graph and table do not reflect the deduction of taxes that a shareholder would pay on fund distributions or the redemption of fund shares. For all or a portion of the periods, the fund had expense limitations, without which returns would have been lower.
Pursuant to a voluntary arrangement, the Adviser has agreed to limit total fund operating expenses (exclusive of any acquired fund fees and expenses, performance fees, taxes, brokerage commissions and interest) to not exceed 2.20%. The Adviser can modify or terminate this arrangement at any time.
See Definitions for Management Teams' Perspectives for index definitions.
Please visit our website at www.usfunds.com for updated performance information for different time periods.
32
Holmes Macro Trends Fund (unaudited)
The Year In Review - Economic And Political Issues That Affected The Fund
After icy weather slowed growth at the beginning of the year, the economy bounced back nicely in 2014. GDP expanded 4.6 percent in the second quarter and 5.0 percent in the third quarter, the best back-to-back quarters since the global financial crisis. Fourth quarter GDP came in moderately below estimates at 2.6 percent but continues the positive economic momentum.
The S&P 500 Index rose 13.69 percent in 2014 and did so with an unusually low level of volatility, essentially grinding higher virtually all year. Defensive sectors of the market outperformed as bond yields were loosely inversely correlated. At the beginning of 2014, expectations were for interest rates to head higher and for the Federal Reserve to normalize monetary policy. The market responded by sending bond yields steadily lower all year, with interest rate-sensitive stocks outperforming relative to more growth-oriented names.
Global economic performance disappointed, with China and Europe being the main culprits. Global manufacturing indicators were moving lower as we headed into year end. This economic sluggishness has put Europe back on the verge of recession and the pressure is on the European Central Bank (ECB) to implement its own quantitative easing (QE) program in the first quarter of 2015 to address this weakness. China has also shifted to a policy of economic reform and has deemphasized outsized growth. China still needs to grow to maintain social stability but is managing for a reduced level of growth.
In the U.S., the automotive sector in particular has performed very well, with annualized sales in December of 16.8 million vehicles; this is its best performance since 2006. The U.S. housing market has been steady but not quite the positive catalyst many were seeking coming into the year. Combined with a rising equity market, home price appreciation has been solid, boosting the wealth effect for consumers.
The Fed completed its QE program at the October 29, 2014 Federal Open Market Committee (FOMC) meeting in an attempt to begin normalizing monetary policy. The Fed is also preparing the market for an interest rate increase by mid-2015. The Fed might not be able to follow through with these projections due to a weak global growth outlook, deflation concerns in Europe and falling inflation expectations in the U.S.
33
Holmes Macro Trends Fund (unaudited)
Investment Highlights
Overview
The Holmes Macro Trends Fund fell 6.74 percent over the past year, underperforming its benchmark, the S&P Composite 1500 Index, which returned 13.08 percent. Overall, smaller companies and growth-oriented stocks underperformed, while utilities and more defensive areas of the market outperformed. The fund is very growth-oriented and has more exposure to both smaller companies and growth-oriented companies than the benchmark. This has been the primary driver of underperformance. Effectively, our investment style was out of favor, and the market did not reward companies demonstrating superior growth metrics. We believe this is transitory and our growth at a reasonable price (GARP) investment style will ultimately be rewarded.
Because the fund is actively managed and holding period is generally not a consideration in investment decisions, the portfolio turnover rate may fluctuate from year to year as the fund adjusts its portfolio composition. The fund's annual portfolio turnover was, and is expected to continue to be, more than 100 percent.
Strengths
• Stock selection was strong in select semiconductor and biotechnology names.
• The fund's underweight in telecommunications was beneficial as the sector underperformed the market.
• Old Dominion Freight Line, Inc.,(1) Facebook, Inc.(2) and Skyworks Solutions, Inc.(3) were among the best positive contributors to fund performance.
Weaknesses
• Stock selection was weak across the board as our growth-oriented investment style was out of favor and the primary driver of underperformance.
• Sector allocation was also a drag, as defensive sectors tended to outperform. Cash and defensive option strategies were also a drag on relative performance as the market rallied strongly.
• Investments in Chicago Bridge & Iron Co.,(4) Pacific Stone Tech, Inc.(5) and Halliburton Co.(4) failed to live up to expectations and were among the worst contributors to the fund's performance.
34
Holmes Macro Trends Fund (unaudited)
Current Outlook
Opportunities
• The global economic outlook should improve as the year progresses. Additional government policy support from many areas around the globe should be supportive of an improving global macro outlook. The U.S. has virtually been the single engine of growth in the developed world, and if Europe or China can improve it would provide a lift to the U.S. equity market.
• Falling gasoline prices have given consumers more disposable income, creating an opportunity for many discretionary areas such as restaurants, retailers and airline companies.
• Corporate cash levels continue to remain high, providing corporations the ability to pursue mergers and acquisitions (M&A). An increase in M&A activity holds promise for both portfolio gains and an increase in overall market valuations.
Threats
• With the S&P 500 trading at nearly 18x earnings, which is at the high end of the historical range, earnings growth will be especially critical to keep the bull market moving forward. Expectations for 2015 are in the low single digits, with big cuts coming from the energy sector in recent months.
• The market has been on an unusually long, almost uninterrupted winning streak for the past two years. A short-term correction of 10 percent or more would not be a surprise at this point.
• Deep value and price reversals led the market in 2012 and early 2013. If this trend were to reemerge, as it did during this past March through May, it would be a threat to relative performance.
(1)This security comprised 3.02% of the fund's total net assets as of 12/31/14.
(2)This security comprised 3.37% of the fund's total net assets as of 12/31/14.
(3)This security comprised 2.83% of the fund's total net assets as of 12/31/14.
(4)The fund did not hold this security as of 12/31/14.
(5)This security comprised 1.39% of the fund's total net assets as of 12/31/14.
35
Holmes Macro Trends Fund (unaudited)
Top 10 Equity Holdings Based on Net Assets December 31, 2014
Apple, Inc.
Computers | | | 5.37 | % | |
Facebook, Inc.
Internet Content - Entertainment | | | 3.37 | % | |
Old Dominion Freight Line, Inc.
Transportation - Truck | | | 3.02 | % | |
Skyworks Solutions, Inc.
Electronic Components - Miscellaneous | | | 2.83 | % | |
Actavis plc
Medical - Generic Drugs | | | 2.78 | % | |
SM Energy Co.
Oil Companies - Exploration & Production | | | 2.50 | % | |
Gilead Sciences, Inc.
Medical - Biomedical/Gene | | | 2.45 | % | |
Mylan, Inc.
Medical - Generic Drugs | | | 2.44 | % | |
Alexion Pharmaceuticals, Inc.
Medical - Biomedical/Gene | | | 2.40 | % | |
Cavium, Inc.
Electronic Components - Miscellaneous | | | 2.27 | % | |
Total Top 10 Equity Holdings | | | 29.43 | % | |
Portfolio Allocation by Industry Sector*
Based on Total Investments December 31, 2014

* Summary information above may differ from the portfolio schedule included in the financial statements due to the use of different classifications of securities for presentation purposes.
36
Global Resources Fund (unaudited)
Management Team's Perspective
Introduction
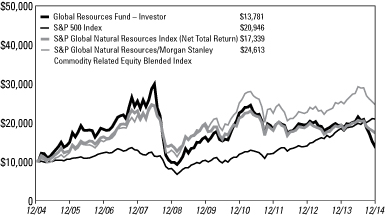
The Global Resources Fund (PSPFX and PIPFX) is a non-diversified natural resources fund with the principal objective of seeking long-term growth of capital while providing protection against inflation and monetary instability. The fund invests in companies involved in the exploration, production and processing of petroleum, natural gas, coal, alternative energies, chemicals, mining, iron and steel, and paper and forest products around the globe.
Performance Graph
Global Resources Fund
Average Annual Performance For the Periods Ended December 31, 2014
| | | One Year | | Five Year | | Ten Year | | Since Inception
(Institutional
Class) | |
Global Resources Fund - Investor Class | | | (28.74 | )% | | | (3.22 | )% | | | 3.26 | % | | | n/a | | |
Global Resources Fund - Institutional Class
(Inception 3/1/10) | | | (28.28 | )% | | | n/a | | | | n/a | | | | (2.81 | )% | |
S&P 500 Index | | | 13.69 | % | | | 15.45 | % | | | 7.67 | % | | | 15.91 | % | |
S&P Global Natural Resources Index
(Net Total Return) | | | (10.18 | )% | | | (1.96 | )% | | | 5.65 | % | | | (0.69 | )% | |
S&P Global Natural Resources/Morgan Stanley
Commodity Related Equity Blended Index | | | (3.03 | )% | | | 4.36 | % | | | 9.42 | % | | | 4.38 | % | |
Performance data quoted above is historical. Past performance is no guarantee of future results. Current performance may be higher or lower than the performance data quoted. The principal value and investment return of an investment will fluctuate so that an investor's shares, when redeemed, may be worth more or less than their original cost. The graph and table do not reflect the deduction of taxes that a shareholder would pay on fund distributions or the redemption of fund shares. For all or a portion of the periods, the fund had expense limitations, without which returns would have been lower.
Pursuant to a voluntary arrangement, the Adviser has agreed to limit total fund operating expenses (exclusive of any acquired fund fees and expenses, performance fees, taxes, brokerage commissions and interest) to not exceed 1.90% for the Investor Class. Also pursuant to a voluntary agreement, the Adviser has agreed to waive all class specific expenses of the Institutional Class. The Adviser can modify or terminate these arrangements at any time.
See Definitions for Management Teams' Perspectives for index definitions.
Please visit our website at www.usfunds.com for updated performance information for different time periods.
37
Global Resources Fund (unaudited)
The Year In Review - Economic And Political Issues That Affected The Fund
The Bloomberg Commodity Index fell 17 percent through the year 2014, primarily dragged down by the decline in crude oil. Fueled by deteriorating global growth and the official end of quantitative easing, a sharp rise in the dollar during the back half of the year is the most striking indicator of the current depressed commodity environment. Concerns that the global economy is slowing, particularly due to weaker economic data from China and the eurozone, pushed down Treasury yields as investors packed into fixed-income and U.S. equities. As a result, the growth-oriented energy and basic materials sectors lagged the S&P 500 Index by 21 and 7 percent, respectively.
Energy's significant relative underperformance to the broader commodities space materialized during the back half of 2014. A surge in supply from U.S. shale producers created a global glut of oil while declining global GDP growth disrupted the balance between supply and demand. The catalyst for oil's rapid decline was the Organization of the Petroleum Exporting Countries' (OPEC's) announcement that it would not cut production, despite the negative impact lower oil prices would have on Saudi Arabia as well as other fiscally-challenged nations of the cartel. Thus, Brent crude prices ended the year down 48 percent to $57 a barrel.
Initially, the global crude market was quick to discount unfavorable supply and demand fundamentals in 2014 but remained relatively complacent regarding rising geopolitical instability in key oil-producing countries such as Libya, Nigeria and Iraq. Going forward, it is likely these tensions could escalate given falling oil revenues, which would threaten government entitlement programs.
With respect to geopolitical concerns, the conflict between Russia and Ukraine, which began with the Russian invasion in Crimea in March, only escalated throughout the year. Both the Russian and Ukrainian economies have seen substantial losses. The combination of tough sanctions and rapidly declining oil prices led the Russian ruble to plunge a staggering 84 percent against the dollar, forcing the government to intervene by selling foreign reserves and raising borrowing costs. The latter of these two interventions has effectively strangled credit markets in Russia, leading analysts to forecast a sharp contraction in Russian GDP growth for 2015. The situation in Ukraine is just as dismal, with bond yields skyrocketing as the financial system braces for a crisis.
Moving into 2015, the eurozone should continue to face deflationary pressures, prompting many to assume a higher probability the European Central Bank (ECB) will enact quantitative easing (QE). Such easing should be positive for regional, and therefore global, growth in the long term as it should boost commodity demand. In the short run, however, heavy monetary stimulus in the eurozone would most likely
38
Global Resources Fund (unaudited)
depress the euro further against the dollar, causing the dollar to rise even higher than it did in 2014. Such a breakout in the dollar could initially harm investor sentiment toward the commodity space.
While many are forecasting further stimulus in Europe, the market is still pricing in a rate increase here in the U.S. However, the likelihood that the Federal Reserve will hike the funds rate has shrunk dramatically over the past year for two main reasons. First, the economic situation outside the U.S. has become much more dismal, as indicated by the collapse of 10-year Treasury yields back to 2.17 percent and the rapid rise in the dollar. The Fed would risk exacerbating both of these effects if rates were allowed to rise any time soon. Second, inflation expectations have come down significantly in the U.S. along with the rest of the world, despite being more than five years into a recovery. If rates should be kept lower in the U.S. for longer than expected, the result should be supportive for commodities
Investment Highlights
Overview
For the year ended December 31, 2014, the Investor Class of the Global Resources Fund declined 28.74 percent and the Institutional Class declined 28.28 percent, trailing the fund's new benchmark, the S&P Global Natural Resources Index (Net Total Return), which fell 10.18 percent. Please note that the fund adopted a new performance benchmark following the discontinuation of the Morgan Stanley Commodity Related Equity Index (CRX) in early July 2014. For purposes of the fund's performance fee calculation, until the new benchmark has been in place one full year, the fund will be compared to a blend of the two indices. For the year ended December 31, 2014, the blended index declined 3.03 percent.
The fund employed a defensive investment position from time to time in the past year with higher-than-average cash balances on hand to protect the liquidity of the fund. However, to maintain varying degrees of investment exposure to the commodities market, the fund utilized a number of rolling call option positions to hedge the fund's benchmark risks and provide optionality to upswings in commodities stocks.
Because the fund is actively managed and holding period is generally not a consideration in investment decisions, the portfolio turnover rate may fluctuate from year to year as the fund adjusts its portfolio composition. The fund's annual portfolio turnover was, and is expected to continue to be, more than 100 percent. Portfolio turnover was higher this year due in part to the fund's transition to a new performance benchmark.
39
Global Resources Fund (unaudited)
Strengths
• The fund outperformed on both an absolute and relative basis versus the benchmark, the S&P Global Natural Resources Index (Net Total Return), within the metals and mining industry group due in part to an underweighting in large index holdings such as BHP Billiton Ltd.(1) and Freeport McMoran, Inc.(2) Positive absolute contributions came from Nevsun Resources, Ltd.,(3) Nickel Asia Corp.(4) and Alcoa Inc.(2) equity options.
• Despite a sharp decline in the price of crude oil in the year, the fund outperformed the benchmark in the oil and gas – exploration/production industry group. Key contributors included Goodrich Petroleum Corp.,(2) Anadarko Petroleum Corp.(2) equity options, and Continental Resources, Inc.(2)
• Oil refining stocks outperformed the broader energy complex during the year as product margins were more resilient than the underlying commodity. Accordingly, equity positions in Valero Energy Corp.,(5) Marathon Petroleum Corp.(6) and Tesoro Corp.(7) were beneficial to fund performance.
Weaknesses
• The fund's core weighting in junior natural resources equities underperformed the large-cap S&P benchmark during a period of declining commodity prices and risk aversion typical of a rising dollar. Notable underperformers included Sable Mining Africa Ltd.,(8) Gran Colombia Gold Corp. notes,(9) Pacific Infrastructure Ventures, Inc.,(10) and Agriterra Ltd.(11)
• Falling crude oil prices and ongoing capital expenditures from oil and gas producers spurred a dramatic selloff in the service and equipment group. Onshore drilling and fracking companies bore the brunt of the selling: Patterson-UTI Energy, Inc.,(2) Halliburton Co.(12) and Hi-Crush Partners L.P.(2) negatively impacted fund performance.
• An underweight position in fertilizer companies adversely affected relative performance for the period as companies rebounded from falling corn prices.
Current Outlook
Opportunities
• Saudi Arabia is assuming $80-per-barrel oil in its budget for 2015, implying the world's largest exporter sees oil recovering soon. In fact, Saudi Arabia Oil Minister Ali Al-Naimi said recently that he is 100 percent sure that prices will go up as they have nowhere else to go. Furthermore, Iraq's Oil Minister, Adel Abdul Mahdi, said that OPEC will need to step in if oil declines further. It would appear that oil prices have reached their bottom. The long-awaited rally in oil prices should be a huge tailwind for energy producers.
40
Global Resources Fund (unaudited)
• Value investors are turning bullish on depressed energy stocks. Large inflows into energy-related exchange-traded funds (ETFs) occurred in December, despite the continued decline in oil prices. This divergence may be signaling a bottom in the energy bear market.
• Libyan oil production is falling due to Islamist militant attacks on various energy facilities. Output is at the lowest level since May 2014, and with no clear resolution to the fighting, supply from Libya may continue to be strained.
Threats
• The dollar continues to reach new highs. Strong growth prospects in the U.S. have caused the greenback to break its key 2009 resistance level. Associated with falling commodity prices, the rising dollar remains a threat and a sign of a global growth imbalance.
• The Federal Reserve Bank's cancellation of its QE program could negatively impact market liquidity and pressure asset prices if economic growth stalls.
• The instability and volatility surrounding Russia has become a serious concern for global investors. Any contagion from the ruble's decline could prove disastrous for the global economic recovery and, therefore, commodities.
(1) This security comprised 3.69% of the fund's total net assets as of 12/31/14.
(2) The fund did not hold this security as of 12/31/14.
(3) This security comprised 1.18% of the fund's total net assets as of 12/31/14.
(4) This security comprised 1.28% of the fund's total net assets as of 12/31/14.
(5) This security comprised 1.58% of the fund's total net assets as of 12/31/14.
(6) This security comprised 1.59% of the fund's total net assets as of 12/31/14.
(7) This security comprised 1.64% of the fund's total net assets as of 12/31/14.
(8) This security comprised 0.16% of the fund's total net assets as of 12/31/14.
(9) This security comprised 1.68% (including 1.53% in notes) of the fund's total net assets as of 12/31/14.
(10)This security comprised 3.79% of the fund's total net assets as of 12/31/14.
(11)This security comprised 0.36% of the fund's total net assets as of 12/31/14.
(12)This security comprised 0.23% of the fund's total net assets as of 12/31/14.
41
Global Resources Fund (unaudited)
Top 10 Equity Holdings Based on Net Assets December 31, 2014
Atlas Development & Support Services Ltd.
Oil - Field Services | | | 5.22 | % | |
Pacific Infrastructure Ventures, Inc.
Real Estate Operating/Development | | | 3.79 | % | |
BHP Billiton Ltd.
Diversified Minerals | | | 3.69 | % | |
TransGlobe Energy Corp.
Oil Companies - Exploration & Production | | | 3.20 | % | |
Potash Corporation of Saskatchewan, Inc.
Agricultural Chemicals | | | 2.98 | % | |
Exxon Mobil Corp.
Oil Companies - Integrated | | | 2.85 | % | |
Syngenta AG
Agricultural Chemicals | | | 2.66 | % | |
Chevron Corp.
Oil Companies - Integrated | | | 2.35 | % | |
Glencore plc
Metal - Diversified | | | 2.29 | % | |
Pacific Power Generation Corp.
Electric - Generation | | | 2.28 | % | |
Total Top 10 Equity Holdings | | | 31.31 | % | |
Portfolio Allocation by Industry Sector*
Based on Total Investments December 31, 2014
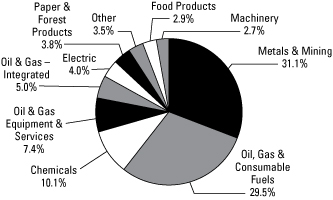
* Summary information above may differ from the portfolio schedule included in the financial statements due to the use of different classifications of securities for presentation purposes.
42
Precious Metals and Minerals Funds (unaudited)
Management Team's Perspective
Introduction
The World Precious Minerals Fund (UNWPX and UNWIX) and the Gold and Precious Metals Fund (USERX) pursue an objective of long-term capital growth through investments in gold, precious metals and mining companies. The Gold and Precious Metals Fund focuses on the equity securities of established gold and precious metals companies and pursues current income as a secondary objective. The World Precious Minerals Fund focuses on equity securities of companies principally engaged in the exploration, mining and processing of precious minerals such as gold, silver, platinum and diamonds. Although this fund has the latitude to invest in a broad range of precious minerals, it currently remains focused on the gold sector.
World Precious Minerals Fund
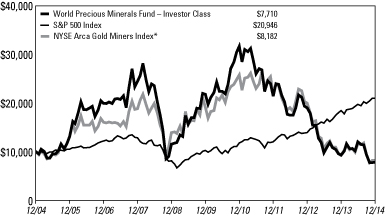
Average Annual Performance For the Periods Ended December 31, 2014
| | | One Year | | Five Year | | Ten Year | | Since Inception
(Institutional
Class) | |
World Precious Minerals Fund - Investor Class | | | (16.52 | )% | | | (18.79 | )% | | | (2.57 | )% | | | n/a | | |
World Precious Minerals Fund - Institutional
Class (Inception 3/1/10) | | | (16.43 | )% | | | n/a | | | | n/a | | | | (18.95 | )% | |
S&P 500 Index | | | 13.69 | % | | | 15.45 | % | | | 7.67 | % | | | 15.91 | % | |
NYSE Arca Gold Miners Index | | | (11.71 | )% | | | (15.63 | )% | | | (1.99 | )% | | | (15.57 | )% | |
Performance data quoted above is historical. Past performance is no guarantee of future results. Current performance may be higher or lower than the performance data quoted. The principal value and investment return of an investment will fluctuate so that an investor's shares, when redeemed, may be worth more or less than their original cost. The graph and table do not reflect the deduction of taxes that a shareholder would pay on fund distributions or the redemption of fund shares. For all or a portion of the periods, the fund had expense limitations, without which returns would have been lower.
Pursuant to a voluntary arrangement, the Adviser has agreed to limit total fund operating expenses (exclusive of any acquired fund fees and expenses, performance fees, taxes, brokerage commissions and interest) to not exceed 1.90%. The Adviser can modify or terminate this arrangement at any time.
See Definitions for Management Teams' Perspectives for index definitions.
Please visit our website at www.usfunds.com for updated performance information for different time periods.
43
Precious Metals and Minerals Funds (unaudited)
Gold and Precious Metals Fund
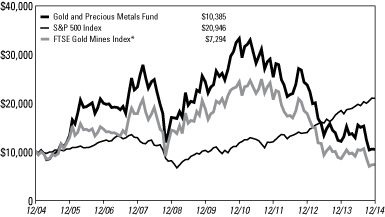
Average Annual Performance For the Year Ended
December 31, 2014
| | | One Year | | Five Year | | Ten Year | |
Gold and Precious Metals Fund | | | (14.00 | )% | | | (15.67 | )% | | | 0.38 | % | |
S&P 500 Index | | | 13.69 | % | | | 15.45 | % | | | 7.67 | % | |
FTSE Gold Mines Index | | | (14.18 | )% | | | (17.21 | )% | | | (3.11 | )% | |
Performance data quoted above is historical. Past performance is no guarantee of future results. Current performance may be higher or lower than the performance data quoted. The principal value and investment return of an investment will fluctuate so that an investor's shares, when redeemed, may be worth more or less than their original cost. The graph and table do not reflect the deduction of taxes that a shareholder would pay on fund distributions or the redemption of fund shares. For all or a portion of the periods, the fund had expense limitations, without which returns would have been lower.
Pursuant to a voluntary arrangement, the Adviser has agreed to limit total fund operating expenses (exclusive of any acquired fund fees and expenses, performance fees, taxes, brokerage commissions and interest) to not exceed 1.90%. The Adviser can modify or terminate this arrangement at any time.
See Definitions for Management Teams' Perspectives for index definitions.
Please visit our website at www.usfunds.com for updated performance information for different time periods.
The Year In Review - Economic And Political Issues That Affected The Funds
At the beginning of 2014, Goldman Sachs was very bearish with a forecasted year-end gold price of $1,050 per ounce. These predictions missed the mark as gold closed the year at $1,184.86, down just 1.72 percent for 2014. Although gold had posted back-to-back gains over the first two quarters, it gave up these gains during the second half of the year as a result of the dollar's ascent. Even with this performance, gold ended the year ahead of all major world currencies except for the U.S. dollar. As a consequence of the currency effect, the fall of gold hurt mainly U.S.-based investors,
44
Precious Metals and Minerals Funds (unaudited)
whereas gold denominated in most major non-U.S. currencies ended the year with significant gains.
There were several notable developments in the gold space during 2014. The Indian government removed its 80/20 import rule, paving the way for increased gold imports. The People's Bank of China circulated a draft plan to further ease import restrictions on bringing gold into the country. China also opened the Shanghai Free Gold Exchange, deregulating the gold market in Shanghai and giving foreign investors direct access to its gold market for the first time. In Europe, the topic of gold repatriation heated up. Switzerland voted down a referendum that would have seen its central bank increase its gold reserves by 20 percent while the Dutch central bank repatriated 122.5 metric tons of gold. Additionally, there was speculation out of Belgium and France about repatriation.
Holdings in the SPDR Gold Trust(1) are hovering close to the lowest amount since September 2008. A confluence of factors has influenced the flight from the metal held by some investors as a haven. First, there is a mistakenly held notion in the markets that gold is one of the most volatile asset classes. In actuality, the return on equities as measured by the S&P 500 Index is typically twice as volatile as the return on gold bullion. Second, low gold prices have prompted some investment advisors to recommend a zero allocation to gold. Third, new highs in the equity market continue to increase investor appetite for risky assets. Perhaps there was some justice with four companies, including Goldman Sachs Group, Inc. and HSBC Holdings plc, being sued over claims that they conspired for eight years to manipulate precious metals prices. The lawsuits join numerous other attacks on financial companies.
Investment Highlights
For the year ended December 31, 2014, the World Precious Minerals Fund Investor Class lost 16.52 percent and the Institutional Class lost 16.43 percent. The fund's benchmark, the NYSE Arca Gold Miners Index, lost 11.71 percent on a total return basis. The strategy of the World Precious Minerals Fund favors junior (exploration and development) stocks and mid-tiered producing stocks. These lower-capitalization stocks have historically outperformed senior gold mining companies over longer time periods, as senior gold miners have typically acquired proven assets of junior gold companies rather than explored for new mining projects with capital-constrained budgets.
The Gold and Precious Metals Fund lost 14.00 percent for the year, outperforming its benchmark, the FTSE Gold Mines Index, which lost 14.18 percent on a total return basis. While focusing on established, gold-producing companies, the Gold and Precious Metals Fund holds a higher weighting of mid-tier stocks compared to its benchmark.
45
Precious Metals and Minerals Funds (unaudited)
Both funds employed a defensive investment position from time to time in the past year with higher-than-average cash balances on hand to protect the liquidity of the funds. However, to maintain varying degrees of investment exposure to the gold market, the funds utilized a number of rolling call option positions to hedge the funds' benchmark risks and provide optionality to upswings in gold stocks.
Spot gold finished the period at $1,184.86 per ounce, down $20.79, or 1.72 percent, for the year. The S&P 500 Index posted a positive return of 13.69 percent, the Trade Weighted U.S. Dollar Index surged 12.79 percent and the yield on a 90-day Treasury bill finished the period at 0.04 percent.
Strengths
• Virginia Mines, Inc.(2) was the largest contributor to performance for the World Precious Minerals Fund. The company finished the year with a 20 percent gain after Osisko Gold Royalties Ltd.(3) announced a friendly takeover of Virginia Mines. The combined companies create a top-tier pure gold-based royalty company, with all their assets located in politically safe Quebec.
• Detour Gold Corp.,(3) the best performer in the Gold and Precious Metals Fund, surged early in the year following a succession of positive news. The biggest factor supporting the stock price appreciation was the release of a new life of mine plan emphasizing the large scale and competitive cost structure that the asset should ultimately deliver. The company also benefited from a series of takeover offers by major mining companies for Osisko Mining Corp.,(3) a company with similar characteristics, which highlighted Detour's cheap valuation and potential as the next takeover target.
• Underweighting Barrick Gold Corp.(3) and Yamana Gold, Inc.(4) contributed to the performance of both funds relative to their respective benchmarks. Barrick Gold was a laggard in the sector, weighing heavily on the performance of the benchmark, as it failed to convince investors that its portfolio optimization strategy would be sufficient to turn around the struggling miner. The company was also tied to a failed merger attempt with Newmont Mining Corp.(5)
Weaknesses
• Gran Colombia Gold Corp.(6) was the worst performer in both funds. The company took aggressive steps to lower its costs to produce gold but also suffered from poor government policies in Colombia. For instance, the value-added tax, which the government collects on certain transactions, squeezed the liquidity of the company, as the government was slow to refund these taxes after the company filed the paperwork to recoup these taxes.
• Overweighting Dundee Precious Metals, Inc.(7) relative to the benchmarks was a drag on the performance of both funds as the company had an earnings miss in the third quarter. Overall, Dundee Precious Metals still remains very attractive as
46
Precious Metals and Minerals Funds (unaudited)
fourth quarter results reported after year-end beat estimates. Dundee Precious Metals also hedged more than 90 percent of its 2015 copper production, about 25 percent of revenue, at $3.21 per pound, while spot prices have dropped to nearly $2.50 per pound in early 2015. Dundee Precious also owns and operates the Tsumeb copper smelter in northern Namibia, one of only a handful of copper smelters in the world that can safely handle high arsenic copper ores. Demand for such environmental safety in the handling of arsenic is on the rise.
• The World Precious Minerals Fund lagged its benchmark with regards to holdings in the exploration and development companies that offer tremendous value yet are being shunned by companies looking to acquire assets. CEOs have to ask themselves the question: "Could anything go wrong if I buy this unproven asset?" In light of all the CEOs who were fired in the mining sector over the last two years, no one wants to lose his or her job. This risk-avoidance attitude has manifested itself in recent deals where two existing small mines – Marigold and Wharf, which have been in production for 20 to 30 years, thus completely de-risked – were sold for premium valuations based on our models. But because these two mines were sold off by a senior mining company, there was no market quote on the individual properties for investors to observe the market valuation of the operations, thus making it difficult to determine how much of a premium was paid to acquire "safe" assets. This attitude of not taking risks should revert back to normal conditions once more bullish conditions emerge in the gold space.
Current Outlook
Opportunities
• With one of China's primary goals being to increase international use of its currency, the yuan, it should accumulate more gold. This is the view taken by Song Xin, President of the China Gold Association, who believes the country should accumulate 8,500 tonnes in reserves. This logic stems from the fact that, when each country's currency became internationalized, the United States and the United Kingdom held over 50 percent of reserves in gold. If China seeks to do the same, gold demand and prices should see substantial gains. Additionally, Alan Greenspan, former Chairman of the Federal Reserve, articulated in a Foreign Affairs article that China would see unexpected strength in the international financial system if it were to convert some of its foreign exchange reserves into gold. Clearly, there is speculation as to the advantages China could have if it were to purchase and hold more gold.
• Moving into 2015, many benefits are expected to be had by mining companies given the current environment. Specifically, declining energy prices and depreciating operating currencies could lead to lower costs and expanding margins. Additionally, more mining companies could close their cash-negative assets, focusing attention on productive assets instead. Consolidation remains an opportunity for the industry as well, especially given the recent correction in gold prices.
47
Precious Metals and Minerals Funds (unaudited)
• Canaccord Genuity recently updated its study looking at the four major S&P/TSX Venture Composite Index corrections in the last three decades. The TSX Venture is considered a good proxy for small-cap gold stocks. It's official: we now have experienced the longest small-cap mining correction in 30 years.
The study by Canaccord Genuity also showed that the best three months to gain exposure to gold has historically been December, January and February. With the authors believing the end of the correction could be nearing, the next couple of months could provide an attractive entry point into gold equities. The following chart shows the upside opportunities that occurred after recent corrections.
48
Precious Metals and Minerals Funds (unaudited)

Threats
• Productivity is now the top business risk facing mining and metals companies, according to Ernst & Young's annual report on risks to the industry. The report highlights that long-term profitability requires a business-wide response to this threat. This risk is compounded by dwindling ranks of geosciences professionals, which has impaired the ability of mining companies to respond to dramatic fluctuations in commodity prices, according to HSBC. The report also highlighted that rising energy costs and competing water demands are serious business risks, especially for operators in Chile, Peru and South Africa.
• The National Mining Association President, Hal Quinn, said that the number one challenge to the mining industry in the United States is the domestic regulatory bureaucracy. While it typically takes seven to ten years to obtain a permit for a mine in the United States, other countries with similar environmental standards do so within two to three years. Continued bureaucracy in the United States continues to weaken the domestic mining industry.
• The recent damage done to the Russian economy and the ruble are leading some to speculate that the Russian government will begin selling gold. That move could put downward pressure on bullion prices.
(1)This security comprised 0.00% of the total net assets of the World Precious Minerals Fund and 0.37% of the Gold and Precious Metals Fund as of 12/31/14.
(2)This security comprised 10.36% of the total net assets of the World Precious Minerals Fund and 1.14% of the Gold and Precious Metals Fund as of 12/31/14.
(3)Neither fund held this security as of 12/31/14.
(4)This security comprised 0.54% of the total net assets of the World Precious Minerals Fund and 2.00% of the Gold and Precious Metals Fund as of 12/31/14.
(5)This security comprised 0.22% of the total net assets of the World Precious Minerals Fund and 1.06% of the Gold and Precious Metals Fund as of 12/31/14.
(6)This security comprised 2.92% of the total net assets of the World Precious Minerals Fund and 2.39% of the Gold and Precious Metals Fund as of 12/31/14.
(7)This security comprised 1.37% of the total net assets of the World Precious Minerals Fund and 1.88% of the Gold and Precious Metals Fund as of 12/31/14.
49
Precious Metals and Minerals Funds (unaudited)
World Precious Minerals Fund
Top 10 Equity Holdings Based on Net Assets December 31, 2014
Virginia Mines, Inc.
Gold Mining | | | 10.36 | % | |
Klondex Mines Ltd.
Gold Mining | | | 9.79 | % | |
Pretium Resources, Inc.
Gold Mining | | | 3.35 | % | |
Lundin Gold, Inc.
Precious Metals | | | 2.88 | % | |
NGEx Resources, Inc.
Gold Mining | | | 2.29 | % | |
Mandalay Resources Corp.
Metal - Diversified | | | 2.28 | % | |
Orex Minerals, Inc.
Metal - Diversified | | | 2.15 | % | |
Lucara Diamond Corp.
Diamonds/Precious Stones | | | 1.82 | % | |
Mirasol Resources Ltd.
Gold Mining | | | 1.80 | % | |
Richmont Mines, Inc.
Gold Mining | | | 1.68 | % | |
Total Top 10 Equity Holdings | | | 38.40 | % | |
Portfolio Allocation by Industry*
Based on Total Investments December 31, 2014
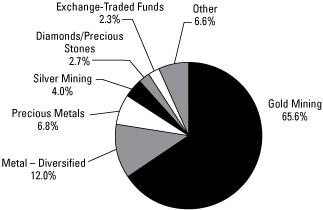
* Summary information above may differ from the portfolio schedule included in the financial statements due to the use of different classifications of securities for presentation purposes.
50
Precious Metals and Minerals Funds (unaudited)
Gold and Precious Metals Fund
Top 10 Equity Holdings Based on Net Assets December 31, 2014
Klondex Mines Ltd.
Gold Mining | | | 10.01 | % | |
Franco-Nevada Corp.
Gold/Mineral Royalty Companies | | | 6.97 | % | |
Royal Gold, Inc.
Gold Mining | | | 5.99 | % | |
Northern Star Resources Ltd.
Gold Mining | | | 3.84 | % | |
Kirkland Lake Gold, Inc.
Gold Mining | | | 3.61 | % | |
Acacia Mining plc
Gold Mining | | | 3.47 | % | |
Mandalay Resources Corp.
Metal - Diversified | | | 3.38 | % | |
Fortuna Silver Mines, Inc.
Silver Mining | | | 2.90 | % | |
Comstock Mining, Inc.
Gold Mining | | | 2.63 | % | |
Alacer Gold Corp.
Gold Mining | | | 2.56 | % | |
Total Top 10 Equity Holdings | | | 45.36 | % | |
Portfolio Allocation by Industry*
Based on Total Investments December 31, 2014
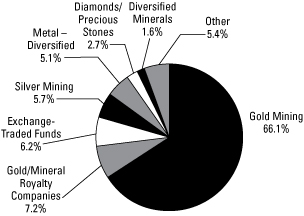
* Summary information above may differ from the portfolio schedule included in the financial statements due to the use of different classifications of securities for presentation purposes.
51
Emerging Europe Fund (unaudited)
Management Team's Perspective
Introduction
The investment objective of the Emerging Europe Fund (EUROX) is to achieve long-term capital growth by investing in a non-diversified portfolio of equity securities of companies located in the emerging markets of Europe.(1)
Performance Graph
Emerging Europe Fund
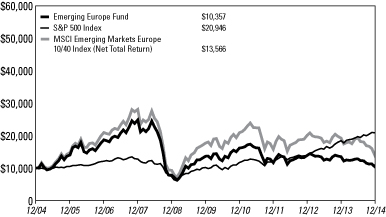
Average Annual Performance For the Years Ended
December 31, 2014
| | | One Year | | Five Year | | Ten Year | |
Emerging Europe Fund | | | (23.22 | )% | | | (5.34 | )% | | | 0.35 | % | |
S&P 500 Index | | | 13.69 | % | | | 15.45 | % | | | 7.67 | % | |
MSCI Emerging Markets Europe 10/40 Index
(Net Total Return) | | | (29.52 | )% | | | (5.21 | )% | | | 3.10 | % | |
Performance data quoted above is historical. Past performance is no guarantee of future results. Current performance may be higher or lower than the performance data quoted. The principal value and investment return of an investment will fluctuate so that an investor's shares, when redeemed, may be worth more or less than their original cost. The graph and table do not reflect the deduction of taxes that a shareholder would pay on fund distributions or the redemption of fund shares. For all or a portion of the periods, the fund had expense limitations, without which returns would have been lower.
Pursuant to a voluntary arrangement, the Adviser has agreed to limit total fund operating expenses (exclusive of any acquired fund fees and expenses, performance fees, taxes, brokerage commissions and interest) to not exceed 2.85%. The Adviser can modify or terminate this arrangement at any time.
See Definitions for Management Teams' Perspectives for index definitions.
Please visit our website at www.usfunds.com for updated performance information for different time periods.
52
Emerging Europe Fund (unaudited)
The Year In Review - Economic And Political Issues That Affected The Fund
Russian intervention in Ukraine and the official annexation of Crimea have hijacked the region's headlines for the year, putting on hold domestic issues such as high inflation and stagnant economic growth. Russia sold off sharply after sanctions were imposed on Russia and the Organization of the Petroleum Exporting Countries' (OPEC's) announcement not to cut oil production. The price of oil fell from over $100 per barrel in the summer to $57 in December. This drop in oil prices hit Russia hard, as roughly half of the Federation's governmental revenue comes from the sale of oil and gas. Russia was the weakest market among emerging Europe countries.
The Greek market also underperformed in the past year. Manufacturing data showed a contraction trend, while retail sales and GDP data showed positive trends. At the end of the year, we saw political turbulence in Greece. On December 29, 2014, the parliament failed to elect a president, forcing an early snap election to take place January 25, 2015. Anti-austerity party Syriza won the elecetion, raising concerns that Greece might exit the eurozone.
The Czech Republic was one of the best-performing indexes in the region. Economically, the threat of disinflation closed in as Consumer Price Index (CPI) numbers fell from 1.4 percent at the end of last year to a low of 0.1 percent in December. After a five-year period of economic recession, revival is coming back to the Czech economy. The Czech National Bank predicts a GDP growth of 3 percent in 2015.
In Poland, the stock market had a negative return and was affected by the selloff in neighboring Russia. Poland is facing threats of disinflation as the Producer Price Index and the CPI dropped below zero in the second half of the year. On a positive note, the unemployment rate is declining, and the country will once again be the biggest recipient of structural funds in the next multiyear European Union (EU) budget from 2014 to 2020. Poland has kept pushing ahead with reforms in a way that Germany and France have not, and it appears as if it can continue to outperform its peers in terms of economic growth.
In Hungary, the aggressive monetary easing program continued, bringing benchmark rates down to 2.10 percent from 5.75 percent at the beginning of 2013. The lowering of rates has spurred a strong economic recovery, resulting in industrial production growth in excess of 6 percent and GDP growth of 3.20 percent. Hungary's market has outperformed the region.
Turkey is the greatest performer in the region. Although inflation continues to stay above the central bank's target of 5 percent for the third year, the stock market appreciated 19 percent, while other emerging Europe counties lost on average 26 percent
53
Emerging Europe Fund (unaudited)
during the same period. Turkey is profiting from the declining oil prices and monetary easing in Europe.
Investment Highlights
Overview
For the year ended December 31, 2014, the fund declined 23.22 percent, while the benchmark MSCI Emerging Markets Europe 10/40 Index (Net Total Return) declined 29.52 percent.
Turkey, Czech Republic, Poland and Hungary outperformed the benchmark index, while Russia and Greece underperformed. On a sector basis, industrials, consumer discretionary, financials, utilities, consumer staples and materials were the best-performing sectors, while telecommunications, health care and energy underperformed.
Strengths
• The fund's underweighting of Russia contributed significantly to the fund's performance relative to the benchmark. The sharp fall in oil prices after OPEC's announcement and continued sanctions imposed on the country due to its annexation of Crimea and assistance to Novorossiya militants fighting Ukraine contributed to a huge selloff this year. The fund dramatically reduced its exposure to Russia in the first six months of the year, and at the end of the year the fund had just a minimal exposure to the Federation.
• The fund's stock selection in financials and telecommunication services had a positive contribution to the performance of the fund relative to its benchmark.
• Turkiye Garanti Bankasi A.S.,(2) the Turkish bank that operates domestically and in other parts of Europe, made the largest single contribution to the performance of the fund.
Weaknesses
• Holdings of Canadian-listed companies with operations in emerging Europe, such as Dundee Precious Metals, Inc.(3) in the materials space and Bankers Petroleum Ltd.(4) in the energy sector, had a negative impact on the fund's performance relative to its benchmark.
• The fund's overweight position in the information technology and materials sectors had a negative effect on the fund's performance.
• Erste Group Bank AG,(5) Austria's bank with operations in Europe and Hong Kong, was the single worst contributor to the performance of the fund.
54
Emerging Europe Fund (unaudited)
Current Outlook
Opportunities
• From a long-term thematic perspective, Poland remains well-positioned to outperform core Europe in the coming years. Since the collapse of communism, Poland has seen its economy grow more than any other country in the EU, as shown in a recent special report by The Economist. That solid economic performance has given Poland extra weight in the EU, both economically and politically. In reality, Poland fought harder against corruption than its Eastern peers, especially in public procurement, as a means to attaining EU's Structural Funds. The country has earned a decent record of using these funds for the benefit of its economy. As a result, the EU rewarded Poland by making it the biggest recipient of its funds – a whopping $139 billion – between 2007 and 2013. The country will once again get the biggest chunk in the next multiyear budget from 2014 to 2020. Poland has kept pushing ahead with reforms in a way that Germany and France have not, and by the looks of it, it can continue to outperform its peers when it comes to economic growth.
• The ECB is aggressively easing monetary policy to avert the risk of deflation and to help spur economic development. This should help the entire European region, including emerging Europe, as stimulus measures take effect and lift growth prospects in the coming months.
• JPMorgan Chase & Co. told investors to dump U.S. equities in favor of their European counterparts, and analysts are projecting earnings across Europe will outpace those for the Standard & Poor's 500 Index. The S&P 500 rose 13.69 percent in 2014. During the same period, the Stoxx Europe 600 Index, which includes companies that the Emerging Europe Fund has exposure to, fell 5.36 percent. Analysts estimate that profits at companies in the Stoxx Europe 600 Index will grow almost 12 percent in 2015, beating the 7.9 percent increase they predict for those in the S&P 500.
Threats
• After three attempts, the Greek parliament did not elect a new president. The total number of votes in favor of the presidential candidate did not reach the minimum of 180 votes required under the constitution. As a result, General Elections took place on January 25, 2015. The far-left Syriza party, which seeks a write-down on Greece's debt, won the elections. The party aims to remove and reverse many of the tough austerity measures put in place over the last few years.
• During his annual speech, Vladimir Putin admitted that Russia is heading into recession. The Russian government said the economy will contract by 0.8 percent in 2015 if oil trades at $80 per barrel, and 3.5 to 4 percent if it trades at $60 per barrel. In the fourth quarter, oil dropped to $57 per barrel. In 2014, Russia needed an oil price of $100 per barrel to have a balanced budget.
55
Emerging Europe Fund (unaudited)
• The International Monetary Fund (IMF) downgraded its outlook for global growth from 4 percent to 3.8 percent in 2015. The IMF cited reduced growth in Germany, France and Italy, and warned that the probability of the eurozone's heading into a recession in the next six months has roughly doubled since April. Growth slowdowns are not limited to the eurozone, as China, Brazil and Russia are all expected to see reduced growth. A weaker eurozone and China implies reduced imports from emerging markets for raw materials and consumer goods.
(1)The following countries are considered to be in the emerging Europe region: Albania, Armenia, Azerbaijan, Belarus, Bulgaria, Croatia, the Czech Republic, Estonia, FYR Macedonia, Georgia, Greece, Hungary, Latvia, Lithuania, Moldova, Poland, Romania, Russia, Slovakia, Slovenia, Turkey and Ukraine.
(2)This security comprised 4.65% of the fund's total net assets as of 12/31/14.
(3)This security comprised 0.32% of the fund's total net assets as of 12/31/14.
(4)This security comprised 0.81% of the fund's total net assets as of 12/31/14.
(5)This security comprised 4.05% of the fund's total net assets as of 12/31/14.
56
Emerging Europe Fund (unaudited)
Top 10 Equity Holdings Based on Net Assets December 31, 2014
Tofas Turk Otomobil Fabrikasi A.S.
Automotive - Cars & Light Trucks | | | 5.23 | % | |
Turkiye Garanti Bankasi A.S.
Commercial Banks - Non US | | | 4.65 | % | |
Turkiye Sinai Kalkinma Bankasi A.S.
Finance - Investment Banker/Broker | | | 4.26 | % | |
Komercni Banka A.S.
Commercial Banks - Non US | | | 4.17 | % | |
Erste Group Bank AG
Commercial Banks - Non US | | | 4.05 | % | |
Turkcell Iletism Hizmetleri A.S.
Cellular Telecommunication | | | 3.42 | % | |
Turkiye Is Bankasi
Commercial Banks - Non US | | | 2.95 | % | |
FF Group
Retail - Miscellaneous/Diversified | | | 2.78 | % | |
Energa S.A.
Electric - Distribution | | | 2.54 | % | |
Haci Omer Sabanci Holding A.S.
Diversified Operations | | | 2.48 | % | |
Total Top 10 Equity Holdings | | | 36.53 | % | |
Country Distribution*
Based on Total Investments December 31, 2014
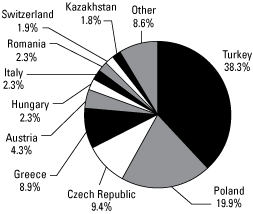
* Country distribution shown is based on domicile. The locale of company operations may be different.
57
China Region Fund (unaudited)
Management Team's Perspective
Introduction
The China Region Fund (USCOX) seeks long-term growth of capital. The fund invests in both established and emerging companies registered and operating in the China region.(1)
Performance Graph
China Region Fund

Average Annual Performance For the Years Ended
December 31, 2014
| | | One Year | | Five Year | | Ten Year | |
China Region Fund - Investor Class | | | (0.97 | )% | | | (0.29 | )% | | | 4.95 | % | |
Hang Seng Composite Index | | | 4.09 | % | | | 4.63 | % | | | 9.39 | % | |
MSCI All Country Far East Free ex Japan Index* | | | 0.54 | % | | | 3.30 | % | | | 6.53 | % | |
* These are not total returns. These returns reflect simple appreciation only and do not reflect dividend reinvestment.
Performance data quoted above is historical. Past performance is no guarantee of future results. Current performance may be higher or lower than the performance data quoted. The principal value and investment return of an investment will fluctuate so that an investor's shares, when redeemed, may be worth more or less than their original cost. The graph and table do not reflect the deduction of taxes that a shareholder would pay on fund distributions or the redemption of fund shares. For all or a portion of the periods, the fund had expense limitations, without which returns would have been lower.
Pursuant to a voluntary arrangement, the Adviser has agreed to limit total fund operating expenses (exclusive of any acquired fund fees and expenses, performance fees, taxes, brokerage commissions and interest) to not exceed 2.55%. The Adviser can modify or terminate this arrangement at any time.
See Definitions for Management Teams' Perspectives for index definitions.
Please visit our website at www.usfunds.com for updated performance information for different time periods.
58
China Region Fund (unaudited)
The Year In Review - Economic And Political Issues That Affected The Fund
2014 was a seminal year of transition for reforming the Chinese economy, and Chinese policymakers took bold steps down the path set forth at the Third Plenary of the 18th Party Congress in November 2013. While laying important groundwork for various structural transformations, the new administration prioritized pragmatism over dogmatism in setting cyclical policies during the year and did a better job balancing short-term growth and long-term reform.
On the reform front, progress has been made in reducing state ownership in the energy sector, streamlining cost structure in the telecommunications sector, and consolidating counterproductive fragments in the railroad sector. Six state-owned corporate groups have been shortlisted to adopt mixed ownership and hire managerial talent from the private sector. Local government debt financing is set to become more transparent under new regulations effective January 2015. A pilot program was officially launched in November to allow mutual market access for investors participating in both Shanghai and Hong Kong exchanges.
On the growth front, targeted ad hoc policy easing for selective sectors earlier in the year failed to sustain economic activity for long, as the rebound of the HSBC China Manufacturing Purchasing Manager's Index (PMI) peaked in July before weakening anew, and year-over-year GDP growth slowed from 7.6 percent in 2013 to 7.3 percent in 2014, below the official target of 7.5 percent. Lower-tier city governments started relaxing home purchase restrictions in July, and the central government loosened mortgage policies in September to curb the tail risk in the all-important property sector. In late November, China's central bank surprised the market by cutting interest rates for the first time since 2012 and, in late December, waived bank reserve requirements for certain deposits. There were also reports of accelerated infrastructure spending programs for the next two years.
In an effort to strengthen party legitimacy and promote rule of law in the country, China intensified its national anticorruption campaign throughout the year, with 477 incumbent and retired party officials disciplined. Forty-one officials at the provincial level and four at the deputy state level were either arrested or expelled. As a result, investor sentiment toward extravaganza-related sectors such as luxury goods and Macau-based casino operators deteriorated over the year.
China also passed new environmental laws in late April, the first such revision of environmental legislation since 1989, pressing more severe punishments such as unlimited fines and actual jail time on polluters. Environmental protection is set to become a government policy priority in the upcoming 13th Five-Year Plan.
59
China Region Fund (unaudited)
Ex-Jakarta governor Joko Widodo was inaugurated in October as the seventh President of Indonesia following his July election victory. Upon taking office, Widodo announced two rounds of national fuel subsidy cuts, anchoring the country on the firm path of reallocating fiscal resources for more productive use, especially in sorely needed public infrastructure.
Investment Highlights
Overview
For the year ended December 31, 2014, the China Region Fund declined 0.97 percent, underperforming the benchmark Hang Seng Composite Index (HSCI), which advanced 4.09 percent in total return.
Because the fund is actively managed and holding period is generally not a consideration in investment decisions, the portfolio turnover rate may fluctuate from year to year as the fund adjusts its portfolio composition. The fund's annual portfolio turnover was, and is expected to continue to be, more than 100 percent.
Strengths
• Besides country diversification, the most positive contributor to the fund's relative performance for the year was the decision to underweight HSBC Holdings plc,(2) an underperforming, major diversified bank incorporated in the U.K. that is dominant in the benchmark index.
• Industry allocation to financials was the largest alpha generator for the fund, as financials finished the year among the top three performing industries within the benchmark. Stock selection within financials proved especially successful.
• Bank of China Ltd.,(3) China Aircraft Leasing Group Holdings Ltd.(4) and China Life Insurance Co. Ltd.(5) finished the year as the top three positive contributors to fund performance.
Weaknesses
• Country allocation to China and Hong Kong overall was less than satisfactory, as stock winners failed to offset losers for the year.
• Industry allocation to utilities was a net detractor for the fund, as stock selection therein underperformed.
• Investments in Biostime International Holdings Ltd.,(6) China Singyes Solar Technologies Holdings Ltd.(7) and NagaCorp Ltd.(6) detracted the most from fund performance for the year.
60
China Region Fund (unaudited)
Opportunities
• Despite a remarkable rally in late 2014, Chinese banks and insurers are still trading at historically attractive valuations. Potential further easing following the release of fourth quarter macro data should help sustain continued re-rating of the Chinese financials sector, as should recent government announcements to relax the definition of the loan-deposit ratio and to reportedly accelerate infrastructure spending.
• Chinese property developers have been relative laggards among interest rate-sensitive sectors. They are likely to play catchup in 2015, given undemanding valuation and expectations of looser restrictions on home purchases in tier-one Chinese cities.
• China's promotion of ground and marine transport links with the rest of Asia, the Middle East, Europe and Africa, and its offer to fund overseas infrastructure projects should help sustain positive market sentiment on state-owned construction companies, especially railroads.
Threats
• Macau's disappointing gross gaming revenue growth in December, coupled with Chinese President Xi Jinping's recent advice for Macau to diversify its economy beyond casino gaming, might continue to weigh on the city's casino operators.
• Speculation that the Bank of Korea will intervene to weaken the South Korean currency, the won, following the Bank of Japan's aggressive yen-weakening measures at the end of October remains the sword of Damocles on the South Korean currency against the U.S. dollar, challenging won-denominated assets.
• Renewed deterioration of eurozone economies and continuous depreciation of the euro since July might negatively affect Asian companies with significant revenue exposure from Europe.
(1)The China region is defined as any country that either shares a border with China or is located in the South China Sea or the East China Sea and includes: the People's Republic of China (PRC or China), Bangladesh, Cambodia, Hong Kong, India, Indonesia, Kazakhstan, Korea, Kyrgyzstan, Laos, Malaysia, Mongolia, Myanmar, Nepal, Pakistan, Philippines, Singapore, Taiwan, Tajikistan, Thailand and Vietnam.
(2)This security comprised less than 0.01% of the fund's total net assets as of 12/31/14.
(3)This security comprised 4.12% of the fund's total net assets as of 12/31/14.
(4)This security comprised 0.60% of the fund's total net assets as of 12/31/14.
(5)This security comprised 4.64% of the fund's total net assets as of 12/31/14.
(6)The fund did not hold this security as of 12/31/14.
(7)This security comprised 1.82% of the fund's total net assets as of 12/31/14.
61
China Region Fund (unaudited)
Top 10 Equity Holdings Based on Net Assets December 31, 2014
China Construction Bank Corp.
Commercial Banks - Non US | | | 6.35 | % | |
Industrial & Commercial Bank of China Ltd.
Commercial Banks - Non US | | | 4.98 | % | |
China Life Insurance Co., Ltd.
Life/Health Insurance | | | 4.64 | % | |
Tencent Holdings Ltd.
Internet Application Software | | | 4.59 | % | |
Bank of China Ltd.
Commercial Banks - Non US | | | 4.12 | % | |
Ping An Insurance Group Co of China Ltd.
Multi-line Insurance | | | 3.86 | % | |
AIA Group Ltd.
Life/Health Insurance | | | 2.63 | % | |
China Railway Construction Corp., Ltd.
Building - Heavy Construction | | | 2.01 | % | |
China Singyes Solar Technologies Holdings Ltd.
Building & Construction - Miscellaneous | | | 1.82 | % | |
Sunac China Holdings Ltd.
Real Estate Operating/Development | | | 1.72 | % | |
Total Top 10 Equity Holdings | | | 36.72 | % | |
Country Distribution*
Based on Total Investments December 31, 2014
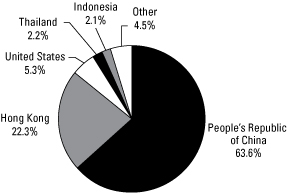
* Country distribution shown is based on domicile and not intended to conform to the China region definition in the prospectus. The locale of company operations may be different.
62
Expense Example (unaudited) December 31, 2014
As a shareholder of the funds, you incur two types of costs: (1) transaction costs, including short-term trading fees and exchange fees; and (2) ongoing costs, including management fees, distribution plan fees, shareholder reports (like this one), and other fund expenses. This example is intended to help you understand your ongoing costs (in dollars) of investing in other mutual funds.
The example is based on an investment of $1,000 invested at the beginning of the period and held for the entire period as indicated below.
• Actual Expenses. The first line of the following table for each fund provides information about actual account values and actual expenses. You may use the information in this line, together with the amount you invested, to estimate the expenses you paid over the period. Simply divide your account value by $1,000 (for example, an $8,600 account value divided by $1,000 = 8.6), then multiply the result by the number in the first line under the heading "Expenses Paid During Period'' to estimate the expenses you paid on your account during this period.
• Hypothetical Example for Comparison Purposes. The second line of the following table for each fund provides information about hypothetical account values and hypothetical expenses based on the fund's actual expense ratio and an assumed rate of return of 5 percent per year before expenses, which is not the fund's actual return. The hypothetical account values and expenses may not be used to estimate the actual ending account balance or expenses you paid for the period. You may use this information to compare the ongoing costs of investing in these funds and other funds. To do so, compare this 5 percent hypothetical example with the 5 percent hypothetical examples that appear in the shareholder reports of other funds.
Please note that the expenses shown in the table are meant to highlight your ongoing costs only and do not reflect any direct or transactional costs, such as small account, exchange or short-term trading fees. Therefore, the second line of the table is useful in comparing ongoing costs only, and will not help you determine the relative total costs of owning different funds. In addition, if these direct or transactional costs were included, your costs would have been higher.
63
Expense Example (unaudited) December 31, 2014
| | | Beginning
Account Value
July 1,
2014 | | Ending
Account Value
December 31,
2014 | | Expenses
Paid During
Period* | |
U.S. Government Securities Ultra-Short
Bond Fund | |
Based on Actual Fund Return | | $ | 1,000.00 | | | $ | 1,001.70 | | | $ | 2.02 | | |
Based on Hypothetical 5% Yearly Return | | $ | 1,000.00 | | | $ | 1,023.19 | | | $ | 2.04 | | |
Near-Term Tax Free Fund | |
Based on Actual Fund Return | | $ | 1,000.00 | | | $ | 1,005.30 | | | $ | 2.27 | | |
Based on Hypothetical 5% Yearly Return | | $ | 1,000.00 | | | $ | 1,022.95 | | | $ | 2.29 | | |
All American Equity Fund | |
Based on Actual Fund Return | | $ | 1,000.00 | | | $ | 996.50 | | | $ | 10.18 | | |
Based on Hypothetical 5% Yearly Return | | $ | 1,000.00 | | | $ | 1,015.00 | | | $ | 10.28 | | |
Holmes Macro Trends Fund | |
Based on Actual Fund Return | | $ | 1,000.00 | | | $ | 940.00 | | | $ | 8.85 | | |
Based on Hypothetical 5% Yearly Return | | $ | 1,000.00 | | | $ | 1,016.08 | | | $ | 9.20 | | |
Global Resources Fund Investor Class | |
Based on Actual Fund Return | | $ | 1,000.00 | | | $ | 643.80 | | | $ | 6.08 | | |
Based on Hypothetical 5% Yearly Return | | $ | 1,000.00 | | | $ | 1,017.80 | | | $ | 7.47 | | |
Global Resources Fund Institutional Class | |
Based on Actual Fund Return | | $ | 1,000.00 | | | $ | 645.70 | | | $ | 3.28 | | |
Based on Hypothetical 5% Yearly Return | | $ | 1,000.00 | | | $ | 1,021.22 | | | $ | 4.03 | | |
World Precious Minerals Fund Investor
Class | |
Based on Actual Fund Return | | $ | 1,000.00 | | | $ | 643.60 | | | $ | 8.12 | | |
Based on Hypothetical 5% Yearly Return | | $ | 1,000.00 | | | $ | 1,015.32 | | | $ | 9.96 | | |
World Precious Minerals Fund Institutional
Class | |
Based on Actual Fund Return | | $ | 1,000.00 | | | $ | 645.10 | | | $ | 7.86 | | |
Based on Hypothetical 5% Yearly Return | | $ | 1,000.00 | | | $ | 1,015.65 | | | $ | 9.63 | | |
Gold and Precious Metals Fund | |
Based on Actual Fund Return | | $ | 1,000.00 | | | $ | 672.80 | | | $ | 7.81 | | |
Based on Hypothetical 5% Yearly Return | | $ | 1,000.00 | | | $ | 1,015.86 | | | $ | 9.42 | | |
Emerging Europe Fund | |
Based on Actual Fund Return | | $ | 1,000.00 | | | $ | 804.30 | | | $ | 10.40 | | |
Based on Hypothetical 5% Yearly Return | | $ | 1,000.00 | | | $ | 1,013.67 | | | $ | 11.61 | | |
China Region Fund | |
Based on Actual Fund Return | | $ | 1,000.00 | | | $ | 1,009.90 | | | $ | 12.68 | | |
Based on Hypothetical 5% Yearly Return | | $ | 1,000.00 | | | $ | 1,012.59 | | | $ | 12.70 | | |
* These calculations are based on expenses incurred in the most recent fiscal half-year. The funds' Investor Class' annualized expense ratios (after reimbursements and offsets) for the six-month period ended December 31, 2014, were 0.40%, 0.45%, 2.02%, 1.81%, 1.47%, 1.96%, 1.85%, 2.29% and 2.50%, respectively, for the U.S. Government Securities Ultra-Short Bond, Near-Term Tax Free, All American Equity, Holmes Macro Trends, Global Resources, World Precious Minerals, Gold and Precious Metals, Emerging Europe and China Region Funds. The funds' Institutional Class' annualized expense ratios (after reimbursements and offsets) for the six-month period ended December 31, 2014, were 0.79% and 1.90%, respectively, for the Global Resources and World Precious Minerals Funds. The dollar amounts shown as "Expenses Paid" are equal to the annualized expense ratio multiplied by the average account value over the period, multiplied by 184, the number of days in the period, then divided by 365 days in the current fiscal year.
64
U.S. Government Securities Ultra-Short Bond Fund
Portfolio of Investments December 31, 2014
United States
Government and Agency
Obligations 91.20% | | Coupon
Rate % | | Maturity
Date | | Principal
Amount | | Value | |
Federal Farm Credit Bank 35.09% | | | |
Fixed Rates: | |
| | | | | | 1.27 | | | 12/18/17 | | $ | 1,310,000 | | | $ | 1,304,898 | | |
| | | | | | 1.50 | | | 06/26/18 | | | 2,200,000 | | | | 2,193,508 | | |
| | | | | | 1.87 | | | 12/26/18 | | | 5,000,000 | | | | 4,989,620 | | |
| | | | | | 1.92 | | | 01/14/19 | | | 5,000,000 | | | | 5,003,039 | | |
| | | | | | 1.93 | | | 12/02/19 | | | 3,984,000 | | | | 3,973,179 | | |
Variable Rates: | |
| | | | | | 0.14 | | | 03/30/15 | | | 5,000,000 | | | | 4,999,884 | | |
| | | | 22,464,128 | | |
Federal Home Loan Bank 47.43% | | | |
Discount Notes: | |
| | Yield | | | | 0.06 | | | 01/07/15 | | | 2,185,000 | | | | 2,184,978 | | |
| | Yield | | | | 0.08 | | | 01/21/15 | | | 1,800,000 | | | | 1,799,920 | | |
| | Yield | | | | 0.08 | | | 01/23/15 | | | 2,600,000 | | | | 2,599,878 | | |
| | Yield | | | | 0.09 | | | 02/04/15 | | | 1,300,000 | | | | 1,299,896 | | |
| | Yield | | | | 0.09 | | | 02/06/15 | | | 6,400,000 | | | | 6,399,471 | | |
| | Yield | | | | 0.06 | | | 02/09/15 | | | 5,000,000 | | | | 4,999,675 | | |
| | Yield | | | | 0.14 | | | 06/03/15 | | | 3,000,000 | | | | 2,998,279 | | |
Fixed Rates: | |
| | | | | | 5.13 | | | 03/10/17 | | | 1,000,000 | | | | 1,088,823 | | |
| | | | | | 1.70 | | | 07/26/18 | | | 3,000,000 | | | | 3,015,453 | | |
| | | | | | 1.50 | | | 03/08/19 | | | 4,000,000 | | | | 3,979,904 | | |
| | | | 30,366,277 | | |
Tennessee Valley Authority 8.68% | | | |
Fixed Rates: | |
| | | | | | 6.25 | | | 12/15/17 | | | 2,930,000 | | | | 3,358,132 | | |
| | | | | | 1.75 | | | 10/15/18 | | | 2,174,000 | | | | 2,196,329 | | |
| | | | 5,554,461 | | |
Total Investments 91.20% | | | 58,384,866 | | |
(cost $58,307,328) | |
Other assets and liabilities, net 8.80% | | | 5,635,323 | | |
Net Assets 100.0% | | $ | 64,020,189 | | |
See notes to portfolios of investments and notes to financial statements.
65
Near-Term Tax Free Fund
Portfolio of Investments December 31, 2014
Municipal Bonds 86.52% | | Coupon
Rate % | | Maturity
Date | | Principal
Amount | | Value | |
Alabama 2.37% | |
Alabama Public School & College
Authority | | | 5.00 | | | 12/01/16 | | $ | 290,000 | | | $ | 314,508 | | |
Bessemer, Alabama Electric Revenue,
Refunding | | | 3.10 | | | 12/01/21 | | | 100,000 | | | | 103,217 | | |
Bessemer, Alabama Water Revenue | | | 4.00 | | | 01/01/16 | | | 500,000 | | | | 505,210 | | |
Jasper Alabama Water Works & Sewer Board,
Inc., Utilities Revenue, Series A | | | 3.00 | | | 06/01/15 | | | 90,000 | | | | 90,670 | | |
Jasper Alabama Water Works & Sewer Board,
Inc., Utilities Revenue, Series A | | | 3.00 | | | 06/01/16 | | | 90,000 | | | | 91,829 | | |
Mountain Brook City Board of Education Capital
Outlay | | | 4.00 | | | 02/15/15 | | | 395,000 | | | | 396,813 | | |
University of Alabama at Birmingham, Hospital
Revenue, Series A | | | 5.00 | | | 09/01/15 | | | 600,000 | | | | 618,414 | | |
| | | | 2,120,661 | | |
Alaska 0.35% | |
Alaska Municipal Bond Bank Authority,
Prerefunded, Series A | | | 4.00 | | | 02/01/16 | | | 195,000 | | | | 202,847 | | |
Alaska Municipal Bond Bank Authority,
Unrefunded, Series A | | | 4.00 | | | 02/01/16 | | | 105,000 | | | | 109,214 | | |
| | | | 312,061 | | |
Arizona 1.78% | |
Arizona Board of Regents Certificates of
Participation, Series B | | | 4.50 | | | 06/01/16 | | | 200,000 | | | | 211,110 | | |
Arizona State School Facilities Board
Certificates of Participation, Series A-1 | | | 5.00 | | | 09/01/17 | | | 325,000 | | | | 335,238 | | |
Arizona State Transportation Board Excise Tax
Revenue | | | 5.00 | | | 07/01/17 | | | 175,000 | | | | 193,331 | | |
McAllister Academic Village LLC, Arizona State
University Hassayampa Revenue, Refunding | | | 5.75 | | | 07/01/18 | | | 200,000 | | | | 229,794 | | |
Page, Arizona, Pledged Revenue, Refunding | | | 3.00 | | | 07/01/16 | | | 350,000 | | | | 362,992 | | |
University of Arizona Certificates of
Participation, Series C | | | 5.00 | | | 06/01/22 | | | 260,000 | | | | 264,550 | | |
| | | | 1,597,015 | | |
California 3.45% | |
California State, GO Unlimited | | | 5.00 | | | 03/01/32 | | | 300,000 | | | | 314,130 | | |
California State, GO Unlimited | | | 4.75 | | | 03/01/34 | | | 205,000 | | | | 211,673 | | |
California State, Refunding, Recreational
Facility, GO Unlimited | | | 5.00 | | | 12/01/19 | | | 5,000 | | | | 5,020 | | |
California State, Statewide Communities
Development Authority, Enloe Medical
Center Revenue, Series A | | | 5.25 | | | 08/15/18 | | | 340,000 | | | | 386,801 | | |
See notes to portfolios of investments and notes to financial statements.
66
Near-Term Tax Free Fund
Portfolio of Investments December 31, 2014
Municipal Bonds (cont'd) | | Coupon
Rate % | | Maturity
Date | | Principal
Amount | | Value | |
California (cont'd) | |
Chaffey Community College District, GO
Unlimited, Series C | | | 5.00 | | | 06/01/32 | | $ | 300,000 | | | $ | 330,834 | | |
Delano, California Union High School District,
GO Unlimited, Refunding, Series A | | | 4.75 | | | 02/01/17 | | | 200,000 | | | | 214,170 | | |
Los Angeles Unified School District,
Election 2004, GO Unlimited, Series H | | | 5.00 | | | 07/01/32 | | | 200,000 | | | | 217,480 | | |
San Diego, California Community College
District, Capital Appreciation, Election 2002,
GO Unlimited (ZCB) | | | 6.35 | (1) | | 05/01/15 | | | 300,000 | | | | 299,685 | | |
Santa Clara County, California Financing
Authority Revenue, Obstetrics and
Gynecology, El Camino Hospital | | | 5.00 | | | 02/01/18 | | | 350,000 | | | | 384,017 | | |
Santa Clara Valley Transportation Authority,
Series A | | | 5.00 | | | 04/01/27 | | | 370,000 | | | | 402,123 | | |
Santa Paula Schools Financing Authority,
Santa Paula Elementary School District
Revenue | | | 4.25 | | | 11/01/22 | | | 300,000 | | | | 323,550 | | |
| | | | 3,089,483 | | |
Colorado 1.55% | |
Denver, Colorado, Health & Hospital Authority,
Healthcare Revenue, Series A | | | 5.00 | | | 12/01/16 | | | 265,000 | | | | 285,031 | | |
Pueblo County, School District No. 70,
GO Unlimited | | | 4.00 | | | 12/01/24 | | | 990,000 | | | | 1,104,146 | | |
| | | | 1,389,177 | | |
Connecticut 1.55% | |
Connecticut State Health & Educational
Facilities Authority Revenue, Bridgeport
Hospital, Series D | | | 5.00 | | | 07/01/19 | | | 395,000 | | | | 447,235 | | |
Connecticut State Health & Educational
Facilities Authority Revenue, William
Backus Hospital, Series G | | | 5.00 | | | 07/01/25 | | | 500,000 | | | | 511,480 | | |
Connecticut State Health & Educational
Facilities Authority Revenue, William
Backus Hospital, Series G | | | 4.00 | | | 07/01/20 | | | 425,000 | | | | 432,697 | | |
| | | | 1,391,412 | | |
District of Columbia 0.69% | |
District of Columbia Income Tax Revenue,
Series A | | | 5.25 | | | 12/01/27 | | | 300,000 | | | | 349,428 | | |
Washington D.C. Convention Center Authority
Dedicated Tax Revenue, Refunding, Series A | | | 5.00 | | | 10/01/16 | | | 250,000 | | | | 268,560 | | |
| | | | 617,988 | | |
See notes to portfolios of investments and notes to financial statements.
67
Near-Term Tax Free Fund
Portfolio of Investments December 31, 2014
Municipal Bonds (cont'd) | | Coupon
Rate % | | Maturity
Date | | Principal
Amount | | Value | |
Florida 7.67% | |
Broward County, Florida School Board
Certificates of Participation, Series A | | | 5.00 | | | 07/01/15 | | $ | 325,000 | | | $ | 332,413 | | |
Cape Coral, Florida Gas Tax Revenue, Series A | | | 4.00 | | | 10/01/16 | | | 255,000 | | | | 269,767 | | |
Citizens Property Insurance Co., Senior
Secured, Coastal Account, Revenue,
Series A-1 | | | 4.00 | | | 06/01/18 | | | 100,000 | | | | 109,063 | | |
Escambia County, Florida, Health Facilities
Authority Revenue, Baptist Hospital, Inc.
Project, Series A | | | 5.00 | | | 08/15/19 | | | 290,000 | | | | 327,158 | | |
Florida Board of Education, GO Unlimited,
Refunding, Series C | | | 4.50 | | | 06/01/28 | | | 300,000 | | | | 307,293 | | |
Florida Gulf Coast University Financing Corp.,
Capital Improvement Revenue, Series B | | | 3.00 | | | 02/01/16 | | | 365,000 | | | | 374,680 | | |
Florida State Board of Education Lottery
Revenue, Series B | | | 5.00 | | | 07/01/26 | | | 100,000 | | | | 110,381 | | |
Florida State Board of Governors Parking
Facilities Revenue, Series A | | | 3.00 | | | 07/01/17 | | | 300,000 | | | | 315,531 | | |
Florida State Department of Management
Services Certificates of Participation,
Series A | | | 5.00 | | | 08/01/24 | | | 340,000 | | | | 383,666 | | |
Florida State Municipal Power Agency,
Stanton Project Revenue, Refunding | | | 5.13 | | | 10/01/17 | | | 300,000 | | | | 332,367 | | |
Fort Pierce, Florida Stormwater Utilities
Revenue | | | 4.50 | | | 10/01/17 | | | 255,000 | | | | 262,349 | | |
Hillsborough County, Florida School Board,
Refunding, Certificates of Participation | | | 4.00 | | | 07/01/19 | | | 100,000 | | | | 105,350 | | |
Jacksonville Florida Special Revenue, Series C | | | 5.00 | | | 10/01/20 | | | 270,000 | | | | 316,238 | | |
Lake County, Florida School Board
Certificates of Participation, Series A | | | 3.70 | | | 06/01/15 | | | 400,000 | | | | 405,404 | | |
Leesburg, Florida Capital Improvement
Revenue Bonds, Refunding | | | 5.00 | | | 10/01/21 | | | 405,000 | | | | 462,538 | | |
Margate, Florida Water & Sewer Revenue,
Refunding | | | 4.00 | | | 10/01/19 | | | 250,000 | | | | 265,150 | | |
Miami - Dade County, Florida Expressway
Authority Toll System Revenue, Series A | | | 5.00 | | | 07/01/21 | | | 430,000 | | | | 506,957 | | |
Miami - Dade County, Florida Water & Sewer
Revenue System, Series A | | | 4.00 | | | 10/01/16 | | | 235,000 | | | | 249,241 | | |
Orlando, Florida Community Redevelopment
Agency Tax Increment Revenue, Downtown
District, Series A | | | 4.00 | | | 09/01/17 | | | 275,000 | | | | 290,598 | | |
Polk County, Florida School District Revenue | | | 5.00 | | | 10/01/17 | | | 215,000 | | | | 237,106 | | |
Port St. Lucie, Florida, Southwest Annexation
Special Assessment District No 1, Revenue,
Series B | | | 4.13 | | | 07/01/17 | | | 25,000 | | | | 26,059 | | |
Reedy Creek, Florida Improvement District
Utilities Revenue, Refunding, Series 2 | | | 5.00 | | | 10/01/16 | | | 300,000 | | | | 309,813 | | |
See notes to portfolios of investments and notes to financial statements.
68
Near-Term Tax Free Fund
Portfolio of Investments December 31, 2014
Municipal Bonds (cont'd) | | Coupon
Rate % | | Maturity
Date | | Principal
Amount | | Value | |
Florida (cont'd) | |
Saint Johns County, Florida Transportation
Revenue, Refunding | | | 5.00 | | | 10/01/20 | | $ | 310,000 | | | $ | 365,307 | | |
Volusia County, Florida School Board Sales
Tax Revenue | | | 4.20 | | | 10/01/16 | | | 200,000 | | | | 208,970 | | |
| | | | 6,873,399 | | |
Georgia 1.69% | |
Atlanta Downtown Development Authority,
Series A | | | 4.25 | | | 12/01/16 | | | 250,000 | | | | 262,293 | | |
Carroll City-County, Georgia Hospital Authority,
Tanner Medical Center, Inc. Project | | | 5.00 | | | 07/01/18 | | | 600,000 | | | | 677,832 | | |
Georgia State Municipal Electric Authority
Revenue, Unrefunded | | | 5.50 | | | 01/01/20 | | | 135,000 | | | | 143,685 | | |
Glynn-Brunswick Memorial Hospital Authority,
Southeast Georgia Health System and
Affiliates Revenue, Anticipation Certificates,
Series A | | | 4.50 | | | 08/01/17 | | | 150,000 | | | | 162,885 | | |
Gwinnett County, Georgia, Hospital Authority,
Gwinnett Hospital Systems Revenue,
Series B | | | 5.00 | | | 07/01/18 | | | 250,000 | | | | 270,393 | | |
| | | | 1,517,088 | | |
Guam 0.29% | |
Guam Education Financing Foundation
Certificate of Participation, Series A | | | 4.25 | | | 10/01/18 | | | 250,000 | | | | 256,820 | | |
Idaho 0.29% | |
Idaho Housing & Finance Association, Grant &
Revenue Anticipation, Federal Highway
Trust Fund, Series A | | | 5.00 | | | 07/15/21 | | | 225,000 | | | | 256,201 | | |
Illinois 8.05% | |
Aurora, Illinois, GO Unlimited, Series B | | | 3.00 | | | 12/30/15 | | | 200,000 | | | | 204,858 | | |
Chicago Board of Education, Dedicated
Revenues, GO Unlimited, Series F | | | 5.00 | | | 12/01/16 | | | 300,000 | | | | 317,700 | | |
Chicago Board of Education, GO Unlimited | | | 5.25 | | | 12/01/19 | | | 300,000 | | | | 335,340 | | |
Chicago, Illinois Sales Tax Revenue | | | 5.50 | | | 01/01/15 | | | 350,000 | | | | 350,000 | | |
Chicago, Illinois, City Colleges, GO Unlimited | | | 5.00 | | | 01/01/17 | | | 115,000 | | | | 122,964 | | |
Chicago, Illinois, Direct Access Bond,
GO Unlimited, Series E-1 B | | | 4.00 | | | 01/01/19 | | | 200,000 | | | | 201,924 | | |
Chicago, Illinois, O'Hare International Airport
Revenue, Gen - Third Lien, Series C | | | 5.25 | | | 01/01/23 | | | 250,000 | | | | 289,920 | | |
Chicago, Illinois, Unrefunded Balance,
GO Unlimited, Series B | | | 5.13 | | | 01/01/15 | | | 165,000 | | | | 165,000 | | |
See notes to portfolios of investments and notes to financial statements.
69
Near-Term Tax Free Fund
Portfolio of Investments December 31, 2014
Municipal Bonds (cont'd) | | Coupon
Rate % | | Maturity
Date | | Principal
Amount | | Value | |
Illinois (cont'd) | |
Clinton Bond Fayette Etc Counties Community
College District No. 501 Kaskaskia,
GO Unlimited | | | 5.75 | | | 12/01/19 | | $ | 500,000 | | | $ | 583,575 | | |
Du Page County, Refunding, GO Unlimited | | | 5.60 | | | 01/01/21 | | | 440,000 | | | | 499,871 | | |
Illinois Finance Authority, Refunding, Shedd
Aquarium Society Project | | | 5.00 | | | 07/01/16 | | | 390,000 | | | | 398,685 | | |
Illinois Regional Transportation Authority,
Series A | | | 7.20 | | | 11/01/20 | | | 165,000 | | | | 190,809 | | |
Illinois State, GO Unlimited | | | 5.00 | | | 03/01/16 | | | 340,000 | | | | 356,150 | | |
Illinois State, GO Unlimited | | | 5.00 | | | 05/01/18 | | | 1,000,000 | | | | 1,100,939 | | |
Illinois State, Refunding, GO Unlimited | | | 5.00 | | | 01/01/16 | | | 300,000 | | | | 312,777 | | |
Illinois State Toll Highway Authority,
Toll Highway Revenue, Series A | | | 5.00 | | | 01/01/16 | | | 200,000 | | | | 204,602 | | |
Lake & McHenry County, Fox Lake, Illinois,
Debt Certificates, Series B | | | 3.00 | | | 11/01/19 | | | 265,000 | | | | 271,826 | | |
Springfield, Illinois Metropolitan Sanitation
District, Sewer Revenue, Senior Lien,
Series A | | | 4.00 | | | 01/01/17 | | | 570,000 | | | | 596,636 | | |
Will Grundy Etc Counties Community College
District No. 525, Joliet Junior College
Project, GO Unlimited | | | 6.25 | | | 06/01/22 | | | 300,000 | | | | 349,488 | | |
Winnebago County Public Safety Sales Tax,
GO Unlimited, Series A | | | 5.00 | | | 12/30/16 | | | 350,000 | | | | 358,166 | | |
| | | | 7,211,230 | | |
Indiana 2.80% | |
Fort Wayne, Indiana Waterworks Utility
Revenue | | | 2.00 | | | 12/01/16 | | | 585,000 | | | | 600,696 | | |
Indianapolis Local Public Improvement Bond
Bank, Waterworks Project, Series 2007 L | | | 5.25 | | | 01/01/33 | | | 305,000 | | | | 333,222 | | |
Merrillville Redevelopment Authority | | | 5.00 | | | 08/15/20 | | | 350,000 | | | | 405,437 | | |
Tippecanoe County, Indiana School
Improvements | | | 4.00 | | | 01/15/15 | | | 300,000 | | | | 300,414 | | |
Tri-Creek 2002 High School Building | | | 5.00 | | | 07/15/19 | | | 800,000 | | | | 865,168 | | |
| | | | 2,504,937 | | |
Iowa 0.70% | |
Johnston Community School District,
GO Unlimited | | | 4.00 | | | 06/01/16 | | | 200,000 | | | | 202,764 | | |
University of Iowa Hospitals and Clinics,
Iowa State Board of Regents, Hospital
Revenue, Series A | | | 3.00 | | | 09/01/19 | | | 400,000 | | | | 426,864 | | |
| | | | 629,628 | | |
See notes to portfolios of investments and notes to financial statements.
70
Near-Term Tax Free Fund
Portfolio of Investments December 31, 2014
Municipal Bonds (cont'd) | | Coupon
Rate % | | Maturity
Date | | Principal
Amount | | Value | |
Kansas 1.91% | |
Douglas County, Kansas, Unified School
District No. 497 Lawrence, Series A | | | 3.00 | | | 09/01/15 | | $ | 1,225,000 | | | $ | 1,247,196 | | |
Kansas State Development Finance Authority
Revenue | | | 4.00 | | | 10/01/15 | | | 450,000 | | | | 462,708 | | |
| | | | 1,709,904 | | |
Kentucky 1.95% | |
Bowling Green, Kentucky, GO Unlimited,
Series B | | | 4.00 | | | 09/01/16 | | | 215,000 | | | | 227,369 | | |
Kentucky Asset Liability Commission,
University of Kentucky Project, Series A | | | 5.00 | | | 10/01/15 | | | 1,000,000 | | | | 1,035,209 | | |
Kentucky Municipal Power Agency, Power
System Revenue, Prairie State Project,
Series A | | | 5.25 | | | 09/01/22 | | | 440,000 | | | | 486,992 | | |
| | | | 1,749,570 | | |
Louisiana 0.29% | |
Louisiana State, Citizens Property Insurance
Corp., Revenue Bonds, Series B | | | 5.00 | | | 06/01/21 | | | 245,000 | | | | 258,933 | | |
Massachusetts 0.98% | |
Massachusetts Water Pollution Abatement
Trust Revenue, Series A | | | 5.00 | | | 02/01/15 | | | 300,000 | | | | 301,173 | | |
New Bedford, Massachusetts, State Qualified
Municipal Loan, GO Limited | | | 3.00 | | | 03/01/15 | | | 345,000 | | | | 346,563 | | |
Stoughton, Massachusetts Public
Improvement, GO Limited | | | 4.00 | | | 05/01/17 | | | 225,000 | | | | 233,764 | | |
| | | | 881,500 | | |
Michigan 3.12% | |
Detroit, Michigan Local Development Financing
Authority, Refunding, Series A | | | 5.38 | | | 05/01/18 | | | 140,000 | | | | 135,241 | | |
Detroit, Michigan Sewer Disposal Revenue,
Refunding, Series C-1 | | | 5.25 | | | 07/01/15 | | | 400,000 | | | | 409,492 | | |
Gibraltar, Michigan School District, Refunding,
GO Unlimited | | | 5.00 | | | 05/01/21 | | | 475,000 | | | | 548,891 | | |
Michigan Public Power Agency AFEC Project
Revenue, Series A | | | 4.50 | | | 01/01/19 | | | 280,000 | | | | 301,893 | | |
Michigan State, Trunk Line Revenue, Refunding | | | 4.50 | | | 11/01/26 | | | 105,000 | | | | 116,797 | | |
Michigan State Grant Anticipation Bonds | | | 5.00 | | | 09/15/16 | | | 200,000 | | | | 214,612 | | |
Michigan State Hospital Finance Authority,
Trinity Health, Series A | | | 6.00 | | | 12/01/18 | | | 200,000 | | | | 234,570 | | |
Michigan Strategic Fund, Series A | | | 5.00 | | | 10/15/17 | | | 200,000 | | | | 221,432 | | |
Portage Public Schools, School Building & Site,
GO Unlimited | | | 5.00 | | | 05/01/20 | | | 300,000 | | | | 336,672 | | |
See notes to portfolios of investments and notes to financial statements.
71
Near-Term Tax Free Fund
Portfolio of Investments December 31, 2014
Municipal Bonds (cont'd) | | Coupon
Rate % | | Maturity
Date | | Principal
Amount | | Value | |
Michigan (cont'd) | |
Wayne County, Michigan Airport Authority
Revenue, Detroit Metropolitan Airport,
Refunding, Series C | | | 4.00 | | | 12/01/19 | | $ | 255,000 | | | $ | 279,702 | | |
| | | | 2,799,302 | | |
Minnesota 0.60% | |
Minneapolis & St Paul, Minnesota Housing &
Redevelopment Authority Health Care
Systems, Children's Health Care, Series B | | | 4.00 | | | 08/15/16 | | | 250,000 | | | | 262,675 | | |
Minneapolis & St Paul, Minnesota Metropolitan
Airports Commission, Airport Revenue,
Airport Revenue, Refunding, Series B | | | 5.00 | | | 01/01/19 | | | 255,000 | | | | 275,324 | | |
| | | | 537,999 | | |
Missouri 0.92% | |
Kansas City, Missouri Water Revenue, Series F | | | 4.00 | | | 12/01/22 | | | 250,000 | | | | 288,948 | | |
Missouri Development Finance Board, Eastland
Center Project, Tax Allocation, Series A | | | 5.00 | | | 04/01/17 | | | 250,000 | | | | 268,620 | | |
Missouri State Health & Educational Facilities
Authority, Southwestern Baptist University
Revenue | | | 3.00 | | | 10/01/17 | | | 265,000 | | | | 269,322 | | |
| | | | 826,890 | | |
Nevada 0.65% | |
Clark County, Nevada, GO Limited | | | 5.00 | | | 11/01/18 | | | 100,000 | | | | 107,911 | | |
Nye County School District, GO Limited | | | 4.00 | | | 05/01/15 | | | 465,000 | | | | 470,352 | | |
| | | | 578,263 | | |
New Hampshire 0.49% | |
New Hampshire Health & Education Facilities
Authority Revenue, Southern New
Hampshire University Project | | | 5.00 | | | 01/01/18 | | | 400,000 | | | | 436,076 | | |
New Jersey 4.82% | |
Atlantic City, New Jersey Municipal Utilities
Authority Revenue, Refunding | | | 5.00 | | | 06/01/17 | | | 150,000 | | | | 154,509 | | |
Atlantic City, New Jersey, Refunding Tax
Appeal, GO Limited | | | 4.00 | | | 11/01/18 | | | 500,000 | | | | 497,005 | | |
Elizabeth, New Jersey Parking Authority
Project Revenue, Elizabethtown Plaza
Redevelopment, Series B | | | 4.00 | | | 11/01/17 | | | 255,000 | | | | 268,405 | | |
Hudson County, New Jersey Improvement
Authority Lease Revenue, North Hudson
Regional Fire, Refunding, Series A | | | 5.63 | | | 09/01/18 | | | 400,000 | | | | 442,480 | | |
See notes to portfolios of investments and notes to financial statements.
72
Near-Term Tax Free Fund
Portfolio of Investments December 31, 2014
Municipal Bonds (cont'd) | | Coupon
Rate % | | Maturity
Date | | Principal
Amount | | Value | |
New Jersey (cont'd) | |
New Jersey Building Authority Revenue,
Refunding, Series A | | | 3.00 | | | 06/15/15 | | $ | 850,000 | | | $ | 859,019 | | |
New Jersey Economic Development Authority
Revenue, School Facilities Construction,
Refunding | | | 5.00 | | | 12/15/18 | | | 710,000 | | | | 797,224 | | |
New Jersey Health Care Facilities Financing
Authority Revenue, Holy Name Medical
Center, Refunding | | | 5.00 | | | 07/01/19 | | | 215,000 | | | | 242,937 | | |
New Jersey Transportation Trust Fund
Authority, Series A | | | 5.00 | | | 06/15/16 | | | 440,000 | | | | 466,959 | | |
Passaic Valley, New Jersey, Sewage
Commissioners Revenue, Series G | | | 5.75 | | | 12/01/21 | | | 500,000 | | | | 589,575 | | |
| | | | 4,318,113 | | |
New Mexico 0.83% | |
Clayton, New Mexico, Jail Project Revenue | | | 4.00 | | | 11/01/17 | | | 235,000 | | | | 240,891 | | |
Los Alamos County, New Mexico, Sales Tax
Revenue | | | 5.75 | | | 06/01/16 | | | 470,000 | | | | 503,826 | | |
| | | | 744,717 | | |
New York 4.07% | |
Arlington Central School District, GO Unlimited | | | 5.00 | | | 12/15/25 | | | 1,000,000 | | | | 1,201,379 | | |
Long Island Power Authority Revenue,
Series B | | | 5.00 | | | 09/01/21 | | | 465,000 | | | | 540,470 | | |
Long Island Power Authority Revenue,
New York Electric Systems, Series E | | | 5.00 | | | 12/01/17 | | | 330,000 | | | | 355,205 | | |
Nassau County Industrial Development
Agency, New York Institute of Technology
Project Revenue, Refunding, Remarketing,
Series A | | | 5.00 | | | 03/01/21 | | | 350,000 | | | | 392,046 | | |
New York State Dormitory Authority,
Nonconstruction Supported Debt,
Municipal Facilities Health Lease, Series 1 | | | 5.00 | | | 01/15/17 | | | 300,000 | | | | 324,057 | | |
New York, New York, GO Unlimited,
Subseries L-1 | | | 4.00 | | | 04/01/15 | | | 300,000 | | | | 302,754 | | |
Ossining, New York, Union Free School
District, Refunding, GO Unlimited | | | 3.00 | | | 04/15/15 | | | 530,000 | | | | 534,198 | | |
| | | | 3,650,109 | | |
North Carolina 0.76% | |
Beaufort County, North Carolina, GO Limited | | | 5.00 | | | 06/01/21 | | | 200,000 | | | | 231,716 | | |
North Carolina State Municipal Power
Agency #1, Catawba Electric Revenue,
Refunding, Series A | | | 5.25 | | | 01/01/20 | | | 400,000 | | | | 449,388 | | |
| | | | 681,104 | | |
See notes to portfolios of investments and notes to financial statements.
73
Near-Term Tax Free Fund
Portfolio of Investments December 31, 2014
Municipal Bonds (cont'd) | | Coupon
Rate % | | Maturity
Date | | Principal
Amount | | Value | |
Ohio 1.49% | |
Canton City School District, Refunding,
GO Unlimited | | | 5.00 | | | 12/01/18 | | $ | 325,000 | | | $ | 331,318 | | |
Cleveland, Ohio, Parking Facility Revenue,
Prerefunding, Refunding | | | 5.25 | | | 09/15/22 | | | 130,000 | | | | 161,339 | | |
Lorain County, Ohio, Community College
District, Revenue | | | 3.25 | | | 12/01/17 | | | 650,000 | | | | 684,652 | | |
Marion County, Ohio, Variable Refunding,
GO Limited | | | 4.00 | | | 12/01/20 | | | 150,000 | | | | 157,065 | | |
| | | | 1,334,374 | | |
Oklahoma 2.47% | |
Oklahoma County Independent School
District No. 52 Midwest City | | | 2.00 | | | 01/01/15 | | | 1,860,000 | | | | 1,860,000 | | |
Oklahoma State Agricultural & Mechanical
Colleges, Oklahoma State University,
Series A | | | 5.00 | | | 08/01/21 | | | 300,000 | | | | 348,924 | | |
| | | | 2,208,924 | | |
Oregon 0.25% | |
Oregon State Facilities Authority, Legacy
Health Project Revenue, Refunding,
Series A | | | 4.50 | | | 05/01/20 | | | 200,000 | | | | 227,816 | | |
Pennsylvania 2.73% | |
Allegheny County, Pennsylvania Sanitary
Authority | | | 5.00 | | | 06/01/19 | | | 700,000 | | | | 800,457 | | |
Delaware Valley, Pennsylvania, Regional
Financial Authority Revenue, Permanently
Fixed Business Development Services | | | 5.50 | | | 08/01/18 | | | 295,000 | | | | 335,748 | | |
Lycoming County, Pennsylvania Authority
Health System, Susquehanna Health
Systems Project, Series A | | | 5.10 | | | 07/01/20 | | | 140,000 | | | | 157,381 | | |
Philadelphia School District, Pennsylvania,
Refunding, GO Unlimited, Series E | | | 5.25 | | | 09/01/24 | | | 625,000 | | | | 707,663 | | |
Reading, Pennsylvania School District,
GO Unlimited, Series A | | | 5.00 | | | 04/01/20 | | | 400,000 | | | | 442,976 | | |
| | | | 2,444,225 | | |
Puerto Rico 0.75% | |
Commonwealth of Puerto Rico, GO Unlimited,
Series A | | | 5.00 | | | 07/01/15 | | | 225,000 | | | | 225,432 | | |
Puerto Rico Infrastructure Financing Authority,
Special Tax Revenue, Refunding, Series C | | | 5.50 | | | 07/01/17 | | | 445,000 | | | | 450,865 | | |
| | | | 676,297 | | |
See notes to portfolios of investments and notes to financial statements.
74
Near-Term Tax Free Fund
Portfolio of Investments December 31, 2014
Municipal Bonds (cont'd) | | Coupon
Rate % | | Maturity
Date | | Principal
Amount | | Value | |
Rhode Island 0.30% | |
Rhode Island State Economic Development
Corporation Revenue, Series A | | | 5.00 | | | 06/15/17 | | $ | 250,000 | | | $ | 264,648 | | |
South Carolina 1.51% | |
Jasper County School District, GO Unlimited | | | 4.00 | | | 03/01/15 | | | 195,000 | | | | 196,215 | | |
Piedmont Municipal Power Agency, Series A-3 | | | 5.00 | | | 01/01/16 | | | 150,000 | | | | 156,632 | | |
Spartanburg County, South Carolina, Regional
Health Services District, Hospital Revenue,
Refunding, Series A | | | 5.00 | | | 04/15/19 | | | 600,000 | | | | 678,114 | | |
Spartanburg County, South Carolina, Sanitation
Sewer District, Series A | | | 3.50 | | | 03/01/19 | | | 300,000 | | | | 324,192 | | |
| | | | 1,355,153 | | |
Tennessee 0.26% | |
Memphis, Tennessee Sanitary Sewage System
Revenue, Refunding | | | 5.00 | | | 05/01/20 | | | 200,000 | | | | 234,762 | | |
Texas 18.28% | |
Addison, Texas Certificates of Obligation,
GO Limited | | | 4.50 | | | 02/15/28 | | | 140,000 | | | | 150,758 | | |
Addison, Texas Certificates of Obligation,
GO Unlimited | | | 4.00 | | | 02/15/20 | | | 250,000 | | | | 268,277 | | |
Annetta, Texas Certificates of Obligation,
GO Limited | | | 4.00 | | | 08/01/16 | | | 200,000 | | | | 204,586 | | |
Bexar County, Texas, Certificates of
Participation | | | 4.00 | | | 06/15/15 | | | 945,000 | | | | 960,544 | | |
Brownwood Independent School District,
GO Unlimited | | | 4.00 | | | 02/15/24 | | | 730,000 | | | | 818,053 | | |
Center, Texas, Certificates of Obligation,
GO Limited (ZCB) | | | 3.36 | (1) | | 02/15/20 | | | 150,000 | | | | 133,731 | | |
Clear Lake, Texas, Waterworks & Sewer
System, GO Unlimited | | | 3.00 | | | 03/01/19 | | | 125,000 | | | | 129,651 | | |
Corpus Christi, Texas Business & Job
Development Corporation, Seawall Project,
Sales Tax Revenue, Refunding | | | 5.00 | | | 03/01/20 | | | 350,000 | | | | 403,011 | | |
Dallas, Texas Waterworks & Sewer Systems
Revenue, Refunding | | | 4.50 | | | 10/01/19 | | | 225,000 | | | | 245,624 | | |
Dallas, Texas, Refunding, GO Limited | | | 5.00 | | | 02/15/15 | | | 1,350,000 | | | | 1,357,925 | | |
Denton County, Texas Fresh Water Supply
District No. 10, GO Limited | | | 2.00 | | | 09/01/15 | | | 150,000 | | | | 151,563 | | |
Forney, Texas, GO Limited | | | 5.00 | | | 02/15/27 | | | 500,000 | | | | 538,455 | | |
Frisco, Texas Independent School District,
School Building, GO Unlimited, Series A | | | 4.50 | | | 08/15/25 | | | 180,000 | | | | 194,819 | | |
Goose Creek, Texas Independent School
District, GO Unlimited, Series A | | | 5.25 | | | 02/15/18 | | | 370,000 | | | | 405,990 | | |
See notes to portfolios of investments and notes to financial statements.
75
Near-Term Tax Free Fund
Portfolio of Investments December 31, 2014
Municipal Bonds (cont'd) | | Coupon
Rate % | | Maturity
Date | | Principal
Amount | | Value | |
Texas (cont'd) | |
Grand Prairie, Texas Independent School
District, Refunding, GO Unlimited (ZCB) | | | 4.78 | (1) | | 08/15/16 | | $ | 400,000 | | | $ | 386,724 | | |
Greenville, Texas Independent School District,
Refunding, GO Unlimited | | | 4.00 | | | 08/15/17 | | | 120,000 | | | | 126,580 | | |
Harris County, Texas Municipal Utility
District No. 382, GO Unlimited | | | 3.00 | | | 04/01/22 | | | 305,000 | | | | 313,747 | | |
Houston, Texas, Hotel Occupancy Tax &
Special Revenue, Refunding, Series B | | | 5.00 | | | 09/01/19 | | | 295,000 | | | | 315,249 | | |
Katy, Texas Independent School District,
School Building, GO Unlimited, Series D | | | 4.50 | | | 02/15/19 | | | 325,000 | | | | 340,499 | | |
Laredo, Texas, Waterworks & Sewer System
Revenue | | | 4.25 | | | 03/01/18 | | | 100,000 | | | | 106,351 | | |
Lavaca-Navidad River Authority, Series A | | | 4.00 | | | 08/01/22 | | | 270,000 | | | | 299,735 | | |
Lavaca-Navidad River Authority, Series B | | | 4.00 | | | 08/01/22 | | | 420,000 | | | | 466,255 | | |
Lewisville, Texas Independent School District,
Refunding, GO Unlimited (ZCB) | | | 5.40 | (1) | | 08/15/15 | | | 400,000 | | | | 399,248 | | |
Lower Colorado River Authority | | | 5.00 | | | 05/15/15 | | | 775,000 | | | | 788,431 | | |
Lower Colorado River Authority, Transmission
Contract Revenue, Refunding, Series A | | | 5.00 | | | 05/15/21 | | | 500,000 | | | | 583,280 | | |
North Texas Tollway Authority Revenue,
Series F | | | 5.75 | | | 01/01/38 | | | 300,000 | | | | 330,249 | | |
Northside, Texas Independent School District,
GO Unlimited, Series A | | | 2.00 | | | 02/15/15 | | | 1,055,000 | | | | 1,057,257 | | |
Prosper, Texas Independent School District,
Capital Appreciation, School Building,
GO Unlimited (ZCB) | | | 12.60 | (1) | | 08/15/33 | | | 1,000,000 | | | | 389,490 | | |
San Antonio, Texas City Public Service Board | | | 5.50 | | | 02/01/15 | | | 650,000 | | | | 652,444 | | |
San Antonio, Texas, Water Revenue, Refunding | | | 4.50 | | | 05/15/21 | | | 400,000 | | | | 463,560 | | |
San Marcos, Texas Tax & Toll Revenue,
GO Limited | | | 5.10 | | | 08/15/27 | | | 400,000 | | | | 445,300 | | |
San Patricio, Texas Municipal Water District,
Refunding | | | 4.00 | | | 07/10/18 | | | 200,000 | | | | 203,164 | | |
Schertz-Cibolo-Universal City, Texas
Independent School District, School
Building, Refunding, GO Unlimited,
Series A (ZCB) | | | 0.25 | (1) | | 02/01/15 | | | 1,600,000 | | | | 1,599,711 | | |
Texarkana, Texas Waterworks & Sanitary
Sewer System Revenue | | | 3.00 | | | 08/01/19 | | | 90,000 | | | | 93,391 | | |
Texarkana, Texas Waterworks & Sanitary
Sewer System Revenue | | | 3.00 | | | 08/01/20 | | | 95,000 | | | | 98,256 | | |
Texarkana, Texas, Refunding, GO Limited | | | 5.00 | | | 02/15/21 | | | 320,000 | | | | 371,142 | | |
Texas Municipal Power Agency Revenue,
Refunding | | | 5.00 | | | 09/01/17 | | | 250,000 | | | | 275,488 | | |
White Settlement, Texas Independent School
District, Prerefunded, GO Unlimited | | | 4.13 | | | 08/15/15 | | | 240,000 | | | | 245,693 | | |
See notes to portfolios of investments and notes to financial statements.
76
Near-Term Tax Free Fund
Portfolio of Investments December 31, 2014
Municipal Bonds (cont'd) | | Coupon
Rate % | | Maturity
Date | | Principal
Amount | | Value | |
Texas (cont'd) | |
White Settlement, Texas Independent School
District, Unrefunded, GO Unlimited | | | 4.13 | | | 08/15/15 | | $ | 60,000 | | | $ | 61,457 | | |
| | | | 16,375,688 | | |
Utah 1.59% | |
Salt Lake County, Utah, Westminster College
Project Revenue | | | 5.00 | | | 10/01/24 | | | 235,000 | | | | 252,745 | | |
Tooele City, Utah Municipal Building Authority,
Municipal Building Authority Lease
Revenue, Refunding | | | 3.75 | | | 12/01/17 | | | 285,000 | | | | 289,152 | | |
Utah State Building Ownership Authority,
Lease Revenue, Refunding, Series C | | | 5.50 | | | 05/15/19 | | | 500,000 | | | | 556,950 | | |
Washington County-St George Interlocal
Agency, Lease Revenue, Refunding,
Series A | | | 4.00 | | | 12/01/19 | | | 300,000 | | | | 330,243 | | |
| | | | 1,429,090 | | |
Virginia 0.35% | |
Virginia College Building Authority Educational
Facilities Revenue, Prerefunded, Series A | | | 5.00 | | | 09/01/15 | | | 10,000 | | | | 10,315 | | |
Virginia College Building Authority Educational
Facilities Revenue, Unrefunded, Series A | | | 5.00 | | | 09/01/15 | | | 290,000 | | | | 299,173 | | |
| | | | 309,488 | | |
Washington 0.29% | |
Spokane County, Washington School
District No. 81, GO Unlimited | | | 5.05 | | | 06/01/22 | | | 255,000 | | | | 260,008 | | |
Wisconsin 1.63% | |
New Holstein, Wisconsin Electric System
Revenue | | | 4.25 | | | 05/01/18 | | | 270,000 | | | | 283,516 | | |
Wisconsin State Health & Educational
Facilities Authority, Luther Hospital Project | | | 5.00 | | | 11/15/21 | | | 1,000,000 | | | | 1,148,929 | | |
Wisconsin State, Refunding, GO Unlimited,
Series 2 | | | 4.13 | | | 11/01/16 | | | 25,000 | | | | 25,713 | | |
| | | | 1,458,158 | | |
Total Investments 86.52% | | | 77,518,211 | | |
(cost $76,069,875) | |
Other assets and liabilities, net 13.48% | | | 12,077,163 | | |
Net Assets 100.0% | | $ | 89,595,374 | | |
(1)Represents Yield on zero coupon bond.
See notes to portfolios of investments and notes to financial statements.
77
All American Equity Fund
Portfolio of Investments December 31, 2014
Common Stocks 97.63% | | Shares | | Value | |
Aerospace/Defense 3.77% | |
General Dynamics Corp. | | | 1,900 | | | $ | 261,478 | | |
Northrop Grumman Corp. | | | 2,000 | | | | 294,780 | | |
Raytheon Co. | | | 2,500 | | | | 270,425 | | |
| | | | 826,683 | | |
Agricultural Operations 1.14% | |
Archer-Daniels-Midland Co. | | | 4,800 | | | | 249,600 | | |
Applications Software 1.02% | |
Microsoft Corp. | | | 4,800 | | | | 222,960 | | |
Automotive - Cars & Light Trucks 1.19% | |
Ford Motor Co. | | | 16,800 | | | | 260,400 | | |
Beverages - Non-alcoholic 2.26% | |
Coca-Cola Co. | | | 5,900 | | | | 249,098 | | |
PepsiCo, Inc. | | | 2,600 | | | | 245,856 | | |
| | | | 494,954 | | |
Cable/Satellite TV 1.16% | |
Comcast Corp., Class A | | | 4,400 | | | | 255,244 | | |
Chemicals - Diversified 2.42% | |
Dow Chemical Co. | | | 5,700 | | | | 259,977 | | |
LyondellBasell Industries N.V., Class A | | | 3,400 | | | | 269,926 | | |
| | | | 529,903 | | |
Computer Services 1.89% | |
Computer Sciences Corp. | | | 3,500 | | | | 220,675 | | |
International Business Machines Corp. | | | 1,200 | | | | 192,528 | | |
| | | | 413,203 | | |
Computers 4.54% | |
Apple, Inc. | | | 7,000 | | | | 772,660 | | |
Hewlett-Packard Co. | | | 5,600 | | | | 224,728 | | |
| | | | 997,388 | | |
Computers - Memory Devices 3.07% | |
EMC Corp. | | | 7,500 | | | | 223,050 | | |
NetApp, Inc. | | | 5,500 | | | | 227,975 | | |
Western Digital Corp. | | | 2,000 | | | | 221,400 | | |
| | | | 672,425 | | |
See notes to portfolios of investments and notes to financial statements.
78
All American Equity Fund
Portfolio of Investments December 31, 2014
Common Stocks (cont'd) | | Shares | | Value | |
Cosmetics & Toiletries 1.12% | |
Procter & Gamble Co. | | | 2,700 | | | $ | 245,943 | | |
Cruise Lines 1.18% | |
Carnival Corp. | | | 5,700 | | | | 258,381 | | |
Data Processing/Management 0.99% | |
Fidelity National Information Services, Inc. | | | 3,500 | | | | 217,700 | | |
Diversified Banking Institution 1.23% | |
JPMorgan Chase & Co. | | | 4,300 | | | | 269,094 | | |
Electric - Integrated 1.16% | |
Entergy Corp. | | | 2,900 | | | | 253,692 | | |
Electric Products - Miscellaneous 1.24% | |
Emerson Electric Co. | | | 4,400 | | | | 271,612 | | |
Electronic Component - Miscellaneous 1.15% | |
Corning, Inc. | | | 11,000 | | | | 252,230 | | |
Electronic Component - Semiconductors 1.03% | |
Broadcom Corp., Class A | | | 5,200 | | | | 225,316 | | |
Electronics - Military 1.21% | |
L-3 Communications Holdings, Inc. | | | 2,100 | | | | 265,041 | | |
Enterprise Software/Services 2.05% | |
CA, Inc. | | | 7,400 | | | | 225,330 | | |
Oracle Corp. | | | 5,000 | | | | 224,850 | | |
| | | | 450,180 | | |
Fiduciary Banks 1.22% | |
Bank of New York Mellon Corp. | | | 6,600 | | | | 267,762 | | |
Food - Miscellaneous/Diversified 1.14% | |
ConAgra Foods, Inc. | | | 6,900 | | | | 250,332 | | |
Food - Retail 1.15% | |
Safeway, Inc. | | | 7,200 | | | | 252,864 | | |
Internet Security 1.02% | |
Symantec Corp. | | | 8,700 | | | | 223,199 | | |
See notes to portfolios of investments and notes to financial statements.
79
All American Equity Fund
Portfolio of Investments December 31, 2014
Common Stocks (cont'd) | | Shares | | Value | |
Investment Management/Advisory Services 1.23% | |
Invesco Ltd. | | | 6,800 | | | $ | 268,736 | | |
Life/Health Insurance 1.24% | |
Prudential Financial, Inc. | | | 3,000 | | | | 271,380 | | |
Machinery - Construction & Mining 1.21% | |
Caterpillar, Inc. | | | 2,900 | | | | 265,437 | | |
Medical - Drugs 5.55% | |
Abbott Laboratories | | | 5,600 | | | | 252,112 | | |
Eli Lilly & Co. | | | 3,700 | | | | 255,263 | | |
Johnson & Johnson | | | 2,400 | | | | 250,968 | | |
Merck & Co, Inc. | | | 4,500 | | | | 255,555 | | |
Pfizer, Inc. | | | 6,500 | | | | 202,475 | | |
| | | | 1,216,373 | | |
Medical - HMO 2.30% | |
Anthem, Inc. | | | 2,000 | | | | 251,340 | | |
UnitedHealth Group, Inc. | | | 2,500 | | | | 252,725 | | |
| | | | 504,065 | | |
Medical Labs & Testing Services 1.16% | |
Quest Diagnostics, Inc. | | | 3,800 | | | | 254,828 | | |
Multi-line Insurance 2.48% | |
Allstate Corp. | | | 3,900 | | | | 273,975 | | |
MetLife, Inc. | | | 5,000 | | | | 270,450 | | |
| | | | 544,425 | | |
Multimedia 1.16% | |
Walt Disney Co. | | | 2,700 | | | | 254,313 | | |
Networking Products 1.01% | |
Cisco Systems, Inc. | | | 8,000 | | | | 222,520 | | |
Non-hazardous Waste Disposal 2.47% | |
Republic Services, Inc., Class A | | | 6,700 | | | | 269,675 | | |
Waste Management, Inc. | | | 5,300 | | | | 271,996 | | |
| | | | 541,671 | | |
Office Automation & Equipment 1.02% | |
Xerox Corp. | | | 16,200 | | | | 224,532 | | |
See notes to portfolios of investments and notes to financial statements.
80
All American Equity Fund
Portfolio of Investments December 31, 2014
Common Stocks (cont'd) | | Shares | | Value | |
Oil - Field Services 1.13% | |
Schlumberger Ltd. | | | 2,900 | | | $ | 247,689 | | |
Oil & Gas Drilling 2.24% | |
Diamond Offshore Drilling, Inc. | | | 6,500 | | | | 238,615 | | |
Ensco plc, Class A | | | 8,400 | | | | 251,580 | | |
| | | | 490,195 | | |
Oil Companies - Exploration & Production 3.42% | |
Apache Corp. | | | 4,000 | | | | 250,680 | | |
Hess Corp. | | | 3,400 | | | | 250,988 | | |
Occidental Petroleum Corp. | | | 3,100 | | | | 249,891 | | |
| | | | 751,559 | | |
Oil Companies - Integrated 2.30% | |
Exxon Mobil Corp. | | | 2,700 | | | | 249,615 | | |
Marathon Oil Corp. | | | 9,000 | | | | 254,610 | | |
| | | | 504,225 | | |
Oil Field Machinery & Equipment 1.13% | |
National Oilwell Varco, Inc. | | | 3,800 | | | | 249,014 | | |
Oil Refining & Marketing 3.40% | |
Marathon Petroleum Corp. | | | 3,000 | | | | 270,780 | | |
Tesoro Corp. | | | 3,000 | | | | 223,050 | | |
Valero Energy Corp. | | | 5,100 | | | | 252,450 | | |
| | | | 746,280 | | |
Paper & Related Products 1.17% | |
International Paper Co. | | | 4,800 | | | | 257,184 | | |
Retail - Apparel/Shoe 2.37% | |
Coach, Inc. | | | 6,900 | | | | 259,164 | | |
Gap, Inc. | | | 6,200 | | | | 261,082 | | |
| | | | 520,246 | | |
Retail - Building Products 2.34% | |
Home Depot, Inc. | | | 2,400 | | | | 251,928 | | |
Lowe's Companies, Inc. | | | 3,800 | | | | 261,440 | | |
| | | | 513,368 | | |
Retail - Computer Equipment 1.19% | |
GameStop Corp., Class A | | | 7,700 | | | | 260,260 | | |
See notes to portfolios of investments and notes to financial statements.
81
All American Equity Fund
Portfolio of Investments December 31, 2014
Common Stocks (cont'd) | | Shares | | Value | |
Retail - Consumer Electronics 1.17% | |
Best Buy Companies, Inc. | | | 6,600 | | | $ | 257,268 | | |
Retail - Discount 1.14% | |
Wal-Mart Stores, Inc. | | | 2,900 | | | | 249,052 | | |
Retail - Drug Store 1.14% | |
CVS Health Corp. | | | 2,600 | | | | 250,406 | | |
Retail - Office Supplies 1.19% | |
Staples, Inc. | | | 14,400 | | | | 260,928 | | |
Retail - Regional Department Store 1.17% | |
Kohl's Corp. | | | 4,200 | | | | 256,368 | | |
Security Services 0.92% | |
ADT Corp. | | | 5,600 | | | | 202,888 | | |
Semiconductors & Semiconductor Equipment 3.07% | |
Intel Corp. | | | 6,200 | | | | 224,998 | | |
NVIDIA Corp. | | | 11,200 | | | | 224,560 | | |
Texas Instruments, Inc. | | | 4,200 | | | | 224,553 | | |
| | | | 674,111 | | |
Super-Regional Banks - US 1.23% | |
Huntington Bancshares, Inc. | | | 25,800 | | | | 271,416 | | |
Telephone - Integrated 3.36% | |
AT&T, Inc. | | | 7,200 | | | | 241,848 | | |
CenturyLink, Inc. | | | 6,300 | | | | 249,354 | | |
Frontier Communications Corp. | | | 37,000 | | | | 246,790 | | |
| | | | 737,992 | | |
Tobacco 1.12% | |
Altria Group, Inc. | | | 5,000 | | | | 246,350 | | |
Transportation - Rail 1.25% | |
Union Pacific Corp. | | | 2,300 | | | | 273,999 | | |
Total Investments 97.63% | | | 21,415,184 | | |
(cost $21,211,929) | |
Other assets and liabilities, net 2.37% | | | 520,421 | | |
Net Assets 100.0% | | $ | 21,935,605 | | |
See notes to portfolios of investments and notes to financial statements.
82
Holmes Macro Trends Fund
Portfolio of Investments December 31, 2014
Common Stocks 92.03% | | Shares | | Value | |
Airlines 2.57% | |
Alaska Air Group, Inc. | | | 10,000 | | | $ | 597,600 | | |
Delta Air Lines, Inc. | | | 12,000 | | | | 590,280 | | |
| | | | 1,187,880 | | |
Applications Software 1.26% | |
Verint Systems, Inc. | | | 10,000 | | | | 582,800 | * | |
Automotive - Cars & Light Trucks 2.35% | |
Tata Motors Ltd., Sponsored ADR | | | 10,000 | | | | 422,800 | | |
Tesla Motors, Inc. | | | 3,000 | | | | 667,230 | * | |
| | | | 1,090,030 | | |
Brewery 1.25% | |
Boston Beer Co., Inc., Class A | | | 2,000 | | | | 579,080 | * | |
Building - Residential/Commercial 1.15% | |
Installed Building Products, Inc. | | | 30,000 | | | | 534,600 | * | |
Coal 0.01% | |
Pacific Coal Resources Ltd. | | | 39,830 | | | | 6,428 | * | |
Commercial Services - Finance 1.30% | |
MasterCard, Inc., Class A | | | 7,000 | | | | 603,120 | | |
Computers 5.37% | |
Apple, Inc. | | | 22,500 | | | | 2,483,550 | | |
Containers - Paper/Plastic 1.01% | |
Packaging Corporation of America | | | 6,000 | | | | 468,300 | | |
Diversified Banking Institutions 2.74% | |
Bank of America Corp. | | | 45,000 | | | | 805,050 | | |
Citigroup, Inc. | | | 8,500 | | | | 459,935 | | |
| | | | 1,264,985 | | |
E-Commerce/Services 1.29% | |
Expedia, Inc. | | | 7,000 | | | | 597,520 | | |
Electric - Generation 0.64% | |
Pacific Power Generation Corp. (RS) | | | 349,057 | | | | 297,117 | *#@ | |
See notes to portfolios of investments and notes to financial statements.
83
Holmes Macro Trends Fund
Portfolio of Investments December 31, 2014
Common Stocks (cont'd) | | Shares | | Value | |
Electronic Components - Miscellaneous 10.22% | |
Ambarella, Inc. | | | 20,000 | | | $ | 1,014,400 | * | |
Cavium, Inc. | | | 17,000 | | | | 1,050,940 | * | |
Methode Electronics, Inc. | | | 24,000 | | | | 876,240 | | |
Micron Technology, Inc. | | | 13,500 | | | | 472,635 | * | |
Skyworks Solutions, Inc. | | | 18,000 | | | | 1,308,780 | | |
| | | | 4,722,995 | | |
Energy - Alternate Sources 0.10% | |
Pacific Green Energy Corp. (RS) | | | 100,000 | | | | 45,790 | *#@ | |
Finance - Commercial 1.60% | |
IOU Financial, Inc. | | | 1,959,000 | | | | 737,703 | * | |
Finance - Investment Banker/Broker 2.11% | |
Canaccord Genuity Group, Inc. | | | 10,000 | | | | 67,223 | | |
Charles Schwab Corp. | | | 30,000 | | | | 905,700 | | |
| | | | 972,923 | | |
Food - Meat Products 1.13% | |
Hormel Foods Corp. | | | 10,000 | | | | 521,000 | | |
Gold/Mineral Royalty Companies 1.60% | |
Franco-Nevada Corp. | | | 15,000 | | | | 737,850 | | |
Gold Mining 0.00% | |
Gran Colombia Gold Corp. | | | 2,232 | | | | 903 | * | |
Human Resources 1.62% | |
Team Health Holdings, Inc. | | | 13,000 | | | | 747,890 | * | |
Industrial Audio & Video Production 0.96% | |
GoPro, Inc., Class A | | | 7,000 | | | | 442,540 | * | |
Internet Application Software 0.78% | |
Tencent Holdings Ltd., Sponsored ADR | | | 25,000 | | | | 362,750 | | |
Internet Content - Entertainment 3.38% | |
Facebook, Inc., Class A | | | 20,000 | | | | 1,560,400 | * | |
Internet Infrastructure Software 1.56% | |
F5 Networks, Inc. | | | 5,500 | | | | 717,558 | * | |
See notes to portfolios of investments and notes to financial statements.
84
Holmes Macro Trends Fund
Portfolio of Investments December 31, 2014
Common Stocks (cont'd) | | Shares | | Value | |
Machinery - General Industrial 3.59% | |
Middleby Corp. | | | 8,000 | | | $ | 792,800 | * | |
Wabtec Corp. | | | 10,000 | | | | 868,900 | | |
| | | | 1,661,700 | | |
Medical - Biomedical/Gene 8.99% | |
Alexion Pharmaceuticals, Inc. | | | 6,000 | | | | 1,110,180 | * | |
Biogen Idec, Inc. | | | 3,000 | | | | 1,018,350 | * | |
Celgene Corp. | | | 8,000 | | | | 894,880 | * | |
Gilead Sciences, Inc. | | | 12,000 | | | | 1,131,119 | * | |
| | | | 4,154,529 | | |
Medical - Drugs 1.95% | |
Jazz Pharmaceuticals plc | | | 5,500 | | | | 900,515 | * | |
Medical - Generic Drugs 5.22% | |
Actavis plc | | | 5,000 | | | | 1,287,050 | * | |
Mylan, Inc. | | | 20,000 | | | | 1,127,400 | * | |
| | | | 2,414,450 | | |
Medical - Hospitals 0.00% | |
African Medical Investments plc | | | 1,000,000 | | | | 0 | *#@ | |
Medical - Wholesale Drug Distribution 2.24% | |
McKesson Corp. | | | 5,000 | | | | 1,037,900 | | |
Oil - US Royalty Trusts 0.11% | |
San Juan Basin Royalty Trust | | | 3,600 | | | | 51,300 | | |
Oil Companies - Exploration & Production 4.72% | |
SM Energy Co. | | | 30,000 | | | | 1,157,400 | | |
Whiting Petroleum Corp. | | | 31,195 | | | | 1,029,435 | * | |
| | | | 2,186,835 | | |
Oil Refining & Marketing 1.13% | |
Tesoro Corp. | | | 7,000 | | | | 520,450 | | |
Property/Casualty Insurance 2.31% | |
United Insurance Holdings Corp. | | | 30,000 | | | | 658,500 | | |
Universal Insurance Holdings, Inc. | | | 20,000 | | | | 409,000 | | |
| | | | 1,067,500 | | |
Quarrying 1.39% | |
Pacific Stone Tech, Inc. (RS) | | | 4,162 | | | | 643,903 | *#@ | |
See notes to portfolios of investments and notes to financial statements.
85
Holmes Macro Trends Fund
Portfolio of Investments December 31, 2014
Common Stocks (cont'd) | | Shares | | Value | |
Real Estate Management/Services 1.85% | |
CBRE Group, Inc., Class A | | | 25,000 | | | $ | 856,250 | * | |
Real Estate Operating/Development 0.85% | |
Pacific Infrastructure Ventures, Inc. (RS) | | | 426,533 | | | | 393,477 | *#@ | |
Reinsurance 0.60% | |
Argo Group International Holdings Ltd. | | | 5,000 | | | | 277,350 | | |
Retail - Major Department Store 2.22% | |
TJX Companies, Inc. | | | 15,000 | | | | 1,028,700 | | |
Retail - Miscellaneous/Diversified 1.77% | |
Five Below, Inc. | | | 20,000 | | | | 816,600 | * | |
Retail - Restaurants 1.77% | |
Starbucks Corp. | | | 10,000 | | | | 820,500 | | |
Semiconductor Components - Integrated Circuits 1.16% | |
NXP Semiconductors NV | | | 7,000 | | | | 534,800 | * | |
Transportation - Truck 3.02% | |
Old Dominion Freight Line, Inc. | | | 18,000 | | | | 1,397,520 | * | |
Wireless Equipment 1.14% | |
InterDigital, Inc. | | | 10,000 | | | | 529,000 | | |
Total Common Stocks | | | 42,558,991 | | |
(cost $37,949,319) | |
Warrants 0.00%
Gold Mining 0.00% | |
Gran Colombia Gold Corp., 144A, Warrants (October 2017) | | | 3,700 | | | | 0 | *#@ | |
Gran Colombia Gold Corp., 144A, Warrants (March 2019) | | | 250 | | | | 20 | * | |
Total Warrants | | | 20 | | |
(cost $0) | |
See notes to portfolios of investments and notes to financial statements.
86
Holmes Macro Trends Fund
Portfolio of Investments December 31, 2014
Master Limited Partnership 1.62% | | Shares | | Value | |
Finance - Investment Banker/Broker 1.62% | |
Lazard Ltd., Class A | | | 15,000 | | | $ | 750,450 | | |
(cost $750,588) | |
Gold-Linked Notes 0.16% | | Principal
Amount | | | |
Gold Mining 0.16% | |
Gran Colombia Gold Corp., 10.00%, maturity 10/31/17 | | $ | 15,000 | | | | 2,963 | ^ | |
Gran Colombia Gold Corp., 144A, 10.00%, maturity 10/31/17 | | | 370,000 | | | | 73,075 | ^ | |
Total Gold-Linked Notes | | | 76,038 | | |
(cost $379,500) | |
Silver-Linked Notes 0.14%
Gold Mining 0.14% | |
Gran Colombia Gold Corp., 5.00%, maturity 08/11/18 | | | 424,000 | | | | 63,600 | ^ | |
(cost $340,261) | |
Corporate Note 0.51%
Electric - Generation 0.51% | |
Pacific Power Generation Corp., 15.00%, maturity 04/03/17 (RS) | | | 237,500 | | | | 237,500 | #@ | |
(cost $237,500) | |
Total Investments 94.46% | | | 43,686,599 | | |
(cost $39,657,168) | |
Other assets and liabilities, net 5.54% | | | 2,563,481 | | |
Net Assets 100.0% | | $ | 46,250,080 | | |
See notes to portfolios of investments and notes to financial statements.
87
Global Resources Fund
Portfolio of Investments December 31, 2014
Common Stocks 90.50% | | Shares | | Value | |
Agricultural Chemicals 6.74% | |
Potash Corporation of Saskatchewan, Inc. | | | 153,000 | | | $ | 5,403,960 | | |
Syngenta AG, Sponsored ADR | | | 75,000 | | | | 4,818,000 | | |
Yara International, ASA | | | 45,000 | | | | 2,003,958 | | |
| | | | 12,225,918 | | |
Agricultural Operations 1.65% | |
Agriterra Ltd. | | | 69,849,776 | | | | 654,406 | *+ | |
Archer-Daniels-Midland Co. | | | 45,000 | | | | 2,340,000 | | |
| | | | 2,994,406 | | |
Chemicals - Diversified 2.84% | |
LyondellBasell Industries N.V., Class A | | | 28,000 | | | | 2,222,920 | | |
Westlake Chemical Corp. | | | 48,000 | | | | 2,932,320 | | |
| | | | 5,155,240 | | |
Coal 0.55% | |
Pacific Coal Resources Ltd. | | | 4,362,314 | | | | 704,023 | *+ | |
Sable Mining Africa Ltd. | | | 28,061,000 | | | | 293,643 | * | |
Walter Energy, Inc., 144A | | | 4,293 | | | | 5,924 | * | |
| | | | 1,003,590 | | |
Containers - Paper/Plastic 1.11% | |
Rock-Tenn Co., Class A | | | 33,000 | | | | 2,012,340 | | |
Diamonds/Precious Stones 0.02% | |
Diamond Fields International Ltd. | | | 1,800,000 | | | | 23,240 | * | |
Rockwell Diamonds, Inc., 144A | | | 63,333 | | | | 14,173 | * | |
| | | | 37,413 | | |
Diversified Minerals 4.31% | |
African Potash Ltd. | | | 14,425,000 | | | | 224,829 | * | |
BHP Billiton Ltd., Sponsored ADR | | | 129,000 | | | | 6,104,280 | | |
Calibre Mining Corp. | | | 581,000 | | | | 75,013 | * | |
Canada Zinc Metals Corp. | | | 1,000,000 | | | | 245,309 | * | |
Dundee Sustainable Technologies, Inc. | | | 3,587,500 | | | | 262,470 | * | |
Encanto Potash Corp., 144A | | | 3,000,000 | | | | 193,665 | * | |
Lithium Americas Corp. | | | 953,334 | | | | 229,759 | * | |
Niocan, Inc., 144A | | | 362,069 | | | | 18,699 | * | |
Woulfe Mining Corp. | | | 5,585,100 | | | | 456,692 | * | |
| | | | 7,810,716 | | |
Electric - Generation 2.28% | |
Pacific Power Generation Corp. (RS) | | | 4,868,396 | | | | 4,143,979 | *#@ | |
See notes to portfolios of investments and notes to financial statements.
88
Global Resources Fund
Portfolio of Investments December 31, 2014
Common Stocks (cont'd) | | Shares | | Value | |
Energy - Alternate Sources 0.61% | |
Pacific Green Energy Corp. (RS) | | | 2,400,000 | | | $ | 1,098,960 | *+#@ | |
Food - Miscellaneous/Diversified 1.12% | |
Cal-Maine Foods, Inc. | | | 52,000 | | | | 2,029,560 | | |
Forestry 1.27% | |
Interfor Corp., Class A | | | 120,000 | | | | 2,267,172 | * | |
Prima Colombia Hardwood, Inc. | | | 15,265,832 | | | | 32,850 | * | |
| | | | 2,300,022 | | |
Gold Mining 4.78% | |
Chesapeake Gold Corp., 144A | | | 52,400 | | | | 92,009 | * | |
Corona Minerals Ltd. | | | 100,000 | | | | 408 | *#@ | |
Gran Colombia Gold Corp. | | | 685,090 | | | | 277,150 | * | |
Kinross Gold Corp., 144A | | | 1 | | | | 3 | * | |
Klondex Mines Ltd. | | | 2,000,000 | | | | 3,356,859 | * | |
New Gold, Inc. | | | 822,570 | | | | 495,609 | * | |
NGEx Resources, Inc. | | | 800,000 | | | | 805,646 | * | |
Royal Gold, Inc. | | | 37,000 | | | | 2,319,900 | | |
Rusoro Mining Ltd. | | | 3,119,433 | | | | 53,700 | * | |
Sunridge Gold Corp. | | | 4,600,000 | | | | 534,515 | *+ | |
Sunridge Gold Corp., 144A | | | 6,333,788 | | | | 735,980 | *+ | |
| | | | 8,671,779 | | |
Machinery - Construction & Mining 2.59% | |
Caterpillar, Inc. | | | 26,000 | | | | 2,379,780 | | |
Joy Global, Inc. | | | 50,000 | | | | 2,326,000 | | |
| | | | 4,705,780 | | |
Medical - Hospitals 0.00% | |
African Medical Investments plc | | | 2,507,500 | | | | 0 | *#@ | |
Metal - Aluminum 1.35% | |
Century Aluminum Co. | | | 100,000 | | | | 2,440,000 | * | |
Metal - Copper 1.27% | |
Catalyst Copper Corp., 144A | | | 166,666 | | | | 43,754 | * | |
Los Andes Copper Ltd. | | | 754,000 | | | | 124,931 | * | |
Nevsun Resources Ltd. | | | 550,000 | | | | 2,139,500 | | |
Verona Development Corp. | | | 708,800 | | | | 0 | *#@ | |
| | | | 2,308,185 | | |
See notes to portfolios of investments and notes to financial statements.
89
Global Resources Fund
Portfolio of Investments December 31, 2014
Common Stocks (cont'd) | | Shares | | Value | |
Metal - Diversified 2.53% | |
Bell Copper Corp. | | | 500,000 | | | $ | 4,304 | * | |
Glencore plc | | | 900,000 | | | | 4,154,255 | | |
GoviEx Uranium, Inc., Class A | | | 755,000 | | | | 188,458 | * | |
GoviEx Uranium, Inc., 144A, Class A | | | 58,000 | | | | 14,478 | * | |
Ivanhoe Mines Ltd., Class A | | | 250,000 | | | | 219,487 | * | |
Orsu Metals Corp., 144A | | | 147,605 | | | | 3,494 | * | |
| | | | 4,584,476 | | |
Metal - Iron 1.73% | |
Fortescue Metals Group Ltd. | | | 1,400,000 | | | | 3,073,897 | | |
Oceanic Iron Ore Corp. | | | 200,000 | | | | 43,037 | * | |
West African Iron Ore Corp., 144A | | | 2,925,000 | | | | 18,882 | * | |
| | | | 3,135,816 | | |
Mining Services 0.42% | |
Bounty Mining Ltd. | | | 22,000,000 | | | | 359,216 | *#@ | |
Natasa Mining Ltd. | | | 1,036,350 | | | | 403,815 | * | |
| | | | 763,031 | | |
Natural Resource Technology 0.03% | |
I-Pulse, Inc., 144A (RS) | | | 15,971 | | | | 54,940 | *#@ | |
Non - Ferrous Metals 3.94% | |
Korea Zinc Co., Ltd. | | | 6,000 | | | | 2,193,099 | * | |
Nickel Asia Corp. | | | 2,200,000 | | | | 2,324,935 | | |
Sterling Group Ventures, Inc., 144A | | | 500,000 | | | | 5,500 | * | |
Vale Indonesia Tbk PT | | | 9,000,000 | | | | 2,615,892 | | |
| | | | 7,139,426 | | |
Oil - Field Services 6.24% | |
Atlas Development & Support Services Ltd. | | | 67,534,983 | | | | 9,475,423 | *+ | |
Helix Energy Solutions Group, Inc. | | | 85,000 | | | | 1,844,500 | * | |
| | | | 11,319,923 | | |
Oil Companies - Exploration & Production 10.81% | |
Birchcliff Energy Ltd. | | | 225,000 | | | | 1,514,460 | * | |
BNK Petroleum, Inc. | | | 3,000,000 | | | | 1,071,613 | * | |
Cimarex Energy Co. | | | 20,000 | | | | 2,120,000 | | |
Horn Petroleum Corp., 144A | | | 2,110,889 | | | | 245,283 | * | |
Ivanhoe Energy, Inc. | | | 18,719 | | | | 9,667 | * | |
Petroamerica Oil Corp. | | | 11,158,000 | | | | 1,344,569 | * | |
Petromanas Energy, Inc. | | | 1,000,000 | | | | 51,644 | * | |
Peyto Exploration & Development Corp. | | | 64,000 | | | | 1,843,760 | | |
Range Energy Resources, Inc. | | | 95,300 | | | | 2,666 | * | |
See notes to portfolios of investments and notes to financial statements.
90
Global Resources Fund
Portfolio of Investments December 31, 2014
Common Stocks (cont'd) | | Shares | | Value | |
Oil Companies - Exploration & Production (cont'd) | |
Range Energy Resources, Inc., 144A | | | 15,000,000 | | | $ | 419,608 | * | |
Royalite Petroleum Co., Inc. | | | 2,266,333 | | | | 3,173 | * | |
TORC Oil & Gas Ltd. | | | 240,000 | | | | 1,590,635 | | |
TransGlobe Energy Corp. | | | 1,400,000 | | | | 5,795,999 | | |
U.S. Oil Sands, Inc. | | | 7,777,777 | | | | 669,459 | * | |
U.S. Oil Sands, Inc., 144A | | | 9,900,000 | | | | 852,126 | * | |
Whitecap Resources, Inc. | | | 210,000 | | | | 2,067,825 | | |
| | | | 19,602,487 | | |
Oil Companies - Integrated 8.80% | |
Chevron Corp. | | | 38,000 | | | | 4,262,840 | | |
Exxon Mobil Corp. | | | 56,000 | | | | 5,177,200 | | |
Pacific Rubiales Energy Corp. | | | 230,000 | | | | 1,423,395 | | |
Phillips 66 | | | 40,000 | | | | 2,868,000 | | |
YPF S.A., Sponsored ADR | | | 85,000 | | | | 2,249,950 | | |
| | | | 15,981,385 | | |
Oil Refining & Marketing 6.48% | |
Marathon Petroleum Corp. | | | 32,000 | | | | 2,888,320 | | |
Tesoro Corp. | | | 40,000 | | | | 2,974,000 | | |
Valero Energy Corp. | | | 58,000 | | | | 2,871,000 | | |
Western Refining, Inc. | | | 80,000 | | | | 3,022,400 | | |
| | | | 11,755,720 | | |
Paper & Related Products 2.42% | |
Domtar Corp. | | | 60,000 | | | | 2,413,199 | | |
International Paper Co. | | | 37,000 | | | | 1,982,460 | | |
| | | | 4,395,659 | | |
Pipelines 1.31% | |
EQT Midstream Partners LP | | | 27,000 | | | | 2,376,000 | | |
Platinum 0.51% | |
Platinum Group Metals Ltd. | | | 1,900,000 | | | | 925,110 | * | |
Precious Metals 1.84% | |
Lundin Gold, Inc. | | | 155,000 | | | | 556,335 | * | |
Tahoe Resources, Inc. | | | 200,000 | | | | 2,774,000 | | |
| | | | 3,330,335 | | |
Quarrying 3.22% | |
Compass Minerals International, Inc. | | | 27,000 | | | | 2,344,410 | | |
Pacific Stone Tech, Inc. (RS) | | | 22,659 | | | | 3,505,574 | *+#@ | |
| | | | 5,849,984 | | |
See notes to portfolios of investments and notes to financial statements.
91
Global Resources Fund
Portfolio of Investments December 31, 2014
Common Stocks (cont'd) | | Shares | | Value | |
Real Estate Operating/Development 3.79% | |
Pacific Infrastructure Ventures, Inc. (RS) | | | 7,443,544 | | | $ | 6,866,669 | *#@ | |
Steel - Producers 2.67% | |
Reliance Steel & Aluminum Co. | | | 40,000 | | | | 2,450,800 | | |
Steel Dynamics, Inc. | | | 121,000 | | | | 2,388,540 | | |
| | | | 4,839,340 | | |
Transport - Rail 1.27% | |
Canadian Pacific Railway Ltd. | | | 12,000 | | | | 2,312,280 | | |
Total Common Stocks | | | 164,170,469 | | |
(cost $264,847,223) | |
Warrants 0.26%
Diversified Minerals 0.00% | |
Encanto Potash Corp., 144A, Warrants (October 2015) | | | 1,500,000 | | | | 0 | *#@ | |
Gold Mining 0.25% | |
Dundee Precious Metals, Inc., Warrants (November 2015) | | | 742,495 | | | | 266,821 | * | |
Gran Colombia Gold Corp., 144A, Warrants (October 2017) | | | 86,150 | | | | 0 | *#@ | |
Gran Colombia Gold Corp., 144A, Warrants (March 2019) | | | 59,500 | | | | 4,865 | * | |
Sunridge Gold Corp., 144A, Warrants (October 2017) | | | 6,333,788 | | | | 177,180 | * | |
| | | | 448,866 | | |
Metal - Copper 0.00% | |
Catalyst Copper Corp., 144A, Warrants (February 2017) | | | 83,333 | | | | 0 | *#@ | |
Metal - Iron 0.01% | |
West African Iron Ore Corp., 144A, Warrants (March 2016) | | | 2,925,000 | | | | 12,588 | * | |
Total Warrants | | | 461,454 | | |
(cost $943,903) | |
Purchased Call Options 2.67% | | Contracts | | | |
Chemicals - Diversified 0.08% | |
LyondellBasell Industries N.V., Strike Price 90.00, Expiration Jun. 2015 | | | 500 | | | | 142,500 | | |
See notes to portfolios of investments and notes to financial statements.
92
Global Resources Fund
Portfolio of Investments December 31, 2014
Purchased Call Options (cont'd) | | Contracts | | Value | |
Diversified Minerals 0.33% | |
BHP Billiton Ltd., Strike Price 62.50, Expiration Jan. 2016 | | | 6,000 | | | $ | 594,000 | | |
Energy 0.38% | |
Energy Select Sector SPDR Fund, Strike Price 85.00, Expiration Jan. 2015 | | | 5,000 | | | | 85,000 | | |
Energy Select Sector SPDR Fund, Strike Price 76.00, Expiration Mar. 2015 | | | 1,000 | | | | 597,500 | | |
| | | | 682,500 | | |
Exchange-Traded Funds 0.11% | |
Martket Vectors Oil Services ETF, Strike Price 40.00, Expiration Apr. 2015 | | | 2,000 | | | | 200,000 | | |
Oil - Field Services 0.42% | |
Halliburton Co., Strike Price 50.00, Expiration Jan. 2016 | | | 2,000 | | | | 422,000 | | |
Schlumberger Ltd., Strike Price 90.00, Expiration Jan. 2016 | | | 500 | | | | 352,500 | | |
| | | | 774,500 | | |
Oil & Gas Drilling 0.30% | |
Nabors Industrial, Ltd., Strike Price 17.00, Expiration Jun. 2015 | | | 5,000 | | | | 540,000 | | |
Oil Companies - Exploration & Production 0.71% | |
EOG Resources, Inc., Strike Price 97.50, Expiration Apr. 2015 | | | 850 | | | | 414,375 | | |
Oil & Gas Exploration SPDR Fund, Strike Price 45.00, Expiration Mar. 2015 | | | 1,500 | | | | 877,500 | | |
| | | | 1,291,875 | | |
Oil Field Machinery & Equipment 0.15% | |
National Oilwell Varco, Strike Price 72.50, Expiration May 2015 | | | 1,200 | | | | 273,600 | | |
Steel Producers 0.19% | |
United States Steel Corp., Strike Price 35.00, Expiration Jan. 2016 | | | 1,500 | | | | 341,250 | | |
Total Purchased Call Options | | | 4,840,225 | | |
(cost $7,509,755) | |
Convertible Bond 0.09% | | Principal
Amount | | | |
Diversified Minerals 0.09% | |
Great Western Minerals Group Ltd., 144A, 8.00%, maturity 04/06/17 | | $ | 1,000,000 | | | | 160,000 | | |
(cost $1,000,000) | |
See notes to portfolios of investments and notes to financial statements.
93
Global Resources Fund
Portfolio of Investments December 31, 2014
Gold-Linked Notes 0.97% | | Principal
Amount | | Value | |
Gold Mining 0.97% | |
Gran Colombia Gold Corp., 10.00%, maturity 10/31/17 | | $ | 332,000 | | | $ | 65,570 | ^ | |
Gran Colombia Gold Corp., 144A, 10.00%, maturity 10/31/17 | | | 8,615,000 | | | | 1,701,463 | ^ | |
Total Gold-Linked Notes | | | 1,767,033 | | |
(cost $8,822,210) | |
Silver-Linked Notes 0.55%
Gold Mining 0.55% | |
Gran Colombia Gold Corp., 5.00%, maturity 08/11/18 | | | 2,000,000 | | | | 300,000 | ^ | |
Gran Colombia Gold Corp., 144A, 5.00%, maturity 08/11/18 | | | 4,705,000 | | | | 705,750 | ^ | |
Total Silver-Linked Notes | | | 1,005,750 | | |
(cost $5,786,165) | |
Corporate Note 1.57%
Electric - Generation 1.57% | |
Pacific Power Generation Corp., 15.00%, maturity 04/03/17 (RS) | | | 2,850,000 | | | | 2,850,000 | #@ | |
(cost $2,850,000) | |
Total Investments 96.61% | | | 175,254,931 | | |
(cost $291,759,256) | |
Other assets and liabilities, net 3.39% | | | 6,150,606 | | |
Net Assets 100.0% | | $ | 181,405,537 | | |
See notes to portfolios of investments and notes to financial statements.
94
World Precious Minerals Fund
Portfolio of Investments December 31, 2014
Common Stocks 88.96% | | Shares | | Value | |
Agricultural Operations 0.35% | |
Agriterra Ltd. | | | 38,536,200 | | | $ | 361,037 | * | |
Capital Pools 0.02% | |
Pinecrest Resources Ltd. (RS) | | | 100,000 | | | | 20,365 | *#@ | |
Coal 0.35% | |
Pacific Coal Resources Ltd. | | | 1,182,764 | | | | 190,883 | * | |
Sable Mining Africa Ltd. | | | 17,014,032 | | | | 178,043 | * | |
| | | | 368,926 | | |
Diamonds/Precious Stones 2.58% | |
Lucapa Diamond Co., Ltd. | | | 1,000,000 | | | | 257,446 | * | |
Lucara Diamond Corp. | | | 1,000,000 | | | | 1,885,006 | | |
Northern Superior Resources, Inc. | | | 1,510,900 | | | | 32,512 | * | |
Olivut Resources Ltd. | | | 645,000 | | | | 77,724 | * | |
Petra Diamonds Ltd. | | | 125,000 | | | | 375,281 | * | |
Rockwell Diamonds, Inc., 144A | | | 171,667 | | | | 38,417 | * | |
| | | | 2,666,386 | | |
Diversified Minerals 1.78% | |
Adamera Minerals Corp. | | | 119,543 | | | | 3,087 | * | |
African Potash Ltd. | | | 2,450,000 | | | | 38,186 | * | |
Amarc Resources Ltd. | | | 695,545 | | | | 56,874 | * | |
Burey Gold Ltd. | | | 7,000,000 | | | | 94,294 | * | |
Calibre Mining Corp. | | | 4,593,000 | | | | 593,002 | * | |
Duketon Mining Ltd. | | | 2,250,000 | | | | 472,578 | * | |
Elissa Resources Ltd., 144A | | | 36,250 | | | | 780 | * | |
Indochine Mining Ltd. | | | 4,000,000 | | | | 39,530 | * | |
Riverside Resources, Inc. | | | 956,000 | | | | 271,544 | * | |
Rubicon Minerals Corp. | | | 300,000 | | | | 289,206 | * | |
| | | | 1,859,081 | | |
Gold/Mineral Royalty Companies 0.24% | |
Franco-Nevada Corp. | | | 5,000 | | | | 245,950 | | |
Gold Mining 59.82% | |
ABM Resources NL | | | 1,000,000 | | | | 235,913 | * | |
Agnico Eagle Mines Ltd. | | | 23,608 | | | | 587,603 | | |
Alacer Gold Corp. | | | 300,000 | | | | 601,653 | | |
Almaden Minerals Ltd. | | | 500,000 | | | | 490,618 | * | |
B2Gold Corp. | | | 178,400 | | | | 289,008 | * | |
Canyon Resources Ltd. | | | 10,006,593 | | | | 359,453 | *+ | |
CB Gold, Inc. | | | 8,562,858 | | | | 626,479 | *+ | |
Chalice Gold Mines Ltd. | | | 4,814,836 | | | | 410,293 | * | |
See notes to portfolios of investments and notes to financial statements.
95
World Precious Minerals Fund
Portfolio of Investments December 31, 2014
Common Stocks (cont'd) | | Shares | | Value | |
Gold Mining (cont'd) | |
Chesapeake Gold Corp., 144A | | | 192,199 | | | $ | 337,481 | * | |
Comstock Mining, Inc. | | | 2,165,000 | | | | 1,645,400 | * | |
CopperBank Resources Corp. | | | 195,000 | | | | 10,910 | * | |
CopperBank Resources Corp., 144A | | | 174,000 | | | | 9,735 | * | |
Corona Minerals Ltd. | | | 1,625,000 | | | | 6,633 | *#@ | |
Coventry Resources, Inc. | | | 1,810,000 | | | | 14,777 | * | |
Doray Minerals Ltd. | | | 1,200,000 | | | | 464,913 | * | |
Dundee Precious Metals, Inc. | | | 375,234 | | | | 884,956 | * | |
Eastmain Resources, Inc. | | | 1,500,000 | | | | 296,953 | * | |
Edgewater Exploration Ltd. | | | 500,000 | | | | 12,911 | * | |
Giyani Gold Corp. | | | 500,000 | | | | 215,183 | *#@ | |
Gold Fields Ltd. ADR | | | 65,000 | | | | 294,450 | | |
Gold Standard Ventures Corp. | | | 2,000,000 | | | | 940,000 | * | |
Gran Colombia Gold Corp. | | | 1,224,762 | | | | 495,471 | *+ | |
Guyana Goldfields, Inc. | | | 150,000 | | | | 364,090 | * | |
Harmony Gold Mining Co. Ltd., Sponsored ADR | | | 450,000 | | | | 850,500 | | |
IAMGOLD Corp. | | | 260,000 | | | | 702,000 | * | |
IDM Mining Ltd. | | | 95,000 | | | | 11,857 | * | |
Integra Gold Corp. | | | 2,495,500 | | | | 418,852 | * | |
Kaminak Gold Corp., Class A | | | 1,000,000 | | | | 662,765 | * | |
Kilo Goldmines Ltd. | | | 251,000 | | | | 23,765 | * | |
Kirkland Lake Gold, Inc. | | | 333,300 | | | | 961,056 | * | |
Klondex Mines Ltd. | | | 6,043,208 | | | | 10,143,102 | * | |
Lake Shore Gold Corp. | | | 500,000 | | | | 335,686 | * | |
Lexam VG Gold, Inc., 144A | | | 2,406,501 | | | | 134,638 | * | |
Malbex Resources, Inc. | | | 450,000 | | | | 2,905 | * | |
Malbex Resources, Inc., 144A | | | 1,333,333 | | | | 8,607 | * | |
Mammoth Resources Corp. | | | 3,641,800 | | | | 47,019 | *+ | |
Midway Gold Corp. | | | 1,500,000 | | | | 1,110,000 | * | |
Mirasol Resources Ltd. | | | 2,000,000 | | | | 1,859,184 | * | |
New Gold, Inc. | | | 352,530 | | | | 212,404 | * | |
Newmont Mining Corp. | | | 12,000 | | | | 226,800 | | |
NGEx Resources, Inc. | | | 2,355,000 | | | | 2,371,622 | * | |
Northern Star Resources Ltd. | | | 325,000 | | | | 391,676 | | |
OceanaGold Corp. | | | 5,348 | | | | 9,298 | * | |
Panoro Minerals Ltd. | | | 2,187,500 | | | | 555,442 | * | |
Petaquilla Minerals Ltd., 144A | | | 2,660,000 | | | | 57,239 | * | |
Pilot Gold, Inc. | | | 1,050,000 | | | | 804,355 | * | |
Pretium Resources, Inc. | | | 600,000 | | | | 3,469,656 | * | |
Pure Gold Mining, Inc. | | | 3,760,000 | | | | 1,067,998 | * | |
Radius Gold, Inc. | | | 3,950,000 | | | | 322,990 | * | |
Radius Gold, Inc., 144A | | | 125.000 | | | | 10,221 | * | |
Randgold Resources Ltd., Sponsored ADR | | | 20,000 | | | | 1,348,200 | | |
Redstar Gold Corp. | | | 4,236,000 | | | | 145,843 | * | |
Richmont Mines, Inc. | | | 550,000 | | | | 1,743,500 | * | |
Rio Alto Mining Ltd. | | | 250,000 | | | | 606,817 | * | |
See notes to portfolios of investments and notes to financial statements.
96
World Precious Minerals Fund
Portfolio of Investments December 31, 2014
Common Stocks (cont'd) | | Shares | | Value | |
Gold Mining (cont'd) | |
Romarco Minerals, Inc. | | | 1,500,000 | | | $ | 632,639 | * | |
Royal Gold, Inc. | | | 25,000 | | | | 1,567,500 | | |
Rusoro Mining Ltd. | | | 6,325,900 | | | | 108,898 | * | |
Rye Patch Gold Corp. | | | 4,710,000 | | | | 689,189 | * | |
Rye Patch Gold Corp., 144A | | | 1,800,000 | | | | 263,384 | * | |
Seafield Resources Ltd., 144A | | | 1,300,000 | | | | 5,595 | *#@ | |
Silver Lake Resources Ltd. | | | 1,000,000 | | | | 157,049 | * | |
Skeena Resources Ltd. | | | 88,000 | | | | 7,385 | *+ | |
Skeena Resources Ltd. (RS) | | | 10,000,000 | | | | 797,298 | *+#@ | |
Solvista Gold Corp. | | | 50,000 | | | | 2,475 | * | |
Solvista Gold Corp., 144A | | | 2,620,000 | | | | 129,669 | * | |
Sunridge Gold Corp. | | | 2,400,921 | | | | 278,985 | * | |
Sunridge Gold Corp., 144A | | | 1,900,000 | | | | 220,778 | * | |
Taurus Gold Ltd., 144A (RS) | | | 2,448,381 | | | | 1,191,137 | *#@ | |
Teranga Gold Corp. | | | 2,425,000 | | | | 949,712 | * | |
Tolima Gold, Inc., 144A | | | 4,100,000 | | | | 26,467 | * | |
Torex Gold Resources, Inc. | | | 1,400,000 | | | | 1,482,183 | * | |
TriStar Gold, Inc. | | | 8,100,000 | | | | 976,072 | *+ | |
Virginia Mines, Inc. | | | 827,800 | | | | 10,730,478 | * | |
Wesdome Gold Mines Ltd. | | | 800,000 | | | | 860,733 | * | |
West Kirkland Mining, Inc. | | | 3,029,000 | | | | 169,465 | * | |
Yamana Gold, Inc. | | | 120,000 | | | | 482,400 | | |
| | | | 61,940,371 | | |
Investment Companies 0.00% | |
Invictus Financial, Inc. | | | 49,800 | | | | 996 | * | |
Medical - Hospitals 0.00% | |
African Medical Investments plc | | | 4,637,500 | | | | 0 | *#@ | |
Metal - Copper 0.31% | |
Catalyst Copper Corp. | | | 52,133 | | | | 13,686 | * | |
Catalyst Copper Corp., 144A | | | 66,666 | | | | 17,501 | * | |
Nevsun Resources Ltd. | | | 75,000 | | | | 291,750 | | |
Verona Development Corp. | | | 48,500 | | | | 0 | *#@ | |
| | | | 322,937 | | |
Metal - Diversified 11.64% | |
Atico Mining Corp. | | | 1,085,000 | | | | 625,710 | * | |
Balmoral Rescources Ltd. (RS) | | | 1,000,000 | | | | 874,935 | *#@ | |
Bell Copper Corp. | | | 400,000 | | | | 3,443 | * | |
Calico Resources Corp. | | | 2,532,500 | | | | 277,925 | * | |
Cardinal Resources Ltd. | | | 3,000,000 | | | | 91,233 | * | |
Dalradian Resources, Inc. | | | 1,800,000 | | | | 1,146,497 | * | |
Falco Resources Ltd. (RS) | | | 1,453,700 | | | | 511,135 | *#@ | |
See notes to portfolios of investments and notes to financial statements.
97
World Precious Minerals Fund
Portfolio of Investments December 31, 2014
Common Stocks (cont'd) | | Shares | | Value | |
Metal - Diversified (cont'd) | |
Falco Resources Ltd. | | | 17,000 | | | $ | 6,292 | * | |
First Point Minerals Corp. | | | 2,000,000 | | | | 77,466 | * | |
Foran Mining Corp. | | | 1,100,000 | | | | 222,500 | * | |
Ivanhoe Mines Ltd., Class A | | | 100,000 | | | | 87,795 | * | |
Mandalay Resources Corp. | | | 3,012,300 | | | | 2,359,436 | | |
Mariana Resources Ltd. | | | 1,895,000 | | | | 40,493 | * | |
Mineral Mountain Resources Ltd. | | | 11,000,000 | | | | 331,382 | *+ | |
Nevada Sunrise Gold Corp. | | | 325,000 | | | | 100,706 | * | |
Novo Resources Corp. | | | 1,150,800 | | | | 792,426 | *# | |
Orex Minerals, Inc. | | | 8,614,500 | | | | 2,224,436 | *+ | |
Orsu Metals Corp. | | | 289,800 | | | | 6,860 | * | |
Orsu Metals Corp., 144A | | | 1,800,000 | | | | 42,606 | * | |
Reservoir Minerals, Inc. | | | 165,100 | | | | 562,744 | * | |
Silver Bull Resources, Inc. | | | 2,350,000 | | | | 347,800 | * | |
Temex Resources Corp. | | | 2,500,000 | | | | 107,592 | * | |
Trevali Mining Corp. | | | 1,325,000 | | | | 1,220,305 | * | |
| | | | 12,061,717 | | |
Mining Services 0.83% | |
Argent Minerals Ltd. | | | 7,100,000 | | | | 204,748 | * | |
Energold Drilling Corp. | | | 200,000 | | | | 141,160 | * | |
Natasa Mining Ltd. | | | 1,300,849 | | | | 506,876 | * | |
| | | | 852,784 | | |
Oil Companies - Exploration & Production 0.00% | |
Big Sky Energy Corp. | | | 2,000,000 | | | | 0 | *#@ | |
Platinum 0.72% | |
Pacific North West Capital Corp. | | | 430,555 | | | | 11,118 | * | |
Platinum Group Metals Ltd. | | | 1,546,500 | | | | 732,118 | * | |
| | | | 743,236 | | |
Precious Metals 6.67% | |
Candente Gold Corp. | | | 765,000 | | | | 23,046 | *+ | |
Candente Gold Corp., 144A | | | 4,875,000 | | | | 146,863 | *+ | |
Lundin Gold, Inc. | | | 760,000 | | | | 2,727,837 | * | |
Lundin Gold, Inc., 144A | | | 70,000 | | | | 251,248 | * | |
Pan African Resources plc | | | 6,500,000 | | | | 1,088,207 | | |
Roxgold, Inc. | | | 3,500,000 | | | | 1,656,912 | * | |
Santana Minerals Ltd. | | | 2,400,000 | | | | 62,415 | * | |
Solitario Exploration & Royalty Corp. | | | 1,034,500 | | | | 951,740 | * | |
| | | | 6,908,268 | | |
See notes to portfolios of investments and notes to financial statements.
98
World Precious Minerals Fund
Portfolio of Investments December 31, 2014
Common Stocks (cont'd) | | Shares | | Value | |
Silver Mining 3.65% | |
Fortuna Silver Mines, Inc. | | | 300,000 | | | $ | 1,365,000 | * | |
MAG Silver Corp. | | | 200,000 | | | | 1,638,836 | * | |
Santacruz Silver Mining Ltd. | | | 1,083,000 | | | | 372,870 | * | |
Silver Wheaton Corp. | | | 20,000 | | | | 406,600 | | |
| | | | 3,783,306 | | |
Total Common Stocks | | | 92,135,360 | | |
(cost $207,613,372) | |
Exchange-Traded Funds 2.23%
Direxion Daily Gold Miners Bull 3x Shares | | | 120,000 | | | | 1,339,200 | | |
Direxion Daily Junior Gold Miners Index Bull 3x Shares | | | 40,000 | | | | 973,600 | | |
Market Vectors Gold Miners ETF | | | 20 | | | | 368 | | |
Market Vectors Junior Gold Miners ETF | | | 8 | | | | 191 | | |
Total Exchange-Traded Funds | | | 2,313,359 | | |
(cost $4,213,728) | |
Warrants 2.23%
Diamonds/Precious Stones 0.05% | |
Lucapa Diamond Co., Ltd., Warrants (August 2015) | | | 500,000 | | | | 46,943 | * | |
Diversified Minerals 0.03% | |
Rubicon Minerals, Warrants (March 2015) | | | 1,000,000 | | | | 30,126 | * | |
Gold/Mineral Royalty Companies 1.08% | |
Franco-Nevada Corp., Warrants (June 2017) | | | 130,000 | | | | 1,118,953 | * | |
Gold Mining 0.98% | |
Alamos Gold, Inc., Warrants (August 2018) | | | 110,000 | | | | 36,925 | * | |
Canyon Resources Ltd., Warrants (January 2017) | | | 6,168,864 | | | | 83,098 | * | |
Crystallex International Corp., 144A, Warrants (December 2049) | | | 162,500 | | | | 0 | *#@ | |
Dundee Precious Metals, Inc., Warrants (November 2015) | | | 1,494,439 | | | | 537,037 | * | |
Gran Colombia Gold Corp., 144A, Warrants (October 2017) | | | 58,450 | | | | 0 | *#@ | |
Gran Colombia Gold Corp., 144A, Warrants (March 2019) | | | 96,250 | | | | 7,870 | * | |
New Gold, Inc., Warrants (June 2017) | | | 500,000 | | | | 301,257 | * | |
Skeena Resources Ltd., Warrants (October 2016) (RS) | | | 10,000,000 | | | | 0 | *#@ | |
Sunridge Gold Corp., 144A, Warrants (October 2017) | | | 1,900,000 | | | | 53,150 | * | |
Tolima Gold, Inc., 144A, Warrants (March 2016) | | | 1,625,000 | | | | 0 | *#@ | |
Tolima Gold, Inc., 144A, Warrants (December 2016) | | | 425,000 | | | | 0 | *#@ | |
Veris Gold Corp., Warrants (August 2016) | | | 250,000 | | | | 0 | *#@ | |
See notes to portfolios of investments and notes to financial statements.
99
World Precious Minerals Fund
Portfolio of Investments December 31, 2014
Warrants (cont'd) | | Shares | | Value | |
Gold Mining (cont'd) | |
Veris Gold Corp., Warrants (December 2016) | | | 282,200 | | | $ | 0 | *#@ | |
| | | | 1,019,337 | | |
Metal - Copper 0.00% | |
Catalyst Copper Corp., 144A, Warrants (February 2017) | | | 33,333 | | | | 0 | *#@ | |
Metal - Diversified 0.08% | |
Calico Resources Corp., Warrants (October 2015) (RS) | | | 1,250,000 | | | | 0 | *#@ | |
Dalradian Resources, Inc., Warrants (July 2017) | | | 889,000 | | | | 76,519 | * | |
HudBay Minerals, Inc., Warrants (July 2018) | | | 17,000 | | | | 15,218 | * | |
Mineral Mountain Resources Ltd., Warrants (October 2016) (RS) | | | 3,500,000 | | | | 0 | *#@ | |
Orex Minerals, Inc., 144A, Warrants (November 2015) | | | 1,250,000 | | | | 0 | *#@ | |
Orex Minerals, Inc., 144A, Warrants (March 2016) | | | 600,000 | | | | 0 | *#@ | |
| | | | 91,737 | | |
Precious Metals 0.01% | |
Primero Mining Corp., Warrants (July 2015) | | | 60,000 | | | | 6,456 | * | |
Santana Minerals, Ltd., Warrants (March 2016) | | | 400,000 | | | | 0 | *#@ | |
| | | | 6,456 | * | |
Total Warrants | | | 2,313,552 | | |
(cost $4,187,420) | |
Special Warrants 0.00%
Gold/Mineral Exploration & Development 0.00% | |
Western Exploration & Development Ltd., 144A, Warrants
(December 2049) (RS) | | | 600,000 | | | | 0 | *#@ | |
(cost $300,000) | |
Rights 0.02%
Metal - Diversified 0.02% | |
Cardinal Resources Ltd. (December 2049) | | | 1,500,000 | | | | 18,369 | * | |
(cost $13,109) | |
See notes to portfolios of investments and notes to financial statements.
100
World Precious Minerals Fund
Portfolio of Investments December 31, 2014
Purchased Call Options 1.02% | | Contracts | | Value | |
Exchange-Traded Fund 0.01% | |
Market Vectors Gold Miners ETF, Strike Price 21.00, Expiration Jan. 2015 | | | 850 | | | $ | 9,350 | | |
Market Vectors Gold Miners ETF, Strike Price 30.00, Expiration Jan. 2015 | | | 404 | | | | 4,040 | | |
| | | | 13,390 | | |
Gold Mining 0.78% | |
AngloGold Ashanti Ltd., Strike Price 13.00, Expiration Jan. 2015 | | | 250 | | | | 1,250 | | |
Eldorado Gold Corp., Strike Price 8.00, Expiration Jan. 2015 | | | 975 | | | | 4,875 | | |
Eldorado Gold Corp., Strike Price 5.00, Expiration Jan. 2016 | | | 846 | | | | 156,510 | | |
Gold Fields Ltd., Strike Price 5.00, Expiration Jan. 2016 | | | 1,000 | | | | 80,500 | | |
IAMGOLD Corp., Strike Price 2.00, Expiration Mar. 2015 | | | 4,250 | | | | 340,000 | | |
IAMGOLD Corp., Strike Price 4.00, Expiration Jan. 2015 | | | 1,617 | | | | 8,085 | | |
IAMGOLD Corp., Strike Price 4.00, Expiration Jan. 2016 | | | 270 | | | | 10,800 | | |
Kinross Gold Corp., Strike Price 3.00, Expiration Jan. 2015 | | | 650 | | | | 5,850 | | |
Newmont Mining Corp., Strike Price 25.00, Expiration Jan. 2015 | | | 825 | | | | 1,650 | | |
Randgold Resources Ltd., Strike Price 65.00, Expiration Jan. 2016 | | | 110 | | | | 130,900 | | |
Yamana Gold, Inc., Strike Price 10.00, Expiration Jan. 2015 | | | 1,509 | | | | 1,509 | | |
Yamana Gold, Inc., Strike Price 4.50, Expiration Apr. 2015 | | | 1,900 | | | | 67,450 | | |
Yamana Gold, Inc., Strike Price 8.00, Expiration Jan. 2016 | | | 314 | | | | 8,321 | | |
| | | | 817,700 | | |
Precious Metals 0.02% | |
Coeur Mining, Inc., Strike Price 7.00, Expiration Jan. 2015 | | | 2,100 | | | | 15,750 | | |
Silver Mining 0.21% | |
First Majestic Silver Corp., Strike Price 12.50, Expiration Jan. 2015 | | | 600 | | | | 3,000 | | |
First Majestic Silver Corp., Strike Price 10.00, Expiration Jan. 2016 | | | 328 | | | | 11,480 | | |
Pan American Silver Corp., Strike Price 13.00, Expiration Jan. 2015 | | | 402 | | | | 2,010 | | |
Pan American Silver Corp., Strike Price 10.00, Expiration Jan. 2016 | | | 263 | | | | 39,450 | | |
Silver Standard Resources, Inc., Strike Price 8.00, Expiration Jan. 2015 | | | 1,175 | | | | 5,875 | | |
Silver Standard Resources, Inc., Strike Price 5.00, Expiration Jan. 2016 | | | 598 | | | | 91,195 | | |
Silver Wheaton Corp., Strike Price 20.00, Expiration Jan. 2016 | | | 154 | | | | 57,750 | | |
| | | | 210,760 | | |
Total Purchased Call Options | | | 1,057,600 | | |
(cost $4,845,258) | |
See notes to portfolios of investments and notes to financial statements.
101
World Precious Minerals Fund
Portfolio of Investments December 31, 2014
Gold-Linked Notes 1.16% | | Principal
Amount | | Value | |
Gold Mining 1.16% | |
Gran Colombia Gold Corp., 10.00%, maturity 10/31/17 | | $ | 215,000 | | | $ | 42,463 | ^ | |
Gran Colombia Gold Corp., 144A, 10.00%, maturity 10/31/17 | | | 5,845,000 | | | | 1,154,387 | ^ | |
Total Gold-Linked Notes | | | 1,196,850 | | |
(cost $5,977,400) | |
Silver-Linked Notes 1.28%
Gold Mining 1.28% | |
Gran Colombia Gold Corp., 5.00%, maturity 08/11/18 | | | 655,000 | | | | 98,250 | ^ | |
Gran Colombia Gold Corp., 144A, 5.00%, maturity 08/11/18 | | | 8,150,000 | | | | 1,222,500 | ^ | |
Total Silver-Linked Notes | | | 1,320,750 | | |
(cost $8,616,219) | |
Corporate Note 0.73%
Electric - Generation 0.73% | |
Pacific Power Generation Corp., 15.00%, maturity 04/03/17 (RS) | | | 760,000 | | | | 760,000 | #@ | |
(cost $760,000) | |
Total Investments 97.63% | | | 101,115,840 | | |
(cost $236,526,506) | |
Other assets and liabilities, net 2.37% | | | 2,450,488 | | |
Net Assets 100.0% | | $ | 103,566,328 | | |
See notes to portfolios of investments and notes to financial statements.
102
Gold and Precious Metals Fund
Portfolio of Investments December 31, 2014
Common Stocks 84.49% | | Shares | | Value | |
Diamonds/Precious Stones 2.67% | |
Lucara Diamond Corp. | | | 450,000 | | | $ | 848,253 | | |
Petra Diamonds Ltd. | | | 275,000 | | | | 825,618 | * | |
| | | | 1,673,871 | | |
Diversified Minerals 1.57% | |
Lundin Mining Corp. | | | 200,000 | | | | 984,679 | * | |
Gold/Mineral Royalty Companies 5.88% | |
Franco-Nevada Corp. | | | 75,000 | | | | 3,689,250 | | |
Gold Mining 60.22% | |
Acacia Mining plc | | | 550,000 | | | | 2,178,978 | | |
Agnico Eagle Mines Ltd. | | | 39,952 | | | | 994,405 | | |
Alacer Gold Corp. | | | 800,000 | | | | 1,604,407 | | |
AuRico Gold, Inc. | | | 350,000 | | | | 1,148,000 | | |
Centamin plc | | | 875,000 | | | | 803,415 | | |
Cia de Minas Buenaventura S.A., Sponsored ADR | | | 75,000 | | | | 717,000 | | |
Comstock Mining, Inc. | | | 2,170,077 | | | | 1,649,259 | * | |
DRDGOLD Ltd., Sponsored ADR | | | 150,000 | | | | 232,500 | | |
Dundee Precious Metals, Inc. | | | 253,466 | | | | 597,777 | * | |
Eldorado Gold Corp. | | | 175,000 | | | | 1,064,000 | | |
Gold Fields Ltd., Sponsored ADR | | | 200,000 | | | | 906,000 | | |
Goldcorp, Inc. | | | 35,000 | | | | 648,200 | | |
Gran Colombia Gold Corp. | | | 484,317 | | | | 195,928 | * | |
Harmony Gold Mining Co. Ltd., Sponsored ADR | | | 300,000 | | | | 567,000 | | |
IAMGOLD Corp. | | | 240,000 | | | | 648,000 | * | |
Kirkland Lake Gold, Inc. | | | 786,483 | | | | 2,267,790 | * | |
Klondex Mines Ltd. | | | 3,742,792 | | | | 6,282,013 | * | |
Lake Shore Gold Corp. | | | 1,500,000 | | | | 1,007,058 | * | |
Marlin Gold Mining Ltd. | | | 411,050 | | | | 198,130 | * | |
Newmont Mining Corp. | | | 35,000 | | | | 661,500 | | |
Northern Star Resources Ltd. | | | 2,000,000 | | | | 2,410,314 | | |
Randgold Resources Ltd., Sponsored ADR | | | 20,000 | | | | 1,348,200 | | |
Richmont Mines, Inc. | | | 400,000 | | | | 1,268,000 | * | |
Rio Alto Mining Ltd. | | | 400,000 | | | | 970,907 | * | |
Royal Gold, Inc. | | | 60,000 | | | | 3,761,999 | | |
Silver Lake Resources Ltd. | | | 3,225,000 | | | | 506,484 | * | |
Teranga Gold Corp. | | | 3,184,600 | | | | 1,247,197 | * | |
Virginia Mines, Inc. | | | 55,100 | | | | 714,242 | * | |
Yamana Gold, Inc. | | | 300,000 | | | | 1,206,000 | | |
| | | | 37,804,703 | | |
Medical - Hospitals 0.00% | |
African Medical Investments plc | | | 2,000,000 | | | | 0 | *#@ | |
See notes to portfolios of investments and notes to financial statements.
103
Gold and Precious Metals Fund
Portfolio of Investments December 31, 2014
Common Stocks (cont'd) | | Shares | | Value | |
Metal - Copper 1.43% | |
Nevsun Resources Ltd. | | | 230,000 | | | $ | 894,700 | | |
Metal - Diversified 4.92% | |
Atico Mining Corp. | | | 1,602,400 | | | | 924,090 | * | |
Mandalay Resources Corp. | | | 2,712,200 | | | | 2,124,378 | | |
Trevali Mining Corp. | | | 50,000 | | | | 46,049 | * | |
| | | | 3,094,517 | | |
Precious Metals 1.36% | |
Pan African Resources plc | | | 3,300,000 | | | | 552,474 | | |
U.S. Silver & Gold, Inc. | | | 1,000,000 | | | | 301,257 | * | |
| | | | 853,731 | | |
Retail - Jewelry 1.22% | |
Signet Jewelers Ltd. | | | 3,000 | | | | 394,710 | | |
Tiffany & Co. | | | 3,441 | | | | 367,705 | | |
| | | | 762,415 | | |
Silver Mining 5.22% | |
First Majestic Silver Corp. | | | 127,500 | | | | 640,050 | * | |
Fortuna Silver Mines, Inc. | | | 400,000 | | | | 1,820,000 | * | |
Silver Wheaton Corp. | | | 40,000 | | | | 813,200 | | |
| | | | 3,273,250 | | |
Total Common Stocks | | | 53,031,116 | | |
(cost $80,777,025) | |
Exchange-Traded Funds 6.03%
Direxion Daily Gold Miners Bull 3x Shares | | | 95,000 | | | | 1,060,200 | | |
Direxion Daily Junior Gold Miners Index Bull 3x Shares | | | 25,000 | | | | 608,500 | | |
ETFS Palladium Trust | | | 9,193 | | | | 712,366 | | |
ETFS Platinum Trust | | | 10,000 | | | | 1,170,500 | | |
Market Vectors Gold Miners ETF | | | 20 | | | | 368 | | |
Market Vectors Junior Gold Miners ETF | | | 8 | | | | 191 | | |
SPDR Gold Trust | | | 2,049 | | | | 232,725 | | |
Total Exchange-Traded Funds | | | 3,784,850 | | |
(cost $5,585,136) | |
See notes to portfolios of investments and notes to financial statements.
104
Gold and Precious Metals Fund
Portfolio of Investments December 31, 2014
Warrants 2.24% | | Shares | | Value | |
Gold/Mineral Royalty Companies 1.09% | |
Franco-Nevada Corp., Warrants (June 2017) | | | 80,000 | | | $ | 688,587 | * | |
Gold Mining 1.13% | |
Crystallex International Corp., 144A, Warrants (December 2049) | | | 62,500 | | | | 0 | *#@ | |
Dundee Precious Metals, Inc., Warrants (November 2015) | | | 1,629,347 | | | | 585,517 | * | |
Gran Colombia Gold Corp., 144A, Warrants (October 2017) | | | 29,400 | | | | 0 | *#@ | |
Gran Colombia Gold Corp., 144A, Warrants (March 2019) | | | 37,500 | | | | 3,066 | * | |
New Gold, Inc., Warrants (June 2017) | | | 201,000 | | | | 121,105 | * | |
Veris Gold Corp., Warrants (August 2016) | | | 250,000 | | | | 0 | *#@ | |
Veris Gold Corp., Warrants (December 2016) | | | 195,300 | | | | 0 | *#@ | |
| | | | 709,688 | | |
Precious Metals 0.02% | |
Primero Mining Corp., Warrants (July 2015) | | | 100,000 | | | | 10,759 | * | |
Total Warrants | | | 1,409,034 | | |
(cost $4,032,470) | |
Purchased Call Options 1.11% | | Contracts | | | |
Exchange-Traded Funds 0.01% | |
Market Vectors Gold Miners ETF, Strike Price 21.00, Expiration Jan. 2015 | | | 450 | | | | 4,950 | | |
Market Vectors Gold Miners ETF, Strike Price 30.00, Expiration Jan. 2015 | | | 227 | | | | 2,270 | | |
| | | | 7,220 | | |
Gold Mining 0.82% | |
AngloGold Ashanti Ltd., Strike Price 13.00, Expiration Jan. 2015 | | | 150 | | | | 750 | | |
Eldorado Gold Corp., Strike Price 8.00, Expiration Jan. 2015 | | | 595 | | | | 2,975 | | |
Eldorado Gold Corp., Strike Price 5.00, Expiration Jan. 2016 | | | 493 | | | | 91,205 | | |
Gold Fields Ltd., Strike Price 5.00, Expiration Jan. 2016 | | | 500 | | | | 40,250 | | |
IAMGOLD Corp., Strike Price 4.00, Expiration Jan. 2015 | | | 1,031 | | | | 5,155 | | |
IAMGOLD Corp., Strike Price 2.00, Expiration Mar. 2015 | | | 2,550 | | | | 204,000 | | |
IAMGOLD Corp., Strike Price 4.00, Expiration Jan. 2016 | | | 180 | | | | 7,200 | | |
Kinross Gold Corp., Strike Price 3.00, Expiration Jan. 2015 | | | 1,075 | | | | 9,675 | | |
New Gold, Inc., Strike Price 8.00, Expiration Jan. 2015 | | | 700 | | | | 3,500 | | |
Newmont Mining Corp., Strike Price 25.00, Expiration Jan. 2015 | | | 500 | | | | 1,000 | | |
Randgold Resources Ltd., Strike Price 65.00, Expiration Jan. 2016 | | | 80 | | | | 95,200 | | |
Yamana Gold, Inc., Strike Price 10.00, Expiration Jan. 2015 | | | 1,509 | | | | 1,509 | | |
Yamana Gold, Inc., Strike Price 4.50, Expiration Apr. 2015 | | | 1,200 | | | | 42,600 | | |
Yamana Gold, Inc., Strike Price 8.00, Expiration Jan. 2016 | | | 314 | | | | 8,321 | | |
| | | | 513,340 | | |
See notes to portfolios of investments and notes to financial statements.
105
Gold and Precious Metals Fund
Portfolio of Investments December 31, 2014
Purchased Call Options (cont'd) | | Contracts | | Value | |
Precious Metals 0.01% | |
Coeur Mining, Inc., Strike Price 7.00, Expiration Jan. 2015 | | | 1,200 | | | $ | 9,000 | | |
Silver Mining 0.27% | |
First Majestic Silver Corp., Strike Price 12.50, Expiration Jan. 2015 | | | 450 | | | | 2,250 | | |
First Majestic Silver Corp., Strike Price 10.00, Expiration Jan. 2016 | | | 249 | | | | 8,715 | | |
Pan American Silver Corp., Strike Price 13.00, Expiration Jan. 2015 | | | 567 | | | | 2,835 | | |
Pan American Silver Corp., Strike Price 10.00, Expiration Jan. 2016 | | | 365 | | | | 54,750 | | |
Silver Standard Resources, Inc., Strike Price 8.00, Expiration Jan. 2015 | | | 700 | | | | 3,500 | | |
Silver Standard Resources, Inc., Strike Price 5.00, Expiration Jan. 2016 | | | 352 | | | | 53,680 | | |
Silver Wheaton Corp., Strike Price 20.00, Expiration Jan. 2016 | | | 116 | | | | 43,500 | | |
| | | | 169,230 | | |
Total Purchased Call Options | | | 698,790 | | |
(cost $3,591,505) | |
Gold-Linked Notes 0.96% | | Principal
Amount | | | |
Gold Mining 0.96% | |
Gran Colombia Gold Corp., 10.00%, maturity 10/31/17 | | $ | 125,000 | | | | 24,688 | ^ | |
Gran Colombia Gold Corp., 144A, 10.00%, maturity 10/31/17 | | | 2,940,000 | | | | 580,650 | ^ | |
Total Gold-Linked Notes | | | 605,338 | | |
(cost $3,019,060) | |
Silver-Linked Notes 1.10%
Gold Mining 1.10% | |
Gran Colombia Gold Corp., 5.00%, maturity 08/11/18 | | | 373,000 | | | | 55,950 | ^ | |
Gran Colombia Gold Corp., 144A, 5.00%, maturity 08/11/18 | | | 4,250,000 | | | | 637,500 | ^ | |
Total Silver-Linked Notes | | | 693,450 | | |
(cost $4,520,041) | |
Corporate Notes 1.23%
Coal 0.78% | |
Pacific Coal Resources Ltd., 12.00%, maturity 06/15/15 (RS) | | | 485,766 | | | | 485,766 | #@ | |
See notes to portfolios of investments and notes to financial statements.
106
Gold and Precious Metals Fund
Portfolio of Investments December 31, 2014
Corporate Notes (cont'd) | | Principal
Amount | | Value | |
Electric - Generation 0.45% | |
Pacific Power Generation Corp., 15.00%, maturity 04/03/17 (RS) | | $ | 285,000 | | | $ | 285,000 | #@ | |
Total Corporate Notes | | | 770,766 | | |
(cost $770,766) | |
Total Investments 97.16% | | | 60,993,344 | | |
(cost $102,296,003) | |
Other assets and liabilities, net 2.84% | | | 1,783,574 | | |
Net Assets 100.0% | | $ | 62,776,918 | | |
See notes to portfolios of investments and notes to financial statements.
107
Emerging Europe Fund
Portfolio of Investments December 31, 2014
Common Stocks 89.17% | | Shares | | Value | |
Airlines 1.02% | |
Pegasus Hava Tasimaciligi A.S. | | | 50,000 | | | $ | 707,168 | * | |
Airport Development/Maintenance 1.77% | |
TAV Havalimanlari Holding A.S. | | | 150,000 | | | | 1,224,548 | | |
Automotive - Cars & Light Trucks 7.25% | |
Ford Otomotiv Sanayi A.S. | | | 100,000 | | | | 1,390,360 | | |
Tofas Turk Otomobil Fabrikasi A.S. | | | 530,200 | | | | 3,613,085 | | |
| | | | 5,003,445 | | |
Automotive Truck Parts & Equipment 1.21% | |
Brembo S.p.A. | | | 25,000 | | | | 837,920 | | |
Building & Construction - Miscellaneous 0.29% | |
Budimex S.A. | | | 5,000 | | | | 198,159 | | |
Cellular Telecommunication 5.15% | |
KCell JSC, 144A, GDR | | | 120,000 | | | | 1,206,001 | | |
Turkcell Iletisim Hizmetleri A.S. | | | 213,094 | | | | 1,300,405 | * | |
Turkcell Iletisim Hizmetleri A.S., Sponsored ADR | | | 70,000 | | | | 1,058,400 | * | |
| | | | 3,564,806 | | |
Coal 0.98% | |
Lubelski Wegiel Bogdanka S.A. | | | 25,000 | | | | 680,075 | | |
Commercial Banks - Non US 26.26% | |
Alpha Bank A.E. | | | 600,000 | | | | 337,047 | * | |
Bank Zachodni WBK S.A. | | | 13,000 | | | | 1,370,854 | | |
Erste Group Bank AG | | | 120,285 | | | | 2,797,678 | | |
ING Bank Slaski S.A. | | | 30,000 | | | | 1,182,468 | | |
Komercni Banka A.S. | | | 14,000 | | | | 2,881,216 | | |
OTP Bank plc | | | 40,000 | | | | 576,980 | | |
Piraeus Bank S.A. | | | 250,000 | | | | 272,034 | * | |
Powszechna Kasa Oszczednosci Bank Polski S.A. | | | 155,000 | | | | 1,555,874 | | |
Turkiye Garanti Bankasi A.S. | | | 800,000 | | | | 3,213,710 | | |
Turkiye Halk Bankasi A.S. | | | 235,000 | | | | 1,392,043 | | |
Turkiye Is Bankasi, Class C | | | 708,600 | | | | 2,037,524 | | |
Yapi ve Kredi Bankasi A.S. | | | 250,000 | | | | 520,609 | | |
| | | | 18,138,037 | | |
Distribution/Wholesale 0.56% | |
Fourlis Holdings S.A. | | | 100,000 | | | | 385,918 | * | |
See notes to portfolios of investments and notes to financial statements.
108
Emerging Europe Fund
Portfolio of Investments December 31, 2014
Common Stocks (cont'd) | | Shares | | Value | |
Diversified Banking Institutions 0.93% | |
UniCredit S.p.A. | | | 100,000 | | | $ | 640,563 | | |
Diversified Operations 2.48% | |
Haci Omer Sabanci Holding A.S. | | | 395,000 | | | | 1,714,581 | | |
Electric - Distribution 3.17% | |
Enea S.A. | | | 100,000 | | | | 430,227 | | |
Energa S.A. | | | 270,000 | | | | 1,755,889 | | |
| | | | 2,186,116 | | |
Electric - Generation 1.67% | |
CEZ A.S. | | | 45,000 | | | | 1,155,505 | | |
Electric - Integrated 2.34% | |
PGE S.A. | | | 182,000 | | | | 962,275 | | |
Public Power Corporation S.A. | | | 100,000 | | | | 652,983 | * | |
| | | | 1,615,258 | | |
Entertainment Software 0.68% | |
CD Projekt S.A. | | | 100,000 | | | | 468,527 | * | |
Finance - Investment Banker/Broker 4.27% | |
Turkiye Sinai Kalkinma Bankasi A.S. | | | 3,420,425 | | | | 2,943,128 | | |
Finance - Other Services 0.56% | |
Warsaw Stock Exchange | | | 30,000 | | | | 388,060 | | |
Food - Confectionery 1.49% | |
Ulker Biskuvi Sanayi A.S. | | | 130,000 | | | | 1,029,042 | | |
Human Resources 0.37% | |
Work Service S.A. | | | 50,000 | | | | 254,738 | * | |
Machinery - Farm 2.19% | |
Turk Traktor ve Ziraat Makineleri A.S. | | | 45,900 | | | | 1,508,288 | | |
Medical - Drugs 2.78% | |
Krka dd Novo mesto | | | 20,000 | | | | 994,195 | | |
Richter Gedeon Nyrt | | | 69,000 | | | | 929,221 | | |
| | | | 1,923,416 | | |
Medical Products 1.82% | |
Straumann Holding AG | | | 5,000 | | | | 1,256,202 | | |
See notes to portfolios of investments and notes to financial statements.
109
Emerging Europe Fund
Portfolio of Investments December 31, 2014
Common Stocks (cont'd) | | Shares | | Value | |
Metal - Diversified 0.57% | |
Grupa Kety S.A. | | | 3,500 | | | $ | 281,205 | | |
Orsu Metals Corp. | | | 664,240 | | | | 15,723 | * | |
Orsu Metals Corp., 144A | | | 4,025,000 | | | | 95,272 | * | |
| | | | 392,200 | | |
Oil Companies - Exploration & Production 3.51% | |
Bankers Petroleum Ltd. | | | 200,000 | | | | 561,198 | * | |
BNK Petroleum, Inc. | | | 300,000 | | | | 107,161 | * | |
DNO ASA | | | 450,000 | | | | 952,148 | * | |
Dragon Oil plc | | | 90,000 | | | | 753,939 | | |
Petromanas Energy, Inc. | | | 1,000,000 | | | | 51,644 | * | |
| | | | 2,426,090 | | |
Property/Casualty Insurance 2.37% | |
Powszechny Zaklad Ubezpieczen S.A. | | | 12,000 | | | | 1,637,669 | | |
Retail - Automobile 1.99% | |
Dogus Otomotiv Servis ve Ticaret A.S. | | | 270,000 | | | | 1,377,535 | | |
Retail - Jewelry 1.17% | |
Pandora A/S | | | 10,000 | | | | 810,571 | | |
Retail - Miscellaneous/Diversified 2.78% | |
FF Group | | | 60,000 | | | | 1,917,024 | | |
Retail - Toy Store 1.77% | |
JUMBO S.A. | | | 120,363 | | | | 1,223,889 | | |
Telecom Services 1.93% | |
Orange Polska S.A. | | | 570,000 | | | | 1,331,851 | | |
Textile - Apparel 0.59% | |
LPP S.A. | | | 200 | | | | 405,907 | * | |
Textile - Products 1.28% | |
Pegas Nonwovens S.A. | | | 31,622 | | | | 882,078 | | |
Tobacco 1.78% | |
Philip Morris CR A.S. | | | 2,610 | | | | 1,232,246 | | |
See notes to portfolios of investments and notes to financial statements.
110
Emerging Europe Fund
Portfolio of Investments December 31, 2014
Common Stocks (cont'd) | | Shares | | Value | |
Transport - Services 0.19% | |
Integer.pl S.A. | | | 3,000 | | | $ | 130,470 | * | |
Total Common Stocks | | | 61,591,030 | | |
(cost $69,776,601) | |
Closed-End Investment Company 2.14%
Fondul Proprietatea S.A. | | | 6,124,074 | | | | 1,476,160 | | |
(cost $1,414,333) | |
Warrants 1.81%
Commercial Banks Non-US 1.49% | |
Alpha Bank S.A., Warrants (December 2017) | | | 900,000 | | | | 1,023,705 | * | |
Gold Mining 0.32% | |
Dundee Precious Metals, Inc., Warrants (November 2015) | | | 622,959 | | | | 223,864 | * | |
Total Warrants | | | 1,247,569 | | |
(cost $2,444,242) | |
Corporate Note 1.48% | | Principal
Amount | | | |
Transportation - Services 1.48% | |
Baghlan Group FZCO, 14.75%, maturity 06/27/15 | | $ | 1,345,845 | | | | 1,022,842 | ^ | |
(cost $1,350,345) | |
Total Investments 94.60% | | | 65,337,601 | | |
(cost $74,985,521) | |
Other assets and liabilities, net 5.40% | | | 3,728,270 | | |
Net Assets 100.0% | | $ | 69,065,871 | | |
See notes to portfolios of investments and notes to financial statements.
111
China Region Fund
Portfolio of Investments December 31, 2014
Common Stocks 93.89% | | Shares | | Value | |
Aerospace/Defense - Equipment 1.40% | |
AviChina Industry & Technology Co., Ltd., H shares | | | 480,000 | | | $ | 294,290 | | |
Airlines 1.11% | |
Air China Ltd., H shares | | | 290,000 | | | | 233,986 | | |
Airport Develop/Maintenence 0.60% | |
Airports of Thailand PCL | | | 14,800 | | | | 126,093 | | |
Alternative Waste Technology 0.56% | |
China Everbright International Ltd. | | | 79,000 | | | | 116,636 | | |
Auction House/Art Dealer 0.46% | |
Poly Culture Group Corp., Ltd., H shares | | | 31,400 | | | | 96,202 | * | |
Automotive - Cars & Light Trucks 1.12% | |
Great Wall Motor Co., Ltd., H shares | | | 41,500 | | | | 234,744 | | |
Automotive/Truck Parts & Equipment - Original 1.01% | |
Nexteer Automotive Group Ltd. | | | 248,000 | | | | 211,827 | | |
Building - Heavy Construction 2.51% | |
China Railway Construction Corp., Ltd., H shares | | | 332,600 | | | | 422,303 | | |
DMCI Holdings, Inc. | | | 301,000 | | | | 105,266 | | |
| | | | 527,569 | | |
Building & Construction - Miscellaneous 1.82% | |
China Singyes Solar Technologies Holdings Ltd. | | | 277,000 | | | | 382,852 | | |
Building Products - Cement/Aggregates 0.51% | |
Semen Indonesia Persero Tbk PT | | | 82,400 | | | | 107,574 | | |
Casino Hotels 0.49% | |
Sands China Ltd. | | | 21,200 | | | | 103,205 | | |
Cellular Telecommunication 1.01% | |
China Mobile Ltd., Sponsored ADR | | | 3,600 | | | | 211,752 | | |
Chemicals - Specialty 1.11% | |
Huabao International Holdings Ltd. | | | 286,000 | | | | 233,072 | | |
See notes to portfolios of investments and notes to financial statements.
112
China Region Fund
Portfolio of Investments December 31, 2014
Common Stocks (cont'd) | | Shares | | Value | |
Commercial Banks - Non US 21.30% | |
Agricultural Bank of China Ltd., H shares | | | 480,000 | | | $ | 241,424 | | |
Bank of China Ltd., H shares | | | 1,542,800 | | | | 865,926 | | |
Bank of Communications Co., Ltd., H shares | | | 283,000 | | | | 263,125 | | |
Bank Rakyat Indonesia Persero Tbk PT | | | 235,000 | | | | 220,896 | | |
BOC Hong Kong Holdings Ltd. | | | 32,500 | | | | 108,295 | | |
China Construction Bank Corp., H shares | | | 1,632,400 | | | | 1,333,315 | | |
Chongqing Rural Commercial Bank Co., Ltd., H shares | | | 459,000 | | | | 284,771 | | |
Industrial & Commercial Bank of China Ltd., H shares | | | 1,432,000 | | | | 1,045,635 | | |
Kasikornbank PCL | | | 15,400 | | | | 106,510 | | |
| | | | 4,469,897 | | |
Computers 0.99% | |
Lenovo Group Ltd. | | | 160,000 | | | | 208,898 | | |
Computers - Integrated Systems 0.98% | |
PAX Global Technology Ltd. | | | 200,000 | | | | 204,861 | * | |
Diversified Minerals 0.61% | |
China Hongqiao Group Ltd. | | | 154,000 | | | | 103,288 | | |
Woulfe Mining Corp. | | | 300,000 | | | | 24,531 | *# | |
| | | | 127,819 | | |
Diversified Operations 0.55% | |
Siam Cement PCL | | | 8,500 | | | | 115,376 | | |
E-Commerce/Products 1.64% | |
Alibaba Group Holding Ltd., Sponsored ADR | | | 1,000 | | | | 103,940 | * | |
E-Commerce China Dangdang, Inc., Class A, Sponsored ADR | | | 13,316 | | | | 123,706 | * | |
Vipshop Holdings Ltd., Sponsored ADR | | | 6,000 | | | | 117,240 | * | |
| | | | 344,886 | | |
E-Commerce/Services 0.91% | |
Bitauto Holdings Ltd., Sponsored ADR | | | 2,700 | | | | 190,107 | * | |
Electric - Generation 4.97% | |
China Resources Power Holdings Co., Ltd. | | | 76,000 | | | | 193,855 | | |
Huadian Fuxin Energy Corp., Ltd., H shares | | | 242,000 | | | | 113,334 | | |
Huadian Power International Corp., Ltd., H shares | | | 382,000 | | | | 331,398 | | |
Huaneng Power International, Inc., H shares | | | 180,000 | | | | 243,224 | | |
Huaneng Renewables Corp., Ltd., H shares | | | 506,000 | | | | 162,313 | | |
| | | | 1,044,124 | | |
See notes to portfolios of investments and notes to financial statements.
113
China Region Fund
Portfolio of Investments December 31, 2014
Common Stocks (cont'd) | | Shares | | Value | |
Electronic Components - Semiconductors 1.02% | |
Inotera Memories, Inc. | | | 136,000 | | | $ | 213,383 | * | |
Entertainment Software 1.27% | |
NetEase, Inc., Sponsored ADR | | | 2,700 | | | | 267,678 | | |
Finance - Investment Banker/Broker 2.39% | |
CITIC Securities Co., Ltd., H shares | | | 57,500 | | | | 214,920 | | |
Guotai Junan International Holdings Ltd. | | | 239,000 | | | | 180,142 | | |
Haitong Securities Co., Ltd., H shares | | | 42,800 | | | | 106,824 | | |
| | | | 501,886 | | |
Finance - Leasing Company 0.60% | |
China Aircraft Leasing Group Holdings Ltd. | | | 84,500 | | | | 125,277 | * | |
Finance - Other Services 1.71% | |
Hong Kong Exchanges and Clearing Ltd. | | | 16,300 | | | | 359,851 | | |
Food - Miscellaneous/Diversified 0.55% | |
Universal Robina Corp. | | | 26,600 | | | | 115,973 | | |
Industrial Automation/Robots 0.53% | |
Hollysys Automation Technologies Ltd. | | | 4,600 | | | | 112,378 | * | |
Internet Application Software 4.59% | |
Tencent Holdings Ltd. | | | 66,600 | | | | 963,631 | | |
Investment Management/Advisory Services 1.04% | |
Value Partners Group Ltd. | | | 262,000 | | | | 218,642 | | |
Investment Companies 0.49% | |
Asian Pay Television Trust | | | 159,000 | | | | 103,157 | | |
Life/Health Insurance 7.28% | |
AIA Group Ltd. | | | 100,100 | | | | 552,098 | | |
China Life Insurance Co., Ltd., H shares | | | 249,000 | | | | 975,618 | | |
| | | | 1,527,716 | | |
Machine Tools & Related Products 1.60% | |
Techtronic Industries Co., Ltd. | | | 105,000 | | | | 336,849 | | |
See notes to portfolios of investments and notes to financial statements.
114
China Region Fund
Portfolio of Investments December 31, 2014
Common Stocks (cont'd) | | Shares | | Value | |
Medical - Drugs 2.59% | |
Consun Pharmaceutical Group Ltd. | | | 148,000 | | | $ | 111,296 | | |
Lee's Pharmaceutical Holdings Ltd. | | | 76,500 | | | | 111,405 | | |
Lijun International Pharmaceutical Holding Co., Ltd. | | | 266,000 | | | | 121,664 | | |
Shanghai Fosun Pharmaceutical Group Co., Ltd., H shares | | | 56,000 | | | | 200,106 | | |
| | | | 544,471 | | |
Medical - Wholesale Drug Distribution 0.50% | |
Sinopharm Group Co., Ltd., H shares | | | 29,600 | | | | 104,158 | | |
Medical Products 0.48% | |
China Medical System Holdings Ltd. | | | 60,750 | | | | 100,085 | | |
Multi-line Insurance 3.86% | |
Ping An Insurance Group Co of China Ltd., H shares | | | 80,000 | | | | 810,043 | | |
Non - Ferrous Metals 0.55% | |
Korea Zinc Co., Ltd. | | | 300 | | | | 109,655 | | |
Sterling Group Ventures, Inc. | | | 500,000 | | | | 5,500 | * | |
| | | | 115,155 | | |
Oil Companies - Exploration & Production 0.55% | |
CNOOC Ltd., Sponsored ADR | | | 850 | | | | 115,124 | | |
Oil Companies - Integrated 0.52% | |
PetroChina Co., Ltd., H shares | | | 98,500 | | | | 109,344 | | |
Petrochemicals 0.00% | |
Danhua Chemical Technology Co., Ltd., B Shares | | | 2 | | | | 1 | * | |
Photo Equipment & Supplies 0.71% | |
Largan Precision Co., Ltd. | | | 2,000 | | | | 149,713 | | |
Real Estate Operating/Development 7.20% | |
China Overseas Land & Investment Ltd. | | | 68,000 | | | | 201,160 | | |
China Resources Land Ltd. | | | 110,000 | | | | 289,082 | | |
China Vanke Co., Ltd., H shares | | | 95,000 | | | | 210,743 | * | |
KWG Property Holding Ltd. | | | 163,500 | | | | 111,336 | | |
Shimao Property Holdings Ltd. | | | 48,500 | | | | 107,408 | | |
Sunac China Holdings Ltd. | | | 357,000 | | | | 360,631 | | |
Yuzhou Properties Co., Ltd. | | | 940,000 | | | | 236,010 | | |
| | | | 1,516,370 | | |
See notes to portfolios of investments and notes to financial statements.
115
China Region Fund
Portfolio of Investments December 31, 2014
Common Stocks (cont'd) | | Shares | | Value | |
Retail - Jewelry 0.52% | |
Chow Tai Fook Jewellery Group Ltd. | | | 82,200 | | | $ | 110,090 | | |
Lao Feng Xiang Co., Ltd., B Shares | | | 1 | | | | 3 | | |
| | | | 110,093 | | |
Satellite Telecommunication 0.51% | |
APT Satellite Holdings Ltd. | | | 75,500 | | | | 106,683 | | |
Schools 1.36% | |
TAL Education Group, Sponsored ADR | | | 6,200 | | | | 174,158 | * | |
Tarena International, Inc., Sponsored ADR | | | 10,100 | | | | 112,110 | * | |
| | | | 286,268 | | |
Telecom Services 3.06% | |
CITIC Telecom International Holdings Ltd. | | | 572,000 | | | | 213,886 | | |
Jasmine International PCL | | | 456,800 | | | | 101,313 | | |
PCCW Ltd. | | | 336,000 | | | | 228,780 | | |
Telekomunikasi Indonesia Persero Tbk PT | | | 441,000 | | | | 101,354 | | |
| | | | 645,333 | | |
Textile - Apparel 0.53% | |
Shenzhou International Group Holdings Ltd. | | | 34,000 | | | | 112,047 | | |
Veterinary Products 0.49% | |
China Animal Healthcare Ltd. | | | 149,000 | | | | 103,125 | | |
Water Treatment Systems 0.64% | |
Sound Global Ltd. | | | 116,000 | | | | 133,486 | * | |
Web Portals/Internet Service Providers 1.09% | |
Baidu, Inc. | | | 1,000 | | | | 227,970 | * | |
Total Common Stocks | | | 19,721,660 | | |
(cost $18,614,683) | |
Exchange-Traded Funds 2.68%
Deutsche X-trackers Harvest CSI 300 China A-Shares ETF | | | 3,100 | | | | 115,351 | | |
Direxion Daily FTSE China Bull 3X Shares | | | 3,800 | | | | 135,888 | | |
iShares MSCI Singapore ETF | | | 7,800 | | | | 102,024 | | |
iShares MSCI South Korea Capped ETF | | | 1,900 | | | | 105,070 | | |
Market Vectors Vietnam ETF | | | 5,500 | | | | 105,710 | | |
Total Exchange-Traded Funds | | | 564,043 | | |
(cost $547,017) | |
See notes to portfolios of investments and notes to financial statements.
116
China Region Fund
Portfolio of Investments December 31, 2014
Closed-End Investment Company 1.53% | | Shares | | Value | |
Morgan Stanley China A Share Fund, Inc. | | | 10,600 | | | $ | 321,922 | | |
(cost $264,327) | |
Purchased Call Options 0.00% | | Contracts | | | |
Diversified Banking Institutions 0.00% | |
HSBC Holdings plc, Strike Price 55.00, Expiration Jan. 2015 | | | 300 | | | | 900 | | |
(cost $76,697) | |
Total Investments 98.10% | | | 20,608,525 | | |
(cost $19,502,724) | |
Other assets and liabilities, net 1.90% | | | 399,463 | | |
Net Assets 100.0% | | $ | 21,007,988 | | |
See notes to portfolios of investments and notes to financial statements.
117
Notes to Portfolios of Investments December 31, 2014
Legend
* Non-income producing security.
+ Affiliated company (see following)
# Illiquid Security
^ In default on interest payments. Rate shown represents the last coupon rate prior to default.
ADR American Depositary Receipt
ETF Exchange Traded Fund
GDR Global Depositary Receipt
GO General Obligation Bond
RS Restricted Security (see following)
ZCB Zero Coupon Bond
@ Security was fair valued at December 31, 2014, by U.S. Global Investors, Inc. (Adviser) (other than international securities fair valued pursuant to systematic fair value models) in accordance with valuation procedures approved by the Board of Trustees. These securities, as a percentage of net assets at December 31, 2014, were 3.50% of Holmes Macro Trends Fund, 10.41% of Global Resources Fund, 4.23% of World Precious Minerals Fund and 1.23% of Gold and Precious Metals Fund, respectively. See the Fair Valuation of Securities section of these Notes to Portfolios of Investments for further discussion of fair valued securities. See further information and detail on restricted securities in the Restricted Securities section of these Notes to Portfolios of Investments.
144A Pursuant to Rule 144A of the Securities Act of 1933, these securities may be resold in transactions exempt from registration, normally to qualified institutional buyers.
General
The yields reflect the effective yield from the date of purchase.
Variable Rate Notes have periodic reset features, which effectively shorten the maturity dates and reset the interest rates as tied to various interest-bearing instruments. Rates shown are current rates at December 31, 2014.
Principal amounts are in U.S. dollars unless otherwise noted.
Fair Valuation of Securities
For the Funds' policies regarding the valuation of investments and other significant accounting policies, please refer to the Notes to Financial Statements.
The Funds are required to disclose information regarding the fair value measurements of a Fund's assets and liabilities. Fair value is the price that would be received to sell an asset or paid to transfer a liability in an orderly transaction between market participants at the measurement date. The measurement requirements established a three-tier hierarchy to maximize the use of observable market data and minimize the use of unobservable inputs and to establish classification of fair value measurements for disclosure purposes. Inputs refer broadly to the assumptions that market participants would use in pricing the asset or liability, including assumptions about risk, for example, the risk inherent in a particular valuation technique used to measure fair value including such a pricing model and/or the risk inherent in the inputs to the valuation technique. Inputs may be observable or unobservable. Observable inputs are inputs that reflect the assumptions market participants would use in pricing the asset or liability developed based on market data obtained from sources independent of the reporting entity. Unobservable inputs are inputs that reflect the reporting entity's own assumptions about the assumptions market participants would use in pricing the asset or liability developed based on the best information available in the circumstances.
118
Notes to Portfolios of Investments December 31, 2014
The inputs or methodology used for valuing securities are not necessarily an indication of the risk associated with investing in those securities. For example, short term U.S. government obligations maturing in sixty days or less are valued using amortized cost. Generally, amortized cost reflects the current fair value of a security, but since the value is not obtained from a quoted price in an active market, such securities are reflected as Level 2. Because of the inherent uncertainties of valuation, the values reflected in the portfolios may materially differ from the values received upon actual sale of those investments.
The three levels defined by the fair value hierarchy are as follows:
Level 1 – Quoted prices in active markets for identical securities.
Level 2 – Prices determined using significant other observable inputs (including quoted prices for similar securities, interest rates, prepayment speeds, credit risk, etc.). Short-term securities with maturities of sixty days or less are valued at amortized cost, which approximates market value, and are categorized as Level 2 in the hierarchy. Municipal securities, long-term U.S. government obligations and corporate debt securities are valued in accordance with the evaluated price supplied by the pricing service and generally categorized as Level 2 in the hierarchy. Other securities that are categorized as Level 2 in the hierarchy include, but are not limited to, warrants that do not trade on an exchange, securities valued at the mean between the last reported bid and ask quotation and international equity securities valued by an independent third party in order to adjust for stale pricing.
Level 3 – Prices determined using significant unobservable inputs (including the Fund's own assumptions). For restricted equity securities and private placements where observable inputs are limited, assumptions about market activity and risk are used in determining fair value.
The following table summarizes the valuation of each Fund's securities as of December 31, 2014, using the fair value hierarchy:
| | | Quoted Prices
in Active
Markets for
Identical
Investments
(Level 1) | | Significant
Other
Observable
Inputs
(Level 2) | | Significant
Unobservable
Inputs
(Level 3) | | Total | |
U.S. Government Securities Ultra-Short Bond Fund | |
Investments in Securities*
United States Government and Agency
Obligations | | $ | — | | | $ | 58,384,866 | | | $ | — | | | $ | 58,384,866 | | |
Total | | $ | — | | | $ | 58,384,866 | | | $ | — | | | $ | 58,384,866 | | |
Near-Term Tax Free Fund | |
Investments in Securities*
Municipal Bonds | | $ | — | | | $ | 77,518,211 | | | $ | — | | | $ | 77,518,211 | | |
Total | | $ | — | | | $ | 77,518,211 | | | $ | — | | | $ | 77,518,211 | | |
119
Notes to Portfolios of Investments December 31, 2014
| | | Quoted Prices
in Active
Markets for
Identical
Investments
(Level 1) | | Significant
Other
Observable
Inputs
(Level 2) | | Significant
Unobservable
Inputs
(Level 3) | | Total | |
All American Equity Fund | |
Investments in Securities*
Common Stocks | | $ | 21,415,184 | | | $ | — | | | $ | — | | | $ | 21,415,184 | | |
Total | | $ | 21,415,184 | | | $ | — | | | $ | — | | | $ | 21,415,184 | | |
Holmes Macro Trends Fund | |
Investments in Securities*
Common Stocks: | |
Electric - Generation | | $ | — | | | $ | — | | | $ | 297,117 | | | $ | 297,117 | | |
Energy - Alternate Sources | | | — | | | | — | | | | 45,790 | | | | 45,790 | | |
Medical - Hospitals | | | — | | | | — | | | | — | | | | — | | |
Quarrying | | | — | | | | — | | | | 643,903 | | | | 643,903 | | |
Real Estate Operating/Development | | | — | | | | — | | | | 393,477 | | | | 393,477 | | |
All Other Common Stocks | | | 41,178,704 | | | | — | | | | — | | | | 41,178,704 | | |
Warrants | | | — | | | | 20 | | | | — | | | | 20 | | |
Master Limited Partnership | | | 750,450 | | | | — | | | | — | | | | 750,450 | | |
Gold-Linked Notes | | | — | | | | 76,038 | | | | — | | | | 76,038 | | |
Silver-Linked Notes | | | — | | | | 63,600 | | | | — | | | | 63,600 | | |
Corporate Note | | | — | | | | — | | | | 237,500 | | | | 237,500 | | |
Total | | $ | 41,929,154 | | | $ | 139,658 | | | $ | 1,617,787 | | | $ | 43,686,599 | | |
Global Resources Fund | |
Investments in Securities*
Common Stocks: | |
Agricultural Chemicals | | $ | 10,221,960 | | | $ | 2,003,958 | | | $ | — | | | $ | 12,225,918 | | |
Agricultural Operations | | | 2,340,000 | | | | 654,406 | | | | — | | | | 2,994,406 | | |
Coal | | | 709,947 | | | | 293,643 | | | | — | | | | 1,003,590 | | |
Diamonds/Precious Stones | | | 23,240 | | | | 14,173 | | | | — | | | | 37,413 | | |
Diversified Minerals | | | 7,585,887 | | | | 224,829 | | | | — | | | | 7,810,716 | | |
Electric - Generation | | | — | | | | — | | | | 4,143,979 | | | | 4,143,979 | | |
Energy - Alternate Sources | | | — | | | | — | | | | 1,098,960 | | | | 1,098,960 | | |
Gold Mining | | | 8,671,371 | | | | — | | | | 408 | | | | 8,671,779 | | |
Medical - Hospitals | | | — | | | | — | | | | — | | | | — | | |
Metal - Copper | | | 2,308,185 | | | | — | | | | — | | | | 2,308,185 | | |
Metal - Diversified | | | 430,221 | | | | 4,154,255 | | | | — | | | | 4,584,476 | | |
Metal - Iron | | | 61,919 | | | | 3,073,897 | | | | — | | | | 3,135,816 | | |
Mining Services | | | — | | | | 403,815 | | | | 359,216 | | | | 763,031 | | |
Natural Resource Technology | | | — | | | | — | | | | 54,940 | | | | 54,940 | | |
Non - Ferrous Metals | | | 5,500 | | | | 7,133,926 | | | | — | | | | 7,139,426 | | |
Oil - Field Services | | | 1,844,500 | | | | 9,475,423 | | | | — | | | | 11,319,923 | | |
Quarrying | | | 2,344,410 | | | | — | | | | 3,505,574 | | | | 5,849,984 | | |
Real Estate Operating/Development | | | — | | | | — | | | | 6,866,669 | | | | 6,866,669 | | |
All Other Common Stocks | | | 84,161,258 | | | | — | | | | — | | | | 84,161,258 | | |
Warrants: | |
Diversified Minerals | | | — | | | | — | | | | — | | | | — | | |
Gold Mining | | | — | | | | 448,866 | | | | — | | | | 448,866 | | |
Metal - Copper | | | — | | | | — | | | | — | | | | — | | |
Metal - Iron | | | 12,588 | | | | — | | | | — | | | | 12,588 | | |
Purchased Call Options | | | 4,840,225 | | | | — | | | | — | | | | 4,840,225 | | |
Convertible Bond | | | — | | | | 160,000 | | | | — | | | | 160,000 | | |
Gold-Linked Notes | | | — | | | | 1,767,033 | | | | — | | | | 1,767,033 | | |
Silver-Linked Notes | | | — | | | | 1,005,750 | | | | — | | | | 1,005,750 | | |
Corporate Note | | | — | | | | — | | | | 2,850,000 | | | | 2,850,000 | | |
Total | | $ | 125,561,211 | | | $ | 30,813,974 | | | $ | 18,879,746 | | | $ | 175,254,931 | | |
120
Notes to Portfolios of Investments December 31, 2014
| | | Quoted Prices
in Active
Markets for
Identical
Investments
(Level 1) | | Significant
Other
Observable
Inputs
(Level 2) | | Significant
Unobservable
Inputs
(Level 3) | | Total | |
World Precious Minerals Fund | |
Investments in Securities*
Common Stocks: | |
Agricultural Operations | | $ | — | | | $ | 361,037 | | | $ | — | | | $ | 361,037 | | |
Capital Pools | | | — | | | | 20,365 | | | | — | | | | 20,365 | | |
Coal | | | 190,883 | | | | 178,043 | | | | — | | | | 368,926 | | |
Diamonds/Precious Stones | | | 2,252,688 | | | | 413,698 | | | | — | | | | 2,666,386 | | |
Diversified Minerals | | | 1,781,365 | | | | 77,716 | | | | — | | | | 1,859,081 | | |
Gold Mining | | | 58,456,632 | | | | 2,065,191 | | | | 1,418,548 | | | | 61,940,371 | | |
Medical - Hospitals | | | — | | | | — | | | | — | | | | — | | |
Metal - Copper | | | 322,937 | | | | — | | | | — | | | | 322,937 | | |
Metal - Diversified | | | 10,635,154 | | | | 1,426,563 | | | | — | | | | 12,061,717 | | |
Mining Services | | | 141,160 | | | | 711,624 | | | | — | | | | 852,784 | | |
Oil Companies - Exploration & Production | | | — | | | | — | | | | — | | | | — | | |
Precious Metals | | | 5,757,646 | | | | 1,150,622 | | | | — | | | | 6,908,268 | | |
All Other Common Stocks | | | 4,773,488 | | | | — | | | | — | | | | 4,773,488 | | |
Exchange Traded Funds | | | 2,313,359 | | | | — | | | | — | | | | 2,313,359 | | |
Warrants: | |
Diamonds/Precious Stones | | | — | | | | 46,943 | | | | — | | | | 46,943 | | |
Diversified Minerals | | | — | | | | 30,126 | | | | — | | | | 30,126 | | |
Gold/Mineral Royalty Companies | | | — | | | | 1,118,953 | | | | — | | | | 1,118,953 | | |
Gold Mining | | | — | | | | 1,019,337 | | | | — | | | | 1,019,337 | | |
Metal - Copper | | | — | | | | — | | | | — | | | | — | | |
Metal - Diversified | | | — | | | | 91,737 | | | | — | | | | 91,737 | | |
Precious Metals | | | — | | | | 6,456 | | | | — | | | | 6,456 | | |
Special Warrants | | | — | | | | — | | | | — | | | | — | | |
Rights | | | 18,369 | | | | — | | | | — | | | | 18,369 | | |
Purchased Call Options | | | 1,057,600 | | | | — | | | | — | | | | 1,057,600 | | |
Gold-Linked Notes | | | — | | | | 1,196,850 | | | | — | | | | 1,196,850 | | |
Silver-Linked Notes | | | — | | | | 1,320,750 | | | | — | | | | 1,320,750 | | |
Corporate Note | | | — | | | | — | | | | 760,000 | | | | 760,000 | | |
Total | | $ | 87,701,281 | | | $ | 11,236,011 | | | $ | 2,178,548 | | | $ | 101,115,840 | | |
Gold and Precious Metals Fund | |
Investments in Securities*
Common Stocks: | |
Diamonds/Precious Stones | | $ | 848,253 | | | $ | 825,618 | | | $ | — | | | $ | 1,673,871 | | |
Gold Mining | | | 31,905,512 | | | | 5,899,191 | | | | — | | | | 37,804,703 | | |
Medical - Hospitals | | | — | | | | — | | | | — | | | | — | | |
Precious Metals | | | 301,257 | | | | 552,474 | | | | — | | | | 853,731 | | |
All Other Common Stocks | | | 12,698,811 | | | | — | | | | — | | | | 12,698,811 | | |
Exchange Traded Funds | | | 3,784,850 | | | | — | | | | — | | | | 3,784,850 | | |
Warrants: | |
Gold/Mineral Royalty Companies | | | — | | | | 688,587 | | | | — | | | | 688,587 | | |
Gold Mining | | | — | | | | 709,688 | | | | — | | | | 709,688 | | |
Precious Metals | | | — | | | | 10,759 | | | | — | | | | 10,759 | | |
Purchased Call Options | | | 698,790 | | | | — | | | | — | | | | 698,790 | | |
Gold-Linked Notes | | | — | | | | 605,338 | | | | — | | | | 605,338 | | |
Silver-Linked Notes | | | — | | | | 693,450 | | | | — | | | | 693,450 | | |
Corporate Notes: | |
Coal | | | — | | | | — | | | | 485,766 | | | | 485,766 | | |
Electric - Generation | | | — | | | | — | | | | 285,000 | | | | 285,000 | | |
Total | | $ | 50,237,473 | | | $ | 9,985,105 | | | $ | 770,766 | | | $ | 60,993,344 | | |
121
Notes to Portfolios of Investments December 31, 2014
| | | Quoted Prices
in Active
Markets for
Identical
Investments
(Level 1) | | Significant
Other
Observable
Inputs
(Level 2) | | Significant
Unobservable
Inputs
(Level 3) | | Total | |
Emerging Europe Fund | |
Investments in Securities*
Common Stocks: | |
Cellular Telecommunication | | $ | 2,264,401 | | | $ | 1,300,405 | | | $ | — | | | $ | 3,564,806 | | |
Medical - Drugs | | | 994,195 | | | | 929,221 | | | | — | | | | 1,923,416 | | |
Metal - Diversified | | | 110,995 | | | | 281,205 | | | | — | | | | 392,200 | | |
Oil Companies - Exploration & Production | | | 720,003 | | | | 1,706,087 | | | | — | | | | 2,426,090 | | |
All Other Common Stocks | | | — | | | | 53,284,518 | | | | — | | | | 53,284,518 | | |
Closed-End Investment Company | | | — | | | | 1,476,160 | | | | — | | | | 1,476,160 | | |
Warrants | | | — | | | | 1,247,569 | | | | — | | | | 1,247,569 | | |
Corporate Note | | | — | | | | 1,022,842 | | | | — | | | | 1,022,842 | | |
Total | | $ | 4,089,594 | | | $ | 61,248,007 | | | $ | — | | | $ | 65,337,601 | | |
China Region Fund | |
Investments in Securities*
Common Stock: | |
Cellular Telecommunication | | $ | 211,752 | | | $ | — | | | $ | — | | | $ | 211,752 | | |
Diversified Minerals | | | 24,531 | | | | 103,288 | | | | — | | | | 127,819 | | |
E-Commerce/Products | | | 344,886 | | | | — | | | | — | | | | 344,886 | | |
E-Commerce/Services | | | 190,107 | | | | — | | | | — | | | | 190,107 | | |
Entertainment Software | | | 267,678 | | | | — | | | | — | | | | 267,678 | | |
Industrial Automation/Robots | | | 112,378 | | | | — | | | | — | | | | 112,378 | | |
Non - Ferrous Metals | | | 5,500 | | | | 109,655 | | | | — | | | | 115,155 | | |
Oil Companies - Exploration & Production | | | 115,124 | | | | — | | | | — | | | | 115,124 | | |
Petrochemicals | | | 1 | | | | — | | | | — | | | | 1 | | |
Schools | | | 286,268 | | | | — | | | | — | | | | 286,268 | | |
Web Portals/Internet Service Providers | | | 227,970 | | | | — | | | | — | | | | 227,970 | | |
All Other Common Stocks | | | — | | | | 17,722,522 | | | | — | | | | 17,722,522 | | |
Exchange Traded Funds | | | 564,043 | | | | — | | | | — | | | | 564,043 | | |
Closed-End Investment Company | | | 321,922 | | | | — | | | | — | | | | 321,922 | | |
Purchased Call Option | | | 900 | | | | — | | | | — | | | | 900 | | |
Total | | $ | 2,673,060 | | | $ | 17,935,465 | | | $ | — | | | $ | 20,608,525 | | |
* Refer to the Portfolio of Investments for a detailed list of the Fund's investments.
The following table shows transfers between Level 1 and Level 2 of the fair value hierarchy during the period January 1, 2014, through December 31, 2014:
Fund | | Transfers From
Level 1 to Level 2* | | Transfers From
Level 2 to Level 1* | |
Holmes Macro Trends | | $ | 63,600 | (1) | | $ | — | | |
Global Resources | | | 1,305,420 | (1) | | | 178,631 | (2) | |
| | | | | | 852,126 | (3) | |
World Precious Minerals | | | 2,555,421 | (1) | | | 972,946 | (2) | |
| | | | | | 197,969 | (3) | |
Gold and Precious Metals | | | 1,400,071 | (1) | | | — | | |
Emerging Europe | | | 1,247,569 | (1) | | | — | | |
* The Funds' policy is to recognize transfers in and transfers out as of the end of the reporting period.
(1) Securities were valued at the mean between bid and ask quotations at the end of the current period, but at a quoted price at the end of the prior fiscal year.
122
Notes to Portfolios of Investments December 31, 2014
(2) Securities were valued at a quoted price at the end of the current period, but at the mean between bid and ask quotations at the end of the prior fiscal year.
(3) Transfer resulted from the expiration of a regulatory hold.
The following is a reconciliation of assets for which unobservable inputs (Level 3) were used in determining fair value during the period January 1, 2014, through December 31, 2014:
| | | Common Stocks | | Warrants | | Corporate Notes | | Total | |
Holmes Macro Trends Fund | |
Ending Balance 12/31/13 | | $ | 2,451,810 | | | $ | — | | | $ | 250,000 | | | $ | 2,701,810 | | |
Sales | | | (572,000 | ) | | | — | | | | — | | | | (572,000 | ) | |
Total realized gain (loss) | | | 172,000 | | | | — | | | | — | | | | 172,000 | | |
Net change in unrealized appreciation (depreciation) | | | (671,523 | ) | | | — | | | | — | | | | (671,523 | ) | |
Paydowns/Maturities | | | — | | | | — | | | | (12,500 | ) | | | (12,500 | ) | |
Ending Balance 12/31/14 | | $ | 1,380,287 | | | $ | — | | | $ | 237,500 | | | $ | 1,617,787 | | |
Net change in unrealized appreciation (depreciation)
from Investments held as of 12/31/14(1) | | $ | (686,259 | ) | | $ | — | | | $ | — | | | $ | (686,259 | ) | |
| | | Common Stocks | | Warrants | | Corporate Notes | | Total | |
Global Resources Fund | |
Beginning Balance 12/31/13 | | $ | 24,073,774 | | | $ | — | | | $ | 3,000,000 | | | $ | 27,073,774 | | |
Purchases | | | 448 | | | | — | | | | — | | | | 448 | | |
Sales | | | (1,949,707 | ) | | | — | | | | — | | | | (1,949,707 | ) | |
Total realized gain (loss) | | | (4,221,805 | ) | | | — | | | | — | | | | (4,221,805 | ) | |
Net change in unrealized appreciation (depreciation) | | | (1,685,754 | ) | | | — | | | | — | | | | (1,685,754 | ) | |
Paydowns/Maturities | | | — | | | | — | | | | (150,000 | ) | | | (150,000 | ) | |
Transfers out of Level 3* | | | (187,210 | ) | | | — | | | | — | | | | (187,210 | ) | |
Ending Balance 12/31/14 | | $ | 16,029,746 | | | $ | — | | | $ | 2,850,000 | | | $ | 18,879,746 | | |
Net change in unrealized appreciation (depreciation)
from Investments held as of 12/31/14(1) | | $ | (5,592,966 | ) | | $ | — | | | $ | — | | | $ | (5,592,966 | ) | |
| | | Common
Stocks | | Warrants | | Special
Warrants | | Corporate
Note | | Total | |
World Precious Minerals Fund | |
Beginning Balance 12/31/13 | | $ | 2,364,876 | | | $ | — | | | $ | — | | | $ | 800,000 | | | $ | 3,164,876 | | |
Purchases | | | 7,287 | | | | — | | | | — | | | | — | | | | 7,287 | | |
Sales | | | (2,574,000 | ) | | | — | | | | — | | | | — | | | | (2,574,000 | ) | |
Total realized gain (loss) | | | 1,374,000 | | | | — | | | | — | | | | — | | | | 1,374,000 | | |
Net change in unrealized appreciation
(depreciation) | | | 26,603 | | | | — | | | | — | | | | — | | | | 26,603 | | |
Paydowns/Maturities | | | — | | | | — | | | | — | | | | (40,000 | ) | | | (40,000 | ) | |
Transfers into Level 3* | | | 220,778 | | | | — | | | | — | | | | — | | | | 220,778 | | |
Transfers out of Level 3* | | | (996 | ) | | | — | | | | — | | | | — | | | | (996 | ) | |
Ending Balance 12/31/14 | | $ | 1,418,548 | | | $ | — | | | $ | — | | | $ | 760,000 | | | $ | 2,178,548 | | |
Net change in unrealized appreciation
(depreciation) from Investments held
as of 12/31/14(1) | | $ | 560,291 | | | $ | — | | | $ | — | | | $ | — | | | $ | 560,291 | | |
123
Notes to Portfolios of Investments December 31, 2014
| | | Common Stocks | | Warrants | | Corporate Notes | | Total | |
Gold and Precious Metals Fund | |
Beginning Balance 12/31/13 | | $ | 7,453 | | | $ | — | | | $ | 300,000 | | | $ | 307,453 | | |
Purchases | | | — | | | | — | | | | 485,766 | | | | 485,766 | | |
Net change in unrealized appreciation (depreciation) | | | (7,453 | ) | | | — | | | | — | | | | (7,453 | ) | |
Paydowns/Maturities | | | — | | | | — | | | | (15,000 | ) | | | (15,000 | ) | |
Ending Balance 12/31/14 | | $ | — | | | $ | — | | | $ | 770,766 | | | $ | 770,766 | | |
Net change in unrealized appreciation (depreciation)
from Investments held as of 12/31/14(1) | | $ | (7,453 | ) | | $ | — | | | $ | — | | | $ | (7,453 | ) | |
* The Funds' policy is to recognize transfers in and transfers out as of the end of the reporting period.
(1) The amounts shown represent the net change in unrealized appreciation (depreciation) attributable to only those investments still held and classified as Level 3 at December 31, 2014.
Significant unobservable inputs developed by the Valuation Committee for Level 3 investments held at year-end are as follows:
| | | Fair Value at
12/31/14 | | Valuation
Technique(s) | | Unobservable
Input | | Range
(Weighted
Average) | |
Holmes Macro Trends Fund | |
Investments in Securities
Common Stocks | | $ | 689,693 | | | Market Transaction(1) | | Discount | |
0%-100%
discount
(8% discount) | |
Common Stocks | | | 690,594 | | | Method of Comparables Pricing(2) | | Multiples | | 1.9-35.6 (7.9) | |
Corporate Note | | | 237,500 | | | Market Transaction(1) | | Discount | | 0% | |
Global Resources Fund | |
Investments in Securities
Common Stocks | | | 5,019,098 | | | Market Transaction(1) | | Discount | |
0%-100%
discount
(29% discount) | |
Common Stocks | | | 11,010,648 | | | Method of Comparables Pricing(2) | | Multiples | | 1.9-35.6 (7.7) | |
Corporate Note | | | 2,850,000 | | | Market Transaction(1) | | Discount | | 0% | |
World Precious Minerals Fund | |
Investments in Securities
Common Stocks | | | 1,418,548 | | | Market Transaction(1) | | Discount | |
0%-100%
discount
(66% discount) | |
Warrants | | | — | | | Market Transaction(1) | | Discount | | 0%-100%
discount
(100% discount) | |
Special Warrants | | | — | | | Market Transaction(1) | | Discount | | 100% | |
Corporate Note | | | 760,000 | | | Market Transaction(1) | | Discount | | 0% | |
Gold and Precious Metals Fund | |
Investments in Securities
Common Stocks | | | — | | | Market Transaction(1) | | Discount | |
100% | |
Warrants | | | — | | | Market Transaction(1) | | Discount | | 0%-100%
discount
(100% discount) | |
Corporate Notes | | | 770,766 | | | Market Transaction(1) | | Discount | | 0% | |
(1) Market Transaction refers to most recent known market transaction, including transactions in which the fund participated, as adjusted for any discount or premium as discussed below.
124
Notes to Portfolios of Investments December 31, 2014
(2) The Method of Comparables Pricing valuation technique involves determining a comparable group of companies that exhibit similar characteristics to that of the Level 3 security (the Comparables), gathering information about the Comparables to determine their range of valuation multiples and selecting the appropriate multiple within the determined range of the Comparables to apply in valuing the Level 3 security.
The majority of securities classified as Level 3 are private companies. The initial valuation is usually cost, which is then adjusted as determined by the Valuation Committee for subsequent known market transactions and evaluated for progress against anticipated milestones and current operations. An evaluation that the holding no longer meets expectations could result in the application of discounts and a significantly lower fair valuation. For certain securities, the last known market transaction is increased or decreased by changes in a market index or industry peers as approved by the Valuation Committee.
Affiliated Companies - Indicated in Portfolio of Investments as "+"
The Investment Company Act of 1940 defines affiliates as companies in which the Fund owns at least 5% of the outstanding voting securities. The following is a summary of transactions with each affiliated company during the year ended December 31, 2014.
| | | Shares of Affiliated Companies | |
Global Resources Fund | | December 31, 2013 | | Additions | | Reductions | | December 31, 2014 | |
African Potash Ltd. | | | 14,967,500 | | | | — | | | | (542,500 | ) | | | 14,425,000 | (a) | |
Agriterra Ltd. | | | 68,588,600 | | | | 1,261,176 | | | | — | | | | 69,849,776 | | |
Atlas Development & Support Services Ltd.(b) | | | 54,624,983 | | | | 12,910,000 | | | | — | | | | 67,534,983 | | |
Pacific Coal Resources Ltd. | | | 3,522,061 | | | | 852,153 | | | | (11,900 | ) | | | 4,362,314 | | |
Pacific Green Energy Corp. | | | 2,400,000 | | | | — | | | | — | | | | 2,400,000 | | |
Pacific Stone Tech, Inc. | | | 22,659 | | | | — | | | | — | | | | 22,659 | | |
Sunridge Gold Corp. | | | 10,833,788 | | | | 100,000 | | | | — | | | | 10,933,788 | | |
At December 31, 2014, the value of investments in affiliated companies was $16,708,881, representing 9.21% of net assets, and the total cost was $47,167,607. Net realized losses on transactions were $92,775, and there was no income earned for the year.
| | | Shares of Affiliated Companies | |
World Precious Minerals Fund | | December 31, 2013 | | Additions | | Reductions | | December 31, 2014 | |
Candente Gold Corp. | | | 5,640,000 | | | | — | | | | — | | | | 5,640,000 | | |
Canyon Resources Ltd. | | | 4,337,729 | | | | 6,168,864 | | | | (500,000 | ) | | | 10,006,593 | | |
CB Gold, Inc. | | | 1,135,000 | | | | 7,427,858 | | | | — | | | | 8,562,858 | | |
Gran Colombia Gold Corp. | | | 1,182,849 | | | | 317,706 | | | | (275,793 | ) | | | 1,224,762 | | |
Klondex Mines Ltd. | | | 5,868,208 | | | | 175,000 | | | | — | | | | 6,043,208 | (a) | |
Mammoth Resources Corp. | | | 1,600,000 | | | | 2,041,800 | | | | — | | | | 3,641,800 | | |
Mineral Mountain Resources Ltd. | | | — | | | | 11,000,000 | | | | — | | | | 11,000,000 | | |
Mirasol Resources Ltd. | | | 2,274,900 | | | | 30,100 | | | | (305,000 | ) | | | 2,000,000 | (a) | |
Moss Lake Gold Mines Ltd. | | | 3,354,500 | | | | 50,000 | | | | (3,404,500 | ) | | | — | (a)(c) | |
Orex Minerals, Inc. | | | 2,584,000 | | | | 6,312,000 | | | | (281,500 | ) | | | 8,614,500 | | |
Skeena Resources Ltd. | | | — | | | | 10,099,000 | | | | (11,000 | ) | | | 10,088,000 | | |
TriStar Gold, Inc. | | | 1,392,000 | | | | 6,976,500 | | | | (268,500 | ) | | | 8,100,000 | | |
West Kirkland Mining, Inc. | | | 1,550,000 | | | | 3,100,000 | | | | (1,621,000 | ) | | | 3,029,000 | (a) | |
At December 31, 2014, the value of investments in affiliated companies was $6,034,904, representing 5.83% of net assets, and the total cost was $30,917,193. Net realized losses on transactions were $6,330,180, and there was no income earned for the year.
125
Notes to Portfolios of Investments December 31, 2014
(a) At December 31, 2014, the company is no longer defined as an affiliate, although it was an affiliated company during the year.
(b) Previously Africa Oilfield Logistics Ltd.; effective October 28, 2014, name was changed to Atlas Development & Support Services Ltd.
(c) Company was acquired by Wesdome Gold Mines Ltd. during the period. The acquiring company is not defined as an affiliate.
Restricted Securities - Indicated in Portfolio of Investments as "RS"
The following securities are subject to contractual and regulatory restrictions on resale or transfer. These investments may involve a high degree of business and financial risk. Because of the thinly traded markets for these investments, a Fund may be unable to liquidate its securities in a timely manner, especially if there is negative news regarding the specific securities or the markets overall. These securities could decline significantly in value before the Fund could liquidate these securities. The issuer bears the cost of registration, if any, involved in the disposition of these securities.
Holmes Macro Trends Fund | | Acquisition
Date | | Cost per
Share/Unit | |
Pacific Green Energy Corp. | | 03/24/11 | | $ | 1.00 | | |
Pacific Infrastructure Ventures, Inc. | | 08/06/10-11/22/10 | | $ | 1.00 | | |
Pacific Power Generation Corp. | | 08/06/10 | | $ | 0.07 | | |
Pacific Power Generation Corp., Corporate Note (April 2017) | | 05/25/12 | | $ | 100.00 | | |
Pacific Stone Tech, Inc. | | 04/19/10 | | $ | 216.24 | | |
As of December 31, 2014, the total cost of restricted securities was $1,687,500, and the total value was $1,617,787, representing 3.50% of net assets.
Global Resources Fund | | Acquisition
Date | | Cost per
Share/Unit | |
I-Pulse Inc. | | 10/04/07 | | $ | 1.88 | | |
Pacific Green Energy Corp. | | 03/24/11 | | $ | 1.00 | | |
Pacific Infrastructure Ventures, Inc. | | 08/06/10-11/22/10 | | $ | 1.00 | | |
Pacific Power Generation Corp. | | 08/06/10 | | $ | 0.07 | | |
Pacific Power Generation Corp., Corporate Note (April 2017) | | 05/25/12 | | $ | 100.00 | | |
Pacific Stone Tech, Inc. | | 04/19/10 | | $ | 216.22 | | |
As of December 31, 2014, the total cost of restricted securities was $17,948,675, and the total value was $18,520,122, representing 10.21% of net assets.
World Precious Minerals Fund | | Acquisition
Date | | Cost per
Share/Unit | |
Balmoral Resources Ltd. | | 11/05/14 | | $ | 0.98 | | |
Calico Resources Corp., Warrants (October 2015) | | 11/07/14 | | $ | 0.00 | | |
Falco Resources Ltd. | | 10/22/14 | | $ | 0.31 | | |
Mineral Mountain Resources Ltd., Warrants (October 2016) | | 10/06/14-10/08/14 | | $ | 0.00 | | |
Pacific Power Generation Corp., Corporate Note (April 2017) | | 05/25/12 | | $ | 100.00 | | |
Pinecrest Resources Ltd. | | 12/18/14 | | $ | 0.16 | | |
Skeena Resources Ltd. | | 10/27/14 | | $ | 0.04 | | |
Skeena Resources Ltd., Warrants (October 2016) | | 10/27/14 | | $ | 0.00 | | |
Taurus Gold Ltd. | | 05/31/11-05/29/13 | | $ | 1.17 | | |
Western Exploration & Development Ltd., 144A, Special Warrants
(December 2049) | | 08/04/97 | | $ | 0.50 | | |
126
Notes to Portfolios of Investments December 31, 2014
As of December 31, 2014, the total cost of restricted securities was $5,824,170, and the total value was $4,154,870, representing 4.01% of net assets.
Gold and Precious Metals Fund | | Acquisition
Date | | Cost per
Share/Unit | |
Pacific Coal Resources Ltd., Corporate Note (June 2015) | | 12/15/14 | | $ | 100.00 | | |
Pacific Power Generation Corp., Corporate Note (April 2017) | | 05/25/12 | | $ | 100.00 | | |
As of December 31, 2014, the total cost of restricted securities was $770,766, and the total value was $770,766, representing 1.23% of net assets.
127
Statements of Assets and Liabilities
| | | U.S. Government
Securities
Ultra-Short
Bond Fund | | Near-Term
Tax Free Fund | |
Investments, at identified cost | | $ | 58,307,328 | | | $ | 76,069,875 | | |
Assets | |
Investments, at value: | |
Securities | | $ | 58,384,866 | | | $ | 77,518,211 | | |
Cash | | | 5,517,743 | | | | 10,719,342 | | |
Receivables: | |
Investments sold | | | — | | | | — | | |
Dividends and interest | | | 125,888 | | | | 837,141 | | |
Capital shares sold | | | 22,644 | | | | 1,011,832 | | |
From adviser | | | 2,852 | | | | — | | |
Other assets | | | 23,925 | | | | 24,406 | | |
Total Assets | | | 64,077,918 | | | | 90,110,932 | | |
Liabilities | |
Payables: | |
Capital shares redeemed | | | 4,440 | | | | 129,848 | | |
Adviser and affiliates | | | — | | | | 5,086 | | |
Investments purchased | | | — | | | | 314,547 | | |
Dividends and distributions | | | — | | | | 712 | | |
Accounts payable and accrued expenses | | | 53,289 | | | | 65,365 | | |
Total Liabilities | | | 57,729 | | | | 515,558 | | |
Net Assets | | $ | 64,020,189 | | | $ | 89,595,374 | | |
Net Assets Consist of: | |
Paid-in capital | | $ | 63,942,465 | | | $ | 88,519,621 | | |
Accumulated undistributed net investment income | | | — | | | | — | | |
Accumulated net realized gains (losses) from investment transactions and other
assets and liabilities denominated in foreign currencies | | | 186 | | | | (372,583 | ) | |
Net unrealized appreciation of investments and other assets and liabilities
denominated in foreign currencies | | | 77,538 | | | | 1,448,336 | | |
Net assets applicable to capital shares outstanding | | $ | 64,020,189 | | | $ | 89,595,374 | | |
By share class | |
Net Assets | |
Investor class | | $ | 64,020,189 | | | $ | 89,595,374 | | |
Capital shares outstanding, an unlimited number of
no par shares authorized | |
Investor class | | | 31,978,927 | | | | 39,797,892 | | |
Net Asset Value, Public Offering Price, Redemption
Price, per share | |
Investor class | | $ | 2.00 | | | $ | 2.25 | | |
See accompanying notes to financial statements.
128
December 31, 2014
| | | All American
Equity Fund | | Holmes Macro
Trends Fund | |
Investments, at identified cost | | $ | 21,211,929 | | | $ | 39,657,168 | | |
Assets | |
Investments, at value: | |
Securities | | $ | 21,415,184 | | | $ | 43,686,599 | | |
Cash | | | 253,382 | | | | 2,640,694 | | |
Receivables: | |
Investments sold | | | 12,137,745 | | | | — | | |
Dividends and interest | | | 12,104 | | | | 13,470 | | |
Capital shares sold | | | 46,143 | | | | 34,940 | | |
From adviser | | | — | | | | — | | |
Other assets | | | 17,032 | | | | 31,557 | | |
Total Assets | | | 33,881,590 | | | | 46,407,260 | | |
Liabilities | |
Payables: | |
Capital shares redeemed | | | 31,083 | | | | 46,509 | | |
Adviser and affiliates | | | 17,992 | | | | 44,312 | | |
Investments purchased | | | 11,847,824 | | | | — | | |
Dividends and distributions | | | — | | | | — | | |
Accounts payable and accrued expenses | | | 49,086 | | | | 66,359 | | |
Total Liabilities | | | 11,945,985 | | | | 157,180 | | |
Net Assets | | $ | 21,935,605 | | | $ | 46,250,080 | | |
Net Assets Consist of: | |
Paid-in capital | | $ | 19,588,108 | | | $ | 41,127,425 | | |
Accumulated undistributed net investment income | | | — | | | | 28,980 | | |
Accumulated net realized gains (losses) from investment transactions and other
assets and liabilities denominated in foreign currencies | | | 2,144,242 | | | | 1,064,244 | | |
Net unrealized appreciation of investments and other assets and liabilities
denominated in foreign currencies | | | 203,255 | | | | 4,029,431 | | |
Net assets applicable to capital shares outstanding | | $ | 21,935,605 | | | $ | 46,250,080 | | |
By share class | |
Net Assets | |
Investor class | | $ | 21,935,605 | | | $ | 46,250,080 | | |
Capital shares outstanding, an unlimited number of
no par shares authorized | |
Investor class | | | 787,823 | | | | 2,284,030 | | |
Net Asset Value, Public Offering Price, Redemption
Price, per share | |
Investor class | | $ | 27.84 | | | $ | 20.25 | | |
129
Statements of Assets and Liabilities
| | | Global
Resources Fund | | World Precious
Minerals Fund | | Gold and Precious
Metals Fund | |
Investments, at identified cost | | $ | 291,759,256 | | | $ | 236,526,506 | | | $ | 102,296,003 | | |
Assets | |
Investments, at value: | |
Securities of unaffiliated issuers | | $ | 158,546,050 | | | $ | 95,080,936 | | | $ | 60,993,344 | | |
Securities of affiliated issuers | | | 16,708,881 | | | | 6,034,904 | | | | — | | |
Cash | | | 6,300,287 | | | | 2,489,690 | | | | 1,907,572 | | |
Foreign currencies (Cost $15,358, $130,820, $13,868, $– and $–) | | | 15,358 | | | | 130,872 | | | | 13,854 | | |
Receivables: | |
Investments sold | | | 652,252 | | | | 234,031 | | | | — | | |
Dividends and interest | | | 263,061 | | | | 45,325 | | | | 44,906 | | |
Capital shares sold | | | 138,393 | | | | 39,305 | | | | 84,743 | | |
Other assets | | | 84,268 | | | | 65,966 | | | | 53,847 | | |
Total Assets | | | 182,708,550 | | | | 104,121,029 | | | | 63,098,266 | | |
Liabilities | |
Payables: | |
Capital shares redeemed | | | 967,736 | | | | 219,456 | | | | 140,362 | | |
Adviser and affiliates | | | 138,225 | | | | 117,490 | | | | 68,962 | | |
Investments purchased | | | 16,704 | | | | 75,101 | | | | 15,264 | | |
Accounts payable and accrued expenses | | | 180,348 | | | | 142,654 | | | | 96,760 | | |
Total Liabilities | | | 1,303,013 | | | | 554,701 | | | | 321,348 | | |
Net Assets | | $ | 181,405,537 | | | $ | 103,566,328 | | | $ | 62,776,918 | | |
Net Assets Consist of: | |
Paid-in capital | | $ | 677,315,856 | | | $ | 504,767,196 | | | $ | 179,802,697 | | |
Accumulated undistributed net investment income (distributions in excess of
net investment income)/accumulated net investment loss | | | (566,859 | ) | | | (2,657,357 | ) | | | (1,256,485 | ) | |
Accumulated net realized losses from investment transactions and other assets
and liabilities denominated in foreign currencies | | | (378,853,434 | ) | | | (263,132,839 | ) | | | (74,466,621 | ) | |
Net unrealized appreciation (depreciation) of investments and other assets and
liabilities denominated in foreign currencies | | | (116,490,026 | ) | | | (135,410,672 | ) | | | (41,302,673 | ) | |
Net assets applicable to capital shares outstanding | | $ | 181,405,537 | | | $ | 103,566,328 | | | $ | 62,776,918 | | |
By share class | |
Net Assets | |
Investor class | | $ | 171,672,558 | | | $ | 103,412,554 | | | $ | 62,776,918 | | |
Institutional class | | | 9,732,979 | | | | 153,774 | | | | — | | |
Capital shares outstanding, an unlimited number of
no par shares authorized | |
Investor class | | | 25,741,193 | | | | 21,756,329 | | | | 12,157,620 | | |
Institutional class | | | 1,458,676 | | | | 32,197 | | | | — | | |
Net Asset Value, Public Offering Price, Redemption
Price, per share | |
Investor class | | $ | 6.67 | | | $ | 4.75 | | | $ | 5.16 | | |
Institutional class | | | 6.67 | | | | 4.78 | | | | — | | |
See accompanying notes to financial statements.
130
December 31, 2014
| | | Emerging Europe
Fund | | China Region
Fund | |
Investments, at identified cost | | $ | 74,985,521 | | | $ | 19,502,724 | | |
Assets | |
Investments, at value: | |
Securities of unaffiliated issuers | | $ | 65,337,601 | | | $ | 20,608,525 | | |
Securities of affiliated issuers | | | — | | | | — | | |
Cash | | | 3,203,832 | | | | 510,413 | | |
Foreign currencies (Cost $15,358, $130,820, $13,868, $– and $–) | | | — | | | | 1 | | |
Receivables: | |
Investments sold | | | 920,445 | | | | 182,908 | | |
Dividends and interest | | | 182,207 | | | | 23,987 | | |
Capital shares sold | | | 7,874 | | | | 4,888 | | |
Other assets | | | 35,214 | | | | 20,377 | | |
Total Assets | | | 69,687,173 | | | | 21,351,099 | | |
Liabilities | |
Payables: | |
Capital shares redeemed | | | 411,004 | | | | 144,801 | | |
Adviser and affiliates | | | 102,679 | | | | 24,399 | | |
Investments purchased | | | — | | | | 103,949 | | |
Accounts payable and accrued expenses | | | 107,619 | | | | 69,962 | | |
Total Liabilities | | | 621,302 | | | | 343,111 | | |
Net Assets | | $ | 69,065,871 | | | $ | 21,007,988 | | |
Net Assets Consist of: | |
Paid-in capital | | $ | 390,373,024 | | | $ | 38,150,672 | | |
Accumulated undistributed net investment income (distributions in excess of
net investment income)/accumulated net investment loss | | | (82,918 | ) | | | 125,962 | | |
Accumulated net realized losses from investment transactions and other assets
and liabilities denominated in foreign currencies | | | (311,561,748 | ) | | | (18,374,866 | ) | |
Net unrealized appreciation (depreciation) of investments and other assets and
liabilities denominated in foreign currencies | | | (9,662,487 | ) | | | 1,106,220 | | |
Net assets applicable to capital shares outstanding | | $ | 69,065,871 | | | $ | 21,007,988 | | |
By share class | |
Net Assets | |
Investor class | | $ | 69,065,871 | | | $ | 21,007,988 | | |
Institutional class | | | — | | | | — | | |
Capital shares outstanding, an unlimited number of
no par shares authorized | |
Investor class | | | 10,530,881 | | | | 2,563,426 | | |
Institutional class | | | — | | | | — | | |
Net Asset Value, Public Offering Price, Redemption
Price, per share | |
Investor class | | $ | 6.56 | | | $ | 8.20 | | |
Institutional class | | | — | | | | — | | |
131
Net Investment Income | | U.S. Government
Securities
Ultra-Short
Bond Fund | | Near-Term
Tax Free Fund | |
Income: | |
Dividends from unaffiliated issuers | | $ | — | | | $ | — | | |
Foreign tax withheld on dividends | | | — | | | | — | | |
Net dividends | | | — | | | | — | | |
Interest and other | | | 471,354 | | | | 1,721,331 | | |
Total income | | | 471,354 | | | | 1,721,331 | | |
Expenses: | |
Management fee | | | 346,170 | | | | 333,667 | | |
Administrative services fee | | | 78,734 | | | | 76,224 | | |
Accounting service fees and expenses | | | 61,579 | | | | 100,324 | | |
Distribution plan fee | | | — | | | | — | | |
Transfer agent fees and expenses | | | 64,254 | | | | 54,146 | | |
Professional fees | | | 52,786 | | | | 61,618 | | |
Custodian fees | | | 20,224 | | | | 15,306 | | |
Shareholder reporting expenses | | | 17,785 | | | | 6,946 | | |
Registration fees | | | 14,930 | | | | 20,552 | | |
Trustee fees and expenses | | | 30,775 | | | | 30,696 | | |
Miscellaneous expenses | | | 51,229 | | | | 24,309 | | |
Total expenses before reductions | | | 738,466 | | | | 723,788 | | |
Expenses offset - Note 1 H | | | — | | | | (2,531 | ) | |
Expenses reimbursed - Note 3 | | | (511,167 | ) | | | (421,164 | ) | |
Net expenses | | | 227,299 | | | | 300,093 | | |
Net Investment Income (Loss) | | | 244,055 | | | | 1,421,238 | | |
Net Realized and Unrealized
Gain (Loss) on Investments | |
Realized gain (loss) from: | |
Securities from unaffiliated issuers | | | 193 | | | | (9,951 | ) | |
Written options | | | — | | | | — | | |
Foreign currency transactions | | | — | | | | — | | |
Net realized gain (loss) | | | 193 | | | | (9,951 | ) | |
Net change in unrealized appreciation (depreciation) of: | |
Investments | | | 157,029 | | | | 622,619 | | |
Other assets and liabilities denominated in foreign currencies | | | — | | | | — | | |
Net unrealized appreciation (depreciation) | | | 157,029 | | | | 622,619 | | |
Net Realized and Unrealized Gain (Loss) on Investments | | | 157,222 | | | | 612,668 | | |
Net Increase (Decrease) In Net Assets
Resulting From Operations | | $ | 401,277 | | | $ | 2,033,906 | | |
See accompanying notes to financial statements.
132
For the Year Ended December 31, 2014
Net Investment Income | | All American
Equity Fund | | Holmes Macro
Trends Fund | |
Income: | |
Dividends from unaffiliated issuers | | $ | 368,916 | | | $ | 281,289 | | |
Foreign tax withheld on dividends | | | (906 | ) | | | (3,562 | ) | |
Net dividends | | | 368,010 | | | | 277,727 | | |
Interest and other | | | — | | | | 113,234 | | |
Total income | | | 368,010 | | | | 390,961 | | |
Expenses: | |
Management fee | | | 175,798 | | | | 496,390 | | |
Administrative services fee | | | 32,747 | | | | 60,890 | | |
Accounting service fees and expenses | | | 49,382 | | | | 56,032 | | |
Distribution plan fee | | | 58,116 | | | | 128,477 | | |
Transfer agent fees and expenses | | | 44,631 | | | | 66,748 | | |
Professional fees | | | 48,266 | | | | 63,893 | | |
Custodian fees | | | 14,253 | | | | 26,459 | | |
Shareholder reporting expenses | | | 9,605 | | | | 12,623 | | |
Registration fees | | | 12,103 | | | | 14,762 | | |
Trustee fees and expenses | | | 30,775 | | | | 30,696 | | |
Miscellaneous expenses | | | 26,179 | | | | 38,163 | | |
Total expenses before reductions | | | 501,855 | | | | 995,133 | | |
Expenses offset - Note 1 H | | | (357 | ) | | | (1,216 | ) | |
Expenses reimbursed - Note 3 | | | (7,134 | ) | | | — | | |
Net expenses | | | 494,364 | | | | 993,917 | | |
Net Investment Income (Loss) | | | (126,354 | ) | | | (602,956 | ) | |
Net Realized and Unrealized
Gain (Loss) on Investments | |
Realized gain (loss) from: | |
Securities from unaffiliated issuers | | | 4,958,378 | | | | 4,811,738 | | |
Written options | | | — | | | | 13,146 | | |
Foreign currency transactions | | | — | | | | (29 | ) | |
Net realized gain (loss) | | | 4,958,378 | | | | 4,824,855 | | |
Net change in unrealized appreciation (depreciation) of: | |
Investments | | | (4,371,450 | ) | | | (7,727,461 | ) | |
Other assets and liabilities denominated in foreign currencies | | | — | | | | 4 | | |
Net unrealized appreciation (depreciation) | | | (4,371,450 | ) | | | (7,727,457 | ) | |
Net Realized and Unrealized Gain (Loss) on Investments | | | 586,928 | | | | (2,902,602 | ) | |
Net Increase (Decrease) In Net Assets
Resulting From Operations | | $ | 460,574 | | | $ | (3,505,558 | ) | |
133
Net Investment Income | | Global
Resources Fund | | World Precious
Minerals Fund | | Gold and Precious
Metals Fund | |
Income: | |
Dividends from unaffiliated issuers | | $ | 4,333,944 | | | $ | 361,571 | | | $ | 447,688 | | |
Foreign tax withheld on dividends | | | (223,731 | ) | | | (32,219 | ) | | | (37,441 | ) | |
Net dividends | | | 4,110,213 | | | | 329,352 | | | | 410,247 | | |
Interest and other | | | 1,797,740 | | | | 1,166,885 | | | | 598,020 | | |
Total income | | | 5,907,953 | | | | 1,496,237 | | | | 1,008,267 | | |
Expenses: | |
Management fee | | | 2,058,281 | | | | 1,569,500 | | | | 791,076 | | |
Administrative services fee | | | 164,826 | | | | 81,236 | | | | 93,098 | | |
Administrative services fee - Investor Class | | | 141,228 | | | | 71,400 | | | | — | | |
Administrative services fee - Institutional Class | | | 14,098 | | | | 336 | | | | — | | |
Accounting service fees and expenses | | | 163,632 | | | | 88,281 | | | | 70,708 | | |
Distribution plan fee | | | 706,141 | | | | 357,004 | | | | 208,997 | | |
Transfer agent fees and expenses | | | — | | | | — | | | | 137,590 | | |
Transfer agent fees and expenses - Investor Class | | | 513,979 | | | | 250,752 | | | | — | | |
Transfer agent fees and expenses - Institutional Class | | | 54,429 | | | | 13,725 | | | | — | | |
Professional fees | | | 182,304 | | | | 102,314 | | | | 74,907 | | |
Custodian fees | | | 161,495 | | | | 128,093 | | | | 76,749 | | |
Shareholder reporting expenses | | | — | | | | — | | | | 35,502 | | |
Shareholder reporting expenses - Investor Class | | | 83,338 | | | | 46,318 | | | | — | | |
Shareholder reporting expenses - Institutional Class | | | 13,559 | | | | 2,640 | | | | — | | |
Registration fees | | | 11,154 | | | | 5,356 | | | | 12,674 | | |
Registration fees - Investor Class | | | 12,540 | | | | 10,060 | | | | — | | |
Registration fees - Institutional Class | | | 14,784 | | | | 10,121 | | | | — | | |
Trustee fees and expenses | | | 30,774 | | | | 30,775 | | | | 30,775 | | |
Miscellaneous expenses | | | 159,608 | | | | 108,404 | | | | 83,205 | | |
Total expenses before reductions | | | 4,486,170 | | | | 2,876,315 | | | | 1,615,281 | | |
Expenses offset - Note 1 H | | | (2,392 | ) | | | (1,659 | ) | | | (2,214 | ) | |
Expenses reimbursed - Note 3 | | | (100,265 | ) | | | (67,943 | ) | | | (41,817 | ) | |
Net expenses | | | 4,383,513 | | | | 2,806,713 | | | | 1,571,250 | | |
Net Investment Income (Loss) | | | 1,524,440 | | | | (1,310,476 | ) | | | (562,983 | ) | |
Net Realized and Unrealized
Gain (Loss) on Investments | |
Realized gain (loss) from: | |
Securities from unaffiliated issuers | | | (22,122,258 | ) | | | (35,303,146 | ) | | | (16,250,666 | ) | |
Securities from affiliated issuers | | | (92,775 | ) | | | (6,330,180 | ) | | | — | | |
Written options | | | (29,822 | ) | | | — | | | | — | | |
Foreign currency transactions | | | (149,157 | ) | | | (144,380 | ) | | | (9,565 | ) | |
Net realized gain (loss) | | | (22,394,012 | ) | | | (41,777,706 | ) | | | (16,260,231 | ) | |
Net change in unrealized appreciation (depreciation) of: | |
Investments | | | (58,516,310 | ) | | | 23,714,284 | | | | 6,590,807 | | |
Other assets and liabilities denominated in foreign currencies | | | 14,408 | | | | 919 | | | | 415 | | |
Net unrealized appreciation (depreciation) | | | (58,501,902 | ) | | | 23,715,203 | | | | 6,591,222 | | |
Net Realized and Unrealized Loss on Investments | | | (80,895,914 | ) | | | (18,062,503 | ) | | | (9,669,009 | ) | |
Net Decrease In Net Assets
Resulting From Operations | | $ | (79,371,474 | ) | | $ | (19,372,979 | ) | | $ | (10,231,992 | ) | |
See accompanying notes to financial statements.
134
For the Year Ended December 31, 2014
Net Investment Income | | Emerging Europe
Fund | | China Region
Fund | |
Income: | |
Dividends from unaffiliated issuers | | $ | 2,745,490 | | | $ | 628,540 | | |
Foreign tax withheld on dividends | | | (347,587 | ) | | | (28,338 | ) | |
Net dividends | | | 2,397,903 | | | | 600,202 | | |
Interest and other | | | — | | | | — | | |
Total income | | | 2,397,903 | | | | 600,202 | | |
Expenses: | |
Management fee | | | 1,203,532 | | | | 280,097 | | |
Administrative services fee | | | 105,628 | | | | 32,741 | | |
Administrative services fee - Investor Class | | | — | | | | — | | |
Administrative services fee - Institutional Class | | | — | | | | — | | |
Accounting service fees and expenses | | | 75,350 | | | | 61,255 | | |
Distribution plan fee | | | 240,320 | | | | 58,103 | | |
Transfer agent fees and expenses | | | 204,859 | | | | 54,043 | | |
Transfer agent fees and expenses - Investor Class | | | — | | | | — | | |
Transfer agent fees and expenses - Institutional Class | | | — | | | | — | | |
Professional fees | | | 75,934 | | | | 58,564 | | |
Custodian fees | | | 111,113 | | | | 43,354 | | |
Shareholder reporting expenses | | | 37,611 | | | | 13,303 | | |
Shareholder reporting expenses - Investor Class | | | — | | | | — | | |
Shareholder reporting expenses - Institutional Class | | | — | | | | — | | |
Registration fees | | | 16,878 | | | | 9,749 | | |
Registration fees - Investor Class | | | — | | | | — | | |
Registration fees - Institutional Class | | | — | | | | — | | |
Trustee fees and expenses | | | 30,775 | | | | 30,775 | | |
Miscellaneous expenses | | | 81,371 | | | | 41,663 | | |
Total expenses before reductions | | | 2,183,371 | | | | 683,647 | | |
Expenses offset - Note 1 H | | | (876 | ) | | | (445 | ) | |
Expenses reimbursed - Note 3 | | | — | | | | (101,029 | ) | |
Net expenses | | | 2,182,495 | | | | 582,173 | | |
Net Investment Income (Loss) | | | 215,408 | | | | 18,029 | | |
Net Realized and Unrealized
Gain (Loss) on Investments | |
Realized gain (loss) from: | |
Securities from unaffiliated issuers | | | 1,267,411 | | | | 3,473,544 | | |
Securities from affiliated issuers | | | — | | | | — | | |
Written options | | | — | | | | — | | |
Foreign currency transactions | | | (137,756 | ) | | | (13,292 | ) | |
Net realized gain (loss) | | | 1,129,655 | | | | 3,460,252 | | |
Net change in unrealized appreciation (depreciation) of: | |
Investments | | | (25,674,486 | ) | | | (3,791,094 | ) | |
Other assets and liabilities denominated in foreign currencies | | | (14,114 | ) | | | 419 | | |
Net unrealized appreciation (depreciation) | | | (25,688,600 | ) | | | (3,790,675 | ) | |
Net Realized and Unrealized Loss on Investments | | | (24,558,945 | ) | | | (330,423 | ) | |
Net Decrease In Net Assets
Resulting From Operations | | $ | (24,343,537 | ) | | $ | (312,394 | ) | |
135
Statements of Changes in Net Assets
| | | U.S. Government Securities
Ultra-Short Bond Fund | | Near-Term Tax Free Fund | |
| | | Year Ended
December 31,
2014 | | Year Ended
December 31,
2013 | | Year Ended
December 31,
2014 | | Year Ended
December 31,
2013 | |
Increase (Decrease) in Net Assets | |
From operations: | |
Net investment income (loss) | | $ | 244,055 | | | $ | 16,652 | | | $ | 1,421,238 | | | $ | 1,031,696 | | |
Net realized gains (losses) | | | 193 | | | | — | | | | (9,951 | ) | | | (5,442 | ) | |
Net unrealized appreciation (depreciation) | | | 157,029 | | | | (79,491 | ) | | | 622,619 | | | | (474,896 | ) | |
Net increase (decrease) in net assets from operations | | | 401,277 | | | | (62,839 | ) | | | 2,033,906 | | | | 551,358 | | |
Distributions to shareholders: | |
From net investment income | |
Investor class | | | (246,094 | ) | | | (17,151 | ) | | | (1,435,770 | ) | | | (1,035,065 | ) | |
From net realized gains | |
Investor class | | | — | | | | — | | | | — | | | | — | | |
Total distributions to shareholders | | | (246,094 | ) | | | (17,151 | ) | | | (1,435,770 | ) | | | (1,035,065 | ) | |
From capital share transactions: | |
Proceeds from shares sold
Investor class | | | 4,512,617 | | | | 74,906,024 | | | | 45,225,356 | | | | 24,389,380 | | |
Issued from fund acquisition
Investor class | | | — | | | | — | | | | — | | | | 16,401,859 | | |
Distributions reinvested
Investor class | | | 192,302 | | | | 16,345 | | | | 1,175,524 | | | | 913,653 | | |
Proceeds from short-term trading fees
Investor class | | | — | | | | — | | | | — | | | | — | | |
| | | 4,704,919 | | | | 74,922,369 | | | | 46,400,880 | | | | 41,704,892 | | |
Cost of shares redeemed
Investor class | | | (16,066,999 | ) | | | (140,040,374 | ) | | | (19,287,158 | ) | | | (23,846,979 | ) | |
Net increase (decrease) in net assets from
capital share transactions | | | (11,362,080 | ) | | | (65,118,005 | ) | | | 27,113,722 | | | | 17,857,913 | | |
Net Increase (Decrease) in Net Assets | | | (11,206,897 | ) | | | (65,197,995 | ) | | | 27,711,858 | | | | 17,374,206 | | |
Net Assets | |
Beginning of year | | | 75,227,086 | | | | 140,425,081 | | | | 61,883,516 | | | | 44,509,310 | | |
End of year | | $ | 64,020,189 | | | $ | 75,227,086 | | | $ | 89,595,374 | | | $ | 61,883,516 | | |
Accumulated undistributed net investment income, end of year | | $ | — | | | $ | 2,032 | | | $ | — | | | $ | 14,525 | | |
Capital Share Activity | |
Investor class: | |
Shares sold | | | 2,253,880 | | | | 37,369,392 | | | | 20,041,597 | | | | 11,061,407 | | |
Shares issued on fund acquisition | | | — | | | | — | | | | — | | | | 7,361,792 | | |
Shares reinvested | | | 96,087 | | | | 8,170 | | | | 522,037 | | | | 406,819 | | |
Shares redeemed | | | (8,024,578 | ) | | | (70,020,187 | ) | | | (8,568,071 | ) | | | (10,634,299 | ) | |
Net share activity | | | (5,674,611 | ) | | | (32,642,625 | ) | | | 11,995,563 | | | | 8,195,719 | | |
See accompanying notes to financial statements.
136
| | | All American Equity Fund | |
| | | Year Ended
December 31,
2014 | | Year Ended
December 31,
2013 | |
Increase (Decrease) in Net Assets | |
From operations: | |
Net investment income (loss) | | $ | (126,354 | ) | | $ | (89,116 | ) | |
Net realized gains (losses) | | | 4,958,378 | | | | 2,351,158 | | |
Net unrealized appreciation (depreciation) | | | (4,371,450 | ) | | | 3,753,621 | | |
Net increase (decrease) in net assets from operations | | | 460,574 | | | | 6,015,663 | | |
Distributions to shareholders: | |
From net investment income | |
Investor class | | | — | | | | (45,897 | ) | |
From net realized gains | |
Investor class | | | (3,451,336 | ) | | | (1,422,808 | ) | |
Total distributions to shareholders | | | (3,451,336 | ) | | | (1,468,705 | ) | |
From capital share transactions: | |
Proceeds from shares sold
Investor class | | | 3,388,992 | | | | 3,898,820 | | |
Issued from fund acquisition
Investor class | | | — | | | | — | | |
Distributions reinvested
Investor class | | | 3,284,819 | | | | 1,435,360 | | |
Proceeds from short-term trading fees
Investor class | | | 50 | | | | 171 | | |
| | | 6,673,861 | | | | 5,334,351 | | |
Cost of shares redeemed
Investor class | | | (5,135,517 | ) | | | (3,339,354 | ) | |
Net increase (decrease) in net assets from
capital share transactions | | | 1,538,344 | | | | 1,994,997 | | |
Net Increase (Decrease) in Net Assets | | | (1,452,418 | ) | | | 6,541,955 | | |
Net Assets | |
Beginning of year | | | 23,388,023 | | | | 16,846,068 | | |
End of year | | $ | 21,935,605 | | | $ | 23,388,023 | | |
Accumulated undistributed net investment income, end of year | | $ | — | | | $ | — | | |
Capital Share Activity | |
Investor class: | |
Shares sold | | | 104,908 | | | | 130,283 | | |
Shares issued on fund acquisition | | | — | | | | — | | |
Shares reinvested | | | 116,731 | | | | 46,108 | | |
Shares redeemed | | | (160,673 | ) | | | (112,837 | ) | |
Net share activity | | | 60,966 | | | | 63,554 | | |
137
Statements of Changes in Net Assets
| | | Holmes Macro Trends Fund | | Global Resources Fund | |
| | | Year Ended
December 31,
2014 | | Year Ended
December 31,
2013 | | Year Ended
December 31,
2014 | | Year Ended
December 31,
2013 | |
Increase (Decrease) in Net Assets | |
From operations: | |
Net investment income (loss) | | $ | (602,956 | ) | | $ | (421,055 | ) | | $ | 1,524,440 | | | $ | 1,025,692 | | |
Net realized gains (losses) | | | 4,824,855 | | | | 4,713,504 | | | | (22,394,012 | ) | | | 31,142,352 | | |
Net unrealized appreciation (depreciation) | | | (7,727,457 | ) | | | 9,777,265 | | | | (58,501,902 | ) | | | (36,630,705 | ) | |
Net increase (decrease) in net assets from operations | | | (3,505,558 | ) | | | 14,069,714 | | | | (79,371,474 | ) | | | (4,462,661 | ) | |
Distributions to shareholders: | |
From net investment income | |
Investor class | | | — | | | | — | | | | — | | | | (11,927,336 | ) | |
Institutional class | | | — | | | | — | | | | — | | | | (2,316,939 | ) | |
From net realized gains | |
Investor class | | | (4,895,166 | ) | | | (2,495,923 | ) | | | — | | | | — | | |
Total distributions to shareholders | | | (4,895,166 | ) | | | (2,495,923 | ) | | | — | | | | (14,244,275 | ) | |
From capital share transactions: | |
Proceeds from shares sold
Investor class | | | 2,829,629 | | | | 2,119,439 | | | | 15,810,878 | | | | 41,069,671 | | |
Institutional class | | | — | | | | — | | | | 13,601,289 | | | | 21,314,286 | | |
Issued from fund acquisition
Investor class | | | — | | | | 13,184,651 | | | | — | | | | — | | |
Distributions reinvested
Investor class | | | 4,645,006 | | | | 2,401,379 | | | | — | | | | 11,426,683 | | |
Institutional class | | | — | | | | — | | | | — | | | | 2,302,573 | | |
Proceeds from short-term trading fees
Investor class | | | 110 | | | | 37 | | | | 3 | | | | 733 | | |
Institutional class | | | — | | | | — | | | | — | | | | 45 | | |
| | | | 7,474,745 | | | | 17,705,506 | | | | 29,412,170 | | | | 76,113,991 | | |
Cost of shares redeemed
Investor class | | | (8,749,961 | ) | | | (7,992,655 | ) | | | (96,715,552 | ) | | | (148,576,808 | ) | |
Institutional class | | | — | | | | — | | | | (49,361,941 | ) | | | (63,835,335 | ) | |
Net increase (decrease) in net assets from
capital share transactions | | | (1,275,216 | ) | | | 9,712,851 | | | | (116,665,323 | ) | | | (136,298,152 | ) | |
Net Increase (Decrease) in Net Assets | | | (9,675,940 | ) | | | 21,286,642 | | | | (196,036,797 | ) | | | (155,005,088 | ) | |
Net Assets | |
Beginning of year | | | 55,926,020 | | | | 34,639,378 | | | | 377,442,334 | | | | 532,447,422 | | |
End of year | | $ | 46,250,080 | | | $ | 55,926,020 | | | $ | 181,405,537 | | | $ | 377,442,334 | | |
Accumulated undistributed net investment income (distributions
in excess of net investment income)/accumulated net
investment loss, end of year | | $ | 28,980 | | | $ | (95,667 | ) | | $ | (566,859 | ) | | $ | (2,684,940 | ) | |
Capital Share Activity | |
Investor class: | |
Shares sold | | | 119,782 | | | | 155,136 | | | | 1,771,672 | | | | 4,231,140 | | |
Shares issued on fund acquisition | | | — | | | | 550,754 | | | | — | | | | — | | |
Shares reinvested | | | 228,368 | | | | 102,404 | | | | — | | | | 1,264,014 | | |
Shares redeemed | | | (370,933 | ) | | | (372,964 | ) | | | (10,892,243 | ) | | | (15,413,782 | ) | |
Net share activity | | | (22,783 | ) | | | 435,330 | | | | (9,120,571 | ) | | | (9,918,628 | ) | |
Institutional class: | |
Shares sold | | | — | | | | — | | | | 1,541,347 | | | | 2,205,943 | | |
Shares reinvested | | | — | | | | — | | | | — | | | | 256,126 | | |
Shares redeemed | | | — | | | | — | | | | (5,576,888 | ) | | | (6,624,446 | ) | |
Net share activity | | | — | | | | — | | | | (4,035,541 | ) | | | (4,162,377 | ) | |
See accompanying notes to financial statements.
138
| | | World Precious Minerals Fund | |
| | | Year Ended
December 31,
2014 | | Year Ended
December 31,
2013 | |
Increase (Decrease) in Net Assets | |
From operations: | |
Net investment income (loss) | | $ | (1,310,476 | ) | | $ | (1,736,491 | ) | |
Net realized gains (losses) | | | (41,777,706 | ) | | | (87,323,508 | ) | |
Net unrealized appreciation (depreciation) | | | 23,715,203 | | | | (66,538,071 | ) | |
Net increase (decrease) in net assets from operations | | | (19,372,979 | ) | | | (155,598,070 | ) | |
Distributions to shareholders: | |
From net investment income | |
Investor class | | | — | | | | — | | |
Institutional class | | | — | | | | — | | |
From net realized gains | |
Investor class | | | — | | | | — | | |
Total distributions to shareholders | | | — | | | | — | | |
From capital share transactions: | |
Proceeds from shares sold
Investor class | | | 32,514,206 | | | | 36,481,853 | | |
Institutional class | | | 329,728 | | | | 6,096,172 | | |
Issued from fund acquisition
Investor class | | | — | | | | — | | |
Distributions reinvested
Investor class | | | — | | | | — | | |
Institutional class | | | — | | | | — | | |
Proceeds from short-term trading fees
Investor class | | | 1,107 | | | | 2,431 | | |
Institutional class | | | — | | | | — | | |
| | | | 32,845,041 | | | | 42,580,456 | | |
Cost of shares redeemed
Investor class | | | (43,496,939 | ) | | | (67,001,940 | ) | |
Institutional class | | | (4,133,556 | ) | | | (2,076,310 | ) | |
Net increase (decrease) in net assets from
capital share transactions | | | (14,785,454 | ) | | | (26,497,794 | ) | |
Net Increase (Decrease) in Net Assets | | | (34,158,433 | ) | | | (182,095,864 | ) | |
Net Assets | |
Beginning of year | | | 137,724,761 | | | | 319,820,625 | | |
End of year | | $ | 103,566,328 | | | $ | 137,724,761 | | |
Accumulated undistributed net investment income (distributions
in excess of net investment income)/accumulated net
investment loss, end of year | | $ | (2,657,357 | ) | | $ | (7,320,306 | ) | |
Capital Share Activity | |
Investor class: | |
Shares sold | | | 5,169,068 | | | | 5,307,378 | | |
Shares issued on fund acquisition | | | — | | | | — | | |
Shares reinvested | | | — | | | | — | | |
Shares redeemed | | | (6,972,038 | ) | | | (9,022,153 | ) | |
Net share activity | | | (1,802,970 | ) | | | (3,714,775 | ) | |
Institutional class: | |
Shares sold | | | 47,824 | | | | 898,155 | | |
Shares reinvested | | | — | | | | — | | |
Shares redeemed | | | (655,506 | ) | | | (324,020 | ) | |
Net share activity | | | (607,682 | ) | | | 574,135 | | |
139
Statements of Changes in Net Assets
| | | Gold and Precious Metals Fund | | Emerging Europe Fund | |
| | | Year Ended
December 31,
2014 | | Year Ended
December 31,
2013 | | Year Ended
December 31,
2014 | | Year Ended
December 31,
2013 | |
Increase (Decrease) in Net Assets | |
From operations: | |
Net investment income (loss) | | $ | (562,983 | ) | | $ | (538,618 | ) | | $ | 215,408 | | | $ | 2,300,503 | | |
Net realized gains (losses) | | | (16,260,231 | ) | | | (43,947,415 | ) | | | 1,129,655 | | | | 2,411,741 | | |
Net unrealized appreciation (depreciation) | | | 6,591,222 | | | | (36,513,770 | ) | | | (25,688,600 | ) | | | (9,574,694 | ) | |
Net increase (decrease) in net assets from operations | | | (10,231,992 | ) | | | (80,999,803 | ) | | | (24,343,537 | ) | | | (4,862,450 | ) | |
Distributions to shareholders: | |
From net investment income | |
Investor class | | | — | | | | — | | | | (2,243,528 | ) | | | (1,969,263 | ) | |
Total distributions to shareholders | | | — | | | | — | | | | (2,243,528 | ) | | | (1,969,263 | ) | |
From capital share transactions: | |
Proceeds from shares sold
Investor class | | | 30,616,079 | | | | 35,768,131 | | | | 6,672,598 | | | | 9,625,381 | | |
Distributions reinvested
Investor class | | | — | | | | — | | | | 2,048,780 | | | | 1,853,073 | | |
Proceeds from short-term trading fees
Investor class | | | 1,241 | | | | 5,074 | | | | 3 | | | | 8,743 | | |
| | | | 30,617,320 | | | | 35,773,205 | | | | 8,721,381 | | | | 11,487,197 | | |
Cost of shares redeemed
Investor class | | | (32,235,266 | ) | | | (46,670,561 | ) | | | (35,638,573 | ) | | | (55,772,036 | ) | |
Net decrease in net assets from capital share transactions | | | (1,617,946 | ) | | | (10,897,356 | ) | | | (26,917,192 | ) | | | (44,284,839 | ) | |
Net Decrease in Net Assets | | | (11,849,938 | ) | | | (91,897,159 | ) | | | (53,504,257 | ) | | | (51,116,552 | ) | |
Net Assets | |
Beginning of year | | | 74,626,856 | | | | 166,524,015 | | | | 122,570,128 | | | | 173,686,680 | | |
End of year | | $ | 62,776,918 | | | $ | 74,626,856 | | | $ | 69,065,871 | | | $ | 122,570,128 | | |
Accumulated undistributed net investment income (distributions
in excess of net investment income)/accumulated net
investment loss, end of year | | $ | (1,256,485 | ) | | $ | (1,672,755 | ) | | $ | (82,918 | ) | | $ | 1,865,410 | | |
Capital Share Activity | |
Investor class: | |
Shares sold | | | 4,547,671 | | | | 4,308,473 | | | | 857,860 | | | | 1,053,243 | | |
Shares reinvested | | | — | | | | — | | | | 310,418 | | | | 211,056 | | |
Shares redeemed | | | (4,828,108 | ) | | | (6,004,151 | ) | | | (4,539,463 | ) | | | (6,170,181 | ) | |
Net share activity | | | (280,437 | ) | | | (1,695,678 | ) | | | (3,371,185 | ) | | | (4,905,882 | ) | |
See accompanying notes to financial statements.
140
| | China Region Fund | |
| | | Year Ended
December 31,
2014 | | Year Ended
December 31,
2013 | |
Increase (Decrease) in Net Assets | |
From operations: | |
Net investment income (loss) | | $ | 18,029 | | | $ | (33,801 | ) | |
Net realized gains (losses) | | | 3,460,252 | | | | 43,701 | | |
Net unrealized appreciation (depreciation) | | | (3,790,675 | ) | | | 2,218,151 | | |
Net increase (decrease) in net assets from operations | | | (312,394 | ) | | | 2,228,051 | | |
Distributions to shareholders: | |
From net investment income | |
Investor class | | | — | | | | (64,297 | ) | |
Total distributions to shareholders | | | — | | | | (64,297 | ) | |
From capital share transactions: | |
Proceeds from shares sold
Investor class | | | 1,378,719 | | | | 4,399,601 | | |
Distributions reinvested
Investor class | | | — | | | | 59,607 | | |
Proceeds from short-term trading fees
Investor class | | | 39 | | | | 5,270 | | |
| | | | 1,378,758 | | | | 4,464,478 | | |
Cost of shares redeemed
Investor class | | | (6,444,792 | ) | | | (9,401,623 | ) | |
Net decrease in net assets from capital share transactions | | | (5,066,034 | ) | | | (4,937,145 | ) | |
Net Decrease in Net Assets | | | (5,378,428 | ) | | | (2,773,391 | ) | |
Net Assets | |
Beginning of year | | | 26,386,416 | | | | 29,159,807 | | |
End of year | | $ | 21,007,988 | | | $ | 26,386,416 | | |
Accumulated undistributed net investment income (distributions
in excess of net investment income)/accumulated net
investment loss, end of year | | $ | 125,962 | | | $ | (46,259 | ) | |
Capital Share Activity | |
Investor class: | |
Shares sold | | | 170,915 | | | | 573,138 | | |
Shares reinvested | | | — | | | | 7,414 | | |
Shares redeemed | | | (795,193 | ) | | | (1,222,797 | ) | |
Net share activity | | | (624,278 | ) | | | (642,245 | ) | |
141
Notes to Financial Statements December 31, 2014
Note 1: Organization and Significant Accounting Policies
U.S. Global Investors Funds (Trust), consisting of the nine separate funds (Funds) included in this report, is organized as a Delaware statutory trust. Each Fund is an open-end management investment company registered under the Investment Company Act of 1940, as amended, and follows the specialized accounting and reporting guidance in FASB Accounting Standards Codification 946. All funds are diversified with the exception of Global Resources, World Precious Minerals, Gold and Precious Metals, Emerging Europe and China Region. A nondiversified fund may invest a greater percentage of its assets in a particular issuer in comparison to a diversified fund.
At a shareholder meeting on December 2, 2013, the shareholders of the U.S. Government Securities Savings Fund approved a proposal resulting in the conversion of the Fund to a U.S. Government ultra-short bond fund that is not a money market fund. The conversion occurred after the close of business on December 20, 2013. The Fund's investment policy which required it to maintain a constant net asset value of $1.00 per share was eliminated as part of the conversion. The following changes also took effect as part of the conversion: (1) the Fund was renamed the U.S. Government Securities Ultra-Short Bond Fund, (2) the Fund's investment objective was changed to seek to achieve a total return with current income and (3) the Fund's dollar-weighted average effective maturity will be two years or less. Concurrent with the conversion, the Fund had a 1-for-2 reverse stock split. All capital share activity and per share data presented in these financial statements has been adjusted to reflect the reverse stock split.
Effective after the close of business on December 20, 2013, the Tax Free Fund merged into the Near-Term Tax Free Fund and the MegaTrends Fund merged into the Holmes Growth Fund. In connection with the reorganization, the Holmes Growth Fund was renamed the Holmes Macro Trends Fund. See Note 9 for more details about these mergers.
The following is a summary of significant accounting policies consistently followed by the Funds in the preparation of their financial statements. The policies are in conformity with U.S. generally accepted accounting principles.
A. Security Valuations
The Funds value investments traded on national or international securities exchanges or over-the-counter at the last sales price reported by the security's primary exchange of its market at the time of daily valuation. Options and securities for which no sale was reported are valued at the mean between the last reported bid and asked quotation. Short-term investments with effective maturities of sixty days or less at the date of purchase are valued at amortized cost, which approximates market value. Municipal securities, long-term U.S. government obligations and corporate debt securities are valued by an independent pricing service using an evaluated quote based on such factors as institutional-size trading in similar groups of
142
Notes to Financial Statements December 31, 2014
securities, yield, quality, maturity, coupon rate, type of issue, individual trading characteristics and other market data.
B. Fair Valued Securities
Securities for which market quotations are not readily available or which are subject to legal restrictions are valued at their fair value as determined in good faith by the Valuation Committee of U.S. Global Investors, Inc. (Adviser), under policies and procedures established by the Funds' Board of Trustees. Fair value is the price that would be received to sell an asset or paid to transfer a liability in an orderly transaction between market participants at the measurement date. The Valuation Committee meets on a regular basis to review securities which may not have readily available market prices and considers a number of factors in determining fair value, including nature and duration of any trading restrictions, trading volume, market values of unrestricted shares of the same or similar class, investment management's judgment regarding the market experience of the issuer, financial status and other operational and market factors affecting the issuer, issuer's management, quality of the underlying property based on review of independent geological studies and other relevant matters. The fair values may differ from what would have been used had a broader market for these securities existed. The Valuation Committee regularly reviews inputs and assumptions and performs transactional back-testing and disposition analysis. The Valuation Committee reports quarterly to the Funds' Board of Trustees.
For securities traded on international exchanges, if events which may materially affect the value of a Fund's securities occur after the close of the primary exchange and before a Fund's net asset value is next determined, then those securities will be valued at their fair value as determined in good faith under the supervision of the Board of Trustees. The Funds use a systematic fair value model provided by an independent third party to value international securities primarily traded on an exchange or market outside the Western Hemisphere in order to adjust for stale pricing, which may occur between the close of certain foreign exchanges and the New York Stock Exchange.
C. Security Transactions and Investment Income
Security transactions are accounted for on trade date. Realized gains and losses from security transactions are determined on an identified cost basis. Dividend income is recorded on the ex-dividend date except that certain dividends from foreign securities where the ex-dividend date may have passed are recorded as soon as the Fund has confirmed the ex-dividend date. Interest income, which may include original issue discount, is recorded on an accrual basis. Discounts and premiums on securities purchased are accreted and amortized, respectively, on a yield-to-maturity basis as adjustments to interest income. Investment income is recorded net of foreign taxes withheld where recovery of such taxes is uncertain. Investment income and realized and unrealized gains (losses) are allocated to each Fund's share class based on their respective net assets.
143
Notes to Financial Statements December 31, 2014
The Funds may purchase securities on a when-issued or delayed-delivery basis and segregate collateral on their books with a value at least equal to the amount of the commitment. Losses may arise due to the changes in the value of the underlying securities or if the counterparty does not perform under the contract.
D. Repurchase Agreements
The Funds may enter into repurchase agreements with recognized financial institutions or registered broker-dealers and, in all instances, hold as collateral, underlying securities with a value exceeding the principal amount of the repurchase obligation. The Funds use joint tri-party repurchase agreement accounts with other funds under common management where uninvested cash is collectively invested in repurchase agreements, and each participating fund owns an undivided interest in the account. There were no repurchase agreements held at December 31, 2014.
E. Foreign Currency Transactions
Some Funds may invest in securities of foreign issuers. The accounting records of these Funds are maintained in U.S. dollars. At each net asset value determination date, the value of assets and liabilities denominated in foreign currencies are translated into U.S. dollars using the current prevailing exchange rate. Security transactions, income and expenses are converted at the prevailing rate of exchange on the respective dates of the transactions. The effect of changes in foreign exchange rates on foreign denominated securities is included with the net realized and unrealized gain or loss on securities. Other foreign currency gains or losses are reported separately.
F. Federal Income Taxes
The Funds intend to continue to comply with the requirements of Subchapter M of the Internal Revenue Code applicable to regulated investment companies and to distribute substantially all of their taxable income to shareholders. Accordingly, no provision for federal income taxes is required. Each Fund may be subject to foreign taxes on income and gains on investments, which are accrued based on the Fund's understanding of the tax rules and regulations in the foreign markets.
The Funds recognize the tax benefits of uncertain tax positions only where the position is "more likely than not" to be sustained assuming examination by tax authorities. Management has analyzed the Funds' tax positions, and has concluded that no liability for unrecognized tax benefits should be recorded related to uncertain tax positions taken on returns filed for open tax years or expected to be taken in 2014 tax returns. The Funds' 2011, 2012, 2013 and 2014 tax returns are open to examination by the federal and applicable state tax authorities. The Funds have no examinations in progress.
G. Dividends and Distributions to Shareholders
The Funds record dividends and distributions to shareholders on the ex-dividend date. Distributions are determined in accordance with income tax regulations, which
144
Notes to Financial Statements December 31, 2014
may differ from accounting principles generally accepted in the United States. Accordingly, periodic reclassifications related to permanent book and tax basis differences are made within the Funds' capital accounts to reflect income and gains available for distribution under income tax regulations.
The Funds, except as noted below, generally pay income dividends and distribute capital gains, if any, annually. Prior to its conversion from a money market fund to an ultra-short bond fund on December 20, 2013, the U.S. Government Securities Ultra-Short Bond Fund (formerly the U.S. Government Securities Savings Fund) accrued dividends on a daily basis and paid dividends monthly. Subsequent to the conversion, the Fund accrues and pays dividends monthly. The Near-Term Tax Free Fund also accrues and pays dividends monthly. A Fund may elect to designate a portion of the earnings and profits distributed to shareholders on the redemption of fund shares during the year as distributions for federal income tax purposes. Differences in per share dividend rates for multiclass funds generally result from the relative weightings of pro rata income and realized gain allocations and from differences in separate class expenses.
H. Expenses
Fund specific expenses are allocated to that Fund and pro rata across share classes. Expenses that are not fund specific are allocated among Funds and pro rata across share classes. Class specific expenses (including, but not limited to, distribution plan fees, if any, a portion of the administrative services fees, transfer agency fees and expenses, shareholder reporting expenses and certain legal and registration fees) are allocated to the class that incurs such expense. Except for the U.S. Government Securities Ultra-Short Bond Fund, expense offset arrangements have been made with the Funds' custodian so the custodian fees may be paid indirectly by credits earned on the Funds' cash balances. Such deposit arrangements are an alternative to overnight investments. Custodian fees are presented in the Statements of Operations gross of such credits, and the credits are presented as offsets to expenses. For the U.S. Government Securities Ultra-Short Bond Fund, credits earned on its cash balance are included in interest and other income.
I. Short-Term Trading (Redemption) Fees
Short-term trading (redemption) fees are assessed on the Equity Funds (listed below). These fees, which are retained by the Funds, are accounted for as an addition to paid-in capital. Prior to March 19, 2013, fees were assessed as follows. Shares held in the All American, Holmes Macro Trends, Global Resources, World Precious Minerals and Gold and Precious Metals Funds for 30 days or less were subject to a short-term trading fee equal to 0.10%, 0.10%, 0.25%, 0.50% and 0.50%, respectively, of the proceeds of the redeemed shares. Shares held in Emerging Europe and China Region Funds for 180 days or less were subject to a short-term trading fee equal to 2.00% and 1.00%, respectively, of the proceeds of the redeemed shares.
Effective March 19, 2013, the fee for each of the Equity Funds was reduced to 0.05% of the amount redeemed on shares held seven days or less.
145
Notes to Financial Statements December 31, 2014
J. Use of Estimates in Financial Statement Preparation
The Funds are investment companies accounted for in conformity with accounting principles generally accepted in the United States of America ("GAAP"). Therefore they follow the accounting and reporting guidelines for investment companies. The preparation of financial statements in conformity with GAAP requires management to make estimates and assumptions that affect the reported amounts of assets and liabilities and disclosure of contingent assets and liabilities at the date of the financial statements and the reported amounts of income and expenses during the reporting period. Actual results could differ from those estimates.
K. Subsequent Events Evaluation
Management has evaluated subsequent events after the balance sheet date of December 31, 2014, through the date that the financial statements were issued and determined that there were no events or transactions that would require adjustments to or disclosure in the financial statements.
Note 2: Financial Derivative Instruments
A. Options Contracts
Equity Funds may purchase or write (sell) options on securities to manage their exposure to stock or commodity markets as well as fluctuations in interest and currency conversion rates. The use of options carries the risks of a change in value of the underlying instruments, an illiquid secondary market, or failure of the counterparty to perform its obligations.
A put option gives the purchaser of the option, upon payment of a premium, the right to sell, and the issuer of the option the obligation to buy, the underlying security, commodity, index, currency or other instrument at the exercise price. A call option, upon payment of a premium, gives the purchaser of the option the right to buy, and the issuer the obligation to sell, the underlying instrument at the exercise price.
Purchasing a put option tends to decrease a Fund's exposure to the underlying instrument, whereas purchasing a call option tends to increase a Fund's exposure to the underlying instrument. A Fund pays a premium which is included in the Statement of Assets and Liabilities as an investment and subsequently marked to market to reflect the current value of the option. Premiums paid to purchase options which expire are treated as realized losses. Premiums paid to purchase options which are exercised or closed are added to the cost of securities acquired or the proceeds from securities sold. The risk associated with purchasing put and call options is limited to the premium paid.
The Funds will realize a loss equal to all or a part of the premium paid for an option if the price of the underlying security or other instrument decreases or does not increase by more than the premium (in the case of a call option), or if the price of the underlying security or other instrument increases or does not decrease by more than the premium (in the case of a put option).
146
Notes to Financial Statements December 31, 2014
Writing a put option tends to increase a Fund's exposure to the underlying instrument, whereas writing a call option tends to decrease a Fund's exposure to the underlying instrument. The premium received is recorded as a liability in the Statement of Assets and Liabilities and subsequently marked to market to reflect the current value of the option written. Premiums received from writing options which expire are treated as realized gains. Premiums received from options which are exercised or closed are added to the proceeds or offset against amounts paid on the underlying transaction to determine the realized gain or loss. Written options include a risk of loss in excess of the option premium. A Fund as a writer of an option has no control over whether the underlying instrument may be sold (call) or purchased (put) and thus bears the market risk of an unfavorable change in the price of the instrument underlying the written option. There is also the risk a Fund may not be able to enter into a closing transaction because of an illiquid market.
A Fund's ability to close out its position as a purchaser or seller of a put or call option is dependent, in part, upon the liquidity of the market for that particular option. There can be no guarantee that a fund will be able to close out an option position when desired. An inability to close out its options positions may reduce a Fund's anticipated profits or increase its losses.
As of December 31, 2014, there were no securities held in escrow by the custodian as cover for call options written.
Transactions in written call options during the year ended December 31, 2014, were as follows:
| | | Holmes Macro Trends Fund
Call Options | | Global Resources Fund
Call Options | |
| | | Number of
Contracts | | Premiums
Received | | Number of
Contracts | | Premiums
Received | |
Options outstanding at December 31, 2013 | | | — | | | $ | — | | | | — | | | $ | — | | |
Options written | | | 100 | | | | 13,146 | | | | 1,200 | | | | 784,235 | | |
Options closed | | | — | | | | — | | | | (1,200 | ) | | | (784,235 | ) | |
Options expired | | | (100 | ) | | | (13,146 | ) | | | — | | | | — | | |
Options exercised | | | — | | | | — | | | | — | | | | — | | |
Options outstanding at December 31, 2014 | | | — | | | $ | — | | | | — | | | $ | — | | |
B. Forward Foreign Currency Contracts
The Funds enter into forward foreign currency contracts to lock in the U.S. dollar cost of purchase and sale transactions or to hedge the portfolio against currency fluctuations. A forward foreign currency contract is a commitment to purchase or sell a foreign currency at a future date at a negotiated rate. These contracts are valued daily, and the Fund's net equity therein, representing unrealized gain or loss on the contracts as measured by the difference between the forward foreign exchange rates at the dates of entry into the contracts and the forward rates at the reporting date, is included in the statement of assets and liabilities. Realized and unrealized gains and losses are included in the statement of operations. Risks may arise upon entering into these contracts from the potential inability of
147
Notes to Financial Statements December 31, 2014
counterparties to meet the terms of the contract and from unanticipated movements in the value of foreign currencies relative to the U.S. dollar.
There were no open forward foreign currency contracts at December 31, 2014.
C. Summary of Derivative Instruments
The following is a summary of the valuations of derivative instruments categorized by location in the Statements of Assets and Liabilities as of December 31, 2014:
Location | | Global
Resources
Fund | | World
Precious
Minerals
Fund | | Gold and
Precious
Metals
Fund | | China
Region
Fund | |
Asset derivatives | |
Investments, at value
Purchased options | | $ | 4,840,225 | | | $ | 1,057,600 | | | $ | 698,790 | | | $ | 900 | | |
Total | | $ | 4,840,225 | | | $ | 1,057,600 | | | $ | 698,790 | | | $ | 900 | | |
The following is a summary of the effect of derivative instruments on the Statements of Operations for the year ended December 31, 2014:
Location | | All
American
Equity Fund | | Holmes
Macro
Trends
Fund | | Global
Resources
Fund | |
Realized gain (loss) on derivatives recognized
in income | |
Realized gain (loss) from securities
Purchased options | | $ | (99,563 | ) | | $ | (240,245 | ) | | $ | (5,041,531 | ) | |
Realized gain (loss) from written options | | | — | | | | 13,146 | | | | (29,822 | ) | |
| | | | (99,563 | ) | | | (227,099 | ) | | | (5,071,353 | ) | |
Change in unrealized appreciation (depreciation)
on derivatives recognized in income | |
Net change in unrealized appreciation
(depreciation) of investments
Purchased options | | | — | | | | — | | | | (2,712,607 | ) | |
| | | | — | | | | — | | | | (2,712,607 | ) | |
Total | | $ | (99,563 | ) | | $ | (227,099 | ) | | $ | (7,783,960 | ) | |
148
Notes to Financial Statements December 31, 2014
Location | | World
Precious
Minerals
Fund | | Gold and
Precious
Metals
Fund | | Emerging
Europe
Fund | | China
Region
Fund | |
Realized gain (loss) on derivatives
recognized in income | |
Realized gain (loss) from securities
Purchased options | | $ | (8,780,892 | ) | | $ | (5,430,737 | ) | | $ | (659,516 | ) | | $ | (109,468 | ) | |
Net realized gain (loss) from foreign
currency transactions
Foreign exchange contracts | | | — | | | | — | | | | (2,828 | ) | | | — | | |
| | | (8,780,892 | ) | | | (5,430,737 | ) | | | (662,344 | ) | | | (109,468 | ) | |
Change in unrealized appreciation
(depreciation) on derivatives
recognized in income | |
Net change in unrealized appreciation
(depreciation) of investments
Purchased options | | | 5,935,548 | | | | 3,583,218 | | | | — | | | | (110,674 | ) | |
| | | | 5,935,548 | | | | 3,583,218 | | | | — | | | | (110,674 | ) | |
Total | | $ | (2,845,344 | ) | | $ | (1,847,519 | ) | | $ | (662,344 | ) | | $ | (220,142 | ) | |
The average notional amounts of written options, purchased options and forward currency contracts outstanding during the year ended December 31, 2014, were approximately as follows:
Fund | | Written
Options | | Purchased
Options | | Forward
Currency
Contracts | |
Holmes Macro Trends | | $ | — | | | $ | 5,577 | | | $ | — | | |
Global Resources | | | 35,664 | | | | 6,091,136 | | | | — | | |
World Precious Minerals | | | — | | | | 4,443,104 | | | | — | | |
Gold and Precious Metals | | | — | | | | 2,950,817 | | | | — | | |
Emerging Europe | | | — | | | | 41,538 | | | | 34,464 | | |
China Region | | | — | | | | 65,397 | | | | — | | |
149
Notes to Financial Statements December 31, 2014
Note 3: Investment Advisory and Other Agreements
The Adviser, under an investment advisory agreement with the Trust in effect through October 1, 2015, furnishes management and investment advisory services and, subject to the supervision of the trustees, directs the investments of each Fund according to each Fund's investment objectives, policies and limitations. The Adviser also furnishes all necessary office facilities, business equipment and personnel for administering the affairs of the Trust. Frank E. Holmes, a trustee of the Funds, is the controlling owner of the Adviser.
For the services of the Adviser, each Fund pays a base management or advisory fee based upon its net assets. Fees are accrued daily and paid monthly. The contractual management fee for each fund is:
| Fund | | Annual Percentage of
Average Daily Net Assets | |
U.S. Government Securities Ultra-Short Bond | | .50% of the first $250,000,000
and .375% of the excess | |
Near-Term Tax Free | | .50% | |
All American Equity | | .80% of the first $500,000,000
and .75% of the excess | |
Holmes Macro Trends | | 1.00% | |
Global Resources | | .95% of the first $500,000,000;
.90% of $500,000,001 to $1,000,000,000
and .85% of the excess | |
World Precious Minerals | | 1.00% of the first $500,000,000;
.95% of $500,000,001 to $1,000,000,000
and .90% of the excess | |
Gold and Precious Metals | | .90% of the first $500,000,000
and .85% of the excess | |
Emerging Europe | | 1.25% | |
China Region | | 1.25% | |
150
Notes to Financial Statements December 31, 2014
The advisory agreement also provides that the base advisory fee of the Equity Funds will be adjusted upwards or downwards by 0.25 percent if there is a performance difference of 5 percent or more between a Fund's performance and that of its designated benchmark index over the prior 12 months. The performance adjustment is calculated separately for each share class. The benchmarks are as follows:
| Fund | | Benchmark Index | |
All American Equity | | S&P 500 Index | |
Holmes Macro Trends | | S&P Composite 1500 Index | |
Global Resources | | S&P Global Natural Resources Index
(Net Total Return)(1) | |
World Precious Minerals | | NYSE Arca Gold Miners Index | |
Gold and Precious Metals | | FTSE Gold Mines Index | |
Emerging Europe | | MSCI Emerging Markets Europe 10/40 Index (Net Total Return) | |
China Region | | Hang Seng Composite Index | |
(1) On July 4, 2014, Morgan Stanley discontinued its Morgan Stanley Commodity Related Index ("CRX"), which was the benchmark used by the Global Resources Fund to calculate its performance fee adjustment. The Fund replaced the CRX with the S&P Global Natural Resources Index (Net Total Return). Because the Global Resources Fund's monthly performance fee adjustment is based on a rolling 12-month period, the Fund's performance will be compared for a period of time to a blend of the CRX and the S&P Global Natural Resources Index (Net Total Return), using the performance of the CRX through June 30, 2014, and the performance of the S&P Global Natural Resources Index (Net Total Return) after June 30, 2014. As each month passes, a month of the CRX performance will roll off and a month of the S&P Global Natural Resources Index (Net Total Return) will be added until the Fund's performance eventually will be compared exclusively to the S&P Global Natural Resources Index (Net Total Return) for determining the Fund's monthly performance fee adjustment.
No performance adjustment is applied unless the difference between the class's investment performance and the benchmark is 5 percent or greater (positive or negative) during the applicable performance measurement period. The performance fee adjustment is calculated monthly in arrears and is accrued ratably during the month. The management fee, net of any performance fee adjustment, is paid monthly in arrears.
The Funds' prospectus and statement of additional information contain additional information about the performance adjustment. The amounts shown as management fees on the Statements of Operations reflects the base fee plus/minus any
151
Notes to Financial Statements December 31, 2014
performance adjustment. During the year ended December 31, 2014, the Funds recorded performance adjustments as follows:
Fund | | Investor Class
Performance Fee
Adjustment | | Institutional Class
Performance Fee
Adjustment | |
All American Equity | | $ | (10,185 | ) | | | N/A | | |
Holmes Macro Trends | | | (17,521 | ) | | | N/A | | |
Global Resources | | | (836,339 | ) | | $ | (123,550 | ) | |
World Precious Minerals | | | 130,956 | | | | 2,143 | | |
Gold and Precious Metals | | | 38,693 | | | | N/A | | |
China Region | | | (10,424 | ) | | | N/A | | |
Under an administrative services agreement, the U.S. Government Securities Ultra-Short Bond, Near-Term Tax Free, All American Equity, Holmes Macro Trends, Gold and Precious Metals, Emerging Europe and China Region Funds compensate the Adviser at an annual rate of 0.10% of the average daily net assets of each Fund for administrative services provided, of which half is a fund-level fee and half is a class-level fee. The Global Resources and World Precious Minerals Funds compensate the Adviser at an annual rate of 0.10% of the average daily net assets for the Investor Class and 0.08% of the average daily net assets for the Institutional Class for administrative services provided, of which half is a fund-level fee and half is a class-level fee.
In addition, effective December 9, 2013, through October 31, 2014, a $10,000 annual base administrative services fee was paid by each Fund. This fee was reduced to $7,000 effective November 1, 2014. This is a fund-level fee.
The Investor Class shares for Equity Funds in the Trust have adopted a distribution plan pursuant to Rule 12b-1 of the Investment Company Act of 1940 in which a subsidiary of the Adviser is paid a fee at an annual rate of 0.25% of the average daily net assets of the Investor Class for sales and promotional services related to the distribution of Investor Class shares. The Institutional Class does not incur distribution plan fees.
The Adviser has voluntarily agreed to reimburse specific funds so that their total operating expenses will not exceed certain annual percentages of average net assets. The expenses for the year ended December 31, 2014, were limited as follows for the Investor Class: U.S. Government Securities Ultra-Short Bond Fund at 0.45%, All American Equity Fund at 2.20%, Holmes Macro Trends Fund at 2.20%, Global Resources, World Precious Minerals, and Gold and Precious Metals Funds at 1.90%, Emerging Europe Fund at 2.85% and China Region Fund at 2.55%. These expense limitations are exclusive of any performance fee adjustments and will continue on
152
Notes to Financial Statements December 31, 2014
a voluntary basis at the Adviser's discretion. The Adviser may temporarily agree to additional reimbursements or limitations.
The Adviser has contractually limited the total operating expenses of the Near-Term Tax Free Fund at 0.45% on an annualized basis through December 31, 2015.
The Adviser has voluntarily agreed to waive all class specific expenses for the Institutional Class of the Global Resources Fund and the World Precious Minerals Fund. These expense waivers are exclusive of any performance fee adjustments, and the Adviser can modify or terminate this arrangement at any time.
Under an agreement entered into while the U.S. Government Securities Ultra-Short Bond Fund was a money market fund, the Adviser had voluntarily agreed to waive fees and/or reimburse the Fund to the extent necessary to maintain the yield at a certain level as determined by the Adviser (Minimum Yield). The Adviser may recapture any fees waived and/or expenses reimbursed within three years after the end of the fiscal year of such waiver and/or reimbursement to the extent that such recapture would not cause the Fund's yield to fall below the Minimum Yield. At December 31, 2014, the Adviser may seek reimbursement of previously waived and reimbursed fees as follows: $509,874 (expires 12/31/2015) and $498,342 (expires 12/31/2016).
U.S. Bancorp Fund Services, LLC is the transfer agent for the Funds. Each Fund's share class pays an annual fee based on the number of shareholder accounts, certain base fees and transaction- and activity-based fees for transfer agency services. Certain account fees are paid directly by shareholders to the transfer agent, which, in turn, reduces its charge to the Funds.
The Adviser was reimbursed for services of the Funds' Chief Compliance Officer during the year ended December 31, 2014, in the amount of $142,796.
Brown Brothers Harriman & Co. (BBH) serves as the custodian, and through October 31, 2014, served as fund accounting and administration service agent with a fee structure based on average net assets of the Funds, certain base fees and transaction-based fees. Effective November 1, 2014, SEI Investments Global Funds Services serves as fund accounting and administration service agent with a fee structure based on average net assets of the Trust, subject to minimum fees.
The independent Trustees receive compensation for serving on the Board. Trustees serving as Chairman of the Board or a special committee or as a member of a committee receive additional compensation. Trustees are also reimbursed for out-of-pocket expenses incurred while attending meetings. Frank E. Holmes receives no compensation from the Funds for serving on the Board.
153
Notes to Financial Statements December 31, 2014
Note 4: Investments
Cost of purchases and proceeds from sales of long-term securities, excluding purchased options, for the year ended December 31, 2014, are summarized as follows:
Fund | | Purchases | | Sales | |
U.S. Government Securities
Ultra-Short Bond | | $ | 27,573,707 | | | $ | 10,230,000 | | |
Near-Term Tax Free | | | 20,196,472 | | | | 6,789,908 | | |
All American Equity | | | 55,855,553 | | | | 57,598,023 | | |
Holmes Macro Trends | | | 86,169,663 | | | | 93,118,330 | | |
Global Resources | | | 1,346,357,527 | | | | 1,473,500,925 | | |
World Precious Minerals | | | 79,643,369 | | | | 94,992,759 | | |
Gold and Precious Metals | | | 75,038,003 | | | | 70,279,102 | | |
Emerging Europe | | | 86,379,277 | | | | 119,825,036 | | |
China Region | | | 51,321,403 | | | | 56,738,486 | | |
Note 5: Tax Information
The following table presents the income tax basis of securities owned at December 31, 2014, and the tax basis components of net unrealized appreciation (depreciation):
Fund | | Aggregate
Tax Cost | | Gross
Unrealized
Appreciation | | Gross
Unrealized
Depreciation | | Net Unrealized
Appreciation
(Depreciation) | |
U.S. Government Securities
Ultra-Short Bond | | $ | 58,307,328 | | | $ | 108,968 | | | $ | (31,430 | ) | | $ | 77,538 | | |
Near-Term Tax Free | | | 76,069,875 | | | | 1,579,116 | | | | (130,780 | ) | | | 1,448,336 | | |
All American Equity | | | 21,294,275 | | | | 494,707 | | | | (373,798 | ) | | | 120,909 | | |
Holmes Macro Trends | | | 39,655,409 | | | | 6,255,093 | | | | (2,223,903 | ) | | | 4,031,190 | | |
Global Resources | | | 299,713,371 | | | | 3,757,892 | | | | (128,216,332 | ) | | | (124,458,440 | ) | |
World Precious Minerals | | | 255,024,837 | | | | 10,639,811 | | | | (164,548,808 | ) | | | (153,908,997 | ) | |
Gold and Precious Metals | | | 103,741,401 | | | | 783,857 | | | | (43,531,914 | ) | | | (42,748,057 | ) | |
Emerging Europe | | | 75,069,878 | | | | 5,866,807 | | | | (15,599,084 | ) | | | (9,732,277 | ) | |
China Region | | | 19,639,902 | | | | 1,809,491 | | | | (840,868 | ) | | | 968,623 | | |
154
Notes to Financial Statements December 31, 2014
As of December 31, 2014, the components of distributable earnings on a tax basis were as follows:
Fund | | Undistributed
Ordinary
Income | | Undistributed
Long-Term
Capital Gains | | Capital
Loss
Carryforwards | | Post
October
Losses | | Net
Unrealized
Appreciation
(Depreciation) | | Other
Temporary
Differences | | Total | |
U.S. Government
Securities
Ultra-Short
Bond | | $ | 186 | | | $ | — | | | $ | — | | | $ | — | | | $ | 77,538 | | | $ | — | | | $ | 77,724 | | |
Near-Term
Tax Free | | | — | | | | — | | | | (372,583 | ) | | | — | | | | 1,448,336 | | | | — | | | | 1,075,753 | | |
All American
Equity | | | 622,334 | | | | 1,604,254 | | | | — | | | | — | | | | 120,909 | | | | — | | | | 2,347,497 | | |
Holmes Macro
Trends | | | — | | | | 2,014,392 | | | | (922,926 | ) | | | — | | | | 4,031,190 | | | | (1 | ) | | | 5,122,655 | | |
Global Resources | | | 307,341 | | | | — | | | | (327,746,325 | ) | | | (44,027,179 | ) | | | (124,444,141 | ) | | | (15 | ) | | | (495,910,319 | ) | |
World Precious
Minerals | | | 7,140,621 | | | | — | | | | (244,612,245 | ) | | | (9,820,234 | ) | | | (153,909,003 | ) | | | (7 | ) | | | (401,200,868 | ) | |
Gold and Precious
Metals | | | — | | | | — | | | | (72,951,260 | ) | | | (1,301,608 | ) | | | (42,748,071 | ) | | | (24,840 | ) | | | (117,025,779 | ) | |
Emerging Europe | | | — | | | | — | | | | (309,814,955 | ) | | | (1,745,353 | ) | | | (9,746,844 | ) | | | (1 | ) | | | (321,307,153 | ) | |
China Region | | | 187,577 | | | | — | | | | (18,299,303 | ) | | | — | | | | 969,042 | | | | — | | | | (17,142,684 | ) | |
The differences between book-basis and tax-basis unrealized appreciation (depreciation) for All American Equity, Holmes Macro Trends, Global Resources, World Precious Minerals, Gold and Precious Metals, Emerging Europe and China Region Funds are attributable primarily to the tax deferral of losses on wash sales, investment in passive foreign investment companies (PFIC), forwards marked to markets, adjustments for partnerships, tax straddle loss deferrals on written options, and adjustments for grantor trusts.
Reclassifications are made to the Funds' capital accounts to reflect income and gains available for distribution (or available capital loss carryovers) under income tax regulations. For the year ended December 31, 2014, the Funds recorded the following reclassifications to increase (decrease) the accounts listed below:
Fund | | Accumulated Net
Investment Income | | Accumulated Net
Realized Gain | | Paid-in
Capital | |
U.S. Government Securities Ultra-Short Bond | | $ | 7 | | | $ | (7 | ) | | $ | — | | |
Near-Term Tax Free | | | 7 | | | | 202,719 | | | | (202,726 | ) | |
All American Equity | | | 126,354 | | | | (126,354 | ) | | | — | | |
Holmes Macro Trends | | | 727,603 | | | | (238,947 | ) | | | (488,656 | ) | |
Global Resources | | | 593,641 | | | | (427,541 | ) | | | (166,100 | ) | |
World Precious Minerals | | | 5,973,425 | | | | (5,978,009 | ) | | | 4,584 | | |
Gold and Precious Metals | | | 979,253 | | | | 14,346 | | | | (993,599 | ) | |
Emerging Europe | | | 79,792 | | | | 72,848 | | | | (152,640 | ) | |
China Region | | | 154,192 | | | | (154,192 | ) | | | — | | |
155
Notes to Financial Statements December 31, 2014
The tax character of distributions paid during the fiscal year ended December 31, 2014, were as follows:
Fund | | Tax-Exempt
Income | | Ordinary
Income | | Long-Term
Capital Gains | | Total | |
U.S. Government Securities
Ultra-Short Bond | | $ | — | | | $ | 246,094 | | | $ | — | | | $ | 246,094 | | |
Near-Term Tax Free | | | 1,382,047 | | | | 53,723 | | | | — | | | | 1,435,770 | | |
All American Equity | | | — | | | | 817,613 | | | | 2,633,723 | | | | 3,451,336 | | |
Holmes Macro Trends | | | — | | | | 750,789 | | | | 4,144,377 | | | | 4,895,166 | | |
Global Resources - Investor Class | | | — | | | | — | | | | — | | | | — | | |
Global Resources - Institutional Class | | | — | | | | — | | | | — | | | | — | | |
World Precious Minerals - Investor Class | | | — | | | | — | | | | — | | | | — | | |
World Precious Minerals - Institutional Class | | | — | | | | — | | | | — | | | | — | | |
Gold and Precious Metals | | | — | | | | — | | | | — | | | | — | | |
Emerging Europe | | | — | | | | 2,243,528 | | | | — | | | | 2,243,528 | | |
China Region | | | — | | | | — | | | | — | | | | — | | |
The tax character of distributions paid during the fiscal year ended December 31, 2013, were as follows:
Fund | | Tax-Exempt
Income | | Ordinary
Income | | Long-Term
Capital Gains | | Total | |
U.S. Government Securities
Ultra-Short Bond | | $ | — | | | $ | 17,151 | | | $ | — | | | $ | 17,151 | | |
Near-Term Tax Free | | | 997,227 | | | | 37,838 | | | | — | | | | 1,035,065 | | |
All American Equity | | | — | | | | 641,884 | | | | 826,821 | | | | 1,468,705 | | |
Holmes Macro Trends | | | — | | | | 859,008 | | | | 1,636,915 | | | | 2,495,923 | | |
Global Resources - Investor Class | | | — | | | | 11,927,336 | | | | — | | | | 11,927,336 | | |
Global Resources - Institutional Class | | | — | | | | 2,316,939 | | | | — | | | | 2,316,939 | | |
World Precious Minerals - Investor Class | | | — | | | | — | | | | — | | | | — | | |
World Precious Minerals - Institutional Class | | | — | | | | — | | | | — | | | | — | | |
Gold and Precious Metals | | | — | | | | — | | | | — | | | | — | | |
Emerging Europe | | | — | | | | 1,969,263 | | | | — | | | | 1,969,263 | | |
China Region | | | — | | | | 64,297 | | | | — | | | | 64,297 | | |
Capital loss carryforwards may be used to offset current or future taxable capital gains until expiration. The Fund's tax-basis capital gains and losses are determined only at the end of each fiscal year. Under the Regulated Investment Company Modernization Act of 2010, the Funds are permitted to carry forward capital losses incurred in taxable years beginning after December 22, 2010, for an unlimited period. Losses incurred during these years are required to be utilized prior to the losses incurred in pre-enactment tax years. As a result of this ordering rule, pre-enactment capital loss carryforwards may be more likely to expire unused. In addition, post-enactment capital losses that are carried forward retain their character as either
156
Notes to Financial Statements December 31, 2014
short-term or long-term capital losses rather than being considered all short-term as under previous law. The loss carryforwards and related expiration dates for each fund, as of December 31, 2014, are as follows:
| | | No Expiration | | Expiration Date | |
Fund | | Short-Term | | Long-Term | | 2015 | | 2016 | |
U.S. Government Securities
Ultra-Short Bond | | $ | — | | | $ | — | | | $ | — | | | $ | — | | |
Near-Term Tax Free (a) | | | 151,673 | | | | 204,359 | | | | 2,488 | | | | 10,809 | | |
All American Equity | | | — | | | | — | | | | — | | | | — | | |
Holmes Macro Trends (a) | | | — | | | | — | | | | — | | | | 922,926 | | |
Global Resources | | | 68,533,813 | | | | — | | | | — | | | | — | | |
World Precious Minerals | | | 63,812,247 | | | | 117,020,486 | | | | — | | | | — | | |
Gold and Precious Metals | | | 34,819,498 | | | | 38,131,762 | | | | — | | | | — | | |
Emerging Europe | | | 3,969,483 | | | | 4,351,309 | | | | — | | | | 28,524,678 | | |
China Region | | | 3,279,036 | | | | — | | | | — | | | | 15,020,267 | | |
| | | Expiration Date | | | |
Fund | | 2017 | | 2018 | | Total | |
U.S. Government Securities
Ultra-Short Bond | | $ | — | | | $ | — | | | $ | — | | |
Near-Term Tax Free (a) | | | 722 | | | | 2,532 | | | | 372,583 | | |
All American Equity | | | — | | | | — | | | | — | | |
Holmes Macro Trends (a) | | | — | | | | — | | | | 922,926 | | |
Global Resources | | | 259,212,512 | | | | — | | | | 327,746,325 | | |
World Precious Minerals | | | 63,779,512 | | | | — | | | | 244,612,245 | | |
Gold and Precious Metals | | | — | | | | — | | | | 72,951,260 | | |
Emerging Europe | | | 257,523,539 | | | | 15,445,946 | | | | 309,814,955 | | |
China Region | | | — | | | | — | | | | 18,299,303 | | |
(a) Utilization of capital loss carryovers is subject to annual limitations.
In accordance with tax rules, the following net capital losses and ordinary losses (currency and late year losses) incurred after October 31, within each Fund's tax year, are deemed to arise on the first day of the Fund's next tax year if the Fund elects to defer such losses.
The Funds elected to defer losses incurred after October 31, 2014, as follows:
Fund | | Post October 31, 2014
Capital Loss Deferral | | Post October 31, 2014
Ordinary Loss Deferral | |
Global Resources | | $ | 44,027,179 | | | $ | — | | |
World Precious Minerals | | | 9,820,234 | | | | — | | |
Gold and Precious Metals | | | 1,301,608 | | | | — | | |
Emerging Europe | | | 1,745,353 | | | | — | | |
157
Notes to Financial Statements December 31, 2014
Note 6: Risks of Concentrations
The Near-Term Tax Free Fund may be exposed to risks related to concentration of investments in a particular state or geographic area. These investments present risks resulting from changes in economic conditions of the region or the issuer.
Because the Global Resources Fund concentrates its investments in a specific industry, the fund may be subject to greater risks and fluctuations than a portfolio representing a broader range of industries.
The World Precious Minerals and Gold and Precious Metals Funds concentrate their investments in gold and other precious metals and minerals and, therefore, may be subject to greater risks and market fluctuations than a portfolio representing a broader range of industries. The funds invest in securities that typically respond to changes in the price of gold and other precious metals and minerals, which can be influenced by a variety of global economic, figures and political factors; increased environmental and labor costs in mining; and changes in laws relating to mining or gold production or sales. Fluctuations in the prices of gold and other precious metals and minerals will affect the market values of the securities held by these funds.
The Emerging Europe Fund invests more than 25% of its investments in companies principally engaged in the oil & gas or banking industries. The risk of concentrating investments in this group of industries will make the fund more susceptible to risk in these industries than funds which do not concentrate their investments in an industry.
The Emerging Europe Fund may be exposed to risks not typically associated with investment in the United States due to their concentration of investments in emerging markets. These risks include possible revaluation of currencies, less public information about companies, disruptive political or economic conditions and the possible imposition of adverse governmental laws or currency exchange restrictions. Moreover, securities of many foreign issuers, including sovereign nations, and their markets may be less liquid and their prices more volatile than those securities of comparable U.S. issuers.
The China Region Fund may be exposed to risks not typically associated with investments in the United States, due to concentration of investments in foreign issuers in the region. These investments present risks resulting from disruptive political or economic conditions and the potential imposition of adverse governmental laws or currency exchange restrictions affecting the area.
Note 7: Credit Arrangements
Each of the Funds has a revolving credit facility with BBH. Borrowings of each Fund are collateralized by any or all of the securities held by BBH as the Fund's custodian up to the amount of the borrowing. Interest on borrowings is charged at the current overnight Federal Funds Rate plus 2%. Each Fund has a maximum borrowing limit of 10% of qualified assets. The aggregate of borrowings by all Funds
158
Notes to Financial Statements December 31, 2014
under the agreement cannot exceed $20,000,000 at any one time. There were no borrowings under the revolving credit facility during the period ended December 31, 2014. The U.S. Global Investors Funds paid BBH a total of $34,083 in commitment fees for the period ended December 31, 2014, under this arrangement.
Note 8: Shares of Beneficial Interest
At December 31, 2014, individual shareholders holding more than 5% of outstanding shares comprised 51.90% of the Institutional Class of the World Precious Minerals Fund. In addition, the Adviser held 20.13% of the U.S. Government Securities Ultra-Short Bond Fund. Control is defined by the 1940 Act as the beneficial ownership, either directly or through one or more controlled companies, of more than 25% of the voting securities of a company. Investment activities of these shareholders could have a material impact on the Funds.
Note 9: 2013 Reorganization Information
On December 20, 2013, the Near-Term Tax Free Fund acquired all of the net assets of the Tax Free Fund, a separate series of the Trust, pursuant to an Agreement and Plan of Reorganization. The Near-Term Tax Free Fund is the legal and accounting survivor. The purpose of the transaction was to combine two funds with the same investment objective and similar strategies and policies, as well as to seek anticipated economies of scale due to the larger asset size of the combined fund after the reorganization.
On December 20, 2013, the Holmes Growth Fund acquired all of the net assets of the MegaTrends Fund, a separate series of the Trust, pursuant to a plan of reorganization approved by the MegaTrends Fund shareholders on December 20, 2013. In connection with the reorganization, the name of the Holmes Growth Fund changed to Holmes Macro Trends Fund. The Holmes Macro Trends Fund is the legal and accounting survivor. The purpose of the transaction was to combine two funds with the same primary investment objective and similar strategies and policies, as well as to seek anticipated economies of scale due to the larger asset size of the combined fund after the reorganization.
The acquisitions were accomplished by a tax-free exchange of the following shares:
Merged Fund | | Shares | | Exchange
Ratio | | Acquiring
Fund | | Shares | | Value | |
Tax Free Fund | | | 1,356,152 | | | | 5.428444 | | | Near-Term Tax Free Fund | | | 7,361,792 | | | $ | 16,401,859 | | |
MegaTrends Fund | | | 1,279,187 | | | | 0.430550 | | | Holmes Growth Fund | | | 550,754 | | | $ | 13,184,651 | | |
159
Notes to Financial Statements December 31, 2014
The net assets and unrealized appreciation immediately before the acquisitions were as follows:
Merged Fund | | Net Assets | | Unrealized
Appreciation | | Acquiring Fund | | Net Assets | |
Tax Free Fund | | $ | 16,401,859 | | | $ | 562,300 | | | Near-Term Tax Free Fund | | $ | 46,718,724 | | |
MegaTrends Fund | | $ | 13,184,651 | | | $ | 1,391,640 | | | Holmes Growth Fund | | $ | 42,046,948 | | |
For financial reporting purposes, assets received and shares issued by each of the acquiring funds were recorded at fair value; however, the cost basis of the investments acquired from each of the merged funds was carried forward to align ongoing reporting of the acquiring funds' realized and unrealized gains and losses with amounts distributable to shareholders for tax purposes.
Assuming the reorganization had been completed on January 1, 2013, the beginning of the annual reporting period, the acquiring funds' results of operations for the year ended December 31, 2013, would have been as follows:
| | | Near-Term
Tax Free Fund | | Holmes Macro
Trends Fund | |
Net investment income (loss) | | $ | 1,709,109 | (a) | | $ | (492,008 | )(c) | |
Net realized and unrealized gain (loss) on investments | | $ | (1,851,554 | )(b) | | $ | 17,471,507 | (d) | |
Net increase (decrease) in net assets resulting
from operations | | $ | (142,445 | ) | | $ | 16,979,499 | | |
(a) $1,031,696 as reported, plus $628,796 from pre-merger Tax Free Fund and $48,617 net benefit from aligning fees, elimination of duplicative expenses and applying the contractual expense limitation of the acquiring fund.
(b) $(480,338) as reported, plus $(1,371,216) from pre-merger Tax Free Fund.
(c) $(421,055) as reported, plus $(105,790) from pre-merger MegaTrends Fund and $34,837 net benefit from aligning fees, elimination of duplicative expenses and applying the voluntary expense limitation of the acquiring fund.
(d) $14,490,769 as reported, plus $2,980,738 from pre-merger MegaTrends Fund.
In the acquisitions, the Near-Term Tax Free Fund acquired $347,713 in capital loss carryforwards from the Tax Free Fund and the Holmes Macro Trends Fund acquired $11,284,894 in capital loss carryforwards from the MegaTrends Fund. The Near-Term Tax Free and Holmes Macro Trends Funds' use of acquired capital loss carryforwards may be limited under certain tax provisions.
For both transactions, because the combined investment portfolios have been managed as a single integrated portfolio since the acquisition was completed, it is not practical to separate the amounts of revenue and earnings of the merged fund that have been included in the acquiring fund's Statement of Operations since December 20, 2013. In addition, because the merged fund and the acquiring fund sold and redeemed shares throughout the period, it is not practical to provide pro forma information on a per share basis.
160
U.S. Government Securities Ultra-Short Bond Fund
For a capital share outstanding during the
| | | Investor Class | |
| | | Year Ended December 31, | |
| | | 2014 | | 2013* | | 2012* | | 2011* | | 2010* | |
Net asset value, beginning of period | | $ | 2.00 | | | $ | 2.00 | | | $ | 2.00 | | | $ | 2.00 | | | $ | 2.00 | | |
Investment Activities | |
Net investment income | | | .01 | | | | — | (a) | | | — | (a) | | | — | (a) | | | — | (a) | |
Net realized and unrealized gain | | | — | (a) | | | — | (a) | | | — | | | | — | | | | — | (a) | |
Total from investment activities | | | .01 | | | | — | | | | — | | | | — | | | | — | | |
Distributions from net investment income | | | (.01 | ) | | | — | (a) | | | — | (a) | | | — | (a) | | | — | (a) | |
Net asset value, end of period | | $ | 2.00 | | | $ | 2.00 | | | $ | 2.00 | | | $ | 2.00 | | | $ | 2.00 | | |
| Total Return (excluding account fees) (b) | | | .36 | % | | | .02 | % | | | .01 | % | | | .01 | % | | | .01 | % | |
Ratios to Average Net Assets: | |
Net investment income | | | .35 | % | | | .01 | % | | | .01 | % | | | .01 | % | | | .01 | % | |
Total expenses | | | 1.07 | % | | | .97 | % | | | .87 | % | | | .81 | % | | | .82 | % | |
Expenses waived or reimbursed (c) | | | (.74 | )% | | | (.91 | )% | | | (.74 | )% | | | (.74 | )% | | | (.67 | )% | |
Net expenses (d) | | | .33 | % | | | .06 | % | | | .13 | % | | | .07 | % | | | .15 | % | |
Portfolio turnover rate (e) | | | 33 | % | | | | | | | | | | | | | | | | | |
Net assets, end of period (in thousands) | | $ | 64,020 | | | $ | 75,227 | | | $ | 140,425 | | | $ | 171,664 | | | $ | 203,835 | | |
* The per share amounts for the periods have been adjusted to reflect a 1-for-2 reverse stock split, which was effective December 20, 2013. In addition, on December 20, 2013, the Fund changed from a constant $1.00 net asset value per share money market fund to a U.S. Government ultra-short bond fund (that is not a money market fund) with an objective of total return with current income.
(a) The per share amount does not round to a full penny.
(b) Assumes investment at the net asset value at the beginning of the period, reinvestment of all distributions and a complete redemption of the investment at the net asset value at the end of the period.
(c) Expenses waived or reimbursed reflect reductions to total expenses, as discussed in the notes to the financial statements. These amounts would increase the net investment loss ratio or decrease the net investment income ratio, as applicable, and decrease total returns had such reductions not occurred. During 2010, 2011, 2012 and 2013, the Adviser waived fees and/or reimbursed expenses under the Minimum Yield Agreement in the amount of $678,107, $736,531, $509,874 and $498,342, respectively. The waivers/reimbursements from 2012-2013 are subject to recapture in future periods.
(d) The net expense ratios shown above reflect expenses after waivers and reimbursements but exclude the effect of reductions to total expenses for any expenses offset. Expense offset arrangements reduce total expenses, as discussed in the notes to the financial statements. These amounts would decrease the net investment income ratio had such reductions not occurred. The effect of expenses offset are as follows:
| | | Investor Class | |
| | | Year Ended December 31, | |
| | | 2014 | | 2013* | | 2012* | | 2011* | | 2010* | |
Ratios to Average Net Assets: | |
Expense offset (f) | | | — | | | | — | | | | — | | | | — | | | | — | | |
(e) Portfolio turnover is not shown for periods that the Fund was a money market fund.
(f) Effect on the expense ratio was not greater than 0.005%.
See accompanying notes to financial statements.
161
Near-Term Tax Free Fund
For a capital share outstanding during the
| | | Investor Class | |
| | | Year Ended December 31, | |
| | | 2014 | | 2013 | | 2012 | | 2011 | | 2010 | |
Net asset value, beginning of period | | $ | 2.23 | | | $ | 2.27 | | | $ | 2.26 | | | $ | 2.22 | | | $ | 2.21 | | |
Investment Activities | |
Net investment income | | | .05 | | | | .05 | | | | .05 | | | | .05 | | | | .06 | | |
Net realized and unrealized gain (loss) | | | .02 | | | | (.04 | ) | | | .01 | | | | .04 | | | | .01 | | |
Total from investment activities | | | .07 | | | | .01 | | | | .06 | | | | .09 | | | | .07 | | |
Distributions from net investment income | | | (.05 | ) | | | (.05 | ) | | | (.05 | ) | | | (.05 | ) | | | (.06 | ) | |
Net asset value, end of period | | $ | 2.25 | | | $ | 2.23 | | | $ | 2.27 | | | $ | 2.26 | | | $ | 2.22 | | |
| Total Return (excluding account fees) (a) | | | 3.07 | % | | | 0.31 | % | | | 2.67 | % | | | 4.24 | % | | | 2.95 | % | |
Ratios to Average Net Assets: | |
Net investment income | | | 2.13 | % | | | 2.08 | % | | | 2.21 | % | | | 2.39 | % | | | 2.46 | % | |
Total expenses | | | 1.08 | % | | | 1.21 | % | | | 1.25 | % | | | 1.26 | % | | | 1.30 | % | |
Expenses waived or reimbursed (b) | | | (.63 | )% | | | (.76 | )% | | | (.80 | )% | | | (.81 | )% | | | (.85 | )% | |
Net expenses (c) | | | .45 | % | | | .45 | % | | | .45 | % | | | .45 | % | | | .45 | % | |
Portfolio turnover rate | | | 12 | % | | | 6 | % | | | 7 | % | | | — | (d) | | | 1 | % | |
Net assets, end of period (in thousands) | | $ | 89,595 | | | $ | 61,884 | | | $ | 44,509 | | | $ | 35,014 | | | $ | 29,138 | | |
(a) Assumes investment at the net asset value at the beginning of the period, reinvestment of all distributions and a complete redemption of the investment at the net asset value at the end of the period.
(b) Expenses waived or reimbursed reflect reductions to total expenses, as discussed in the notes to the financial statements. These amounts would increase the net investment loss ratio or decrease the net investment income ratio, as applicable, and decrease total returns had such reductions not occurred.
(c) The net expense ratios shown above reflect expenses after waivers and reimbursements but exclude the effect of reductions to total expenses for any expenses offset. Expense offset arrangements reduce total expenses, as discussed in the notes to the financial statements. These amounts would decrease the net investment income ratio had such reductions not occurred. The effect of expenses offset are as follows:
| | | Investor Class | |
| | | Year Ended December 31, | |
| | | 2014 | | 2013 | | 2012 | | 2011 | | 2010 | |
Ratios to Average Net Assets: | |
Expense offset (e) | | | — | | | | — | | | | — | | | | — | | | | — | | |
(d) Portfolio turnover rate was not greater than 0.5%.
(e) Effect on the expense ratio was not greater than 0.005%.
See accompanying notes to financial statements.
162
All American Equity Fund
For a capital share outstanding during the
| | | Investor Class | |
| | | Year Ended December 31, | |
| | | 2014 | | 2013 | | 2012 | | 2011 | | 2010 | |
Net asset value, beginning of period | | $ | 32.18 | | | $ | 25.40 | | | $ | 22.72 | | | $ | 22.72 | | | $ | 19.60 | | |
Investment Activities | |
Net investment income (loss) | | | (.16 | ) | | | (.12 | ) | | | .07 | | | | (.07 | ) | | | .02 | | |
Net realized and unrealized gain | | | .84 | | | | 9.08 | | | | 2.61 | | | | .10 | | | | 3.10 | | |
Total from investment activities | | | .68 | | | | 8.96 | | | | 2.68 | | | | .03 | | | | 3.12 | | |
Distributions | |
From net investment income | | | — | | | | (.07 | ) | | | — | | | | (.03 | ) | | | — | | |
From net realized gains | | | (5.02 | ) | | | (2.11 | ) | | | — | | | | — | | | | — | | |
Total distributions | | | (5.02 | ) | | | (2.18 | ) | | | — | | | | (.03 | ) | | | — | | |
Short -Term Trading fees *(a) | | | — | | | | — | | | | — | | | | — | | | | — | | |
Net asset value, end of period | | $ | 27.84 | | | $ | 32.18 | | | $ | 25.40 | | | $ | 22.72 | | | $ | 22.72 | | |
| Total Return (excluding account fees) (b) | | | 1.94 | % | | | 35.55 | % | | | 11.80 | % | | | 0.14 | % | | | 15.92 | % | |
Ratios to Average Net Assets: | |
Net investment income (loss) | | | (.54 | )% | | | (.45 | )% | | | .28 | % | | | (.32 | )% | | | .10 | % | |
Total expenses | | | 2.16 | % | | | 2.44 | % | | | 2.72 | % | | | 2.42 | % | | | 2.56 | % | |
Expenses waived or reimbursed (c) | | | (.03 | )% | | | (.28 | )% | | | (.52 | )% | | | (.24 | )% | | | (.48 | )% | |
Net expenses (d) | | | 2.13 | % | | | 2.16 | % | | | 2.20 | % | | | 2.18 | % | | | 2.08 | % | |
Portfolio turnover rate | | | 253 | % | | | 150 | % | | | 221 | % | | | 223 | % | | | 299 | % | |
Net assets, end of period (in thousands) | | $ | 21,936 | | | $ | 23,388 | | | $ | 16,846 | | | $ | 16,399 | | | $ | 17,760 | | |
(a) The per share amount does not round to a full penny.
(b) Assumes investment at the net asset value at the beginning of the period, reinvestment of all distributions and a complete redemption of the investment at the net asset value at the end of the period.
(c) Expenses waived or reimbursed reflect reductions to total expenses, as discussed in the notes to the financial statements. These amounts would increase the net investment loss ratio or decrease the net investment income ratio, as applicable, and decrease total returns had such reductions not occurred.
(d) The net expense ratios shown above reflect expenses after waivers and reimbursements but exclude the effect of reductions to total expenses for any expenses offset. Expense offset arrangements reduce total expenses, as discussed in the notes to the financial statements. These amounts would decrease the net investment income (loss) ratio had such reductions not occurred. The effect of expenses offset are as follows:
| | | Investor Class | |
| | | Year Ended December 31, | |
| | | 2014 | | 2013 | | 2012 | | 2011 | | 2010 | |
Ratios to Average Net Assets: | |
Expense offset (e) | | | — | | | | — | | | | — | | | | — | | | | — | | |
(e) Effect on the expense ratio was not greater than 0.005%.
See accompanying notes to financial statements.
163
Holmes Macro Trends Fund
For a capital share outstanding during the
| | | Investor Class | |
| | | Year Ended December 31, | |
| | | 2014 | | 2013 | | 2012 | | 2011 | | 2010 | |
Net asset value, beginning of period | | $ | 24.24 | | | $ | 18.51 | | | $ | 17.62 | | | $ | 18.65 | | | $ | 15.54 | | |
Investment Activities | |
Net investment loss | | | (.26 | ) | | | (.18 | ) | | | (.10 | ) | | | (.26 | ) | | | (.22 | ) | |
Net realized and unrealized gain (loss) | | | (1.36 | ) | | | 7.42 | | | | 1.29 | | | | (.77 | ) | | | 3.54 | | |
Total from investment activities | | | (1.62 | ) | | | 7.24 | | | | 1.19 | | | | (1.03 | ) | | | 3.32 | | |
Distributions | |
From net investment income | | | — | | | | — | | | | — | | | | — | | | | (.21 | ) | |
From net realized gains | | | (2.37 | ) | | | (1.51 | ) | | | (.30 | ) | | | — | | | | — | | |
Total distributions | | | (2.37 | ) | | | (1.51 | ) | | | (.30 | ) | | | — | | | | (.21 | ) | |
Short -Term Trading fees *(a) | | | — | | | | — | | | | — | | | | — | | | | — | | |
Net asset value, end of period | | $ | 20.25 | | | $ | 24.24 | | | $ | 18.51 | | | $ | 17.62 | | | $ | 18.65 | | |
| Total Return (excluding account fees) (b) | | | (6.74 | )% | | | 39.38 | % | | | 6.77 | % | | | (5.52 | )% | | | 21.35 | % | |
Ratios to Average Net Assets: | |
Net investment loss | | | (1.17 | )% | | | (1.11 | )% | | | (0.51 | )% | | | (1.25 | )% | | | (1.29 | )% | |
Total expenses | | | 1.94 | % | | | 2.00 | % | | | 1.85 | % | | | 2.00 | % | | | 1.93 | % | |
Expenses waived or reimbursed (c) | | | — | | | | (.04 | )% | | | — | (e) | | | — | | | | — | (e) | |
Net expenses (d) | | | 1.94 | % | | | 1.96 | % | | | 1.85 | % | | | 2.00 | % | | | 1.93 | % | |
Portfolio turnover rate | | | 183 | %(f) | | | 109 | % | | | 214 | % | | | 210 | % | | | 160 | % | |
Net assets, end of period (in thousands) | | $ | 46,250 | | | $ | 55,926 | | | $ | 34,639 | | | $ | 35,316 | | | $ | 40,604 | | |
* Based on average monthly shares outstanding.
(a) The per share amount does not round to a full penny.
(b) Assumes investment at the net asset value at the beginning of the period, reinvestment of all distributions and a complete redemption of the investment at the net asset value at the end of the period.
(c) Expenses waived or reimbursed reflect reductions to total expenses, as discussed in the notes to the financial statements. These amounts would increase the net investment loss ratio or decrease the net investment income ratio, as applicable, and decrease total returns had such reductions not occurred.
(d) The net expense ratios shown above reflect expenses after waivers and reimbursements but exclude the effect of reductions to total expenses for any expenses offset. Expense offset arrangements reduce total expenses, as discussed in the notes to the financial statements. These amounts would decrease the net investment income ratio had such reductions not occurred. The effect of expenses offset are as follows:
| | | Investor Class | |
| | | Year Ended December 31, | |
| | | 2014 | | 2013 | | 2012 | | 2011 | | 2010 | |
Ratios to Average Net Assets: | |
Expense offset (e) | | | — | | | | — | | | | — | | | | — | | | | — | | |
(e) Effect on the expense ratio was not greater than 0.005%.
(f) Excludes option transactions.
See accompanying notes to financial statements.
164
Global Resources Fund
For a capital share outstanding during the
| | | Investor Class | |
| | | Year Ended December 31, | |
| | | 2014 | | 2013 | | 2012 | | 2011 | | 2010 | |
Net asset value, beginning of period | | $ | 9.36 | | | $ | 9.79 | | | $ | 9.36 | | | $ | 11.91 | | | $ | 8.85 | | |
Investment Activities | |
Net investment income (loss) | | | 0.04 | * | | | .02 | * | | | .04 | * | | | (.19 | ) | | | (.09 | ) | |
Net realized and unrealized gain (loss) | | | (2.73 | )* | | | (.10 | )* | | | .61 | * | | | (2.02 | ) | | | 3.44 | | |
Total from investment activities | | | (2.69 | ) | | | (.08 | ) | | | .65 | | | | (2.21 | ) | | | 3.35 | | |
Distributions from net investment income | | | — | | | | (.35 | ) | | | (.22 | ) | | | (.34 | ) | | | (.29 | ) | |
Short -Term Trading fees *(a) | | | — | | | | — | | | | — | | | | — | | | | — | | |
Net asset value, end of period | | $ | 6.67 | | | $ | 9.36 | | | $ | 9.79 | | | $ | 9.36 | | | $ | 11.91 | | |
| Total Return (excluding account fees) (b) | | | (28.74 | )% | | | (.72 | )% | | | 6.93 | % | | | (18.69 | )% | | | 38.00 | % | |
Ratios to Average Net Assets: | |
Net investment income (loss) | | | .44 | % | | | .16 | % | | | .44 | % | | | (.79 | )% | | | (1.04 | )% | |
Total expenses | | | 1.45 | % | | | 1.59 | % | | | 1.57 | % | | | 1.72 | % | | | 1.73 | % | |
Expenses waived or reimbursed (c) | | | — | (e) | | | — | | | | — | | | | — | | | | — | | |
Net expenses (d) | | | 1.45 | % | | | 1.59 | % | | | 1.57 | % | | | 1.72 | % | | | 1.73 | % | |
Portfolio turnover rate (f) | | | 444 | %(g) | | | 138 | % | | | 117 | % | | | 232 | % | | | 145 | % | |
Net assets, end of period (in thousands) | | $ | 171,673 | | | $ | 326,320 | | | $ | 438,372 | | | $ | 551,793 | | | $ | 911,559 | | |
* Based on average monthly shares outstanding.
(a) The per share amount does not round to a full penny.
(b) Assumes investment at the net asset value at the beginning of the period, reinvestment of all distributions and a complete redemption of the investment at the net asset value at the end of the period.
(c) Expenses waived or reimbursed reflect reductions to total expenses, as discussed in the notes to the financial statements. These amounts would increase the net investment loss ratio or decrease the net investment income ratio, as applicable, and decrease total returns had such reductions not occurred.
(d) The net expense ratios shown above reflect expenses after waivers and reimbursements but exclude the effect of reductions to total expenses for any expenses offset. Expense offset arrangements reduce total expenses, as discussed in the notes to the financial statements. These amounts would decrease the net investment income ratio had such reductions not occurred. The effect of expenses offset are as follows:
| | | Investor Class | |
| | | Year Ended December 31, | |
| | | 2014 | | 2013 | | 2012 | | 2011 | | 2010 | |
Ratios to Average Net Assets: | |
Expense offset (e) | | | — | | | | — | | | | — | | | | — | | | | — | | |
(e) Effect on the expense ratio was not greater than 0.005%.
(f) Portfolio turnover rate is calculated at the fund level.
(g) Excludes option transactions.
See accompanying notes to financial statements.
165
Global Resources Fund
For a capital share outstanding during the
| | | Institutional Class | |
| | | Year Ended December 31, | | Period
Ended
December 31, | |
| | | 2014 | | 2013 | | 2012 | | 2011 | | 2010 (a) | |
Net asset value, beginning of period | | $ | 9.30 | | | $ | 9.74 | | | $ | 9.39 | | | $ | 11.98 | | | $ | 8.87 | | |
Investment Activities | |
Net investment income (loss) | | | 0.08 | * | | | .07 | * | | | .10 | * | | | — | *(b) | | | (.01 | ) | |
Net realized and unrealized gain (loss) | | | (2.71 | )* | | | (.10 | )* | | | .60 | * | | | (2.17 | )* | | | 3.41 | | |
Total from investment activities | | | (2.63 | ) | | | (.03 | ) | | | .70 | | | | (2.17 | ) | | | 3.40 | | |
Distributions from net investment income | | | — | | | | (.41 | ) | | | (.35 | ) | | | (.42 | ) | | | (.29 | ) | |
Short -Term Trading fees *(b) | | | — | | | | — | (b) | | | — | (b) | | | — | (b) | | | — | (b) | |
Net asset value, end of period | | $ | 6.67 | | | $ | 9.30 | | | $ | 9.74 | | | $ | 9.39 | | | $ | 11.98 | | |
| Total Return (excluding account fees) (c) | | | (28.28 | )% | | | (0.15 | )% | | | 7.44 | % | | | (18.23 | )% | | | 38.53 | % | |
Ratios to Average Net Assets: (d) | |
Net investment income (loss) | | | .85 | % | | | .68 | % | | | 1.02 | % | | | (.02 | )% | | | (.35 | )% | |
Total expenses | | | 1.13 | % | | | 1.25 | % | | | 1.21 | % | | | 1.29 | % | | | 1.74 | % | |
Expenses waived or reimbursed (e) | | | (.27 | )% | | | (.22 | )% | | | (.14 | )% | | | (.20 | )% | | | (.66 | )% | |
Net expenses (f) | | | .86 | % | | | 1.03 | % | | | 1.07 | % | | | 1.09 | % | | | 1.08 | % | |
Portfolio turnover rate (h) | | | 444 | %(i) | | | 138 | % | | | 117 | % | | | 232 | % | | | 145 | % | |
Net assets, end of period (in thousands) | | $ | 9,733 | | | $ | 51,122 | | | $ | 94,076 | | | $ | 55,985 | | | $ | 17,923 | | |
* Based on average monthly shares outstanding.
(a) From March 1, 2010, commencement of operations.
(b) The per share amount does not round to a full penny.
(c) Total returns for periods less than one year are not annualized. Assumes investment at the net asset value at the beginning of the period, reinvestment of all distributions and a complete redemption of the investment at the net asset value at the end of the period.
(d) Ratios are annualized for periods of less than on year.
(e) Expenses waived or reimbursed reflect reductions to total expenses, as discussed in the notes to the financial statements. These amounts would increase the net investment loss ratio or decrease the net investment income ratio, as applicable, and decrease total returns had such reductions not occurred.
(f) The net expense ratios shown above reflect expenses after waivers and reimbursements but exclude the effect of reductions to total expenses for any expenses offset. Expense offset arrangements reduce total expenses, as discussed in the notes to the financial statements. These amounts would decrease the net investment income (loss) ratio had such reductions not occurred. The effect of expenses offset are as follows:
| | | Institutional Class | |
| | | Year Ended December 31, | | Period
Ended
December 31, | |
| | | 2014 | | 2013 | | 2012 | | 2011 | | 2010 (a) | |
Ratios to Average Net Assets: (d) | |
Expense offset (g) | | | — | | | | — | | | | — | | | | — | | | | — | | |
(g) Effect on the expense ratio was not greater than 0.005%.
(h) Portfolio turnover rate is calculated at the fund level.
(i) Excludes option transactions.
See accompanying notes to financial statements.
166
World Precious Minerals Fund
For a capital share outstanding during the
| | | Investor Class | |
| | | Year Ended December 31, | |
| | | 2014 | | 2013 | | 2012 | | 2011 | | 2010 | |
Net asset value, beginning of period | | $ | 5.69 | | | $ | 11.70 | | | $ | 13.18 | | | $ | 22.28 | | | $ | 17.42 | | |
Investment Activities | |
Net investment loss | | | (.06 | )* | | | (.07 | )* | | | (.11 | )* | | | (.32 | ) | | | (.32 | )* | |
Net realized and unrealized gain (loss) | | | (.88 | )* | | | (5.94 | )* | | | (1.37 | )* | | | (6.76 | ) | | | 8.16 | * | |
Total from investment activities | | | (.94 | ) | | | (6.01 | ) | | | (1.48 | ) | | | (7.08 | ) | | | 7.84 | | |
Distributions from net investment income | | | — | | | | — | | | | — | | | | (2.02 | ) | | | (2.98 | ) | |
Short -Term Trading fees *(a) | | | — | | | | — | | | | — | | | | — | | | | — | | |
Net asset value, end of period | | $ | 4.75 | | | $ | 5.69 | | | $ | 11.70 | | | $ | 13.18 | | | $ | 22.28 | | |
| Total Return (excluding account fees) (b) | | | (16.52 | )% | | | (51.37 | )% | | | (11.23 | )% | | | (32.58 | )% | | | 45.38 | % | |
Ratios to Average Net Assets: | |
Net investment loss | | | (.91 | )% | | | (.90 | )% | | | (.85 | )% | | | (1.43 | )% | | | (1.68 | )% | |
Total expenses | | | 1.99 | % | | | 1.85 | % | | | 1.45 | % | | | 1.67 | % | | | 1.84 | % | |
Expenses waived or reimbursed (c) | | | (.03 | )% | | | (.02 | )% | | | — | | | | — | | | | — | | |
Net expenses (d) | | | 1.96 | % | | | 1.83 | % | | | 1.45 | % | | | 1.67 | % | | | 1.84 | % | |
Portfolio turnover rate (f) | | | 61 | %(g) | | | 34 | % | | | 44 | % | | | 96 | % | | | 68 | % | |
Net assets, end of period (in thousands) | | $ | 103,413 | | | $ | 134,065 | | | $ | 319,052 | | | $ | 436,504 | | | $ | 826,598 | | |
* Based on average monthly shares outstanding.
(a) The per share amount does not round to a full penny.
(b) Assumes investment at the net asset value at the beginning of the period, reinvestment of all distributions and a complete redemption of the investment at the net asset value at the end of the period.
(c) Expenses waived or reimbursed reflect reductions to total expenses, as discussed in the notes to the financial statements. These amounts would increase the net investment loss ratio or decrease the net investment income ratio, as applicable, and decrease total returns had such reductions not occurred.
(d) The net expense ratios shown above reflect expenses after waivers and reimbursements but exclude the effect of reductions to total expenses for any expenses offset. Expense offset arrangements reduce total expenses, as discussed in the notes to the financial statements. These amounts would decrease the net investment income ratio had such reductions not occurred. The effect of expenses offset are as follows:
| | | Investor Class | |
| | | Year Ended December 31, | |
| | | 2014 | | 2013 | | 2012 | | 2011 | | 2010 | |
Ratios to Average Net Assets: | |
Expense offset (e) | | | — | | | | — | | | | — | | | | — | | | | — | | |
(e) Effect on the expense ratio was not greater than 0.005%.
(f) Portfolio turnover rate is calculated at the fund level.
(g) Excludes option transactions.
See accompanying notes to financial statements.
167
World Precious Minerals Fund
For a capital share outstanding during the
| | | Institutional Class | |
| | | Year Ended December 31, | | Period
Ended
December 31, | |
| | | 2014 | | 2013 | | 2012 | | 2011 | | 2010 (a) | |
Net asset value, beginning of period | | $ | 5.72 | | | $ | 11.69 | | | $ | 13.10 | | | $ | 22.29 | | | $ | 17.36 | | |
Investment Activities | |
Net investment loss | | | (.05 | )* | | | (.01 | )* | | | (.04 | )* | | | (.16 | )* | | | (.10 | )* | |
Net realized and unrealized gain (loss) | | | (.89 | )* | | | (5.96 | )* | | | (1.37 | )* | | | (6.84 | )* | | | 8.14 | * | |
Total from investment activities | | | (.94 | ) | | | (5.97 | ) | | | (1.41 | ) | | | (7.00 | ) | | | 8.04 | | |
Distributions from net investment income | | | — | | | | — | | | | — | | | | (2.19 | ) | | | (3.11 | ) | |
Short -Term Trading fees | | | — | | | | — | | | | — | | | | — | | | | — | | |
Net asset value, end of period | | $ | 4.78 | | | $ | 5.72 | | | $ | 11.69 | | | $ | 13.10 | | | $ | 22.29 | | |
| Total Return (excluding account fees) (b) | | | (16.43 | )% | | | (51.07 | )% | | | (10.76 | )% | | | (32.28 | )% | | | 46.72 | % | |
Ratios to Average Net Assets: (c) | |
Net investment loss | | | (.71 | )% | | | (.15 | )% | | | (.32 | )% | | | (.87 | )% | | | (.86 | )% | |
Total expenses | | | 4.86 | % | | | 3.30 | % | | | 3.56 | % | | | 2.38 | % | | | 15.19 | % | |
Expenses waived or reimbursed (d) | | | (3.23 | )% | | | (1.97 | )% | | | (2.69 | )% | | | (1.27 | )% | | | (14.06 | )% | |
Net expenses (e) | | | 1.63 | % | | | 1.33 | % | | | .87 | % | | | 1.11 | % | | | 1.13 | % | |
Portfolio turnover rate (g) | | | 61 | %(h) | | | 34 | % | | | 44 | % | | | 96 | % | | | 68 | % | |
Net assets, end of period (in thousands) | | $ | 154 | | | $ | 3,660 | | | $ | 769 | | | $ | 1,683 | | | $ | 2,233 | | |
* Based on average monthly shares outstanding.
(a) From March 1, 2010, commencement of operations.
(b) Total returns for the periods less than one year are not annualized. Assumes investment at the net asset value at the beginning of the period, reinvestment of all distributions and a complete redemption of the investment at the net asset value at the end of the period.
(c) Ratios are annualized for periods of less than one year.
(d) Expenses waived or reimbursed reflect reductions to total expenses, as discussed in the notes to the financial statements. These amounts would increase the net investment loss ratio or decrease the net investment income ratio, as applicable, and decrease total returns had such reductions not occurred.
(e) The net expense ratios shown above reflect expenses after waivers and reimbursements but exclude the effect of reductions to total expenses for any expenses offset. Expense offset arrangements reduce total expenses, as discussed in the notes to the financial statements. These amounts would decrease the net investment income ratio had such reductions not occurred. The effect of expenses offset are as follows:
| | | Institutional Class | |
| | | Year Ended December 31, | | Period
Ended
December 31, | |
| | | 2014 | | 2013 | | 2012 | | 2011 | | 2010 (a) | |
Ratios to Average Net Assets: (c) | |
Expense offset (f) | | | — | | | | — | | | | — | | | | — | | | | — | | |
(f) Effect on the expense ratio was not greater than 0.005%.
(g) Portfolio turnover rate is calculated at the fund level.
(h) Excludes option transactions.
See accompanying notes to financial statements.
168
Gold and Precious Metals Fund
For a capital share outstanding during the
| | | Investor Class | |
| | | Year Ended December 31, | |
| | | 2014 | | 2013 | | 2012 | | 2011 | | 2010 | |
Net asset value, beginning of period | | $ | 6.00 | | | $ | 11.78 | | | $ | 12.61 | | | $ | 19.60 | | | $ | 15.46 | | |
Investment Activities | |
Net investment loss | | | (.05 | ) | | | (.06 | ) | | | (.09 | ) | | | (.17 | ) | | | (.21 | ) | |
Net realized and unrealized gain (loss) | | | (.79 | ) | | | (5.72 | ) | | | (.72 | ) | | | (4.28 | ) | | | 5.91 | | |
Total from investment activities | | | (.84 | ) | | | (5.78 | ) | | | (.81 | ) | | | (4.45 | ) | | | 5.70 | | |
Distributions | |
From net investment income | | | — | | | | — | | | | (.02 | ) | | | — | | | | (.26 | ) | |
From net realized gains | | | — | | | | — | | | | — | | | | (2.54 | ) | | | (1.31 | ) | |
Total distributions | | | — | | | | — | | | | (.02 | ) | | | (2.54 | ) | | | (1.57 | ) | |
Short -Term Trading fees * | | | — | (a) | | | — | (a) | | | — | (a) | | | — | (a) | | | 0.01 | | |
Net asset value, end of period | | $ | 5.16 | | | $ | 6.00 | | | $ | 11.78 | | | $ | 12.61 | | | $ | 19.60 | | |
| Total Return (excluding account fees) (b) | | | (14.00 | )% | | | (49.07 | )% | | | (6.44 | )% | | | (23.97 | )% | | | 36.88 | % | |
Ratios to Average Net Assets: | |
Net investment loss | | | (.67 | )% | | | (.48 | )% | | | (.60 | )% | | | (1.06 | )% | | | (1.46 | )% | |
Total expenses | | | 1.93 | % | | | 2.12 | % | | | 1.61 | % | | | 1.56 | % | | | 1.80 | % | |
Expenses waived or reimbursed (c) | | | (.05 | )% | | | (.06 | )% | | | — | | | | — | | | | — | | |
Net expenses (d) | | | 1.88 | % | | | 2.06 | % | | | 1.61 | % | | | 1.56 | % | | | 1.80 | % | |
Portfolio turnover rate | | | 99 | %(f) | | | 64 | % | | | 95 | % | | | 155 | % | | | 103 | % | |
Net assets, end of period (in thousands) | | $ | 62,777 | | | $ | 74,627 | | | $ | 166,524 | | | $ | 195,087 | | | $ | 300,949 | | |
* Based on average monthly shares outstanding.
(a) The per share amount does not round to a full penny.
(b) Assumes investment at the net asset value at the beginning of the period, reinvestment of all distributions and a complete redemption of the investment at the net asset value at the end of the period.
(c) Expenses waived or reimbursed reflect reductions to total expenses, as discussed in the notes to the financial statements. These amounts would increase the net investment loss ratio or decrease the net investment income ratio, as applicable, and decrease total returns had such reductions not occurred.
(d) The net expense ratios shown above reflect expenses after waivers and reimbursements but exclude the effect of reductions to total expenses for any expenses offset. Expense offset arrangements reduce total expenses, as discussed in the notes to the financial statements. These amounts would decrease the net investment loss ratio had such reductions not occurred. The effect of expenses offset are as follows:
| | | Investor Class | |
| | | Year Ended December 31, | |
| | | 2014 | | 2013 | | 2012 | | 2011 | | 2010 | |
Ratios to Average Net Assets: | |
Expense offset (e) | | | — | | | | — | | | | — | | | | — | | | | — | | |
(e) Effect on the expense ratio was not greater than 0.005%.
(f) Excludes option transactions.
See accompanying notes to financial statements.
169
Emerging Europe Fund
For a capital share outstanding during the
| | | Investor Class | |
| | | Year Ended December 31, | |
| | | 2014 | | 2013 | | 2012 | | 2011 | | 2010 | |
Net asset value, beginning of period | | $ | 8.82 | | | $ | 9.23 | | | $ | 7.79 | | | $ | 10.81 | | | $ | 9.11 | | |
Investment Activities | |
Net investment income (loss) | | | .06 | | | | .19 | | | | .15 | | | | .03 | | | | (.04 | ) | |
Net realized and unrealized gain (loss) | | | (2.11 | ) | | | (.46 | ) | | | 1.35 | | | | (3.05 | ) | | | 1.74 | | |
Total from investment activities | | | (2.05 | ) | | | (.27 | ) | | | 1.50 | | | | (3.02 | ) | | | 1.70 | | |
Distributions from net investment income | | | (.21 | ) | | | (.14 | ) | | | (.06 | ) | | | — | | | | — | | |
Short -Term Trading fees *(a) | | | — | | | | — | | | | — | | | | — | | | | — | | |
Net asset value, end of period | | $ | 6.56 | | | $ | 8.82 | | | $ | 9.23 | | | $ | 7.79 | | | $ | 10.81 | | |
| Total Return (excluding account fees) (b) | | | (23.22 | )% | | | (2.93 | )% | | | 19.27 | % | | | (27.94 | )% | | | 18.66 | % | |
Ratios to Average Net Assets: | |
Net investment income (loss) | | | .22 | % | | | 1.59 | % | | | 1.39 | % | | | .25 | % | | | (.36 | )% | |
Total expenses | | | 2.28 | % | | | 2.13 | % | | | 2.15 | % | | | 1.98 | % | | | 1.91 | % | |
Expenses waived or reimbursed (c) | | | — | | | | — | | | | — | | | | — | | | | — | | |
Net expenses (d) | | | 2.28 | % | | | 2.13 | % | | | 2.15 | % | | | 1.98 | % | | | 1.91 | % | |
Portfolio turnover rate | | | 93 | %(f) | | | 74 | % | | | 85 | % | | | 85 | % | | | 69 | % | |
Net assets, end of period (in thousands) | | $ | 69,066 | | | $ | 122,570 | | | $ | 173,687 | | | $ | 193,599 | | | $ | 440,037 | | |
* Based on average monthly shares outstanding.
(a) The per share amount does not round to a full penny.
(b) Assumes investment at the net asset value at the beginning of the period, reinvestment of all distributions and a complete redemption of the investment at the net asset value at the end of the period.
(c) Expenses waived or reimbursed reflect reductions to total expenses, as discussed in the notes to the financial statements. These amounts would increase the net investment loss ratio or decrease the net investment income ratio, as applicable, and decrease total returns had such reductions not occurred.
(d) The net expense ratios shown above reflect expenses after waivers and reimbursements but exclude the effect of reductions to total expenses for any expenses offset. Expense offset arrangements reduce total expenses, as discussed in the notes to the financial statements. These amounts would decrease the net investment income (loss) ratio had such reductions not occurred. The effect of expenses offset are as follows:
| | | Investor Class | |
| | | Year Ended December 31, | |
| | | 2014 | | 2013 | | 2012 | | 2011 | | 2010 | |
Ratios to Average Net Assets: | |
Expense offset (e) | | | — | | | | — | | | | — | | | | — | | | | — | | |
(e) Effect on the expense ratio was not greater than 0.005%.
(f) Excludes option transactions.
See accompanying notes to financial statements.
170
China Region Fund
For a capital share outstanding during the
| | | Investor Class | |
| | | Year Ended December 31, | |
| | | 2014 | | 2013 | | 2012 | | 2011 | | 2010 | |
Net asset value, beginning of period | | $ | 8.28 | | | $ | 7.61 | | | $ | 6.81 | | | $ | 9.47 | | | $ | 8.36 | | |
Investment Activities | |
Net investment income (loss) | | | — | (a) | | | (.01 | ) | | | .04 | | | | (.08 | ) | | | (.12 | ) | |
Net realized and unrealized gain (loss) | | | (.08 | ) | | | .70 | | | | .78 | | | | (2.59 | ) | | | 1.22 | | |
Total from investment activities | | | (.08 | ) | | | .69 | | | | .82 | | | | (2.67 | ) | | | 1.10 | | |
Distributions from net investment income | | | — | | | | (.02 | ) | | | (.02 | ) | | | — | | | | — | | |
Short -Term Trading fees * | | | — | (a) | | | — | (a) | | | — | (a) | | | .01 | | | | .01 | | |
Net asset value, end of period | | $ | 8.20 | | | $ | 8.28 | | | $ | 7.61 | | | $ | 6.81 | | | $ | 9.47 | | |
| Total Return (excluding account fees) (b) | | | (.97 | )% | | | 9.07 | % | | | 12.00 | % | | | (28.09 | )% | | | 13.28 | % | |
Ratios to Average Net Assets: | |
Net investment income (loss) | | | .08 | % | | | (.12 | )% | | | .60 | % | | | (.64 | )% | | | (1.02 | )% | |
Total expenses | | | 2.94 | % | | | 2.75 | % | | | 2.64 | % | | | 2.49 | % | | | 2.39 | % | |
Expenses waived or reimbursed (c) | | | (.43 | )% | | | (.37 | )% | | | (.39 | )% | | | (.08 | )% | | | — | | |
Net expenses (d) | | | 2.51 | % | | | 2.38 | % | | | 2.25 | % | | | 2.41 | % | | | 2.39 | % | |
Portfolio turnover rate | | | 235 | %(f) | | | 201 | % | | | 374 | % | | | 426 | % | | | 242 | % | |
Net assets, end of period (in thousands) | | $ | 21,008 | | | $ | 26,386 | | | $ | 29,160 | | | $ | 30,635 | | | $ | 51,843 | | |
* Based on average monthly shares outstanding.
(a) The per share amount does not round to a full penny.
(b) Assumes investment at the net asset value at the beginning of the period, reinvestment of all distributions and a complete redemption of the investment at the net asset value at the end of the period.
(c) Expenses waived or reimbursed reflect reductions to total expenses, as discussed in the notes to the financial statements. These amounts would increase the net investment loss ratio or decrease the net investment income ratio, as applicable, and decrease total returns had such reductions not occurred.
(d) The net expense ratios shown above reflect expenses after waivers and reimbursements but exclude the effect of reductions to total expenses for any expenses offset. Expense offset arrangements reduce total expenses, as discussed in the notes to the financial statements. These amounts would decrease the net investment income ratio had such reductions not occurred. The effect of expenses offset are as follows:
| | | Investor Class | |
| | | Year Ended December 31, | |
| | | 2014 | | 2013 | | 2012 | | 2011 | | 2010 | |
Ratios to Average Net Assets: | |
Expense offset (e) | | | — | | | | — | | | | — | | | | — | | | | — | | |
(e) Effect on the expense ratio was not greater than 0.005%.
(f) Excludes option transactions.
See accompanying notes to financial statements.
171
Report of Independent Registered Public Accounting Firm
The Board of Trustees and Shareholders
of U.S. Global Investors Funds:
We have audited the accompanying statements of assets and liabilities of the U.S. Government Securities Ultra-Short Bond Fund, Near-Term Tax Free Fund, All American Equity Fund, Holmes Macro Trends Fund, Global Resources Fund, World Precious Minerals Fund, Gold and Precious Metals Fund, Emerging Europe Fund, and China Region Fund, each a fund within the U.S. Global Investors Funds (the Trust), including the portfolios of investments, as of December 31, 2014 and the related statements of operations for the year then ended, the statements of changes in net assets for each of the years in the two-year period then ended, and the financial highlights for each of the years or periods in the five-year period then ended. These financial statements and financial highlights are the responsibility of the Trust's management. Our responsibility is to express an opinion on these financial statements and financial highlights based on our audits.
We conducted our audits in accordance with the standards of the Public Company Accounting Oversight Board (United States). Those standards require that we plan and perform the audit to obtain reasonable assurance about whether the financial statements and financial highlights are free of material misstatement. An audit includes examining, on a test basis, evidence supporting the amounts and disclosures in the financial statements. Our procedures included confirmation of securities owned as of December 31, 2014, by correspondence with custodians and brokers or by other appropriate auditing procedures. An audit also includes assessing the accounting principles used and significant estimates made by management, as well as evaluating the overall financial statement presentation. We believe that our audits provide a reasonable basis for our opinion.
In our opinion, the financial statements and financial highlights referred to above present fairly, in all material respects, the financial position of each of the funds within the U.S. Global Investors Funds listed above, as of December 31, 2014, the results of their operations for the year then ended, the changes in their net assets for each of the years in the two-year period then ended, and the financial highlights for each of the years or periods in the five-year period then ended, in conformity with U.S. generally accepted accounting principles.
Boston, Massachusetts
February 28, 2015
172
Trustees and Officers (unaudited) December 31, 2014
The following table presents information about the Trustees as of December 31, 2014, together with a brief description of their principal occupations during the last five years. The Agreement and Declaration of Trust provides that each trustee shall serve as a trustee of the Trust during the lifetime of this Trust and until its termination except as such trustee sooner dies, resigns or is removed. In addition, each trustee who is not an "interested person" of the Trust shall be required to retire in accordance with the terms of any retirement policy then in effect that has been approved by a majority vote of all independent trustees. The current retirement policy provides that the retirement age for non-interested trustees is 75 years of age. If you would like more information about the Trustees, you may call 1-800-US-FUNDS (1-800-873-8637) to request a free copy of the Statement of Additional Information.
The business address of each is 7900 Callaghan Road, San Antonio, TX 78229.
Non-Interested Trustees | |
Name (Age)
Positions Held with Trust
Length of Time Served*
Number of Portfolios in Fund
Complex Overseen by Trustee | | Principal Occupation(s) and Previous Positions
During Past 5 Years and Other Directorships Held | |
J. Michael Belz (61)
Trustee
November 1998 to present
Nine portfolios | | Principal Occupation: President and Chief Executive
Officer of Catholic Life Insurance since 1984.
Other Directorships Held: Director, Broadway
National Bank from October 2003 to present. | |
James F. Gaertner (71)
Trustee
November 2002 to present
Nine portfolios | | Principal Occupation: President Emeritus, Sam
Houston State University. Served as President from
August 2001 to August 2010.
Other Directorships Held: None. | |
Clark R. Mandigo (71)
Trustee
May 1993 to present
Nine portfolios | | Principal Occupation: Restaurant operator, business consultant from 1991 to present.
Other Directorships Held: None. | |
Joe C. McKinney (68)
Trustee
October 2008 to present
Nine portfolios | | Principal Occupation: Vice Chairman, Broadway
National Bank from October 2002 to present.
Other Directorships Held: Director, Broadway
National Bank from October 2002 to present;
Director, USAA Real Estate Company from
September 2004 to present; Director, Luby's, Inc.
from January 2003 to present. | |
* These dates include service for a predecessor trust.
173
Trustees and Officers (unaudited) December 31, 2014
Interested Trustee | |
Name (Age)
Positions Held with Trust
Length of Time Served*
Number of Portfolios in Fund
Complex overseen by Trustee | | Principal Occupation(s) and Previous Positions
During Past 5 Years and Other Directorships Held | |
Frank E. Holmes ** (59)
Trustee, Chief Executive
Officer, Chief Investment
Officer, President
January 1990 to present
Nine portfolios | | Principal Occupation: Director, Chief Executive Officer, and Chief Investment Officer of the Adviser. Since October 1989, Mr. Holmes has served and continues to serve in various positions with the Adviser, its subsidiaries, and the investment companies it sponsors.
Other Directorships Held: Director, Galileo Global Equity Advisors Inc. from March 2013 to present. | |
* These dates include service for a predecessor trust.
** Mr. Holmes is an "interested person" of the Trust by virtue of his positions with U.S. Global Investors, Inc.
The following table presents information about each Officer of the Trust as of December 31, 2014, together with a brief description of their principal occupations during the last five years. Each holds office until his or her successor is duly elected and qualified. The business address of each is 7900 Callaghan Road, San Antonio, TX 78229.
Officers | |
Name (Age)
Positions Held with Trust
Length of Time Served* | | Principal Occupation(s) During Past 5 Years | |
Frank E. Holmes (59)
Trustee, Chief Executive
Officer, Chief Investment
Officer, President
January 1990 to present | | Director, Chief Executive Officer, and Chief Investment Officer of the Adviser. Since October 1989, Mr. Holmes has served and continues to serve in various positions with the Adviser, its subsidiaries, and the investment companies it sponsors. | |
Susan B. McGee (55)
Executive Vice President,
Secretary, General Counsel
March 1997 to present | | President and General Counsel of the Adviser. Since September 1992, Ms. McGee has served and continues to serve in various positions with the Adviser, its subsidiaries, and the investment companies it sponsors. | |
Lisa C. Callicotte (41)
Treasurer
July 2013 to present | | Chief Financial Officer of the Adviser. Since July 2009, Ms. Callicotte has served and continues to serve in various positions with the Adviser, its subsidiaries, and the investment companies it sponsors. | |
James L. Love, Jr. (46)
Chief Compliance Officer
September 2007 to present | | Chief Compliance Officer and Deputy General Counsel of the Adviser. Since September 2007, Mr. Love has served and continues to serve in various positions with the Adviser, its subsidiaries, and the investment companies it sponsors. | |
Susan K. Filyk (45)
Vice President, Marketing
December 2008 to present | | Director of Marketing of the Adviser since August 2007. Ms. Filyk has served and continues to serve in various positions with the Adviser, its subsidiaries, and the investment companies it sponsors. | |
* These dates include service for a predecessor trust.
174
Additional Information (unaudited)
Additional Federal Tax Information
The percentage of tax-exempt dividends paid by the Near-Term Tax Free Fund for the year ended December 31, 2014, was 93.47%.
The percentage of ordinary income dividends paid by the Funds during the year ended December 31, 2014, which qualify as Qualified Dividends Income (QDI) and the Dividends Received Deduction (DRD) available to corporate shareholders was:
| | | Qualified Dividend
Income | | Dividend Received
Deduction | |
All American Equity | | | 40.45 | % | | | 43.26 | % | |
Holmes Macro Trends | | | 24.06 | % | | | 22.84 | % | |
World Precious Minerals | | | 4.63 | % | | | 0.71 | % | |
Emerging Europe | | | 100.00 | % | | | 9.37 | % | |
China Region | | | 100.00 | % | | | 1.12 | % | |
The amounts which represent foreign source income and foreign taxes paid during the year ended December 31, 2014, are as follows:
| | | Foreign Source
Income | | Foreign Tax
Credit | |
Global Resources | | $ | 3,952,100 | | | $ | — | | |
World Precious Minerals | | $ | 1,503,767 | | | $ | 31,819 | | |
Emerging Europe | | $ | 2,745,490 | | | $ | — | | |
China Region | | $ | 609,452 | | | $ | 20,309 | | |
In early 2015, the Funds reported on Form 1099-DIV the tax status of all distributions made during the 2014 calendar year. The Funds intend to distribute the maximum amount of qualified dividend income allowable. The amount of qualified dividend income distributed by each fund will be reported to shareholders on their Form 1099-DIV. Shareholders should use the information on Form 1099-DIV for their income tax returns.
Proxy Voting
A description of the policies and procedures that the Funds use to determine how to vote proxies relating to portfolio securities is available without charge, upon request, by calling 1-800-US-FUNDS (1-800-873-8637). It also appears in the Funds' statement of additional information (Form 485B), which can be found on the SEC's website at www.sec.gov.
Information regarding how the Funds voted proxies relating to portfolio securities during the most recent 12-month period ended June 30 is available without charge, upon request, by calling 1-800-US-FUNDS (1-800-873-8637) or accessing the Funds' Form N-PX on the SEC's website at www.sec.gov.
Availability of Quarterly Portfolio Schedules
The Funds provide complete lists of holdings four times in each fiscal year, at the quarter-ends. For the second and fourth quarters, the lists appear in the Funds' semi-annual and annual reports to shareholders. For the first and third quarters, the
175
Additional Information (unaudited)
Funds file the lists with the SEC on Form N-Q. The Funds' Forms N-Q are available on the SEC's website at http://www.sec.gov. The Funds' Forms N-Q may also be reviewed and copied at the SEC's Public Room in Washington D.C. Information on the operation of the Public Reference Room may be obtained by calling 1-800-SEC-0330.
Approval of the Advisory Agreement for Each Fund
On September 9, 2014, the Board of Trustees (the "Board") of U.S. Global Investors Funds (the "Trust"), including all the trustees who are not "interested persons" of the Trust (the "Independent Trustees"), approved continuation of the advisory agreement with U.S. Global Investors, Inc. (the "Adviser") for each fund for an additional one-year term ending October 1, 2015.
In considering approval of the agreement the Board reviewed a variety of materials relating to each fund and the Adviser, including (i) the nature, extent and quality of services provided; (ii) a comparison of services rendered and amounts paid to other registered investment companies, including other registered investment companies managed by the Adviser, and other accounts managed by the Adviser; (iii) the investment performance of the fund measured against appropriate benchmarks; (iv) the costs of services provided and estimated profits realized by the Adviser (and its affiliates); (v) the extent to which economies of scale are realized as the fund grows; (vi) whether fee levels reflect any possible economies of scale for the benefit of fund shareholders; and (vii) benefits realized by the Adviser (and its affiliates) from its relationship with the fund.
The Independent Trustees began their process at the Board's April 18, 2014 meeting by developing a "15(c) request letter," which requested the Adviser to provide specific information relative to their consideration of continuing the agreement. At the Board's June 10, 2014 meeting, the Independent Trustees reviewed the initial information provided by the Adviser, which included, among other things, information on the performance of each fund, along with the performance information of a relevant securities index, a peer group and a peer universe, using information supplied by Lipper Inc. ("Lipper"). The Independent Trustees were represented by independent legal counsel throughout the process. After the June 10, 2014 Board meeting, at the direction of the Independent Trustees, independent legal counsel requested additional information from the Adviser. The Independent Trustees also had separate meetings among themselves and with independent legal counsel during this period. In addition, the Independent Trustees received materials from their independent legal counsel discussing the legal standards applicable to their consideration of the agreement. After their review of the information received, the Independent Trustees presented their findings and recommendations to the full Board.
The Board reviewed the functions performed by the Adviser, the portfolio management team and support staff of the Adviser, the Adviser's investment strategy and process for each fund, and the Adviser's financial condition, and considered the quality of services provided. The Board also reviewed performance information provided by Lipper.
176
Additional Information (unaudited)
For the All American Equity Fund, the information showed that for the one-, two-, three-, four- and five-year periods ended December 31, 2013, the fund's performance was in the 3rd, 3rd, 2nd, 2nd and 3rd quintile, respectively, of its applicable Lipper peer group and for the one-, two-, three-, four- and five-year periods ended December 31, 2013, the fund's performance was in the 2nd, 3rd, 3rd, 3rd and 5th quintile, respectively, of its applicable Lipper peer universe (the 1st quintile being the best performers and the 5th quintile being the worst performers). The Board noted that the fund outperformed its benchmark index for the one-year period ended December 31, 2013. The Board noted that the fund's advisory fee includes a performance incentive adjustment based on the performance of the fund during the prior 12-month period.
For the Holmes Macro Trends Fund, the information showed that for the one-, two-, three-, four- and five-year periods ended December 31, 2013, the fund's performance was in the 1st, 4th, 4th, 3rd and 5th quintile, respectively, of its applicable Lipper peer group, and for the one-, two-, three-, four- and five-year periods ended December 31, 2013, the fund's performance was in the 2nd, 4th, 5th, 4th and 5th quintile, respectively, of its applicable Lipper peer universe. The Board noted that the fund outperformed its benchmark index for the one-year period ended December 31, 2013. The Board noted that the fund's advisory fee includes a performance incentive adjustment based on the performance of the fund during the prior 12-month period.
For the Global Resources Fund, the information showed that for the one- and two-year periods ended December 31, 2013, the fund's investor class performance was in the 3rd and 4th quintile, respectively, of its applicable Lipper peer group and for the one-, two-, three-, four- and five-year periods ended December 31, 2013, the fund's investor class performance was in the 4th, 4th, 4th, 3rd and 1st quintile, respectively, of its applicable Lipper peer universe. In addition, the information showed that for the one-, two- and three-year periods ended December 31, 2013, the fund's institutional class performance was in the 4th quintile of its applicable Lipper peer group and its applicable Lipper peer universe. This information also showed that the fund underperformed its benchmark index for the one-year period ended December 31, 2013. The Board noted that the Adviser attributed recent underperformance to the fund's emphasis in junior mining companies, which have significantly underperformed over the past three years, but have historically added value to the fund's portfolio by outperforming senior gold mining companies. The Board further considered that the Adviser made personnel changes at the end of 2013 to address performance issues. The Board noted that the fund's advisory fee includes a performance incentive adjustment based on the performance of the fund during the prior 12-month period.
For the World Precious Minerals Fund, the information showed that for the one-, two-, three-, four- and five-year periods ended December 31, 2013, the fund's investor class performance was in the 5th, 5th, 5th, 5th and 3rd quintile, respectively, of its applicable Lipper peer group and for the one-, two-, three-, four- and five-year periods ended December 31, 2013, the fund's investor class performance was in the 4th, 4th,
177
Additional Information (unaudited)
5th, 5th and 3rd quintile, respectively, of its applicable Lipper peer universe. In addition, the information showed that for the one-, two- and three-year periods ended December 31, 2013, the fund's institutional class performance was in the 4th, 5th and 5th quintile, respectively, of its applicable Lipper peer group and for the one-, two and three-year periods ended December 31, 2013, the Fund's institutional class performance was in the 4th, 4th and 5th quintile, respectively, of its applicable Lipper peer universe. This information also showed that the fund outperformed its benchmark index for the one-year period ended December 31, 2013. The Board noted that the Adviser attributed recent underperformance relative to the fund's peers to the fund's emphasis in junior mining companies, which have significantly underperformed over the past three years, but have historically added value to the fund's portfolio by outperforming senior gold mining companies. The Board also took into consideration that the fund's advisory fee includes a performance incentive adjustment based on the performance of the fund during the prior 12-month period.
For the Gold and Precious Metals Fund, the information showed that for the one-, two-, three-, four- and five-year periods ended December 31, 2013, the fund's performance was in the 3rd, 2nd, 4th, 4th and 4th quintile, respectively, of its applicable Lipper peer group, and for the one-, two-, three-, four- and five-year periods ended December 31, 2013, the funds' performance was in the 3rd, 2nd, 3rd, 4th and 4th quintile, respectively, of its applicable Lipper peer universe. The information also showed that the fund outperformed its benchmark index for the one-year period ended December 31, 2013. The Board noted that the Adviser attributed recent underperformance relative to the fund's peers to the fund's emphasis in junior mining companies, which have significantly underperformed over the past three years, but have historically added value to the fund's portfolio by outperforming senior gold mining companies. The Board also took into consideration that the fund's advisory fee includes a performance incentive adjustment based on the performance of the fund during the prior 12-month period.
For the Emerging Europe Fund, the information showed that for the one-, two-, three-, four- and five-year periods ended December 31, 2013, the fund's performance was in the 4th, 4th, 5th, 5th and 3rd quintile of its applicable Lipper peer group and for the one-, two-, three-, four- and five-year periods ended December 31, 2013, the funds' performance was in the 4th, 3rd, 5th, 5th and 5th quintile, respectively, of its applicable Lipper peer universe. In addition, the information showed that the fund outperformed its benchmark index for the one-year period ended December 31, 2013. The Board noted the Adviser's belief that the funds within the fund's peer group do not necessarily have the same regional focus as the fund, making performance comparisons difficult. The Board also took into consideration that the fund's advisory fee includes a performance incentive adjustment based on the performance of the fund during the prior 12-month period.
For the China Region Fund, the information showed that for the one-, two-, three-, four-and five-year periods ended December 31, 2013, the fund's performance was in
178
Additional Information (unaudited)
the 4th, 4th, 5th, 5th and 5th quintile, respectively, of its applicable Lipper peer group and applicable Lipper peer universe. The Board noted that the fund outperformed its benchmark index for the one-year period ended December 31, 2013. The Board considered that the Adviser made personnel changes at the end of 2013 to address performance issues. The Board also noted that that the fund's advisory fee includes a performance incentive adjustment based on the performance of the fund during the prior 12-month period.
For the Near-Term Tax Free Fund, the information showed that for the one-, two-, three-, four- and five-year periods ended December 31, 2013, the fund's performance was in the 3rd, 2nd, 3rd, 3rd and 3rd quintile, respectively, of its applicable Lipper peer group and for the one-, two-, three-, four- and five-year periods ended December 31, 2013 was in the 2nd, 1st, 3rd, 2nd and 3rd quintile, respectively, of its applicable Lipper peer universe. This information also showed that the fund underperformed its benchmark index for the one-year period ended December 31, 2013.
For the U.S. Government Securities Ultra-Short Bond Fund, the Board noted that prior to December 20, 2013, the fund was a money market fund and, consequently, determined that prior period performance was not relevant. For the first quarter after the Fund converted from a money market fund, the information showed that for the quarter ended March 31, 2014, the fund's performance was in the 2nd quintile of its applicable Lipper peer universe. In addition, this information showed that the fund outperformed its benchmark index for the quarter ended March 31, 2014.
The Board also reviewed information on each fund's advisory fee and expense ratio (on both a net basis giving effect to any expense cap) compared to the expenses of a peer group of funds based upon information prepared by Lipper. The Board also compared the advisory fees to the fees charged by the Adviser to two non-U.S. registered funds managed by the Adviser. (The Board noted that, although these non-U.S. registered funds may have investment objectives and policies that are similar to some of the funds, the contractual fees payable to the Adviser for managing those client assets are the same as or higher than the advisory fees of the similar funds.)
For the All American Equity Fund, the information showed that, with respect to the fund's advisory fee, the fund is in the 3rd quintile of its applicable Lipper peer group and in the 5th quintile of its applicable Lipper peer group with respect to its net expenses (the 1st quintile being the lowest fees or expenses and the 5th quintile being the highest fees or expenses).
For the Holmes Macro Trends Fund, the information showed that, with respect to the fund's advisory fee, the fund is in the 4th quintile of its applicable Lipper peer group and in the 5th quintile of its applicable Lipper peer group with respect to its net expenses.
179
Additional Information (unaudited)
For the Global Resources Fund's investor class, the information showed that, with respect to the advisory fee and net expenses, it is in the 4th quintile of its applicable Lipper peer group. In addition, for the fund's institutional class, the information showed that, with respect to the advisory fee, it is in the 4th quintile of its applicable Lipper peer group and in the 4th quintile of its applicable Lipper peer group with respect to its net expenses.
For the World Precious Minerals Fund's investor class, the information showed that, with respect to the advisory fee and net expenses, the fund is in the 4th and 5th quintile, respectively, of its applicable Lipper peer group. In addition, the information showed that, with respect to the fund's institutional class, it is in the 5th quintile of its applicable Lipper peer group with respect to its advisory fee and net expenses.
For the Gold and Precious Metals Fund, the information showed that, with respect to the fund's advisory fee, the fund is in the 5th quintile of its applicable Lipper peer group and in the 5th quintile of its applicable Lipper peer group with respect to its net expenses.
For the Emerging Europe Fund, the information showed that, with respect to the fund's advisory fee and net expenses, the fund is in the 5th quintile of its applicable Lipper peer group.
For the China Region Fund, the information showed that, with respect to the fund's advisory fee, the fund is in the 1st quintile of its applicable Lipper peer group and in the 5th quintile of its applicable Lipper peer group with respect to its net expenses.
For the Near-Term Tax Free Fund, the information showed that, with respect to the fund's advisory fee, the fund is in the 1st quintile of its applicable Lipper peer group and in the 2nd quintile of its applicable Lipper peer group with respect to its net expenses.
For the U.S. Government Securities Ultra-Short Bond Fund, the information showed that, with respect to the fund's advisory fee, the fund is in the 1st quintile of its applicable Lipper peer group and in the 1st quintile of its applicable Lipper peer group with respect to its net expenses.
The Board considered the Adviser's belief that higher expenses are inherent in small fund complexes, such as the U.S. Global Investors Funds, and that it could not operate effectively at a lower level of fees or with the burden of contractual expense caps for most funds. However, the Board noted that the Adviser is contractually limiting expenses on an annualized basis for the Near-Term Tax Free Fund at 0.45% of average net assets through December 31, 2014 and will voluntarily limit expenses at that level thereafter. The Board also noted that the Adviser will voluntarily reimburse all
180
Additional Information (unaudited)
class specific expenses for the Institutional Class of the Global Resources Fund and the World Precious Minerals Fund and is currently voluntarily limiting expenses at the following levels for the funds (the voluntary expense limitation may be modified or removed by the Adviser at any time):
Fund | | Voluntary Expense Limitation
(% of Average Net Assets) | |
All American Equity Fund | | | 2.20 | % | |
Holmes Macro Trends Fund | | | 2.20 | % | |
Global Resources Fund (Investor Class) | | | 1.90 | % | |
World Precious Minerals Fund (Investor Class) | | | 1.90 | % | |
Gold and Precious Metals Fund | | | 1.90 | % | |
Emerging Europe Fund | | | 2.85 | % | |
China Region Fund | | | 2.55 | % | |
U.S. Government Securities Ultra-Short Bond Fund | | | 0.45 | % | |
The Board considered the fee structure of the agreement, including the costs of the services provided and the profits realized by the Adviser and its affiliates from their relationship with the funds. For all funds except the World Precious Minerals Fund, Global Resources Fund and Emerging Europe Fund, the net income generated from the advisory relationship was negative.
As part of its review of the agreement, the Board considered whether there will be economies of scale with respect to the management of each fund and whether each fund will benefit from any economies of scale. The Board considered that the advisory fees for the All American Equity Fund, Gold and Precious Metals Fund, World Precious Minerals Fund, Global Resources Fund and U.S. Government Securities Ultra-Short Bond Fund include a breakpoint. For the remaining funds, the Board reviewed each fund's asset size and whether the Adviser was realizing economies of scale. The Board noted that, in all cases, the Adviser did not believe, with respect to the investment advisory services provided, that it was realizing significant economies of scale, and that the current fees represent an appropriate sharing of economies of scale.
The Board considered that the Adviser engages in soft-dollar arrangements in connection with brokerage transactions for the funds. The Board also considered benefits derived by the Adviser from its relationship with the funds, including the other services provided and fees received by the Adviser and its affiliates for providing such services.
Based on all the above-mentioned factors and related conclusions, with no single factor or conclusion being determinative and with each Trustee not necessarily attributing the same weight to each factor, the Board, including the Independent Trustees, concluded that approval of the advisory agreement would be in the interests of each fund.
181
[THIS PAGE INTENTIONALLY LEFT BLANK]

Fund Services, LLC
PO Box 701
Milwaukee WI
53201-0701
Want to reduce paper waste? You can receive this report and other important documents electronically. Please visit www.usfunds.com and sign up at Access My Account. If you need further assistance, please call us at 800-873-8637.
U.S. Global Investors Funds Annual Report December 31, 2014
ITEM 2. CODE OF ETHICS.
(a) The registrant has adopted a code of ethics that applies to its principal executive officer and principal financial officer.
(b) During the period covered by this report, no material amendments were made to the provisions of the code of ethics adopted in 2(a) above.
(c) During the period covered by this report, no implicit or explicit waivers to the provisions of the code of ethics adopted in 2(a) above were granted.
(d) Not applicable.
(e) Not applicable.
(f) The registrant has posted such code of ethics on its Internet website at www.usfunds.com.
ITEM 3. AUDIT COMMITTEE FINANCIAL EXPERT.
For the covered period, the registrant’s Board of Trustees designated three independent trustees as audit committee financial experts: Mr. Clark Mandigo, Dr. James F. Gaertner, and Mr. Joe C. McKinney.
An “audit committee financial expert” is not an “expert” for any purpose, including for purposes of Section 11 of the Securities Act of 1933, as a result of being designated as an “audit committee financial expert.” Further, the designation of a person as an “audit committee financial expert” does not mean that the person has any greater duties, obligations, or liability than those imposed on the person without the “audit committee financial expert” designation. Similarly, the designation of a person as an “audit committee financial expert” does not affect the duties, obligations, or liability of any other member of the audit committee or Board of Trustees.
ITEM 4. PRINCIPAL ACCOUNTANT FEES AND SERVICES.
(A) AUDIT FEES
The aggregate fees billed to the registrant for professional services rendered by the registrant’s principal accountant for the audit of the registrant’s annual financial statements or for services that are normally provided by the accountant in connection with statutory or regulatory filings or engagements were $250,900 and $253,400 for the fiscal years ended December 31, 2014, and 2013, respectively.
(B) AUDIT-RELATED FEES
There were no fees billed for assurance and related services by the registrant’s principal accountant that were reasonably related to the performance of the audit of the registrant’s financial statements and were not reported under paragraph (a) of this Item for the last two fiscal years.
(C) TAX FEES
The aggregate fees billed for professional services rendered by the registrant’s principal accountant for tax compliance, tax advice and tax planning were $72,747 and $68,558 for the fiscal years ended December 31,
2014, and 2013, respectively. The nature of the services comprising the tax fees included the review of the registrant’s income and excise tax returns and distribution requirements.
(D) ALL OTHER FEES
There were no other fees during the last two fiscal years billed to the registrant.
(E)(1) The registrant’s audit committee is directly responsible for approving the services to be provided by the auditors, including approval in advance of audit and non-audit services at regularly scheduled audit committee meetings. If non-audit services are required between regularly scheduled audit committee meetings, approval may be authorized by the chairman of the audit committee for non-prohibited services for engagements of less than $3,500 with notification of other audit committee members at the next scheduled audit committee meeting.
(2) No services included in (b) - (d) above were approved pursuant to paragraph (c)(7)(i)(C) of Rule 2-01 of Regulation S-X.
(F) Less than 50 percent of the hours expended on the principal accountant’s engagement to audit the registrant’s financial statements for the most recent fiscal year were attributed to work performed by persons other than the principal accountant’s full-time, permanent employees.
(G) The aggregate fees billed by the registrant’s principal accountant for non-audit services rendered to the registrant, its investment adviser, and any entity controlling, controlled by, or under common control with the investment adviser that provides ongoing services to the registrant were $72,747 and $128,758 for the fiscal years ended December 31, 2014, and 2013, respectively. These fees related to tax services rendered to the registrant and the issuance of a report on internal controls for an entity controlled by the investment adviser.
(H) All non-audit services rendered in (g) above were considered by the registrant’s audit committee in maintaining the principal accountant’s independence.
ITEM 5. AUDIT COMMITTEE OF LISTED REGISTRANTS.
Not applicable to the registrant.
ITEM 6. SCHEDULE OF INVESTMENTS.
Not applicable. The complete schedule of investments is included in Item 1 of this Form N-CSR.
ITEM 7. DISCLOSURE OF PROXY VOTING POLICIES AND PROCEDURES FOR CLOSED-END MANAGEMENT INVESTMENT COMPANIES.
Not applicable.
ITEM 8. PORTFOLIO MANAGERS OF CLOSED-END MANAGEMENT INVESTMENT COMPANIES.
Not applicable.
ITEM 9. PURCHASES OF EQUITY SECURITIES BY CLOSED-END MANAGEMENT INVESTMENT COMPANY AND AFFILIATED PURCHASERS.
Not applicable.
ITEM 10. SUBMISSION OF MATTERS TO A VOTE OF SECURITY HOLDERS.
Not applicable.
ITEM 11. CONTROLS AND PROCEDURES.
(a) The registrant’s president and treasurer have determined that the registrant’s disclosure controls and procedures are effective based on their evaluation of the disclosure controls and procedures as of a date within 90 days of the filing date of this report.
(b) There was no change in the registrant’s internal control over financial reporting that occurred in the registrant’s second fiscal quarter of the period covered by this report that has materially affected, or is reasonably likely to materially affect, the registrant’s internal control over financial reporting.
ITEM 12. EXHIBITS.
(a)(1) | Code of ethics is posted on registrant’s Internet website at www.usfunds.com. |
| |
(a)(2) | Certifications of principal executive officer and principal financial officer pursuant to section 302 of the Sarbanes-Oxley Act of 2002 are filed as exhibits to this report. |
| |
(a)(3) | Not applicable. |
| |
(b) | Certifications of principal executive officer and principal financial officer pursuant to section 906 of the Sarbanes-Oxley Act of 2002 are filed as exhibits to this report. |
SIGNATURES
Pursuant to the requirements of the Securities Exchange Act of 1934 and the Investment Company Act of 1940, the registrant has duly caused this report to be signed on its behalf by the undersigned, thereunto duly authorized.
U.S. GLOBAL INVESTORS FUNDS
By: | /s/ Frank E. Holmes | |
| Frank E. Holmes | |
| President, Chief Executive Officer | |
| | |
Date: | March 5, 2015 | |
Pursuant to the requirements of the Securities Exchange Act of 1934 and the Investment Company Act of 1940, this report has been signed below by the following persons on behalf of the registrant and in the capacities and on the dates indicated.
By: | /s/ Frank E. Holmes | |
| Frank E. Holmes | |
| President, Chief Executive Officer | |
| | |
Date: | March 5, 2015 | |
| | |
| | |
By: | /s/ Lisa C. Callicotte | |
| Lisa C. Callicotte | |
| Treasurer | |
| | |
Date: | March 5, 2015 | |
