As filed with the Securities and Exchange Commission on March 9, 2007
UNITED STATES
SECURITIES AND EXCHANGE COMMISSION
Washington, D.C. 20549
FORM N-CSR
CERTIFIED SHAREHOLDER REPORT OF REGISTERED
MANAGEMENT INVESTMENT COMPANIES
Investment Company Act file number 811-07763
The Masters’ Select Funds Trust
(Exact name of registrant as specified in charter)
4 Orinda Way, Suite 200-D, Orinda, CA 94563
(Address of principal executive offices) (Zip code)
Kenneth E. Gregory
4 Orinda Way, Suite 200-D
Orinda, CA 94563
(Name and address of agent for service)
(925) 254-8999
Registrant's telephone number, including area code
Date of fiscal year end: December 31
Date of reporting period: December 31, 2006
Item 1. Report to Stockholders.
The Masters’ Select Funds Trust
 | |
Annual Report The Masters’ Select Equity Fund The Masters’ Select International Fund The Masters’ Select Value Fund The Masters’ Select Smaller Companies Fund The Masters’ Select Focused Opportunities Fund December 31, 2006 |
www.mastersfunds.com
The Masters’ Select Concept
In constructing the Masters’ Select Funds, our goal was to design funds that would isolate the stock-picking skills of a group of highly regarded portfolio managers. To meet this objective, we designed the funds with both risk and return in mind, placing particular emphasis on the following factors:
| 1. | First, only stock pickers we believe to be exceptionally skilled are chosen to manage each fund’s sub-portfolios. |
| 2. | Second, and of equal importance, each stock picker runs a very focused sub-portfolio of not more than 15 of his or her favorite stocks within each Masters’ Select Fund; the exception being the Masters’ Select Focused Opportunities Fund, in which each manager selects no more than 7 of their highest conviction ideas. We believe that most stock pickers have an unusually high level of conviction in only a small number of stocks and that a portfolio limited to these stocks will, on average, outperform (a more diversified portfolio) over a market cycle. |
| 3. | Third, even though each manager’s portfolio is focused, we seek ways to diversify each of our funds. With the Equity, International and Focused Opportunities funds, we have done this by including managers with differing investment styles and market-cap orientations (the Focused Opportunities Fund is classified as non-diversified so that it may invest in a smaller range (15-21) of securities). With the Value Fund, we have selected managers who each take a distinctive approach to assessing companies and defining value. With the Smaller Companies Fund, we have selected managers with varying investment approaches who each focus on the securities of smaller companies. |
| 4. | Finally, we believe that excessive asset growth can result in diminished performance. We have committed to closing each Masters’ Select Fund to new shareholders at levels that we believe will preserve the managers’ ability to effectively implement the “select” concept. |
Portfolio Fit
As with all equity funds, Masters’ Select Funds are appropriate for investors with a long-term time horizon, who are willing to ride out occasional periods when the funds’ net asset values decline. Within that context, we created the Masters’ Select Equity and Masters’ Select International Funds to be used as core equity and international fund holdings. Masters’ Select Smaller Companies Fund has been created to provide a core domestic small cap investment opportunity. We created Masters’ Select Value Fund for investors who seek additional, dedicated value exposure in their portfolios. Masters’ Select Focused Opportunities Fund has been created to provide a core large-cap holding for long-term investors. Although performance in each specific down market will vary, we purposely set the allocations to each manager with the objective of keeping risk about equal to the funds’ overall benchmarks. In the end, the focus on the highest conviction stocks of a group of very distinguished managers with superior track records is what we believe makes the funds ideal portfolio holdings.
Contents
| Our Commitment to Shareholders | 2 |
| Letter to Shareholders | 3 |
| Long-Term Performance Metrics | 6 |
| Masters’ Select Equity Fund | |
| Equity Fund Review | 7 |
| Equity Fund Managers | 13 |
| Equity Fund Stock Highlights | 14 |
| Equity Fund Schedule of Investments | 16 |
| Masters’ Select International Fund | |
| International Fund Review | 18 |
| International Fund Managers | 23 |
| International Fund Stock Highlights | 24 |
| International Fund Schedule of Investments | 26 |
| Masters’ Select Value Fund | |
| Value Fund Review | 28 |
| Value Fund Managers | 34 |
| Value Fund Stock Highlights | 35 |
| Value Fund Schedule of Investments | 37 |
| Masters’ Select Smaller Companies Fund | |
| Smaller Companies Fund Review | 38 |
| Smaller Companies Fund Managers | 42 |
| Smaller Companies Fund Stock Highlights | 43 |
| Smaller Companies Fund Schedule of Investments | 46 |
| Masters’ Select Focused Opportunities Fund | |
| Focused Opportunities Fund Review | 47 |
| Focused Opportunities Fund Managers | 50 |
| Focused Opportunities Fund Stock Highlights | 51 |
| Focused Opportunities Fund Schedule of Investments | 52 |
| Expense Examples | 53 |
| Statements of Assets and Liabilities | 54 |
| Statements of Operations | 55 |
| Statements of Changes in Net Assets | |
| Equity Fund | 56 |
| International Fund | 56 |
| Value Fund | 57 |
| Smaller Companies Fund | 57 |
| Focused Opportunities Fund | 58 |
| Financial Highlights | |
| Equity Fund | 59 |
| International Fund | 60 |
| Value Fund | 61 |
| Smaller Companies Fund | 62 |
| Focused Opportunities Fund | 63 |
| Notes to Financial Statements | 64 |
| Report of Independent Registered Public Accounting Firm | 71 |
| Other Information | 72 |
| Tax Information | 76 |
| Index Definitions | 78 |
| Industry Terms and Definitions | 79 |
| Trustee and Officer Information | 80 |
This report is intended for shareholders of the funds and may not be used as sales literature unless preceded or accompanied by a current prospectus for the Masters’ Select Funds. Statements and other information in this report are dated and are subject to change.
Litman/Gregory Fund Advisors, LLC has ultimate responsibility for the funds’ performance due to its responsibility to oversee its investment managers and recommend their hiring, termination and replacement.
v2007-02
Table of Contents | 1
Litman/Gregory Fund Advisors’
Commitment to Shareholders
We are deeply committed to making each Masters’ Select Fund a highly satisfying long-term investment for shareholders. In following through on this commitment we are guided by our core values, which influence four specific areas of service:
First, we are committed to the Masters’ Select concept.
| • | We will only hire managers who we strongly believe will deliver exceptional long-term returns relative to their benchmarks. We base this belief on extremely thorough due diligence research. This not only requires us to assess their stock picking skills, but also to evaluate their ability to add incremental performance by investing in a concentrated portfolio of their highest conviction ideas. |
| • | We will monitor each of the managers so that we can maintain our confidence in their ability to deliver the long-term performance we expect. In addition, our monitoring will seek to assess whether they are staying true to their Masters’ Select mandate. Consistent with this mandate we focus on long-term performance evaluation so that the Masters’ Select stock pickers will not be distracted by short-term performance pressure. |
Second, we will do all we can to ensure that the framework within which our stock pickers do their work further increases the odds of success.
| • | New investments in each Fund are expected to be limited when that Fund reaches certain asset levels. By limiting Fund size in this manner, we believe each manager’s Masters’ Select asset base will remain small enough so that a high level of flexibility to add value through individual stock picking will be retained. |
| • | The framework also includes the diversified multi-manager structure that makes it possible for each manager to invest in a concentrated manner knowing that the potential volatility within his or her portfolio will be diluted at the fund level by the performance of the other managers. The multi-manager structure seeks to provide the diversification necessary to temper the volatility of each manager’s sub-portfolio. |
| • | We will work hard to discourage short-term speculators so that cash flows into the Funds are not volatile. Lower volatility helps prevent our managers from being forced to sell stocks at inopportune times or to hold excessive cash for non-investment purposes. This is why years ago the Funds implemented a 2% redemption fee for the first six months of a shareholder’s investment in any Fund, which is paid to each Fund for the benefit of shareholders. |
Third, is our commitment to do all we can from an operational standpoint to maximize shareholder returns.
| • | We will remain attentive to Fund overhead, and whenever we achieve savings we will pass them through to shareholders. For example, we have had several manager changes that resulted in lower sub-advisory fees to our Funds. In every case we have passed through the full savings to shareholders in the form of fee waivers. |
| • | There will be no loads, 12b-1 charges or any distribution charges. |
| • | We also will work closely with our sub-advisors to make sure they are aware of tax-loss selling opportunities (only to be taken if there are equally attractive stocks to swap into). We account for partial sales on a specific tax lot basis so that shareholders will benefit from the most favorable tax treatment. The goal is not to favor taxable shareholders over tax-exempt shareholders but to make sure that the Masters’ Select stock pickers are taking advantage of tax savings opportunities when doing so is not expected to reduce pre-tax returns. |
Fourth, is our commitment to communicate honestly about all relevant developments and expectations.
| • | We will continue to do this by providing thorough and educational shareholder reports. |
| • | We will continue to provide what we believe are realistic assessments of the investment environment. |
Our commitment to Masters’ Select is also evidenced by our own investment. Our employees have, collectively, substantial investments in the Funds, as does our company retirement plan. In addition, we use the Funds extensively in the client accounts of our investment advisor practice (through our affiliate Litman/Gregory Asset Management, LLC). We have no financial incentive to do so because the fees we receive from Masters’ Select held in client accounts are fully offset against the advisory fees paid by our clients. In fact, we have a disincentive to use the Funds in our client accounts because each Masters’ Select Fund is capacity constrained (they will be closed at the pre-determined asset levels mentioned above), and by using them in client accounts we are using up capacity for which we are not paid. But we believe these Funds offer value that we can’t get elsewhere and this is why we enthusiastically invest in them ourselves and on behalf of clients.
While we believe highly in the ability of the Funds’ sub-advisors, our commitments are not intended as guarantees of future results.
This information is authorized for use when preceded or accompanied by a prospectus for the Masters’ Select Funds. Mutual fund investing involves risk; principal loss is possible. While the Funds are no-load, there are management fees and operating expenses that do apply. The prospectus contains more information regarding the Funds’ investment objectives, risks, fees and expenses. Read the prospectus carefully before you invest in the Funds.
2 | The Masters’ Select Funds Trust
Dear Fellow Shareholder,
A Milestone
On the last day of 2006, Masters’ Select Equity, the first Masters’ Select fund, reached a milestone with the tenth anniversary of its launch. In our first shareholder report back in 1997 we discussed our objective of “superior long-term performance relative to the overall stock market.” We also referred to this objective in terms of a “full market cycle.” In discussing what makes a great stock picker we mentioned a number of factors, including a long-term orientation. Since that first shareholder report we’ve written repeatedly about our belief in the importance of a long-term focus and the discipline and patience that are required to be a truly long-term investor.
There is no precise investment definition of what constitutes “long-term.” At Litman/Gregory we view ten years as a reasonably long period of time for an investor. So reaching this milestone is cause for some reflection. In thinking back about the last ten years it’s hard not to conclude that it’s been quite an amazing period. The stock market gave us:
| • | The tech bubble followed by a massive bear market. The NASDAQ remains 52% below its high point reached almost seven years ago. |
| • | Huge outperformance of large-cap stocks in 1997 and 1998 followed by an eight -year run of small-cap outperformance. |

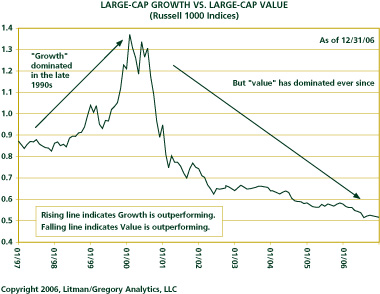
| • | Massive growth stock outperformance -- remember when “value” was dead in the late 90s? -- followed by an even more massive run of value stock outperformance. Value (as measured by the Russell 3000 Value Index and other value benchmarks) has now outperformed growth stocks (as measured by the Russell 3000 Growth Index) for seven consecutive years. |
Shareholder Letter | 3
| • | P/Es that grew to the sky but are now below where they were ten years ago, below their 25-year average and at their 50-year average. |
Bull market/bear market, growth/value, large-cap/small-cap—everything had its day. If anything, the last ten years drives home the point that investing with a rear-view mirror is a good way to get whipsawed, but not a good way to make money.
Looking beyond the stock market, over the last ten years there were plenty of big headlines and noteworthy developments, including the Asian currency crisis, the Russian debt default, the meltdown of the Long-Term Capital Management hedge fund run by two Nobel prize winners, Y2K, the 2000 election fiasco, 9/11 and other terrorist acts, the Iraq war, cooked corporate books, a recession, deflation fears, the oil price surge, North Korean and Iranian nuclear threats, inflation fears, a new Fed Chairman, the rise of China as an economic power, outsourcing, the incredible impact of the Internet on the global economy and popular culture, a huge and growing U.S. trade deficit, and the list goes on.
Every ten-year period has its share of big stories. It’s always fascinating to look back on the headlines and developments and think about how investors worried and obsessed over them at the time. Years later many of them are forgotten (have you thought about Y2K lately?). And over most periods as long as ten years the relevance of even some of the biggest stories fades in the shadow of a global economy that keeps growing and a world that keeps innovating. This has not been the case in every ten-year period but much more often than not, it has, as positive forces seem to swamp the negative. So despite turmoil, war, recession, corruption and the worst bear market in a generation, the overall stock market, as measured by the Russell 3000, managed to deliver an average annual return of 8.64% over the past ten years. As to Masters’ Select Equity’s goal of “superior long-term performance relative to the overall stock market” we’re very pleased with the results. In its ten-year life Masters’ Select Equity out-returned its Russell 3000 benchmark by a material margin: 10.12% to 8.64%.
4 | The Masters’ Select Funds Trust
Average Annual Total Returns | |||||||||||||
Performance as of 12/31/06 | One-Year | Three-Year | Five-Year | Ten-Year (Inception) | |||||||||
Masters’ Select Equity Fund | 9.34 | % | 9.23 | % | 6.82 | % | 10.12 | % | |||||
Custom Equity Index | 17.46 | % | 12.10 | % | 8.22 | % | 8.78 | % | |||||
Russell 3000 Index | 15.71 | % | 11.19 | % | 7.17 | % | 8.64 | % | |||||
Lipper Multi Cap Core Fund Index | 14.16 | % | 11.56 | % | 7.36 | % | 8.34 | % | |||||
Performance quoted represents past performance and does not guarantee future results. The investment return and principal value of an investment will fluctuate so that an investor’s shares, when redeemed, may be worth more or less than their original cost. Current performance of the funds may be lower or higher than the performance quoted. To obtain the performance of the funds as of the most recently completed calendar month, please visit our website at www.mastersfunds.com or call 1-800-960-0188. The Fund imposes a 2% redemption fee on shares held less than 180 days. Performance does not reflect the redemption fee. If reflected, performance would be lower.
Committed As Ever
We believe the success of Masters’ Select is a function of a concept that makes sense and its careful execution. And we continue to believe in that concept which includes several teams of exceptionally skilled managers filling each Masters’ Select Fund with their most compelling stock picks.
Over ten years Masters’ Select became a fund family with five funds. As the advisor to the funds, we at Litman/Gregory remain as committed as we were on day one to our long-term performance goals for each Masters’ Select Fund, and to delivering meaningful and honest shareholder reporting and stewardship. In addition, we have continued to invest our own money in Masters’ Select. The combined dollar investment from Litman/Gregory employees and the funds’ independent trustees was $17 million as of the end of 2006. We thank you for your confidence and we hope to continue to earn it for many years.
Sincerely,
Ken Gregory and Jeremy DeGroot
Litman/Gregory Fund Advisors, LLC
Advisor to the Masters’ Select Funds
Shareholder Letter | 5
Masters’ Select Long-Term Performance Metrics
As we always point out, long-term performance is what we care about, and over long periods of time the Masters’ Select fund family is, we believe, building an encouraging record. There are three metrics we track and present in these reports that serve as a helpful report card on the Masters’ Select long-term performance and ultimately, the success of the Masters’ Select concept. These metrics are updated below:
1st Metric: Each Fund’s Overall Fund Performance Since Inception
The two oldest Masters’ Select Funds have out-returned their passive benchmarks by a clear margin since their inception. Masters’ Select Value trails its Russell 3000 Value benchmark by a very small margin, five one hundredths of a percentage point (5 basis points). Masters’ Select Smaller Companies, which reached its three-year anniversary during 2006, trails its benchmark. As is well documented, we believe that beating a benchmark over the long-term is a demanding standard.
MASTERS’ SELECT PERFORMANCE VS. BENCHMARKS SINCE INCEPTION | |||
Fund | Length of Operation as of 12/31/06 | Index Benchmark | Average Annual Outperformance Over Benchmark |
Masters’ Select Equity | 10 years | Russell 3000 | 1.48% (148 basis points) |
Masters’ Select International | 9 years and 1 month | MSCI ACWI ex-US | 4.04% (404 basis points) |
Masters’ Select Value | 6 years and 6 months | Russell 3000 Value | -0.05% (-5 basis points) |
Masters’ Select Smaller Companies | 3 years and 6 months | Russell 2000 | -3.14% (-314 basis points) |
2nd Metric: Frequency of Long-Term Outperformance
Because beating a passive index over the long run is a rare feat for active managers there are many investment professionals and academics who believe active management is folly, especially given the alternative of low cost index funds. Given the difficulty in beating a passive benchmark, investors considering an actively managed fund should have some reason to believe it is likely to do better. Though past performance is no guarantee of future performance, an interesting performance measure is the percentage of times that each fund beat its benchmark over longer time periods. The table below shows the aggregate performance of the Masters’ Select Funds over rolling three-year and five-year time periods. Generally we believe five years is a better time frame to measure—especially for funds focused on long-term returns. While we would like each Masters’ Select Fund to outperform its index benchmark in every three-year period, this is an unrealistic standard given each fund’s extreme lack of benchmark sensitivity, and since one bad year can have a huge impact on any three-year period. What we do seek is for the Masters’ Select Funds to outperform their benchmarks in the majority of the intermediate time period of three years, and a higher percentage of the time over five-year periods. See the report on each fund for more detail.
MASTERS’ SELECT FUNDS: PERFORMANCE VERSUS BENCHMARKS OVER INTERMEDIATE-TERM (THREE YEARS) AND LONG-TERM (FIVE-YEARS) PERIODS* | ||
Three-Year | Five-Year | |
Percentage of Times Masters’ Select Outperformed | 57% | 77% |
Total Number of Rolling Return Periods** | 209 | 130 |
| * | Masters’ Select Equity is benchmarked against the Russell 3000 Index. Masters’ Select International is benchmarked against the MSCI All-Countries World Free (ex-US) Index. Masters’ Select Value is benchmarked against the Russell 3000 Value Index. Masters’ Select Smaller Companies is benchmarked against the Russell 2000 Index. |
| ** | The first rolling three-year period is reached 36 months after each fund’s inception (based on month-end dates). The starting and ending periods then “roll” forward one month at a time to comprise a new 36-month period. The first rolling five-year period is reached 60 months after each fund’s inception (based on month-end dates). The starting and ending periods then “roll” forward one month at a time to comprise a new 60-month period. |
We believe the strong outperformance across five-year time periods in particular suggests that Masters’ Select has performed well for reasons that are unlikely to be due to mere chance.
3rd Metric: Performance of the Underlying Sub-advisors
A third measure for assessing performance is the performance of the underlying sub-advisors. If a fund’s success was the result of spectacular performance by one or two sub-advisors, one could perhaps make the argument that there was luck involved and thereby question the likelihood that the outperformance may be repeated. In our opinion, the more managers who outperform their benchmarks over the long run, the more likely it is that the group is truly skilled and that the Masters’ Select structure enhances the ability of managers to succeed. With respect to this test, the evidence seems compelling. Of the 21 sub-advisors who have run a Masters’ Select portfolio for at least three years (including those no longer part of Masters’ Select) 15 outperformed his or her benchmark after taking into account all fees for their full tenure with the funds. (There is more detail on this metric in the sections on each individual fund.) This includes four managers who are no longer part of Masters’ and four others who are included twice because they are part of two Masters’ Select Funds. The odds of this outperformance happening by chance would seem to be quite low.
We continue to believe that together, the above metrics offer strong evidence that the Masters’ Select concept is being well executed.
Performance quoted represents past performance and does not guarantee future results. Please refer to pages 7, 18, 28, 38, and 47 to view the performance of the funds and their respective benchmarks
See page 78 for index definitions
Indices are unmanaged and do not incur fees, expenses or taxes.
6 | The Masters’ Select Funds Trust
Masters’ Select Equity Fund Review
2006 was a strong year for the stock market with almost all of the year’s return delivered in the second half of the year. Both inflation and recession fears, which are usually mutually exclusive, were a source of concern as investors feared rising rates would lead to economic weakness. But during the second half of the year, those fears subsided somewhat, as corporate earnings continued to show surprising strength, abundant global liquidity continued to look for a home, and the Fed stopped raising interest rates. The result was a robust stock market. The fund’s primary benchmark, the Russell 3000 Index, returned 15.71% for the full year. With a return of 9.34%, Masters’ Select Equity trailed its benchmark by a wide margin with all the underperformance coming in the first seven months of the year. The fund has experienced a relative performance rebound since July, returning 14.76% versus 12.20% for the benchmark.
It was also a milestone year as Masters’ Select Equity reached its 10th anniversary as of the last day of the year. Despite underperforming in this past year, over the full ten years the fund outperformed the best-performing of its benchmarks by 1.48% in average annual return. This is a material margin of outperformance over this long of a time period.
Comparison Chart
The value of a hypothetical $10,000 investment in Masters’ Select Equity Fund from its inception (12/31/96) to present as compared with the Russell 3000 Index, the Custom Equity Index and the Lipper Multi-Cap Core Index.
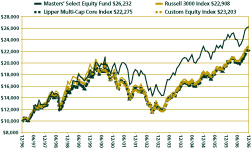
The hypothetical $10,000 investment at fund inception includes changes due to share price and reinvestment of dividends and capital gains. This chart does not imply any future performance. Indexes are unmanaged, do not incur fees and cannot be invested in directly.
Performance as of December 31, 2006
Average Annual Total Returns | |||||||||||||
One-Year | Three-Year | Five-Year | Ten-Year (Inception) | ||||||||||
Masters’ Select Equity Fund | 9.34 | % | 9.23 | % | 6.82 | % | 10.12 | % | |||||
Custom Equity Index | 17.46 | % | 12.10 | % | 8.22 | % | 8.78 | % | |||||
Russell 3000 Index | 15.71 | % | 11.19 | % | 7.17 | % | 8.64 | % | |||||
Lipper Multi-Cap Core Index | 14.16 | % | 11.56 | % | 7.36 | % | 8.34 | % | |||||
Performance quoted represents past performance and does not guarantee future results. The investment return and principal value of an investment will fluctuate so that an investor’s shares, when redeemed, may be worth more or less than their original cost. Current performance of the funds may be lower or higher than the performance quoted. To obtain the performance of the funds as of the most recently completed calendar month, please visit our website at www.mastersfunds.com or call 1-800-960-0188. The Fund imposes a 2% redemption fee on shares held less than 180 days. Performance does not reflect the redemption fee. If reflected, performance would be lower.
Though the fund primarily invests in securities of U.S. domiciled companies it can and has invested in foreign securities as well. Investment in foreign securities subjects investors to political, economic and market risks and fluctuations in currency rates. Though the fund invests primarily in mid-sized and larger-sized companies it can also invest in smaller companies. Smaller companies involve more risk such as limited liquidity and greater volatility.
See page 78 for index definitions
Long-Term Performance Analysis
For the second consecutive year Masters’ Select Equity trailed its Russell 3000 benchmark in the first half of the year and was unable to make up the difference over the rest of the year, despite a strong finish. The fund had out-returned the Russell 3000 for six consecutive years prior to 2005. Despite this recent underperformance and its underperformance in is first two years (1997 and 1998) the fund out-returned each of its benchmarks over its ten-year life by a meaningful margin.
As we’ve stated repeatedly over the years, the goal of the Masters’ Select Funds is to outperform its benchmarks and peer group over the long run. Above-average shorter-term performance, while desirable, is not a primary objective. In pursuing long-term returns the Masters’ Select managers are not concerned about their short-term performance relative to any benchmarks. The lack of benchmark sensitivity has resulted in a Masters’ Select Equity portfolio that has typically looked very different than its benchmarks resulting in significantly positive and negative relative performance at times. We believe this willingness to look different and withstand periods of temporary underperformance makes it possible for the fund to deliver material outperformance over the long run.
Though occasional periods of lagging performance can be frustrating, investors who have stuck with the fund over the ten-year life of the fund have been rewarded. Evidence of the fund’s long-term success and other interesting performance observations are outlined below (all performance numbers are net of all fund fees and expenses including advisory fees, fund operating overhead and trading costs).
| • | The fund has outperformed the Russell 3000, the best-performing of its benchmarks, by 1.48 percentage points (148 basis points) since its inception, as measured by average annual total return. In dollar terms, $10,000 invested in the fund ten years ago would be worth $26,232 vs. $22,908 for the index. Thus, the fund has generated $16,232 of return vs. $12,908 for the index, or 26% excess total return. |
| • | Over its full life the fund has outperformed the S&P 500 by an average annualized margin of 1.69% (169 basis points). We don’t view this index as a primary benchmark because it is more large-cap oriented than Masters’ Select Equity. However, it is the most widely followed U.S. equity benchmark. The S&P 500 Index’s performance over the past one and five years, and since the fund’s inception date (12/31/96) has been 15.79%, 6.19% and 8.43%, respectively. |
Fund Summary | 7
| • | The fund outperformed each of its benchmarks in a variety of environments including strong growth years (1999) and several strong value years (2000, 2001 and 2004). We feel this is a testament to the diversified style exposure in the fund, the flexibility of the managers to pursue the most compelling opportunities without artificial style-box constraints, and of course, the skill of the managers. |
| • | The fund has outperformed, on a total-return basis, all of its benchmarks in down years for the stock market (2000, 2001 and 2002). Its performance has varied in the up years. It outperformed in the very strong return year of 1999. In the very strong return years of 1997 and 2003 it outperformed two of its three benchmarks. However, in 1998 and 2006, also strong years for stocks, the fund underperformed. In the more moderate return year of 2004 it outperformed two of three benchmarks but in 2005 it trailed its benchmarks. |
| • | We believe consistency over five-year time periods is also an important metric. There have been 61 rolling five-year time periods during the fund’s life (the first starting at the fund’s inception, and then in each subsequent period commencing at the beginning of the next month). Masters’ Select Equity has out-returned its Russell 3000 benchmark in 58 of these periods as measured by average annual total return. This amounts to outperformance in 95% of the defined five-year periods. We believe this consistency is noteworthy. |
| • | As noted in the table, the fund’s worst return experiences over one, three and five years have been significantly better than its Russell 3000 benchmark and the fund has experienced fewer negative return periods. |
MASTERS' SELECT EQUITY
Performance | MSEFX | Russell 3000 | Number of Periods | |||||||
Best Rolling 12-Mo. Period 1 | 47.7 | % | 47.7 | % | 109 | |||||
| Worst Rolling 12-Mo. Period | -22.8 | % | -27.9 | % | 109 | |||||
| Best Rolling 36-Mo. Period | 104.0 | % | 105.0 | % | 85 | |||||
| Worst Rolling 36-Mo. Period | -28.3 | % | -40.4 | % | 85 | |||||
| Best Rolling 60-Mo. Period | 89.6 | % | 62.2 | % | 61 | |||||
| Worst Rolling 60-Mo. Period | 0.1 | % | -17.3 | % | 61 | |||||
| Percentage of Negative 12-Mo. Rolling Periods | 22.9 | % | 27.5 | % | 109 | |||||
| Percentage of Negative 36-Mo. Rolling Periods | 20.0 | % | 34.1 | % | 85 | |||||
| Percentage of Negative 60-Mo. Rolling Periods | 0.0 | % | 45.9 | % | 61 | |||||
| Percent Beat Benchmark 12-Mo. | 64.2 | % | n/a | 109 | ||||||
| Percent Beat Benchmark 36-Mo. | 75.3 | % | n/a | 85 | ||||||
| Percent Beat Benchmark 60-Mo. | 95.1 | % | n/a | 61 | ||||||
1 | The best performing 12 and 36 month rolling periods for the Fund commenced in May 1997; the best rolling 60 month period commenced in April 1997. The worst 12, 36 and 60 month rolling periods for the Fund commenced in April 2002, April 2000 and April 1999, respectively. |
| • | Though the fund’s performance over the last two years has hurt its Lipper peer group ranking, the fund remains ranked in the top third compared to its Lipper Category for the ten years since its inception. The Lipper Multi-Cap Core category includes a somewhat odd mishmash of funds but we believe it is the most appropriate fund benchmark because of its market-cap diversity and style neutrality. (Note: lower percentile scores reflect a higher ranking.) |
MASTERS’ SELECT EQUITY FUND LIPPER MULTI-CAP CORE FUND CATEGORY RANKING BASED ON TOTAL FUND RETURNS | |||||||||||||||||||||||||||||||
Annual Ranking As of December 31, 2006 | |||||||||||||||||||||||||||||||
1997 | 1998 | 1999 | 2000 | 2001 | 2002 | 2003 | 2004 | 2005 | 2006 | ||||||||||||||||||||||
| % Rank in Category | 34.0 | % | 64.2 | % | 40.3 | % | 25.2 | % | 19.9 | % | 32.8 | % | 27.1 | % | 23.8 | % | 74.5 | % | 85.9 | % | |||||||||||
| Funds in Category | 156 | 187 | 253 | 310 | 457 | 470 | 597 | 722 | 828 | 910 | |||||||||||||||||||||
Trailing Periods | |||||||||||||
One Year | Three Years | Five Years | Ten Years | ||||||||||
| % Rank in Category | 85.9 | % | 67.9 | % | 48.0 | % | 33.3 | % | |||||
| Funds in Category | 910 | 647 | 469 | 198 | |||||||||
Lipper, Inc. is an independent mutual fund research and rating service. Each Lipper average represents a universe of funds with similar investment objectives. Rankings for the periods shown are based on fund total returns with dividends and distributions reinvested and do not reflect sales charges. As of December 31, 2006, Lipper has recategorized Masters’ Select Equity Fund as a Multi-Cap Growth Fund. For consistency of presentation, we have included the Fund’s ranking within the Multi-Cap Core category, which we believe more accurately reflects the Funds investment objectives and peer group.
8 | The Masters’ Select Funds Trust
| • | The fund is highly ranked in its Morningstar Large Blend peer group over the trailing five and ten years as outlined in the table. (Note: lower percentile scores reflect higher rankings.) It also delivered six consecutive years of top quartile returns through 2004. |
Annual Ranking | |||||||||||||||||||||||||||||||
1997 | 1998 | 1999 | 2000 | 2001 | 2002 | 2003 | 2004 | 2005 | 2006 | ||||||||||||||||||||||
| % Rank in Category | 49 | % | 78 | % | 19 | % | 15 | % | 5 | % | 23 | % | 10 | % | 12 | % | 57 | % | 95 | % | |||||||||||
| Funds in Category | 476 | 623 | 768 | 917 | 1,072 | 1,243 | 1,386 | 1,216 | 1,851 | 1,989 | |||||||||||||||||||||
Trailing Periods | |||||||||||||
One-Year | Three-Year | Five-Year | Ten-Year | ||||||||||
| % Rank in Category | 95 | % | 67 | % | 28 | % | 11 | % | |||||
| Funds in Category | 1,989 | 1,574 | 1,238 | 518 | |||||||||
Morningstar, Inc. is an independent mutual fund research and rating service. Each Morningstar category represents a universe of funds with similar investment objectives. Rankings for the periods shown are based on fund total returns with dividends and distributions reinvested and do not reflect sales charges. The highest percentile rank is 1 and the lowest is 100.
The information contained herein: (1) is proprietary to Morningstar; (2) may not be copied or distributed; and (3) is not warranted to be accurate, complete or timely. Neither Morningstar nor its content providers are responsible for any damages or losses arising from any use of this information. Past performance is no guarantee of future results.
| • | Four of the fund’s five long-tenured managers have outperformed their benchmarks during their time with the fund (this does not include the TCW team which has been part of the fund for just three years). In addition, Sig Segalas, who was replaced in October 2003, also outperformed his benchmark during his almost seven-year tenure. Two other managers, who had been replaced in earlier years did not outperform their benchmarks (one replaced the other and was then replaced by Bill Miller—neither was part of the fund for three years). The following table shows the outperformance of each long-tenured manager (without identifying the managers), relative to his benchmark: |
CURRENT MASTERS’ SELECT MANAGERS’ PERFORMANCE Margin versus BENCHMARKS Manager Return Less Benchmark Return Over Full Tenure Through December 31, 2006* | |
Masters’ Select Equity | Annualized Performance Margin (Net of Allocated Expenses) |
Manager 1 | 11.71% |
Manager 2 | 6.27% |
Manager 3 | 3.47% |
Manager 4 | 2.86% |
Manager 5 | -1.17% |
| * | This table does not include the two managers that preceded Bill Miller prior to March 2000. Both of those managers underperformed their benchmarks. It also does not include Sig Segalas who for his almost seven-year tenure outperformed his benchmark. Listed alphabetically are the managers and their respective benchmarks. |
Manager | Tenure | Benchmark |
| Bill D’Alonzo | 12/31/96 | Russell 2500 Growth |
| Chris Davis | 12/31/96 | S&P 500 |
| Mason Hawkins | 12/31/96 | Russell 3000 Value |
| Bill Miller | 03/24/00 | S&P 500 |
| Dick Weiss | 12/31/96 | Russell 2000 |
| • | Masters’ Select Equity’s after-tax returns since inception have also been strong. The fund’s returns after taxes on distributions have slightly outperformed the pre-tax returns of each of its benchmarks. The fund’s average annual return over its life, assuming all shares were liquidated on December 31, 2006, and taxes were paid on distributions in each year at the highest tax rate in place at the time of each distribution, was 8.18%. If we assume the Russell 3000 Index compounded without any taxes paid over the same ten-year period, then was liquidated on December 31, 2006 and paid taxes on accumulated gains at the current capital gains rate of 15%, its theoretical after-tax return would be lower, at 7.68%. (This hypothetical tax calculation on the index is also more favorable because it assumes no taxes on returns from dividends until the liquidation date.) Masters’ Select Equity Fund’s average annual total return after taxes on distributions for the one-year, five-year and since inception (12/31/96) periods ended December 31, 2006 are 8.28%, 6.46% and 8.66%, respectively. The average annual total return after taxes on distributions and the sale of fund shares for the one-year, five-year and since inception (12/31/96) periods ended December 31, 2006 are 7.25%, 5.87% and 8.18%, respectively. |
Fund Summary | 9
We continue to have a very high degree of confidence in the fund’s six stock pickers and we believe that taken together, the above evidence is supportive of the confidence we have in the Masters’ Select approach and the fund’s potential to continue to meet its long-term performance objectives. However, it is important for shareholders to have realistic expectations. Despite our confidence, we expect that there will again be occasional years in which performance will be disappointing and that the timing of periods of outperformance and underperformance will be unpredictable. Moreover, the stock market will likely remain volatile with occasional losing years.
Portfolio Commentary
A number of factors contributed to the fund’s performance during 2006. The highlights follow.
Performance of managers: In 2006, two of the six Masters’ Select stock pickers outperformed their respective benchmarks. The remaining four managers all significantly trailed their benchmarks for the year. The dispersion of the individual manager returns was extremely wide, ranging from a loss of 7.4% to a gain of 30.8%.
It is typical for some, but not all, of the fund’s stock pickers to beat their benchmarks in any specific shorter-term period. But over the long run our objective is for each sub-advisor to beat their benchmarks. As mentioned above, to date, four of the current Masters’ Select Equity sub-advisors have achieved that goal by a substantial margin since inception after taking into account all allocated expenses. We believe the two underperformers have the potential to ultimately outperform as well.
Sector and stock-picking impact: Though all the Masters’ Select funds are driven by bottom-up stock picking, the sector exposure that results from this process may provide some insight into the fund’s relative performance. However, based on our attribution analysis, the fund’s sector exposures relative to the Russell 3000 Index had very little net impact on relative performance for 2006. It was the managers’ stock selection that led to the underperformance for the year. The aggregate performance of our managers’ stockholdings in the financials, energy, information technology, consumer discretionary and health care sectors did not keep pace with the benchmark returns for each of those sectors. In contrast, stock picking added value in the materials and telecom services sectors. Read on for more specific insights.
Leaders and laggards: During the year, all four of the fund’s large-cap managers owned at least one stock that was among the fund’s ten largest dollar gainers. Mason Hawkins owned six of the top ten winners. All of the large-cap managers and one of the small-cap managers also held at least one stock that was among the fund’s ten largest dollar losers for the year. DirecTV was the biggest dollar contributor to performance, gaining 77% on the year. Other top contributors were Level 3 (up 95%), Comcast (up 50%), JPMorgan/Chase (up 25%) and General Motors (up 63%). It is worth noting that both General Motors and Comcast were two of the fund’s worst performers in 2005. Among the biggest laggards in 2006 were Amazon.com, Progressive Corp. and EOG Resources. All three of those stocks were top contributors to performance in 2005. The stock pickers who own these stocks continue to believe their long-term business value is substantially higher than their current stock price.
See the table on page 12 for a list of the leaders and laggards over the past six and 12 months. The table includes dollar gains and losses as well as percentage gains and losses. It is important to understand that the fact that a stock has lost money for Masters’ Select Equity for the 12-month period ended December 31, 2006 tells us nothing about how successful the holding has been during the entire period it was held, or how successful it may become. The fund will hold many stocks for significantly longer periods of time and the success of these holdings won’t be known until they are ultimately sold. So in that respect, while it is interesting to know how specific stocks performed during the period, this information is of limited value in assessing the ultimate success of these stock holdings. All of the fund’s ten largest winners and seven of the largest losers for the year were still held in the portfolio at year-end.
Portfolio mix: There were some notable changes to the fund’s sector exposures during the year. The allocation to the consumer discretionary sector declined from 29.8% at the end of 2005 to 22.8% at year-end 2006. The portfolio’s exposure to technology and telecom stocks increased by 3.8% and 3.3%, respectively, from the prior year-end. Technology now accounts for 16.4% of the portfolio, and is the third-largest sector exposure behind financials and consumer discretionary. Relative to the Russell 3000 benchmark, at year-end the fund was significantly overweighted to the consumer discretionary sector and heavily underweighted to health care, consumer staples and utilities.
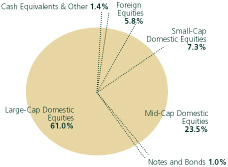
The fund’s exposure to large-cap stocks (with greater than $12.3 billion market cap) rose during the latter part of the year and ended at 61.0%, an all-time high. The weighting in mid-cap and small-cap names declined to 23.5% and 7.3%, respectively. The small-cap weighting is the fund’s lowest year-end weighting since the fund’s inception. Foreign stocks accounted for 5.8% of the portfolio at year-end, down slightly from the previous year. The portfolio ended the year with a 1.4% cash position.
Please see page 13 for a breakout of the fund’s sector and market-cap exposures.
Miscellaneous
Market-cap flexibility: After eight consecutive years of small-cap outperformance and our belief that small-cap stocks are now less attractive than large-cap stocks we have given Dick Weiss and Bill D’Alonzo, our two dedicated smaller-cap managers, more flexibility to pursue companies of any size. Both managers run accounts for other clients and funds that include larger-cap stocks, so they have expertise in all market-caps. By removing their smaller-cap mandate they are now free to pursue their best stock-picking ideas regardless of company size. After discussing this with them we believe this will gradually result in more mid- and large-cap exposure in the fund, at least in the foreseeable future, but that they will also continue to hold a number of smaller-cap stocks. When the attractiveness of smaller-caps becomes compelling again, it is likely that their small-cap exposure will increase.
10 | The Masters’ Select Funds Trust
Taxes: Masters’ Select Equity distributed $0.98 in capital gains in December. Approximately 76% of the gains were long-term. We will continue to work with the fund’s sub-advisors to manage the fund in a tax-aware manner. This will include taking short-term losses when there is an alternative investment that is equally attractive, and using other tax-management techniques. However, the managers will not sacrifice pre-tax performance in pursuit of after-tax performance since the fund has tax-exempt, as well as taxable shareholders.
Expenses: For the year the expense ratio was 1.18% down from 1.19% in 2005.
Accolades: During 2006 Masters’ Select Equity maintained its “A” stewardship grade from Morningstar. It also is a Morningstar Fund Analyst Pick in the Large Blend category. In Morningstar’s December update they were complimentary to the fund in their report titled: “Investors Should Disregard Masters’ Select Equity’s Recent Struggles.”2
Kiplinger.com had similar comments in their August article “A Bad Year for a Great Fund.”
In Closing
The first ten years for Masters’ Select Equity had its share of ups and downs but in the end the fund achieved our original performance objectives of outperforming its benchmarks. We will be aiming to do as well over the next ten years—and while there can be no guarantees, this is a goal that we believe is quite achievable. As we look forward, the price/earnings ratio for the overall stock market is very close to where it was when we launched the fund ten years ago (though bond yields are lower—a positive factor).
As always, we value your confidence and continue to invest alongside you while staying focused on the goal of extending the success of Masters’ Select into the future.
Please see page 14 for specific stock commentaries written by the Masters’ Select Equity managers.
| 2 | Morningstar, Inc. is an independent mutual fund research and rating service. The Morningstar Stewardship Grade is based on the evaluation of five areas critical for mutual fund governance and operations. The five areas are: 1) Regulatory Issues- they examine the firm’s record in the past three years, 2) Board Quality- examines the quality of the fund’s board of directors, 3) Manager Incentives- examines the fund managers’ pay as well as the level of their investment in fund shares, 4) Fees- examines the amount that a management company charges fund shareholders and 5) Corporate Culture- evidence that a firm has a deep-rooted understanding of its role as a fiduciary. Each area will receive one of the following ratings Excellent, Good, Fair, Poor or Very Poor. Funds are assigned a letter grade from A (best) to F (worst) based on the cumulative total of points they received from each category. The Masters’ Select Equity Fund received an Overall Grade of “A” for 2006. |
See page 79 for Industry Terms and Definitions
Neither the information contained herein nor any opinion expressed shall be construed to constitute an offer to sell or a solicitation to buy any security or any other funds mentioned herein. The views herein are those of Litman/Gregory Fund Advisors, LLC at the time the material is written and may not be reflective of current conditions. Performance quoted represents past performance and does not guarantee future results.
Fund Summary | 11
Masters’ Select Equity Fund Leaders and Laggards (Unaudited)
For the Six Months Ended December 31, 2006
By Percentage Gain / Loss
Security | Six Month Dollar Contribution/(Loss) | Six Month % Change | |||||
| Fairfax Financial Holdings Ltd. | 6,259,935 | 108.9 | % | ||||
| RTI International Metals, Inc. | 3,148,766 | 67.4 | % | ||||
| DIRECTV Group, Inc. (The) | 8,428,184 | 51.2 | % | ||||
| Parametric Technologies Corp. | 1,975,320 | 41.8 | % | ||||
| IAC/InterActiveCorp | 5,038,692 | 40.0 | % | ||||
| Mittal Steel Co. NV - Class A | 2,681,435 | 39.1 | % | ||||
| Salesforce.com, Inc. | 3,828,264 | 37.4 | % | ||||
| Hasbro, Inc. | 1,029,295 | 34.1 | % | ||||
| Tempur-Pedic International, Inc. | 1,566,109 | 27.0 | % | ||||
| Level 3 Communications, Inc. | 3,828,000 | 26.1 | % | ||||
| 37,784,000 | |||||||
| Merge Technologies, Inc. | (1,347,859 | ) | (38.6 | %) | |||
| Astec Industries, Inc. | (1,913,701 | ) | (37.4 | %) | |||
| Foxhollow Technologies, Inc. | (1,253,549 | ) | (23.4 | %) | |||
| Emmis Communications Corp. | (1,335,256 | ) | (21.2 | %) | |||
| Mastec, Inc. | (810,396 | ) | (19.0 | %) | |||
| Alpha Natural Resources, Inc. | (855,092 | ) | (14.5 | %) | |||
| Eagle Materials, Inc. | (565,934 | ) | (14.4 | %) | |||
| Kirby Corp. | (1,074,000 | ) | (13.6 | %) | |||
| ResMed, Inc. | (818,556 | ) | (13.3 | %) | |||
| ImClone Systems, Inc. | (622,451 | ) | (13.3 | %) | |||
| (10,596,793 | ) | ||||||
By Dollar Gain / Loss
Security | Six Month Dollar Contribution/(Loss) | Six Month % Change | |||||
| DIRECTV Group, Inc. (The) | 8,428,184 | 51.2 | % | ||||
| Fairfax Financial Holdings Ltd. | 6,259,935 | 108.9 | % | ||||
| IAC/InterActiveCorp | 5,038,692 | 40.0 | % | ||||
| JPMorgan Chase & Co. | 4,807,436 | 16.4 | % | ||||
| Tyco International Ltd. | 4,118,284 | 10.8 | % | ||||
| Salesforce.com, Inc. | 3,828,264 | 37.4 | % | ||||
| Level 3 Communications, Inc. | 3,828,000 | 26.1 | % | ||||
| Comcast Corp. | 3,802,898 | 22.0 | % | ||||
| Google, Inc. | 3,754,976 | 12.6 | % | ||||
| American International Group, Inc. | 3,554,073 | 21.5 | % | ||||
| 47,420,742 | |||||||
| EOG Resources, Inc. | (2,873,221 | ) | (9.4 | %) | |||
| Astec Industries, Inc. | (1,913,701 | ) | (37.4 | %) | |||
| Capital One Financial Corp. | (1,709,727 | ) | (10.0 | %) | |||
| Merge Technologies, Inc. | (1,347,859 | ) | (38.6 | %) | |||
| Emmis Communications Corp. | (1,335,256 | ) | (21.2 | %) | |||
| Foxhollow Technologies, Inc. | (1,253,549 | ) | (23.4 | %) | |||
| Yahoo!, Inc. | (1,349,176 | ) | (10.2 | %) | |||
| FedEx Corp. | (1,192,880 | ) | (6.9 | %) | |||
| MGIC Investment Corp. | (1,079,914 | ) | (8.3 | %) | |||
| Kirby Corp. | (1,074,000 | ) | (13.6 | %) | |||
| (15,129,283 | ) | ||||||
For the Year Ended December 31, 2006
By Percentage Gain / Loss
Security | Twelve Month Dollar Contribution/(Loss) | Twelve Month % Change | |||||
| Level 3 Communications, Inc. | 9,009,000 | 95.1 | % | ||||
| Level 3 Communications, Inc. - Bond | 3,993,680 | 81.1 | % | ||||
| DIRECTV Group, Inc. (The) | 10,804,852 | 76.6 | % | ||||
| RTI International Metals, Inc. | 3,148,766 | 67.4 | % | ||||
| General Motors Corp. | 5,424,300 | 63.3 | % | ||||
| Mittal Steel Co. NV - Class A | 3,486,903 | 57.0 | % | ||||
| United States Steel Corp. | 3,238,623 | 53.9 | % | ||||
| Comcast Corp. | 7,003,904 | 49.7 | % | ||||
| Tempur-Pedic International, Inc. | 2,435,180 | 49.5 | % | ||||
| Gemstar-TV Guide International, Inc. | 2,239,153 | 45.9 | % | ||||
| 50,784,360 | |||||||
| Merge Technologies, Inc. | (2,624,658 | ) | (55.0 | %) | |||
| Astec Industries, Inc. | (2,558,836 | ) | (44.4 | %) | |||
| Ryland Group, Inc. | (5,529,857 | ) | (36.5 | %) | |||
| eBay, Inc. | (6,160,971 | ) | (32.9 | %) | |||
| Emmis Communications Corp. | (2,567,915 | ) | (31.9 | %) | |||
| Expedia, Inc. | (4,289,432 | ) | (30.1 | %) | |||
| Conn’s, Inc. | (2,034,933 | ) | (25.9 | %) | |||
| Alpha Natural Resources, Inc. | (1,543,458 | ) | (23.5 | %) | |||
| Foxhollow Technologies, Inc. | (1,253,549 | ) | (23.4 | %) | |||
| Mastec, Inc. | (811,858 | ) | (19.0 | %) | |||
| (29,375,466 | ) | ||||||
By Dollar Gain / Loss
Security | Twelve Month Dollar Contribution/(Loss) | Twelve Month % Change | |||||
| DIRECTV Group, Inc. (The) | 10,804,852 | 76.6 | % | ||||
| Level 3 Communications, Inc. | 9,009,000 | 95.1 | % | ||||
| Comcast Corp. | 7,003,904 | 49.7 | % | ||||
| JPMorgan Chase & Co. | 6,890,270 | 24.9 | % | ||||
| General Motors Corp. | 5,424,300 | 63.3 | % | ||||
| Disney (Walt) Co. | 5,035,212 | 41.3 | % | ||||
| Google, Inc. | 4,314,215 | 14.7 | % | ||||
| Network Appliance, Inc. | 4,313,347 | 44.1 | % | ||||
| IAC/InterActiveCorp | 4,139,172 | 30.7 | % | ||||
| Level 3 Communications, Inc. - Bond | 3,993,680 | 81.1 | % | ||||
| 60,927,953 | |||||||
| Amazon.Com, Inc. | (7,672,393 | ) | (16.6 | %) | |||
| eBay, Inc. | (6,160,971 | ) | (32.9 | %) | |||
| Ryland Group, Inc. | (5,529,857 | ) | (36.5 | %) | |||
| Yahoo!, Inc. | (5,010,014 | ) | (18.7 | %) | |||
| EOG Resources, Inc. | (4,602,421 | ) | (14.3 | %) | |||
| Expedia, Inc. | (4,289,432 | ) | (30.1 | %) | |||
| Progressive Corp. | (3,576,877 | ) | (17.0 | %) | |||
| Dell, Inc. | (3,430,000 | ) | (16.3 | %) | |||
| Merge Technologies, Inc. | (2,624,658 | ) | (55.0 | %) | |||
| Emmis Communications Corp. | (2,567,915 | ) | (31.9 | %) | |||
| (45,464,539 | ) | ||||||
Please refer to the fund’s schedule of investments in this report for complete holdings information. Fund holdings and sector allocations are subject to change and should not be considered a recommendation to buy or sell any security.
12 | The Masters’ Select Funds Trust
Masters’ Select Equity Fund Managers
INVESTMENT MANAGER | FIRM | TARGET ASSET ALLOCATION | MARKET CAPITALIZATION OF COMPANIES IN PORTFOLIO | STOCK-PICKING STYLE | ||||
Craig Blum/Stephen Burlingame | TCW Investment Management Company | 20% | Mostly mid- and large-sized companies | Growth | ||||
Christopher Davis/ Kenneth Feinberg | Davis Selected Advisers, L.P. | 20% | Mostly large companies | Growth at a reasonable price | ||||
| Bill D’Alonzo and team | Friess Associates, LLC | 10% | Small and mid-sized companies | Growth | ||||
| Mason Hawkins | Southeastern Asset Management, Inc. | 20% | All sizes and global, may have up to 50% foreign stocks | Value | ||||
| Bill Miller | Legg Mason Capital Management, Inc. | 20% | All sizes, but mostly large and mid-sized companies | Eclectic, may invest in traditional value stocks or growth stocks | ||||
| Dick Weiss | Wells Capital Management, Inc. | 10% | Small and mid-sized companies | Growth at a reasonable price |
Portfolio Composition*
As reflected in this chart, your fund is well diversified in terms of market capitalization. The fund holds 77 securities, excluding of cash equivalents.
By Asset Class
Market Capitalization:
Small-Cap Domestic < $1.6 billion
Mid-Cap Domestic $1.6 - $12.3 billion
Large-Cap Domestic > $12.3 billion
* Totals may not add up to 100% due to rounding.
By Sector
| Sector Weights | |||||||
| Fund | Russell 3000 Index | ||||||
| Consumer Discretionary | 22.8 | % | 11.8 | % | |||
| Consumer Staples | 1.8 | % | 8.2 | % | |||
| Energy | 7.6 | % | 8.7 | % | |||
| Finance | 25.0 | % | 22.5 | % | |||
| Health Care & Pharmaceuticals | 4.6 | % | 12.1 | % | |||
| Industrials | 8.4 | % | 10.9 | % | |||
| Materials | 6.5 | % | 3.4 | % | |||
| Technology | 16.4 | % | 15.3 | % | |||
| Telecommunications | 4.4 | % | 3.3 | % | |||
| Utilities | 0.0 | % | 3.8 | % | |||
| Notes & Bonds | 1.0 | % | 0.0 | % | |||
| Cash Equivalents & Other | 1.4 | % | 0.0 | % | |||
100.0 | % | 100.0 | % | ||||
Fund Summary | 13
Masters’ Select Equity Fund Stock Highlights
Countrywide Financial Corp. - Craig Blum and Steve Burlingame
Countrywide is the dominant player in the mortgage industry with the potential to double its market share over the next five years. Competitive advantages enabling this market share capture include scale, skill, technology and an intensely focused and aggressive culture.
Earnings quality and visibility is increasing over time as Countrywide’s diversified businesses, particularly its Bank, provide an increasing percentage of the company’s earnings. Not only are Countrywide’s diversified businesses reducing the company’s earnings volatility but they allow Countrywide to capture an increasing share of the economics in the mortgage value chain.
Although industry origination margins and volumes have been in decline since the mortgage market peak in 2003, Countrywide’s earnings have held up better than in any previous mortgage cycle due to the company’s more diversified earnings streams. In fact, Countrywide will likely earn more in both 2006 and 2007 than it did at the peak of the refinancing boom in 2003, despite a 30-40% decline in industry volumes and decline in Countrywide’s mortgage production margins of more than two-thirds. For the first nine months of 2006, earnings from Countrywide’s diversified businesses represented 52% of total earnings and more than compensated for the decline in earnings from mortgage production activities.
Near-term, Countrywide’s diversified earnings stream, $2.5 billion stock buyback and $500 million cost cutting initiative should help Countrywide continue to manage against a very difficult mortgage and housing industry backdrop. Countrywide also has the most seasoned and experienced management team in the mortgage industry led by the company’s founder and CEO, Angelo Mozilo, who recently extended his contract as CEO until 2009. The current mortgage market difficulties should benefit Countrywide longer-term, however, as they catalyze industry consolidation and industry capacity reductions. And, longer-term Countrywide is extremely well positioned to take advantage of an improved rate and mortgage environment. We believe the current valuation does not fully reflect the improved earnings profile of the company nor does it reflect the earnings potential of this market leader should the mortgage market fundamentals improve over the next several years.
Tyco International Ltd. - Christopher Davis and
Kenneth Feinberg
Tyco is a Bermuda domiciled conglomerate that generated just over $40 billion in revenues and $4.1 billion in net income from continuing operations in its most recent fiscal year ending September 2006. Tyco is infamous to many as the company that was mismanaged and looted by a former CEO and CFO who are both now serving time in prison for their misdeeds.
Our firm has owned Tyco since 1998 and we have experienced both the good times as well as the bad times. However, there are several reasons why we believe the company represents a compelling investment opportunity today. New management led by CEO Ed Breen, who took over in summer 2002, has done an excellent job of working diligently to create value for shareholders and has greatly improved corporate governance at Tyco. However, almost all of Tyco’s four different segments have had occasional operational problems over the past two years that have disappointed many investors. To allow these different divisions to execute better and become even more entrepreneurial, CEO Breen and the board decided to break Tyco up into three separate publicly traded companies. The breakup is currently scheduled to occur by late April pending final approval from the SEC.
We expect that this pending breakup is an important catalyst for better operational and shareholder returns going forward. Over the years several studies have concluded that companies that break themselves up to operate independently tend to significantly outperform the S&P 500. There are several reasons for this outperformance in our opinion. The most important reason is that entrepreneurial forces in senior management get unleashed. There are now multiple CEOs who wake up each day with the single minded focus of trying to make their company perform better thereby resulting in increasing earnings and cash flows. These improved results lead to a rising stock price which increases the value of all management’s newly granted options and restricted stock.
As Charlie Munger has advised, incentives can be a very powerful force. These “newly created” CEOs can no longer hide as part of a huge conglomerate. They must perform or suffer the consequences. Accountability and responsibility, pride and visibility help energize the entire company. Finally, this is management’s big chance to become truly rich so hard work and pure drive gets magnified as well.
Also some positive surprises often occur post break-up. One or more units may engage in value-creating transactions - perhaps merging with another company in its industry, restructuring by shedding lower margin or underperforming businesses or undergoing a significant share repurchase program. Many of these opportunities might not have been able to have been accomplished as part of a conglomerate.
Tyco, today as one company, trades at a discount to its conglomerate peers. In 2006 Tyco earned approximately $2 per share but free cash flow was even greater at approximately $2.15 per share. At the current $32 stock price Tyco trades at just under 15x 2006 free cash flow which we believe is cheap. But more importantly the three soon to be free-standing companies trade at an even steeper 25% discount to its publicly traded peers. So if the companies execute well over time we think investors have a good chance for an upwards revaluation of the multiple as well.
All three companies - “new” Tyco, Tyco electronics and Tyco healthcare - have opportunities to increase their margins and grow their existing businesses both organically and via acquisition. All three units have excellent scale and are among the market leaders in their industries. Finally, all three companies will be generating significant free cash flow that can be used to create additional value for shareholders.
So we are optimistic that Tyco will be just one more example of a company that successfully creates considerable shareholder value by splitting itself up into smaller parts where managements can become more entrepreneurial and are better incentivised to drive shareholder value creation.
14 | The Masters’ Select Funds Trust
Nuance Communications, Inc. - Bill D’Alonzo
U.S. health care companies spend $10 billion a year to manually convert dictations into electronic transcripts, but Nuance Communications is determined to see that number fall. The company’s voice-recognition technology can instantly transform dictations into digital text, increasing productivity and reducing costs by an estimated 70 percent.
With $394 million in annual sales, NASDAQ-listed Nuance Communications is the market-leading provider of voice-recognition solutions. More than half of the companies in the Fortune-100 use its various technologies that enable voice-activated services over a telephone, turn speech into written words and permit the control of electronic devices. Nuance commands market shares of about 90 percent in desktop dictation, 80 percent in call centers and 60 percent in health care dictation.
September-quarter earnings grew 133 percent, topping Wall Street estimates. Quarterly revenues jumped 115 percent. Results were driven by strong adoption of the company’s new Dragon 9 software product, increasing demand from automobile and cell-phone manufacturers, and momentum related to its acquisition of Dictaphone, a leading provider of speech recognition solutions to the health care industry.
The Friess team spoke with Chief Executive Paul Ricci regarding Nuance’s competitive advantage. Based on complex mathematical formulas, which require extensive amounts of linguistic and image data, acoustic models and recognition techniques, Nuance’s technology is considered the industry’s most accurate, with rates as high as 98 percent. To date, Nuance has filed 500 speech-related patents produced by 475 speech engineers and scientists.
The roughly $1.2 billion businesses spent on speech recognition in 2005 is expected to grow to $2.7 billion by 2009. With penetration rates of only 5 to 10 percent in each of its end markets, we believe that significant growth opportunities lie ahead. Following the 73 percent growth it posted in the fiscal year ended September 2006, Wall Street predicts Nuance will grow earnings 24 percent in fiscal 2007.
Yahoo!, Inc. - Bill Miller
Yahoo!, Inc. is held in both the Equity Fund and the Value Fund. Please refer to the discussion appearing on page 35.
HCC Insurance Holdings, Inc. - Dick Weiss
HCC Insurance Holdings, Inc. provides property and casualty, surety, and group life, accident and health insurance products. HCC concentrates its activities in selected, narrowly defined, specialty lines of business such as professional indemnity, medical stop-loss, and aviation. HCC also owns a number of underwriting agencies and insurance brokers that enable the company to generate fee income without taking underwriting risk.
HCC’s niche strategy enables the company to develop underwriting expertise in lines of insurance that are often too small for larger companies to pursue. The range of insurance offered combined with a mix of risk-bearing insurance business and fee-based businesses give the company a great deal of operating flexibility. As a result, the company can pursue profitable lines of business when the pricing is strong for certain types of insurance and shift emphasis to fee based business when the insurance pricing cycle becomes less attractive.
This unique positioning within the industry and good execution has resulted in consistently better profitability than that of the average property and casualty insurance company. HCC tends to have a combined ratio around 90% compared to the overall U.S. insurance industry average which is closer to 103%. Because many insurance companies have a “combined ratio” at or above 100%, they rely solely on their investment income to be profitable. In contrast, HCC’s strategy is to focus on lines of business in which they can be consistently profitable on underwriting.
During the fourth quarter of 2006, HCC’s stock declined from 35 to 29 after the company announced that it was investigating its historic option-granting process and that its CEO would retire from active management. Since that announcement, the company has completed a restatement of its historic financial statements and brought back a long time executive, Frank Bramanti to run the company. The stock has begun to recover and remains attractive.
Insurance stock investors tend to prefer valuing insurance company stocks using a price-to-book ratio. Over the last five years, the P/B multiple on HCC has ranged from a low of 1.5x to a high of 2.5x, with an average of 1.9x. We were able to buy the stock at a discounted price/book multiple of 1.6x. HCC has grown its book value per share about 14 - 15% per year on a consistent basis for the last 10 years. Given its continued attractive growth rate in book value, we believe that the prospect of the stock returning to its normal price/book multiple makes the risk/reward highly rewarding.
In keeping with Southeastern Asset Management’s disclosure policies, Mason Hawkins has not contributed commentary on his holdings for this report.
See page 79 for Industry Terms and Definitions
Neither the information contained herein nor any opinion expressed shall be construed to constitute an offer to sell or a solicitation to buy any securities mentioned herein. The views herein are those of the portfolio managers at the time the commentaries are written and may not be reflective of current conditions.
Fund Summary | 15
Masters’ Select Equity Fund
SCHEDULE OF INVESTMENTS IN SECURITIES at December 31, 2006
Shares | Value | ||||
COMMON STOCKS: 97.5% | |||||
Consumer Discretionary: 22.8% | |||||
| 755,500 | Amazon.Com, Inc.* | $ | 29,812,030 | ||
| 60,000 | Comcast Corp. - Class A* | 2,539,800 | |||
| 250,000 | Comcast Corp. - Special Class A* | 10,470,000 | |||
| 223,000 | Conn’s, Inc.* | 5,189,210 | |||
| 998,600 | DIRECTV Group, Inc. (The)* | 24,905,084 | |||
| 498,000 | Disney (Walt) Co. | 17,066,460 | |||
| 600,000 | Eastman Kodak Co. | 15,480,000 | |||
| 410,000 | Emmis Communications Corp. - Class A* | 3,378,400 | |||
| 1,420,000 | Gemstar-TV Guide International, Inc.* | 5,694,200 | |||
| 441,000 | General Motors Corp. | 13,547,520 | |||
| 340,000 | Home Depot, Inc. (The) | 13,654,400 | |||
| 405,000 | IAC/InterActiveCorp* | 15,049,800 | |||
| 68,000 | Liberty Media Holding Corp. - Capital* | 6,662,640 | |||
| 449,250 | Liberty Media Holding Corp. - Interactive* | 9,690,322 | |||
| 176,100 | News Corp. | 3,782,628 | |||
| 453,400 | Pulte Homes, Inc. | 15,016,608 | |||
| 193,000 | Ruby Tuesday, Inc. | 5,295,920 | |||
| 197,235,022 | |||||
Consumer Staples: 1.8% | |||||
| 102,200 | Altria Group, Inc. | 8,770,804 | |||
| 131,400 | Costco Wholesale Corp. | 6,947,118 | |||
| 15,717,922 | |||||
Energy: 7.6% | |||||
| 259,900 | ConocoPhillips | 18,699,805 | |||
| 428,400 | EOG Resources, Inc. | 26,753,580 | |||
| 88,000 | FMC Technologies, Inc.* | 5,423,440 | |||
| 70,000 | GlobalSantaFe Corp. | 4,114,600 | |||
| 173,480 | Schlumberger Ltd. | 10,956,997 | |||
| 65,948,422 | |||||
Finance: 25.0% | |||||
| 275,700 | American Express Co. | 16,726,719 | |||
| 262,300 | American International Group, Inc. | 18,796,418 | |||
| 485,000 | AON Corp. | 17,139,900 | |||
| 150 | Berkshire Hathaway, Inc. - Class A* | 16,498,500 | |||
| 190,000 | Capital One Financial Corp. | 14,595,800 | |||
| 218,500 | Commerce Bancorp, Inc. | 7,706,495 | |||
| 245,000 | Conseco, Inc.* | 4,895,100 | |||
| 534,100 | Countrywide Financial Corp. | 22,672,545 | |||
| 60,500 | Fairfax Financial Holdings Ltd. | 12,009,250 | |||
| 71,500 | GFI Group, Inc.* | 4,451,590 | |||
| 155,000 | HCC Insurance Holdings, Inc. | 4,973,950 | |||
| 507,590 | HSBC Holdings Plc | 9,255,915 | |||
| 647,400 | JPMorgan Chase & Co. | 31,269,420 | |||
| 650,500 | Progressive Corp. | 15,755,110 | |||
| 198,100 | SLM Corp. | 9,661,337 | |||
| 146,000 | Transatlantic Holdings, Inc. | 9,066,600 | |||
| 215,474,649 | |||||
Healthcare, Pharmaceuticals & Biotechnology: 4.6% | |||
| 75,000 | Covance, Inc.* | 4,418,250 | |
| 190,000 | Foxhollow Technologies, Inc.* | 4,100,200 | |
| 95,500 | Genentech, Inc.* | 7,747,915 | |
| 58,400 | Genzyme Corp.* | 3,596,272 | |
| 105,000 | ICU Medical, Inc.* | 4,271,400 | |
| 243,000 | Neurometrix, Inc.* | 3,623,130 | |
| 175,000 | PRA International* | 4,422,250 | |
| 77,000 | SurModics, Inc.* | 2,396,240 | |
| 107,400 | Varian Medical Systems, Inc.* | 5,109,018 | |
| 39,684,675 | |||
Industrials: 8.4% | |||
| 192,800 | AAR Corp.* | 5,627,832 | |
| 148,000 | FedEx Corp. | 16,075,760 | |
| 283,600 | HUB Group, Inc.* | 7,813,180 | |
| 200,000 | Kirby Corp.* | 6,826,000 | |
| 1,203,100 | Tyco International Ltd. | 36,574,240 | |
| 72,917,012 | |||
Materials: 6.5% | |||
| 578,548 | Cemex S.A. de C.V. -- ADR* | 19,601,206 | |
| 75,000 | Minerals Technologies, Inc. | 4,409,250 | |
| 215,000 | Mittal Steel Co. NV - Class A | 9,068,700 | |
| 229,900 | Sealed Air Corp. | 14,925,108 | |
| 115,000 | United States Steel Corp. | 8,411,100 | |
| 56,415,364 | |||
Technology: 16.4% | |||
| 146,900 | aQuantive, Inc.* | 3,622,554 | |
| 450,000 | Arris Group, Inc.* | 5,629,500 | |
| 100,000 | CheckFree Corp.* | 4,016,000 | |
| 700,000 | Dell, Inc.* | 17,563,000 | |
| 300,400 | eBay, Inc.* | 9,033,028 | |
| 63,000 | Google, Inc. - Class A* | 29,010,240 | |
| 193,000 | Insight Enterprises, Inc.* | 3,641,910 | |
| 286,300 | Network Appliance, Inc.* | 11,245,864 | |
| 550,000 | Nuance Communications, Inc.* | 6,303,000 | |
| 372,000 | Parametric Technology Corp.* | 6,703,440 | |
| 184,000 | Progress Software Corp.* | 5,139,120 | |
| 371,700 | QUALCOMM, Inc. | 14,046,543 | |
| 386,100 | Salesforce.com, Inc.* | 14,073,345 | |
| 110,000 | Transaction Systems Architects, Inc.* | 3,582,700 | |
| 300,000 | Yahoo!, Inc.* | 7,662,000 | |
| 141,272,244 | |||
16 | The Masters’ Select Funds Trust
Masters’ Select Equity Fund
SCHEDULE OF INVESTMENTS IN SECURITIES at December 31, 2006
Shares | Value | ||
Telecommunications: 4.4% | |||
| 3,300,000 | Level 3 Communications, Inc.* | $ | 18,480,000 |
| 1,029,000 | Sprint Nextel Corp. | 19,437,810 | |
| 37,917,810 | |||
TOTAL COMMON STOCKS | |||
| (cost $649,095,789) | 842,583,120 | ||
NOTES & BONDS: 1.0% | |||
Telecommunications: 1.0% | |||
| 4,650,000 | Level 3 Communications, Inc, 10.000%, 05/01/11 | 8,451,375 | |
TOTAL NOTES & BONDS | |||
| (cost $4,650,000) | 8,451,375 | ||
SHORT-TERM INVESTMENTS: 1.4% | |||
| $12,142,000 | State Street Bank & Trust Co., 8.280%, 12/31/06, due 01/02/07 [collateral: $9,910,000, US Treasury Notes, 7.125%, due 02/15/23, Federal Home Loan, 6.096%, due 09/01/36, value $12,407,242] (proceeds $12,146,922) | 12,142,000 | |
TOTAL SHORT-TERM INVESTMENTS | |||
| (cost $12,142,000) | 12,142,000 | ||
TOTAL INVESTMENTS IN SECURITIES | |||
| (cost $665,887,789): 99.9% | 863,176,495 | ||
| Other Assets less Liabilities: 0.1% | 521,265 | ||
Net Assets: 100.0% | $ | 863,697,760 | |
| ADR | American Depository Receipt |
| * | Non-income producing security. |
The accompanying notes are an integral part of these financial statements.
Schedule of Investments | 17
Masters’ Select International Fund Review
Masters’ Select International returned a healthy 23.61% in 2006. This return trailed its benchmarks in what was a very strong year for international stocks. Since the inception of the fund, over nine years ago, it has out-returned its benchmarks by a wide margin and ranked very high among its international fund peers. Read on for details.
Comparison Chart
The value of a hypothetical $10,000 investment in the Masters’ Select International Fund from its inception (12/1/97) to present as compared with the MSCI All Countries World Free (ex US) Index, the S&P Citigroup PMI Index and the Lipper International Fund Index.
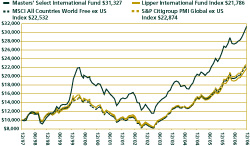
The hypothetical $10,000 investment at fund inception includes changes due to share price and reinvestment of dividends and capital gains. This chart does not imply any future performance. Indices are unmanaged, do not incur fees and cannot be invested in directly.
Performance as of December 31, 2006
Average Annual Total Returns | ||||||||
One-Year | Three-Year | Five-Year | Since Inception (12/1/97) | |||||
Masters’ Select International Fund | 23.61% | 20.48% | 15.78% | 13.40% | ||||
MSCI All Countries World Free (ex US) Index | 27.16% | 21.81% | 16.87% | 9.36% | ||||
S&P Citigroup Global PMI (ex US) Index | 26.30% | 21.52% | 16.47% | 9.54% | ||||
Lipper International Fund Index | 25.91% | 19.98% | 15.14% | 8.95% | ||||
Performance quoted represents past performance and does not guarantee future results. The investment return and principal value of an investment will fluctuate so that an investor’s shares, when redeemed, may be worth more or less than their original cost. Current performance of the funds may be lower or higher than the performance quoted. To obtain the performance of the funds as of the most recently completed calendar month, please visit our website at www.mastersfunds.com or call 1-800-960-0188. The Fund imposes a 2% redemption fee on shares held less than 180 days. Performance does not reflect the redemption fee. If reflected, performance would be lower.
Investment in foreign securities subjects investors to political, economic and market risks and fluctuations in currency rates. The fund may invest in smaller companies which involve more risk such as limited liquidity and greater volatility.
See page 78 for index definitions
Long-Term Performance Analysis
Masters’ Select International has built a very strong record over its nine-year and one-month life. The record is strong relative to both its peer group and benchmarks. We believe that the long-term performance has been mostly a function of the skills of the fund’s sub-advisors and their ability to add incremental value by concentrating on their most compelling ideas. Though they have made mistakes at times and individually and collectively gone through rough patches of performance, shareholders who have stuck with the fund since inception have been rewarded.
The following points shed additional light on the fund’s performance over the years and add to our confidence in the fund’s future potential (all performance numbers are net of all fund fees and expenses including advisory fees, fund operating overhead and trading costs):
| • | The fund out-returned, as measured by average annual total return, the best-performing of its benchmarks by 3.86 percentage points (386 basis points) since its inception nine years and one month ago. In dollar terms, a hypothetical $10,000 investment in the fund is worth $31,327 vs. $22,874 invested in the index. Thus the fund has generated $21,327 of total return vs. $12,874 with the index, an excess return of 66%. |
| • | The fund outperformed its benchmarks in a variety of environments including 1999, a strong year for foreign growth stocks, and also in 2000 and 2001, strong years for foreign value stocks, as measured by total return. It is noteworthy that the fund was in the top quintile of its Lipper International Fund (1999 - 40th out of 516 funds; 2000 - 92nd out of 605 funds) and Morningstar Foreign Large Blend Fund (1999 -3rd percentile out of 266 funds; 2000 -6th percentile of 305 funds) peer groups in both 1999, an extreme growth year, and 2000, an extreme value year. See the table on the next page for ranking information, including one-year, three-year, five-year and since inception periods. |
| • | Continuing on with the theme of outperforming in different types of market environments, the fund beat its primary benchmarks, as measured by total return, in the down years for the international stock markets of 2000 and 2001 and beat one index but trailed another in 2002 (another negative-return year). It also beat its benchmarks in 1999 and 2005, both strong years for international stocks, and in 2003, another strong year, it beat one of its two benchmarks. The fund’s performance in different types of stock market environments is a testament to the mix of management styles, the skill of the sub-advisors, and their flexibility to pursue their most compelling ideas without artificial style-box constraints. |
| • | There have been 50 rolling five-year time periods (the first starting at the fund’s inception, and then in each subsequent period commencing at the beginning of the next month) during the fund’s life. Masters’ Select International has outperformed its MSCI benchmark in 34 of these periods (68% of the time), as measured by average annual total return. |
18 | The Masters’ Select Funds Trust
| • | The table that follows includes more rolling period analysis returns. One interesting statistic is that over longer time periods (three and five years) the fund has experienced fewer negative returns than the index. |
MASTERS’ SELECT INTERNATIONAL |
Performance | MSILX | MSCI ACWI (ex US) | Number of Periods | |||||||
Best Rolling 12-Mo. Period 1 | 88.3 | % | 59.9 | % | 98 | |||||
| Worst Rolling 12-Mo. Period | -31.1 | % | -29.3 | % | 98 | |||||
| Best Rolling 36-Mo. Period | 136.9 | % | 138.0 | % | 74 | |||||
| Worst Rolling 36-Mo. Period | -47.4 | % | -46.3 | % | 74 | |||||
| Best Rolling 60-Mo. Period | 112.6 | % | 118.1 | % | 50 | |||||
| Worst Rolling 60-Mo. Period | -6.1 | % | -28.7 | % | 50 | |||||
| Percentage of Negative 12-Mo. Rolling Periods | 30.6 | % | 33.7 | % | 98 | |||||
| Percentage of Negative 36-Mo. Rolling Periods | 21.6 | % | 43.2 | % | 74 | |||||
| Percentage of Negative 60-Mo. Rolling Periods | 6.0 | % | 24.0 | % | 50 | |||||
| Percent Beat Benchmark 12-Mo. | 62.2 | % | n/a | 98 | ||||||
| Percent Beat Benchmark 36-Mo. | 54.1 | % | n/a | 74 | ||||||
| Percent Beat Benchmark 60-Mo. | 68.0 | % | n/a | 50 | ||||||
1 | The best performing 12, 36 and 60 month rolling periods for the Fund commenced in March 1999, April 2003 and October 2001, respectively. The worst performing 12 month rolling period for the Fund commenced in October 2000; the worst 36 and 60 month rolling periods for the Fund commenced in April 2000. |
| • | Since its inception and over most shorter time periods the fund is highly ranked compared to its international fund Lipper Category peer group (note: the lower the percentage ranking the better). As reflected in the table below, for the period since the fund’s inception (December 1, 1997), Masters’ Select International is ranked in the top 5% of its International peer group. It is also highly ranked compared to its Morningstar Foreign Large Blend peer group over the past five years. (Note: Morningstar does not provide a “since-inception” ranking.) 2006 and 2004 were the only years in the last eight that the fund failed to rank at least in the top 30% of its Lipper and Morningstar peer groups. |
MASTERS’ SELECT INTERNATIONAL FUND LIPPER INTERNATIONAL FUND CATEGORY RANKING BASED ON TOTAL FUND RETURNS | ||||||||||||||||||||||||||
Annual Ranking As of December 31 | Trailing Periods As of December 31, 2006 | |||||||||||||||||||||||||
1998 | 1999 | 2000 | 2001 | 2002 | 2003 | 2004 | 2005 | 2006 | One-Year | Three-Year | Five-Year | Since Inception | ||||||||||||||
| % Rank in Category | 63.4% | 7.8% | 15.2% | 23.5% | 28.6% | 25.7% | 80.9% | 3.7% | 65.1% | 65.1% | 25.9% | 24.3% | 5.0% | |||||||||||||
| Funds in Category | 435 | 516 | 605 | 759 | 808 | 834 | 854 | 875 | 968 | 968 | 798 | 650 | 300 | |||||||||||||
Lipper, Inc. is an independent mutual fund research and rating service. Each Lipper average represents a universe of funds with similar investment objectives. Rankings for the periods shown are based on fund total returns with dividends and distributions reinvested and do not reflect sales charges.
MASTERS’ SELECT INTERNATIONAL FUND MORNINGSTAR FOREIGN LARGE BLEND PEER GROUP RANKINGS BASED ON TOTAL FUND RETURNS | ||||||||||||||||||||||||
Annual Ranking As of December 31 | Trailing Periods As of December 31, 2006 | |||||||||||||||||||||||
1998 | 1999 | 2000 | 2001 | 2002 | 2003 | 2004 | 2005 | 2006 | One-Year | Three-Year | Five-Year | |||||||||||||
| % Rank in Category | 69% | 3% | 6% | 18% | 23% | 16% | 86% | 3% | 67% | 67% | 18% | 12% | ||||||||||||
| Funds in Category | 229 | 266 | 305 | 348 | 405 | 450 | 489 | 602 | 648 | 648 | 537 | 435 | ||||||||||||
Morningstar, Inc. is an independent mutual fund research and rating service. Each Morningstar category represents a universe of funds with similar investment objectives. Rankings for the periods shown are based on fund total returns with dividends and distributions reinvested and do not reflect sales charges. The highest percentile rank is 1 and the lowest is 100. The information contained herein: (1) is proprietary to Morningstar; (2) may not be copied or distributed; and (3) is not warranted to be accurate, complete or timely. Neither Morningstar nor its content providers are responsible for any damages or losses arising from any use of this information. Past performance is no guarantee of future results.
| • | Historically, each of the fund’s long-term managers has outperformed his or her benchmarks during their tenure at the fund. This includes sub-advisors who were replaced. We don’t include Amit Wadhwaney or Jim Gendelman who were added to the fund in early 2005 (so far one is outperforming). Of the three current managers who have at least three-year tenures with Masters’ Select, one has outperformed his benchmark by 7.6 percentage points on an annualized basis, one has outperformed by 2.2 percentage points on an annualized basis and the third has outperformed by 0.6 percentage points on average per year. |
Fund Summary | 19
| • | Masters’ Select International has also out-returned each of its benchmarks by a significant margin over its life, after taking taxes into account. Though performance reporting regulations do not provide any methodology for measuring a benchmark’s after-tax performance, we can nevertheless say with certainty that the fund has out-returned its benchmarks after taking into account taxes because its after-tax return exceeds the pre-tax return of all its benchmarks. Masters’ Select International’s after-tax return over its life, assuming all shares were liquidated on December 31, 2006, and taxes were paid on distributions in each year at the highest tax rate in place at the time of each distribution, was 11.41%. Masters’ Select International Fund average annual total return after taxes on distributions for the one-year, five-year and since inception (12/01/97) periods ended December 31, 2006 are 20.39%, 14.50% and 12.08%, respectively. The average annual total return after taxes on distributions and the sale of fund shares for the one-year, five-year and since inception (12/01/97) periods ended December 31, 2006 are 17.74%, 13.55% and 11.41%, respectively. |
Portfolio Commentary
A number of factors contributed to the fund’s performance during 2006. The highlights follow.
Performance of managers: In 2006, two of the fund’s five managers outperformed their respective benchmarks. The other three managers trailed their benchmarks. In most periods the fund will have a mix of underperforming and outperforming managers. But historically, the outperforming managers have more than offset the underperforming managers. As noted earlier, since inception, the three managers with tenures on the fund of at least three years have beaten their benchmarks. One of the two newer managers is also outperforming since joining the fund, while the fifth manager trails his benchmark. For the year, the performance of the individual managers ranged from a gain of 11.9% to a gain of 33.5%.
Sector, regional and stock-picking impact: Though all the Masters’ Select funds are driven by bottom-up stock picking, the sector exposure that results from this process may provide some insight into the fund’s relative performance. Based on our attribution analysis, the fund’s overall sector exposure relative to the S&P/Citigroup PMI Global ex-US Index had a slight negative effect on performance during 2006. The fund was hurt by its overweightings to the health care and consumer discretionary sectors, as both sectors returned less than the overall benchmark. On the other hand, the fund’s underweighting to the bottom-performing technology sector helped its relative return. When looked at in terms of the fund’s country and regional allocations, its underweighting to the strong European markets hurt relative performance a bit, while its underweighting to the weak Japanese market and its overweighting to Hong Kong and Chinese stocks (two strong markets) helped relative performance.
The managers’ stock selection was mixed for the year. It was strong in the consumer discretionary and financial sectors, paced by the fund’s top-performer, Hong Kong Exchange (up 115% on the year) and Inditex (up 68%). Interestingly, the fund’s worst-performing stock in dollar terms was also in the financials sector: KK Davinci Advisors dropped 24% and cost the fund roughly 80 basis points (0.80%) of absolute return. Stock picking was poor within the information technology sector, but technology was a small weighting overall in the fund. The fund’s worst performer (in percentage terms) was in the materials sector: global paper company, Abitibi-Consolidated (down 41%). From a country and regional perspective, the managers’ stock picking was strong within Asia (ex Japan) and Latin America, and generally weak in Europe and Japan. It is important to remember that the fund’s sector and country weightings are a residual of the managers’ bottom-up stock-selection process rather than the result of top-down asset allocation decisions.
Leaders and laggards: All five of the fund’s managers owned at least one stock that was among the fund’s ten largest dollar gainers for the year. Bill Fries owned six of the top ten winners. Four of the five managers also had at least one stock among the biggest losers for the year; David Herro avoided this losers’ list. The aggregate (dollar) gain from the top ten winners was three times the aggregate loss from the bottom ten laggards. All ten of the largest winners remained in the portfolio at year-end, while only two of the ten biggest losers were still held.
See the table on page 22 that lists the leaders and laggards over the past six and 12 months. The table includes the biggest dollar gains and losses as well as the largest percentage winners and losers.
Portfolio mix: Please see page 23 for sector, asset class and regional allocations as of year-end. Following are some observations.
• | The fund’s exposure to the consumer discretionary sector dropped by almost nine percentage points (to 16.5%) and its energy weighting dropped four percentage points (to 3.6%). The financials, telecom, utilities and materials sector allocations all increased by at least three percentage points. |
| • | The fund’s largest sector exposure is now to financial companies, at 24.7% of assets, but this is still below the benchmark’s 31.7% weighting. The fund is also significantly underweighted to energy and technology. The fund has large overweightings to consumer discretionary stocks (16.5% of fund assets versus 8.8% for the benchmark), health care (13.8% vs. 5.8%) and telecom (10.9% vs. 6.6%). |
| • | Exposure to Japanese stocks dropped to 10.2% of the portfolio at year-end, from 15.6% a year earlier. The index’s Japan weighting is 18.6%, so the fund has a large underweight there. |
| • | The fund’s weighting in European stocks held steady at roughly 50%, about five percentage points below the benchmark weighting. |
20 | The Masters’ Select Funds Trust
| • | The fund’s exposure to Asia (ex Japan) rose nine percentage points to 21.6%, its highest allocation ever and more than double the benchmark’s 10.7% weighting. The fund also has a slight overweighting to Latin American stocks. |
| • | In terms of the fund’s market-cap breakout, the largest change was an increase in the exposure to mid-cap stocks ($2 to $10 billion market cap) to 29% of the portfolio. The fund’s median market cap is $11.8 billion. |
| • | The fund’s cash position fell to 2.9% of assets by year-end. |
| • | At year-end, less than 2% of the Fund’s foreign currency exposure (in the Philippine peso) was hedged back into the U.S. dollar to protect against dollar appreciation. |
Miscellaneous
Taxes: Masters’ Select International distributed $2.79 during 2006. Approximately 74% of the distribution was categorized as either long-term capital gain or qualifying dividends, and subject to favorable tax treatment. This was the second year in a row that the distribution was significantly higher than we expect in the average year. As was the case in 2005, the reason was largely a function of the strong nominal return of over 170% achieved by the fund (this number is cumulative, not annualized) over the past 45 months. As a result of this high average return, a number of individual holdings appreciated significantly, making them much less attractively valued, resulting in their sale from the portfolio. During this 45-month period there were no capital gain distributions made until the year-end 2005 distribution—so there were significant gains accumulated in the fund. Importantly, and as noted earlier, the fund has outperformed its benchmarks since its inception, even after taking taxes into account.
We will continue to work with the fund’s sub-advisors to manage the fund in a tax-aware manner. This will include taking short-term losses when there is an alternative investment that is equally attractive and using other tax-management techniques. However, the managers will not sacrifice pre-tax performance in pursuit of after-tax performance since the fund has tax-exempt, as well as taxable shareholders.
Expenses: Expenses for 2006 were 1.06% of assets. The expense ratio in 2005 was 1.08%. The reduction was primarily due to break points in management fees that result in lower percentage charges at higher asset levels.
Accolades: Because the fund has been closed to new shareholders for over a year, it doesn’t get much media exposure. However, during 2006, the fund was Morningstar Fund Analyst Pick (one of only two actively managed funds in the foreign large blend category that made the cut) and had Morningstar’s highest stewardship grade of “A”.2
In Closing
Given the strong returns in international stock markets over the last four years (Masters’ Select International’s average annual return was 24.83%) we feel it is important to caution shareholders that nominal average annual returns are likely to be significantly lower over the long-term and also in the foreseeable future.
Even though we expect nominal returns to be much lower, foreign stocks still appear to be in a fair-value range. Similar to the U.S., the performance run started from a point of undervaluation after a three-year bear market, and since that time earnings growth has been strong enough to support valuations. While there can be no guarantees, we believe returns in the high single digits to low double digits are achievable, though individual years could be significantly higher or lower, and various factors could cause returns to fall outside of this range for lengthy time periods.
We are always grateful for your confidence. Along with the fund’s sub-advisors, we will work hard to continue to earn it.
Please see page 24 for specific stock commentaries written by the Masters’ Select International managers.
2 | Morningstar, Inc. is an independent mutual fund research and rating service. The Morningstar Stewardship Grade is based on the evaluation of five areas critical for mutual fund governance and operations. The five areas are: 1) Regulatory Issues- they examine the firm’s record in the past three years, 2) Board Quality- examines the quality of the fund’s board of directors, 3) Manager Incentives- examines the fund managers’ pay as well as the level of their investment in fund shares, 4) Fees- examines the amount that a management company charges fund shareholders and 5) Corporate Culture- evidence that a firm has a deep-rooted understanding of its role as a fiduciary. Each area will receive one of the following ratings Excellent, Good, Fair, Poor or Very Poor. Funds are assigned a letter grade from A (best) to F (worst) based on the cumulative total of points they received from each category. The Masters’ Select International Fund received an Overall Grade of “A” for 2006. |
See page 79 for Industry Terms and Definitions
Neither the information contained herein nor any opinion expressed shall be construed to constitute an offer to sell or a solicitation to buy any security or any other funds mentioned herein. The views herein are those of Litman/Gregory Fund Advisors, LLC at the time the material is written and may not be reflective of current conditions.
Fund Summary | 21
Masters’ Select International Fund Leaders and Laggards (Unaudited)
For the Six Months Ended December 31, 2006
By Percentage Gain / Loss
Security | Six Month Dollar Contribution/(Loss) | Six Month % Change | |||||
| Hong Kong Exchanges and Clearing Ltd. | 19,992,281 | 61.7 | % | ||||
| Veolia Environnement | 2,672,248 | 49.2 | % | ||||
| Alstom | 15,052,932 | 44.3 | % | ||||
| Eurazeo | 8,418,449 | 44.3 | % | ||||
| Capitaland Ltd. | 5,066,065 | 37.6 | % | ||||
| Gafisa S.A. | 5,665,201 | 36.3 | % | ||||
| China Merchants Holdings International Co. Ltd. | 11,589,242 | 35.4 | % | ||||
| Aker Kvaerner ASA | 2,458,383 | 33.2 | % | ||||
| Brit Insurance Holdings | 6,153,788 | 33.1 | % | ||||
| Telecom Corp of New Zealand | 5,735,729 | 31.8 | % | ||||
| 82,804,318 | |||||||
| Sysmex Corp. | (5,092,603 | ) | (19.0 | %) | |||
KK DaVinci Advisors | (2,304,728 | ) | (17.0 | %) | |||
Toray Industries, Inc. | (4,195,861 | ) | (15.3 | %) | |||
Nippon Sheet Glass Co. Ltd. | (2,884,237 | ) | (15.1 | %) | |||
| Yamada Denki Co. Ltd. | (3,361,166 | ) | (15.0 | %) | |||
| Asahi Glass | (2,407,408 | ) | (12.6 | %) | |||
Miraca Holdings | (1,614,493 | ) | (10.8 | %) | |||
| Mitsubishi UFJ Financial Group, Inc. | (2,327,903 | ) | (10.2 | %) | |||
Abitibi Consolidated, Inc. | (860,086 | ) | (9.3 | %) | |||
| Komatsu Ltd. | (2,181,440 | ) | (7.9 | %) | |||
| (27,229,924 | ) | ||||||
By Dollar Gain / Loss
Security | Six Month Dollar Contribution/(Loss) | Six Month % Change | |||||
| Hong Kong Exchanges and Clearing Ltd. | 19,992,281 | 61.7 | % | ||||
| Alstom | 15,052,932 | 44.3 | % | ||||
| America Movil S.A. de C.V. | 13,668,475 | 26.2 | % | ||||
| Stada Arzneimittel AG | 11,706,716 | 26.2 | % | ||||
| China Merchants Holdings International Co. Ltd. | 11,589,242 | 35.4 | % | ||||
| Industrial de Diseno Textil, S.A. | 10,562,290 | 29.8 | % | ||||
| Eurazeo | 8,418,449 | 44.3 | % | ||||
| NII Holdings, Inc. | 7,820,985 | 22.2 | % | ||||
| Serono S.A. | 7,687,608 | 27.7 | % | ||||
| Wal-Mart de Mexico S.A. de C.V. | 7,211,307 | 29.5 | % | ||||
| 113,710,285 | |||||||
| Sysmex Corp. | (5,092,603 | ) | (19.0 | %) | |||
| Toray Industries, Inc. | (4,195,861 | ) | (15.3 | %) | |||
| Yamada Denki Co. Ltd. | (3,361,166 | ) | (15.0 | %) | |||
| Nippon Sheet Glass Co. Ltd. | (2,884,237 | ) | (15.1 | %) | |||
| Asahi Glass | (2,407,408 | ) | (12.6 | %) | |||
| Mitsubishi UFJ Financial Group, Inc. | (2,327,903 | ) | (10.2 | %) | |||
| KK DaVinci Advisors | (2,304,728 | ) | (17.0 | %) | |||
| Komatsu Ltd. | (2,181,440 | ) | (7.9 | %) | |||
| GlaxoSmithKline Plc | (1,777,105 | ) | (6.4 | %) | |||
| Talisman Energy, Inc. | (1,714,033 | ) | (4.6 | %) | |||
| (28,246,484 | ) | ||||||
For the Year ended December 31, 2006
By Percentage Gain / Loss
Security | Twelve Month Dollar Contribution/(Loss) | Twelve Month % Change | |||||
| Hong Kong Exchanges and Clearing Ltd. | 33,877,372 | 114.6 | % | ||||
| Aker Kvaerner ASA | 7,538,221 | 88.3 | % | ||||
| Industrial de Diseno Textil, S.A. | 18,567,609 | 67.7 | % | ||||
| Capitaland Ltd. | 10,398,230 | 61.4 | % | ||||
| Southern Copper Corp. | 13,302,513 | 58.2 | % | ||||
| Veolia Environnement | 2,900,271 | 55.8 | % | ||||
| China Merchants Holdings International Co. Ltd. | 15,496,454 | 53.2 | % | ||||
| Eurazeo | 9,974,404 | 52.2 | % | ||||
| Alstom | 16,196,296 | 49.4 | % | ||||
| Bank of Ireland | 9,566,138 | 48.8 | % | ||||
| 137,817,507 | |||||||
| Abitibi Consolidated, Inc. | (5,929,655 | ) | (41.3 | %) | |||
| Boliden | (4,263,321 | ) | (26.5 | %) | |||
| KK DaVinci Advisors | (11,957,399 | ) | (24.3 | %) | |||
| Yamada Denki Co. Ltd. | (5,739,134 | ) | (23.2 | %) | |||
| USG People NV | (4,682,779 | ) | (22.0 | %) | |||
| Korea Investment Holding Co. Ltd. | (4,089,074 | ) | (20.5 | %) | |||
| Vallourec | (4,890,102 | ) | (18.9 | %) | |||
| Toray Industries, Inc. | (4,926,129 | ) | (17.5 | %) | |||
| Thomson SA | (3,418,232 | ) | (16.6 | %) | |||
| Empresa Brasileira de Aeronautica SA | (4,562,598 | ) | (14.1 | %) | |||
| (54,458,423 | ) | ||||||
By Dollar Gain / Loss
Security | Twelve Month Dollar Contribution/(Loss) | Twelve Month % Change | |||||
| Hong Kong Exchanges and Clearing Ltd. | 33,877,372 | 114.6 | % | ||||
| America Movil S.A. de C.V. | 23,551,030 | 27.9 | % | ||||
| Industrial de Diseno Textil, S.A. | 18,567,609 | 67.7 | % | ||||
| UBS AG | 16,417,674 | 17.8 | % | ||||
| Alstom | 16,196,296 | 49.4 | % | ||||
| China Merchants Holdings International Co. Ltd. | 15,496,454 | 53.2 | % | ||||
| Southern Copper Corp. | 13,302,513 | 58.2 | % | ||||
| Roche Holding AG | 11,624,439 | 14.6 | % | ||||
| Capitaland Ltd. | 10,398,230 | 61.4 | % | ||||
| Eurazeo | 9,974,404 | 52.2 | % | ||||
| 169,406,020 | |||||||
| KK DaVinci Advisors | (11,957,399 | ) | (24.3 | %) | |||
| Abitibi Consolidated, Inc. | (5,929,655 | ) | (41.3 | %) | |||
| Teva Pharmaceutical Industries Ltd. | (5,888,074 | ) | (11.3 | %) | |||
| Yamada Denki Co. Ltd. | (5,739,134 | ) | (23.2 | %) | |||
| Toray Industries, Inc. | (4,926,129 | ) | (17.5 | %) | |||
| Vallourec | (4,890,102 | ) | (18.9 | %) | |||
| USG People NV | (4,682,779 | ) | (22.0 | %) | |||
| Empresa Brasileira de Aeronautica SA | (4,562,598 | ) | (14.1 | %) | |||
| Boliden | (4,263,321 | ) | (26.5 | %) | |||
| Korea Investment Holding Co. Ltd. | (4,089,074 | ) | (20.5 | %) | |||
| (56,928,265 | ) | ||||||
Please refer to the fund’s schedule of investments in this report for complete holdings information. Fund holdings and sector allocations are subject to change and should not be considered a recommendation to buy or sell any security.
22 | The Masters’ Select Funds Trust
Masters’ Select International Fund Managers
INVESTMENT MANAGER | FIRM | TARGET ASSET ALLOCATION | MARKET CAPITALIZATION OF COMPANIES IN PORTFOLIO | STOCK-PICKING STYLE | ||||
| Bill Fries | Thornburg Investment Management, Inc. | 24% | All sizes | Eclectic, may invest in traditional value stocks or growth stocks | ||||
| David Herro | Harris Associates L.P. | 23% | All sizes, but mostly large and mid-sized companies | Value | ||||
| Jim Gendelman | Marsico Capital Management, LLC | 15% | All sizes, but mostly large and mid-sized companies | Growth | ||||
| Ted Tyson | Mastholm Asset Management, LLC | 23% | All sizes | Growth | ||||
| Amit Wadhwaney | Third Avenue Management, LLC | 15% | All sizes | Value |
Portfolio Composition*
The fund holds 65 securities, exclusive of cash equivalents.
By Sector
| Sector Weights | |||||||
| Fund | Citigroup PMI Global (ex US) Index | ||||||
| Consumer Discretionary | 16.5 | % | 8.8 | % | |||
| Consumer Staples | 4.6 | % | 7.1 | % | |||
| Energy | 3.6 | % | 10.9 | % | |||
| Finance | 24.7 | % | 31.7 | % | |||
| Health Care & Pharmaceuticals | 13.8 | % | 5.8 | % | |||
| Industrials | 10.9 | % | 8.5 | % | |||
| Materials | 5.6 | % | 8.5 | % | |||
| Technology | 2.7 | % | 6.8 | % | |||
| Telecommunications | 10.9 | % | 6.6 | % | |||
| Utilities | 3.9 | % | 5.4 | % | |||
| Cash Equivalents & Other | 2.9 | % | 0.0 | % | |||
100.0 | % | 100.0 | % | ||||
By Asset Class
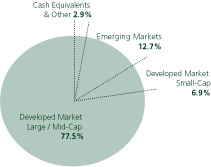
Market Capitalization:
Develop Markets Small-Cap < $2.0 billion
Develop Markets Large and Mid-Cap > $2.0 billion
By Region
| Region Weights | |||||||
| Fund | Citigroup PMI Global (ex US) Index | ||||||
| Africa | 0.0 | % | 1.6 | % | |||
| Australia/New Zealand | 2.5 | % | 4.5 | % | |||
| Asia (ex Japan) | 21.6 | % | 10.7 | % | |||
| Japan | 10.2 | % | 18.6 | % | |||
| Western Europe & United Kingdom | 49.7 | % | 54.9 | % | |||
| Latin America | 3.9 | % | 2.8 | % | |||
| North America | 7.7 | % | 6.1 | % | |||
| Middle East | 1.6 | % | 0.7 | % | |||
| Cash Equivalents & Other | 2.9 | % | 0.0 | % | |||
100.0 | % | 100.0 | % | ||||
By Market Capitalization
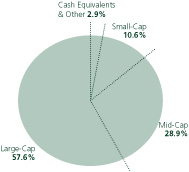
Market Capitalization:
Small-Cap < $2.0 billion
Mid-Cap $2.0 billion - $10.0 billion
Large-Cap > $10.0 billion
* Totals may not add up to 100% due to rounding.
Fund Summary | 23
Masters’ Select International Fund Stock Highlights
Canadian Natural Resources Ltd. - Bill Fries
Alberta-based Canadian Natural Resources is an independent oil and natural gas exploration, development, and production company. Its operations are focused in Western Canada (80% of production and growing), the North Sea (14%), and off the coast of West Africa (6%). Since 1994, the current management team has grown daily production from 50,000 barrels of oil equivalent (BOE) per day to more than 550,000. It increased proved reserves from 100 million BOE to 1.5 billion between 1994 and the end of 2005. Canadian Natural is the second largest natural gas producer in Canada, where it has mature production fields in Saskatchewan and Eastern Alberta, and significant current production and growth prospects in Western Alberta and Northeastern British Columbia. The company is not integrated into downstream operations such as product refining and marketing of finished products.
In addition to the “conventional” reserves referred to above, Canadian Natural controls significant heavy oil and oil sands resources in Western Canada. As a result, Canadian Natural Resources possesses one of its industry’s best production-growth profiles. In particular, the company’s 100%-owned Horizon Oil Sands Project, comprising both a bitumen mining operation and an onsite crude oil upgrader, is the world’s 5th largest announced oil development project, according to Goldman Sachs. The Horizon oil-sands project is scheduled to start production in 2008 at 110,000 barrels a day and rise to 232,000 by 2012 after a second development phase. The Horizon Project has significant construction and completion cost risk, although the company has taken steps to mitigate these. Upon formally beginning construction of the $7 billion first phase of the Horizon project in 2005, Canadian Natural added some 1.8 billion barrels of synthetic crude oil equivalent to its proved reserves. The firm believes it can add up to 4 billion barrels of additional proved mineable reserves (with little exploration risk) when future phases of the overall project are developed during the next decade and beyond. Depending upon the rate of development, the Horizon Project could increase Canadian Natural’s current daily production rate by 50% or more within the next decade. Management has indicated that Horizon will produce high investment returns with oil prices at or above $35 per barrel, but that new oil-sands projects may need crude prices of at least $45 a barrel to be viable.
MLP AG - David Herro
MLP is a German based financial services company focusing on the distribution of investment services. Though German based, they do have operations in Central Europe as well as the United Kingdom.
We, as value investors, look for high quality businesses that sell at a discount to their intrinsic value. MLP fits our criteria quite snugly. Though MLP used to be more vertically integrated as they owned an insurance business, today their business is mostly involved in the distribution of investment services. As Germany, like much of Europe, is moving from a state focused pension system to one which is more individually focused, MLP should see a very opportunistic operating environment. Though MLP was primarily focused on marketing to recent college grads, they have expanded their reach to include older, wealthy individuals. We believe that they are in a prime position to benefit from increasing demand for savings and investing products by German and European citizens.
From a valuation perspective, we think MLP is very attractively priced. It sells for roughly 8.5x its enterprise value to operating profit and yields just under 4%. Its balance sheet is fine and management has been very proactive in its allocation of free cash. As an example, they sold an underperforming insurance business at a very good price and used the proceeds to both buy back their own stock as well as to make a growth-oriented acquisition. This acquisition, Feri Finance, in our view, will give them further growth opportunities outside of their core target client base.
Veolia Environnement - Jim Gendelman
Veolia Environnement (“Veolia” or the “Company”) is a France-based company that provides environmental services to public authorities and industrial customers worldwide.
We believe that a number of factors may make Veolia a compelling long-term investment. For example, we believe that Veolia may be well positioned to address the growing, worldwide need for clean drinking water and sanitation facilities. According to our research, less than 50% of the world’s population has access to clean water and less than 25% has access to sanitary systems. Veolia has a strong and growing market presence as a leading provider of water and waste management services and the Company may be well positioned to benefit from the demand for these services.
Budgetary constraints, lack of technical expertise, and stringent drinking water regulations are forcing many public authorities to increasingly look to providers such as Veolia for assistance in efficiently managing their water-treatment and sanitation infrastructure. As a result, companies like Veolia provide client-specific solutions that tend to result in long-term contracts with its customers. Another attractive aspect of Veolia’s business model may be the Company’s over 90% renewal rate on approximately 15,000 customers. Finally, we think that Veolia may be well positioned geographically. For example, the Company has been successful in building a commanding market position in China as well as maintaining a leading market share in European and North American markets.
As of this writing, we believe that Veolia’s stock valuation may be compelling given our internal compounded annual growth forecasts of more than 18% over the next three years. The stock is currently trading around 20x our 2008 earnings estimate, a valuation that we consider attractive.
Omega Pharma - Ted Tyson
Omega Pharma is a pan-European distributor to pharmacists based in Belgium. Its core division sells products ranging from over-the-counter drugs (such as lice treatment products and athletes foot remedies) to generics and “lifestyle” beauty products from anti-wrinkle creams to age spot removers. Organic sales growth (that is, excluding acquisitions) has been in the high-single-digit range for several years—much faster than the 3% growth seen in Europe generally. Omega is typically, in the niche OTC drugs it sells, one of the top three producers in its geographical territory.
24 | The Masters’ Select Funds Trust
Both the OTC and pharmacy markets are consolidating across Europe, but the process has a considerable way to go. The largest maker of OTC drugs in Europe (Bayer) has only a 4.4% market share, and Omega has just over 2.6%. Laws promoting the creation of chain pharmacies (which have historically been banned in most of Europe) have been widely enacted, partly to help in reducing medical costs for an aging population.
Omega has responded to these changes by increasing R&D on niche OTC products and buying small producers including Pharmygiene (France) and Chefaro and Bional (Netherlands) to extend its product range and geographical scope. It has also purchased 60 Consumer Health brands from Pfizer.
In 2006, the company made a major strategic decision to buy the Austrian company Bittner Pharma, which is a major producer and distributor of OTC products in Central Europe, the Ukraine, and Russia, where OTC sales growth is above 20%. Based on discussions with the company, it seems clear that margins at Bittner are well above 30% and that the deal, which closes in early 2007, will add to earnings immediately.
Omega also made the decision to reduce its business lines to focus on core areas of OTC drugs and associated products. Its historical second division, Arseus, which dominates the distribution of a number of dental and hospital products in Belgium and sells compounds that pharmacists use for creating pills in their shops, will be sold (probably through an IPO) in 2007, with the proceeds used to expand the company’s war chest for further acquisitions.
Omega reported earnings of 2.86 Euros per share in 2005 and is expected to earn 3.35 Euros in 2006. On an operating earnings level, however, growth will be more subdued due to increased costs and write downs of some product development costs. Using slightly more conservative estimates for Bittner (due to lack of a track record in the region for OTC sales) we still believe Omega has the potential to post gains in earnings of approximately 25% in each of the next two years, and to have strong long-term prospects.
Yuanta Core Pacific Securities Co. - Amit Wadhwaney
Yuanta Core Pacific Securities (“Yuanta”) is Taiwan’s largest securities brokerage firm, with the top market share in trading, underwriting, and margin lending. Yuanta also owns a 28.3% stake in Kim Eng Holdings (number two brokerage in Singapore and number one broker in Thailand and Indonesia). We initiated a position in Yuanta at a slight premium to its tangible book value.
Brokerage firms’ revenues and earnings are highly sensitive to trading turnover. Taiwan’s trading environment has been bleak for a decade; since its peak in 1997, the turnover on Taiwan’s stock exchanges has been declining (with a brief respite in 2000) until 2005. Turnover picked up in 2006 but still remains below levels achieved ten years ago.
Despite the difficult environment, Yuanta performed well throughout the period, never losing money and growing book value per share per share at the rate of 11% per year since 1996. The company is significantly overcapitalized (2.5x the regulatory requirement, among the highest in the industry). Its strong balance sheet allowed it to acquire weaker competitors at attractive prices and weather even the most severe downturns with little disruption.
As of the beginning of 2007, Yuanta is in the process of merging with Fuhwa Financial Holdings via a reverse takeover. Fuhwa Financial is a Taiwanese bank with its own securities brokerage subsidiary. The combined company will have a much greater brokerage market share, especially in margin lending. Further benefits of the merger include easier expansion abroad, synergies between banking and securities businesses (especially in the area of wealth management), and standard operating cost synergies from closing redundant branches, consolidating back offices and corporate overhead. The takeover was effected at reasonable prices, paying no premium over the market price of Fuhwa shares.
See page 79 for Industry Terms and Definitions
Neither the information contained herein nor any opinion expressed shall be construed to constitute an offer to sell or a solicitation to buy any securities mentioned herein. The views herein are those of the portfolio managers at the time the commentaries are written and may not be reflective of current conditions.
Fund Summary | 25
Masters’ Select International Fund
SCHEDULE OF INVESTMENTS IN SECURITIES at December 31, 2006
Shares | Value | ||
COMMON STOCKS: 97.0% | |||
Australia: 1.1% | |||
| 309,855 | Macquarie Bank Ltd. | $ | 19,278,117 |
Austria: 1.7% | |||
| 387,587 | Erste Bank Der Oesterreichischen Sparkassen AG | 29,715,830 | |
Belgium: 1.1% | |||
| 243,400 | Omega Pharma | 18,356,055 | |
Brazil: 0.8% | |||
| 878,673 | Gafisa S.A.* | 13,145,113 | |
Canada: 3.3% | |||
| 670,400 | Canadian Natural Resources Ltd. | 35,685,392 | |
| 1,918,500 | Canfor Corp.* | 17,762,670 | |
| 285,856 | Canfor Pulp Income Fund | 3,026,826 | |
| 56,474,888 | |||
France: 8.5% | |||
| 361,600 | Alstom* | 49,005,113 | |
| 1,049,300 | AXA SA | 42,467,430 | |
| 192,153 | Eurazeo | 27,435,758 | |
| 130,200 | Pinault-Printemps-Redoute S.A. | 19,449,120 | |
| 105,096 | Veolia Environnement | 8,099,190 | |
| 146,456,611 | |||
Germany: 5.9% | |||
| 334,300 | Bayerische Motoren Werke (BMW) AG | 19,194,110 | |
| 1,339,000 | MLP AG | 26,574,858 | |
| 984,553 | Stada Arzneimittel AG | 56,450,971 | |
| 102,219,939 | |||
Greece: 2.3% | |||
| 1,017,100 | OPAP S.A. | 39,298,616 | |
Hong Kong: 12.0% | |||
| 10,746,500 | China Merchants Holdings International Co. Ltd. | 44,077,010 | |
| 166,233 | CNOOC Ltd. ADR | 15,730,629 | |
| 1,536,930 | Guoco Group Ltd. | 18,970,541 | |
| 3,253,800 | Hong Kong Exchanges and Clearing Ltd. | 35,811,212 | |
| 11,729,000 | Hutchison Telecommunications* | 29,648,239 | |
| 1,844,000 | Hutchison Whampoa Ltd. | 18,730,199 | |
| 10,620,000 | Melco International Development | 25,261,006 | |
| 2,655 | Melco PBL Entertainment* | 56,445 | |
| 45,630,261 | Shanghai Electric Group Co. Ltd. | 19,067,366 | |
| 207,352,647 | |||
Ireland: 1.4% | |||
| 1,088,500 | Bank of Ireland | 25,136,744 | |
Israel: 1.6% | |||
| 885,400 | Teva Pharmaceutical Industries Ltd. | 27,518,232 | |
Japan: 10.2% | |||
| 395,000 | Asatsu-DK, Inc. | 12,544,423 | |
| 1,290,000 | Daiwa Securities Group, Inc. | 14,468,809 | |
| 654,200 | Honda Motor Co. Ltd. | 25,832,724 | |
| 1,223,200 | Nichicon Corp. | 15,014,452 | |
| 3,431,000 | Nippon Sheet Glass Co. Ltd. | 16,084,839 | |
| 232,900 | Rohm Co. Ltd. | 23,187,272 | |
| 1,496,000 | Sekisui House Ltd. | 21,781,710 | |
| 5,336,000 | Tokyo Gas Co. Ltd. | 28,377,971 | |
| 223,700 | Yamada Denki Co. Ltd. | 18,982,315 | |
| 176,274,515 | |||
Mexico: 3.2% | |||
| 1,212,611 | America Movil S.A. de C.V. | 54,834,269 | |
Netherlands: 1.3% | |||
| 1,448,000 | Qiagen NV* | 22,203,284 | |
New Zealand: 1.3% | |||
| 6,724,600 | Telecom Corp of New Zealand Ltd. | 23,027,424 | |
Norway: 1.7% | |||
| 79,000 | Aker Kvaerner ASA | 9,868,658 | |
| 1,117,600 | Norske Skogindustrier ASA | 19,290,623 | |
| 29,159,281 | |||
Philippines: 1.8% | |||
| 309,580,000 | PNOC Energy Develo* | 30,629,600 | |
Poland: 0.7% | |||
| 6,996,000 | Netia S.A. | 12,140,825 | |
Singapore: 3.0% | |||
| 20,486,000 | BIL International Ltd. | 22,436,507 | |
| 3,320,000 | Capitaland Ltd. | 13,418,951 | |
| 1,379,600 | Keppel Corp. Ltd. | 15,829,043 | |
| 51,684,501 | |||
South Korea: 3.6% | |||
| 705,817 | Shinhan Financial Group* | 36,049,793 | |
| 108,600 | SK Telecom | 25,982,258 | |
| 62,032,051 | |||
Spain: 2.6% | |||
| 841,000 | Industrial de Diseno Textil, S.A. | 45,290,292 | |
Switzerland: 11.9% | |||
| 278,581 | Lonza Group AG | 24,051,637 | |
| 80,200 | Nestle S.A. | 28,472,595 | |
| 106,400 | Nobel Biocare Holding AG | 31,427,541 | |
| 311,930 | Roche Holding AG | 55,882,183 | |
| 1,081,515 | UBS AG | 65,663,252 | |
| 205,497,208 | |||
Taiwan: 1.1% | |||
| 10,129,000 | Giga Byte Technology Co. Ltd. | 7,691,141 | |
| 14,339,000 | Yuanta Core Pacific Securities Co. | 11,899,677 | |
| 19,590,818 |
26 | The Masters’ Select Funds Trust
Masters’ Select International Fund
SCHEDULE OF INVESTMENTS IN SECURITIES at December 31, 2006
Shares/ Principal Amount | Value | ||
United Kingdom: 10.5% | |||
| 3,819,624 | Brit Insurance Holdings | $ | 23,622,213 |
| 2,932,900 | British Sky Broadcasting Group Plc | 29,986,403 | |
| 2,118,700 | Cadbury Schweppes Plc | 22,678,600 | |
| 1,146,800 | Carpetright Plc | 29,447,402 | |
| 1,395,600 | Diageo Plc | 27,403,243 | |
| 973,100 | GlaxoSmithKline Plc | 25,616,121 | |
| 571,300 | Willis Group Holdings Ltd. | 22,686,323 | |
| 181,440,305 | |||
United States: 4.4% | |||
| 667,155 | NII Holdings, Inc.* | 42,991,468 | |
| 613,000 | Southern Copper Corp. | 33,034,570 | |
| 76,026,038 | |||
TOTAL COMMON STOCKS (cost $1,334,519,823) | 1,674,783,203 | ||
SHORT-TERM INVESTMENTS: 2.7% | |||
| $47,482,000 | State Street Bank & Trust Co., 3.600%, 12/31/06, due 01/02/07 [collateral: $42,015,000, If US Treasury Notes, 7.125%, due 02/15/23, US Treasury Notes, 4.500%, due 11/15/15, US Treasury Notes, 7.250%, due 08/15/22, value $48,446,845] (proceeds $47,500,993) | 47,482,000 | |
TOTAL SHORT-TERM INVESTMENTS | |||
| (cost $47,482,000) | 47,482,000 | ||
TOTAL INVESTMENTS IN SECURITIES | |||
| (cost $1,382,001,823): 99.7% | 1,722,265,203 | ||
| Other Assets less Liabilities: 0.3% | 4,531,266 | ||
Net Assets: 100.0% | $ | 1,726,796,469 | |
* Non-income producing security.
The accompanying notes are an integral part of these financial statements.
Schedule of Investments | 27
Masters’ Select Value Fund Review
After a very rough first part of 2006, Masters’ Select Value bounced back during the last part of the year. During the rebound, which began in August, the fund returned 18.23% compared to 12.12% for the Russell 3000 Value benchmark. Despite this rebound and a strong absolute return of 16.77% for all of 2006, the fund trailed its Russell 3000 Value benchmark in what was an outstanding year for traditional value stocks. Since its inception six and one half years ago, Masters’ Select Value has slightly trailed its Russell 3000 Value benchmark (9.61% versus 9.67%) while besting its Lipper Multi-Cap Value benchmark (9.01%).
Comparison Chart
The value of a hypothetical $10,000 investment in the Masters’ Select Value Fund from inception (06/30/00) to present compared with the Russell 3000 Value Index and the Lipper Multi-Cap Value Index.
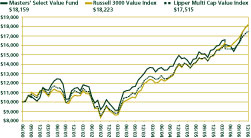
The hypothetical $10,000 investment at fund inception includes changes due to share price and reinvestment of dividends and capital gains. This chart does not imply future performance. Indices are unmanaged, do not incur fees, expenses or taxes and cannot be invested in directly
Performance As of December 31, 2006
Average Annual Total Returns | |||||||
One-Year | Three-Year | Five-Year | Since Inception (6/30/00) | ||||
Masters’ Select Value Fund | 16.77% | 11.73% | 9.65% | 9.61% | |||
Russell 3000 Value Index | 22.34% | 15.20% | 11.20% | 9.67% | |||
Lipper Multi-Cap Value Index | 17.07% | 12.67% | 9.37% | 9.01% | |||
Performance quoted represents past performance and does not guarantee future results. The investment return and principal value of an investment will fluctuate so that an investor’s shares, when redeemed, may be worth more or less than their original cost. Current performance of the funds may be lower or higher than the performance quoted. To obtain the performance of the funds as of the most recently completed calendar month, please visit our website at www.mastersfunds.com or call 1-800-960-0188. The Fund imposes a 2% redemption fee on shares held less than 180 days. Performance does not reflect the redemption fee. If reflected, performance would be lower.
Though the fund invests primarily in securities of U.S.-domiciled companies, it can and has invested in foreign securities as well. Investment in foreign securities subjects investors to political, economic and market risks and fluctuations in currency rates. Though the fund invests primarily in mid- and larger-sized companies it can also invest in smaller companies. Smaller companies can involve more risk such as limited liquidity and greater volatility. Though to date the fund has met the criteria of a “diversified fund,” it is registered as “non-diversified,” which allows it to concentrate more of its assets in a smaller number of securities, potentially exposing it to more risk than a diversified fund.
See page 78 for index definitions
Long-Term Performance Analysis
We were happy to see the fund’s second-half rebound and we hope it is the start of a lengthy period of outperformance. But as we write in every report, it is the fund’s longer-term performance that is our focus. In this regard we are disappointed that the fund has slightly trailed one of its benchmarks since inception. The fund’s performance in recent years has lagged during a time when some of the sub-advisors’ approach to value investing has faced a relative performance headwind.
In analyzing the fund’s long-term record it is useful to point out that the fund’s launch was well timed—it occurred in June of 2000, very close to the peak of the powerful relative-performance run for growth stocks. Since that time—the entire operating life of Masters’ Select Value—the stock market has experienced a huge run of value-stock dominance. During this period the Russell 3000 Value Index has posted a 9.67% average annual return while the Russell 3000 Growth Index has an average annual loss of 5.43%—an almost 15 percentage point average annual performance differential. From its launch, Masters’ Select Value performed very well relative to the Russell 3000 Value Index into 2004. Since that time it has struggled on a relative basis though absolute returns have been double-digit.
As we’ve written in the past, we believe the fund’s recent relative performance struggles (at least until the period of outperformance during the last five months) are partly explained by the fact that several of our sub-advisors are finding some of the most compelling values among slumping “growth” stocks. In fact, as of the end of 2006 the fund had six holdings, held by three of the fund’s four managers, that fell in the top 50 holdings of the Russell 3000 Growth Index (Google, Home Depot, Dell, Intel, Yahoo, FedEx). There is other evidence of the current portfolio’s exposure to stocks thought of as growth-oriented. For example, based on the portfolio’s characteristics, Morningstar recently re-categorized the fund as “blend” rather than “value”—a trend we’ve seen with several renowned value funds including Longleaf Partners and Oakmark Fund, each run by one of the Masters’ Select Value sub-advisors. The portfolio’s overall valuation and growth statistics also indicate that the fund is more growth-oriented than the Russell 3000 Value benchmark.
So far the problem with the exposure to “growthy” stocks is that in general it has hurt returns because value stocks’ returns have continued to dominate growth stocks’ returns (we say this based on benchmark performance). However, when we drill down into detailed discussions with the sub-advisors about stocks like Dell, Home Depot, Amazon and Yahoo, their analysis is compelling. In some cases, long-term expected growth rates may be slowing. This is often a turn-off for many investors—especially growth investors who often take a “shoot first and ask questions later” approach to any sign of decelerating growth. So they dump their holdings, driving the stock price lower. But for several of the growth stocks held in the fund, even though the company’s long-term growth rate may be slowing, the sub-advisor(s) still believe that earnings will grow at an above-average rate—a rate that the stock price doesn’t adequately account for. In their view, this is not yet understood by the average investor which is the reason why there is a value opportunity.
28 | The Masters’ Select Funds Trust
Overall we believe the fund’s sub-advisors will be proven right. Throughout their careers we’ve observed that they tend to be early more often than wrong—though they are not immune to making mistakes. All four of the fund’s sub-advisors have achieved long-term success partly by at times holding what is not popular and being patient when they are confident their analysis is sound. After seven consecutive years of value dominance over growth, we are not surprised to hear that there are beaten-up growth stocks that offer attractive “value.”
You may be wondering whether it makes sense for a value fund to own growth stocks. We believe every company has a theoretical fair value—so any company can sell at a bargain price. Some companies are harder to value than others. And most value-oriented stock pickers don’t like to pay much for growth because future cash flows are uncertain. (Bill Miller is unusual in his willingness to tackle valuation for some companies that other value investors would not touch—part of his approach involves looking at a variety of scenarios for each company.) However, even old-fashioned value investors can be tempted when stock prices reflect very little value for future growth. For several companies this seems to be the case now. As Bill Nygren has stated more than once over the last couple of years, he is finding above-average companies selling for average prices. So, to answer the question we posed, yes, it makes sense for a value fund to buy growth stocks when that growth is clearly undervalued. Generally, this seems to be a somewhat rare occurrence but it appears to be the case today for a number of stocks. As long as our stock pickers are sticking to their investment process and executing it consistently, then we have no problem with them buying such stocks. It is the categorization of such companies as “growth stocks” or “value stocks” that is transient, not our managers’ investment approach.
Getting back to long-term performance metrics, though the fund’s slight underperformance against the Russell 3000 Value Index is disappointing to us, we don’t view the less than one tenth of one percent return shortfall as a serious concern. And the environment has been unusual. In the early years of the fund’s operations, the value-stock universe was beaten down so that there were many great stock-picking opportunities there. The fund was able to take advantage of these opportunities and deliver good performance in those early years. Since that time, growth stocks collapsed but we believe the fund’s gradual shift into some “growthier” names has been early. There have also been a few mistakes including missing out on the energy sector move, which based on our attribution analysis cost the fund over four percentage points of return. But, it is important to note that many of the names that haven’t worked are still in the portfolio because the sub-advisors believe in them. We believe the cycle should shift and that some of the fund’s more controversial holdings could well lead to future outperformance instead of dragging performance down. An environment that is not so heavily (and unusually) skewed to the value-stock universe (as measured by indexes like the Russell 3000 Value) is likely to be a much better one for Masters’ Select Value, given the more eclectic approach to value investing that is represented in the fund’s portfolio.
Other performance metrics follow:
Manager performance: As indicated in the table three of four managers have outperformed their benchmarks since inception. Our long-term goal is for all the Masters’ Select managers to outperform.
MASTERS’ SELECT VALUE MANAGERS’ PERFORMANCE Margin versus BENCHMARKS Manager Return Less Benchmark Return Over Full Manager Tenure Through December 31, 2006 | |
Masters’ Select Value | Annualized Margin of Out- (Under-) Performance (Net of Allocated Expenses) |
| Manager 1 | 5.65% |
| Manager 2 | 1.61% |
| Manager 3 | 1.41% |
| Manager 4 | (1.34%) |
Listed alphabetically are the managers and their respective benchmarks
Manager | Tenure | Benchmark |
| Mason Hawkins | 06/30/00 | Russell 3000 Value Index |
| Bill Miller | 06/30/00 | S&P 500 Index |
| Bill Nygren | 06/30/00 | Russell 3000 Value Index |
| Franklin Mutual | 06/30/00 | Russell 3000 Value Index |
Performance versus competitors: Over the long run the fund has performed better than the majority of its competitors, though its more recent struggles have pulled its three-year returns behind its average Lipper Multi-Cap Value peer. (The Lipper category is a somewhat unusual mishmash of funds but we felt it was the best peer group comparison given the fund’s market-cap flexibility. Despite this flexibility, Masters’ Select Value has been primarily large- and mid-cap focused throughout its operating life.)
We also show how the fund ranks against its Morningstar peer group. This ranking is based on Morningstar’s categorization of the fund as “blend” rather than “value.” Against this group the fund is very highly ranked with a five-year return in the top decile and a three-year return in the top quintile (inception-to-date rankings are not available). This ranking is more representative of how the fund’s performance compares to the large-cap core equity fund universe.
Fund Summary | 29
MASTERS’ SELECT VALUE FUND LIPPER MULTI-CAP VALUE FUND CATEGORY RANKING BASED ON TOTAL FUND RETURNS | ||||||||||||
Annual Ranking As of December 31, 2006 | ||||||||||||
2001 | 2002 | 2003 | 2004 | 2005 | 2006 | |||||||
| % Rank in Category | 6.5% | 25.2% | 34.6% | 44.3% | 76.4% | 62.2% | ||||||
| Funds in Category | 461 | 476 | 462 | 476 | 467 | 445 | ||||||
Trailing Periods | ||||||||
One-Year | Three-Year | Five-Year | Since Inception | |||||
| % Rank in Category | 62.2% | 68.1% | 33.5% | 39.9% | ||||
| Funds in Category | 445 | 342 | 254 | 173 | ||||
Lipper, Inc. is an independent mutual fund research and rating service. Each Lipper average represents a universe of funds with similar investment objectives. Rankings for the periods shown are based on fund total returns with dividends and distributions reinvested and do not reflect sales charges. Lipper categorizes the Fund as a Multi-Cap Core fund. For consistency of presentation, we have included the Fund’s ranking within the Multi-Cap Value category, which we believe more accurately reflects the Funds investment objectives and peer group.
MASTERS’ SELECT VALUE FUND MORNINGSTAR LARGE BLEND FUND PEER GROUP RANKING BASED ON TOTAL FUND RETURNS | ||||||||||||
Annual Ranking As of December 31, 2006 | ||||||||||||
2001 | 2002 | 2003 | 2004 | 2005 | 2006 | |||||||
| % Rank in Category | 3.0% | 6.0% | 13.0% | 9.0% | 73.0% | 12.0% | ||||||
| Funds in Category | 1,072 | 1,243 | 1,386 | 1,216 | 1,851 | 1,989 | ||||||
Trailing Periods | |||||||
One-Year | Three-Year | Five-Year | |||||
| % Rank in Category | 12.0% | 19.0% | 7.0% | ||||
| Funds in Category | 1,989 | 1,574 | 1,238 | ||||
Morningstar, Inc. is an independent mutual fund research and rating service. Each Morningstar category represents a universe of funds with similar investment objectives. Rankings for the periods shown are based on fund total returns with dividends and distributions reinvested and do not reflect sales charges. The highest percentile rank is 1 and the lowest is 100.
The information contained herein: (1) is proprietary to Morningstar; (2) may not be copied or distributed; and (3) is not warranted to be accurate, complete or timely. Neither Morningstar nor its content providers are responsible for any damages or losses arising from any use of this information. Past performance is no guarantee of future results.
Rolling period performance: Rolling period performance analysis is reflected in the table below. There is a lot of information in this table. Over rolling five-year periods, the most relevant time frame, Masters’ Select Value has outperformed its Russell 3000 Value benchmark 42% of the time. This number is below our goal of outperforming in a high percentage of five-year periods. (So far in the fund’s six and one half year life, there have been 19 rolling five-year periods, one ending with each month after the fund’s five-year anniversary. This is a relatively small number of five year periods. For a frame of reference, 12 new periods are added in each year.) As discussed above, we believe the last few years have been unusual and we remain confident in our belief that this percentage will increase with the passage of time. On the positive side, it is worth noting that the fund’s worst three-year return (+7.7%) was significantly better than the worst three-year return for the benchmark (which was a loss of 3.3%)
30 | The Masters’ Select Funds Trust
MASTERS’ SELECT VALUE
Performance | MSVFX | Russell 3000 Value | Number of Periods | |||||||
Best Rolling 12-Mo. Period 1 | 49.6 | % | 43.8 | % | 67 | |||||
| Worst Rolling 12-Mo. Period | -22.9 | % | -22.8 | % | 67 | |||||
| Best Rolling 36-Mo. Period | 81.1 | % | 83.6 | % | 43 | |||||
| Worst Rolling 36-Mo. Period | 7.7 | % | -3.3 | % | 43 | |||||
| Best Rolling 60-Mo. Period | 68.4 | % | 76.8 | % | 19 | |||||
| Worst Rolling 60-Mo. Period | 23.7 | % | 30.0 | % | 19 | |||||
| Percentage of Negative 12-Mo. Rolling Periods | 26.9 | % | 31.3 | % | 67 | |||||
| Percentage of Negative 36-Mo. Rolling Periods | 0.0 | % | 4.7 | % | 43 | |||||
| Percentage of Negative 60-Mo. Rolling Periods | 0.0 | % | 0.0 | % | 19 | |||||
| Percent Beat Benchmark 12-Mo. | 44.8 | % | n/a | 67 | ||||||
| Percent Beat Benchmark 36-Mo. | 37.2 | % | n/a | 43 | ||||||
| Percent Beat Benchmark 60-Mo. | 42.1 | % | n/a | 19 | ||||||
| 1 | The best performing 12 and 36 month rolling performance periods for the Fund commenced in April 2003, the best performing 60 month rolling performance period for the Fund commenced in April 2001. The worst performing 12 month rolling performance period for the Fund commenced in April 2002; the worst performing 36 and 60 month rolling performance periods for the Fund commenced in August 2001. |
A number of factors contributed to the fund’s performance during 2006. The highlights follow.
Performance of managers: Two of the fund’s four sub-advisors outperformed the Russell 3000 Value benchmark for the year, one by a very substantial margin. The other two managers significantly trailed their benchmark. The individual manager returns ranged from a loss of 6.1% to a gain 35.5%, an unusually wide spread. Over shorter-term time periods we do not expect every Masters’ Select sub-advisor to outperform their benchmark. However, over the long term that is our objective. As discussed earlier, since the Value Fund’s inception, three of the four managers have achieved this goal taking into account all allocated expenses. The fourth manager trails his benchmark by 134 basis points (1.34%) on an annualized basis.
Sector and stock-picking impact: As with all Masters’ Select funds, the portfolio is built through bottom-up stock picking, but the sector exposure that results from this process may provide some insight into the fund’s relative performance. Based on our attribution analysis the fund’s overall sector exposure relative to the Russell 3000 Value Index had a minimal impact on relative performance during 2006. The fund benefited slightly from its underweighting in the health care and financials sectors, as both of those sectors underperformed the broader benchmark return. However, as has been the case for the past three years, the fund’s large under-allocation to the strong-performing energy sector hurt its relative performance. In 2006, the fund held no energy stocks (compared to the Russell 3000 Value Index’s 13% weighting) and the energy sector returned 27%.
The managers’ stock selection was the primary driver of the fund’s underperformance for the year. The aggregate performance of the fund’s information technology, financials, and consumer discretionary stocks was poor compared to the benchmark returns for those sectors. In contrast, the managers’ stock picking was very strong in the consumer staples sector, led by KT&G Corp and Japan Tobacco.
Leaders and laggards: For the year, three of the four Masters’ Select Value stock pickers owned at least one stock among the fund’s top ten dollar gainers and three of four also had at least one stock among the fund’s ten biggest losers. [Note: although Nygren also owned both Dell and Pulte, his positions were not the ones that generated the large losses for the year.] It is typical for most, if not all, of the managers to appear on both lists. DirecTV was the fund’s biggest dollar gainer (up 76% for the year), followed by Korea Tobacco & Ginseng (KT&G) (up 41%). KT&G was also the number-two contributor to performance in 2005. Among the other top-ten contributors, there were four companies - Disney, Level 3, Liberty Media, and General Motors - that appeared on last year’s top-ten losers’ list. This demonstrates the importance of maintaining a longer-term perspective when judging the success or failure of the managers’ stock picks. In terms of the worst performers, three internet names - Expedia, Amazon and eBay - topped the list. All of the fund’s ten largest winners and six of the largest losers remained in the portfolio at year-end.
See the table on page 33 that lists the leaders and laggards over the past six and twelve months. The table includes dollar gains and losses as well as percentage gains and losses. As noted above, the fact that a stock has lost money for Masters’ Select Value for the twelve month period ended December 31, 2006 tells us nothing about how successful the holding will ultimately become. The fund will hold many stocks for significantly longer periods of time and the success of these holdings won’t be known until they are ultimately sold. In that respect, while it is interesting to know how specific stocks performed during the period, this information is of limited value in assessing the ultimate success of these stock holdings.
Portfolio mix: The fund’s allocation to financial stocks fell during the year to 12.6% from 17.6% a year earlier. Meanwhile, the weightings to technology and industrials companies jumped to 11.1% and 10.5%, respectively. From a sector perspective, the fund continues to look quite different from its Russell 3000 Value benchmark. As of year-end 2006, the fund had large overweightings to the consumer discretionary sector (39.6% of assets versus 9.2% for the index) and technology (11.1% versus 4.3%), and large underweightings to energy (0.0% versus 13.3%), finance (12.6% versus 36.2%) and utilities (0.0% versus 6.4%).
Fund Summary | 31
The fund’s cash position declined to 1.3% of assets from 5.4% at the end of 2005. The foreign stock exposure declined slightly during the year and ended at 19.8%. The allocation to large-cap U.S. stocks rose by five percentage points, to 56.3%, and the mid-cap weighting rose to 21.4% of net assets. The fund held no small-cap stocks at year-end.
Please see page 34 for a breakout of the fund’s sector and market-cap exposure.
Miscellaneous
Expenses: During 2006 the ratio of expenses to net assets was 1.21%, unchanged from 2005.
Taxes: The fund distributed $0.70 in distributions during 2006. All of this distribution was either long-term capital gains or qualifying dividends and subject to favorable tax treatment. We will continue to work with the fund’s sub-advisors to manage the fund in a tax-aware manner. This will include taking short-term losses when there is an alternative investment that is equally attractive and using other tax-management techniques. However, the managers will not sacrifice pre-tax performance in pursuit of after-tax performance since the fund has tax-exempt, as well as taxable shareholders.
Accolades: During 2006 Masters’ Select Value maintained its “A” stewardship grade from Morningstar, which is their highest grade. The fund had a Five Star Overall Morningstar Rating, although it was among 1,574 Large Blend Funds for the period ended 12/31/06 (derived from a weighted average of the fund’s three, five-and ten-year risk adjusted return measure, if applicable).2
Final Thoughts
As the Advisor to the Masters’ Select Funds we are grateful for the confidence and trust that your investment represents. We are also exceptionally fortunate to have the considerable talents of Mike Embler, Mason Hawkins, Bill Nygren and Bill Miller, along with their firms, working for Masters’ Select Value. Their stock-picking skill coupled with their commitment to the Masters’ Select high-conviction approach to concentrated investing, is the source of our great confidence in the future of this fund. This skill and commitment continues to be made apparent to us through our regular contact with each sub-advisor. As for Litman/Gregory’s role of monitoring and coordinating with the sub-advisors, managing the fund’s operations and providing informative and relevant reporting—we remain as focused as ever.
Please see page 35 for comments for stock discussions provided by the sub-advisors.
2 | Morningstar, Inc. is an independent mutual fund research and rating service. The Morningstar Stewardship Grade is based on the evaluation of five areas critical for mutual fund governance and operations. The five areas are: 1) Regulatory Issues- they examine the firm’s record in the past three years, 2) Board Quality-examines the quality of the fund’s board of directors, 3) Manager Incentives- examines the fund managers’ pay as well as the level of their investment in fund shares, 4) Fees- examines the amount that a management company charges fund shareholders and 5) Corporate Culture- evidence that a firm has a deep-rooted understanding of its role as a fiduciary. Each area will receive one of the following ratings Excellent, Good, Fair, Poor or Very Poor. Funds are assigned a letter grade from A (best) to F (worst) based on the cumulative total of points they received from each category. The Masters’ Select Value Fund received an Overall Grade of “A” for 2006. For each fund with at least a three-year history, Morningstar calculates a Morningstar Rating™ (based on a Morningstar Risk-Adjusted Return measure that accounts for variation in a fund’s monthly performance, including the effects of sales charges, loads, and redemption fees), placing more emphasis on downward variations and rewarding consistent performance. The top 10% of funds in each category receive 5 stars, the next 22.5% receive 4 stars, the next 35% receive 3 stars, the next 22.5% receive 2 stars and the bottom 10% receive 1 star. (Each share class is counted as a fraction of one fund within this scale and rated separately, which may cause slight variations in the distribution percentages.) The Overall Morningstar Rating for a fund is derived from a weighted average of the performance figures associated with its three-, five- and ten-year (if applicable) Morningstar Rating metrics. As of 12/31/06, The Masters’ Select Value Fund received 5 stars among 1,574 and 1,238 Large Blend Funds for the three and five-year periods, respectively. |
See page 79 for Industry Terms and Definitions
32 | The Masters’ Select Funds Trust
Masters’ Select Value Fund Leaders and Laggards (Unaudited)
For The Six Months Ended December 31, 2006
By Percentage Gain / Loss
Security | Six Month Dollar Contribution/(Loss) | Six Month % Change | |||||
| Fairfax Financial Holdings Ltd. | 2,071,587 | 108.8 | % | ||||
| DIRECTV Group, Inc. (The) | 3,971,864 | 51.2 | % | ||||
| IAC/InterActiveCorp | 2,560,800 | 40.3 | % | ||||
| Sika AG | 1,405,712 | 39.6 | % | ||||
| Japan Tobacco, Inc. | 1,987,462 | 33.1 | % | ||||
| McDonald’s Corp. | 1,813,969 | 30.0 | % | ||||
| Telephone & Data Systems, Inc. | 2,016,000 | 29.9 | % | ||||
| Imperial Tobacco Group Plc | 2,182,903 | 28.7 | % | ||||
| Comcast Corp. | 1,392,300 | 27.8 | % | ||||
| Level 3 Communications, Inc. | 1,624,000 | 26.1 | % | ||||
| 21,026,597 | |||||||
| Mitsubishi UFJ Financial Group, Inc. | (726,872 | ) | (11.3 | %) | |||
| Capital One Financial Corp. | (857,667 | ) | (10.0 | %) | |||
| eBay, Inc. | (657,387 | ) | (8.4 | %) | |||
| FedEx Corp. | (354,640 | ) | (6.9 | %) | |||
| Amazon.Com, Inc. | (301,212 | ) | (2.7 | %) | |||
| Yahoo!, Inc. | (39,620 | ) | (0.5 | %) | |||
| (2,937,398 | ) | ||||||
By Dollar Gain / Loss
Security | Six Month Dollar Contribution/(Loss) | Six Month % Change | |||||
| DIRECTV Group, Inc. (The) | 3,971,864 | 51.2 | % | ||||
| IAC/InterActiveCorp | 2,560,800 | 40.3 | % | ||||
| Imperial Tobacco | 2,182,903 | 28. 7 | % | ||||
| Fairfax Financial Holdings Ltd. | 2,071,587 | 108.8 | % | ||||
| Telephone & Data Systems, Inc. | 2,016,000 | 29.9 | % | ||||
| Japan Tobacco, Inc. | 1,987,462 | 33.1 | % | ||||
| McDonald’s Corp. | 1,813,969 | 30.0 | % | ||||
| Tyco International, Inc. | 1,766,784 | 11.6 | % | ||||
| Level 3 Communications, Inc. | 1,624,000 | 26.1 | % | ||||
| Orkla ASA | 1,567,111 | 19.6 | % | ||||
| 21,562,480 | |||||||
| Capital One Financial Corp. | (857,667 | ) | (10.0 | %) | |||
| Mitsubishi Tokyo Financial | (726,872 | ) | (11.3 | %) | |||
| eBay, Inc. | (657,387 | ) | (8.4 | %) | |||
| FedEx Corp. | (354,640 | ) | (6.9 | %) | |||
| Amazon.Com, Inc. | (301,212 | ) | (2.7 | %) | |||
| Yahoo!, Inc. | (39,620 | ) | (0.5 | %) | |||
| (2,937,398 | ) | ||||||
For the Year ended December 31, 2006
By Percentage Gain / Loss
Security | Twelve Month Dollar Contribution/(Loss) | Twelve Month % Change | |||||
| Level 3 Communications, Inc. | 3,822,000 | 95.1 | % | ||||
| Sika AG | 2,306,227 | 86.9 | % | ||||
| Level 3 Communications, Inc. - Bond | 2,175,482 | 81.1 | % | ||||
| DIRECTV Group, Inc. (The) | 5,091,892 | 76.6 | % | ||||
| Japan Tobacco, Inc. | 3,206,635 | 66.6 | % | ||||
| General Motors Corp. | 2,742,900 | 63.3 | % | ||||
| Comcast Corp. | 2,477,070 | 63.0 | % | ||||
| Telephone & Data Systems, Inc. | 2,858,520 | 48.2 | % | ||||
| KT & G Corp. | 4,542,636 | 41.5 | % | ||||
| Fairfax Financial Holdings Ltd. | 1,122,032 | 38.9 | % | ||||
| 30,345,394 | |||||||
| Expedia, Inc. | (2,813,631 | ) | (30.6 | %) | |||
| eBay, Inc. | (2,622,960 | ) | (26.8 | %) | |||
| Amazon.Com, Inc. | (2,630,462 | ) | (19.6 | %) | |||
| Capital One Financial Corp. | (947,333 | ) | (11.0 | %) | |||
| Embarq Corp. | (77,279 | ) | (9.4 | %) | |||
| UnumProvident Corp. | (603,224 | ) | (8.8 | %) | |||
| Pulte Homes, Inc. | (1,111,877 | ) | (8.6 | %) | |||
| Mitsubishi UFJ Financial Group, Inc. | (479,199 | ) | (7.7 | %) | |||
| Dell, Inc. | (1,269,185 | ) | (7.4 | %) | |||
| NTL, Inc. | (351,626 | ) | (5.2 | %) | |||
| (12,906,776 | ) | ||||||
By Dollar Gain / Loss
Security | Twelve Month Dollar Contribution/(Loss) | Twelve Month % Change | |||||
| DIRECTV Group, Inc. (The) | 5,091,892 | 76.6 | % | ||||
| KT & G Corp. | 4,542,636 | 41.5 | % | ||||
| Disney (Walt) Co. | 4,015,052 | 35.3 | % | ||||
| Level 3 Communications, Inc. | 3,822,000 | 95.1 | % | ||||
| Liberty Media Holding Corp. | 3,324,800 | 23.5 | % | ||||
| Japan Tobacco, Inc. | 3,206,635 | 66.6 | % | ||||
| Telephone & Data Systems, Inc. | 2,858,520 | 48.2 | % | ||||
| General Motors Corp. | 2,742,900 | 63.3 | % | ||||
| Orkla ASA | 2,623,581 | 36.7 | % | ||||
| Imperial Tobacco Group Plc | 2,600,928 | 35.4 | % | ||||
| 34,828,944 | |||||||
| Expedia, Inc. | (2,813,631 | ) | (30.6 | %) | |||
| Amazon.Com, Inc. | (2,630,462 | ) | (19.6 | %) | |||
| eBay, Inc. | (2,622,960 | ) | (26.8 | %) | |||
| Dell, Inc. | (1,269,185 | ) | (7.4 | %) | |||
| Pulte Homes, Inc. | (1,111,877 | ) | (8.6 | %) | |||
| Capital One Financial Corp. | (947,333 | ) | (11.0 | %) | |||
| UnumProvident Corp. | (603,224 | ) | (8.8 | %) | |||
| Mitsubishi UFJ Financial Group, Inc. | (479,199 | ) | (7.7 | %) | |||
| NTL, Inc. | (351,626 | ) | (5.2 | %) | |||
| Embarq Corp. | (77,279 | ) | (9.4 | %) | |||
| (12,906,776 | ) | ||||||
Please refer to the fund’s schedule of investments in this report for complete holdings information. Fund holdings and sector allocations are subject to change and should not be considered a recommendation to buy or sell any security.
Fund Summary | 33
Masters’ Select Value Fund Managers
INVESTMENT MANAGER | FIRM | TARGET ASSET ALLOCATION | MARKET CAPITALIZATION OF COMPANIES IN PORTFOLIO | STOCK-PICKING STYLE | ||||
| Mason Hawkins | Southeastern Asset Management, Inc. | 25% | All sizes | Value | ||||
| Bill MIller | Legg Mason Capital Management, Inc. | 25% | All sizes, but mostly large and mid-sized companies | Eclectic, may invest traditional value stocks or growth stocks | ||||
| Bill Nygren | Harris Associates L.P. | 25% | Mostly large and mid-sized companies | Value | ||||
| Michael Embler/Peter Langerman | Franklin Mutual Advisers, LLC | 25% | All sizes | Value |
Portfolio Composition*
The fund holds 53 securities, exclusive of cash equivalents.
By Asset Class
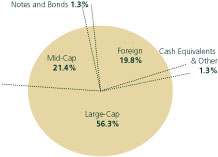
Market Capitalization:
Small-Cap Domestic < $1.6 billion
Mid-Cap Domestic $1.3 billion - $12.3 billion
Large-Cap Domestic > $12.3 billion
* Totals may not add up to 100% due to rounding.
By Sector
| Sector Weights | |||||||
| Fund | Russell 3000 Value Index | ||||||
| Consumer Discretionary | 39.6 | % | 9.2 | % | |||
| Consumer Staples | 7.1 | % | 7.2 | % | |||
| Energy | 0.0 | % | 13.3 | % | |||
| Finance | 12.6 | % | 36.2 | % | |||
| Health Care & Pharmaceuticals | 0.9 | % | 6.7 | % | |||
| Industrials | 10.5 | % | 7.3 | % | |||
| Materials | 7.3 | % | 3.9 | % | |||
| Technology | 11.1 | % | 4.3 | % | |||
| Telecommunications | 8.4 | % | 5.8 | % | |||
| Utilities | 0.0 | % | 6.4 | % | |||
| Notes & Bonds | 1.3 | % | 0.0 | % | |||
| Cash Equivalents & Other | 1.3 | % | 0.0 | % | |||
100.0 | % | 100.0 | % | ||||
34 | The Masters’ Select Funds Trust
Masters’ Select Value Fund Stock Highlights
Yahoo! Inc. - Bill Miller
Yahoo generates revenue by selling both branded and paid search advertising to businesses and by charging individual users for premium services. Yahoo’s shares came under significant pressure in 2006 as the company delayed its eagerly anticipated paid search upgrade (dubbed “Project Panama”) and experienced weakness in ad sales to auto and financial services companies. If Yahoo can successfully implement Panama and recharge growth in its paid search business, we believe the stock has substantial upside.
We expect that the monetization benefits Panama should bring will not be fully felt until the second half of 2007, causing many investors to shy away from Yahoo and creating a “time arbitrage” opportunity for long-term investors. Yahoo trades at a consensus 2008 EV/EBITDA multiple of 11.9x, which is only a slight premium to established consumer brand companies such as Coca-Cola, Procter & Gamble, and PepsiCo and terrestrial radio providers such as Clear Channel and Radio One, despite Yahoo’s much higher long-term expected earnings growth rate in the mid-20s. Using our internal estimates, which indicate higher-than-consensus 2008 EBITDA, Yahoo appears even cheaper. The company has also become an attractive acquisition target, and at current levels represents a very compelling valuation opportunity.
Investors’ fear that the monetization improvements Panama promises might not materialize and that recent sales weakness might signal slowing growth trends caused the stock to fall 35% in 2006. Our analysis indicates that the delay in Panama was due to Yahoo’s desire to make sure the product was fully ready for release, not because of fears that it will not work. Regarding the sales weaknesses, Yahoo’s third quarter results came in well above the company’s own lowered expectations, indicating that this was a temporary issue that reflected macroeconomic factors rather than weakness in Yahoo’s business model.
On a long-term basis, we feel that there are several reasons to be optimistic about Yahoo’s investment merits. We continue to view online advertising as a secular growth industry, as we expect the Internet’s share of global advertising to increase from about 4% now to about 20% within 15 years. Yahoo should benefit tremendously from this heightened demand for its services. In addition, we have a high regard for Sue Decker, Yahoo’s CFO, and her ability to allocate capital rationally and effectively with an eye towards long-term results. She was recently promoted to head Yahoo’s Advertiser & Publisher group, a move widely seen as a stepping-stone to the CEO position.
Discovery Holding Co. - Bill Nygren
In 2005, Liberty Media spun off its interest in Discovery Communications into a separate publicly traded holding company, Discovery Holdings (DISCA). The holding company’s main asset is a 50% stake in Discovery Communications. Discovery Communications is best known for its non-fiction cable TV networks — The Discovery Channel, TLC, Animal Planet, and Travel Channel. The Discovery brand rates as one of the highest-ranked consumer brands not just in television, but in any business. But typical analyst reports say that Discovery isn’t worth owning because it trades at as high a multiple of cash flow as other media companies despite having the complexity of a two-tiered holding company. We take the opposite position, saying Discovery is a bargain, selling at just more than half its value. What do we think the analysts are missing?
First, we generally find media stocks attractively priced, selling in the stock market at lower multiples than have been paid in private transactions. Investors fear technology advancements will lessen the value of media businesses. We believe that producers of branded content, rather than being hurt, will actually benefit from viewers watching programs on something other than a TV screen. Pricing Discovery consistent with other media companies, to us, would say that it, too, is attractively priced relative to private value. Next, though most of Discovery’s profit is earned by its fully distributed networks, it has many subscribers in development-stage networks in both the U.S. and International markets. Valuing these developing networks on a per-subscriber basis exposes significantly more value than one sees when using a multiple of cashflow.
Further, Discovery is spending money to develop a Commerce & Education business. Using GAAP accounting, this investment spending flows through the income statement as an expense. Analysts who simply value Discovery on a multiple of cashflow are effectively valuing this division at a large negative number. Finally, the complex Discovery holding company structure is likely to disappear. The current structure allowed Liberty to spin-off Discovery shares on a tax-free basis. Two years following the spin-off, this summer, Discovery can initiate talks with owners of the other 50% (Cox Communications and Advance/Newhouse) toward collapsing the Discovery Holdings structure and making Discovery Communications a public company. Importantly, we view the current two-tiered structure as only an annoyance, we do not believe it impedes value growth.
Combining these items, we conclude that DISCA is priced at large discount to its growing value, and therefore, we believe it is a very attractive investment opportunity.
Weyerhaeuser Co. - Michael Embler
Weyerhaeuser Company is among the largest U.S. integrated forest product companies, with substantial timber holdings in the southern and northwestern parts of the U.S. and western Canada. In addition to these valuable timber assets, the company has significant lumber, homebuilding, containerboard and white paper operations. We believe these assets are collectively undervalued by the public markets.
Timber has been, over the past century, among the best performing asset classes in the U.S. marketplace. Weyerhaeuser’s timber assets are considered among the nation’s finest, given the geographic location and species mix which the company controls. Weyerhaeuser currently suffers from a competitive disadvantage versus most other large timber owners in that it is taxed as a “C-Corp”, paying the full U.S. corporate tax rate on timber-generated earnings, versus many of their competitors who have reorganized as, or sold their timber to, Timber REITs or TIMOs (Timber Investment Management Organizations). Both of these structures are more structurally efficient compared to traditional C-Corp’s. Legislation designed to eliminate this structural disadvantage failed to gain congressional approval in 2006 - we anticipate that Weyerhaeuser and other C-Corp. timber owners will actively consider alternatives to unlock this negative value differential.
Fund Summary | 35
In addition to timber holdings, the company has been active in seeking to enhance and crystallize the value of its other operations. Currently pending is a transaction which will result in the combination of Weyerhaeuser’s white paper division with Domtar Inc. of Canada which we believe will unlock substantial value for Weyerhaeuser shareholders. The company is also restructuring its containerboard division.
Given its business lines, Weyerhaeuser is a cyclical company with substantial exposure to the U.S. housing market. Despite the weakness in housing and prospects for further general economic weakness, we believe the value and long-term performance of Weyerhaeuser’s timber and other assets are under-appreciated and under-valued by the market and that catalysts which will unlock substantial shareholder value are likely to be forthcoming.
In keeping with Southeastern Asset Management’s disclosure policies, Mason Hawkins has not contributed commentary on his holdings for this report.
See page 79 for Industry Terms and Definitions
Neither the information contained herein nor any opinion expressed shall be construed to constitute an offer to sell or a solicitation to buy any securities mentioned herein. The views herein are those of the portfolio managers at the time the commentaries are written and may not be reflective of current conditions.
36 | The Masters’ Select Funds Trust
Masters’ Select Value Fund
SCHEDULE OF INVESTMENTS IN SECURITIES at December 31, 2006
Shares | Value | ||
COMMON STOCKS: 97.5% | |||
Consumer Discretionary: 39.6% | |||
| 192,500 | Amazon.Com, Inc.* | $ | 7,596,050 |
| 153,000 | Comcast Corp. - Special Class A* | 6,407,640 | |
| 470,600 | DIRECTV Group, Inc. (The)* | 11,736,764 | |
| 360,400 | Discovery Holding Co. - Class A* | 5,798,836 | |
| 255,000 | Disney (Walt) Co. | 8,738,850 | |
| 300,000 | Eastman Kodak Co. | 7,740,000 | |
| 223,000 | General Motors Corp. | 6,850,560 | |
| 315,000 | Home Depot, Inc. (The) | 12,650,400 | |
| 240,000 | IAC/InterActiveCorp.* | 8,918,400 | |
| 470,250 | Liberty Media Holding Corp. - Interactive* | 10,143,293 | |
| 43,750 | Liberty Media Holding Corp.- Capital* | 4,286,625 | |
| 142,320 | Limited Brands | 4,118,741 | |
| 140,500 | McDonald’s Corp. | 6,228,365 | |
| 357,240 | News Corp. | 7,673,515 | |
| 254,947 | NTL, Inc. | 6,434,862 | |
| 162,000 | Pulte Homes, Inc. | 5,365,440 | |
| 119,100 | Ryland Group, Inc. | 6,505,242 | |
| 287,000 | Time Warner, Inc. | 6,250,860 | |
| 147,500 | Viacom, Inc. - Class B* | 6,051,925 | |
| 100,000 | Yum! Brands, Inc. | 5,880,000 | |
| 145,376,368 | |||
Consumer Staples: 7.1% | |||
| 234,139 | Imperial Tobacco Group Plc | 9,217,782 | |
| 1,650 | Japan Tobacco, Inc. | 7,971,015 | |
| 144,299 | KT&G Corp. | 8,766,552 | |
| 25,955,349 | |||
Finance: 12.6% | |||
| 170,000 | Aon Corp. | 6,007,800 | |
| 2,392 | Berkshire Hathaway, Inc. - Class B* | 8,769,072 | |
| 100,000 | Capital One Financial Corp. | 7,682,000 | |
| 20,000 | Fairfax Financial Holdings Ltd. | 3,975,802 | |
| 175,000 | JPMorgan Chase & Co. | 8,452,500 | |
| 460 | Mitsubishi UFJ Financial Group, Inc. | 5,681,160 | |
| 126,500 | Washington Mutual, Inc. | 5,754,485 | |
| 46,322,819 | |||
Healthcare, Pharmaceuticals & Biotechnology: 0.9% | |||
| 117,000 | IMS Health, Inc. | 3,215,160 | |
Industrials: 10.5% | |||
| 72,129 | Armstrong World Industries, Inc.* | 3,057,548 | |
| 63,000 | Dun & Bradstreet Corp.* | 5,215,770 | |
| 44,000 | FedEx Corp. | 4,779,280 | |
| 153,600 | Orkla ASA - Class A | 8,705,973 | |
| 552,120 | Tyco International Ltd. | 16,784,448 | |
| 38,543,019 | |||
Materials: 7.3% | |||
| 274,876 | Cemex S.A. de C.V. - ADR | 9,312,799 | |
| 3,200 | Sika AG* | 4,958,800 | |
| 131,180 | Temple-Inland, Inc. | 6,038,215 | |
| 93,510 | Weyerhaeuser Co. | 6,606,481 | |
| 26,916,295 | |||
Shares/ Principal Amount | Value | ||
Technology: 11.1% | |||
| 36 | Comdisco Holding Co., Inc. | $ | 425 |
| 3,650,000 | Comdisco, Inc.* | - | |
| 619,000 | Dell, Inc.* | 15,530,710 | |
| 15,000 | Google, Inc. - Class A* | 6,907,200 | |
| 264,000 | Intel Corp. | 5,346,000 | |
| 234,000 | Western Union Co. (The) | 5,246,280 | |
| 300,000 | Yahoo!, Inc.* | 7,662,000 | |
| 40,692,615 | |||
Telecommunication Services: 8.4% | |||
| 1,400,000 | Level 3 Communications, Inc.* | 7,840,000 | |
| 753,000 | Sprint Nextel Corp. | 14,224,170 | |
| 84,000 | Telephone & Data Systems, Inc. - Special Shares | 4,166,400 | |
| 84,000 | Telephone & Data Systems, Inc. | 4,563,720 | |
| 30,794,290 | |||
TOTAL COMMON STOCKS (cost $268,334,913) | 357,815,915 | ||
PREFERRED STOCKS: 0.0% | |||
Telecommunication Services: 0.0% | |||
| 54 | PTV, Inc.* | 216 | |
TOTAL PREFERRED STOCKS (cost $0) | 216 | ||
NOTES & BONDS: 1.3% | |||
Telecommunications: 1.3% | |||
| 2,533,000 | Level 3 Communications, Inc. | ||
| 10.000%, 05/01/2011 | 4,603,727 | ||
TOTAL NOTES & BONDS (cost $2,533,000) | 4,603,727 | ||
SHORT-TERM INVESTMENTS: 1.2% | |||
| $4,427,000 | State Street Bank & Trust Co., 3.600%, 12/31/06, due 01/02/07 [collateral: $3,565,000, US Treasury Notes, 7.125%, due 02/15/23, value $4,521,714] (proceeds $4,428,771) | 4,427,000 | |
TOTAL SHORT-TERM INVESTMENTS (cost $4,427,000) | 4,427,000 | ||
TOTAL INVESTMENTS IN SECURITIES (cost $275,294,913): 100.0% | 366,846,858 | ||
| Other Assets less Liabilities: 0.0% | 171,393 | ||
Net Assets: 100.00% | $ | 367,018,251 | |
| ADR | American Depository Receipt |
| * | Non-income producing security. |
The accompanying notes are an integral part of these financial statements.
Schedule of Investments | 37
Masters’ Select Smaller Companies Fund Review
In what was yet another very strong year for small-cap stocks, Masters’ Select Smaller Companies returned 9.67%. This return materially lagged the Russell 2000 benchmark return of 18.37%. The Lipper Small Cap Core Index returned 13.70%.
The fund’s below benchmark return in 2006 dragged down its average annual return since its inception to 15.69%. Though this is a strong absolute return, it now lags its Russell 2000 benchmark which returned 18.82% over the same time period. Most of this underperformance is attributable to the fund’s 2006 performance.
Comparison Chart
The value of a hypothetical $10,000 investment in the Masters’ Select Smaller Companies Fund from its inception (6/30/03) to present as compared with the Russell 2000 Index and the Lipper Small Cap Core Index.
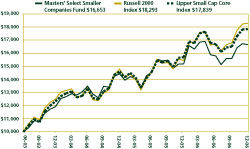
The hypothetical $10,000 investment at fund inception includes changes due to share price and reinvestment of dividends and capital gains. This chart does not imply future performance. Indices are unmanaged, do not incur fees and cannot be invested in directly.
Performance as of December 31, 2006
Average Annual Total Returns | ||||||||||
One-Year | Three-Year | Since Inception (6/30/03) | ||||||||
Masters’ Select Smaller Companies Fund | 9.67 | % | 11.80 | % | 15.69 | % | ||||
Russell 2000 Index | 18.37 | % | 13.56 | % | 18.82 | % | ||||
Lipper Small Cap Core Index | 13.70 | % | 13.12 | % | 17.98 | % | ||||
Performance quoted represents past performance and does not guarantee future results. The investment return and principal value of an investment will fluctuate so that an investor’s shares, when redeemed, may be worth more or less than their original cost. Current performance of the funds may be lower or higher than the performance quoted. To obtain the performance of the funds as of the most recently completed calendar month, please visit our website at www.mastersfunds.com or call 1-800-960-0188. The Fund imposes a 2% redemption fee on shares held less than 180 days. Performance does not reflect the redemption fee. If reflected, performance would be lower.
The fund invests in smaller companies which involve more risk such as limited liquidity and greater volatility. Though the fund primarily invests in securities of U.S. domiciled companies it can and has invested in foreign securities as well. Investment in foreign securities subjects investors to political, economic and market risks and fluctuations in currency rates.
See page 78 for index definitions
Performance Commentary
Over the fund’s 42 month life a 15.69% average annual return seems quite good. But, it has been an exceptionally strong period for small-cap stocks and within that context the fund’s performance has been disappointing. Three and one-half years is not a long time, so we are not overly concerned—but we are certainly not satisfied with the performance. There are several factors behind the fund’s disappointing performance:
Cash drag: Over the life of the fund its average cash reserve has been about 13%. With small-cap stocks returning almost 19% per year during this period, these cash holdings have been very costly. Based on our attribution analysis, holding cash cost the fund over 12 percentage points of return over its life (this number is not annualized). This drag on performance almost fully accounts for the performance difference between the fund and the benchmark.
We’ve discussed the cash holdings with the sub-advisors, two of whom have been the primary holders of cash. Bob Rodriguez has had the highest cash reserves on average, and his reasons for holding cash have been mostly valuation driven. He believes there are currently few bargains in the small-cap world and at any point in time several of his positions have been close to reaching his sell targets so that he hasn’t wanted to buy more shares. In some cases other stocks which were undervalued were in sectors that already were heavily weighted in the portfolio or were exposed to areas of the economy that he is concerned about (e.g. the consumer.) Rodriguez’s performance on the stock portion of his portfolio has been excellent and we continue to consider ourselves very fortunate to have the services of Rodriguez and his team on the fund.
We don’t expect the fund’s cash holdings will average out at such a high level over the long run (and over the long run we believe that small-cap stock returns will be significantly lower than the lofty levels of the last few years). As of the end of 2006 cash was down to about 7% of assets.
Manager performance: A poor relative performance year in 2006 for four of the fund’s five sub-advisors hurt their long-term standing relative to their benchmarks. But, while only one of the managers has beaten his benchmarks since the fund’s inception, all but one are within striking distance (note: Copper Rock has been part of the fund for only six months). The one that isn’t has experienced serious performance struggles and has underperformed by a very sizable margin—a margin that comes close to accounting for the fund’s entire underperformance relative to its benchmark.
We have increased our ongoing due diligence with respect to this sub-advisor with multiple meetings during 2006 and we will continue to carefully consider whether he is well suited to run a concentrated portfolio. Our job is to determine whether the performance problems are a function of errors in discipline, bad judgment, research shortcomings or other factors that would tend to undermine our confidence. On the other hand it could be a combination of mistakes (they happen even to great stock pickers), an environment not conducive to the stock picker’s style, bad luck, or being early in buying some stocks that ultimately could be strong performers. If the latter group of reasons can explain the underperformance, the stock picker may be due for a powerful rebound and may be worthy of our confidence with respect to his long-term skill.
38 | The Masters’ Select Funds Trust
With respect to the other four sub-advisors we continue to have a high level of confidence and expect them to reward that confidence over the long run. Two of these four, Dick Weiss and Bill D’Alonzo, have run similar portfolios for Masters’ Select Equity Fund for ten years.
Despite the struggles of Masters’ Select Smaller Companies, it is still early in its life and we remain very optimistic about its long-run potential. While there is no guarantee that this fund will perform as our other funds, the two oldest Masters’ Select Funds, Equity and International, have both had some very rough performance periods, but over the long run still built very strong records. (See the individual reports on each of these funds.)
Portfolio Commentary
A number of factors contributed to the fund’s performance during 2006. The highlights follow.
Performance of managers: In 2006, one of the fund’s five sub-advisors beat their benchmark by a wide margin and three of the managers significantly underperformed their benchmarks. The fifth sub-advisor, who has only been on the fund for six months, trailed their benchmark during that short period. The individual manager returns ranged from a loss of 4.3% to a gain of 20.9%.
Sector and stock-picking impact: Though all the Masters’ Select funds are driven by bottom-up stock picking, the sector exposure that results from this process may provide some insight into the fund’s shorter term performance relative to the Russell 2000 Index. Based on our attribution analysis, the fund’s overall sector exposure had a net negative effect in 2006. Specifically, the fund was hurt by its lack of exposure to the top-performing materials sector, as well as its over-weighting to the information technology sector, one of the poorer-performing sectors for the year. The fund’s average cash position of 12% was also a significant drag on returns.
Performance was also hurt by poor stock selection within the consumer discretionary, information technology, health care and industrials sectors. The biggest negative contributors were newspaper company, Journal Register, which declined 47% and detracted roughly 130 basis points (1.3%) from the fund’s performance, and Global Power Equipment, which fell 84%, and cost the fund almost 100 basis points of performance. On the plus side, Natco Group, an oil and gas equipment manufacturer, gained 64% and contributed roughly 115 basis points to the fund’s return. Transportation/logistics company, Hub Group (up 51%), and retailer, Jo-Ann Stores (up 105%), each contributed roughly 80 basis points to the fund’s overall return.
Leaders and laggards: Three of the fund’s managers placed at least one stock on the list of the fund’s top ten dollar gainers for the year. Three managers also had at least one name on the list of the ten largest losers. Six of the top ten stock winners remained in the portfolio at year-end, while only three of the ten largest losers remained in the fund. See the table on page 41 for the portfolio leaders and laggards over the past six and twelve months. The table includes dollar gains and losses as well as percentage gains and losses.
Portfolio mix: There were some notable changes to the fund’s sector exposures during the year. Most significantly, the exposure to energy stocks dropped to 9.5% from 17.3% at the end of 2005. Meanwhile, the fund’s allocation to health care and technology stocks each increased by more than five percentage points. The fund’s biggest overweighting relative to the Russell 2000 Index is now in the technology sector (27.4% of the fund’s assets versus 18.4% for the index). It is also overweighted to energy and industrials. The fund remains significantly underweighted to financials (10.2% versus 22.5%) and materials (0.0% versus 4.6%). At year-end the fund’s cash position stood at 7.3%, down from 14.4% a year earlier.
The fund’s allocation to micro-cap stocks (below $500 million market cap) dropped slightly during the year to 11.9% of the portfolio at year-end, while the exposure to mid-cap stocks (greater than $4 billion market cap) increased slightly to 8.8%. The fund’s weighted average market cap is $1.8 billion. Relative to the index, the fund is significantly underweighted to stocks with market caps in the $500 million to $1.6 billion range (44% for the fund vs. 59% for the index) and overweighted to companies above $1.6 billion in market cap (37% vs. 26%).
Please see the table on page 42 for the fund’s sector weights and market cap exposure.
Miscellaneous
Taxes: Masters’ Select Smaller Companies Fund made a tax distribution of $0.62 per share in December. Approximately 73% of the distribution was eligible for favorable tax treatment as either a long-term capital gain or qualifying dividend. We will continue to work with the fund’s sub-advisors to manage the fund in a tax-aware manner. This will include taking short-term losses when there is an alternative investment that is equally attractive and using other tax-management techniques. However, the managers will not sacrifice pre-tax performance in pursuit of after-tax performance since the fund has tax-exempt, as well as taxable, investors.
Expenses: Expenses for all of 2006 were 1.31% of average net assets.
Accolades: During 2006, Masters’ Select Smaller Companies maintained its “A” stewardship grade from Morningstar. It also is a Fund Analyst Pick in the Small Growth category. (Note: we believe the fund is a “small blend” fund but that its portfolio has looked somewhat growthier because the fund’s growth-oriented sub-advisors have been more fully invested than the fund’s other sub-advisors, on average.) In Morningstar’s recent analyst research report published in December 2006 they wrote about the fund: “It hasn’t delivered on its tremendous potential thus far, but Masters’ Select Smaller Companies is a fine holding…We think investors who take a patient approach with this fund will ultimately be rewarded. It will likely outpace its benchmark when growth finally returns to favor, and its sub-advisors’ almost uniformly excellent long-term records provide a measure of comfort. Furthermore, the fund’s advisor, Litman/Gregory, has put the fund in a position to succeed by committing to closing it at a small size (thus giving the sub-advisors flexibility), yet charging a modest expense ratio.”1
Fund Summary | 39
In Closing
Small-cap stock returns have been very strong since Masters’ Select Smaller Companies was launched. We believe that average annual returns in the mid-to-high teens are not sustainable over the long run and shareholders should not expect them. However, while absolute returns are likely to be lower over the next few years, on average, we believe Masters’ Select Smaller Companies’ relative return is likely to be better. This belief stems from our confidence in our group of sub-advisors, their ability to execute a concentrated investment strategy and the history of the most established Masters’ Select funds. This history has taught us that the typical Masters’ Select portfolio is unique, usually very different from its benchmarks, and because they are different, prone to periods of sharp outperformance and underperformance. As time periods extend, the funds have tended to outperform as evidenced by the fact that, in aggregate, the Masters’ Select funds have outperformed their benchmarks in 77% of the 130 rolling five-year time periods in which they have operated (see page 6 in the Masters’ Select Long-Term Performance Metrics section for more detail.) There is no guarantee that the Smaller Companies Fund will perform in the same manner of the other Masters’ Select Funds, as each Fund is unique with respect to its investment strategies, portfolio composition and risks.
As always, we value your confidence and continue to invest alongside you while staying focused on the goal of extending the success of Masters’ Select into the future.
Please see page 43 for specific stock commentaries written by the Masters’ Select Smaller Companies’ managers.
| 1 | Morningstar, Inc. is an independent mutual fund research and rating service. The Morningstar Stewardship Grade is based on the evaluation of five areas critical for mutual fund governance and operations. The five areas are: 1) Regulatory Issues- they examine the firm’s record in the past three years, 2) Board Quality- examines the quality of the fund’s board of directors, 3) Manager Incentives- examines the fund managers’ pay as well as the level of their investment in fund shares, 4) Fees- examines the amount that a management company charges fund shareholders and 5) Corporate Culture- evidence that a firm has a deep-rooted understanding of its role as a fiduciary. Each area will receive one of the following ratings Excellent, Good, Fair, Poor or Very Poor. Funds are assigned a letter grade from A (best) to F (worst) based on the cumulative total of points they received from each category. The Masters’ Select Smaller Companies Fund received an Overall Grade of “A” for 2006. |
See page 79 for Industry Terms and Definitions
Neither the information contained herein nor any opinion expressed shall be construed to constitute an offer to sell or a solicitation to buy any security or any other funds mentioned herein. The views herein are those of Litman/Gregory Fund Advisors, LLC at the time the material is written and may not be reflective of current conditions.
40 | The Masters’ Select Funds Trust
Masters’ Select Smaller Companies Fund Leaders and Laggards (Unaudited)
For the Six Months Ended December 31, 2006
By Percentage Gain / Loss
Security | Six Month Dollar Contribution/(Loss) | Six Month % Change | |||||
| Isilon Systems, Inc. | 12,136 | 84.9 | % | ||||
| Cbeyond, Inc. | 923,452 | 70.3 | % | ||||
| Jo-Ann Stores, Inc. | 1,606,925 | 67.9 | % | ||||
| Interpublic Group of Companies, Inc. | 1,649,749 | 46.6 | % | ||||
| Vasco Data Security International | 1,560,273 | 42.3 | % | ||||
| Parametric Technologies Corp. | 1,678,267 | 36.4 | % | ||||
| Embarcadero Technologies, Inc. | 1,624,706 | 32.9 | % | ||||
| dELiA*s, Inc. | 1,467,049 | 32.7 | % | ||||
| Big Lots, Inc. | 846,623 | 32.5 | % | ||||
| Anadigics, Inc. | 1,167,309 | 31.4 | % | ||||
| 12,536,487 | |||||||
| Global Power Equipment Group, Inc. | (1,718,334 | ) | (77.8 | %) | |||
| Tweeter Home Entertainment Group, Inc. | (2,062,583 | ) | (43.4 | %) | |||
| Journal Register Co. | (1,084,690 | ) | (21.5 | %) | |||
| Albany International Corp. | (1,294,052 | ) | (20.1 | %) | |||
| Witness Systems, Inc. | (1,436,596 | ) | (19.6 | %) | |||
| Williams Scotsman International, Inc. | (587,005 | ) | (18.2 | %) | |||
| Microsemi Corp. | (451,749 | ) | (16.8 | %) | |||
| PetroHawk Energy Corp. | (910,193 | ) | (14.7 | %) | |||
| Manitowoc Co. | (993,667 | ) | (13.1 | %) | |||
| Trinity Industries, Inc. | (697,992 | ) | (12.6 | %) | |||
| (11,236,862 | ) | ||||||
By Dollar Gain / Loss
Security | Six Month Dollar Contribution/(Loss) | Six Month % Change | |||||
| Parametric Technologies Corp. | 1,678,267 | 36.4 | % | ||||
| Interpublic Group of Companies, Inc. | 1,649,749 | 46.6 | % | ||||
| Embarcadero Technologies, Inc. | 1,624,706 | 32.9 | % | ||||
| Jo-Ann Stores, Inc. | 1,606,925 | 67.9 | % | ||||
| Vasco Data Security International | 1,560,273 | 42.3 | % | ||||
| dELiA*s, Inc. | 1,467,049 | 32.7 | % | ||||
| Epicor Spftware Corp. | 1,386,173 | 27.8 | % | ||||
| Avnet, Inc. | 1,356,568 | 26.7 | % | ||||
| Anadigics, Inc. | 1,167,309 | 31.4 | % | ||||
| Magma Design Automation, Inc. | 1,150,491 | 21.7 | % | ||||
| 14,647,509 | |||||||
| Tweeter Home Entertainment Group, Inc. | (2,062,583 | ) | (43.4 | %) | |||
| Global Power Equipment Group, Inc. | (1,718,334 | ) | (77.8 | %) | |||
| Witness Systems, Inc. | (1,436,596 | ) | (19.6 | %) | |||
| Albany International Corp. | (1,294,052 | ) | (20.1 | %) | |||
| Journal Register Co. | (1,084,690 | ) | (21.5 | %) | |||
| Manitowoc Co. | (993,667 | ) | (13.1 | %) | |||
| PetroHawk Energy Corp. | (910,193 | ) | (14.7 | %) | |||
| Trinity Industries, Inc. | (697,992 | ) | (12.6 | %) | |||
| Dynamic Materials Corp. | (669,297 | ) | (12.6 | %) | |||
| Williams Scotsman International, Inc. | (587,005 | ) | (18.2 | %) | |||
| (11,454,409 | ) | ||||||
For the Year Ended December 31, 2006
By Percentage Gain / Loss
Security | Twelve Month Dollar Contribution/(Loss) | Twelve Month % Change | |||||
| Jo-Ann Stores, Inc. | 2,037,377 | 105.3 | % | ||||
| Big Lots, Inc. | 1,597,200 | 86.1 | % | ||||
| Isilon Systems, Inc. | 12,136 | 84.9 | % | ||||
| Cbeyond, Inc. | 923,452 | 70.3 | % | ||||
| NATCO Group, Inc. | 3,465,185 | 63.8 | % | ||||
| Rent-A-Center, Inc. | 971,538 | 54.9 | % | ||||
| HUB Group, Inc. | 2,184,813 | 50.5 | % | ||||
| Manitowoc Co. | 2,131,815 | 47.9 | % | ||||
| Core Laboratories NV | 1,987,460 | 43.7 | % | ||||
| Markel Corp. | 1,313,972 | 40.6 | % | ||||
| 16,624,947 | |||||||
| Global Power Equipment Group, Inc. | (2,637,497 | ) | (84.3 | %) | |||
| Journal Register Co. | (3,584,798 | ) | (47.4 | %) | |||
| DynCorp International, Inc. | (2,065,425 | ) | (34.4 | %) | |||
| Tweeter Home Entertainment Group, Inc. | (1,388,932 | ) | (32.7 | %) | |||
| Radio One, Inc. | (1,370,616 | ) | (28.1 | %) | |||
| Autobytel, Inc. | (735,266 | ) | (27.9 | %) | |||
| Lee Enterprises, Inc. | (1,319,617 | ) | (27.2 | %) | |||
| Invacare Corp. | (1,268,628 | ) | (18.9 | %) | |||
| Dynamic Materials Corp. | (1,084,021 | ) | (18.9 | %) | |||
| Williams Scotsman International, Inc. | (587,005 | ) | (18.2 | %) | |||
| (16,041,804 | ) | ||||||
By Dollar Gain / Loss
Security | Twelve Month Dollar Contribution/(Loss) | Twelve Month % Change | |||||
| NATCO Group, Inc. | 3,465,185 | 63.8 | % | ||||
| HUB Group, Inc. | 2,184,813 | 50.5 | % | ||||
| Manitowoc Co. | 2,131,815 | 47.9 | % | ||||
| Jo-Ann Stores, Inc. | 2,037,377 | 105.3 | % | ||||
| Core Laboratories NV | 1,987,460 | 43.7 | % | ||||
| Skechers U.S.A., Inc. | 1,615,715 | 27.4 | % | ||||
| Big Lots, Inc. | 1,597,200 | 86.1 | % | ||||
| CapitalSource, Inc. | 1,537,526 | 33.6 | % | ||||
| Trinity Industries, Inc. | 1,518,453 | 26.2 | % | ||||
| dELiA*s, Inc. | 1,433,317 | 31.7 | % | ||||
| 19,508,860 | |||||||
| Journal Register Co. | (3,584,798 | ) | (47.4 | %) | |||
| Global Power Equipment Group, Inc. | (2,637,497 | ) | (84.3 | %) | |||
| DynCorp International, Inc. | (2,065,425 | ) | (34.4 | %) | |||
| Tweeter Home Entertainment Group, Inc. | (1,388,932 | ) | (32.7 | %) | |||
| Radio One, Inc. | (1,370,616 | ) | (28.1 | %) | |||
| Lee Enterprises, Inc. | (1,319,617 | ) | (27.2 | %) | |||
| Invacare Corp. | (1,268,628 | ) | (18.9 | %) | |||
| Witness Systems, Inc. | (1,264,678 | ) | (17.6 | %) | |||
| Dynamic Materials Corp. | (1,084,021 | ) | (18.9 | %) | |||
| PetroHawk Energy Corp. | (954,256 | ) | (15.3 | %) | |||
| (16,938,467 | ) | ||||||
Please refer to the fund’s schedule of investments in this report for complete holdings information. Fund holdings and sector allocations are subject to change and should not be considered a recommendation to buy or sell any security.
Fund Summary | 41
Masters’ Select Smaller Companies Fund Managers
INVESTMENT MANAGER | FIRM | TARGET ASSET ALLOCATION | MARKET CAPITALIZATION OF COMPANIES IN PORTFOLIO | STOCK-PICKING STYLE | ||||
| Bill D’Alonzo and team | Friess Associates, LLC | 20% | Small and mid-sized companies | Growth | ||||
| John Rogers, Jr. | Ariel Capital Management, LLC | 20% | Small and mid-sized companies | Value | ||||
| Robert Rodriguez | First Pacific Advisors, LLC | 20% | Small and mid-sized companies | Value | ||||
| Dick Weiss | Wells Capital Management, Inc. | 20% | Small and mid-sized companies | Growth at a reasonable price | ||||
| Michael Malouf and Tucker Walsh | Copper Rock Capital Partners, LLC | 20% | Small and mid-sized companies | Growth |
Portfolio Composition*
The fund holds 65 securities, exclusive of cash equivalents.
By Asset Class
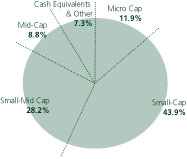
Market Capitalization:
Micro-Cap < $500 million
Small-Cap $500 million - $1.6 billion
Small-Mid Cap $1.6 billion - $4 billion
Mid-Cap > $4 billion
* Totals may not add up to 100% due to rounding.
By Sector
| Sector Weights | |||||||
| Fund | Russell 2000 Index | ||||||
| Consumer Discretionary | 16.0 | % | 15.8 | % | |||
| Consumer Staples | 0.0 | % | 3.2 | % | |||
| Energy | 9.5 | % | 5.1 | % | |||
| Finance | 10.2 | % | 22.5 | % | |||
| Health Care & Pharmaceuticals | 10.8 | % | 11.8 | % | |||
| Industrials | 17.9 | % | 14.2 | % | |||
| Materials | 0.0 | % | 4.6 | % | |||
| Technology | 27.4 | % | 18.4 | % | |||
| Telecommunications | 0.8 | % | 1.5 | % | |||
| Utilities | 0.0 | % | 3.0 | % | |||
| Cash Equivalents & Other | 7.3 | % | 0.0 | % | |||
100.0 | % | 100.0 | % | ||||
42 | The Masters’ Select Funds Trust
Masters’ Select Smaller Companies Stock Highlights
Washington Group International, Inc. - Bill D’Alonzo
Five years ago a company that helped build the Hoover Dam, San Francisco Bay Bridge and Kennedy Space Center was just emerging from Chapter 11 reorganization. Now debt-free with over $3 billion in annual revenue, Washington Group is again adding chapters to its storied past.
NASDAQ-listed Washington Group International is a leading provider of engineering, construction and management solutions. With a presence in more than 45 countries throughout Asia, the Middle East, Europe and the Americas, it operates six primary business units: power, infrastructure, mining, industrial process, defense, and energy and environment.
An ill-advised purchase of Raytheon’s engineering and construction unit in 2000 saddled the company with debt and resulted in bankruptcy. Following a restructuring, its size and vast technical expertise make it a solid choice for high-profile government contracts, including destroying weapons of mass destruction and helping rebuild war-torn Iraq. Government work generates about half of revenue.
September-quarter earnings rose to $22.1 million, excluding charges related to cost overruns from two legacy highway construction projects. Results were fueled by worldwide demand for heavy construction services. Washington Group benefits from increased investment in existing oil-and-gas and power infrastructure as well as the new construction and management of coal and nuclear plants. Its specialized competency in the decommissioning and disposal of hazardous materials ensures a stream of new government opportunities.
The Friess team spoke with Treasurer Earl Ward about the company’s conservative operating strategy. Management has focused on structuring new business as cost-reimbursable rather than higher-risk fixed-price contracts. At $5.1 billion, backlogged business recently reached its highest level since reorganization, with 82 percent of the contracts made under cost-reimbursable terms.
The Friess team bought Washington Group at 19 times current 2006 earnings estimates. Wall Street predicts the company will finish the year with 31 percent earnings growth.
Markel Corp. - John Rogers
An international specialty insurance holding company, Markel Corporation provides insurance products for niche markets such as children’s camps, medical malpractice, horse mortality and extreme sports. By clearly defining its competencies, the company has developed expertise and significant market knowledge that enable it to tailor specialized coverage for unique risks. We believe Markel’s differentiated product offerings position the company to maintain and successfully grow its client base while insulating it against aggressive price competition. Markel differs from traditional insurers by placing a larger portion of its investment portfolio in equity securities. The company executes a value-oriented investment philosophy, with 23% of total investments ($1.5 billion) in equity securities, with internal expectations of double digit returns.
Over the course of its 76-year history, Markel has developed a track record of superior underwriting results as well as an ability to steer the company through difficult periods. Key to this is the discipline of the company’s management and its strict standards for profitability, underwriting integrity and shareholder value. The 2005 hurricane season was the largest and most costly on record. Hurricanes Katrina, Rita and Wilma are estimated to have caused over $50 billion in insured losses for the industry. Despite its diverse portfolio, the severity of the 2005 hurricanes took a substantial toll on Markel’s bottom line, with an estimated cost of more than $300 million. Notwithstanding these losses, for the full year 2005 the company experienced a total underwriting loss of only $12 million on $1.9 billion of net earned premium. Furthermore, Markel was able to grow book value per share by 3%, driven primarily by income from its investment portfolio.
On the heels of the 2005 hurricane season, insurance companies were able to raise prices in response to the consensus opinion that catastrophes had permanently increased in frequency and severity. As the 2006 hurricane season came to a close with no major storm activity, Markel reported impressive results and investors were handsomely rewarded.
We believe Markel boasts a very high quality management team that executes a disciplined underwriting strategy that should produce gains through all parts of the insurance cycle and earn good returns on its investment portfolio, and thus remains a solid holding.
Big Lots, Inc. - Robert Rodriguez
As value investors, we like nothing more than to find a good business that has stumbled, where the wax holding its wings together has melted and its once high-flying stock price has plummeted to earth. We expend our time and energy establishing that its wings are reparable and the company will once again take flight. We claim a better expertise at ascertaining such likelihood than we do at understanding its timing. In the case of Big Lots, Inc., the timing has certainly taken longer than we expected but its business seems finally to have begun its long-awaited ascent.
Big Lots operates 1,403 stores, making them the largest purveyor of close-out merchandise in the country, but they compete for the consumer’s wallet with all discount stores, including Wal-Mart and Target. As the competition has improved in its ability to deliver merchandise at terrific prices to their customer, Big Lots’ pricing umbrella shrunk and their operating margins contracted commensurately, from 7.5% in 1997 to 0.8% in 2005. Prior management failed to rise to the competitive challenge. Steven Fishman joined the company as CEO in July 2005. Although the jury is still out, he has proven far more adept at controlling costs, keeping the stores in stock and clean, and offering the merchandise that their customer wants.
We made our investment in this once high-flying growth stock at an average cost of $13.58 in 2003, when we began investing a portion of the Masters’ Select Smaller Companies Fund. The business had been performing poorly but we believed that 6% operating margins, 20% below the 1997 level, were still attainable. At current sales levels, that would equate to $1.55 in potential earnings per share, just 8.8x our average cost. Should Big Lots achieve its potential, its stock price performance would not be dissimilar to other successful investments we have made, many of which trade in a narrow range for many years until one day Wall Street recognizes that the business has turned and accords it a higher multiple on what would then be higher earnings.
Fund Summary | 43
We look back and can point to stocks we have owned that have barely budged for years that suddenly double (or more) in a matter of months. To be fair, we can also point out those that did not. Although we espouse long-term investing, long-term does not mean forever. In 2005, when the new CEO joined the company, we stated that if we did not see an improvement in various operating metrics, we would reconsider our investment in Big Lots. Fortunately, Mr. Fishman’s initial steps have borne fruit and comparable store sales and margins have improved, and the company has repurchased shares at lower prices. Although operating margins remain well below their potential at just 2.3% for the trailing twelve months, Wall Street has begun to anticipate further improvement and driven Big Lots stock to higher levels. Its stock price almost doubled in 2006. Analyst consensus expectation for 2007 projects operating margins approaching 4% and earnings per share of $1.02. The 2007 Price/Earnings ratio would be 23.8x should this come to pass. As we prefer to buy into weakness and sell into strength, we have liquidated more than one-third of our position at $22.13. With margins recovering but still below our expectation, we believe that additional upside from the $24.27 current price is available and thus, we hold the remaining position and continue to monitor the company’s progress.1
dELiA*s, Inc. - Dick Weiss
dELiA*s, INC. is a teen retailer selling a variety of products through its retail stores and direct channels. It offers three lifestyle brands—dELiA*s, Alloy, and CCS—and targets consumers between the ages of 12 and 19. The company operates dELiA*s mall-based specialty retail stores that sell a range of lifestyle-oriented apparel and accessories for teenage girls. The company currently operates 71 dELiA*s mall-based specialty retail stores, including two outlet stores. The company was founded in 1997 and is based in New York. The company has three brands: 1) dELiA*s, which targets teenage girls and includes apparel, shoes, accessories, and home goods in both retail stores and through a direct channel; 2) Alloy, a predominantly branded junior apparel catalog and e-commerce site for teenage girls; and 3) Central California Skate (CCS), a catalog and e-commerce site for skateboarding and snowboarding equipment, apparel, and footwear products targeted toward teenage boys.
dELiA*s was spun off from Alloy, Inc. in December 2005. Prior to the spin, Alloy had two primary lines of business: media & marketing services and merchandising. As these businesses grew, it became apparent that the two businesses were not synergistic. In fact they had two distinct operating profiles and capital requirements and required different management expertise. We added the stock to the portfolio shortly after the IPO. At the time the company was not followed by any sell-side research firms and we felt it was undiscovered. The company’s strong management team, which draws from their previous experience at a number of high-quality retailers, is well regarded within the industry.
With its roots in the direct channel, internet and catalog are an important business segment for dELiA*s. Historically, approximately two-thirds of sales have come from the segment with the remainder attributable to retail locations. dELiA*s expansion plan includes opening regionally clustered stores. Over the long term, the company believes that there is demand for approximately 350 to 400 stores.
dELiA*s competes in a crowded market. The company differentiates itself by finding the “white space” in the competitive landscape and offers difficult-to-find products for its “girl next door” customer. As an example, dELiA*s carries a wider variety of fits and longer inseam bottoms, versus typical retailers.
We believe that dELiA*s is one of the few pure, early-stage square-footage growth stories in the specialty apparel space. Significant long-term square-footage growth from a current base of approximately 71 stores will drive top line growth for years to come. dELiA*s has committed to 25% square-footage growth for FY06 and we believe that 20-25% annual square-footage growth for the next several years would be reasonable to assume. dELiA*s also is a margin turnaround story. Based on competitors’ models, it is reasonable to believe that operating margins could move from current low-single-digits to the high-single-digit range. Shares of DLIA are attractive at 1.0x 2006E EV/Sales compared to the group average of 1.6x.
BE Aerospace, Inc. - Michael Malouf and Tucker Walsh
B/E AEROSPACE (BEAV) manufactures cabin interior products for commercial passenger aircraft and business jets and retrofits airlines for commercial and freighter use. BEAV has approximately 45% leading market share in all major product segments with customers comprising every airline and aircraft manufacturer. The commercial aerospace market forecasts a good outlook for the next 12 - 18 months and further into the back half of the decade, despite some of the inherent industry risks like competition and government regulation. During this time, it is estimated that a majority of the US airline carriers will require new cabin interior upgrades to remain competitive with the international airlines and their fleets.
Copper Rock considers three primary questions when adding a stock to the portfolio: is the company exhibiting strong revenue growth of 15% or more and strong earnings growth upwards of 20%, is this growth sustainable, and is the growth priced into the market. BEAV has exhibited all of these characteristics. It is one of the larger positions in the portfolio and has been a top contributor to performance in the second half of 2006. The company has improved its leadership in the space by acquiring premier companies, improving its operations, and constantly innovating. Specifically, the company has the largest market share in the seating and interior equipment markets. BEAV has positioned itself very well to capitalize on further growth because it has already installed more than one million seats in the existing global airline fleet. The company is typically the primary supplier for upgrades, replacements, and new installations since airlines usually employ the original supplier. Finally, 2007 revenue is expected to be over $1.35 billion, which is up 23% over 2006.
44 | The Masters’ Select Funds Trust
In October 2006, the company announced that third quarter financial results exceeded expectations. Guidance for the 2006 year was raised and the company was confident establishing 2007 guidance and providing an extensive three year outlook. Some of the highlights most important to Copper Rock’s decision to own the stock were: record third quarter revenues reflecting a 32.6% year over year growth, including organic growth of 25.5%. The organic growth figure was especially important as the company captured market share quickly by successfully acquiring and integrating other companies. The increase in sales volume for seating, interiors and engineering services was another indication of solid growth. The business jet segment generated higher revenues for the quarter compared to the same period in 2005, but it had slightly lower operating earnings due to a delay in delivery of the Airbus 380. Despite this fact, Copper Rock does not believe it will have a long term negative impact on the company, particularly since the margin expansion for the seating and interior systems segment remains so strong and manufacturing efficiencies have been realized. Within the US, the company also won two retrofit contracts from domestic airlines, implying the beginning of the domestic retrofit cycle is just around the corner.
Both decreasing energy prices and continued improvement in business travel since the lows after 9/11 contribute to a favorable market environment where BEAV can outperform. The company also forecasts operating earnings growth over the next three years to be approximately 40 - 45%, which is well above 20% target that Copper Rock seeks when it evaluates a company.
See page 79 for Industry Terms and Definitions
Neither the information contained herein nor any opinion expressed shall be construed to constitute an offer to sell or a solicitation to buy any securities mentioned herein. The views herein are those of the portfolio managers at the time the commentaries are written and may not be reflective of current conditions.
Fund Summary | 45
Masters’ Select Smaller Companies Fund
SCHEDULE OF INVESTMENTS IN SECURITIES at December 31, 2006
Shares | Value | ||
COMMON STOCKS: 92.7% | |||
Consumer Discretionary: 16.1% | |||
| 96,000 | Big Lots, Inc.* | $ | 2,200,320 |
| 71,900 | Career Education Corp.* | 1,781,682 | |
| 302,900 | Charming Shoppes, Inc.* | 4,098,237 | |
| 60,600 | Cox Radio, Inc. - Class A* | 987,780 | |
| 568,000 | dELiA*s, Inc.* | 5,958,320 | |
| 204,100 | Foot Locker, Inc. | 4,475,913 | |
| 190,000 | Interface, Inc.* | 2,701,800 | |
| 424,100 | Interpublic Group of Companies, Inc.* | 5,190,984 | |
| 161,500 | Jo-Ann Stores, Inc.* | 3,972,900 | |
| 412,600 | Journal Register Co. | 3,011,980 | |
| 125,749 | Pinnacle Entertainment, Inc.* | 4,167,322 | |
| 274,200 | Radio One, Inc.* | 1,848,108 | |
| 92,900 | Rent-A-Center, Inc.* | 2,741,479 | |
| 43,136,825 | |||
Energy: 9.5% | |||
| 83,439 | Hercules Offshore, Inc.* | 2,411,387 | |
| 77,000 | Lufkin Industries, Inc. | 4,472,160 | |
| 85,300 | National Oilwell Varco, Inc.* | 5,218,654 | |
| 167,800 | Patterson-UTI Energy, Inc. | 3,897,994 | |
| 260,000 | Petroquest Energy, Inc.* | 3,312,400 | |
| 179,900 | Rosetta Resourses, Inc.* | 3,358,733 | |
| 84,800 | Rowan Companies, Inc. | 2,815,360 | |
| 25,486,688 | |||
Finance: 10.2% | |||
| 17,909 | Affiliated Managers Group, Inc.* | 1,882,773 | |
| 190,000 | CapitalSource, Inc. | 5,188,900 | |
| 57,668 | GFI Group, Inc.* | 3,590,410 | |
| 57,450 | HCC Insurance Holdings, Inc. | 1,843,570 | |
| 81,500 | Investors Financial Services Corp. | 3,477,605 | |
| 205,400 | Janus Capital Group, Inc. | 4,434,586 | |
| 7,405 | Markel Corp.* | 3,555,141 | |
| 12,200 | Mercury General Corp. | 643,306 | |
| 94,300 | Nasdaq Stock Market, Inc.* | 2,903,497 | |
| 27,519,788 | |||
Healthcare, Pharmaceuticals & Biotechnology: 10.8% | |||
| 149,972 | Adams Respiratory Therapeutics, Inc.* | 6,120,357 | |
| 150,000 | Angiodynamics, Inc.* | 3,223,500 | |
| 29,200 | Apria Healthcare Group, Inc.* | 778,180 | |
| 970,000 | Draxis Health, Inc.* | 4,685,100 | |
| 139,200 | Invacare Corp. | 3,417,360 | |
| 139,046 | Radiation Therapy Services, Inc.* | 4,382,730 | |
| 118,000 | Respironics, Inc.* | 4,454,500 | |
| 80,000 | The Providence Service Corp.* | 2,010,400 | |
| 29,072,127 | |||
Industrials: 17.9% | |||
| 146,200 | AAR Corp.* | 4,267,578 | |
| 166,100 | ACCO Brands Corp.* | 4,396,667 | |
| 145,000 | Albany International Corp. | 4,771,950 | |
| 60,400 | American Commercial Lines* | 3,956,804 | |
| 144,177 | BE Aerospace, Inc.* | 3,702,465 | |
| 77,700 | ESCO Technologies, Inc.* | 3,530,688 | |
| 236,200 | HUB Group, Inc.* | 6,507,310 | |
| 202,000 | Interline Brands, Inc.* | 4,538,940 | |
| 87,100 | Kenexa Corp.* | 2,896,946 | |
| 137,400 | Trinity Industries, Inc. | 4,836,480 | |
| 80,000 | Washington Group International, Inc.* | 4,783,200 | |
| 48,189,028 | |||
Shares/ Principal Amount | Value | ||
Technology: 27.4% | |||
| 338,180 | Anadigics, Inc.* | $ | 2,996,275 |
| 660,000 | Ariba, Inc.* | 5,108,400 | |
| 370,000 | Arris Group, Inc.* | 4,628,700 | |
| 239,700 | Avnet, Inc.* | 6,119,541 | |
| 772,400 | BearingPoint, Inc.* | 6,078,788 | |
| 55,300 | Black Box Corp. | 2,322,047 | |
| 121,600 | Blackboard, Inc.* | 3,652,864 | |
| 383,000 | Epicor Software Corp.* | 5,174,330 | |
| 220,000 | Heartland Payment Systems, Inc. | 6,215,000 | |
| 228,100 | Hewitt Associates, Inc. - Class A* | 5,873,575 | |
| 59,100 | Littelfuse, Inc.* | 1,884,108 | |
| 625,000 | Magma Design Automation, Inc.* | 5,581,250 | |
| 313,200 | Parametric Technology Corp.* | 5,643,864 | |
| 156,100 | Rackable Systems, Inc.* | 4,834,417 | |
| 235,000 | SimpleTech, Inc.* | 2,979,800 | |
| 376,500 | Vasco Data Security International* | 4,461,525 | |
| 73,554,484 | |||
Telecommunications: 0.8% | |||
| 73,100 | Cbeyond, Inc.* | 2,236,129 | |
TOTAL COMMON STOCKS (cost $213,630,278) | 249,195,069 | ||
SHORT-TERM INVESTMENTS: 7.0% | |||
| $18,910,000 | State Street Bank & Trust Co., 3.600%, 12/31/06, due 01/02/07 [collateral: $15,085,000, US Treasury Notes, 7.125%, due 02/15/23, US Treasury Notes, 8.125, due 05/15/21, value $19,298,388] (proceeds $18,917,564) | 18,910,000 | |
TOTAL SHORT-TERM INVESTMENTS (cost $18,910,000) | 18,910,000 | ||
TOTAL INVESTMENTS IN SECURITIES (cost $232,540,278): 99.7% | 268,105,069 | ||
| Other Assets less Liabilities: 0.3% | 810,441 | ||
Net Assets: 100.0% | $ | 268,915,510 | |
| * Non-income producing security. |
| The accompanying notes are an integral part of these financial statements. |
46 | The Masters’ Select Funds Trust
Masters’ Select Focused Opportunities Fund Review
Comparison Chart
The value of a hypothetical $10,000 investment in Masters’ Select Focused Opportunities Fund from its inception (6/30/06) to present as compared with the S&P 500 Index.
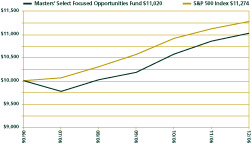
The hypothetical $10,000 investment at fund inception includes changes due to share price and reinvestment of dividends and capital gains. This chart does not imply any future performance. Indexes are unmanaged, do not incur fees and cannot be invested in directly.
In the six months since the launch of the Masters’ Select Focused Opportunities Fund, U.S. stocks moved sharply higher. Masters’ Select Focused Opportunities participated in this move, gaining 10.20%, but it trailed its benchmark, the S&P 500, which was up 12.74%.
Performance as of December 31, 2006
Since Inception (6/30/2006) | ||||
Masters’ Select Focused Opportunities Fund | 10.20 | % | ||
S&P 500 Index | 12.74 | % | ||
Performance quoted represents past performance and does not guarantee future results. The investment return and principal value of an investment will fluctuate so that an investor’s shares, when redeemed, may be worth more or less than their original cost. Current performance of the funds may be lower or higher than the performance quoted. To obtain the performance of the funds as of the most recently completed calendar month, please visit our website at www.mastersfunds.com or call 1-800-960-0188. The Fund imposes a 2% redemption fee on shares held less than 180 days. Performance does not reflect the redemption fee. If reflected, performance would be lower.
Though the fund primarily invests in securities of U.S. domiciled companies it can and has invested in foreign securities as well. Investment in foreign securities subjects investors to political, economic and market risks and fluctuations in currency rates. Though the fund invests primarily in mid-sized and larger-sized companies it can also invest in smaller companies. Smaller companies involve more risk such as limited liquidity and greater volatility. The Fund is non-diversified, which means it may hold larger positions in a smaller number of companies than a diversified fund.
See page 78 for index definitions
Performance Analysis and Expectations
As we’ve stated repeatedly, our primary objective with all of the Masters’ Select Funds is to achieve superior long-term performance relative to each fund’s benchmarks and peer groups. Neither we nor the funds’ sub-advisors focus on short-term relative returns, and we believe this longer-term investment perspective is one important element for the funds’ (and our shareholders’) ultimate success. While we would of course be happy to have our funds beat their benchmarks over all time periods - short, medium and long - we know this is an unrealistic expectation.
Moreover, because we give the Masters’ managers a great deal of flexibility in constructing their portfolios, we expect that our funds will often look very different (e.g., in terms of market cap, sector, industry and/or regional allocations) from their benchmarks. That is a good thing, in our view. In order to significantly outperform a benchmark over the long-term, you need to be different from the benchmark. But, as we have seen throughout the history of our funds, this can (and will) lead to periods of underperformance relative to the benchmark.
In the case of Masters’ Select Focused Opportunities, the potential for such “out-of-sync” performance relative to its S&P 500 benchmark is probably even higher than for our other funds, both because of the fund’s highly concentrated portfolio - each sub-advisor must select only five to seven stocks for their sub-portfolio - as well as the very broad investment universe from which each stock picker may choose their holdings (including mid-cap companies, foreign stocks, and distressed debt). Therefore, it is especially critical that investors in this fund have patience and a long-term investment horizon because there will inevitably be periods when the fund is underperforming. For investors such as us, what matters is performance over multi-year periods. That is how we will judge the success of each sub-advisor and the overall fund.
Portfolio Commentary
Keeping in mind the fund’s short history, following are some of the factors that contributed to the fund’s performance in the second half of 2006.
Performance of managers: Two of the fund’s three sub-advisors underperformed their respective benchmarks, while the third manager performed in line with their benchmark. The individual manager returns ranged from 8.5% to 12.6%.
Sector and stock-picking impact: As with all Masters’ Select funds, the portfolio is built through bottom-up stock picking, but the sector exposure that results from this process may provide some insight into the fund’s relative performance. Based on our attribution analysis the fund’s overall sector exposure relative to the S&P 500 Index had a negative impact on relative performance during the last half of 2006. Specifically, the fund was hurt by its overweighting to energy stocks as that sector underperformed the broader index return. The fund also suffered some drag from its average cash position of roughly 8%, as cash returned less than the index.
On the positive side, the managers’ stock selection added value relative to the benchmark. Stock picking was strongest within the information technology sector, highlighted by the fund’s top-performer, Salesforce.com (up 25)% and Network Appliance (up 24)%. Stock selection was also a positive contributor in the industrials (Orkla, up 22)% and utilities (RWE, up 24)% sectors. In contrast, the managers’ stock picking was weak within the financials sector (Progressive Corp., down 4)% and energy (EOG Resources, down 11)%.
Fund Summary | 47
Leaders and laggards: All three of the Masters’ Select Focused Opportunities managers owned at least one stock among the top ten dollar gainers. Two of the three also had at least one stock among the fund’s biggest losers. Nine of the fund’s ten largest winners and all of the largest losers remained in the portfolio at year-end. The one top-ten winner that was sold was Network Appliance, which the managers replaced with Qualcomm.
See the table on page 49 that lists the leaders and laggards over the past six months. The table includes dollar gains and losses as well as percentage gains and losses. The fact that a stock has lost money or underperformed for the period ended December 31, 2006 tells us nothing about how successful the holding will ultimately become. The fund will hold many stocks for significantly longer periods of time and the success of these holdings won’t be known until they are ultimately sold. In that respect, while it is interesting to know how specific stocks performed during the period, this information is of limited value in assessing the ultimate success of these stock holdings.
Portfolio mix: Even more so than the other Masters’ Select funds, because it is highly concentrated, Focused Opportunities’ overall portfolio mix will be driven by the managers’ bottom-up stock picking. With a maximum of 21 holdings, there may be some sectors with no allocation and others where just one or two stocks comprise the entire sector weighting. At the end of 2006, the fund’s portfolio looked quite different from its S&P 500 benchmark.
| • | The fund was heavily overweighted to the energy sector at 19.8% of assets versus 9.9% for the S&P 500. The energy weighting was comprised of three companies: ConocoPhillips (the fund’s top holding at 12.3% of assets), Schlumberger and EOG Resources. |
| • | The fund was also overweighted to the financials (26.1% vs. 22.2% for the index) and technology (16.9% vs. 15.1)% sectors. |
| • | The fund was significantly underweighted to health care (0.0% for the fund vs.12.0%for the index). Other underweighted sectors included consumer discretionary (6.8% vs. 10.6)%, telecom services (0.0% vs. 3.5)% and industrials (9.1% vs. 10.8)%. |
| • | Large-cap stocks (greater than $12.3 billion market cap) comprised 65% of portfolio and mid-caps ($1.3 billion to $12.3 billion market cap) accounted for 10% of the portfolio. |
| • | Foreign stocks accounted for 22% of the portfolio. |
| • | The fund’s cash position stood at 3.4% at the end of 2006. |
Please see page 50 for a breakout of the fund’s sector and market-cap exposure.
Miscellaneous
Expenses: As a new fund, Masters’ Select Focused Opportunities has a small asset base ($57 million at year-end) and this means the fund’s fixed overhead cost is not spread across many shares (please refer to page 63 to see the actual expenses for the Fund as of 12/31/2006). As the asset base grows, this overhead will be spread across more shares, resulting in a lower cost per share. This has already happened as the asset base has grown. As we write this in January 2007, we estimate that expenses are accruing at about 1.39%. If assets continue to grow as we anticipate, per share expenses should continue to decline.
In Closing
We are very excited about the long-term prospects for the Focused Opportunities fund. We created this fund because we believe it has the potential to deliver strong long-run returns relative to large-cap stock benchmarks and peer groups. Our confidence stems from the Masters’ Select concept, which is based on the belief that a skilled stock picker’s best ideas are likely to deliver higher long-term returns than a more diversified portfolio run by the same stock picker. Focused Opportunities takes this idea to another level, with even more concentrated sub-portfolios than those found in the other Masters’ Select funds because we believe this higher level of concentration has the potential to result in even higher returns over the long run.
All three of the fund’s sub-advisors also manage portions of other Masters’ Select funds and we have exceptionally high confidence in them. Our confidence stems from the extensive contact we have had with them and their firms over many years. Our exposure to their investment process, execution discipline, thorough research, intelligence and team quality has resulted in our high confidence in their investment edge and the sustainability of that edge. Our confidence has been reinforced by each sub-advisor’s success running concentrated portfolios. In addition, each manager is enthusiastic about being part of Focused Opportunities and confident in their ability to add incremental returns by holding few stocks. Finally, over the years each of these sub-advisors has demonstrated that they greatly value their relationship with Masters’ Select and, as a result, show a strong commitment to executing their portfolio management duties in a highly thoughtful and diligent way. As shareholders, we feel we are very fortunate to have them working for us.
As always, we thank you for your trust and confidence. Along with the fund’s sub-advisors, we will work hard to earn it.
Please see page 51 for comments for stock discussions provided by the sub-advisors.
See page 79 for Industry Terms and Definitions
48 | The Masters’ Select Funds Trust
Masters’ Select Focused Opportunities Fund Leaders and Laggards (Unaudited)
For The Six Months Ended December 31, 2006 (Unaudited)
By Percentage Gain / Loss
Security | Six Month Dollar Contribution/(Loss) | Six Month % Change | |||||
| Salesforce.com, Inc. | 717,573 | 24.5 | % | ||||
| RWE AG | 410,939 | 24.0 | % | ||||
| Network Appliance, Inc. | 313,788 | 23.9 | % | ||||
| Orkla ASA | 355,025 | 22.1 | % | ||||
| American International Group, Inc. | 504,061 | 20.6 | % | ||||
| Weyerhaeuser Co. | 441,238 | 18.2 | % | ||||
| Svenska Handelsbanken | 389,665 | 16.4 | % | ||||
| Countrywide Financial Corp. | 376,812 | 14.5 | % | ||||
| American Express Co. | 206,379 | 13.9 | % | ||||
| News Corp. | 91,211 | 12.1 | % | ||||
| 3,806,691 | |||||||
| EOG Resources, Inc. | (190,082 | ) | (11.1 | %) | |||
| The Progressive Corp. | (73,666 | ) | (4.4 | %) | |||
| Schlumberger Ltd. | (21,728 | ) | (0.8 | %) | |||
| (285,476 | ) | ||||||
By Dollar Gain / Loss
Security | Six Month Dollar Contribution/(Loss) | Six Month % Change | ||||
| Salesforce.com, Inc. | 717,573 | 24.5 | % | |||
| ConocoPhillips | 512,090 | 7.8 | % | |||
| American International Group, Inc. | 504,061 | 20.6 | % | |||
| Weyerhaeuser Co. | 441,238 | 18.2 | % | |||
| Google, Inc. | 434,996 | 11.5 | % | |||
| RWE AG | 410,939 | 24.0 | % | |||
| Svenska Handelsbanken | 389,665 | 16.4 | % | |||
| Countrywide Financial Corp. | 376,812 | 14.5 | % | |||
| Orkla ASA | 355,025 | �� | 22.1 | % | ||
| Network Appliance, Inc. | 313,788 | 23.9 | % | |||
| 4,456,187 | ||||||
| EOG Resources, Inc. | (190,082 | ) | (11.1 | %) | ||
| The Progressive Corp. | (73,666 | ) | (4.4 | %) | ||
| Schlumberger Ltd. | (21,728 | ) | (0.8 | %) | ||
| (285,476 | ) | |||||
Please refer to the fund’s schedule of investments in this report for complete holdings information. Fund holdings and sector allocations are subject to change and should not be considered a recommendation to buy or sell any security.
Fund Summary | 49
Masters’ Select Focused Opportunities Fund Managers
INVESTMENT MANAGER | FIRM | TARGET ASSET ALLOCATION | MARKET CAPITALIZATION OF COMPANIES IN PORTFOLIO | STOCK-PICKING STYLE | ||||
Craig Blum and Steven Burlingame | TCW Investment Management Company | 33.33% | Mostly mid- and large-sized companies | Growth | ||||
Christopher Davis/ Kenneth Feinberg | Davis Selected Advisers, L.P. | 33.33% | Mostly large companies | Growth at a reasonable price | ||||
Michael Embler and Peter Langerman | Franklin Mutual Advisers, LLC | 33.33% | All sizes and global | Value |
Portfolio Composition*
The fund holds 21 securities, exclusive of cash equivalents.
By Asset Class
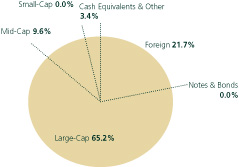
Market Capitalization:
Small-Cap Domestic < $1.6 billion
Mid-Cap Domestic $1.6 - $12.3 billion
Large-Cap Domestic > $12.3 billion
* Totals may not add up to 100% due to rounding.
By Sector
| Sector Weights | |||||||
| Fund | S&P 500 Index | ||||||
| Consumer Discretionary | 6.8 | % | 10.6 | % | |||
| Consumer Staples | 9.2 | % | 9.2 | % | |||
| Energy | 19.8 | % | 9.9 | % | |||
| Finance | 26.1 | % | 22.2 | % | |||
| Health Care & Pharmaceuticals | 0.0 | % | 12.0 | % | |||
| Industrials | 9.1 | % | 10.8 | % | |||
| Materials | 4.9 | % | 3.0 | % | |||
| Technology | 16.9 | % | 15.1 | % | |||
| Telecommunications | 0.0 | % | 3.5 | % | |||
| Utilities | 3.7 | % | 3.6 | % | |||
| Cash Equivalents & Other | 3.4 | % | 0.0 | % | |||
100.0 | % | 100.0 | % | ||||
50 | The Masters’ Select Funds Trust
Masters’ Select Focused Opportunities Fund Stock Highlights
Weyerhaeuser Co. - Michael Embler
Weyerhaeuser Co. is held in both the Value Fund and the Focused Opportunities Fund. Please refer to the discussion appearing on page 35.
Countrywide Financial Corp. - Craig Blum and Steve Burlingame
Countrywide Financial Corp. is held in both the Equity Fund and the Focused Opportunities Fund. Please refer to the discussion appearing on page 14.
Tyco International Ltd. - Christopher Davis and Kenneth Feinberg
Tyco International Ltd. is held in both the Equity Fund and the Focused Opportunities Fund. Please refer to the discussion appearing on page 14.
Neither the information contained herein nor any opinion expressed shall be construed to constitute an offer to sell or a solicitation to buy any securities mentioned herein. The views herein are those of the portfolio managers at the time the commentaries are written and may not be reflective of current conditions.
Fund Summary | 51
Masters’ Select Focused Opportunities Fund
SCHEDULE OF INVESTMENTS IN SECURITIES at December 31, 2006
Shares | Value | ||
COMMON STOCKS: 96.5% | |||
Consumer Discretionary: 6.8% | |||
| 39,200 | News Corp. | $ | 842,016 |
| 120,558 | NTL, Inc. | 3,042,884 | |
| 3,884,900 | |||
Consumer Staples: 9.2% | |||
| 31,713 | Altria Group, Inc. | 2,721,610 | |
| 41,908 | KT&G Corp.* | 2,546,024 | |
| 5,267,634 | |||
Energy: 19.8% | |||
| 97,700 | ConocoPhillips | 7,029,515 | |
| 24,300 | EOG Resources, Inc. | 1,517,535 | |
| 44,200 | Schlumberger Ltd. | 2,791,672 | |
| 11,338,722 | |||
Financials: 26.1% | |||
| 27,800 | American Express Co. | 1,686,626 | |
| 41,000 | American International Group, Inc. | 2,938,060 | |
| 52,500 | Commerce Bancorp, Inc. | 1,851,675 | |
| 69,700 | Countrywide Financial Corp. | 2,958,765 | |
| 24,200 | JPMorgan Chase & Co. | 1,168,860 | |
| 65,800 | The Progressive Corp. | 1,593,676 | |
| 91,213 | Svenska Handelsbanken | 2,761,524 | |
| 14,959,186 | |||
Industrials: 9.1% | |||
| 34,580 | Orkla ASA | 1,959,977 | |
| 106,200 | Tyco International Ltd. | 3,228,480 | |
| 5,188,457 | |||
Materials: 4.9% | |||
| 39,950 | Weyerhaeuser Co. | 2,822,467 | |
Technology: 16.9% | |||
| 8,300 | Google, Inc.* | 3,821,984 | |
| 58,400 | QUALCOMM, Inc. | 2,206,936 | |
| 100,200 | Salesforce.com, Inc.* | 3,652,290 | |
| 9,681,210 | |||
Shares/ Principal Amount | Value | ||
Utilities: 3.7% | |||
| 19,276 | RWE AG* | $ | 2,123,958 |
TOTAL COMMON STOCKS (cost $50,424,999) | 55,266,534 | ||
SHORT-TERM INVESTMENTS: 3.9% | |||
| $2,217,000 | State Street Bank & Trust Co., 8.280%, 12/31/06, due 01/02/07 [collateral: $1,915,000, US Treasury Notes, 7.250%, due 08/15/22, US Treasury Notes, 7.125%, due 02/15/23, Federal Home Loan, 6.096%, due 09/01/36, value $2,269,823] (proceeds $2,217,957) | 2,217,000 | |
TOTAL SHORT-TERM INVESTMENTS (cost $2,217,000) | 2,217,000 | ||
TOTAL INVESTMENTS IN SECURITIES (cost $52,641,999): 100.4% | 57,483,534 | ||
| Liabilities in Excess of Other Assets: (0.4%) | (246,875) | ||
Net Assets: 100.0% | $ | 57,236,659 | |
* Non-income producing security.
The accompanying notes are an integral part of these financial statements.
52 | The Masters’ Select Funds Trust
Masters’ Select Funds Trust
EXPENSE EXAMPLES - (Unaudited)
As a shareholder of the Funds, you incur two types of costs: (1) redemptions fees; and (2) ongoing costs, including advisory fees; and other fund expenses. The examples below are intended to help you understand your ongoing costs (in dollars) of investing in the Funds and to compare these costs with the ongoing costs of investing in other mutual funds.
The examples are based on an investment of $1,000 invested at the beginning of the period shown and held for the entire period from July 1, 2006 to December 31, 2006.
Actual Expenses
For each Fund, the first line of the table below provides information about actual account values and actual expenses. You may use the information in this line, together with the amount you invested, to estimate the expenses that you paid over the period. Simply divide your account value by $1,000 (for example, an $8,600 account value divided by $1,000 = 8.6), then multiply the result by the number in the first line under the heading entitled “Expenses Paid During Period” to estimate the expenses you paid on your account during this period.
Hypothetical Example for Comparison Purposes
For each Fund, the second line of the table below provides information about hypothetical account values and hypothetical expenses based on the Fund’s actual expense ratio and an assumed rate of return of 5% per year before expenses, which is not the Fund’s actual return. The hypothetical account values and expenses may not be used to estimate the actual ending account balance or expenses you paid for the period. You may use this information to compare the ongoing costs of investing in the Fund and other funds. To do so, compare this 5% hypothetical example with the 5% hypothetical examples that appear in the shareholder reports of the other funds.
Please note that the expenses shown in the table are meant to highlight your ongoing costs only and do not reflect any redemption fees. Therefore, the second line for each Fund of the table is useful in comparing ongoing costs only, and will not help you determine the relative total costs of owning different funds. In addition, if these redemption fees were included, your costs would have been higher.
Beginning Account Value (07/01/06) | Ending Account Value (12/31/06) | Expenses Paid During Period* (07/01/06 to 12/31/06) | Expense Ratio During Period* (07/01/06 to 12/31/06) | ||||||||||
| Masters’ Select Equity Fund Actual | $ | 1,000.00 | $ | 1,094.10 | $ | 6.28 | 1.19 | % | |||||
| Masters’ Select Equity Fund Hypothetical (5% return before expenses) | $ | 1,000.00 | $ | 1,019.21 | $ | 6.06 | 1.19 | % | |||||
| Masters’ Select International Fund Actual | $ | 1,000.00 | $ | 1,145.60 | $ | 5.79 | 1.07 | % | |||||
| Masters’ Select International Fund Hypothetical (5% return before expenses) | $ | 1,000.00 | $ | 1,019.81 | $ | 5.45 | 1.07 | % | |||||
| Masters’ Select Value Fund Actual | $ | 1,000.00 | $ | 1,142.70 | $ | 6.64 | 1.23 | % | |||||
| Masters’ Select Value Fund Hypothetical (5% return before expenses) | $ | 1,000.00 | $ | 1,019.00 | $ | 6.26 | 1.23 | % | |||||
| Masters’ Select Smaller Companies Fund Actual | $ | 1,000.00 | $ | 1,054.80 | $ | 7.04 | 1.36 | % | |||||
| Masters’ Select Smaller Companies Fund Hypothetical (5% return before expenses) | $ | 1,000.00 | $ | 1,018.35 | $ | 6.92 | 1.36 | % | |||||
| Masters’ Select Focused Opportunities Fund Actual | $ | 1,000.00 | $ | 1,102.00 | $ | 7.42 | 1.40 | % | |||||
| Masters’ Select Focused Opportunities Fund Hypothetical (5% return before expenses) | $ | 1,000.00 | $ | 1,018.15 | $ | 7.12 | 1.40 | % | |||||
*Expenses are equal to the Funds’ annualized expense ratio as indicated, multiplied by the average account value over the period, multiplied by the number of days in most recent fiscal half-year period (184), then divided by the number of days in the fiscal year (365) (to reflect the one-half year period).
Expense Examples | 53
Masters’ Select Funds Trust
STATEMENTS OF ASSETS AND LIABILITIES at December 31, 2006
Equity Fund | International Fund | Value Fund | Smaller Companies Fund | Focused Opportunities Fund | ||||||||||||
ASSETS | ||||||||||||||||
| Investments in securities at cost | $ | 653,745,789 | $ | 1,334,519,823 | $ | 270,867,913 | $ | 213,630,278 | $ | 50,424,999 | ||||||
| Repurchase agreements at cost | 12,142,000 | 47,482,000 | 4,427,000 | 18,910,000 | 2,217,000 | |||||||||||
| Total investments at cost | $ | 665,887,789 | $ | 1,382,001,823 | $ | 275,294,913 | $ | 232,540,278 | $ | 52,641,999 | ||||||
| Investments in securities at value | $ | 851,034,495 | $ | 1,674,783,203 | $ | 362,419,858 | $ | 249,195,069 | $ | 55,266,534 | ||||||
| Repurchase agreements at value | 12,142,000 | 47,482,000 | 4,427,000 | 18,910,000 | 2,217,000 | |||||||||||
| Cash | 74,368 | 3,503 | 94,410 | 9,091 | 85,204 | |||||||||||
| Cash, denominated in foreign currency (cost of $6, $2,026,755, $—, $— and $—, respectively) | 6 | 2,049,257 | — | — | — | |||||||||||
| Receivables: | ||||||||||||||||
| Securities sold | — | 544,183 | — | 1,502,612 | — | |||||||||||
| Dividends and interest | 656,669 | 1,415,937 | 188,247 | 39,408 | 50,717 | |||||||||||
| Fund shares sold | 1,558,250 | 4,786,222 | 749,573 | 425,443 | 67,514 | |||||||||||
| Foreign tax reclaim | 2,813 | 187,033 | — | — | — | |||||||||||
| Unrealized gain on forward exchange contracts | — | 231,861 | 524,683 | — | 58,213 | |||||||||||
| Prepaid expenses | 12,356 | 14,041 | 4,781 | 5,942 | 14,823 | |||||||||||
| Total assets | 865,480,957 | 1,731,497,240 | 368,408,552 | 270,087,565 | 57,760,005 | |||||||||||
LIABILITIES | ||||||||||||||||
| Payables: | ||||||||||||||||
| Advisory fees | 798,421 | 1,306,157 | 335,050 | 261,906 | 48,033 | |||||||||||
| Trustee fees | 2,113 | 305 | 68 | — | — | |||||||||||
| Securities purchased | — | 2,272,120 | — | 752,112 | 380,268 | |||||||||||
| Fund shares redeemed | 842,267 | 776,668 | 637,905 | 57,571 | — | |||||||||||
| Foreign taxes withheld | — | 31,954 | — | — | — | |||||||||||
| Unrealized loss on forward exchange contracts | — | — | 328,312 | — | 28,314 | |||||||||||
| Accrued other expenses | 140,396 | 313,567 | 88,966 | 100,466 | 66,731 | |||||||||||
| Total liabilities | 1,783,197 | 4,700,771 | 1,390,301 | 1,172,055 | 523,346 | |||||||||||
NET ASSETS | $ | 863,697,760 | $ | 1,726,796,469 | $ | 367,018,251 | $ | 268,915,510 | $ | 57,236,659 | ||||||
| Number of shares issued and outstanding (unlimited number of shares authorized, $0.01 par value) | 55,064,113 | 92,146,114 | 22,461,704 | 18,094,265 | 5,194,398 | |||||||||||
Net asset value, offering and redemption price per share | $ | 15.69 | $ | 18.74 | $ | 16.34 | $ | 14.86 | $ | 11.02 | ||||||
COMPONENTS OF NET ASSETS | ||||||||||||||||
| Paid in capital | $ | 659,763,420 | $ | 1,362,978,501 | $ | 275,029,162 | $ | 231,180,370 | $ | 52,210,092 | ||||||
| Undistributed net investment income (loss) | — | (11,183,847 | ) | (574,466 | ) | — | (200,302 | ) | ||||||||
| Accumulated net realized gain (loss) on investments and options | 6,645,634 | 34,451,304 | 815,239 | 2,170,349 | 355,435 | |||||||||||
| Net unrealized appreciation on: | ||||||||||||||||
| Investments | 197,288,706 | 340,263,380 | 91,551,945 | 35,564,791 | 4,841,535 | |||||||||||
| Foreign currency | — | 287,131 | 196,371 | — | 29,899 | |||||||||||
| Net assets | $ | 863,697,760 | $ | 1,726,796,469 | $ | 367,018,251 | $ | 268,915,510 | $ | 57,236,659 | ||||||
The accompanying notes are an integral part of these financial statements.
54 | The Masters’ Select Funds Trust
STATEMENTS OF OPERATIONS For the Year Ended December 31, 2006
Equity Fund | International Fund | Value Fund | Smaller Companies Fund | Focused Opportunities Fund* | ||||||||||||
INVESTMENT INCOME | ||||||||||||||||
| Income | ||||||||||||||||
| Dividends (net of foreign taxes withheld of $75,544, $2,942,901, $148,115, $— and $—, respectively) | $ | 8,605,294 | $ | 40,392,952 | $ | 5,311,313 | $ | 974,038 | $ | 216,738 | ||||||
| Interest | 1,061,456 | 3,442,220 | 631,841 | 1,211,448 | 82,053 | |||||||||||
| Total income | 9,666,750 | 43,835,172 | 5,943,154 | 2,185,486 | 298,791 | |||||||||||
| Expenses | ||||||||||||||||
| Advisory fees | 9,546,067 | 17,059,194 | 3,839,949 | 3,335,238 | 237,163 | |||||||||||
| Administration fees | 169,373 | 308,407 | 67,008 | 56,313 | 4,142 | |||||||||||
| Custody fees | 77,268 | 971,537 | 52,484 | 42,546 | 6,915 | |||||||||||
| Transfer agent fees | 265,903 | 429,139 | 98,307 | 131,385 | 15,515 | |||||||||||
| Chief compliance officer fees | 11,667 | 11,667 | 11,667 | 11,667 | 5,832 | |||||||||||
| Fund accounting fees | 80,875 | 74,971 | 67,593 | 72,000 | 17,287 | |||||||||||
| Professional fees | 69,700 | 120,834 | 61,219 | 61,883 | 24,823 | |||||||||||
| Trustee fees | 50,918 | 68,420 | 35,131 | 33,901 | 17,438 | |||||||||||
| Registration expense | 20,011 | 44,002 | 23,543 | 20,871 | 14,067 | |||||||||||
| Insurance expense | 28,000 | 44,662 | 11,001 | 9,001 | 504 | |||||||||||
| Reports to shareholders | 81,001 | 124,665 | 38,800 | 60,726 | 6,595 | |||||||||||
| Miscellaneous | 41,052 | 94,294 | 19,418 | 24,863 | 664 | |||||||||||
| Total expenses | 10,441,835 | 19,351,792 | 4,326,120 | 3,860,394 | 350,945 | |||||||||||
| Less: fees waived | (48,315 | ) | (2,405,816 | ) | (89,130 | ) | (21,736 | ) | (48,429 | ) | ||||||
| Less: expenses paid indirectly | (2,866 | ) | (14,131 | ) | (1,179 | ) | (4,246 | ) | — | |||||||
| Net expenses | 10,390,654 | 16,931,845 | 4,235,811 | 3,834,412 | 302,516 | |||||||||||
Net investment income (loss) | (723,904 | ) | 26,903,327 | 1,707,343 | (1,648,926 | ) | (3,725 | ) | ||||||||
REALIZED AND UNREALIZED GAIN (LOSS) FROM INVESTMENTS, OPTIONS AND FOREIGN CURRENCY: | ||||||||||||||||
| Net realized gain (loss) on: | ||||||||||||||||
| Investments | 61,299,569 | 161,520,554 | 8,846,903 | 13,722,681 | 355,435 | |||||||||||
| Options | 727,427 | — | — | (27,791 | ) | — | ||||||||||
| Foreign currency transactions | (377 | ) | (2,099,619 | ) | (1,432,053 | ) | — | (196,578 | ) | |||||||
| Net realized gain | 62,026,619 | 159,420,935 | 7,414,850 | 13,694,890 | 158,857 | |||||||||||
| Net unrealized appreciation (depreciation) on: | ||||||||||||||||
| Investments | 13,901,128 | 153,460,041 | 44,444,550 | 12,650,620 | 4,841,536 | |||||||||||
| Options | — | — | — | (115,178 | ) | — | ||||||||||
| Foreign currency translations | 2,410 | 183,365 | (11,296 | ) | — | 29,899 | ||||||||||
| Net unrealized appreciation: | 13,903,538 | 153,643,406 | 44,433,254 | 12,535,442 | 4,871,435 | |||||||||||
| Net realized and unrealized gain on investments, options and foreign currency | 75,930,157 | 313,064,341 | 51,848,104 | 26,230,332 | 5,030,292 | |||||||||||
Net increase in net assets resulting from operations | $ | 75,206,253 | $ | 339,967,668 | $ | 53,555,447 | $ | 24,581,406 | $ | 5,026,567 | ||||||
* Inception date: June 30, 2006
The accompanying notes are an integral part of these financial statements.
Statements of Operations | 55
Masters’ Select Funds Trust
STATEMENTS OF CHANGES IN NET ASSETS
Equity Fund | International Fund | ||||||||||||
Year Ended December 31, | Year Ended December 31, | ||||||||||||
2006 | 2005 | 2006 | 2005 | ||||||||||
INCREASE (DECREASE) IN NET ASSETS FROM: OPERATIONS | |||||||||||||
| Net investment income (loss) | $ | (723,904 | ) | $ | (1,227,905 | ) | $ | 26,903,327 | $ | 14,362,272 | |||
| Net realized gain on investments and foreign currency | 62,026,619 | 46,517,973 | 159,420,935 | 277,058,749 | |||||||||
| Net unrealized appreciation (depreciation) on investments and foreign currency | 13,903,538 | (2,021,513 | ) | 153,643,406 | (19,250,209 | ) | |||||||
Net increase in net assets resulting from operations | 75,206,253 | 43,268,555 | 339,967,668 | 272,170,812 | |||||||||
DISTRIBUTIONS TO SHAREHOLDERS | |||||||||||||
| From net investment income | — | — | (33,725,178 | ) | (23,731,832 | ) | |||||||
| From net realized gain | (51,936,141 | ) | (42,553,682 | ) | (196,379,185 | ) | (202,047,091 | ) | |||||
| Total distributions | (51,936,141 | ) | (42,553,682 | ) | (230,104,363 | ) | (225,778,923 | ) | |||||
CAPITAL SHARE TRANSACTIONS | |||||||||||||
| Proceeds from shares sold | 83,425,309 | 122,717,342 | 252,997,184 | 268,488,836 | |||||||||
| Reinvested distributions | 50,607,837 | 40,301,739 | 193,640,910 | 184,765,585 | |||||||||
| Redemption fee proceeds | 38,098 | 59,973 | 146,525 | 68,803 | |||||||||
| Payment for shares redeemed | (186,217,664 | ) | (126,538,493 | ) | (259,015,177 | ) | (208,256,973 | ) | |||||
| Net increase (decrease) in net assets from capital share transactions | (52,146,420 | ) | 36,540,561 | 187,769,442 | 245,066,251 | ||||||||
Total increase (decrease) in net assets | (28,876,308 | ) | 37,255,434 | 297,632,747 | 291,458,140 | ||||||||
NET ASSETS | |||||||||||||
| Beginning of year | 892,574,068 | 855,318,634 | 1,429,163,722 | 1,137,705,582 | |||||||||
End of year | $ | 863,697,760 | $ | 892,574,068 | $ | 1,726,796,469 | $ | 1,429,163,722 | |||||
| Accumulated net investment loss | $ | — | $ | — | $ | (11,183,847 | ) | $ | (2,307,109 | ) | |||
CAPITAL TRANSACTIONS IN SHARES: | |||||||||||||
| Sold | 5,386,586 | 8,299,712 | 13,427,863 | 15,244,561 | |||||||||
| Reinvested distributions | 3,211,102 | 2,723,090 | 10,633,629 | 11,057,997 | |||||||||
| Redeemed | (12,088,077 | ) | (8,526,959 | ) | (13,654,836 | ) | (11,943,049 | ) | |||||
| Net increase (decrease) from capital share transactions | (3,490,389 | ) | 2,495,843 | 10,406,656 | 14,359,509 | ||||||||
The accompanying notes are an integral part of these financial statements.
56 | The Masters’ Select Funds Trust
Masters’ Select Funds Trust
STATEMENTS OF CHANGES IN NET ASSETS
Value Fund | Smaller Companies Fund | ||||||||||||
Year Ended December 31, | Year Ended December 31, | ||||||||||||
2006 | 2005 | 2006 | 2005 | ||||||||||
INCREASE (DECREASE) IN NET ASSETS FROM: OPERATIONS | |||||||||||||
| Net investment income (loss) | $ | 1,707,343 | $ | 849,302 | $ | (1,648,926 | ) | $ | (1,428,631 | ) | |||
| Net realized gain on investments and foreign currency | 7,414,850 | 26,514,174 | 13,694,890 | 8,593,310 | |||||||||
| Net unrealized appreciation (depreciation) on investments and foreign currency | 44,433,254 | (13,738,242 | ) | 12,535,442 | 6,387,814 | ||||||||
Net increase in net assets resulting from operations | 53,555,447 | 13,625,234 | 24,581,406 | 13,552,493 | |||||||||
DISTRIBUTIONS TO SHAREHOLDERS | |||||||||||||
| From net investment income | (904,026 | ) | (1,300,783 | ) | — | — | |||||||
| From net realized gain | (14,392,152 | ) | (18,497,416 | ) | (10,775,552 | ) | (8,519,063 | ) | |||||
| Total distributions | (15,296,178 | ) | (19,798,199 | ) | (10,775,552 | ) | (8,519,063 | ) | |||||
CAPITAL SHARE TRANSACTIONS | |||||||||||||
| Proceeds from shares sold | 54,133,929 | 84,410,504 | 66,840,935 | 130,022,928 | |||||||||
| Reinvested distributions | 15,046,070 | 19,450,889 | 10,582,591 | 8,364,485 | |||||||||
| Redemption fee proceeds | 36,192 | 58,385 | 53,886 | 56,383 | |||||||||
| Payment for shares redeemed | (78,683,144 | ) | (66,062,709 | ) | (95,646,437 | ) | (32,828,973 | ) | |||||
| Net increase (decrease) in net assets from capital share transactions | (9,466,953 | ) | 37,857,069 | (18,169,025 | ) | 105,614,823 | |||||||
Total increase (decrease) in net assets | 28,792,316 | 31,684,104 | (4,363,171 | ) | 110,648,253 | ||||||||
NET ASSETS | |||||||||||||
| Beginning of year | 338,225,935 | 306,541,831 | 273,278,681 | 162,630,428 | |||||||||
End of year | $ | 367,018,251 | $ | 338,225,935 | $ | 268,915,510 | $ | 273,278,681 | |||||
| Accumulated net investment income (loss) | $ | (574,466 | ) | $ | (176,883 | ) | $ | — | $ | — | |||
CAPITAL TRANSACTIONS IN SHARES: | |||||||||||||
| Sold | 3,555,206 | 5,760,832 | 4,492,247 | 9,388,565 | |||||||||
| Reinvested distributions | 924,209 | 1,354,413 | 698,982 | 600,897 | |||||||||
| Redeemed | (5,184,228 | ) | (4,521,142 | ) | (6,484,177 | ) | (2,354,239 | ) | |||||
| Net increase from capital share transactions | (704,813 | ) | 2,594,103 | (1,292,948 | ) | 7,635,223 | |||||||
The accompanying notes are an integral part of these financial statements.
Statements of Changes in Net Assets | 57
Masters’ Select Funds Trust
STATEMENTS OF CHANGES IN NET ASSETS
Focused Opportunities Fund | ||||
June 30, 2006* through December 31, 2006 | ||||
INCREASE IN NET ASSETS FROM:OPERATIONS | ||||
| Net investment income (loss) | $ | (3,725 | ) | |
| Net realized gain on investments and foreign currency | 158,857 | |||
| Net unrealized appreciation on investments and foreign currency | 4,871,435 | |||
Net increase in net assets resulting from operations | 5,026,567 | |||
DISTRIBUTIONS TO SHAREHOLDERS | ||||
| From net investment income | — | |||
| From net realized gain | — | |||
| Total distributions | — | |||
CAPITAL SHARE TRANSACTIONS | ||||
| Proceeds from shares sold | 52,346,838 | |||
| Reinvested distributions | — | |||
| Redemption fee proceeds | 169 | |||
| Payment for shares redeemed | (136,915 | ) | ||
| Net increase in net assets from capital share transactions | 52,210,092 | |||
Total increase in net assets | 57,236,659 | |||
NET ASSETS | ||||
| Beginning of period | — | |||
End of period | $ | 57,236,659 | ||
| Accumulated net investment loss | $ | (200,302 | ) | |
CAPITAL TRANSACTIONS IN SHARES: | ||||
| Sold | 5,206,936 | |||
| Reinvested distributions | — | |||
| Redeemed | (12,538 | ) | ||
| Net increase from capital share transactions | 5,194,398 | |||
* Inception date.
The accompanying notes are an integral part of these financial statements.
58 | The Masters’ Select Funds Trust
Masters’ Select Equity Fund
FINANCIAL HIGHLIGHTS
For a capital share outstanding throughout each year.
Year Ended December 31, | ||||||||||||||||
2006 | 2005 | 2004 | 2003 | 2002 | ||||||||||||
| Net asset value, beginning of year | $ | 15.24 | $ | 15.26 | $ | 13.44 | $ | 10.19 | $ | 12.59 | ||||||
| Income from investment operations: | ||||||||||||||||
| Net investment loss | (0.01 | ) | (0.02 | ) | (0.06 | ) | (0.04 | ) | (0.03 | ) | ||||||
| Net realized and unrealized gain (loss) on investments and foreign currency | 1.44 | 0.75 | 1.88 | 3.29 | (2.37 | ) | ||||||||||
| Total income (loss) from investment operations | 1.43 | 0.73 | 1.82 | 3.25 | (2.40 | ) | ||||||||||
| Less distributions: | ||||||||||||||||
| From net realized gain | (0.98 | ) | (0.75 | ) | — | — | — | |||||||||
| Total distributions | (0.98 | ) | (0.75 | ) | — | — | — | |||||||||
Redemption fee proceeds | — | ^ | — | ^ | — | ^ | — | ^ | — | ^ | ||||||
Net asset value, end of year | $ | 15.69 | $ | 15.24 | $ | 15.26 | $ | 13.44 | $ | 10.19 | ||||||
| Total return | 9.34 | % | 4.96 | % | 13.54 | % | 31.89 | % | (19.06 | )% | ||||||
| Ratios/supplemental data: | ||||||||||||||||
| Net assets, end of year (millions) | $ | 863.7 | $ | 892.6 | $ | 855.3 | $ | 609.9 | $ | 431.2 | ||||||
| Ratio of total expenses to average net assets: | ||||||||||||||||
| Before fees waived | 1.19 | % | 1.19 | % | 1.22 | % | 1.25 | % | 1.27 | % | ||||||
| After fees waived | 1.18 | % | 1.19 | % | 1.22 | % | 1.23 | % | 1.25 | % | ||||||
| Ratio of net investment loss to average net assets: | (0.08 | )% | (0.14 | )% | (0.46 | )% | (0.39 | )% | (0.30 | )% | ||||||
| Portfolio turnover rate | 38.39 | % | 46.05 | % | 39.34 | % | 84.28 | % | 93.76 | % | ||||||
^ Amount represents less than $0.01 per share.
The accompanying notes are an integral part of these financial statements.
Financial Highlights | 59
FINANCIAL HIGHLIGHTS
For a capital share outstanding throughout each year.
Year Ended December 31, | ||||||||||||||||
2006 | 2005 | 2004 | 2003 | 2002 | ||||||||||||
| Net asset value, beginning of year | $ | 17.48 | $ | 16.88 | $ | 14.83 | $ | 10.70 | $ | 12.53 | ||||||
| Income from investment operations: | ||||||||||||||||
| Net investment income | 0.34 | 0.17 | 0.10 | 0.07 | 0.05 | |||||||||||
| Net realized and unrealized gain (loss) on investments and foreign currency | 3.71 | 3.64 | 2.01 | 4.09 | (1.85 | ) | ||||||||||
| Total income (loss) from investment operations | 4.05 | 3.81 | 2.11 | 4.16 | (1.80 | ) | ||||||||||
| Less distributions: | ||||||||||||||||
| From net investment income | (0.41 | ) | (0.29 | ) | (0.07 | ) | (0.03 | ) | (0.03 | ) | ||||||
| From net realized gain | (2.38 | ) | (2.92 | ) | — | — | — | |||||||||
| Return of capital | — | — | — | — | — | ^ | ||||||||||
| Total distributions | (2.79 | ) | (3.21 | ) | (0.07 | ) | (0.03 | ) | (0.03 | ) | ||||||
Redemption fee proceeds | — | ^ | — | ^ | 0.01 | — | ^ | — | ^ | |||||||
Net asset value, end of year | $ | 18.74 | $ | 17.48 | $ | 16.88 | $ | 14.83 | $ | 10.70 | ||||||
| Total return | 23.61 | % | 23.78 | % | 14.30 | % | 38.86 | % | (14.34 | )% | ||||||
| Ratios/supplemental data: | ||||||||||||||||
| Net assets, end of year (millions) | $ | 1,726.8 | $ | 1,429.1 | $ | 1,137.7 | $ | 733.5 | $ | 336.0 | ||||||
| Ratio of total expenses to average net assets: | ||||||||||||||||
| Before fees waived | 1.21 | % | 1.24 | % | 1.28 | % | 1.30 | % | 1.32 | % | ||||||
| After fees waived | 1.06 | % | 1.08 | % | 1.09 | % | 1.10 | % | 1.13 | % | ||||||
| Ratio of net investment income to average net assets: | 1.68 | % | 1.17 | % | 0.76 | % | 0.69 | % | 0.47 | % | ||||||
| Portfolio turnover rate | 98.03 | % | 160.12 | % | 87.88 | % | 110.19 | % | 141.07 | % | ||||||
^ Amount represents less than $0.01 per share.
The accompanying notes are an integral part of these financial statements.
60 | The Masters’ Select Funds Trust
Masters’ Select Value Fund
FINANCIAL HIGHLIGHTS
For a capital share outstanding throughout each year.
Year Ended December 31, | ||||||||||||||||
2006 | 2005 | 2004 | 2003 | 2002 | ||||||||||||
| Net asset value, beginning of year | $ | 14.60 | $ | 14.90 | $ | 12.99 | $ | 9.82 | $ | 11.43 | ||||||
Income from investment operations: | ||||||||||||||||
| Net investment income | 0.08 | 0.05 | 0.02 | 0.04 | 0.06 | |||||||||||
| Net realized and unrealized gain (loss) on investments and foreign currency | 2.36 | 0.55 | 1.89 | 3.13 | (1.67 | ) | ||||||||||
| Total income (loss) from investment operations | 2.44 | 0.60 | 1.91 | 3.17 | (1.61 | ) | ||||||||||
Less distributions: | ||||||||||||||||
| From net investment income | (0.04 | ) | (0.06 | ) | — | — | — | |||||||||
| From net realized gain | (0.66 | ) | (0.84 | ) | — | — | — | |||||||||
| Total distributions | (0.70 | ) | (0.90 | ) | — | — | — | |||||||||
Redemption fee proceeds | — | ^ | — | ^ | — | ^ | — | ^ | — | ^ | ||||||
Net asset value, end of year | $ | 16.34 | $ | 14.60 | $ | 14.90 | $ | 12.99 | $ | 9.82 | ||||||
| Total return | 16.77 | % | 4.13 | % | 14.70 | % | 32.28 | % | (14.09 | )% | ||||||
Ratios/supplemental data: | ||||||||||||||||
| Net assets, end of year (millions) | $ | 367.0 | $ | 338.2 | $ | 306.5 | $ | 181.0 | $ | 137.9 | ||||||
| Ratio of total expenses to average net assets: | ||||||||||||||||
| Before fees waived | 1.24 | % | 1.24 | % | 1.25 | % | 1.30 | % | 1.31 | % | ||||||
| After fees waived | 1.21 | % | 1.21 | % | 1.23 | % | 1.28 | % | 1.29 | % | ||||||
| Ratio of net investment income (loss) to average net assets: | 0.49 | % | 0.26 | % | 0.20 | % | 0.35 | % | 0.55 | % | ||||||
| Portfolio turnover rate | 31.00 | % | 30.21 | % | 29.14 | % | 21.54 | % | 54.08 | % | ||||||
^ Amount represents less than $0.01 per share.
The accompanying notes are an integral part of these financial statements.
Financial Highlights | 61
FINANCIAL HIGHLIGHTS
For a capital share outstanding throughout each period.
Year Ended December 31, | |||||||||||||
2006 | 2005 | 2004 | Period Ended** December 31, 2003 | ||||||||||
| Net asset value, beginning of period | $ | 14.10 | $ | 13.84 | $ | 11.79 | $ | 10.00 | |||||
| Income from investment operations: | |||||||||||||
| Net investment loss | (0.09 | ) | (0.07 | ) | (0.08 | ) | (0.06 | ) | |||||
| Net realized and unrealized gain on investments | 1.47 | 0.80 | 2.56 | 1.98 | |||||||||
| Total income from investment operations | 1.38 | 0.73 | 2.48 | 1.92 | |||||||||
| Less distributions: | |||||||||||||
| From net realized gain | (0.62 | ) | (0.47 | ) | (0.43 | ) | (0.13 | ) | |||||
| Total distributions | (0.62 | ) | (0.47 | ) | (0.43 | ) | (0.13 | ) | |||||
Redemption fee proceeds | — | ^ | — | ^ | — | ^ | — | ^ | |||||
Net asset value, end of period | $ | 14.86 | $ | 14.10 | $ | 13.84 | $ | 11.79 | |||||
| Total return | 9.67 | % | 5.29 | % | 21.01 | % | 19.17 | %+ | |||||
| Ratios/supplemental data: | |||||||||||||
| Net assets, end of period (millions) | $ | 268.9 | $ | 273.2 | $ | 162.6 | $ | 51.2 | |||||
| Ratio of total expenses to average net assets: | |||||||||||||
| Before fees waived | 1.32 | % | 1.33 | % | 1.43 | % | 1.67 | %* | |||||
| After fees waived | 1.31 | % | 1.30 | % | 1.40 | % | 1.65 | %* | |||||
| Ratio of net investment loss to average net assets: | (0.56 | )% | (0.64 | )% | (1.07 | )% | (1.33 | )%* | |||||
| Portfolio turnover rate | 102.72 | % | 118.76 | % | 148.81 | % | 43.49 | %+ | |||||
* Annualized.
+ Not annualized.
^ Amount represents less than $0.01 per share.
** Commenced operations on June 30, 2003.
The accompanying notes are an integral part of these financial statements.
62 | The Masters’ Select Funds Trust
FINANCIAL HIGHLIGHTS
For a capital share outstanding throughout each period.
Period Ended** December 31, 2006 | ||||
| Net asset value, beginning of period | $ | 10.00 | ||
Income from investment operations: | ||||
| Net investment gain (loss) | — | |||
| Net realized and unrealized gain on investments and foreign currency | 1.02 | |||
| Total income from investment operations | 1.02 | |||
Less distributions: | ||||
| From net realized gain | — | |||
| Total distributions | — | |||
Redemption fee proceeds | — | ^ | ||
Net asset value, end of period | $ | 11.02 | ||
| Total return | 10.20 | %+ | ||
Ratios/supplemental data: | ||||
| Net assets, end of period (millions) | $ | 57.2 | ||
| Ratio of total expenses to average net assets: | ||||
| Before fees waived | 1.63 | %* | ||
| After fees waived | 1.40 | %* | ||
| Ratio of net investment loss to average net assets: | (0.02 | )%* | ||
| Portfolio turnover rate | 7.12 | %+ | ||
* Annualized.
+ Not annualized.
^ Amount represents less than $0.01 per share.
** Commenced operations on June 30, 2006.
The accompanying notes are an integral part of these financial statements.
Financial Highlights | 63
Masters’ Select Funds Trust
NOTES TO FINANCIAL STATEMENTS
Note 1 - Organization
The Masters’ Select Funds Trust (the “Trust”) was organized as a Delaware business trust on August 1, 1996 and is registered under the Investment Company Act of 1940 (the “1940 Act”) as an open-end management investment company. The Trust consists of five separate series: the Masters’ Select Equity Fund, the Masters’ Select International Fund, the Masters’ Select Value Fund, the Masters’ Select Smaller Companies Fund and the Masters’ Select Focused Opportunities Fund (each a “Fund” and collectively the “Funds”).
The Masters’ Select Equity Fund seeks to increase the value of your investment over the long-term by using the combined talents and favorite stock-picking ideas of six highly regarded portfolio managers.
The Masters’ Select International Fund seeks to increase the value of your investment over the long-term by using the combined talents and favorite stock-picking ideas of five highly regarded international portfolio managers.
The Masters’ Select Value Fund seeks to increase the value of your investment over the long-term by using the combined talents and favorite stock-picking ideas of four highly regarded value portfolio managers.
The Masters’ Select Smaller Companies Fund seeks to increase the value of your investment over the long-term by using the combined talents and favorite stock-picking ideas of five highly regarded smaller company portfolio managers.
The Masters’ Select Focused Opportunities Fund seeks to increase the value of your investment over the long-term by using the combined talents and favorite stock-picking ideas of three highly regarded portfolio managers. The Fund commenced operations on June 30, 2006.
The Masters’ Select International Fund is closed to most new investors.
Note 2 - Significant Accounting Policies
The following is a summary of the significant accounting policies followed by the Funds. These policies are in conformity with accounting principles generally accepted in the United States of America.
| A. | Security Valuation. Investments in securities traded on a national securities exchange are valued at the last reported sales price at the close of regular trading on each day that the exchange is open for trading. Securities listed on the NASDAQ Global Market and the NASDAQ Global Select Market are valued using the NASDAQ Official Closing Price (“NOCP”). Securities traded on an exchange for which there have been no sales are valued at the mean between the closing bid and asked prices. Debt securities maturing within 60 days or less are valued at amortized cost unless the Valuation Committee determines that amortized cost does not represent fair value. Securities for which market prices are not readily available are valued at fair value as determined in good faith by the Managers and the Trust’s Valuation Committee in accordance with procedures approved by the Board of Trustees. In determining fair value, the Funds take into account all relevant factors and available information. Consequently, the price of the security used by a Fund to calculate its net asset value may differ from quoted or published prices for the same security. Fair value pricing involves subjective judgments and there is no single standard for determining the fair value of a security. As a result, different mutual funds could reasonably arrive at a different value for the same security. It is possible that the fair value determined for a security as materially different from the value that could be realized upon the sale of that security or from the values that other mutual funds may determine. |
| Investments in other mutual funds are valued at their respective net asset values as determined by those funds in accordance with Investment Company Act of 1940. |
| B. | Foreign Currency Translation. The Funds’ records are maintained in U.S. dollars. The value of securities, currencies and other assets and liabilities denominated in currencies other than U.S. dollars are translated into U.S. dollars based upon foreign exchange rates prevailing at the end of the reporting period. The currencies are translated into US dollars by using the exchange rates quoted at the close of the London Stock Exchange prior to when each Fund’s net asset value is next determined. Purchases and sales of investment securities, income and expenses are translated on the respective dates of such transactions. |
| The Funds do not isolate that portion of their net realized and unrealized gains and losses on investments resulting from changes in foreign exchange rates from the impact arising from changes in market prices. Such fluctuations are included with net realized and unrealized gain or loss from investments and foreign currency. |
| Net realized foreign currency transaction gains and losses arise from sales of foreign currencies, currency gains or losses realized between the trade and settlement dates on securities transactions, and the differences between the amounts of dividends, interest, and foreign withholding taxes recorded on the Funds’ books and the U.S. dollar equivalent of the amounts actually received or paid. Net unrealized foreign currency translation gains and losses arise from changes in the value of assets and liabilities, other than investments in securities, resulting from changes in the exchange rates. |
64 | The Masters’ Select Funds Trust
Masters’ Select Funds Trust
NOTES TO FINANCIAL STATEMENTS— (Continued)
| C. | Restricted Securities. A restricted security cannot be resold to the general public without prior registration under the Securities Act of 1933. If the security is subsequently registered and resold, the issuers would typically bear the expense of all registrations at no cost to the Fund. Restricted securities are valued according to the guidelines and procedures adopted by the Funds’ Board of Trustees. As of December 31, 2006, there were no restricted securities held by the Funds. |
| D. | Forward Foreign Currency Exchange Contracts. The Funds may utilize forward foreign currency exchange contracts (“forward contracts”) under which they are obligated to exchange currencies on specified future dates at specified rates, and are subject to the translations of foreign exchange rates fluctuations. All contracts are “marked-to-market” daily and any resulting unrealized gains or losses are recorded as unrealized appreciation or depreciation on foreign currency translations. The Funds record realized gains or losses at the time the forward contract is settled. Counter-parties to these forward contracts are major U.S. financial institutions. For further information on the Forward Contracts held by each Fund, please refer to Note 6. |
| E. | Purchasing Put and Call Options. Each Fund may purchase covered “put” and “call” options with respect to securities which are otherwise eligible for purchase by a Fund and with respect to various stock indices subject to certain restrictions. Each Fund will engage in trading of such derivative securities primarily for hedging purposes. |
| If a Fund purchases a put option, a Fund acquires the right to sell the underlying security at a specified price at any time during the term of the option (for “American-style” options) or on the option expiration date (for “European-style” options). Purchasing put options may be used as a portfolio investment strategy when a Manager perceives significant short-term risk but substantial long-term appreciation for the underlying security. The put option acts as an insurance policy, as it protects against significant downward price movement while it allows full participation in any upward movement. If a Fund is holding a stock which it feels has strong fundamentals, but for some reason may be weak in the near term, a Fund may purchase a put option on such security, thereby giving itself the right to sell such security at a certain strike price throughout the term of the option. Consequently, a Fund will exercise the put only if the price of such security falls below the strike price of the put. The difference between the put’s strike price and the market price of the underlying security on the date a Fund exercises the put, less transaction costs, will be the amount by which a Fund will be able to hedge against a decline in the underlying security. If during the period of the option the market price for the underlying security remains at or above the put’s strike price, the put will expire worthless, representing a loss of the price a Fund paid for the put, plus transaction costs. If the price of the underlying security increases, the profit a Fund realizes on the sale of the security will be reduced by the premium paid for the put option less any amount for which the put may be sold. |
| If a Fund purchases a call option, it acquires the right to purchase the underlying security at a specified price at any time during the term of the option. The purchase of a call option is a type of insurance policy to hedge against losses that could occur if a Fund has a short position in the underlying security and the security thereafter increases in price. Each Fund will exercise a call option only if the price of the underlying security is above the strike price at the time of exercise. If during the option period the market price for the underlying security remains at or below the strike price of the call option, the option will expire worthless, representing a loss of the price paid for the option, plus transaction costs. If the call option has been purchased to hedge a short position of a Fund in the underlying security and the price of the underlying security thereafter falls, the profit a Fund realizes on the cover of the short position in the security will be reduced by the premium paid for the call option less any amount for which such option may be sold. |
| Prior to exercise or expiration, an option may be sold when it has remaining value by a purchaser through a “closing sale transaction,” which is accomplished by selling an option of the same series as the option previously purchased. Each Fund generally will purchase only those options for which a Manager believes there is an active secondary market to facilitate closing transactions. |
Writing Call Options. Each Fund may write covered call options. A call option is “covered” if a Fund owns the security underlying the call or has an absolute right to acquire the security without additional cash consideration (or, if additional cash consideration is required, cash or cash equivalents in such amount as are held in a segregated account by the Custodian). The writer of a call option receives a premium and gives the purchaser the right to buy the security underlying the option at the exercise price. The writer has the obligation upon exercise of the option to deliver the underlying security against payment of the exercise price during the option period. If the writer of an exchange-traded option wishes to terminate his obligation, he may effect a “closing purchase transaction.” This is accomplished by buying an option of the same series as the option previously written. A writer may not effect a closing purchase transaction after it has been notified of the exercise of an option. |
| Effecting a closing transaction in the case of a written call option will permit a Fund to write another call option on the underlying security with either a different exercise price, expiration date or both. Also, effecting a closing transaction will permit the cash or proceeds from the concurrent sale of any securities subject to the option to be used for other investments of a Fund. If a Fund desires to sell a particular security from its portfolio on which it has written a call option, it will effect a closing transaction prior to or concurrent with the sale of the security. |
| Each Fund will realize a gain from a closing transaction if the cost of the closing transaction is less than the premium received from writing the option or if the proceeds from the closing transaction are more than the premium paid to purchase the option. Each Fund will realize a loss from a closing transaction if the cost of the closing transaction is more than the premium received from writing the option or if the proceeds from the closing transaction are less than the premium paid to purchase the option. However, because increases in the market price of a call option will generally reflect increases in the market price of the underlying security, any loss to a Fund resulting from the repurchase of a call option is likely to be offset in whole or in part by appreciation of the underlying security owned by a Fund. |
Notes to Financial Statements | 65
NOTES TO FINANCIAL STATEMENTS— (Continued)
Risks Of Investing in Options. There are several risks associated with transactions in options on securities. Options may be more volatile than the underlying instruments and, therefore, on a percentage basis, an investment in options may be subject to greater fluctuation than an investment in the underlying instruments themselves. There are also significant differences between the securities and options markets that could result in an imperfect correlation between these markets, causing a given transaction not to achieve its objective. In addition, a liquid secondary market for particular options may be absent for reasons which include the following: there may be insufficient trading interest in certain options; restrictions may be imposed by an exchange on opening transactions or closing transactions or both; trading halts, suspensions or other restrictions may be imposed with respect to particular classes or series of option of underlying securities; unusual or unforeseen circumstances may interrupt normal operations on an exchange; the facilities of an exchange or clearing corporation may not at all times be adequate to handle current trading volume; or one or more exchanges could, for economic or other reasons, decide or be compelled at some future date to discontinue the trading of options (or a particular class or series of options), in which event the secondary market on that exchange (or in that class or series of options) would cease to exist, although outstanding options that had been issued by a clearing corporation as a result of trades on that exchange would continue to be exercisable in accordance with their terms. |
| A decision as to whether, when and how to use options involves the exercise of skill and judgment, and even a well-conceived transaction may be unsuccessful to some degree because of market behavior or unexpected events. The extent to which a Fund may enter into options transactions may be limited by the requirements of the Internal Revenue Code of 1986, as amended (the “Code”), with respect to qualification of a Fund as a regulated investment company |
| F. | Federal Income Taxes. The Funds intend to comply with the requirements of Subchapter M of the Internal Revenue Code applicable to regulated investment companies and to distribute all of their taxable income to their shareholders. Accordingly, no provisions for federal income taxes are required. |
| G. | Distributions to Shareholders. Distributions paid to shareholders are recorded on the ex-dividend date. The amount of dividends and distributions from net investment income and net realized capital gains is determined in accordance with federal income tax regulations, which may differ from generally accepted accounting principles. To the extent these “book/tax” differences are permanent in nature (i.e., that they result from other than timing of recognition - “temporary differences”), such amounts are reclassified within the capital accounts based on their federal tax-basis. |
| H. | Security Transactions, Dividend and Interest Income and Expenses. Security transactions are accounted for on the trade date. Realized gains and losses on securities transactions are reported on an identified cost basis. Dividend income is recorded on the ex-dividend date. Interest income is recorded on an accrual basis. Purchase discounts and premiums on fixed-income securities are accreted and amortized to maturity using the effective interest method. Many expenses of the Trust can be directly attributed to a specific Fund. Each Fund is charged for expenses directly attributable to it. Expenses that cannot be directly attributed to a specific Fund are allocated among the Funds in the Trust in proportion to their respective net assets or another appropriate method. |
| I. | Repurchase Agreements. Each Fund may enter into repurchase agreements through which the Fund acquires a security (the “underlying security”) from a seller, a well-established securities dealer or a bank that is a member of the Federal Reserve System. The bank or securities dealer agrees to repurchase the underlying security at the same price, plus a specified amount of interest, at a later date, generally for a period of less than one week. It is the Trust’s policy that its Custodian takes possession of securities as collateral under repurchase agreements and to determine on a daily basis that the value of such securities, including recorded interest, is sufficient to cover the value of the repurchase agreements. If the counterparty defaults and the value of the collateral declines or if bankruptcy proceedings are commenced with respect to the counterparty of the security, realization of the collateral by a Fund may be delayed or limited. |
| J. | Expenses Paid Indirectly. Under terms of the Trust’s Custodial Agreement, the Funds earn credits on cash balances which are applied against custodian fees. |
| K. | Indemnification Obligations. Under the Funds’ organizational documents, its current and former officers and trustees are indemnified against certain liabilities arising out of the performance of their duties to the Funds. In addition, in the normal course of business, the Funds enter into contracts that contain a variety of representations and warranties that provide general indemnifications. The Funds’ maximum exposure under these arrangements is unknown as this would involve future claims that may be made against the Funds that have not yet occurred or that would be covered by other parties. |
66 | The Masters’ Select Funds Trust
Masters’ Select Funds Trust
NOTES TO FINANCIAL STATEMENTS— (Continued)
| L. | Accounting Estimates. The preparation of financial statements in conformity with accounting principles generally accepted in the United States of America requires management to make estimates and assumptions. These estimates and assumptions affect the reported amounts of assets and liabilities and the disclosure of contingent assets and liabilities at the date of financial statements and the reported amounts of increases and decreases in net assets from operations during the reporting period. Actual results could differ from those estimates. |
Note 3 - Investment Advisory and Other Agreements
The Trust, on behalf of the Funds, entered into an Investment Advisory Agreement (the “Agreement”) with Litman/Gregory Fund Advisors, LLC (the “Advisor”). Under the terms of the Agreement, each Fund pays a monthly investment advisory fee to the Advisor at the annual rate below of the respective Fund’s average daily net assets before any fee waivers:
| Equity Fund | 1.10% on the first $750 million and 1.00% on assets in excess of $750 million | |
| International Fund | 1.10% on the first $1 billion and 1.00% on assets in excess of $1 billion | |
| Value Fund | 1.10% on the first $1 billion and 1.00% on assets in excess of $1 billion | |
| Smaller Companies Fund | 1.14% on the first $450 million and 1.04% on assets in excess of $450 million | |
| Focused Opportunities Fund | 1.10% on the first $1 billion and 1.00% on assets in excess of $1 billion |
The Advisor engages Managers to manage the funds and pays the Managers from its advisory fees.
Through December 31, 2006, the Advisor contractually agreed to waive a portion of its advisory fees equal to approximately 0.13% of the average daily net assets of the Masters’ Select International Fund, and 0.02% of the average daily net assets of the Masters’ Select Value Fund. The Advisor has contractually agreed to limit the operating expenses of the Masters’ Select Focused Opportunitites Fund to 1.50% of the Fund’s average daily net assets through December 31, 2007. Additionally, the Advisor has voluntarily agreed to waive its management fee on the daily cash values of the Funds not allocated to Managers. For the year ended December 31, 2006, the total amount waived, contractual and voluntary, was $48,315, $2,405,816, $89,130, $21,736 and $48,429 for the Masters’ Select Equity Fund, Masters’ Select International Fund, Masters’ Select Value Fund, Masters’ Select Smaller Companies Fund and Masters’ Select Focused Opportunities Fund, respectively. The Advisor has agreed not to seek recoupment of such waived fees.
U.S. Bancorp Fund Services, LLC (“USBFS”) serves as the Administrator to the Funds. State Street Bank and Trust (“State Street”) serves as the Funds’ Custodian and Fund Accountant. Boston Financial Data Services (“BFDS”), an affiliate of State Street, serves as the Funds’ Transfer Agent. Quasar Distributors, LLC (“Quasar”), an affiliate of USBFS, acts as the Funds’ distributor and principal underwriter.
An employee of the Advisor serves as the Funds’ Chief Compliance Officer (“CCO”). The CCO receives no compensation from the Funds for his services, however, USBFS reimbursed the Advisor $52,500 for the year ended December 31, 2006 for the services of the CCO.
Affiliated entities of the Managers received net commissions on purchases and sales of the Funds’ portfolio securities for the year ended December 31, 2006 of $305,967 for the Masters’ Select International Fund.
Each independent Trustee, within the meaning of the 1940 Act, is compensated by the Trust at the rate of $55,000 per year.
Note 4 - Investment Transactions
The cost of securities purchased and the proceeds from securities sold for the year ended December 31, 2006, excluding short-term investments, were as follows:
Fund | Purchases | Sales | |||||
| Equity Fund | $ | 331,581,166 | $ | 376,540,319 | |||
| International Fund | 1,664,030,162 | 1,483,883,470 | |||||
| Value Fund | 104,946,402 | 106,925,648 | |||||
| Smaller Companies Fund | 267,440,162 | 264,349,992 | |||||
| Focused Opportunities Fund | 53,230,937 | 2,805,938 | |||||
Notes to Financial Statements | 67
Masters’ Select Funds Trust
NOTES TO FINANCIAL STATEMENTS— (Continued)
Note 5 - Income Taxes and Distributions to Shareholders
As of December 31, 2006, the components of distributable accumulated earnings/(losses) on a tax basis were as follows:
Equity Fund | International Fund | Value Fund | Smaller Companies Fund | Focused Opportnities Fund | ||||||||||||
| Cost of investments for tax purposes | $ | 668,405,353 | $ | 1,399,106,599 | $ | 275,708,620 | $ | 233,457,313 | $ | 52,654,129 | ||||||
| Gross tax unrealized appreciation | $ | 221,806,272 | $ | 348,961,769 | $ | 96,918,143 | $ | 41,886,207 | $ | 5,136,762 | ||||||
| Gross tax unrealized depreciation | (27,035,130 | ) | (25,516,034 | ) | (5,976,276 | ) | (7,238,451 | ) | (337,256 | ) | ||||||
| Net tax unrealized appreciation on investments | 194,771,142 | 323,445,735 | 90,941,867 | 34,647,756 | 4,799,506 | |||||||||||
| Net tax unrealized appreciation on forward contracts and foreign-currency | — | — | 196,371 | — | 29,899 | |||||||||||
| Net tax unrealized appreciation | $ | 194,771,142 | $ | 323,445,735 | $ | 91,138,238 | $ | 34,647,756 | $ | 4,829,405 | ||||||
| Undistributed ordinary income | $ | 3,238,078 | $ | 40,414,636 | $ | — | $ | 727,878 | $ | 367,565 | ||||||
| Undistributed long-term gain (capital loss carryforward) | $ | 5,925,120 | $ | — | $ | 1,228,946 | $ | 2,359,505 | $ | — | ||||||
| Post October Currency Losses | $ | — | $ | (42,403 | ) | $ | (378,095 | ) | $ | — | $ | (170,404 | ) | |||
On the Statements of Assets and Liabilities, the following adjustments were made for permanent tax adjustments:
Undistributed Net Investment Income (Loss) | Accumulated Net Realized Gain (Loss) | Paid In Capital | ||||||||||||||
| Equity Fund | $ | 723,904 | $ | (723,904 | ) | $ | — | |||||||||
| International Fund | (2,054,887 | ) | 2,099,618 | (44,731 | ) | |||||||||||
| Value Fund | (1,200,900 | ) | 1,200,898 | 2 | ||||||||||||
| Smaller Companies Fund | 1,648,926 | (1,648,926 | ) | — | ||||||||||||
| Focused Opportunities Fund | (196,578 | ) | 196,577 | 1 | ||||||||||||
The permanent differences primarily relate to net operating losses and adjustments for the tax treatment of foreign currency.
The tax components of dividends (other than return of capital dividends for the years ended December 31, 2006 and 2005) were as follows:
2006 | 2005 | ||||||||||||||||||||||||
Ordinary Income | Long-term Capital Gain | Ordinary Income | Long-term Capital Gain | ||||||||||||||||||||||
| Equity Fund | $ | 12,654,791 | $ | 39,281,350 | $ | — | $ | 42,553,682 | |||||||||||||||||
| International Fund | 113,424,155 | 116,680,208 | 35,676,041 | 190,099,882 | |||||||||||||||||||||
| Value Fund | 4,419,758 | 10,876,420 | 1,300,783 | 18,497,416 | |||||||||||||||||||||
| Smaller Companies Fund | 3,539,554 | 7,235,998 | 2,399,278 | 6,119,785 | |||||||||||||||||||||
| Focused Opportunities Fund | — | — | — | — | |||||||||||||||||||||
Net investment income and net realized gains differ for financial statement and tax purposes due to differing treatments of wash sale losses deferred, foreign currency transactions and net losses realized subsequent to October 31 on the sale of securities and foreign currencies.
Note 6 - Off-Balance Sheet Risk
The Funds are parties to financial instruments with off-balance sheet risk, primarily forward contracts, in order to hedge the impact of adverse changes in the relationship between the U.S. dollar and various foreign currencies and certain assets and liabilities denominated in foreign currencies. These instruments involve market risk in excess of the amount recognized in the Statement of Assets and Liabilities. Risks also arise from the possible inability of counter parties to meet the terms of their contracts, future adverse movement in currency values and contract positions that are not exact offsets. The contract amount indicates the extent of the Funds’ involvement in such currencies.
68 | The Masters’ Select Funds Trust
Masters’ Select Funds Trust
NOTES TO FINANCIAL STATEMENTS— (Continued)
A forward exchange contract is an agreement between two parties to exchange different currencies at a specified rate at an agreed future date. Forward contracts are reported in the financial statements as unrealized gain (loss) as measured by the difference between the forward exchange rate at the reporting date and the forward exchange rate on the date the contract is entered into. At December 31, 2006, the Funds had the following forward contracts outstanding:
Masters’ Select International Fund | ||||||||||
Contracts to Buy | In Exchange For | Settlement Date | Unrealized Gain (Loss) | |||||||
| 28,073,517 | Philippine Peso | U.S. | $ 571,064 | 01/02/2007 | $ 1,631 | |||||
| 81,045,004 | Philippine Peso | 1,653,305 | 01/03/2007 | - | ||||||
| 1,631 | ||||||||||
Contracts to Sell | ||||||||||
| 1,450,000,000 | Philippine Peso | U.S. | $29,652,352 | 06/18/2007 | $ 230,230 | |||||
| Net unrealized gain on forward contracts | $ 231,861 | |||||||||
Masters’ Select Value Fund | ||||||||||
Contracts to Buy | In Exchange For | Settlement Date | Unrealized Gain (Loss) | |||||||
| 560,000,000 | South Korean Won | U.S. | $ 602,799 | 03/22/2007 | $ 429 | |||||
Contracts to Sell | ||||||||||
| 4,604,528 | Swiss Franc | U.S. | $ 3,897,419 | 03/07/2007 | $ 99,197 | |||||
| 3,461,276 | British Pound Sterling | 6,566,975 | 01/08/2007 | (212,902 | ) | |||||
| 174,000 | British Pound Sterling | 329,859 | 01/08/2007 | (10,969 | ) | |||||
| 343,140,000 | Japanese Yen | 3,000,000 | 03/19/2007 | 86,462 | ||||||
| 630,731,900 | Japanese Yen | 5,513,391 | 03/19/2007 | 157,964 | ||||||
| 89,700,000 | Japanese Yen | 774,143 | 03/19/2007 | 12,518 | ||||||
| 79,400,000 | Japanese Yen | 673,612 | 03/19/2007 | (559 | ) | |||||
| 2,357,500,000 | South Korean Won | 2,500,000 | 03/22/2007 | (39,481 | ) | |||||
| 2,287,800,000 | South Korean Won | 2,400,000 | 03/22/2007 | (64,401 | ) | |||||
| 47,247,600 | Norwegian Krone | 7,776,743 | 03/07/2007 | 168,113 | ||||||
| 195,942 | ||||||||||
| Net unrealized gain on forward contracts | $ 196,371 | |||||||||
Masters’ Select Focused Opportunities Fund | ||||||||||
Contracts to Buy | In Exchange For | Settlement Date | Unrealized Gain (Loss) | |||||||
| None | ||||||||||
Contracts to Sell | ||||||||||
| 1,321,560 | Euro | U.S. | $ 1,773,930 | 05/24/2007 | $ 19,367 | |||||
| 471,500,000 | South Korean Won | 500,000 | 03/22/2007 | (7,896 | ) | |||||
| 667,275,000 | South Korean Won | 700,000 | 03/22/2007 | (18,784 | ) | |||||
| 10,642,525 | Norwegian Krone | 1,751,712 | 03/07/2007 | 37,867 | ||||||
| 15,343,530 | Swedish Krona | 2,255,506 | 03/15/2007 | 979 | ||||||
| 1,600,000 | Swedish Krona | 233,464 | 03/15/2007 | (1,634 | ) | |||||
| 29,899 | ||||||||||
| Net unrealized gain on forward contracts | $ 29,899 | |||||||||
The Masters’ Select Equity Fund and the Masters’ Select Smaller Companies Fund do not have outstanding forward exchange contracts as of December 31, 2006.
Notes to Financial Statements | 69
Masters’ Select Funds Trust
NOTES TO FINANCIAL STATEMENTS— (Continued)
Note 7 - Line of Credit
The Trust has an unsecured $45,000,000 line of credit with its custodian. Borrowings under this arrangement bear interest at the federal funds rate plus 0.50% per annum. As compensation for holding available the lending commitment, the Trust pays a 0.10% per annum fee on the unused portion of the commitment, which is allocated among the Funds based on their relative net assets. The fee is payable quarterly in arrears. The Trust made no borrowings during the year ended December 31, 2006.
Note 8 - Accounting Pronouncements
In December, 2005, the Financial Accounting Standards Board (“FASB”) released Financial Accounting Standard Board Statement No. 157 Fair Value Measurements (“SFAS 157”). SFAS 157 establishes a fair valuation hierarchy to increase consistency and comparability in fair value measurements and related disclosures. The fair value hierarchy prioritizes the inputs to valuation techniques used to measure fair value into three broad levels. The fair value hierarchy gives the highest priority to quoted prices (unadjusted) in active markets for identical assets or liabilities (Level 1) and the lowest priority to unobservable inputs (Level 3). SFAS 157 is effective for financial statements issued for fiscal years beginning after November 15, 2007.
In July, 2006, the Financial Accounting Standards Board (“FASB”) released FASB Interpretation No. 48 “Accounting for Uncertainty in Income Taxes” (“FIN 48”). FIN 48 provides guidance for how uncertain tax positions should be recognized, measured, presented and disclosed in the financial statements. FIN 48 requires the evaluation of tax positions taken or expected to be taken in the course of preparing the Fund’s tax returns to determine whether the tax positions are ‘‘more-likely-than-not’’ of being sustained by the applicable tax authority. Tax positions not deemed to meet the more-likely-than-not threshold would be recorded as a tax benefit or expense in the current year. Adoption of FIN 48 is required as of the date of the last Net Asset Value (“NAV”) calculation in the first required financial statement reporting period for fiscal years beginning after December 15, 2006 and is to be applied to all open tax years as of the effective date. At this time, management is evaluating the implications of FIN 48 and its impact on the financial statements has not yet been determined.
70 | The Masters’ Select Funds Trust
REPORT OF INDEPENDENT REGISTERED PUBLIC ACCOUNTING FIRM
To the Board of Trustees and Shareholders of:
The Masters’ Select Equity Fund
The Masters’ Select International Fund
The Masters’ Select Value Fund
The Masters’ Select Smaller Companies Fund
The Masters’ Select Focused Opportunities Fund
In our opinion, the accompanying statements of assets and liabilities, including the schedules of investments in securities, and the related statements of operations and of changes in net assets and the financial highlights present fairly, in all material respects, the financial position of The Masters’ Select Equity Fund, The Masters’ Select International Fund, The Masters’ Select Value Fund, The Masters’ Select Smaller Companies Fund and The Masters’ Select Focused Opportunities Fund (hereafter referred to as the “Funds”) at December 31, 2006, the results of each of their operations, changes in net assets and financial highlights for the periods presented, in conformity with accounting principles generally accepted in the United States of America. These financial statements and financial highlights (hereafter referred to as “financial statements”) are the responsibility of the Funds’ management; our responsibility is to express an opinion on these financial statements based on our audits. We conducted our audits of these financial statements in accordance with the standards of the Public Company Accounting Oversight Board (United States). Those standards require that we plan and perform the audits to obtain reasonable assurance about whether the financial statements are free of material misstatement. An audit includes examining, on a test basis, evidence supporting the amounts and disclosures in the financial statements, assessing the accounting principles used and significant estimates made by management, and evaluating the overall financial statement presentation. We believe that our audits, which included confirmation of securities at December 31, 2006 by correspondence with the custodian and brokers, provide a reasonable basis for our opinion.
PricewaterhouseCoopers LLP
San Francisco, California
February 22, 2007
Report of the Independent Registered Public Accounting Firm | 71
Masters’ Select Funds Trust
OTHER INFORMATION - (Unaudited)
Proxy Voting Policies and Procedures
The sub-advisors of the Funds vote proxies relating to portfolio securities in accordance with procedures that have been approved by the Board of Trustees of the Funds. You may obtain a description of these procedures, without charge, by calling toll-free, 1-800-960-0188. This information is also available through the Securities and Exchange Commission’s website at http://www.sec.gov.
Proxy Voting Record
Information regarding how the sub-advisors of the Funds voted proxies relating to portfolio securities during the most recent 12-month period ended June 30 is available, without charge, by calling toll-free, 1-800-960-0188. This information is also available through the Securities and Exchange Commission’s website at http://www.sec.gov.
Form N-Q Disclosure
The Funds file their complete schedule of portfolio holdings with the Securities and Exchange Commission for the first and third quarters of each fiscal year on Form N-Q. The Funds’ Form N-Q is available on the Securities and Exchange Commission’s website at http://www.sec.gov. The Funds’ Form N-Q may be reviewed and copied at the Commission’s Public Reference Room in Washington, DC, and information on the operation of the Public Reference Room may be obtained by calling 1-800-SEC-0330. This information is also available, without charge, by calling toll-free, 1-800-960-0188 or by visiting the Funds’ website at http://www.mastersfunds.com.
Householding Mailings
To reduce expenses, the Trust may mail only one copy of the Funds’ prospectus and each annual and semi-annual report to those addresses shared by two or more accounts. If you wish to receive individual copies of these documents, please call us at 1-800-960-0188 (or contact your financial institution). The Trust will begin sending you individual copies thirty days after receiving your request.
Board Consideration of and Continuation of Investment Advisory Agreement
At a meeting held on November 28, 2006, the Board of Trustees, including the independent trustees of the Board of Trustees (the “Independent Trustees”), considered and approved the one-year renewal of: (1) the Unified Investment Advisory Agreement (the “Advisory Agreement”) between the Masters’ Select Funds Trust (the “Trust”) and Litman/Gregory Fund Advisors, LLC (the “Advisor”), with respect to the Masters’ Select Equity Fund, the Masters’ Select International Fund, the Masters’ Select Value Fund, and the Masters’ Select Smaller Companies Fund (together with the New Fund below, the “Funds”), and (2) the investment manager agreements (together with the New Manger Agreements below, the “Manager Agreements”) between the Advisor and each of Southeastern Asset Management, Inc., Friess Associates, LLC, Wells Capital Management, Inc., Legg Mason Capital Management, Inc., Davis Selected Advisor, L.P., and TCW Investment Management Company with respect to Masters’ Select Equity Fund, each of Mastholm Asset Management, LLC, Marsico Capital Management, LLC, Third Avenue Management, LLC, Harris Associates, L.P., and Thornburg Investment Management, Inc., with respect to Masters’ Select International Fund, each of Franklin Mutual Advisers, LLC, Harris Associates, L.P., Southeastern Asset Management, Inc., and Legg Mason Capital Management, Inc., with respect to Masters’ Select Value Fund, and each of Ariel Capital Management, LLC, Friess Associates, LLC, First Pacific Advisors, LLC, Copper Rock Capital Partners, LLC and Wells Capital Management, Inc. with respect to Masters’ Select Smaller Companies Fund (the “Managers”). The one-year renewal of all agreements is for the period ending December 31, 2007. At a meeting held on May 30, 2006, the Board of Trustees, including the Independent Trustees considered and approved the addition of a new fund, the Masters’ Select Focused Opportunities Fund (the “New Fund”) to (1) the Advisory Agreement between the Trust and the Advisor for the 16-month period ending December 31, 2007, and with respect to the New Fund (2) investment manager agreements (the “New Manager Agreements”) between the Advisor and each of Franklin Mutual Advisers, LLC, Davis Selected Advisers, L.P., and TCW Investment Management Company, also for a 16-month period ending December 31, 2007.
Prior to each meeting, the Independent Trustees had requested detailed information from the Advisor regarding the Funds. The materials provided by the Advisor were extensive and included information relating to each Fund’s investment objectives and, where applicable, results, portfolio composition, advisory fee and expense comparisons, as well as information on each Manager’s performance within the various Funds and in comparison to other accounts (including other mutual funds) managed by such Manager. Financial and profitability information regarding the Advisor, descriptions of various functions, such as compliance monitoring and portfolio trading practices, and information about the personnel providing investment management and administrative services to each Fund was also provided. In addition, the Independent Trustees discussed the approval of the Advisory Agreement and Manager Agreements with representatives of the Advisor and were advised by independent counsel on these and other relevant matters.
In addition, the Board had received information about the Funds throughout the year which included a wide variety of materials relating to the services provided (or to be provided) by the Advisor and the Managers, including reports on the Funds’ and each Manager’s investment results, portfolio composition, portfolio trading practices, and shareholder services, in addition to other information relating to the nature, extent, and quality of services provided (or to be provided) by the Advisor and the Managers. Throughout the course of the year, the Board of Trustees also received in-person presentations from various members of senior management at the Advisor and requested and reviewed supplemental information, which included extensive materials regarding the Funds’ investment results, advisory fees and expense comparisons, financial and profitability information regarding the Advisor, compliance monitoring, and information about the personnel providing investment management and administrative services to the Funds.
72 | The Masters’ Select Funds Trust
Masters’ Select Funds Trust
OTHER INFORMATION - (Unaudited) (Continued)
The information provided to the Board of Trustees at the meeting, together with the information provided throughout the course of the year, formed the primary (but not exclusive) basis for the Board of Trustees’ determinations. The Board of Trustees did not identify any single issue or particular datum point that, in isolation, would be controlling in their decision to renew the Advisory Agreement or the Manager Agreements. Rather, the Board of Trustees considered the total mix of information provided. The following summary describes the key factors considered by the Board of Trustees, including the Independent Trustees, and the conclusions thereto that formed the basis for approving the renewal of the Advisory Agreement and the Manager Agreements, in light of the legal advice furnished to them by independent legal counsel and their own business judgment. The following list of factors is not inclusive of all factors that were considered.
| 1. | Nature, extent and quality of services |
The Advisor, its personnel and its resources. For each Fund and for the Trust as a whole, the Board of Trustees considered the depth and quality of the Advisor’s investment management process, including: (1) the Advisor’s sophisticated monitoring and oversight of the Managers; (2) the experience, capability, and integrity of the Advisor’s senior management and other personnel; (3) the low turnover rates of the Advisor’s key personnel; and (4) the overall financial strength and stability of its organization. The Board of Trustees discussed the high level of due diligence on each Manager continually undertaken by the Advisor. The Board of Trustees also noted the high quality of the non-advisory management services provided by the Advisor, such as responsiveness to shareholder inquiries and requests, the preparation of shareholder communications, and responsiveness to requests of the Board of Trustees. In addition, the Board of Trustees noted that because the Advisor is a significant shareholder in the Funds, the Advisor has an additional incentive to ensure that the Funds perform well for shareholders.
The Board of Trustees then considered the Advisor’s policies, procedures, and systems to ensure compliance with applicable laws and regulations and its commitment to those programs. In addition, the Board of Trustees considered the Advisor’s efforts to keep the Board of Trustees informed and its attention to matters that may involve potential conflicts of interest with each Fund. The Board of Trustees took note of the extent and effectiveness of the Advisor’s compliance operations and the Advisor’s oversight of the Managers and service providers’ compliance operations. The Board of Trustees discussed the Advisor’s commitment to compliance at length with senior management of the Advisor. The Board of Trustees also considered the nature, extent, quality, and cost of administrative, distribution, and shareholder services provided by the Advisor to the Funds under the Advisory Agreement and other agreements, including the administrative, legal, and fund accounting and treasury functions.
The Board of Trustees, with the assistance of counsel, then considered various matters relating to the Managers, including: (1) each Manager Agreement; (2) the Form ADV for each Manager; (3) financial information relating to each Manager; and (4) other information deemed relevant to the Board of Trustees’ evaluation of each Manager, including qualitative assessments provided by senior management of the Advisor and an assessment of each Manager’s commitment to compliance. The Board of Trustees also considered the Advisor’s lengthy and extensive due diligence process for selecting each Manager, as well as its process for monitoring each Manager’s ongoing investment performance, attentiveness to its portfolios for the Funds, and responsiveness to the Advisor’s inquiries.
| 2. | Investment results |
With the exception of the New Fund, The Board of Trustees considered the investment results of each Fund in light of its investment objective. The Board of Trustees also considered information regarding the selection of indices and funds comparable to the Funds that were used to evaluate relative investment results. The Board of Trustees reviewed each Fund’s absolute investment results and its relative results measured against such comparable indices and funds. The Board of Trustees also compared the investment results of each Manager in comparison to the Manager’s own fund (if applicable), as well as to other relevant comparable funds and indices. For Funds with longer performance histories, the Board of Trustees examined the performance of each Fund as of September 30, 2006, at one-, three- and five-year intervals and since inception, noting that the Funds were designed for long term investment and therefore longer term performance was more relevant. For the Masters’ Select Smaller Companies Fund, the Board of Trustees considered only three-year and since-inception performance due to the fact that the Fund had only been in existence since June 30, 2003.
In assessing relative performance and fees and expenses, the Board of Trustees relied upon data independently assembled by the Funds’ administrator (the “Administrator”) from data provided by Lipper, Inc. (the “Lipper Data”). The Lipper Data consisted of reports showing the relative investment results for each Fund in comparison to appropriate passive indices and comparable fund peer groups for each of the Funds (collectively, the “Benchmarks”). The selection of Benchmarks was based on criteria including asset classification, primary channel of distribution, asset size, expense structure, and load type. The Board of Trustees noted that the Administrator, which is independent of and not affiliated with the Advisor, had been primarily responsible for compiling this data. Additional benchmarking data was supplied by the Advisor.
Other Information | 73
Masters’ Select Funds Trust
OTHER INFORMATION - (Unaudited) (Continued)
For the Masters’ Select Equity Fund, the Board of Trustees compared its investment results to: (1) the Custom Equity Index, which is composed of a 70% weighting in the S&P 500 Index, a 20% weighting in the Russell 2000 Index, and a 10% weighting in the MSCI EAFE Index; (2) the Lipper Multi-Cap Core Index; and (3) the Russell 3000 Index. The Board of Trustees observed that the Benchmarks for the Masters’ Select Equity Fund had outperformed the Fund on the basis of one- and three-year performance, but that the Fund had performed better than one of its Benchmarks over the last five years and all of its benchmarks since its inception on December 31, 1996, by wide margins.
The Master’s Select International Fund’s Benchmarks included: (1) the Morgan Stanley Capital International All Countries World Free (excluding US) Index; (2) the S&P Citigroup PMI Global Index (excluding US); and (3) the Lipper International Fund Index. The Board of Trustees observed that the Masters’ Select International Fund trailed all of its Benchmarks over the last year and two of its benchmarks over the last three years, was ahead of two of its three Benchmarks for five-year performance, and had significantly outperformed each of the Benchmarks since its inception on December 1, 1997.
The investment results of the Masters’ Select Value Fund were compared to: (1) the Russell 3000 Value Index; and (2) the Lipper Multi-Cap Value Index. The Board of Trustees noted that the Masters’ Select Value Fund trailed all of its benchmarks for one-, three-and five-year performance but was ahead of one of its benchmarks since inception.
Finally, the Masters’ Select Smaller Companies Fund was compared to: (1) the Russell 2000 Index; and (2) the Lipper Small-Cap Core Index. The Board of Trustees noted that although the Fund had underperformed its Benchmarks over the one-and three-year periods and since its inception on June 30, 2003.
The New Fund did not have any investment history.
The Board of Trustees also reviewed the Advisor’s detailed monitoring of Manager investment results, particularly those Managers that were experiencing periods of underperformance. The Board of Trustees noted that the Advisor had terminated certain Managers in the past year due to concerns regarding changes in a Manager’s investment process or changes in a Manager’s business that impacted its ability to give the expected degree of attention to the Funds. In addition, the Board of Trustees noted that the Advisor generally showed good discipline in terminating Managers that did not appear to meet the standards demanded by the Funds.
The Board of Trustees concluded that the Advisor had a strong record of effectively managing each of the Funds and monitoring the effectiveness of the contributions being made by each of the multiple Managers. The Board of Trustees further concluded that the Advisor was applying appropriate discipline and oversight to ensure that each Fund adhered to its stated investment objectives and strategies and that the Advisor’s record in managing each Fund indicated that its continued management would benefit each Fund and its respective shareholders.
| 3. | Advisory fees and total expenses |
The Board of Trustees reviewed the advisory fees and total expenses of each Fund (each as a percentage of average net assets) and compared such amounts with the median fee and expense levels of other funds in applicable peer fund groups based on the Lipper Data assembled by the Administrator. According to the Lipper Data, each Fund had relatively high advisory expenses. However, the Board of Trustees noted that the Advisor’s advisory fees included management and administrative services and that such services were unbundled in many other advisory fees used in the comparison data. Accordingly, the Board of Trustees focused on the total expenses of each Fund, its performance, and, where appropriate, the level of subsidization by the Advisor.
The Board of Trustees found that the total expenses for each of the Funds were in the mid-to-higher range for their core style peers and were in the mid-range when compared to manager-of-managers peers. The Board considered the manager-of-managers comparisons to be more appropriate because they more closely reflect the structure of the Funds. Thus, the Board of Trustees concluded that the fees were reasonable in comparison to other funds. In addition, the Board of Trustees noted that, while the advisory fees may be slightly higher than the industry norm, the higher fees were fully justified by the long-term performance results of the Funds and the fact that the Funds allowed shareholders to have access to Managers which they otherwise might not be able to access.
| 4. | The Advisor’s financial information |
The Board of Trustees reviewed information regarding the Advisor’s costs of managing the Funds and information regarding the profitability of the Advisor. The Board of Trustees also considered the extent to which economies of scale may be realized as each Fund grows and whether the advisory fee level reflects economies of scale if the Funds grow in size. The Board of Trustees also noted that the Advisor had voluntarily forgone profits to subsidize the Funds when they were at lower asset levels. With respect to the New Fund, the Board of Trustees reviewed the Advisors commitment to subsidize the Fund’s expenses during its initial operations.
The Advisor’s Costs and Profitability. The Board of Trustees noted that the Advisor appeared to be providing products that are competitively priced with other funds, especially funds with multiple managers. The Board of Trustees reviewed the total advisory fees, the amounts paid by the Advisor to the Managers, and the general cost of the services provided by the Advisor in compensation for its retained portion of the total advisory fee. The Board of Trustees took note of information provided on advisory fees waived by the Advisor, noting that the Advisor had voluntarily waived approximately $2.5 million of fees payable under its advisory contracts and followed a policy of not charging advisory fees on unallocated cash. The Board of Trustees also noted that the Advisor had voluntarily agreed not to seek recoupment of a substantial portion of waived advisory fees. In addition, the Board of Trustees considered the Advisor’s willingness to invest in staff to accommodate changing regulatory requirements. The Board of Trustees received information that assured them that the Advisor was financially sound and able to honor its sponsorship commitments to the Funds, and that the Advisor’s profits in managing the Funds were in the range of reasonableness for the mutual fund management industry.
74 | The Masters’ Select Funds Trust
Masters’ Select Funds Trust
OTHER INFORMATION - (Unaudited) (Continued)
The Board of Trustees did not engage in an analysis of Fund-by-Fund profitability given the integrated nature of the Advisor’s management of the Funds. Similarly, although the Board of Trustees had financial information on the Managers, the Board of Trustees did not engage in an extended analysis of Manager profitability given the arm’s length nature of the bargaining between the Advisor and each Manager and the difficulty of interpreting profitability information with respect to each Manager due to the use of disparate accounting conventions, disparate ownership structures, the fact that each Manager managed only a portion of each Fund, and other related factors. The Board of Trustees also reviewed information provided during the past year regarding the structure and manner in which the Advisor’s and the Managers’ investment professionals were compensated and their respective views of the relationship of such compensation to the attraction and retention of quality personnel.
Economies of Scale. The Board of Trustees noted that the Advisor had taken steps to reduce expenses. The Board of Trustees considered the economies of scale the Funds had experienced and the Advisor’s commitment to keep total expenses for the Funds low. The Board of Trustees concluded that the Advisor had taken steps to ensure that shareholders benefit as the size of the Funds increases by agreeing to breakpoints in its fee schedules, negotiating favorable terms with service providers, and providing certain support services to the Funds on a cost-only basis. The Board of Trustees also noted that the Advisor had acted in the interests of shareholder by closing certain of the Funds to new investments. Even though additional investments would have increased Fund size and possibly generated additional economies of scale, the Board of Trustees observed that responsible management of Fund size often benefited shareholders more than allowing uncontrolled growth, notwithstanding economies of scale that might accompany such growth.
In addition, the Board of Trustees took note of information provided on fees rebated to separate account clients of the Advisor’s affiliate to the extent these clients’ assets were invested in the Funds. The Board of Trustees noted that the rebates represented over $1.4 million in fees, and, although they nominally benefited only separate account clients of the Advisor’s affiliate who were also Fund shareholders, the Board of Trustees recognized that these separate account investments helped reduce costs for all shareholders by increasing the asset base of the Funds. The Board of Trustees also took note of the willingness of the Advisor’s affiliate to extend such rebates while, at the same time, the Advisor was limiting the size and total assets in the various Funds to levels that promoted optimum investment returns.
| 5. | Conclusions |
Based on its review, including consideration of each of the factors referred to above, the Board of Trustees, including the Independent Trustees, concluded that: (1) the Advisory Agreement and Manager Agreements are fair and reasonable with respect to each Fund and its respective shareholders; (2) each Fund’s shareholders receive reasonable value in return for the advisory fees and other amounts paid to the Advisor and Managers; and (3) the renewal (or in the case of the New Fund, the initiation) of the Advisory Agreement and Manager Agreements would be in the best interests of each Fund and its respective shareholders.
Other Information | 75
Masters’ Select Funds Trust
TAX INFORMATION - (Unaudited)
The percentage of dividend income distributed for the year ended December 31, 2006, which is designated as qualified dividend income under the Jobs and Growth Tax Relief Reconciliation Act of 2003 is as follows:
| Masters’ Select Equity Fund | 54.41% |
| Masters’ Select International Fund | 46.92% |
| Masters’ Select Value Fund | 100.00% |
| Masters’ Select Smaller Companies Fund | 20.06% |
| Masters’ Select Focused Opportunities Fund | N/A |
The percent of dividend income distributed for the year ended December 31, 2006, which qualifies for the corporate dividends received deduction is as follows:
| Masters’ Select Equity Fund | 42.20% |
| Masters’ Select International Fund | 0.00% |
| Masters’ Select Value Fund | 100.00% |
| Masters’ Select Smaller Companies Fund | 20.00% |
| Masters’ Select Focused Opportunities Fund | N/A |
Additional Information Applicable to Foreign Shareholders Only (Unaudited):
The percent of ordinary dividend distributions for the year ended December 31, 2006, which are designated as interest-related dividends under Internal Revenue Code Section 871 (k)(1)(C) is as follows:
| Masters’ Select Equity Fund | 4.03% |
| Masters’ Select International Fund | 2.85% |
| Masters’ Select Value Fund | 6.87% |
| Masters’ Select Smaller Companies Fund | 16.75% |
| Masters’ Select Focused Opportunities Fund | N/A |
The percent of ordinary dividend distributions for the year ended December 31, 2006, which are designated as short-term capital gain distributions under Internal Revenue Code Section 871 (k)(2)(C).
| Masters’ Select Equity Fund | 100.00% |
| Masters’ Select International Fund | 70.27% |
| Masters’ Select Value Fund | 84.78% |
| Masters’ Select Smaller Companies Fund | 100.00% |
| Masters’ Select Focused Opportunities Fund | N/A |
76 | The Masters’ Select Funds Trust
Masters’ Select Funds Trust
TAX INFORMATION - (Unaudited) (Continued)
For the year ended December 31, 2006 the International Fund earned foreign source income and paid foreign taxes, which they intend to pass through to their shareholders pursuant to Section 853 of the Internal Revenue Code as follows:
Country | Gross Foreign Income | Foreign Tax Paid | |||||
| Austria | $ | 106,624 | $ | 15,994 | |||
| Britain | 8,630,070 | — | |||||
| Canada | 2,335,229 | 91,419 | |||||
| China | 160,796 | — | |||||
| Denmark | 996,260 | 149,439 | |||||
| France | 4,144,851 | 603,324 | |||||
| Germany | 1,706,470 | — | |||||
| Hong Kong | 3,737,246 | — | |||||
| Ireland | 868,613 | — | |||||
| Isreal | 122,515 | 19,611 | |||||
| Japan | 2,151,462 | 150,602 | |||||
| Mexico | 275,611 | — | |||||
| New Zealand | 724,594 | 108,689 | |||||
| Norway | 105,461 | 15,819 | |||||
| South Korea | 1,148,964 | 189,579 | |||||
| Spain | 714,696 | 107,204 | |||||
| Singapore | 8,106,371 | — | |||||
| Switzerland | 3,469,062 | 520,359 | |||||
| Taiwan | 39,701 | 5,090 | |||||
| Sweden | 386,299 | 58,309 | |||||
| $ | 39,930,895 | $ | 2,035,438 | ||||
Tax Information | 77
Masters’ Select Funds Trust
INDEX DEFINITIONS
Custom Equity Index
The Custom Equity Index is composed of a 70% weighting in the S&P 500 Index, a 20% weighting in the Russell 2000 Index, and a 10% weighting in the MSCI EAFE index.
Lipper Multi-Cap Core Index
The Lipper Multi-Cap Core Index measures the performance of the 30 largest mutual funds that invest in a variety of capitalization ranges, without concentrating 75% or more of their equity assets in any one market capitalization range over an extended period of time, as determined by Lipper, Inc.
Lipper International Fund Index
The Lipper International Fund Index measures the performance of the 30 largest mutual funds in the international equity fund objective, as determined by Lipper, Inc.
Lipper Multi-Cap Value Index
The Lipper Multi-Cap Value Index measures the performance of the 30 largest mutual funds that invest in a variety of market capitalization ranges without concentrating 75% or more of their assets in any one market capitalization range over an extended period of time, as determined by Lipper, Inc. Value Funds seek long-term growth of capital by investing in companies that are considered to be undervalued relative to a major unmanaged stock index based on a price-to-earnings, price-to-book value, asset value or other factors.
Lipper Small-Cap Core Index
The Lipper Small-Cap Core Index measures the performance of the 30 largest mutual funds in the small capitalization range, as determined by Lipper, Inc.
MSCI EAFE Index
The Morgan Stanley Capital International Europe, Australasia, Far East Index is a broad based index that measures the performance of all of the publicly traded stocks in 21 developed non-U.S. markets. Among the countries included are Australia, Austria, Belgium, Denmark, Finland, France, Germany, Greece, Hong Kong, Ireland, Italy, Japan, the Netherlands, New Zealand, Norway, Portugal, Singapore, Spain, Sweden, Switzerland and the United Kingdom.
MSCI All Countries World Free (ex US) Index
The MSCI All Countries World Free (ex US) Index is a broad based index that measures the performance of common equities in 48 countries.
MSCI All Countries World Free Growth (ex US) Index
The MSCI All Countries World Free Growth (ex US) Index is a broad based index that measures the performance those common equities in 48 countries with higher price-to-book ratios and higher forecasted growth rates.
MSCI World Value Index
The MSCI World Value Index is a broad based index that measures the performance of common equities in 48 countries with lower price-to-book ratios and lower forecasted growth rates.
Russell 1000 Index
The Russell 1000 Index measures the performance of the 1,000 largest companies in the Russell 3000 Index.
Russell 1000 Growth Index
The Russell 1000 Growth Index measures the performance of those Russell 1000 companies with higher price-to-book ratios and higher forecasted growth rates.
Russell 2000 Index
The Russell 2000 Index measures the performance of the 2,000 smallest companies in the Russell 3000 Index.
Russell 2500 Growth Index
The Russell 2500 Growth Index measures the performance of those companies within the 2,500 smallest U.S. companies in the Russell 3000 Index, based on total market capitalization, that have higher price-to-book ratios and higher forecasted growth rates.
Russell 3000 Index
The Russell 3000 Index is a broad based index that measures the performance of the 3000 largest U.S. companies as measured by market capitalization, and represents about 98% of the U.S. stock market.
Russell 3000 Value Index
The Russell 3000 Value Index is a broad based index that measures the performance of those companies within the 3000 largest U.S. companies, based on total market capitalization, that have lower price-to-book ratios and lower forecasted growth rates.
S&P Citigroup PMI Global (ex US) Index
S&P Citigroup PMI Global (ex US) index is a broad based index that represents the largest 80% of investable companies in 52 developed and emerging market countries.
S&P 500 Index
The S&P 500 Index, which is widely regarded as the standard for measuring large-cap U.S. stock market performance, consists of 500 stocks that represent a sample of the leading companies in leading industries.
Indices are unmanaged, do not incur fees, and cannot be invested in directly
78 | The Masters’ Select Funds Trust
Masters’ Select Funds Trust
INDUSTRY TERMS AND DEFINITIONS
Price to earnings ratio is a common tool for comparing the prices of different common stocks and is calculated by dividing the current market price of a stock by the earnings per share. Similarly, multiples of earnings and cash flow are means of expressing a company’s stock price relative to its earnings per share or cash flow per share, and are calculated by dividing the current stock price by its earnings per share or cash per share. Forecasted earnings growth is the projected rate that a company’s earnings are estimated to grow in a future period.
Price to book ratio is calculated by dividing the current market price of a stock by the book value per share.
Combined ratio is a formula used by insurance companies to relate premium income to claims, administration and dividend expenses. It is used in the annual statement filed by an insurer with the state insurance department. It is calculated by dividing the sum of incurred losses and expenses by earned premium.
Free cash flow is the amount of cash a company has after expenses, debt service, capital expenditures, and dividends.
EV/EBITDA is the enterprise value of a company divided by earnings before interest, taxes, depreciation, and amortization.
“Growth” stocks are generally considered to be stocks of companies with high expected earnings growth compared to “value” stocks. Because of this higher expected growth, growth stocks tend to be priced at a higher multiple of their current earnings than value stocks. However, the premium paid for growth stocks compared to value stocks can vary dramatically depending on the market environment.
Book value is the net asset value of a company, calculated by subtracting total liabilities and intangible assets from total assets.
Earnings per share (EPS) is calculated by taking the total earnings divided by the number of shares outstanding.
EV/Sales is the ratio of enterprise value of a company divided by the total sales of the company for a particular period, usually one year.
EBITDA is a company’s earnings before interest, taxes, depreciation, and amortization.
Enterprise value is calculated by adding a corporation’s market capitalization, preferred stock, and outstanding debt together and then subtracting out the cash and cash equivalents.
Industry Terms and Definitions | 79
Masters’ Select Fund Trust
TRUSTEE AND OFFICER INFORMATION
Background information for the Trustees and Officers of the Trust is presented below. All Trustees oversee the Masters’ Select Funds. The SAI includes additional information about the Trust’s Trustees and is available, without charge, by calling 1-800-960-0188.
Name, Address and Year of Birth | Position(s) Held with Trust | Term of Office and Length of Time Served | Principal Occupation(s) During the Past 5 Years | Other Directorships Held by Trustee | ||||
A. George Battle 4 Orinda Way, Suite 200-D Orinda, CA 94563 (born 1944) | Trustee | Term: Open Ended Time Served: 10 years | Executive Chairman, Ask Jeeves, 2004 - 2005; Chief Executive Officer, Ask Jeeves from 2000 to 2003; Senior Fellow, The Aspen Institute since 1995. | Director of Advent Software; Expedia Inc; Fair Isaac Co.; and Netflix Inc. | ||||
Frederick August Eigenbrod, Jr. PhD 4 Orinda Way, Suite 200-D Orinda, CA 94563 (born 1941) | Trustee | Term: Open Ended Time Served: 10 years | Vice President, RoutSource Consulting Services (organizational planning and development) since 2002; Senior Vice President, Consulting Services, Silicon Valley, Right Associates (industrial psychologists) from 1990 to 2002. | None | ||||
Taylor M. Welz Bowman & Company LLP 2431 W. March Lane, Suite 100 Stockton, CA 95207 (born 1959) | Trustee | Term: Open Ended Time Served: 10 years | CPA/PFS, CFP. Partner, Bowman & Company LLP (certified public accountants). | None | ||||
Harold M. Shefrin, PhD 4 Orinda Way, Suite 200-D Orinda, CA 94563 (born 1948) | Trustee | Term: Open Ended Time Served: Since February 2005 | Professor, Department of Finance, Santa Clara University, since 1979 | SA Funds - Investment Trust | ||||
Kenneth E. Gregory* 4 Orinda Way, Suite 200-D Orinda, CA 94563 (born 1957) | President and Trustee | Term: Open Ended Time Served: 10 years | President of the Advisor; President of Litman/Gregory Research, Inc. (publishers) and Litman/Gregory Asset Management, LLC (investment advisors), Officer of Litman/Gregory Analytics, LLC (web based publisher of financial research), since 2000. | None | ||||
Craig A. Litman* 100 Larkspur Landing Circle, Suite 204 Larkspur, CA 94939 (born 1946) | Secretary and Trustee | Term: Open Ended Time Served: 10 years | Treasurer and Secretary of the Advisor; Vice President and Secretary of Litman/Gregory Research Inc.; Chairman of Litman/Gregory Asset Management, LLC. | None | ||||
John Coughlan 4 Orinda Way, Suite 200-D Orinda, CA 94563 (born 1956) | Treasurer and Chief Compliance Officer | Term: Open Ended Time Served: 10 years | Chief Operating Officer, Litman/Gregory Fund Advisors, LLC and Chief Financial Officer of Litman/Gregory Asset Management, LLC. | None |
* Denotes Trustees who are “interested persons” of the Trust under the 1940 Act.
Trustee and Officer Information
80 | The Masters’ Select Funds Trust
Advisor:
Litman/Gregory Fund Advisors, LLC
Orinda, CA 94563
Distributor:
Quasar Distributors, LLC
615 E. Michigan St., 2nd Floor
Milwaukee, WI 53202
Transfer Agent:
BFDS
P.O. Box 219922
Kansas City, MO 64121-9922
1-800-960-0188
For Overnight Delivery:
Masters’ Select Funds
C/O BFDS
330 W. 9th Street
Kansas City, MO 64105
Investment Professionals:
Registered Investment Advisors, broker/dealers, and other investment professionals may contact Fund Services at 1-925-253-5238.
Prospectus:
To request a current prospectus, statement of additional information, or an IRA application, call 1-800-656-8864.
Shareholder Inquiries:
To request action on your existing account, contact the Transfer agent, BFDS, at 1-800-960-0188, from 9:00 a.m. to 6:00 p.m. eastern time, Monday through Friday.
24-Hour Automated Information:
For access to automated reporting of daily prices, account balances and transaction activity, call 1-800-960-0188, 24 hours a day, seven days a week. Please have your Fund number (see below) and account number ready in order to access your account information.
Fund Information:
Fund | Symbol | CUSIP | Fund Number | |
| Equity Fund | MSEFX | 576417109 | 305 | |
| International Fund | MSILX | 576417208 | 306 | |
| Value Fund | MSVFX | 576417406 | 307 | |
| Smaller Companies Fund | MSSFX | 576417307 | 308 | |
| Focused Opportunities Fund | MSFOX | 57641T101 | 314 |
Website:
www.mastersfunds.com
Item 2. Code of Ethics.
The registrant has adopted a code of ethics that applies to the registrant’s principal executive officer and principal financial officer. The registrant has not made any amendments to its code of ethics during the period covered by this report. The registrant has not granted any waivers from any provisions of the code of ethics during the period covered by this report.
The registrant undertakes to provide to any person without charge, upon request, a copy of its code of ethics by mail when they call the registrant at 1-800-960-0188.
Item 3. Audit Committee Financial Expert.
The registrant’s board of trustees has determined that there is at least one audit committee financial expert serving on its audit committee. Mr. Harold M. Shefrin is the “audit committee financial expert” and is considered to be “independent” as each term is defined in Item 3 of Form N-CSR.
Item 4. Principal Accountant Fees and Services.
The registrant has engaged its principal accountant to perform audit services, audit-related services, tax services and other services during the past two fiscal years. “Audit services” refer to performing an audit of the registrant's annual financial statements or services that are normally provided by the accountant in connection with statutory and regulatory filings or engagements for those fiscal years. “Audit-related services” refer to the assurance and related services by the principal accountant that are reasonably related to the performance of the audit. “Tax services” refer to professional services rendered by the principal accountant for tax compliance, tax advice, and tax planning. The following table details the aggregate fees billed or expected to be billed for each of the last two fiscal years for audit fees, audit-related fees, tax fees and other fees by the principal accountant.
| FYE 12/31/2006 | FYE 12/31/2005 | |
| Audit Fees | $151,875 | $125,000 |
| Audit-Related Fees | $0 | $0 |
| Tax Fees | $32,535 | $24,900 |
| All Other Fees | $0 | $0 |
The audit committee has adopted pre-approval policies and procedures that require the audit committee to pre-approve all audit and non-audit services of the registrant, including services provided to any entity affiliated with the registrant. All of the principal accountant’s hours spent on auditing the registrant’s financial statements were attributed to work performed by full-time permanent employees of the principal accountant. (If more than 50 percent of the accountant’s hours were spent to audit the registrant's financial statements for the most recent fiscal year, state how many hours were attributed to work performed by persons other than the principal accountant's full-time, permanent employees.)
The following table indicates the non-audit fees billed or expected to be billed by the registrant’s accountant for services to the registrant and to the registrant’s investment adviser (and any other controlling entity, etc.—not sub-adviser) for the last two years. The audit committee of the board of trustees/directors has considered whether the provision of non-audit services that were rendered to the registrant's investment adviser is compatible with maintaining the principal accountant's independence and has concluded that the provision of such non-audit services by the accountant has not compromised the accountant’s independence.
| Non-Audit Related Fees | FYE 12/31/2006 | FYE 12/31/2005 |
| Registrant | None | None |
| Registrant’s Investment Adviser | None | None |
Item 5. Audit Committee of Listed Registrants.
Not applicable to registrants who are not listed issuers (as defined in Rule 10A-3 under the Securities Exchange Act of 1934).
Item 6. Schedule of Investments.
Schedule of Investments is included as part of the report to shareholders filed under Item 1 of this Form.
Item 7. Disclosure of Proxy Voting Policies and Procedures for Closed-End Management Investment Companies.
Not applicable to open-end investment companies.
Item 8. Portfolio Managers of Closed-End Management Investment Companies.
Not applicable to open-end investment companies.
Item 9. Purchases of Equity Securities by Closed-End Management Investment Company and Affiliated Purchasers.
Not applicable to open-end investment companies.
Item 10. Submission of Matters to a Vote of Security Holders.
There have been no material changes to the procedures by which shareholders may recommend nominees to the registrant’s board of trustees.
Item 11. Controls and Procedures.
| (a) | The Registrant’s President and Treasurer have reviewed the Registrant's disclosure controls and procedures (as defined in Rule 30a-3(c) under the Investment Company Act of 1940 (the “Act”)) as of a date within 90 days of the filing of this report, as required by Rule 30a-3(b) under the Act and Rules 13a-15(b) or 15d-15(b) under the Securities Exchange Act of 1934. Based on their review, such officers have concluded that the disclosure controls and procedures are effective in ensuring that information required to be disclosed in this report is appropriately recorded, processed, summarized and reported and made known to them by others within the Registrant and by the Registrant’s service provider. |
| (b) | There were no changes in the Registrant's internal control over financial reporting (as defined in Rule 30a-3(d) under the Act) that occurred during the second fiscal quarter of the period covered by this report that has materially affected, or is reasonably likely to materially affect, the Registrant's internal control over financial reporting. |
Item 12. Exhibits.
| (a) | (1) Any code of ethics or amendment thereto, that is subject of the disclosure required by Item 2, to the extent that the registrant intends to satisfy Item 2 requirements through filing an exhibit. Incorporated by reference to the Registrant’s Form N-CSR filed March 9, 2005. |
(2) Certifications pursuant to Section 302 of the Sarbanes-Oxley Act of 2002. Filed herewith.
(3) Any written solicitation to purchase securities under Rule 23c-1 under the Act sent or given during the period covered by the report by or on behalf of the registrant to 10 or more persons. Not applicable to open-end investment companies.
| (b) | Certification pursuant to Section 906 of the Sarbanes-Oxley Act of 2002. Furnished herewith. |
SIGNATURES
Pursuant to the requirements of the Securities Exchange Act of 1934 and the Investment Company Act of 1940, the registrant has duly caused this report to be signed on its behalf by the undersigned, thereunto duly authorized.
(Registrant) The Masters’ Select Funds Trust
By (Signature and Title)* /s/ Kenneth E. Gregory
Kenneth E. Gregory, President
Date March 7, 2007
Pursuant to the requirements of the Securities Exchange Act of 1934 and the Investment Company Act of 1940, this report has been signed below by the following persons on behalf of the registrant and in the capacities and on the dates indicated.
By (Signature and Title)* /s/ Kenneth E. Gregory
Kenneth E. Gregory, President
Date March 7, 2007
By (Signature and Title)* /s/ John Coughlan
John Coughlan, Treasurer
Date March 7, 2007
* Print the name and title of each signing officer under his or her signature.
4