As filed with the Securities and Exchange Commission on March 4, 2009
UNITED STATES
SECURITIES AND EXCHANGE COMMISSION
Washington, D.C. 20549
FORM N-CSR
CERTIFIED SHAREHOLDER REPORT OF REGISTERED
MANAGEMENT INVESTMENT COMPANIES
Investment Company Act file number 811-07763
The Masters’ Select Funds Trust
4 Orinda Way, Suite 200-D, Orinda, CA 94563
Kenneth E. Gregory
4 Orinda Way, Suite 200-D
Orinda, CA 94563
(925) 254-8999
Date of fiscal year end: December 31
Date of reporting period: December 31, 2008
Item 1. Reports to Stockholders.
The Masters’ Select Funds Trust

Annual Report
The Masters’ Select Equity Fund
The Masters’ Select International Fund
The Masters’ Select Value Fund
The Masters’ Select Smaller Companies Fund
The Masters’ Select Focused Opportunities Fund
December 31, 2008
www.mastersfunds.com
The Masters’ Select Concept
In constructing the Masters’ Select Funds, the goal was to design funds that would isolate the stock-picking skills of a group of highly regarded portfolio managers. To meet this objective, we designed the funds with both risk and return in mind, placing particular emphasis on the following factors:
| 1. | Only stock pickers Litman/Gregory believes to be exceptionally skilled are chosen to manage each fund’s sub-portfolios |
| 2. | Of equal importance, each stock picker runs a very concentrated sub-portfolio of not more than 15 of his or her “highest conviction” stocks. In the Focused Opportunities Fund, each stock picker may own no more than seven stocks. |
| 3. | Although each manager’s portfolio is concentrated, Masters’ Select seeks to manage risk partly by building diversification into each Fund. |
| Ÿ | With the Equity and International Funds, Litman/Gregory has sought to achieve this by including managers with differing investment styles and market cap orientations. |
| Ÿ | With the Smaller Companies Fund, much like Equity and International, Litman/Gregory has brought together managers who use different investment approaches, though each focuses on the securities of smaller companies. |
| Ÿ | With the Value Fund, Litman/Gregory has included managers who each take a distinct approach to assessing companies and defining value. Please note that the Value Fund is classified as a “non-diversified” fund; however, its portfolio has historically met the qualifications of a “diversified” fund. |
| Ÿ | With the Focused Opportunities Fund, this is done by using multiple managers with diverse investment styles. However, even with this diversification, the Fund is classified as a “non-diversified” fund, as it may hold as few as 15 stocks and no more than 21 stocks. In the future, if more sub-advisors are added, the Fund could become more diversified. |
| 4. | Litman/Gregory believes that excessive asset growth often results in diminished performance. Therefore, each Masters’ Select Fund may close to new investors at a level that Litman/ Gregory believes will preserve each manager’s ability to effectively implement the “select” concept. If more sub-advisors are added to a particular Fund, the Fund’s closing asset level may be increased. |
Portfolio Fit
As with all equity funds, Masters’ Select Funds are appropriate for investors with a long-term time horizon, who are willing to ride out occasional periods when the funds’ net asset values decline. Within that context, we created the Masters’ Select Equity and Masters’ Select International Funds to be used as core equity and international fund holdings. Masters’ Select Smaller Companies Fund has been created to provide a core domestic small cap investment opportunity. We created Masters’ Select Value Fund for investors who seek additional, dedicated value exposure in their portfolios. Masters’ Select Focused Opportunities Fund has been created to provide a core large-cap holding for long-term investors. Although performance in each specific down market will vary, we purposely set the allocations to each manager with the objective of keeping risk about equal to the funds’ overall benchmarks. In the end, the focus on the highest conviction stocks of a group of very distinguished managers with superior track records is what we believe makes the funds ideal portfolio holdings.

Contents
| Our Commitment to Shareholders | 2 |
| Letter to Shareholders | 3 |
| Funds’ Performance | 5 |
| Masters’ Select Equity Fund | |
| Equity Fund Review | 6 |
| Equity Fund Managers | 9 |
| Equity Fund Stock Highlights | 10 |
| Equity Fund Schedule of Investments | 13 |
| Masters’ Select International Fund | |
| International Fund Review | 15 |
| International Fund Managers | 18 |
| International Fund Stock Highlights | 19 |
| International Fund Schedule of Investments | 22 |
| Masters’ Select Value Fund | |
| Value Fund Review | 24 |
| Value Fund Managers | 27 |
| Value Fund Stock Highlights | 28 |
| Value Fund Schedule of Investments | 30 |
| Masters’ Select Smaller Companies Fund | |
| Smaller Companies Fund Review | 31 |
| Smaller Companies Fund Managers | 34 |
| Smaller Companies Fund Stock Highlights | 35 |
| Smaller Companies Fund Schedule of Investments | 37 |
| Masters’ Select Focused Opportunities Fund | |
| Focused Opportunities Fund Review | 39 |
| Focused Opportunities Fund Managers | 42 |
| Focused Opportunities Fund Stock Highlights | 43 |
| Focused Opportunities Fund Schedule of Investments | 44 |
| Expense Examples | 45 |
| Statements of Assets and Liabilities | 46 |
| Statements of Operations | 47 |
| Statements of Changes in Net Assets | |
| Equity Fund | 48 |
| International Fund | 48 |
| Value Fund | 49 |
| Smaller Companies Fund | 49 |
| Focused Opportunities Fund | 50 |
| Financial Highlights | |
| Equity Fund | 51 |
| International Fund | 52 |
| Value Fund | 53 |
| Smaller Companies Fund | 54 |
| Focused Opportunities Fund | 55 |
| Notes to Financial Statements | 56 |
| Report of Independent Registered Public Accounting Firm | 64 |
| Other Information | 65 |
| Index Definitions | 71 |
| Industry Terms and Definitions | 72 |
| Trustee and Officer Information | 73 |
This report is intended for shareholders of the funds and may not be used as sales literature unless preceded or accompanied by a current prospectus for the Masters’ Select Funds. Statements and other information in this report are dated and are subject to change.
Litman/Gregory Fund Advisors, LLC has ultimate responsibility for the funds’ performance due to its responsibility to oversee its investment managers and recommend their hiring, termination and replacement.
v2008-08
Table of Contents 1
Litman/Gregory Fund Advisors’
Commitment to Shareholders
We are deeply committed to making each Masters’ Select Fund a highly satisfying long-term investment for shareholders. In following through on this commitment we are guided by our core values, which influence four specific areas of service:
First, we are committed to the Masters’ Select concept.
| Ÿ | We will only hire managers who we strongly believe will deliver exceptional long-term returns relative to their benchmarks. We base this belief on extremely thorough due diligence research. This not only requires us to assess their stock picking skills, but also to evaluate their ability to add incremental performance by investing in a concentrated portfolio of their highest conviction ideas. |
| Ÿ | We will monitor each of the managers so that we can maintain our confidence in their ability to deliver the long-term performance we expect. In addition, our monitoring will seek to assess whether they are staying true to their Masters’ Select mandate. Consistent with this mandate we focus on long-term performance evaluation so that the Masters’ Select stock pickers will not be distracted by short-term performance pressure. |
Second, we will do all we can to ensure that the framework within which our stock pickers do their work further increases the odds of success.
| Ÿ | Investments from new shareholders in each Fund are expected to be limited so that each manager’s Masters’ Select asset base remains small enough to retain flexibility to add value through individual stock picking. |
| Ÿ | The framework also includes the diversified multi-manager structure that makes it possible for each manager to invest in a concentrated manner knowing that the potential volatility within his or her portfolio will be diluted at the fund level by the performance of the other managers. In this way the multi-manager structure seeks to provide the fund-level diversification necessary to temper the volatility of each manager’s sub-portfolio. |
| Ÿ | We will work hard to discourage short-term speculators so that cash flows into the Funds are not volatile. Lower volatility helps prevent our managers from being forced to sell stocks at inopportune times or to hold excessive cash for non-investment purposes. This is why years ago the Funds implemented a 2% redemption fee for the first 180 days of a shareholder’s investment in any Fund, which is paid to each Fund for the benefit of shareholders. |
Third, is our commitment to do all we can from an operational standpoint to maximize shareholder returns.
| Ÿ | We will remain attentive to Fund overhead, and whenever we achieve savings we will pass them through to shareholders. For example, we have had several manager changes that resulted in lower sub-advisory fees to our Funds. In every case we have passed through the full savings to shareholders in the form of fee waivers. |
| Ÿ | We will provide investors with a low minimum, no-load, no 12b-1 share class. |
| Ÿ | We also will work closely with our sub-advisors to make sure they are aware of tax-loss selling opportunities (only to be taken if there are equally attractive stocks to swap into). We account for partial sales on a specific tax lot basis so that shareholders will benefit from the most favorable tax treatment. The goal is not to favor taxable shareholders over tax-exempt shareholders but to make sure that the Masters’ Select stock pickers are taking advantage of tax savings opportunities when doing so is not expected to reduce pre-tax returns. |
Fourth, is our commitment to communicate honestly about all relevant developments and expectations.
| Ÿ | We will continue to do this by providing thorough and educational shareholder reports. |
| Ÿ | We will continue to provide what we believe are realistic assessments of the investment environment. |
Our commitment to Masters’ Select is also evidenced by our own investment. Our employees have, collectively, substantial investments in the Funds, as does our company retirement plan. In addition, we use the Funds extensively in the client accounts of our investment advisor practice (through our affiliate Litman/Gregory Asset Management, LLC). We have no financial incentive to do so because the fees we receive from Masters’ Select held in client accounts are fully offset against the advisory fees paid by our clients. In fact, we have a disincentive to use the Funds in our client accounts because each Masters’ Select Fund is capacity constrained (they may be closed as mentioned above), and by using them in client accounts we are using up capacity for which we may not be paid. But we believe these Funds offer value that we can’t get elsewhere and this is why we enthusiastically invest in them ourselves and on behalf of clients.
While we believe highly in the ability of the Funds’ sub-advisors, our commitments are not intended as guarantees of future results.
While the fund is no-load, management and other expenses still apply. Please refer to the prospectus for further details.
2 The Masters’ Select Funds Trust
Dear Fellow Shareholder,
2008 was the worst year for the stock market since 1931 and it was a year in which the Masters’ Select Funds posted disappointing performance.
A year ago we recognized that economic risk was mounting and the financial sector was stressed, but we did not come close to imagining how bad it would get in 2008. We’ve had to adjust our thinking as the financial and economic deleveraging may be “re-setting” the economy at a lower level from which sustainable growth will resume. As we look forward in the midst of what may turn out to be the worst economic downturn since the 1930s, it is reasonable to ask whether stocks are cheap compared to their intrinsic value—value that in most cases has been reduced as the result of the deleveraging process we are going through. In considering this question, there are many stock market valuation metrics that analysts look to. In our opinion there is no single metric that is solely reliable. Consequently, we use a weight-of-the-evidence approach to assessing market valuation. As we move into 2009, we believe the following three metrics, together, provide useful insight into potential returns for long-term investors. (In the following analysis, the S&P 500 is the index used to measure stock values.)
Normalized P/E Ratio: There are many different types of price-to-earnings ratios. Each has its own problems. One big problem is the volatility of earnings. Because earnings vary with the economic cycle, at any point in time earnings may be depressed or inflated and therefore not reflective of the normal earnings power of the business. By using average historical earnings we can smooth out the impact of the economic cycle on earnings. Yale professor Robert Shiller uses a version of this approach that also accounts for inflation by adjusting earnings and stock prices for inflation. Based on similar methodology, our analysis indicates that at the end of 2008 the S&P 500 P/E was around 15 times. This is lower than it had been for most of the last 55 years, except for a few brief instances and for an extended period in the mid-1970s until the late 1980s when interest rates were very high (higher interest rates typically coincide with lower P/Es). Historically, stocks have delivered 10-year average annual returns ranging from the mid-single digits up into the low teens with a starting P/E of around 15. The primary exception occurred in the period starting at the onset of the Great Depression in the early 1930s, when the subsequent 10-year returns were lower.
Trailing Risk Premium: Another insight into valuation comes from examining the trailing risk premium. The risk premium reflects the return delivered by stocks less the returns delivered by a risk-free investment which we define as T-Bills. Our calculation goes back nine years because it was approximately nine years ago, in 2000, when the stock market peaked. As of the end of 2008, the trailing nine-year cumulative risk premium was -59%, meaning that the return from T-bills was 59% greater than the return from stocks (this number is not annualized and reflects the fact that stocks lost a lot of value over the period.) This risk premium was so bad that it was even slightly worse than the worst nine-year period during the Great Depression. The only nine-year risk premium that was worse than the last nine years, in the 80 years we analyzed, was in the inflationary 1970s when T-Bill yields were much higher. The thinking here is that when stocks have performed very poorly over an extended time period, it is likely that the excesses have been eliminated, leaving them at least reasonably priced if not cheap. We looked at each of the three worst trailing nine-year risk premiums and found that the 5, 7, 10 and 15-year average annual returns that followed were in the teens (the nine years just ended was worse than two of these three periods).
| Worst Nine-Year Risk Premiums Since 1935 | ||||||||||||||||||||||||||||
Cumulative Nine-Year Return | Annualized Returns in Following Years | |||||||||||||||||||||||||||
| Nine-Year Period Ending | Risk Premium* | S&P 500** | T-bills | Next Five | Next Seven | Next 10 | Next 15 | |||||||||||||||||||||
| Dec-08 | -59 | % | -28 | % | 31 | % | n/a | n/a | n/a | n/a | ||||||||||||||||||
| Jul-82 | -58 | % | 52 | % | 111 | % | 29.7 | % | 23.1 | % | 19.2 | % | 19.7 | % | ||||||||||||||
| Sep-74 | -67 | % | -5 | % | 62 | % | 16.8 | % | 14.4 | % | 15.6 | % | 17.2 | % | ||||||||||||||
| Mar-38 | -56 | % | -46 | % | 10 | % | 13.0 | % | 13.4 | % | 11.9 | % | 14.1 | % | ||||||||||||||
| * | S&P 500 return less the T-bill return. |
| ** | Source: Ned Davis Research |
Scenario Analysis: Our own market research projects a range of possible stock market returns by assessing a variety of earnings scenarios and P/E assumptions looking out five years. (This research is used in our investment management practice and not directly relevant to Masters’ Select.) Our most pessimistic scenario assumes corporate earnings continue to suffer and experience their worst downturn since the 1930s. Five years from now, at the beginning of 2014, we assume corporate earnings are still more than 30% below their 2007 peak. We then assume a below-average P/E is applied to the earnings. Even in this scenario, S&P 500 returns are positive from a starting level of 828 (the level of the S&P 500 as we write this) with an expected average annual return of about 5%. This is not an exciting return, but based on these assumptions, which are far worse than we believe most investment strategists expect, five-year stock market returns are still respectable. In the other possible scenarios we consider, stocks would deliver higher returns.
As far as the near term is concerned, we don’t know whether November 20, 2008 marked the bottom for stocks. It is very possible that it did but it is also possible that we will experience another leg down to an even lower level (though if that happens stocks may not stay down that low for long—the S&P 500’s low thus far was 752 on November 20th and the index was 19% higher five trading days later.) However, regardless of short-term risk, considering the metrics discussed above (and others) we believe the weight of
Shareholder Letter 3
the evidence is that stocks will deliver acceptable returns, or better, over the next five to 10 years. However there are no guarantees, especially over the near term. The economic challenges are significant. We expect this recession to be severe and long, possibly not ending until 2010 which would make it the longest downturn since the 1930s. When the economy does recover it is likely that economic growth could be subpar for several years because consumers will spend less as they rebuild their savings. Nevertheless, we believe that we are effectively nine years into a bear market that started with the popping of the tech bubble in 2000. At the end of 2008 stocks were more than 40% below their peak of almost nine years ago. The NASDAQ Composite was 69% below its March 2000 peak. We don’t believe that the markets are table-pounding cheap; we do believe they are at least reasonably priced for the long-term investor and we know that the stock market has almost always begun to recover in advance of the economy.
There is a tendency when risk is foremost in investors’ minds to want to wait until the economy is clearly past its riskiest point to own stocks. For some investors that may make sense. However, investors who don’t need their equity money for a number of years should consider that it is highly likely that when economic risk is clearly past, stock prices will already be much higher. This is because the price of stocks are forward-looking and have typically bottomed months before the economy began to recover. Another way to think about this is that investor pessimism won’t be as high when risk has clearly abated as it is now. And periods of great pessimism have been much better entry points for investors than periods of great optimism—in theory investors are most pessimistic at a market bottom. The mountain of cash sitting on the sidelines reflects that pessimism. At a time when money market funds have been yielding nearly nothing, money market fund assets are equal to almost a third of total domestic stock market value. This is an all-time high (the data series goes back to 1980) and is particularly noteworthy given that money market yields are lower now than at any time during that period. This cash reflects potential buying power.
Masters’ Select
We’d like to forget 2008. Since that is not possible, we must look forward. The near-collapse of the financial system in 2008 caught most investors off guard and a number of our stock pickers held stocks of companies that suffered significant fundamental damage. Some of this damage could not have been foreseen, but there were clearly mistakes made. Looking forward, stock pickers have been adjusting to the grim economic outlook. Actions include re-evaluating their assessments of business fundamentals in anticipation of an extended and severe economic contraction, assuming lower market valuations and intensifying the vetting process. As an example, Sands Capital is stress-testing the growth potential of each business assuming an extended global consumer and capital spending pullback, general cost cutting across industries and limited access to credit and a higher cost of capital. Bill D’Alonzo of Friess Associates is focusing on less cyclical companies with high earnings visibility.
For some time we have been reporting that a number of our managers have been excited about opportunities in the stocks they are seeing. It is now clear that these stock pickers did not anticipate the equivalent of “an economic Pearl Harbor” as Warren Buffett has referred to the economic developments of last year. However, even some managers who did understand the potential risks suffered large losses in 2008—though perhaps less large than they otherwise would have. We realize that all stock pickers are human and make mistakes. While we have always known that skilled managers make occasional mistakes and go through sometimes lengthy performance slumps, it is disappointing that a number of our managers have been struggling at the same time. At this time we particularly value our more than 20 years of experience evaluating stock pickers and the knowledge and perspective we continue to build. Though we did remove two managers from the Masters’ Select line-up in 2008 (impacting three funds), we continue to believe that the group of stock pickers we have working for us is extremely skilled at assessing and valuing businesses and that this will pay off over time, as it has over the long careers of each of the Masters’ managers. Moreover, we believe that the market dysfunction we have seen, including indiscriminate forced selling at times, could be setting up good active managers for a run of strong outperformance.
We thank you for your confidence in Masters’ Select. Discipline may continue to be important in this challenging economic environment, but when the situation improves we believe investors will look back at 2009 as a time where there were good bargains to be had. The employees and independent trustees of Masters’ Select continue to have a significant collective investment in the Masters’ Select funds. As of the end of 2008 that investment amounted to $8.4 million.
Sincerely,
Ken Gregory and Jeremy DeGroot
Litman/Gregory Fund Advisors, LLC
Advisor to the Masters’ Select Funds
Some of the comments are based on current management expectations and are considered “forward-looking statements”. Actual future results, however, may prove to be different from our expectations. You can identify forward-looking statements by words such as “estimate”, “may”, “expect”, “should”, “could”, “believe”, “plan”, and similar terms. We cannot promise future returns and our opinions are a reflection of our best judgment at the time this report is compiled.
Opinions expressed are subject to change, are not guaranteed and should not be considered recommendations to buy or sell any security. Fund holdings and/or sector allocations are subject to change at any time and are not recommendations to buy or sell any security.
Please see page 71 for index definitions
Please see page 72 for industry definitions
4 The Masters’ Select Funds Trust
Masters’ Select Funds’ Performance
| Average Annual Total Returns | ||||||||||||||||||||
| Performance as of 12/31/2008 | One Year | Three- Year | Five-Year | Ten-Year | Since Inception | |||||||||||||||
| Masters’ Select Equity Fund (12/31/1996) | -46.76 | % | -15.25 | % | -6.22 | % | -0.16 | % | 3.21 | % | ||||||||||
| Custom Equity Index | -36.91 | % | -8.11 | % | -1.43 | % | -0.10 | % | 3.63 | % | ||||||||||
| Russell 3000 Index | -37.31 | % | -8.63 | % | -1.95 | % | -0.80 | % | 3.49 | % | ||||||||||
| Lipper Multi Cap Core Fund Index | -39.45 | % | -9.85 | % | -2.28 | % | -0.47 | % | 3.02 | % | ||||||||||
| Gross Expense Ratio: 1.21% Net Expense Ratio as of 4/30/08: 1.20% | ||||||||||||||||||||
| Masters’ Select International Fund (12/1/1997) | -45.47 | % | -6.64 | % | 2.86 | % | 6.45 | % | 6.75 | % | ||||||||||
| S&P Global (ex US) Large Mid Index | -44.80 | % | -6.31 | % | 3.16 | % | 2.48 | % | 3.66 | % | ||||||||||
| Lipper International Fund Index | -43.63 | % | -6.75 | % | 2.15 | % | 2.14 | % | 3.10 | % | ||||||||||
| Gross Expense Ratio: 1.19% Net Expense Ratio as of 4/30/08: 1.03% | ||||||||||||||||||||
| Masters’ Select Value Fund (6/30/2000) | -47.35 | % | -15.64 | % | -6.44 | % | n/a | -0.80 | % | |||||||||||
| Russell 3000 Value Index | -36.25 | % | -8.26 | % | -0.72 | % | n/a | 1.66 | % | |||||||||||
| Lipper Multi-Cap Value Index | -37.64 | % | -10.27 | % | -2.47 | % | n/a | 0.92 | % | |||||||||||
| Gross Expense Ratio: 1.23% Net Expense Ratio as of 4/30/08: 1.21% | ||||||||||||||||||||
| Masters’ Select Smaller Companies Fund (6/30/2003) | -44.81 | % | -14.95 | % | -4.75 | % | n/a | -1.23 | % | |||||||||||
| Russell 2000 Index | -33.79 | % | -8.29 | % | -0.93 | % | n/a | 3.25 | % | |||||||||||
| Lipper Small Cap Core Index | -35.60 | % | -9.29 | % | -1.02 | % | n/a | 2.91 | % | |||||||||||
| Gross Expense Ratio: 1.32% Net Expense Ratio as of 4/30/08: 1.31% | ||||||||||||||||||||
| Masters’ Select Focused Opportunities Fund (6/30/2006) | -49.34 | % | n/a | n/a | n/a | -18.40 | % | |||||||||||||
| S&P 500 | -37.00 | % | n/a | n/a | n/a | -10.90 | % | |||||||||||||
| Gross Expense Ratio: 1.34% Net Expense Ratio as of 4/30/08: 1.26% | ||||||||||||||||||||
Performance quoted represents past performance and does not guarantee future results. The investment return and principal value of an investment will fluctuate so that an investor’s shares, when redeemed, may be worth more or less than their original cost. Current performance of the funds may be lower or higher than the performance quoted. To obtain the performance of the funds as of the most recently completed calendar month, please visit www.mastersfunds.com. The funds impose a 2.00% redemption fee on shares held less than 180 days. Performance does not reflect the redemption fee. If reflected, performance would be lower.
The performance quoted does not include a deduction for taxes that a shareholder would pay on distributions or the redemption of fund shares. Indexes are unmanaged, do not incur expenses, taxes or fees and cannot be invested in directly. See page 71 for the index definitions.
Each of the funds may invest in foreign securities. Investing in foreign securities exposes investors to economic, political and market risks and fluctuations in foreign currencies. Each of the funds may invest in the securities of small companies. Small-company investing subjects investors to additional risks, including security price volatility and less liquidity than investing in larger companies. Masters’ Select Value and Masters’ Select Focused Opportunities are non-diversified funds, which means that each respective fund may concentrate more of its assets in fewer individual holdings than a diversified fund. Though primarily equity funds, the Value and Focused Opportunities funds may invest portions of assets in securities of distressed companies. Debt obligations of distressed companies typically are unrated, lower rated, in default or close to default and may become worthless.
Gross and net expense ratios are per the Prospectus dated April 30, 2008. Through April 30, 2009, Litman/Gregory has contractually agreed to waive a portion of its advisory fees effectively reducing total advisory fees to approximately 0.97% of the average daily net assets of the International Fund, 1.08% of the average daily net assets of the Value Fund and 1.02% of the Focused Opportunities Fund. Litman/Gregory may voluntarily waive a portion of its advisory fee in addition to those fees that are contractually waived. Litman/Gregory has agreed not to seek recoupment of advisory fees waived. Through 4/30/09, Litman/Gregory has voluntarily agreed to waive a portion of its management fee to pass through any costs benefits resulting from sub-advisor breakpoints, changes in the sub-advisory fee schedules or allocations within the Equity Fund, the International Fund, the Value Fund, the Smaller Companies Fund, and the Focused Opportunities Fund.
Funds’ Performance 5
Masters’ Select Equity Fund Review
Masters’ Select Equity suffered a horrible year in what was the worst year for the stock market since 1931. After beating its benchmarks for five consecutive years starting in 1999, and beating the S&P 500 for six consecutive years, the fund has slumped since that time. The fund’s relative underperformance recently was primarily the result of a poor relative 2006 and a terrible 2008. The size of the fund’s underperformance in 2008 damaged its long-term record. Still, its ten-year record remains slightly ahead of its primary Russell 3000 benchmark, but slightly behind the benchmark on a since-inception basis. The last time the since-inception return trailed the benchmark was in 2000 as the tech bubble began to deflate.
The value of a hypothetical $10,000 investment in the Masters’ Select Equity Fund from inception (12/31/96) to present compared with the Russell 3000 Index and the Lipper Multi-Cap Core Index.

The hypothetical $10,000 investment at fund inception includes changes due to share price and reinvestment of dividends and capital gains. The chart does not imply future performance. Indices are unmanaged, do not incur fees, expenses or taxes and cannot be invested in directly.
Performance as of December 31, 2008
| Average Annual Total Returns | ||||||||||||||||
| One-year | Five-Year | Ten-Year | Since Inception | |||||||||||||
Masters’ Select Equity Fund (12/31/96) | -46.76% | -6.22% | -0.16% | 3.21% | ||||||||||||
Past performance is no guarantee of future results. See page 5 for a detailed discussion of the risks and costs associated with investing in the Masters’ Select Equity Fund.
Portfolio Commentary
A number of factors contributed to the fund’s performance during 2008. The highlights follow.
Performance of managers: In 2008, three of the four Masters’ Select Equity sub-advisors with a full year’s track record underperformed their respective benchmark. For the year, the individual sub-advisors’ returns ranged from a 39% loss to a 54% loss. The Russell 3000 Index, the fund’s primary benchmark, was down 37% for the year. (Note: not all the managers invest using the same style or with the same market-cap focus, therefore not all sub-advisors are benchmarked against the Russell 3000 Index.)1
Over shorter time periods, it is typical for some, but not all, managers to beat their benchmarks. However, we are focused primarily on long-term performance and we aim to select sub-advisors who will beat their benchmarks over longer time periods. Through 2008, three of the four sub-advisors with long-term records have achieved that goal by a significant margin since their respective inception dates. The fourth sub-advisor is trailing his benchmark by a small margin since inception. The three newest sub-advisors do not yet have sufficiently lengthy records with Masters’ Select Equity for us to evaluate their long-term contributions to performance. Ultimately, we believe that all of our sub-advisors will outperform their benchmarks over the long term.
Sector and stock-picking impact: Though all the Masters’ Select funds are driven by bottom-up stock picking, the sector exposure that results from this may provide some insight into the fund’s relative performance. Based on our attribution analysis, in 2008 the fund’s overall sector exposure detracted from performance, although stock selection was the primary reason for the fund’s underperformance relative to the Russell 3000 Index. All sectors making up the index had negative returns for the year, so the fund’s small cash position added some value; however, the fund’s underweighting to the best-performing consumer staples sector, which was down much less than the index at -16.6%, more than offset that. As for stock selection, the fund’s information technology, consumer discretionary, health care, and energy stocks were particularly detrimental to performance.
Leaders and laggards: Of the four sub-advisors with track records for the entire calendar year, three owned at least one stock that was among the fund’s ten largest positive contributors to performance. A different three sub-advisors were responsible for most of the top ten detractors from the fund’s performance. (Several of the newest sub-advisors also had names on both lists.) Among the largest positive contributors to performance were Fairfax Financial Holdings, which was owned by Mason Hawkins, as well as W-H Energy Services and Mentor Graphics, which were owned by Dick Weiss. The biggest detractor from performance was American International Group, the large insurer that was all but nationalized in the fourth quarter, which two of the sub-advisors owned in their respective sleeves during the year. Also on that list are several consumer discretionary, energy, and information technology stocks, including Google, which was owned by four different sub-advisors at various times during the year. As of 12/31/08, only three of the ten top-contributing stocks (including Fairfax Financial Holdings) remained in the portfolio; the other seven holdings were sold from the portfolio by year-end. All but one of the ten biggest detractors in 2008 continued to be held in the portfolio at year-end.
See the table on page 8 for a list of the biggest contributors and detractors to the fund’s performance over the past six and 12 months. It is important to understand that the fact a stock has lost (or made) money for Masters’ Select Equity for the 12-month period ending December 31, 2008 tells us nothing about how successful the holding has been during the entire period it was held, or how successful it may become. The fund will hold many stocks for significantly longer periods of time and the success of these holdings won’t be known until they are ultimately sold.
6 The Masters’ Select Funds Trust
So in that respect, while it is interesting to know how specific stocks performed during the period, this information is of limited value in assessing the ultimate success of these stock holdings.
Portfolio mix: There were some notable changes to the fund’s sector exposure during the year. Financials remained the largest position in 2008, although they declined to 17.8% of the portfolio from 22.6% a year earlier. Health care exposure was up in 2008, at 9.7% versus 2.8% in 2007. Consumer staples also increased to 7% of the portfolio at year-end. Materials, which accounted for 9.5% of the portfolio in 2007, were down to 3.6% of the fund as of 12/31/08. Relative to the Russell 3000 benchmark, at year-end the fund was meaningfully overweighted to the consumer discretionary sector and somewhat underweighted to consumer staples, health care, industrials, and utilities.
The fund’s exposure to large-cap stocks (with market caps greater than $18.3 billion) decreased significantly during 2008, ending the year at 34.7% of the portfolio, down from 50.4% a year earlier. The fund’s small-cap stock (with market caps less than $2.5 billion) exposure increased more than 5% (five percentage points) to end the year at 18.2%. Mid-cap and foreign stock exposures also increased approximately 5% each from year-end 2007 to 31.5% and 12.4%, respectively. The shifts in market-cap exposure were driven in part by the significant decline in value of most stocks in 2008—this contributed to the increase in small-cap exposure and the decrease in large-cap exposure. The remainder of the portfolio (3.2%) was held in cash.
Please see page 9 for a breakout of the Fund’s sector and market cap exposures.
In Closing
The stock market and Masters’ Select have both taken major blows. In the case of the market, as discussed in the shareholder letter earlier in this report, we expect a very challenging economic environment in 2009 and possibly beyond. However, despite near-term economic uncertainty, our analysis suggests that the damage that has been done to asset prices, even in light of a decline in the intrinsic value of most companies, now makes a more compelling case for decent and possibly strong long-term returns going forward.
We are obviously aware that the last few years, and 2008 and 2006 in particular, have damaged what had been a very strong long-term record. We know that good stock pickers struggle at times and there is no doubt that we have been through those times recently. We also know that good stock pickers rebound from their struggles. It is tough for investors to stick with managers who are struggling. As the Advisor to Masters’ Select, we evaluate each stock picker based on a variety of factors with a primary focus on their research and stock-picking process and the execution of that process, not solely their recent performance. We have made changes when we believed they were justified. In the last year we made two sub-advisor changes, removing Bill Miller of Legg Mason and Craig Blum of TCW (see the last quarter’s report for a discussion of the impact of one of the manager sleeves on the fund’s long-term performance—a problem we believe we have corrected). In their place we have added three stock pickers with long histories of success and experience running concentrated portfolios (Clyde McGregor from Harris Associates, and teams from Sands Capital and Turner Investments.) In their November 22nd report, Morningstar (the independent mutual fund research firm) wrote “….we think the replacements are fundamentally sound stock-pickers who will serve this fund well. What's more, the fine managers who run the other 60% of the fund (two skippers who run 40% manage large-blend Analyst Picks Longleaf Partners and Selected American Shares) have been in place since the fund's 1996 inception.”
The dysfunction in the markets that has resulted from forced selling, has, we believe, presented some very compelling long-term opportunities that we think our stock pickers could benefit from, especially given their Masters’ Select mandate. We’re looking forward to better times both for the markets and Masters’ Select Equity.
The collapse of financial asset prices in 2008 does offer a silver lining beyond the opportunities being created going forward. That silver lining is that we can enjoy material returns going forward without triggering capital gains because of sizable loss carry forwards and unrealized losses in our portfolios. It is very unlikely that Masters’ Select Equity will have a capital gain distribution in 2009 and it is possible that will be the case in 2010 and possibly beyond. We will keep you updated.
We remain convinced that Masters’ Select is founded on a powerful concept that will be validated over the long term for all of our funds, and we greatly appreciate your continued confidence. As major shareholders ourselves, we have suffered through the very disappointing recent results alongside you and we can tell you that we are dissatisfied with our showing. While we have no control over what the overall market does over the shorter term, our decisions are focused on maximizing our relative performance over the longer term and we and our sub-advisors are extending every effort to make sure we get these decisions right.
| 1 | The Managers and their respective benchmarks are: Bill D’Alonzo: Russell 2500 Growth Index; Chris Davis and Ken Feinberg: S&P 500 Index; Mason Hawkins: Russell 3000 Value Index; Clyde McGregor: Russell 3000 Value Index; Frank Sands: Russell 1000 Growth Index; Bob Turner: Russell 1000 Growth Index; Dick Weiss: Russell 2000 Index, |
Neither the information contained herein nor any opinion expressed shall be construed to constitute an offer to sell or a solicitation to buy any security or any other funds mentioned herein. The views herein are those of Litman/Gregory Fund Advisors, LLC at the time the material is written and may not be reflective of current conditions. Performance quoted represents past performance and does not guarantee future results.
Fund Summary 7
Masters’ Select Equity Fund Leaders and Laggards
Masters’ Select Equity Fund Contribution by Holding
For the Six Months Ended December 31, 2008
Top 10 Contributors
| Security | Portfolio Contribution | |||
| Fairfax Financial Holdings Ltd. | 0.45 | % | ||
| Capital One Financial Corp. | 0.19 | % | ||
| Bank of America Corp. | 0.19 | % | ||
| HCC Insurance Holdings Inc. | 0.15 | % | ||
| Advance Auto Parts Inc. | 0.15 | % | ||
| Centex Corp. | 0.12 | % | ||
| Auxilium Pharmaceutica | 0.12 | % | ||
| Skywest Inc. | 0.10 | % | ||
| Cephalon Inc. | 0.08 | % | ||
| Apollo Group Inc. | 0.08 | % | ||
Bottom 10 Contributors
| Security | Portfolio Contribution | |||
| EOG Resources Inc. | (3.00 | )% | ||
| Level 3 Communications | (1.75 | )% | ||
| Cemex S.A.B. de C.V. | (1.60 | )% | ||
| Dell Inc. | (1.47 | )% | ||
| Chesapeake Energy Corp. | (1.45 | )% | ||
| Conocophillips | (1.42 | )% | ||
| Liberty Media Corp. New | (1.39 | )% | ||
| Sun Microsystems Inc. | (1.30 | )% | ||
| National Oilwell Varco | (1.21 | )% | ||
| Google Inc. | (1.20 | )% | ||
Masters’ Select Equity Fund Contribution by Holding
For the Year Ended December 31, 2008
Top 10 Contributors
| Security | Portfolio Contribution | |||
| Fairfax Financial Holdings Ltd. | 0.39 | % | ||
| W-H Energy Services Inc. | 0.28 | % | ||
| Mentor Graphics Corp. | 0.21 | % | ||
| C H Robinson Worldwide | 0.19 | % | ||
| DirecTV Group Inc. | 0.17 | % | ||
| FMC Corp. | 0.15 | % | ||
| Advance Auto Parts Inc. | 0.14 | % | ||
| Centex Corp. | 0.11 | % | ||
| Auxilium Pharmaceutica | 0.11 | % | ||
| Mosaic Co. | 0.10 | % | ||
Bottom 10 Contributors
| Security | Portfolio Contribution | |||
| American International Group Inc. | (1.94 | )% | ||
| Google Inc. | (1.91 | )% | ||
| Level 3 Communications | (1.76 | )% | ||
| Dell Inc. | (1.59 | )% | ||
| Liberty Media Corp. New | (1.56 | )% | ||
| Cemex S.A.B. de C.V. | (1.56 | )% | ||
| Chesapeake Energy Corp. | (1.39 | )% | ||
| EOG Resources Inc. | (1.39 | )% | ||
| Sun Microsystems Inc. | (1.25 | )% | ||
| Amazon.com Inc. | (1.23 | )% | ||
8 The Masters’ Select Funds Trust
Masters’ Select Equity Fund Managers
INVESTMENT MANAGER | FIRM | TARGET MANAGER ALLOCATION | MARKET CAPITALIZATION OF COMPANIES IN PORTFOLIO | STOCK-PICKING STYLE |
Christopher Davis/ Kenneth Feinberg | Davis Selected Advisers, L.P. | 20% | Mostly large companies | Growth at a reasonable price |
| Bill D’Alonzo and Team | Friess Associates, LLC | 10% | All sizes, emphasis is on small and mid-sized companies | Growth |
| Mason Hawkins | Southeastern Asset Management, Inc. | 20% | All sizes and global, may have up to 50% foreign stocks | Value |
| Clyde McGregor | Harris Associates L.P. | 20% | Mostly mid- and large- sized companies | Value |
Frank Sands, Jr./ Michael Sramek | Sands Capital Management, LLC | 10% | All sizes, but mostly large and mid-size companies | Growth |
Robert Turner/ Christopher McHugh/ William McVail | Turner Investment Partners, Inc. | 10% | All sizes, but mostly large and mid-size companies | Growth |
| Richard Weiss | Wells Capital Management, Inc. | 10% | All sizes, emphasis is on small and mid-sized companies | Growth at a reasonable price |
Portfolio Composition*
By Asset Class

Market Capitalization:
Small-Cap Domestic < $2.5 billion
Mid-Cap Domestic
Large-Cap Domestic > $18.3 billion
| * | Totals may not add up to 100% due to rounding. |
By Sector
| Sector Allocation | ||||||||
| Fund | Russell 3000 Index | |||||||
| Consumer Discretionary | 17.4 | % | 9.1 | % | ||||
| Consumer Staples | 7.0 | % | 11.4 | % | ||||
| Energy | 15.6 | % | 12.1 | % | ||||
| Finance | 17.8 | % | 14.6 | % | ||||
| Health Care & Pharmaceuticals | 9.7 | % | 14.5 | % | ||||
| Industrials | 7.5 | % | 11.7 | % | ||||
| Technology | 17.2 | % | 15.4 | % | ||||
| Telecom | 1.0 | % | 3.5 | % | ||||
| Utilities | 0.0 | % | 4.4 | % | ||||
| Materials | 3.6 | % | 3.4 | % | ||||
| Cash Equivalents & Other | 3.2 | % | 0.0 | % | ||||
| 100.0 | % | 100.0 | % | |||||
Fund Summary 9
Masters’ Select Equity Fund Stock Highlights
Procter & Gamble – Christopher Davis/Kenneth Feinberg
Procter and Gamble (PG) generates $84 billion of sales and possesses a number of durable competitive advantages, most notably in its tremendous brand portfolio including 24 brands that each achieved more than $1 billion in sales and 44 brands that each achieved more than $500 million in sales in FY2008. These household name brands are category leaders such as Pampers, Gillette, Tide, Ivory Snow, Crest and many others. Such brands tend to produce strong customer loyalty which in turn increases P&G’s clout with merchants relative to less well- positioned competitors. This relative pricing advantage allows for greater investment in marketing and advertising which reinforces the brands’ strength. This strong competitive position also generally allows P&G to price ahead of inflation which, when combined with modest but sustainable volume growth (particularly globally), has helped P&G improve margins over the long term, driving further economies of scale. The company also invests more than $2 billion a year in Research and Development (R&D). This level of spending is roughly twice the level of its nearest competitor Unilever, and more than the combined total of its next closest competitors – Avon, Clorox, Energizer, Colgate, Reckitt Benckiser, L’Oreal, and Kimberly-Clark. Such spending generally leads to more brand innovation, which results in increasing sales, higher returns on capital, and overall better financial metrics.
As the world continues to grow over time, hundreds of millions of new entrants to the middle class become potential new customers or candidates to trade up to higher quality and more profitable P&G brands. Today 55% of the company’s $84 billion in sales are outside of North America. International sales continue to grow faster than in the United States especially in emerging markets where the company has enviable scale and considerable room to expand its business.
Finally, since taking over as CEO in 2000, A.G. Lafley and his management team have done an excellent job in re-energizing P&G, improving the level of innovation as well as speed to market, and driving considerable improvements in earnings, free cash flow and shareholder value.
P&G currently trades at a bit more than 2x sales and approximately 15x our estimate of current year owner earnings. We consider this a fair price for a great business.
McDonald’s Corp., – Bill D’Alonzo
Challenging economic conditions make consumers hungry for a good deal. As they look to make the most of their dining dollars, McDonald’s uses its global reach, evolving menu and innovative business practices to make the most of the increased demand for value-priced meals.
NYSE-listed McDonald’s Corp. is perhaps the most recognized restaurateur in the world. The company consists of more than 30,000 local quick-service restaurants in over 100 countries. Nearly 80 percent of McDonald’s storefronts worldwide are independently owned and operated. Revenues, which come from the rent, royalties and fees paid by the franchisees, as well as sales in company-operated restaurants, are expected to top $23 billion for 2008.
September-quarter earnings grew 27 percent, beating estimates by 7 percent despite higher commodity costs for chicken and beef. Consumers continued to respond to McDonald’s value proposition even as other restaurant companies saw customer traffic fall. U.S. customers bought more dollar-menu items and cups of coffee, while European and Asian counterparts looking for values also purchased locally inspired snack-sized sandwiches and wraps.
Strong traffic and sales trends continued, with October and November same-store sales up 8.2 and 7.7 percent, respectively. New breakfast items, the roll-out of espresso-based coffee drinks, extended hours, healthier salad and fruit menu choices, and changes to the dollar menu all contributed to growth. Monthly comparative store sales have now experienced positive increases for five consecutive years.
Friess Associates researchers call on the largest McDonald’s franchise owners throughout the U.S., Europe, South America, Middle East and Asia Pacific to get visibility on business and cost trends shaped by some 56 million daily customers. Collectively, owners are upbeat about their 2009 profit prospects now that commodity and gasoline prices are down from 2008 highs.
The Friess Associates team bought McDonald’s at 14 times 2009 earnings estimates. Wall Street predicts the company will finish 2008 with 27 percent earnings growth.
Amazon.com – Frank Sands, Jr./Michael Sramek
Amazon is an internet retailer with a clear focus on being the Earth’s most customer-centric company where people can find and discover nearly anything they want to buy online. We expect online retail to continue to significantly outpace overall retail spending, growing approximately 15% per year for the next three to five years. We expect Amazon to benefit from this growth as it has become the shopping destination on the Web. For context, eCommerce is still less than 3.5% of retail sales in the US today.
As eCommerce matures, we believe that Amazon will take share from both eRetailers as well as offline retailers due to its unparalleled product selection, every day low price (EDLP) strategy, easy-to-use interface, and sterling reputation for customer service. In addition, we anticipate that Amazon will leverage its investments in fulfillment and technology, driving operating margins to mid- to high- single digit levels. As a result, we expect robust top-line growth coupled with modest, scale-based expense leverage to drive 25% average annual EPS growth over the next 3-5 years.
Amazon’s competitive position is rooted in its key pillars of Convenience, Selection, Service, and Value, which are stronger than ever in this current economic downturn. While many retailers on and off the Web are likely to fail in the coming year, we think Amazon will emerge stronger.
Convenience: Most items sold by Amazon can be delivered for free within days, all year long. With its growing network of fulfillment centers and the scale it enjoys from high volume throughput, Amazon is able to offer expedited shipping at low or no cost to consumers as well as compelling services such as Amazon PRIME that its competition cannot match. Moreover,
10 The Masters’ Select Funds Trust
through programs like Fulfillment by Amazon, third parties can leverage Amazon’s network, which creates a positive feedback loop for these partners and consumers.
Selection: With literally millions of SKUs in stock, the breadth and depth of Amazon’s inventory far exceeds any other retailer on the planet. Outside of perishables, consumers can buy practically anything on Amazon. As such, Amazon has become the de facto shopping destination for many consumers.
Service: Amazon consistently ranks among the best retailers, offline or online, for its customer service and its “A to Z Guarantee” gives consumers confidence when buying from third parties on Amazon.
Value: Every day low prices (EDLP) ensure customers that they are getting the best price when shopping on Amazon. Further, Amazon’s expanding market of third party sellers creates a natural clearinghouse for the best price.
For its last reported quarter, Q308, Amazon delivered strong results in the face of a very difficult retail environment. Revenue of $4.26 billion increased +31% year-over-year and Pro Forma earnings per share of $0.30 increased +40% year-over-year (excluding a net foreign exchange benefit). While the company did see slower sales of items that cost over $1,000 and lowered its full year revenue guidance from $19.4-20.1 billion to $18.5-19.5 billion, current guidance still implies 24-28% year-over-year revenue growth. Recession or not, these are very are strong results.
Qualcomm Inc. – Robert Turner
QUALCOMM Incorporated designs, manufactures and markets digital wireless telecommunications products and services based on its code division multiple access (CDMA) technology and other technologies. The Company operates through four segments: Qualcomm CDMA Technologies (QCT); Qualcomm Technology Licensing (QTL); Qualcomm Wireless & Internet (QWI), and Qualcomm Strategic Initiatives (QSI). Their QCT business (which comprises more than 60% of total revenues) develops and supplies integrated circuits and system software for wireless voice and data communications, multimedia functions and global positioning. Their QTL business (which makes up about 33% of total revenues) grants licenses to use portions of its intellectual property portfolio, which includes certain patent rights essential to and/or useful in the manufacture and sale of CDMA products. Their QWI business generates revenue primarily through mobile communication products and services, software and software development. Finally, their QSI business makes investments to promote the worldwide adoption of CDMA products and services.
Within the backdrop of a recession, demand for chipsets has fallen and forecasts indicate approximately 6% growth for semiconductors in 2009. Despite these muted projections, we feel Qualcomm remains the best positioned in the 3G chipset market as their intellectual property is far more advanced and reliable than the competition. Qualcomm’s main competition comes from Infineon, Marvell, ST-NXP Wireless, Texas Instruments, VIA Telecom, Ericsson, Matsushita and Motorola. One of the primary competitors, Freescale, recently exited the wireless semiconductor industry which provides Qualcomm additional market share gain opportunities.
In response to the slowing global economy, inventory levels have contracted across the industry resulting in decreased demand for chipsets. We expect wireless operators to work down their inventory levels over the next two quarters and see a minimal impact to QCOM’s results as these expectations have been factored into the Street’s estimates. In addition, 3G subscriptions, which enable network operators to offer their users a wider range of services while achieving greater network capacity through improved spectral efficiency, are gaining traction globally. We forecast unit subscriptions to grow to 1.6 billion by 2012, up substantially from the 705 million subscriptions as of September 30, 2008. We expect Qualcomm to be a key player in this growth cycle as consumers replace their older, slower mobile phones with quicker, more efficient phones.
We believe Qualcomm continues to be an attractive growth story due to a number of potential catalysts that may be beneficial to the company. Among them is the introduction of the 3G technology in China, further penetration into Research In Motion as they offer new phones, a potential introduction into the new version of the Apple iPhone, and the potential benefit from an expanded Nokia/Qualcomm relationship. China and India represent significant growth opportunities for Qualcomm as demand for mobile broadband drives 3G subscriptions. This consumer appetite should result in significant CDMA chipset growth for the company in 2009 and beyond. The growth in these markets should help to offset slowing demand in the U.S., Japan, and Korea until we see signs of an economic recovery which we feel could happen in the second half of 2009. With the popularity of Apple’s iPhone and Research In Motion’s appetite for rolling out new products, we feel Qualcomm is well positioned to expand within these product offerings. Additionally, the potential for a Nokia partnership appears to be gaining strength as the litigation that persisted over the past few years is behind the two companies.
At its recent analyst day, Qualcomm highlighted their Snapdragon chip platform which is their solution for the ever expanding netbook market. The Snapdragon platform empowers a new generation of Pocketable Computing Devices (PCDs) and Mobile Computing Devices (MCDs) that deliver real-time ubiquitous communication, high performance multimedia, location-aware content, full Internet browsing and productivity applications, all with the lowest levels of power consumption for an all-day battery life. With a shift from the GSM (Global System for Mobile communication) to the WCDMA (Wideband Code Division Multiple Access) platform along with the profitability of the replacement cycle for WCDMA phones coming around the corner, the new Snapdragon chipset should help drive the company’s growth in 2009 expanding their market share into the mobile computing device market.
Smith International Inc. – Dick Weiss
Until earlier this year, the Masters’ Select Equity and Masters’ Select Smaller Companies funds owned a fine company, W.H. Energy Services (WHQ). This oil service company was a direct beneficiary of the dramatic move toward horizontal drilling, providing high tech services such as logging-while-drilling (LWS) and measurement- while-drilling (MWD). Together with its remaining drilling products/services and its completion/work-over division, WHQ became one of the most attractive ways
Fund Summary 11
to participate in the growth of horizontal drilling and the stock performed quite well. Unusual for an oil service company with a lot of technical expertise, WHQ was largely U.S. focused (90% of sales). To sustain longer term growth, it needed to move overseas and faced a period of heavy investment to build its infrastructure outside the U.S.
Around mid year, Smith International (SII) purchased WHQ for $93.55 per share in a deal consisting of $56/share in cash and .48 shares of SII stock. At that time, we opted to retain the stock portion of the offer and become owners of SII. Knowing WHQ, we believed SII had made an attractive deal paying only 9X EBITDA or a PE of 17X. Although skeptical of most mergers, we were attracted by the valuation as well as the potential that SII could accelerate WHQ’s growth due to Smith’s already established global infrastructure and larger capital base. Moreover, WHQ could provide SII with additional high technology components to complement its existing directional drilling product offerings while enabling it to penetrate new market segments. With directional drilling among the fastest growing oil service segments, WHQ was really the only way to gain scale with a suite of MWD/LWD/rotary steerable capabilities.
Aside from WHQ, SII was an attractive stock in its own right. It is the leader in drilling fluids through its 60% ownership of a joint venture with Schlumberger and is among the largest drill bit companies in the world. A third part of the business is a large distribution network providing pipes and valves as well as safety/ maintenance products for a broad swath of the worldwide energy complex, both upstream and downstream. Smith’s business model is considered one of the more stable in the oil service industry due to its high mix of consumable products, its exposure to attractive end markets and its high ROE.
Subsequent to the deal in August, worldwide credit markets seized up and energy prices have plummeted as have energy related stocks. SII was not immune and has had to carry the added burden of concern over the $1 billion bridge loan taken on to purchase WHQ. We believe these concerns are overblown due to the strong free cash flow (“FCF”) nature of SII’s business model. For example, it is expected that SII will generate sufficient FCF to have paid down half of the bridge loan by its 8/09 refinancing date. Despite a decline in 09 earnings, the stock is selling at 8X depressed 2009 EPS compared to its 15 year average PE of 17X. It is also selling under 5X EBITDA. We believe the stock reflects excessive concern over its balance sheet providing an attractive risk/reward.
In keeping with Southeastern Asset Management’s disclosure policies, Mason Hawkins has not contributed commentary on his holdings for this report.
See page 72 for Industry Terms and Definitions
Neither the information contained herein nor any opinion expressed shall be construed to constitute an offer to sell or a solicitation to buy any securities mentioned herein. The views herein are those of the portfolio managers at the time the commentaries are written and may not be reflective of current conditions.
12 The Masters’ Select Funds Trust
Masters’ Select Equity Fund
SCHEDULE OF INVESTMENTS IN SECURITIES at December 31, 2008
| Shares | Value | |||
| COMMON STOCKS: 96.8% | ||||
| Consumer Discretionary: 17.4% | ||||
| 92,800 | Advance Auto Parts, Inc. | $ | 3,122,720 | |
| 59,300 | Amazon.com, Inc.* | 3,040,904 | ||
| 26,900 | Apollo Group, Inc.* | 2,061,078 | ||
| 386,000 | Disney (Walt) Co. | 8,758,340 | ||
| 440,200 | Interpublic Group of Companies, Inc.* | 1,743,192 | ||
| 36,000 | Kohl’s Corp.* | 1,303,200 | ||
| 347,000 | Las Vegas Sands Corp.* | 2,057,710 | ||
| 461,000 | Liberty Media Holding | |||
| Corp. – Entertainment* | 8,058,280 | |||
| 70,080 | Lowe’s Companies, Inc. | 1,508,122 | ||
| 30,000 | McDonald’s Corp. | 1,865,700 | ||
| 74,400 | Mohawk Industries, Inc.* | 3,196,968 | ||
| 13,820 | News Corp. | 125,624 | ||
| 105,000 | Snap-on, Inc. | 4,134,900 | ||
| 7,500 | Strayer Education, Inc. | 1,608,075 | ||
| 38,400 | Wal-Mart Stores, Inc. | 2,152,704 | ||
| 44,737,517 | ||||
| Consumer Staples: 7.0% | ||||
| 64,246 | BJ’s Wholesale Club, Inc.* | 2,201,068 | ||
| 32,000 | Church & Dwight Co., Inc. | 1,795,840 | ||
| 74,330 | Costco Wholesale Corp. | 3,902,325 | ||
| 113,300 | CVS Caremark Corp. | 3,256,242 | ||
| 32,300 | General Mills, Inc. | 1,962,225 | ||
| 45,000 | Procter & Gamble Co. | 2,781,900 | ||
| 35,900 | Ralcorp Holdings, Inc.* | 2,096,560 | ||
| 17,996,160 | ||||
| Energy: 15.6% | ||||
| 88,200 | Canadian Natural Resources Ltd. | 3,526,236 | ||
| 281,500 | Chesapeake Energy Corp. | 4,551,855 | ||
| 144,230 | ConocoPhillips | 7,471,114 | ||
| 72,200 | EnCana Corp. | 3,355,856 | ||
| 127,130 | EOG Resources, Inc. | 8,464,315 | ||
| 105,000 | National Oilwell Varco, Inc.* | 2,566,200 | ||
| 61,900 | Range Resources Corp. | 2,128,741 | ||
| 68,900 | Smith International, Inc. | 1,577,121 | ||
| 56,300 | Transocean, Inc. | 2,660,175 | ||
| 104,000 | XTO Energy, Inc. | 3,668,080 | ||
| 39,969,693 | ||||
| Finance: 17.8% | ||||
| 210,100 | American Express Co. | 3,897,355 | ||
| 145,100 | American International Group, Inc.* | 227,807 | ||
| 277,500 | Bank of New York Mellon Corp. | 7,861,575 | ||
| 81 | Berkshire Hathaway, Inc. – Class A* | 7,824,600 | ||
| 7,000 | Brookfield Asset Management, Inc. | 106,890 | ||
| 380,800 | CapitalSource, Inc. | 1,759,296 | ||
| 107,960 | Charles Schwab Corp. | 1,745,713 | ||
| 31,100 | Fairfax Financial Holdings Ltd. | 9,747,051 | ||
| 83,800 | HCC Insurance Holdings, Inc. | 2,241,650 | ||
| 36,200 | IntercontinentalExchange, Inc.* | 2,984,328 | ||
| 129,000 | JPMorgan Chase & Co. | 4,067,370 | ||
| 81,600 | Transatlantic Holdings, Inc. | 3,268,896 | ||
| 45,732,531 | ||||
| Health Care, Pharmaceuticals & Biotechnology: 9.7% | ||||
| 77,900 | Allergan, Inc. | 3,140,928 | ||
| 53,580 | Auxilium Pharmaceuticals, Inc.* | 1,523,815 | ||
| 24,300 | Cephalon, Inc.* | 1,872,072 | ||
| 83,200 | Covidien Ltd. | 3,015,168 | ||
| 674,100 | Health Management Association, Inc.* | 1,206,639 | ||
| 11,850 | Intuitive Surgical, Inc.* | 1,504,832 | ||
| 43,300 | Laboratory Corporation of | |||
| America Holdings* | 2,788,953 | |||
| 427,000 | MDS, Inc.* | 2,617,510 | ||
| 91,500 | Mindray Medical International Ltd. | 1,647,000 | ||
| 60,500 | NuVasive, Inc.* | 2,096,325 | ||
| 59,700 | Psychiatric Solutions, Inc.* | 1,662,645 | ||
| 104,700 | QIAGEN N.V.* | 1,838,532 | ||
| 24,914,419 | ||||
| Industrials: 7.5% | ||||
| 80,800 | Carlisle Cos, Inc. | 1,672,560 | ||
| 41,000 | FedEx Corp. | 2,630,150 | ||
| 11,430 | First Solar, Inc.* | 1,576,883 | ||
| 65,400 | GATX Corp. | 2,025,438 | ||
| 89,320 | HUB Group, Inc.* | 2,369,659 | ||
| 117,600 | Kirby Corp.* | 3,217,536 | ||
| 87,100 | Rockwell Collins, Inc. | 3,404,739 | ||
| 116,000 | SYKES Enterprises, Inc.* | 2,217,920 | ||
| 19,114,885 | ||||
| Materials: 3.6% | ||||
| 614,242 | Cemex S.A.B. de C.V. – ADR | 5,614,172 | ||
| 62,900 | International Flavors & Fragrances, Inc. | 1,869,388 | ||
| 24,220 | Monsanto Co. | 1,703,877 | ||
| 9,187,437 | ||||
| Technology: 17.2% | ||||
| 30,010 | Apple, Inc.* | 2,561,354 | ||
| 162,500 | Ariba, Inc.* | 1,171,625 | ||
| 232,560 | Broadcom Corp.* | 3,946,543 | ||
| 171,500 | Corning, Inc. | 1,634,395 | ||
| 607,000 | Dell, Inc.* | 6,215,680 | ||
| 15,000 | Google, Inc. – Class A* | 4,614,750 | ||
| 82,980 | LAM Research Corp.* | 1,765,814 | ||
| 66,700 | MEMC Electronic Materials, Inc.* | 952,476 | ||
| 133,700 | Polycom, Inc.* | 1,806,287 | ||
| 57,890 | QUALCOMM, Inc. | 2,074,199 | ||
| 87,000 | Salesforce.com, Inc.* | 2,784,870 | ||
| 183,670 | SanDisk Corp.* | 1,763,232 | ||
| 1,073,000 | Sun Microsystems, Inc.* | 4,098,860 | ||
| 594,400 | Symmetricom, Inc.* | 2,347,880 | ||
| 115,800 | Texas Instruments, Inc. | 1,797,216 | ||
| 189,300 | Tyco Electronics Ltd. | 3,068,553 | ||
| 134,650 | Ultratech, Inc.* | 1,610,414 | ||
| 44,214,148 | ||||
Schedule of Investments 13
Masters’ Select Equity Fund
SCHEDULE OF INVESTMENTS IN SECURITIES at December 31, 2008
Shares/ Principal Amount | Value | |||
| Telecommunication Services: 1.0% | ||||
| 3,587,480 | Level 3 Communications, Inc.* | $ | 2,511,236 | |
| TOTAL COMMON STOCKS | ||||
| (cost $332,190,022) | 248,378,026 | |||
| SHORT-TERM INVESTMENTS: 1.8% | ||||
| 4,669,000 | State Street Bank & Trust Co., 0.010%, | |||
| 12/31/08, due 01/02/09 [collateral: | ||||
| par value: $4,475,000, | ||||
| Federal Home Loan Bank, | ||||
| 4.375%, due 09/17/10, value | ||||
| 4,764,532] (proceeds $4,669,003) | 4,669,000 | |||
| TOTAL SHORT-TERM INVESTMENTS | ||||
| (cost $4,669,000) | 4,669,000 | |||
| TOTAL INVESTMENTS IN SECURITIES | ||||
| (cost $336,859,022): 98.6% | 253,047,026 | |||
| Other Assets Less Liabilities: 1.4% | 3,597,224 | |||
Net Assets: 100% | $ | 256,644,250 | ||
Percentages are stated as a percent of net assets.
| ADR | American Depository Receipt |
| * | Non Income Producing |
The accompanying notes are an integral part of these financial statements.
14 The Masters’ Select Funds Trust
Masters’ Select International Fund Review
During a terrible year for stocks everywhere in the world, Masters’ Select International lagged its benchmark slightly. The fund experienced a loss of 45.47% for the year, while its benchmark, the S&P Global ex-US LargeMid-Cap Index, declined 44.80% (note that this is the same index the fund has been using but its name was recently changed). In the fourth quarter, the International fund lost 24.94%, compared to a 22.12% loss for the index. Since its inception over 10 years ago, the fund’s average annual return of 6.75% is well ahead of its benchmark’s 3.66% return. It has also exhibited very strong long and intermediate-term performance relative to its peer group, though that may be of little consolation given large market level losses in 2008. As of December 31 2008, Morningstar Inc. ranked the Masters’ Select International Fund in the 66th, 32nd, 22nd and 3rd percentile among 778, 570, 452, and 238 Foreign Large Blend Funds for the one-, three-, five-, and ten-year periods, respectively, based on total return.1 As of the end of 2008, Masters’ Select International continued to be included in Morningstar’s Fund Analyst Picks in the Foreign Large Blend category. Only three other actively managed funds were included.2
As with all Masters’ Select funds, the primary focus of Masters’ Select International is to generate superior long-term returns, and in pursuit of that objective, the fund’s portfolio continues to look very different from its benchmark. About 40% of the fund’s holdings are not in the benchmark. This variance from the benchmark contributes to the fund having a high tracking error over shorter time periods. In this instance, tracking error refers to the difference between the fund’s return and the benchmark’s return. Tracking error can be positive (returns higher than the benchmark) or negative (returns lower than the benchmark). We believe the managers’ willingness to invest differently from the benchmark is one factor that has made it possible for the fund to generate strong long-term performance relative to its benchmark and peers.
The value of a hypothetical $10,000 investment in the Masters’ Select International Fund from inception (12/1/97) to present compared with the S&P Global (ex U.S.) LargeMid-Cap Index and the Lipper International Fund Index.

The hypothetical $10,000 investment at fund inception includes changes due to share price and reinvestment of dividends and capital gains. The chart does not imply future performance. Indices are unmanaged, do not incur fees, expenses or taxes and cannot be invested in directly.
Performance as of December 31, 2008
| Average Annual Total Returns | ||||||||||||||||
| One-Year | Five-Year | Ten-Year | Since Inception | |||||||||||||
| Masters’ Select | ||||||||||||||||
| International Fund (12/1/97) | -45.47% | 2.86% | 6.45 | 6.75 | ||||||||||||
Past performance is no guarantee of future results. See page 5 for a detailed discussion of the risks and costs associated with investing in the Masters’ Select International Fund.
Portfolio Commentary
A number of factors contributed to the fund’s performance during 2008. The highlights follow.
Performance of managers: In 2008, three of the fund’s six managers outperformed their respective benchmarks; one did so by more than six percentage points. The other three managers trailed their benchmarks. For the year, the performance of individual managers ranged from - -38.7% to -55.3%, highlighting a difficult market for all managers irrespective of their investment approaches. There are five managers who have been with the fund for at least three years. Four out of these five have beaten their benchmarks over their full tenure with Masters’ Select International. We expect that over shorter periods we will have a mix of underperforming and outperforming managers. Longer term, we expect all of our managers to beat their respective benchmarks (our expectation should not be construed as a guarantee that it will happen).
Sector, regional, and stock-picking impact: Though all the Masters’ Select funds are driven by bottom-up stock picking, the sector and regional exposures that result from this process may provide some insight into the fund’s relative performance. Based on our attribution analysis versus the S&P Global ex-US Large Mid-Cap Index, the fund’s cash position and overall sector exposures contributed positively to relative performance. With the broad international market down nearly 45% for the year, the fund’s average cash weighting of 7% was a significant positive. In terms of sectors, an overweighting to health care and underweighting to materials was a positive, unlike the previous year when the same sector positions detracted from relative performance. The fund’s regional allocations did not have a material impact on its relative performance.
Stock selection overall detracted from the fund’s relative performance. It was particularly weak in the energy and utilities sectors. Gazprom, a Russian gas company, declined nearly 75% during the holding period. Energy Development Corporation, a Philippine utility, saw a similar decline in its stock price. Within financials, the worst-performing sector in the market, stock selection detracted from overall performance due to picks like Carnegie, a Scandinavian asset management and consulting firm, and Lloyds TSB Group, a U.K. bank.
On the positive side, picks in the technology and consumer discretionary areas contributed positively to the fund’s relative performance. Neopost, a technology company focused on postal services, declined only 8% during the fund’s holding period, while Fast Retailing, a Japanese retailing company, rose over 40%, a rare occurrence in a market like last year’s.
Leaders and laggards: Other than Fast Retailing, the fund’s two biggest winners, in terms of contribution to performance, came from Actelion, a Swiss pharmaceutical company, and NTT
Fund Summary 15
Docomo, a Japanese telecommunications company. Both were up over 20% during the fund’s holding period. The fund’s two worst performers, other than Carnegie, Lloyds, and Gazprom, were America Movil, a Mexican company that provides wireless communication services (down 60)%, and Potash (down 63)%, a Canadian producer of fertilizers.
See the table on page 17 for a list of the biggest contributors and detractors to the fund’s performance in 2008. It is important to understand that a stock that has made or lost money for the fund over the past year does not determine whether it will be a successful holding over the long term. The ultimate success of a holding won’t be known until it is sold. (America Movil, for example, was sold and was one of the laggards of 2008, but it generated a long-term gain for the fund.) So, while it is interesting to know how specific stocks performed during the period, this information is of limited value in assessing the long-term contribution of these stock holdings.
Portfolio mix: Please see page 18 for sector, market cap, and regional allocations as of year-end.
| Ÿ | There were no material changes in the fund’s sector weightings comparing the end of 2007 to the end of 2008. The fund’s weighting in the utilities sector decreased slightly while the technology weighting increased. |
| Ÿ | The fund’s largest sector exposure, at 21.8% of assets, was to financials, though this is below the benchmark’s 24.1% weighting. Throughout the year, the fund remained underweighted to the energy and materials sectors relative to its benchmark. |
| Ÿ | Regionally, the fund’s weighting to Japan increased by over 7% from a year earlier, with about 5% coming from Europe and the rest from Asia ex Japan. As of year-end, the fund was slightly overweighted to Japan versus its index (20.4% versus 18.8)%. This is the fund’s largest weighting in Japanese stocks since its inception. The weighting to Europe stood at 45%, below the 50% weighting in the index. |
| Ÿ | The fund’s weighting to emerging markets increased slightly and stood at nearly 20% as of year-end. This is well above the fund’s historical average of 11.4% in this asset class and higher than the benchmark’s 14% weighting. |
| Ÿ | In terms of market-cap breakout, the fund’s allocation to large-caps (greater than $10 billion in market cap) decreased in favor of small- and mid-caps. As of year-end, the fund had 52% of its assets in large-cap stocks, 28% in mid-caps, and 14% in small-caps (with the remainder in cash). The fund’s allocation to small-caps is close to its historical average. |
| Ÿ | The fund’s cash position declined slightly from 6.1% as of December 31, 2007 to 5.3%. Historically, the fund has held slightly higher levels of cash on average. |
| Ÿ | At year-end, about 3.5% of the fund’s foreign currency exposure was hedged to the dollar compared to 9.3% at the end of 2007. The currency hedging benefited the fund as the dollar appreciated in 2008. |
Please see page 18 for a breakout of the Fund’s sector and market cap exposures.
In Closing
Foreign markets were pummeled in 2008 with even bigger declines than in the U.S. for dollar-based investors. And just like in the U.S., we expect a very challenging economic environment in 2009 and possibly beyond. But also similar to the U.S., despite near-term economic uncertainty, our analysis suggests that the damage that has been done to asset prices now makes a more compelling case for decent and possibly strong long-term returns going forward. As one measure of value, many foreign markets are selling at price-to-earnings ratios that are not far from their 35-year lows.
Looking beyond the potential at a market level, we believe the dysfunction in the markets that has resulted from forced and indiscriminate selling in some cases, has presented some very compelling long-term opportunities. If we are right, our stock pickers may be presented with opportunities that could increase the likelihood that they will significantly beat their benchmarks over the next few years. As they consider the opportunities, they do so with a hardened set of assumptions about the impact of a very severe economic downturn on the businesses they evaluate.
The collapse of financial asset prices in 2008 does offer a silver lining beyond the opportunities being created going forward. The silver lining is that we can enjoy material returns going forward without triggering capital gains because of sizable loss carry-forwards and unrealized losses in our portfolios. It is very unlikely that Masters’ Select International will have a capital gain distribution in 2009 and it is possible that will be the case in 2010 and possibly beyond. We will keep you updated.
We continue to greatly appreciate your confidence in Masters’ Select. As major shareholders ourselves, we have suffered along with you in this bear market. We, along with our sub-advisors, feel an enormous level of responsibility to you and will continue to stay intently focused on our primary goal of extending the fund’s strong long-term performance relative to international benchmarks and its international peer group.
| 1 | Morningstar, Inc., is an independent mutual fund research and rating service. Each Morningstar category represents a universe of funds with similar investment objectives. Rankings for the period shown are based on fund total returns with dividends and distributions reinvested and do not reflect sales charges. The highest percentile rank is 1 and the lowest is 100. The information contained herein: (1) is proprietary to Morningstar; (2) may not be copied or distributed; and (3) is not warranted to be accurate, complete or timely. Neither Morningstar nor its content providers are responsible for any damages or losses arising from any use of this information. |
| 2 | According to Morningstar, “The overwhelming majority of the picks offer a combination of strong track records, reasonable volatility, compelling strategies, great managers, and low expenses, either on an absolute basis or at least relative to their categories.” |
| 3 | The managers and their respective benchmarks are: Bill Fries and Vin Walden: MSCI All Countries World Free ex U.S. Index; Jim Gendelman: MSCI All Countries World Growth ex U.S. Index; David Herro: MSCI World ex U.S. Value Index; Northern Cross Team: S&P Global ex U.S. LargeMid-Cap Index; Ted Tyson: MSCI All Countries World Growth ex U.S. Index; Amit Wadhwaney: MSCI All Countries World ex U.S. Value Index. |
Past performance does not guarantee future results.
Neither the information contained herein nor any opinion expressed shall be construed to constitute an offer to sell or a solicitation to buy any securities mentioned herein. The views herein are those of the portfolio managers at the time the commentaries are written and may not be reflective of current conditions.
16 The Masters’ Select Funds Trust
Masters’ Select International Fund Leaders and Laggards
Masters’ Select International Fund Contribution by Holding
For the Six Months Ended December 31, 2008
Top 10 Contributors
| Security | Portfolio Contribution |
| Fast Retailing Co. | 0.47% |
| NTT Docomo | 0.17% |
| Continental AG | 0.11% |
| Toyo Suisan Kaisha | 0.09% |
| Seven Bank | 0.09% |
| Vivendi SA | 0.08% |
| Roche Holdings AG | 0.07% |
| Actelion | 0.07% |
| Suez | 0.06% |
| Swiss Reinsurance | 0.06% |
Bottom 10 Contributors
| Security | Portfolio Contribution |
| D.Carnegie & Co. AB | (2.52)% |
| Lloyds TSB Group | (1.74)% |
| Gazprom | (1.72)% |
| Potash Corp. Sask Inc. | (1.52)% |
| America Movil S.A.B. de C.V. | (1.18)% |
| Carpetright | (1.02)% |
| Energy Development Corp. | (0.98)% |
| Lonza Group AG | (0.95)% |
| Hong Kong Exchange | (0.93)% |
| Canadian Natural Resources Ltd. | (0.93)% |
Masters’ Select International Fund Contribution by Holding
For the Year Ended December 31, 2008
Top 10 Contributors
| Security | Portfolio Contribution |
| Fast Retailing Co. | 0.44% |
| Actelion | 0.39% |
| NTT Docomo | 0.16% |
| Suez | 0.15% |
| MLP AG | 0.11% |
| Neuf Cegetel | 0.09% |
| Toyo Suisan Kaisha | 0.09% |
| Seven Bank | 0.08% |
| Vivendi SA | 0.08% |
| Honda Motor Co. | 0.06% |
Bottom 10 Contributors
| Security | Portfolio Contribution |
| D.Carnegie & Co. AB | (2.46)% |
| Lloyds TSB Group | (1.68)% |
| Gazprom | (1.59)% |
| America Movil S.A.B. de C.V. | (1.54)% |
| Energy Development Corp. | (1.36)% |
| Potash Corp. Sask Inc. | (1.34)% |
| Country Garden Holding | (1.21)% |
| Carpetright | (1.19)% |
| Nintendo Co. Ltd. | (0.99)% |
| Veolia Environnement | (0.97)% |
Fund Summary 17
Masters’ Select International Fund Managers
INVESTMENT MANAGER | FIRM | TARGET MANAGER ALLOCATION | MARKET CAPITALIZATION OF COMPANIES IN PORTFOLIO | STOCK-PICKING STYLE |
Bill Fries Vinson Walden | Thornburg Investment Management, Inc. | 20% | All sizes | Eclectic, may invest in traditional value stocks or growth stocks |
| James Gendelman | Marsico Capital Management, LLC | 17% | All sizes, but mostly large and mid-sized companies | Growth |
| David Herro | Harris Associates L.P. | 20% | All sizes, but mostly large and mid-sized companies | Value |
| Ted Tyson | Mastholm Asset Management, LLC | 18% | All sizes | Growth |
| Amit Wadhwaney | Third Avenue Management, LLC | 15% | All sizes | Value |
Howard Appleby, Jean-Francois Ducrest, Jim LaTorre, Ted Wendell | Northern Cross, LLC | 10% | Mostly large and mid-sized companies | Blend |
Portfolio Composition*
By Sector
| Sector Allocation | ||||||||
| Fund | S&P Global (ex U.S.) Large Mid-Cap Index | |||||||
| Consumer Discretionary | 13.5 | % | 7.7 | % | ||||
| Consumer Staples | 7.5 | % | 9.0 | % | ||||
| Energy | 7.2 | % | 11.3 | % | ||||
| Finance | 21.8 | % | 24.1 | % | ||||
| Health Care & Pharmaceuticals | 11.6 | % | 7.9 | % | ||||
| Industrials | 10.8 | % | 10.2 | % | ||||
| Technology | 11.8 | % | 6.1 | % | ||||
| Telecom | 4.0 | % | 7.9 | % | ||||
| Utilities | 1.9 | % | 6.9 | % | ||||
| Materials | 4.7 | % | 8.9 | % | ||||
| Cash Equivalents & Other | 5.3 | % | 0.0 | % | ||||
| 100.0 | % | 100.0 | % | |||||
By Region
| Regional Allocation | ||||||||
| Fund | S&P Global (ex U.S.) Large Mid-Cap Index | |||||||
| Africa | 0.0 | % | 1.7 | % | ||||
| Australia/New Zealand | 0.0 | % | 4.7 | % | ||||
| Asia ex | 13.7 | % | 13.0 | % | ||||
| Japan | 20.4 | % | 18.8 | % | ||||
| Western Europe and UK | 44.7 | % | 50.3 | % | ||||
| Latin America | 5.2 | % | 3.6 | % | ||||
| North America | 7.1 | % | 6.7 | % | ||||
| Middle East | 3.5 | % | 1.1 | % | ||||
| Cash Equivalents & Other | 5.3 | % | 0.0 | % | ||||
| 100.0 | % | 100.0 | % | |||||
By Asset Class

Market Capitalization:
Developed Markets Small-Cap < $2.0 billion
Developed Markets Large and Mid-Cap > $2.0 billion
| * | Totals may not add up to 100% due to rounding |
By Market Capitalization
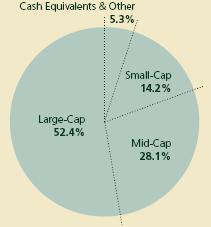
Market Capitalization:
Small-Cap < $2.0 billion
Mid-Cap $2.0 billion - $10.0 billion
Large-Cap > $10.0 billion
18 The Masters’ Select Funds Trust
Masters’ Select International Fund Stock Highlights
Millicom International Cellular S.A. – Bill Fries/Vinson Walden
Based in Luxembourg, Millicom is a global wireless telecommunications provider which serves exclusively emerging economies. The company has grown rapidly in recent years, and now has over 32 million subscribers in more than 15 countries across Latin America, Africa, and Asia. We believe that Millicom’s broad portfolio of markets mitigates some of the risks generally associated with investing in any one emerging country.
In most of Millicom’s markets, penetration of wireless services lags behind that of other undeveloped economies. For example, Millicom is active in some countries where less than 20% of the population owns a cellular phone; in contrast, some emerging economies have penetration rates above 90% (including subscribers which use multiple handsets). In addition, advanced services such as text messaging or web browsing are generally at a nascent stage of adoption in Millicom’s markets.
Millicom enjoys a strong competitive position in its major regions, and we believe has developed the marketing, distribution, and other elements necessary to operate very profitably. The company sells its service primarily on a prepaid basis under the Tigo brand, with a focus on affordability and value. A prepay approach provides lower revenues per customer but also less collection risk. Though Millicom faces competition in all of its markets, its focus on being the price leader has enabled it to achieve high market share.
Millicom stock declined dramatically in late 2008 in connection with the broad sell-off in emerging markets equities. Based on conventional valuation metrics such as the price-earnings ratio, Millicom is valued in the market similar to other telecommunications companies (as of early 2009). However, the company appears to have an opportunity to continue growing at what we believe is an above-average rate.
Publicis – David Herro
Publicis is the 4th largest advertising holding company in the world. It is based in France but has operations worldwide including Europe, The USA, Asia and Latin America. Publicis, besides being a global leader in traditional advertising has a competitive strength in media buying and is owns the largest digital adverting company, ‘Digitas’.
The stock is off with the general market and has been especially hard hit because it is invariably counted as a “consumer” stock. Though ad budgets are being slashed, we still believe given the long-term track record of Publicis as well as its strategic positioning- especially in digital- that is well positioned for future economic success.
This company has been able to grow its cash flows at high levels, has consistently expanded its margins and has done a very good job at acquisition integration. Though revenues will be soft in the short term as businesses are cutting ad spend, the fact that Publicis is “asset light” should enable it to weather the storm with only a minimal decline in profitability.
As value investors, Publicis fits our “low-price” but high in quality criteria perfectly as it sells for well under 10x’s normal earnings, earns high returns on sales and equity, and has been very good at allocating free cash. As such, we believe Publicis not only has substantial upside at today’s price, but also offers some downside protection.
Teva Pharmaceutical Industries Ltd. – James Gendelman
Teva Pharmaceutical Industries Ltd. (“the Company”), based in Israel, is a global leader in developing, manufacturing and distributing generic pharmaceuticals. The Company also develops proprietary branded drugs.
We believe the Company may be a compelling long-term investment for several reasons. With the recent acquisition of rival generic drug maker Barr Pharmaceuticals, Teva reinforced its position as the largest distributor of off-patent medicines. In the highly competitive generic drug sector, we view Teva as a likely market share gainer as consolidation in the industry accelerates. Teva currently has 200 potential approvals in front of the Food & Drug Administration, which involve proposals to manufacture generic versions of up to $125 billion in current annual sales of branded product. Additionally, the Company is well positioned to take share of the $60 billion in branded drugs coming off patent by 2012, including Lipitor and Plavix.
As worldwide demand for lower cost pharmaceuticals increases, opportunities for global growth in the generic pharmaceutical market are significant in our view. We estimate that 65% of the U.S. pharmaceutical market is comprised of generics. The Barr acquisition moves Teva closer to its stated goal of increasing its market share in the U.S. to an estimated 30 percent of generic prescriptions by 2012. The generic drug penetration rate worldwide is only in the mid-teens and provides ample opportunity for growth in the sector. Teva is pursuing business development in Japan and the Barr acquisition adds new opportunities in Central and Eastern Europe.
Barriers to entry in the generic pharmaceutical business are substantial, in our opinion, and Teva’s size provides numerous advantages. As the largest generic drug manufacturer, Teva benefits from economies of scale which are pivotal for generic companies. Teva’s distribution network is immense, enabling the Company to distribute drugs to 30,000 pharmacies in a single day.
Teva also has several successful proprietary drugs that complement its generic products, including multiple sclerosis treatment Copaxone, its most profitable branded drug, and Parkinson’s disease treatment Azilect. Results of a phase III trial completed last year for Parkinson’s patients who took Azilect demonstrated promising results which could be another positive for the stock.
As of this writing in early 2009, we find Teva’s valuation attractive. The company’s price earnings ratio is approximately 12X 2010 earnings estimates with a 7 percent free cash flow yield. We believe that Teva’s business model and attractive valuation offer a potentially compelling long-tem opportunity for investors.
Fast Retailing – Ted Tyson
Fast Retailing is a Japanese clothing brand centered around the chain named Uniglo. Originally a discount oriented store focused on trendy, high fashion clothing, it has shifted emphasis to more predictable everyday wear. For example, thermal goods such as pants and innerwear are a product area in which Fast continues to gain market share. Japan’s retail environment has been tough, but its competitors have commented that Fast is one of the best “value” clothes retailers in the world.
Fund Summary 19
Fast has a strong balance sheet and is focusing its spending on expanding sales outside of Japan, particularly in China, where there is already high brand name recognition. Through 2008 it has opened 14 stores in China and has plans over the next couple of years to open over 100 new outlets. The China operations are already quite profitable.
Store-for-store sales growth above 10% has lead to strong earnings growth – over 15%. The P/E for 2009 of less than 15 is low for a company with such resilience, and we believe that high quality, notoriously “bargain priced” clothes are likely to do well in the current market. China has the potential to grow to over half of sales by 2010.
EnCana Corporation – Amit Wadhwaney
Calgary-based EnCana Corporation (“EnCana”), an independent oil and natural gas exploration and production (E&P) company, is currently the second largest producer of natural gas in North America (behind ConocoPhillips). The company’s share price has been under pressure recently, due to negative sentiment which is primarily attributable to falling commodity prices and difficult macroeconomic conditions. However, we believe in EnCana’s potential to create value over the long term, given its attractive portfolio of high-quality assets, strong financial position, solid track record of strong business performance, and proven management team.
EnCana’s portfolio of high-quality assets includes resource plays with less exploration risk than conventional plays, as well as a large undeveloped acreage position which should support future growth over the long term. Much of EnCana’s acreage was acquired at an extremely low cost, dating back to a land grant by the Canadian Government in the nineteenth century. Additionally, the company owns the mineral rights on a significant portion of its total net acreage in Canada, resulting in lower taxes than the royalties imposed on land owned by the government.
EnCana has an impressive management team, led by CEO Randall Eresman, which has produced a solid long-term track record and skillfully navigated the company through smart acquisitions and the disposal of non-core assets. The management team should benefit from the company’s strong financial position – net debt is modest as compared to cash generation, and near-term debt maturities are minimal. EnCana appears to be well-positioned to grow its net asset value at meaningful rates over the long term, given its high-quality assets and solid fundamentals.
The current industry-related pessimism enabled us to purchase EnCana shares at a modest multiple of operating profit, and at a significant discount to both our conservative estimate of net asset value and to the value of comparable transactions.
ABB – Howard Appleby
ABB is a global leader (No 1 or 2) in power distribution (high and medium voltage) and automation technologies. It offers transmission and distribution equipment, and grid automation systems to utilities and industrial clients, as well as automation components and systems to industrial customers. The company operates 5 divisions- Power Products, Power Systems, Automation products, process controls and robotics.
Our investment strategy /process involves finding good companies with strong market positions / high barriers to entry and buying them when they are out of favor. In this market environment, every sector, baring the most defensive, is out of favor and capital goods is no exception. In the European sphere, the stock valuations have fallen from 12x to 6x EBITDA (12 month forward estimate), and is now some 40% below the long-term average of 10.8x. Clearly the market has discounted a very severe deterioration in cash-flow and earnings for the group and ABB is no exception.
ABB’s earnings and order book have held up very well to this point, but it is clear that the risk of an order book slowdown and subsequent revenue and earnings declines is very high, particularly as the business is skewed toward project / capex spending (75% of Revs), not to mention their direct exposure to stressed industries such as Autos (3)% and Construction (8)%.
In spite of these obvious risks, we are convinced that ABB is a survivor and will thrive when the recovery is underway. 50% of the business derives from the deployment of power systems in emerging markets , as well as the much needed upgrades to the power infrastructure of mature markets in USA/Europe. Whilst we have witnessed some near-term slowdown in electricity demand growth in powerhouse economies such as China, we are convinced that the long-term case for greater electricity demand is still very much in place. In the mature markets, there is an almost urgent need for a reconfiguration of the grid systems to provide more efficient transfer of power particularly in Europe. In USA a large part of the grid is more than 50 years old. The Obama stimulus package has earmarked $32bn for spending on transmission and distribution equipment and systems which is at least 2.5 times the current annual spend. ABB is No 1 in USA in this field.
China is set to double annual investment spend on the grid systems and ABB is very well placed, particularly in the HVDC systems which transport electricity over very long distances.
On the Automation side, there are clear cyclical risks, both in terms of order cancellations, and declining revenue developments in the next 2 years, but we feel the market has discounted a great deal of bad news on this front. Our base case is that we will see an upswing in orders/ revenues after a tough 2009, and early 2010.
20 The Masters’ Select Funds Trust
In the meantime, ABB enjoys one of the strongest balance sheets in the sector with net cash of $6bn (20% of market cap, does include some prepayments), and even on negative stress tests will still produce operating free cash flow of >$2bn in 2009 implying a 6.5% free cash flow yield on equity. Additionally the company has indicated the potential for a further $1bn of restructuring benefits if a weak environment unfolds (compares with about $4bn of EBIT), which provides some backstop to profitability.
It is quite possible that that the company will have to back off their targets of 11-16% operating margin and 8-11% organic revenue growth for 2007-2011 when they announce results in February 2009, but we feel that the market at large has already sidelined those targets, and certainly we are not expecting the lower end of that range to hold over the next couple of years.
The company should be lauded for not having deployed their precious cash into overpriced acquisitions at the peak of the market despite being under some pressure internally and externally to do so. The new CEO has inherited a strong financial platform and may well look to make selective acquisitions to infill existing competencies in certain markets, which will strengthen the long-term position of the group.
In conclusion, we have chosen to invest in a world-class company which has spent the last 5-6 years restructuring and positioning itself as a market leader. The stock has fallen 60% from the highs and we feel this is a very attractive entry point.
See page 72 for Industry Terms and Definitions
Neither the information contained herein nor any opinion expressed shall be construed to constitute an offer to sell or a solicitation to buy any securities mentioned herein. The views herein are those of the portfolio managers at the time the commentaries are written and may not be reflective of current conditions.
Fund Summary 21
Masters’ Select International Fund
SCHEDULE OF INVESTMENTS IN SECURITIES at December 31, 2008
| Shares | Value | |||
| COMMON STOCKS: 94.7% | ||||
| Belgium: 1.2% | ||||
| 211,435 | Nationale A Portefeuille | $ | 10,281,208 | |
| Brazil: 4.8% | ||||
| 585,850 | Banco Bradesco S.A. | 5,782,340 | ||
| 2,597,543 | Gafisa S.A. | 11,948,066 | ||
| 689,000 | Petroleo Brasileiro S.A. | 16,873,610 | ||
| 126,899 | Unibanco-Uniao de Bancos | |||
| Brasileiros S.A. GDR | 8,200,213 | |||
| 42,804,229 | ||||
| Canada: 5.1% | ||||
| 85,581 | EnCana Corp. | 3,977,805 | ||
| 251,600 | Potash Corp. of Saskatchewan | 18,336,351 | ||
| 1,530,300 | Precision Drilling Trust | 12,482,885 | ||
| 1,401,536 | Viterra, Inc.* | 10,785,413 | ||
| 45,582,454 | ||||
| China: 1.8% | ||||
| 5,313,000 | China Life Insurance Co. Ltd. | 16,372,447 | ||
| Denmark: 3.3% | ||||
| 149,815 | Novo Nordisk A/S | 7,623,993 | ||
| 365,224 | Vestas Wind Systems A/S* | 21,706,682 | ||
| 29,330,675 | ||||
| France: 7.1% | ||||
| 153,300 | Alstom | 9,052,798 | ||
| 248,640 | GDF Suez | 12,314,394 | ||
| 135,400 | Neopost S.A. | 12,255,515 | ||
| 655,300 | Publicis Groupe | 16,868,256 | ||
| 87,400 | Schneider Electric S.A. | 6,528,462 | ||
| 198,400 | Vivendi S.A. | 6,459,439 | ||
| 63,478,864 | ||||
| Germany: 3.7% | ||||
| 351,500 | Commerzbank AG | 3,350,613 | ||
| 80,000 | Linde AG | 6,769,878 | ||
| 70,865 | Muenchener Rueckversicherungs AG | 11,136,222 | ||
| 325,600 | SAP AG | 11,669,220 | ||
| 32,925,933 | ||||
| Greece: 2.0% | ||||
| 627,979 | OPAP S.A. | 18,065,939 | ||
| Guernsey: 1.6% | ||||
| 800,000 | Amdocs Ltd.* | 14,632,000 | ||
| Hong Kong: 4.9% | ||||
| 709,000 | Cheung Kong Holdings Ltd. | 6,759,575 | ||
| 9,645,811 | CNOOC Ltd. | 9,166,321 | ||
| 2,071,442 | Esprit Holdings Ltd. | 11,807,287 | ||
| 891,930 | Guoco Group Ltd. | 5,244,731 | ||
| 2,054,000 | Hutchison Whampoa Ltd. | 10,360,990 | ||
| 43,338,904 | ||||
| Ireland: 0.9% | ||||
| 1,150,000 | Babcock & Brown Air Ltd. | 7,785,500 | ||
| Israel: 3.5% | ||||
| 742,340 | Teva Pharmaceutical Industries Ltd. | 31,601,414 | ||
| Japan: 20.4% | ||||
| 395,800 | Asatsu-DK, Inc. | 8,873,653 | ||
| 2,632,000 | Daiwa Securities Group, Inc. | 15,685,317 | ||
| 126,300 | Fanuc Ltd. | 8,982,336 | ||
| 98,900 | Fast Retailing Co. Ltd. | 14,413,713 | ||
| 1,818,900 | Ichiyoshi Securities Co. Ltd. | 14,560,381 | ||
| 2,449 | Japan Tobacco, Inc. | 8,109,627 | ||
| 714,000 | Mitsui Fudosan Co. Ltd. | 11,865,201 | ||
| 2,489 | Net One Systems Co. Ltd. | 4,999,707 | ||
| 50,636 | Nintendo Co. Ltd. | 19,454,092 | ||
| 2,711,000 | Nippon Sheet Glass Co. Ltd. | 8,903,042 | ||
| 5,253 | NTT DoCoMo, Inc. | 10,355,196 | ||
| 60,150 | ORIX Corp. | 3,417,663 | ||
| 267,500 | Rohm Co. Ltd. | 13,507,536 | ||
| 2,732 | Seven Bank Ltd. | 10,450,592 | ||
| 404,000 | Toyo Suisan Kaisha Ltd. | 11,612,100 | ||
| 533,500 | Toyota Motor Corp. | 17,462,964 | ||
| 182,653,120 | ||||
| Luxembourg: 1.8% | ||||
| 359,200 | Millicom International Cellular S.A. | 16,131,672 | ||
| Mexico: 0.4% | ||||
| 422,899 | Cemex S.A.B. de C.V. – ADR | 3,865,297 | ||
| Norway: 0.7% | ||||
| 3,270,600 | Norske Skogindustrier ASA | 6,470,644 | ||
| Philippines: 0.5% | ||||
| 102,247,000 | Energy Development Corp. | 4,229,637 | ||
| Poland: 1.0% | ||||
| 11,401,016 | Netia S.A. | 9,258,264 | ||
| Russia: 2.0% | ||||
| 1,256,672 | Gazprom OAO | 18,011,887 | ||
| Singapore: 1.0% | ||||
| 13,933,000 | GuocoLeisure Ltd. | 2,824,257 | ||
| 2,112,000 | Keppel Corp. Ltd. | 6,401,186 | ||
| 9,225,443 | ||||
| South Korea: 1.1% | ||||
| 285,980 | LG Corp. | 9,996,008 | ||
| Sweden: 0.0% | ||||
| 3,239,800 | D. Carnegie AB | 0 | ||
| Switzerland: 12.8% | ||||
| 470,000 | ABB Ltd. | 7,084,879 | ||
| 561,293 | Actelion Ltd.* | 31,612,758 | ||
| 587,700 | Credit Suisse Group AG | 16,108,412 | ||
| 152,870 | Lonza Group AG | 14,132,063 | ||
| 646,591 | Nestle S.A. | 25,483,816 | ||
| 56,000 | Roche Holding AG | 8,620,287 | ||
| 228,500 | Swiss Re | 11,100,835 | ||
| 114,143,050 |
22 The Masters’ Select Funds Trust
Masters’ Select International Fund
SCHEDULE OF INVESTMENTS IN SECURITIES at December 31, 2008
Shares/ Principal Amount | Value | |||
| Taiwan: 4.4% | ||||
| 3,922,350 | HON HAI Precision Industry Co. Ltd. | $ | 7,732,745 | |
| 1,726,249 | Taiwan Semiconductor | |||
| Manufacturing Co. Ltd. - ADR | 13,637,367 | |||
| 31,491,785 | United Microelectronics Corp. | 7,222,538 | ||
| 22,936,485 | Yuanta Financial Holding Co. Ltd. | 10,440,085 | ||
| 39,032,735 | ||||
| United Kingdom: 8.3% | ||||
| 339,600 | BHP Billiton Plc | 6,397,004 | ||
| 2,917,627 | Brit Insurance Holdings Plc | 9,276,101 | ||
| 1,912,400 | British Sky Broadcasting Group Plc | 13,305,856 | ||
| 2,013,800 | Carpetright Plc | 10,176,319 | ||
| 809,500 | Diageo Plc | 11,260,572 | ||
| 564,500 | GlaxoSmithKline Plc | 10,479,603 | ||
| 6,995,000 | Lloyds TSB Group Plc | 12,803,075 | ||
| 73,698,530 | ||||
| United States: 0.4% | ||||
| 76,924 | Transocean Ltd. | 3,634,659 | ||
| TOTAL COMMON STOCKS | ||||
| (cost $1,221,231,859) | 846,550,513 | |||
| RIGHTS: 0.0% | ||||
| 3,040,726 | Lloyds TSB Group Plc | 0 | ||
| TOTAL RIGHTS | ||||
| (cost $0) | 0 | |||
| SHORT-TERM INVESTMENTS: 5.0% | ||||
| 44,457,000 | State Street Bank & Trust Co., 0.010%, | |||
| 12/31/08, due 01/02/09 [collateral: | ||||
| par value: $42,605,000, | ||||
| Federal Home Loan Bank, | ||||
| 4.375%, due 09/17/10, value | ||||
| $45,361,543] (proceeds $44,457,025) | 44,457,000 | |||
| TOTAL SHORT-TERM INVESTMENTS | ||||
| (cost $44,457,000) | 44,457,000 | |||
| TOTAL INVESTMENTS IN SECURITIES | ||||
| (cost $1,265,688,859): 99.7% | 891,007,513 | |||
| Other Assets Less Liabilities: 0.3% | 2,868,219 | |||
Net Assets: 100% | $ | 893,875,732 | ||
| ADR | American Depository Receipt |
| GDR | Global Depository Receipt |
| * | Non Income Producing |
The accompanying notes are an integral part of these financial statements.
Schedule of Investments 23
Masters’ Select Value Fund Review
Masters’ Select Value suffered a horrible year in what was the worst year for the stock market since 1931. As discussed in the Third Quarter Shareholder Letter, we made a manager change during the quarter, adding Clyde McGregor who replaced Bill Miller.
The value of a hypothetical $10,000 investment in the Masters’ Select Value Fund from inception (6/30/00) to present compared with the Russell 3000 Value Index and the Lipper Multi-Cap Value Index.

The hypothetical $10,000 investment at fund inception includes changes due to share price and reinvestment of dividends and capital gains. The chart does not imply future performance. Indices are unmanaged, do not incur fees, expenses or taxes and cannot be invested in directly.
Performance as of December 31, 2008
| Average Annual Total Returns | ||||||||||||
| One-Year | Five-Year | Since Inception | ||||||||||
| Masters’ Select Value Fund (6/30/00) | -47.35% | -6.44% | -0.80% | |||||||||
Past performance is no guarantee of future results. See page 5 for a detailed discussion of the risks and costs associated with investing in the Masters’ Select Value Fund.
Portfolio Commentary
A number of factors contributed to the fund’s performance during 2008. The highlights follow.
Performance of managers: In 2008, the three Masters’ Select Value sub-advisors with a full year’s track record underperformed their respective benchmarks (the manager who was replaced also underperformed). For the year, the individual sub-advisors’ returns ranged from a 39% loss to a 52% loss. The Russell 3000 Value Index, the fund’s primary benchmark, was down 36% for the year.1
Over shorter time periods, it is typical for some, but not all, managers to beat their benchmarks. However, we are focused primarily on long-term performance and we aim to select sub-advisors who will beat their benchmarks over longer time periods. As a result of a very poor 2008, the long-term records of two of the three original sub-advisors’ slipped behind their benchmarks. McGregor, whose tenure began in October, does not yet have a sufficiently long record with Masters’ Select Value for us to evaluate his long-term contribution to performance. Ultimately, we believe that all of our sub-advisors will outperform their benchmarks.
Sector and stock-picking impact: Though all the Masters’ Select funds are driven by bottom-up stock picking, the sector exposure that results from this may provide some insight into the fund’s relative performance. Based on our attribution analysis, in 2008 the fund’s overall sector exposure detracted from performance, although stock selection was the primary reason for the fund’s underperformance relative to the Russell 3000 Value Index. All sectors had negative returns for the year, so the fund’s small cash position added some value as did the portfolio’s significant underweighting to financials, which was the worst-performing sector, losing 50% for the year. However, the fund’s sizable underweighting to energy, one of the better performing sectors in 2008 with a loss of 27%, detracted from relative performance. Also hurting the fund’s performance was its overweighting to information technology stocks, which were down 47% for the year. As for stock selection, the fund’s telecom, financials, and information technology stocks were particularly detrimental to performance.
Leaders and laggards: All three sub-advisors with track records for the entire calendar year owned at least one stock that was among the fund’s ten largest contributors to performance as well as several stocks among the top ten detractors from performance. Notably, Clyde McGregor of Harris Associates—the newest sub-advisor in the lineup—had several names among the top contributors list, despite his short tenure on the fund. Among the largest contributors to performance were Fairfax Financial Holdings and DIRECTV Group, which were owned by Mason Hawkins, as well as Advance Auto Parts, which was owned by Clyde McGregor. The biggest detractors from performance included Dell and Liberty Media Corp, which owns the QVC television shopping networks. Both of these stocks were owned by two different sub-advisors in their respective sleeves of the fund during the year and remained in the portfolios at year-end. Other big detractors from performance included Level 3 Communications and Freddie Mac (which had been owned by Bill Miller). As of 12/31/08, five of the ten top-contributing stocks remained in the portfolio; the other five holdings were sold from the portfolio by year-end. All but one of the ten biggest detractors in 2008 were still in the portfolio at year-end.
See the table on page 26 for a list of the biggest contributors and detractors to the fund’s performance over the past six and 12 months. It is important to understand that whether a stock has lost (or made) money for Masters’ Select Value for the past 12 months tells us nothing about how successful the holding has been during the entire period it was held, or how successful it may become. The fund will hold many stocks for significantly longer periods of time and the success of these holdings won’t be known until they are ultimately sold. So in that respect, while it is interesting to know how specific stocks performed during the period, this information is of limited value in assessing the ultimate success of these stock holdings.
Portfolio mix: There were some material changes to the fund’s sector exposure during the year. Consumer discretionary declined a bit from a year earlier, but remained the largest position in 2008 at 28.9% of the portfolio, versus an 8.3% weighting in the Russell 3000 Value Index. Information technology exposure increased and was the second largest position in 2008 at 16.4% of the portfolio versus 3.3% for the benchmark. Health
24 The Masters’ Select Funds Trust
care, which accounted for 3.8% of the portfolio in 2007, increased to 10.6% of the fund as of 12/31/08. Exposure to financial stocks decreased during the year to 10.5% of the fund compared to 16.9% a year earlier, and ended 2008 meaningfully underweighted to the sector, as financials accounted for 25.0% of Russell 3000 Value Index at year-end.
The fund’s exposure to large-cap stocks (with market caps greater than $18.3 billion) decreased significantly during 2008, ending the year at 25.0% of the portfolio, down from 46.2% a year earlier. The fund’s small-cap stock (with market caps less than $2.5 billion) exposure increased more than 11 percentage points to end the year at 13.6%. Mid-cap stock exposure was virtually unchanged in 2008; it comprised 27.9% of the portfolio at year-end. The shifts in market-cap exposure were driven in part by the significant decline in value of most stocks in 2008—this contributed to the increase in small-cap exposure and the decrease in large-cap exposure. Foreign stock exposure also increased meaningfully to 29.8% from 20.5% a year earlier. The remainder of the portfolio (3.7)% was held in cash.
Please see page 27 for a breakout of the Fund’s sector and market cap exposures.
In Closing
The stock market and Masters’ Select Value have both taken major blows. In the case of the market, as discussed in the shareholder letter earlier in this report, we expect a very challenging economic environment in 2009 and possibly beyond. However, despite near-term economic uncertainty, our analysis suggests that the damage that has been done to asset prices, even taking into account the decline in underlying intrinsic value of most companies, now makes a more compelling case for decent and possibly strong long-term returns going forward.
We are obviously aware that the relative performance of Masters’ Select Value over the last few years has not been acceptable and it has pulled the fund’s long-term performance below that of its benchmark. We know that good stock pickers struggle at times and there is no denying that we have been through those times recently. We also know that good stock pickers rebound from their struggles, but that it is tough for investors to stick with managers who are struggling. As the Advisor to Masters’ Select, we evaluate each stock picker based on a variety of factors with a primary focus on their research and stock-picking process and the execution of that process, not solely their recent performance. Our evaluation involves lengthy discussions with the manager and the analysts supporting the manager, with a focus on the stocks they own or have owned and the underlying research supporting their decisions. We have made changes when we believed they were justified. As already mentioned, we recently replaced Bill Miller with Clyde McGregor. With the benefit of hindsight we can say that it was a mistake on our part not to make this decision earlier and we have learned some lessons from that mistake. With that decision behind us, we believe the fund is in good hands now and that the stock pickers who have struggled will ultimately rebound. Morningstar, the independent investment research firm, also has been supportive in their comments. In their November 21 report they wrote that Masters’ Select Value “is run by some of the most experienced, proven value managers around.” The fund’s return in December means nothing by itself, but its strong outperformance (with a return of 5.00% compared to 1.76% for the benchmark) is a reminder that deviating from a benchmark can happen strongly on the positive side as well as the negative. But clearly the fund will need to deliver a sustained run of outperformance to rebuild its record.
The dysfunction in the markets that has resulted from forced selling, has, we believe, presented some very compelling long-term opportunities that we believe our stock pickers may benefit from, especially given their Masters’ Select mandate. We’re looking forward to better times both for the markets and Masters’ Select Value.
The collapse of financial asset prices in 2008 does offer a silver lining beyond the opportunities being created going forward. That silver lining is that we can enjoy material returns going forward without triggering capital gains because of sizable loss carry-forwards and unrealized losses in our portfolios. It is very unlikely that Masters’ Select Value will have a capital gain distribution in 2009 and it is possible that will be the case in 2010 and possibly beyond. We will keep you updated.
We remain convinced that Masters’ Select is founded on a powerful concept that will be validated over the long term for all of our funds, and we greatly appreciate your continued confidence. As major shareholders ourselves, we have suffered through the very disappointing recent results alongside you and we can tell you that we are dissatisfied with our showing. While we have no control over what the overall market does over the shorter term, our decisions are focused on maximizing our relative performance over the longer term and we and our sub-advisors are extending every effort to make sure we get these decisions right.
1 The managers and their respective benchmarks are: Mike Embler & Peter Langerman; Russell 3000 Value Index; Mason Hawkins: Russell 3000 Value Index; Clyde McGregor: Russell 3000 Value Index; Bill Nygren: Russell 3000 Value Index.
Current and future portfolio holdings are subject to risk.
See page 72 for Industry Terms and Definitions
Neither the information contained herein nor any opinion expressed shall be construed to constitute an offer to sell or a solicitation to buy any security or any other funds mentioned herein. The views herein are those of Litman/Gregory Fund Advisors, LLC at the time the material is written and may not be reflective of current conditions. Performance quoted represents past performance and does not guarantee future results.
Fund Summary 25
Masters’ Select Value Fund Leaders and Laggards
Masters’ Select Value Fund Contribution by Holding
For the Six Months Ended December 31, 2008
Top 10 Contributors
| Security | Portfolio Contribution |
| Covidien Ltd. | 0.02% |
| Laboratory Corp. of America Holdings | 0.03% |
| Home Depot Inc. | 0.04% |
| KT&G Corporation | 0.05% |
| Eastman Kodak Co. | 0.05% |
| McDonalds Corp. | 0.06% |
| Rockwell Collins Inc. | 0.06% |
| Bristol Myers Squibb Co. | 0.19% |
| Advance Auto Parts Inc. | 0.20% |
| Fairfax Financial Holdings Ltd. | 0.64% |
Bottom 10 Contributors
| Security | Portfolio Contribution |
| Level 3 Communications | (3.79)% |
| Liberty Media Corp. New | (3.42)% |
| Dell Inc. | (2.33)% |
| Cemex S.A.B de C.V. | (2.01)% |
| Sun Microsystems Inc. | (1.79)% |
| Weyerhaeuser Co. | (1.51)% |
| Federal Home Loan Mortgage Corp. | (1.44)% |
| SOC Generale | (1.33)% |
| Virgin Media Inc. | (1.27)% |
| LSI Corporation | (1.23)% |
Masters’ Select Value Fund Contribution by Holding
For the Year Ended December 31, 2008
Top 10 Contributors
| Security | Portfolio Contribution |
| Fairfax Financial Holdings Ltd. | 0.42% |
| Directv Group Inc. | 0.38% |
| Advance Auto Parts Inc. | 0.18% |
| Bristol Myers Squibb Co. | 0.15% |
| KT&G Corporation | 0.12% |
| Comcast Corp. New | 0.11% |
| Rockwell Collins Inc. | 0.05% |
| Laboratory Corp. of America Holdings | 0.03% |
| Home Depot Inc. | 0.03% |
| Tyco International Ltd. Bermuda | 0.01% |
Bottom 10 Contributors
| Security | Portfolio Contribution |
| Liberty Media Corp. New | (3.66)% |
| Level 3 Communications | (3.56)% |
| Dell Inc. | (2.46)% |
| Federal Home Loan Mortgage Corp. | (2.05)% |
| Weyerhaeuser Co. | (2.01)% |
| Cemex S.A.B. de C.V. | (1.88)% |
| Sun Microsystems Inc. | (1.64)% |
| Siemens AG | (1.50)% |
| Virgin Media Inc. | (1.46)% |
| Japan Tobacco Inc. | (1.42)% |
26 The Masters’ Select Funds Trust
Masters’ Select Value Fund Managers
INVESTMENT MANAGER | FIRM | TARGET MANAGER ALLOCATION | MARKET CAPITALIZATION OF COMPANIES IN PORTFOLIO | STOCK-PICKING STYLE |
| Mason Hawkins | Southeastern Asset Management, Inc. | 30% | All sizes | Value |
| Clyde McGregor | Harris Associates L.P | 20% | Mostly mid- and large- | Value |
| sized companies | ||||
| Bill Nygren | Harris Associates L.P. | 20% | Mostly large and mid- | Value |
| sized companies | ||||
| Michael Embler/ | Franklin Mutual Advisers, LLC | 30% | All sizes | Value |
| Peter Langerman |
Portfolio Composition*
By Asset Class
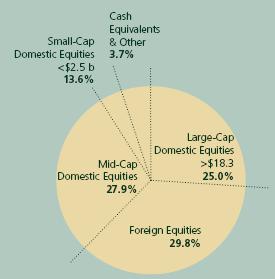
Market Capitalization:
Small-Cap Domestic < $2.5 billion
Mid-Cap Domestic
Large-Cap Domestic > $18.3 billion
| * Totals may not add up to 100% due to rounding. |
By Sector
| Sector Allocation | ||||||||
| Fund | Russell 3000 Value Index | |||||||
| Consumer Discretionary | 28.9 | % | 8.3 | % | ||||
| Consumer Staples | 8.7 | % | 9.2 | % | ||||
| Energy | 3.5 | % | 16.0 | % | ||||
| Finance | 10.5 | % | 25.0 | % | ||||
| Health Care & Pharmaceuticals | 10.6 | % | 12.7 | % | ||||
| Industrials | 8.4 | % | 9.4 | % | ||||
| Technology | 16.4 | % | 3.3 | % | ||||
| Telecom | 3.1 | % | 6.1 | % | ||||
| Utilities | 0.0 | % | 6.9 | % | ||||
| Materials | 6.2 | % | 3.1 | % | ||||
| Cash Equivalents & Other | 3.7 | % | 0.0 | % | ||||
| 100.0 | % | 100.0 | % | |||||
Fund Summary 27
Masters’ Select Value Fund Stock Highlights
Snap-on Incorporated – Clyde McGregor
Snap-on Incorporated (SNA) is one of the core holdings in my Masters’ portfolios. SNA is a company that I followed when I was an analyst at Harris Associates L.P in the early 1980’s. The company, which manufactures and distributes mechanics hand tools through dealers, has maintained a “best-in-class” reputation for its products for decades. While few shareholders will have used SNA’s products, most have seen SNA dealer vans as they service their routes.
Typical of most value stocks, SNA is normally a free cash flow generator. In the 1990’s a new management team attempted to leverage the free cash flow generation by expanding the company beyond the niche that it dominates. This effort was generally unproductive, and as a result the stock languished for many years. At the beginning of the current decade, another new management team was installed charged with cutting costs, increasing efficiencies, and re-energizing sales and marketing. After several years this team was also deemed to have failed, and the Board responded by installing a new team headed by Jack Michaels, the retired CEO of Hon Industries. This immediately piqued our interest as we had previous experience with Hon during Michaels’ tenure there. Our conversations with Michaels gave us confidence that the company now had a sensible, manageable plan and a leader with a demonstrated history of success. In particular, Michaels initiated programs to rationalize manufacturing, increase product innovation, enhance productivity of the dealer network, improve supply chain efficiency, and expand into emerging markets, and all of this with a sense of urgency previously absent at the company.
Four years have passed since the Michaels’ team took over the company, and progress has been considerable. Profit margins are up, debt is down, shares have been repurchased, ancillary operations have been divested, and one important acquisition completed. Michaels has retired once again, and his successor Nick Pinchuk continues to follow the same game plan. While the economy will have an impact on SNA’s business, particularly if mileage driven shrinks, SNA should still be solidly profitable in 2009. The company may even benefit from consumers holding off on purchases of new cars both because older automobiles require more maintenance but also because SNA’s penetration of new car dealers lags that of other repair shops. The balance sheet is solid with easily manageable debt maturities. At the current share price the dividend yield exceeds 3% and the total capitalization to EBITA multiple on 2008 earnings we estimate at 6 times. The price to cash EPS multiple for 2008 is 9X.
Schering Plough – Bill Nygren
Schering-Plough is a pharmaceutical company that we believe is undervalued, growing, and well-managed. Unlike most of its industry peers, SGP does not face significant patent expiration in any of its major products between now and 2014. The company’s product pipeline appears to be on the verge of producing a number of commercially viable medicines (12 compounds are in late stage development, with 15 more in Phase II), giving SGP one of the largest pipelines in the industry in terms of projected dollar sales. While current margins are below industry averages due to high R&D expenditures and a large SG&A infrastructure, cost-cutting measures and revenue growth should provide good operating leverage, giving Schering strong EPS growth potential.
Schering’s CEO Fred Hassan understands how to create value for shareholders. He did so in the past as CEO of Pharmacia by purchasing Searle from Monsanto, optimizing the combined entity’s margins and pipeline, then selling the company to Pfizer. He’s following the same playbook thus far: SGP purchased Organon Bioscience from Akzo Nobel in March 2007, and Hassan is now focused on improving margins and pipeline productivity. The Organon purchase also helped to diversify SGP’s sales base. 16% of SGP’s revenues now come from Animal Health and 7% more are from over-the-counter consumer products, while 65% of SGP’s sales are outside the U.S., reducing the risk that possible U.S. legislation affecting pharma companies will dramatically hurt Schering’s results.
Typically, a pharma company with a large pipeline, little patent exposure, and a proven CEO would be highly valued in the marketplace, but analysts have been overly focused on the future of Vytorin and Zetia, two cholesterol medicines produced by a joint venture between SGP and Merck. The efficacy of these compounds has been relentlessly questioned over the past year as a result of unclear clinical trial data, and as a result the JV sales have fallen by 30%. Despite representing less than 10% of SGP’s total revenues, the negative headlines associated with these products helped drive SGP stock down from $28 in January ‘08 to $12 just ten months later. We believe SGP’s price more than fully discounts the Vytorin/Zetia risks, and that the stock is attractive.
Japan Tobacco – Michael Embler
Japan Tobacco is the third largest tobacco company in the world with a 15% market share and 610 billion sticks produced. It is the dominant player in Japan with a 65% market share, market share that has remained fairly stable over the last several years. Its international business is based on the former RJ Reynolds International business and Gallaher, a 2007 acquisition.
While shares have performed poorly in 2008 on some legislative concerns in Japan, the stock is extremely attractively valued, trading at 8.4x 2009 estimated earnings vs. European peers at 12.1x and US comparables at 10.8x. The company’s cash flow generation is steady and resilient in economic downturns. The free cash flow yield on the stock is double digits (10.7% on our 2009 estimates), while synergies from the recent Gallaher acquisition should translate into double digit growth of EBITDA for the international division.
There are various measures the company can implement to save costs in its domestic Japanese operations, such as acquiring tobacco leaves on the international market at a cheaper cost than the ones produced domestically, and reducing the number of plants. Japan Tobacco is expected to release a new mid-term plan outlining such measures in Q2 2009.
Japan’s cigarette prices are low compared to other developed markets and have barely increased in over ten years. This leaves room for some significant increase in retail prices to offset declining volumes. This would lift margins that remain substantially below international peers.
28 The Masters’ Select Funds Trust
Accounting rules will change in Japan with the end of the amortization of the former RJR trademark rights for the Japanese operations in April 2009, and potentially the end of amortization of goodwill for accounting purposes by the fiscal year ending March 2011. This will positively impact reported earnings and improve perceptions of the stock by Japanese investors, who currently own over 70% of the shares.
In keeping with Southeastern Asset Management’s disclosure policies, Mason Hawkins has not contributed commentary on his holdings for this report.
See page 72 for Industry Terms and Definitions
Neither the information contained herein nor any opinion expressed shall be construed to constitute an offer to sell or a solicitation to buy any securities mentioned herein. The views herein are those of the portfolio managers at the time the commentaries are written and may not be reflective of current conditions.
Fund Summary 29
Masters’ Select Value Fund
SCHEDULE OF INVESTMENTS IN SECURITIES at December 31, 2008
| Shares | Value | |||
| COMMON STOCKS: 96.3% | ||||
| Consumer Discretionary: 28.9% | ||||
| 40,900 | Advance Auto Parts, Inc. | $ | 1,376,285 | |
| 89,200 | Discovery Communications, Inc.* | 1,194,388 | ||
| 327,000 | Liberty Media Corp. – Entertainment* | 5,715,960 | ||
| 479,500 | Liberty Media Corp. – Interactive* | 1,496,040 | ||
| 32,300 | Mohawk Industries, Inc.* | 1,387,931 | ||
| 347,110 | News Corp. | 3,155,230 | ||
| 47,800 | Snap-on, Inc. | 1,882,364 | ||
| 122,000 | Time Warner, Inc. | 1,227,320 | ||
| 66,500 | Viacom, Inc. – Class B* | 1,267,490 | ||
| 333,627 | Virgin Media, Inc. | 1,664,799 | ||
| 199,000 | Walt Disney Co. (The) | 4,515,310 | ||
| 39,000 | Yum! Brands, Inc. | 1,228,500 | ||
| 26,111,617 | ||||
| Consumer Staples: 8.7% | ||||
| 50,700 | CVS Caremark Corp. | 1,457,118 | ||
| 119,349 | Imperial Tobacco Group Plc | 3,174,491 | ||
| 1,002 | Japan Tobacco, Inc. | 3,260,783 | ||
| 7,892,392 | ||||
| Energy: 3.5% | ||||
| 32,400 | EnCana Corp. | 1,505,952 | ||
| 47,300 | XTO Energy, Inc. | 1,668,271 | ||
| 3,174,223 | ||||
| Financials: 10.5% | ||||
| 65,000 | Bank of America Corp. | 915,200 | ||
| 777 | Berkshire Hathaway, Inc. – Class B* | 2,497,278 | ||
| 37,000 | Capital One Financial Corp. | 1,179,930 | ||
| 15,500 | Fairfax Financial Holdings Ltd. | 4,896,719 | ||
| 9,489,127 | ||||
| Health Care, Pharmaceuticals & Biotechnology: 10.6% | ||||
| 48,000 | Bristol Myers Squibb Co. | 1,116,000 | ||
| 35,100 | Covidien Ltd. | 1,272,024 | ||
| 19,900 | Laboratory Corp. of America Holdings* | 1,281,759 | ||
| 187,000 | MDS, Inc.* | 1,146,310 | ||
| 151,310 | Rhoen Klinikum AG | 3,590,305 | ||
| 72,000 | Schering Plough Corp. | 1,226,160 | ||
| 9,632,558 | ||||
| Industrials: 8.4% | ||||
| 269 | Armstrong World Industries, Inc. | 5,816 | ||
| 18,000 | FedEx Corp. | 1,154,700 | ||
| 49,800 | Kirby Corp.* | 1,362,528 | ||
| 38,200 | Rockwell Collins, Inc. | 1,493,238 | ||
| 49,130 | Siemens AG | 3,597,681 | ||
| 7,613,963 | ||||
Shares/ Principal Amount | Value | |||
| Materials: 6.2% | ||||
| 291,834 | Cemex S.A.B. de C.V. – ADR | $ | 2,667,363 | |
| 97,302 | Weyerhaeuser Co. | 2,978,414 | ||
| 5,645,777 | ||||
| Technology: 16.4% | ||||
| 75 | Comdisco Holding Co., Inc.* | 585 | ||
| 362,000 | Dell, Inc.* | 3,706,880 | ||
| 70,000 | eBay, Inc.* | 977,200 | ||
| 81,000 | Intel Corp. | 1,187,460 | ||
| 759,570 | LSI Corp.* | 2,498,985 | ||
| 531,000 | Sun Microsystems, Inc.* | 2,028,420 | ||
| 125,400 | Texas Instruments, Inc. | 1,946,208 | ||
| 80,900 | Tyco Electronics Ltd. | 1,311,389 | ||
| 82,000 | Western Union Co. (The) | 1,175,880 | ||
| 14,833,007 | ||||
| Telecommunication Services: 3.1% | ||||
| 2,783,708 | Level 3 Communications, Inc.* | 1,948,595 | ||
| 28,729 | Telephone & Data Systems, Inc. – | |||
| Special Shares | 807,285 | |||
| 2,755,880 | ||||
| TOTAL COMMON STOCKS | ||||
| (cost $129,692,197) | 87,148,544 | |||
| PREFERRED STOCK – 0.0% | ||||
| Telecommunication Services | ||||
| 54 | PTV, Inc. | 49 | ||
| TOTAL PREFERRED STOCKS | ||||
| (cost $0) | 49 | |||
| SHORT-TERM INVESTMENTS: 3.5% | ||||
| 3,180,000 | State Street Bank & Trust Co., 0.010%, | |||
| 12/31/08, due 01/02/09 [collateral: | ||||
| par value: $3,060,000, | ||||
| Federal Home Loan Bank, | ||||
| 4.375%, due 09/17/10, value | ||||
| $3,257,982] (proceeds $3,180,002) | 3,180,000 | |||
| TOTAL SHORT-TERM INVESTMENTS | ||||
| (cost $3,180,000) | 3,180,000 | |||
| TOTAL INVESTMENTS IN SECURITIES | ||||
| (cost $132,872,197): 99.8% | 90,328,593 | |||
| Other Assets Less Liabilities: 0.2% | 197,055 | |||
Net Assets: 100% | $ | 90,525,648 | ||
| ADR | American Depository Receipt |
| * | Non Income Producing |
The accompanying notes are an integral part of these financial statements.
30 The Masters’ Select Funds Trust
Masters’ Select Smaller Companies Fund Review
Masters’ Select Smaller Companies suffered a horrible year in what was the worst year for the stock market since 1931.
The value of a hypothetical $10,000 investment in the Masters’ Select Smaller Companies Fund from inception (6/30/2003) to present compared with the Russell 2000 Index and the Lipper Small-Cap Core Index.

The hypothetical $10,000 investment at fund inception includes changes due to share price and reinvestment of dividends and capital gains. The chart does not imply future performance. Indices are unmanaged, do not incur fees, expenses or taxes and cannot be invested in directly.
Performance as of December 31, 2008
| Average Annual Total Returns | ||||||||||||
| Since | ||||||||||||
| One-Year | Five-Year | Inception | ||||||||||
| Masters’ Select | ||||||||||||
| Smaller Companies Fund (6/30/03) | -44.81% | -4.75% | -1.23% | |||||||||
Past performance is no guarantee of future results. See page 5 for a detailed discussion of the risks and costs associated with investing in the Masters’ Select Smaller Companies Fund.
Portfolio Commentary
A number of factors contributed to the fund’s performance during 2008. The highlights follow.
Performance of managers: In 2008, four of the five Masters’ Select Smaller Companies sub-advisors underperformed their respective benchmarks while the fifth performed in line with his. For the year, the individual sub-advisors’ returns ranged from a 39% loss to a 59% loss. The Russell 2000 Index, the fund’s primary benchmark, was down 34% for the year (some managers have different individual benchmarks).1
Over shorter time periods, it is typical for some managers to beat and some to trail their benchmarks. We are focused primarily on long-term performance and we aim to select sub-advisors who will beat their benchmarks over longer time periods. Through 2008, one of the three sub-advisors with a long-term record has achieved that goal by a significant margin since his inception date. After a disappointing 2008, the other two sub-advisors are now trailing their respective benchmarks since inception. (One of the sub-advisors who has trailed the benchmark on a since-inception basis has also run a portfolio for Masters’ Select Equity for 12 years, and there he has soundly beaten his benchmark. That portfolio is run with the same concentrated approach but with slightly more market-cap flexibility.) The newest sub-advisors do not yet have sufficiently lengthy records with Masters’ Select Smaller Companies for us to evaluate their long-term contributions to performance. Ultimately, we believe that all of our sub-advisors will outperform their benchmarks over the long term.
Sector and stock-picking impact: Though all the Masters’ Select funds are driven by bottom-up stock picking, the sector exposure that results from this may provide some insight into the fund’s relative performance. Based on our attribution analysis, in 2008 the fund’s overall sector exposure detracted from performance, although stock selection was the primary reason for the fund’s underperformance relative to the Russell 2000 Index. All sectors had negative returns for the year, so the fund’s cash position added some value as, did the portfolio’s overweighting to industrials, which was one of the better-performing sectors in the small-cap market despite a 30% loss for the year. However, the fund’s significant overweighting to energy, the worst-performing sector in 2008 with a 50% loss, detracted from relative performance. Also hurting the fund’s performance was its meaningful underweighting to financials, which surprisingly, held up relatively well in the Russell 2000 Index, losing 23% for the year. Although the portfolio’s consumer staples stocks helped the fund’s performance relative to the index, the fund’s information technology, energy, and financials stocks more than offset this.
Leaders and laggards: Four of the five sub-advisors each owned several stocks that were among the fund’s 10 largest detractors from performance; and four sub-advisors were responsible for the top ten contributors to performance. Notably, Dick Weiss of Wells Capital Management was responsible for half of the top ten contributors to performance. Among the largest contributors to performance were W-H Energy Services and Central Garden & Pet. The biggest detractors from performance were LodgeNet Interactive, which is a media and internet provider to the hotel industry, and Rosetta Resources, a North American oil and gas producer. Other big detractors from performance included GFI Group and National Oilwell Varco. As of 12/31/08, only three of the ten top-contributing stocks remained in the portfolio; the other seven holdings were sold from the portfolio by year-end. Six of the ten biggest detractors in 2008 continued to be held in the portfolio at year-end.
See the table on page 33 for a list of the biggest contributors and detractors to the fund’s performance over the past six and 12 months. It is important to understand that the fact a stock has lost (or made) money for Masters’ Select Smaller Companies for the past 12 months tells us nothing about how successful the holding has been during the entire period it was held, or how successful it may become. The fund will hold many stocks for significantly longer periods of time and the success of these holdings won’t be known until they are ultimately sold. So in that respect, while it is interesting to know how specific stocks performed during the period, this information is of limited value in assessing the ultimate success of these stock holdings.
Portfolio mix: There were some material changes to the fund’s sector exposure during the year. Consumer discretionary became the largest position in 2008, increasing more than 11 percentage points to 24% of the portfolio; this represents a 12.9% overweighting to the sector compared to the Russell
Fund Summary 31
2000 Index. Industrials decreased during the year, but remain the portfolio’s second-largest exposure at 13.2%. Financials are the third-largest sector weighting at 12.1% of the fund, which is 11.4 percentage points below the weighting of the Russell 2000 Index. A notable change from year-end 2007 is that information technology exposure decreased from a little over 20% to 11.4% of the portfolio. Exposure to energy stocks was largely unchanged from the prior year, but ended 2008 at 11.6% of the portfolio, more than double the weighting of the index.
The fund’s exposure to small-cap stocks (with market caps less than $2.5 billion) increased during 2008, ending the year at 77.3% of the portfolio, up from 67.7% a year earlier. The fund’s mid-cap stock (with market caps between $2.5 billion and $18.3 billion) exposure decreased from almost 20% to end the year at 14.4%. The remainder of the portfolio was compromised of foreign stocks (4.4)% and cash (4.0)% at the end of the year. The fund’s large-cap exposure, which accounted for 3.1% of the portfolio as of 12/31/07, was completely eliminated from the portfolio by the end of 2008.
Please see page 34 for a breakout of the Fund’s sector and market cap exposures.
In Closing
The stock market and Masters’ Select Smaller Companies have both taken major blows. In the case of the market, as discussed in the shareholder letter earlier in this report, we expect a very challenging economic environment in 2009 and possibly beyond. However, despite near-term economic uncertainty, our analysis suggests that the damage that has been done to asset prices, even in light of a decline in the underlying intrinsic value of most companies, now makes a more compelling case for decent and possibly strong long-term returns going forward.
We are obviously aware that the relative performance of Masters’ Select Smaller Companies over the last three years has not been acceptable and it has pulled the fund’s long-term performance below that of its benchmark. We know that good stock pickers struggle at times and there is no denying that we have been through those times recently. We also know that good stock pickers rebound from their struggles. And we know that it is tough for investors to stick with managers who are struggling. As the Advisor to Masters’ Select, we evaluate each stock picker based on a variety of factors with a primary focus on their research and stock-picking process and the execution of that process, not solely their recent performance. Our evaluation involves lengthy discussions with the manager and the analysts supporting the manager, with a focus on the stocks they own or have owned, and the underlying research supporting their decisions. We have made changes when we believed they were justified, as recently as 2007 for Smaller Companies. Though we are very disappointed with the fund’s recent performance, we believe that the stock pickers who have struggled will ultimately rebound. Morningstar, the independent investment research firm, also has been supportive in their comments. In their last report on September 15 they wrote “Masters’ Select Smaller Companies continues to struggle, but it should make up ground in a hurry once things turn its way.” They also referred to the fund’s “topnotch management team.”
The dysfunction in the markets that has resulted from forced selling, has, we believe, presented some very compelling long-term opportunities that we believe our stock pickers may benefit from, especially given their Masters’ Select mandate. We’re looking forward to better times both for the markets and Masters’ Smaller Companies.
The collapse of financial asset prices in 2008 also offers a silver lining beyond the opportunities being created going forward. That silver lining is that we can enjoy material returns going forward without triggering capital gains because of sizable loss carry- forwards and unrealized losses in our portfolios. It is very unlikely that Masters’ Select Smaller Companies will have a capital gain distribution in 2009 and it is possible that will be the case in 2010 and possibly beyond. We will keep you updated.
We remain convinced that Masters’ Select is founded on a powerful concept that will be validated over the long term for all of our funds, and we greatly appreciate your continued confidence. As major shareholders ourselves, we have suffered through the very disappointing recent results alongside you and we can tell you that we are dissatisfied with our showing. While we have no control over what the overall market does over the shorter term, our decisions are focused on maximizing our relative performance over the longer term and we and our sub-advisors are extending every effort to make sure we get these decisions right.
| 1 | The managers and their benchmarks are: Jeff Bronchick: Russell 2000 Value Index; Bill D’Alonzo: Russell 2000 Growth Index; Tucker Walsh: Russell 2000 Growth Index; Bob Rodriguez: Russell 2000 Value Index; Dick Weiss: Russell 2000 Index. |
See page 72 for Industry Terms and Definitions
Neither the information contained herein nor any opinion expressed shall be construed to constitute an offer to sell or a solicitation to buy any security or any other funds mentioned herein. The views herein are those of Litman/Gregory Fund Advisors, LLC at the time the material is written and may not be reflective of current conditions. Performance quoted represents past performance and does not guarantee future results.
32 The Masters’ Select Funds Trust
Masters’ Select Smaller Companies Fund Leaders and Laggards
Masters’ Select Smaller Companies Fund Contribution by Holding
For the Six Months Ended December 31, 2008
Top 10 Contributors
| Security | Portfolio Contribution |
| Central Garden & Pet Co. | 0.94% |
| Capitalsource Inc | 0.33% |
| Allied World Assurance Co. | 0.32% |
| HNI Corp. | 0.30% |
| Resmed Inc. | 0.28% |
| Annaly Capital Management Inc. | 0.25% |
| Capella Education Comp. | 0.20% |
| Questcor Pharmaceutica | 0.20% |
| Ralcorp Holdings Inc. New | 0.18% |
| Fair Isaac Corp. | 0.17% |
Bottom 10 Contributors
| Security | Portfolio Contribution |
| Rosetta Resources Inc. | (2.10)% |
| Patterson-UTI Energy Inc. | (1.64)% |
| National Oilwell Varco | (1.48)% |
| Rowan Companies Inc. | (1.42)% |
| Smith Intl. Inc. | (1.21)% |
| Foot Locker Inc. | (1.13)% |
| Edge Pete Corp. Del | (1.13)% |
| Trinity Industries Inc. | (1.10)% |
| Hornbeck Offshore Services | (1.04)% |
| Genco Shipping & Trading | (1.02)% |
Masters’ Select Smaller Companies Fund Contribution by Holding
For the Year Ended December 31, 2008
Top 10 Contributors
| Security | Portfolio Contribution |
| W-H Energy Services Inc. | 0.63% |
| Central Garden & Pet Co. | 0.62% |
| Ariba Inc. | 0.42% |
| Chart Industries Inc. | 0.40% |
| Stanley Inc. | 0.37% |
| Allied World Assurance Co. | 0.31% |
| Resmed Inc. | 0.29% |
| Federal Signal Corp. | 0.25% |
| Rent A Ctr Inc. New | 0.23% |
| Watson Wyatt Worldwide | 0.22% |
Bottom 10 Contributors
| Security | Portfolio Contribution |
| Lodgenet Interactive Corp. | (2.03)% |
| Rosetta Resources Inc. | (1.48)% |
| GFI Group Inc. | (1.33)% |
| National Oilwell Varco | (1.22)% |
| Smith Intl. Inc. | (1.17)% |
| Foot Locker Inc. | (1.14)% |
| Rowan Companies Inc. | (1.14)% |
| Magma Design Automation | (1.03)% |
| Dealertrack Holdings Inc. | (1.00)% |
| Chimera Investment Corp. | (0.95)% |
Fund Summary 33
Masters’ Select Smaller Companies Fund Managers
INVESTMENT MANAGER | FIRM | TARGET MANAGER ALLOCATION | MARKET CAPITALIZATION OF COMPANIES IN PORTFOLIO | STOCK-PICKING STYLE |
| Bill D’Alonzo and Team | Friess Associates, LLC | 20% | Small and mid-sized companies | Growth |
Jeff Bronchick/ Tom Kerr | Reed Conner & Birdwell, LLC | 20% | Small and mid-sized companies | Value |
| Tucker Walsh | Copper Rock Capital Partners, LLC | 20% | Small and mid-sized companies | Growth |
| Robert Rodriguez | First Pacific Advisors, LLC | 20% | Small and mid-sized companies | Value |
| Richard Weiss | Wells Capital Management, Inc. | 20% | Small and mid-sized companies | Growth at a reasonable price |
Portfolio Composition*
By Asset Class

Market Capitalization:
Micro-Cap < $711 million
Small-Cap $711 million - $2.5 billion
Small/Mid-Cap $2.5 billion - $7 billion
Mid-Cap $7 billion - $18.3 billion
Large-Cap $18.3 billion - $50 billion
| * | Totals may not add up to 100% due to rounding. |
By Sector
| Sector Allocation | ||||||||
| Fund | Russell 2000 Index | |||||||
| Consumer Discretionary | 23.9 | % | 11.0 | % | ||||
| Consumer Staples | 8.1 | % | 3.9 | % | ||||
| Energy | 11.6 | % | 4.4 | % | ||||
| Finance | 12.1 | % | 23.4 | % | ||||
| Health Care & Pharmaceuticals | 10.9 | % | 15.3 | % | ||||
| Industrials | 13.2 | % | 16.9 | % | ||||
| Technology | 11.4 | % | 15.8 | % | ||||
| Telecom | 0.9 | % | 1.2 | % | ||||
| Utilities | 2.2 | % | 4.4 | % | ||||
| Materials | 1.6 | % | 3.7 | % | ||||
| Cash Equivalents & Other | 4.0 | % | 0.0 | % | ||||
| 100.0 | % | 100.0 | % | |||||
34 The Masters’ Select Funds Trust
Masters’ Select Smaller Companies Fund Stock Highlights
Sykes Enterprises Inc. – Bill D’Alonzo
Given the current economic challenges, many businesses have tightened their belts in efforts to shore up their financial positions. In turn, Sykes Enterprises’ own financial health places it in a unique position to sell services that help its customers improve their profitability.
Nasdaq-listed Sykes Enterprises Inc. operates call centers for Fortune 1000 companies, primarily in the communications, financial services, health care, technology, transportation and leisure industries. The company emphasizes customer support outsourcing solutions, especially on inbound technical support and customer service. More than 27,000 service representatives are spread throughout the company’s 45 contact centers in 19 countries. Revenue is expected to rise 15 percent to $816 million in 2008.
September-quarter earnings grew 57 percent, beating estimates by 68 percent even as industry peers struggled. Revenue rose 18 percent. Strong growth in international markets and tight cost controls drove results. The trend toward outsourcing remains strong globally as clients look to better manage increasingly complex and costly customer care operations. Adding new clients has resulted in better utilization levels and widening profit margins.
About half of the company’s revenue originates outside the U.S. With nearly 200 clients, no one customer represents more than 6 percent of sales. The company’s diverse customer base, mix of clients offering different services and global footprint have helped maintain stable growth despite domestic economic uncertainty.
The Friess Associates team spoke with Chief Executive Officer Charles Sykes regarding the increased due diligence large companies are performing on potential outsourcing partners. Debt-free with $220 million in cash, Sykes’ balance sheet is the best in the industry, making it an attractive and stable partner.
The Friess Associates team bought Sykes at 16 times 2008 earnings estimates. Wall Street analysts predict the company will finish the year with 51 percent earnings growth.
Liberty Media Interactive – Jeffrey Bronchick/Thomas Kerr
Liberty Media Interactive is one of the tracking stocks of John Malone’s Liberty Media empire. It represents ownership in renowned retailer QVC, a collection of other fast growing e-commerce businesses, and a roughly 30% ownership in Barry Diller’s Interactive Corporation and its related spin-offs.
Liberty Media Interactive was a poor performer in 2008 falling from over $20 per share to below $3 per share due to the effects of the consumer recession on the QVC business compounded by high leverage attributed to this tracking stock.
At $3 we feel the market is grossly discounting the franchise value of QVC and post-recession performance, both domestically and internationally, as well as ignores the available options Liberty can chose with regards to its leverage situation.
Based on current retailing trends and QVC’s 3rd quarter performance, there are fears that Liberty may default on its debt covenant. Although we are not optimistic or bullish on the retail environment in 2009, we feel the covenant issues are overblown. These outstanding debt levels can be addressed in several ways including: the application of free cash flow (approx $300mm); the application of existing cash balances ($700mm); the sale of Interactive Corp related stocks ($1.6 bil); the sale of LINTA’s other e-commerce businesses (approx $1 bil); the leveraging of the other e-commerce businesses (approx $300-$500mm); and last but not least, the shifting of assets from other Liberty tracking stocks to LINTA.
The QVC business is a cyclical retailer yet has the benefit of limited fixed costs relative to other brick-and-mortar retailers as well as generating over 20% of its sales via online transactions. The offset to this is QVC sales are largely very discretionary and there is no “new store” growth for the business as the channel is fully distributed across all cable and satellite operators. Nonetheless, good cost controls, relative strong international growth, and a proven 20-year franchise should make this a long-term winner and we feel that post recession, the intrinsic value of the franchise will be recognized. Also not being properly recognized by investors within LINTA is an eclectic group of e-commerce businesses that are pioneers in the ODAT (One Deal At a Time) business model. The deep discount nature of this business model results in positive sales growth in this bad economic environment with these businesses collectively producing approximately $800mm revenues.
In summary, we feel a purchase price of LINTA in the low single digits will still show gains in 2009 as covenant fears are alleviated and investors look out to the next few years versus the next few months. Beyond 2009, the gains could continue to be significant as the long-term intrinsic value of this collection of assets far exceeds its current enterprise value.
BJ Services Company – Robert Rodriguez
We continue to believe the long-term fundamentals for the oil and gas sector are favorable, which is why they constitute our largest investment area. Over the last four decades, worldwide oil consumption has virtually doubled from 45 million barrels per day in 1970 to 86 million barrels today. Discoveries have been going the opposite direction. Despite continually improving discovery techniques, including 2D seismic, 3D seismic, and diamond-bore technologies, global discoveries have declined from 60 billion barrels per year, during the peak years of the 1960s, to around 10 billion today. Thus, after five decades of significant improvements in technology and understanding of where oil is, we are now finding a fraction of what we found five decades ago. The easy finds were discovered first and they were the large ones, leaving the smaller, less prolific producers to be discovered later.
Due to the declining discovery trend, we are now relying on old fields for the majority of our supply. Eighty percent of global oil production today comes from fields discovered before the 1970s, according to 13D Research. How fast these older fields are depleting is critical when assessing future production levels. To study the impact of depletion, the U.S. is one of the best case studies. Depletion of the U.S. oil reserves was first signaled by the drop in yield to exploration in 1940, as measured by barrels per foot drilled. But with enhanced technology, oil production kept growing for another 30 years despite a deceleration in
Fund Summary 35
yields. Then the inevitable happened, production peaked in 1970 and it has declined ever since. We believe the U.S. is a good precursor for the global arena. According to Colin Campbell, a retired oil geologist, regular conventional oil production has been falling globally by 1.8% per year since 2005. Regular conventional oil, which excludes heavy, deepwater and polar oil and natural gas liquids, accounts for more than three quarters of all oil and natural gas liquids produced today.
The evidence from large fields such as the Mexican Cantarell field seems to support this data. The Cantarell field was discovered 32 years ago in 1976. Five years later it produced 1.16 million barrels, and kept that production with a slow decline rate until the year 2000, when a nitrogen injection project started. This brought production to 2.1 million barrels per day in 2003, at which time it ranked as the second largest producing field in the world behind the Ghawar Field in Saudi Arabia. Then the decline started setting in, such that today the field has declined more than 50% from its 2003 production level to less than 1 million barrels per day. The reason for this rapid decline was the decision to use secondary and tertiary recovery techniques to drive production higher. When the pressure in the field started to drop, the ensuing decline in production was a lot sharper had these techniques not been used. We believe decline rates around the world will continue to increase as production in major fields is mature and many are declining sharply, including the North Sea, Russia and Alaska. In a recent article by the Financial Times, the International Energy Agency confirms this view when it reports that global decline rates in existing oil fields has now reached a current level of 9.1%. This compares with a decline rate in the 5-6% range, according to executives in the business, less than a decade ago. This acceleration is likely due to the temporary propping up of production via the use of secondary and tertiary production techniques, like the Cantarell field. We believe this will drive oil prices higher over time.
Another set of data points comes from the oil companies themselves. Ultimately, it is the marginal producers that set the price. According to Total, the French oil company, its heavy oil projects in Canada require an oil price of $90 a barrel to deliver an internal rate of return of 12.5% and its deepwater projects off Angola require $70. With deepwater production and heavy oil projects needed to offset production declines in regular conventional oil, prices need to stay above these thresholds to incent marginal production.
Because of this outlook, we recently purchased a new oil service company, BJ Services Company (BJS), which provides pressure pumping and oilfield services for the petroleum industry in the United States and internationally. The company’s pressure pumping services comprise cementing services, as well as stimulation services that include fracturing, acidizing, sand control, nitrogen services, coiled tubing, and service tools. BJS was purchased at 1x book value and 6x trailing-twelve-month earnings. For the reasons discussed above, we think it is a low probability that oil prices will decline to those experienced in 1999 and 2001. If that occurs, cutbacks in spending by exploration and production companies, combined with the natural reduction in production due to high decline rates in existing fields, should act as a natural balancing mechanism and bring prices back up.
Neutral Tandem, Inc. – Tucker Walsh
Neutral Tandem (TNDM) provides competitive telecommunications carriers the ability to transfer calls from one network to another at lower costs and without having to make payments for these services directly to competitors. TNDM currently has its switches embedded in almost 90 markets across the US and does business with over 75 major wireless, wireline, cable and VOIP providers in the US.
We believe TNDM is attractive given its overall value proposition, i.e. it is a lower cost solution with high barriers to entry and a scalable margin structure. In addition, Copper Rock believes TNDM offers several unique catalysts over the next 12 months that will allow them to grow nicely despite the current economic slowdown. These catalysts should allow TNDM to grow in excess of 20% in 2009 and make it an attractive stock at current levels.
The first catalyst should be growth driven by markets added in the last 2 years. TNDM normally takes 18-24 months to get a market up to full capacity, which means the 30 markets TNDM added in 2007 and 25 added in 2008 will start to have major contributions in 2009. Second, TNDM signed Verizon Wireless as a customer in February 2008 and should have started to see traffic from them in Q4. Verizon Wireless is the largest provider by subscribers and the last major customer TNDM needed to sign. Finally, TNDM will be moving beyond its core services focused on terminating local calls and will be adding origination services and long distance services.
Neutral Tandem does have several risks that we are constantly monitoring. The major risk is TNDM’s customer concentration, namely Sprint being a 25% customer. Sprint continues to have line losses, but we believe the addition of Verizon Wireless and TNDM’s success with other customers can offset this. Also, TNDM’s major competitors are large ILEC’s (incumbent local exchange provider) who may begin to compete on price. Price competition could also come from small providers who might try to make a push to gain share. Finally, there is the risk that given the current economic environment customers might seek better terms at the time of contract renewals.
See page 72 for Industry Terms and Definitions
Neither the information contained herein nor any opinion expressed shall be construed to constitute an offer to sell or a solicitation to buy any securities mentioned herein. The views herein are those of the portfolio managers at the time the commentaries are written and may not be reflective of current conditions.
36 The Masters’ Select Funds Trust
Masters’ Select Smaller Companies Fund
SCHEDULE OF INVESTMENTS IN SECURITIES at December 31, 2008
| Shares | Value | |||
| COMMON STOCKS: 96.0% | ||||
| Consumer Discretionary: 23.0% | ||||
| 84,700 | Cablevision Systems Corp. | $ | 1,426,348 | |
| 29,000 | Capella Education Co.* | 1,704,040 | ||
| 454,400 | Charming Shoppes, Inc.* | 1,108,736 | ||
| 430,500 | Circuit City Stores, Inc. | 55,965 | ||
| 736,500 | dELiA*s, Inc.* | 1,620,300 | ||
| 45,000 | Fisher Communications, Inc. | 928,800 | ||
| 233,300 | Foot Locker, Inc. | 1,712,422 | ||
| 161,500 | Jo-Ann Stores, Inc.* | 2,501,635 | ||
| 330,000 | Liberty Media Corp. – Interactive* | 1,029,600 | ||
| 18,951 | New Oriental Education & | |||
| Technology Group, Inc. – ADR* | 1,040,599 | |||
| 100,860 | Red Robin Gourmet Burgers, Inc.* | 1,697,474 | ||
| 90,001 | Scientific Games Corp.* | 1,578,617 | ||
| 72,995 | Signet Jewelers Ltd. | 632,867 | ||
| 41,700 | Tractor Supply Co.* | 1,507,038 | ||
| 400,000 | Wendy’s/Arby’s Group, Inc. | 1,976,000 | ||
| 20,520,441 | ||||
| Consumer Staples: 8.1% | ||||
| 44,254 | BJ’s Wholesale Club, Inc.* | 1,516,142 | ||
| 600,000 | Central Garden and Pet Co.* | 3,540,000 | ||
| 45,000 | Diamond Foods, Inc. | 906,750 | ||
| 47,500 | TreeHouse Foods, Inc.* | 1,293,900 | ||
| 7,256,792 | ||||
| Energy: 11.6% | ||||
| 27,400 | Atwood Oceanics, Inc.* | 418,672 | ||
| 29,400 | BJ Services Co. | 343,098 | ||
| 37,812 | Concho Resources, Inc.* | 862,870 | ||
| 56,400 | Continental Resources, Inc.* | 1,168,044 | ||
| 70,000 | Exterran Holdings, Inc.* | 1,491,000 | ||
| 26,000 | National Oilwell Varco, Inc.* | 635,440 | ||
| 148,300 | Patterson-UTI Energy, Inc. | 1,706,933 | ||
| 179,900 | Rosetta Resources, Inc.* | 1,273,692 | ||
| 93,300 | Rowan Companies, Inc. | 1,483,470 | ||
| 44,500 | Smith International, Inc. | 1,018,605 | ||
| 10,401,824 | ||||
| Financials: 12.1% | ||||
| 10,000 | Alleghany Corp.* | 2,820,000 | ||
| 29,400 | Allied World Assurance | |||
| Company Holdings, Ltd. | 1,193,640 | |||
| 400,000 | Chimera Investment Corp. | 1,380,000 | ||
| 675,000 | Conseco, Inc.* | 3,496,500 | ||
| 17,500 | Mercury General Corp. | 804,825 | ||
| 60,497 | MSCI, Inc.* | 1,074,427 | ||
| 10,769,392 | ||||
| Health Care: 10.9% | ||||
| 32,419 | Alexion Pharmaceuticals, Inc.* | 1,173,244 | ||
| 52,400 | Community Health Systems, Inc.* | 763,992 | ||
| 55,328 | Conceptus, Inc.* | 842,092 | ||
| 64,500 | Cooper Cos, Inc. | 1,057,800 | ||
| 38,300 | Merit Medical Systems, Inc.* | 686,719 | ||
| 87,151 | Psychiatric Solutions, Inc.* | 2,427,155 | ||
| 173,200 | Questcor Pharmaceuticals, Inc.* | 1,612,492 | ||
| 31,600 | Sun Healthcare Group, Inc.* | 279,660 | ||
| 45,898 | Wright Medical Group, Inc.* | 937,696 | ||
| 9,780,850 | ||||
| Industrials: 13.2% | ||||
| 24,113 | FTI Consulting, Inc.* | 1,077,369 | ||
| 61,280 | HUB Group, Inc.* | 1,625,758 | ||
| 46,999 | Mine Safety Appliances Co. | 1,123,746 | ||
| 27,955 | Quanta Services, Inc.* | 553,509 | ||
| 54,900 | Republic Services, Inc. | 1,360,971 | ||
| 77,000 | Spirit Aerosystems Holdings, Inc.* | 783,090 | ||
| 51,700 | Stanley, Inc.* | 1,872,574 | ||
| 81,800 | SYKES Enterprises, Inc.* | 1,564,016 | ||
| 114,900 | Trinity Industries, Inc. | 1,810,824 | ||
| 11,771,857 | ||||
| Information Technology: 11.4% | ||||
| 33,700 | Amdocs Ltd.* | 616,373 | ||
| 837,400 | ARM Holdings PLC | 1,041,436 | ||
| 20,800 | Arrow Electronics, Inc.* | 391,872 | ||
| 96,800 | Avnet, Inc.* | 1,762,728 | ||
| 32,830 | DTS, Inc.* | 602,431 | ||
| 567,600 | Extreme Networks, Inc.* | 1,328,184 | ||
| 153,966 | Neutral Tandem, Inc.* | 2,497,329 | ||
| 38,440 | Power Integrations, Inc. | 764,187 | ||
| 47,720 | Sybase, Inc.* | 1,182,024 | ||
| 10,186,564 | ||||
| Materials: 1.6% | ||||
| 484,725 | Novamerican Steel, Inc.* | 324,766 | ||
| 175,000 | Spartech Corp. | 1,095,500 | ||
| 1,420,266 | ||||
| Other Investment Company: 1.0% | ||||
| 40,000 | SPDR KBW Bank ETF | 875,600 | ||
| Telecommunications: 0.9% | ||||
| 50,472 | SBA Communcations Corp.* | 823,703 | ||
| Utilities: 2.2% | ||||
| 240,000 | AES Corp.* | 1,977,600 | ||
| TOTAL COMMON STOCKS | ||||
| (cost $125,485,814) | 85,784,889 | |||
Schedule of Investments 37
Masters’ Select Smaller Companies Fund
SCHEDULE OF INVESTMENTS IN SECURITIES at December 31, 2008
Principal Amount | Value | ||||
| SHORT-TERM INVESTMENTS: 4.4% | |||||
| 3,966,000 | State Street Bank & Trust Co., 0.010%, | ||||
| 12/31/08, due 01/02/09 [collateral: | |||||
| par value: $3,810,000, | |||||
| Federal Home Loan Bank, | |||||
| 4.375%, due 09/17/10, value | |||||
| $4,056,507] (proceeds $3,966,002) | $ | 3,966,000 | |||
| TOTAL SHORT-TERM INVESTMENTS | |||||
| (cost $3,966,000) | 3,966,000 | ||||
| TOTAL INVESTMENTS IN SECURITIES | |||||
| (cost $129,451,814): 100.4% | 89,750,889 | ||||
| Liabilities in Excess of Other Assets: (0.4)% | (397,136 | ) | |||
Net Assets: 100% | $ | 89,353,753 | |||
| ADR | American Depository Receipt |
| * | Non Income Producing |
The accompanying notes are an integral part of these financial statements.
38 The Masters’ Select Funds Trust
Masters’ Select Focused Opportunities Fund Review
Masters’ Select Focused Opportunities suffered a horrible year in what was the worst year for the stock market since 1931. After a solid 2007, the fund’s performance in 2008 has now left it significantly behind its S&P 500 benchmark since its launch 2 ½ years ago. The fund, because it is much more concentrated than other Masters’ Select funds, has the potential for wider swings in performance over the short-term, both on the downside and the upside.
The value of a hypothetical $10,000 investment in the Masters’ Select Smaller Focused Opportunities Fund from inception (6/30/2006) to present compared with the S&P 500 Index.

The hypothetical $10,000 investment at fund inception includes changes due to share price and reinvestment of dividends and capital gains. The chart does not imply future performance. Indices are unmanaged, do not incur fees, expenses or taxes and cannot be invested in directly.
Performance as of December 31, 2008
| Average Annual Total Returns | ||||||||
| One-Year | Since Inception | |||||||
| Masters’ Select Focused | ||||||||
| Opportunities Fund (6/30/06) | -49.34% | -18.40% | ||||||
Past performance is no guarantee of future results. See page 5 for a detailed discussion of the risks and costs associated with investing in the Masters’ Select Focused Opportunities Fund.
Portfolio Commentary
A number of factors contributed to the fund’s performance during 2008. The highlights follow.
Performance of managers: In 2008, both of the Masters’ Select Focused Opportunities sub-advisors with a full year’s record underperformed their respective benchmarks. For the year, the individual sub-advisors’ returns ranged from a 51% loss to a 53% loss. The S&P 500 Index, the fund’s primary benchmark, was down 37% for the year.1 Over shorter time periods, we do not expect every manager to outperform his benchmark, but that is our (and their) long-term goal. In the relatively short time since the fund’s inception, the two managers who have been with the fund since its inception are trailing their respective benchmarks. The third sub-advisor, Sands Capital Management, was added to the fund during 2008.
Sector and stock-picking impact: Given its highly concentrated portfolio, the long-term success of Masters’ Select Focused Opportunities will depend on skilled stock picking from its sub-advisors to an even greater degree than for the other Masters’ Select funds. Therefore, in our performance discussions we expect to focus on the value added or detracted at the individual stock level rather than on performance attribution based on sector exposures relative to the benchmark.
As we would expect in such a concentrated portfolio, stock selection drove the fund’s relative performance during the year. Insurance company American International Group (AIG) and American Express, the credit services company, were the biggest detractors from performance for the year, costing the fund 10 percentage points combined. National Oilwell Varco, the oil and gas equipment provider, also cost the fund several percentage points in performance, as did Las Vegas Sands Corp., which owns hotels and casinos in Las Vegas and Macao. A top contributor to performance in 2008 was Qualcomm, a digital wireless telecommunications product and service provider. At the end of the year, all three of the biggest detractors from performance for the year remained in the portfolio; the top three contributors to performance had been sold.
See the table on page 41 for the portfolio leaders and laggards over the past six and 12 months. It is important to understand that the fact that a stock has lost (or made) money for Masters’ Select Focused Opportunities for the past six or 12 months tells us nothing about how successful the holding will ultimately become. The fund will hold some stocks for significantly longer periods of time and the success of these holdings won’t be known until they are ultimately sold. So in that respect, while it is interesting to know how specific stocks performed during the period, this information is of limited value in assessing the ultimate success of these stock holdings.
Portfolio mix: There were several notable changes to the fund’s sector exposure during the year. Financials remained the largest sector exposure in 2008 and increased slightly to 28.2% of the portfolio; this represents a nearly 15% overweighting to the sector compared to the S&P 500 Index. Energy stocks increased a bit to become the portfolio’s second-largest position at 13.2%. Information technology stocks decreased more than eight percentage points to 12.2% of the portfolio and were the third-largest sector exposure at year-end. The fund gained some exposure to health care and pharmaceutical stocks during the year; as of 12/31/08, they comprised 5.7% of the fund, versus a 14.8% weighting in the S&P 500 Index. The fund had an overweighting to industrials relative to the S&P 500 Index; they accounted for 5.4% of the fund at year-end, compared to 11.1% for the benchmark.
The fund’s exposure to large-cap stocks (with market caps greater than $18.3 billion) decreased during 2008, ending the year at 36.2% of the portfolio compared to 44.4% a year earlier. The fund’s mid-cap stock (with market caps between $2.5 billion and $18.3 billion) exposure increased nearly eight percentage points to end the year at 28.9%. Small-cap stock (with market caps less than $2.5 billion) exposure also increased to 3.7% of the fund; a year earlier the fund had no exposure to small-cap stocks. At year-end 2007, the fund had approximately 10% in cash equivalents; as of 12/31/08 cash in the portfolio decreased to 5.1%. The remainder of the portfolio was compromised of 26.1% in foreign stocks, which was largely unchanged from year-end 2007.
Please see page 42 for a breakout of the Fund’s sector and market cap exposures.
Fund Summary 39
In Closing
The stock market and Masters’ Select Focused Opportunities have both taken major blows. In the case of the market, as discussed in the shareholder letter earlier in this report, we expect a very challenging economic environment in 2009 and possibly beyond. However, despite near-term economic uncertainty, our analysis suggests that the damage that has been done to asset prices, even taking into account a decline in the underlying intrinsic value of most companies, now makes a more compelling case for decent and possibly strong long-term returns going forward.
We are obviously aware that the relative performance of Masters’ Select Focused Opportunities over the last year has been disappointing. We know that good stock pickers struggle at times, and that in a highly concentrated fund the impact is magnified. There is no denying that we have been through such a time recently. We also know that while investors understand intellectually that good stock pickers rebound from their struggles, it is nevertheless tough for investors to stick with managers who are struggling. As the Advisor to Masters’ Select, we evaluate each stock picker based on a variety of factors with a primary focus on their research and stock-picking process and the execution of that process, not solely their recent performance. Our evaluation involves lengthy discussions with the manager and the analysts supporting the manager, with a focus on the stocks they own or have owned and the underlying research supporting their decisions. We make changes when we believe they are justified, and did so earlier in 2008 (primarily because of team changes at TCW—the manager that was removed). Though we are very disappointed with the fund’s performance in 2008, we believe that the stock pickers who have struggled will ultimately rebound, and this fund’s extreme concentration could work as strongly in its favor as it worked against it in 2008.
The dysfunction in the markets that has resulted from forced selling, has, we believe, presented some very compelling long-term opportunities that we believe our stock pickers may benefit from, especially given their Masters’ Select mandate. We’re looking forward to better times both for the markets and Focused Opportunities.
The collapse of financial asset prices in 2008 also offers a silver lining beyond the opportunities being created going forward. That silver lining is that we can enjoy material returns going forward without triggering capital gains because of sizable loss carry-forwards and unrealized losses in our portfolios. It is very unlikely that Focused Opportunities will have a capital gain distribution in 2009 and it is possible that will be the case in 2010 and possibly beyond. We will keep you updated.
We remain convinced that Masters’ Select is founded on a powerful concept that will be validated over the long term for all of our funds, and we greatly appreciate your continued confidence. As major shareholders ourselves, we have suffered through the very disappointing recent results alongside you and we can tell you that we are dissatisfied with our showing. While we have no control over what the overall market does over the shorter term, our decisions are focused on maximizing our relative performance over the longer term, and we and our sub-advisors are extending every effort to make sure we get these decisions right.
| 1 | The managers and their respective benchmarks are: Chris Davis and Ken Feinberg: S&P 500 Index; Mike Embler and Peter Langerman: Russell 3000 Value Index; Frank Sands Jr. and Michael Sramek: Russell 1000 Growth Index. |
Neither the information contained herein nor any opinion expressed shall be construed to constitute an offer to sell or a solicitation to buy any security or any other funds mentioned herein. The views herein are those of Litman/Gregory Fund Advisors, LLC at the time the material is written and may not be reflective of current conditions. Performance quoted represents past performance and does not guarantee future results.
40 The Masters’ Select Funds Trust
Masters’ Select Focused Opportunities Fund Leaders and Laggards
Masters’ Select Focused Opportunities Fund Contribution by Holding
For the Six Months Ended December 31, 2008
Top 10 Contributors
| Security | Portfolio Contribution |
| Mindray Medical International Ltd. | 0.00% |
| Visa Inc. | 0.00% |
| Wells Fargo & Co. | (0.03)% |
| Apple Inc. | (0.07)% |
| CVS Caremark Corp. | (0.22)% |
| Fortis | (0.36)% |
| E. ON AG | (0.45)% |
| Bank of New York Mellon Corp. | (0.81)% |
| News Corp. | (0.84)% |
| IntercontinentalExchange | (0.99)% |
Bottom 10 Contributors
| Security | Portfolio Contribution |
| National Oilwell Varco | (5.47)% |
| American Express Co. | (4.71)% |
| Canadian Natural Resources Ltd. | (4.23)% |
| Virgin Media Inc. | (2.56)% |
| Google Inc. | (2.43)% |
| American International Group Inc. | (2.19)% |
| Salesforce.com Inc. | (2.17)% |
| LSI Corporation | (2.04)% |
| Las Vegas Sands Corp. | (1.96)% |
| Weyerhaeuser Co. | (1.78)% |
Masters’ Select Focused Opportunities Fund Contribution by Holding
For the Year Ended December 31, 2008
Top 10 Contributors
| Security | Portfolio Contribution |
| Qualcomm Inc. | 0.16% |
| Progressive Corp. | 0.01% |
| Fortis | 0.00% |
| Mindray Medical International Ltd. | 0.00% |
| Visa Inc. | 0.00% |
| Philip Morris International Inc. | (0.03)% |
| Wells Fargo & Co. | (0.03)% |
| Apple Inc. | (0.06)% |
| Schlumberger Ltd. | (0.10)% |
| KT&G Corp. | (0.13)% |
Bottom 10 Contributors
| Security | Portfolio Contribution |
| American Express Co. | (6.27)% |
| American International Group Inc. | (3.93)% |
| National Oilwell Varco | (3.62)% |
| Las Vegas Sands Corp. | (3.17)% |
| Google Inc. | (3.04)% |
| Virgin Media Inc. | (2.87)% |
| Weyerhaeuser Co. | (2.66)% |
| Canadian Natural Resources Ltd. | (2.64)% |
| Siemens AG | (2.40)% |
| Salesforce.com Inc. | (2.14)% |
Fund Summary 41
Masters’ Select Focused Opportunities Fund Managers
INVESTMENT MANAGER | FIRM | TARGET MANAGER ALLOCATION | MARKET CAPITALIZATION OF COMPANIES IN PORTFOLIO | STOCK-PICKING STYLE |
Christopher Davis/ Kenneth Feinberg | Davis Selected Advisers, L.P. | 33.33% | Mostly large companies | Growth at a reasonable price |
Michael Embler/ Peter Langerman | Franklin Mutual Advisers, LLC | 33.33% | All sizes and global | Value |
Frank Sands, Jr./ Michael Sramek | Sands Capital Management, LLC | 33.33% | All sizes, but mostly large and mid-sized companies | Growth |
Portfolio Composition*
By Asset Class

Market Capitalization:
Small-Cap Domestic < $2.5 billion
Mid-Cap Domestic $2.5 - $18.3 billion
Large-Cap Domestic > $18.3 billion
| * | Totals may not add up to 100% due to rounding. |
By Sector
| Sector Allocation | ||||||||
| Fund | S&P 500 Index | |||||||
| Consumer Discretionary | 10.8 | % | 8.4 | % | ||||
| Consumer Staples | 9.7 | % | 12.9 | % | ||||
| Energy | 13.2 | % | 13.3 | % | ||||
| Finance | 28.2 | % | 13.3 | % | ||||
| Health Care & Pharmaceuticals | 5.7 | % | 14.8 | % | ||||
| Industrials | 5.4 | % | 11.1 | % | ||||
| Technology | 12.2 | % | 15.3 | % | ||||
| Telecom | 0.0 | % | 3.8 | % | ||||
| Utilities | 5.9 | % | 4.2 | % | ||||
| Materials | 3.8 | % | 2.9 | % | ||||
| Cash Equivalents & Other | 5.1 | % | 0.0 | % | ||||
| 100.0 | % | 100.0 | % | |||||
42 The Masters’ Select Funds Trust
Masters’ Select Focused Opportunities Fund Stock Highlights
Procter & Gamble (PG)
PG is held in both the Equity Fund and the Focused Opportunities Fund. PG was not added to the Focused Opportunities Fund until January 2009. Please refer to the discussion appearing on page 10.
Amazon.com
Amazon.com is held in both the Equity Fund and the Focused Opportunities Fund. Please refer to the discussion appearing on page 10.
Japan Tobacco
Japan Tobacco is held in both the Value Fund and the Focused Opportunities Fund. Please refer to the discussion appearing on page 28.
Fund Summary 43
Masters’ Select Focused Opportunities Fund
SCHEDULE OF INVESTMENTS IN SECURITIES at December 31, 2008
| Shares | Value | |||
| COMMON STOCKS: 94.9% | ||||
| Consumer Discretionary: 10.8% | ||||
| 50,900 | Amazon.com, Inc.* | $ | 2,610,152 | |
| 236,700 | Las Vegas Sands Corp.* | 1,403,631 | ||
| 304,759 | Virgin Media, Inc. | 1,520,747 | ||
| 5,534,530 | ||||
| Consumer Staples: 9.7% | ||||
| 71,580 | CVS Caremark Corp. | 2,057,209 | ||
| 891 | Japan Tobacco, Inc. | 2,899,559 | ||
| 4,956,768 | ||||
| Energy: 13.2% | ||||
| 78,500 | Canadian Natural Resources Ltd. | 3,138,430 | ||
| 24,300 | EOG Resources, Inc. | 1,617,894 | ||
| 82,500 | National Oilwell Varco, Inc.* | 2,016,300 | ||
| 6,772,624 | ||||
| Financials: 28.2% | ||||
| 202,500 | American Express Co. | 3,756,375 | ||
| 99,300 | American International Group, Inc. | 155,901 | ||
| 112,189 | Bank of New York Mellon Corp. | 3,178,314 | ||
| 36,300 | IntercontinentalExchange, Inc.* | 2,992,572 | ||
| 103,600 | JPMorgan Chase & Co. | 3,266,508 | ||
| 36,900 | Wells Fargo & Co. | 1,087,812 | ||
| 14,437,482 | ||||
| Health Care: 5.7% | ||||
| 72,100 | Allergan, Inc. | 2,907,072 | ||
| Industrials: 5.4% | ||||
| 38,020 | Siemens AG | 2,784,121 | ||
| Materials: 3.8% | ||||
| 62,680 | Weyerhaeuser Co. | 1,918,635 | ||
| Technology: 12.2% | ||||
| 8,300 | Google, Inc.* | 2,553,495 | ||
| 581,118 | LSI Corp.* | 1,911,878 | ||
| 55,700 | Salesforce.com, Inc.* | 1,782,957 | ||
| 6,248,330 | ||||
| Utilities: 5.9% | ||||
| 75,990 | E.ON AG | 3,004,113 | ||
| TOTAL COMMON STOCKS | ||||
| (cost $90,058,782) | 48,563,675 | |||
Principal Amount | Value | |||
| SHORT-TERM INVESTMENTS: 6.2% | ||||
| 3,185,000 | State Street Bank & Trust Co., 0.010%, | |||
| 12/31/08, due 01/02/09 [collateral: | ||||
| par value: $3,315,000, | ||||
| Federal Home Loan Bank, | ||||
| 4.375%, due 09/17/10, Freddie Mac, | ||||
| 6.080%, due 10/01/36, value | ||||
| 3,256,875] (proceeds $3,185,002) | $ | 3,185,000 | ||
| TOTAL SHORT-TERM INVESTMENTS | ||||
| (cost $3,185,000) | 3,185,000 | |||
| TOTAL INVESTMENTS IN SECURITIES | ||||
| (cost $93,243,782): 101.1% | 51,748,675 | |||
| Liabilities in Excess of Other Assets: (1.1)% | (593,052) | |||
Net Assets: 100% | $ | 51,155,623 | ||
| * | Non-income producing security. |
The accompanying notes are an integral part of these financial statements.
44 The Masters’ Select Funds Trust
Masters’ Select Funds Trust
EXPENSE EXAMPLES – (Unaudited)
As a shareholder of the Funds, you incur two types of costs: (1) redemptions fees; and (2) ongoing costs, including advisory fees; and other fund expenses. The examples below are intended to help you understand your ongoing costs (in dollars) of investing in the Funds and to compare these costs with the ongoing costs of investing in other mutual funds.
The examples are based on an investment of $1,000 invested at the beginning of the period shown and held for the entire period from July 1, 2008 to December 31, 2008.
Actual Expenses
For each Fund, the first line of the table below provides information about actual account values and actual expenses. You may use the information in this line, together with the amount you invested, to estimate the expenses that you paid over the period. Simply divide your account value by $1,000 (for example, an $8,600 account value divided by $1,000 = 8.6), then multiply the result by the number in the first line under the heading entitled “Expenses Paid During Period” to estimate the expenses you paid on your account during this period.
Hypothetical Example for Comparison Purposes
For each Fund, the second line of the table below provides information about hypothetical account values and hypothetical expenses based on the Fund’s actual expense ratio and an assumed rate of return of 5% per year before expenses, which is not the Fund’s actual return. The hypothetical account values and expenses may not be used to estimate the actual ending account balance or expenses you paid for the period. You may use this information to compare the ongoing costs of investing in the Fund and other funds. To do so, compare this 5% hypothetical example with the 5% hypothetical examples that appear in the shareholder reports of the other funds.
Please note that the expenses shown in the table are meant to highlight your ongoing costs only and do not reflect any redemption fees. Therefore, the second line for each Fund of the table is useful in comparing ongoing costs only, and will not help you determine the relative total costs of owning different funds. In addition, if these redemption fees were included, your costs would have been higher.
Beginning Account Value (07/01/08) | Ending Account Value (12/31/08) | Expenses Paid During Period* (07/01/08 to 12/31/08) | Expense Ratio During Period* (07/01/08 to 12/31/08) | |||||||||||||
| Masters’ Select Equity Fund Actual | $ | 1,000.00 | $ | 587.30 | $ | 5.07 | 1.27% | |||||||||
| Masters’ Select Equity Fund Hypothetical | ||||||||||||||||
| (5% return before expenses) | $ | 1,000.00 | $ | 1,018.75 | $ | 6.44 | 1.27% | |||||||||
| Masters’ Select International Fund Actual | $ | 1,000.00 | $ | 621.80 | $ | 4.53 | 1.11% | |||||||||
| Masters’ Select International Fund Hypothetical | ||||||||||||||||
| (5% return before expenses) | $ | 1,000.00 | $ | 1,019.56 | $ | 5.63 | 1.11% | |||||||||
| Masters’ Select Value Fund Actual | $ | 1,000.00 | $ | 645.90 | $ | 5.42 | 1.31% | |||||||||
| Masters’ Select Value Fund Hypothetical | ||||||||||||||||
| (5% return before expenses) | $ | 1,000.00 | $ | 1,018.55 | $ | 6.65 | 1.31% | |||||||||
| Masters’ Select Smaller Companies Fund Actual | $ | 1,000.00 | $ | 603.90 | $ | 5.72 | 1.42% | |||||||||
| Masters’ Select Smaller Companies Fund Hypothetical | ||||||||||||||||
| (5% return before expenses) | $ | 1,000.00 | $ | 1,018.00 | $ | 7.20 | 1.42% | |||||||||
| Masters’ Select Focused Opportunities Fund Actual | $ | 1,000.00 | $ | 596.50 | $ | 5.34 | 1.33% | |||||||||
| Masters’ Select Focused Opportunities Fund Hypothetical | ||||||||||||||||
| (5% return before expenses) | $ | 1,000.00 | $ | 1,018.45 | $ | 6.75 | 1.33% | |||||||||
*Expenses are equal to the Funds’ annualized expense ratio as indicated, multiplied by the average account value over the period, multiplied by the number of days in most recent fiscal half-year period (184), then divided by the number of days in the fiscal year (366) (to reflect the one-half year period).
Expense Examples 45
Masters’ Select Funds Trust
STATEMENTS OF ASSETS AND LIABILITIES at December 31, 2008
| Equity Fund | International Fund | Value Fund | Smaller Companies Fund | Focused Opportunities Fund | ||||||||||||||||
| ASSETS | ||||||||||||||||||||
| Investments in securities at cost | $ | 332,190,022 | $ | 1,221,231,859 | $ | 129,692,197 | $ | 125,485,814 | $ | 90,058,782 | ||||||||||
| Repurchase agreements at cost | 4,669,000 | 44,457,000 | 3,180,000 | 3,966,000 | 3,185,000 | |||||||||||||||
| Total investments at cost | $ | 336,859,022 | $ | 1,265,688,859 | $ | 132,872,197 | $ | 129,451,814 | $ | 93,243,782 | ||||||||||
| Investments in securities at value | $ | 248,378,026 | $ | 846,550,513 | $ | 87,148,593 | $ | 85,784,889 | $ | 48,563,675 | ||||||||||
| Repurchase agreements at value | 4,669,000 | 44,457,000 | 3,180,000 | 3,966,000 | 3,185,000 | |||||||||||||||
| Total investments at value | 253,047,026 | 891,007,513 | 90,328,593 | 89,750,889 | 51,748,675 | |||||||||||||||
| Cash | 1,071 | 3,554 | 16,986 | 28,897 | 54,889 | |||||||||||||||
| Cash, denominated in foreign currency | ||||||||||||||||||||
| (cost of $—, $93,300, $—, $— and | ||||||||||||||||||||
| $—, respectively) | — | 95,069 | — | — | — | |||||||||||||||
| Receivables: | ||||||||||||||||||||
| Securities sold | 6,689,846 | 3,189,282 | 1,453,125 | 1,247,260 | — | |||||||||||||||
| Dividends and interest | 268,734 | 1,370,716 | 97,501 | 39,437 | 4,818 | |||||||||||||||
| Fund shares sold | 493,546 | 4,920,991 | 476,097 | 314,833 | 65,476 | |||||||||||||||
| Foreign tax reclaim | 80 | 915,881 | — | — | 71 | |||||||||||||||
| Unrealized gain on forward exchange contracts | — | 779,724 | 685,880 | — | — | |||||||||||||||
| Prepaid expenses | 16,154 | 31,821 | 9,937 | 8,305 | 6,970 | |||||||||||||||
| Total assets | 260,516,457 | 902,314,551 | 93,068,119 | 91,389,621 | 51,880,899 | |||||||||||||||
| LIABILITIES | ||||||||||||||||||||
| Payables: | ||||||||||||||||||||
| Advisory fees | 249,222 | 706,912 | 84,852 | 86,460 | 42,437 | |||||||||||||||
| Securities purchased | 829,464 | 743,239 | 89,990 | 162,038 | — | |||||||||||||||
| Fund shares redeemed | 2,630,987 | 6,031,898 | 1,315,046 | 1,674,031 | 84,216 | |||||||||||||||
| Foreign taxes withheld | 815 | 87,592 | 11,095 | — | 723 | |||||||||||||||
| Unrealized loss on forward exchange contracts | — | 447,185 | 940,330 | — | 528,038 | |||||||||||||||
| Accrued other expenses | 161,719 | 421,993 | 101,158 | 113,339 | 69,862 | |||||||||||||||
| Total liabilities | 3,872,207 | 8,438,819 | 2,542,471 | 2,035,868 | 725,276 | |||||||||||||||
| NET ASSETS | $ | 256,644,250 | $ | 893,875,732 | $ | 90,525,648 | $ | 89,353,753 | $ | 51,155,623 | ||||||||||
| Number of shares issued and outstanding (unlimited | ||||||||||||||||||||
| number of shares authorized, $0.01 par value) | 34,033,142 | 94,392,002 | 12,310,104 | 12,794,804 | 8,993,579 | |||||||||||||||
| Net asset value, offering and redemption price per share | $ | 7.54 | $ | 9.47 | $ | 7.35 | $ | 6.98 | $ | 5.69 | ||||||||||
| COMPONENTS OF NET ASSETS | ||||||||||||||||||||
| Paid in capital | $ | 404,473,406 | $ | 1,606,590,594 | $ | 167,666,638 | $ | 190,206,949 | $ | 102,483,378 | ||||||||||
| Undistributed net investment income (loss) | — | 2,899,345 | 363,215 | (7 | ) | 249,746 | ||||||||||||||
| Accumulated net realized loss on investments | (64,017,240 | ) | (341,257,499 | ) | (34,695,056 | ) | (61,152,264 | ) | (9,554,427 | ) | ||||||||||
| Net unrealized appreciation (depreciation) on: | ||||||||||||||||||||
| Investments | (83,811,996 | ) | (374,681,346 | ) | (42,543,604 | ) | (39,700,925 | ) | (41,495,107 | ) | ||||||||||
| Foreign currency | 80 | 324,638 | (265,545 | ) | — | (527,967 | ) | |||||||||||||
| Net assets | $ | 256,644,250 | $ | 893,875,732 | $ | 90,525,648 | $ | 89,353,753 | $ | 51,155,623 | ||||||||||
The accompanying notes are an integral part of these financial statements.
46 The Masters’ Select Funds Trust
Masters’ Select Funds Trust
STATEMENTS OF OPERATIONS FOR THE YEAR ENDED December 31, 2008
| Equity Fund | International Fund | Value Fund | Smaller Companies Fund | Focused Opportunities Fund | ||||||||||||||||
| INVESTMENT INCOME | ||||||||||||||||||||
| Income | ||||||||||||||||||||
| Dividends (net of foreign taxes withheld of $65,281, | ||||||||||||||||||||
| $4,169,261, $140,855, $— and $100,415, respectively) | $ | 6,221,973 | $ | 52,072,606 | $ | 3,907,512 | $ | 2,140,991 | $ | 1,414,334 | ||||||||||
| Interest | 131,345 | 745,221 | 53,154 | 119,620 | 58,564 | |||||||||||||||
| Total income | 6,353,318 | 52,817,827 | 3,960,666 | 2,260,611 | 1,472,898 | |||||||||||||||
| Expenses | ||||||||||||||||||||
| Advisory fees | 5,812,922 | 17,210,207 | 2,410,555 | 2,084,926 | 1,042,921 | |||||||||||||||
| Administration fees | 107,024 | 332,010 | 45,797 | 38,263 | 19,004 | |||||||||||||||
| Custody fees | 84,053 | 1,137,212 | 46,413 | 47,115 | 23,849 | |||||||||||||||
| Transfer agent fees | 201,238 | 491,760 | 77,766 | 114,262 | 10,911 | |||||||||||||||
| Chief compliance officer fees | 10,800 | 10,800 | 10,800 | 10,800 | 10,800 | |||||||||||||||
| Fund accounting fees | 82,344 | 82,339 | 66,122 | 73,278 | 55,767 | |||||||||||||||
| Professional fees | 67,124 | 106,443 | 53,343 | 52,615 | 47,510 | |||||||||||||||
| Trustee fees | 60,261 | 108,778 | 47,365 | 45,707 | 40,067 | |||||||||||||||
| Registration expense | 25,260 | 41,536 | 25,525 | 20,335 | 20,145 | |||||||||||||||
| Insurance expense | 26,871 | 80,605 | 13,132 | 9,824 | 4,687 | |||||||||||||||
| Reports to shareholders | 78,802 | 161,852 | 27,437 | 42,775 | 6,460 | |||||||||||||||
| Miscellaneous | 27,916 | 85,358 | 13,408 | 11,075 | 4,728 | |||||||||||||||
| Total expenses | 6,584,615 | 19,848,900 | 2,837,663 | 2,550,975 | 1,286,849 | |||||||||||||||
| Less: fees waived | (32,216 | ) | (2,441,303 | ) | (51,851 | ) | (8,902 | ) | (77,862 | ) | ||||||||||
| Less: expenses paid indirectly | (2,312 | ) | (10,741 | ) | (227 | ) | (1,201 | ) | (352 | ) | ||||||||||
| Net expenses | 6,550,087 | 17,396,856 | 2,785,585 | 2,540,872 | 1,208,635 | |||||||||||||||
| Net investment income (loss) | (196,769 | ) | 35,420,971 | 1,175,081 | (280,261 | ) | 264,263 | |||||||||||||
| REALIZED AND UNREALIZED GAIN (LOSS) FROM INVESTMENTS | ||||||||||||||||||||
| AND FOREIGN CURRENCY: | ||||||||||||||||||||
| Net realized gain (loss) on: | ||||||||||||||||||||
| Investments | (58,961,927 | ) | (329,794,720 | ) | (34,152,796 | ) | (60,745,109 | ) | (9,542,297 | ) | ||||||||||
| Foreign currency transactions | (272 | ) | 15,521,103 | 1,553,841 | (553 | ) | 1,086,638 | |||||||||||||
| Net realized loss | (58,962,199 | ) | (314,273,617 | ) | (32,598,955 | ) | (60,745,662 | ) | (8,455,659 | ) | ||||||||||
| Net unrealized appreciation (depreciation) on: | ||||||||||||||||||||
| Investments | (238,059,018 | ) | (644,531,466 | ) | (97,423,979 | ) | (39,473,151 | ) | (49,191,135 | ) | ||||||||||
| Foreign currency translations | 127 | (1,581,453 | ) | (628,959 | ) | — | (727,965 | ) | ||||||||||||
| Net unrealized depreciation: | (238,058,891 | ) | (646,112,919 | ) | (98,052,938 | ) | (39,473,151 | ) | (49,919,100 | ) | ||||||||||
| Net realized and unrealized loss on investments | ||||||||||||||||||||
| and foreign currency | (297,021,090 | ) | (960,386,536 | ) | (130,651,893 | ) | (100,218,813 | ) | (58,374,759 | ) | ||||||||||
| Net decrease in net assets resulting from operations | $ | (297,217,859 | ) | $ | (924,965,565 | ) | $ | (129,476,812 | ) | $ | (100,499,074 | ) | $ | (58,110,496 | ) | |||||
The accompanying notes are an integral part of these financial statements.
Statements of Operations 47
Masters’ Select Funds Trust
STATEMENTS OF CHANGES IN NET ASSETS
| Equity Fund | International Fund | |||||||||||||||
Year Ended December 31, 2008 | Year Ended December 31, 2007 | Year Ended December 31, 2008 | Year Ended December 31, 2007 | |||||||||||||
| INCREASE (DECREASE) IN NET ASSETS FROM: | ||||||||||||||||
| OPERATIONS | ||||||||||||||||
| Net investment income (loss) | $ | (196,769 | ) | $ | (1,578,173 | ) | $ | 35,420,971 | $ | 17,233,734 | ||||||
| Net realized gain (loss) on investments and foreign currency | (58,962,199 | ) | 82,626,408 | (314,273,617 | ) | 401,186,734 | ||||||||||
| Net unrealized depreciation on investments and foreign currency | (238,058,891 | ) | (43,041,731 | ) | (646,112,919 | ) | (68,794,300 | ) | ||||||||
| Net increase (decrease) in net assets resulting from operations | (297,217,859 | ) | 38,006,504 | (924,965,565 | ) | 349,626,168 | ||||||||||
| DISTRIBUTIONS TO SHAREHOLDERS | ||||||||||||||||
| From net investment income | (347,380 | ) | — | (39,004,663 | ) | (19,363,909 | ) | |||||||||
| From net realized gain | (22,270,924 | ) | (56,890,903 | ) | (36,804,181 | ) | (367,301,721 | ) | ||||||||
| Total distributions | (22,618,304 | ) | (56,890,903 | ) | (75,808,844 | ) | (386,665,630 | ) | ||||||||
| CAPITAL SHARE TRANSACTIONS | ||||||||||||||||
| Proceeds from shares sold | 45,306,589 | 48,490,404 | 437,227,741 | 453,130,478 | ||||||||||||
| Reinvested distributions | 22,244,561 | 55,625,610 | 63,004,901 | 338,267,694 | ||||||||||||
| Redemption fee proceeds | 28,895 | 31,141 | 649,211 | 170,561 | ||||||||||||
| Payment for shares redeemed | (199,822,660 | ) | (240,237,488 | ) | (677,229,248 | ) | (410,328,204 | ) | ||||||||
| Net increase (decrease) in net assets from capital share transactions | (132,242,615 | ) | (136,090,333 | ) | (176,347,395 | ) | 381,240,529 | |||||||||
| Total increase (decrease) in net assets | (452,078,778 | ) | (154,974,732 | ) | (1,177,121,804 | ) | 344,201,067 | |||||||||
| NET ASSETS | ||||||||||||||||
| Beginning of year | 708,723,028 | 863,697,760 | 2,070,997,536 | 1,726,796,469 | ||||||||||||
| End of year | $ | 256,644,250 | $ | 708,723,028 | $ | 893,875,732 | $ | 2,070,997,536 | ||||||||
| Accumulated net investment loss | $ | — | $ | — | $ | 2,899,345 | $ | (17,736,922 | ) | |||||||
| CAPITAL TRANSACTIONS IN SHARES: | ||||||||||||||||
| Sold | 4,069,572 | 2,974,750 | 29,471,686 | 21,145,017 | ||||||||||||
| Reinvested distributions | 2,680,068 | 3,568,033 | 6,287,674 | 17,572,363 | ||||||||||||
| Redeemed | (19,425,425 | ) | (14,897,969 | ) | (52,217,125 | ) | (20,013,727 | ) | ||||||||
| Net increase (decrease) from capital share transactions | (12,675,785 | ) | (8,355,186 | ) | (16,457,765 | ) | 18,703,653 | |||||||||
The accompanying notes are an integral part of these financial statements.
48 The Masters’ Select Funds Trust
Masters’ Select Funds Trust
STATEMENTS OF CHANGES IN NET ASSETS
| Value Fund | Smaller Companies Fund | |||||||||||||||
Year Ended December 31, 2008 | Year Ended December 31, 2007 | Year Ended December 31, 2008 | Year Ended December 31, 2007 | |||||||||||||
| INCREASE (DECREASE) IN NET ASSETS FROM: | ||||||||||||||||
| OPERATIONS | ||||||||||||||||
| Net investment income (loss) | $ | 1,175,081 | $ | 1,721,213 | $ | (280,261 | ) | $ | (1,131,937 | ) | ||||||
| Net realized gain (loss) on investments and foreign currency | (32,598,955 | ) | 26,929,968 | (60,745,662 | ) | 41,764,147 | ||||||||||
| Net unrealized depreciation on investments and foreign currency | (98,052,938 | ) | (36,504,527 | ) | (39,473,151 | ) | (35,792,565 | ) | ||||||||
| Net increase (decrease) in net assets resulting from operations | (129,476,812 | ) | (7,853,346 | ) | (100,499,074 | ) | 4,839,645 | |||||||||
| DISTRIBUTIONS TO SHAREHOLDERS | ||||||||||||||||
| From net investment income | (2,000,062 | ) | — | — | — | |||||||||||
| From net realized gain | (7,028,244 | ) | (20,002,631 | ) | (5,980,537 | ) | (30,497,734 | ) | ||||||||
| Total distributions | (9,028,306 | ) | (20,002,631 | ) | (5,980,537 | ) | (30,497,734 | ) | ||||||||
| CAPITAL SHARE TRANSACTIONS | ||||||||||||||||
| Proceeds from shares sold | 29,695,793 | 51,726,933 | 27,238,388 | 64,217,276 | ||||||||||||
| Reinvested distributions | 8,919,959 | 19,715,916 | 5,752,905 | 29,295,708 | ||||||||||||
| Redemption fee proceeds | 42,222 | 24,480 | 23,908 | 46,357 | ||||||||||||
| Payment for shares redeemed | (151,824,094 | ) | (68,432,717 | ) | (82,293,467 | ) | (91,705,132 | ) | ||||||||
| Net increase (decrease) in net assets from capital share transactions | (113,166,120 | ) | 3,034,612 | (49,278,266 | ) | 1,854,209 | ||||||||||
| Total decrease in net assets | (251,671,238 | ) | (24,821,365 | ) | (155,757,877 | ) | (23,803,880 | ) | ||||||||
| NET ASSETS | ||||||||||||||||
| Beginning of year | 342,196,886 | 367,018,251 | 245,111,630 | 268,915,510 | ||||||||||||
| End of year | $ | 90,525,648 | $ | 342,196,886 | $ | 89,353,753 | $ | 245,111,630 | ||||||||
| Accumulated net investment loss | $ | 363,215 | $ | (365,548 | ) | $ | (7 | ) | $ | — | ||||||
| CAPITAL TRANSACTIONS IN SHARES: | ||||||||||||||||
| Sold | 2,563,638 | 3,063,238 | 2,596,805 | 4,132,333 | ||||||||||||
| Reinvested distributions | 1,156,934 | 1,243,907 | 810,268 | 2,133,701 | ||||||||||||
| Redeemed | (14,082,445 | ) | (4,096,872 | ) | (8,954,269 | ) | (6,018,299 | ) | ||||||||
| Net increase (decrease) from capital share transactions | (10,361,873 | ) | 210,273 | (5,547,196 | ) | 247,735 | ||||||||||
The accompanying notes are an integral part of these financial statements.
Statements of Changes in Net Assets 49
Masters’ Select Funds Trust
STATEMENTS OF CHANGES IN NET ASSETS
| Focused Opportunities Fund | ||||||||
Year Ended December 31, 2008 | Year Ended December 31, 2007 | |||||||
| INCREASE IN NET ASSETS FROM: | ||||||||
| OPERATIONS | ||||||||
| Net investment income | $ | 264,263 | $ | 684,441 | ||||
| Net realized gain (loss) on investments and foreign currency | (8,455,659 | ) | 2,628,958 | |||||
| Net unrealized appreciation (depreciation) on investments and foreign currency | (49,919,100 | ) | 3,024,592 | |||||
| Net increase (decrease) in net assets resulting from operations | (58,110,496 | ) | 6,337,991 | |||||
| DISTRIBUTIONS TO SHAREHOLDERS | ||||||||
| From net investment income | (849,956 | ) | — | |||||
| From net realized gain | (551,710 | ) | (3,560,916 | ) | ||||
| Total distributions | (1,401,666 | ) | (3,560,916 | ) | ||||
| CAPITAL SHARE TRANSACTIONS | ||||||||
| Proceeds from shares sold | 27,337,148 | 58,200,714 | ||||||
| Reinvested distributions | 1,398,789 | 3,544,589 | ||||||
| Redemption fee proceeds | 6,770 | 5,057 | ||||||
| Payment for shares redeemed | (35,845,489 | ) | (3,993,527 | ) | ||||
| Net increase (decrease) in net assets from capital share transactions | (7,102,782 | ) | 57,756,833 | |||||
| Total increase (decrease) in net assets | (66,614,944 | ) | 60,533,908 | |||||
| NET ASSETS | ||||||||
| Beginning of year | 117,770,567 | 57,236,659 | ||||||
| End of year | $ | 51,155,623 | $ | 117,770,567 | ||||
| Accumulated net investment loss | $ | 249,746 | $ | (251,181 | ) | |||
| CAPITAL TRANSACTIONS IN SHARES: | ||||||||
| Sold | 3,065,872 | 5,109,362 | ||||||
| Reinvested distributions | 221,678 | 303,475 | ||||||
| Redeemed | (4,555,972 | ) | (345,234 | ) | ||||
| Net increase (decrease) from capital share transactions | (1,268,422 | ) | 5,067,603 | |||||
The accompanying notes are an integral part of these financial statements.
50 The Masters’ Select Funds Trust
Masters’ Select Equity Fund
FINANCIAL HIGHLIGHTS
For a capital share outstanding throughout each year.
| Year Ended December 31, | ||||||||||||||||||||
| 2008 | 2007 | 2006 | 2005 | 2004 | ||||||||||||||||
| Net asset value, beginning of year | $ | 15.17 | $ | 15.69 | $ | 15.24 | $ | 15.26 | $ | 13.44 | ||||||||||
| Income from investment operations: | ||||||||||||||||||||
| Net investment loss | (0.01 | ) | (0.03 | ) | (0.01 | ) | (0.02 | ) | (0.06 | ) | ||||||||||
| Net realized and unrealized gain (loss) on | ||||||||||||||||||||
| investments and foreign currency | (7.03 | ) | 0.78 | 1.44 | 0.75 | 1.88 | ||||||||||||||
| Total income (loss) from investment operations | (7.04 | ) | 0.75 | 1.43 | 0.73 | 1.82 | ||||||||||||||
| Less distributions: | ||||||||||||||||||||
| From net investment income | (0.01 | ) | –– | –– | –– | –– | ||||||||||||||
| From net realized gain | (0.58 | ) | (1.27 | ) | (0.98 | ) | (0.75 | ) | –– | |||||||||||
| Total distributions | (0.59 | ) | (1.27 | ) | (0.98 | ) | (0.75 | ) | –– | |||||||||||
| Redemption fee proceeds | –– | ^ | –– | ^ | –– | ^ | –– | ^ | –– | ^ | ||||||||||
| Net asset value, end of year | $ | 7.54 | $ | 15.17 | $ | 15.69 | $ | 15.24 | $ | 15.26 | ||||||||||
| Total return | (46.76 | )% | 4.57 | % | 9.34 | % | 4.96 | % | 13.54 | % | ||||||||||
| Ratios/supplemental data: | ||||||||||||||||||||
| Net assets, end of year (millions) | $ | 256.6 | $ | 708.7 | $ | 863.7 | $ | 892.6 | $ | 855.3 | ||||||||||
| Ratio of total expenses to average net assets: | ||||||||||||||||||||
| Before fees waived and expenses paid indirectly | 1.25 | % | 1.21 | % | 1.19 | % | 1.19 | % | 1.22 | % | ||||||||||
| After fees waived and expenses paid indirectly | 1.24 | % | 1.20 | % | 1.18 | % | 1.19 | % | 1.22 | % | ||||||||||
| Ratio of net investment loss to average net assets: | (0.04 | )% | (0.20 | )% | (0.08 | )% | (0.14 | )% | (0.46 | )% | ||||||||||
| Portfolio turnover rate | 101.71 | % | 35.19 | % | 38.39 | % | 46.05 | % | 39.34 | % | ||||||||||
^ Amount represents less than $0.01 per share.
The accompanying notes are an integral part of these financial statements.
Financial Highlights 51
Masters’ Select international Fund
FINANCIAL HIGHLIGHTS
For a capital share outstanding throughout each year.
| Year Ended December 31, | ||||||||||||||||||||
| 2008 | 2007 | 2006 | 2005 | 2004 | ||||||||||||||||
| Net asset value, beginning of year | $ | 18.68 | $ | 18.74 | $ | 17.48 | $ | 16.88 | $ | 14.83 | ||||||||||
| Income from investment operations: | ||||||||||||||||||||
| Net investment income | 0.32 | 0.20 | 0.34 | 0.17 | 0.10 | |||||||||||||||
| Net realized and unrealized gain (loss) on | ||||||||||||||||||||
| investments and foreign currency | (8.77 | ) | 3.81 | 3.71 | 3.64 | 2.01 | ||||||||||||||
| Total income (loss) from investment operations | (8.45 | ) | 4.01 | 4.05 | 3.81 | 2.11 | ||||||||||||||
| Less distributions: | ||||||||||||||||||||
| From net investment income | (0.39 | ) | (0.20 | ) | (0.41 | ) | (0.29 | ) | (0.07 | ) | ||||||||||
| From net realized gain | (0.37 | ) | (3.87 | ) | (2.38 | ) | (2.92 | ) | –– | |||||||||||
| Total distributions | (0.76 | ) | (4.07 | ) | (2.79 | ) | (3.21 | ) | (0.07 | ) | ||||||||||
| Redemption fee proceeds | –– | ^ | –– | ^ | –– | ^ | –– | ^ | 0.01 | |||||||||||
| Net asset value, end of year | $ | 9.47 | $ | 18.68 | $ | 18.74 | $ | 17.48 | $ | 16.88 | ||||||||||
| Total return | (45.47 | )% | 20.75 | % | 23.61 | % | 23.78 | % | 14.30 | % | ||||||||||
| Ratios/supplemental data: | ||||||||||||||||||||
| Net assets, end of year (millions) | $ | 893.9 | $ | 2,071.0 | $ | 1,726.8 | $ | 1,429.1 | $ | 1,137.7 | ||||||||||
| Ratio of total expenses to average net assets: | ||||||||||||||||||||
| Before fees waived and expenses paid indirectly | 1.22 | % | 1.19 | % | 1.21 | % | 1.24 | % | 1.28 | % | ||||||||||
| After fees waived and expenses paid indirectly | 1.07 | % | 1.03 | % | 1.06 | % | 1.08 | % | 1.09 | % | ||||||||||
| Ratio of net investment income to average net assets: | 2.19 | % | 0.88 | % | 1.68 | % | 1.17 | % | 0.76 | % | ||||||||||
| Portfolio turnover rate | 113.63 | % | 92.66 | % | 98.03 | % | 160.12 | % | 87.88 | % | ||||||||||
^ Amount represents less than $0.01 per share.
The accompanying notes are an integral part of these financial statements.
52 The Masters’ Select Funds Trust
Masters’ Select Value Fund
FINANCIAL HIGHLIGHTS
For a capital share outstanding throughout each year.
| Year Ended December 31, | ||||||||||||||||||||
| 2008 | 2007 | 2006 | 2005 | 2004 | ||||||||||||||||
| Net asset value, beginning of year | $ | 15.09 | $ | 16.34 | $ | 14.60 | $ | 14.90 | $ | 12.99 | ||||||||||
| Income from investment operations: | ||||||||||||||||||||
| Net investment income | 0.06 | 0.08 | 0.08 | 0.05 | 0.02 | |||||||||||||||
| Net realized and unrealized gain (loss) on | ||||||||||||||||||||
| investments and foreign currency | (7.17 | ) | (0.42 | ) | 2.36 | 0.55 | 1.89 | |||||||||||||
| Total income (loss) from investment operations | (7.11 | ) | (0.34 | ) | 2.44 | 0.60 | 1.91 | |||||||||||||
| Less distributions: | ||||||||||||||||||||
| From net investment income | (0.14 | ) | –– | (0.04 | ) | (0.06 | ) | –– | ||||||||||||
| From net realized gain | (0.49 | ) | (0.91 | ) | (0.66 | ) | (0.84 | ) | –– | |||||||||||
| Total distributions | (0.63 | ) | (0.91 | ) | (0.70 | ) | (0.90 | ) | –– | |||||||||||
| Redemption fee proceeds | –– | ^ | –– | ^ | –– | ^ | –– | ^ | –– | ^ | ||||||||||
| Net asset value, end of year | $ | 7.35 | $ | 15.09 | $ | 16.34 | $ | 14.60 | $ | 14.90 | ||||||||||
| Total return | (47.35 | )% | (2.34 | )% | 16.77 | % | 4.13 | % | 14.70 | % | ||||||||||
| Ratios/supplemental data: | ||||||||||||||||||||
| Net assets, end of year (millions) | $ | 90.5 | $ | 342.2 | $ | 367.0 | $ | 338.2 | $ | 306.5 | ||||||||||
| Ratio of total expenses to average net assets: | ||||||||||||||||||||
| Before fees waived and expenses paid indirectly | 1.29 | % | 1.23 | % | 1.24 | % | 1.24 | % | 1.25 | % | ||||||||||
| After fees waived and expenses paid indirectly | 1.27 | % | 1.21 | % | 1.21 | % | 1.21 | % | 1.23 | % | ||||||||||
| Ratio of net investment income to average net assets: | 0.54 | % | 0.45 | % | 0.49 | % | 0.26 | % | 0.20 | % | ||||||||||
| Portfolio turnover rate | 38.76 | % | 24.42 | % | 31.00 | % | 30.21 | % | 29.14 | % | ||||||||||
^ Amount represents less than $0.01 per share.
The accompanying notes are an integral part of these financial statements.
Financial Highlights 53
Masters’ Select Smaller Companies Fund
FINANCIAL HIGHLIGHTS
For a capital share outstanding throughout each year.
| Year Ended December 31, | ||||||||||||||||||||
| 2008 | 2007 | 2006 | 2005 | 2004 | ||||||||||||||||
| Net asset value, beginning of year | $ | 13.36 | $ | 14.86 | $ | 14.10 | $ | 13.84 | $ | 11.79 | ||||||||||
| Income from investment operations: | ||||||||||||||||||||
| Net investment loss | (0.02 | ) | (0.06 | ) | (0.09 | ) | (0.07 | ) | (0.08 | ) | ||||||||||
| Net realized and unrealized gain (loss) on | ||||||||||||||||||||
| investments | (5.96 | ) | 0.35 | 1.47 | 0.80 | 2.56 | ||||||||||||||
| Total income (loss) from investment operations | (5.98 | ) | 0.29 | 1.38 | 0.73 | 2.48 | ||||||||||||||
| Less distributions: | ||||||||||||||||||||
| From net realized gain | (0.40 | ) | (1.79 | ) | (0.62 | ) | (0.47 | ) | (0.43 | ) | ||||||||||
| Total distributions | (0.40 | ) | (1.79 | ) | (0.62 | ) | (0.47 | ) | (0.43 | ) | ||||||||||
| Redemption fee proceeds | –– | ^ | — | ^ | — | ^ | — | ^ | — | ^ | ||||||||||
| Net asset value, end of year | $ | 6.98 | $ | 13.36 | $ | 14.86 | $ | 14.10 | $ | 13.84 | ||||||||||
| Total return | (44.81 | )% | 1.64 | % | 9.67 | % | 5.29 | % | 21.01 | % | ||||||||||
| Ratios/supplemental data: | ||||||||||||||||||||
| Net assets, end of year (millions) | $ | 89.4 | $ | 245.1 | $ | 268.9 | $ | 273.2 | $ | 162.6 | ||||||||||
| Ratio of total expenses to average net assets: | ||||||||||||||||||||
| Before fees waived and expenses paid indirectly | 1.39 | % | 1.32 | % | 1.32 | % | 1.33 | % | 1.43 | % | ||||||||||
| After fees waived and expenses paid indirectly | 1.39 | % | 1.31 | % | 1.31 | % | 1.30 | % | 1.40 | % | ||||||||||
| Ratio of net investment loss to average net assets: | (0.15 | )% | (0.40 | )% | (0.56 | )% | (0.64 | )% | (1.07 | )% | ||||||||||
| Portfolio turnover rate | 142.21 | % | 130.65 | % | 102.72 | % | 118.76 | % | 148.81 | % | ||||||||||
^ Amount represents less than $0.01 per share.
The accompanying notes are an integral part of these financial statements.
54 The Masters’ Select Funds Trust
Masters’ Select Focused Opportunities Fund
FINANCIAL HIGHLIGHTS
For a capital share outstanding throughout each period.
| Year Ended December 31, | ||||||||||||
| 2008 | 2007 | Period Ended** December 31, 2006 | ||||||||||
| Net asset value, beginning of period | $ | 11.48 | $ | 11.02 | $ | 10.00 | ||||||
| Income from investment operations: | ||||||||||||
| Net investment income | 0.01 | 0.09 | –– | |||||||||
| Net realized and unrealized gain (loss) on | ||||||||||||
| investments and foreign currency | (5.66 | ) | 0.77 | 1.02 | ||||||||
| Total income (loss) from investment operations | (5.65 | ) | 0.86 | 1.02 | ||||||||
| Less distributions: | ||||||||||||
| From net investment income | (0.08 | ) | –– | –– | ||||||||
| From net realized gain | (0.06 | ) | (0.40 | ) | –– | |||||||
| Total distributions | (0.14 | ) | (0.40 | ) | –– | |||||||
| Redemption fee proceeds | –– | ^ | –– | ^ | –– | ^ | ||||||
| Net asset value, end of period | $ | 5.69 | $ | 11.48 | $ | 11.02 | ||||||
| Total return | (49.34 | )% | 7.73 | % | 10.20 | %+ | ||||||
| Ratios/supplemental data: | ||||||||||||
| Net assets, end of period (millions) | $ | 51.2 | $ | 117.8 | $ | 57.2 | ||||||
| Ratio of total expenses to average net assets: | ||||||||||||
| Before fees waived and expenses paid indirectly | 1.36 | % | 1.34 | % | 1.63 | %* | ||||||
| After fees waived and expenses paid indirectly | 1.28 | % | 1.26 | % | 1.40 | %* | ||||||
| Ratio of net investment income (loss) to average net assets: | 0.28 | % | 0.72 | % | (0.02 | )%* | ||||||
| Portfolio turnover rate | 72.09 | % | 45.66 | % | 7.12 | %+ | ||||||
* Annualized.
+ Not annualized.
^ Amount represents less than $0.01 per share.
** Commenced operations on June 30, 2006.
The accompanying notes are an integral part of these financial statements.
Financial Highlights 55
Masters’ Select Funds Trust
NOTES TO FINANCIAL STATEMENTS
Note 1 – Organization
The Masters’ Select Funds Trust (the “Trust”) was organized as a Delaware business trust on August 1, 1996 and is registered under the Investment Company Act of 1940 (the "1940 Act") as an open-end management investment company. The Trust consists of five separate series: the Masters’ Select Equity Fund, the Masters’ Select International Fund, the Masters’ Select Value Fund, the Masters’ Select Smaller Companies Fund and the Masters’ Select Focused Opportunities Fund (each a “Fund” and collectively the “Funds”).
The Masters’ Select Equity Fund seeks to increase the value of your investment over the long-term by using the combined talents and favorite stock-picking ideas of six highly regarded portfolio managers.
The Masters’ Select International Fund seeks to increase the value of your investment over the long-term by using the combined talents and favorite stock-picking ideas of six highly regarded international portfolio managers.
The Masters’ Select Value Fund seeks to increase the value of your investment over the long-term by using the combined talents and favorite stock-picking ideas of four highly regarded value portfolio managers.
The Masters’ Select Smaller Companies Fund seeks to increase the value of your investment over the long-term by using the combined talents and favorite stock-picking ideas of five highly regarded smaller company portfolio managers.
The Masters’ Select Focused Opportunities Fund seeks to increase the value of your investment over the long-term by using the combined talents and favorite stock-picking ideas of three highly regarded portfolio managers.
Note 2 – Significant Accounting Policies
The following is a summary of the significant accounting policies followed by the Funds. These policies are in conformity with accounting principles generally accepted in the United States of America.
| A. | Security Valuation. Investments in securities traded on a national securities exchange are valued at the last reported sales price at the close of regular trading on each day that the exchanges are open for trading. Securities listed on the NASDAQ Global Market, the NASDAQ Global Select Market and the NASDAQ Capital Market are valued using the NASDAQ Official Closing Price (“NOCP”). Securities traded on an exchange for which there have been no sales are valued at the mean between the closing bid and asked prices. Debt securities maturing within 60 days or less are valued at amortized cost unless the Valuation Committee determines that amortized cost does not represent fair value. Securities for which market prices are not readily available or if a security’s value has materially changed after the close of the security’s primary market but before the close of trading on the NYSE, the securities are valued at fair value as determined in good faith by the Investment Managers that selected the security for the Fund’s portfolio and the Trust’s Valuation Committee in accordance with procedures approved by the Board of Trustees. In determining fair value, the Funds take into account all relevant factors and available information. Consequently, the price of the security used by a Fund to calculate its net asset value may differ from quoted or published prices for the same security. Fair value pricing involves subjective judgments and there is no single standard for determining the fair value of a security. As a result, different mutual funds could reasonably arrive at a different value for the same security. It is possible that the fair value determined for a security is materially different from the value that could be realized upon the sale of that security or from the values that other mutual funds may determine. |
Investments in other funds are valued at their respective net asset values as determined by those funds in accordance with the Investment Company Act of 1940.
The Funds adopted the provisions of Statement of Financial Accounting Standards No. 157, “Fair Value Measurements” (“SFAS 157”), effective with the beginning of the Funds’ fiscal year. SFAS 157 establishes a hierarchy that prioritizes the inputs to valuation techniques giving the highest priority to readily available unadjusted quoted prices in active markets for identical assets (level 1 measurements) and the lowest priority to unobservable inputs (level 3 measurements) when market prices are not readily available or reliable. See Note 5 – Fair Value of Financial Instruments for further disclosure.
| B. | Foreign Currency Translation. The Funds’ records are maintained in U.S. dollars. The value of securities, currencies and other assets and liabilities denominated in currencies other than U.S. dollars are translated into U.S. dollars based upon foreign exchange rates prevailing at the end of the reporting period. The currencies are translated into U.S. dollars by using the exchange rates quoted at the close of the London Stock Exchange prior to when each Fund’s net asset value is next determined. Purchases and sales of investment securities, income and expenses are translated on the respective dates of such transactions. |
The Funds do not isolate that portion of their net realized and unrealized gains and losses on investments resulting from changes in foreign exchange rates from the impact arising from changes in market prices. Such fluctuations are included with net realized and unrealized gain or loss from investments and foreign currency.
Net realized foreign currency transaction gains and losses arise from sales of foreign currencies, currency gains or losses realized between the trade and settlement dates on securities transactions, and the differences between the amounts of dividends, interest, and foreign withholding taxes recorded on the Funds’ books and the U.S. dollar equivalent of the amounts actually received or paid. Net unrealized foreign currency translation gains and losses arise from changes in the value of assets and liabilities, other than investments in securities, resulting from changes in the exchange rates.
56 The Masters’ Select Funds Trust
Masters’ Select Funds Trust
NOTES TO FINANCIAL STATEMENTS – (Continued)
| C. | Restricted Securities. A restricted security cannot be resold to the general public without prior registration under the Securities Act of 1933. If the security is subsequently registered and resold, the issuers would typically bear the expense of all registrations at no cost to the Fund. Restricted securities are valued according to the guidelines and procedures adopted by the Funds’ Board of Trustees. As of December 31, 2008, there were no restricted securities held by the Funds. |
| D. | Forward Foreign Currency Exchange Contracts. The Funds may utilize forward foreign currency exchange contracts (“forward contracts”) under which they are obligated to exchange currencies on specified future dates at specified rates, and are subject to the translations of foreign exchange rates fluctuations. All contracts are “marked-to-market” daily and any resulting unrealized gains or losses are recorded as unrealized appreciation or depreciation on foreign currency translations. The Funds record realized gains or losses at the time the forward contract is settled. These gains and losses are reflected on the Statement of Operations as Realized Gain (loss) on foreign currency transactions. Counter-parties to these forward contracts are major U.S. financial institutions. For further information on the forward contracts held by each Fund, please refer to Note 6. |
| E. | Purchasing Put and Call Options. Each Fund may purchase covered “put” and “call” options with respect to securities which are otherwise eligible for purchase by a Fund and with respect to various stock indices subject to certain restrictions. Each Fund will engage in trading of such derivative securities primarily for hedging purposes. |
If a Fund purchases a put option, a Fund acquires the right to sell the underlying security at a specified price at any time during the term of the option (for “American-style” options) or on the option expiration date (for “European-style” options). Purchasing put options may be used as a portfolio investment strategy when a Manager perceives significant short-term risk but substantial long-term appreciation for the underlying security. The put option acts as an insurance policy, as it protects against significant downward price movement while it allows full participation in any upward movement. If a Fund is holding a stock which it feels has strong fundamentals, but for some reason may be weak in the near term, a Fund may purchase a put option on such security, thereby giving itself the right to sell such security at a certain strike price throughout the term of the option. Consequently, a Fund will exercise the put only if the price of such security falls below the strike price of the put. The difference between the put’s strike price and the market price of the underlying security on the date a Fund exercises the put, less transaction costs, will be the amount by which a Fund will be able to hedge against a decline in the underlying security. If during the period of the option the market price for the underlying security remains at or above the put’s strike price, the put will expire worthless, representing a loss of the price a Fund paid for the put, plus transaction costs. If the price of the underlying security increases, the profit a Fund realizes on the sale of the security will be reduced by the premium paid for the put option less any amount for which the put may be sold.
If a Fund purchases a call option, it acquires the right to purchase the underlying security at a specified price at any time during the term of the option. The purchase of a call option is a type of insurance policy to hedge against losses that could occur if a Fund has a short position in the underlying security and the security thereafter increases in price. Each Fund will exercise a call option only if the price of the underlying security is above the strike price at the time of exercise. If during the option period the market price for the underlying security remains at or below the strike price of the call option, the option will expire worthless, representing a loss of the price paid for the option, plus transaction costs. If the call option has been purchased to hedge a short position of a Fund in the underlying security and the price of the underlying security thereafter falls, the profit a Fund realizes on the cover of the short position in the security will be reduced by the premium paid for the call option less any amount for which such option may be sold.
Prior to exercise or expiration, an option may be sold when it has remaining value by a purchaser through a “closing sale transaction,” which is accomplished by selling an option of the same series as the option previously purchased. Each Fund generally will purchase only those options for which a Manager believes there is an active secondary market to facilitate closing transactions.
Writing Call Options. Each Fund may write covered call options. A call option is “covered” if a Fund owns the security underlying the call or has an absolute right to acquire the security without additional cash consideration (or, if additional cash consideration is required, cash or cash equivalents in such amount as are held in a segregated account by the Custodian). The writer of a call option receives a premium and gives the purchaser the right to buy the security underlying the option at the exercise price. The writer has the obligation upon exercise of the option to deliver the underlying security against payment of the exercise price during the option period. If the writer of an exchange-traded option wishes to terminate his obligation, he may effect a “closing purchase transaction.” This is accomplished by buying an option of the same series as the option previously written. A writer may not effect a closing purchase transaction after it has been notified of the exercise of an option.
Effecting a closing transaction in the case of a written call option will permit a Fund to write another call option on the underlying security with either a different exercise price, expiration date or both. Also, effecting a closing transaction will permit the cash or proceeds from the concurrent sale of any securities subject to the option to be used for other investments of a Fund. If a Fund desires to sell a particular security from its portfolio on which it has written a call option, it will effect a closing transaction prior to or concurrent with the sale of the security.
Notes to Financial Statements 57
Masters’ Select Funds Trust
NOTES TO FINANCIAL STATEMENTS – (Continued)
Each Fund will realize a gain from a closing transaction if the cost of the closing transaction is less than the premium received from writing the option or if the proceeds from the closing transaction are more than the premium paid to purchase the option. Each Fund will realize a loss from a closing transaction if the cost of the closing transaction is more than the premium received from writing the option or if the proceeds from the closing transaction are less than the premium paid to purchase the option. However, because increases in the market price of a call option will generally reflect increases in the market price of the underlying security, any loss to a Fund resulting from the repurchase of a call option is likely to be offset in whole or in part by appreciation of the underlying security owned by a Fund.
Risks of Investing in Options. There are several risks associated with transactions in options on securities. Options may be more volatile than the underlying instruments and, therefore, on a percentage basis, an investment in options may be subject to greater fluctuation than an investment in the underlying instruments themselves. There are also significant differences between the securities and options markets that could result in an imperfect correlation between these markets, causing a given transaction not to achieve its objective. In addition, a liquid secondary market for particular options may be absent for reasons which include the following: there may be insufficient trading interest in certain options; restrictions may be imposed by an exchange on opening transactions or closing transactions or both; trading halts, suspensions or other restrictions may be imposed with respect to particular classes or series of option of underlying securities; unusual or unforeseen circumstances may interrupt normal operations on an exchange; the facilities of an exchange or clearing corporation may not at all times be adequate to handle current trading volume; or one or more exchanges could, for economic or other reasons, decide or be compelled at some future date to discontinue the trading of options (or a particular class or series of options), in which event the secondary market on that exchange (or in that class or series of options) would cease to exist, although outstanding options that had been issued by a clearing corporation as a result of trades on that exchange would continue to be exercisable in accordance with their terms.
A decision as to whether, when and how to use options involves the exercise of skill and judgment, and even a well-conceived transaction may be unsuccessful to some degree because of market behavior or unexpected events. The extent to which a Fund may enter into options transactions may be limited by the requirements of the Internal Revenue Code of 1986, as amended (the “Code”), with respect to qualification of a Fund as a regulated investment company. As of December 31, 2008, there were no options held by the Funds.
| F. | Federal Income Taxes. The Funds intend to comply with the requirements of Subchapter M of the Internal Revenue Code applicable to regulated investment companies and to distribute all of their taxable income to their shareholders. Accordingly, no provisions for federal income taxes are required. |
Effective June 29, 2007, the Funds adopted Financial Accounting Standards Board (FASB) Interpretation No. 48 (FIN 48), Accounting for Uncertainty in Income Taxes, a clarification of FASB Statement No. 109, Accounting for Income Taxes. FIN 48 establishes financial reporting rules regarding recognition and measurement of tax positions taken or expected to be taken on a tax return. The adoption of FIN 48 had no impact on the Funds’ net assets or results of operations.
| G. | Distributions to Shareholders. Distributions paid to shareholders are recorded on the ex-dividend date. The amount of dividends and distributions from net investment income and net realized capital gains is determined in accordance with federal income tax regulations, which may differ from generally accepted accounting principles. To the extent these “book/tax” differences are permanent in nature (i.e., that they result from other than timing of recognition – “temporary differences”), such amounts are reclassified within the capital accounts based on their federal tax-basis. |
| H. | Security Transactions, Dividend and Interest Income and Expenses. Security transactions are accounted for on the trade date. Realized gains and losses on securities transactions are reported on an identified cost basis. Dividend income and, where applicable, foreign tax withholding expenses are recorded on the ex-dividend date. Interest income is recorded on an accrual basis. Purchase discounts and premiums on fixed-income securities are accreted and amortized to maturity using the effective interest method. Many expenses of the Trust can be directly attributed to a specific Fund. Each Fund is charged for expenses directly attributed to it. Expenses that cannot be directly attributed to a specific Fund are allocated among the Funds in the Trust in proportion to their respective net assets or other appropriate method. |
| I. | Repurchase Agreements. Each Fund may enter into repurchase agreements through which the Fund acquires a security (the “underlying security”) from a seller, a well-established securities dealer or a bank that is a member of the Federal Reserve System. The bank or securities dealer agrees to repurchase the underlying security at the same price, plus a specified amount of interest, at a later date, generally for a period of less than one week. It is the Trust’s policy that its Custodian takes possession of securities as collateral under repurchase agreements and to determine on a daily basis that the value of such securities, including recorded interest, is sufficient to cover the value of the repurchase agreements. The Funds’ policy states that the value of the collateral is at least 102% of the value of the repurchase agreement. If the counterparty defaults and the value of the collateral declines or if bankruptcy proceedings are commenced with respect to the counterparty of the security, realization of the collateral by a Fund may be delayed or limited. |
| J. | Expenses Paid Indirectly. Under terms of the Trust’s Custodial Agreement, the Funds earn credits on cash balances which are applied against custodian fees. |
58 The Masters’ Select Funds Trust
Masters’ Select Funds Trust
NOTES TO FINANCIAL STATEMENTS – (Continued)
| K. | Indemnification Obligations. Under the Funds' organizational documents, its current and former officers and trustees are indemnified against certain liabilities arising out of the performance of their duties to the Funds. In addition, in the normal course of business, the Funds enter into contracts that contain a variety of representations and warranties that provide general indemnifications. The Funds' maximum exposure under these arrangements is unknown as this would involve future claims that may be made against the Funds that have not yet occurred or that would be covered by other parties. |
| L. | Accounting Estimates. The preparation of financial statements in conformity with accounting principles generally accepted in the United States of America requires management to make estimates and assumptions. These estimates and assumptions affect the reported amounts of assets and liabilities and the disclosure of contingent assets and liabilities at the date of financial statements and the reported amounts of increases and decreases in net assets from operations during the reporting period. Actual results could differ from those estimates. |
Note 3 – Investment Advisory and Other Agreements
The Trust, on behalf of the Funds, entered into an Investment Advisory Agreement (the “Agreement”) with Litman/Gregory Fund Advisors, LLC (the “Advisor”). Under the terms of the Agreement, each Fund pays a monthly investment advisory fee to the Advisor at the annual rate below of the respective Fund’s average daily net assets before any fee waivers:
| Equity Fund | 1.10% on the first $ 750 million and |
| 1.00% on assets in excess of $ 750 million | |
| International Fund | 1.10% on the first $ 1 billion and |
| 1.00% on assets in excess of $ 1 billion | |
| Value Fund | 1.10% on the first $ 1 billion and |
| 1.00% on assets in excess of $ 1 billion | |
| Smaller Companies Fund | 1.14% on the first $450 million and |
| 1.04% on assets in excess of $450 million | |
| Focused Opportunities Fund | 1.10% on the first $ 1 billion and |
| 1.00% on assets in excess of $ 1 billion |
The Advisor engages Managers to manage the funds and pays the Managers from its advisory fees.
Through April 30, 2009, the Advisor has contractually agreed to waive a portion of its advisory fees effectively reducing total advisory fees to approximately 0.97% of the average daily net assets of the International Fund, 1.08% of the average daily net assets of the Value Fund, and 1.02% of the Focused Opportunities Fund. Additionally, the Advisor has voluntarily agreed to waive its management fee on the daily cash values of the Funds not allocated to Managers. For the year ended December 31, 2008, the amount waived, contractual and voluntary, was $32,216, $2,441,303, $51,851, $8,902 and $77,862 for the Masters’ Select Equity Fund, Masters’ Select International Fund, Masters’ Select Value Fund, Masters’ Select Smaller Companies Fund and Masters’ Select Focused Opportunities Fund, respectively. The Advisor has agreed not to seek recoupment of such waived fees.
U.S. Bancorp Fund Services, LLC (“USBFS”) serves as the Administrator to the Funds. State Street Bank and Trust (“State Street”) serves as the Funds’ Custodian and Fund Accountant. Boston Financial Data Services (“BFDS”), an affiliate of State Street, serves as the Funds’ Transfer Agent. Quasar Distributors, LLC (“Quasar”), an affiliate of USBFS, acts as the Funds’ distributor and principal underwriter.
An employee of the Advisor serves as the Funds’ Chief Compliance Officer (“CCO”). The CCO receives no compensation from the Funds for his services, however, the Funds reimbursed the Advisor $54,000 for the year ended December 31, 2008 for the services of the CCO.
Affiliated entities of the Managers received net commissions on purchases and sales of the Funds’ portfolio securities for the year ended December 31, 2008 of $233,041 for the Masters’ Select International Fund.
Each independent Trustee, within the meaning of the 1940 Act, is compensated by the Trust at the rate of $75,000 per year.
Notes to Financial Statements 59
Masters’ Select Funds Trust
NOTES TO FINANCIAL STATEMENTS – (Continued)
Note 4 – Investment Transactions
The cost of securities purchased and the proceeds from securities sold for the year ended December 31, 2008, excluding short-term investments, were as follows:
| Fund | Purchases | Sales | ||||||
| Equity Fund | $ | 520,414,851 | $ | 663,777,187 | ||||
| International Fund | 1,713,880,928 | 1,838,624,782 | ||||||
| Value Fund | 82,235,103 | 197,491,517 | ||||||
| Smaller Companies Fund | 237,081,371 | 278,136,650 | ||||||
| Focused Opportunities Fund | 64,882,882 | 63,105,403 | ||||||
Note 5 – Fair Value of Financial Instruments
In September 2006, the Financial Accounting Standards Board issued Standard No. 157, “Fair Value Measurements” effective for fiscal years beginning after November 15, 2007. SFAS 157 clarifies the definition of fair value for financial reporting, establishes a framework for measuring fair value and requires additional disclosure about the use of fair value measurements in an effort to make the measurement of fair value more consistent and comparable. The Funds adopted SFAS 157 effective January 1, 2008. A summary of the fair value hierarchy under SFAS 157 is described below.
Various inputs are used in determining the value of the Fund’s investments. These inputs are summarized in the three broad levels listed below:
Level 1 – Quoted prices in active markets for identical securities.
Level 2 – Other significant observable inputs (including quoted prices for similar securities, interest rates, prepayment speeds, credit risk, etc.).
Level 3 – Significant unobservable inputs (including the Fund’s own assumptions in determining the fair value of investments). The following tables provide the fair value measurements of applicable Fund assets by level within the fair value hierarchy for each Fund as of December 31, 2008. These assets are measured on a recurring basis.
| Fund | Description | Total | Quoted prices in active markets for identical assets (Level 1) | Significant other observable inputs (Level 2) | Significant unobservable inputs (Level 3)** | ||||||||||||
| Equity Fund | Assets: | ||||||||||||||||
| Securities | $ | 253,047,026 | $ | 248,378,026 | $ | 4,669,000 | $ | — | |||||||||
| Other Financial instruments* | $ | — | $ | — | $ | — | $ | — | |||||||||
| Total | $ | 253,047,026 | $ | 248,378,026 | $ | 4,669,000 | $ | — | |||||||||
| International Fund | Assets: | ||||||||||||||||
| Securities | $ | 891,007,513 | $ | 153,432,704 | $ | 737,574,809 | $ | — | ** | ||||||||
| Other Financial instruments* | $ | 332,539 | $ | 332,539 | $ | — | $ | — | |||||||||
| Total | $ | 891,340,052 | $ | 153,765,243 | $ | 737,574,809 | $ | — | |||||||||
| Value Fund | Assets: | ||||||||||||||||
| Securities | $ | 90,328,593 | $ | 87,148,593 | $ | 3,180,000 | $ | — | |||||||||
| Other Financial instruments* | $ | (254,450 | ) | $ | (254,450 | ) | $ | — | $ | — | |||||||
| Total | $ | 90,074,143 | $ | 86,894,143 | $ | 3,180,000 | $ | — | |||||||||
| Smaller Companies Fund | Assets: | ||||||||||||||||
| Securities | $ | 89,750,889 | $ | 85,784,889 | $ | 3,966,000 | $ | — | |||||||||
| Other Financial instruments* | $ | — | $ | — | $ | — | $ | — | |||||||||
| Total | $ | 89,750,889 | $ | 85,784,889 | $ | 3,966,000 | $ | — | |||||||||
| Focused Opportunities Fund | Assets: | ||||||||||||||||
| Securities | $ | 51,748,675 | $ | 48,563,675 | $ | 3,185,000 | $ | — | |||||||||
| Other Financial instruments* | $ | (528,038 | ) | $ | (528,038 | ) | $ | — | $ | — | |||||||
| Total | $ | 51,220,637 | $ | 48,035,637 | $ | 3,185,000 | $ | — | |||||||||
| * | Other financial instruments include forward contracts. |
| ** | Significant unobservable inputs were used in determining the value of portfolio securities for the International Fund. However, the value of these securities was $0 as of December 31, 2008. |
60 The Masters’ Select Funds Trust
Masters’ Select Funds Trust
NOTES TO FINANCIAL STATEMENTS – (Continued)
Note 6 – Income Taxes and Distributions to Shareholders
As of December 31, 2008, the components of accumulated earnings (losses) for income tax purposes were as follows:
| Equity Fund | International Fund | Value Fund | Smaller Companies Fund | Focused Opportunities Fund | ||||||||||||||||
| Tax cost of Investments | 344,978,860 | 1,285,863,896 | 133,719,109 | 133,682,034 | 93,285,925 | |||||||||||||||
| Gross Tax Unrealized Appreciation | 23,083,203 | 31,557,330 | 9,071,150 | 3,346,006 | 243,443 | |||||||||||||||
| Gross Tax Unrealized Depreciation | (115,015,037 | ) | (426,413,713 | ) | (52,461,666 | ) | (47,277,151 | ) | (41,780,693 | ) | ||||||||||
| Net Tax unrealized appreciation (depreciation) | ||||||||||||||||||||
| on investments | (91,931,834 | ) | (394,856,383 | ) | (43,390,516 | ) | (43,931,145 | ) | (41,537,250 | ) | ||||||||||
| Net Tax unrealized appreciation (depreciation) | ||||||||||||||||||||
| on forward contracts and foreign currency | 80 | (8,059 | ) | (6,285 | ) | — | 71 | |||||||||||||
| Net Tax unrealized appreciation (depreciation) | (91,931,754 | ) | (394,864,442 | ) | (43,396,801 | ) | (43,931,145 | ) | (41,537,179 | ) | ||||||||||
| Undistributed ordinary Income | — | 5,273,018 | 598,006 | — | 256,841 | |||||||||||||||
| Capital Loss Carry Forward | (38,082,419 | ) | (222,222,862 | ) | (31,962,945 | ) | (46,712,456 | ) | (6,874,237 | ) | ||||||||||
| Post-October Currency Losses | — | (2,020,795 | ) | (494,051 | ) | (7 | ) | (535,133 | ) | |||||||||||
| Post-October Capital Losses | (17,814,983 | ) | (98,879,781 | ) | (1,885,199 | ) | (10,209,588 | ) | (2,638,047 | ) | ||||||||||
| Total accumulated gain/(loss) | (147,829,156 | ) | (712,714,862 | ) | (77,140,990 | ) | (100,853,196 | ) | (51,327,755 | ) | ||||||||||
The difference between book-basis and tax-basis unrealized appreciation is attributable primarily to wash sales. The capital loss carry forwards for each Fund expire on December 31, 2016.
On the Statements of Assets and Liabilities, the following adjustments were made for permanent tax adjustments:
Undistributed Net Investment Income (Loss) | Accumulated Net Realized Gain (Loss) | Paid In Capital | ||||||||||
| Equity Fund | 544,149 | (540,868 | ) | (3,281 | ) | |||||||
| International Fund | 24,219,959 | (24,219,959 | ) | — | ||||||||
| Value Fund | 1,553,744 | (1,553,744 | ) | — | ||||||||
| Smaller Companies Fund | 280,254 | 736 | (280,990 | ) | ||||||||
| Focused Opportunities Fund | 1,086,620 | (1,086,620 | ) | — | ||||||||
The permanent differences primarily relate to foreign currencies, securities litigation income and PFIC adjustments.
The tax composition of dividends (other than return of capital dividends for the years ended December 31, 2008 and 2007) were as follows:
| 2008 | 2007 | |||||||||||||||
Ordinary Income | Long-term Capital Gain | Ordinary Income | Long-term Capital Gain | |||||||||||||
| Equity Fund | $ | 609,326 | $ | 22,008,978 | $ | 1,239,055 | $ | 55,651,848 | ||||||||
| International Fund | $ | 53,325,301 | $ | 22,483,543 | $ | 167,422,575 | $ | 219,243,055 | ||||||||
| Value Fund | $ | 2,000,062 | $ | 7,028,244 | — | $ | 20,002,631 | |||||||||
| Smaller Companies Fund | $ | 639,687 | $ | 5,340,850 | $ | 5,217,908 | $ | 25,279,826 | ||||||||
| Focused Opportunities Fund | $ | 849,956 | $ | 551,710 | $ | 367,565 | $ | 3,193,351 | ||||||||
The Funds designated as long-term capital gain dividend, pursuant to Internal Revenue Code Section 852(b)(3), the amount necessary to reduce the earnings and profits of the Funds related to net capital gain to zero for the tax year ended December 31, 2008.
Net investment income and net realized gains differ for financial statement and tax purposes due to differing treatments of wash sale losses deferred, foreign currency transactions and losses realized subsequent to October 31 on the sale of securities and foreign currencies.
Notes to Financial Statements 61
Masters’ Select Funds Trust
NOTES TO FINANCIAL STATEMENTS – (Continued)
Note 7 – Off-Balance Sheet Risk
The Funds are parties to financial instruments with off-balance sheet risk, primarily forward contracts, in order to hedge the impact of adverse changes in the relationship between the U.S. dollar and various foreign currencies and certain assets and liabilities denominated in foreign currencies. These instruments involve market risk in excess of the amount recognized in the Statement of Assets and Liabilities. Risks also arise from the possible inability of counterparties to meet the terms of their contracts, future adverse movement in currency values and contract positions that are not exact offsets. The contract amount indicates the extent of the Funds’ involvement in such currencies.
A forward contract is an agreement between two parties to exchange different currencies at a specified rate at an agreed future date. Forward contracts are reported in the financial statements as unrealized gain (loss) as measured by the difference between the forward exchange rate at the reporting date and the forward exchange rate on the date the contract is entered into. At December 31, 2008, the Funds had the following forward contracts outstanding:
| Masters’ Select International Fund | ||||||||||||
| Contracts to Buy | In Exchange For | Settlement Date | Unrealized Gain (Loss) | |||||||||
| None | ||||||||||||
| Contracts to Sell | ||||||||||||
| 6,870,000 | Swiss Franc | U.S. | $ | 6,499,035 | 05/11/2009 | $ | 31,022 | |||||
| 3,820,000 | Swiss Franc | 3,706,615 | 05/26/2009 | 108,466 | ||||||||
| 4,000,000 | Euro | 6,177,600 | 05/26/2009 | 639,689 | ||||||||
| 1,341,000,000 | Japanese Yen | 14,383,782 | 04/28/2009 | (446,480 | ) | |||||||
| 163,265 | Euro | 227,494 | 01/02/2009 | 547 | ||||||||
| 6,331,766 | Hong Kong Dollar | 816,939 | 01/02/2009 | (42 | ) | |||||||
| 2,288,703 | Hong Kong Dollar | 295,305 | 01/05/2009 | (4 | ) | |||||||
| 1,525,794 | Hong Kong Dollar | 196,869 | 01/05/2009 | (3 | ) | |||||||
| 4,773,000 | Hong Kong Dollar | 615,847 | 01/05/2009 | (8 | ) | |||||||
| 23,219,976 | Japanese Yen | 255,502 | 01/07/2009 | (648 | ) | |||||||
| 332,539 | ||||||||||||
| Net unrealized gain on forward contracts | $ | 332,539 | ||||||||||
Masters’ Select Value Fund
| Contracts to Buy | In Exchange For | Settlement Date | Unrealized Gain (Loss) | |||||||||
| 378,900 | Euro | U.S. | $ | 527,887 | 05/13/2009 | $ | (3,161 | ) | ||||
| 280,000 | British Pound Sterling | 486,304 | 01/12/2009 | (83,813 | ) | |||||||
| 140,099,890 | Japanese Yen | 1,483,700 | 02/19/2009 | 63,229 | ||||||||
| 52,552,450 | Japanese Yen | 579,908 | 02/19/2009 | 356 | ||||||||
| 26,108,326 | Japanese Yen | 290,909 | 02/19/2009 | (2,631 | ) | |||||||
| 21,000,000 | Japanese Yen | 235,162 | 02/19/2009 | (3,288 | ) | |||||||
| (29,308 | ) | |||||||||||
| Contracts to Sell | ||||||||||||
| 4,320,086 | Euro | U.S. | $ | 5,427,324 | 05/13/2009 | $ | (555,424 | ) | ||||
| 200,000 | Euro | 259,510 | 05/13/2009 | (17,464 | ) | |||||||
| 2,035,845 | British Pound Sterling | 3,543,949 | 01/12/2009 | 617,486 | ||||||||
| 335,940,000 | Japanese Yen | 3,472,428 | 02/19/2009 | (236,893 | ) | |||||||
| 52,000,000 | Japanese Yen | 548,865 | 02/19/2009 | (25,299 | ) | |||||||
| 50,000,000 | Japanese Yen | 539,724 | 02/19/2009 | (12,357 | ) | |||||||
| 588,595 | Euro | 822,986 | 01/02/2009 | 4,809 | ||||||||
| (225,142 | ) | |||||||||||
| Net unrealized loss on forward contracts | $ | (254,450 | ) | |||||||||
62 The Masters’ Select Funds Trust
Masters’ Select Funds Trust
NOTES TO FINANCIAL STATEMENTS – (Continued)
Masters’ Select Focused Opportunities Fund
| Contracts to Buy | In Exchange For | Settlement Date | Unrealized Gain (Loss) | |||||||||
| 33,000,000 | Japanese Yen | U.S. | $ | 369,541 | 02/19/2009 | $ | (5,168 | ) | ||||
| (5,168 | ) | |||||||||||
| Contracts to Sell | ||||||||||||
| 2,765,273 | Euro | U.S. | $ | 3,474,013 | 05/13/2009 | $ | (355,525 | ) | ||||
| 300,000 | Euro | 389,265 | 05/13/2009 | (26,195 | ) | |||||||
| 179,811,811 | Japanese Yen | 1,858,617 | 02/19/2009 | (126,797 | ) | |||||||
| 29,500,000 | Japanese Yen | 311,375 | 02/19/2009 | (14,353 | ) | |||||||
| (522,870 | ) | |||||||||||
| Net unrealized loss on forward contracts | $ | (528,038 | ) | |||||||||
The Masters’ Select Equity Fund and the Masters’ Select Smaller Companies Fund do not have outstanding forward exchange contracts as of December 31, 2008.
Note 8 – Line of Credit
The Trust has an unsecured $75,000,000 line of credit with its custodian. Borrowings under this arrangement bear interest at the federal funds rate plus 0.50% per annum. As compensation for holding available the lending commitment, the Trust pays 0.12% per annum fee on the unused portion of the commitment, which is allocated among the Funds based on their relative net assets. The fee is payable quarterly in arrears. The Trust made no borrowings during the year ended December 31, 2008.
Note 9 – Accounting Pronouncements
In March 2008, Statement of Financial Accounting Standards No. 161, “Disclosures about Derivative Instruments and Hedging Activities” (“SFAS 161”) was issued and is effective for fiscal years beginning after November 15, 2008. SFAS 161 is intended to improve financial reporting for derivative instruments by requiring enhanced disclosure that enables investors to understand how and why an entity uses derivatives, how derivates are accounted for, and how derivative instruments affect an entity’s results of operations and financial position. Management is currently evaluating the implications of SFAS 161. The impact on the Funds’ financial statement disclosures, if any, is currently being assessed.
Notes to Financial Statements 63
REPORT OF INDEPENDENT REGISTERED PUBLIC ACCOUNTING FIRM
To the Board of Trustees and Shareholders of:
The Masters' Select Equity Fund
The Masters' Select International Fund
The Masters' Select Value Fund
The Masters' Select Smaller Companies Fund
The Masters' Select Focused Opportunities Fund
In our opinion, the accompanying statements of assets and liabilities, including the schedules of investments in securities, and the related statements of operations and of changes in net assets and the financial highlights present fairly, in all material respects, the financial position of The Masters' Select Equity Fund, The Masters' Select International Fund, The Masters' Select Value Fund, The Masters' Select Smaller Companies Fund and The Masters' Select Focused Opportunities Fund (hereafter referred to as the "Funds") at December 31, 2008, and results of each of their operations for the year then ended, changes in each of their net assets and financial highlights for each of the periods presented in conformity with accounting principles generally accepted in the United States of America. These financial statements and financial highlights (hereafter referred to as "financial statements") are the responsibility of the Funds' management. Our responsibility is to express an opinion on these financial statements based on our audits. We conducted our audits of these financial statements in accordance with the standards of the Public Company Accounting Oversight Board (United States). Those standards require that we plan and perform the audit to obtain reasonable assurance about whether the financial statements are free of material misstatement. An audit includes examining, on a test basis, evidence supporting the amounts and disclosures in the financial statements, assessing the accounting principles used and significant estimates made by management, and evaluating the overall financial statement presentation. We believe that our audits, which included confirmation of securities at December 31, 2008 by correspondence with the custodian and brokers, provide a reasonable basis for our opinion.
PricewaterhouseCoopers LLP
San Francisco, California
February 20, 2009
64 The Masters’ Select Funds Trust
Masters’ Select Funds Trust
OTHER INFORMATION – (unaudited)
Proxy Voting Policies and Procedures
The sub-advisors of the Funds vote proxies relating to portfolio securities in accordance with procedures that have been approved by the Board of Trustees of the Funds. You may obtain a description of these procedures, without charge, by calling toll-free, 1-800-960-0188. This information is also available through the Securities and Exchange Commission’s website at http://www.sec.gov.
Proxy Voting Record
Information regarding how the sub-advisors of the Funds voted proxies relating to portfolio securities during the 12-month period ended December 31 is available, without charge, by calling toll-free, 1-800-960-0188. This information is also available through the Securities and Exchange Commission’s website at http://www.sec.gov.
Form N-Q Disclosure
The Funds file their complete schedule of portfolio holdings with the Securities and Exchange Commission for the first and third quarters of each fiscal year on Form N-Q. The Funds’ Form N-Q is available on the Securities and Exchange Commission’s website at http://www.sec.gov. The Funds’ Form N-Q may be reviewed and copied at the Commission’s Public Reference Room in Washington, DC, and information on the operation of the Public Reference Room may be obtained by calling 1-800-SEC-0330. This information is also available, without charge, by calling toll-free, 1-800-960-0188 or by visiting the Funds’ website at http://www.mastersfunds.com.
Householding Mailings
To reduce expenses, the Trust may mail only one copy of the Funds’ prospectus and each annual and semi-annual report to those addresses shared by two or more accounts. If you wish to receive individual copies of these documents, please call us at 1-800-960-0188 (or contact your financial institution). The Trust will begin sending you individual copies thirty days after receiving your request.
Board Consideration of and Continuation of Investment Advisory Agreement
At the meeting held on December 4, 2008, the Board of Trustees, including the independent trustees of the Board of Trustees (the “Independent Trustees”), considered and approved the one-year renewal of: (1) the Unified Investment Advisory Agreement (the “Advisory Agreement”) between the Masters’ Select Funds Trust (the “Trust”) and Litman/Gregory Fund Advisors, LLC (the “Advisor”), with respect to the Masters’ Select Equity Fund, the Masters’ Select International Fund, the Masters’ Select Value Fund, the Masters’ Select Smaller Companies Fund, and the Masters’ Select Focused Opportunities Fund (the “Funds”), and (2) the investment manager agreements (the “Manager Agreements”) between the Advisor and each of Davis Selected Advisers, L.P., Friess Associates, LLC, Southeastern Asset Management, Inc., and Wells Capital Management, Inc. with respect to Masters’ Select Equity Fund, each of Harris Associates, L.P., Marsico Capital Management, LLC, Mastholm Asset Management, LLC, Northern Cross, LLC, Third Avenue Management, LLC, and Thornburg Investment Management, Inc., with respect to Masters’ Select International Fund, each of Franklin Mutual Advisers, LLC, Harris Associates, L.P., and Southeastern Asset Management, Inc., with respect to Masters’ Select Value Fund, and each of Copper Rock Capital Partners, LLC, First Pacific Advisors, LLC, Friess Associates, LLC, Reed Conner & Birdwell, LLC and Wells Capital Management, Inc. with respect to Masters’ Select Smaller Companies Fund, and each of Davis Selected Advisers, L.P. and Franklin Mutual Advisers, LLC, with respect to Masters’ Select Focused Opportunities Fund (the “Managers”). The one-year renewal of all agreements is for the period ending December 31, 2009. At a meeting held on March 4, 2008, the Independent Trustees considered and approved Manager Agreements between the Advisor and Sands Capital Management, LLC with respect the Masters’ Select Equity Fund and the Masters’ Select Focused Opportunities Fund, and Turner Investment Partners, Inc. with respect to the Masters’ Select Equity Fund. Similarly, at a meeting held on September 12, 2008, the Independent Trustees considered and approved a Manager Agreement between the Advisor and Harris Associates, L.P. with respect to the Masters’ Select Equity Fund. Each of these agreements (Sands Capital Management, LLC, Turner Investment Partners, Inc. and Harris Associates, L.P.) was approved through December 31, 2009.
Prior to each meeting, the Independent Trustees had requested detailed information from the Advisor regarding the Funds. The materials provided by the Advisor were extensive and included information relating to each Fund’s investment objectives and, where applicable, results, portfolio composition, advisory fee and expense comparisons, as well as information on each Manager’s performance within the various Funds and in comparison to other accounts (including other mutual funds) managed by such Manager. Financial and profitability information regarding the Advisor, descriptions of various functions, such as compliance monitoring and portfolio trading practices, and information about the personnel providing investment management and administrative services to each Fund was also provided. In addition, the Independent Trustees discussed the approval of the Advisory Agreement and Manager Agreements with representatives of the Advisor and were advised by independent counsel on these and other relevant matters.
In addition, the Board had received information about the Funds throughout the year which included a wide variety of materials relating to the services provided (or to be provided) by the Advisor and the Managers, including reports on the Funds’ and each Manager’s investment results, portfolio composition, portfolio trading practices, and shareholder services, in addition to other
Other Information 65
information relating to the nature, extent, and quality of services provided (or to be provided) by the Advisor and the Managers. Throughout the course of the year, the Board of Trustees also received in-person presentations from various members of senior management at the Advisor and requested and reviewed supplemental information, which included extensive materials regarding the Funds’ investment results, advisory fees and expense comparisons, financial and profitability information regarding the Advisor, compliance monitoring, and information about the personnel providing investment management and administrative services to the Funds.
The information provided to the Board of Trustees at the meeting, together with the information provided throughout the course of the year, formed the primary (but not exclusive) basis for the Board of Trustees’ determinations. The Board of Trustees did not identify any single issue or particular datum point that, in isolation, would be controlling in their decision to renew the Advisory Agreement or the Manager Agreements. Rather, the Board of Trustees considered the total mix of information provided. The following summary describes the key factors considered by the Board of Trustees, including the Independent Trustees, and the conclusions thereto that formed the basis for approving the renewal of the Advisory Agreement and the Manager Agreements, in light of the legal advice furnished to them by independent legal counsel and their own business judgment. The following list of factors is not inclusive of all factors that were considered.
| 1. | Nature, extent and quality of services |
The Advisor, its personnel and its resources. The Trustees considered the depth and quality of the Advisor’s investment management process, including its sophisticated monitoring and oversight of the Managers; the experience, capability and integrity of its senior management and other personnel; the low turnover rates of its key personnel; and the overall financial strength and stability of its organization. The Trustees discussed the high level of Manager due diligence continually being undertaken by the Advisor. The Trustees also noted the high quality of the non-advisory management services provided by the Advisor, such as responsiveness to shareholder inquiries and the preparation of shareholder communications, as well as the Advisor’s responsiveness with respect to requests of both the Board and the shareholders. In addition, the Trustees noted that, because the Advisor is a significant shareholder in the Funds, the Advisor has an additional incentive to ensure that the Funds perform well for the shareholders. The Board also noted that the members of senior management of the Advisor, including the Interested Trustees, were also shareholders of the Funds.
The Trustees then considered the Advisor’s policies, procedures and systems to ensure compliance with applicable laws and regulations and its commitment to those programs; its efforts to keep the Trustees informed; and its attention to matters that may involve potential conflicts of interest with each Fund. The Trustees expressed appreciation for the extent and effectiveness of the Advisor’s compliance operations and the Advisor’s oversight of Manager and service providers’ compliance operations. The Trustees discussed the Advisor’s commitment to compliance at length in a private session with senior management of the Advisor. The Trustees also considered the nature, extent, quality and cost of administrative, distribution and shareholder services provided by the Advisor to the Funds under the Agreement and other agreements, including the administrative, legal and fund accounting and treasury functions.
The Trustees then considered various matters relating to the Managers, including copies of each Manager Agreement; copies of the Form ADV for each Manager; financial information relating to each Manager; and other information deemed relevant to the Board’s evaluation of each Manager, including qualitative assessments provided verbally by senior management of the Advisor and an assessment of each Manager’s commitment to compliance. The Trustees also considered the Advisor’s lengthy and extensive due diligence process for selecting each Manager and for monitoring each Manager’s ongoing investment performance, attentiveness to their portfolios for the Funds, and responsiveness to the Advisor’s inquiries.
| 2. | Investment results |
The Trustees considered the investment results of each Fund in light of its investment objective. They also considered information regarding the selection of indexes and funds comparable to the Funds that were used to evaluate relative investment results. The Board reviewed each Fund’s absolute investment results and its relative results measured against such comparable indexes and funds. The Trustees also compared the investment results of each Manager in comparison to the Manager’s own fund (if applicable), as well as to other relevant comparable funds and indexes. The Trustees examined the performance of each Fund as of September 30, 2008 at (as applicable) one-, three-, and five-year intervals and since inception. The Board also considered the Equity and International Fund’s performance for the ten-year period ended September 30, 2008. With respect to the Focused Opportunities Fund, the Trustees reviewed and considered performance for the one-year period and the period from the Fund’s inception on June 30, 2006 through September 30, 2008.
In assessing relative performance and fees and expenses, the Trustees relied upon data assembled by the Funds’ Administrator (not affiliated with the Advisor) using data from Lipper, Inc., which consisted of reports showing the relative investment results for each Fund in comparison to appropriate passive indexes and comparable fund peer groups for each of the Funds (collectively the “benchmarks”). The selection of indexes and funds was based on criteria including asset classification, primary channel of distribution, asset size, expense structure and load type, and the Trustees noted that the Administrator, which is independent of the Advisor, had been primarily responsible for compiling this data.
For the Equity Fund, the Board compared its investment results to (1) the Custom Equity Index, which is composed of a 70% weighting in the S&P 500 Index, a 20% weighting in the Russell 2000 Index, and a 10% weighting in the MSCI EAFE Index; (2) the Lipper Multi-Cap Core Index; and (3) the Russell 3000 Index. The Trustees observed that the benchmarks for the Equity Fund had outperformed the Fund on the basis of one-, three- and five-year periods. The Board also considered that the Fund had outperformed each benchmark for the ten-year period and the period from the Fund’s inception through September 30, 2008.
66 The Masters’ Select Funds Trust
The International Fund’s comparable funds and indexes were as follows: (1) the S&P Citigroup PMI Global (excluding US) Index and (2) the Lipper International Fund Index. The Trustees observed that the International Fund had outperformed its benchmarks over the three- and five-year periods, but had underperformed the benchmarks during the year-ended September 30, 2008. The Board noted and considered that the Fund had outperformed each benchmark for the ten-year period and the period from the Fund’s inception on December 1, 1997 by a wide margin.
The investment results of the Value Fund were compared to (1) the Russell 3000 Value Index; and (2) the Lipper Multi-Cap Value Index. The Trustees noted that the Value Fund trailed all of its benchmarks for one-, three- and five-year periods, by significant margins in some cases. The Trustees observed that the Fund had also underperformed the indices for the period from the Fund’s inception on June 30, 2000 through September 30, 2008, but to a lesser extent.
The Smaller Companies Fund was compared to (1) the Russell 2000 Index; and (2) the Lipper Small-Cap Core Index. The Trustees observed that the Fund had underperformed its benchmarks for the one-, three-, and five-year periods and the period from the Fund’s inception on June 30, 2003 through September 30, 2008.
Finally, the investment performance of the Focused Opportunities Fund was compared to the performance of the S&P 500 Index. The Trustees reviewed the performance of the Fund and considered that the Fund had underperformed the S&P 500 during the year ended September 30, 2008 and the period from the Fund’s inception. The Trustees noted the unique mandate of the Fund with respect to its concentrated portfolio and the relatively short time period over which investment results could be evaluated.
The Trustees also noted and acknowledged the Advisor’s detailed monitoring of Managers’ investment results, particularly those Managers that were experiencing periods of underperformance. The Trustees noted and considered the comments by the Advisor with respect to underperforming Managers and discussion at Trustee’s meetings throughout the year regarding the potential sources of underperformance. The Board considered the Advisor’s process for terminating Managers and noted the Advisor’s continued willingness to terminate Managers if the Advisor determined that the termination was in the best interest of the a Fund and its respective shareholders. The Board also noted and considered the Advisor’s ability to attract and retain world-class investment managers to serve as Managers to the Fund as well as the Advisor’s extensive screening process before hiring a Manager.
Ultimately, the Trustees concluded that the Advisor has a strong long-term record of effectively managing each of the Funds and monitoring the effectiveness of the contributions being made by each of the multiple Managers. The Trustees further concluded that the Advisor was applying appropriate discipline and oversight to ensure the each Fund adhered to its stated investment objective(s) and strategies and that the Advisor’s record in managing each Fund indicated that its continued management should benefit each Fund and its shareholders.
| 3. | Advisory fees and total expenses |
The Trustees reviewed the advisory fees and total expenses of each Fund (each as a percentage of average net assets) and compared such amounts with the median fee and expense levels of other funds in applicable peer fund groups based on the Lipper data. According to the Lipper data, each Fund had relatively high advisory expenses, but the Trustees noted that the Advisor’s advisory fees included management and administrative-type services that were unbundled in many other advisory fees used in the comparison data. Accordingly, the Trustees focused on the total expenses of each Fund, its performance and, where appropriate, the level of subsidization by the Advisor. The Trustees found that the total expenses for each of the Funds were in the higher range of their core style peers. However, when compared to Manager-of-Manager peers the total expenses for each of the Funds were generally in the mid-range, though still above the median. The Board considered the Manager-of-Sub-Manager comparisons to be more apposite because they more closely reflected the structure of the Funds. Thus, the Board concluded that the fees were reasonable in comparison to other funds. In addition, the Trustees noted that while the advisory fees may be slightly higher than the industry norm, the higher fees allowed shareholders to have access to Managers to which they otherwise might not have access and that the higher fees were fully justified by the long-term performance results of the Funds.
| 4. | The Advisor’s financial information |
The Trustees reviewed information regarding the Advisor’s costs of managing the Funds and information regarding the profitability of the Advisor. The Trustees also considered the extent to which economies of scale may be realized as each Fund grows and whether advisory fee levels reflect economies of scale if the Funds grow in size. The Trustees also noted that the Advisor had voluntarily forgone profits to subsidize the Funds when they were at lower asset levels.
The Advisor’s Costs and Profitability. The Trustees first noted that the Advisor appeared to be providing products that are competitively priced with other funds, especially funds with multiple Managers. The Trustees reviewed the total advisory fees, the amounts paid by the Advisor to the various Managers, and the general cost of the services provided by the Advisor in compensation for its retained portion of the total advisory fee. The Trustees took note of information provided on advisory fees waived by the Advisor, noting that the Advisor had voluntarily waived more than $3 million of fees payable under its advisory contracts, and followed a policy of not charging advisory fees on unallocated cash. The Trustees also noted that the Advisor had voluntarily agreed not to seek recoupment of a substantial portion of waived advisory fees. The Trustees also considered the Advisor’s willingness to invest in staff to accommodate changing regulatory requirements. The Trustees received information that assured them that the Advisor was financially sound and able to honor its sponsorship commitments to the Funds, and that the Advisor’s profits were in the range of reasonableness for the mutual fund management industry. The Trustees did not engage in an analysis of Fund-by-Fund profitability given the integrated nature of
Other Information 67
the Advisor’s management of the Funds. Similarly, although the Trustees had financial information on the Managers, the Trustees did not engage in an extended analysis of Manager profitability given the arm’s length nature of the bargaining between the Advisor and each Manager and the difficulty of interpreting profitability information with respect to each Manager due to the use of disparate accounting conventions, disparate ownership structures, the fact that each Manager managed only a portion of each Fund, and other factors; in this regard, the Trustees were advised by legal counsel that they could give less weight to the profitability assessment of each contract with each Manager because of the existence of arm’s length bargaining in those contractual relationships. The Trustees also reviewed information provided during the past year regarding the structure and manner in which the Advisor’s and the Managers’ investment professionals were compensated and their respective views of the relationship of such compensation to the attraction and retention of quality personnel.
Economies of Scale. The Trustees also noted that the Advisor had taken steps to reduce expenses. The Trustees considered the economies of scale the Funds have experienced and are experiencing and the Advisor’s commitment to regulate each Fund’s total expenses and ensure that the expenses charged by each Fund were fair and reasonable. The Trustees concluded that the Advisor had taken steps to ensure that shareholders benefit as the size of the Funds increases by agreeing to breakpoints in its fee schedules, negotiating favorable terms with service providers, and providing certain support services to the Funds on a cost only basis. The Trustees also noted that the Advisor had acted in shareholders’ best interests in closing certain of the Funds to new monies at certain times. Even though additional investments would have increased Fund size and possibly generated additional economies of scale, the Trustees observed that responsible management of Fund size often benefited shareholders more than allowing growth notwithstanding economies of scale that might accompany such growth. In addition, the Trustees took note of information provided on fees rebated to separate account clients of the Advisor’s affiliate to the extent these clients’ assets were invested in the Funds. With respect to these fee rebates, the Trustees noted that these rebates by the Advisor’s affiliate represented over $1.4 million in fees, and, although they nominally benefited only separate account clients of the Advisor’s affiliate who were also Fund shareholders, the Trustees recognized that these separate account investments helped reduce costs for all shareholders by increasing the asset base of the Funds. The Trustees took note of the willingness of the Advisor’s affiliate to extend such rebates while at the same time the Advisor was limiting the size and total assets in the various Funds to levels that promoted optimum investment returns. The Trustees also took favorable note of the Advisor’s efforts to invest in its advisory organization to ensure strong research and analytic capability.
| 5. | Conclusions |
Based on their review, including their non-exclusive consideration of each of the factors referred to above, the Trustees concluded that the Agreements are fair and reasonable to each Fund and its shareholders, that the Funds’ shareholders receive reasonable value in return for the advisory fees and other amounts paid to the Advisor and its respective Managers by the Funds, and that the renewal of the Agreements would be in the best interests of the Funds and its shareholders. Each of the factors discussed above supported such approval.
68 The Masters’ Select Funds Trust
Masters’ Select Funds Trust
TAX INFORMATION – (unaudited)
The percent of dividend income distributed for the year ended December 31, 2008, which is designated as qualified dividend income under the Jobs and Growth Tax Relief Reconciliation Act of 2003 is as follows:
| Masters’ Select Equity Fund | 100 | % | ||
| Masters’ Select International Fund | 78.38 | % | ||
| Masters’ Select Value Fund | 100 | % | ||
| Masters’ Select Smaller Companies Fund | 24.54 | % | ||
| Masters’ Select Focused Opportunities Fund | 100 | % |
The percent of dividend income distributed for the year ended December 31, 2008, which qualifies for the corporate dividends received deduction is as follows:
| Masters’ Select Equity Fund | 100 | % | ||
| Masters’ Select International Fund | N/A | |||
| Masters’ Select Value Fund | 100 | % | ||
| Masters’ Select Smaller Companies Fund | 24.54 | % | ||
| Masters’ Select Focused Opportunities Fund | 100 | % |
The Funds hereby designate the following amounts as long-term capital gains distributions for the fiscal year ended December 31, 2007:
| Masters’ Select Equity Fund | $ | 22,008,978 | ||
| Masters’ Select International Fund | 22,483,543 | |||
| Masters’ Select Value Fund | 7,028,244 | |||
| Masters’ Select Smaller Companies Fund | 5,340,850 | |||
| Masters’ Select Focused Opportunities Fund | 551,710 |
Additional Information Applicable to Foreign Shareholders Only (Unaudited):
The percent of ordinary dividend distributions for the year ended December 31, 2007, which are designated as interest-related dividends under Internal Revenue Code Section 871 (k)(1)(C) is as follows:
| Masters’ Select Equity Fund | 1.89 | % | ||
| Masters’ Select International Fund | 1.40 | % | ||
| Masters’ Select Value Fund | 0.98 | % | ||
| Masters’ Select Smaller Companies Fund | 10.48 | % | ||
| Masters’ Select Focused Opportunities Fund | 2.53 | % |
The percent of ordinary dividend distributions for the year ended December 31, 2007, which are designated as short-term capital gain distributions under Internal Revenue Code Section 871 (k)(2)(C) is as follows:
| Masters’ Select Equity Fund | 42.99 | % | ||
| Masters’ Select International Fund | 26.86 | % | ||
| Masters’ Select Value Fund | N/A | |||
| Masters’ Select Smaller Companies Fund | 100 | % | ||
| Masters’ Select Focused Opportunities Fund | N/A |
Tax Information 69
Masters’ Select Funds Trust
TAX INFORMATION – (unaudited) (Continued)
For the year ended December 31, 2008, the Masters’ Select International Fund earned foreign source income and paid foreign taxes which they intend to pass through to their shareholders pursuant to Section 853 of the Internal Revenue Code as follows:
| Portion of Ordinary Income Distribution | ||
| Creditable Foreign Taxes Paid | Per Share Amount | Derived from foreign Sourced Income |
| $2,789,768 | $0.0279 | 67.83% |
70 Notes to Financial Statements
Masters’ Select Funds Trust
INDEX DEFINITIONS
Custom Equity Index
The Custom Equity Index is composed of a 70% weighting in the S&P 500 Index, a 20% weighting in the Russell 2000 Index, and a 0% weighting in the MSCI EAFE Index. The S&P 500 Index consists of 500 stocks that represent a sample of the leading companies in leading industries. This index is widely regarded as the standard for measuring large-cap U.S. stock market performance. The Russell 2000 Index measures the performance of the 2,000 smallest companies in the Russell 3000 Index. The MSCI EAFE Index measures the performance of all of the publicly traded stocks in 2_ developed non-U.S. markets.
Lipper International Equity Fund Index
The Lipper International Equity Fund Index measures the performance of the 30 largest mutual funds in the international equity fund objective, as determined by Lipper, Inc.
Lipper Multi-Cap Core Fund Index
The Lipper Multi-Cap Core Fund Index measures the performance of the 30 largest mutual funds that invest in a variety of capitalization ranges, without concentrating 75% or more of their equity assets in any one market capitalization range over an extended period of time, as determined by Lipper, Inc.
Lipper Multi-Cap Value Fund Index
The Lipper Multi-Cap Value Fund Index measures the performance of the 30 largest mutual funds that invest in a variety of market capitalization ranges without concentrating 75% or more of their assets in any one market capitalization range over an extended period of time, as determined by Lipper, Inc. Value Funds seek long-term growth of capital by investing in companies that are considered to be undervalued relative to a major unmanaged stock index based on a price-to-earnings, price-to-book value, asset value or other factors.
Lipper Small-Cap Core Fund Index
The Lipper Small-Cap Core Fund Index measures the performance of the 30 largest mutual funds in the small capitalization range, as determined by Lipper, Inc.
NASDAQ Composite Index
The NASDAQ Composite Index is a market capitalization-weighted index that is designed to represent the performance of the National Market System which includes over 5,000 stocks traded only over-the-counter and not on an exchange.
Russell 2000 Index
The Russell 2000 Index measures the performance of the 2,000 largest companies in the Russell 3000 Index.
Russell 3000 Index
The Russell 3000 Index measures the performance of the 3,000 largest U.S. companies as measured by total market capitalization, and represents about 98% of the U.S. stock market.
Russell 3000 Value Index
The Russell 3000 Value Index is a broad based index that measures the performance of those companies within the 3,000 largest U.S. companies, based on total market capitalization, that have lower price-to-book ratios and lower forecasted growth rates.
S&P 500 Index
The S&P 500 Index is widely regarded as the standard for measuring large-cap stock performance, and consists of 500 stocks that represent a sample of the leading companies in leading industries.
S&P Global Ex-U.S. LargeMid-Cap Index
The S&P Global Ex-U.S. LargeMid-Cap Index is a broad based index that represents the largest 80% of investable companies in 52 developed and emerging market countries.
References to other funds should not be interpreted as an offer of these securities.
Indices are unmanaged, do not incur fees, and cannot be invested in directly.
Index Definitions 71
Masters’ Select Funds Trust
INDUSTRY TERMS AND DEFINITIONS
Price to earnings ratio (P/E Ratio) is a common tool for comparing the prices of different common stocks and is calculated by dividing the current market price of a stock by the earnings per share. Similarly, multiples of earnings and cash flow are means of expressing a company’s stock price relative to its earnings per share or cash flow per share, and are calculated by dividing the current stock price by its earnings per share or cash per share. Forecasted earnings growth is the projected rate that a company’s earnings are estimated to grow in a future period.
Price to book ratio is calculated by dividing the current market price of a stock by the book value per share.
Combined ratio is a formula used by insurance companies to relate premium income to claims, administration and dividend expenses. It is used in the annual statement filed by an insurer with the state insurance department. It is calculated by dividing the sum of incurred losses and expenses by earned premium.
Free cash flow is the amount of cash a company has after expenses, debt service, capital expenditures, and dividends
EV/EBITDA is the enterprise value of a company divided by earnings before interest, taxes, depreciation, and amortization
“Growth” stocks are generally considered to be stocks of companies with high expected earnings growth compared to “value” stocks. Because of this higher expected growth, growth stocks tend to be priced at a higher multiple of their current earnings than value stocks. However, the premium paid for growth stocks compared to value stocks can vary dramatically depending on the market environment.
Book value is the net asset value of a company, calculated by subtracting total liabilities and intangible assets from total assets.
Earnings per share (EPS) is calculated by taking the total earnings divided by the number of shares outstanding
EV/Sales is the ratio of enterprise value of a company divided by the total sales of the company for a particular period, usually one year.
EBITDA is a company’s earnings before interest, taxes, depreciation, and amortization.
Enterprise value is calculated by adding a corporation’s market capitalization, preferred stock, and outstanding debt together and then subtracting out the cash and cash equivalents.
Discounted cash flow is calculated by multiplying future cash flows by discount factors to obtain present values.
Return on investment capital (ROIC) is calculated by subtracting dividends from net income and dividing by total capital.
One basis point equals 1/100th of 1 percent.
Operating cash flow is calculated by summing net profit, depreciation, change in accruals, and change in accounts payable, minus change in accounts receivable, minus change in inventories.
Return on equity (ROE) is a measure of how well a company used reinvested earnings to generate additional earnings. Expressed as a percentage, it is calculated by dividing net worth at the beginning of the period into net income for the period after preferred stock dividends but before common stock dividends.
Return on capital (ROC) is a measure of how effectively a company uses the money (borrowed or owned) invested in its operations. It is calculated by dividing net income by invested capital.
Dividend yield is the return on an investor’s capital investment that a company pays out to its shareholders in the form of dividends. It is calculated by taking the amount of dividends paid per share over the course of a year and dividing by the stock's price.
Compound annual growth rate (CAGR) is the rate of growth of a number, compounded over several years.
72 The Masters’ Select Funds Trust
Masters’ Select Funds Trust
TRUSTEE AND OFFICER INFORMATION
Background information for the Trustees and Officers of the Trust is presented below. All Trustees oversee the Masters’ Select Funds. The SAI includes additional information about the Trust’s Trustees and is available, without charge, by calling 1-800-960-0188.
Name, Address and Year of Birth | Position(s) Held with Trust | Term of Office and Length of Time Served | Principal Occupation(s) During the Past 5 Years | Other Directorships Held by Trustee | ||||
A. George Battle 4 Orinda Way, Suite 200-D Orinda, CA 94563 (born 1944) | Trustee | Term: Open Ended Time Served: 11 years | Executive Chairman, Ask Jeeves, 2004 - 2005; Chief Executive Officer, Ask Jeeves from 2000 to 2003; Senior Fellow, The Aspen Institute since 1995. | Director of Advent Software; Expedia Inc.; Fair Isaac Co.; and Netflix Inc. | ||||
Frederick August Eigenbrod, Jr. PhD 4 Orinda Way, Suite 200-D Orinda, CA 94563 (born 1941) | Trustee | Term: Open Ended Time Served: 11 years | Vice President, RoutSource Consulting Services (organizational planning and development) since 2002 | None | ||||
Taylor M. Welz 4 Orinda Way, Suite 200-D Orinda, CA 94563 (born 1959) | Trustee | Term: Open Ended Time Served: 11 years | CPA/PFS, CFP. President, CCO & Sole Owner, Welz Financial Services, Inc., since 2007. Partner, Bowman & Company LLP (certified public accountants) from 1987 to 2007. | None | ||||
Harold M. Shefrin, PhD 4 Orinda Way, Suite 200-D Orinda, CA 94563 (born 1948) | Trustee | Term: Open Ended Time Served: Since February 2005 | Professor, Department of Finance, Santa Clara University, since 1979 | SA Funds – Investment Trust | ||||
Kenneth E. Gregory* 4 Orinda Way, Suite 200-D Orinda, CA 94563 (born 1957) | President and Trustee | Term: Open Ended Time Served: 11 years | President of the Advisor; President of Litman/Gregory Research, Inc. (publishers) and Litman/Gregory Asset Management, LLC (investment advisors), Officer of Litman/Gregory Analytics, LLC (web based publisher of financial research), since 2000. | None | ||||
Craig A. Litman* 100 Larkspur Landing Circle, Suite 204 Larkspur, CA 94939 (born 1946) | Secretary and Trustee | Term: Open Ended Time Served: 11 years | Treasurer and Secretary of the Advisor; Vice President and Secretary of Litman/ Gregory Research Inc.; Chairman of Litman/Gregory Asset Management, LLC. | None | ||||
Jeremy DeGroot* 4 Orinda Way, Suite 200-D Orinda, CA 94563 (born 1963) | Assistant Secretary and Trustee | Term: Open Ended Time Served: Elected Trustee December 2008 | Chief Investment Officer of Litman/ Gregory Asset Management, LLC. | None | ||||
John Coughlan 4 Orinda Way, Suite 200-D Orinda, CA 94563 (born 1956) | Treasurer and Chief Compliance Officer | Term: Open Ended Time Served: 11 years | Chief Operating Officer, Litman/ Gregory Fund Advisors, LLC and Chief Financial Officer of Litman/ Gregory Asset Management, LLC. | None |
* Denotes Trustees who are “interested persons” of the Trust under the 1940 Act.
Trustee and Officer Information 73
Advisor:
Litman/Gregory Fund Advisors, LLC
Orinda, CA 94563
Distributor:
Quasar Distributors, LLC
615 E. Michigan St., 2nd Floor
Milwaukee, WI 53202
Transfer Agent:
BFDS
P.O. Box 219922
Kansas City, MO 64121-9922
1-800-960-0188
For Overnight Delivery:
Masters’ Select Funds
C/O BFDS
330 W. 9th Street
Kansas City, MO 64105
Investment Professionals:
Registered Investment Advisors, broker/dealers, and other investment professionals may contact Fund Services at 1-925-253-5238.
Prospectus:
To request a current prospectus, statement of additional information, or an IRA application, call 1-800-656-8864.
Shareholder Inquiries:
To request action on your existing account, contact the Transfer agent, BFDS, at 1-800-960-0188, from 9:00 a.m. to 6:00 p.m. eastern time, Monday through Friday.
24-Hour Automated Information:
For access to automated reporting of daily prices, account balances and transaction activity, call 1-800-960-0188, 24 hours a day, seven days a week. Please have your Fund number (see below) and account number ready in order to access your account information.
Fund Information:
| Fund | Symbol | CUSIP | Fund Number | |||
| Equity Fund | MSEFX | 576417109 | 305 | |||
| International Fund | MSILX | 576417208 | 306 | |||
| Value Fund | MSVFX | 576417406 | 307 | |||
| Smaller Companies Fund | MSSFX | 576417307 | 308 | |||
| Focused Opportunities Fund | MSFOX | 57641T101 | 314 |
Website:
www.mastersfunds.com
Item 2. Code of Ethics.
The registrant has adopted a code of ethics that applies to the registrant’s principal executive officer and principal financial officer. The registrant has not made any amendments to its code of ethics during the period covered by this report. The registrant has not granted any waivers from any provisions of the code of ethics during the period covered by this report.
The registrant undertakes to provide to any person without charge, upon request, a copy of its code of ethics by mail when they call the registrant at 1-800-960-0188.
Item 3. Audit Committee Financial Expert.
The registrant’s board of trustees has determined that there is at least one audit committee financial expert serving on its audit committee. Mr. Harold M. Shefrin is the “audit committee financial expert” and is considered to be “independent” as each term is defined in Item 3 of Form N-CSR.
Item 4. Principal Accountant Fees and Services.
The registrant has engaged its principal accountant to perform audit services, audit-related services, tax services and other services during the past two fiscal years. “Audit services” refer to performing an audit of the registrant's annual financial statements or services that are normally provided by the accountant in connection with statutory and regulatory filings or engagements for those fiscal years. “Audit-related services” refer to the assurance and related services by the principal accountant that are reasonably related to the performance of the audit. “Tax services” refer to professional services rendered by the principal accountant for tax compliance, tax advice, and tax planning. The following table details the aggregate fees billed or expected to be billed for each of the last two fiscal years for audit fees, audit-related fees, tax fees and other fees by the principal accountant.
| FYE 12/31/2008 | FYE 12/31/2007 | |
| Audit Fees | $188,000 | $178,875 |
| Audit-Related Fees | $0 | $0 |
| Tax Fees | $42,550 | $39,659 |
| All Other Fees | $0 | $0 |
The audit committee has adopted pre-approval policies and procedures that require the audit committee to pre-approve all audit and non-audit services of the registrant, including services provided to any entity affiliated with the registrant.
The percentage of fees billed by PricewaterhouseCoopers applicable to non-audit services pursuant to waiver of pre-approval requirement were as follows:
| FYE 12/31/2008 | FYE 12/31/2007 | |
| Audit-Related Fees | 0% | 0% |
| Tax Fees | 0% | 0% |
| All Other Fees | 0% | 0% |
All of the principal accountant’s hours spent on auditing the registrant’s financial statements were attributed to work performed by full-time permanent employees of the principal accountant. (If more than 50 percent of the accountant’s hours were spent to audit the registrant's financial statements for the most recent fiscal year, state how many hours were attributed to work performed by persons other than the principal accountant's full-time, permanent employees.) The following table indicates the non-audit fees billed or expected to be billed by the registrant’s accountant for services to the registrant and to the registrant’s investment adviser (and any other controlling entity, etc.—not sub-adviser) for the last two years. The audit committee of the board of trustees/directors has considered whether the provision of non-audit services that were rendered to the registrant's investment adviser is compatible with maintaining the principal accountant's independence and has concluded that the provision of such non-audit services by the accountant has not compromised the accountant’s independence.
| Non-Audit Related Fees | FYE 12/31/2008 | FYE 12/31/2007 |
| Registrant | None | None |
| Registrant’s Investment Adviser | None | None |
Item 5. Audit Committee of Listed Registrants.
Not applicable to registrants who are not listed issuers (as defined in Rule 10A-3 under the Securities Exchange Act of 1934).
Item 6. Investments.
| (a) | Schedule of Investments is included as part of the report to shareholders filed under Item 1 of this Form. |
Item 7. Disclosure of Proxy Voting Policies and Procedures for Closed-End Management Investment Companies.
Not applicable to open-end investment companies.
Item 8. Portfolio Managers of Closed-End Management Investment Companies.
Not applicable to open-end investment companies.
Item 9. Purchases of Equity Securities by Closed-End Management Investment Company and Affiliated Purchasers.
Not applicable to open-end investment companies.
Item 10. Submission of Matters to a Vote of Security Holders.
There have been no material changes to the procedures by which shareholders may recommend nominees to the registrant’s board of trustees.
Item 11. Controls and Procedures.
| (a) | The Registrant’s President and Treasurer have reviewed the Registrant's disclosure controls and procedures (as defined in Rule 30a-3(c) under the Investment Company Act of 1940 (the “Act”)) as of a date within 90 days of the filing of this report, as required by Rule 30a-3(b) under the Act and Rules 13a-15(b) or 15d-15(b) under the Securities Exchange Act of 1934. Based on their review, such officers have concluded that the disclosure controls and procedures are effective in ensuring that information required to be disclosed in this report is appropriately recorded, processed, summarized and reported and made known to them by others within the Registrant and by the Registrant’s service provider. |
| (b) | There were no changes in the Registrant's internal control over financial reporting (as defined in Rule 30a-3(d) under the Act) that occurred during the second fiscal quarter of the period covered by this report that has materially affected, or is reasonably likely to materially affect, the Registrant's internal control over financial reporting. |
Item 12. Exhibits.
| (a) | (1) Any code of ethics or amendment thereto, that is the subject of the disclosure required by Item 2, to the extent that the registrant intends to satisfy Item 2 requirements through filing an exhibit. Incorporated by reference to the Registrant’s Form N-CSR filed March 9, 2005. |
(2) A separate certification for each principal executive and principal financial officer pursuant to Section 302 of the Sarbanes-Oxley Act of 2002. Filed herewith.
(3) Any written solicitation to purchase securities under Rule 23c-1 under the Act sent or given during the period covered by the report by or on behalf of the registrant to 10 or more persons. Not applicable to open-end investment companies.
| (b) | Certifications pursuant to Section 906 of the Sarbanes-Oxley Act of 2002. Furnished herewith. |
SIGNATURES
Pursuant to the requirements of the Securities Exchange Act of 1934 and the Investment Company Act of 1940, the registrant has duly caused this report to be signed on its behalf by the undersigned, thereunto duly authorized.
(Registrant) The Masters’ Select Funds Trust
By (Signature and Title)* /s/ Kenneth E. Gregory
Kenneth E. Gregory, President
Date February 26, 2009
Pursuant to the requirements of the Securities Exchange Act of 1934 and the Investment Company Act of 1940, this report has been signed below by the following persons on behalf of the registrant and in the capacities and on the dates indicated.
By (Signature and Title)* /s/ Kenneth E. Gregory
Kenneth E. Gregory, President
Date February 26, 2009
By (Signature and Title)* /s/ John Coughlan
John Coughlan, Treasurer
Date February 26, 2009
* Print the name and title of each signing officer under his or her signature.