As filed with the Securities and Exchange Commission on March 3, 2008
UNITED STATES
SECURITIES AND EXCHANGE COMMISSION
Washington, D.C. 20549
FORM N-CSR
CERTIFIED SHAREHOLDER REPORT OF REGISTERED
MANAGEMENT INVESTMENT COMPANIES
Investment Company Act file number 811-07763
The Masters’ Select Funds Trust
(Exact name of registrant as specified in charter)
4 Orinda Way, Suite 200-D, Orinda, CA 94563
(Address of principal executive offices) (Zip code)
Kenneth E. Gregory
4 Orinda Way, Suite 200-D
Orinda, CA 94563
(Name and address of agent for service)
(925) 254-8999
Registrant's telephone number, including area code
Date of fiscal year end: December 31
Date of reporting period: December 31, 2007
Item 1. Report to Stockholders.
The Masters’ Select Funds Trust

Annual Report
The Masters’ Select Equity Fund
The Masters’ Select International Fund
The Masters’ Select Value Fund
The Masters’ Select Smaller Companies Fund
The Masters’ Select Focused Opportunities Fund
December 31, 2007
www.mastersfunds.com
The Masters’ Select Concept
In constructing the Masters’ Select Funds, our goal was to design funds that would isolate the stock-picking skills of a group of highly regarded portfolio managers. To meet this objective, we designed the funds with both risk and return in mind, placing particular emphasis on the following factors:
| 1. | First, only stock pickers we believe to be exceptionally skilled are chosen to manage each fund’s sub-portfolios. |
| 2. | Second, and of equal importance, each stock picker runs a very focused sub-portfolio of not more than 15 of his or her favorite stocks within each Masters’ Select Fund; the exception being the Masters’ Select Focused Opportunities Fund, in which each manager selects no more than 7 of their highest conviction ideas. We believe that most stock pickers have an unusually high level of conviction in only a small number of stocks and that a portfolio limited to these stocks will, on average, outperform (a more diversified portfolio) over a market cycle. |
| 3. | Third, even though each manager’s portfolio is focused, we seek ways to diversify each of our funds. With the Equity, International and Focused Opportunities funds, we have done this by including managers with differing investment styles and market-cap orientations (the Focused Opportunities Fund is classified as non-diversified so that it may invest in a smaller range (15-21) of securities). With the Value Fund, we have selected managers who each take a distinctive approach to assessing companies and defining value. With the Smaller Companies Fund, we have selected managers with varying investment approaches who each focus on the securities of smaller companies. |
| 4. | Finally, we believe that excessive asset growth can result in diminished performance. We have committed to closing each Masters’ Select Fund to new shareholders at levels that we believe will preserve the managers’ ability to effectively implement the “select” concept. |
Portfolio Fit
As with all equity funds, Masters’ Select Funds are appropriate for investors with a long-term time horizon, who are willing to ride out occasional periods when the funds’ net asset values decline. Within that context, we created the Masters’ Select Equity and Masters’ Select International Funds to be used as core equity and international fund holdings. Masters’ Select Smaller Companies Fund has been created to provide a core domestic small-cap investment opportunity. We created Masters’ Select Value Fund for investors who seek additional, dedicated value exposure in their portfolios. Masters’ Select Focused Opportunities Fund has been created to provide a core large-cap holding for long-term investors. Although performance in each specific down market will vary, we purposely set the allocations to each manager with the objective of keeping risk about equal to the funds’ overall benchmarks. In the end, the focus on the highest conviction stocks of a group of very distinguished managers with superior track records is what we believe makes the funds ideal portfolio holdings.

Contents
| Fund’s Performance | 2 |
| Our Commitment to Shareholders | 3 |
| Letter to Shareholders | 4 |
| Long-Term Performance Metrics | 6 |
| Masters’ Select Equity Fund | |
Equity Fund Review | 8 |
Equity Fund Managers | 13 |
Equity Fund Stock Highlights | 14 |
Equity Fund Schedule of Investments | 17 |
| Masters’ Select International Fund | |
International Fund Review | 19 |
International Fund Managers | 23 |
International Fund Stock Highlights | 24 |
International Fund Schedule of Investments | 27 |
| Masters’ Select Value Fund | |
Value Fund Review | 29 |
Value Fund Managers | 33 |
Value Fund Stock Highlights | 34 |
Value Fund Schedule of Investments | 36 |
| Masters’ Select Smaller Companies Fund | |
Smaller Companies Fund Review | 37 |
Smaller Companies Fund Managers | 40 |
Smaller Companies Fund Stock Highlights | 41 |
Smaller Companies Fund Schedule of Investments | 43 |
| Masters’ Select Focused Opportunities Fund | |
Focused Opportunities Fund Review | 45 |
Focused Opportunities Fund Managers | 48 |
Focused Opportunities Fund Stock Highlights | 49 |
Focused Opportunities Fund Schedule of Investments | 50 |
| Expense Examples | 51 |
| Statements of Assets and Liabilities | 52 |
| Statements of Operations | 53 |
| Statements of Changes in Net Assets | |
Equity Fund | 54 |
International Fund | 54 |
Value Fund | 55 |
Smaller Companies Fund | 55 |
Focused Opportunities Fund | 56 |
| Financial Highlights | |
Equity Fund | 57 |
International Fund | 58 |
Value Fund | 59 |
Smaller Companies Fund | 60 |
Focused Opportunities Fund | 61 |
| Notes to Financial Statements | 62 |
| Report of Independent Registered Public Accounting Firm | 69 |
| Other Information | 70 |
| Tax Information | 74 |
| Index Definitions | 76 |
| Industry Terms and Definitions | 77 |
| Trustee and Officer Information | 78 |
This report is intended for shareholders of the funds and may not be used as sales literature unless preceded or accompanied by a current prospectus for the Masters’ Select Funds. Statements and other information in this report are dated and are subject to change.
Litman/Gregory Fund Advisors, LLC has ultimate responsibility for the funds’ performance due to its responsibility to oversee its investment managers and recommend their hiring, termination and replacement.
v2008-02
Table of Contents | 1 |
Masters’ Select Funds’ Performance
Average Annual Total Returns | |||||
Performance as of 12/31/2007 | One-Year | Three- Year | Five-Year | Ten-Year | Since Inception |
Masters’ Select Equity Fund 12/31/1996 | 4.57% | 6.27% | 12.44% | 7.83% | 9.61% |
| Custom Equity Index | 4.69% | 9.16% | 14.48% | 6.63% | 8.41% |
| Russell 3000 Index | 5.14% | 8.89% | 13.63% | 6.22% | 8.32% |
| Lipper Multi Cap Core Index | 5.98% | 9.39% | 14.07% | 6.46% | 8.12% |
| Gross Expense Ratio: 1.19% | |||||
Masters’ Select International Fund 12/1/1997 | 20.75% | 22.70% | 24.00% | 14.37% | 14.10% |
| S&P Citigroup PMI Global (ex US) Index | 17.95% | 20.59% | 24.39% | 10.28% | 10.34% |
| Lipper International Fund Index | 14.24% | 18.49% | 21.83% | 9.46% | 9.46% |
| Gross Expense Ratio: 1.21% Net Expense Ratio as of 12/31/07: 1.03% | |||||
Masters’ Select Value Fund 6/30/2000 | -2.34% | 5.90% | 12.50% | n/a | 7.94% |
| Russell 3000 Value Index | -1.01% | 8.97% | 14.69% | n/a | 8.18% |
| Lipper Multi-Cap Value Index | -1.04% | 7.20% | 13.45% | n/a | 7.61% |
| Gross Expense Ratio: 1.24% Net Expense Ratio as of 12/31/07: 1.21% | |||||
Masters’ Select Smaller Companies Fund 6/30/2003 | 1.64% | 5.49% | n/a | n/a | 12.41% |
| Russell 2000 Index | -1.57% | 6.80% | n/a | n/a | 13.96% |
| Lipper Small Cap Core Index | 1.92% | 7.62% | n/a | n/a | 14.21% |
| Gross Expense Ratio: 1.32% Net Expense Ratio as of 12/31/07: 1.31% | |||||
Masters’ Select Focused Opportunities Fund 6/30/2006 | 7.73% | n/a | n/a | n/a | 12.12% |
| S&P 500 Index | 5.49% | n/a | n/a | n/a | 12.25% |
| Gross Expense Ratio: 1.63% Net Expense Ratio as of 12/31/07: 1.26% | |||||
Performance quoted represents past performance and does not guarantee future results. The investment return and principal value of an investment will fluctuate so that an investor’s shares, when redeemed, may be worth more or less than their original cost. Current performance of the funds may be lower or higher than the performance quoted. To obtain the performance of the funds as of the most recently completed calendar month, please visit our website at www.mastersfunds.com or call 1-800-960-0188. The Fund imposes a 2% redemption fee on shares held less than 180 days. Performance does not reflect the redemption fee. If reflected, performance would be lower.
The performance quoted does not include a deduction for taxes that a shareholder would pay on distributions or the redemption of fund shares. Indexes are unmanaged, do not incur expenses, taxes or fees and cannot be invested in directly. See page 76 for the index definitions.
Each of the funds may invest in foreign securities. Investing in foreign securities exposes investors to economic, political and market risks and fluctuations in foreign currencies. Each of the funds may invest in the securities of small companies. Small-company investing subjects investors to additional risks, including security price volatility and less liquidity than investing in larger companies. Masters’ Select Value and Masters’ Select Focused Opportunities are non-diversified funds, which means that each respective fund may concentrate more of its assets in fewer individual holdings than a diversified fund. Though primarily equity funds, the Value and Focused Opportunities funds may invest portions of assets in securities of distressed companies. Debt obligations of distressed companies typically are unrated, lower rated, in default or close to default and may become worthless.
Gross expense ratios are per the Prospectus dated April 30, 2007. Through December 31, 2008, Litman/Gregory has contractually agreed to waive a portion of its advisory fees effectively reducing total advisory fees to approximately 0.97% of the average daily net assets of the International Fund and 1.08% of the average daily net assets of the Value Fund. Litman/Gregory may voluntarily waive a portion of its advisory fee in addition to those fees that are contractually waived. Litman/Gregory has agreed not to seek recoupment of advisory fees waived. Through 12/31/08, Litman/Gregory has voluntarily agreed to waive a portion of its management fee to pass through any costs benefits resulting from changes in the sub-advisory fee schedules or allocations within the Equity Fund and Smaller Companies Fund. Through December 31, 2007, the Advisor had agreed to reimburse the Focused Opportunities Fund for any ordinary operating expenses above 1.50% of the Fund’s average daily net assets. The Advisor reserves the right to be repaid by the Fund within three fiscal years, provided the Fund remains within the applicable expense limitation for the relevant fiscal year. The Advisor may not request or receive reimbursement of such amounts before payment of the Fund’s operating expenses for the current fiscal year.
| 2 | The Masters’ Select Funds Trust |
Litman/Gregory Fund Advisors’
Commitment to Shareholders
We are deeply committed to making each Masters’ Select Fund a highly satisfying long-term investment for shareholders. In following through on this commitment we are guided by our core values, which influence four specific areas of service:
First, we are committed to the Masters’ Select concept.
| • | We will only hire managers who we strongly believe will deliver exceptional long-term returns relative to their benchmarks. We base this belief on extremely thorough due diligence research. This not only requires us to assess their stock-picking skills, but also to evaluate their ability to add incremental performance by investing in a concentrated portfolio of their highest conviction ideas. |
| • | We will monitor each of the managers so that we can maintain our confidence in their ability to deliver the long-term performance we expect. In addition, our monitoring will seek to assess whether they are staying true to their Masters’ Select mandate. Consistent with this mandate we focus on long-term performance evaluation so that the Masters’ Select stock pickers will not be distracted by short-term performance pressure. |
Second, we will do all we can to ensure that the framework within which our stock pickers do their work further increases the odds of success.
| • | New investments in each Fund are expected to be limited when that Fund reaches certain asset levels. By limiting Fund size in this manner, we believe each manager’s Masters’ Select asset base will remain small enough so that a high level of flexibility to add value through individual stock picking will be retained. |
| • | The framework also includes the diversified multi-manager structure that makes it possible for each manager to invest in a concentrated manner knowing that the potential volatility within his or her portfolio will be diluted at the fund level by the performance of the other managers. The multi-manager structure seeks to provide the diversification necessary to temper the volatility of each manager’s sub-portfolio. |
| • | We will work hard to discourage short-term speculators so that cash flows into the Funds are not volatile. Lower volatility helps prevent our managers from being forced to sell stocks at inopportune times or to hold excessive cash for non-investment purposes. This is why years ago the Funds implemented a 2% redemption fee for the first 180 days of a shareholder’s investment in any Fund, which is paid to each Fund for the benefit of shareholders. |
Third, is our commitment to do all we can from an operational standpoint to maximize shareholder returns.
| • | We will remain attentive to Fund overhead, and whenever we achieve savings we will pass them through to shareholders. For example, we have had several manager changes that resulted in lower sub-advisory fees to our Funds. In every case we have passed through the full savings to shareholders in the form of fee waivers. |
| • | There will be no loads, 12b-1 charges or any distribution charges. |
| • | We also will work closely with our sub-advisors to make sure they are aware of tax-loss selling opportunities (only to be taken if there are equally attractive stocks to swap into). We account for partial sales on a specific tax lot basis so that shareholders will benefit from the most favorable tax treatment. The goal is not to favor taxable shareholders over tax-exempt shareholders but to make sure that the Masters’ Select stock pickers are taking advantage of tax savings opportunities when doing so is not expected to reduce pre-tax returns. |
Fourth, is our commitment to communicate honestly about all relevant developments and expectations.
| • | We will continue to do this by providing thorough and educational shareholder reports. |
| • | We will continue to provide what we believe are realistic assessments of the investment environment. |
Our commitment to Masters’ Select is also evidenced by our own investment. Our employees have, collectively, substantial investments in the Funds, as does our company retirement plan. In addition, we use the Funds extensively in the client accounts of our investment advisor practice (through our affiliate Litman/Gregory Asset Management, LLC). We have no financial incentive to do so because the fees we receive from Masters’ Select held in client accounts are fully offset against the advisory fees paid by our clients. In fact, we have a disincentive to use the Funds in our client accounts because each Masters’ Select Fund is capacity constrained (they will be closed at the pre-determined asset levels as mentioned above), and by using them in client accounts we are using up capacity for which we are not paid. But we believe these Funds offer value that we can’t get elsewhere and this is why we enthusiastically invest in them ourselves and on behalf of clients.
While we believe highly in the ability of the Funds’ sub-advisors, our commitments are not intended as guarantees of future results.
This information is authorized for use when preceded or accompanied by a prospectus for the Masters’ Select Funds. Mutual fund investing involves risk; principal loss is possible. While the Funds are no-load, there are management fees and operating expenses that do apply. The prospectus contains more information regarding the Funds’ investment objectives, risks, fees and expenses. Read the prospectus carefully before you invest in the Funds.
Commitment to Shareholders | 3 |
Dear Fellow Shareholder,
The Masters’ Select funds experienced another milestone in 2007 as Masters’ Select International celebrated its 10th anniversary in December. Because our primary goal is excellent performance over the long run, we are particularly pleased to report that as of the end of 2007, the fund’s 10-year return was 4.09 percentage points (409 basis points) ahead of its benchmark, the S&P Citigroup PMI Global (ex U.S.) Index, which placed it in the top 2% of its Morningstar Foreign Large Blend peer group1. As of December 31 2007, Morningstar ranked the Masters’ Select International Fund in the 7th, 4th, 8th, and 2nd percentile among 743, 557, 462, and 227 Foreign Large Blend Funds for the one-, three-, five-, and ten-year periods, respectively, based on total return. At this point, the only other Masters’ Select Fund with a ten-year record is Masters’ Select Equity, which also has a strong record, having beaten the best-performing of its benchmarks, the Custom Equity Index, by 1.2% for the ten-year period ending December 31, 2007. We are quite proud of the long-term performance record delivered by the two oldest Masters’ Select funds.
While we are proud of these long-term records, we are not satisfied with the performance of some of the Masters’ Select funds over the past three years. Masters’ Select Equity and Masters’ Select Value both trail their benchmarks (the Russell 3000 Index and the Russell 3000 Value Index, respectively) over these three years ending December 31, 2007. For both funds, the three-year performance is the result of two mediocre years (slightly trailing their benchmarks) sandwiched around a year of more significant underperformance. Masters’ Select Smaller Companies also trails over three years ending December 31 2007, because of a very poor 2006. The fund actually outperformed its benchmark last year and also in 2005 and 2004. 2
How is it that a concept that we believe is so compelling, and that has delivered over ten years for the two oldest Masters’ Select funds, can fail to deliver over a period as long as three years? For each fund there were specific reasons that are discussed in the individual fund section of this report. However, that the funds underperformed over a three-year period is not altogether surprising. In fact it is consistent with the findings in our study we wrote about in the September 2006 shareholder letter. As we reported back then, we looked at funds in different style categories that outperformed their benchmarks by 1% or more per year over the ten years ending 12/31/2005. We found that almost all the outperforming funds had at least one three-year period in which they underperformed by at least two percentage points per year (depending on the style category the likelihood of this having happened ranged from 88% to 100%). Surprisingly, between 50% and 72% (depending on the style category) of the ten-year outperformers had at least one three-year period in which the fund trailed its benchmark by an even larger amount of at least five percentage points per year (for a three-year period). Even bigger underperformance was less common, but not rare. (Go to www.mastersfunds.com to see the study in our September 2006 shareholder report.)
So experiencing a period of underperformance over three years is more the norm than the exception—even for most funds that have soundly beaten their benchmarks over the long run. In fact, Masters’ Select International, now coming off a very strong year and with an exceptionally high ten-year peer group ranking by Morningstar as noted above, posted the single worst three-year relative return run of all the Masters’ funds! At the end of February 2005, Masters’ Select International trailed its S&P Citigroup PMI Global (ex U.S.) Index benchmark by an annualized 4.16 percentage points. Since that time the fund has rebounded strongly.
But why does underperformance happen to skilled stock pickers? Based on our observations, we’d say it is a confluence of factors that usually includes costly analytical mistakes by the stock picker (they do make mistakes occasionally), unforeseen events that impact some of the holdings, not participating in particularly strong sectors or stocks that are in the benchmark (e.g. energy, recently) and sometimes, a stock picker’s style being temporarily out of sync with the benchmark. Recently, some of the Masters’ funds have suffered through a period where several of our managers have struggled at the same time—something we considered unlikely.
Going beyond the question of why it can happen, the key factor for investors to consider about underperformance is whether it is likely to continue. If the stock picker is truly skilled and continues to be motivated and focused, we believe he or she is likely to outperform again—as was the case with the group of sub-advisors responsible for Masters’ Select International. This underscores the importance we place on continually assessing our confidence in the stock-picking skills and focus of our sub-advisors. Litman/Gregory’s ongoing evaluation of the quality of each sub-advisor’s investment process, team, research and decision-making usually results in a reaffirmation of our confident view. Occasionally it doesn’t. In these instances we have made changes. And it is important for us to communicate that, having made one manager change in 2007 (and also a manager addition) and one in 2006, we are happy with all of our sub-advisors across all five Masters’ Select funds, despite the poor performance some of them have generated recently. Based on the confidence we have in our sub-advisors, we expect Equity, Value and Smaller Companies to do well going forward. Obviously, this expectation is not a guarantee, and we don’t know when a relative performance rebound might start. But based on the study mentioned above (and our own experience over more than 20 years) we do know that, it is not uncommon for stock pickers who build index-beating long-term records to struggle through surprisingly lengthy periods of underperformance along the way, after which they rebound and perform well again.
Interesting Research
Over the past 20-plus years, Litman/Gregory has researched hundreds of stock pickers and fund managers. Over that time we’ve formed strong opinions about what traits skilled stock pickers have in common. Given our interest in the evaluation of stock pickers, a study published early last year on the concept of “Active Share” caught our eye.
| 1 | Morningstar, Inc., is an independent mutual fund research and rating service. Each Morningstar category represents a universe of funds with similar investment objectives. Rankings for the period shown are based on fund total returns with dividends and distributions reinvested and do not reflect sales charges. The highest percentile rank is 1 and the lowest is 100. The information contained herein: (1) is proprietary to Morningstar; (2) may not be copied or distributed; and (3) is not warranted to be accurate, complete or timely. Neither Morningstar nor its content providers are responsible for any damages or losses arising from any use of this information. |
| 2 | The annual returns for the Masters’ Select Smaller Companies Fund for the years ended 12/31/04, 12/31/05 and 12/31/06 were 21.01%, 5.29% and 9.67%, respectively. The annual returns for the Russell 2000 Index for the years ended 12/31/04, 12/31/05 and 12/31/06 were 18.33%, 4.55% and 18.37%, respectively. |
| 4 | The Masters’ Select Funds Trust |
The study was conducted by two Yale professors, Martijn Cremers and Antti Petajisto. The concept of Active Share has to do with the degree of difference in a fund’s portfolio holdings compared to its benchmark’s holdings. For example, if 70% of a fund’s positions were different than its benchmark, then it would have an “active” weight of 70% (this measure factors in both the different holdings, and the differences in the allocation to common holdings).
There are a number of interesting points in the paper but the most interesting is how Active Share relates to fund performance. Cremers and Petajisto analyzed the period from 1990 through 2003 and found that funds with the highest Active Share (at least 80%) outperformed their benchmarks by 1.39% to 1.49% (they did the study in two different ways so there are two different performance measures) on average (per year), while funds in the bottom quintile of Active Share lagged their benchmarks by 1.41% to 1.79%. Among Cremers and Pentajisto’s conclusions: “The best performers are concentrated stock pickers (high Active Share, high tracking error)… and even after fees and transaction costs the most active of them beat their benchmarks.” They later write that “Funds with the highest Active Share significantly outperform their benchmarks both before and after expenses…”
This is only one study, and the conclusions do not apply to every fund. The evidence of a high correlation between Active Share and outperformance is compelling, but correlation is not the same thing as causation. With regards to the performance conclusions of the study, they are talking about the overall category of high Active Share funds—and some of the funds in that category surely underperform. So even if Cremers’ and Petajisto’s conclusions are good, Active Share would not by itself be a reliable predictor of future performance and we would certainly not be confident in using it as a means of selecting stock pickers or picking funds. That the data is so compelling is somewhat surprising to us. But the conclusions are not surprising to us and are consistent with what we look for in stock pickers: individuals and teams who have the confidence, based on their process and depth of research, to invest in their most compelling ideas and are not afraid to stray from the benchmarks (as opposed to closet indexers).
Recently we measured the Active Share of the Masters’ Select funds using Cremers’ and Petajisto’s methodology. They identified the group of high Active Share managers as those with at least an 80% measure (80% of the portfolio was different than the benchmark). Using September 30, 2007 numbers we found each of the Masters’ funds to have an extremely high level of active management (as we would expect):
Fund | Active Share %* | Benchmark |
| Masters’ Select Equity | 90% | Russell 3000 Index |
| Masters’ Select Focused Opportunities | 91% | S&P 500 Index |
| Masters’ Select Value | 90% | Russell 3000 Value Index |
| Masters’ Select Smaller Companies | 98% | Russell 2000 Index |
| Masters’ Select International | 93% | S&P Citigroup PMI Global ex-US Index |
* Represents the portion of the portfolio that is different from the benchmark portfolio
For a fund to outperform its benchmark by a material margin over the long run requires a portfolio that is consistently different than the benchmark. While this creates the opportunity for outperformance, it also creates opportunity for underperformance, which will also happen at times. If the stock picker is skilled, we believe the likelihood is that over the long run there will be more periods of strong performance than periods of bad performance. If we are right, we expect this would lead to benchmark-beating, long-term returns.
In Closing
As always, we believe it is important to communicate to you the strong financial commitment to the Masters’ Select funds on the part of Litman/Gregory employees and the independent trustees. As of December 31, 2007 employees and trustees held $17.7 million worth of Masters’ Select shares.
We continue to feel fortunate that as of the end of the year, out of the five Masters’ Select funds, the Equity, International, and Smaller Companies funds were included in the small group of actively managed funds named as Fund Analyst picks in their fund categories (Large Blend, Foreign Large Blend, and Small Growth, respectively) by Morningstar.
Of most importance, we are as committed as ever to doing all we can to deliver strong long-term returns relative to each fund’s benchmarks. In this regard we want to recognize our analyst team, who has made important contributions to our initial and ongoing due diligence efforts.
Sincerely,
Ken Gregory and Jeremy DeGroot
Litman/Gregory Fund Advisors, LLC
Advisor to the Masters’ Select Funds
Some of the comments are based on current management expectations and are considered “forward-looking statements”. Actual future results, however, may prove to be different from our expectations. You can identify forward-looking statements by words such as “estimate”, “may”, “expect”, “should”, “could”, “believe”, “plan” and similar terms. We cannot promise future returns and our opinions are a reflection of our best judgment at the time this report is compiled.
Shareholder Letter | 5 |
Masters’ Select Long-Term Performance Metrics
As we always point out, long-term performance is what we care about, and over long periods of time the Masters’ Select fund family is, we believe, building an encouraging record despite the fact that the last three years have been difficult for several of our funds. There are three metrics we track and present in these reports that serve as a helpful report card on the Masters’ Select long-term performance and ultimately, the success of the Masters’ Select concept. These metrics are updated below:
1st Metric: Each Fund’s Overall Fund Performance Since Inception
The two oldest Masters’ Select Funds have out-returned their passive benchmarks by a clear margin since their inception. Masters’ Select Value, the third oldest Masters’ Select Fund trails its benchmark, the Russell 3000 Value Index, but by a very small margin. Masters’ Select Smaller Companies, which is four and one half years old, also trails its benchmark, the Russell 2000 Index, thus far. At one-and-a-half years old, Masters’ Select Focused Opportunities is not yet old enough to measure long-term performance and therefore is not included in the chart below. As is well documented by others, we believe that beating a benchmark over the long-term is a demanding standard. Nevertheless it is our objective to meet this standard over long time periods for each of our funds.
MASTERS’ SELECT PERFORMANCE VS. BENCHMARKS SINCE INCEPTION | ||||
Fund | Length of Operation as of 12/31/07 | Index Benchmark | Average Annual Out-performance Over Benchmark | |
Masters’ Select Equity | 11 years | Russell 3000 | 1.29% (129 basis points) | |
Masters’ Select International | 10 years and 1 month | S&P CGI PMI Global ex. US Index | 3.76% (376 basis points) | |
Masters’ Select Value | 7 years and 6 months | Russell 3000 Value | -0.24% (-24 basis points) | |
Masters’ Select Smaller Companies | 4 years and 6 months | Russell 2000 | -1.56% (-156 basis points) | |
2nd Metric: Frequency of Long-Term Out-Performance
Because beating a passive index over the long run is a rare feat for active managers there are many investment professionals and academics who believe active management is folly, especially given the alternative of low cost index funds. Given the difficulty in beating a passive benchmark, investors considering an actively managed fund should have some reason to believe it is likely to do better. Though past performance is no guarantee of future performance, an interesting performance measure is the percentage of times that each fund beat its benchmark over longer time periods. The table below shows the aggregate performance of the Masters’ Select Funds over rolling three-year and five-year time periods. Generally we believe five years is a better time frame to measure—especially for funds focused on long-term returns (ten years is even better but we will have to wait another year before we have enough ten-year periods to warrant reporting). While we would like each Masters’ Select Fund to outperform its index benchmark in every three-year period, this is an unrealistic standard given each fund’s extreme lack of benchmark sensitivity, and since one bad year can have a huge impact on any three-year period. What we do seek is for the Masters’ Select Funds to outperform their benchmarks in the majority of the intermediate time period of three years, and a higher percentage of the time over five-year periods. See the report on each fund for more detail.
MASTERS’ SELECT FUNDS: PERFORMANCE VERSUS BENCHMARKS OVER INTERMEDIATE-TERM (THREE YEARS) AND LONG-TERM (FIVE-YEARS) PERIODS* | ||
Three Years | Five Years | |
Percentage of Times Masters’ Select Outperformed | 55% | 67% |
Total Number of Rolling Return Periods** | 238 | 166 |
| * | Masters’ Select Equity is benchmarked against the Russell 3000 Index. Masters’ Select International is benchmarked against the S&P Citigroup PMI Global (ex-US) Index. Masters’ Select Value is benchmarked against the Russell 3000 Value Index. Masters’ Select Smaller Companies is benchmarked against the Russell 2000 Index. |
| ** | The first rolling three-year period is reached 36 months after each fund’s inception (based on month-end dates). The starting and ending periods then “roll” forward one month at a time to comprise a new 36-month period. The first rolling five-year period is reached 60 months after each fund’s inception (based on month-end dates). The starting and ending periods then “roll” forward one month at a time to comprise a new 60-month period. |
We believe the strong out-performance across five-year time periods in particular suggests that Masters’ Select has performed well for reasons that are unlikely to be due to mere chance.
3rd Metric: Performance of the Underlying Sub-advisors
A third measure for assessing performance is the performance of the underlying sub-advisors. If a fund’s success was the result of spectacular performance by one or two sub-advisors, one could perhaps make the argument that there was luck involved and thereby question the likelihood that the out-performance may be repeated. In our opinion, the more managers who outperform their benchmarks over the long run, the more likely it is that the group is truly skilled and that the Masters’ Select structure enhances the ability of managers to succeed. With respect to this test, the evidence seems compelling. Of the 21 sub-advisors who have run a
| 6 | The Masters’ Select Funds Trust |
Masters’ Select portfolio for at least three years (including those no longer part of Masters’ Select) 15 (71%) outperformed his or her benchmark after taking into account all fees for their full tenure with the funds. This includes four managers who are no longer part of Masters’ and four others who are included twice because they are part of two Masters’ Select Funds. We believe the odds of this outperformance happening by chance are quite low.
We continue to believe that together, the above metrics offer strong evidence that the Masters’ Select concept is being well executed.
Performance quoted represents past performance and does not guarantee future results. Please refer to page 2 to view the performance of the funds and their respective benchmarks
See page 76 for index definitions
Indices are unmanaged and do not incur fees, expenses or taxes.
Performance Metrics | 7 |
Masters’ Select Equity Fund Review
Falling housing prices, rising sub-prime mortgage defaults, tightening credit and fears of a broad economic slowdown, if not outright recession, weighed on the U.S. stock market in the second half of 2007. The financial sector was the hardest hit, dropping 20%, while consumer discretionary stocks dropped 17%. Energy was the top performer, gaining 12%.
The value of a hypothetical $10,000 investment in the Masters’ Select Equity Fund from inception (12/31/96) to present compared with the Russell 3000 Index and the Lipper Multi-Cap Core Index.
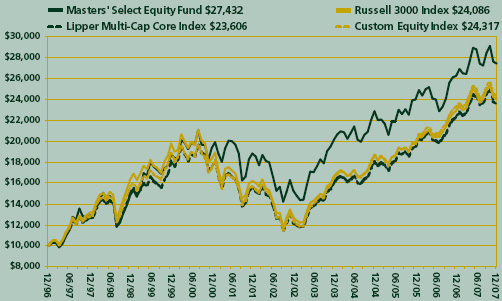
The hypothetical $10,000 investment at fund inception includes changes due to share price and reinvestment of dividends and capital gains. The chart does not imply future performance. Indices are unmanaged, do not incur fees, expenses or taxes and cannot be invested in directly.
Performance as of December 31, 2007
Average Annual Total Returns | ||||
One-Year | Five-Year | Ten-Year | Since Inception | |
Masters’ Select Equity Fund (12/31/96) | 4.57% | 12.44% | 7.83% | 9.61% |
Performance data quoted represents past performance and does not guarantee future results. The funds impose a 2% redemption fee on shares held less than 180 days. Performance data does not reflect the redemption fee. If reflected, total returns would be reduced. The graph and table do not reflect the deduction of taxes that a shareholder would pay on fund distributions or the redemption of fund shares.
After a strong first half of 2007, Masters’ Select Equity ended the year trailing its benchmarks by a small margin. In the fourth quarter, the Equity fund declined 3.54%, versus a loss of 3.34% for the Russell 3000 Index. For the year, the Equity fund gained 4.57%, compared to a 5.14% gain for the index. Since inception, the fund has outperformed its benchmarks, gaining 9.61% on an annualized basis, versus 8.32% for the Russell 3000 Index.
As we wrote in the shareholder letter earlier in this report, though we are pleased with Masters’ Select Equity’s long-term performance compared to its benchmarks, we are not satisfied with the fund’s trailing three-year return. (We strongly urge you to read the introductory letter, which provides important perspective to the last three years.) After beating its benchmarks for six consecutive years (1999 through 2004), the fund’s return trails the Russell 3000 Index over the last three years. Over this period, relative performance was driven mostly by a very poor year in 2006, but also lagging performance in 2005 and now to a minor extent 2007.
At a manager level, over the three year time period ended 12/31/07, three of the fund’s managers trailed their benchmarks, two of them by wide margins. Though it is discouraging, performance slumps by managers who outperform over the long run are not rare. (Based on the findings of the study we referenced in the shareholder letter earlier in this report, the majority of managers experience three-year periods of material underperformance—more details of this study were included in the September 2006 shareholder report.) When underperformance happens, it is important to assess whether the factors that supported our confidence in the stock picker are still present. These factors include the investment process, team quality, execution, focus and the ability to successfully implement a concentrated portfolio. In the case of the fund’s underperforming managers, though some stock-picking mistakes were made, we continue to be very confident in their skills, and because of that we believe we will see them eventually begin outperforming again (in fact, one did turn around and put in a strong performance in 2007).
It is worth mentioning that we have been through this before. Masters’ Select International experienced an even more severe period of relative underperformance that ended in early 2005. Since that time the fund has experienced very strong relative and absolute performance and over the last ten years the fund ranks in the top 2% of its Morningstar peer group. As of December 31 2007, Morningstar ranked the Masters’ Select International Fund in the 7th, 4th, 8th, and 2nd percentile among 743, 557, 462, and 227 Foreign Large Blend Funds for the one-, three-, five-, and ten-year periods, respectively, based on total return. While there are obvious differences between the Equity and International Funds, this pattern of ups and downs in relative performance over shorter time periods is not surprising in the context of what the data tell us about funds that have outperformed over the long run.
Long-Term Performance Analysis
Though occasional periods of lagging performance can be frustrating, investors who have stuck with the fund over its 11-year life have been rewarded. Evidence of the fund’s long-term success and other performance observations are outlined below (all performance numbers are net of all fund fees and expenses including advisory fees, fund operating overhead and trading costs).
| • | The fund has outperformed the Custom Equity Index (a blend of the S&P 500, Russell 2000 and the MSCI EAFE Index), the best-performing of its benchmarks, by 1.19 percentage points (119 basis points) since its inception, as measured by average annual total return. In dollar terms, $10,000 invested in the fund 11 years ago would be worth $27,432 vs. $24,317 for the index. Thus, the fund has generated $17,432 of return vs. $14,317 for the index, or 22% excess total return. |
| • | Over its full life the fund has outperformed the S&P 500 by an average annualized margin of 1.45% (145 basis points). We don't view this index as a primary benchmark because it is more large-cap oriented than Masters' Select Equity. However, it is the most widely followed U.S. equity |
| 8 | The Masters’ Select Funds Trust |
benchmark. The S&P 500 Index’s performance over the past one, five and ten years, and since the fund’s inception date (12/31/96) has been 5.49%, 12.83% 5.91% and 8.16% respectively.
| • | The fund outperformed each of its benchmarks in a variety of environments including strong growth years (1999) and several strong value years (2000, 2001 and 2004). We feel this is a testament to the diversified style exposure in the fund, the flexibility of the managers to pursue the most compelling opportunities without artificial style-box constraints, and of course, the skill of the managers. |
| • | The fund has outperformed, on a total-return basis, all of its benchmarks in down years for the stock market (2000, 2001 and 2002). Its performance has varied in the up years. It outperformed in the very strong return year of 1999. In the very strong return years of 1997 and 2003 it outperformed two of its three benchmarks. However, in 1998 and 2006, also strong years for stocks, the fund underperformed. In the more moderate return year of 2004 it outperformed all three benchmarks but in 2005 and 2007 it trailed its benchmarks. |
| • | We believe consistency over five-year time periods is also an important metric. There have been 73 rolling five-year time periods during the fund’s life (the first starting at the fund's inception, and then in each subsequent period commencing at the beginning of the next month). Masters' Select Equity has out-returned its Russell 3000 benchmark in 60 of these periods as measured by average annual total return. This amounts to outperformance in 82% of the defined five-year periods. We believe this consistency is noteworthy. |
| • | As depicted in the table, the fund’s worst return experiences over one, three and five years have been significantly better than its Russell 3000 benchmark and the fund has experienced fewer negative return periods. |
Performance | MSEFX | Russell 3000 | Number of Periods |
Best Rolling 12-Mo. Period 1 | 47.7% | 47.7% | 121 |
| Worst Rolling 12-Mo. Period | -22.8% | -27.9% | 121 |
| Best Rolling 36-Mo. Period | 104.0% | 105.0% | 97 |
| Worst Rolling 36-Mo. Period | -28.3% | -40.4% | 97 |
| Best Rolling 60-Mo. Period | 99.5% | 111.8% | 73 |
| Worst Rolling 60-Mo. Period | 0.1% | -17.3% | 73 |
| Percent Negative 12-Mo. Rolling | 20.7% | 24.8% | 121 |
| Percent Negative 36-Mo. Rolling | 17.5% | 29.9% | 97 |
| Percent Negative 60-Mo. Rolling | 0.0% | 38.4% | 73 |
| Percent Beat Benchmark 12-Mo. | 61.2% | n/a | 121 |
| Percent Beat Benchmark 36-Mo. | 66.0% | n/a | 97 |
| Percent Beat Benchmark 60-Mo. | 82.2% | n/a | 73 |
| 1 | The best performing 12 and 36 month rolling periods for the Fund commenced in May 1997; the best rolling 60 month period commenced in October 2002. The worst 12, 36 and 60 month rolling periods for the Fund commenced in April 2002, April 2000 and April 1999, respectively. |
| • | Four of the fund’s six long-tenured managers have outperformed their benchmarks during their time with the fund. In addition, Sig Segalas, who was replaced in October 2003, also outperformed his benchmark during his almost seven-year tenure. Two other managers who had been replaced in earlier years did not outperform their benchmarks (one replaced the other and was then replaced by Bill Miller—neither was part of the fund for three years). The following table shows the outperformance of each long-tenured manager (without identifying the managers), relative to his benchmark: |
CURRENT MASTERS’ SELECT MANAGERS’ PERFORMANCE Margin versus BENCHMARKS Manager Return Less Benchmark Return Over Full Tenure Through December 31, 2007* | |
Masters’ Select Equity | Annualized Performance Margin (Net of Allocated Expenses) |
Manager 1 | 11.20% |
Manager 2 | 5.71% |
Manager 3 | 2.68% |
Manager 4 | 2.59% |
Manager 5 | -1.50% |
Manager 6 | -2.55% |
| * | This table does not include the two managers that preceded Bill Miller prior to March 2000. Both of those managers underperformed their benchmarks. It also does not include Sig Segalas who for his almost seven-year tenure outperformed his benchmark. Listed alphabetically are the managers and their respective benchmarks. |
Manager | Tenure | Benchmark |
Craig Blum & Steve Burlingame | 10/31/03 | Russell 1000 Growth Index |
| Bill D’Alonzo | 12/31/96 | Russell 2500 Growth Index |
| Chris Davis | 12/31/96 | S&P 500 Index |
| Mason Hawkins | 12/31/96 | Russell 3000 Value Index |
| Bill Miller | 03/24/00 | S&P 500 Index |
| Dick Weiss | 12/31/96 | Russell 2000 Index |
| • | Masters’ Select Equity’s after-tax returns since inception have also been strong. The fund's average annual return over its life assuming all shares were liquidated on December 31, 2007, and taxes were paid on distributions in each year at the highest tax rate in place at the time of each distribution, was 7.80%. If we assume the Russell 3000 Index compounded without any taxes paid over the same eleven-year period, then was liquidated on December 31, 2007 and paid taxes on accumulated gains at the current capital gains rate of 15%, its theoretical after-tax return would be lower, at 7.42%. (This hypothetical tax calculation on the index unrealistically favors the index because it assumes no taxes on returns from dividends until the liquidation date, and no annual expenses.) Masters’ Select Equity Fund’s average annual total return after taxes on distributions for the one-year, five-year, ten-year and since inception (12/31/96) periods ended December 31, 2007 are 3.38%, 11.80%, 6.63% and 8.17%, respectively. The average annual total return after taxes on distributions and the |
Fund Summary | 9 |
sale of fund shares for the one-year, five-year, ten-year and since inception (12/31/96) periods ended December 31, 2007 are 4.60%, 10.85%, 6.36% and 7.80%, respectively.
Portfolio Commentary
A number of factors contributed to the fund’s performance during 2007. The highlights follow.
Performance of managers: In 2007, four of the six Masters’ Select Equity stock pickers outperformed their respective benchmarks; the other two managers underperformed their respective benchmarks. For the year, the individual sub-advisors’ returns ranged from a loss of 5.9% to a gain of 14.8%.
Over shorter time periods, it is typical for some, but not all, managers to beat their benchmarks. However, we are focused primarily on long-term performance and we aim to select sub-advisors who will beat their benchmarks over longer time periods. Through 2007, four of the six sub-advisors have achieved that goal by a significant margin since their respective inception dates. While the other two managers trail their benchmarks, we believe that they will ultimately outperform, as well.
Sector and stock-picking impact: Though all the Masters’ Select funds are driven by bottom-up stock picking, the sector exposure that results from this may provide some insight into the fund’s relative performance. Based on our attribution analysis, the fund’s overall sector exposure detracted from performance relative to the Russell 3000 benchmark. The fund’s overweighting to the top-performing materials sector was a positive, but this was more than offset by the fund’s over-allocation to the hard-hit consumer discretionary sector. In contrast, stock selection was a positive contributor to relative performance. The fund’s financial and consumer-discretionary stocks, in particular, added value relative to the benchmark’s returns for those sectors. This includes the 106% return for Amazon.com, the fund’s top holding. On the negative side, the fund’s telecom services and materials stocks hurt performance relative to the benchmark’s returns for those sectors.
Leaders and laggards: During 2007, four of the fund’s six sub-advisors had at least two stocks that were among the fund’s ten largest percentage gainers; those same sub-advisors also had at least two stocks that were among the fund’s largest percentage losers. Chris Davis/Ken Feinberg and Mason Hawkins were not on either list. Bill D’Alonzo claimed the portfolio’s biggest percentage winner for the year: Aquantive, which was a digital marketing company that was acquired by Microsoft in the second quarter. Interestingly, Amazon.com—the fund’s largest position and owned by both Bill Miller and Craig Blum/ Stephen Burlingame—was one of the best-performing stocks in the portfolio for 2007 after being one of the fund’s worst performers the year before. Other big winners by percentage include Taser (up 99%), Arcelor Mittal (up 81%), VMWare (up 77%), and FMC Technologies (up 76%). The two largest percentage losers for the year were housing-related stocks Countrywide Financial (down 56%) and Pulte Homes (down 51%). Seven of the fund’s ten largest winners and seven of the ten largest losers remained in the portfolio at the end of the year.
See the table on page 12 for a list of the leaders and laggards over the past six and 12 months. The table includes dollar gains and losses as well as percentage gains and losses. It is important to understand that the fact a stock has lost (or made) money for Masters’ Select Equity for the 12-month period ended December 31, 2007 tells us nothing about how successful the holding has been during the entire period it was held, or how successful it may become. The fund will hold many stocks for significantly longer periods of time and the success of these holdings won’t be known until they are ultimately sold. So in that respect, while it is interesting to know how specific stocks performed during the period, this information is of limited value in assessing the ultimate success of these stock holdings.
Portfolio mix: There were some notable changes to the fund’s sector exposure during the year. The fund’s allocation to the technology sector ended the year at 20.7%, up 4.3% from year-end 2006—making it the portfolio’s second-largest sector exposure behind financials, which were down slightly from the prior year to 22.6%. Energy accounted for 12.6% of the fund at year-end (compared to 7.6% the year before), making it the third-largest sector allocation. The consumer discretionary and materials sectors—the fund’s fourth- and fifth-largest sector allocations—accounted for 18.0% (down 4.8% from the year before) and 9.5% (up 3.0% from the prior year), respectively. Relative to the Russell 3000 benchmark, at year-end the fund was significantly overweighted to the consumer discretionary, materials, financial, and technology sectors while being heavily underweighted to health care, consumer staples, industrials, and utilities.
The fund’s exposure to large-cap stocks (with market caps greater than $18.3 billion) and small-cap stocks (with market caps less than $2.5 billion) rose in the fourth quarter, ending the year at 50.4% and 13.0%, respectively. This came at the expense of mid-caps, which were down to 27.0% at year-end. (Note that we updated our market-cap definitions after the 6/30/07 shareholder report.) The rest of the portfolio was comprised of foreign stocks (up slightly from the year before, to 7.0%) and cash (2.6%).
Please see page 13 for a breakout of the fund’s sector and market-cap exposures.
Miscellaneous
Taxes: Masters’ Select Equity distributed $1.27 in capital gains in December. Approximately 98% of the gains were long-term. We will continue to work with the fund’s sub-advisors to manage the fund in a tax-aware manner. This will include taking short-term losses when there is an alternative investment that is equally attractive, and using other tax-management techniques. However, the managers will not sacrifice pre-tax performance in pursuit of after-tax performance since the fund has both tax-exempt and taxable shareholders.
Accolades: Masters’ Select Equity continues to be included as a Fund Analyst Pick in the Large Blend Category by Morningstar, the fund rating firm. Morningstar updated their opinion of the fund in December in a report titled: “Masters’ Select Equity can be streaky, but it’s one of our favorite large-blend funds.”
| 10 | The Masters’ Select Funds Trust |
In Closing
As we write this, recession fears are rising and the stock market is coming off of a negative quarter and has declined more in the first couple of weeks in 2008. However, negative headlines don’t necessarily foreshadow rough performance periods—though they can. Often headlines can be a contrarian indicator as the stock market tends to be forward looking. That is why stocks tend to decline months before a recession has started and often begin to rebound during the depths of recession—as investors look ahead to recovery. As far as longer-term prospects, based on our analysis and at an S&P 500 level of 1380, stock market valuations are attractive based on many metrics and at least reasonable based on others. These valuation metrics tell us nothing about how stocks might do in the short term. But they suggest to us that stocks, as is typically the case, remain likely to outperform their primary competitor, bonds, over reasonably long time frames.
A source of encouragement comes from some of the fund’s sub-advisors who tell us that they are finding more compelling stock picking opportunities now than they have in the last few years. This may be due to the large variance in performance in different sectors. This is unlike the last several years when we were hearing that there were not a lot of valuation discrepancies. So, while the overall market has underlying questions, we are more optimistic about the potential to add value from good stock picking. This is a long-term confidence builder for us, though it does not mean that the fund or the markets will necessarily do well over the short term. In fact, if there is an economic downturn, it is likely that stocks will decline below early January levels before rebounding in anticipation of a recovery.
Whatever the future is for the stock market, over shorter time periods shareholders should be prepared for the fund to track differently than its benchmarks - sometimes positively and sometimes negatively. Recently it has been negatively. But over the longer time horizon based on which the fund is managed, the quality of its stock pickers and the strength of the Masters’ Select concept together give us confidence in our belief that the fund will outperform its benchmarks, as it has since its inception.
Neither the information contained herein nor any opinion expressed shall be construed to constitute an offer to sell or a solicitation to buy any security or any other funds mentioned herein. The views herein are those of Litman/Gregory Fund Advisors, LLC at the time the material is written and may not be reflective of current conditions. Performance quoted represents past performance and does not guarantee future results.
Fund Summary | 11 |
Masters’ Select Equity Fund Leaders and Laggards
For the Six Months Ended December 31, 2007
By Percentage Gain (Loss)
Security | $ Contribution (Loss) | % Change |
| VMware | 20,049 | 76.8% |
| CNinsure, Inc. | 40,898 | 56.8% |
| FMC Technologies, Inc. | 2,721,079 | 52.0% |
| Fairfalx Financial | 5,879,461 | 50.7% |
| Salesforce.com, Inc. | 7,824,801 | 45.6% |
| Amazon.com, Inc. | 12,086,075 | 32.4% |
| Google, Inc. | 8,112,391 | 28.0% |
| Berkshire Hathaway, Inc. Del | 4,103,771 | 28.8% |
| Foxhollow Technologies, Inc. | 974,743 | 24.2% |
| Dril-Quip, Inc. | 1,178,100 | 23.8% |
| 42,941,368 | ||
| Countrywide Financial Corp. | (13,151,849) | (54.3%) |
| Level 3 Communications, Inc. | (8,151,766) | (42.8%) |
| Symmetricom, Inc. | (2,525,824) | (42.5%) |
| Emmis Communications Corp. | (2,464,939) | (40.3%) |
| Capital One Financial Corp. | (4,980,267) | (39.7%) |
| Lennar Corp. | (2,846,768) | (38.7%) |
| Ceradyne, Inc. Calif | (1,744,924) | (38.7%) |
| Sprint Nextel Corp. | (4,653,540) | (36.4%) |
| Conseco, Inc. | (2,270,501) | (34.7%) |
| General Motors Corp. | (4,765,440) | (32.8%) |
| (47,555,818) |
By Dollar Gain (Loss)
Security | $ Contribution (Loss) | % Change |
| Amazon.com, Inc. | 12,086,075 | 32.4% |
| Google, Inc. | 8,112,391 | 28.0% |
| Salesforce.com, Inc. | 7,824,801 | 45.6% |
| Fairfalx Financial | 5,879,461 | 50.7% |
| EOG Resources, Inc. | 5,363,547 | 21.5% |
| Berkshire Hathaway, Inc. Del | 4,103,771 | 28.8% |
| Arcelor Mittal | 3,013,848 | 23.6% |
| Schlumberger Ltd. | 2,838,677 | 18.4% |
| FMC Technologies, Inc. | 2,721,079 | 52.0% |
| AON Corp. | 2,266,340 | 12.5% |
| 54,209,990 | ||
| Countrywide Financial Corp. | (13,151,849) | (54.3%) |
| Level 3 Communications, Inc. | (8,151,766) | (42.8%) |
| Cemex | (6,549,832) | (29.9%) |
| Capital One Financial Corp. | (4,980,267) | (39.7%) |
| General Motors Corp. | (4,765,440) | (32.8%) |
| Sprint Nextel Corp. | (4,653,540) | (36.4%) |
| Tyco International Ltd. | (3,219,329) | (9.1%) |
| Fedex Corp. | (3,196,800) | (19.5%) |
| Eastman Kodak Co. | (3,140,500) | (20.5%) |
| Sealed Air Corp. | (3,055,143) | (24.7%) |
| (54,864,468) |
For the Year Ended December 31, 2007
By Percentage Gain (Loss)
Security | $ Contribution (Loss) | % Change |
| aQuantive, Inc. | 3,894,322 | 107.5% |
| Amazon.com, Inc. | 32,635,085 | 105.7% |
| Taser International Inc. | 4,158,187 | 99.2% |
| Arcelor Mittal | 7,339,710 | 80.9% |
| VMware | 20,049 | 76.8% |
| FMC Technologies, Inc. | 4,112,652 | 75.8% |
| Salesforce.com, Inc. | 10,299,702 | 70.1% |
| U.S. Steel Corp. | 4,949,200 | 58.8% |
| Surmodics, Inc. | 2,272,612 | 58.3% |
| Schlumberger Ltd. | 7,388,838 | 57.5% |
| 77,070,357 | ||
| Countrywide Financial Corp. | (16,193,154) | (55.6%) |
| Pulte Homes, Inc. | (7,676,468) | (51.1%) |
| Symmetricom, Inc. | (2,244,459) | (39.7%) |
| Lennar Corp. | (2,846,768) | (38.7%) |
| Ceradyne, Inc. Calif | (1,744,924) | (38.7%) |
| Network Appliance, Inc. | (3,659,813) | (32.5%) |
| Force Protn, Inc. | (1,284,450) | (32.3%) |
| Capital One Financial Corp. | (4,661,364) | (31.9%) |
| Emmis Communications Corp. | (1,999,968) | (31.8%) |
| Conseco, Inc. | (2,015,222) | (30.5%) |
| (44,326,590) |
By Dollar Gain (Loss)
Security | $ Contribution (Loss) | % Change |
| Amazon.com, Inc. | 32,635,085 | 105.7% |
| Google, Inc. | 11,738,218 | 40.5% |
| Salesforce.com, Inc. | 10,299,702 | 70.1% |
| EOG Resources, Inc. | 9,164,165 | 34.3% |
| Schlumberger Ltd. | 7,388,838 | 57.5% |
| Arcelor Mittal | 7,339,710 | 80.9% |
| Fairfalx Financial | 5,632,621 | 46.9% |
| AON Corp. | 5,499,496 | 32.1% |
| U.S. Steel Corp. | 4,949,200 | 58.8% |
| Taser International Inc. | 4,158,187 | 99.2% |
| 98,805,222 | ||
| Countrywide Financial Corp. | (16,193,154) | (55.6%) |
| Pulte Homes, Inc. | (7,676,468) | (51.1%) |
| Level 3 Communications, Inc. | (5,672,454) | (19.2%) |
| Capital One Financial Corp. | (4,661,364) | (31.9%) |
| Cemex | (4,278,749) | (21.2%) |
| Network Appliance, Inc. | (3,659,813) | (32.5%) |
| Sealed Air Corp. | (3,558,392) | (23.8%) |
| InterActiveCorp | (3,365,948) | (22.4%) |
| Sprint Nextel Corp. | (3,084,351) | (15.9%) |
| American International Group, Inc. | (2,964,196) | (15.8%) |
| (55,114,889) |
12 | The Masters’ Select Funds Trust |
Masters’ Select Equity Fund Managers
INVESTMENT MANAGER | FIRM | TARGET ASSET ALLOCATION | MARKET CAPITALIZATION OF COMPANIES IN PORTFOLIO | STOCK-PICKING STYLE |
| Craig Blum/Stephen | TCW Investment Management | 20% | Mostly mid- and | Growth |
| Burlingame | Company | large-sized companies | ||
| Christopher Davis/ | Davis Selected Advisers, L.P. | 20% | Mostly large companies | Growth at a |
| Kenneth Feinberg | reasonable price | |||
| Bill D’Alonzo and Team | Friess Associates, LLC | 10% | Small and mid-sized | Growth |
companies | ||||
| Mason Hawkins | Southeastern Asset Management, Inc. | 20% | All sizes and global, | Value |
may have up to 50% | ||||
foreign stocks | ||||
| Bill Miller | Legg Mason Capital Management, Inc. | 20% | All sizes, but mostly | Eclectic, may invest |
large and mid-sized | in traditional value | |||
companies | stocks or growth | |||
stocks | ||||
| Dick Weiss | Wells Capital Management, Inc. | 10% | Small and mid-sized | Growth at a |
companies | reasonable price |
Portfolio Composition*
As reflected in this chart, your fund is well diversified in terms of market capitalization. The fund holds 79 securities, exclusive of cash equivalents.
By Asset Class
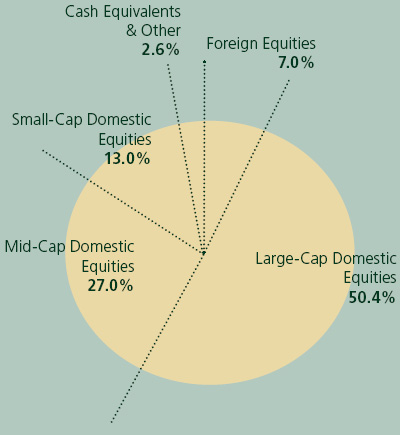
Market Capitalization:
Small-Cap Domestic < $2.5 billion
Mid-Cap Domestic
Large-Cap Domestic > $18.3 billion
| * | Totals may not add up to 100% due to rounding. |
By Sector
Sector Allocation | |||||||
| Fund | Russell 3000 Index | ||||||
| Consumer Discretionary | 18.0 | % | 9.6 | % | |||
| Consumer Staples | 2.1 | % | 9.0 | % | |||
| Energy | 12.6 | % | 12.0 | % | |||
| Finance | 22.6 | % | 17.6 | % | |||
| Health Care & Pharmaceuticals | 2.8 | % | 12.0 | % | |||
| Industrials | 6.3 | % | 12.1 | % | |||
| Technology | 20.7 | % | 16.6 | % | |||
| Telecom | 2.7 | % | 3.3 | % | |||
| Utilities | 0.0 | % | 3.9 | % | |||
| Materials | 9.5 | % | 3.9 | % | |||
| Cash Equivalents & Other | 2.7 | % | 0.0 | % | |||
| 100.0 | % | 100.0 | % | ||||
Fund Summary | 13 |
Masters’ Select Equity Fund Stock Highlights
Salesforce.com, Inc. - Craig Blum and Steve Burlingame
Salesforce.com is the leading provider of Software as a Service (SaaS), with over 1,000,000 paying subscribers at more than 38,000 customers. The company has less than 10% market share in customer relationship management (CRM) software, their first targeted market. With a lower cost of ownership and a superior product offering, Salesforce.com is aggressively growing its subscriber base in CRM software and leveraging its technology platform to attack additional software markets. Over the long run, we believe the company’s strategy is likely to significantly expand their addressable market, increase revenue per customer, and widen profit margins.
Traditional enterprise software from the likes of Microsoft, Oracle, Peoplesoft, etc. requires substantial up-front expense for customers, with mixed long-term returns on investment. Additionally, customers using traditional software are often forced to upgrade to a new version of the software every 3-5 years. Salesforce.com allows their products to be trialed for free and then charges customers a flat monthly subscription fee per user. Salesforce.com hosts the application on their servers and stores the client’s data in their databases, which often enables lower cost of ownership for the customer. Since Salesforce.com controls the applications itself, it is able to provide constant updates to the software based on the usage patterns and feedback of subscribers. The company has a superior model for innovation that provides constant improvements on a monthly, not yearly basis.
Salesforce.com’s strategy of delivering Software as a Service over the Internet, charging customers on a monthly basis per user, and constantly upgrading the product offering presents a significant threat to the business models of traditional software vendors. To date, the strategic responses from Oracle and Peoplesoft have failed to forestall Salesforce.com’s momentum and market share gains. Microsoft’s Live / Dynamics strategy, representing a hydra of products and technologies, will purportedly offer a Software as a Service product line to compete with Salesforce.com in 2008. Traditional software vendors are constrained by cultures and incentives optimized for selling big up-front software licenses for products that get upgraded every 3-5 years. These businesses aren’t organized to offer product innovations every few months and pay sales reps and channel partners based on a subscription revenue model. We think it will be a cultural challenge for traditional software vendors to successfully execute a Software as a Service strategy while simultaneously supporting a huge legacy product line of traditional enterprise software products. The virtues of Software as a Service contradict many of the selling points of traditional software, which creates a confusing and inconsistent value proposition for companies seeking to navigate both paradigms simultaneously.
Our analysis suggests that Salesforce.com has reached critical mass and that the market is underestimating their long-term ability to attack additional software markets with their innovative product offerings.
Bank of New York Mellon Corp. - Christopher Davis and Kenneth Feinberg
Bank of New York and Mellon Financial merged in mid-2007 and today is the largest custody bank in the world. Bank of New York Mellon (BK) is a big bank with a market capitalization of $54 billion however over 80% of its revenues come from fees rather than lending activities. We believe that despite being a “financial stock” at a time when most financial stocks are suffering from weakening balance sheets and declining earnings due to missteps in subprime mortgage lending, CDO exposure, SIV exposure, highly leveraged lending exposure and deteriorating credit trends to name just a few items, BK has only negligible exposure to any of these problem areas. We believe that not only should BK provide attractive returns for shareholders over the long term but also could provide a relative advantage should the macroeconomic environment deteriorate meaningfully.
BK is a leader in almost all of its business lines. 25% of earnings come from the asset servicing businesses in which the largest business line is the custody business. Every time a security is purchased by an institutional investor the certificate must be safely housed in a bank. BK is the #1 player globally in the custody business with $21 trillion in assets under custody or a 15% worldwide share of a $140 trillion market. Importantly, BK provides outstanding customer service and has been gaining profitable market share as smaller banks have exited the business over the years because they did not have the scale to make the necessary technology investments to remain competitive with the leaders including BK, State Street, JP Morgan Chase and Northern Trust.
25% of profits come from the issuer services business whose largest business line is the corporate trust business. All those bond coupons that get paid annually must find their way to the rightful owner of the security with almost no errors and that is what BK does.
25% of earnings comes from the asset and wealth management business where BK is one of the largest players in the world with $1.1 trillion in assets under management. They have a broad array of capabilities including equities, fixed income, money markets as well as several hedge funds and their long term performance has been quite good.
Management is outstanding, led by CEO Bob Kelly. Bob was formerly the CFO at First Union and led the superior integration of the merger between First Union and Wachovia. Bob is a no-nonsense fellow who thinks about creating superior long term shareholder value. Bob holds his people accountable with margin goals that are benchmarked against the appropriate peers and openly displayed to chart progress. Bob is also a super-numerate fellow who hates corporate waste and understands the importance of allocating capital in driving long term value. BK generates enormous free cash flow and we expect aggressive share repurchases to begin in early 2008.
14 | The Masters’ Select Funds Trust |
To date the merger between these two big banks has gone almost flawlessly as over 99% of customer relationships have been retained. BK also expects to generate $700 million in expense savings by the end of 2009 and between $250-400 million of revenue synergies by 2011. We hope they can exceed these goals. 30% of revenues now come from overseas but this figure could approach 50% of total revenues in five years as emerging markets and cross border investing continue to boom.
At only 14x what we expect BK can earn in 2008, the price one must pay to own these high ROE, recurring revenue global businesses with a very talented and shareholder oriented management team seems extremely compelling. We expect BK to be able to increase earnings per share for many years to come.
Hornbeck Offshore Services, Inc. - Bill D’Alonzo
With more energy industry activity taking place in deep ocean waters, getting crews and critical equipment to these locations has become more complex. Hornbeck steers the best supply ships to the places they are most needed.
NYSE-listed Hornbeck Offshore Services provides marine transportation services with a fleet of 45 technically-advanced offshore supply vessels (OSVs), primarily in the Gulf of Mexico. With the youngest fleet of any public company, Hornbeck commands roughly 21 percent of the new generation OSV market in the Gulf. It also operates 17 oceangoing tugs and 21 tank barges that transport petroleum and petroleum products.
September-quarter earnings grew 27 percent, exceeding expectations by 31 percent. Revenues increased 22 percent from a year ago. The age and capabilities of Hornbeck’s fleet enable a 93 percent utilization rate compared to a peer average of 65 percent while also earning two times the average per-day rate for its services.
The Friess team spoke with Hornbeck Chief Financial Officer Jim Harp regarding favorable industry dynamics. The offshore oil and gas market is expected to add 153 new rigs over the next four years, with 68 deepwater rigs currently under construction. All of these will require attendant supply vessels with the age, size and design specifications that Hornbeck’s fleet possesses.
Hornbeck also increasingly profits from high-margin projects not related to direct drilling activity, including platform and subsea installations, floating production platforms, decommissioning work and well testing. Hornbeck’s acquisition of Nabors Industries’ Sea Mar fleet earlier this year nearly doubled its size by adding 20 supply vessels. Hornbeck also has a strong pipeline of new generation ships under construction.
The Friess team bought Hornbeck at just 9 times 2008 earnings estimates. Wall Street expects the company to complete 2007 with 27 percent earnings growth.
Freddie Mac - Bill Miller
Freddie Mac is held in both the Equity Fund and the Value Fund. Please refer to the discussion appearing on page 34.
W-H Energy Service Inc. - Dick Weiss
W-H Energy Services, Inc. (W-H Energy) is an oil services company that provides products and services used in connection with the drilling and completion of oil and natural gas wells and the production of oil and gas. Since W-H Energy was established in 1989, the company has completed over 20 acquisitions. The company currently employs approximately 3,000 people and is headquartered in Houston, Texas.
W-H Energy’s business focuses on products and services that provide alternatives to the integrated services typically marketed by the major oilfield service companies. The company operates within two business segments, Drilling Products & Services and Completion & Workover Products and Services. The Drilling Products & Services division provides a variety of drilling services: logging-while-drilling (LWD), measurement-while-drilling (MWD), directional drilling, and down-hole drilling motors; drilling fluids; and rental tools. LWD & MWD are high tech services with limited competition. In the Completion & Workover division the company provides cased-hole wireline logging, perforating, tubing conveyed perforating services; coiled tubing services; completion fluids; and rental tools. While approximately 90% of W-H Energy’s revenue is derived in the US, the Company has expanded its international operations into areas such as Brazil, the North Sea, Italy and the Middle East.
W-H Energy has exhibited a commitment to technological advancement, most notably in measurement-while-drilling (MWD) and logging-while-drilling (LWD). Recent successes include the PathMaker™ 3-D, which allows accurate real-time steering and feedback operators desire, and PZIG™, which moves critical drill-bit location measurement equipment from 35’ behind the drill bit to 11” behind, the equivalent of steering an automobile (drill bit) from the rearview mirror versus the windshield. W-H Energy remains focused on technology. We expect the company will continue to grow via new technologies and will make technology-based acquisitions a priority. The company is continuing to add MWD and LWD equipment as capacity remains tight. The continued shift toward higher technology revenue could prove beneficial to margins.
W-H Energy is one of the few small-cap oil service companies that have a strong technology component to its business. This technology component is leveraged to the secular growth trend in directional drilling. The company is also expanding its presence in the Rockies and has deepwater growth opportunities. Accelerating decline rates and growth in unconventional drilling provide a strong backdrop for W-H Energy’s services.
Fund Summary | 15 |
While the international markets represent only 10%-11% of W-H Energy’s revenue, we expect double-digit growth of international revenues in 2008. We expect a meaningful increase in revenue contribution to come from Saudi Arabia during 2008 as a 10 rig deal ramps up in the 1H. All international revenue is derived from the companies M/LWD and directional drilling services.
Valuation is compelling. W-H Energy is trading at 5.2x TEV/EBITDA, 1.5x sales, and 11.5x EPS our 2008 forecast. Additionally, the company is currently trading near the low end of its historical forward-12- month earnings valuation ranges. We believe investor preoccupation with international oil plays at the expense of domestic focused service companies has given us the opportunity to purchase a stock comprised of unique assets and hard to duplicate technology.
In keeping with Southeastern Asset Management’s disclosure policies, Mason Hawkins has not contributed commentary on his holdings for this report.
See page 77 for Industry Terms and Definitions
Neither the information contained herein nor any opinion expressed shall be construed to constitute an offer to sell or a solicitation to buy any securities mentioned herein. The views herein are those of the portfolio managers at the time the commentaries are written and may not be reflective of current conditions.
16 | The Masters’ Select Funds Trust |
Masters’ Select Equity Fund
SCHEDULE OF INVESTMENTS IN SECURITIES at December 31, 2007
Shares | Value | ||
COMMON STOCKS: 97.3% | |||
Consumer Discretionary: 17.5% | |||
| 374,920 | Amazon.com, Inc.* | $ | 34,732,589 |
| 210,000 | Conn’s, Inc.* | 3,593,100 | |
| 434,000 | DIRECTV Group, Inc. (The)* | 10,034,080 | |
| 438,000 | Disney (Walt) Co. | 14,138,640 | |
| 550,000 | Eastman Kodak Co. | 12,028,500 | |
| 520,000 | Emmis Communications Corp. - Class A* | 2,002,000 | |
| 384,000 | General Motors Corp. | 9,557,760 | |
| 335,000 | IAC/InterActiveCorp* | 9,018,200 | |
| 39,300 | Las Vegas Sands Corp.* | 4,049,865 | |
| 250,000 | Lennar Corp. | 4,472,500 | |
| 68,000 | Liberty Media Holding Corp. - Capital* | 7,921,320 | |
| 449,250 | Liberty Media Holding Corp. - Interactive* | 8,571,690 | |
| 136,000 | News Corp. | 2,786,640 | |
| 75,000 | Ruby Tuesday, Inc. | 731,250 | |
| 123,638,134 | |||
Consumer Staples: 2.1% | |||
| 18,300 | Altria Group, Inc. | 1,383,114 | |
| 192,300 | Costco Wholesale Corp. | 13,414,848 | |
| 14,797,962 | |||
Energy: 12.6% | |||
| 93,600 | Canadian Natural Resources Ltd. | 6,845,904 | |
| 200,900 | ConocoPhillips | 17,739,470 | |
| 110,000 | Dril-Quip, Inc.* | 6,122,600 | |
| 304,400 | EOG Resources, Inc. | 27,167,700 | |
| 97,000 | Grant Prideco, Inc.* | 5,384,470 | |
| 95,800 | Hornbeck Offshore Services, Inc.* | 4,306,210 | |
| 131,280 | Schlumberger Ltd. | 12,914,014 | |
| 28,542 | Transocean, Inc. | 4,085,787 | |
| 87,000 | W-H Energy Services, Inc.* | 4,890,270 | |
| 89,456,425 | |||
Finance: 22.6% | |||
| 213,100 | American Express Co. | 11,085,462 | |
| 202,700 | American International Group, Inc. | 11,817,410 | |
| 249,058 | AON Corp. | 11,877,576 | |
| 427,200 | Bank of New York Mellon Corp. | 20,830,272 | |
| 116 | Berkshire Hathaway, Inc. - Class A* | 16,425,600 | |
| 160,000 | Capital One Financial Corp. | 7,561,600 | |
| 310,000 | Conseco, Inc.* | 3,893,600 | |
| 500,000 | Countrywide Financial Corp. | 4,470,000 | |
| 48,000 | Fairfax Financial Holdings Ltd. | 13,734,240 | |
| 100,000 | Federal Home Loan Mortgage Corp. | 3,407,000 | |
| 57,000 | GFI Group, Inc.* | 5,456,040 | |
| 168,000 | HCC Insurance Holdings, Inc. | 4,818,240 | |
| 515,800 | JPMorgan Chase & Co. | 22,514,670 | |
| 100,000 | Merrill Lynch & Co., Inc. | 5,368,000 | |
| 472,900 | Progressive Corp. | 9,060,764 | |
| 112,700 | Transatlantic Holdings, Inc. | 8,189,909 | |
| 160,510,383 | |||
Health Care, Pharmaceuticals & Biotechnology: 2.8% | |||
| 100,000 | Covidien Ltd | 4,429,000 | |
| 96,800 | Genzyme Corp.* | 7,205,792 | |
| 475,000 | Neurometrix, Inc.* | 4,370,000 | |
| 75,000 | SurModics, Inc.* | 4,070,250 | |
| 20,075,042 | |||
Industrials: 6.3% | |||
| 98,018 | C H Robinson Worldwide, Inc. | 5,304,734 | |
| 148,000 | FedEx Corp. | 13,197,160 | |
| 179,000 | HUB Group, Inc.* | 4,757,820 | |
| 140,000 | Kirby Corp.* | 6,507,200 | |
| 218,000 | Orbital Sciences Corp.* | 5,345,360 | |
| 160,500 | Spirit Aerosystems Holdings, Inc.* | 5,537,250 | |
| 100,000 | Tyco International Ltd. | 3,965,000 | |
| 44,614,524 | |||
Materials: 9.5% | |||
| 126,000 | Allegheny Technologies, Inc. | 10,886,400 | |
| 180,000 | ArcelorMittal | 13,923,000 | |
| 592,745 | Cemex S.A. de C.V. - ADR | 15,322,458 | |
| 90,000 | FMC Corp. | 4,909,500 | |
| 61,000 | Minerals Technologies, Inc. | 4,083,950 | |
| 355,300 | Sealed Air Corp. | 8,221,642 | |
| 80,000 | United States Steel Corp. | 9,672,800 | |
| 67,019,750 | |||
Other Investment Company: 0.5% | |||
| 198,000 | SPDR S&P Homebuilders ETF | 3,831,300 | |
Technology: 20.7% | |||
| 190,300 | Autodesk, Inc.* | 9,469,328 | |
| 90,000 | CACI International, Inc.* | 4,029,300 | |
| 607,000 | Dell, Inc.* | 14,877,570 | |
| 239,500 | eBay, Inc.* | 7,949,005 | |
| 42,500 | Google, Inc. - Class A* | 29,387,900 | |
| 236,600 | Insight Enterprises, Inc.* | 4,315,584 | |
| 450,000 | Lawson Software, Inc.* | 4,608,000 | |
| 410,000 | Mentor Graphics Corp.* | 4,419,800 | |
| 190,700 | Network Appliance, Inc.* | 4,759,872 | |
| 135,000 | Nvidia Corp.* | 4,592,700 | |
| 141,700 | Perficient, Inc.* | 2,230,358 | |
| 140,000 | Progress Software Corp.* | 4,715,200 | |
| 376,900 | QUALCOMM, Inc. | 14,831,015 | |
| 398,600 | Salesforce.com, Inc.* | 24,988,234 | |
| 80,000 | SYKES Enterprises, Inc.* | 1,440,000 | |
| 725,000 | Symmetricom, Inc.* | 3,414,750 | |
| 300,000 | Yahoo!, Inc.* | 6,978,000 | |
| 147,006,616 | |||
Schedule of Investments | 17 |
Masters’ Select Equity Fund
SCHEDULE OF INVESTMENTS IN SECURITIES at December 31, 2007
Shares/ Principal Amount | Value | ||||
Telecommunication Services: 2.7% | |||||
| 3,587,480 | Level 3 Communications, Inc.* | $ | 10,905,939 | ||
| 618,000 | Sprint Nextel Corp. | 8,114,340 | |||
| 19,020,279 | |||||
TOTAL COMMON STOCKS | |||||
(cost $535,723,393) | 689,970,415 | ||||
SHORT-TERM INVESTMENTS: 2.6% | |||||
| 18,498,000 | State Street Bank & Trust Co., 2.5% - | ||||
| 3.63%, 12/31/07, due 01/02/08 [collateral: | |||||
| $19,160,000, Fannie Mae, 4.250%, due | |||||
| 05/15/09, Federal Home Loan Bank, | |||||
| 4.375%, due 09/17/10, Federal Home | |||||
| Loan Bank, 5.700%, due 02/01/34, value | |||||
| $18,498,000] (proceeds $18,500,578) | 18,498,000 | ||||
TOTAL SHORT-TERM INVESTMENTS | |||||
(cost $18,498,000) | 18,498,000 | ||||
TOTAL INVESTMENTS IN SECURITIES | |||||
(cost $554,221,393): 99.9% | 708,468,415 | ||||
| Other Assets less Liabilities: 0.1% | 254,613 | ||||
Net Assets: 100% | $ | 708,723,028 | |||
ADR American Depository Receipt
| * | Non-income producing security. |
The accompanying notes are an integral part of these financial statements. |
18 | The Masters’ Select Funds Trust |
Masters’ Select International Fund Review
In another excellent year for foreign stocks, Masters’ Select International generated strong absolute and relative returns. In 2007, the fund gained 20.75%, beating its benchmark, the S&P/Citigroup PMI Global ex-US Index, which gained 17.95%. In the fourth quarter, the International fund lost 4.44%, compared to a 0.11% loss for the index.
Masters’ Select International reached its tenth “birthday” in December. Over the trailing ten years ending December 31, the fund has returned 14.37% on an annualized basis, versus 10.28% for its benchmark. This performance places the fund in the top 2% of its international fund peers according to Morningstar and the top 10% based on Lipper. 1 As of December 31 2007, Morningstar ranked the Masters’ Select International Fund in the 7th, 4th, 8th, and 2nd percentile among 743, 557, 462, and 227 Foreign Large Blend Funds for the one-, three-, five-, and ten-year periods, respectively, based on total return. As of December 31 2007, Lipper ranked the Masters’ Select International Fund in the 9th, 5th, 13th, and 10th percentile among 1,088, 797, 680, and 355 Lipper International Funds for the one-, three-, five-, and ten-year periods, respectively, based on total return.
The value of a hypothetical $10,000 investment in the Masters’ Select International Fund from inception (12/01/97) to present compared with the S&P Citigroup PMI (Ex US) Index and the Lipper International Fund Index.

The hypothetical $10,000 investment at fund inception includes changes due to share price and reinvestment of dividends and capital gains. The chart does not imply future performance. Indices are unmanaged, do not incur fees, expenses or taxes and cannot be invested in directly.
Performance as of December 31, 2007
Average Annual Total Returns | ||||
One-Year | Five-Year | Ten-Year | Since Inception | |
Masters’ Select | ||||
International Fund (12/1/97) | 20.75% | 24.00% | 14.37% | 14.10% |
Performance data quoted represents past performance and does not guarantee future results. The funds impose a 2% redemption fee on shares held less than 180 days. Performance data does not reflect the redemption fee. If reflected, total returns would be reduced. The graph and table do not reflect the deduction of taxes that a shareholder would pay on fund distributions or the redemption of fund shares.
| 1 | Lipper, Inc. is an independent mutual fund research and rating service. Each Lipper average represents a universe of funds with similar investment objectives. Rankings for the period mentioned are based on fund total returns with dividends and distributions reinvested and do not reflect sales charges. |
Long-Term Performance Analysis
Masters’ Select International has built a very strong record over its ten-year and one-month life. The record is strong relative to both its peer group and benchmarks. We believe that the long-term performance has been mostly a function of the skills of the fund’s sub-advisors and their ability to add incremental value by limiting their investments to, only, their most compelling ideas. Though they have made mistakes at times and individually and collectively gone through rough patches of performance, shareholders who have stuck with the fund over most multi-year periods have been rewarded.
The following points shed additional light on the fund’s performance over the years and add to our confidence in the fund’s future potential (all performance numbers are net of all fund fees and expenses including advisory fees, fund operating overhead and trading costs):
| • | The fund out-returned, as measured by average annual total return, the best-performing of its benchmarks by 3.76 percentage points (376 basis points) since its inception ten years and one month ago. In dollar terms, a hypothetical $10,000 investment in the fund is worth $37,828 vs. $26,980 invested in the index. Thus the fund has generated $27,828 of total return vs. $16,980 with the index, an excess return of 64%. |
| • | The fund outperformed its benchmarks in a variety of environments including 1999 and 2007, strong years for foreign growth stocks, and also in 2000 and 2001, strong years for foreign value stocks, as measured by total return. |
| • | In the same theme of performance in different types of market environments, the fund beat its primary benchmarks, as measured by total return, in the down years for the international stock markets of 2000 and 2001 and beat one index but trailed another in 2002 (another negative-return year). It also beat its benchmarks in 1999, 2005 and 2007, all strong years for international stocks, and in 2003, another strong year, it beat one of its two benchmarks. The fund’s performance in different types of stock market environments is a testament to the mix of management styles, the skill of the sub-advisors, and their flexibility to pursue their most compelling ideas without artificial style-box constraints. |
| • | There have been 62 rolling five-year time periods during the fund’s life (the first starting at the fund’s inception, and then in each subsequent period commencing at the beginning of the next month). Masters’ Select International has outperformed its benchmark in 42 of these periods (68% of the time), as measured by average annual return. |
| • | The table that follows includes more rolling-period analysis returns. One interesting statistic is that over longer time periods (three and five years) the fund has experienced fewer negative returns than the index. |
Fund Summary | 19 |
Performance | MSILX | S&P CGI PMI Global (ex US) Index | Number of Periods |
Best Rolling 12-Mo. Period 1 | 88.3% | 59.1% | 110 |
| Worst Rolling 12-Mo. Period | -31.1% | -29.5% | 110 |
| Best Rolling 36-Mo. Period | 136.9% | 135.7% | 86 |
| Worst Rolling 36-Mo. Period | -47.4% | -45.7% | 86 |
| Best Rolling 60-Mo. Period | 222.1% | 218.8% | 62 |
| Worst Rolling 60-Mo. Period | -6.1% | -27.6% | 62 |
| Percent Negative 12-Mo. Rolling | 27.3% | 30.0% | 110 |
| Percent Negative 36-Mo. Rolling | 18.6% | 34.9% | 86 |
| Percent Negative 60-Mo. Rolling | 4.8% | 21.0% | 62 |
| Percent Beat Benchmark 12-Mo. | 65.5% | n/a | 110 |
| Percent Beat Benchmark 36-Mo. | 59.3% | n/a | 86 |
| Percent Beat Benchmark 60-Mo. | 67.7% | n/a | 62 |
| 1 | The best performing 12, 36 and 60 month rolling periods for the Fund commenced in March 1999, April 2003 and November 2002, respectively. The worst performing 12 month rolling period for the Fund commenced in October 2000; the worst 36 and 60 month rolling periods for the Fund commenced in April 2000. |
| • | Historically, each of the fund’s long-term managers has outperformed his or her benchmarks during their tenure at the fund. This includes sub-advisors who were replaced. Of the three current managers who have at least three-year tenures with Masters’ Select, one has outperformed his benchmark by 7.55 percentage points on an annualized basis, one has outperformed by 7.24 percentage points on an annualized basis and the third has outperformed by 0.86 percentage points on average per year. |
| • | Masters’ Select International has also out-returned each of its benchmarks by a significant margin over its life, after taking taxes into account. Though performance reporting regulations do not provide any methodology for measuring a benchmark’s after-tax performance, we can nevertheless say with certainty that the fund has out-returned its benchmarks after taking into account taxes because the after-tax return of the fund exceeds the pre-tax return of all its benchmarks. Masters’ Select International’s after-tax return over its life, assuming all shares were liquidated on December 31, 2007, and taxes were paid on distributions in each year at the highest tax rate in place at the time of each distribution, was 11.99%. Masters’ Select International Fund average annual total return after taxes on distributions for the one-year, five-year, ten-year and since inception (12/01/97) periods ended December 31, 2007 are 16.25%, 21.74%, 12.73% and 12.49%, respectively. The average annual total return after taxes on distributions and the sale of fund shares for the one-year, five-year, ten-year and since inception (12/01/97) periods ended December 31, 2006 are 16.54%, 20.67%, 12.22% and 11.99%, respectively. |
Portfolio Commentary
A number of factors contributed to the fund’s performance during 2007. The highlights follow.
Performance of managers: In 2007, three of the fund’s five managers outperformed their respective benchmarks, one by a very large margin. (The sixth manager, Northern Cross, was added in September.) The other two managers trailed their benchmarks. For the year, the performance of individual managers ranged from a loss of 2.5% to a gain of 46.8%. We expect that over short term periods we will have a mix of underperforming and outperforming managers because of the concentrated portfolios they run. Longer term, we expect all of our managers to beat their respective benchmarks (our expectation should not be construed as a guarantee that it will happen).
Sector, regional, and stock-picking impact: Though all the Masters’ Select funds are driven by bottom-up stock picking, the sector and regional exposures that result from this process may provide some insight into the fund’s relative performance. Based on our attribution analysis versus the S&P/Citigroup PMI Global ex-US Index, the fund’s overall sector exposures detracted from relative performance. The fund was hurt by being underweighted to the materials sector (the best performing sector for the year) and its overweighted position in the bottom-performing health care sector. These negative sector effects were offset to some degree by the fund’s below-benchmark position in the underperforming financial sector. Looking at the fund’s regional exposures, an overweighting to the top-performing Latin America region was a slight positive.
The managers’ stock selection was the driver of the fund’s outperformance for the year. It was particularly strong in the energy and financial sectors. China Coal Energy rose 140% during its holding period to become the top contributor to the fund’s absolute performance. Among financials, Agile Property, a Chinese land developer, was up 97%. However, Bank of Ireland, another financial stock, was a big loser, dropping 26%. The materials sector also had a top winner and loser. Norske Skogsindust, a Norwegian paper company, lost almost half of its market value. On the other hand, Southern Copper was a big winner, gaining 50%. At the regional level, stock selection in Europe detracted from overall performance, but that was more than offset by very strong stock selection in the Asia &
20 | The Masters’ Select Funds Trust |
Pacific region. For example, in addition to big gains in China Coal Energy and Agile Property, Nintendo, the Japanese video-game company, rose 54% during the holding period.
Leaders and laggards: Four of the five fund managers owned at least one stock that was among the fund’s ten largest percentage gainers for the year. Like last year, Bill Fries owned the most top ten winners (four this year compared to six last year). Four of the five managers also had at least one stock among the biggest percentage losers for the year; Jim Gendelman avoided this loser’s list. The aggregate (dollar) gain from the top ten winners was over four times the aggregate loss from the bottom ten laggards. Nine of the top ten winners and nine of the top ten losers remained in the portfolio at the end of December. See table on page 22 that lists the leaders and laggards in percentage and dollar terms over the past six and 12 months.
It is important to understand that the fact that a stock has lost (or made) money for the fund over the past year tells us nothing about how successful the holding will ultimately become. The fund will hold some stocks for significantly longer periods of time and the success of these holdings won’t be known until they are ultimately sold. In that respect, while it is interesting to know how specific stocks performed during the period, this information is of limited value in assessing the ultimate success of these stock holdings.
Portfolio mix: Please see page 23 for sector, asset class, and regional allocations as of year-end.
| • | The fund’s allocation to the technology sector increased from 2.7% at the end of 2006 to 9.1% and its telecommunications weighting decreased six percentage points to 4.9%. During the year, the fund’s allocation to the energy sector increased slightly, while its weighting in the financial sector decreased. |
| • | The fund’s largest sector exposure, at 21.2% of assets, was to financials, though this is below the benchmark’s 28.5% weighting. The fund also has large underweightings to the energy sector (7% of fund assets versus 12% for the benchmark) and materials (5.7% versus 10%). The fund is overweighted to the consumer discretionary sector (14.8% versus 7.8%) and technology (9.1% versus 6.6%). |
| • | The fund’s regional weightings did not change much over the past year. The fund’s Asia ex-Japan weighting decreased, while its allocation to Latin America went up slightly. Europe remained at around 50% of fund assets, slightly lower than the benchmark weighting of 53%. The fund’s weighting to Japan increased slightly to 13.2%, though it remains less than the 15.1% index weighting. |
| • | The fund’s weighting to emerging markets increased slightly to 17%, and is now well above the fund’s historical average of 10.9%. |
| • | In terms of the market-cap breakout, the fund’s exposure to mid-caps ($2 billion to $10 billion market cap) declined to 20%, while exposure to large-caps (greater than $10 billion) increased to 63% during the year (compared to a historical average of 51%). The fund continues to have over 10% of its assets in small-caps (less than $2 billion market cap), though this allocation is below its historical average of over 14%. The fund’s median market cap increased from $11.8 billion to $17.9 billion. |
| • | The fund’s cash position rose to 6.1%. Historically, the fund has held slightly higher levels of cash on average. |
| • | At year-end, 9.3% of the fund’s foreign currency exposure was hedged back into the U.S. dollar. Key currencies being hedged are the Philippine peso and the British pound. |
In Closing
International stock markets have performed extremely well in recent years as evidenced by the fund’s primary benchmark returning 24.4% (annualized) over the past five years. We believe it is highly likely that returns will be much lower over the next five years. Stock market returns are likely to be lower and currency may not have as much of a tailwind—especially in Europe. Nevertheless, in general, foreign stocks still appear fairly valued based on metrics we follow, so we believe long-term returns should still be satisfactory.
Whatever the future is for the foreign stock markets, over shorter time periods shareholders should be prepared for the fund to track differently than its benchmarks - sometimes positively and sometimes negatively. More recently that tracking has been positive. Over the longer time horizon based on which the fund is managed, the quality of its stock pickers and the strength of the Masters’ Select concept together give us confidence in our belief that the fund will continue to outperform its benchmarks, as it has since its inception
Neither the information contained herein nor any opinion expressed shall be construed to constitute an offer to sell or a solicitation to buy any security or any other funds mentioned herein. The views herein are those of Litman/Gregory Fund Advisors, LLC at the time the material is written and may not be reflective of current conditions. Performance quoted represents past performance and does not guarantee future results.
Fund Summary | 21 |
Masters’ Select International Fund Leaders and Laggards
For the Six Months Ended December 31, 2007
By Percentage Gain (Loss)
Security | $ Contribution (Loss) | % Change |
| China Coal Energy Co. | 37,581,512 | 87.5% |
| Shanghai Electric Group Co. Ltd. | 13,866,477 | 67.5% |
| CNOOC Ltd. | 8,622,781 | 45.8% |
| BOVESPA | 576,504 | 44.9% |
| LG Corp. | 5,269,648 | 43.8% |
| Agile Property Holdings Ltd. | 13,339,480 | 40.8% |
| Nintendo Co. Ltd. | 27,285,862 | 36.8% |
| Petroleo Brasileiro S.A. | 2,613,303 | 34.7% |
| Saskatchewan Wheat Pool, Inc. | 6,460,809 | 30.6% |
| Gafisa S.A. | 6,615,480 | 30.5% |
| 122,231,856 | ||
| GuocoLeisure Ltd. | (7,001,861) | (33.3%) |
| Canfor Corp. | (7,523,168) | (31.0%) |
| Brit Insurance Holdings Plc | (7,048,433) | (30.6%) |
| Nichicon Corp. | (4,598,410) | (26.4%) |
| Norske Skogsindust | (5,369,987) | (24.0%) |
| Bank of Ireland | (7,242,875) | (22.7%) |
| A.P. Moeller Maersk | (1,085,053) | (20.4%) |
| Babcock & Brown Air Ltd. | (5,284,365) | (20.1%) |
| Omega Pharma | (5,848,488) | (18.8%) |
| Ericsson (LM) Tel | (7,934,941) | (17.7%) |
| (58,937,581) |
By Dollar Gain (Loss)
Security | $ Contribution (Loss) | % Change |
| China Coal Energy Co. | 37,581,512 | 87.5% |
| Nintendo Co. Ltd. | 27,285,862 | 36.8% |
| Country Garden Holdings | 14,706,928 | 26.6% |
| Shanghai Electric Group Co. Ltd. | 13,866,477 | 67.5% |
| Alstom | 13,760,272 | 22.7% |
| Agile Property Holdings Ltd. | 13,339,480 | 40.8% |
| PNOC Energy Development Corp. | 11,271,499 | 30.1% |
| CNOOC Ltd. | 8,622,781 | 45.8% |
| Qiagen NV | 8,183,279 | 23.2% |
| Gafisa S.A. | 6,615,480 | 30.5% |
| 155,233,570 | ||
| UBS AG | (10,756,621) | (16.4%) |
| Ericsson (LM) Tel | (7,934,941) | (17.7%) |
| Canfor Corp. | (7,523,168) | (31.0%) |
| Bank of Ireland | (7,242,875) | (22.7%) |
| Brit Insurance Holdings Plc | (7,048,433) | (30.6%) |
| GuocoLeisure Ltd. | (7,001,861) | (33.3%) |
| Omega Pharma | (5,848,488) | (18.8%) |
| Carpetright Plc | (5,506,079) | (9.7%) |
| MLP | (5,374,983) | (11.7%) |
| Norske Skogsindust | (5,369,987) | (24.0%) |
| (69,607,436) |
For the Year Ended December 31, 2007
By Percentage Gain (Loss)
Security | $ Contribution (Loss) | % Change |
| China Coal Energy Co. | 54,812,858 | 139.8% |
| Agile Property Holdings Ltd. | 28,983,806 | 97.2% |
| Shanghai Electric Group Co. Ltd. | 15,705,435 | 82.4% |
| CNOOC Ltd. | 12,032,065 | 76.5% |
| Saskatchewan Wheat Pool, Inc. | 11,917,678 | 76.2% |
| LG Corp. | 7,011,437 | 68.1% |
| PNOC Energy Development Corp. | 18,775,855 | 61.3% |
| Nintendo Co. Ltd. | 35,636,008 | 53.9% |
| Alstom | 25,482,011 | 52.0% |
| Teva Pharmaceutical Industries Ltd. | 14,141,836 | 51.4% |
| 224,498,989 | ||
| GuocoLeisure Ltd. | (8,418,160) | (37.5%) |
| Bank of Ireland | (9,723,847) | (26.0%) |
| Norske Skogsindust | (7,211,056) | (23.5%) |
| A.P. Moeller Maersk | (1,085,053) | (20.4%) |
| Babcock & Brown Air Ltd. | (5,284,365) | (20.1%) |
| Ericsson (LM) Tel | (6,338,875) | (17.7%) |
| Brit Insurance Holdings Plc | (4,147,041) | (16.9%) |
| Schibsted ASA | (3,828,846) | (14.5%) |
| Nichicon Corp. | (2,068,493) | (13.8%) |
| Ericsson (LM) Tel | (947,018) | (13.1%) |
| (49,052,754) |
By Dollar Gain (Loss)
Security | $ Contribution (Loss) | % Change |
| China Coal Energy Co. | 54,812,858 | 139.8% |
| Agile Property Holdings Ltd. | 28,983,806 | 97.2% |
| Nintendo Co. Ltd. | 35,636,008 | 53.9% |
| Southern Copper Corp. Del. | 27,439,262 | 50.2% |
| Alstom | 25,482,011 | 52.0% |
| PNOC Energy Development Corp. | 18,775,855 | 61.3% |
| Shanghai Electric Group Co. Ltd. | 15,705,435 | 82.4% |
| Canadian Natural Resources Ltd. | 15,259,954 | 34.2% |
| Country Garden Holdings | 14,706,928 | 26.6% |
| America Movil S.A. de C.V. | 16,360,936 | 20.7% |
| 253,163,053 | ||
| UBS AG | (10,756,621) | (6.6%) |
| Bank of Ireland | (9,723,847) | (26.0%) |
| GuocoLeisure Ltd. | (8,418,160) | (37.5%) |
| Carpetright Plc | (7,586,779) | (12.8%) |
| Norske Skogsindust | (7,211,056) | (23.5%) |
| Ericsson (LM) Tel | (6,338,875) | (17.7%) |
| MLP | (5,433,789) | (11.6%) |
| Babcock & Brown Air Ltd. | (5,284,365) | (20.1%) |
| Anglo Platinum Ltd. | (4,902,397) | (13.0%) |
| Brit Insurance Holdings Plc | (4,147,041) | (16.9%) |
| (69,802,930) |
22 | The Masters’ Select Funds Trust |
Masters’ Select International Fund Managers
INVESTMENT MANAGER | FIRM | TARGET ASSET ALLOCATION | MARKET CAPITALIZATION OF COMPANIES IN PORTFOLIO | STOCK-PICKING STYLE |
| Bill Fries | Thornburg Investment Management, Inc. | 20% | All sizes | Eclectic, may invest in |
traditional value stocks or | ||||
growth stocks | ||||
| David Herro | Harris Associates L.P. | 20% | All sizes, but mostly large | Value |
and mid-sized companies | ||||
| Jim Gendelman | Marsico Capital Management, LLC | 17% | All sizes, but mostly large | Growth |
and mid-sized companies | ||||
| Ted Tyson | Mastholm Asset Management, LLC | 18% | All sizes | Growth |
| Amit Wadhwaney | Third Avenue Management, LLC | 15% | All sizes | Value |
| Howard Appleby, | Northern Cross, LLC | 10% | Mostly large and mid-sized | Blend |
| Jean-Francois Ducrest, | companies | |||
| Jim LaTorre, | ||||
| Ted Wendell |
Portfolio Composition*
The fund holds 77 securities, exclusive of cash equivalents.
By Sector
| Sector Allocation | |||||||
| Fund | S&P Citigroup PMI global (ex US) Index | ||||||
| Consumer Discretionary | 14.8 | % | 7.8 | % | |||
| Consumer Staples | 6.1 | % | 7.3 | % | |||
| Energy | 7.0 | % | 12.0 | % | |||
| Finance | 21.2 | % | 28.5 | % | |||
| Healthcare & Pharmaceuticals | 11.4 | % | 5.0 | % | |||
| Industrials | 9.3 | % | 10.0 | % | |||
| Technology | 9.1 | % | 6.6 | % | |||
| Telecom | 4.9 | % | 7.3 | % | |||
| Utilities | 4.5 | % | 5.5 | % | |||
| Materials | 5.7 | % | 10.0 | % | |||
| Cash Equivalents & Other | 6.0 | % | 0.0 | % | |||
100.0 | % | 100.0 | % | ||||
By Asset Class
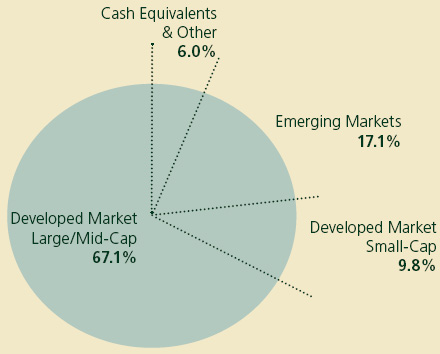
Market Capitalization:
Developed Markets Small-Cap < $2.0 billion
Developed Markets Large and Mid-Cap > $2.0 billion
| * | Totals may not add up to 100% due to rounding. |
By Region
| Regional Allocation | |||||||
| Fund | S&P Citigroup PMI global (ex US) Index | ||||||
| Africa | 0.0 | % | 1.8 | % | |||
| Australia/New Zealand | 1.9 | % | 4.9 | % | |||
| Asia (ex Japan) | 16.8 | % | 14.0 | % | |||
| Japan | 13.2 | % | 15.1 | % | |||
| Western Europe and UK | 49.5 | % | 53.0 | % | |||
| Latin America | 6.4 | % | 4.0 | % | |||
| North America | 4.8 | % | 6.4 | % | |||
| Middle East | 1.3 | % | 0.9 | % | |||
| Cash Equivalents & Other | 6.0 | % | 0.0 | % | |||
100.0 | % | 100.0 | % | ||||
By Market Capitalization
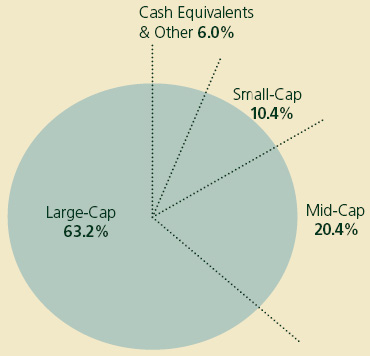
Market Capitalization:
Small-Cap < $2.0 billion
Mid-Cap $2.0 billion - $10.0 billion
Large-Cap > $10.0 billion
Fund Summary | 23 |
Masters’ Select International Fund Stock Highlights
Canadian Natural Resources - Bill Fries
We first purchased Canadian Natural Resources for the Masters’ Select International Fund in September 2006. Since then energy prices have appreciated substantially and the company’s assets seem more attractive.
Alberta-based Canadian Natural Resources is an independent oil and natural gas exploration, development, and production company. Its operations are focused in Western Canada (more than 80% of production), as well as the North Sea and off the coast of West Africa. Since 1994, the current management team has grown daily production from 50,000 barrels of oil equivalent (BOE) per day to more than 580,000 in 2006; proved reserves increased from 100 million BOE to 2.2 billion. Canadian Natural is the second largest natural gas producer in Canada, where it has mature production fields in Saskatchewan and Eastern Alberta, and significant current production and growth prospects in Western Alberta and Northeastern British Columbia. The company is not integrated into downstream operations such as refining and marketing of finished products.
In addition to the “conventional” reserves referred to above, Canadian Natural controls significant heavy oil and oil sands resources in Western Canada. As a result, the company possesses one of its industry’s best production-growth profiles. In particular, the company’s 100%-owned Horizon Oil Sands Project, comprising both a bitumen mining operation and an onsite crude oil upgrader, is the world’s 5th largest announced oil development project (according to Goldman Sachs). The Horizon oil-sands project is scheduled to start production in mid-2008 at 110,000 barrels a day and rise to about 240,000 by 2013 after a second development phase. The Horizon Project has significant execution risk, although the company has taken steps to mitigate this. Management believes it can add up to 4 billion barrels of additional proved mineable reserves (with little exploration risk) when future phases of the overall project are developed during the next decade and beyond. Depending upon the rate of development, the Horizon Project could increase Canadian Natural’s current daily production rate by 50% or more within the next decade. Management has indicated that Horizon may produce high investment returns with oil prices at or above $35 per barrel and that additional oil-sands projects may be viable with crude prices of at least $45 a barrel.
Neopost - David Herro
Neopost is a French company that is one of the world leaders in electronic mailing systems. The industry is nearly a duopoly with Pitney Bowes being their largest competitor. We have been very familiar with this company since it came public in 1999 and believe it is not only a solid business but is extremely well managed. The company earns a ROE of around 30%, is extremely cash generative and has grown its top line at a close to 10% rate over the last 10 years.
Frequently, this growth was a function of both geographic expansion as well as changing postal standards. The company has made a number of acquisitions buying up some of the national champions of the various European countries. We have admired their discipline, as not only have they been careful not to overpay, but they have done a good job at integrating their purchases.
As both growth avenues have slowed at this point, the share price has been hard hit, falling over 40% from its summer of 2007 highs. Today, the company yields over 5% and trades at around 9x its cash flow, most of which is free cash flow and will be returned to owners. Inevitably, as postal standards are constantly changing, and the market becomes more concentrated, we expect Neopost to be able to continue to grow free cash at a steady, mid-single digit rate. Given the high quality of this business and management team, as well as the discounted price, we believe Neopost is an exceptional value and is a perfect example of the type of business that we seek as long-term investors: high quality, low price, and out of favor for temporary reasons.
Continental AG - Jim Gendelman
Continental AG (“Continental” or the “Company”) has transformed itself in recent years from a tire manufacturer into a global supplier of parts and components for the automotive industry. The company, based in Germany, offers comprehensive tire and brake technology, vehicle dynamics control, and electronics and sensor systems.
We believe that a number of factors may make Continental a compelling long-term investment. After completing the acquisition of Siemens VDO Automotive AG in December 2007, Continental formed three new divisions: Chassis and Safety, Powertrain, and Interior. The Chassis and Safety division will drive the development of brake systems, sensors and undercarriage electronic systems. Continental is the largest traditional brake manufacturer and leader in electronic stability programs. The Company’s Powertrain division also has a strong worldwide market and technology presence in the area of economical and eco-friendly driving and should be well positioned to benefit from the growing demand for fuel efficient, hybrid, and diesel vehicles. The announcement of a new eco-tax in France and increased fuel efficiency standards called for in the recently enacted U.S. Energy legislation of 2007 may present Continental with additional opportunities. The Interior division may capitalize on providing the driver with information flow from dashboard instrumentation, multimedia platforms, and navigation systems. Continental is an industry leader in the design, development, and manufacture of embedded telematics and hands-free communications systems using Bluetooth wireless technology. Additionally, synergies may emerge from the merger of Continental with VDO which could result in associated cost savings and efficiencies.
As of this writing, we find Continental’s valuation attractive. The Company’s P/E is approximately 8.5x 2009 earnings estimates with a 10% free cash flow yield. Although the company’s stock trades in-line with other tire manufacturers, given its dominant industry position in automotive electronics, we believe the company should trade at a higher multiple.
We believe the combination of Continental’s business model and attractive valuation offers a compelling long-term opportunity for investors.
24 | The Masters’ Select Funds Trust |
Schibsted ASA - Ted Tyson
Schibsted ASA is a Scandanavian media company headquartered in Oslo, Norway. It publishes the leading high-end newspapers in Oslo (Aftenposten) and Stockholm (Svenska Dagbladet) and well as the largest general circulation tabloids in both countries (VG and Aftonbladet, respectively). It also runs television and cable channels, and a group of film and entertainment companies in Norway and Sweden.
Schibsted has capitalized on its dominant position in Scandanavian media over the past decade to consolidate printing plants and to move into the free newspaper called 20Min, which is now the most widely read paper in both Spain and France. It has also, unlike most newspaper groups globally, moved aggressively to dominate internet news sites and advertising, and has the largest online newspaper sites in Norway, Sweden, France, and Spain with a combined level of almost 11 million hits per week and ad growth well in excess of 20%.
Scandanavia has an extraordinarily high level of internet penetration in the home (only Korea is higher globally) and internet advertising is much higher than in other OECD countries. Advertising, of course, is a cyclical business, but even in a flat market, the company expects that earnings will grow over 65% in 2008 and over 30% in 2009 which would put it on a P/E multiple of barely over 10 times. That is a 34.5% discount to newspaper-based stocks in the U.S. and Europe which seems unreasonable considering that under current growth and advertising trends over two-thirds of the company’s earnings in 2009 will be derived from online activities which globally trade at an enormous premium to “old-line” media stocks.
United Microelectronics Corp. - Amit Wadhwaney
As the cost of building semiconductor factories (“fabs”) increases rapidly, and now exceeds an average of $3 billion, fewer and fewer companies can afford or justify spending on a new fab. The semiconductor industry is dividing between companies that design and market chips and those that manufacture them. Starting in late 1980s, dedicated manufacturing specialists, called foundries, began to take market share away from integrated design and manufacturing companies. United Microelectronics (“UMC”) is the world’s second largest semiconductor foundry and a direct beneficiary of the long-term move to foundries.
Economies of scale are crucial in the foundry business. UMC is one-third the size of the industry leader Taiwan Semiconductor (“TSMC”) and, therefore, suffers from smaller margins. It has, however, been consistently profitable and generated positive free cash flow over the long term, even after meeting the large capital spending requirements inherent in the semiconductor business. Apart from TSMC and UMC, no other semiconductor foundry in the world has managed to consistently generate cash. In fact, several of the second-tier companies consumed billions of dollars of capital, yet failed to reach profitability. Numerous entrants to the foundry business went bankrupt, or were forced to leave the industry.
Unlike its competitors, UMC used the cash flow from its core business to build a portfolio of investments anchored around a venture capital portfolio. UMC is one of the largest venture capital investors in Taiwan and it presents an attractive partner for semiconductor startups, as it offers technological expertise to its investees and access to UMC’s manufacturing capacity. This investment portfolio has performed remarkably well over the long term. In the past five years, gains on the portfolio exceeded operating earnings from the semiconductor business by a multiple of three, despite the bursting of the technology bubble and widespread decline in valuations of technology firms. The company continues to invest in new ventures, both in Taiwan and in China.
We have been able to initiate a position in UMC common shares at 3x trailing EBITDA from operations (taking into account only the liquidation value of UMC’s venture capital and investment portfolio).
Petroleo Brazileiro S.A. (Petrobras) - Howard Appleby, Jean-Francois Ducrest, Jim LaTorre and Ted Wendell
Petrobras is one of the leading oil and gas producing companies in the world, with 97% of operating income derived from Brazil. 80% of the income (2006) comes from exploration and production (oil and gas), with the balance from local refining and gas supply. The Brazilian state maintains control of the company through 55% holding of the voting shares, and the non-voting shares are listed on the NYSE (PBR).
We believe that this stock represents a compelling multiyear investment case both from a micro and a country perspective:
The company produced 2.3 million boepd in 2006, similar to Total and Conoco Phillips, but, unlike these two, PBR has been increasing production by 9% p.a since the mid-1990’s, and is forecast to increase by 7% p.a over the next 5-6 years. This alone puts the company in a class of it’s own. It has a consistent record of increasing reserves despite this rapid production growth, and is achieving international oil product pricing through the downstream assets (2m bpd at 11 refineries in Brazil).
PBR exploration position in Brazil is unassailable and this has been borne out recently by a major discovery in the Santos basin 500km south of Rio De Janeiro in deep waters. It is estimated that 5-8bn Boe (65% to Petrobras) lie in the pre-salt layers in the TUPI block, and this is proving to be the tip of the iceberg. Several other discoveries have been made in the surrounding waters, and it appears that the 5 blocks drilled contain oil from the same reservoir split into 2 structures. In our discussions with management and industry sources, a total reserve base of at least 15bn boe (unrisked) seems to be a conservative indication of the potential of these structures. This would increase PBR reserves by 100% (SEC basis). The company (with its partners) is undertaking further significant drilling activity in 2008/9 in not just the Santos, but also the Campos and Espirito Santo basins.
Fund Summary | 25 |
This stock has the potential to be somewhat volatile over this period considering the amount of news flow we expect from the drilling program and the ebbs and flows of the oil price, but we believe that the downside could be hedged by the current growth profile from existing fields. In addition the opportunity outside Brazil is considerable from an admittedly low base (2% of 2006 Income) particularly from Angola and deep-water Gulf of Mexico; the company is allocating 13% of it’s investment spending to the international operations.
Although the valuation in PE and EV/ cash flow terms is at the high end of global peers (12.5x and 8x 2008 estimates) we feel that a premium is justified on the grounds of the superior track record of growth and reserve additions. On a resource based valuation basis , using conservative assumptions for oil price, costs of development and extraction, taxes and royalties, the stock could be worth up to $150 per share in 2-3 years from now, compared with $88 (at the time of writing).
See page 77 for Industry Terms and Definitions
Neither the information contained herein nor any opinion expressed shall be construed to constitute an offer to sell or a solicitation to buy any securities mentioned herein. The views herein are those of the portfolio managers at the time the commentaries are written and may not be reflective of current conditions.
26 | The Masters’ Select Funds Trust |
Masters’ Select International Fund
SCHEDULE OF INVESTMENTS IN SECURITIES at December 31, 2007
Shares | Value | ||
COMMON STOCKS: 94.0% | |||
Australia: 1.9% | |||
| 1,245,200 | CSL Ltd. | $ | 39,754,139 |
Brazil: 3.6% | |||
| 254,600 | Banco Bradesco S.A. - ADR | 8,147,200 | |
| 1,517,773 | Gafisa S.A. | 28,300,498 | |
| 87,800 | Petroleo Brasileiro S.A. - ADR | 10,118,072 | |
| 1,709,100 | Redecard S.A. | 27,652,854 | |
| 74,218,624 | |||
Canada: 3.7% | |||
| 540,900 | Canadian Natural Resources Ltd. | 39,561,426 | |
| 1,173,800 | Canfor Corp.* | 10,382,769 | |
| 2,039,836 | Saskatchewan Wheat Pool, Inc.* | 27,550,549 | |
| 77,494,744 | |||
China: 2.8% | |||
| 35,944,900 | Country Garden Holdings Co. Ltd.* | 41,673,108 | |
| 19,056,261 | Shanghai Electric Group Co. Ltd. | 16,105,466 | |
| 57,778,574 | |||
Denmark: 0.6% | |||
| 398 | A P Moller - Maersk A/S | 4,245,292 | |
| 122,340 | Novo Nordisk A/S | 8,035,980 | |
| 12,281,272 | |||
France: 11.5% | |||
| 200,663 | Accor S.A. | 16,047,853 | |
| 226,200 | Alstom | 48,615,219 | |
| 201,760 | Eurazeo | 25,884,782 | |
| 328,800 | Neopost S.A. | 33,886,103 | |
| 552,400 | Neuf Cegetel | 27,944,226 | |
| 312,400 | Schneider Electric S.A. | 42,331,081 | |
| 477,806 | Veolia Environnement | 43,626,096 | |
| 238,335,360 | |||
Germany: 6.3% | |||
| 416,000 | Bayer AG | 38,031,554 | |
| 519,700 | Bayerische Motoren Werke (BMW) AG | 32,178,696 | |
| 192,100 | Commerzbank AG | 7,375,380 | |
| 125,081 | Continental AG | 16,274,020 | |
| 2,331,583 | MLP AG | 36,645,585 | |
| 130,505,235 | |||
Greece: 1.4% | |||
| 708,100 | OPAP S.A. | 28,387,318 | |
Hong Kong: 6.7% | |||
| 17,439,800 | Agile Property Holdings Ltd. | 31,804,699 | |
| 435,000 | Cheung Kong Holdings Ltd. | 8,050,184 | |
| 10,060,811 | CNOOC Ltd. ADR | 17,134,887 | |
| 15,817,000 | Gome Electrical AP | 40,164,234 | |
| 1,536,930 | Guoco Group Ltd. | 20,578,076 | |
| 1,844,000 | Hutchison Whampoa Ltd. | 20,929,284 | |
| 138,661,364 | |||
Ireland: 2.4% | |||
| 1,150,000 | Babcock & Brown Air Ltd. - ADR* | 20,941,500 | |
| 1,864,200 | Bank of Ireland | 27,767,142 | |
| 48,708,642 | |||
Israel: 1.3% | |||
| 591,200 | Teva Pharmaceutical Industries Ltd. | 27,478,976 | |
Japan: 13.2% | |||
| 484,800 | Asatsu-DK, Inc. | 13,582,992 | |
| 143,900 | Canon, Inc. | 6,698,116 | |
| 2,223,000 | Daiwa Securities Group, Inc. | 20,217,231 | |
| 74,400 | Fanuc Ltd. | 7,245,867 | |
| 824,000 | Honda Motor Co. Ltd. | 27,659,670 | |
| 1,942,400 | Ichiyoshi Securities Co. Ltd. | 17,630,521 | |
| 1,022,000 | Nichicon Corp. | 10,383,297 | |
| 114,200 | Nintendo Co. Ltd. | 68,388,130 | |
| 3,431,000 | Nippon Sheet Glass Co. Ltd. | 17,536,598 | |
| 36,900 | ORIX Corp. | 6,305,518 | |
| 320,700 | Rohm Co. Ltd. | 27,989,303 | |
| 584,000 | Terumo Corp. | 30,738,218 | |
| 161,810 | Yamada Denki Co. Ltd. | 18,496,296 | |
| 272,871,757 | |||
Mexico: 2.8% | |||
| 960,500 | America Movil S.A. de C.V. | 58,965,095 | |
Norway: 3.7% | |||
| 2,044,600 | Norske Skogindustrier ASA | 17,019,977 | |
| 518,800 | Schibsted ASA | 22,501,063 | |
| 1,185,300 | StatoilHydro ASA | 36,891,572 | |
| 76,412,612 | |||
Philippines: 2.4% | |||
| 309,080,000 | PNOC Energy Development Corp. | 48,674,016 | |
Poland: 0.7% | |||
| 8,856,000 | Netia S.A. | 13,683,615 | |
Russia: 2.0% | |||
| 744,600 | Gazprom OAO - ADR | 42,218,820 | |
Singapore: 0.7% | |||
| 20,486,000 | Guocoleisure Ltd. | 14,018,347 | |
South Korea: 2.7% | |||
| 195,980 | LG Corp. | 14,634,904 | |
| 705,817 | Shinhan Financial Group Co Ltd. | 40,341,018 | |
| 54,975,922 | |||
Spain: 1.5% | |||
| 503,400 | Inditex S.A. | 30,926,557 | |
Schedule of Investments | 27 |
Masters’ Select International Fund
SCHEDULE OF INVESTMENTS IN SECURITIES at December 31, 2007
Shares/ Principal Amount | Value | ||||
Switzerland: 9.5% | |||||
| 1,157,593 | Actelion Ltd.* | $ | 53,219,729 | ||
| 111,050 | Compagnie Financiere Richemont S.A. | 7,621,415 | |||
| 532,000 | Credit Suisse Group | 32,000,353 | |||
| 218,504 | Holcim Ltd. | 23,410,798 | |||
| 184,629 | Lonza Group AG | 22,406,947 | |||
| 16,900 | Nestle S.A. | 7,762,222 | |||
| 1,105,800 | UBS AG | 51,180,427 | |||
| 197,601,891 | |||||
Taiwan: 1.6% | |||||
| 22,001,000 | United Microelectronics Corp. | 13,668,166 | |||
| 29,541,485 | Yuanta Financial Holding Co. Ltd. | 19,263,513 | |||
| 32,931,679 | |||||
United Kingdom: 9.9% | |||||
| 195,500 | BHP Billiton Plc | 6,016,450 | |||
| 3,396,124 | Brit Insurance Holdings Plc | 15,481,146 | |||
| 1,411,900 | British Sky Broadcasting Group Plc | 17,397,172 | |||
| 2,202,200 | Cadbury Schweppes Plc | 27,222,778 | |||
| 1,266,400 | Carpetright Plc | 21,427,619 | |||
| 1,062,400 | Diageo Plc | 22,839,990 | |||
| 1,196,100 | GlaxoSmithKline Plc | 30,452,442 | |||
| 2,367,486 | Southern Cross Healthcare Ltd. | 24,977,408 | |||
| 4,218,678 | Tesco Plc | 40,078,033 | |||
| 205,893,038 | |||||
United States: 1.1% | |||||
| 217,500 | Southern Copper Corp. | 22,865,775 | |||
TOTAL COMMON STOCKS | |||||
(cost $1,675,793,252) | 1,945,643,372 | ||||
SHORT-TERM INVESTMENTS: 5.1% | |||||
| 105,586,000 | State Street Bank & Trust Co., 2.500%, | ||||
| 12/31/07, due 01/02/08 [collateral: | |||||
| $105,620,000, Federal Home Loan | |||||
| Bank, 4.375%, due 09/17/10, | |||||
| Fannie Mae, 4.250%, due 05/15/09, | |||||
| Fannie Mae, 3.250%, due 02/15/09, | |||||
| value $105,586,000] (proceeds | |||||
| $105,600,665) | 105,586,000 | ||||
TOTAL SHORT-TERM INVESTMENTS | |||||
(cost $105,586,000) | 105,586,000 | ||||
TOTAL INVESTMENTS IN SECURITIES | |||||
(cost $1,781,379,252): 99.1% | 2,051,229,372 | ||||
| Other Assets less Liabilities: 0.9% | 19,768,164 | ||||
Net Assets: 100% | $ | 2,070,997,536 | |||
ADR American Depository Receipt
| * | Non-income producing security. |
The accompanying notes are an integral part of these financial statements.
28 | The Masters’ Select Funds Trust |
Masters’ Select Value Fund Review
Masters’ Select Value lagged its benchmark, the Russell 3000 Value Index, in the second half of 2007 and, as a result, ended the year trailing the benchmark. For all of 2007, the Value fund declined 2.34%, compared to a 1.01% decline for the index. In the fourth quarter, the fund lost 7.38%, versus a loss of 5.91% for the Russell 3000 Value Index.
The value of a hypothetical $10,000 investment in the Masters’ Select Value Fund from inception (6/30/00) to present compared with the Russell 3000 Value Index and the Lipper Multi-Cap Value Index.$10,000 investment at fund inception includes changes due to share price and reinvestment of dividends and capital gains. The chart does not imply future performance. Indices are unmanaged, do not incur fees, expenses or taxes and cannot be invested in directly.
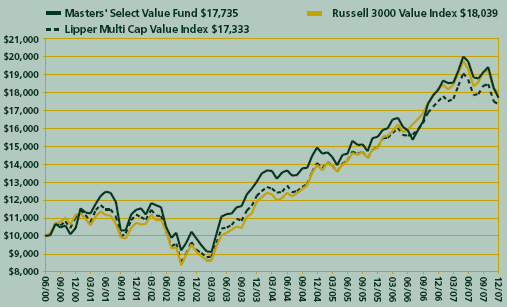
The hypothetical $10,000 investment at fund inception includes changes due to share price and reinvestment of dividends and capital gains. The chart does not imply future performance. Indices are unmanaged, do not incur fees, expenses or taxes and cannot be invested in directly.
Performance as of December 31, 2007
Average Annual Total Returns | |||
One-Year | Five-Year | Since Inception | |
Masters’ Select Value Fund (6/30/00) | -2.34% | 12.50% | 7.94% |
Performance data quoted represents past performance and does not guarantee future results. The funds impose a 2% redemption fee on shares held less than 180 days. Performance data does not reflect the redemption fee. If reflected, total returns would be reduced. The graph and table do not reflect the deduction of taxes that a shareholder would pay on fund distributions or the redemption of fund shares.
Long-Term Performance Commentary
Since its launch in mid-2000, Masters’ Select Value has delivered an average annual return of 7.94%, compared to 8.18% for the benchmark. This is not the benchmark-beating performance we seek—but it hasn’t been terrible either. In our analysis of the fund’s performance there are three factors that we think are particularly noteworthy in explaining the benchmark-like performance of the fund:
| • | The lack of any energy exposure in recent years has hurt. The benchmark’s energy sector had a cumulative return of 115% over the last three years. At an average weighting of 13%, energy stocks contributed over 11 percentage points of return to the benchmark index. Their decision not to own energy effectively put the team’s managers in a position of having to pick up a material amount of additional return elsewhere in order to offset the lack of participation in energy stocks. While not owning energy the past few years detracted significantly from performance, going forward, there are strong differences of opinion regarding whether oil prices at current levels are sustainable and how energy stocks will do. |
| • | There has been an above-average (in our view) number of stock-picking mistakes in the last three years. This has contributed to the underperformance of three of the fund’s sub-advisors over this time period. |
| • | As we have written in the past, the fund has owned some growth stocks that the sub-advisors view as good value relative to their growth prospects. As a result the fund has more growth characteristics than its benchmark (though it also owns plenty of traditional value-oriented stocks). Because value-oriented stocks significantly outperformed growth-oriented stocks from the fund’s launch date up until 2007, the fund’s mild growth bias relative to its value benchmark hurt its relative performance. Longer-term the sub-advisors expect these positions to pay off. In fact, last year, in a strong year for growth stocks, some of the growth names (e.g. Amazon.com and Google) were big performance contributors, but not enough to overcome the other drags on performance (lack of energy and stock-picking mistakes). |
As part of our ongoing due diligence, we’ve asked our sub-advisors tough questions, and focused our work on a variety of issues (as we always do). When there were mistakes, we’ve attempted to understand why the mistakes happened and what was learned so we can assess whether there is any reason to question the analytical capabilities or judgment of the stock picker. We have debated what we know internally among our research team with an emphasis on staying objective—which means not being reactive (as investors often are) nor allowing the fact that we’ve already hired them and expressed our confidence in them impact our ability to recognize any shortcomings. We’re willing to make changes, as we have on a number of occasions across the Masters’ Select funds, when we think something has changed or we made a mistake. But we do this only when our research suggests it is the right thing to do. With respect to the Masters’ Select Value sub-advisors who have struggled the past few years, our confidence remains intact. And if their analysis is right, many of their beaten-up holdings have significant upside potential. So, in time, we believe they will prove themselves again. (See our discussion in the opening letter of this report for more discussion of this topic.)
Fund Summary | 29 |
Portfolio Commentary
A number of factors contributed to the fund’s performance during 2007. The highlights follow.
Performance of managers: In 2007, one of the four Masters’ Select Value stock pickers outperformed their benchmark by a very wide margin; the other three managers underperformed their respective benchmarks by significant margins. There was a wide dispersion of returns for the individual sub-advisors this year, ranging from a loss of 10.4% to a gain of 14.3%.
Over shorter time periods, it is typical for some, but not all, managers to beat their benchmarks. However, we are focused primarily on long-term performance and we aim to select sub-advisors who we believe will beat their benchmarks over longer time periods. Through 2007, one of the four sub-advisors has achieved that goal by a significant margin since their inception date. While the other three managers trail their benchmarks since their respective inception dates, we note that two of those three are trailing by very small margins measured in basis points (hundredths of a percentage point). As discussed above, we believe that all of the Masters’ Select managers have the potential to outperform and believe they are likely to do so.
MASTERS’ SELECT VALUE MANAGERS’ PERFORMANCE Margin versus BENCHMARKS Manager Return Less Benchmark Return Over Full Manager Tenure Through December 31, 2007 | |
Masters’ Select Value | Annualized Margin of Out- (Under-) Performance (Net of Allocated Expenses) |
Manager 1 | 6.99% |
Manager 2 | -0.07% |
Manager 3 | -0.12% |
Manager 4 | -2.14% |
Listed alphabetically are the managers and their respective benchmarks
Manager | Tenure | Benchmark |
| Mason Hawkins | 06/30/00 | Russell 3000 Value Index |
| Bill Miller | 06/30/00 | S&P 500 Index |
| Bill Nygren | 06/30/00 | Russell 3000 Value Index |
| Embler/Langerman | 06/30/00 | Russell 3000 Value Index |
Sector and stock-picking impact: Though all the Masters’ Select funds are driven by bottom-up stock picking, the sector exposure that results from this may provide some insight into the fund’s relative performance. Based on our attribution analysis, the fund’s overall sector exposure detracted from performance relative to the Russell 3000 Value benchmark. The fund’s under-weighting to the bottom-performing financials sector was a positive, but this was more than offset by the fund’s lack of exposure to the top-performing energy sector and its over-allocation to the hard-hit consumer discretionary sector. In contrast, stock selection made up for almost all of the underperformance caused by sector exposure. Individual financial and consumer discretionary stocks, in particular, added value relative to the benchmark’s returns for those sectors, as did the portfolio’s technology and consumer staples stocks. This includes the 132% return for Amazon.com, the fund’s number-two holding. Detractors from performance on the stock-selection side came primarily from the fund’s telecom and materials stocks.
Leaders and laggards: For the year, all four of the fund’s sub-advisors had at least two stocks that were among the fund’s ten largest dollar gainers and at least one stock that was among the fund’s largest dollar losers. It is typical for most, if not all, of the managers to appear on both lists. One of last year’s biggest losers, Amazon.com, was the fund’s best-performing stock in 2007 on both a percentage basis and a dollar basis. Other big winners by dollars include Orkla (up 44%), Korea Tobacco & Ginseng (KT&G) (up 42%), Discovery (up 60%), and Google (up 50%). Remarkably, this is the fourth year in a row that KT&G was among the fund’s top performers. Mike Embler and his team from Franklin Mutual Advisers deserve special recognition for that. The worst performers for the year include housing-related stocks Washington Mutual (down 59%) and Pulte Homes (down 39%). Other poorly-performing stocks this year were Level 3 Communications (down 41%) and Sprint Nextel (down 26%). Nine of the fund’s ten largest dollar winners and eight of the fund’s ten largest dollar losers remained in the portfolio at the end of the year.
See the table on page 32 for a list of the leaders and laggards over the past six and 12 months. The table includes dollar gains and losses as well as percentage gains and losses. It is important to understand that the fact a stock has lost (or made) money for Masters’ Select Value for the 12-month period ended December 31, 2007 tells us nothing about how successful the holding has been during the entire period it was held, or how successful it may become. The fund will hold many stocks for significantly longer periods of time and the success of these holdings won’t be known until they are ultimately sold. So in that respect, while it is interesting to know how specific stocks performed during the period, this information is of limited value in assessing the ultimate success of these stock holdings.
Portfolio mix: There were some notable changes to the fund’s sector exposure during the year. The fund’s allocation to the financial sector ended the year at 16.9%--up 4.3% from year-end 2006—making it the portfolio’s second-largest sector exposure behind consumer discretionary, which was down from the prior year to 36.0%. Technology accounted for 14.1% of the fund at year-end (compared to 11.1% the year before), making it the third-largest sector allocation. The industrial sector exposure was down significantly and accounted for 4.7% at the end of the year, compared to 10.5% for 2006. Relative to the Russell 3000 Value benchmark, at year-end the fund was significantly overweighted to the consumer discretionary and technology sectors while being heavily underweighted to energy, financials, industrials, and utilities.
The fund’s exposure to large-cap stocks (with market caps greater than $18.3 billion) and mid-cap stocks decreased marginally in the fourth quarter, ending the year at 46.2% and 28.7%, respectively. The portfolio’s allocation to small-cap stocks (with market caps less than $2.5 billion) rose slightly to 2.2%. (Note that we updated our market cap definitions after the 6/30/07 shareholder report.) The rest of the portfolio was comprised of foreign stocks, at 20.5% (up from 18.1% the year before) and cash at 2.4%.
30 | The Masters’ Select Funds Trust |
Please see page 33 for a breakout of the fund’s sector and market-cap exposures.
Miscellaneous
Taxes: In December, Masters’ Select Value distributed $0.91 in capital gains, all of which was long-term. We will continue to work with the fund’s sub-advisors to manage the fund in a tax-aware manner. This will include taking short-term losses when there is an alternative investment that is equally attractive, and using other tax-management techniques. However, the managers will not sacrifice pre-tax performance in pursuit of after-tax performance since the fund has both tax-exempt and taxable shareholders.
Expenses: In 2007, the funds expenses were 1.21% of average net assets.
In Closing
As we write this, recession fears are rising and the stock market is coming off of a negative quarter and has declined more in the first couple of weeks in 2008. However, negative headlines don’t necessarily foreshadow rough performance periods—though they can. Often headlines can be a contrarian indicator as the stock market tends to be forward looking. That is why stocks tend to decline months before a recession has started and often begin to rebound during the depths of recession, as investors look ahead to recovery. As far as longer-term prospects, based on our analysis and at an S&P 500 level of 1380 (as we write this), stock market valuations are attractive based on many metrics and at least reasonable based on others. These valuation metrics tell us nothing about how stocks might do in the short term. But they suggest to us that stocks, as is typically the case, remain likely to outperform their primary competitor, bonds, over reasonably long time frames.
A source of encouragement comes from some of the fund’s sub-advisors who tell us that they are finding more compelling stock-picking opportunities now than they have in the last few years. This may be due to the large variance in performance in different sectors. This is unlike the last several years when we were hearing that there were not a lot of valuation discrepancies. So, while the overall market has underlying questions, we are more optimistic about the potential to add value from good stock picking. This is a long-term confidence builder for us, though it does not mean that the fund or the markets will necessarily do well over the short-term. In fact, if there is an economic downturn, it is likely that stocks will decline further before rebounding in anticipation of a recovery.
Whatever the future is for the stock market, over shorter time periods shareholders should be prepared for the fund to track differently than its benchmarks - sometimes positively and sometimes negatively. More recently that tracking has been negative. But over the longer time horizon based on which the fund is managed, the quality of its stock pickers and the strength of the Masters’ Select concept together give us confidence in our belief that the fund will outperform its benchmarks.
Neither the information contained herein nor any opinion expressed shall be construed to constitute an offer to sell or a solicitation to buy any security or any other funds mentioned herein. The views herein are those of Litman/Gregory Fund Advisors, LLC at the time the material is written and may not be reflective of current conditions. Performance quoted represents past performance and does not guarantee future results.
Fund Summary | 31 |
Masters’ Select Value Fund Leaders and Laggards
For the Six Months Ended December 31, 2007
By Percentage Gain (Loss)
Security | $ Contribution (Loss) | % Change |
| Fairfax Financial Holdings Ltd. | 1,988,731 | 52.0% |
| Amazon.com, Inc. | 4,463,538 | 33.9% |
| Google, Inc. | 2,521,500 | 32.1% |
| Siemens AG | 2,264,740 | 31.9% |
| Berkshire Hathaway, Inc. Del | 2,555,194 | 29.6% |
| Japan Tobacco, Inc. | 1,768,550 | 21.8% |
| Korea Tob & Ginseng Corp. | 1,926,323 | 19.0% |
| McDonald’s Corp. | 1,226,609 | 19.0% |
| Yum! Brands, Inc. | 1,076,400 | 17.9% |
| Western Union Co. | 886,460 | 16.8% |
| 20,678,045 | ||
| Washington Mut, Inc. | (6,515,986) | (58.0%) |
| Level 3 Communications, Inc. | (6,436,667) | (43.2%) |
| Capital One Financial Corp. | (3,076,129) | (39.2%) |
| Pulte Homes, Inc. | (1,693,937) | (39.2%) |
| Sprint Nextel Corp. | (7,724,428) | (36.5%) |
| Lennar | (1,693,937) | (35.8%) |
| Comcast Corp. New | (2,258,280) | (35.2%) |
| General Motors Corp. | (2,767,430) | (32.8%) |
| Cemex | (3,111,912) | (29.9%) |
| Limited | (1,663,070) | (29.9%) |
| (36,941,776) |
By Dollar Gain (Loss)
Security | $ Contribution (Loss) | % Change |
| Amazon.com, Inc. | 4,463,538 | 33.9% |
| Berkshire Hathaway, Inc. Del | 2,555,194 | 29.6% |
| Google, Inc. | 2,521,500 | 32.1% |
| Siemens AG | 2,264,740 | 31.9% |
| Fairfax Financial Holdings Ltd. | 1,988,731 | 52.0% |
| Korea Tob & Ginseng Corp. | 1,926,323 | 19.0% |
| Japan Tobacco, Inc. | 1,768,550 | 21.8% |
| Imperial Tobacco Group Plc | 1,679,769 | 16.3% |
| McDonald’s Corp. | 1,226,609 | 19.0% |
| Yum! Brands, Inc. | 1,076,400 | 17.9% |
| 21,471,354 | ||
| Sprint Nextel Corp. | (7,724,428) | (36.5%) |
| Washington Mut, Inc. | (6,515,986) | (58.0%) |
| Level 3 Communications, Inc. | (6,436,667) | (43.2%) |
| Cemex | (3,111,912) | (29.9%) |
| Capital One Financial Corp. | (3,076,129) | (39.2%) |
| General Motors Corp. | (2,767,430) | (32.8%) |
| Virgin Media, Inc. | (2,390,238) | (29.4%) |
| Comcast Corp. New | (2,258,280) | (35.2%) |
| Dell, Inc. | (2,192,345) | (11.8%) |
| Home Depot, Inc. | (2,165,875) | (16.3%) |
| (38,639,290) |
For the Year Ended December 31, 2007
By Percentage Gain (Loss)
Security | $ Contribution (Loss) | % Change |
| Amazon.com, Inc. | 10,036,413 | 132.1% |
| Discovery Holding Co. | 3,504,628 | 60.4% |
| Google Inc. | 3,465,000 | 50.2% |
| Fairfax Financial Holdings Ltd. | 1,895,095 | 47.7% |
| Orkla | 3,808,019 | 43.7% |
| Korea Tob & Ginseng Corp. | 3,684,507 | 42.0% |
| AON Corp. | 2,333,215 | 38.8% |
| Imperial Tobacco Group Plc | 3,421,655 | 37.1% |
| Sika AG | 1,802,977 | 36.4% |
| Intel Corp. | 1,811,040 | 33.9% |
| 35,762,549 | ||
| Washington Mut, Inc. | (6,784,525) | (58.6%) |
| Level 3 Communications, Inc. | (5,848,304) | (40.9%) |
| Pulte Homes, Inc. | (3,698,534) | (39.3%) |
| Ryland Group, Inc. | (2,507,281) | (38.5%) |
| Capital One Financial Corp. | (2,911,462) | (37.9%) |
| Lennar | (1,693,937) | (35.8%) |
| Comcast Corp. New | (2,249,100) | (35.1%) |
| Limited | (1,868,251) | (32.1%) |
| Virgin Media, Inc. | (2,606,943) | (31.2%) |
| InterActiveCorp. | (2,352,112) | (26.4%) |
| (32,520,449) |
By Dollar Gain (Loss)
Security | $ Contribution (Loss) | % Change |
| Amazon.com, Inc. | 10,036,413 | 132.1% |
| Orkla | 3,808,019 | 43.7% |
| Korea Tob & Ginseng Corp. | 3,684,507 | 42.0% |
| Google, Inc. | 3,465,000 | 50.2% |
| Imperial Tobacco Group Plc | 3,421,655 | 37.1% |
| Discovery Holding Co. | 3,504,628 | 60.4% |
| Berkshire Hathaway, Inc. Del | 2,409,282 | 27.5% |
| AON Corp. | 2,333,215 | 38.8% |
| Siemens AG | 2,264,740 | 31.9% |
| McDonald’s Corp. | 2,109,458 | 33.9% |
| 37,036,917 | ||
| Washington Mut, Inc. | (6,784,525) | (58.6%) |
| Level 3 Communications, Inc. | (5,848,304) | (40.9%) |
| Sprint Nextel Corp. | (5,319,142) | (26.3%) |
| Pulte Homes, Inc. | (3,698,534) | (39.3%) |
| Capital One Financial Corp. | (2,911,462) | (37.9%) |
| Virgin Media, Inc. | (2,606,943) | (31.2%) |
| Ryland Group, Inc. | (2,507,281) | (38.5%) |
| IAC/InterActiveCorp. | (2,352,112) | (26.4%) |
| Home Depot, Inc. | (2,263,917) | (17.4%) |
| Comcast Corp. New | (2,249,100) | (35.1%) |
| (36,541,320) |
32 | The Masters’ Select Funds Trust |
Masters’ Select Value Fund Managers
INVESTMENT MANAGER | FIRM | TARGET ASSET ALLOCATION | MARKET CAPITALIZATION OF COMPANIES IN PORTFOLIO | STOCK-PICKING STYLE |
| Mason Hawkins | Southeastern Asset Management, Inc. | 25% | All sizes | Value |
| Bill Miller | Legg Mason Capital Management, Inc. | 25% | All sizes, but mostly | Eclectic, may invest |
| large and mid-sized | traditional value | |||
| companies | stocks or growth | |||
| stocks | ||||
| Bill Nygren | Harris Associates L.P. | 25% | Mostly large and | Value |
| mid-sized companies | ||||
| Michael Embler/Peter Langerman | Franklin Mutual Advisers, LLC | 25% | All sizes | Value |
Portfolio Composition*
The fund holds 55 securities, exclusive of cash equivalents.
By Asset Class
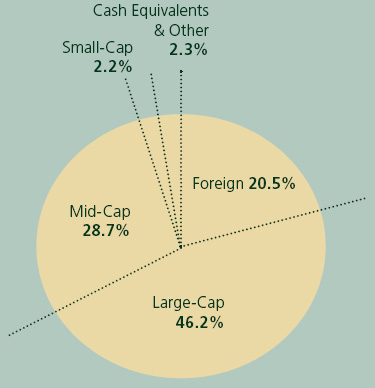
Market Capitalization:
Small-Cap Domestic < $2.5 billion
Mid-Cap Domestic
Large-Cap Domestic > $18.3 billion
| * | Totals may not add up to 100% due to rounding. |
By Sector
| Sector Allocation | |||||||
| Fund | Russell 3000 Value Index | ||||||
| Consumer Discretionary | 36.0 | % | 7.5 | % | |||
| Consumer Staples | 8.3 | % | 8.4 | % | |||
| Energy | 0.0 | % | 15.7 | % | |||
| Finance | 16.9 | % | 29.3 | % | |||
| Health Care & Pharmaceuticals | 3.8 | % | 7.2 | % | |||
| Industrial | 4.7 | % | 10.7 | % | |||
| Technology | 14.1 | % | 4.1 | % | |||
| Telecom | 8.5 | % | 6.1 | % | |||
| Utilities | 0.0 | % | 6.6 | % | |||
| Materials | 5.4 | % | 4.3 | % | |||
| Cash Equivalents & Other | 2.3 | % | 0.0 | % | |||
100.0 | % | 100.0 | % | ||||
Fund Summary | 33 |
Masters’ Select Value Fund Stock Highlights
Freddie Mac - Bill Miller
Freddie Mac is a corporation established by the government to create a continuous flow of funds to mortgage lenders. The company operates in duopoly with Fannie Mae as the primary means by which liquidity is provided to the mortgage market. Freddie Mac purchases single-family and multi-family residential mortgages and mortgage-related securities, which it finances primarily by issuing mortgage-related securities and debt instruments in the capital markets. The Company has two business activities: portfolio investment activities and credit guarantee activities.
The company traded as high as $65 per share in October and sold off sharply after it reported its 3Q when they were forced to take draconian marks on their derivatives portfolios. Despite the selloff, unlike most companies with exposure to the housing market, we believe FRE will be a beneficiary of the current turmoil. The company recently raised their guarantee charges and is one of the few companies to expand its portfolio while spreads are wide and returns are good. We believe many of the write-downs experienced in the 3Q will be reversed.
At the current price, FRE trades approximately in line with written down book value, thereby assigning no value to the ongoing business despite its duopoly status. We believe the government is poised to significantly relax and/or restructure the conditions under which both Fannie Mae and Freddie Mac operate in order to mitigate the effects of the current housing difficulties. We estimate Freddie Mac’s earnings power to be over $7 per share and the fair value for the company to be approximately $70 per share providing potential upside of over 100% from the current price.
Viacom - Bill Nygren
Viacom is one of the largest cable network operators providing programming to over half a billion households in more than 160 countries. They own many of the best recognized cable brands including: Nickelodeon, MTV, Comedy Central, Spike TV and BET. In addition, the company owns Paramount Pictures. Going back a few years, Viacom was more diversified, also owning CBS which included the network and many TV and radio stations. At the end of 2005, Viacom spun-off CBS, leaving new-Viacom a pure play in entertainment content.
Viacom stock has been stagnant since it began trading separately two years ago. That despite achieving EPS growth of about 25% over the two year period. Investors are fearful that the MTV generation will abandon traditional TV in favor of new forms of video entertainment including the Internet and the iPod. First, Nickelodeon, not MTV, is Viacom’s most profitable network. For over a decade Nickelodeon has been the most watched cable network (not in prime time, but over a 24 hour day) and has developed strong franchises including Sponge Bob and Dora the Explorer. We expect Nickelodeon to continue to dominate this niche. As for MTV, or any other video content, we believe new technology will enhance the value of original programming. With the ability to watch video while commuting, or sitting in a coffee shop, we expect video entertainment to continue taking share from print. And series like Real World, South Park, and The Daily Show will remain popular regardless of the device chosen to view them.
Viacom stock is priced at a mid-teens multiple of expected 2008 earnings, consistent with pricing for most businesses. We believe this gives no credit for a business that is growing faster than average, that is not unusually exposed to various macro risks, and that converts an above average percentage of its earnings into free cash. For the past few years, that cash has been used to repurchase shares, an investment we believe offers high returns. With above average earnings growth and a shrinking share base, we expect Viacom to enjoy good growth in per-share value.
Siemens AG - Michael Embler
160 year-old Siemens AG is Germany’s largest engineering group. As a result of its long standing focus on technological excellence, the company enjoys world class operations in sectors such as industrial automation & drives, power generation & transmission, medical equipment and lighting. For many years, however, Siemens had been perceived by investors as a large, complex, unwieldy conglomerate, where underperformers were tolerated and operating margins lagged behind their peers. 2007 was a tumultuous and transforming year at Siemens, beginning with the investigation into alledged briberies that led to the resignation of both the Chairman of the Supervisory Board and the Chief Executing Officer. This created an unprecedented opportunity for Siemens to engage new leadership that could give new impetus to a long awaited restructuring. The appointment of Gerhard Cromme as Chairman of the Supervisory Board and Peter Loescher as Chief Executive Officer heralded a new era in Siemens’ history with both individuals being outsiders with no legacy ties to the company.
With an ambitious timetable, Peter Loescher has set out a strategy to streamline Siemens’ organizational structure, promote fresh talent from within the company and realign divisions to reinforce key megatrends. Plans are already in place to unravel the company’s complex management matrix, delineate clearer reporting lines and align incentive structures with new, ambitious operating margin targets. With such a large and complex organization, changes will expectedly take time to execute. However, with a more transparent management strategy, the engagement of key stakeholders and the full support of the Supervisory Board, something that was not always the case in the past, Siemens appears to be taking the right steps in the right direction. Responding to the voice of shareholders, Siemens also announced a substantial share buyback plan, the first in the company’s long history.
34 | The Masters’ Select Funds Trust |
Siemens still trades at a significant discount to its peers that we believe is unwarranted. From outsourcing manufacturing from low cost countries, to global procurement and the elimination of unnecessary layers of middle management, the low hanging opportunities at Siemens are significant. With fears of a global slowdown looming, the company has inherent margin expansion opportunities that are independent of the economic environment, which should help it outperform its peers.
In keeping with Southeastern Asset Management’s disclosure policies, Mason Hawkins has not contributed commentary on his holdings for this report.
See page 77 for Industry Terms and Definitions
Neither the information contained herein nor any opinion expressed shall be construed to constitute an offer to sell or a solicitation to buy any securities mentioned herein. The views herein are those of the portfolio managers at the time the commentaries are written and may not be reflective of current conditions.
Fund Summary | 35 |
Masters’ Select Value Fund
SCHEDULE OF INVESTMENTS IN SECURITIES at December 31, 2007
Shares | Value | ||
COMMON STOCKS: 97.7% | |||
Consumer Discretionary: 36.0% | |||
| 125,000 | Amazon.com, Inc.* | $ | 11,580,000 |
| 229,500 | Comcast Corp. - Special Class A* | 4,158,540 | |
| 470,600 | DIRECTV Group, Inc. (The)* | 10,880,272 | |
| 297,200 | Discovery Holding Co. - Special Class A* | 7,471,608 | |
| 300,000 | Eastman Kodak Co. | 6,561,000 | |
| 223,000 | General Motors Corp. | 5,550,470 | |
| 150,000 | Home Depot, Inc. (The) | 4,041,000 | |
| 230,000 | IAC/InterActiveCorp* | 6,191,600 | |
| 169,100 | Lennar Corp. | 3,025,199 | |
| 43,750 | Liberty Media Corp. - Capital* | 5,096,437 | |
| 495,250 | Liberty Media Corp. - Interactive* | 9,449,370 | |
| 202,320 | Limited Brands, Inc. | 3,829,918 | |
| 117,500 | McDonald’s Corp. | 6,921,925 | |
| 125,900 | News Corp. | 2,579,691 | |
| 537,910 | Time Warner, Inc. | 8,880,894 | |
| 135,500 | Viacom, Inc. - Class B* | 5,951,160 | |
| 333,627 | Virgin Media, Inc. | 5,718,367 | |
| 255,000 | Walt Disney Co. (The) | 8,231,400 | |
| 184,000 | Yum! Brands, Inc. | 7,041,680 | |
| 123,160,531 | |||
Consumer Staples: 8.3% | |||
| 186,479 | Imperial Tobacco Group Plc | 10,067,084 | |
| 1,650 | Japan Tobacco, Inc. | 9,866,177 | |
| 99,876 | KT&G Corp. | 8,503,945 | |
| 28,437,206 | |||
Financials: 16.9% | |||
| 112,000 | Aon Corp. | 5,341,280 | |
| 1,612 | Berkshire Hathaway, Inc. - Class B* | 7,634,432 | |
| 190,000 | Capital One Financial Corp. | 8,979,400 | |
| 20,000 | Fairfax Financial Holdings Ltd. | 5,815,898 | |
| 100,000 | Federal Home Loan Mortgage Corp. | 3,407,000 | |
| 44,353 | Forestar Real Estate Group, Inc.* | 1,046,287 | |
| 397,804 | Fortis | 7,639,711 | |
| 44,353 | Guaranty Financial Group, Inc.* | 709,648 | |
| 170,000 | JPMorgan Chase & Co. | 7,420,500 | |
| 100,000 | Merrill Lynch & Co., Inc. | 5,368,000 | |
| 331,500 | Washington Mutual, Inc. | 4,511,715 | |
| 57,873,871 | |||
Health Care, Pharmaceuticals & Biotechnology: 3.8% | |||
| 73,750 | Covidien Ltd. | 3,266,388 | |
| 167,000 | IMS Health, Inc. | 3,847,680 | |
| 187,620 | Rhoen Klinikum AG | 5,919,607 | |
| 13,033,675 | |||
Industrials: 4.7% | |||
| 44,000 | FedEx Corp. | 3,923,480 | |
| 58,800 | Siemens AG | 9,358,537 | |
| 73,750 | Tyco International Ltd. | 2,924,188 | |
| 16,206,205 | |||
Shares/ Principal Amount | Value | ||||
Materials: 5.4% | |||||
| 281,621 | Cemex S.A. de C.V. - ADR | $ | 7,279,903 | ||
| 133,060 | Temple-Inland, Inc. | 2,774,301 | |||
| 112,602 | Weyerhaeuser Co. | 8,303,271 | |||
| 18,357,475 | |||||
Technology: 14.1% | |||||
| 74 | Comdisco Holding Co., Inc.* | 674 | |||
| 3,650,000 | Comdisco, Inc.* | 0 | |||
| 582,000 | Dell, Inc.* | 14,264,820 | |||
| 15,000 | Google, Inc. - Class A* | 10,372,200 | |||
| 264,000 | Intel Corp. | 7,038,240 | |||
| 622,740 | LSI Corp.* | 3,306,749 | |||
| 254,000 | Western Union Co. (The) | 6,167,120 | |||
| 300,000 | Yahoo!, Inc.* | 6,978,000 | |||
| 48,127,803 | |||||
Telecommunication Services: 8.5% | |||||
| 2,783,708 | Level 3 Communications, Inc.* | 8,462,472 | |||
| 793,000 | Sprint Nextel Corp. | 10,412,090 | |||
| 84,000 | Telephone & Data Systems, Inc. - | ||||
Special Shares | 5,258,400 | ||||
| 84,000 | Telephone & Data Systems, Inc. | 4,838,400 | |||
| 28,971,362 | |||||
TOTAL COMMON STOCKS | |||||
(cost $279,287,842) | 334,168,128 | ||||
PREFERRED STOCK: 0.0% | |||||
Telecommunication Services | |||||
| 54 | PTV, Inc. * | 89 | |||
TOTAL PREFERRED STOCKS | |||||
| (cost $0) | 89 | ||||
SHORT-TERM INVESTMENTS: 2.5% | |||||
| 8,468,000 | State Street Bank & Trust Co., 2.500%, | ||||
12/31/07, due 01/02/08 [collateral: | |||||
| $19,160,000, Fannie Mae, 4.250%, due | |||||
05/15/09, Federal Home Loan Bank, 4.375%, | |||||
due 09/17/10, value $8,468,000] (proceeds | |||||
| $8,469,176) | 8,468,000 | ||||
TOTAL SHORT-TERM INVESTMENTS | |||||
(cost $8,468,000) | 8,468,000 | ||||
TOTAL INVESTMENTS IN SECURITIES | |||||
(cost $287,755,842) - 100.2% | 342,636,217 | ||||
| Liabilities in Excess of Other Assets - (0.2%) | (439,331) | ||||
Net Assets: 100.0% | $ | 342,196,886 | |||
ADR American Depository Receipt
| * | Non-income producing security. |
The accompanying notes are an integral part of these financial statements.
36 | The Masters’ Select Funds Trust |
Masters’ Select Smaller Companies Fund Review
In what was a tough year for small-cap stocks, Masters’ Select Smaller Companies fund out-returned its Russell 2000 benchmark by over three percentage points, gaining 1.64%, compared to a loss of 1.57% for the index. In the fourth quarter, the fund lost 4.95% versus a loss of 4.58% for the index.
The value of a hypothetical $10,000 investment in the Masters’ Select Smaller Companies Fund from inception (6/30/03) to present compared with the Russell 2000 Index and the Lipper Small-Cap Core Index.
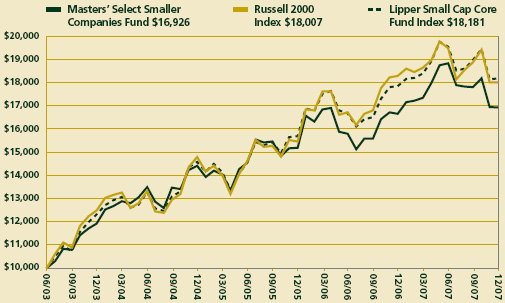
The hypothetical $10,000 investment at fund inception includes changes due to share price and reinvestment of dividends and capital gains. The chart does not imply future performance. Indices are unmanaged, do not incur fees, expenses or taxes and cannot be invested in directly.
Performance as of December 31, 2007
Average Annual Total Returns | ||
One-Year | Since Inception | |
Masters’ Select | ||
Smaller Companies Fund (6/30/03) | 1.64% | 12.41% |
Performance data quoted represents past performance and does not guarantee future results. The funds impose a 2% redemption fee on shares held less than 180 days. Performance data does not reflect the redemption fee. If reflected, total returns would be reduced. The graph and table do not reflect the deduction of taxes that a shareholder would pay on fund distributions or the redemption of fund shares.
Long-Term Performance Commentary
The fund’s since inception return of 12.41% trails its Russell 2000 benchmark, which has returned 13.96% over the same time period. The fund outperformed the benchmark in 2007, 2005 and 2004 but trailed in 2006 and over the last six months of 2003 (the fund was launched June, 30, 2003).
Though the absolute return was not particularly pleasing, we are pleased that Masters’ Select Smaller Companies outperformed its benchmark by over three percentage points (over 300 basis points) in 2007 and hope that the fund is back on track after a disappointing 2006. As discussed in past reports, high cash holdings and very weak performance by one sub-advisor have been a drag on the fund’s long-term record. However, we remain optimistic over the long run because of the team we now have in place. We believe the manager additions we made over the past 18 months (Copper Rock and RCB) and the three managers who have been on the fund since inception (Bill D’Alonzo, Bob Rodriguez and Dick Weiss) give us a team of skilled stock pickers. Weiss and D’Alonzo each have a record of benchmark-beating performance since inception, and we have observed their skill managing concentrated portfolios for 11 years. Rodriguez has over 30 years of experience investing in his highest-conviction ideas, and the new teams of Malouf/Walsh (Copper Rock) and Bronchick/Kerr (Reed, Conner & Birdwell) are also veterans with, in our opinion, a high level of stock-picking skill.
Portfolio Commentary
A number of factors contributed to the fund’s performance during 2007. The highlights follow.
Performance of managers: In 2007, three of the four Masters’ Select Smaller Companies stock pickers who were with the fund for the full year, outperformed their respective benchmarks. The fifth sub-advisor, who was added to the fund in June, trailed their benchmark through the end of the year. Over the year, there was a wide dispersion of returns for the individual sub-advisors, ranging from a loss of 8.3% to a gain of 20.8% (this excludes the sub-advisor added in mid-year).
Over shorter time periods, it is typical for some, but not all, managers to beat their benchmarks. However, we are focused primarily on long-term performance and we aim to select sub-advisors who we believe will beat their benchmarks over longer time periods. Through 2007, two of the three sub-advisors who have been on the fund since its inception have achieved that goal by a significant margin. The third original manager trails their benchmark. The team from Copper Rock, which was added in July 2006, has outperformed their benchmark by a wide margin. (Another original manager, who was replaced in 2007, significantly underperformed their benchmark during their tenure on the fund.) As mentioned, though we obviously can’t predict with certainty, we believe that all of the managers we hire will ultimately outperform.1
Sector and stock-picking impact: Though all the Masters’ Select funds are driven by bottom-up stock picking, the sector exposure that results from this may provide some insight into the fund’s relative performance. Based on our attribution analysis, the fund’s overall sector exposure contributed to the fund’s 2007 outperformance relative to the Russell 2000 benchmark. The fund’s under-weighting to the bottom-performing financials sector and its over-weighting to the strong-performing energy sector were positives. This was partially offset by the fund’s under-weighting to the top-performing materials sector. Stock selection also contributed to the fund’s relative outperformance. Specifically, individual financial, energy, and industrial stocks added value relative to the benchmark’s returns for those sectors. These gains were largely offset by the fund’s consumer-discretionary, health care, and materials stocks.
Leaders and laggards: For the year, all five of the fund’s sub-advisors had at least one stock that was among the fund’s ten largest dollar gainers and at least one stock among the fund’s largest dollar losers; however, the biggest losers list was
Fund Summary | 37 |
dominated by primarily two managers. It is typical for most, if not all, of the managers to appear on both lists. In 2007, the best-performing stock in the portfolio on both a percentage basis and a dollar basis was National Oilwell Varco (up 117%). Other big winners by dollars include BE Aerospace (up 67%), Avnet (up 41%), Magma Design (up 39%), and Capella Education (up 80%). The worst performers for the year were mostly consumer-related stocks, including dELiA*s (down 66%), Central Garden & Pet (down 50%), Lodgenet Entertainment Corp. (down 43%), Charming Shoppes (down 51%), and Triarc (down 37%). Six of the fund’s ten largest dollar winners and eight of the fund’s ten largest dollar losers remained in the portfolio at the end of the year.
See the table on page 39 for a list of the leaders and laggards over the past six and 12 months. The table includes dollar gains and losses as well as percentage gains and losses. It is important to understand that the fact a stock has lost (or made) money for Masters’ Select Smaller Companies for the 12-month period ended December 31, 2007 tells us nothing about how successful the holding has been during the entire period it was held, or how successful it may become. The fund will hold many stocks for significantly longer periods of time and the success of these holdings won’t be known until they are ultimately sold. So in that respect, while it is interesting to know how specific stocks performed during the period, this information is of limited value in assessing the ultimate success of these stock holdings.
Portfolio mix: There were some changes to the fund’s sector exposure during the year. The fund’s allocation to the technology sector ended the year at 21.8%—down 5.6% from year-end 2006—but it remained the fund’s largest sector exposure. Consumer discretionary accounted for 12.8% of the fund at year-end (compared to 16.0% the year before) and the energy exposure increased to 12.1%, up from 9.5% in 2006. Relative to the Russell 2000 benchmark, at year-end the fund was materially overweighted to the energy, industrial, and technology sectors while being underweighted to financials, heath care, and utilities.
The fund’s exposure to micro-cap stocks (with market caps less than $711 million) increased substantially in the fourth quarter, rising to 29.3% of the portfolio. In total, small-cap stocks (with market caps less than $2.5 billion) accounted for 67.7% of the portfolio at year-end. The cash position also decreased, going from 13% at the end of the third quarter to 7.4% at year-end. Mid-cap stock exposure ($2.5 billion to $18.3 billion market cap) decreased slightly in the fourth quarter, ending the year at 19.0%. (Note that we updated our market-cap definitions after the 6/30/07 shareholder report.) The rest of the portfolio was comprised of large-caps stocks at 3.1% and foreign stocks at 2.9%.
Please see page 40 for a breakout of the fund’s sector and market-cap exposures.
Miscellaneous
Taxes: In December, Masters’ Select Smaller Companies distributed $1.79 in capital gains, 83% of which was long-term. We will continue to work with the fund’s sub-advisors to manage the fund in a tax-aware manner. This will include taking short-term losses when there is an alternative investment that is equally attractive, and using other tax-management techniques. However, the managers will not sacrifice pre-tax performance in pursuit of after-tax performance since the fund has both tax-exempt and taxable shareholders.
Expenses: Expenses for all of 2007 were 1.31% of average net assets.
Accolades: Masters’ Select Smaller Companies continues to be included as a Fund Analyst Pick in the Small Growth Category by Morningstar, the fund rating firm. (Note: we think the fund should be categorized as small blend not small growth.)
In Closing
As we write this, recession fears are rising and the stock market is coming off of a negative quarter and has declined more in the first couple of weeks in 2008. However, negative headlines don’t necessarily foreshadow rough performance periods—though they can. Often headlines can be a contrarian indicator as the stock market tends to be forward looking. That is why stocks tend to decline months before a recession has started and often begin to rebound during the depths of recession—as investors look ahead to recovery. As far as longer-term prospects, based on our analysis early in 2008, stock market valuations are attractive based on many metrics and at least reasonable based on others. However, in general small-cap stocks remain highly priced compared to large-cap stocks though a source of encouragement comes from some of the fund’s sub-advisors who tell us that they are finding more compelling stock-picking opportunities now than they have in the last few years. In general, valuations suggest that stocks, as is typically the case, remain likely to outperform their primary competitor, bonds, over reasonably long time frames.
Whatever the future is for the stock market, over shorter time periods shareholders should be prepared for the fund to track differently than its benchmarks - sometimes positively and sometimes negatively. But over the longer time horizon based on which the fund is managed, the quality of its stock pickers and the strength of the Masters’ Select concept together give us confidence in our belief that the fund will outperform its benchmarks.
| 1 | The managers and their respective benchmarks are: Jeff Bronchick: Russell 2000 Value Index, Bill D’Alonzo: Russell 2000 Growth Index; Mike Malouf/Tucker Walsh: Russell 2000 Growth Index; Bob Rodriguez: Russell 2000 Value Index; Dick Weiss: Russell 2000 Index. |
Neither the information contained herein nor any opinion expressed shall be construed to constitute an offer to sell or a solicitation to buy any security or any other funds mentioned herein. The views herein are those of Litman/Gregory Fund Advisors, LLC at the time the material is written and may not be reflective of current conditions. Performance quoted represents past performance and does not guarantee future results.
38 | The Masters’ Select Funds Trust |
Masters’ Select Smaller Companies Fund Leaders and Laggards
For the Six Months Ended December 31, 2007
By Percentage Gain (Loss)
Security | $ Contribution (Loss) | % Change |
| VMware | 17,821 | 76.8% |
| CNinsure, Inc. | 34,536 | 56.8% |
| Atwood Oceanics, Inc. | 433,194 | 46.1% |
| Capella Education Co. | 1,667,321 | 45.1% |
| Double Take Software | 948,023 | 37.3% |
| National Oil Well/Varco | 2,533,931 | 30.1% |
| BE Aerospace, Inc. | 1,592,658 | 25.9% |
| Authorize Net Hldgs, Inc. | 721,702 | 24.2% |
| Dolan Media Co. | 110,679 | 23.0% |
| Mentor Graphics | 462,713 | 22.3% |
| 8,522,578 | ||
| dELiA*s, Inc. New | (2,637,120) | (64.5%) |
| Circuit City Stores, Inc. | (1,727,532) | (57.5%) |
| JoAnns Stores | (2,479,025) | (54.0%) |
| Central Garden and Pet Co. | (3,089,841) | (47.8%) |
| Novamerica Steel Inc. Del | (1,514,245) | (46.8%) |
| Rent a Center | (1,087,859) | (44.6%) |
| Lodgenet Entertainment Corp. | (3,116,905) | (41.7%) |
| Charming Shoppes, Inc. | (1,706,333) | (41.0%) |
| Ceragon Networks Ltd. | (1,761,952) | (37.0%) |
| Triarc Companies, Inc. | (2,351,712) | (36.9%) |
| (21,472,524) |
By Dollar Gain (Loss)
Security | $ Contribution (Loss) | % Change |
| National Oil Well/Varco | 2,533,931 | 30.1% |
| Capella Education Co. | 1,667,321 | 45.1% |
| BE Aerospace, Inc. | 1,592,658 | 25.9% |
| GFI Group, Inc. | 1,339,900 | 20.7% |
| Annaly Capital Management, Inc. | 1,234,696 | 21.4% |
| eHealth, Inc. | 1,034,928 | 20.0% |
| Double Take Software | 948,023 | 37.3% |
| Aribam Inc. | 931,496 | 15.2% |
| Zumiex, Inc. | 844,902 | 22.2% |
| Ralcorp Holdings, Inc. | 734,000 | 13.7% |
| 12,861,855 | ||
| Lodgenet Entertainment Corp. | (3,116,905) | (41.7% ) |
| Central Garden and Pet Co. | (3,089,841) | (47.8% ) |
| Symmetry Hldgs, Inc. | (3,046,267) | (100.0% ) |
| dELiA*s, Inc. New | (2,637,120) | (64.5% ) |
| JoAnns Stores | (2,479,025) | (54.0% ) |
| Triarc Companies, Inc. | (2,351,712) | (36.9% ) |
| Spartech Corp. | (1,827,722) | (35.2% ) |
| Trinity Industries, Inc. | (1,798,185) | (35.9% ) |
| Ceragon Networks Ltd. | (1,761,952) | (37.0% ) |
| Circuit City Stores, Inc. | (1,727,532) | (57.5% ) |
| (23,836,260) |
For the Year Ended December 31, 2007
By Percentage Gain (Loss)
Security | $ Contribution (Loss) | % Change |
| National Oil Well/Varco | 6,097,338 | 116.8% |
| Atwood Oceanics, Inc. | 688,512 | 100.5% |
| Capella Education Co. | 2,377,675 | 79.6% |
| VMware | 17,821 | 76.8% |
| BE Aerospace, Inc. | 3,764,441 | 66.8% |
| CNinsure, Inc. | 34,536 | 56.8% |
| Ariba, Inc. | 2,378,535 | 46.6% |
| Avnet, Inc. | 2,520,145 | 41.2% |
| Investor Financial Services Corp. | 1,404,417 | 40.4% |
| Magma Design Automation, Inc. | 2,416,786 | 39.3% |
| 21,700,206 | ||
| dELiA*s, Inc. New | (4,101,889) | (65.7%) |
| Circuit City Stores, Inc. | (1,727,532) | (57.5%) |
| Rent a Center | (1,392,571) | (50.8%) |
| Charming Shoppes, Inc. | (2,524,163) | (50.7%) |
| Central Garden and Pet Co. | (3,327,545) | (49.6%) |
| Novamerica Steel Inc. Del | (1,514,245) | (46.8%) |
| JoAnns Stores | (1,834,968) | (46.2%) |
| Lodgenet Entertainment Corp. | (3,254,815) | (42.7%) |
| Ceragon Networks Ltd. | (1,761,952) | (37.0%) |
| Triarc Companies, Inc. | (2,351,970) | (36.9%) |
| (23,791,650) |
By Dollar Gain (Loss)
Security | $ Contribution (Loss) | % Change |
| National Oil Well/Varco | 6,097,338 | 116.8% |
| BE Aerospace, Inc. | 3,764,441 | 66.8% |
| Avnet, Inc. | 2,520,145 | 41.2% |
| Magma Design Automation, Inc. | 2,416,786 | 39.3% |
| Ariba, Inc. | 2,378,535 | 46.6% |
| Capella Education Co. | 2,377,675 | 79.6% |
| Taser International, Inc. | 1,901,909 | 37.0% |
| Cbeyond, Inc. | 1,894,859 | 27.5% |
| GFI Group, Inc. | 1,835,248 | 23.8% |
| Investor Financial Services Corp. | 1,404,417 | 40.4% |
| 26,591,353 | ||
| dELiA*s, Inc. New | (4,101,889) | (65.7%) |
| Central Garden and Pet Co. | (3,327,545) | (49.6%) |
| Lodgenet Entertainment Corp. | (3,254,815) | (42.7%) |
| Charming Shoppes, Inc. | (2,524,163) | (50.7%) |
| Triarc Companies, Inc. | (2,351,970) | (36.9%) |
| JoAnns Stores | (1,834,968) | (46.2%) |
| Spartech Corp. | (1,827,722) | (35.2%) |
| Ceragon Networks Ltd. | (1,761,952) | (37.0%) |
| Radiation Therapy Services, Inc. | (1,741,667) | (21.2%) |
| Circuit City Stores, Inc. | (1,727,532) | (57.5%) |
| (24,454,223) |
Fund Summary | 39 |
Masters’ Select Smaller Companies Fund Managers
INVESTMENT MANAGER | FIRM | TARGET ASSET ALLOCATION | MARKET CAPITALIZATION OF COMPANIES IN PORTFOLIO | STOCK-PICKING STYLE |
| Bill D’Alonzo and Team | Friess Associates, LLC | 20% | Small and mid-sized | Growth |
| companies | ||||
| Jeff Bronchick and | Reed, Conner & Birdwell, LLC | 20% | Small and mid-sized | Value |
| Tom Kerr | companies | |||
| Robert Rodriguez | First Pacific Advisors, LLC | 20% | Small and mid-sized | Value |
| companies | ||||
| Dick Weiss | Wells Capital Management, Inc. | 20% | Small and mid-sized | Growth at a |
| companies | reasonable price | |||
| Michael Malouf and | Copper Rock Capital Partners, LLC | 20% | Small and mid-sized | Growth |
| Tucker Walsh | companies |
Portfolio Composition*
The fund holds 69 securities, exclusive of cash equivalents.
By Asset Class
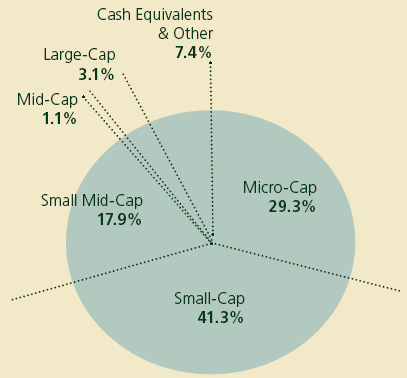
Market Capitalization:
Micro-Cap < $711 million
Small-Cap $711 million - $2.5 billion
Small/Mid-Cap $2.5 billion - $7 billion
Mid-Cap $7 billion - $18.3 billion
Large-Cap > $18.3 billion
| * | Totals may not add up to 100% due to rounding. |
By Sector
| Sector Allocation | |||||||
| Fund | Russell 2000 Index | ||||||
| Consumer Discretionary | 12.8 | % | 13.5 | % | |||
| Consumer Staples | 3.9 | % | 3.0 | % | |||
| Energy | 12.1 | % | 6.7 | % | |||
| Finance | 10.7 | % | 18.9 | % | |||
| Health Care & Pharmaceuticals | 8.6 | % | 14.5 | % | |||
| Industrials | 18.9 | % | 14.8 | % | |||
| Technology | 21.8 | % | 18.3 | % | |||
| Telecom | 0.0 | % | 1.4 | % | |||
| Utilities | 0.0 | % | 3.0 | % | |||
| Materials | 3.8 | % | 5.6 | % | |||
| Cash Equivalents & Other | 7.4 | % | 0.3 | % | |||
100.0 | % | 100.0 | % | ||||
40 | The Masters’ Select Funds Trust |
Masters’ Select Smaller Companies Fund Stock Highlights
Chart Industries Inc. - Bill D’ Alonzo
While finding and extracting natural gas under U.S. soil is increasingly challenging, gas is still easily accessible in Russia, the Middle East and parts of West Africa. The hard part is getting the gas from there to here, which is where Chart comes in.
NASDAQ-listed Chart Industries Inc. makes equipment used in the production, storage and transportation of natural gas and industrial gases. Chilling natural gas to approximately -163 degrees Celsius transforms it into liquid natural gas (LNG), which is more cost-efficient to transport over long distances.
The majority of Chart’s revenues, which reached $628 million in the 12 months through September, come from products used throughout the liquid-gas supply chain, including vacuum insulated containment vessels, heat exchangers, cold boxes and other cryogenic components. In addition to natural gas and other hydrocarbons, Chart’s products are used in applications for nitrogen, argon, hydrogen dioxide and other industrial gases.
September-quarter earnings grew 56 percent. Revenues increased 15 percent from a year ago due in large part to continued expansion in the global industrial gas market driven by growing economies in developing nations. Based on mounting orders and recent operating performance, Chart raised its 2007 forecasts for sales and earnings per share.
Chart’s backlogged orders stood at $426 million at the end of September, representing a 64 percent increase from a year ago. Expansion at facilities in Louisiana and Wisconsin is expected to nearly double production capacity for 2008 versus year-ago levels.
The Friess team spoke with Chart Chief Executive Sam Thomas regarding global trends in capital spending to support energy infrastructure and industrial gas projects. Southeast Asia’s strong demand for energy and industrial gas infrastructure has been apparent in recent contract wins. Chart’s operations span from the U.S. to Australia, China, the Czech Republic, Germany and the United Kingdom.
The Friess team bought Chart at 13 times 2007 estimates. Wall Street predicts the company will grow December-quarter earnings 23 percent.
Ralcorp - Jeffrey Bronchick and Thomas Kerr
Ralcorp is the leading producer of private label (or store brand) foods and a major producer of food service products. It also holds an interest of approximately 19% in Vail Resorts, a leading mountain resort operator in the United States.
Ralcorp’s strategy has been successfully driven by an experienced management team who has built an exceptional track record of creating shareholder value through efficient operations and effective capital deployment, particularly in divesting and acquiring businesses (including 20 in the past 10 years) as well as opportunistic share repurchases. We believe the Post Cereals acquisition from Kraft will be a transforming event for Ralcorp, providing it with a foothold in the branded space, lifting sales by 50% and margins by over 5%. The deal was struck at an attractive price and should prove to be highly accretive to shareholder value, which we estimate at $80 per share. Additionally, Post Cereals will provide Ralcorp with product diversification and some insulation from rising commodity costs. The transaction was announced in November 2007 and is expected to be completed in mid-2008.
Additionally, Ralcorp is well positioned to benefit from the structure of the food industry and long-term secular trends. Food retailers are looking to drive the sales of their private label business, which provides higher operating income per comparable transaction relative to their branded suppliers. Consolidation within the retail industry is being led by national players that are looking for large suppliers like Ralcorp who can provide a one-stop shop for reliable, nationwide delivery and quality products. Further, retailer consolidation has increased the need for stores to further differentiate themselves, providing an opportunity for private label expansion as manufacturers have steadily increased the quality of their products to match or beat the quality of its branded peers. The U.S. remains underpenetrated in private label compared to Europe, suggesting private label will continue to take share within the food category.
Rowan Companies - Robert Rodriguez
We added to our position in Rowan Companies, a major oil drilling company, when the stock was selling at attractive prices in 2007. The world is now consuming approximately three times the volume of crude it is finding each year. Put another way, at current levels of oil consumption we are using up and not replacing two thirds of our daily oil consumption. This is why oil drilling companies should see increasing demand for their services going forward - current low levels of drilling are not sustainable. Exploration, and thereby drilling for oil, needs to increase to keep production levels from declining over time, benefiting oil drillers.
Rowan has a large fleet of premium jack-up rigs that operate around the world. Rowan’s drilling fleet consists of 9 domestic jack-up rigs and 12 international jack-up rigs, for a total of 21 rigs. Many of Rowan’s rigs are best in class, in particular its 7 Gorilla-class rigs. The Gorilla rigs earn substantially more than other jack-up rigs because of their superior capabilities. Rowan expects to take delivery of 9 new builds the next four years, 2 in 2008, one in 2009 and 3 in each of 2010 and 2011. This will bring its fleet to 30 rigs. We believe the company has the wherewithal to add these rigs without compromising its balance sheet. At current levels of profitability, Rowan is earning more than $500m in free cash flows annually, before new build expenditures, and its balance sheet has less than $100m in net debt. Among Rowan’s other assets is a fleet of land rigs and a manufacturing division named Le Tourneau that builds rigs, makes rig kits including mud pumps, top drives, draw works and rotary tables. Le Tourneau has seen steady increases in sales and operating margins in recent years as demand for its equipment has increased.
The current replacement value of Rowan’s offshore drilling rigs is estimated to be $39 per share. After adding in the value of its land rigs, the Le Tourneau division, cash and working capital and deducting debt, Rowan has a total replacement value of $53 per share. This means that, at our purchase price and factoring in the value of Le Tourneau, we were paying around 50% of the replacement value of Rowan’s drilling fleet. That is at the low end of the range of where the stock has traded historically
Fund Summary | 41 |
and very cheap on an asset and normal earnings basis. We also get a free option on increased demand for its drilling services as exploration and drilling for oil should increase to keep global production from declining over time.
W-H Energy Service Inc. - Dick Weiss
W-H Energy Services, Inc. is held in both the Equity Fund and the Smaller Companies Fund. Please refer to the discussion appearing on page 15.
eHealth - Michael Malouf and Tucker Walsh
eHealth (EHTH) is a leading broker in the online health insurance market serving individuals, families and employers. The business model allows customers to search, compare and purchase health insurance products. It has secured over 160 relationships with healthcare carriers and integrates over 7,000 healthcare plans into its online network providing a very high barrier to entry.
The fundamentals for consumer health insurance are extremely strong. Currently, 17 million individuals in the U.S. purchase health insurance. There are another 47 million individuals who do not have coverage. The increasing costs for healthcare have caused more employers to reduce health insurance benefits or eliminate them altogether. As more people shop for health insurance, we believe they will first turn to the Internet to learn about various plans. eHealth.com is the primary beneficiary of this process. With 500,000 active members, eHealth is in the very early stages of penetrating this market.
The eHealth business plan is similar to on-line travel providers like Expedia and Priceline, however, we believe EHTH has distinct advantages to even these highly-profitable companies. On EHTH, consumers can purchase a product at the same price the insurers offer. This is different than the airline industry where airlines offer a discount to the aggregators. The other important part of the EHTH model is that the average policy is held for more than 2 years. This provides a monthly recurring revenue stream with virtually zero incremental costs. Longer term this leverage can lead to operating margins well north of 30% vs. 24% today.
There are numerous catalysts that will help accelerate its growth. The move to mandate health insurance like we have seen in Massachusetts creates growing demand for EHTH’s products. Later this year the company will offer instant enrollment with a major carrier. This would allow qualified individuals to pay for the insurance with a credit card and print out a prescription drug card for use at a local pharmacy. We believe this instant gratification may drive an even higher conversion percentage by eHealth’s visitors. The company is taking advantage of the growing number of Health Savings Accounts (HSAs) by offering a product for employers. Lastly, eHealth is just now launching a product offering in China where much of its technology work is conducted.
Current risks are threefold: First, the healthcare regulatory environment which could change significantly with the upcoming Presidential election. Second, if insurance reform continues to trend towards mandating insurance coverage regardless of pre-existing conditions, this will limit the number of large insurance carriers who service a particular state because the costs of doing business in that state and patient coverage are too high. Finally, the third risk centers on competition. While there are not many online providers like eHealth.com, competition for insurance related products is still strong and the sale of insurance over the Internet is still relatively new and yet to be widely adopted.
See page 77 for Industry Terms and Definitions
Neither the information contained herein nor any opinion expressed shall be construed to constitute an offer to sell or a solicitation to buy any securities mentioned herein. The views herein are those of the portfolio managers at the time the commentaries are written and may not be reflective of current conditions.
42 | The Masters’ Select Funds Trust |
Masters’ Select Smaller Companies Fund
SCHEDULE OF INVESTMENTS IN SECURITIES at December 31, 2007
Shares | Value | ||
COMMON STOCKS: 92.6% | |||
Consumer Discretionary: 11.7% | |||
| 454,400 | Charming Shoppes, Inc.* | $ | 2,458,304 |
| 299,500 | Circuit City Stores, Inc. | 1,257,900 | |
| 182,000 | Comcast Corp.* | 3,323,320 | |
| 230,000 | Cox Radio, Inc.* | 2,794,500 | |
| 536,000 | dELiA*s, Inc.* | 1,452,560 | |
| 20,301 | Dolan Media Co.* | 592,180 | |
| 233,300 | Foot Locker, Inc. | 3,186,878 | |
| 161,500 | Jo-Ann Stores, Inc.* | 2,112,420 | |
| 250,000 | Lodgenet Entertainment Corp.* | 4,360,000 | |
| 92,900 | Rent-A-Center, Inc.* | 1,348,908 | |
| 1,323,900 | Signet Group PLC | 1,838,161 | |
| 450,000 | Triarc Cos, Inc. | 3,942,000 | |
| 28,667,131 | |||
Consumer Staples: 3.9% | |||
| 630,000 | Central Garden and Pet Co.* | 3,376,800 | |
| 100,000 | Ralcorp Holdings, Inc.* | 6,079,000 | |
| 9,455,800 | |||
Energy: 12.1% | |||
| 108,500 | ATP Oil & Gas Corp.* | 5,483,590 | |
| 13,700 | Atwood Oceanics, Inc.* | 1,373,288 | |
| 80,300 | Hornbeck Offshore Services, Inc.* | 3,609,485 | |
| 58,000 | National Oilwell Varco, Inc.* | 4,260,680 | |
| 167,800 | Patterson-UTI Energy, Inc. | 3,275,456 | |
| 179,900 | Rosetta Resources, Inc.(b) | 3,567,417 | |
| 35,900 | Rosetta Resources, Inc.* | 711,897 | |
| 93,300 | Rowan Companies, Inc. | 3,681,618 | |
| 66,000 | W-H Energy Services, Inc.* | 3,709,860 | |
| 29,673,291 | |||
Financials: 10.7% | |||
| 14,000 | Alleghany Corp.* | 5,628,000 | |
| 144,000 | Annaly Capital Management, Inc. | 2,617,920 | |
| 215,000 | CapitalSource, Inc. | 3,781,850 | |
| 160,000 | Chimera Investment Corp. | 2,860,800 | |
| 81,135 | eHealth, Inc.* | 2,605,245 | |
| 75,668 | GFI Group, Inc.* | 7,242,941 | |
| 28,800 | Mercury General Corp. | 1,434,528 | |
| 26,171,284 | |||
Health Care: 8.6% | |||
| 40,046 | Alexion Pharmaceuticals, Inc.* | 3,004,651 | |
| 55,500 | Analogic Corp. | 3,758,460 | |
| 308,373 | Conceptus, Inc.* | 5,933,097 | |
| 300,000 | Draxis Health, Inc.* | 1,215,000 | |
| 153,000 | Micrus Endovascular Corp.* | 3,011,040 | |
| 245,000 | Sun Healthcare Group, Inc.* | 4,206,650 | |
| 21,128,898 | |||
Industrials: 18.9% | |||
| 103,445 | Aegean Marine Petroleum Network, Inc. | 3,971,254 | |
| 80,900 | Aerovironment, Inc.* | 1,957,780 | |
| 115,000 | Albany International Corp. | 4,266,500 | |
| 76,847 | BE Aerospace, Inc.* | 4,065,206 | |
| 160,300 | Chart Industries, Inc.* | 4,953,270 | |
| 265,000 | Federal Signal Corp. | 2,973,300 | |
| 60,350 | FTI Consulting, Inc.* | 3,719,974 | |
| 162,400 | HUB Group, Inc.* | 4,316,592 | |
| 165,000 | Interline Brands, Inc.* | 3,615,150 | |
| 180,000 | Orbital Sciences Corp.* | 4,413,600 | |
| 50,450 | Quanta Services, Inc.* | 1,323,808 | |
| 114,900 | Trinity Industries, Inc. | 3,189,624 | |
| 80,000 | Watson Wyatt Worldwide, Inc. | 3,712,800 | |
| 46,478,858 | |||
Information Technology: 2.8% | |||
| 365,000 | Ariba, Inc.* | 4,069,750 | |
| 211,145 | Aruba Networks, Inc.* | 3,148,172 | |
| 96,800 | Avnet, Inc.* | 3,385,096 | |
| 172,936 | Cybersource Corp.* | 3,073,073 | |
| 116,955 | DealerTrack Holdings, Inc.* | 3,914,484 | |
| 157,262 | Double-Take Software, Inc.* | 3,415,730 | |
| 290,000 | Epicor Software Corp.* | 3,416,200 | |
| 700,000 | Extreme Networks, Inc.* | 2,478,000 | |
| 150,000 | Fair Isaac Corp. | 4,822,500 | |
| 160,000 | Heartland Payment Systems, Inc. | 4,288,000 | |
| 277,800 | Magma Design Automation, Inc.* | 3,391,938 | |
| 139,800 | Manhattan Associates, Inc.* | 3,685,128 | |
| 95,000 | MAXIMUS, Inc. | 3,667,950 | |
| 125,000 | Novatel Wireless, Inc.* | 2,025,000 | |
| 174,120 | Riverbed Technology, Inc.* | 4,655,969 | |
| 53,436,990 | |||
Materials: 3.8% | |||
| 80,000 | GenTek, Inc.* | 2,341,600 | |
| 399,425 | Novamerican Steel, Inc.* | 1,721,521 | |
| 85,000 | Sealed Air Corp. | 1,966,900 | |
| 234,550 | Spartech Corp. | 3,307,155 | |
| 9,337,176 | |||
Other Investment Company: 1.1% | |||
| 140,000 | SPDR S&P Homebuilders ETF | 2,709,000 | |
TOTAL COMMON STOCKS | |||
(cost $227,286,202) | 227,058,428 | ||
Schedule of Investments | 43 |
Masters’ Select Smaller Companies Fund
SCHEDULE OF INVESTMENTS IN SECURITIES at December 31, 2007
Principal Amount | Value | ||
SHORT-TERM INVESTMENTS: 7.8% | |||
| 19,101,000 | State Street Bank & Trust Co., 2.500%, 12/31/07, due 01/02/08 [collateral: $19,160,000, Federal Home Loan Bank, 4.375%, due 09/17/10, Fannie Mae, 4.250%, due 05/15/09, Federal Home Loan Bank, 4.375%, due 04/18/08, value $19,101,000] (proceeds $19,103,653) | $ | 19,101,000 |
TOTAL SHORT-TERM INVESTMENTS | |||
(cost $19,101,000) | 19,101,000 | ||
TOTAL INVESTMENTS IN SECURITIES | |||
(cost $246,387,202): 100.4% | 246,159,428 | ||
| Liabilities in Excess of Other Assets: (0.4%) | (1,047,798) | ||
Net Assets: 100% | $ | 245,111,630 | |
| * | Non-income producing security. |
The accompanying notes are an integral part of these financial statements.
44 | The Masters’ Select Funds Trust |
Masters’ Select Focused Opportunities Fund Review
In 2007, its first full calendar year, Masters’ Select Focused Opportunities gained 7.73%, beating the 5.49% return for the S&P 500. Since its inception on June 30, 2006, the fund is up 12.12% annualized, compared to a 12.25% return for the market index. As we have noted, given Focused Opportunities’ highly concentrated portfolio and the broad investment opportunity set available to our sub-advisors, the fund’s performance relative to its benchmark in any given month, quarter or year is likely to be highly variable.
The value of a hypothetical $10,000 investment in the Masters’ Select Focused Opportunities Fund from inception (6/30/06) to present compared with the S&P 500 Index.
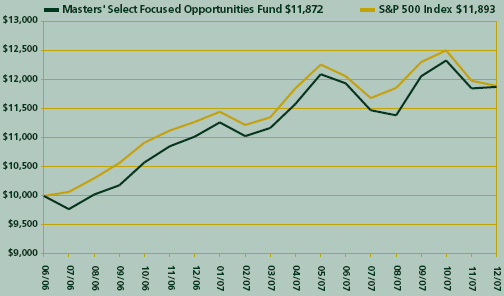
The hypothetical $10,000 investment at fund inception includes changes due to share price and reinvestment of dividends and capital gains. The chart does not imply future performance. Indices are unmanaged, do not incur fees, expenses or taxes and cannot be invested in directly.
Performance as of December 31, 2007
Average Annual Total Returns | ||
One-Year | Since Inception | |
Masters’ Select Focused | ||
Opportunities Fund (6/30/06) | 7.73% | 12.12% |
Performance data quoted represents past performance and does not guarantee future results. The funds impose a 2% redemption fee on shares held less than 180 days. Performance data does not reflect the redemption fee. If reflected, total returns would be reduced. The graph and table do not reflect the deduction of taxes that a shareholder would pay on fund distributions or the redemption of fund shares.
Performance and Portfolio Commentary
Performance of managers: For the year, two of the three sub-advisors significantly outperformed their benchmarks while the third manager significantly lagged. The individual manager returns ranged from a loss of 4.3% to a gain of 17.9%. Over shorter time periods, we do not expect every manager to outperform his benchmark, but that is our (and their) long-run goal. In the relatively short time since the fund’s inception, two of the three managers are ahead of their benchmarks.1
Sector and stock-picking impact: Given its highly concentrated portfolio, the long-term success of Masters’ Select Focused Opportunities will require skilled stock picking from its sub-advisors to an even greater degree than for the other Masters’ Select funds. Therefore, in our performance discussions we expect to focus on the value added or detracted at the individual stock level rather than on performance attribution based on sector exposures relative to the benchmark.
Indeed, stock selection drove the fund’s positive relative performance during the year. Orkla, a Norwegian company that sells branded consumer goods, aluminum and other specialty materials was the top performer, gaining nearly 60%. Two information technology stocks, Salesforce.com (up 58%) and Google (up 46%), and two energy companies, Schlumberger (up 57%) and EOG Resources (up 43%) rounded out the top five. All three of the fund’s managers were represented among these top five names. Likewise, each manager held at least one name among the five worst performers for the year. Countrywide Financial (down 49%) and Virgin Media (down 34%) were the biggest losers. Eight of the fund’s ten biggest gainers and eight of the ten worst-performing stocks remained in the portfolio at year end. Interestingly, both the best performer (Orkla) and worst performer (Countrywide) were sold before year-end. New additions to the portfolio in the fourth quarter were Las Vegas Sands, Bank of New York Mellon and Canadian Natural Resources.
See the table on page 47 for the portfolio leaders and laggards over the past six and 12 months. The table includes dollar gains and losses as well as percentage gains and losses. It is important to understand that the fact that a stock has lost (or made) money for Masters’ Select Focused Opportunities for the past six or 12 months tells us nothing about how successful the holding will ultimately become. The fund will hold some stocks for significantly longer periods of time and the success of these holdings won’t be known until they are ultimately sold. So in that respect, while it is interesting to know how specific stocks performed during the period, this information is of limited value in assessing the ultimate success of these stock holdings.
Portfolio mix: The biggest change in fund’s sector weightings was in energy, which stood at 10.2% of the portfolio at year end, down from 19.8% in the prior year. The allocation to industrials stocks also dropped significantly, to 3.4% (from 9.1%). The largest sector increases for the year were in materials and technology. The fund’s cash position also rose substantially, ending the year at 10.4%. We expect much of this cash to be transitional, i.e., in the process of being invested.
As we would expect, many of the fund’s sector allocations differ significantly from the S&P 500 sector weightings.
| • | The fund remains over-allocated to the financial sector at 27% of assets versus 18% for the index. The fund is also overweighted to materials (9% versus 3%) and technology (21% versus 17%). |
| • | The fund continues to be significantly underweighted to health care, with no exposure versus a 12% weighting for the index. It also has a large underweight to industrials (3% versus 12%) and telecom (0% versus 4%). |
| • | Foreign-domiciled stocks accounted for 24% of the portfolio. |
| • | Large-cap domestic stocks comprised 44% of the portfolio and mid-caps 21%. |
| • | The portfolio held 21 stocks at year end. |
Fund Summary | 45 |
Miscellaneous
Expenses: The fund’s net expense ratio as of 12/31/2007 was 1.26% of average net assets. This is a decline of 14 basis points (0.14%) from the expense ratio at the end of 2006. Assets in the fund topped the $115 million mark at year end. Should the asset base continue to grow we expect the fund’s expense ratio to decline further.
In Closing
The fund’s goal, and the focus of our sub-advisors, is to generate superior performance over the long-term. To achieve this goal, each sub-advisor invests in only their five to seven highest-conviction ideas. The fund’s long-term objective coupled with its concentrated portfolio can (and inevitably will) lead to periods of underperformance relative to the benchmark. Therefore, it is critical that investors in this fund (and all of the Masters’ Select funds) have a long-term investment horizon, and the patience and fortitude to ride out the inevitable shorter-term periods of underperformance. While there are no guarantees, we believe short-term performance volatility is often the price one must pay in order to achieve long-term outperformance.
We remain very excited about the long-term prospects for Masters’ Select Focused Opportunities. We created this fund because we believe it has the potential to deliver strong long-run returns relative to large-cap stock benchmarks and peer groups. The fund’s managers remain very enthusiastic about the names they own while also acknowledging that there is near-term economic uncertainty as a result of the credit crunch. We are fortunate to have this talented and committed group of stock pickers as our partners executing the fund’s highly concentrated and highly flexible mandate.
As always, we thank you for your trust and confidence. We will work hard to continue to earn it.
| 1 | The managers and their benchmarks are: Embler/Langerman: Russell 3000 Value Index; Blum/Burlingame: Russell 1000 Growth Index; Davis/Feinberg: S&P 500 Index. |
Neither the information contained herein nor any opinion expressed shall be construed to constitute an offer to sell or a solicitation to buy any security or any other funds mentioned herein. The views herein are those of Litman/Gregory Fund Advisors, LLC at the time the material is written and may not be reflective of current conditions. Performance quoted represents past performance and does not guarantee future results.
46 | The Masters’ Select Funds Trust |
Masters’ Select Focused Opportunities Fund Leaders and Laggards
For the Six Months Ended December 31, 2007
By Percentage Gain (Loss)
Security | $ Contribution (Loss) | % Change |
| Salesforce.com, Inc. | 3,906,505 | 47.7% |
| Google, Inc. | 2,023,799 | 29.0% |
| RWE AG (Neu) | 1,332,062 | 27.9% |
| Siemens AG | 856,727 | 27.6% |
| EOG Resources, Inc. | 397,791 | 22.4% |
| KT&G Corp. | 997,418 | 19.6% |
| Schlumberger Ltd. | 978,067 | 16.8% |
| Altria Group, Inc. | 510,262 | 9.9% |
| Conocophillips | 199,612 | 2.6% |
| Canadian Natural Resources Ltd. | 120,064 | 2.1% |
| 11,322,307 | ||
| Countrywide Financial Corp. | (2,508,847) | (46.6%) |
| Virgin Media, Inc. | (1,482,506) | (29.7%) |
| Fortis | (1,400,182) | (17.5%) |
| Tyco Electronics | (187,439) | (15.1%) |
| American International Group, Inc. | (913,464) | (15.1%) |
| Allegheny Technologies, Inc. | (896,553) | (14.3%) |
| Progressive Corp. Ohio | (292,548) | (11.7%) |
| American Express Co. | (913,700) | (9.3%) |
| Las Vegas Sands Corp. | (216,208) | (9.2%) |
| Tyco International Ltd. | (373,939) | (8.8%) |
| (9,185,386) |
By Dollar Gain (Loss)
Security | $ Contribution (Loss) | % Change |
| Salesforce.com, Inc. | 3,906,505 | 47.7% |
| Google, Inc. | 2,023,799 | 29.0% |
| RWE AG (Neu) | 1,332,062 | 27.9% |
| KT&G Corp. | 997,418 | 19.6% |
| Schlumberger Ltd. | 978,067 | 16.8% |
| Siemens AG | 856,727 | 27.6% |
| Altria Group, Inc. | 510,262 | 9.9% |
| EOG Resources, Inc. | 397,791 | 22.4% |
| Conocophillips | 199,612 | 2.6% |
| Canadian Natural Resources Ltd. | 120,064 | 2.1% |
| 11,322,307 | ||
| Countrywide Financial Corp. | (2,508,847) | (46.6%) |
| Virgin Media, Inc. | (1,482,506) | (29.7%) |
| Fortis | (1,400,182) | (17.5%) |
| American Express Co. | (913,700) | (9.3%) |
| American International Group, Inc. | (913,464) | (15.1%) |
| Allegheny Technologies, Inc. | (896,553) | (14.3%) |
| QUALCOMM, Inc. | (582,560) | (7.9%) |
| Tyco International Ltd. | (373,939) | (8.8%) |
| JPMorgan Chase & Co. | (337,598) | (6.8%) |
| Progressive Corp. Ohio | (292,548) | (11.7%) |
| (9,701,897) |
For the Year Ended December 31, 2007
By Percentage Gain (Loss)
Security | $ Contribution (Loss) | % Change |
| Orkla ASA | 1,512,639 | 58.9% |
| Salesforce.com | 4,438,985 | 58.0% |
| Schlumberger Ltd. | 2,470,018 | 56.7% |
| Google, Inc. | 2,858,428 | 46.5% |
| EOG Resources, Inc. | 659,259 | 43.4% |
| KT&G Corp. | 1,803,452 | 41.0% |
| RWE AG (Neu) | 1,505,214 | 31.4% |
| Siemens AG | 856,727 | 27.6% |
| Altria Group, Inc. | 909,811 | 15.5% |
| Conocophillips | 919,661 | 13.1% |
| 17,934,194 | ||
| Countrywide Financial Corp. | (3,011,558) | (48.6%) |
| Virgin Media, Inc. | (1,803,039) | (33.9%) |
| Fortis | (1,288,773) | (16.1%) |
| Tyco Electronics | (187,439) | (15.1%) |
| American International Group, Inc. | (908,243) | (14.9%) |
| Allegheny Technologies, Inc. | (896,553) | (14.3%) |
| Progressive Corp. Ohio | (278,727) | (11.2%) |
| News Corp. | (303,388) | (10.7%) |
| JPMorgan Chase & Co. | (468,652) | (9.2%) |
| Las Vegas Sands Corp. | (216,208) | (9.2%) |
| (9,362,580) |
By Dollar Gain (Loss)
Security | $ Contribution (Loss) | % Change |
| Salesforce.com | 4,438,985 | 58.0% |
| Google, Inc. | 2,858,428 | 46.5% |
| Schlumberger Ltd. | 2,470,018 | 56.7% |
| KT&G Corp. | 1,803,452 | 41.0% |
| Orkla ASA | 1,512,639 | 58.9% |
| RWE AG (Neu) | 1,505,214 | 31.4% |
| Conocophillips | 919,661 | 13.1% |
| Altria Group, Inc. | 909,811 | 15.5% |
| Siemens AG | 856,727 | 27.6% |
| EOG Resources, Inc. | 659,259 | 43.4% |
| 17,934,194 | ||
| Countrywide Financial Corp. | (3,011,558) | (48.6%) |
| Virgin Media, Inc. | (1,803,039) | (33.9%) |
| Fortis | (1,288,773) | (16.1%) |
| American International Group, Inc. | (908,243) | (14.9%) |
| Allegheny Technologies, Inc. | (896,553) | (14.3%) |
| American Express Co. | (714,222) | (7.4%) |
| JPMorgan Chase & Co. | (468,652) | (9.2%) |
| News Corp. | (303,388) | (10.7%) |
| Progressive Corp. Ohio | (278,727) | (11.2%) |
| Las Vegas Sands Corp. | (216,208) | (9.2%) |
| (9,889,363) |
Fund Summary | 47 |
Masters’ Select Focused Opportunities Fund Managers
INVESTMENT MANAGER | FIRM | TARGET ASSET ALLOCATION | MARKET CAPITALIZATION OF COMPANIES IN PORTFOLIO | STOCK-PICKING STYLE |
| Craig Blum and | TCW Investment Management | 33.33% | Mostly mid- and | Growth |
| Stephen Burlingame | Company | large-sized companies | ||
| Christopher Davis/ | Davis Selected Advisers, L.P. | 33.33% | Mostly large | Growth at a |
| Kenneth Feinberg | companies | reasonable price | ||
| Michael Embler and | Franklin Mutual Advisers, LLC | 33.33% | All sizes and global | Value |
| Peter Langerman |
Portfolio Composition*
The fund holds 21 securities, exclusive of cash equivalents.
By Asset Class
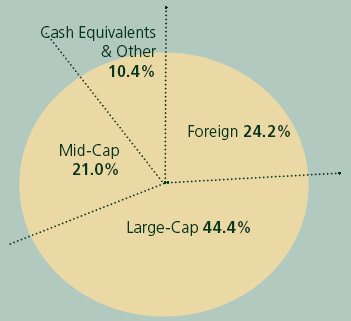
Market Capitalization:
Small-Cap Domestic < $2.5 billion
Mid-Cap Domestic $2.5 - $18.3 billion
Large-Cap Domestic > $18.3 billion
| * | Totals may not add up to 100% due to rounding. |
By Sector
| Sector Allocation | |||||||
| Fund | S&P 500 Index | ||||||
| Consumer Discretionary | 6.9 | % | 9.6 | % | |||
| Consumer Staples | 8.8 | % | 9.0 | % | |||
| Energy | 10.2 | % | 12.0 | % | |||
| Finance | 26.6 | % | 17.6 | % | |||
| Health Care & Pharmaceuticals | 0.0 | % | 12.0 | % | |||
| Industrials | 3.4 | % | 12.1 | % | |||
| Technology | 20.5 | % | 16.6 | % | |||
| Telecom | 0.0 | % | 3.3 | % | |||
| Utilities | 4.0 | % | 3.9 | % | |||
| Materials | 9.2 | % | 3.9 | % | |||
| Cash Equivalents & Other | 10.4 | % | 0.0 | % | |||
100.0 | % | 100.0 | % | ||||
48 | The Masters’ Select Funds Trust |
Masters’ Select Focused Opportunities Fund Stock Highlights
Siemens AG - Michael Embler
Siemens AG is held in both the Value Fund and the Focused Opportunities Fund. Please refer to the discussion appearing on page 34.
Salesforce.com, Inc. - Craig Blum and Steve Burlingame
Salesforce.com is held in both the Equity Fund and the Focused Opportunities Fund. Please refer to the discussion appearing on page 14.
Bank of New York Mellon Corp. - Christopher Davis and Kenneth Feinberg
Bank of New York Mellon Corp. is held in both the Equity Fund and the Focused Opportunities Fund. Please refer to the discussion appearing on page 14.
See page 77 for Industry Terms and Definitions
Neither the information contained herein nor any opinion expressed shall be construed to constitute an offer to sell or a solicitation to buy any securities mentioned herein. The views herein are those of the portfolio managers at the time the commentaries are written and may not be reflective of current conditions.
Fund Summary | 49 |
Masters’ Select Focused Opportunities Fund
SCHEDULE OF INVESTMENTS IN SECURITIES at December 31, 2007
Shares | Value | ||
COMMON STOCKS: 89.6% | |||
Consumer Discretionary: 6.9% | |||
| 20,800 | Las Vegas Sands Corp.* | $ | 2,143,440 |
| 122,500 | News Corp. | 2,510,025 | |
| 203,510 | Virgin Media, Inc. | 3,488,161 | |
| 8,141,626 | |||
Consumer Staples: 8.8% | |||
| 73,525 | Altria Group, Inc. | 5,557,020 | |
| 56,266 | KT&G Corp. | 4,790,770 | |
| 10,347,790 | |||
Energy: 10.2% | |||
| 81,000 | Canadian Natural Resources Ltd. | 5,924,340 | |
| 24,300 | EOG Resources, Inc. | 2,168,775 | |
| 40,100 | Schlumberger Ltd. | 3,944,637 | |
| 12,037,752 | |||
Financials: 26.6% | |||
| 170,000 | American Express Co. | 8,843,400 | |
| 87,800 | American International Group, Inc. | 5,118,740 | |
| 112,189 | Bank of New York Mellon Corp. | 5,470,335 | |
| 280,758 | Fortis* | 5,591,618 | |
| 103,600 | JPMorgan Chase & Co. | 4,522,140 | |
| 94,100 | The Progressive Corp. | 1,802,956 | |
| 31,349,189 | |||
Industrials: 3.4% | |||
| 24,900 | Siemens AG | 3,963,054 | |
Materials: 9.2% | |||
| 61,800 | Allegheny Technologies, Inc. | 5,339,520 | |
| 74,835 | Weyerhaeuser Co. | 5,518,333 | |
| 10,857,853 | |||
Technology: 20.5% | |||
| 7,650 | Google, Inc.* | 5,289,822 | |
| 170,900 | QUALCOMM, Inc. | 6,724,915 | |
| 192,900 | Salesforce.com, Inc.* | 12,092,901 | |
| 24,107,638 | |||
Utilities: 4.0% | |||
| 33,591 | RWE AG | 4,714,726 | |
TOTAL COMMON STOCKS | |||
(cost $97,823,600) | 105,519,628 | ||
Principal Amount | Value | ||
SHORT-TERM INVESTMENTS: 10.6% | |||
| 12,449,000 | State Street Bank & Trust Co., 2.5% - 3.63%, 12/31/07, due 01/02/08 [collateral: $16,085,000, Federal Home Loan Bank, 4.375%, due 09/17/10, Federal Home Loan Bank, 4.000%, due 09/01/10, value $12,449,000] (proceeds $12,450,957) | $ | 12,449,000 |
TOTAL SHORT-TERM INVESTMENTS | |||
(cost $12,449,000) | 12,449,000 | ||
TOTAL INVESTMENTS IN SECURITIES | |||
(cost $110,272,600): 100.2% | $ | 117,968,628 | |
| Liabilities in Excess of Other Assets: (0.2%) | (198,061) | ||
Net Assets: 100% | $ | 117,770,567 | |
| * | Non-income producing security. |
The accompanying notes are an integral part of these financial statements.
50 | The Masters’ Select Funds Trust |
Masters’ Select Funds Trust
EXPENSE EXAMPLES - (Unaudited)
As a shareholder of the Funds, you incur two types of costs: (1) redemptions fees; and (2) ongoing costs, including advisory fees; and other fund expenses. The examples below are intended to help you understand your ongoing costs (in dollars) of investing in the Funds and to compare these costs with the ongoing costs of investing in other mutual funds.
The examples are based on an investment of $1,000 invested at the beginning of the period shown and held for the entire period from July 1, 2007 to December 31, 2007.
Actual Expenses
For each Fund, the first line of the table below provides information about actual account values and actual expenses. You may use the information in this line, together with the amount you invested, to estimate the expenses that you paid over the period. Simply divide your account value by $1,000 (for example, an $8,600 account value divided by $1,000 = 8.6), then multiply the result by the number in the first line under the heading entitled “Expenses Paid During Period” to estimate the expenses you paid on your account during this period.
Hypothetical Example for Comparison Purposes
For each Fund, the second line of the table below provides information about hypothetical account values and hypothetical expenses based on the Fund’s actual expense ratio and an assumed rate of return of 5% per year before expenses, which is not the Fund’s actual return. The hypothetical account values and expenses may not be used to estimate the actual ending account balance or expenses you paid for the period. You may use this information to compare the ongoing costs of investing in the Fund and other funds. To do so, compare this 5% hypothetical example with the 5% hypothetical examples that appear in the shareholder reports of the other funds.
Please note that the expenses shown in the table are meant to highlight your ongoing costs only and do not reflect any redemption fees. Therefore, the second line for each Fund of the table is useful in comparing ongoing costs only, and will not help you determine the relative total costs of owning different funds. In addition, if these redemption fees were included, your costs would have been higher.
Beginning Account Value (07/01/07) | Ending Account Value (12/31/07) | Expenses Paid During Period* (07/01/07 to 12/31/07) | Expense Ratio During Period* (07/01/07 to 12/31/07) | ||||||||||
| Masters’ Select Equity Fund Actual | $ | 1,000.00 | $ | 952.80 | $ | 5.91 | 1.20 | % | |||||
| Masters’ Select Equity Fund Hypothetical | |||||||||||||
(5% return before expenses) | $ | 1,000.00 | $ | 1,019.16 | $ | 6.11 | 1.20 | % | |||||
| Masters’ Select International Fund Actual | $ | 1,000.00 | $ | 1,051.50 | $ | 5.27 | 1.02 | % | |||||
| Masters’ Select International Fund Hypothetical | |||||||||||||
(5% return before expenses) | $ | 1,000.00 | $ | 1,020.06 | $ | 5.19 | 1.02 | % | |||||
| Masters’ Select Value Fund Actual | $ | 1,000.00 | $ | 897.50 | $ | 5.79 | 1.21 | % | |||||
| Masters’ Select Value Fund Hypothetical | |||||||||||||
(5% return before expenses) | $ | 1,000.00 | $ | 1,019.11 | $ | 6.16 | 1.21 | % | |||||
| Masters’ Select Smaller Companies Fund Actual | $ | 1,000.00 | $ | 898.50 | $ | 6.27 | 1.31 | % | |||||
| Masters’ Select Smaller Companies Fund Hypothetical | |||||||||||||
(5% return before expenses) | $ | 1,000.00 | $ | 1,018.60 | $ | 6.67 | 1.31 | % | |||||
| Masters’ Select Focused Opportunities Fund Actual | $ | 1,000.00 | $ | 995.10 | $ | 6.19 | 1.23 | % | |||||
| Masters’ Select Focused Opportunities Fund Hypothetical | |||||||||||||
(5% return before expenses) | $ | 1,000.00 | $ | 1,019.00 | $ | 6.26 | 1.23 | % | |||||
*Expensesare equal to the Funds’ annualized expense ratio as indicated, multiplied by the average account value over the period, multiplied by the number of days in most recent fiscal half-year period (184), then divided by the number of days in the fiscal year (365) (to reflect the one-half year period).
Expense Examples | 51 |
Masters’ Select Funds Trust
STATEMENTS OF ASSETS AND LIABILITIES at December 31, 2007
Equity Fund | International Fund | Value Fund | Smaller Companies Fund | Focused Opportunities Fund | ||||||||||||
ASSETS | ||||||||||||||||
Investments in securities at cost | $ | 535,723,393 | $ | 1,675,793,252 | $ | 279,287,842 | $ | 227,286,202 | $ | 97,823,600 | ||||||
Repurchase agreements at cost | 18,498,000 | 105,586,000 | 8,468,000 | 19,101,000 | 12,449,000 | |||||||||||
Total investments at cost | $ | 554,221,393 | $ | 1,781,379,252 | $ | 287,755,842 | $ | 246,387,202 | $ | 110,272,600 | ||||||
Investments in securities at value | $ | 689,970,415 | $ | 1,945,643,372 | $ | 334,168,217 | $ | 227,058,428 | $ | 105,519,628 | ||||||
Repurchase agreements at value | 18,498,000 | 105,586,000 | 8,468,000 | 19,101,000 | 12,449,000 | |||||||||||
Total investments at value | 708,468,415 | 2,051,229,372 | 342,636,217 | 246,159,428 | 117,968,628 | |||||||||||
Cash | 10,824 | 10,842 | 27,772 | 55,038 | 3,136 | |||||||||||
Cash, denominated in foreign currency | ||||||||||||||||
(cost of $1,467, $4,151,434, $240,292, $— and | ||||||||||||||||
$571, respectively) | 1,420 | 4,156,142 | 237,048 | — | 564 | |||||||||||
Receivables: | ||||||||||||||||
Securities sold | 2,793,219 | 13,914,693 | — | 2,711,336 | — | |||||||||||
Dividends and interest | 339,045 | 1,449,236 | 105,301 | 118,070 | 91,439 | |||||||||||
Fund shares sold | 1,605,126 | 12,060,175 | 611,554 | 772,259 | 615,826 | |||||||||||
Foreign tax reclaim | — | 220,367 | 17,637 | — | 12,642 | |||||||||||
Unrealized gain on forward exchange contracts | — | 2,434,455 | 485,627 | — | 199,047 | |||||||||||
Prepaid expenses | 13,984 | 33,301 | 10,357 | 10,956 | 8,950 | |||||||||||
Total assets | 713,232,033 | 2,085,508,583 | 344,131,513 | 249,827,087 | 118,900,232 | |||||||||||
LIABILITIES | ||||||||||||||||
Payables: | ||||||||||||||||
Advisory fees | 671,074 | 1,560,129 | 322,620 | 240,348 | 95,932 | |||||||||||
Securities purchased | 993,747 | 8,759,427 | — | 1,191,937 | 964,281 | |||||||||||
Fund shares redeemed | 2,699,004 | 3,259,544 | 1,404,458 | 3,194,135 | 5,166 | |||||||||||
Foreign taxes withheld | — | 35,566 | — | — | 656 | |||||||||||
Unrealized loss on forward exchange contracts | — | 566,311 | 120,079 | — | — | |||||||||||
Accrued other expenses | 145,180 | 330,070 | 87,470 | 89,037 | 63,630 | |||||||||||
Total liabilities | 4,509,005 | 14,511,047 | 1,934,627 | 4,715,457 | 1,129,665 | |||||||||||
NET ASSETS | $ | 708,723,028 | $ | 2,070,997,536 | $ | 342,196,886 | $ | 245,111,630 | $ | 117,770,567 | ||||||
Number of shares issued and outstanding (unlimited number | ||||||||||||||||
of shares authorized, $0.01 par value) | 46,708,927 | 110,849,767 | 22,671,977 | 18,342,000 | 10,262,001 | |||||||||||
Net asset value, offering and redemption price per share | $ | 15.17 | $ | 18.68 | $ | 15.09 | $ | 13.36 | $ | 11.48 | ||||||
COMPONENTS OF NET ASSETS | ||||||||||||||||
Paid in capital | $ | 536,719,302 | $ | 1,782,937,989 | $ | 280,832,758 | $ | 239,766,205 | $ | 109,586,160 | ||||||
Undistributed net investment income (loss) | — | (17,736,922 | ) | (365,548 | ) | — | (251,181 | ) | ||||||||
Accumulated net realized gain (loss) on investments | 17,756,751 | 34,040,258 | 6,485,887 | 5,573,199 | 539,562 | |||||||||||
Net unrealized appreciation (depreciation) on: | ||||||||||||||||
Investments | 154,247,022 | 269,850,120 | 54,880,375 | (227,774 | ) | 7,696,028 | ||||||||||
Foreign currency | (47 | ) | 1,906,091 | 363,414 | — | 199,998 | ||||||||||
Net assets | $ | 708,723,028 | $ | 2,070,997,536 | $ | 342,196,886 | $ | 245,111,630 | $ | 117,770,567 | ||||||
The accompanying notes are an integral part of these financial statements.
52 | The Masters’ Select Funds Trust |
Masters’ Select Funds Trust
STATEMENTS OF OPERATIONS For the Year Ended December 31, 2007
Equity Fund | International Fund | Value Fund | Smaller Companies Fund | Focused Opportunities Fund | ||||||||||||
INVESTMENT INCOME | ||||||||||||||||
Income | ||||||||||||||||
Dividends (net of foreign taxes withheld of $60,764, | ||||||||||||||||
$2,668,325, $185,542, $— and $92,547, respectively) | $ | 7,183,737 | $ | 33,553,847 | $ | 5,919,349 | $ | 1,526,609 | $ | 1,692,764 | ||||||
Interest | 623,355 | 3,827,234 | 418,069 | 1,039,317 | 179,873 | |||||||||||
Total income | 7,807,092 | 37,381,081 | 6,337,418 | 2,565,926 | 1,872,637 | |||||||||||
Expenses | ||||||||||||||||
Advisory fees | 8,571,980 | 20,530,696 | 4,214,392 | 3,220,565 | 1,040,181 | |||||||||||
Administration fees | 148,574 | 370,474 | 72,871 | 53,733 | 17,003 | |||||||||||
Custody fees | 67,375 | 1,382,243 | 59,521 | 45,526 | 27,281 | |||||||||||
Transfer agent fees | 259,418 | 417,991 | 98,646 | 142,764 | 11,617 | |||||||||||
Chief compliance officer fees | 10,800 | 10,800 | 10,800 | 10,800 | 10,800 | |||||||||||
Fund accounting fees | 81,807 | 79,128 | 67,036 | 67,363 | 50,481 | |||||||||||
Professional fees | 76,577 | 106,037 | 57,396 | 55,471 | 46,880 | |||||||||||
Trustee fees | 56,068 | 88,452 | 43,570 | 40,483 | 30,584 | |||||||||||
Registration expense | 17,937 | 16,686 | 24,909 | 30,154 | 16,235 | |||||||||||
Insurance expense | 33,562 | 72,465 | 16,150 | 11,783 | 2,811 | |||||||||||
Reports to shareholders | 75,016 | 135,256 | 33,495 | 42,341 | 4,628 | |||||||||||
Miscellaneous | 34,614 | 71,960 | 16,850 | 12,594 | 4,864 | |||||||||||
Total expenses | 9,433,728 | 23,282,188 | 4,715,636 | 3,733,577 | 1,263,365 | |||||||||||
Less: fees waived | (40,735 | ) | (3,121,198 | ) | (96,870 | ) | (29,180 | ) | (74,742 | ) | ||||||
Less: expenses paid indirectly | (7,728 | ) | (13,643 | ) | (2,561 | ) | (6,534 | ) | (427 | ) | ||||||
Net expenses | 9,385,265 | 20,147,347 | 4,616,205 | 3,697,863 | 1,188,196 | |||||||||||
Net investment income (loss) | (1,578,173 | ) | 17,233,734 | 1,721,213 | (1,131,937 | ) | 684,441 | |||||||||
REALIZED AND UNREALIZED GAIN (LOSS) FROM INVESTMENTS | ||||||||||||||||
AND FOREIGN CURRENCY: | ||||||||||||||||
Net realized gain (loss) on: | ||||||||||||||||
Investments | 82,600,259 | 411,439,196 | 28,781,991 | 41,764,160 | 3,787,812 | |||||||||||
Foreign currency transactions | 26,149 | (10,252,462 | ) | (1,852,023 | ) | (13 | ) | (1,158,854 | ) | |||||||
Net realized gain | 82,626,408 | 401,186,734 | 26,929,968 | 41,764,147 | 2,628,958 | |||||||||||
Net unrealized appreciation (depreciation) on: | ||||||||||||||||
Investments | (43,041,684 | ) | (70,413,260 | ) | (36,671,570 | ) | (35,792,565 | ) | 2,854,493 | |||||||
Foreign currency translations | (47 | ) | 1,618,960 | 167,043 | — | 170,099 | ||||||||||
Net unrealized appreciation (depreciation): | (43,041,731 | ) | (68,794,300 | ) | (36,504,527 | ) | (35,792,565 | ) | 3,024,592 | |||||||
Net realized and unrealized gain (loss) on investments | ||||||||||||||||
and foreign currency | 39,584,677 | 332,392,434 | (9,574,559 | ) | 5,971,582 | 5,653,550 | ||||||||||
Net increase (decrease) in net assets | ||||||||||||||||
resulting from operations | $ | 38,006,504 | $ | 349,626,168 | $ | (7,853,346 | ) | $ | 4,839,645 | $ | 6,337,991 | |||||
The accompanying notes are an integral part of these financial statements.
Statements of Operations | 53 |
Masters’ Select Funds Trust
STATEMENTS OF CHANGES IN NET ASSETS
Equity Fund | International Fund | ||||||||||||
Year Ended December 31, 2007 | Year Ended December 31, 2006 | Year Ended December 31, 2007 | Year Ended December 31, 2006 | ||||||||||
INCREASE (DECREASE) IN NET ASSETS FROM: | |||||||||||||
OPERATIONS | |||||||||||||
Net investment income (loss) | $ | (1,578,173 | ) | $ | (723,904 | ) | $ | 17,233,734 | $ | 26,903,327 | |||
Net realized gain on investments and foreign currency | 82,626,408 | 62,026,619 | 401,186,734 | 159,420,935 | |||||||||
Net unrealized appreciation (depreciation) on investments and foreign currency | (43,041,731 | ) | 13,903,538 | (68,794,300 | ) | 153,643,406 | |||||||
Net increase in net assets resulting from operations | 38,006,504 | 75,206,253 | 349,626,168 | 339,967,668 | |||||||||
DISTRIBUTIONS TO SHAREHOLDERS | |||||||||||||
From net investment income | — | — | (19,363,909 | ) | (33,725,178 | ) | |||||||
From net realized gain | (56,890,903 | ) | (51,936,141 | ) | (367,301,721 | ) | (196,379,185 | ) | |||||
Total distributions | (56,890,903 | ) | (51,936,141 | ) | (386,665,630 | ) | (230,104,363 | ) | |||||
CAPITAL SHARE TRANSACTIONS | |||||||||||||
Proceeds from shares sold | 48,490,404 | 83,425,309 | 453,130,478 | 252,997,184 | |||||||||
Reinvested distributions | 55,625,610 | 50,607,837 | 338,267,694 | 193,640,910 | |||||||||
Redemption fee proceeds | 31,141 | 38,098 | 170,561 | 146,525 | |||||||||
Payment for shares redeemed | (240,237,488 | ) | (186,217,664 | ) | (410,328,204 | ) | (259,015,177 | ) | |||||
Net increase (decrease) in net assets from capital share transactions | (136,090,333 | ) | (52,146,420 | ) | 381,240,529 | 187,769,442 | |||||||
Total increase (decrease) in net assets | (154,974,732 | ) | (28,876,308 | ) | 344,201,067 | 297,632,747 | |||||||
NET ASSETS | |||||||||||||
Beginning of year | 863,697,760 | 892,574,068 | 1,726,796,469 | 1,429,163,722 | |||||||||
End of year | $ | 708,723,028 | $ | 863,697,760 | $ | 2,070,997,536 | $ | 1,726,796,469 | |||||
Accumulated net investment loss | $ | — | $ | — | $ | (17,736,922 | ) | $ | (11,183,847 | ) | |||
CAPITAL TRANSACTIONS IN SHARES: | |||||||||||||
Sold | 2,974,750 | 5,386,586 | 21,145,017 | 13,427,863 | |||||||||
Reinvested distributions | 3,568,033 | 3,211,102 | 17,572,363 | 10,633,629 | |||||||||
Redeemed | (14,897,969 | ) | (12,088,077 | ) | (20,013,727 | ) | (13,654,836 | ) | |||||
Net increase (decrease) from capital share transactions | (8,355,186 | ) | (3,490,389 | ) | 18,703,653 | 10,406,656 | |||||||
The accompanying notes are an integral part of these financial statements.
54 | The Masters’ Select Funds Trust |
Masters’ Select Funds Trust
STATEMENTS OF CHANGES IN NET ASSETS
Value Fund | Smaller Companies Fund | ||||||||||||
Year Ended December 31, 2007 | Year Ended December 31, 2006 | Year Ended December 31, 2007 | Year Ended December 31, 2006 | ||||||||||
INCREASE (DECREASE) IN NET ASSETS FROM: | |||||||||||||
OPERATIONS | |||||||||||||
Net investment income (loss) | $ | 1,721,213 | $ | 1,707,343 | $ | (1,131,937 | ) | $ | (1,648,926 | ) | |||
Net realized gain on investments and foreign currency | 26,929,968 | 7,414,850 | 41,764,147 | 13,694,890 | |||||||||
Net unrealized appreciation (depreciation) on investments and foreign currency | (36,504,527 | ) | 44,433,254 | (35,792,565 | ) | 12,535,442 | |||||||
Net increase (decrease) in net assets resulting from operations | (7,853,346 | ) | 53,555,447 | 4,839,645 | 24,581,406 | ||||||||
DISTRIBUTIONS TO SHAREHOLDERS | |||||||||||||
From net investment income | — | (904,026 | ) | — | — | ||||||||
From net realized gain | (20,002,631 | ) | (14,392,152 | ) | (30,497,734 | ) | (10,775,552 | ) | |||||
Total distributions | (20,002,631 | ) | (15,296,178 | ) | (30,497,734 | ) | (10,775,552 | ) | |||||
CAPITAL SHARE TRANSACTIONS | |||||||||||||
Proceeds from shares sold | 51,726,933 | 54,133,929 | 64,217,276 | 66,840,935 | |||||||||
Reinvested distributions | 19,715,916 | 15,046,070 | 29,295,708 | 10,582,591 | |||||||||
Redemption fee proceeds | 24,480 | 36,192 | 46,357 | 53,886 | |||||||||
Payment for shares redeemed | (68,432,717 | ) | (78,683,144 | ) | (91,705,132 | ) | (95,646,437 | ) | |||||
Net increase (decrease) in net assets from capital share transactions | 3,034,612 | (9,466,953 | ) | 1,854,209 | (18,169,025 | ) | |||||||
Total increase (decrease) in net assets | (24,821,365 | ) | 28,792,316 | (23,803,880 | ) | (4,363,171 | ) | ||||||
NET ASSETS | |||||||||||||
Beginning of year | 367,018,251 | 338,225,935 | 268,915,510 | 273,278,681 | |||||||||
End of year | $ | 342,196,886 | $ | 367,018,251 | $ | 245,111,630 | $ | 268,915,510 | |||||
Accumulated net investment income (loss) | $ | (365,548 | ) | $ | (574,466 | ) | $ | — | $ | — | |||
CAPITAL TRANSACTIONS IN SHARES: | |||||||||||||
Sold | 3,063,238 | 3,555,206 | 4,132,333 | 4,492,247 | |||||||||
Reinvested distributions | 1,243,907 | 924,209 | 2,133,701 | 698,982 | |||||||||
Redeemed | (4,096,872 | ) | (5,184,228 | ) | (6,018,299 | ) | (6,484,177 | ) | |||||
Net increase (decrease) from capital share transactions | 210,273 | (704,813 | ) | 247,735 | (1,292,948 | ) | |||||||
The accompanying notes are an integral part of these financial statements.
Statements of Changes in Net Assets | 55 |
Masters’ Select Funds Trust
STATEMENTS OF CHANGES IN NET ASSETS
Focused Opportunities Fund | |||||||
Year Ended December 31, 2007 | June 30, 2006* through December 31, 2006 | ||||||
INCREASE (DECREASE) IN NET ASSETS FROM: | |||||||
OPERATIONS | |||||||
Net investment income (loss) | $ | 684,441 | $ | (3,725 | ) | ||
Net realized gain on investments and foreign currency | 2,628,958 | 158,857 | |||||
Net unrealized appreciation on investments and foreign currency | 3,024,592 | 4,871,435 | |||||
Net increase in net assets resulting from operations | 6,337,991 | 5,026,567 | |||||
DISTRIBUTIONS TO SHAREHOLDERS | |||||||
From net investment income | — | — | |||||
From net realized gain | (3,560,916 | ) | — | ||||
Total distributions | (3,560,916 | ) | — | ||||
CAPITAL SHARE TRANSACTIONS | |||||||
Proceeds from shares sold | 58,200,714 | 52,346,838 | |||||
Reinvested distributions | 3,544,589 | — | |||||
Redemption fee proceeds | 5,057 | 169 | |||||
Payment for shares redeemed | (3,993,527 | ) | (136,915 | ) | |||
Net increase in net assets from capital share transactions | 57,756,833 | 52,210,092 | |||||
Total increase in net assets | 60,533,908 | 57,236,659 | |||||
NET ASSETS | |||||||
Beginning of period | 57,236,659 | — | |||||
End of period | $ | 117,770,567 | $ | 57,236,659 | |||
Accumulated net investment income (loss) | $ | (251,181 | ) | $ | (200,302 | ) | |
CAPITAL TRANSACTIONS IN SHARES: | |||||||
Sold | 5,109,362 | 5,206,936 | |||||
Reinvested distributions | 303,475 | — | |||||
Redeemed | (345,234 | ) | (12,538 | ) | |||
Net increase from capital share transactions | 5,067,603 | 5,194,398 | |||||
| * | Inception date. |
The accompanying notes are an integral part of these financial statements.
56 | The Masters’ Select Funds Trust |
Masters’ Select Equity Fund
FINANCIAL HIGHLIGHTS
For a capital share outstanding throughout each year.
Year Ended December 31, | ||||||||||||||||
2007 | 2006 | 2005 | 2004 | 2003 | ||||||||||||
| Net asset value, beginning of year | $ | 15.69 | $ | 15.24 | $ | 15.26 | $ | 13.44 | $ | 10.19 | ||||||
Income from investment operations: | ||||||||||||||||
Net investment loss | (0.03 | ) | (0.01 | ) | (0.02 | ) | (0.06 | ) | (0.04 | ) | ||||||
Net realized and unrealized gain on investments and foreign currency | 0.78 | 1.44 | 0.75 | 1.88 | 3.29 | |||||||||||
Total income from investment operations | 0.75 | 1.43 | 0.73 | 1.82 | 3.25 | |||||||||||
Less distributions: | ||||||||||||||||
From net realized gain | (1.27 | ) | (0.98 | ) | (0.75 | ) | — | — | ||||||||
Total distributions | (1.27 | ) | (0.98 | ) | (0.75 | ) | — | — | ||||||||
Redemption fee proceeds | — | ^ | — | ^ | — | ^ | — | ^ | — | ^ | ||||||
Net asset value, end of year | $ | 15.17 | $ | 15.69 | $ | 15.24 | $ | 15.26 | $ | 13.44 | ||||||
| Total return | 4.57 | % | 9.34 | % | 4.96 | % | 13.54 | % | 31.89 | % | ||||||
Ratios/supplemental data: | ||||||||||||||||
Net assets, end of year (millions) | $ | 708.7 | $ | 863.7 | $ | 892.6 | $ | 855.3 | $ | 609.9 | ||||||
Ratio of total expenses to average net assets: | ||||||||||||||||
Before fees waived | 1.21 | % | 1.19 | % | 1.19 | % | 1.22 | % | 1.25 | % | ||||||
After fees waived | 1.20 | % | 1.18 | % | 1.19 | % | 1.22 | % | 1.23 | % | ||||||
Ratio of net investment loss to average net assets: | (0.20 | )% | (0.08 | )% | (0.14 | )% | (0.46 | )% | (0.39 | )% | ||||||
Portfolio turnover rate | 35.19 | % | 38.39 | % | 46.05 | % | 39.34 | % | 84.28 | % | ||||||
| ^ | Amount represents less than $0.01 per share. |
The accompanying notes are an integral part of these financial statements.
Financial Highlights | 57 |
Masters’ Select International Fund
FINANCIAL HIGHLIGHTS
For a capital share outstanding throughout each year.
Year Ended December 31, | ||||||||||||||||
2007 | 2006 | 2005 | 2004 | 2003 | ||||||||||||
| Net asset value, beginning of year | $ | 18.74 | $ | 17.48 | $ | 16.88 | $ | 14.83 | $ | 10.70 | ||||||
Income from investment operations: | ||||||||||||||||
Net investment income | 0.20 | 0.34 | 0.17 | 0.10 | 0.07 | |||||||||||
Net realized and unrealized gain on investments and foreign currency | 3.81 | 3.71 | 3.64 | 2.01 | 4.09 | |||||||||||
Total income from investment operations | 4.01 | 4.05 | 3.81 | 2.11 | 4.16 | |||||||||||
Less distributions: | ||||||||||||||||
From net investment income | (0.20 | ) | (0.41 | ) | (0.29 | ) | (0.07 | ) | (0.03 | ) | ||||||
From net realized gain | (3.87 | ) | (2.38 | ) | (2.92 | ) | — | — | ||||||||
Total distributions | (4.07 | ) | (2.79 | ) | (3.21 | ) | (0.07 | ) | (0.03 | ) | ||||||
Redemption fee proceeds | — | ^ | — | ^ | — | ^ | 0.01 | — | ^ | |||||||
Net asset value, end of year | $ | 18.68 | $ | 18.74 | $ | 17.48 | $ | 16.88 | $ | 14.83 | ||||||
| Total return | 20.75 | % | 23.61 | % | 23.78 | % | 14.30 | % | 38.86 | % | ||||||
Ratios/supplemental data: | ||||||||||||||||
Net assets, end of year (millions) | $ | 2,071.0 | $ | 1,726.8 | $ | 1,429.1 | $ | 1,137.7 | $ | 733.5 | ||||||
Ratio of total expenses to average net assets: | ||||||||||||||||
Before fees waived | 1.19 | % | 1.21 | % | 1.24 | % | 1.28 | % | 1.30 | % | ||||||
After fees waived | 1.03 | % | 1.06 | % | 1.08 | % | 1.09 | % | 1.10 | % | ||||||
Ratio of net investment income to average net assets: | 0.88 | % | 1.68 | % | 1.17 | % | 0.76 | % | 0.69 | % | ||||||
Portfolio turnover rate | 92.66 | % | 98.03 | % | 160.12 | % | 87.88 | % | 110.19 | % | ||||||
| ^ | Amount represents less than $0.01 per share. |
The accompanying notes are an integral part of these financial statements.
58 | The Masters’ Select Funds Trust |
Masters’ Select Value Fund
FINANCIAL HIGHLIGHTS
For a capital share outstanding throughout each year.
Year Ended December 31, | ||||||||||||||||
2007 | 2006 | 2005 | 2004 | 2003 | ||||||||||||
| Net asset value, beginning of year | $ | 16.34 | $ | 14.60 | $ | 14.90 | $ | 12.99 | $ | 9.82 | ||||||
Income from investment operations: | ||||||||||||||||
Net investment income | 0.08 | 0.08 | 0.05 | 0.02 | 0.04 | |||||||||||
Net realized and unrealized gain (loss) on investments and foreign currency | (0.42 | ) | 2.36 | 0.55 | 1.89 | 3.13 | ||||||||||
Total income (loss) from investment operations | (0.34 | ) | 2.44 | 0.60 | 1.91 | 3.17 | ||||||||||
Less distributions: | ||||||||||||||||
From net investment income | — | (0.04 | ) | (0.06 | ) | — | — | |||||||||
From net realized gain | (0.91 | ) | (0.66 | ) | (0.84 | ) | — | — | ||||||||
Total distributions | (0.91 | ) | (0.70 | ) | (0.90 | ) | — | — | ||||||||
Redemption fee proceeds | — | ^ | — | ^ | — | ^ | — | ^ | — | ^ | ||||||
Net asset value, end of year | $ | 15.09 | $ | 16.34 | $ | 14.60 | $ | 14.90 | $ | 12.99 | ||||||
| Total return | (2.34 | )% | 16.77 | % | 4.13 | % | 14.70 | % | 32.28 | % | ||||||
Ratios/supplemental data: | ||||||||||||||||
Net assets, end of year (millions) | $ | 342.2 | $ | 367.0 | $ | 338.2 | $ | 306.5 | $ | 181.0 | ||||||
Ratio of total expenses to average net assets: | ||||||||||||||||
Before fees waived | 1.23 | % | 1.24 | % | 1.24 | % | 1.25 | % | 1.30 | % | ||||||
After fees waived | 1.21 | % | 1.21 | % | 1.21 | % | 1.23 | % | 1.28 | % | ||||||
Ratio of net investment income to average net assets: | 0.45 | % | 0.49 | % | 0.26 | % | 0.20 | % | 0.35 | % | ||||||
Portfolio turnover rate | 24.42 | % | 31.00 | % | 30.21 | % | 29.14 | % | 21.54 | % | ||||||
| ^ | Amount represents less than $0.01 per share. |
The accompanying notes are an integral part of these financial statements.
Financial Highlights | 59 |
Masters’ Select Smaller Companies Fund
FINANCIAL HIGHLIGHTS
For a capital share outstanding throughout each period.
Year Ended December 31, | ||||||||||||||||
2007 | 2006 | 2005 | 2004 | Period Ended** December 31, 2003 | ||||||||||||
| Net asset value, beginning of period | $ | 14.86 | $ | 14.10 | $ | 13.84 | $ | 11.79 | $ | 10.00 | ||||||
Income from investment operations: | ||||||||||||||||
Net investment loss | (0.06 | ) | (0.09 | ) | (0.07 | ) | (0.08 | ) | (0.06 | ) | ||||||
Net realized and unrealized gain on investments | 0.35 | 1.47 | 0.80 | 2.56 | 1.98 | |||||||||||
Total income from investment operations | 0.29 | 1.38 | 0.73 | 2.48 | 1.92 | |||||||||||
Less distributions: | ||||||||||||||||
From net realized gain | (1.79 | ) | (0.62 | ) | (0.47 | ) | (0.43 | ) | (0.13 | ) | ||||||
Total distributions | (1.79 | ) | (0.62 | ) | (0.47 | ) | (0.43 | ) | (0.13 | ) | ||||||
Redemption fee proceeds | — | ^ | — | ^ | — | ^ | — | ^ | — | ^ | ||||||
Net asset value, end of period | $ | 13.36 | $ | 14.86 | $ | 14.10 | $ | 13.84 | $ | 11.79 | ||||||
| Total return | 1.64 | % | 9.67 | % | 5.29 | % | 21.01 | % | 19.17 | %+ | ||||||
Ratios/supplemental data: | ||||||||||||||||
Net assets, end of period (millions) | $ | 245.1 | $ | 268.9 | $ | 273.2 | $ | 162.6 | $ | 51.2 | ||||||
Ratio of total expenses to average net assets: | ||||||||||||||||
Before fees waived | 1.32 | % | 1.32 | % | 1.33 | % | 1.43 | % | 1.67 | %* | ||||||
After fees waived | 1.31 | % | 1.31 | % | 1.30 | % | 1.40 | % | 1.65 | %* | ||||||
Ratio of net investment loss to average net assets: | (0.40 | )% | (0.56 | )% | (0.64 | )% | (1.07 | )% | (1.33 | )%* | ||||||
Portfolio turnover rate | 130.65 | % | 102.72 | % | 118.76 | % | 148.81 | % | 43.49 | %+ | ||||||
| * | Annualized. |
| + | Not annualized. |
| ^ | Amount represents less than $0.01 per share. |
| ** | Commenced operations on June 30, 2003. |
The accompanying notes are an integral part of these financial statements.
60 | The Masters’ Select Funds Trust |
Masters’ Select Focused Opportunities Fund
FINANCIAL HIGHLIGHTS
For a capital share outstanding throughout each period.
Year Ended December 31, 2007 | Period Ended** December 31, 2006 | ||||||
| Net asset value, beginning of period | $ | 11.02 | $ | 10.00 | |||
Income from investment operations: | |||||||
Net investment gain | 0.09 | — | |||||
Net realized and unrealized gain on investments and foreign currency | 0.77 | 1.02 | |||||
Total income from investment operations | 0.86 | 1.02 | |||||
Less distributions: | |||||||
From net realized gain | (0.40 | ) | — | ||||
Total distributions | (0.40 | ) | — | ||||
Redemption fee proceeds | — | ^ | — | ^ | |||
Net asset value, end of period | $ | 11.48 | $ | 11.02 | |||
| Total return | 7.73 | % | 10.20 | %+ | |||
Ratios/supplemental data: | |||||||
Net assets, end of period (millions) | $ | 117.8 | $ | 57.2 | |||
Ratio of total expenses to average net assets: | |||||||
Before fees waived | 1.34 | % | 1.63 | %* | |||
After fees waived | 1.26 | % | 1.40 | %* | |||
Ratio of net investment income (loss) to average net assets: | 0.72 | % | (0.02 | )%* | |||
Portfolio turnover rate | 45.66 | % | 7.12 | %+ | |||
| * | Annualized. |
| + | Not annualized. |
| ^ | Amount represents less than $0.01 per share. |
| ** | Commenced operations on June 30, 2006. |
The accompanying notes are an integral part of these financial statements.
Financial Highlights | 61 |
Masters’ Select Funds Trust
NOTES TO FINANCIAL STATEMENTS
Note 1 - Organization
The Masters’ Select Funds Trust (the “Trust”) was organized as a Delaware business trust on August 1, 1996 and is registered under the Investment Company Act of 1940 (the “1940 Act”) as an open-end management investment company. The Trust consists of five separate series: the Masters’ Select Equity Fund, the Masters’ Select International Fund, the Masters’ Select Value Fund, the Masters’ Select Smaller Companies Fund and the Masters’ Select Focused Opportunities Fund (each a “Fund” and collectively the “Funds”).
The Masters’ Select Equity Fund seeks to increase the value of your investment over the long-term by using the combined talents and favorite stock-picking ideas of six highly regarded portfolio managers.
The Masters’ Select International Fund seeks to increase the value of your investment over the long-term by using the combined talents and favorite stock-picking ideas of six highly regarded international portfolio managers.
The Masters’ Select Value Fund seeks to increase the value of your investment over the long-term by using the combined talents and favorite stock-picking ideas of four highly regarded value portfolio managers.
The Masters’ Select Smaller Companies Fund seeks to increase the value of your investment over the long-term by using the combined talents and favorite stock-picking ideas of five highly regarded smaller company portfolio managers.
The Masters’ Select Focused Opportunities Fund seeks to increase the value of your investment over the long-term by using the combined talents and favorite stock-picking ideas of three highly regarded portfolio managers.
Note 2 - Significant Accounting Policies
The following is a summary of the significant accounting policies followed by the Funds. These policies are in conformity with accounting principles generally accepted in the United States of America.
| A. | Security Valuation. Investments in securities traded on a national securities exchange are valued at the last reported sales price at the close of regular trading on each day that the exchanges are open for trading. Securities listed on the NASDAQ Global Market, the NASDAQ Global Select Market and the NASDAQ Capital Market are valued using the NASDAQ Official Closing Price (“NOCP”). Securities traded on an exchange for which there have been no sales are valued at the mean between the closing bid and asked prices. Debt securities maturing within 60 days or less are valued at amortized cost unless the Valuation Committee determines that amortized cost does not represent fair value. Securities for which market prices are not readily available are valued at fair value as determined in good faith by the Investment Managers that selected the security for the Fund’s portfolio and the Trust’s Valuation Committee in accordance with procedures approved by the Board of Trustees. In determining fair value, the Funds take into account all relevant factors and available information. Consequently, the price of the security used by a Fund to calculate its net asset value may differ from quoted or published prices for the same security. Fair value pricing involves subjective judgments and there is no single standard for determining the fair value of a security. As a result, different mutual funds could reasonably arrive at a different value for the same security. It is possible that the fair value determined for a security is materially different from the value that could be realized upon the sale of that security or from the values that other mutual funds may determine. |
Investments in other funds are valued at their respective net asset values as determined by those funds in accordance with the Investment Company Act of 1940.
| B. | Foreign Currency Translation. The Funds’ records are maintained in U.S. dollars. The value of securities, currencies and other assets and liabilities denominated in currencies other than U.S. dollars are translated into U.S. dollars based upon foreign exchange rates prevailing at the end of the reporting period. The currencies are translated into U.S. dollars by using the exchange rates quoted at the close of the London Stock Exchange prior to when each Fund’s net asset value is next determined. Purchases and sales of investment securities, income and expenses are translated on the respective dates of such transactions. |
The Funds do not isolate that portion of their net realized and unrealized gains and losses on investments resulting from changes in foreign exchange rates from the impact arising from changes in market prices. Such fluctuations are included with net realized and unrealized gain or loss from investments and foreign currency.
Net realized foreign currency transaction gains and losses arise from sales of foreign currencies, currency gains or losses realized between the trade and settlement dates on securities transactions, and the differences between the amounts of dividends, interest, and foreign withholding taxes recorded on the Funds’ books and the U.S. dollar equivalent of the amounts actually received or paid. Net unrealized foreign currency translation gains and losses arise from changes in the value of assets and liabilities, other than investments in securities, resulting from changes in the exchange rates.
| C. | Restricted Securities. A restricted security cannot be resold to the general public without prior registration under the Securities Act of 1933. If the security is subsequently registered and resold, the issuers would typically bear the expense of all registrations at no cost to the Fund. Restricted securities are valued according to the guidelines and procedures adopted by the Funds’ Board of Trustees. As of December 31, 2007, there were no restricted securities held by the Funds. |
62 | The Masters’ Select Funds Trust |
Masters’ Select Funds Trust
NOTES TO FINANCIAL STATEMENTS - (Continued)
| D. | Forward Foreign Currency Exchange Contracts. The Funds may utilize forward foreign currency exchange contracts (“forward contracts”) under which they are obligated to exchange currencies on specified future dates at specified rates, and are subject to the translations of foreign exchange rates fluctuations. All contracts are “marked-to-market” daily and any resulting unrealized gains or losses are recorded as unrealized appreciation or depreciation on foreign currency translations. The Funds record realized gains or losses at the time the forward contract is settled. Counter-parties to these forward contracts are major U.S. financial institutions. For further information on the forward contracts held by each Fund, please refer to Note 6. |
| E. | Purchasing Put and Call Options. Each Fund may purchase covered “put” and “call” options with respect to securities which are otherwise eligible for purchase by a Fund and with respect to various stock indices subject to certain restrictions. Each Fund will engage in trading of such derivative securities primarily for hedging purposes. |
If a Fund purchases a put option, a Fund acquires the right to sell the underlying security at a specified price at any time during the term of the option (for “American-style” options) or on the option expiration date (for “European-style” options). Purchasing put options may be used as a portfolio investment strategy when a Manager perceives significant short-term risk but substantial long-term appreciation for the underlying security. The put option acts as an insurance policy, as it protects against significant downward price movement while it allows full participation in any upward movement. If a Fund is holding a stock which it feels has strong fundamentals, but for some reason may be weak in the near term, a Fund may purchase a put option on such security, thereby giving itself the right to sell such security at a certain strike price throughout the term of the option. Consequently, a Fund will exercise the put only if the price of such security falls below the strike price of the put. The difference between the put’s strike price and the market price of the underlying security on the date a Fund exercises the put, less transaction costs, will be the amount by which a Fund will be able to hedge against a decline in the underlying security. If during the period of the option the market price for the underlying security remains at or above the put’s strike price, the put will expire worthless, representing a loss of the price a Fund paid for the put, plus transaction costs. If the price of the underlying security increases, the profit a Fund realizes on the sale of the security will be reduced by the premium paid for the put option less any amount for which the put may be sold.
If a Fund purchases a call option, it acquires the right to purchase the underlying security at a specified price at any time during the term of the option. The purchase of a call option is a type of insurance policy to hedge against losses that could occur if a Fund has a short position in the underlying security and the security thereafter increases in price. Each Fund will exercise a call option only if the price of the underlying security is above the strike price at the time of exercise. If during the option period the market price for the underlying security remains at or below the strike price of the call option, the option will expire worthless, representing a loss of the price paid for the option, plus transaction costs. If the call option has been purchased to hedge a short position of a Fund in the underlying security and the price of the underlying security thereafter falls, the profit a Fund realizes on the cover of the short position in the security will be reduced by the premium paid for the call option less any amount for which such option may be sold.
Prior to exercise or expiration, an option may be sold when it has remaining value by a purchaser through a “closing sale transaction,” which is accomplished by selling an option of the same series as the option previously purchased. Each Fund generally will purchase only those options for which a Manager believes there is an active secondary market to facilitate closing transactions.
Writing Call Options. Each Fund may write covered call options. A call option is “covered” if a Fund owns the security underlying the call or has an absolute right to acquire the security without additional cash consideration (or, if additional cash consideration is required, cash or cash equivalents in such amount as are held in a segregated account by the Custodian). The writer of a call option receives a premium and gives the purchaser the right to buy the security underlying the option at the exercise price. The writer has the obligation upon exercise of the option to deliver the underlying security against payment of the exercise price during the option period. If the writer of an exchange-traded option wishes to terminate his obligation, he may effect a “closing purchase transaction.” This is accomplished by buying an option of the same series as the option previously written. A writer may not effect a closing purchase transaction after it has been notified of the exercise of an option.
Effecting a closing transaction in the case of a written call option will permit a Fund to write another call option on the underlying security with either a different exercise price, expiration date or both. Also, effecting a closing transaction will permit the cash or proceeds from the concurrent sale of any securities subject to the option to be used for other investments of a Fund. If a Fund desires to sell a particular security from its portfolio on which it has written a call option, it will effect a closing transaction prior to or concurrent with the sale of the security.
Each Fund will realize a gain from a closing transaction if the cost of the closing transaction is less than the premium received from writing the option or if the proceeds from the closing transaction are more than the premium paid to purchase the option. Each Fund will realize a loss from a closing transaction if the cost of the closing transaction is more than the premium received from writing the option or if the proceeds from the closing transaction are less than the premium paid to purchase the option. However, because increases in the market price of a call option will generally reflect increases in the market price of the underlying security, any loss to a Fund resulting from the repurchase of a call option is likely to be offset in whole or in part by appreciation of the underlying security owned by a Fund.
Notes to Financial Statements | 63 |
Masters’ Select Funds Trust
NOTES TO FINANCIAL STATEMENTS - (Continued)
Risks of Investing in Options. There are several risks associated with transactions in options on securities. Options may be more volatile than the underlying instruments and, therefore, on a percentage basis, an investment in options may be subject to greater fluctuation than an investment in the underlying instruments themselves. There are also significant differences between the securities and options markets that could result in an imperfect correlation between these markets, causing a given transaction not to achieve its objective. In addition, a liquid secondary market for particular options may be absent for reasons which include the following: there may be insufficient trading interest in certain options; restrictions may be imposed by an exchange on opening transactions or closing transactions or both; trading halts, suspensions or other restrictions may be imposed with respect to particular classes or series of option of underlying securities; unusual or unforeseen circumstances may interrupt normal operations on an exchange; the facilities of an exchange or clearing corporation may not at all times be adequate to handle current trading volume; or one or more exchanges could, for economic or other reasons, decide or be compelled at some future date to discontinue the trading of options (or a particular class or series of options), in which event the secondary market on that exchange (or in that class or series of options) would cease to exist, although outstanding options that had been issued by a clearing corporation as a result of trades on that exchange would continue to be exercisable in accordance with their terms.
A decision as to whether, when and how to use options involves the exercise of skill and judgment, and even a well-conceived transaction may be unsuccessful to some degree because of market behavior or unexpected events. The extent to which a Fund may enter into options transactions may be limited by the requirements of the Internal Revenue Code of 1986, as amended (the “Code”), with respect to qualification of a Fund as a regulated investment company. As of December 31, 2007, there were no options held by the Funds.
| F. | Federal Income Taxes. The Funds intend to comply with the requirements of Subchapter M of the Internal Revenue Code applicable to regulated investment companies and to distribute all of their taxable income to their shareholders. Accordingly, no provisions for federal income taxes are required. |
| G. | Distributions to Shareholders. Distributions paid to shareholders are recorded on the ex-dividend date. The amount of dividends and distributions from net investment income and net realized capital gains is determined in accordance with federal income tax regulations, which may differ from generally accepted accounting principles. To the extent these “book/tax” differences are permanent in nature (i.e., that they result from other than timing of recognition - “temporary differences”), such amounts are reclassified within the capital accounts based on their federal tax-basis. |
| H. | Security Transactions, Dividend and Interest Income and Expenses. Security transactions are accounted for on the trade date. Realized gains and losses on securities transactions are reported on an identified cost basis. Dividend income is recorded on the ex-dividend date. Interest income is recorded on an accrual basis. Purchase discounts and premiums on fixed-income securities are accreted and amortized to maturity using the effective interest method. Many expenses of the Trust can be directly attributed to a specific Fund. Each Fund is charged for expenses directly attributed to it. Expenses that cannot be directly attributed to a specific Fund are allocated among the Funds in the Trust in proportion to their respective net assets or other appropriate method. |
| I. | Repurchase Agreements. Each Fund may enter into repurchase agreements through which the Fund acquires a security (the “underlying security”) from a seller, a well-established securities dealer or a bank that is a member of the Federal Reserve System. The bank or securities dealer agrees to repurchase the underlying security at the same price, plus a specified amount of interest, at a later date, generally for a period of less than one week. It is the Trust’s policy that its Custodian takes possession of securities as collateral under repurchase agreements and to determine on a daily basis that the value of such securities, including recorded interest, is sufficient to cover the value of the repurchase agreements. If the counterparty defaults and the value of the collateral declines or if bankruptcy proceedings are commenced with respect to the counterparty of the security, realization of the collateral by a Fund may be delayed or limited. |
| J. | Expenses Paid Indirectly. Under terms of the Trust’s Custodial Agreement, the Funds earn credits on cash balances which are applied against custodian fees. |
| K. | Indemnification Obligations. Under the Funds’ organizational documents, its current and former officers and trustees are indemnified against certain liabilities arising out of the performance of their duties to the Funds. In addition, in the normal course of business, the Funds enter into contracts that contain a variety of representations and warranties that provide general indemnifications. The Funds’ maximum exposure under these arrangements is unknown as this would involve future claims that may be made against the Funds that have not yet occurred or that would be covered by other parties. |
| L. | Accounting Estimates. The preparation of financial statements in conformity with accounting principles generally accepted in the United States of America requires management to make estimates and assumptions. These estimates and assumptions affect the reported amounts of assets and liabilities and the disclosure of contingent assets and liabilities at the date of financial statements and the reported amounts of increases and decreases in net assets from operations during the reporting period. Actual results could differ from those estimates. |
| M. | New Accounting Standards. Effective June 29, 2007, the Funds adopted Financial Accounting Standards Board (FASB) Interpretation No. 48 (FIN 48), Accounting for Uncertainty in Income Taxes, a clarification of FASB Statement No. 109, Accounting for Income Taxes. FIN 48 establishes financial reporting rules regarding recognition and measurement of tax positions taken or expected to be taken on a tax return. The adoption of FIN 48 had no impact on the Funds’ net assets or results of operations. |
64 | The Masters’ Select Funds Trust |
Masters’ Select Funds Trust
NOTES TO FINANCIAL STATEMENTS - (Continued)
Note 3 - Investment Advisory and Other Agreements
The Trust, on behalf of the Funds, entered into an Investment Advisory Agreement (the “Agreement”) with Litman/Gregory Fund Advisors, LLC (the “Advisor”). Under the terms of the Agreement, each Fund pays a monthly investment advisory fee to the Advisor at the annual rate below of the respective Fund’s average daily net assets before any fee waivers:
| Equity Fund | 1.10% on the first $750 million and | |
1.00% on assets in excess of $750 million | ||
| International Fund | 1.10% on the first $1 billion and | |
1.00% on assets in excess of $1 billion | ||
| Value Fund | 1.10% on the first $1 billion and | |
1.00% on assets in excess of $1 billion | ||
| Smaller Companies Fund | 1.14% on the first $450 million and | |
1.04% on assets in excess of $450 million | ||
| Focused Opportunities Fund | 1.10% on the first $1 billion and | |
1.00% on assets in excess of $1 billion |
The Advisor engages Managers to manage the funds and pays the Managers from its advisory fees.
Through December 31, 2007, the Advisor has contractually agreed to waive a portion of its advisory fees effectively reducing total advisory fees to approximately 0.97% of the average daily net assets of the International Fund, and 1.08% of the average daily net assets of the Value Fund. The Advisor has contractually agreed to limit the operating expenses of the Masters’ Select Focused Opportunities Fund to 1.50% of the Fund’s average daily net assets through December 31, 2007. Additionally, the Advisor has voluntarily agreed to waive its management fee on the daily cash values of the Funds not allocated to Managers. For the year ended December 31, 2007, the amount waived, contractual and voluntary, was $40,735, $3,121,198, $96,870, $29,180 and $74,742 for the Masters’ Select Equity Fund, Masters’ Select International Fund, Masters’ Select Value Fund, Masters’ Select Smaller Companies Fund and Masters’ Select Focused Opportunities Fund, respectively. The Advisor has agreed not to seek recoupment of such waived fees.
U.S. Bancorp Fund Services, LLC (“USBFS”) serves as the Administrator to the Funds. State Street Bank and Trust (“State Street”) serves as the Funds’ Custodian and Fund Accountant. Boston Financial Data Services (“BFDS”), an affiliate of State Street, serves as the Funds’ Transfer Agent. Quasar Distributors, LLC (“Quasar”), an affiliate of USBFS, acts as the Funds’ distributor and principal underwriter.
An employee of the Advisor serves as the Funds’ Chief Compliance Officer (“CCO”). The CCO receives no compensation from the Funds for his services, however, the Funds reimbursed the Advisor $54,000 for the year ended December 31, 2007 for the services of the CCO.
Affiliated entities of the Managers received net commissions on purchases and sales of the Funds’ portfolio securities for the year ended December 31, 2007 of $432 and $101,611 for the Masters’ Select Equity Fund and the Masters’ Select International Fund, respectively.
Each independent Trustee, within the meaning of the 1940 Act, is compensated by the Trust at the rate of $64,000 per year.
Note 4 - Investment Transactions
The cost of securities purchased and the proceeds from securities sold for the year ended December 31, 2007, excluding short-term investments, were as follows:
Fund | Purchases | Sales | |||||
| Equity Fund | $ | 269,126,914 | $ | 469,530,161 | |||
| International Fund | 1,712,006,595 | 1,782,242,059 | |||||
| Value Fund | 90,228,314 | 110,541,553 | |||||
| Smaller Companies Fund | 329,861,126 | 357,969,362 | |||||
| Focused Opportunities Fund | 84,500,698 | 40,889,909 | |||||
Notes to Financial Statements | 65 |
Masters’ Select Funds Trust
NOTES TO FINANCIAL STATEMENTS - (Continued)
Note 5 - Income Taxes and Distributions to Shareholders
As of December 31, 2007, the components of distributable accumulated earnings/(losses) on a tax basis were as follows:
Equity Fund | International Fund | Value Fund | Smaller Companies Fund | Focused Opportunities Fund | ||||||||||||
| Cost of investments for tax purposes | $ | 558,732,285 | $ | 1,799,009,436 | $ | 288,298,102 | $ | 246,794,357 | $ | 110,284,730 | ||||||
| Gross tax unrealized appreciation | $ | 198,221,691 | $ | 317,009,020 | $ | 85,023,921 | $ | 27,154,165 | $ | 14,219,441 | ||||||
| Gross tax unrealized depreciation | (48,485,561 | ) | (64,786,915 | ) | (30,685,806 | ) | (27,789,094 | ) | (6,535,543 | ) | ||||||
| Net tax unrealized appreciation (depreciation) | ||||||||||||||||
on investments | 149,736,130 | 252,222,105 | 54,338,115 | (634,929 | ) | 7,683,898 | ||||||||||
| Net tax unrealized appreciation (depreciation) | ||||||||||||||||
on forward contracts and foreign-currency | ||||||||||||||||
denominated assets and liabilities | (47 | ) | 302,464 | (2,134 | ) | — | 951 | |||||||||
| Net tax unrealized appreciation (depreciation) | $ | 149,736,083 | $ | 252,524,569 | $ | 54,335,981 | $ | (634,929 | ) | $ | 7,684,849 | |||||
| Undistributed ordinary income | $ | 261,946 | $ | 14,320,111 | — | $ | 639,652 | — | ||||||||
| Undistributed long-term gain (capital | ||||||||||||||||
loss carryforward) | $ | 22,005,697 | $ | 22,482,597 | $ | 7,028,147 | $ | 5,340,702 | $ | 551,692 | ||||||
| Post October Currency Losses | — | $ | (1,267,730 | ) | — | — | $ | (52,134 | ) | |||||||
The Funds may use earnings and profits distributed to shareholders on redemption of shares as part of the dividends paid deduction. This may reduce the distributable earnings shown above.
On the Statements of Assets and Liabilities, the following adjustments were made for permanent tax adjustments:
Undistributed Net Investment Income (Loss) | Accumulated Net Realized Gain (Loss) | Paid In Capital | ||||||||
| Equity Fund | $ | 1,578,173 | $ | (14,624,388 | ) | $ | 13,046,215 | |||
| International Fund | (4,422,900 | ) | (34,296,059 | ) | 38,718,959 | |||||
| Value Fund | (1,512,295 | ) | (1,256,689 | ) | 2,768,984 | |||||
| Smaller Companies Fund | 1,131,937 | (7,863,563 | ) | 6,731,626 | ||||||
| Focused Opportunities Fund | (735,320 | ) | 1,116,085 | (380,765 | ) | |||||
The permanent differences primarily relate to net operating losses and adjustments for the tax treatment of foreign currency.
The tax composition of dividends (other than return of capital dividends for the years ended December 31, 2007 and 2006) were as follows:
2007 | 2006 | ||||||||||||
Ordinary Income | Long-term Capital Gain | Ordinary Income | Long-term Capital Gain | ||||||||||
| Equity Fund | $ | 1,239,055 | $ | 55,651,848 | $ | 12,654,791 | $ | 39,281,350 | |||||
| International Fund | $ | 167,422,575 | $ | 219,243,055 | $ | 113,424,155 | $ | 116,680,208 | |||||
| Value Fund | — | $ | 20,002,631 | $ | 4,419,758 | $ | 10,876,420 | ||||||
| Smaller Companies Fund | $ | 5,217,908 | $ | 25,279,826 | $ | 3,539,554 | $ | 7,235,998 | |||||
| Focused Opportunities Fund | $ | 367,565 | $ | 3,193,351 | — | — | |||||||
The Funds designated as long-term capital gain dividend, pursuant to Internal Revenue Code Section 852(b)(3), the amount necessary to reduce the earnings and profits of the Funds related to net capital gain to zero for the tax year ended December 31, 2007.
Net investment income and net realized gains differ for financial statement and tax purposes due to differing treatments of wash sale losses deferred, foreign currency transactions and losses realized subsequent to October 31 on the sale of securities and foreign currencies.
Note 6 - Off-Balance Sheet Risk
The Funds are parties to financial instruments with off-balance sheet risk, primarily forward contracts, in order to hedge the impact of adverse changes in the relationship between the U.S. dollar and various foreign currencies and certain assets and liabilities denominated in foreign currencies. These instruments involve market risk in excess of the amount recognized in the Statement of Assets and Liabilities. Risks also arise from the possible inability of counterparties to meet the terms of their contracts, future adverse movement in currency values and contract positions that are not exact offsets. The contract amount indicates the extent of the Funds’ involvement in such currencies.
66 | The Masters’ Select Funds Trust |
Masters’ Select Funds Trust
NOTES TO FINANCIAL STATEMENTS - (Continued)
A forward contract is an agreement between two parties to exchange different currencies at a specified rate at an agreed future date. Forward contracts are reported in the financial statements as unrealized gain (loss) as measured by the difference between the forward exchange rate at the reporting date and the forward exchange rate on the date the contract is entered into. At December 31, 2007, the Funds had the following forward contracts outstanding:
Masters’ Select International Fund | ||||||
Contracts to Buy | In Exchange For | Settlement Date | Unrealized Gain (Loss) | |||
| 307,420 | British Pound Sterling | U.S. $ | 612,135 | 01/03/2008 | $ | (184) |
| 100,742 | British Pound Sterling | 202,521 | 01/04/2008 | (1,985) | ||
| (2,169) | ||||||
Contracts to Sell | ||||||
| 6,940,000 | Swiss Franc | U.S. $ | 6,183,179 | 05/09/2008 | $ | 12,057 |
| 2,560,000 | Swiss Franc | 2,331,002 | 05/23/2008 | 53,324 | ||
| 11,710,000 | Euro | 16,576,735 | 03/31/2008 | (556,287) | ||
| 6,150,000 | Euro | 9,106,920 | 05/23/2008 | 111,192 | ||
| 10,400,000 | British Pound Sterling | 20,830,160 | 01/07/2008 | 132,076 | ||
| 14,730,000 | British Pound Sterling | 29,896,008 | 01/18/2008 | 589,609 | ||
| 5,360,000 | British Pound Sterling | 10,948,336 | 01/23/2008 | 285,758 | ||
| 8,410,000 | British Pound Sterling | 17,092,484 | 04/04/2008 | 394,738 | ||
| 13,810,000 | British Pound Sterling | 27,984,929 | 04/21/2008 | 581,351 | ||
| 2,054,441 | Japanese Yen | 18,208 | 01/04/2008 | (190) | ||
| 3,374,840 | Philippine Peso | 81,616 | 01/04/2008 | (136) | ||
| 2,105,100,000 | Philippine Peso | 50,970,944 | 06/16/2008 | 274,351 | ||
| 579,540 | Euro | 846,940 | 01/02/2008 | (377) | ||
| 134,998 | British Pound Sterling | 267,228 | 01/02/2008 | (1,499) | ||
| 21,517,038 | Japanese Yen | 189,898 | 01/04/2008 | (2,709) | ||
| 23,394,150 | Japanese Yen | 206,464 | 01/04/2008 | (2,945) | ||
| 1,870,313 | ||||||
| Net unrealized gain on forward contracts | $ | 1,868,144 | ||||
Masters’ Select Value Fund | ||||||
Contracts to Buy | In Exchange For | Settlement Date | Unrealized Gain (Loss) | |||
| None | ||||||
Contracts to Sell | ||||||
| 13,200,093 | Euro | U.S. $ | 19,562,868 | 03/13/2008 | $ | 249,446 |
| 3,925,000 | British Pound Sterling | 7,971,518 | 01/10/2008 | 160,654 | ||
| 707,840,000 | Japanese Yen | 6,270,452 | 03/19/2008 | (120,079) | ||
| 791,561,500 | South Korean Won | 865,000 | 03/27/2008 | 15,027 | ||
| 1,595,580,000 | South Korean Won | 1,740,000 | 03/27/2008 | 26,679 | ||
| 1,798,466,250 | South Korean Won | 1,965,000 | 03/27/2008 | 33,821 | ||
| 365,548 | ||||||
| Net unrealized gain on forward contracts | $ | 365,548 | ||||
Masters’ Select Focused Opportunities Fund | ||||||
Contracts to Buy | In Exchange For | Settlement Date | Unrealized Gain (Loss) | |||
| None | ||||||
Contracts to Sell | ||||||
| 8,437,296 | Euro | U.S. $ | 12,504,283 | 03/13/2008 | $ | 159,442 |
| 420,946,000 | South Korean Won | 460,000 | 03/27/2008 | 7,992 | ||
| 825,300,000 | South Korean Won | 900,000 | 03/27/2008 | 13,799 | ||
| 947,283,750 | South Korean Won | 1,035,000 | 03/27/2008 | 17,814 | ||
| 199,047 | ||||||
| Net unrealized gain on forward contracts | $ | 199,047 | ||||
The Masters’ Select Equity Fund and the Masters’ Select Smaller Companies Fund do not have outstanding forward exchange contracts as of December 31, 2007.
Notes to Financial Statements | 67 |
Masters’ Select Funds Trust
NOTES TO FINANCIAL STATEMENTS - (Continued)
Note 7 - Line of Credit
The Trust has an unsecured $45,000,000 line of credit with its custodian. Borrowings under this arrangement bear interest at the federal funds rate plus 0.50% per annum. As compensation for holding available the lending commitment, the Trust pays a 0.10% per annum fee on the unused portion of the commitment, which is allocated among the Funds based on their relative net assets. The fee is payable quarterly in arrears. The Trust made no borrowings during the year ended December 31, 2007.
Note 8 - Accounting Pronouncements
In September 2006, the Financial Accounting Standards Board (“FASB”) released Financial Accounting Standards Board Statement No. 157 Fair Value Measurements (“SFAS 157”). SFAS 157 establishes a fair valuation hierarchy to increase consistency and comparability in fair value measurements and related disclosures. The fair value hierarchy prioritizes the inputs to valuation techniques used to measure fair value into three broad levels. The fair value hierarchy gives the highest priority to quoted prices (unadjusted) in active markets for identical assets or liabilities (Level 1) and the lowest priority to unobservable inputs (Level 3). SFAS 157 is effective for financial statements issued for fiscal years beginning after November 15, 2007. At this time, management is evaluating the implications of SFAS 157 and its impact on the financial statements has not yet been determined.
68 | The Masters’ Select Funds Trust |
REPORT OF INDEPENDENT REGISTERED PUBLIC ACCOUNTING FIRM
To the Board of Trustees and Shareholders of:
The Masters’ Select Equity Fund
The Masters’ Select International Fund
The Masters’ Select Value Fund
The Masters’ Select Smaller Companies Fund
The Masters’ Select Focused Opportunities Fund
In our opinion, the accompanying statements of assets and liabilities, including the schedules of investments in securities, and the related statements of operations and of changes in net assets and the financial highlights present fairly, in all material respects, the financial position of The Masters’ Select Equity Fund, The Masters’ Select International Fund, The Masters’ Select Value Fund, The Masters’ Select Smaller Companies Fund and The Masters’ Select Focused Opportunities Fund (hereafter referred to as the “Funds”) at December 31, 2007, and results of each of their operations for the year then ended, changes in net assets and financial highlights for each of the periods presented in conformity with accounting principles generally accepted in the United States of America. These financial statements and financial highlights (hereafter referred to as “financial statements”) are the responsibility of the Funds’ management. Our responsibility is to express an opinion on these financial statements based on our audits. We conducted our audits of these statements in accordance with the standards of the Public Company Accounting Oversight Board (United States). Those standards require that we plan and perform the audit to obtain reasonable assurance about whether the financial statements are free of material misstatement. An audit of financial statements includes examining, on a test basis, evidence supporting the amounts and disclosures in the financial statements, assessing the accounting principles used and significant estimates made by management, and evaluating the overall financial statement presentation. We believe that our audits, which included confirmation of securities at December 31, 2007 by correspondence with the custodian and brokers, provide a reasonable basis for our opinion.
PricewaterhouseCoopers LLP
San Francisco, California
February 21, 2008
Report of Independent Registered Public Accounting Firm | 69 |
Masters’ Select Funds Trust
OTHER INFORMATION - (Unaudited)
Proxy Voting Policies and Procedures
The sub-advisors of the Funds vote proxies relating to portfolio securities in accordance with procedures that have been approved by the Board of Trustees of the Funds. You may obtain a description of these procedures, without charge, by calling toll-free, 1-800-960-0188. This information is also available through the Securities and Exchange Commission’s website at http://www.sec.gov.
Proxy Voting Record
Information regarding how the sub-advisors of the Funds voted proxies relating to portfolio securities during the 12-month period ended June 30 is available, without charge, by calling toll-free, 1-800-960-0188. This information is also available through the Securities and Exchange Commission’s website at http://www.sec.gov.
Form N-Q Disclosure
The Funds file their complete schedule of portfolio holdings with the Securities and Exchange Commission for the first and third quarters of each fiscal year on Form N-Q. The Funds’ Form N-Q is available on the Securities and Exchange Commission’s website at http://www.sec.gov. The Funds’ Form N-Q may be reviewed and copied at the Commission’s Public Reference Room in Washington, DC, and information on the operation of the Public Reference Room may be obtained by calling 1-800-SEC-0330. This information is also available, without charge, by calling toll-free, 1-800-960-0188 or by visiting the Funds’ website at http://www.mastersfunds.com.
Householding Mailings
To reduce expenses, the Trust may mail only one copy of the Funds’ prospectus and each annual and semi-annual report to those addresses shared by two or more accounts. If you wish to receive individual copies of these documents, please call us at 1-800-960-0188 (or contact your financial institution). The Trust will begin sending you individual copies thirty days after receiving your request.
Board Consideration of and Continuation of Investment Advisory Agreement
At a meeting held on December 10, 2007, the Board of Trustees, including the independent trustees of the Board of Trustees (the “Independent Trustees”), considered and approved the one-year renewal of: (1) the Unified Investment Advisory Agreement (the “Advisory Agreement”) between the Masters’ Select Funds Trust (the “Trust”) and Litman/Gregory Fund Advisors, LLC (the “Advisor”), with respect to the Masters’ Select Equity Fund, the Masters’ Select International Fund, the Masters’ Select Value Fund, the Masters’ Select Smaller Companies Fund, and the Masters’ Select Focused Opportunities Fund (the “Funds”), and (2) the investment manager agreements (the “Manager Agreements”) between the Advisor and each of Davis Selected Advisers, L.P., Friess Associates, LLC, Legg Mason Capital Management, Inc., Southeastern Asset Management, Inc., TCW Investment Management Company and Wells Capital Management, Inc. with respect to Masters’ Select Equity Fund, each of Harris Associates, L.P., Marsico Capital Management, LLC, Mastholm Asset Management, LLC, Third Avenue Management, LLC, and Thornburg Investment Management, Inc., with respect to Masters’ Select International Fund, each of Franklin Mutual Advisers, LLC, Harris Associates, L.P., Legg Mason Capital Management, Inc. and Southeastern Asset Management, Inc., with respect to Masters’ Select Value Fund, and each of Copper Rock Capital Partners, LLC, First Pacific Advisors, LLC, Friess Associates, LLC, and Wells Capital Management, Inc. with respect to Masters’ Select Smaller Companies Fund, and each of Davis Selected Advisers, L.P., Franklin Mutual Advisers, LLC, and TCW Investment Management Company, with respect to Masters’ Select Focused Opportunities Fund (the “Managers”). The one-year renewal of all agreements is for the period ending December 31, 2008. At a meeting held on May 29, 2007, the Independent Trustees considered and approved a Manager Agreement between the Advisor and Reed Conner & Birdwell, LLC with respect to the Masters’ Select Smaller Companies Fund. At a meeting held on August 29, 2007, the Independent Trustees considered and approved a Manager Agreement between the Advisor and Northern Cross, LLC with respect to the Masters’ Select International Fund. Each of these agreements (Reed Conner & Birdwell, LLC and Northern Cross, LLC) was approved through December 31, 2008.
Prior to each meeting, the Independent Trustees had requested detailed information from the Advisor regarding the Funds. The materials provided by the Advisor were extensive and included information relating to each Fund’s investment objectives and, where applicable, results, portfolio composition, advisory fee and expense comparisons, as well as information on each Manager’s performance within the various Funds and in comparison to other accounts (including other mutual funds) managed by such Manager. Financial and profitability information regarding the Advisor, descriptions of various functions, such as compliance monitoring and portfolio trading practices, and information about the personnel providing investment management and administrative services to each Fund was also provided. In addition, the Independent Trustees discussed the approval of the Advisory Agreement and Manager Agreements with representatives of the Advisor and were advised by independent counsel on these and other relevant matters.
In addition, the Board had received information about the Funds throughout the year which included a wide variety of materials relating to the services provided (or to be provided) by the Advisor and the Managers, including reports on the Funds’ and each Manager’s investment results, portfolio composition, portfolio trading practices, and shareholder services, in addition to other information relating to the nature, extent, and quality of services provided (or to be provided) by the Advisor and the Managers. Throughout the course of the year, the Board of Trustees also received in-person presentations from various members of senior management at the Advisor and requested and reviewed supplemental information, which included extensive materials regarding
70 | The Masters’ Select Funds Trust |
the Funds’ investment results, advisory fees and expense comparisons, financial and profitability information regarding the Advisor, compliance monitoring, and information about the personnel providing investment management and administrative services to the Funds.
The information provided to the Board of Trustees at the meeting, together with the information provided throughout the course of the year, formed the primary (but not exclusive) basis for the Board of Trustees’ determinations. The Board of Trustees did not identify any single issue or particular datum point that, in isolation, would be controlling in their decision to renew the Advisory Agreement or the Manager Agreements. Rather, the Board of Trustees considered the total mix of information provided. The following summary describes the key factors considered by the Board of Trustees, including the Independent Trustees, and the conclusions thereto that formed the basis for approving the renewal of the Advisory Agreement and the Manager Agreements, in light of the legal advice furnished to them by independent legal counsel and their own business judgment. The following list of factors is not inclusive of all factors that were considered.
| 1. | Nature, extent and quality of services |
The Adviser, its personnel and its resources. The Trustees considered the depth and quality of the Adviser’s investment management process, including its sophisticated monitoring and oversight of the Sub-Advisers; the experience, capability and integrity of its senior management and other personnel; the low turnover rates of its key personnel; and the overall financial strength and stability of its organization. The Trustees discussed the high level of Sub-Adviser due diligence continually being undertaken by the Adviser. The Trustees also noted the high quality of the non-advisory management services provided by the Adviser, such as responsiveness to shareholder inquiries and the preparation of shareholder communications, as well as the Adviser’s responsiveness with respect to requests of both the Board and the shareholders. In addition, the Trustees noted that, because the Adviser is a significant shareholder in the Funds, the Adviser has an additional incentive to ensure that the Funds perform well for the shareholders.
The Trustees then considered the Adviser’s policies, procedures and systems to ensure compliance with applicable laws and regulations and its commitment to those programs; its efforts to keep the Trustees informed; and its attention to matters that may involve potential conflicts of interest with each Fund. The Trustees expressed appreciation for the extent and effectiveness of the Adviser’s compliance operations and the Adviser’s oversight of Sub-Adviser and service providers’ compliance operations. The Trustees discussed the Adviser’s commitment to compliance at length in a private session with senior management of the Adviser. The Trustees also considered the nature, extent, quality and cost of administrative, distribution and shareholder services provided by the Adviser to the Funds under the Agreement and other agreements, including the administrative, legal and fund accounting and treasury functions.
The Trustees then considered various matters relating to the Sub-Advisers, including copies of each Subadvisory Agreement; copies of the Form ADV for each Sub-Adviser; financial information relating to each Sub-Adviser; and other information deemed relevant to the Board’s evaluation of each Sub-Adviser, including qualitative assessments provided verbally by senior management of the Adviser and an assessment of each Sub-Adviser’s commitment to compliance. The Trustees also considered the Adviser’s lengthy and extensive due diligence process for selecting each Sub-Adviser and for monitoring each Sub-Adviser’s ongoing investment performance, attentiveness to their portfolios for the Funds, and responsiveness to the Adviser’s inquiries.
| 2. | Investment results |
The Trustees considered the investment results of each Fund in light of its investment objective. They also considered information regarding the selection of indexes and funds comparable to the Funds that were used to evaluate relative investment results. The Board reviewed each Fund’s absolute investment results and its relative results measured against such comparable indexes and funds. The Trustees also compared the investment results of each Sub-Adviser in comparison to the Sub-Adviser’s own fund (if applicable), as well as to other relevant comparable funds and indexes. The Trustees examined the performance of each Fund as of September 30, 2007 at (as applicable) one-, three-, and five-year intervals and since inception. The Board also considered the Equity Fund’s performance for the ten-year period ended September 30, 2007. For the Smaller Companies Fund, the Trustees did not consider five-year performance because that Fund has only been in existence since June 30, 2003. With respect to the Focused Opportunities Fund, the Trustees reviewed and considered performance for the one-year period and the period from the Fund’s inception on June 30, 2006 through September 30, 2007.
In assessing relative performance and fees and expenses, the Trustees relied upon data assembled by the Funds’ Administrator (not affiliated with the Adviser) using data from Lipper, Inc., which consisted of reports showing the relative investment results for each Fund in comparison to appropriate passive indexes and comparable fund peer groups for each of the Funds (collectively the “benchmarks”). The selection of indexes and funds was based on criteria including asset classification, primary channel of distribution, asset size, expense structure and load type, and the Trustees noted that the Administrator, which is independent of the Adviser, had been primarily responsible for compiling this data.
For the Equity Fund, the Board compared its investment results to (1) the Custom Equity Index, which is composed of a 70% weighting in the S&P 500 Index, a 20% weighting in the Russell 2000 Index, and a 10% weighting in the MSCI EAFE Index; (2) the Lipper Multi-Cap Core Index; and (3) the Russell 3000 Index. The Trustees observed that the benchmarks for the Equity Fund had outperformed the Fund on the basis of three- and five-year performance, but outperformed these benchmarks for the one-year period. The Board also considered that the Fund had outperformed these benchmarks for the ten-year period and the period from the Fund’s inception through September 30, 2007.
Other Information | 71 |
The International Fund’s comparable funds and indexes were as follows: (1) the S&P Citigroup PMI Global (excluding US) Index and (2) the Lipper International Fund Index. The Trustees observed that the International Fund had measurably outperformed its benchmarks over the one- and three-year periods and in-line with the benchmarks for the five-year period. The Board noted and considered that the Fund had outperformed each since its inception on December 1, 1997 by a wide margin.
The investment results of the Value Fund were compared to (1) the Russell 3000 Value Index; and (2) the Lipper Multi-Cap Value Index. The Trustees noted that the Value Fund beaten its benchmark during the last year, but trailed all of its benchmarks for three- and five-year periods. The Trustees observed that the Fund had performed in line with the Russell 3000 Value Index and slightly outperformed the Lipper Multi-Cap Value Fund Index for the period from the Fund’s inception on June 30, 2000 through September 30, 2007.
The Smaller Companies Fund was compared to (1) the Russell 2000 Index; and (2) the Lipper Small-Cap Core Index. The Trustees observed that the Fund had outperformed the Russell 2000 Index, but trailed the Lipper Small Cap Core Fund Index during the year ended September 30, 2007. The Board noted that the Fund had underperformed its benchmarks for the three-year period and the period from the Fund’s inception on June 30, 2003.
Finally, the investment performance of the Focused Opportunities Fund was compared to the performance of the S&P 500 Index. The Trustees reviewed the performance of the Fund and considered that the Fund had outperformed the S&P 500 during the year ended September 30, 2007, but trailed the Index during the period from the Fund’s inception. The Trustees noted the unique mandate of the Fund with respect to its concentrated portfolio and the relatively short time period over which investment results could be evaluated.
The Trustees also noted and acknowledged the Adviser’s detailed monitoring of Sub-Advisers’ investment results, particularly those Sub-Advisers that were experiencing periods of underperformance. The Trustees noted and considered the comments by the Adviser with respect to underperforming Sub-Advisers and discussion at Trustee’s meetings throughout the year regarding the sources of underperformance. The Board considered the Adviser’s process for terminating Sub-Advisers and noted the Adviser’s continued willingness to terminate Sub-Advisers if the Adviser determined that the termination was in the best interest of the a Fund and its respective shareholders. The Board also noted and considered the Adviser’s ability to attract and retain world-class investment Sub-Advisers to serve as Sub-Advisers to the Fund as well as the Adviser’s extensive screening process before hiring a Sub-Adviser.
Ultimately, the Trustees concluded that the Adviser has a strong record of effectively managing each of the Funds and monitoring the effectiveness of the contributions being made by each of the multiple Sub-Advisers. The Trustees further concluded that the Adviser was applying appropriate discipline and oversight to ensure the each Fund adhered to its stated investment objective(s) and strategies and that the Adviser’s record in managing each Fund indicated that its continued management would benefit each Fund and its shareholders.
| 3. | Advisory fees and total expenses |
The Trustees reviewed the advisory fees and total expenses of each Fund (each as a percentage of average net assets) and compared such amounts with the median fee and expense levels of other funds in applicable peer fund groups based on the Lipper data. According to the Lipper data, each Fund had relatively high advisory expenses, but the Trustees noted that the Adviser’s advisory fees included management and administrative-type services that were unbundled in many other advisory fees used in the comparison data. Accordingly, the Trustees focused on the total expenses of each Fund, its performance and, where appropriate, the level of subsidization by the Adviser. The Trustees found that the total expenses for each of the Funds were in the mid-to-higher range for their core style peers, but that the total expenses for each of the Funds were generally in the mid-range when compared to Sub-Adviser-of-Sub-Advisers peers. The Board considered the Sub-Adviser-of-Sub-Advisers comparisons to be more apposite because they more closely reflected the structure of the Funds. Thus, the Board concluded that the fees were reasonable in comparison to other funds. In addition, the Trustees noted that while the advisory fees may be slightly higher than the industry norm, the higher fees allowed shareholders to have access to Sub-Advisers to which they otherwise might not have access and that the higher fees were fully justified by the long-term performance results of the Funds.
| 4. | The Adviser’s financial information |
The Trustees reviewed information regarding the Adviser’s costs of managing the Funds and information regarding the profitability of the Adviser. The Trustees also considered the extent to which economies of scale may be realized as each Fund grows and whether advisory fee levels reflect economies of scale if the Funds grow in size. The Trustees also noted that the Adviser had voluntarily forgone profits to subsidize the Funds when they were at lower asset levels.
The Adviser’s Costs and Profitability. The Trustees first noted that the Adviser appeared to be providing products that are competitively priced with other funds, especially funds with multiple Sub-Advisers. The Trustees reviewed the total advisory fees, the amounts paid by the Adviser to the various Sub-Advisers, and the general cost of the services provided by the Adviser in compensation for its retained portion of the total advisory fee. The Trustees took note of information provided on advisory fees waived by the Adviser, noting that the Adviser had voluntarily waived more than $3 million of fees payable under its advisory contracts, and followed a policy of not charging advisory fees on unallocated cash. The Trustees also noted that the Adviser had voluntarily agreed not to seek recoupment of a substantial portion of waived advisory fees. The Trustees also considered the Adviser’s willingness to invest in staff to accommodate changing regulatory requirements. The Trustees received information that assured them that the Adviser was financially sound and able to honor its sponsorship commitments to the Funds, and that the Adviser’s profits were in the range of reasonableness for the mutual fund management industry. The Trustees did not engage in an analysis of Fund-by-Fund profitability given the integrated nature of the Adviser’s management of the Funds. Similarly, although the Trustees had financial information on the Sub-Advisers, the Trustees did not engage in an extended analysis of Sub-Adviser profitability given the arm’s length nature of
72 | The Masters’ Select Funds Trust |
the bargaining between the Adviser and each Sub-Adviser and the difficulty of interpreting profitability information with respect to each Sub-Adviser due to the use of disparate accounting conventions, disparate ownership structures, the fact that each Sub-Adviser managed only a portion of each Fund, and other factors; in this regard, the Trustees were advised by legal counsel that they could give less weight to the profitability assessment of each contract with each Sub-Adviser because of the existence of arm’s length bargaining in those contractual relationships. The Trustees also reviewed information provided during the past year regarding the structure and manner in which the Adviser’s and the Sub-Advisers’ investment professionals were compensated and their respective views of the relationship of such compensation to the attraction and retention of quality personnel.
Economies of Scale. The Trustees also noted that the Adviser had taken steps to reduce expenses. The Trustees considered the economies of scale the Funds have experienced and are experiencing and the Adviser’s commitment regulate each Fund’s total expenses and ensure that the expenses charged by each Fund were fair and reasonable. The Trustees concluded that the Adviser had taken steps to ensure that shareholders benefit as the size of the Funds increases by agreeing to breakpoints in its fee schedules, negotiating favorable terms with service providers, and providing certain support services to the Funds on a cost only basis. The Trustees also noted that the Adviser had acted in shareholder interests in closing certain of the Funds to new monies at certain times. Even though additional investments would have increased Fund size and possibly generated additional economies of scale, the Trustees observed that responsible management of Fund size often benefited shareholders more than allowing growth notwithstanding economies of scale that might accompany such growth. In addition, the Trustees took note of information provided on fees rebated to separate account clients of the Adviser’s affiliate to the extent these clients’ assets were invested in the Funds. With respect to these fee rebates, the Trustees noted that these rebates by the Adviser’s affiliate represented over $1.4 million in fees, and, although they nominally benefited only separate account clients of the Adviser’s affiliate who were also Fund shareholders, the Trustees recognized that these separate account investments helped reduce costs for all shareholders by increasing the asset base of the Funds. The Trustees took note of the willingness of the Adviser affiliate to extend such rebates while at the same time the Adviser was limiting the size and total assets in the various Funds to levels that promoted optimum investment returns. The Trustees also took favorable note of the Adviser’s efforts to invest in its advisory organization to ensure strong research and analytic capability.
| 5. | Conclusions |
Based on their review, including their consideration of each of the factors referred to above, the Trustees concluded that the Agreements are fair and reasonable to each Fund and its shareholders, that the Funds’ shareholders receive reasonable value in return for the advisory fees and other amounts paid to the Adviser and its respective Sub-Advisers by the Funds, and that the renewal of the Agreements would be in the best interests of the Funds and its shareholders. Each of the factors discussed above supported such approval.
Other Information | 73 |
Masters’ Select Funds Trust
TAX INFORMATION - (Unaudited)
The percent of dividend income distributed for the year ended December 31, 2007, which is designated as qualified dividend income under the Jobs and Growth Tax Relief Reconciliation Act of 2003 is as follows:
| Masters’ Select Equity Fund | 57.18 | % | ||
| Masters’ Select International Fund | 21.52 | % | ||
| Masters’ Select Value Fund | N/A | |||
| Masters’ Select Smaller Companies Fund | 24.53 | % | ||
| Masters’ Select Focused Opportunities Fund | N/A |
The percent of dividend income distributed for the year ended December 31, 2007, which qualifies for the corporate dividends received deduction is as follows:
| Masters’ Select Equity Fund | 42.2 | % | ||
| Masters’ Select International Fund | N/A | |||
| Masters’ Select Value Fund | N/A | |||
| Masters’ Select Smaller Companies Fund | 24.5 | % | ||
| Masters’ Select Focused Opportunities Fund | N/A |
The Funds hereby designate the following amounts as long-term capital gains distributions for the fiscal year ended December 31, 2007:
| Masters’ Select Equity Fund | $ | 62,954,250 | ||
| Masters’ Select International Fund | 234,800,194 | |||
| Masters’ Select Value Fund | 21,882,397 | |||
| Masters’ Select Smaller Companies Fund | 28,543,519 | |||
| Masters’ Select Focused Opportunities Fund | 3,236,120 |
The amount above for the Equity, International, Value, Smaller Companies and Focused Opportunities Funds include, $7,302,402, $15,557,139, $1,879,766, $3,263,693, $42,769 respectively, of earnings and profits distributed to shareholders on redemptions.
Additional Information Applicable to Foreign Shareholders Only (Unaudited):
The percent of ordinary dividend distributions for the year ended December 31, 2007, which are designated as interest-related dividends under Internal Revenue Code Section 871 (k)(1)(C) is as follows:
| Masters’ Select Equity Fund | 4.03 | % | ||
| Masters’ Select International Fund | 2.18 | % | ||
| Masters’ Select Value Fund | N/A | |||
| Masters’ Select Smaller Companies Fund | 10.48 | % | ||
| Masters’ Select Focused Opportunities Fund | N/A |
The percent of ordinary dividend distributions for the year ended December 31, 2007, which are designated as short-term capital gain distributions under Internal Revenue Code Section 871 (k)(2)(C) is as follows:
| Masters’ Select Equity Fund | 100 | % | ||
| Masters’ Select International Fund | 88.4 | % | ||
| Masters’ Select Value Fund | N/A | |||
| Masters’ Select Smaller Companies Fund | 100 | % | ||
| Masters’ Select Focused Opportunities Fund | 100 | % |
74 | The Masters’ Select Funds Trust |
Masters’ Select Funds Trust
TAX INFORMATION - (Unaudited) (Continued)
For the year ended December 31, 2007 the International Fund earned foreign source income and paid foreign taxes, which they intend to pass through to their shareholders pursuant to Section 853 of the Internal Revenue Code as follows:
Country | Gross Foreign Income | Foreign Tax Paid | |||||
| Australia | $ | 576,008 | $ | — | |||
| Austria | 258,023 | 38,703 | |||||
| Belgium | 172,044 | 25,807 | |||||
| Bermuda | 285,650 | — | |||||
| Brazil | 315,281 | 3,881 | |||||
| Canada | 195,900 | 29,385 | |||||
| China | 816,332 | — | |||||
| France | 2,702,209 | 402,577 | |||||
| Germany | 1,785,206 | 267,781 | |||||
| Greece | 1,813,086 | — | |||||
| Hong Kong | 2,122,140 | — | |||||
| Ireland | 1,183,477 | — | |||||
| Israel | 348,166 | 59,428 | |||||
| Japan | 2,737,570 | 191,630 | |||||
| Mexico | 2,064,233 | — | |||||
| New Zealand | 583,533 | 93,038 | |||||
| Norway | 2,223,819 | 333,573 | |||||
| Philippines | 649,675 | 162,419 | |||||
| Singapore | 856,729 | 53,765 | |||||
| South Korea | 1,633,240 | 269,485 | |||||
| Spain | 715,862 | 107,379 | |||||
| Switzerland | 4,124,679 | 610,099 | |||||
| Taiwan | 184,449 | 19,375 | |||||
| United Kingdom | 6,349,545 | — | |||||
| $ | 34,696,856 | $ | 2,668,325 | ||||
Tax Information | 75 |
Masters’ Select Funds Trust
INDEX DEFINITIONS
Custom Equity Index
The Custom Equity Index is composed of a 70% weighting in the S&P 500 Index, a 20% weighting in the Russell 2000 Index, and a 10% weighting in the MSCI EAFE index.
Lipper Multi-Cap Core Index
The Lipper Multi-Cap Core Index measures the performance of the 30 largest mutual funds that invest in a variety of capitalization ranges, without concentrating 75% or more of their equity assets in any one market capitalization range over an extended period of time, as determined by Lipper, Inc.
Lipper International Fund Index
The Lipper International Fund Index measures the performance of the 30 largest mutual funds in the international equity fund objective, as determined by Lipper, Inc.
Lipper Multi-Cap Value Index
The Lipper Multi-Cap Value Index measures the performance of the 30 largest mutual funds that invest in a variety of market capitalization ranges without concentrating 75% or more of their assets in any one market capitalization range over an extended period of time, as determined by Lipper, Inc. Value Funds seek long-term growth of capital by investing in companies that are considered to be undervalued relative to a major unmanaged stock index based on a price-to-earnings, price-to-book value, asset value or other factors.
Lipper Small-Cap Core Index
The Lipper Small-Cap Core Index measures the performance of the 30 largest mutual funds in the small capitalization range, as determined by Lipper, Inc.
MSCI EAFE Index
The Morgan Stanley Capital International Europe, Australasia, Far East Index is a broad based index that measures the performance of all of the publicly traded stocks in 21 developed non-U.S. markets. Among the countries included are Australia, Austria, Belgium, Denmark, Finland, France, Germany, Greece, Hong Kong, Ireland, Italy, Japan, the Netherlands, New Zealand, Norway, Portugal, Singapore, Spain, Sweden, Switzerland and the United Kingdom.
MSCI All Countries World Free (ex US) Index
The MSCI All Countries World Free (ex US) Index is a broad based index that measures the performance of common equities in 48 countries.
MSCI All Countries World Free Growth (ex US) Index
The MSCI All Countries World Free Growth (ex US) Index is a broad based index that measures the performance those common equities in 48 countries with higher price-to-book ratios and higher forecasted growth rates.
MSCI World Value Index
The MSCI World Value Index is a broad based index that measures the performance of common equities in 48 countries with lower price-to-book ratios and lower forecasted growth rates.
Russell 1000 Index
The Russell 1000 Index measures the performance of the 1,000 largest companies in the Russell 3000 Index.
Russell 1000 Growth Index
The Russell 1000 Growth Index measures the performance of those Russell 1000 companies with higher price-to-book ratios and higher forecasted growth rates.
Russell 2000 Index
The Russell 2000 Index measures the performance of the 2,000 smallest companies in the Russell 3000 Index.
Russell 2500 Growth Index
The Russell 2500 Growth Index measures the performance of those companies within the 2,500 smallest U.S. companies in the Russell 3000 Index, based on total market capitalization, that have higher price-to-book ratios and higher forecasted growth rates.
Russell 3000 Index
The Russell 3000 Index is a broad based index that measures the performance of the 3000 largest U.S. companies as measured by market capitalization, and represents about 98% of the U.S. stock market.
Russell 3000 Value Index
The Russell 3000 Value Index is a broad based index that measures the performance of those companies within the 3000 largest U.S. companies, based on total market capitalization, that have lower price-to-book ratios and lower forecasted growth rates.
S&P Citigroup PMI Global (ex US) Index
S&P Citigroup PMI Global (ex US) index is a broad based index that represents the largest 80% of investable companies in 52 developed and emerging market countries.
S&P 500 Index
The S&P 500 Index, which is widely regarded as the standard for measuring large-cap U.S. stock market performance, consists of 500 stocks that represent a sample of the leading companies in leading industries.
Indices are unmanaged, do not incur fees, and cannot be invested in directly
76 | The Masters’ Select Funds Trust |
Masters’ Select Funds Trust
INDUSTRY TERMS AND DEFINITIONS
Price to earnings ratio is a common tool for comparing the prices of different common stocks and is calculated by dividing the current market price of a stock by the earnings per share. Similarly, multiples of earnings and cash flow are means of expressing a company’s stock price relative to its earnings per share or cash flow per share, and are calculated by dividing the current stock price by its earnings per share or cash per share. Forecasted earnings growth is the projected rate that a company’s earnings are estimated to grow in a future period.
Price to book ratio is calculated by dividing the current market price of a stock by the book value per share.
Combined ratio is a formula used by insurance companies to relate premium income to claims, administration and dividend expenses. It is used in the annual statement filed by an insurer with the state insurance department. It is calculated by dividing the sum of incurred losses and expenses by earned premium.
Free cash flow is the amount of cash a company has after expenses, debt service, capital expenditures, and dividends.
EV/EBITDA is the enterprise value of a company divided by earnings before interest, taxes, depreciation, and amortization.
“Growth” stocks are generally considered to be stocks of companies with high expected earnings growth compared to “value” stocks. Because of this higher expected growth, growth stocks tend to be priced at a higher multiple of their current earnings than value stocks. However, the premium paid for growth stocks compared to value stocks can vary dramatically depending on the market environment.
Book value is the net asset value of a company, calculated by subtracting total liabilities and intangible assets from total assets.
Earnings per share (EPS) is calculated by taking the total earnings divided by the number of shares outstanding.
EV/Sales is the ratio of enterprise value of a company divided by the total sales of the company for a particular period, usually one year.
EBITDA is a company’s earnings before interest, taxes, depreciation, and amortization.
Enterprise value is calculated by adding a corporation’s market capitalization, preferred stock, and outstanding debt together and then subtracting out the cash and cash equivalents.
Discounted cash flow is calculated by multiplying future cash flows by discount factors to obtain present values.
Return on investment capital (ROIC) is calculated by subtracting dividends from net income and dividing by total capital.
One Basis point equals 1/100th of 1 percent.
Operating cash flow is calculated by summing net profit, depreciation, change in accruals, and change in accounts payable, minus change in accounts receivable, minus change in inventories.
Return on equity (ROE) is a measure of how well a company used reinvested earnings to generate additional earnings. Expressed as a percentage, it is calculated by dividing net worth at the beginning of the period into net income for the period after preferred stock dividends but before common stock dividends.
Return on capital (ROC) is a measure of how effectively a company uses the money (borrowed or owned) invested in its operations. It is calculated by dividing net income by invested capital.
Dividend yield is the return on an investor’s capital investment that a company pays out to its shareholders in the form of dividends. It is calculated by taking the amount of dividends paid per share over the course of a year and dividing by the stock’s price.
Compound annual growth rate (CAGR) is the rate of growth of a number, compounded over several years.
OECD is Organization for Economic Cooperation and Development.
boepd is barrel of equivalent per day.
Industry Terms and Definitions | 77 |
Masters’ Select Funds Trust
TRUSTEE AND OFFICER INFORMATION
Background information for the Trustees and Officers of the Trust is presented below. All Trustees oversee the Masters’ Select Funds. The SAI includes additional information about the Trust’s Trustees and is available, without charge, by calling 1-800-960-0188.
Name, Address and Year of Birth | Position(s) Held with Trust | Term of Office and Length of Time Served | Principal Occupation(s) During the Past 5 Years | Other Directorships Held by Trustee |
A. George Battle 4 Orinda Way, Suite 200-D Orinda, CA 94563 (born 1944) | Trustee | Term: Open Ended Time Served: 11 years | Executive Chairman, Ask Jeeves, 2004 - 2005; Chief Executive Officer, Ask Jeeves from 2000 to 2003; Senior Fellow, The Aspen Institute since 1995. | Director of Advent Software; Expedia Inc.; Fair Isaac Co.; and Netflix Inc. |
Frederick August Eigenbrod, Jr. PhD 4 Orinda Way, Suite 200-D Orinda, CA 94563 (born 1941) | Trustee | Term: Open Ended Time Served: 11 years | Vice President, RoutSource Consulting Services (organizational planning and development) since 2002 | None |
Taylor M. Welz 4 Orinda Way, Suite 200-D Orinda, CA 94563 (born 1959) | Trustee | Term: Open Ended Time Served: 11 years | CPA/PFS, CFP. President, CCO & Sole Owner, Welz Financial Services, Inc., since 2007. Partner, Bowman & Company LLP (certified public accountants) from 1987 to 2007. | None |
Harold M. Shefrin, PhD 4 Orinda Way, Suite 200-D Orinda, CA 94563 (born 1948) | Trustee | Term: Open Ended Time Served: 3 years | Professor, Department of Finance, Santa Clara University, since 1979 | SA Funds - Investment Trust |
Kenneth E. Gregory* 4 Orinda Way, Suite 200-D Orinda, CA 94563 (born 1957) | President and Trustee | Term: Open Ended Time Served: 11 years | President of the Advisor; President of Litman/Gregory Research, Inc. (publishers) and Litman/Gregory Asset Management, LLC (investment advisors), Officer of Litman/Gregory Analytics, LLC (web based publisher of financial research), since 2000. | None |
Craig A. Litman* 4 Orinda Way, Suite 200-D Orinda, CA 94563 (born 1946) | Secretary and Trustee | Term: Open Ended Time Served: 11 years | Treasurer and Secretary of the Advisor; Vice President and Secretary of Litman/Gregory Research Inc.; Chairman of Litman/Gregory Asset Management, LLC. | None |
John Coughlan 4 Orinda Way, Suite 200-D Orinda, CA 94563 (born 1956) | Treasurer and Chief Compliance Officer | Term: Open Ended Time Served: 11 years | Chief Operating Officer, Litman/ Gregory Fund Advisors, LLC and Chief Financial Officer of Litman/ Gregory Asset Management, LLC. | None |
| * | Denotes Trustees who are “interested persons” of the Trust under the 1940 Act. |
78 | The Masters’ Select Funds Trust |
Advisor:
Litman/Gregory Fund Advisors, LLC
Orinda, CA 94563
Distributor:
Quasar Distributors, LLC
615 E. Michigan St., 2nd Floor
Milwaukee, WI 53202
Transfer Agent:
BFDS
P.O. Box 219922
Kansas City, MO 64121-9922
1-800-960-0188
For Overnight Delivery:
Masters’ Select Funds
C/O BFDS
330 W. 9th Street
Kansas City, MO 64105
Investment Professionals:
Registered Investment Advisors, broker/dealers, and other investment professionals may contact Fund Services at 1-925-253-5238.
Prospectus:
To request a current prospectus, statement of additional information, or an IRA application, call 1-800-656-8864.
Shareholder Inquiries:
To request action on your existing account, contact the Transfer agent, BFDS, at 1-800-960-0188, from 9:00 a.m. to 6:00 p.m. eastern time, Monday through Friday.
24-Hour Automated Information:
For access to automated reporting of daily prices, account balances and transaction activity, call 1-800-960-0188, 24 hours a day, seven days a week. Please have your Fund number (see below) and account number ready in order to access your account information.
Fund Information:
Fund | Symbol | CUSIP | Fund Number | ||||
| Equity Fund | MSEFX | 576417109 | 305 | ||||
| International Fund | MSILX | 576417208 | 306 | ||||
| Value Fund | MSVFX | 576417406 | 307 | ||||
| Smaller Companies Fund | MSSFX | 576417307 | 308 | ||||
| Focused Opportunities Fund | MSFOX | 57641T101 | 314 |
Website:
www.mastersfunds.com
Item 2. Code of Ethics.
The registrant has adopted a code of ethics that applies to the registrant’s principal executive officer and principal financial officer. The registrant has not made any amendments to its code of ethics during the period covered by this report. The registrant has not granted any waivers from any provisions of the code of ethics during the period covered by this report.
The registrant undertakes to provide to any person without charge, upon request, a copy of its code of ethics by mail when they call the registrant at
1-800-960-0188.
Item 3. Audit Committee Financial Expert.
The registrant’s board of trustees has determined that there is at least one audit committee financial expert serving on its audit committee. Mr. Harold M. Shefrin is the “audit committee financial expert” and is considered to be “independent” as each term is defined in Item 3 of Form N-CSR.
Item 4. Principal Accountant Fees and Services.
The registrant has engaged its principal accountant to perform audit services, audit-related services, tax services and other services during the past two fiscal years. “Audit services” refer to performing an audit of the registrant's annual financial statements or services that are normally provided by the accountant in connection with statutory and regulatory filings or engagements for those fiscal years. “Audit-related services” refer to the assurance and related services by the principal accountant that are reasonably related to the performance of the audit. “Tax services” refer to professional services rendered by the principal accountant for tax compliance, tax advice, and tax planning. The following table details the aggregate fees billed or expected to be billed for each of the last two fiscal years for audit fees, audit-related fees, tax fees and other fees by the principal accountant.
| FYE 12/31/2007 | FYE 12/31/2006 | |
| Audit Fees | $178,875 | $151,875 |
| Audit-Related Fees | $0 | $0 |
| Tax Fees | $40,675 | $32,535 |
| All Other Fees | $0 | $0 |
The audit committee has adopted pre-approval policies and procedures that require the audit committee to pre-approve all audit and non-audit services of the registrant, including services provided to any entity affiliated with the registrant. All of the principal accountant’s hours spent on auditing the registrant’s financial statements were attributed to work performed by full-time permanent employees of the principal accountant. (If more than 50 percent of the accountant’s hours were spent to audit the registrant's financial statements for the most recent fiscal year, state how many hours were attributed to work performed by persons other than the principal accountant's full-time, permanent employees.)
1
The following table indicates the non-audit fees billed or expected to be billed by the registrant’s accountant for services to the registrant and to the registrant’s investment adviser (and any other controlling entity, etc.—not sub-adviser) for the last two years. The audit committee of the board of trustees/directors has considered whether the provision of non-audit services that were rendered to the registrant's investment adviser is compatible with maintaining the principal accountant's independence and has concluded that the provision of such non-audit services by the accountant has not compromised the accountant’s independence.
| Non-Audit Related Fees | FYE 12/31/2007 | FYE 12/31/2006 |
| Registrant | None | None |
| Registrant’s Investment Adviser | None | None |
Item 5. Audit Committee of Listed Registrants.
Not applicable to registrants who are not listed issuers (as defined in Rule 10A-3 under the Securities Exchange Act of 1934).
Item 6. Schedule of Investments.
Schedule of Investments is included as part of the report to shareholders filed under Item 1 of this Form.
Item 7. Disclosure of Proxy Voting Policies and Procedures for Closed-End Management Investment Companies.
Not applicable to open-end investment companies.
Item 8. Portfolio Managers of Closed-End Management Investment Companies.
Not applicable to open-end investment companies.
Item 9. Purchases of Equity Securities by Closed-End Management Investment Company and Affiliated Purchasers.
Not applicable to open-end investment companies.
Item 10. Submission of Matters to a Vote of Security Holders.
There have been no material changes to the procedures by which shareholders may recommend nominees to the registrant’s board of trustees.
Item 11. Controls and Procedures.
| (a) | The Registrant’s President and Treasurer have reviewed the Registrant's disclosure controls and procedures (as defined in Rule 30a-3(c) under the Investment Company Act of 1940 (the “Act”)) as of a date within 90 days of the filing of this report, as required by Rule 30a-3(b) under the Act and Rules 13a-15(b) or 15d-15(b) under the Securities Exchange Act of 1934. Based on their review, such officers have concluded that the disclosure controls and procedures are effective in ensuring that information required to be disclosed in this report is appropriately recorded, processed, summarized and reported and made known to them by others within the Registrant and by the Registrant’s service provider. |
2
| (b) | There were no changes in the Registrant's internal control over financial reporting (as defined in Rule 30a-3(d) under the Act) that occurred during the second fiscal quarter of the period covered by this report that has materially affected, or is reasonably likely to materially affect, the Registrant's internal control over financial reporting. |
Item 12. Exhibits.
| (a) | (1) Any code of ethics or amendment thereto, that is subject of the disclosure required by Item 2, to the extent that the registrant intends to satisfy Item 2 requirements through filing an exhibit. Incorporated by reference to the Registrant’s Form N-CSR filed March 9, 2005. |
(2) Certifications pursuant to Section 302 of the Sarbanes-Oxley Act of 2002. Filed herewith.
(3) Any written solicitation to purchase securities under Rule 23c-1 under the Act sent or given during the period covered by the report by or on behalf of the registrant to 10 or more persons. Not applicable to open-end investment companies.
(b) | Certification pursuant to Section 906 of the Sarbanes-Oxley Act of 2002. Furnished herewith. |
3
SIGNATURES
Pursuant to the requirements of the Securities Exchange Act of 1934 and the Investment Company Act of 1940, the registrant has duly caused this report to be signed on its behalf by the undersigned, thereunto duly authorized.
(Registrant) The Masters’ Select Funds Trust
By (Signature and Title)*_/s/ Kenneth E. Gregory
Kenneth E. Gregory, President
Date March 3, 2008
Pursuant to the requirements of the Securities Exchange Act of 1934 and the Investment Company Act of 1940, this report has been signed below by the following persons on behalf of the registrant and in the capacities and on the dates indicated.
By (Signature and Title)* _/s/ Kenneth E. Gregory
Kenneth E. Gregory, President
Date March 3, 2008
By (Signature and Title)* _/s/ John Coughlan
John Coughlan, Treasurer
Date March 3, 2008
* Print the name and title of each signing officer under his or her signature.
4