UNITED STATES
SECURITIES AND EXCHANGE COMMISSION
Washington, D.C. 20549
SECURITIES AND EXCHANGE COMMISSION
Washington, D.C. 20549
FORM N-CSR
CERTIFIED SHAREHOLDER REPORT OF REGISTERED
MANAGEMENT INVESTMENT COMPANIES
Investment Company Act file number: 811-07831
FMI Funds, Inc.
(Exact name of registrant as specified in charter)
(Exact name of registrant as specified in charter)
100 East Wisconsin Avenue
Suite 2200
Milwaukee, WI 53202
(Address of principal executive offices) (Zip code)
John S. Brandser
Fiduciary Management, Inc.
100 East Wisconsin Avenue
Suite 2200
Milwaukee, WI 53202
(Name and address of agent for service)
(414) 226-4545
Registrant's telephone number, including area code
Date of fiscal year end: September 30
Date of reporting period: March 31, 2023
Item 1. Reports to Stockholders.
| (a) |
SEMI-ANNUAL REPORT
March 31, 2023
FMI Large Cap Fund
Investor Class (Ticker Symbol: FMIHX)
Institutional Class (Ticker Symbol: FMIQX)
FMI Common Stock Fund
Investor Class (Ticker Symbol: FMIMX)
Institutional Class (Ticker Symbol: FMIUX)
FMI International Fund
Investor Class (Ticker Symbol: FMIJX)
Institutional Class (Ticker Symbol: FMIYX)
FMI International Fund II – Currency Unhedged
Investor Class (Not Available For Sale)
Institutional Class (Ticker Symbol: FMIFX)
 | |
| FMI Funds, Inc. | |
| Advised by Fiduciary Management, Inc. | |
| www.fmifunds.com | |
FMI Funds, Inc.
TABLE OF CONTENTS
| Shareholder Letter | 1 |
| FMI Large Cap Fund | |
| Schedule of Investments | 9 |
| Industry Sectors | 11 |
| FMI Common Stock Fund | |
| Schedule of Investments | 12 |
| Industry Sectors | 14 |
| FMI International Fund | |
| Schedule of Investments | 15 |
| Schedule of Forward Currency Contracts | 18 |
| Industry Sectors | 19 |
| Concentration by Country | 19 |
| FMI International Fund II – Currency Unhedged | |
| Schedule of Investments | 20 |
| Industry Sectors | 23 |
| Concentration by Country | 23 |
| Financial Statements | |
| Statements of Assets and Liabilities | 24 |
| Statements of Operations | 26 |
| Statements of Changes in Net Assets | 28 |
| Financial Highlights | 32 |
| Notes to Financial Statements | 39 |
| Expense Example | 51 |
| Advisory Agreements | 53 |
| Disclosure Information | 60 |
| Additional Information | 64 |
FMI Funds, Inc.
Shareholder Letter
(Unaudited)
March 31, 2023
Dear Fellow Shareholders:
From this point forward, we are moving to a new format for our shareholder letters. At FMI, we have one investment team, one philosophy, and one research process, thus we have decided to transition to a single shareholder letter, where we will cover all our investment strategies collectively. We will discuss our performance by Fund at the outset of each letter, touch on key domestic and international investment topics, and feature a few existing portfolio holdings at the end. As we have done historically, we will provide perspective on the market, the investment landscape, and our portfolios.
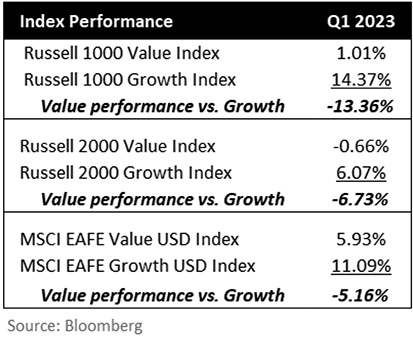
The first quarter of 2023 was one for the history books, highlighted by a global banking crisis and severe financial market volatility. Three banks failed (Silvergate Capital Corp., SVB Financial Group “Silicon Valley Bank”, and Signature Bank), while Credit Suisse Group AG was “rescued” by UBS Group AG, and a consortium of big U.S. banks have attempted to shore up First Republic Bank. Global bond yields declined dramatically, adding fuel to the growth stock rally that had already been underway since the start the year. Financials came under significant pressure during the quarter, while technology stocks were off to the races. Growth significantly outperformed Value across market capitalizations and geographies, a relative headwind for FMI given our valuation discipline. FMI’s quarterly performance commentary is outlined below:
FMI Large Cap Fund: Performance
The FMI Large Cap Fund (“Fund”) gained 3.95%1 in the March quarter, compared to a 7.50% increase in the S&P 500 Index and a 0.93% gain in the iShares Russell 1000 Value ETF.2 There was significant performance concentration in the S&P 500 this quarter, as five names contributed approximately 70% of the return. Relative to the S&P 500 Index, sectors that contributed to performance included Health Technology, Consumer Services, and Consumer Non-Durables, while Retail Trade, our underweight in Electronic Technology, and overweight in Finance (despite limited banking exposure) were key detractors in the period. Booking Holdings Inc., Sony Group Corp. –SP-ADR, and Alphabet Inc. Cl A performed strongly, while Charles Schwab Corp., Dollar General Corp., and Schlumberger Ltd. each lagged.
FMI Common Stock Fund: Performance
The FMI Common Stock Fund (“Fund”) gained 7.51%3 in the March quarter, compared to a 2.74% gain in the Russell 2000 Index (“Russell 2000”) and a 0.66% decline in the Russell 2000 Value Index (“Russell 2000 Value”). Relative to the Russell 2000, sectors that contributed to performance included Finance, Technology Services, and Distribution Services, while Electronic Technology, a lack of exposure to Transportation, and Consumer Services detracted. Strong stock
_______________
1 | The FMI Large Cap Fund Investor Class (FMIHX) and the FMI Large Cap Fund Institutional Class (FMIQX) had a return of 3.95% and 4.04%, respectively, for the first quarter of 2023. |
2 | Source: Bloomberg — returns do not reflect management fees, transaction costs or expenses. Performance is based on market price returns. Beginning 8/10/20, market price returns are calculated using closing price. Prior to 8/10/20, market price returns were calculated using midpoint bid/ask spread at 4:00 PM ET. |
3 | The FMI Common Stock Fund Investor Class (FMIMX) and the FMI Common Stock Fund Institutional Class (FMIUX) had a return of 7.51% and 7.53%, respectively, for the first quarter of 2023. |
1
performance from Insight Enterprises Inc., BJ’s Wholesale Club Holdings Inc., and Primerica Inc. were additive, while Zions Bancorporation N.A., Plexus Corp., and Carlisle Cos. Inc. weighed. A significant underweight in banking helped the relative comparison. The high-quality nature of the portfolio has really shined through in terms of performance in recent years.
FMI International Fund & FMI International Fund II – Currency Unhedged: Performance
The FMI International Funds (“International Funds”) gained 10.28%4 on a currency hedged basis and 10.49%5 currency unhedged in the March quarter, compared with the MSCI EAFE Index’s increase of 7.49% in local currency (LOC) and 8.47% in U.S. Dollars (USD). The MSCI EAFE Value Index advanced 4.96% (LOC) and 5.93% (USD) over the same period. Outperformance relative to the MSCI EAFE Index was driven by the Finance, Retail Trade, and Consumer Services sectors, while Producer Manufacturing, Industrial Services, and Consumer Non-Durables did not keep pace with the benchmark. B&M European Value Retail S.A., Howden Joinery Group PLC, and Rexel S.A. were strong individual performers, as Sodexo S.A., Unilever PLC, and Roche Holding AG underperformed. Performance was aided by our significant underweight in financials and a bounce back in our UK consumer stocks, which were hit hard in 2022. A slight decline in the USD was a headwind for FMI’s currency hedged fund.
Global Banking Crisis
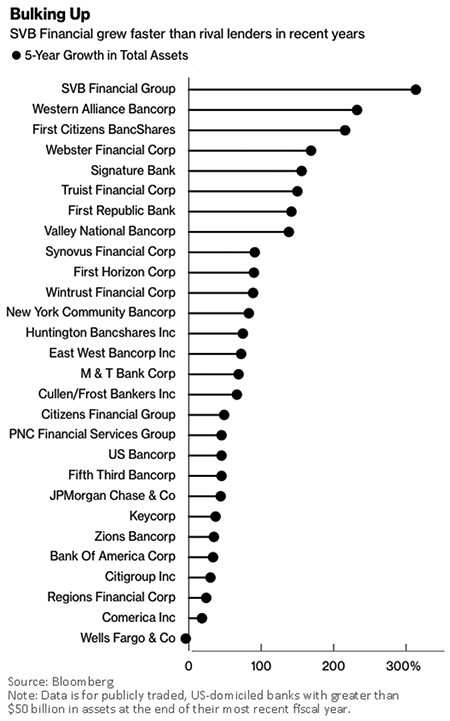
The first quarter of 2023 housed the worst banking meltdown since the Global Financial Crisis (GFC). Banking is a levered business model built on trust. Just the whisper of trouble at an otherwise sound bank can be enough to set off a run. Historically, we have been under-weight the banking industry for these reasons. Where we do invest, we pick our spots carefully. Unfortunately, we have recently gotten another reminder of just how fragile these businesses can be with the failure of three banks, including Silicon Valley Bank (SVB), the 16th largest bank in the U.S. and key engine for the tech ecosystem. This failure resulted from both well-documented environmental factors (ultra-low interest rates, tech/venture capital boom, COVID benefits, and lack of risk management) and more arcane company-specific factors (misunderstood deposit duration, asset/liability mismatches, and subpar management).
During COVID, tech companies were flush with cash as their businesses did well and they raised large sums from venture capitalists. SVB received a lot of this cash, with deposits swelling from $62 billion at the end of Q4 2019 to $198 billion at the end of Q1 2022, up more than three times! Loan demand didn’t keep up with deposit growth, creating tremendous pressure to deploy that cash (earn something on it, they said). SVB did just that by buying longer duration securities. Their timing couldn’t have been worse, as the Fed rapidly raised rates throughout 2022, leaving their large bond portfolio underwater. As long as these securities can be held to maturity, this isn’t an issue. But just as quickly as the cash came in the door, it went back out, as cash-burning tech companies struggled, and venture capital funding dried up. SVB clearly misunderstood the correlation of their customers’ behavior, particularly given only 6% of their deposits were FDIC-insured. Said another way, they overestimated their liability duration (deposits) and then gravely mismatched it with longer duration assets. The final nail in SVB’s coffin was their longtime CEO Greg Becker’s violation of the first rule of bank runs: don’t tell your clients not to panic! The clients, of course, did the exact opposite of what he asked, and SVB was taken over by the FDIC in less than 48 hours.
_______________
4 | The FMI International Fund [currency hedged] Investor Class (FMIJX) and the FMI International Fund [currency hedged] Institutional Class (FMIYX) had a return of 10.28% and 10.32%, respectively, for the first quarter of 2023. |
5 | The FMI International Fund [currency unhedged] Institutional Class (FMIFX) had a return of 10.49% for the first quarter of 2023. |
2
Post-GFC regulation focused on capital adequacy and credit risk, largely ignoring liquidity risk. This is yet another case of the folly in fighting the last war, and how regulations meant to ensure safety can often shift risk to different areas. Risk is akin to energy, it cannot be created or destroyed, only transferred. This is why at FMI we prefer, all else equal, less regulation and to let capitalism do its job. Alas, we must live in the world as it is, not as we want it to be, and are prepared for a more onerous regulatory environment which will likely mean lower profitability, return on equity, and multiples for the banking sector.
Our two most impacted holdings during this recent crisis were Zions Bancorporation N.A. (Common Stock Fund) and discount broker Charles Schwab Corp. (Large Cap Fund). We believe both have sticky deposit bases, best-in-class management teams, conservative balance sheets, and attractive valuations. In both cases, outside of absolute contagion/panic resulting in a run on their deposits (a very low probability tail risk), we view the impact on the businesses as more of an “earnings” event, not a “balance sheet” event. Zions and Schwab got caught up in the contagious fear around SVB’s collapse due to some optical similarities between their balance sheets (namely bonds carried at mark-to-market losses), and Zions being a West Coast regional bank. We believe the similarities largely end there. Zions has a much more diverse deposit base than SVB. We estimate that half of Zions’ deposit base are small and medium- sized business operating deposits, which have historically been quite stable and a competitive advantage. Nearly half of Zions’ deposits
3
are FDIC-insured, and the bank has ample liquidity to meet outflows without selling its securities portfolio. Similarly, Schwab’s retail deposit base is very sticky. Over 80% of their customers’ cash is FDIC-insured, and the cash is spread across approximately 34 million brokerage accounts (average ~$10,000 in bank cash per account). Schwab has more balance sheet liquidity than deposits. In both cases, there appears to be a low risk of correlation among their respective client bases. Although there will likely be some profit headwinds that stem from this crisis, we viewed the large declines in these shares as overly punitive, and thus believe the risk/reward for each is increasingly attractive. We have added to both positions.
The banking crisis has also spread overseas with the Credit Suisse “takeunder” by UBS. The circumstances that led to this outcome share some parallels with the bank failures in the U.S., specifically the lack of risk control, management missteps, and concerns around liquidity, all highlighting some of the challenges of investing in the banking industry. Credit Suisse never fit our eye in terms of quality and governance standards, and was too opaque to analyze with much precision. In Europe in particular, it has been especially difficult to find investments in the banking industry that meet our stringent criteria.
We own two banks in the International Funds – Lloyds Banking Group PLC and DBS Group Holdings Ltd. They share some important characteristics that set them apart from most international banks. To start, both operate in countries with a favorable market structure. Lloyds is the market leader in the UK, and DBS is the market leader in Singapore. The UK and Singapore have relatively consolidated banking markets with strong rule of law. Lloyds and DBS both have superior deposit franchises and digital capabilities. Their deposit market share is over 20%. To put this in perspective, JPMorgan (the largest bank in the U.S.) has a deposit market share of around 11%. They have healthy capital ratios and ample liquidity. As opposed to the failed U.S. banks, the balance sheet values of their securities portfolios approximate fair value. Finally, both have management teams that think and act like shareholders. The combination of these attributes makes these banks compelling investment opportunities in what is an otherwise difficult industry.
Speculative Fever
With global bond yields and discount rates falling sharply in recent weeks amidst the banking crisis, the growth/momentum trade (which dominated most of the last decade) is back on, after a welcome but short-lived reprieve in 2022. Year-to-date, the Nasdaq composite is up 17.05%, while the poster child for technology speculation, the Ark Innovation ETF (ARKK), is up a whopping 29.13%. According to Goldman Sachs, some of the top performing themes in the U.S. include Artificial Intelligence, Megacap Tech, Secular Growth, Retail Favorites, Non-Profitable Tech, and Expensive Software. The extreme divergence between Growth and Value is depicted below:
4
Ironically, the collapse of SVB – which catered to money-losing tech companies – helped trigger tech’s stock dramatic resurgence! At FMI, we find it troubling that some tech companies are among the most aggressive users and abusers of “adjusted earnings.” Investors are asked to ignore a host of costs, such as stock-based compensation (SBC), restructuring charges, integration costs, and the amortization of acquired intangibles (some of which can be warranted). SBC is the most egregious adjustment, in our view, as there is a real economic cost, which includes dilution that ultimately transfers ownership from investors to employees.
Barron’s recently penned an article noting that high levels of equity-based compensation is a “structural problem for the tech industry.” We agree. They write that, “The trend has particularly taken off in the last decade. The average stock-based compensation for the industry rose from just 4.2% of revenue in 2012 to 10.5% in 2020, accelerating to 22.5% in 2021, according to SVB MoffettNathanson. The full numbers for 2022 aren’t yet available.” That’s quite a ramp! While many Wall Street analysts simply ignore SBC (to management’s delight), at FMI we rigorously account for it. Disregarding an expense that equates to over 20% of sales is neither prudent nor in a business owner’s best interest. Needless to say, valuations in the tech space are higher than the sanitized “adjusted earnings” multiples would suggest on the surface.
Furthermore, a recent article by Bloomberg states that “Corporate America’s earnings quality is the worst in three decades,” according to a recent study by UBS. “Earnings across U.S. industries have started to expand noticeably faster than cash is coming in the door. Income at S&P 500 companies, adjusted for amortization and depreciation, topped cash flows from operations by 14% in the year through September,” per the report. Here again, the perception of corporate earnings does not appear to match reality, as management teams play fast and loose with the numbers. The article cites Sanjeev Bhorraj, alumni professor in asset management at Cornell University: “Managers are under so much pressure to deliver earnings that they’re using a lot more accounting than they have in the past to make their earnings look good.”
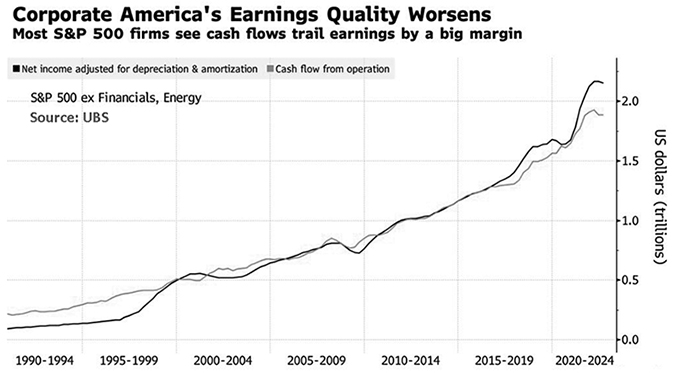
This is a dangerous game, and one we have called attention to on several occasions. In recent years, while money was free and stock markets soared (irrespective of valuation), quality of earnings was largely an afterthought. Perhaps as markets settle into a more normal cost of capital, investor attention on true earnings and cash flow will come back in vogue. As fundamental investors, we can only hope.
5
Contrarian Special: Housing Exposure
As we highlighted last quarter, stocks with economic sensitivity were under significant selling pressure in 2022, with housing-related companies among the most out of favor. Rising interest rates and inflation have weighed on sentiment causing consumer confidence, affordability, and home prices to wane. Though we acknowledge the near-term pressures, our long-term investment horizon (three to five years) and focus on full-cycle business value give us confidence to go against the grain.
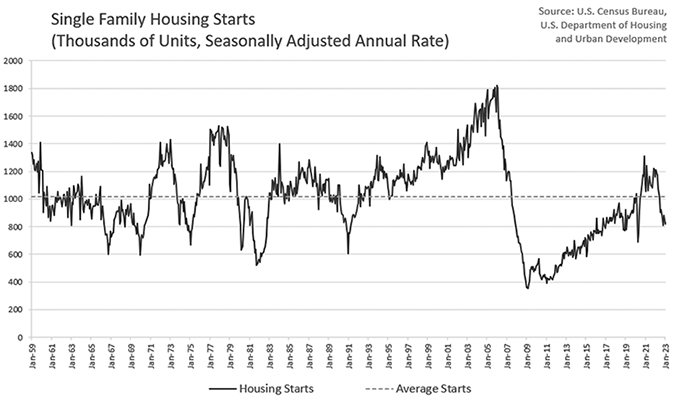
If we take a step back, there is a lot to like in terms of the long-run secular outlook for housing. In the U.S., total housing inventory remains near multi-decade lows, as the housing market has been underbuilt since the GFC (see housing start chart below). The median age of an occupied home continues to climb, reaching ~40 years (up around 30% since 2005). An aging housing stock should lead to rising demand for new construction and repair and remodel (R&R) work over the long-term. Secular changes including work-from-home, urban flight, and aging in place have boosted demand. Millennials continue to come of age in terms of first-time home buying (average age ~36 years), and household formation has accelerated since the pandemic, driven by younger-aged cohorts. Homeownership rates are near long-term averages and have meaningfully trended up the past five years, which is encouraging.
We are particularly attracted to the R&R market. Homeowners balance sheets are strong and have built up significant equity as home prices appreciated in recent years. Low-ticket R&R has historically been resilient during periods of economic weakness, and there is believed to be significant underinvestment in R&R over the last 20 years, creating pent-up demand. Locked-in mortgages at ultra-low rates, and limited home supply have discouraged moving and will likely lead homeowners to invest more in their current homes.
The dynamics in the UK are similar; the housing stock is very old (70-year average), new supply of housing is constrained (and not getting better), people are staying in their homes longer, unemployment remains low, work-from home and aging in place are prevalent, and consumers have significant savings built up from COVID. These are tailwinds for R&R activity, which should bode well for future growth prospects.
6
In each portfolio, we’ve taken advantage of the market’s extreme pessimism around housing. We’ve added to several positions where we see a temporary mark-to-market creating a significant discount to intrinsic value. In our September shareholder letters, we featured three such holdings: Simpson Manufacturing Co. Inc. (Common Stock Fund), Ferguson PLC (Large Cap Fund), and Howden Joinery Group PLC (International Funds). Below, we highlight Fortune Brands Innovations Inc., a fourth quarter purchase with a very strong position in the R&R market. Two additional holdings in managed care and travel are also featured:
UnitedHealth Group Inc. (Large Cap Fund)
UnitedHealth Group (UNH) is the largest, best-managed, and most-diversified managed care organization in the U.S. and is among the largest providers of health services and technology through its fast-growing Optum businesses. In managed care (health insurance), UNH is the number one national provider in the rapidly expanding Medicare Advantage market, in addition to the number one or number two positions in most other sub-segments. Today, scale is more important than ever in delivering top benefits at competitive prices. Scaled buying power (and network building) ensures the most visibility into medical costs at a given site-of-care and scaled investment gives UNH the most enhanced capabilities (tools and technology, typically from Optum) that nudge participants towards lower cost sites-of-care. We view the forward valuation (17 times 2024 estimated EPS) and long-term growth algorithm as attractive.
Fortune Brands Innovations Inc. (Common Stock Fund)
Fortune Brands (FBIN) has one of the highest quality portfolios of branded building products in the world. Recognizable brands include Moen, Therma-Tru, Larson, Master Lock, and Sentry Safe. The stock traded down on housing-related macro concerns, along with an overhang from the company’s now-completed spinoff of its lower-quality cabinetry business. Brand, innovation, and distribution strength are key differentiators, as the company has a leading market position in the attractive and consolidated global plumbing market. R&R accounts for over two thirds of the revenue mix, which should perform more defensively given the lower-ticket nature of the products. The company has a strong track record of organic growth, margin expansion, and a strong (mid-teens) return on invested capital (ROIC). Organic sales growth averaged 7% annually over the last decade, approximately 2-3% above estimated end-market growth. The company is embracing simplification and capital returns, which should be accretive to shareholder value. On 2024 estimates, the stock trades at only 14 times earnings per share (EPS).
Booking Holdings Inc. (International Funds)
Booking Holdings (BKNG) is the world’s largest online travel agency. It has a network effect business model, where Booking acts as an aggregator of supply (independent hotels) on one side and demand (leisure travelers) on the other. This aggregation of fragmented supply and demand allows them to charge a healthy 15% commission when a user books a room. It also allows them to outspend all other players on customer acquisition while still earning good returns on ad spend. Given Booking has to invest very little tangible capital, ROIC is over 80%. Booking has tremendous scale as the global number one. Booking is a capital-light business in a secularly growing industry, has a net cash balance sheet, and a solid management team. Travel continues to recover, with particular improvement in Europe (over 70% of sales), and Booking is taking market share from competitors. We find ~17 times normalized earnings (2024 estimated) to be a punitive valuation. We believe Booking has a long runway for growth when the dust fully settles after COVID and the Ukraine war.
7
In over 40 years in business, we have managed through several stock market crises. We want to remind our shareholders that volatility creates opportunities, and that the funds continue to hold strong businesses with robust balance sheets. While stock prices can come under near-term pressure amidst fear and emotion, in the fullness of time, a company’s intrinsic value will be recognized by the market. As risk-averse investors with a focus on downside protection, we remain optimistic about our ability to outperform through a cycle.
Thank you for your continued support of FMI Funds, Inc.
Please see page 60 for important disclosures.
This shareholder letter is unaudited.
8
FMI Large Cap Fund
SCHEDULE OF INVESTMENTS
March 31, 2023 (Unaudited)
| Shares | Cost | Value | |||||||||
| COMMON STOCKS — 98.3% (a) | |||||||||||
COMMERCIAL SERVICES SECTOR — 3.6% | |||||||||||
| Advertising/Marketing Services — 3.6% | |||||||||||
| 675,000 | Omnicom Group Inc. | $ | 44,893,237 | $ | 63,679,500 | ||||||
CONSUMER NON-DURABLES SECTOR — 3.2% | |||||||||||
| Household/Personal Care — 3.2% | |||||||||||
| 1,070,000 | Unilever PLC — SP-ADR | 42,253,441 | 55,565,100 | ||||||||
CONSUMER SERVICES SECTOR — 5.7% | |||||||||||
| Other Consumer Services — 5.7% | |||||||||||
| 38,000 | Booking Holdings Inc.* | 65,391,235 | 100,791,580 | ||||||||
DISTRIBUTION SERVICES SECTOR — 4.5% | |||||||||||
| Wholesale Distributors — 4.5% | |||||||||||
| 585,000 | Ferguson PLC | 72,354,339 | 78,243,750 | ||||||||
ELECTRONIC TECHNOLOGY SECTOR — 8.8% | |||||||||||
| Computer Processing Hardware — 5.1% | |||||||||||
| 990,000 | Sony Group Corp. — SP-ADR | 63,634,281 | 89,743,500 | ||||||||
| Semiconductors — 3.7% | |||||||||||
| 1,085,000 | Micron Technology Inc. | 52,953,109 | 65,468,900 | ||||||||
FINANCE SECTOR — 18.7% | |||||||||||
| Financial Conglomerates — 3.4% | |||||||||||
| 680,000 | Northern Trust Corp. | 58,598,675 | 59,928,400 | ||||||||
| Investment Banks/Brokers — 4.1% | |||||||||||
| 1,380,000 | The Charles Schwab Corp. | 55,191,627 | 72,284,400 | ||||||||
| Investment Managers — 2.1% | |||||||||||
| 55,000 | BlackRock Inc. | 32,391,948 | 36,801,600 | ||||||||
| Multi-Line Insurance — 4.4% | |||||||||||
| 555,000 | Arch Capital Group Ltd. * | 20,032,891 | 37,667,850 | ||||||||
| 270,000 | Progressive Corp. | 20,106,402 | 38,626,200 | ||||||||
| 40,139,293 | 76,294,050 | ||||||||||
| Property/Casualty Insurance — 4.7% | |||||||||||
| 265,000 | Berkshire Hathaway Inc. — Cl B* | 12,615,105 | 81,824,050 | ||||||||
HEALTH SERVICES SECTOR — 6.3% | |||||||||||
| Managed Health Care — 4.5% | |||||||||||
| 166,000 | UnitedHealth Group Inc. | 24,279,956 | 78,449,940 | ||||||||
| Medical/Nursing Services — 1.8% | |||||||||||
| 1,450,000 | Fresenius Medical | ||||||||||
| Care AG & Co. KGaA — SP-ADR | 57,339,807 | 30,827,000 | |||||||||
The accompanying notes to financial statements are an integral part of this schedule.
9
FMI Large Cap Fund
SCHEDULE OF INVESTMENTS (Continued)
March 31, 2023 (Unaudited)
| Shares | Cost | Value | |||||||||
| COMMON STOCKS — 98.3% (a) (Continued) | |||||||||||
HEALTH TECHNOLOGY SECTOR — 4.9% | |||||||||||
| Medical Specialties — 4.9% | |||||||||||
| 2,200,000 | Koninklijke Philips N.V. — SP-ADR | $ | 84,063,028 | $ | 40,370,000 | ||||||
| 1,610,000 | Smith & Nephew PLC — SP-ADR | 57,375,513 | 44,935,100 | ||||||||
| 141,438,541 | 85,305,100 | ||||||||||
INDUSTRIAL SERVICES SECTOR — 1.9% | |||||||||||
| Contract Drilling — 1.9% | |||||||||||
| 695,000 | Schlumberger Ltd. | 13,371,244 | 34,124,500 | ||||||||
PROCESS INDUSTRIES SECTOR — 3.5% | |||||||||||
| Containers/Packaging — 3.5% | |||||||||||
| 347,000 | Avery Dennison Corp. | 59,793,155 | 62,088,710 | ||||||||
PRODUCER MANUFACTURING SECTOR — 12.4% | |||||||||||
| Building Products — 6.5% | |||||||||||
| 225,000 | Carlisle Cos. Inc. | 53,067,335 | 50,865,750 | ||||||||
| 1,285,000 | Masco Corp. | 40,441,804 | 63,890,200 | ||||||||
| 93,509,139 | 114,755,950 | ||||||||||
| Electrical Products — 2.7% | |||||||||||
| 280,000 | Eaton Corp. PLC | 25,464,008 | 47,975,200 | ||||||||
| Trucks/Construction/Farm Machinery — 3.2% | |||||||||||
| 760,000 | PACCAR Inc. | 20,219,086 | 55,632,000 | ||||||||
RETAIL TRADE SECTOR — 12.4% | |||||||||||
| Apparel/Footwear Retail — 1.8% | |||||||||||
| 395,000 | The TJX Cos. Inc. | 13,364,371 | 30,952,200 | ||||||||
| Discount Stores — 7.5% | |||||||||||
| 335,000 | Dollar General Corp. | 23,537,385 | 70,504,100 | ||||||||
| 425,000 | Dollar Tree Inc.* | 36,451,825 | 61,008,750 | ||||||||
| 59,989,210 | 131,512,850 | ||||||||||
| Specialty Stores — 3.1% | |||||||||||
| 835,000 | CarMax Inc.* | 74,415,601 | 53,673,800 | ||||||||
TECHNOLOGY SERVICES SECTOR — 12.4% | |||||||||||
| Information Technology Services — 4.1% | |||||||||||
| 365,000 | CDW Corp. | 63,631,726 | 71,134,850 | ||||||||
| Internet Software/Services — 4.5% | |||||||||||
| 765,000 | Alphabet Inc. — Cl A* | 84,802,983 | 79,353,450 | ||||||||
| Packaged Software — 3.8% | |||||||||||
| 530,000 | SAP SE — SP-ADR | 60,554,485 | 67,071,500 | ||||||||
| Total common stocks | 1,332,589,602 | 1,723,481,880 | |||||||||
The accompanying notes to financial statements are an integral part of this schedule.
10
FMI Large Cap Fund
SCHEDULE OF INVESTMENTS (Continued)
March 31, 2023 (Unaudited)
| Shares | Cost | Value | |||||||||
| SHORT-TERM INVESTMENTS — 1.6% (a) | |||||||||||
| Money Market Fund — 1.6% | |||||||||||
| 28,240,692 | First American Treasury | ||||||||||
| Obligations Fund, Cl X, 4.717%^ | $ | 28,240,692 | $ | 28,240,692 | |||||||
| Total short-term investments | 28,240,692 | 28,240,692 | |||||||||
| Total investments — 99.9% | $ | 1,360,830,294 | 1,751,722,572 | ||||||||
Other assets, less liabilities — 0.1% (a) | 1,938,301 | ||||||||||
| TOTAL NET ASSETS — 100.0% | $ | 1,753,660,873 | |||||||||
| * | Non-income producing security. |
| ^ | The rate quoted is the annualized 7-day yield as of March 31, 2023. |
| (a) | Percentages for the various classifications relate to total net assets. |
| PLC | Public Limited Company |
| SP-ADR | Sponsored American Depositary Receipt |
The accompanying notes to financial statements are an integral part of this schedule.
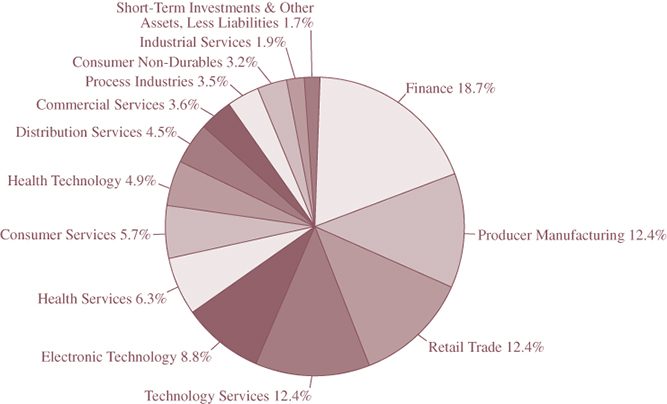
INDUSTRY SECTORS as a percentage of net assets
as of March 31, 2023 (Unaudited)
11
FMI Common Stock Fund
SCHEDULE OF INVESTMENTS
March 31, 2023 (Unaudited)
| Shares | Cost | Value | |||||||||
| COMMON STOCKS — 94.1% (a) | |||||||||||
COMMERCIAL SERVICES SECTOR — 14.7% | |||||||||||
| Advertising/Marketing Services — 4.9% | |||||||||||
| 1,620,000 | Interpublic Group of Cos. Inc. | $ | 34,565,254 | $ | 60,328,800 | ||||||
| Miscellaneous Commercial Services — 4.5% | |||||||||||
| 1,191,000 | Genpact Ltd. | 28,655,380 | 55,048,020 | ||||||||
| Personnel Services — 5.3% | |||||||||||
| 177,000 | ManpowerGroup Inc. | 11,934,821 | 14,607,810 | ||||||||
| 627,000 | Robert Half International Inc. | 37,817,406 | 50,517,390 | ||||||||
| 49,752,227 | 65,125,200 | ||||||||||
CONSUMER DURABLES SECTOR — 2.2% | |||||||||||
| Homebuilding — 2.2% | |||||||||||
| 238,000 | LGI Homes Inc.* | 28,898,459 | 27,139,140 | ||||||||
CONSUMER NON-DURABLES SECTOR — 4.5% | |||||||||||
| Apparel/Footwear — 4.5% | |||||||||||
| 1,147,000 | Skechers U.S.A. Inc. — Cl A* | 49,133,498 | 54,505,440 | ||||||||
DISTRIBUTION SERVICES SECTOR — 14.4% | |||||||||||
| Electronics Distributors — 2.8% | |||||||||||
| 270,000 | Arrow Electronics Inc.* | 10,451,866 | 33,714,900 | ||||||||
| Medical Distributors — 5.1% | |||||||||||
| 762,000 | Henry Schein Inc.* | 50,395,070 | 62,133,480 | ||||||||
| Wholesale Distributors — 6.5% | |||||||||||
| 262,000 | Applied Industrial Technologies Inc. | 18,390,691 | 37,238,060 | ||||||||
| 711,000 | Beacon Roofing Supply Inc.* | 38,848,202 | 41,842,350 | ||||||||
| 57,238,893 | 79,080,410 | ||||||||||
ELECTRONIC TECHNOLOGY SECTOR — 7.6% | |||||||||||
| Electronic Components — 4.0% | |||||||||||
| 1,129,000 | nVent Electric PLC | 27,214,174 | 48,479,260 | ||||||||
| Electronic Production Equipment — 3.6% | |||||||||||
| 455,000 | Plexus Corp.* | 35,615,843 | 44,394,350 | ||||||||
FINANCE SECTOR — 16.2% | |||||||||||
| Finance/Rental/Leasing — 5.6% | |||||||||||
| 466,000 | FirstCash Holdings Inc. | 20,534,430 | 44,442,420 | ||||||||
| 379,000 | Triton International Ltd. | 24,578,680 | 23,960,380 | ||||||||
| 45,113,110 | 68,402,800 | ||||||||||
| Investment Banks/Brokers — 3.1% | |||||||||||
| 439,000 | Houlihan Lokey Inc. — Cl A | 25,225,815 | 38,408,110 | ||||||||
| Life/Health Insurance — 3.8% | |||||||||||
| 272,000 | Primerica Inc. | 37,301,462 | 46,849,280 | ||||||||
| Major Banks — 2.1% | |||||||||||
| 877,000 | Zions Bancorporation N.A. | 30,553,661 | 26,248,610 | ||||||||
The accompanying notes to financial statements are an integral part of this schedule.
12
FMI Common Stock Fund
SCHEDULE OF INVESTMENTS (Continued)
March 31, 2023 (Unaudited)
| Shares | Cost | Value | |||||||||
| COMMON STOCKS — 94.1% (a) (Continued) | |||||||||||
FINANCE SECTOR — 16.2% (Continued) | |||||||||||
| Multi-Line Insurance — 1.6% | |||||||||||
| 14,000 | White Mountains Insurance Group Ltd. | $ | 13,183,019 | $ | 19,284,860 | ||||||
PROCESS INDUSTRIES SECTOR — 2.0% | |||||||||||
| Containers/Packaging — 2.0% | |||||||||||
| 209,000 | AptarGroup Inc. | 21,858,583 | 24,701,710 | ||||||||
PRODUCER MANUFACTURING SECTOR — 23.0% | |||||||||||
| Auto Parts: OEM — 4.0% | |||||||||||
| 756,000 | Donaldson Co. Inc. | 36,613,365 | 49,397,040 | ||||||||
| Building Products — 10.0% | |||||||||||
| 193,000 | Carlisle Cos. Inc. | 19,345,560 | 43,631,510 | ||||||||
| 670,000 | Fortune Brands Innovations Inc. | 38,777,666 | 39,349,100 | ||||||||
| 358,000 | Simpson Manufacturing Co. Inc. | 37,611,565 | 39,251,120 | ||||||||
| 95,734,791 | 122,231,730 | ||||||||||
| Industrial Machinery — 4.5% | |||||||||||
| 2,165,000 | Gates Industrial Corp. PLC* | 29,682,644 | 30,071,850 | ||||||||
| 287,000 | ITT Inc. | 23,298,032 | 24,768,100 | ||||||||
| 52,980,676 | 54,839,950 | ||||||||||
| Miscellaneous Manufacturing — 4.5% | |||||||||||
| 189,000 | LCI Industries | 25,536,322 | 20,765,430 | ||||||||
| 1,224,000 | TriMas Corp. | 29,036,028 | 34,100,640 | ||||||||
| 54,572,350 | 54,866,070 | ||||||||||
RETAIL TRADE SECTOR — 3.9% | |||||||||||
| Specialty Stores — 3.9% | |||||||||||
| 632,000 | BJ’s Wholesale Club Holdings Inc.* | 36,887,046 | 48,076,240 | ||||||||
TECHNOLOGY SERVICES SECTOR — 5.6% | |||||||||||
| Information Technology Services — 5.6% | |||||||||||
| 478,000 | Insight Enterprises Inc.* | 36,432,986 | 68,334,880 | ||||||||
| Total common stocks | 858,377,528 | 1,151,590,280 | |||||||||
The accompanying notes to financial statements are an integral part of this schedule.
13
FMI Common Stock Fund
SCHEDULE OF INVESTMENTS (Continued)
March 31, 2023 (Unaudited)
| Shares | Cost | Value | |||||||||
| SHORT-TERM INVESTMENTS — 5.7% (a) | |||||||||||
| Money Market Fund — 5.7% | |||||||||||
| 70,449,016 | First American Treasury | ||||||||||
| Obligations Fund, Cl X, 4.717%^ | $ | 70,449,016 | $ | 70,449,016 | |||||||
| Total short-term investments | 70,449,016 | 70,449,016 | |||||||||
| Total investments — 99.8% | $ | 928,826,544 | 1,222,039,296 | ||||||||
Other assets, less liabilities — 0.2% (a) | 2,311,362 | ||||||||||
| TOTAL NET ASSETS — 100.0% | $ | 1,224,350,658 | |||||||||
| * | Non-income producing security. |
| ^ | The rate quoted is the annualized 7-day yield as of March 31, 2023. |
| (a) | Percentages for the various classifications relate to total net assets. |
| PLC | Public Limited Company |
The accompanying notes to financial statements are an integral part of this schedule.
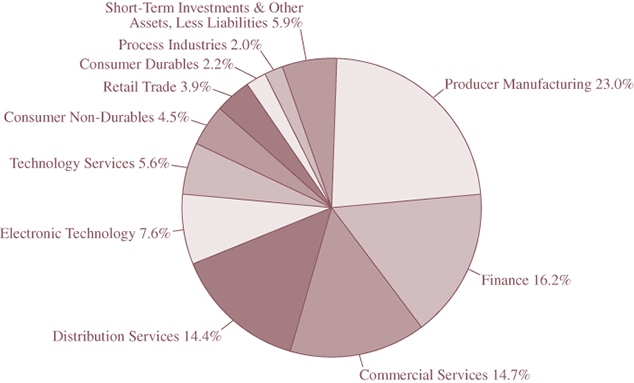
INDUSTRY SECTORS as a percentage of net assets
as of March 31, 2023 (Unaudited)
14
FMI International Fund
SCHEDULE OF INVESTMENTS
March 31, 2023 (Unaudited)
| Shares | Cost | Value | |||||||||
| LONG-TERM INVESTMENTS — 95.9% (a) | |||||||||||
| COMMON STOCKS — 91.0% (a) | |||||||||||
COMMERCIAL SERVICES SECTOR — 4.6% | |||||||||||
| Advertising/Marketing Services — 2.1% | |||||||||||
| 6,800,000 | WPP PLC (Jersey)* (b) | $ | 84,337,772 | $ | 80,789,811 | ||||||
| Miscellaneous Commercial Services — 2.5% | |||||||||||
| 2,060,000 | Genpact Ltd. (Bermuda) | 92,701,175 | 95,213,200 | ||||||||
CONSUMER DURABLES SECTOR — 2.4% | |||||||||||
| Electronics/Appliances — 2.4% | |||||||||||
| 10,340,000 | Howden Joinery Group PLC (Britain) (b) | 76,308,220 | 89,280,487 | ||||||||
CONSUMER NON-DURABLES SECTOR — 9.2% | |||||||||||
| Beverages: Alcoholic — 2.1% | |||||||||||
| 1,750,000 | Diageo PLC (Britain) (b) | 76,138,174 | 78,101,504 | ||||||||
| Food: Specialty/Candy — 3.7% | |||||||||||
| 4,125,000 | Greggs PLC (Britain) (b) | 109,615,345 | 141,655,341 | ||||||||
| Household/Personal Care — 3.4% | |||||||||||
| 2,475,000 | Unilever PLC (Britain) (b) | 104,620,471 | 128,251,405 | ||||||||
CONSUMER SERVICES SECTOR — 10.3% | |||||||||||
| Other Consumer Services — 5.3% | |||||||||||
| 75,000 | Booking Holdings Inc. (United States)* | 137,732,575 | 198,930,750 | ||||||||
| Restaurants — 5.0% | |||||||||||
| 1,935,000 | Sodexo S.A. (France) (b) | 157,266,344 | 188,993,463 | ||||||||
DISTRIBUTION SERVICES SECTOR — 12.1% | |||||||||||
| Medical Distributors — 2.8% | |||||||||||
| 1,325,000 | DKSH Holding AG (Switzerland) (b) | 75,162,258 | 106,821,859 | ||||||||
| Wholesale Distributors — 9.3% | |||||||||||
| 1,620,000 | Ferguson PLC (Jersey) (b) | 101,715,903 | 214,181,892 | ||||||||
| 5,775,000 | Rexel S.A. (France) (b) | 106,006,865 | 137,299,642 | ||||||||
| 207,722,768 | 351,481,534 | ||||||||||
ELECTRONIC TECHNOLOGY SECTOR — 11.8% | |||||||||||
| Aerospace & Defense — 5.3% | |||||||||||
| 1,355,000 | Safran S.A. (France) (b) | 144,204,905 | 200,590,541 | ||||||||
| Computer Processing Hardware — 5.1% | |||||||||||
| 2,130,000 | Sony Group Corp. (Japan) (b) | 134,755,032 | 194,007,604 | ||||||||
| Electronic Equipment/Instruments — 1.4% | |||||||||||
| 3,340,000 | Yokogawa Electric Corp. (Japan) (b) | 59,113,396 | 54,386,988 | ||||||||
FINANCE SECTOR — 8.6% | |||||||||||
| Finance/Rental/Leasing — 2.1% | |||||||||||
| 1,300,000 | Ashtead Group PLC (Britain) (b) | 63,126,241 | 79,825,974 | ||||||||
The accompanying notes to financial statements are an integral part of this schedule.
15
FMI International Fund
SCHEDULE OF INVESTMENTS (Continued)
March 31, 2023 (Unaudited)
| Shares | Cost | Value | |||||||||
| LONG-TERM INVESTMENTS — 95.9% (a) (Continued) | |||||||||||
| COMMON STOCKS — 91.0% (a) (Continued) | |||||||||||
FINANCE SECTOR — 8.6% (Continued) | |||||||||||
| Major Banks — 4.6% | |||||||||||
| 3,665,000 | DBS Group Holdings Ltd. (Singapore) (b) | $ | 81,476,563 | $ | 91,118,281 | ||||||
| 139,400,000 | Lloyds Banking Group PLC (Britain) (b) | 68,801,532 | 81,959,579 | ||||||||
| 150,278,095 | 173,077,860 | ||||||||||
| Multi-Line Insurance — 1.9% | |||||||||||
| 1,053,000 | Arch Capital Group Ltd. (Bermuda)* | 41,982,008 | 71,467,110 | ||||||||
HEALTH SERVICES SECTOR — 1.6% | |||||||||||
| Medical/Nursing Services — 1.6% | |||||||||||
| 1,460,000 | Fresenius Medical | ||||||||||
| Care AG & Co. KGaA (Germany) (b) | 110,112,481 | 61,968,857 | |||||||||
HEALTH TECHNOLOGY SECTOR — 7.8% | |||||||||||
| Medical Specialties — 4.7% | |||||||||||
| 4,220,000 | Koninklijke Philips N.V. (Netherlands) (b) | 146,059,368 | 77,508,628 | ||||||||
| 7,190,000 | Smith & Nephew PLC (Britain) (b) | 126,451,258 | 99,944,353 | ||||||||
| 272,510,626 | 177,452,981 | ||||||||||
| Pharmaceuticals: Major — 3.1% | |||||||||||
| 405,000 | Roche Holding AG (Switzerland) (b) | 141,241,246 | 115,725,754 | ||||||||
INDUSTRIAL SERVICES SECTOR — 2.4% | |||||||||||
| Contract Drilling — 2.4% | |||||||||||
| 1,845,000 | Schlumberger Ltd. (Curacao) | 68,316,952 | 90,589,500 | ||||||||
PROCESS INDUSTRIES SECTOR — 1.8% | |||||||||||
| Chemicals: Specialty — 1.8% | |||||||||||
| 1,415,000 | NOF Corp. (Japan) (b) | 74,286,266 | 66,123,322 | ||||||||
PRODUCER MANUFACTURING SECTOR — 5.9% | |||||||||||
| Building Products — 1.7% | |||||||||||
| 6,050,000 | Sanwa Holdings Corp. (Japan) (b) | 76,000,029 | 64,905,767 | ||||||||
| Electrical Products — 1.5% | |||||||||||
| 2,650,000 | Smiths Group PLC (Britain) (b) | 39,232,604 | 56,202,958 | ||||||||
| Industrial Conglomerates — 1.5% | |||||||||||
| 1,155,000 | Jardine Matheson Holdings Ltd. (Bermuda) (b) | 74,573,963 | 56,181,785 | ||||||||
| Industrial Machinery — 1.2% | |||||||||||
| 1,877,000 | Nabtesco Corp. (Japan) (b) | 67,961,048 | 46,166,950 | ||||||||
RETAIL TRADE SECTOR — 8.3% | |||||||||||
| Discount Stores — 6.0% | |||||||||||
| 37,900,000 | B&M European Value | ||||||||||
| Retail S.A. (Luxembourg) (b) | 153,506,861 | 225,798,610 | |||||||||
| Specialty Stores — 2.3% | |||||||||||
| 13,825,000 | CK Hutchison | ||||||||||
| Holdings Ltd. (Cayman Islands) (b) | 128,000,076 | 85,530,403 | |||||||||
The accompanying notes to financial statements are an integral part of this schedule.
16
FMI International Fund
SCHEDULE OF INVESTMENTS (Continued)
March 31, 2023 (Unaudited)
| Shares | Cost | Value | |||||||||
| LONG-TERM INVESTMENTS — 95.9% (a) (Continued) | |||||||||||
| COMMON STOCKS — 91.0% (a) (Continued) | |||||||||||
TECHNOLOGY SERVICES SECTOR — 4.2% | |||||||||||
| Packaged Software — 4.2% | |||||||||||
| 1,245,000 | SAP SE (Germany) (b) | $ | 137,394,342 | $ | 157,207,485 | ||||||
| Total common stocks | 3,058,201,273 | 3,436,729,803 | |||||||||
| PREFERRED STOCKS — 4.9% (a) | |||||||||||
CONSUMER NON-DURABLES SECTOR — 0.6% | |||||||||||
| Household/Personal Care — 0.6% | |||||||||||
| 642,003 | Amorepacific Corp. (South Korea) (b) | 39,547,180 | 21,931,596 | ||||||||
ELECTRONIC TECHNOLOGY SECTOR — 4.3% | |||||||||||
| Telecommunications Equipment — 4.3% | |||||||||||
| 3,890,000 | Samsung | ||||||||||
| Electronics Co. Ltd. (South Korea) (b) | 94,251,836 | 161,880,813 | |||||||||
| Total preferred stocks | 133,799,016 | 183,812,409 | |||||||||
| Total long-term investments | 3,192,000,289 | 3,620,542,212 | |||||||||
| SHORT-TERM INVESTMENTS — 3.8% (a) | |||||||||||
| Money Market Fund — 3.8% | |||||||||||
| 144,892,565 | First American Treasury | ||||||||||
| Obligations Fund, Cl X, 4.717%^ | 144,892,565 | 144,892,565 | |||||||||
Principal Amount | |||||||||||
| Bank Deposit Account — 0.0% | |||||||||||
| $ | 119,117 | U.S. Bank N.A., 4.480% +(c) | 119,117 | 119,117 | |||||||
| Total short-term investments | 145,011,682 | 145,011,682 | |||||||||
| Total investments — 99.7% | $ | 3,337,011,971 | 3,765,553,894 | ||||||||
Other assets, less liabilities — 0.3% (a) | 12,500,521 | ||||||||||
| TOTAL NET ASSETS — 100.0% | $ | 3,778,054,415 | |||||||||
| * | Non-income producing security. |
| ^ | The rate quoted is the annualized 7-day yield as of March 31, 2023. |
+ | The rate shown is as of March 31, 2023. |
| (a) | Percentages for the various classifications relate to total net assets. |
| (b) | Security does not trade during New York Stock Exchange hours, provided that certain foreign exchanges may trade during a portion of the New York Stock Exchange hours, and has been valued in accordance with the pricing procedures discussed in Note 2(a) to the financial statements and has been classified as Level 2. As of March 31, 2023, the aggregate value of these securities was $3,164,341,652. |
| (c) | This $119,117 security is held as collateral for certain forward currency contracts. |
| PLC | Public Limited Company |
The accompanying notes to financial statements are an integral part of this schedule.
17
FMI International Fund
SCHEDULE OF FORWARD CURRENCY CONTRACTS
March 31, 2023 (Unaudited)
| U.S. $ Value on | U.S. $ Value on | |||||||||||||||||||
| March 31, 2023 | March 31, 2023 | Unrealized | ||||||||||||||||||
| Settlement | Currency to | of Currency to | Currency to | of Currency to | Appreciation | |||||||||||||||
| Date | Counterparty | be Delivered | be Delivered | be Received | be Received | (Depreciation) | ||||||||||||||
| 4/14/23 | State Street Bank | 970,000,000 | $ | 1,196,937,856 | 1,177,261,380 | $ | 1,177,261,380 | $ | (19,676,476 | ) | ||||||||||
| and Trust Co. | British Pound | U.S. Dollar | ||||||||||||||||||
| 4/14/23 | The Bank of | 690,000,000 | 748,884,990 | 747,701,250 | 747,701,250 | (1,183,740 | ) | |||||||||||||
| New York Mellon | Euro | U.S. Dollar | ||||||||||||||||||
| 4/14/23 | JPMorgan Chase | 590,000,000 | 75,219,322 | 75,730,349 | 75,730,349 | 511,027 | ||||||||||||||
| Bank, N.A. | Hong Kong Dollar | U.S. Dollar | ||||||||||||||||||
| 4/14/23 | The Bank of | 45,000,000,000 | 339,660,146 | 343,634,739 | 343,634,739 | 3,974,593 | ||||||||||||||
| New York Mellon | Japanese Yen | U.S. Dollar | ||||||||||||||||||
| 4/14/23 | JPMorgan Chase | 115,000,000 | 86,452,105 | 86,550,763 | 86,550,763 | 98,658 | ||||||||||||||
| Bank, N.A. | Singapore Dollar | U.S. Dollar | ||||||||||||||||||
| 4/14/23 | State Street Bank | 190,000,000,000 | 146,070,552 | 152,616,571 | 152,616,571 | 6,546,019 | ||||||||||||||
| and Trust Co. | South Korea Won | U.S. Dollar | ||||||||||||||||||
| 4/14/23 | JPMorgan Chase | 195,000,000 | 213,446,857 | 212,010,216 | 212,010,216 | (1,436,641 | ) | |||||||||||||
| Bank, N.A. | Swiss Franc | U.S. Dollar | ||||||||||||||||||
| $ | 2,806,671,828 | $ | 2,795,505,268 | $ | (11,166,560 | ) | ||||||||||||||
The accompanying notes to financial statements are an integral part of this schedule.
18
FMI International Fund
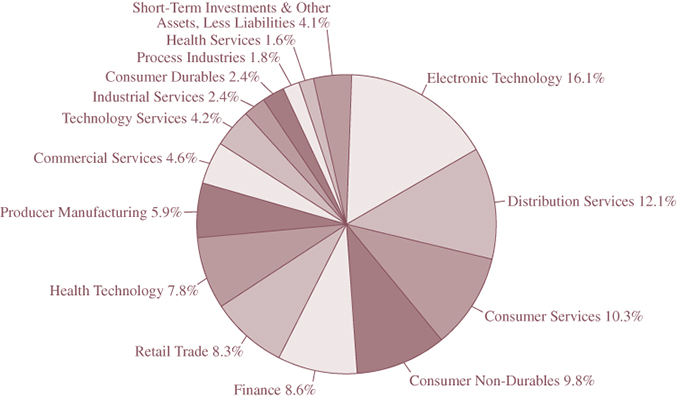
INDUSTRY SECTORS as a percentage of net assets
as of March 31, 2023 (Unaudited)
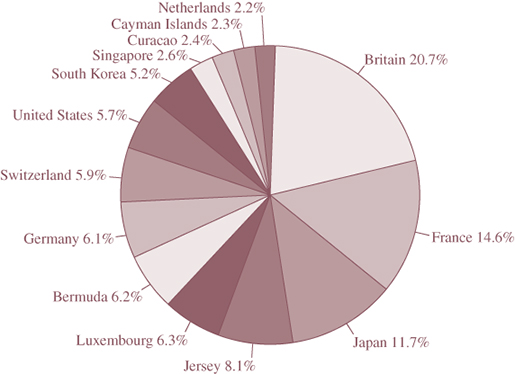
CONCENTRATION BY COUNTRY based on domicile of issuer as
a percentage of long-term investments only
as of March 31, 2023 (Unaudited)

19
FMI International Fund II – Currency Unhedged
SCHEDULE OF INVESTMENTS
March 31, 2023 (Unaudited)
| Shares | Cost | Value | |||||||||
| LONG-TERM INVESTMENTS — 94.5% (a) | |||||||||||
| COMMON STOCKS — 89.5% (a) | |||||||||||
COMMERCIAL SERVICES SECTOR — 4.5% | |||||||||||
| Advertising/Marketing Services — 2.0% | |||||||||||
| 114,600 | WPP PLC (Jersey)* (b) | $ | 1,216,631 | $ | 1,361,546 | ||||||
| Miscellaneous Commercial Services — 2.5% | |||||||||||
| 37,000 | Genpact Ltd. (Bermuda) | 1,665,419 | 1,710,140 | ||||||||
CONSUMER DURABLES SECTOR — 2.2% | |||||||||||
| Electronics/Appliances — 2.2% | |||||||||||
| 174,500 | Howden Joinery Group PLC (Britain) (b) | 1,362,045 | 1,506,716 | ||||||||
CONSUMER NON-DURABLES SECTOR — 9.3% | |||||||||||
| Beverages: Alcoholic — 2.1% | |||||||||||
| 31,500 | Diageo PLC (Britain) (b) | 1,370,492 | 1,405,827 | ||||||||
| Food: Specialty/Candy — 3.8% | |||||||||||
| 76,000 | Greggs PLC (Britain) (b) | 2,073,260 | 2,609,892 | ||||||||
| Household/Personal Care — 3.4% | |||||||||||
| 44,900 | Unilever PLC (Britain) (b) | 2,456,406 | 2,326,662 | ||||||||
CONSUMER SERVICES SECTOR — 10.1% | |||||||||||
| Other Consumer Services — 5.4% | |||||||||||
| 1,380 | Booking Holdings Inc. (United States)* | 2,561,699 | 3,660,326 | ||||||||
| Restaurants — 4.7% | |||||||||||
| 32,400 | Sodexo S.A. (France) (b) | 2,668,278 | 3,164,542 | ||||||||
DISTRIBUTION SERVICES SECTOR — 12.0% | |||||||||||
| Medical Distributors — 2.7% | |||||||||||
| 22,675 | DKSH Holding AG (Switzerland) (b) | 1,350,450 | 1,828,065 | ||||||||
| Wholesale Distributors — 9.3% | |||||||||||
| 28,975 | Ferguson PLC (Jersey) (b) | 2,695,455 | 3,830,815 | ||||||||
| 105,200 | Rexel S.A. (France) (b) | 1,977,861 | 2,501,112 | ||||||||
| 4,673,316 | 6,331,927 | ||||||||||
ELECTRONIC TECHNOLOGY SECTOR — 12.0% | |||||||||||
| Aerospace & Defense — 5.4% | |||||||||||
| 24,875 | Safran S.A. (France) (b) | 2,783,739 | 3,682,428 | ||||||||
| Computer Processing Hardware — 5.2% | |||||||||||
| 39,100 | Sony Group Corp. (Japan) (b) | 2,938,642 | 3,561,360 | ||||||||
| Electronic Equipment/Instruments — 1.4% | |||||||||||
| 56,700 | Yokogawa Electric Corp. (Japan) (b) | 869,289 | 923,276 | ||||||||
FINANCE SECTOR — 8.5% | |||||||||||
| Finance/Rental/Leasing — 2.0% | |||||||||||
| 21,775 | Ashtead Group PLC (Britain) (b) | 1,062,800 | 1,337,085 | ||||||||
The accompanying notes to financial statements are an integral part of this schedule.
20
FMI International Fund II – Currency Unhedged
SCHEDULE OF INVESTMENTS (Continued)
March 31, 2023 (Unaudited)
| Shares | Cost | Value | |||||||||
| LONG-TERM INVESTMENTS — 94.5% (a) (Continued) | |||||||||||
| COMMON STOCKS — 89.5% (a) (Continued) | |||||||||||
FINANCE SECTOR — 8.5% (Continued) | |||||||||||
| Major Banks — 4.6% | |||||||||||
| 66,900 | DBS Group Holdings Ltd. (Singapore) (b) | $ | 1,493,075 | $ | 1,663,250 | ||||||
| 2,520,800 | Lloyds Banking Group PLC (Britain) (b) | 1,188,109 | 1,482,093 | ||||||||
| 2,681,184 | 3,145,343 | ||||||||||
| Multi-Line Insurance — 1.9% | |||||||||||
| 19,200 | Arch Capital Group Ltd. (Bermuda)* | 756,771 | 1,303,104 | ||||||||
HEALTH SERVICES SECTOR — 1.5% | |||||||||||
| Medical/Nursing Services — 1.5% | |||||||||||
| 24,650 | Fresenius Medical | ||||||||||
| Care AG & Co. KGaA (Germany) (b) | 1,942,395 | 1,046,255 | |||||||||
HEALTH TECHNOLOGY SECTOR — 7.5% | |||||||||||
| Medical Specialties — 4.6% | |||||||||||
| 77,600 | Koninklijke Philips N.V. (Netherlands) (b) | 2,850,425 | 1,425,277 | ||||||||
| 121,450 | Smith & Nephew PLC (Britain) (b) | 2,247,158 | 1,688,212 | ||||||||
| 5,097,583 | 3,113,489 | ||||||||||
| Pharmaceuticals: Major — 2.9% | |||||||||||
| 6,850 | Roche Holding AG (Switzerland) (b) | 2,362,069 | 1,957,337 | ||||||||
INDUSTRIAL SERVICES SECTOR — 2.2% | |||||||||||
| Contract Drilling — 2.2% | |||||||||||
| 30,800 | Schlumberger Ltd. (Curacao) | 650,062 | 1,512,280 | ||||||||
PROCESS INDUSTRIES SECTOR — 1.7% | |||||||||||
| Chemicals: Specialty — 1.7% | |||||||||||
| 24,100 | NOF Corp. (Japan) (b) | 1,229,748 | 1,126,199 | ||||||||
PRODUCER MANUFACTURING SECTOR — 5.7% | |||||||||||
| Building Products — 1.7% | |||||||||||
| 105,000 | Sanwa Holdings Corp. (Japan) (b) | 1,289,920 | 1,126,464 | ||||||||
| Electrical Products — 1.4% | |||||||||||
| 44,000 | Smiths Group PLC (Britain) (b) | 716,849 | 933,181 | ||||||||
| Industrial Conglomerates — 1.4% | |||||||||||
| 19,250 | Jardine Matheson Holdings Ltd. (Bermuda) (b) | 1,261,360 | 936,363 | ||||||||
| Industrial Machinery — 1.2% | |||||||||||
| 31,800 | Nabtesco Corp. (Japan) (b) | 1,114,864 | 782,157 | ||||||||
RETAIL TRADE SECTOR — 8.1% | |||||||||||
| Discount Stores — 6.0% | |||||||||||
| 679,675 | B&M European Value | ||||||||||
| Retail S.A. (Luxembourg) (b) | 3,557,660 | 4,049,332 | |||||||||
| Specialty Stores — 2.1% | |||||||||||
| 234,675 | CK Hutchison | ||||||||||
| Holdings Ltd. (Cayman Islands) (b) | 1,585,927 | 1,451,851 | |||||||||
The accompanying notes to financial statements are an integral part of this schedule.
21
FMI International Fund II – Currency Unhedged
SCHEDULE OF INVESTMENTS (Continued)
March 31, 2023 (Unaudited)
| Shares | Cost | Value | |||||||||
| LONG-TERM INVESTMENTS — 94.5% (a) (Continued) | |||||||||||
| COMMON STOCKS — 89.5% (a) (Continued) | |||||||||||
TECHNOLOGY SERVICES SECTOR — 4.2% | |||||||||||
| Packaged Software — 4.2% | |||||||||||
| 22,600 | SAP SE (Germany) (b) | $ | 2,604,414 | $ | 2,853,726 | ||||||
| Total common stocks | 55,903,272 | 60,746,873 | |||||||||
| PREFERRED STOCKS — 5.0% (a) | |||||||||||
CONSUMER NON-DURABLES SECTOR — 0.6% | |||||||||||
| Household/Personal Care — 0.6% | |||||||||||
| 10,613 | Amorepacific Corp. (South Korea) (b) | 586,911 | 362,553 | ||||||||
ELECTRONIC TECHNOLOGY SECTOR — 4.4% | |||||||||||
| Telecommunications Equipment — 4.4% | |||||||||||
| 71,800 | Samsung Electronics Co. Ltd. (South Korea) (b) | 3,116,925 | 2,987,929 | ||||||||
| Total preferred stocks | 3,703,836 | 3,350,482 | |||||||||
| Total long-term investments | 59,607,108 | 64,097,355 | |||||||||
| SHORT-TERM INVESTMENTS — 5.0% (a) | |||||||||||
| Money Market Fund — 5.0% | |||||||||||
| 3,433,132 | First American Treasury | ||||||||||
| Obligations Fund, Cl X, 4.717%^ | 3,433,132 | 3,433,132 | |||||||||
| Total short-term investments | 3,433,132 | 3,433,132 | |||||||||
| Total investments — 99.5% | $ | 63,040,240 | 67,530,487 | ||||||||
Other assets, less liabilities — 0.5% (a) | 322,654 | ||||||||||
| TOTAL NET ASSETS — 100.0% | $ | 67,853,141 | |||||||||
| * | Non-income producing security. |
| ^ | The rate quoted is the annualized 7-day yield as of March 31, 2023. |
| (a) | Percentages for the various classifications relate to total net assets. |
| (b) | Security does not trade during New York Stock Exchange hours, provided that certain foreign exchanges may trade during a portion of the New York Stock Exchange hours, and has been valued in accordance with the Fund’s pricing procedures discussed in Note 2(a) to the financial statements and has been classified as level 2. As of March 31, 2023, the aggregate value of these securities was $55,911,505. |
| PLC | Public Limited Company |
The accompanying notes to financial statements are an integral part of this schedule.
22
FMI International Fund II – Currency Unhedged
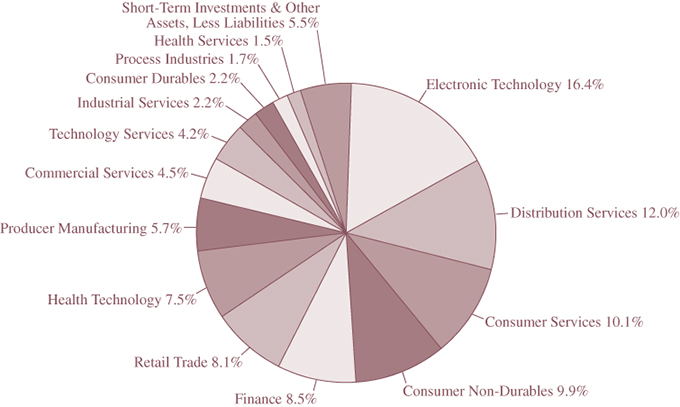
INDUSTRY SECTORS as a percentage of net assets
as of March 31, 2023 (Unaudited)
CONCENTRATION BY COUNTRY based on domicile of issuer as
a percentage of long-term investments only
as of March 31, 2023 (Unaudited)
23
FMI Funds, Inc.
STATEMENTS OF ASSETS AND LIABILITIES
March 31, 2023 (Unaudited)
| FMI | ||||||||||||||||
| FMI | FMI | FMI | International | |||||||||||||
| Large Cap | Common Stock | International | Fund II – Currency | |||||||||||||
| Fund | Fund | Fund | Unhedged | |||||||||||||
| ASSETS: | ||||||||||||||||
| Investments in securities, | ||||||||||||||||
| at value (a) | $ | 1,751,722,572 | $ | 1,222,039,296 | $ | 3,765,553,894 | $ | 67,530,487 | ||||||||
| Restricted cash | — | — | 6,040,000 | — | ||||||||||||
| Receivable from shareholders | ||||||||||||||||
| for purchases | 390,213 | 3,598,975 | 7,161,168 | 12,214 | ||||||||||||
| Dividends, interest and | ||||||||||||||||
| other receivables | 3,890,252 | 394,910 | 20,194,616 | 334,715 | ||||||||||||
| Receivable for | ||||||||||||||||
| investments sold | — | — | 326,379 | 5,407 | ||||||||||||
| Unrealized appreciation on | ||||||||||||||||
| forward currency contracts | — | — | 11,130,297 | — | ||||||||||||
| Prepaid directors’ retainer | 6,441 | 6,441 | 6,441 | 6,441 | ||||||||||||
| Prepaid expenses | 58,690 | 73,951 | 119,203 | 19,569 | ||||||||||||
| Total assets | $ | 1,756,068,168 | $ | 1,226,113,573 | $ | 3,810,531,998 | $ | 67,908,833 | ||||||||
| LIABILITIES: | ||||||||||||||||
| Payable to shareholders | ||||||||||||||||
| for redemptions | $ | 1,373,363 | $ | 944,477 | $ | 1,740,132 | $ | 2,728 | ||||||||
| Payable to brokers | ||||||||||||||||
| for collateral received | — | — | 6,040,000 | — | ||||||||||||
| Payable to adviser | ||||||||||||||||
| for management fees | 757,709 | 728,631 | 2,093,004 | 24,002 | ||||||||||||
| Unrealized depreciation on | ||||||||||||||||
| forward currency contracts | — | — | 22,296,857 | — | ||||||||||||
| Other liabilities | 276,223 | 89,807 | 307,590 | 28,962 | ||||||||||||
| Total liabilities | 2,407,295 | 1,762,915 | 32,477,583 | 55,692 | ||||||||||||
| Net assets | $ | 1,753,660,873 | $ | 1,224,350,658 | $ | 3,778,054,415 | $ | 67,853,141 | ||||||||
| NET ASSETS: | ||||||||||||||||
| Capital stock | $ | 1,231,583,967 | $ | 903,542,564 | $ | 3,887,208,036 | $ | 67,211,024 | ||||||||
| Total distributable | ||||||||||||||||
| earnings/(accumulated | ||||||||||||||||
| losses) | 522,076,906 | 320,808,094 | (109,153,621 | ) | 642,117 | |||||||||||
| Net assets | $ | 1,753,660,873 | $ | 1,224,350,658 | $ | 3,778,054,415 | $ | 67,853,141 | ||||||||
The accompanying notes to financial statements are an integral part of these financial statements.
24
FMI Funds, Inc.
STATEMENTS OF ASSETS AND LIABILITIES (Continued)
March 31, 2023 (Unaudited)
| FMI | ||||||||||||||||
| FMI | FMI | FMI | International | |||||||||||||
| Large Cap | Common Stock | International | Fund II – Currency | |||||||||||||
| Fund | Fund | Fund | Unhedged | |||||||||||||
| CALCULATION OF NET | ||||||||||||||||
| ASSET VALUE PER SHARE: | ||||||||||||||||
| Investor Class shares: | ||||||||||||||||
| Net assets | $ | 982,776,025 | $ | 448,938,000 | $ | 939,027,852 | $ | — | ||||||||
| Shares outstanding | 69,198,072 | 14,856,098 | 30,594,613 | — | ||||||||||||
| Shares authorized | ||||||||||||||||
| ($0.0001 par value) | 300,000,000 | 300,000,000 | 300,000,000 | — | ||||||||||||
| Net asset value, offering and | ||||||||||||||||
| redemption price per share | $ | 14.20 | $ | 30.22 | $ | 30.69 | $ | — | ||||||||
| Institutional Class shares: | ||||||||||||||||
| Net assets | $ | 770,884,848 | $ | 775,412,658 | $ | 2,839,026,563 | $ | 67,853,141 | ||||||||
| Shares outstanding | 54,416,441 | 25,626,028 | 92,203,696 | 3,501,594 | ||||||||||||
| Shares authorized | ||||||||||||||||
| ($0.0001 par value) | 300,000,000 | 300,000,000 | 300,000,000 | 300,000,000 | ||||||||||||
| Net asset value, offering and | ||||||||||||||||
| redemption price per share | $ | 14.17 | $ | 30.26 | $ | 30.79 | $ | 19.38 | ||||||||
| (a) Identified cost of investments | $ | 1,360,830,294 | $ | 928,826,544 | $ | 3,337,011,971 | $ | 63,040,240 | ||||||||
The accompanying notes to financial statements are an integral part of these financial statements.
25
FMI Funds, Inc.
STATEMENTS OF OPERATIONS
For the Six Month Period Ending March 31, 2023 (Unaudited)
| FMI | ||||||||||||||||
| FMI | FMI | FMI | International | |||||||||||||
| Large Cap | Common Stock | International | Fund II – Currency | |||||||||||||
| Fund | Fund | Fund | Unhedged | |||||||||||||
| INCOME: | ||||||||||||||||
| Dividends* | $ | 14,401,218 | $ | 5,632,472 | $ | 42,553,956 | $ | 729,953 | ||||||||
| Interest | 375,938 | 1,353,109 | 2,730,297 | 57,379 | ||||||||||||
| Total income | 14,777,156 | 6,985,581 | 45,284,253 | 787,332 | ||||||||||||
| EXPENSES: | ||||||||||||||||
| Management fees | 6,030,010 | 4,508,830 | 12,689,311 | 227,530 | ||||||||||||
| Shareholder servicing fees | ||||||||||||||||
| (Investor Class) | 722,667 | 213,602 | 628,111 | — | ||||||||||||
| Administration and | ||||||||||||||||
| accounting services | 203,137 | 130,045 | 359,878 | 15,783 | ||||||||||||
| Printing and postage expense | 88,196 | 27,098 | 280,356 | 2,791 | ||||||||||||
| Registration fees | 46,594 | 48,278 | 51,433 | 14,257 | ||||||||||||
| Transfer agent fees | 45,042 | 34,010 | 51,728 | 9,050 | ||||||||||||
| Custodian fees | 42,809 | 20,072 | 201,583 | 12,606 | ||||||||||||
| Board of Directors fees | 36,059 | 36,059 | 36,059 | 36,059 | ||||||||||||
| Professional fees | 23,676 | 21,459 | 25,275 | 20,492 | ||||||||||||
| Interest expense | 41,306 | — | — | — | ||||||||||||
| Other expenses | 80,151 | 42,888 | 109,082 | 18,489 | ||||||||||||
| Total expenses | ||||||||||||||||
| before reimbursement | 7,359,647 | 5,082,341 | 14,432,816 | 357,057 | ||||||||||||
| Less expenses | ||||||||||||||||
| reimbursed by adviser | — | — | — | (83,740 | ) | |||||||||||
| Net expenses | 7,359,647 | 5,082,341 | 14,432,816 | 273,317 | ||||||||||||
| NET INVESTMENT INCOME | 7,417,509 | 1,903,240 | 30,851,437 | 514,015 | ||||||||||||
The accompanying notes to financial statements are an integral part of these financial statements.
26
FMI Funds, Inc.
STATEMENTS OF OPERATIONS (Continued)
For the Six Month Period Ending March 31, 2023 (Unaudited)
| FMI | ||||||||||||||||
| FMI | FMI | FMI | International | |||||||||||||
| Large Cap | Common Stock | International | Fund II – Currency | |||||||||||||
| Fund | Fund | Fund | Unhedged | |||||||||||||
| NET REALIZED GAIN (LOSS) | ||||||||||||||||
| ON INVESTMENTS: | ||||||||||||||||
| Securities | $ | 130,028,973 | $ | 32,773,627 | $ | (48,884,814 | ) | $ | (2,289,135 | ) | ||||||
| Forward currency contracts | — | — | (27,554,816 | ) | — | |||||||||||
| Foreign currency transactions | — | — | 36,201,952 | (10,023 | ) | |||||||||||
| NET REALIZED GAIN (LOSS) | ||||||||||||||||
| ON INVESTMENTS | 130,028,973 | 32,773,627 | (40,237,678 | ) | (2,299,158 | ) | ||||||||||
| NET CHANGE IN UNREALIZED | ||||||||||||||||
| APPRECIATION/DEPRECIATION | ||||||||||||||||
| ON INVESTMENTS: | ||||||||||||||||
| Securities | 166,991,820 | 162,189,477 | 968,158,822 | 18,014,063 | ||||||||||||
| Forward currency contracts | — | — | (213,574,598 | ) | — | |||||||||||
| Foreign currency transactions | — | — | 898,522 | 40,345 | ||||||||||||
| NET CHANGE IN UNREALIZED | ||||||||||||||||
| APPRECIATION/DEPRECIATION | ||||||||||||||||
| ON INVESTMENTS | 166,991,820 | 162,189,477 | 755,482,746 | 18,054,408 | ||||||||||||
| NET GAIN (LOSS) | ||||||||||||||||
| ON INVESTMENTS | 297,020,793 | 194,963,104 | 715,245,068 | 15,755,250 | ||||||||||||
| NET INCREASE (DECREASE) IN | ||||||||||||||||
| NET ASSETS RESULTING | ||||||||||||||||
| FROM OPERATIONS | $ | 304,438,302 | $ | 196,866,344 | $ | 746,096,505 | $ | 16,269,265 | ||||||||
| * Net withholding taxes | $ | 27,340 | $ | — | $ | 4,464,258 | $ | 77,670 | ||||||||
The accompanying notes to financial statements are an integral part of these financial statements.
27
FMI Large Cap Fund
STATEMENTS OF CHANGES IN NET ASSETS
For the Six Month Period Ending March 31, 2023 (Unaudited) and For the Year Ended September 30, 2022
| 2023 | 2022 | |||||||
| OPERATIONS: | ||||||||
| Net investment income | $ | 7,417,509 | $ | 19,154,954 | ||||
| Net realized gain (loss) on investments | 130,028,973 | 435,120,201 | ||||||
| Net change in unrealized appreciation/depreciation | ||||||||
| on investments | 166,991,820 | (841,127,660 | ) | |||||
| Net increase (decrease) in net assets from operations | 304,438,302 | (386,852,505 | ) | |||||
| DISTRIBUTIONS TO SHAREHOLDERS FROM: | ||||||||
| Investor Class | (195,562,163 | ) | (220,026,036 | ) | ||||
| Institutional Class | (141,809,940 | ) | (278,028,660 | ) | ||||
| Total distributions (Note 8) | (337,372,103 | ) | (498,054,696 | ) | ||||
| FUND SHARE ACTIVITIES: | ||||||||
| Net increase (decrease) in net assets | ||||||||
| derived from Fund share activities (Note 9) | (285,578,672 | ) | (254,087,896 | ) | ||||
| TOTAL INCREASE (DECREASE) | (318,512,473 | ) | (1,138,995,097 | ) | ||||
| NET ASSETS AT THE BEGINNING OF THE PERIOD | 2,072,173,346 | 3,211,168,443 | ||||||
| NET ASSETS AT THE END OF THE PERIOD | $ | 1,753,660,873 | $ | 2,072,173,346 | ||||
| FUND SHARE TRANSACTIONS: | ||||||||
| Net increase (decrease) in shares outstanding (Note 9) | (14,812,412 | ) | (14,849,295 | ) | ||||
The accompanying notes to financial statements are an integral part of these financial statements.
28
FMI Common Stock Fund
STATEMENTS OF CHANGES IN NET ASSETS
For the Six Month Period Ending March 31, 2023 (Unaudited) and For the Year Ended September 30, 2022
| 2023 | 2022 | |||||||
| OPERATIONS: | ||||||||
| Net investment income | $ | 1,903,240 | $ | 1,609,589 | ||||
| Net realized gain (loss) on investments | 32,773,627 | 69,318,084 | ||||||
| Net change in unrealized appreciation/depreciation | ||||||||
| on investments | 162,189,477 | (165,647,805 | ) | |||||
| Net increase (decrease) in net assets from operations | 196,866,344 | (94,720,132 | ) | |||||
| DISTRIBUTIONS TO SHAREHOLDERS FROM: | ||||||||
| Investor Class | (24,761,425 | ) | (49,540,457 | ) | ||||
| Institutional Class | (43,252,226 | ) | (62,187,565 | ) | ||||
| Total distributions (Note 8) | (68,013,651 | ) | (111,728,022 | ) | ||||
| FUND SHARE ACTIVITIES: | ||||||||
| Net increase (decrease) in net assets | ||||||||
| derived from Fund share activities (Note 9) | 148,555,359 | 213,119,547 | ||||||
| TOTAL INCREASE (DECREASE) | 277,408,052 | 6,671,393 | ||||||
| NET ASSETS AT THE BEGINNING OF THE PERIOD | 946,942,606 | 940,271,213 | ||||||
| NET ASSETS AT THE END OF THE PERIOD | $ | 1,224,350,658 | $ | 946,942,606 | ||||
| FUND SHARE TRANSACTIONS: | ||||||||
| Net increase (decrease) in shares outstanding (Note 9) | 5,089,911 | 7,123,584 | ||||||
The accompanying notes to financial statements are an integral part of these financial statements.
29
FMI International Fund
STATEMENTS OF CHANGES IN NET ASSETS
For the Six Month Period Ending March 31, 2023 (Unaudited) and For the Year Ended September 30, 2022
| 2023 | 2022 | |||||||
| OPERATIONS: | ||||||||
| Net investment income | $ | 30,851,437 | $ | 44,549,159 | ||||
| Net realized gain (loss) on investments | (40,237,678 | ) | 345,393,466 | |||||
| Net change in unrealized appreciation/depreciation | ||||||||
| on investments | 755,482,746 | (996,553,440 | ) | |||||
| Net increase (decrease) in net assets from operations | 746,096,505 | (606,610,815 | ) | |||||
| DISTRIBUTIONS TO SHAREHOLDERS FROM: | ||||||||
| Investor Class | (116,170,330 | ) | (36,245,422 | ) | ||||
| Institutional Class | (331,682,134 | ) | (85,786,033 | ) | ||||
| Total distributions (Note 8) | (447,852,464 | ) | (122,031,455 | ) | ||||
| FUND SHARE ACTIVITIES: | ||||||||
| Net increase (decrease) in net assets | ||||||||
| derived from Fund share activities (Note 9) | 509,049,790 | 281,706,526 | ||||||
| TOTAL INCREASE (DECREASE) | 807,293,831 | (446,935,744 | ) | |||||
| NET ASSETS AT THE BEGINNING OF THE PERIOD | 2,970,760,584 | 3,417,696,328 | ||||||
| NET ASSETS AT THE END OF THE PERIOD | $ | 3,778,054,415 | $ | 2,970,760,584 | ||||
| FUND SHARE TRANSACTIONS: | ||||||||
| Net increase (decrease) in shares outstanding (Note 9) | 17,903,934 | 8,435,897 | ||||||
The accompanying notes to financial statements are an integral part of these financial statements.
30
FMI International Fund II – Currency Unhedged
STATEMENTS OF CHANGES IN NET ASSETS
For the Six Month Period Ending March 31, 2023 (Unaudited) and For the Year Ended September 30, 2022
| 2023 | 2022 | |||||||
| OPERATIONS: | ||||||||
| Net investment income | $ | 514,015 | $ | 896,687 | ||||
| Net realized gain (loss) on investments | (2,299,158 | ) | (1,764,791 | ) | ||||
| Net change in unrealized appreciation/depreciation | ||||||||
| on investments | 18,054,408 | (19,766,819 | ) | |||||
| Net increase (decrease) in net assets from operations | 16,269,265 | (20,634,923 | ) | |||||
| DISTRIBUTIONS TO SHAREHOLDERS FROM: | ||||||||
| Institutional Class | (830,255 | ) | (3,350,974 | ) | ||||
| Total distributions (Note 8) | (830,255 | ) | (3,350,974 | ) | ||||
| FUND SHARE ACTIVITIES: | ||||||||
| Net increase (decrease) in net assets | ||||||||
| derived from Fund share activities (Note 9) | 3,428,404 | 974,406 | ||||||
| TOTAL INCREASE (DECREASE) | 18,867,414 | (23,011,491 | ) | |||||
| NET ASSETS AT THE BEGINNING OF THE PERIOD | 48,985,727 | 71,997,218 | ||||||
| NET ASSETS AT THE END OF THE PERIOD | $ | 67,853,141 | $ | 48,985,727 | ||||
| FUND SHARE TRANSACTIONS: | ||||||||
| Net increase (decrease) in shares outstanding (Note 9) | 190,172 | (6,004 | ) | |||||
The accompanying notes to financial statements are an integral part of these financial statements.
31
FMI Large Cap Fund
FINANCIAL HIGHLIGHTS
(Selected data for each share of the Fund outstanding throughout each period)
Investor Class
| (Unaudited) | ||||||||||||||||||||||||
| For the | ||||||||||||||||||||||||
| Six Month | ||||||||||||||||||||||||
| Period Ending | Years Ended September 30, | |||||||||||||||||||||||
| March 31, | ||||||||||||||||||||||||
| 2023 | 2022 | 2021 | 2020 | 2019 | 2018 | |||||||||||||||||||
| PER SHARE OPERATING | ||||||||||||||||||||||||
| PERFORMANCE: | ||||||||||||||||||||||||
| Net asset value, | ||||||||||||||||||||||||
| beginning of period | $ | 14.98 | $ | 20.96 | $ | 18.81 | $ | 20.14 | $ | 22.85 | $ | 22.17 | ||||||||||||
| Income from | ||||||||||||||||||||||||
| investment operations: | ||||||||||||||||||||||||
| Net investment | ||||||||||||||||||||||||
income (loss)(1) | 0.06 | 0.11 | 0.15 | 0.18 | 0.25 | 0.24 | ||||||||||||||||||
| Net realized and unrealized | ||||||||||||||||||||||||
| gain (loss) on investments | 2.25 | (2.73 | ) | 4.25 | 0.03 | (2) | 0.55 | 2.43 | ||||||||||||||||
| Total from | ||||||||||||||||||||||||
| investment operations | 2.31 | (2.62 | ) | 4.40 | 0.21 | 0.80 | 2.67 | |||||||||||||||||
| Less distributions: | ||||||||||||||||||||||||
| Distributions from | ||||||||||||||||||||||||
| net investment income | (0.11 | ) | (0.16 | ) | (0.30 | ) | (0.17 | ) | (0.28 | ) | (0.17 | ) | ||||||||||||
| Distributions from | ||||||||||||||||||||||||
| net realized gains | (2.98 | ) | (3.20 | ) | (1.95 | ) | (1.37 | ) | (3.23 | ) | (1.82 | ) | ||||||||||||
| Total from distributions | (3.09 | ) | (3.36 | ) | (2.25 | ) | (1.54 | ) | (3.51 | ) | (1.99 | ) | ||||||||||||
| Net asset value, end of period | $ | 14.20 | $ | 14.98 | $ | 20.96 | $ | 18.81 | $ | 20.14 | $ | 22.85 | ||||||||||||
| TOTAL RETURN | 16.51 | %(3) | (15.86 | )% | 24.48 | % | 0.71 | % | 5.72 | % | 12.67 | % | ||||||||||||
| RATIOS/SUPPLEMENTAL DATA: | ||||||||||||||||||||||||
| Net assets, end of | ||||||||||||||||||||||||
| period (in 000’s $) | 982,776 | 1,001,682 | 1,422,451 | 1,475,504 | 2,337,118 | 3,155,818 | ||||||||||||||||||
| Ratio of expenses to | ||||||||||||||||||||||||
| average net assets | 0.85 | %(4) | 0.83 | % | 0.82 | % | 0.81 | % | 0.82 | % | 0.85 | % | ||||||||||||
| Ratio of net investment | ||||||||||||||||||||||||
| income (loss) to | ||||||||||||||||||||||||
| average net assets | 0.74 | %(4) | 0.60 | % | 0.72 | % | 0.99 | % | 1.25 | % | 1.07 | % | ||||||||||||
Portfolio turnover rate(5) | 7 | %(3) | 25 | % | 17 | % | 28 | % | 20 | % | 25 | % | ||||||||||||
| (1) | Net investment income (loss) per share was calculated using average shares outstanding. |
| (2) | Realized and unrealized gain (loss) per share in this caption are balancing amounts necessary to reconcile the change in net asset value per share for the period, and may not reconcile with the aggregate gains on the Statement of Operations due to share transactions for the period. |
| (3) | Not annualized. |
| (4) | Annualized. |
| (5) | Portfolio turnover rate is disclosed for the Fund as a whole. |
The accompanying notes to financial statements are an integral part of these financial statements.
32
FMI Large Cap Fund
FINANCIAL HIGHLIGHTS
(Selected data for each share of the Fund outstanding throughout each period)
Institutional Class
| (Unaudited) | ||||||||||||||||||||||||
| For the | ||||||||||||||||||||||||
| Six Month | ||||||||||||||||||||||||
| Period Ending | Years Ended September 30, | |||||||||||||||||||||||
| March 31, | ||||||||||||||||||||||||
| 2023 | 2022 | 2021 | 2020 | 2019 | 2018 | |||||||||||||||||||
| PER SHARE OPERATING | ||||||||||||||||||||||||
| PERFORMANCE: | ||||||||||||||||||||||||
| Net asset value, | ||||||||||||||||||||||||
| beginning of period | $ | 14.96 | $ | 20.94 | $ | 18.80 | $ | 20.13 | $ | 22.85 | $ | 22.18 | ||||||||||||
| Income from | ||||||||||||||||||||||||
| investment operations: | ||||||||||||||||||||||||
| Net investment | ||||||||||||||||||||||||
income (loss)(1) | 0.07 | 0.14 | 0.18 | 0.21 | 0.25 | 0.27 | ||||||||||||||||||
| Net realized and unrealized | ||||||||||||||||||||||||
| gain (loss) on investments | 2.25 | (2.73 | ) | 4.24 | 0.02 | (2) | 0.58 | 2.43 | ||||||||||||||||
| Total from | ||||||||||||||||||||||||
| investment operations | 2.32 | (2.59 | ) | 4.42 | 0.23 | 0.83 | 2.70 | |||||||||||||||||
| Less distributions: | ||||||||||||||||||||||||
| Distributions from | ||||||||||||||||||||||||
| net investment income | (0.13 | ) | (0.19 | ) | (0.33 | ) | (0.19 | ) | (0.32 | ) | (0.21 | ) | ||||||||||||
| Distributions from | ||||||||||||||||||||||||
| net realized gains | (2.98 | ) | (3.20 | ) | (1.95 | ) | (1.37 | ) | (3.23 | ) | (1.82 | ) | ||||||||||||
| Total from distributions | (3.11 | ) | (3.39 | ) | (2.28 | ) | (1.56 | ) | (3.55 | ) | (2.03 | ) | ||||||||||||
| Net asset value, end of period | $ | 14.17 | $ | 14.96 | $ | 20.94 | $ | 18.80 | $ | 20.13 | $ | 22.85 | ||||||||||||
| TOTAL RETURN | 16.61 | %(3) | (15.73 | )% | 24.63 | % | 0.84 | % | 5.89 | % | 12.82 | % | ||||||||||||
| RATIOS/SUPPLEMENTAL DATA: | ||||||||||||||||||||||||
| Net assets, end of | ||||||||||||||||||||||||
| period (in 000’s $) | 770,885 | 1,070,491 | 1,788,717 | 1,924,284 | 2,652,783 | 2,861,755 | ||||||||||||||||||
| Ratio of expenses to | ||||||||||||||||||||||||
| average net assets | 0.72 | %(4) | 0.69 | % | 0.68 | % | 0.67 | % | 0.68 | % | 0.71 | % | ||||||||||||
| Ratio of net investment | ||||||||||||||||||||||||
| income (loss) to | ||||||||||||||||||||||||
| average net assets | 0.87 | %(4) | 0.73 | % | 0.85 | % | 1.13 | % | 1.26 | % | 1.20 | % | ||||||||||||
Portfolio turnover rate(5) | 7 | %(3) | 25 | % | 17 | % | 28 | % | 20 | % | 25 | % | ||||||||||||
| (1) | Net investment income (loss) per share was calculated using average shares outstanding. |
| (2) | Realized and unrealized gain (loss) per share in this caption are balancing amounts necessary to reconcile the change in net asset value per share for the period, and may not reconcile with the aggregate gains on the Statement of Operations due to share transactions for the period. |
| (3) | Not annualized. |
| (4) | Annualized. |
| (5) | Portfolio turnover rate is disclosed for the Fund as a whole. |
The accompanying notes to financial statements are an integral part of these financial statements.
33
FMI Common Stock Fund
FINANCIAL HIGHLIGHTS
(Selected data for each share of the Fund outstanding throughout each period)
Investor Class
| (Unaudited) | ||||||||||||||||||||||||
| For the | ||||||||||||||||||||||||
| Six Month | ||||||||||||||||||||||||
| Period Ending | Years Ended September 30, | |||||||||||||||||||||||
| March 31, | ||||||||||||||||||||||||
| 2023 | 2022 | 2021 | 2020 | 2019 | 2018 | |||||||||||||||||||
| PER SHARE OPERATING | ||||||||||||||||||||||||
| PERFORMANCE: | ||||||||||||||||||||||||
| Net asset value, | ||||||||||||||||||||||||
| beginning of period | $ | 26.72 | $ | 33.23 | $ | 22.25 | $ | 26.39 | $ | 27.55 | $ | 28.83 | ||||||||||||
| Income from | ||||||||||||||||||||||||
| investment operations: | ||||||||||||||||||||||||
| Net investment | ||||||||||||||||||||||||
income (loss)(1) | 0.04 | 0.03 | 0.08 | 0.17 | 0.15 | 0.06 | ||||||||||||||||||
| Net realized and unrealized | ||||||||||||||||||||||||
| gain (loss) on investments | 5.33 | (2.57 | ) | 11.11 | (3.02 | ) | 0.94 | 1.80 | ||||||||||||||||
| Total from | ||||||||||||||||||||||||
| investment operations | 5.37 | (2.54 | ) | 11.19 | (2.85 | ) | 1.09 | 1.86 | ||||||||||||||||
| Less distributions: | ||||||||||||||||||||||||
| Distributions from | ||||||||||||||||||||||||
| net investment income | (0.04 | ) | (0.11 | ) | (0.21 | ) | (0.11 | ) | (0.10 | ) | (0.01 | ) | ||||||||||||
| Distributions from | ||||||||||||||||||||||||
| net realized gains | (1.83 | ) | (3.86 | ) | — | (1.18 | ) | (2.15 | ) | (3.13 | ) | |||||||||||||
| Total from distributions | (1.87 | ) | (3.97 | ) | (0.21 | ) | (1.29 | ) | (2.25 | ) | (3.14 | ) | ||||||||||||
| Net asset value, end of period | $ | 30.22 | $ | 26.72 | $ | 33.23 | $ | 22.25 | $ | 26.39 | $ | 27.55 | ||||||||||||
| TOTAL RETURN | 20.65 | %(2) | (9.10 | )% | 50.49 | % | (11.51 | )% | 5.28 | % | 6.92 | % | ||||||||||||
| RATIOS/SUPPLEMENTAL DATA: | ||||||||||||||||||||||||
| Net assets, end of | ||||||||||||||||||||||||
| period (in 000’s $) | 448,938 | 357,946 | 423,286 | 345,428 | 529,234 | 635,174 | ||||||||||||||||||
| Ratio of expenses to | ||||||||||||||||||||||||
| average net assets | 0.99 | %(3) | 1.00 | % | 1.01 | % | 1.02 | % | 1.02 | % | 1.04 | % | ||||||||||||
| Ratio of net investment | ||||||||||||||||||||||||
| income (loss) to | ||||||||||||||||||||||||
| average net assets | 0.27 | %(3) | 0.09 | % | 0.28 | % | 0.71 | % | 0.59 | % | 0.23 | % | ||||||||||||
Portfolio turnover rate(4) | 14 | %(2) | 36 | % | 29 | % | 32 | % | 28 | % | 26 | % | ||||||||||||
| (1) | Net investment income (loss) per share was calculated using average shares outstanding. |
| (2) | Not annualized. |
| (3) | Annualized. |
| (4) | Portfolio turnover rate is disclosed for the Fund as a whole. |
The accompanying notes to financial statements are an integral part of these financial statements.
34
FMI Common Stock Fund
FINANCIAL HIGHLIGHTS
(Selected data for each share of the Fund outstanding throughout each period)
Institutional Class
| (Unaudited) | ||||||||||||||||||||||||
| For the | ||||||||||||||||||||||||
| Six Month | ||||||||||||||||||||||||
| Period Ending | Years Ended September 30, | |||||||||||||||||||||||
| March 31, | ||||||||||||||||||||||||
| 2023 | 2022 | 2021 | 2020 | 2019 | 2018 | |||||||||||||||||||
| PER SHARE OPERATING | ||||||||||||||||||||||||
| PERFORMANCE: | ||||||||||||||||||||||||
| Net asset value, | ||||||||||||||||||||||||
| beginning of period | $ | 26.77 | $ | 33.29 | $ | 22.28 | $ | 26.42 | $ | 27.59 | $ | 28.85 | ||||||||||||
| Income from | ||||||||||||||||||||||||
| investment operations: | ||||||||||||||||||||||||
| Net investment | ||||||||||||||||||||||||
income (loss)(1) | 0.06 | 0.07 | 0.12 | 0.20 | 0.18 | 0.10 | ||||||||||||||||||
| Net realized and unrealized | ||||||||||||||||||||||||
| gain (loss) on investments | 5.33 | (2.58 | ) | 11.12 | (3.02 | ) | 0.93 | 1.79 | ||||||||||||||||
| Total from | ||||||||||||||||||||||||
| investment operations | 5.39 | (2.51 | ) | 11.24 | (2.82 | ) | 1.11 | 1.89 | ||||||||||||||||
| Less distributions: | ||||||||||||||||||||||||
| Distributions from | ||||||||||||||||||||||||
| net investment income | (0.07 | ) | (0.15 | ) | (0.23 | ) | (0.14 | ) | (0.13 | ) | (0.02 | ) | ||||||||||||
| Distributions from | ||||||||||||||||||||||||
| net realized gains | (1.83 | ) | (3.86 | ) | — | (1.18 | ) | (2.15 | ) | (3.13 | ) | |||||||||||||
| Total from distributions | (1.90 | ) | (4.01 | ) | (0.23 | ) | (1.32 | ) | (2.28 | ) | (3.15 | ) | ||||||||||||
| Net asset value, end of period | $ | 30.26 | $ | 26.77 | $ | 33.29 | $ | 22.28 | $ | 26.42 | $ | 27.59 | ||||||||||||
| TOTAL RETURN | 20.72 | %(2) | (8.99 | )% | 50.68 | % | (11.41 | )% | 5.40 | % | 7.02 | % | ||||||||||||
| RATIOS/SUPPLEMENTAL DATA: | ||||||||||||||||||||||||
| Net assets, end of | ||||||||||||||||||||||||
| period (in 000’s $) | 775,413 | 588,996 | 516,985 | 344,811 | 448,262 | 433,491 | ||||||||||||||||||
| Ratio of expenses to | ||||||||||||||||||||||||
| average net assets | 0.88 | %(3) | 0.89 | % | 0.90 | % | 0.90 | % | 0.91 | % | 0.94 | % | ||||||||||||
| Ratio of net investment | ||||||||||||||||||||||||
| income (loss) to | ||||||||||||||||||||||||
| average net assets | 0.39 | %(3) | 0.22 | % | 0.39 | % | 0.84 | % | 0.71 | % | 0.37 | % | ||||||||||||
Portfolio turnover rate(4) | 14 | %(2) | 36 | % | 29 | % | 32 | % | 28 | % | 26 | % | ||||||||||||
| (1) | Net investment income (loss) per share was calculated using average shares outstanding. |
| (2) | Not annualized. |
| (3) | Annualized. |
| (4) | Portfolio turnover rate is disclosed for the Fund as a whole. |
The accompanying notes to financial statements are an integral part of these financial statements.
35
FMI International Fund
FINANCIAL HIGHLIGHTS
(Selected data for each share of the Fund outstanding throughout each period)
Investor Class
| (Unaudited) | ||||||||||||||||||||||||
| For the | ||||||||||||||||||||||||
| Six Month | ||||||||||||||||||||||||
| Period Ending | Years Ended September 30, | |||||||||||||||||||||||
| March 31, | ||||||||||||||||||||||||
| 2023 | 2022 | 2021 | 2020 | 2019 | 2018 | |||||||||||||||||||
| PER SHARE OPERATING | ||||||||||||||||||||||||
| PERFORMANCE: | ||||||||||||||||||||||||
| Net asset value, | ||||||||||||||||||||||||
| beginning of period | $ | 28.25 | $ | 35.36 | $ | 27.69 | $ | 31.89 | $ | 33.80 | $ | 33.59 | ||||||||||||
| Income from | ||||||||||||||||||||||||
| investment operations: | ||||||||||||||||||||||||
| Net investment | ||||||||||||||||||||||||
income (loss)(1) | 0.25 | 0.41 | 1.10 | 0.35 | 0.48 | 0.48 | ||||||||||||||||||
| Net realized and unrealized | ||||||||||||||||||||||||
| gain (loss) on investments | 6.43 | (6.29 | ) | 6.57 | (3.40 | ) | (0.26 | ) | 0.28 | |||||||||||||||
| Total from | ||||||||||||||||||||||||
| investment operations | 6.68 | (5.88 | ) | 7.67 | (3.05 | ) | 0.22 | 0.76 | ||||||||||||||||
| Less distributions: | ||||||||||||||||||||||||
| Distributions from | ||||||||||||||||||||||||
| net investment income | (4.24 | ) | (1.23 | ) | — | (1.15 | ) | (1.32 | ) | (0.10 | ) | |||||||||||||
| Distributions from | ||||||||||||||||||||||||
| net realized gains | — | — | — | — | (0.81 | ) | (0.45 | ) | ||||||||||||||||
| Total from distributions | (4.24 | ) | (1.23 | ) | — | (1.15 | ) | (2.13 | ) | (0.55 | ) | |||||||||||||
| Net asset value, end of period | $ | 30.69 | $ | 28.25 | $ | 35.36 | $ | 27.69 | $ | 31.89 | $ | 33.80 | ||||||||||||
| TOTAL RETURN | 25.20 | %(2) | (17.24 | )% | 27.70 | % | (10.06 | )% | 1.27 | % | 2.27 | % | ||||||||||||
| RATIOS/SUPPLEMENTAL DATA: | ||||||||||||||||||||||||
| Net assets, end of | ||||||||||||||||||||||||
| period (in 000’s $) | 939,028 | 792,421 | 1,066,600 | 1,207,016 | 2,798,739 | 3,267,841 | ||||||||||||||||||
| Ratio of expenses to | ||||||||||||||||||||||||
| average net assets | 0.94 | %(3) | 0.94 | % | 0.94 | % | 0.91 | % | 0.90 | % | 0.90 | % | ||||||||||||
| Ratio of net investment | ||||||||||||||||||||||||
| income (loss) to | ||||||||||||||||||||||||
| average net assets | 1.68 | %(3) | 1.22 | % | 3.29 | % | 1.19 | % | 1.55 | % | 1.43 | % | ||||||||||||
Portfolio turnover rate(4) | 9 | %(2) | 20 | % | 27 | % | 23 | % | 13 | % | 21 | % | ||||||||||||
| (1) | Net investment income (loss) per share was calculated using average shares outstanding. |
| (2) | Not annualized. |
| (3) | Annualized. |
| (4) | Portfolio turnover rate is disclosed for the Fund as a whole. |
The accompanying notes to financial statements are an integral part of these financial statements.
36
FMI International Fund
FINANCIAL HIGHLIGHTS
(Selected data for each share of the Fund outstanding throughout each period)
Institutional Class
| (Unaudited) | ||||||||||||||||||||||||
| For the | ||||||||||||||||||||||||
| Six Month | ||||||||||||||||||||||||
| Period Ending | Years Ended September 30, | |||||||||||||||||||||||
| March 31, | ||||||||||||||||||||||||
| 2023 | 2022 | 2021 | 2020 | 2019 | 2018 | |||||||||||||||||||
| PER SHARE OPERATING | ||||||||||||||||||||||||
| PERFORMANCE: | ||||||||||||||||||||||||
| Net asset value, | ||||||||||||||||||||||||
| beginning of period | $ | 28.35 | $ | 35.46 | $ | 27.73 | $ | 31.93 | $ | 33.86 | $ | 33.62 | ||||||||||||
| Income from | ||||||||||||||||||||||||
| investment operations: | ||||||||||||||||||||||||
| Net investment | ||||||||||||||||||||||||
income (loss)(1) | 0.28 | 0.45 | 1.18 | 0.38 | 0.53 | 0.49 | ||||||||||||||||||
| Net realized and unrealized | ||||||||||||||||||||||||
| gain (loss) on investments | 6.43 | (6.29 | ) | 6.55 | (3.39 | ) | (0.27 | ) | 0.31 | |||||||||||||||
| Total from | ||||||||||||||||||||||||
| investment operations | 6.71 | (5.84 | ) | 7.73 | (3.01 | ) | 0.26 | 0.80 | ||||||||||||||||
| Less distributions: | ||||||||||||||||||||||||
| Distributions from | ||||||||||||||||||||||||
| net investment income | (4.27 | ) | (1.27 | ) | — | (1.19 | ) | (1.38 | ) | (0.11 | ) | |||||||||||||
| Distributions from | ||||||||||||||||||||||||
| net realized gains | — | — | — | — | (0.81 | ) | (0.45 | ) | ||||||||||||||||
| Total from distributions | (4.27 | ) | (1.27 | ) | — | (1.19 | ) | (2.19 | ) | (0.56 | ) | |||||||||||||
| Net asset value, end of period | $ | 30.79 | $ | 28.35 | $ | 35.46 | $ | 27.73 | $ | 31.93 | $ | 33.86 | ||||||||||||
| TOTAL RETURN | 25.25 | %(2) | (17.10 | )% | 27.88 | % | (9.95 | )% | 1.42 | % | 2.40 | % | ||||||||||||
| RATIOS/SUPPLEMENTAL DATA: | ||||||||||||||||||||||||
| Net assets, end of | ||||||||||||||||||||||||
| period (in 000’s $) | 2,839,026 | 2,178,340 | 2,351,096 | 2,142,615 | 4,480,109 | 4,045,361 | ||||||||||||||||||
| Ratio of expenses to | ||||||||||||||||||||||||
| average net assets | 0.80 | %(3) | 0.81 | % | 0.80 | % | 0.77 | % | 0.76 | % | 0.76 | % | ||||||||||||
| Ratio of net investment | ||||||||||||||||||||||||
| income (loss) to | ||||||||||||||||||||||||
| average net assets | 1.83 | %(3) | 1.37 | % | 3.48 | % | 1.31 | % | 1.69 | % | 1.44 | % | ||||||||||||
Portfolio turnover rate(4) | 9 | %(2) | 20 | % | 27 | % | 23 | % | 13 | % | 21 | % | ||||||||||||
| (1) | Net investment income (loss) per share was calculated using average shares outstanding. |
| (2) | Not annualized. |
| (3) | Annualized. |
| (4) | Portfolio turnover rate is disclosed for the Fund as a whole. |
The accompanying notes to financial statements are an integral part of these financial statements.
37
FMI International Fund II – Currency Unhedged
FINANCIAL HIGHLIGHTS
(Selected data for each share of the Fund outstanding throughout each period)
Institutional Class
| (Unaudited) | For the | |||||||||||||||
| For the | Period from | |||||||||||||||
| Six Month | December 31, | |||||||||||||||
| Period Ending | Years Ended September 30, | 2019* to | ||||||||||||||
| March 31, | September 30, | |||||||||||||||
| 2023 | 2022 | 2021 | 2020 | |||||||||||||
| PER SHARE OPERATING PERFORMANCE: | ||||||||||||||||
| Net asset value, beginning of period | $ | 14.79 | $ | 21.70 | $ | 17.24 | $ | 20.00 | ||||||||
| Income from investment operations: | ||||||||||||||||
Net investment income (loss)(1) | 0.15 | 0.26 | 0.77 | 0.13 | ||||||||||||
| Net realized and unrealized | ||||||||||||||||
| gain (loss) on investments | 4.69 | (6.22 | ) | 3.87 | (2.89 | ) | ||||||||||
| Total from investment operations | 4.84 | (5.96 | ) | 4.64 | (2.76 | ) | ||||||||||
| Less distributions: | ||||||||||||||||
| Distributions from net investment income | (0.25 | ) | (0.66 | ) | (0.18 | ) | — | |||||||||
| Distributions from net realized gains | — | (0.29 | ) | — | — | |||||||||||
| Total from distributions | (0.25 | ) | (0.95 | ) | (0.18 | ) | — | |||||||||
| Net asset value, end of period | $ | 19.38 | $ | 14.79 | $ | 21.70 | $ | 17.24 | ||||||||
| TOTAL RETURN | 32.89 | %(2) | (28.71 | )% | 26.96 | % | (13.80 | )%(2) | ||||||||
| RATIOS/SUPPLEMENTAL DATA: | ||||||||||||||||
| Net assets, end of period (in 000’s $) | 67,853 | 48,986 | 71,997 | 47,555 | ||||||||||||
| Ratio of expenses to average net assets: | ||||||||||||||||
| Before expense reimbursement | 1.18 | %(3) | 1.15 | % | 1.16 | % | 1.43 | %(3) | ||||||||
| After expense reimbursement | 0.90 | %(3) | 0.90 | % | 0.90 | % | 0.90 | %(3) | ||||||||
| Ratio of net investment income (loss) | ||||||||||||||||
| to average net assets: | ||||||||||||||||
| Before expense reimbursement | 1.42 | %(3) | 1.07 | % | 3.35 | % | 0.49 | %(3) | ||||||||
| After expense reimbursement | 1.70 | %(3) | 1.32 | % | 3.61 | % | 1.02 | %(3) | ||||||||
| Portfolio turnover rate | 10 | %(2) | 27 | % | 31 | % | 15 | %(2) | ||||||||
| * | Inception date. |
| (1) | Net investment income (loss) per share was calculated using average shares outstanding. |
| (2) | Not annualized. |
| (3) | Annualized. |
The accompanying notes to financial statements are an integral part of these financial statements.
38
FMI Funds, Inc.
NOTES TO FINANCIAL STATEMENTS
March 31, 2023 (Unaudited)
| (1) | Organization — |
| The following is a summary of significant accounting policies of the FMI Large Cap Fund, the FMI Common Stock Fund, the FMI International Fund, and the FMI International Fund II – Currency Unhedged (collectively, the “Funds” or, individually, a “Fund”). The FMI Large Cap Fund (the “Large Cap Fund”), the FMI Common Stock Fund (the “Common Stock Fund”), the FMI International Fund (the “International Fund”), and the FMI International Fund II – Currency Unhedged (the “International Currency Unhedged Fund”) are each a series of FMI Funds, Inc. (the “Company”). The Company was incorporated under the laws of Maryland on September 5, 1996. The Large Cap Fund commenced operations on December 31, 2001 and the International Fund commenced operations on December 31, 2010. The Common Stock Fund is the successor to the FMI Common Stock Fund, the sole series of FMI Common Stock Fund, Inc. (the “Predecessor Common Stock Fund”). The Predecessor Common Stock Fund commenced operations on December 18, 1981. The reorganization was effective as of January 31, 2014, and the Common Stock Fund is the accounting survivor of the reorganization. As the accounting survivor of the reorganization, the Common Stock Fund adopted the Financial Statements of the Predecessor Common Stock Fund. The Predecessor Common Stock Fund was incorporated under the laws of Wisconsin on July 29, 1981. The International Currency Unhedged Fund commenced operations on December 31, 2019. | |
| Effective October 31, 2016, the Large Cap Fund, Common Stock Fund, and International Fund offer two classes of shares (Investor and Institutional). The International Currency Unhedged Fund currently only offers Institutional Class shares. The Institutional Class has the same management fee as the Investor Class and does not have a shareholder servicing plan. A higher investment minimum is required for the Institutional Class than the Investor Class. Each class of shares has exclusive voting rights with respect to matters that affect just that class. Income, expenses (other than expenses attributable to a specific class) and realized and unrealized gains or losses on investments are allocated to each class of shares based on its relative net assets. The Company’s Board of Directors (the “Board”) may elect to have certain expenses specific to the Investor Class shares or Institutional Class shares be borne solely by the Class to which such expenses are attributable, but any expenses not specifically allocated to the Investor Class shares or Institutional Class shares are generally allocated to each such Class proportionately (after any applicable base fee to be paid by a class of shares of a Fund attributable to such expense) on the basis of the net asset value of that Class in relation to the net asset value of the applicable Fund. | |
| The Funds are diversified, open-end management investment companies under the Investment Company Act of 1940 (the “Act”), as amended. The financial statements are prepared in accordance with accounting principles generally accepted in the United States of America (“GAAP”). The Funds follow the investment company accounting and financial reporting guidance under Financial Accounting Standards Board (“FASB”) Accounting Standards Codification “Financial Services – Investment Companies” Topic 946 (“ASC 946”). The assets and liabilities of each Fund in the Company are segregated and a shareholder’s interest is limited to the Fund in which the shareholder owns shares. The investment objective of the Large Cap Fund is to seek long-term capital appreciation by investing mainly in limited a number of large capitalization value stocks. The investment objective of the Common Stock Fund is to seek long-term capital appreciation by investing mainly in small to medium capitalization value stocks. |
39
FMI Funds, Inc.
NOTES TO FINANCIAL STATEMENTS (Continued)
March 31, 2023 (Unaudited)
| (1) | Organization — (Continued) |
| The investment objective of the International Fund and International Currency Unhedged Fund is to seek capital appreciation by investing mainly in a limited number of large capitalization value stocks of non-U.S. companies. | |
| (2) | Summary of Significant Accounting Policies and Other Information — |
| (a) | The Funds apply the provisions of the FASB Accounting Standards Codification “Fair Value Measurement” Topic 820 (“ASC 820”), which defines fair value as the price that would be received to sell an asset or paid to transfer a liability (i.e., the “exit price”) in an orderly transaction between market participants at the measurement date. | |
| Each security is valued at the current day last sale price reported by the principal security exchange on which the issue is traded. Securities that are traded on the Nasdaq Markets are valued at the Nasdaq Official Closing Price, or if no sale is reported, the latest bid price. Securities that are traded over-the-counter, including U.S. Treasury securities are valued at the close price, if not close, then at the latest bid price. Money market funds are valued at net asset value per share. Bank deposits are valued at acquisition cost which approximates fair value. Unlisted equity securities for which market quotations are readily available are valued at the close price, if not close, then at the most recent bid price. Foreign securities are valued on a basis of quotations from the primary market in which they are traded, and are converted from the local currency into U.S. dollars using exchange rates as of the close of the New York Stock Exchange. For the International Fund and International Currency Unhedged Fund only, options purchased or written by each of the Funds’ are valued at the average of the most recent bid and ask prices. Securities for which quotations are not readily available are valued at fair value as determined by the investment adviser as the Board appointed valuation designee, in accordance with procedures approved by the Board. The fair value of a security is the amount which a Fund might reasonably expect to receive upon a current sale. The fair value of a security may differ from the last quoted price and a Fund may not be able to sell a security at the fair value. Market quotations may not be available, for example, if trading in particular securities was halted during the day and not resumed prior to the close of trading on the New York Stock Exchange. The foreign markets in which the International Fund and International Currency Unhedged Fund may invest are sometimes open on days when the New York Stock Exchange is not open and the International Fund and International Currency Unhedged Fund do not calculate their net asset value. For securities that do not trade during New York Stock Exchange hours, fair value determinations are based on analyses of market movements after the close of those securities’ primary markets, and may include reviews of developments in foreign markets, the performance of U.S. securities markets, and the performance of instruments trading in U.S. markets that represent foreign securities and baskets of foreign securities. The investment adviser utilizes a service provided by an independent third party to assist in fair valuation of certain securities for the International Fund and the International Currency Unhedged Fund. As of March 31, 2023, there were no securities that were internally fair valued. | ||
| In determining fair value, the Funds use various valuation approaches. ASC 820 establishes a fair value hierarchy for inputs used in measuring fair value that maximizes the use of observable inputs and minimizes the use of unobservable inputs by generally requiring |
40
FMI Funds, Inc.
NOTES TO FINANCIAL STATEMENTS (Continued)
March 31, 2023 (Unaudited)
| (2) | Summary of Significant Accounting Policies and Other Information — (Continued) |
| that the most observable inputs be used when available. Observable inputs are those that market participants would use in pricing the asset or liability based on market data obtained from sources independent of the Funds. Unobservable inputs reflect the Funds’ assumptions about the inputs market participants would use in pricing the asset or liability developed based on the best information available in the circumstances. The inputs or methodologies used for valuing securities are not necessarily an indication of the risks associated with investing in those securities. Over the counter derivatives such as forward currency contracts may be valued using quantitative models. These models may use pricing curves based on market inputs including current exchange rates or indices. These curves are combined with volatility factors to value the overall positions. The market inputs are generally significant and can be corroborated with observable market data and therefore are classified in level 2. | ||
| The fair value hierarchy is categorized into three levels based on the inputs as follows: |
| Level 1 — | Valuations based on unadjusted quoted prices in active markets for identical assets. | ||
| Level 2 — | Valuations based on quoted prices for similar securities or in markets that are not active or for which all significant inputs are observable, either directly or indirectly. | ||
| Level 3 — | Valuations based on inputs that are unobservable and significant to the overall fair value measurement. |
| The following table summarizes the Funds’ investments as of March 31, 2023, based on the inputs used to value them: |
| Large Cap Fund | Common Stock Fund | |||||||||
| Investments | Investments | |||||||||
Valuations | in Securities | in Securities | ||||||||
| Assets: | ||||||||||
| Level 1 — | Common Stocks* | $ | 1,723,481,880 | $ | 1,151,590,280 | |||||
| Money Market Fund | 28,240,692 | 70,449,016 | ||||||||
| Total Level 1 | 1,751,722,572 | 1,222,039,296 | ||||||||
| Level 2 — | Common Stocks* | — | — | |||||||
| Preferred Stocks* | — | — | ||||||||
| Forward Currency Contracts | — | — | ||||||||
| Total Level 2 | — | — | ||||||||
| Level 3 — | None | — | — | |||||||
| Total Assets | 1,751,722,572 | 1,222,039,296 | ||||||||
| Liabilities: | ||||||||||
| Level 2 — | Forward Currency Contracts | — | — | |||||||
| Total | $ | 1,751,722,572 | $ | 1,222,039,296 | ||||||
41
FMI Funds, Inc.
NOTES TO FINANCIAL STATEMENTS (Continued)
March 31, 2023 (Unaudited)
| (2) | Summary of Significant Accounting Policies and Other Information — (Continued) |
| International | ||||||||||||||
| International | International | Currency | ||||||||||||
| Fund | Fund | Unhedged Fund | ||||||||||||
| Investments | Other Financial | Investments | ||||||||||||
Valuations | in Securities | Instruments** | in Securities | |||||||||||
| Assets: | ||||||||||||||
| Level 1 — | Common Stocks* | $ | 456,200,560 | $ | — | $ | 8,185,850 | |||||||
| Money Market Fund | 144,892,565 | — | 3,433,132 | |||||||||||
| Bank Deposit Account | 119,117 | — | — | |||||||||||
| Total Level 1 | 601,212,242 | — | 11,618,982 | |||||||||||
| Level 2 — | Common Stocks* | 2,980,529,243 | — | 52,561,023 | ||||||||||
| Preferred Stocks* | 183,812,409 | — | 3,350,482 | |||||||||||
| Forward Currency Contracts | — | 11,130,297 | — | |||||||||||
| Total Level 2 | 3,164,341,652 | 11,130,297 | 55,911,505 | |||||||||||
| Level 3 — | None | — | — | — | ||||||||||
| Total Assets | 3,765,553,894 | 11,130,297 | 67,530,487 | |||||||||||
| Liabilities: | ||||||||||||||
| Level 2 — | Forward Currency Contracts | — | (22,296,857 | ) | — | |||||||||
| Total | $ | 3,765,553,894 | $ | (11,166,560 | ) | $ | 67,530,487 | |||||||
| * | See the Schedules of Investments for investments detailed by industry classifications. | |
| ** | Other financial instruments are derivative instruments, specifically forward currency contracts, which are valued at the unrealized appreciation/(depreciation) on the instrument. |
| (b) | Net realized gains and losses on sales of securities are computed on the identified cost basis. For financial reporting purposes, investment transactions are recorded on the trade date. | |
| (c) | Investment securities and other assets and liabilities denominated in foreign currencies are translated into U.S. dollar amounts at the date of valuation. Purchases and sales of investment securities and income and expense items denominated in foreign currencies are translated into U.S. dollar amounts on the respective date of such transactions. The Company does not isolate that portion of the results of operations resulting from changes in foreign exchange rates on investments from the fluctuations arising from changes in market prices of securities held. Such fluctuations are included with the net realized and unrealized gain or loss from investments. Reported net realized foreign exchange gains or losses arise from sales of foreign currencies, currency gains or losses realized between the trade and settlement dates on securities transactions, and the difference between the amounts of dividends, interest, and foreign withholding taxes recorded on the Company’s books and the U.S. dollar equivalent of the amounts actually received or paid. Net unrealized foreign exchange gains and losses arise from changes in the fair values of assets and liabilities, other than investments in securities at fiscal period-end, resulting from changes in exchange rates. | |
| (d) | Dividend income is recorded on the ex-dividend date. Interest income is recorded on an accrual basis. The Funds record the amortization and accretion of discounts and premiums on securities purchased using the effective interest method. Withholding taxes on foreign dividends have been provided for in accordance with the Funds’ understanding of the applicable country’s tax rules and regulations. |
42
FMI Funds, Inc.
NOTES TO FINANCIAL STATEMENTS (Continued)
March 31, 2023 (Unaudited)
| (2) | Summary of Significant Accounting Policies and Other Information — (Continued) |
| (e) | The International Fund may enter into forward currency contracts in order to hedge its exposure to changes in foreign currency rates on its foreign portfolio holdings or to hedge certain purchase and sale commitments denominated in foreign currencies. The International Currency Unhedged Fund normally does not seek to reduce currency risk by hedging its perceived foreign currency exposure back into the U.S. dollar and will generally not be exposed to currency fluctuations. However, the investment adviser reserves the right to temporarily hedge all or a portion of the International Currency Unhedged Fund’s currency exposure. A forward currency contract is a commitment to purchase or sell a foreign currency at a future date at a negotiated rate. These contracts are valued daily and the asset or liability therein represents unrealized gain or loss on the contracts as measured by the difference between the forward foreign exchange rates at the dates of entry into the contracts and the forward rates at the reporting date. The International Fund and International Currency Unhedged Fund have made an election under Section 988 of the Internal Revenue Code of 1986, as amended (the “Code”), which provides special rules for certain transactions in foreign currency other than the taxpayer’s functional currency (i.e., unless certain special rules apply, currencies other than the U.S. dollar). Section 988 gains or losses will increase or decrease the amount of a Fund’s investment company taxable income available to be distributed to shareholders as net capital gain, rather than increasing or decreasing the amount of a Fund’s ordinary income. On a quarterly average there were seven forward currency contracts with an average quarterly value of $2,496,948,872 outstanding during the six month period ending March 31, 2023. These contracts are not subject to master netting agreements. For Non-Deliverable Forward Currency Contracts (“Contract”), the International Fund posts collateral, in the form of cash or cash equivalents, to a segregated account at the custodian when the Contract is in an unrealized loss position. When the Contract is in an unrealized gain position, the counterparty posts collateral to a segregated account at the custodian. | |
| The fair value of the forward currency contracts as of March 31, 2023, is included in the following location on the Statements of Assets and Liabilities for the International Fund: |
| Fair Value of | Fair Value of | ||||
| Asset Forward | (Liability) Forward | ||||
Location | Currency Contracts | Location | Currency Contracts | ||
| Forward currency | Unrealized | $11,130,297 | Unrealized | $(22,296,857) | |
| contracts | appreciation on | depreciation on | |||
| forward currency | forward currency | ||||
| contracts | contracts |
| Realized and unrealized gains and losses on forward currency contracts entered into during the six month period ending March 31, 2023, are recorded in the following location on the Statements of Operations for the International Fund: |
| Realized | Unrealized | ||||
Location | Gain (Loss) | Location | Depreciation | ||
| Forward currency | Net realized | $(27,554,816) | Net change in | $213,574,598 | |
| contracts | gain (loss) on | unrealized appreciation/ | |||
| forward currency | depreciation on | ||||
| contracts | forward currency | ||||
| contracts |
43
FMI Funds, Inc.
NOTES TO FINANCIAL STATEMENTS (Continued)
March 31, 2023 (Unaudited)
| (2) | Summary of Significant Accounting Policies and Other Information — (Continued) |
| These instruments involve market risk, credit risk, or both kinds of risks, in excess of the amount recognized on the Statements of Assets and Liabilities for the International Fund. Risks arise from the possible inability of counterparties to meet the terms of their contracts and from movement in currency and securities values and interest rates. | ||
| (f) | The preparation of financial statements in conformity with GAAP requires management to make estimates and assumptions that affect the reported amounts of assets and liabilities and disclosure of contingent assets and liabilities at the date of the financial statements and the reported amounts of income and expenses during the reporting period. Actual results could differ from these estimates. | |
| (g) | The Funds may own certain securities that are restricted. Restricted securities include Section 4(a)(2) commercial paper or securities issued in a private placement. The Funds did not hold any restricted securities as of March 31, 2023. | |
| (h) | No provision has been made for Federal income taxes since the Funds have elected to be taxed as “regulated investment companies.” The Funds intend to distribute substantially all net investment company taxable income and net capital gains to their respective shareholders and otherwise comply with the provisions of the Code, applicable to regulated investment companies. | |
| (i) | The Funds have reviewed all open tax years and major jurisdictions, which include Federal and the state of Maryland for the Funds and concluded that there are no significant uncertain tax positions that would require recognition in the financial statements. The Funds recognize interest and penalties, if any, related to unrecognized tax benefits on certain tax benefits on uncertain tax positions as income tax expense in the Statements of Operations. During the six month period ending March 31, 2023, the Funds did not incur any interest or penalties. Open tax years are those that are open for exam by taxing authorities and, as of September 30, 2022, open Federal tax years include the prior four fiscal tax years ended September 30, 2022. The Funds have no examinations in progress and are also not aware of any tax positions for which it is reasonably possible that the total amounts of unrecognized tax benefits will significantly change in the next twelve months. | |
| (j) | Net investment income and net realized gains, if any, are distributed to shareholders at least annually. Distributions to shareholders are recorded on the ex-dividend date. On December 16, 2022, the following distributions were declared and paid to shareholders of records of the respective Funds on December 15, 2022: |
| International | |||||||||||||||||
| Large | Common | International | Currency | ||||||||||||||
| Cap Fund | Stock Fund | Fund | Unhedged Fund | ||||||||||||||
| Net Investment Income (Investor Class) | $ | 7,261,946 | $ | 525,679 | $ | 116,170,330 | $ | N/A | |||||||||
| Per Share Amount (Investor Class) | $ | 0.11475482 | $ | 0.03966624 | $ | 4.23843152 | $ | N/A | |||||||||
| Net Investment Income (Institutional Class) | $ | 6,070,730 | $ | 1,697,180 | $ | 331,682,134 | $ | 830,255 | |||||||||
| Per Share Amount (Institutional Class) | $ | 0.13307740 | $ | 0.07468974 | $ | 4.27362960 | $ | 0.24678715 | |||||||||
| Short-Term Realized Gain (Investor Class) | $ | 0.00 | $ | 494,983 | $ | 0.00 | $ | N/A | |||||||||
| Per Share Amount (Investor Class) | $ | 0.00000 | $ | 0.03735 | $ | 0.00000 | $ | N/A | |||||||||
| Short-Term Realized Gain | |||||||||||||||||
| (Institutional Class) | $ | 0.00 | $ | 848,707 | $ | 0.00 | $ | 0.00 | |||||||||
| Per Share Amount (Institutional Class) | $ | 0.00000 | $ | 0.03735 | $ | 0.00000 | $ | 0.00000 | |||||||||
| Long-Term Realized Gain (Investor Class) | $ | 188,300,217 | $ | 23,740,763 | $ | 0.00 | $ | N/A | |||||||||
| Per Share Amount (Investor Class) | $ | 2.97556 | $ | 1.79141 | $ | 0.00000 | $ | N/A | |||||||||
| Long-Term Realized Gain | |||||||||||||||||
| (Institutional Class) | $ | 135,739,210 | $ | 40,706,339 | $ | 0.00 | $ | 0.00 | |||||||||
| Per Share Amount (Institutional Class) | $ | 2.97556 | $ | 1.79141 | $ | 0.00000 | $ | 0.00000 | |||||||||
44
FMI Funds, Inc.
NOTES TO FINANCIAL STATEMENTS (Continued)
March 31, 2023 (Unaudited)
| (2) | Summary of Significant Accounting Policies and Other Information — (Continued) |
| (k) | Common Company expenses are typically allocated evenly between the Funds of the Company, or by other equitable means. |
| (3) | Investment Adviser and Advisory Agreement and Transactions With Related Parties — |
| The Funds each have an investment advisory agreement with Fiduciary Management, Inc. (“FMI” or the “Adviser”), with whom certain officers and directors of the Funds are affiliated, to serve as investment adviser and manager. | |
| Under the terms of the current advisory agreement for the International Currency Unhedged Fund, effective as of December 31, 2019, the Adviser is entitled to receive a fee. The fee is computed daily and payable at the end of each month. The following annual percentages of the International Currency Unhedged Fund’s average daily net assets are used: |
| • | 0.75% of the assets from $0 – $2.5 billion; 0.70% of the assets from $2.5 – $5.0 billion; 0.65% of the assets from $5.0 – $10.0 billion; and 0.60% of the assets over $10.0 billion. |
| Under the terms of the current advisory agreements for the Large Cap Fund, Common Stock Fund and International Fund, effective as of January 1, 2019, the Adviser is entitled to receive a fee. The fee is computed daily and payable at the end of each month. The following annual percentages of each Fund’s average daily net assets are used: |
| • | Large Cap Fund: 0.65% of the assets from $0 – $2.5 billion; 0.60% of the assets from $2.5 – $5.0 billion; and 0.55% of the assets over $5.0 billion. | ||
| • | Common Stock Fund: 0.85% of the assets from $0 – $500 million; 0.80% of the assets from $500 million – $1.0 billion; 0.75% of the assets over $1.0 billion. | ||
| • | International Fund: 0.75% of the assets from $0 – $2.5 billion; 0.70% of the assets from $2.5 – $5.0 billion; 0.65% of the assets from $5.0 – $10.0 billion; and 0.60% of the assets over $10.0 billion. |
| The Funds are responsible for paying their proportionate share of the compensation, benefits and expenses of the Funds’ Chief Compliance Officer. For administrative convenience, FMI initially makes these payments and is later reimbursed by the Funds. | |
| Under the respective advisory agreement or operating expenses limitation agreements, FMI will reimburse the Funds for expenses (excluding federal, state and local taxes, interest, brokerage commissions and extraordinary items) as follows: |
| Investor Class | Institutional Class | ||
Expense Cap | Expense Cap | ||
| Large Cap Fund | 1.20% | 1.10% | |
| Common Stock Fund | 1.30% | 1.20% | |
| International Fund | 1.75% | 1.65% | |
| International Currency Unhedged Fund | 1.75% | 1.65% |
| For the six month period ending March 31, 2023, there were no contractual or voluntary reimbursements required for the Large Cap Fund, Common Stock Fund or International Fund. For the six month period ending March 31, 2023, for the International Currency Unhedged Fund, there is no contractual reimbursement required and the voluntary reimbursement is $83,740. The voluntary 0.90% expense cap/reimbursement agreement for the International Currency |
45
FMI Funds, Inc.
NOTES TO FINANCIAL STATEMENTS (Continued)
March 31, 2023 (Unaudited)
| (3) | Investment Adviser and Advisory Agreement and Transactions With Related Parties — |
| (Continued) |
| Unhedged Fund will continue in effect until January 31, 2024, with successive renewal terms of one year unless terminated by the Adviser prior to any such renewal. The Adviser is entitled to recoup such amounts for a one year period from the date the Adviser reduced its compensation and/or assumed expenses for the International Currency Unhedged Fund. | |
| The Large Cap Fund, the International Fund and the International Currency Unhedged Fund have each entered into a Distribution Plan (the “Plan”), pursuant to Rule 12b-1 under the Act. Each Plan, if implemented, provides that the applicable Fund may incur certain costs which may not exceed the lesser of a monthly amount equal to 0.25% of such Fund’s daily net assets or the actual distribution costs incurred during the year. Amounts payable under each Plan would be paid monthly for any activities or expenses primarily intended to result in the sale of shares of such Fund. For the six month period ending March 31, 2023, no such expenses were charged to the shareholders of any Fund as the Funds had not implemented the Plan. | |
| Under the Funds’ organizational documents, each director, officer, employee or other agent of any Fund (including the Adviser) is indemnified, to the extent permitted by the Act, against certain liabilities that may arise out of performance of their duties to the Funds. Additionally, in the normal course of business, the Funds enter into contracts that contain a variety of indemnification clauses. The Funds’ maximum exposure under these arrangements is unknown as this would involve future claims that may be made against such Fund that have not yet occurred. However, the Funds have not had prior claims or losses pursuant to these contracts and believe the risk of loss to be remote. | |
| At March 31, 2023, no person is deemed to “control” a Fund, as that term is defined in the Act, because the Funds do not know of any person who owns beneficially or through controlled companies more than 25% of a Fund’s Investor Class and Institutional Class shares, on a combined basis, or who acknowledges the existence of control. | |
| (4) | Investments in Affiliated Issuers — |
| An issuer in which a Fund’s holdings represent 5% or more of the outstanding voting securities of an issuer is an “affiliated” issuer as defined in the 1940 Act. For the six month period ending March 31, 2023, there were no Funds with an investment in a security of an affiliated issuer. | |
| (5) | Shareholder Servicing Plan — |
| The Funds have adopted a Shareholder Servicing Plan pursuant to which Investor Class shares, (if available), may pay financial intermediaries for assets maintained in an omnibus account at an annual rate of up to 0.15% of the average daily net assets of such Fund, or an annual per account rate approved by the Board. The Board may also authorize the Funds to pay for shareholder services outside of the plan. | |
| For the six month period ending March 31, 2023, shareholder servicing fees incurred are disclosed on the Statements of Operations. |
46
FMI Funds, Inc.
NOTES TO FINANCIAL STATEMENTS (Continued)
March 31, 2023 (Unaudited)
| (6) | Loan Agreements — |
| U.S. Bank, N.A. (the “Bank”) has made available to the Company a $600,000,000 umbrella credit facility, pursuant to the loan agreement (the “Agreement”) effective May 27, 2022 for the FMI Funds, Inc. (consisting of Large Cap Fund, Common Stock Fund, International Fund and International Currency Unhedged Fund), for the purposes of having cash available to satisfy redemption requests and is subject to certain restrictions and covenants. Principal is due not more than 45 days after the date of the loan. Amounts under the credit facility bear interest at a rate per annum equal to the Bank’s current prime rate minus one percent on the amount borrowed. Advances will be collateralized by securities owned by the borrowing Fund. The Agreement is subject to renewal on May 26, 2023. During the six month period ending March 31, 2023, the Large Cap Fund is the only Fund that borrowed against the loan agreement, at an interest rate in the range of 5.25% – 6.50%, as follows: |
| Amount | ||||||
| Average | Outstanding as | Interest | Maximum | Maximum | ||
Borrowings | of March 31, 2023 | Expense | Borrowing | Borrowing Date | ||
| Large Cap Fund | $1,481,648 | $ — | $41,306 | $182,055,000 | 10/05/2022 |
| (7) | Investment Transactions — |
| For the six month period ending March 31, 2023, purchases and sales of investment securities (excluding short-term investments) were as follows: |
| International | |||||
| Currency | |||||
Large Cap Fund | Common Stock Fund | International Fund | Unhedged Fund | ||
| Purchases | $124,288,524 | $215,354,680 | $404,712,031 | $7,371,768 | |
| Sales | 748,947,869 | 146,009,286 | 309,448,935 | 5,503,063 |
| (8) | Income Tax Information — |
| The following information for the Funds is presented on an income tax basis as of September 30, 2022: |
| Net Unrealized | |||||||||||||||||
| Gross | Gross | Appreciation | |||||||||||||||
| Cost of | Unrealized | Unrealized | (Depreciation) | ||||||||||||||
| Investments | Appreciation(1) | Depreciation(1) | on Investments(1) | ||||||||||||||
| Large Cap Fund | $ | 1,853,000,120 | $ | 524,105,325 | $ | (306,466,568 | ) | $ | 217,638,757 | ||||||||
| Common Stock Fund | 816,596,223 | 198,536,901 | (68,515,365 | ) | 130,021,536 | ||||||||||||
| International Fund | 3,322,786,589 | 347,246,292 | (912,210,961 | ) | (564,964,669 | ) | |||||||||||
| International Currency | |||||||||||||||||
| Unhedged Fund | 63,253,894 | 1,937,861 | (16,615,580 | ) | (14,677,719 | ) | |||||||||||
(1) | Represents amounts of investments in securities, forward currency contracts and foreign currency transactions. |
| The difference between the cost amounts for financial statement and federal income tax purposes is due primarily to timing differences in recognizing certain gains and losses on security transactions. The International Funds are the only Funds with temporary mark to market differences. The components of accumulated earnings (deficit) on a tax-basis are as follows: |
47
FMI Funds, Inc.
NOTES TO FINANCIAL STATEMENTS (Continued)
March 31, 2023 (Unaudited)
| (8) | Income Tax Information — (Continued) |
| Total | |||||||||||||||||||||
| Net | Distributable | ||||||||||||||||||||
| Unrealized | Undistributed | Undistributed | Other | Earnings/ | |||||||||||||||||
| Appreciation | Ordinary | Long-Term | Accumulated | (Accumulated | |||||||||||||||||
| (Depreciation) | Income | Capital Gains | (Losses) | Losses) | |||||||||||||||||
| Large Cap Fund | $ | 217,638,757 | $ | 13,332,676 | $ | 324,039,274 | $ | — | $ | 555,010,707 | |||||||||||
| Common Stock Fund | 130,021,536 | 1,029,632 | 60,904,233 | — | 191,955,401 | ||||||||||||||||
| International Fund | (564,964,669 | ) | 447,852,464 | — | (290,285,457 | ) | (407,397,662 | ) | |||||||||||||
| International Currency | |||||||||||||||||||||
| Unhedged Fund | (14,677,719 | ) | 684,384 | — | (803,558 | ) | (14,796,893 | ) | |||||||||||||
| The International Fund utilized $64,601,667 of prior year capital loss carryovers. | |
| The other accumulated losses above for the International Fund and International Currency Unhedged Fund are all capital loss carryovers, which may be used indefinitely to offset future gains as follows: |
| Short-Term Capital | Long-Term Capital | Total Capital | |||||||||||
| Loss Carryovers | Loss Carryovers | Loss Carryovers | |||||||||||
| International Fund | $ | 52,750,194 | $ | 237,535,263 | $ | 290,285,457 | |||||||
| International Currency | |||||||||||||
| Unhedged Fund | 517,956 | 285,602 | 803,558 | ||||||||||
| The tax components of dividends paid during the six month period ending March 31, 2023 (Unaudited) and the year ended September 30, 2022 are as follows: |
| For the Six Month Period Ending | Year Ended | ||||||||||||||||
| March 31, 2023 (Unaudited) | September 30, 2022 | ||||||||||||||||
| Ordinary | Long-Term | Ordinary | Long-Term | ||||||||||||||
| Income | Capital Gains | Income | Capital Gains | ||||||||||||||
| Distributions* | Distributions | Distributions* | Distributions | ||||||||||||||
| Large Cap Fund | $ | 13,332,676 | $ | 324,039,427 | $ | 49,296,828 | $ | 448,757,868 | |||||||||
| Common Stock Fund | 3,566,549 | 64,447,102 | 3,572,626 | 108,155,396 | |||||||||||||
| International Fund | 447,852,464 | — | 122,031,455 | — | |||||||||||||
| International Fund | |||||||||||||||||
| Currency Unhedged | 830,255 | — | 2,556,915 | 794,059 | |||||||||||||
| * | For federal income tax purposes, distributions on short-term capital gains are treated as ordinary income distributions. |
48
FMI Funds, Inc.
NOTES TO FINANCIAL STATEMENTS (Continued)
March 31, 2023 (Unaudited)
| (9) | Fund Share Transactions — |
| For the Six Month Period Ending | Year Ended | ||||||||||||||||
| March 31, 2023 (Unaudited) | September 30, 2022 | ||||||||||||||||
Large Cap Fund | Shares | Amount | Shares | Amount | |||||||||||||
| Sales | |||||||||||||||||
| Investor Class | 1,819,709 | $ | 27,742,695 | 4,339,661 | $ | 78,378,013 | |||||||||||
| Institutional Class | 6,838,124 | 98,859,773 | 9,846,281 | 180,623,327 | |||||||||||||
| Reinvestment of dividends | |||||||||||||||||
| and distributions | |||||||||||||||||
| Investor Class | 14,439,158 | 194,784,241 | 11,559,346 | 219,049,619 | |||||||||||||
| Institutional Class | 10,425,357 | 140,221,056 | 14,610,684 | 276,141,925 | |||||||||||||
| Redemptions | |||||||||||||||||
| Investor Class | (13,925,338 | ) | (208,443,677 | ) | (16,894,122 | ) | (310,952,388 | ) | |||||||||
| Institutional Class | (34,409,422 | ) | (538,742,760 | ) | (38,311,145 | ) | (697,328,392 | ) | |||||||||
| Total Investor Class | 2,333,529 | 14,083,259 | (995,115 | ) | (13,524,756 | ) | |||||||||||
| Total Institutional Class | (17,145,941 | ) | (299,661,931 | ) | (13,854,180 | ) | (240,563,140 | ) | |||||||||
| Net increase (decrease) | (14,812,412 | ) | $ | (285,578,672 | ) | (14,849,295 | ) | $ | (254,087,896 | ) | |||||||
| For the Six Month Period Ending | Year Ended | ||||||||||||||||
| March 31, 2023 (Unaudited) | September 30, 2022 | ||||||||||||||||
Common Stock Fund | Shares | Amount | Shares | Amount | |||||||||||||
| Sales | |||||||||||||||||
| Investor Class | 1,783,889 | $ | 52,907,902 | 1,136,942 | $ | 34,957,499 | |||||||||||
| Institutional Class | 3,610,975 | 107,250,914 | 7,467,492 | 223,727,902 | |||||||||||||
| Reinvestment of dividends | |||||||||||||||||
| and distributions | |||||||||||||||||
| Investor Class | 862,363 | 24,146,160 | 1,606,701 | 48,811,581 | |||||||||||||
| Institutional Class | 1,527,951 | 42,813,205 | 2,016,282 | 61,315,144 | |||||||||||||
| Redemptions | |||||||||||||||||
| Investor Class | (1,183,994 | ) | (34,325,255 | ) | (2,088,297 | ) | (64,365,803 | ) | |||||||||
| Institutional Class | (1,511,273 | ) | (44,237,567 | ) | (3,015,536 | ) | (91,326,776 | ) | |||||||||
| Total Investor Class | 1,462,258 | 42,728,807 | 655,346 | 19,403,277 | |||||||||||||
| Total Institutional Class | 3,627,653 | 105,826,552 | 6,468,238 | 193,716,270 | |||||||||||||
| Net increase (decrease) | 5,089,911 | $ | 148,555,359 | 7,123,584 | $ | 213,119,547 | |||||||||||
49
FMI Funds, Inc.
NOTES TO FINANCIAL STATEMENTS (Continued)
March 31, 2023 (Unaudited)
| (9) | Fund Share Transactions — (Continued) |
| For the Six Month Period Ending | Year Ended | ||||||||||||||||
| March 31, 2023 (Unaudited) | September 30, 2022 | ||||||||||||||||
International Fund | Shares | Amount | Shares | Amount | |||||||||||||
| Sales | |||||||||||||||||
| Investor Class | 2,034,927 | $ | 61,617,634 | 2,361,842 | $ | 78,578,721 | |||||||||||
| Institutional Class | 13,515,808 | 409,568,096 | 21,475,543 | 710,562,881 | |||||||||||||
| Reinvestment of dividends | |||||||||||||||||
| and distributions | |||||||||||||||||
| Investor Class | 4,125,604 | 114,691,780 | 1,044,980 | 35,895,075 | |||||||||||||
| Institutional Class | 11,174,269 | 311,538,626 | 2,269,865 | 78,151,463 | |||||||||||||
| Redemptions | |||||||||||||||||
| Investor Class | (3,611,756 | ) | (107,844,063 | ) | (5,523,380 | ) | (183,656,096 | ) | |||||||||
| Institutional Class | (9,334,918 | ) | (280,522,283 | ) | (13,192,953 | ) | (437,825,518 | ) | |||||||||
| Total Investor Class | 2,548,775 | 68,465,351 | (2,116,558 | ) | (69,182,300 | ) | |||||||||||
| Total Institutional Class | 15,355,159 | 440,584,439 | 10,552,455 | 350,888,826 | |||||||||||||
| Net increase (decrease) | 17,903,934 | $ | 509,049,790 | 8,435,897 | $ | 281,706,526 | |||||||||||
| For the Six Month Period Ending | Year Ended | ||||||||||||||||
| International Currency | March 31, 2023 (Unaudited) | September 30, 2022 | |||||||||||||||
Unhedged Fund | Shares | Amount | Shares | Amount | |||||||||||||
| Sales | |||||||||||||||||
| Institutional Class | 221,353 | $ | 4,010,495 | 759,339 | $ | 14,921,914 | |||||||||||
| Reinvestment of dividends | |||||||||||||||||
| and distributions | |||||||||||||||||
| Institutional Class | 47,688 | 830,255 | 152,788 | 3,152,021 | |||||||||||||
| Redemptions | |||||||||||||||||
| Institutional Class | (78,869 | ) | (1,412,346 | ) | (918,131 | ) | (17,099,529 | ) | |||||||||
| Total Institutional Class | 190,172 | 3,428,404 | (6,004 | ) | 974,406 | ||||||||||||
| Net increase (decrease) | 190,172 | $ | 3,428,404 | (6,004 | ) | $ | 974,406 | ||||||||||
| (10) | Subsequent Events — |
| Management has evaluated related events and transactions that occurred subsequent to March 31, 2023, through the date of issuance of the Funds’ financial statements and has determined there are no subsequent events or transactions. |
50
FMI Funds, Inc.
EXPENSE EXAMPLE (Unaudited)
As a shareholder of the FMI Funds you incur ongoing costs, including management fees and other Fund expenses. You do not incur transaction costs such as sales charges (loads) on purchase payments, reinvested dividends, or other distributions; redemption fees; or exchange fees because the Funds do not charge these fees. This example is intended to help you understand your ongoing costs (in dollars) of investing in each Fund and to compare these costs with the ongoing costs of investing in other mutual funds. The example is based on an investment of $1,000 invested at the beginning of the period and held for the entire period from October 1, 2022 through March 31, 2023.
Actual Expenses
The table below provides information about actual account values and actual expenses. You may use the information in these lines, together with the amount you invested, to estimate the expenses that you paid over the period. Simply divide your account value by $1,000 (for example, an $8,600 account value divided by $1,000 = 8.6), then multiply the result by the number in the line under the heading entitled “Actual Expenses Paid During Period” to estimate the expenses you paid on your account during this period.
In addition to the costs highlighted and described below, the only Fund transaction costs you might currently incur would be wire fees ($15 per wire), if you choose to have proceeds from a redemption wired to your bank account instead of receiving a check. Additionally, U.S. Bank charges an annual processing fee ($15) if you maintain an IRA account with a Fund. To determine your total costs of investing in a Fund, you would need to add any applicable wire or IRA processing fees you’ve incurred during the period to the costs provided in the example at the end of this article.
Hypothetical Example for Comparison Purposes
The table below provides information about hypothetical account values and hypothetical expenses based on each Fund’s actual expense ratio and an assumed rate of return of 5% per year before expenses, which is not the Fund’s actual return. The hypothetical account values and expenses may not be used to estimate the actual ending account balance or expenses you paid for the period. You may use this information to compare the ongoing costs of investing in a Fund and other funds. To do so, compare this 5% hypothetical example with the 5% hypothetical examples that appear in the shareholder reports of the other funds.
Please note that the expenses shown in the table are meant to highlight your ongoing costs only and do not reflect any transactional costs, such as sales charges (loads), redemption fees or exchange fees. Therefore, the hypothetical line of the table is useful in comparing ongoing costs only, and will not help you determine the relative total costs of owning different funds. In addition, if these transactional costs were included, your costs would have been higher.
51
FMI Funds, Inc.
EXPENSE EXAMPLE (Unaudited) (Continued)
| FMI | FMI | FMI | FMI International | |||||||||||||
| Large Cap | Common | International | Fund II – Currency | |||||||||||||
| Fund | Stock Fund | Fund | Unhedged | |||||||||||||
| Investor Class | ||||||||||||||||
| Actual Beginning | ||||||||||||||||
| Account Value 10/1/22 | $ | 1,000.00 | $ | 1,000.00 | $ | 1,000.00 | $ | — | ||||||||
| Actual Ending | ||||||||||||||||
| Account Value 3/31/23 | $ | 1,165.10 | $ | 1,206.50 | $ | 1,252.00 | $ | — | ||||||||
| Actual Expenses Paid | ||||||||||||||||
| During Period* 10/1/22-3/31/23 | $ | 4.59 | $ | 5.45 | $ | 5.28 | $ | — | ||||||||
| Hypothetical Beginning | ||||||||||||||||
| Account Value 10/1/22 | $ | 1,000.00 | $ | 1,000.00 | $ | 1,000.00 | $ | — | ||||||||
| Hypothetical Ending | ||||||||||||||||
| Account Value 3/31/23 | $ | 1,020.69 | $ | 1,020.00 | $ | 1,020.24 | $ | — | ||||||||
| Hypothetical Expenses Paid | ||||||||||||||||
| During Period* 10/1/22-3/31/23 | $ | 4.28 | $ | 4.99 | $ | 4.73 | $ | — | ||||||||
| Annualized Expense Ratio* | 0.85% | 0.99% | 0.94% | $ | — | |||||||||||
| Institutional Class | ||||||||||||||||
| Actual Beginning | ||||||||||||||||
| Account Value 10/1/22 | $ | 1,000.00 | $ | 1,000.00 | $ | 1,000.00 | $ | 1,000.00 | ||||||||
| Actual Ending | ||||||||||||||||
| Account Value 3/31/23 | $ | 1,166.10 | $ | 1,207.20 | $ | 1,252.50 | $ | 1,328.90 | ||||||||
| Actual Expenses Paid | ||||||||||||||||
| During Period* 10/1/22-3/31/23 | $ | 3.89 | $ | 4.84 | $ | 4.49 | $ | 5.23 | ||||||||
| Hypothetical Beginning | ||||||||||||||||
| Account Value 10/1/22 | $ | 1,000.00 | $ | 1,000.00 | $ | 1,000.00 | $ | 1,000.00 | ||||||||
| Hypothetical Ending | ||||||||||||||||
| Account Value 3/31/23 | $ | 1,021.34 | $ | 1,020.54 | $ | 1,020.94 | $ | 1,020.44 | ||||||||
| Hypothetical Expenses Paid | ||||||||||||||||
| During Period* 10/1/22-3/31/23 | $ | 3.63 | $ | 4.43 | $ | 4.03 | $ | 4.53 | ||||||||
| Annualized Expense Ratio* | 0.72% | 0.88% | 0.80% | 0.90% | ||||||||||||
| * | Expenses are equal to the Fund's annualized expense ratio, multiplied by the average account value over the period, multiplied by 182/365 (to reflect the one-half year period between October 1, 2022 and March 31, 2023). |
52
FMI Funds, Inc.
ADVISORY AGREEMENTS (Unaudited)
Renewal of Advisory Agreements for FMI Large Cap Fund, FMI Common Stock Fund, FMI International Fund and FMI International Fund II – Currency Unhedged
On December 16, 2022, the Directors of FMI Funds, Inc. approved the continuation of the investment advisory agreements for the FMI Large Cap Fund (the “Large Cap Fund”), the FMI Common Stock Fund (the “Common Stock Fund”), the FMI International Fund (the “International Fund”) and the FMI International Fund II – Currency Unhedged (the “International Fund II”). (The Large Cap Fund, the Common Stock Fund, the International Fund and the International Fund II are sometimes referred to herein as a “Fund” and, collectively, as the “Funds”).
In advance of approving the continuation of the investment advisory agreements, the Directors who are not “interested persons” (as that term is defined by the Investment Company Act of 1940) of the Funds (the “Independent Directors”) met with their independent legal counsel. They discussed with their independent legal counsel, in executive session, a memorandum describing their fiduciary duties with respect to approving the continuation of the investment advisory agreements and the relevant factors for their consideration of the investment advisory agreements. As part of the discussion regarding the fiduciary duties of the Directors, the Independent Directors confirmed their understanding of the need to have asked about, and received answers to, any matters that they believe are relevant to determining whether to approve the continuation of the investment advisory agreements.
The Independent Directors also reviewed and discussed with their independent legal counsel, in executive session, all of the materials that the Funds’ investment adviser, Fiduciary Management, Inc. (the “Adviser”), had provided to the Independent Directors to assist them in their consideration of the investment advisory agreement (collectively, the “15(c) Material”). Following this review, they concluded that the 15(c) Material addressed all of the relevant matters that they wanted to consider in assessing the performance of the Funds and the performance of the Adviser under the investment advisory agreements, and that the 15(c) Material provided them with an understanding of the investment advisory agreements and the services that the Adviser provides the Funds.
The Independent Directors then met in general session to discuss the 15(c) Material with the other Directors and management of the Funds. In discussing the 15(c) Material with management of the Funds, management highlighted various sections of the 15(c) Material and addressed the questions and comments of the Directors to their satisfaction. The Directors confirmed that in considering the investment advisory agreements, they focused on the following items, among others:
| • | The nature and quality of the investment advisory services provided by the Adviser, including the Adviser’s organization and operations, financial condition and stability and ownership structure; and the terms of the investment advisory agreements and how the services performed by the Adviser under the investment advisory agreements differ from those performed for other accounts managed by the Adviser. | |
| • | A comparison of the fees and expenses of the Funds to other similar funds, including a comparison of the Funds’ total expenses and the total expense ratios. | |
| • | A comparison of the fee structures of other accounts managed by the Adviser. | |
| • | Whether economies of scale are recognized by the Funds, and whether existing breakpoints are appropriate. | |
| • | The costs and profitability of the Funds to the Adviser. |
53
FMI Funds, Inc.
ADVISORY AGREEMENTS (Unaudited) (Continued)
| • | The independence, expertise, care, and conscientiousness of the Board of Directors. | |
| • | Short-term and long-term investment performance of the Funds. | |
| • | The other benefits to the Adviser from serving as investment adviser to the Funds (in addition to the advisory fee under the investment advisory agreements). |
All of the factors discussed by the Directors were considered as a whole, and were considered separately by the Independent Directors, meeting in executive session both before and after their general session with the other Directors and management of the Funds. The factors were viewed in their totality by the Directors, with no single factor being the principal or determinative factor in the Directors’ determination of whether to approve the continuation of the investment advisory agreements. The Directors recognized that the management and fee arrangements for the Funds are the result of years of review and discussion between the Independent Directors and the Adviser, that certain aspects of such arrangements may receive greater scrutiny in some years than in others and that the Directors’ conclusions may be based, in part, on their consideration of these same arrangements and information received during the course of the year and in prior years.
The material considerations and determinations of the Directors, including all of the Independent Directors, are described below:
Nature and Quality of Investment Advisory Services
The Directors discussed the efforts of the Adviser in supervising the investment portfolios of the Large Cap Fund, the Common Stock Fund, the International Fund and the International Fund II directing the day-to-day management of the Funds’ portfolios, including the purchase and sale of investment securities, and the performance of the Adviser in these efforts. They noted that the investment process employed is team-based and highly research intensive, utilizing primarily in-house, fundamental research.
Noting the research intensive process of the Adviser, the Directors considered the background and experience of the Adviser’s senior management and expertise of, and the level of attention given to the Funds by investment personnel of the Adviser, and determined that the personnel servicing the Funds are well qualified. In addition, the Directors deliberated on the quality of the material service providers to the Funds, who provide administrative and distribution services on behalf of the Funds and are overseen by the Adviser, and the overall reputation and capabilities of the Adviser, concluding that they believe the services providers are respected in the industry and provide valuable services to the Funds.
The Directors concluded, based on the well qualified personnel serving the Funds and the positive performance of the Funds, adjusted for risk, as discussed herein, that the nature, extent and quality of the investment advisory services provided to the Funds by the Adviser are good. The Directors then assessed the risk management of the Funds, and the operation of the Funds’ compliance programs, as reported to them in discussions with the CCO of the Funds. They noted that the Funds have not had material breaches of the compliance program, and that the CCO’s annual and quarterly reports have reflected that the compliance program is reasonably designed to prevent material violations of securities law and is operating effectively. Based on the Directors’ assessment of the Funds’ compliance program, the Directors determined that the nature and extent of the services provided by the Adviser are appropriate to assure that the Funds’ operations are conducted in compliance with applicable laws, rules and regulations.
54
FMI Funds, Inc.
ADVISORY AGREEMENTS (Unaudited) (Continued)
Comparative Fees and Expenses
Management discussed with the Directors the fact that several variables in addition to the management fee, such as service, administrative and transaction fees could have an impact on costs to the shareholders of the Funds. The Directors noted that the Adviser had engaged Broadridge Financial Solutions 15(c) Services to provide peer group comparative fee, expense and performance analysis for each Fund (the “15(c) Report”), to assist the Directors with their analysis on whether to continue the investment advisory agreements. They discussed the Morningstar fee level methodology used in the 15(c) Report, as well as the custom 15(c) categories and peer groups created explicitly for the 15(c) Report, and determined it was reasonable.
The Directors noted that the peer grouping methodology in the 15(c) Report considers three factors in selecting potential peers: investment style, share class characteristics, and assets. While it would be ideal if each peer matched closely with the applicable Fund on all three dimensions, the Directors noted that in practice it is often necessary to relax one of the peer grouping factors to find an appropriate number of peers. They concluded that they were comfortable with the peer group methodology in the 15(c) Report.
The Directors then reviewed the expense analysis contained in the 15(c) Report. In summary, the Directors noted the following: (1) the peer group comparative fee and expense analysis for the Common Stock Fund show that its net expense ratio and advisory fee are within a reasonable range of industry averages; (2) the peer group comparative fee and expense analysis for the Large Cap Fund show that its net expense ratio and advisory fee are within a reasonable range of industry averages; and (3) the peer group comparative fee and expense analysis for the International Fund show that its net expense ratio and advisory fee are within a reasonable range of industry averages.
After assessing the expense information discussed above, the Directors concluded that the expense ratios of the Funds are within the range of comparable mutual funds, and that the Funds’ fees are reasonable.
Comparison of Fee Structures of Other Accounts
The Directors believe that management of a mutual fund involves more comprehensive and substantive duties than the management of institutional separate accounts or sub-advised funds. Mutual funds require considerable compliance, third-party oversight, and shareholder services that institutional accounts do not, due to the more retail nature of the fund shareholder and the legal and regulatory burdens associated with managing a mutual fund family. For instance, the Adviser provides tailored investment advisory services to the Funds to accommodate the cash flow volatility presented by the purchases and redemptions of shareholders. Moreover, the Adviser attempts to serve the needs of thousands of accounts, ranging from direct accounts holding a few thousand dollars to the large omnibus accounts of intermediaries who in turn service thousands of large and small accounts.
The Adviser has implemented robust shareholder communication efforts to reach potential shareholders through direct contact, through intermediaries, or via the financial press. The Adviser does not engage in equivalent efforts for separate accounts.
Separate accounts or sub-advised funds engage the Adviser for investment management services and client service only. It also is important to remember that sub-advised funds have a layer of investment management fees, in addition to sub-advisory fees. The adviser to those funds assumes some of the cash flow management duties, board maintenance, and most operational and compliance obligations and third-party oversight.
55
FMI Funds, Inc.
ADVISORY AGREEMENTS (Unaudited) (Continued)
The mutual fund industry has increasingly moved to brokerage platforms (intermediaries) as the transaction vehicle of choice for investors seeking to buy and sell shares of mutual funds that are offered to the general public. Fewer investors are going directly to the Funds’ transfer agent to effect share transactions. Regarding the intermediaries, the Adviser absorbs all costs in excess of the fees paid by the Funds for sub-transfer agent services performed by the intermediaries. So, the cost of obtaining, retaining and servicing shareholders for the Funds is significantly higher than the costs for separately managed accounts. None of the Funds utilize 12b-1 plans to fund distribution costs, with the Adviser absorbing all such costs.
In summary, the Directors noted the following: (1) management of a mutual fund involves more comprehensive and substantive duties than the management of institutional separate accounts or sub-advised funds; (2) separate accounts and sub-advised funds do not present equivalent risks to the Adviser, as separate accounts or sub-advised funds engage the Adviser for investment management services and client service only; (3) the adviser to sub-advised funds assumes some of the cash flow management duties for such funds, and it assumes the board maintenance, and most operational and compliance obligations and third-party oversight for such funds; and (4) the Adviser absorbs all costs in excess of the fees paid by the Funds for sub-transfer agent services performed by the intermediaries, which results in the cost of obtaining, retaining and servicing shareholders for the Funds being significantly higher than the costs for separately managed accounts.
Based on the materials and information discussed above, the Directors concluded that the differential in advisory fees between the Funds and the separate accounts managed by the Adviser is reasonable, and concluded that the fee rates charged to the Funds in comparison to those charged to the Adviser’s other clients is reasonable.
Performance
The Directors then reviewed the performance and risk analysis contained in the 15(c) Report:
| • | The Large Cap Fund has underperformed the benchmark S&P 500 by 2.79% annualized over the last ten years, while outperforming the benchmark by 0.25% annualized since inception through the fiscal year ended September 30, 2022. The Fund has underperformed the iShares Russell 1000 Value ETF proxy benchmark over one (4.33%), three (2.30%), and five (0.33%) year annualized periods, while performing roughly in-line at the ten-year period. The Fund has outperformed the value benchmark by 1.14% annualized since inception through the fiscal year ended September 30, 2022. | |
| • | The Common Stock Fund has outperformed the benchmark Russell 2000 by 1.02% annualized over the last ten years and by 1.68% annualized since inception through the fiscal year ended September 30, 2022. The Fund has outperformed the Russell 2000 Value benchmark over one-, three-, five-, and ten-year annualized periods by 8.70%, 1.98%, 3.64%, and 1.63%, respectively. The Fund outperformed the value benchmark by 0.28% annualized since inception through fiscal year ended September 30, 2022. | |
| • | While outperforming on an annualized basis against the MSCI EAFE (USD) benchmark by 2.81%, the International Fund trails the MSCI EAFE (Local) benchmark by (0.29%) since inception. At the one-, three-, five-, and ten-year annualized periods, FMIYX has underperformed the MSCI EAFE (Local) by (5.99%), (4.05%), (3.00%), and (1.81%), respectively on an annualized basis through September 30, 2022. Notwithstanding the recent relative strength of the MSCI EAFE Value (USD) and MSCI EAFE Value (Local) |
56
FMI Funds, Inc.
ADVISORY AGREEMENTS (Unaudited) (Continued)
| benchmarks, the Fund surpassed the MSCI EAFE Value (USD) on an annualized basis over the one, three, five, ten and since inception periods (investor class) through Fiscal Year End 2022 by 3.06%, 1.25%, 2.57%, and 3.24%, respectively. The Fund also outperformed the MSCI EAFE Value (Local) since inception by 0.80%, while underperforming at the one-, three-, five-, and ten-year annualized periods by (12.31%), (3.11%), (1.10%), and (0.57%) respectively. | ||
| • | Through September 30, 2022, the International II Fund underperformed on an annualized basis against the MSCI EAFE (USD) benchmark at the one year and since inception periods by (3.58%) and (3.87%), respectively, and similarly against the MSCI EAFE Value (USD) index, where the Fund underperformed by (8.55%) at the one year, and (2.98%) annualized since inception. |
Based on the information and materials discussed by the Directors, as reflected above, the Directors concluded that the performance of the Funds, adjusting for risk, has been satisfactory on a relative basis and more than satisfactory on an absolute basis. They continue to believe that the Adviser’s discipline should lead to favorable results in the long-term, and concluded that continuation of the existing advisory agreements was in the best interest of the Funds’ shareholders. In particular, the Directors noted that the Funds’ performance during periods of stock market decline was better than the market, as intended by the Funds’ principal investment strategies, supporting the conclusion that the Funds provide positive risk adjusted returns.
Costs and Profitability
The Adviser uses a team-oriented approach so no one individual is assigned to any one of the Adviser’s clients from a portfolio management, research, trading, operations or administrative perspective. Instead, every teammate is working on behalf of all the Adviser’s clients, including each Fund. Accordingly, in determining the Adviser’s costs relative to the services performed on behalf of all the Adviser’s clients, the Adviser has determined to allocate its overall costs proportionately to each Adviser client based upon the percentage of that client’s assets under our management. The Directors believe this method of allocation is appropriate.
In summary, the Directors noted the following: (1) the peer group comparative fee and expense analysis for the Funds show that their net expense ratios and advisory fees are within a reasonable range of industry averages; (2) the shareholder service fees paid to intermediaries by the Adviser for the benefit of the Funds significantly reduce the pre-tax profit margin to the Adviser, which results in the pre-tax profit margin for the Funds being lower than the pre-tax profit margin for all other clients of the Adviser on an aggregate basis; and (3) the Adviser’s pre-tax profit margin for the Funds compares reasonably to several publicly traded companies that the Directors reviewed.
In assessing and evaluating the information discussed above, the Directors recognized that it is difficult to make comparisons of profitability from investment advisory contracts. This is because comparative information is not generally publicly available and is affected by numerous factors, including the structure of the particular adviser, the type of clients it advises, its business mix, and numerous assumptions regarding allocations and the adviser’s capital structure and cost of capital. Taking this into account, following their discussion of the material presented above, the Directors concluded that the level of profitability realized by the Adviser from its provision of services to the Funds is reasonable, and that the overall expense ratios and investment advisory fees were fair and within the range of industry averages.
57
FMI Funds, Inc.
ADVISORY AGREEMENTS (Unaudited) (Continued)
Economies of Scale
The Directors discussed the possibility that as fund assets grow, certain fixed costs are spread over the larger asset base leading to some economies of scale, which should benefit the Funds’ shareholders. Additionally, some variable costs, such as accounting, administration, custody and management fees are on a sliding scale relative to asset size. Based on the materials the Directors reviewed, the Funds’ expense ratios have generally fallen over the fiscal years, primarily as a consequence of the Adviser’s renegotiation of service contracts and the addition of management fee breakpoints. The Directors determined that the breakpoints are at levels that will appropriately benefit shareholders by passing along economies of scale.
In summary, the Directors noted the following: (1) some variable costs, such as accounting, administration, custody and management fees are on a sliding scale relative to asset size; (2) the Funds’ expense ratios have generally fallen over the fiscal years, primarily as a consequence of the Adviser’s renegotiation of service contracts and the addition of management fee breakpoints; and (3) the fact that the Adviser has made significant investments into the Funds’ portfolio management and research teams.
After discussing the matters referenced above, the Directors concluded that the current fees and breakpoints were appropriate.
Fall-Out Benefits
The Directors reviewed the Adviser’s use of research, analytical, statistical and other information and services obtained in connection with effecting trades for the Funds. While the research, analytical, statistical and other information and services provided by brokers have substantial value, the Directors determined that such information and services are supplemental to the Adviser’s own efforts in the performance of its duties under the investment advisory agreements, and are used for the benefit of the Funds.
With regard to research services furnished by brokers through whom the Adviser effects security transactions (credits that allow the Adviser to obtain research, so-called “soft-dollars”), the Directors noted that the research may be used in servicing all of the Adviser’s accounts, not just the Funds, regardless of which security transactions generated the soft-dollars. So, the Directors discussed with the Adviser, the Adviser’s allocation policies and procedures for soft-dollars, noting that the Adviser generally allocates soft-dollars proportionately based upon the percentage of a client’s assets under management. The Directors determined that this allocation methodology is appropriate.
In summary, the Directors noted the following: (1) although the Adviser could derive benefits from the conversion of Fund shareholders into separate account clients, the Funds also could benefit from potential institutional shareholders who might choose to invest in the Funds because they want the Adviser’s services, but do not meet minimum separate account size requirements; (2) the Directors concluded that the research, analytical, statistical and other information and services provided by brokers are merely supplemental to the Adviser’s own efforts in the performance of its duties under the investment advisory agreements; and (3) the Directors concluded that the allocation methodology for soft-dollars is appropriate.
After discussing and evaluating the materials presented above, the Directors concluded that the other benefits realized by the Adviser from its relationship with the Funds were reasonable.
58
FMI Funds, Inc.
ADVISORY AGREEMENTS (Unaudited) (Continued)
Conclusion
After reviewing the material provided for the meeting, management’s presentation, as well as other information regularly provided at the Board’s quarterly meetings throughout the year regarding the quality of services provided by the Adviser, the performance of the Funds, expense information, regulatory compliance issues, trading information and related matters and other factors deemed relevant by the Board, the Directors, including all of the Independent Directors, concluded that the investment advisory arrangements between the Funds and the Adviser were fair and reasonable and that the continuation of the investment advisory agreements would be in the best interest of the Funds and their shareholders. Accordingly, the Directors, including the Independent Directors voting separately, approved the continuation of the investment advisory agreements.
59
FMI Funds, Inc.
DISCLOSURE INFORMATION (Unaudited)
Performance for Period Ended March 31, 2023
| Average Annual Total Returns | |||||||||||||||||||||
| 3 | 1 | 3 | 5 | 10 | Since | Inception | |||||||||||||||
| FMI FUND / INDEX | Months(1) | Year | Year | Year | Year | Inception(1) | Date | ||||||||||||||
| Large Cap – Investor Class | 3.95 | % | -5.35 | % | 14.91 | % | 6.92 | % | 9.17 | % | 8.58 | % | 12-31-01 | ||||||||
| S&P 500 Index | 7.50 | % | -7.73 | % | 18.60 | % | 11.19 | % | 12.24 | % | 8.29 | % | 12-31-01 | ||||||||
| iShares Russell 1000 Value ETF | 0.93 | % | -6.18 | % | 17.71 | % | 7.31 | % | 8.94 | % | 7.32 | % | 12-31-01 | ||||||||
| Large Cap – Institutional Class | 4.04 | % | -5.19 | % | 15.07 | % | 7.07 | % | N/A | 9.42 | % | 10-31-16 | |||||||||
| S&P 500 Index | 7.50 | % | -7.73 | % | 18.60 | % | 11.19 | % | 12.24 | % | 12.86 | % | 10-31-16 | ||||||||
| iShares Russell 1000 Value ETF | 0.93 | % | -6.18 | % | 17.71 | % | 7.31 | % | 8.94 | % | 8.61 | % | 10-31-16 | ||||||||
| Common Stock – Investor Class | 7.51 | % | 6.01 | % | 24.26 | % | 9.83 | % | 9.98 | % | 11.70 | % | 12-18-81 | ||||||||
| Russell 2000 Index | 2.74 | % | -11.61 | % | 17.51 | % | 4.71 | % | 8.04 | % | 9.77 | % | 12-18-81 | ||||||||
| Russell 2000 Value Index | -0.66 | % | -12.96 | % | 21.01 | % | 4.55 | % | 7.22 | % | 11.11 | % | 12-18-81 | ||||||||
| Common Stock – Institutional Class | 7.53 | % | 6.13 | % | 24.42 | % | 9.95 | % | N/A | 11.63 | % | 10-31-16 | |||||||||
| Russell 2000 Index | 2.74 | % | -11.61 | % | 17.51 | % | 4.71 | % | 8.04 | % | 8.10 | % | 10-31-16 | ||||||||
| Russell 2000 Value Index | -0.66 | % | -12.96 | % | 21.01 | % | 4.55 | % | 7.22 | % | 7.04 | % | 10-31-16 | ||||||||
| International – Investor Class | 10.28 | % | 5.71 | % | 16.42 | % | 4.41 | % | 6.41 | % | 7.34 | % | 12-31-10 | ||||||||
| MSCI EAFE (LOC) | 7.49 | % | 3.84 | % | 14.63 | % | 6.25 | % | 7.34 | % | 7.02 | % | 12-31-10 | ||||||||
| MSCI EAFE (LOC) Value | 4.96 | % | 5.31 | % | 16.25 | % | 4.50 | % | 6.15 | % | 5.93 | % | 12-31-10 | ||||||||
| MSCI EAFE (USD) | 8.47 | % | -1.38 | % | 12.99 | % | 3.52 | % | 5.00 | % | 4.75 | % | 12-31-10 | ||||||||
| MSCI EAFE (USD) Value | 5.93 | % | -0.31 | % | 14.58 | % | 1.75 | % | 3.75 | % | 3.62 | % | 12-31-10 | ||||||||
| International – Institutional Class | 10.32 | % | 5.84 | % | 16.56 | % | 4.56 | % | N/A | 5.71 | % | 10-31-16 | |||||||||
| MSCI EAFE (LOC) | 7.49 | % | 3.84 | % | 14.63 | % | 6.25 | % | 7.34 | % | 7.39 | % | 10-31-16 | ||||||||
| MSCI EAFE (LOC) Value | 4.96 | % | 5.31 | % | 16.25 | % | 4.50 | % | 6.15 | % | 5.80 | % | 10-31-16 | ||||||||
| MSCI EAFE (USD) | 8.47 | % | -1.38 | % | 12.99 | % | 3.52 | % | 5.00 | % | 6.35 | % | 10-31-16 | ||||||||
| MSCI EAFE (USD) Value | 5.93 | % | -0.31 | % | 14.58 | % | 1.75 | % | 3.75 | % | 4.77 | % | 10-31-16 | ||||||||
| International II – Currency Unhedged – | |||||||||||||||||||||
| Institutional Class | 10.49 | % | -0.38 | % | 13.59 | % | N/A | N/A | 1.12 | % | 12-31-19 | ||||||||||
| MSCI EAFE (USD) | 8.47 | % | -1.38 | % | 12.99 | % | 3.52 | % | 5.00 | % | 3.35 | % | 12-31-19 | ||||||||
| MSCI EAFE (USD) Value | 5.93 | % | -0.31 | % | 14.58 | % | 1.75 | % | 3.75 | % | 2.40 | % | 12-31-19 | ||||||||
(1) | Returns for periods less than one year are not annualized. |
Performance data quoted represents past performance; past performance does not guarantee future results. Investment return and principal value of an investment will fluctuate so that an investor’s shares, when redeemed, may be worth more or less than their original cost. Current performance of a Fund may be lower or higher than the performance quoted. Performance data current to the most recent month end may be obtained by visiting www.fmifunds.com or by calling 1-800-811-5311. The returns do not reflect the deduction of taxes that a shareholder would pay on Fund distributions or the redemption of Fund shares.
Securities named in the Letters to Shareholders, but not listed in the Schedules of Investments are not held in the Funds as of the date of this disclosure. Portfolio holdings are subject to change without notice and are not intended as recommendations of individual securities.
This report is not authorized for use as an offer of sale or a solicitation of an offer to buy shares of the Funds unless accompanied or preceded by the Funds’ current prospectus.
60
FMI Funds, Inc.
DISCLOSURE INFORMATION (Unaudited) (Continued)
As of the Funds’ Prospectus dated January 31, 2023, the annual operating expense ratios for the Investor Class of FMI Large Cap Fund, FMI Common Stock Fund and FMI International Fund are: 0.84%, 1.00% and 0.94%, respectively. The annual operating expense ratios for the Institutional Class of FMI Large Cap Fund, FMI Common Stock Fund, FMI International Fund and FMI International Fund II – Currency Unhedged are: 0.70%, 0.89%, 0.81% and 0.90%*, respectively.
| * | Note that the annual operating expenses for the Institutional Class of FMI International Fund II – Currency Unhedged are 1.15% before the investment adviser’s voluntary reimbursement such that annual fund operating expenses do not exceed 0.90%, which will continue at least through January 31, 2024. |
Risks associated with investing in the Funds are as follows:
FMI Large Cap Fund: Stock Market Risk, Medium and Large Capitalization Companies Risks, Value Investing Risk, Foreign Securities Risk (fluctuation of currency, different financial standards, and political instability), Liquidity Risk, and Tax Law Change Risk.
FMI Common Stock Fund: Stock Market Risk, Medium and Small Capitalization Companies Risks (which includes the potential for greater volatility and less financial resources than Large-Cap Companies), Value Investing Risk, Foreign Securities Risk (fluctuation of currency, different financial standards, and political instability), Liquidity Risk, and Tax Law Change Risk.
FMI International Fund: Stock Market Risk, Value Investing Risk, Foreign Securities Risk (fluctuation of currency, different financial standards, and political instability), Geographic Concentration Risk, Currency Hedging Risk, Large Capitalization Companies Risk, Liquidity Risk, and Tax Law Change Risk.
FMI International Fund II – Currency Unhedged: Stock Market Risk, Value Investing Risk, Foreign Securities Risk (fluctuation of currency, different financial standards, and political instability), Geographic Concentration Risk, Large Capitalization Companies Risk, Liquidity Risk, and Tax Law Change Risk.
For details regarding these risks, please refer to the Funds’ Summary or Statutory Prospectuses dated January 31, 2023.
The Standard and Poor’s 500 Index (S&P 500) consists of 500 selected common stocks, most of which are listed on the New York Stock Exchange. The S&P’s Ratings Group designates the stocks to be included in the Index on a statistical basis. A particular stock’s weighting in the Index is based on its relative total market value (i.e., its market price per share times the number of shares outstanding). Stocks may be added or deleted from the Index from time to time.
The iShares Russell 1000 Value ETF seeks to track investment results of an index composed of large- and mid-capitalization U.S. equities that exhibit value characteristics. Performance is compared to the iShares Russell 1000 Value ETF for illustrative purposes only. The metrics regarding the comparative ETF have been obtained from Bloomberg and the returns are calculated assuming all dividends are reinvested. The ETF is not subject to the same fees or expenses as the Fund. The Fund is not restricted to investing in those securities which comprise the ETF. The Fund’s performance may or may not correlate to the ETF, and it should not be considered a proxy for the ETF.
The Russell 2000 Index measures the performance of the 2,000 smallest companies in the Russell 3000 Index. The Russell 2000 Value Index includes equities that exhibit value characteristics and the Russell 2000 Growth Index includes equities that exhibit growth characteristics.
The MSCI EAFE Index (Europe, Australasia, Far East) is a free float-adjusted market capitalization index that is designed to measure the equity market performance of developed markets, excluding the U.S. and Canada. The MSCI EAFE Index consists of the following 21 developed market country indices: Australia, Austria, Belgium, Denmark, Finland, France, Germany, Hong Kong, Ireland, Israel, Italy, Japan, the Netherlands, New
61
FMI Funds, Inc.
DISCLOSURE INFORMATION (Unaudited) (Continued)
Zealand, Norway, Portugal, Singapore, Spain, Sweden, Switzerland and the United Kingdom. Index results are inclusive of dividends and net of foreign withholding taxes. The reported figures include reinvestment of dividends and capital gains distributions and do not reflect any fees or expenses.
The MSCI EAFE Value Index captures large and mid cap securities exhibiting overall value style characteristics across Developed Markets countries around the world, excluding the U.S. and Canada. The value investment style characteristics for index construction are defined using three variables: book value to price, 12-month forward earnings to price and dividend yield.
The MSCI EAFE Index and MSCI EAFE Value Index are calculated in local currency (LOC) as well as in U.S. Dollars (USD). The concept of a LOC calculation excludes the impact of currency fluctuations. All currencies of listing are considered in the Index calculation in LOC where current prices (t) and previous day prices (t-1) are converted into USD using the same exchange rate (exchange rate t-1) in the numerator and denominator. As a consequence, the FX factor drops out of the equation. The USD calculation includes exchange rates at t and t-1. Therefore, the LOC calculation only represents the price appreciation or depreciation of the securities, whereas the USD calculation also accounts for the performance of the currency (or currencies) relative to the USD.
MSCI EAFE is a service mark of MSCI Barra.
All indices are unmanaged. These indices are used herein for comparative purposes in accordance with the Securities and Exchange Commission regulations. It is not possible to invest directly into an index.
GLOSSARY
ADR – American Depositary Receipt refer to a negotiable certificate issued by a U.S. depository bank representing a specified number of shares, usually one share, of a foreign company’s stock. The ADR trades on U.S. stock markets as any domestic shares would.
Bond Yield is a return an investor realizes on a bond and can be derived in different ways. The coupon rate is the annual interest rate established when the bond is issued. The current yield depends on the bond’s price and its coupon, or interest payment. Additional calculations of a bond’s yield include yield to maturity (YTM), bond equivalent yield (BEY), and effective annual yield (EAY).
Cost of Capital is a company’s calculation of the minimum return that would be necessary in order to justify undertaking a capital budgeting project. Investors may also use the term to refer to an evaluation of an investment’s potential return in relation to its costs and risks.
Discount Rate is the interest rate charged to commercial banks and financial institutions for short-term loans they take from the Federal Reserve Bank. The discount rate is applied at the Fed’s lending facility, which is called the discount window. A discount rate can also refer to the interest rate used in discounted cash flow (DCF) analysis to determine the present value of future cash flows. In this case, the discount rate can be used by investors and businesses for potential investments.
EPS – Earnings Per Share is calculated as a company’s profit divided by the outstanding shares of its common stock. The resulting number serves as an indicator of a company’s profitability. It is common for a company to report EPS that is adjusted for extraordinary items and potential share dilution. The higher a company’s EPS, the more profitable it is considered to be.
GFC – Global Financial Crisis – This financial crisis was the worst economic disaster since the Stock Market Crash of 1929. It started with a subprime mortgage lending crisis in 2007 and expanded into a global banking crisis with the failure of investment bank Lehman Brothers in September 2008. Huge bailouts and other measures meant to limit the spread of the damage failed and the global economy fell into recession.
Intrinsic value is a measure of what an asset is worth. This measure is arrived at by means of an objective calculation or complex financial model. Intrinsic value is different from the current market price of an asset. However, comparing it to that current price can give investors an idea of whether the asset is undervalued or overvalued.
62
FMI Funds, Inc.
DISCLOSURE INFORMATION (Unaudited) (Continued)
Mark to market (MTM) is a method of measuring the fair value of accounts that can fluctuate over time, such as assets and liabilities. Mark to market aims to provide a realistic appraisal of an institution’s or company’s current financial situation based on current market conditions.
P/E ratio – Price-to-earnings ratio is the ratio for valuing a company that measures its current share price relative to its per-share earnings. The trailing P/E ratio is calculated by dividing the current share price by per-share earnings over the previous 12 months and the forward P/E ratio estimates likely per-share earnings over the next 12 months.
ROIC – Return on Invested Capital is a calculation used to assess a company’s efficiency at allocating the capital under its control to profitable investments. The return on invested capital measure gives a sense of how well a company is using its money to generate returns.
Reference definitions found at Investopedia.com
Distributed by Foreside Financial Services, LLC, Three Canal Plaza, Suite 100, Portland, ME 04101
63
FMI Funds, Inc.
ADDITIONAL INFORMATION (Unaudited)
For additional information about the Directors and Officers or for a description of the policies and procedures that the Funds use to determine how to vote proxies relating to portfolio securities, please review the Statement of Additional Information. You may call (800) 811-5311 and request a Statement of Additional Information, and it will be mailed to you free of charge. The Statement of Additional Information is also available on the website of the Securities and Exchange Commission (the “Commission”) at http://www.sec.gov. Information on how each of the Funds voted proxies relating to portfolio securities during the most recent 12-month period ended June 30 is available free of charge on the Funds’ website at http://www.fmifunds.com or the website of the Commission no later than August 31 for the prior 12 months ended June 30. The Funds file their complete schedules of portfolio holdings with the Commission for the first and third quarters of each fiscal year as exhibits to their reports on Form N-PORT. The Funds’ Form N-PORT reports are available on the Commission’s website provided above.
64
(This Page Intentionally Left Blank.)
| FMI Large Cap Fund | FMI Common Stock Fund | FMI International Fund | FMI International Fund II – |
| Currency Unhedged |
100 East Wisconsin Avenue, Suite 2200
Milwaukee, Wisconsin 53202
www.fmifunds.com
414-226-4555
BOARD OF DIRECTORS
| ROBERT C. ARZBAECHER | REBECCA W. HOUSE | ||
| JOHN S. BRANDSER | PAUL S. SHAIN | ||
| LAWRENCE J. BURNETT | ROBERT J. VENABLE | ||
| PATRICK J. ENGLISH |
INVESTMENT ADVISER
FIDUCIARY MANAGEMENT, INC.
100 East Wisconsin Avenue, Suite 2200
Milwaukee, Wisconsin 53202
ADMINISTRATOR, ACCOUNTANT, TRANSFER
AGENT AND DIVIDEND DISBURSING AGENT
U.S. BANCORP FUND SERVICES, LLC
615 East Michigan Street
Milwaukee, Wisconsin 53202
800-811-5311 or 414-765-4124
| CUSTODIAN | INDEPENDENT REGISTERED | ||
| U.S. BANK, N.A. | PUBLIC ACCOUNTING FIRM | ||
| Milwaukee, Wisconsin | COHEN & COMPANY, LTD. | ||
| Milwaukee, Wisconsin | |||
| DISTRIBUTOR | LEGAL COUNSEL | ||
| FORESIDE FINANCIAL SERVICES, LLC | FOLEY & LARDNER LLP | ||
| Portland, Maine | Milwaukee, Wisconsin |
| |||
| FMI Funds, Inc. | |||
| 1-800-811-5311 | |||
| www.fmifunds.com | |||
| (b) | Not applicable. |
Item 2. Code of Ethics.
Not applicable for semi-annual reports.
Item 3. Audit Committee Financial Expert.
Not applicable for semi-annual reports.
Item 4. Principal Accountant Fees and Services.
Not applicable for semi-annual reports.
Item 5. Audit Committee of Listed Registrants.
Not applicable to registrants who are not listed issuers (as defined in Rule 10A-3 under the Securities Exchange Act of 1934).
Item 6. Investments.
| (a) | Schedule of Investments is included as part of the report to shareholders filed under Item 1 of this Form. |
| (b) | Not applicable. |
Item 7. Disclosure of Proxy Voting Policies and Procedures for Closed-End Management Investment Companies.
Not applicable to open-end investment companies.
Item 8. Portfolio Managers of Closed-End Management Investment Companies.
Not applicable to open-end investment companies.
Item 9. Purchases of Equity Securities by Closed‑End Management Investment Company and Affiliated Purchasers.
Not applicable to open-end investment companies.
Item 10. Submission of Matters to a Vote of Security Holders.
Not applicable.
Item 11. Controls and Procedures.
| (a) | The Registrant’s principal executive and principal financial officers have concluded that the Registrant’s disclosure controls and procedures are effective, as of a date within 90 days of the filing of this report, based on their evaluation of the Registrant’s disclosure controls and procedures. |
| (b) | There were no changes in the Registrant's internal control over financial reporting (as defined in Rule 30a-3(d) under the Act) that occurred during the period covered by this report that have materially affected, or are reasonably likely to materially affect, the Registrant's internal control over financial reporting. |
Item 12. Disclosure of Securities Lending Activities for Closed-End Management Investment Companies
Not applicable to open-end investment companies.
Item 13. Exhibits.
| (a) | (1) Any code of ethics or amendment thereto, that is the subject of the disclosure required by Item 2, to the extent that the registrant intends to satisfy Item 2 requirements through filing an exhibit. Not Applicable. |
(3) Any written solicitation to purchase securities under Rule 23c‑1 under the Act sent or given during the period covered by the report by or on behalf of the registrant to 10 or more persons. Not applicable to open-end investment companies.
(4) Change in the registrant’s independent public accountant. There was no change in the registrant’s independent public accountant for the period covered by this report.
SIGNATURES
Pursuant to the requirements of the Securities Exchange Act of 1934 and the Investment Company Act of 1940, the registrant has duly caused this report to be signed on its behalf by the undersigned, thereunto duly authorized.
(Registrant) FMI Funds, Inc.
By /s/John S. Brandser
John S. Brandser, President/Principal Executive Officer
Date 5/9/2023
Pursuant to the requirements of the Securities Exchange Act of 1934 and the Investment Company Act of 1940, this report has been signed below by the following persons on behalf of the registrant and in the capacities and on the dates indicated.
By /s/John S. Brandser
John S. Brandser, President/Principal Executive Officer
Date 5/9/2023
By /s/John S. Brandser
John S. Brandser, Treasurer/Principal Financial Officer
Date 5/9/2023