SEMI-ANNUAL REPORT
March 31, 2021
FMI Large Cap Fund
Investor Class (Ticker Symbol: FMIHX)
Institutional Class (Ticker Symbol: FMIQX)
FMI Common Stock Fund
Investor Class (Ticker Symbol: FMIMX)
Institutional Class (Ticker Symbol: FMIUX)
FMI International Fund
Investor Class (Ticker Symbol: FMIJX)
Institutional Class (Ticker Symbol: FMIYX)
FMI International Fund II – Currency Unhedged
Investor Class (Not Available For Sale)
Institutional Class (Ticker Symbol: FMIFX)
| | |

| |
| |
| |
| FMI Funds, Inc. |
| |
| Advised by Fiduciary Management, Inc. |
| www.fmifunds.com |
| |
| |
| | |
FMI Funds, Inc.
TABLE OF CONTENTS
| FMI Large Cap Fund | |
| Shareholder Letter | 1 |
| Schedule of Investments | 7 |
| Industry Sectors | 9 |
| | |
| FMI Common Stock Fund | |
| Shareholder Letter | 10 |
| Schedule of Investments | 15 |
| Industry Sectors | 17 |
| | |
| FMI International Fund and FMI International Fund II – Currency Unhedged | |
| Shareholder Letter | 18 |
| | |
| FMI International Fund | |
| Schedule of Investments | 25 |
| Schedule of Forward Currency Contracts | 29 |
| Industry Sectors | 30 |
| Concentration by Country | 30 |
| | |
| FMI International Fund II – Currency Unhedged | |
| Schedule of Investments | 31 |
| Industry Sectors | 35 |
| Concentration by Country | 35 |
| | |
| Financial Statements | |
| Statements of Assets and Liabilities | 36 |
| Statements of Operations | 38 |
| Statements of Changes in Net Assets | 40 |
| Financial Highlights | 44 |
| Notes to Financial Statements | 51 |
| | |
| Additional Information | 63 |
| Expense Example | 64 |
| Advisory Agreements | 66 |
| Disclosure Information | 73 |
FMI
Large Cap
Fund
(unaudited)
March 31, 2021
Dear Fellow Shareholders:
The FMI Large Cap Fund (“Fund”) returned 6.05%1 in the March quarter compared to 6.17% for the Standard & Poor’s 500 Index and 11.26% for the Russell 1000 Value Index. Relative to the S&P 500, sectors that outperformed included Electronic Technology, Finance, and Commercial Services. Underperforming areas included Energy Minerals, Consumer Non-Durables, and Health Services. From an individual stock perspective, Micron Technology Inc., The Charles Schwab Corp., and Omnicom Group Inc. were outstanding, while Unilever PLC, Dollar General Corp., and Nestlé S.A. lagged. Most stocks did reasonably well in the quarter; deeper-value names (many of suspect quality) and cyclical enterprises were standouts. Firms with a high probability of default, money-losing companies, and other highly-speculative stocks also continued to perform well. Recall that 2020 was a banner year for the most speculative stocks. Companies with over $1 billion in market value as of year-end 2020, who also lost money in 2019 (409 money-losing companies), gained on average 123% last year. When the other side of this stock market cycle has been completed, we believe most of these stocks will better reflect fundamental reality.
We lead this note with a reiteration of what we said in December. Vaccines are helping to drive COVID-19 into the background, economies are generally improving, and the outlook is brightening for revenue growth. This should favor value-oriented securities. The absence of generalized growth helped drive a high premium for those relatively few companies that were growing rapidly. There are still nearly ten million Americans out of work, and once the disincentive of a government check is removed, the expectation is that many people will rejoin the workforce. There is pent-up demand, and this should drive good GDP growth.
We also have to consider, however, the ramifications of unprecedented deficit spending. The U.S. government is set to borrow more money than it generates in tax receipts, pushing the deficit to likely exceed 20% of GDP this year, and the federal debt at least 30% greater than the total output of the economy. The U.S. has never had such a stretched balance sheet in non-war times. Someday the piper will have to be paid.
The “character” of the stock market is rambunctious, casino-like, and schizophrenic. Stocks rip up or down seemingly based on whether professional traders, CNBC, or the Reddit/Robinhood crowd deem it a “risk-on” or “risk-off” day. Social media-driven campaigns have perhaps mortally wounded short sellers. Short selling is a legitimate and useful endeavor as it helps with price discovery; however, if a loosely-organized mob can run up the stock of a low-quality, heavily-shorted business, it makes the profession untenable. At least one major hedge fund needed a multi-billion-dollar bailout after its short position in GameStop was attacked. Broken bets, at least so far, haven’t curbed the chaotic action in the retail investor camp. Recall last year’s head-scratching rally in the bankrupt rental car company, Hertz Corp. Trading around $20 per share in February of 2020, it filed for bankruptcy on May 22nd. The stock immediately went to $0.56. Retail
_______________
1 | The FMI Large Cap Fund Investor Class (FMIHX) and the FMI Large Cap Fund Institutional Class (FMIQX) had a return of 6.05% and 6.12%, respectively, for the first quarter of 2021. |
traders, taking cues from popular sites on Redditt like WallStreetBets, sent the stock up tenfold in a month. Today, trading in the pink sheets, Hertz is at $1.72 – still a highly-speculative price, considering the likelihood of equity investors getting zero in the restructuring.
Traders moving “baskets” of securities are causing stocks to lurch back-and-forth between various indices (growth or value) and subsectors (Special Purpose Acquisition Companies, or “SPACs,” shorts, rate-sensitive financials, high-beta reopening stories, non-profitable tech, oil, renewables, high beta coronavirus beneficiaries, infrastructure, etc.), furthering the disconnection between individual stocks and underlying fundamentals. Stocks are viewed by many as pieces of paper, not fractional ownership of businesses. There might be a whole generation of investors who simply do not consider valuation at all in the selection of their investments. It’s possible this multi-year phenomenon can continue. If so, investors can throw away the textbooks and simply follow momentum. Of course, we don’t believe it will persist; there is no historical precedent, and it just violates common sense.
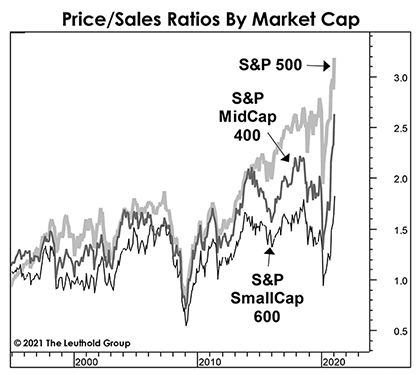
Most valuations are higher than at any time we have studied. Few would buy a company trading at 39.9 times trailing earnings (price-to-earnings), 27.7 times EBITDA (enterprise value-to-EBITDA), or 6.6 times revenue (price-to-sales), yet this is what index investors are paying for the S&P 500 today.2 It’s similar for other market caps. Below is a chart depicting the median price-to-sales ratio for three S&P indices. Lately, around our firm, we’ve marveled at some Wall Street research reports that literally do not mention a stock’s valuation. Many investors have a distorted view of how fast companies grow. Most would be surprised to learn that over the past decade, the median growth rates of the S&P 500 sales and earnings were 2.61% and 2.75%, respectively. Eventually, we expect that reality will be reflected in fundamental valuations.
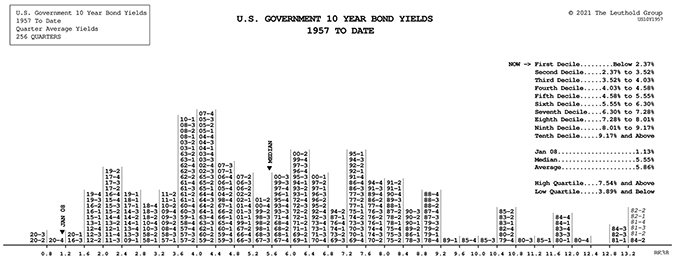
Growth stocks underperformed in the quarter. Higher interest rates are perhaps the culprit, although meeting elevated expectations may also be a factor. The 10-Year Treasury yield rose to 1.74% from 0.93% at the start of the year. As the economy gains speed coming out of coronavirus-induced shutdowns and dormant money starts to get deployed within the banking system, inflation concerns may surface. As mentioned, we are seeing anecdotal evidence of inflation in several places. Perhaps this sets the stage for the long-awaited “normalization” of interest rates. Since 1957, the median 10-Year Treasury yield is 5.55%. As the following histogram reveals, today’s level could rise 0.60% and still be in the first decile. We’ve reviewed Wall Street models for some growth companies that incorporate a cost of capital below 2%! Imagine what those long-term discount models would look like with a more normal 10% hurdle rate on equity capital and 5-6% on debt.
_______________
2 | Valuations are estimates based on the following scrubbing criteria: money losing companies are ascribed a 40 P/E ratio to them (which is probably conservative) and those with P/E ratios greater than 100 are capped at 100. For P/S, those with greater than a 30 multiple are capped at 30x. We assign the same multiple for no sales. The EV/EBITDA calculation excludes financials, and uses a cap of a 200 multiple, while those with a negative EV/EBITDA receive a 20 multiple in the calculation. |
Inflation is in almost nobody’s muscle memory. Very few investors were around in the early 1980s, the last time inflation was a real problem. Economies were much different back then. Natural resource dependency, labor mobility, supply chain efficiency, technology, and many other elements have fundamentally changed, making high inflation appear less likely than in the past. Nevertheless, warp speed increases in deficits and overall debt, low productivity, wanton Fed money printing, and complete political disfunction may help foster higher prices. Our companies are telling us their costs are rising. This could begin to change the interest rate environment. It is hard to believe, but the effort to bring inflation under control saw the Federal Funds Rate move from 5% in 1976 to 20% in 1980. Going from today’s street-level rates to something even remotely close to the lower end of this range would certainly change the character of what works, and what does not, in the stock market. Nobody has a crystal ball, but the Fund is not built with the notion that interest rates will stay low forever. Our approach is to buy all-weather vehicles, but with a dollop of contrarianism. We remain optimistic that good-quality, reasonably-valued businesses with solid balance sheets will prevail over the long run. Following are a couple of ideas that reflect this strategy.
Masco Corp. (MAS)
(Analyst: Jordan Teschendorf)
Description
Masco Corp., headquartered in Livonia, Michigan, is a global leader in the design, manufacture, and distribution of branded home improvement and building products. The company’s portfolio of well-recognized brands includes Behr paint, and Delta and Hansgrohe bath and shower fixtures. Operations are divided across two segments: Plumbing Products (58% sales, and 58% operating profit) and Decorative Architectural Products: (42%, and 42%). The company generated a 2020 sales profit of $7.2 billion, and operating profit of $1.3 billion. Sales are split between North America (81%), Europe (12%), China (3%), UK (2%), and Other (2%).
Good Business
| | • | Following several key portfolio actions in recent years (the 2015 spin-off of their installation business serving new construction, and the sale of their windows and cabinetry businesses in 2019 and 2020, respectively), the business has structurally increased its sustainable growth, margin, and return profile. |
| | | |
| | • | Masco is now comprised mostly of low-ticket and high-impact home improvement products in growing categories (paints, stains, faucets, etc.), with a sector-leading 89% of sales from the less cyclical and higher-margin repair and remodel (R&R) market. |
| | | |
| | • | The company generally holds number one or two positions in its major markets. Competitive advantages include its brand strength built over several decades, and close alignment with advantaged retail and distribution partners. |
| | • | Masco’s return on invested capital (ROIC) was 26% in 2020. The company’s ROIC has averaged around 20% over the last 3, 5, and 10-year periods. |
| | | |
| | • | The company has been a terrific generator of free cash flow, is conservatively financed, and is easy to understand. |
Valuation
| | • | The stock trades at a mid-teens forward earnings per share multiple (EPS), a discount to its 10-year average of 19.6 times. |
| | | |
| | • | It also trades at about a 20% discount to the median of its peers on a forward enterprise value-to-EBITDA. |
| | | |
| | • | Masco’s discount is particularly notable considering it leads its peer group in ROIC and long-term EPS growth, while also carrying well-below-average exposure to more cyclical new construction markets. |
Management
| | • | Keith Allman has been with Masco since 1998 and has served as Chief Executive Officer since February 2014. Under his leadership, the company has focused the business on higher-margin and less cyclical markets where it has competitive advantage and emphasized innovation and capital discipline. He beneficially owns over 1.1 million shares of the company as of the latest proxy. |
| | | |
| | • | Management demonstrates discipline in allocating free cash flow and has a clear understanding of ROIC (tied to compensation), steering clear of high-priced acquisitions, and accelerating share repurchase activity when the stock has traded below intrinsic value. |
Investment Thesis
Masco provides FMI exposure to the residential housing market through a best-in-class branded building products company with strong leverage to the attractive R&R segment. Although the stock has periodically reflected concerns over higher raw material costs, rising interest rates, and the outlook for new construction, we believe the company provides a good balance of offensive and defensive attributes. At a reasonable valuation, considering our expectation for mid-single-digit organic sales and double-digit EPS growth over the long-term, we continue to believe in Masco’s prospects.
Micron Technology Inc. (MU)
(Analyst: Dan Sievers)
Description
Micron Technology, founded in 1978 and headquartered in Boise, Idaho, is focused on the production of innovative memory and storage solutions. Approximately 70% of its revenue (85% of operating income) comes from dynamic random-access memory (DRAM) and 25% from “not and” (NAND) solid storage, and the balance from other emerging memory technologies. By broad market segment, 2020 sales were approximately 25% Mobile, 20% Client and Graphics, 20% Enterprise and Cloud Server, 20% Solid State Storage Devices, and 15% Automotive, Industrial, and Consumer.
Good Business
| | • | Following decades of consolidation culminating in the acquisition of Elpida Memory Inc. (out of bankruptcy) by Micron in 2013, DRAM entered a new paradigm, where none of the remaining three large players were seeking to win material market share. By 2019, nearly all of the global DRAM market was controlled by Samsung Electronics Co. Ltd. (46%), SK Hynix Inc. (30%), and Micron (21%) because migrating process technology to the next “node” has become increasingly difficult and costly. Barriers to entry have never been higher and the DRAM industry may soon be entering an extended period of structural undersupply. In the NAND market, where Micron is #4 of 7 (soon to be 6), a similar dynamic is gradually playing out. Industry leader Samsung still intends on near-term market share gains which may drive further consolidation. |
| | | |
| | • | Demand growth remains strong because almost anywhere there is a processing unit, dynamic memory and storage are needed, and as performance increases, memory demand increases. While industry demand growth may come in part from memory being added to new devices, the larger driver will continue to be growth in memory per device, or “content per box.” |
| | | |
| | • | PC DRAM and laptop NAND have been somewhat commoditized, but the end market demand for both is broadening. Micron is #1 in specialized DRAM for graphics, automotive, and networking. There are advantages to producing both DRAM and NAND, including shared research and development for other emerging and hybrid memory technologies. |
| | | |
| | • | Full cycle margins have been rising, and the memory industry appears to be becoming somewhat less cyclical because of predictable supply growth trends. With this, we expect Micron will have greater full cycle margin than historically. |
| | | |
| | • | As of 2019, Micron’s 5-year trailing ROIC was 18.3%. |
| | | |
| | • | Micron’s balance sheet tipped into a net cash position just nine quarters ago and had net cash and investments of $2.5 billion for the fourth quarter of 2020. Once carrying significant net debt, the company was upgraded to investment grade in recent years by both Moody’s and Standard & Poor’s. |
Valuation
| | • | Micron trades for a high single-digit 2022 EPS estimate. |
| | | |
| | • | While cyclicality remains a trait of Micron, we feel the multiple will be sustainably higher over the next five years due to the oligopolistic nature of the market and the strong secular demand. |
| | | |
| | • | Micron is likely to institute a dividend within a year or two. |
Management
| | • | Sanjay Mehrotra joined Micron as CEO in February 2017. On his watch, Micron has significantly closed the technology and cost gap versus Samsung. Mr. Mehrotra is focused on technological competitiveness, continuous cost reduction, capital expenditure discipline, and return on investment. He initiated the company’s first $10 billion buyback program in May 2018. He co-founded SanDisk Corp. in 1988 and was CEO when SanDisk was sold to Western Digital Corp. in 2016. |
Investment Thesis
The global memory industry has structurally improved since 2013 due to consolidation, higher barriers to supply growth, and the ongoing broadening of demand. While not recently evident, industry cyclicality is diminishing. Following an extraordinary demand-led increase, DRAM prices surged in fiscal year 2017 and 2018 (hyperscale cloud data center buying), but receded drastically in 2019 and 2020 ended September 30. Prior to COVID, Micron was anticipating a fairly smooth calendar year 2020, but demand was pulled forward from datacenter buyers (work-from-home trends) and Chinese smartphone manufacturers, building inventory anticipating trade frictions. Though smartphone demand rebounded in the second half of 2020, these two factors created a demand hole for a few quarters. Looking forward, the DRAM industry appears headed for structural undersupply, which supports firming prices, rising margins, and significant earnings growth ahead.
Thank you for your confidence in the FMI Large Cap Fund.
This shareholder letter is unaudited.
FMI Large Cap Fund
SCHEDULE OF INVESTMENTS
March 31, 2021 (Unaudited)
| Shares | | | | Cost | | | Value | |
| COMMON STOCKS — 97.7% (a) | | | | | | |
| | | | | | | |
COMMERCIAL SERVICES SECTOR — 2.7% | | | | | | |
| | | | | | | | | |
| | | Advertising/Marketing Services — 2.7% | | | | | | |
| | 1,250,000 | | Omnicom Group Inc. | | $ | 83,142,288 | | | $ | 92,687,500 | |
| | | | | | | | | |
CONSUMER DURABLES SECTOR — 4.5% | | | | | | | | |
| | | | | | | | | | | | |
| | | | Electronics/Appliances — 4.5% | | | | | | | | |
| | 1,425,000 | | Sony Group Corp. — SP-ADR* | | | 89,894,994 | | | | 151,064,250 | |
| | | | | | | | | |
CONSUMER NON-DURABLES SECTOR — 7.5% | | | | | | | | |
| | | | | | | | | | | | |
| | | | Beverages: Non-Alcoholic — 2.1% | | | | | | | | |
| | 495,000 | | PepsiCo Inc. | | | 49,489,098 | | | | 70,017,750 | |
| | | | | | | | | | | | |
| | | | Food: Major Diversified — 1.8% | | | | | | | | |
| | 555,000 | | Nestlé S.A. — SP-ADR | | | 22,838,608 | | | | 61,888,050 | |
| | | | | | | | | | | | |
| | | | Household/Personal Care — 3.6% | | | | | | | | |
| | 2,150,000 | | Unilever PLC — SP-ADR | | | 88,689,949 | | | | 120,034,500 | |
| | | | | | | | | |
CONSUMER SERVICES SECTOR — 8.2% | | | | | | | | |
| | | | | | | | | | | | |
| | | | Cable/Satellite TV — 4.7% | | | | | | | | |
| | 2,900,000 | | Comcast Corp. — Cl A | | | 128,277,020 | | | | 156,919,000 | |
| | | | | | | | | | | | |
| | | | Other Consumer Services — 3.5% | | | | | | | | |
| | 50,000 | | Booking Holdings Inc.* | | | 86,729,684 | | | | 116,492,000 | |
| | | | | | | | | |
ELECTRONIC TECHNOLOGY SECTOR — 2.9% | | | | | | | | |
| | | | | | | | | | | | |
| | | | Semiconductors — 2.9% | | | | | | | | |
| | 1,115,000 | | Micron Technology Inc.* | | | 55,149,596 | | | | 98,354,150 | |
| | | | | | | | | |
FINANCE SECTOR — 23.8% | | | | | | | | |
| | | | | | | | | | | | |
| | | | Investment Banks/Brokers — 4.1% | | | | | | | | |
| | 2,135,000 | | The Charles Schwab Corp. | | | 77,583,151 | | | | 139,159,300 | |
| | | | | | | | | | | | |
| | | | Major Banks — 3.9% | | | | | | | | |
| | 855,000 | | JPMorgan Chase & Co. | | | 54,460,960 | | | | 130,156,650 | |
| | | | | | | | | | | | |
| | | | Multi-Line Insurance — 7.7% | | | | | | | | |
| | 1,038,437 | | Arch Capital Group Ltd.* | | | 37,856,480 | | | | 39,844,828 | |
| | 865,000 | | Berkshire Hathaway Inc. — Cl B* | | | 47,098,294 | | | | 220,981,550 | |
| | | | | | | 84,954,774 | | | | 260,826,378 | |
| | | | Property/Casualty Insurance — 5.2% | | | | | | | | |
| | 543,559 | | Chubb Ltd. | | | 71,924,228 | | | | 85,866,015 | |
| | 925,000 | | Progressive Corp. | | | 71,985,977 | | | | 88,439,250 | |
| | | | | | | 143,910,205 | | | | 174,305,265 | |
| | | | Regional Banks — 2.9% | | | | | | | | |
| | 930,000 | | Northern Trust Corp. | | | 79,842,526 | | | | 97,752,300 | |
| | | | | | | | | |
HEALTH SERVICES SECTOR — 10.2% | | | | | | | | |
| | | | | | | | | | | | |
| | | | Health Industry Services — 4.2% | | | | | | | | |
| | 1,115,000 | | Quest Diagnostics Inc. | | | 109,158,654 | | | | 143,099,100 | |
The accompanying notes to financial statements are an integral part of this schedule.
FMI Large Cap Fund
SCHEDULE OF INVESTMENTS (Continued)
March 31, 2021 (Unaudited)
| Shares | | | | Cost | | | Value | |
| COMMON STOCKS — 97.7% (a) (Continued) | | | | | | |
| | | | | | | |
HEALTH SERVICES SECTOR — 10.2% (Continued) | | | | | | |
| | | | | | | | | |
| | | Managed Health Care — 3.7% | | | | | | |
| | 335,000 | | UnitedHealth Group Inc. | | $ | 23,921,781 | | | $ | 124,643,450 | |
| | | | | | | | | | | | |
| | | | Medical/Nursing Services — 2.3% | | | | | | | | |
| | 2,100,000 | | Fresenius Medical Care AG & Co. KGaA | | | 84,929,501 | | | | 77,448,000 | |
| | | | | | | | | |
HEALTH TECHNOLOGY SECTOR — 6.0% | | | | | | | | |
| | | | | | | | | | | | |
| | | | Medical Specialties — 6.0% | | | | | | | | |
| | 2,100,000 | | Koninklijke Philips N.V. — SP-ADR* | | | 98,186,296 | | | | 119,763,000 | |
| | 2,200,000 | | Smith & Nephew PLC — SP-ADR | | | 81,768,368 | | | | 83,380,000 | |
| | | | | | | 179,954,664 | | | | 203,143,000 | |
INDUSTRIAL SERVICES SECTOR — 1.6% | | | | | | | | |
| | | | | | | | | | | | |
| | | | Oilfield Services/Equipment — 1.6% | | | | | | | | |
| | 1,995,000 | | Schlumberger Ltd. | | | 38,502,804 | | | | 54,244,050 | |
| | | | | | | | | |
PROCESS INDUSTRIES SECTOR — 2.9% | | | | | | | | |
| | | | | | | | | | | | |
| | | | Industrial Specialties — 2.9% | | | | | | | | |
| | 640,000 | | PPG Industries Inc. | | | 63,061,315 | | | | 96,166,400 | |
| | | | | | | | | |
PRODUCER MANUFACTURING SECTOR — 14.1% | | | | | | | | |
| | | | | | | | | | | | |
| | | | Building Products — 5.2% | | | | | | | | |
| | 2,930,000 | | Masco Corp. | | | 100,827,714 | | | | 175,507,000 | |
| | | | | | | | | | | | |
| | | | Electrical Products — 4.7% | | | | | | | | |
| | 780,000 | | Eaton Corp. PLC | | | 71,502,214 | | | | 107,858,400 | |
| | 555,000 | | Emerson Electric Co. | | | 25,997,940 | | | | 50,072,100 | |
| | | | | | | 97,500,154 | | | | 157,930,500 | |
| | | | Industrial Machinery — 2.0% | | | | | | | | |
| | 500,000 | | Dover Corp. | | | 67,511,523 | | | | 68,565,000 | |
| | | | | | | | | | | | |
| | | | Trucks/Construction/Farm Machinery — 2.2% | | | | | | | | |
| | 790,000 | | PACCAR Inc. | | | 31,557,064 | | | | 73,406,800 | |
| | | | | | | | | |
RETAIL TRADE SECTOR — 11.1% | | | | | | | | |
| | | | | | | | | | | | |
| | | | Apparel/Footwear Retail — 2.4% | | | | | | | | |
| | 1,215,000 | | The TJX Companies Inc. | | | 41,480,803 | | | | 80,372,250 | |
| | | | | | | | | | | | |
| | | | Discount Stores — 8.7% | | | | | | | | |
| | 750,000 | | Dollar General Corp. | | | 61,785,760 | | | | 151,965,000 | |
| | 1,250,000 | | Dollar Tree Inc.* | | | 110,348,944 | | | | 143,075,000 | |
| | | | | | | 172,134,704 | | | | 295,040,000 | |
TRANSPORTATION SECTOR — 2.2% | | | | | | | | |
| | | | | | | | | | | | |
| | | | Air Freight/Couriers — 2.2% | | | | | | | | |
| | 685,000 | | Expeditors International of Washington Inc. | | | 25,076,809 | | | | 73,767,650 | |
| | | | Total common stocks | | | 2,080,580,343 | | | | 3,292,990,293 | |
The accompanying notes to financial statements are an integral part of this schedule.
FMI Large Cap Fund
SCHEDULE OF INVESTMENTS (Continued)
March 31, 2021 (Unaudited)
Principal Amount | | Cost | | | Value | |
| SHORT-TERM INVESTMENTS — 2.5% (a) | | | | | | |
| | | | | | | | | |
| | | Bank Deposit Account — 2.5% | | | | | | |
| $ | 85,038,114 | | U.S. Bank N.A., 0.01%^ | | $ | 85,038,114 | | | $ | 85,038,114 | |
| | | | Total short-term investments | | | 85,038,114 | | | | 85,038,114 | |
| | | | Total investments — 100.2% | | $ | 2,165,618,457 | | | | 3,378,028,407 | |
| | | | Other liabilities, less assets — (0.2%) (a) | | | | | | | (5,895,772 | ) |
| | | | TOTAL NET ASSETS — 100.0% | | | | | | $ | 3,372,132,635 | |
| * | Non-income producing security. |
| ^ | The rate shown is as of March 31, 2021. |
| (a) | Percentages for the various classifications relate to total net assets. |
| PLC | Public Limited Company |
| SP-ADR | Sponsored American Depositary Receipt |
The accompanying notes to financial statements are an integral part of this schedule.
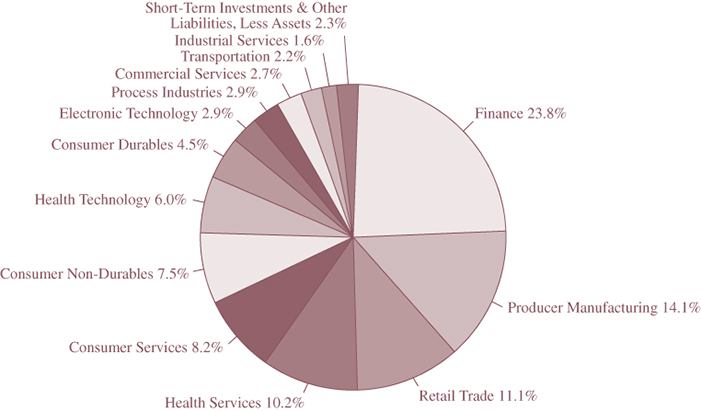
INDUSTRY SECTORS as a percentage of net assets
as of March 31, 2021 (Unaudited)
FMI
Common Stock
Fund
(unaudited)
March 31, 2021
Dear Fellow Shareholders:
The FMI Common Stock Fund (“Fund”) returned 12.51%1 in the March quarter compared to 12.70% for the Russell 2000 Index (“Russell 2000”) and 21.17% for the Russell 2000 Value Index. Relative to the Russell 2000, sectors that outperformed included Health Technology, Technology Services, and Electronic Technology. Underperforming areas included Producer Manufacturing, Finance, and Retail Trade. From an individual stock perspective, Robert Half International Inc., Insight Enterprises Inc., and Interpublic Group of Cos. Inc. were outstanding, while FirstCash Inc., TriMas Corp., and Houlihan Lokey Inc. lagged. Most stocks did reasonably well in the quarter; deeper-value names (many of suspect quality) and cyclical enterprises were standouts. Firms with a high probability of default, money-losing companies, and other highly-speculative stocks also continued to perform well. Recall that 2020 was a banner year for the most speculative stocks. Companies with over $1 billion in market value as of year-end 2020, who also lost money in 2019 (409 money-losing companies), gained on average 123% last year. When the other side of this stock market cycle has been completed, we believe most of these stocks will better reflect fundamental reality.
We lead this note with a reiteration of what we said in December. Vaccines are helping to drive COVID-19 into the background, economies are generally improving, and the outlook is brightening for revenue growth. This should favor value-oriented securities. The absence of generalized growth helped drive a high premium for those relatively few companies that were growing rapidly. There are still nearly ten million Americans out of work, and once the disincentive of a government check is removed, the expectation is that many people will rejoin the workforce. There is pent-up demand, and this should drive good GDP growth.
We also have to consider, however, the ramifications of unprecedented deficit spending. The U.S. government is set to borrow more money than it generates in tax receipts, pushing the deficit to likely exceed 20% of GDP this year, and the federal debt at least 30% greater than the total output of the economy. The U.S. has never had such a stretched balance sheet in non-war times. Someday the piper will have to be paid.
The “character” of the stock market is rambunctious, casino-like, and schizophrenic. Stocks rip up or down seemingly based on whether professional traders, CNBC, or the Reddit/Robinhood crowd deem it a “risk-on” or “risk-off” day. Social media-driven campaigns have perhaps mortally wounded short sellers. Short selling is a legitimate and useful endeavor as it helps with price discovery; however, if a loosely-organized mob can run up the stock of a low-quality, heavily-shorted business, it makes the profession untenable. At least one major hedge fund needed a multi-billion-dollar bailout after its short position in GameStop was attacked. Broken bets, at least so far, haven’t curbed the chaotic action in the retail investor camp. Recall last year’s head-scratching rally in the bankrupt rental car company, Hertz Corp. Trading around $20 per share in February of 2020, it filed for bankruptcy on May 22nd. The stock immediately went to $0.56. Retail
_______________
1 | The FMI Common Stock Fund Investor Class (FMIMX) and the FMI Common Stock Fund Institutional Class (FMIUX) had a return of 12.51% and 12.50%, respectively, for the first quarter of 2021. |
traders, taking cues from popular sites on Redditt like WallStreetBets, sent the stock up tenfold in a month. Today, trading in the pink sheets, Hertz is at $1.72 – still a highly-speculative price, considering the likelihood of equity investors getting zero in the restructuring.
Traders moving “baskets” of securities are causing stocks to lurch back-and-forth between various indices (growth or value) and subsectors (Special Purpose Acquisition Companies, or “SPACs,” shorts, rate-sensitive financials, high-beta reopening stories, non-profitable tech, oil, renewables, high beta coronavirus beneficiaries, infrastructure, etc.), furthering the disconnection between individual stocks and underlying fundamentals. Stocks are viewed by many as pieces of paper, not fractional ownership of businesses. There might be a whole generation of investors who simply do not consider valuation at all in the selection of their investments. It’s possible this multi-year phenomenon can continue. If so, investors can throw away the textbooks and simply follow momentum. Of course, we don’t believe it will persist; there is no historical precedent, and it just violates common sense.
Most valuations are higher than at any time we have studied. Few would buy a company trading at 39.9 times trailing earnings (price-to-earnings), 27.7 times EBITDA (enterprise value-to-EBITDA), or 6.6 times revenue (price-to-sales), yet this is what index investors are paying for the S&P 500 today.2 It’s similar for other market caps. Below is a chart depicting the median price-to-sales ratio for three S&P indices. Lately, around our firm, we’ve marveled at some Wall Street research reports that literally do not mention a stock’s valuation. Many investors have a distorted view of how fast companies grow. Most would be surprised to learn that over the past decade, the median growth rates of the S&P 500 sales and earnings were 2.61% and 2.75%, respectively. Eventually, we expect that reality will be reflected in fundamental valuations.
Growth stocks underperformed in the quarter. Higher interest rates are perhaps the culprit, although meeting elevated expectations may also be a factor. The 10-Year Treasury yield rose to 1.74% from 0.93% at the start of the year. As the economy gains speed coming out of coronavirus-induced shutdowns and dormant money starts to get deployed within the banking system, inflation concerns may surface. As mentioned, we are seeing anecdotal evidence of inflation in several places. Perhaps this sets the stage for the long-awaited “normalization” of interest rates. Since 1957, the median 10-Year Treasury yield is 5.55%. As the following histogram reveals, today’s level could rise 0.60% and still be in the first decile. We’ve reviewed Wall Street models for some growth companies that incorporate a cost of capital below 2%! Imagine what those long-term discount models would look like with a more normal 10% hurdle rate on equity capital and 5-6% on debt.
_______________
2 | Valuations are estimates based on the following scrubbing criteria: money losing companies are ascribed a 40 price-to-earnings (P/E) ratio to them (which is probably conservative) and those with P/E ratios greater than 100 are capped at 100. For P/S, those with greater than a 30 multiple are capped at 30x. We assign the same multiple for no sales. The EV/EBITDA calculation excludes financials, and uses a cap of a 200 multiple, while those with a negative EV/EBITDA receive a 20 multiple in the calculation. |
Inflation is in almost nobody’s muscle memory. Very few investors were around in the early 1980s, the last time inflation was a real problem. Economies were much different back then. Natural resource dependency, labor mobility, supply chain efficiency, technology, and many other elements have fundamentally changed, making high inflation appear less likely than in the past. Nevertheless, warp speed increases in deficits and overall debt, low productivity, wanton Fed money printing, and complete political disfunction may help foster higher prices. Our companies are telling us their costs are rising. This could begin to change the interest rate environment. It is hard to believe, but the effort to bring inflation under control saw the Federal Funds Rate move from 5% in 1976 to 20% in 1980. Going from today’s street-level rates to something even remotely close to the lower end of this range would certainly change the character of what works, and what does not, in the stock market. Nobody has a crystal ball, but the Fund is not built with the notion that interest rates will stay low forever. Our approach is to buy all-weather vehicles, but with a dollop of contrarianism. We remain optimistic that good-quality, reasonably-valued businesses with solid balance sheets will prevail over the long run. Following are a couple of ideas that reflect this strategy.
Insight Enterprises Inc. (NSIT)
(Analyst: Matt Sullivan)
Description
Insight specializes in digital innovation, cloud/data center modernization, and connected workforce and supply chain optimization. The company designs and implements an array of solutions from over 6,000 information technology (IT) vendors for more than 150,000 end customers including government organizations, businesses, and healthcare and education institutions. Insight derives 78% of sales from North America, 19% from Europe, the Middle East and Africa, and 3% from Asia-Pacific. In total, the company operates across 19 countries.
Good Business
| | • | As one of the largest value-added resellers of necessary technology product and service solutions, Insight benefits from scale and global growth in technology without being exposed to the same obsolescence risk as technology manufacturers. |
| | | |
| | • | Insight helps customers manage a complex IT environment in a cost-efficient manner. |
| | | |
| | • | The company is focused on services and integrated solutions to customers, which should benefit margins and returns over time. |
| | | |
| | • | Over the past five years the company has averaged a 12% return on invested capital (ROIC), exceeding its cost of capital. |
| | | |
| | • | Its balance sheet leverage is low, and the business is easy to understand. |
Valuation
| | • | The stock trades at a significant discount to the Russell 2000 despite it being a better-than-average business. |
| | | |
| | • | Insight is being valued at a low double-digit enterprise value-to-EBITDA multiple and, using our estimate for next year’s earnings, a mid-teens forward price-to-earnings multiple. |
Management
| | • | Ken Lamneck was appointed President and Chief Executive Officer and a director in January 2010. From 2004 through 2009, he was President of the Americas at Tech Data Corp., and from 1996 to 2003, held various executive management positions at Arrow Electronics Inc. He currently owns around $29.4 million of Insight stock. |
| | | |
| | • | Glynis Bryan joined Insight in December 2007 as Chief Financial Officer. Prior to joining Insight, Ms. Bryan served as Executive Vice President and CFO at Swift Transportation Co., Inc. from April 2005 to May 2007. Prior to joining Swift, she served as CFO at APL Logistics Ltd. in Oakland, California and in various finance roles at Ryder System Inc., including CFO of Ryder’s largest business unit. She currently owns approximately $7.2 million worth of Insight stock. |
Investment Thesis
As a reseller of IT solutions, the company gives investors exposure to technology growth without subjecting them to the short product cycles, cut-throat competition, and poor capital allocation decisions that are typically inherent in technology investments. We believe Insight has solid long-term growth prospects, and that it will continue to expand its margins over time by selling more services and solutions to end customers. Given the earnings growth potential and the company’s ROIC profile, we view the current valuation as attractive.
Flowserve Corp. (FLS)
(Analyst: Andy Ramer)
Description
Flowserve is a leading manufacturer and aftermarket service provider of flow control systems, with sales of $3.7 billion. The company has two divisions: Flowserve Pump Division (pumps), with 72% of sales, and Flowserve Control Division (valves), with 28% of sales. Flowserve serves more than 10,000 customers in over 50 countries. End markets served include Oil & Gas (35%), Chemical (29%), General Industries (18%), Power (14%), and Water (4%). North America accounts for 37% of sales, followed by Asia Pacific (23%), Europe (22%), Middle East & Africa (12%), and Latin America (6%). The company’s market cap is $5.2 billion.
Good Business
| | • | Flowserve has respected brands and technical expertise across broad industry process applications, and a history of strong customer relationships with end users, engineering and construction companies, and distributors. |
| | | |
| | • | A significant installed base with more than five million assets provides recurring aftermarket opportunities. The aftermarket accounts for one-half of sales. The products and services are used in mission-critical applications. |
| | | |
| | • | As restructuring expenses have declined, operating margins have improved. Flowserve has become less working capital-intensive as it has grown. |
| | | |
| | • | Net debt is at the lowest level since 2012. The leverage ratio is a relatively modest 1.35 times. Free cash flow (FCF) is abundant. |
Valuation
| | • | Flowserve trades for around 20 times depressed 2021 estimates and 10 times prior peak earnings. After the company completes a multi-year restructuring process, it is expected to be a better business than historically, and therefore, should garner a higher multiple. |
| | | |
| | • | The company is being valued at a low-teens enterprise value-to-EBITDA multiples on 2021 and 2022 estimates. |
| | | |
| | • | Flowserve converts approximately 100% of its net income into FCF. There should be ample room for share repurchases and dividends in the future. |
Management
| | • | Scott Rowe has been President and CEO since April 2017. Although the turnaround may take a little more time to complete, we have been impressed by his progress to date. |
| | | |
| | • | There has been a much-needed wholesale upgrade of leadership directly reporting to Mr. Rowe, and multiple changeouts from the board. |
| | | |
| | • | A large number of senior leaders now have FCF and working capital metrics as part of their incentive compensation benchmarks, which will be measured quarterly, rather than simply a year-end target. |
Investment Thesis
Flowserve is in a far better place than it was just four years ago, aided by the implementation of self-help initiatives under new management which has taken, or is taking action to optimize its manufacturing footprint, improve (standardize) processes, invest in systems, reinvigorate innovation, and improve the capture rate of its large installed base. The company’s long-term targets include revenue growth of 2% above the industry growth rate and achieving an operating margin of mid-teens, up from 10% in 2020. Flowserve is a higher-quality way to gain exposure to the out-of-favor energy space.
Thank you for your confidence in the FMI Common Stock Fund.
This shareholder letter is unaudited.
FMI Common Stock Fund
SCHEDULE OF INVESTMENTS
March 31, 2021 (Unaudited)
| Shares | | | | Cost | | | Value | |
| COMMON STOCKS — 96.1% (a) | | | | | | |
| | | | | | | |
COMMERCIAL SERVICES SECTOR — 18.3% | | | | | | |
| | | | | | | | | |
| | | Advertising/Marketing Services — 4.1% | | | | | | |
| | 1,275,000 | | Interpublic Group of Cos. Inc. | | $ | 22,046,035 | | | $ | 37,230,000 | |
| | | | | | | | | | | | |
| | | | Miscellaneous Commercial Services — 9.0% | | | | | | | | |
| | 315,000 | | CDK Global Inc. | | | 15,824,113 | | | | 17,028,900 | |
| | 174,000 | | FTI Consulting Inc.* | | | 19,681,508 | | | | 24,379,140 | |
| | 940,000 | | Genpact Ltd. | | | 17,185,315 | | | | 40,250,800 | |
| | | | | | | 52,690,936 | | | | 81,658,840 | |
| | | | Personnel Services — 5.2% | | | | | | | | |
| | 160,000 | | ManpowerGroup Inc. | | | 10,005,094 | | | | 15,824,000 | |
| | 400,000 | | Robert Half International Inc. | | | 16,456,716 | | | | 31,228,000 | |
| | | | | | | 26,461,810 | | | | 47,052,000 | |
CONSUMER DURABLES SECTOR — 1.1% | | | | | | | | |
| | | | | | | | | | | | |
| | | | Homebuilding — 1.1% | | | | | | | | |
| | 65,000 | | LGI Homes Inc.* | | | 9,150,625 | | | | 9,705,150 | |
| | | | | | | | | |
CONSUMER SERVICES SECTOR — 2.3% | | | | | | | | |
| | | | | | | | | | | | |
| | | | Other Consumer Services — 2.3% | | | | | | | | |
| | 37,000 | | Graham Holdings Co. | | | 16,690,194 | | | | 20,810,280 | |
| | | | | | | | | |
DISTRIBUTION SERVICES SECTOR — 8.9% | | | | | | | | |
| | | | | | | | | | | | |
| | | | Electronics Distributors — 3.7% | | | | | | | | |
| | 300,000 | | Arrow Electronics Inc.* | | | 9,893,291 | | | | 33,246,000 | |
| | | | | | | | | | | | |
| | | | Medical Distributors — 2.9% | | | | | | | | |
| | 386,000 | | Henry Schein Inc.* | | | 21,459,047 | | | | 26,726,640 | |
| | | | | | | | | | | | |
| | | | Wholesale Distributors — 2.3% | | | | | | | | |
| | 225,000 | | Applied Industrial Technologies Inc. | | | 13,908,440 | | | | 20,513,250 | |
| | | | | | | | | |
ELECTRONIC TECHNOLOGY SECTOR — 7.2% | | | | | | | | |
| | | | | | | | | | | | |
| | | | Aerospace & Defense — 1.5% | | | | | | | | |
| | 67,000 | | Huntington Ingalls Industries Inc. | | | 11,054,904 | | | | 13,791,950 | |
| | | | | | | | | | | | |
| | | | Electronic Components — 5.7% | | | | | | | | |
| | 910,000 | | nVent Electric PLC | | | 18,334,725 | | | | 25,398,100 | |
| | 285,000 | | Plexus Corp.* | | | 20,719,925 | | | | 26,174,400 | |
| | | | | | | 39,054,650 | | | | 51,572,500 | |
FINANCE SECTOR — 24.4% | | | | | | | | |
| | | | | | | | | | | | |
| | | | Finance/Rental/Leasing — 6.5% | | | | | | | | |
| | 578,000 | | FirstCash Inc. | | | 28,793,574 | | | | 37,957,260 | |
| | 275,000 | | Ryder System Inc. | | | 11,426,250 | | | | 20,803,750 | |
| | | | | | | 40,219,824 | | | | 58,761,010 | |
| | | | Investment Banks/Brokers — 3.1% | | | | | | | | |
| | 420,000 | | Houlihan Lokey Inc. | | | 21,230,306 | | | | 27,934,200 | |
| | | | | | | | | | | | |
| | | | Life/Health Insurance — 1.5% | | | | | | | | |
| | 95,000 | | Primerica Inc. | | | 11,278,740 | | | | 14,042,900 | |
The accompanying notes to financial statements are an integral part of this schedule.
FMI Common Stock Fund
SCHEDULE OF INVESTMENTS (Continued)
March 31, 2021 (Unaudited)
| Shares | | | | Cost | | | Value | |
| COMMON STOCKS — 96.1% (a) (Continued) | | | | | | |
| | | | | | | |
FINANCE SECTOR — 24.4% (Continued) | | | | | | |
| | | | | | | | | |
| | | Multi-Line Insurance — 1.4% | | | | | | |
| | 11,000 | | White Mountains Insurance Group Ltd. | | $ | 9,528,437 | | | $ | 12,263,900 | |
| | | | | | | | | | | | |
| | | | Property/Casualty Insurance — 2.7% | | | | | | | | |
| | 320,000 | | W.R. Berkley Corp. | | | 5,439,248 | | | | 24,112,000 | |
| | | | | | | | | | | | |
| | | | Real Estate Development — 5.1% | | | | | | | | |
| | 240,000 | | The Howard Hughes Corp.* | | | 24,086,139 | | | | 22,831,200 | |
| | 1,150,000 | | Kennedy-Wilson Holdings Inc. | | | 21,156,377 | | | | 23,241,500 | |
| | | | | | | 45,242,516 | | | | 46,072,700 | |
| | | | Regional Banks — 4.1% | | | | | | | | |
| | 670,000 | | Zions Bancorporation N.A. | | | 20,922,754 | | | | 36,823,200 | |
| | | | | | | | | |
HEALTH TECHNOLOGY SECTOR — 4.1% | | | | | | | | |
| | | | | | | | | | | | |
| | | | Medical Specialties — 3.1% | | | | | | | | |
| | 440,000 | | Dentsply Sirona Inc. | | | 14,747,639 | | | | 28,076,400 | |
| | | | | | | | | | | | |
| | | | Pharmaceuticals: Major — 1.0% | | | | | | | | |
| | 380,000 | | Phibro Animal Health Corp. | | | 10,167,044 | | | | 9,272,000 | |
| | | | | | | | | |
PROCESS INDUSTRIES SECTOR — 7.3% | | | | | | | | |
| | | | | | | | | | | | |
| | | | Containers/Packaging — 5.1% | | | | | | | | |
| | 253,000 | | Avery Dennison Corp. | | | 10,258,363 | | | | 46,463,450 | |
| | | | | | | | | | | | |
| | | | Industrial Specialties — 2.2% | | | | | | | | |
| | 350,000 | | Donaldson Co. Inc. | | | 14,991,016 | | | | 20,356,000 | |
| | | | | | | | | |
PRODUCER MANUFACTURING SECTOR — 19.4% | | | | | | | | |
| | | | | | | | | | | | |
| | | | Building Products — 2.5% | | | | | | | | |
| | 150,000 | | A.O. Smith Corp. | | | 5,616,286 | | | | 10,141,500 | |
| | 144,000 | | Armstrong World Industries Inc. | | | 5,892,139 | | | | 12,972,960 | |
| | | | | | | 11,508,425 | | | | 23,114,460 | |
| | | | Industrial Machinery — 5.7% | | | | | | | | |
| | 170,000 | | EnPro Industries Inc. | | | 12,166,948 | | | | 14,495,900 | |
| | 530,000 | | Flowserve Corp. | | | 13,162,928 | | | | 20,569,300 | |
| | 140,000 | | Woodward Inc. | | | 5,679,554 | | | | 16,888,200 | |
| | | | | | | 31,009,430 | | | | 51,953,400 | |
| | | | Miscellaneous Manufacturing — 9.5% | | | | | | | | |
| | 170,000 | | Brady Corp. — Cl A | | | 8,474,567 | | | | 9,086,500 | |
| | 287,000 | | Carlisle Cos. Inc. | | | 21,469,984 | | | | 47,234,460 | |
| | 990,000 | | TriMas Corp.* | | | 21,908,123 | | | | 30,016,800 | |
| | | | | | | 51,852,674 | | | | 86,337,760 | |
| | | | Trucks/Construction/Farm Machinery — 1.7% | | | | | | | | |
| | 530,000 | | Trinity Industries Inc. | | | 10,096,736 | | | | 15,099,700 | |
| | | | | | | | | |
TECHNOLOGY SERVICES SECTOR — 3.1% | | | | | | | | |
| | | | | | | | | | | | |
| | | | Information Technology Services — 3.1% | | | | | | | | |
| | 292,000 | | Insight Enterprises Inc.* | | | 17,101,647 | | | | 27,862,640 | |
| | | | Total common stocks | | | 548,004,731 | | | | 870,852,330 | |
The accompanying notes to financial statements are an integral part of this schedule.
FMI Common Stock Fund
SCHEDULE OF INVESTMENTS (Continued)
March 31, 2021 (Unaudited)
Principal Amount | | Cost | | | Value | |
| SHORT-TERM INVESTMENTS — 4.0% (a) | | | | | | |
| | | | | | | | | |
| | | Bank Deposit Account — 4.0% | | | | | | |
| $ | 36,404,090 | | U.S. Bank N.A., 0.01%^ | | $ | 36,404,090 | | | $ | 36,404,090 | |
| | | | Total short-term investments | | | 36,404,090 | | | | 36,404,090 | |
| | | | Total investments — 100.1% | | $ | 584,408,821 | | | | 907,256,420 | |
| | | | Other liabilities, less assets — (0.1%) (a) | | | | | | | (501,067 | ) |
| | | | TOTAL NET ASSETS — 100.0% | | | | | | $ | 906,755,353 | |
| * | Non-income producing security. |
| ^ | The rate shown is as of March 31, 2021. |
| (a) | Percentages for the various classifications relate to total net assets. |
| PLC | Public Limited Company |
The accompanying notes to financial statements are an integral part of this schedule.
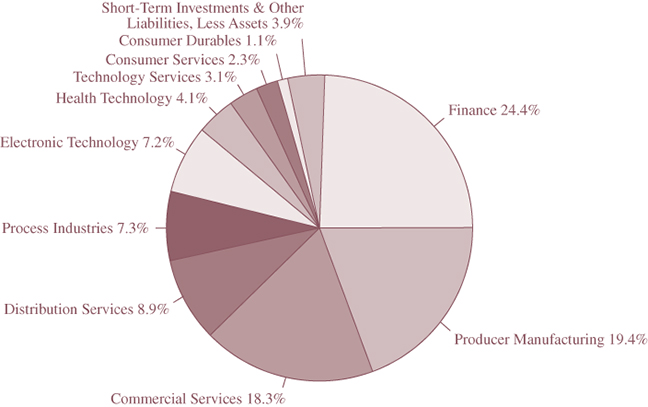
INDUSTRY SECTORS as a percentage of net assets
as of March 31, 2021 (Unaudited)
FMI International Fund
and
FMI International Fund II – Currency Unhedged
(unaudited)
March 31, 2021
Dear Fellow Shareholders:
Value investing’s resurgence continued in the March quarter, marking the second consecutive period of outperformance. Growth stocks had been the primary beneficiary of low inflation, unprecedented interest rates, and coronavirus lockdowns, but the tide finally appears to be turning. Improving global economic growth prospects are now working in favor of the value trade, driven by increased vaccine production and roll-outs, the gradual re-opening of hard-hit sectors of the economy, rebounding industrial production and global trade, and continued fiscal and monetary support (helping fuel concerns over higher inflation and interest rates). With the world economy on the mend and value stocks trading at a significant discount to their growth counterparts, the relative outlook from here looks attractive.
In the first quarter, the FMI International portfolios gained 7.07% (currency hedged)1 and 4.95% (currency unhedged),2 respectively, which compares with an MSCI EAFE Index gain of 7.59% in local currency (LOC) and 3.48% in U.S. Dollars (USD). The MSCI EAFE Value Index advanced 11.32% in LOC and 7.44% in USD, outpacing the MSCI EAFE Growth Indices by over 8%. “Deep” value stocks (e.g., lower-quality, significantly out-of-favor, having poor balance sheets), including the financial and energy sectors, led the charge. FMI’s focus on business quality and conservative balance sheets weighed on the relative comparison. The FMI International portfolios generated strong results from the Retail Trade, Consumer Services, and Consumer Non-Durables sectors, but lagged in Electronic Technology, Distribution Services, and Finance. Individual stock performance was driven by Shaw Communications Inc., Jardine Strategic Holdings Ltd., and CNH Industrial N.V., while Samsung Electronics Co. Ltd., Ferguson PLC, and Smith & Nephew PLC came up short. FMI’s currency hedged performance benefited from a strong USD in the period.
Diverging Paths
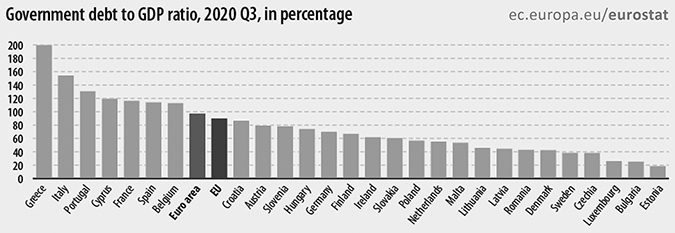
Despite an encouraging global economic outlook, it’s been a challenging period for continental Europe. As of late March, the European Union (EU) had fallen behind on the vaccine front, having administered only 12 doses per 100 people, compared with 34.1 in the U.S. and 40.5 in the UK. Infections and deaths have fallen significantly in the U.S. and UK, while cases and hospitalizations in the EU are on the rise.3 New COVID-19 variants are spreading and the EU retreated to tighter restrictions and lockdowns amid concern that Europe could be headed toward another disappointing summer tourism season. Economists are cutting growth expectations, as reported by the Financial Times:
“From the outset, the pandemic inflicted deeper economic scars on Europe than the US. Now, their responses to the crisis mean the economies are about to drift further apart. The EU’s ‘output gap’ – the shortfall in what the bloc was producing compared with its full potential at the start of this year – was double the equivalent in the US, meaning the EU was creating fewer jobs, yielding weaker demand and generating lower inflation.”
_______________
1 | The FMI International Fund [currency hedged] Investor Class (FMIJX) and the FMI International Fund [currency hedged] Institutional Class (FMIYX) had a return of 7.07% and 7.12%, respectively, for the first quarter of 2021. |
2 | The FMI International Fund [unhedged] Institutional Class (FMIFX) had a return of 4.95% for the first quarter of 2021. |
3 | Ben Hall, Michael Peel, Sam Fleming, Leila Abboud and Guy Chazan. “Europe’s vaccine disarray.” Financial Times, March 19, 2021. |
The U.S. is expected to catch up with its pre-crisis growth trajectory by 2021, while it may be 2023 before Europe can say the same.4
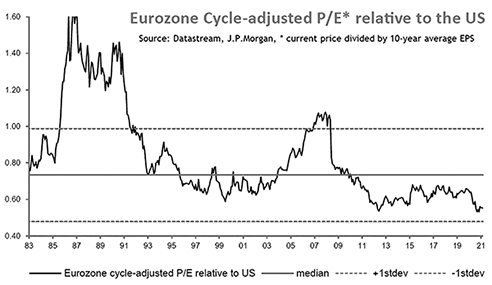
While it may sound bleak, it is not all gloom and doom for Europe. The EU will eventually arrest the spread of the virus and re-open its economies, however many months behind the U.S. and UK. Having a 3 to 5-year investment time horizon works to FMI’s advantage in this scenario, with most investors focused on the here and now. As we wait for the business activity in Europe to resume, cheaper relative valuations abound. The eurozone now trades at a historic discount to the U.S. (see chart),5 boding well for future returns.
Onward and Upward
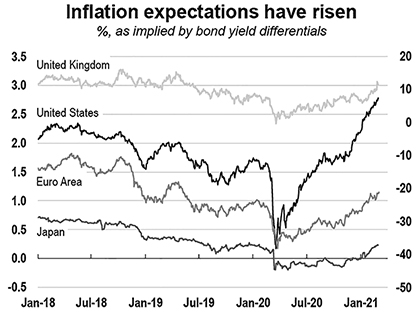
After an extraordinary (and worrisome) period of ultra-low interest rates, inflation expectations have started to rise in the U.S., Europe and Japan, with the eurozone Consumer Price Index jumping the most in over a decade.6 Yields for U.S. Treasuries, German Bunds, UK Gilts, and Japanese Government Bonds have all started to move upward, but with $13.4 trillion of negative-yielding bonds globally (from December’s peak of $18.4 trillion), there is still plenty of room to run.7 Apparently $28 trillion of money printing (a.k.a. fiscal and monetary stimulus) over the past 12 months,8 combined with vaccine relief and an improving economic outlook, has finally started to spark concerns about a long-overdue increase in the cost of capital.
On that topic, BofA Global Research opined about the “mother-of-all policy bubbles” in February, calculating that global central banks had purchased “$1.1 billion of financial assets every hour since March.” This profligacy helped inflate the “mother-of-all-asset bubbles,” as global market capitalizations increased by “$6.2 billion per hour,” or over “$50 trillion in 11 months.”9 No, these are not figures taken from an article in The Onion. Central banks have taken market manipulation to unthinkable levels.
_______________
4 | Martin Arnold and James Politi. “US to leave EU trailing in race for recovery after pandemic.” Financial Times, March 16, 2021. |
5 | Mislav Matejka, Prabhav Bhadani and Nitya Saldanha. “Equity Strategy.” J.P. Morgan Cazenove, March 1, 2021. |
6 | Martin Arnold. “Eurozone inflation in biggest jump for decade.” Financial Times, February 3, 2021. |
7 | Source: Bloomberg. |
8 | Michael Hartnett, David Jones, Shirley Wu. “The Flow Show.” BofA Global Research, March 11, 2021. |
9 | Michael Hartnett, David Jones, Shirley Wu. “The Flow Show.” BofA Global Research, February 18, 2021. |
Print money, buy assets, drive up asset prices, rinse, and repeat. This has been the central bank playbook. However, money printing is a dangerous game with serious negative consequences (just ask Venezuela or Argentina). Rising interest rates seem inevitable over the long run, and are most detrimental for growth stocks, which have a far greater proportion of their value derived from earnings many years into the future, and thus are more sensitive to higher discount rates. The days of speculative fervor being rewarded may be numbered, as justifying sky-high valuations with aggressively low discount rates can only go on for so long.
Portfolio Positioning
Most financial stocks fall into the value camp, and as such, financials make up a significant portion of the MSCI EAFE (~20% of sector weight) and MSCI EAFE Value (~31%) indices. The sector, and the banking industry in particular, has significantly outperformed to start the year. The FMI International portfolios are underweight financials, because we have struggled to find higher-quality companies with solid balance sheets. Many of the businesses are commoditized in nature. We think a good measure of the strong upward move in the second-tier players will not last.
In the first quarter of 2020, we purchased Lloyds Banking Group PLC, which is the market leader in the homogenous and consolidated UK market. With Lloyds we were able to buy a well-capitalized, low-cost, high-quality bank that traded down to around half of tangible book value. The loan book is roughly two-thirds residential mortgages with an average loan-to-value of under 45%, allowing us to sleep at night. In the eurozone, however, it has been much more challenging to find suitable investments in the banking industry that meet our quality standards and also have transparency. To start, capital controls vary by regions, making underlying economic viability and returns more difficult to assess. In addition, eurozone banks have been piling on government debt, raising their holdings by 19% to €1.2 trillion in late 2020. Banks have set aside little-to-no capital to account for sovereign debt because regulators consider these to be “risk-free” assets.10 This is where we part ways. We believe European sovereign debt carries tremendous risk, especially at the current price levels. The European debt crisis, which took place less than a decade ago, is a case in point. Given that these same eurozone countries are starting from a place of weakness today (huge fiscal deficits and record debt-to-GDP), caution appears warranted.
Eurozone banks could also be facing significant bad debt problems from their corporate loan books. As noted by The Wall Street Journal (WSJ), “The region’s generous lockdown-support programs and patchwork of insolvency laws could create [more] so-called zombie firms,”11 or companies whose interest expense exceeds their earnings before interest and taxes. Support from eurozone governments has included significant loan guarantees, subsidies for millions of employee
_______________
10 | Patricia Kowsmann. “Banks Pile Into Government Debt, Setting Up ‘Doom Loop’ Sequel in Europe.” The Wall Street Journal, December 30, 2020. |
11 | Rochelle Toplensky. “Zombies Could Stunt the Bank Recovery.” The Wall Street Journal, January 12, 2021. |
wages, and bailouts for large numbers of companies. What happens when the money fountain runs dry? Per the Financial Times, French bank Natixis “estimates that the proportion of [European] companies that are ‘zombies’ has risen from 3.5 per cent at the beginning of the 1990s, to close to 11 per cent in 2008, to 21 per cent in 2019.”12 And that was before a once-in-a-lifetime global pandemic! Unproductive zombie companies have been kept on life support for years with low interest rates and accommodative policies, which may spell trouble down the road. While we continue to assess eurozone banks because they are statistically cheap, in most cases we believe the risks outweigh the potential rewards.
An additional contributor for the MSCI EAFE indices was the Energy Minerals sector (another FMI underweight), driven in large part by Integrated Oil. These exploration and production (E&P) companies have rarely aligned well with our investment principles. The E&P space is generally a low-returning sector over a full cycle. Discipline is in short supply, and illogical capital flows tend to ruin the economics of this business; E&P can have wonderful ‘trading’ moves from time to time, but it is a difficult place for long-term buy-and-hold type investors. E&P is a commodity business where differentiation is next to impossible and companies don’t control their own destiny. FMI has opted for energy exposure through the likes of Schlumberger Ltd., among other tangential exposure through Yokogawa Electric Corp. and Smiths Group PLC. Schlumberger supplies the “picks and shovels” to a broad array of producers. Among service providers, Schlumberger is the gold standard, given the breadth and value-added nature of their products, technology and services, exposure to the entire lifecycle of the well, and broad geographic exposure. They are also a leader in emerging carbon-neutral technologies, which is becoming an increasing area of focus for the industry. While the company has disappointed in recent years, we believe the outlook is bright.
Our largest sector overweight is in Retail Trade, where we own B&M European Value Retail S.A., the largest general merchandise discounter in the UK. The company’s competitive positioning was strengthened during the pandemic, as more affluent shoppers traded down to the concept, expanding their addressable market. This quarter, we also purchased Greggs PLC, the UK’s leading convenience food-to-go store operator, which closed stores for nearly 15 weeks during the pandemic, culminating in the first loss in the company’s history. We believe Greggs is poised for a swift recovery as the UK economy reopens. We have also found opportunities in Consumer Services (our second-largest sector overweight), where corporate action has been plentiful. A spinoff of Universal Music Group (#1 in global recorded music) is unlocking significant value at both our Vivendi and Bolloré holdings, while Shaw Communications Inc. is being acquired by Rogers Communications Inc. (we sold our shares following the March announcement). Our exposure to Electronic Technology also exceeds that of the MSCI EAFE, led by Samsung Electronics Co. Ltd. Samsung dominates the world’s semiconductor memory business (#1 in DRAM & NAND storage technologies) as it has become a much more consolidated industry in recent years. Based on exchange classification, our greatest country overweight continues to be the UK, where a cocktail of Brexit and COVID-19 sent investors running for the exits. We have taken a contrarian approach, as we believe Brexit will be a long-term positive for the UK as they further distance themselves from the dysfunction of the EU. With COVID cases down over 90%, as soon as restrictions and lockdowns ease, it should only be a matter of time before the economy starts to regain its footing.
Valuation Discipline
Even great companies can get too expensive. In early January, we sold our long-standing position in Accenture PLC after the company’s valuation exceeded 30 times next 12 months (NTM) earnings per share (EPS). We originally invested in Accenture at the launch of the FMI International strategy at a valuation below 15 times NTM EPS and held the stock for over ten years. We added to the holding numerous times in the early years, growing the position size to as high as 5.5% in
_______________
12 | Claire Jones. “European Zombification becomes even scarier.” Financial Times, December 2, 2021. |
late 2014, before dialing it back in recent years as the valuation became less compelling. It is one of the world’s largest information technology services firms, specializing in helping complex, global businesses navigate disruption, and focusing on next-generation services like digital, cloud, and security. For years, the investment allowed FMI to capture the inherently higher growth of technology-related industries (GDP+) without investing directly in pure “invention-oriented” technology companies. Through Accenture we were able to avoid some of the shortfalls of tech investing: technology obsolescence, short product cycles, and subpar return on invested capital (ROIC). It grew steadily, was solidly profitable, capital-light, and generated high returns, all while maintaining a rock-solid balance sheet. It compounded its business value for many years, outperforming the MSCI EAFE indices by over 450% during our holding period. Unfortunately, the market increasingly recognized the company’s positive attributes, and the stock’s discount to intrinsic value slowly evaporated. Despite our admiration for the business, it exceeded our valuation threshold. We will continue to follow the company closely for future opportunities. Outlined below are a couple of out-of-favor investments that soaked up the Accenture proceeds.
Fresenius Medical Care AG & Co. KGaA (FME GR)
(Analyst: Dan Sievers)
Description
Fresenius Medical Care is the #1 global provider of products and services for patients with chronic kidney failure and end stage renal disease (ESRD), providing over 53 million dialysis treatments to about 350,000 patients annually. Fresenius equipment (with more than 11,000 patents) and related products are used to treat more than half of worldwide dialysis patients. The company operates a global network of about 4,100 outpatient dialysis clinics in the U.S. (2,600) and about 50 other countries (1,500). In 2020, Fresenius revenue was €17.9 billion with €14.1 billion (79%) from Services and €3.7 billion (21%) from Products. This understates the size of its razor and blade-type products business, as Fresenius eliminates intercompany revenue.
Good Business
| | • | In 2019, the number of worldwide dialysis patients grew to 3.5 million, up 6% year-over-year, in line with the long-term average. In 2020, COVID-related excess mortality contributed to slower-than-expected worldwide patient growth of just 3%. |
| | | |
| | • | Fresenius Medical and DaVita, Inc. are the low-cost providers in the U.S., accounting for just over 80% of treatments in the $25 billion U.S. dialysis services industry ($30-$40 lower cost per treatment). |
| | | |
| | • | While Fresenius and DaVita have historically had significant influence over pricing from private insurers, they are mostly price-takers from Medicare. |
| | | |
| | • | Treatment is necessary several times a week and clinic utilization is high, with limited excess capacity nationwide. |
| | | |
| | • | About 88% of patients receive in-center treatment with 12% receiving treatment at home (increasing). |
| | | |
| | • | The U.S. market is shifting toward home treatment (more profitable and less capital intensive) and coordinated care models (value-based care), which will sometimes entail broader patient healthcare cost risk in exchange for greater oversight. In 2021, Medicare Advantage is newly mandated to provide broad access to care for ESRD and these negotiated rates are often 10 percentage points higher than traditional Medicare. |
| | | |
| | • | The company’s internal ROIC was 6% for 2020, with one-third of long-term executive compensation tied to increasing this ROIC level 100-150 basis points by 2025. If adjusting for goodwill (because industry consolidation is mostly behind us), the underlying tangible ROIC is in the mid-to-upper teens. |
| | | |
| | • | 2020 Net debt-to-EBITDA finished at 2.7 times, with a 2.3% weighted average cost of debt. |
Valuation
| | • | Fresenius shares trade for a mid-teens multiple of 2020, and of 2021 EPS estimates. The roll-off of COVID-related costs and a return to something like conventional patient growth during 2022 should result in a meaningful earnings rebound (making the stock attractive in absolute terms) and represents a large discount to medical technology sector averages. |
| | | |
| | • | Fresenius’ shares are more than 30% below their early 2018 highs, and its enterprise value-to-sales ratio is 1.5 times, versus the 5-year average of 1.8 times. Despite advantages from larger scale, vertical integration, and a stronger international footprint, the stock’s historical premium to DiVita has recently become a discount. |
Management
| | • | Chief Executive Officer Rice Powell has been with Fresenius for 24 years. During his tenure, patient outcomes have improved. With U.S. dialysis service consolidation via mergers and acquisitions largely in the rearview mirror, Mr. Powell has made several investments in home dialysis, related chronic kidney disease treatments, and care coordination that should advantage the company in the future. ROIC was added to the compensation plan in 2016 and a €1 billion buyback was announced in 2019. |
Investment Thesis
Fresenius Medical is a dependable top-line grower with low exposure to the typical business cycle. Despite the pandemic, it grew in 2020 and increased its dividend more than 10%. That said, unlike medical technology peers who saw their most severe COVID-related business impact from deferred procedures in the middle of 2020, the company will see the greatest business impact throughout 2021 from excess mortality in its patient population. A difficult 2021 outlook has resulted in an interesting multi-year investment opportunity, as COVID-related costs begin to roll off later this year, the dialysis services patient population resumes growth in 2022, and the company begins to adjust its clinic and cost base as necessary. While investments in Care Coordination and Home Dialysis contributed to recent margin compression, these same investments, along with expanded Medicare Advantage coverage, should contribute toward improving financial metrics and multiple expansion back towards historical averages.
Henkel AG & Co. KGaA (HEN GR)
(Analyst: Dain Tofson)
Description
Henkel is the global leader in adhesives and has strong regional market positions in laundry, home care, and beauty care products. Henkel reports three segments: Adhesives (45% of sales and 49% of operating profit), Laundry & Home Care (35% and 37%), and Beauty Care (20% and 14%). Key brands for Henkel include Loctite, Persil, all, Bref, Schwarzkopf, Dial, and Syoss. Sales by geography are split Western Europe (30%), North America (27%), Asia-Pacific (16%), Eastern Europe (15%), Africa/Middle East (6%), and Latin America (6%). Emerging markets represent approximately 40% of sales.
Good Business
| | • | As the global leader in Adhesives and a top three player in key Laundry & Home Care and Beauty Care categories, Henkel benefits from economies of scale compared with smaller competitors. |
| | | |
| | • | Henkel earns a mid-teens return on capital over a market cycle. |
| | | |
| | • | The Adhesives segment benefits from the secular trends of electrification, connectivity, and sustainability, and represents a low share of total product/project cost, but high cost of failure. |
| | | |
| | • | Adhesives and consumer staple products (laundry detergent, cleaning products, hair care, etc.) are recurring in nature; trust and brand loyalty tend to foster repeat consumption. |
| | • | Henkel’s products are necessary, and the business is easy to understand. |
| | | |
| | • | The balance sheet is strong, with net debt-to-EBITDA at only 0.3 times. |
Valuation
| | • | Henkel trades at an upper-teens price-to-earnings (P/E) multiple on estimates that are depressed due to COVID; this valuation is attractive given the growth prospects of the business and mid-teens return on capital profile. |
| | | |
| | • | The current P/E is around a 20% discount to peers, a level last seen in the Global Financial Crisis. |
| | | |
| | • | The ordinary shares, which we own, trade at a 12% discount to the preferred shares. |
Management
| | • | Carsten Knobel, CEO, is executing a strategic plan to improve the business through reinvesting in innovation, sustainability, and digital initiatives, disposing of or fixing underperforming businesses, reorganizing closer to the customer, and transforming the culture. |
| | | |
| | • | The Henkel family controls the business through their majority ownership of the ordinary shares, which we believe allows management to take a long-term view. |
| | | |
| | • | Management compensation is tied to return on capital. |
Investment Thesis
Henkel is the global leader in Adhesives and a top three player in key Laundry & Home Care and Beauty Care categories. Henkel is currently performing below its potential due to COVID impacts in Adhesives and Beauty Care, challenges related to North American laundry, and two years of elevated reinvestment costs in Laundry & Home Care and Beauty Care to correct previous underinvestment in innovation. While these challenges have weighed on past performance, the outlook is attractive as growth is accelerating in Adhesives, and Laundry & Home Care and Beauty Care are set to benefit from the reinvestments and continued execution of the strategic plan. Given this setup, we are confident management can meet its target for mid-to-high single-digit EPS growth (compound annual growth rate) over the medium term. The valuation is undemanding for this growth potential, and the balance sheet is very strong.
Thank you for your support of the FMI International Funds.
This shareholder letter is unaudited.
FMI International Fund
SCHEDULE OF INVESTMENTS
March 31, 2021 (Unaudited)
| Shares | | | | Cost | | | Value | |
| LONG-TERM INVESTMENTS — 96.3% (a) | | | | | | |
| | | | | | | |
| COMMON STOCKS — 85.7% (a) | | | | | | |
| | | | | | | |
COMMERCIAL SERVICES SECTOR — 8.2% | | | | | | |
| | | | | | | | | |
| | | Advertising/Marketing Services — 2.1% | | | | | | |
| | 5,975,000 | | WPP PLC (Jersey) (b) | | $ | 78,739,956 | | | $ | 76,142,655 | |
| | | | | | | | | | | | |
| | | | Miscellaneous Commercial Services — 6.1% | | | | | | | | |
| | 2,400,000 | | Bureau Veritas S.A. (France) (b) | | | 58,172,890 | | | | 68,296,230 | |
| | 1,265,000 | | DKSH Holding AG (Switzerland) (b) | | | 69,346,588 | | | | 97,131,534 | |
| | 595,000 | | Secom Co. Ltd. (Japan) (b) | | | 34,985,221 | | | | 50,159,509 | |
| | | | | | | 162,504,699 | | | | 215,587,273 | |
COMMUNICATIONS SECTOR — 1.8% | | | | | | | | |
| | | | | | | | | | | | |
| | | | Wireless Telecommunications — 1.8% | | | | | | | | |
| | 1,675,000 | | Millicom International | | | | | | | | |
| | | | Cellular S.A. (Luxembourg)* | | | 80,004,555 | | | | 64,001,750 | |
| | | | | | | | | |
CONSUMER DURABLES SECTOR — 6.2% | | | | | | | | |
| | | | | | | | | | | | |
| | | | Electronics/Appliances — 4.9% | | | | | | | | |
| | 1,640,000 | | Sony Group Corp. (Japan) (b) | | | 88,971,699 | | | | 173,566,897 | |
| | | | | | | | | | | | |
| | | | Home Furnishings — 1.3% | | | | | | | | |
| | 4,500,000 | | Howden Joinery Group PLC (Britain) (b) | | | 33,633,224 | | | | 45,471,062 | |
| | | | | | | | | |
CONSUMER NON-DURABLES SECTOR — 7.8% | | | | | | | | |
| | | | | | | | | | | | |
| | | | Food: Major Diversified — 1.1% | | | | | | | | |
| | 365,000 | | Nestlé S.A. (Switzerland) (b) | | | 25,240,035 | | | | 40,688,883 | |
| | | | | | | | | | | | |
| | | | Household/Personal Care — 6.7% | | | | | | | | |
| | 1,240,000 | | Henkel AG & Co. KGaA (Germany) (b) | | | 115,868,760 | | | | 122,850,130 | |
| | 2,050,000 | | Unilever PLC (Britain) (b) | | | 87,177,197 | | | | 114,390,175 | |
| | | | | | | 203,045,957 | | | | 237,240,305 | |
CONSUMER SERVICES SECTOR — 9.5% | | | | | | | | |
| | | | | | | | | | | | |
| | | | Media Conglomerates — 2.5% | | | | | | | | |
| | 2,675,000 | | Vivendi (France) (b) | | | 49,298,777 | | | | 87,803,568 | |
| | | | | | | | | | | | |
| | | | Movies/Entertainment — 2.6% | | | | | | | | |
| | 19,500,000 | | Bolloré (France) (b) | | | 71,365,315 | | | | 94,105,148 | |
| | | | | | | | | | | | |
| | | | Other Consumer Services — 3.3% | | | | | | | | |
| | 50,000 | | Booking Holdings Inc. (United States)* | | | 86,486,789 | | | | 116,492,000 | |
| | | | | | | | | | | | |
| | | | Restaurants — 1.1% | | | | | | | | |
| | 1,845,000 | | Compass Group PLC (Britain) (b)* | | | 27,085,868 | | | | 37,276,160 | |
| | | | | | | | | |
DISTRIBUTION SERVICES SECTOR — 5.0% | | | | | | | | |
| | | | | | | | | | | | |
| | | | Wholesale Distributors — 5.0% | | | | | | | | |
| | 1,410,000 | | Ferguson PLC (Jersey) (b) | | | 73,582,547 | | | | 168,432,459 | |
| | 517,771 | | Rexel S.A. (France) (b) | | | 9,908,680 | | | | 10,248,865 | |
| | | | | | | 83,491,227 | | | | 178,681,324 | |
The accompanying notes to financial statements are an integral part of this schedule.
FMI International Fund
SCHEDULE OF INVESTMENTS (Continued)
March 31, 2021 (Unaudited)
| Shares | | | | Cost | | | Value | |
| LONG-TERM INVESTMENTS — 96.3% (a) (Continued) | | | | | | |
| | | | | | | |
| COMMON STOCKS — 85.7% (a) (Continued) | | | | | | |
| | | | | | | |
ELECTRONIC TECHNOLOGY SECTOR — 4.8% | | | | | | |
| | | | | | | | | |
| | | Aerospace & Defense — 3.0% | | | | | | |
| | 785,000 | | Safran S.A. (France) (b)* | | $ | 84,840,811 | | | $ | 106,781,979 | |
| | | | | | | | | | | | |
| | | | Electronic Equipment/Instruments — 1.8% | | | | | | | | |
| | 3,515,000 | | Yokogawa Electric Corp. (Japan) (b) | | | 62,344,220 | | | | 64,931,808 | |
| | | | | | | | | |
FINANCE SECTOR — 5.1% | | | | | | | | |
| | | | | | | | | | | | |
| | | | Major Banks — 2.1% | | | | | | | | |
| | 129,200,000 | | Lloyds Banking Group PLC (Britain) (b) | | | 65,790,017 | | | | 75,792,275 | |
| | | | | | | | | | | | |
| | | | Multi-Line Insurance — 0.3% | | | | | | | | |
| | 293,159 | | Arch Capital Group Ltd. (Bermuda)* | | | 11,345,246 | | | | 11,248,511 | |
| | | | | | | | | | | | |
| | | | Property/Casualty Insurance — 2.7% | | | | | | | | |
| | 614,850 | | Chubb Ltd. (Switzerland) | | | 81,458,401 | | | | 97,127,854 | |
| | | | | | | | | |
HEALTH SERVICES SECTOR — 2.3% | | | | | | | | |
| | | | | | | | | | | | |
| | | | Medical/Nursing Services — 2.3% | | | | | | | | |
| | 1,100,000 | | Fresenius Medical Care | | | | | | | | |
| | | | AG & Co. KGaA (Germany) (b) | | | 88,293,890 | | | | 81,027,942 | |
| | | | | | | | | |
HEALTH TECHNOLOGY SECTOR — 7.5% | | | | | | | | |
| | | | | | | | | | | | |
| | | | Medical Specialties — 5.7% | | | | | | | | |
| | 2,005,000 | | Koninklijke Philips N.V. (Netherlands) (b) | | | 90,434,402 | | | | 114,336,305 | |
| | 4,650,000 | | Smith & Nephew PLC (Britain) (b) | | | 86,117,364 | | | | 88,280,568 | |
| | | | | | | 176,551,766 | | | | 202,616,873 | |
| | | | Pharmaceuticals: Major — 1.8% | | | | | | | | |
| | 200,000 | | Roche Holding AG (Switzerland) (b) | | | 70,610,155 | | | | 64,788,681 | |
| | | | | | | | | |
INDUSTRIAL SERVICES SECTOR — 1.9% | | | | | | | | |
| | | | | | | | | | | | |
| | | | Oilfield Services/Equipment — 1.9% | | | | | | | | |
| | 2,525,000 | | Schlumberger Ltd. (Curacao) | | | 98,306,749 | | | | 68,654,750 | |
| | | | | | | | | |
PROCESS INDUSTRIES SECTOR — 1.8% | | | | | | | | |
| | | | | | | | | | | | |
| | | | Industrial Specialties — 1.8% | | | | | | | | |
| | 580,000 | | Akzo Nobel N.V. (Netherlands) (b) | | | 36,823,546 | | �� | | 64,754,853 | |
| | | | | | | | | |
PRODUCER MANUFACTURING SECTOR — 7.9% | | | | | | | | |
| | | | | | | | | | | | |
| | | | Building Products — 1.0% | | | | | | | | |
| | 2,700,000 | | Sanwa Holdings Corp. (Japan) (b) | | | 34,325,222 | | | | 35,368,499 | |
| | | | | | | | | | | | |
| | | | Industrial Conglomerates — 5.1% | | | | | | | | |
| | 1,015,000 | | Jardine Matheson Holdings Ltd. (Bermuda) (b) | | | 67,258,773 | | | | 66,499,769 | |
| | 5,520,000 | | Smiths Group PLC (Britain) (b) | | | 86,315,345 | | | | 116,938,776 | |
| | | | | | | 153,574,118 | | | | 183,438,545 | |
| | | | Trucks/Construction/Farm Machinery — 1.8% | | | | | | | | |
| | 4,250,000 | | CNH Industrial N.V. (Netherlands) (b) | | | 39,564,295 | | | | 65,791,099 | |
The accompanying notes to financial statements are an integral part of this schedule.
FMI International Fund
SCHEDULE OF INVESTMENTS (Continued)
March 31, 2021 (Unaudited)
| Shares | | | | Cost | | | Value | |
| LONG-TERM INVESTMENTS — 96.3% (a) (Continued) | | | | | | |
| | | | | | | |
| COMMON STOCKS — 85.7% (a) (Continued) | | | | | | |
| | | | | | | |
RETAIL TRADE SECTOR — 13.4% | | | | | | |
| | | | | | | | | |
| | | Department Stores — 5.0% | | | | | | |
| | 24,525,000 | | B&M European Value | | | | | | |
| | | | Retail S.A. (Luxembourg) (b) | | $ | 98,745,164 | | | $ | 178,433,888 | |
| | | | | | | | | | | | |
| | | | Food Retail — 1.0% | | | | | | | | |
| | 1,151,000 | | Greggs PLC (Britain) (b)* | | | 32,724,121 | | | | 35,626,996 | |
| | | | | | | | | | | | |
| | | | Specialty Stores — 7.4% | | | | | | | | |
| | 17,000,000 | | CK Hutchison Holdings Ltd. | | | | | | | | |
| | | | (Cayman Islands) (b) | | | 171,762,467 | | | | 135,818,310 | |
| | 3,920,963 | | Jardine Strategic Holdings Ltd. | | | | | | | | |
| | | | (Bermuda) (b) | | | 115,971,802 | | | | 129,553,550 | |
| | | | | | | 287,734,269 | | | | 265,371,860 | |
TECHNOLOGY SERVICES SECTOR — 1.4% | | | | | | | | |
| | | | | | | | | | | | |
| | | | Packaged Software — 1.4% | | | | | | | | |
| | 395,000 | | SAP SE (Germany) (b) | | | 50,837,303 | | | | 48,449,564 | |
| | | | | | | | | |
TRANSPORTATION SECTOR — 1.1% | | | | | | | | |
| | | | | | | | | | | | |
| | | | Air Freight/Couriers — 1.1% | | | | | | | | |
| | 375,000 | | Expeditors International of | | | | | | | | |
| | | | Washington Inc. (United States) | | | 23,457,256 | | | | 40,383,750 | |
| | | | Total common stocks | | | 2,487,194,650 | | | | 3,057,646,752 | |
| | | | | | | | | | | | |
| PREFERRED STOCKS — 10.6% (a) | | | | | | | | |
| | | | | | | | | |
CONSUMER DURABLES SECTOR — 1.3% | | | | | | | | |
| | | | | | | | | | | | |
| | | | Motor Vehicles — 1.3% | | | | | | | | |
| | 515,000 | | Hyundai Motor Co. (South Korea) (b) | | | 41,069,214 | | | | 44,834,881 | |
| | | | | | | | | |
CONSUMER NON-DURABLES SECTOR — 3.5% | | | | | | | | |
| | | | | | | | | | | | |
| | | | Household/Personal Care — 3.5% | | | | | | | | |
| | 825,000 | | Amorepacific Corp. (South Korea) (b) | | | 55,372,300 | | | | 61,170,073 | |
| | 105,000 | | LG Household & Health Care Ltd. | | | | | | | | |
| | | | (South Korea) (b) | | | 30,865,104 | | | | 63,637,410 | |
| | | | | | | 86,237,404 | | | | 124,807,483 | |
ELECTRONIC TECHNOLOGY SECTOR — 5.8% | | | | | | | | |
| | | | | | | | | | | | |
| | | | Telecommunications Equipment — 5.8% | | | | | | | | |
| | 3,185,000 | | Samsung Electronics Co. Ltd. | | | | | | | | |
| | | | (South Korea) (b) | | | 58,250,535 | | | | 206,286,777 | |
| | | | Total preferred stocks | | | 185,557,153 | | | | 375,929,141 | |
| | | | Total long-term investments | | | 2,672,751,803 | | | | 3,433,575,893 | |
The accompanying notes to financial statements are an integral part of this schedule.
FMI International Fund
SCHEDULE OF INVESTMENTS (Continued)
March 31, 2021 (Unaudited)
Principal Amount | | Cost | | | Value | |
| SHORT-TERM INVESTMENTS — 1.6% (a) | | | | | | |
| | | | | | | | | |
| | | Bank Deposit Account — 1.6% | | | | | | |
| $ | 56,869,417 | | U.S. Bank N.A., 0.01%^(c) | | $ | 56,869,417 | | | $ | 56,869,417 | |
| | | | Total short-term investments | | | 56,869,417 | | | | 56,869,417 | |
| | | | Total investments — 97.9% | | $ | 2,729,621,220 | | | | 3,490,445,310 | |
| | | | Other assets, less liabilities — 2.1% (a) | | | | | | | 75,955,745 | |
| | | | TOTAL NET ASSETS — 100.0% | | | | | | $ | 3,566,401,055 | |
| * | Non-income producing security. |
| ^ | The rate shown is as of March 31, 2021. |
| (a) | Percentages for the various classifications relate to total net assets. |
| (b) | Security does not trade during New York Stock Exchange hours, provided that certain foreign exchanges may trade during a portion of the New York Stock Exchange hours, and has been valued in accordance with the procedures discussed in Note 1(a) to the financial statements and has been classified as Level 2. As of March 31, 2021 the aggregate value of these securities was $3,035,667,278. |
| (c) | $13,215 of this security is held as collateral for certain forward currency contracts. |
| PLC | Public Limited Company |
The accompanying notes to financial statements are an integral part of this schedule.
FMI International Fund
SCHEDULE OF FORWARD CURRENCY CONTRACTS
March 31, 2021 (Unaudited)
| |
| | | | | U.S. $ Value on | | | | U.S. $ Value on | | | |
| | | | | | | March 31, 2021 | | | | March 31, 2021 | | Unrealized | |
| Settlement | | | | Currency to | | of Currency to | | Currency to | | of Currency to | | Appreciation | |
| Date | | Counterparty | | be Delivered | | be Delivered | | be Received | | be Received | | (Depreciation) | |
| 4/16/21 | | State Street Bank | | 580,000,000 | | $ | 799,628,838 | | 793,126,800 | | $ | 793,126,800 | | $ | (6,502,038 | ) |
| | | and Trust Co. | | British Pound | | | | | U.S. Dollar | | | | | | | |
| | | | | | | | | | | | | | | | | |
| 4/16/21 | | JPMorgan Chase | | 215,000,000 | | | 171,090,158 | | 169,074,108 | | | 169,074,108 | | | (2,016,050 | ) |
| | | Bank, N.A. | | Canadian Dollar | | | | | U.S. Dollar | | | | | | | |
| | | | | | | | | | | | | | | | | |
| 4/16/21 | | The Bank of New | | 550,000,000 | | | 645,197,980 | | 670,670,000 | | | 670,670,000 | | | 25,472,020 | |
| | | York Mellon | | Euro | | | | | U.S. Dollar | | | | | | | |
| | | | | | | | | | | | | | | | | |
| 4/16/21 | | The Bank of New | | 840,000,000 | | | 108,056,230 | | 108,324,596 | | | 108,324,596 | | | 268,366 | |
| | | York Mellon | | Hong Kong Dollar | | | | | U.S. Dollar | | | | | | | |
| | | | | | | | | | | | | | | | | |
| 4/16/21 | | The Bank of New | | 27,000,000,000 | | | 243,889,795 | | 260,228,423 | | | 260,228,423 | | | 16,338,628 | |
| | | York Mellon | | Japanese Yen | | | | | U.S. Dollar | | | | | | | |
| | | | | | | | | | | | | | | | | |
| 4/16/21 | | State Street | | 370,000,000,000 | | | 326,890,655 | | 336,485,995 | | | 336,485,995 | | | 9,595,340 | |
| | | Bank and | | South Korea Won | | | | | U.S. Dollar | | | | | | | |
| | | Trust Co. | | | | | | | | | | | | | | |
| | | | | | | | | | | | | | | | | |
| 4/16/21 | | JPMorgan Chase | | 160,000,000 | | | 169,358,921 | | 180,878,845 | | | 180,878,845 | | | 11,519,924 | |
| | | Bank, N.A. | | Swiss Franc | | | | | U.S. Dollar | | | | | | | |
| | | | | | | $ | 2,464,112,577 | | | | $ | 2,518,788,767 | | $ | 54,676,190 | |
| | | | | | | | | | | | | | | | | |
| 4/16/21 | | JPMorgan Chase | | 129,880,276 | | $ | 129,880,276 | | 165,000,000 | | $ | 131,301,748 | | $ | 1,421,472 | |
| | | Bank, N.A. | | U.S. Dollar | | | | | Canadian Dollar | | | | | | | |
| | | | | | | | | | | | | | | | | |
| 4/16/21 | | JPMorgan Chase | | 40,194,348 | | | 40,194,348 | | 50,000,000 | | | 39,788,409 | | | (405,939 | ) |
| | | Bank, N.A. | | U.S. Dollar | | | | | Canadian Dollar | | | | | | | |
| | | | | | | $ | 170,074,624 | | | | $ | 171,090,157 | | $ | 1,015,533 | |
| | | | | | | $ | 2,634,187,201 | | | | $ | 2,689,878,924 | | $ | 55,691,723 | |
The accompanying notes to financial statements are an integral part of this schedule.
FMI International Fund
INDUSTRY SECTORS as a percentage of net assets
as of March 31, 2021 (Unaudited)
CONCENTRATION BY COUNTRY based on domicile of issuer as a percentage of long-term investments onlyas of March 31, 2021 (Unaudited)
FMI International Fund II – Currency Unhedged
SCHEDULE OF INVESTMENTS
March 31, 2021 (Unaudited)
| Shares | | | | Cost | | | Value | |
| LONG-TERM INVESTMENTS — 95.7% (a) | | | | | | |
| | | | | | | |
| COMMON STOCKS — 84.9% (a) | | | | | | |
| | | | | | | |
COMMERCIAL SERVICES SECTOR — 8.1% | | | | | | |
| | | | | | | | | |
| | | Advertising/Marketing Services — 2.1% | | | | | | |
| | 116,300 | | WPP PLC (Jersey) (b) | | $ | 1,248,345 | | | $ | 1,482,074 | |
| | | | | | | | | | | | |
| | | | Miscellaneous Commercial Services — 6.0% | | | | | | | | |
| | 45,600 | | Bureau Veritas S.A. (France) (b) | | | 1,111,552 | | | | 1,297,628 | |
| | 24,600 | | DKSH Holding AG (Switzerland) (b) | | | 1,502,413 | | | | 1,888,882 | |
| | 11,300 | | Secom Co. Ltd. (Japan) (b) | | | 995,789 | | | | 952,609 | |
| | | | | | | 3,609,754 | | | | 4,139,119 | |
COMMUNICATIONS SECTOR — 1.7% | | | | | | | | |
| | | | | | | | | | | | |
| | | | Wireless Telecommunications — 1.7% | | | | | | | | |
| | 31,000 | | Millicom International | | | | | | | | |
| | | | Cellular S.A. (Luxembourg)* | | | 1,159,087 | | | | 1,184,510 | |
| | | | | | | | | |
CONSUMER DURABLES SECTOR — 6.2% | | | | | | | | |
| | | | | | | | | | | | |
| | | | Electronics/Appliances — 4.9% | | | | | | | | |
| | 31,900 | | Sony Group Corp. (Japan) (b) | | | 2,446,136 | | | | 3,376,088 | |
| | | | | | | | | | | | |
| | | | Home Furnishings — 1.3% | | | | | | | | |
| | 87,600 | | Howden Joinery Group PLC (Britain) (b) | | | 708,236 | | | | 885,170 | |
| | | | | | | | | |
CONSUMER NON-DURABLES SECTOR — 7.8% | | | | | | | | |
| | | | | | | | | | | | |
| | | | Food: Major Diversified — 1.1% | | | | | | | | |
| | 7,050 | | Nestlé S.A. (Switzerland) (b) | | | 775,014 | | | | 785,909 | |
| | | | | | | | | | | | |
| | | | Household/Personal Care — 6.7% | | | | | | | | |
| | 24,150 | | Henkel AG & Co. KGaA (Germany) (b) | | | 2,167,726 | | | | 2,392,605 | |
| | 40,200 | | Unilever PLC (Britain) (b) | | | 2,250,332 | | | | 2,243,163 | |
| | | | | | | 4,418,058 | | | | 4,635,768 | |
CONSUMER SERVICES SECTOR — 9.2% | | | | | | | | |
| | | | | | | | | | | | |
| | | | Media Conglomerates — 2.4% | | | | | | | | |
| | 52,000 | | Vivendi (France) (b) | | | 1,345,753 | | | | 1,706,836 | |
| | | | | | | | | | | | |
| | | | Movies/Entertainment — 2.7% | | | | | | | | |
| | 383,000 | | Bolloré (France) (b) | | | 1,570,948 | | | | 1,848,322 | |
| | | | | | | | | | | | |
| | | | Other Consumer Services — 3.1% | | | | | | | | |
| | 925 | | Booking Holdings Inc. (United States)* | | | 1,614,455 | | | | 2,155,102 | |
| | | | | | | | | | | | |
| | | | Restaurants — 1.0% | | | | | | | | |
| | 34,600 | | Compass Group PLC (Britain) (b)* | | | 519,942 | | | | 699,054 | |
| | | | | | | | | |
DISTRIBUTION SERVICES SECTOR — 5.0% | | | | | | | | |
| | | | | | | | | | | | |
| | | | Wholesale Distributors — 5.0% | | | | | | | | |
| | 27,425 | | Ferguson PLC (Jersey) (b) | | | 2,484,572 | | | | 3,276,071 | |
| | 9,772 | | Rexel S.A. (France) (b) | | | 187,042 | | | | 193,429 | |
| | | | | | | 2,671,614 | | | | 3,469,500 | |
The accompanying notes to financial statements are an integral part of this schedule.
FMI International Fund II – Currency Unhedged
SCHEDULE OF INVESTMENTS (Continued)
March 31, 2021 (Unaudited)
| Shares | | | | Cost | | | Value | |
| LONG-TERM INVESTMENTS — 95.7% (a) (Continued) | | | | | | |
| | | | | | | |
| COMMON STOCKS — 84.9% (a) (Continued) | | | | | | |
| | | | | | | |
ELECTRONIC TECHNOLOGY SECTOR — 4.7% | | | | | | |
| | | | | | | | | |
| | | Aerospace & Defense — 2.9% | | | | | | |
| | 14,900 | | Safran S.A. (France) (b)* | | $ | 1,737,316 | | | $ | 2,026,817 | |
| | | | | | | | | | | | |
| | | | Electronic Equipment/Instruments — 1.8% | | | | | | | | |
| | 68,400 | | Yokogawa Electric Corp. (Japan) (b) | | | 1,120,042 | | | | 1,263,538 | |
| | | | | | | | | �� |
FINANCE SECTOR — 5.1% | | | | | | | | |
| | | | | | | | | | | | |
| | | | Major Banks — 2.1% | | | | | | | | |
| | 2,514,000 | | Lloyds Banking Group PLC (Britain) (b) | | | 1,186,834 | | | | 1,474,782 | |
| | | | | | | | | | | | |
| | | | Multi-Line Insurance — 0.3% | | | | | | | | |
| | 5,865 | | Arch Capital Group Ltd. (Bermuda)* | | | 226,975 | | | | 225,040 | |
| | | | | | | | | | | | |
| | | | Property/Casualty Insurance — 2.7% | | | | | | | | |
| | 11,885 | | Chubb Ltd. (Switzerland) | | | 1,579,787 | | | | 1,877,473 | |
| | | | | | | | | |
HEALTH SERVICES SECTOR — 2.3% | | | | | | | | |
| | | | | | | | | | | | |
| | | | Medical/Nursing Services — 2.3% | | | | | | | | |
| | 21,400 | | Fresenius Medical Care | | | | | | | | |
| | | | AG & Co. KGaA (Germany) (b) | | | 1,699,713 | | | | 1,576,362 | |
| | | | | | | | | |
HEALTH TECHNOLOGY SECTOR — 7.5% | | | | | | | | |
| | | | | | | | | | | | |
| | | | Medical Specialties — 5.7% | | | | | | | | |
| | 39,000 | | Koninklijke Philips N.V. (Netherlands) (b) | | | 1,882,910 | | | | 2,223,998 | |
| | 90,300 | | Smith & Nephew PLC (Britain) (b) | | | 1,859,031 | | | | 1,714,352 | |
| | | | | | | 3,741,941 | | | | 3,938,350 | |
| | | | Pharmaceuticals: Major — 1.8% | | | | | | | | |
| | 3,900 | | Roche Holding AG (Switzerland) (b) | | | 1,366,389 | | | | 1,263,379 | |
| | | | | | | | | |
INDUSTRIAL SERVICES SECTOR — 1.9% | | | | | | | | |
| | | | | | | | | | | | |
| | | | Oilfield Services/Equipment — 1.9% | | | | | | | | |
| | 47,900 | | Schlumberger Ltd. (Curacao) | | | 1,351,718 | | | | 1,302,401 | |
| | | | | | | | | |
PROCESS INDUSTRIES SECTOR — 1.8% | | | | | | | | |
| | | | | | | | | | | | |
| | | | Industrial Specialties — 1.8% | | | | | | | | |
| | 11,000 | | Akzo Nobel N.V. (Netherlands) (b) | | | 801,661 | | | | 1,228,109 | |
| | | | | | | | | |
PRODUCER MANUFACTURING SECTOR — 8.1% | | | | | | | | |
| | | | | | | | | | | | |
| | | | Building Products — 1.0% | | | | | | | | |
| | 54,500 | | Sanwa Holdings Corp. (Japan) (b) | | | 697,701 | | | | 713,920 | |
| | | | | | | | | | | | |
| | | | Industrial Conglomerates — 5.3% | | | | | | | | |
| | 21,000 | | Jardine Matheson Holdings Ltd. (Bermuda) (b) | | | 1,391,856 | | | | 1,375,857 | |
| | 107,350 | | Smiths Group PLC (Britain) (b) | | | 2,110,598 | | | | 2,274,163 | |
| | | | | | | 3,502,454 | | | | 3,650,020 | |
| | | | Trucks/Construction/Farm Machinery — 1.8% | | | | | | | | |
| | 82,000 | | CNH Industrial N.V. (Netherlands) (b) | | | 709,969 | | | | 1,269,381 | |
The accompanying notes to financial statements are an integral part of this schedule.
FMI International Fund II – Currency Unhedged
SCHEDULE OF INVESTMENTS (Continued)
March 31, 2021 (Unaudited)
| Shares | | | | Cost | | | Value | |
| LONG-TERM INVESTMENTS — 95.7% (a) (Continued) | | | | | | |
| | | | | | | |
| COMMON STOCKS — 84.9% (a) (Continued) | | | | | | |
| | | | | | | |
RETAIL TRADE SECTOR — 13.0% | | | | | | |
| | | | | | | | | |
| | | Department Stores — 5.0% | | | | | | |
| | 477,000 | | B&M European Value Retail S.A. | | | | | | |
| | | | (Luxembourg) (b) | | $ | 2,663,768 | | | $ | 3,470,457 | |
| | | | | | | | | | | | |
| | | | Food Retail — 1.0% | | | | | | | | |
| | 23,450 | | Greggs PLC (Britain) (b)* | | | 672,753 | | | | 725,850 | |
| | | | | | | | | | | | |
| | | | Specialty Stores — 7.0% | | | | | | | | |
| | 330,600 | | CK Hutchison Holdings Ltd. | | | | | | | | |
| | | | (Cayman Islands) (b) | | | 2,491,851 | | | | 2,641,267 | |
| | 66,611 | | Jardine Strategic Holdings Ltd. (Bermuda) (b) | | | 1,616,445 | | | | 2,200,911 | |
| | | | | | | 4,108,296 | | | | 4,842,178 | |
TECHNOLOGY SERVICES SECTOR — 1.4% | | | | | | | | |
| | | | | | | | | | | | |
| | | | Packaged Software — 1.4% | | | | | | | | |
| | 7,800 | | SAP SE (Germany) (b) | | | 1,000,342 | | | | 956,726 | |
| | | | | | | | | |
TRANSPORTATION SECTOR — 1.1% | | | | | | | | |
| | | | | | | | | | | | |
| | | | Air Freight/Couriers — 1.1% | | | | | | | | |
| | 7,100 | | Expeditors International of | | | | | | | | |
| | | | Washington Inc. (United States) | | | 545,447 | | | | 764,599 | |
| | | | Total common stocks | | | 50,800,448 | | | | 58,936,834 | |
| | | | | | | | | | | | |
| PREFERRED STOCKS — 10.8% (a) | | | | | | | | |
| | | | | | | | | |
CONSUMER DURABLES SECTOR — 1.2% | | | | | | | | |
| | | | | | | | | | | | |
| | | | Motor Vehicles — 1.2% | | | | | | | | |
| | 9,600 | | Hyundai Motor Co. (South Korea) (b) | | | 678,704 | | | | 835,757 | |
| | | | | | | | | |
CONSUMER NON-DURABLES SECTOR — 3.8% | | | | | | | | |
| | | | | | | | | | | | |
| | | | Household/Personal Care — 3.8% | | | | | | | | |
| | 17,400 | | Amorepacific Corp. (South Korea) (b) | | | 1,151,496 | | | | 1,290,132 | |
| | 2,200 | | LG Household & Health Care Ltd. | | | | | | | | |
| | | | (South Korea) (b) | | | 1,406,748 | | | | 1,333,355 | |
| | | | | | | 2,558,244 | | | | 2,623,487 | |
ELECTRONIC TECHNOLOGY SECTOR — 5.8% | | | | | | | | |
| | | | | | | | | | | | |
| | | | Telecommunications Equipment — 5.8% | | | | | | | | |
| | 61,900 | | Samsung Electronics Co. Ltd. | | | | | | | | |
| | | | (South Korea) (b) | | | 2,721,160 | | | | 4,009,153 | |
| | | | Total preferred stocks | | | 5,958,108 | | | | 7,468,397 | |
| | | | Total long-term investments | | | 56,758,556 | | | | 66,405,231 | |
The accompanying notes to financial statements are an integral part of this schedule.
FMI International Fund II – Currency Unhedged
SCHEDULE OF INVESTMENTS (Continued)
March 31, 2021 (Unaudited)
Principal Amount | | Cost | | | Value | |
| SHORT-TERM INVESTMENTS — 3.8% (a) | | | | | | |
| | | | | | | | | |
| | | Bank Deposit Account — 3.8% | | | | | | |
| $ | 2,669,526 | | U.S. Bank N.A., 0.01%^ | | $ | 2,669,526 | | | $ | 2,669,526 | |
| | | | Total short-term investments | | | 2,669,526 | | | | 2,669,526 | |
| | | | Total investments — 99.5% | | $ | 59,428,082 | | | | 69,074,757 | |
| | | | Other assets, less liabilities — 0.5% (a) | | | | | | | 315,620 | |
| | | | TOTAL NET ASSETS — 100.0% | | | | | | $ | 69,390,377 | |
| * | Non-income producing security. |
| ^ | The rate shown is as of March 31, 2021. |
| (a) | Percentages for the various classifications relate to total net assets. |
| (b) | Security does not trade during New York Stock Exchange hours, provided that certain foreign exchanges may trade during a portion of the New York Stock Exchange hours, and has been valued in accordance with the procedures discussed in Note 1(a) to the financial statements and has been classified as Level 2. As of March 31, 2021 the aggregate value of these securities was $58,896,106. |
| PLC | Public Limited Company |
The accompanying notes to financial statements are an integral part of this schedule.
FMI International Fund II – Currency Unhedged
INDUSTRY SECTORS as a percentage of net assets
as of March 31, 2021 (Unaudited)
CONCENTRATION BY COUNTRY based on domicile of issuer as a percentage of long-term investments onlyas of March 31, 2021 (Unaudited)
FMI Funds, Inc.
STATEMENTS OF ASSETS AND LIABILITIES
March 31, 2021 (Unaudited)
| | | | | | | | | | | | FMI | |
| | | FMI | | | FMI | | | FMI | | | International | |
| | | Large Cap | | | Common Stock | | | International | | | Fund II – Currency | |
| | | Fund | | | Fund | | | Fund | | | Unhedged | |
| ASSETS: | | | | | | | | | | | | |
| Investments in securities, | | | | | | | | | | | | |
| at value (a) | | $ | 3,378,028,407 | | | $ | 907,256,420 | | | $ | 3,490,445,310 | | | $ | 69,074,757 | |
| Receivable for | | | | | | | | | | | | | | | | |
| investments sold | | | 1,988,011 | | | | — | | | | 2,114,878 | | | | 38,141 | |
| Receivables from shareholders | | | | | | | | | | | | | | | | |
| for purchases | | | 2,433,586 | | | | 660,454 | | | | 3,928,558 | | | | 45,685 | |
| Dividends and | | | | | | | | | | | | | | | | |
| interest receivable | | | 2,934,711 | | | | 403,247 | | | | 24,256,570 | | | | 301,910 | |
| Unrealized appreciation on | | | | | | | | | | | | | | | | |
| forward currency contracts | | | — | | | | — | | | | 64,615,750 | | | | — | |
| Prepaid directors fees | | | 5,168 | | | | 5,168 | | | | 5,168 | | | | 5,168 | |
| Prepaid expenses | | | 60,371 | | | | 39,122 | | | | 74,490 | | | | 24,889 | |
| Total assets | | $ | 3,385,450,254 | | | $ | 908,364,411 | | | $ | 3,585,440,724 | | | $ | 69,490,550 | |
| | | | | | | | | | | | | | | | | |
| LIABILITIES: | | | | | | | | | | | | | | | | |
| Payable to brokers for | | | | | | | | | | | | | | | | |
| investments purchased | | $ | 1,360,116 | | | $ | — | | | $ | 2,878,041 | | | $ | 57,553 | |
| Payable to shareholders | | | | | | | | | | | | | | | | |
| for redemptions | | | 10,085,433 | | | | 946,913 | | | | 4,814,254 | | | | — | |
| Payable to adviser | | | | | | | | | | | | | | | | |
| for management fees | | | 1,459,467 | | | | 559,721 | | | | 1,951,333 | | | | 22,460 | |
| Payable for | | | | | | | | | | | | | | | | |
| professional services | | | 17,748 | | | | 15,668 | | | | 22,474 | | | | 16,076 | |
| Unrealized depreciation on | | | | | | | | | | | | | | | | |
| forward currency contracts | | | — | | | | — | | | | 8,924,027 | | | | — | |
| Other liabilities | | | 394,855 | | | | 86,756 | | | | 449,540 | | | | 4,084 | |
| Total liabilities | | | 13,317,619 | | | | 1,609,058 | | | | 19,039,669 | | | | 100,173 | |
| Net assets | | $ | 3,372,132,635 | | | $ | 906,755,353 | | | $ | 3,566,401,055 | | | $ | 69,390,377 | |
| | | | | | | | | | | | | | | | | |
| NET ASSETS: | | | | | | | | | | | | | | | | |
| Capital Stock | | $ | 1,766,806,258 | | | $ | 557,458,014 | | | $ | 3,320,512,798 | | | $ | 59,970,548 | |
| Total distributable earnings | | | 1,605,326,377 | | | | 349,297,339 | | | | 245,888,257 | | | | 9,419,829 | |
| Net assets | | $ | 3,372,132,635 | | | $ | 906,755,353 | | | $ | 3,566,401,055 | | | $ | 69,390,377 | |
The accompanying notes to financial statements are an integral part of these statements.
FMI Funds, Inc.
STATEMENTS OF ASSETS AND LIABILITIES (Continued)
March 31, 2021 (Unaudited)
| | | | | | | | | | | | FMI | |
| | | FMI | | | FMI | | | FMI | | | International | |
| | | Large Cap | | | Common Stock | | | International | | | Fund II – Currency | |
| | | Fund | | | Fund | | | Fund | | | Unhedged | |
| CALCULATION OF NET | | | | | | | | | | | | |
| ASSET VALUE PER SHARE: | | | | | | | | | | | | |
| Investor Class shares: | | | | | | | | | | | | |
| Net assets | | $ | 1,533,045,372 | | | $ | 429,201,306 | | | $ | 1,125,052,583 | | | $ | — | |
| Shares outstanding | | | 74,118,467 | | | | 13,833,653 | | | | 32,447,978 | | | | — | |
| Shares authorized | | | | | | | | | | | | | | | | |
| ($0.0001 par value) | | | 300,000,000 | | | | 300,000,000 | | | | 300,000,000 | | | | 300,000,000 | |
| Net asset value, offering and | | | | | | | | | | | | | | | | |
| redemption price per share | | $ | 20.68 | | | $ | 31.03 | | | $ | 34.67 | | | $ | — | |
| Institutional Class shares: | | | | | | | | | | | | | | | | |
| Net assets | | $ | 1,839,087,263 | | | $ | 477,554,047 | | | $ | 2,441,348,472 | | | $ | 69,390,377 | |
| Shares outstanding | | | 89,062,974 | | | | 15,373,872 | | | | 70,253,460 | | | | 3,207,600 | |
| Shares authorized | | | | | | | | | | | | | | | | |
| ($0.0001 par value) | | | 300,000,000 | | | | 300,000,000 | | | | 300,000,000 | | | | 300,000,000 | |
| Net asset value, offering and | | | | | | | | | | | | | | | | |
| redemption price per share | | $ | 20.65 | | | $ | 31.06 | | | $ | 34.75 | | | $ | 21.63 | |
| (a) Identified cost of investments | | $ | 2,165,618,457 | | | $ | 584,408,821 | | | $ | 2,729,621,220 | | | $ | 59,428,082 | |
The accompanying notes to financial statements are an integral part of these statements.
FMI Funds, Inc.
STATEMENTS OF OPERATIONS
For the Six Month Period Ending March 31, 2021 (Unaudited)
| | | | | | | | | | | | FMI | |
| | | FMI | | | FMI | | | FMI | | | International | |
| | | Large Cap | | | Common Stock | | | International | | | Fund II – Currency | |
| | | Fund | | | Fund | | | Fund | | | Unhedged | |
| INCOME: | | | | | | | | | | | | |
| Dividends* | | $ | 27,201,371 | | | $ | 5,396,935 | | | $ | 49,374,875 | | | $ | 793,889 | |
| Interest | | | 8,464 | | | | 3,506 | | | | 9,368 | | | | 253 | |
| Total income | | | 27,209,835 | | | | 5,400,441 | | | | 49,384,243 | | | | 794,142 | |
| | | | | | | | | | | | | | | | | |
| EXPENSES: | | | | | | | | | | | | | | | | |
| Management fees | | | 10,772,757 | | | | 3,361,203 | | | | 12,768,773 | | | | 210,562 | |
| Shareholder servicing fees | | | | | | | | | | | | | | | | |
| (Investor Class) | | | 1,067,673 | | | | 205,867 | | | | 896,791 | | | | — | |
| Administration and | | | | | | | | | | | | | | | | |
| accounting services | | | 336,945 | | | | 92,990 | | | | 347,419 | | | | 8,458 | |
| Printing and postage expense | | | 135,246 | | | | 25,728 | | | | 268,316 | | | | 1,915 | |
| Transfer agent fees | | | 77,258 | | | | 33,400 | | | | 77,171 | | | | 8,984 | |
| Custodian fees | | | 60,563 | | | | 14,111 | | | | 246,416 | | | | 11,530 | |
| Registration fees | | | 43,135 | | | | 46,330 | | | | 72,136 | | | | 15,036 | |
| Board of Directors fees | | | 32,519 | | | | 32,519 | | | | 32,519 | | | | 32,519 | |
| Professional fees | | | 23,954 | | | | 22,024 | | | | 25,158 | | | | 20,644 | |
| Interest expense | | | 21,625 | | | | — | | | | 1,987 | | | | 110 | |
| Other expenses | | | 80,609 | | | | 38,624 | | | | 137,628 | | | | 23,650 | |
| Total expenses | | | | | | | | | | | | | | | | |
| before reimbursement | | | 12,652,284 | | | | 3,872,796 | | | | 14,874,314 | | | | 333,408 | |
| Less expenses | | | | | | | | | | | | | | | | |
| reimbursed by adviser | | | — | | | | — | | | | — | | | | (80,497 | ) |
| Net expenses | | | 12,652,284 | | | | 3,872,796 | | | | 14,874,314 | | | | 252,911 | |
| NET INVESTMENT INCOME | | | 14,557,551 | | | | 1,527,645 | | | | 34,509,929 | | | | 541,231 | |
The accompanying notes to financial statements are an integral part of these statements.
FMI Funds, Inc.
STATEMENTS OF OPERATIONS (Continued)
For the Six Month Period Ending March 31, 2021 (Unaudited)
| | | | | | | | | | | | FMI | |
| | | FMI | | | FMI | | | FMI | | | International | |
| | | Large Cap | | | Common Stock | | | International | | | Fund II – Currency | |
| | | Fund | | | Fund | | | Fund | | | Unhedged | |
| NET REALIZED GAIN (LOSS) | | | | | | | | | | | | |
| ON INVESTMENTS: | | | | | | | | | | | | |
| Securities | | $ | 418,176,158 | | | $ | 46,245,514 | | | $ | 187,869,005 | | | $ | 698,025 | |
| Forward currency contracts | | | — | | | | — | | | | (154,686,403 | ) | | | — | |
| Foreign currency transactions | | | — | | | | — | | | | (13,787,716 | ) | | | 4,718 | |
| NET REALIZED GAIN (LOSS) | | | | | | | | | | | | | | | | |
| ON INVESTMENTS | | | 418,176,158 | | | | 46,245,514 | | | | 19,394,886 | | | | 702,743 | |
| NET CHANGE IN UNREALIZED | | | | | | | | | | | | | | | | |
| APPRECIATION/DEPRECIATION | | | | | | | | | | | | | | | | |
| ON INVESTMENTS: | | | | | | | | | | | | | | | | |
| Securities | | | 271,108,906 | | | | 221,424,561 | | | | 613,254,303 | | | | 11,107,112 | |
| Forward currency contracts | | | — | | | | — | | | | 113,576,402 | | | | — | |
| Foreign currency transactions | | | — | | | | — | | | | (437,116 | ) | | | (5,068 | ) |
| NET CHANGE IN UNREALIZED | | | | | | | | | | | | | | | | |
| APPRECIATION/DEPRECIATION | | | | | | | | | | | | | | | | |
| ON INVESTMENTS | | | 271,108,906 | | | | 221,424,561 | | | | 726,393,589 | | | | 11,102,044 | |
| NET GAIN (LOSS) | | | | | | | | | | | | | | | | |
| ON INVESTMENTS | | | 689,285,064 | | | | 267,670,075 | | | | 745,788,475 | | | | 11,804,787 | |
| NET INCREASE (DECREASE) | | | | | | | | | | | | | | | | |
| IN NET ASSETS RESULTING | | | | | | | | | | | | | | | | |
| FROM OPERATIONS | | $ | 703,842,615 | | | $ | 269,197,720 | | | $ | 780,298,404 | | | $ | 12,346,018 | |
| | | | | | | | | | | | | | | | | |
| * Net withholding taxes | | $ | 72,865 | | | $ | — | | | $ | 6,568,445 | | | $ | 105,428 | |
The accompanying notes to financial statements are an integral part of these statements.
FMI Large Cap Fund
STATEMENTS OF CHANGES IN NET ASSETS
For the Six Month Period Ending March 31, 2021 (Unaudited) and For the Year Ended September 30, 2020
| | | 2021 | | | 2020 | |
| OPERATIONS: | | | | | | |
| Net investment income | | $ | 14,557,551 | | | $ | 44,297,776 | |
| Net realized gain (loss) on investments | | | 418,176,158 | | | | 472,389,104 | |
| Net change in unrealized appreciation/depreciation | | | | | | | | |
| on investments | | | 271,108,906 | | | | (588,845,221 | ) |
| Net increase (decrease) in net assets from operations | | | 703,842,615 | | | | (72,158,341 | ) |
| DISTRIBUTIONS TO SHAREHOLDERS FROM: | | | | | | | | |
| Investor Class | | | (167,535,731 | ) | | | (166,160,881 | ) |
| Institutional Class | | | (196,110,923 | ) | | | (206,048,278 | ) |
| Total distributions (Note 8) | | | (363,646,654 | ) | | | (372,209,159 | ) |
| FUND SHARE ACTIVITIES: | | | | | | | | |
| Net increase (decrease) in net assets | | | | | | | | |
| derived from Fund share activities (Note 9) | | | (367,851,402 | ) | | | (1,145,745,468 | ) |
| TOTAL INCREASE (DECREASE) | | | (27,655,441 | ) | | | (1,590,112,968 | ) |
| NET ASSETS AT THE BEGINNING OF THE PERIOD | | | 3,399,788,076 | | | | 4,989,901,044 | |
| NET ASSETS AT THE END OF THE PERIOD | | $ | 3,372,132,635 | | | $ | 3,399,788,076 | |
| FUND SHARE TRANSACTIONS: | | | | | | | | |
| Net increase (decrease) in shares outstanding (Note 9) | | | (17,646,162 | ) | | | (67,005,235 | ) |
The accompanying notes to financial statements are an integral part of these statements.
FMI Common Stock Fund
STATEMENTS OF CHANGES IN NET ASSETS
For the Six Month Period Ending March 31, 2021 (Unaudited) and For the Year Ended September 30, 2020
| | | 2021 | | | 2020 | |
| OPERATIONS: | | | | | | |
| Net investment income | | $ | 1,527,645 | | | $ | 6,574,100 | |
| Net realized gain (loss) on investments | | | 46,245,514 | | | | (14,339,788 | ) |
| Net change in unrealized appreciation/depreciation | | | | | | | | |
| on investments | | | 221,424,561 | | | | (119,130,686 | ) |
| Net increase (decrease) in net assets from operations | | | 269,197,720 | | | | (126,896,374 | ) |
| DISTRIBUTIONS TO SHAREHOLDERS FROM: | | | | | | | | |
| Investor Class | | | (3,085,944 | ) | | | (25,060,595 | ) |
| Institutional Class | | | (3,488,077 | ) | | | (23,991,070 | ) |
| Total distributions (Note 8) | | | (6,574,021 | ) | | | (49,051,665 | ) |
| FUND SHARE ACTIVITIES: | | | | | | | | |
| Net increase (decrease) in net assets | | | | | | | | |
| derived from Fund share activities (Note 9) | | | (46,107,279 | ) | | | (111,309,384 | ) |
| TOTAL INCREASE (DECREASE) | | | 216,516,420 | | | | (287,257,423 | ) |
| NET ASSETS AT THE BEGINNING OF THE PERIOD | | | 690,238,933 | | | | 977,496,356 | |
| NET ASSETS AT THE END OF THE PERIOD | | $ | 906,755,353 | | | $ | 690,238,933 | |
| FUND SHARE TRANSACTIONS: | | | | | | | | |
| Net increase (decrease) in shares outstanding (Note 9) | | | (1,797,823 | ) | | | (6,020,804 | ) |
The accompanying notes to financial statements are an integral part of these statements.
FMI International Fund
STATEMENTS OF CHANGES IN NET ASSETS
For the Six Month Period Ending March 31, 2021 (Unaudited) and For the Year Ended September 30, 2020
| | | 2021 | | | 2020 | |
| OPERATIONS: | | | | | | |
| Net investment income | | $ | 34,509,929 | | | $ | 68,176,520 | |
| Net realized gain (loss) on investments | | | 19,394,886 | | | | (632,112,650 | ) |
| Net change in unrealized appreciation/depreciation | | | | | | | | |
| on investments | | | 726,393,589 | | | | (338,781,617 | ) |
| Net increase (decrease) in net assets from operations | | | 780,298,404 | | | | (902,717,747 | ) |
| DISTRIBUTIONS TO SHAREHOLDERS FROM: | | | | | | | | |
| Investor Class | | | — | | | | (97,089,683 | ) |
| Institutional Class | | | — | | | | (167,806,435 | ) |
| Total distributions (Note 8) | | | — | | | | (264,896,118 | ) |
| FUND SHARE ACTIVITIES: | | | | | | | | |
| Net increase (decrease) in net assets | | | | | | | | |
| derived from Fund share activities (Note 9) | | | (563,528,024 | ) | | | (2,761,603,041 | ) |
| TOTAL INCREASE (DECREASE) | | | 216,770,380 | | | | (3,929,216,906 | ) |
| NET ASSETS AT THE BEGINNING OF THE PERIOD | | | 3,349,630,675 | | | | 7,278,847,581 | |
| NET ASSETS AT THE END OF THE PERIOD | | $ | 3,566,401,055 | | | $ | 3,349,630,675 | |
| FUND SHARE TRANSACTIONS: | | | | | | | | |
| Net increase (decrease) in shares outstanding (Note 9) | | | (18,150,115 | ) | | | (107,212,437 | ) |
The accompanying notes to financial statements are an integral part of these statements.
FMI International Fund II – Currency Unhedged
STATEMENTS OF CHANGES IN NET ASSETS
For the Six Month Period Ending March 31, 2021 (Unaudited) and For the Period from December 31, 2019 (Inception date) to September 30, 2020
| | | | | | For the Period from | |
| | | | | | December 31, 2019* to | |
| | | 2021 | | | September 30, 2020 | |
| OPERATIONS: | | | | | | |
| Net investment income | | $ | 541,231 | | | $ | 238,457 | |
| Net realized gain (loss) on investments | | | 702,743 | | | | (1,226,870 | ) |
| Net change in unrealized appreciation/depreciation | | | | | | | | |
| on investments | | | 11,102,044 | | | | (1,459,258 | ) |
| Net increase (decrease) in net assets from operations | | | 12,346,018 | | | | (2,447,671 | ) |
| DISTRIBUTIONS TO SHAREHOLDERS FROM: | | | | | | | | |
| Investor Class | | | — | | | | — | |
| Institutional Class | | | (478,518 | ) | | | — | |
| Total distributions (Note 8) | | | (478,518 | ) | | | — | |
| FUND SHARE ACTIVITIES: | | | | | | | | |
| Net increase (decrease) in net assets | | | | | | | | |
| derived from Fund share activities (Note 9) | | | 9,968,103 | | | | 50,002,445 | |
| TOTAL INCREASE (DECREASE) | | | 21,835,603 | | | | 47,554,774 | |
| NET ASSETS AT THE BEGINNING OF THE PERIOD | | | 47,554,774 | | | | — | |
| NET ASSETS AT THE END OF THE PERIOD | | $ | 69,390,377 | | | $ | 47,554,774 | |
| FUND SHARE TRANSACTIONS: | | | | | | | | |
| Net increase (decrease) in shares outstanding (Note 9) | | | 449,870 | | | | 2,757,730 | |
* Inception date.
The accompanying notes to financial statements are an integral part of this statement.
FMI Large Cap Fund
FINANCIAL HIGHLIGHTS
(Selected data for each share of the Fund outstanding throughout each period)
Investor Class
| | | (Unaudited) | | | | | | | | | | | | | | | | |
| | | For the | | | | | | | | | | | | | | | | |
| | | Six Month | | | | | | | | | | | | | | | | |
| | | Period Ending | | | | | | | | | | | | | | | | |
| | | March 31, | | | Years Ended September 30, | |
| | | 2021 | | | 2020 | | | 2019 | | | 2018 | | | 2017 | | | 2016 | |
| PER SHARE OPERATING | | | | | | | | | | | | | | | | | | |
| PERFORMANCE: | | | | | | | | | | | | | | | | | | |
| Net asset value, | | | | | | | | | | | | | | | | | | |
| beginning of period | | $ | 18.81 | | | $ | 20.14 | | | $ | 22.85 | | | $ | 22.17 | | | $ | 20.20 | | | $ | 20.00 | |
| Income from | | | | | | | | | | | | | | | | | | | | | | | | |
| investment operations: | | | | | | | | | | | | | | | | | | | | | | | | |
| Net investment | | | | | | | | | | | | | | | | | | | | | | | | |
income (loss)(1) | | | 0.08 | | | | 0.18 | | | | 0.25 | | | | 0.24 | | | | 0.15 | | | | 0.21 | |
| Net realized and | | | | | | | | | | | | | | | | | | | | | | | | |
| unrealized gain (loss) | | | | | | | | | | | | | | | | | | | | | | | | |
| on investments | | | 4.04 | | | | 0.03 | (2) | | | 0.55 | | | | 2.43 | | | | 3.30 | | | | 2.04 | |
| Total from | | | | | | | | | | | | | | | | | | | | | | | | |
| investment operations | | | 4.12 | | | | 0.21 | | | | 0.80 | | | | 2.67 | | | | 3.45 | | | | 2.25 | |
| Less distributions: | | | | | | | | | | | | | | | | | | | | | | | | |
| Distributions from | | | | | | | | | | | | | | | | | | | | | | | | |
| net investment income | | | (0.30 | ) | | | (0.17 | ) | | | (0.28 | ) | | | (0.17 | ) | | | (0.23 | ) | | | (0.21 | ) |
| Distributions from | | | | | | | | | | | | | | | | | | | | | | | | |
| net realized gains | | | (1.95 | ) | | | (1.37 | ) | | | (3.23 | ) | | | (1.82 | ) | | | (1.25 | ) | | | (1.84 | ) |
| Total from distributions | | | (2.25 | ) | | | (1.54 | ) | | | (3.51 | ) | | | (1.99 | ) | | | (1.48 | ) | | | (2.05 | ) |
| Net asset value, | | | | | | | | | | | | | | | | | | | | | | | | |
| end of period | | $ | 20.68 | | | $ | 18.81 | | | $ | 20.14 | | | $ | 22.85 | | | $ | 22.17 | | | $ | 20.20 | |
| TOTAL RETURN | | | 22.82 | %(3) | | | 0.71 | % | | | 5.72 | % | | | 12.67 | % | | | 17.86 | % | | | 12.36 | % |
| RATIOS/SUPPLEMENTAL DATA: | | | | | | | | | | | | | | | | | | | | | |
| Net assets, end of | | | | | | | | | | | | | | | | | | | | | | | | |
| period (in 000’s $) | | | 1,533,046 | | | | 1,475,504 | | | | 2,337,118 | | | | 3,155,818 | | | | 3,856,953 | | | | 6,576,109 | |
| Ratio of expenses to | | | | | | | | | | | | | | | | | | | | | | | | |
| average net assets | | | 0.82 | %(4) | | | 0.81 | % | | | 0.82 | % | | | 0.85 | % | | | 0.86 | % | | | 0.90 | % |
| Ratio of net investment | | | | | | | | | | | | | | | | | | | | | | | | |
| income (loss) to | | | | | | | | | | | | | | | | | | | | | | | | |
| average net assets | | | 0.78 | %(4) | | | 0.99 | % | | | 1.25 | % | | | 1.07 | % | | | 0.71 | % | | | 1.09 | % |
| Portfolio turnover rate | | | 9 | %(3)(5) | | | 28 | %(5) | | | 20 | %(5) | | | 25 | %(5) | | | 16 | %(5) | | | 17 | % |
| (1) | Net investment income (loss) per share was calculated using average shares outstanding. |
| (2) | Realized and unrealized gain (loss) per share in this caption are balancing amounts necessary to reconcile the change in net asset value per share for the period, and may not reconcile with the aggregate gains on the Statement of Operations due to share transactions for the period. |
| (3) | Not annualized. |
| (4) | Annualized. |
| (5) | Portfolio turnover rate is disclosed for the Fund as a whole. |
The accompanying notes to financial statements are an integral part of this statement.
FMI Large Cap Fund
FINANCIAL HIGHLIGHTS
(Selected data for each share of the Fund outstanding throughout each period)
Institutional Class
| | | (Unaudited) | | | | | | | | | | | | For the | |
| | | For the | | | | | | | | | | | | Period from | |
| | | Six Month | | | | | | | | | | | | October 31, | |
| | | Period Ending | | | | | | | | | | | | 2016* to | |
| | | March 31, | | | Years Ended September 30, | | | September 30, | |
| | | 2021 | | | 2020 | | | 2019 | | | 2018 | | | 2017 | |
| PER SHARE OPERATING | | | | | | | | | | | | | | | |
| PERFORMANCE: | | | | | | | | | | | | | | | |
| Net asset value, | | | | | | | | | | | | | | | |
| beginning of period | | $ | 18.80 | | | $ | 20.13 | | | $ | 22.85 | | | $ | 22.18 | | | $ | 19.73 | |
| Income from investment operations: | | | | | | | | | | | | | | | | | | | | |
Net investment income (loss)(1) | | | 0.09 | | | | 0.21 | | | | 0.25 | | | | 0.27 | | | | 0.16 | |
| Net realized and unrealized | | | | | | | | | | | | | | | | | | | | |
| gain (loss) on investments | | | 4.04 | | | | 0.02 | (2) | | | 0.58 | | | | 2.43 | | | | 3.77 | |
| Total from investment operations | | | 4.13 | | | | 0.23 | | | | 0.83 | | | | 2.70 | | | | 3.93 | |
| Less distributions: | | | | | | | | | | | | | | | | | | | | |
| Distributions from | | | | | | | | | | | | | | | | | | | | |
| net investment income | | | (0.33 | ) | | | (0.19 | ) | | | (0.32 | ) | | | (0.21 | ) | | | (0.23 | ) |
| Distributions from | | | | | | | | | | | | | | | | | | | | |
| net realized gains | | | (1.95 | ) | | | (1.37 | ) | | | (3.23 | ) | | | (1.82 | ) | | | (1.25 | ) |
| Total from distributions | | | (2.28 | ) | | | (1.56 | ) | | | (3.55 | ) | | | (2.03 | ) | | | (1.48 | ) |
| Net asset value, end of period | | $ | 20.65 | | | $ | 18.80 | | | $ | 20.13 | | | $ | 22.85 | | | $ | 22.18 | |
| TOTAL RETURN | | | 22.91 | %(3) | | | 0.84 | % | | | 5.89 | % | | | 12.82 | % | | | 20.76 | %(3) |
| RATIOS/SUPPLEMENTAL DATA: | | | | | | | | | | | | | | | | | | | | |
| Net assets, end of | | | | | | | | | | | | | | | | | | | | |
| period (in 000’s $) | | | 1,839,087 | | | | 1,924,284 | | | | 2,652,783 | | | | 2,861,755 | | | | 2,520,266 | |
| Ratio of expenses to | | | | | | | | | | | | | | | | | | | | |
| average net assets | | | 0.69 | %(4) | | | 0.67 | % | | | 0.68 | % | | | 0.71 | % | | | 0.72 | %(4) |
| Ratio of net investment income | | | | | | | | | | | | | | | | | | | | |
| (loss) to average net assets | | | 0.93 | %(4) | | | 1.13 | % | | | 1.26 | % | | | 1.20 | % | | | 0.81 | %(4) |
Portfolio turnover rate(5) | | | 9 | %(3) | | | 28 | % | | | 20 | % | | | 25 | % | | | 16 | %(3) |
| * | Inception date. |
| (1) | Net investment income (loss) per share was calculated using average shares outstanding. |
| (2) | Realized and unrealized gain (loss) per share in this caption are balancing amounts necessary to reconcile the change in net asset value per share for the period, and may not reconcile with the aggregate gains on the Statement of Operations due to share transactions for the period. |
| (3) | Not annualized. |
| (4) | Annualized. |
| (5) | Portfolio turnover rate is disclosed for the Fund as a whole. |
The accompanying notes to financial statements are an integral part of this statement.
FMI Common Stock Fund
FINANCIAL HIGHLIGHTS
(Selected data for each share of the Fund outstanding throughout each period)
Investor Class
| | | (Unaudited) | | | | | | | | | | | | | | | | |
| | | For the | | | | | | | | | | | | | | | | |
| | | Six Month | | | | | | | | | | | | | | | | |
| | | Period Ending | | | | | | | | | | | | | | | | |
| | | March 31, | | | Years Ended September 30, | |
| | | 2021 | | | 2020 | | | 2019 | | | 2018 | | | 2017 | | | 2016 | |
| PER SHARE OPERATING | | | | | | | | | | | | | | | | | | |
| PERFORMANCE: | | | | | | | | | | | | | | | | | | |
| Net asset value, | | | | | | | | | | | | | | | | | | |
| beginning of period | | $ | 22.25 | | | $ | 26.39 | | | $ | 27.55 | | | $ | 28.83 | | | $ | 25.42 | | | $ | 25.05 | |
| Income from | | | | | | | | | | | | | | | | | | | | | | | | |
| investment operations: | | | | | | | | | | | | | | | | | | | | | | | | |
| Net investment | | | | | | | | | | | | | | | | | | | | | | | | |
income (loss)(1) | | | 0.04 | | | | 0.17 | | | | 0.15 | | | | 0.06 | | | | 0.00 | * | | | (0.01 | ) |
| Net realized and | | | | | | | | | | | | | | | | | | | | | | | | |
| unrealized gain (loss) | | | | | | | | | | | | | | | | | | | | | | | | |
| on investments | | | 8.95 | | | | (3.02 | ) | | | 0.94 | | | | 1.80 | | | | 4.69 | | | | 2.84 | |
| Total from | | | | | | | | | | | | | | | | | | | | | | | | |
| investment operations | | | 8.99 | | | | (2.85 | ) | | | 1.09 | | | | 1.86 | | | | 4.69 | | | | 2.83 | |
| Less distributions: | | | | | | | | | | | | | | | | | | | | | | | | |
| Distributions from | | | | | | | | | | | | | | | | | | | | | | | | |
| net investment income | | | (0.21 | ) | | | (0.11 | ) | | | (0.10 | ) | | | (0.01 | ) | | | 0.00 | * | | | — | |
| Distributions from | | | | | | | | | | | | | | | | | | | | | | | | |
| net realized gains | | | — | | | | (1.18 | ) | | | (2.15 | ) | | | (3.13 | ) | | | (1.28 | ) | | | (2.46 | ) |
| Total from distributions | | | (0.21 | ) | | | (1.29 | ) | | | (2.25 | ) | | | (3.14 | ) | | | (1.28 | ) | | | (2.46 | ) |
| Net asset value, | | | | | | | | | | | | | | | | | | | | | | | | |
| end of period | | $ | 31.03 | | | $ | 22.25 | | | $ | 26.39 | | | $ | 27.55 | | | $ | 28.83 | | | $ | 25.42 | |
| TOTAL RETURN | | | 40.53 | %(2) | | | (11.51 | %) | | | 5.28 | % | | | 6.92 | % | | | 18.96 | % | | | 12.61 | % |
| RATIOS/SUPPLEMENTAL DATA: | | | | | | | | | | | | | | | | | | | | | |
| Net assets, end of | | | | | | | | | | | | | | | | | | | | | | | | |
| period (in 000’s $) | | | 429,201 | | | | 345,428 | | | | 529,234 | | | | 635,174 | | | | 825,176 | | | | 944,654 | |
| Ratio of expenses to | | | | | | | | | | | | | | | | | | | | | | | | |
| average net assets | | | 1.01 | %(3) | | | 1.02 | % | | | 1.02 | % | | | 1.04 | % | | | 1.06 | % | | | 1.12 | % |
| Ratio of net investment | | | | | | | | | | | | | | | | | | | | | | | | |
| income (loss) to | | | | | | | | | | | | | | | | | | | | | | | | |
| average net assets | | | 0.33 | %(3) | | | 0.71 | % | | | 0.59 | % | | | 0.23 | % | | | 0.00 | % | | | (0.06 | %) |
| Portfolio turnover rate | | | 13 | %(2)(4) | | | 32 | %(4) | | | 28 | %(4) | | | 26 | %(4) | | | 26 | %(4) | | | 17 | % |
| * | Amount is less than $0.005. |
| (1) | Net investment income (loss) per share was calculated using average shares outstanding. |
| (2) | Not annualized. |
| (3) | Annualized. |
| (4) | Portfolio turnover rate is disclosed for the Fund as a whole. |
The accompanying notes to financial statements are an integral part of this statement.
FMI Common Stock Fund
FINANCIAL HIGHLIGHTS
(Selected data for each share of the Fund outstanding throughout each period)
Institutional Class
| | | (Unaudited) | | | | | | | | | | | | For the | |
| | | For the | | | | | | | | | | | | Period from | |
| | | Six Month | | | | | | | | | | | | October 31, | |
| | | Period Ending | | | | | | | | | | | | 2016* to | |
| | | March 31, | | | Years Ended September 30, | | | September 30, | |
| | | 2021 | | | 2020 | | | 2019 | | | 2018 | | | 2017 | |
| PER SHARE OPERATING | | | | | | | | | | | | | | | |
| PERFORMANCE: | | | | | | | | | | | | | | | |
| Net asset value, | | | | | | | | | | | | | | | |
| beginning of period | | $ | 22.28 | | | $ | 26.42 | | | $ | 27.59 | | | $ | 28.85 | | | $ | 24.72 | |
| Income from investment operations: | | | | | | | | | | | | | | | | | | | | |
Net investment income (loss)(1) | | | 0.06 | | | | 0.20 | | | | 0.18 | | | | 0.10 | | | | 0.03 | |
| Net realized and unrealized | | | | | | | | | | | | | | | | | | | | |
| gain (loss) on investments | | | 8.95 | | | | (3.02 | ) | | | 0.93 | | | | 1.79 | | | | 5.39 | |
| Total from investment operations | | | 9.01 | | | | (2.82 | ) | | | 1.11 | | | | 1.89 | | | | 5.42 | |
| Less distributions: | | | | | | | | | | | | | | | | | | | | |
| Distributions from | | | | | | | | | | | | | | | | | | | | |
| net investment income | | | (0.23 | ) | | | (0.14 | ) | | | (0.13 | ) | | | (0.02 | ) | | | (0.01 | ) |
| Distributions from | | | | | | | | | | | | | | | | | | | | |
| net realized gains | | | — | | | | (1.18 | ) | | | (2.15 | ) | | | (3.13 | ) | | | (1.28 | ) |
| Total from distributions | | | (0.23 | ) | | | (1.32 | ) | | | (2.28 | ) | | | (3.15 | ) | | | (1.29 | ) |
| Net asset value, end of period | | $ | 31.06 | | | $ | 22.28 | | | $ | 26.42 | | | $ | 27.59 | | | $ | 28.85 | |
| TOTAL RETURN | | | 40.59 | %(2) | | | (11.41 | %) | | | 5.40 | % | | | 7.02 | % | | | 22.43 | %(2) |
| RATIOS/SUPPLEMENTAL DATA: | | | | | | | | | | | | | | | | | | | | |
| Net assets, end of | | | | | | | | | | | | | | | | | | | | |
| period (in 000’s $) | | | 477,554 | | | | 344,811 | | | | 448,262 | | | | 433,491 | | | | 278,174 | |
| Ratio of expenses to | | | | | | | | | | | | | | | | | | | | |
| average net assets | | | 0.90 | %(3) | | | 0.90 | % | | | 0.91 | % | | | 0.94 | % | | | 0.97 | %(3) |
| Ratio of net investment income | | | | | | | | | | | | | | | | | | | | |
| (loss) to average net assets | | | 0.43 | %(3) | | | 0.84 | % | | | 0.71 | % | | | 0.37 | % | | | 0.12 | %(3) |
Portfolio turnover rate(4) | | | 13 | %(2) | | | 32 | % | | | 28 | % | | | 26 | % | | | 26 | %(2) |
| * | Inception date. |
| (1) | Net investment income (loss) per share was calculated using average shares outstanding. |
| (2) | Not annualized. |
| (3) | Annualized. |
| (4) | Portfolio turnover rate is disclosed for the Fund as a whole. |
The accompanying notes to financial statements are an integral part of this statement.
FMI International Fund
FINANCIAL HIGHLIGHTS
(Selected data for each share of the Fund outstanding throughout each period)
Investor Class
| | | (Unaudited) | | | | | | | | | | | | | | | | |
| | | For the | | | | | | | | | | | | | | | | |
| | | Six Month | | | | | | | | | | | | | | | | |
| | | Period Ending | | | | | | | | | | | | | | | | |
| | | March 31, | | | Years Ended September 30, | |
| | | 2021 | | | 2020 | | | 2019 | | | 2018 | | | 2017 | | | 2016 | |
| PER SHARE OPERATING | | | | | | | | | | | | | | | | | | |
| PERFORMANCE: | | | | | | | | | | | | | | | | | | |
| Net asset value, | | | | | | | | | | | | | | | | | | |
| beginning of period | | $ | 27.69 | | | $ | 31.89 | | | $ | 33.80 | | | $ | 33.59 | | | $ | 30.67 | | | $ | 27.63 | |
| Income from | | | | | | | | | | | | | | | | | | | | | | | | |
| investment operations: | | | | | | | | | | | | | | | | | | | | | | | | |
| Net investment | | | | | | | | | | | | | | | | | | | | | | | | |
income (loss)(1) | | | 0.30 | | | | 0.35 | | | | 0.48 | | | | 0.48 | | | | 0.32 | | | | 0.29 | |
| Net realized and | | | | | | | | | | | | | | | | | | | | | | | | |
| unrealized gain (loss) | | | | | | | | | | | | | | | | | | | | | | | | |
| on investments | | | 6.68 | | | | (3.40 | ) | | | (0.26 | ) | | | 0.28 | | | | 3.72 | | | | 3.27 | |
| Total from | | | | | | | | | | | | | | | | | | | | | | | | |
| investment operations | | | 6.98 | | | | (3.05 | ) | | | 0.22 | | | | 0.76 | | | | 4.04 | | | | 3.56 | |
| Less distributions: | | | | | | | | | | | | | | | | | | | | | | | | |
| Distributions from | | | | | | | | | | | | | | | | | | | | | | | | |
| net investment income | | | — | | | | (1.15 | ) | | | (1.32 | ) | | | (0.10 | ) | | | (0.91 | ) | | | (0.51 | ) |
| Distributions from | | | | | | | | | | | | | | | | | | | | | | | | |
| net realized gains | | | — | | | | — | | | | (0.81 | ) | | | (0.45 | ) | | | (0.21 | ) | | | (0.01 | ) |
| Total from distributions | | | — | | | | (1.15 | ) | | | (2.13 | ) | | | (0.55 | ) | | | (1.12 | ) | | | (0.52 | ) |
| Net asset value, end of period | | $ | 34.67 | | | $ | 27.69 | | | $ | 31.89 | | | $ | 33.80 | | | $ | 33.59 | | | $ | 30.67 | |
| TOTAL RETURN | | | 25.21 | %(2) | | | (10.06 | %) | | | 1.27 | % | | | 2.27 | % | | | 13.66 | % | | | 13.07 | % |
| RATIOS/SUPPLEMENTAL DATA: | | | | | | | | | | | | | | | | | | | | | |
| Net assets, end of | | | | | | | | | | | | | | | | | | | | | | | | |
| period (in 000’s $) | | | 1,125,053 | | | | 1,207,016 | | | | 2,798,739 | | | | 3,267,841 | | | | 5,369,580 | | | | 5,025,742 | |
| Ratio of expenses to | | | | | | | | | | | | | | | | | | | | | | | | |
| average net assets | | | 0.96 | %(3) | | | 0.91 | % | | | 0.90 | % | | | 0.90 | % | | | 0.91 | % | | | 0.94 | % |
| Ratio of net investment income | | | | | | | | | | | | | | | | | | | | | | | | |
| (loss) to average net assets | | | 1.88 | %(3) | | | 1.19 | % | | | 1.55 | % | | | 1.43 | % | | | 1.02 | % | | | 1.01 | % |
| Portfolio turnover rate | | | 16 | %(2)(4) | | | 23 | %(4) | | | 13 | %(4) | | | 21 | %(4) | | | 26 | %(4) | | | 16 | % |
| (1) | Net investment income (loss) per share was calculated using average shares outstanding. |
| (2) | Not annualized. |
| (3) | Annualized. |
| (4) | Portfolio turnover rate is disclosed for the Fund as a whole. |
The accompanying notes to financial statements are an integral part of this statement.
FMI International Fund
FINANCIAL HIGHLIGHTS
(Selected data for each share of the Fund outstanding throughout each period)
Institutional Class
| | | (Unaudited) | | | | | | | | | | | | For the | |
| | | For the | | | | | | | | | | | | Period from | |
| | | Six Month | | | | | | | | | | | | October 31, | |
| | | Period Ending | | | | | | | | | | | | 2016* to | |
| | | March 31, | | | Years Ended September 30, | | | September 30, | |
| | | 2021 | | | 2020 | | | 2019 | | | 2018 | | | 2017 | |
| PER SHARE OPERATING | | | | | | | | | | | | | | | |
| PERFORMANCE: | | | | | | | | | | | | | | | |
| Net asset value, | | | | | | | | | | | | | | | |
| beginning of period | | $ | 27.73 | | | $ | 31.93 | | | $ | 33.86 | | | $ | 33.62 | | | $ | 30.36 | |
| Income from investment operations: | | | | | | | | | | | | | | | | | | | | |
Net investment income (loss)(1) | | | 0.32 | | | | 0.38 | | | | 0.53 | | | | 0.49 | | | | 0.35 | |
| Net realized and unrealized | | | | | | | | | | | | | | | | | | | | |
| gain (loss) on investments | | | 6.70 | | | | (3.39 | ) | | | (0.27 | ) | | | 0.31 | | | | 4.04 | |
| Total from investment operations | | | 7.02 | | | | (3.01 | ) | | | 0.26 | | | | 0.80 | | | | 4.39 | |
| Less distributions: | | | | | | | | | | | | | | | | | | | | |
| Distributions from | | | | | | | | | | | | | | | | | | | | |
| net investment income | | | — | | | | (1.19 | ) | | | (1.38 | ) | | | (0.11 | ) | | | (0.92 | ) |
| Distributions from | | | | | | | | | | | | | | | | | | | | |
| net realized gains | | | — | | | | — | | | | (0.81 | ) | | | (0.45 | ) | | | (0.21 | ) |
| Total from distributions | | | — | | | | (1.19 | ) | | | (2.19 | ) | | | (0.56 | ) | | | (1.13 | ) |
| Net asset value, end of period | | $ | 34.75 | | | $ | 27.73 | | | $ | 31.93 | | | $ | 33.86 | | | $ | 33.62 | |
| TOTAL RETURN | | | 25.32 | %(2) | | | (9.95 | %) | | | 1.42 | % | | | 2.40 | % | | | 14.95 | %(2) |
| RATIOS/SUPPLEMENTAL DATA: | | | | | | | | | | | | | | | | | | | | |
| Net assets, end of | | | | | | | | | | | | | | | | | | | | |
| period (in 000’s $) | | | 2,441,348 | | | | 2,142,615 | | | | 4,480,109 | | | | 4,045,361 | | | | 2,736,673 | |
| Ratio of expenses to | | | | | | | | | | | | | | | | | | | | |
| average net assets | | | 0.81 | %(3) | | | 0.77 | % | | | 0.76 | % | | | 0.76 | % | | | 0.77 | %(3) |
| Ratio of net investment income | | | | | | | | | | | | | | | | | | | | |
| (loss) to average net assets | | | 2.05 | %(3) | | | 1.31 | % | | | 1.69 | % | | | 1.44 | % | | | 1.19 | %(3) |
Portfolio turnover rate(4) | | | 16 | %(2) | | | 23 | % | | | 13 | % | | | 21 | % | | | 26 | %(2) |
| * | Inception date. |
| (1) | Net investment income (loss) per share was calculated using average shares outstanding. |
| (2) | Not annualized. |
| (3) | Annualized. |
| (4) | Portfolio turnover rate is disclosed for the Fund as a whole. |
The accompanying notes to financial statements are an integral part of this statement.
FMI International Fund II – Currency Unhedged
FINANCIAL HIGHLIGHTS
(Selected data for each share of the Fund outstanding throughout each period)
Institutional Class
| | | (Unaudited) | | | | |
| | | For the Six Month | | | For the Period from | |
| | | Period Ending | | | December 31, 2019* to | |
| | | March 31, 2021 | | | September 30, 2020 | |
| PER SHARE OPERATING PERFORMANCE: | | | | | | |
| Net asset value, beginning of period | | $ | 17.24 | | | $ | 20.00 | |
| Income from investment operations: | | | | | | | | |
Net investment income (loss)(1) | | | 0.19 | | | | 0.13 | |
| Net realized and unrealized gain (loss) on investments | | | 4.38 | | | | (2.89 | ) |
| Total from investment operations | | | 4.57 | | | | (2.76 | ) |
| Less distributions: | | | | | | | | |
| Distributions from net investment income | | | (0.18 | ) | | | — | |
| Distributions from net realized gains | | | — | | | | — | |
| Total from distributions | | | (0.18 | ) | | | — | |
| Net asset value, end of period | | $ | 21.63 | | | $ | 17.24 | |
| TOTAL RETURN | | | 26.55 | %(4) | | | (13.80 | %)(4) |
| RATIOS/SUPPLEMENTAL DATA: | | | | | | | | |
| Net assets, end of period (in 000’s $) | | | 69,390 | | | | 47,555 | |
| Ratio of expenses to average net assets: | | | | | | | | |
| Before expense reimbursement | | | 1.19 | %(2)(5) | | | 1.43 | %(5) |
| After expense reimbursement | | | 0.90 | %(3)(5) | | | 0.90 | %(5) |
| Ratio of net investment income (loss) to average net assets: | | | | | | | | |
| Before expense reimbursement | | | 1.64 | %(5) | | | 0.49 | %(5) |
| After expense reimbursement | | | 1.93 | %(5) | | | 1.02 | %(5) |
| Portfolio turnover rate | | | 24 | %(4) | | | 15 | %(4) |
| * | Inception date. |
| (1) | Net investment income (loss) per share was calculated using average shares outstanding. |
| (2) | The expense ratio before reimbursements of expenses excluding interest expense is 1.19% for the six month period ending March 31, 2021. |
| (3) | The expense ratio after reimbursements of expenses excluding interest expense is 0.90% for the six month period ending March 31, 2021 |
| (4) | Not annualized. |
| (5) | Annualized. |
The accompanying notes to financial statements are an integral part of this statement.
FMI Funds, Inc.
NOTES TO FINANCIAL STATEMENTS
March 31, 2021 (Unaudited)
| (1) | Organization — |
| | |
| | The following is a summary of significant accounting policies of the FMI Large Cap Fund, the FMI Common Stock Fund, the FMI International Fund, and the FMI International Fund II – Currency Unhedged (collectively, the “Funds” or, individually, a “Fund”). The FMI Large Cap Fund (the “Large Cap Fund”), the FMI Common Stock Fund (the “Common Stock Fund”), the FMI International Fund (the “International Fund”), and the FMI International Fund II – Currency Unhedged (the “International Currency Unhedged Fund”) are each a series of FMI Funds, Inc. (the “Company”). The Company was incorporated under the laws of Maryland on September 5, 1996. The Large Cap Fund commenced operations on December 31, 2001 and the International Fund commenced operations on December 31, 2010. The Common Stock Fund is the successor to the FMI Common Stock Fund, the sole series of FMI Common Stock Fund, Inc. (the “Predecessor Common Stock Fund”). The Predecessor Common Stock Fund commenced operations on December 18, 1981. The reorganization was effective as of January 31, 2014, and the Common Stock Fund is the accounting survivor of the reorganization. As the accounting survivor of the reorganization, the Common Stock Fund adopted the Financial Statements of the Predecessor Common Stock Fund. The Predecessor Common Stock Fund was incorporated under the laws of Wisconsin on July 29, 1981. The International Currency Unhedged Fund commenced operations on December 31, 2019. Organizational and offering costs, which consist of costs incurred to establish the International Currency Unhedged Fund and enable the Fund to legally do business, including the legal fees incurred in the registration of the Fund, were borne by the Adviser and are not subject to reimbursement by the Fund. |
| | |
| | Effective October 31, 2016, the Large Cap Fund, Common Stock Fund, and International Fund offer two classes of shares (Investor and Institutional). The International Currency Unhedged Fund currently only offers Institutional Class shares. The Institutional Class has the same management fee as the Investor Class and does not have a shareholder servicing plan. A higher investment minimum is required for the Institutional Class than the Investor Class. Each class of shares has exclusive voting rights with respect to matters that affect just that class. Income, expenses (other than expenses attributable to a specific class) and realized and unrealized gains or losses on investments are allocated to each class of shares on its relative net assets. The Board of Directors (the “Board”) may elect to have certain expenses specific to the Investor Class shares or Institutional Class shares be borne solely by the Class to which such expenses are attributable, but any expenses not specifically allocated to the Investor Class shares or Institutional Class shares are generally allocated to each such Class proportionately (after any applicable base fee to be paid by a class of shares of a Fund attributable to such expense) on the basis of the net asset value of that Class in relation to the net asset value of the applicable Fund. |
| | |
| | The Large Cap Fund and the International Currency Unhedged Fund are non-diversified, open-end management investment companies under the Investment Company Act of 1940 (the “Act”), as amended. The Common Stock Fund and the International Fund are diversified open-end management investment companies under the Act. The financial statements are prepared in accordance with accounting principles generally accepted in the United States of America (“GAAP”). The Funds follow the investment company accounting and financial reporting guidance under Financial Accounting Standards Board (“FASB”) Accounting Standards Codification “Financial Services – Investment Companies” Topic 946 (“ASC 946”). The assets and liabilities of each Fund in the Company are segregated and a shareholder’s interest is limited |
FMI Funds, Inc.
NOTES TO FINANCIAL STATEMENTS (Continued)
March 31, 2021 (Unaudited)
| (1) | Organization — (Continued) |
| | |
| | to the Fund in which the shareholder owns shares. The investment objective of the Large Cap Fund is to seek long-term capital appreciation by investing mainly in limited a number of large capitalization value stocks. The investment objective of the Common Stock Fund is to seek long-term capital appreciation by investing mainly in small to medium capitalization value stocks. The investment objective of the International Fund and International Currency Unhedged Fund is to seek capital appreciation by investing mainly in a limited number of large capitalization value stocks of non-U.S. companies. |
| | |
| (2) | Summary of Significant Accounting Policies and Other Information — |
| | (a) | The Funds apply the provisions of the FASB Accounting Standards Codification “Fair Value Measurement” Topic 820 (“ASC 820”), which defines fair value as the price that would be received to sell an asset or paid to transfer a liability (i.e., the “exit price”) in an orderly transaction between market participants at the measurement date. |
| | | |
| | | Each security is valued at the current day last sale price reported by the principal security exchange on which the issue is traded. Securities that are traded on the Nasdaq Markets are valued at the Nasdaq Official Closing Price, or if no sale is reported, the latest bid price. Securities that are traded over-the-counter, including U.S. Treasury securities are valued at the close price, if not close, then at the latest bid price. Bank deposits are valued at acquisition cost which approximates fair value. Unlisted equity securities for which market quotations are readily available are valued at the close price, if not close, then at the most recent bid price. Foreign securities are valued on a basis of quotations from the primary market in which they are traded, and are converted from the local currency into U.S. dollars using exchange rates as of the close of the New York Stock Exchange. For the International Fund and International Currency Unhedged Fund only, options purchased or written by each of the Funds’ are valued at the average of the most recent bid and ask prices. Securities for which quotations are not readily available are valued at fair value as determined by the investment adviser in accordance with procedures approved by the Board. The fair value of a security is the amount which a Fund might reasonably expect to receive upon a current sale. The fair value of a security may differ from the last quoted price and a Fund may not be able to sell a security at the fair value. Market quotations may not be available, for example, if trading in particular securities was halted during the day and not resumed prior to the close of trading on the New York Stock Exchange. The foreign markets in which the International Fund and International Currency Unhedged Fund may invest are sometimes open on days when the New York Stock Exchange is not open and the International Fund and International Currency Unhedged Fund do not calculate their net asset value. For securities that do not trade during New York Stock Exchange hours, fair value determinations are based on analyses of market movements after the close of those securities’ primary markets, and may include reviews of developments in foreign markets, the performance of U.S. securities markets, and the performance of instruments trading in U.S. markets that represent foreign securities and baskets of foreign securities. The Board utilizes a service provided by an independent third party to assist in fair valuation of certain securities for the International Fund and the International Currency Unhedged Fund. As of March 31, 2021, there were no securities that were internally fair valued. |
FMI Funds, Inc.
NOTES TO FINANCIAL STATEMENTS (Continued)
March 31, 2021 (Unaudited)
| (2) | Summary of Significant Accounting Policies and Other Information — (Continued) |
| | In determining fair value, the Funds use various valuation approaches. ASC 820 establishes a fair value hierarchy for inputs used in measuring fair value that maximizes the use of observable inputs and minimizes the use of unobservable inputs by generally requiring that the most observable inputs be used when available. Observable inputs are those that market participants would use in pricing the asset or liability based on market data obtained from sources independent of the Funds. Unobservable inputs reflect the Funds’ assumptions about the inputs market participants would use in pricing the asset or liability developed based on the best information available in the circumstances. The inputs or methodologies used for valuing securities are not necessarily an indication of the risks associated with investing in those securities. Over the counter derivatives such as forward currency contracts may be valued using quantitative models. These models may use pricing curves based on market inputs including current exchange rates or indices. These curves are combined with volatility factors to value the overall positions. The market inputs are generally significant and can be corroborated with observable market data and therefore are classified in level 2. |
| | |
| | The fair value hierarchy is categorized into three levels based on the inputs as follows: |
| | Level 1 — | Valuations based on unadjusted quoted prices in active markets for identical assets. |
| | | |
| | Level 2 — | Valuations based on quoted prices for similar securities or in markets that are not active or for which all significant inputs are observable, either directly or indirectly. |
| | | |
| | Level 3 — | Valuations based on inputs that are unobservable and significant to the overall fair value measurement. |
| | The following table summarizes the Funds’ investments as of March 31, 2021, based on the inputs used to value them: |
| | | | | Large Cap Fund | | | Common Stock Fund | |
| | | | | Investments | | | Investments | |
| | Valuations | | | in Securities | | | in Securities | |
| | Assets: | | | | | | | |
| | Level 1 — | Common Stocks | | $ | 3,292,990,293 | | | $ | 870,852,330 | |
| | | Bank Deposit Account | | | 85,038,114 | | | | 36,404,090 | |
| | | Total Level 1 | | | 3,378,028,407 | | | | 907,256,420 | |
| | Level 2 — | Common Stocks | | | — | | | | — | |
| | | Preferred Stocks | | | — | | | | — | |
| | | Forward Currency Contracts | | | — | | | | — | |
| | | Total Level 2 | | | — | | | | — | |
| | Level 3 — | | | | — | | | | — | |
| | Total Assets | | | 3,378,028,407 | | | | 907,256,420 | |
| | Liabilities: | | | | | | | | |
| | Level 2 — | Forward Currency Contracts | | | — | | | | — | |
| | Total | | | $ | 3,378,028,407 | | | $ | 907,256,420 | |
FMI Funds, Inc.
NOTES TO FINANCIAL STATEMENTS (Continued)
March 31, 2021 (Unaudited)
| (2) | Summary of Significant Accounting Policies and Other Information — (Continued) |
| | | | | | | | | | | International | |
| | | | | International | | | International | | | Currency Unhedged | |
| | | | | Fund | | | Fund | | | Fund | |
| | | | | Investments | | | Other Financial | | | Investments | |
| | Valuations | | | in Securities | | | Instruments* | | | in Securities | |
| | Assets: | | | | | | | | | | |
| | Level 1 — | Common Stocks | | $ | 397,908,615 | | | $ | — | | | $ | 7,509,125 | |
| | | Bank Deposit Account | | | 56,869,417 | | | | — | | | | 2,669,526 | |
| | | Total Level 1 | | | 454,778,032 | | | | — | | | | 10,178,651 | |
| | Level 2 — | Common Stocks | | | 2,659,738,137 | | | | — | | | | 51,427,709 | |
| | | Preferred Stocks | | | 375,929,141 | | | | — | | | | 7,468,397 | |
| | | Forward Currency Contracts | | | — | | | | 64,615,750 | | | | — | |
| | | Total Level 2 | | | 3,035,667,278 | | | | 64,615,750 | | | | 58,896,106 | |
| | Level 3 — | | | | — | | | | — | | | | — | |
| | Total Assets | | | 3,490,445,310 | | | | 64,615,750 | | | | 69,074,757 | |
| | Liabilities: | | | | | | | | | | | | |
| | Level 2 — | Forward Currency Contracts | | | — | | | | (8,924,027 | ) | | | — | |
| | Total | | | $ | 3,490,445,310 | | | $ | 55,691,723 | | | $ | 69,074,757 | |
| | * | Other financial instruments are derivative instruments, specifically forward currency contracts, which are valued at the unrealized appreciation/(depreciation) on the instrument. |
| | | See the Schedules of Investments for investments detailed by industry classifications. |
| | | |
| | (b) | Net realized gains and losses on sales of securities are computed on the identified cost basis. For financial reporting purposes, investment transactions are recorded on the trade date. |
| | | |
| | (c) | Investment securities and other assets and liabilities denominated in foreign currencies are translated into U.S. dollar amounts at the date of valuation. Purchases and sales of investment securities and income and expense items denominated in foreign currencies are translated into U.S. dollar amounts on the respective date of such transactions. The Company does not isolate that portion of the results of operations resulting from changes in foreign exchange rates on investments from the fluctuations arising from changes in market prices of securities held. Such fluctuations are included with the net realized and unrealized gain or loss from investments. Reported net realized foreign exchange gains or losses arise from sales of foreign currencies, currency gains or losses realized between the trade and settlement dates on securities transactions, and the difference between the amounts of dividends, interest, and foreign withholding taxes recorded on the Company’s books and the U.S. dollar equivalent of the amounts actually received or paid. Net unrealized foreign exchange gains and losses arise from changes in the fair values of assets and liabilities, other than investments in securities at fiscal period-end, resulting from changes in exchange rates. |
| | | |
| | (d) | Dividend income is recorded on the ex-dividend date. Interest income is recorded on an accrual basis. The Funds record the amortization and accretion of discounts and premiums on securities purchased using the effective interest method in accordance with GAAP. Withholding taxes on foreign dividends have been provided for in accordance with the Funds’ understanding of the applicable country’s tax rules and regulations. |
FMI Funds, Inc.
NOTES TO FINANCIAL STATEMENTS (Continued)
March 31, 2021 (Unaudited)
| (2) | Summary of Significant Accounting Policies and Other Information — (Continued) |
| | (e) | The International Fund may enter into forward currency contracts in order to hedge its exposure to changes in foreign currency rates on its foreign portfolio holdings or to hedge certain purchase and sale commitments denominated in foreign currencies. The International Currency Unhedged Fund normally does not seek to reduce currency risk by hedging its perceived foreign currency exposure back into the U.S. dollar and will generally not be exposed to currency fluctuations. However, the investment adviser reserves the right to temporarily hedge all or a portion of the International Currency Unhedged Fund’s currency exposure. A forward currency contract is a commitment to purchase or sell a foreign currency at a future date at a negotiated rate. These contracts are valued daily and the asset or liability therein represents unrealized gain or loss on the contracts as measured by the difference between the forward foreign exchange rates at the dates of entry into the contracts and the forward rates at the reporting date. On a quarterly average there were eleven forward currency contracts with an average quarterly value of $2,719,717,156 outstanding during the six month period ended March 31, 2021. These contracts are not subject to master netting agreements. For Non-Deliverable Forward Currency Contracts (“Contract”) the Fund posts collateral, in the form of cash or cash equivalents to a segregated account at the custodian when the Contract is in an unrealized loss position. When the Contract is in an unrealized gain position, the counterparty posts collateral to a segregated account at the custodian. |
| | | |
| | | The fair value of the forward currency contracts as of March 31, 2021, is included in the following location on the Statements of Assets and Liabilities for the International Fund: |
| | | | Fair Value of | | Fair Value of |
| | | | Asset Forward | | (Liability) Forward |
| | | Location | Currency Contracts | Location | Currency Contracts |
| | Forward currency | Unrealized | $64,615,750 | Unrealized | $(8,924,027) |
| | contracts | appreciation on | | depreciation on | |
| | | forward currency | | forward currency | |
| | | contracts | | contracts | |
| | Realized and unrealized gains and losses on forward currency contracts entered into during the six month period ending March 31, 2021, are recorded in the following location on the Statements of Operations for the International Fund: |
| | | | Realized | | Unrealized |
| | | Location | Gain (Loss) | Location | Appreciation |
| | Forward currency | Net realized | $(154,686,403) | Net change in | $113,576,402 |
| | contracts | gain (loss) on | | unrealized appreciation/ | |
| | | forward currency | | depreciation on | |
| | | contracts | | forward currency | |
| | | | | contracts | |
| | | These instruments involve market risk, credit risk, or both kinds of risks, in excess of the amount recognized on the Statements of Assets and Liabilities for the International Fund. Risks arise from the possible inability of counterparties to meet the terms of their contracts and from movement in currency and securities values and interest rates. |
| | | |
| | (f) | The preparation of financial statements in conformity with GAAP requires management to make estimates and assumptions that affect the reported amounts of assets and liabilities |
FMI Funds, Inc.
NOTES TO FINANCIAL STATEMENTS (Continued)
March 31, 2021 (Unaudited)
| (2) | Summary of Significant Accounting Policies and Other Information — (Continued) |
| | | and disclosure of contingent assets and liabilities at the date of the financial statements and the reported amounts of income and expenses during the reporting period. Actual results could differ from these estimates. |
| | | |
| | (g) | The Funds may own certain securities that are restricted. Restricted securities include Section 4(a)(2) commercial paper or securities issued in a private placement. The Funds did not hold any restricted securities as of March 31, 2021. |
| | | |
| | (h) | No provision has been made for Federal income taxes since the Funds have elected to be taxed as “regulated investment companies.” The Funds intend to distribute substantially all net investment company taxable income and net capital gains to their respective shareholders and otherwise comply with the provisions of the Internal Revenue Code applicable to regulated investment companies. |
| | | |
| | (i) | The Funds have reviewed all open tax years and major jurisdictions, which include Federal and the state of Maryland for the Funds and concluded that there are no significant uncertain tax positions that would require recognition in the financial statements. The Funds recognize interest and penalties, if any, related to unrecognized tax benefits on certain tax benefits on uncertain tax positions as income tax expense in the Statements of Operations. During the six month period ending March 31, 2021, the Funds did not incur any interest or penalties. Open tax years are those that are open for exam by taxing authorities and, as of September 30, 2020, open Federal tax years include the prior four fiscal tax years ended September 30, 2020. The Funds have no examinations in progress and are also not aware of any tax positions for which it is reasonably possible that the total amounts of unrecognized tax benefits will significantly change in the next twelve months. |
| | | |
| | (j) | Net investment income and net realized gains, if any, are distributed to shareholders at least annually. Distributions to shareholders are recorded on the ex-dividend date. On December 18, 2020, the following distributions were declared and paid to shareholders of records of the respective Funds on December 17, 2020: |
| | | | | | | | | | | | | International | |
| | | | Large | | | Common | | | International | | | Currency | |
| | | | Cap Fund | | | Stock Fund | | | Fund | | | Unhedged Fund | |
| | Net Investment Income (Investor Class) | | $ | 22,553,728 | | | $ | 3,085,944 | | | $ | 0.00 | | | $ | N/A | |
| | Per Share Amount (Investor Class) | | $ | 0.30347864 | | | $ | 0.21025318 | | | $ | 0.00000000 | | | $ | N/A | |
| | Net Investment Income (Institutional Class) | | $ | 28,685,020 | | | $ | 3,488,077 | | | $ | 0.00 | | | $ | 478,518 | |
| | Per Share Amount (Institutional Class) | | $ | 0.33423844 | | | $ | 0.23387644 | | | $ | 0.00000000 | | | $ | 0.17553554 | |
| | Short-Term Realized Gain (Investor Class) | | $ | 174,646 | | | $ | 0.00 | | | $ | 0.00 | | | $ | N/A | |
| | Per Share Amount (Investor Class) | | $ | 0.00235 | | | $ | 0.00000 | | | $ | 0.00000 | | | $ | N/A | |
| | Short-Term Realized Gain (Institutional Fund) | | $ | 201,682 | | | $ | 0.00 | | | $ | 0.00 | | | $ | 0.00 | |
| | Per Share Amount (Institutional Amount) | | $ | 0.00235 | | | $ | 0.00000 | | | $ | 0.00000 | | | $ | 0.00000 | |
| | Long-Term Realized Gain (Investor Class) | | $ | 144,807,357 | | | $ | 0.00 | | | $ | 0.00 | | | $ | N/A | |
| | Per Share Amount (Investor Class) | | $ | 1.94850 | | | $ | 0.00000 | | | $ | 0.00000 | | | $ | N/A | |
| | Long-Term Realized Gain (Institutional Fund) | | $ | 167,224,221 | | | $ | 0.00 | | | $ | 0.00 | | | $ | 0.00 | |
| | Per Share Amount (Institutional Amount) | | $ | 1.94850 | | | $ | 0.00000 | | | $ | 0.00000 | | | $ | 0.00000 | |
| | (k) | Common Company expenses are typically allocated evenly between the Funds of the Company, or by other equitable means. |
FMI Funds, Inc.
NOTES TO FINANCIAL STATEMENTS (Continued)
March 31, 2021 (Unaudited)
| (3) | Investment Adviser and Advisory Agreement and Transactions With Related Parties — |
| | |
| | The Funds each have an investment advisory agreement with Fiduciary Management, Inc. (“FMI” or the “Adviser”), with whom certain officers and directors of the Funds are affiliated, to serve as investment adviser and manager. |
| | |
| | Under the terms of the current advisory agreements, effective as of December 31, 2019, the Adviser is entitled to receive a fee. The fee is computed daily and payable at the end of each month. The following annual percentages of the International Currency Unhedged Fund’s average daily net assets are used: |
| | • | 0.75% of the assets from $0 – $2.5 billion; 0.70% of the assets from $2.5 – $5.0 billion; 0.65% of the assets from $5.0 – $10.0 billion; and 0.60% of the assets over $10.0 billion. |
| | Under the terms of the current advisory agreements, effective as of January 1, 2019, the Adviser is entitled to receive a fee. The fee is computed daily and payable at the end of each month. The following annual percentages of each Fund’s average daily net assets are used: |
| | • | Large Cap Fund: 0.65% of the assets from $0 – $2.5 billion; 0.60% of the assets from $2.5 – $5.0 billion; and 0.55% of the assets over $5.0 billion. |
| | | |
| | • | Common Stock Fund: 0.85% of the assets from $0 – $500 million; 0.80% of the assets from $500 million – $1.0 billion; 0.75% of the assets over $1.0 billion. |
| | | |
| | • | International Fund: 0.75% of the assets from $0 – $2.5 billion; 0.70% of the assets from $2.5 – $5.0 billion; 0.65% of the assets from $5.0 – $10.0 billion; and 0.60% of the assets over $10.0 billion. |
| | The Funds are responsible for paying their proportionate share of the compensation, benefits and expenses of the Funds’ Chief Compliance Officer. For administrative convenience, FMI initially makes these payments and is later reimbursed by the Funds. |
| | |
| | Under the respective advisory agreement or operating expenses limitation agreements, FMI will reimburse the Funds for expenses (excluding federal, state and local taxes, interest, brokerage commissions and extraordinary items) as follows: |
| | | Investor Class | Institutional Class |
| | | Expense Cap | Expense Cap |
| | Large Cap Fund | 1.20% | 1.10% |
| | Common Stock Fund | 1.30% | 1.20% |
| | International Fund | 1.75% | 1.65% |
| | International Currency Unhedged Fund | 1.75% | 1.65% |
| | For the six month period ending March 31, 2021, there were no contractual or voluntary reimbursements required for the Large Cap Fund, Common Stock Fund or International Fund. For the International Currency Unhedged Fund, there is no contractual reimbursement and the voluntary reimbursement is $80,497. The voluntary 0.90% expense cap/reimbursement agreement for the International Currency Unhedged Fund will continue in effect until January 31, 2022, with successive renewal terms of one year unless terminated by the Adviser prior to any such renewal. The Adviser is entitled to recoup such amounts for a one year period from the date the Adviser reduced its compensation and/or assumed expenses for the International Currency Unhedged Fund. |
FMI Funds, Inc.
NOTES TO FINANCIAL STATEMENTS (Continued)
March 31, 2021 (Unaudited)
| (3) | Investment Adviser and Advisory Agreement and Transactions With Related Parties — (Continued) |
| | |
| | The Large Cap Fund, the International Fund and the International Currency Unhedged Fund have each entered into a Distribution Plan (the “Plan”), pursuant to Rule 12b-1 under the Act. Each Plan, if implemented, provides that the applicable Fund may incur certain costs which may not exceed the lesser of a monthly amount equal to 0.25% of such Fund’s daily net assets or the actual distribution costs incurred during the year. Amounts payable under each Plan would be paid monthly for any activities or expenses primarily intended to result in the sale of shares of such Fund. For the six month period ending March 31, 2021, no such expenses were charged to the shareholders of any Fund as the Funds had not implemented the Plan. |
| | |
| | Under the Funds’ organizational documents, each director, officer, employee or other agent of any Fund (including the Funds’ investment manager) is indemnified, to the extent permitted by the Act, against certain liabilities that may arise out of performance of their duties to the Funds. Additionally, in the normal course of business, the Funds enter into contracts that contain a variety of indemnification clauses. The Funds’ maximum exposure under these arrangements is unknown as this would involve future claims that may be made against such Fund that have not yet occurred. However, the Funds have not had prior claims or losses pursuant to these contracts and believe the risk of loss to be remote. |
| | |
| | At March 31, 2021, no person is deemed to “control” a Fund, as that term is defined in the Act, because the Funds do not know of any person who owns beneficially or through controlled companies more than 25% of a Fund’s Investor Class and Institutional Class shares, on a combined basis, or who acknowledges the existence of control. |
| | |
| (4) | Investments in Affiliated Issuers — |
| | |
| | An issuer in which a Fund’s holdings represent 5% or more of the outstanding voting securities of an issuer is an “affiliated” issuer as defined in the 1940 Act. For the six month period ending March 31, 2021 there were no Fund’s with an investment in a security of an affiliated issuer. |
| | |
| (5) | Shareholder Servicing Plan — |
| | |
| | The Funds have adopted a Shareholder Servicing Plan pursuant to which Investor Class shares, (if available), may pay financial intermediaries for assets maintained in an omnibus account at an annual rate of up to 0.15% of the average daily net assets, or an annual per account rate approved by the Board. The Board may also authorize the Funds to pay for shareholder services outside of the plan. |
| | |
| | For the six month period ending March 31, 2021, shareholder servicing fees incurred are disclosed on the Statements of Operations. |
| | |
| (6) | Loan Agreements — |
| | |
| | U.S. Bank, N.A. (the “Bank”) has made available to the Company a $650,000,000 umbrella credit facility, pursuant to the loan agreement (the “Agreement”) effective May 29, 2020 for the FMI Funds, Inc. (consisting of Large Cap Fund, Common Stock Fund, International Fund and International Currency Unhedged Fund) for the purposes of having cash available to satisfy redemption requests and is subject to certain restrictions and covenants. Principal is due not more than 45 days after the date of the loan. Amounts under the credit facility bear interest at a |
FMI Funds, Inc.
NOTES TO FINANCIAL STATEMENTS (Continued)
March 31, 2021 (Unaudited)
| (6) | Loan Agreements — (Continued) |
| | |
| | rate per annum equal to the Bank’s current prime rate minus one percent on the amount borrowed. Advances will be collateralized by securities owned by the borrowing Fund. The Agreement is subject to renewal on May 28, 2021. During the six month period ending March 31, 2021, the Common Stock Fund is the only Fund that did not borrow against the loan agreement. The Large Cap Fund, International Fund and International Currency Unhedged Fund borrowed, at a rate of 2.25%, against the Agreement as follows: |
| | | | Amount | | | | | | | | | | | | | |
| | | | Average | | | Outstanding as | | | Interest | | | Maximum | | | Maximum | |
| | | | Borrowings | | | of March 31, 2021 | | | Expense | | | Borrowing | | | Borrowing Date | |
| | Large Cap Fund | | $ | 1,901,121 | | | $ | — | | | $ | 21,625 | | | $ | 128,287,000 | | | 11/12/2020 | |
| | International Fund | | | 174,681 | | | | — | | | | 1,987 | | | | 7,948,000 | | | 01/15/2021 | |
| | International Currency | | | | | | | | | | | | | | | | | | | |
| | Unhedged Fund | | | 9,632 | | | | — | | | | 110 | | | | 881,000 | | | 10/28/2020 | |
| (7) | Investment Transactions — |
| | |
| | For the six month period ending March 31, 2021, purchases and sales of investment securities (excluding short-term investments) were as follows: |
| | | | | | | | | | | | | International | |
| | | | | | | | | | | | | Currency | |
| | | | Large Cap Fund | | | Common Stock Fund | | | International Fund | | | Unhedged Fund | |
| | Purchases | | $ | 302,479,491 | | | $ | 98,559,219 | | | $ | 541,298,642 | | | $ | 22,036,020 | |
| | Sales | | | 1,044,080,607 | | | | 156,091,065 | | | | 1,209,640,680 | | | | 12,610,351 | |
| (8) | Income Tax Information — |
| | |
| | The following information for the Funds is presented on an income tax basis as of September 30, 2020: |
| | | | | | | | | | | | | Net Unrealized | |
| | | | | | | Gross | | | Gross | | | Appreciation | |
| | | | Cost of | | | Unrealized | | | Unrealized | | | (Depreciation) | |
| | | | Investments | | | Appreciation(1) | | | Depreciation(1) | | | on Investments(1) | |
| | Large Cap Fund | | $ | 2,467,745,093 | | | $ | 1,014,299,476 | | | $ | (81,663,963 | ) | | $ | 932,635,513 | |
| | Common Stock Fund | | | 591,307,001 | | | | 145,010,312 | | | | (45,470,866 | ) | | | 99,539,446 | |
| | International Fund | | | 3,303,132,037 | | | | 675,998,282 | | | | (575,672,256 | ) | | | 100,326,026 | |
| | International Currency Unhedged Fund | | | 49,052,713 | | | | 2,586,374 | | | | (4,202,768 | ) | | | (1,616,394 | ) |
| | | | | | | | | | | | | | | | | | |
| | (1) Represents amounts of investments in securities, forward currency contracts and foreign currency transactions. |
FMI Funds, Inc.
NOTES TO FINANCIAL STATEMENTS (Continued)
March 31, 2021 (Unaudited)
| (8) | Income Tax Information — (Continued) |
| | |
| | The difference between the cost amounts for financial statement and federal income tax purposes is due primarily to timing differences in recognizing certain gains and losses on security transactions. The International Fund and International Currency Unhedged Fund are the only Funds with temporary mark to market differences. The components of accumulated earnings (deficit) on a tax-basis are as follows: |
| | | | | | | | | | | | | | | | Total | |
| | | | Net | | | | | | | | | | | | Distributable | |
| | | | Unrealized | | | Undistributed | | | Undistributed | | | Other | | | Earnings/ | |
| | | | Appreciation | | | Ordinary | | | Long-Term | | | Accumulated | | | (Accumulated | |
| | | | (Depreciation) | | | Income | | | Capital Gains | | | (Losses) | | | Losses) | |
| | Large Cap Fund | | $ | 932,635,513 | | | $ | 44,297,775 | | | $ | 288,197,128 | | | $ | — | | | $ | 1,265,130,416 | |
| | Common Stock Fund | | | 99,539,446 | | | | 6,574,021 | | | | — | | | | (19,439,827 | ) | | | 86,673,640 | |
| | International Fund | | | 100,326,026 | | | | — | | | | — | | | | (634,736,173 | ) | | | (534,410,147 | ) |
| | International Currency | | | | | | | | | | | | | | | | | | | | |
| | Unhedged Fund | | | (1,616,394 | ) | | | 234,004 | | | | — | | | | (1,065,281 | ) | | | (2,447,671 | ) |
| | The other accumulated losses above are all capital loss carryovers, which may be used indefinitely to offset future gains as follows: |
| | | | Short-Term Capital | | | Long-Term Capital | | | Total Capital | |
| | | | Loss Carryovers | | | Loss Carryovers | | | Loss Carryovers | |
| | Large Cap Fund | | $ | — | | | $ | — | | | $ | — | |
| | Common Stock Fund | | | 16,540,493 | | | | 2,899,334 | | | | 19,439,827 | |
| | International Fund | | | 53,953,841 | | | | 580,782,332 | | | | 634,736,173 | |
| | International Currency | | | | | | | | | | | | |
| | Unhedged Fund | | | 1,065,281 | | | | — | | | | 1,065,281 | |
| | The tax components of dividends paid during the six month period ending March 31, 2021 (Unaudited) and the year ended September 30, 2020 are as follows: |
| | | | For the Six Month Period Ending | | | | | | | |
| | | | March 31, 2021 (Unaudited) | | | September 30, 2020 | |
| | | | Ordinary | | | Long-Term | | | Ordinary | | | Long-Term | |
| | | | Income | | | Capital Gains | | | Income | | | Capital Gains | |
| | | | Distributions* | | | Distributions | | | Distributions* | | | Distributions | |
| | Large Cap Fund | | $ | 51,615,076 | | | $ | 312,031,578 | | | $ | 43,982,413 | | | $ | 328,226,746 | |
| | Common Stock Fund | | | 6,574,021 | | | | — | | | | 4,710,556 | | | | 44,341,109 | |
| | International Fund | | | — | | | | — | | | | 264,896,118 | | | | — | |
| | International Fund | | | | | | | | | | | | | | | | |
| | Currency Unhedged | | | 478,518 | | | | — | | | | — | | | | — | |
| | | | | | | | | | | | | | | | | | |
| | * For federal income tax purposes, distributions on short-term capital gains are treated as ordinary income distributions. |
FMI Funds, Inc.
NOTES TO FINANCIAL STATEMENTS (Continued)
March 31, 2021 (Unaudited)
| (9) | Fund Share Transactions — |
| | | | For the Six Month Period Ending | | | Year Ended | |
| | | | March 31, 2021 (Unaudited) | | | September 30, 2020 | |
| | Large Cap Fund | | Shares | | | Amount | | | Shares | | | Amount | |
| | Sales | | | | | | | | | | | | |
| | Investor Class | | | 2,832,291 | | | $ | 56,578,575 | | | | 6,949,510 | | | $ | 122,473,700 | |
| | Institutional Class | | | 9,259,019 | | | | 184,790,021 | | | | 27,651,702 | | | | 494,035,656 | |
| | Reinvestment of dividends | | | | | | | | | | | | | | | | |
| | and distributions | | | | | | | | | | | | | | | | |
| | Investor Class | | | 8,627,384 | | | | 166,077,149 | | | | 8,295,454 | | | | 162,673,843 | |
| | Institutional Class | | | 10,113,907 | | | | 194,288,146 | | | | 10,281,091 | | | | 201,200,945 | |
| | Redemptions | | | | | | | | | | | | | | | | |
| | Investor Class | | | (15,788,518 | ) | | | (314,106,599 | ) | | | (52,825,286 | ) | | | (948,242,497 | ) |
| | Institutional Class | | | (32,690,245 | ) | | | (655,478,694 | ) | | | (67,357,706 | ) | | | (1,177,887,115 | ) |
| | Total Investor Class | | | (4,328,843 | ) | | | (91,450,875 | ) | | | (37,580,322 | ) | | | (663,094,954 | ) |
| | Total Institutional Class | | | (13,317,319 | ) | | | (276,400,527 | ) | | | (29,424,913 | ) | | | (482,650,514 | ) |
| | Net increase (decrease) | | | (17,646,162 | ) | | $ | (367,851,402 | ) | | | (67,005,235 | ) | | $ | (1,145,745,468 | ) |
| | | | | | | | | | | | | | | | | | |
| | | | For the Six Month Period Ending | | | Year Ended | |
| | | | March 31, 2021 (Unaudited) | | | September 30, 2020 | |
| | Common Stock Fund | | Shares | | | Amount | | | Shares | | | Amount | |
| | Sales | | | | | | | | | | | | | | | | |
| | Investor Class | | | 746,929 | | | $ | 20,056,889 | | | | 2,116,906 | | | $ | 48,600,753 | |
| | Institutional Class | | | 1,815,137 | | | | 50,609,300 | | | | 7,136,020 | | | | 163,844,506 | |
| | Reinvestment of dividends | | | | | | | | | | | | | | | | |
| | and distributions | | | | | | | | | | | | | | | | |
| | Investor Class | | | 109,266 | | | | 3,009,192 | | | | 922,566 | | | | 24,078,967 | |
| | Institutional Class | | | 125,236 | | | | 3,451,515 | | | | 899,124 | | | | 23,476,124 | |
| | Redemptions | | | | | | | | | | | | | | | | |
| | Investor Class | | | (2,550,607 | ) | | | (69,071,756 | ) | | | (7,568,853 | ) | | | (172,591,759 | ) |
| | Institutional Class | | | (2,043,784 | ) | | | (54,162,419 | ) | | | (9,526,567 | ) | | | (198,717,975 | ) |
| | Total Investor Class | | | (1,694,412 | ) | | | (46,005,675 | ) | | | (4,529,381 | ) | | | (99,912,039 | ) |
| | Total Institutional Class | | | (103,411 | ) | | | (101,604 | ) | | | (1,491,423 | ) | | | (11,397,345 | ) |
| | Net increase (decrease) | | | (1,797,823 | ) | | $ | (46,107,279 | ) | | | (6,020,804 | ) | | $ | (111,309,384 | ) |
FMI Funds, Inc.
NOTES TO FINANCIAL STATEMENTS (Continued)
March 31, 2021 (Unaudited)
| (9) | Fund Share Transactions — (Continued) |
| | | | For the Six Month Period Ending | | | Year Ended | |
| | | | March 31, 2021 (Unaudited) | | | September 30, 2020 | |
| | International Fund | | Shares | | | Amount | | | Shares | | | Amount | |
| | Sales | | | | | | | | | | | | |
| | Investor Class | | | 1,069,735 | | | $ | 34,392,730 | | | | 6,775,232 | | | $ | 198,701,774 | |
| | Institutional Class | | | 8,204,455 | | | | 263,230,092 | | | | 34,097,366 | | | | 963,338,176 | |
| | Reinvestment of dividends | | | | | | | | | | | | | | | | |
| | and distributions | | | | | | | | | | | | | | | | |
| | Investor Class | | | — | | | | — | | | | 2,958,802 | | | | 95,036,724 | |
| | Institutional Class | | | — | | | | — | | | | 4,954,564 | | | | 159,239,678 | |
| | Redemptions | | | | | | | | | | | | | | | | |
| | Investor Class | | | (12,211,635 | ) | | | (385,276,624 | ) | | | (53,901,852 | ) | | | (1,457,347,271 | ) |
| | Institutional Class | | | (15,212,670 | ) | | | (475,874,222 | ) | | | (102,096,549 | ) | | | (2,720,572,122 | ) |
| | Total Investor Class | | | (11,141,900 | ) | | | (350,883,894 | ) | | | (44,167,818 | ) | | | (1,163,608,773 | ) |
| | Total Institutional Class | | | (7,008,215 | ) | | | (212,644,130 | ) | | | (63,044,619 | ) | | | (1,597,994,268 | ) |
| | Net increase (decrease) | | | (18,150,115 | ) | | $ | (563,528,024 | ) | | | (107,212,437 | ) | | $ | (2,761,603,041 | ) |
| | | | | | | | | | | | | | | | | | |
| | | | | | | | | | | | For the Period | |
| | | | For the Six Month Period Ending | | | December 31, 2019 | |
| | International Currency | | March 31, 2021 (Unaudited) | | | to September 30, 2020 | |
| | Unhedged Fund | | Shares | | | Amount | | | Shares | | | Amount | |
| | Sales | | | | | | | | | | | | | | | | |
| | Institutional Class | | | 604,935 | | | $ | 12,723,532 | | | | 2,828,036 | | | $ | 51,142,790 | |
| | Reinvestment of dividends | | | | | | | | | | | | | | | | |
| | and distributions | | | | | | | | | | | | | | | | |
| | Institutional Class | | | 21,853 | | | | 444,942 | | | | — | | | | — | |
| | Redemptions | | | | | | | | | | | | | | | | |
| | Institutional Class | | | (176,918 | ) | | | (3,200,371 | ) | | | (70,306 | ) | | | (1,140,345 | ) |
| | Total Institutional Class | | | 449,870 | | | | 9,968,103 | | | | 2,757,730 | | | | 50,002,445 | |
| | Net increase (decrease) | | | 449,870 | | | $ | 9,968,103 | | | | 2,757,730 | | | $ | 50,002,445 | |
| (10) | Subsequent Events — |
| | |
| | Management has evaluated related events and transactions that occurred subsequent to March 31, 2021, through the date of issuance of the Funds’ financial statements and has determined there are no subsequent events or transactions. |
FMI Funds, Inc.
ADDITIONAL INFORMATION (Unaudited)
For additional information about the Directors and Officers or for a description of the policies and procedures that the Funds use to determine how to vote proxies relating to portfolio securities, please review the Statement of Additional Information. You may call (800) 811-5311 and request a Statement of Additional Information, and it will be mailed to you free of charge. The Statement of Additional Information is also available on the website of the Securities and Exchange Commission (the “Commission”) at http://www.sec.gov. Information on how each of the Funds voted proxies relating to portfolio securities during the most recent 12-month period ended June 30 is available on the Funds’ website at http://www.fmifunds.com or the website of the Commission no later than August 31 for the prior 12 months ended June 30. The Funds file their complete schedules of portfolio holdings with the Commission for the first and third quarters of each fiscal year as exhibits to their reports on Form N-PORT. The Funds’ Form N-PORT reports are available on the Commission’s website provided above.
FMI Funds, Inc.
EXPENSE EXAMPLE (Unaudited)
As a shareholder of the FMI Funds you incur ongoing costs, including management fees and other Fund expenses. You do not incur transaction costs such as sales charges (loads) on purchase payments, reinvested dividends, or other distributions; redemption fees; and exchange fees because the Funds do not charge these fees. This example is intended to help you understand your ongoing costs (in dollars) of investing in each Fund and to compare these costs with the ongoing costs of investing in other mutual funds. The example is based on an investment of $1,000 invested at the beginning of the period and held for the entire period from October 1, 2020 through March 31, 2021.
Actual Expenses
The table below provides information about actual account values and actual expenses. You may use the information in these lines, together with the amount you invested, to estimate the expenses that you paid over the period. Simply divide your account value by $1,000 (for example, an $8,600 account value divided by $1,000 = 8.6), then multiply the result by the number in the line under the heading entitled “Actual Expenses Paid During Period” to estimate the expenses you paid on your account during this period.
In addition to the costs highlighted and described below, the only Fund transaction costs you might currently incur would be wire fees ($15 per wire), if you choose to have proceeds from a redemption wired to your bank account instead of receiving a check. Additionally, U.S. Bank charges an annual processing fee ($15) if you maintain an IRA account with the Fund. To determine your total costs of investing in a Fund, you would need to add any applicable wire or IRA processing fees you’ve incurred during the period to the costs provided in the example at the end of this article.
Hypothetical Example for Comparison Purposes
The table below provides information about hypothetical account values and hypothetical expenses based on each Fund’s actual expense ratio and an assumed rate of return of 5% per year before expenses, which is not the Fund’s actual return. The hypothetical account values and expenses may not be used to estimate the actual ending account balance or expenses you paid for the period. You may use this information to compare the ongoing costs of investing in a Fund and other funds. To do so, compare this 5% hypothetical example with the 5% hypothetical examples that appear in the shareholder reports of the other funds.
Please note that the expenses shown in the table are meant to highlight your ongoing costs only and do not reflect any transactional costs, such as sales charges (loads), redemption fees or exchange fees. Therefore, the hypothetical line of the table is useful in comparing ongoing costs only and will not help you determine the relative total costs of owning different funds. In addition, if these transactional costs were included, your costs would have been higher.
FMI Funds, Inc.
EXPENSE EXAMPLE (Unaudited) (Continued)
| | | FMI | | | FMI | | | FMI | | | FMI International | |
| | | Large Cap | | | Common | | | International | | | Fund II – Currency | |
| | | Fund | | | Stock Fund | | | Fund | | | Unhedged | |
| Investor | | | | | | | | | | | | |
| Actual Beginning | | | | | | | | | | | | |
| Account Value 10/01/20 | | $ | 1,000.00 | | | $ | 1,000.00 | | | $ | 1,000.00 | | | $ | — | |
| Actual Ending | | | | | | | | | | | | | | | | |
| Account Value 3/31/21 | | $ | 1,228.20 | | | $ | 1,405.30 | | | $ | 1,252.10 | | | $ | — | |
| Actual Expenses Paid | | | | | | | | | | | | | | | | |
| During Period* 10/01/20-3/31/21 | | $ | 4.56 | | | $ | 6.06 | | | $ | 5.39 | | | $ | — | |
| Hypothetical Beginning | | | | | | | | | | | | | | | | |
| Account Value 10/01/20 | | $ | 1,000.00 | | | $ | 1,000.00 | | | $ | 1,000.00 | | | $ | — | |
| Hypothetical Ending | | | | | | | | | | | | | | | | |
| Account Value 3/31/21 | | $ | 1,020.84 | | | $ | 1,019.90 | | | $ | 1,020.14 | | | $ | — | |
| Hypothetical Expenses Paid | | | | | | | | | | | | | | | | |
| During Period* 10/01/20-3/31/21 | | $ | 4.13 | | | $ | 5.09 | | | $ | 4.84 | | | $ | — | |
| Annualized Expense Ratio* | | | 0.82% |
| | | 1.01% |
| | | 0.96% |
| | | — | |
| | | | | | | | | | | | | | | | | |
| Institutional | | | | | | | | | | | | | | | | |
| Actual Beginning | | | | | | | | | | | | | | | | |
| Account Value 10/01/20 | | $ | 1,000.00 | | | $ | 1,000.00 | | | $ | 1,000.00 | | | $ | 1,000.00 | |
| Actual Ending | | | | | | | | | | | | | | | | |
| Account Value 3/31/21 | | $ | 1,229.10 | | | $ | 1,405.90 | | | $ | 1,253.20 | | | $ | 1,265.50 | |
| Actual Expenses Paid | | | | | | | | | | | | | | | | |
| During Period* 10/01/20-3/31/21 | | $ | 3.83 | | | $ | 5.40 | | | $ | 4.55 | | | $ | 5.08 | |
| Hypothetical Beginning | | | | | | | | | | | | | | | | |
| Account Value 10/01/20 | | $ | 1,000.00 | | | $ | 1,000.00 | | | $ | 1,000.00 | | | $ | 1,000.00 | |
| Hypothetical Ending | | | | | | | | | | | | | | | | |
| Account Value 3/31/21 | | $ | 1,021.49 | | | $ | 1,020.44 | | | $ | 1,020.89 | | | $ | 1,020.44 | |
| Hypothetical Expenses Paid | | | | | | | | | | | | | | | | |
| During Period* 10/01/20-3/31/21 | | $ | 3.48 | | | $ | 4.53 | | | $ | 4.08 | | | $ | 4.53 | |
| Annualized Expense Ratio* | | | 0.69% |
| | | 0.90% |
| | | 0.81% |
| | | 0.90% |
|
| * | Expenses are equal to the Fund’s annualized expense ratio, multiplied by the average account value over the period, multiplied by 182/365 (to reflect the one-half year period between October 1, 2020 and March 31, 2021). |
FMI Funds, Inc.
ADVISORY AGREEMENTS (Unaudited)
Renewal Advisory Agreements FMI Large Cap Fund, FMI Common Stock Fund and FMI International Fund
On December 18, 2020, the Directors of FMI Funds, Inc. approved the continuation of the investment advisory agreements for the FMI Large Cap Fund (the “Large Cap Fund”), the FMI Common Stock Fund (the “Common Stock Fund”) and the FMI International Fund (the “International Fund”). (The Large Cap Fund, the Common Stock Fund and the International Fund are sometimes referred to herein as a “Fund” and, collectively, as the “Funds”). The investment advisory agreement for the FMI International Fund II – Currency Unhedged was not renewed at this time as it does not terminate until December 31, 2021.
In advance of approving the continuation of the investment advisory agreements, the Directors who are not “interested persons” (as that term is defined by the Investment Company Act of 1940) of the Funds (the “Independent Directors”) met with their independent legal counsel. They discussed with their independent legal counsel, in executive session, a memorandum describing their fiduciary duties with respect to approving the continuation of the investment advisory agreements and the relevant factors for their consideration of the investment advisory agreements. As part of the discussion regarding the fiduciary duties of the Directors, the Independent Directors confirmed their understanding of the need to have asked about, and received answers to, any matters that they believe are relevant to determining whether to approve the continuation of the investment advisory agreements.
The Independent Directors also reviewed and discussed with their independent legal counsel, in executive session, all of the materials that the Funds’ investment adviser, Fiduciary Management, Inc. (the “Adviser”), had provided to the Independent Directors to assist them in their consideration of the investment advisory agreement (collectively, the “15(c) Material”). Following this review, they concluded that the 15(c) Material addressed all of the relevant matters that they wanted to consider in assessing the performance of the Funds and the performance of the Adviser under the investment advisory agreements, and that the 15(c) Material provided them with an understanding of the investment advisory agreements and the services that the Adviser provides the Funds.
The Independent Directors then met in general session to discuss the 15(c) Material with the other Directors and management of the Funds. In discussing the 15(c) Material with management of the Funds, management highlighted various sections of the 15(c) Material and addressed the questions and comments of the Directors to their satisfaction. The Directors confirmed that in considering the investment advisory agreements, they focused on the following items, among others:
| | • | The nature and quality of the investment advisory services provided by the Adviser, including the Adviser’s organization and operations, financial condition and stability and ownership structure; and the terms of the investment advisory agreements and how the services performed by the Adviser under the investment advisory agreements differ from those performed for other accounts managed by the Adviser. |
| | | |
| | • | A comparison of the fees and expenses of the Funds to other similar funds, including a comparison of the Funds’ total expenses and the total expense ratios. |
| | | |
| | • | A comparison of the fee structures of other accounts managed by the Adviser. |
| | | |
| | • | Whether economies of scale are recognized by the Funds, and whether existing breakpoints are appropriate. |
FMI Funds, Inc.
ADVISORY AGREEMENTS (Unaudited) (Continued)
| | • | The costs and profitability of the Funds to the Adviser. |
| | | |
| | • | The independence, expertise, care, and conscientiousness of the Board of Directors. |
| | | |
| | • | Short-term and long-term investment performance of the Funds. |
| | | |
| | • | The other benefits to the Adviser from serving as investment adviser to the Funds (in addition to the advisory fee under the investment advisory agreements). |
All of the factors discussed by the Directors were considered as a whole, and were considered separately by the Independent Directors, meeting in executive session both before and after their general session with the other Directors and management of the Funds. The factors were viewed in their totality by the Directors, with no single factor being the principal or determinative factor in the Directors’ determination of whether to approve the continuation of the investment advisory agreements. The Directors recognized that the management and fee arrangements for the Funds are the result of years of review and discussion between the Independent Directors and the Adviser, that certain aspects of such arrangements may receive greater scrutiny in some years than in others and that the Directors’ conclusions may be based, in part, on their consideration of these same arrangements and information received during the course of the year and in prior years.
The material considerations and determinations of the Directors, including all of the Independent Directors, are described below:
Nature and Quality of Investment Advisory Services
The Directors discussed the efforts of the Adviser in supervising the investment portfolios of the Large Cap Fund, the Common Stock Fund and the International Fund, directing the day-to-day management of the Funds’ portfolios, including the purchase and sale of investment securities, and the performance of the Adviser in these efforts. They noted that the investment process employed is team-based and highly research intensive, utilizing primarily in-house, fundamental research.
Noting the research intensive process of the Adviser, the Directors considered the background and experience of the Adviser’s senior management and expertise of, and the level of attention given to the Funds by investment personnel of the Adviser, and determined that the personnel servicing the Funds are well qualified. In addition, the Directors deliberated on the quality of the material service providers to the Funds, who provide administrative and distribution services on behalf of the Funds and are overseen by the Adviser, and the overall reputation and capabilities of the Adviser, concluding that they believe the services providers are respected in the industry and provide valuable services to the Funds.
The Directors concluded, based on the well qualified personnel serving the Funds and the positive performance of the Funds, adjusted for risk, as discussed herein, that the nature, extent and quality of the investment advisory services provided to the Funds by the Adviser are good. The Directors then assessed the risk management of the Funds, and the operation of the Funds’ compliance programs, as reported to them in discussions with the CCO of the Funds. They noted that the Funds have not had material breaches of the compliance program, and that the CCO’s annual and quarterly reports have reflected that the compliance program is reasonably designed to prevent material violations of securities law and is operating effectively. Based on the Directors’ assessment of the Funds’ compliance program, the Directors determined that the nature and extent of the services provided by the Adviser are appropriate to assure that the Funds’ operations are conducted in compliance with applicable laws, rules and regulations.
FMI Funds, Inc.
ADVISORY AGREEMENTS (Unaudited) (Continued)
Comparative Fees and Expenses
Management discussed with the Directors the fact that several variables in addition to the management fee, such as service, administrative and transaction fees could have an impact on costs to the shareholders of the Funds. The Directors noted that the Adviser had engaged Broadridge Financial Solutions 15(c) Services to provide peer group comparative fee, expense and performance analysis for each Fund (the “15(c) Report”), to assist the Directors with their analysis on whether to continue the investment advisory agreements. They discussed the Morningstar fee level methodology used in the 15(c) Report, as well as the custom 15(c) categories and peer groups created explicitly for the 15(c) Report. The Directors noted that the methodology underlying the Morningstar fee level calculation uses the prospectus net expense ratio rather than the annual report net expense ratio. Morningstar reported that it made this change so that fee cuts at existing funds would be reflected more quickly in the fee level assignment, so that newly-incepted share classes would be included, and to uniformly include acquired fund fees in the comparisons, regardless of fund-of-funds status.
The Directors noted that the peer grouping methodology in the 15(c) Report considers three factors in selecting potential peers: investment style, share class characteristics, and assets. While it would be ideal if each peer matched closely with the applicable Fund on all three dimensions, the Directors noted that in practice it is often necessary to relax one of the peer grouping factors to find an appropriate number of peers. They concluded that they were comfortable with the peer group methodology in the 15(c) Report.
The Directors then reviewed the expense analysis contained in the 15(c) Report. In summary, the Directors noted the following: (1) the peer group comparative fee and expense analysis for the Common Stock Fund show that its net expense ratio and advisory fee are within a reasonable range of industry averages; (2) the peer group comparative fee and expense analysis for the Large Cap Fund show that its net expense ratio and advisory fee are within a reasonable range of industry averages; and (3) the peer group comparative fee and expense analysis for the International Fund show that its net expense ratio and advisory fee are within a reasonable range of industry averages.
After assessing the expense information discussed above, the Directors concluded that the expense ratios of the Funds are within the range of comparable mutual funds, and that the Funds’ fees are reasonable. They noted that the Funds’ performance during periods of stock market decline was better than the market, as intended by the Funds’ principal investment strategies. The Directors determined that the positive performance during periods of stock market decline supports the conclusion that the Funds provide positive risk adjusted returns.
Comparison of Fee Structures of Other Accounts
The Directors believe that management of a mutual fund involves more comprehensive and substantive duties than the management of institutional separate accounts or sub-advised funds. Mutual funds require considerable compliance, third-party oversight, and shareholder services that institutional accounts do not, due to the more retail nature of the fund shareholder and the legal and regulatory burdens associated with managing a mutual fund family. For instance, the Adviser provides tailored investment advisory services to the Funds to accommodate the cash flow volatility presented by the purchases and redemptions of shareholders. Moreover, the Adviser attempts to serve the needs of thousands of accounts, ranging from direct accounts holding a few thousand dollars to the large omnibus accounts of intermediaries who in turn service thousands of large and small accounts.
FMI Funds, Inc.
ADVISORY AGREEMENTS (Unaudited) (Continued)
The Adviser has implemented robust shareholder communication efforts to reach potential shareholders through direct contact, through intermediaries, or via the financial press. The Adviser does not engage in equivalent efforts for separate accounts.
Separate accounts or sub-advised funds engage the Adviser for investment management services and client service only. And with regard to sub-advised funds, the adviser to those funds assumes some of the cash flow management duties, board maintenance, and most operational and compliance obligations and third-party oversight.
Separate accounts or sub-advised funds engage the Adviser for investment management services and client service only. It also is important to remember that sub-advised funds have a layer of investment management fees, in addition to sub-advisory fees. The adviser to those funds assumes some of the cash flow management duties, board maintenance, and most operational and compliance obligations and third-party oversight.
The mutual fund industry has increasingly moved to brokerage platforms (intermediaries) as the transaction vehicle of choice for investors seeking to buy and sell shares of mutual funds that are offered to the general public. Fewer investors are going directly to the Funds’ transfer agent to effect share transactions. Regarding the intermediaries, the Adviser absorbs all costs in excess of the fees paid by the Funds for sub-transfer agent services performed by the intermediaries. So, the cost of obtaining, retaining and servicing shareholders for the Funds is significantly higher than the costs for separately managed accounts. None of the Funds utilize 12b-1 plans to fund distribution costs, with the Adviser absorbing all such costs.
In summary, the Directors noted the following: (1) management of a mutual fund involves more comprehensive and substantive duties than the management of institutional separate accounts or sub-advised funds; (2) separate accounts and sub-advised funds do not present equivalent risks to the Adviser, as separate accounts or sub-advised funds engage the Adviser for investment management services and client service only; (3) the adviser to sub-advised funds assumes some of the cash flow management duties for such funds, and it assumes the board maintenance, and most operational and compliance obligations and third-party oversight for such funds; and (4) the Adviser absorbs all costs in excess of the fees paid by the Funds for sub-transfer agent services performed by the intermediaries, which results in the cost of obtaining, retaining and servicing shareholders for the Funds being significantly higher than the costs for separately managed accounts.
Based on the materials and information discussed above, the Directors concluded that the differential in advisory fees between the Funds and the separate accounts managed by the Adviser is reasonable, and concluded that the fee rates charged to the Funds in comparison to those charged to the Adviser’s other clients is reasonable.
Performance
The Directors then reviewed the performance and risk analysis contained in the 15(c) Report:
| | • | The Large Cap Fund has underperformed the benchmark S&P 500 by 2.94% annualized over the last ten years, while outperforming the benchmark by 0.55% annualized since inception through the fiscal year ended September 30, 2020. The Fund has outperformed the Russell 1000 Value benchmark over one, three, five and ten years and since inception through the fiscal year ended September 30, 2020 annualized by 5.74%, 3.62%, 2.04%, 0.85%, and 1.85%, respectively. |
FMI Funds, Inc.
ADVISORY AGREEMENTS (Unaudited) (Continued)
| | • | The Common Stock Fund has underperformed the benchmark Russell 2000 by 1.40% annualized over the last ten years, while outperforming the benchmark by 1.22% annualized since inception through the fiscal year ended September 30, 2020. The Fund has outperformed the Russell 2000 Value benchmark over one, three, five and ten years and since inception through the fiscal year ended September 30, 2020 annualized by 3.37%, 5.00%, 1.83%, 1.36%, and 0.26% respectively. |
| | | |
| | • | While outperforming both the MSCI EAFE (USD) and MSCI EAFE (Local) benchmarks by 2.16% and 0.38% annualized since inception, at the five-year mark, the International Fund underperformed by 1.60% and 1.17%, respectively, on an annualized basis through the fiscal year ended September 30, 2020. Notwithstanding the strength of the core benchmarks, the MSCI EAFE Value (USD) and MSCI EAFE Value (Local) benchmarks were both surpassed by the Fund over one, three, and five years and since inception through the fiscal year ended September 30, 2020 annualized by 1.87%, 3.52%, 2.52%, and 4.60% (USD) and 6.40%, 3.50%, 2,81%, and 2.79% (Local), respectively. |
Based on the information and materials discussed by the Directors, as reflected above, the Directors concluded that the performance of the Funds, adjusting for risk, has been satisfactory on a relative basis and more than satisfactory on an absolute basis. They continue to believe that the Adviser’s discipline should lead to favorable results in the long-term, and concluded that continuation of the existing advisory agreements was in the best interest of the Funds’ shareholders. In particular, the Directors noted that the Funds’ performance during periods of stock market decline was better than the market, as intended by the Funds’ principal investment strategies, supporting the conclusion that the Funds provide positive risk adjusted returns.
Costs and Profitability
The Adviser uses a team-oriented approach so no one individual is assigned to any one of the Adviser’s clients from a portfolio management, research, trading, operations or administrative perspective. Instead, every teammate is working on behalf of all the Adviser’s clients, including each Fund. Accordingly, in determining the Adviser’s costs relative to the services performed on behalf of all the Adviser’s clients, the Adviser has determined to allocate its overall costs proportionately to each Adviser client based upon the percentage of that client’s assets under our management. The Directors believe this method of allocation is appropriate.
In summary, the Directors noted the following: (1) the peer group comparative fee and expense analysis for the Funds show that their net expense ratios and advisory fees are within a reasonable range of industry averages; (2) the shareholder service fees paid to intermediaries by the Adviser for the benefit of the Funds significantly reduce the pre-tax profit margin to the Adviser, which results in the pre-tax profit margin for the Funds being lower than the pre-tax profit margin for all other clients of the Adviser on an aggregate basis; and (3) the Adviser’s pre-tax profit margin for the Funds compares reasonably to several publicly traded companies that the Directors reviewed.
In summary, the Directors noted the following: (1) the peer group comparative fee and expense analysis for the Funds show that their net expense ratios and advisory fees are within a reasonable range of industry averages; (2) the shareholder service fees paid to intermediaries by the Adviser for the benefit of the Funds significantly reduce the pre-tax profit margin to the Adviser, which results in the pre-tax profit margin for the Funds being lower than the pre-tax profit margin for all other clients of the Adviser on an aggregate basis; and (3) the Adviser’s pre-tax profit margin for the Funds compares reasonably to several publicly traded companies that the Directors reviewed.
FMI Funds, Inc.
ADVISORY AGREEMENTS (Unaudited) (Continued)
In assessing and evaluating the information discussed above, the Directors recognized that it is difficult to make comparisons of profitability from investment advisory contracts. This is because comparative information is not generally publicly available and is affected by numerous factors, including the structure of the particular adviser, the type of clients it advises, its business mix, and numerous assumptions regarding allocations and the adviser’s capital structure and cost of capital. Taking this into account, following their discussion of the material presented above, the Directors concluded that the level of profitability realized by the Adviser from its provision of services to the Funds is reasonable, and that the overall expense ratios and investment advisory fees were fair and within the range of industry averages.
Economies of Scale
The Directors discussed the possibility that as fund assets grow, certain fixed costs are spread over the larger asset base leading to some economies of scale, which should benefit the Funds’ shareholders. Additionally, some variable costs, such as accounting, administration, custody and management fees are on a sliding scale relative to asset size. Based on the materials the Directors reviewed, the Funds’ expense ratios have generally fallen over the fiscal years, primarily as a consequence of the Adviser’s renegotiation of service contracts and the addition of management fee breakpoints. The Directors determined that the breakpoints are at levels that will appropriately benefit shareholders by passing along economies of scale.
In summary, the Directors noted the following: (1) some variable costs, such as accounting, administration, custody and management fees are on a sliding scale relative to asset size; (2) the Funds' expense ratios have generally fallen over the fiscal years, primarily as a consequence of the Adviser’s renegotiation of service contracts and the addition of management fee breakpoints; and (3) the fact that the Adviser has made significant investments into the Funds’ portfolio management and research teams.
After discussing the matters referenced above, the Directors concluded that the current fees and breakpoints were appropriate. They noted favorably the Adviser has in the recent past voluntarily reduced the investment advisory fee for the FMI Large Cap Fund and the FMI Common Stock Fund, to keep those Funds more competitive in the marketplace.
Fall-Out Benefits
The Directors reviewed the Adviser’s use of research, analytical, statistical and other information and services obtained in connection with effecting trades for the Funds. While the research, analytical, statistical and other information and services provided by brokers have substantial value, the Directors determined that such information and services are supplemental to the Adviser’s own efforts in the performance of its duties under the investment advisory agreements, and are used for the benefit of the Funds.
With regard to research services furnished by brokers through whom the Adviser effects security transactions (credits that allow the Adviser to obtain research, so-called “soft-dollars”), the Directors noted that the research may be used in servicing all of the Adviser’s accounts, not just the Funds, regardless of which security transactions generated the soft-dollars. So, the Directors discussed with the Adviser, the Adviser’s allocation policies and procedures for soft-dollars, noting that the Adviser generally allocates soft-dollars proportionately based upon the percentage of a client’s assets under management. The Directors determined that this allocation methodology is appropriate.
FMI Funds, Inc.
ADVISORY AGREEMENTS (Unaudited) (Continued)
In summary, the Directors noted the following: (1) although the Adviser could derive benefits from the conversion of Fund shareholders into separate account clients, the Funds also could benefit from potential institutional shareholders who might choose to invest in the Funds because they want the Adviser’s services, but do not meet minimum separate account size requirements; (2) the Directors concluded that the research, analytical, statistical and other information and services provided by brokers are merely supplemental to the Adviser’s own efforts in the performance of its duties under the investment advisory agreements; and (3) the Directors concluded that the allocation methodology for soft-dollars is appropriate.
After discussing and evaluating the materials presented above, the Directors concluded that the other benefits realized by the Adviser from its relationship with the Funds were reasonable.
Conclusion
After reviewing the material provided for the meeting, management’s presentation, as well as other information regularly provided at the Board’s quarterly meetings throughout the year regarding the quality of services provided by the Adviser, the performance of the Funds, expense information, regulatory compliance issues, trading information and related matters and other factors deemed relevant by the Board, the Directors, including all of the Independent Directors, concluded that the investment advisory arrangements between the Funds and the Adviser were fair and reasonable and that the continuation of the investment advisory agreements would be in the best interest of the Funds and their shareholders. Accordingly, the Directors, including the Independent Directors voting separately, approved the continuation of the investment advisory agreements.
FMI Funds, Inc.
DISCLOSURE INFORMATION (Unaudited)
Performance for Period Ended March 31, 2021
| | | | Average Annual Total Returns | |
| | 3 | 1 | 3 | 5 | 10 | Since | Inception |
| FMI FUND / INDEX | Months(1) | Year | Year | Year | Year | Inception(1) | Date |
| Large Cap –Investor Class | 6.05% | 52.69% | 12.03% | 12.76% | 11.61% | 9.54% | 12-31-01 |
| S&P 500 Index | 6.17% | 56.35% | 16.78% | 16.29% | 13.91% | 8.82% | 12-31-01 |
| Russell 1000 Value Index | 11.26%
| 56.09% | 10.96% | 11.74% | 10.99% | 8.01% | 12-31-01 |
| Large Cap – Institutional Class | 6.12% | 52.92% | 12.20% | — | — | 14.07% | 10-31-16 |
| S&P 500 Index | 6.17% | 56.35% | 16.78% | 16.29% | 13.91% | 17.48% | 10-31-16 |
| Russell 1000 Value Index | 11.26% | 56.09% | 10.96% | 11.74% | 10.99% | 11.78% | 10-31-16 |
| Common Stock – Investor Class | 12.51% | 63.36% | 10.81% | 11.97% | 10.11% | 11.88% | 12-18-81 |
| Russell 2000 Index | 12.70% | 94.85% | 14.76% | 16.35% | 11.68% | 10.81% | 12-18-81 |
| Russell 2000 Value Index | 21.17% | 97.05% | 11.57% | 13.56% | 10.06% | 12.02% | 12-18-81 |
| Common Stock – Institutional Class | 12.50% | 63.57% | 10.92% | — | — | 13.07% | 10-31-16 |
| Russell 2000 Index | 12.70% | 94.85% | 14.76% | 16.35% | 11.68% | 16.72% | 10-31-16 |
| Russell 2000 Value Index | 21.17% | 97.05% | 11.57% | 13.56% | 10.06% | 13.07% | 10-31-16 |
| International – Investor Class | 7.07% | 49.31% | 5.51% | 7.24% | 8.38% | 8.25% | 12-31-10 |
| MSCI EAFE (LOC) | 7.59% | 36.56% | 7.07% | 8.82% | 7.50% | 7.42% | 12-31-10 |
| MSCI EAFE (LOC) Value | 11.32% | 37.06% | 2.83% | 6.55% | 5.65% | 5.71% | 12-31-10 |
| MSCI EAFE (USD) | 3.48% | 44.57% | 6.02% | 8.85% | 5.52% | 5.73% | 12-31-10 |
| MSCI EAFE (USD) Value | 7.44% | 45.71% | 1.85% | 6.57% | 3.65% | 4.02% | 12-31-10 |
| International – Institutional Class | 7.12% | 49.46% | 5.65% | — | — | 6.99% | 10-31-16 |
| MSCI EAFE (LOC) | 7.59% | 36.56% | 7.07% | 8.82% | 7.50% | 8.49% | 10-31-16 |
| MSCI EAFE (LOC) Value | 11.32% | 37.06% | 2.83% | 6.55% | 5.65% | 5.24% | 10-31-16 |
| MSCI EAFE (USD) | 3.48% | 44.57% | 6.02% | 8.85% | 5.52% | 9.41% | 10-31-16 |
| MSCI EAFE (USD) Value | 7.44% | 45.71% | 1.85% | 6.57% | 3.65% | 6.24% | 10-31-16 |
| International II – Currency Unhedged – | | | | | | | |
| Institutional Class | 4.95% | 54.18% | — | — | — | 7.21% | 12-31-19 |
| MSCI EAFE (USD) | 3.48% | 44.57% | 6.02% | 8.85% | 5.52% | 9.16% | 12-31-19 |
| MSCI EAFE (USD) Value | 7.44% | 45.71% | 1.85% | 6.57% | 3.65% | 3.68% | 12-31-19 |
(1) Returns for periods less than one year are not annualized.
Performance data quoted represents past performance; past performance does not guarantee future results. Investment return and principal value of an investment will fluctuate so that an investor’s shares, when redeemed, may be worth more or less than their original cost. Current performance of a Fund may be lower or higher than the performance quoted. Performance data current to the most recent month end may be obtained by visiting www.fmifunds.com or by calling 1-800-811-5311. The returns do not reflect the deduction of taxes that a shareholder would pay on Fund distributions or the redemption of Fund shares.
Securities named in the Letters to Shareholders, but not listed in the Schedules of Investments are not held in the Funds as of the date of this disclosure. Portfolio holdings are subject to change without notice and are not intended as recommendations of individual securities.
This report is not authorized for use as an offer of sale or a solicitation of an offer to buy shares of the Funds unless accompanied or preceded by the Funds’ current prospectus.
FMI Funds, Inc.
DISCLOSURE INFORMATION (Unaudited) (Continued)
As of the Funds’ Prospectus dated January 31, 2021, the annual operating expense ratios for the Investor Class of FMI Large Cap Fund, FMI Common Stock Fund and FMI International Fund are: 0.81%, 1.02% and 0.91%, respectively. The annual operating expense ratios for the Institutional Class of FMI Large Cap Fund, FMI Common Stock Fund, FMI International Fund and FMI International Fund II – Currency Unhedged are: 0.67%, 0.90%, 0.77% and 0.90%*, respectively.
| * | Note that the annual operating expenses for the Institutional Class of FMI International Fund II – Currency Unhedged are 1.43% before the investment adviser’s voluntary reimbursement such that annual fund operating expenses do not exceed 0.90%, which will continue at least through January 31, 2022. |
Risks associated with investing in the Funds are as follows:
FMI Large Cap Fund: Stock Market Risk, Medium and Large Capitalization Companies Risks, Non-Diversification Risk (Non-Diversified funds are subject to higher volatility than funds that are invested more broadly), Value Investing Risk, Foreign Securities Risk (fluctuation of currency, different financial standards, and political instability) and Liquidity Risk.
FMI Common Stock Fund: Stock Market Risk, Medium and Small Capitalization Companies Risks (which includes the potential for greater volatility and less financial resources than Large-Cap Companies), Value Investing Risk, Foreign Securities Risk (fluctuation of currency, different financial standards, and political instability) and Liquidity Risk.
FMI International Fund: Stock Market Risk, Value Investing Risk, Foreign Securities Risk (fluctuation of currency, different financial standards, and political instability), Geographic Concentration Risk, Currency Hedging Risk, Large Capitalization Companies Risk and Liquidity Risk.
FMI International Fund II – Currency Unhedged: Stock Market Risk, Non-Diversified Risk (Non-Diversified Funds are subject to higher volatility than funds that are invested more broadly). Value Investing Risk, Foreign Securities Risk (fluctuation of currency, different financial standards, and political instability), Geographic Concentration Risk, Large Capitalization Companies Risk, and Liquidity Risk.
For details regarding these risks, please refer to the Funds’ Summary or Statutory Prospectuses dated January 31, 2021.
For more information about the FMI Funds, call 1-800-811-5311 for a free Prospectus or Summary Prospectus. Please read these Prospectuses carefully to consider the investment objectives, risks, charges and expenses, before investing or sending money. These Prospectuses contain this and more information about the FMI Funds. Please read the Prospectuses or Summary Prospectuses carefully before investing.
The Standard and Poor’s 500 Index (S&P 500) consists of 500 selected common stocks, most of which are listed on the New York Stock Exchange. The S&P’s Ratings Group designates the stocks to be included in the Index on a statistical basis. A particular stock’s weighting in the Index is based on its relative total market value (i.e., its market price per share times the number of shares outstanding). Stocks may be added or deleted from the Index from time to time.
The Russell 1000 Index measures the performance of the 1,000 largest companies in the Russell 3000 Index which comprises the 3,000 largest U.S. companies based on total market capitalization. The Russell 1000 Value Index includes equities that exhibit value characteristics and the Russell 1000 Growth Index includes equities that exhibit growth characteristics.
The Russell 2000 Index measures the performance of the 2,000 smallest companies in the Russell 3000 Index. The Russell 2000 Value Index includes equities that exhibit value characteristics and the Russell 2000 Growth Index includes equities that exhibit growth characteristics.
The MSCI EAFE Index (Europe, Australasia, Far East) is a free float-adjusted market capitalization index that is designed to measure the equity market performance of developed markets, excluding the U.S. and Canada.
FMI Funds, Inc.
DISCLOSURE INFORMATION (Unaudited) (Continued)
The MSCI EAFE Index consists of the following 21 developed market country indices: Australia, Austria, Belgium, Denmark, Finland, France, Germany, Hong Kong, Ireland, Israel, Italy, Japan, the Netherlands, New Zealand, Norway, Portugal, Singapore, Spain, Sweden, Switzerland and the United Kingdom. Index results are inclusive of dividends and net of foreign withholding taxes. The reported figures include reinvestment of dividends and capital gains distributions and do not reflect any fees or expenses.
The MSCI EAFE Value Index captures large and mid cap securities exhibiting overall value style characteristics across Developed Markets countries around the world, excluding the U.S. and Canada. The value investment style characteristics for index construction are defined using three variables: book value to price, 12-month forward earnings to price and dividend yield.
The MSCI EAFE Index and MSCI EAFE Value Index are calculated in local currency (LOC) as well as in U.S. Dollars (USD). The concept of a LOC calculation excludes the impact of currency fluctuations. All currencies of listing are considered in the Index calculation in LOC where current prices (t) and previous day prices (t-1) are converted into USD using the same exchange rate (exchange rate t-1) in the numerator and denominator. As a consequence, the FX factor drops out of the equation. The USD calculation includes exchange rates at t and t-1. Therefore, the LOC calculation only represents the price appreciation or depreciation of the securities, whereas the USD calculation also accounts for the performance of the currency (or currencies) relative to the USD.
The MSCI EAFE Growth Index captures large and mid cap securities exhibiting overall growth style characteristics across Developed Markets countries around the world, excluding the U.S. and Canada. The growth investment style characteristics for index construction are defined using five variables: long-term forward EPS growth rate, short-term forward EPS growth rate, current internal growth rate and long-term historical EPS growth trend and long-term historical sales per share growth trend.
MSCI EAFE is a service mark of MSCI Barra.
The Consumer Price Index (CPI) is a measure of the average change over time in the prices paid by urban consumers for a market basket of consumer goods and services.
The Standard and Poor’s 400 Index (S&P 400) measures the mid-cap segment of the U.S. equity market using a market-capitalization-weighted index composed of 400 constituent companies. Individual companies may change over time.
The Standard and Poor’s 600 Index (S&P 600) measures the small-cap segment of the U.S. equity market using a market-capitalization-weighted index composed of 600 constituent companies. Individual companies may change over time.
All indices are unmanaged. These indices are used herein for comparative purposes in accordance with the Securities and Exchange Commission regulations. It is not possible to invest directly into an index.
GLOSSARY
EBITDA – Earnings Before Interest Taxes Depreciation and Amortization is net income with interest, taxes, depreciation, and amortization added back to it, and can be used to analyze and compare profitability between companies and industries because it eliminates the effects of financing and accounting decisions.
EPS – Earnings per Share – The portion of a company’s profit allocated to each outstanding share of common stock. Earnings per share serves as an indicator of a company’s profitability.
EV/EBITDA – Enterprise Value to Earnings Before Interest Taxes Depreciation and Amortization is a measure of the value of a stock that compares a company’s enterprise value (market cap plus debt, minority interest and preferred shares, minus total cash and cash equivalents) to its earnings before interest taxes depreciation and amortization. EV/EBITDA is one of several fundamental indicators that investors use to determine whether a stock is priced well. The EV/EBITDA multiple is also often used to determine a company’s valuation in the case of a potential acquisition.
FMI Funds, Inc.
DISCLOSURE INFORMATION (Unaudited) (Continued)
EV/Sales – Enterprise-Value-To-Sales is a valuation measure that compares the enterprise value of a company to the company’s sales. EV/sales gives investors an idea of how much it costs to buy the company’s sales.
GDP – Gross Domestic Product – Gross Domestic Product is the monetary value of all finished goods and services produced within a country’s borders in a specific time period.
Net Debt-to-GDP – Net debt-to-GDP is a measurement of a country’s public debt to its gross domestic product. The ratio is an indicator of the country’s ability to pay its debt.
Net Debt-to-EBITDA – Net debt-to-EBITDA is a measurement of the total amount of outstanding company debt as a percentage of EBITDA. The ratio is an indicator of the company’s ability to pay its debt.
P/E ratio – Price-to-earnings ratio is the ratio for valuing a company that measures its current share price relative to its per-share earnings. The trailing P/E ratio is calculated by dividing the current share price by per-share earnings over the previous 12 months and the forward P/E ratio estimates likely per-share earnings over the next 12 months.
P/S ratio – Price-to-sales ratio is a valuation ratio that compares a company’s stock price to its revenues. The price-to-sales ratio is an indicator of the value placed on each dollar of a company’s sales or revenues. It can be calculated either by dividing the company’s market capitalization by its total sales over a 12-month period, or on a per-share basis by dividing the stock price by sales per share for a 12-month period.
ROIC – Return on Invested Capital is a calculation used to assess a company’s efficiency at allocating the capital under its control to profitable investments. The return on invested capital measure gives a sense of how well a company is using its money to generate returns.
Reference definitions found at Investopedia.com
Distributed by Rafferty Capital Markets, LLC, 1010 Franklin Avenue, Garden City, NY 11530
(This Page Intentionally Left Blank.)
| FMI Large Cap Fund | FMI Common Stock Fund | FMI International Fund | FMI International Fund II – |
| Currency Unhedged |
100 East Wisconsin Avenue, Suite 2200
Milwaukee, Wisconsin 53202
www.fmifunds.com
414-226-4555
BOARD OF DIRECTORS
| | ROBERT C. ARZBAECHER | REBECCA W. HOUSE | |
| | JOHN S. BRANDSER | PAUL S. SHAIN | |
| | LAWRENCE J. BURNETT | ROBERT J. VENABLE | |
| | PATRICK J. ENGLISH | | |
INVESTMENT ADVISER
FIDUCIARY MANAGEMENT, INC.
100 East Wisconsin Avenue, Suite 2200
Milwaukee, Wisconsin 53202
ADMINISTRATOR, ACCOUNTANT, TRANSFER
AGENT AND DIVIDEND DISBURSING AGENT
U.S. BANCORP FUND SERVICES, LLC
615 East Michigan Street
Milwaukee, Wisconsin 53202
800-811-5311 or 414-765-4124
| CUSTODIAN | INDEPENDENT REGISTERED |
| U.S. BANK, N.A. | PUBLIC ACCOUNTING FIRM |
| Milwaukee, Wisconsin | COHEN & COMPANY, LTD. |
| | Milwaukee, Wisconsin |
| DISTRIBUTOR | |
| RAFFERTY CAPITAL MARKETS, LLC | LEGAL COUNSEL |
| Garden City, New York | FOLEY & LARDNER LLP |
| | Milwaukee, Wisconsin |
| |
| |
| |
| FMI Funds, Inc. |
| |
| 1-800-811-5311 |
| www.fmifunds.com |
| |
| |
| |
Item 2. Code of Ethics.
Not applicable for semi-annual reports.
Item 3. Audit Committee Financial Expert.
Not applicable for semi-annual reports.
Item 4. Principal Accountant Fees and Services.
Not applicable for semi-annual reports.
Item 5. Audit Committee of Listed Registrants.
Not applicable to registrants who are not listed issuers (as defined in Rule 10A-3 under the Securities Exchange Act of 1934).
Item 6. Investments.
| (a) | A Schedule of Investments in securities of unaffiliated issuers as of the close of the reporting period is included as part of the report to shareholders filed under Item 1, Report to Shareholders, of this Form N-CSR. |
(b) Not Applicable.
Item 7. Disclosure of Proxy Voting Policies and Procedures for Closed-End Management Investment Companies.
Not applicable to open-end investment companies.
Item 8. Portfolio Managers of Closed-End Management Investment Companies.
Not applicable to open-end investment companies.
Item 9. Purchases of Equity Securities by Closed‑End Management Investment Company and Affiliated Purchasers.
Not applicable to open-end investment companies.
Item 10. Submission of Matters to a Vote of Security Holders.
Not applicable.
Item 11. Controls and Procedures.
(a) | The Registrant’s principal executive and principal financial officers have concluded that the Registrant’s disclosure controls and procedures are effective, as of a date within 90 days of the filing of this report, based on their evaluation of the Registrant’s disclosure controls and procedures. |
(b) | There were no changes in the Registrant’s internal control over financial reporting during the Registrant’s period covered by this report that have materially affected, or are reasonably likely to materially affect, the Registrant’s internal control over financial reporting. |
Item 12. Disclosure of Securities Lending Activities for Closed-End Management Investment Companies
Not applicable to open-end investment companies.
Item 13. Exhibits.
| (a) | (1) Any code of ethics or amendment thereto, that is the subject of the disclosure required by Item 2, to the extent that the registrant intends to satisfy Item 2 requirements through filing an exhibit. Not applicable |
(3) Any written solicitation to purchase securities under Rule 23c‑1 under the Act sent or given during the period covered by the report by or on behalf of the registrant to 10 or more persons. Not applicable to open-end investment companies.
(4) There was no change in registrant’s independent public accountant for the period covered by this report.
SIGNATURES
Pursuant to the requirements of the Securities Exchange Act of 1934 and the Investment Company Act of 1940, the registrant has duly caused this report to be signed on its behalf by the undersigned, thereunto duly authorized.
FMI Funds, Inc.
Registrant
By /s/John S. Brandser
John S. Brandser, President/Principal Executive Officer
Date April 28, 2021
Pursuant to the requirements of the Securities Exchange Act of 1934 and the Investment Company Act of 1940, this report has been signed below by the following persons on behalf of the registrant and in the capacities and on the dates indicated.
By /s/John S. Brandser
John S. Brandser, President/Principal Executive Officer
Date April 28, 2021
By /s/John S. Brandser
John S. Brandser, Treasurer/Principal Financial Officer
Date April 28, 2021