As filed with the U.S. Securities and Exchange Commission on May 21, 2024
UNITED STATES
SECURITIES AND EXCHANGE COMMISSION
Washington, D.C. 20549
SECURITIES AND EXCHANGE COMMISSION
Washington, D.C. 20549
FORM N-CSR
CERTIFIED SHAREHOLDER REPORT OF REGISTERED
MANAGEMENT INVESTMENT COMPANIES
Investment Company Act file number 811-07831
FMI Funds, Inc.
(Exact name of registrant as specified in charter)
(Exact name of registrant as specified in charter)
790 North Water Street, Suite 2100
Milwaukee, WI 53202
(Address of principal executive offices) (Zip code)
John S. Brandser
Fiduciary Management, Inc.
790 North Water Street
Suite 2100
Milwaukee, WI 53202
(Name and address of agent for service)
(414) 226-4545
Registrant's telephone number, including area code
Date of fiscal year end: September 30
Date of reporting period: March 31, 2024
Item 1. Reports to Stockholders.
| (a) |
SEMI-ANNUAL REPORT
March 31, 2024
FMI Common Stock Fund
Investor Class (Ticker Symbol: FMIMX)
Institutional Class (Ticker Symbol: FMIUX)
FMI Large Cap Fund
Investor Class (Ticker Symbol: FMIHX)
Institutional Class (Ticker Symbol: FMIQX)
FMI International Fund
Investor Class (Ticker Symbol: FMIJX)
Institutional Class (Ticker Symbol: FMIYX)
FMI International Fund II – Currency Unhedged
Investor Class (Not Available For Purchase)
Institutional Class (Ticker Symbol: FMIFX)
 | FMI Funds, Inc. Advised by Fiduciary Management, Inc. www.fmifunds.com |
FMI Funds, Inc.
TABLE OF CONTENTS
| Shareholder Letter | 1 | |
| FMI Common Stock Fund | ||
| Schedule of Investments | 8 | |
| Industry Sectors | 10 | |
| FMI Large Cap Fund | ||
| Schedule of Investments | 11 | |
| Industry Sectors | 13 | |
| FMI International Fund | ||
| Schedule of Investments | 14 | |
| Schedule of Forward Currency Contracts | 17 | |
| Industry Sectors | 18 | |
| Concentration by Country | 18 | |
| FMI International Fund II – Currency Unhedged | ||
| Schedule of Investments | 19 | |
| Industry Sectors | 22 | |
| Concentration by Country | 22 | |
| Financial Statements | ||
| Statements of Assets and Liabilities | 24 | |
| Statements of Operations | 26 | |
| Statements of Changes in Net Assets | 28 | |
| Financial Highlights | 32 | |
| Notes to Financial Statements | 39 | |
| Expense Example | 51 | |
| Advisory Agreements | 53 | |
| Disclosure Information | 60 | |
| Additional Information | 64 |
FMI Funds, Inc.
Shareholder Letter
(Unaudited)
March 31, 2024
Dear Fellow Shareholders:
Last year’s stock market momentum carried over into the first quarter, with growth stocks leading the charge (once again) across market caps and geographies. Investors seem complacent, as the fundamentals do not appear to justify the current levels of exuberance. Germany, the UK, and Japan are all either in – or teetering on the verge of – a recession. China’s growth is coming under significant pressure, global trade is slowing, geopolitical risks remain elevated, and debt levels continue to march higher. The U.S. economy has been resilient but is expected to decelerate in 2024. The S&P 500 has taken on a life of its own, with an incredible concentration in mega cap technology, leaving most other asset classes in the dust in recent years. Is the S&P 500’s exceptional run of outperformance sustainable? Consider us skeptical.
Before further addressing the question at hand, our first quarter performance commentary is outlined below:
FMI Common Stock Fund: Performance
In the first quarter, the FMI Common Stock Fund (“Common Stock Fund”) increased 8.91%1, compared with 5.18% and 2.90% for the Russell 2000® Index (“Russell 2000”) and Russell 2000® Value Index (“Russell 2000 Value”), respectively. The Common Stock Fund outperformed despite growth eclipsing value by over 4% in the period. Relative to the Russell 2000, FMI’s sector performance was driven by Finance, Producer Manufacturing, and Distribution Services, while Commercial Services, Electronic Technology, and Consumer Non-Durables each lost some ground. Core & Main Inc. Class A, Gates Industrial Corp. PLC, and nVent Electric PLC were among the top performing stocks, as Plexus Corp., Robert Half Inc., and Genpact Ltd. failed to keep pace. With Small/SMID Cap stocks lagging in recent years, the relative valuations have become more appealing.
FMI Large Cap Fund: Performance
In the first quarter, the FMI Large Cap Fund (“Large Cap Fund”) advanced 8.43%2, compared with 10.56% and 8.86% for the S&P 500® Index (S&P 500) and iShares Russell 1000 Value ETF3, respectively. Growth outpaced value by over 2% in the period. Relative to the S&P 500, Finance, Producer Manufacturing, and Consumer Durables were FMI’s top performing sectors, while Health Services, Health Technology, and Electronic Technology underperformed. Top individual contributors included Micron Technology Inc., Progressive Corp., and Eaton Corp. PLC, while UnitedHealth Group Inc., Sony Group Corp. – SP-ADR, and Dollar Tree Inc. weighed. Speculation remains high, as can be seen by the top-performing themes in the U.S. (tracked by Goldman Sachs): Bitcoin Sensitive Equities (+53%), High Beta 12M Winners (+29%), Obesity Drugs (+28%), Artificial Intelligence (+24%), Mega cap Tech (23%), and AI Hardware/Data Centers (+20%). Meanwhile, Quality Compounders (+5%) trailed the market, yet again.
| 1 | The FMI Common Stock Fund Investor Class (FMIMX) and the FMI Common Stock Fund Institutional Class (FMIUX) had a return of 8.91% and 8.92%, respectively, for the first quarter of 2024. |
| 2 | The FMI Large Cap Fund Investor Class (FMIHX) and the FMI Large Cap Fund Institutional Class (FMIQX) had a return of 8.43% and 8.53%, respectively, for the first quarter of 2024. |
| 3 | Source: Bloomberg – returns do not reflect management fees, transaction costs or expenses. Performance is based on market price returns. Beginning 8/10/20, market price returns are calculated using closing price. Prior to 8/10/20, market price returns were calculated using midpoint bid/ask spread at 4:00 PM ET. |
1
FMI International Fund & FMI International Fund II – Currency Unhedged: Performance
In the first quarter, the FMI International Funds (“International Funds”) gained 5.66%4 on a currency hedged basis and 3.47%5 currency unhedged, compared with the MSCI EAFE Index’s increase of 9.96% in local currency (LOC) and 5.78% in U.S. Dollars (USD). The MSCI EAFE Value Index gained 8.54% in LOC and 4.48% in USD. Growth outpaced value by nearly 3% in the period. Relative to the MSCI EAFE Index, the International Funds’ Transportation sector exposure, and the lack of direct exposure in Utilities and Non-Energy Minerals sectors were additive to performance, while Health Technology, Producer Manufacturing, and Commercial Services detracted. Safran S.A., Yokogawa Electric Corp., and Arch Capital Group Ltd. were the top individual performers, while Smiths Group PLC, NOF Corp., and Smith & Nephew PLC lagged. A strong USD was a tailwind for the currency hedged Fund. A key variance in the quarter was FMI’s underweight in Japan, a geography with a portfolio weight of ~7% compared with ~23% for the MSCI EAFE. The Japanese market outperformed significantly to start the year, with the Nikkei 225 up over 20%.
Who Would Have Guessed?
If you had a crystal ball and had known five years ago that the following would happen …
• A once-in-a-century global pandemic, relegating billions of people to shelter in place, bringing entire industries to a screeching halt.
• U.S. inflation goes from 1.9% to over 9%, before settling in at 3.2% (68% higher).
• The U.S. Federal Funds Rate more than doubles, from 2.4% to 5.3%.
• Mortgage rates in the U.S. rise from 4.1% to 6.8%.
• U.S. Federal Debt increases from $22 trillion to $34 trillion, with ballooning deficits.
• U.S. productivity is well below historical averages.
• A regional banking crisis takes place in the U.S. and several banks fail.
• U.S. economy grows real GDP at a below-average rate of only 2.1%.
• Global growth is on pace for the weakest half-decade in 30 years.
• A Cold War with China, Proxy War with Russia (Ukraine), and the Middle East aflame.
• Political dysfunction deepens, creating a massive cultural divide within the U.S.
… where would you have expected the U.S. stock market would be today?
We highly doubt investors would have predicted a rising stock market, much less an S&P 500 up 102% (vs. 48% for the Russell 2000 and 42% for the MSCI EAFE USD). Unprecedented global stimulus surely helped. The S&P 500 grew earnings by ~37% cumulatively, accounting for about a third of the index’s total return (with multiple expansion making up the majority). Earnings growth was boosted by the Magnificent Seven (Apple, Microsoft, Alphabet, Amazon, Nvidia, Tesla, and Meta Platforms), as the average company grew at a much slower rate. Normalized valuations in the S&P 500 increased considerably, as seen in the graph on the following page:
The market turned a blind eye to numerous negative macro developments, which is not all that uncommon when looking back over a 100-year history. Stocks don’t always follow earnings or macro conditions over 5-year periods. During long periods of time, however, they do eventually track earnings and fundamentals. Periods of excess returns relative to the fundamentals are often followed by periods of subpar returns relative to the fundamentals, and vice versa.
| 4 | The FMI International Fund [currency hedged] Investor Class (FMIJX) and the FMI International Fund [currency hedged] Institutional Class (FMIYX) had a return of 5.66% and 5.70%, respectively, for the first quarter of 2024. |
| 5 | The FMI International Fund [currency unhedged] Institutional Class (FMIFX) had a return of 3.47% for the first quarter of 2024. |
2
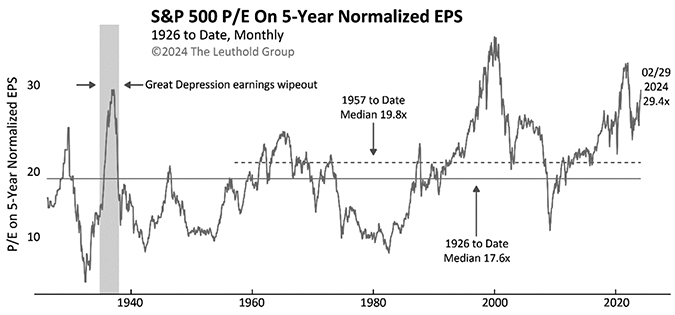
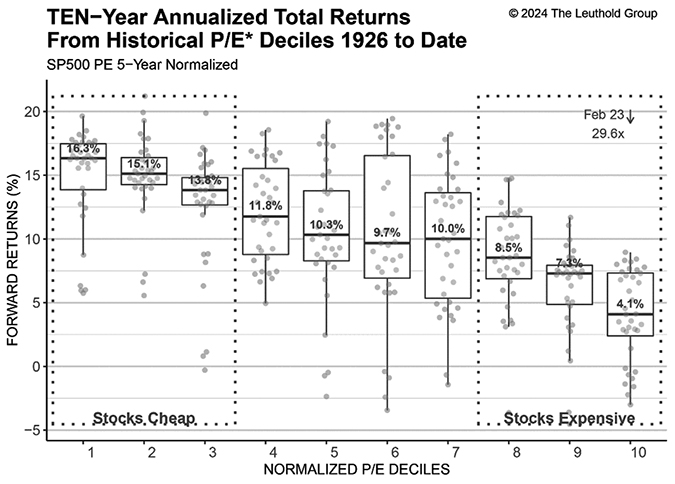
This dynamic is illustrated in the graphic below. The Leuthold Group charts the forward 10-year return from different starting valuation deciles (1st decile = cheapest valuations, 10th decile = most expensive valuations). When valuations are high, the forward-looking returns tend to be below-average. When valuation multiples are low, the forward returns tend to be above-average. Today, the S&P 500 is currently in the 10th decile of historical valuation (on 5-year normalized earnings), one of the most expensive stock markets on record. Since 1926, when starting in the 10th decile of valuation, the forward 10-year returns have averaged only 4.1%. This pales in comparison to the ~15% compound annual return of the last 5 years.
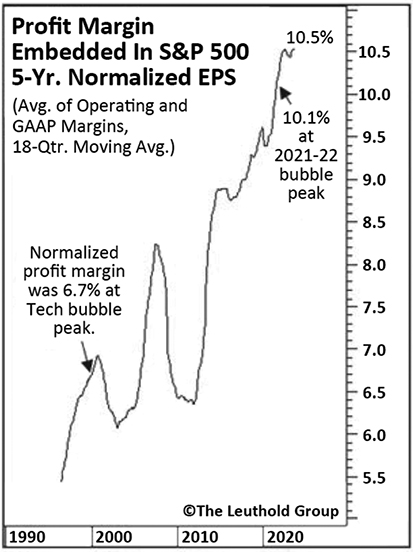
To make matters worse, normalized profit margins in the S&P 500 are currently at a 40-year high, and 56% above where they peaked in the late 1990s tech bubble (see chart on the following page). With both margins and valuations running hot at the same time, we’re left with a potentially unattractive combination.
3
Ultra-low interest rates helped boost valuations (low discount rates) and profit margins (low borrowing costs) in recent years, but the rate environment is much less accommodative today.
Should there be any reversion to the mean in terms of valuations or profit margins (or both), the downside risk could be substantial. Furthermore, it doesn’t help that companies have been facing higher inflation, in both rising input costs and wage growth, which may weigh on profitability over the long-term. The sustainability of the S&P 500’s spectacular run remains an open question, but in our view, improbable.
Not So Active, After All
For many years, the shift from active to passive investing has added fuel to the S&P 500 fire. Active share is a measure of the difference between a portfolio’s holdings and its benchmark index: Active share “always falls between 0% and 100%, with zero indicating a pure passive strategy while a higher reading suggests more active management.” Increasingly, active managers appear to be following the crowd and hugging their benchmarks. As reported by Bloomberg, active core managers have been gravitating toward the S&P 500 Index since 2017, and now have the lowest active share ratio in a decade (see Bank of America chart below). Some active managers have clearly capitulated, as keeping up with the S&P 500 has been elusive.

4
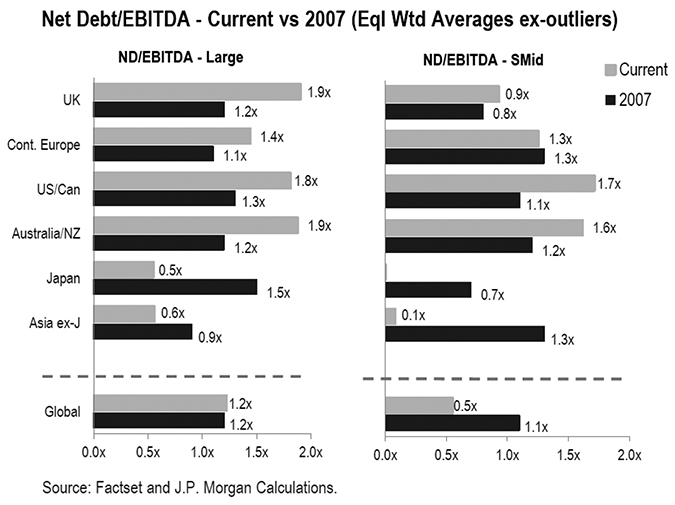
For comparison, FMI’s Common Stock Fund, Large Cap Fund, and International Funds have active shares of 98%, 92%, and 97%, respectively. We look different for a reason. In order to beat the market, you have to do something different. Despite the litany of macro risks, there are always opportunities. We look to invest in advantaged companies that we view as all-weather vehicles through a full cycle. We go where we find the best risk/reward, which can mean zero exposure to some economic sectors when the setup does not fit our eye. We offer our shareholders focused portfolios which trade at a discount to their intrinsic value for temporary reasons. With an investment time horizon of 3-5 years, we let time work on our side, sidestepping the market’s obsession with the here and now. Additionally, we strive to provide downside protection, which may become crucially important given the backdrop. A robust balance sheet is a pre-requisite for our investments. At a time when corporate debt levels in the U.S. and Europe are well above 2007 (which was on the eve of the Great Financial Crisis, as illustrated below), balance sheet strength will likely swing back into focus in the coming years, especially if higher rates are here to stay.
In the Common Stock Fund, we have held the line on business quality, avoiding money-losing businesses, which now comprise roughly 40% of the Russell 2000 constituents. In recent years, we have leaned into high-quality businesses with exposure to housing and construction (Simpson Manufacturing Co. Inc., Fortune Brands Innovations Inc., Beacon Roofing Supply Inc., nVent Electric PLC), which came under pressure due to cyclical concerns and rising interest rates. Our Finance weighting is well below that of the Russell 2000, as it has been more difficult to find financials that meet our quality threshold in the Small Cap arena. We own a number of manufacturers in diversified end-markets (AptarGroup Inc., Donaldson Co. Inc., Fabrinet, Gates Industrial Corp. PLC, ITT Inc.). We do not presently have direct exposure to the Health Technology (which is littered with money-losing biotech companies), Utilities, Transportation, Non-Energy Minerals, and Energy Minerals sectors.
In the Large Cap Fund, we have been finding opportunities outside of the Magnificent Seven, where valuations and expectations are far less lofty (see our December letter for more color). While rising tides have lifted most U.S. Large Cap boats, it’s less extreme apart from mega cap technology. Similar to the Common Stock Fund, we have built positions in companies exposed to housing and
5
construction materials (Carlisle Cos. Inc., Carrier Global Corp., Ferguson PLC, Eaton Corp. PLC, Masco Corp.). We are also overweight in Finance, where we own best-in-class companies in insurance (Progressive Corp., Arch Capital Group Ltd.), discount brokerage (Charles Schwab Corp.), and investment management (BlackRock Inc.). We do not have direct holdings in the Utilities, Transportation, Consumer Durables, Non-Energy Minerals, and Energy Minerals sectors, as we have not found investments that meet our criteria.
In the International Funds, we expanded our travel exposure in recent years (Booking Holdings Inc., Safran S.A., Ryanair Holdings PLC-SP-ADR) when the post-COVID recovery was less certain, added several top-notch UK businesses (B&M European Value Retail S.A., Greggs PLC, Howden Joinery Group PLC) amidst Brexit fears, and built housing and construction materials positions into the aforementioned pressures (Ferguson PLC, Rexel S.A., Ashtead Group PLC, Techtronic Industries Co. Ltd.). We have a significant underweight in the Finance sector, and do not have direct investments in the Utilities, Technology Services, Non-Energy Minerals, and Energy Minerals sectors. We are also underweight Japan, as it has been difficult to find management teams that are shareholder-oriented. While some investors have become enthusiastic about improving corporate governance in Japan, we view most of the company changes as incremental in nature, not needle-moving. We continue to follow the developments on this front, but will remain discerning in our stock selection.
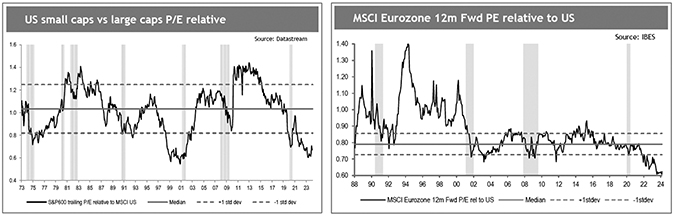
Given the underperformance in recent years, U.S. Small Cap and International stocks continue to trade at a meaningful discount. The following charts illustrate the divergence, with relative valuations around two standard deviations below historical levels. The setup appears favorable.
We remain optimistic as we look forward. All of FMI’s portfolios trade at a sizeable discount to their core benchmarks, while owning well-run, durable businesses. We have great conviction in our research process, which has been finetuned over 40+ years and numerous business cycles. Listed below are holdings from each Fund where the long-term prospects look attractive:
Gates Industrial Corp. PLC (GTES) – FMI Common Stock Fund
Gates manufactures highly engineered power transmission and fluid power solutions. The company is most well-known for its belts, which enable and control motion and are used in a broad range of applications. Blackstone took Gates public in early 2018 and remains the largest shareholder with a 27% ownership interest. Blackstone’s ownership stake is an overhang on the stock as they will inevitably sell their remaining stake. Destocking and a more challenging end market have also weighed on results. These transitory pressures have provided us with an opportunity to own a high-quality, well-run industrial company with solid through-cycle growth prospects and re-rating potential. The company is a leader in its large and fragmented markets with a well-recognized brand known for quality and technological innovation. These markets are largely replacement driven, which helps to reduce cyclicality, and management is targeting a handful of growth opportunities including chain-to-belt conversions, personal mobility, and automotive aftermarket, to name a few, that should drive revenue growth at 2 times underlying industrial
6
production growth. There is also a margin opportunity as management executes on internal initiatives to reduce costs and improve productivity. Finally, with Gates stock trading at around 12 times 2024 P/E, we believe there is an opportunity for Gates to re-rate more in-line with other high-quality industrial peers given its attractive EPS growth outlook and strong return profile.
Charles Schwab Corp. (SCHW) – FMI Large Cap Fund
We last wrote about Charles Schwab a year ago in the midst of the banking crisis. At the time, the worst fears were a bank run and/or balance sheet impairment. Positively, these did not come to pass. As a refresh of our interest in the business, Charles Schwab is a leading discount broker. The business benefits from long run market appreciation and Schwab’s better mousetrap has allowed it to gain share on top of market growth, which has driven long run revenue growth of 10%. The competitive advantage comes from shared economies of scale, whereby Schwab lowers costs to the customer, thereby attracting new assets which then lets them lower costs even more to the customer. The rapid rise in interest rates that precipitated the banking crisis contributed to a challenging last 18 months for Schwab, as clients moved bank cash to higher yielding instruments. This led to a significant, albeit short-term, earnings headwind. As we move into 2024, we believe the worst is behind them. We expect Schwab will experience strong earnings growth for the next few years, driven by accelerating revenue growth and renewed expense discipline. Despite this attractive outlook, Schwab trades for 21 times trough earnings and only 14 times our estimate of normalized earnings.
Weir Group PLC (WEIR LN) – FMI International Funds
Weir is a focused mining technology company. Key products include slurry pumps and ESCO ground engaging tools. The company has undergone a simplification program since Jon Stanton became CEO in 2016. Jon sold Weir’s Flow Control business in 2019 and its Oil & Gas business in 2021 in order to focus on the mining end market. Today, the business employs a razor/razor blade business model, enjoys high barriers to entry, and is highly resilient. The company’s core value proposition to customers is lowest total cost of ownership, which it achieves by manufacturing products that operate more efficiently (using less energy and water) and last longer than alternatives. The cloud hovering over the stock revolves around mining end market concerns, particularly the dearth of large capex projects. We believe these concerns reflect a misunderstanding of Weir’s business model. Weir’s revenue and profitability are driven by the aftermarket, and the aftermarket is largely insensitive to mining capex cycles as evidenced by Weir’s more than 7% aftermarket revenue compound annual growth rate (CAGR) from 2011-2023. Weir targets a mid-to-high single digit organic revenue growth CAGR through the cycle, driven by a favorable ore production backdrop and growing installed base. There is also an opportunity to improve the margin as management executes on its Performance Excellence program and generates operating leverage. All in, we believe double-digit EPS growth through the cycle is an attainable target. The valuation at just over 16 times forward earnings does not reflect the quality of the transformed Weir and through-cycle EPS growth potential.
Thank you for your continued support of Fiduciary Management, Inc.
Please see page 60 for important disclosures.
This shareholder letter is unaudited.
7
FMI Common Stock Fund
SCHEDULE OF INVESTMENTS
March 31, 2024 (Unaudited)
| Shares | Value | |||||||
| COMMON STOCKS — 94.6% | ||||||||
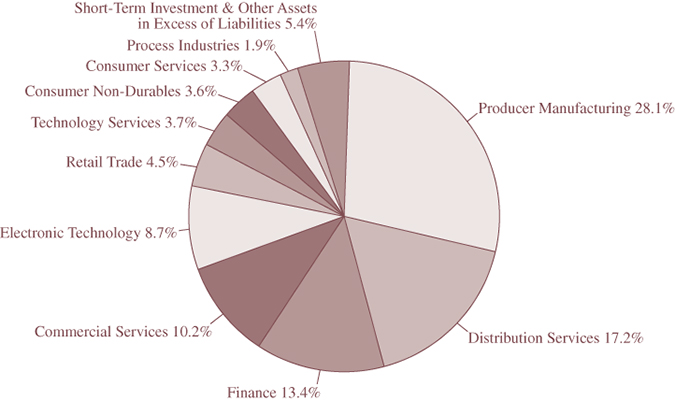
Commercial Services Sector — 10.2% | ||||||||
| Advertising/Marketing Services — 3.1% | ||||||||
| Interpublic Group of Cos. Inc. | 1,930,000 | $ | 62,975,900 | |||||
| Miscellaneous Commercial Services — 3.5% | ||||||||
| Genpact Ltd. | 2,225,000 | 73,313,750 | ||||||
| Personnel Services — 3.6% | ||||||||
| Robert Half Inc. | 940,000 | 74,523,200 | ||||||
| Total Commercial Services | 210,812,850 | |||||||
Consumer Non-Durables Sector — 3.6% | ||||||||
| Apparel/Footwear — 3.6% | ||||||||
Skechers U.S.A. Inc. — Class A(a) | 1,200,000 | 73,512,000 | ||||||
Consumer Services Sector — 3.3% | ||||||||
| Other Consumer Services — 3.3% | ||||||||
Valvoline Inc.(a) | 1,540,000 | 68,637,800 | ||||||
Distribution Services Sector — 17.2% | ||||||||
| Electronics Distributors — 2.7% | ||||||||
Arrow Electronics Inc.(a) | 430,000 | 55,667,800 | ||||||
| Medical Distributors — 4.1% | ||||||||
Henry Schein Inc.(a) | 1,135,000 | 85,715,200 | ||||||
| Wholesale Distributors — 10.4% | ||||||||
| Applied Industrial Technologies Inc. | 270,000 | 53,338,500 | ||||||
Beacon Roofing Supply Inc.(a) | 940,000 | 92,138,800 | ||||||
Core & Main Inc. — Class A(a) | 1,195,000 | 68,413,750 | ||||||
| 213,891,050 | ||||||||
| Total Distribution Services | 355,274,050 | |||||||
Electronic Technology Sector — 8.7% | ||||||||
| Electronic Components — 3.4% | ||||||||
| nVent Electric PLC | 935,000 | 70,499,000 | ||||||
| Electronic Production Equipment — 4.2% | ||||||||
| CTS Corp. | 615,000 | 28,775,850 | ||||||
Plexus Corp.(a) | 610,000 | 57,840,200 | ||||||
| 86,616,050 | ||||||||
| Semiconductors — 1.1% | ||||||||
Fabrinet(a) | 120,000 | 22,682,400 | ||||||
| Total Electronic Technology | 179,797,450 | |||||||
Finance Sector — 13.4% | ||||||||
| Finance/Rental/Leasing — 2.9% | ||||||||
| FirstCash Holdings Inc. | 465,000 | 59,306,100 | ||||||
The accompanying notes to financial statements are an integral part of this schedule.
8
FMI Common Stock Fund
SCHEDULE OF INVESTMENTS (Continued)
March 31, 2024 (Unaudited)
| Shares | Value | |||||||
| COMMON STOCKS — 94.6% (Continued) | ||||||||
Finance Sector — 13.4% (Continued) | ||||||||
| Investment Banks/Brokers — 3.6% | ||||||||
| Houlihan Lokey Inc. — Class A | 580,000 | $ | 74,350,200 | |||||
| Life/Health Insurance — 2.9% | ||||||||
| Primerica Inc. | 240,000 | 60,710,400 | ||||||
| Major Banks — 2.4% | ||||||||
| Zions Bancorporation N.A. | 1,165,000 | 50,561,000 | ||||||
| Multi-Line Insurance — 1.6% | ||||||||
| White Mountains Insurance Group Ltd. | 19,000 | 34,091,700 | ||||||
| Total Finance | 279,019,400 | |||||||
Process Industries Sector — 1.9% | ||||||||
| Containers/Packaging — 1.9% | ||||||||
| AptarGroup Inc. | 275,000 | 39,569,750 | ||||||
Producer Manufacturing Sector — 28.1% | ||||||||
| Auto Parts: OEM — 3.2% | ||||||||
| Donaldson Co. Inc. | 880,000 | 65,718,400 | ||||||
| Building Products — 13.0% | ||||||||
| Carlisle Cos. Inc. | 220,000 | 86,207,000 | ||||||
| Fortune Brands Innovations Inc. | 1,030,000 | 87,210,100 | ||||||
| Simpson Manufacturing Co. Inc. | 470,000 | 96,434,600 | ||||||
| 269,851,700 | ||||||||
| Electrical Products — 1.6% | ||||||||
| Atkore Inc. | 175,000 | 33,313,000 | ||||||
| Industrial Machinery — 8.2% | ||||||||
Gates Industrial Corp. PLC(a) | 3,675,000 | 65,084,250 | ||||||
| ITT Inc. | 385,000 | 52,371,550 | ||||||
| Timken Co. | 585,000 | 51,146,550 | ||||||
| 168,602,350 | ||||||||
| Miscellaneous Manufacturing — 2.1% | ||||||||
| TriMas Corp. | 1,605,000 | 42,901,650 | ||||||
| Total Producer Manufacturing | 580,387,100 | |||||||
Retail Trade Sector — 4.5% | ||||||||
| Specialty Stores — 4.5% | ||||||||
BJ’s Wholesale Club Holdings Inc.(a) | 1,225,000 | 92,671,250 | ||||||
Technology Services Sector — 3.7% | ||||||||
| Information Technology Services — 3.7% | ||||||||
Insight Enterprises Inc.(a) | 415,000 | 76,990,800 | ||||||
TOTAL COMMON STOCKS (Cost $1,293,853,546) | 1,956,672,450 | |||||||
The accompanying notes to financial statements are an integral part of this schedule.
9
FMI Common Stock Fund
SCHEDULE OF INVESTMENTS (Continued)
March 31, 2024 (Unaudited)
| Shares | Value | |||||||
| SHORT-TERM INVESTMENT — 5.2% | ||||||||
| Money Market Fund — 5.2% | ||||||||
First American Treasury Obligations Fund — Class X, 5.22%(b) | 108,379,704 | $ | 108,379,704 | |||||
TOTAL SHORT-TERM INVESTMENT (Cost $108,379,704) | 108,379,704 | |||||||
TOTAL INVESTMENTS — 99.8% (Cost $1,402,233,250) | 2,065,052,154 | |||||||
Other Assets in Excess of Liabilities — 0.2% | 3,103,210 | |||||||
| TOTAL NET ASSETS — 100.0% | $ | 2,068,155,364 | ||||||
Percentages are stated as a percent of net assets.
| PLC | Public Limited Company |
| (a) | Non-income producing security. |
| (b) | The rate shown represents the 7-day effective yield as of March 31, 2024. |
The accompanying notes to financial statements are an integral part of this schedule.
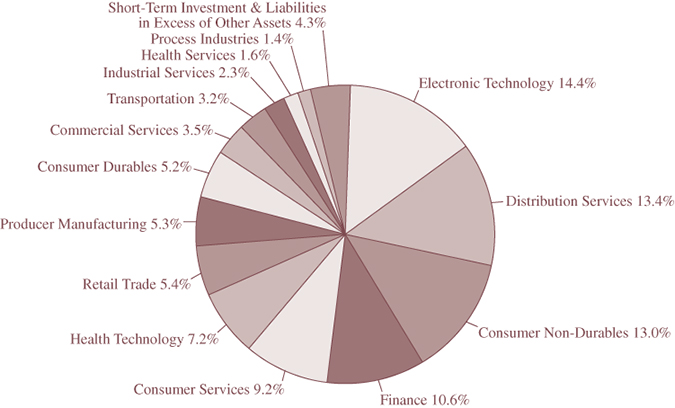
INDUSTRY SECTORS as a percentage of net assets
as of March 31, 2024 (Unaudited)
10
FMI Large Cap Fund
SCHEDULE OF INVESTMENTS
March 31, 2024 (Unaudited)
| Shares | Value | |||||||
| COMMON STOCKS — 96.7% | ||||||||
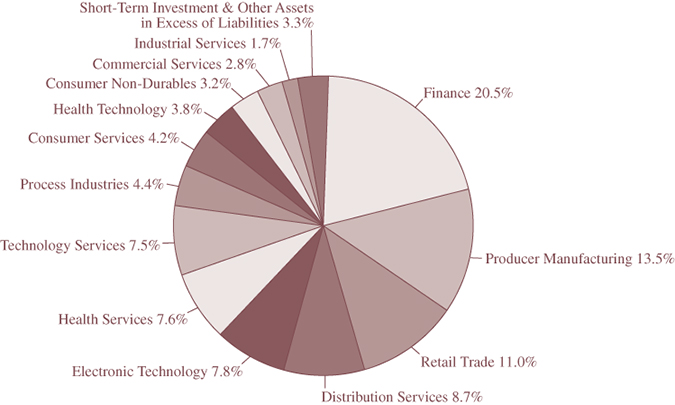
Commercial Services Sector — 2.8% | ||||||||
| Advertising/Marketing Services — 2.8% | ||||||||
| Omnicom Group Inc. | 500,000 | $ | 48,380,000 | |||||
Consumer Non-Durables Sector — 3.2% | ||||||||
| Household/Personal Care — 3.2% | ||||||||
| Unilever PLC — SP-ADR | 1,085,000 | 54,456,150 | ||||||
Consumer Services Sector — 4.2% | ||||||||
| Other Consumer Services — 4.2% | ||||||||
| Booking Holdings Inc. | 20,000 | 72,557,600 | ||||||
Distribution Services Sector — 8.7% | ||||||||
| Food Distributors — 3.1% | ||||||||
| Sysco Corp. | 650,000 | 52,767,000 | ||||||
| Wholesale Distributors — 5.6% | ||||||||
| Ferguson PLC | 445,000 | 97,201,350 | ||||||
| Total Distribution Services | 149,968,350 | |||||||
Electronic Technology Sector — 7.8% | ||||||||
| Computer Processing Hardware — 3.8% | ||||||||
| Sony Group Corp. — SP-ADR | 755,000 | 64,733,700 | ||||||
| Semiconductors — 4.0% | ||||||||
| Micron Technology Inc. | 585,000 | 68,965,650 | ||||||
| Total Electronic Technology | 133,699,350 | |||||||
Finance Sector — 20.5% | ||||||||
| Investment Banks/Brokers — 5.2% | ||||||||
| The Charles Schwab Corp. | 1,230,000 | 88,978,200 | ||||||
| Investment Managers — 4.9% | ||||||||
| BlackRock Inc. | 45,000 | 37,516,500 | ||||||
| Northern Trust Corp. | 520,000 | 46,238,400 | ||||||
| 83,754,900 | ||||||||
| Multi-Line Insurance — 5.4% | ||||||||
Arch Capital Group Ltd.(a) | 425,000 | 39,287,000 | ||||||
| Progressive Corp. | 260,000 | 53,773,200 | ||||||
| 93,060,200 | ||||||||
| Property/Casualty Insurance — 5.0% | ||||||||
Berkshire Hathaway Inc. — Class B(a) | 205,000 | 86,206,600 | ||||||
| Total Finance | 351,999,900 | |||||||
Health Services Sector — 7.6% | ||||||||
| Health Industry Services — 3.0% | ||||||||
| Quest Diagnostics Inc. | 385,000 | 51,247,350 | ||||||
| Managed Health Care — 3.0% | ||||||||
| UnitedHealth Group Inc. | 105,000 | 51,943,500 | ||||||
The accompanying notes to financial statements are an integral part of this schedule.
11
FMI Large Cap Fund
SCHEDULE OF INVESTMENTS (Continued)
March 31, 2024 (Unaudited)
| Shares | Value | |||||||
| COMMON STOCKS — 96.7% (Continued) | ||||||||
Health Services Sector — 7.6% (Continued) | ||||||||
| Medical/Nursing Services — 1.6% | ||||||||
| Fresenius Medical Care AG & Co. KGaA — SP-ADR | 1,440,000 | $ | 27,763,200 | |||||
| Total Health Services | 130,954,050 | |||||||
Health Technology Sector — 3.8% | ||||||||
| Medical Specialties — 3.8% | ||||||||
Koninklijke Philips N.V. — SP-ADR(a) | 1,775,000 | 35,500,000 | ||||||
| Smith & Nephew PLC — SP-ADR | 1,210,000 | 30,685,600 | ||||||
| 66,185,600 | ||||||||
| Total Health Technology | 66,185,600 | |||||||
Industrial Services Sector — 1.7% | ||||||||
| Contract Drilling — 1.7% | ||||||||
| Schlumberger Ltd. | 525,000 | 28,775,250 | ||||||
Process Industries Sector — 4.4% | ||||||||
| Containers/Packaging — 4.4% | ||||||||
| Avery Dennison Corp. | 340,000 | 75,905,000 | ||||||
Producer Manufacturing Sector — 13.5% | ||||||||
| Building Products — 8.6% | ||||||||
| Carlisle Cos. Inc. | 180,000 | 70,533,000 | ||||||
| Masco Corp. | 975,000 | 76,908,000 | ||||||
| 147,441,000 | ||||||||
| Electrical Products — 1.7% | ||||||||
| Eaton Corp. PLC | 95,000 | 29,704,600 | ||||||
| Industrial Machinery — 3.2% | ||||||||
| Carrier Global Corp. | 955,000 | 55,514,150 | ||||||
| Total Producer Manufacturing | 232,659,750 | |||||||
Retail Trade Sector — 11.0% | ||||||||
| Apparel/Footwear Retail — 1.2% | ||||||||
| The TJX Cos. Inc. | 210,000 | 21,298,200 | ||||||
| Discount Stores — 5.6% | ||||||||
| Dollar General Corp. | 345,000 | 53,840,700 | ||||||
Dollar Tree Inc.(a) | 325,000 | 43,273,750 | ||||||
| 97,114,450 | ||||||||
| Specialty Stores — 4.2% | ||||||||
CarMax Inc.(a) | 830,000 | 72,301,300 | ||||||
| Total Retail Trade | 190,713,950 | |||||||
Technology Services Sector — 7.5% | ||||||||
| Information Technology Services — 2.4% | ||||||||
| CDW Corp. | 165,000 | 42,203,700 | ||||||
The accompanying notes to financial statements are an integral part of this schedule.
12
FMI Large Cap Fund
SCHEDULE OF INVESTMENTS (Continued)
March 31, 2024 (Unaudited)
| Shares | Value | |||||||
| COMMON STOCKS — 96.7% (Continued) | ||||||||
Technology Services Sector — 7.5% (Continued) | ||||||||
| Internet Software/Services — 5.1% | ||||||||
Alphabet Inc. — Class A(a) | 580,000 | $ | 87,539,400 | |||||
| Total Technology Services | 129,743,100 | |||||||
TOTAL COMMON STOCKS (Cost $1,071,722,258) | 1,665,998,050 | |||||||
| SHORT-TERM INVESTMENT — 2.5% | ||||||||
| Money Market Fund — 2.5% | ||||||||
First American Treasury Obligations Fund — Class X, 5.22%(b) | 42,480,463 | 42,480,463 | ||||||
TOTAL SHORT-TERM INVESTMENT (Cost $42,480,463) | 42,480,463 | |||||||
TOTAL INVESTMENTS — 99.2% (Cost $1,114,202,721) | 1,708,478,513 | |||||||
Other Assets in Excess of Liabilities — 0.8% | 14,534,041 | |||||||
| TOTAL NET ASSETS — 100.0% | $ | 1,723,012,554 | ||||||
Percentages are stated as a percent of net assets.
| PLC | Public Limited Company |
| SP-ADR | Sponsored American Depositary Receipt |
| (a) | Non-income producing security. |
| (b) | The rate shown represents the 7-day effective yield as of March 31, 2024. |
The accompanying notes to financial statements are an integral part of this schedule.
INDUSTRY SECTORS as a percentage of net assets
as of March 31, 2024 (Unaudited)
13
FMI International Fund
SCHEDULE OF INVESTMENTS
March 31, 2024 (Unaudited)
| Shares | Value | |||||||
| LONG-TERM INVESTMENTS — 94.4% | ||||||||
| COMMON STOCKS — 89.8% | ||||||||
Bermuda — 4.7% | ||||||||
| Miscellaneous Commercial Services — 2.4% | ||||||||
| Genpact Ltd. | 3,465,000 | $ | 114,171,750 | |||||
| Multi-Line Insurance — 2.3% | ||||||||
Arch Capital Group Ltd.(a) | 1,220,000 | 112,776,800 | ||||||
| Total Bermuda | 226,948,550 | |||||||
Britain — 26.7%(b) | ||||||||
| Beverages: Alcoholic — 2.9% | ||||||||
| Diageo PLC | 3,765,000 | 139,313,154 | ||||||
| Beverages: Non-Alcoholic — 2.5% | ||||||||
| Coca-Cola Europacific Partners PLC | 1,770,000 | 123,811,500 | ||||||
| Electrical Products — 2.1% | ||||||||
| Smiths Group PLC | 4,950,000 | 102,605,984 | ||||||
| Electronics/Appliances — 2.6% | ||||||||
| Howden Joinery Group PLC | 10,840,000 | 124,087,285 | ||||||
| Finance/Rental/Leasing — 2.0% | ||||||||
| Ashtead Group PLC | 1,345,000 | 95,803,158 | ||||||
| Food: Specialty/Candy — 3.6% | ||||||||
| Greggs PLC | 4,825,000 | 175,018,048 | ||||||
| Household/Personal Care — 3.8% | ||||||||
| Unilever PLC | 3,670,000 | 184,240,495 | ||||||
| Major Banks — 2.1% | ||||||||
| Lloyds Banking Group PLC | 158,900,000 | 103,919,959 | ||||||
| Medical Specialties — 2.0% | ||||||||
| Smith & Nephew PLC | 7,615,000 | 95,331,957 | ||||||
| Trucks/Construction/Farm Machinery — 3.1% | ||||||||
| Weir Group PLC | 5,950,000 | 151,988,015 | ||||||
| Total Britain | 1,296,119,555 | |||||||
Curacao — 2.2% | ||||||||
| Contract Drilling — 2.2% | ||||||||
| Schlumberger Ltd. | 1,975,000 | 108,249,750 | ||||||
France — 14.0% | ||||||||
| Aerospace & Defense — 3.6% | ||||||||
| Safran S.A. | 780,000 | 176,648,494 | ||||||
| Regional Banks — 1.8% | ||||||||
| Edenred SE | 1,629,966 | 87,031,900 | ||||||
The accompanying notes to financial statements are an integral part of this schedule.
14
FMI International Fund
SCHEDULE OF INVESTMENTS (Continued)
March 31, 2024 (Unaudited)
| Shares | Value | |||||||
| LONG-TERM INVESTMENTS — 94.4% (Continued) | ||||||||
| COMMON STOCKS — 89.8% (Continued) | ||||||||
France — 14.0% (Continued) | ||||||||
| Restaurants — 4.9% | ||||||||
| Sodexo S.A. | 2,750,000 | $ | 235,739,882 | |||||
| Wholesale Distributors — 3.7% | ||||||||
| Rexel S.A. | 6,665,000 | 180,041,143 | ||||||
| Total France | 679,461,419 | |||||||
Germany — 1.6% | ||||||||
| Medical/Nursing Services — 1.6% | ||||||||
| Fresenius Medical Care AG & Co. KGaA | 2,035,000 | 78,194,478 | ||||||
Hong Kong — 2.5% | ||||||||
| Tools & Hardware — 2.5% | ||||||||
| Techtronic Industries Co. Ltd. | 9,100,000 | 123,649,574 | ||||||
Ireland — 3.2% | ||||||||
| Airlines — 3.2% | ||||||||
| Ryanair Holdings PLC — SP-ADR | 1,065,000 | 155,053,350 | ||||||
Japan — 7.3% | ||||||||
| Chemicals: Specialty — 1.3% | ||||||||
| NOF Corp. | 4,770,000 | 65,326,035 | ||||||
| Computer Processing Hardware — 4.3% | ||||||||
| Sony Group Corp. | 2,425,000 | 207,945,520 | ||||||
| Electronic Equipment/Instruments — 1.7% | ||||||||
| Yokogawa Electric Corp. | 3,630,000 | 83,596,619 | ||||||
| Total Japan | 356,868,174 | |||||||
Jersey — 7.5% | ||||||||
| Wholesale Distributors — 7.5% | ||||||||
| Ferguson PLC | 1,670,000 | 365,386,342 | ||||||
Luxembourg — 5.3% | ||||||||
| Discount Stores — 5.3% | ||||||||
| B&M European Value Retail S.A. | 37,400,000 | 257,829,218 | ||||||
Netherlands — 3.2% | ||||||||
| Medical Specialties — 2.1% | ||||||||
Koninklijke Philips N.V.(a) | 5,085,000 | 101,771,284 | ||||||
| Miscellaneous Commercial Services — 1.1% | ||||||||
Pluxee N.V.(a) | 1,777,190 | 52,534,773 | ||||||
| Total Netherlands | 154,306,057 | |||||||
Singapore — 2.2% | ||||||||
| Major Banks — 2.2% | ||||||||
| DBS Group Holdings Ltd. | 4,040,000 | 107,818,790 | ||||||
The accompanying notes to financial statements are an integral part of this schedule.
15
FMI International Fund
SCHEDULE OF INVESTMENTS (Continued)
March 31, 2024 (Unaudited)
| Shares | Value | |||||||
| LONG-TERM INVESTMENTS — 94.4% (Continued) | ||||||||
| COMMON STOCKS — 89.8% (Continued) | ||||||||
Switzerland — 5.1% | ||||||||
| Medical Distributors — 2.0% | ||||||||
| DKSH Holding AG | 1,435,000 | $ | 97,695,459 | |||||
| Pharmaceuticals: Major — 3.1% | ||||||||
| Roche Holding AG | 585,000 | 149,361,641 | ||||||
| Total Switzerland | 247,057,100 | |||||||
United States — 4.3% | ||||||||
| Other Consumer Services — 4.3% | ||||||||
| Booking Holdings Inc. | 57,000 | 206,789,160 | ||||||
TOTAL COMMON STOCKS (Cost $3,481,645,294) | 4,363,731,517 | |||||||
| PREFERRED STOCK — 4.6% | ||||||||
South Korea — 4.6% | ||||||||
| Telecommunications Equipment — 4.6% | ||||||||
| Samsung Electronics Co. Ltd. | 4,515,000 | 225,353,590 | ||||||
TOTAL PREFERRED STOCK (Cost $121,528,178) | 225,353,590 | |||||||
TOTAL LONG-TERM INVESTMENTS (Cost $3,603,173,472) | 4,589,085,107 | |||||||
| SHORT-TERM INVESTMENT — 5.0% | ||||||||
| Money Market Fund — 5.0% | ||||||||
First American Treasury Obligations Fund — Class X, 5.22(b) | 244,867,068 | 244,867,068 | ||||||
TOTAL SHORT-TERM INVESTMENT (Cost $244,867,068) | 244,867,068 | |||||||
TOTAL INVESTMENTS — 99.4% (Cost $3,848,040,540) | 4,833,952,175 | |||||||
Money Market Deposit Account — 0.0%(c) | 223,781 | |||||||
Other Assets in Excess of Liabilities — 0.6% | 30,099,314 | |||||||
| TOTAL NET ASSETS — 100.0% | $ | 4,864,275,270 | ||||||
Percentages are stated as a percent of net assets.
| PLC | Public Limited Company |
| SP-ADR | Sponsored American Depositary Receipt |
| (a) | Non-income producing security. |
| (b) | The rate shown represents the 7-day effective yield as of March 31, 2024. |
| (c) | The U.S. Bank Money Market Deposit Account (the “MMDA”) is a short-term vehicle in which the Fund holds cash balances. The MMDA will bear interest at a variable rate that is determined based on market conditions and is subject to change daily. The rate as of March 31, 2024 was 5.17%. This MMDA is held as collateral for certain forward currency contracts. |
The accompanying notes to financial statements are an integral part of this schedule.
16
FMI International Fund
SCHEDULE OF FORWARD CURRENCY CONTRACTS
March 31, 2024 (Unaudited)
| U.S. $Value on | U.S. $Value on | |||||||||||||||||||
| March 31, 2024 | March 31, 2024 | Unrealized | ||||||||||||||||||
| Settlement | Currency to | of Currency to | Currency to | of Currency to | Appreciation | |||||||||||||||
| Date | Counterparty | be Delivered | be Delivered | be Received | be Received | (Depreciation) | ||||||||||||||
| 4/19/24 | State Street Bank | 1,250,000,000 | $ | 1,577,874,847 | 1,582,985,500 | $ | 1,582,985,500 | $ | 5,110,653 | |||||||||||
| and Trust Co. | British Pound | U.S. Dollar | ||||||||||||||||||
| 4/19/24 | The Bank of | 800,000,000 | 863,836,788 | 872,020,000 | 872,020,000 | 8,183,212 | ||||||||||||||
| New York Mellon | Euro | U.S. Dollar | ||||||||||||||||||
| 4/19/24 | JPMorgan Chase | 825,000,000 | 105,482,919 | 105,621,819 | 105,621,819 | 138,900 | ||||||||||||||
| Bank, N.A. | Hong Kong Dollar | U.S. Dollar | ||||||||||||||||||
| 4/19/24 | The Bank of | 48,000,000,000 | 318,148,358 | 328,250,017 | 328,250,017 | 10,101,659 | ||||||||||||||
| New York Mellon | Japanese Yen | U.S. Dollar | ||||||||||||||||||
| 4/19/24 | JPMorgan Chase | 125,000,000 | 92,670,051 | 93,183,575 | 93,183,575 | 513,524 | ||||||||||||||
| Bank, N.A. | Singapore Dollar | U.S. Dollar | ||||||||||||||||||
| 4/19/24 | State Street Bank | 230,000,000,000 | 171,053,925 | 171,003,717 | 171,003,717 | (50,208 | ) | |||||||||||||
| and Trust Co. | South Korea Won | U.S. Dollar | ||||||||||||||||||
| 4/19/24 | State Street Bank | 20,000,000,000 | 14,874,254 | 14,985,764 | 14,985,764 | 111,510 | ||||||||||||||
| and Trust Co. | South Korea Won | U.S. Dollar | ||||||||||||||||||
| 4/19/24 | The Bank of | 200,000,000 | 222,307,268 | 233,045,910 | 233,045,910 | 10,738,642 | ||||||||||||||
| New York Mellon | Swiss Franc | U.S. Dollar | ||||||||||||||||||
| $ | 3,366,248,410 | $ | 3,401,096,302 | $ | 34,847,892 | |||||||||||||||
The accompanying notes to financial statements are an integral part of this schedule.
17
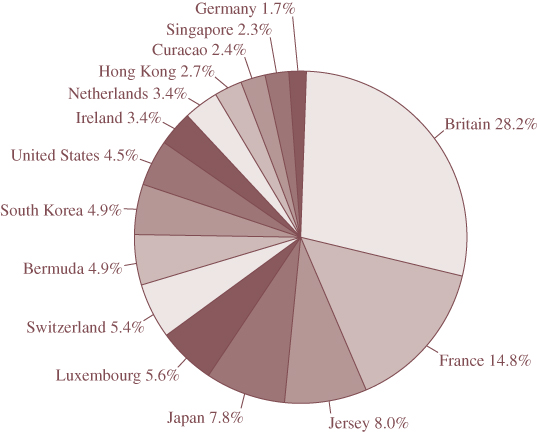
FMI International Fund
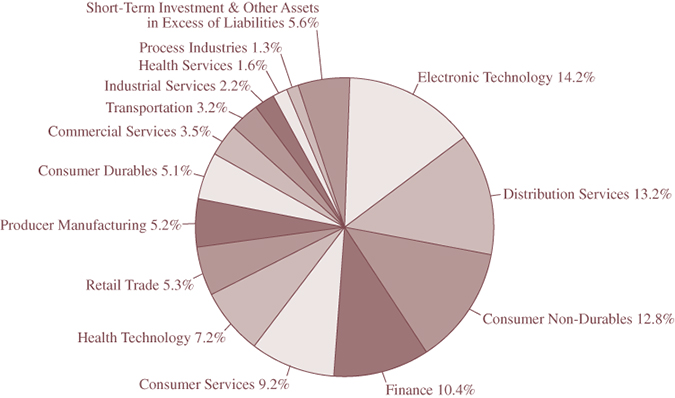
INDUSTRY SECTORS as a percentage of net assets
as of March 31, 2024 (Unaudited)
CONCENTRATION BY COUNTRY based on domicile of issuer as
a percentage of long-term investments only
as of March 31, 2024 (Unaudited)
18
FMI International Fund II – Currency Unhedged
SCHEDULE OF INVESTMENTS
March 31, 2024 (Unaudited)
| Shares | Value | |||||||
| LONG-TERM INVESTMENTS — 95.7% | ||||||||
| COMMON STOCKS — 91.0% | ||||||||
Bermuda — 4.7% | ||||||||
| Miscellaneous Commercial Services — 2.4% | ||||||||
| Genpact Ltd. | 58,850 | $ | 1,939,108 | |||||
| Multi-Line Insurance — 2.3% | ||||||||
Arch Capital Group Ltd.(a) | 20,725 | 1,915,819 | ||||||
| Total Bermuda | 3,854,927 | |||||||
Britain — 27.1% | ||||||||
| Beverages: Alcoholic — 2.9% | ||||||||
| Diageo PLC | 63,900 | 2,364,438 | ||||||
| Beverages: Non-Alcoholic — 2.6% | ||||||||
| Coca-Cola Europacific Partners PLC | 30,000 | 2,098,500 | ||||||
| Electrical Products — 2.1% | ||||||||
| Smiths Group PLC | 84,000 | 1,741,192 | ||||||
| Electronics/Appliances — 2.6% | ||||||||
| Howden Joinery Group PLC | 184,400 | 2,110,858 | ||||||
| Finance/Rental/Leasing — 2.0% | ||||||||
| Ashtead Group PLC | 22,850 | 1,627,585 | ||||||
| Food: Specialty/Candy — 3.7% | ||||||||
| Greggs PLC | 82,000 | 2,974,400 | ||||||
| Household/Personal Care — 3.8% | ||||||||
| Unilever PLC | 62,350 | 3,130,080 | ||||||
| Major Banks — 2.2% | ||||||||
| Lloyds Banking Group PLC | 2,705,800 | 1,769,583 | ||||||
| Medical Specialties — 2.0% | ||||||||
| Smith & Nephew PLC | 129,850 | 1,625,588 | ||||||
| Trucks/Construction/Farm Machinery — 3.2% | ||||||||
| Weir Group PLC | 101,000 | 2,579,965 | ||||||
| Total Britain | 22,022,189 | |||||||
Curacao — 2.3% | ||||||||
| Contract Drilling — 2.3% | ||||||||
| Schlumberger Ltd. | 33,500 | 1,836,135 | ||||||
France — 14.1% | ||||||||
| Aerospace & Defense — 3.7% | ||||||||
| Safran S.A. | 13,200 | 2,989,436 | ||||||
| Regional Banks — 1.8% | ||||||||
| Edenred SE | 27,527 | 1,469,802 | ||||||
The accompanying notes to financial statements are an integral part of this schedule.
19
FMI International Fund II – Currency Unhedged
SCHEDULE OF INVESTMENTS (Continued)
March 31, 2024 (Unaudited)
| Shares | Value | |||||||
| LONG-TERM INVESTMENTS — 95.7% (Continued) | ||||||||
| COMMON STOCKS — 91.0% (Continued) | ||||||||
France — 14.1% (Continued) | ||||||||
| Restaurants — 4.9% | ||||||||
| Sodexo S.A. | 46,600 | $ | 3,994,720 | |||||
| Wholesale Distributors — 3.7% | ||||||||
| Rexel S.A. | 113,150 | 3,056,512 | ||||||
| Total France | 11,510,470 | |||||||
Germany — 1.6% | ||||||||
| Medical/Nursing Services — 1.6% | ||||||||
| Fresenius Medical Care AG & Co. KGaA | 34,875 | 1,340,065 | ||||||
Hong Kong — 2.6% | ||||||||
| Tools & Hardware — 2.6% | ||||||||
| Techtronic Industries Co. Ltd. | 154,500 | 2,099,325 | ||||||
Ireland — 3.2% | ||||||||
| Airlines — 3.2% | ||||||||
| Ryanair Holdings PLC — SP-ADR | 18,000 | 2,620,620 | ||||||
Japan — 7.4% | ||||||||
| Chemicals: Specialty — 1.4% | ||||||||
| NOF Corp. | 81,000 | 1,109,310 | ||||||
| Computer Processing Hardware — 4.3% | ||||||||
| Sony Group Corp. | 41,200 | 3,532,930 | ||||||
| Electronic Equipment/Instruments — 1.7% | ||||||||
| Yokogawa Electric Corp. | 61,600 | 1,418,609 | ||||||
| Total Japan | 6,060,849 | |||||||
Jersey — 7.6% | ||||||||
| Wholesale Distributors — 7.6% | ||||||||
| Ferguson PLC | 28,375 | 6,208,286 | ||||||
Luxembourg — 5.4% | ||||||||
| Discount Stores — 5.4% | ||||||||
| B&M European Value Retail S.A. | 635,200 | 4,378,960 | ||||||
Netherlands — 3.2% | ||||||||
| Medical Specialties — 2.1% | ||||||||
Koninklijke Philips N.V.(a) | 86,500 | 1,731,213 | ||||||
| Miscellaneous Commercial Services — 1.1% | ||||||||
Pluxee N.V.(a) | 29,810 | 881,201 | ||||||
| Total Netherlands | 2,612,414 | |||||||
The accompanying notes to financial statements are an integral part of this schedule.
20
FMI International Fund II – Currency Unhedged
SCHEDULE OF INVESTMENTS (Continued)
March 31, 2024 (Unaudited)
| Shares | Value | |||||||
| LONG-TERM INVESTMENTS — 95.7% (Continued) | ||||||||
| COMMON STOCKS — 91.0% (Continued) | ||||||||
Singapore — 2.3% | ||||||||
| Major Banks — 2.3% | ||||||||
| DBS Group Holdings Ltd. | 68,700 | $ | 1,833,453 | |||||
Switzerland — 5.2% | ||||||||
| Medical Distributors — 2.1% | ||||||||
| DKSH Holding AG | 24,375 | 1,659,461 | ||||||
| Pharmaceuticals: Major — 3.1% | ||||||||
| Roche Holding AG | 9,950 | 2,540,425 | ||||||
| Total Switzerland | 4,199,886 | |||||||
United States — 4.3% | ||||||||
| Other Consumer Services — 4.3% | ||||||||
| Booking Holdings Inc. | 970 | 3,519,044 | ||||||
TOTAL COMMON STOCKS (Cost $61,279,720) | 74,096,623 | |||||||
| PREFERRED STOCK — 4.7% | ||||||||
South Korea — 4.7% | ||||||||
| Telecommunications Equipment — 4.7% | ||||||||
| Samsung Electronics Co. Ltd. | 76,700 | 3,828,266 | ||||||
TOTAL PREFERRED STOCK (Cost $3,327,870) | 3,828,266 | |||||||
TOTAL LONG-TERM INVESTMENTS (Cost $64,607,590) | 77,924,889 | |||||||
| SHORT-TERM INVESTMENT — 4.4% | ||||||||
| Money Market Fund — 4.4% | ||||||||
First American Treasury Obligations Fund — Class X, 5.22%(b) | 3,542,930 | 3,542,930 | ||||||
TOTAL SHORT-TERM INVESTMENT (Cost $3,542,930) | 3,542,930 | |||||||
TOTAL INVESTMENTS — 100.1% (Cost $68,150,520) | 81,467,819 | |||||||
Liabilities in Excess of Other Assets — (0.1)% | (79,725 | ) | ||||||
| TOTAL NET ASSETS — 100.0% | $ | 81,388,094 | ||||||
Percentages are stated as a percent of net assets.
| PLC | Public Limited Company |
| SP-ADR | Sponsored American Depositary Receipt |
| (a) | Non-income producing security. |
| (b) | The rate shown represents the 7-day effective yield as of March 31, 2024. |
The accompanying notes to financial statements are an integral part of this schedule.
21
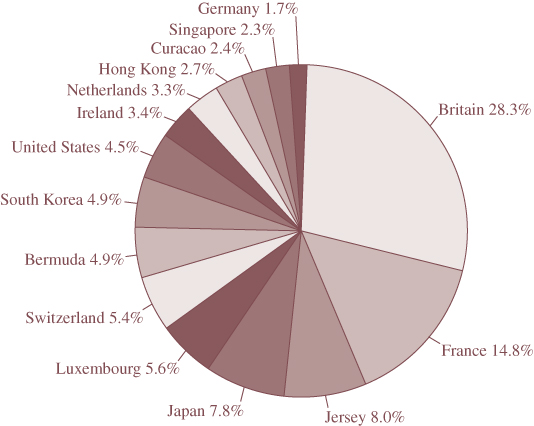
FMI International Fund II – Currency Unhedged
INDUSTRY SECTORS as a percentage of net assets
as of March 31, 2024 (Unaudited)
CONCENTRATION BY COUNTRY based on domicile of issuer as
a percentage of long-term investments only
as of March 31, 2024 (Unaudited)
22
(This Page Intentionally Left Blank.)
23
FMI Funds, Inc.
STATEMENTS OF ASSETS AND LIABILITIES
March 31, 2024 (Unaudited)
| FMI | |||||||||||||||||
| FMI | FMI | FMI | International | ||||||||||||||
| Common Stock | Large Cap | International | Fund II – Currency | ||||||||||||||
| Fund | Fund | Fund | Unhedged | ||||||||||||||
| ASSETS: | |||||||||||||||||
| Investments in securities, | |||||||||||||||||
at value(1) | $ | 2,065,052,154 | $ | 1,708,478,513 | $ | 4,833,952,175 | $ | 81,467,819 | |||||||||
| Cash | — | 89,300 | 223,767 | — | |||||||||||||
| Restricted cash | — | — | 640,000 | — | |||||||||||||
| Receivable from shareholders | |||||||||||||||||
| for purchases | 4,802,392 | 13,217,269 | 7,994,205 | 14,675 | |||||||||||||
| Dividends, interest and | |||||||||||||||||
| other receivables | 644,699 | 3,204,093 | 19,012,062 | 345,007 | |||||||||||||
| Receivable for | |||||||||||||||||
| investments sold | — | — | 826,899 | 32,146 | |||||||||||||
| Unrealized appreciation on | |||||||||||||||||
| forward currency contracts | — | — | 34,898,100 | — | |||||||||||||
| Prepaid directors’ retainer | 586 | 586 | 586 | 586 | |||||||||||||
| Prepaid expenses | 118,588 | 47,958 | 128,483 | 20,117 | |||||||||||||
| Total assets | $ | 2,070,618,419 | $ | 1,725,037,719 | $ | 4,897,676,277 | $ | 81,880,350 | |||||||||
| LIABILITIES: | |||||||||||||||||
| Payable to brokers | |||||||||||||||||
| for collateral received | $ | — | $ | — | $ | 640,000 | $ | — | |||||||||
| Payable to brokers | |||||||||||||||||
| for investments purchased | — | — | 25,919,841 | 437,758 | |||||||||||||
| Payable to shareholders | |||||||||||||||||
| for redemptions | 1,211,878 | 1,140,589 | 3,806,604 | — | |||||||||||||
| Payable for foreign | |||||||||||||||||
| currency transactions | — | — | 74,117 | 1,198 | |||||||||||||
| Payable to adviser | |||||||||||||||||
| for management fees | 1,182,191 | 723,843 | 2,645,211 | 31,790 | |||||||||||||
| Payable to custodian | 6,016 | 13,085 | 84,989 | 3,734 | |||||||||||||
| Unrealized depreciation on | |||||||||||||||||
| forward currency contracts | — | — | 50,208 | — | |||||||||||||
| Other liabilities | 62,970 | 147,648 | 180,037 | 17,776 | |||||||||||||
| Total liabilities | 2,463,055 | 2,025,165 | 33,401,007 | 492,256 | |||||||||||||
| Net assets | $ | 2,068,155,364 | $ | 1,723,012,554 | $ | 4,864,275,270 | $ | 81,388,094 | |||||||||
| NET ASSETS: | |||||||||||||||||
| Capital stock | $ | 1,400,210,192 | $ | 1,067,068,171 | $ | 4,296,893,725 | $ | 72,051,552 | |||||||||
| Total distributable | |||||||||||||||||
| earnings/(accumulated | |||||||||||||||||
| deficit) | 667,945,172 | 655,944,383 | 567,381,545 | 9,336,542 | |||||||||||||
| Net assets | $ | 2,068,155,364 | $ | 1,723,012,554 | $ | 4,864,275,270 | $ | 81,388,094 | |||||||||
The accompanying notes to financial statements are an integral part of these financial statements.
24
FMI Funds, Inc.
STATEMENTS OF ASSETS AND LIABILITIES (Continued)
March 31, 2024 (Unaudited)
| FMI | |||||||||||||||||
| FMI | FMI | FMI | International | ||||||||||||||
| Common Stock | Large Cap | International | Fund II – Currency | ||||||||||||||
| Fund | Fund | Fund | Unhedged | ||||||||||||||
| CALCULATION OF NET | |||||||||||||||||
| ASSET VALUE PER SHARE: | |||||||||||||||||
| Investor Class Shares: | |||||||||||||||||
| Net assets | $ | 772,213,580 | $ | 1,012,240,191 | $ | 1,215,940,656 | $ | — | |||||||||
| Shares outstanding | 20,775,354 | 62,466,107 | 33,944,634 | — | |||||||||||||
| Shares authorized | |||||||||||||||||
| ($0.0001 par value) | 300,000,000 | 300,000,000 | 300,000,000 | — | |||||||||||||
| Net asset value, offering and | |||||||||||||||||
| redemption price per share | $ | 37.17 | $ | 16.20 | $ | 35.82 | $ | — | |||||||||
| Institutional Class Shares: | |||||||||||||||||
| Net assets | $ | 1,295,941,784 | $ | 710,772,363 | $ | 3,648,334,614 | $ | 81,388,094 | |||||||||
| Shares outstanding | 34,808,558 | 43,988,665 | 101,401,628 | 3,740,145 | |||||||||||||
| Shares authorized | |||||||||||||||||
| ($0.0001 par value) | 300,000,000 | 300,000,000 | 300,000,000 | 300,000,000 | |||||||||||||
| Net asset value, offering and | |||||||||||||||||
| redemption price per share | $ | 37.23 | $ | 16.16 | $ | 35.98 | $ | 21.76 | |||||||||
(1) | Identified cost of investments | $ | 1,402,233,250 | $ | 1,114,202,721 | $ | 3,848,040,540 | $ | 68,150,520 | ||||||||
The accompanying notes to financial statements are an integral part of these financial statements.
25
FMI Funds, Inc.
STATEMENTS OF OPERATIONS
For the Six Month Period Ending March 31, 2024 (Unaudited)
| FMI | |||||||||||||||||
| FMI | FMI | FMI | International | ||||||||||||||
| Common Stock | Large Cap | International | Fund II – Currency | ||||||||||||||
| Fund | Fund | Fund | Unhedged | ||||||||||||||
| INCOME: | |||||||||||||||||
Dividends(1) | $ | 7,037,604 | $ | 10,410,704 | $ | 48,305,210 | $ | 839,990 | |||||||||
| Interest | 2,679,107 | 880,069 | 6,867,645 | 95,526 | |||||||||||||
| Total income | 9,716,711 | 11,290,773 | 55,172,855 | 935,516 | |||||||||||||
| EXPENSES: | |||||||||||||||||
| Management fees | 6,847,556 | 5,250,844 | 16,000,936 | 282,431 | |||||||||||||
| Shareholder servicing fees | |||||||||||||||||
| (Investor Class) | 318,141 | 583,097 | 614,983 | — | |||||||||||||
| Administration and | |||||||||||||||||
| accounting services | 185,402 | 175,209 | 438,135 | 16,290 | |||||||||||||
| Printing and postage expense | 39,178 | 66,008 | 363,867 | 3,104 | |||||||||||||
| Transfer agent fees | 39,794 | 39,617 | 55,100 | 9,161 | |||||||||||||
| Custodian fees | 27,175 | 32,067 | 246,241 | 14,455 | |||||||||||||
| Registration fees | 56,060 | 36,344 | 75,182 | 15,141 | |||||||||||||
| Board of Directors fees | 41,914 | 41,914 | 41,914 | 41,914 | |||||||||||||
| Professional fees | 19,469 | 20,292 | 22,392 | 19,182 | |||||||||||||
| Other expenses | 44,730 | 52,224 | 153,256 | 17,794 | |||||||||||||
| Total expenses | |||||||||||||||||
| before reimbursement | 7,619,419 | 6,297,616 | 18,012,006 | 419,472 | |||||||||||||
| Less expenses | |||||||||||||||||
| reimbursed by adviser | — | — | — | (80,555 | ) | ||||||||||||
| Net expenses | 7,619,419 | 6,297,616 | 18,012,006 | 338,917 | |||||||||||||
| NET INVESTMENT INCOME | 2,097,292 | 4,993,157 | 37,160,849 | 596,599 | |||||||||||||
The accompanying notes to financial statements are an integral part of these financial statements.
26
FMI Funds, Inc.
STATEMENTS OF OPERATIONS (Continued)
For the Six Month Period Ending March 31, 2024 (Unaudited)
| FMI | ||||||||||||||||
| FMI | FMI | FMI | International | |||||||||||||
| Common Stock | Large Cap | International | Fund II – Currency | |||||||||||||
| Fund | Fund | Fund | Unhedged | |||||||||||||
| NET REALIZED GAIN (LOSS) | ||||||||||||||||
| ON INVESTMENTS: | ||||||||||||||||
| Securities | $ | 8,354,859 | $ | 80,537,717 | $ | 50,875,717 | $ | 794,989 | ||||||||
| Forward currency contracts | — | — | 116,170,067 | — | ||||||||||||
| Foreign currency transactions | — | — | 6,973,858 | (4,012 | ) | |||||||||||
| NET REALIZED GAIN (LOSS) | ||||||||||||||||
| ON INVESTMENTS | 8,354,859 | 80,537,717 | 174,019,642 | 790,977 | ||||||||||||
| NET CHANGE IN UNREALIZED | ||||||||||||||||
| APPRECIATION/DEPRECIATION | ||||||||||||||||
| ON INVESTMENTS: | ||||||||||||||||
| Securities | 345,620,144 | 247,082,099 | 468,228,821 | 8,074,177 | ||||||||||||
| Forward currency contracts | — | — | (154,437,854 | ) | — | |||||||||||
| Foreign currency transactions | — | — | 104,951 | 4,834 | ||||||||||||
| NET CHANGE IN UNREALIZED | ||||||||||||||||
| APPRECIATION/DEPRECIATION | ||||||||||||||||
| ON INVESTMENTS | 345,620,144 | 247,082,099 | 313,895,918 | 8,079,011 | ||||||||||||
| NET GAIN (LOSS) | ||||||||||||||||
| ON INVESTMENTS | 353,975,003 | 327,619,816 | 487,915,560 | 8,869,988 | ||||||||||||
| NET INCREASE (DECREASE) IN | ||||||||||||||||
| NET ASSETS RESULTING | ||||||||||||||||
| FROM OPERATIONS | $ | 356,072,295 | $ | 332,612,973 | $ | 525,076,409 | $ | 9,466,587 | ||||||||
(1) Net withholding taxes | $ | — | $ | (24,301 | ) | $ | (5,049,855 | ) | $ | (88,991 | ) | |||||
The accompanying notes to financial statements are an integral part of these financial statements.
27
FMI Common Stock Fund
STATEMENTS OF CHANGES IN NET ASSETS
For the Six Month Period Ending March 31, 2024 (Unaudited) and For the Year Ended September 30, 2023
| 2024 | 2023 | ||||||||
| OPERATIONS: | |||||||||
| Net investment income | $ | 2,097,292 | $ | 5,338,663 | |||||
| Net realized gain (loss) on investments | 8,354,859 | 49,844,575 | |||||||
| Net change in unrealized appreciation/depreciation | |||||||||
| on investments | 345,620,144 | 186,175,485 | |||||||
| Net increase (decrease) in net assets from operations | 356,072,295 | 241,358,723 | |||||||
| DISTRIBUTIONS TO SHAREHOLDERS FROM: | |||||||||
| Investor Class | (17,421,723 | ) | (24,761,425 | ) | |||||
| Institutional Class | (31,829,415 | ) | (43,252,225 | ) | |||||
| Total distributions (Note 8) | (49,251,138 | ) | (68,013,650 | ) | |||||
| FUND SHARE ACTIVITIES: | |||||||||
| Net increase (decrease) in net assets | |||||||||
| derived from Fund share activities (Note 9) | 304,953,175 | 336,093,353 | |||||||
| TOTAL INCREASE (DECREASE) | 611,774,332 | 509,438,426 | |||||||
| NET ASSETS AT THE BEGINNING OF THE PERIOD | 1,456,381,032 | 946,942,606 | |||||||
| NET ASSETS AT THE END OF THE PERIOD | $ | 2,068,155,364 | $ | 1,456,381,032 | |||||
| FUND SHARE TRANSACTIONS: | |||||||||
| Net increase (decrease) in shares outstanding (Note 9) | 9,126,859 | 11,064,838 | |||||||
The accompanying notes to financial statements are an integral part of these financial statements.
28
FMI Large Cap Fund
STATEMENTS OF CHANGES IN NET ASSETS
For the Six Month Period Ending March 31, 2024 (Unaudited) and For the Year Ended September 30, 2023
| 2024 | 2023 | ||||||||
| OPERATIONS: | |||||||||
| Net investment income | $ | 4,993,157 | $ | 12,424,663 | |||||
| Net realized gain (loss) on investments | 80,537,717 | 224,712,914 | |||||||
| Net change in unrealized appreciation/depreciation | |||||||||
| on investments | 247,082,099 | 123,293,235 | |||||||
| Net increase (decrease) in net assets from operations | 332,612,973 | 360,430,812 | |||||||
| DISTRIBUTIONS TO SHAREHOLDERS FROM: | |||||||||
| Investor Class | (94,753,313 | ) | (195,562,163 | ) | |||||
| Institutional Class | (67,059,664 | ) | (141,809,940 | ) | |||||
| Total distributions (Note 8) | (161,812,977 | ) | (337,372,103 | ) | |||||
| FUND SHARE ACTIVITIES: | |||||||||
| Net increase (decrease) in net assets | |||||||||
| derived from Fund share activities (Note 9) | (66,192,598 | ) | (476,826,899 | ) | |||||
| TOTAL INCREASE (DECREASE) | 104,607,398 | (453,768,190 | ) | ||||||
| NET ASSETS AT THE BEGINNING OF THE PERIOD | 1,618,405,156 | 2,072,173,346 | |||||||
| NET ASSETS AT THE END OF THE PERIOD | $ | 1,723,012,554 | $ | 1,618,405,156 | |||||
| FUND SHARE TRANSACTIONS: | |||||||||
| Net increase (decrease) in shares outstanding (Note 9) | (4,355,574 | ) | (27,616,579 | ) | |||||
The accompanying notes to financial statements are an integral part of these financial statements.
29
FMI International Fund
STATEMENTS OF CHANGES IN NET ASSETS
For the Six Month Period Ending March 31, 2024 (Unaudited) and For the Year Ended September 30, 2023
| 2024 | 2023 | ||||||||
| OPERATIONS: | |||||||||
| Net investment income | $ | 37,160,849 | $ | 68,966,866 | |||||
| Net realized gain (loss) on investments | 174,019,642 | (216,154,731 | ) | ||||||
| Net change in unrealized appreciation/depreciation | |||||||||
| on investments | 313,895,918 | 1,044,743,127 | |||||||
| Net increase (decrease) in net assets from operations | 525,076,409 | 897,555,262 | |||||||
| DISTRIBUTIONS TO SHAREHOLDERS FROM: | |||||||||
| Investor Class | — | (116,170,330 | ) | ||||||
| Institutional Class | — | (331,682,134 | ) | ||||||
| Total distributions (Note 8) | — | (447,852,464 | ) | ||||||
| FUND SHARE ACTIVITIES: | |||||||||
| Net increase (decrease) in net assets | |||||||||
| derived from Fund share activities (Note 9) | 253,629,401 | 665,106,078 | |||||||
| TOTAL INCREASE (DECREASE) | 778,705,810 | 1,114,808,876 | |||||||
| NET ASSETS AT THE BEGINNING OF THE PERIOD | 4,085,569,460 | 2,970,760,584 | |||||||
| NET ASSETS AT THE END OF THE PERIOD | $ | 4,864,275,270 | $ | 4,085,569,460 | |||||
| FUND SHARE TRANSACTIONS: | |||||||||
| Net increase (decrease) in shares outstanding (Note 9) | 7,661,539 | 22,790,348 | |||||||
The accompanying notes to financial statements are an integral part of these financial statements.
30
FMI International Fund II – Currency Unhedged
STATEMENTS OF CHANGES IN NET ASSETS
For the Six Month Period Ending March 31, 2024 (Unaudited) and For the Year Ended September 30, 2023
| 2024 | 2023 | ||||||||
| OPERATIONS: | |||||||||
| Net investment income | $ | 596,599 | $ | 1,166,440 | |||||
| Net realized gain (loss) on investments | 790,977 | (3,305,489 | ) | ||||||
| Net change in unrealized appreciation/depreciation | |||||||||
| on investments | 8,079,011 | 18,801,887 | |||||||
| Net increase (decrease) in net assets from operations | 9,466,587 | 16,662,838 | |||||||
| DISTRIBUTIONS TO SHAREHOLDERS FROM: | |||||||||
| Institutional Class | (1,165,735 | ) | (830,255 | ) | |||||
| Total distributions (Note 8) | (1,165,735 | ) | (830,255 | ) | |||||
| FUND SHARE ACTIVITIES: | |||||||||
| Net increase (decrease) in net assets | |||||||||
| derived from Fund share activities (Note 9) | 1,898,831 | 6,370,101 | |||||||
| TOTAL INCREASE (DECREASE) | 10,199,683 | 22,202,684 | |||||||
| NET ASSETS AT THE BEGINNING OF THE PERIOD | 71,188,411 | 48,985,727 | |||||||
| NET ASSETS AT THE END OF THE PERIOD | $ | 81,388,094 | $ | 71,188,411 | |||||
| FUND SHARE TRANSACTIONS: | |||||||||
| Net increase (decrease) in shares outstanding (Note 9) | 92,049 | 336,674 | |||||||
The accompanying notes to financial statements are an integral part of these financial statements.
31
FMI Common Stock Fund
FINANCIAL HIGHLIGHTS
(Selected data for each share of the Fund outstanding throughout each period)
Investor Class
| (Unaudited) | ||||||||||||||||||||||||
| For the | ||||||||||||||||||||||||
| Six Month | ||||||||||||||||||||||||
| Period Ending | ||||||||||||||||||||||||
| March 31, | Years Ended September 30, | |||||||||||||||||||||||
| 2024 | 2023 | 2022 | 2021 | 2020 | 2019 | |||||||||||||||||||
| PER SHARE OPERATING | ||||||||||||||||||||||||
| PERFORMANCE: | ||||||||||||||||||||||||
| Net asset value, | ||||||||||||||||||||||||
| beginning of period | $ | 31.31 | $ | 26.72 | $ | 33.23 | $ | 22.25 | $ | 26.39 | $ | 27.55 | ||||||||||||
| Income from | ||||||||||||||||||||||||
| investment operations: | ||||||||||||||||||||||||
| Net investment | ||||||||||||||||||||||||
income (loss)(1) | 0.03 | 0.11 | 0.03 | 0.08 | 0.17 | 0.15 | ||||||||||||||||||
| Net realized and unrealized | ||||||||||||||||||||||||
| gain (loss) on investments | 6.80 | 6.35 | (2.57 | ) | 11.11 | (3.02 | ) | 0.94 | ||||||||||||||||
| Total from | ||||||||||||||||||||||||
| investment operations | 6.83 | 6.46 | (2.54 | ) | 11.19 | (2.85 | ) | 1.09 | ||||||||||||||||
| Less distributions: | ||||||||||||||||||||||||
| Distributions from | ||||||||||||||||||||||||
| net investment income | (0.09 | ) | (0.04 | ) | (0.11 | ) | (0.21 | ) | (0.11 | ) | (0.10 | ) | ||||||||||||
| Distributions from | ||||||||||||||||||||||||
| net realized gains | (0.88 | ) | (1.83 | ) | (3.86 | ) | — | (1.18 | ) | (2.15 | ) | |||||||||||||
| Total from distributions | (0.97 | ) | (1.87 | ) | (3.97 | ) | (0.21 | ) | (1.29 | ) | (2.25 | ) | ||||||||||||
| Net asset value, end of period | $ | 37.17 | $ | 31.31 | $ | 26.72 | $ | 33.23 | $ | 22.25 | $ | 26.39 | ||||||||||||
| TOTAL RETURN | 22.02 | %(2) | 25.08 | % | (9.10 | %) | 50.49 | % | (11.51 | %) | 5.28 | % | ||||||||||||
| RATIOS/SUPPLEMENTAL DATA: | ||||||||||||||||||||||||
| Net assets, end of | ||||||||||||||||||||||||
| period (in 000’s $) | 772,214 | 531,535 | 357,946 | 423,286 | 345,428 | 529,234 | ||||||||||||||||||
| Ratio of expenses to | ||||||||||||||||||||||||
| average net assets | 0.95 | %(3) | 0.99 | % | 1.00 | % | 1.01 | % | 1.02 | % | 1.02 | % | ||||||||||||
| Ratio of net investment | ||||||||||||||||||||||||
| income (loss) to | ||||||||||||||||||||||||
| average net assets | 0.18 | %(3) | 0.35 | % | 0.09 | % | 0.28 | % | 0.71 | % | 0.59 | % | ||||||||||||
Portfolio turnover rate(4) | 8 | %(2) | 23 | % | 36 | % | 29 | % | 32 | % | 28 | % | ||||||||||||
| (1) | Net investment income (loss) per share was calculated using average shares outstanding. |
| (2) | Not annualized. |
| (3) | Annualized. |
| (4) | Portfolio turnover rate is disclosed for the Fund as a whole. |
The accompanying notes to financial statements are an integral part of these financial statements.
32
FMI Common Stock Fund
FINANCIAL HIGHLIGHTS
(Selected data for each share of the Fund outstanding throughout each period)
Institutional Class
| (Unaudited) | ||||||||||||||||||||||||
| For the | ||||||||||||||||||||||||
| Six Month | ||||||||||||||||||||||||
| Period Ending | ||||||||||||||||||||||||
| March 31, | Years Ended September 30, | |||||||||||||||||||||||
| 2024 | 2023 | 2022 | 2021 | 2020 | 2019 | |||||||||||||||||||
| PER SHARE OPERATING | ||||||||||||||||||||||||
| PERFORMANCE: | ||||||||||||||||||||||||
| Net asset value, | ||||||||||||||||||||||||
| beginning of period | $ | 31.37 | $ | 26.77 | $ | 33.29 | $ | 22.28 | $ | 26.42 | $ | 27.59 | ||||||||||||
| Income from | ||||||||||||||||||||||||
| investment operations: | ||||||||||||||||||||||||
| Net investment | ||||||||||||||||||||||||
income (loss)(1) | 0.05 | 0.15 | 0.07 | 0.12 | 0.20 | 0.18 | ||||||||||||||||||
| Net realized and unrealized | ||||||||||||||||||||||||
| gain (loss) on investments | 6.81 | 6.35 | (2.58 | ) | 11.12 | (3.02 | ) | 0.93 | ||||||||||||||||
| Total from | ||||||||||||||||||||||||
| investment operations | 6.86 | 6.50 | (2.51 | ) | 11.24 | (2.82 | ) | 1.11 | ||||||||||||||||
| Less distributions: | ||||||||||||||||||||||||
| Distributions from | ||||||||||||||||||||||||
| net investment income | (0.12 | ) | (0.07 | ) | (0.15 | ) | (0.23 | ) | (0.14 | ) | (0.13 | ) | ||||||||||||
| Distributions from | ||||||||||||||||||||||||
| net realized gains | (0.88 | ) | (1.83 | ) | (3.86 | ) | — | (1.18 | ) | (2.15 | ) | |||||||||||||
| Total from distributions | (1.00 | ) | (1.90 | ) | (4.01 | ) | (0.23 | ) | (1.32 | ) | (2.28 | ) | ||||||||||||
| Net asset value, end of period | $ | 37.23 | $ | 31.37 | $ | 26.77 | $ | 33.29 | $ | 22.28 | $ | 26.42 | ||||||||||||
| TOTAL RETURN | 22.08 | %(2) | 25.22 | % | (8.99 | %) | 50.68 | % | (11.41 | %) | 5.40 | % | ||||||||||||
| RATIOS/SUPPLEMENTAL DATA: | ||||||||||||||||||||||||
| Net assets, end of | ||||||||||||||||||||||||
| period (in 000’s $) | 1,295,942 | 924,846 | 588,996 | 516,985 | 344,811 | 448,262 | ||||||||||||||||||
| Ratio of expenses to | ||||||||||||||||||||||||
| average net assets | 0.84 | %(3) | 0.87 | % | 0.89 | % | 0.90 | % | 0.90 | % | 0.91 | % | ||||||||||||
| Ratio of net investment | ||||||||||||||||||||||||
| income (loss) to | ||||||||||||||||||||||||
| average net assets | 0.28 | %(3) | 0.48 | % | 0.22 | % | 0.39 | % | 0.84 | % | 0.71 | % | ||||||||||||
Portfolio turnover rate(4) | 8 | %(2) | 23 | % | 36 | % | 29 | % | 32 | % | 28 | % | ||||||||||||
| (1) | Net investment income (loss) per share was calculated using average shares outstanding. |
| (2) | Not annualized. |
| (3) | Annualized. |
| (4) | Portfolio turnover rate is disclosed for the Fund as a whole. |
The accompanying notes to financial statements are an integral part of these financial statements.
33
FMI Large Cap Fund
FINANCIAL HIGHLIGHTS
(Selected data for each share of the Fund outstanding throughout each period)
Investor Class
| (Unaudited) | ||||||||||||||||||||||||
| For the | ||||||||||||||||||||||||
| Six Month | ||||||||||||||||||||||||
| Period Ending | ||||||||||||||||||||||||
| March 31, | Years Ended September 30, | |||||||||||||||||||||||
| 2024 | 2023 | 2022 | 2021 | 2020 | 2019 | |||||||||||||||||||
| PER SHARE OPERATING | ||||||||||||||||||||||||
| PERFORMANCE: | ||||||||||||||||||||||||
| Net asset value, | ||||||||||||||||||||||||
| beginning of period | $ | 14.62 | $ | 14.98 | $ | 20.96 | $ | 18.81 | $ | 20.14 | $ | 22.85 | ||||||||||||
| Income from | ||||||||||||||||||||||||
| investment operations: | ||||||||||||||||||||||||
| Net investment | ||||||||||||||||||||||||
income (loss)(1) | 0.04 | 0.09 | 0.11 | 0.15 | 0.18 | 0.25 | ||||||||||||||||||
| Net realized and unrealized | ||||||||||||||||||||||||
| gain (loss) on investments | 3.11 | 2.64 | (2.73 | ) | 4.25 | 0.03 | (5) | 0.55 | ||||||||||||||||
| Total from | ||||||||||||||||||||||||
| investment operations | 3.15 | 2.73 | (2.62 | ) | 4.40 | 0.21 | 0.80 | |||||||||||||||||
| Less distributions: | ||||||||||||||||||||||||
| Distributions from | ||||||||||||||||||||||||
| net investment income | (0.14 | ) | (0.11 | ) | (0.16 | ) | (0.30 | ) | (0.17 | ) | (0.28 | ) | ||||||||||||
| Distributions from | ||||||||||||||||||||||||
| net realized gains | (1.43 | ) | (2.98 | ) | (3.20 | ) | (1.95 | ) | (1.37 | ) | (3.23 | ) | ||||||||||||
| Total from distributions | (1.57 | ) | (3.09 | ) | (3.36 | ) | (2.25 | ) | (1.54 | ) | (3.51 | ) | ||||||||||||
| Net asset value, end of period | $ | 16.20 | $ | 14.62 | $ | 14.98 | $ | 20.96 | $ | 18.81 | $ | 20.14 | ||||||||||||
| TOTAL RETURN | 22.67 | %(2) | 19.95 | % | (15.86 | %) | 24.48 | % | 0.71 | % | 5.72 | % | ||||||||||||
| RATIOS/SUPPLEMENTAL DATA: | ||||||||||||||||||||||||
| Net assets, end of | ||||||||||||||||||||||||
| period (in 000’s $) | 1,012,240 | 919,253 | 1,001,682 | 1,422,451 | 1,475,504 | 2,337,118 | ||||||||||||||||||
| Ratio of expenses to | ||||||||||||||||||||||||
| average net assets | 0.83 | %(3) | 0.84 | % | 0.83 | % | 0.82 | % | 0.81 | % | 0.82 | % | ||||||||||||
| Ratio of net investment | ||||||||||||||||||||||||
| income (loss) to | ||||||||||||||||||||||||
| average net assets | 0.57 | %(3) | 0.63 | % | 0.60 | % | 0.72 | % | 0.99 | % | 1.25 | % | ||||||||||||
Portfolio turnover rate(4) | 7 | %(2) | 14 | % | 25 | % | 17 | % | 28 | % | 20 | % | ||||||||||||
| (1) | Net investment income (loss) per share was calculated using average shares outstanding. |
| (2) | Not annualized. |
| (3) | Annualized. |
| (4) | Portfolio turnover rate is disclosed for the Fund as a whole. |
| (5) | Realized and unrealized gain (loss) per share in this caption are balancing amounts necessary to reconcile the change in net asset value per share for the year, and may not reconcile with the aggregate gains on the Statement of Operations due to share transactions for the year. |
The accompanying notes to financial statements are an integral part of these financial statements.
34
FMI Large Cap Fund
FINANCIAL HIGHLIGHTS
(Selected data for each share of the Fund outstanding throughout each period)
Institutional Class
| (Unaudited) | ||||||||||||||||||||||||
| For the | ||||||||||||||||||||||||
| Six Month | ||||||||||||||||||||||||
| Period Ending | ||||||||||||||||||||||||
| March 31, | Years Ended September 30, | |||||||||||||||||||||||
| 2024 | 2023 | 2022 | 2021 | 2020 | 2019 | |||||||||||||||||||
| PER SHARE OPERATING | ||||||||||||||||||||||||
| PERFORMANCE: | ||||||||||||||||||||||||
| Net asset value, | ||||||||||||||||||||||||
| beginning of period | $ | 14.59 | $ | 14.96 | $ | 20.94 | $ | 18.80 | $ | 20.13 | $ | 22.85 | ||||||||||||
| Income from | ||||||||||||||||||||||||
| investment operations: | ||||||||||||||||||||||||
| Net investment | ||||||||||||||||||||||||
income (loss)(1) | 0.05 | 0.11 | 0.14 | 0.18 | 0.21 | 0.25 | ||||||||||||||||||
| Net realized and unrealized | ||||||||||||||||||||||||
| gain (loss) on investments | 3.11 | 2.63 | (2.73 | ) | 4.24 | 0.02 | (5) | 0.58 | ||||||||||||||||
| Total from | ||||||||||||||||||||||||
| investment operations | 3.16 | 2.74 | (2.59 | ) | 4.42 | 0.23 | 0.83 | |||||||||||||||||
| Less distributions: | ||||||||||||||||||||||||
| Distributions from | ||||||||||||||||||||||||
| net investment income | (0.16 | ) | (0.13 | ) | (0.19 | ) | (0.33 | ) | (0.19 | ) | (0.32 | ) | ||||||||||||
| Distributions from | ||||||||||||||||||||||||
| net realized gains | (1.43 | ) | (2.98 | ) | (3.20 | ) | (1.95 | ) | (1.37 | ) | (3.23 | ) | ||||||||||||
| Total from distributions | (1.59 | ) | (3.11 | ) | (3.39 | ) | (2.28 | ) | (1.56 | ) | (3.55 | ) | ||||||||||||
| Net asset value, end of period | $ | 16.16 | $ | 14.59 | $ | 14.96 | $ | 20.94 | $ | 18.80 | $ | 20.13 | ||||||||||||
| TOTAL RETURN | 22.82 | %(2) | 20.07 | % | (15.73 | %) | 24.63 | % | 0.84 | % | 5.89 | % | ||||||||||||
| RATIOS/SUPPLEMENTAL DATA: | ||||||||||||||||||||||||
| Net assets, end of | ||||||||||||||||||||||||
| period (in 000’s $) | 710,772 | 699,152 | 1,070,491 | 1,788,717 | 1,924,284 | 2,652,783 | ||||||||||||||||||
| Ratio of expenses to | ||||||||||||||||||||||||
| average net assets | 0.71 | %(3) | 0.71 | % | 0.69 | % | 0.68 | % | 0.67 | % | 0.68 | % | ||||||||||||
| Ratio of net investment | ||||||||||||||||||||||||
| income (loss) to | ||||||||||||||||||||||||
| average net assets | 0.69 | %(3) | 0.77 | % | 0.73 | % | 0.85 | % | 1.13 | % | 1.26 | % | ||||||||||||
Portfolio turnover rate(4) | 7 | %(2) | 14 | % | 25 | % | 17 | % | 28 | % | 20 | % | ||||||||||||
| (1) | Net investment income (loss) per share was calculated using average shares outstanding. |
| (2) | Not annualized. |
| (3) | Annualized. |
| (4) | Portfolio turnover rate is disclosed for the Fund as a whole. |
| (5) | Realized and unrealized gain (loss) per share in this caption are balancing amounts necessary to reconcile the change in net asset value per share for the year, and may not reconcile with the aggregate gains on the Statement of Operations due to share transactions for the year. |
The accompanying notes to financial statements are an integral part of these financial statements.
35
FMI International Fund
FINANCIAL HIGHLIGHTS
(Selected data for each share of the Fund outstanding throughout each period)
Investor Class
| (Unaudited) | ||||||||||||||||||||||||
| For the | ||||||||||||||||||||||||
| Six Month | ||||||||||||||||||||||||
| Period Ending | ||||||||||||||||||||||||
| March 31, | Years Ended September 30, | |||||||||||||||||||||||
| 2024 | 2023 | 2022 | 2021 | 2020 | 2019 | |||||||||||||||||||
| PER SHARE OPERATING | ||||||||||||||||||||||||
| PERFORMANCE: | ||||||||||||||||||||||||
| Net asset value, | ||||||||||||||||||||||||
| beginning of period | $ | 31.90 | $ | 28.25 | $ | 35.36 | $ | 27.69 | $ | 31.89 | $ | 33.80 | ||||||||||||
| Income from | ||||||||||||||||||||||||
| investment operations: | ||||||||||||||||||||||||
| Net investment | ||||||||||||||||||||||||
income (loss)(1) | 0.27 | 0.54 | 0.41 | 1.10 | 0.35 | 0.48 | ||||||||||||||||||
| Net realized and unrealized | ||||||||||||||||||||||||
| gain (loss) on investments | 3.65 | 7.35 | (6.29 | ) | 6.57 | (3.40 | ) | (0.26 | ) | |||||||||||||||
| Total from | ||||||||||||||||||||||||
| investment operations | 3.92 | 7.89 | (5.88 | ) | 7.67 | (3.05 | ) | 0.22 | ||||||||||||||||
| Less distributions: | ||||||||||||||||||||||||
| Distributions from | ||||||||||||||||||||||||
| net investment income | — | (4.24 | ) | (1.23 | ) | — | (1.15 | ) | (1.32 | ) | ||||||||||||||
| Distributions from | ||||||||||||||||||||||||
| net realized gains | — | — | — | — | — | (0.81 | ) | |||||||||||||||||
| Total from distributions | — | (4.24 | ) | (1.23 | ) | — | (1.15 | ) | (2.13 | ) | ||||||||||||||
| Net asset value, end of period | $ | 35.82 | $ | 31.90 | $ | 28.25 | $ | 35.36 | $ | 27.69 | $ | 31.89 | ||||||||||||
| TOTAL RETURN | 12.29 | %(2) | 30.14 | % | (17.24 | %) | 27.70 | % | (10.06 | %) | 1.27 | % | ||||||||||||
| RATIOS/SUPPLEMENTAL DATA: | ||||||||||||||||||||||||
| Net assets, end of | ||||||||||||||||||||||||
| period (in 000’s $) | 1,215,941 | 1,028,428 | 792,421 | 1,066,600 | 1,207,016 | 2,798,739 | ||||||||||||||||||
| Ratio of expenses to | ||||||||||||||||||||||||
| average net assets | 0.90 | %(3) | 0.94 | % | 0.94 | % | 0.94 | % | 0.91 | % | 0.90 | % | ||||||||||||
| Ratio of net investment | ||||||||||||||||||||||||
| income (loss) to | ||||||||||||||||||||||||
| average net assets | 1.61 | %(3) | 1.73 | % | 1.22 | % | 3.29 | % | 1.19 | % | 1.55 | % | ||||||||||||
Portfolio turnover rate(4) | 11 | %(2) | 21 | % | 20 | % | 27 | % | 23 | % | 13 | % | ||||||||||||
| (1) | Net investment income (loss) per share was calculated using average shares outstanding. |
| (2) | Not annualized. |
| (3) | Annualized. |
| (4) | Portfolio turnover rate is disclosed for the Fund as a whole. |
The accompanying notes to financial statements are an integral part of these financial statements.
36
FMI International Fund
FINANCIAL HIGHLIGHTS
(Selected data for each share of the Fund outstanding throughout each period)
Institutional Class
| (Unaudited) | ||||||||||||||||||||||||
| For the | ||||||||||||||||||||||||
| Six Month | ||||||||||||||||||||||||
| Period Ending | ||||||||||||||||||||||||
| March 31, | Years Ended September 30, | |||||||||||||||||||||||
| 2024 | 2023 | 2022 | 2021 | 2020 | 2019 | |||||||||||||||||||
| PER SHARE OPERATING | ||||||||||||||||||||||||
| PERFORMANCE: | ||||||||||||||||||||||||
| Net asset value, | ||||||||||||||||||||||||
| beginning of period | $ | 32.03 | $ | 28.35 | $ | 35.46 | $ | 27.73 | $ | 31.93 | $ | 33.86 | ||||||||||||
| Income from | ||||||||||||||||||||||||
| investment operations: | ||||||||||||||||||||||||
| Net investment | ||||||||||||||||||||||||
income (loss)(1) | 0.29 | 0.59 | 0.45 | 1.18 | 0.38 | 0.53 | ||||||||||||||||||
| Net realized and unrealized | ||||||||||||||||||||||||
| gain (loss) on investments | 3.66 | 7.36 | (6.29 | ) | 6.55 | (3.39 | ) | (0.27 | ) | |||||||||||||||
| Total from | ||||||||||||||||||||||||
| investment operations | 3.95 | 7.95 | (5.84 | ) | 7.73 | (3.01 | ) | 0.26 | ||||||||||||||||
| Less distributions: | ||||||||||||||||||||||||
| Distributions from | ||||||||||||||||||||||||
| net investment income | — | (4.27 | ) | (1.27 | ) | — | (1.19 | ) | (1.38 | ) | ||||||||||||||
| Distributions from | ||||||||||||||||||||||||
| net realized gains | — | — | — | — | — | (0.81 | ) | |||||||||||||||||
| Total from distributions | — | (4.27 | ) | (1.27 | ) | — | (1.19 | ) | (2.19 | ) | ||||||||||||||
| Net asset value, end of period | $ | 35.98 | $ | 32.03 | $ | 28.35 | $ | 35.46 | $ | 27.73 | $ | 31.93 | ||||||||||||
| TOTAL RETURN | 12.33 | %(2) | 30.30 | % | (17.10 | %) | 27.88 | % | (9.95 | %) | 1.42 | % | ||||||||||||
| RATIOS/SUPPLEMENTAL DATA: | ||||||||||||||||||||||||
| Net assets, end of | ||||||||||||||||||||||||
| period (in 000’s $) | 3,648,335 | 3,057,141 | 2,178,340 | 2,351,096 | 2,142,615 | 4,480,109 | ||||||||||||||||||
| Ratio of expenses to | ||||||||||||||||||||||||
| average net assets | 0.79 | %(3) | 0.80 | % | 0.81 | % | 0.80 | % | 0.77 | % | 0.76 | % | ||||||||||||
| Ratio of net investment | ||||||||||||||||||||||||
| income (loss) to | ||||||||||||||||||||||||
| average net assets | 1.72 | %(3) | 1.88 | % | 1.37 | % | 3.48 | % | 1.31 | % | 1.69 | % | ||||||||||||
Portfolio turnover rate(4) | 11 | %(2) | 21 | % | 20 | % | 27 | % | 23 | % | 13 | % | ||||||||||||
| (1) | Net investment income (loss) per share was calculated using average shares outstanding. |
| (2) | Not annualized. |
| (3) | Annualized. |
| (4) | Portfolio turnover rate is disclosed for the Fund as a whole. |
The accompanying notes to financial statements are an integral part of these financial statements.
37
FMI International Fund II – Currency Unhedged
FINANCIAL HIGHLIGHTS
(Selected data for each share of the Fund outstanding throughout each period)
Institutional Class
| (Unaudited) | For the | |||||||||||||||||||
| For the | Period from | |||||||||||||||||||
| Six Month | December 31, | |||||||||||||||||||
| Period Ending | 2019(1) to | |||||||||||||||||||
| March 31, | Years Ended September 30, | September 30, | ||||||||||||||||||
| 2024 | 2023 | 2022 | 2021 | 2020 | ||||||||||||||||
| PER SHARE OPERATING | ||||||||||||||||||||
| PERFORMANCE: | ||||||||||||||||||||
| Net asset value, beginning of period | $ | 19.51 | $ | 14.79 | $ | 21.70 | $ | 17.24 | $ | 20.00 | ||||||||||
| Income from investment operations: | ||||||||||||||||||||
Net investment income (loss)(2) | 0.16 | 0.34 | 0.26 | 0.77 | 0.13 | |||||||||||||||
| Net realized and unrealized | ||||||||||||||||||||
| gain (loss) on investments | 2.41 | 4.63 | (6.22 | ) | 3.87 | (2.89 | ) | |||||||||||||
| Total from investment operations | 2.57 | 4.97 | (5.96 | ) | 4.64 | (2.76 | ) | |||||||||||||
| Less distributions: | ||||||||||||||||||||
| Distributions from | ||||||||||||||||||||
| net investment income | (0.32 | ) | (0.25 | ) | (0.66 | ) | (0.18 | ) | — | |||||||||||
| Distributions from net realized gains | — | — | (0.29 | ) | — | — | ||||||||||||||
| Total from distributions | (0.32 | ) | (0.25 | ) | (0.95 | ) | (0.18 | ) | — | |||||||||||
| Net asset value, end of period | $ | 21.76 | $ | 19.51 | $ | 14.79 | $ | 21.70 | $ | 17.24 | ||||||||||
| TOTAL RETURN | 13.26 | %(3) | 33.78 | % | (28.71 | %) | 26.96 | % | (13.80 | %)(3) | ||||||||||
| RATIOS/SUPPLEMENTAL DATA: | ||||||||||||||||||||
| Net assets, end of period (in 000’s $) | 81,388 | 71,188 | 48,986 | 71,997 | 47,555 | |||||||||||||||
| Ratio of expenses to average net assets: | ||||||||||||||||||||
| Before expense reimbursement | 1.11 | %(4) | 1.14 | % | 1.15 | % | 1.16 | % | 1.43 | %(4) | ||||||||||
| After expense reimbursement | 0.90 | %(4) | 0.90 | % | 0.90 | % | 0.90 | % | 0.90 | %(4) | ||||||||||
| Ratio of net investment income (loss) | ||||||||||||||||||||
| to average net assets: | ||||||||||||||||||||
| Before expense reimbursement | 1.37 | %(4) | 1.54 | % | 1.07 | % | 3.35 | % | 0.49 | %(4) | ||||||||||
| After expense reimbursement | 1.58 | %(4) | 1.78 | % | 1.32 | % | 3.61 | % | 1.02 | %(4) | ||||||||||
| Portfolio turnover rate | 12 | %(3) | 21 | % | 27 | % | 31 | % | 15 | %(3) | ||||||||||
| (1) | Inception date. |
| (2) | Net investment income (loss) per share was calculated using average shares outstanding. |
| (3) | Not annualized. |
| (4) | Annualized. |
The accompanying notes to financial statements are an integral part of these financial statements.
38
FMI Funds, Inc.
NOTES TO FINANCIAL STATEMENTS
March 31, 2024 (Unaudited)
| (1) | Organization — |
| The following is a summary of significant accounting policies of the FMI Common Stock Fund, the FMI Large Cap Fund, the FMI International Fund, and the FMI International Fund II – Currency Unhedged (collectively, the “Funds” or, individually, a “Fund”). The FMI Common Stock Fund (the “Common Stock Fund”), the FMI Large Cap Fund (the “Large Cap Fund”), the FMI International Fund (the “International Fund”), and the FMI International Fund II – Currency Unhedged (the “International Currency Unhedged Fund”) are each a series of FMI Funds, Inc. (the “Company”). The Company was incorporated under the laws of Maryland on September 5, 1996. The Common Stock Fund is the successor to the FMI Common Stock Fund, the sole series of FMI Common Stock Fund, Inc. (the “Predecessor Common Stock Fund”). The Predecessor Common Stock Fund commenced operations on December 18, 1981. The reorganization was effective as of January 31, 2014, and the Common Stock Fund is the accounting survivor of the reorganization. As the accounting survivor of the reorganization, the Common Stock Fund adopted the Financial Statements of the Predecessor Common Stock Fund. The Predecessor Common Stock Fund was incorporated under the laws of Wisconsin on July 29, 1981. The Large Cap Fund commenced operations on December 31, 2001, and the International Fund commenced operations on December 31, 2010. The International Currency Unhedged Fund commenced operations on December 31, 2019. | |
| Effective October 31, 2016, the Common Stock Fund, Large Cap Fund, and International Fund offer two classes of shares (Investor and Institutional). The International Currency Unhedged Fund currently only offers Institutional Class shares. The Institutional Class has the same management fee as the Investor Class and does not have a shareholder servicing plan. A higher investment minimum is required for the Institutional Class than the Investor Class. Each class of shares has exclusive voting rights with respect to matters that affect just that class. Income, expenses (other than expenses attributable to a specific class) and realized and unrealized gains or losses on investments are allocated to each class of shares based on its relative net assets. The Company’s Board of Directors (the “Board”) may elect to have certain expenses specific to the Investor Class shares or Institutional Class shares be borne solely by the Class to which such expenses are attributable, but any expenses not specifically allocated to the Investor Class shares or Institutional Class shares are generally allocated to each such Class proportionately (after any applicable base fee to be paid by a class of shares of a Fund attributable to such expense) on the basis of the net asset value of that Class in relation to the net asset value of the applicable Fund. | |
| The Funds are diversified, open-end management investment companies under the Investment Company Act of 1940 (the “1940 Act”), as amended. The financial statements are prepared in accordance with accounting principles generally accepted in the United States of America (“GAAP”). The Funds follow the investment company accounting and financial reporting guidance under Financial Accounting Standards Board (“FASB”) Accounting Standards Codification “Financial Services – Investment Companies” Topic 946 (“ASC 946”). The assets and liabilities of each Fund in the Company are segregated, and a shareholder’s interest is limited to the Fund in which the shareholder owns shares. The investment objective of the Common Stock Fund is to seek long-term capital appreciation by investing mainly in small- to medium capitalization value stocks. The investment objective of the Large Cap Fund is to seek long-term capital appreciation by investing mainly in a limited number of large capitalization value stocks. |
39
FMI Funds, Inc.
NOTES TO FINANCIAL STATEMENTS (Continued)
March 31, 2024 (Unaudited)
| (1) | Organization — (Continued) |
| The investment objective of the International Fund and International Currency Unhedged Fund is to seek capital appreciation by investing mainly in a limited number of large capitalization value stocks of non-U.S. companies. |
| (2) | Summary of Significant Accounting Policies and Other Information — | |
| (a) | The Funds apply the provisions of the FASB Accounting Standards Codification “Fair Value Measurement” Topic 820 (“ASC 820”), which defines fair value as the price that would be received to sell an asset or paid to transfer a liability (i.e., the “exit price”) in an orderly transaction between market participants at the measurement date. | |
| Each security is valued at the current day last sale price reported by the principal security exchange on which the issue is traded. Securities that are traded on the Nasdaq Markets are valued at the Nasdaq Official Closing Price, or if no sale is reported, the latest bid price. Securities that are traded over-the-counter, including U.S. Treasury securities are valued at the close price, if not close, then at the latest bid price. Money market funds are valued at net asset value per share. Bank deposits are valued at acquisition cost which approximates fair value. Unlisted equity securities for which market quotations are readily available are valued at the close price, if not close, then at the most recent bid price. Foreign securities are valued on a basis of quotations from the primary market in which they are traded and are converted from the local currency into U.S. dollars using exchange rates as of the close of the New York Stock Exchange. For the International Fund and International Currency Unhedged Fund only, options purchased or written by each of the Funds are valued at the average of the most recent bid and ask prices. Securities for which quotations are not readily available are valued at fair value as determined by the investment adviser as the Board appointed valuation designee, in accordance with fair value methodologies established by the investment adviser. The fair value of a security is the amount which a Fund might reasonably expect to receive upon a current sale. The fair value of a security may differ from the last quoted price and a Fund may not be able to sell a security at the fair value. Market quotations may not be available, for example, if trading in particular securities was halted during the day and not resumed prior to the close of trading on the New York Stock Exchange. The foreign markets in which the International Fund and International Currency Unhedged Fund may invest are sometimes open on days when the New York Stock Exchange is not open, and the International Fund and International Currency Unhedged Fund do not calculate their net asset value. For securities that do not trade during New York Stock Exchange hours, fair value determinations are based on analyses of market movements after the close of those securities’ primary markets, and may include reviews of developments in foreign markets, the performance of U.S. securities markets, and the performance of instruments trading in U.S. markets that represent foreign securities and baskets of foreign securities. The investment adviser utilizes a service provided by an independent third party to assist in fair valuation of certain securities for the International Fund and the International Currency Unhedged Fund. As of March 31, 2024, there were no securities that were internally fair valued. | ||
| In determining fair value, the Funds use various valuation approaches. ASC 820 establishes a fair value hierarchy for inputs used in measuring fair value that maximizes the use of observable inputs and minimizes the use of unobservable inputs by generally requiring | ||
40
FMI Funds, Inc.
NOTES TO FINANCIAL STATEMENTS (Continued)
March 31, 2024 (Unaudited)
| (2) | Summary of Significant Accounting Policies and Other Information — (Continued) | |
| that the most observable inputs be used when available. Observable inputs are those that market participants would use in pricing the asset or liability based on market data obtained from sources independent of the Funds. Unobservable inputs reflect the Funds’ assumptions about the inputs market participants would use in pricing the asset or liability developed based on the best information available in the circumstances. The inputs or methodologies used for valuing securities are not necessarily an indication of the risks associated with investing in those securities. Over the counter derivatives such as forward currency contracts may be valued using quantitative models. These models may use pricing curves based on market inputs including current exchange rates or indices. These curves are combined with volatility factors to value the overall positions. The market inputs are generally significant and can be corroborated with observable market data and therefore are classified in level 2. | ||
| The fair value hierarchy is categorized into three levels based on the inputs as follows: |
| Level 1 — | Quoted prices (unadjusted) in active markets for identical assets or liabilities that the reporting entity can access at the measurement date. | ||
| Level 2 — | Inputs other than quoted prices included within Level 1 that are observable for the asset or liability, either directly or indirectly. | ||
| Level 3 — | Unobservable inputs for the asset or liability. |
| The following table summarizes the Funds’ investments as of March 31, 2024, based on the inputs used to value them: |
| Common Stock Fund | Large Cap Fund | |||||||||
| Investments | Investments | |||||||||
Valuations | in Securities | in Securities | ||||||||
| Assets: | ||||||||||
| Level 1 — | Common Stocks(1) | $ | 1,956,672,450 | $ | 1,665,998,050 | |||||
| Money Market Fund | 108,379,704 | 42,480,463 | ||||||||
| Total Level 1 | 2,065,052,154 | 1,708,478,513 | ||||||||
| Level 2 — | Common Stocks(1) | — | — | |||||||
Preferred Stocks(1) | — | — | ||||||||
| Forward Currency Contracts | — | — | ||||||||
| Total Level 2 | — | — | ||||||||
| Level 3 — | None | — | — | |||||||
| Total Assets | 2,065,052,154 | 1,708,478,513 | ||||||||
| Liabilities: | ||||||||||
| Level 2 — | Forward Currency Contracts | — | — | |||||||
| Total | $ | 2,065,052,154 | $ | 1,708,478,513 | ||||||
41
FMI Funds, Inc.
NOTES TO FINANCIAL STATEMENTS (Continued)
March 31, 2024 (Unaudited)
| (2) | Summary of Significant Accounting Policies and Other Information — (Continued) |
| International | ||||||||||||||
| International | International | Currency | ||||||||||||
| Fund | Fund | Unhedged Fund | ||||||||||||
| Investments | Other Financial | Investments | ||||||||||||
Valuations | in Securities | Instruments(2) | in Securities | |||||||||||
| Assets: | ||||||||||||||
| Level 1 — | Common Stocks(1) | $ | 873,387,083 | $ | — | $ | 14,810,427 | |||||||
| Money Market Fund | 244,867,068 | — | 3,542,930 | |||||||||||
| Total Level 1 | 1,118,254,151 | — | 18,353,357 | |||||||||||
| Level 2 — | Common Stocks(1) | 3,490,344,434 | — | 59,286,196 | ||||||||||
Preferred Stocks(1) | 225,353,590 | — | 3,828,266 | |||||||||||
| Forward Currency Contracts | — | 34,898,100 | — | |||||||||||
| Total Level 2 | 3,715,698,024 | 34,898,100 | 63,114,462 | |||||||||||
| Level 3 — | None | — | — | — | ||||||||||
| Total Assets | 4,833,952,175 | 34,898,100 | 81,467,819 | |||||||||||
| Liabilities: | ||||||||||||||
| Level 2 — | Forward Currency Contracts | — | (50,208 | ) | — | |||||||||
| Total | $ | 4,833,952,175 | $ | 34,847,892 | $ | 81,467,819 | ||||||||
(1) | See the Schedules of Investments for investments detailed by industry classifications. | |
(2) | Other financial instruments are derivative instruments, specifically forward currency contracts, which are valued at the unrealized appreciation/(depreciation) on the instrument. |
| (b) | Net realized gains and losses on sales of securities are computed on the identified cost basis. For financial reporting purposes, investment transactions are recorded on the trade date. | |
| (c) | Investment securities and other assets and liabilities denominated in foreign currencies are translated into U.S. dollar amounts at the date of valuation. Purchases and sales of investment securities and income and expense items denominated in foreign currencies are translated into U.S. dollar amounts on the respective date of such transactions. The Company does not isolate that portion of the results of operations resulting from changes in foreign exchange rates on investments from the fluctuations arising from changes in market prices of securities held. Such fluctuations are included with the net realized and unrealized gain or loss from investments. Reported net realized foreign exchange gains or losses arise from sales of foreign currencies, currency gains or losses realized between the trade and settlement dates on securities transactions, and the difference between the amounts of dividends, interest, and foreign withholding taxes recorded on the Company’s books and the U.S. dollar equivalent of the amounts actually received or paid. Net unrealized foreign exchange gains and losses arise from changes in the fair values of assets and liabilities, other than investments in securities at fiscal period end, resulting from changes in exchange rates. | |
| (d) | Dividend income is recorded on the ex-dividend date. Interest income is recorded on an accrual basis. The Funds record the amortization and accretion of premiums and discounts on securities purchased using the effective interest method. Withholding taxes on foreign dividends have been provided for in accordance with the Funds’ understanding of the applicable country’s tax rules and regulations. |
42
FMI Funds, Inc.
NOTES TO FINANCIAL STATEMENTS (Continued)
March 31, 2024 (Unaudited)
| (2) | Summary of Significant Accounting Policies and Other Information — (Continued) | |
| (e) | The International Fund may enter into forward currency contracts in order to hedge its exposure to changes in foreign currency rates on its foreign portfolio holdings or to hedge certain purchase and sale commitments denominated in foreign currencies. The International Currency Unhedged Fund normally does not seek to reduce currency risk by hedging its perceived foreign currency exposure back into the U.S. dollar and will generally not be exposed to currency fluctuations. However, the investment adviser reserves the right to temporarily hedge all or a portion of the International Currency Unhedged Fund’s currency exposure. A forward currency contract is a commitment to purchase or sell a foreign currency at a future date at a negotiated rate. These contracts are valued daily and the asset or liability therein represents unrealized gain or loss on the contracts as measured by the difference between the forward foreign exchange rates at the dates of entry into the contracts and the forward rates at the reporting date. The International Fund and International Currency Unhedged Fund have made an election under Section 988 of the Internal Revenue Code of 1986, as amended (the “Code”), which provides special rules for certain transactions in foreign currency other than the taxpayer’s functional currency (i.e. unless certain special rules apply, currencies other than the U.S. dollar). Certain section 988 gains or losses will increase or decrease the amount of a Fund’s investment company taxable income available to be distributed to shareholders as net capital gain, rather than increasing or decreasing the amount of a Fund’s ordinary income. On a quarterly average there were eight forward currency contracts with an average quarterly value of $3,296,129,071 outstanding during the six month period ending March 31, 2024. These contracts are not subject to master netting agreements. For Non-Deliverable Forward Currency Contracts (“Contract”), the International Fund posts collateral, in the form of cash or cash equivalents, to a segregated account at the custodian when the Contract is in an unrealized loss position. When the Contract is in an unrealized gain position, the counterparty posts collateral to a segregated account at the custodian. | |
| The fair value of the forward currency contracts as of March 31, 2024, is included in the following location on the Statements of Assets and Liabilities for the International Fund: | ||
| Fair Value of | Fair Value of | ||||
| Asset Forward | Liability Forward | ||||
Location | Currency Contracts | Location | Currency Contracts | ||
| Forward currency | Unrealized | $34,898,100 | Unrealized | $50,208 | |
| contracts | appreciation on | depreciation on | |||
| forward currency | forward currency | ||||
| contracts | contracts |
| Realized and unrealized gains and losses on forward currency contracts entered into during the six month period ending March 31, 2024, are recorded in the following location on the Statements of Operations for the International Fund: |
| Realized | Unrealized | ||||
Location | Gain | Location | Depreciation | ||
| Forward currency | Net realized | $116,170,067 | Net change in | $154,437,854 | |
| contracts | gain (loss) on | unrealized appreciation/ | |||
| forward currency | depreciation on | ||||
| contracts | forward currency | ||||
| contracts |
43
FMI Funds, Inc.
NOTES TO FINANCIAL STATEMENTS (Continued)
March 31, 2024 (Unaudited)
| (2) | Summary of Significant Accounting Policies and Other Information — (Continued) | |
| These instruments involve market risk, credit risk, or both kinds of risks, in excess of the amount recognized on the Statements of Assets and Liabilities for the International Fund. Risks arise from the possible inability of counterparties to meet the terms of their contracts and from movement in currency and securities values and interest rates. | ||
| (f) | The preparation of financial statements in conformity with GAAP requires management to make estimates and assumptions that affect the reported amounts of assets and liabilities and disclosure of contingent assets and liabilities at the date of the financial statements and the reported amounts of income and expenses during the reporting period. Actual results could differ from these estimates. | |
| (g) | The Funds may own certain securities that are restricted. Restricted securities include Section 4(a)(2) commercial paper or securities issued in a private placement. The Funds did not hold any restricted securities as of March 31, 2024. | |
| (h) | No provision has been made for Federal income taxes since the Funds have elected to be taxed as “regulated investment companies.” The Funds intend to distribute substantially all net investment company taxable income and net capital gains to their respective shareholders and otherwise comply with the provisions of the Code, applicable to regulated investment companies. | |
| (i) | The Funds have reviewed all open tax years and major jurisdictions, which include Federal and the state of Maryland for the Funds and concluded that there are no significant uncertain tax positions that would require recognition in the financial statements. The Funds recognize interest and penalties, if any, related to unrecognized tax benefits on certain tax benefits on uncertain tax positions as income tax expense in the Statements of Operations. During the six month period ending March 31, 2024, the Funds did not incur any interest or penalties. Open tax years are those that are open for exam by taxing authorities and, as of September 30, 2023, open Federal tax years include the prior four fiscal tax years ended September 30, 2023. The Funds have no examinations in progress and are also not aware of any tax positions for which it is reasonably possible that the total amounts of unrecognized tax benefits will significantly change in the next twelve months. | |
| (j) | Net investment income and net realized gains, if any, are distributed to shareholders at least annually. Distributions to shareholders are recorded on the ex-dividend date. On December 15, 2023, the following distributions were declared and paid to shareholders of records of the respective Funds on December 14, 2023: | |
| International | |||||||||||||||||
| Common | Large | International | Currency | ||||||||||||||
| Stock Fund | Cap Fund | Fund | Unhedged Fund | ||||||||||||||
| Net Investment Income (Investor Class) | $ | 1,653,528 | $ | 8,559,418 | $ | 0.00 | $ | N/A | |||||||||
| Per Share Amount (Investor Class) | $ | 0.09194120 | $ | 0.14228011 | $ | 0.0000000 | $ | N/A | |||||||||
| Net Investment Income (Institutional Class) | $ | 3,894,273 | $ | 6,870,450 | $ | 0.00 | $ | 1,165,735 | |||||||||
| Per Share Amount (Institutional Class) | $ | 0.12222392 | $ | 0.16354715 | $ | 0.0000000 | $ | 0.31762961 | |||||||||
| Short-Term Realized Gain (Investor Class) | $ | 7,570,086 | $ | 0.00 | $ | 0.00 | $ | N/A | |||||||||
| Per Share Amount (Investor Class) | $ | 0.42092 | $ | 0.00000 | $ | 0.00000 | $ | N/A | |||||||||
| Short-Term Realized Gain (Institutional Fund) | $ | 13,411,264 | $ | 0.00 | $ | 0.00 | $ | 0.00 | |||||||||
| Per Share Amount (Institutional Amount) | $ | 0.42092 | $ | 0.00000 | $ | 0.00000 | $ | 0.00000 | |||||||||
| Long-Term Realized Gain (Investor Class) | $ | 8,198,109 | $ | 86,193,895 | $ | 0.00 | $ | N/A | |||||||||
| Per Share Amount (Investor Class) | $ | 0.45584 | $ | 1.43277 | $ | 0.00000 | $ | N/A | |||||||||
| Long-Term Realized Gain (Institutional Fund) | $ | 14,523,878 | $ | 60,189,214 | $ | 0.00 | $ | 0.00 | |||||||||
| Per Share Amount (Institutional Amount) | $ | 0.45584 | $ | 1.43277 | $ | 0.00000 | $ | 0.00000 | |||||||||
44
FMI Funds, Inc.
NOTES TO FINANCIAL STATEMENTS (Continued)
March 31, 2024 (Unaudited)
| (2) | Summary of Significant Accounting Policies and Other Information — (Continued) | |
| (k) | Common Company expenses are typically allocated evenly between the Funds of the Company, or by other equitable means. | |
| (l) | In October 2022, the Securities and Exchange Commission (the “SEC”) adopted a final rule relating to Tailored Shareholder Reports for Mutual Funds and Exchange-Traded Funds; Fee Information in Investment Company Advertisements. The rule and form amendments will, among other things, require the Fund to transmit concise and visually engaging shareholder reports that highlight key information. The amendments will require that funds tag information in a structured data format and that certain more in-depth information be made available online and available for delivery free of charge to investors on request. The amendments became effective January 24, 2023. There is an 18-month transition period after the effective date of the amendment. | |
| (3) | Investment Adviser and Advisory Agreement and Transactions With Related Parties — |
| The Funds each have an investment advisory agreement with Fiduciary Management, Inc. (“FMI” or the “Adviser”), with whom certain officers and directors of the Funds are affiliated, to serve as investment adviser and manager. | |
| Under the terms of the current advisory agreement for the International Currency Unhedged Fund, effective as of December 31, 2019, the Adviser is entitled to receive a fee. The fee is computed daily and payable at the end of each month. The following annual percentages of the International Currency Unhedged Fund’s average daily net assets are used: |
| • | 0.75% of the assets from $0 – $2.5 billion; 0.70% of the assets from $2.5 – $5.0 billion; 0.65% of the assets from $5.0 – $10.0 billion; and 0.60% of the assets over $10.0 billion. |
| Under the terms of the current advisory agreements for the Common Stock Fund, Large Cap Fund and International Fund, effective as of January 1, 2019, the Adviser is entitled to receive a fee. The fee is computed daily and payable at the end of each month. The following annual percentages of each Fund’s average daily net assets are used: |
| • | Common Stock Fund: 0.85% of the assets from $0 – $500 million; 0.80% of the assets from $500 million – $1.0 billion; 0.75% of the assets over $1.0 billion. | |
| • | Large Cap Fund: 0.65% of the assets from $0 – $2.5 billion; 0.60% of the assets from $2.5 – $5.0 billion; and 0.55% of the assets over $5.0 billion. | |
| • | International Fund: 0.75% of the assets from $0 – $2.5 billion; 0.70% of the assets from $2.5 – $5.0 billion; 0.65% of the assets from $5.0 – $10.0 billion; and 0.60% of the assets over $10.0 billion. |
| The Funds are responsible for paying their proportionate share of the compensation, benefits and expenses of the Funds’ Chief Compliance Officer. For administrative convenience, FMI initially makes these payments and is later reimbursed by the Funds. |
45
FMI Funds, Inc.
NOTES TO FINANCIAL STATEMENTS (Continued)
March 31, 2024 (Unaudited)
| (3) | Investment Adviser and Advisory Agreement and Transactions With Related Parties — (Continued) |
| Under the respective advisory agreement or operating expenses limitation agreements, FMI will reimburse the Funds for expenses (excluding federal, state and local taxes, interest, brokerage commissions and extraordinary items) as follows: |
| Investor Class | Institutional Class | ||
Expense Cap | Expense Cap | ||
| Common Stock Fund | 1.30% | 1.20% | |
| Large Cap Fund | 1.20% | 1.10% | |
| International Fund | 1.75% | 1.65% | |
| International Currency Unhedged Fund | 1.75% | 1.65% |
| For the six month period ending March 31, 2024, there were no contractual or voluntary reimbursements required for the Common Stock Fund, Large Cap Fund or International Fund. For the six month period ending March 31, 2024, for the International Currency Unhedged Fund, there is no contractual reimbursement and the voluntary reimbursement is $80,555. The voluntary 0.90% expense cap/reimbursement agreement for the International Currency Unhedged Fund will continue in effect until January 31, 2025, with successive renewal terms of one year unless terminated by the Adviser prior to any such renewal. The Adviser is entitled to recoup such amounts for a one-year period from the date the Adviser reduced its compensation and/or assumed expenses for the International Currency Unhedged Fund. | |
| The Large Cap Fund, the International Fund and the International Currency Unhedged Fund have each entered into a Distribution Plan (the “Plan”), pursuant to Rule 12b-1 under the 1940 Act. Each Plan, if implemented, provides that the applicable Fund may incur certain costs which may not exceed the lesser of a monthly amount equal to 0.25% of such Fund’s daily net assets or the actual distribution costs incurred during the year. Amounts payable under each Plan would be paid monthly for any activities or expenses primarily intended to result in the sale of shares of such Fund. For the six month period ending March 31, 2024, no such expenses were charged to the shareholders of any Fund as the Funds had not implemented the Plan. | |
| Under the Funds’ organizational documents, each director, officer, employee or other agent of any Fund (including the Adviser) is indemnified, to the extent permitted by the 1940 Act, against certain liabilities that may arise out of performance of their duties to the Funds. Additionally, in the normal course of business, the Funds enter into contracts that contain a variety of indemnification clauses. The Funds’ maximum exposure under these arrangements is unknown as this would involve future claims that may be made against such Fund that have not yet occurred. However, the Funds have not had prior claims or losses pursuant to these contracts and believe the risk of loss to be remote. | |
| At March 31, 2024, no person is deemed to “control” a Fund, as that term is defined in the 1940 Act, because the Funds do not know of any person who owns beneficially or through controlled companies more than 25% of a Fund’s Investor Class and Institutional Class shares, on a combined basis, or who acknowledges the existence of control. | |
| (4) | Investments in Affiliated Issuers — |
| An issuer in which a Fund’s holdings represent 5% or more of the outstanding voting securities of an issuer is an “affiliated” issuer as defined in the 1940 Act. For the six month period ending March 31, 2024, there were no Funds with an investment in a security of an affiliated issuer. |
46
FMI Funds, Inc.
NOTES TO FINANCIAL STATEMENTS (Continued)
March 31, 2024 (Unaudited)
| (5) | Shareholder Servicing Plan — |
| The Funds have adopted a Shareholder Servicing Plan pursuant to which Investor Class shares, (if available), may pay financial intermediaries for assets maintained in an omnibus account at an annual rate of up to 0.15% of the average daily net assets of such Fund, or an annual per account rate approved by the Board. The Board may also authorize the Funds to pay for shareholder services outside of the plan. | |
| For the six month period ending March 31, 2024, shareholder servicing fees incurred are disclosed on the Statements of Operations. | |
| (6) | Loan Agreements — |
| U.S. Bank, N.A. (the “Bank”) has made available to the Company a $600,000,000 umbrella credit facility, pursuant to the loan agreement (the “Agreement”) effective May 26, 2023 for the FMI Funds, Inc. (consisting of Common Stock Fund, Large Cap Fund, International Fund and International Currency Unhedged Fund), for the purposes of having cash available to satisfy redemption requests and is subject to certain restrictions and covenants. Principal is due not more than 45 days after the date of the loan. Amounts under the credit facility bear interest at a rate per annum equal to the Bank’s current prime rate minus one percent on the amount borrowed. Advances will be collateralized by securities owned by the borrowing Fund. The Agreement is subject to renewal on May 25, 2024. During the six month period ending March 31, 2024, none of the Funds borrowed against the loan agreement. | |
| (7) | Investment Transactions — |
| For the six month period ending March 31, 2024, purchases and sales of investment securities (excluding short-term investments) were as follows: |
| International | |||||
| Currency | |||||
Common Stock Fund | Large Cap Fund | International Fund | Unhedged Fund | ||
| Purchases | $348,367,596 | $103,315,651 | $767,448,950 | $9,204,124 | |
| Sales | 124,492,204 | 355,019,814 | 466,293,264 | 8,414,186 |
| (8) | Income Tax Information — |
| The following information for the Funds are presented on an income tax basis as of September 30, 2023: |
| Net Unrealized | |||||||||||||||||
| Gross | Gross | Appreciation | |||||||||||||||
| Cost of | Unrealized | Unrealized | (Depreciation) | ||||||||||||||
| Investments | Appreciation(1) | Depreciation(1) | on Investments(1) | ||||||||||||||
| Common Stock Fund | $ | 1,107,254,595 | $ | 362,076,969 | $ | (45,230,650 | ) | $ | 316,846,319 | ||||||||
| Large Cap Fund | 1,283,827,414 | 453,517,766 | (120,681,781 | ) | 332,835,985 | ||||||||||||
| International Fund | 3,384,441,170 | 1,204,450,263 | (705,843,165 | ) | 498,607,098 | ||||||||||||
| International Currency | |||||||||||||||||
| Unhedged Fund | 66,574,710 | 11,429,445 | (7,035,440 | ) | 4,394,005 | ||||||||||||
(1) | Represents amounts of investments in securities, forward currency contracts and foreign currency transactions. |
47
FMI Funds, Inc.
NOTES TO FINANCIAL STATEMENTS (Continued)
March 31, 2024 (Unaudited)
| (8) | Income Tax Information — (Continued) |
| The difference between the cost amounts for financial statement and federal income tax purposes is due primarily to timing differences in recognizing certain gains and losses on security transactions. The International Fund is the only Fund with temporary mark to market differences. The components of accumulated earnings (deficit) on a tax-basis are as follows: |
| Total | |||||||||||||||||||||
| Net | Distributable | ||||||||||||||||||||
| Unrealized | Undistributed | Undistributed | Other | Earnings/ | |||||||||||||||||
| Appreciation | Ordinary | Long-Term | Accumulated | (Accumulated | |||||||||||||||||
| (Depreciation) | Income | Capital Gains | (Deficit) | Deficit) | |||||||||||||||||
| Common Stock Fund | $ | 316,846,319 | $ | 23,805,718 | $ | 20,471,978 | $ | — | $ | 361,124,015 | |||||||||||
| Large Cap Fund | 332,835,985 | 12,424,663 | 139,883,739 | — | 485,144,387 | ||||||||||||||||
| International Fund | 498,607,098 | — | — | (456,301,962 | ) | 42,305,136 | |||||||||||||||
| International Currency | |||||||||||||||||||||
| Unhedged Fund | 4,394,005 | 1,004,104 | — | (4,362,419 | ) | 1,035,690 | |||||||||||||||
| The International Fund and International Currency Unhedged Fund utilized $52,750,194 and $196,557, respectively, of prior year short-term capital loss carryovers. | |
| The other accumulated deficit above includes $119,190,880 of late-year losses for the International Fund only. For the International Fund and International Currency Unhedged Fund all capital loss carryovers may be used indefinitely to offset future gains as follows: |
| Short-Term Capital | Long-Term Capital | Total Capital | |||||||||||
| Loss Carryovers | Loss Carryovers | Loss Carryovers | |||||||||||
| International Fund | $ | — | $ | 337,111,082 | $ | 337,111,082 | |||||||
| International Currency | |||||||||||||
| Unhedged Fund | 321,399 | 4,041,020 | 4,362,419 | ||||||||||
| The tax components of dividends paid during the six month period ending March 31, 2024 (Unaudited) and the year ended September 30, 2023 are as follows: |
| For the Six Month Period Ending | Year Ended | ||||||||||||||||
| March 31, 2024 (Unaudited) | September 30, 2023 | ||||||||||||||||
| Ordinary | Long-Term | Ordinary | Long-Term | ||||||||||||||
| Income | Capital Gains | Income | Capital Gains | ||||||||||||||
| Distributions* | Distributions | Distributions* | Distributions | ||||||||||||||
| Common Stock Fund | $ | 26,529,151 | $ | 22,721,987 | $ | 3,566,548 | $ | 64,447,102 | |||||||||
| Large Cap Fund | 15,429,868 | 146,383,109 | 13,332,676 | 324,039,427 | |||||||||||||
| International Fund | — | — | 447,852,464 | — | |||||||||||||
| International Fund | |||||||||||||||||
| Currency Unhedged | 1,165,735 | — | 830,255 | — | |||||||||||||
| * | For federal income tax purposes, distributions on short-term capital gains are treated as ordinary income distributions. |
48
FMI Funds, Inc.
NOTES TO FINANCIAL STATEMENTS (Continued)
March 31, 2024 (Unaudited)
| (9) | Fund Share Transactions — |
| For the Six Month Period Ending | Year Ended | ||||||||||||||||
| March 31, 2024 (Unaudited) | September 30, 2023 | ||||||||||||||||
Common Stock Fund | Shares | Amount | Shares | Amount | |||||||||||||
| Sales | |||||||||||||||||
| Investor Class | 5,523,366 | $ | 185,808,530 | 6,228,283 | $ | 192,408,466 | |||||||||||
| Institutional Class | 7,454,620 | 249,009,604 | 10,041,791 | 308,599,109 | |||||||||||||
| Reinvestment of dividends | |||||||||||||||||
| and distributions | |||||||||||||||||
| Investor Class | 500,553 | 17,028,821 | 862,363 | 24,146,161 | |||||||||||||
| Institutional Class | 926,012 | 31,539,953 | 1,527,952 | 42,813,205 | |||||||||||||
| Redemptions | |||||||||||||||||
| Investor Class | (2,225,019 | ) | (75,282,345 | ) | (3,508,032 | ) | (106,952,699 | ) | |||||||||
| Institutional Class | (3,052,673 | ) | (103,151,388 | ) | (4,087,519 | ) | (124,920,889 | ) | |||||||||
| Total Investor Class | 3,798,900 | 127,555,006 | 3,582,614 | 109,601,928 | |||||||||||||
| Total Institutional Class | 5,327,959 | 177,398,169 | 7,482,224 | 226,491,425 | |||||||||||||
| Net increase (decrease) | 9,126,859 | $ | 304,953,175 | 11,064,838 | $ | 336,093,353 | |||||||||||
| For the Six Month Period Ending | Year Ended | ||||||||||||||||
| March 31, 2024 (Unaudited) | September 30, 2023 | ||||||||||||||||
Large Cap Fund | Shares | Amount | Shares | Amount | |||||||||||||
| Sales | |||||||||||||||||
| Investor Class | 903,288 | $ | 13,730,506 | 2,705,696 | $ | 40,863,349 | |||||||||||
| Institutional Class | 2,513,145 | 38,728,998 | 9,390,128 | 136,250,495 | |||||||||||||
| Reinvestment of dividends | |||||||||||||||||
| and distributions | |||||||||||||||||
| Investor Class | 6,420,461 | 94,444,981 | 14,439,158 | 194,784,241 | |||||||||||||
| Institutional Class | 4,549,616 | 66,697,369 | 10,425,358 | 140,221,056 | |||||||||||||
| Redemptions | |||||||||||||||||
| Investor Class | (7,748,030 | ) | (116,762,975 | ) | (21,119,009 | ) | (314,911,197 | ) | |||||||||
| Institutional Class | (10,994,054 | ) | (163,031,477 | ) | (43,457,910 | ) | (674,034,843 | ) | |||||||||
| Total Investor Class | (424,281 | ) | (8,587,488 | ) | (3,974,155 | ) | (79,263,607 | ) | |||||||||
| Total Institutional Class | (3,931,293 | ) | (57,605,110 | ) | (23,642,424 | ) | (397,563,292 | ) | |||||||||
| Net increase (decrease) | (4,355,574 | ) | $ | (66,192,598 | ) | (27,616,579 | ) | $ | (476,826,899 | ) | |||||||
49
FMI Funds, Inc.
NOTES TO FINANCIAL STATEMENTS (Continued)
March 31, 2024 (Unaudited)
| (9) | Fund Share Transactions — (Continued) |
| For the Six Month Period Ending | Year Ended | ||||||||||||||||
| March 31, 2024 (Unaudited) | September 30, 2023 | ||||||||||||||||
International Fund | Shares | Amount | Shares | Amount | |||||||||||||
| Sales | |||||||||||||||||
| Investor Class | 4,670,377 | $ | 154,597,981 | 6,361,817 | $ | 199,563,117 | |||||||||||
| Institutional Class | 13,140,494 | 437,691,785 | 25,248,383 | 784,774,621 | |||||||||||||
| Reinvestment of dividends | |||||||||||||||||
| and distributions | |||||||||||||||||
| Investor Class | — | — | 4,125,604 | 114,691,779 | |||||||||||||
| Institutional Class | — | — | 11,174,269 | 311,538,626 | |||||||||||||
| Redemptions | |||||||||||||||||
| Investor Class | (2,960,509 | ) | (98,455,251 | ) | (6,298,493 | ) | (193,666,671 | ) | |||||||||
| Institutional Class | (7,188,823 | ) | (240,205,114 | ) | (17,821,232 | ) | (551,795,394 | ) | |||||||||
| Total Investor Class | 1,709,868 | 56,142,730 | 4,188,928 | 120,588,225 | |||||||||||||
| Total Institutional Class | 5,951,671 | 197,486,671 | 18,601,420 | 544,517,853 | |||||||||||||
| Net increase (decrease) | 7,661,539 | $ | 253,629,401 | 22,790,348 | $ | 665,106,078 | |||||||||||
| For the Six Month Period Ending | Year Ended | ||||||||||||||||
| International Currency | March 31, 2024 (Unaudited) | September 30, 2023 | |||||||||||||||
Unhedged Fund | Shares | Amount | Shares | Amount | |||||||||||||
| Sales | |||||||||||||||||
| Institutional Class | 165,615 | $ | 3,370,717 | 520,897 | $ | 9,997,541 | |||||||||||
| Reinvestment of dividends | |||||||||||||||||
| and distributions | |||||||||||||||||
| Institutional Class | 56,810 | 1,165,735 | 47,688 | 830,255 | |||||||||||||
| Redemptions | |||||||||||||||||
| Institutional Class | (130,376 | ) | (2,637,621 | ) | (231,911 | ) | (4,457,695 | ) | |||||||||
| Total Institutional Class | 92,049 | 1,898,831 | 336,674 | 6,370,101 | |||||||||||||
| Net increase (decrease) | 92,049 | $ | 1,898,831 | 336,674 | $ | 6,370,101 | |||||||||||
| (10) | Subsequent Events — |
| Management has evaluated related events and transactions that occurred subsequent to March 31, 2024, through the date of issuance of the Funds’ financial statements and has determined there are no subsequent events or transactions. |
50
FMI Funds, Inc.
EXPENSE EXAMPLE (Unaudited)
As a shareholder of the FMI Funds you incur ongoing costs, including management fees and other Fund expenses. You do not incur transaction costs such as sales charges (loads) on purchase payments, reinvested dividends, or other distributions; redemption fees; and exchange fees because the Funds do not charge these fees. This example is intended to help you understand your ongoing costs (in dollars) of investing in each Fund and to compare these costs with the ongoing costs of investing in other mutual funds. The example is based on an investment of $1,000 invested at the beginning of the period and held for the entire period from October 1, 2023 through March 31, 2024.
Actual Expenses
The table below provides information about actual account values and actual expenses. You may use the information in these lines, together with the amount you invested, to estimate the expenses that you paid over the period. Simply divide your account value by $1,000 (for example, an $8,600 account value divided by $1,000 = 8.6), then multiply the result by the number in the line under the heading entitled “Actual Expenses Paid During Period” to estimate the expenses you paid on your account during this period.
In addition to the costs highlighted and described below, the only Fund transaction costs you might currently incur would be wire fees ($15 per wire), if you choose to have proceeds from a redemption wired to your bank account instead of receiving a check. Additionally, U.S. Bank charges an annual processing fee ($15) if you maintain an IRA account with a Fund. To determine your total costs of investing in a Fund, you would need to add any applicable wire or IRA processing fees you’ve incurred during the period to the costs provided in the example at the end of this article.
Hypothetical Example for Comparison Purposes
The table below provides information about hypothetical account values and hypothetical expenses based on each Fund’s actual expense ratio and an assumed rate of return of 5% per year before expenses, which is not the Fund’s actual return. The hypothetical account values and expenses may not be used to estimate the actual ending account balance or expenses you paid for the period. You may use this information to compare the ongoing costs of investing in a Fund and other funds. To do so, compare this 5% hypothetical example with the 5% hypothetical examples that appear in the shareholder reports of the other funds.
Please note that the expenses shown in the table are meant to highlight your ongoing costs only and do not reflect any transactional costs, such as sales charges (loads), redemption fees or exchange fees. Therefore, the hypothetical line of the table is useful in comparing ongoing costs only, and will not help you determine the relative total costs of owning different funds. In addition, if these transactional costs were included, your costs would have been higher.
51
FMI Funds, Inc.
EXPENSE EXAMPLE (Unaudited) (Continued)
| FMI | FMI | FMI | FMI International | |||||||||||||
| Common | Large Cap | International | Fund II – Currency | |||||||||||||
| Stock Fund | Fund | Fund | Unhedged | |||||||||||||
| Investor Class | ||||||||||||||||
| Actual Beginning | ||||||||||||||||
| Account Value 10/1/23 | $ | 1,000.00 | $ | 1,000.00 | $ | 1,000.00 | $ | — | ||||||||
| Actual Ending | ||||||||||||||||
| Account Value 3/31/24 | $ | 1,220.20 | $ | 1,226.70 | $ | 1,122.90 | $ | — | ||||||||
| Actual Expenses Paid | ||||||||||||||||
During Period(1) 10/1/23-3/31/24 | $ | 5.27 | $ | 4.62 | $ | 4.78 | $ | — | ||||||||
| Hypothetical Beginning | ||||||||||||||||
| Account Value 10/1/23 | $ | 1,000.00 | $ | 1,000.00 | $ | 1,000.00 | $ | — | ||||||||
| Hypothetical Ending | ||||||||||||||||
| Account Value 3/31/24 | $ | 1,020.25 | $ | 1,020.85 | $ | 1,020.50 | $ | — | ||||||||
| Hypothetical Expenses Paid | ||||||||||||||||
During Period(1) 10/1/23-3/31/24 | $ | 4.80 | $ | 4.19 | $ | 4.55 | $ | — | ||||||||
Annualized Expense Ratio(1) | 0.95 | % | 0.83 | % | 0.90 | % | — | |||||||||
| Institutional Class | ||||||||||||||||
| Actual Beginning | ||||||||||||||||
| Account Value 10/1/23 | $ | 1,000.00 | $ | 1,000.00 | $ | 1,000.00 | $ | 1,000.00 | ||||||||
| Actual Ending | ||||||||||||||||
| Account Value 3/31/24 | $ | 1,220.80 | $ | 1,228.20 | $ | 1,123.30 | $ | 1,132.60 | ||||||||
| Actual Expenses Paid | ||||||||||||||||
During Period(1) 10/1/23-3/31/24 | $ | 4.66 | $ | 3.96 | $ | 4.19 | $ | 4.80 | ||||||||
| Hypothetical Beginning | ||||||||||||||||
| Account Value 10/1/23 | $ | 1,000.00 | $ | 1,000.00 | $ | 1,000.00 | $ | 1,000.00 | ||||||||
| Hypothetical Ending | ||||||||||||||||
| Account Value 3/31/24 | $ | 1,020.80 | $ | 1,021.45 | $ | 1,021.05 | $ | 1,020.50 | ||||||||
| Hypothetical Expenses Paid | ||||||||||||||||
During Period(1) 10/1/23-3/31/24 | $ | 4.24 | $ | 3.59 | $ | 3.99 | $ | 4.55 | ||||||||
Annualized Expense Ratio(1) | 0.84 | % | 0.71 | % | 0.79 | % | 0.90 | % | ||||||||
| (1) | Expenses are equal to the Fund’s annualized net expense ratio, multiplied by the average account value over the period, multiplied by 183/366 (to reflect the one-half year period between October 1, 2023 and March 31, 2024). |
52
FMI Funds, Inc.
ADVISORY AGREEMENTS (Unaudited)
Renewal of Advisory Agreements for FMI Common Stock Fund, FMI Large Cap Fund, FMI International Fund and FMI International Fund II – Currency Unhedged
On December 20, 2024, the Directors of FMI Funds, Inc. approved the continuation of the investment advisory agreements for the FMI Common Stock Fund (the “Common Stock Fund”), the FMI Large Cap Fund (the “Large Cap Fund”), the FMI International Fund (the “International Fund”) and the FMI International Fund II – Currency Unhedged (the “International Fund II”). (The Common Stock Fund, the Large Cap Fund, the International Fund and the International Fund II are sometimes referred to herein as a “Fund” and, collectively, as the “Funds”).
In advance of approving the continuation of the investment advisory agreements, the Directors who are not “interested persons” (as that term is defined by the Investment Company Act of 1940) of the Funds (the “Independent Directors”) met with their independent legal counsel. They discussed with their independent legal counsel, in executive session, a memorandum describing their fiduciary duties with respect to approving the continuation of the investment advisory agreements and the relevant factors for their consideration of the investment advisory agreements.
The Independent Directors also reviewed and discussed with their independent legal counsel, in executive session, all of the materials that the Funds’ investment adviser, Fiduciary Management, Inc. (the “Adviser”), had provided to the Independent Directors to assist them in their consideration of the investment advisory agreements (collectively, the “15(c) Material”). Following this review, they concluded that the 15(c) Material addressed all of the relevant matters that they wanted to consider in assessing the performance of the Funds and the performance of the Adviser under the investment advisory agreements.
In considering the continuation of the investment advisory agreements, Directors focused on the following items, among others:
| • | The nature and quality of the investment advisory services provided by the Adviser, including the Adviser’s organization and operations, financial condition and stability and ownership structure; and the terms of the investment advisory agreements and how the services performed by the Adviser under the investment advisory agreements differ from those performed for other accounts managed by the Adviser. | |
| • | A comparison of the fees and expenses of the Funds to other similar funds, including a comparison of the Funds’ total expenses and the total expense ratios. | |
| • | A comparison of the fee structures of other accounts managed by the Adviser. | |
| • | Whether economies of scale are recognized by the Funds, and whether existing breakpoints are appropriate. | |
| • | The costs and profitability of the Funds to the Adviser. | |
| • | The independence, expertise, care, and conscientiousness of the Board of Directors. | |
| • | Short-term and long-term investment performance of the Funds. | |
| • | The other benefits to the Adviser from serving as investment adviser to the Funds (in addition to the advisory fee under the investment advisory agreements). |
All of the factors discussed by the Directors were considered as a whole, and were considered separately by the Independent Directors, meeting in executive session both before and after their general session with the other Directors and management of the Funds. The factors were viewed in
53
FMI Funds, Inc.
ADVISORY AGREEMENTS (Unaudited) (Continued)
their totality by the Directors, with no single factor being the principal or determinative factor in the Directors’ determination of whether to approve the continuation of the investment advisory agreements. The Directors recognized that the management and fee arrangements for the Funds are the result of years of review and discussion between the Independent Directors and the Adviser, that certain aspects of such arrangements may receive greater scrutiny in some years than in others and that the Directors’ conclusions may be based, in part, on their consideration of these same arrangements and information received during the course of the year and in prior years.
The material considerations and determinations of the Directors, including all of the Independent Directors, are described below:
Nature and Quality of Investment Advisory Services
The Directors discussed the efforts of the Adviser in supervising the investment portfolios of the Common Stock Fund, the Large Cap Fund, the International Fund and the International Fund II and directing the day-to-day management of the Funds’ portfolios, including the purchase and sale of investment securities, and the performance of the Adviser in these efforts. They noted that the investment process employed is team-based and highly research intensive, utilizing primarily in-house, fundamental research.
Noting the research intensive process of the Adviser, the Directors considered the background and experience of the Adviser’s senior management and expertise of, and the level of attention given to the Funds by investment personnel of the Adviser, and determined that the personnel servicing the Funds are well qualified. In addition, the Directors deliberated on the quality of the material service providers to the Funds, who provide administrative and distribution services on behalf of the Funds and are overseen by the Adviser, and the overall reputation and capabilities of the Adviser, concluding that they believe the service providers are respected in the industry and provide valuable services to the Funds.
The Directors concluded, based on the well qualified personnel serving the Funds and the positive; absolute performance of the Funds, adjusted for risk, as discussed herein, that the nature, extent and quality of the investment advisory services provided to the Funds by the Adviser are good. The Directors then assessed the risk management of the Funds, and the operation of the Funds’ compliance programs, as reported to them in discussions with the Chief Compliance Officer (CCO) of the Funds. They noted that the Funds have not had material breaches of the compliance program, and that the CCO’s annual and quarterly reports have reflected that the compliance program is reasonably designed to prevent material violations of securities law and is operating effectively. Based on the Directors’ assessment of the Funds’ compliance program, the Directors determined that the nature and extent of the services provided by the Adviser are appropriate to assure that the Funds’ operations are conducted in compliance with applicable laws, rules and regulations.
Comparative Fees and Expenses
Management discussed with the Directors the fact that several variables in addition to the management fee, such as service, administrative and transaction fees could have an impact on costs to the shareholders of the Funds. The Directors noted that the Adviser had engaged Broadridge Financial Solutions 15(c) Services to provide peer group comparative fee, expense and performance analysis for each Fund (the “15(c) Report”), to assist the Directors with their analysis on whether
54
FMI Funds, Inc.
ADVISORY AGREEMENTS (Unaudited) (Continued)
to continue the investment advisory agreements. They discussed the Morningstar fee level methodology used in the 15(c) Report, as well as the custom 15(c) categories and peer groups created explicitly for the 15(c) Report, and determined it was reasonable.
The Directors noted that the peer grouping methodology in the 15(c) Report considers three factors in selecting potential peers: investment style, share class characteristics, and asset levels. While it would be ideal if each peer matched closely with the applicable Fund on all three dimensions, the Directors noted that in practice it is often necessary to relax one of the peer grouping factors to find an appropriate number of peers. They concluded that they were comfortable with the peer group methodology in the 15(c) Report.
The Directors then reviewed the expense analysis contained in the 15(c) Report. In summary, the Directors noted the following: (1) the peer group comparative fee and expense analysis for the Common Stock Fund show that its net expense ratio and advisory fee are within a reasonable range of industry averages; (2) the peer group comparative fee and expense analysis for the Large Cap Fund show that its net expense ratio and advisory fee are within a reasonable range of industry averages; (3) the peer group comparative fee and expense analysis for the International Fund show that its net expense ratio and advisory fee are within a reasonable range of industry averages; and (4) the peer group comparative fee and expense analysis for the International Fund II show that its net expense ratio and advisory fee are within a reasonable range of industry averages.
After assessing the expense information discussed above, the Directors concluded that the expense ratios of the Funds are within the range of comparable mutual funds, and that the Funds’ fees are reasonable.
Comparison of Fee Structures of Other Accounts
The Directors believe that management of a mutual fund involves more comprehensive and substantive duties than the management of institutional separate accounts or sub-advised funds. Mutual funds require considerable compliance, third-party oversight, and shareholder services that institutional accounts do not, due to the more retail nature of the fund shareholder and the legal and regulatory burdens associated with managing a mutual fund family. For instance, the Adviser provides tailored investment advisory services to the Funds to accommodate the cash flow volatility presented by the purchases and redemptions of shareholders. Moreover, the Adviser attempts to serve the needs of thousands of accounts, ranging from direct accounts holding a few thousand dollars to the large omnibus accounts of intermediaries who in turn service thousands of large and small accounts.
The Adviser has implemented robust shareholder communication efforts to reach potential shareholders through direct contact, through intermediaries, or via the financial press. The Adviser does not engage in equivalent efforts for separate accounts.
Separate accounts or sub-advised funds engage the Adviser for investment management services and client service only. It also is important to remember that sub-advised funds have a layer of investment management fees, in addition to sub-advisory fees. The adviser to those funds assumes some of the cash flow management duties, board maintenance, and most operational and compliance obligations and third-party oversight.
Regarding the brokerage platforms of intermediaries, the Adviser absorbs all costs in excess of the fees paid by the Funds for sub-transfer agent services performed by the intermediaries. So, the cost of obtaining, retaining and servicing shareholders for the Funds is significantly higher than
55
FMI Funds, Inc.
ADVISORY AGREEMENTS (Unaudited) (Continued)
the costs for separately managed accounts, as a majority of investors invest through such platforms. None of the Funds utilize 12b-1 plans to fund distribution costs, with the Adviser absorbing all such costs.
In summary, the Directors noted the following: (1) management of a mutual fund involves more comprehensive and substantive duties than the management of institutional separate accounts or sub-advised funds; (2) separate accounts and sub-advised funds do not present equivalent risks to the Adviser, as separate accounts or sub-advised funds engage the Adviser for investment management services and client service only; (3) the adviser to sub-advised funds assumes some of the cash flow management duties for such funds, and it assumes the board maintenance, and most operational and compliance obligations and third-party oversight for such funds; and (4) the Adviser absorbs all costs in excess of the fees paid by the Funds for sub-transfer agent services performed by the intermediaries, which results in the cost of obtaining, retaining and servicing shareholders for the Funds being significantly higher than the costs for separately managed accounts.
Based on the materials and information discussed above, the Directors concluded that the differential in advisory fees between the Funds and the separate accounts managed by the Adviser is reasonable, and concluded that the fee rates charged to the Funds in comparison to those charged to the Adviser’s other clients is reasonable.
Performance | ||
| The Directors then reviewed the performance and risk analysis contained in the 15(c) Report: | ||
| • | The FMI Common Stock Fund – Institutional Class has outperformed the benchmark Russell 2000 by 2.79% annualized over the last ten years, and to a greater degree in more recent periods. At the one, three, five-year annualized periods the Fund has outperformed by 16.29%, 12.59%, and 7.50% respectively, and the Investor Class outperformed the benchmark by 2.01% annualized since inception through Fiscal Year End 2023. The Institutional Class has also outperformed the Russell 2000 Value benchmark over one-, three-, five-, and ten-year annualized periods by 17.38%, 6.43%, 7.31%, and 3.25%, respectively. The Investor Class is outperforming the value benchmark by 0.67% annualized since inception through Fiscal Year End 2023. | |
| • | The FMI Large Cap Fund – Institutional Class underperformed the benchmark S&P 500 by (3.09%) annualized over the last ten years, while the Investor Class outperformed the benchmark by 0.18% annualized since inception through Fiscal Year End 2023. The Institutional Class outperformed the iShares Russell 1000 Value ETF (proxy benchmark) over a one-year annualized period (5.94%) while underperforming on a three-year annualized period (2.84%). The Institutional Class outperformed at the ten-year period (0.56%). The returns on a five-year annualized period were roughly in-line with the benchmark. The Investor Class has outperformed the value benchmark by 1.34% annualized since inception through Fiscal Year End 2023. | |
| • | The FMI International Fund – Investor Class outperformed on an annualized basis against the MSCI EAFE (USD) benchmark by 2.92% and the MSCI EAFE (Local) benchmark by (0.39%) since inception. At the one- and three-year annualized periods, Investor Class has outperformed the MSCI EAFE (Local) by (9.98%) and (0.56%) while underperforming | |
56
FMI Funds, Inc.
ADVISORY AGREEMENTS (Unaudited) (Continued)
| at the five- and ten-year annualized period by (0.89%) and (0.34%), respectively through Fiscal Year End 2023. Notwithstanding the recent relative strength of the MSCI EAFE Value (USD) and MSCI EAFE Value (Local) benchmarks, the Institutional Class underperformed the MSCI EAFE Value (USD) on an annualized basis over the one-year period by 1.21% while surpassing the MSCI EAFE Value (USD) in the three, five, ten and since inception periods (investor class) through Fiscal Year End 2023 by 0.26%, 1.95%, 3.44% and 3.60%, respectively. The Investor Class also outperformed the MSCI EAFE Value (Local) at the one, ten, and inception annualized periods by (4.25%), (0.30%) and (1.02%), while underperforming at the three- and five-year annualized periods by (5.24%) and (0.66%), respectively. | ||
| • | For the Fiscal Year End 2023, the FMI International Fund II – Currency Unhedged – Institutional Class outperformed on an annualized basis against the MSCI EAFE (USD) benchmark at the one- and three-year periods by (8.13%) and (0.84%) while underperforming since inception by (1.40%), respectively. Against the MSCI EAFE Value (USD) index, the Fund outperformed at the one-year period by (2.27%) while underperforming at the three-year period and annualized since inception by (4.52%) and (1.93%), respectfully. |
Based on the information and materials discussed by the Directors, as reflected above, the Directors concluded that the performance of the Funds, adjusting for risk, has been satisfactory on a relative basis and more than satisfactory on an absolute basis. They continue to believe that the Adviser’s discipline should lead to favorable results in the long-term, and concluded that continuation of the existing advisory agreements was in the best interest of the Funds’ shareholders.
Costs and Profitability
The Adviser uses a team-oriented approach so no one individual is assigned to any one of the Adviser’s clients from a portfolio management, research, trading, operations or administrative perspective. Instead, every teammate is working on behalf of all the Adviser’s clients, including each Fund. Accordingly, in determining the Adviser’s costs relative to the services performed on behalf of all the Adviser’s clients, the Adviser has determined to allocate its overall costs proportionately to each Adviser client based upon the percentage of that client’s assets under our management. The Directors believe this method of allocation is appropriate.
In summary, the Directors noted the following: (1) the peer group comparative fee and expense analysis for the Funds show that their net expense ratios and advisory fees are within a reasonable range of industry averages; (2) the shareholder service fees paid to intermediaries by the Adviser for the benefit of the Funds significantly reduce the pre-tax profit margin to the Adviser, which results in the pre-tax profit margin for the Funds being lower than the pre-tax profit margin for all other clients of the Adviser on an aggregate basis; and (3) the Adviser’s pre-tax profit margin for the Funds compares reasonably to several publicly traded companies that the Directors reviewed.
In assessing and evaluating the information discussed above, the Directors recognized that it is difficult to make comparisons of profitability from investment advisory contracts. This is because comparative information is not generally publicly available and is affected by numerous factors, including the structure of the particular adviser, the type of clients it advises, its business mix, and numerous assumptions regarding allocations and the adviser’s capital structure and cost of capital. Taking this into account, following their discussion of the material presented above, the Directors concluded that the level of profitability realized by the Adviser from its provision of services to the
57
FMI Funds, Inc.
ADVISORY AGREEMENTS (Unaudited) (Continued)
Funds is reasonable, and that the overall expense ratios and investment advisory fees were fair and within the range of industry averages.
Economies of Scale
The Directors discussed the possibility that as fund assets grow, certain fixed costs are spread over the larger asset base leading to some economies of scale, which should benefit the Funds’ shareholders. Additionally, some variable costs, such as accounting, administration, custody and management fees are on a sliding scale relative to asset size. Based on the materials the Directors reviewed, the Funds’ expense ratios have generally fallen over the fiscal years, primarily as a consequence of the Adviser’s renegotiation of service contracts and the addition of management fee breakpoints. The Directors determined that the breakpoints are at levels that will appropriately benefit shareholders by passing along economies of scale.
In summary, the Directors noted the following: (1) some variable costs, such as accounting, administration, custody and management fees are on a sliding scale relative to asset size; (2) the Funds’ expense ratios have generally fallen over the fiscal years, primarily as a consequence of the Adviser’s renegotiation of service contracts and the addition of management fee breakpoints; and (3) the fact that the Adviser has made significant investments into the Funds’ portfolio management and research teams.
After discussing the matters referenced above, the Directors concluded that the current fees and breakpoints were appropriate.
Fall-Out Benefits
The Directors reviewed the Adviser’s use of research, analytical, statistical and other information and services obtained in connection with effecting trades for the Funds. While the research, analytical, statistical and other information and services provided by brokers have substantial value, the Directors determined that such information and services are supplemental to the Adviser’s own efforts in the performance of its duties under the investment advisory agreements, and are used for the benefit of the Funds.
With regard to research services furnished by brokers through whom the Adviser effects security transactions (credits that allow the Adviser to obtain research, so-called “soft-dollars”), the Directors noted that the research may be used in servicing all of the Adviser’s accounts, not just the Funds, regardless of which security transactions generated the soft-dollars. So, the Directors discussed with the Adviser, the Adviser’s allocation policies and procedures for soft-dollars, noting that the Adviser generally allocates soft-dollars proportionately based upon the percentage of a client’s assets under management. The Directors determined that this allocation methodology is appropriate.
In summary, the Directors noted the following: (1) although the Adviser could derive benefits from the conversion of Fund shareholders into separate account clients, the Funds also could benefit from potential institutional shareholders who might choose to invest in the Funds because they want the Adviser’s services, but do not meet minimum separate account size requirements; (2) the Directors concluded that the research, analytical, statistical and other information and services provided by brokers are merely supplemental to the Adviser’s own efforts in the performance of its duties under the investment advisory agreements; and (3) the Directors concluded that the allocation methodology for soft-dollars is appropriate.
58
FMI Funds, Inc.
ADVISORY AGREEMENTS (Unaudited) (Continued)
After discussing and evaluating the materials presented above, the Directors concluded that the other benefits realized by the Adviser from its relationship with the Funds were reasonable.
Conclusion
After reviewing the material provided for the meeting, management’s presentation, as well as other information regularly provided at the Board’s quarterly meetings throughout the year regarding the quality of services provided by the Adviser, the performance of the Funds, expense information, regulatory compliance issues, trading information and related matters and other factors deemed relevant by the Board, the Directors, including all of the Independent Directors, concluded that the investment advisory arrangements between the Funds and the Adviser were fair and reasonable and that the continuation of the investment advisory agreements would be in the best interest of the Funds and their shareholders. Accordingly, the Directors, including the Independent Directors voting separately, approved the continuation of the investment advisory agreements.
59
FMI Funds, Inc.
DISCLOSURE INFORMATION (Unaudited)
Performance for Period Ended March 31, 2024
| Average Annual Total Returns | ||||||||
| 3 | 1 | 3 | 5 | 10 | Since | Inception | ||
| FMI FUND / INDEX | Months(1) | Year | Year | Year | Year | Inception(1) | Date | |
| Common Stock – Investor Class | 8.91% | 26.50% | 14.11% | 13.90% | 10.39% | 12.03% | 12-18-81 | |
| Russell 2000 Index | 5.18% | 19.71% | -0.10% | 8.10% | 7.58% | 10.00% | 12-18-81 | |
| Russell 2000 Value Index | 2.90% | 18.75% | 2.22% | 8.17% | 6.87% | 11.29% | 12-18-81 | |
| Common Stock – Institutional Class | 8.92% | 26.64% | 14.25% | 14.03% | N/A | 13.55% | 10-31-16 | |
| Russell 2000 Index | 5.18% | 19.71% | -0.10% | 8.10% | 7.58% | 9.59% | 10-31-16 | |
| Russell 2000 Value Index | 2.90% | 18.75% | 2.22% | 8.17% | 6.87% | 8.55% | 10-31-16 | |
| Large Cap – Investor Class | 8.43% | 26.30% | 7.86% | 10.39% | 9.73% | 9.32% | 12-31-01 | |
| S&P 500 Index | 10.56% | 29.88% | 11.49% | 15.05% | 12.96% | 9.18% | 12-31-01 | |
| iShares Russell 1000 Value ETF | 8.86% | 20.11% | 7.88% | 10.12% | 8.82% | 7.86% | 12-31-01 | |
| Large Cap – Institutional Class | 8.53% | 26.46% | 8.01% | 10.55% | N/A | 11.58% | 10-31-16 | |
| S&P 500 Index | 10.56% | 29.88% | 11.49% | 15.05% | 12.96% | 15.02% | 10-31-16 | |
| iShares Russell 1000 Value ETF | 8.86% | 20.11% | 7.88% | 10.12% | 8.82% | 10.09% | 10-31-16 | |
| International – Investor Class | 5.66% | 16.72% | 7.24% | 7.38% | 6.55% | 8.02% | 12-31-10 | |
| MSCI EAFE (LOC) | 9.96% | 18.82% | 9.43% | 9.36% | 7.66% | 7.87% | 12-31-10 | |
| MSCI EAFE (LOC) Value | 8.54% | 21.02% | 11.52% | 8.51% | 6.42% | 7.00% | 12-31-10 | |
| MSCI EAFE (USD) | 5.78% | 15.32% | 4.78% | 7.33% | 4.80% | 5.51% | 12-31-10 | |
| MSCI EAFE (USD) Value | 4.48% | 17.32% | 6.59% | 6.39% | 3.49% | 4.59% | 12-31-10 | |
| International – Institutional Class | 5.70% | 16.86% | 7.38% | 7.52% | N/A | 7.15% | 10-31-16 | |
| MSCI EAFE (LOC) | 9.96% | 18.82% | 9.43% | 9.36% | 7.66% | 8.87% | 10-31-16 | |
| MSCI EAFE (LOC) Value | 8.54% | 21.02% | 11.52% | 8.51% | 6.42% | 7.74% | 10-31-16 | |
| MSCI EAFE (USD) | 5.78% | 15.32% | 4.78% | 7.33% | 4.80% | 7.51% | 10-31-16 | |
| MSCI EAFE (USD) Value | 4.48% | 17.32% | 6.59% | 6.39% | 3.49% | 6.38% | 10-31-16 | |
| International II – Currency Unhedged – | ||||||||
| Institutional Class | 3.47% | 14.02% | 2.72% | N/A | N/A | 4.02% | 12-31-19 | |
| MSCI EAFE (USD) | 5.78% | 15.32% | 4.78% | 7.33% | 4.80% | 6.05% | 12-31-19 | |
| MSCI EAFE (USD) Value | 4.48% | 17.32% | 6.59% | 6.39% | 3.49% | 5.73% | 12-31-19 | |
(1) | Returns for periods less than one year are not annualized. |
Performance data quoted represents past performance; past performance does not guarantee future results. Investment return and principal value of an investment will fluctuate so that an investor’s shares, when redeemed, may be worth more or less than their original cost. Current performance of a Fund may be lower or higher than the performance quoted. Performance data current to the most recent month end may be obtained by visiting www.fmifunds.com or by calling 1-800-811-5311. The returns do not reflect the deduction of taxes that a shareholder would pay on Fund distributions or the redemption of Fund shares.
Securities named in the Letter to Shareholders, but not listed in the Schedules of Investments are not held in the Funds as of the date of this disclosure. Portfolio holdings are subject to change without notice and are not intended as recommendations of individual securities.
This report is not authorized for use as an offer of sale or a solicitation of an offer to buy shares of the Funds unless accompanied or preceded by the Funds’ current prospectus.
60
FMI Funds, Inc.
DISCLOSURE INFORMATION (Unaudited) (Continued)
As of the Funds’ Prospectus dated January 31, 2024, the annual operating expense ratios for the Investor Class of FMI Common Stock Fund, FMI Large Cap Fund and FMI International Fund are: 1.00%, 0.84% and 0.94%, respectively. The annual operating expense ratios for the Institutional Class of FMI Common Stock Fund, FMI Large Cap Fund, FMI International Fund and FMI International Fund II – Currency Unhedged are: 0.88%, 0.71%, 0.80% and 0.90%*, respectively.
| * | Note that the annual operating expenses for the Institutional Class of FMI International Fund II – Currency Unhedged are 1.14% before the investment adviser’s voluntary reimbursement such that annual fund operating expenses do not exceed 0.90%, which will continue at least through January 31, 2025. |
Risks associated with investing in the Funds are as follows:
| FMI Common Stock Fund: Stock Market Risk, Medium and Small Capitalization Companies Risks (which includes the potential for greater volatility and less financial resources than Large-Cap Companies), Value Investing Risk, Foreign Securities Risk (fluctuation of currency, different financial standards, and political instability), Liquidity Risk, and Tax Law Change Risk. | |
| FMI Large Cap Fund: Stock Market Risk, Medium and Large Capitalization Companies Risks, Value Investing Risk, Foreign Securities Risk (fluctuation of currency, different financial standards, and political instability), Liquidity Risk, and Tax Law Change Risk. | |
| FMI International Fund: Stock Market Risk, Value Investing Risk, Foreign Securities Risk (fluctuation of currency, different financial standards, and political instability), Geographic Concentration Risk, Currency Hedging Risk, Large Capitalization Companies Risk, Liquidity Risk, and Tax Law Change Risk. | |
| FMI International Fund II – Currency Unhedged: Stock Market Risk, Value Investing Risk, Foreign Securities Risk (fluctuation of currency, different financial standards, and political instability), Geographic Concentration Risk, Large Capitalization Companies Risk, Liquidity Risk, and Tax Law Change Risk. |
For details regarding these risks, please refer to the Funds’ Summary or Statutory Prospectuses dated January 31, 2024.
The Standard and Poor’s 500 Index (S&P 500) consists of 500 selected common stocks, most of which are listed on the New York Stock Exchange. The S&P’s Ratings Group designates the stocks to be included in the Index on a statistical basis. A particular stock’s weighting in the Index is based on its relative total market value (i.e., its market price per share times the number of shares outstanding). Stocks may be added or deleted from the Index from time to time.
The iShares Russell 1000 Value ETF seeks to track investment results of an index composed of large- and mid-capitalization U.S. equities that exhibit value characteristics. Performance is compared to the iShares Russell 1000 Value ETF for illustrative purposes only. The metrics regarding the comparative ETF have been obtained from Bloomberg and the returns are calculated assuming all dividends are reinvested. The ETF is not subject to the same fees or expenses as the Fund. The Fund is not restricted to investing in those securities which comprise the ETF. The Fund’s performance may or may not correlate to the ETF, and it should not be considered a proxy for the ETF.
The Russell 2000 Index measures the performance of the 2,000 smallest companies in the Russell 3000 Index. The Russell 2000 Value Index includes equities that exhibit value characteristics and the Russell 2000 Growth Index includes equities that exhibit growth characteristics.
The MSCI EAFE Index (Europe, Australasia, Far East) is a free float-adjusted market capitalization index that is designed to measure the equity market performance of developed markets, excluding the U.S. and Canada. The MSCI EAFE Index consists of the following 21 developed market country indices: Australia, Austria, Belgium, Denmark, Finland, France, Germany, Hong Kong, Ireland, Israel, Italy, Japan, the Netherlands, New
61
FMI Funds, Inc.
DISCLOSURE INFORMATION (Unaudited) (Continued)
Zealand, Norway, Portugal, Singapore, Spain, Sweden, Switzerland and the United Kingdom. Index results are inclusive of dividends and net of foreign withholding taxes. The reported figures include reinvestment of dividends and capital gains distributions and do not reflect any fees or expenses.
The MSCI EAFE Value Index captures large and mid cap securities exhibiting overall value style characteristics across Developed Markets countries around the world, excluding the U.S. and Canada. The value investment style characteristics for index construction are defined using three variables: book value to price, 12-month forward earnings to price and dividend yield.
The MSCI EAFE Index and MSCI EAFE Value Index are calculated in local currency (LOC) as well as in U.S. Dollars (USD). The concept of a LOC calculation excludes the impact of currency fluctuations. All currencies of listing are considered in the Index calculation in LOC where current prices (t) and previous day prices (t-1) are converted into USD using the same exchange rate (exchange rate t-1) in the numerator and denominator. As a consequence, the FX factor drops out of the equation. The USD calculation includes exchange rates at t and t-1. Therefore, the LOC calculation only represents the price appreciation or depreciation of the securities, whereas the USD calculation also accounts for the performance of the currency (or currencies) relative to the USD.
MSCI EAFE is a service mark of MSCI Barra.
The MSCI Eurozone Index captures large- and mid-capitalization equities from developed market countries that use the Euro as their official currency.
The MSCI USA Index captures large- and mid-capitalization equities in the U.S. Market.
All indices are unmanaged. All of the indices are used herein for comparative purposes in accordance with the Securities and Exchange Commission regulations. It is not possible to invest directly into an index.
GLOSSARY
ADR – American Depositary Receipt refer to a negotiable certificate issued by a U.S. depository bank representing a specified number of shares, usually one share, of a foreign company’s stock. The ADR trades on U.S. stock markets as any domestic shares would.
CAGR – Compound Annual Growth Rate is the rate of return that would be required for an investment to grow from its beginning balance to its ending balance, assuming the profits were reinvested at the end of each period of the investment’s life span.
CapEx – Capital expenditures are funds used by a company to acquire, upgrade, and maintain physical assets such as property, plants, buildings, technology, or equipment. CapEx is often used to undertake new projects or investments by a company. Making capital expenditures on fixed assets can include repairing a roof (if the useful life of the roof is extended), purchasing a piece of equipment, or building a new factory. This type of financial outlay is made by companies to increase the scope of their operations or add some future economic benefit to the operation.
Discount Rate is the interest rate charged to commercial banks and financial institutions for short-term loans they take from the Federal Reserve Bank. The discount rate is applied at the Fed’s lending facility, which is called the discount window. A discount rate can also refer to the interest rate used in discounted cash flow (DCF) analysis to determine the present value of future cash flows. In this case, the discount rate can be used by investors and businesses for potential investments.
EPS – Earnings Per Share is calculated as a company’s profit divided by the outstanding shares of its common stock. The resulting number serves as an indicator of a company’s profitability. It is common for a company to report EPS that is adjusted for extraordinary items and potential share dilution. The higher a company’s EPS, the more profitable it is considered to be.
EBITDA – Earnings Before Interest Taxes Depreciation and Amortization is net income with interest, taxes, depreciation, and amortization added back to it, and can be used to analyze and compare profitability between companies and industries because it eliminates the effects of financing and accounting decisions.
62
FMI Funds, Inc.
DISCLOSURE INFORMATION (Unaudited) (Continued)
Generally accepted accounting principles (GAAP) are a set of accounting rules, standards, and procedures issued and frequently revised by the Financial Accounting Standards Board (FASB). Public companies in the U.S. must follow GAAP when their accountants compile their financial statements.
GDP – Gross Domestic Product – Gross Domestic Product is the monetary value of all finished goods and services produced within a country’s borders in a specific time period.
Intrinsic value is a measure of what an asset is worth. This measure is arrived at by means of an objective calculation or complex financial model. Intrinsic value is different from the current market price of an asset. However, comparing it to that current price can give investors an idea of whether the asset is undervalued or overvalued.
Net Debt-to-EBITDA – Net debt-to-EBITDA is a measurement of the total amount of outstanding company debt as a percentage of EBITDA. The ratio is an indicator of the company’s ability to pay its debt.
P/E ratio – Price-to-earnings ratio is the ratio for valuing a company that measures its current share price relative to its per-share earnings. The trailing P/E ratio is calculated by dividing the current share price by per-share earnings over the previous 12 months and the forward P/E ratio estimates likely per-share earnings over the next 12 months.
SMID caps is a contraction of “small and mid caps” which are companies with small and medium-sized capitalizations or market value.
Std dev – Standard Deviation is a basic mathematical concept that measures volatility in the market or the average amount by which individual data points differ from the mean. Simply put, standard deviation helps determine the spread of asset prices from their average price.
Reference definitions found at Investopedia.com
Distributed by Foreside Financial Services, LLC, Three Canal Plaza, Suite 100, Portland, ME 04101
63
FMI Funds, Inc.
ADDITIONAL INFORMATION (Unaudited)
For additional information about the Directors and Officers or for a description of the policies and procedures that the Funds use to determine how to vote proxies relating to portfolio securities, please review the Statement of Additional Information. You may call (800) 811-5311 and request a Statement of Additional Information, and it will be mailed to you free of charge. The Statement of Additional Information is also available on the website of the Securities and Exchange Commission (the “Commission”) at http://www.sec.gov. Information on how each of the Funds voted proxies relating to portfolio securities during the most recent 12-month period ended June 30 is available on the Funds’ website at http://www.fmifunds.com or the website of the Commission no later than August 31 for the prior 12 months ended June 30. The Funds file their complete schedules of portfolio holdings with the Commission for the first and third quarters of each fiscal year as exhibits to their reports on Form N-PORT. The Funds’ Form N-PORT reports are available on the Commission’s website provided above.
64
(This Page Intentionally Left Blank.)
| FMI Common Stock Fund | FMI Large Cap Fund | FMI International Fund | FMI International Fund II – |
| Currency Unhedged |
790 North Water Street, Suite 2100
Milwaukee, Wisconsin 53202
www.fmifunds.com
414-226-4555
BOARD OF DIRECTORS
| ROBERT C. ARZBAECHER | PATRICK J. ENGLISH | |||
| JONATHAN T. BLOOM | REBECCA W. HOUSE | |||
| JOHN S. BRANDSER | PAUL S. SHAIN | |||
| LAWRENCE J. BURNETT | ROBERT J. VENABLE |
INVESTMENT ADVISER
FIDUCIARY MANAGEMENT, INC.
790 North Water Street, Suite 2100
Milwaukee, Wisconsin 53202
ADMINISTRATOR, ACCOUNTANT, TRANSFER
AGENT AND DIVIDEND DISBURSING AGENT
U.S. BANCORP FUND SERVICES, LLC
615 East Michigan Street
Milwaukee, Wisconsin 53202
800-811-5311 or 414-765-4124
| CUSTODIAN | INDEPENDENT REGISTERED | ||
| U.S. BANK, N.A. | PUBLIC ACCOUNTING FIRM | ||
| Milwaukee, Wisconsin | COHEN & COMPANY, LTD. | ||
| Milwaukee, Wisconsin | |||
| DISTRIBUTOR | LEGAL COUNSEL | ||
| FORESIDE FINANCIAL SERVICES, LLC | FOLEY & LARDNER LLP | ||
| Portland, Maine | Milwaukee, Wisconsin | ||
| FMI Funds, Inc. | ||
1-800-811-5311 www.fmifunds.com | |||
| (b) | Not applicable. |
Item 2. Code of Ethics.
Not applicable for semi-annual reports.
Item 3. Audit Committee Financial Expert.
Not applicable for semi-annual reports.
Item 4. Principal Accountant Fees and Services.
Not applicable for semi-annual reports.
Item 5. Audit Committee of Listed Registrants.
Not applicable to registrants who are not listed issuers (as defined in Rule 10A-3 under the Securities Exchange Act of 1934).
Item 6. Investments.
| (a) | Schedule of Investments is included as part of the report to shareholders filed under Item 1 of this Form. |
(b) | Not applicable. |
Item 7. Disclosure of Proxy Voting Policies and Procedures for Closed-End Management Investment Companies.
Not applicable to open-end investment companies.
Item 8. Portfolio Managers of Closed-End Management Investment Companies.
Not applicable to open-end investment companies.
Item 9. Purchases of Equity Securities by Closed‑End Management Investment Company and Affiliated Purchasers.
Not applicable to open-end investment companies.
Item 10. Submission of Matters to a Vote of Security Holders.
Not applicable.
Item 11. Controls and Procedures.
| (a) | The registrant’s principal executive and principal financial officers have concluded that the registrant’s disclosure controls and procedures are effective, as of a date within 90 days of the filing of this report, based on their evaluation of the registrant’s disclosure controls and procedures. |
| (b) | There were no changes in the registrant's internal control over financial reporting (as defined in Rule 30a-3(d) under the Act) that occurred during the period covered by this report that have materially affected, or are reasonably likely to materially affect, the registrant's internal control over financial reporting. |
Item 12. Disclosure of Securities Lending Activities for Closed-End Management Investment Companies
Not applicable to open-end investment companies.
Item 13. Exhibits.
| (a) | (1) Any code of ethics or amendment thereto, that is the subject of the disclosure required by Item 2, to the extent that the registrant intends to satisfy Item 2 requirements through filing an exhibit. Not Applicable. |
(3) Any written solicitation to purchase securities under Rule 23c‑1 under the Act sent or given during the period covered by the report by or on behalf of the registrant to 10 or more persons. Not applicable to open-end investment companies.
(4) Change in the registrant’s independent public accountant. There was no change in the registrant’s independent public accountant for the period covered by this report.
SIGNATURES
Pursuant to the requirements of the Securities Exchange Act of 1934 and the Investment Company Act of 1940, the registrant has duly caused this report to be signed on its behalf by the undersigned, thereunto duly authorized.
(Registrant) FMI Funds, Inc.
By /s/ John S. Brandser
John S. Brandser, President & Principal Executive Officer
Date 5/15/2024
Pursuant to the requirements of the Securities Exchange Act of 1934 and the Investment Company Act of 1940, this report has been signed below by the following persons on behalf of the registrant and in the capacities and on the dates indicated.
By /s/ John S. Brandser
John S. Brandser, President & Principal Executive Officer
Date 5/15/2024
By /s/ Jonathan T. Bloom
Jonathan T. Bloom, Treasurer & Principal Financial Officer
Date 5/15/2024