UNITED STATES
SECURITIES AND EXCHANGE COMMISSION
Washington, D.C. 20549
SECURITIES AND EXCHANGE COMMISSION
Washington, D.C. 20549
FORM N-CSR
CERTIFIED SHAREHOLDER REPORT OF REGISTERED
MANAGEMENT INVESTMENT COMPANIES
Investment Company Act file number 811-07831
FMI Funds, Inc.
(Exact name of registrant as specified in charter)
(Exact name of registrant as specified in charter)
100 East Wisconsin Avenue
Suite 2200
Milwaukee, WI 53202
(Address of principal executive offices) (Zip code)
John S. Brandser
Fiduciary Management, Inc.
100 East Wisconsin Avenue
Suite 2200
Milwaukee, WI 53202
(Name and address of agent for service)
(414) 226-4545
Registrant's telephone number, including area code
Date of fiscal year end: September 30
Date of reporting period: March 31, 2022
Item 1. Reports to Stockholders.
| (a) |
SEMI-ANNUAL REPORT
March 31, 2022
FMI Large Cap Fund
Investor Class (Ticker Symbol: FMIHX)
Institutional Class (Ticker Symbol: FMIQX)
FMI Common Stock Fund
Investor Class (Ticker Symbol: FMIMX)
Institutional Class (Ticker Symbol: FMIUX)
FMI International Fund
Investor Class (Ticker Symbol: FMIJX)
Institutional Class (Ticker Symbol: FMIYX)
FMI International Fund II – Currency Unhedged
Investor Class (Not Available For Sale)
Institutional Class (Ticker Symbol: FMIFX)
 | |
FMI Funds, Inc. | |
| Advised by Fiduciary Management, Inc. | |
| www.fmifunds.com | |
FMI Funds, Inc.
TABLE OF CONTENTS
| FMI Large Cap Fund | |||
| Shareholder Letter | 1 | ||
| Schedule of Investments | 9 | ||
| Industry Sectors | 11 | ||
| FMI Common Stock Fund | |||
| Shareholder Letter | 12 | ||
| Schedule of Investments | 19 | ||
| Industry Sectors | 21 | ||
| FMI International Fund and FMI International Fund II – Currency Unhedged | |||
| Shareholder Letter | 22 | ||
| FMI International Fund | |||
| Schedule of Investments | 30 | ||
| Schedule of Forward Currency Contracts | 34 | ||
| Industry Sectors | 35 | ||
| Concentration by Country | 35 | ||
| FMI International Fund II – Currency Unhedged | |||
| Schedule of Investments | 36 | ||
| Industry Sectors | 40 | ||
| Concentration by Country | 40 | ||
| Financial Statements | |||
| Statements of Assets and Liabilities | 42 | ||
| Statements of Operations | 44 | ||
| Statements of Changes in Net Assets | 46 | ||
| Financial Highlights | 50 | ||
| Notes to Financial Statements | 57 | ||
| Expense Example | 69 | ||
| Advisory Agreements | 71 | ||
| Disclosure Information | 78 | ||
| Additional Information | 81 | ||
FMI
Large Cap
Fund
(unaudited)
| March 31, 2022 |
Dear Fellow Shareholders:
The FMI Large Cap Fund (“Fund”) declined 6.16%1 in the March quarter compared to a 4.60% drop in the Standard & Poor’s 500 Index, and 0.74% loss in the Russell 1000 Value Index. Areas where the Fund had little exposure such as Energy & Non-Energy Minerals, and our overweighting in Producer Manufacturing, explain the lion’s share of the difference between the Fund and the Russell 1000 Value. Compared to the S&P 500, sectors that helped performance included Finance, Technology Services, and Commercial Services. Sectors that detracted included Producer Manufacturing, Health Technology, and Energy Minerals. Berkshire Hathaway Inc. — Cl B, Omnicom Group Inc., and Dollar Tree Inc. added to performance in the quarter while Masco Corp., Quest Diagnostics Inc., and PPG Industries Inc. detracted. Since the Russian invasion of Ukraine on February 24, the market has moved in somewhat of a barbell fashion, with Energy/Non-Energy Minerals and Industrial Service companies tied to these segments driving the value trade, while many speculative growth names also moved up sharply.
Quarterly investment letters across the land will be focused on the Russian invasion and what it means for geopolitical stability, supply chains, energy, inflation, globalization, economic growth, and interest rates. All of these elements were in play long before the invasion. Although markets have largely ignored it, China and Russia substantially increased their belligerence toward the U.S. (and the “West”) in recent years. A new two-pronged cold war with China and Russia has been underway for some time. Historically, sanctions have not been terribly effective, as authoritarian leaders (Mussolini, Castro, Kim Jung Un/IL, Chavez, Maduro, Khomeini) survived by controlling the narrative and crushing popular dissent. Maybe the coordinated effort of a surprisingly large number of Russian trading partners and central banks will prove to be the exception. We don’t expect Putin to change course because of sanctions or exposure of war atrocities, but perhaps Xi Jinping has taken notice and pauses any moves on Taiwan. On a gross basis, China exported $577 billion to the U.S. and $701 billion to the European Union in 2021. China can ill afford a trade war with the West, although the reverse is also true. The war has already had impacts on commodities, intermediate products, and the supply chain. Energy and mineral prices have blown out. Inflation, which started rising rapidly twelve months ago, remains at a 40-year high. For at least three decades, the world’s inflation picture has benefitted from a giant Chinese labor arbitrage that is now in the rearview mirror, as the Chinese working-age population is no longer growing, and wages there have risen markedly. Additionally, both politically and strategically, the West will need to secure more production domestically or with friendly regimes – whether it be in energy, materials, or manufactured goods – adding to inflation pressure in the short-to-intermediate term. While the end of the pandemic and possible slowing of the economy may bring inflation down somewhat, we cannot avoid the ramifications tied to years of quantitative easing, rapid money supply growth, and unprecedented fiscal expansion. The market hasn’t figured this out yet, in fact,
_______________
1 | The FMI Large Cap Fund Investor Class (FMIHX) and the FMI Large Cap Fund Institutional Class (FMIQX) had a return of -6.16% and -6.12%, respectively, for the first quarter of 2022. |
1
speculative activity has reemerged in recent weeks. Despite this, if higher interest rates and inflation characterize the landscape for the next several years, it likely spells the end of the era of unbridled speculation and high multiples. We believe the Fund is well-positioned to thrive in the tougher world that may be upon us.
Interest Rates and Inflation
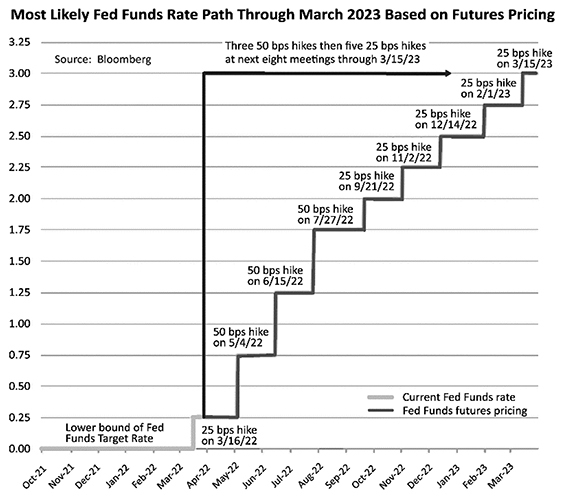
Below is the latest illustration of the expected Fed Funds Rate to March 2023. If these moves come to pass, the recent 0% Fed Funds Rate would be 3%.
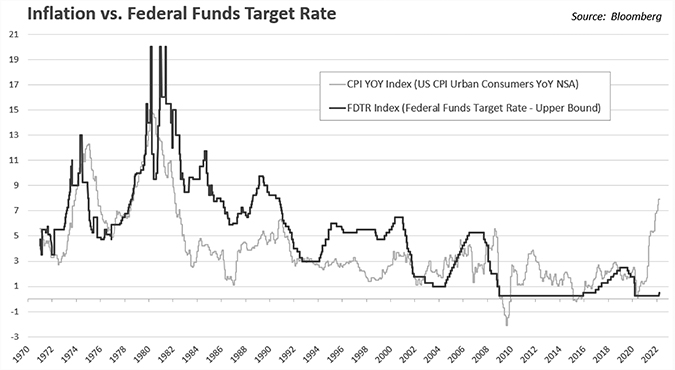
Now observe the below chart showing the Fed Funds Rate and the inflation rate over fifty years. Tracking the Federal Funds Target Rate back to 1971, the average inflation rate as measured by CPI from 1971 until today is 3.9%.
2
Inflation Episode 1
The CPI went from 2.7% to 12.3% from the 3rd quarter of 1972 to the 4th quarter of 1974. The Fed Funds rate went from 5% to 13% from the 3rd quarter of 1972 to the 2nd quarter of 1974. From the 4th quarter of 1974 to the 4th quarter of 1976, CPI went from 12.3% to 4.9%.
Inflation Episode 2
CPI went from 4.9% to 14.8% from the 4th quarter of 1976 to the 1st quarter of 1980. Fed Funds went from 6% to 20% from the 4th quarter of 1976 to the 1st quarter of 1980. Inflation finally got to a more normal level by the 4th quarter of 1982. From the 1st quarter of 1980 to the 4th quarter of 1982, CPI averaged 9.7% while the Fed Funds target rate averaged 13.6%.
Inflation Episode 3
CPI went from 1.1% to 6.2% from the 4th quarter of 1986 to the 3rd quarter of 1990. Fed Funds went from 6% to 9.75% from the 4th quarter of 1986 to the 1st quarter of 1989. CPI from the 3rd quarter of 1990 to the 4th quarter of 1991 went from 6.2% to 3.1%. CPI was under control from 1991 until the financial crisis in 2008, averaging 2.7% while the Fed Funds target rate averaged 3.95%.
Virtually every time inflation spiked over the past fifty years, the Fed Funds Rate went higher than the inflation rate to tame it. How many investors today believe the Fed Funds Rate is on a path toward 8%? Inflation is taking longer to stabilize than expected and Chairman Powell is pointing toward short-term supply chain problems, or transient war impacts. The stock and bond markets seem to agree it’s a temporary challenge. As of 3/31/22 the S&P 500 is only 5.2% off its high, and the bond market (using inflation-adjusted Treasury securities) expects five-year inflation to drop dramatically. A recent study from AllianceBernstein concluded that only 1.5 percentage points of the 7.9% inflation rate is likely due to one-time supply chain effects. More traditional monetary factors appear to be the culprit. In a recent piece from The Wall Street Journal by Hanke and Hanlon,2 titled, “Jerome Powell is Wrong. Printing Money Causes Inflation,” the authors point out that in two separate communications with Congress over the past year, Powell said the connection between money supply growth and inflation ended 40 years ago. The below chart throws cold water on these assertions.

_______________
2 | Steve Hanke, professor, and Nicholas Hanlon, chief of staff, at the Johns Hopkins Institute of Applied Economics. |
3
Why is the market not yet buying the high inflation, higher rate thesis? One possible explanation gaining traction is the notion that we are headed for a recession, complete with demand destruction and falling prices, or at least a much slower growth rate in the CPI. Given the downward action in many stocks recently (aside from energy and commodities), this seems plausible. Yield curves have flattened in recent weeks. Inverted yield curves (short-term rates exceeding long-term rates) have a better-than-average track record of predicting recessions. Talking to our companies, however, and observing demand across many industries, it does not feel like a downturn is imminent. Perhaps stagflation is on the horizon. Whether underlying economic growth remains solid or weakens enough to cause a recession, we do not see inflation returning to 2% anytime soon. Moreover, with quantitative easing ending, Fed Funds rising, and bond investors wanting more compensation for the risk of inflation, longer maturity interest rates may continue to normalize. As we indicated in our letter of December 31, 2021, the 10-Year Treasury’s median yield since 1957 is 5.38% compared to 2.34% today (up from 1.51% as of 12/31/21). It is hard to imagine P/E multiples remaining near all-time highs with the discount rate escalating.
Market Behavior
The value move in the market this year is mostly related to hydrocarbon exploration and production stocks, as well as other commodity-oriented equities. The Fund has little-to-no exposure to these sectors, as over long periods of time, most of the companies in these sectors have proven unable to earn their cost of capital and are highly volatile. These stocks periodically race higher, but elevated commodity prices almost always spur a supply response that typically ends the rally. Higher raw material prices have temporarily affected a few of our stocks, but these companies have good market power and are already raising prices aggressively. We expect within a few quarters that margins will recover.
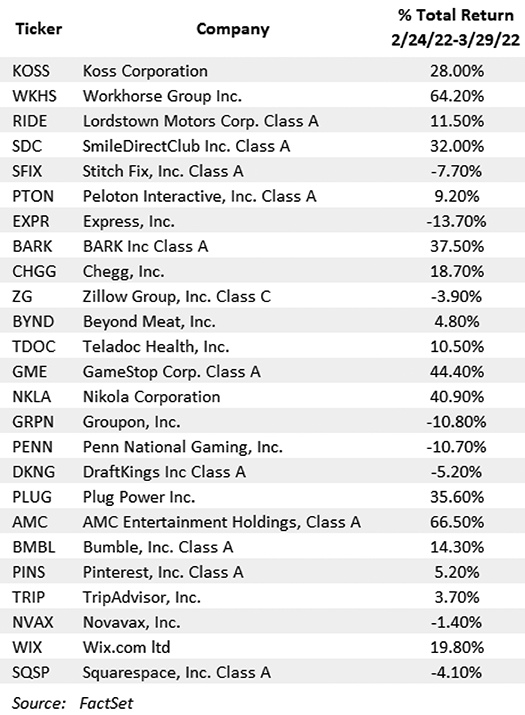
In the latter parts of last year and into the beginning of this year, the market was correcting a significant amount of excess, and it looked like the growth fever had broken. In our letter of December 31, 2021, we presented a table with a number of notable names down between 50-90% from their highs. Strangely, considering war, inflation, and rapidly rising rates, many meme stocks and other speculative issues have once again rallied. The same names are depicted below, with their performance since the Russian invasion through 3/29/22. Based on EBIT, only four of these companies have earnings.
4
Remarkably, the Nasdaq-100 and S&P 500 indices are up 6.25% and 5.80% through 3/31/22, respectively, since the war started. Tesla, Inc. went up 57% from its low on February 24 ($700) to the close on March 29th ($1099), which equates to an advance of $413 billion. To put that in perspective, the 24 trading day gain in Tesla was greater than the entire market value of Walmart, Inc.! Tesla trades for 120 times estimated 2022 GAAP3 earnings, compared to Walmart’s 21.8 multiple (1/2023 fiscal year). Robinhood Markets, Inc. gained 47% from February 24th to March 29th, which gives another indication of how the speculative candle has reignited. Additionally, the high yield market has outperformed investment grade credits and treasuries, both year-to-date and, inexplicably, post the Russian invasion. It is difficult to understand this; our only explanation is that after years of aggressive behavior being rewarded, investors’ muscle memory remains strong, kicking in whenever trouble surfaces, knowing the Fed has a long history of coming to the rescue (or losing its nerve when it comes to interest rate hikes). Of course, the difference this time around is that market interest rates are rising sharply, and inflation is proving to be sticky. It could also be that the market is anticipating the end of the war and are thus bidding up the most aggressive growth stocks; it is hard to know for sure. What does seem apparent is that investor psychology has not been significantly tempered by rates, inflation, or a war.
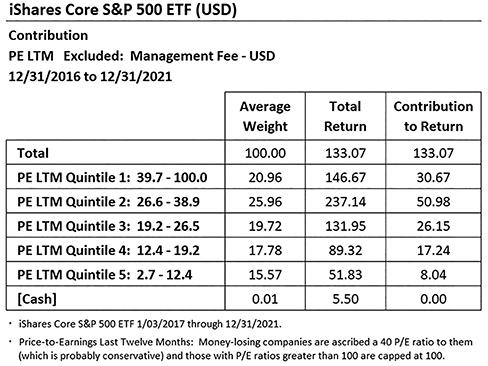
Though the S&P 500 has outperformed the FMI Large Cap Fund over the past five years, it hasn’t meaningfully outperformed on a fundamental basis. As in any multi-year time-frame, we’ve had some companies that have come up short, but even with these, we estimate that the Large Cap Fund, on a median basis, grew sales and earnings at 5.5% and 12.4%, respectively, in the five years ending 12/31/21. Similarly measured, we estimate the S&P 500 (using the iShares S&P 500 as a proxy) over that time frame grew sales and earnings at 5.9% and 12.7%, respectively.4 Throughout this period, our portfolio valuation was considerably cheaper than the S&P 500 and our balance sheets were better (and these conditions remain today). In hindsight, one could say we cared too much about risk. We certainly did not expect interest rates to remain low for so long and valuations to expand and remain high. Contrary to decades of history, over the last 5 years, for all but one quintile, the higher the trailing price-to-earnings ratio, the better the stock performance, as illustrated by the below table.
In hindsight, almost every stock sold for valuation reasons looks like a mistake. Perhaps we underestimated the power of some of the big technology companies to continue growing. Moreover, many of the heaviest-weighted companies in the S&P 500 outperformed significantly, which was a major factor, as most of these companies were in the technology arena where we were underweight
_______________
3 | Generally accepted accounting principles. |
4 | Because of COVID, 2020 had many negative growth rates and thus, comparison to 2021 was impossible to calculate. Therefore, we took 2021 earnings and compared them to 2019, chain linking this growth rate to the other years. |
5
due to very high valuations. We had a few problem stocks that, in retrospect, may have been too complicated, a couple where we misjudged the quality of the management, and a handful that were really hit by COVID. We’ve made some adjustments, are optimistic about the COVID-affected names, and are confident in the lineup we have today. We make no apologies about having a deep concern about downside risk and sticking with high-quality businesses and relatively low valuations. The portfolio trades at roughly a 30-50% discount to the iShares S&P 500 based on an array of valuation metrics. These attributes should be rewarded in time, although no one knows when the music will stop and aggressive behavior penalized.
As per usual in the March letter, we include below a brief commentary on two portfolio holdings.
Carlisle Cos. Inc. (CSL)
(Analyst: Ben Karek)
Description
Carlisle is a diversified manufacturer of a broad range of products selling into industries such as commercial construction, aerospace, transports, and general industrial. The company is headquartered in Scottsdale, AZ and operates in three segments: Carlisle Construction Materials (CCM), Carlisle Interconnect Technologies (CIT), and Carlisle Fluid Technologies (CFT). CCM accounts for 80% of sales and 99% of EBIT, with marginal earnings contribution from CIT and CFT. Carlisle’s geographic exposure is U.S. (84%), Europe (7%), Asia (4%), and Other (5%). Its operating companies are given significant autonomy and responsibility for the performance of their businesses.
Good Business
| • | The majority of Carlisle’s sales are in markets where it enjoys #1 or #2 positions. | |
| • | The company’s largest segment, CCM, derives 70% of its sales from aftermarket. Commercial roofs are replaced roughly every 25 years, and we are approaching a long runway of replacement demand through 2030. | |
| • | Carlisle’s products are specialized, highly engineered, and recurring in nature. | |
| • | The company’s businesses are necessary and easy to understand. | |
| • | It is conservatively financed at 2.2 times forward net debt/EBITDA. | |
| • | They are cash generative, with free cash flow averaging >100% of net income. | |
| • | Return on total capital has averaged 12% over the last five years. |
Valuation
| • | The stock trades at a reasonable 17.0 times 2022 P/E ratio, which approximates its 10-year average. We believe a mix shift toward buildings products will structurally expand its fair multiple. |
Management
| • | Carlisle has a strong track record of value creation; its returns on invested capital are above its cost of capital, despite completing numerous small and mid-size acquisitions. Its shares have meaningfully outperformed the S&P 500 and the Russell 2000 indices over the last 5, 10, and 15 years, while still trading at a reasonable multiple. | |
| • | CEO Chris Koch, who owns $45 million in the stock, took over in 2016 and has demonstrated a continuity with the Carlisle model and a willingness to shrink the portfolio of businesses if it creates value. We believe we are entering a period where this could accelerate, with Carlisle becoming a pureplay building products company. | |
| • | Carlisle’s variable compensation includes metrics on sales, EBIT margin, and working capital. We believe these roughly approximate business value creation over time. |
6
Investment Thesis
Over the last six years, Carlisle has been on a simplification journey by selling two of its smaller, lower-quality businesses. We expect that the company will continue down this path by selling CIT and CFT over the next couple years. What will remain is a pureplay building products company with a good long-term demand profile and pricing power. Carlisle, like many others, is currently dealing with unprecedented cost inflation. The company has historically shown the ability to pass through raw material inflation, albeit with a lag, as evidenced by the decade-long margin expansion that this segment has experienced through multiple cycles. Carlisle was one of the rare industrials who was price/cost neutral in 2021, and it is also set to benefit from a decade-long reroofing cycle that should allow for +3-4% volume growth before considering any benefit from new construction. Despite strong and improving fundamentals, the shares have recently traded sideways and reached a level that we believe makes it a compelling addition to the Fund.
CarMax Inc. (KMX)
(Analyst: Jordan Teschendorf)
Business Description
CarMax, headquartered in Richmond, VA, is the largest and most profitable used car retailer in the U.S., selling a combined 1.596 million used vehicles annually through retail and wholesale channels across its 226 stores and omni-channel platform. The company has just 4% of a huge $750 billion market. It operates across two segments, CarMax Sales Operation and CarMax Auto Finance (CAF), together covering all aspects of auto merchandising, service, and financing. By segment, the profit is also split into CarMax Sales Operations (80%) and CAF (20%).5 CarMax Sales Operation has three primary sources of revenue: Used (78% of sales and 63% of segment gross profit), Wholesale (19% of sales and 21% of segment gross profit), and Other (3% of sales and 16% of segment gross profit).
Good Business
| • | The CarMax brand stands for providing a large selection of high-quality used vehicles at fair prices, and it has earned the trust of customers since beginning operations nearly 30 years ago. | |
| • | The company has demonstrated consistent growth and leading profitability in one of the largest retail markets in the world ($750 billion). Sales and earnings per share (EPS) have grown at +8% and +11% annually over the last decade, with return on equity averaging approximately 20%. | |
| • | Competitive advantages include brand strength, sourcing, fulfillment, and technology capability. We see opportunity for an acceleration in share gains with omni-channel consumer adoption. | |
| • | Excluding non-recourse notes payable, the company’s balance sheet is well-capitalized with 1.8 times net debt/EBITDA. | |
Valuation | ||
| • | The stock trades at 13.4 times forward EPS, approximately one standard deviation below its 5, 10, and 15-year averages. | |
| • | In a poor environment, with slower volume growth, disappointing operating leverage, and more challenging credit results, we model earnings power could decrease to $6 per share. The stock trades at 16.1 times this depressed figure. | |
_______________
5 | CAF income as a percentage of CAF income plus CarMax Sales gross profit. Note CarMax does not separately assign SG&A to CAF for accounting purposes. |
7
| • | Assuming a reasonably supportive used vehicle market and strong execution, earnings could exceed $9 per share over the next four to five years. The stock trades at 10.7 times this figure. |
Management
| • | Bill Nash has been President and CEO since September 2016 and has been with the company since its founding, previously holding executive roles within the company’s merchandising, auction, and human resources areas. | |
| • | Enrique Mayor-Mora has been CFO since October 2019. He’s been with CarMax since 2011, previously serving as VP of Finance and VP of Treasury. | |
| • | Management is well-regarded by industry experts, peers, and employees. | |
| • | The company has a strong corporate culture. |
Investment Thesis
CarMax is a profitable, well-managed, and growing franchise serving one of the largest retail markets in the world. Its stock price has fallen over 33% from its 52-week high as investors have grown concerned on normalizing demand trends, rising interest rates, and used vehicle affordability. We acknowledge these concerns, although we expect the company to continue growing over the long term in a highly fragmented marketplace, and are encouraged by investments being made to reinforce its already strong customer proposition. We are pleased to buy this leading franchise at a steep discount to the market and its historical average.
Thank you for your confidence in the FMI Large Cap Fund.
Please see page 78 for important disclosures.
This shareholder letter is unaudited.
8
FMI Large Cap Fund
SCHEDULE OF INVESTMENTS
March 31, 2022 (Unaudited)
| Shares | Cost | Value | |||||||||
| COMMON STOCKS — 97.6% (a) | |||||||||||
COMMERCIAL SERVICES SECTOR — 3.0% | |||||||||||
| Advertising/Marketing Services — 3.0% | |||||||||||
| 1,030,000 | Omnicom Group Inc. | $ | 68,504,464 | $ | 87,426,400 | ||||||
CONSUMER DURABLES SECTOR — 3.9% | |||||||||||
| Electronics/Appliances — 3.9% | |||||||||||
| 1,100,000 | Sony Group Corp. — SP-ADR* | 69,013,676 | 112,981,000 | ||||||||
CONSUMER NON-DURABLES SECTOR — 3.1% | |||||||||||
| Household/Personal Care — 3.1% | |||||||||||
| 1,960,000 | Unilever PLC — SP-ADR | 77,967,671 | 89,317,200 | ||||||||
CONSUMER SERVICES SECTOR — 6.8% | |||||||||||
| Cable/Satellite TV — 3.1% | |||||||||||
| 1,915,000 | Comcast Corp. — Cl A | 83,291,504 | 89,660,300 | ||||||||
| Other Consumer Services — 3.7% | |||||||||||
| 46,000 | Booking Holdings Inc.* | 79,545,826 | 108,028,700 | ||||||||
ELECTRONIC TECHNOLOGY SECTOR — 3.7% | |||||||||||
| Semiconductors — 3.7% | |||||||||||
| 1,390,000 | Micron Technology Inc. | 74,786,313 | 108,267,100 | ||||||||
FINANCE SECTOR — 23.0% | |||||||||||
| Investment Banks/Brokers — 3.8% | |||||||||||
| 1,330,000 | The Charles Schwab Corp. | 48,094,571 | 112,132,300 | ||||||||
| Major Banks — 2.9% | |||||||||||
| 615,000 | JPMorgan Chase & Co. | 39,147,333 | 83,836,800 | ||||||||
| Multi-Line Insurance — 8.4% | |||||||||||
| 1,375,000 | Arch Capital Group Ltd.* | 51,382,441 | 66,577,500 | ||||||||
| 502,000 | Berkshire Hathaway Inc. — Cl B* | 25,434,039 | 177,160,820 | ||||||||
| 76,816,480 | 243,738,320 | ||||||||||
| Property/Casualty Insurance — 4.9% | |||||||||||
| 270,000 | Chubb Ltd. | 35,441,992 | 57,753,000 | ||||||||
| 760,000 | Progressive Corp. | 57,274,070 | 86,632,400 | ||||||||
| 92,716,062 | 144,385,400 | ||||||||||
| Regional Banks — 3.0% | |||||||||||
| 755,000 | Northern Trust Corp. | 64,469,113 | 87,919,750 | ||||||||
HEALTH SERVICES SECTOR — 8.5% | |||||||||||
| Health Industry Services — 2.6% | |||||||||||
| 561,510 | Quest Diagnostics Inc. | 54,535,451 | 76,848,258 | ||||||||
| Managed Health Care — 3.5% | |||||||||||
| 200,000 | UnitedHealth Group Inc. | 14,281,660 | 101,994,000 | ||||||||
| Medical/Nursing Services — 2.4% | |||||||||||
| 2,110,000 | Fresenius Medical Care AG & Co. KGaA | 85,121,631 | 71,064,800 | ||||||||
The accompanying notes to financial statements are an integral part of this schedule.
9
FMI Large Cap Fund
SCHEDULE OF INVESTMENTS (Continued)
March 31, 2022 (Unaudited)
| Shares | Cost | Value | |||||||||
| COMMON STOCKS — 97.6% (a) (Continued) | |||||||||||
HEALTH TECHNOLOGY SECTOR — 5.2% | |||||||||||
| Medical Specialties — 5.2% | |||||||||||
| 2,400,000 | Koninklijke Philips N.V. — SP-ADR | $ | 108,433,816 | $ | 73,272,000 | ||||||
| 2,450,000 | Smith & Nephew PLC — SP-ADR | 88,708,491 | 78,155,000 | ||||||||
| 197,142,307 | 151,427,000 | ||||||||||
INDUSTRIAL SERVICES SECTOR — 2.3% | |||||||||||
| Oilfield Services/Equipment — 2.3% | |||||||||||
| 1,655,000 | Schlumberger Ltd. | 31,847,576 | 68,368,050 | ||||||||
PROCESS INDUSTRIES SECTOR — 3.0% | |||||||||||
| Containers/Packaging — 0.6% | |||||||||||
| 93,430 | Avery Dennison Corp. | 16,608,728 | 16,254,017 | ||||||||
| Industrial Specialties — 2.4% | |||||||||||
| 530,000 | PPG Industries Inc. | 51,926,045 | 69,467,100 | ||||||||
PRODUCER MANUFACTURING SECTOR — 13.6% | |||||||||||
| Building Products — 4.4% | |||||||||||
| 2,490,000 | Masco Corp. | 84,285,829 | 126,990,000 | ||||||||
| Electrical Products — 1.9% | |||||||||||
| 360,000 | Eaton Corp. PLC | 32,796,682 | 54,633,600 | ||||||||
| Industrial Machinery — 2.5% | |||||||||||
| 460,000 | Dover Corp. | 62,435,851 | 72,174,000 | ||||||||
| Miscellaneous Manufacturing — 1.7% | |||||||||||
| 206,438 | Carlisle Cos. Inc. | 49,796,897 | 50,767,233 | ||||||||
| Trucks/Construction/Farm Machinery — 3.1% | |||||||||||
| 1,035,000 | PACCAR Inc. | 52,230,730 | 91,152,450 | ||||||||
RETAIL TRADE SECTOR — 12.5% | |||||||||||
| Apparel/Footwear Retail — 1.9% | |||||||||||
| 925,000 | The TJX Companies Inc. | 38,825,953 | 56,036,500 | ||||||||
| Discount Stores — 8.7% | |||||||||||
| 625,000 | Dollar General Corp. | 44,736,530 | 139,143,750 | ||||||||
| 725,000 | Dollar Tree Inc.* | 63,136,566 | 116,108,750 | ||||||||
| 107,873,096 | 255,252,500 | ||||||||||
| Specialty Stores — 1.9% | |||||||||||
| 565,000 | CarMax Inc.* | 61,080,505 | 54,511,200 | ||||||||
TECHNOLOGY SERVICES SECTOR — 9.0% | |||||||||||
| Information Technology Services — 0.9% | |||||||||||
| 140,758 | CDW Corp. | 25,328,678 | 25,180,199 | ||||||||
| Internet Software/Services — 6.1% | |||||||||||
| 45,000 | Alphabet Inc. — Cl A* | 106,405,145 | 125,160,750 | ||||||||
| 240,000 | Meta Platforms Inc. Cl A | ||||||||||
| (formerly Facebook Inc.)* | 76,040,052 | 53,366,400 | |||||||||
| 182,445,197 | 178,527,150 | ||||||||||
The accompanying notes to financial statements are an integral part of this schedule.
10
FMI Large Cap Fund
SCHEDULE OF INVESTMENTS (Continued)
March 31, 2022 (Unaudited)
| Shares | Cost | Value | |||||||||
| COMMON STOCKS — 97.6% (a) (Continued) | |||||||||||
TECHNOLOGY SERVICES SECTOR — 9.0% (Continued) | |||||||||||
| Packaged Software — 2.0% | |||||||||||
| 520,000 | SAP SE — SP-ADR | $ | 67,611,380 | $ | 57,699,200 | ||||||
| Total common stocks | 1,990,527,209 | 2,846,040,527 | |||||||||
| Principal Amount | |||||||||||
| SHORT-TERM INVESTMENTS — 3.2% (a) | |||||||||||
| Bank Deposit Account — 3.2% | |||||||||||
| $ | 94,072,606 | U.S. Bank N.A., 0.096%^ | 94,072,606 | 94,072,606 | |||||||
| Total short-term investments | 94,072,606 | 94,072,606 | |||||||||
| Total investments — 100.8% | $ | 2,084,599,815 | 2,940,113,133 | ||||||||
Other liabilities, less assets — (0.8%) (a) | (23,861,271 | ) | |||||||||
| TOTAL NET ASSETS — 100.0% | $ | 2,916,251,862 | |||||||||
| * | Non-income producing security. |
| ^ | The rate shown is as of March 31, 2022. |
| (a) | Percentages for the various classifications relate to total net assets. |
| PLC | Public Limited Company |
| SP-ADR | Sponsored American Depositary Receipt |
The accompanying notes to financial statements are an integral part of this schedule.
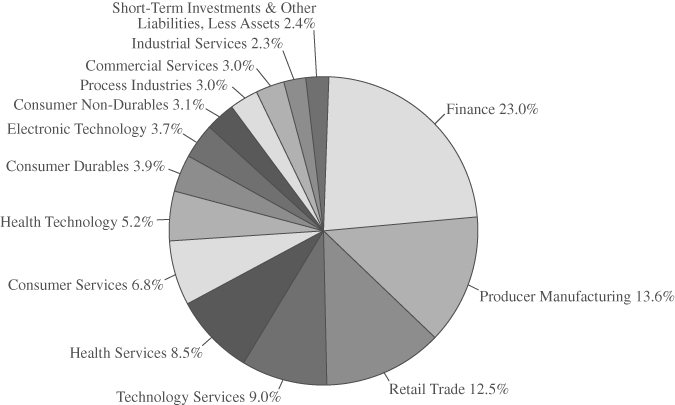
INDUSTRY SECTORS as a percentage of net assets
as of March 31, 2022 (Unaudited)
11
FMI
Common Stock
Fund
(unaudited)
| March 31, 2022 |
Dear Fellow Shareholders:
The FMI Common Stock Fund (“Fund”) declined 4.58%1 in the March quarter compared to a 7.53% drop in the Russell 2000 Index, and 2.40% loss in the Russell 2000 Value Index. Areas where the Fund had little exposure, such as Energy Minerals & Utilities, accounted for the performance difference between the Fund and the Russell 2000 Value. Compared to the Russell 2000, sectors that helped performance included Commercial Services, Health Technology, and Technology Services. Sectors that detracted included Energy Minerals, Industrial Services, and Utilities. Henry Schein Inc., Zions Bancorporation N.A., and Robert Half International Inc. added to performance in the quarter while LCI Industries, Genpact Ltd., and LGI Homes Inc. detracted. Since the Russian invasion of Ukraine on February 24, the market has moved in somewhat of a barbell fashion, with Energy/Non-Energy Minerals and Industrial Service companies tied to these segments driving the value trade, while many speculative growth names also moved up sharply.
Quarterly investment letters across the land will be focused on the Russian invasion and what it means for geopolitical stability, supply chains, energy, inflation, globalization, economic growth, and interest rates. All of these elements were in play long before the invasion. Although markets have largely ignored it, China and Russia substantially increased their belligerence toward the U.S. (and the “West”) in recent years. A new two-pronged cold war with China and Russia has been underway for some time. Historically, sanctions have not been terribly effective, as authoritarian leaders (Mussolini, Castro, Kim Jung Un/IL, Chavez, Maduro, Khomeini) survived by controlling the narrative and crushing popular dissent. Maybe the coordinated effort of a surprisingly large number of Russian trading partners and central banks will prove to be the exception. We don’t expect Putin to change course because of sanctions or exposure of war atrocities, but perhaps Xi Jinping has taken notice and pauses any moves on Taiwan. On a gross basis, China exported $577 billion to the U.S. and $701 billion to the European Union in 2021. China can ill afford a trade war with the West, although the reverse is also true. The war has already had impacts on commodities, intermediate products, and the supply chain. Energy and mineral prices have blown out. Inflation, which started rising rapidly twelve months ago, remains at a 40-year high. For at least three decades, the world’s inflation picture has benefitted from a giant Chinese labor arbitrage that is now in the rearview mirror, as the Chinese working-age population is no longer growing, and wages there have risen markedly. Additionally, both politically and strategically, the West will need to secure more production domestically or with friendly regimes – whether it be in energy, materials, or manufactured goods – adding to inflation pressure in the short-to-intermediate term. While the end of the pandemic and possible slowing of the economy may bring inflation down somewhat, we cannot avoid the ramifications tied to years of quantitative easing, rapid money supply growth, and unprecedented fiscal expansion. The market hasn’t figured this out yet, in fact, speculative activity has reemerged in recent weeks. Despite this, if higher interest rates and inflation characterize the landscape for the next several years, it likely spells the end of the era of unbridled speculation and high multiples. We believe the Fund is well-positioned to thrive in the tougher world that may be upon us.
_______________
1 | The FMI Common Stock Fund Investor Class (FMIMX) and the FMI Common Stock Fund Institutional Class (FMIUX) had a return of -4.58% and -4.55%, respectively, for the first quarter of 2022. |
12
Interest Rates and Inflation
Below is the latest illustration of the expected Fed Funds Rate to March 2023. If these moves come to pass, the recent 0% Fed Funds Rate would be 3%.
Now observe the below chart showing the Fed Funds Rate and the inflation rate over fifty years. Tracking the Federal Funds Target Rate back to 1971, the average inflation rate as measured by CPI from 1971 until today is 3.9%.
Inflation Episode 1
The CPI went from 2.7% to 12.3% from the 3rd quarter of 1972 to the 4th quarter of 1974. The Fed Funds rate went from 5% to 13% from the 3rd quarter of 1972 to the 2nd quarter of 1974. From the 4th quarter of 1974 to the 4th quarter of 1976, CPI went from 12.3% to 4.9%.
13
Inflation Episode 2
CPI went from 4.9% to 14.8% from the 4th quarter of 1976 to the 1st quarter of 1980. Fed Funds went from 6% to 20% from the 4th quarter of 1976 to the 1st quarter of 1980. Inflation finally got to a more normal level by the 4th quarter of 1982. From the 1st quarter of 1980 to the 4th quarter of 1982, CPI averaged 9.7% while the Fed Funds target rate averaged 13.6%.
Inflation Episode 3
CPI went from 1.1% to 6.2% from the 4th quarter of 1986 to the 3rd quarter of 1990. Fed Funds went from 6% to 9.75% from the 4th quarter of 1986 to the 1st quarter of 1989. CPI from the 3rd quarter of 1990 to the 4th quarter of 1991 went from 6.2% to 3.1%. CPI was under control from 1991 until the financial crisis in 2008, averaging 2.7% while the Fed Funds target rate averaged 3.95%.
Virtually every time inflation spiked over the past fifty years, the Fed Funds Rate went higher than the inflation rate to tame it. How many investors today believe the Fed Funds Rate is on a path toward 8%? Inflation is taking longer to stabilize than expected and Chairman Powell is pointing toward short-term supply chain problems, or transient war impacts. The stock and bond markets seem to agree it’s a temporary challenge. As of 3/31/22 the S&P 500 is only 5.2% off its high, and the bond market (using inflation-adjusted Treasury securities) expects five-year inflation to drop dramatically. A recent study from AllianceBernstein concluded that only 1.5 percentage points of the 7.9% inflation rate is likely due to one-time supply chain effects. More traditional monetary factors appear to be the culprit. In a recent piece from The Wall Street Journal by Hanke and Hanlon,2 titled, “Jerome Powell is Wrong. Printing Money Causes Inflation,” the authors point out that in two separate communications with Congress over the past year, Powell said the connection between money supply growth and inflation ended 40 years ago. The below chart throws cold water on these assertions.
Why is the market not yet buying the high inflation, higher rate thesis? One possible explanation gaining traction is the notion that we are headed for a recession, complete with demand destruction and falling prices, or at least a much slower growth rate in the CPI. Given the downward action in many stocks recently (aside from energy and commodities), this seems plausible. Yield
_______________
2 | Steve Hanke, professor, and Nicholas Hanlon, chief of staff, at the Johns Hopkins Institute of Applied Economics. |
14
curves have flattened in recent weeks. Inverted yield curves (short-term rates exceeding long-term rates) have a better-than-average track record of predicting recessions. Talking to our companies, however, and observing demand across many industries, it does not feel like a downturn is imminent. Perhaps stagflation is on the horizon. Whether underlying economic growth remains solid or weakens enough to cause a recession, we do not see inflation returning to 2% anytime soon. Moreover, with quantitative easing ending, Fed Funds rising, and bond investors wanting more compensation for the risk of inflation, longer maturity interest rates may continue to normalize. As we indicated in our letter of December 31, 2021, the 10-Year Treasury’s median yield since 1957 is 5.38% compared to 2.34% today (up from 1.51% as of 12/31/21). It is hard to imagine P/E multiples remaining near all-time highs with the discount rate escalating.
Market Behavior
The value move in the market this year is mostly related to hydrocarbon exploration and production stocks, as well as other commodity-oriented equities. The Fund has little-to-no exposure to these sectors, as over long periods of time, most of the companies in these sectors have proven unable to earn their cost of capital and are highly volatile. These stocks periodically race higher, but elevated commodity prices almost always spur a supply response that typically ends the rally. Higher raw material prices have temporarily affected a few of our stocks, but these companies have good market power and are already raising prices aggressively. We expect within a few quarters that margins will recover.
In the latter parts of last year and into the beginning of this year, the market was correcting a significant amount of excess, and it looked like the growth fever had broken. In our letter of December 31, 2021, we presented a table with a number of notable names down between 50-90% from their highs. Strangely, considering war, inflation, and rapidly rising rates, many meme stocks and other speculative issues have once again rallied. The same names are depicted below, with their performance since the Russian invasion through 3/29/22. Based on EBIT, only four of these companies have earnings.
Remarkably, the Nasdaq-100 and Russell 2000 indices are up 6.25% and 3.90% through 3/31/22, respectively, since the war started. Tesla, Inc. went up 57% from its low on February 24 ($700) to the close on March 29th ($1099), which equates to an advance of $413 billion. To put
15
that in perspective, the 24 trading day gain in Tesla was greater than the entire market value of Walmart, Inc.! Tesla trades for 120 times estimated 2022 GAAP3 earnings, compared to Walmart’s 21.8 multiple (1/2023 fiscal year). Robinhood Markets, Inc. gained 47% from February 24th to March 29th, which gives another indication of how the speculative candle has reignited. Additionally, the high yield market has outperformed investment grade credits and treasuries, both year-to-date and, inexplicably, post the Russian invasion. It is difficult to understand this; our only explanation is that after years of aggressive behavior being rewarded, investors’ muscle memory remains strong, kicking in whenever trouble surfaces, knowing the Fed has a long history of coming to the rescue (or losing its nerve when it comes to interest rate hikes). Of course, the difference this time around is that market interest rates are rising sharply, and inflation is proving to be sticky. It could also be that the market is anticipating the end of the war and are thus bidding up the most aggressive growth stocks; it is hard to know for sure. What does seem apparent is that investor psychology has not been significantly tempered by rates, inflation, or a war.
Looking back over the years, we have been surprised by how long interest rates have stayed low. It has created many problems, which we have discussed at length in previous letters and will not address here. One byproduct is high valuations that have rewarded speculative behavior. Throughout these years, our portfolio valuations have been considerably cheaper than the benchmark, and our balance sheets were better (and these conditions remain today). In hindsight, one could say we cared too much about risk. Data on price-to-earnings (P/E) ratios for the Russell 2000 is very difficult to develop, owing to the fact that roughly 40% (as of 2/28/22) of the companies do not have earnings. But in the S&P 500, contrary to decades of history, over the last 5 years, for all but one quintile, the higher the trailing price-to-earnings ratio, the better the stock performance, as illustrated by the below table.
In hindsight, almost every stock sold for valuation reasons looks like a mistake. We had a few problem stocks that, in retrospect, may have been too complicated, a couple where we misjudged the quality of the management, and a handful that were really hit by COVID. We’ve made some adjustments, are optimistic about the COVID-affected names, and are confident in the lineup we have today. We make no apologies about having a deep concern about downside risk and sticking with high-quality businesses and relatively low valuations. The Fund trades at a 15-50% discount to the iShares Russell 2000 based on an array of valuation metrics. These attributes should be rewarded in time.
As per usual in the March letter, we include a brief commentary on two portfolio holdings.
_______________
3 | Generally accepted accounting principles. |
16
Skechers U.S.A. Inc. — Cl A (SKX)
(Analyst: Matt Sullivan)
Description
Skechers is the third largest footwear brand in the world. The company designs, manufactures, and distributes footwear for men, women, and children in U.S. and international markets. Its products cover a wide range of footwear categories including casuals, dress casuals, sandals, boots, work boots, performance footwear, and kids footwear. The company operates in three business segments: Domestic Wholesale (23% of sales), International Wholesale (48% of sales), and Direct-to-Consumer (29% of sales). In total, international sales account for approximately 60% of revenue.
Good Business
| • | Excluding net cash on the balance sheet, return on invested capital (ROIC) is in the mid-teens, which easily exceeds the company’s cost of capital. | |
| • | Skechers has established a brand over the past 30 years that customers associate with comfortable, quality shoes at low prices, which we believe is an attractive niche. | |
| • | This is a scaled player in the industry that can efficiently design, manufacture, market, and distribute shoes all over the world. | |
| • | The company has exposure to a wide range of domestic and international distribution channels, including both third party and owned e-commerce websites. Consumers can find the company’s products however they’d like to shop. | |
| • | Sketchers sells a broad assortment of shoes and uses a fast follower model, which we believe reduces fashion risk. | |
| • | The company is in a net cash position and the business is easy to understand. |
Valuation
| • | Excluding net cash on the balance sheet, Skechers trades for 12.3 times our next 12-months earnings per share (EPS) estimate, which is below the company’s 5-year average and is a significant discount to the Russell 2000, as well as other comparable companies serving similar end markets. | |
| • | The EV/sales multiple is 1.0 times, which is below the company’s 5-year average of 1.2 times. |
Management
| • | Management and the board own ~41 million shares of stock, which equates to ~26% of the company. | |
| • | The company’s founder, Robert Greenberg, is Chairman and CEO. | |
| • | Michael Greenberg, son of the founder, is President, and has been at Skechers for 29 years. |
Investment Thesis
Skechers has built an impressive global business over many years. The growth and ROIC track record of the company has been terrific. We believe the company can continue to grow nicely and with rising margins over the next number of years, as it keeps expanding internationally and further develops its direct-to-consumer business, which includes fully owned stores and the Skechers.com website. These segments sport accretive margins, meaning outsized growth in these channels will boost consolidated company margins. Near-term supply chain challenges are weighing on the stock’s multiple and distracting from Skechers’ attractive longer-term outlook. The company has a fortress balance sheet, reports GAAP earnings, and doesn’t engage in mergers and acquisitions activity. All in, this appears to be a rare value in a very expensive market.
17
nVent Electric PLC (NVT)
(Analyst: Dain Tofson)
Description
nVent is a global provider of electrical connection and protection solutions. It was spun out of Pentair in 2018. The company is headquartered in Minneapolis, MN, although it’s incorporated in Ireland, and reports three segments: Enclosures (51% of sales and 40% of EBITA), Electrical & Fastening Solutions (27% of sales and 36% of EBITA), and Thermal Management (22% of sales and 24% of EBITA). By geography, sales are split 63% U.S. and Canada, 23% Developed Europe, 11% Developing, and 3% Other Developed. By vertical, sales are split 43% Industrial, 28% Commercial & Residential, 21% Infrastructure, and 8% Energy.
Good Business
| • | The company has industry-leading positions and strong brands across its segments. Key brands include Hoffman and Schroff in Enclosures, Raychem and Tracer in Thermal Management, and Erico and Caddy in Electrical & Fastening Solutions. | |
| • | The cost of the products typically represents a small proportion of the total cost of a customer’s end systems. | |
| • | nVent operates in an attractive industry structure with relatively high barriers to entry. | |
| • | EBITA margin was 17.7% in 2021, which is better than the average industrial company. | |
| • | nVent generates consistent free cash flow throughout an economic cycle, and has attractive ROIC prospects. |
Valuation
| • | The stock trades at 16.0 times 2022 consensus EPS versus industrial peers at >20.0 times. |
Management
| • | The management team led by Beth Wozniak has executed well since the spinout and has invested in new product launches, a digital transformation, and structural cost reductions. | |
| • | Management has laid out sensible capital allocation priorities including (1) reinvesting in the company to drive organic growth, (2) maintaining a competitive dividend, and (3) pursuing bolt-on acquisitions and/or share repurchases with an objective to allocate capital to the highest return, while appropriately managing liquidity and leverage. | |
| • | Randy Hogan, non-executive Chairman of the Board, was the CEO of Pentair from 2001 until the spinout. Pentair significantly outperformed the S&P 500 during his tenure as CEO. |
Investment Thesis
nVent has industry-leading positions, strong brands across its segments, leverage to mega-trends such as electrification, and consistent free cash flow generation throughout an economic cycle. It’s a better-than-average industrial business, in our opinion; however, the stock trades at a discount to industrial peers. The opportunity to own an above-average industrial business at a below-average price is an attractive proposition. Additionally, management’s investments since the spinout should increase the earnings power of the business, and subsequently, magnify the earnings gains in an upcycle. Finally, there is takeout optionality given nVent’s size and business quality.
Thank you for your confidence in the FMI Common Stock Fund.
Please see page 78 for important disclosures.
This shareholder letter is unaudited.
18
FMI Common Stock Fund
SCHEDULE OF INVESTMENTS
March 31, 2022 (Unaudited)
| Shares | Cost | Value | |||||||||
| COMMON STOCKS — 96.3% (a) | |||||||||||
COMMERCIAL SERVICES SECTOR — 21.3% | |||||||||||
| Advertising/Marketing Services — 4.4% | |||||||||||
| 1,279,000 | Interpublic Group of Cos. Inc. | $ | 23,665,275 | $ | 45,340,550 | ||||||
| Miscellaneous Commercial Services — 11.8% | |||||||||||
| 455,000 | CDK Global Inc. | 22,288,066 | 22,149,400 | ||||||||
| 131,000 | Concentrix Corp. | 21,183,829 | 21,819,360 | ||||||||
| 200,000 | FTI Consulting Inc.* | 23,470,798 | 31,444,000 | ||||||||
| 1,043,000 | Genpact Ltd. | 21,872,178 | 45,380,930 | ||||||||
| 88,814,871 | 120,793,690 | ||||||||||
| Personnel Services — 5.1% | |||||||||||
| 155,000 | ManpowerGroup Inc. | 10,113,108 | 14,557,600 | ||||||||
| 326,000 | Robert Half International Inc. | 13,750,987 | 37,222,680 | ||||||||
| 23,864,095 | 51,780,280 | ||||||||||
CONSUMER DURABLES SECTOR — 1.5% | |||||||||||
| Homebuilding — 1.5% | |||||||||||
| 158,000 | LGI Homes Inc.* | 21,447,789 | 15,433,440 | ||||||||
CONSUMER NON-DURABLES SECTOR — 3.1% | |||||||||||
| Apparel/Footwear — 3.1% | |||||||||||
| 770,000 | Skechers U.S.A. Inc. — Cl A* | 34,921,452 | 31,385,200 | ||||||||
DISTRIBUTION SERVICES SECTOR — 13.2% | |||||||||||
| Electronics Distributors — 2.5% | |||||||||||
| 215,000 | Arrow Electronics Inc.* | 4,060,851 | 25,505,450 | ||||||||
| Medical Distributors — 5.3% | |||||||||||
| 482,000 | Henry Schein Inc.* | 28,716,693 | 42,025,580 | ||||||||
| 393,000 | Herbalife Nutrition Ltd.* | 20,597,164 | 11,931,480 | ||||||||
| 49,313,857 | 53,957,060 | ||||||||||
| Wholesale Distributors — 5.4% | |||||||||||
| 235,000 | Applied Industrial Technologies Inc. | 15,033,348 | 24,125,100 | ||||||||
| 528,000 | Beacon Roofing Supply Inc.* | 28,401,724 | 31,299,840 | ||||||||
| 43,435,072 | 55,424,940 | ||||||||||
ELECTRONIC TECHNOLOGY SECTOR — 6.6% | |||||||||||
| Electronic Components — 6.6% | |||||||||||
| 1,004,000 | nVent Electric PLC | 22,230,604 | 34,919,120 | ||||||||
| 405,000 | Plexus Corp.* | 30,903,780 | 33,133,050 | ||||||||
| 53,134,384 | 68,052,170 | ||||||||||
FINANCE SECTOR — 19.9% | |||||||||||
| Finance/Rental/Leasing — 4.8% | |||||||||||
| 510,000 | FirstCash Holdings Inc. | 23,121,515 | 35,873,400 | ||||||||
| 184,000 | Triton International Ltd. | 11,496,005 | 12,913,120 | ||||||||
| 34,617,520 | 48,786,520 | ||||||||||
The accompanying notes to financial statements are an integral part of this schedule.
19
FMI Common Stock Fund
SCHEDULE OF INVESTMENTS (Continued)
March 31, 2022 (Unaudited)
| Shares | Cost | Value | |||||||||
| COMMON STOCKS — 96.3% (a) (Continued) | |||||||||||
FINANCE SECTOR — 19.9% (Continued) | |||||||||||
| Investment Banks/Brokers — 2.9% | |||||||||||
333,000 | Houlihan Lokey Inc. — Cl A | $ | 16,329,299 | $ | 29,237,400 | ||||||
| Life/Health Insurance — 2.3% | |||||||||||
| 171,000 | Primerica Inc. | 23,078,014 | 23,396,220 | ||||||||
| Multi-Line Insurance — 1.3% | |||||||||||
| 12,000 | White Mountains Insurance Group Ltd. | 10,542,912 | 13,634,880 | ||||||||
| Real Estate Development — 5.0% | |||||||||||
| 230,000 | The Howard Hughes Corp.* | 22,299,619 | 23,830,300 | ||||||||
| 1,133,000 | Kennedy-Wilson Holdings Inc. | 19,953,832 | 27,633,870 | ||||||||
| 42,253,451 | 51,464,170 | ||||||||||
| Regional Banks — 3.6% | |||||||||||
| 560,000 | Zions Bancorporation N.A. | 16,009,613 | 36,713,600 | ||||||||
HEALTH TECHNOLOGY SECTOR — 2.8% | |||||||||||
| Medical Specialties — 2.0% | |||||||||||
| 422,000 | Dentsply Sirona Inc. | 15,794,081 | 20,770,840 | ||||||||
| Pharmaceuticals: Major — 0.8% | |||||||||||
| 433,817 | Phibro Animal Health Corp. | 11,185,315 | 8,654,649 | ||||||||
PROCESS INDUSTRIES SECTOR — 2.3% | |||||||||||
| Industrial Specialties — 2.3% | |||||||||||
| 450,000 | Donaldson Co. Inc. | 20,302,487 | 23,368,500 | ||||||||
PRODUCER MANUFACTURING SECTOR — 17.1% | |||||||||||
| Building Products — 1.7% | |||||||||||
| 164,000 | Simpson Manufacturing Co. Inc. | 18,845,085 | 17,882,560 | ||||||||
| Industrial Machinery — 4.4% | |||||||||||
| 534,000 | Flowserve Corp. | 13,201,252 | 19,170,600 | ||||||||
| 847,000 | Gates Industrial Corp. PLC* | 13,584,417 | 12,755,820 | ||||||||
| 106,000 | Woodward Inc. | 4,291,548 | 13,240,460 | ||||||||
| 31,077,217 | 45,166,880 | ||||||||||
| Miscellaneous Manufacturing — 11.0% | |||||||||||
| 180,000 | Brady Corp. — Cl A | 8,964,075 | 8,328,600 | ||||||||
| 222,000 | Carlisle Cos. Inc. | 16,155,706 | 54,594,240 | ||||||||
| 148,000 | LCI Industries | 21,035,310 | 15,363,880 | ||||||||
| 1,071,000 | TriMas Corp. | 24,577,630 | 34,368,390 | ||||||||
| 70,732,721 | 112,655,110 | ||||||||||
RETAIL TRADE SECTOR — 2.2% | |||||||||||
| Specialty Stores — 2.2% | |||||||||||
| 339,000 | BJ’s Wholesale Club Holdings Inc.* | 18,298,643 | 22,919,790 | ||||||||
The accompanying notes to financial statements are an integral part of this schedule.
20
FMI Common Stock Fund
SCHEDULE OF INVESTMENTS (Continued)
March 31, 2022 (Unaudited)
| Shares | Cost | Value | |||||||||
| COMMON STOCKS — 96.3% (a) (Continued) | |||||||||||
TECHNOLOGY SERVICES SECTOR — 6.3% | |||||||||||
| Information Technology Services — 6.3% | |||||||||||
| 345,000 | Insight Enterprises Inc.* | $ | 22,543,701 | $ | 37,025,400 | ||||||
| 502,000 | KBR Inc. | 19,641,037 | 27,474,460 | ||||||||
| 42,184,738 | 64,499,860 | ||||||||||
| Total common stocks | 713,908,742 | 986,823,759 | |||||||||
Principal Amount | |||||||||||
| SHORT-TERM INVESTMENTS — 3.7% (a) | |||||||||||
| Bank Deposit Account — 3.7% | |||||||||||
| $ | 37,638,101 | U.S. Bank N.A., 0.096%^ | 37,638,101 | 37,638,101 | |||||||
| Total short-term investments | 37,638,101 | 37,638,101 | |||||||||
| Total investments — 100.0% | $ | 751,546,843 | 1,024,461,860 | ||||||||
Other assets, less liabilities — 0.0% (a) | 83,587 | ||||||||||
| TOTAL NET ASSETS — 100.0% | $ | 1,024,545,447 | |||||||||
| * | Non-income producing security. |
| ^ | The rate shown is as of March 31, 2022. |
| (a) | Percentages for the various classifications relate to total net assets. |
| PLC | Public Limited Company |
The accompanying notes to financial statements are an integral part of this schedule.
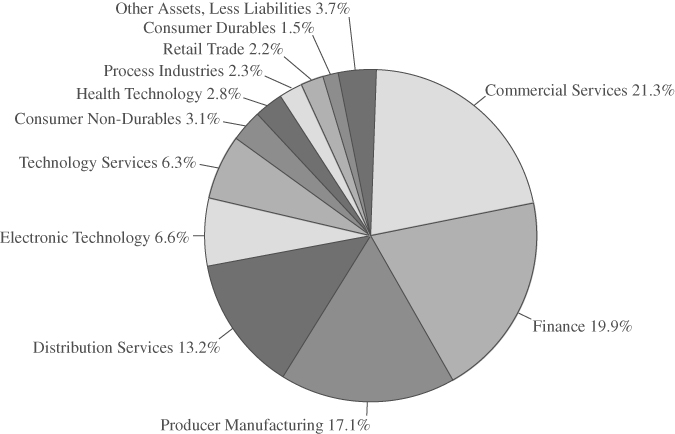
INDUSTRY SECTORS as a percentage of net assets
as of March 31, 2022 (Unaudited)
21
FMI International Fund
and
FMI International Fund II – Currency Unhedged
(unaudited)
| March 31, 2022 |
Dear Fellow Shareholders:
Global equities declined during the March quarter as Russia’s invasion of Ukraine left a dark cloud of uncertainty over financial markets. The FMI International portfolios were outperforming handily up until the eve of the war (February 24, 2022), ahead of the comparable MSCI EAFE indices by around 3%. Unfortunately, the tide turned after the onset of the invasion, as energy, commodity, and defense-related stocks — sectors where FMI has minimal exposure given our focus on business quality — soared. Growth stocks also rebounded strongly in the latter part of the period, amounting to an even tougher comparison.
For the quarter, the FMI International portfolios fell by 5.96% (currency hedged)1 and 8.32% (currency unhedged),2 respectively, compared with an MSCI EAFE Index down 3.73% in local currency (LOC) and 5.91% in U.S. Dollars (USD). The MSCI EAFE Value Index gained 2.68% in LOC and 0.33% in USD. Industrial Services, Producer Manufacturing, and Finance contributed to the FMI International portfolios performance, while Distribution Services, Energy, and Non-Energy Minerals all hurt on a relative basis. Schlumberger Ltd., CK Hutchison Holdings Ltd., and Chubb Ltd. were the strongest individual performers, while Ferguson PLC, Samsung Electronics Co. Inc., and Akzo Nobel N.V. each lagged. A strong USD boosted FMI’s currency-hedged performance.
State of War
Russia’s large-scale invasion of Ukraine has quickly proven to be a humanitarian catastrophe. Thousands of innocent lives have been lost, over 4 million refugees have fled the country,3 homes have been destroyed, and infrastructure obliterated. Our hearts go out to those who are suffering through this needless tragedy. From where we stand today, the path of the war remains unknown, as Russian President Vladimir Putin is far from predictable or rational. Much has been written about the conflict, potential outcomes, and global ramifications; our discussion will center on the economic impact and what it could mean for our portfolios.
The FMI International portfolios’ exposure to Russia and Ukraine is quite limited, with no direct investments in either country, and around 1% of our aggregate revenue there. Both economies are expected to contract by over 30% this year.4 Unfortunately, the economic impact of the war is also far broader, spanning the globe. Energy and commodity prices have skyrocketed as Western nations have imposed the most sweeping economic sanctions against a major country in decades,
_______________
1 | The FMI International Fund [currency hedged] Investor Class (FMIJX) and the FMI International Fund [currency hedged] Institutional Class (FMIYX) had a return of -5.96% and -5.89%, respectively, for the first quarter of 2022. |
2 | The FMI International Fund [unhedged] Institutional Class (FMIFX) had a return of -8.32% for the first quarter of 2022. |
3 | Jon Henley. “More than 4 million have fled Russia’s ’senseless’ war on Ukraine, says UN.” The Guardian, March 30, 2022. |
4 | Mohamed A. El-Erian. “The Ukraine War’s Multifaceted Economic Fallout.” March 7, 2022. https://www.project-syndicate.org/ |
22
with the United States banning the import of Russian oil, gas, and coal. We witnessed the largest one-week price increase in commodities ever,5 with heavy Russia/Ukraine exports including Wheat (80%+ from January average price), Fertilizer (70%+), Nickel (60%+), Maize (40%+), and Palladium (30%+) on the move, in addition to the aforementioned fossil fuels. Russia supplies around 19% of the world’s natural gas and 11% of its oil, with Europe being highly dependent on Russian energy imports. The European Union gets around 40% of its gas from Russia and 27% of its oil.6 Shockingly, gas spot prices in Europe are ten times higher than they were a year ago, while the price for oil has nearly doubled7. If elevated prices hold, we’d expect to see a supply response. As they say in commodity markets: “The cure for high prices is high prices.” Long-term, we also expect to see Europe diversify away from Russian fossil fuels. Unfortunately, the near-term pain appears unavoidable.

Rising energy and food prices are coming at a time when Europe and the U.S. (prior to the war) had already been facing the highest level of inflation in decades. After $30 trillion of global fiscal and monetary stimulus since 2020,8 and years of aggressive money printing and quantitative easing, the European Central Bank (ECB) and the Fed were well behind the curve in terms of raising interest rates (neither had even started). The commodity spike, in addition to another round of supply chain disruptions and increasing transportation costs, will add more fuel to the inflation fire. In Germany, for example, consumer prices rose 7.6% in March,9 the highest level in more than 40 years, after producer prices had risen by 25.9% in February.10 Europe’s economy, given its proximity to the war and reliance on Russian energy, is likely to be the hardest hit. The OECD11
_______________
5 | Bloomberg Commodity Index (BCOM). |
6 | Rowena Mason, Heather Stewart, Julia Kollewe. “UK to phase out Russian oil imports by 2023 and explore ending gas imports.” The Guardian, March 8, 2022. |
7 | “Economic and Social Impacts and Policy Implications of the War in Ukraine.” OECD Economic Outlook, March 17, 2022. https://www.oecd.org/economic-outlook/ |
8 | Michael Hartnett, David Jones, Shirley Wu, and Myung-Jee Jung. “The Flow Show: Buy Signal.” BofA Global Research. March 24, 2022. |
9 | Zuzanna Szymanska and Miranda Murray. “’Welcome back to the 1970s’: Oil, gas prices push German inflation above 7%.” Reuters, March 30, 2022. |
10 | “German producer prices jump by record 25.9%.” Reuters, March 21, 2022. |
11 | Organisation for Economic Co-operation and Development. |
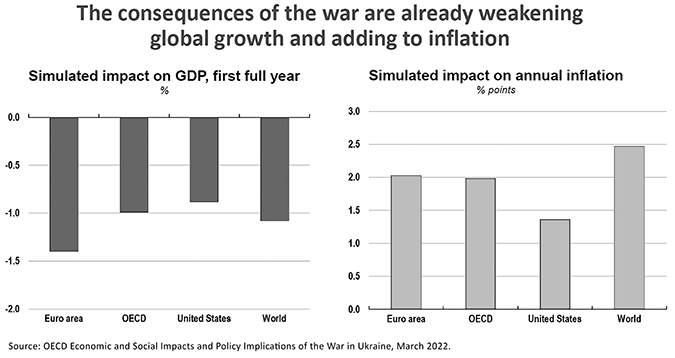
23
estimated the potential impact to economic growth and inflation from the war in the chart below. Tough times may lie ahead for the global consumer, as companies look to maintain profits by continuing to raise prices to offset rising input costs. Unfortunately, given the composition of their income, assets, and consumption baskets, high inflation tends to have an outsized impact on low-income households, as they tend to spend disproportionately more on food and energy.12
Compared with the MSCI EAFE Index, the FMI International portfolios’ revenue exposure is over-indexed to the UK (13.6% vs. 6.1%), and under-indexed to the rest of Europe (20.2% vs. 25.8%). We believe we are well-positioned from a relative standpoint. The UK is much less dependent on Russian energy than the rest of the continent, importing only 4% of its gas and 8% of its oil from Russia.13 Furthermore, we have long argued that Brexit was the right move for the UK, as they have distanced themselves from the dysfunction of the EU, which has demonstrated an inability to reform, a lack of desire to address their own structural problems, and a propensity for high government debt levels that could once again become a problem.
Our domestic UK businesses are durable. B&M European Value Retail S.A. is a leading discount retailer that performs well in most economic environments, offering low prices on consumables and necessities. Greggs PLC is the UK’s top convenience food-to-go store operator, selling baked goods, food, and coffee at value prices, resulting in repeat consumption. Lloyds Banking Group PLC, the UK’s largest bank, is predominantly a mortgage and credit card lender; it is well-capitalized, has a low-cost position, and de minimis exposure to Russia. The risk profile of the Eurozone banks (which we do not own) is far greater, as their Russian (and other counterparty) exposure is much less clear, and sovereign debt is being carried on their balance sheets with little-to-no capital requirements. Howden Joinery Group PLC is the UK’s largest supplier of fitted kitchens. Although we could certainly see an air pocket if discretionary spending falls, effectively all of their business is replacement, the company runs with no debt, and they have a history of taking market share during periods of dislocation.
_______________
12 | Indermit Gill and Peter Nagle. “Inflation could wreak vengeance on the world’s poor.” Brookings Institute, March 18, 2022. |
13 | Rowena Mason, Heather Stewart, Julia Kollewe. “UK to phase out Russian oil imports by 2023 and explore ending gas imports.” The Guardian, March 8, 2022. |
24
The balance of our European exposure is well-diversified, though there are certainly some risk points we are monitoring. Leisure travel in Europe is a near-term concern for Booking Holdings Inc. and Safran S.A., but demand should recover as time passes. Oil derivatives are a significant percentage of the raw material costs at Akzo Nobel N.V., with a pricing lag weighing on current profitability. However, price increases are coming and tend to be sticky, as paints and coatings companies often see margin expansion after significant inflationary periods. Rexel S.A. (electrical distribution) faces the prospect of a slowdown in commercial construction, but 50-60% of their European commercial business is retrofit, which should prove more resilient. We are constantly monitoring the downside risks of our holdings. Collectively, given their business quality and balance sheet strength, we’d expect our companies to hold up well during challenging times.
The portfolios have very little exposure to Exploration & Production and commodity-related stocks, which were a big driver of returns in the quarter. Over long periods of time, most of the companies in these sectors have failed to earn their cost of capital, and are highly volatile. Commodities, by definition, lack differentiation. Poor discipline and bad actors can ruin the business economics. While these can be great trading stocks, like we are seeing today, they do not fit our eye in terms of business quality and long-term value creation.
Back to the Disco Era?
The risk of a global recession has undoubtedly increased due to the war. As penned by The Wall Street Journal, “Economists are increasingly warning of a possible bout of stagflation, particularly in Europe, a situation of high inflation and low growth that afflicted major economies during the 1970s. Back then, central banks responded to a surge in oil prices with easy-money policies that caused a wage-price spiral. Now, some central banks might give up on their plans to increase interest rates after keeping them down during the pandemic.”14 Herein lies the conundrum. If central banks stay accommodative and keep rates too low for too long, they could lose control of inflation (we think they already have). If they raise interest rates too aggressively, they risk choking off the growth of the economy. Years of profligate government spending and money printing have left central banks no choice but to try to “thread the needle.” We do not envy their position, but in many ways it has been self-made. The Fed and Bank of England are finally moving down the path of rate hikes (albeit slowly), while the ECB and Bank of Japan continue to drag their feet. Time is of the essence.
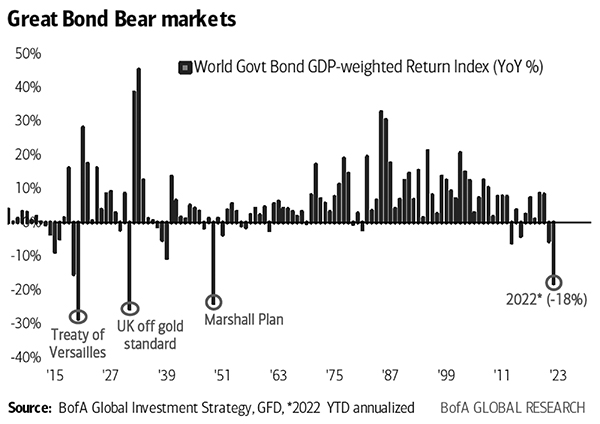
Fortunately, despite the disappointing reluctance of central banks to raise rates more decisively, market forces are starting to move interest rates higher on their own accord. Higher rates mean lower bond prices, so it appears that a global bond bear market is finally upon us, per the chart below. To approach something that starts to resemble normalcy, we still have a very long way for rates to go. At the very least, it is encouraging to see negative yielding debt falling precipitously, from $18.3 trillion in late 2020 to under $3 trillion today.15 As we’ve said many times, money is not supposed to be free (or even worse, negative yielding). We welcome a day when price discovery determines the cost of capital, not manipulation by central banks.
_______________
14 | Tom Fairless. “Global Economy Braces for Impact of Russia’s War on Ukraine.” The Wall Street Journal, March 7, 2022. |
15 | Bloomberg. |
25
If indeed the next economic cycle features higher interest rates and inflation, as it appears it will, we should be operating from a position of strength. Our quality businesses have pricing power given their advantaged competitive positions. Our companies’ solid balance sheets should allow for investment and market share gains during tough times, while their levered competitors are compromised. High valuation multiples may get knocked down off their perch, allowing for our valuation discipline and discount to the market to shine through. We remain optimistic, but discerningly cautious.
Taking Taiwan
At the outset of the Ukraine war, observers wondered whether Russia’s invasion would embolden China to attempt to annex Taiwan. This would be another extremely negative development with significant global economic implications. Taiwan is home to the world’s leading semiconductor company (Taiwan Semiconductor Mfg. Co. Ltd.) and the most advanced semiconductor technology. China is significantly behind in this area, with little chance of quickly catching up through organic investment. In recent years, China has muscled its way into second place in the global economy and will remain a powerful force. However, China President Xi Jinping has been clear in his intentions to make China number one in economic, military, and geopolitical leadership over the next two decades. We hope Xi Jinping will learn some valuable lessons from the war, giving him some pause. Russia clearly miscalculated the military resolve of Ukraine, as their advancement has been much slower than originally anticipated. Furthermore, the swift and unprecedented sanctions from the West were bolder than many expected. Taiwan is of great strategic importance to the West and its invasion could elicit an even fiercer economic response, if not a military one as well. China’s reliance on approximately $1.3 trillion of exports to the U.S. and Europe16 may be an additional deterrent to a 21st Century Cold War. We hope that these factors will keep China from going too far, but recognize that anything is possible. With the U.S. and Europe keenly aware of Taiwan’s global significance, we hope there will be enough diplomatic pressure to forestall another war.
[As a reminder, FMI does not have any direct investments in China. China’s authoritarian government, rule of law, lack of disclosure, accounting practices, management distrust, and poor corporate governance have been roadblocks. When we cannot do our customary level of due diligence, we simply pass.]
_______________
16 | Bloomberg. |
26
While there is tremendous uncertainty in the world, with it comes new opportunities. Though some of our investments have been recently out-of-step with the market (the nature of contrarian investing), in the fullness of time we expect their positive attributes to prevail. As Ben Graham wisely said: “In the short run, the market is a voting machine, but in the long run, it is a weighing machine.” We remain focused on finding strong businesses that can weather the storm, are soundly financed, and trade below their intrinsic value.
Described below are two holdings where we see an attractive risk/reward:
Sodexo S.A. (SW FP)
(Analyst: Dain Tofson)
Description
Sodexo is a leading global caterer, facilities manager, and benefits and rewards services provider. The company is headquartered in Paris, France, and controlled by the Bellon family. Sodexo reports two segments: On-site Services and Benefits & Rewards Services. On-site Services represented 96% of revenue and 79% of EBITA in fiscal year (FY) 2019. By service type, On-site Services revenue was split 66% food services and 34% facilities management services. By geography, On-Site Services revenue was split 45% North America, 39% Europe, and 16% rest of the world. Benefits & Rewards Services represented 4% of revenue and 21% of EBITA in FY 2019. By activity, Benefits & Rewards Services revenue was split 77% Employee Benefits and 23% Services Diversification, which includes fuel passes and public benefits programs. By geography, Benefits & Rewards Services revenue was split 67% Europe, USA, and Asia and 33% Latin America.
Good Business
| • | Sodexo is one of the largest players in On-site Services and Benefits & Rewards Services. In On-site Services, the company’s scale gives them procurement advantages over smaller competitors. In Benefits & Rewards Services, Sodexo’s large, two-sided network constitutes a defensible moat. | |
| • | The On-Site Services industry is large and fragmented. The large players such as Sodexo have a long runway to take market share from smaller operators. | |
| • | The business is relatively stable and defensive in non-pandemic downturns, with client retention rates around 93-94%, new sales development around 7%, and consistent same site sales growth. | |
| • | Returns on capital employed have generally been mid-teens or higher. | |
| • | The company has a strong balance sheet with net debt-to-EBITDA of 1.7 times. | |
| • | This is an easily understandable business. |
Valuation
| • | The stock trades at around 14 times FY 2023 earnings per share (EPS) versus 17-18 times historically, which is at a discount to the MSCI EAFE Index, despite being a much better-than-average business. | |
| • | The stock is trading at a discount to the company’s sum-of-the-parts value. | |
| • | We believe Sodexo can improve its EBITA margin more than consensus expectations. If the company can earn 6.25% EBITA margin on FY 2023 consensus revenue, then that implies €1.4 billion of EBITA and inexpensive valuation multiples of 8.4 times EV/EBITA and 11.9 times EV/NOPAT. |
Management
| • | Sophie Bellon is Chairwoman and CEO. The Bellon family is turning into a “self-activist,” having embarked on a plan to improve performance and unlock value in the business. |
27
| • | Sodexo is a member of several Sustainability Indices and ranks amongst leaders in its sector for the sixteenth consecutive year. | |
| • | Long-term incentive compensation is based on revenue, margin, total shareholder return versus peers, and corporate responsibility. |
Investment Thesis
Sodexo is a very FMI-like business – it has solid growth prospects in structurally attractive industries, relatively defensive performance, mid-teens or higher return on capital employed, a solid balance sheet, and is easy to understand. However, despite the company’s attractive intrinsic qualities, the business and stock have been through a multiyear period of underperformance. The underperformance began in 2018 due to management issues in On-site Services North America Healthcare and On-site Services Education sectors, and was followed by pandemic-induced lockdowns in 2020 and 2021 that significantly impacted the overall business. However, there are signs that the future looks brighter than the past. Trends are improving in these two sectors, and the acute phase of the pandemic looks to be coming to an end. In our opinion, Sodexo is posed for a strong recovery, but the market hasn’t recognized this yet.
Greggs PLC (GRG LN)
(Analyst: Jordan Teschendorf)
Description
Greggs is the UK’s leading convenience food-to-go store operator, offering fresh prepared baked items, food, coffee, other drinks, and snacks from convenient locations at value prices. It operates a unique vertically integrated model, manufacturing and distributing the majority of the products it sells. Greggs serves over 6.5 million customers each week from its shop network (2,181 at year-end 2021) and estimates it has around 5% market share in the UK “food-on-the-go” sector (sized at £24 billion in 2019; growing mid-single digits). As of 12/31/21, approximately 17% of Greggs shops were franchised.
Good Business
| • | Greggs has historically grown strongly in good economic periods, and has been resilient in recessions. Prior to COVID the company grew sales for >35 consecutive years, including +7%/+5% in 2008-2009. | |
| • | Greggs sells products that are low-ticket (£3 estimated average transaction value), consumed immediately, and often need to be replenished during the day. The company’s vertically integrated model, large scale, and network density enable it to deliver fresh-baked foods and ingredients for on-site preparation multiple times daily to each shop in its network, control and assure food quality, flex its range to meet changing tastes/preferences, and drive economies of scale across the value chain. | |
| • | Consistent operational delivery in the industry creates habitual purchasing behavior. Greggs operational model within stores is built on speed-of-service, with efficient layouts, teams, and the latest technologies. As Greggs expands its network, its convenience and value to the customer improves while fixed cost and overhead per store declines, justifying further expansion. | |
| • | The industry has proven to be rational, with pricing offsetting inflation over time. | |
| • | Return on invested capital is 21%, fully burdened for leases. Greggs recently outlined a significant investment program over the next several years, supporting an acceleration in its growth rate. With strong execution, the business is capable of growing its shop base around 7% annually with strong unit economics. |
28
| • | The company is conservatively financed, with net financial cash on the balance sheet. Net cash has averaged around 15% of the invested capital base over the last two decades. | |
| • | Since the 1980s, Greggs has shared 10% of annual profits with employees. |
Valuation
| • | The stock trades at 10.6 times trailing EV/EBITDA, a discount to its long-term historical average, despite improved growth prospects. | |
| • | It trades at approximately 20 times trailing EPS ex-cash, which is below its five-year average leading up to the pandemic of 23.5 times. | |
| • | The multiple appears reasonable based on normalized potential growth of high-single to low-double-digit revenue (slightly faster EPS), high-teens or better incremental returns, and a net cash balance sheet. |
Management
| • | Roger Whiteside has been CEO since February 2013 and on the board since March 2008. He has driven a significant investment program, deepening existing competitive advantages for the company. | |
| • | In early February, the board named Roisin Curry successor to long-time CEO Roger Whiteside, effective May 2022. She served as retail and property director, having been with Greggs since 2010. Mr. Whiteside will remain on the board and support Ms. Curry through January 5, 2023. | |
| • | Richard Hutton has been CFO since March 2006, having joined the company from Proctor & Gamble Co. in 1998. | |
| • | Long-term compensation is paid in the form of performance shares and linked to return on capital employed (ROCE), while annual incentives are linked to profit before tax, sales growth, and cost savings. All investments in shops and infrastructure are evaluated based on ROCE and discounted cash flow analysis. |
Investment thesis
Greggs is a strong franchise we have admired for some time, gaining appreciation for the company and the food-to-go industry through previous UK portfolio companies. The stock’s high valuation and light liquidity had historically been constraints on potential ownership, although the pandemic provided an opening. Preventative coronavirus measures and social distancing restrictions led Greggs to temporarily close shops for nearly fifteen weeks, which led to the first loss in company history during 2020. While disruptive, our thesis was that this would ultimately prove manageable given the company’s strong financial position, the business would eventually return to its strong pre-COVID growth trajectory, and its competitive position could be enhanced. We established our initial position at a significant discount to long-term average valuation levels and the broader market. Greggs’ recent results and fundamental outlook are supportive of our thesis. Considering the combination of its business model resilience, growth prospects, returns on capital, and strong balance sheet, we believe the valuation remains reasonable on an absolute basis and attractive on a relative basis.
Thank you for your continued support of the FMI International Funds.
Please see page 78 for important disclosures.
This shareholder letter is unaudited.
29
FMI International Fund
SCHEDULE OF INVESTMENTS
March 31, 2022 (Unaudited)
| Shares | Cost | Value | |||||||||
| LONG-TERM INVESTMENTS — 94.1% (a) | |||||||||||
| COMMON STOCKS — 86.2% (a) | |||||||||||
COMMERCIAL SERVICES SECTOR — 8.8% | |||||||||||
| Advertising/Marketing Services — 2.2% | |||||||||||
| 5,700,000 | WPP PLC (Jersey) (b) | $ | 74,265,099 | $ | 74,601,929 | ||||||
| Miscellaneous Commercial Services — 6.6% | |||||||||||
| 1,230,000 | DKSH Holding AG (Switzerland) (b) | 67,774,028 | 103,593,216 | ||||||||
| 560,000 | Secom Co. Ltd. (Japan) (b) | 32,776,772 | 40,511,473 | ||||||||
| 995,000 | Sodexo S.A. (France) (b) | 88,229,923 | 80,969,474 | ||||||||
| 188,780,723 | 225,074,163 | ||||||||||
COMMUNICATIONS SECTOR — 1.2% | |||||||||||
| Wireless Telecommunications — 1.2% | |||||||||||
| 1,560,000 | Millicom International | ||||||||||
| Cellular S.A. (Luxembourg)* | 73,873,857 | 39,327,600 | |||||||||
CONSUMER DURABLES SECTOR — 5.6% | |||||||||||
| Electronics/Appliances — 4.3% | |||||||||||
| 1,435,000 | Sony Group Corp. (Japan) (b) | 78,481,644 | 147,626,653 | ||||||||
| Home Furnishings — 1.3% | |||||||||||
| 4,375,000 | Howden Joinery Group PLC (Britain) (b) | 33,093,696 | 43,859,392 | ||||||||
CONSUMER NON-DURABLES SECTOR — 5.3% | |||||||||||
| Household/Personal Care — 5.3% | |||||||||||
| 1,200,000 | Henkel AG & Co. KGaA (Germany) (b) | 111,159,535 | 79,206,016 | ||||||||
| 2,235,000 | Unilever PLC (Britain) (b) | 96,387,735 | 101,474,945 | ||||||||
| 207,547,270 | 180,680,961 | ||||||||||
CONSUMER SERVICES SECTOR — 7.1% | |||||||||||
| Media Conglomerates — 1.0% | |||||||||||
| 2,535,000 | Vivendi (France) (b) | 46,556,730 | 33,118,735 | ||||||||
| Movies/Entertainment — 2.5% | |||||||||||
| 16,300,000 | Bolloré (France) (b) | 56,254,373 | 85,354,352 | ||||||||
| Other Consumer Services — 3.6% | |||||||||||
| 52,000 | Booking Holdings Inc. (United States)* | 91,952,689 | 122,119,400 | ||||||||
DISTRIBUTION SERVICES SECTOR — 8.1% | |||||||||||
| Wholesale Distributors — 8.1% | |||||||||||
| 1,360,000 | Ferguson PLC (Jersey) (b) | 73,601,487 | 184,252,112 | ||||||||
| 4,350,000 | Rexel S.A. (France) (b) | 88,004,327 | 92,863,547 | ||||||||
| 161,605,814 | 277,115,659 | ||||||||||
ELECTRONIC TECHNOLOGY SECTOR — 4.9% | |||||||||||
| Aerospace & Defense — 3.2% | |||||||||||
| 940,000 | Safran S.A. (France) (b) | 103,347,682 | 110,671,975 | ||||||||
| Electronic Equipment/Instruments — 1.7% | |||||||||||
| 3,340,000 | Yokogawa Electric Corp. (Japan) (b) | 59,113,396 | 56,908,627 | ||||||||
The accompanying notes to financial statements are an integral part of this schedule.
30
FMI International Fund
SCHEDULE OF INVESTMENTS (Continued)
March 31, 2022 (Unaudited)
| Shares | Cost | Value | |||||||||
| LONG-TERM INVESTMENTS — 94.1% (a) (Continued) | |||||||||||
| COMMON STOCKS — 86.2% (a) (Continued) | |||||||||||
FINANCE SECTOR — 9.4% | |||||||||||
| Major Banks — 5.4% | |||||||||||
| 4,173,500 | DBS Group Holdings Ltd. (Singapore) (b) | $ | 93,778,132 | $ | 109,354,981 | ||||||
| 126,200,000 | Lloyds Banking Group PLC (Britain) (b) | 63,764,256 | 76,851,463 | ||||||||
| 157,542,388 | 186,206,444 | ||||||||||
| Multi-Line Insurance — 1.8% | |||||||||||
| 1,305,000 | Arch Capital Group Ltd. (Bermuda)* | 53,005,864 | 63,188,100 | ||||||||
| Property/Casualty Insurance — 2.2% | |||||||||||
| 355,000 | Chubb Ltd. (Switzerland) | 46,704,710 | 75,934,500 | ||||||||
HEALTH SERVICES SECTOR — 2.6% | |||||||||||
| Medical/Nursing Services — 2.6% | |||||||||||
| 1,330,000 | Fresenius Medical Care | ||||||||||
| AG & Co. KGaA (Germany) (b) | 106,670,311 | 89,124,877 | |||||||||
HEALTH TECHNOLOGY SECTOR — 8.2% | |||||||||||
| Medical Specialties — 5.5% | |||||||||||
| 2,815,000 | Koninklijke Philips N.V. (Netherlands) (b) | 123,954,054 | 85,840,210 | ||||||||
| 6,465,000 | Smith & Nephew PLC (Britain) (b) | 116,752,300 | 102,824,728 | ||||||||
| 240,706,354 | 188,664,938 | ||||||||||
| Pharmaceuticals: Major — 2.7% | |||||||||||
| 233,000 | Roche Holding AG (Switzerland) (b) | 84,268,179 | 92,189,214 | ||||||||
INDUSTRIAL SERVICES SECTOR — 2.9% | |||||||||||
| Oilfield Services/Equipment — 2.9% | |||||||||||
| 2,395,000 | Schlumberger Ltd. (Curacao) | 88,959,306 | 98,937,450 | ||||||||
PROCESS INDUSTRIES SECTOR — 3.3% | |||||||||||
| Chemicals: Specialty — 1.7% | |||||||||||
| 1,415,000 | NOF Corp. (Japan) (b) | 74,286,266 | 57,815,733 | ||||||||
| Industrial Specialties — 1.6% | |||||||||||
| 655,000 | Akzo Nobel N.V. (Netherlands) (b) | 44,437,173 | 56,279,430 | ||||||||
PRODUCER MANUFACTURING SECTOR — 6.8% | |||||||||||
| Building Products — 1.8% | |||||||||||
| 6,050,000 | Sanwa Holdings Corp. (Japan) (b) | 76,000,029 | 61,230,484 | ||||||||
| Industrial Conglomerates — 3.5% | |||||||||||
| 1,035,000 | Jardine Matheson Holdings Ltd. (Bermuda) (b) | 68,461,837 | 56,778,538 | ||||||||
| 3,360,000 | Smiths Group PLC (Britain) (b) | 50,481,119 | 63,658,260 | ||||||||
| 118,942,956 | 120,436,798 | ||||||||||
| Industrial Machinery — 1.5% | |||||||||||
| 1,877,000 | Nabtesco Corp. (Japan) (b) | 67,961,049 | 49,557,598 | ||||||||
The accompanying notes to financial statements are an integral part of this schedule.
31
FMI International Fund
SCHEDULE OF INVESTMENTS (Continued)
March 31, 2022 (Unaudited)
| Shares | Cost | Value | |||||||||
| LONG-TERM INVESTMENTS — 94.1% (a) (Continued) | |||||||||||
| COMMON STOCKS — 86.2% (a) (Continued) | |||||||||||
RETAIL TRADE SECTOR — 9.8% | |||||||||||
| Discount Stores — 4.9% | |||||||||||
| 24,090,000 | B&M European Value | ||||||||||
| Retail S.A. (Luxembourg) (b) | $ | 98,863,025 | $ | 168,540,474 | |||||||
| Food Retail — 1.4% | |||||||||||
| 1,485,000 | Greggs PLC (Britain) (b) | 44,475,923 | 47,694,513 | ||||||||
| Specialty Stores — 3.5% | |||||||||||
| 16,550,000 | CK Hutchison Holdings Ltd. | ||||||||||
| (Cayman Islands) (b) | 163,424,686 | 121,020,389 | |||||||||
TECHNOLOGY SERVICES SECTOR — 2.2% | |||||||||||
| Packaged Software — 2.2% | |||||||||||
| 675,000 | SAP SE (Germany) (b) | 86,908,964 | 74,809,399 | ||||||||
| Total common stocks | 2,728,030,156 | 2,948,089,787 | |||||||||
| PREFERRED STOCKS — 7.9% (a) | |||||||||||
CONSUMER NON-DURABLES SECTOR — 3.0% | |||||||||||
| Household/Personal Care — 3.0% | |||||||||||
| 850,000 | Amorepacific Corp. (South Korea) (b) | 56,985,599 | 55,585,359 | ||||||||
| 110,000 | LG Household & Health Care Ltd. | ||||||||||
| (South Korea) (b) | 33,028,464 | 45,864,801 | |||||||||
| 90,014,063 | 101,450,160 | ||||||||||
ELECTRONIC TECHNOLOGY SECTOR — 4.9% | |||||||||||
| Telecommunications Equipment — 4.9% | |||||||||||
| 3,255,000 | Samsung Electronics Co. Ltd. | ||||||||||
| (South Korea) (b) | 68,768,205 | 168,659,292 | |||||||||
| Total preferred stocks | 158,782,268 | 270,109,452 | |||||||||
| Total long-term investments | 2,886,812,424 | 3,218,199,239 | |||||||||
The accompanying notes to financial statements are an integral part of this schedule.
32
FMI International Fund
SCHEDULE OF INVESTMENTS (Continued)
March 31, 2022 (Unaudited)
Principal Amount | Cost | Value | |||||||||
| SHORT-TERM INVESTMENTS — 3.3% (a) | |||||||||||
| Bank Deposit Account — 3.3% | |||||||||||
| $ | 112,664,099 | U.S. Bank N.A., 0.096%^ | $ | 112,664,099 | $ | 112,664,099 | |||||
| Total short-term investments | 112,664,099 | 112,664,099 | |||||||||
| Total investments — 97.4% | $ | 2,999,476,523 | 3,330,863,338 | ||||||||
Other assets, less liabilities — 2.6% (a) | 90,078,891 | ||||||||||
| TOTAL NET ASSETS — 100.0% | $ | 3,420,942,229 | |||||||||
| * | Non-income producing security. |
| ^ | The rate shown is as of March 31, 2022. |
| (a) | Percentages for the various classifications relate to total net assets. |
| (b) | Security does not trade during New York Stock Exchange hours, provided that certain foreign exchanges may trade during a portion of the New York Stock Exchange hours, and has been valued in accordance with the procedures discussed in Note 1(a) to the financial statements and has been classified as Level 2. As of March 31, 2022 the aggregate value of these securities was $2,818,692,189. |
| PLC | Public Limited Company |
The accompanying notes to financial statements are an integral part of this schedule.
33
FMI International Fund
SCHEDULE OF FORWARD CURRENCY CONTRACTS
March 31, 2022 (Unaudited)
| U.S. $ Value on | U.S. $ Value on | ||||||||||||||||||||
| March 31, 2022 | March 31, 2022 | Unrealized | |||||||||||||||||||
| Settlement | Currency to | of Currency to | Currency to | of Currency to | Appreciation | ||||||||||||||||
| Date | Counterparty | be Delivered | be Delivered | be Received | be Received | (Depreciation) | |||||||||||||||
| 6/10/22 | State Street Bank | 645,000,000 | $ | 847,063,088 | 870,895,125 | $ | 870,895,125 | $ | 23,832,037 | ||||||||||||
| and Trust Co. | British Pound | U.S. Dollar | |||||||||||||||||||
| 6/10/22 | The Bank of New | 665,000,000 | 737,702,145 | 757,415,050 | 757,415,050 | 19,712,905 | |||||||||||||||
| York Mellon | Euro | U.S. Dollar | |||||||||||||||||||
| 6/10/22 | JPMorgan Chase | 860,000,000 | 109,901,766 | 110,280,446 | 110,280,446 | 378,680 | |||||||||||||||
| Bank, N.A. | Hong Kong Dollar | U.S. Dollar | |||||||||||||||||||
| 6/10/22 | The Bank of New | 44,500,000,000 | 366,232,688 | 385,570,146 | 385,570,146 | 19,337,458 | |||||||||||||||
| York Mellon | Japanese Yen | U.S. Dollar | |||||||||||||||||||
| 6/10/22 | JPMorgan Chase | 140,000,000 | 103,292,459 | 104,023,479 | 104,023,479 | 731,020 | |||||||||||||||
| Bank, N.A. | Singapore Dollar | U.S. Dollar | |||||||||||||||||||
| 6/10/22 | State Street Bank | 300,000,000,000 | 247,332,926 | 249,712,830 | 249,712,830 | 2,379,904 | |||||||||||||||
| and Trust Co. | South Korea Won | U.S. Dollar | |||||||||||||||||||
| 6/10/22 | JPMorgan Chase | 155,000,000 | 168,262,564 | 167,851,554 | 167,851,554 | (411,010 | ) | ||||||||||||||
| Bank, N.A. | Swiss Franc | U.S. Dollar | |||||||||||||||||||
| $ | 2,579,787,636 | $ | 2,645,748,630 | $ | 65,960,994 | ||||||||||||||||
The accompanying notes to financial statements are an integral part of this schedule.
34
FMI International Fund
INDUSTRY SECTORS as a percentage of net assets
as of March 31, 2022 (Unaudited)
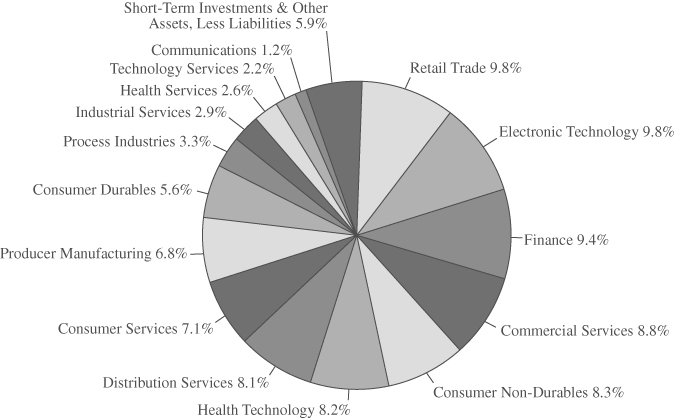
CONCENTRATION BY COUNTRY based on domicile of issuer as
a percentage of long-term investments only
as of March 31, 2022 (Unaudited)
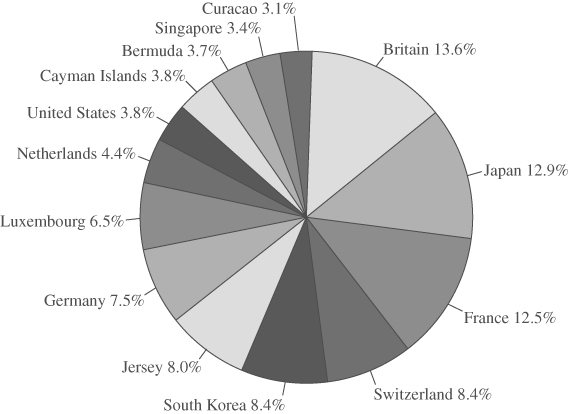
35
FMI International Fund II – Currency Unhedged
SCHEDULE OF INVESTMENTS
March 31, 2022 (Unaudited)
| Shares | Cost | Value | |||||||||
| LONG-TERM INVESTMENTS — 99.5% (a) | |||||||||||
| COMMON STOCKS — 91.0% (a) | |||||||||||
COMMERCIAL SERVICES SECTOR — 9.3% | |||||||||||
| Advertising/Marketing Services — 2.3% | |||||||||||
| 124,200 | WPP PLC (Jersey) (b) | $ | 1,353,611 | $ | 1,625,537 | ||||||
| Miscellaneous Commercial Services — 7.0% | |||||||||||
| 26,725 | DKSH Holding AG (Switzerland) (b) | 1,671,698 | 2,250,836 | ||||||||
| 12,400 | Secom Co. Ltd. (Japan) (b) | 1,070,671 | 897,040 | ||||||||
| 21,975 | Sodexo S.A. (France) (b) | 1,945,073 | 1,788,245 | ||||||||
| 4,687,442 | 4,936,121 | ||||||||||
COMMUNICATIONS SECTOR — 1.2% | |||||||||||
| Wireless Telecommunications — 1.2% | |||||||||||
| 34,000 | Millicom International | ||||||||||
| Cellular S.A. (Luxembourg)* | 1,263,742 | 857,140 | |||||||||
CONSUMER DURABLES SECTOR — 6.0% | |||||||||||
| Electronics/Appliances — 4.6% | |||||||||||
| 31,600 | Sony Group Corp. (Japan) (b) | 2,369,176 | 3,250,873 | ||||||||
| Home Furnishings — 1.4% | |||||||||||
| 94,825 | Howden Joinery Group PLC (Britain) (b) | 786,611 | 950,621 | ||||||||
CONSUMER NON-DURABLES SECTOR — 5.6% | |||||||||||
| Household/Personal Care — 5.6% | |||||||||||
| 26,575 | Henkel AG & Co. KGaA (Germany) (b) | 2,359,563 | 1,754,083 | ||||||||
| 48,600 | Unilever PLC (Britain) (b) | 2,686,941 | 2,206,569 | ||||||||
| 5,046,504 | 3,960,652 | ||||||||||
CONSUMER SERVICES SECTOR — 7.3% | |||||||||||
| Media Conglomerates — 1.0% | |||||||||||
| 55,925 | Vivendi (France) (b) | 1,421,012 | 730,637 | ||||||||
| Movies/Entertainment — 2.6% | |||||||||||
| 351,375 | Bolloré (France) (b) | 1,418,240 | 1,839,962 | ||||||||
| Other Consumer Services — 3.7% | |||||||||||
| 1,125 | Booking Holdings Inc. (United States)* | 2,037,017 | 2,642,006 | ||||||||
DISTRIBUTION SERVICES SECTOR — 8.5% | |||||||||||
| Wholesale Distributors — 8.5% | |||||||||||
| 29,625 | Ferguson PLC (Jersey) (b) | 2,792,107 | 4,013,580 | ||||||||
| 94,625 | Rexel S.A. (France) (b) | 1,915,525 | 2,020,049 | ||||||||
| 4,707,632 | 6,033,629 | ||||||||||
ELECTRONIC TECHNOLOGY SECTOR — 5.2% | |||||||||||
| Aerospace & Defense — 3.4% | |||||||||||
| 20,475 | Safran S.A. (France) (b) | 2,389,859 | 2,410,648 | ||||||||
| Electronic Equipment/Instruments — 1.8% | |||||||||||
| 72,800 | Yokogawa Electric Corp. (Japan) (b) | 1,181,066 | 1,240,404 | ||||||||
The accompanying notes to financial statements are an integral part of this schedule.
36
FMI International Fund II – Currency Unhedged
SCHEDULE OF INVESTMENTS (Continued)
March 31, 2022 (Unaudited)
| Shares | Cost | Value | |||||||||
| LONG-TERM INVESTMENTS — 99.5% (a) (Continued) | |||||||||||
| COMMON STOCKS — 91.0% (a) (Continued) | |||||||||||
FINANCE SECTOR — 10.0% | |||||||||||
| Major Banks — 5.7% | |||||||||||
| 90,750 | DBS Group Holdings Ltd. (Singapore) (b) | $ | 2,045,654 | $ | 2,377,852 | ||||||
| 2,742,750 | Lloyds Banking Group PLC (Britain) (b) | 1,332,946 | 1,670,240 | ||||||||
| 3,378,600 | 4,048,092 | ||||||||||
| Multi-Line Insurance — 2.0% | |||||||||||
| 28,400 | Arch Capital Group Ltd. (Bermuda)* | 1,152,654 | 1,375,128 | ||||||||
| Property/Casualty Insurance — 2.3% | |||||||||||
| 7,650 | Chubb Ltd. (Switzerland) | 932,918 | 1,636,335 | ||||||||
HEALTH SERVICES SECTOR — 2.8% | |||||||||||
| Medical/Nursing Services — 2.8% | |||||||||||
| 28,975 | Fresenius Medical Care | ||||||||||
| AG & Co. KGaA (Germany) (b) | 2,306,931 | 1,941,649 | |||||||||
HEALTH TECHNOLOGY SECTOR — 8.6% | |||||||||||
| Medical Specialties — 5.8% | |||||||||||
| 61,100 | Koninklijke Philips N.V. (Netherlands) (b) | 2,806,523 | 1,863,175 | ||||||||
| 141,150 | Smith & Nephew PLC (Britain) (b) | 2,737,359 | 2,244,967 | ||||||||
| 5,543,882 | 4,108,142 | ||||||||||
| Pharmaceuticals: Major — 2.8% | |||||||||||
| 5,075 | Roche Holding AG (Switzerland) (b) | 1,818,046 | 2,007,984 | ||||||||
INDUSTRIAL SERVICES SECTOR — 3.1% | |||||||||||
| Oilfield Services/Equipment — 3.1% | |||||||||||
| 52,050 | Schlumberger Ltd. (Curacao) | 1,478,674 | 2,150,185 | ||||||||
PROCESS INDUSTRIES SECTOR — 3.5% | |||||||||||
| Chemicals: Specialty — 1.8% | |||||||||||
| 31,600 | NOF Corp. (Japan) (b) | 1,654,564 | 1,291,150 | ||||||||
| Industrial Specialties — 1.7% | |||||||||||
| 14,200 | Akzo Nobel N.V. (Netherlands) (b) | 1,097,390 | 1,220,104 | ||||||||
PRODUCER MANUFACTURING SECTOR — 7.2% | |||||||||||
| Building Products — 1.9% | |||||||||||
| 131,700 | Sanwa Holdings Corp. (Japan) (b) | 1,644,850 | 1,332,902 | ||||||||
| Industrial Conglomerates — 3.7% | |||||||||||
| 23,000 | Jardine Matheson Holdings Ltd. (Bermuda) (b) | 1,512,013 | 1,261,745 | ||||||||
| 72,500 | Smiths Group PLC (Britain) (b) | 1,310,041 | 1,373,579 | ||||||||
| 2,822,054 | 2,635,324 | ||||||||||
| Industrial Machinery — 1.6% | |||||||||||
| 41,900 | Nabtesco Corp. (Japan) (b) | 1,502,915 | 1,106,267 | ||||||||
The accompanying notes to financial statements are an integral part of this schedule.
37
FMI International Fund II – Currency Unhedged
SCHEDULE OF INVESTMENTS (Continued)
March 31, 2022 (Unaudited)
| Shares | Cost | Value | |||||||||
| LONG-TERM INVESTMENTS — 99.5% (a) (Continued) | |||||||||||
| COMMON STOCKS — 91.0% (a) (Continued) | |||||||||||
RETAIL TRADE SECTOR — 10.4% | |||||||||||
| Discount Stores — 5.2% | |||||||||||
| 524,800 | B&M European Value Retail S.A. | ||||||||||
| (Luxembourg) (b) | $ | 3,033,622 | $ | 3,671,650 | |||||||
| Food Retail — 1.5% | |||||||||||
| 32,900 | Greggs PLC (Britain) (b) | 1,000,949 | 1,056,666 | ||||||||
| Specialty Stores — 3.7% | |||||||||||
| 360,100 | CK Hutchison Holdings Ltd. | ||||||||||
| (Cayman Islands) (b) | 2,680,547 | 2,633,199 | |||||||||
TECHNOLOGY SERVICES SECTOR — 2.3% | |||||||||||
| Packaged Software — 2.3% | |||||||||||
| 14,450 | SAP SE (Germany) (b) | 1,855,933 | 1,601,475 | ||||||||
| Total common stocks | 62,566,441 | 64,294,482 | |||||||||
| PREFERRED STOCKS — 8.5% (a) | |||||||||||
CONSUMER NON-DURABLES SECTOR — 3.3% | |||||||||||
| Household/Personal Care — 3.3% | |||||||||||
| 19,350 | Amorepacific Corp. (South Korea) (b) | 1,288,657 | 1,265,384 | ||||||||
| 2,550 | LG Household & Health Care Ltd. | ||||||||||
| (South Korea) (b) | 1,619,989 | 1,063,229 | |||||||||
| 2,908,646 | 2,328,613 | ||||||||||
ELECTRONIC TECHNOLOGY SECTOR — 5.2% | |||||||||||
| Telecommunications Equipment — 5.2% | |||||||||||
| 71,500 | Samsung Electronics Co. Ltd. | ||||||||||
| (South Korea) (b) | 3,259,295 | 3,704,805 | |||||||||
| Total preferred stocks | 6,167,941 | 6,033,418 | |||||||||
| Total long-term investments | 68,734,382 | 70,327,900 | |||||||||
The accompanying notes to financial statements are an integral part of this schedule.
38
FMI International Fund II – Currency Unhedged
SCHEDULE OF INVESTMENTS (Continued)
March 31, 2022 (Unaudited)
| Principal Amount | Cost | Value | |||||||||
| SHORT-TERM INVESTMENTS — 0.0% (a) | |||||||||||
| Bank Deposit Account — 0.0% | |||||||||||
| $ | 914 | U.S. Bank N.A., 0.096%^ | $ | 914 | $ | 914 | |||||
| Total short-term investments | 914 | 914 | |||||||||
| Total investments — 99.5% | $ | 68,735,296 | 70,328,814 | ||||||||
Other assets, less liabilities — 0.5% (a) | 340,711 | ||||||||||
TOTAL NET ASSETS — 100.0% | $ | 70,669,525 | |||||||||
| * | Non-income producing security. |
| ^ | The rate shown is as of March 31, 2022. |
| (a) | Percentages for the various classifications relate to total net assets. |
| (b) | Security does not trade during New York Stock Exchange hours, provided that certain foreign exchanges may trade during a portion of the New York Stock Exchange hours, and has been valued in accordance with the procedures discussed in Note 1(a) to the financial statements and has been classified as Level 2. As of March 31, 2022 the aggregate value of these securities was $61,667,106. |
| PLC | Public Limited Company |
The accompanying notes to financial statements are an integral part of this schedule.
39
FMI International Fund II – Currency Unhedged
INDUSTRY SECTORS as a percentage of net assets
as of March 31, 2022 (Unaudited)
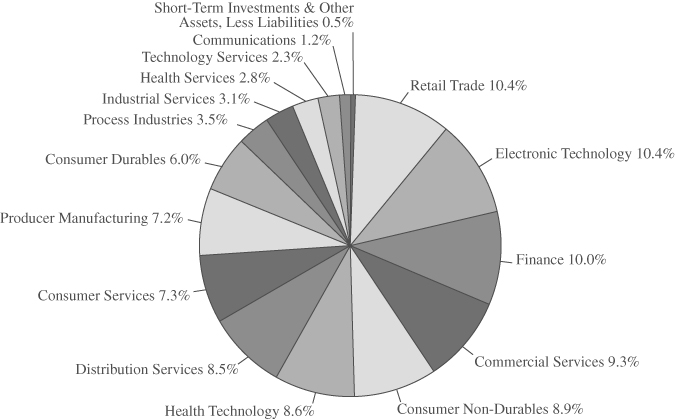
CONCENTRATION BY COUNTRY based on domicile of issuer as
a percentage of long-term investments only
as of March 31, 2022 (Unaudited)
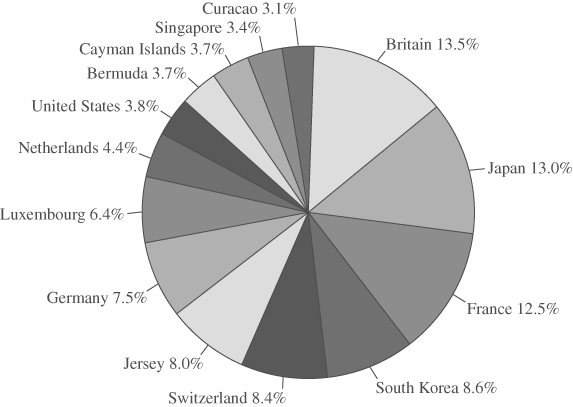
40
(This Page Intentionally Left Blank.)
41
FMI Funds, Inc.
STATEMENTS OF ASSETS AND LIABILITIES
March 31, 2022 (Unaudited)
| FMI | ||||||||||||||||
| FMI | FMI | FMI | International | |||||||||||||
| Large Cap | Common Stock | International | Fund II – Currency | |||||||||||||
| Fund | Fund | Fund | Unhedged | |||||||||||||
| ASSETS: | ||||||||||||||||
| Investments in securities, | ||||||||||||||||
| at value (a) | $ | 2,940,113,133 | $ | 1,024,461,860 | $ | 3,330,863,338 | $ | 70,328,814 | ||||||||
| Receivable for | ||||||||||||||||
| investments sold | 7,703,385 | — | — | 145,838 | ||||||||||||
| Dividends, interest and | ||||||||||||||||
| reclaims receivable | 4,297,478 | 493,189 | 22,262,696 | 510,653 | ||||||||||||
| Receivables from shareholders | ||||||||||||||||
| for purchases | 4,018,709 | 915,196 | 5,455,733 | 185,216 | ||||||||||||
| Restricted cash | — | — | 1,670,000 | — | ||||||||||||
| Unrealized appreciation on | ||||||||||||||||
| forward currency contracts | — | — | 66,372,004 | — | ||||||||||||
| Prepaid expenses | 82,398 | 40,365 | 74,587 | 16,394 | ||||||||||||
| Total assets | $ | 2,956,215,103 | $ | 1,025,910,610 | $ | 3,426,698,358 | $ | 71,186,915 | ||||||||
| LIABILITIES: | ||||||||||||||||
| Payable to brokers for | ||||||||||||||||
| investments purchased | $ | 35,611,297 | $ | — | $ | — | $ | — | ||||||||
| Payable to shareholders | ||||||||||||||||
| for redemptions | 2,706,749 | 593,960 | 1,392,970 | — | ||||||||||||
| Payable to adviser for | ||||||||||||||||
| management fees | 1,275,375 | 635,328 | 1,891,633 | 21,700 | ||||||||||||
| Payable to brokers for | ||||||||||||||||
| collateral received | — | — | 1,670,000 | — | ||||||||||||
| Unrealized depreciation on | ||||||||||||||||
| forward currency contracts | — | — | 411,010 | — | ||||||||||||
| Payable for | ||||||||||||||||
| loans outstanding | — | — | — | 470,000 | ||||||||||||
| Other liabilities | 369,820 | 135,875 | 390,516 | 25,690 | ||||||||||||
| Total liabilities | 39,963,241 | 1,365,163 | 5,756,129 | 517,390 | ||||||||||||
| Net assets | $ | 2,916,251,862 | $ | 1,024,545,447 | $ | 3,420,942,229 | $ | 70,669,525 | ||||||||
| NET ASSETS: | ||||||||||||||||
| Capital Stock | $ | 1,749,075,999 | $ | 696,122,236 | $ | 3,288,853,225 | $ | 68,451,249 | ||||||||
| Total distributable earnings | 1,167,175,863 | 328,423,211 | 132,089,004 | 2,218,276 | ||||||||||||
| Net assets | $ | 2,916,251,862 | $ | 1,024,545,447 | $ | 3,420,942,229 | $ | 70,669,525 | ||||||||
The accompanying notes to financial statements are an integral part of these statements.
42
FMI Funds, Inc.
STATEMENTS OF ASSETS AND LIABILITIES (Continued)
March 31, 2022 (Unaudited)
| FMI | ||||||||||||||||
| FMI | FMI | FMI | International | |||||||||||||
| Large Cap | Common Stock | International | Fund II – Currency | |||||||||||||
| Fund | Fund | Fund | Unhedged | |||||||||||||
| CALCULATION OF NET | ||||||||||||||||
| ASSET VALUE PER SHARE: | ||||||||||||||||
| Investor Class shares: | ||||||||||||||||
| Net assets | $ | 1,343,515,274 | $ | 416,878,203 | $ | 991,541,195 | $ | — | ||||||||
| Shares outstanding | 72,849,101 | 13,710,782 | 29,633,710 | — | ||||||||||||
| Shares authorized | ||||||||||||||||
| ($0.0001 par value) | 300,000,000 | 300,000,000 | 300,000,000 | 300,000,000 | ||||||||||||
| Net asset value, offering and | ||||||||||||||||
| redemption price per share | $ | 18.44 | $ | 30.41 | $ | 33.46 | $ | — | ||||||||
| Institutional Class shares: | ||||||||||||||||
| Net assets | $ | 1,572,736,588 | $ | 607,667,244 | $ | 2,429,401,034 | $ | 70,669,525 | ||||||||
| Shares outstanding | 85,457,299 | 19,959,431 | 72,418,511 | 3,582,158 | ||||||||||||
| Shares authorized | ||||||||||||||||
| ($0.0001 par value) | 300,000,000 | 300,000,000 | 300,000,000 | 300,000,000 | ||||||||||||
| Net asset value, offering and | ||||||||||||||||
| redemption price per share | $ | 18.40 | $ | 30.45 | $ | 33.55 | $ | 19.73 | ||||||||
| (a) Identified cost of investments | $ | 2,084,599,815 | $ | 751,546,843 | $ | 2,999,476,523 | $ | 68,735,296 | ||||||||
The accompanying notes to financial statements are an integral part of these statements.
43
FMI Funds, Inc.
STATEMENTS OF OPERATIONS
For the Six Month Period Ending March 31, 2022 (Unaudited)
| FMI | ||||||||||||||||
| FMI | FMI | FMI | International | |||||||||||||
| Large Cap | Common Stock | International | Fund II – Currency | |||||||||||||
| Fund | Fund | Fund | Unhedged | |||||||||||||
| INCOME: | ||||||||||||||||
| Dividends* | $ | 21,233,812 | $ | 4,796,484 | $ | 33,244,554 | $ | 734,210 | ||||||||
| Interest | 3,617 | 2,109 | 5,675 | 107 | ||||||||||||
| Other income | — | — | — | 115 | ||||||||||||
| Total income | 21,237,429 | 4,798,593 | 33,250,229 | 734,432 | ||||||||||||
| EXPENSES: | ||||||||||||||||
| Management fees | 10,151,730 | 4,079,492 | 12,774,433 | 285,445 | ||||||||||||
| Shareholder servicing fees | ||||||||||||||||
| (Investor Class) | 1,000,423 | 245,621 | 784,053 | — | ||||||||||||
| Administration and | ||||||||||||||||
| accounting services | 323,744 | 116,759 | 354,373 | 16,905 | ||||||||||||
| Printing and postage expense | 102,519 | 24,772 | 238,685 | 2,403 | ||||||||||||
| Transfer agent fees | 60,136 | 32,807 | 56,364 | 9,013 | ||||||||||||
| Custodian fees | 58,531 | 18,365 | 236,707 | 13,712 | ||||||||||||
| Board of Directors fees | 42,500 | 42,500 | 42,500 | 42,500 | ||||||||||||
| Registration fees | 38,341 | 32,012 | 47,810 | 16,769 | ||||||||||||
| Professional fees | 23,360 | 20,555 | 24,594 | 19,949 | ||||||||||||
| Interest expense | 673 | 517 | — | 644 | ||||||||||||
| Other expenses | 131,500 | 37,641 | 107,872 | 18,058 | ||||||||||||
| Total expenses | ||||||||||||||||
| before reimbursement | 11,933,457 | 4,651,041 | 14,667,391 | 425,398 | ||||||||||||
| Less expenses | ||||||||||||||||
| reimbursed by adviser | — | — | — | (82,049 | ) | |||||||||||
| Net expenses | 11,933,457 | 4,651,041 | 14,667,391 | 343,349 | ||||||||||||
| NET INVESTMENT INCOME | 9,303,972 | 147,552 | 18,582,838 | 391,083 | ||||||||||||
The accompanying notes to financial statements are an integral part of these statements.
44
FMI Funds, Inc.
STATEMENTS OF OPERATIONS (Continued)
For the Six Month Period Ending March 31, 2022 (Unaudited)
| FMI | ||||||||||||||||
| FMI | FMI | FMI | International | |||||||||||||
| Large Cap | Common Stock | International | Fund II – Currency | |||||||||||||
| Fund | Fund | Fund | Unhedged | |||||||||||||
| NET REALIZED GAIN (LOSS) | ||||||||||||||||
| ON INVESTMENTS: | ||||||||||||||||
| Securities | $ | 328,491,028 | $ | 56,540,173 | $ | 86,165,400 | $ | 608,567 | ||||||||
| Forward currency contracts | — | — | 80,533,935 | — | ||||||||||||
| Foreign currency transactions | — | — | 8,514,940 | — | ||||||||||||
| NET REALIZED GAIN (LOSS) | ||||||||||||||||
| ON INVESTMENTS | 328,491,028 | 56,540,173 | 175,214,275 | 608,567 | ||||||||||||
| NET CHANGE IN UNREALIZED | ||||||||||||||||
| APPRECIATION/DEPRECIATION | ||||||||||||||||
| ON INVESTMENTS: | ||||||||||||||||
| Securities | (209,514,800 | ) | (23,756,063 | ) | (265,618,535 | ) | (4,609,307 | ) | ||||||||
| Forward currency contracts | — | — | 4,826,484 | — | ||||||||||||
| Foreign currency transactions | — | — | (129,211 | ) | (10,097 | ) | ||||||||||
| NET CHANGE IN UNREALIZED | ||||||||||||||||
| APPRECIATION/DEPRECIATION | ||||||||||||||||
| ON INVESTMENTS | (209,514,800 | ) | (23,756,063 | ) | (260,921,262 | ) | (4,619,404 | ) | ||||||||
| NET GAIN (LOSS) | ||||||||||||||||
| ON INVESTMENTS | $ | 118,976,228 | $ | 32,784,110 | $ | (85,706,987 | ) | $ | (4,010,837 | ) | ||||||
| NET INCREASE (DECREASE) | ||||||||||||||||
| IN NET ASSETS RESULTING | ||||||||||||||||
| FROM OPERATIONS | $ | 128,280,200 | $ | 32,931,662 | $ | (67,124,149 | ) | $ | (3,619,754 | ) | ||||||
* Net withholding taxes | $ | 38,239 | $ | — | $ | 3,295,367 | $ | 74,454 | ||||||||
The accompanying notes to financial statements are an integral part of these statements.
45
FMI Large Cap Fund
STATEMENTS OF CHANGES IN NET ASSETS
For the Six Month Period Ending March 31, 2022 (Unaudited) and For the Year Ended September 30, 2021
| 2022 | 2021 | |||||||
| OPERATIONS: | ||||||||
| Net investment income | $ | 9,303,972 | $ | 27,038,378 | ||||
| Net realized gain (loss) on investments | 328,491,028 | 605,957,266 | ||||||
| Net change in unrealized appreciation/depreciation | ||||||||
| on investments | (209,514,800 | ) | 123,727,074 | |||||
| Net increase (decrease) in net assets from operations | 128,280,200 | 756,722,718 | ||||||
| DISTRIBUTIONS TO SHAREHOLDERS FROM: | ||||||||
| Investor Class | (220,026,036 | ) | (167,535,731 | ) | ||||
| Institutional Class | (278,028,660 | ) | (196,110,923 | ) | ||||
| Total distributions (Note 8) | (498,054,696 | ) | (363,646,654 | ) | ||||
| FUND SHARE ACTIVITIES: | ||||||||
| Net increase (decrease) in net assets | ||||||||
| derived from Fund share activities (Note 9) | 74,857,915 | (581,695,697 | ) | |||||
| TOTAL INCREASE (DECREASE) | (294,916,581 | ) | (188,619,633 | ) | ||||
| NET ASSETS AT THE BEGINNING OF THE PERIOD | 3,211,168,443 | 3,399,788,076 | ||||||
| NET ASSETS AT THE END OF THE PERIOD | $ | 2,916,251,862 | $ | 3,211,168,443 | ||||
| FUND SHARE TRANSACTIONS: | ||||||||
| Net increase (decrease) in shares outstanding (Note 9) | 5,030,180 | (27,551,383 | ) | |||||
The accompanying notes to financial statements are an integral part of these statements.
46
FMI Common Stock Fund
STATEMENTS OF CHANGES IN NET ASSETS
For the Six Month Period Ending March 31, 2022 (Unaudited) and For the Year Ended September 30, 2021
| 2022 | 2021 | |||||||
| OPERATIONS: | ||||||||
| Net investment income | $ | 147,552 | $ | 2,992,669 | ||||
| Net realized gain (loss) on investments | 56,540,173 | 136,275,567 | ||||||
| Net change in unrealized appreciation/depreciation | ||||||||
| on investments | (23,756,063 | ) | 195,248,042 | |||||
| Net increase (decrease) in net assets from operations | 32,931,662 | 334,516,278 | ||||||
| DISTRIBUTIONS TO SHAREHOLDERS FROM: | ||||||||
| Investor Class | (49,540,458 | ) | (3,085,944 | ) | ||||
| Institutional Class | (62,187,565 | ) | (3,488,077 | ) | ||||
| Total distributions (Note 8) | (111,728,023 | ) | (6,574,021 | ) | ||||
| FUND SHARE ACTIVITIES: | ||||||||
| Net increase (decrease) in net assets | ||||||||
| derived from Fund share activities (Note 9) | 163,070,595 | (77,909,977 | ) | |||||
| TOTAL INCREASE (DECREASE) | 84,274,234 | 250,032,280 | ||||||
| NET ASSETS AT THE BEGINNING OF THE PERIOD | 940,271,213 | 690,238,933 | ||||||
| NET ASSETS AT THE END OF THE PERIOD | $ | 1,024,545,447 | $ | 940,271,213 | ||||
| FUND SHARE TRANSACTIONS: | ||||||||
| Net increase (decrease) in shares outstanding (Note 9) | 5,401,582 | (2,736,717 | ) | |||||
The accompanying notes to financial statements are an integral part of these statements.
47
FMI International Fund
STATEMENTS OF CHANGES IN NET ASSETS
For the Six Month Period Ending March 31, 2022 (Unaudited) and For the Year Ended September 30, 2021
| 2022 | 2021 | |||||||
| OPERATIONS: | ||||||||
| Net investment income | $ | 18,582,838 | $ | 122,132,223 | ||||
| Net realized gain (loss) on investments | 175,214,275 | 165,224,047 | ||||||
| Net change in unrealized appreciation/depreciation | ||||||||
| on investments | (260,921,262 | ) | 568,298,485 | |||||
| Net increase (decrease) in net assets from operations | (67,124,149 | ) | 855,654,755 | |||||
| DISTRIBUTIONS TO SHAREHOLDERS FROM: | ||||||||
| Investor Class | (36,245,422 | ) | — | |||||
| Institutional Class | (85,786,033 | ) | — | |||||
| Total distributions (Note 8) | (122,031,455 | ) | — | |||||
| FUND SHARE ACTIVITIES: | ||||||||
| Net increase (decrease) in net assets | ||||||||
| derived from Fund share activities (Note 9) | 192,401,505 | (787,589,102 | ) | |||||
| TOTAL INCREASE (DECREASE) | 3,245,901 | 68,065,653 | ||||||
| NET ASSETS AT THE BEGINNING OF THE PERIOD | 3,417,696,328 | 3,349,630,675 | ||||||
| NET ASSETS AT THE END OF THE PERIOD | $ | 3,420,942,229 | $ | 3,417,696,328 | ||||
| FUND SHARE TRANSACTIONS: | ||||||||
| Net increase (decrease) in shares outstanding (Note 9) | 5,593,743 | (24,393,075 | ) | |||||
The accompanying notes to financial statements are an integral part of these statements.
48
FMI International Fund II – Currency Unhedged
STATEMENTS OF CHANGES IN NET ASSETS
For the Six Month Period Ending March 31, 2022 (Unaudited) and For the Year Ended September 30, 2021
| 2022 | 2021 | |||||||
| OPERATIONS: | ||||||||
| Net investment income | $ | 391,083 | $ | 2,381,692 | ||||
| Net realized gain (loss) on investments | 608,567 | 2,272,074 | ||||||
| Net change in unrealized appreciation/depreciation | ||||||||
| on investments | (4,619,404 | ) | 7,661,699 | |||||
| Net increase (decrease) in net assets from operations | (3,619,754 | ) | 12,315,465 | |||||
| DISTRIBUTIONS TO SHAREHOLDERS FROM: | ||||||||
| Institutional Class | (3,350,974 | ) | (478,518 | ) | ||||
| Total distributions (Note 8) | (3,350,974 | ) | (478,518 | ) | ||||
| FUND SHARE ACTIVITIES: | ||||||||
| Net increase (decrease) in net assets | ||||||||
| derived from Fund share activities (Note 9) | 5,643,035 | 12,605,497 | ||||||
| TOTAL INCREASE (DECREASE) | (1,327,693 | ) | 24,442,444 | |||||
| NET ASSETS AT THE BEGINNING OF THE PERIOD | 71,997,218 | 47,554,774 | ||||||
| NET ASSETS AT THE END OF THE PERIOD | $ | 70,669,525 | $ | 71,997,218 | ||||
| FUND SHARE TRANSACTIONS: | ||||||||
| Net increase (decrease) in shares outstanding (Note 9) | 264,732 | 559,696 | ||||||
The accompanying notes to financial statements are an integral part of this statement.
49
FMI Large Cap Fund
FINANCIAL HIGHLIGHTS
(Selected data for each share of the Fund outstanding throughout each period)
| Investor Class | ||||||||||||||||||||||||
| (Unaudited) | ||||||||||||||||||||||||
| For the | ||||||||||||||||||||||||
| Six Month | ||||||||||||||||||||||||
| Period Ending | ||||||||||||||||||||||||
| March 31, | Years Ended September 30, | |||||||||||||||||||||||
| 2022 | 2021 | 2020 | 2019 | 2018 | 2017 | |||||||||||||||||||
| PER SHARE OPERATING | ||||||||||||||||||||||||
| PERFORMANCE: | ||||||||||||||||||||||||
| Net asset value, | ||||||||||||||||||||||||
| beginning of period | $ | 20.96 | $ | 18.81 | $ | 20.14 | $ | 22.85 | $ | 22.17 | $ | 20.20 | ||||||||||||
| Income from | ||||||||||||||||||||||||
| investment operations: | ||||||||||||||||||||||||
| Net investment | ||||||||||||||||||||||||
income (loss)(1) | 0.05 | 0.15 | 0.18 | 0.25 | 0.24 | 0.15 | ||||||||||||||||||
| Net realized and | ||||||||||||||||||||||||
| unrealized gain (loss) | ||||||||||||||||||||||||
| on investments | 0.79 | 4.25 | 0.03 | (2) | 0.55 | 2.43 | 3.30 | |||||||||||||||||
| Total from | ||||||||||||||||||||||||
| investment operations | 0.84 | 4.40 | 0.21 | 0.80 | 2.67 | 3.45 | ||||||||||||||||||
| Less distributions: | ||||||||||||||||||||||||
| Distributions from | ||||||||||||||||||||||||
| net investment income | (0.16 | ) | (0.30 | ) | (0.17 | ) | (0.28 | ) | (0.17 | ) | (0.23 | ) | ||||||||||||
| Distributions from | ||||||||||||||||||||||||
| net realized gains | (3.20 | ) | (1.95 | ) | (1.37 | ) | (3.23 | ) | (1.82 | ) | (1.25 | ) | ||||||||||||
| Total from distributions | (3.36 | ) | (2.25 | ) | (1.54 | ) | (3.51 | ) | (1.99 | ) | (1.48 | ) | ||||||||||||
| Net asset value, | ||||||||||||||||||||||||
| end of period | $ | 18.44 | $ | 20.96 | $ | 18.81 | $ | 20.14 | $ | 22.85 | $ | 22.17 | ||||||||||||
| TOTAL RETURN | 3.58 | %(3) | 24.48 | % | 0.71 | % | 5.72 | % | 12.67 | % | 17.86 | % | ||||||||||||
| RATIOS/SUPPLEMENTAL DATA: | ||||||||||||||||||||||||
| Net assets, end of | ||||||||||||||||||||||||
| period (in 000's $) | 1,343,515 | 1,422,451 | 1,475,504 | 2,337,118 | 3,155,818 | 3,856,953 | ||||||||||||||||||
| Ratio of expenses to | ||||||||||||||||||||||||
| average net assets | 0.83 | %(4) | 0.82 | % | 0.81 | % | 0.82 | % | 0.85 | % | 0.86 | % | ||||||||||||
| Ratio of net investment | ||||||||||||||||||||||||
| income (loss) to | ||||||||||||||||||||||||
| average net assets | 0.51 | %(4) | 0.72 | % | 0.99 | % | 1.25 | % | 1.07 | % | 0.71 | % | ||||||||||||
Portfolio turnover rate(5) | 10 | %(3) | 17 | % | 28 | % | 20 | % | 25 | % | 16 | % | ||||||||||||
| (1) | Net investment income (loss) per share was calculated using average shares outstanding. |
| (2) | Realized and unrealized gain (loss) per share in this caption are balancing amounts necessary to reconcile the change in net asset value per share for the period, and may not reconcile with the aggregate gains on the Statement of Operations due to share transactions for the period. |
| (3) | Not annualized. |
| (4) | Annualized. |
| (5) | Portfolio turnover rate is disclosed for the Fund as a whole. |
The accompanying notes to financial statements are an integral part of this statement.
50
FMI Large Cap Fund
FINANCIAL HIGHLIGHTS
(Selected data for each share of the Fund outstanding throughout each period)
Institutional Class
| (Unaudited) | For the | |||||||||||||||||||||||
| For the | Period from | |||||||||||||||||||||||
| Six Month | October 31, | |||||||||||||||||||||||
| Period Ending | 2016* to | |||||||||||||||||||||||
| March 31, | Years Ended September 30, | September 30, | ||||||||||||||||||||||
| 2022 | 2021 | 2020 | 2019 | 2018 | 2017 | |||||||||||||||||||
| PER SHARE OPERATING | ||||||||||||||||||||||||
| PERFORMANCE: | ||||||||||||||||||||||||
| Net asset value, | ||||||||||||||||||||||||
| beginning of period | $ | 20.94 | $ | 18.80 | $ | 20.13 | $ | 22.85 | $ | 22.18 | $ | 19.73 | ||||||||||||
| Income from | ||||||||||||||||||||||||
| investment operations: | ||||||||||||||||||||||||
| Net investment | ||||||||||||||||||||||||
income (loss)(1) | 0.07 | 0.18 | 0.21 | 0.25 | 0.27 | 0.16 | ||||||||||||||||||
| Net realized and | ||||||||||||||||||||||||
| unrealized gain (loss) | ||||||||||||||||||||||||
| on investments | 0.78 | 4.24 | 0.02 | (2) | 0.58 | 2.43 | 3.77 | |||||||||||||||||
| Total from | ||||||||||||||||||||||||
| investment operations | 0.85 | 4.42 | 0.23 | 0.83 | 2.70 | 3.93 | ||||||||||||||||||
| Less distributions: | ||||||||||||||||||||||||
| Distributions from | ||||||||||||||||||||||||
| net investment income | (0.19 | ) | (0.33 | ) | (0.19 | ) | (0.32 | ) | (0.21 | ) | (0.23 | ) | ||||||||||||
| Distributions from | ||||||||||||||||||||||||
| net realized gains | (3.20 | ) | (1.95 | ) | (1.37 | ) | (3.23 | ) | (1.82 | ) | (1.25 | ) | ||||||||||||
| Total from distributions | (3.39 | ) | (2.28 | ) | (1.56 | ) | (3.55 | ) | (2.03 | ) | (1.48 | ) | ||||||||||||
| Net asset value, | ||||||||||||||||||||||||
| end of period | $ | 18.40 | $ | 20.94 | $ | 18.80 | $ | 20.13 | $ | 22.85 | $ | 22.18 | ||||||||||||
| TOTAL RETURN | 3.64 | %(3) | 24.63 | % | 0.84 | % | 5.89 | % | 12.82 | % | 20.76 | %(3) | ||||||||||||
| RATIOS/SUPPLEMENTAL DATA: | ||||||||||||||||||||||||
| Net assets, end of | ||||||||||||||||||||||||
| period (in 000's $) | 1,572,737 | 1,788,717 | 1,924,284 | 2,652,783 | 2,861,755 | 2,520,266 | ||||||||||||||||||
| Ratio of expenses to | ||||||||||||||||||||||||
| average net assets | 0.69 | %(4) | 0.68 | % | 0.67 | % | 0.68 | % | 0.71 | % | 0.72 | %(4) | ||||||||||||
| Ratio of net investment | ||||||||||||||||||||||||
| income (loss) to | ||||||||||||||||||||||||
| average net assets | 0.65 | %(4) | 0.85 | % | 1.13 | % | 1.26 | % | 1.20 | % | 0.81 | %(4) | ||||||||||||
Portfolio turnover rate(5) | 10 | %(3) | 17 | % | 28 | % | 20 | % | 25 | % | 16 | %(3) | ||||||||||||
| * | Inception date. |
| (1) | Net investment income (loss) per share was calculated using average shares outstanding. |
| (2) | Realized and unrealized gain (loss) per share in this caption are balancing amounts necessary to reconcile the change in net asset value per share for the period, and may not reconcile with the aggregate gains on the Statement of Operations due to share transactions for the period. |
| (3) | Not annualized. |
| (4) | Annualized. |
| (5) | Portfolio turnover rate is disclosed for the Fund as a whole. |
The accompanying notes to financial statements are an integral part of this statement.
51
FMI Common Stock Fund
FINANCIAL HIGHLIGHTS
(Selected data for each share of the Fund outstanding throughout each period)
Investor Class
| (Unaudited) | ||||||||||||||||||||||||
| For the | ||||||||||||||||||||||||
| Six Month | ||||||||||||||||||||||||
| Period Ending | ||||||||||||||||||||||||
| March 31, | Years Ended September 30, | |||||||||||||||||||||||
| 2022 | 2021 | 2020 | 2019 | 2018 | 2017 | |||||||||||||||||||
| PER SHARE OPERATING | ||||||||||||||||||||||||
| PERFORMANCE: | ||||||||||||||||||||||||
| Net asset value, | ||||||||||||||||||||||||
| beginning of period | $ | 33.23 | $ | 22.25 | $ | 26.39 | $ | 27.55 | $ | 28.83 | $ | 25.42 | ||||||||||||
| Income from | ||||||||||||||||||||||||
| investment operations: | ||||||||||||||||||||||||
| Net investment | ||||||||||||||||||||||||
income (loss)(1) | (0.01 | ) | 0.08 | 0.17 | 0.15 | 0.06 | 0.00 | * | ||||||||||||||||
| Net realized and | ||||||||||||||||||||||||
| unrealized gain (loss) | ||||||||||||||||||||||||
| on investments | 1.16 | 11.11 | (3.02 | ) | 0.94 | 1.80 | 4.69 | |||||||||||||||||
| Total from | ||||||||||||||||||||||||
| investment operations | 1.15 | 11.19 | (2.85 | ) | 1.09 | 1.86 | 4.69 | |||||||||||||||||
| Less distributions: | ||||||||||||||||||||||||
| Distributions from | ||||||||||||||||||||||||
| net investment income | (0.11 | ) | (0.21 | ) | (0.11 | ) | (0.10 | ) | (0.01 | ) | 0.00 | * | ||||||||||||
| Distributions from | ||||||||||||||||||||||||
| net realized gains | (3.86 | ) | — | (1.18 | ) | (2.15 | ) | (3.13 | ) | (1.28 | ) | |||||||||||||
| Total from distributions | (3.97 | ) | (0.21 | ) | (1.29 | ) | (2.25 | ) | (3.14 | ) | (1.28 | ) | ||||||||||||
| Net asset value, | ||||||||||||||||||||||||
| end of period | $ | 30.41 | $ | 33.23 | $ | 22.25 | $ | 26.39 | $ | 27.55 | $ | 28.83 | ||||||||||||
| TOTAL RETURN | 3.46 | %(2) | 50.49 | % | (11.51 | %) | 5.28 | % | 6.92 | % | 18.96 | % | ||||||||||||
| RATIOS/SUPPLEMENTAL DATA: | �� | |||||||||||||||||||||||
| Net assets, end of | ||||||||||||||||||||||||
| period (in 000's $) | 416,878 | 423,286 | 345,428 | 529,234 | 635,174 | 825,176 | ||||||||||||||||||
| Ratio of expenses to | ||||||||||||||||||||||||
| average net assets | 1.01 | %(3) | 1.01 | % | 1.02 | % | 1.02 | % | 1.04 | % | 1.06 | % | ||||||||||||
| Ratio of net investment | ||||||||||||||||||||||||
| income (loss) to | ||||||||||||||||||||||||
| average net assets | (0.03 | %)(3) | 0.28 | % | 0.71 | % | 0.59 | % | 0.23 | % | 0.00 | % | ||||||||||||
Portfolio turnover rate(4) | 17 | %(2) | 29 | % | 32 | % | 28 | % | 26 | % | 26 | % | ||||||||||||
| * | Amount is less than $0.005. |
| (1) | Net investment income (loss) per share was calculated using average shares outstanding. |
| (2) | Not annualized. |
| (3) | Annualized. |
| (4) | Portfolio turnover rate is disclosed for the Fund as a whole. |
The accompanying notes to financial statements are an integral part of this statement.
52
FMI Common Stock Fund
FINANCIAL HIGHLIGHTS
(Selected data for each share of the Fund outstanding throughout each period)
Institutional Class
| (Unaudited) | For the | |||||||||||||||||||||||
| For the | Period from | |||||||||||||||||||||||
| Six Month | October 31, | |||||||||||||||||||||||
| Period Ending | 2016* to | |||||||||||||||||||||||
| March 31, | Years Ended September 30, | September 30, | ||||||||||||||||||||||
| 2022 | 2021 | 2020 | 2019 | 2018 | 2017 | |||||||||||||||||||
| PER SHARE OPERATING | ||||||||||||||||||||||||
| PERFORMANCE: | ||||||||||||||||||||||||
| Net asset value, | ||||||||||||||||||||||||
| beginning of period | $ | 33.29 | $ | 22.28 | $ | 26.42 | $ | 27.59 | $ | 28.85 | $ | 24.72 | ||||||||||||
| Income from | ||||||||||||||||||||||||
| investment operations: | ||||||||||||||||||||||||
| Net investment | ||||||||||||||||||||||||
income (loss)(1) | 0.01 | 0.12 | 0.20 | 0.18 | 0.10 | 0.03 | ||||||||||||||||||
| Net realized and | ||||||||||||||||||||||||
| unrealized gain (loss) | ||||||||||||||||||||||||
| on investments | 1.16 | 11.12 | (3.02 | ) | 0.93 | 1.79 | 5.39 | |||||||||||||||||
| Total from | ||||||||||||||||||||||||
| investment operations | 1.17 | 11.24 | (2.82 | ) | 1.11 | 1.89 | 5.42 | |||||||||||||||||
| Less distributions: | ||||||||||||||||||||||||
| Distributions from | ||||||||||||||||||||||||
| net investment income | (0.15 | ) | (0.23 | ) | (0.14 | ) | (0.13 | ) | (0.02 | ) | (0.01 | ) | ||||||||||||
| Distributions from | ||||||||||||||||||||||||
| net realized gains | (3.86 | ) | — | (1.18 | ) | (2.15 | ) | (3.13 | ) | (1.28 | ) | |||||||||||||
| Total from distributions | (4.01 | ) | (0.23 | ) | (1.32 | ) | (2.28 | ) | (3.15 | ) | (1.29 | ) | ||||||||||||
| Net asset value, | ||||||||||||||||||||||||
| end of period | $ | 30.45 | $ | 33.29 | $ | 22.28 | $ | 26.42 | $ | 27.59 | $ | 28.85 | ||||||||||||
| TOTAL RETURN | 3.52 | %(2) | 50.68 | % | (11.41 | %) | 5.40 | % | 7.02 | % | 22.43 | %(2) | ||||||||||||
| RATIOS/SUPPLEMENTAL DATA: | ||||||||||||||||||||||||
| Net assets, end of | ||||||||||||||||||||||||
| period (in 000's $) | 607,667 | 516,985 | 344,811 | 448,262 | 433,491 | 278,174 | ||||||||||||||||||
| Ratio of expenses to | ||||||||||||||||||||||||
| average net assets | 0.89 | %(3) | 0.90 | % | 0.90 | % | 0.91 | % | 0.94 | % | 0.97 | %(3) | ||||||||||||
| Ratio of net investment | ||||||||||||||||||||||||
| income (loss) to | ||||||||||||||||||||||||
| average net assets | 0.08 | %(3) | 0.39 | % | 0.84 | % | 0.71 | % | 0.37 | % | 0.12 | %(3) | ||||||||||||
Portfolio turnover rate(4) | 17 | %(2) | 29 | % | 32 | % | 28 | % | 26 | % | 26 | %(2) | ||||||||||||
| * | Inception date |
| (1) | Net investment income (loss) per share was calculated using average shares outstanding. |
| (2) | Not annualized. |
| (3) | Annualized. |
| (4) | Portfolio turnover rate is disclosed for the Fund as a whole. |
The accompanying notes to financial statements are an integral part of this statement.
53
FMI International Fund
FINANCIAL HIGHLIGHTS
(Selected data for each share of the Fund outstanding throughout each period)
Investor Class
| (Unaudited) | ||||||||||||||||||||||||
| For the | ||||||||||||||||||||||||
| Six Month | ||||||||||||||||||||||||
| Period Ending | ||||||||||||||||||||||||
| March 31, | Years Ended September 30, | |||||||||||||||||||||||
| 2022 | 2021 | 2020 | 2019 | 2018 | 2017 | |||||||||||||||||||
| PER SHARE OPERATING | ||||||||||||||||||||||||
| PERFORMANCE: | ||||||||||||||||||||||||
| Net asset value, | ||||||||||||||||||||||||
| beginning of period | $ | 35.36 | $ | 27.69 | $ | 31.89 | $ | 33.80 | $ | 33.59 | $ | 30.67 | ||||||||||||
| Income from | ||||||||||||||||||||||||
| investment operations: | ||||||||||||||||||||||||
| Net investment | ||||||||||||||||||||||||
income (loss)(1) | 0.17 | 1.10 | 0.35 | 0.48 | 0.48 | 0.32 | ||||||||||||||||||
| Net realized and | ||||||||||||||||||||||||
| unrealized gain (loss) | ||||||||||||||||||||||||
| on investments | (0.84 | ) | 6.57 | (3.40 | ) | (0.26 | ) | 0.28 | 3.72 | |||||||||||||||
| Total from | ||||||||||||||||||||||||
| investment operations | (0.67 | ) | 7.67 | (3.05 | ) | 0.22 | 0.76 | 4.04 | ||||||||||||||||
| Less distributions: | ||||||||||||||||||||||||
| Distributions from | ||||||||||||||||||||||||
| net investment income | (1.23 | ) | — | (1.15 | ) | (1.32 | ) | (0.10 | ) | (0.91 | ) | |||||||||||||
| Distributions from | ||||||||||||||||||||||||
| net realized gains | — | — | — | (0.81 | ) | (0.45 | ) | (0.21 | ) | |||||||||||||||
| Total from distributions | (1.23 | ) | — | (1.15 | ) | (2.13 | ) | (0.55 | ) | (1.12 | ) | |||||||||||||
| Net asset value, | ||||||||||||||||||||||||
| end of period | $ | 33.46 | $ | 35.36 | $ | 27.69 | $ | 31.89 | $ | 33.80 | $ | 33.59 | ||||||||||||
| TOTAL RETURN | (1.98 | %)(2) | 27.70 | % | (10.06 | %) | 1.27 | % | 2.27 | % | 13.66 | % | ||||||||||||
| RATIOS/SUPPLEMENTAL DATA: | ||||||||||||||||||||||||
| Net assets, end of | ||||||||||||||||||||||||
| period (in 000's $) | 991,541 | 1,066,600 | 1,207,016 | 2,798,739 | 3,267,841 | 5,369,580 | ||||||||||||||||||
| Ratio of expenses to | ||||||||||||||||||||||||
| average net assets | 0.95 | %(3) | 0.94 | % | 0.91 | % | 0.90 | % | 0.90 | % | 0.91 | % | ||||||||||||
| Ratio of net investment | ||||||||||||||||||||||||
| income (loss) to | ||||||||||||||||||||||||
| average net assets | 0.96 | %(3) | 3.29 | % | 1.19 | % | 1.55 | % | 1.43 | % | 1.02 | % | ||||||||||||
Portfolio turnover rate(4) | 9 | %(2) | 27 | % | 23 | % | 13 | % | 21 | % | 26 | % | ||||||||||||
| (1) | Net investment income (loss) per share was calculated using average shares outstanding. |
| (2) | Not annualized. |
| (3) | Annualized. |
| (4) | Portfolio turnover rate is disclosed for the Fund as a whole. |
The accompanying notes to financial statements are an integral part of this statement.
54
FMI International Fund
FINANCIAL HIGHLIGHTS
(Selected data for each share of the Fund outstanding throughout each period)
Institutional Class
| (Unaudited) | For the | |||||||||||||||||||||||
| For the | Period from | |||||||||||||||||||||||
| Six Month | October 31, | |||||||||||||||||||||||
| Period Ending | 2016* to | |||||||||||||||||||||||
| March 31, | Years Ended September 30, | September 30, | ||||||||||||||||||||||
| 2022 | 2021 | 2020 | 2019 | 2018 | 2017 | |||||||||||||||||||
| PER SHARE OPERATING | ||||||||||||||||||||||||
| PERFORMANCE: | ||||||||||||||||||||||||
| Net asset value, | ||||||||||||||||||||||||
| beginning of period | $ | 35.46 | $ | 27.73 | $ | 31.93 | $ | 33.86 | $ | 33.62 | $ | 30.36 | ||||||||||||
| Income from | ||||||||||||||||||||||||
| investment operations: | ||||||||||||||||||||||||
| Net investment | ||||||||||||||||||||||||
income (loss)(1) | 0.20 | 1.18 | 0.38 | 0.53 | 0.49 | 0.35 | ||||||||||||||||||
| Net realized and | ||||||||||||||||||||||||
| unrealized gain (loss) | ||||||||||||||||||||||||
| on investments | (0.84 | ) | 6.55 | (3.39 | ) | (0.27 | ) | 0.31 | 4.04 | |||||||||||||||
| Total from | ||||||||||||||||||||||||
| investment operations | (0.64 | ) | 7.73 | (3.01 | ) | 0.26 | 0.80 | 4.39 | ||||||||||||||||
| Less distributions: | ||||||||||||||||||||||||
| Distributions from | ||||||||||||||||||||||||
| net investment income | (1.27 | ) | — | (1.19 | ) | (1.38 | ) | (0.11 | ) | (0.92 | ) | |||||||||||||
| Distributions from | ||||||||||||||||||||||||
| net realized gains | — | — | — | (0.81 | ) | (0.45 | ) | (0.21 | ) | |||||||||||||||
| Total from distributions | (1.27 | ) | — | (1.19 | ) | (2.19 | ) | (0.56 | ) | (1.13 | ) | |||||||||||||
| Net asset value, | ||||||||||||||||||||||||
| end of period | $ | 33.55 | $ | 35.46 | $ | 27.73 | $ | 31.93 | $ | 33.86 | $ | 33.62 | ||||||||||||
| TOTAL RETURN | (1.89 | %)(2) | 27.88 | % | (9.95 | %) | 1.42 | % | 2.40 | % | 14.95 | %(2) | ||||||||||||
| RATIOS/SUPPLEMENTAL DATA: | ||||||||||||||||||||||||
| Net assets, end of | ||||||||||||||||||||||||
| period (in 000's $) | 2,429,401 | 2,351,096 | 2,142,615 | 4,480,109 | 4,045,361 | 2,736,673 | ||||||||||||||||||
| Ratio of expenses to | ||||||||||||||||||||||||
| average net assets | 0.80 | %(3) | 0.80 | % | 0.77 | % | 0.76 | % | 0.76 | % | 0.77 | %(3) | ||||||||||||
| Ratio of net investment | ||||||||||||||||||||||||
| income (loss) to | ||||||||||||||||||||||||
| average net assets | 1.12 | %(3) | 3.48 | % | 1.31 | % | 1.69 | % | 1.44 | % | 1.19 | %(3) | ||||||||||||
Portfolio turnover rate(4) | 9 | %(2) | 27 | % | 23 | % | 13 | % | 21 | % | 26 | %(2) | ||||||||||||
| * | Inception date. |
| (1) | Net investment income (loss) per share was calculated using average shares outstanding. |
| (2) | Not annualized. |
| (3) | Annualized. |
| (4) | Portfolio turnover rate is disclosed for the Fund as a whole. |
The accompanying notes to financial statements are an integral part of this statement.
55
FMI International Fund II – Currency Unhedged
FINANCIAL HIGHLIGHTS
(Selected data for each share of the Fund outstanding throughout each period)
Institutional Class
| (Unaudited) | For the | |||||||||||
| For the | Period from | |||||||||||
| Six Month | December 31, | |||||||||||
| Period Ending | Year Ended | 2019* to | ||||||||||
| March 31, | September 30, | September 30, | ||||||||||
| 2022 | 2021 | 2020 | ||||||||||
| PER SHARE OPERATING PERFORMANCE: | ||||||||||||
| Net asset value, beginning of period | $ | 21.70 | $ | 17.24 | $ | 20.00 | ||||||
| Income from investment operations: | ||||||||||||
Net investment income (loss)(1) | 0.11 | 0.77 | 0.13 | |||||||||
| Net realized and unrealized | ||||||||||||
| gain (loss) on investments | (1.13 | ) | 3.87 | (2.89 | ) | |||||||
| Total from investment operations | (1.02 | ) | 4.64 | (2.76 | ) | |||||||
| Less distributions: | ||||||||||||
| Distributions from net investment income | (0.66 | ) | (0.18 | ) | — | |||||||
| Distributions from net realized gains | (0.29 | ) | — | — | ||||||||
| Total from distributions | (0.95 | ) | (0.18 | ) | — | |||||||
| Net asset value, end of period | $ | 19.73 | $ | 21.70 | $ | 17.24 | ||||||
| TOTAL RETURN | (4.89 | %)(2) | 26.96 | % | (13.80 | %)(2) | ||||||
| RATIOS/SUPPLEMENTAL DATA: | ||||||||||||
| Net assets, end of period (in 000's $) | 70,670 | 71,997 | 47,555 | |||||||||
| Ratio of expenses to average net assets: | ||||||||||||
| Before expense reimbursement | 1.12 | %(3) | 1.16 | % | 1.43 | %(3) | ||||||
| After expense reimbursement | 0.90 | %(3) | 0.90 | % | 0.90 | %(3) | ||||||
| Ratio of net investment income (loss) | ||||||||||||
| to average net assets: | ||||||||||||
| Before expense reimbursement | 0.81 | %(3) | 3.35 | % | 0.49 | %(3) | ||||||
| After expense reimbursement | 1.03 | %(3) | 3.61 | % | 1.02 | %(3) | ||||||
| Portfolio turnover rate | 13 | %(2) | 31 | % | 15 | %(2) | ||||||
| * | Inception date. |
| (1) | Net investment income (loss) per share was calculated using average shares outstanding. |
| (2) | Not annualized. |
| (3) | Annualized. |
The accompanying notes to financial statements are an integral part of this statement.
56
FMI Funds, Inc.
NOTES TO FINANCIAL STATEMENTS
March 31, 2022 (Unaudited)
| (1) | Organization — |
| The following is a summary of significant accounting policies of the FMI Large Cap Fund, the FMI Common Stock Fund, the FMI International Fund, and the FMI International Fund II – Currency Unhedged (collectively, the “Funds” or, individually, a “Fund”). The FMI Large Cap Fund (the “Large Cap Fund”), the FMI Common Stock Fund (the “Common Stock Fund”), the FMI International Fund (the “International Fund”), and the FMI International Fund II – Currency Unhedged (the “International Currency Unhedged Fund”) are each a series of FMI Funds, Inc. (the “Company”). The Company was incorporated under the laws of Maryland on September 5, 1996. The Large Cap Fund commenced operations on December 31, 2001 and the International Fund commenced operations on December 31, 2010. The Common Stock Fund is the successor to the FMI Common Stock Fund, the sole series of FMI Common Stock Fund, Inc. (the “Predecessor Common Stock Fund”). The Predecessor Common Stock Fund commenced operations on December 18, 1981. The reorganization was effective as of January 31, 2014, and the Common Stock Fund is the accounting survivor of the reorganization. As the accounting survivor of the reorganization, the Common Stock Fund adopted the Financial Statements of the Predecessor Common Stock Fund. The Predecessor Common Stock Fund was incorporated under the laws of Wisconsin on July 29, 1981. The International Currency Unhedged Fund commenced operations on December 31, 2019. | |
| Effective October 31, 2016, the Large Cap Fund, Common Stock Fund, and International Fund offer two classes of shares (Investor and Institutional). The International Currency Unhedged Fund currently only offers Institutional Class shares. The Institutional Class has the same management fee as the Investor Class and does not have a shareholder servicing plan. A higher investment minimum is required for the Institutional Class than the Investor Class. Each class of shares has exclusive voting rights with respect to matters that affect just that class. Income, expenses (other than expenses attributable to a specific class) and realized and unrealized gains or losses on investments are allocated to each class of shares on its relative net assets. The Board of Directors (the “Board”) may elect to have certain expenses specific to the Investor Class shares or Institutional Class shares be borne solely by the Class to which such expenses are attributable, but any expenses not specifically allocated to the Investor Class shares or Institutional Class shares are generally allocated to each such Class proportionately (after any applicable base fee to be paid by a class of shares of a Fund attributable to such expense) on the basis of the net asset value of that Class in relation to the net asset value of the applicable Fund. | |
| The Large Cap Fund and the International Currency Unhedged Fund are non-diversified, open-end management investment companies under the Investment Company Act of 1940 (the “Act”), as amended. The Common Stock Fund and the International Fund are diversified open-end management investment companies under the Act. The financial statements are prepared in accordance with accounting principles generally accepted in the United States of America (“GAAP”). The Funds follow the investment company accounting and financial reporting guidance under Financial Accounting Standards Board (“FASB”) Accounting Standards Codification “Financial Services – Investment Companies” Topic 946 (“ASC 946”). The assets and liabilities of each Fund in the Company are segregated and a shareholder’s interest is limited to the Fund in which the shareholder owns shares. The investment objective of the Large Cap Fund is to seek long-term capital appreciation by investing mainly in limited a number of large capitalization value stocks. The investment objective of the Common Stock Fund is to seek |
57
FMI Funds, Inc.
NOTES TO FINANCIAL STATEMENTS (Continued)
March 31, 2022 (Unaudited)
| (1) | Organization — (Continued) |
| long-term capital appreciation by investing mainly in small to medium capitalization value stocks. The investment objective of the International Fund and International Currency Unhedged Fund is to seek capital appreciation by investing mainly in a limited number of large capitalization value stocks of non-U.S. companies. |
| (2) | Summary of Significant Accounting Policies and Other Information — |
| (a) | The Funds apply the provisions of the FASB Accounting Standards Codification “Fair Value Measurement” Topic 820 (“ASC 820”), which defines fair value as the price that would be received to sell an asset or paid to transfer a liability (i.e., the “exit price”) in an orderly transaction between market participants at the measurement date. | |
| Each security is valued at the current day last sale price reported by the principal security exchange on which the issue is traded. Securities that are traded on the Nasdaq Markets are valued at the Nasdaq Official Closing Price, or if no sale is reported, the latest bid price. Securities that are traded over-the-counter, including U.S. Treasury securities are valued at the close price, if not close, then at the latest bid price. Bank deposits are valued at acquisition cost which approximates fair value. Unlisted equity securities for which market quotations are readily available are valued at the close price, if not close, then at the most recent bid price. Foreign securities are valued on a basis of quotations from the primary market in which they are traded, and are converted from the local currency into U.S. dollars using exchange rates as of the close of the New York Stock Exchange. For the International Fund and International Currency Unhedged Fund only, options purchased or written by each of the Funds’ are valued at the average of the most recent bid and ask prices. Securities for which quotations are not readily available are valued at fair value as determined by the investment adviser in accordance with procedures approved by the Board. The fair value of a security is the amount which a Fund might reasonably expect to receive upon a current sale. The fair value of a security may differ from the last quoted price and a Fund may not be able to sell a security at the fair value. Market quotations may not be available, for example, if trading in particular securities was halted during the day and not resumed prior to the close of trading on the New York Stock Exchange. The foreign markets in which the International Fund and International Currency Unhedged Fund may invest are sometimes open on days when the New York Stock Exchange is not open and the International Fund and International Currency Unhedged Fund do not calculate their net asset value. For securities that do not trade during New York Stock Exchange hours, fair value determinations are based on analyses of market movements after the close of those securities’ primary markets, and may include reviews of developments in foreign markets, the performance of U.S. securities markets, and the performance of instruments trading in U.S. markets that represent foreign securities and baskets of foreign securities. The Board utilizes a service provided by an independent third party to assist in fair valuation of certain securities for the International Fund and the International Currency Unhedged Fund. As of March 31, 2022, there were no securities that were internally fair valued. | ||
| In determining fair value, the Funds use various valuation approaches. ASC 820 establishes a fair value hierarchy for inputs used in measuring fair value that maximizes the use of observable inputs and minimizes the use of unobservable inputs by generally requiring |
58
FMI Funds, Inc.
NOTES TO FINANCIAL STATEMENTS (Continued)
March 31, 2022 (Unaudited)
| (2) | Summary of Significant Accounting Policies and Other Information — (Continued) |
| that the most observable inputs be used when available. Observable inputs are those that market participants would use in pricing the asset or liability based on market data obtained from sources independent of the Funds. Unobservable inputs reflect the Funds’ assumptions about the inputs market participants would use in pricing the asset or liability developed based on the best information available in the circumstances. The inputs or methodologies used for valuing securities are not necessarily an indication of the risks associated with investing in those securities. Over the counter derivatives such as forward currency contracts may be valued using quantitative models. These models may use pricing curves based on market inputs including current exchange rates or indices. These curves are combined with volatility factors to value the overall positions. The market inputs are generally significant and can be corroborated with observable market data and therefore are classified in level 2. |
| The fair value hierarchy is categorized into three levels based on the inputs as follows: |
| Level 1 — | Valuations based on unadjusted quoted prices in active markets for identical assets. | ||
| Level 2 — | Valuations based on quoted prices for similar securities or in markets that are not active or for which all significant inputs are observable, either directly or indirectly. | ||
| Level 3 — | Valuations based on inputs that are unobservable and significant to the overall fair value measurement. |
| The following table summarizes the Funds’ investments as of March 31, 2022, based on the inputs used to value them: |
| Large Cap Fund | Common Stock Fund | ||||||||||
| Investments | Investments | ||||||||||
Valuations | in Securities | in Securities | |||||||||
| Assets: | |||||||||||
| Level 1 — | Common Stocks | $ | 2,846,040,527 | $ | 986,823,759 | ||||||
| Bank Deposit Account | 94,072,606 | 37,638,101 | |||||||||
| Total Level 1 | 2,940,113,133 | 1,024,461,860 | |||||||||
| Level 2 — | Common Stocks | — | — | ||||||||
| Preferred Stocks | — | — | |||||||||
| Forward Currency Contracts | — | — | |||||||||
| Total Level 2 | — | — | |||||||||
| Level 3 — | — | — | |||||||||
| Total Assets | 2,940,113,133 | 1,024,461,860 | |||||||||
| Liabilities: | |||||||||||
| Level 2 — | Forward Currency Contracts | — | — | ||||||||
| Total | $ | 2,940,113,133 | $ | 1,024,461,860 | |||||||
59
FMI Funds, Inc.
NOTES TO FINANCIAL STATEMENTS (Continued)
March 31, 2022 (Unaudited)
| (2) | Summary of Significant Accounting Policies and Other Information — (Continued) |
| International | |||||||||||||||
| International | International | Currency | |||||||||||||
| Fund | Fund | Unhedged Fund | |||||||||||||
| Investments | Other Financial | Investments | |||||||||||||
Valuations | in Securities | Instruments* | in Securities | ||||||||||||
| Assets: | |||||||||||||||
| Level 1 — | Common Stocks | $ | 399,507,050 | $ | — | $ | 8,660,794 | ||||||||
| Bank Deposit Account | 112,664,099 | — | 914 | ||||||||||||
| Total Level 1 | 512,171,149 | — | 8,661,708 | ||||||||||||
| Level 2 — | Common Stocks | 2,548,582,737 | — | 55,633,688 | |||||||||||
| Preferred Stocks | 270,109,452 | — | 6,033,418 | ||||||||||||
| Forward Currency Contracts | — | 66,372,004 | — | ||||||||||||
| Total Level 2 | 2,818,692,189 | 66,372,004 | 61,667,106 | ||||||||||||
| Level 3 — | — | — | — | ||||||||||||
| Total Assets | 3,330,863,338 | 66,372,004 | 70,328,814 | ||||||||||||
| Liabilities: | |||||||||||||||
| Level 2 — | Forward Currency Contracts | — | (411,010 | ) | — | ||||||||||
| Total | $ | 3,330,863,338 | $ | 65,960,994 | $ | 70,328,814 | |||||||||
| * | Other financial instruments are derivative instruments, specifically forward currency contracts, which are valued at the unrealized appreciation/(depreciation) on the instrument. |
| See the Schedules of Investments for investments detailed by industry classifications. | ||
| (b) | Net realized gains and losses on sales of securities are computed on the identified cost basis. For financial reporting purposes, investment transactions are recorded on the trade date. | |
| (c) | Investment securities and other assets and liabilities denominated in foreign currencies are translated into U.S. dollar amounts at the date of valuation. Purchases and sales of investment securities and income and expense items denominated in foreign currencies are translated into U.S. dollar amounts on the respective date of such transactions. The Company does not isolate that portion of the results of operations resulting from changes in foreign exchange rates on investments from the fluctuations arising from changes in market prices of securities held. Such fluctuations are included with the net realized and unrealized gain or loss from investments. Reported net realized foreign exchange gains or losses arise from sales of foreign currencies, currency gains or losses realized between the trade and settlement dates on securities transactions, and the difference between the amounts of dividends, interest, and foreign withholding taxes recorded on the Company’s books and the U.S. dollar equivalent of the amounts actually received or paid. Net unrealized foreign exchange gains and losses arise from changes in the fair values of assets and liabilities, other than investments in securities at fiscal period-end, resulting from changes in exchange rates. | |
| (d) | Dividend income is recorded on the ex-dividend date. Interest income is recorded on an accrual basis. The Funds record the amortization and accretion of discounts and premiums on securities purchased using the effective interest method in accordance with GAAP. Withholding taxes on foreign dividends have been provided for in accordance with the Funds’ understanding of the applicable country’s tax rules and regulations. |
60
FMI Funds, Inc.
NOTES TO FINANCIAL STATEMENTS (Continued)
March 31, 2022 (Unaudited)
| (2) | Summary of Significant Accounting Policies and Other Information — (Continued) |
| (e) | The International Fund may enter into forward currency contracts in order to hedge its exposure to changes in foreign currency rates on its foreign portfolio holdings or to hedge certain purchase and sale commitments denominated in foreign currencies. The International Currency Unhedged Fund normally does not seek to reduce currency risk by hedging its perceived foreign currency exposure back into the U.S. dollar and will generally not be exposed to currency fluctuations. However, the investment adviser reserves the right to temporarily hedge all or a portion of the International Currency Unhedged Fund’s currency exposure. A forward currency contract is a commitment to purchase or sell a foreign currency at a future date at a negotiated rate. These contracts are valued daily and the asset or liability therein represents unrealized gain or loss on the contracts as measured by the difference between the forward foreign exchange rates at the dates of entry into the contracts and the forward rates at the reporting date. On a quarterly average there were seven forward currency contracts with an average quarterly value of $2,676,681,922 outstanding during the six month period ending March 31, 2022. These contracts are not subject to master netting agreements. For Non-Deliverable Forward Currency Contracts (“Contract”), the Fund posts collateral, in the form of cash or cash equivalents, to a segregated account at the custodian when the Contract is in an unrealized loss position. When the Contract is in an unrealized gain position, the counterparty posts collateral to a segregated account at the custodian. | |
| The fair value of the forward currency contracts as of March 31, 2022, is included in the following location on the Statements of Assets and Liabilities for the International Fund: |
| Fair Value of | Fair Value of | |||||
| Asset Forward | (Liability) Forward | |||||
Location | Currency Contracts | Location | Currency Contracts | |||
Forward currency | Unrealized | $66,372,004 | Unrealized | $(411,010) | ||
contracts | appreciation on | depreciation on | ||||
| forward currency | forward currency | |||||
| contracts | contracts |
| Realized and unrealized gains and losses on forward currency contracts entered into during the six month ending March 31, 2022, are recorded in the following location on the Statements of Operations for the International Fund: |
| Realized | Unrealized | |||||
Location | Gain (Loss) | Location | Appreciation | |||
Forward currency | Net realized | $80,533,935 | Net change in | $4,826,484 | ||
contracts | gain (loss) on | unrealized appreciation/ | ||||
| forward currency | depreciation on | |||||
| contracts | forward currency | |||||
contracts |
| These instruments involve market risk, credit risk, or both kinds of risks, in excess of the amount recognized on the Statements of Assets and Liabilities for the International Fund. Risks arise from the possible inability of counterparties to meet the terms of their contracts and from movement in currency and securities values and interest rates. |
61
FMI Funds, Inc.
NOTES TO FINANCIAL STATEMENTS (Continued)
March 31, 2022 (Unaudited)
| (2) | Summary of Significant Accounting Policies and Other Information — (Continued) |
| (f) | The preparation of financial statements in conformity with GAAP requires management to make estimates and assumptions that affect the reported amounts of assets and liabilities and disclosure of contingent assets and liabilities at the date of the financial statements and the reported amounts of income and expenses during the reporting period. Actual results could differ from these estimates. | |
| (g) | The Funds may own certain securities that are restricted. Restricted securities include Section 4(a)(2) commercial paper or securities issued in a private placement. The Funds did not hold any restricted securities as of March 31, 2022. | |
| (h) | No provision has been made for Federal income taxes since the Funds have elected to be taxed as “regulated investment companies.” The Funds intend to distribute substantially all net investment company taxable income and net capital gains to their respective shareholders and otherwise comply with the provisions of the Internal Revenue Code applicable to regulated investment companies. | |
| (i) | The Funds have reviewed all open tax years and major jurisdictions, which include Federal and the state of Maryland for the Funds and concluded that there are no significant uncertain tax positions that would require recognition in the financial statements. The Funds recognize interest and penalties, if any, related to unrecognized tax benefits on certain tax benefits on uncertain tax positions as income tax expense in the Statements of Operations. During the six month period ending March 31, 2022, the Funds did not incur any interest or penalties. Open tax years are those that are open for exam by taxing authorities and, as of September 30, 2021, open Federal tax years include the prior four fiscal tax years ended September 30, 2021. The Funds have no examinations in progress and are also not aware of any tax positions for which it is reasonably possible that the total amounts of unrecognized tax benefits will significantly change in the next twelve months. | |
| (j) | Net investment income and net realized gains, if any, are distributed to shareholders at least annually. Distributions to shareholders are recorded on the ex-dividend date. On December 17, 2021, the following distributions were declared and paid to shareholders of records of the respective Funds on December 16, 2021: |
| International | ||||||||||||||||
| Large | Common | International | Currency | |||||||||||||
| Cap Fund | Stock Fund | Fund | Unhedged Fund | |||||||||||||
| Net Investment Income (Investor Class) | $ | 10,352,049 | $ | 1,303,172 | $ | 36,245,422 | $ | N/A | ||||||||
| Per Share Amount (Investor Class) | $ | 0.15811471 | $ | 0.10430932 | $ | 1.23232474 | $ | N/A | ||||||||
| Net Investment Income (Institutional Class) | $ | 15,567,336 | $ | 2,269,454 | $ | 85,786,033 | $ | 2,323,935 | ||||||||
| Per Share Amount (Institutional Class) | $ | 0.18995008 | $ | 0.14624010 | $ | 1.27118680 | $ | 0.65868695 | ||||||||
| Short-Term Realized Gain (Investor Class) | $ | 10,381,858 | $ | 0.00 | $ | 0.00 | $ | N/A | ||||||||
| Per Share Amount (Investor Class) | $ | 0.15857 | $ | 0.00000 | $ | 0.00000 | $ | N/A | ||||||||
| Short-Term Realized Gain (Institutional Fund) | $ | 12,995,585 | $ | 0.00 | $ | 0.00 | $ | 232,962 | ||||||||
| Per Share Amount (Institutional Amount) | $ | 0.15857 | $ | 0.00000 | $ | 0.00000 | $ | 0.06603 | ||||||||
| Long-Term Realized Gain (Investor Class) | $ | 199,292,129 | $ | 48,237,286 | $ | 0.00 | $ | N/A | ||||||||
| Per Share Amount (Investor Class) | $ | 3.04394 | $ | 3.86103 | $ | 0.00000 | $ | N/A | ||||||||
| Long-Term Realized Gain (Institutional Fund) | $ | 249,465,739 | $ | 59,918,111 | $ | 0.00 | $ | 794,077 | ||||||||
| Per Share Amount (Institutional Amount) | $ | 3.04394 | $ | 3.86103 | $ | 0.00000 | $ | 0.22507 | ||||||||
| (k) | Common Company expenses are typically allocated evenly between the Funds of the Company, or by other equitable means. |
62
FMI Funds, Inc.
NOTES TO FINANCIAL STATEMENTS (Continued)
March 31, 2022 (Unaudited)
| (3) | Investment Adviser and Advisory Agreement and Transactions With Related Parties — |
| The Funds each have an investment advisory agreement with Fiduciary Management, Inc. (“FMI” or the “Adviser”), with whom certain officers and directors of the Funds are affiliated, to serve as investment adviser and manager. | ||
| Under the terms of the current advisory agreements, effective as of December 31, 2019, the Adviser is entitled to receive a fee. The fee is computed daily and payable at the end of each month. The following annual percentages of the International Currency Unhedged Fund’s average daily net assets are used: | ||
| • | 0.75% of the assets from $0 – $2.5 billion; 0.70% of the assets from $2.5 – $5.0 billion; 0.65% of the assets from $5.0 – $10.0 billion; and 0.60% of the assets over $10.0 billion. | |
| Under the terms of the current advisory agreements, effective as of January 1, 2019, the Adviser is entitled to receive a fee. The fee is computed daily and payable at the end of each month. The following annual percentages of each Fund’s average daily net assets are used: | ||
| • | Large Cap Fund: 0.65% of the assets from $0 – $2.5 billion; 0.60% of the assets from $2.5 – $5.0 billion; and 0.55% of the assets over $5.0 billion. | |
| • | Common Stock Fund: 0.85% of the assets from $0 – $500 million; 0.80% of the assets from $500 million – $1.0 billion; 0.75% of the assets over $1.0 billion. | |
| • | International Fund: 0.75% of the assets from $0 – $2.5 billion; 0.70% of the assets from $2.5 – $5.0 billion; 0.65% of the assets from $5.0 – $10.0 billion; and 0.60% of the assets over $10.0 billion. | |
| The Funds are responsible for paying their proportionate share of the compensation, benefits and expenses of the Funds’ Chief Compliance Officer. For administrative convenience, FMI initially makes these payments and is later reimbursed by the Funds. | ||
Under the respective advisory agreement or operating expenses limitation agreements, FMI will reimburse the Funds for expenses (excluding federal, state and local taxes, interest, brokerage commissions and extraordinary items) as follows: | ||
| Investor Class | Institutional Class | ||
Expense Cap | Expense Cap | ||
| Large Cap Fund | 1.20% | 1.10% | |
| Common Stock Fund | 1.30% | 1.20% | |
| International Fund | 1.75% | 1.65% | |
| International Currency Unhedged Fund | 1.75% | 1.65% |
| For the six month period ending March 31, 2022, there were no contractual or voluntary reimbursements required for the Large Cap Fund, Common Stock Fund or International Fund. For the International Currency Unhedged Fund, there is no contractual reimbursement and the voluntary reimbursement is $82,049. The voluntary 0.90% expense cap/reimbursement agreement for the International Currency Unhedged Fund will continue in effect until January 31, 2023, with successive renewal terms of one year unless terminated by the Adviser prior to any such renewal. The Adviser is entitled to recoup such amounts for a one year period from the date the Adviser reduced its compensation and/or assumed expenses for the International Currency Unhedged Fund. |
63
FMI Funds, Inc.
NOTES TO FINANCIAL STATEMENTS (Continued)
March 31, 2022 (Unaudited)
| (3) | Investment Adviser and Advisory Agreement and Transactions With Related Parties — (Continued) |
| The Large Cap Fund, the International Fund and the International Currency Unhedged Fund have each entered into a Distribution Plan (the “Plan”), pursuant to Rule 12b-1 under the Act. Each Plan, if implemented, provides that the applicable Fund may incur certain costs which may not exceed the lesser of a monthly amount equal to 0.25% of such Fund’s daily net assets or the actual distribution costs incurred during the year. Amounts payable under each Plan would be paid monthly for any activities or expenses primarily intended to result in the sale of shares of such Fund. For the six month period ending March 31, 2022, no such expenses were charged to the shareholders of any Fund as the Funds had not implemented the Plan. | |
| Under the Funds’ organizational documents, each director, officer, employee or other agent of any Fund (including the Funds’ investment manager) is indemnified, to the extent permitted by the Act, against certain liabilities that may arise out of performance of their duties to the Funds. Additionally, in the normal course of business, the Funds enter into contracts that contain a variety of indemnification clauses. The Funds’ maximum exposure under these arrangements is unknown as this would involve future claims that may be made against such Fund that have not yet occurred. However, the Funds have not had prior claims or losses pursuant to these contracts and believe the risk of loss to be remote. | |
| At March 31, 2022, no person is deemed to “control” a Fund, as that term is defined in the Act, because the Funds do not know of any person who owns beneficially or through controlled companies more than 25% of a Fund’s Investor Class and Institutional Class shares, on a combined basis, or who acknowledges the existence of control. | |
| (4) | Investments in Affiliated Issuers — |
| An issuer in which a Fund’s holdings represent 5% or more of the outstanding voting securities of an issuer is an “affiliated” issuer as defined in the 1940 Act. For the six month period ending March 31, 2022 there were no Funds with an investment in a security of an affiliated issuer. | |
| (5) | Shareholder Servicing Plan — |
| The Funds have adopted a Shareholder Servicing Plan pursuant to which Investor Class shares, (if available), may pay financial intermediaries for assets maintained in an omnibus account at an annual rate of up to 0.15% of the average daily net assets, or an annual per account rate approved by the Board. The Board may also authorize the Funds to pay for shareholder services outside of the plan. | |
| For the six month period ending March 31, 2022, shareholder servicing fees incurred are disclosed on the Statements of Operations. | |
| (6) | Loan Agreements — |
| U.S. Bank, N.A. (the “Bank”) has made available to the Company a $600,000,000 umbrella credit facility, pursuant to the loan agreement (the “Agreement”) effective May 28, 2021 for the FMI Funds, Inc. (consisting of Large Cap Fund, Common Stock Fund, International Fund and International Currency Unhedged Fund), for the purposes of having cash available to satisfy redemption requests and is subject to certain restrictions and covenants. Principal is due not more than 45 days after the date of the loan. Amounts under the credit facility bear interest at a |
64
FMI Funds, Inc.
NOTES TO FINANCIAL STATEMENTS (Continued)
March 31, 2022 (Unaudited)
| (6) | Loan Agreements — (Continued) |
| rate per annum equal to the Bank’s current prime rate minus one percent on the amount borrowed. Advances will be collateralized by securities owned by the borrowing Fund. The Agreement is subject to renewal on May 27, 2022. During the six month period ending March 31, 2022, the International Fund is the only Fund that did not borrow against the loan agreement. The Large Cap Fund, Common Stock Fund and International Currency Unhedged Fund borrowed, at a rate in the range of 2.25% – 2.50%, against the Agreement as follows: |
| Amount | ||||||||||||||||||
| Average | Outstanding as | Interest | Maximum | Maximum | ||||||||||||||
| Borrowings | of March 31, 2022 | Expense | Borrowing | Borrowing Date | ||||||||||||||
Large Cap Fund | $ | 59,181 | $ | — | $ | 673 | $ | 6,304,000 | 01/06/2022 | |||||||||
Common Stock Fund | 45,423 | — | 517 | 4,641,000 | 12/21/2021 | |||||||||||||
International Currency | ||||||||||||||||||
Unhedged Fund | 53,786 | 470,000 | 644 | 1,878,000 | 03/23/2022 | |||||||||||||
| (7) | Investment Transactions — |
| For the six month period ending March 31, 2022, purchases and sales of investment securities (excluding short-term investments) were as follows: |
| International | |||||||||||||||||
| Currency | |||||||||||||||||
| Large Cap Fund | Common Stock Fund | International Fund | Unhedged Fund | ||||||||||||||
| Purchases | $ | 335,757,550 | $ | 194,120,664 | $ | 412,574,344 | $ | 10,871,131 | |||||||||
| Sales | 801,295,610 | 165,510,995 | 309,931,363 | 9,311,954 | |||||||||||||
| (8) | Income Tax Information — |
| The following information for the Funds is presented on an income tax basis as of September 30, 2021: |
| Net Unrealized | |||||||||||||||||
| Gross | Gross | Appreciation | |||||||||||||||
| Cost of | Unrealized | Unrealized | (Depreciation) | ||||||||||||||
| Investments | Appreciation(1) | Depreciation(1) | on Investments(1) | ||||||||||||||
Large Cap Fund | $ | 2,151,307,201 | $ | 1,094,872,539 | $ | (36,505,558 | ) | $ | 1,058,366,981 | ||||||||
Common Stock Fund | 641,637,707 | 314,930,614 | (18,858,981 | ) | 296,071,633 | ||||||||||||
International Fund | 2,778,795,038 | 826,530,745 | (272,430,467 | ) | 554,100,278 | ||||||||||||
International Currency | |||||||||||||||||
Unhedged Fund | 66,743,320 | 10,778,842 | (4,751,477 | ) | 6,027,365 | ||||||||||||
(1) | Represents amounts of investments in securities, forward currency contracts and foreign currency transactions. |
| The difference between the cost amounts for financial statement and federal income tax purposes is due primarily to timing differences in recognizing certain gains and losses on security transactions. The International Fund is the only Fund with temporary mark to market differences. The components of accumulated earnings (deficit) on a tax-basis are as follows: |
65
FMI Funds, Inc.
NOTES TO FINANCIAL STATEMENTS (Continued)
March 31, 2022 (Unaudited)
| (9) | Income Tax Information — (Continued) |
| Total | |||||||||||||||||||||
| Net | Distributable | ||||||||||||||||||||
| Unrealized | Undistributed | Undistributed | Other | Earnings/ | |||||||||||||||||
| Appreciation | Ordinary | Long-Term | Accumulated | (Accumulated | |||||||||||||||||
| (Depreciation) | Income | Capital Gains | (Losses) | Losses) | |||||||||||||||||
Large Cap Fund | $ | 1,058,366,981 | $ | 43,474,550 | $ | 435,108,828 | $ | — | $ | 1,536,950,359 | |||||||||||
Common Stock Fund | 296,071,633 | 2,992,669 | 108,155,270 | — | 407,219,572 | ||||||||||||||||
International Fund | 554,100,278 | 122,031,454 | — | (354,887,124 | ) | 321,244,608 | |||||||||||||||
International Currency | |||||||||||||||||||||
Unhedged Fund | 6,027,365 | 2,367,580 | 794,059 | — | 9,189,004 | ||||||||||||||||
| The Common Stock Fund, International Fund and International Currency Unhedged Fund utilized $19,439,827, $279,849,049 and $1,065,291, respectively of prior year capital loss carryovers to offset current year gains. The Large Cap Fund did not have any prior year capital loss carryovers. | |
| The other accumulated losses above for the International Fund are all capital loss carryovers, which may be used indefinitely to offset future gains as follows: |
| Short-Term Capital | Long-Term Capital | Total Capital |
Loss Carryovers | Loss Carryovers | Loss Carryovers |
| $46,085,203 | $308,801,921 | $354,887,124 |
| The tax components of dividends paid during the six month period ending March 31, 2022 (Unaudited) and the year ended September 30, 2021 are as follows: |
| For the Six Month Period Ending | ||||||||||||||||
| March 31, 2022 (Unaudited) | September 30, 2021 | |||||||||||||||
| Ordinary | Long-Term | Ordinary | Long-Term | |||||||||||||
| Income | Capital Gains | Income | Capital Gains | |||||||||||||
| Distributions* | Distributions | Distributions* | Distributions | |||||||||||||
Large Cap Fund | $ | 49,296,828 | $ | 448,757,868 | $ | 51,615,076 | $ | 312,031,578 | ||||||||
Common Stock Fund | 3,572,626 | 108,155,397 | 6,574,021 | |||||||||||||
International Fund | 122,031,455 | — | — | — | ||||||||||||
International Fund | ||||||||||||||||
Currency Unhedged | 2,556,897 | 794,077 | 478,518 | — | ||||||||||||
| * | For federal income tax purposes, distributions on short-term capital gains are treated as ordinary income distributions. |
66
FMI Funds, Inc.
NOTES TO FINANCIAL STATEMENTS (Continued)
March 31, 2022 (Unaudited)
| (9) | Fund Share Transactions — |
| For the Six Month Period Ending | Year Ended | ||||||||||||||||
| March 31, 2022 (Unaudited) | September 30, 2021 | ||||||||||||||||
Large Cap Fund | Shares | Amount | Shares | Amount | |||||||||||||
| Sales | |||||||||||||||||
| Investor Class | 2,563,514 | $ | 48,954,972 | 4,107,617 | $ | 84,115,258 | |||||||||||
| Institutional Class | 5,902,670 | 114,430,965 | 15,411,571 | 317,662,390 | |||||||||||||
| Reinvestment of dividends | |||||||||||||||||
| and distributions | |||||||||||||||||
| Investor Class | 11,559,346 | 219,049,619 | 8,627,384 | 166,077,149 | |||||||||||||
| Institutional Class | 14,610,684 | 276,141,925 | 10,113,907 | 194,288,146 | |||||||||||||
| Redemptions | |||||||||||||||||
Investor Class | (9,133,417 | ) | (181,268,845 | ) | (23,322,653 | ) | (476,766,459 | ) | |||||||||
Institutional Class | (20,472,617 | ) | (402,450,721 | ) | (42,489,209 | ) | (867,072,181 | ) | |||||||||
Total Investor Class | 4,989,443 | 86,735,746 | (10,587,652 | ) | (226,574,052 | ) | |||||||||||
Total Institutional Class | 40,737 | (11,877,831 | ) | (16,963,731 | ) | (355,121,645 | ) | ||||||||||
| Net increase (decrease) | 5,030,180 | $ | 74,857,915 | (27,551,383 | ) | $ | (581,695,697 | ) | |||||||||
| For the Six Month Period Ending | Year Ended | ||||||||||||||||
| March 31, 2022 (Unaudited) | September 30, 2021 | ||||||||||||||||
Common Stock Fund | Shares | Amount | Shares | Amount | |||||||||||||
| Sales | |||||||||||||||||
Investor Class | 643,455 | $ | 20,723,060 | 1,358,888 | $ | 40,468,948 | |||||||||||
Institutional Class | 4,103,385 | 126,877,564 | 3,246,842 | 98,202,692 | |||||||||||||
| Reinvestment of dividends | |||||||||||||||||
| and distributions | |||||||||||||||||
Investor Class | 1,606,701 | 48,811,581 | 109,266 | 3,009,192 | |||||||||||||
Institutional Class | 2,016,282 | 61,315,144 | 125,236 | 3,451,515 | |||||||||||||
| Redemptions | |||||||||||||||||
Investor Class | (1,277,868 | ) | (41,161,929 | ) | (4,257,725 | ) | (126,034,802 | ) | |||||||||
Institutional Class | (1,690,373 | ) | (53,494,825 | ) | (3,319,224 | ) | (97,007,522 | ) | |||||||||
Total Investor Class | 972,288 | 28,372,712 | (2,789,571 | ) | (82,556,662 | ) | |||||||||||
Total Institutional Class | 4,429,294 | 134,697,883 | 52,854 | 4,646,685 | |||||||||||||
| Net increase (decrease) | 5,401,582 | $ | 163,070,595 | (2,736,717 | ) | $ | (77,909,977 | ) | |||||||||
67
FMI Funds, Inc.
NOTES TO FINANCIAL STATEMENTS (Continued)
March 31, 2022 (Unaudited)
| (9) | Fund Share Transactions — (Continued) |
| For the Six Month Period Ending | Year Ended | ||||||||||||||||
| March 31, 2022 (Unaudited) | September 30, 2021 | ||||||||||||||||
International Fund | Shares | Amount | Shares | Amount | |||||||||||||
| Sales | |||||||||||||||||
Investor Class | 1,472,148 | $ | 50,496,833 | 1,977,475 | $ | 66,993,021 | |||||||||||
Institutional Class | 10,604,065 | 371,765,080 | 16,940,301 | 577,800,531 | |||||||||||||
| Reinvestment of dividends | |||||||||||||||||
| and distributions | |||||||||||||||||
Investor Class | 1,044,980 | 35,895,075 | — | — | |||||||||||||
Institutional Class | 2,269,865 | 78,151,463 | — | — | |||||||||||||
| Redemptions | |||||||||||||||||
Investor Class | (3,045,814 | ) | (106,584,734 | ) | (15,404,957 | ) | (499,915,121 | ) | |||||||||
Institutional Class | (6,751,501 | ) | (237,322,212 | ) | (27,905,894 | ) | (932,467,533 | ) | |||||||||
Total Investor Class | (528,686 | ) | (20,192,826 | ) | (13,427,482 | ) | (432,922,100 | ) | |||||||||
Total Institutional Class | 6,122,429 | 212,594,331 | (10,965,593 | ) | (354,667,002 | ) | |||||||||||
| Net increase (decrease) | 5,593,743 | $ | 192,401,505 | (24,393,075 | ) | $ | (787,589,102 | ) | |||||||||
| For the Six Month Period Ending | Year Ended | ||||||||||||||||
| International Currency | March 31, 2022 (Unaudited) | September 30, 2021 | |||||||||||||||
Unhedged Fund | Shares | Amount | Shares | Amount | |||||||||||||
| Sales | |||||||||||||||||
Institutional Class | 500,673 | $ | 10,449,699 | 956,205 | $ | 20,663,931 | |||||||||||
| Reinvestment of dividends | |||||||||||||||||
| and distributions | |||||||||||||||||
Institutional Class | 152,788 | 3,152,021 | 21,853 | 444,942 | |||||||||||||
| Redemptions | |||||||||||||||||
Institutional Class | (388,729 | ) | (7,958,685 | ) | (418,362 | ) | (8,503,376 | ) | |||||||||
Total Institutional Class | 264,732 | 5,643,035 | 559,696 | 12,605,497 | |||||||||||||
| Net increase (decrease) | 264,732 | $ | 5,643,035 | 559,696 | $ | 12,605,497 | |||||||||||
| (10) | Subsequent Events — |
| Management has evaluated related events and transactions that occurred subsequent to March 31,2022, through the date of issuance of the Funds’ financial statements and has determined there are no subsequent events or transactions. |
68
FMI Funds, Inc.
EXPENSE EXAMPLE (Unaudited)
As a shareholder of the FMI Funds you incur ongoing costs, including management fees and other Fund expenses. You do not incur transaction costs such as sales charges (loads) on purchase payments, reinvested dividends, or other distributions; redemption fees; and exchange fees because the Funds do not charge these fees. This example is intended to help you understand your ongoing costs (in dollars) of investing in each Fund and to compare these costs with the ongoing costs of investing in other mutual funds. The example is based on an investment of $1,000 invested at the beginning of the period and held for the entire period from October 1, 2021 through March 31, 2022.
Actual Expenses
The table below provides information about actual account values and actual expenses. You may use the information in these lines, together with the amount you invested, to estimate the expenses that you paid over the period. Simply divide your account value by $1,000 (for example, an $8,600 account value divided by $1,000 = 8.6), then multiply the result by the number in the line under the heading entitled “Actual Expenses Paid During Period” to estimate the expenses you paid on your account during this period.
In addition to the costs highlighted and described below, the only Fund transaction costs you might currently incur would be wire fees ($15 per wire), if you choose to have proceeds from a redemption wired to your bank account instead of receiving a check. Additionally, U.S. Bank charges an annual processing fee ($15) if you maintain an IRA account with the Fund. To determine your total costs of investing in a Fund, you would need to add any applicable wire or IRA processing fees you’ve incurred during the period to the costs provided in the example at the end of this article.
Hypothetical Example for Comparison Purposes
The table below provides information about hypothetical account values and hypothetical expenses based on each Fund’s actual expense ratio and an assumed rate of return of 5% per year before expenses, which is not the Fund’s actual return. The hypothetical account values and expenses may not be used to estimate the actual ending account balance or expenses you paid for the period. You may use this information to compare the ongoing costs of investing in a Fund and other funds. To do so, compare this 5% hypothetical example with the 5% hypothetical examples that appear in the shareholder reports of the other funds.
Please note that the expenses shown in the table are meant to highlight your ongoing costs only and do not reflect any transactional costs, such as sales charges (loads), redemption fees or exchange fees. Therefore, the hypothetical line of the table is useful in comparing ongoing costs only and will not help you determine the relative total costs of owning different funds. In addition, if these transactional costs were included, your costs would have been higher.
69
FMI Funds, Inc.
EXPENSE EXAMPLE (Unaudited) (Continued)
| FMI | FMI | FMI | FMI International | |||||||||||||
| Large Cap | Common | International | Fund II – Currency | |||||||||||||
| Fund | Stock Fund | Fund | Unhedged | |||||||||||||
| Investor | ||||||||||||||||
| Actual Beginning | ||||||||||||||||
| Account Value 10/01/21 | $ | 1,000.00 | $ | 1,000.00 | $ | 1,000.00 | $ | — | ||||||||
| Actual Ending | ||||||||||||||||
| Account Value 3/31/22 | $ | 1,035.80 | $ | 1,034.60 | $ | 980.20 | $ | — | ||||||||
| Actual Expenses Paid | ||||||||||||||||
| During Period* 10/01/21-3/31/22 | $ | 4.21 | $ | 5.12 | $ | 4.69 | $ | — | ||||||||
| Hypothetical Beginning | ||||||||||||||||
| Account Value 10/01/21 | $ | 1,000.00 | $ | 1,000.00 | $ | 1,000.00 | $ | — | ||||||||
| Hypothetical Ending | ||||||||||||||||
| Account Value 3/31/22 | $ | 1,020.79 | $ | 1,019.90 | $ | 1,020.19 | $ | — | ||||||||
| Hypothetical Expenses Paid | ||||||||||||||||
| During Period* 10/01/21-3/31/22 | $ | 4.18 | $ | 5.09 | $ | 4.78 | $ | — | ||||||||
| Annualized Expense Ratio* | 0.83 | % | 1.01 | % | 0.95 | % | — | |||||||||
| Institutional | ||||||||||||||||
| Actual Beginning | ||||||||||||||||
| Account Value 10/01/21 | $ | 1,000.00 | $ | 1,000.00 | $ | 1,000.00 | $ | 1,000.00 | ||||||||
| Actual Ending | ||||||||||||||||
| Account Value 3/31/22 | $ | 1,036.40 | $ | 1,035.20 | $ | 981.10 | $ | 951.10 | ||||||||
| Actual Expenses Paid | ||||||||||||||||
| During Period* 10/01/21-3/31/22 | $ | 3.50 | $ | 4.52 | $ | 3.95 | $ | 4.38 | ||||||||
| Hypothetical Beginning | ||||||||||||||||
| Account Value 10/01/21 | $ | 1,000.00 | $ | 1,000.00 | $ | 1,000.00 | $ | 1,000.00 | ||||||||
| Hypothetical Ending | ||||||||||||||||
| Account Value 3/31/22 | $ | 1,021.49 | $ | 1,020.49 | $ | 1,020.94 | $ | 1,020.44 | ||||||||
| Hypothetical Expenses Paid | ||||||||||||||||
| During Period* 10/01/21-3/31/22 | $ | 3.48 | $ | 4.48 | $ | 4.03 | $ | 4.53 | ||||||||
| Annualized Expense Ratio* | 0.69 | % | 0.89 | % | 0.80 | % | 0.90 | % | ||||||||
| * | Expenses are equal to the Fund’s annualized expense ratio, multiplied by the average account value over the period, multiplied by 182/365 (to reflect the one-half year period between October 1, 2021 and March 31, 2022). |
70
FMI Funds, Inc.
ADVISORY AGREEMENTS (Unaudited)
Continuation of Advisory Agreements for FMI Large Cap Fund, FMI Common Stock Fund, FMI International Fund and FMI International Fund II – Currency Unhedged
On December 17, 2021, the Directors of FMI Funds, Inc. approved the continuation of the investment advisory agreements for the FMI Large Cap Fund (the “Large Cap Fund”), the FMI Common Stock Fund (the “Common Stock Fund”), the FMI International Fund (the “International Fund”) and the FMI International Fund II – Currency Unhedged (the “International Fund II”). (The Large Cap Fund, the Common Stock Fund, the International Fund and the International Fund II are sometimes referred to herein as a “Fund” and, collectively, as the “Funds”).
In advance of approving the continuation of the investment advisory agreements, the Directors who are not “interested persons” (as that term is defined by the Investment Company Act of 1940) of the Funds (the “Independent Directors”) met with their independent legal counsel. They discussed with their independent legal counsel, in executive session, a memorandum describing their fiduciary duties with respect to approving the continuation of the investment advisory agreements and the relevant factors for their consideration of the investment advisory agreements. As part of the discussion regarding the fiduciary duties of the Directors, the Independent Directors confirmed their understanding of the need to have asked about, and received answers to, any matters that they believe are relevant to determining whether to approve the continuation of the investment advisory agreements.
The Independent Directors also reviewed and discussed with their independent legal counsel, in executive session, all of the materials that the Funds’ investment adviser, Fiduciary Management, Inc. (the “Adviser”), had provided to the Independent Directors to assist them in their consideration of the investment advisory agreement (collectively, the “15(c) Material”). Following this review, they concluded that the 15(c) Material addressed all of the relevant matters that they wanted to consider in assessing the performance of the Funds and the performance of the Adviser under the investment advisory agreements, and that the 15(c) Material provided them with an understanding of the investment advisory agreements and the services that the Adviser provides the Funds.
The Independent Directors then met in general session to discuss the 15(c) Material with the other Directors and management of the Funds. In discussing the 15(c) Material with management of the Funds, management highlighted various sections of the 15(c) Material and addressed the questions and comments of the Directors to their satisfaction. The Directors confirmed that in considering the investment advisory agreements, they focused on the following items, among others:
| • | The nature and quality of the investment advisory services provided by the Adviser, including the Adviser’s organization and operations, financial condition and stability and ownership structure; and the terms of the investment advisory agreements and how the services performed by the Adviser under the investment advisory agreements differ from those performed for other accounts managed by the Adviser. | |
| • | A comparison of the fees and expenses of the Funds to other similar funds, including a comparison of the Funds’ total expenses and the total expense ratios. | |
| • | A comparison of the fee structures of other accounts managed by the Adviser. | |
| • | Whether economies of scale are recognized by the Funds, and whether existing breakpoints are appropriate. | |
| • | The costs and profitability of the Funds to the Adviser. |
71
FMI Funds, Inc.
ADVISORY AGREEMENTS (Unaudited) (Continued)
| • | The independence, expertise, care, and conscientiousness of the Board of Directors. | |
| • | Short-term and long-term investment performance of the Funds. | |
| • | The other benefits to the Adviser from serving as investment adviser to the Funds (in addition to the advisory fee under the investment advisory agreements). |
All of the factors discussed by the Directors were considered as a whole, and were considered separately by the Independent Directors, meeting in executive session both before and after their general session with the other Directors and management of the Funds. The factors were viewed in their totality by the Directors, with no single factor being the principal or determinative factor in the Directors’ determination of whether to approve the continuation of the investment advisory agreements. The Directors recognized that the management and fee arrangements for the Funds are the result of years of review and discussion between the Independent Directors and the Adviser, that certain aspects of such arrangements may receive greater scrutiny in some years than in others and that the Directors’ conclusions may be based, in part, on their consideration of these same arrangements and information received during the course of the year and in prior years.
The material considerations and determinations of the Directors, including all of the Independent Directors, are described below:
Nature and Quality of Investment Advisory Services
The Directors discussed the efforts of the Adviser in supervising the investment portfolios of the Large Cap Fund, the Common Stock Fund, the International Fund and the International Fund II directing the day-to-day management of the Funds’ portfolios, including the purchase and sale of investment securities, and the performance of the Adviser in these efforts. They noted that the investment process employed is team-based and highly research intensive, utilizing primarily in-house, fundamental research.
Noting the research intensive process of the Adviser, the Directors considered the background and experience of the Adviser’s senior management and expertise of, and the level of attention given to the Funds by investment personnel of the Adviser, and determined that the personnel servicing the Funds are well qualified. In addition, the Directors deliberated on the quality of the material service providers to the Funds, who provide administrative and distribution services on behalf of the Funds and are overseen by the Adviser, and the overall reputation and capabilities of the Adviser, concluding that they believe the services providers are respected in the industry and provide valuable services to the Funds.
The Directors concluded, based on the well qualified personnel serving the Funds and the positive performance of the Funds, adjusted for risk, as discussed herein, that the nature, extent and quality of the investment advisory services provided to the Funds by the Adviser are good. The Directors then assessed the risk management of the Funds, and the operation of the Funds’ compliance programs, as reported to them in discussions with the CCO of the Funds. They noted that the Funds have not had material breaches of the compliance program, and that the CCO’s annual and quarterly reports have reflected that the compliance program is reasonably designed to prevent material violations of securities law and is operating effectively. Based on the Directors’ assessment of the Funds’ compliance program, the Directors determined that the nature and extent of the services provided by the Adviser are appropriate to assure that the Funds’ operations are conducted in compliance with applicable laws, rules and regulations.
72
FMI Funds, Inc.
ADVISORY AGREEMENTS (Unaudited) (Continued)
Comparative Fees and Expenses
Management discussed with the Directors the fact that several variables in addition to the management fee, such as service, administrative and transaction fees could have an impact on costs to the shareholders of the Funds. The Directors noted that the Adviser had engaged Broadridge Financial Solutions 15(c) Services to provide peer group comparative fee, expense and performance analysis for each Fund (the “15(c) Report”), to assist the Directors with their analysis on whether to continue the investment advisory agreements. They discussed the Morningstar fee level methodology used in the 15(c) Report, as well as the custom 15(c) categories and peer groups created explicitly for the 15(c) Report. The Directors noted that the methodology underlying the Morningstar fee level calculation uses the prospectus net expense ratio rather than the annual report net expense ratio. Morningstar reported that it made this change so that fee cuts at existing funds would be reflected more quickly in the fee level assignment, so that newly-incepted share classes would be included, and to uniformly include acquired fund fees in the comparisons, regardless of fund-of-funds status.
The Directors noted that the peer grouping methodology in the 15(c) Report considers three factors in selecting potential peers: investment style, share class characteristics, and assets. While it would be ideal if each peer matched closely with the applicable Fund on all three dimensions, the Directors noted that in practice it is often necessary to relax one of the peer grouping factors to find an appropriate number of peers. They concluded that they were comfortable with the peer group methodology in the 15(c) Report.
The Directors then reviewed the expense analysis contained in the 15(c) Report. In summary, the Directors noted the following: (1) the peer group comparative fee and expense analysis for the Common Stock Fund show that its net expense ratio and advisory fee are within a reasonable range of industry averages; (2) the peer group comparative fee and expense analysis for the Large Cap Fund show that its net expense ratio and advisory fee are within a reasonable range of industry averages; (3) the peer group comparative fee and expense analysis for the International Fund show that its net expense ratio and advisory fee are within a reasonable range of industry averages; and (4) the peer group comparative fee and expense analysis for the International Fund II show that its net expense ratio and advisory fee are within a reasonable range of industry averages.
After assessing the expense information discussed above, the Directors concluded that the expense ratios of the Funds are within the range of comparable mutual funds, and that the Funds’ fees are reasonable. The Directors noted that the Funds’ performance during periods of stock market decline was generally better than the market, as intended by the Funds’ principal investment strategies, they concluded that the Funds provide positive risk adjusted returns.
Comparison of Fee Structures of Other Accounts
The Directors believe that management of a mutual fund involves more comprehensive and substantive duties than the management of institutional separate accounts or sub-advised funds. Mutual funds require considerable compliance, third-party oversight, and shareholder services that institutional accounts do not, due to the more retail nature of the fund shareholder and the legal and regulatory burdens associated with managing a mutual fund family. For instance, the Adviser provides tailored investment advisory services to the Funds to accommodate the cash flow volatility presented by the purchases and redemptions of shareholders. Moreover, the Adviser attempts to serve the needs of thousands of accounts, ranging from direct accounts holding a few thousand dollars to the large omnibus accounts of intermediaries who in turn service thousands of large and small accounts.
73
FMI Funds, Inc.
ADVISORY AGREEMENTS (Unaudited) (Continued)
The Adviser has implemented robust shareholder communication efforts to reach potential shareholders through direct contact, through intermediaries, or via the financial press. The Adviser does not engage in equivalent efforts for separate accounts.
Separate accounts or sub-advised funds engage the Adviser for investment management services and client service only. And with regard to sub-advised funds, the adviser to those funds assumes some of the cash flow management duties, board maintenance, and most operational and compliance obligations and third-party oversight.
Separate accounts or sub-advised funds engage the Adviser for investment management services and client service only. It also is important to remember that sub-advised funds have a layer of investment management fees, in addition to sub-advisory fees. The adviser to those funds assumes some of the cash flow management duties, board maintenance, and most operational and compliance obligations and third-party oversight.
The mutual fund industry has increasingly moved to brokerage platforms (intermediaries) as the transaction vehicle of choice for investors seeking to buy and sell shares of mutual funds that are offered to the general public. Fewer investors are going directly to the Funds’ transfer agent to effect share transactions. Regarding the intermediaries, the Adviser absorbs all costs in excess of the fees paid by the Funds for sub-transfer agent services performed by the intermediaries. So, the cost of obtaining, retaining and servicing shareholders for the Funds is significantly higher than the costs for separately managed accounts. None of the Funds utilize 12b-1 plans to fund distribution costs, with the Adviser absorbing all such costs.
In summary, the Directors noted the following: (1) management of a mutual fund involves more comprehensive and substantive duties than the management of institutional separate accounts or sub-advised funds; (2) separate accounts and sub-advised funds do not present equivalent risks to the Adviser, as separate accounts or sub-advised funds engage the Adviser for investment management services and client service only; (3) the adviser to sub-advised funds assumes some of the cash flow management duties for such funds, and it assumes the board maintenance, and most operational and compliance obligations and third-party oversight for such funds; and (4) the Adviser absorbs all costs in excess of the fees paid by the Funds for sub-transfer agent services performed by the intermediaries, which results in the cost of obtaining, retaining and servicing shareholders for the Funds being significantly higher than the costs for separately managed accounts.
Based on the materials and information discussed above, the Directors concluded that the differential in advisory fees between the Funds and the separate accounts managed by the Adviser is reasonable, and concluded that the fee rates charged to the Funds in comparison to those charged to the Adviser’s other clients is reasonable.
Performance
The Directors then reviewed the performance and risk analysis contained in the 15(c) Report:
| • | The Large Cap Fund has underperformed the benchmark S&P 500 by 3.22% annualized over the last ten years, while outperforming the benchmark by 0.30% annualized since inception through the fiscal year ended September 30, 2021. The Fund has underperformed the Russell 1000 Value benchmark over one-year (10.36%) and performed roughly in-line at the three- and ten-year periods, while outperforming at five-years (1.17%). The Fund has outperformed the value benchmark by 1.33% annualized since inception through the fiscal year ended September 30, 2021. |
74
FMI Funds, Inc.
ADVISORY AGREEMENTS (Unaudited) (Continued)
| • | The Common Stock Fund has underperformed the benchmark Russell 2000 by 1.76% annualized over the last ten years, while outperforming the benchmark by 1.25% annualized since inception through the fiscal year ended September 30, 2021. The Fund has underperformed the Russell 2000 Value benchmark over one-year (13.25% annualized), and at the ten-year period (0.35% annualized) while outperforming at the three- and five-year periods by annualized 3.47% and 1.36%, respectively. The Fund was roughly in-line with the value benchmark since inception through fiscal year ended September 30, 2021. | |
| • | While outperforming both the MSCI EAFE (USD) and MSCI EAFE (Local) benchmarks by 2.15% and 0.39% annualized since inception, at the five-year mark, the International Fund underperformed by 2.46% and 2.66%, respectively, on an annualized basis through the fiscal year ended September 30, 2021. Notwithstanding the strength of the core benchmarks, the MSCI EAFE Value (USD) and MSCI EAFE Value (Local) benchmarks were both surpassed by the Fund over one, three, and five years and since inception through the fiscal year ended September 30, 2021 annualized by 2.26%, 0.39%, 3.97%, and 4.03% (USD) and 2.74%, 0.23%, 1.96%, and 2.27% (Local), respectively. | |
| • | The FMI International Fund II, while underperforming on an annualized basis against the MSCI EAFE (USD) since inception by 3.99%, has outperformed at the one-year period the benchmark by 1.23% for the fiscal year ended September 30, 2021. The opposite proves true when comparing the Fund against the MSCI EAFE Value (USD), where the Fund outperformed the value benchmark by 1.50% annualized since inception, while underperforming by 3.70% at one-year. |
Based on the information and materials discussed by the Directors, as reflected above, the Directors concluded that the performance of the Funds, adjusting for risk, has been satisfactory on a relative basis and more than satisfactory on an absolute basis. They continue to believe that the Adviser’s discipline should lead to favorable results in the long-term, and concluded that continuation of the existing advisory agreements was in the best interest of the Funds’ shareholders. In particular, the Directors noted that the Funds’ performance during periods of stock market decline was better than the market, as intended by the Funds’ principal investment strategies, supporting the conclusion that the Funds provide positive risk adjusted returns.
Costs and Profitability
The Adviser uses a team-oriented approach so no one individual is assigned to just one of the Adviser’s clients from a portfolio management, research, trading, operations or administrative perspective. Instead, every teammate is working on behalf of all the Adviser’s clients, including each Fund. Accordingly, in determining the Adviser’s costs relative to the services performed on behalf of all the Adviser’s clients, the Adviser has determined to allocate its overall costs proportionately to each Adviser client based upon the percentage of that client’s assets under our management. The Directors believe this method of allocation is appropriate.
In summary, the Directors noted the following: (1) the peer group comparative fee and expense analysis for the Funds show that their net expense ratios and advisory fees are within a reasonable range of industry averages; (2) the shareholder service fees paid to intermediaries by the Adviser for the benefit of the Funds significantly reduce the pre-tax profit margin to the Adviser, which results in the pre-tax profit margin for the Funds being lower than the pre-tax profit margin for all
75
FMI Funds, Inc.
ADVISORY AGREEMENTS (Unaudited) (Continued)
other clients of the Adviser on an aggregate basis; and (3) the Adviser’s pre-tax profit margin for the Funds compares reasonably to several publicly traded companies that the Directors reviewed.
In assessing and evaluating the information discussed above, the Directors recognized that it is difficult to make comparisons of profitability from investment advisory contracts. This is because comparative information is not generally publicly available and is affected by numerous factors, including the structure of the particular adviser, the type of clients it advises, its business mix, and numerous assumptions regarding allocations and the adviser’s capital structure and cost of capital. Taking this into account, following their discussion of the material presented above, the Directors concluded that the level of profitability realized by the Adviser from its provision of services to the Funds is reasonable, and that the overall expense ratios and investment advisory fees were fair and within a reasonable range of industry averages.
Economies of Scale
The Directors discussed the possibility that as fund assets grow, certain fixed costs are spread over the larger asset base leading to some economies of scale, which should benefit the Funds’ shareholders. Additionally, some variable costs, such as accounting, administration, custody and management fees are on a sliding scale relative to asset size. Based on the materials the Directors reviewed, the Funds’ expense ratios have generally fallen over the fiscal years, primarily as a consequence of the Adviser’s renegotiation of service contracts and the addition of management fee breakpoints. The Directors determined that the breakpoints are at levels that will appropriately benefit shareholders by passing along economies of scale.
In summary, the Directors noted the following: (1) some variable costs, such as accounting, administration, custody and management fees are on a sliding scale relative to asset size; (2) the Funds’ expense ratios have generally fallen over the fiscal years, primarily as a consequence of the Adviser’s renegotiation of service contracts and the addition of management fee breakpoints; and (3) the fact that the Adviser has made significant investments into the Funds’ portfolio management and research teams.
After discussing the matters referenced above, the Directors concluded that the current fees and breakpoints were appropriate. They noted favorably the Adviser has in the recent past voluntarily reduced the investment advisory fee for the FMI Large Cap Fund and the FMI Common Stock Fund, to keep those Funds more competitive in the marketplace.
Fall-Out Benefits
The Directors reviewed the Adviser’s use of research, analytical, statistical and other information and services obtained in connection with effecting trades for the Funds. While the research, analytical, statistical and other information and services provided by brokers have substantial value, the Directors determined that such information and services are supplemental to the Adviser’s own efforts in the performance of its duties under the investment advisory agreements, and are used for the benefit of the Funds.
The Directors reviewed the Adviser’s Procedure for Selection and Approval of Brokers, the Procedure for Selection, Approval and Administration of Soft-Dollar Services, the Domestic Commission Summary, the International Commission Summary and the Commission Purpose Reports for each Fund and the Aggregate Non-Directed Separate Accounts for each Adviser Strategy.
76
FMI Funds, Inc.
ADVISORY AGREEMENTS (Unaudited) (Continued)
With regard to research services furnished by brokers through whom the Adviser effects security transactions (commission payments to a brokerage firm that are used, in part, to obtain research, so-called “soft-dollars”), the Directors noted that the research may be used in servicing all of the Adviser’s accounts, not just the Funds, regardless of which security transactions generated the soft-dollars. So, the Directors discussed with the Adviser, the Adviser’s allocation policies and procedures for soft-dollars, noting that the Adviser generally allocates soft-dollars proportionately based upon the percentage of a client’s assets under management. The Directors determined that this allocation methodology is appropriate.
In summary, the Directors noted the following: (1) although the Adviser could derive benefits from the conversion of Fund shareholders into separate account clients, the Funds also could benefit from potential institutional shareholders who might choose to invest in the Funds because they want the Adviser’s services, but do not meet minimum separate account size requirements; (2) the Directors concluded that the research, analytical, statistical and other information and services provided by brokers are merely supplemental to the Adviser’s own efforts in the performance of its duties under the investment advisory agreements; and (3) the Directors concluded that the allocation methodology for soft-dollars is appropriate.
After discussing and evaluating the materials presented above, the Directors concluded that the other benefits realized by the Adviser from its relationship with the Funds were reasonable.
Conclusion
After reviewing the material provided for the meeting, management’s presentation, as well as other information regularly provided at the Board’s quarterly meetings throughout the year regarding the quality of services provided by the Adviser, the performance of the Funds, expense information, regulatory compliance matters, trading information and related matters and other factors deemed relevant by the Board, the Directors, including all of the Independent Directors, concluded that the investment advisory arrangements between the Funds and the Adviser were fair and reasonable and that the continuation of the investment advisory agreements would be in the best interest of the Funds and their shareholders. Accordingly, the Directors, including all of the Independent Directors voting separately, approved the continuation of the investment advisory agreements.
77
FMI Funds, Inc.
DISCLOSURE INFORMATION (Unaudited)
Performance for Period Ended March 31, 2022
| Average Annual Total Returns | |||||||
| 3 | 1 | 3 | 5 | 10 | Since | Inception | |
| FMI FUND / INDEX | Months(1) | Year | Year | Year | Year | Inception(1) | Date |
| Large Cap – Investor Class | -6.16% | 4.98% | 11.10% | 10.52% | 11.34% | 9.31% | 12-31-01 |
| S&P 500 Index | -4.60% | 15.65% | 18.92% | 15.99% | 14.64% | 9.15% | 12-31-01 |
| Russell 1000 Value Index | -0.74% | 11.67% | 13.02% | 10.29% | 11.70% | 8.19% | 12-31-01 |
| Large Cap – Institutional Class | -6.12% | 5.10% | 11.26% | 10.66% | — | 12.36% | 10-31-16 |
| S&P 500 Index | -4.60% | 15.65% | 18.92% | 15.99% | 14.64% | 17.14% | 10-31-16 |
| Russell 1000 Value Index | -0.74% | 11.67% | 13.02% | 10.29% | 11.70% | 11.76% | 10-31-16 |
| Common Stock – Investor Class | -4.58% | 10.79% | 12.66% | 10.57% | 10.42% | 11.85% | 12-18-81 |
| Russell 2000 Index | -7.53% | -5.79% | 11.74% | 9.74% | 11.04% | 10.36% | 12-18-81 |
| Russell 2000 Value Index | -2.40% | 3.32% | 12.73% | 8.57% | 10.54% | 11.79% | 12-18-81 |
| Common Stock – Institutional Class | -4.55% | 10.95% | 12.78% | 10.69% | — | 12.68% | 10-31-16 |
| Russell 2000 Index | -7.53% | -5.79% | 11.74% | 9.74% | 11.04% | 12.19% | 10-31-16 |
| Russell 2000 Value Index | -2.40% | 3.32% | 12.73% | 8.57% | 10.54% | 11.20% | 10-31-16 |
| International – Investor Class | -5.96% | -0.03% | 4.98% | 4.40% | 7.64% | 7.49% | 12-31-10 |
| MSCI EAFE (LOC) | -3.73% | 6.21% | 8.23% | 6.55% | 8.61% | 7.31% | 12-31-10 |
| MSCI EAFE (LOC) Value | 2.68% | 8.84% | 5.68% | 3.98% | 7.21% | 5.98% | 12-31-10 |
| MSCI EAFE (USD) | -5.91% | 1.16% | 7.78% | 6.72% | 6.27% | 5.31% | 12-31-10 |
| MSCI EAFE (USD) Value | 0.33% | 3.55% | 5.24% | 4.18% | 4.87% | 3.97% | 12-31-10 |
| International – Institutional Class | -5.89% | 0.11% | 5.13% | 4.55% | — | 5.68% | 10-31-16 |
| MSCI EAFE (LOC) | -3.73% | 6.21% | 8.23% | 6.55% | 8.61% | 8.06% | 10-31-16 |
| MSCI EAFE (LOC) Value | 2.68% | 8.84% | 5.68% | 3.98% | 7.21% | 5.89% | 10-31-16 |
| MSCI EAFE (USD) | -5.91% | 1.16% | 7.78% | 6.72% | 6.27% | 7.84% | 10-31-16 |
| MSCI EAFE (USD) Value | 0.33% | 3.55% | 5.24% | 4.18% | 4.87% | 5.74% | 10-31-16 |
| International II – Currency Unhedged – | | ||||||
| Institutional Class | -8.32% | -4.58% | — | — | — | 1.79% | 12-31-19 |
| MSCI EAFE (USD) | -5.91% | 1.16% | 7.78% | 6.72% | 6.27% | 5.53% | 12-31-19 |
| MSCI EAFE (USD) Value | 0.33% | 3.55% | 5.24% | 4.18% | 4.87% | 3.62% | 12-31-19 |
(1) | Returns for periods less than one year are not annualized. |
Performance data quoted represents past performance; past performance does not guarantee future results. Investment return and principal value of an investment will fluctuate so that an investor’s shares, when redeemed, may be worth more or less than their original cost. Current performance of a Fund may be lower or higher than the performance quoted. Performance data current to the most recent month end may be obtained by visiting www.fmifunds.com or by calling 1-800-811-5311. The returns do not reflect the deduction of taxes that a shareholder would pay on Fund distributions or the redemption of Fund shares.
Securities named in the Letters to Shareholders, but not listed in the Schedules of Investments are not held in the Funds as of the date of this disclosure. Portfolio holdings are subject to change without notice and are not intended as recommendations of individual securities.
This report is not authorized for use as an offer of sale or a solicitation of an offer to buy shares of the Funds unless accompanied or preceded by the Funds’ current prospectus.
78
FMI Funds, Inc.
DISCLOSURE INFORMATION (Unaudited) (Continued)
As of the Funds’ Prospectus dated January 31, 2022, the annual operating expense ratios for the Investor Class of FMI Large Cap Fund, FMI Common Stock Fund and FMI International Fund are: 0.82%, 1.01% and 0.94%, respectively. The annual operating expense ratios for the Institutional Class of FMI Large Cap Fund, FMI Common Stock Fund, FMI International Fund and FMI International Fund II – Currency Unhedged are: 0.68%, 0.90%, 0.80% and 0.90%*, respectively.
| * | Note that the annual operating expenses for the Institutional Class of FMI International Fund II – Currency Unhedged are 1.16% before the investment adviser’s voluntary reimbursement such that annual fund operating expenses do not exceed 0.90%, which will continue at least through January 31, 2023. |
Risks associated with investing in the Funds are as follows:
FMI Large Cap Fund: Stock Market Risk, Medium and Large Capitalization Companies Risks, Non-Diversification Risk (Non-Diversified funds are subject to higher volatility than funds that are invested more broadly), Value Investing Risk, Foreign Securities Risk (fluctuation of currency, different financial standards, and political instability), Liquidity Risk, and Tax Law Change Risk.
FMI Common Stock Fund: Stock Market Risk, Medium and Small Capitalization Companies Risks (which includes the potential for greater volatility and less financial resources than Large-Cap Companies), Value Investing Risk, Foreign Securities Risk (fluctuation of currency, different financial standards, and political instability), Liquidity Risk, and Tax Law Change Risk.
FMI International Fund: Stock Market Risk, Value Investing Risk, Foreign Securities Risk (fluctuation of currency, different financial standards, and political instability), Geographic Concentration Risk, Currency Hedging Risk, Large Capitalization Companies Risk, Liquidity Risk, and Tax Law Change Risk.
FMI International Fund II – Currency Unhedged: Stock Market Risk, Non-Diversified Risk (Non-Diversified Funds are subject to higher volatility than funds that are invested more broadly). Value Investing Risk, Foreign Securities Risk (fluctuation of currency, different financial standards, and political instability), Geographic Concentration Risk, Large Capitalization Companies Risk, Liquidity Risk, and Tax Law Change Risk.
For details regarding these risks, please refer to the Funds’ Summary or Statutory Prospectuses dated January 31, 2022.
The Standard and Poor’s 500 Index (S&P 500) consists of 500 selected common stocks, most of which are listed on the New York Stock Exchange. The S&P’s Ratings Group designates the stocks to be included in the Index on a statistical basis. A particular stock’s weighting in the Index is based on its relative total market value (i.e., its market price per share times the number of shares outstanding). Stocks may be added or deleted from the Index from time to time.
The Russell 1000 Index measures the performance of the 1,000 largest companies in the Russell 3000 Index which comprises the 3,000 largest U.S. companies based on total market capitalization. The Russell 1000 Value Index includes equities that exhibit value characteristics and the Russell 1000 Growth Index includes equities that exhibit growth characteristics.
The Russell 2000 Index measures the performance of the 2,000 smallest companies in the Russell 3000 Index. The Russell 2000 Value Index includes equities that exhibit value characteristics and the Russell 2000 Growth Index includes equities that exhibit growth characteristics.
The MSCI EAFE Index (Europe, Australasia, Far East) is a free float-adjusted market capitalization index that is designed to measure the equity market performance of developed markets, excluding the U.S. and Canada. The MSCI EAFE Index consists of the following 21 developed market country indices: Australia, Austria, Belgium, Denmark, Finland, France, Germany, Hong Kong, Ireland, Israel, Italy, Japan, the Netherlands, New Zealand, Norway, Portugal, Singapore, Spain, Sweden, Switzerland and the United Kingdom. Index results are inclusive of dividends and net of foreign withholding taxes. The reported figures include reinvestment of dividends and capital gains distributions and do not reflect any fees or expenses.
79
FMI Funds, Inc.
DISCLOSURE INFORMATION (Unaudited) (Continued)
The MSCI EAFE Value Index captures large and mid cap securities exhibiting overall value style characteristics across Developed Markets countries around the world, excluding the U.S. and Canada. The value investment style characteristics for index construction are defined using three variables: book value to price, 12-month forward earnings to price and dividend yield.
The MSCI EAFE Index and MSCI EAFE Value Index are calculated in local currency (LOC) as well as in U.S. Dollars (USD). The concept of a LOC calculation excludes the impact of currency fluctuations. All currencies of listing are considered in the Index calculation in LOC where current prices (t) and previous day prices (t-1) are converted into USD using the same exchange rate (exchange rate t-1) in the numerator and denominator. As a consequence, the FX factor drops out of the equation. The USD calculation includes exchange rates at t and t-1. Therefore, the LOC calculation only represents the price appreciation or depreciation of the securities, whereas the USD calculation also accounts for the performance of the currency (or currencies) relative to the USD.
The MSCI EAFE Growth Index captures large and mid cap securities exhibiting overall growth style characteristics across Developed Markets countries around the world, excluding the U.S. and Canada. The growth investment style characteristics for index construction are defined using five variables: long-term forward EPS growth rate, short-term forward EPS growth rate, current internal growth rate and long-term historical EPS growth trend and long-term historical sales per share growth trend.
MSCI EAFE is a service mark of MSCI Barra.
The Bloomberg Commodity Index is a broadly diversified index composed of futures contracts on physical commodities that allows investors to track commodity futures.
The CRB Commodity Index Total Return acts as a representative indicator of today’s global commodity markets. It measures the aggregated price direction of various commodity sectors.
The Consumer Price Index (CPI) is a measure of the average change over time in the prices paid by urban consumers for a market basket of consumer goods and services.
The Federal Funds Target Rate – Upper Bound Index (FDTR) is a target interest rate set by the Federal Open Market Committee of the Board of Governors of the Federal Reserve system in its effort to influence short-term interest rates as part of its monetary policy strategy.
The Nasdaq-100 Index is made up of 101 equity securities issued by 100 of the largest non-financial companies listed on the Nasdaq stock market. It is a modified capitalization-weighted index. The stocks’ weights in the index are based on their market capitalizations, with certain rules capping the influence of the largest components. It is based on exchange, and it does not have any financial companies.
The World Government Bond GDP-weighted return index measures the performance of fixed-rate, local currency, investment grade sovereign bonds.
All indices are unmanaged. These indices are used herein for comparative purposes in accordance with the Securities and Exchange Commission regulations. It is not possible to invest directly into an index.
GLOSSARY
Bps – Basis points refers to a common unit of measure for interest rates and other percentages in finance. One basis point is equal to 1/100 of 1% or .01% and is used to denote the percentage change in a financial instrument.
Cost of Capital is a company’s calculation of the minimum return that would be necessary in order to justify undertaking a capital budgeting project. Investors may also use the term to refer to an evaluation of an investment’s potential return in relation to its costs and risks.
EBIT – Earnings Before Interest and Taxes is an indicator of a company’s profitability and is used to analyze the performance of a company’s core operations without the costs of the capital structure and tax expenses impacting profit.
EBITDA – Earnings Before Interest Taxes Depreciation and Amortization is net income with interest, taxes, depreciation, and amortization added back to it, and can be used to analyze and compare profitability between companies and industries because it eliminates the effects of financing and accounting decisions.
80
FMI Funds, Inc.
DISCLOSURE INFORMATION (Unaudited) (Continued)
EPS – Earnings per Share – The portion of a company’s profit allocated to each outstanding share of common stock. Earnings per share serves as an indicator of a company’s profitability.
EV/EBITDA – Enterprise Value to Earnings Before Interest Taxes Depreciation and Amortization is a measure of the value of a stock that compares a company’s enterprise value (market cap plus debt, minority interest and preferred shares, minus total cash and cash equivalents) to its earnings before interest taxes depreciation and amortization. EV/EBITDA is one of several fundamental indicators that investors use to determine whether a stock is priced well. The EV/EBITDA multiple is also often used to determine a company’s valuation in the case of a potential acquisition.
EV/Sales – Enterprise Value To Sales is a valuation measure that compares the enterprise value of a company to the company’s sales. EV/sales gives investors an idea of how much it costs to buy the company’s sales.
EV/NOPAT – Enterprise Value To Net Operating Profit After Tax is a valuation measure that compares enterprise value of a company to its net operating profit after tax. The valuation measure rates a company’s core operations independently of its capital structure, net of taxes.
GDP – Gross Domestic Product – Gross Domestic Product is the monetary value of all finished goods and services produced within a country’s borders in a specific time period.
Debt-to-EBITDA – Net debt-to-EBITDA is a measurement of the total amount of outstanding company debt as a percentage of EBITDA. The ratio is an indicator of the company’s ability to pay its debt.
P/E LTM ratio – Price-to-earnings Last Twelve Months ratio is the ratio for valuing a company that measures its current share price relative to its per-share earnings. The trailing P/E ratio is calculated by dividing the current share price by per-share earnings over the previous 12 months and the forward P/E ratio estimates likely per-share earnings over the next 12 months.
ROCE – Return on Capital Employed is a financial ratio that can be used to assess a company’s profitability and capital efficiency. This ratio can help to understand how well a company is generating profits from its capital as it is put to use.
ROIC – Return on Invested Capital is a calculation used to assess a company’s efficiency at allocating the capital under its control to profitable investments. The return on invested capital measure gives a sense of how well a company is using its money to generate returns.
Stagflation is characterized by slow economic growth and relatively high unemployment which is at the same time accompanied by rising prices (i.e. inflation).
Standard Deviation is a statistic that measure the dispersion of a dataset relative to its mean and is calculated as the square root of the variance.
Reference definitions found at Investopedia.com
Distributed by Foreside Financial Services, LLC, Three Canal Plaza, Suite 100, Portland, ME 04101
ADDITIONAL INFORMATION (Unaudited)
For additional information about the Directors and Officers or for a description of the policies and procedures that the Funds use to determine how to vote proxies relating to portfolio securities, please review the Statement of Additional Information. You may call (800) 811-5311 and request a Statement of Additional Information, and it will be mailed to you free of charge. The Statement of Additional Information is also available on the website of the Securities and Exchange Commission (the “Commission”) at http://www.sec.gov. Information on how each of the Funds voted proxies relating to portfolio securities during the most recent 12-month period ended June 30 is available on the Funds’ website at http://www.fmifunds.com or the website of the Commission no later than August 31 for the prior 12 months ended June 30. The Funds file their complete schedules of portfolio holdings with the Commission for the first and third quarters of each fiscal year as exhibits to their reports on Form N-PORT. The Funds’ Form N-PORT reports are available on the Commission’s website provided above.
81
| FMI Large Cap Fund | FMI Common Stock Fund | FMI International Fund | FMI International Fund II – |
| Currency Unhedged |
100 East Wisconsin Avenue, Suite 2200
Milwaukee, Wisconsin 53202
www.fmifunds.com
414-226-4555
BOARD OF DIRECTORS
ROBERT C. ARZBAECHER | REBECCA W. HOUSE | ||
JOHN S. BRANDSER | PAUL S. SHAIN | ||
LAWRENCE J. BURNETT | ROBERT J. VENABLE | ||
PATRICK J. ENGLISH |
INVESTMENT ADVISER
FIDUCIARY MANAGEMENT, INC.
100 East Wisconsin Avenue, Suite 2200
Milwaukee, Wisconsin 53202
ADMINISTRATOR, ACCOUNTANT, TRANSFER
AGENT AND DIVIDEND DISBURSING AGENT
U.S. BANCORP FUND SERVICES, LLC
615 East Michigan Street
Milwaukee, Wisconsin 53202
800-811-5311 or 414-765-4124
| CUSTODIAN | INDEPENDENT REGISTERED |
| U.S. BANK, N.A. | PUBLIC ACCOUNTING FIRM |
| Milwaukee, Wisconsin | COHEN & COMPANY, LTD. |
| Milwaukee, Wisconsin | |
| DISTRIBUTOR | LEGAL COUNSEL |
| FORESIDE FINANCIAL SERVICES, LLC | FOLEY & LARDNER LLP |
| Portland, Maine | Milwaukee, Wisconsin |
| |
FMI Funds, Inc. | |
1-800-811-5311 | |
| www.fmifunds.com | |
| (b) | Not applicable. |
Item 2. Code of Ethics.
Not applicable for semi-annual reports.
Item 3. Audit Committee Financial Expert.
Not applicable for semi-annual reports.
Item 4. Principal Accountant Fees and Services.
Not applicable for semi-annual reports.
Item 5. Audit Committee of Listed Registrants.
Not applicable to registrants who are not listed issuers (as defined in Rule 10A-3 under the Securities Exchange Act of 1934).
Item 6. Investments.
(a) | Schedule of Investments is included as part of the report to shareholders filed under Item 1 of this Form. |
(b) | Not applicable. |
Item 7. Disclosure of Proxy Voting Policies and Procedures for Closed-End Management Investment Companies.
Not applicable to open-end investment companies.
Item 8. Portfolio Managers of Closed-End Management Investment Companies.
Not applicable to open-end investment companies.
Item 9. Purchases of Equity Securities by Closed‑End Management Investment Company and Affiliated Purchasers.
Not applicable to open-end investment companies.
Item 10. Submission of Matters to a Vote of Security Holders.
Not applicable.
Item 11. Controls and Procedures.
(a) | The Registrant’s principal executive and principal financial officers have concluded that the Registrant’s disclosure controls and procedures are effective, as of a date within 90 days of the filing of this report, based on their evaluation of the Registrant’s disclosure controls and procedures. |
(b) | There were no changes in the Registrant's internal control over financial reporting (as defined in Rule 30a-3(d) under the Act) that occurred during the period covered by this report that have materially affected, or are reasonably likely to materially affect, the Registrant's internal control over financial reporting. |
Item 12. Disclosure of Securities Lending Activities for Closed-End Management Investment Companies
Not applicable to open-end investment companies.
Item 13. Exhibits.
(a) | (1) Any code of ethics or amendment thereto, that is the subject of the disclosure required by Item 2, to the extent that the registrant intends to satisfy Item 2 requirements through filing an exhibit. Not Applicable |
(3) Any written solicitation to purchase securities under Rule 23c‑1 under the Act sent or given during the period covered by the report by or on behalf of the registrant to 10 or more persons. Not applicable to open-end investment companies.
(4) Change in the registrant’s independent public accountant. There was no change in the registrant’s independent public accountant for the period covered by this report.
SIGNATURES
Pursuant to the requirements of the Securities Exchange Act of 1934 and the Investment Company Act of 1940, the registrant has duly caused this report to be signed on its behalf by the undersigned, thereunto duly authorized.
(Registrant) FMI Funds, Inc.
By /s/John S. Brandser
John S. Brandser, President/Principal Executive Officer
Date May 5, 2022
Pursuant to the requirements of the Securities Exchange Act of 1934 and the Investment Company Act of 1940, this report has been signed below by the following persons on behalf of the registrant and in the capacities and on the dates indicated.
By /s/John S. Brandser
John S. Brandser, President/Principal Executive Officer
Date May 5, 2022
By /s/John S. Brandser
John S. Brandser, Treasurer/Principal Financial Officer
Date May 5, 2022